nearshore distribution of heavy metals in the albanian part of lake ohrid
TRANSCRIPT
Environ Monit Assess (2012) 184:1823–1839DOI 10.1007/s10661-011-2081-z
Near-shore distribution of heavy metals in the Albanianpart of Lake Ohrid
Egina Malaj · Diederik P. L. Rousseau ·Gijs Du Laing · Piet N. L. Lens
Received: 10 November 2010 / Accepted: 11 April 2011 / Published online: 4 May 2011© Springer Science+Business Media B.V. 2011
Abstract The heavy metal contamination in LakeOhrid, a lake shared between Albania andMacedonia, was studied. Lake Ohrid is believedto be one of the oldest lakes in the world, with alarge variety of endemic species. Different anthro-pogenic pressures, especially heavy metal influxesfrom mining activities, might have influenced thefragile equilibrium of the lake ecosystem. Heavymetal concentrations in water, sediment, emer-gent vegetation, and fish were investigated at se-lected sites of the lake and a study of the heavymetals in five tributaries was conducted. The lakesurface water was found to have low levels ofheavy metals, but sediments contained very high
E. Malaj · D. P. L. Rousseau (B) · P. N. L. LensDepartment of Environmental Resources,UNESCO-IHE Institute for Water Education,P.O. Box 3015, 2601DA, Delft, The Netherlandse-mail: [email protected]
G. Du LaingLaboratory of Analytical Chemistry and AppliedEcochemistry, Faculty of Bioscience Engineering,Ghent University, Coupure Links 653,B-9000, Ghent, Belgium
Present Address:E. MalajDepartment of Effect-Directed Analysis,UFZ-Helmholtz Centre for Environmental Research,Permoserstrasse 15, 04318, Leipzig, Germany
levels mostly near river mouths and mineral dumpareas with concentrations reaching 1,501 mg/kgfor Ni, 576 mg/kg for Cr, 116.8 mg/kg for Co and64.8 g/kg for Fe. Sequential extraction of metalsdemonstrates that heavy metals in the sedimentare mainly present in the residual fraction vary-ing from 75% to 95% in different sites. Highheavy metal levels (400 mg/kg Ni, 89 mg/kg Cr,and 39 mg/kg Co) were found in plants (stem ofPhragmites australis), but heavy metals could notbe detected in fish tissue (gill, muscle, and liver ofSalmo letnica and Salmothymus ohridanus).
Keywords Heavy metal pollution · Lake Ohrid ·Mining · Sequential extraction
Introduction
Heavy metals are natural components found in theearth’s crust deriving from geological weatheringof rocks. It is expected that in areas characterizedby metal-bearing formations, these elements willalso occur in elevated levels in water and bottomsediment of lakes (Förstner and Wittmann 1983).Once they enter in the aquatic environment,heavy metals are distributed among the aque-ous phase, suspended particles, and sediments(Pertsemli and Voutsa 2007). Analyzing the totalconcentrations in the sediment can give generalinformation on the amount of heavy metals
1824 Environ Monit Assess (2012) 184:1823–1839
in the system, but does not account for theirpotential mobility or toxicity to aquatic organisms(Tokalioglu et al. 2000). Several authors (Tessieret al. 1979; Förstner and Wittmann 1983; Kiratliand Ergin 1996) studying the sediments ofwater systems have related the boundingcharacteristics of heavy metals to four majorprocesses: (a) adsorption (b) reduction/co-precipitation with iron and manganese oxides,(c) oxidation/complexation by organic matter,and (d) incorporation into crystalline minerals. Inorder to explain the mobility/immobility of heavymetals, quantifying these phases is important. Forinstance, the presence of organic matter can altermetal availability depending on the molecularweight of organic matter (Du Laing et al. 2009a).Furthermore, heavy metals can change theirmobility depending on the presence of Fe andMn oxides due to their ability to co-precipitateor adsorb to these oxides (Du Laing et al.2009a). Other studies (Förstner and Wittmann1983; Pardo et al. 1990; Tessier et al. 1979)demonstrated that binding in the mineral fractionis related with relatively unpolluted sedimentsand that the metals cannot be remobilized whenthey are attached to the mineral fraction. Thisis due to the fact that the residual solids containmainly primary and secondary minerals, whichocclude the trace metals within their crystalstructures (Tokalioglu et al. 2000).
One of the input sources of heavy metals inlakes can be attributed to direct transporters ofpollution such as tributaries. A study conducted inLake Balaton, Hungary, showed that heavy metalsin bottom sediments and in suspended particulatematter in the lake correlated very well with thosefound in the Zala River (Nguyen et al. 2005).Furthermore, the existence of hot spots near thelakes, such as dump sites, can exert importantpressure on the aquatic environment through di-rect runoff or transportation by wind.
Our study focused on Lake Ohrid, a transboundary lake shared between Albania andMacedonia. Extensive studies have been done inthe lake with regards to its biology, particularly itsendemism (Popovska and Bonacci 2007; Albrechtet al. 2006; Albrecht and Wilke 2008), eutrophica-tion (Matzinger et al. 2006, 2007), and its uniquehydrological system (Amataj et al. 2007; Popovska
and Bonacci 2007). In contrast there is a lackof research, monitoring programs, or informationregarding heavy metal pollution. However, fewauthors (Vogel et al. 2010; Watzin et al. 2002)acknowledge heavy metals as a threat to biodi-versity of Lake Ohrid. The natural occurrencein the Albanian part of the lake of minerals inthe form of ferrochromium (FeCr), ferronickel(FeNi), chromites (FeCr2O4) and coal deposits,made the region suitable for metal mining andprocessing. Closure of the mine sites in the earlynineties left behind piles of waste near the gal-leries and several ore dump sites near the shore ofthe lake. Lack of proper identification of these hotspots, deficiency in studies regarding distributionof heavy metals, the proximity of contaminated ar-eas, and improper storage and management of theopen pits or tailings dumps were the main driversfor conducting this research. A detailed monitor-ing program was conducted in order to identify thelevel, distribution and potential sources of heavymetal pollution in the lake, and also to assess po-tential accumulation of heavy metals in the biotaof the lake.
Materials and methods
Study area
Lake Ohrid is located on the Balkan Peninsulain southeastern Europe. Formed in the tertiaryperiod between 3.5 and 4 million years ago,Lake Ohrid is considered as one of the oldestlakes in the world (Popovska and Bonacci 2007),with numerous freshwater organisms whose closerelatives can be found only as fossil remains(Spirkovski et al. 2001). Ten of the 17 identifiedfish species of Lake Ohrid are endemic, as aremany of the lake’s snails, worms, and sponges(Watzin et al. 2002). Lake Ohrid receives its wa-ter from both surface and underground waterflow from the Lake Prespa system (Popovska andBonacci 2007). The only outflow of Lake Ohridis the Black Drin River, which leaves from thenorth of the lake towards the Adriatic Sea andaccounts for 63% of the water loss of the lake(Watzin et al. 2002). Because of its unique hy-drological system and ecological value, UNESCO
Environ Monit Assess (2012) 184:1823–1839 1825
declared the Macedonian side of Lake Ohrid as a“site of cultural and natural values of the globalpatrimony” (UNESCO 1979).
Lake Ohrid is an oligotrophic ecosystem(Matzinger et al. 2006; Spirkovski et al. 2001), butit was recently proven to go through the processof eutrophication (Matzinger et al. 2007). Furtherproblems related with human activity are exten-sive use of fertilizers and pesticides, overfishing,habitat destruction, extinction of endemic speciesand introduction of invasive species, destructionof reed belts, and lack of enforcement of the exist-ing laws on lake preservation. Another importantpressure on Lake Ohrid, originating mainly fromthe Albanian part, is heavy metal pollution as aresult of former mining activities in the lake wa-tershed. Several Fe–Ni and Cr mines are locatedclose to the lake (2.5 km), whereas four other coalmines (Alarup, Petrush, Verdove, and Dardhas)can be found within a distance of 10 km from thelake shore (Watzin et al. 2002).
Sampling sites
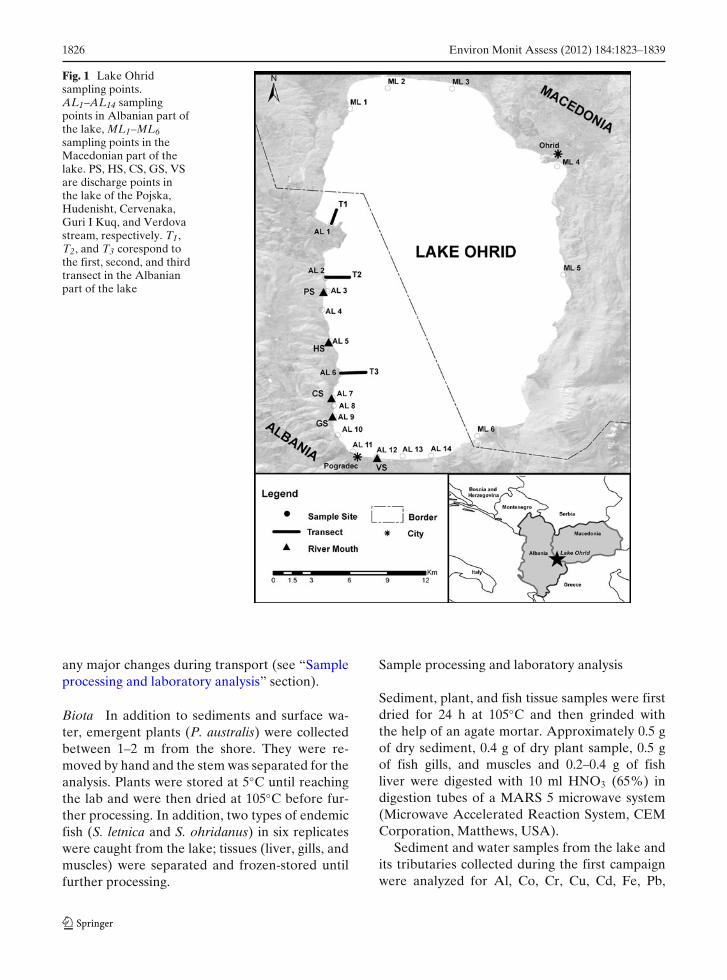
Two monitoring campaigns were carried out inOctober and December 2009, respectively, to as-sess the impact of heavy metals in the lake. DuringOctober 2009, samples of surface water and sedi-ment at 20 sites were collected; 14 samples in theAlbanian part and 6 samples in the Macedonianpart of the lake. The locations of sampling sites arepresented in Fig. 1. At ML1, sediment samplingwas not possible due to coverage of the bottomsediment with plants. In addition, surface waterand sediment of five streams were sampled, eitherbefore, after, and/or at the discharge point in thelake; details are given in Table 1/a. Note that Fig. 1includes only the discharge points of the streams,because the scale does not permit to include thesampling points, detailed in Table 1/a.
After processing the results from the first sam-pling campaign, three sites were selected for asecond sampling campaign in December 2009 andtransects (T1, T2, T3) were defined moving fromthese sampling points into the lake perpendicularto its shoreline (Table 1/b). Along these transects,sediment samples were collected at 1–2-, 5-, 10-,20-, and 30-m distances below the water surfaceof the lake. Water samples were not collected
because lake water was not found to be contam-inated with heavy metals in the first measurementcampaign (see the section “Lake Ohrid waterquality”). Emergent plants (Phragmites australis)from the shore, as well as two types of endemicfish (Salmo letnica and Salmothymus ohridanus)were also collected.
Sample collection and preservation
Water Surface water samples from the lake andstreams were collected and preserved in poly-ethylene (PE) bottles previously rinsed with weakacid. Three replicates were taken from each sam-pling location within an area of 30–60 m2. Nitricacid (65%) was added until pH dropped to avalue of 2 (APHA 2005). A pH meter (WTW-330), dissolved oxygen (DO) meter (WTW-340),and electrical conductivity (EC) meter (WTW-340) were used to measure, respectively, pH, DO,and EC in the surface water (top layer).
Sediment samples for total metal analysis Ap-proximately 500 g of sediment from each samplinglocation was collected with the help of an Eckmangrab sampler for the lake samples and with ashovel for the stream samples. Three replicateswere taken from each sampling site, within an areaof 30–60 m2 and preserved in PE bags. These werestored at 5◦C until reaching the lab and then driedat 105◦C before further processing.
Sediment samples for sequential extraction of met-als With the help of the Eckman grab sampler,anoxic sediment (300 g) was sampled in threereplicates, by carefully removing the top layer(mostly covered with plants and bivalves) andcollecting the sample from the middle of thesediment profile. The color of the sediment wasblack to gray, indicating anoxic conditions. Im-mediately, the sample was placed in PE bags androlled in order to avoid bubbles of air in thebag, then placed in vacuum sealed bags. Air waspumped out with the help of a suction device.Vacuum sealing helped to prevent oxidation ofthe samples inside the bags. Because of transport,these samples could only be analyzed 14 daysafter collection of the sediment. A quality con-trol experiment was therefore set up to rule out
1826 Environ Monit Assess (2012) 184:1823–1839
Fig. 1 Lake Ohridsampling points.AL1–AL14 samplingpoints in Albanian part ofthe lake, ML1–ML6sampling points in theMacedonian part of thelake. PS, HS, CS, GS, VSare discharge points inthe lake of the Pojska,Hudenisht, Cervenaka,Guri I Kuq, and Verdovastream, respectively. T1,T2, and T3 corespond tothe first, second, and thirdtransect in the Albanianpart of the lake
any major changes during transport (see “Sampleprocessing and laboratory analysis” section).
Biota In addition to sediments and surface wa-ter, emergent plants (P. australis) were collectedbetween 1–2 m from the shore. They were re-moved by hand and the stem was separated for theanalysis. Plants were stored at 5◦C until reachingthe lab and were then dried at 105◦C before fur-ther processing. In addition, two types of endemicfish (S. letnica and S. ohridanus) in six replicateswere caught from the lake; tissues (liver, gills, andmuscles) were separated and frozen-stored untilfurther processing.
Sample processing and laboratory analysis
Sediment, plant, and fish tissue samples were firstdried for 24 h at 105◦C and then grinded withthe help of an agate mortar. Approximately 0.5 gof dry sediment, 0.4 g of dry plant sample, 0.5 gof fish gills, and muscles and 0.2–0.4 g of fishliver were digested with 10 ml HNO3 (65%) indigestion tubes of a MARS 5 microwave system(Microwave Accelerated Reaction System, CEMCorporation, Matthews, USA).
Sediment and water samples from the lake andits tributaries collected during the first campaignwere analyzed for Al, Co, Cr, Cu, Cd, Fe, Pb,
Environ Monit Assess (2012) 184:1823–1839 1827
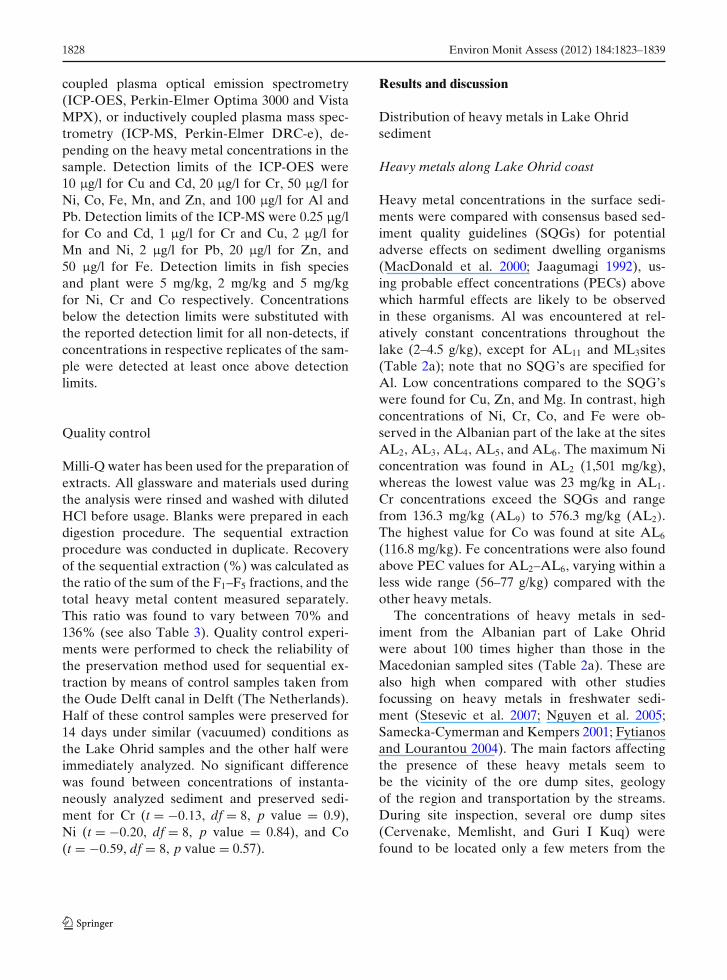
Table 1 a Stream sampling sites. PS, HS, CS, VS, GS are the Pojska, Hudenisht, Cervenaka, Verdova and Guri I Kuqstream, respectively; b transects sampling points
Site name Coordinates Site description
North East
aPS 41◦ 01′ 9.40′′ 20◦ 38′ 3.14′′ Waters from Pojska Cr galleries, close to the outletHS 40◦ 58′ 45.72′′ 20◦ 38′ 13.55′′ Hudenisht Fe–Ni dump site, close to the outletCS1 40◦ 56′ 35.96′′ 20◦ 38′ 18.58′′ Before Cervenaka Fe–Ni dump siteCS2 40◦ 56′ 19.48′′ 20◦ 38′ 22.12′′ After Cr dump site, before it reaches Cervenaka Fe–Ni dump siteCS3 40◦ 56′ 38.59′′ 20◦ 38′ 23.59′′ After Cervenaka Fe–Ni dump site close to the outlet in the lakeVS1 40◦ 54′ 5.6′′ 20◦ 40′ 20.45′′ Outlet in the lakeVS2 40◦ 52′ 25.12′′ 20◦ 36′ 53.46′′ Before the coal stock sitesVS3 40◦ 52′ 25.37′′ 20◦ 36′ 53.24′′ Nearby coal stock siteVS4 40◦ 52′ 36.25′′ 20◦ 36′ 27.11′′ Nearby coal stock siteGS1 40◦ 55′ 49.59′′ 20◦ 38′ 9.36′′ Before the enrichment plant and the Fe–Ni dump siteGS2 40◦ 55′ 51.39′′ 20◦ 38′ 26.20′′ After the enrichment plant and the Fe–Ni dump site, close to the outlet
bT1 41◦ 4′ 4.37′′ 20◦ 38′ 23.27′′ 1 m below the water surface
41◦ 4′ 20.60′′ 20◦ 38′ 20.13′′ 5 m below the water surface41◦ 4′ 24.43′′ 20◦ 38′ 23.38′′ 10 m below the water surface41◦ 4′ 24.58′′ 20◦ 38′ 26.60′′ 20 m below the water surface41◦ 4′ 25.41′′ 20◦ 38′ 31.12′′ 30 m below the water surface
T2 41◦ 1′ 51.29′′ 20◦ 38′ 7.26′′ 2 m below the water surface41◦ 1′ 50.28′′ 20◦ 38′ 10.30′′ 5 m below the water surface41◦ 1′ 52.33′′ 20◦ 38′ 15.14′′ 10 m below the water surface41◦ 1′ 52.12′′ 20◦ 38′ 16.12′′ 20 m below the water surface41◦ 1′ 53.13′′ 20◦ 38′ 17.96′′ 30 m below the water surface
T3 40◦ 57′ 40.26′′ 20◦ 38′ 48.72′′ 2 m below the water surface40◦ 57′ 43.30′′ 20◦ 38′ 48.25′′ 5 m below the water surface40◦ 57′ 43.26′′ 20◦ 38′ 55.37′′ 10 m below the water surface40◦ 57′ 39.54′′ 20◦ 38′ 58.48′′ 20 m below the water surface40◦ 57′ 42.14′′ 20◦ 39′ 0.11′′ 30 m below the water surface
Mn, Ni, and Zn, in order to determine the mostproblematic heavy metals in the lake and identifythe most polluted sites. Subsequently, Cr, Co, andNi were analyzed in extracts of the sequentialextraction of sediments, plants, and fish samplesfrom the second sampling campaign. Transect sed-iment samples were analyzed for total Cr, Co, Ni,Fe, and Mn.
Loss on ignition (LOI) was also determinedon the sediment samples from the defined laketransects. Pre-weighed sediment samples, dried at105◦C, were placed in aluminum cups, and com-busted at 520◦C in a furnace for 4 h. The weightloss on ignition gives a rough approximation ofthe amount of organic matter present in the solidfraction of the sediment (APHA 2005).
A five-step sequential extraction procedurefrom Tessier et al. (1979), modified by Kelderman
and Osman (2007), was conducted on all freshsediment samples to fractionate the heavy metalsinto different binding fractions. These fractions in-cluded: (F1) the exchangeable fraction, extractedusing 1 M MgCl2; (F2) the fraction bound to car-bonates, extracted using 1 M NaOAc; (F3) thefraction associated with Fe–Mn oxides, extractedby 0.04 M NH2OH.HCl in 25% HOAc; (F4) thefraction associated with organic matter, releasedby oxidation with H2O2 (30%) and with the helpof 3.2 M NH4OAc in 20% HNO3, and finally(F5) the residual fraction, determined by digestionusing 65% HNO3 in a MARS 5 microwave system.Analysis of F1 and F2 fractions was done in a glovebox, flushed with nitrogen in order to maintainanoxic conditions.
Total heavy metal contents in extracts andwater samples were analysed using inductively
1828 Environ Monit Assess (2012) 184:1823–1839
coupled plasma optical emission spectrometry(ICP-OES, Perkin-Elmer Optima 3000 and VistaMPX), or inductively coupled plasma mass spec-trometry (ICP-MS, Perkin-Elmer DRC-e), de-pending on the heavy metal concentrations in thesample. Detection limits of the ICP-OES were10 μg/l for Cu and Cd, 20 μg/l for Cr, 50 μg/l forNi, Co, Fe, Mn, and Zn, and 100 μg/l for Al andPb. Detection limits of the ICP-MS were 0.25 μg/lfor Co and Cd, 1 μg/l for Cr and Cu, 2 μg/l forMn and Ni, 2 μg/l for Pb, 20 μg/l for Zn, and50 μg/l for Fe. Detection limits in fish speciesand plant were 5 mg/kg, 2 mg/kg and 5 mg/kgfor Ni, Cr and Co respectively. Concentrationsbelow the detection limits were substituted withthe reported detection limit for all non-detects, ifconcentrations in respective replicates of the sam-ple were detected at least once above detectionlimits.
Quality control
Milli-Q water has been used for the preparation ofextracts. All glassware and materials used duringthe analysis were rinsed and washed with dilutedHCl before usage. Blanks were prepared in eachdigestion procedure. The sequential extractionprocedure was conducted in duplicate. Recoveryof the sequential extraction (%) was calculated asthe ratio of the sum of the F1–F5 fractions, and thetotal heavy metal content measured separately.This ratio was found to vary between 70% and136% (see also Table 3). Quality control experi-ments were performed to check the reliability ofthe preservation method used for sequential ex-traction by means of control samples taken fromthe Oude Delft canal in Delft (The Netherlands).Half of these control samples were preserved for14 days under similar (vacuumed) conditions asthe Lake Ohrid samples and the other half wereimmediately analyzed. No significant differencewas found between concentrations of instanta-neously analyzed sediment and preserved sedi-ment for Cr (t = −0.13, df = 8, p value = 0.9),Ni (t = −0.20, df = 8, p value = 0.84), and Co(t = −0.59, df = 8, p value = 0.57).
Results and discussion
Distribution of heavy metals in Lake Ohridsediment
Heavy metals along Lake Ohrid coast
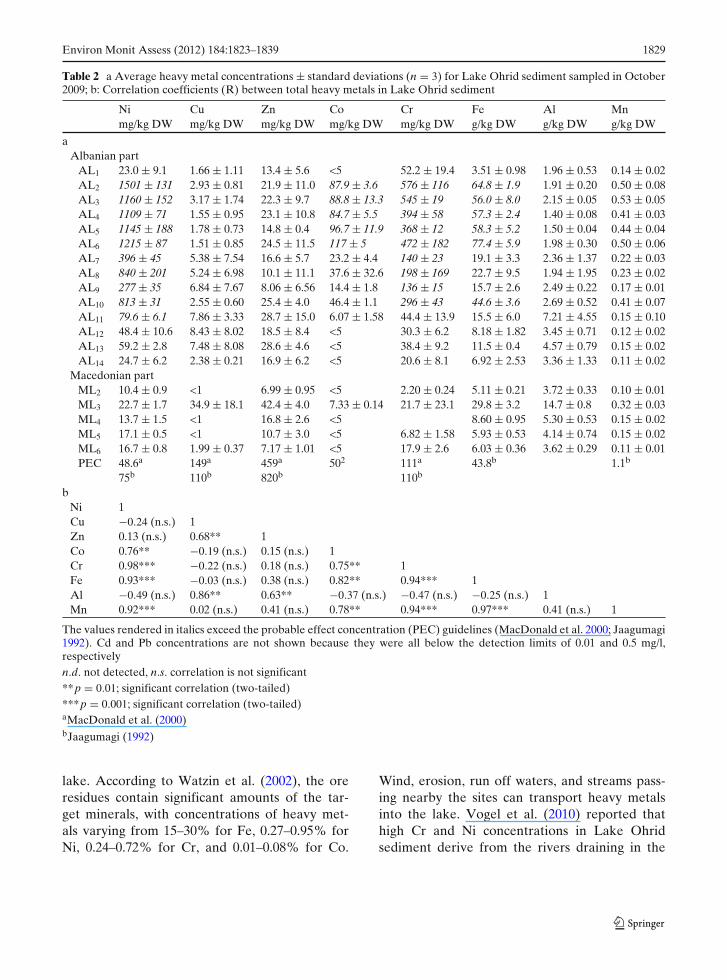
Heavy metal concentrations in the surface sedi-ments were compared with consensus based sed-iment quality guidelines (SQGs) for potentialadverse effects on sediment dwelling organisms(MacDonald et al. 2000; Jaagumagi 1992), us-ing probable effect concentrations (PECs) abovewhich harmful effects are likely to be observedin these organisms. Al was encountered at rel-atively constant concentrations throughout thelake (2–4.5 g/kg), except for AL11 and ML3sites(Table 2a); note that no SQG’s are specified forAl. Low concentrations compared to the SQG’swere found for Cu, Zn, and Mg. In contrast, highconcentrations of Ni, Cr, Co, and Fe were ob-served in the Albanian part of the lake at the sitesAL2, AL3, AL4, AL5, and AL6. The maximum Niconcentration was found in AL2 (1,501 mg/kg),whereas the lowest value was 23 mg/kg in AL1.Cr concentrations exceed the SQGs and rangefrom 136.3 mg/kg (AL9) to 576.3 mg/kg (AL2).The highest value for Co was found at site AL6
(116.8 mg/kg). Fe concentrations were also foundabove PEC values for AL2–AL6, varying within aless wide range (56–77 g/kg) compared with theother heavy metals.
The concentrations of heavy metals in sed-iment from the Albanian part of Lake Ohridwere about 100 times higher than those in theMacedonian sampled sites (Table 2a). These arealso high when compared with other studiesfocussing on heavy metals in freshwater sedi-ment (Stesevic et al. 2007; Nguyen et al. 2005;Samecka-Cymerman and Kempers 2001; Fytianosand Lourantou 2004). The main factors affectingthe presence of these heavy metals seem tobe the vicinity of the ore dump sites, geologyof the region and transportation by the streams.During site inspection, several ore dump sites(Cervenake, Memlisht, and Guri I Kuq) werefound to be located only a few meters from the
Environ Monit Assess (2012) 184:1823–1839 1829
Table 2 a Average heavy metal concentrations ± standard deviations (n = 3) for Lake Ohrid sediment sampled in October2009; b: Correlation coefficients (R) between total heavy metals in Lake Ohrid sediment
Ni Cu Zn Co Cr Fe Al Mnmg/kg DW mg/kg DW mg/kg DW mg/kg DW mg/kg DW g/kg DW g/kg DW g/kg DW
aAlbanian part
AL1 23.0 ± 9.1 1.66 ± 1.11 13.4 ± 5.6 <5 52.2 ± 19.4 3.51 ± 0.98 1.96 ± 0.53 0.14 ± 0.02AL2 1501 ± 131 2.93 ± 0.81 21.9 ± 11.0 87.9 ± 3.6 576 ± 116 64.8 ± 1.9 1.91 ± 0.20 0.50 ± 0.08AL3 1160 ± 152 3.17 ± 1.74 22.3 ± 9.7 88.8 ± 13.3 545 ± 19 56.0 ± 8.0 2.15 ± 0.05 0.53 ± 0.05AL4 1109 ± 71 1.55 ± 0.95 23.1 ± 10.8 84.7 ± 5.5 394 ± 58 57.3 ± 2.4 1.40 ± 0.08 0.41 ± 0.03AL5 1145 ± 188 1.78 ± 0.73 14.8 ± 0.4 96.7 ± 11.9 368 ± 12 58.3 ± 5.2 1.50 ± 0.04 0.44 ± 0.04AL6 1215 ± 87 1.51 ± 0.85 24.5 ± 11.5 117 ± 5 472 ± 182 77.4 ± 5.9 1.98 ± 0.30 0.50 ± 0.06AL7 396 ± 45 5.38 ± 7.54 16.6 ± 5.7 23.2 ± 4.4 140 ± 23 19.1 ± 3.3 2.36 ± 1.37 0.22 ± 0.03AL8 840 ± 201 5.24 ± 6.98 10.1 ± 11.1 37.6 ± 32.6 198 ± 169 22.7 ± 9.5 1.94 ± 1.95 0.23 ± 0.02AL9 277 ± 35 6.84 ± 7.67 8.06 ± 6.56 14.4 ± 1.8 136 ± 15 15.7 ± 2.6 2.49 ± 0.22 0.17 ± 0.01AL10 813 ± 31 2.55 ± 0.60 25.4 ± 4.0 46.4 ± 1.1 296 ± 43 44.6 ± 3.6 2.69 ± 0.52 0.41 ± 0.07AL11 79.6 ± 6.1 7.86 ± 3.33 28.7 ± 15.0 6.07 ± 1.58 44.4 ± 13.9 15.5 ± 6.0 7.21 ± 4.55 0.15 ± 0.10AL12 48.4 ± 10.6 8.43 ± 8.02 18.5 ± 8.4 <5 30.3 ± 6.2 8.18 ± 1.82 3.45 ± 0.71 0.12 ± 0.02AL13 59.2 ± 2.8 7.48 ± 8.08 28.6 ± 4.6 <5 38.4 ± 9.2 11.5 ± 0.4 4.57 ± 0.79 0.15 ± 0.02AL14 24.7 ± 6.2 2.38 ± 0.21 16.9 ± 6.2 <5 20.6 ± 8.1 6.92 ± 2.53 3.36 ± 1.33 0.11 ± 0.02
Macedonian partML2 10.4 ± 0.9 <1 6.99 ± 0.95 <5 2.20 ± 0.24 5.11 ± 0.21 3.72 ± 0.33 0.10 ± 0.01ML3 22.7 ± 1.7 34.9 ± 18.1 42.4 ± 4.0 7.33 ± 0.14 21.7 ± 23.1 29.8 ± 3.2 14.7 ± 0.8 0.32 ± 0.03ML4 13.7 ± 1.5 <1 16.8 ± 2.6 <5 8.60 ± 0.95 5.30 ± 0.53 0.15 ± 0.02ML5 17.1 ± 0.5 <1 10.7 ± 3.0 <5 6.82 ± 1.58 5.93 ± 0.53 4.14 ± 0.74 0.15 ± 0.02ML6 16.7 ± 0.8 1.99 ± 0.37 7.17 ± 1.01 <5 17.9 ± 2.6 6.03 ± 0.36 3.62 ± 0.29 0.11 ± 0.01PEC 48.6a 149a 459a 502 111a 43.8b 1.1b
75b 110b 820b 110b
bNi 1Cu −0.24 (n.s.) 1Zn 0.13 (n.s.) 0.68** 1Co 0.76** −0.19 (n.s.) 0.15 (n.s.) 1Cr 0.98*** −0.22 (n.s.) 0.18 (n.s.) 0.75** 1Fe 0.93*** −0.03 (n.s.) 0.38 (n.s.) 0.82** 0.94*** 1Al −0.49 (n.s.) 0.86** 0.63** −0.37 (n.s.) −0.47 (n.s.) −0.25 (n.s.) 1Mn 0.92*** 0.02 (n.s.) 0.41 (n.s.) 0.78** 0.94*** 0.97*** 0.41 (n.s.) 1
The values rendered in italics exceed the probable effect concentration (PEC) guidelines (MacDonald et al. 2000; Jaagumagi1992). Cd and Pb concentrations are not shown because they were all below the detection limits of 0.01 and 0.5 mg/l,respectivelyn.d. not detected, n.s. correlation is not significant**p = 0.01; significant correlation (two-tailed)***p = 0.001; significant correlation (two-tailed)aMacDonald et al. (2000)bJaagumagi (1992)
lake. According to Watzin et al. (2002), the oreresidues contain significant amounts of the tar-get minerals, with concentrations of heavy met-als varying from 15–30% for Fe, 0.27–0.95% forNi, 0.24–0.72% for Cr, and 0.01–0.08% for Co.
Wind, erosion, run off waters, and streams pass-ing nearby the sites can transport heavy metalsinto the lake. Vogel et al. (2010) reported thathigh Cr and Ni concentrations in Lake Ohridsediment derive from the rivers draining in the
1830 Environ Monit Assess (2012) 184:1823–1839
southwestern part of the catchment with ultra-mafic bedrock and associated weathering crustexposures. Yücesoy and Ergin (1992) linked thepresence of Cr with weathering of ultrabasic rockslike chlorite or montmorillonite; minerals that canbe found in Lake Ohrid’s watershed (e.g., Pojskaregion (Bani et al. 2007)). In addition, Co is knownto be commonly associated with ferromagnesianminerals in mafic/ultrabasic rocks or their weath-ering products (Kiratli and Ergin 1996), which arethought to be the major terrigenous source of Coin the Lake Ohrid basin. Ni and Cr are mined inthe form of Fe alloys, which accounts for the pres-ence of Fe in the sediment. Significant correlationswere found between sediment concentrations ofNi, and Co, Cr, Fe, and Mn (Table 2b), suggestingthat these metals are mined together.
Sites like AL2, AL4 and AL6 were not directlylinked with any source of pollution (streams orore dump sites). Thus, elevated concentrations inthese sites can not be explained without takinginto account possible variations in mineralogy andinner redistribution mechanisms in the lake itself,like wind, tides and currents (Mortimer 1987; Leeet al. 1981). The velocity of water flow above thesediment affects settling of suspended particles andresuspension of already settled particles. Heavyparticles, such as sand, settle already at high flowrates, whereas lighter particles need lower flowrates to settle. The lighter particles mainly consistof clay and/or organic matter and are known toretain heavy metals. In that way, water flow affectsthe spatial variability of heavy metal accumulationwithin sediments (Du Laing et al. 2007).
Furthermore, occurrence of strong wind drivensurface currents was reported to be the main trans-portation process inducing the spatial variabilityin concentrations of heavy metals, mineral phases,and grain-size distributions of surface sedimentsof Lake Ohrid (Vogel et al. 2010). According tothese authors, wind towards the south would beexpected mainly along the western shore, where-as wind towards the north is probably equallydistributed.
Heavy metals within transects
Fluctuations in heavy metal levels were noticedin the investigated transects reaching maximal
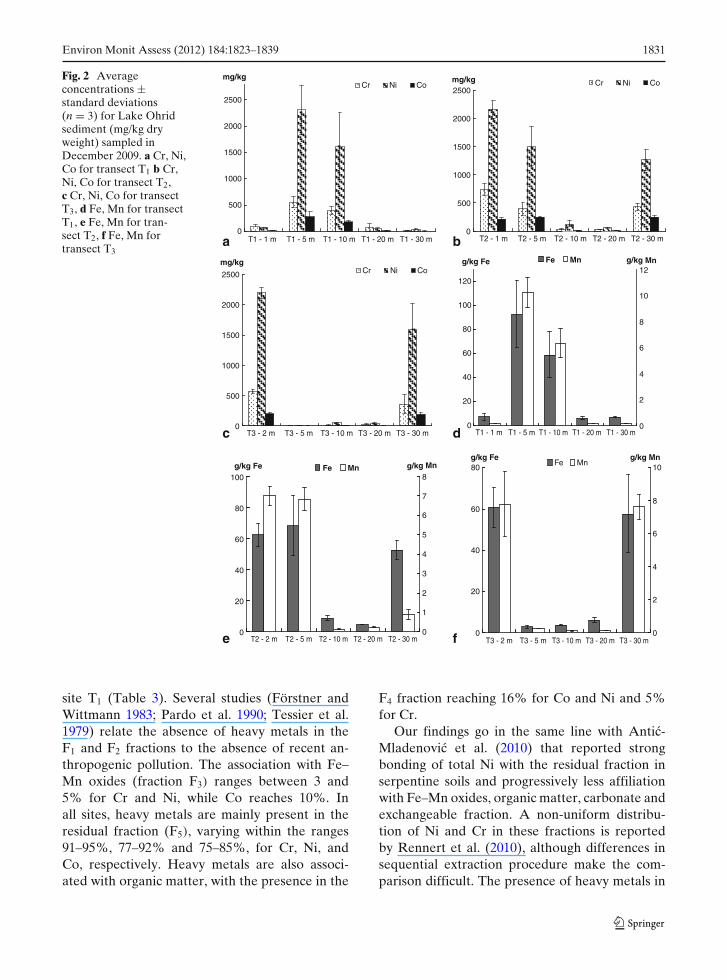
values of 735 mg/kg for Cr (T2), 2306 mg/kg forNi (T1), 281 mg/kg for Co (T1), 239 g/kg forFe (T2), and 23.6 g/kg for Mn (T2). Generallyhigher concentrations were observed in surfacesediments sampled at 1–10 m below the watersurface, although for T2 and T3 high values werealso found at 30 m. At the T1 transect, heavymetal concentrations were lower than PECs whensurface sediment samples were taken at 1, 20 and30 m below the water surface, whereas highervalues were measured at 5 and 10 m depth forall the heavy metals analyzed (Fig. 2a and d).Furthermore, concentrations in the surface sedi-ments of transect T2 were below the PECs at 10,20, and 30 m depth, with the exception of Ni at10 m which exceeds the SQG (127 mg/kg). Highervalues were observed at 2, 5, and 30 m (Fig. 2band e). In transect T3, high concentrations in thesurface sediments were measured at 2 and 30 m(Fig. 2c and f).
Generally, higher concentrations of contami-nants are expected to occur along the coast, nearthe inflow of wastewater, runoff waters, and wheredredged material has been dumped (Laane et al.1999). However, several authors (Tam and Wong1995; Gorenc et al. 2004; Förstner and Wittmann1983) have reported the presence of the so called“hot spots” in sediments of other lakes, definingthem as sites where the concentrations at differentdepths are aberrant from the expected linear de-crease of concentration with distance from theshore and depth. Transect T1 has a very gradualslope and an anticipated progressive decrease inconcentration was found. T2 and T3 transects havemuch steeper slopes, thus creating a possibility ofeasy accumulation of heavy metals, which explainsthe high concentrations at 30 m and the formationof ‘hot spots’. Finally, the same transportationfactors influencing the distribution along the shoregiven above, might also play a role in the unequaldistribution patterns of heavy metals along thesampling points of the transects.
Heavy metals in dif ferent fractions of the sediment
Cr, Ni, and Co were little associated with theexchangeable fraction (F1), and with carbonates(F2). Their presence in these fractions ranges fromless than 1% for Cr and Ni until 3% for Co at
Environ Monit Assess (2012) 184:1823–1839 1831
Fig. 2 Averageconcentrations ±standard deviations(n = 3) for Lake Ohridsediment (mg/kg dryweight) sampled inDecember 2009. a Cr, Ni,Co for transect T1 b Cr,Ni, Co for transect T2,c Cr, Ni, Co for transectT3, d Fe, Mn for transectT1, e Fe, Mn for tran-sect T2, f Fe, Mn fortransect T3
a0
500
1000
1500
2000
2500
0
500
1000
1500
2000
2500
T1 - 1 m T1 - 5 m T1 - 10 m T1 - 20 m T1 - 30 m
T1 - 1 m T1 - 5 m T1 - 10 m T1 - 20 m T1 - 30 m
T3 - 2 m T3 - 5 m T3 - 10 m T3 - 20 m T3 - 30 mT2 - 2 m T2 - 5 m T2 - 10 m T2 - 20 m T2 - 30 m
T3 - 2 m T3 - 5 m T3 - 10 m T3 - 20 m T3 - 30 m
T2 - 1 m T2 - 5 m T2 - 10 m T2 - 20 m T2 - 30 m
mg/kg
0
500
1000
1500
2000
2500
mg/kg
mg/kgCr Ni Co
b
c0
20
40
60
80
100
120
0
2
4
6
8
10
12
d
Fe Mng/kg Fe g/kg Mn
0
20
40
60
80
100
0
1
2
3
4
5
6
7
8
e
Fe Mng/kg Fe g/kg Mn
0
20
40
60
80
0
2
4
6
8
10
f
Fe Mng/kg Fe g/kg Mn
Cr Ni Co
Cr Ni Co
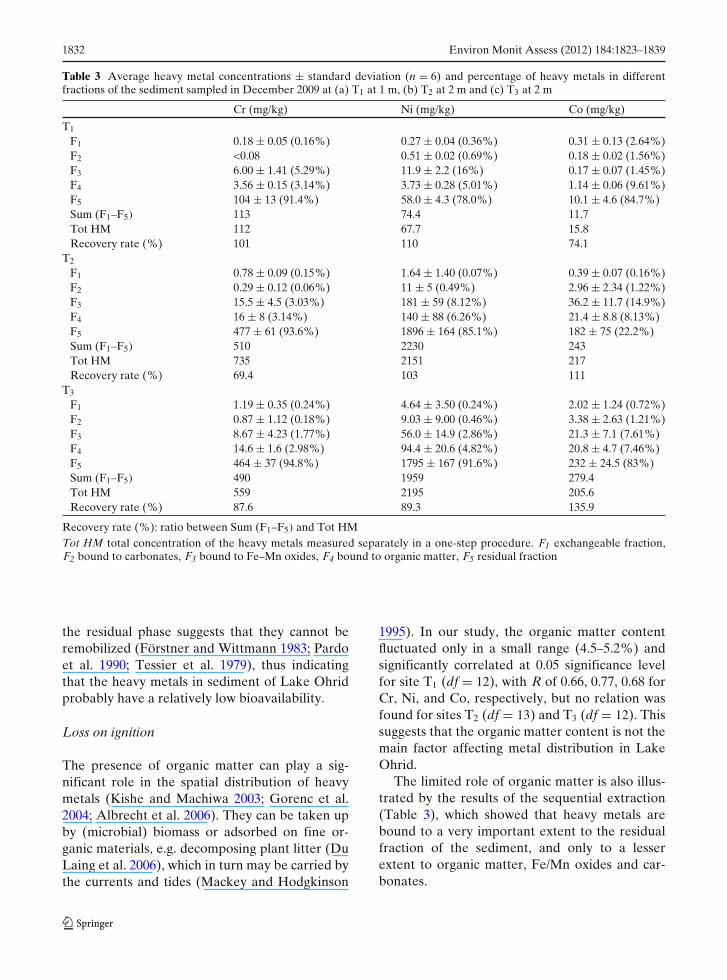
site T1 (Table 3). Several studies (Förstner andWittmann 1983; Pardo et al. 1990; Tessier et al.1979) relate the absence of heavy metals in theF1 and F2 fractions to the absence of recent an-thropogenic pollution. The association with Fe–Mn oxides (fraction F3) ranges between 3 and5% for Cr and Ni, while Co reaches 10%. Inall sites, heavy metals are mainly present in theresidual fraction (F5), varying within the ranges91–95%, 77–92% and 75–85%, for Cr, Ni, andCo, respectively. Heavy metals are also associ-ated with organic matter, with the presence in the
F4 fraction reaching 16% for Co and Ni and 5%for Cr.
Our findings go in the same line with Antic-Mladenovic et al. (2010) that reported strongbonding of total Ni with the residual fraction inserpentine soils and progressively less affiliationwith Fe–Mn oxides, organic matter, carbonate andexchangeable fraction. A non-uniform distribu-tion of Ni and Cr in these fractions is reportedby Rennert et al. (2010), although differences insequential extraction procedure make the com-parison difficult. The presence of heavy metals in
1832 Environ Monit Assess (2012) 184:1823–1839
Table 3 Average heavy metal concentrations ± standard deviation (n = 6) and percentage of heavy metals in differentfractions of the sediment sampled in December 2009 at (a) T1 at 1 m, (b) T2 at 2 m and (c) T3 at 2 m
Cr (mg/kg) Ni (mg/kg) Co (mg/kg)
T1
F1 0.18 ± 0.05 (0.16%) 0.27 ± 0.04 (0.36%) 0.31 ± 0.13 (2.64%)F2 <0.08 0.51 ± 0.02 (0.69%) 0.18 ± 0.02 (1.56%)F3 6.00 ± 1.41 (5.29%) 11.9 ± 2.2 (16%) 0.17 ± 0.07 (1.45%)F4 3.56 ± 0.15 (3.14%) 3.73 ± 0.28 (5.01%) 1.14 ± 0.06 (9.61%)F5 104 ± 13 (91.4%) 58.0 ± 4.3 (78.0%) 10.1 ± 4.6 (84.7%)Sum (F1–F5) 113 74.4 11.7Tot HM 112 67.7 15.8Recovery rate (%) 101 110 74.1
T2
F1 0.78 ± 0.09 (0.15%) 1.64 ± 1.40 (0.07%) 0.39 ± 0.07 (0.16%)F2 0.29 ± 0.12 (0.06%) 11 ± 5 (0.49%) 2.96 ± 2.34 (1.22%)F3 15.5 ± 4.5 (3.03%) 181 ± 59 (8.12%) 36.2 ± 11.7 (14.9%)F4 16 ± 8 (3.14%) 140 ± 88 (6.26%) 21.4 ± 8.8 (8.13%)F5 477 ± 61 (93.6%) 1896 ± 164 (85.1%) 182 ± 75 (22.2%)Sum (F1–F5) 510 2230 243Tot HM 735 2151 217Recovery rate (%) 69.4 103 111
T3
F1 1.19 ± 0.35 (0.24%) 4.64 ± 3.50 (0.24%) 2.02 ± 1.24 (0.72%)F2 0.87 ± 1.12 (0.18%) 9.03 ± 9.00 (0.46%) 3.38 ± 2.63 (1.21%)F3 8.67 ± 4.23 (1.77%) 56.0 ± 14.9 (2.86%) 21.3 ± 7.1 (7.61%)F4 14.6 ± 1.6 (2.98%) 94.4 ± 20.6 (4.82%) 20.8 ± 4.7 (7.46%)F5 464 ± 37 (94.8%) 1795 ± 167 (91.6%) 232 ± 24.5 (83%)Sum (F1–F5) 490 1959 279.4Tot HM 559 2195 205.6Recovery rate (%) 87.6 89.3 135.9
Recovery rate (%): ratio between Sum (F1–F5) and Tot HMTot HM total concentration of the heavy metals measured separately in a one-step procedure. F1 exchangeable fraction,F2 bound to carbonates, F3 bound to Fe–Mn oxides, F4 bound to organic matter, F5 residual fraction
the residual phase suggests that they cannot beremobilized (Förstner and Wittmann 1983; Pardoet al. 1990; Tessier et al. 1979), thus indicatingthat the heavy metals in sediment of Lake Ohridprobably have a relatively low bioavailability.
Loss on ignition
The presence of organic matter can play a sig-nificant role in the spatial distribution of heavymetals (Kishe and Machiwa 2003; Gorenc et al.2004; Albrecht et al. 2006). They can be taken upby (microbial) biomass or adsorbed on fine or-ganic materials, e.g. decomposing plant litter (DuLaing et al. 2006), which in turn may be carried bythe currents and tides (Mackey and Hodgkinson
1995). In our study, the organic matter contentfluctuated only in a small range (4.5–5.2%) andsignificantly correlated at 0.05 significance levelfor site T1 (df = 12), with R of 0.66, 0.77, 0.68 forCr, Ni, and Co, respectively, but no relation wasfound for sites T2 (df = 13) and T3 (df = 12). Thissuggests that the organic matter content is not themain factor affecting metal distribution in LakeOhrid.
The limited role of organic matter is also illus-trated by the results of the sequential extraction(Table 3), which showed that heavy metals arebound to a very important extent to the residualfraction of the sediment, and only to a lesserextent to organic matter, Fe/Mn oxides and car-bonates.
Environ Monit Assess (2012) 184:1823–1839 1833
Total heavy metal content in the lake biota
Stems of reeds (P. australis) collected from 1–2 m depth were analyzed for total Cr, Ni and Cowhere T2 revealed the highest values (Table 4).According to Bonanno and Lo Giudice (2010),the common reed (P. australis) is influenced moreby heavy metals in the sediment than by thosepresent in the water phase; consequently, bioac-cumulation is greater when sediments are contam-inated. Table 4 also shows a proportional increaseof heavy metal content in the plants with increas-ing heavy metal contents in the sediments (T2 andT3 sites). Other authors (Di Toro et al. 1992) ar-gue that total heavy metals in the sediment can notbe used as a measure of the bioavailability as longas different sediments exhibit different degrees oftoxicity for the same total quantity of a metal.In addition, relations between concentrations ofheavy metals in soil and plants can be influencedby other factors like soil properties or vegetationcomposition (Overesch et al. 2007).
The concentrations found in the stem of P.australis in Lake Ohrid are higher when comparedwith reeds grown at other sites (Bonanno andLo Giudice 2010; Vymazal et al. 2009; Du Lainget al. 2009b), but similar to those reported byWatzin et al. (2002) in Lake Ohrid reeds. Thisis not in agreement with the fact that most met-als are incorporated in the residual fraction (F5)of the sequential extraction procedure. However,it indicates that the low concentrations in F1–F4 can still be sufficient to cause a remarkableincrement of the bioaccumulation. Indeed, highertotal Cr, Ni, and Co concentrations in transectsT2 and T3 compared to transect T1 imply notonly higher concentrations in the F5 fraction, butare also accompanied by higher concentrationsin the F1–F4 fractions (Table 3). An important
Table 4 Average concentrations (mg/kg) ± standard devi-ation (n = 6) of Cr, Ni, Co in emergent plants (Phragmitesaustralis) from Lake Ohrid transects for T1 site at 1 m, T2site at 2 m and T3 site at 2 m
Cr (mg/kg) Ni (mg/kg) Co (mg/kg)
T1 21.8 ± 10.7 55.8 ± 53.0 3.10 ± 2.79T2 88.7 ± 120.9 399 ± 592 39.0 ± 64.5T3 32.7 ± 25.7 110 ± 93 9.38 ± 5.57
factor influencing the availability of heavy metalslike Ni to plants, is pH, where lower pH values(<5.0) increase their mobility in soils (Overeschet al. 2007). Another factor increasing heavy metalbioavailability can be leaching from the mineralstructure, possibly under the influence of root–sediment interactions such as the release of oxy-gen or protons from the roots (Stoltz and Greger2002).
In contrast with the high concentrations in theplants, heavy metal concentrations were foundbelow the detection limits for both types of en-demic fish analyzed (S. ohridanus, also known asBelushka; and S. letnica, known as Koran). Mooreand Sutherland (1981) suggest that one of thereasons for little accumulation of heavy metalsin fish tissues is continuous migration of fish tothe uncontaminated parts of the lake. However,a more detailed investigation should be made re-garding the food chain of the fish to draw con-clusions. Heavy metal concentrations should bemeasured also for the species they feed on, likezooplankton, benthic invertebrates, fish larvae,freshwater prawns for S. ohridanus, or other fishsuch as bleak for S. letnica (Rakaj and Flloko1995). Furthermore, other organisms, especiallybottom feeders, can be more representative of theheavy metal transfer from sediments to the biotaof the lake.
Lake Ohrid water quality
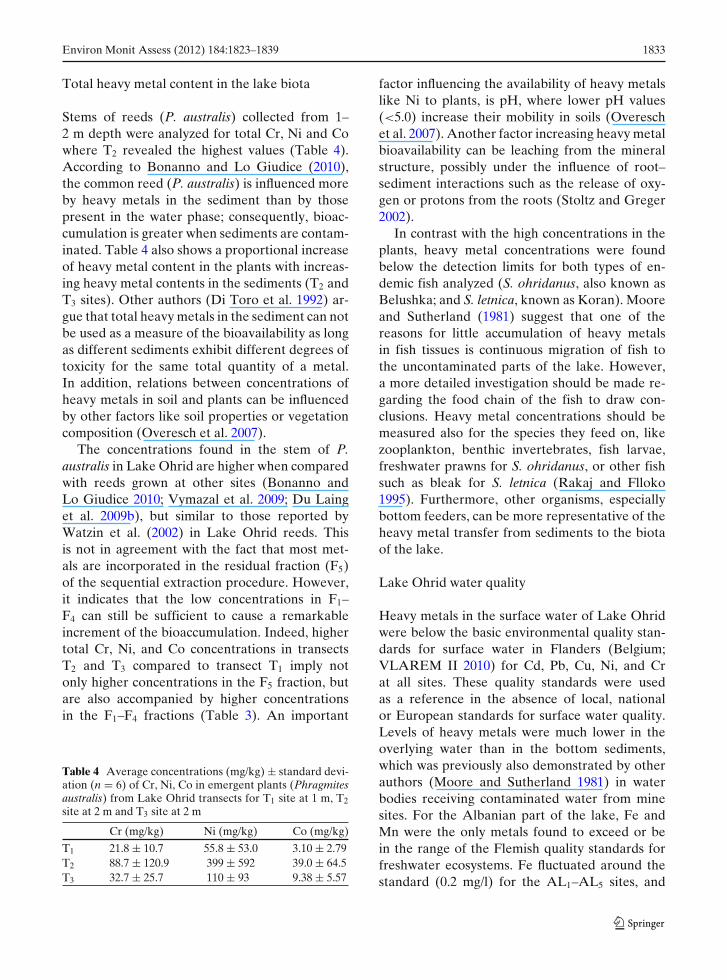
Heavy metals in the surface water of Lake Ohridwere below the basic environmental quality stan-dards for surface water in Flanders (Belgium;VLAREM II 2010) for Cd, Pb, Cu, Ni, and Crat all sites. These quality standards were usedas a reference in the absence of local, nationalor European standards for surface water quality.Levels of heavy metals were much lower in theoverlying water than in the bottom sediments,which was previously also demonstrated by otherauthors (Moore and Sutherland 1981) in waterbodies receiving contaminated water from minesites. For the Albanian part of the lake, Fe andMn were the only metals found to exceed or bein the range of the Flemish quality standards forfreshwater ecosystems. Fe fluctuated around thestandard (0.2 mg/l) for the AL1–AL5 sites, and
1834 Environ Monit Assess (2012) 184:1823–1839
was exceeding the standard for the AL12–AL14
sites (0.42–1.06 mg/l; Table 5); all other sites hadFe concentrations below the standard. However,it should be mentioned that samples were notfiltered prior to analysis and may contain someparticulate material, whereas VLAREM II (2010)specifies its standard only for dissolved Fe insteadof total Fe, i.e. after filtering the sample overa 0.45 μm filter. Mn concentrations were abovethe standard for only two sites (AL4 and AL9),but standard deviations in these cases were high,counting for high variability at these samplingsites.
Physico-chemical parameters like temperatureand EC measured in the surface water were rela-tively constant within the ranges 13.2–13.9◦C and210–285 μS/cm, respectively. DO was in the rangeof 8.4–8.9 mg/l and manifested the highest value
(9.3 mg/l) at AL14, located near the Tushemishtsprings which naturally enrich the lake with oxy-gen. Most of the samples had a pH within therange 8.6–9.2, with the exception of L10 (6.7) situ-ated near Trani stream mouth. Such small fluctua-tions in these parameters will not influence eitherthe heavy metals content in the water phase, ortheir bioavailability to the biota.
Lake Ohrid water is characterized by hightransparency (average 14 m and maximal 21.4 mof Secchi depth; Spirkovski et al. 2001; Matzingeret al. 2006), which probably counts for little par-ticulate matter in the water phase, less heavy met-als attached to the latter, and consequently lowabundance of heavy metals in this phase. Watzinet al. (2002) found much higher concentrationsof 12 mg/l of Fe, 5.3 mg/l of Ni, and 0.07 mg/lof Co in the water phase at a sampling site
Table 5 Average heavy metal concentrations ± standard deviations (n = 3) for Lake Ohrid surface water sampled inOctober 2009
Cd Pb Fe Mn Cu Ni Crμg/l μg/l mg/l μg/l μg/l μg/l μg/l
Albanian partAL1 <0.25 <2.5 0.20 ± 0.17 36.5 ± 30.3 24.1 ± 13.0 2.44 ± 0.77 <1AL2 <0.25 3.40 ± 1.08 0.34 ± 0.18 78.8 ± 80.3 38.2 ± 21.1 2.53 ± 0.47 <1AL3 0.36 ± 0.11 <2.5 0.20 ± 0.17 20.6 ± 15.3 10.5 ± 5.2 <2 <1AL4 0.52 ± 0.47 <2.5 0.21 ± 0.14 345 ± 491 11.0 ± 5.7 2.56 ± 0.98 <1AL5 <0.25 <2.5 0.24 ± 0.20 10.4 ± 32.7 8.06 ± 2.26 <2 <1AL6 <0.25 <2.5 0.09 ± 0.03 10.4 ± 11.2 4.44 ± 2.66 5.22 ± 3.01 2.11 ± 1.19AL7 <0.25 <2.5 0.15 ± 0.17 126 ± 192 6.95 ± 3.44 <2 <1AL8 <0.25 <2.5 0.15 ± 0.10 34.5 ± 43.7 17.9 ± 12.8 <2 <1AL9 <0.25 2.90 ± 0.69 0.68 ± 0.92 204 ± 340 42.4 ± 47.4 <2 <1AL10 <0.25 <2.5 <0.05 3.80 ± 1.46 5.11 ± 1.35 <2 <1AL11 <0.25 <2.5 0.11 ± 0.10 7.95 ± 6.16 13.2 ± 6.0 <2 <1AL12 <0.25 5.27 ± 4.79 0.42 ± 0.58 14.5 ± 16.6 43.3 ± 46.0 7.80 ± 6.55 1.53 ± 0.91AL13 <0.25 <2.5 1.06 ± 1.76 115 ± 195 5.47 ± 4.00 <2 <1AL14 <0.25 <2.5 0.70 ± 1.13 20.3 ± 31.6 8.95 ± 4.43 <2 <1
Macedonian partML1 <0.25 <2.5 0.05 ± 0.03 2.60 ± 0.52 23.0 ± 28.7 <2 <1ML2 <0.25 <2.5 0.07 ± 0.03 3.62 ± 0.68 25.3 ± 5.8 <2 <1ML3 <0.25 <2.5 0.16 ± 0.18 20.3 ± 27.6 18.1 ± 16.4 <2 <1ML4 <0.25 2.70 ± 0.34 0.13 ± 0.10 6.82 ± 5.59 12.9 ± 8.4 <2 2.55 ± 1.42ML5 <0.25 2.53 ± 0.05 <0.05 2.53 ± 0.91 13.2 ± 3.0 <2 2.04 ± 1.80ML6 <0.25 <2.5 <0.05 7.13 ± 8.89 8.83 ± 13.6 <2 3.81 ± 4.87
Water quality standards 1 <50 <0.2a <200 <50 <50 <50(VLAREM II 2010)
Values rendered in italics exceed the Flemish basic freshwater quality standards (VLAREM II 2010). Co, Al and Zn are notshown because they were all below the detection limits of 0.25 μg/l, 0.1 mg/l and 0.02 mg/l, respectivelyaQuality standard for dissolved Fe
Environ Monit Assess (2012) 184:1823–1839 1835
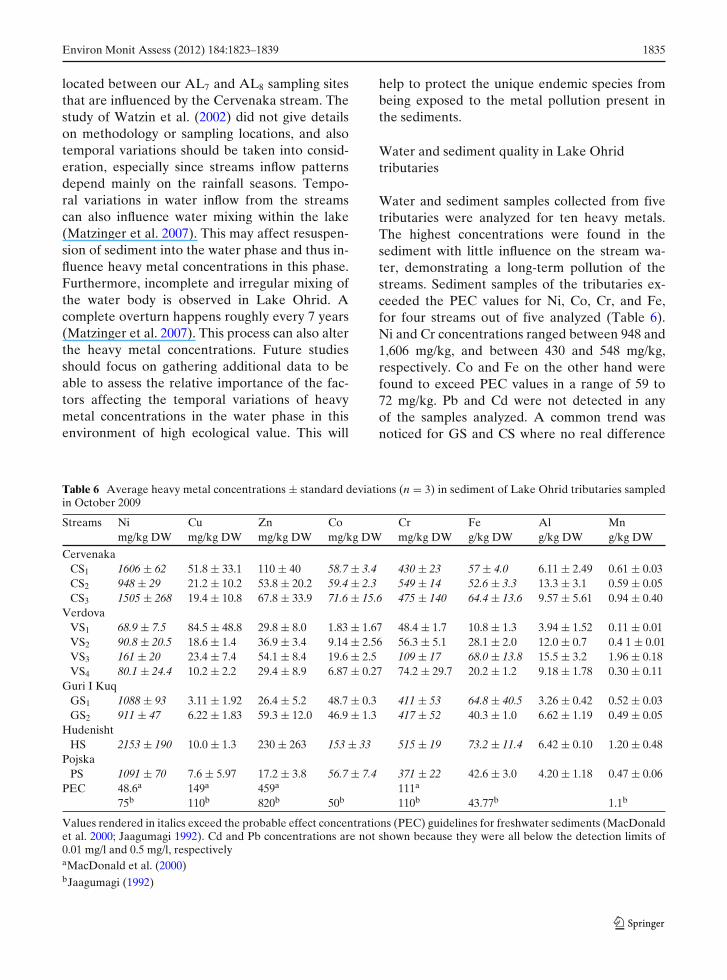
located between our AL7 and AL8 sampling sitesthat are influenced by the Cervenaka stream. Thestudy of Watzin et al. (2002) did not give detailson methodology or sampling locations, and alsotemporal variations should be taken into consid-eration, especially since streams inflow patternsdepend mainly on the rainfall seasons. Tempo-ral variations in water inflow from the streamscan also influence water mixing within the lake(Matzinger et al. 2007). This may affect resuspen-sion of sediment into the water phase and thus in-fluence heavy metal concentrations in this phase.Furthermore, incomplete and irregular mixing ofthe water body is observed in Lake Ohrid. Acomplete overturn happens roughly every 7 years(Matzinger et al. 2007). This process can also alterthe heavy metal concentrations. Future studiesshould focus on gathering additional data to beable to assess the relative importance of the fac-tors affecting the temporal variations of heavymetal concentrations in the water phase in thisenvironment of high ecological value. This will
help to protect the unique endemic species frombeing exposed to the metal pollution present inthe sediments.
Water and sediment quality in Lake Ohridtributaries
Water and sediment samples collected from fivetributaries were analyzed for ten heavy metals.The highest concentrations were found in thesediment with little influence on the stream wa-ter, demonstrating a long-term pollution of thestreams. Sediment samples of the tributaries ex-ceeded the PEC values for Ni, Co, Cr, and Fe,for four streams out of five analyzed (Table 6).Ni and Cr concentrations ranged between 948 and1,606 mg/kg, and between 430 and 548 mg/kg,respectively. Co and Fe on the other hand werefound to exceed PEC values in a range of 59 to72 mg/kg. Pb and Cd were not detected in anyof the samples analyzed. A common trend wasnoticed for GS and CS where no real difference
Table 6 Average heavy metal concentrations ± standard deviations (n = 3) in sediment of Lake Ohrid tributaries sampledin October 2009
Streams Ni Cu Zn Co Cr Fe Al Mnmg/kg DW mg/kg DW mg/kg DW mg/kg DW mg/kg DW g/kg DW g/kg DW g/kg DW
CervenakaCS1 1606 ± 62 51.8 ± 33.1 110 ± 40 58.7 ± 3.4 430 ± 23 57 ± 4.0 6.11 ± 2.49 0.61 ± 0.03CS2 948 ± 29 21.2 ± 10.2 53.8 ± 20.2 59.4 ± 2.3 549 ± 14 52.6 ± 3.3 13.3 ± 3.1 0.59 ± 0.05CS3 1505 ± 268 19.4 ± 10.8 67.8 ± 33.9 71.6 ± 15.6 475 ± 140 64.4 ± 13.6 9.57 ± 5.61 0.94 ± 0.40
VerdovaVS1 68.9 ± 7.5 84.5 ± 48.8 29.8 ± 8.0 1.83 ± 1.67 48.4 ± 1.7 10.8 ± 1.3 3.94 ± 1.52 0.11 ± 0.01VS2 90.8 ± 20.5 18.6 ± 1.4 36.9 ± 3.4 9.14 ± 2.56 56.3 ± 5.1 28.1 ± 2.0 12.0 ± 0.7 0.4 1 ± 0.01VS3 161 ± 20 23.4 ± 7.4 54.1 ± 8.4 19.6 ± 2.5 109 ± 17 68.0 ± 13.8 15.5 ± 3.2 1.96 ± 0.18VS4 80.1 ± 24.4 10.2 ± 2.2 29.4 ± 8.9 6.87 ± 0.27 74.2 ± 29.7 20.2 ± 1.2 9.18 ± 1.78 0.30 ± 0.11
Guri I KuqGS1 1088 ± 93 3.11 ± 1.92 26.4 ± 5.2 48.7 ± 0.3 411 ± 53 64.8 ± 40.5 3.26 ± 0.42 0.52 ± 0.03GS2 911 ± 47 6.22 ± 1.83 59.3 ± 12.0 46.9 ± 1.3 417 ± 52 40.3 ± 1.0 6.62 ± 1.19 0.49 ± 0.05
HudenishtHS 2153 ± 190 10.0 ± 1.3 230 ± 263 153 ± 33 515 ± 19 73.2 ± 11.4 6.42 ± 0.10 1.20 ± 0.48
PojskaPS 1091 ± 70 7.6 ± 5.97 17.2 ± 3.8 56.7 ± 7.4 371 ± 22 42.6 ± 3.0 4.20 ± 1.18 0.47 ± 0.06
PEC 48.6a 149a 459a 111a
75b 110b 820b 50b 110b 43.77b 1.1b
Values rendered in italics exceed the probable effect concentrations (PEC) guidelines for freshwater sediments (MacDonaldet al. 2000; Jaagumagi 1992). Cd and Pb concentrations are not shown because they were all below the detection limits of0.01 mg/l and 0.5 mg/l, respectivelyaMacDonald et al. (2000)bJaagumagi (1992)
1836 Environ Monit Assess (2012) 184:1823–1839
was noticed between the concentrations beforeor after the contamination site. Relatively con-stant concentrations of Cr, Ni, Fe, and Co in thesediment were found for GS1, CS1, and CS2 (up-stream) and GS2 and CS3 (downstream); derivingmainly as a result of vicinity between the samplingpoints, influence from other upstream sources orthe regional background. In contrast, differenceswere noticed between Verdova Stream site 2(VS2) and VS3 that represent before and afterthe stock pile sites sampling points, demonstrat-ing leaching of the latter in the stream water(Table 6). Low concentrations at the lake outlet(VS1) can be attributed to the high distance be-tween the stock piles and the discharge point.
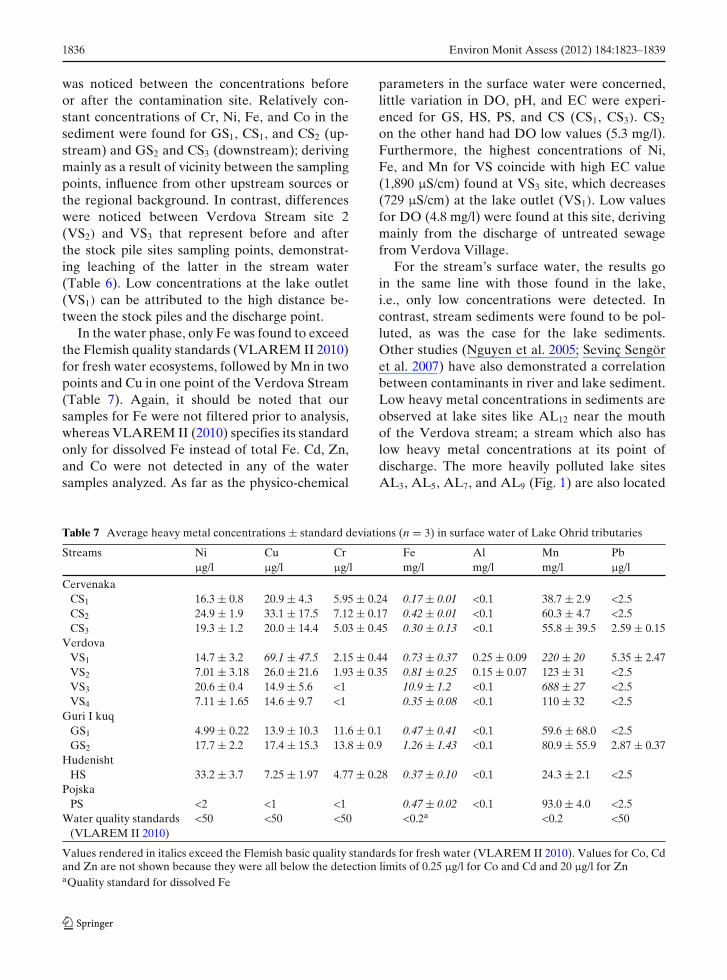
In the water phase, only Fe was found to exceedthe Flemish quality standards (VLAREM II 2010)for fresh water ecosystems, followed by Mn in twopoints and Cu in one point of the Verdova Stream(Table 7). Again, it should be noted that oursamples for Fe were not filtered prior to analysis,whereas VLAREM II (2010) specifies its standardonly for dissolved Fe instead of total Fe. Cd, Zn,and Co were not detected in any of the watersamples analyzed. As far as the physico-chemical
parameters in the surface water were concerned,little variation in DO, pH, and EC were experi-enced for GS, HS, PS, and CS (CS1, CS3). CS2
on the other hand had DO low values (5.3 mg/l).Furthermore, the highest concentrations of Ni,Fe, and Mn for VS coincide with high EC value(1,890 μS/cm) found at VS3 site, which decreases(729 μS/cm) at the lake outlet (VS1). Low valuesfor DO (4.8 mg/l) were found at this site, derivingmainly from the discharge of untreated sewagefrom Verdova Village.
For the stream’s surface water, the results goin the same line with those found in the lake,i.e., only low concentrations were detected. Incontrast, stream sediments were found to be pol-luted, as was the case for the lake sediments.Other studies (Nguyen et al. 2005; Sevinç Sengöret al. 2007) have also demonstrated a correlationbetween contaminants in river and lake sediment.Low heavy metal concentrations in sediments areobserved at lake sites like AL12 near the mouthof the Verdova stream; a stream which also haslow heavy metal concentrations at its point ofdischarge. The more heavily polluted lake sitesAL3, AL5, AL7, and AL9 (Fig. 1) are also located
Table 7 Average heavy metal concentrations ± standard deviations (n = 3) in surface water of Lake Ohrid tributaries
Streams Ni Cu Cr Fe Al Mn Pbμg/l μg/l μg/l mg/l mg/l mg/l μg/l
CervenakaCS1 16.3 ± 0.8 20.9 ± 4.3 5.95 ± 0.24 0.17 ± 0.01 <0.1 38.7 ± 2.9 <2.5CS2 24.9 ± 1.9 33.1 ± 17.5 7.12 ± 0.17 0.42 ± 0.01 <0.1 60.3 ± 4.7 <2.5CS3 19.3 ± 1.2 20.0 ± 14.4 5.03 ± 0.45 0.30 ± 0.13 <0.1 55.8 ± 39.5 2.59 ± 0.15
VerdovaVS1 14.7 ± 3.2 69.1 ± 47.5 2.15 ± 0.44 0.73 ± 0.37 0.25 ± 0.09 220 ± 20 5.35 ± 2.47VS2 7.01 ± 3.18 26.0 ± 21.6 1.93 ± 0.35 0.81 ± 0.25 0.15 ± 0.07 123 ± 31 <2.5VS3 20.6 ± 0.4 14.9 ± 5.6 <1 10.9 ± 1.2 <0.1 688 ± 27 <2.5VS4 7.11 ± 1.65 14.6 ± 9.7 <1 0.35 ± 0.08 <0.1 110 ± 32 <2.5
Guri I kuqGS1 4.99 ± 0.22 13.9 ± 10.3 11.6 ± 0.1 0.47 ± 0.41 <0.1 59.6 ± 68.0 <2.5GS2 17.7 ± 2.2 17.4 ± 15.3 13.8 ± 0.9 1.26 ± 1.43 <0.1 80.9 ± 55.9 2.87 ± 0.37
HudenishtHS 33.2 ± 3.7 7.25 ± 1.97 4.77 ± 0.28 0.37 ± 0.10 <0.1 24.3 ± 2.1 <2.5
PojskaPS <2 <1 <1 0.47 ± 0.02 <0.1 93.0 ± 4.0 <2.5
Water quality standards <50 <50 <50 <0.2a <0.2 <50(VLAREM II 2010)
Values rendered in italics exceed the Flemish basic quality standards for fresh water (VLAREM II 2010). Values for Co, Cdand Zn are not shown because they were all below the detection limits of 0.25 μg/l for Co and Cd and 20 μg/l for ZnaQuality standard for dissolved Fe
Environ Monit Assess (2012) 184:1823–1839 1837
close to the inflows of polluted streams. Never-theless, high concentrations of heavy metals in thesediment were also observed at several sites (AL2,AL4, and AL6) that are not directly influenced bythe contaminated streams. These results togetherwith the distribution patterns along the transectsand along the shore, can be explained by the lakedynamics which count for a larger spatial distrib-ution of heavy metals rather than only near thesources of pollution.
Conclusions
Lake Ohrid sediment serves as the major sinkfor heavy metals, especially in sites influenced bycontaminated sources like waste mineral dumpsor discharge points from the tributaries. A het-erogenic distribution (“hot spots”) of the heavymetals in the lake sediment is observed, whichmay be attributed to variations in mineralogy andredistribution due to sediment resuspension andsettling within the lake. The presence of organicmatter, Fe/Mn oxides, and carbonates in the sedi-ment plays only a minor role when compared withthe mineral fraction where Cr, Ni, Co were foundto be mainly bound. This indicates low mobilityof heavy metals in the sediment and thereforelow bioavailability. However, heavy metals werepresent in relatively high concentrations in thestems of plants (P. australis) and they increasedwith increasing concentrations in the sediment.The heavy metals in the fractions other than theresidual one, even at low concentrations, can beheld responsible for accumulation in plants. Incontrast, we could not detect heavy metals in S.letnica and S. ohridanus tissues (gill, muscle, liver).In order to draw a conclusion for heavy metalsaccumulation in these endemic species an inves-tigation of their food chain is required. Surfacewater of the lake and streams are not consideredcontaminated based on this study, leaving thesediment’s mechanisms as the main heavy metalenrichment source. However, future research ontemporal variations of the metal concentrationsin the water phase can help in studying moreclosely factors that influence bioavailability ofmetals.
Acknowledgements The authors are grateful to theNEWEN project (Netherlands and Western Balkan Envi-ronmental Network, funded through the Dutch Embassyin Belgrade) and the Waterpass Foundation for financiallysupporting this study. We would like to thank Dr.Peter Kelderman for critical reading of the manuscriptand Aleksander Pavlov for sample collection in theMacedonian part of Lake Ohrid.
References
Albrecht, C., Trajanovski, S., Kuhn, K., Streit, B., & Wilke,T. (2006). Rapid evolution of an ancient lake speciesflock: Freshwater limpets (Gastropoda: Ancylidae) inthe Balkan Lake Ohrid. Organisms Diversity & Evo-lution, 6(4), 294–307.
Albrecht, C., & Wilke, T. (2008). Ancient Lake Ohrid: Bio-diversity and evolution. Hydrobiologia, 615(1), 103–140.
Amataj, S., Anovski, T., Benischke, R., Eftimi, R., Gourcy,L., Kola, L., et al. (2007). Tracer methods used toverify the hypothesis of Cvijic about the undergroundconnection between Prespa and Ohrid Lake. Environ-mental Geology, 51(5), 749–753.
Antic-Mladenovic, S., Rinklebe, J., Frohne, T., Stärk,H.-J., Wennrich, R., Tomic, Z., et al. (2010). Impact ofcontrolled redox conditions on nickel in a serpentinesoil. Journal of Soils and Sediments, 1–10. doi:10.1007/s11368-010-0325-0.
APHA (2005). Standard methods for the examination of thewater and wastewater. United States of America.
Bani, A., Echevarria, G., Sulçe, S., Morel, J., & Mullai,A. (2007). In-situ phytoextraction of Ni by a nativepopulation of Alyssum murale on an ultramafic site(Albania). Plant and Soil, 293(1), 79–89.
Bonanno, G., & Lo Giudice, R. (2010). Heavy metalbioaccumulation by the organs of Phragmites australis(common reed) and their potential use as contami-nation indicators. Ecological Indicators, 10(3), 639–645.
Di Toro, D. M., Mahony, J. D., Hansen, D. J., Scott, K. J.,Carlson, A. R., & Ankley, G. T. (1992). Acid volatilesulfide predicts the acute toxicity of cadmium andnickel in sediments. Environmental Science & Tech-nology, 26(1), 96–101.
Du Laing, G., Rinklebe, J., Vandecasteele, B., Meers, E.,& Tack, F. M. G. (2009a). Trace metal behaviour inestuarine and riverine floodplain soils and sediments:A review. Science of The Total Environment, 407(13),3972–3985.
Du Laing, G., Ryckegem, G. V., Tack, F. M. G., & Verloo,M. G. (2006). Metal accumulation in intertidal litterthrough decomposing leaf blades, sheaths and stems ofPhragmites australis. Chemosphere, 63(11), 1815–1823.
Du Laing, G., Vandecasteele, B., De Grauwe, P., Moors,W., Lesage, E., Meers, E., et al. (2007). Factorsaffecting metal concentrations in the upper sediment
1838 Environ Monit Assess (2012) 184:1823–1839
layer of intertidal reedbeds along the River Scheld.Environmental Monitoring, 9, 449–455.
Du Laing, G., Van de Moortel, A. M. K., Moors, W., DeGrauwe, P., Meers, E., Tack, F. M. G., et al. (2009b).Factors affecting metal concentrations in reed plants(Phragmites australis) of intertidal marshes in theScheldt estuary. Ecological Engineering, 35(2), 310–318.
Förstner, U., & Wittmann, G. T. W. (1983). Metal pollutionin the aquatic environment. Berlin: Springer.
Fytianos, K., & Lourantou, A. (2004). Speciation of ele-ments in sediment samples collected at Lakes Volviand Koronia in Greece. Environment International,30(1), 11–17.
Gorenc, S., Kostaschuk, R., & Chen, Z. (2004). Spatialvariations in heavy metals on tidal flats in the VangtzeEstuary, China. Environmental Geology, 45(8), 1101–1108.
Jaagumagi, R. (1992). Development of the Ontario provin-cial sediment quality guidelines for arsenic, cadmium,chromium, copper, iron, lead, manganese, mercury,nickel, and zinc. Water resources branch, OntarioMinistry of the Environment. http://www.ene.gov.on.ca/envision/gp/B1-3.pdf. Accessed 13/03/2010.
Kelderman, P., & Osman, A. A. (2007). Effect of redoxpotential on heavy metal binding forms in pollutedcanal sediments in Delft (The Netherlands). Water Re-search, 41(18), 4251–4261.
Kiratli, N., & Ergin, M. (1996). Partitioning of heavy metalsin surface Black Sea sediments. Applied Geochem-istry, 11(6), 775–788.
Kishe, M. A., & Machiwa, J. F. (2003). Distribution ofheavy metals in sediments of Mwanza Gulf of LakeVictoria, Tanzania. Environment International, 28(7),619–625.
Laane, R. W. P. M., Sonneveldt, H. L. A., Van der Weyden,A. J., Loch, J. P. G., & Groeneveld, G. (1999). Trendsin the spatial and temporal distribution of metals (Cd,Cu, Zn and Pb) and organic compounds (PCBs andPAHs) in Dutch coastal zone sediments from 1981 to1996: A model case study for Cd and PCBs. Journal ofSea Research, 41(1–2), 1–17.
Lee, D.-Y., Lick, W., & Kang, S. W. (1981). The entrain-ment and deposition of fine-grained sediments in LakeErie. Journal of Great Lakes Research, 7(3), 224–233.
MacDonald, D. D., Ingersoll, C. G., & Berger, T. A. (2000).Development and evaluation of consensus-based sed-iment quality guidelines for freshwater ecosystems.Archives of Environmental Contamination and Toxi-cology, 39(1), 20–31.
Mackey, A. P., & Hodgkinson, M. C. (1995). Concentra-tions and spatial distribution of trace metals in man-grove sediments from the Brisbane River, Australia.Environmental Pollution, 90(2), 181–186.
Matzinger, A., Schmid, M., Veljanoska-Sarafiloska, E.,Patceva, S., Guseska, D., Wagner, B., et al. (2007).Eutrophication of ancient Lake Ohrid: Global warm-ing amplifies detrimental effects of increased nutrientinputs. Limnology and Oceanography, 52, 338–353.
Matzinger, A., Spirkovski, Z., Patceva, S., & Wüest, A.(2006). Sensitivity of ancient Lake Ohrid to local an-
thropogenic impacts and global warming. Journal ofGreat Lakes Research, 32, 158–179.
Moore, J. W., & Sutherland, D. J. (1981). Distribution ofheavy metals and radionuclides in sediments, water,and fish in an area of Great Bear Lake contaminatedwith mine wastes. Archives of Environmental Contam-ination and Toxicology, 10(3), 329–338.
Mortimer, C. H. (1987). Fifty years of physical investiga-tions and related limnological studies on Lake Erie,1928–1977. Journal of Great Lakes Research, 13(4),407–435.
Nguyen, H. L., Leermakers, M., Osán, J., Török, S., &Baeyens, W. (2005). Heavy metals in Lake Balaton:Water column, suspended matter, sediment and biota.Science of The Total Environment, 340(1–3), 213–230.
Overesch, M., Rinklebe, J., Broll, G., & Neue, H. U. (2007).Metals and arsenic in soils and corresponding veg-etation at central Elbe river floodplains (Germany).Environmental Pollution, 145(3), 800–812.
Pardo, R., Barrado, E., Lourdes, P., & Vega, M. (1990).Determination and speciation of heavy metals in sed-iments of the Pisuerga River. Water Research, 24(3),373–379.
Pertsemli, E., & Voutsa, D. (2007). Distribution of heavymetals in Lakes Doirani and Kerkini, NorthernGreece. Journal of Hazardous Materials, 148(3), 529–537.
Popovska, C., & Bonacci, O. (2007). Basic data on thehydrology of Lakes Ohrid and Prespa. HydrologicalProcesses, 21(5), 658–664.
Rakaj, N., & Flloko, A. (1995). Conservation status offreshwater fish of Albania. Biological Conservation,72(2), 195–199.
Rennert, T., Meißner, S., Rinklebe, J., & Totsche, K.(2010). Dissolved inorganic contaminants in a flood-plain soil: Comparison of in situ soil solutions and lab-oratory methods. Water, Air, & Soil Pollution, 209(1),489–500. doi:10.1007/s11270-009-0217-3.
Samecka-Cymerman, A., & Kempers, A. J. (2001). Con-centrations of heavy metals and plant nutrients inwater, sediments and aquatic macrophytes of anthro-pogenic lakes (former open cut brown coal mines)differing in stage of acidification. The Science of TheTotal Environment, 281(1–3), 87–98.
Sevinç Sengör, S., Spycher, N. F., Ginn, T. R., Sani, R. K., &Peyton, B. (2007). Biogeochemical reactive-diffusivetransport of heavy metals in Lake Coeur D’alene sed-iments. Applied Geochemistry, 22(12), 2569–2594.
Spirkovski, Z., Avramovski, O., & Kodzoman, A. (2001).Watershed management in the Lake Ohrid regionof Albania and Macedonia. Lakes & Reservoirs: Re-search and Management, 6(3), 237–242.
Stesevic, D., Feiler, U., Sundic, D., Mijovic, S., Erdinger,L., Seiler, T.-B., et al. (2007). Application of a new sed-iment contact test with Myriophyllum aquaticum andof the aquatic Lemna test to assess the sediment qual-ity of Lake Skadar. Journal of Soils and Sediments,7(5), 342–349.
Stoltz, E., & Greger, M. (2002). Accumulation proper-ties of As, Cd, Cu, Pb and Zn by four wetland plant
Environ Monit Assess (2012) 184:1823–1839 1839
species growing on submerged mine tailings. En-vironmental and Experimental Botany, 47(3), 271–280.
Tam, N. F. Y., & Wong, Y. S. (1995). Spatial and temporalvariations of heavy metal contamination in sedimentsof a mangrove swamp in Hong Kong. Marine PollutionBulletin, 31(4–12), 254–261.
Tessier, A., Campbell, P. G. C., & Bisson, M. (1979). Se-quential extraction procedure for the speciation ofparticulate trace metals. Analytical Chemistry, 51(7),844–851.
Tokalioglu, S., Kartal, S., & Elçi, L. (2000). Determina-tion of heavy metals and their speciation in lake sedi-ments by flame atomic absorption spectrometry after afour-stage sequential extraction procedure. AnalyticaChimica Acta, 413(1–2), 33–40.
UNESCO (1979). Ohrid region with its cultural and his-torical aspect and its natural environment. http://whc.unesco.org. Accessed: 13/03/2011.
VLAREM II (2010). Decision of the Flemish government of21/05/2010 concerning general and sectoral regulations
with regards to environmental issues. Belgian Govern-ment Gazette, 09/07/2010 (revision of the original de-cision from 1995) [in Dutch].
Vogel, H., Wessels, M., Albrecht, C., Stich, H.-B., &Wagner, B. (2010). Spatial variability of recent sed-imentation in Lake Ohrid (Albania/Macedonia)—Acomplex interplay of natural and anthropogenic fac-tors and their possible impact on biodiversity patterns.Biogeosciences, 7(3), 3911–3930.
Vymazal, J., Kröpfelová, L., Svehla, J., Chrastný, V., &Stíchová, J. (2009). Trace elements in Phragmites aus-tralis growing in constructed wetlands for treatment ofmunicipal wastewater. Ecological Engineering, 35(2),303–309.
Watzin, M. C., Puka, V., & Naumoski, T. (2002). LakeOhrid and its watershed, state of the environmental re-port. Lake Ohrid Conservation Project, Tirana.
Yücesoy, F., & Ergin, M. (1992). Heavy-metal geochem-istry of surface sediments from the southern Black Seashelf and upper slope. Chemical Geology, 99(4), 265–287.