near real time gps water vapor monitoring for numerical weather prediction in germany
TRANSCRIPT
Journal of the Meteorological Society of Japan, Vol. 82, No. 1B, pp. 361--370, 2004 361
Near Real Time GPS Water Vapor Monitoring for
Numerical Weather Prediction in Germany
Gerd GENDT, Galina DICK, Christoph REIGBER, Maria TOMASSINI,Yanxiong LIU and Markus RAMATSCHI
GeoForschungsZentrum Potsdam (GFZ), Department Geodesy & Remote SensingPotsdam, Germany
(Manuscript received 26 February 2003, in revised form 31 Desember 2003)
Abstract
Within the framework of the Helmholtz Association Strategy Project ‘‘GPS Atmosphere Sounding’’(GASP), an operational monitoring of integrated water vapor was established using 170 GPS sites inGermany and neighboring countries. The product, which can be obtained within 12–15 minutes of com-puter time on a single Linux PC, is generated each hour with a 30-minute time resolution and an accu-racy of G1–2 mm in the precipitable water vapor. The GPS estimates are regularly validated using col-located instruments and the local model (LM) of the German Weather Service (DWD). First experimentsfor numerical weather predictions are performed at DWD and showed 2% improvement for the relativehumidity in a 12-hour forecast, whilst the impact on the precipitation forecast over 24 hours is mixed upto now.
1. Introduction
Water vapor is an important greenhousegas, which transports energy through the atmo-sphere and changes the radiation by clouds.Its highly variable distribution is not suffi-ciently monitored up to now, especially underthe clouds and during the precipitation, whereits knowledge is most important. Ground-based GPS receiver network can partly fill thisgap.
In the year 2000 the GFZ in cooperationwith three other large research centers ofthe German Helmholtz Association (AWI—Alfred Wegener Institute for Polar Research;DLR—German Space Agency; GKSS—GKSSResearch Center Geestracht) has started the
‘‘GPS Atmosphere Sounding Project’’ (GASP,www.gfz-potsdam.de/pb1/pg1/gasp1/index_GASP1.html; Gendt et al. 2001; Dick et al.2001; Reigber et al. 2002) on using ground-based and space-born GPS observations for ap-plications in numerical weather prediction, cli-mate research and space weather monitoring.
Within the ground-based part, presentlydata from 170 sites in Germany and neighbor-ing countries are analyzed each hour to retrievethe vertical integrated water vapor (IWV) ateach of the network sites. This product is ex-tensively used by the German Weather Service(DWD) and the countries participating in theCOST-Action 716. An effective software solu-tion has to be implemented to obtain the re-sults of such a dense network within 10 to 15minutes of computer time on a single PC.
A regularly performed long-term validationwith other collocated instruments and espe-cially with the local model (LM) of the DWDis performed. First case studies using GPSIWV in assimilation and forecast experimentsshowed some positive impacts.
Corresponding author: Gerd Gendt, Geo-ForschungsZentrum Potsdam (GFZ), DepartmentGeodesy & Remote Sensing, Telegrafenberg A17,D-14473 Potsdam, Germany.E-mail: [email protected]( 2004, Meteorological Society of Japan

2. Data and software
2.1 GPS and meteorological surface dataa. GPS Data
The analysis is based on hourly GPS datasampled with 30 seconds and used with an ele-vation cut-off angle of 7�. The German networkof GPS receivers has increased during the lasttwo years and consist now of about 110 sites(Fig. 1). The network is based on the satellitepositioning system SAPOS of the German LandSurveying Agencies, which in August 2002comprises 250 sites in total. This large networkallows for further significant densification ifthe ongoing studies will propose it. The dataretrieval has been stabilized during the projectby introducing internet connection to the sites,so that 85% of the data are available within 5minutes now. The network is supplemented by24 GPS receivers from GFZ installed at synop-tic sites of the German Weather Service. Thisguarantees optimal possibilities for validationof the GPS results. The data are transferred inhourly batches to GFZ, checked for quality andmerged to usual daily RINEX files.
In addition to the German sites, about 25sites from the neighboring countries are addedto enlarge the area of the monitoring, andabout 20 stations from the global IGS networkare added to enable GPS orbit determinationand prediction as well as satellite clock deter-mination.
b. Meteorological surface dataFor conversion of the adjusted tropospheric
zenith total path delay (ZTD) into the in-tegrated water vapor (IWV) the meteorologicalsurface data at the stations are necessary (thepressure for getting the zenith wet delay; thetemperature profile, approximated by linearregression from surface data (see Bevis et al.1992), for converting into IWV). For some sta-tions, e.g., the 24 GFZ-DWD sites, local mea-surements are available. However, for most ofthe sites the necessary pressure and tempera-ture have to be interpolated using the synopticsites of the DWD (about 200 sites with hourlysampling rate of data). For each site the small-est surrounding station triangle is used for alinear interpolation, correcting for the heightdifferences beforehand. Stations with a heightover 1000 m are excluded because of limi-tations of interpolation accuracy caused byerrors in height correction. The quality of theinterpolation is normally 0.3 hPa (rms). Inmountainside regions the error can reachhigher values, but 0.5 to 1 hPa (correspondingto about 0.2 to 0.4 mm IWV) can be acceptedfor numerical weather prediction if these areonly random fluctuations. There are only a fewsites that do not meet this limit.
The pressure data are checked beforehand bymutual interpolation to eliminate sites, whichcan be regarded as outliers in the pressurefield over Germany. That means, each pressurevalue is compared to the interpolated value us-ing surrounding sited, and it is excluded if thedifference exceeds the given accuracy limit.
2.2 Software and processing strategyFor the analysis, the GFZ software
EPOS.P.V2 (Gendt et al. 1999) is used. It isbased on least squares adjustment of un-differenced GPS measurements and makes useof the IERS standards (McCarthy 1996). Itshould be noted that for all sites the oceanloading effect is applied, using the model of Pa-giatakis (1992). The mapping function to derivethe partial derivatives for the ZTD is that ofNiell (1996). For the conversion from ZTD toIWV, the physical constants given in Bevis et al.(1992) are taken. The station coordinates aredetermined in the ITRF reference frame usingIGS final products and are then fixed duringthe NRT data processing. An accuracy check for
Fig. 1. GASP NRT Network.
Journal of the Meteorological Society of Japan362 Vol. 82, No. 1B

the station coordinates is performed regularly,using the results of the coordinate adjustmentfrom the post-processed analysis based on dailydata batches. The various steps for of the anal-ysis procedure are summarized below and il-lustrated in Fig. 2. The main characteristic aregiven in Table 1.
a. 3-hourly Ultra Rapid orbit predictionsThe NRT data analysis needs predicted or-
bits. For GFZ the most driving application forimproving the prediction quality was the GASPproject. Whereas the Ultra Rapid orbit predic-tions submitted to the IGS (Gendt et al. 1999;Zumberge et al. 2001) are generated at GFZtwice a day and for internal use, a 3-hourlyrepetition was chosen. The reduction of themaximum prediction interval from 15 h to 4 himproves the reliability of the predicted orbitssignificantly. In this step, global hourly IGSdata are analyzed in a 24 h-data window,which is shifted each time by 3 hours.
b. Hourly estimated orbits and clocks(Step ‘‘Base’’)
Estimation of the tropospheric results isbased on high quality GPS orbits and clocks, sothat the hourly NRT data analysis starts withthis ‘‘base’’ estimation step. Here predicted Ul-tra Rapid orbits of GFZ with 3 h repetition(GFU 3 h) are used as initials for the orbit andclock adjustment. To achieve sufficient qualityin the GPS orbits, about 20 well-distributed
global sites (base cluster) in a 12 h data win-dow are used for orbit estimation. For goodclock coverage over Germany five additionalGASP stations are included.
c. Tropospheric results (Step ‘‘PPP’’)Due to the steadily increasing number of
sites an analysis strategy had to be developed,which keeps the computation time within 15minutes for more than 100 stations even withincreasing number of parameters like highsampling rate (15 or 30 minutes) and gradientsfor tropospheric estimates. Therefore a tech-nique of parallel processing of a large numberof stations in clusters, where each cluster maybe processed on a separate computer, was im-plemented. Presently the efficient ‘‘PrecisePoint Positioning’’ (PPP) method (Zumbergeet al. 1997) is used for analyzing the data. Themain idea of the PPP strategy is to process eachsite separately while fixing the high qualityGPS orbits and clocks. The computational loadcan easily be distributed over various PCs ifneeded.
Starting from Feb 2001, data retrieval andprocessing are running in NRT and is presentlyperformed on two LINUX PCs. One PC is de-voted only to the data handling. Permanentlyall possible global and regional data centers
Fig. 2. Analysis scheme for the genera-tion of zenith total delay estimatesusing a network analysis for a basicstation cluster and the precise pointpositioning (PPP) in parallel clusters.
Table 1. Main characteristics of the NRTanalysis
Data: . Sliding 12-hour data window. Elevation cut-off angle: 7�
. Sampling rate: 2.5 minutesReference
frame:
. Earth rotation parameters:GFZ GPS solution/prediction
. Station coordinates:GFZ solution within ITRF 2000
. for step ‘‘Base’’:Adjustedparameters: – GPS orbits (predicted Ultra
Rapid orbits from GFZ asinitial ones)
– Satellite clocks– ZTD for 1-hour intervals
. for step ‘‘PPP’’ (GPS orbits andclocks are fixed):– ZTD with resolution of 30
minutes– ZTD gradients with hourly
resolution– Random walk constraints
applied
G. GENDT et al. 363March 2004

are checked for new data. From the Germansites the data are put directly into the incom-ing directories. All data are immediately re-formatted, checked and accumulated to usualdaily batches.
A second PC is used for the data analysis,which takes about 20 minutes for the UltraRapid orbit analysis (every 3 hours) and 12–15minutes for the determination of troposphericresults for the 170-station network each hour.Both PCs have a usual hardware with twoCPUs of 1 GHz, 500 MBytes memory and 160GBytes disk space.
3. GPS products
3.1 Ultra Rapid orbit predictions, internalorbits and clocks
Besides the official IGS Ultra Rapid orbitswith an update cycle of 12 hours, two internalorbit products are generated as described inSection 2. The 12 h and 3 h-predicted orbitscan be fixed during the ZTD estimation, orthe orbits can be adjusted by the data itself(named GASP orbits—hourly estimated orbitsfrom NRT analysis based on 12 h data win-dows). In Fig. 3 all three orbits are compared tothe Final GFZ orbits (estimated high qualityGPS orbits, official product of GFZ IGS Analy-sis center), which have an accuracy of about2 cm and can be considered as true in our case.For the well behaving satellites, the predictedorbits already have reasonable quality and maybe fixed without problems. The 3 h-predictionsare in the mean 5 cm better than in the 12 h-case. For the well behaving satellites the pre-dicted orbits have a quality comparable to the
adjusted GASP orbits. But for the satellites,which are not well model-able (e.g., satellites ineclipse), one can gain significant improvementsby orbit relaxation. In the mean we end up with12 cm for those orbits compared with 17 cmand 22 cm for the 3 h- and 12 h-predictions,respectively. Further improvements for theGASP orbits can be expected by using 24 h in-stead of 12 h data intervals. Its implementa-tion is under way. The influence of orbit accu-racy on the accuracy of ZTD is discussed insection 4.
3.2 Product generationPresently the DWD and the European COST-
Action 716 have set a maximum delay forproduct submission of 1 hour 45 minutes, i.e.,in case of an hourly data transfer 45 min areleft to meet the deadline. Having such a delay,it is preferred to wait as long as possible (e.g.,30 minutes) to get the most complete set ofproducts for validation and case studies. Sup-pose the realistic case that all data including areasonable global set of stations are availablewithin 5 minutes the product can be ready evenin 15 minutes. The product delivery statisticsreveals reliability for the hourly product files of95%.
The data are analyzed in sliding 12 h-windows shifted each hour. The ZTD productsare extracted from the last hour only. Becausethe applied random walk constraints are notso effective at the interval boundaries they donot have the highest quality. In addition to the30-minute sampled ZTD values, the ZTD gra-dients in north and east direction are estimatedevery 60 minutes. Whether the gradients con-tain physically reasonable information can bechecked by inspecting their values during fron-tal passages and by checking if its estimatesfrom nearby sites are in a reasonable agree-ment (Fig. 5). Even if the gradients itself arenot considered to be an additional product,their estimation improves the ZTD productsin case of frontal passages. The quality of theoriginal ZTD results may be deteriorated byerrors during the conversion into IWV (e.g.,caused by instrumental problems for the sur-face data). Therefore the ZTD values are pre-ferred for the assimilation. Nevertheless, con-version into IWV is performed so that theresults can be used to monitor the moving wa-
Fig. 3. Quality of adjusted relaxed orbitsfrom NRT analysis based on 12 h datawindows (GASP orbits) and predictedorbits with 3 h and 12 h repetition(GFU 3 h-pred, GFU 12 h-pred) areshown for April 2002. As a measure ofquality, the rms differences to the FinalGFZ orbits (product of GFZ IGS Analy-sis center) are given for each satellite aswell as the total rms over all satellites.
Journal of the Meteorological Society of Japan364 Vol. 82, No. 1B

ter vapor fields with rather detailed informa-tion over Germany (Fig. 14).
As soon as the IGS final products are avail-able, the data are also analyzed in a post-processing mode using daily data batches toobtain the products with the highest accuracy.A first check of the NRT estimates using thepost-processed products shows a NRT quality ofthe level of 0.6 mm IWV (see Fig. 4).
4. Validation
The data for April 2002 were analyzed us-ing three variants for the orbits, taking re-laxed GASP orbits or fixing the two predictionvariants (see 3.1). The difference to the post-processed results improved by 8% in the stan-dard deviation switching from 12 h- to 3 h-predicted orbits, and taking the adjusted orbitseven by 13%. The bias change between the var-ious variants is small (site scatter @0.3 mm).Having a level of 0.6 to 0.7 mm IWV for allvariants, one can state that fixed predicted or-bits can also be chosen, which demonstrates thehigh quality of the IGS and internal GFZ UltraRapid products.
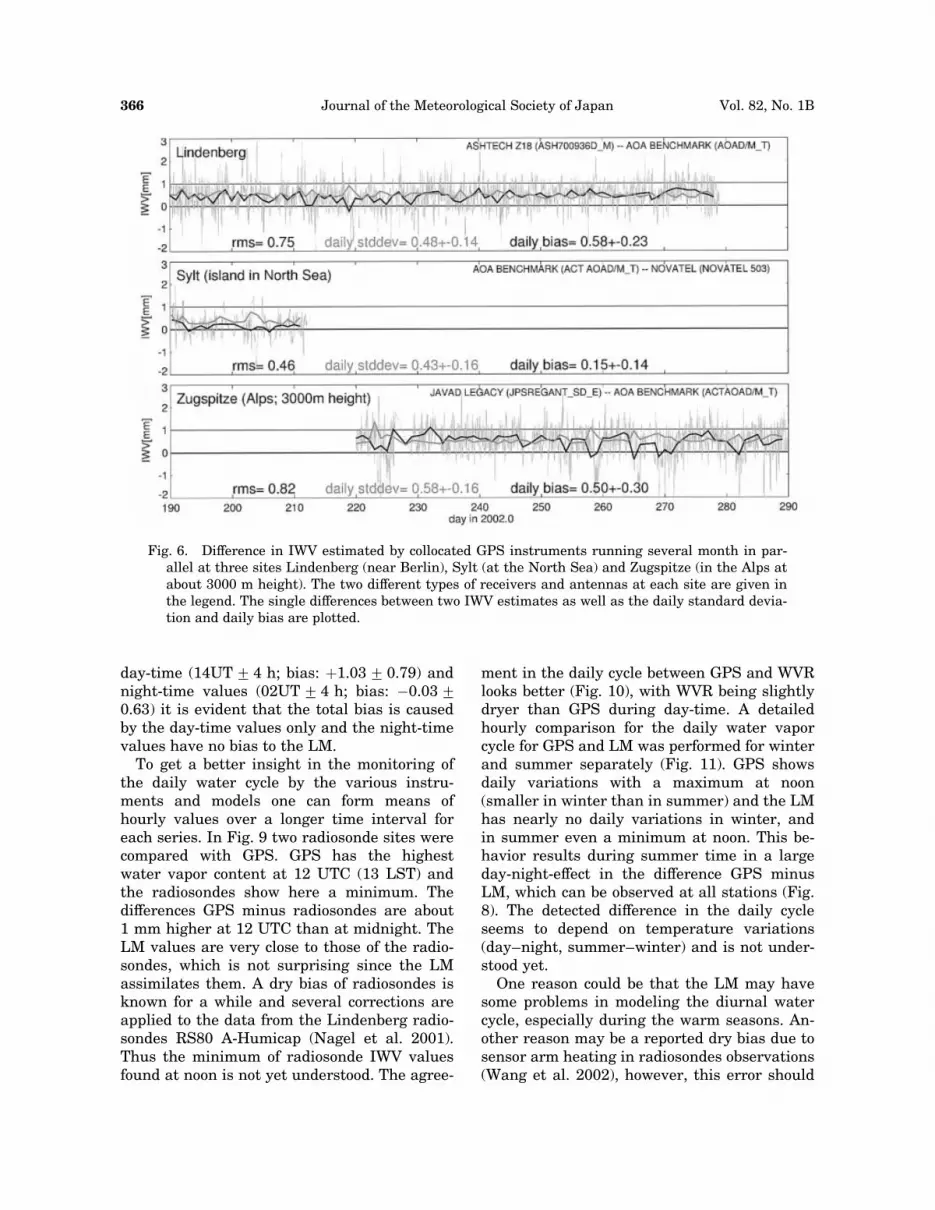
At three sites, collocated GPS receivers (in-cluding one at the coast, one in 3000 m height)only a few meters apart from each other wererunning over many months in parallel. The re-sults differ by about half a mm IWV in stan-dard deviation and bias. This is mainly causedby the residual errors in the different antennamodels (different vendors), and gives a measureof the accuracy, which could be expected for theGPS results (Fig. 6).
Besides consistency checks between NRT andpost-processed estimates, important checks areperformed with independent time series. Ex-amples of comparisons over the last two yearsare shown in Fig. 7 for two stations and fourother series. Comparing to the official combinedIGS product for station Potsdam one can seethe high internal consistency within the GPSanalysis, as well as between GASP NRT andother analyses. Statistics over the whole datainterval and for each 24 h interval are com-puted. There is no global bias, the daily stan-dard deviation is G0.6 mm and the bias israther stable from day to day with a scatter of0.3 mm only.
The differences between GPS and radio-sondes have biases and standard deviations atthe mm level. The mean bias and the bias scat-ter from day to day amount to half a mm. Thesame holds for the comparisons to WVR, wherethe trend from negative to positive values is notexplained yet. In general, the agreement be-tween all these series corresponds to the errorbudget for the individual instruments, namelyG1–2 mm IWV.
The differences to the analysis fields of LM(not assimilating GPS results) are at a highlevel of about G2 mm rms. The standard devi-ation in summer is larger than in winter, andthe biases show a seasonal behavior. Thehigher differences between LM and GPS, espe-cially in summer, can be explained by phaseshifts between the modeled and GPS observedfrontal systems.
Figure 8 summarizes LM differences forall stations in the GASP network (individualvalues of about 40 sites are given) for April andAugust. Compared to summer, the consistencein winter is better by one 1 mm IWV and nosignificant wet bias of GPS can be stated. Insummer a significant wet bias can be seen.However, if one computes separate biases for
Fig. 4. Quality of ZTD estimates usingthree different types of orbits—relaxedorbits from NRT analysis based on 12 hdata windows (GASP orbits) and pre-dicted orbits with 3 h and 12 h repeti-tion (GFU 3 h-pred, GFU 12 h-pred). Asa measure of quality, the rms differ-ences to the post-processed ZTD aregiven for each station (subset is plottedhere only) as well as the total rms overall stations.
Fig. 5. Tropospheric gradients in northdirection for two nearby GPS stationsPotsdam and Wuensdorf (30 km apart).
G. GENDT et al. 365March 2004
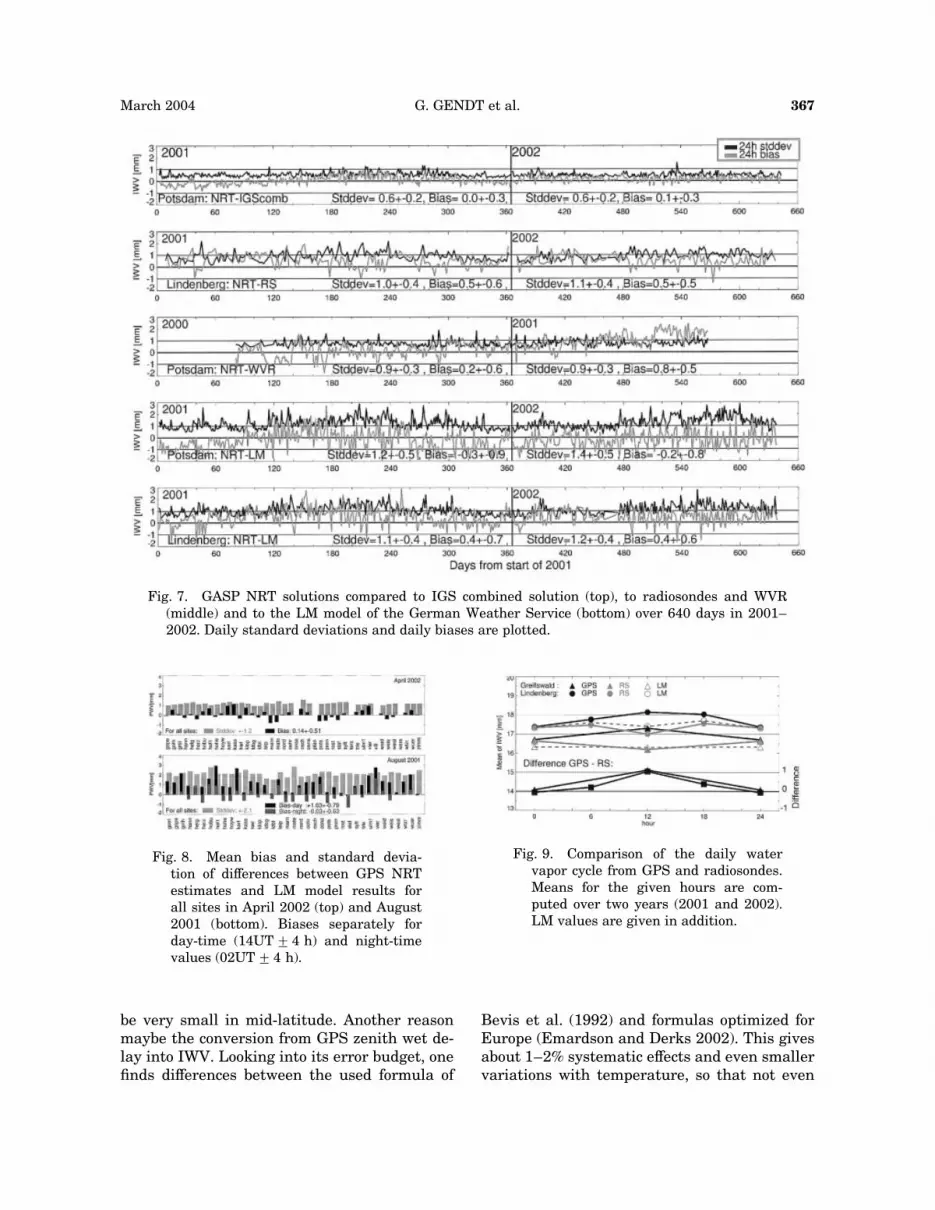
day-time (14UTG 4 h; bias: þ1.03G 0.79) andnight-time values (02UTG 4 h; bias: �0.03G0.63) it is evident that the total bias is causedby the day-time values only and the night-timevalues have no bias to the LM.
To get a better insight in the monitoring ofthe daily water cycle by the various instru-ments and models one can form means ofhourly values over a longer time interval foreach series. In Fig. 9 two radiosonde sites werecompared with GPS. GPS has the highestwater vapor content at 12 UTC (13 LST) andthe radiosondes show here a minimum. Thedifferences GPS minus radiosondes are about1 mm higher at 12 UTC than at midnight. TheLM values are very close to those of the radio-sondes, which is not surprising since the LMassimilates them. A dry bias of radiosondes isknown for a while and several corrections areapplied to the data from the Lindenberg radio-sondes RS80 A-Humicap (Nagel et al. 2001).Thus the minimum of radiosonde IWV valuesfound at noon is not yet understood. The agree-
ment in the daily cycle between GPS and WVRlooks better (Fig. 10), with WVR being slightlydryer than GPS during day-time. A detailedhourly comparison for the daily water vaporcycle for GPS and LM was performed for winterand summer separately (Fig. 11). GPS showsdaily variations with a maximum at noon(smaller in winter than in summer) and the LMhas nearly no daily variations in winter, andin summer even a minimum at noon. This be-havior results during summer time in a largeday-night-effect in the difference GPS minusLM, which can be observed at all stations (Fig.8). The detected difference in the daily cycleseems to depend on temperature variations(day–night, summer–winter) and is not under-stood yet.
One reason could be that the LM may havesome problems in modeling the diurnal watercycle, especially during the warm seasons. An-other reason may be a reported dry bias due tosensor arm heating in radiosondes observations(Wang et al. 2002), however, this error should
Fig. 6. Difference in IWV estimated by collocated GPS instruments running several month in par-allel at three sites Lindenberg (near Berlin), Sylt (at the North Sea) and Zugspitze (in the Alps atabout 3000 m height). The two different types of receivers and antennas at each site are given inthe legend. The single differences between two IWV estimates as well as the daily standard devia-tion and daily bias are plotted.
Journal of the Meteorological Society of Japan366 Vol. 82, No. 1B
be very small in mid-latitude. Another reasonmaybe the conversion from GPS zenith wet de-lay into IWV. Looking into its error budget, onefinds differences between the used formula of
Bevis et al. (1992) and formulas optimized forEurope (Emardson and Derks 2002). This givesabout 1–2% systematic effects and even smallervariations with temperature, so that not even
Fig. 7. GASP NRT solutions compared to IGS combined solution (top), to radiosondes and WVR(middle) and to the LM model of the German Weather Service (bottom) over 640 days in 2001–2002. Daily standard deviations and daily biases are plotted.
Fig. 8. Mean bias and standard devia-tion of differences between GPS NRTestimates and LM model results forall sites in April 2002 (top) and August2001 (bottom). Biases separately forday-time (14UTG4 h) and night-timevalues (02UTG 4 h).
Fig. 9. Comparison of the daily watervapor cycle from GPS and radiosondes.Means for the given hours are com-puted over two years (2001 and 2002).LM values are given in addition.
G. GENDT et al. 367March 2004

half of the effect could be explained by con-version errors. The general 2% error of usingsurface data instead of temperature profilesmentioned by Bevis is questionable to be ofsystematic nature and amounts only to half ofthe effect too.
5. Assimilation experiments
Several experiments with LM assimilatingGPS data were run and the results were com-pared to a control run of LM (as the routine notincluding GPS data). The current LM of DWD,a non-hydrostatic regional model for centraland western Europe, has a spatial grid resolu-tion of approximately 7 km and 35 layers onthe vertical. The assimilation scheme of LM isnudging towards observation (Tomassini et al.2002).
During the period from 17 to 25 August 2001,assimilation experiments with and withoutGPS data were performed. Two 24-hour fore-casts were produced every day, starting fromthe 00 UTC and 12 UTC analyses of the ex-periments. During the assimilation, the model
IWV is relaxed towards the GPS IWV from2.6 mm to 1.1 mm. The forecasts of the experi-ment have been verified against the GPS IWVthemselves and upper-level observations fromradiosondes. Both comparisons indicate thatthe assimilation of the additional GPS datahas an effect within a forecast range of up to 15hours. The verification against radiosondesshows that the assimilation of the additionalGPS data reduces the rms error of relative hu-midity in the 12 hour forecast (Fig. 12). Theimprovement in the humidity rms error ismostly concentrated between 800 and 600 hPaand it is of the order of 2% relative humidity(10% improvement). A minor improvement isalso detectable in the forecast of temperatureand wind velocity. The impact on all variablesafter 24 hours is neutral.
An evaluation of the results has also beenmade comparing analyses and forecasts of pre-cipitation with surface observations and radarimages. The signal in the precipitation analysisfields is mixed, with the GPS data improvingsome bad cases but also tending to deterioratethe analysis in some areas without precipita-
Fig. 10. Comparison of the daily watervapor cycle from GPS and WVR. Hourlymeans are computed for the whole year2000.
Fig. 11. Comparison of the daily watervapor cycle from GPS and LM. Meansfor the given hours are computed forsummer (months MJJA) and winter in2001 (months JFND). For plotting rea-sons curves are shifted by the valuesgiven in parenthesis.
Fig. 12. Relative humidity rms error ofthe 12 hour forecast from experimentwith GPS data (dashed curve) and ofcontrol (solid curve). The statistic iscomputed comparing 15 forecasts todata from radiosondes in Germany andsurrounding countries.
Journal of the Meteorological Society of Japan368 Vol. 82, No. 1B

tion. The same can be said in respect to thepredicted precipitation. Figure 13 shows a caseof positive impact of GPS data on the first 6hour of a forecast started at 00 UTC. However,there are also cases of negative impact, andthey are mostly forecasts started from the 12UTC analyses predicting excessive rainfall. Theoverall impact later on the precipitation fore-cast (6 to 18 hour range) is neutral.
The problem of excessive rainfall in the 12UTC forecasts can be well related to the dis-agreement in daily cycle between GPS andLM. The extra amount of GPS moisture at noonand in the early afternoon can erroneouslytrigger the convective parameterization. Evenif the data are correct, their assimilation withthe present model leads to a deterioration ofthe forecast. The solution would be, of course,to correct the model climate by improving themodel itself. But as long as this is not possible,it is necessary to adjust the observations to themodel diurnal cycle by means of a day-time de-pendant bias correction. This approach is plan-ned and is to be tested in the near future.
Further work has to be dedicated to the tun-ing of GPS IWV nudging, especially to under-stand and correct the cases of negative impact.For example, information on cloudiness couldbe used to improve the vertical distribution ofthe influence of the integrated value. Inves-tigations on a possible bias correction of theGPS data are also required.
6. Summary
GASP has demonstrated an efficient opera-tional determination of water vapor within aregional network of up to 170 sites with a qual-ity of 1–2 mm for the integrated water vapor.
Fig. 13. Accumulated precipitation from 0 to 6 UTC on 21 August 2001 from radar observations(left) and in the first 6 hours of the forecast started from the 00 UTC analysis of GPS experiment(middle) and control experiment (right).
Fig. 14. Water vapor field over Germanyon August 12th 2002, where extremevalues occurred over the eastern partconnected with the flood disaster at theriver Elbe.
G. GENDT et al. 369March 2004
First experiments for numerical weather pre-dictions are performed at DWD and showed 2%improvement for the relative humidity in a 12-hour forecast, while the impact on the precipi-tation forecast over 24 hours is mixed up tonow.
Assimilation experiments over longer timeperiods and the subjective and statistical eval-uation of the resulting forecasts, with a specialfocus on the precipitation, are required andplanned to assess the impact of GPS data.
To have the significant benefit from a parallelrun with GPS, all modeling problems should beinvestigated in more details and possibly cor-rected before. Otherwise a negative impact maybe obtained, which will not demonstrate thereal potential of the GPS.
Meanwhile at DWD also the now-castinggroup has proved a significant gain of informa-tion looking into the GPS water vapor fields.
Acknowledgement
This study was carried out under BMBFgrant 01SF9922/2.
References
Bevis, M., S. Businger, T. Herring, Ch. Rocken,R. Anthes, and R.H. Ware, 1992: GPS Meteo-rology: Remote sensing of atmospheric watervapor using the Global Positioning System. J.Geophys. Res., 97, 15787–15801.
Emardson, T.R., and H.J.P. Derks, 2002: On therelation between the wet delay and the in-tegrated precipitable water vapour in theEuropean atmosphere. Meteorological Applica-tions, 7, 61–68.
Gendt, G., G. Dick, and W. Sohne, 1999: GFZ Analy-sis Center of IGS—Annual Report 1998. JPL,IGS 1998 Technical Reports, 79–87.
———, P. Fang, and J.F. Zumberge, 2000: MovingIGS products towards real-time. JPL, IGS1999 Technical Reports, 391–404.
———, Ch. Reigber, and G. Dick, 2001: Near real-
time water vapor estimation in a German GPSnetwork—first results from the ground pro-gram of the HGF GASP Project. Phys. andChem. of the Earth, 26, 413–416.
Dick, G., G. Gendt, and Ch. Reigber, 2001: First ex-perience with near real-time water vapor esti-mation in a German GPS network. J. Atmos.Sol.Terr.l Phys., 63, 1295–1304.
McCarthy, D.D., 1996: IERS-Conventions (1996).Observatoire de Paris; IERS Technical Note21.
Nagel, D., U. Leiterer, H. Dier, A. Kats, J. Reichardt,and A. Behrendt, 2001: High accuracy hu-midity measurements using the standardizedfrequency method with a research upper-airsounding system. Meteorol. Zeitschrift, 10,395–405.
Niell, A., 1996: Global mapping functions for theatmospheric delay at radio wavelengths. J. Ge-ophy. Res., 101, 3227–3246.
Pagiatakis, S.D., 1992: Program LOAADGPS for thecalculation of ocean load effects. Man. Geod.,17, 315–320.
Reigber, Ch., G. Gendt, G. Dick, and M. Tomassini,2002: Near real-time water vapor monitoringfor weather forecast. GPS World, 13, 18–27.
Tomassini, M., G. Gendt, G. Dick, M. Ramatschi, andC. Schraff, 2002: Monitoring of integrated wa-ter vapor from ground-based GPS observationsand their assimilation in a limited-area model.Phys. and Chem. of the Earth, 27, 314–346.
Wang, J., H.L. Cole, D.J. Carlson, E.R. Miller, K.Beierle, A. Paukkunen, and T. Laine, 2002:Corrections of humidity measurements errorsfrom Vaisala RS80 radiosondes—Applicationto TOGA COARE data. J. Atmos. Ocean. Tech.,19, 981–1002.
Zumberge, J.F., and G. Gendt, 2001: The demise ofselective availability and implications for theInternational GPS Service Network. Phys. andChem. of the Earth, 26, 637–644.
———, M.B. Heflin, D.C. Jefferson, M.M. Watkins,and F.H. Webb, 1997: Precise point positioningfor the efficient and robust analysis of GPSdata from large networks. J. Geophy. Res., 102,5005–5017.
Journal of the Meteorological Society of Japan370 Vol. 82, No. 1B