natural language processing and information systems
TRANSCRIPT

Elisabeth Métais · Farid MezianeMohamad Saraee · Vijayan SugumaranSunil Vadera (Eds.)
123
LNCS
961
2
21st International Conference on Applicationsof Natural Language to Information Systems, NLDB 2016Salford, UK, June 22–24, 2016, Proceedings
Natural LanguageProcessing andInformation Systems

Lecture Notes in Computer Science 9612
Commenced Publication in 1973Founding and Former Series Editors:Gerhard Goos, Juris Hartmanis, and Jan van Leeuwen
Editorial Board
David HutchisonLancaster University, Lancaster, UK
Takeo KanadeCarnegie Mellon University, Pittsburgh, PA, USA
Josef KittlerUniversity of Surrey, Guildford, UK
Jon M. KleinbergCornell University, Ithaca, NY, USA
Friedemann MatternETH Zurich, Zürich, Switzerland
John C. MitchellStanford University, Stanford, CA, USA
Moni NaorWeizmann Institute of Science, Rehovot, Israel
C. Pandu RanganIndian Institute of Technology, Madras, India
Bernhard SteffenTU Dortmund University, Dortmund, Germany
Demetri TerzopoulosUniversity of California, Los Angeles, CA, USA
Doug TygarUniversity of California, Berkeley, CA, USA
Gerhard WeikumMax Planck Institute for Informatics, Saarbrücken, Germany

More information about this series at http://www.springer.com/series/7409

Elisabeth Métais • Farid MezianeMohamad Saraee • Vijayan SugumaranSunil Vadera (Eds.)
Natural LanguageProcessing andInformation Systems21st International Conference on Applicationsof Natural Language to Information Systems, NLDB 2016Salford, UK, June 22–24, 2016Proceedings
123

EditorsElisabeth MétaisConservatoire National des Arts et MétiersParisFrance
Farid MezianeUniversity of SalfordSalfordUK
Mohamad SaraeeUniversity of SalfordSalfordUK
Vijayan SugumaranOakland UniversityRochester, MIUSA
Sunil VaderaUniversity of SalfordSalfordUK
ISSN 0302-9743 ISSN 1611-3349 (electronic)Lecture Notes in Computer ScienceISBN 978-3-319-41753-0 ISBN 978-3-319-41754-7 (eBook)DOI 10.1007/978-3-319-41754-7
Library of Congress Control Number: 2016942797
LNCS Sublibrary: SL3 – Information Systems and Applications, incl. Internet/Web, and HCI
© Springer International Publishing Switzerland 2016This work is subject to copyright. All rights are reserved by the Publisher, whether the whole or part of thematerial is concerned, specifically the rights of translation, reprinting, reuse of illustrations, recitation,broadcasting, reproduction on microfilms or in any other physical way, and transmission or informationstorage and retrieval, electronic adaptation, computer software, or by similar or dissimilar methodology nowknown or hereafter developed.The use of general descriptive names, registered names, trademarks, service marks, etc. in this publicationdoes not imply, even in the absence of a specific statement, that such names are exempt from the relevantprotective laws and regulations and therefore free for general use.The publisher, the authors and the editors are safe to assume that the advice and information in this book arebelieved to be true and accurate at the date of publication. Neither the publisher nor the authors or the editorsgive a warranty, express or implied, with respect to the material contained herein or for any errors oromissions that may have been made.
Printed on acid-free paper
This Springer imprint is published by Springer NatureThe registered company is Springer International Publishing AG Switzerland

Preface
This volume of Lecture Notes in Computer Science (LNCS) contains the papers pre-sented at the 21st International Conference on Application of Natural Language toInformation Systems, held at MediacityUK, University of Salford, during June 22–24,2016 (NLDB 2016). Since its foundation in 1995, the NLDB conference has attractedstate-of-the-art research and followed closely the developments of the application ofnatural language to databases and information systems in the wider meaning of theterm.
The NLDB conference is now a well-established conference that is attracting par-ticipants from all over the world. The conference evolved from the early years whenmost of the submitted papers where in the areas of natural language, databases andinformation systems to encompass more recent developments in the data and languageengineering fields. The content of the current proceedings reflects these advancements.The conference also supports submissions on studies related to languages that were notwell supported in the early years such as Arabic, Tamil, and Farsi.
We received 83 papers and each paper was reviewed by at least three reviewers withthe majority having four or five reviews. The conference co-chairs and ProgramCommittee co-chairs had a final consultation meeting to look at all the reviews andmake the final decisions on the papers to be accepted. We accepted 17 papers (20.5 %)as long/regular papers, 22 short papers, and 13 poster presentations.
We would like to thank all the reviewers for their time, their effort, and for com-pleting their assignments on time despite tight deadlines. Many thanks to the authorsfor their contributions.
May 2016 Elisabeth MétaisFarid Meziane
Mohamad SaraeeVijay Sugumaran
Sunil Vadera

Organization
Conference Chairs
Elisabeth Métais Conservatoire National des Arts et Metiers, Paris,France
Farid Meziane University of Salford, UKSunil Vadera University of Salford, UK
Program Committee Chairs
Mohamad Saraee University of Salford, UKVijay Sugumaran Oakland University Rochester, USA
Program Committee
Hidir Aras FIZ Karlsruhe, GermanyImran Sarwar Bajwa The Islamia University of Bahawalpur, PakistanPierpaolo Baslie University of Bali, ItalyNicolas Béchet IRISA, FranceChris Biemann TU Darmstadt, GermanySandra Bringay LIRMM, FranceJohan Bos Groningen University, The NetherlandsGoss Bouma Groningen University, The NetherlandsMihaela Bornea IBM Research, USACornelia Caragea University of North Texas, USAChristian Chiarcos University of Frankfurt, GermanyRaja Chiky ISEP, FranceKostadin Cholakov HU Berlin, GermanyPhilipp Cimiano Universität Bielefeld, GermanyIsabelle Comyn-Wattiau CNAM, FranceErnesto William De Luca Potsdam University of Applied Sciences, GermanyBart Desmet Ghent University, BelgiumZhou Erqiang University of Electronic Science and Technology,
ChinaAntske Fokkens VU Amsterdam, The NetherlandsVladimir Fomichov National Research University Higher School
of Economics, RussiaThierry Fontenelle CDT, LuxemburgAndré Freitas University of Passau, Germany/Insight, IrelandDebasis Ganguly Dublin City University, IrelandAhmed Guessoum USTHB, Algiers, Algeria

Yaakov Hacohen-Kerner Jerusalem College of Technology, IsraelSebastian Hellmann University of Leipzig, GermanyHelmut Horacek Saarland University, GermanyMichael Herweg IBM, GermanyDino Ienco IRSTEA, FranceAshwin Ittoo HEC, University of Liege, BelgiumPaul Johannesson Stockholm University, SwedenRichard Johansson University of Gothenburg, SwedenSaurabh Kataria Xerox PARC, NY, USASophia Katrenko Utrecht University, The NetherlandsEpaminondas Kapetanios University of Westminster, UKZoubida Kedad UVSQ, FranceEric Kergosien GERiiCO, University of Lille, FranceChristian Kop University of Klagenfurt, AustriaValia Kordoni Saarland University, GermanyLeila Kosseim Concordia University, CanadaMathieu Lafourcade LIRMM, FranceEls Lefever Ghent University, BelgiumJochen Leidner Thomson Reuters, USAJohannes Leveling Elsevier, Amsterdam, The NetherlandsDeryle W. Lonsdale Brigham Young University, USACédric Lopez VISEO – Objet Direct, FranceJohn McCrae CITEC, Universität Bielefeld, GermanyFarid Meziane Salford University, UKElisabeth Métais CNAM, FranceMarie-Jean Meurs UQAM, Montreal, CanadaLuisa Mich University of Trento, ItalyClaudiu Mihaila University of Manchester, UKShamima Mithun Concordia University, CanadaAndres Montoyo Universidad de Alicante, SpainAndrea Moro Università di Roma La Sapienza, ItalyRafael Muñoz Universidad de Alicante, SpainAhmed Ragab Nabhan Faculty of Computers and Information, Fayoum
University, EgyptJan Odijk Utrecht University, The NetherlandsJim O’Shea Manchester Metropolitan University, UKAlexander Panchenko TU Darmstadt, GermanySimone Paolo Ponzetto University of Mannheim, GermanyHeiko Paulheim University of Mannheim, GermanyDavide Picca UNIL, SwitzerlandPascal Poncelet LIRMM Montpellier, FranceViolaine Prince LIRMM, FranceGábor Prószéky MorphoLogic, HungaryBehrang Qasemizadeh NUI Galway, IrelandShaolin Qu Michigan State University, USAReinhard Rapp Mainz, Germany
VIII Organization

Martin Riedl TU Darmstadt, GermanyMathieu Roche Cirad, TETIS, FranceMike Rosner University of Malta, MaltaPaolo Rosso NLEL València, SpainPatrick Saint Dizier IRIT-CNRS, FranceMohamad Saraee University of Salford, UKBahar Sateli Concordia University, CanadaKhaled Shaalan The British University in Dubai, UAERoman Schneider IDS Mannheim, GermanyMax Silberztein Université de Franche-Comté, FranceVeda Storey Georgia State University, USAVijayan Sugumaran Oakland University Rochester, USAMaguelonne Teisseire Irstea, TETIS, FranceBernhard Thalheim Kiel University, GermanyKrishnaprasad Thirunarayan Wright State University, USAJuan Carlos Trujillo Universidad de Alicante, SpainDan Tufis RACAI, Bucharest, RomaniaChristina Unger CITEC, Universität Bielefeld, GermanySunil Vadera University of Salford, UKPanos Vassiliadis University of Ioannina, GreeceTonio Wandmacher IRT SystemX, Saclay, FranceFeiyu Xu DFKI Saarbrücken, GermanyWlodek Zadrozny UNCC, USAFabio Massimo Zanzotto University of Rome Tor Vergata, ItalyTorsten Zesch University of Duisburg-Essen, GermanyErqiang Zhou University of Electronic Science and Technology,
ChinaMichael Zock CNRS-LIF, France
Organization IX
Contents
Full Papers
A Methodology for Biomedical Ontology Reuse . . . . . . . . . . . . . . . . . . . . . 3Nur Zareen Zulkarnain, Farid Meziane, and Gillian Crofts
Tamil Morphological Analyzer Using Support Vector Machines . . . . . . . . . . 15T. Mokanarangan, T. Pranavan, U. Megala, N. Nilusija, G. Dias,S. Jayasena, and S. Ranathunga
The Role of Community Acceptance in Assessing Ontology Quality . . . . . . . 24Melinda McDaniel, Veda C. Storey, and Vijayan Sugumaran
How to Complete Customer Requirements: Using Concept Expansionfor Requirement Refinement . . . . . . . . . . . . . . . . . . . . . . . . . . . . . . . . . . . 37
Michaela Geierhos and Frederik Simon Bäumer
An Information Gain-Driven Feature Study for Aspect-BasedSentiment Analysis . . . . . . . . . . . . . . . . . . . . . . . . . . . . . . . . . . . . . . . . . 48
Kim Schouten, Flavius Frasincar, and Rommert Dekker
ESSOT: An Expert Supporting System for Ontology Translation . . . . . . . . . 60Mihael Arcan, Mauro Dragoni, and Paul Buitelaar
Adapting Semantic Spreading Activation to Entity Linking in Text . . . . . . . . 74Farhad Nooralahzadeh, Cédric Lopez, Elena Cabrio, Fabien Gandon,and Frédérique Segond
Evaluating Multiple Summaries Without Human Models:A First Experiment with a Trivergent Model . . . . . . . . . . . . . . . . . . . . . . . 91
Luis Adrián Cabrera-Diego, Juan-Manuel Torres-Moreno,and Barthélémy Durette
PatEx: Pattern Oriented RDF Graphs Exploration . . . . . . . . . . . . . . . . . . . . 102Hanane Ouksili, Zoubida Kedad, Stéphane Lopes, and Sylvaine Nugier
Multilingual Protest Event Data Collection with GATE . . . . . . . . . . . . . . . . 115Vera Danilova, Svetlana Popova, and Mikhail Alexandrov
A Multi-lingual Approach to Improve Passage Retrieval for AutomaticQuestion Answering . . . . . . . . . . . . . . . . . . . . . . . . . . . . . . . . . . . . . . . . 127
Nouha Othman and Rim Faiz
Information Extraction on Weather Forecasts with Semantic Technologies . . . 140Angel L. Garrido, María G. Buey, Gema Muñoz,and José-Luis Casado-Rubio
Keyword Identification Using Text Graphlet Patterns. . . . . . . . . . . . . . . . . . 152Ahmed Ragab Nabhan and Khaled Shaalan
Disentangling the Structure of Tables in Scientific Literature . . . . . . . . . . . . 162Nikola Milosevic, Cassie Gregson, Robert Hernandez,and Goran Nenadic
Extracting and Representing Higher Order Predicate Relationsbetween Concepts . . . . . . . . . . . . . . . . . . . . . . . . . . . . . . . . . . . . . . . . . . 175
Sanjay Chatterji, Nitish Varshney, Parnab Kumar Chanda,Vibhor Mittal, and Bhavi Bhagwan Jagwani
Towards Evaluating the Impact of Anaphora Resolution on TextSummarisation from a Human Perspective . . . . . . . . . . . . . . . . . . . . . . . . . 187
Mostafa Bayomi, Killian Levacher, M. Rami Ghorab, Peter Lavin,Alexander O’Connor, and Séamus Lawless
An LDA-Based Approach to Scientific Paper Recommendation . . . . . . . . . . 200Maha Amami, Gabriella Pasi, Fabio Stella, and Rim Faiz
Short Papers
Topic Shifts in StackOverflow: Ask it Like Socrates . . . . . . . . . . . . . . . . . . 213Toni Gruetze, Ralf Krestel, and Felix Naumann
Semantic-Syntactic Word Valence Vectors for Building a Taxonomy. . . . . . . 222Oleksandr Marchenko
Generating Tailored Classification Schemas for German Patents . . . . . . . . . . 230Oliver Pimas, Stefan Klampfl, Thomas Kohl, Roman Kern,and Mark Kröll
A Platform Based ANLP Tools for the Construction of an ArabicHistorical Dictionary . . . . . . . . . . . . . . . . . . . . . . . . . . . . . . . . . . . . . . . . 239
Faten Khalfallah, Handi Msadak, Chafik Aloulou,and Lamia Hadrich Belguith
Extracting Knowledge Using Wikipedia Semi-structured Resources . . . . . . . . 249Nazanin Firoozeh
Mixing Crowdsourcing and Graph Propagation to Build a SentimentLexicon: Feelings Are Contagious. . . . . . . . . . . . . . . . . . . . . . . . . . . . . . . 258
Mathieu Lafourcade, Nathalie Le Brun, and Alain Joubert
XII Contents
Comparing Two Strategies for Query Expansion in a NewsMonitoring System . . . . . . . . . . . . . . . . . . . . . . . . . . . . . . . . . . . . . . . . . 267
Parvaz Mahdabi and Andrei Popescu-Belis
An Active Ingredients Entity Recogniser System Based on Profiles . . . . . . . . 276Isabel Moreno, Paloma Moreda, and M.T. Romá-Ferri
Improving the Sentiment Analysis Process of Spanish Tweets with BM25 . . . 285Juan Sixto, Aitor Almeida, and Diego López-de-Ipiña
Validating Learning Outcomes of an E-Learning System Using NLP. . . . . . . 292Eiman Aeiad and Farid Meziane
Aspects from Appraisals!! A Label Propagation with Prior InductionApproach . . . . . . . . . . . . . . . . . . . . . . . . . . . . . . . . . . . . . . . . . . . . . . . . 301
Nitin Ramrakhiyani, Sachin Pawar, Girish K. Palshikar,and Manoj Apte
Mining Hidden Knowledge from the Counterterrorism DatasetUsing Graph-Based Approach. . . . . . . . . . . . . . . . . . . . . . . . . . . . . . . . . . 310
Kishlay Jha and Wei Jin
An Empirical Assessment of Citation Information in ScientificSummarization . . . . . . . . . . . . . . . . . . . . . . . . . . . . . . . . . . . . . . . . . . . . 318
Francesco Ronzano and Horacio Saggion
PIRAT: A Personalized Information Retrieval System in Arabic TextsBased on a Hybrid Representation of a User Profile . . . . . . . . . . . . . . . . . . 326
Houssem Safi, Maher Jaoua, and Lamia Hadrich Belguith
YATS: Yet Another Text Simplifier . . . . . . . . . . . . . . . . . . . . . . . . . . . . . 335Daniel Ferrés, Montserrat Marimon, Horacio Saggion,and Ahmed AbuRa’ed
Are Deep Learning Approaches Suitable for Natural Language Processing? . . . 343S. Alshahrani and E. Kapetanios
An Approach to Analyse a Hashtag-Based Topic Thread in Twitter. . . . . . . . 350Ekaterina Shabunina, Stefania Marrara, and Gabriella Pasi
Identification of Occupation Mentions in Clinical Narratives. . . . . . . . . . . . . 359Azad Dehghan, Tom Liptrot, Daniel Tibble, Matthew Barker-Hewitt,and Goran Nenadic
Multi-objective Word Sense Induction Using Content and InterlinkConnections . . . . . . . . . . . . . . . . . . . . . . . . . . . . . . . . . . . . . . . . . . . . . . 366
Sudipta Acharya, Asif Ekbal, Sriparna Saha, Prabhakaran Santhanam,Jose G. Moreno, and Gaël Dias
Contents XIII

Re-expressing Business Processes Information from Corporate Documentsinto Controlled Language . . . . . . . . . . . . . . . . . . . . . . . . . . . . . . . . . . . . . 376
Bell Manrique-Losada, Carlos M. Zapata-Jaramillo,and Diego A. Burgos
Using Semantic Frames for Automatic Annotation of Regulatory Texts . . . . . 384Kartik Asooja, Georgeta Bordea, and Paul Buitelaar
Automatic Evaluation of a Summary’s Linguistic Quality. . . . . . . . . . . . . . . 392Samira Ellouze, Maher Jaoua, and Lamia Hadrich Belguith
Poster Papers
Extracting Formal Models from Normative Texts . . . . . . . . . . . . . . . . . . . . 403John J. Camilleri, Normunds Gruzitis, and Gerardo Schneider
Sentiment Analysis in Arabic . . . . . . . . . . . . . . . . . . . . . . . . . . . . . . . . . . 409Sanjeera Siddiqui, Azza Abdel Monem, and Khaled Shaalan
Automatic Creation of Ontology Using a Lexical Database: An Applicationfor the Energy Sector. . . . . . . . . . . . . . . . . . . . . . . . . . . . . . . . . . . . . . . . 415
Alexandra Moreira, Jugurta Lisboa Filho,and Alcione de Paiva Oliveira
Computer-Generated Text Detection Using Machine Learning:A Systematic Review . . . . . . . . . . . . . . . . . . . . . . . . . . . . . . . . . . . . . . . 421
Daria Beresneva
Sentiment Analysis for German Facebook Pages . . . . . . . . . . . . . . . . . . . . . 427Florian Steinbauer and Mark Kröll
An Information Retrieval Based Approach for MultilingualOntology Matching . . . . . . . . . . . . . . . . . . . . . . . . . . . . . . . . . . . . . . . . . 433
Andi Rexha, Mauro Dragoni, Roman Kern, and Mark Kröll
Automatic Text Summarization with a Reduced VocabularyUsing Continuous Space Vectors . . . . . . . . . . . . . . . . . . . . . . . . . . . . . . . 440
Elvys Linhares Pontes, Stéphane Huet, Juan-Manuel Torres-Moreno,and Andréa Carneiro Linhares
A Platform for the Conceptualization of Arabic Texts Dedicatedto the Design of the UML Class Diagram . . . . . . . . . . . . . . . . . . . . . . . . . 447
Kheira Zineb Bousmaha, Mustapha Kamel Rahmouni,Belkacem Kouninef, and Lamia Hadrich Belguith
Reversing the Polarity with Emoticons. . . . . . . . . . . . . . . . . . . . . . . . . . . . 453Phoey Lee Teh, Paul Rayson, Irina Pak, Scott Piao, and Seow Mei Yeng
XIV Contents

Spatial-Temporal Representation and Reasoning About Objectsand Regions . . . . . . . . . . . . . . . . . . . . . . . . . . . . . . . . . . . . . . . . . . . . . . 459
Aldjia Aider, Fatiha Mamache, and Fatma-Zohra Belkredim
Bias Based Navigation for News Articles and Media . . . . . . . . . . . . . . . . . . 465Anish Anil Patankar and Joy Bose
Learning to Rank Entity Relatedness Through Embedding-Based Features . . . 471Pierpaolo Basile, Annalina Caputo, Gaetano Rossiello,and Giovanni Semeraro
Arabic Quranic Search Tool Based on Ontology . . . . . . . . . . . . . . . . . . . . . 478Mohammad Alqahtani and Eric Atwell
Author Index . . . . . . . . . . . . . . . . . . . . . . . . . . . . . . . . . . . . . . . . . . . . 487
Contents XV

Full Papers

A Methodology for Biomedical Ontology Reuse
Nur Zareen Zulkarnain1(B), Farid Meziane1, and Gillian Crofts2
1 School of Computing, Science and Engineering, Informatics Research Centre,University of Salford, Salford M5 4WT, UK
[email protected], [email protected] School of Health Science, University of Salford, Salford M6 6PU, UK
Abstract. The abundance of biomedical ontologies is beneficial to thedevelopment of biomedical related systems. However, existing biomed-ical ontologies such as the National Cancer Institute Thesaurus (NCIT),Foundational Model of Anatomy (FMA) and Systematized Nomencla-ture of Medicine-Clinical Terms (SNOMED CT) are often too large to beimplemented in a particular system and cause unnecessary high usage ofmemory and slow down the system’s processing time. Developing a newontology from scratch just for the use of a particular system is deemed asinefficient since it requires additional time and causes redundancy. Thus,a potentially better method is by reusing existing ontologies. However,currently there are no specific methods or tools for reusing ontologies.This paper aims to provide readers with a step by step method in reusingontologies together with the tools that can be used to ease the process.
Keywords: Ontology · Ontology reuse · Biomedical ontology ·BioPortal
1 Introduction
Biomedical systems are an integral part of today’s medical world. Systems suchas electronic patient records and clinical decision support systems (CDSS) haveplayed an important role in assisting the works of medical personnel. One areathat could benefit from the development of biomedical systems is ultrasoundreporting. In ultrasound, reports generated have more value compared to theimage captured during the examination [2]. Variations in ultrasound reportingimpacts the way a report is interpreted as well as in decision making. Thus,the standardization of these reports is important. In order to achieve this goal,ontologies are used to understand the reports and structure them according toa certain format [16] as well as recognizing the relationships between the partsof the text composing the report.
General and established domains such as medicine have existing ontologiesthat cover the general concepts in the domain. Examples of these ontologiesinclude the National Cancer Institute Thesaurus (NCIT), Foundational Model
c© Springer International Publishing Switzerland 2016E. Metais et al. (Eds.): NLDB 2016, LNCS 9612, pp. 3–14, 2016.DOI: 10.1007/978-3-319-41754-7 1

4 N.Z. Zulkarnain et al.
of Anatomy (FMA) and Systematized Nomenclature of Medicine-Clinical Terms(SNOMED CT). These ontologies however are often too large to be manipu-lated or processed in a specific application. Thus, a domain specific ontologyis needed to solve this problem. Building a new domain specific ontology fromscratch would not be efficient since this will cause redundancy and takes a lotof time. Thus, ontology reuse has been potentially seen as a better alternative.This paper discusses how ontology reuse has been done before and proposes amethodology to reuse ontologies together with the existing tools that can be usedto ease the reuse process. The development of the Abdominal Ultrasound Ontol-ogy (AUO) as the knowledge base for an ultrasound reporting system developedby Zulkarnain et al. [16] is used in this paper to explain the proposed ontologyreuse methodology.
2 Related Work
Ontology reuse can be defined as a process where a small portion of existingontologies is taken as an input to build a new one [3]. The process of reusinglarge existing ontologies allows their use without slowing down the process ofan application. Ontology reuse also increases interoperability [14]. Indeed, whenan ontology is reused by several other new ontologies, interoperability betweenthese ontologies can be achieved much easier since they share several featuressuch as classes naming method and concept modelling.
Even though ontology reuse brings a lot of benefits, there are currently notools that provide adequate support for the ontology reuse process [8,14] whichhinders the effort of ontology reuse. There is also no one specific method agreedin reusing ontologies. Even so, most ontology reuse methodologies that havebeen used in previous works [1,4,5,11,12,14,15] falls along the line of thesefour steps: (i) Ontology selection for reuse, (ii) Concept selection, (iii) Conceptcustomization and (iv) Ontology integration.
The first step for ontology reuse is to select the ontology to be reused. Ontol-ogy selection is done according to several criteria according to the needs of thenew ontology, for example the language of the ontology, its comprehensivenessand its reasoning capabilities. Once the ontology for reuse is chosen, the next stepwould be to select the concepts that would be reused. One or several ontologiescan be selected for reuse depending on the needs of the new ontology. Russ et al.[11] in their work merged two aircraft ontologies where most of its concepts wereselected to develop a broader aircraft ontology. Shah et al. [12] on the other handreused just one ontology; SNOMED CT where he selected the concepts neededthen adds other relevant concepts not included in SNOMED CT.
Concepts selected are then translated into the same semantic language andthen merged. In Caldarola et al.’s work [4] this includes manually translatingmetadata to better understand concepts. Alani [1] in developing his ontology hasmerged several ontologies that contain different properties for one same conceptwhich resulted in additional knowledge representation. Several different conceptshave also been selected from different ontologies which are then compared andmerged. Finally, the ontology will be integrated into the system or application.

A Methodology for Biomedical Ontology Reuse 5
In this research, these four steps serve as a guideline in developing an ontologyreuse methodology for the biomedical domain. The methodology proposed inthis research will allow for the ontology to be reused from multiple existingontologies and suggest tools that would help in each step of the methodology.The ontology developed, Abdominal Ultrasound Ontology (AUO), will servetwo purposes in this research: (i) it will be used to standardize the developmentof ultrasound reports and enforce the use of standard terminology and (ii) toanalyse the reports written in Natural Language (English free-text) with the aimof automatically transforming them into a structured format.
3 The Proposed Methodology
In developing a new ontology by reusing existing biomedical ones, proper plan-ning and execution are important in order to ensure the modularity of the con-cepts reused. Thus, the ontology reuse methodology developed in this paper,adopted the general four steps mentioned in Sect. 2 and summarised in Fig. 1.
Fig. 1. Ontology reuse methodology
3.1 Term Extraction
The first step in ontology reuse or even in developing one from scratch is to decideon its scope and domain. In this case of developing the Abdominal UltrasoundOntology (AUO), the scope and domain of the ontology is abdominal ultra-sound. 49 sample ultrasound reports have been collected and used as the basisof our ontology corpus. These sample reports were obtained from the RadiologyDepartments in a large NHS Trust incorporating 4 regionally based hospitals inManchester and Salford. Once we have our corpus, the next step is to extractrelevant terms from the corpus to generate a list of terms for reuse. Two biomed-ical term extraction applications; (i) TerMine1 and (ii) BioTex2 have been used1 http://www.nactem.ac.uk/software/termine.2 http://tubo.lirmm.fr/biotex/.

6 N.Z. Zulkarnain et al.
Table 1. Comparison of biomedical term extraction using TerMine and BioTex
TerMine BioTex
Language English English
License Open Open
POS Tagger GENIA Tagger/Tree Tagger Tree Tagger
Terms found 241 (GENIA Tagger) 761
232 (Tree Tagger)
Extraction type Multi-word extraction Multi-word and single-wordextraction
for the extraction. All 49 sample reports were submitted to both applicationsand the results are shown in Table 1.
From this comparison, BioTex was chosen as the better biomedical termextractor in this research because of its ability to extract more terms comparedto TerMine. BioTex is an automatic term recognition and extraction applicationthat allows for both multi-word and single-word extraction [7]. It is importantthat the term extractor is able to extract not only multi-word but also single-word terms.
For example, if the sentence “Unremarkable appearances of the liver withno intrahepatic lesions” was submitted to both applications, TerMine will onlyextract two multi-word terms “Unremarkable appearance” and “intrahepaticlesion” while BioTex will extract not only the two multi-word terms but also“liver” which is a single word term. If single-word terms such as “liver”, “kidney”and “spleen” were not extracted, the ontology developed would be incomplete.Terms which are extracted from BioTex were also validated using the UnifiedMedical Language System (UMLS) [7] which is a set of documents containinghealth and biomedical vocabularies and standards.
3.2 Ontology Recommendation
The next step after obtaining a list of terms for ontology reuse would be toselect the suitable ontology to be reused. Three important criteria were used forselecting the ontology in this research: (i) Ontology coverage - To which extenddoes the ontology covers the terms extracted from the corpus? (ii) Ontologyacceptance - Is the ontology being accepted in the medical field and how often isit used? and (iii) Ontology language - Is the ontology written in OWL, OBO orother semantic languages? Initial review resulted in choosing FMA, SNOMED-CT and RadLex as suitable candidates because of their domain coverage, accep-tance in the biomedical community and language which is OWL. In order toverify this, an ontology recommender was developed using BioPortal’s ontologyrecommender API3 which is an open ontology library that contains ontologieswith domains that range from anatomy, phenotype and chemistry to experimen-tal conditions [10].
3 http://bioportal.bioontology.org.

A Methodology for Biomedical Ontology Reuse 7
Fig. 2. BioPortal’s ontology recommender
BioPortal has an ontology recommender available on its portal that can beused to obtain suggestions on suitable ontology to be reused for certain corpus.The ontology recommender makes a decision according to the following threecriteria: (i) Coverage - Which ontology provides most coverage to the inputtext?, (ii) Connectivity - How often the ontology is mapped by other ontologies?and (iii) Size - Number of concepts in the ontology [6]. When a list of terms issubmitted to the recommender, it will give a recommendation of 25 ontologieswhich are ranked from the highest to lowest scores (see Fig. 2). The final scoreis calculated based on the following formula:
FinalScore =(CoverageScore ∗ 0.55) + (AcceptanceScore ∗ 0.15)
+ (KnowledgeDetailScore ∗ 0.15) + (SpecializationScore ∗ 0.15) (1)
The coverage score is given based on the number of terms in the input thatare covered by the ontology. The acceptance score indicates how well-known andtrusted the ontology is in the biomedical field. Knowledge detail score on theother hand indicates the level of details in the ontology; i.e. does the ontologyhave definitions, synonym or other details. Specialization score is given based onhow well the ontology covers the domain of the input. An example is given inFig. 2 where 21 terms where submitted. There is however a limitation in usingit on the portal whereby it only allows for 500 words to be submitted. This lim-itation has prompted us to develop our own recommender by manipulating thedata from BioPortal’s ontology recommender API. We first develop the recom-mender that would give 25 ontology recommendations just like how it would bein the BioPortal’s recommender. However, it seems that 761 terms were too bigfor the recommender’s server to handle. Because of this, a recommender thatwould suggest ontology for each term was developed.

8 N.Z. Zulkarnain et al.
A list of terms, in this case the 761 terms that have been extracted, aresubmitted to the algorithm that would submit each term to BioPortal’s recom-mender and get ontology recommendations for each term. Then, the frequency ofeach ontology recommended will be counted and sorted from highest to lowest.The recommender has ranked NCI Thesaurus as the ontology with the high-est frequency (341) followed by SNOMED CT (140) and RadLex (37). Figure 3shows an excerpt of the result from processing 761 terms using the recommenderwe have developed.
Fig. 3. (a) Ontology recommendation for each term, (b) Ranking of ontology recom-mended
3.3 Term to Concept Mapping
Once the ontology for reuse has been selected, the next step in building theabdominal ultrasound ontology is to map the terms extracted to concepts in theontology which is done by referring to the result from BioPortal’s Search API.The API allows us to insert several parameters to perform concept search whichin this case, the parameters used are “q” to specify the term that we would liketo search for, and “ontologies” which specifies the ontology where we would liketo look for the term. Once these parameters have been submitted, the API willreturn a concept if there is a match with the term submitted. The concept willbe returned with several other properties such as the preferred label, definition,synonym, match type and the terms relationship with its children, descendant,parents and ancestors.
In previous works by Mejino et al. [9] and Shah et al. [13], term to con-cept mapping was done by referring to the existing ontology and mapping itinto the new one by deleting and adding concepts in the ontology to make itcomplete. Using BioPortal’s API consumes less time and work as the terms arequeried according to the provided parameters. This will also ensure the accuracy

A Methodology for Biomedical Ontology Reuse 9
of the relationship between concepts and its children, descendant, parents andancestors since there are links that can be clearly seen in the API result.
There was an intention to auto populate these data into Protege (the OWLeditor that was used in this research) by taking advantage of the option of savingthe results in XML compared to JSON. However, there are two reasons why thisis not possible at the moment. The first reason was that data from the API doesnot give the complete properties of a concept. For example, parents and ancestorswere provided as links which makes it hard for the data to be manipulatedsince the properties of the parents and ancestors can only be obtained afterthe link is visited. The second reason is there are terms which matched severalconcepts in the ontology. For example, the term “calculus” could mean “branch ofmathematics concerned with calculation” or “an abnormal concretion occurringmostly in the urinary and biliary tracts, usually composed of mineral salts”.Thus, it is important to know in which context it is being used in order to adoptthe correct meaning.
Fig. 4. Term to concept mapping guide
In deciding whether a term should be reused or not, the term to conceptmapping guide (see Fig. 4) was used. Firstly, a term from the term list will bequeried using the Search API in the ontology with the highest frequency whichin this case is NCIT. If there is a match, we will see whether the match is apreferred label, synonym or partial match. A preferred label (PrefLabel) matchmeans that the API found a concept that has an exact match to the term whilesynonym match means that the term is found as a synonym to the concept.Partial match on the other hand means that there is no exact match for the termbut there are at least two concepts that match the term. For example, for theterm “intrahepatic biliary”, there are no concepts that match the term exactly.
10 N.Z. Zulkarnain et al.
However, there is the concept “intrahepatic” which is an anatomy qualifier inNCIT and the concept “duct” in NCIT which is an organ that matches.
If the match is a PrefLabel or synonym match, the concept will be reused.If the match is partial, the concepts that make up the term will also be reused.However, the term would still remain in the term list so that it could be comparedto concepts in other ontologies. After the concept has been reused, we will findout if the term has a parent or ancestors. If there is, the parent or ancestorswill also be reused. Once all terms have been searched, this process will then berepeated for the remaining recommended ontologies.
In this research, all terms are first searched in NCIT followed by SNOMEDCT and RadLex. The Abdominal Ultrasound Ontology modelling follows themodelling of NCIT since it is the main ontology being reused. When merg-ing ontologies from SNOMED CT and RadLex into the ontologies reused fromNCIT, we would first find a parent that would be suitable for the concept. If nosuch parent exists, the parent and ancestors of the concept will then be reused.This is done to ensure the modularity of the ontology developed. If no match isfound in any of these ontologies, a new concept will then be created with thehelp of domain experts. The main objective of using this ontology reuse method-ology is to achieve as much coverage as possible and reduce the need for domainexperts in developing the ontology.
3.4 Ontology Evaluation by Domain Expert
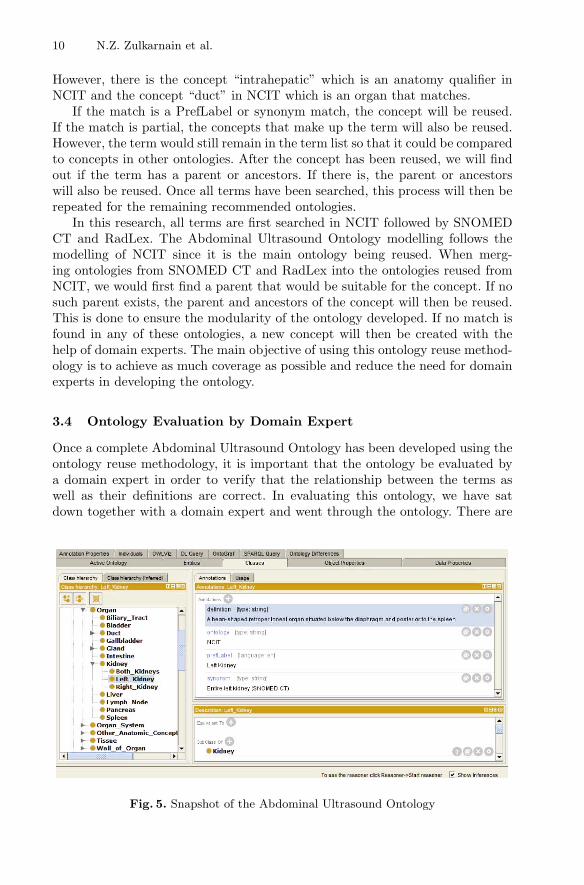
Once a complete Abdominal Ultrasound Ontology has been developed using theontology reuse methodology, it is important that the ontology be evaluated bya domain expert in order to verify that the relationship between the terms aswell as their definitions are correct. In evaluating this ontology, we have satdown together with a domain expert and went through the ontology. There are
Fig. 5. Snapshot of the Abdominal Ultrasound Ontology

A Methodology for Biomedical Ontology Reuse 11
some corrections that need to be done but overall, the domain expert believesthat the 92.6 % ontology coverage is enough to cover all the important conceptsthat an abdominal ultrasound report would need. For the other 7.4 % terms thathave no match in the ontology, some of it were caused by human error wherebyspelling mistakes were made by the reporter. As for the rest of it, the domainexpert will help in giving definitions and suggestions on where it would fit inthe ontology. Out of the 7.4 % terms that have no match in the ontology, thereare also several terms that the domain expert believes we can omit since thesewords should not be in an ultrasound report for good practice. Examples of suchwords are “comet tail”, “NAD”, and “hepatopetal”. Figure 5 shows a snapshotof the complete Abdominal Ultrasound Ontology.
4 Result and Discussion
The ontology reuse methodology used to develop the Abdominal UltrasoundOntology (AUO) has given the highest number of concept match compared tousing only one ontology. This can be proved by performing a term to conceptmatching using the 761 terms extracted from the sample ultrasound report cor-pus. Figure 6 shows the comparison of total matches according to type (PrefLabelmatch, synonym match, partial match and no match) between NCIT, SNOMEDCT and AUO. Between NCIT and SNOMED CT, NCIT has the higher conceptmatch total with 151 PrefLabel matches, 79 synonyms matches and 438 par-tial matches. SNOMED CT on the other hand has only 98 PrefLabel matches,
Fig. 6. Breakdown of total match according to type against NCIT, SNOMED CT andAbdominal Ultrasound Ontology (AUO) (Color figure online)
12 N.Z. Zulkarnain et al.
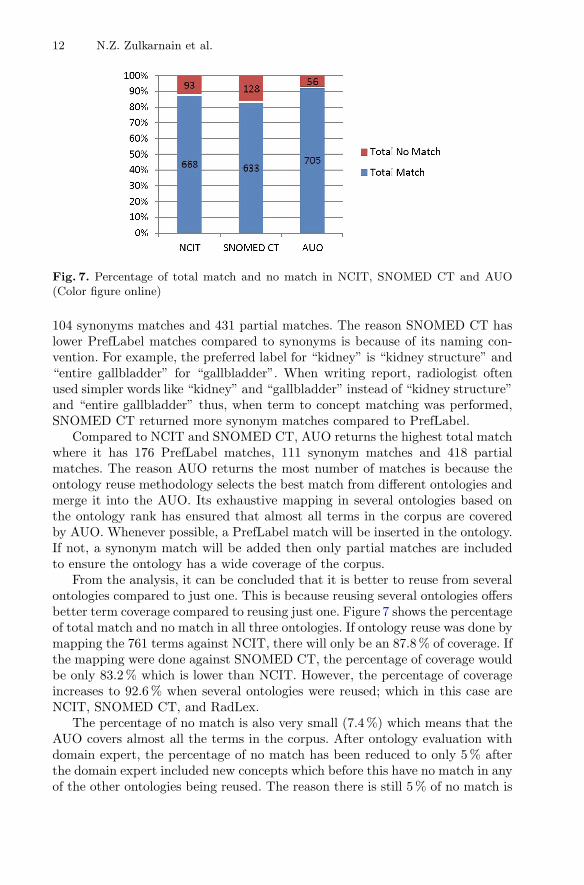
Fig. 7. Percentage of total match and no match in NCIT, SNOMED CT and AUO(Color figure online)
104 synonyms matches and 431 partial matches. The reason SNOMED CT haslower PrefLabel matches compared to synonyms is because of its naming con-vention. For example, the preferred label for “kidney” is “kidney structure” and“entire gallbladder” for “gallbladder”. When writing report, radiologist oftenused simpler words like “kidney” and “gallbladder” instead of “kidney structure”and “entire gallbladder” thus, when term to concept matching was performed,SNOMED CT returned more synonym matches compared to PrefLabel.
Compared to NCIT and SNOMED CT, AUO returns the highest total matchwhere it has 176 PrefLabel matches, 111 synonym matches and 418 partialmatches. The reason AUO returns the most number of matches is because theontology reuse methodology selects the best match from different ontologies andmerge it into the AUO. Its exhaustive mapping in several ontologies based onthe ontology rank has ensured that almost all terms in the corpus are coveredby AUO. Whenever possible, a PrefLabel match will be inserted in the ontology.If not, a synonym match will be added then only partial matches are includedto ensure the ontology has a wide coverage of the corpus.
From the analysis, it can be concluded that it is better to reuse from severalontologies compared to just one. This is because reusing several ontologies offersbetter term coverage compared to reusing just one. Figure 7 shows the percentageof total match and no match in all three ontologies. If ontology reuse was done bymapping the 761 terms against NCIT, there will only be an 87.8 % of coverage. Ifthe mapping were done against SNOMED CT, the percentage of coverage wouldbe only 83.2 % which is lower than NCIT. However, the percentage of coverageincreases to 92.6 % when several ontologies were reused; which in this case areNCIT, SNOMED CT, and RadLex.
The percentage of no match is also very small (7.4 %) which means that theAUO covers almost all the terms in the corpus. After ontology evaluation withdomain expert, the percentage of no match has been reduced to only 5 % afterthe domain expert included new concepts which before this have no match in anyof the other ontologies being reused. The reason there is still 5 % of no match is
A Methodology for Biomedical Ontology Reuse 13
because there are several term in the corpus that the domain experts believe arepoor usage of terms to describe findings in an ultrasound report. The domainexpert believes that this is bad practice and the medical ultrasound experts arenow slowly cutting down the usage of such words thus making it irrelevant tobe in the AUO. Another reason for the 5 % of no match is spelling errors madeby ultrasound reporters. This is not a concern for now but for future work, wecould consider using the ontology to also correct and understand these errors.
NCIT has a total of 113,794 classes while SNOMED CT has 316,031 classes.However, there are only 668 and 633 matches respectively for each NCIT andSNOMED CT regarding abdominal ultrasound terminology. On the other hand,AUO has only 509 classes which is less than 0.5 % of either NCIT or SNOMEDCT but still managed to have 705 matches which is more than the matches NCITand SNOMED CT each gets. This is because of the specialization of the ontology.Since the ontology has an intended purpose in an application, it is much betterand more efficient to build a domain specific ontology through reuse. It definitelywould not be efficient to store a large ontology such as NCIT and SNOMED CTand use only less than 0.3 % of it. This is because it would take a lot of storagespace and it will also slow down the application since the application will need togo through the whole ontology to find a match. Thus the better way to developan ontology based application is to build a new domain specific ontology throughontology reuse methodology.
5 Conclusion
Ontology reuse can be beneficial in developing domain specific ontologies forapplication system whereby it reduces development time and redundancy. Thelack of proper methodology and tools in reusing ontology has hindered thiseffort. Thus, this paper proposed a methodology to reuse ontology together withsupporting tools that would make the ontology reuse process much easier. Thedevelopment of AUO using this methodology has proven that ontology reuse isbeneficial in developing a small domain specific ontology which has wide cover-age of the terminology used in the application system compared to using a largegeneral domain ontology. It is hoped that the proposed ontology reuse method-ology would encourage more usage of ontology in medical system without thedevelopment of similar domain ontologies that would cause redundancy.
References
1. Alani, H.: Position paper: ontology construction from online ontologies. In: Pro-ceedings of the 15th International Conference on World Wide Web, WWW 2006,pp. 491–495. ACM, New York (2006)
2. Boland, G.: Enhancing the radiology product: the value of voice-recognition tech-nology. Clin. Radiol. 62(11), 1127 (2007)
3. Bontas, E.P., Mochol, M., Tolksdorf, R.: Case studies on ontology reuse. In: Pro-ceedings of the 5th International Conference on Knowledge Management IKNOW2005 (2005)
14 N.Z. Zulkarnain et al.
4. Caldarola, E.G., Picariello, A., Rinaldi, A.M.: An approach to ontology integrationfor ontology reuse in knowledge based digital ecosystems. In: Proceedings of the7th International Conference on Management of Computational and CollectiveIntElligence in Digital EcoSystems, pp. 1–8. ACM (2015)
5. Capellades, M.A.: Assessment of reusability of ontologies: a practical example. In:Proceedings of AAAI 1999 Workshop on Ontology Management, pp. 74–79. AAAIPress (1999)
6. Jonquet, C., Musen, M.A., Shah, N.H.: Building a biomedical ontology recom-mender web service. J. Biomed. Semant. 1(S1), 1 (2010)
7. Lossio-Ventura, J.A., Jonquet, C., Roche, M., Teisseire, M.: Biotex: a system forbiomedical terminology extraction, ranking, and validation. In: 13th InternationalSemantic Web Conference (2014)
8. Maedche, A., Motik, B., Stojanovic, L., Studer, R., Volz, R.: An infrastructure forsearching, reusing and evolving distributed ontologies. In: Proceedings of the 12thInternational Conference on World Wide Web, WWW 2003, pp. 439–448. ACM,New York (2003)
9. Mejino Jr., J.L., Rubin, D.L., Brinkley, J.F.: FMA-RadLex: an application ontologyof radiological anatomy derived from the foundational model of anatomy referenceontology. In: AMIA Annual Symposium Proceedings, vol. 2008, p. 465. AmericanMedical Informatics Association (2008)
10. Noy, N.F., Shah, N.H., Whetzel, P.L., Dai, B., Dorf, M., Griffith, N., Jonquet, C.,Rubin, D.L., Storey, M.-A., Chute, C.G., et al.: Bioportal: ontologies and integrateddata resources at the click of a mouse. Nucleic acids research, pp. W170–W173(2009)
11. Russ, T., Valente, A., MacGregor, R., Swartout, W.: Practical experiences in trad-ing off ontology usability and reusability. In: Proceedings of the 12th Workshopon Knowledge Acquisition, Modeling and Management (KAW 1999), pp. 16–21(1999)
12. Shah, T., Rabhi, F., Ray, P.: OSHCO: a cross-domain ontology for semantic inter-operability across medical and oral health domains. In: 2013 IEEE 15th Interna-tional Conference on e-Health Networking, Applications Services (Healthcom), pp.460–464, October 2013
13. Shah, T., Rabhi, F., Ray, P., Taylor, K.: A guiding framework for ontology reuse inthe biomedical domain. In: 2014 47th Hawaii International Conference on SystemSciences (HICSS), pp. 2878–2887. IEEE (2014)
14. Simperl, E.: Reusing ontologies on the semantic web: a feasibility study. Dataknowl. Eng. 68(10), 905–925 (2009)
15. Uschold, M., Clark, P., Healy, M., Williamson, K., Woods, S.: An experimentin ontology reuse. In: Proceedings of the 11th Knowledge Acquisition Workshop(1998)
16. Zulkarnain, N.Z., Crofts, G., Meziane, F.: An architecture to support ultrasoundreport generation and standardisation. In: Proceedings of the International Con-ference on Health Informatics, pp. 508–513 (2015)
All links were last followed on January 25, 2016.

Tamil Morphological Analyzer Using SupportVector Machines
T. Mokanarangan(&), T. Pranavan, U. Megala, N. Nilusija, G. Dias,S. Jayasena, and S. Ranathunga
Department of Computer Science Engineering, University of Moratuwa,Moratuwa, Sri Lanka
mokanarangan.11,pranavan.11,megala.11,nilu.11,gihan,
sanath,[email protected]
Abstract. Morphology is the process of analyzing the internal structure ofwords. Grammatical features and properties are used for this analysis. Like otherDravidian languages, Tamil is a highly agglutinative language with a richmorphology. Most of the current morphological analyzers for Tamil mainly usesegmentation to deconstruct the word to generate all possible candidates andthen either grammar rules or tagging mismatch is used during post processing toget the best candidate. This paper presents a morphological engine for Tamil thatuses grammar rules and an annotated corpus to get all possible candidates.A support vector machines classifier is employed to determine the most probablemorphological deconstruction for a given word. Lexical labels, respective fre-quency scores, average length and suffixes are used as features. The accuracy ofour system is 98.73 % and a F-measure of .943, which is more than the samereported by other similar research.
Keywords: Tamil Morphological analyzer Support vector machine Natural language processing Dravidian languages
1 Introduction
Morphological analysis is the process of segmentation of words into their componentmorphemes, and the assignment of grammatical morphemes to grammatical categoriesand lexical morphemes to lexemes [1]. Tamil language is morphologically rich andagglutinative. Each word is pinned with morphemes and during morphological con-struction, the original form of the word changes, hence making the morphologicaldeconstruction tough.
Morphological analysis is the basis for many natural language processing taskssuch as Named Entity Recognition, Part of Speech Tagging and Machine translation.Morphological analysis can provide a wealth of information. For Tamil in particular,like many other Dravidian languages, a good morphological analyzer can extract manyinformation about a word ranging from verb or noun to tense and gender due to its richmorphology.
Previous attempts on morphological analysis for Tamil have been made using threeapproaches: rule based, machine learning based, and hybrid approaches that combine
© Springer International Publishing Switzerland 2016E. Métais et al. (Eds.): NLDB 2016, LNCS 9612, pp. 15–23, 2016.DOI: 10.1007/978-3-319-41754-7_2

both the rule based and the machine learning approaches. This paper outlines anapproach that uses a morphological engine encompassing all grammar rules in Tamilthat generates all possible candidates for a word along with the Part of Speech(PoS) tags for each morpheme. These PoS tags, respective frequency scores, averagelength and suffixes are used as features in a Support Vector Machines (SVM) classifierto select the best candidate out of the candidate list.
Rest of the paper is organized as follows. The next section discusses the previousattempts on building morphological analyzers for Tamil. Third section describes ourapproach and the fourth section gives the evaluation results. Final section discussesfuture work and concludes the paper.
2 Related Work
First ever Tamil morphological analyzer was built by AU-KBC Research Centre in2003 [2]. Since then research on Tamil morphological analysis was continued in twodirections, using machine learning and using rule based approaches. Selvam andNatarajan [3] carried out research on morphological analysis and PoS tagging for Tamilusing a rule based approach via projection and induction techniques. Another mor-phological analyzer for Tamil was implemented using the sequence labelling basedmachine learning approach [4]. It was a supervised machine learning approach and acorpus with morphological information was used for training. Another approach usedthe open source platform apertium [5]. Apertium tool uses the computational algorithmcalled Finite State Transducers for one-pass analysis and generation, and the database isbased on the morphological model called Word and Paradigm. In a very recentresearch, a rule-based morphological analyzer was presented [6]. Researchers haveused a set of rules, a postposition suffix word list and a root word dictionary developedfrom classical Tamil text. Not considering all the grammar rules coupled with highambiguity has been the problem for this approach.
Our approach drew inspiration from morphological analyzers designed for two dif-ferent languages: first from an Arabic morphological analyzer [6]. In this approach, text isbroken down into each of the hundreds and thousands of possible lexical labels, whichrepresent their constituent elements including lemma ID and part-of-speech. Features arecomputed for each lexical token based on their local and document-level context. Basedon these features the support vector machines classifier is implemented to do the classi-fication. The second method was from a compound word splitting approach for German[7]. This approach introduced methods to learn splitting rules from monolingual andparallel corpora. These rules were then evaluated against a gold standard [7].
3 Our Approach
3.1 Outline
As show in the Fig. 1 the first step is to get all possible lexical units of a single wordand annotate each lexical unit with part of speech tags. In some cases one lexical unit
16 T. Mokanarangan et al.

can have more than one part of speech tag. For example (ōṭu) can mean ‘Roof’ and‘Run’. Morphological rules of Tamil can also affect the spelling of the root.
Consider the following example for the word (Transliteration - ōṭināṉ,Translation – ran) (Table 1).
In the next step, the annotated lexical labels along with other features were fed intothe SVM classifier. The SVM then predicts the best candidate for a certain word. Thereason to choose SVM over other available options such as multilayer perceptron andboosted is the best trade-off SVM provided between accuracy and training time. This isexplained in detail below in Sect. 4.
3.2 Data Sources
To generate all possible candidates, annotate with PoS labels for each lexical label, andto get the total frequency of each word, we used two sources: a lexicon corpus alongwith PoS annotations, and a list of high frequency words along with the frequencyscore for each word.
Fig. 1. Outline of the morphological analyzer
Table 1. All possible combinations for the word (transliteration - ōṭināṉ, translation –ran)
Tamil Morphological Analyzer Using Support Vector Machines 17

3.2.1 Annotated Tamil Lexicon CorpusAnnotated Tamil lexicon corpus was obtained from an online Tamil lexicon created byUniversity of Madras [10]. Initially this corpus had 16 different types of lexical labelsbut eventually we reduced to 5 types: verb, noun, adjective, adverb and other. Thepurpose of this reduction is to limit the possibilities of combinations of lexical labelsand hence reducing the amount of training data. Table 2 illustrates a sample of howwords and tags are stored.
3.2.2 High Frequency Words ListThe high frequency word list was built using the usage data obtained by crawling TamilWikipedia and other Tamil news websites. Each entry in this list has the word and theword count. Here the word count was used to calculate the frequency score.
3.3 Morphological Engine
Morphological Engine is the vital part in the system. Encompassing all the grammarrules regarding morphological construction, this engine generates all possible candi-dates along with their lexical labels. Some of the rules in morphological engine areshown in Fig. 2.
As illustrated in the diagram. The word (Transliteration: Kiliyai, Trans-lation: ‘the parrot’) can be deconstructed under two grammar rules:
Grammar rule 1: (Transliteration – “Uyir munn uyirpunarthal”, Translation: “Vowel on Vowel morphological construction”).
Grammar rule 2: (Transliteration – “Iyalpu punarchi”, Transla-tion: “Natural morphological construction”).
Based on the last letter of the first word and the first letter of the second word thegrammar rules define the morphological construction. To ensure that all grammar rulesand all types of morphological deconstruction is covered, two Tamil grammar books[9, 10] were followed to obtain 14 rules. Using these rules all the candidate are
Table 2. Lexicon words with tag
Word Tagn
n
v
18 T. Mokanarangan et al.

generated and then lexical labels. To get all the approaches a finite state machine thatuses brute force approach to get all possible combinations was implemented.
The word given in the diagram is relatively easy to deconstruct, now consider a com-plicated word: (Transliteration – Oodichchendran, Meaning – ‘He ran’).
All candidates possible for this is:
3.4 Classifier
3.4.1 Features Set
Frequency Based Scores
This frequency based approach was proposed by Koehn and Knight [8] to split com-pound words in German. The more frequent a word occurring in a training corpus, thebigger the statistical basis to estimate translation probabilities, and the more likely thecorrect translation probability distribution is learned. This insight leads to define asplitting metric based on word frequency [8].
Given the count of words in the corpus, the split S with the highest geometric meanof word frequencies of its parts pi (n being the number of parts) is selected. Herecount pið Þ is frequency count the word pi obtained from the high frequency words list.
argmaxsðY
pi2ScountðpiÞÞ
1n
Consider the following example:
Fig. 2. Grammar rules and morphological deconstruction
Tamil Morphological Analyzer Using Support Vector Machines 19

Lexical Labels
Other important feature set is the lexical labels generated by the morphological engine.The morphology engine has been developed for the particular case of Tamil and theparticular set of lexical labels. This tagging order gives more priority to more com-monly occurring patterns and indirectly covers more subtle grammar patterns in Tamil.
Suffix ( )
Tamil is a morphologically rich language with many morphemes pinned to each word.But in many cases, certain morphemes do not appear as suffixes for certain type ofwords. For example ‘ ’ suffix is not present in a verb. In retrospect, the model was fedwith the final suffix of a word as a feature to the system to differentiate verbs, adjective,adverbs and noun stem based words.
Average Length
This is a new feature that has not been tried in any previous approaches. When themodel was tried on with only the above mentioned features, it was found that for somecompound noun cases, the morphological deconstruction was going a step further.
Therefore, to eliminate this issue, we introduced a threshold feature called averagelength. It is obtained by calculating the average length of the lexical parts in thecandidate. This feature was found out based on the factor analysis carried out on thetraining data.
3.5 Training Data
Over 70,000 words were manually labelled and used as training data. Correct mor-phological disambiguation candidate was labelled as ‘Yes’ while mismatches werelabelled as ‘No’.
20 T. Mokanarangan et al.
3.6 Prediction
Using the training data, a probabilistic model was built using the SVM classifier. Thecandidates are then classified using the classifier and the one with highest probability ofclassified as ‘Yes’ is selected. This probabilistic model not only provides us with thebest candidate but also if there is ambiguity the top candidates are displayed. Thisfeature can come in handy while implementing a Part of Speech tagger for Tamil.
4 Evaluation Results
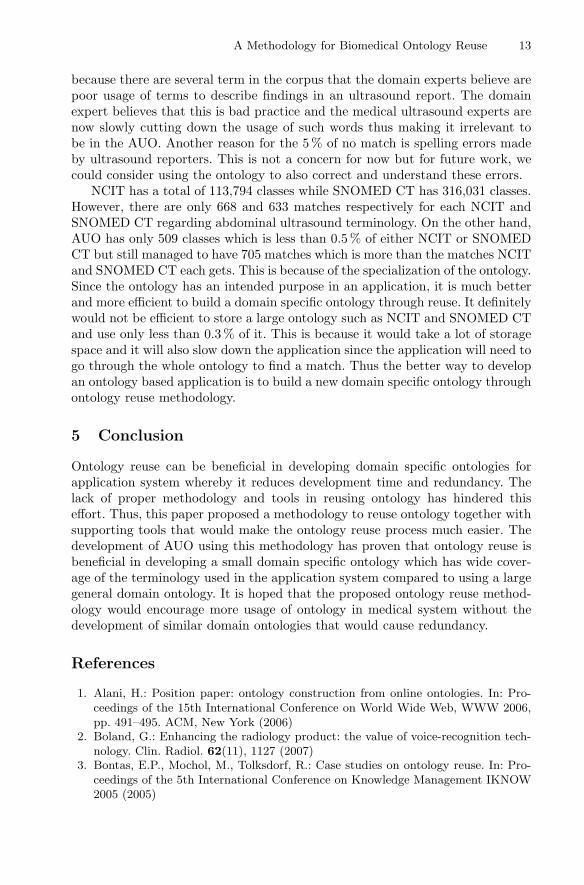
Upon generating all the candidates, the next step is to feed the data into the classifier toselect the best suitable candidate. We selected SVM because of the best trade-offbetween accuracy and time taken to build the model. Table 3 illustrates the comparisonof accuracies between various classifiers.
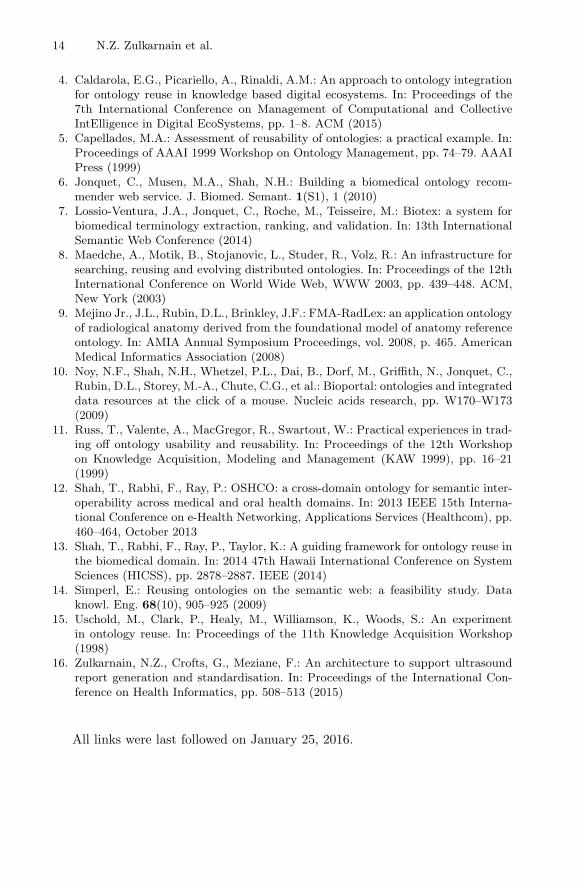
Table 4 illustrates the difference in accuracy by using average length and not usingaverage length as features.
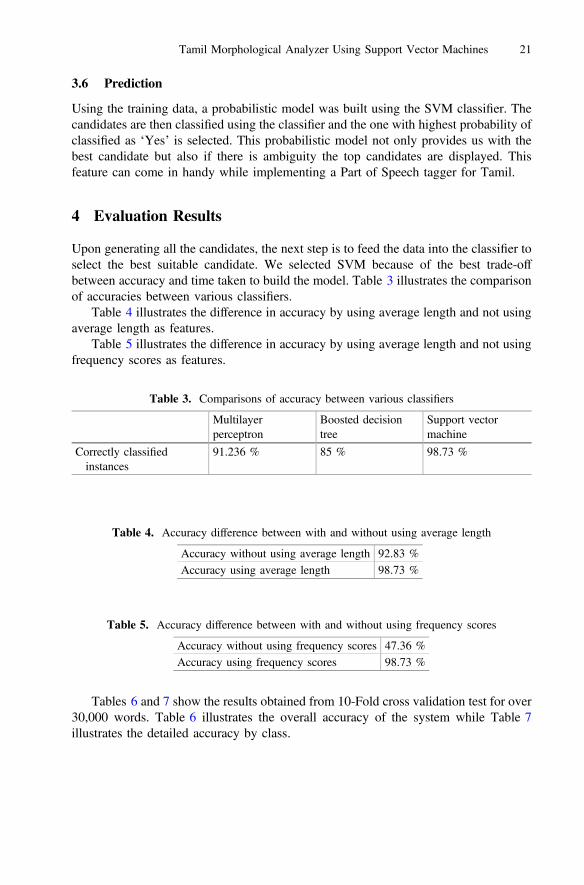
Table 5 illustrates the difference in accuracy by using average length and not usingfrequency scores as features.
Tables 6 and 7 show the results obtained from 10-Fold cross validation test for over30,000 words. Table 6 illustrates the overall accuracy of the system while Table 7illustrates the detailed accuracy by class.
Table 3. Comparisons of accuracy between various classifiers
Multilayerperceptron
Boosted decisiontree
Support vectormachine
Correctly classifiedinstances
91.236 % 85 % 98.73 %
Table 4. Accuracy difference between with and without using average length
Accuracy without using average length 92.83 %Accuracy using average length 98.73 %
Table 5. Accuracy difference between with and without using frequency scores
Accuracy without using frequency scores 47.36 %Accuracy using frequency scores 98.73 %
Tamil Morphological Analyzer Using Support Vector Machines 21

5 Conclusion and Future Work
We presented a morphological engine for Tamil that uses grammar rules and anannotated corpus to get all possible candidates. A support vector machines classifierwas employed to determine the most probable morphological deconstruction for agiven word. Lexical labels, respective frequency scores, average length and suffixes areused as features. The accuracy of our system is 98.73 %, which is more than the samereported by other similar research.
Tamil is a morphologically rich language. Computationally, each root word of cantake a few thousand inflected word-forms, out of which only a few hundred will exist ina typical corpus. This morphological analyzer which uses a different approach fromprevious approaches have proved to be effective.
Though the main intention of this approach is to tackle the ambiguity sometimesthis approach fails when encountering name entities. It tends to break into meaninglessmorphological disambiguation. This is a pitfall that should be taken care of in thefurther researches.
Since most Dravidian language share the same characteristics, hoping that thisapproach can be used in other languages to get a highly accurate morphological ana-lyzer. The analyzer not only outputs the construct the deconstructed morphology butalso the lexical labels.
As future work we intend to build on this approach and along with it build a PoStagger and Name Entity recognizer that uses the features extracted from morphologicalanalyzer. Once these goals have been achieved we eventually hope to build a successfulTamil machine translator and eventually preserve an ancient endangered language.
Table 7. Detailed accuracy by class
TP rate FP rate Precision Recall F-measure Range of coverage area Class
0.89 0.01 0.888 0.899 0.89 0.99 Yes0.99 0.10 0.994 0.993 0.99 0.99 No
Table 6. Stratified cross validation
Correctly classified instances 98.7376 %Kappa statistic 0.8869Mean absolute error 0.0265Root mean squared error 0.1033Relative absolute error 23.9067 %Root relative squared error 43.8834 %
22 T. Mokanarangan et al.
References
1. Jayan, J.P., Rajeev, R., Rajendran, S.: Morphological analyzer and morphological generatorfor Malayalam - Tamil machine translation. Int. J. Comput. Appl. (0975 – 8887) 13(8), 15–18 (2011)
2. Au-kbc.org. Tamil Morphological Analyzer (2015)3. Selvam, M., Natarajan, A.M.: Improvement of rule based morphological analysis and POS
tagging in Tamil language via projection and induction techniques. Int. J. Comput. 3(4),357–367 (2009)
4. Anand Kumar, M., Dhanalakshmi, V., Soman, K.P., Rajendran, S.: A sequence labelingapproach to morphological analyzer for Tamil language. Int. J. Comput. Sci. Eng. 2(6),1944–1951 (2010)
5. Parameshwari, K.: An implementation of APERTIUM morphological analyzer andgenerator for Tamil. Probl. Parsing Indian Lang. 11, 41–44 (2011)
6. Akilan, R., Naganathan, E.R.: Morphological analyzer for classical Tamil texts: a rule-basedapproach. Int. J. Innov. Sci. Eng. Technol. 1(5), 563–568 (2014)
7. Shah, R., Dhillon, P.S., Liberman, M., Foster, D., Maamouri, M., Ungar, L.: A newapproach to lexical disambiguation of Arabic text. In: Proceedings of the 2010 Conferenceon Empirical Methods in Natural Language Processing, Cambridge, Massachusetts,pp. 725–735, 09–11 October 2010
8. Koehn, P., Knight, K.: Empirical methods for compound splitting. In: Proceedings of theTenth Conference on European Chapter of the Association for Computational Linguistics,Budapest, Hungary, 12–17 April 2003
9. Nuhman, M.A.: , Revised edn, pp. 93–260.Poobalasingam Publications, Sri Lanka (2010)
10. Naavalar, A.: , 10th edn, pp. 88–180. Poobalasingam Publications, SriLanka (2008)
Tamil Morphological Analyzer Using Support Vector Machines 23

The Role of Community Acceptancein Assessing Ontology Quality
Melinda McDaniel1, Veda C. Storey2, and Vijayan Sugumaran3(&)
1 Department of Computer Science, Georgia State University,Atlanta, GA 30302, USA
[email protected] Department of Computer Information Systems,
J. Mack Robinson College of Business, Georgia State University,Box 4015, Atlanta, GA 30302, USA
[email protected] School of Business Administration, Oakland University,
Rochester, MI 48309, [email protected]
Abstract. Ontologies are crucial for the Semantic Web to flourish. Severalcommunities are beginning to develop and maintain ontology repositories indifferent domains. Although a developer can often find multiple ontologies inthe library that fit a particular domain, he or she then must select which of thepotential ontologies would be most suitable for a specific purpose. Users,therefore, need a way to assess the quality of the ontologies stored in the librarybased upon a broad set of criteria; for example, the level of acceptance by thecommunity of which it is a part. The history of an ontology’s development andthe authority an ontology receives via links from other ontologies can be used toassess the level of endorsement within the group that shares its domain. Thisresearch defines metrics for history and authority within a community and showshow they can be weighted for a particular task. A case study demonstrates theusefulness of these metrics and discusses why they should be incorporated inany broad metrics suite that is used to rank ontologies in a library.
1 Introduction
The Semantic Web is “a set of standards for knowledge representation and exchangethat is aimed at providing interoperability across applications and organizations” [1].The degree of this interoperability between human and software agents depends uponhow many communities they have in common and how many ontologies they share [1].An ontology, which has been called the third component of the Semantic Web, isdefined simply as a group of consistent and related terms [1] and more formally as “aformalization of a shared conceptualization” [2]. The latter definition, and the idea thatthe conceptualization is “shared” is expanded further by Hepp et al. (2006) whoasserted that “ontologies are not just formal representations of a domain, but muchmore community contracts about such formal representations” [3].
© Springer International Publishing Switzerland 2016E. Métais et al. (Eds.): NLDB 2016, LNCS 9612, pp. 24–36, 2016.DOI: 10.1007/978-3-319-41754-7_3

A community consists of a set of relationships between people sharing a commoninterest [4]. An online community can then be considered as a community that employsthe Internet for communication among its members [4]. Berners-Lee and Kagaldescribed the Semantic Web as composed of overlapping online communities ofvarying sizes and fractal in nature, as membership in these communities changesfrequently [1]. Many online communities allow members to participate fully in the sitethrough contributing and accessing information, as well as by commenting on theinformation added by other members. The BioPortal ontology repository [5], forexample, considers anyone who uses this portal to be a member and allows them toactively contribute to the content in the library -– a fact that its designers claim shouldincrease the quality of that content [7].
This feeling of shared responsibility within a community for the overall improve-ment of the ontological content is consistent with what Shadbolt and Berners-Lee haveasserted will greatly reduce the effort involved in developing an ontology as the size ofthe community grows [6]. Noy et al. contend that the Wisdom of the Crowd could evenreplace knowledge experts when a consensus is able to be reached within a community[7]. Reaching this consensus, however, is not always easy, requiring time and effort, anda large number of dedicated participants. Therefore, the degree of participation in theprocess of revising, adopting, expanding and reviewing of any ontology is a factor in theassessment of that ontology’s value.
The selection of an ontology from among the options available in an ontologyrepository should be made based upon a broad set of attributes that may be weighteddepending upon the requirements of each application [24]. One of the attributes toinclude in such a list of criteria should be the acceptance of the ontology within itscommunity. Metrics to assess this acceptance should include measures of how manycommunity members endorse the ontology, how long the ontology has been available,how much active participation has been done by community members in the ontology’sdevelopment. This community acceptance attribute is difficult to assess, with metrics tomeasure it not applied successfully in the past [18]. While much work has been carriedout developing metrics related to syntactic, semantic and pragmatic aspects ofontologies, the social quality of ontologies has not been thoroughly investigated. Theobjective of this research, therefore, is to do so.
This research introduces new metrics for social quality assessment, defines themformally, applies them to existing ontologies, and analyzes the challenges involved inusing them. The result is to show how these attributes provide valuable insight intoontology quality and should, therefore, be included in any rigorous ontology evalua-tion. The results of this assessment could promote interoperability between systems andhelp progress the use of ontologies in the Semantic Web. Terms related to social qualityassessment used in this paper are defined in Table 1.
The next section provides an overview of prior work on assessing ontology qualitybased on its social valuation. Sections 3 and 4 present history and authority metrics forassessing ontology social quality, and outlines the implementation of these metrics.Section 5 describes a case study validating the results of the social quality metrics.Section 6 summarizes the work and suggests future research directions.
The Role of Community Acceptance in Assessing Ontology Quality 25

2 Related Research
In the decade and a half since the introduction of the Semantic Web [14], much work hasbeen carried out on ontology evaluation. Many researchers have addressed the com-plexity of choosing a high-quality ontology for a particular task or domain. Attributesconsidered to be valid measures of ontology quality include adaptability, clarity, com-prehensiveness, conciseness, correctness, craftsmanship, relevance, reusability, richnessand stability as well as many others [14]. Numerous metrics have been developed toassess these and other aspects of ontology quality. Specific metrics which assess oneparticular attribute and broad suites of metrics that attempt to provide an overall picture ofan ontology’s quality have been developed [15–25].
D’Aquin and Noy (2012) defined an ontology library as “a Web-based system thatprovides access to an extensible collection of ontologies with the primary purpose ofenabling users to find and use one or several ontologies from this collection” [26].Although ontologies should reside in libraries and be developed and endorsed bycommunities that share a common interest [6], little work has been conducted todevelop a means for assessing the amount of recognition received by each ontologywithin a library. To provide a comprehensive picture of an ontology’s quality, factorssuch as how much the ontology is being used, how many other ontologies refer to thisone as an authority, and how long the ontology has been in existence, should all betaken into consideration [18].
Table 1. Definitions of terms related to social quality assessment
Term Definition References
Authority “The degree of reputation of an ontology in a givencommunity or culture”
Stvilia et al.[8]
Community “A set of relationships where people interact socially formutual benefit”
Andrews [4]
History “The way that a particular subject or object hasdeveloped or changed throughout its existence”
History [9]
OnlineCommunity
“A social network that uses computer support as the basisof communication among members instead offace-to-face interaction”
Andrews [4]
Revising “The act of thinking, comparing, deciding, choosing thentaking action”
Sudol [10]
Revision “The act of making changes to a written document tomake it better”
Horning andBecker [11]
SocialNetwork
“A set of people (or organizations or other social entities)connected by a set of socially-meaningfulrelationships”
Wellman [12]
SocialQuality
“The level of agreement among participants’interpretations”
Su andIlebrekke[13]
26 M. McDaniel et al.

2.1 Ontology Role in Communities
A community can no longer be considered as a physical place, but, rather, as a set ofrelationships between people who interact socially for their mutual benefit [4]. Anonline community is a social network that uses the Internet to facilitate the commu-nication among its members rather than face-to-face meetings [4]. These virtual socialnetworks are frequently used for information sharing and problem solving amongmembers who share common interests [12].
Ontologies have been defined as formal representations of a domain, but in orderfor those representations to be meaningful, they must be agreed upon by the membersof a community [6]. This type of meaningful discourse between members of a group isa dynamic social process consisting of shared topics being added, expanded, revised oreven discarded. Therefore, an ontology representing the shared communicationbetween members should not be static, but should be able to reflect the communityconsensus of meaning at any particular time [1]. When a community shows its approvalof an ontology by actively participating in its ongoing evolution, the quality of theontology is more likely to be high within that community [26]. A way of measuring thistype of active participation would be helpful in assessing community endorsement of aparticular ontology.
2.2 Metrics Suites
The usefulness of metrics to provide a quantified measurement of ontological qualityhas long been recognized [19] with many metric suites being created that attempt toprovide a broad picture of many aspects of an ontology’s quality. OntoQA [19],OQuaRE [25], OntoMetric [17], and AKTiveRank [20] are a few of the most com-prehensive suites of metrics. Table 2 summarizes these, and other, metric suites cur-rently available for broad ontology assessment, identifies the number of metrics, andspecifies how many of them measure an ontology’s social importance within a par-ticular library.
Table 2. Examples of broad metrics suites
Assessment approach Totalmetrics
Socialmetrics
Description of social assessment
Protégé-2000 (Noy et al.) [15] Varies 0 noneOntoClean (Guarino and Welty)[16]
Varies 0 none
OntoMetric (Lozano-Tello andGómez-Pérez) [17]
160 3 Assesses whether an ontology fitsa system’s requirements
Semiotic Metrics Suite(Burton-Jones et al.) [18]
10 2 Assesses History and Authority ofan ontology by countingontology links
(Continued)
The Role of Community Acceptance in Assessing Ontology Quality 27

2.3 Social Assessment Within Metrics Suites
Although communities should support the development, maintenance and endorsementof ontologies [6], very few assessment systems have a means by which to measure anontology’s value within its community. OntoMetric [17], the BioPortal Recommender[22], and the Semiotic Metrics Suite [18] are among the few suites that attempt toassess an ontology’s acceptance within a community as one of the factors to measureits quality. Unfortunately, none of these assessment suites are able to fully evaluate thelevel of acceptance an ontology receives within its community.
OntoMetric [17] contains approximately 160 metrics for assessing ontology quality,which focus primarily on the fitness of an ontology for a particular software project forwhich it will be used. However, only three of its metrics relate to its relationship withother ontologies. The large number of metrics makes the OntoMetric system difficult toemploy [19]. The OntoMetric system reflects the fact that part of the suitability of anontology for a given project is the methodology used to create it. It, therefore, assessesthe social acceptance of that methodology by counting the number of other ontologiesthat were created with it, the number of domains that have been expressed with itsdeveloped ontologies, and how important the ontologies developed with thismethodology have become. Unfortunately, in most situations, a user must attempt toanswer these questions (perhaps by conducting additional research) as well as toprovide an answer expressed on a scale between “very low” and “very high,” reducingthe accuracy of the results in this factor’s assessment.
The BioPortal recommender system includes Acceptance metrics as part of theranking system that it provides as a tool for choosing an ontology for a particularpurpose [22]. Users enter desired keywords and the recommender system presents a listof ontologies from the BioPortal repository containing the keywords. The list ofapplicable ontologies is ranked in order of each ontology’s score on four individually
Table 2. (Continued)
Assessment approach Totalmetrics
Socialmetrics
Description of social assessment
OntoQA (Tartir et al.) [19] 12 0 noneAKTiveRank (Alani et al.) [20] Varies 0 Ranks ontologies based on user
criteriaOQual (Gangemi et al.) [21] Varies 0 noneBiomedical OntologyRecommender web service(Jonquet et al.) [22]
8 2 Assesses ontologies based on pagerankings
ROMEO (Yu et al.) [23] varies 0 none(Vrandečić) [24] 8 0 noneOQuaRE (Duque-Ramos et al.)[25]
14 0 none
28 M. McDaniel et al.

weighted attributes, one of which is the Acceptance of the ontology within theBioPortal community. The other three attributes that are included in the Recommendersystem are Coverage, Detail of knowledge and Specialization. Unfortunately, themetrics used by the BioPortal recommender system to assess Acceptance are based onfactors such as the number of site visits to the BioPortal website, membership in theUMLS database and mentions in the BioPortal journal, so those metrics cannot be usedon ontologies in other libraries without access to this information.
The Semiotic Metrics Suite developed by Burton-Jones et al. [18] is based upon thetheory of semiotics, the study of signs and their meanings, and builds upon Stamperet al.’s [27] framework for assessing the quality of signs. One of the layers of theframework is the Social layer, which evaluates a sign’s usefulness on a social level byevaluating its “potential and actual social consequences” and asks the question “Can itbe trusted?” [27]. The Semiotic Metrics Suite includes the Social layer, which measuresan ontology’s recognition within a community by two metrics: (1) Authority whichmeasures the link from an ontology to other ontologies in the same library; and(2) History which measures the frequency with which these links are employed.Unfortunately the calculations for these measurements require information that is notavailable for most ontologies. The number of links from other ontologies to a particularone, and the number of times the linking ontologies have been used for other appli-cations are usually not provided by ontology libraries, making these metrics difficult touse for ontology assessment. This research introduces new Authority and Historymetrics using information available for most ontologies and includes a case studydemonstrating their effectiveness.
3 Metrics for Assessing Social Quality
Social Quality is “the level of agreement among participants’ interpretations” [27] andreflects the fact that, because agents and ontologies exist in communities, agreement inmeaning is essential within the community. This research proposes two new metrics tomeasure the level of an ontology’s recognition within its community by measuring itsauthority within the library and the history of its participation and use in the library.These metrics can be combined to determine the overall assessment for Social Qualitywithin the library.
Stvilia defines Authority as the “degree of reputation of an ontology in a givencommunity or culture” [8]. One way to measure Authority is by the number of otherontologies that link to it as well as how many shared terms there are within those linkedontologies. More authoritative ontologies signal that the knowledge they provide isaccurate or useful [18].
Another social metric is the History of an ontology. The history of a conceptual-ization is a valuable part of its definition [3]. The History metric measures the numberof years an ontology has existed in a library, as well as the number of revisions made toit during the course of its residence there. Ontologies with longer histories are expectedto be more dependable because each new revision should improve upon the previous
The Role of Community Acceptance in Assessing Ontology Quality 29
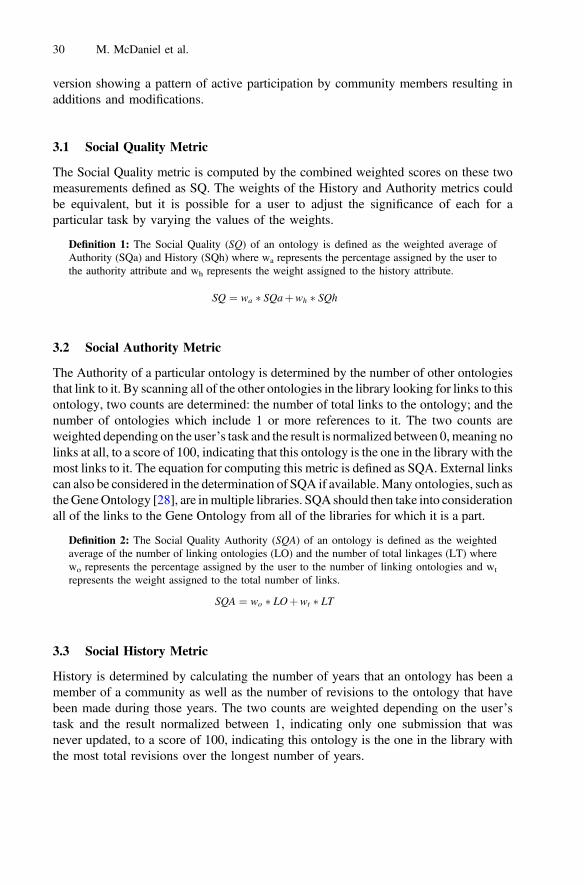
version showing a pattern of active participation by community members resulting inadditions and modifications.
3.1 Social Quality Metric
The Social Quality metric is computed by the combined weighted scores on these twomeasurements defined as SQ. The weights of the History and Authority metrics couldbe equivalent, but it is possible for a user to adjust the significance of each for aparticular task by varying the values of the weights.
Definition 1: The Social Quality (SQ) of an ontology is defined as the weighted average ofAuthority (SQa) and History (SQh) where wa represents the percentage assigned by the user tothe authority attribute and wh represents the weight assigned to the history attribute.
SQ ¼ wa SQaþwh SQh
3.2 Social Authority Metric
The Authority of a particular ontology is determined by the number of other ontologiesthat link to it. By scanning all of the other ontologies in the library looking for links to thisontology, two counts are determined: the number of total links to the ontology; and thenumber of ontologies which include 1 or more references to it. The two counts areweighted depending on the user’s task and the result is normalized between 0,meaning nolinks at all, to a score of 100, indicating that this ontology is the one in the library with themost links to it. The equation for computing this metric is defined as SQA. External linkscan also be considered in the determination of SQA if available.Many ontologies, such astheGeneOntology [28], are inmultiple libraries. SQA should then take into considerationall of the links to the Gene Ontology from all of the libraries for which it is a part.
Definition 2: The Social Quality Authority (SQA) of an ontology is defined as the weightedaverage of the number of linking ontologies (LO) and the number of total linkages (LT) wherewo represents the percentage assigned by the user to the number of linking ontologies and wt
represents the weight assigned to the total number of links.
SQA ¼ wo LOþwt LT
3.3 Social History Metric
History is determined by calculating the number of years that an ontology has been amember of a community as well as the number of revisions to the ontology that havebeen made during those years. The two counts are weighted depending on the user’stask and the result normalized between 1, indicating only one submission that wasnever updated, to a score of 100, indicating this ontology is the one in the library withthe most total revisions over the longest number of years.
30 M. McDaniel et al.

Definition 3: The Social Quality History (SQH) of an ontology is defined as the weighted averageof the number of years it has been in the library (Y) and the number of submissions (includingrevisions) that have been uploaded (S) where wy represents the percentage assigned by the user tothe number of years and ws represents the weight assigned to the total number of submissions.
SQH ¼ wy Y þws S
4 Implementation
A system has been developed to assess community recognition of an ontology byapplying the revised Social Quality metrics. This system can be employed by any com-munity containing an ontology repository, and aids in the selection of an ontology whenmultiple options are available. By entering relevant keywords and desired metric weightsinto the system, a user retrieves a set of potential ontologies containing the keywords. Thesystem then assesses the Authority of each of those ontologies by searching all the otherontologies in the repository counting the number of ontologies that link to each of thepotential ontologies as well as the total number of links. Each ontology in the list ofpotential ontologies then has its History assessment computed by counting the number ofyears each ontology has been stored in the library and the number of revisions made to theontology during that time. TheAuthority andHistorymetrics are thenweighted accordingto the metric weights entered by the user and the list of potential ontologies is sorted indecreasing order of the overall Social Quality score. At this time the user receives a list ofrecommended ontologies that contain the desired keywords and that rank high in socialrecognition from the community. The specific steps carried out for Social Quality metricassessment and ontology ranking are shown in Fig. 1.
Fig. 1. Social quality assessment and ranking of ontologies
The Role of Community Acceptance in Assessing Ontology Quality 31

5 Case Studies
To obtain an understanding of how information about an ontology’s acceptance withinits community could help a user choose an appropriate ontology from a list of options,two case studies were carried out using the social quality metrics. The BioPortalontology library was chosen for both studies as an example of a large, well maintainedontology repository that has been deemed useful to the biomedical community [5]. TheBioPortal website was also selected because of the availability of additional informa-tion included in the library that could be used to examine the results of the case studieswith other information on its ontology profile pages. The BioPortal website allowsmembers of the community to contribute reviews to its ontologies, list projects, andmake suggestions. BioPortal also keeps track of the number of site visits for each of theontologies, and provides annotation and term mappings services for its ontologies [7].
The first case study applied the social quality metrics to all 383 of the ontologiescurrently in the library, ranking them from highest Social Quality score to lowest. Thiscase study was carried out to assess whether the highest-ranking ontologies in thelibrary were in actuality the ones that were most endorsed by the biomedical com-munity. The second case study searched the BioPortal library for ontologies matchingkey terms and determining a list of recommended ontologies ranked by their SocialQuality assessments as well as using our SQ metric. The ontology list for each termwas then examined to ascertain whether the highest-ranking ontologies on each list wasactually more likely to be frequently accessed than the ontologies that showed up lateron the list. In both case studies, all metrics were weighted equally in the overalldetermination of Social Quality. It is possible to weight the individual metrics differ-ently, depending on the particular task requirements. However, for the purposes of thecase studies, all metrics were considered equally.
The two case studies showed that useful information could be obtained fromassessing the ontologies on their level of endorsement within the BioPortal community.By examining the difference between ontologies high on the list to the ontologies thatranked lower, a pattern can be easily observed about whether the ontologies arewell-supported by the BioPortal membership.
5.1 Case Study 1
The Authority metrics were first applied to all 383 of the ontologies currently part ofthe BioPortal library assigning equal weights to the number of links and the number oflinking ontologies. For each ontology, all other ontologies were scanned for referencesto that ontology and counts made of the number of ontologies that included at least onereference to the ontology, as well as the total number of links to the ontology.
The History metric was then computed for all of the BioPortal ontologies usingequal weighting for the number of years that the ontology has been in the library andthe number of revisions that have been done to each of them, including the originalsubmission.
The scores for Authority and History were individually normalized between 1 and100 and then the two scores averaged to generate the overall Social Quality metric for
32 M. McDaniel et al.

each of them. The list of ontologies was ordered from 100 to 1 in order to identify themost highly ranked ontologies at the top of the list.
Table 3 shows the highest ranked ontologies from the library on the combinedsocial metrics. Examining other information available on the BioPortal website, it isclear that the ontologies that scored high on the Social Quality metric were the onesinvolved in many biomedical projects and with good reviews from members who haveused them. On the other hand, 70 of the ontologies tested scored only 1 out of 100 onthe combined social quality metrics. Exploring the BioPortal website revealed thatthese 70 had no other ontologies linking to them and no revisions after the initialsubmission, which was often several years prior, and were not currently involved inany listed projects.
5.2 Case Study 2
The BioPortal repository was searched for ontologies containing each of ten prese-lected keywords. A list of applicable ontologies was generated for each of the key-words, and each ontology’s Social Quality score determined by applying the methodoutlined in Case Study 1. Each potential ontology list was sorted in descending order toidentify the highest results for each of the terms based upon social quality. The key-word searches each retrieved at least 30 potential ontologies. The results of rankingthese ontology lists in reverse order of Social Quality was used to identify the bestcandidates for a possible task requiring each of the keywords. The top three ontologiesrecommended for each of the keywords are shown in Table 4.
Additional information provided by the BioPortal website showed that these listedontologies are favorably reviewed and frequently accessed. In comparison, ontologiesretrieved by the keyword search but scoring low on the Social Quality metric, wereaccessed infrequently, indicating little use within the community. For example, theCurrent Procedural Terminology ontology (CPT), which ranked highest for two of thekeywords and obtained an SQ score of 53, received over 35,000 site visits in the lasttwo years. In contrast, the Bone Dysplasia Ontology (BDO) containing the same twokeywords, received an SQ score of 2 and only received 894 site visits.
Table 3. Highest ranked ontologies from BioPortal using History and Authority metrics
Name of ontology Authority History Combined metrics
Gene Ontology (GO) 69 100 85Human Phenotype Ontology (HP) 51 100 75Mosquito Insecticide Resistance Ontology (MIRO) 17 100 58Mass Spectrometry Ontology (MS) 85 27 56Systems Biology Ontology (SB) 10 100 55Minimal Anatomical Ontology (MAT) 100 2 51Sequence Types and Features Ontology (SO) 60 42 51Human Disease Ontology (HD) 1 100 51Mammalian Phenotype Ontology (MP) 38 61 50Plant Trait Ontology (PTO) 7 79 43
The Role of Community Acceptance in Assessing Ontology Quality 33
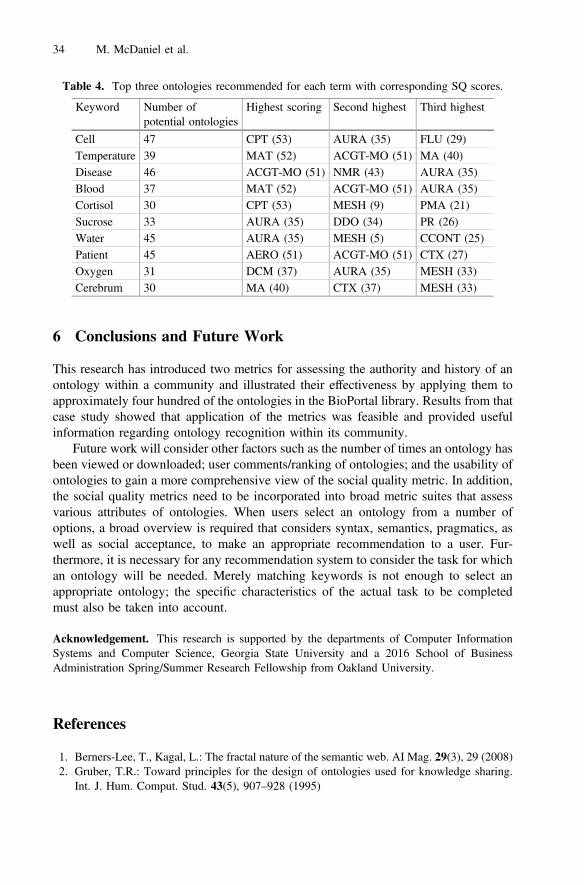
6 Conclusions and Future Work
This research has introduced two metrics for assessing the authority and history of anontology within a community and illustrated their effectiveness by applying them toapproximately four hundred of the ontologies in the BioPortal library. Results from thatcase study showed that application of the metrics was feasible and provided usefulinformation regarding ontology recognition within its community.
Future work will consider other factors such as the number of times an ontology hasbeen viewed or downloaded; user comments/ranking of ontologies; and the usability ofontologies to gain a more comprehensive view of the social quality metric. In addition,the social quality metrics need to be incorporated into broad metric suites that assessvarious attributes of ontologies. When users select an ontology from a number ofoptions, a broad overview is required that considers syntax, semantics, pragmatics, aswell as social acceptance, to make an appropriate recommendation to a user. Fur-thermore, it is necessary for any recommendation system to consider the task for whichan ontology will be needed. Merely matching keywords is not enough to select anappropriate ontology; the specific characteristics of the actual task to be completedmust also be taken into account.
Acknowledgement. This research is supported by the departments of Computer InformationSystems and Computer Science, Georgia State University and a 2016 School of BusinessAdministration Spring/Summer Research Fellowship from Oakland University.
References
1. Berners-Lee, T., Kagal, L.: The fractal nature of the semantic web. AI Mag. 29(3), 29 (2008)2. Gruber, T.R.: Toward principles for the design of ontologies used for knowledge sharing.
Int. J. Hum. Comput. Stud. 43(5), 907–928 (1995)
Table 4. Top three ontologies recommended for each term with corresponding SQ scores.
Keyword Number ofpotential ontologies
Highest scoring Second highest Third highest
Cell 47 CPT (53) AURA (35) FLU (29)Temperature 39 MAT (52) ACGT-MO (51) MA (40)Disease 46 ACGT-MO (51) NMR (43) AURA (35)Blood 37 MAT (52) ACGT-MO (51) AURA (35)Cortisol 30 CPT (53) MESH (9) PMA (21)Sucrose 33 AURA (35) DDO (34) PR (26)Water 45 AURA (35) MESH (5) CCONT (25)Patient 45 AERO (51) ACGT-MO (51) CTX (27)Oxygen 31 DCM (37) AURA (35) MESH (33)Cerebrum 30 MA (40) CTX (37) MESH (33)
34 M. McDaniel et al.
3. Hepp, M., Bachlechner, D., Siorpaes, K.: OntoWiki: community-driven ontology engineeringand ontology usage based on Wikism. In: Proceedings of 2006 International Symposium onWikis. ACM (2006)
4. Andrews, D.C.: Audience-specific online community design. Commun. ACM 45(4), 64–68(2002)
5. Noy, N.F., Shah, N.H., Whetzel, P.L., Dai, B., Dorf, M., Griffith, N., Jonquet, C., Rubin,D.L., Storey, M.A., Chute, C.G., Musen, M.A.: BioPortal: ontologies and integrated dataresources at the click of a mouse. Nucleic Acids Res. 37, 197 (2009)
6. Shadbolt, N., Hall, W., Berners-Lee, T.: The semantic web revisited. IEEE Intell. Syst.21(3), 96–101 (2006)
7. Noy, N.F., Griffith, N., Musen, M.A.: Collecting community-based mappings in an ontologyrepository. In: Sheth, A.P., Staab, S., Dean, M., Paolucci, M., Maynard, D., Finin, T.,Thirunarayan, K. (eds.) ISWC 2008. LNCS, vol. 5318, pp. 371–386. Springer, Heidelberg(2008)
8. Stvilia, B., et al.: A framework for information quality assessment. J. Am. Soc. Inf. Sci.Technol. 58, 1720–1733 (2007)
9. History. In: Macmillan Online Dictionary. http://www.macmillandictionary.com10. Sudol, R.: Revising: new essays for teachers of writing. National Council of Teachers of
English, 1111 Kenyon Rd., Urbana, IL (1982)11. Horning, A., Becker, A.: Revision: History, Theory, and Practice. Parlor Press, Anderson
(2006)12. Wellman, B.: An electronic group is virtually a social network. Cult. Internet 4, 179–205
(1997)13. Su, X., Ilebrekke, L.: A comparative study of ontology languages and tools. In: Pidduck, A.,
Mylopoulos, J., Woo, C.C., Ozsu, M. (eds.) CAiSE 2002. LNCS, vol. 2348, pp. 761–765.Springer, Heidelberg (2002)
14. Berners-Lee, T., Hendler, J., Lassila, O.: The semantic web. Sci. Am. 284(5), 28–37 (2001)15. Noy, N.F., Fergerson, R.W., Musen, M.A.: The knowledge model of Protege-2000. In:
Knowledge Engineering and Knowledge Management Methods, pp. 17–32 (2000)16. Guarino, N., Welty, C.: Evaluating ontological decisions with OntoClean. Commun. ACM
45, 61–65 (2002)17. Lozano-Tello, A., Gómez-Pérez, A.: Ontometric: a method to choose the appropriate
ontology. J. Database Manag. 15, 1–18 (2004)18. Burton-Jones, A., Storey, V.C., Sugumaran, V., Ahluwalia, P.: A semiotic metrics suite for
assessing the quality of ontologies. Data Knowl. Eng. 55(1), 84–102 (2005)19. Tartir, S., Arpinar, I.B., Moore, M., Sheth, A.P., Aleman-Meza, B.: OntoQA: metric-based
ontology quality analysis (2005)20. Alani, H., Brewster, C., Shadbolt, N.R.: Ranking ontologies with AKTiveRank. In: Cruz, I.,
Decker, S., Allemang, D., Preist, C., Schwabe, D., Mika, P., Uschold, M., Aroyo, L.M.(eds.) ISWC 2006. LNCS, vol. 4273, pp. 1–15. Springer, Heidelberg (2006)
21. Gangemi, A., Catenacci, C., Ciaramita, M., Lehmann, J.: Modelling ontology evaluation andvalidation. In: Sure, Y., Domingue, J. (eds.) ESWC 2006. LNCS, vol. 4011, pp. 140–154.Springer, Heidelberg (2006)
22. Jonquet, C., Musen, M.A., Shah, N.H.: Building a biomedical ontology recommender webservice. Biomed. Seman. 1, S1 (2010)
23. Yu, J., Thom, J.A., Tam, A.: Requirements-oriented methodology for evaluating ontologies.Inf. Syst. 34, 766–767 (2009)
24. Vrandečić, D.: Ontology evaluation. In: Handbook on Ontologies, pp. 293–313 (2009)
The Role of Community Acceptance in Assessing Ontology Quality 35

25. Duque-Ramos, A., Fernández-Breis, J.T., Stevens, R., Aussenac-Gilles, N.: OQuaRE: aSQuaRE-based approach for evaluating the quality of ontologies. J. Res. Pract. Inf. Technol.43, 159 (2011)
26. d’Aquin, M., Noy, N.F.: Where to publish and find ontologies? A survey of ontologylibraries. Web Seman. Sci. Serv. Agents World Wide Web 11, 96–111 (2012)
27. Stamper, R., Liu, K., Hafkamp, M., Ades, Y.: Understanding the roles of signs and norms inorganizations-a semiotic approach to information systems design. Behav. Inf. Technol.19(1), 15–27 (2000)
28. Ashburner, M., et al.: Gene ontology: tool for the unification of biology, the gene ontologyconsortium. Nat. Genet. 25, 25–29 (2000)
36 M. McDaniel et al.

How to Complete Customer Requirements
Using Concept Expansion for Requirement Refinement
Michaela Geierhos(B) and Frederik Simon Baumer
Heinz Nixdorf Institute, University of Paderborn,Furstenallee 11, 33102 Paderborn, Germany
geierhos,[email protected]://wiwi.upb.de/seminfo
Abstract. One purpose of requirement refinement is that higher-levelrequirements have to be translated to something usable by developers.Since customer requirements are often written in natural language byend users, they lack precision, completeness and consistency. Althoughuser stories are often used in the requirement elicitation process inorder to describe the possibilities how to interact with the software,there is always something unspoken. Here, we present techniques howto automatically refine vague software descriptions. Thus, we can bridgethe gap by first revising natural language utterances from higher-levelto more detailed customer requirements, before functionality matters.We therefore focus on the resolution of semantically incomplete user-generated sentences (i.e. non-instantiated arguments of predicates) andprovide ontology-based gap-filling suggestions how to complete unver-balized information in the user’s demand.
Keywords: Requirement refinement · Concept expansion · Ontology-based instantiation of predicate-argument structure
1 Introduction
In the Collaborative Research Center “On-The-Fly Computing”, we developtechniques and processes for the automatic ad-hoc configuration of individualservice compositions that fulfill customer requirements1. Upon request, suitablebasic software and hardware services available on world-wide markets have tobe automatically discovered and composed. For that purpose, customers have toprovide software descriptions. These descriptions are subject to the same qualitystandards as software requirements collected and revised by experts: They shouldbe complete, unambiguous and consistent [11]. To achieve these quality goals,techniques and approaches are often proposed, which are also used in classicalrequirement engineering. Popular examples are controlled languages and formalmethods, which indeed can achieve the goal of clarity and completeness but arehardly to use for non-experts and therefore miss the target group.1 Refer to http://sfb901.uni-paderborn.de for more information.
c© Springer International Publishing Switzerland 2016E. Metais et al. (Eds.): NLDB 2016, LNCS 9612, pp. 37–47, 2016.DOI: 10.1007/978-3-319-41754-7 4

38 M. Geierhos and F.S. Baumer
From the customer’s point of view, natural language (NL) cannot be formal-ized without partial loss in expressiveness [24]. Even if some details are missing,native speakers are able to understand what was meant in a concrete situa-tion. Since the complexity and unrestrictedness of NL makes the automatedrequirement extraction process more difficult, we want to support the require-ment refinement process by filling individual knowledge gaps. We therefore defineincompleteness as missing information in user-generated requirements necessaryfor a feasible implementation or selection of the wanted software application.
Besides consistency, clarity and verifiability [9,12], completeness is one ofthe fundamental quality characteristics of software requirements. Although thenotion of completeness is widely discussed, there is broad consensus on the neg-ative impact of incomplete requirements for a software product [8], the prod-uct safety [10] or an entire project [15,25]. However, users are encouraged toexpress their individual requirements for a wanted software application in NL toimprove user acceptance and satisfaction [6]. Therefore, our approach analyzesunrestricted NL requirement descriptions in order to provide suggestions how toelaborate the user’s incomplete software specifications where possible.
This paper is structured as follows: In Sect. 2, we provide a brief overview ofrelated work before we describe by means of a concrete example how an ontologycan help to refine NL requirement descriptions (see Sect. 3). Finally, we presentour next development steps and conclude in Sect. 4.
2 Related Work
The term of incomplete requirements often refers to the complete absence ofrequirements within a requirements documentation. Here, we focus on exist-ing but incomplete requirements, which we call incomplete individual require-ments [6]. In general, the preparation of checklists for request types as well asthe application of “project-specific requirement completeness guidelines and/orstandards” is recommended for hand-crafted requirement gathering [6]. Otherapproaches for the identification (and compensation) of incompleteness are oftenbased on third-party reviews and are therefore affected by subjectivity, limitedviews, and even again inconsistency [17,28]. Especially, the perception of com-pleteness can widely vary due to explicit and implicit assumptions [1].
Especially NL requirement descriptions suffer from incompleteness if not allrequired arguments of a predicate are given. For example, “send” is a three-place predicate because it requires the agent (“sender”), the theme (“sent”)and the beneficiary argument (“sent-to”). If the beneficiary is not specifiedhere, it is unknown whether one or more recipients are possible. But how manyarguments does any predicate require? This information is provided by linguis-tic resources like FrameNet [2] to enable to automatic recognition of incom-pleteness [13,14] and its compensation [16]. For instance, RAT (RequirementsAnalysis Tool) can deal with incomplete (i.e. missing arguments of predicates)and missing NL requirements [27]. It therefore uses glossaries, controlled syn-tax and domain-specific ontologies. Another application is RESI (Requirements
How to Complete Customer Requirements 39
Engineering Specification Improver), which can point out linguistic errors inrequirements by using WordNet [18] and asks the user to give suggestions forimprovement.
Since it remains unclear when some state of completeness will be reached[6], Ferrari et al. [5] developed the Completeness Assistant for Requirements(CAR), which is a tool to measure the completeness of requirement specifica-tions by aligning mentioned requirements to descriptions in transcripts. Here,completeness is reached when all concepts and dependencies mentioned in theadditional input documents are covered by the user’s statement. This approachextracts terms and their dependencies from the existing document sources inorder to create a kind of benchmark but without any use of external linguisticresources (e.g. ontologies).
Incompleteness occurs not only on the requester side (user requirements)but on the service provider side (service specifications) in software projects. Thereasons therefor range from knowledge gaps on the requester side to consciousomission of information due to non-disclosure agreements on the provider side[21,22]. Even the perception of (in)completeness can vary due to explicit andimplicit assumptions [1]. Previous work in the OTF context considered incom-plete requirements as far as only (semi-)formal specifications – not NL – weresupported as input format [19,22]. Geierhos et al. (2015) consider NL require-ments and discuss an approach based on domain-based similarity search to com-pensate missing information. Their goal is to allow unrestricted requirementdescriptions but to support the user by a “how to complete” feature [7]. Here,NL requirements descriptions that are unique in form and content are reduced totheir main semantic cues and stored in templates for matching purposes (betweenrequests and the provider’s offers). Another way of reducing incompleteness isthe transformation of NL requirements into formal specifications [4,23], whichgoes along with information loss due to the restrictions of the formal language [7].
3 Ontology-Based NL Requirement Refinement
3.1 Customer Requirements as Input Data
Given the following sample NL requirement description by a user:
“I want to send e-mails with large attachments.”
We assume our input to be at least one sentence but do not limit it to a maximumnumber of words or sentences. Moreover, we probably have to deal with spellingor grammatical errors. Furthermore, we expect epistemic modality expressed byauxiliaries like “want” which is important for the ranking requirements accordingto user’s priority. In order to detect the wanted functionality, we have to recognizethe relevant parts of a sentence. We therefore start with the predicate argumentanalysis because especially full verbs (i.e. predicates) can be put on a level withfunction names (“send”) that developers would choose. Furthermore, the nounphrases surrounding the predicate bear additional information specifying the

40 M. Geierhos and F.S. Baumer
input (“e-mails”) or output parameters of the same function or hint at anotherone (e.g. “large attachments”).
But how can we distinguish between parameters and further specificationsof objects associated with the expressed functionality? For this purpose, wepursue two directions: predicate argument analysis to identify unspoken butsemantically missing information (see Sect. 3.2) and ontology look-up for conceptclarification and expansion (see Sect. 3.3).
Fig. 1. Processing pipeline for knowledge gap filling during requirements analysis
3.2 Predicate Argument Analysis
In Fig. 1, we pick up the idea of semantic dependency [5] and combine it withexternal linguistic resources such as PropBank [20] to analyze the predicate-argument structure of NL requirement descriptions. Based on the results of thisstep, we are able to identify missing information and therefor provide similarinstantiated arguments from our messaging ontology (see Fig. 2) in order togenerate requirement-specific predicate-argument templates.
Preprocessing. Since NL requirement descriptions vary widely in quality andscope, further preprocessing is necessary: (1) sentence splitting, (2) filtering,(3) lemmatization, and (4) POS tagging. First we limit the recognition of apredicate and its argument(s) to the scope of a sentence, then we separate theoff-topic sentences from the on-topic ones which we lemmatize and annotatetheir syntactic structure. We need the morpho-syntactic information to look-upin the PropBank [20] how many arguments (noun phrases) can be instantiatedfor the identified predicate (here: “send”).
Semantic Role Labeling. Per each sentence, a semantic role labeler (SRL)2
assigns iteratively semantic roles such as agent, theme, beneficiary representedby Arg0, ..., Argn to the arguments of a recognized predicate. In order to identifythe different arguments, we use PropBank [20]. PropBank contains verbal propo-sitions and their arguments. For the predicate send (“send.01”), we can obtain2 Curator’s SRL [3] is used because of its convincing results on user-generated text.

How to Complete Customer Requirements 41
three possible arguments: “sender” (Arg0), “sent” (Arg1), “sent-to” (Arg2). Bymatching this information to our sample input sentence given in Sect. 3.1, thethird argument position Arg2 (“sent-to”) remains non-instantiated.
In this case, it is irrelevant to whom (in person) the e-mail should be sent.However, the number of recipients matters for the functionality of the softwareapplication: addressing a single person or a group of people. Since we cannotexpect the user to specify a concrete number of addressees (e.g. “to a groupof 4 persons”), it is sufficient to distinguish the number (i.e., between plural,e.g. “to my friends” and singular, e.g. “to Peter”). Of course, it is not helpful toonly point out the user’s mistake without providing concrete suggestions. Basedon the shared user stories, it would be possible to fill the gap with argumentcandidates such as “to my friends” or “to Peter”. But if we suggested the userto elaborate his NL requirement description by replacing the undefined senderby e.g. Peter, this would be quite confusing. For this reason, we have to learndifferent variants for recipients, which will later be classified according to theirsemantic type (e.g. human being).
Grouping Argument Candidates. Semantically is the key to an intuitiveuser guidance. We therefore gathered 77,649 unique software descriptions andtheir corresponding reviews from download.com. Each record contains informa-tion about the rating, platform, publisher, version and the (sub-)category thesoftware application belongs to (e.g. “messaging → e-mail”). After preprocessing,we applied SRL on the texts and received a very long frequency list of possiblearguments for the predicate send per category.
Table 1. Possible instances for Arg2 of send
Arg2 Text Category
sent-to “colleagues” e-mail
sent-to “all costumers” e-mail
sent-to “the (...) mailing list” e-mail
sent-to “a specified address” e-mail
According to the predicate argument analysis, send only occurred in 5.7 %of all texts, but it appeared in 36.3 % of all e-mail app descriptions where Arg2was non-instantiated in 60.1 % of these texts. To prove these results, we took arandom sample of 200 texts and manually searched for utterances of send wherearguments were unspecified.
As shown in Table 2, Arg2 is missing in most of the 200 texts. This shows thate-mail writers premise that there has to be at least one recipient and he/she ishuman. For this reason, it does not seem to be necessary to specify the argumentsend-to in the category “e-mail”. Even Arg0 is often skipped. But the object Arg1is specified in most cases. At this point, we can identify a missing argument andprovide the user with a list of suggestions sorted by frequency.

42 M. Geierhos and F.S. Baumer
Table 2. Absence of Arg2 in our test set
Argument Absence
sender (Arg0) 21 %
sent (Arg1) 8 %
sent-to (Arg2) 59 %
Ranking of Argument Suggestions. Table 3 shows the top three suggestionsfor our sample input in Sect. 3.1 that are provided to the user based on the abovedescribed approach. But why is “multiple recipients” on first place?
Table 3. Suggestions for Arg2 of “send.01”
# Argument Semantic type
1 “multiple recipients” Human
2 “all your customers” Human
3 “multiple addresses” Abstract
When we have a look on the most similar customer requirement to this inputsentence, we retrieve the following annotated text as result of the predicateargument analysis:
“[...] youArg0want to sendS01 an e − mailArg1
to multiple recipientsArg2.
It features multi [image]IR0 [attachments]IR1 [...]”3.
Here, three possible arguments for send in the sense S01 (according to Prop-Bank) were identified because of keywords such as “image” and “attachments”which specify the meaning of send in our ontology (see next section).
As already mentioned, our approach is also able to semantically group argu-ment candidates (e.g. suggestion no. 1 and no. 2 in Table 3 are typed as human).Thus, the user gets one more helpful hint that he or she only has to specify somekind of human being as Arg2.
3.3 Ontology Look-Up
Disambiguation. In our sample sentence, the predicate send can also be usedin the sense of faxing (Arg1 = fax). This may change the possible instanti-ations for Arg2 because a standard fax is not sent to “a mailing list” or to“multiple addresses” like an e-mail. This is extremely important because onlycontext-dependent analysis can lead to precise suggestions. Thus, we created ourown ontology (see Fig. 2) representing messaging functionality with its entities,relations and corresponding cardinality in order to disambiguate between the
3 See http://download.cnet.com/PS/3000-2369 4-10970917.html for more details.

How to Complete Customer Requirements 43
concepts or word senses (here: “send”) respectively. When send co-occurs with“e-mail” or “attachment” in the customer requirement, we can limit the searchto this domain, even if related terms were initially used.
Fig. 2. Snapshot of the ontological representation of an e-mail
Clarification. However, it is still unclear what was meant by “large” in thecontext of e-mail attachment. We therefore determined the size limits by auto-matically extracting the maximum sizes of an e-mail from the help websitesprovided by Gmail, Yahoo! and others. In general, 10 MB is considered as themaximum size of an e-mail but Gmail increased its limit to 25 MB. Thus, wedefined the interval for “large” as greater than 10 MB and smaller than 25 MB.Figure 3 shows that we foresee small, medium and large attachments in ourontology representing each different intervals and the derived unit is MB in thisdomain. So if a customer uses NL to specify requirements for a file upload in thecontext of messaging, we can clarify for the developer what was probably meant.
Semantic Typing. We therefore use the OpenCyc Ontology4. That way, weprovide a better ranking of requirement refinement candidates by sorting thedifferent argument instances grouped by semantic type.
When we have a look at Table 3, we can see that “multiple recipients” isArg2 in this specific context. In order to determine the semantic type of thisnoun phrase, we apply the Stanford CoreNLP dependency parser on this wordsequence to identify the phrase head. In this case, the adjective “multiple” istagged as modifier of the head “recipients”. We need the phrase head to look upits semantic class, subtypes and its attributed term in the OpenCyc Ontology.
4 http://sw.opencyc.org/.
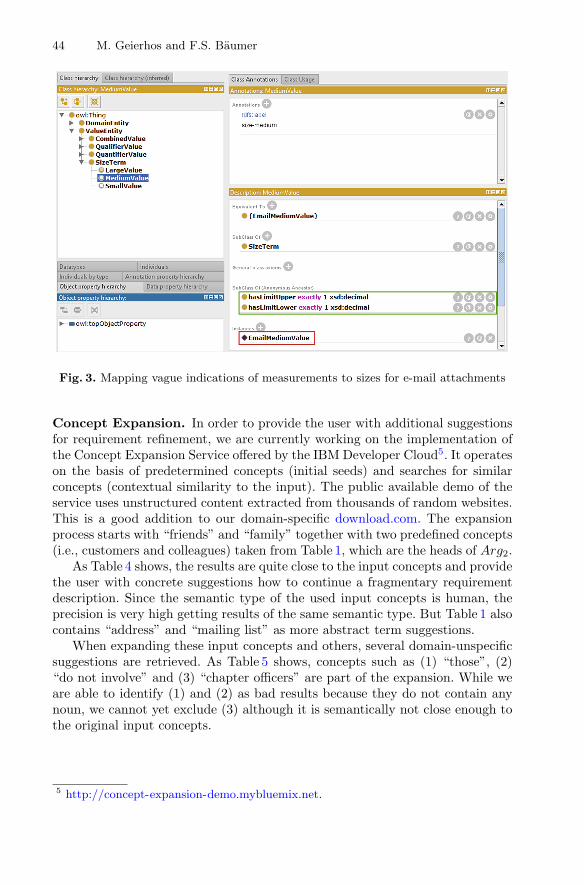
44 M. Geierhos and F.S. Baumer
Fig. 3. Mapping vague indications of measurements to sizes for e-mail attachments
Concept Expansion. In order to provide the user with additional suggestionsfor requirement refinement, we are currently working on the implementation ofthe Concept Expansion Service offered by the IBM Developer Cloud5. It operateson the basis of predetermined concepts (initial seeds) and searches for similarconcepts (contextual similarity to the input). The public available demo of theservice uses unstructured content extracted from thousands of random websites.This is a good addition to our domain-specific download.com. The expansionprocess starts with “friends” and “family” together with two predefined concepts(i.e., customers and colleagues) taken from Table 1, which are the heads of Arg2.
As Table 4 shows, the results are quite close to the input concepts and providethe user with concrete suggestions how to continue a fragmentary requirementdescription. Since the semantic type of the used input concepts is human, theprecision is very high getting results of the same semantic type. But Table 1 alsocontains “address” and “mailing list” as more abstract term suggestions.
When expanding these input concepts and others, several domain-unspecificsuggestions are retrieved. As Table 5 shows, concepts such as (1) “those”, (2)“do not involve” and (3) “chapter officers” are part of the expansion. While weare able to identify (1) and (2) as bad results because they do not contain anynoun, we cannot yet exclude (3) although it is semantically not close enough tothe original input concepts.
5 http://concept-expansion-demo.mybluemix.net.

How to Complete Customer Requirements 45
Table 4. Other possible human instances for Arg2 of send
Heads Expanded concepts Prevalence
friends co-workers 0.73
family family members 0.70
customers coworkers 0.69
colleagues acquaintances 0.68
extended family 0.66
close friends 0.66
loved ones 0.66
neighbors 0.65
Table 5. Abstract input concepts can lead to poor results
Heads Expanded concepts Prevalence
addresses e-mail service provider 0.69
lists distribution lists 0.68
individuals chapter officers 0.67
anyone those 0.66
do not involve 0.65
information seekers 0.65
We are still working on this issue how to decide whether to suggest anexpanded concept for requirement refinement, especially when the results maybe more confusing than helpful for the user.
4 Conclusion and Future Work
When running out of words, users provide incomplete NL requirement descrip-tions containing lots of implicit knowledge. In order to assist them with words,we developed a gap-filling matching approach based on a messaging ontology.With regard to the requested software domain, context-sensitive solutions forthe instantiation of argument positions of the user input are suggested.
Because no suitable gold standard exists [26], we are building a gold standardfor colloquial requirement descriptions, which allows us to evaluate our methodon a large data base. However, this is a very time-consuming process, becauseevery sentence must be manually annotated. Unfortunately, our gold standardfor the domain “e-mail” only consists of 645 sentences, which cover the ninepredicates “to answer”, “to attach”, “to create”, “to delete”, “to encrypt”, “toreply”, “to send”, “to share” and “to zip”. These are the most frequently usedpredicates in the e-mail domain from the Download.com data.
As soon as we have enough data to ensure a good coverage, we will performsuch a gold standard based evaluation. Moreover, the approach of the concept

46 M. Geierhos and F.S. Baumer
expansion must be evaluated. For this purpose, first we have to solve the issuehow to decide if an expanded concept for requirement refinement should besuggested or not, especially when the results may be more confusing than helpfulfor the user.
Acknowledgments. This work was partially supported by the German ResearchFoundation (DFG) within the Collaborative Research Centre On-The-Fly Computing(SFB 901).
References
1. Albayrak, O., Kurtoglu, H., Biaki, M.: Incomplete software requirements andassumptions made by software engineers. In: Proceedings of the 9th Asia-PacificSoftware Engineering Conference, pp. 333–339, December 2009
2. Baker, C.F., Fillmore, C.J., Lowe, J.B.: The Berkeley FrameNet project. In:COLING-ACL 1998: Proceedings of the Conference, Montreal, pp. 86–90 (1998)
3. Clarke, J., Srikumar, V., Sammons, M., Roth, D.: An NLP curator (or: HowI Learned to Stop Worrying and Love NLP Pipelines). In: Proceedings of the8th International Conference on Language Resources and Evaluation (LREC’12),Istanbul, Turkey, pp. 3276–3283, 23–25 May 2012
4. Fatwanto, A.: Software requirements specification analysis using natural languageprocessing technique. In: Proceedings of the International Conference on Qualityin Research QiR 2013, Yogyakarta, pp. 105–110, June 2013
5. Ferrari, A., dell’Orletta, F., Spagnolo, G.O., Gnesi, S.: Measuring and improvingthe completeness of natural language requirements. In: Salinesi, C., van de Weerd,I. (eds.) REFSQ 2014. LNCS, vol. 8396, pp. 23–38. Springer, Heidelberg (2014)
6. Firesmith, D.G.: Are your requirements complete? J. Object Technol. 4(2), 27–43(2005)
7. Geierhos, M., Schulze, S., Baumer, F.S.: What did you mean? Facing the challengesof user-generated software requirements. In: Loiseau, S., Filipe, J., Duval, B., vanden Herik, J. (eds.) Proceedings of the 7th International Conference on Agents andArtificial Intelligence. Special Session on Partiality, Underspecification, and Nat-ural Language Processing (PUaNLP 2015), pp. 277–283. SCITEPRESS - Scienceand Technology Publications, Lissabon (2015)
8. Ghazarian, A.: A case study of defect introduction mechanisms. In: van Eck,P., Gordijn, J., Wieringa, R. (eds.) CAiSE 2009. LNCS, vol. 5565, pp. 156–170.Springer, Heidelberg (2009)
9. Grande, M.: 100 Minuten fur Anforderungsmanagement - Kompaktes Wissen nichtnur fur Projektleiter und Entwickler. Springer, Wiesbaden (2011)
10. HSE. Out of control: why control systems go wrong and how to prevent fail-ure. http://automatie-pma.com/wp-content/uploads/2015/02/hsg238.pdf (2003).Accessed 14 Feb 2016
11. Hsia, P., Davis, A., Kung, D.: Status report: requirements engineering. IEEE Softw.10(6), 75–79 (1993)
12. IEEE. IEEE Std 830-1998 - Recommended practice for software requirements spec-ifications. Institute of Electrical and Electronics Engineers, New York (1998)
13. Kaiya, H., Saeki, M.: Ontology based requirements analysis: lightweight seman-tic processing approach. In: Proceedings of the 5th International Conference onQuality Software, pp. 223–230, September 2005
How to Complete Customer Requirements 47
14. Kaiya, H., Saeki, M.: Using domain ontology as domain knowledge for requirementselicitation. In: 14th IEEE International Requirements Engineering Conference, pp.189–198, September 2006
15. Kamata, M.I., Tamai, T.: How does requirements quality relate to project successor failure? In: Proceedings of the 15th IEEE International Requirements Engineer-ing Conference, pp. 69–78, October 2007
16. Korner, S.J.: RECAA - Werkzeugunterstutzung in der Anforderungserhebung.PhD thesis, Karlsruher Institut fur Technologie (KIT), Karlsruhe, February 2014
17. Menzel, I., Mueller, M., Gross, A., Doerr, J.: An experimental comparison regard-ing the completeness of functional requirements specifications. In: Proceedings ofthe 18th IEEE International Requirements Engineering Conference, pp. 15–24,September 2010
18. Miller, G.A.: WordNet: a lexical database for English. Commun. ACM 38(11),39–41 (1995)
19. Naeem, M., Heckel, R., Orejas, F., Hermann, F.: Incremental service compositionbased on partial matching of visual contracts. In: Rosenblum, D.S., Taentzer, G.(eds.) FASE 2010. LNCS, vol. 6013, pp. 123–138. Springer, Heidelberg (2010)
20. Palmer, M., Gildea, D., Kingsbury, P.: The proposition bank: an annotated corpusof semantic roles. Comput. Linguist. 31(1), 71–106 (2005)
21. Platenius, M.C.: Fuzzy service matching in on-the-fly computing. In: Proceedingsof the 2013 9th Joint Meeting on Foundations of Software Engineering, ESEC/FSE2013, pp. 715–718. ACM, New York (2013)
22. Platenius, M.C., Arifulina, S., Petrlic, R., Schafer, W.: Matching of incompleteservice specifications exemplified by privacy policy matching. In: Ortiz, G., Tran,C. (eds.) ESOCC 2014. CCIS, vol. 508, pp. 6–17. Springer, Heidelberg (2015)
23. Saeki, M., Horai, H., Enomoto, H.: Software development process from naturallanguage specification. In: Proceedings of the 11th International Conference onSoftware Engineering, ICSE 1989, pp. 64–73. ACM, New York (1989)
24. Sommerville, I.: Web Chapter 27: formal specification. http://www.SoftwareEngineering-9.com/Web/ExtraChaps/FormalSpec.pdf (2009). Zuletztabgerufen am 19 Aug 2015
25. Standish Group International. The CHAOS report (1994). https://www.standishgroup.com/sample research files/chaos report 1994.pdf (1995). Accessed14 Feb 2016
26. Tichy, W.F., Landhaußer, M., Korner, S.J.: nlrpBENCH: a benchmark for nat-ural language requirements processing. In: Multikonferenz Software Engineering &Management 2015, March 2015
27. Verma, K., Kass, A.: Requirements analysis tool: a tool for automatically analyzingsoftware requirements documents. In: Sheth, A.P., Staab, S., Dean, M., Paolucci,M., Maynard, D., Finin, T., Thirunarayan, K. (eds.) ISWC 2008. LNCS, vol. 5318,pp. 751–763. Springer, Heidelberg (2008)
28. Yadav, S.B., Bravoco, R.R., Chatfield, A.T., Rajkumar, T.M.: Comparison ofanalysis techniques for information requirement determination. Commun. ACM31(9), 1090–1097 (1988)
An Information Gain-Driven Feature Studyfor Aspect-Based Sentiment Analysis
Kim Schouten(B), Flavius Frasincar, and Rommert Dekker
Erasmus University Rotterdam,Burgemeester Oudlaan 50, 3062 PA Rotterdam, The Netherlands
schouten,frasincar,[email protected]
Abstract. Nowadays, opinions are a ubiquitous part of the Web andsharing experiences has never been more popular. Information regardingconsumer opinions is valuable for consumers and producers alike, aidingin their respective decision processes. Due to the size and heterogeneityof this type of information, computer algorithms are employed to gainthe required insight. Current research, however, tends to forgo a rigorousanalysis of the used features, only going so far as to analyze completefeature sets. In this paper we analyze which features are good predictorsfor aspect-level sentiment using Information Gain and why this is thecase. We also present an extensive set of features and show that it ispossible to use only a small fraction of the features at just a minor costto accuracy.
Keywords: Sentiment analysis · Aspect-level sentiment analysis · Datamining · Feature analysis · Feature selection · Information gain
1 Introduction
Nowadays, opinions are a ubiquitous part of the Web and sharing experienceshas never been more popular [4]. Information regarding consumer opinions isvaluable for consumers and producers alike, aiding in their respective decisionprocesses. Due to the size and heterogeneity of this type of information, computeralgorithms are employed to gain insight into the sentiment expressed by con-sumers and on what particular aspects that sentiment is expressed, and researchinto this type of algorithms has enjoyed increasingly high popularity over thelast decade [8].
Research has led to a number of different approaches to aspect-level senti-ment analysis [13], that can be divided into three categories. The first groupconsists of methods that predominantly use a sentiment dictionary (e.g., [6]).Sentiment values are then assigned to certain words or phrases that appear inthe dictionary and using a few simple rules (e.g., for negation and aggregation),the sentiment values are combined into one score for each aspect. The secondtype is categorized by the use of supervised machine learning methods (e.g., [3]).Using a significant amount of annotated data, where the sentiment is given forc© Springer International Publishing Switzerland 2016E. Metais et al. (Eds.): NLDB 2016, LNCS 9612, pp. 48–59, 2016.DOI: 10.1007/978-3-319-41754-7 5

An Information Gain-Driven Feature Study 49
each aspect, a classifier can be trained that can predict the sentiment value foryet unseen aspects. Last, some methods based on unsupervised machine learn-ing are also available, but these usually combine aspect detection and sentimentclassification into one algorithm (e.g., [14]).
Supervised learning has the advantage of high performance, and given thefact that sentiment is usually annotated as a few distinct classes (i.e., positive,neutral, and negative), traditional statistical classifiers work remarkably well.Unfortunately, most of these methods are somewhat of a black box: once providedwith enough input, the method will do its task and will classify aspect sentimentwith relatively good accuracy. However, the inner workings are often unknown,and because of that, it is also not known how the various input features relate tothe task. Since most classifiers can deal with large dimensionality on the input,one tends to just give all possible features and let the classifier decide whichones to use. While this is perfectly fine when aiming for performance, it does notgive much insight into which particular features are good predictors for aspectsentiment. Knowing which features are relevant is important for achieving insightinto the performed task, but it also allows to speed up the training process byonly employing the relevant features with possibly only a minor decrease inperformance.
This focus on performance instead of explanation is most typically foundin benchmark venues, such as the Semantic Evaluation workshops [12]. Here,participants get annotated training data and are asked to let their algorithmprovide the annotations for a non-annotated data set. The provided annotationsare then centrally evaluated and a ranking is given, showing how each of theparticipating systems fared against each other. Scientifically speaking, this hasthe big benefit of comparability, since all of the participants use the same dataand evaluation is done centrally, as well as reproducibility, since the paperspublished in the workshop proceedings tend to focus on how the system wasbuilt. The one thing missing, however, is an explanation of why certain featuresor algorithms perform so great or that bad, since there usually is not enoughspace in the allowed system descriptions to include this.
Hence, this paper aims to provide insight into which features are useful, usinga feature selection method based on Information Gain [11], which is one of themost popular feature filtering approaches. Compared to wrapper approaches,such as Forward Feature Selection, it does not depend on the used classificationalgorithm. Using Information Gain, we can compute a score for each individualfeature that represents how well that feature divides the aspects between thevarious sentiment classes. Thus, we can move beyond the shallow analysis doneper feature set, and provide deeper insight, on the individual feature level.
The remainder of this paper is organized as follows. First, the problem ofaspect-level sentiment analysis is explained in more detail in Sect. 2, followedby Sect. 3, in which the framework that is responsible for the natural languageprocessing is described, together with the methods for training the classifier andcomputing the Information Gain score. Then, in Sect. 4, the main feature analysisis performed, after which Sect. 5 closes with a conclusion and some suggestionsfor future work.

50 K. Schouten et al.
2 Problem Description
Sentiment analysis can be performed on different levels of granularity. Forinstance, a sentiment value can be assigned to a complete review, much likethe star ratings that are used on websites like Amazon. However, to get a morein-depth analysis of the entity that is being reviewed, whether in a traditionalreview or in a short statement on social media, it is important to know on whichaspect of the entity a statement is being made. Since entities, like products orservices, have many facets and characteristics, ideally one would want to assigna sentiment value to a single aspect instead of to the whole package. This chal-lenge is known as aspect-level sentiment analysis [13], or aspect-based sentimentanalysis [12], and this is the field this research is focused on.
More precisely, we use a data set where each review is already split intosentences and for each sentence it is known what the aspects are. Finding theaspects is a task that is outside the scope of this paper. Given that these aspectsare known, one would want to assign the right sentiment value to each of theseaspects. Most of the annotated aspects are explicit, meaning that they are lit-erally mentioned in the text. As such, it is known which words in the sentencerepresent this aspect. Some aspects, however, are implicit, which means thatthey are only implied by the context of the sentence or the review as a whole.For these aspects, there are no words that directly represent the aspect, eventhough there will be words or expressions that point to a certain aspect. Bothexplicit and implicit aspects are assigned to an aspect category which comesfrom a predefined list of possible aspect categories.
For explicit aspects, since we know the exact words in the sentence that rep-resent this aspect, we can use a context of n words before and after each aspectfrom which to derive the features. This allows for contrasting aspects within thesame sentence. For implicit aspects, this is not possible and hence we extractthe features from the whole sentence. Note that each aspect will have a set ofextracted features, since it is the sentiment value of each aspect that is the object
Fig. 1. A snippet from the used dataset showing an annotated sentence from a restau-rant review.

An Information Gain-Driven Feature Study 51
of classification. An example from the used data set showing both explicit andimplicit aspects (i.e., target="NULL" for implicit features) is shown in Fig. 1.
3 Framework
In this section we present the steps of our framework. First, all textual data ispreprocessed, which is an essential task for sentiment analysis [5], by feeding itthrough a natural language pipeline based on Stanford’s CoreNLP package [10].This extracts information like the lemma, Part-of-Speech (PoS) tag, and gram-matical relations for words in the text. Furthermore, we employ a spell checkercalled JLanguageTool1 to correct obvious misspellings and a simple word sensedisambiguation algorithm based on Lesk [7] to link words to their meaning, rep-resented by WordNet synsets. Stop words are not removed since some of thesewords actually carry sentiment (e.g., emoticons are a famous example), and thefeature selection will filter out features that are not useful anyway, regardless ofwhether they are stopwords or not.
The next step is to prepare all the features that will be used by an SVM [2],the employed classifier in this work. For example, if we want to use the lemmaof each word as a feature, each unique lemma in the dataset will be collectedand assigned a unique feature number, so when this feature is present in thetext when training or testing, it can be denoted using that feature number. Notethat, unless otherwise mentioned, all features are binary, denoting the presenceor absence of that particular feature. For the feature analysis, the following typesof features are considered:
– Word-based features:• Lemma: the dictionary form of a word;• Negation: whether or not one or more negation terms from the General
Inquirer Lexicon2 are present;• The number of positive words and the number of negative words in the con-
text are also considered as features, again using the General Inquirer Lexicon;– Synset-based features:
• Synset: the WordNet synset associated with this word, representing itsmeaning in the current context;
• Related synsets: synsets that are related in WordNet to one of the synsetsin the context (e.g., hypernyms that generalize the synsets in the context);
– Grammar-based features:• Lemma-grammar: a binary grammatical relation between words represented
by their lemma (e.g., “keep-nsubj-we”);• Synset-grammar: a binary grammatical relation between words represented
by their synsets which is only available in certain cases, since not everyword has a synset (e.g., “ok#JJ#1-cop-be#VB#1”);
• PoS-grammar: a binary grammatical relation between words represented byPoS tags (e.g., “VB-nsubj-PRP”), generalizing the lemma-grammar casewith respect to Part-of-Speech;
1 wiki.languagetool.org/java-api.2 http://www.wjh.harvard.edu/∼inquirer.

52 K. Schouten et al.
• Polarity-grammar: a binary grammatical relation between synsets repre-sented by polarity labels (e.g., “neutral-nsubj-neutral”). The polarity classis retrieved from SentiWordNet [1], with the neutral class being the defaultwhen no entry was found in SentiWordNet;
– Aspect features:• Aspect Category: the category label assigned to each aspect is encoded as
a set of binary features (e.g., “FOOD#QUALITY”).
Note that with grammar-based features, we experiment with various sorts oftriples, where two features are connected by means of a grammatical relation.This kind of feature is not well studied in literature, since n-grams are usuallypreferred by virtue of their simplicity. Apart from the effect of Information Gain,the benefit of using this kind of feature will be highlighted in the evaluationsection.
With all the features known, the Information Gain score can be computed foreach individual feature. This is done using only the training data. InformationGain is a statistical property that measures how well a given feature separatesthe training examples according to their target classification [11]. InformationGain is defined based on the measure entropy. The entropy measure characterizesthe (im)purity of a collection of examples. Entropy is defined as:
Entropy(S) = −∑
i
p(i|S) log2 p(i|S)
with S a set of all aspects and p(i|S) the fraction of the aspects in S belongingto class i. These classes are either positive, negative, or neutral. The entropytypically changes when we partition the training instances into smaller subsets,i.e., when analyzing the entropy value per feature. Information Gain representsthe expected reduction in entropy caused by partitioning the samples accordingto the feature in question. The Information Gain of a feature t relative to acollection of aspects S, is defined as:
Information Gain(S, t) = Entropy(S) −∑
v∈V alues(t)
|Sv||St|Entropy(Sv)
where Values(t) is the set of all possible values for feature t. These values againare either positive, negative, or neutral. Sv is the subset of S with aspects ofclass v related to feature t. St is the set of all aspects belonging to feature t. | · |denotes the cardinality of a set.
In this paper, we will analyze the optimal number of features with Informa-tion Gain, one of the most popular measures used in conjunction with a filteringapproach for feature selection. This is executed as follows. First, the Informa-tion Gain is computed for each feature. Next, the IG scores of all the featuresare sorted from high to low and the top k% features are used in the SVM.This percentage k can either be determined using validation data or it can bemanually set.
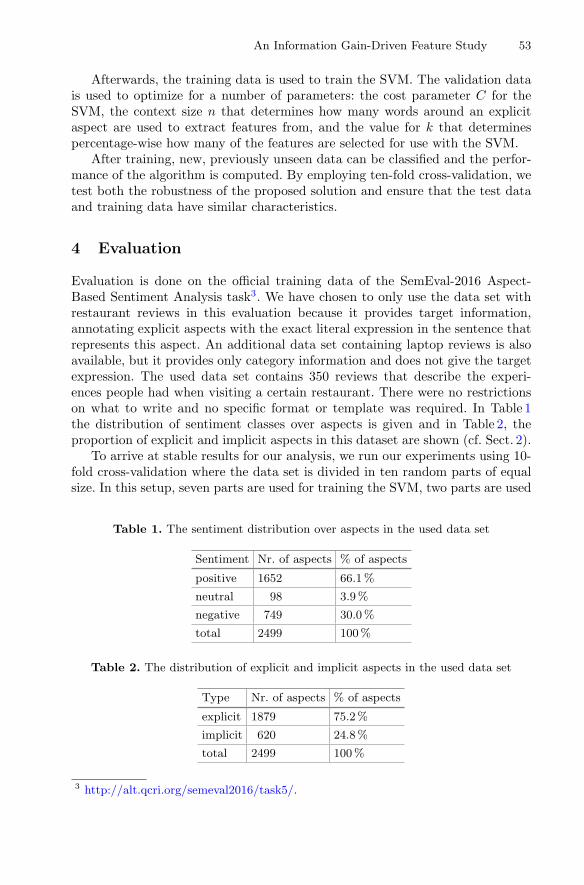
An Information Gain-Driven Feature Study 53
Afterwards, the training data is used to train the SVM. The validation datais used to optimize for a number of parameters: the cost parameter C for theSVM, the context size n that determines how many words around an explicitaspect are used to extract features from, and the value for k that determinespercentage-wise how many of the features are selected for use with the SVM.
After training, new, previously unseen data can be classified and the perfor-mance of the algorithm is computed. By employing ten-fold cross-validation, wetest both the robustness of the proposed solution and ensure that the test dataand training data have similar characteristics.
4 Evaluation
Evaluation is done on the official training data of the SemEval-2016 Aspect-Based Sentiment Analysis task3. We have chosen to only use the data set withrestaurant reviews in this evaluation because it provides target information,annotating explicit aspects with the exact literal expression in the sentence thatrepresents this aspect. An additional data set containing laptop reviews is alsoavailable, but it provides only category information and does not give the targetexpression. The used data set contains 350 reviews that describe the experi-ences people had when visiting a certain restaurant. There were no restrictionson what to write and no specific format or template was required. In Table 1the distribution of sentiment classes over aspects is given and in Table 2, theproportion of explicit and implicit aspects in this dataset are shown (cf. Sect. 2).
To arrive at stable results for our analysis, we run our experiments using 10-fold cross-validation where the data set is divided in ten random parts of equalsize. In this setup, seven parts are used for training the SVM, two parts are used
Table 1. The sentiment distribution over aspects in the used data set
Sentiment Nr. of aspects % of aspects
positive 1652 66.1%
neutral 98 3.9%
negative 749 30.0%
total 2499 100%
Table 2. The distribution of explicit and implicit aspects in the used data set
Type Nr. of aspects % of aspects
explicit 1879 75.2%
implicit 620 24.8%
total 2499 100%
3 http://alt.qcri.org/semeval2016/task5/.
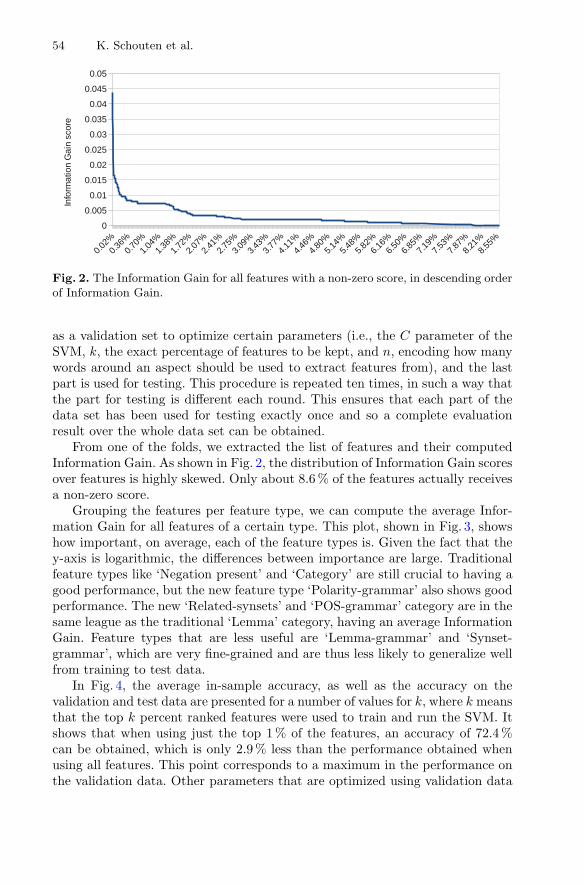
54 K. Schouten et al.
Fig. 2. The Information Gain for all features with a non-zero score, in descending orderof Information Gain.
as a validation set to optimize certain parameters (i.e., the C parameter of theSVM, k, the exact percentage of features to be kept, and n, encoding how manywords around an aspect should be used to extract features from), and the lastpart is used for testing. This procedure is repeated ten times, in such a way thatthe part for testing is different each round. This ensures that each part of thedata set has been used for testing exactly once and so a complete evaluationresult over the whole data set can be obtained.
From one of the folds, we extracted the list of features and their computedInformation Gain. As shown in Fig. 2, the distribution of Information Gain scoresover features is highly skewed. Only about 8.6 % of the features actually receivesa non-zero score.
Grouping the features per feature type, we can compute the average Infor-mation Gain for all features of a certain type. This plot, shown in Fig. 3, showshow important, on average, each of the feature types is. Given the fact that they-axis is logarithmic, the differences between importance are large. Traditionalfeature types like ‘Negation present’ and ‘Category’ are still crucial to having agood performance, but the new feature type ‘Polarity-grammar’ also shows goodperformance. The new ‘Related-synsets’ and ‘POS-grammar’ category are in thesame league as the traditional ‘Lemma’ category, having an average InformationGain. Feature types that are less useful are ‘Lemma-grammar’ and ‘Synset-grammar’, which are very fine-grained and are thus less likely to generalize wellfrom training to test data.
In Fig. 4, the average in-sample accuracy, as well as the accuracy on thevalidation and test data are presented for a number of values for k, where k meansthat the top k percent ranked features were used to train and run the SVM. Itshows that when using just the top 1 % of the features, an accuracy of 72.4 %can be obtained, which is only 2.9 % less than the performance obtained whenusing all features. This point corresponds to a maximum in the performance onthe validation data. Other parameters that are optimized using validation data

An Information Gain-Driven Feature Study 55
Fig. 3. The average Information Gain for each feature type.
Fig. 4. The average accuracy on training, validation, and test set for each of the subsetsof features. (Color figure online)
are C, which is on average set to 1, and n, which is on average set to 4. Notethat since all parameters that are optimized with validation data are optimizedper fold, their exact value differs per fold and thus an average is given. Thepicture is split into five different levels of granularity on the x-axis, providingmore details for lower values of k. In the first split, the method start at thebaseline performance, since at such a low value of k, no features are selected atall. Then, in the second block, one can see that, because these are all features withhigh Information Gain, the performance on the test data closely tracks the in-sample performance on the training data. However, in the third split, some minoroverfitting starts to occur. The best features have already been used, so lesserfeatures make their way into the SVM, and while in-sample performance goes

56 K. Schouten et al.
Fig. 5. The average Information Gain score for each of the subsets of added features.
up, out-of-sample performance does not grow as fast. This effect is illustratedeven stronger in the fourth block, where performance on the training data goesup spectacularly, while performance on the test data actually goes down. Thefeatures that are added here all have a very low Information Gain.
The last block is slightly different because for almost all of these features,roughly 90 % of the total number, the Information Gain is zero. However, asis made evident by the upward slope of the out-of-sample performance, thesefeatures are not necessarily useless and the SVM is able to use them to boostperformance with a few percent. This is possible due to the fact that, whileInformation Gain is computed for each feature in isolation, the SVM takes inter-action effects between features into account. Hence, while these features maynot be useful on their own, given the features already available to the SVM,they can still be of use. This interaction effect accounts for the 2.9 % penalty toperformance increase when using feature selection based on Information Gain.
The diminishing Information Gain is also clearly illustrated in Fig. 5. It fol-lows roughly the same setup in levels of detail as Fig. 4, with this exceptionthat the first split is combined into the first bar, since not enough features wereselected in the first split to create a meaningful set of bars. Furthermore, whileFig. 4 has a cumulative x-axis, this figure does not, showing the average Informa-tion Gain of features that are added in each range (instead of all features addedup to that point). Given that the lowest 90 % of the features has an InformationGain of zero, there are no visible bars in the last split.
For each of the feature selections, we can also look at how well each type offeature is represented in that subset. Hence, we plot the percentage of featuresselected belonging to each of the feature types in Fig. 6. Features whose propor-tion decrease when adding more features are generally more important accordingto the Information Gain ranking, while features whose proportion increases whenadding more features are generally less important since they generally have alower Information Gain. This corresponds to the feature types with high bars inFig. 3. It is interesting to see that ‘Negation’ and ‘Category’ are small but strongfeature sets, and that ‘Related-synsets’, while not having many strong features,

An Information Gain-Driven Feature Study 57
Fig. 6. Proportion of each feature type for each of the cumulative subsets of features.(Color figure online)
has many features that get a non-zero Information Gain, making it still a usefulcategory of features.
Analyzing the top ranked features per feature type in Table 3, some of thefeatures are easily recognized as being helpful to detect sentiment. For instance,the lemma ‘not’, as well as its corresponding synset in WordNet are good indi-cators of negative sentiment. Other features, like the ‘SERVICE#GENERAL’category feature are not so self-evident. These more generic features, while notdirectly pointing to a certain sentiment value, are still useful by virtue of theirstatistics. Again looking at the ‘SERVICE#GENERAL’ category, we check thedataset and see that about 56 % of all aspects with this category have a negativesentiment, whereas overall, only 30 % of the aspects are negative. This is such asharp deviation from the norm, that having this category label is a strong signfor an aspect to be negative. It seems that in the used data set, people tend tobe dissatisfied with the provided service.
Sometimes features that appear in different categories might still represent(almost) the same information. For instance, the two top ‘Lemma-grammar’features are basically the same as the two top ‘Synset-grammar’ features, corre-sponding to a phrase like “some aspect is ok” or “some aspect is good”. Anotherexample of this is the lemma ‘ok’ and its corresponding synset ‘ok#JJ#1’.
An interesting type of features is the ‘Related-synsets’ category. In Table 3,we seen that any synset that is similar to concepts like ‘big’, ‘alarming’, and‘satisfactory’ are good predictors of sentiment, and this corresponds well withour intuition. Sometimes, a high ranked feature can give insight into how con-sumers write their reviews. A good example is the ‘CD-dep-$’ feature in the‘POS-grammar’ category, which denotes a concrete price, such as “$100”, and ispredominantly used in conjunction with a negative sentiment. Apparently, when
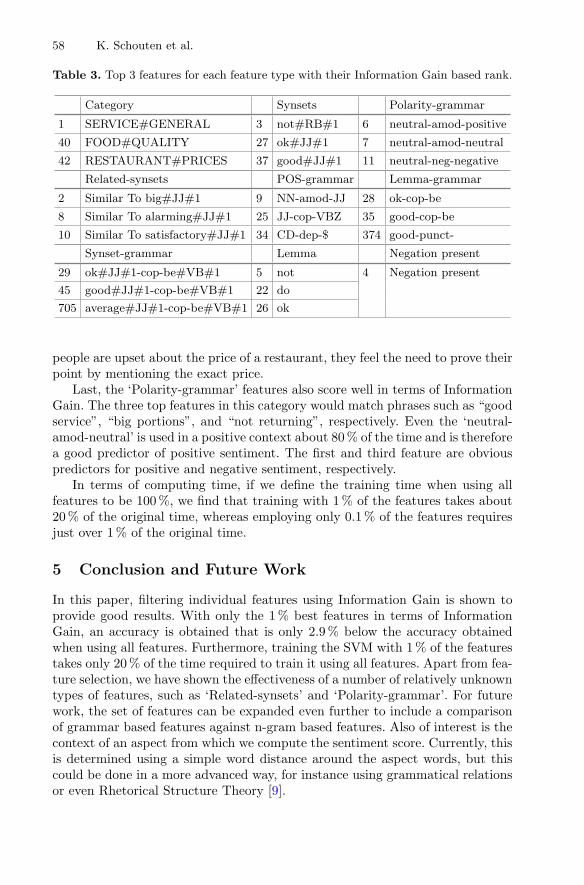
58 K. Schouten et al.
Table 3. Top 3 features for each feature type with their Information Gain based rank.
Category Synsets Polarity-grammar
1 SERVICE#GENERAL 3 not#RB#1 6 neutral-amod-positive
40 FOOD#QUALITY 27 ok#JJ#1 7 neutral-amod-neutral
42 RESTAURANT#PRICES 37 good#JJ#1 11 neutral-neg-negative
Related-synsets POS-grammar Lemma-grammar
2 Similar To big#JJ#1 9 NN-amod-JJ 28 ok-cop-be
8 Similar To alarming#JJ#1 25 JJ-cop-VBZ 35 good-cop-be
10 Similar To satisfactory#JJ#1 34 CD-dep-$ 374 good-punct-
Synset-grammar Lemma Negation present
29 ok#JJ#1-cop-be#VB#1 5 not 4 Negation present
45 good#JJ#1-cop-be#VB#1 22 do
705 average#JJ#1-cop-be#VB#1 26 ok
people are upset about the price of a restaurant, they feel the need to prove theirpoint by mentioning the exact price.
Last, the ‘Polarity-grammar’ features also score well in terms of InformationGain. The three top features in this category would match phrases such as “goodservice”, “big portions”, and “not returning”, respectively. Even the ‘neutral-amod-neutral’ is used in a positive context about 80 % of the time and is thereforea good predictor of positive sentiment. The first and third feature are obviouspredictors for positive and negative sentiment, respectively.
In terms of computing time, if we define the training time when using allfeatures to be 100 %, we find that training with 1 % of the features takes about20 % of the original time, whereas employing only 0.1 % of the features requiresjust over 1 % of the original time.
5 Conclusion and Future Work
In this paper, filtering individual features using Information Gain is shown toprovide good results. With only the 1 % best features in terms of InformationGain, an accuracy is obtained that is only 2.9 % below the accuracy obtainedwhen using all features. Furthermore, training the SVM with 1 % of the featurestakes only 20 % of the time required to train it using all features. Apart from fea-ture selection, we have shown the effectiveness of a number of relatively unknowntypes of features, such as ‘Related-synsets’ and ‘Polarity-grammar’. For futurework, the set of features can be expanded even further to include a comparisonof grammar based features against n-gram based features. Also of interest is thecontext of an aspect from which we compute the sentiment score. Currently, thisis determined using a simple word distance around the aspect words, but thiscould be done in a more advanced way, for instance using grammatical relationsor even Rhetorical Structure Theory [9].
An Information Gain-Driven Feature Study 59
Acknowledgments. The authors are supported by the Dutch national programCOMMIT. We would like to thank Nienke Dijkstra, Vivian Hinfelaar, Isabelle Houck,Tim van den IJssel, and Eline van de Ven, for many fruitful discussions during thisresearch.
References
1. Baccianella, S., Esuli, A., Sebastiani, F.: SentiWordNet 3.0: an enhanced lexicalresource for sentiment analysis and opinion mining. In: Proceedings of the SeventhInternational Conference on Language Resources and Evaluation (LREC 2010),vol. 10, pp. 2200–2204 (2010)
2. Chang, C., Lin, C.: LIBSVM: a library for support vector machines. ACM Trans.Intell. Syst. Technol. 2(3), 27 (2011)
3. Choi, Y., Cardie, C.: Learning with compositional semantics as structural inferencefor subsentential sentiment analysis. In: Proceedings of the Conference on Empir-ical Methods in Natural Language Processing 2008 (EMNLP 2008), pp. 793–801(2008)
4. Feldman, R.: Techniques and applications for sentiment analysis. Commun. ACM56(4), 82–89 (2013)
5. Haddi, E., Liu, X., Shi, Y.: The role of text pre-processing in sentiment analysis.Procedia Comput. Sci. 17, 26–32 (2013)
6. Hu, M., Liu, B.: Mining and summarizing customer reviews. In: Proceedings of10th ACM SIGKDD International Conference on Knowledge Discovery and DataMining (KDD 2004), pp. 168–177. ACM (2004)
7. Lesk, M.: Automatic sense disambiguation using machine readable dictionaries:how to tell a pine cone from an ice cream cone. In: Proceedings of the Fifth AnnualInternational Conference on Systems Documentation (SIGDOC 1986), pp. 24–26.ACM (1986)
8. Liu, B.: Sentiment Analysis and Opinion Mining. Synthesis Lectures on HumanLanguage Technologies. Morgan & Claypool Publishers, San Rafael (2012)
9. Mann, W.C., Thompson, S.A.: Rhetorical structure theory: toward a functionaltheory of text organization. Text Interdiscip. J. Study Discourse 8(3), 243–281(1988)
10. Manning, C.D., Surdeanu, M., Bauer, J., Finkel, J., Bethard, S.J., McClosky, D.:The Stanford CoreNLP natural language processing toolkit. In: Proceedings of52nd Annual Meeting of the Association for Computational Linguistics: SystemDemonstrations, pp. 55–60. Association for Computational Linguistics (2014)
11. Mitchell, T.M.: Machine Learning, 1st edn. McGraw-Hill Inc., New York (1997)12. Pontiki, M., Galanis, D., Papageorgiou, H., Manandhar, S., Androutsopoulos, I.:
SemEval-2015 task 12: aspect based sentiment analysis. In: Proceedings of the9th International Workshop on Semantic Evaluation (SemEval 2015), pp. 486–495.Association for Computational Linguistics (2015)
13. Schouten, K., Frasincar, F.: Survey on aspect-level sentiment analysis. IEEE Trans.Knowl. Data Eng. 28(3), 813–830 (2016)
14. Titov, I., McDonald, R.: A joint model of text and aspect ratings for sentimentsummarization. In: Proceedings of the 46th Annual Meeting of the Associationfor Computational Linguistics: Human Language Technologies (HLT 2008), pp.308–316. ACL (2008)

ESSOT: An Expert Supporting Systemfor Ontology Translation
Mihael Arcan1, Mauro Dragoni2(B), and Paul Buitelaar1
1 Insight Centre for Data Analytics, National University of Ireland, Galway, Irelandmihael.arcan,[email protected]
2 FBK-Fondazione Bruno Kessler, via Sommarive 18, 38123 Trento, [email protected]
Abstract. To enable knowledge access across languages, ontologies,mostly represented only in English, need to be translated into differentlanguages. The main challenge in translating ontologies with machinetranslation is to disambiguate an ontology label with respect to thedomain modelled by the ontology itself; however, a crucial requirementis to have translations validated by experts before the ontologies aredeployed. Real-world applications have to implement a support systemaddressing this task to help experts in validating automatically gener-ated translations. In this paper, we present ESSOT, an Expert Support-ing System for Ontology Translation. The peculiarity of this system isto exploit the semantic information of the label’s context to improvethe quality of label translations. The system has been tested within theOrganic.Lingua project by translating the modelled ontology in three lan-guages, whereby the results are compared with translations provided bythe Microsoft Translator API. The provided results demonstrate the via-bility of our proposed approach.
1 Introduction
Nowadays, semantically structured data, i.e. ontologies or taxonomies, typicallyhave labels stored in English only. Although the increasing number of ontologiesoffers an excellent opportunity to link this knowledge together, non-English usersmay encounter difficulties when using the ontological knowledge represented inEnglish only [1]. Furthermore, applications in information retrieval or knowledgemanagement, using monolingual ontologies are limited to the language in whichthe ontology labels are stored. Therefore, to make ontological knowledge accessi-ble beyond language borders, these monolingual resources need to be enhancedwith multilingual information [2].
Since manual multilingual enhancement of domain-specific ontologies is verytime consuming and expensive, we engage a domain-aware statistical machinetranslation (SMT) system, called OTTO, embedded within the ESSOT system toautomatically translate the ontology labels. As ontologies may change over time,having in place an SMT system adaptable to an ontology can therefore be very ben-eficial. Nevertheless, the quality of the SMT generated translations relies stronglyon the translation model learned from the information stored in parallel corpora.c© Springer International Publishing Switzerland 2016E. Metais et al. (Eds.): NLDB 2016, LNCS 9612, pp. 60–73, 2016.DOI: 10.1007/978-3-319-41754-7 6

ESSOT: An Expert Supporting System for Ontology Translation 61
In most cases, the inference of translation candidates cannot always be learnedaccurately when domain-specific vocabulary, like ontology labels, appears infre-quent in a parallel corpus. Additionally, ambiguous labels built out of only afew words do not express enough semantic information to guide the SMT sys-tem in translating a label correctly in the targeted domain. This can be observedin domain-independent systems, e.g. Microsoft Translator,1 where an ambiguousexpression, like vessel stored in a medical ontology, is translated as Schiff 2 (en.ship) in German, but not into the targeted medical domain as Gefaβ.
In this paper, we present ESSOT with the domain-aware SMT system, calledOTTO, integrated into a collaborative knowledge management platform for sup-porting language experts in the task of translating ontologies. The benefits ofsuch a platform are (i) the possibility of having an all-in-one solution, containingboth an environment for modelling ontologies which enables the collaborationbetween different type of experts and (ii) a pluggable domain-adaptable servicefor supporting ontology translations. The proposed solution has been validatedin a real-world context, namely Organic.Lingua,3 from quantitative and qualita-tive points of view by demonstrating the effort decrease required by the languageexperts for completing the translation of an entire ontology.
2 Related Work
In this section, we summarize approaches related to ontology translation andpresent a brief review of the available ontology management tools with a partic-ular emphasis on their capabilities in supporting language experts for translatingontologies.
The task of ontology translation involves generating an appropriate trans-lation for the lexical layer, i.e. labels stored in the ontology. Most of the pre-vious related work focused on accessing existing multilingual lexical resources,like EuroWordNet or IATE [3,4]. This work focused on the identification ofthe lexical overlap between the ontology and the multilingual resources, whichguarantees a high precision but a low recall. Consequently, external translationservices like BabelFish, SDL FreeTranslation tool or Google Translate were usedto overcome this issue [5,6]. Additionally, [5,7] performed ontology label disam-biguation, where the ontology structure is used to annotate the labels with theirsemantic senses. Similarly, [8] show positive effect of different domain adaptationtechniques, i.e., using web resources as additional bilingual knowledge, re-scoringtranslations with Explicit Semantic Analysis, language model adaptation) forautomatic ontology translation. Differently to the aforementioned approaches,which rely on external knowledge or services, the machinery implemented inESSOT is supported by a domain-aware SMT system, which provides adequatetranslations using the ontology hierarchy and the contextual information of labelsin domain-relevant background text data.1 http://www.bing.com/translator/.2 Translation performed on 2.3.2016.3 http://www.organic-lingua.eu.

62 M. Arcan et al.
Concerning the multilingual ontology management tools, we identified threethat may be compared with the capabilities provided by MoKi: Neon [9],VocBench [10], and Protege [11].
The main features of the The NeOn toolkit4 include the management and theevolution of ontologies in an open, networked environment; the support for col-laborative development of networked ontologies; the possibility of using contextsfor developing, sharing, adapting and maintaining networked ontologies and animproved human-ontology interaction (i.e. making it easier for users with differ-ent levels of expertise and experience to browse and make sense of ontologies).
VocBench5 is a web-based, multilingual, editing and workflow tool that man-ages thesauri, authority lists and glossaries using SKOS-XL. Designed to meetthe needs of semantic web and linked data environments, VocBench providestools and functionalities that facilitate both collaborative editing and multilin-gual terminology. It also includes administration and group management featuresthat permit flexible roles for maintenance, validation and publication.
Protege6 is a free, open source visual ontology editor and knowledge-baseframework. The Protege platform supports two main ways of modelling ontolo-gies via the Protege-Frames and Protege-OWL editors. Protege ontologies can beexported into a variety of formats including RDF(S), OWL, and XML Schema.
While the first two, Neon and VocBench, are the ones more oriented for sup-porting the management of multilinguality in ontologies by including dedicatedmechanisms for modelling the multilingual fashion of each concept; the supportfor multilinguality provided by Protege is restricted to the sole description of thelabels. However, differently from MoKi, none of them implements the capabilityof connecting the tool to an external machine translation system for suggestingtranslations automatically.
3 The Organic.Lingua Project
Organic.Lingua is an EU-funded project that aims at providing automated mul-tilingual services and tools facilitating the discovery, retrieval, exploitation andextension of digital educational content related to Organic Agriculture andAgroEcology. More concretely, the project aims at providing, on top of a webportal, cross-lingual facility services enabling users to (i) find resources in lan-guages different from the ones in which the query has been formulated and/orthe resource described (e.g., providing services for cross-lingual retrieval); (ii)manage meta-data information for resources in different languages (e.g., offer-ing automated meta-data translation services); and (iii) contribute to evolvingcontent (e.g., providing services supporting the users in content generation).
These objectives are reached in the Organic.Lingua project by means of twocomponents: on the one hand, a web portal offering software components andlinguistic resources able to provide multilingual services and, on the other hand,4 http://neon-toolkit.org/wiki/Main Page.5 http://vocbench.uniroma2.it/.6 http://protege.stanford.edu/.

ESSOT: An Expert Supporting System for Ontology Translation 63
a conceptual model (formalized in the “Organic.Lingua ontology”) used for man-aging information associated with the resources provided to the final users andshared with other components deployed on the Organic.Lingua platform. In a nut-shell, the usage of the Organic.Lingua ontology is twofold: (i) resource annotation(each time a content provider inserts a resource in the repository, the resourceis annotated with one or more concepts extracted from the ontology) and (ii)resource retrieval (when web users perform queries on the system, the ontol-ogy is used, by the back-end information retrieval system, to perform advancedsearches based on semantic techniques). Due to this intensive use of the ontologyin the entire Organic.Lingua portal, the accuracy of the linguistic layer, repre-sented by the set of translated labels, is crucial for supporting the annotationand retrieval functionalities.
4 Machine Translation for Ontology Translation
Due to the shortness of ontology labels, there is a lack of contextual informa-tion, which can otherwise help disambiguating expressions. Therefore, our goalis to translate the identified ontology labels within the textual context of thetargeted domain, rather than in isolation. To identify the most domain-specificsource sentences containing the label to be translated we engage the OnTol-ogy TranslatiOn System, called OTTO7 [12]. With this approach, we aim toretain relevant sentences, where the English label vessel belongs to the medicaldomain, but not to the technical domain, which would cause a wrong, out-of-domain translation. This process reduces the semantic noise in the translationprocess, since we try to avoid contextual information that does not belong tothe domain of the targeted ontology.
Statistical Machine Translation. Our approach is based on statisticalmachine translation, where we wish to find the best translation e, of a stringf , given by a log-linear model combining a set of features. The translation thatmaximizes the score of the log-linear model is obtained by searching all possibletranslations candidates. The decoder, which is essentially a search procedure,provides the most probable translation based on a statistical translation modellearned from the training data.
For a broader domain coverage of an SMT system, we merged several parallelcorpora necessary to train an SMT system, e.g. JRC-Acquis [13], Europarl [14],DGT (translation memories generated by the Directorate-General for Trans-lation) [15], MultiUN corpus [16] and TED talks [17] among others, into oneparallel dataset. For the translation approach, the OTTO System engages thewidely used Moses toolkit [18]. Word alignments were built with GIZA++ [19]and a 5-gram language model was built with KenLM [20].
Relevant Sentence Selection. In order to translate an ontology label in theclosest domain-specific contextual environment, we identify within the concate-nated corpus only those source sentences, which are most relevant to the labels7 http://server1.nlp.insight-centre.org/otto/.

64 M. Arcan et al.
to be translated. Nevertheless, due to the specificity of the ontology labels, justan n-gram overlap approach is not sufficient to select all the useful sentences.For this reason, we follow the idea of [21], where the authors extend the semanticinformation of ontology labels using Word2Vec [22] for computing distributedrepresentations of words. The technique is based on a neural network that analy-ses the textual data provided as input and outputs a list of semantically relatedwords. Each input string, in our experiment ontology labels or source sentences,is vectorized using the surrounding context and compared to other vectorizedsets of words in a multi-dimensional vector space. Word relatedness is measuredthrough the cosine similarity between two word vectors.
The usage of the ontology hierarchy allows us to further improve the dis-ambiguation of short labels, i.e., the related words of a label are concatenatedwith the related words of its direct parent. Given a label and a source sentencefrom the concatenated corpus, related words and their weights are extractedfrom both of them, and used as entries of the vectors to calculate the cosinesimilarity. Finally, the most similar source sentence and the label should sharethe largest number of related words.
OTTO Service in Action. The OTTO service8 works as a pipeline of tasks.When a user invokes the translation service, all labels contained in the ontologycontext (where as “context” we mean the set of concepts that are connecteddirectly or with a maximum distance of N arcs with the concept that has to betranslated) are extracted from the ontology and stored in the message that is sentto the OTTO service (left part in Fig. 1). When the service receives the transla-tion request, the service looks into the model for the best candidate translationsby considering the contextual information accompanying the ontology label totranslate. A ranked list based on log probabilities of candidate translations withinthe JSON output format (Fig. 1) is generated from the OTTO service and sentback to the user that will select, among the proposed translations, the one tosave in the ontology.
Fig. 1. JSON representations provided to and from the OTTO system.
8 For more information how to invoke the service, see also: http://server1.nlp.insight-centre.org/otto/rest service.html.

ESSOT: An Expert Supporting System for Ontology Translation 65
5 Supporting the Ontology Translation Activitywith MoKi
The translation component described in the previous section has been integratedin a collaborative knowledge management tool called MoKi 9[23]. It is a collabora-tive MediaWiki-based10 tool for modelling ontological and procedural knowledgein an integrated manner11 and is grounded on three main pillars:
– each basic entity of the ontology (i.e., concepts, object and datatype proper-ties, and individuals) is associated with a wiki page;
– each wiki page describes an entity by means of both unstructured (e.g., freetext, images) and structured (e.g. OWL axioms) content;
– multi-mode access to the page content is provided to support easy usage byusers with different skills and competencies.
In order to meet the needs of the specific ontology translation task within theOrganic.Lingua project, MoKi has been customized with additional facilities: (i)connection with the OTTO service that is in charge of providing the translationsof labels and descriptions associated with the ontology entities; and (ii) user-friendly collaborative features specifically targeting linguistic issues. Translatingdomain-specific ontologies, in fact, demands that experts discuss and reach anagreement not only with respect to modelling choices, but also to (automated)ontology label translations.
Below, we present the list of the implemented facilities specifically designedfor supporting the management of the multilingual layer of the Organic.Linguaontology.12
Domain and Language Experts View. The semi-structured access mode,dedicated to the Domain and Language Experts, has been equipped with func-tionalities that permits revisions of the linguistic layer. This set of functionalitiespermits to revise the translation of names and descriptions of each entity (con-cepts, individuals, and properties).
For browsing and editing of the translations, a quick view box has beeninserted into the mask (as shown in Fig. 2); in this way, language experts areable to navigate through the available translations and, eventually, invoke thetranslation service for retrieving a suggestion or, alternatively, to edit the trans-lation by themselves (Fig. 3).
Approval and Discussion Facilities. Given the complexity of translatingdomain specific ontologies, translations often need to be checked and agreedupon by a community of experts. This is especially true when ontologies are9 http://moki.fbk.eu.
10 Wikimedia Foundation/Mediawiki: http://www.mediawiki.org.11 Though MoKi allows to model both ontological and procedural knowledge, here we
will limit our description only to the features for building multilingual ontologies.12 A read-only version, but with all functionalities available, of the MoKi instance
described in this paper is available at https://dkmtools.fbk.eu/moki/3 5/essot/.

66 M. Arcan et al.
Fig. 2. Multilingual box for facilitating the entity translation
Fig. 3. Quick translation box for editing entities translations
used to represent terminological standards which need to be carefully discussedand evaluated. To support this collaborative activity we foresee the usage of thewiki-style features of MoKi, expanded with the possibility of assigning specifictranslations of ontology labels to specific experts who need to monitor, check,and approve the suggested translations. This customization promotes the man-agement of the changes carried out on the ontology (in both layers) by providingthe facilities necessary to manage the life-cycle of each change.
These facilities may be split in two different sets of features. The first groupmay be considered as a monitor of the activities performed on each entity page.When changes are committed, approval requests are created. They contain theidentification of the expert in charge of approving the change, the date on whichthe change has been performed, and a natural language description of the change.Moreover, a mechanism for managing the approvals and for maintaining thehistory of all approval requests for each entity is provided. Instead, the secondset contains the facilities for managing the discussions associated with each entitypage. A user interface for creating the discussions has been implemented togetherwith a notification procedure that alerts users when new topics/replies, relatedto the discussions that they are following, have been posted.
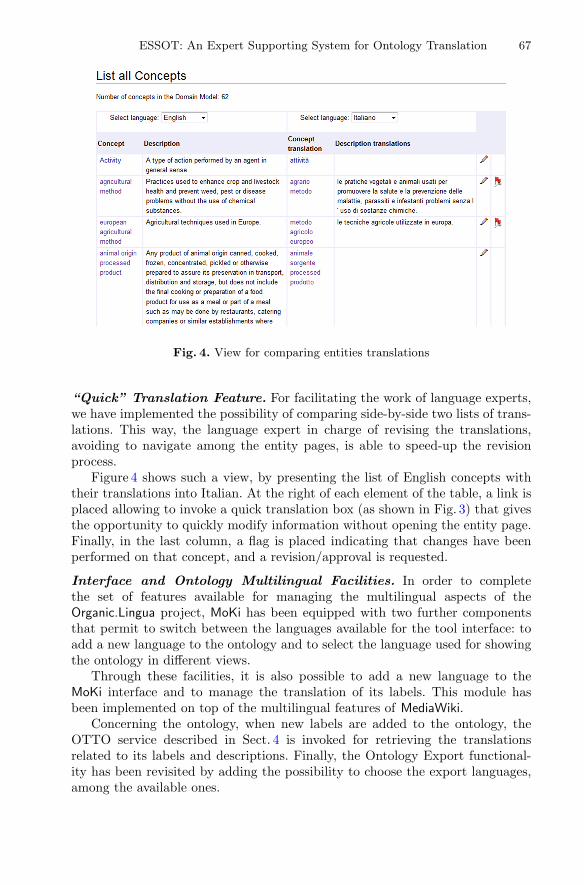
ESSOT: An Expert Supporting System for Ontology Translation 67
Fig. 4. View for comparing entities translations
“Quick” Translation Feature. For facilitating the work of language experts,we have implemented the possibility of comparing side-by-side two lists of trans-lations. This way, the language expert in charge of revising the translations,avoiding to navigate among the entity pages, is able to speed-up the revisionprocess.
Figure 4 shows such a view, by presenting the list of English concepts withtheir translations into Italian. At the right of each element of the table, a link isplaced allowing to invoke a quick translation box (as shown in Fig. 3) that givesthe opportunity to quickly modify information without opening the entity page.Finally, in the last column, a flag is placed indicating that changes have beenperformed on that concept, and a revision/approval is requested.
Interface and Ontology Multilingual Facilities. In order to completethe set of features available for managing the multilingual aspects of theOrganic.Lingua project, MoKi has been equipped with two further componentsthat permit to switch between the languages available for the tool interface: toadd a new language to the ontology and to select the language used for showingthe ontology in different views.
Through these facilities, it is also possible to add a new language to theMoKi interface and to manage the translation of its labels. This module hasbeen implemented on top of the multilingual features of MediaWiki.
Concerning the ontology, when new labels are added to the ontology, theOTTO service described in Sect. 4 is invoked for retrieving the translationsrelated to its labels and descriptions. Finally, the Ontology Export functional-ity has been revisited by adding the possibility to choose the export languages,among the available ones.

68 M. Arcan et al.
6 Evaluation
Our goal is to evaluate the usage and the usefulness of the MoKi tools and ofthe underlying service for suggesting domain-adapted translations.
In detail, we are interested in answering two main research questions:
RQ1. Does the proposed system provide an effective support, in terms ofthe quality of suggested translations, to the management of multilingualontologies?
RQ2. Do the MoKi functionalities provide an effective support to the collabo-rative management of a multilingual ontology?
In order to answer these questions, we performed two types of analysis:
1. Quantitative: we collected objective measures concerning the effectiveness ofthe translations suggested by the embedded machine translation service. Thisinformation allows to have an estimation of the effort needed for adapting alltranslations by the language experts.
2. Qualitative: we collected subjective judgements from the language expertsinvolved in the evaluation of the tool on general usability of the componentsand to provide feedback for future improvements.
Six language experts have been involved in the evaluation of the proposedplatform for translating the Organic.Lingua ontology in three different languages:German, Spanish, and Italian. Most of the experts had no previous knowledgeof the tool, hence an initial phase of training was necessary.
After the initial training, experts were asked to translate the ontology in thethree languages mentioned above. Experts used MoKi facilities for completingthe translation task and, at the end, they provided feedback about tool supportfor accomplishing the task. A summary of these findings and lessons learned arepresented in Sect. 6.2.
6.1 Quantitative Evaluation Results
The automatic evaluation on label translations provided by OTTO is based onthe correspondence between the SMT output of OTTO and reference trans-lations (gold standard), provided by domain and language experts. For theautomatic evaluation we used the BLEU [24], METEOR [25] and TER [26]algorithms.
BLEU is calculated for individual translated segments (n-grams) by com-paring them with reference translations. Those scores, between 0 and 1 (perfecttranslation), are then averaged over the whole evaluation dataset to reach anestimate the automatically generated translation’s overall quality. METEOR isbased on the harmonic mean of precision and recall, whereby recall is weightedhigher than precision. Along with standard exact word (or phrase) matching ithas additional features, i.e. stemming, paraphrasing and synonymy matching.Differently to BLEU, the metric produces good correlation with human judge-ment at the sentence or segment level. TER is an error metric (lowers scores

ESSOT: An Expert Supporting System for Ontology Translation 69
Table 1. Automatic translation evaluation of the Organic.Lingua ontology by theMicrosoft Translator API and OTTO System (bold results = best performance)
English → German English → Italian English → Spanish
System BLEU METEOR TER BLEU METEOR TER BLEU METEOR TER
Microsoft 0.037 0.196 0.951 0.135 0.286 0.871 0.210 0.369 0.733
OTTO 0.074 0.310 0.991 0.130 0.342 0.788 0.257 0.444 0.667
Microsoft n-best 0.076 0.279 0.872 0.145 0.328 0.829 0.274 0.402 0.657
OTTO n-best 0.074 0.310 1.00 0.150 0.408 0.719 0.333 0.523 0.566
are better) for machine translation measuring the number of edits required tochange a system output into one of the references.
We evaluate the automatically generated translations into German, Italianand Spanish provided by OTTO and the Microsoft Translator API. Since ref-erence translations are needed to evaluate automatically generated translations,we use the translated labels provided by the domain experts. The Organic.Linguaontology provides 274 German, 354 Italian and 355 Spanish existing translationsout of 404 English labels. As seen in Table 1, with the help of contextual informa-tion OTTO significantly outperforms (p-value < 0.05) Microsoft Translator APIwhen translating English labels into German (51.3 % averaged improvement overall metrics) or Spanish (51.7 %) and produces comparable results when translat-ing into Italian (10.5 %).
Since both translation systems can provide additional, less probable transla-tions of an English label, we identify with METEOR the best translation (due thegold standard) out of a set of possible translations. In this setting, the MicrosoftTranslator API provided on average 1.2 translations per label for German andItalian, and 1.6 for the Spanish, respectively. The OTTO system provided 9.5,10.4 and 8.9 possible translations for German, Italian and Spanish. This addi-tional information, seen as OTTO n-best and Microsoft n-best in the last partin Table 1 allows us to provide better translation candidates of labels. Comparedto the first-best translation evaluation (upper part in Table 1), the translationquality improves for both systems. In the n-best scenario, OTTO demonstrates a13.7 % averaged improvement in terms of the evaluation metrics over Microsoftand 14.4 % over OTTO first-best scenario when translating into Italian. ForSpanish the improvements are 21.8 % and 20.8 %, respectively. Only for German(−2.1 %; −4.9 %) Microsoft Translator performs better.
6.2 Qualitative Evaluation Results
To investigate the subjective perception of the six experts about the supportprovided for translating ontologies, we analysed the subjective data collectedthrough a questionnaire. For each functionality described in Sect. 5, we providethe information how often each aspect has been raised by the language experts.
Language Experts ViewPros: Easy to use for managing translations (3)Usable interface for showing concept translations (2)
70 M. Arcan et al.
Approval And DiscussionPros: Pending approvals give a clear situation about concept status (4)Cons: Discussion masks are not very useful (5)
Quick Translation FeaturePros: Best facility for translating concepts (5)Cons: Interface design improvable (2)
The results show, in general, a good perception of the implemented functionali-ties, in particular concerning the procedure of translating a concept by exploitingthe quick translation feature. Indeed, 5 out of 6 experts reported advantages onusing this capability. Similar opinions have been collected about the languageexpert view, where the users perceived such a facility as a usable reference forhaving the big picture about the status of concept translations.
Controversial results are reported concerning the approach and discussionfacility. On the one hand, the experts perceived positively the solution of listingapproval requests on top of each concept page. On the other hand, we receivednegative opinions by almost all experts (5 out of 6) about the usability of discus-sion forms. This result shows us to focus future effort in improving this aspectof the tool.
Finally, concerning the “quick” translation facility, 5 out of 6 experts judgedthis facility as the most usable way for translating a concept. The main char-acteristic that has been highlighted is the possibility of performing a “mass-translation” activity without opening the page of each concept, with the positiveconsequence of saving a lot of time.
6.3 Findings and Lessons Learned
The quantitative and qualitative results demonstrate the viability of the pro-posed platform in real-world scenarios and, in particular, its effectiveness in theproposed use case. Therefore, we can positively answer to both research ques-tions, RQ1: the back-end component provides helpful suggestions for performingthe ontology translation task, and RQ2: the provided interfaces are usable anduseful for supporting the language experts in the translation activity. Besidesthese, there were other insights, either positive and negative, that emerged dur-ing the subjective evaluation that we conducted.
The main positive aspect highlighted by the experts was related to the easyand quick way of translating a concept with respect to other available knowledgemanagement tools (see details in Sect. 2), which do not enable specific supportfor translation. The suggestion-based service allowed effective suggestions andreduced effort required for finalizing the translation of the ontology. However,even if on one hand, the experts perceived such a service very helpful from thepoint of view of domain experts (i.e. experts that are generally in charge ofmodelling ontologies, but that might not have enough linguistic expertise fortranslating label properly with respect to the domain), the facilities supportinga direct interaction with language experts (i.e. discussion form) should be moreintuitive, for instance as the approval one.

ESSOT: An Expert Supporting System for Ontology Translation 71
The criticism concerning the interface design was reported also about the quicktranslation feature, where some of the experts commented that the comparativeview might be improved from the graphical point of view. In particular, they sug-gested (i) to highlight translations that have to be revised, instead of using a flag,and (ii) to publish only the concept label instead of putting also the full descriptionin order to avoid misalignments in the visualization of information.
Connected to the quick translation facility, experts judged it as the easiestway for executing a first round of translations. Indeed, by using the providedtranslation box, experts are able to translate concept information without nav-igating to the concept page and by avoiding a reload of the concepts list afterthe storing of each change carried out by the concept translation.
Finally, we can judge the proposed platform as a useful service for supportingthe ontology translation task, especially in a collaborative environment whenthe multilingual ontology is created by two different types of experts: domainexperts and language experts. Future work in this direction will focus on theusability aspects of the tool and on the improvement of the semantic model usedfor suggesting translations in order to further reduce the effort of the languageexperts. We plan also to extend the evaluation on other use cases.
7 Conclusions
This paper presents ESSOT, an Expert Supporting System for Ontology Trans-lation implementing an automatic translation approach based on the enrichmentof the text to translate with semantically structured data, i.e. ontologies or tax-onomies. The ESSOT system integrates the OTTO domain-adaptable semantictranslation service and the MoKi collaborative knowledge management tool forsupporting language experts in the ontology translation activity. The platformhas been concretely used in the context of the Organic.Lingua EU project bydemonstrating the effectiveness in the quality of the suggested translations andin the usefulness from the language experts point of view.
Acknowledgement. This publication has emanated from research conducted withthe financial support of Science Foundation Ireland (SFI) under Grant NumberSFI/12/RC/2289 and the European Unions Horizon 2020 programme MixedEmotions(Grant Number 644632).
References
1. Gomez-Perez, A., Vila-Suero, D., Montiel-Ponsoda, E., Gracia, J., Aguado-de Cea,G.: Guidelines for multilingual linked data. In: Proceedings of the 3rd InternationalConference on Web Intelligence, Mining and Semantics. ACM (2013)
2. Gracia, J., Montiel-Ponsoda, E., Cimiano, P., Gomez-Perez, A., Buitelaar, P.,McCrae, J.: Challenges for the multilingual web of data. Web Semant. Sci. Serv.Agents World Wide Web 11, 63–71 (2012)
3. Cimiano, P., Montiel-Ponsoda, E., Buitelaar, P., Espinoza, M., Gomez-Perez, A.:A note on ontology localization. Appl. Ontol. 5(2), 127–137 (2010)

72 M. Arcan et al.
4. Declerck, T., Perez, A.G., Vela, O., Gantner, Z., Manzano, D.: Multilingual lexicalsemantic resources for ontology translation. In: Proceedings of the 5th InternationalConference on Language Resources and Evaluation, Saarbrucken, Germany (2006)
5. Espinoza, M., Montiel-Ponsoda, E., Gomez-Perez, A.: Ontology localization.In: Proceedings of the Fifth International Conference on Knowledge Capture,New York (2009)
6. Fu, B., Brennan, R., O’Sullivan, D.: Cross-lingual ontology mapping–an investiga-tion of the impact of machine translation. In: Gomez-Perez, A., Yu, Y., Ding, Y.(eds.) ASWC 2009. LNCS, vol. 5926, pp. 1–15. Springer, Heidelberg (2009)
7. McCrae, J., Espinoza, M., Montiel-Ponsoda, E., Aguado-de Cea, G., Cimiano, P.:Combining statistical and semantic approaches to the translation of ontologies andtaxonomies. In: Fifth workshop on Syntax, Structure and Semantics in StatisticalTranslation (SSST-5) (2011)
8. McCrae, J.P., Arcan, M., Asooja, K., Gracia, J., Buitelaar, P., Cimiano, P.: Domainadaptation for ontology localization. Web Semant. Sci. Serv. Agents World WideWeb 36, 23–31 (2015)
9. Espinoza, M., Gomez-Perez, A., Mena, E.: Enriching an ontology with multilingualinformation. In: Bechhofer, S., Hauswirth, M., Hoffmann, J., Koubarakis, M. (eds.)ESWC 2008. LNCS, vol. 5021, pp. 333–347. Springer, Heidelberg (2008)
10. Stellato, A., Rajbhandari, S., Turbati, A., Fiorelli, M., Caracciolo, C., Lorenzetti,T., Keizer, J., Pazienza, M.T.: VocBench: a web application for collaborative devel-opment of multilingual thesauri. In: Gandon, F., Sabou, M., Sack, H., d’Amato,C., Cudre-Mauroux, P., Zimmermann, A. (eds.) ESWC 2015. LNCS, vol. 9088, pp.38–53. Springer, Heidelberg (2015)
11. Gennari, J., Musen, M., Fergerson, R., Grosso, W., Crubezy, M., Eriksson, H., Noy,N., Tu, S.: The evolution of Protege: an environment for knowledge-based systemsdevelopment. Int. J. Hum. Comput. Stud. 58(1), 89–123 (2003)
12. Arcan, M., Asooja, K., Ziad, H., Buitelaar, P.: Otto-ontology translation system.In: ISWC 2015 Posters & Demonstrations Track, Bethlehem, PA, USA, vol. 1486(2015)
13. Steinberger, R., Pouliquen, B., Widiger, A., Ignat, C., Erjavec, T., Tufis, D., Varga,D.: The JRC-acquis: a multilingual aligned parallel corpus with 20+ languages.In: Proceedings of the 5th International Conference on Language Resources andEvaluation (LREC) (2006)
14. Koehn, P.: Europarl: a parallel corpus for statistical machine translation. In: Con-ference Proceedings the Tenth Machine Translation Summit, AAMT (2005)
15. Steinberger, R., Ebrahim, M., Poulis, A., Carrasco-Benitez, M., Schluter, P., Przy-byszewski, M., Gilbro, S.: An overview of the european union’s highly multilingualparallel corpora. Lang. Resour. Eval. 48(4), 679–707 (2014)
16. Eisele, A., Chen, Y.: Multiun: a multilingual corpus from united nation docu-ments. In: Tapias, D., Rosner, M., Piperidis, S., Odjik, J., Mariani, J., Maegaard,B., Choukri, K., Chair, N.C.C. (eds.) Proceedings of the Seventh Conference onInternational Language Resources and Evaluation, pp. 2868–2872. European Lan-guage Resources Association (ELRA) (2010)
17. Cettolo, M., Girardi, C., Federico, M.: Wit3: web inventory of transcribed andtranslated talks. In: Proceedings of the 16th Conference of the European Associa-tion for Machine Translation (EAMT), Trento, Italy, pp. 261–268, May 2012
18. Koehn, P., Hoang, H., Birch, A., Callison-Burch, C., Federico, M., Bertoldi, N.,Cowan, B., Shen, W., Moran, C., Zens, R., et al.: Moses: open source toolkit forstatistical machine translation. In: Proceedings of the 45th Annual Meeting of the

ESSOT: An Expert Supporting System for Ontology Translation 73
ACL on Interactive Poster and Demonstration Sessions, pp. 177–180. Associationfor Computational Linguistics (2007)
19. Och, F.J., Ney, H.: A systematic comparison of various statistical alignment mod-els. Comput. Linguist. 29, 19 (2003)
20. Heafield, K.: KenLM: faster and smaller language model queries. In: Proceedings ofthe EMNLP 2011 Sixth Workshop on Statistical Machine Translation, Edinburgh,Scotland, UK, pp. 187–197, July 2011
21. Arcan, M., Turchi, M., Buitelaar, P.: Knowledge portability with semantic expan-sion of ontology labels. In: Proceedings of the 53rd Annual Meeting of the Associ-ation for Computational Linguistics, Beijing, China, July 2015
22. Mikolov, T., Chen, K., Corrado, G., Dean, J.: Efficient estimation of word repre-sentations in vector space. In: ICLR Workshop (2013)
23. Dragoni, M., Bosca, A., Casu, M., Rexha, A.: Modeling, managing, exposing, andlinking ontologies with a wiki-based tool. In: Calzolari, N., Choukri, K., Declerck,T., Loftsson, H., Maegaard, B., Mariani, J., Moreno, A., Odijk, J., Piperidis, S.(eds.) Proceedings of the Ninth International Conference on Language Resourcesand Evaluation (LREC-2014), Reykjavik, Iceland, 26–31 May 2014, pp. 1668–1675.European Language Resources Association (ELRA) (2014)
24. Papineni, K., Roukos, S., Ward, T., Zhu, W.J.: BLEU: a method for automaticevaluation of machine translation. In: Proceedings of the 40th Annual Meeting onAssociation for Computational Linguistics, ACL 2002, pp. 311–318 (2002)
25. Denkowski, M., Lavie, A.: Meteor universal: language specific translation evalu-ation for any target language. In: Proceedings of the EACL 2014 Workshop onStatistical Machine Translation (2014)
26. Snover, M., Dorr, B., Schwartz, R., Micciulla, L., Makhoul, J.: A study of transla-tion edit rate with targeted human annotation. In: Proceedings of Association forMachine Translation in the Americas (2006)
Adapting Semantic Spreading Activationto Entity Linking in Text
Farhad Nooralahzadeh1(B), Cedric Lopez2, Elena Cabrio3, Fabien Gandon1,and Frederique Segond2
1 INRIA Sophia Antipolis, Valbonne, Francefarhad.nooralahzdeh,[email protected]
2 Viseo Research Center, Grenoble, Francecedric.lopez,[email protected]
3 University of Nice, Nice, [email protected]
Abstract. The extraction and the disambiguation of knowledge guidedby textual resources on the web is a crucial process to advance the Webof Linked Data. The goal of our work is to semantically enrich raw databy linking the mentions of named entities in the text to the correspond-ing known entities in knowledge bases. In our approach multiple aspectsare considered: the prior knowledge of an entity in Wikipedia (i.e. thekeyphraseness and commonness features that can be precomputed bycrawling the Wikipedia dump), a set of features extracted from the inputtext and from the knowledge base, along with the correlation/relevancyamong the resources in Linked Data. More precisely, this work exploresthe collective ranking approach formalized as a weighted graph model,in which the mentions in the input text and the candidate entities fromknowledge bases are linked using the local compatibility and the globalrelatedness measures. Experiments on the datasets of the Open Knowl-edge Extraction (OKE) challenge with different configurations of ourapproach in each phase of the linking pipeline reveal its optimum mode.We investigate the notion of semantic relatedness between two entitiesrepresented as sets of neighbours in Linked Open Data that relies onan associative retrieval algorithm, with consideration of common neigh-bourhood. This measure improves the performance of prior link-basedmodels and outperforms the explicit inter-link relevancy measure amongentities (mostly Wikipedia-centric). Thus, our approach is resilient tonon-existent or sparse links among related entities.
Keywords: Entity linking · Linked data · Collective entity ranking ·Semantic spreading
1 Introduction
The Web publishes information from many heterogeneous sources, and such datacan be extremely valuable for several domains and applications as, for instance,
This work has been founded by the French ANR national grant (ANR-13-LAB2-0001).
c© Springer International Publishing Switzerland 2016E. Metais et al. (Eds.): NLDB 2016, LNCS 9612, pp. 74–90, 2016.DOI: 10.1007/978-3-319-41754-7 7
Adapting Semantic Spreading Activation to Entity Linking in Text 75
business intelligence. A large volume of information on the Web is made ofunstructured texts, and contains mentions of named entities (NE) such as people,places and organizations. Names are often ambiguous and could refer to severaldifferent named entities (i.e. homonymy) and, vice-versa, entities may have sev-eral equivalent names (i.e. synonymy). On the other hand, the recent evolution ofpublishing and connecting data over the Web under the name of “Linked Data”provides a machine-readable and enriched representation of the world’s entities,together with their semantic characteristics. This process results in the creationof large knowledge bases (KB) from different communities, often interlinked toeach other as is the case of DBpedia, i.e. the structured version of Wikipedia,Yago and FreeBase1. This characteristic of the Web of data empowers both thehumans and computer agents to discover more “things” by easily navigatingamong the datasets, and can be profitably exploited in complex tasks such asinformation retrieval, question answering, knowledge extraction and reasoning.The NE recognition and linking task, i.e. establishing the mapping between theNE mentions in the text to their related resources in KB is of critical importanceto achieve this goal. Such mappings (i.e. links) can be used to provide semanticannotations to human readers, as well as a machine-readable representation ofthe pieces of knowledge in the text, exploitable to improve many Natural Lan-guage Processing (NLP) applications. The preliminary step in the entity linkingtask is identifying the textual boundaries of words, i.e. as a single-word or mul-tiwords in a document such that the recognized boundary corresponds to anindividual entity (e.g., person, organization, location, event) in the real world.The detection of entity mentions is currently referred as named entity recogni-tion. Then, the main challenge of entity linking is to map each entity mentionfound in the text to the corresponding entry in a given KB(e.g. DBpedia). Moreprecisely, the task can be described as follows: given a KB ‘KB’ (e.g., Wikipedia,DBpedia) and an unstructured text document D in which a sequence of NE men-tions
−→M = m1,m2, ...,mi, ... appear in the text, the aim of entity linking isto output a sequence of entity candidates
−→C = c1, c2, ..., ci, ..., where ci ∈ KBand corresponds to mi with a high confidence score. Here mi refers to a sequenceof tokens which is recognized by NER tools as a NE. If an entity mention mi intext does not have its corresponding entity candidate ci in the KB, it is labeledas “NIL” [16,31].
The state-of-the-art entity linking systems exploit various features extractedfrom the input text and from the knowledge base. The most important featureis the semantic relatedness among the candidate entities and the effectiveness ofthis function is a key-point for the accuracy of entity linking system [3]. Most ofthe entity linking algorithms focus on the extensive link structure of Wikipediaand they consider the overlap of the incoming/outgoing links of entity articlesas a notion of their relatedness. However, this approach has a limitation for theentities that do not have explicit links. In order to deal with this limitation, inthis paper we answer the following research questions:
1 dbpedia.org; www.mpi-inf.mpg.de/yago/; www.freebase.com.
76 F. Nooralahzadeh et al.
– How can we configure an accurate entity linking pipeline?– What is the best approach to deal with non-existent or sparse links among
related entities?– How does the Linked Data-based relatedness measure impact on the perfor-
mance of the entity linking task?
Taking into account these questions, the main goals of this work are (i) toinvestigate and compare several state-of-art approaches proposed in the litera-ture at each phase of the entity linking pipeline; (ii) to introduce and evaluate theLinked Data-based relatedness measure among the entities that we are proposingin our approach, and (iii) to compare the effectiveness of this measure againstother state-of-art components in entity discovering task. To address these issues,we implemented different components for each step of the entity linking taskby employing the open source framework Dexter [2]. We designed the inferencepart as a collective ranking model by constructing the weighted graph amongthe named entity mentions and their potential candidates. Finally, we evaluatedthe performance of our approach against publicly available datasets, with TAC(Text Analysis Conference) evaluation tools for the named entity linking task.The rest of the paper is as follows: Sect. 2 presents the related work. Section 3introduces our approach, whose features are detailed in Sect. 4. In Sect. 5.1 thedataset is described. Section 5 details the experiments and the obtained results.Conclusions end the paper (Sect. 6).
2 Related Work
The entity linking task has been widely studied in the last decade ([6] amongmany others), and generally consists of 3 steps. The first step is the mentionidentification: the NLP field provides NE recognizers which are particularly effi-cient for persons, organizations, and locations [13]. To avoid the specificationof types of mentions to be recognized, a spotting identification can consider n-grams of words to be compared to entries of a resources (for instance Wikipedia).The second step consists in candidate generation which have to be mapped withentities in a KB. Mapping approaches such as exact string matching and partialmatching are often used based on string similarity with e.g. Dice score, skipbi-gram score, Hamming distance, Levenshtein, the Jaro similarity. Comparedwith exact matching, partial matching leads to higher recall, but more noiseappears in the candidate entity set. In [10] the authors used also the number ofWikipedia pages linking to an entity’s page.
The last step consists in selecting the relevant URI among the candidates.The candidate ranking process relies on the context information provided by aset of features. According to [9] the features can be classified into three groups:(i) Extracted from the prior knowledge (Keyphraseness, Commonness, Popu-larity); (ii) Extracted from the text of the document/articles (Local features):Mention-candidate context similarity: use similarity measure to compare thecontext of the mention with the text associated with a candidate title (the textin the corresponding page); (iii) Based on existing links (Global features [3]).

Adapting Semantic Spreading Activation to Entity Linking in Text 77
In [3], the authors explored the various type of global features as a related-ness measure among the candidate entities. They showed that the entity linkingalgorithms benefit from maximizing the relatedness among the relevant entitiesselected as candidates in ranking process, since this minimizes errors in disam-biguating entity-linking. The key role of effective relatedness function in anyentity-linking algorithm encouraged us to adapt semantic spreading activationto model another relevancy feature which incorporates multiple types of entityknowledge from the knowledge base.
3 The Entity Linking Task
The task of entity discovery can be divided into a series of steps [9] (Fig. 1):(i) spotting or mention identification, i.e. detecting the anchors to link, (ii) can-didate generation and pruning, i.e. searching for candidate identifiers for eachanchor and filtering, (iii) candidate ranking, i.e. selecting the best candidate fromthe results of the searching step. This section, provides a step by step descriptionof our approach. Afterward we explain the employed feature set.
Fig. 1. Entity linking pipeline
3.1 Spotting or Mention Identification
A mention is a phrase used to refer to something in the world like NEs, object,substance, event, philosophy, mental state, rule, etc. (e.g., Stanford University,Berlin, MBA, U.S.Open Tennis). To extract mentions from the text, we imple-ment the following techniques, and then we select the most appropriate to includein our approach, based on their performances (see Sect. 5.3):
– N-grams linked in lexicon (prior anchor text). An n-gram is a contigu-ous sequences of n words from an input text (n represents any integer > 0).Each n-gram is a potential entity mention if it has exact or partial match inthe repository. The spotting step uses a dictionary of NEs or a KB, to extractpossible mentions of NE in the text. It provides the highest recall, but for largedocuments it becomes intractable and introduces noise in the mention extrac-tion. We follow a standard approach [16,25] to create an anchor repository toaddress this issue. The token extractor generates a list of possible spots from

78 F. Nooralahzadeh et al.
a given document. In the extraction phase, the tool produces all the possiblen-grams of terms (up to six words in our case), afterward the spotter looksfor the matching of each fragment in the spot repository. The filtering processhelps us to discard the meaningless mentions, because even stop words maymatch the anchor text. We use the keyphraseness feature [23] to apply thisfiltering. Keyphraseness estimates the probability of a term to be selected asa link to the entities in the knowledge base KB, by counting the number oftimes where the term was already selected as a anchor, divided by the totalnumber of times where the term appeared. These counts are collected fromall Wikipedia articles, permitting to throw out spots that are rarely used as amention of the relevant entity. In case of overlap among the fragments, we takethe union of the fragments boundaries, and if one fragment contains anotherwe consider the longest one as a mention (see Sect. 3.2).
– Named Entity Tagging. To avoid the noise and have precise mentions, sta-tistics and symbolic-based filtering could be applied. This will have negativeimpact on the system recall but will increase the precision. The most promi-nent named entity tagger for English is Stanford NER [13], which we use todetect the mentions, and segment the text accordingly, in our approach.
3.2 Candidate Entity Generation
At this step, for each entity mention mi ∈ M, the entity linking system aimsat retrieving a candidate entity set C(mi) = (ci1, c
i2, . . . , c
ij , . . . ) from KB which
contains possible resources that the entity mention mi may refer to. To achievethis goal, we create a repository which maps strings (surface forms) to entitiesrepresented by Wikipedia articles or DBpedia resources [3,19]. The structureof Wikipedia supplies useful features for generating candidate entities such asentity pages (articles), redirect pages, disambiguation pages, bold phrases fromthe first paragraphs, and hyperlinks inside the articles. Leveraging these featuresfrom Wikipedia2, we build an offline dictionary D as key-value map < K,V >between various names as key (K) and their possible mapping entities as values(V). We exploit D to generate candidate entities C(mi). This dictionary compilesa vast amount of information about possible variation of named entities, likeabbreviations, alternative names, ambiguous terms, misspellings, initial letters.Based on such dictionary, the simplest way to generate the candidate entity setC(mi) for mention mi ∈ M is the exact matching between the mention namemi and the keys (K). If a key is similar to mi, the set of entities mapped to thekey will be added to the candidate entity set C(mi).
Beside exact matching, we apply partial matching between the mention mi,and the key (K) in the dictionary. If the mention has a strong string similaritybased on Jaro-Winkler distance with the name as key in dictionary, then the setof entities assigned to that key will be added to the candidate set. Comparedwith exact matching, partial matching leads to higher recall, but imposes morenoise in the candidate entity set.
2 English Wikipedia dump downloaded on 2015/07/02.

Adapting Semantic Spreading Activation to Entity Linking in Text 79
3.3 Candidate Entity Pruning
Since the set of candidates is quite large that contains unrelated candidates,we need to filter some of them to ensure the quality of the entity candidates.To limit the set of candidate entities C(mi) to the most meaningful ones, thecommonness property was exploited [3]. The commonness of a candidate cij forentity mention mi is the chance of candidate cij being target of a link by mentionmi as an anchor. It is defined as the fraction between the number of occurrencesof mention mi in KB actually pointing to candidate cij , and the total number ofoccurrences of mi in KB as an entity mention. Setting a threshold on minimumcommonness is a simple and effective strategy to prune the number of candidates,without affecting the recall of the entity linking process [25]. Moreover, we exploitthe context-based similarity feature (Sect. 4.3) to prune the candidates that donot have any contextual similarity compared to the context of the target mentionin the input text.
3.4 Candidate Ranking
The objective of the ranking module is to create a ranking function f : cij ∈C(mi) → R, such that for each entity mention mi the elements in its cor-responding candidates list can be assigned relevance scores using the function,and then be ranked according to the scores. Several approaches have been stud-ied to formulate the ranking function in recent years, and we take inspirationfrom the successful application of Graph-based model in entity linking problem(known under various names like “collective entity linking” [16], “Entity linkingvia random walk” [15] and “Neighborhood relevance model” [7]). Adopting agraph based model, let G = (V,E) a undirected graph, in which the vertex setV = M ∪ C contains all entity mentions mi ∈ M in a document and allpossible entity candidates of these mentions cij ∈ C(mi). The set of edges Eincludes all the links that represent the mention-entity and entity-entity edges.Each edge between a mention and a candidate entity denotes a “local compat-ibility” relation; each edge between two candidate entities indicates a “globalrelatedness/coherence” (Figs. 1 and 2).
The goal is to find the best assignment C that is contextually compatiblewith mentions in M and has a maximum coherence as the following objectivefunction:
C∗ = arg maxC
[Φ(M, C) + Ψ(C)]
where C∗ is the best candidate set; Φ(M, C) is the local compatibility of mentionsand candidates, while Ψ(C) measures the global coherence of selected candidates.
The local compatibility Φ formalizes the intuition that the mention m anda candidate entity c are compatible when their name matches and the contextsurrounding m has terms similar to the context of the entity candidate c inKB; it has been applied to conventional entity linking approaches [1,6] as dis-criminative features. Local features work best, when the context is rich enoughto uniquely link a mention, which is not always true. Furthermore, the feature

80 F. Nooralahzadeh et al.
Fig. 2. Graph model for entity linking
sparsity problem arises when there is no similarity between the mention andthe related entity to match; therefore no similarity match is applied [15]. Withglobal coherence Ψ , we rely on the idea that the best selected candidates forthe neighbor mentions in the text, would be good clues to disambiguate thecurrent mention. It takes into account the relation of the candidate with othercandidates within neighbor mentions. In other words, if each neighboring men-tion of mi is linked to its correct entity candidate ckj , k = i, the true candidatecij will achieve a high score in Ψ for most of the neighbors ckj . To satisfy theobjective function, the disambiguation is done collectively on all mentions atthe same time. In [16,19,20] authors seek to find a sub-graph embedded in theconstructed graph, in which each mention is linked to a single candidate entity.However solving the objective function is a recursive problem [14] and is NP-hard [20], therefore all methods turn to approximate algorithms or heuristics.To solve this disambiguation problem, we design the two following methods:
PageRank-like method: The problem described above can be addressed bya PageRank-like algorithm [11]. In PageRank, the objective is to assign ascore of the “importance” to each page. The score (PageRank) of each pagedepends on the score of pages linking to it. In essence, the PageRank of apage is a weighted sum of pageranks of articles linking to it. A page has ahigh rank if the sum of the ranks of the pages that link to it is high [27].In the entity linking problem, we would like to rank the possible candidatesassociated with a certain mention in the document. So, it can be said thata candidate has a high score if the sum of the scores in the document of thecandidates that typically co-occur with it is high. This is formalized as:
V t+1 = (1 − λ) ∗ M ∗ V t + λ ∗ S
Where M is a matrix with (n + m)2 dimensions, n as reallocate condition,is the number of mentions and m is the number of candidates. M [i, j] if idenotes the mention and j denotes the candidate are the local feature value

Adapting Semantic Spreading Activation to Entity Linking in Text 81
φ(mi, cj), and when i, j represent the candidates, its value will be ψ(ci, cj),otherwise it will be 0. The (n + m) × 1 vector S shows the prior importanceof each mention p(m), and for the candidates it is 0. V is the (n + m) × 1preference vector and λ ∈ (0, 1) is the fraction of the reallocation conditionat each iteration. To find the final preference vector V ∗, we use the powermethod with k iteration or until convergence condition. The ith value of vectorV ∗ where i points to the candidate, will be the final rank of each candidate.It should be mentioned that in each iteration, since we have the preferencescore for each mention in previous iteration, we can update the reallocationvector S with its posterior importance ppost(mi) = ppripr(mi) ∗ V [i] [16].
Naive method: The expression that we use to select the best assignment Cusing the maximum aposteriori decision rule can be formalized like:For each mi ∈ M the best candidate ci∗ is:
ci∗ = arg maxc
⎡
⎣α.∑
φ(mi, c) + β.∑
ckj ∈C,k =i
ψ(c, ckj )
⎤
⎦
Here we compute the local compatibility and coherence individually for eachcandidate and solve the problem linearly by assigning the coefficient α and β,where α + β = 1. During the annotation process, if there is only one mentionto disambiguate and no need to build a graph among the neighbours, we usenaive method to find the best candidate entity for mention.
In Sect. 4, the local Φ and global Ψ relatedness features applied in our work areexplained.
4 Local (Φ) and Global (Ψ) Features
In this section, we present the features used in this study. Local features rely onlyon compatibility of the mention and its candidates, while global ones computethe coherence among the candidates.
4.1 Prominence/Prior Feature ∈ Φ
As a context-independent feature, we choose the commonness feature of candi-dates based on Wikipedia link anchors [23]. It is the popularity of the candidateentity with respect to the mention in the text, and has been found to be veryuseful in entity linking [19,31]. It tells the prior probability of the appearance ofa candidate entity given the mention term. For each surface form that appearsas an anchor text in Wikipedia, we compute how often it refers to a particularentity:
Commonness(cij) =x
y
where x is the number of times a mention mi links to a candidate entity cij inWikipedia and y is the number of times a mention mi appears as anchor text inWikipedia.
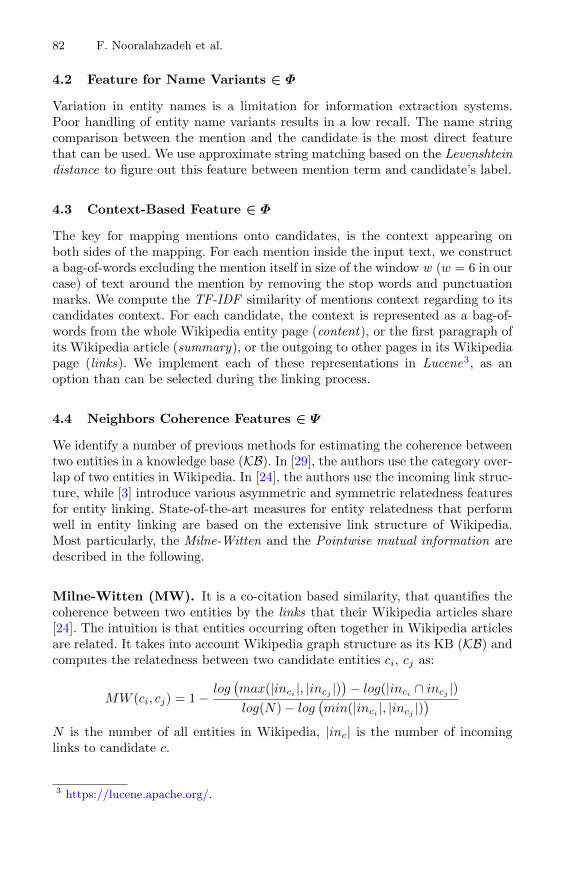
82 F. Nooralahzadeh et al.
4.2 Feature for Name Variants ∈ Φ
Variation in entity names is a limitation for information extraction systems.Poor handling of entity name variants results in a low recall. The name stringcomparison between the mention and the candidate is the most direct featurethat can be used. We use approximate string matching based on the Levenshteindistance to figure out this feature between mention term and candidate’s label.
4.3 Context-Based Feature ∈ Φ
The key for mapping mentions onto candidates, is the context appearing onboth sides of the mapping. For each mention inside the input text, we constructa bag-of-words excluding the mention itself in size of the window w (w = 6 in ourcase) of text around the mention by removing the stop words and punctuationmarks. We compute the TF-IDF similarity of mentions context regarding to itscandidates context. For each candidate, the context is represented as a bag-of-words from the whole Wikipedia entity page (content), or the first paragraph ofits Wikipedia article (summary), or the outgoing to other pages in its Wikipediapage (links). We implement each of these representations in Lucene3, as anoption than can be selected during the linking process.
4.4 Neighbors Coherence Features ∈ Ψ
We identify a number of previous methods for estimating the coherence betweentwo entities in a knowledge base (KB). In [29], the authors use the category over-lap of two entities in Wikipedia. In [24], the authors use the incoming link struc-ture, while [3] introduce various asymmetric and symmetric relatedness featuresfor entity linking. State-of-the-art measures for entity relatedness that performwell in entity linking are based on the extensive link structure of Wikipedia.Most particularly, the Milne-Witten and the Pointwise mutual information aredescribed in the following.
Milne-Witten (MW). It is a co-citation based similarity, that quantifies thecoherence between two entities by the links that their Wikipedia articles share[24]. The intuition is that entities occurring often together in Wikipedia articlesare related. It takes into account Wikipedia graph structure as its KB (KB) andcomputes the relatedness between two candidate entities ci, cj as:
MW (ci, cj) = 1 − log(max(|inci |, |incj |)
) − log(|inci ∩ incj |)log(N) − log
(min(|inci |, |incj |)
)
N is the number of all entities in Wikipedia, |inc| is the number of incominglinks to candidate c.
3 https://lucene.apache.org/.
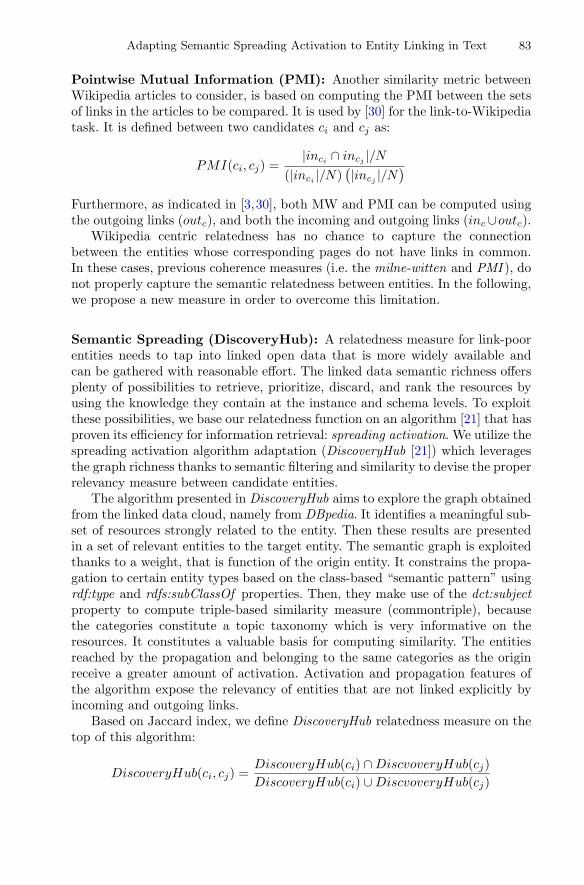
Adapting Semantic Spreading Activation to Entity Linking in Text 83
Pointwise Mutual Information (PMI): Another similarity metric betweenWikipedia articles to consider, is based on computing the PMI between the setsof links in the articles to be compared. It is used by [30] for the link-to-Wikipediatask. It is defined between two candidates ci and cj as:
PMI(ci, cj) =|inci ∩ incj |/N
(|inci |/N)(|incj |/N
)
Furthermore, as indicated in [3,30], both MW and PMI can be computed usingthe outgoing links (outc), and both the incoming and outgoing links (inc∪outc).
Wikipedia centric relatedness has no chance to capture the connectionbetween the entities whose corresponding pages do not have links in common.In these cases, previous coherence measures (i.e. the milne-witten and PMI ), donot properly capture the semantic relatedness between entities. In the following,we propose a new measure in order to overcome this limitation.
Semantic Spreading (DiscoveryHub): A relatedness measure for link-poorentities needs to tap into linked open data that is more widely available andcan be gathered with reasonable effort. The linked data semantic richness offersplenty of possibilities to retrieve, prioritize, discard, and rank the resources byusing the knowledge they contain at the instance and schema levels. To exploitthese possibilities, we base our relatedness function on an algorithm [21] that hasproven its efficiency for information retrieval: spreading activation. We utilize thespreading activation algorithm adaptation (DiscoveryHub [21]) which leveragesthe graph richness thanks to semantic filtering and similarity to devise the properrelevancy measure between candidate entities.
The algorithm presented in DiscoveryHub aims to explore the graph obtainedfrom the linked data cloud, namely from DBpedia. It identifies a meaningful sub-set of resources strongly related to the entity. Then these results are presentedin a set of relevant entities to the target entity. The semantic graph is exploitedthanks to a weight, that is function of the origin entity. It constrains the propa-gation to certain entity types based on the class-based “semantic pattern” usingrdf:type and rdfs:subClassOf properties. Then, they make use of the dct:subjectproperty to compute triple-based similarity measure (commontriple), becausethe categories constitute a topic taxonomy which is very informative on theresources. It constitutes a valuable basis for computing similarity. The entitiesreached by the propagation and belonging to the same categories as the originreceive a greater amount of activation. Activation and propagation features ofthe algorithm expose the relevancy of entities that are not linked explicitly byincoming and outgoing links.
Based on Jaccard index, we define DiscoveryHub relatedness measure on thetop of this algorithm:
DiscoveryHub(ci, cj) =DiscoveryHub(ci) ∩ DiscvoveryHub(cj)DiscoveryHub(ci) ∪ DiscvoveryHub(cj)
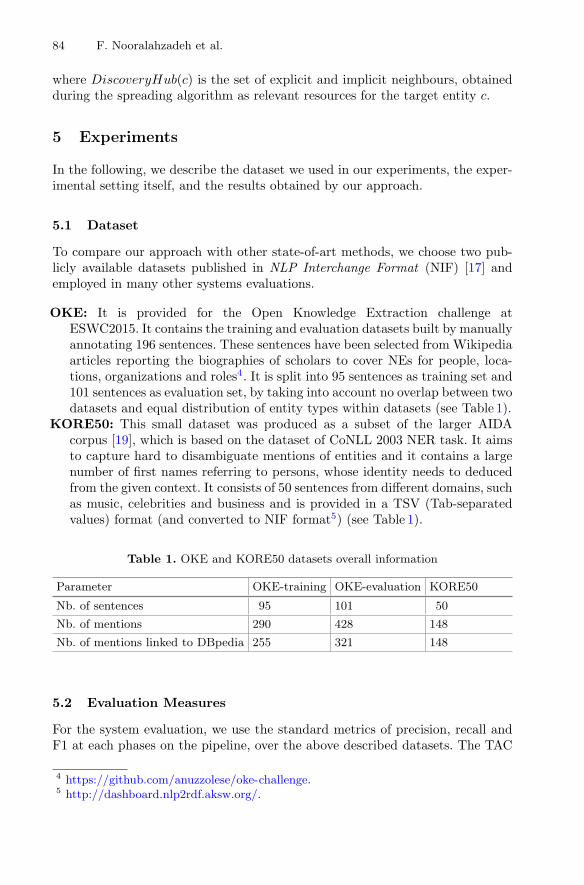
84 F. Nooralahzadeh et al.
where DiscoveryHub(c) is the set of explicit and implicit neighbours, obtainedduring the spreading algorithm as relevant resources for the target entity c.
5 Experiments
In the following, we describe the dataset we used in our experiments, the exper-imental setting itself, and the results obtained by our approach.
5.1 Dataset
To compare our approach with other state-of-art methods, we choose two pub-licly available datasets published in NLP Interchange Format (NIF) [17] andemployed in many other systems evaluations.
OKE: It is provided for the Open Knowledge Extraction challenge atESWC2015. It contains the training and evaluation datasets built by manuallyannotating 196 sentences. These sentences have been selected from Wikipediaarticles reporting the biographies of scholars to cover NEs for people, loca-tions, organizations and roles4. It is split into 95 sentences as training set and101 sentences as evaluation set, by taking into account no overlap between twodatasets and equal distribution of entity types within datasets (see Table 1).
KORE50: This small dataset was produced as a subset of the larger AIDAcorpus [19], which is based on the dataset of CoNLL 2003 NER task. It aimsto capture hard to disambiguate mentions of entities and it contains a largenumber of first names referring to persons, whose identity needs to deducedfrom the given context. It consists of 50 sentences from different domains, suchas music, celebrities and business and is provided in a TSV (Tab-separatedvalues) format (and converted to NIF format5) (see Table 1).
Table 1. OKE and KORE50 datasets overall information
Parameter OKE-training OKE-evaluation KORE50
Nb. of sentences 95 101 50
Nb. of mentions 290 428 148
Nb. of mentions linked to DBpedia 255 321 148
5.2 Evaluation Measures
For the system evaluation, we use the standard metrics of precision, recall andF1 at each phases on the pipeline, over the above described datasets. The TAC
4 https://github.com/anuzzolese/oke-challenge.5 http://dashboard.nlp2rdf.aksw.org/.
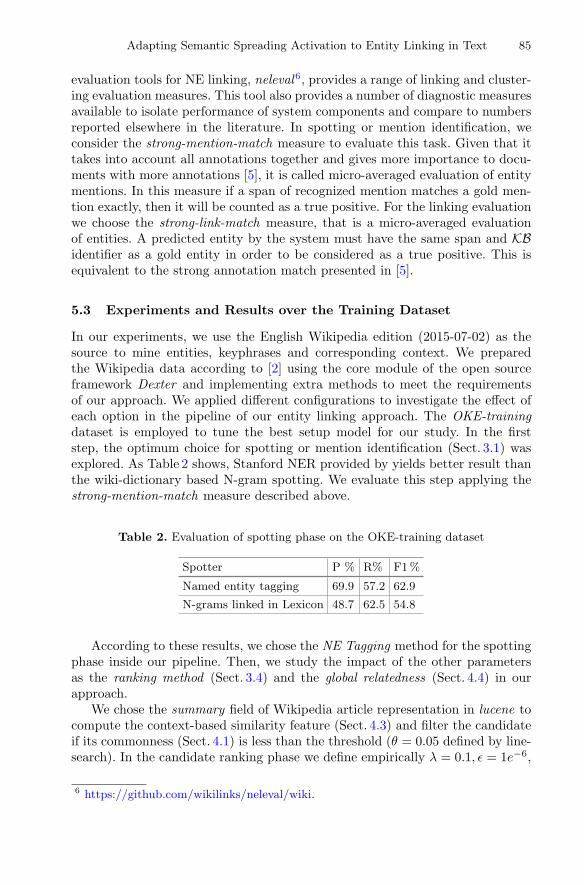
Adapting Semantic Spreading Activation to Entity Linking in Text 85
evaluation tools for NE linking, neleval6, provides a range of linking and cluster-ing evaluation measures. This tool also provides a number of diagnostic measuresavailable to isolate performance of system components and compare to numbersreported elsewhere in the literature. In spotting or mention identification, weconsider the strong-mention-match measure to evaluate this task. Given that ittakes into account all annotations together and gives more importance to docu-ments with more annotations [5], it is called micro-averaged evaluation of entitymentions. In this measure if a span of recognized mention matches a gold men-tion exactly, then it will be counted as a true positive. For the linking evaluationwe choose the strong-link-match measure, that is a micro-averaged evaluationof entities. A predicted entity by the system must have the same span and KBidentifier as a gold entity in order to be considered as a true positive. This isequivalent to the strong annotation match presented in [5].
5.3 Experiments and Results over the Training Dataset
In our experiments, we use the English Wikipedia edition (2015-07-02) as thesource to mine entities, keyphrases and corresponding context. We preparedthe Wikipedia data according to [2] using the core module of the open sourceframework Dexter and implementing extra methods to meet the requirementsof our approach. We applied different configurations to investigate the effect ofeach option in the pipeline of our entity linking approach. The OKE-trainingdataset is employed to tune the best setup model for our study. In the firststep, the optimum choice for spotting or mention identification (Sect. 3.1) wasexplored. As Table 2 shows, Stanford NER provided by yields better result thanthe wiki-dictionary based N-gram spotting. We evaluate this step applying thestrong-mention-match measure described above.
Table 2. Evaluation of spotting phase on the OKE-training dataset
Spotter P % R% F1 %
Named entity tagging 69.9 57.2 62.9
N-grams linked in Lexicon 48.7 62.5 54.8
According to these results, we chose the NE Tagging method for the spottingphase inside our pipeline. Then, we study the impact of the other parametersas the ranking method (Sect. 3.4) and the global relatedness (Sect. 4.4) in ourapproach.
We chose the summary field of Wikipedia article representation in lucene tocompute the context-based similarity feature (Sect. 4.3) and filter the candidateif its commonness (Sect. 4.1) is less than the threshold (θ = 0.05 defined by line-search). In the candidate ranking phase we define empirically λ = 0.1, ε = 1e−6,
6 https://github.com/wikilinks/neleval/wiki.

86 F. Nooralahzadeh et al.
N = 100 (max-number-of-iteration) and w = 6 (window-size) in PageRank-like method and α = 0.4, β = 0.6 in naive method (Sect. 3.4). In Table 3, wecan see that the PageRank-like method including the DiscoveryHub as globalrelatedness has better results than the other configurations. This result indicatesthat the semantic spreading nature of DiscoveryHub relatedness identifies newlinks among related entities and PageRank-like method takes advantage of thisfavor to assign proper entities to the mentions.
Table 3. Evaluation of candidate ranking on the OKE-training dataset
Candidate ranking Global relatedness P% R% F1 %
PageRank-like DiscoveryHub 62.6 47.2 53.8
Naive DiscoveryHub 55.8 48.5 52.0
PageRank-like MW 60.9 46.6 53.0
Naive MW 56.6 46.0 48.6
PageRank-like PMI 55.1 47.9 51.2
Naive PMI 50.9 44.3 47.4
In this phase (see Fig. 2) we are trying to find proper links among thedbr:Martti Ahtissan as a candidate entity for mention Martti Ahtissar and theset of candidate for mention YMCA. Modeling the graph with MW and PMIrelatedness returns graph without any links among these sets. However, usingthe DiscoveryHub coherence features unveil the implicit connection betweendbr:Martti Ahtissan and dbr:YMCA, contributing in assigning a higher scoreto dbr:YMCA.
It is obvious that the performance on the candidate ranking phase dependson the result of the spotting process in our pipeline. In order to evaluate theperformance of the scoring function independently, we assume that the spottingphase extracts the mentions exactly as gold spans (100 % accuracy). Table 4presents the evaluation of our approach with the most favorable setup.
Table 4. Evaluation of selected ranking approach on the OKE-training dataset
Candidate ranking P % R% F1 %
PageRank-like + DiscoveryHub 70.2 69.5 69.9
5.4 Comparison with State-of-the-Art Entity Linking Tools
We conduct an experiment with the final configuration of our approach on theOKE-evaluation dataset. We compare our results to the performances of state-of-art systems, i.e. Adel (winning system at the OKE challenge for the entity liking

Adapting Semantic Spreading Activation to Entity Linking in Text 87
task), AIDA, TagMe and DBpedia Spotlight (Table 5). We use the figures whichare reported in [28] for this comparison, since the authors used the public APIof these tools with default setting on the OKE-evaluation dataset to comparetheir findings. Our experiment shows that the pipeline which we present in thisstudy outperforms the other systems in the linking task in terms of precisionand f1-measure in OKE-evaluation dataset.
Table 5. Comparison on the OKE-evaluation dataset
Method Measure P% R% F1 %
Adel-without pruning Spotting 78.2 65.4 71.2
Linking 49.4 46.6 48
Adel- with pruning Spotting 83.8 9.3 16.8
Linking 57.9 6.2 11.1
AIDA Spotting 55.7 49.1 52.2
Linking 51.6 43.9 47.4
TagMe Spotting 39.7 61.7 48.3
Linking 28.5 54.9 37.5
DBpedia spotlight Spotting 40.3 52.6 45.6
Linking 28.3 45.7 34.9
Our approach Spotting 87.5 57.1 69.1
Linking 73.1 46.1 56.5
We also compare our method by taking into account only the candidate rank-ing task and assuming full annotation in the mention identification phase, withrespect to the same state-of-the-art entity linking systems over KORE50 dataset.In order to make this comparison, we report the facts from [26], adding our app-roach’s ranking performance. Over this dataset (Table 6) we classify fourth interms of performances after Babelfy and the two AIDA-KORE systems. Based
Table 6. State-of-the-art EL systems (Accuracy) on the KORE50 dataset
System KORE50
Babelfy [26] 71.5
AIDA-KORE-LSH-G [18] 64.6
AIDA-KORE [18] 63.9
Our Ranking Method 60.6
MW [24] 57.6
Tagme [12] 56.3
Illinois wikifier [4] 41.7
DBpedia spotlight [22] 35.4
88 F. Nooralahzadeh et al.
on the error analysis of the results, we found out that this differences comes fromthe candidate generation phase, and we plan to investigate more this aspect.
6 Conclusion and Future Work
In this work, we implemented and benchmarked different approaches for eachstep of the entity linking task to build the most accurate pipeline. We also pro-posed and evaluated a new collective ranking model by constructing the weightedgraph among the named entity mentions and their potential candidates. We eval-uated the performances of our approach against publicly available datasets, withthe TAC evaluation tools. The performance of the graph-based collective entitylinking system highly relies on modeling coherence among the candidate entities.Our system incorporates multiple types of entity knowledge from the KB. To dealwith non-existent or sparse links among related entities we took advantage ofsemantic spreading approach to model the entity relatedness measure and itoutperformed other Wikipedia-centric measures. Our experiments showed thatthe Linked-data based measure assists our graph-based model to achieve com-petitive performance in the target datasets compared to other well-known entitylinking systems.
There are several directions for future work: we are interested in the jointinference model [8] to reduce the interdependency nature of our pipeline app-roach. On the other hand we want to investigate the word embedding impact incomputing the contextual similarity between the mentions context and the can-didate entities. Finally, we would like to use the Wikilinks [32] and crossWikis[33] corpora to enrich our repository and improve the candidate generation com-ponents.
References
1. Adafre, S.F., de Rijke, M.: Discovering missing links in wikipedia. In: Proceedingsof the 3rd International Workshop on Link Discovery, LinkKDD 2005, pp. 90–97.ACM, New York (2005). http://doi.acm.org/10.1145/1134271.1134284
2. Ceccarelli, D., Lucchese, C., Orlando, S., Perego, R., Trani, S.: Dexter: an opensource framework for entity linking. In: Proceedings of the Sixth InternationalWorkshop on Exploiting Semantic Annotations in Information Retrieval, pp. 17–20 (2013)
3. Ceccarelli, D., Lucchese, C., Orlando, S., Perego, R., Trani, S.: Learning related-ness measures for entity linking. In: Proceedings of the 22nd ACM InternationalConference on Conference on Information & Knowledge Management, CIKM 2013,pp. 139–148 (2013)
4. Cheng, X., Roth, D.: Relational inference for wikification. In: EMNLP (2013).http://cogcomp.cs.illinois.edu/papers/ChengRo13.pdf
5. Cornolti, M., Ferragina, P., Ciaramita, M.: A framework for benchmarking entity-annotation systems. In: Proceedings of the 22nd International Conference on WorldWide Web, WWW 2013, pp. 249–260 (2013)

Adapting Semantic Spreading Activation to Entity Linking in Text 89
6. Cucerzan, S.: Large-scale named entity disambiguation based on wikipedia data.In: EMNLP-CoNLL 2007, Proceedings of the 2007 Joint Conference on EmpiricalMethods in Natural Language Processing and Computational Natural LanguageLearning, Prague, Czech Republic, 28–30 June 2007, pp. 708–716 (2007)
7. Dalton, J., Dietz, L.: A neighborhood relevance model for entity linking. In: Pro-ceedings of the 10th Conference on Open Research Areas in Information Retrieval,OAIR 2013, pp. 149–156 (2013)
8. Durrett, G., Klein, D.: A joint model for entity analysis: coreference, typing, andlinking. In: Proceedings of the Transactions of the Association for ComputationalLinguistics (2014)
9. Erbs, N., Zesch, T., Gurevych, I.: Link discovery: a comprehensive analysis. In:2011 Fifth IEEE International Conference on Semantic Computing (ICSC), pp.83–86, September 2011
10. Fader, A., Soderland, S., Etzioni, O.: Scaling wikipedia-based named entity disam-biguation to arbitrary web text. In: Proceedings of WIKIAI (2009)
11. Fernandez, N., Arias Fisteus, J., Sanchez, L., Lopez, G.: Identityrank: named entitydisambiguation in the news domain. Expert Syst. Appl. 39(10), 9207–9221 (2012)
12. Ferragina, P., Scaiella, U.: Tagme: on-the-fly annotation of short text fragments(by wikipedia entities). In: Proceedings of the 19th ACM International Conferenceon Information and Knowledge Management, CIKM 2010, pp. 1625–1628 (2010)
13. Finkel, J.R., Grenager, T., Manning, C.: Incorporating non-local information intoinformation extraction systems by gibbs sampling. In: ACL, pp. 363–370 (2005)
14. Garcıa, N.F., Arias-Fisteus, J., Fernandez, L.S., Martın, E.: Webtlab: Acooccurrence-based approach to KBP 2010 entity-linking task. In: Proceedingsof the Third Text Analysis Conference, TAC 2010, Gaithersburg, Maryland, USA,15–16 November 2010 (2010)
15. Guo, Z., Barbosa, D.: Robust entity linking via random walks. In: Proceedings ofthe 23rd ACM International Conference on Conference on Information and Knowl-edge Management, CIKM 2014, pp. 499–508. ACM (2014). http://doi.acm.org/10.1145/2661829.2661887
16. Han, X., Sun, L., Zhao, J.: Collective entity linking in web text: a graph-basedmethod. In: Proceedings of the 34th international Conference on Research andDevelopment in Information Retrieval, pp. 765–774 (2011)
17. Hellmann, S., Lehmann, J., Auer, S., Brummer, M.: Integrating NLP using linkeddata. In: Alani, H., et al. (eds.) ISWC 2013, Part II. LNCS, vol. 8219, pp. 98–113.Springer, Heidelberg (2013)
18. Hoffart, J., Seufert, S., Nguyen, D.B., Theobald, M., Weikum, G.: Kore: keyphraseoverlap relatedness for entity disambiguation. In: Proceedings of the 21st ACMInternational Conference on Information and Knowledge Management, CIKM2012, pp. 545–554 (2012)
19. Hoffart, J., Yosef, M.A., Bordino, I., Furstenau, H., Pinkal, M., Spaniol, M.,Taneva, B., Thater, S., Weikum, G.: Robust disambiguation of named entities intext. In: Proceedings of the Conference on Empirical Methods in Natural LanguageProcessing, pp. 782–792 (2011)
20. Kulkarni, S., Singh, A., Ramakrishnan, G., Chakrabarti, S.: Collective annotationof wikipedia entities in web text. In: Proceedings of the 15th ACM SIGKDD Inter-national Conference on Knowledge Discovery and Data Mining, KDD 2009, pp.457–466. ACM, New York (2009)
90 F. Nooralahzadeh et al.
21. Marie, N., Gandon, F.L., Giboin, A., Palagi, E.: Exploratory search on topicsthrough different perspectives with DBpedia. In: Proceedings of the 10th Interna-tional Conference on Semantic Systems, SEMANTICS 2014, Leipzig, Germany, 4–5September 2014, pp. 45–52 (2014). http://doi.acm.org/10.1145/2660517.2660518
22. Mendes, P.N., Jakob, M., Garcıa-Silva, A., Bizer, C.: DBpedia spotlight: sheddinglight on the web of documents. In: Proceedings of the 7th International Conferenceon Semantic Systems, I-Semantics 2011, pp. 1–8. ACM, New York (2011). http://doi.acm.org/10.1145/2063518.2063519
23. Mihalcea, R., Csomai, A.: Wikify!: linking documents to encyclopedic knowledge.In: Proceedings of the Sixteenth ACM Conference on Conference on Informationand Knowledge Management, pp. 233–242 (2007)
24. Milne, D., Witten, I.H.: An effective, low-cost measure of semantic relatednessobtained from wikipedia links. In: Proceeding of AAAI Workshop on Wikipediaand Artificial Intelligence: An Evolving Synergy, pp. 25–30, July 2008
25. Milne, D., Witten, I.H.: Learning to link with wikipedia. In: Proceedings of the17th ACM Conference on Information and Knowledge Management, pp. 509–518(2008)
26. Moro, A., Raganato, A., Navigli, R.: Entity linking meets word sense disambigua-tion: a unified approach. Trans. Assoc. Comput. Linguist. 2, 231–244 (2014)
27. Page, L., Brin, S., Motwani, R., Winograd, T.: The pagerank citation ranking:Bringing order to the web. Technical Report 1999–66, Stanford InfoLab, November1999. http://ilpubs.stanford.edu:8090/422/
28. Plu, J., Rizzo, G., Troncy, R.: A hybrid approach for entity recognition and link-ing. In: ESWC 2015, 12th European Semantic Web Conference, Open ExtractionChallenge, Portoroz, Slovenia, 31 May-4 June 2015 (2015). http://www.eurecom.fr/publication/4613
29. Ponzetto, S.P., Strube, M.: Knowledge derived from wikipedia for computingsemantic relatedness. J. Artif. Intell. Res. (JAIR) 30, 181–212 (2007)
30. Ratinov, L., Roth, D., Downey, D., Anderson, M.: Local and global algorithms fordisambiguation to wikipedia. In: Proceedings of the 49th Annual Meeting of theAssociation for Computational Linguistics: Human Language Technologies, HLT2011, vol. 1, pp. 1375–1384 (2011)
31. Shen, W., Wang, J., Han, J.: Entity linking with a knowledge base: issues, tech-niques, and solutions. IEEE Trans. Knowl. Data Eng. 27(2), 443–460 (2015)
32. Singh, S., Subramanya, A., Pereira, F., McCallum, A.: Wikilinks: A large-scalecross-document coreference corpus labeled via links to Wikipedia. Technical report,UM-CS-2012-015 (2012)
33. Spitkovsky, V.I., Chang, A.X.: A cross-lingual dictionary for english wikipediaconcepts. In: Chair, N.C.C., Choukri, K., Declerck, T., Doan, M.U., Maegaard, B.,Mariani, J., Moreno, A., Odijk, J., Piperidis, S. (eds.) Proceedings of the EightInternational Conference on Language Resources and Evaluation (LREC 2012),Istanbul, Turkey, May 2012

Evaluating Multiple Summaries WithoutHuman Models: A First Experiment
with a Trivergent Model
Luis Adrian Cabrera-Diego1(B), Juan-Manuel Torres-Moreno1,2,and Barthelemy Durette3
1 LIA, Universite d’Avignon et des Pays de Vaucluse, Avignon, Franceluis-adrian.cabrera-diego,[email protected]
2 Ecole Polytechnique de Montreal, Montreal, Canada3 Adoc Talent Management, Paris, France
Abstract. In this work, we extend the task of evaluating summarieswithout human models by using a trivergent model. In this model, threeelements are compared simultaneously: a summary to evaluate, its sourcedocument and a set of other summaries from the same source. We presentin this paper, a first pilot experiment using a French corpus from whichwe obtained promising results.
Keywords: Divergence of probability distributions · Trivergence ofprobability distributions · Text summarization evaluation
1 Introduction
Since the creation of the first Automatic Text Summarization (ATS) system, theevaluation of summaries has been a key but not less ambitious and controversialpart of the research [6,14,17–19,21]. The evaluation of summaries consists inapplying different techniques or measures to create a score that is correlatedwith the one a human evaluator would give [5].
According to [18], summaries can be evaluated intrinsically or extrinsically.In the first case, the condensed documents are compared against human models;both kinds of documents come from the same source document. In the secondcase, the summaries are evaluated with respect to their effect over other systems’performance, e.g. QA systems or search engines.
In the literature, we can find that most of the developed evaluation method-ologies are intrinsic [6], for example, Rouge [11] and Pyramids [15]. However,the problem with these methods is that they have to face up to the definitionof “ideal summary”, which is hard to establish [19]. In other words, humans cangenerate summaries, either by extraction or abstraction, with different points ofviews. Thus, for frameworks like Rouge and Pyramids it is necessary to have sev-eral man-made summary models in order to represent correctly the perspectivediversity.c© Springer International Publishing Switzerland 2016E. Metais et al. (Eds.): NLDB 2016, LNCS 9612, pp. 91–101, 2016.DOI: 10.1007/978-3-319-41754-7 8
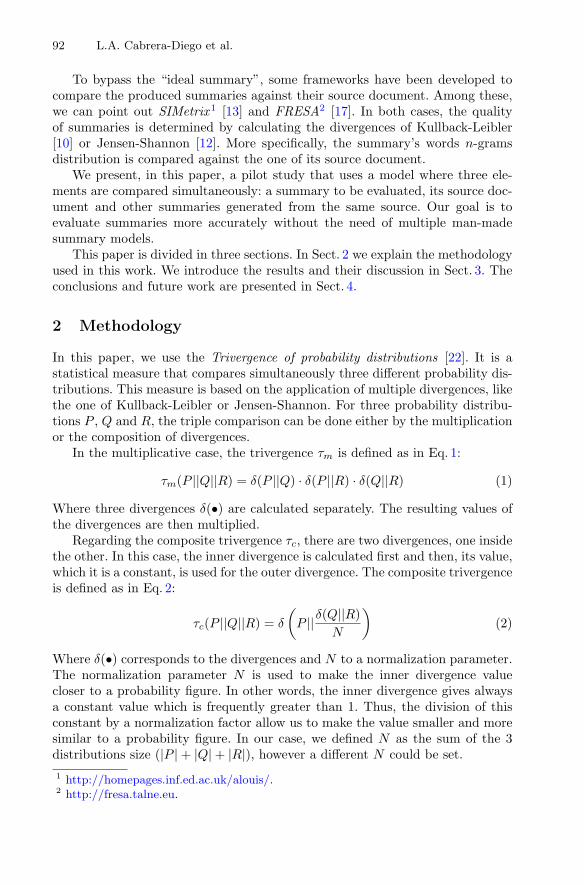
92 L.A. Cabrera-Diego et al.
To bypass the “ideal summary”, some frameworks have been developed tocompare the produced summaries against their source document. Among these,we can point out SIMetrix1 [13] and FRESA2 [17]. In both cases, the qualityof summaries is determined by calculating the divergences of Kullback-Leibler[10] or Jensen-Shannon [12]. More specifically, the summary’s words n-gramsdistribution is compared against the one of its source document.
We present, in this paper, a pilot study that uses a model where three ele-ments are compared simultaneously: a summary to be evaluated, its source doc-ument and other summaries generated from the same source. Our goal is toevaluate summaries more accurately without the need of multiple man-madesummary models.
This paper is divided in three sections. In Sect. 2 we explain the methodologyused in this work. We introduce the results and their discussion in Sect. 3. Theconclusions and future work are presented in Sect. 4.
2 Methodology
In this paper, we use the Trivergence of probability distributions [22]. It is astatistical measure that compares simultaneously three different probability dis-tributions. This measure is based on the application of multiple divergences, likethe one of Kullback-Leibler or Jensen-Shannon. For three probability distribu-tions P , Q and R, the triple comparison can be done either by the multiplicationor the composition of divergences.
In the multiplicative case, the trivergence τm is defined as in Eq. 1:
τm(P ||Q||R) = δ(P ||Q) · δ(P ||R) · δ(Q||R) (1)
Where three divergences δ(•) are calculated separately. The resulting values ofthe divergences are then multiplied.
Regarding the composite trivergence τc, there are two divergences, one insidethe other. In this case, the inner divergence is calculated first and then, its value,which it is a constant, is used for the outer divergence. The composite trivergenceis defined as in Eq. 2:
τc(P ||Q||R) = δ
(P ||δ(Q||R)
N
)(2)
Where δ(•) corresponds to the divergences and N to a normalization parameter.The normalization parameter N is used to make the inner divergence valuecloser to a probability figure. In other words, the inner divergence gives alwaysa constant value which is frequently greater than 1. Thus, the division of thisconstant by a normalization factor allow us to make the value smaller and moresimilar to a probability figure. In our case, we defined N as the sum of the 3distributions size (|P | + |Q| + |R|), however a different N could be set.1 http://homepages.inf.ed.ac.uk/alouis/.2 http://fresa.talne.eu.

Evaluating Multiple Summaries with a Trivergent Model 93
Using as base the divergence of Kullback-Leibler, the inner divergenceδ(Q||R) from Eq. 2 is defined as in Eq. 3:
KL(Q||R) =∑
ω∈Q
qwlogqw
rw(3)
Where ω are the words belonging to Q; qω and rω are the probabilities of ω tooccur in Q and R respectively. The composite trivergence of Kullback-Leibler,thus, is defined as in Eq. 4:
τc(P ||Q||R) =∑
σ∈P
pσlogpσ(
KL(Q||R)N
) (4)
Where σ are the words belonging to P ; pσ represents the probabilities of σ tooccur in P ; N is the normalization parameter. It should be said that we makeuse of
(KL(Q||R)
N
)only if σ exists in Q, otherwise a smoothing value is used. We
decided to do this, because a σ that does not exist in Q, should be consideredas a unseen event.
As it was indicated previously, it is possible to have in some distributionsunseen events, either in the multiplicative or composite trivergence. For example,not all the events in the distribution Q exist in distribution R. Therefore, we seta smoothing based on Eq. 5:
Smoothing =1
|P | + |Q| + |R| (5)
Where |P |, |Q| and |R| corresponds to the respective distribution size of P , Qand R. Other smoothing methods can be used without having to change thetrivergent model, e.g. Kat’s back-off model [7] or Good-Turing estimation [4].However, in order to use a more complex smoothing, it is necessary to take someconsiderations for the composite trivergence because its inner divergence is aconstant value.
For our study, we considered the existence of a source document from wherea set of summaries was generated. Thus, we defined Q as the source document,R as a summary to evaluate and P as all the summaries of the set excepting R.Every condensed document from the set can be evaluated with the trivergence.It is only necessary to interchange the summary of R by one from P .
In our experiments, two different divergences were used for the trivergentmodel: Kullback-Leibler (KL) and Jensen-Shannon (JS).
Despite [22] set a cardinality condition3 for both trivergences, multiplicativeand composite, in this experiment we decided to test all the possible model com-binations4. The reason to test the different combinations was to verify whether3 The cardinality condition consists in computing the divergences from the smallest
distribution to the largest one. For example, using as base Eqs. 1 and 2, the conditionwould be |P | > |Q| > |R|.
4 We did not test the combinations given by the possible trivergence’s associativeproperty.

94 L.A. Cabrera-Diego et al.
the performance of our methodology could change due to the divergences’ com-mutative property. For example, the divergence of Kullback-Leibler is not sym-metric, therefore KL(P ||Q) = KL(Q||P ). This methodology is similar to the oneused by [1], nonetheless, it was applied in an e-Recruitment context for rankingresumes.
Following the representation of documents used by other summarization eval-uation frameworks [11,13,17], we decided to use 3 types of words n-grams: uni-grams, bigrams and skip-bigrams (SU4). In consequence, we defined the scorefor each summary as the average trivergence according to the 3 types of wordsn-grams.
2.1 Corpus
For this pilot experiment, we created a small French corpus called “Puces”.5
This corpus comprises one source document and a set of 170 extracts created byseveral humans and 10 ATS systems. The source document is composed of 30sentences that belong to two topics: a new electronic microchips for computersand a fleas invasion in a military Swiss company. The topic mixture is due to thepolysemy of the French word puces; one sense corresponds to microchips, whilethe other corresponds to fleas.
To produce the human summaries, each person had 15 min for reading thesource document, then, they extracted the 8 sentences that represented betterfor them the subject. Regarding the ATS systems, they generated the summariesrespecting the same size of 8 sentences. Among the ATS systems we used, wecan name Essential Summarizer6, Microsoft Word, Cortex [23], Artex [20] andEnertex [2]. All the documents of the corpus Puces were preprocessed beforeobtaining the n-grams. In first place we deleted the stop-words using the listavailable in FRESA. Then we stemmed the words with the French Snowballstemmer7.
As the performance of the trivergence can change according to the dataand the size of distribution P, we decided to test how this would affect ourmethodology. Thus, we set 12 different sizes, in terms of documents, for P (4, 8,16, 32, 48, 64, 80, 96, 112, 128, 144, 160). For each size, we built 25 subcorporaby selecting randomly documents from Puces. All the 300 different subcorporawere used to determine R and P distributions. For example, when a subcorpushad 32 summaries, one of the extracts was used as R and the remaining 31 as P.
2.2 Evaluation
The application of the trivergence over each subcorpus generated a ranking,which was based, in turn, on the score obtained by each summary. Therefore, to
5 The corpus can be downloaded from: http://dev.termwatch.es/∼fresa/CORPUS/PUCES/.
6 https://essential-mining.com.7 http://snowballstem.org.

Evaluating Multiple Summaries with a Trivergent Model 95
evaluate our methodology, we calculated the correlation between the rankingsgiven by Rouge and those obtained by the trivergent model. The evaluation withRouge consisted in compare the summaries against 67 abstracts done by humansafter reading the source document of Puces.
The correlation measures we used were: Spearman’s Rank-order Correla-tion Coefficient (Spearman’s rho) and Kendall’s tau-b Correlation Coefficient(Kendall’s tau-b). These two correlation coefficients were chosen because theyare specific tests to compare two ranks. Furthermore, they have been used inother researches with similar goals [5,13,17].
To be more specific, for each subcorpus, we calculated the correlation coeffi-cients between the scores given by the trivergent model and Rouge. Then, con-sidering the subcorpora size, we calculated the average correlation coefficientswith their respective 95% confidence interval bars.
We compared, as well, the trivergent model against two baselines under thesame conditions. The baselines consisted in the average correlation betweenRouge and the rankings given by FRESA and SIMetrix. From FRESA, weused its 3 measures: Kullback-Leibler, Symmetric Kullback-Leibler and Jensen-Shannon. In the case of SIMetrix, we tested its 4 measures based on divergences:Kullback-Leibler between source and summary, Kullback-Leibler between sum-mary and source, Smoothed and Unsmoothed Jensen-Shannon. For SIMetrix,we needed to use its own English Porter stemmer as it was not possible to set aFrench one.
The statistical analysis was done with the programming language R [16] andits package irr [3].
3 Results and Discussion
In Fig. 1 we present the 3 trivergence combinations with the highest averageKendall’s tau-b. We show in Fig. 1 as well, the measures coming from FRESAand SIMetrix with the best average Kendall’s tau-b coefficients.
As it can be seen in Fig. 1, the correlation coefficients of the measures varyaccording to the subcorpora size. Small subcorpora give low average correlationcoefficients and large confidence interval bars. While larger copora indicates moreprecisely the measures’ performance, as the confidence interval bars becomeshorter. It can be seen, as well, that the result from the trivergence measuresbecome more correlated to Rouge as we increase the copora size. This contrastwith the outcomes coming from FRESA and SIMetrix, which are more stable nomatter the corpus size.
Concerning the Spearman’s rho, it can be seen in Fig. 2 that the trivergentmodel and baselines behave in the same way that for Kendall’s tau-b. How-ever, the correlations coefficients are higher. This difference should not be takenas a disagreement or discrepancy between the coefficients. In fact, the differ-ence between these two coefficients is well known. Moreover, [8] states that theKendall’s tau will be about two-thirds of the value of Spearman’s rho when theanalyzed sample size is large.

96 L.A. Cabrera-Diego et al.
Fig.1.R
esult
sacc
ord
ing
toth
eKen
dall’s
tau-b
corr
elati
on
coeffi
cien
t
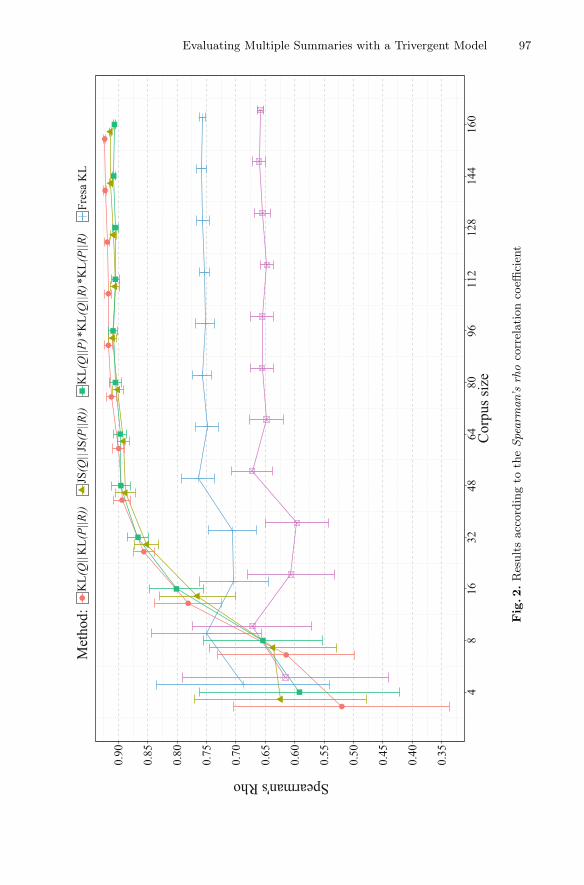
Evaluating Multiple Summaries with a Trivergent Model 97
Fig.2.R
esult
sacc
ord
ing
toth
eSpearm
an’srho
corr
elati
on
coeffi
cien
t

98 L.A. Cabrera-Diego et al.
In both correlation coefficients, for subcorpora greater than 16 documents, weobserved that the trivergences measures become more correlated to Rouge withrespect to the other frameworks. This means that the rankings of the trivergencesbecome more similar to the ones given by Rouge as we increase the size of P .
To validate our results for the subcorpora of 32 documents, we decided todetermine whether the Kendall’s tau-b correlation coefficients of each measurewere statistically different. To do this, we used a Kruskal-Wallis test [9] with aGames-Howell post hoc test.8 For the Kruskal-Wallis test, we got a p-value =3.88 × 10⁻¹⁴, meaning that at least the correlation coefficients of one measurewere statistically different with respect to the others. In Table 1, we present theresults of the Games-Howell post hoc test by measure couples. It can be seen inTable 1 that the trivergent model measures are statistically different with respectto the baselines’ measures.
Table 1. Results of the Games-Howell post hoc test for the subcorpora of 32 documents
Measure couples Adjusted Statistically different
p-value (α = 0.05)
KL(Q||P )· KL(Q||R)·KL(P ||R) vs.KL(Q||KL(P ||R))
0.915 NO
KL(Q||P )· KL(Q||R)·KL(P ||R) vs.JS(Q||JS(P ||R))
0.759 NO
KL(Q||P )· KL(Q||R)·KL(P ||R) vs. FRESA KL 2.94 × 10⁻⁷ YES
KL(Q||P )· KL(Q||R)·KL(P ||R) vs. SIMetrixUnsmoothed JS
3.18 × 10⁻¹⁰ YES
KL(Q||KL(P ||R)) vs. JS(Q||JS(P ||R)) 0.995 NO
KL(Q||KL(P ||R)) vs. FRESA KL 2.07 × 10⁻⁶ YES
KL(Q||KL(P ||R)) vs. SIMetrix Unsmoothed JS 1.36 × 10⁻⁹ YES
JS(Q||JS(P ||R)) vs. FRESA KL 8.34 × 10⁻⁶ YES
JS(Q||JS(P ||R)) vs. SIMetrix Unsmoothed JS 2.93 × 10⁻⁹ YES
FRESA KL vs. SIMetrix Unsmoothed JS 0.020 YES
The good correlation coefficients obtained by our methodology may be relatedto the fact that as we increase the number of extracts in P , we make P to havea distribution more similar to the “ideal extract”. Expressed differently, thesentences more relevant from the source document correspond to the sentencesthat appear more frequently in all the summaries belonging to P . This willaffect, in consequence, the probability of the words n-grams; those belonging torelevant sentences have higher probabilities than those coming from less relevantsentences.8 We applied a Kruskal-Wallis test and a Games-Howell post hoc test as the results
had heterogeneous variances.

Evaluating Multiple Summaries with a Trivergent Model 99
If we make a comparison with Rouge, we generate the distribution of the“ideal summary by extraction” instead of building the distribution of the “idealsummary by abstraction”. Moreover, we add in our methodology the comparisonbetween the summary and its source document, as Fresa and SIMetrix do.
We found that for KL(R||KL(Q||P )), the inner divergence resulted in a neg-ative constant. This made impossible to continue with the outer divergence asthe logarithm is not defined for negative values. However, after a deep analysis,we found that the problem resides in the fact that the smoothing value wasnot small enough to make the divergence to be positive. The use of a smallersmoothing value or another smoothing method may solve the problem.
In addition, we observed that each sentence of the Puces source documentappears at least in one summary, even when all the possible summaries are nearof 6 millions due to the combinatorial
(308
).
4 Conclusions and Future Work
In this paper we presented a first study about the trivergence of probabilitiesand its application in the evaluation of summaries without human models. Thetrivergence is a statistical measure where multiple divergences are used, eitherby multiplication or composition. The aim is to calculate the dissimilarity of 3different distributions.
The tests were done over a small French corpus of summaries. To evaluate thetrivergent model, we calculated the correlation of our rankings and 2 baselineswith respect to Rouge. The results showed that the trivergence can have a betterperformance, in comparison to the baselines, when more than 16 summariesare analyzed. These outcomes are really favorable, especially for summarizationchallenges, where multiple artificial summaries must be evaluated. Moreover, ourmethodology could be a way to bypass the creation of abstracts by humans inorder to evaluate ATS systems.
We consider feasible a reduction in the number of summaries that our evalu-ation methodology needs to have a good performance. A potential solution is tochange the stemmer by a lemmatizer during the preprocessing step, as we usea highly inflected language. Another possible solution is to test other kinds ofn-grams or to use TF-IDF to weight differently the n-grams.
As future work, we consider it fundamental to test our methodology in otherlanguages and with other corpora like DUC/TAC, MultiLing and RPM2. Aswell, we want to continue testing and improving the trivergence of probabilitiesin other tasks and domains, for example, to rank resumes for the e-Recruitment.

100 L.A. Cabrera-Diego et al.
References
1. Cabrera-Diego, L.A.: Automatic methods for assisted recruitment. Ph.D. thesis,Universite d’Avignon et des Pays de Vaucluse, December 2015
2. Fernandez, S., SanJuan, E., Torres-Moreno, J.M.: Textual energy of associativememories: performant applications of enertex algorithm in text summarizationand topic segmentation. In: Gelbukh, A., Kuri Morales, A.F. (eds.) MICAI 2007.LNCS (LNAI), vol. 4827, pp. 861–871. Springer, Heidelberg (2007)
3. Gamer, M., Lemon, J., Singh, I.F.P.: irr: Various Coefficients of Interrater Relia-bility and Agreement (2012), rpackageversion0.84. https://CRAN.R-project.org/package=irr
4. Good, I.J.: The population frequencies of species and the estimation of populationparameters. Biometrika 40(3–4), 237–264 (1953)
5. Hovy, E., Lin, C.Y., Zhou, L., Fukumoto, J.: Automated summarization evalua-tion with basic elements. In: Proceedings of the Fifth Conference on LanguageResources and Evaluation (LREC 2006), pp. 604–611 (2006)
6. Jing, H., Barzilay, R., McKeown, K., Elhadad, M.: Summarization evaluation meth-ods: experiments and analysis. In: AAAI Symposium on Intelligent Summarization,pp. 51–59 (1998)
7. Katz, S.M.: Estimation of probabilities from sparse data for the language modelcomponent of a speech recognizer. IEEE Trans. Acoustics Speech Signal Process.35(3), 400–401 (1987)
8. Kendall, M.G., Stuart, A.: The Advanced Theory of Statistics, vol. 1, 2nd edn.Charles Griffin and Co., London (1948)
9. Kruskal, W.H., Wallis, W.A.: Use of ranks in one-criterion variance analysis. J.Am. Stat. Assoc. 47(260), 583–621 (1952)
10. Kullback, S., Leibler, R.A.: On information and sufficiency. Ann. Math. Stat. 22(1),79–86 (1951)
11. Lin, C.Y.: Rouge: a package for automatic evaluation of summaries. In: Text Sum-marization Branches Out: Proceedings of the Association for Computational Lin-guistics 2004 Workshop, vol. 8 (2004)
12. Lin, J.: Divergence measures based on the Shannon entropy. IEEE Trans. Inf.Theory 37(1), 145–151 (1991)
13. Louis, A., Nenkova, A.: Automatically evaluating content selection in summariza-tion without human models. In: Proceedings of the 2009 Conference on EmpiricalMethods in Natural Language Processing, vol. 1, pp. 306–314. Association forComputational Linguistics (2009)
14. Mani, I.: Summarization evaluation: an overview. In: Proceedings of the NorthAmerican Chapter of the Association for Computational Linguistics (NAACL)Workshop on Automatic Summarization (2001)
15. Nenkova, A., Passonneau, R.: Evaluating content selection in summarization: thepyramid method. In: Susan Dumais, D.M., Roukos, S. (eds.) Proceedings of HLT-NAACL 2004, pp. 145–152. Association for Computational Linguistics, Boston(2004)
16. R Core Team: R: A Language and Environment for Statistical Computing. R Foun-dation for Statistical Computing, Vienna, Austria (2016). https://www.R-project.org/
17. Saggion, H., Torres-Moreno, J.M., da Cunha, I., SanJuan, E., Velazquez-Morales,P.: Multilingual summarization evaluation without human models. In: 23rd Inter-national Conference on Computational Linguistics (COLING 2010), pp. 1059–1067.Association for Computational Linguistics (2010)

Evaluating Multiple Summaries with a Trivergent Model 101
18. Sparck-Jones, K., Galliers, J.R.: Evaluating Natural Language Processing Systems:An Analysis and Review. LNCS(LNAI), vol. 1083. Springer, New York (1996)
19. Steinberger, J., Jezek, K.: Evaluation measures for text summarization. Comput.Inform. 28(2), 251–275 (2012)
20. Torres-Moreno, J.M.: Artex is another text summarizer (2012). arXiv:1210.331221. Torres-Moreno, J.M.: Automatic Text Summarization. Wiley, New York (2014)22. Torres-Moreno, J.M.: Trivergence of Probability Distributions, at Glance. Com-
puting Research Repository (CoRR) abs/1506.06205 (2015). http://arxiv.org/abs/1506.06205
23. Torres-Moreno, J.M., Velazquez-Morales, P., Meunier, J.G.: Condenses automa-tiques de textes. Lexicometrica. L’analyse de donnees textuelles: De l’enquete auxcorpus litteraires, Special (2004)

PatEx: Pattern Oriented RDFGraphs Exploration
Hanane Ouksili1,2(B), Zoubida Kedad1, Stephane Lopes1,and Sylvaine Nugier2
1 DAVID Lab., Univ. Versailles St Quentin, Versailles, Francehanane.ouksili,zoubida.kedad,[email protected]
2 Department STEP, EDF R&D, Chatou, [email protected]
Abstract. An increasing number of RDF datasets are available on theWeb. In order to query these datasets, users must have information abouttheir content as well as some knowledge of a query language such asSPARQL. Our goal is to facilitate the exploration of these datasets. Wepresent in this paper PatEx, a system designed to explore RDF(S)/OWLdata. PatEx provides two exploration strategies: theme-based explo-ration and keyword search, and users can interactively switch betweenthe two. Moreover, the system allows the definition of patterns to formal-ize users’ requirements during the exploration process. We also presentsome evaluations performed on real datasets.
Keywords: RDF graph exploration · Theme discovery · Keywordsearch
1 Introduction
A huge volume of RDF datasets is available on the Web, enabling the designof novel intelligent applications. However, in order to use such datasets, theuser needs to understand them. The exploration of RDF datasets is deemed tobe a complex and burdensome task requiring a long time and some knowledgeabout the data. Formal query languages are powerful solutions to express usersinformational needs and to retrieve knowledge from an RDF dataset. However,in order to write these structured queries, users must have some informationabout the dataset schema. Besides, they must be familiar with a formal querylanguage that could be used to query this data, such as SPARQL.
To illustrate the problem and highlight our contributions, consider thedataset provided by the AIFB1 institute, which represents a research communityincluding persons, organizations, publications and their relationships. Assumethat the user is interested in the scientist named “Rudi Studer” and wants tohave all his cooperators in the domain of the Semantic Web only. The user has
This work is supported by EDF and french ANR project CAIR.1 http://www.aifb.kit.edu/web/Hauptseite/en.
c© Springer International Publishing Switzerland 2016E. Metais et al. (Eds.): NLDB 2016, LNCS 9612, pp. 102–114, 2016.DOI: 10.1007/978-3-319-41754-7 9

PatEx: Pattern Oriented RDF Graphs Exploration 103
first to submit several queries and manually browse the dataset in order to col-lect all the relevant properties, which will be used to formulate the queries thatwill provide the final answer. Our proposal to address this issue is to combinekeyword search and theme browsing to guide the user during the identificationof the relevant information. We argue that if the data is presented as a set ofthemes along with the description of their content, it is easier to target the rel-evant resources and properties by exploring the relevant themes only. The usercan perform a theme-based exploration, then, she may select the desired theme,the field of Semantic Web in our example, and perform a keyword search withthe query “Studer Cooperator”.
In this paper, we propose a system, called PatEx, which enables users toexplore and to understand RDF datasets. Our approach does not require priorknowledge about the schema, or about a formal query language. Moreover,users can enrich the exploration process with some domain knowledge as well astheir specific requirements. PatEx provides two exploration strategies: a themebrowser and a keyword search engine, and the users can interactively switchbetween the two. To support the exploration process, we define the notion ofpattern to formalize both users preferences and specific domain knowledge.
The paper is organized as follows. Section 2 presents an overview of the PatExsystem. Section 3 defines the notion of pattern. In Sect. 4, we describe the wayexternal knowledge is captured during the exploration. Sections 5 and 6 describethe approaches used to support the exploration strategies. Section 7 presentssome evaluation results. In Sect. 8, we discuss related works and finally, we con-clude the paper in Sect. 9.
2 The PatEx System: An Overview
Our system provides two complementary approaches to query RDF datasets:theme-based exploration and keyword search. Moreover, since two users canhave different point of views, the system enables to specify some preferenceswhich are formalized as patterns. An overview of the system’s architecture isgiven in Fig. 1.
The user interacts with the system through the RDF Graph Manager. Itenables to choose the RDF data to explore, to select the exploration strategy andto visualize the results. This module also enables an iterative exploration; forexample, the user might select one or several identified themes from the initialRDF graph to refine the exploration. Moreover, it is possible to switch betweenthe exploration modes, i.e. keyword search can be performed on a subgraphcorresponding to one or several themes identified in the initial dataset.
The Pattern Manager module captures user preferences and domainknowledge. It translates them into patterns evaluated on the selected RDFgraph. The result is stored in the Pattern Store, then they are used to guidethe exploration process. Theme-based exploration is performed by the Theme
Browser. It receives the selected RDF graph from the RDF Graph Man-
ager and uses the evaluated patterns from the Pattern Store. The result

104 H. Ouksili et al.
Fig. 1. Architecture of the PatEx System
of pattern evaluation on the RDF graph is mapped into graph transformations.Themes are then identified using a density based graph clustering algorithm exe-cuted on the enriched graph. Keyword queries are processed by the Keyword
Search Engine module which will look for elements that match the keywords,taking into account the result of patterns evaluation from the Pattern Store.The result is a set of subgraphs containing these elements, which are returnedto the user through the RDF Graph Manager.
3 Pattern Definition
According to the knowledge available for a specific domain, or to the user’spoint of view, some equivalence relations can be defined between a property anda path in the dataset. In PatEx, we express these relations through patterns.The definition of patterns relies on the definition of property expression and pathexpression which are defined hereafter.
A property expression denoted exp is a 3-tuple (X, p, Y ), where X and Yare either resources, literals or variables and p is a property. For example, (X,swrc:isAbout, Database) is a property expression that represents triples havingDatabase as object and swrc:isAbout as predicate.
A path expression describes a relation (possibly indirect) between resources.The relation is a path (a sequence of properties) between two resources. Note thata property expression is a special case of path expression where the path length is1. More formally, A path expression denoted exP is defined as a 3-tuple (X, P, Y ),where X and Y are either resources, literals or variables and P is a SPARQL 1.1path expression2. For example, (D.B., (owl:sameAs|ˆowl:sameAs )+, Y ) repre-sents all the resources related to D.B. by a sequence of owl:sameAs or its inverse.
A pattern represents the equivalence between two expressions, one propertyexpression and one path expression. More formally, a pattern is a pair [exp, exP ]where exp is a property expression and exP is a path expression.2 http://www.w3.org/TR/sparql11-property-paths/.
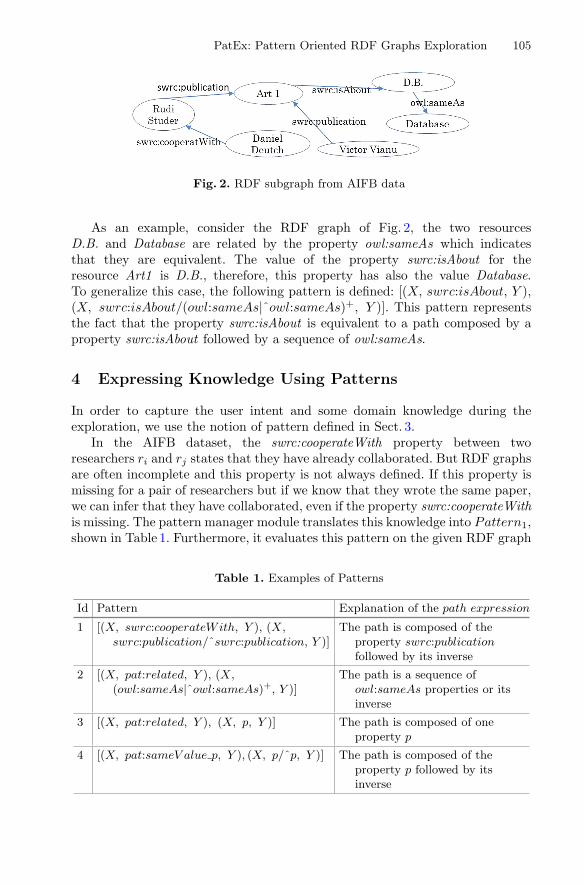
PatEx: Pattern Oriented RDF Graphs Exploration 105
Fig. 2. RDF subgraph from AIFB data
As an example, consider the RDF graph of Fig. 2, the two resourcesD.B. and Database are related by the property owl:sameAs which indicatesthat they are equivalent. The value of the property swrc:isAbout for theresource Art1 is D.B., therefore, this property has also the value Database.To generalize this case, the following pattern is defined: [(X, swrc:isAbout, Y ),(X, swrc:isAbout/(owl:sameAs|ˆowl:sameAs)+, Y )]. This pattern representsthe fact that the property swrc:isAbout is equivalent to a path composed by aproperty swrc:isAbout followed by a sequence of owl:sameAs.
4 Expressing Knowledge Using Patterns
In order to capture the user intent and some domain knowledge during theexploration, we use the notion of pattern defined in Sect. 3.
In the AIFB dataset, the swrc:cooperateWith property between tworesearchers ri and rj states that they have already collaborated. But RDF graphsare often incomplete and this property is not always defined. If this property ismissing for a pair of researchers but if we know that they wrote the same paper,we can infer that they have collaborated, even if the property swrc:cooperateWithis missing. The pattern manager module translates this knowledge into Pattern1,shown in Table 1. Furthermore, it evaluates this pattern on the given RDF graph
Table 1. Examples of Patterns
Id Pattern Explanation of the path expression
1 [(X, swrc:cooperateWith, Y ), (X,swrc:publication/ˆswrc:publication, Y )]
The path is composed of theproperty swrc:publicationfollowed by its inverse
2 [(X, pat:related, Y ), (X,(owl:sameAs|ˆowl:sameAs)+, Y )]
The path is a sequence ofowl:sameAs properties or itsinverse
3 [(X, pat:related, Y ), (X, p, Y )] The path is composed of oneproperty p
4 [(X, pat:sameV alue p, Y ), (X, p/ˆp, Y )] The path is composed of theproperty p followed by itsinverse
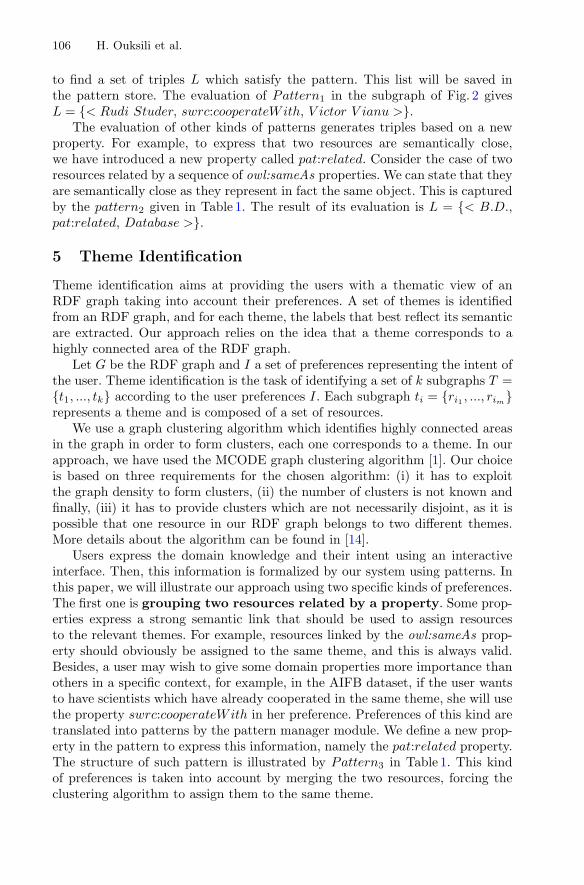
106 H. Ouksili et al.
to find a set of triples L which satisfy the pattern. This list will be saved inthe pattern store. The evaluation of Pattern1 in the subgraph of Fig. 2 givesL = < Rudi Studer, swrc:cooperateWith, V ictor V ianu >.
The evaluation of other kinds of patterns generates triples based on a newproperty. For example, to express that two resources are semantically close,we have introduced a new property called pat:related. Consider the case of tworesources related by a sequence of owl:sameAs properties. We can state that theyare semantically close as they represent in fact the same object. This is capturedby the pattern2 given in Table 1. The result of its evaluation is L = < B.D.,pat:related, Database >.
5 Theme Identification
Theme identification aims at providing the users with a thematic view of anRDF graph taking into account their preferences. A set of themes is identifiedfrom an RDF graph, and for each theme, the labels that best reflect its semanticare extracted. Our approach relies on the idea that a theme corresponds to ahighly connected area of the RDF graph.
Let G be the RDF graph and I a set of preferences representing the intent ofthe user. Theme identification is the task of identifying a set of k subgraphs T =t1, ..., tk according to the user preferences I. Each subgraph ti = ri1 , ..., rimrepresents a theme and is composed of a set of resources.
We use a graph clustering algorithm which identifies highly connected areasin the graph in order to form clusters, each one corresponds to a theme. In ourapproach, we have used the MCODE graph clustering algorithm [1]. Our choiceis based on three requirements for the chosen algorithm: (i) it has to exploitthe graph density to form clusters, (ii) the number of clusters is not known andfinally, (iii) it has to provide clusters which are not necessarily disjoint, as it ispossible that one resource in our RDF graph belongs to two different themes.More details about the algorithm can be found in [14].
Users express the domain knowledge and their intent using an interactiveinterface. Then, this information is formalized by our system using patterns. Inthis paper, we will illustrate our approach using two specific kinds of preferences.The first one is grouping two resources related by a property. Some prop-erties express a strong semantic link that should be used to assign resourcesto the relevant themes. For example, resources linked by the owl:sameAs prop-erty should obviously be assigned to the same theme, and this is always valid.Besides, a user may wish to give some domain properties more importance thanothers in a specific context, for example, in the AIFB dataset, if the user wantsto have scientists which have already cooperated in the same theme, she will usethe property swrc:cooperateWith in her preference. Preferences of this kind aretranslated into patterns by the pattern manager module. We define a new prop-erty in the pattern to express this information, namely the pat:related property.The structure of such pattern is illustrated by Pattern3 in Table 1. This kindof preferences is taken into account by merging the two resources, forcing theclustering algorithm to assign them to the same theme.

PatEx: Pattern Oriented RDF Graphs Exploration 107
The second type of preferences is grouping resources according to val-ues of a property. In some cases, two resources are semantically close notbecause they are in the same highly connected area or related by a given prop-erty, but because they share the same value for a specific property. For example,if the user wants a theme to be related to a single country, she could state thatresources having the same value for the localisation property should be groupedtogether. We introduce the property pat:sameV alue p in the pattern to expressthis information, where p is the considered property. The structure of such pat-terns is shown by Pattern4 of Table 1. This preference is mapped on the graphby creating a complete graph with the resources resulting from the evaluationof the pattern.
Once the themes have been defined, the user is provided with a description ofthe content of each theme. In our approach, we provide these labels by extracting(i) the names of the classes having the highest number of instances, and (ii) thelabels of the resources corresponding to nodes having the highest degree in theRDF graph.
6 Keyword Search
Another kind of exploration of an RDF graph is keyword search, where an answerto a keyword query is a set of connected subgraphs, each one containing thehighest number of query keywords. Indeed, several elements (nodes or edges)may match a given keyword, therefore many subgraphs may satisfy the query.Our contribution is to use the patterns defined in Sect. 3 for the extraction ofrelevant elements for each keyword, even the ones which do not contain a querykeywords but are relevant to the query.
Let G be an RDF graph and Q = k1, ..., kn a keyword query. Keywordsearch on RDF graphs involves three key issues: (i) matching the keywords tothe graph elements using an index and a mapping function; a set of lists El =El1, ..., ELn is returned, each list Eli contains graph elements elij which matchthe keyword ki; we refer to these as keyword elements; (ii) merging keywordelements to form a subgraph, which provides a list of connected subgraphs, eachone containing a single corresponding keyword element for a given keyword.Finally (iii) results have to be ranked according to their relevance.
Consider the RDF graph given in Fig. 2. Let “Studer Cooperator” be thekeyword query issued to find the collaborators of the researcher named Studer.Using a mapping function and some standard transformation functions suchas abbreviations and synonyms, two keyword elements will be identified: thenode Rudi Studer and the property swrc:cooperateWith. Without using the pat-terns, the only answer to the query will therefore be the subgraph G1 of Fig. 3representing Daniel Deutch, a collaborator of Rudi Studer, both linked by theswrc:cooperateWith property. However, Victor Vianu is also a collaborator ofRudi Studer as they published a paper together (Art1 ) as is shown in Fig. 2.The subgraph G2 of Fig. 3 will not be returned using the above process. In otherwords, the link swrc:cooperateWith between Rudi Studer and Victor Vianu can
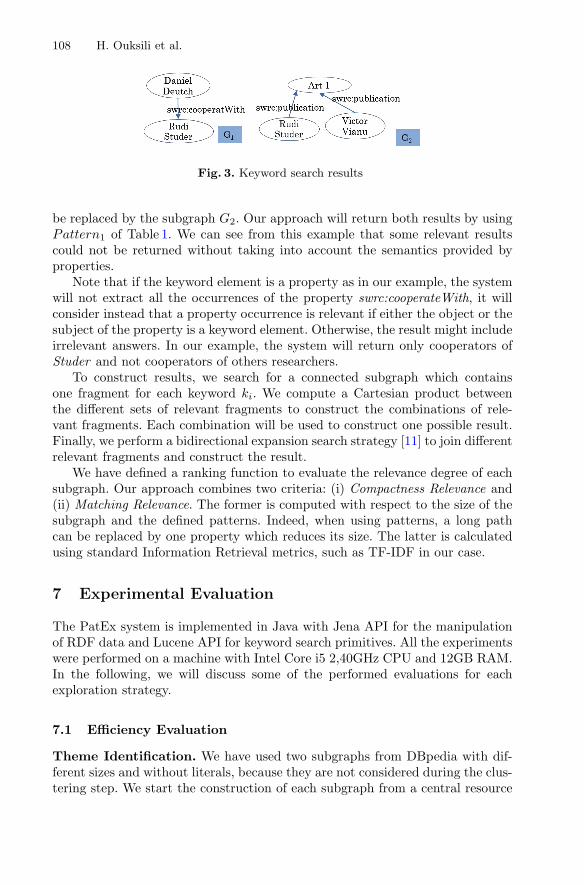
108 H. Ouksili et al.
Fig. 3. Keyword search results
be replaced by the subgraph G2. Our approach will return both results by usingPattern1 of Table 1. We can see from this example that some relevant resultscould not be returned without taking into account the semantics provided byproperties.
Note that if the keyword element is a property as in our example, the systemwill not extract all the occurrences of the property swrc:cooperateWith, it willconsider instead that a property occurrence is relevant if either the object or thesubject of the property is a keyword element. Otherwise, the result might includeirrelevant answers. In our example, the system will return only cooperators ofStuder and not cooperators of others researchers.
To construct results, we search for a connected subgraph which containsone fragment for each keyword ki. We compute a Cartesian product betweenthe different sets of relevant fragments to construct the combinations of rele-vant fragments. Each combination will be used to construct one possible result.Finally, we perform a bidirectional expansion search strategy [11] to join differentrelevant fragments and construct the result.
We have defined a ranking function to evaluate the relevance degree of eachsubgraph. Our approach combines two criteria: (i) Compactness Relevance and(ii) Matching Relevance. The former is computed with respect to the size of thesubgraph and the defined patterns. Indeed, when using patterns, a long pathcan be replaced by one property which reduces its size. The latter is calculatedusing standard Information Retrieval metrics, such as TF-IDF in our case.
7 Experimental Evaluation
The PatEx system is implemented in Java with Jena API for the manipulationof RDF data and Lucene API for keyword search primitives. All the experimentswere performed on a machine with Intel Core i5 2,40GHz CPU and 12GB RAM.In the following, we will discuss some of the performed evaluations for eachexploration strategy.
7.1 Efficiency Evaluation
Theme Identification. We have used two subgraphs from DBpedia with dif-ferent sizes and without literals, because they are not considered during the clus-tering step. We start the construction of each subgraph from a central resource
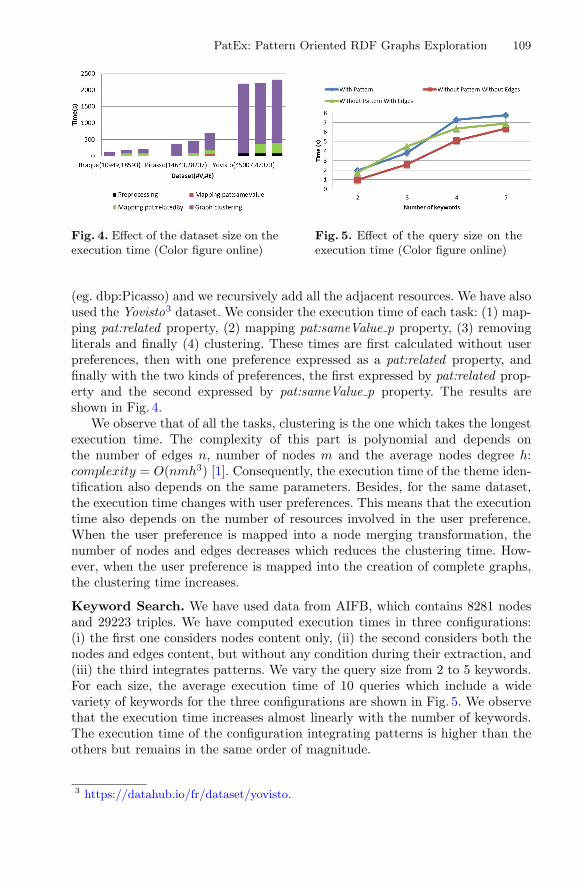
PatEx: Pattern Oriented RDF Graphs Exploration 109
Fig. 4. Effect of the dataset size on theexecution time (Color figure online)
Fig. 5. Effect of the query size on theexecution time (Color figure online)
(eg. dbp:Picasso) and we recursively add all the adjacent resources. We have alsoused the Yovisto3 dataset. We consider the execution time of each task: (1) map-ping pat:related property, (2) mapping pat:sameValue p property, (3) removingliterals and finally (4) clustering. These times are first calculated without userpreferences, then with one preference expressed as a pat:related property, andfinally with the two kinds of preferences, the first expressed by pat:related prop-erty and the second expressed by pat:sameValue p property. The results areshown in Fig. 4.
We observe that of all the tasks, clustering is the one which takes the longestexecution time. The complexity of this part is polynomial and depends onthe number of edges n, number of nodes m and the average nodes degree h:complexity = O(nmh3) [1]. Consequently, the execution time of the theme iden-tification also depends on the same parameters. Besides, for the same dataset,the execution time changes with user preferences. This means that the executiontime also depends on the number of resources involved in the user preference.When the user preference is mapped into a node merging transformation, thenumber of nodes and edges decreases which reduces the clustering time. How-ever, when the user preference is mapped into the creation of complete graphs,the clustering time increases.
Keyword Search. We have used data from AIFB, which contains 8281 nodesand 29223 triples. We have computed execution times in three configurations:(i) the first one considers nodes content only, (ii) the second considers both thenodes and edges content, but without any condition during their extraction, and(iii) the third integrates patterns. We vary the query size from 2 to 5 keywords.For each size, the average execution time of 10 queries which include a widevariety of keywords for the three configurations are shown in Fig. 5. We observethat the execution time increases almost linearly with the number of keywords.The execution time of the configuration integrating patterns is higher than theothers but remains in the same order of magnitude.
3 https://datahub.io/fr/dataset/yovisto.
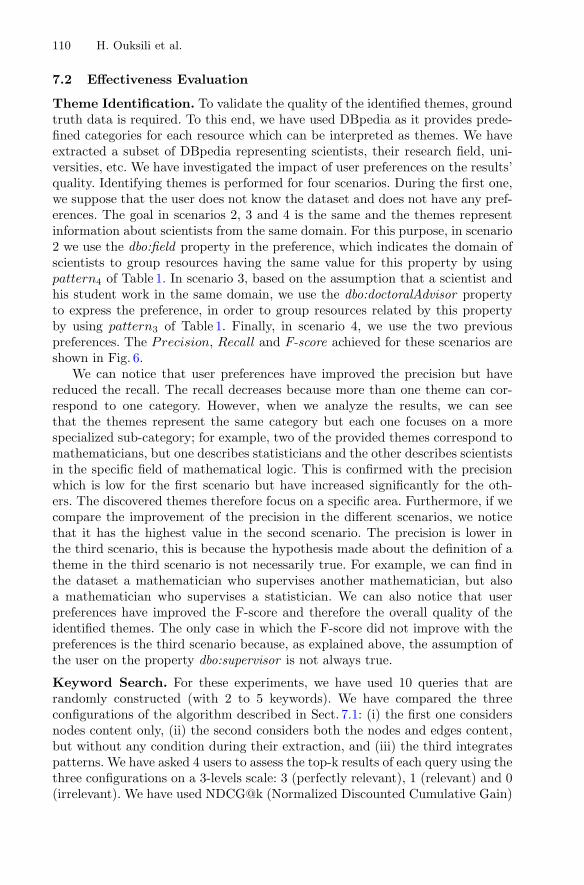
110 H. Ouksili et al.
7.2 Effectiveness Evaluation
Theme Identification. To validate the quality of the identified themes, groundtruth data is required. To this end, we have used DBpedia as it provides prede-fined categories for each resource which can be interpreted as themes. We haveextracted a subset of DBpedia representing scientists, their research field, uni-versities, etc. We have investigated the impact of user preferences on the results’quality. Identifying themes is performed for four scenarios. During the first one,we suppose that the user does not know the dataset and does not have any pref-erences. The goal in scenarios 2, 3 and 4 is the same and the themes representinformation about scientists from the same domain. For this purpose, in scenario2 we use the dbo:field property in the preference, which indicates the domain ofscientists to group resources having the same value for this property by usingpattern4 of Table 1. In scenario 3, based on the assumption that a scientist andhis student work in the same domain, we use the dbo:doctoralAdvisor propertyto express the preference, in order to group resources related by this propertyby using pattern3 of Table 1. Finally, in scenario 4, we use the two previouspreferences. The Precision, Recall and F-score achieved for these scenarios areshown in Fig. 6.
We can notice that user preferences have improved the precision but havereduced the recall. The recall decreases because more than one theme can cor-respond to one category. However, when we analyze the results, we can seethat the themes represent the same category but each one focuses on a morespecialized sub-category; for example, two of the provided themes correspond tomathematicians, but one describes statisticians and the other describes scientistsin the specific field of mathematical logic. This is confirmed with the precisionwhich is low for the first scenario but have increased significantly for the oth-ers. The discovered themes therefore focus on a specific area. Furthermore, if wecompare the improvement of the precision in the different scenarios, we noticethat it has the highest value in the second scenario. The precision is lower inthe third scenario, this is because the hypothesis made about the definition of atheme in the third scenario is not necessarily true. For example, we can find inthe dataset a mathematician who supervises another mathematician, but alsoa mathematician who supervises a statistician. We can also notice that userpreferences have improved the F-score and therefore the overall quality of theidentified themes. The only case in which the F-score did not improve with thepreferences is the third scenario because, as explained above, the assumption ofthe user on the property dbo:supervisor is not always true.
Keyword Search. For these experiments, we have used 10 queries that arerandomly constructed (with 2 to 5 keywords). We have compared the threeconfigurations of the algorithm described in Sect. 7.1: (i) the first one considersnodes content only, (ii) the second considers both the nodes and edges content,but without any condition during their extraction, and (iii) the third integratespatterns. We have asked 4 users to assess the top-k results of each query using thethree configurations on a 3-levels scale: 3 (perfectly relevant), 1 (relevant) and 0(irrelevant). We have used NDCG@k (Normalized Discounted Cumulative Gain)
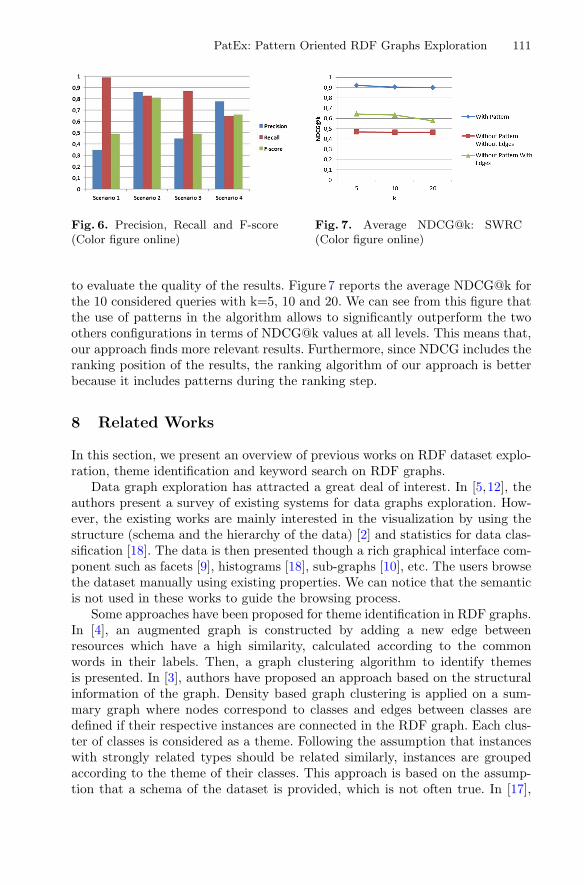
PatEx: Pattern Oriented RDF Graphs Exploration 111
Fig. 6. Precision, Recall and F-score(Color figure online)
Fig. 7. Average NDCG@k: SWRC(Color figure online)
to evaluate the quality of the results. Figure 7 reports the average NDCG@k forthe 10 considered queries with k=5, 10 and 20. We can see from this figure thatthe use of patterns in the algorithm allows to significantly outperform the twoothers configurations in terms of NDCG@k values at all levels. This means that,our approach finds more relevant results. Furthermore, since NDCG includes theranking position of the results, the ranking algorithm of our approach is betterbecause it includes patterns during the ranking step.
8 Related Works
In this section, we present an overview of previous works on RDF dataset explo-ration, theme identification and keyword search on RDF graphs.
Data graph exploration has attracted a great deal of interest. In [5,12], theauthors present a survey of existing systems for data graphs exploration. How-ever, the existing works are mainly interested in the visualization by using thestructure (schema and the hierarchy of the data) [2] and statistics for data clas-sification [18]. The data is then presented though a rich graphical interface com-ponent such as facets [9], histograms [18], sub-graphs [10], etc. The users browsethe dataset manually using existing properties. We can notice that the semanticis not used in these works to guide the browsing process.
Some approaches have been proposed for theme identification in RDF graphs.In [4], an augmented graph is constructed by adding a new edge betweenresources which have a high similarity, calculated according to the commonwords in their labels. Then, a graph clustering algorithm to identify themesis presented. In [3], authors have proposed an approach based on the structuralinformation of the graph. Density based graph clustering is applied on a sum-mary graph where nodes correspond to classes and edges between classes aredefined if their respective instances are connected in the RDF graph. Each clus-ter of classes is considered as a theme. Following the assumption that instanceswith strongly related types should be related similarly, instances are groupedaccording to the theme of their classes. This approach is based on the assump-tion that a schema of the dataset is provided, which is not often true. In [17],

112 H. Ouksili et al.
a probabilistic approach for theme identification in text documents (LDA) hasbeen adapted to RDF datasets. The approach is based on the co-occurence ofterms in documents. In the case of RDF graphs, the authors define each resourceand the values of its properties as a document. The approach is then used onthe constructed collection of textual documents. Hence, the semantic providedbut properties is not considered.
Another field that is close to theme identification is topical profiling [7,13].The goal of these works is to facilitate the understanding of a dataset by pro-viding descriptive information (metadata) about its content. The description isgiven as labels that represent the existing topics in the dataset [7,13]. However,unlike our approach, these works return a set of topics that exist in the dataset,but they do not assign each node to one or more of these topics.
There are mainly two categories of approaches dealing with keyword searchover RDF graphs. The first one uses information retrieval techniques. They definewhat a document is, for example, a triple [6] or a resource with its neighborhood[8]. Documents are indexed, then query keywords are mapped to the defineddocuments. Finally, a ranked list of documents is returned to the user. Theseworks do not merge the relevant fragments corresponding to the query keywords.
In the second category, approaches use graphs to construct results [19,20].To do so, they typically use a keyword-to-graph mapping function to identifya set of elements that contain the query keywords. Then, a connected “mini-mal” subgraph, which contains one identified element for each query keywordis returned as an answer. Since several elements can contain the same keyword,several results are returned to the user, and each approach defines a ranking func-tion mainly based on the size of the subgraph, the matching relevance and thecoverage. In these works, only the structure is considered during the constructionof the result, unlike our approach, which integrates the semantics through pat-terns. In [15,16], the authors have predefined templates for the results based onthe type of keyword elements. However, defining templates for the result mightresult in capturing some interpretations of the keywords only, which may notsatisfy the user’s needs.
9 Conclusion
In this paper, we have proposed an approach which combines thematic and key-words exploration in RDF data. To support the exploration process, we havedefined the notion of pattern to formalize both users preferences and specificdomain knowledge. We have implemented the two exploration strategies andproved that they reduce the user effort to explore, browse and understand anRDF(S)/OWL dataset without having any knowledge about the data. The exper-iments have shown that the result’s quality is improved by including externalknowledge formalized using patterns.
Future works include the definition of other types of patterns to express morethan equivalence between property and path expressions. Besides, for the themeidentification approach, we are currently working on the optimization of the

PatEx: Pattern Oriented RDF Graphs Exploration 113
clustering process in order to improve the efficiency of our approach. We willalso address the problem of maintaining the themes over time as the datasetevolves.
References
1. Bader, G.D., Hogue, C.W.: An automated method for finding molecular complexesin large protein interaction networks. BMC Bioinform. 4, 2 (2003)
2. Benedetti, F., Po, L., Bergamaschi, S.: A visual summary for linked open datasources. In Proceedings of the Posters & Demonstrations Track within ISWC, pp.173–176 (2014)
3. Bohm, C., Kasneci, G., Naumann, F.: Latent topics in graph-structured data. In:CIKM, pp. 2663–2666 (2012)
4. Castano, S., Ferrara, A., Montanelli, S.: Thematic clustering and exploration oflinked data. In: Ceri, S., Brambilla, M. (eds.) Search Computing III. LNCS, vol.7538, pp. 157–175. Springer, Heidelberg (2012)
5. Dadzie, A.-S., Rowe, M.: Approaches to visualising linked data: a survey. Semant.Web 2, 89–124 (2011)
6. Elbassuoni, S., Blanco, R.: Keyword search over RDF graphs. In: CIKM, pp. 237–242 (2011)
7. Fetahu, B., Dietze, S., Pereira Nunes, B., Antonio Casanova, M., Taibi, D., Nejdl,W.: A scalable approach for efficiently generating structured dataset topic profiles.In: Presutti, V., d’Amato, C., Gandon, F., d’Aquin, M., Staab, S., Tordai, A. (eds.)ESWC 2014. LNCS, vol. 8465, pp. 519–534. Springer, Heidelberg (2014)
8. Guha, R., McCool, R., Miller, E.: Semantic search. In: WWW, pp. 700–709 (2003)9. Heim, P., Ertl, T., Ziegler, J.: Facet graphs: complex semantic querying made
easy. In: Aroyo, L., Antoniou, G., Hyvonen, E., ten Teije, A., Stuckenschmidt,H., Cabral, L., Tudorache, T. (eds.) ESWC 2010. LNCS, vol. 6088, pp. 288–302.Springer, Heidelberg (2010)
10. Heim, P., Lohmann, S., Stegemann, T.: Interactive relationship discovery via thesemanticweb. In:Aroyo,L.,Antoniou,G.,Hyvonen,E., tenTeije,A.,Stuckenschmidt,H.,Cabral,L.,Tudorache,T. (eds.)ESWC2010,Part I.LNCS,vol. 6088,pp. 303–317.Springer, Heidelberg (2010)
11. Kacholia, V., Pandit, S., Chakrabarti, S., Sudarshan, S., Desai, R., Karambelkar,H.: Bidirectional expansion for keyword search on graph databases. In: VLDB, pp.505–516 (2005)
12. Marie, N., Gandon, F.L.: Survey of linked data based exploration systems. In:IESD (2014)
13. Meusel, R., Spahiu, B., Bizer, C., Paulheim, H.: Towards automatic topical classi-fication of LOD datasets. In: LDOW co-located with WWW, vol. 1409 (2015)
14. Ouksili, H., Kedad, Z., Lopes, S.: Theme identification in RDF graphs. In: AitAmeur, Y., Bellatreche, L., Papadopoulos, G.A. (eds.) MEDI 2014. LNCS, vol.8748, pp. 321–329. Springer, Heidelberg (2014)
15. Pradel, C., Haemmerle, O., Hernandez, N.: Swip: a natural language to SPARQLinterface implemented with SPARQL. In: Hernandez, N., Jaschke, R., Croitoru,M. (eds.) ICCS 2014. LNCS, vol. 8577, pp. 260–274. Springer, Heidelberg (2014)
16. Rahoman, M., Ichise, R.: Automatic inclusion of semantics over keyword-basedlinked data retrieval. IEICE Trans. 97–D, 2852–2862 (2014)

114 H. Ouksili et al.
17. Sleeman, J., Finin, T., Joshi, A.: Topic modeling for RDF graphs. In: LD4IE co-located with ISWC, pp. 48–62 (2015)
18. Voigt, M., Tietz, V., Piccolotto, N., Meibner, K.: Attract me! How could end-usersidentify interesting resources? In: WIMS, pp. 1–12 (2013)
19. Wang, H., Zhang, K., Liu, Q., Tran, T., Yu, Y.: Q2Semantic: a lightweight key-word interface to semantic search. In: Bechhofer, S., Hauswirth, M., Hoffmann,J., Koubarakis, M. (eds.) ESWC 2008. LNCS, vol. 5021, pp. 584–598. Springer,Heidelberg (2008)
20. Yang, S., Wu, Y., Sun, H., Yan, X.: Schemaless and structureless graph querying.VLDB Endow. 7, 565–576 (2014)
Multilingual Protest Event DataCollection with GATE
Vera Danilova1,2,3(B), Svetlana Popova3,4, and Mikhail Alexandrov1,2
1 Russian Presidential Academy (RANEPA), Moscow, [email protected], [email protected] Autonomous University of Barcelona, Barcelona, Spain
3 ITMO University, St. Petersburg, [email protected]
4 Saint Petersburg State University, St. Petersburg, Russia
Abstract. Protest event databases are key sources that sociologistsneed to study the collective action dynamics and properties. This paperdescribes a finite-state approach to protest event features collectionfrom short texts (news lead sentences) in several European languages(Bulgarian, French, Polish, Russian, Spanish, Swedish) using the GeneralArchitecture for Text Engineering (GATE). The results of the annotationperformance evaluation are presented.
Keywords: Protest event data · Event features · Informationextraction · GATE
1 Introduction
Protest activity reflects peoples satisfaction, confidence and belief in leader. It hasbeen a hot issue in the recent years. “Presidents, prime ministers and assortedrulers, consider that you have been warned: Amassive protest can start at any time,seemingly over any issue, and can grow to a size and intensity no one expected. Yourcountrys image, your own prestige, could risk unraveling as you face the wrath of thepeople” - wrote Frida Ghitis, special to CNN, in June 2013 referring to the dramaticevents that took place in Turkey and Brazil. November of the same year markedthe beginning of the civil unrest in Ukraine, which lead to the coup detat and grewinto an international conflict and a civil war.
Research related to the protest phenomenon, contentious collective actionmore broadly, is of prime interest to social scientists and governmental work-ers. For decades sociologists from the institutions, such as Berkman Center forInternet and Society, University of Illinois at Urbana-Champaign Cline Centerfor Democracy and others have been studying regularities in contentious collec-tive action and accumulating statistics for protest prediction and the analysisof its origins, dynamics and aftermath from protest event data (single events,small event sets and, since recently, big data).
Under partial support of the Government of the Russian Federation Grant 074-U01.
c© Springer International Publishing Switzerland 2016E. Metais et al. (Eds.): NLDB 2016, LNCS 9612, pp. 115–126, 2016.DOI: 10.1007/978-3-319-41754-7 10

116 V. Danilova et al.
Earlier protest studies have been based on the manual analysis of newspapersdata. Since 90’s, automatic approaches have been applied to the protest databasepopulation and coding that mostly apply natural language processing techniques.
News media remains the most used source for protest event data collection.Its advantages are accessibility and good temporal coverage, while the biasedview of events is known to be its main pitfall. Since recently, social media datais being used to study the connections between real and virtual protest activity,between protest-related news reports often controlled by the government andsocial media discussions.
Event selection and event coding are two main subtasks within the computa-tional approach to protest database population, where, giving a rough definition,event selection is the automatic collection of relevant articles describing events ina given domain or domains, and event coding is the procedure of automatic codeassignation to certain pieces of information (event type, actor, location, etc.).
This article provides additional details on our system for multilingual protestevent data collection described in [3] and continues the evaluation of protestevent features’ (Event Type, Event Reason, Event Location and Event Weight)annotation performance.
2 Related Work
The pioneer systems for automatic socio-political event data collection, such asKEDS (Kansas Event Data System) [13] and its adapted versions, used keywordsto speed up the search of relevant texts in digital archives and extracted eventsby matching the entries of ontology-based lexicons.
A description of the active projects in socio-political event data collec-tion, such as El:DIABLO1, W-ICEWS2, SPEED (Social, Political, and Eco-nomic Event Database [7]), GDELT (Global Database of Events, Language andTone [15]), is given in [3]. Event extraction in these systems also relies on theuse ontology-based lexicons. SPEED employs its own ontology of destabilizingevents, and the rest of the projects use CAMEO (Conflict and Mediation EventObservations [14]), which covers only 4 types of protest events. Event annota-tion and coding in the above systems is based on the application of relationextraction techniques (ICEWS) or the simple identification of event trigger andsurrounding entities (other projects). Geocoding in these systems is performedusing either special external tools or by quering an ontology followed by theapplication of heuristics. The characteristics of the above systems are shortlydescribed in Table 1.
A description of the prototypes for protest event data collection from English-language news that experiment with machine learning techniques is presentedin [3]. An overview of the general approaches to event extraction is given in [8].1 Event/Location: Dataset In A Box, Linux-Option: http://openeventdata.github.io/eldiablo/.
2 World-Wide Integrated Crisis Early Warning System: http://www.lockheedmartin.com/us/products/W-ICEWS/iData.html.
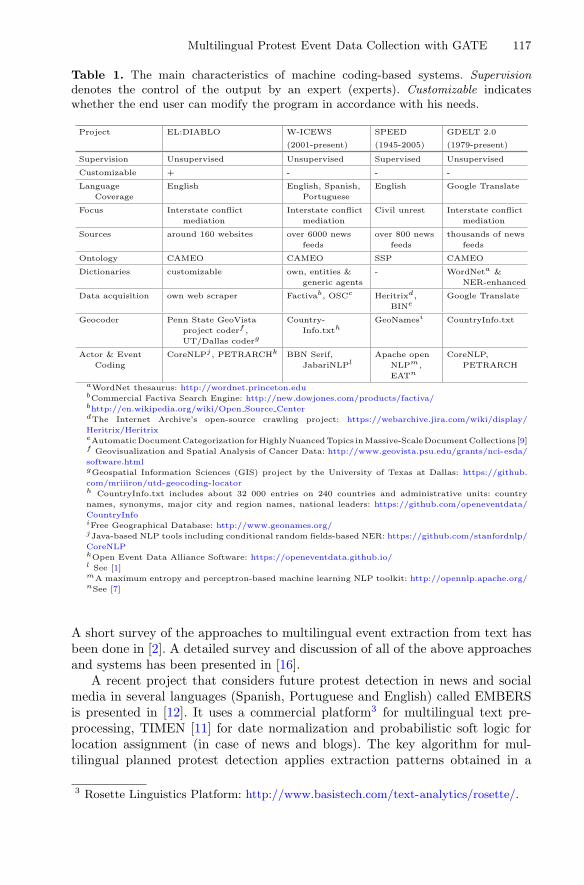
Multilingual Protest Event Data Collection with GATE 117
Table 1. The main characteristics of machine coding-based systems. Supervisiondenotes the control of the output by an expert (experts). Customizable indicateswhether the end user can modify the program in accordance with his needs.
Project EL:DIABLO W-ICEWS SPEED GDELT 2.0
(2001-present) (1945-2005) (1979-present)
Supervision Unsupervised Unsupervised Supervised Unsupervised
Customizable + - - -
Language
Coverage
English English, Spanish,
Portuguese
English Google Translate
Focus Interstate conflict
mediation
Interstate conflict
mediation
Civil unrest Interstate conflict
mediation
Sources around 160 websites over 6000 news
feeds
over 800 news
feeds
thousands of news
feeds
Ontology CAMEO CAMEO SSP CAMEO
Dictionaries customizable own, entities &
generic agents
- WordNeta &
NER-enhanced
Data acquisition own web scraper Factivab, OSCc Heritrixd,
BINeGoogle Translate
Geocoder Penn State GeoVista
project coderf ,
UT/Dallas coderg
Country-
Info.txthGeoNamesi CountryInfo.txt
Actor & Event
Coding
CoreNLPj , PETRARCHk BBN Serif,
JabariNLPlApache open
NLPm,
EATn
CoreNLP,
PETRARCH
aWordNet thesaurus: http://wordnet.princeton.edubCommercial Factiva Search Engine: http://new.dowjones.com/products/factiva/bhttp://en.wikipedia.org/wiki/Open Source CenterdThe Internet Archive’s open-source crawling project: https://webarchive.jira.com/wiki/display/
Heritrix/HeritrixeAutomaticDocumentCategorization forHighlyNuancedTopics inMassive-ScaleDocumentCollections [9]f Geovisualization and Spatial Analysis of Cancer Data: http://www.geovista.psu.edu/grants/nci-esda/
software.htmlgGeospatial Information Sciences (GIS) project by the University of Texas at Dallas: https://github.
com/mriiiron/utd-geocoding-locatorh CountryInfo.txt includes about 32 000 entries on 240 countries and administrative units: country
names, synonyms, major city and region names, national leaders: https://github.com/openeventdata/
CountryInfoiFree Geographical Database: http://www.geonames.org/jJava-based NLP tools including conditional random fields-based NER: https://github.com/stanfordnlp/
CoreNLPkOpen Event Data Alliance Software: https://openeventdata.github.io/l See [1]mA maximum entropy and perceptron-based machine learning NLP toolkit: http://opennlp.apache.org/nSee [7]
A short survey of the approaches to multilingual event extraction from text hasbeen done in [2]. A detailed survey and discussion of all of the above approachesand systems has been presented in [16].
A recent project that considers future protest detection in news and socialmedia in several languages (Spanish, Portuguese and English) called EMBERSis presented in [12]. It uses a commercial platform3 for multilingual text pre-processing, TIMEN [11] for date normalization and probabilistic soft logic forlocation assignment (in case of news and blogs). The key algorithm for mul-tilingual planned protest detection applies extraction patterns obtained in a
3 Rosette Linguistics Platform: http://www.basistech.com/text-analytics/rosette/.

118 V. Danilova et al.
semi-automatic way. The algorithm of pattern generalization from a seed setrelies on syntactic parsing. The resulting patterns include two or more wordlemmas for an event type term (e.g., demonstration, protest, strike, march, etc.)and an indicator of a planned action (future-tense of the verbs like to organize,to plan, to announce, to prepare, etc.), language specification and separationthreshold. EMBERS is geared towards the identification of planned events andis reported to be quite accurate in this task. Authors consider the portion ofevents that has not been captured during the experiments as referring to spon-taneous events. The data obtained by this system (the fact of a planned protest,location and date) is insufficient to populate protest event databases.
As compared to the previously mentioned systems, our prototype has thefollowing advantages:
– detects events at the sentence level and enriches them with protest-specificfeatures;
– determines the event weight (combines size, duration, violence involvement,regular character, intensity of a protest);
– uses a protest event ontology;– uses simple generic multilingual patterns (no need of large labeled datasets
for learning);– employs few external tools;– does not use deep linguistic processing.
We opted for the GATE framework4, because it is a well-known free-sourcearchitecture with a large community of contributors that provides resources formultilayer text annotation in multiple languages (incl. semantic annotation).Also, it performs fast processing of simple cascaded grammars on big corporaand allows easy incorporation of external tools.
3 Data
A multilingual corpus that includes news reports in Bulgarian, French, Polish,Russian, Spanish and Swedish has been collected using Scrapy5. These languageshave been selected, because the authors have a good command of them. Englishhas been currently excluded, because the instruments for this language are beingdeveloped by other groups of researchers. In the nearest future we will addEnglish for performance comparison purposes. The feasibility of the use of newsreports lead sentences (titles and subtitles) as the unit of analysis has beenproved by a number of studies, [10,17] to name a few.
The corpus has been crawled from the following number of news-orientedsites per language: 12 (Bulgarian), 10 (French), 12 (Polish) 35 + Livejournal(Russian), 16 (Spanish), 14 (Swedish).
The crawled data (URL, title, subtitle, metadata, text body, time) is savedin a JSON file (Fig. 1). Next, duplicates, near-duplicates, as well as messages4 General Architecture for Text Engineering: http://gate.ac.uk.5 Python-based Scrapy crawling framework: http://scrapy.org.

Multilingual Protest Event Data Collection with GATE 119
containing stopwords in the title are filtered out. Stopwords list has been con-structed by an expert on the basis of the corpus analysis. The resulting corpusincludes 13710 messages.
Fig. 1. An entry of the obtained corpus (output.json).
A detailed description of data collection and filtering is given in [3,16].
4 Knowledge Resources
The following features are selected to be extracted in the current version:
– Event Type (the what of an event: rally, march, boycott, strike, picketing,etc.),
– Event Reason (the position of a protesting group towards an issue: for acause (expressions of support incl. conmemorations and demands) or againsta cause),
– Event Location (the where of an event: names of countries, cities and phys-ical settings),
– Event Weight (an attribute that defines the importance of an event andtakes into account the values of the following slots: Event Duration, EventIntensity, Event Iteration, Event Size, Violence Use).
These features have been selected, because they most frequently define thegiven event (protest action) in the studied examples. Event Weight allows toselect events featured by press as long-term, intensive, repeating, large-scale andviolent.
The following knowledge resources have been developed for the extraction ofthe above features:
(i) Ontology that includes a classification of protest forms, subevents (eventsconnected by temporal and/or causal relations with the main event) andevent properties;
(ii) Multilingual lexicons that correspond to ontology classes;(iii) JAPE6 patterns for event features annotation that take into account lexical,
syntactic, semantic and discourse properties.
6 Java Annotation Patterns Language:http://en.wikipedia.org/wiki/JAPE (linguistics).
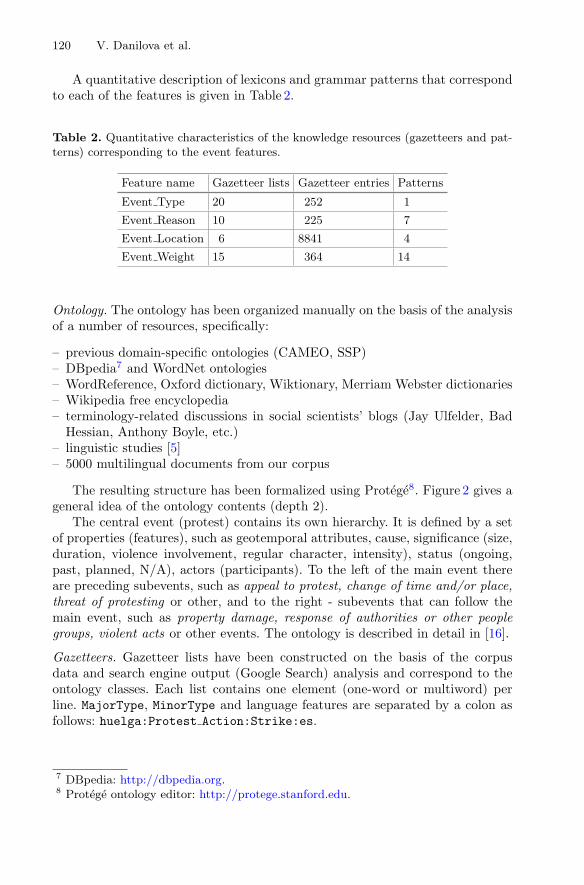
120 V. Danilova et al.
A quantitative description of lexicons and grammar patterns that correspondto each of the features is given in Table 2.
Table 2. Quantitative characteristics of the knowledge resources (gazetteers and pat-terns) corresponding to the event features.
Feature name Gazetteer lists Gazetteer entries Patterns
Event Type 20 252 1
Event Reason 10 225 7
Event Location 6 8841 4
Event Weight 15 364 14
Ontology. The ontology has been organized manually on the basis of the analysisof a number of resources, specifically:
– previous domain-specific ontologies (CAMEO, SSP)– DBpedia7 and WordNet ontologies– WordReference, Oxford dictionary, Wiktionary, Merriam Webster dictionaries– Wikipedia free encyclopedia– terminology-related discussions in social scientists’ blogs (Jay Ulfelder, Bad
Hessian, Anthony Boyle, etc.)– linguistic studies [5]– 5000 multilingual documents from our corpus
The resulting structure has been formalized using Protege8. Figure 2 gives ageneral idea of the ontology contents (depth 2).
The central event (protest) contains its own hierarchy. It is defined by a setof properties (features), such as geotemporal attributes, cause, significance (size,duration, violence involvement, regular character, intensity), status (ongoing,past, planned, N/A), actors (participants). To the left of the main event thereare preceding subevents, such as appeal to protest, change of time and/or place,threat of protesting or other, and to the right - subevents that can follow themain event, such as property damage, response of authorities or other peoplegroups, violent acts or other events. The ontology is described in detail in [16].
Gazetteers. Gazetteer lists have been constructed on the basis of the corpusdata and search engine output (Google Search) analysis and correspond to theontology classes. Each list contains one element (one-word or multiword) perline. MajorType, MinorType and language features are separated by a colon asfollows: huelga:Protest Action:Strike:es.
7 DBpedia: http://dbpedia.org.8 Protege ontology editor: http://protege.stanford.edu.

Multilingual Protest Event Data Collection with GATE 121
Fig. 2. A schematic representation of the semantic resource.
In order to improve the annotation of locations, we populate gazetteer listswith the entries from DBpedia (612845 elements) via Large Knowledge Basegazetteer (LKB) by Ontotext9 using SPARQL queries. The problem with thedirect text annotation with LKB gazetteer PR is that it is not flexible (pre-processed (e.g., lemmatized) text cannot be taken as input). Therefore, it is notable to perform high-quality annotation of texts in inflected languages. Onto-text has developed another gazetteer10 that has this functionality, but it is notavailable for download.
Patterns. Patterns are two-level: morphosyntactic and informational. A schematic representation of a pattern (type I) for the annotation of event reason ispresented in Fig. 3.
Here, in the phrase “Demonstration in solidarity to the New Greek Gov-ernment” we identify Event Type (“demonstration”) and Event Reason thatincludes the Position of the protesting group (here, Position = Support)towards an Issue (here, Issue = “new greek government”) on the basis of thepattern. Here, the event type can be represented by a noun phrase or a verb,the position - by a simple or complex preposition, and the issue - by a (nested)noun phrase.
The system uses cascaded finite-state transducers that are connected to themain GATE pipeline using Jape Plus Extended processing resource (PR). Thesequence of grammars is indicated in the main.jape file. Each grammar includesone or more rule/action pairs, where the left hand side describes a pattern or asequence of patterns and the right hand side manipulates the annotations.
9 Gazetteer LKB: https://confluence.ontotext.com/display/KimDocs37EN/Large+Knowledge+Base+(LKB)+gazetteer.
10 Linked Data Gazetteer PR: https://confluence.ontotext.com/display/SWS/Linked+Data+Gazetteer+PR.
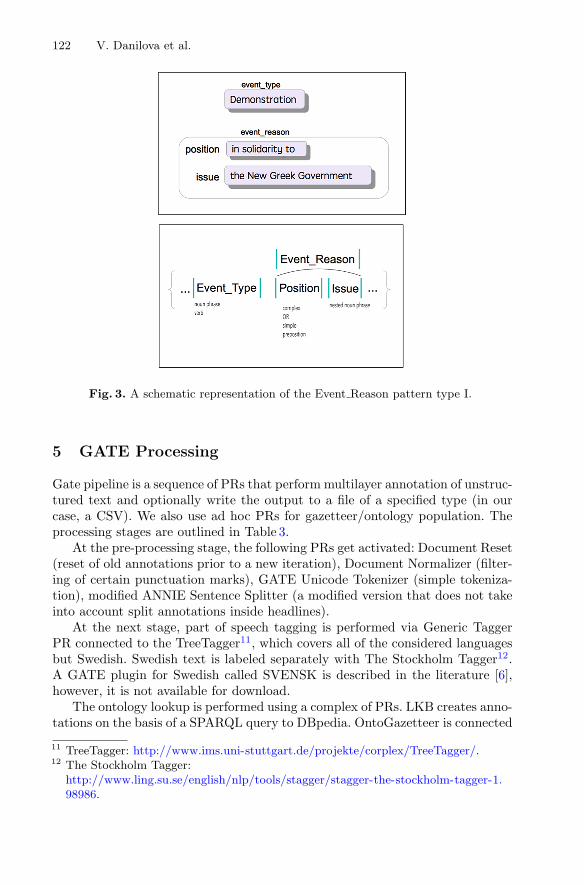
122 V. Danilova et al.
Fig. 3. A schematic representation of the Event Reason pattern type I.
5 GATE Processing
Gate pipeline is a sequence of PRs that perform multilayer annotation of unstruc-tured text and optionally write the output to a file of a specified type (in ourcase, a CSV). We also use ad hoc PRs for gazetteer/ontology population. Theprocessing stages are outlined in Table 3.
At the pre-processing stage, the following PRs get activated: Document Reset(reset of old annotations prior to a new iteration), Document Normalizer (filter-ing of certain punctuation marks), GATE Unicode Tokenizer (simple tokeniza-tion), modified ANNIE Sentence Splitter (a modified version that does not takeinto account split annotations inside headlines).
At the next stage, part of speech tagging is performed via Generic TaggerPR connected to the TreeTagger11, which covers all of the considered languagesbut Swedish. Swedish text is labeled separately with The Stockholm Tagger12.A GATE plugin for Swedish called SVENSK is described in the literature [6],however, it is not available for download.
The ontology lookup is performed using a complex of PRs. LKB creates anno-tations on the basis of a SPARQL query to DBpedia. OntoGazetteer is connected
11 TreeTagger: http://www.ims.uni-stuttgart.de/projekte/corplex/TreeTagger/.12 The Stockholm Tagger:
http://www.ling.su.se/english/nlp/tools/stagger/stagger-the-stockholm-tagger-1.98986.

Multilingual Protest Event Data Collection with GATE 123
to the in-house ontology and it is run with several auxiliary gazetteers: its defaultHash Gazetteer, BWPgazetteer13(uses the Levenshtein distance calculation) andFlexible Gazetteer (token, lemma or other annotation can be used as input).
Grammar-based annotation of informational blocks is done via Jape PlusExtended PR. As compared to the standard Jape Transducer PR, Jape PlusExtended allows the use of additional constraints14 without including them intothe right hand side.
Gazetteers are populated using Gazetteer List Collector PR. When checkedby the expert, the updated versions are used in the following iterations. Cur-rently, we do not directly populate the in-house ontology, however, this func-tionality is available via a special grammar.
The results can be exported via Configurable Exporter PR to any format (inour case, CSV), specified in the corresponding configuration file.
Table 3. GATE pipeline stages with the corresponding processing resources.
Stage Processing resource
Pre-processing Document Reset
Document Normalizer
GATE Unicode Tokenizer
modified ANNIE sentence splitter
Part-of-speech tagging Generic Tagger [TreeTagger], Swedish Stagger
Ontology-based gazetteer lookup Large KB Gazetteer [DBpedia]
Ontogazetteer [in-house ontology]
Hash Gazetteer
BWPgazetteer
Flexible Gazetteer
Grammar processing Jape Plus Extended
Gazetteer population Gazetteer List Collector
Export to CSV Configurable Exporter
6 Evaluation
The evaluation of protest-related documents’ selection performance is describedin [3]. The annotation quality has been evaluated as follows.
Datasets. For the purposes of annotation performance evaluation, 2 datasetshave been formed on the basis of the crawled headlines. The development set
13 BWP Gazetteer: https://sourceforge.net/projects/bwp-gazetteer/.14 https://code.google.com/archive/p/gateplugin-japeutils/wikis/Constraints.wiki.
124 V. Danilova et al.
contains 575 information-rich multilingual headlines (90-100 per language) thatare used both for runtime settings tuning, patterns enhancement and perfor-mance evaluation. The test set includes 3000 multilingual headlines (500 perlanguage) randomly selected from the main dataset.
Metrics. Protest features annotation performance has been evaluated on boththe development and test sets using the standard Precision and Recall metrics.Precision is the fraction of retrieved documents that are relevant, and Recall isthe fraction of relevant documents that are retrieved15.
Precision =|G⋂
C||G| , Recall =
|G⋂C|
|C| , (1)
where G is the total amount of sequences retrieved from the reports’ lead sen-tences for a given scenario slot, and C is the amount of documents that containtext spans, which are approved by the expert as relevant representatives of thesame slot.
Comparison to the Gold Standard. The annotation quality has been evaluatedas follows. The Gold Standard annotations have been created in GATE bya multilingual expert. The development and test sets have been divided intolanguage-specific subsets. The number of false positive, false negative and truepositive annotations has been counted automatically (GATE’s Annotation Difffunction). An annotation is considered a true positive if it covers and doesnot lie beyond the natural language representation of a semantic component(for Event Reason Issue feature and Event Location) and is associated with acorrect class/instance in the concept hierarchy (Event Type, Event Location,Event Weight, Event Reason Position feature). An annotation is considered afalse positive if it does not cover or lies beyond the natural language represen-tation of a semantic component. In case an extra function word is spanned by agiven Event Type or Event Reason annotation, it will nonetheless be consideredas a true positive (partially correct). A false negative is a span of text corre-sponding to the natural language representation of a target semantic componentthat has not been covered by the target annotation.
Results. The evaluation results are shown in Tables 4 and 5. Here, ET stands forEvent Type, ER - Event Reason, EL - Event Location, EW - Event Weight. Thelowest Precision and Recall values are observed for the Event Weight featureannotation in the test set, because of the insufficiency of the correspondinggazetteer data.
15 http://nlp.stanford.edu/IR-book/html/htmledition/evaluation-of-unranked-retrieval-sets-1.html.

Multilingual Protest Event Data Collection with GATE 125
Table 4. Annotation quality evaluation on the development set
Language No. of Docs No. of Annots Precision Recall
ET ER EL EW ET ER EL EW
Bulgarian 93 244 1 0.97 0.93 1 1 0.97 0.82 1
French 85 218 1 0.94 0.92 0.98 1 0.98 0.87 0.88
Polish 93 231 1 0.96 0.96 0.98 1 0.72 0.90 0.90
Russian 107 293 1 0.98 1 0.92 1 0.98 0.89 0.80
Spanish 89 218 1 1 0.83 0.98 1 0.94 0.78 1
Swedish 108 195 1 0.98 1 1 1 0.95 0.65 0.88
Table 5. Annotation quality evaluation on the test set (500 documents per language)
Language No. of Annots Precision Recall
ET ER EL EW ET ER EL EW
Bulgarian 1053 0.99 0.98 0.95 0.87 1 0.97 0.87 0.86
French 1093 0.92 0.92 0.91 0.66 0.99 0.90 0.91 0.62
Polish 893 0.91 0.96 0.90 0.90 1 0.84 0.84 0.67
Russian 1031 0.93 0.95 0.97 0.67 0.99 0.90 0.89 0.75
Spanish 1023 0.96 0.93 0.90 0.90 0.99 0.88 0.93 0.83
Swedish 906 0.99 0.97 0.95 0.80 1 0.95 0.91 0.54
7 Conclusions
This paper presents a strategy of the protest features’ annotation in the unstruc-tured text using GATE for multilingual protest event data collection and showsthe annotation quality evaluation results. The system first crawls and filters thedata (title, subtitle, time, text body, metadata, URL) on the documents relatedto protests and processes the lead sentences with GATE. The output is a CSVwith event features that correspond to the input documents.
Information extraction from lead sentences obviously does not allow to obtaincomplete descriptions of events of interest and find the relationships with otherevents, however, obtaining maximum useful data from titles and subtitles canspeed up the algorithm of protest event extraction in general. Also, in [4], wehave proved that the use of the obtained event features is beneficial in that itenhances short-text (headlines) clustering accuracy.
This work continues as follows: (i) improvement of protest-related documentsselection (experiments with introducing additional constraints into queries, clus-tering similar events, etc.), (ii) selection of resources (PoS taggers, morphologicalanalyzers) to enhance multilingual text pre-processing, e.g., to be able to anno-tate noun plurality, animacy, etc., for the whole set of languages, as well asto reduce the error rate (TreeTagger yields satisfactory results within the cur-rent implementation, however, there is a number of significant drawbacks [16]),
126 V. Danilova et al.
(iii) multilingual data annotation (for feature classifier training, evaluation andcomparison of results).
References
1. Boschee, E., Weischedel, R., Zamanian, A.: Automatic information extraction. In:Proceedings of the International Conference on Intelligence Analysis (2005)
2. Danilova, V., Alexandrov, M., Blanco, X.: A survey of multilingual event extractionfrom text. In: Metais, E., Roche, M., Teisseire, M. (eds.) NLDB 2014. LNCS, vol.8455, pp. 85–88. Springer, Heidelberg (2014)
3. Danilova, V.: A pipeline for multilingual protest event selection and annotation. In:Proceedings of TIR15 Workshop (Text-based Information Retrieval), pp. 309–314.IEEE (2015)
4. Danilova, V., Popova, S.: Socio-political event extraction using a rule-based app-roach. In: Meersman, R., et al. (eds.) OTM 2014. LNCS, vol. 8842, pp. 537–546.Springer, Heidelberg (2014)
5. Dobrovolskiy, D., Poppel, L.: Lexical synonymy within the semantic field POWER.In: Chahine, I.K. (ed.) Current Studies in Slavic Linguistics, pp. 281–295 (2013)
6. Eriksson, M., Gamback, B.: SVENSK: a toolbox of Swedish language processingresources. In: Proceedings of the 2nd International Conference on Recent Advancesin Natural Language Processing (RANLP), Tzigov Chark, Bulgaria, pp. 336–341(1997)
7. Hayes, M., Nardulli, P.F.: SPEEDs Societal Stability Protocol and the Study ofCivil Unrest: an Overview and Comparison with Other Event Data Projects, Octo-ber 2011. Cline Center for Democracy University of Illinois at Urbana-Champaign(2011)
8. Hogenboom, F., Frasincar, F., Kaymak, U., de Jong, F.: An overview of eventextraction from text. In: Workshop on Detection, Representation, and Exploita-tion of Events in the Semantic Web (DeRiVE 2011), vol. 779, pp. 48–57. CEURWorkshop Proceedings (2011)
9. Leetaru, K.: Automatic Document Categorization for Highly Nuanced Topics inMassive-Scale Document Collections: The SPEED BIN Program. Cline Center forDemocracy University of Illinois at Urbana-Champaign, March 2011
10. Lejeune, G.: Structure patterns in information extraction: a multilingual solution?In: Advances in Method of Information and Communication Technology AMICT2009, Petrozavodsk, Russia, vol. 11, pp. 105–111 (2009)
11. Llorens, H., Derczynski, L., Gaizauskas, R.J., Saquete, E.: TIMEN: an open tem-poral expression normalisation resource. In: LREC, vol. 34, pp. 3044–3051 (2012)
12. Muthiah, S., Huang, B., Arredondo, J., Mares, D., Getoor, L., Katz, G.,Ramakrishnan, N.: Planned protest modeling in news and social media. In: AAAI2005, pp. 3920–3927 (2015)
13. Schrodt, P.A.: KEDS: Kansas Event Data System, version 1.0 (1998)14. Schrodt, P.A.: CAMEO: Conflict and mediation event observations. event and
actor codebook. Department of Political Science, Pennsylvania State University,Version: 1.1b3, March 2012
15. Schrodt, P.A.: GDELT: global data on events, location and tone. In: Workshop atthe Conflict Research Society, Essex University, 17 September 2013
16. Danilova, V.: Linguistic support for protest event data collection. Ph.D. Thesis,Autonomous University of Barcelona, 27th November 2015. http://www.tdx.cat/handle/10803/374232
17. Wunderwald, M.: Event Extraction from News Articles (Diploma Thesis), DresdenUniversity of Technology, Department of Computer Science (2011)

A Multi-lingual Approach to Improve PassageRetrieval for Automatic Question Answering
Nouha Othman1(B) and Rim Faiz2
1 Institut Superieur de Gestion de Tunis, LARODEC,Universite de Tunis, Tunis, Tunisia
[email protected] IHEC Carthage, LARODEC, Universite de Carthage, Tunis, Tunisia
Abstract. Retrieving topically relevant passages over a huge documentcollection is deemed to be of central importance to many informationretrieval tasks, particularly to Question Answering (QA). Indeed, Pas-sage Retrieval (PR) is a longstanding problem in QA, that has beenwidely studied over the last decades and still requires further efforts inorder to enable a user to have a better chance to find a relevant answer tohis human natural language question. This paper describes a successfulattempt to improve PR and ranking for open domain QA by finding outthe most relevant passage to a given question. It uses a support vectormachine (SVM) model that incorporates a set of different powerful textsimilarity measures constituting our features. These latter include ournew proposed n-gram based metric relying on the dependency degreeof n-gram words of the question in the passage, as well as other lexicaland semantic features which have already been proven successful in arecent Semantic Textual Similarity task (STS). We implemented a sys-tem named PRSYS to validate our approach in different languages. Ourexperimental evaluations have shown a comparable performance withother similar systems endowing with strong performance.
Keywords: Question answering · Passage retrieval · Support vectormachine · N-gram · Text similarity measures
1 Introduction
Question answering (QA) is a complex form of information retrieval (IR) char-acterised by information needs expressed by human natural language questions.Unlike classical IR, where full documents are considered relevant to the infor-mation request, in QA, the user is rather interested in a precise and conciseinformation which should be directly generated as a response to a his naturallanguage question. Today, the explosive rise in the amount of data and infor-mation has made the need to direct and precise information more than ever
c© Springer International Publishing Switzerland 2016E. Metais et al. (Eds.): NLDB 2016, LNCS 9612, pp. 127–139, 2016.DOI: 10.1007/978-3-319-41754-7 11

128 N. Othman and R. Faiz
necessary, hence why QA has attracted increasing interest in recent years [18],thanks to the QA tracks in the yearly TREC1 and CLEF2 campaigns.
We emphasize that the domain of a QA system (QAS) can be either closeddealing with questions under a specific domain such as in [1], or open dealing withgeneral questions in various domains without any limitation such as in [8,15,18].In this work, we focus on the second category as the techniques employed arenot tailored toward a specific domain.
Fundamentally, a typical QA system (QAS) can be viewed as a pipeline com-posed of four main modules [20] namely, question analysis, document retrieval,passage retrieval and answer extraction each of which has to deal with specificissues and challenges. One significant module that serves as the building blockof efforts is Passage Retrieval (PR) module, which allows reducing the searchspace from a massive collection of documents to a fixed number of passages.Undoubtedly, a correct answer to a posted question can be found only when italready exists in one of the retrieved passages. Additionally, it has been provedthat the performance of the PR module significantly affects that of the wholesystem [20].
In fact, the issue of retrieving a relevant passage to a given natural languagequestion over a sizable document collection has been a lively topic of research inrecent years, such as in [5,11]. However, most existing QASs are still unable toprovide correct answer to any given question from a large repository even thoughit contains the correct answers. Therefore, we assume that if we improve the PRengine of QASs, we could enhance their performance and increase the number ofcorrect passages retrieved containing the relevant answers to the given question.
In the present paper, we propose a multi-lingual approach to improve PR andranking tasks for an open domain QAS. Our approach is based on a RankingSVM model which combines different textual similarity measures. These latterinvolves our new proposed n-gram similarity measures, relying on the depen-dency degree of n-gram words of the question in the passage, as well as otherpowerful lexical and semantic features which have already shown promise inthe Semantic Textual Similarity task (STS) at *SEM 2013 [4]. Our approachattempts to automatically deliver the top one relevant passage in return for theuser’s natural language question.
The remainder of this paper is organized as follows. In Sect. 2, we providean overview of major related work on PR. Our approach is then introduced inSect. 3 where we detail its different steps. Section 4 is advocated to describing ourexperimental study carried out on the CLEF dataset to validate our proposedapproach and comparing our results with those of similar solutions perform-ing the same task. Finally, we draw our conclusion and our main future workdirections in Sect. 5.
1 http://trec.nist.gov/.2 http://www.clef-initiative.eu/.

Improving Passage Retrieval for QA 129
2 Related Work
There is an abundance of work on PR which is usually considered as the kernel ofmost QASs and it attempts to reduce the search space for finding out an answer.Indeed, PR was initially explored to overcome the shortcomings of documentretrieval and then integrated into QA, basically because a passage unit is moreappropriate than a document to rank for QA [2]. Through an early quantitativeevaluation performed by [20] of the existing PR algorithms for QA based onlexical matching between the question and the passage, it was deduced that mostproposed PR algorithms based on lexical matching process each question term asan independent symbol and take into account neither the order of words nor theirdependency relations. In order to address this drawback, there have been severalattempts to consider term dependencies. There are further numerous works thatinclude syntactic matching such as [7] drawing syntactic relations dependenciesinstead of keywords to match passages with the given query. Nonetheless, themajor limitation of syntactic matching is the need of a syntactic parser whichrequires adaptation and its performance significantly affects that of the entireQAS. Other works relied on semantics such as [19] in order to answer specificquestion types. Although semantic matching based approaches allow to capturerelevant answers, they are difficult to adapt to multilingual tasks as they requiresemantic resources such as FrameNet which is currently available only in Englishand do not cover neither all domains nor all terms. Also, it is claimed thatsuch approaches are often more time consuming than bag-of-words ones. It isimportant to note that there have been further subsequent works combiningboth semantic and syntactic approaches in the context of PR such as [17] inorder to take advantage of both approaches. Otherwise, another powerful methodwas proposed to go beyond the above simple lexical matching, relying on n-gram structures which refer to contiguous term sequences extracted from a giventext. N-grams is a statistical model that has been widely employed in naturallanguage processing, since it take into account the simple dependency betweenterms rather than independent symbols. Within this context, [14] conducted aprobabilistic method for web-based QA, where the web documents are shortenedinto passages to be ranked using an n-gram score based on tf-idf. In addition,[6] proposed a PR engine for QA based on an n-gram similarity measure wherethe passages containing more question n-grams and longer ones are favored whencomparing the extracted candidate passages using a keyword technique. Besides,the same previous approach was followed by [5] but the only difference is aboutthe n-gram model applied which considers the passage n-grams occurring inthe question as well as their proximity. By and large, our proposed n-grammeasure is different from the cited n-gram based ones insofar as we put morefocus on common n-grams between the passage and the question and we proceeddifferently to determine the n-grams.
We emphasize that passage ranking is viewed as a crucial subtask to improvethe PR performance and ensure the relevance of the retrieved passages. Someproposed methods were based on knowledge such as [2,3], where knowledge aboutquestion and answers is represented in the form of rules and inferences are derived
130 N. Othman and R. Faiz
from a knowledge base. Nevertheless, the major disadvantage of such methodsis the need of a huge number of inferences and manual design of features. Otherworks like [16] resort to pattern-matching approaches where patterns are pre-defined context evaluation rules designed and extracted from the query and thepassages and they are often related to a specific domain and depend on the ques-tion type. Such approaches work well only if it is possible to reach high answerredundancy such as in the web. They also usually are extremely complex andneed a large amount of training data. Furthermore, the words context was usedas a simple intuition for passage ranking, such as [21] who introduced a machinelearning-based QA framework that integrates context-ranking model which re-rank the passages retrieved from the initial retrievers to find out the relevantanswers. This model utilizes a Support Vector Machine (SVM) to incorporatecontextual information of proper names, semantic features and syntactic pat-terns and the position of each term in the context window to predict whether agiven candidate passage is relevant to the question type. Nonetheless, the per-formance of this context model highly dependents on the question classification.Inspired by the success of SVM application in the latter work, we resorted toSVM to combine different lexical and semantic text features with our proposedn-gram measure to boost the PR engine and further ensure the relevance of theretrieved passages.
3 Proposed Approach Overview
The general architecture of our approach is illustrated in Fig. 1. Its basic principleis to extract from a given document collection a set of candidate passages thatare most likely to fit the user’s query, filter and rank them using a RankingSVM model that incorporates powerful similarity measures in order to returnthe top ranking passage. It is noteworthy that we can not only rely on ourn-gram measure to guarantee high relevance, since it is just based on simpledependencies between terms, thus, we attempt to improve the performance ofour approach by adding other effective lexical and semantic features.
A crucial step that should precede retrieving passages is question processingwhich attempts to generate a formal query by preprocessing the question enteredby the user and extracting the useful terms by applying text cleaning, questionwords elimination, tokenization, stop words removal and stemming. The formalquery can be defined as: Q = t1, t2, ..., tq where t represents a separate termof the query Q and q denotes the number of query terms.
3.1 Candidate Passage Extraction:
At this stage, all passages containing the question terms should be extracted ascandidate passages. In advance, the document collection should be segmentedinto paragraphs called passages, which must preferably be neither too shortnor too long as, short excerpts may not include the answer while long onesmay contain additional information that can skew the response or require more

Improving Passage Retrieval for QA 131
Fig. 1. Architecture of our proposed passage retrieval approach
robust extraction module. To index our passages, for each one, we save its id,number, text and its document name. Then, we extract their terms, apply thestemming and remove all the stopwords. A passage P can be formally defined as:P = t1, t2, ..., tp where t denotes a separate passage term and p is the numberof passage terms. Subsequently, we assign a frequency to each passage term inorder to calculate the maximum frequency as well as the term weights. Once thepassages are indexed, their terms will be stored in an inverted index.
Query and Passage Term Weighting: To calculate the weight of the queryterms, we are based on the formula used in [6]: w(ti, q) = 1 − log(n(ti))
1+logN wheren is the number of passages containing the term t and N is the total numberof passages. This formula does not take into account the frequency of wordsbut it only considers their discriminating power between passages. Therefore,a term occurred in a single passage will have a maximum weight as the ratiovalue in the formula is low. Candidate passages that contain at least one of thequery terms can be determined by looking for the query terms in the invertedindex, where for each term the list of related passages is recorded and takingthe intersection of these passages. The candidate passages are defined as follows:Pc = P1, P2, ..., Pn where Pi represents a candidate passage and n their num-ber. Notice that the weight of the candidate passages terms is calculated in thesame manner as that of the query terms (using formula [6]).
Candidate Passage Filtering: In order to filter the candidate passages, weneed to calculate the textual similarity between each passage and the questionby means of a metric that only considers common words between the queryand the passage, defined as follows: s(p, q) =
∑ti∈P∩Q w(ti,q)∑
ti∈Q w(ti,q). The candidate
passages are then ranked according to their similarity scores. Their number (n)will be reduced to (nb) which should be a happy medium between a big and asmall number, because a big nb does not meet our main goal of reducing thesearch space mentioned above, but it has the advantage of not excluding passages

132 N. Othman and R. Faiz
that may contain the response and are misclassified, while a small number canreduce the system complexity but with a big chance to ignore some passages. Forexample, we suggest to set nb to 100 passages to satisfy the given constraints.
3.2 Passage Ranking
RankSVM Model: At this second stage, we propose to integrate significantsimilarity measures into a Ranking SVM model referred to as RankSVM, whichis a ranking version of SVM that was successfully applied in IR and aims tosolve the ranking problem in a supervised manner by transforming it into pair-wise classification and then learn a prediction ranking function using the SVMprinciple. Our passage ranking model consists of two phases: training and test-ing, where in both, the different metrics are computed for each passage andentered into the RankSVM classifier to be ranked given their scores. During theformer phase, a set of annotated passages entered in the passage ranking modelwhere each one is labeled either Right (R) or Wrong (W) while in the testingphase, the passages are unlabeled since they are the output of the first stage.It is worth noting that most incorporated features have already shown promisein the Semantic Textual Similarity task (STS) at *SEM 2013 track [4] whichrequires participants to determine the similarity degree between pairs of textsentences. Among the proposed features, we will apply WordNet-based Concep-tual Similarity, Named Entity Overlap, Edit distance, Syntactic Dependenciesand instead of the N-gram based similarity applied in this work and was notworking very well, we resort to that introduced by ourselves. The given featureswere adapted to the context of QA, that is to say, the sentence pairs becomepairs of passage-question. Note that we have selected lexical and semantic fea-tures in order to further ensure answer relevance since, at this stage, featuresbased on term frequencies are not sufficient for retrieving relevant passages.
Feature Extraction: In what follows, we start by introducing our proposedn-gram passage similarity measure, then we briefly remind the other employedfeatures fully detailed in [4].
NGpsim: our n-gram based passage similarity measure: Our basic intuition is tojust focus on the common n-grams between the question and the passage. Thus,we begin by identifying the common terms between the question and a passageto derive their corresponding n-grams. We build the vector
−−−→CTqp of common
terms between the question and the passage, by browsing through the questionterms and check for each of them if it is also a passage term to add it in thevector. This vector is defined as follows:
−−−→CTqp
⎛
⎜⎜⎝
t1 p1Q [p11, .., p1m]t2 p2Q [p21, .., p2m].. ..tn pnQ [pn1, .., pnm]
⎞
⎟⎟⎠
where ti is the ith term in common between the question and the passage withi=1..n, n is the number of question terms, piQ is the position of ith term in

Improving Passage Retrieval for QA 133
the question, pij is the jth position of the ith term in the passage and j=1..m.m is the passage terms number. Thereafter, we construct the n-gram vectors ofthe question
−−−→NGQ and the passage
−−−→NGP by browsing the vector
−−−→CTqp and
grouping the terms having successive positions in the question and the passageas follows:
−−−→NGQ = ngQ1, ngQ2, ..., ngQq and
−−−→NGP = ngP1, ngP2, ..., ngPp
where q is the number of query n-grams and p it that of the passage n-grams.The weight of each question n-gram is calculated on the basis of its length andthe sum of its term weights using formula 1:
w(ngQ) = l ×∑
ti∈terms(ngQ)
w(ti, q) (1)
where l denotes the number of terms included in the question n-gram (ngQ).Indeed, the weights sum when multiplied by the n-gram length can favor adja-cent words over the independent ones in the similarity calculation. We supposethat grouped terms are more significant and less ambiguous than separate ones.Hence, a term that belongs to an n-gram should have a greater weight thanan independent one while for the passage n-grams, they are weighted regardingtheir similarity degree with those of the question. We give a cumulative weightto the passage by browsing through the question n-grams and at each one eitherits full weight or a lower one is added to the passage weight. More concretely, ifa question n-gram fully occurs in the passage, its whole weight will be added tothe total weight, while if it is divided into smaller n-grams named subn-grams,a lower weight will be added to the cumulative weight which should be fixedaccording to the number of subn-grams in the passage. Note that there are threepossible cases:
– Case 1: The n-gram of the query is one of the passage n-grams:ngQi = ngPj , ngPj ∈ NGP
– Case 2: It is made by combining a number n of the passage n-grams:ngQi = ∪ ngP , ngP ∈ NGP
– Case 3: It is included in one of the passage n-grams:ngQi ∈ ngPj , ngPj ∈ NGP
Let w be the weight to add to the passage when we browse through the questionn-grams ngQ. In the cases 1 and 3, ngQ exists in the passage, so the additionalweight w is set to: w(ngP ) = w(ngQ) = l × ∑
ti∈terms(ngQ) w(ti, q) where l
denotes the length of the n-gram ngQ and w(ti, q) is the weight of its term ti.In the case 2, ngQ is divided into subn-grams in the passage, let sng be thenumber of these subn-grams. In this case, the additional weight w is computedas follows: w(ngP ) = w(ngQ)
sng = lsng ×∑
ti∈terms(ngQ) w(ti, q). Our n-gram basedpassage similarity measure named NGpsim between a passage and a question isequal to the ratio between the weight of the passage and that of the questionpreviously computed. Recall that the weight of a passage is a sum of partialweights calculated at each step to be added to the total passage weight, while
134 N. Othman and R. Faiz
the query weight is calculated on the basis of its length and the sum of theweight of its terms. We can define NGpsim as follows :
NGpsim(p, q) =w(P )w(Q)
=
∑qi=1
lisngi
× ∑t∈terms(ngQi)
w(t, q)
l(Q) × ∑ti∈(Q) w(ti, q)
(2)
where q is the number of the question n-grams, l(Q) is the number of the questionterms and w(ti, q) is the weight of a question term. For instance, let us considerthe following terms of a question Q and those of a passage P :
Q(terms)=Commission, Member, States, draw, guidelines, Television, Fron-
tiers, Directive.
P(terms)= Commission , encourage, audiovisual, benefits, media, service,
providers, Member, States, ensure, implementation, new, Television, Frontiers,
Directive, once, adopted, Directive
The corresponding vector−−−→CTqp between the given Q and P is set to:−−−−−−−−→
CTqp(Q,P )= Commission, Member, States, Television, Frontiers, Directive.From which we can generate:−−−−−−→NGQ(Q) =[Commission, Member, States][Television, Frontiers, Directive]
and−−−−−−→NGP (P ) =[Commission][Member, States][Television, Frontiers, Directive].
In this example,−−−→NGQ is composed of two n-grams so, we have two partial
passage weights to calculate. The first question n-gram is divided into two subn-grams in the passage so, sng equals 2 while the second one exactly equals apassage n-gram so, sng equals 1.
In a nutshell, NGpsim is different from the existing n-gram based measuresinsofar as instead of extracting all n-grams for all n possible values of the queryand the passage, as in [5,6], or all the n-grams of size n, as in [14], we justextract common n-grams between the question and the passages with differentlengths. So, no additional step is needed to select common n-grams from all theextracted n-grams. Also, for the weight of n-grams, we consider both the sum ofthe terms weight and their lengths like in [14] while [5,6] consider only the sumof the terms weight.
WordNet-based Conceptual Similarity: First, both the question q and a passage pare analysed to extract all the corresponding WordNet synsets. For each synset,we keep only noun synsets and group them respectively into the set of synsetsof the question named Cq and that of the passage named Cp. If the synsetsbelong to another POS categories such as verb, adjective, pronoun, we seektheir derivationally related forms to obtain a related noun synset and we putit in the corresponding set of synsets. Given Cp and Cq the sets of conceptscontained in a passage p and the question q, with |Cp|≥|Cq|, WordNet-basedConceptual Similarity between p and q is set to:
ss(p, q) =
∑c1∈Cp
maxc2∈Cq
s(c1, c2,)
|Cp| (3)

Improving Passage Retrieval for QA 135
where s(c1, c2) is a conceptual similarity measure calculated using a variation ofthe Wu-Palmer formula, called ProxiGenea defined by formula 4 as follows:
pg3(c1, c2) =1
1 + d(c1) + d(c2) − 2d(c0)(4)
where c0 denotes the most specific concept that is present both in the synsetpath of c1 and c2 and d denotes the function returning the depth of a givenconcept which constitutes the number of nodes between a concept and the root.
Named Entity Overlap: A Named Entity Recognizer is used such as that imple-mented by [9], which is composed by 7 classes trained for MUC: Organization,Person, Money, Time, Location, Percent, Date. Thereafter, a per-class overlapmeasure is computed considering the class of each named entity. For instance,“Manchester” as a Location does not correspond to “Manchester” as an Orga-nization. This similarity measure is calculated as:
ONER(p, q) =2 ∗ |Np ∩ Nq||Np| + |Nq| (5)
where Np and Nq are the sets of NEs detected in p and q.
Edit distance: Edit distance is a similarity measure that quantifies how dissimilartwo text fragments are by calculating the minimum number of operations neededto transform one string into the other. Numerous variants of edit distance usingdifferent operations exist. One of the most common one, that we have applied,is called Levenshtein distance. The edit distance is defined as follows:
simED(p, q) = 1 − Lev(p, q)max(|p| , |q|) (6)
where Lev(p, q) is the Levenshtein distance between the passage and the query.
4 Evaluation
4.1 Datasets, Tools and Metrics:
In order to evaluate the proposed approach, we implemented a system namedPRSYS using the open source system JIRS3 (JAVA Information Retrieval Sys-tem) described in [10] for indexing and search and SVM light4 for passage rank-ing, adapting them to our requirements. For our experiments, we selected thedataset proposed in the ResPubliQA2010 exercise [12] of CLEF claimed to bethe most suitable ones to validate our approach as it is based on passages. Theaim of this exercise is to output either paragraphs or exact answers to a poolof 200 complex questions from two test collections. The document collection3 http://sourceforge.net/projects/jirs/.4 http://svmlight.joachims.org/.

136 N. Othman and R. Faiz
includes a subset of JRC-Acquis5 as well as a small portion of the Europarl6
collection made up of approximately 50 parallel documents. Note that we usedall the questions and the full english collection because we utilized the englishversions of major tools deemed to achieve higher performance like the englishversion of WordNet Lexical Database, but we can certainly validate our app-roach in other languages by integrating multilingual tools. But beforehand, weshould evaluate the performance to our NGpsim measure. To this end, we usedthe dataset provided in the ResPubliQA 2009 exercise [13] of CLEF where theaim is to retrieve passages from the corpus to answer a question picked out froma set of 500 different questions falling into five types: factual, definition, reason,purpose and procedure. The corpus includes only JRC-Acquis, where for eachlanguage, roughly 10700 documents are used containing over 1 million passages.In our experiments, we employ that of English, French and Spanish and all thequestion pool.
To evaluate our NGpsim measure, we are mainly based on the followingmeasures which were widely used in QA:
– The accuracy: is the percentage of correctly answered questions.– The Mean Reciprocal Rank (MRR): is the multiplicative inverse of the rank
position of the first correct answer.– The number of questions having correct passages ranked first.
To evaluate the performance of our PR approach, we used the following metricsproposed by CLEF:
– The c@1 measure: is the main CLEF evaluation metric for passage and answerselection tasks, defined as: c@1 = 1
n (nR+nUnR
n ) where nR denotes the numberof correctly answered questions, nU is the number of questions unanswered andn is the total number of questions.
– The number of: unanswered questions (#NoA), questions correctly answered(#R), questions wrongly answered (#W), unanswered questions where a rightcandidate answer is discarded (#NoA R) and questions unanswered withwrong candidate answer (#NoA W).
Note that we have set a threshold value for the final score to be 0.15 as it is themost common used value for ranking. Thus, we answer the question only if thehighest score value exceeds 0.15, otherwise, no answer is outputted to the user,as we think that returning no response is better that delivering a wrong one.
4.2 Experimental Results
We report the results of our PR engine when using only NGpsim feature in orderto evaluate its performance. Obviously, in this first evaluation we have not needRankSVM yet as we test just one similarity measure.
Table 1 shows that NGpsim measure has yielded significant results for thethree languages. It is important to note that we have compared our system5 https://ec.europa.eu/jrc/en/language-technologies/jrc-acquis.6 http://www.europarl.europa.eu/.

Improving Passage Retrieval for QA 137
Table 1. Experimental PR results using only NGpsim
Language English Spanish French
System PRSYS NLEL PRSYS NLEL PRSYS NLEL
MRR 0.453 0.377 0.413 0.373 0.411 0.367
Accuracy 0.851 0.782 0.811 0.762 0.805 0.742
Number of questions havingcorrect passages in the first10 positions
298 274 284 267 282 265
Number of questions whosecorrect passage is in firstposition
186 161 174 154 171 153
results to those obtained by NLEL System [6] which is based on an n-gramPR model and it was ranked first in the CLEF 2009 QA track for French andSpanish and second for English language. PRSYS when just based on NGpsimmeasure succeeded in outperforming NLEL for the 3 languages on all criteria.A significant number of questions was answered correctly with a good differenceequals 24 for English and 17 questions more than NLEL for both Spanish andFrench languages. We also got more answers in the first position with a differencebetween 18 and 25 questions. Moreover, we got a greater accuracy and MRRvalues for all languages as the number of correct answers is higher in the firstpositions and lower in the last ones. Thus, we can so admit that our proposeNGpsim measure is more efficient than that of NLEL.
We move on to evaluate our PR approach combining different features otherthan NGpsim, we compared the results obtained by our system run with thosereported by the best participant systems in the CLEF paragraph selection taskdescribed in [12]. From Table 2, we see that PRSYS gives better results than allother ones performing the same task in terms of both accuracy and c@1. Besides,the fact that our c@1 value is greater than the accuracy score proves that theuse of our NoA criterion is justified and has enabled to get higher c@1. We have
Table 2. Comparison between PRSYS and similar systems
System c@1 Accuracy #R #W #NoA #NoA R #NoA W
PRSYS 0.85 0.77 154 23 23 0 0
uiir101PSenen 0.73 0.72 143 54 3 0 3
bpac102PSenen 0.68 0.68 136 64 0 0 0
dict102PSenen 0.68 0.67 117 52 31 17 14
elix101PSenen 0.65 0.65 130 70 0 0 0
nlel101PSenen 0.65 0.64 128 68 4 2 2
uned102PSenen 0.65 0.65 129 71 0 0 0

138 N. Othman and R. Faiz
also observed that most unanswered and incorrectly answered questions whereopinion ones which are very complex. Furthermore, we can reason out that thecombination of different lexical and semantic features has allowed to generaterelevant passages with high accuracy and c@1 values.
5 Conclusion
Getting directly a precise answer to a human natural question constitutes a bigchallenge mainly in the database and information systems field due to the everincreasing amount of data and information. In this paper, we have proposeda multi-lingual approach for retrieving passages for open domain QA using aRankSVM classifier to combine different state-of-the-art features other than ourproposed n-gram measure. Our experiments and analysis have shown promiseand demonstrated that our approach is competitive and our new similarity mea-sure is efficient outperforming the system ranked first in the PR task of CLEF.Interesting perspectives emerge then to further strengthen our proposed solu-tion. We mainly look forward to extending our experiments on larger datasetsto decide on the threshold value for the ranking final score and better refiningthe ranking model by incorporating other features such as a syntactic one butwithout increasing the program complexity. We also look forward to making oursystem find a precise answer rather than a full passage.
References
1. Abacha, A.B., Zweigenbaum, P.: MEANS: a medical question-answering systemcombining NLP techniques and semantic web technologies. IPM 51(5), 570–594(2015)
2. Araki, J., Callan, J.: An annotation similarity model in passage ranking for histor-ical fact validation. In: Proceedings of the 37th International ACM SIGIR Confer-ence on Research and Development in IR, pp. 1111–1114. ACM (2014)
3. Bilotti, M.W., Elsas, J., Carbonell, J., Nyberg, E.: Rank learning for factoid ques-tion answering with linguistic and semantic constraints. In: Proceedings of the 19thACM International Conference on Information and KM, pp. 459–468. ACM (2010)
4. Buscaldi, D., Le Roux, J., Flores, J.J.G., Popescu, A.: Lipn-core: semantic textsimilarity using n-grams, wordnet, syntactic analysis, esa and information retrievalbased features. In: Proceedings of the 2nd Joint Conference on LCS, p. 63 (2013)
5. Buscaldi, D., Rosso, P., Gomez-Soriano, J.M., Sanchis, E.: Answering questionswith an n-gram based passage retrieval engine. JIIS 34(2), 113–134 (2010)
6. Correa, S., Buscaldi, D., Rosso, P.: NLEL-MAAT at ResPubliQA. In: Peters, C.,Di Nunzio, G.M., Kurimo, M., Mandl, T., Mostefa, D., Penas, A., Roda, G. (eds.)CLEF 2009. LNCS, vol. 6241, pp. 223–228. Springer, Heidelberg (2010)
7. Cui, H., Sun, R., Li, K., Kan, M.Y., Chua, T.S.: Question answering passageretrieval using dependency relations. In: Proceedings of the 28th Annual Inter-national ACM SIGIR Conference, pp. 400–407. ACM (2005)
8. Fader, A., Zettlemoyer, L., Etzioni, O.: Open question answering over curated andextracted knowledge bases. In: Proceedings of the 20th ACM SIGKDD Interna-tional Conference on Knowledge Discovery and Data Mining, pp. 1156–1165. ACM(2014)
Improving Passage Retrieval for QA 139
9. Finkel, J.R., Grenager, T., Manning, C.: Incorporating non-local information intoinformation extraction systems by gibbs sampling. In: Proceedings of the 43rdAnnual Meeting on Association for Computational Linguistics, pp. 363–370. ACL(2005)
10. Gomez, J.M., Buscaldi, D., Rosso, P., Sanchis, E.: JIRS language-independent pas-sage retrieval system: a comparative study. In: Proceedings of the 5th InternationalConference on NLP (ICON-2007), pp. 4–6 (2007)
11. Keikha, M., Park, J.H., Croft, W.B., Sanderson, M.: Retrieving passages and find-ing answers. In: Proceedings of the 2014 Australasian Document Computing Sym-posium, p. 81. ACM (2014)
12. Penas, A., Forner, P., Rodrigo, A., Sutcliffe, R.F.E., Forascu, C., Mota, C.:Overview of respubliqa 2010: question answering evaluation over european leg-islation. In: CLEF 2010 LABs and Workshops, Notebook Papers (2010)
13. Penas, A., Forner, P., Sutcliffe, R., Rodrigo, A., Forascu, C., Alegria, I., Giampic-colo, D., Moreau, N., Osenova, P.: Overview of ResPubliQA 2009: question answer-ing evaluation over European legislation. In: Peters, C., Di Nunzio, G.M., Kurimo,M., Mandl, T., Mostefa, D., Penas, A., Roda, G. (eds.) CLEF 2009. LNCS, vol.6241, pp. 174–196. Springer, Heidelberg (2010)
14. Radev, D., Fan, W., Qi, H., Wu, H., Grewal, A.: Probabilistic question answeringon the web. JASIST 56(6), 571–583 (2005)
15. Ryu, P.M., Jang, M.G., Kim, H.K.: Open domain question answering usingwikipedia-based knowledge model. IPM 50(5), 683–692 (2014)
16. Severyn, A., Nicosia, M., Moschitti, A.: Building structures from classifiers forpassage reranking. In: Proceedings of the 22nd ACM International Conference onCIKM, pp. 969–978. ACM (2013)
17. Shen, D., Lapata, M.: Using semantic roles to improve question answering. In:Proceedings of EMNLP/CoNLL, pp. 12–21 (2007)
18. Sun, H., Ma, H., Yih, W.t., Tsai, C.T., Liu, J., Chang, M.W.: Open domainques-tion answering via semantic enrichment. In: Proceedings of the 24th InternationalConference on WWW, pp. 1045–1055 (2015)
19. Tari, L., Tu, P.H., Lumpkin, B., Leaman, R., Gonzalez, G., Baral, C.: Passagerelevancy through semantic relatedness. In: TREC (2007)
20. Tellex, S., Katz, B., Lin, J., Fernandes, A., Marton, G.: Quantitative evaluationof passage retrieval algorithms for question answering. In: Proceedings of the 26thAnnual International ACM SIGIR Conference, pp. 41–47. ACM (2003)
21. Yen, S.J., Wu, Y.C., Yang, J.C., Lee, Y.S., Lee, C.J., Liu, J.J.: A support vec-tor machine-based context-ranking model for question answering. JIS 224, 77–87(2013)

Information Extraction on Weather Forecastswith Semantic Technologies
Angel L. Garrido1(B), Marıa G. Buey1, Gema Munoz1,and Jose-Luis Casado-Rubio2
1 IIS Department, University of Zaragoza, Zaragoza, Spainalgarrido,mgbuey,[email protected]
2 Spanish Meteorological Service (AEMET), Madrid, [email protected]
Abstract. In this paper, we describe a natural language applicationwhich extracts information from worded weather forecasts with the aimof quantifying the accuracy of weather forecasts. Our system obtains thedesired information from the weather predictions taking advantage of thestructure and language conventions with the help of a specific ontology.This automatic system is used in verification tasks, it increases produc-tivity and avoids the typical human errors and probable biases in whatpeople may incur when performing this task manually. The proposedimplementation uses a framework that allows to address different typesof forecasts and meteorological variables with minimal effort. Experimen-tal results with real data are very good, and more important, it is viableto being used in a real environment.
Keywords: Weather forecast · Information extraction · Ontologies
1 Introduction
Nowadays, weather forecasts rely on mathematical models of the atmosphereand oceans in order to predict the weather based on current weather condi-tions. Several global and regional forecast models are used in different countriesworldwide, which make use of different weather observations as inputs. Powerfulsupercomputers are used to work with vast datasets and they perform necessarycomplex calculations to deliver weather forecasts. These predictions are numer-ical, and are hardly interpretable by those who are not experts in the field.In order to convert these numerical results into information understandable byeveryone, forecasters make their own interpretation of the mathematical modelsand create graphics, maps, and texts in natural language to explain the weatherconditions of the atmosphere which may occur in the next few hours or days.
However, these interpretations are prone to errors that can be produced byboth mathematical models and humans (or in some cases by software). There-fore, comparing weather forecasts with the data coming from actual observations
This research work has been supported by the CICYT project TIN2013-46238-C4-4-R, and DGA-FSE. Our gratitude to Dr. Eduardo Mena and AEMET.
c© Springer International Publishing Switzerland 2016E. Metais et al. (Eds.): NLDB 2016, LNCS 9612, pp. 140–151, 2016.DOI: 10.1007/978-3-319-41754-7 12
Information Extraction on Weather Forecasts with Semantic Technologies 141
Fig. 1. A sample of a meteorological service’s web page offering worded forecasts.
is a very interesting task, which can provide useful information to meteorolog-ical services. The problem is that many forecasts are published using naturallanguage (a sample is shown in Fig. 1), and thus the verification is not trivial.
Therefore, meteorological services must convert by hand these wordedweather forecasts into verifiable data, and then compare these data with actualobservations of the different meteorological stations in the forecast area. Sincewe are talking about a closed domain environment, with great influence of spe-cific knowledge to interpret texts, machine learning based approaches may notbe the ideal to get good results [1]. On the other hand, the simple use of regularexpressions can also be insufficient because the predictions often use ambigu-ous terms. Hence, we have investigated to improve information extraction onweather forecasts expressed in natural language, by using an ontology whichguides the extraction process using a new methodology, based mainly on hav-ing different extraction methods stored in the ontology, and applying the mostappropriate depending on the case. We have also developed an application thatdeals with real data in collaboration with the Spanish Meteorological Service(AEMET). Despite the fact that experimental dataset is written in Spanish, ourapproximation is generic enough to be applied to forecasts in other languages.
The remainder of the paper is organized as follows: Sect. 2 studies the state ofthe art related to information extraction based on ontologies close to this mete-orological context. The information extraction process with a complete exampleis explained in Sect. 3. Section 4 interprets the results of our first experimentswith real data. Finally, Sect. 5 summarizes the key points of this work, providesour conclusions, and explores future work.

142 A.L. Garrido et al.
2 State of the Art
Regarding methodologies, there are different ways to automatically extract infor-mation from texts in natural language, all framed within the context of Infor-mation Extraction [2]. These methods have evolved considerably over the lasttwenty years to address the different needs of extracting information. The firstsystems were based on rules that were manually coded [3] and which relied onan exhaustive natural language processing [4]. However, as manual coding wasa tedious work and the computational cost of the process was high, researchersbegan to design algorithms that learned automatically these rules [5]. Then, thestatistical learning was developed, where two types of techniques were developedin parallel: generative models based on hidden Markov models [6] and condi-tional models based on the maximum entropy [7]. Both were replaced later bythe global conditional models, known as Conditional Random Fields [8]. Then,as the scope of the extraction systems increased, a more comprehensive analysisof the structure of a document was required. So, grammatical construction tech-niques were developed [9]. Both type of methods, those based on rules and thosestatistical methods, continue to be used in parallel depending on the nature ofthe extraction tasks.
Recently, the influence of ontologies has increased, and they are widely usedas resources to allow exchange knowledge between humans and computers. Anontology [10] is a formal and explicit specification of a shared conceptualiza-tion that can be used to model human knowledge and to implement intelli-gent systems. Ontologies are sometimes used to model data repositories [11,12],or they can be used to classify elements [13–15]. And in other cases, they areused to guide extraction data processes from heterogeneous sources [16]. Whenthe used method is based on the use of ontologies in an information extrac-tion system, it belongs to the OBIE (Ontology Based Information Extraction)system group [17]. The characteristics of these systems are: (1) they processsemi-structured texts in natural language, (2) perform the information extrac-tion process guided by one or more ontologies, and (3) the output is formallyrepresented according to the information of the ontologies used in the system. Inthis context, there are different approaches. Some oriented to automatic labelingof content: those which process the documents looking for instances of a givenontology [18], or those that obtain structured information from semi-structuredresources [19]. There are also other existing works that aim to build an ontologyfrom the processed information [20]. Most of these approaches try to providemethods and extraction techniques for general purposes or for certain domains.
However, our work focuses on a particular domain (weather forecasts) andit highly depends on the context, so the application of these methods turnscomplicated or limited in many ways. Moreover, our work is clearly differentfrom them because it uses embedded information extraction procedures withinthe ontology, i.e. the ontology itself knows how to extract the information. Thesystem exploits an ontological model defined for the domain to detect importantevents in the extraction stage, and then, the model is used to evaluate differenttreatment options of information that may exist.

Information Extraction on Weather Forecasts with Semantic Technologies 143
Regarding weather issues, predictions are the result of numerical and sta-tistical methods which try to anticipate the weather that is going to affect anarea. There are many approaches to make these predictions understandable byeverybody, i.e. to translate them into natural language format [21], but we havenot found any approach focused on describing the semantics and the linguis-tic information about different atmospheric variables in order to extract themfrom texts, or the formal structure of predictions. Moreover, there are manyapproaches which focus on determining and verifying the actual effectiveness ofthe weather predictions. However, to the best of our knowledge, there are notworks specially dedicated to the treatment of worded weather forecasts that alsoperform an evaluation of the accuracy of the interpretations of predictions madeby people or automatic systems.
3 Information Extraction Process
Next, we describe our proposed system, called AEMIX, which identifies andextracts information contained in weather forecasts expressed in natural lan-guage format. AEMIX aims at verifying that forecasts match the real observationdata in a specific date. Some screenshots of the software and a figure explainingthe complete process can be found in the webpage of our research group1.
On the one hand AEMIX receives a set of weather forecasts, and in the otherhand, a spreadsheet with the corresponding actual data from all the observationstations. The first step consists of a preprocess, which cleans the texts and storesall the textual information into a database. Then, AEMIX fragments the forecastinto several paragraphs according to the atmospheric variable described. Thethree most relevant variables to verify are: the temperature, the precipitation,and the wind. Each of these sets of sentences is analyzed with the aid of anontology in order to facilitate the extraction process. The words are convertedinto numerical information, and finally they are also stored in the database.With this database, AEMIX will be able to execute verification tasks, but thisissue is out of the scope of this work.
For each meteorological variable we need: (1) a set of attributes, and (2)information about the data required to be found. For instance, if we refer to pre-cipitation, the attributes are the typology, the quantification, and the temporalevolution. Respectively, the information required could be drizzle, rain, snow,hail, weak, moderate, heavy, very heavy, torrential, and persistent, frequent,intermittent. Certain attributes of atmospheric variables can not be verified,because observations of them are sparse or non-existent (snow).
As we mentioned before, the extraction process is guided by a proprietaryontology designed by us containing the knowledge about different meteorologicalvariables, and how to identify and extract them in the text of a forecast. A frag-ment of the ontology can be appreciated in Fig. 2. This sample shows an excerptof the ontology which focuses on extracting information about precipitation,one of the variables studied. The ontology includes references to the extraction1 http://sid.cps.unizar.es/SEMANTICWEB/GENIE/Genie-Projects.html.

144 A.L. Garrido et al.
methods used during the process. One advantage of this architecture is that newatmospheric variables can be added dynamically in a quick and easy way.
The stages of the process are explained in detail with examples in the fol-lowing subsections.
Fig. 2. A partial sample of the AEMIX ontology model. It shows the informationabout the atmospheric variable “Precipitation”, and details about the extraction ofthe information about “Drizzle”
3.1 Stage 1: Adjusting the Input Texts
In this first stage, we perform a number of different tasks which clean weatherforecasts before the data extraction. The four key elements in this stage are:(1) date and time, (2) time period when the weather forecast is valid, (3) geo-graphical scope of validity of the prediction, and (4) the textual content of theforecast. Following, we show an example of a Spanish weather forecast2, down-loaded from the Spanish Meteorological Service (AEMET) website3:
“ZCZC FPSP85 LECR 260600 SPANISH METEOROLOGICAL SERVICEWEATHER FORECAST FOR GALICIA REGION DAY JANUARY 26th2015 AT 10:00 OFFICIAL TIME FORECAST VALID FROM 00 UNTIL 24HO FRIDAY 28. CLOUD OR OVERCAST WITH WEAK SHOWERS, ANDPOSSIBILITY OF LOCAL MODERATE STORMS, LESS LIKELY IN THESOUTHWEST. SNOW LEVEL AROUND 600–800 M. MINIMUM TEMPERA-TURE DECREASING SLIGHTLY, AND MAXIMUM UNCHANGED. WEAKFROST INLAND. STRONG NORTHEAST WINDS IN THE NORTH COASTOF FISTERRA AND WEAK IN THE REST. NNNN”
Once AEMIX has completed this stage, the output result is:
– Date and time: 01/26/2015 - 10:00 AM.– Range or Type of weather forecast: FP854.2 For clarity’s sake, we show the examples translated to English.3 http://www.aemet.es/.4 FP85 is the tag used by AEMET to indicate that this is a two-day weather forecast.

Information Extraction on Weather Forecasts with Semantic Technologies 145
– Geographical information: Galicia5.– Weather forecast text: “CLOUD OR OVERCAST WITH WEAK SHOWERS,AND POSSIBILITY OF LOCAL MODERATE STORMS, LESS LIKELYIN THE SOUTHWEST. SNOW LEVEL AROUND 600–800 M. MIN-IMUM TEMPERATURE DECREASING SLIGHTLY, AND MAXIMUMUNCHANGED. WEAK FROST INLAND. STRONG NORTHEAST WINDSIN THE NORTH COAST OF FISTERRA AND WEAK IN THE REST.”
This information is stored in the system database together with observationdata from a standardized spreadsheet for the same date, also retrieved from thecorporate website of the meteorological service.
3.2 Stage 2: Text Analyzer
At this stage, AEMIX queries the ontology to obtain the expected text structure,according to the type of weather forecast. With this information:
1. AEMIX studies the weather forecast and it finds the different possible mete-orological variables by using pattern matching.
2. According to the information provided by the ontology, the system uses themost adequate method for fragmenting the texts into groups of sentences,taking into account the heterogeneity of this kind of texts. For example, theinformation about a given variable could be located in two (or more) differentsentences. Or the opposite, the same sentence may contain information aboutmore than one variable.
3. AEMIX returns a set of tuples (<V,S>) for each variable. V stands for thetype of an atmospheric variable, namely: temperature, precipitation, storms,visibility, cloudiness or wind. S represents a list of sentences referred to thesame variable in the forecast. In those cases, where the same sentence appearslinked to two (or more) variables, the next stage will be responsible for filteringthe relevant information for each one.
Following the previous example, at this stage we obtain the next set of tuples:
– V1= cloudiness, S1= “CLOUD OR OVERCAST”.– V2= precipitation, S2= “WEAK SHOWERS, AND POSSIBILITY OFLOCAL MODERATE STORMS. SNOW LEVEL AROUND 600–800 M”.
– V3= temperature, S3= “MINIMUM TEMPERATURE DECREASINGSLIGHTLY, AND MAXIMUM UNCHANGED. WEAK FROST INLAND”.
– V4= wind, S4= “STRONG NORTHEAST WINDS IN THE NORTH COASTOF FISTERRA AND WEAK IN THE REST.”.
We have designed different methods, based on patterns rules and machinelearning techniques, in order to analyze the text and identify meteorologicalvariables, and then to cut off the text and provide the tuples. The advantageof our modular development is we can interchange these methods easily, onlymodifying the ontology.5 Galicia is a Spanish region.

146 A.L. Garrido et al.
3.3 Stage 3: Data Extractor
At the third stage is where the information extraction is properly located. There-fore, it aims at converting the tuples (<V,S>), obtained in the previous stage fromthe worded weather forecast, to a numerical format. For doing this, the systemqueries the ontology to obtain the most appropriate methods to extract thedesired data from the sentences. The ontology has been previously populatedwith different methods which can be applied on the input text according tothe related variable. These methods, mainly based on pattern rules, are readilyexchangeable for testing through the ontology.
In summary, through the knowledge of the atmospheric variable featuresdepicted on the ontology, the system identifies the sentence format, and conse-quently, it is able to use regular expressions to recover the accurate data. Atthe end of this stage, AEMIX returns a list of tuples of elements (<Attribute,Value>). The attributes represent each of the features of an atmospheric vari-able. For instance, regarding temperature, the features could be “minimum”,“maximum”, or “frosts”. The values are is the quantity which establishes thedetermination of a variable. As an example, in the case of wind, the possiblevalues of the attribute “direction” are “N”, “NE”, “SE”, “S”, “SW”,“W” or “NW”.
Following the running example, at this stage we obtain the next set of tupleswith extracted data referring, for instance, to temperature (V3):
1. Attribute: minimum —— Value: “DECREASING SLIGHTLY”.2. Attribute: maximum —— Value: “UNCHANGED”.3. Attribute: frosts —— Value: N/A6.
The system uses lexical patterns and morpho-syntactic analyzers to locatethese attributes. As soon as AEMIX has extracted the textual information, itconverts them into numerical information using the rules provided by the ontol-ogy. If we go ahead with the aforementioned example, rules can be similar tothese:
– DECREASING SLIGHTLY = -5, -2– UNCHANGED = -2, +27
These rules have been previously established and stated into the ontology,inferred through a writing style guide of weather forecasts. An example of thisstyle guide can be downloaded from our research group website8. After consultingthe ontology, AEMIX obtains for each prediction a set of atmospheric variablesidentified in the forecast, and for each variable a set of tuples (<Attribute,Value>). Therefore, the system achieves exactly:6 The system returns a N/A (Not Applicable) value when there is no possibility of
performing the verification process. For example, frosts: there are no observationaldata related to frost.
7 This means that if it is said in the weather prediction temperature values remainunchanged, verification values will be actually valid between 2 degrees up or down.
8 http://sid.cps.unizar.es/SEMANTICWEB/GENIE/Genie-Projects.html.

Information Extraction on Weather Forecasts with Semantic Technologies 147
1. Atmospheric variable: cloudiness.– Attribute: adjetive —— Value:N/A.
2. Atmospheric variable: precipitation.– Attribute: type —— Value:0, 2.– Attribute: storms —— Value:N/A.– Attribute: snow-level —— Value:N/A.
3. Atmospheric variable: temperature.– Attribute: minimum —— Value:-5, -2.– Attribute: maximum —— Value:-2, 2.– Attribute: frosts —— Value:N/A.
4. Atmospheric variable: wind.– Attribute: direction —— Value:“NE”.– Attribute: speed —— Value:41, 70.– Attribute: location —— Value:(42.9, -9.35), (42.9, -9.05), (43.9, -7.7),
(43.6, -7.5).5. Atmospheric variable: wind.
– Attribute: direction —— Value:“NE”.– Attribute: speed —— Value:6, 20.– Attribute: location —— Value:Rest.
As we can see, if the attributes are geographical (“location”), the values area set of geographical points defining the area of interest, or a specific word, like“Rest”, which is translated as the set of the stations in the region included inthe forecast, and not mentioned yet. When no location is indicated, it impliesthat the forecast is referred to the region as a whole. We can also appreciatethat there are two items for the wind, because there are two different forecastsaccording to the location. The first one for the north coast of Fisterra, and thesecond one for the rest of the Galicia region. Besides, there are several attributeswith the value “N/A” (not applicable). In these cases, since observational dataare not available, AEMIX does not make the effort of extracting them becausethere is no way of verifying (and we have to remember that this is the final aimof the project). It is important to point out that numerical data units are notspecified in the extracted data, but they are defined within the ontology itself,related to attributes that require them by their nature.
Finally, all these data are stored in an appropriate format in the database,ready for the next stage: the verification against the observation data stored inthe first stage.
3.4 Stage 4: Verification
The aim of this stage is to verify the accuracy of the forecast, compared withobservation data. Verification is a wide and complicated field in meteorology.The techniques to apply depend on the meteorological variable to study (con-tinuous variables, such as temperature, and discrete ones, such as the presenceof thunderstorms, are treated differently), its statistical properties (tempera-ture and precipitation behave in a very different way), and the type of forecast
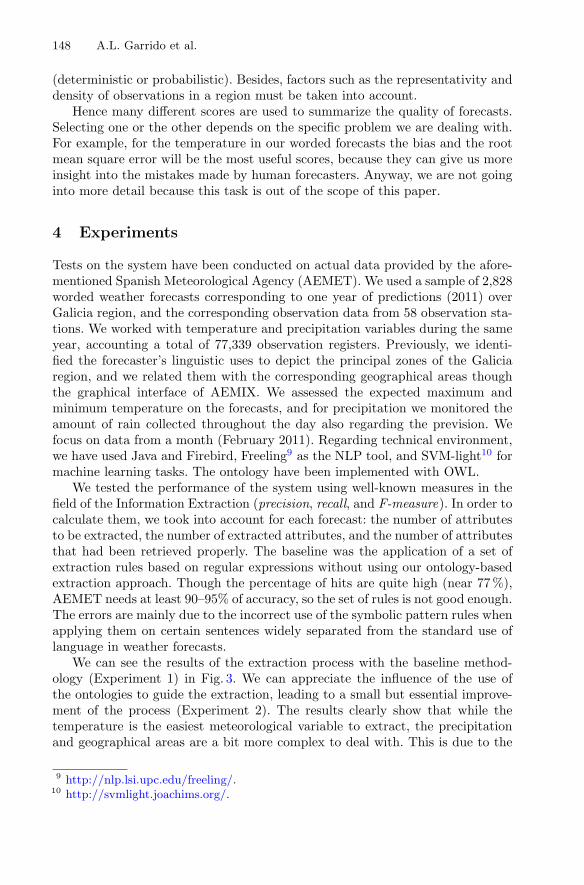
148 A.L. Garrido et al.
(deterministic or probabilistic). Besides, factors such as the representativity anddensity of observations in a region must be taken into account.
Hence many different scores are used to summarize the quality of forecasts.Selecting one or the other depends on the specific problem we are dealing with.For example, for the temperature in our worded forecasts the bias and the rootmean square error will be the most useful scores, because they can give us moreinsight into the mistakes made by human forecasters. Anyway, we are not goinginto more detail because this task is out of the scope of this paper.
4 Experiments
Tests on the system have been conducted on actual data provided by the afore-mentioned Spanish Meteorological Agency (AEMET). We used a sample of 2,828worded weather forecasts corresponding to one year of predictions (2011) overGalicia region, and the corresponding observation data from 58 observation sta-tions. We worked with temperature and precipitation variables during the sameyear, accounting a total of 77,339 observation registers. Previously, we identi-fied the forecaster’s linguistic uses to depict the principal zones of the Galiciaregion, and we related them with the corresponding geographical areas thoughthe graphical interface of AEMIX. We assessed the expected maximum andminimum temperature on the forecasts, and for precipitation we monitored theamount of rain collected throughout the day also regarding the prevision. Wefocus on data from a month (February 2011). Regarding technical environment,we have used Java and Firebird, Freeling9 as the NLP tool, and SVM-light10 formachine learning tasks. The ontology have been implemented with OWL.
We tested the performance of the system using well-known measures in thefield of the Information Extraction (precision, recall, and F-measure). In order tocalculate them, we took into account for each forecast: the number of attributesto be extracted, the number of extracted attributes, and the number of attributesthat had been retrieved properly. The baseline was the application of a set ofextraction rules based on regular expressions without using our ontology-basedextraction approach. Though the percentage of hits are quite high (near 77 %),AEMET needs at least 90–95% of accuracy, so the set of rules is not good enough.The errors are mainly due to the incorrect use of the symbolic pattern rules whenapplying them on certain sentences widely separated from the standard use oflanguage in weather forecasts.
We can see the results of the extraction process with the baseline method-ology (Experiment 1) in Fig. 3. We can appreciate the influence of the use ofthe ontologies to guide the extraction, leading to a small but essential improve-ment of the process (Experiment 2). The results clearly show that while thetemperature is the easiest meteorological variable to extract, the precipitationand geographical areas are a bit more complex to deal with. This is due to the
9 http://nlp.lsi.upc.edu/freeling/.10 http://svmlight.joachims.org/.
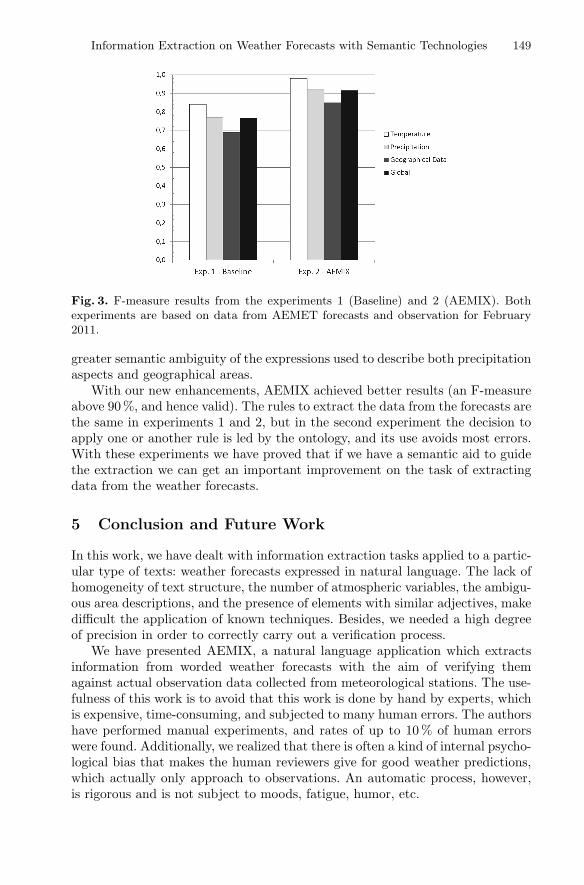
Information Extraction on Weather Forecasts with Semantic Technologies 149
Fig. 3. F-measure results from the experiments 1 (Baseline) and 2 (AEMIX). Bothexperiments are based on data from AEMET forecasts and observation for February2011.
greater semantic ambiguity of the expressions used to describe both precipitationaspects and geographical areas.
With our new enhancements, AEMIX achieved better results (an F-measureabove 90 %, and hence valid). The rules to extract the data from the forecasts arethe same in experiments 1 and 2, but in the second experiment the decision toapply one or another rule is led by the ontology, and its use avoids most errors.With these experiments we have proved that if we have a semantic aid to guidethe extraction we can get an important improvement on the task of extractingdata from the weather forecasts.
5 Conclusion and Future Work
In this work, we have dealt with information extraction tasks applied to a partic-ular type of texts: weather forecasts expressed in natural language. The lack ofhomogeneity of text structure, the number of atmospheric variables, the ambigu-ous area descriptions, and the presence of elements with similar adjectives, makedifficult the application of known techniques. Besides, we needed a high degreeof precision in order to correctly carry out a verification process.
We have presented AEMIX, a natural language application which extractsinformation from worded weather forecasts with the aim of verifying themagainst actual observation data collected from meteorological stations. The use-fulness of this work is to avoid that this work is done by hand by experts, whichis expensive, time-consuming, and subjected to many human errors. The authorshave performed manual experiments, and rates of up to 10 % of human errorswere found. Additionally, we realized that there is often a kind of internal psycho-logical bias that makes the human reviewers give for good weather predictions,which actually only approach to observations. An automatic process, however,is rigorous and is not subject to moods, fatigue, humor, etc.
150 A.L. Garrido et al.
Usually doing this information extraction work by hand can assume about5 min for each weather prediction, so crafting the entire process shown in exper-iments (2,828 texts) would be almost 18 weeks of work from one person, whichis highly unfeasible. With AEMIX the extraction is achieved without effort: inless than one hour all the data is extracted and ready.
The main contribution of this work is the design of an ontology-driven app-roach which improves the results of the classical approach. In our solution, themotivation of using an ontology is two-fold: (1) to represent knowledge aboutaspects of weather forecasts, and (2) to guide the automatic information extrac-tion, helping the system to decide how to split the forecasts in order to group thesentences referred to the same meteorological variables. Besides, this ontologyis populated with the extraction methods to be applied for each meteorologicalvariable. The proposed architecture has the advantage of allowing to incorporateseveral and very different methods to perform the data extraction with minimaleffort, and it avoids errors due to ambiguous language. The first tests seem toindicate that using semantics tools to guide the extraction process improves theresults obtained by other approaches, and therefore the application can be usedin a real environment with severe restrictions in terms of effectiveness.
With regard to the information extraction through semantic techniques, wewant to advance in the following working lines: (1) to check the system operationby testing more extensively in new geographical locations, and by analyzingother atmospheric variables, (2) to explore tools that automate the constructionof the ontology; its development has been completed manually in this work withthe help of experts, but it would be interesting to do it automatically, given aforecast style guide, and (3) to check rigorously the generality of the method withother languages than Spanish. Moreover, and this is another reason of havingused ontologies, we want to explore their capacity to store rules and axioms toimprove the extraction mechanism.
References
1. Sarawagi, S.: Information extraction. Found. Trends Databases 1(3), 261–377(2008)
2. Russell, S., Norvig, P.: Artificial Intelligence: A Modern Approach. Artificial Intel-ligence. Prentice-Hall, Upper Saddle River (1995)
3. Appelt, D.E., Hobbs, J.R., Israel, D., Tyson, M.: Fastus: a finite-state processorfor information extraction from real-world text. In: 13th International Joint Con-ferences on Artificial Intelligence (IJCAI 1993), vol. 93, pp. 1172–1178 (1993)
4. Grishman, R.: Information extraction: techniques and challenges. In: InformationExtraction a Multidisciplinary Approach to an Emerging Information Technology,pp. 10–27 (1997)
5. Soderland, S.: Learning information extraction rules for semi-structured and freetext. Mach. Learn. 34(1–3), 233–272 (1999)
6. Seymore, K., McCallum, A., Rosenfeld, R.: Learning hidden Markov model struc-ture for information extraction. In: AAAI 1999 Workshop on Machine Learningfor Information Extraction, pp. 37–42 (1999)

Information Extraction on Weather Forecasts with Semantic Technologies 151
7. McCallum, A., Freitag, D., Pereira, F.C.: Maximum entropy Markovmodels forinformation extraction and segmentation. In: 27th International Conference onMachine Learning (ICML 2000), vol. 17, pp. 591–598 (2000)
8. Lafferty, J., McCallum, A., Pereira, F.C.: Conditional random fields: probabilisticmodels for segmenting and labeling sequence data (2001)
9. Viola, P., Narasimhan, M.: Learning to extract information from semi-structuredtext using a discriminative context free grammar. In: 28th International ACMSIGIR Conference on Research and Development in Information Retrieval, pp.330–337 (2005)
10. Gruber, T.R.: A translation approach to portable ontology specifications. Knowl.Acquisition 5(2), 199–220 (1993)
11. Mika, P.: Ontologies are us: a unified model of social networks and semantics. In:Gil, Y., Motta, E., Benjamins, V.R., Musen, M.A. (eds.) ISWC 2005. LNCS, vol.3729, pp. 522–536. Springer, Heidelberg (2005)
12. Barbau, R., Krima, S., Rachuri, S., Narayanan, A., Fiorentini, X., Foufou, S.,Sriram, R.D.: Ontostep: enriching product model data using ontologies. Comput.Aided Des. 44(6), 575–590 (2012)
13. Vogrincic, S., Bosnic, Z.: Ontology-based multi-label classification of economic arti-cles. Comput. Sci. Inf. Syst. 8, 101–119 (2011)
14. Garrido, A.L., Gomez, O., Ilarri, S., Mena, E.: An experience developing a seman-tic annotation system in a media group. In: Bouma, G., Ittoo, A., Metais, E.,Wortmann, H. (eds.) NLDB 2012. LNCS, vol. 7337, pp. 333–338. Springer,Heidelberg (2012)
15. Garrido, A.L., Buey, M.G., Ilarri, S., Mena, E.: GEO-NASS: a semantic taggingexperience from geographical data on the media. In: Catania, B., Guerrini, G.,Pokorny, J. (eds.) ADBIS 2013. LNCS, vol. 8133, pp. 56–69. Springer, Heidelberg(2013)
16. Kara, S., Alan, O., Sabuncu, O., Akpınar, S., Cicekli, N.K., Alpaslan, F.N.: Anontology-based retrieval system using semantic indexing. Inf. Syst. 37(4), 294–305(2012)
17. Wimalasuriya, D.C., Dou, D.: Ontology-based information extraction: an introduc-tion and a survey of current approaches. J. Inf. Sci. 36(3), 306–323 (2010)
18. Cimiano, P., Handschuh, S., Staab, S.: Towards the self-annotating web. In: 13thInternational Conference on World Wide Web, pp. 462–471 (2004)
19. Buitelaar, P., Cimiano, P., Frank, A., Hartung, M., Racioppa, S.: Ontology-basedinformation extraction and integration from heterogeneous data sources. Int. J.Hum. Comput. Stud. 66(11), 759–788 (2008)
20. Getman, A.P., Karasiuk, V.V.: A crowdsourcing approach to building a legal ontol-ogy from text. Artif. Intell. Law 22(3), 313–335 (2014)
21. Goldberg, E., Driedger, N., Kittredge, R.: Using natural-language processing toproduce weather forecasts. IEEE Expert 9(2), 45–53 (1994)
Keyword Identification UsingText Graphlet Patterns
Ahmed Ragab Nabhan1,2(B) and Khaled Shaalan3,4
1 Faculty of Computers and Information, Fayoum University, Faiyum, [email protected]
2 Member Technology, Sears Holdings, Hoffman Estates, USA3 The British University in Dubai, Dubai, United Arab Emirates4 School of Informatics, University of Edinburgh, Edinburgh, UK
Abstract. Keyword identification is an important task that providesuseful information for NLP applications including: document retrieval,clustering, and categorization, among others. State-of-the-art methodsrely on local features of words (e.g. lexical, syntactic, and presentationfeatures) to assess their candidacy as keywords. In this paper, we pro-pose a novel keyword identification method that relies on representa-tion of text abstracts as word graphs. The significance of the proposedmethod stems from a flexible data representation that expands the con-text of words to span multiple sentences and thus can enable capturingof important non-local graph topological features. Specifically, graphlets(small subgraph patterns) were efficiently extracted and scored to reflectthe statistical dependency between these graphlet patterns and wordslabeled as keywords. Experimental results demonstrate the capability ofthe graphlet patterns in a keyword identification task when applied toMEDLINE, a standard research abstract dataset.
Keywords: Word graphs · Pattern analysis · Graph features · Machinelearning · MEDLINE
1 Introduction
Keywords are important meta data that is useful for many document processingtasks including indexing and retrieval, clustering, and classification. Keywordscan act as relevancy indicators about documents that are retrieved given a searchquery. This meta data can be provided by authors, or by manual or automaticmethods to provide better search and access experience when using scientificdatabases. Lists of keywords, as document fields, are of high quality consideringthey are provided manually either by authors or assigned by librarians. Althoughthese lists are typically limited in size (three to five items), there is an oppor-tunity to utilize them through supervised learning methods that aim to identifystatistical dependencies between text features and word labels (e.g. keyword vs.non-keyword).c© Springer International Publishing Switzerland 2016E. Metais et al. (Eds.): NLDB 2016, LNCS 9612, pp. 152–161, 2016.DOI: 10.1007/978-3-319-41754-7 13
Keyword Identification Using Text Graphlet Patterns 153
The problem of automatic extraction of keywords within text has beenaddressed through both NLP and graph-based methods. Several resourcesincluding manually-generated keywords, lexical, and syntactic annotations havebeen used to identify keywords within texts [1–5]. Machine learning techniqueshave been developed to extract useful features for the task of keywords identifi-cation. Witten et al. (1999) proposed a Naive Bayes method for learning featuresrelevant to keyword extraction, see also [6]. Li et al. developed a semi-supervisedapproach to learning an indicator by assigning a value to each important phrasein the document title and to propagate that value to other phrases through-out the document [7]. Tomokiyo (2003) proposed an approach to key phraseextraction based on language models (cf. [8]).
Automatic methods for keyword identification utilize lexical, syntactic,semantic, and presentation features of texts. These features can be used to learnrules for identifying keywords in testing data. Counting-based methods (e.g. TF-IDF [9]) are built on lexical features (e.g. stemmed, lemmatized, or surface formsof the words). Morpho-Syntactic features (e.g. part-of-speech tagging informa-tion, base-phrase chunks) can be used as a filter to exclude words (e.g. adverbsand prepositions) or phrases (e.g. verb phrases) unlikely to be keywords.
Graph-based document representation can enable powerful methods such asrandom walks and frequent subgraph mining to capture relevant features for manyNLP tasks. Ranking-based graph methods have been proposed to quantify theimportance of a word in a document relative to neighboring words. TextRank [10],LexRank [11], and NeRank [12] are examples of methods that employed graphproperties such as vertex centrality and ranking for keyword extraction and textsummarization. Mining of frequent subgraphs and subtrees were demonstrated tobe useful for document categorization [13]. Graph-based term weighting methodswere proposed for information retrieval applications [14].
In this paper, a graph pattern mining method is proposed to identify key-words in word graphs constructed from text abstracts. Word graphs provide aflexible representation that enables exploration of complex, non-local featuresthat can span multiple sentences. The method combined lexical features withgraph substructures (e.g. graphlets) to explore contexts of keywords and identifysiginificant patterns. Then, these graph-based features were used by a machinelearning based classifier for testing data.
2 Research Methods
The problem being addressed in this study can be defined as follows. Let atext document be mapped to a word graph where vertices represent words, andedges indicate word co-occurrences in sentences. That is, if the words wi andwj appear next to each other in a sentence, an edge is created to link the twovertices representing wi and wj . Given a set of word graphs D = G1, G2, ..., Gnwhere each graph Gi represents a text document, the problem is to structurallyanalyze elements in D to extract significant graph substructures (e.g. graphlets,paths) in the neighborhood of each word vertex. Then, a binary classifier can

154 A.R. Nabhan and K. Shaalan
be used to classify word vertices in a test corpus as keywords or non-keywordsbased on their graph substructure features.
Vertex labels in word graphs can represent content at some linguistic level.For instance, at the very basic level, a vertex can correspond to a primitive lexicalunit (e.g. surface, lemmatized or stemmed word form), syntactic unit (e.g. aphrase) or a sentence (in which case a graph can represent a whole corpus). Edgesin these graphs can represent a lexical relationship (e.g. neighborhood, lexicalsimilarity) or syntactic relationships (e.g. subject-verb-object relationships). Inthis study, text abstracts were mapped to graphs where vertices representedwords and edges between a pair of vertices were created if the pair of verticesappeared next to each other in a sentence. The edges did not have weights andthe vertices had two features: a lexical label and a part-of-speech tag.
2.1 Notations
A graph is a structure G = (V,E), where V = v1, v2, ..., vn is a set of ver-tices and E ⊆ V × V is the set of edges. A graph is said to be undirectediff ∀e = (vi, vj) ∈ E,∃e′ = (vj , vi) ∈ E. A graph G(V,E) is isomorphicto graph G′(V ′, E′) if there exists a bijective function f : V → V ′ such thate = (vi, vj) ∈ E iff e′(f(vi), f(vj)) ∈ E′. Graph automorphism is a symmetryproperty of a graph so that its vertex set can be mapped into itself while pre-serving edge-vertex connectivity. A subgraph H(V ′, E′) of G is defined such thatV ′ ⊆ V and E′ ⊆ E. The size of a graph or a subgraph is defined as the numberof items in the vertex set.
Graphlets are small-sized nonisomorphic subgraphs (typically 2 ≤ |V | ≤ 5)within a given larger graph [15]. A graph can be characterized by its collectionof graphlets [16]. Graphlet automorphism allows for modeling the relationshipof a graphlet and its component vertices. Automorphism orbits are defined bydistances of a vertex of interest (pivot) and the rest of vertices in a graphlet.Each vertex reachable from a pivot vertex p in a number of edges d are said tobe in d − orbit.
2.2 The Graph-Based Method
In this study, we present a graph-based method for identification of keywordsin research abstracts. Text preprocessing operations (e.g. removing punctua-tion marks and stop words, lower-casing) were applied. Text were processed toextract bigram patterns and these patterns were used to represent edges withend points representing vertices. The NLTK toolkit [17] part-of-speech taggerprovided syntactic information that were used during classification to apply thegraphlet methods only to vertices with nouns and adjectives part of speech tags.These helped in increasing the true negative (non-keywords) score.
The method relied on graphlets that were extracted from a word graph rep-resentation of the abstracts. For each word vertex, a graph search algorithm wasdesigned to extract 3-graphlet and 4-graphlet subgraphs such that this word wasa pivot vertex. The relationships between the pivot vertex (a candidate keyword)

Keyword Identification Using Text Graphlet Patterns 155
Fig. 1. An example 4-graphlet with four possible orbit forms of the configuration< 0, 1, 1, 2 >.
and its neighbors are defined based on orbit positions and inter-edges betweenthese non-pivot vertices.
Graphlets can be enumerated systematically and thus are efficient to extract.Automorphism orbits allow for efficient comparison and counting of graphletsand thus they can be efficiently explored and scored. A string representation ofgraphlet determines (1) the layout of neighboring vertices in each orbit, and (2)an indicator of the configuration (e.g. how other non-pivot vertices are linked).Illustration of orbit configurations are given in Figs. 1 and 2. For instance, a4-graphlet orbit 0 1 2 2 (Fig. 2) represents a pivot vertex at the origin (0) andthe next neighbor is at distance 1, and then two vertices are connected to thatneighbor at a two-edges distance from the pivot. In this case, two graphlet formscan be possible: (1) a form where the neighbors-of-a-neighbor can be linked byone edge, or (2) another form where there are no edges between those neighbors-of-a-neighbor.
In this paper, we followed the methodology proposed by Vacic et al. [16]for enumerating and counting graphlets using the configuration-form scheme.Table 1 shows the graphlet orbit configuration and form schemes used in thisstudy. During feature extraction, graphlet patterns were discovered systemati-cally by applying each scheme in Table 1, starting with a pivot vertex (the wordfor which the features were extracted). Two trivial graphlets (namely: 1-graphletand 2-graphlets) were not used in our study.
Figure 1 shows four varieties of graphlets of the same configuration, only dif-fering by the way non-pivot vertices are linked. The feature extraction algorithmstores and retrieves graphlets using the configuration string (e.g. < 0, 1, 2, 2 >),a named form (e.g. O7), together with labels (words surface forms) of the ver-tices ordered by the configuration string. Hash function values were generatedusing these compact string representations of graphlets and were used to readfrom and write to the feature table where features frequency were stored.
In this study, 3-graphlet and 4-graphlet subgraphs were used as features forclassification of words as keywords vs. non-keywords. A minimum support valueof 5 was used to reduce feature space size. Graphlets of size 5 were not useddue to their somewhat large number of orbit configurations that would increase
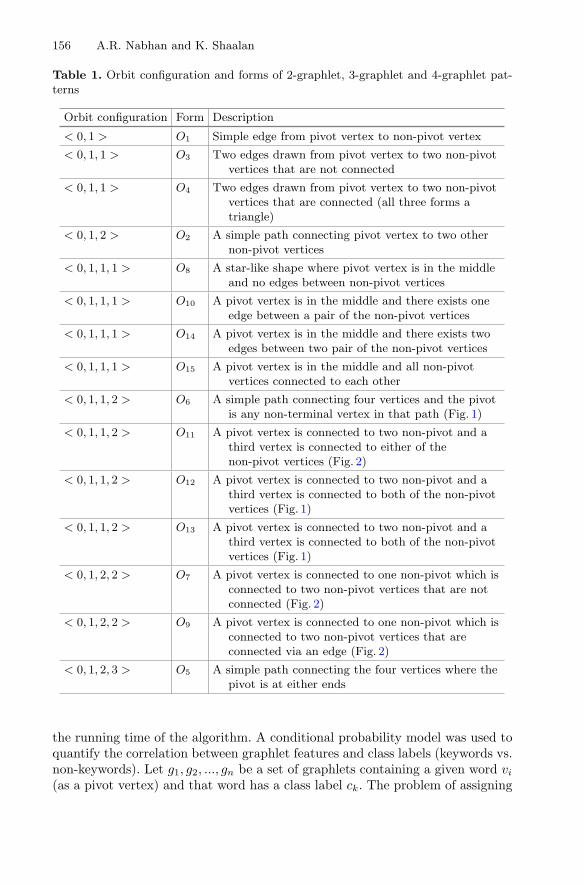
156 A.R. Nabhan and K. Shaalan
Table 1. Orbit configuration and forms of 2-graphlet, 3-graphlet and 4-graphlet pat-terns
Orbit configuration Form Description
< 0, 1 > O1 Simple edge from pivot vertex to non-pivot vertex
< 0, 1, 1 > O3 Two edges drawn from pivot vertex to two non-pivotvertices that are not connected
< 0, 1, 1 > O4 Two edges drawn from pivot vertex to two non-pivotvertices that are connected (all three forms atriangle)
< 0, 1, 2 > O2 A simple path connecting pivot vertex to two othernon-pivot vertices
< 0, 1, 1, 1 > O8 A star-like shape where pivot vertex is in the middleand no edges between non-pivot vertices
< 0, 1, 1, 1 > O10 A pivot vertex is in the middle and there exists oneedge between a pair of the non-pivot vertices
< 0, 1, 1, 1 > O14 A pivot vertex is in the middle and there exists twoedges between two pair of the non-pivot vertices
< 0, 1, 1, 1 > O15 A pivot vertex is in the middle and all non-pivotvertices connected to each other
< 0, 1, 1, 2 > O6 A simple path connecting four vertices and the pivotis any non-terminal vertex in that path (Fig. 1)
< 0, 1, 1, 2 > O11 A pivot vertex is connected to two non-pivot and athird vertex is connected to either of thenon-pivot vertices (Fig. 2)
< 0, 1, 1, 2 > O12 A pivot vertex is connected to two non-pivot and athird vertex is connected to both of the non-pivotvertices (Fig. 1)
< 0, 1, 1, 2 > O13 A pivot vertex is connected to two non-pivot and athird vertex is connected to both of the non-pivotvertices (Fig. 1)
< 0, 1, 2, 2 > O7 A pivot vertex is connected to one non-pivot which isconnected to two non-pivot vertices that are notconnected (Fig. 2)
< 0, 1, 2, 2 > O9 A pivot vertex is connected to one non-pivot which isconnected to two non-pivot vertices that areconnected via an edge (Fig. 2)
< 0, 1, 2, 3 > O5 A simple path connecting the four vertices where thepivot is at either ends
the running time of the algorithm. A conditional probability model was used toquantify the correlation between graphlet features and class labels (keywords vs.non-keywords). Let g1, g2, ..., gn be a set of graphlets containing a given word vi(as a pivot vertex) and that word has a class label ck. The problem of assigning

Keyword Identification Using Text Graphlet Patterns 157
Fig. 2. An example 4-graphlet with two possible orbit forms of the configuration< 0, 1, 2, 2 >. There are two cases with the outer vertices on orbit 2: first case is whereno edges between these vertices and second case where there is an edge linking them.
a class label ck to a word vi given a set of graphlets with v at the origin can bestated as estimating the probability value P (ck|vi, g1, g2, ..., gn), as a function ofgraphlet features. Using Bayes’ rule,
P (ck|vi, g1, g2, ..., gn) ∝ P (ck) × P (vi, g1, g2, ..., gn|ck)= P (ck) × P (vi|ck) × P (vi, g1, g2, ..., gn|ck)
= P (ck) × P (vi|ck) ×n∏
i=1
P (gi|ck),(1)
assuming graphlet features are conditionally independent on class label ck. Theprobability value P (ck) represents prior information about class distributionin the data set. The probability model P (vi|ck) can be viewed as a unigramprobability of word vertex vi. During initial phases of the study, there was noobserved performance improvements of using the unigram probability P (vi|ck)and thus this probability value was not used in the final model. Finally, a labelwas assigned to a word such that it maximized the probability value that is afunction of graphlet features:
y = argmaxk∈1,2
P (ck) ×n∏
i=1
P (gi|ck) (2)
Using the above model, a Naive Bayes classifier was used to decide on whetheror not a test word vertex represented a keyword, given graphlets that wereexplored for that test word vertex.
2.3 TF-IDF Method
In this study, TF-IDF scores were used in the baseline system. TF-IDF is afrequency-based method that takes into account word as well as document fre-quencies [18]. For a given word i in a document j, the wij score was computedas follows.

158 A.R. Nabhan and K. Shaalan
wij =nij
djlog2
N
ni, (3)
where nij is the frequency of word i in document j, |dj| is total words in documentj, N is the total number of documents in the corpus, and ni is the size of setof document containing word i. After computing wij for all words, a normalizedscore was computed as
Wij =wij√∑
i wij(4)
The TF-IDF score was computed for words after applying the syntactic filterwhere words other than nouns and adjectives were excluded. Words were rankedaccording to the score and top five high scored words were labeled as keywords.
3 Experiments and Results
3.1 Data Description
The dataset of the present study was drawn from MEDLINE research abstractdatabase. MEDLINE is a high quality medical publication database supported bythe National Library of Medicine (NLM) in the United States. One of the fieldsof an abstract record is the Other Term (OT) field that indicates author-suppliedlist of keywords. Not all MEDLINE abstracts have that field and the data wascollected such that only abstracts with non-empty OT fields were included inthe test dataset. A corpus of around 10,000 abstracts was collected. Text pre-processing steps were applied. For each abstract, a word graph was constructedand 3-and 4-graphlets were extracted for every word that pass the syntactic fil-ter (only nouns and adjectives were considered). Other word types (e.g. adverbs,conjunctions) were included in the graphs to serve as hubs to connect otherwords, but no specific graphlets are generated for these category of words.
3.2 Performance Evaluation
A 5-fold cross validation was conducted for two systems. A system based on TF-IDF method was implemented as a baseline. The evaluation of both experimentaland baseline systems were based on top five scoring candidate keywords. For theexperimental model, for each document, the five top scoring keywords in thepositive class (keyword) were considered if (y) probability score is higher thanthat value of the negative class (non-keyword) according to Eq. 2. When, for atest document, the top five model scores given positive class labels were lowerthan scores corresponding to negative class labels, no keyword was generated.
A frequent pattern mining system was implemented to extract 3- and 4-graphlets based on a minimum support value of five (a graphlet has to appear infive documents to be selected as a feature). A probability model of graphlets con-ditionally independent on word class label (keyword vs. non-keyword) was build

Keyword Identification Using Text Graphlet Patterns 159
Table 2. Keyword classification accuracy
System Recall Precision
TFIDF 0.55 0.73
graph-based 0.6 0.79
Table 3. A sample of graphlet patterns
Orbit Configuration Form Vertex Labels
< 0, 1, 2 > O2 vascular,endothelial,growth
< 0, 1, 2, 2 > O7 control,and,cervical,prevention
< 0, 1, 2, 2 > O7 cervical,cancer,early,screening
< 0, 1, 2, 2 > O7 overall,survival,(pfs),(os)
< 0, 1, 1, 2 > O6 cancer,early,screening,detection
by counting pattern occurrences and normalization. A uniform prior probability(0.5) was used for P (ck). A small probability value ε = 1 × 10⁻⁵ was used forunseen graphlet parameters. Recall and precision scores were computed basedon the five top scoring candidate keywords in each test document. Performanceresults for the two systems are shown in Table 2.
As a by-product of the feature extraction process, a number of significantpatterns were discovered. Here, we present some of the graphlet patterns thatachieved high scores. A number of these patterns is shown in Table 3.
4 Discussion and Conclusions
This study addressed the problem of keyword identification in scientific abstractsusing a novel graph-based method. An important advantage of the proposedmethod is the use of efficient enumeration of significant graphlet patterns inword graphs. A Bayes’ rule-based model was applied to measure the statisticaldependency between significant graphlet patterns and word class labels (e.g.keywords vs. non-keywords labels). The pivot vertices in the graphlets feature setrepresent candidate keywords. The proposed method was compared to standard,frequency-based method (TF-IDF) and experimental results showed competitiveperformance in terms of Recall and Precision.
This study advances the state-of-the-art of keyword identification methods byintroducing an efficient method for exploring significant patterns in word graphs.Graph-based representation of text has an important advantage over traditionalmethods of text analysis. These graphs allow access to a wider context of theword vertex and hence enables capturing of non-local dependencies that mightnot be straightforward to obtain through syntactic and lexical analysis.
A major contribution of this study is an efficient algorithm for mining signif-icant patterns in word graphs. While graph-based algorithms are known to be
160 A.R. Nabhan and K. Shaalan
computationally expensive, the methods presented in this study enabled calcula-tion of pattern frequency without resorting to testing of graph isomorphism. Thiswas possible through usage of an orbit-based scheme representation of graphlets.This graphlet-based method is different from sequence-based methods (e.g. n-gram models) in two aspects. First, one graphlet pattern may contain wordsfrom multiple sentences in a given utterance (e.g. a text abstract), whereassequence-based methods only contain words that co-occur within sentences. Sec-ond, sequence-based methods cannot capture some subtle topological patternsof a candidate keyword (e.g. as illustrated by the patterns shown in Fig. 1).
The presented method utilized a simple text structure, that is of words co-occurrences, to identify vertices and edges of text graphs. This simplicity ofgraph representation ignores the syntactic structure of sentences. One way tocapture syntactic relationships is to identify graph vertices at a multi-word orphrase level (e.g. noun phrases). However, this might affect graph topology ina way that can prevent capturing of some significant, micro-level (e.g. wordlevel) graph substructures. Another limitation of the presented method is lackof edge information (i.e. edges were unlabeled, unweighted). One potential futureenhancement of the work would include, in addition to adjacency, some infor-mation such as bigram frequency and syntactic dependency.
While the method was designed to solve the problem of identification ofword vertices that are keywords, as a by-product, a set of significant graphletpatterns are produced. These patterns can be useful in other tasks such as explo-ration, text categorization, and document clustering. The proposed probabilitymodel allows for quantification of pattern importance and thus these patternsare already measured as significant. Future work includes designing a text cate-gorization method that rely on text graphlets.
References
1. Andrade, M.A., Valencia, A.: Automatic extraction of keywords from scientifictext: application to the knowledge domain of protein families. Bioinformatics 14(7),600–607 (1998)
2. Matsuo, Y., Ishizuka, M.: Keyword extraction from a single document using wordco-occurrence statistical information. Int. J. Artif. Intell. Tools 13(1), 157–169(2004)
3. Hammouda, K.M., Matute, D.N., Kamel, M.S.: CorePhrase: keyphrase extrac-tion for document clustering. In: Perner, P., Imiya, A. (eds.) MLDM 2005. LNCS(LNAI), vol. 3587, pp. 265–274. Springer, Heidelberg (2005)
4. Hasan, K.S., Ng, V.: Automatic keyphrase extraction: a survey of the state of theart. In: ACL, pp. 1262–1273 (2005)
5. Daiber, J., Jakob, M., Hokamp, C., Mendes, P.N.: Improving efficiency and accu-racy in multilingual entity extraction. In: Proceedings of the 9th InternationalConference on Semantic Systems, pp. 121–124. ACM (2013)
6. Witten, I.H., Paynter, G.W., Frank, E., Gutwin, C., Nevill-Manning, C.G.: KEA:practical automatic keyphrase extraction. In: Proceedings of the Fourth ACM Con-ference on Digital Libraries, pp. 254–255. ACM (1999)

Keyword Identification Using Text Graphlet Patterns 161
7. Liu, F., Pennell, D., Liu, F., Liu, Y.: Unsupervised approaches for automatic key-word extraction using meeting transcripts. In: Proceedings of Human LanguageTechnologies, pp. 620–628. Association for Computational Linguistics (2009)
8. Tomokiyo, T., Hurst, M.: A language model approach to keyphrase extraction.In: Proceedings of the ACL 2003 Workshop on Multiword Expressions: Analy-sis, Acquisition and Treatment, vol. 18, pp. 33–40. Association for ComputationalLinguistics (2003)
9. Zhang, Y., Zincir-Heywood, N., Milios, E.: Narrative text classification for auto-matic key phrase extraction in web document corpora. In: Proceedings of the 7thAnnual ACM International Workshop on Web Information and Data Management,pp. 51–58. ACM (2005)
10. Mihalcea, R., Tarau, P.: TextRank: Bringing Order into Texts. Association forComputational Linguistics, Stroudsburg (2004)
11. Erkan, G., Radev, D.R.: LexRank: graph-based lexical centrality as salience in textsummarization. J. Artif. Intell. Res. 22, 457–479 (2004)
12. Bellaachia, A., Al-Dhelaan, M.: Ne-rank: a novel graph-based keyphrase extrac-tion in twitter. In: Proceedings of the 2012 IEEE/WIC/ACM InternationalJoint Conferences on Web Intelligence and Intelligent Agent Technology, vol. 01,pp. 372–379. IEEE Computer Society (2012)
13. Jiang, C., Coenen, F., Sanderson, R., Zito, M.: Text classification using graphmining-based feature extraction. Knowl. Based Syst. 23(4), 302–308 (2010)
14. Blanco, R., Lioma, C.: Graph-based term weighting for information retrieval. Inf.Retrieval 15(1), 54–92 (2012)
15. Przulj, N.: Biological network comparison using graphlet degree distribution. Bioin-formatics 23(2), e177–e183 (2007)
16. Vacic, V., Iakoucheva, L.M., Lonardi, S., Radivojac, P.: Graphlet kernels for pre-diction of functional residues in protein structures. J. Comput. Biol. 17(1), 55–72(2010)
17. Bird, S.: NLTK: the natural language toolkit. In: Proceedings of the COLING/ACLon Interactive Presentation Sessions, pp. 69–72. Association for ComputationalLinguistics (2006)
18. Aizawa, A.: An information-theoretic perspective of TF-IDF measures. Inf.Process. Manage. 39(1), 45–65 (2003)

Disentangling the Structure of Tablesin Scientific Literature
Nikola Milosevic1(B), Cassie Gregson2, Robert Hernandez2,and Goran Nenadic1,3
1 School of Computer Science, University of Manchester,Kilburn Building, Oxford Road, M13 9WJ Manchester, UK
nikola.milosevic,[email protected] AstraZeneca Ltd, Riverside, Granta Park, Cambridge CB21 6GH, UK
3 Health EResearch Centre, Manchester, UK
Abstract. Within the scientific literature, tables are commonly used topresent factual and statistical information in a compact way, which is easyto digest by readers. The ability to “understand” the structure of tables iskey for information extraction in many domains. However, the complexityand variety of presentation layouts and value formats makes it difficult toautomatically extract roles and relationships of table cells. In this paper,we present a model that structures tables in a machine readable way anda methodology to automatically disentangle and transform tables into themodelled data structure. The method was tested in the domain of clinicaltrials: it achieved an F-score of 94.26 % for cell function identification and94.84 % for identification of inter-cell relationships.
Keywords: Table mining · Text mining · Data management · Datamodelling · Natural language processing
1 Introduction
Tables are used in a variety of printed and electronic documents for presentinglarge amounts of factual and/or statistical data in a structured way [1,21,25].They are a frequent option in written language for presenting large, multi-dimensional information. For example, in experimental sciences, tables are usu-ally used to present settings and results of experiments, as well as supportinginformation about previous experiments, background or definitions of terms.Tables are, in particular, widely used in the biomedical domain. However, whilethere have been numerous attempts to automatically extract information fromthe main body of literature [11,20,27], there have been relatively few attemptsto extract information from tables.
One of the main challenges in table mining is that the existing models usedto represent tables in the literature are focused on visualisation, rather thanon content representation and mining. For example, tables in PubMedCentral(PMC)1 are presented in XML with tags describing rows, cells, header and body1 http://www.ncbi.nlm.nih.gov/pmc/.
c© Springer International Publishing Switzerland 2016E. Metais et al. (Eds.): NLDB 2016, LNCS 9612, pp. 162–174, 2016.DOI: 10.1007/978-3-319-41754-7 14

Disentangling the Structure of Tables in Scientific Literature 163
of the table. However, these tags are used only for formatting and there is noguarantee that cells labelled as headers are also semantically headers of thetable. Therefore, the table layout structure and relationships between cells makepreprocessing and decomposition necessary before machine understanding taskscan be performed.
Hurst [10] introduced five components of table processing: graphical (a basicgraphical representation of the table, e.g. bitmap, rendered table on screen orpaper), physical (a description of the table in terms of physical relationshipsbetween its basic elements when rendered on a page), functional (the purpose ofareas of the table with respect to the use of the table by the reader), structural(the organisation of cells as an indication of the relationships between them), andsemantic (the meaning of the text in the cell). Following Hurst, we differentiatefive steps of table processing:
1. Table detection locates the table in document.2. Functional analysis detects and marks functional areas of tables such as
navigational (e.g. headers, stubs, super-row) and data cells.3. Structural analysis determines the relationships between the cells. For each
cell in the table, it finds related header(s), stub(s) and super-row cells.4. Syntactic analysis looks at the value of the cells at the syntactic level, for
example, by identifying whether the value is a numeric expression.5. Semantic analysis determines the meaning of data and attempts to extract
and represent specific information from tables.
In this paper, we focus on functional and structural analysis of tables in clin-ical literature available openly in PMC. The aim is to facilitate further syntacticand semantic processing of tables by providing a model to capture necessaryinformation about cells’ functions, relationships and content.
2 Background
There are three main areas of table processing in literature: (1) table detec-tion, (2) functional analysis and (3) table mining applications, which includeinformation retrieval, information extraction, question answering and knowledgediscovery.
Table detection is a hard problem for graphical document formats because itmay involve visual processing of the document in order to find visual structuresrecognisable as tables [2]. Other formats can be also challenging. For example,table tags exist in HTML, but they are often used for formatting web page layout.Previous work focused on detecting tables from PDF, HTML and ASCII doc-uments using Optical Character Recognition [13], machine learning algorithmssuch as C4.5 decision trees [17] or SVM [19,22], and heuristics [26].
Functional analysis examines the purpose of areas of the table. The aimhere is to differentiate between cells containing data and cells containing navi-gational information, such as headers, stubs or super-rows (see Fig. 1). To solvethis problem, several machine learning methods like C4.5 decision trees [5,12],

164 N. Milosevic et al.
Fig. 1. Table components (PMC29053): Cell – the basic grouping within a table; Cap-tion – a textual description of the table’s content; Footer – additionally describes dataor symbols used in the table; Column – a set of vertically aligned cells; Row – a setof horizontally aligned cells. Header – top-most row (or set of several top-most rows)that defines data categories of data columns; Stub or column header – typically theleft-most column of the table that categorizes the data in the rows. Super-row – groupscolumn headers and data by some concept.
conditional random fields [23] and hierarchical clustering [9] were used on weband ASCII text tables in general domain. Hurst also developed a system thatis able to perform text mining analysis according to his model [10]. His systemwas composed of several components performing smaller tasks such as detection,functional analysis and structural analysis of tables by using rule based and/ormachine learning approaches.
There are several applications that use tables. For example, the BioText Searchengine [6,8] performs information retrieval from text, abstracts, figures and tablesin biomedical documents. Wei et al. [23] created a question-answering system thatlooked for answers in tables, using CRF and information retrieval techniques.Few attempts were made to extract information using linked data and databases[16,24] with machine learning methods trained on a standardized set of tables [21].There have been several approaches to semantically annotate columns using exter-nal resources, such as search engines [18] or linked data resources [14]. WebTa-bles used a hypothesis that tables in web documents could be viewed as rela-tional database tables [4]. They created a huge corpus database that consists of154 million distinct relational tables from the world wide web that can be usedfor schema auto-complete, attribute synonym finding or joint graph traversal indatabase applications. Most of these approaches restricted themselves to simpletables because they lacked functional or structural processing steps.
Doush and Pontelli [7] created an spreadsheet ontology that included a modelof table for screen reader’s purposes. Their model considered tables that can befound in spreadsheets (usually simple matrix tables). They differentiate betweendata and header cells, but they do not include other possible cell roles such asstub and super-row cells.

Disentangling the Structure of Tables in Scientific Literature 165
3 Table Model
Since current table models focus mainly on visualization for human readers, wehere propose a new model for computational processing which is comprised oftwo components:
– Table types: common table structural types that determine the way of readingthe table;
– Data model: models the table structure and data in a way that data can beautomatically processed by the machine (including visualisation).
3.1 Table Types
We define three main structural table types with several sub-types based on thetable’s dimensionality:
– One-dimensional (list) tables are described by a single label. The labelis usually placed in the header (see Fig. 2 for an example). One-dimensionaltables may have multiple columns, representing the same category, wheremulti-column structure is used for space saving purposes.
– Two-dimensional or matrix tables have data arranged into a matrix cate-gorised usually by two labels: a column header and row header (stub). In ourmodel, these tables may have multiple layers of column or row headers (seeFig. 4 for an example).
– Multi-dimensional tables contain more than two dimensions. We identifytwo types of multi-dimensional tables:• Super-row tables contain super-rows that group row headers below
them (see example in Fig. 1). A super-row table can have multiple layersof super-rows, forming a tree-like structure. This structure is typicallyvisually presented with an appropriate number of white spaces in front ofeach stub’s label.
• Multi-tables are tables composed of multiple, usually similar tables,merged into one table. In some cases, headers of concatenated tablesinherit some categorisation from the header of the first table.
3.2 Data Model
The proposed data model captures necessary information for semantic under-standing of tables to facilitate further processing and knowledge gathering. Wehave extended the spreadsheet ontology for tables [7] by adding entities that arenot specific for navigation in screen readers, so it contains information that canaid text mining from tables and visualization.
The model has article, table and cell layers (see Fig. 3), which are arrangedin a tree-like instantiation, with the Article node as the top element, containingthe article information (i.e. title, reference, authors, text) and a list of tables.The article layer also stores where tables are mentioned within the document.

166 N. Milosevic et al.
Fig. 2. Example of a list table (PMC161814)
Fig. 3. Hierarchy of the proposed table model
Caption, footer, order of the table in the document and its structural type(dimensionality of the table, as defined above) are stored in the table layer. Thetable node also contains a list of table’s cells. Finally, in the cell layer, the modelstores the information about each cell including its value, function and positionin the table. In the cell layer, the model also stores information regarding struc-tural references to the navigational cells (headers, stubs and super-rows). Thereferences to navigational cells are set by the ID of the closest cell in the navi-gational area. If navigational cells contain multiple layers, we apply a cascadingstyle of cell referencing, where lower layers (closer to the data cell) referencethe higher order layer (see Fig. 4). In this layer, the model further captures any
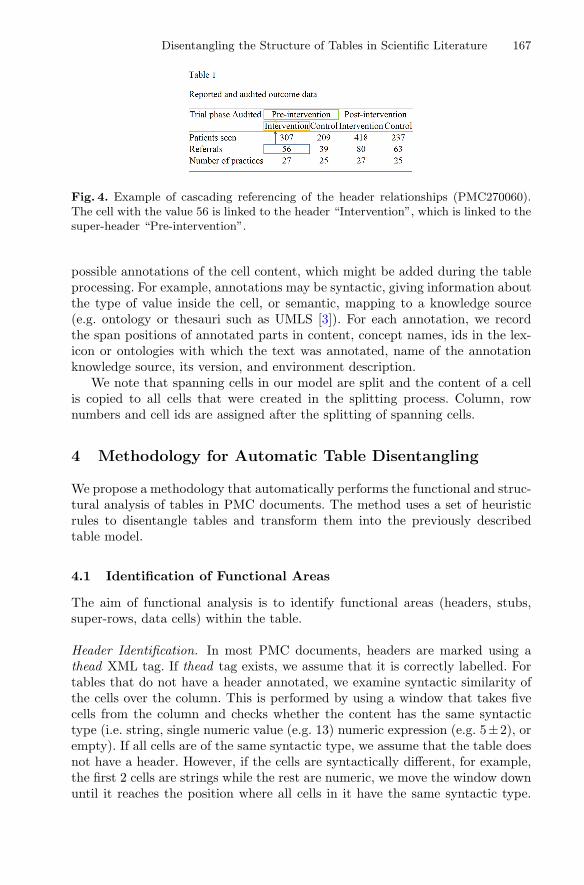
Disentangling the Structure of Tables in Scientific Literature 167
Fig. 4. Example of cascading referencing of the header relationships (PMC270060).The cell with the value 56 is linked to the header “Intervention”, which is linked to thesuper-header “Pre-intervention”.
possible annotations of the cell content, which might be added during the tableprocessing. For example, annotations may be syntactic, giving information aboutthe type of value inside the cell, or semantic, mapping to a knowledge source(e.g. ontology or thesauri such as UMLS [3]). For each annotation, we recordthe span positions of annotated parts in content, concept names, ids in the lex-icon or ontologies with which the text was annotated, name of the annotationknowledge source, its version, and environment description.
We note that spanning cells in our model are split and the content of a cellis copied to all cells that were created in the splitting process. Column, rownumbers and cell ids are assigned after the splitting of spanning cells.
4 Methodology for Automatic Table Disentangling
We propose a methodology that automatically performs the functional and struc-tural analysis of tables in PMC documents. The method uses a set of heuristicrules to disentangle tables and transform them into the previously describedtable model.
4.1 Identification of Functional Areas
The aim of functional analysis is to identify functional areas (headers, stubs,super-rows, data cells) within the table.
Header Identification. In most PMC documents, headers are marked using athead XML tag. If thead tag exists, we assume that it is correctly labelled. Fortables that do not have a header annotated, we examine syntactic similarity ofthe cells over the column. This is performed by using a window that takes fivecells from the column and checks whether the content has the same syntactictype (i.e. string, single numeric value (e.g. 13) numeric expression (e.g. 5±2), orempty). If all cells are of the same syntactic type, we assume that the table doesnot have a header. However, if the cells are syntactically different, for example,the first 2 cells are strings while the rest are numeric, we move the window downuntil it reaches the position where all cells in it have the same syntactic type.

168 N. Milosevic et al.
The cells above the window are marked as header cells. The window size of fivecells is chosen based on experimental experience. We have encountered tablesthat had up to four rows of headers, so the window size needs to be large enoughto capture syntactic type differences. The algorithm then marks as header onlyrows with all cells marked as headers.
Another heuristic for determining header rows is to check whether some ofthe first row cells spans over several columns. If they do, we assume that theheader contains the next rows, until we reach first one with no spanning cells.
Headers in multi-tables are usually placed between horizontal lines. Only thefirst header is usually marked with thead tags. If multiple cells between the lineshave content, these cells are marked as header cells. However, if only one cellhas content, these cells are classified as super-rows.
Stub Identification. Stubs or column headers are usually cells in the left mostcolumn. However, if cells in the left-most columns are row-spanning, the stubcontains the next columns, until the first column with no spanning cells is iden-tified.
Super-row Identification. Super-rows are rows that group and categorise stublabels. They can have multiple layers. In order to recognise super-rows, ourmethod uses the following heuristics:
– A super-row can be presented as cells that span over the whole row. If thesecells have regular content, they are labelled as super-rows.
– A tables may have multiple layers of super-rows. Authors usually present sub-group of relationships with leading blank spaces (indentation) at the beginningof the grouped elements. The number of blank spaces determines the layer ofcategorisation (i.e. the first layer has usually one blank space, the second hastwo, etc.). In other words, indentation level visually structures the super-rowand stub layers. The row with a label that has less blank spaces than the labelsin a stub below, is categorising them, and is therefore considered their super-row. Since there can be multiple levels of super-rows, we used a stack datastructure in order to save the associated super-rows of the currently processedcell.
– In PMC documents, it is usual for spanning cells to be presented as a columnwith multiple cells where only one cell has content (usually the leading one).Rows with only one cell with content are labelled as super-rows.
4.2 Identification of Inter-cell Relationships
Once the functional areas are detected, we further attempt to identify relation-ships between cells. Using the detected functional areas, the method classifiestables into one of the four structural classes (one-dimensional, matrix, super-row,multi-table). This classification is based on a set of rules about the functionalareas of the table. For example, if the table contains multiple headers, it is clas-sified as multi-table. If it contains super-rows it is a super-row table. If table hasonly one dimension, it is a list table. Otherwise, it is matrix table.
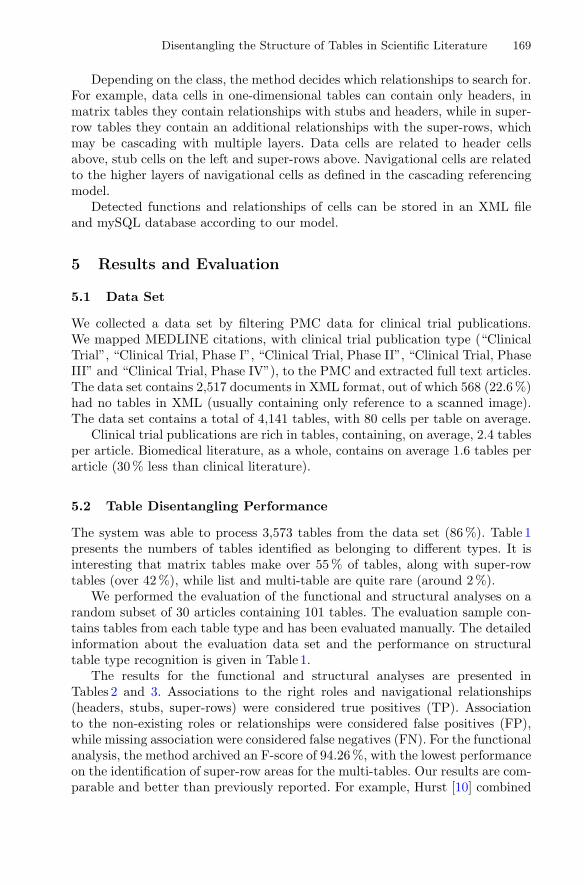
Disentangling the Structure of Tables in Scientific Literature 169
Depending on the class, the method decides which relationships to search for.For example, data cells in one-dimensional tables can contain only headers, inmatrix tables they contain relationships with stubs and headers, while in super-row tables they contain an additional relationships with the super-rows, whichmay be cascading with multiple layers. Data cells are related to header cellsabove, stub cells on the left and super-rows above. Navigational cells are relatedto the higher layers of navigational cells as defined in the cascading referencingmodel.
Detected functions and relationships of cells can be stored in an XML fileand mySQL database according to our model.
5 Results and Evaluation
5.1 Data Set
We collected a data set by filtering PMC data for clinical trial publications.We mapped MEDLINE citations, with clinical trial publication type (“ClinicalTrial”, “Clinical Trial, Phase I”, “Clinical Trial, Phase II”, “Clinical Trial, PhaseIII” and “Clinical Trial, Phase IV”), to the PMC and extracted full text articles.The data set contains 2,517 documents in XML format, out of which 568 (22.6 %)had no tables in XML (usually containing only reference to a scanned image).The data set contains a total of 4,141 tables, with 80 cells per table on average.
Clinical trial publications are rich in tables, containing, on average, 2.4 tablesper article. Biomedical literature, as a whole, contains on average 1.6 tables perarticle (30 % less than clinical literature).
5.2 Table Disentangling Performance
The system was able to process 3,573 tables from the data set (86 %). Table 1presents the numbers of tables identified as belonging to different types. It isinteresting that matrix tables make over 55 % of tables, along with super-rowtables (over 42 %), while list and multi-table are quite rare (around 2 %).
We performed the evaluation of the functional and structural analyses on arandom subset of 30 articles containing 101 tables. The evaluation sample con-tains tables from each table type and has been evaluated manually. The detailedinformation about the evaluation data set and the performance on structuraltable type recognition is given in Table 1.
The results for the functional and structural analyses are presented inTables 2 and 3. Associations to the right roles and navigational relationships(headers, stubs, super-rows) were considered true positives (TP). Associationto the non-existing roles or relationships were considered false positives (FP),while missing association were considered false negatives (FN). For the functionalanalysis, the method archived an F-score of 94.26 %, with the lowest performanceon the identification of super-row areas for the multi-tables. Our results are com-parable and better than previously reported. For example, Hurst [10] combined
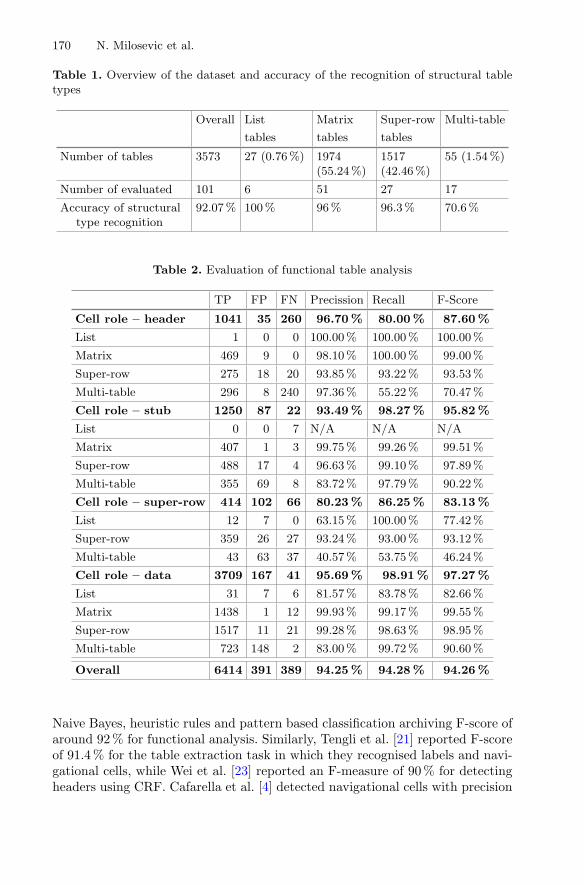
170 N. Milosevic et al.
Table 1. Overview of the dataset and accuracy of the recognition of structural tabletypes
Overall List Matrix Super-row Multi-table
tables tables tables
Number of tables 3573 27 (0.76 %) 1974(55.24 %)
1517(42.46 %)
55 (1.54 %)
Number of evaluated 101 6 51 27 17
Accuracy of structuraltype recognition
92.07 % 100 % 96% 96.3 % 70.6 %
Table 2. Evaluation of functional table analysis
TP FP FN Precission Recall F-Score
Cell role – header 1041 35 260 96.70% 80.00% 87.60%
List 1 0 0 100.00 % 100.00 % 100.00 %
Matrix 469 9 0 98.10 % 100.00 % 99.00 %
Super-row 275 18 20 93.85 % 93.22 % 93.53 %
Multi-table 296 8 240 97.36 % 55.22 % 70.47 %
Cell role – stub 1250 87 22 93.49% 98.27% 95.82%
List 0 0 7 N/A N/A N/A
Matrix 407 1 3 99.75 % 99.26 % 99.51 %
Super-row 488 17 4 96.63 % 99.10 % 97.89 %
Multi-table 355 69 8 83.72 % 97.79 % 90.22 %
Cell role – super-row 414 102 66 80.23% 86.25% 83.13%
List 12 7 0 63.15 % 100.00 % 77.42 %
Super-row 359 26 27 93.24 % 93.00 % 93.12 %
Multi-table 43 63 37 40.57 % 53.75 % 46.24 %
Cell role – data 3709 167 41 95.69% 98.91% 97.27%
List 31 7 6 81.57 % 83.78 % 82.66 %
Matrix 1438 1 12 99.93 % 99.17 % 99.55 %
Super-row 1517 11 21 99.28 % 98.63 % 98.95 %
Multi-table 723 148 2 83.00 % 99.72 % 90.60 %
Overall 6414 391 389 94.25% 94.28% 94.26%
Naive Bayes, heuristic rules and pattern based classification archiving F-score ofaround 92 % for functional analysis. Similarly, Tengli et al. [21] reported F-scoreof 91.4 % for the table extraction task in which they recognised labels and navi-gational cells, while Wei et al. [23] reported an F-measure of 90 % for detectingheaders using CRF. Cafarella et al. [4] detected navigational cells with precision

Disentangling the Structure of Tables in Scientific Literature 171
Table 3. Evaluation of structural table analysis
TP FP FN Precission Recall F-Score
References – header 5402 768 47 87.55% 99.13% 92.98%
List 7 0 0 100.00% 100.00 % 100.00 %
Matrix 2076 15 3 99.30 % 99.85 % 99.60 %
Super-row 2501 61 6 97.61 % 98.63 % 98.95 %
Multi-table 818 692 38 54.17 % 95.56 % 69.15 %
References – stub 4982 147 0 97.10% 100.00% 98.55%
Matrix 1788 14 0 99.22 % 100.00 % 99.61 %
Super-row 2057 95 0 95.58 % 100.00 % 97.74 %
Multi-table 1137 38 0 96.70 % 100.00 % 98.35 %
References – Super-row 1663 78 269 95.52% 86.07% 90.55%
List 29 0 6 100.00% 82.85 % 90.62 %
Super-row 1456 66 215 95.66 % 87.13 % 91.12 %
Multi-table 178 12 42 93.68 % 80.91 % 86.82 %
Overall 12047 993 316 92.38% 97.44% 94.84%
and recall not exceeding 89 % and Jung et al. [12] reported 82.1 % accuracy inextracting table headers.
For the task of structural analysis, the system achieved an F-score of 94.84 %.For comparison, Hurst’s system performed with 81.21 % recall and 85.14 % preci-sion. It is also important to note that input data in Hurst’s system were perfectlyformatted, while the PMC data is often not. To the best of our knowledge, thereis no other system that attempted to performing the combined task of functionaland structural table analysis.
During the error analysis, we identified misleading mark-up and complextables unique to a specific paper in the evaluation set as the main reasons forerrors. In PMC documents, XML mark-up features such as spanning cells, headtags, and breaking lines are often misused to make tables look visually appealing.Although we have applied some heuristics that can overcome some of the issues,some of the misleading XML labelling remains challenging. Furthermore, thereare tables that are not only complex in structure, but their structure is uniqueto specific paper, and thus difficult to generalise. Our method made significantnumber of errors on multi-tables, since it is challenging to determine whether arow is a new header or just an emphasized row or super-row just by analysingXML structure. Errors in wrongly recognizing headers or super-rows cause highamount of false links in structural analysis, since relationships in the subsequentrows will be wrongly annotated. However, multi-tables are relatively rare, so thisdid not heavily affect the overall results.
172 N. Milosevic et al.
6 Conclusion
In this paper we have presented a model to computationally represent tablesfound in scientific literature. We also presented a domain-independent method-ology to disentangle tables and add annotations about functional areas and rela-tionships between table cells. The evaluation has shown that the table struc-ture can be identified with high F-scores (above 94 %) which is encouraging.Even though we performed evaluation on the PMC clinical trial documents,the proposed approach can be extended to HTML or any other XML-like for-mat. The Implementation of the method is available at https://github.com/nikolamilosevic86/TableAnnotator.
Although the results for these steps are encouraging, there are still a numberof challenges in table mining, mainly in the semantic analysis of the cell contentand the methods to query and retrieve table data.
The proposed model can serve as a basis to support applications in informa-tion retrieval, information extraction and question answering. We have alreadyperformed several information extraction experiments [15] and in the future weare planning to develop a general methodology for information extraction fromtables in biomedical literature that uses the presented approach as its basis.Our methodology can be also used as a basis for semantic analysis and query-ing of tables. In addition, the model can aid systems in accessibility domain.For example, screen readers for visually impaired people could enable easy nav-igation through tables by providing information about cell’s relationships andfunctions.
Acknowledgments. This research is funded by a doctoral funding grant from theEngineering and Physical Sciences Research Council (EPSRC) and AstraZeneca Ltd.
References
1. Alley, M.: The Craft of Scientific Writing. Springer Science & Business Media, NewYork (1996)
2. Attwood, T.K., Kell, D.B., McDermott, P., Marsh, J., Pettifer, S., Thorne, D.:Utopia documents: linking scholarly literature with research data. Bioinformatics26(18), i568–i574 (2010)
3. Bodenreider, O.: The unified medical language system (UMLS): integrating bio-medical terminology. Nucleic Acids Res. 32(Suppl 1), D267–D270 (2004)
4. Cafarella, M.J., Halevy, A., Wang, D.Z., Wu, E., Zhang, Y.: Webtables: exploringthe power of tables on the web. Proc. VLDB Endowment 1(1), 538–549 (2008)
5. Chavan, M.M., Shirgave, S.: A methodology for extracting head contents frommeaningful tables in web pages. In: 2011 International Conference on Communi-cation Systems and Network Technologies (CSNT), pp. 272–277. IEEE (2011)
6. Divoli, A., Wooldridge, M.A., Hearst, M.A.: Full text and figure display improvesbioscience literature search. PloS One 5(4), e9619 (2010)
7. Doush, I.A., Pontelli, E.: Non-visual navigation of spreadsheets. Univ. Access Inf.Soc. 12(2), 143–159 (2013)
Disentangling the Structure of Tables in Scientific Literature 173
8. Hearst, M.A., Divoli, A., Guturu, H., Ksikes, A., Nakov, P., Wooldridge, M.A.,Ye, J.: Biotext search engine: beyond abstract search. Bioinformatics 23(16),2196–2197 (2007)
9. Hu, J., Kashi, R., Lopresti, D., Wilfong, G.: A system for understanding andreformulating tables. In: Proceedings of the Fourth IAPR International Workshopon Document Analysis Systems, pp. 361–372 (2000)
10. Hurst, M.F.: The interpretation of tables in texts. Ph.D. Thesis, University ofEdinburgh (2000)
11. Jensen, L.J., Saric, J., Bork, P.: Literature mining for the biologist: from informa-tion retrieval to biological discovery. Nat. Rev. Genet. 7(2), 119–129 (2006)
12. Jung, S.W., Kwon, H.C.: A scalable hybrid approach for extracting head compo-nents from web tables. IEEE Trans. Knowl. Data Eng. 18(2), 174–187 (2006)
13. Kieninger, T., Dengel, A.R.: The T-Recs table recognition and analysis system. In:Lee, S.-W., Nakano, Y. (eds.) DAS 1998. LNCS, vol. 1655, pp. 255–270. Springer,Heidelberg (1999)
14. Limaye, G., Sarawagi, S., Chakrabarti, S.: Annotating and searching web tablesusing entities, types and relationships. Proc. VLDB Endowment 3(1–2), 1338–1347(2010)
15. Milosevic, N., Gregson, C., Hernandez, R., Nenadic, G.: Extracting patient datafrom tables in clinical literature: Case study on extraction of BMI, weight andnumber of patients. In: Proceedings of the 9th International Joint Conferenceon Biomedical Engineering Systems and Technologies (BIOSTEC 2016), vol. 5,pp. 223–228 (2016)
16. Mulwad, V., Finin, T., Syed, Z., Joshi, A.: Using linked data to interpret tables.In: Proceedings of the First International Conference on Consuming Linked Data,vol. 665, pp. 109–120. CEUR-WS.org (2010)
17. Ng, H.T., Lim, C.Y., Koo, J.L.T.: Learning to recognize tables in free text. In:Proceedings of the 37th Annual Meeting of the Association for ComputationalLinguistics on Computational Linguistics, pp. 443–450. ACL (1999)
18. Quercini, G., Reynaud, C.: Entity discovery and annotation in tables. In: Pro-ceedings of the 16th International Conference on Extending Database Technology,pp. 693–704. ACM (2013)
19. Son, J.W., Lee, J.A., Park, S.B., Song, H.J., Lee, S.J., Park, S.Y.: Discriminatingmeaningful web tables from decorative tables using a composite kernel. In: 2008IEEE/WIC/ACM International Conference on Web Intelligence and IntelligentAgent Technology, WI-IAT 2008, vol. 1, pp. 368–371. IEEE (2008)
20. Spasic, I., Livsey, J., Keane, J.A., Nenadic, G.: Text mining of cancer-related infor-mation: review of current status and future directions. Int. J. Med. Inf. 83(9),605–623 (2014)
21. Tengli, A., Yang, Y., Ma, N.L.: Learning table extraction from examples. In:Proceedings of the 20th International Conference on Computational Linguistics,pp. 987–994. ACL (2004)
22. Wang, Y., Hu, J.: A machine learning based approach for table detection on theweb. In: Proceedings of the 11th International Conference on World Wide Web,pp. 242–250. ACM (2002)
23. Wei, X., Croft, B., McCallum, A.: Table extraction for answer retrieval. Inf.Retrieval 9(5), 589–611 (2006)
24. Wong, W., Martinez, D., Cavedon, L.: Extraction of named entities from tables ingene mutation literature. In: Proceedings of the Workshop on Current Trends inBiomedical Natural Language Processing, pp. 46–54. ACL (2009)

174 N. Milosevic et al.
25. Yesilada, Y., Stevens, R., Goble, C., Hussein, S.: Rendering tables in audio: theinteraction of structure and reading styles. In: ACM SIGACCESS Accessibilityand Computing, pp. 16–23. No. 77–78. ACM (2004)
26. Yildiz, B., Kaiser, K., Miksch, S.: pdf2table: a method to extract table informationfrom pdf files. In: IICAI, pp. 1773–1785 (2005)
27. Zhu, F., Patumcharoenpol, P., Zhang, C., Yang, Y., Chan, J., Meechai, A.,Vongsangnak, W., Shen, B.: Biomedical text mining and its applications in cancerresearch. J. Biomed. Inf. 46(2), 200–211 (2013)

Extracting and Representing Higher OrderPredicate Relations between Concepts
Sanjay Chatterji(B), Nitish Varshney, Parnab Kumar Chanda, Vibhor Mittal,and Bhavi Bhagwan Jagwani
Samsung R&D Institute India, Bangalore, Indiasanjay.chatt,nitish.var,p.chanda,vibhor.m21,[email protected]
Abstract. In a text, two concepts can hold either direct or higher orderrelationship where function of some concepts is considered as anotherconcept. Essentially, we require a mechanism to capture complex associ-ations between concepts. Keeping this in view, we propose a knowledgerepresentation scheme which is flexible enough to capture any order ofassociations between concepts in factual as well as non-factual sentences.We utilize a five-tuple representation scheme to capture associationsbetween concepts and based on our evaluation strategy we found thatby this we are able to represent 90.7 % of the concept associations cor-rectly. This is superior to existing pattern based methods. A use case inthe domain of content retrieval has also been evaluated which has shownto retrieve more accurate content using our knowledge representationscheme thereby proving the effectiveness of our approach.
1 Introduction
Knowledge representation is a well researched topic. Popular methods of knowl-edge representations include predicate logic (propositional or zero-order, first-order, higher order), semantic network and frame. Predicate logic is very pop-ular when we wish to capture the expressiveness of a natural language textranging from less expressive (propositional) to more expressive (higher order)logic. Predicate logic is useful when we wish to capture concepts in terms offunctions and arguments. In higher order predicate logic, the arguments canthemselves be functions(predicates) thereby allowing us to capture more com-plex expressions. Semantic network is a graphical way of representing conceptsand the relationship between concepts. This is a very intuitive way of knowledgerepresentation and is almost similar to how humans tend to store, retrieve andmanipulate knowledge. In semantic network, the associations between conceptsare arbitrary: without contextual information. It is hard to interpret without acontext. Consider the text: The ideal voltmeter is a potentiometer. From here,semantic network captures the relation as (potentiometer is-A voltmeter). Sim-ilarly, from other texts it may find that (Micro-ammeter is-A voltmeter) and(Electrostatic-voltmeter is-A voltmeter). Using these relations we cannot inferwhat is an “ideal” voltmeter unless the context ideal is taken into considerationwhile capturing the relations.c© Springer International Publishing Switzerland 2016E. Metais et al. (Eds.): NLDB 2016, LNCS 9612, pp. 175–186, 2016.DOI: 10.1007/978-3-319-41754-7 15

176 S. Chatterji et al.
To this end, we propose a knowledge representation scheme that utilizes theadvantage of both higher order predicate logic and semantic network. With thiswe can represent arbitrary relation between concepts using complex terms. AComplex term is defined a unit of knowledge which encapsulates one or moreconcept terms and their direct or hierarchical relations or functions. For exam-ple, the complex term “The ideal voltmeter is a potentiometer” holds a binaryrelation between a concept term and a function of another concept term, whichcan be represented as is-A(potentiometer, ideal(voltmeter)). To capture thesecomplex relationships we have introduced a five-tuple knowledge representationscheme that gives us enough flexibility to capture from the simplest relationsto complex higher order relations or functions between concept terms. Usingthese higher order functions, we are able to derive more relations by inferencing.Again, these representations allow us to capture the nonfactual or conditionalrelations that exist in a sentence. This can be used in answering the nonfactualquestions.
Our work is presented as follows. In Sect. 2, we discuss some related work. InSect. 3, we present the system architecture and describe the methodology whichtakes natural language text as input, generates tuples and stores in a relationaldatabase. Additionally, we also use clustering to normalize the extracted rela-tions that help us in inferring relations under similar context. Further, we alsopresent a mechanism for visualizing the relationship between concepts followinga hierarchical graphical structure. In Sect. 4, we describe the evaluation strategyfor our representation scheme. We present the accuracy of our tuple representa-tion and also evaluate a use case in the domain of content retrieval for educationtext materials utilizing our proposed knowledge representation scheme.
2 Related Work
Semantic roles in different parts of a sentence are annotated by the Seman-tic Role Labeling (SRL) tools. The LTH-SRL of [1] is a SRL tool that givespredicate/argument structure of input sentences based on NomBank [2] andPropBank [3] semantic role structures. Given an input sentence this tool returnsthe POS and lemma of each word, existing dependency relations between words,verbal predicates with their arguments (as annotated in PropBank) and nominalpredicates with their arguments (as annotated in NomBank).
There are four general schemes for representing knowledge, namely, logic,semantic network, production rules and frames. There are a few comparativestudies on different representation schemes [4,5]. Each of these schemes has spe-cific usage in some particular application. Some uses of different representationschemes are discussed by Clark [6]. Theoretically, these four knowledge repre-sentation schemes are equivalent. Anything which can be represented by onescheme can also be represented by another scheme.
Logical representation schemes can be arranged in terms of their expressive-ness. Propositional logic is the most restrictive logical representation scheme[7] which is able to represent sentences which can either be true or false.

Extracting and Representing Higher Order 177
This scheme uses propositions, connectives, brackets and True/False symbols andthe syntactic rules of the language. First order predicate logic is more expressiveas along with symbols and rules of propositional logic it also allows constants,variables, predicates, functions, quantifiers and semantic rules of the language[8]. Ali and Khan [5] have given first order predicate logic representations ofdifferent syntactic relations of linguistic phrases. Their algorithm splits the sen-tences into phrases and based on the patterns of the phrase categories and someother factors they have identified 36 different types of representations. They areable to capture 80 % of sentences in these representation types.
Logical relations between concepts can best be represented graphically usingOntology. Uschold and King [9] and Gomez and Perez [10] gave a skeletonmethodology for building ontology. These techniques are then extended andrefined in multiple ways [11–13]. The Suggested Upper Merged Ontology [14]is the largest formal ontology in existence today. Though, it began as just anupper level ontology encoded in first order logic but subsequently its logic hasbeen expanded to also include some higher-order elements of the logical relations.
3 Overview of the Work with System Architecture
In simple natural text, Ali and Khan [5] have manually identified different pat-terns of grammatical categories of words and phrases. In complex natural text,each argument of a relation may have a hierarchy of such patterns. It is verydifficult, if not impossible, to manually create all such hierarchy of patterns incomplex natural text. In this paper, we are trying to extract all levels of syntacticand semantic relations semi-automatically and represent them using a commonhigher order predicate logic knowledge representation framework. We use theterm relation for indicating both function and relation to make it consistent.Such relations can be unary function of a concept term, binary relation betweentwo concept terms or hierarchy of functions and relations of concept terms ofany depth.
There are several steps in this task. The first step is to collect documentsof a domain and run Semantic and Syntactic Role Labeling (SSRL) tools. Theconcept terms are identified using the index of the books of that domain. Then,we extract different levels of relations between the concept terms and filter outthe relations where no concept term is present. The filtered relations are calledcomplex terms.
We design a unique representation scheme for representing such hierarchy ofrelations between concept terms in a five-tuple format and store them in a data-base. The relations in the database are clustered into groups such that similartypes of relations are in same group. We store the cluster information for eachrelation in the database. We have also represented these higher order predicatelogic relationships using our higher order graphical network. The system archi-tecture is shown in Fig. 1. Each step of the system is described in details in thefollowing subsections.

178 S. Chatterji et al.
Fig. 1. System architecture for extracting and representing higher order predicate logic.
3.1 Building Syntactic and Semantic Role Labeling (SSRL) Tools
The LTH SRL parser [1] identifies the predicate relations and their arguments.But, each predicate relation is returned as an independent relation. Similarly, thesyntactic parser also identifies the relations between the words. Olney et al. [15]have used the LTH SRL and syntactic parser outputs for identifying the relationsbetween the concepts and stored them in ConceptMap. They have consideredall the predicate relations given by LTH SRL parser and extracted is-a, type-ofand location relations from syntactic parser. They have also represented theserelations independently, as the ConceptNet does not have the power to representhierarchical relations. We have used this technique to extract the same set ofpredicate relations and their arguments.
Hearst [16] has written some grammatical rules for identifying the hyponymrelations between the phrases. They have identified six lexico-syntactic patternsthat capture all possible hyponymy relations in simple English phrases. We haveextracted these relations and combined them with the is-a relation. We have alsocombined the prepositions and other words (upto a certain distance) followingthe relation as suggested by [17].
Most of these extractors extract relations from factual sentences. There isscope in identifying more rules for extracting relations especially from non-factual sentences. By observing these gaps, we have implemented a few rulesfor extracting If-Then relation, Mathematical relation and Of-Nmod relation.The If-Then relation is extracted from the compound sentences with the follow-ing patterns. Here, X and Y should be complete phrases which are related bythe If-Then relation.

Extracting and Representing Higher Order 179
Patterns of If-Then relation:
– If X Then Y– If X, Y– When X, Y– Y when X
The Mathematical relations include proportional, directly proportional,inversely proportional, reverse, ratio, etc. Such relations are extracted from sim-ple sentences with the following patterns. Here, X and Y are related by thecorresponding Mathematical relation.
Patterns of Mathematical relation:
– X is proportional/directly proportional/inversely proportional to Y– X is reverse of Y– ratio of X and Y– X divided by Y
We have also created rules for extracting OF and Nmod (Of-Nmod) relations.The corresponding patterns are given below. The Nmod relation is based onthe occurrence of the Nominal MODifier (NMOD) dependency relation betweenthe concepts. We have shown the dependency relation in angle bracket. In thefollowing patterns, X, Y and Z are nouns or noun phrases. The phrase withoutconcept term is the relation of the phrases containing the concept term.
Patterns of Of-Nmod relation:
– X of Y– X of Y and Z– X <NMOD> Y
3.2 Collecting Hierarchical Relations from SSRL Tools
Now, to get the hierarchy of relations, we have considered the starting and endingpoints of the arguments of each relation. If a relation (R1) and all its argumentsare contained in an argument of another relation (R2) then we consider R1 isinside R2. We combine each such pair or relations, iteratively. One examplesentence containing three predicate relations is shown below. First the relations‘call’ and ‘IN’ are combined and then the combined relation is combined with‘word’ and ‘derive from’.
Example 1:
– Input Sentence: The word magnet is derived from an island in Greece calledMagnesia.
– Predicate and Arguments given by LTH-SRL: derive from(word magnet,island in Greece called Magnesia), call(island in Greece, Magnesia)
– Predicate and Arguments extracted using [15]: IN(island, Greece)– Predicate and Arguments extracted using our NMOD rule: word(magnet)

180 S. Chatterji et al.
– Hierarchical relation combining derive from and call: derive from(word mag-net, call(island in Greece, Magnesia))
– Hierarchical relation combining derive from, call and word: derive from(word(magnet), call(island in Greece, Magnesia))
– Hierarchical relation combining derive from, call, word and IN: derive from(word(magnet), call(IN(island, Greece), Magnesia))
3.3 Representing Hierarchical Relations Using Five-Tuple andStoring in Database
In complex natural text, a complex term is related to another complex term by arelation. We represent such knowledge in the database using five-tuple (C1, T1,C2, T2, R), where C1 and C2 are complex terms of type T1 and T2, respectively.R is the relation between the complex terms. The type of the complex term can bea concept term (T = 0) or a unary (T=1) or binary (T=2) relation of complexterms. We use underscore ( ) where the corresponding field is not applicable.Each five-tuple itself is a complex term.
In the five tuple representation, the innermost complex term is representedfirst. We attach a global unique identifier to this complex term as a reference.This unique identifier is reused across the five-tuples where the particular com-plex term is used. The complex term “Modulus of elasticity is called Young’sModulus” is represented by the following five-tuples.
4. (elasticity, 0, , , Modulus)5. (4, 1, Young’s Modulus, 0, call)
The fourth five-tuple means ‘Modulus’ is the unary relation of the conceptterm ‘elasticity’. The fifth five-tuple means ‘call’ is the binary relation of 4th
complex term and the concept term ‘Young’s Modulus’. Similarly, the complexsentence of Example 1 is represented by the following five-tuples.
6. (magnet, 0, , , word)7. (island, 0, Greece, 0, IN)8. (7, 2, Magnesia, 0, call)9. (6, 1, 8, 2, derive from)
The sixth and seventh five-tuples mean that the ‘word’ is the unary relationof the concept term ‘magnet’ and the ‘IN’ is the binary relation of the conceptterms ‘island’ and ‘Greece’, respectively. The eighth five-tuple means ‘call’ isthe binary relation of 7th complex term and the concept term ‘Magnesia’. Theninth five-tuple means ‘derive from’ is the binary relation of 6th and 8th complexterms.
3.4 Relation Clustering
Consider a factual statement “Ribosome is responsible for protein synthesisin cells”. With the use of the SSRL tool, we are able to capture a relationrepresented as responsible(Ribosome, IN(protein synthesis, cells)). Using this

Extracting and Representing Higher Order 181
representation, we should be easily able to reason with queries which ask for therole, function or purpose of Ribosomes. For this purpose, we should interpretresponsible, role, function and purpose under same type. We can achieve this byclustering the contextually similar relations stored in the database.
Olney et al. [15] have manually clustered the extracted relations from Biologybook and manually mapped the clusters with a fixed set of relation names. Theydid not consider goal driven relationships and logical patterns as these are notappropriate for the biology domain. But, it is not possible to manually judge thetype of logical relations. We have discussed below the steps of a semi-automaticprocess we have followed for identifying the types of logical relations stored inthe database.
We have first collected the pre-trained vectors trained on a part of GoogleNews dataset. The model contains 300-dimensional vectors for 3 million wordsand phrases. With the help of this model, we have calculated the vector foreach relation word using word2vec tool1. Then, the cosine similarities of thevectors for each pair of logical relation words are used to measure the similarityfor clustering the logical relations. We have used the WEKA tool [18] for thisclustering implementation.
We further expanded each cluster using Roget’s thesaurus2 to cover wordsthat may not be seen in the corpus vocabulary. For an input relation word, whichmay not still exist in the relation clusters we use the following heuristic to findthe semantically closest cluster. We compute the average vector for each clusterand the vector of the unseen relation word. We assign the unseen relation wordto the cluster whose average vector has the highest cosine similarity with thevector of the unseen relation word.
3.5 Graphical Network Representation
We have also designed a scheme for representing the higher order predicate rela-tionships graphically. There are two levels of representation. At the first level,similar to the ConceptNet representation scheme [19], we have considered con-cept terms as nodes. When there is a logical relation between two terms then wegive an edge between the corresponding concepts. The first level representationof the sentence in Example 1 is shown in Fig. 2.
There can be multiple types of relations between concept terms. We arenot able to show the exact relation at the first level graph. The exact logicalrelation between the concepts is represented at the second level. The secondlevel graphical representation of the sentence in Example 1 is shown Fig. 3. Here,White nodes indicate concept terms, Gray nodes indicate unary relation andBlack nodes indicate binary relation.
1 http://deeplearning4j.org/word2vec.html.2 http://www.thesaurus.com/.

182 S. Chatterji et al.
Fig. 2. First level graphical representation of the sentence in Example 1.
Fig. 3. Second level graphical representation of the sentence in Example 1.
4 Evaluation
In this section we will first discuss the strategy we follow to evaluate the effec-tiveness of our work. It will also help in understanding the real need of suchrepresentation scheme. We have discussed this strategy using three real exam-ple statements, three questions and their five-tuple representations. Finally, theactual results are displayed.
4.1 Evaluation Strategy
The above stated knowledge representation mechanism can best be used in sug-gesting content for a question posed by a student. Our evaluation strategy isbased on this usecase. Consider the following three statements.
– Statement 1: Glass is made up of silica.– Statement 2: When glass is heated it melts.– Statement 3: When glass falls it breaks.

Extracting and Representing Higher Order 183
Now, consider the following questions.
– Question 1: What is the temperature at which glass will melt?– Question 2: What happens when you heat glass?– Question 3: What will happen if glass is warmed up at high pressure?
If we represent the above three statements by the simple two-tuple represen-tations (glass, silica), (glass, melt) and (glass, break) then given any question on‘glass’ the content retrieval engine based on this knowledge base will return allthree statements as output. So, it is clear that we have to take relation namesinto consideration, for reasoning.
Now, suppose we represent them using triplets make(glass, silica), heat(glass,melt) and fall(glass, break) as is usually done in ConceptNet and Ontology.Then for each of the first two questions which are represented as the triplets?(glass,melt) and heat(glass, ?), respectively, the second statement will begiven as a relevant content. For the third question which is represented aswarm up(glass, ?) it will not be able to suggest any content. This is because,warm up and heat did not match.
Consider, [S 10 - S 16] proposed five-tuple representations for the above threestatements. These numbers are preceded by S to denote statement. The abovethree questions are also processed via the same pipeline as that of the text andsimilar five-tuple representations were generated which are shown using [Q 17 -Q 22]. These numbers are preceded by Q to denote question. Here, the questionmark (?) denotes an unknown concept which needs to be inferred following ourhierarchy of relations present in our knowledge base.
S 10. (glass, 0, silica, 0, make)S 11. (glass, 0, , , heat)S 12. (glass, 0, , , melt)S 13. (11, 1, 12, 1, if-then)
heat(glass) ==> melt(glass)S 14. (glass, 0, , , fall)S 15. (glass, 0, , , break)S 16. (14, 1, 15, 1, if-then)
Q 17. (glass, 0, ?, , temperature)Q 18. (17, 2, 12, 1, if-then)Q 19. (11, 1, ?, , if-then)Q 20. (pressure, 0, , , high)Q 21. (glass, 0, 20, 1, warm)Q 22. (21, 2, ?, , if-then)
Using these five-tuple representations we are able to return some statementfor a question. For example, the question five-tuple Q19 has a direct match withthe statement five-tuple S13. Therefore, Statement 2 is returned as the relevantcontent for the Question 2.
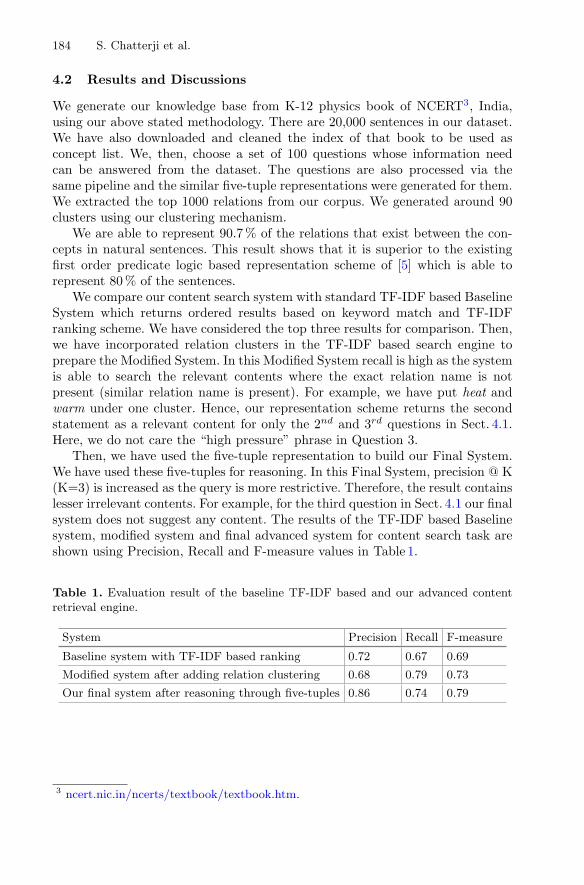
184 S. Chatterji et al.
4.2 Results and Discussions
We generate our knowledge base from K-12 physics book of NCERT3, India,using our above stated methodology. There are 20,000 sentences in our dataset.We have also downloaded and cleaned the index of that book to be used asconcept list. We, then, choose a set of 100 questions whose information needcan be answered from the dataset. The questions are also processed via thesame pipeline and the similar five-tuple representations were generated for them.We extracted the top 1000 relations from our corpus. We generated around 90clusters using our clustering mechanism.
We are able to represent 90.7 % of the relations that exist between the con-cepts in natural sentences. This result shows that it is superior to the existingfirst order predicate logic based representation scheme of [5] which is able torepresent 80 % of the sentences.
We compare our content search system with standard TF-IDF based BaselineSystem which returns ordered results based on keyword match and TF-IDFranking scheme. We have considered the top three results for comparison. Then,we have incorporated relation clusters in the TF-IDF based search engine toprepare the Modified System. In this Modified System recall is high as the systemis able to search the relevant contents where the exact relation name is notpresent (similar relation name is present). For example, we have put heat andwarm under one cluster. Hence, our representation scheme returns the secondstatement as a relevant content for only the 2nd and 3rd questions in Sect. 4.1.Here, we do not care the “high pressure” phrase in Question 3.
Then, we have used the five-tuple representation to build our Final System.We have used these five-tuples for reasoning. In this Final System, precision @ K(K=3) is increased as the query is more restrictive. Therefore, the result containslesser irrelevant contents. For example, for the third question in Sect. 4.1 our finalsystem does not suggest any content. The results of the TF-IDF based Baselinesystem, modified system and final advanced system for content search task areshown using Precision, Recall and F-measure values in Table 1.
Table 1. Evaluation result of the baseline TF-IDF based and our advanced contentretrieval engine.
System Precision Recall F-measure
Baseline system with TF-IDF based ranking 0.72 0.67 0.69
Modified system after adding relation clustering 0.68 0.79 0.73
Our final system after reasoning through five-tuples 0.86 0.74 0.79
3 ncert.nic.in/ncerts/textbook/textbook.htm.

Extracting and Representing Higher Order 185
5 Conclusion
In this paper, we have presented a knowledge representation scheme for capturinghigher order relations between concepts. We have developed an approach wherewe use syntactic and semantic analysis to extract such higher order relations.For visual interpretation of the complex associations between concepts, we havepresented a hierarchical graphical structure. Finally, we have demonstrated theeffectiveness of our representation scheme by evaluating a use case in the domainof content retrieval for education materials.
The future research work is focused on the following fields: (1) Increasingthe set of rules to extract more relations (2) Exploring the possibility to extendthe use case from trivial content retrieval to more focused question-answeringsystem.
Acknowledgments. This research was supported by Samsung R & D Institute India -Bangalore. We thank our colleagues Mr. Tripun Goel, Mr. Krishnamraju MuraliVenkata Mutyala, Mr. Chandragouda Patil, Mr. Ramachandran Narasimhamurthy,Mr. Srinidhi Nirgunda Seshadri, Dr. Shankar M. Venkatesan for providing insight andexpertise that greatly assisted the research. We thank them for comments to improvethe manuscript.
References
1. Johansson, R., Nugues, P.M.: Dependency-based syntactic-semantic analysis withPropBank and NomBank. In: Proceedings of CoNNL, pp. 183–187 (2008)
2. Meyers, A., Reeves, R., Macleod, C., Szekely, R., Zielinska, V., Young, B.,Grishman, R.: The nombank project: an interim report. In: Meyers, A. (ed.) HLT-NAACL 2004 Workshop: Frontiers in Corpus Annotation, pp. 24–31. Associationfor Computational Linguistics, Boston, Massachusetts (2004)
3. Palmer, M., Gildea, D., Kingsbury, P.: The proposition bank: an annotated corpusof semantic roles. Comput. Linguist. 31, 71–106 (2005)
4. Colton, S.: Knowledge representation (2007). http://tinyurl.com/gozhw5t.Accessed 21 Feb 2016
5. Ali, A., Khan, M.A.: Selecting predicate logic for knowledge representation by com-parative study of knowledge representation schemes. In: International Conferenceon Emerging Technologies, ICET 2009, pp. 23–28 (2009)
6. Clark, P.: Knowledge representation in machine learning. Mach. Hum. Learn. 35–49(1989)
7. Brachman, R.J., Levesque, H.J., Reiter, R.: Knowledge Representation. MIT Press,Cambridge (1992)
8. Mylopoulos, J.: An overview of knowledge representation. SIGART Bull. 5–12(1980)
9. Uschold, M., King, M.: Towards a methodology for building ontologies. Citeseer(1995)
10. Gmez-Prez, A., Fernndez-Lpez, M., de Vincente, A.: Towards a method to concep-tualize domain ontologies. In: Proceedings of ECAI-1996 Workshop on OntologicalEngineering (1996)

186 S. Chatterji et al.
11. Uschold, M.: Converting an informal ontology into ontolingua: some experiences.Technical report, University of Edinburgh Artificial Intelligence Applications Insti-tute AIAI TR (1996)
12. Uschold, M.: Building ontologies: towards a unified methodology. Technical report,University of Edinburgh Artificial Intelligence Applications Institute AIAI TR(1996)
13. Fernndez-Lpez, M., Gmez-Prez, A., Juristo, N.: Methontology: from ontologicalart towards ontological engineering. In: Proceedings of Symposium on OntologicalEngineering of AAAI (1997)
14. Pease, A., Niles, I., Li, J.: The suggested upper merged ontology: a large ontologyfor the semantic web and its applications. In: Working Notes of the AAAI-2002Workshop on Ontologies and the Semantic Web, vol. 28 (2002)
15. Olney, A.M., Cade, W.L., Williams, C.: Generating concept map exercises fromtextbooks. In: Proceedings of the 6th Workshop on Innovative Use of NLP forBuilding Educational Applications, IUNLPBEA 2011, pp. 111–119. Associationfor Computational Linguistics, Stroudsburg (2011)
16. Hearst, M.A.: Automatic acquisition of hyponyms from large text corpora. In:Proceedings of the 14th Conference on Computational Linguistics, COLING 1992,vol. 2, pp. 539–545. Association for Computational Linguistics, Stroudsburg (1992)
17. Fader, A., Soderland, S., Etzioni, O.: Identifying relations for open informationextraction. In: Proceedings of the Conference on Empirical Methods in NaturalLanguage Processing, EMNLP 2011, pp. 1535–1545. Association for ComputationalLinguistics, Stroudsburg (2011)
18. Hall, M., Frank, E., Holmes, G., Pfahringer, B., Reutemann, P., Witten, I.H.: Theweka data mining software: an update. ACM SIGKDD Explor. Newsl. 11, 10–18(2009)
19. Speer, R., Havasi, C.: Representing general relational knowledge in conceptnet 5.In: Chair, N.C.C., Choukri, K., Declerck, T., Doan, M.U., Maegaard, B., Mariani,J., Moreno, A., Odijk, J., Piperidis, S. (eds.) Proceedings of the Eight Interna-tional Conference on Language Resources and Evaluation (LREC 2012). EuropeanLanguage Resources Association (ELRA), Istanbul (2012)

Towards Evaluating the Impact of AnaphoraResolution on Text Summarisation
from a Human Perspective
Mostafa Bayomi1(&), Killian Levacher1, M. Rami Ghorab3,Peter Lavin1, Alexander O’Connor2, and Séamus Lawless1
1 ADAPT Centre, Knowledge and Data Engineering Group, School of ComputerScience and Statistics, Trinity College Dublin, Dublin, Ireland
bayomim,killian.levacher,peter.lavin,
[email protected] ADAPT Centre, School of Computing, Dublin City University, Dublin, Ireland
[email protected] IBM Analytics, IBM Technology Campus, Dublin, Ireland
Abstract. Automatic Text Summarisation (TS) is the process of abstracting keycontent from information sources. Previous research attempted to combinediverse NLP techniques to improve the quality of the produced summaries. Thestudy reported in this paper seeks to establish whether Anaphora Resolution(AR) can improve the quality of generated summaries, and to assess whether ARhas the same impact on text from different subject domains. Summarisationevaluation is critical to the development of automatic summarisation systems.Previous studies have evaluated their summaries using automatic techniques.However, automatic techniques lack the ability to evaluate certain factors whichare better quantified by human beings. In this paper the summaries are evaluatedvia human judgment, where the following factors are taken into consideration:informativeness, readability and understandability, conciseness, and the overallquality of the summary. Overall, the results of this study depict a pattern ofslight but not significant increases in the quality of summaries produced usingAR. At a subject domain level, however, the results demonstrate that the con-tribution of AR towards TS is domain dependent and for some domains it has astatistically significant impact on TS.
Keywords: Text summarisation Anaphora resolution TextRank
1 Introduction
Natural Language Processing (NLP) has different tasks [1, 2]. One of these tasks isAutomatic Text Summarisation (TS) that has been the subject of a lot of interest in theNLP community in recent years [2]. The goal of automatic summarisation is to process
M.R. Ghorab—Postdoctoral Researcher at Trinity College Dublin at the time of conducting thisresearch.
© Springer International Publishing Switzerland 2016E. Métais et al. (Eds.): NLDB 2016, LNCS 9612, pp. 187–199, 2016.DOI: 10.1007/978-3-319-41754-7_16

the source text to produce a shorter version of the information contained in it thenpresent this version in a way that suits the needs of a particular user or application. Textsummaries attempt to provide concise overviews of content, and can allow a reader tomake a quick and informed decision regarding whether a document contains theinformation they seek, and thus whether it would be worth the time and effort requiredto read the entire document. The rapid growth of the Web has resulted in a massiveincrease in the amount of information available online, which in turn has increased theimportance of text summarisation.
Various techniques have been proposed in the literature for the automatic sum-marisation of text, some of which are supervised, while others are unsupervised.Supervised techniques involve the need for an existing dataset of example summaries[3]. In contrast, unsupervised techniques do not rely upon any external knowledgesources, models or on linguistic processing and interpretation to summarise text [4].
There are two primary approaches to automatic summarisation. Extractive methodswork by selecting a subset of existing words, phrases, or sentences from the originaltext to form the summary. In contrast, abstractive methods build an internal semanticrepresentation and then use natural language generation techniques to create a summarythat is closer to what a human might generate. Such a summary may contain words thatare not included in the original text. These approaches are outlined in more detail inSect. 2, below.
Throughout the evolution of automatic text summarisation, attempts have contin-uously been made to improve the quality of the summaries produced. As a result,diverse NLP techniques have been combined together in an attempt to deliveradvancements in the process, with mixed results. While some combinations of tech-niques demonstrated positive impact [5], some did not [6].
One approach that has been shown to deliver a positive impact on summarisation isAnaphora Resolution (AR). A number of studies have combined AR with the sum-marisation algorithm, and their results have shown a positive impact on summaries [6, 7].
Various systems were developed to carry out automatic evaluation, of the producedsummaries, taking into consideration some measures and aspects in the evaluationprocess, such as comparing the summary to other (ideal) summaries created by humans[9]. An example of these measurements involves counting the number of overlappingunits such as n-gram, word sequences, and word-pairs between the computer-generatedsummaries and the ideal summaries created by humans. The problems with theseevaluations are: (1) the necessity for existing human summaries and the fact that(2) automatic systems lack evaluation measurements, such as conciseness and infor-mativeness. Metrics such as these are often missing from evaluation systems, as theyare difficult to quantify automatically and need to be assessed by human beings. Ourresearch attempts to take these factors into consideration as part of the evaluation.
The contribution of this paper involves investigating the impact of AR on textsummarisation, both in general, and with respect to different domains, by using humanevaluation to judge the generated summaries. The evaluation includes factors thatcannot be quantified by automatic systems, and therefore require a human to judge.These factors are: informativeness, readability & understandability, conciseness and theoverall quality of the summary.
188 M. Bayomi et al.
The summarisation system proposed in this paper builds upon TextRank [4] for thegeneration of summaries. In the evaluation carried out for this study, a comparison isconducted between two summarisation approaches. In the first approach, summarisa-tion is performed directly on the original text. In the second approach, however, theanaphora of the original text is resolved before summarisation is performed.
2 Related Work
Many advances have been achieved in the field of text summarisation, which generatesummaries of a variety of documents in different repositories, such as scientificrepositories and meeting recordings [10]. The two main approaches to text summari-sation consist of abstraction [11] and extraction [12] methods. Abstraction involves“understanding” the meaning of a text in order to build an internal semantic repre-sentation of it and subsequently use natural language generation techniques to create asummary that is close to what a human would generate. The challenge faced byabstraction techniques is that they rely upon the requirements for semantics andtraining data to automatically interpret and “understand” the meaning of the content inorder to summarise the original text. As a result of this, summarisation techniquesbased upon abstraction have so far met with limited success [13]. On the other hand,extraction approaches require the identification of the most important sentences (orpassages), in the text in order to extract the summary. Thus, the extraction method isdeemed more feasible [4] and is selected as the approach to be used in this paper.
Various methods have been discussed in the literature to improve extractivesummarisation systems. Early systems depended upon simple approaches, such as:Sentence Location, where the importance of the sentence is determined by: (1) itslocation in the text (being at the beginning or end of the text); (2) the emphasis of thetext (e.g. being a heading); and (3) the formatting of the text (e.g. a sentence high-lighted in bold would be considered more important than other sentences) [14]. TheCue Phrase approach focuses on words that are used to determine the appropriatesentences for the summary such as “this paper”, “propose”, and “concluding” [15]. Themost frequent words approach extracts a summary by determining the most importantconcepts by exploring the term distribution of a document [16]. Another approach thatextracts summaries by measuring the length of the sentences is the Sentence Lengthapproach, which automatically ignores sentences that have a length that falls under apredefined threshold [15].
Robust graph-based methods for NLP tasks have also been gaining a lot of interest.Arguably, these methods can be singled out as key elements of the paradigm-shifttriggered in the field of NLP. Graph-based ranking algorithms are essentially a way ofdeciding the importance of a vertex within a graph, based on global informationrecursively drawn from the entire graph. The basic idea implemented by a graph-basedranking model is that of “voting” or “recommendation”. When one vertex links toanother, it is basically casting a vote for that vertex. The higher the number of votes fora vertex, the higher the importance of that vertex. Moreover, the importance of the voteis determined by the importance of the vertex casting the vote. One of the most
Towards Evaluating the Impact of Anaphora Resolution 189

significant algorithms in this spectrum is the TextRank algorithm [4], which is based onthe PageRank algorithm [17].
TextRank is an unsupervised graph-based ranking model that summarises text byextracting the most important sentences of the text after ranking them according to thenumber of overlapping words between them. TextRank can be applied to tasks rangingfrom automated extraction of keyphrases, to extractive summarisation and word-sensedisambiguation, and it works as follows:
Formally, let G = (V, E) be a directed graph with the set of vertices V and set ofedges E, where E is a subset of V V. In this model, the graphs are built from naturallanguage texts where V represents a sentence from the text, and E is the edge thatrepresents the connection between two sentences. Each edge acts as a weight thatrepresents the similarity between two sentences. For a given vertex Vi., let In (Vi) be theset of vertices that point to it (predecessors), and let Out (Vi). be the set of vertices thatvertex Vi points to (successors). The score of a vertex Vi is defined as follows:
SðViÞ ¼ ð1 dÞþ d X
j2InðViÞ1
OutðViÞ SðViÞ ð1Þ
where d is a damping factor that can be set between 0 and 1, which has the role ofintegrating into the model the probability of jumping from a given vertex to anotherrandom vertex in the graph. The factor d is usually set to 0.85.
TextRank has been demonstrated to perform well as an algorithm for extractingsummaries [4], however, combining it with other NLP approaches may enhance thequality of these summaries. These additional approaches can be employed in the textpre-processing step, or furthermore in the ranking process. In this research we combineTextRank with other approaches such as Sentence Location and Anaphora Resolution.Furthermore, we combine different approaches in the text pre-processing step such asstopword removal and stemming.
Information about anaphoric relations can be beneficial for text summarisation.Anaphora is a reference which points back to some previous item, with the ‘pointingback’ word or phrase called an anaphor, and the entity to which it refers, or for which itstands, its antecedent [6]. For example: “The boy is clever, he is the first in the class”.Here, “he” is the reference (anaphor) that points back to its antecedent “The boy”.
Anaphoric information is used to enrich the latent semantic representation of adocument, from which a summary is then extracted. Different algorithms for textsummarisation are based on the similarity between sentences. AR can be used toidentify which discourse entities are repeatedly mentioned, especially when differentmentioning forms are used. Previous work involving the inclusion of AR in sum-marisation, reports some increase in performance. Vodolazova et al. [5] achieved animprovement of around 1.5 % over their summarisation system based on the lexicalLatent Semantic Analysis (LSA) by incorporating anaphoric information into it. Theperformance was tested on the DUC 2002 data using the ROUGE evaluation toolkit[9]. The authors also mentioned two strategies for including anaphoric relations:(1) addition, when anaphoric chains are treated as another category of term for theinput matrix construction; (2) substitution, when each representative of an anaphoricchain in the text is substituted by the chain’s first representative. The evaluation results
190 M. Bayomi et al.

show that the substitution approach performs significantly worse than the additionapproach and in some tests even worse than the same system without including AR [5].Although the addition strategy is better, in some cases the output summary becomesincoherent. This happens when a pronoun appears in the summary and its antecedentdoes not. As a result, for coherency, in this research the addition strategy is used, andafter that the anaphora chain is tracked. If a pronoun appears in the summary without itsantecedent, the pronoun is substituted by its antecedent.
Various researchers have investigated how the quality of automatically generatedsummaries can be evaluated. Vodolazova et al. [12] attempted to analyse the impact ofshallow linguistic properties of the original text on the quality of the generated sum-maries. Nenkova et al. [18] focused on how sentence structure can help to predict thelinguistic quality of generated summaries.
Summarisation evaluation methods can be broadly classified into two categories[19]: extrinsic evaluation, where the summary quality is judged on the basis of howhelpful summaries are for a given task, and intrinsic evaluation which is based on ananalyses of the summary, and involves a comparison between the original text (thesource document) and the generated summary to measure how many ideas of thesource document are covered by the summary. Intrinsic evaluations can then be dividedinto: content evaluation and text quality evaluation. Content evaluation measures theability to identify the key topics of the original document, while text quality evaluationjudges the readability, grammar and coherence of automatic summaries [8].
Text Summarisation evaluation can be classified into two approaches: Automaticevaluation and Human evaluation. Many evaluation studies [4, 5, 8] used automaticevaluation systems such as ROUGE [9]. ROUGE is a tool which includes severalautomatic evaluation methods that measure the similarity between summaries. Otherstudies have asked human judges to evaluate the quality of generated summariesgenerated using their approach [20].
The problems with the automatic evaluation are that (1) they first of all necessitatethe existence of human summaries for comparison with the generated summaries;additionally (2) automatic systems lack evaluation measurements such as concisenessand informativeness because these criteria are difficult to quantify automatically andneed to be assessed by humans. We take these factors into consideration as part of theevaluation in this research where we adopted the intrinsic method and used humanevaluation to judge the quality of summaries generated by two different approaches.
3 Design
In order to evaluate the impact of Anaphora Resolution from a human perspective asystem has been developed. The system consists of the following modules:
Summarisation:
– Summarisation Algorithm: The task of summarisation is an unsupervised extractivetask, so TextRank is used as the summarisation module.
– Stemming: TextRank measures the similarity between sentences by calculating thenumber of overlapping words between them. Therefore, to ensure that words that
Towards Evaluating the Impact of Anaphora Resolution 191

share the same root (i.e. ones which are deemed very close to each other inmeaning), words are stemmed before comparing them to each other. The Lancasterstemmer was selected to be used in this research. This follows on the successfulapproach of Augat and Ladlow [21], where they compared the performance of threestemmers: WordNet stemmer, Lancaster stemmer, and Porter stemmer; of the three,the Lancaster stemmer performed best.
– Stopword Removal: As stopwords are generally assumed to be of less, or no,informational value, the system performs stopword removal on the original textbefore stemming and summarisation.
Anaphora Resolution. The AR system used is the Stanford Deterministic CoreferenceResolution System [22] which implements a multi-pass sieve coreference resolution (oranaphora resolution) system. The system relates pronouns to their nominal antecedents.
Addition Approach. As it has been shown by Vodolazova et al. [5], that the sub-stitution approach performs significantly worse than the addition approach, the additionapproach is used in this system.
Sentence Location. The sentence location approach is applied to extract the firstsentence from the original document to be used as the first sentence in the summary,even if TextRank did not extract it. The selected dataset for this research is Wikipedia,and since the first sentence in any Wikipedia article states the definition of the article,the sentence location can provide valuable information to the summarisation process.
Chain Tracking. The Anaphora resolution system produces an anaphoric chain. Thischain consists of an antecedent (first representative, a name for example) and theanaphor that refers to that antecedent (and may be more than one anaphor). This chainis used to check the coherence of the summary produced by the system, by checkingthat the anaphoric expressions contained in the summary still have the same inter-pretation that they had in the original text, and if it does not have the same interpre-tation, the anaphor is substituted by its antecedent.
The system implemented for this research carries out the text processing in thefollowing order:
1. Anaphora in the original text is resolved.2. Stopwords are removed.3. Stemming is applied.4. TextRank is executed on the new text.5. Sentence ranks are produced.6. The highest ranked sentences are selected and extracted from the original text.7. The first sentence is selected to be used in the summary (if it was not already
selected by TextRank).8. If a pronoun is found in the summary without its antecedent, it is replaced by the
antecedent.
192 M. Bayomi et al.

4 Evaluation
4.1 Dataset
In order to investigate the impact of AR on summaries generated from different subjectdomains, 70 Wikipedia abstracts were selected from various subject domains. Theabstract is the first section from the Wikipedia article. The abstracts have differentlength (from around 180 words to more than 560 words.) Wikipedia was chosen as anopen source of content in multiple domains. The domains were selected at random andthe abstracts were randomly chosen from within the following domains: Accidents,Natural Disasters, Politics, Famous People, Sports, and Animals. Two summaries weregenerated for each abstract, one summary was generated without applying AnaphoraResolution and the second summary was generated by applying Anaphora Resolutionbefore summarisation1.
When we tried to generate the two summaries for each article, we noticed in 45articles that the two summaries were identical, which reflected the possibility that ARmay have had no impact on the produced summaries.
We also noticed that in producing the two summaries, the identical summaries wereoften produced from the shorter articles. This means that, the length of text in the articleproportional to the impact of AR on the produced summaries (i.e. the shorter the article,the less the impact of AR on the summary, and vice versa).
Hence, 45 abstracts were removed and the final selected set of abstracts, for theexperiment, are 25 articles of the original document-set where each domain has 5 articles.
4.2 Experimental Setup
To conduct the comparative evaluation between the two summaries, a web applicationwas built. The abstracts were divided into groups; each group had five abstracts thatcame randomly from different domains. When the first user logged in, they wererandomly assigned a group. The next user was then randomly assigned a group fromthe remaining unassigned groups. This continued until all the groups were assigned tousers. The process was then repeated for the next set of users who logged in to thesystem. This ensured an even spread of assessment. Each article in the group that ispresented to the user was followed by the two generated summaries. The users were notaware of which summary was produced using which technique. Each participant in theexperiment was asked to evaluate each summary according to the followingcharacteristics:
1. Readability and Understandability: Whether the grammar and the spelling of thesummary are correct and appropriate.
2. Informativeness: How much information from the source text is preserved in thesummary.
1 In our experiment, the first summary is marked as TR and the second summary is marked asTR + AR.
Towards Evaluating the Impact of Anaphora Resolution 193
3. Conciseness: As a summary presents a short text, conciseness means to assess ifthis summary contains any unnecessary or redundant information.
4. Overall: The overall quality of the summary.
An open call for participation in the experiment was made on several mailing listsand through social media. The selected participants’ ages were ranging from 24 to 50years old and they were from different backgrounds.
The users were asked to evaluate each characteristic on a six-point Likert scale(ranging from one to six, where one is the lowest quality and six is the highest). For thesake of data completeness, each participant was asked to fill in answers for all theevaluation characteristics. A text box was provided in case the user had any commentsregarding the quality of the summaries or regarding the difference between them. Theusers were allowed to leave this box empty in case they did not have any comments.After each summary was evaluated individually, the user was asked to indicate whichsummary they preferred. In most cases this characteristic was automatically set by thesystem based upon the user’s individual evaluation of the two summaries, while stillallowing for manual adjustment if the user so wished. However if the user evaluated thetwo summaries equally, then neither summary was preselected, and they had tomanually make a selection.
5 Results and Discussion
Thirty-eight users participated in the experiment. Each user evaluated at least fourabstracts in different domains and also added comments about the two summaries. Thefinal results were analysed regarding:
(a) The general impact of Anaphora Resolution on Text Summarisation.(b) The domain-specific impact of Anaphora Resolution on Text Summarisation.
5.1 General AR Impact
Table 1 reports the mean scores of the user evaluations, the variance, and p-value foreach characteristic. The results show that the difference between the two approaches(TR and TR + AR) is not statistically significant, which coincides with results obtainedby Mitkov et al. [6]. However, from the results obtained in our research, we can noticea pattern. Although the difference is not significant, the differences are constantlypositive, which would suggest the combined approach does have a positive influenceoverall. Nevertheless, this pattern will need to be confirmed with future experimentsand more detailed analyses.
As part of the analysis, the users’ comments were also examined. In general, thecomments show that the majority of the users preferred the second summary (TR +AR). The users’ comments also showed that AR has no significant impact on thequality of the produced summaries. This is demonstrated by the following samplecomment: “I noticed that usually the difference between the two summaries is just one
194 M. Bayomi et al.

or two sentences. This is why it is hard to judge which one is better than the other. Theyare very close to each other with just a small difference.”
5.2 Domain Specific AR Impact
Table 2 reports the mean scores of the user evaluations, the variance, and p-value foreach characteristic in each of the different domains tested. In this experiment, abstractswere divided by domains to investigate the intuition that language characteristics differby subject domain, and thus to assess if the impact of AR on summarisation alsodiffered.
The impact is shown to be statistically significant in the “Politics” domain forConciseness (p-value = 0.02) and Readability (p-value = 0.05). Also in the “Animals”domain, the difference between the two summarisation approaches is statistically sig-nificant with respect to two characteristics: Informativeness (p-value = 0.001) and UserPreference (p-value = 0.02). In the “Politics” and “Animals” domains, AR has apositive impact on the generated summaries in all characteristics. In support of thisargument, user comments confirmed this finding. The following is a sample of usertestimonies: “First summary did not summarise first part of the topic as efficient as thesecond summary.” Where the first summary here refers to the TR summary and thesecond summary is the TR + AR summary.
Table 1. General Anaphora resolution impact
Criteria / Approach TR TR + AR
Readability& Understand-ability
Mean 4.8625 4.8688Variance 0.00625
P-Value 0.9291 (> 0.05)
Informativeness
Mean 4.3875 4.4563
Variance 0.0688
P-Value 0.4671 (> 0.05)
ConcisenessMean 4.2375 4.375
Variance 0.1375
P-Value 0.1276 (> 0.05)
OverallMean 4.35625 4.4
Variance 0.04375
P-Value 0.6195 (> 0.05)
PreferableMean 0.8375 1.09375
Variance 0.2563
P-Value 0.1596 (> 0.05)
Towards Evaluating the Impact of Anaphora Resolution 195

In contrast, in the “Accidents” domain, the summaries generated with TR only aremore preferable and are evaluated more positively with respect to all characteristicsthan summaries with AR.
Regarding the “Famous People” domain, although it was expected that AR wouldhave a positive impact on its articles as they have more pronouns than others, theresults actually show a negative impact of AR in all characteristics (variance rangesfrom −0.17 to −0.72). User comments on these domains show that the summary thatwas generated with TR only is more preferable than TR + AR. One of these commentsis: “The first summary [the TR summary] included an extra piece of information about
Table 2. Domain specific Anaphora resolution impact
Domain / CriteriaC1a C2b C3c C4d C5 e
Accidents
TR 5.21 4.50 4.71 4.50 0.93
TR+AR 5.00 4.36 4.29 4.14 0.79
Varience -0.21 -0.14 -0.43 -0.36 -0.14
P-Value 0.27 0.61 0.16 0.29 0.81
Natural Disasters
TR 5.00 4.60 4.33 4.56 0.82
TR+AR 4.96 4.61 4.51 4.60 1.22
Varience -0.04 -0.09 0.18 0.04 0.40
P-Value 0.75 0.64 0.27 0.79 0.28
Politics
TR 4.61 4.33 3.56 4.11 0.72
TR+AR 5.00 4.33 4.44 4.28 1.11
Varience 0.39 0.00 0.89 0.17 0.39
P-Value 0.05 0.99 0.02 0.62 0.44
Famous People
TR 4.79 4.21 4.34 4.31 1.28
TR+AR 4.62 4.17 4.21 4.21 0.55
Varience -0.17 -0.03 -0.14 -0.10 -0.72
P-Value 0.38 0.89 0.53 0.63 0.07
Sports
TR 4.63 4.43 4.27 4.30 0.73
TR+AR 4.80 4.37 4.30 4.37 1.10
Varience 0.17 -0.07 0.03 0.07 0.37
P-Value 0.28 0.71 0.84 0.71 0.38
Animals
TR 4.96 4.13 4.13 4.21 0.50
TR+AR 4.92 4.96 4.42 4.54 1.67
Varience -0.04 0.83 0.29 0.33 1.17
P-Value 0.80 0.001 0.18 0.12 0.02
a.Readability & understand-ability, b.
Informativeness, c.
Conciseness, d.
Overall, e.
Preferable
196 M. Bayomi et al.

travels which was omitted in the second [the TR + AR summary].” Which means thatthe TR summary is more informative than the TR + AR summary.
It was noted from the results in the “Natural Disasters” and “Sports” domains thatthe impact of AR varies from one characteristic to another. For example, the secondsummary (AR + TR) in both domains is more preferable than the first (positive vari-ance, 0.40 and 0.37 respectively), however, the first summary is slightly more readablethan the second one. A user comment shows that: “These two are tight. The first ismore readable.”
6 Conclusion and Future Work
This paper presented an alternative approach to evaluate the impact of AnaphoraResolution on Text Summarisation. Various researchers have attempted to evaluate thisimpact automatically, however, automatic evaluation always lack evaluation charac-teristics that are difficult to effectively measure automatically and need to be evaluatedmanually. In this research we measured this impact by asking humans to evaluate twosummaries, one of which was generated without Anaphora Resolution (AR), while thesecond was generated with Anaphora Resolution. The results showed that, in general,AR has a slight but not significant impact on the quality of the summaries produced.Further experimentation on the domain-specific impact of AR showed that AR isdomain dependent and its impact varies from one domain to another. The resultsshowed that AR has a statistically significant impact on TS for some criteria.
In the experimental setup stage, it was noticed that the length of the article and thedensity of the anaphoric references have an influence upon the summaries produced.
Future work will therefore be carried out in order to expand upon these findings. Itwill investigate the relation between text characteristics, such as the length, the style,the domain, and the number of anaphors in the original text, and their impact upon thegenerated summaries.
Acknowledgements. This research is supported by Science Foundation Ireland through theCNGL Programme (Grant 12/CE/I2267) in the ADAPT Centre (www.adaptcentre.ie) at TrinityCollege Dublin.
References
1. Bayomi, M., Levacher, K., Ghorab, M.R., Lawless, S.: OntoSeg: a novel approach to textsegmentation using ontological similarity. In: Proceedings of 5th ICDM Workshop onSentiment Elicitation from Natural Text for Information Retrieval and Extraction,ICDM SENTIRE. Held in Conjunction with the IEEE International Conference on DataMining, ICDM 2015, Atlantic City, NJ, USA, 14 November 2015
2. Lawless, S., Lavin, P., Bayomi, M., Cabral, J.P., Ghorab, M.: Text summarization andspeech synthesis for the automated generation of personalized audio presentations. In:Biemann, C., Handschuh, S., Freitas, A., Meziane, F., Métais, E. (eds.) NLDB 2015. LNCS,vol. 9103, pp. 307–320. Springer, Heidelberg (2015)
Towards Evaluating the Impact of Anaphora Resolution 197
3. Cruz, F., Troyano, J.A., Enríquez, F.: Supervised TextRank. In: Salakoski, T., Ginter, F.,Pyysalo, S., Pahikkala, T. (eds.) FinTAL 2006. LNCS (LNAI), vol. 4139, pp. 632–639.Springer, Heidelberg (2006)
4. Mihalcea, R., Tarau, P.: TextRank: bringing order into texts. In: Proceedings of EMNLP2004, pp. 404–411. Association for Computational Linguistics, Barcelona, Spain (2004)
5. Vodolazova, T., Lloret, E., Muñoz, R., Palomar, M.: A comparative study of the impact ofstatistical and semantic features in the framework of extractive text summarization. In:Sojka, P., Horák, A., Kopeček, I., Pala, K. (eds.) TSD 2012. LNCS, vol. 7499, pp. 306–313.Springer, Heidelberg (2012)
6. Mitkov, R., Evans, R., Orăsan, C., Dornescu, I., Rios, M.: Coreference resolution: to whatextent does it help NLP applications? In: Sojka, P., Horák, A., Kopeček, I., Pala, K. (eds.)TSD 2012. LNCS, vol. 7499, pp. 16–27. Springer, Heidelberg (2012)
7. Ježek, K., Poesio, M., Kabadjov, M.A., Steinberger, J.: Two uses of anaphora resolution insummarization. Inf. Process. Manag. 43(6), 1663–1680 (2007)
8. Steinberger, J., Ježek, K.: Evaluation measures for text summarization. Comput. Inform.28(2), 251–275 (2012)
9. Lin, C., Rey, M.: ROUGE : a package for automatic evaluation of summaries. In: TextSummarization Branches Out: Proceedings of ACL-2004 Workshop, vol. 8 (2004)
10. Murray, G., Renals, S., Carletta, J.: Extractive summarization of meeting recordings. In:Proceedings of Interspeech 2005 - Eurospeech, 9th European Conference on SpeechCommunication and Technology, Lisbon, Portugal, 4–8 September 2005
11. Fiszman, M., Rindflesch, T.C.: Abstraction Summarization for Managing the BiomedicalResearch Literature (2003)
12. Vodolazova, T., Lloret, E., Muñoz, R., Palomar, M.: Extractive text summarization: can weuse the same techniques for any text? In: Métais, E., Meziane, F., Saraee, M., Sugumaran,V., Vadera, S. (eds.) NLDB 2013. LNCS, vol. 7934, pp. 164–175. Springer, Heidelberg(2013)
13. Nenkova, A., Mckeown, K.R.: Automatic summarization. In: Proceedings of 49th AnnualMeeting of the Association for Computational Linguistics: Tutorial Abstracts of ACL 2011.Association for Computational Linguistics (2011)
14. Edmundson, H.P.: New methods in automatic extracting. J. ACM (JACM) 16(2), 264–285(1969)
15. Teufel, S., Moens, M.: Sentence extraction as a classification task. In: Proceedings of ACL,vol. 97 (1997)
16. Luhn, H.P.: The automatic creation of literature abstracts. IBM J. Res. Dev. 2(2), 159–165(1958)
17. Page, L., Brin, S., Motwani, R., Winograd, T.: The PageRank citation ranking: bringingorder to the web. Stanford InfoLab (1999)
18. Nenkova, A., Chae, J., Louis, A., Pitler, E.: Structural features for predicting the linguisticquality of text. In: Krahmer, E., Theune, M. (eds.) Empirical Methods. LNCS, vol. 5790,pp. 222–241. Springer, Heidelberg (2010)
19. Sparck Jones, K., Galliers, J.R., Walter, S.M.: Evaluating Natural Language ProcessingSystems: An Analysis and Review. LNCS, vol. 1083. Springer, Heidelberg (1996)
20. Saggion, H., Lapalme, G.: Concept identification and presentation in the context of technicaltext summarization. In: Proceedings of 2000 NAACL-ANLP Workshop on AutomaticSummarization, pp. 1–10. Association for Computational Linguistics, Stroudsburg, PA,USA (2000)
198 M. Bayomi et al.

21. Augat, M., Ladlow, M.: An NLTK package for lexical-chain based word sensedisambiguation (2009)
22. Lee, H., Peirsman, Y., Chang, A., Chambers, N., Surdeanu, M., Jurafsky, D.: Stanford’smulti-pass sieve coreference resolution system at the CoNLL-2011 shared task. In:Proceedings of 15th Conference on Computational Natural Language Learning: SharedTask, pp. 28–34. Association for Computational Linguistics, Stroudsburg, PA, USA (2011)
Towards Evaluating the Impact of Anaphora Resolution 199

An LDA-Based Approach to Scientific PaperRecommendation
Maha Amami1,2(B), Gabriella Pasi1, Fabio Stella1, and Rim Faiz3
1 Department of Informatics, Systems and Communication,University of Milano Bicocca, Milan, Italyamami,pasi,[email protected]
2 LARODEC, ISG, University of Tunis, Tunis, Tunisia3 LARODEC, IHEC, University of Carthage, Tunis, Tunisia
Abstract. Recommendation of scientific papers is a task aimed to sup-port researchers in accessing relevant articles from a large pool of unseenarticles. When writing a paper, a researcher focuses on the topics relatedto her/his scientific domain, by using a technical language.
The core idea of this paper is to exploit the topics related to theresearchers scientific production (authored articles) to formally defineher/his profile; in particular we propose to employ topic modeling toformally represent the user profile, and language modeling to formallyrepresent each unseen paper. The recommendation technique we pro-pose relies on the assessment of the closeness of the language used inthe researchers papers and the one employed in the unseen papers. Theproposed approach exploits a reliable knowledge source for building theuser profile, and it alleviates the cold-start problem, typical of collabo-rative filtering techniques. We also present a preliminary evaluation ofour approach on the DBLP.
Keywords: Content-based recommendation · Scientific papers recom-mendation · Researcher profile · Topic modeling · Language modeling
1 Introduction
In the last years a big deal of research has addressed the issue of scientific papersrecommendation. This problem has become more and more compelling due tothe information overload phenomenon suffered by several categories of users,including the scientific community. Indeed, the increasing number of scientificpapers published every day implies that a researcher spends a lot of time to findpublications relevant to her/his research interests. In particular, recommendersystems serve in this context the purpose of providing the researchers with adirect recommendation of contents that are likely to fit their needs.
Most approaches in the literature have addressed this problem by meansof collaborative filtering (CF) techniques, which evaluate items (in this casepapers) based on the behavior of other users (researchers), by exploiting thec© Springer International Publishing Switzerland 2016E. Metais et al. (Eds.): NLDB 2016, LNCS 9612, pp. 200–210, 2016.DOI: 10.1007/978-3-319-41754-7 17
An LDA-Based Approach to Scientific Paper Recommendation 201
rates assigned by other users to the considered items. However, generally, CFapproaches assume that the number of users is much larger than the number ofitems [9].
This is verified in applications like movie recommendations, where there areusually few items and several users. For instance, the MovieLens 1M1 datasetcontains 1,000,209 ratings from 6,040 users and 3,706 movies [8]. Moreover theusers are clients who are very likely to interact with the system several times,often consuming similar items; therefore ratings are quite easy to obtain. Hence,CF recommendation models can make accurate recommendations for most usersin e-commerce domains.
On the contrary, in the domain of scientific papers recommendation, thereare usually less users than papers, which results in the data sparsity problem.In fact usually there are few users who select the same papers, and thus findingsimilar users only based on explicit ratings of papers is a difficult task.
A second general issue that affects CF is the cold start problem, which occurswhen a new item to be recommended has not been rated by any user. Further-more, when a new user is introduced, the system is not able to provide recom-mendations. A possible strategy is to force the user to rate a minimum numberof items before starting to use the system.
Content-based approaches recommend items based on both the items con-tent and a profile that formally represents the user interests [12]. Content-basedapproaches exploit the items metadata and content to provide recommendationsbased on users preferences represented in the user profile. However, content-based recommendation approaches need reliable sources of the user interests.More precisely they rely on a user model (the profile) that specifies the usertopical preferences; these preferences must be captured either by means of anexplicit user involvement or by means of the analysis of various kinds of interac-tions of the user with the system (implicit feedback). In this way the cold startproblem could be shifted from items to users [6,9].
To improve the recommendations some systems apply hybrid approaches [4],which combine content-based and collaborative filtering techniques.
By means of hybrid approaches [11,17,19] the cold start problem for bothnew users and items can be alleviated. For instance, in [17] the authors suggest tocombine ratings and content analysis into a uniform model based on probabilistictopic modeling.
However, in [1] the authors show that producing accurate recommendationsdepends on the choice of the recommendation algorithm, and mainly it dependson the quality of the information about users. The noise injected in a user profileaffects the accuracy of the produced recommendations.
In this paper we make the assumption that the users (researcher) scientificcorpus (publications co-authored by the researcher) is a reliable source of dataand information. In fact, in the task of writing articles, a researcher focuses on aset of topics related to her/his scientific investigations, and s/he uses a technicallanguage related to those topics. These core topics play an important role in the
1 www.grouplens.org/.

202 M. Amami et al.
selection of unseen papers. The rationale behind the approach we propose in thispaper is to make use of the researchers scientific corpus to formally define her/hisprofile: in this way the user model will exploit the core concepts contained inthe articles authored by the researcher.
Formally, the approach we propose relies on topic modeling: the profile of aresearcher is a topic model obtained by applying LDA to the abstract of a sampleof the articles written by the researcher. Topic models provide the identificationof core topics from a provided text collection; each topic is formally representedby means of a probability distribution of n-grams, i.e. sequences of n words.We propose then to formally represent each unseen article (to be recommended)by means of a language model. Then the topics generated by topic modelingfrom the authors collection and the language models of the unseen papers arecompared to assess their similarity, which is employed by the recommendationmechanism.
The outline of this paper is the following. In Sect. 2 we review the relatedworks based on LDA-recommendation models with a brief discussion of theirlimitations. The proposed content-based recommendation model is presented inSect. 3. The evaluation of our recommendation model is presented in Sect. 4, witha description of the employed dataset and a discussion of the obtained results.In Sect. 5 we draw some conclusions and outline our future work.
2 Related Work
Several content-based recommender systems formally represent the user profileas a bag of words, represented by a vector. For example in [13] both researchersand unseen papers are represented as vectors in an n-dimensional space of terms,and the cosine similarity measure is applied to determine the relevance of a paperto a user profile.
In [5] both user profiles and unseen papers are represented as trees of conceptsfrom the ACM’s Computing Classification System (CCS); the recommender sys-tem matches the concepts in the user profile to each concept in the paper rep-resentation by means of a tree matching algorithm. Based on this technique theunseen papers in a scientific library are recommended to a user (researcher). Alimitation of this approach is that the considered concepts are limited and toogeneral to be able to well distinguish different topics.
Latent Dirichlet allocation (LDA) [3] has been employed as a technique toidentify and annotate large text corpora with concepts, to track changes in topicsover time, and to assess the similarity between documents. The purpose of thisalgorithm is the analysis of texts in natural language in order to discover thetopics they contain and to represent them by means of probability distributionsover words. For real world tasks, LDA has been successfully applied to addressseveral tasks (e.g., analysis of scientific trends [2], information retrieval [18], andscholarly publication search engines2).
2 Rexa.info.
An LDA-Based Approach to Scientific Paper Recommendation 203
In [10] the authors have proposed an LDA-based method for recommendingproblem-related papers or solution-related papers to researchers, in order tosatisfy user-specific reading purposes. Here the LDA algorithm was used witha fixed number of topics to generate the document-topic distributions from theentire corpus. In this paper any comparative evaluation with an appropriatebaseline is provided.
In [17] the authors have proposed an extension of LDA for recommendingscientific articles called collaborative topic regression (CTR). This hybrid app-roach combines collaborative filtering based on latent factor models and contentanalysis based on topic models. Here matrix factorization and LDA are mergedinto a single generative process, where item latent factors are obtained by addingan offset latent variable to the document-topic distribution. Like CF approaches,this method is able to predict articles already rated by similar users. However, itperforms differently on unseen papers, and it can make predictions to the onesthat have similar content to other articles that a user likes.
In [19] the authors have proposed a hybrid recommender which is a latentfactor model called CAT. It incorporates content and descriptive attributes ofitems (e.g., author, venue, publication year) to improve the recommendationaccuracy.
However, both the CTR and the CAT systems suffer two limitations. First,they have problems when asked to make accurate predictions to researchers whohave only few ratings. Second, they may not effectively support tasks that arespecific to a certain research field such as recommending citations. For instance,a biological scientist who is interested in data mining applications to biologicalscience might desire the recommender systems to support tasks such as rec-ommending unseen papers on data mining techniques. While both CAT andCTR are using a rich source of metadata to generate recommendations, theyare subject to certain limitations that affect their effectiveness in modeling cita-tion patterns. The citation context, defined as a sequence of words that appeararound a particular citation [14] is not highlighted in the learned models.
3 The Proposed Approach
In this section we introduce our LDA-based approach to scientific paper recom-mendation to address the issues pointed out in Sect. 2.
The rationale behind our approach is that the generation of the researcherprofile should rely on the content generated by the researcher her/himself, as itexposes the topics of interests of the researcher, as well as the technical languages/he uses to generate her/his articles. The researcher profile is then conceived as amixture of topics extracted by the LDA algorithm from the researcher past pub-lications. To estimate if an unseen article could be of interests to the researcher,a formal representation of the unseen article by a language model is provided,which is then compared with each topic characterizing the researcher profile (weremind that a topic is formally represented as a probability distribution over theconsidered vocabulary, as also a language model is).

204 M. Amami et al.
Fig. 1. Process flow of our recommendation model
3.1 Notation and Approach
We denote by Qi the set of articles (co-)authored by a researcher Ai, and byD = d1, d2, . . . , dM the set (consisting of M papers) that contains the articlesunseen by researcher Ai and that could be potentially interesting to her/him.We refer to Qi as to the researcher’s corpus and to D as to the recommendationcorpus. Furthermore, let Wi be the vocabulary employed in the extended setof articles, i.e., the set including both the researcher’s corpus and the recom-mendation corpus (Qi ∪ D). Wi contains then the set of words w occurring inthe corpus Qi of researcher Ai and/or in the recommendation corpus D. Theresearcher profile is formally represented as a topic model obtained by applyingthe LDA algorithm to the texts constituted by the abstracts of the consideredarticles authored by the considered researcher (as it will be better explained inSect. 3.2). We remind that formally each topic is represented by a probabilitydistribution over the considered vocabulary pi(w|k) where w ranges over thevocabulary Wi and k is a topic among the Ki topics. In particular, we denoteby pi(w|1 : Ki) the topic model associated with researcher Ai.

An LDA-Based Approach to Scientific Paper Recommendation 205
The objective of the content-based filtering algorithm is to recommend toresearcher Ai the top m papers from the recommendation corpus D. We addressthis task by means of the following sub-tasks (see Fig. 1); (i) to define the topicmodel representing the researcher’s interests: as previously outlined this is doneby applying the LDA algorithm to the researcher’s corpus Qi, (ii) to validatethe topics extracted by the LDA algorithm form the researcher’s corpus, (iii) toevaluate if a given article dj from corpus D has to be recommended to researcherAi; to this purpose the distance between the validated topics and the languagemodel of the article to be recommended is computed, and (iv) to rank papersbelonging to D in descending order of similarity and recommend, to researcherAi, the first m papers in the provided ranking. In Sect. 3.2 the above sub-taskswill be detailed.
3.2 Generation of the Researcher Profile and Topic Validation
As explained in Sect. 3.1, sub-tasks (i) and (ii) are performed by applying LDAto the texts extracted from the researcher’s corpus Qi for each researcher Ai. Inparticular, to select in a distinct way the optimal number of topics Ki for eachresearcher Ai the researcher’s corpus Qi is cross validated. More specifically, theoptimal number of topics Ki for a given researcher Ai is selected by optimizingthe cross validated perplexity, where perplexity [16] measures the uncertainty inpredicting the occurrence of a word when using a given model. In topic modeling,the perplexity measures how well the topics extracted by LDA using the trainingpapers (in-sample papers, i.e., a portion of Qi), allows to predict the occurrenceof words belonging to validation papers (out-of-sample papers, i.e., the papersbelonging to Qi which are not used by LDA to extract topics). Perplexity isdefined as follows [7]:
Perplexity(Qout−of−samplei ) = exp− log
p(Qout−of−samplei |pi(w|1 : Ki))
|Qout−of−samplei | (1)
where Qout−of−samplei is the set of out-of-sample papers belonging to Qi.
3.3 The Recommendation Algorithm
Step (iii) of the proposed procedure consists of computing, for each researcher,the similarity between her/his Ki validated topics and the language model com-puted for each article in the recommendation corpus D. Formally, we proposeto define the similarity between the profile of the researcher Ai and the articledj ∈ D as the maximum value among the Ki similarity values between the lan-guage model of article dj and the Ki topics (probability distributions over words,as illustrated in Sect. 3.2) associated with the profile of author Ai. As each topicis represented as a probability distribution over words (as produced by the LDAalgorithm), the similarity between a topic in the LDA-based researcher profileand the language model representing the article to be recommended is defined
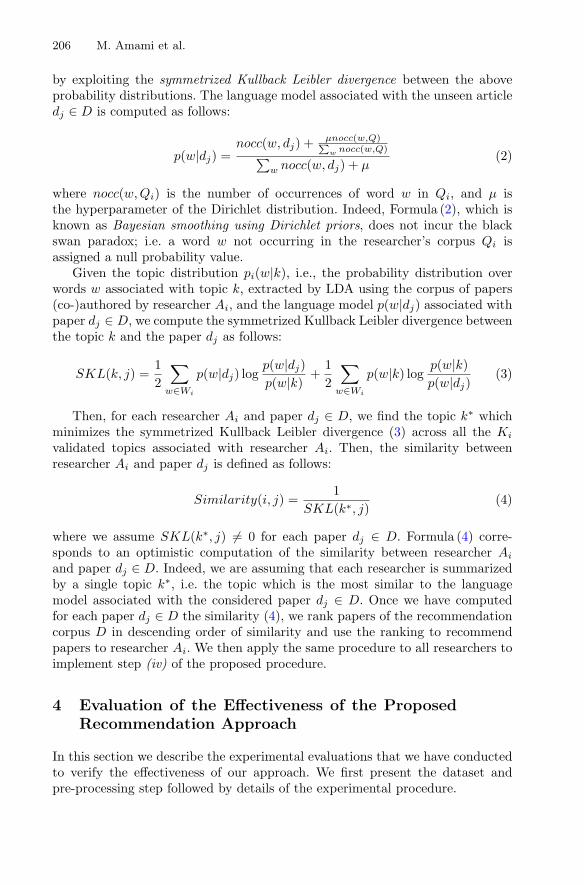
206 M. Amami et al.
by exploiting the symmetrized Kullback Leibler divergence between the aboveprobability distributions. The language model associated with the unseen articledj ∈ D is computed as follows:
p(w|dj) =nocc(w, dj) + µnocc(w,Q)∑
w nocc(w,Q)∑w nocc(w, dj) + µ
(2)
where nocc(w,Qi) is the number of occurrences of word w in Qi, and µ isthe hyperparameter of the Dirichlet distribution. Indeed, Formula (2), which isknown as Bayesian smoothing using Dirichlet priors, does not incur the blackswan paradox; i.e. a word w not occurring in the researcher’s corpus Qi isassigned a null probability value.
Given the topic distribution pi(w|k), i.e., the probability distribution overwords w associated with topic k, extracted by LDA using the corpus of papers(co-)authored by researcher Ai, and the language model p(w|dj) associated withpaper dj ∈ D, we compute the symmetrized Kullback Leibler divergence betweenthe topic k and the paper dj as follows:
SKL(k, j) =12
∑
w∈Wi
p(w|dj) logp(w|dj)p(w|k)
+12
∑
w∈Wi
p(w|k) logp(w|k)p(w|dj) (3)
Then, for each researcher Ai and paper dj ∈ D, we find the topic k∗ whichminimizes the symmetrized Kullback Leibler divergence (3) across all the Ki
validated topics associated with researcher Ai. Then, the similarity betweenresearcher Ai and paper dj is defined as follows:
Similarity(i, j) =1
SKL(k∗, j)(4)
where we assume SKL(k∗, j) = 0 for each paper dj ∈ D. Formula (4) corre-sponds to an optimistic computation of the similarity between researcher Ai
and paper dj ∈ D. Indeed, we are assuming that each researcher is summarizedby a single topic k∗, i.e. the topic which is the most similar to the languagemodel associated with the considered paper dj ∈ D. Once we have computedfor each paper dj ∈ D the similarity (4), we rank papers of the recommendationcorpus D in descending order of similarity and use the ranking to recommendpapers to researcher Ai. We then apply the same procedure to all researchers toimplement step (iv) of the proposed procedure.
4 Evaluation of the Effectiveness of the ProposedRecommendation Approach
In this section we describe the experimental evaluations that we have conductedto verify the effectiveness of our approach. We first present the dataset andpre-processing step followed by details of the experimental procedure.

An LDA-Based Approach to Scientific Paper Recommendation 207
4.1 Dataset
We used the dataset of ArnetMiner3, which contains 1.5 million papers fromDBLP and 700 thousand authors. We have preprocessed this dataset to selectonly papers with complete titles and abstracts [15]; we denote this reduced setby L with |L| = 236, 012. To the purpose of our evaluations we have randomlyselected 1,600 authors. We denote the set of the considered authors as U =A1, . . . , A1,600 with |U | = 1, 600 and we denote by QA = q1, . . . , qNA
the setof papers written by author Ai with NA ≥ 10.
We build the profile for each author based on her/his scientific production,namely the papers s/he (co-)authored by using the MALLET topic model API4.We have applied the following pre-processing steps to the titles and abstracts ofthe author’s scientific production. First, we eliminated any words occurring in astandard stop list. Then, we converted the abstracts to a sequence of unigrams.To the purpose of defining a feasible test set, we have assumed that citations inpapers written by a researcher Ai represent her/his preferences. We denote thetest set by C, and its cardinality is defined as:
|C| =∑
A∈U
|CA| = 24, 539
where C = dj ∈ L|∃qi ∈ Q, (qi → dj) and dj /∈ Q where qi → dj means qicites dj .
4.2 Metrics
Two possible metrics to quantitatively assess the effectiveness are precision andrecall. However, as the unrated papers (false positives) in the test set are unla-beled. It is not possible to establish if they are known by the user. This makesit difficult to accurately compute precision.
Hence, the measure we have used to assess the effectiveness of the proposedalgorithm is recall. In particular, we have performed a comparative study toevaluate our approach with respect to the CAT and CTR algorithms. The recallquantifies the fraction of rated papers that are in the top-m of the ranking listsorted by their estimated ratings from among all rated papers in the test set.For each researcher Ai:
Recall@m =|N(m;Ai)||N(Ai)| (5)
where |.| denotes the cardinality of a set, N(Ai) is the set of items rated by Ai
in the test set and N(m;Ai) is the subset of N(Ai) contained in the top-m listof all papers sorted by their estimated relevance to the user model.
The recall for the entire system can be summarized using the average recallfrom all researchers.3 aminer.org/citation.4 mallet.cs.umass.edu/index.php.

208 M. Amami et al.
4.3 Parameters
To the purpose of our experiments, we have selected the optimal number of topicsKi for each researcher by optimizing the cross validated perplexity as describedin Sect. 3.2 with 5-cross validations. We used the left-to-right method defined in[16] to compute the perplexity.
The value of µ in the language model presented in Sect. 3.3 is a value deter-mined empirically, and it is set to µ = 0.000001.
4.4 Results
We compare the average Recall@m results for 1,600 researchers produced byour approach to the results produced by the state-of-the-art LDA-based recom-mender systems CTR and CAT. We report the averaged results of 5 repeatedexperiments to measure the performance of the different methods. Figure 2shows the comparison of the average Recall@m values for 1,600 researchers withm ≤ 100. Our approach achieves better Recall@m values than CTR and CATsystems. For m = 40, our approach performs better with a 60.4 % improvementover CTR and CAT.
As explained in Sect. 2, CTR and CAT systems are not able to make accuraterecommendations to researchers who use few metadata (rates) to create the userprofile.
The advantage of our approach does not only consist in being as accurateas or better than other hybrid approaches, but in employing a researcher profilethat is only based on past publications and therefore using few metadata (onlycontent item) and alleviate the cold start problem for new items. Furthermore,
Fig. 2. Comparison of average Recall@m results for 1600 researchers
An LDA-Based Approach to Scientific Paper Recommendation 209
our approach offers ways to better explain researchers why a specific paper isrecommended.
5 Conclusion and Future Work
In this paper we have proposed a fully content-based approach to the recom-mendation of scientific papers based on the researchers corpus. The researcherprofile is built upon the topics generated by LDA algorithm on the researcherspublications corpus. The profile built by this technique is easily interpretable,and it can explain the recommendation results. Our preliminary experimentsshow that our approach is performing well compared to the LDA-state-of-theart models, which make use of several metadata.
As a future work we aim to extend our work to include various attributesfrom the citation graph such as unseen article’s recency, and the author’s impactfactor to improve the recommendation results.
References
1. Bellogın, A., Said, A., de Vries, A.P.: The magic barrier of recommender systems –no magic, just ratings. In: Dimitrova, V., Kuflik, T., Chin, D., Ricci, F., Dolog, P.,Houben, G.-J. (eds.) UMAP 2014. LNCS, vol. 8538, pp. 25–36. Springer, Heidelberg(2014)
2. Blei, D., Lafferty., J.: Dynamic topic models. In: Proceedings of the 23rd Interna-tional Conference on Machine Learning, pp. 113–120 (2006)
3. Blei, D.M.: Probabilistic topic models. Commun. ACM 55, 77–84 (2012)4. Burke, R.: Hybrid recommender systems: survey and experiments. User Model.
User-Adap. Inter. 12(4), 331–370 (2002)5. Chandrasekaran, K., Gauch, S., Lakkaraju, P., Luong, H.P.: Concept-based docu-
ment recommendations for CiteSeer authors. In: Nejdl, W., Kay, J., Pu, P., Herder,E. (eds.) AH 2008. LNCS, vol. 5149, pp. 83–92. Springer, Heidelberg (2008)
6. De Nart, D., Tasso, C.: A personalized concept-driven recommender system forscientific libraries. In: The 10th Italian Research Conference on Digital Libraries,pp. 84–91 (2014)
7. Griffiths, T.L., Steyvers, M.: Finding scientific topics. Proc. Natl. Acad. Sci. 101,5228–5235 (2004)
8. Herlocker, J.L., Konstan, J.A., Terveen, L.G., Riedl, J.T.: Evaluating collaborativefiltering recommender systems. ACM Trans. Inf. Syst. (TOIS) 22(1), 5–53 (2004)
9. Jannach, D., Zanker, M., Felfernig, A., Friedrich, G.: Recommender Systems: AnIntroduction. Cambridge University Press, New York (2010)
10. Jiang, Y., Jia, A., Feng, Y., Zhao, D.: Recommending academic papers via users’reading purposes. In Proceedings of the 6th ACM International Conference onRecommender Systems, Dublin, Ireland, pp. 241–244 (2012)
11. Liu, Q., Chen, E., Xiong, H., Ding, C.H., Chen, J.: Enhancing collaborative filteringby user interest expansion via personalized ranking. IEEE Trans. Syst. 42(1), 218–233 (2012)
12. Lops, P., De Gemmis, M., Semeraro, G.: Content-based recommender systems:state of the art and trends. In: Ricci, F., Rokach, L., Shapira, B., Kantor, P.B.(eds.) Recommender Systems Handbook, pp. 77–105. Springer, Heidelberg (2010)

210 M. Amami et al.
13. Philip, S., John, A.O.: Application of content-based approach in research paperrecommendation system for a digital library. Int. J. Adv. Comput. Sci. Appl. 5(10),37–40 (2014)
14. Sugiyama, K., Kan, M.A.: Exploiting potential citation papers in scholarly paperrecommendation. In: Proceedings of the 13th ACM/IEEE-CS Joint Conference onDigital libraries, pp. 153–162 (2013)
15. Tang, J., Zhang, J., Yao, L., Li, J., Zhang, L., Su, Z.: ArnetMiner: extractionand mining of academic social networks. In: Proceedings of the Fourteenth ACMSIGKDD International Conference on Knowledge Discovery and Data Mining, pp.990–998 (2008)
16. Wallach, H.M., Murray, I., Salakhutdinov, R., Mimno, D.: Evaluation methodsfor topic models. In Proceedings of the 26th Annual International Conference onMachine Learning, pp. 1105–1112 (2009)
17. Wang, C., Blei, D.M.: Collaborative topic modeling for recommending scientificarticles. In: Proceedings of the 17th ACM SIGKDD International Conference onKnowledge Discovery and Data Mining, pp. 448–456 (2011)
18. Wei, X., Croft, B.C.: LDA-based document models for Ad-hoc retrieval. In: Pro-ceedings of the 29th Annual International ACM SIGIR Conference on Researchand Development in Information Retrieval, pp. 178–185 (2006)
19. Zhang, C., Zhao, X., Wang, K., Sun, J.: Content + attributes: a latent factormodel for recommending scientific papers in heterogeneous academic networks. In:de Rijke, M., Kenter, T., de Vries, A.P., Zhai, C.X., de Jong, F., Radinsky, K.,Hofmann, K. (eds.) ECIR 2014. LNCS, vol. 8416, pp. 39–50. Springer, Heidelberg(2014)

Short Papers

Topic Shifts in StackOverflow:Ask it Like Socrates
Toni Gruetze(B), Ralf Krestel, and Felix Naumann
Hasso Plattner Institute, Potsdam, Germanytoni.gruetze,ralf.krestel,[email protected]
Abstract. Community based question-and-answer (Q&A) sites rely onwell-posed and appropriately tagged questions. However, most platformshave only limited capabilities to support their users in finding the righttags. In this paper, we propose a temporal recommendation model tosupport users in tagging new questions and thus improve their acceptancein the community. To underline the necessity of temporal awareness ofsuch a model, we first investigate the changes in tag usage and showdifferent types of collective attention in StackOverflow, a community-driven Q&A website for computer programming topics. Furthermore,we examine the changes over time in the correlation between questionterms and topics. Our results show that temporal awareness is indeedimportant for recommending tags in Q&A communities.
1 Tags in Q&A Communities
During the last two decades, various popular question-and-answer (Q&A) plat-forms, such as Ask.com, Experts-Exchange, Quora, and Yahoo! Answers haveemerged. These platforms provide their users with the opportunity to ask ques-tions and challenge other users of the community to share their knowledge basedon these questions. Since 2008 StackOverflow (SO) is the de facto standardquestion-and-answer website for topics in computer science and programming.In SO, users earn reputation through active participation in the community, e.g.,by posing well-received questions or providing helpful answers. After achievinga high reputation level, a user is allowed to up-vote or comment on questionsand answers or even edit posts of other users.
Vasilescu et al. showed that experienced programmers (i.e., active GitHubcommitters) ask fewer questions and give more answers [9]. Anderson et al. inves-tigated the correlation between delay of and reputation for a given answer [1].Wang et al. show that the majority of questioners in SO asks only one ques-tion during their membership [10]. Only little research has been done on how tosupport these “newbies” on posing well-received questions. A qualitative studydiscusses efficient ways on how to give code examples for well-received ques-tions [7]. Bazelli et al. establish a connection between extroversion and opennessused in the questions and high reputation points of users [2].
Another means of improving a question is by categorizing the post appropri-ately and help a skilled responder to find it. To this end SO supports tags toc© Springer International Publishing Switzerland 2016E. Metais et al. (Eds.): NLDB 2016, LNCS 9612, pp. 213–221, 2016.DOI: 10.1007/978-3-319-41754-7 18
214 T. Gruetze et al.
categorize questions. Questioners are forced to choose at least one computer sci-ence topic for their new post so that other users, who subscribed topics of theirinterest and profession, have the chance to find the post. Hence, an appropriatelytagged question has a higher probability of getting useful answers.
Depending on the social platform, tags are used with different temporalcharacteristics. In platforms like Twitter many topics, such as sport eventsor disasters, are discussed in a very narrow time span (e.g., the Superbowlfinal: #SuperBowl or the Paris attacks of November 2015: #PrayForParis).Lehmann et al. study different classes of collective attention on Twitter [5] andGruetze et al. evaluate the influence of such temporal changes for the tag rec-ommendation task [4]. Based on the example of Quora, Maity et al. show thatthe topics discussed in general-purpose Q&A platforms underly strong temporaldynamics (e.g., political topics) [6]. The topics posted on SO (i.e., programminglanguages, databases, or operating systems) seem to be more static and lead tothe assumption that they slowly evolve over time.
In contrast to this first intuition, we show that tag usage in SO indeed under-lies strong temporal effects. In the following, we discuss four different types oftemporal topic popularity patterns in SO. We further show how the likelihoodfor question terms can strongly change over time for SO topics. Finally, we showthat recommender systems that incorporate these temporal changes outperformtheir static counterparts and thus improve the support for SO users in ask-ing well-received questions to receive appropriate answers and thus earning theSocratic badge, which is awarded for asking a well-received questions.
2 Tags in StackOverflow
As the basis for the following analysis, we use the Stack Exchange dataset con-taining approximately 10 million questions posted between August 1st 2008 andJuly 31st 2015 on StackOverflow. The questions were posted by over 4.5 millionusers and categorized using over 40 thousand unique tags. The dataset is licensedunder Attribution-ShareAlike 3.0 and available online.1
Figure 1b shows the number of questions and answers provided by theSO community. The steady growth of posts emphasizes the increase ofpopularity and spread of this Q&A platform. We presume that the large2014 drop in the number of answers and questions originates from theMighty Mjolnir community update that allows experienced users to close dupli-cated questions.
The temporal dynamics of discussed topics (i.e., applied tags) is shown inFig. 1c. While the number of distinct topics per month increases nearly linearlyover time, the number of new topics, i.e., tags that were not used before, doesnot. During the first two years, the number of new topics is relatively high butstrongly decreasing. This shows that the platform is gaining coverage of the rele-vant topics for developers. As of mid 2010 the number of new topics is relatively
1 https://archive.org/details/stackexchange.
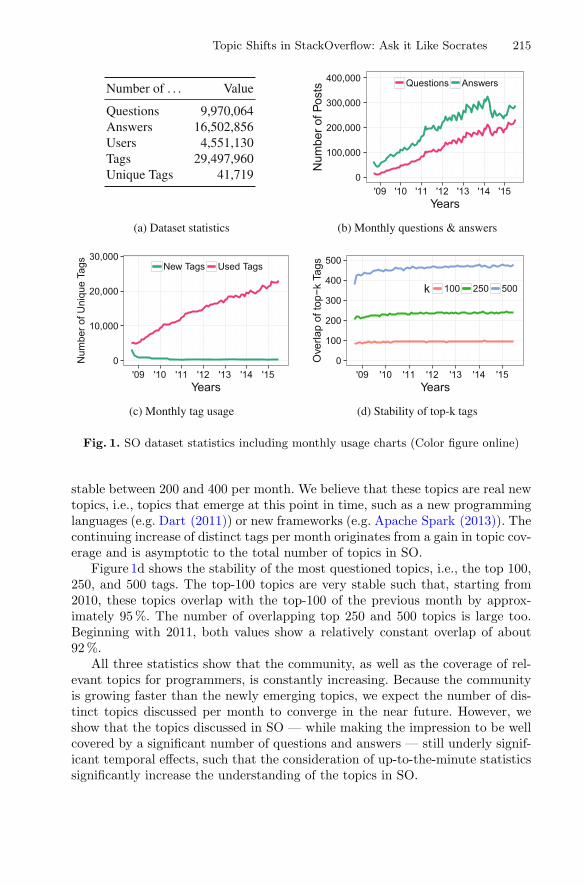
Topic Shifts in StackOverflow: Ask it Like Socrates 215
Fig. 1. SO dataset statistics including monthly usage charts (Color figure online)
stable between 200 and 400 per month. We believe that these topics are real newtopics, i.e., topics that emerge at this point in time, such as a new programminglanguages (e.g. Dart (2011)) or new frameworks (e.g. Apache Spark (2013)). Thecontinuing increase of distinct tags per month originates from a gain in topic cov-erage and is asymptotic to the total number of topics in SO.
Figure 1d shows the stability of the most questioned topics, i.e., the top 100,250, and 500 tags. The top-100 topics are very stable such that, starting from2010, these topics overlap with the top-100 of the previous month by approx-imately 95 %. The number of overlapping top 250 and 500 topics is large too.Beginning with 2011, both values show a relatively constant overlap of about92 %.
All three statistics show that the community, as well as the coverage of rel-evant topics for programmers, is constantly increasing. Because the communityis growing faster than the newly emerging topics, we expect the number of dis-tinct topics discussed per month to converge in the near future. However, weshow that the topics discussed in SO — while making the impression to be wellcovered by a significant number of questions and answers — still underly signif-icant temporal effects, such that the consideration of up-to-the-minute statisticssignificantly increase the understanding of the topics in SO.
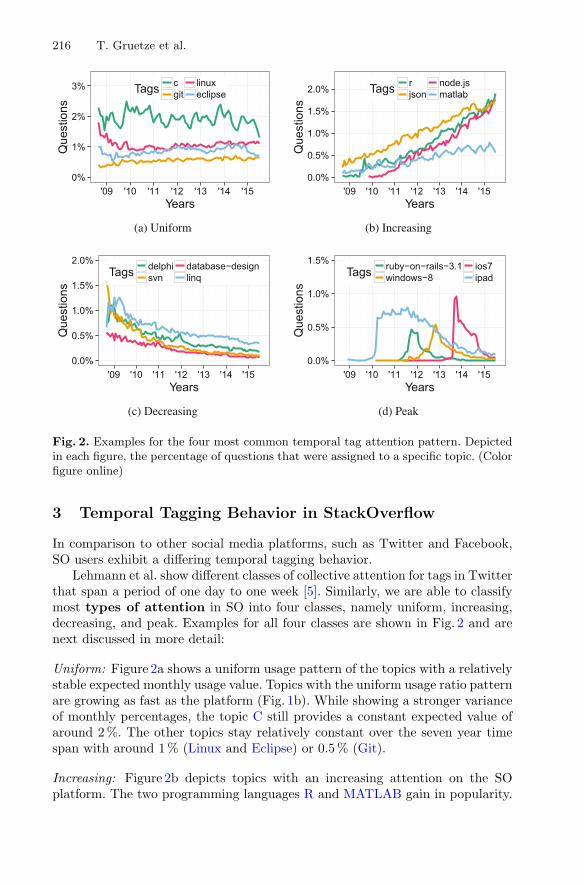
216 T. Gruetze et al.
Fig. 2. Examples for the four most common temporal tag attention pattern. Depictedin each figure, the percentage of questions that were assigned to a specific topic. (Colorfigure online)
3 Temporal Tagging Behavior in StackOverflow
In comparison to other social media platforms, such as Twitter and Facebook,SO users exhibit a differing temporal tagging behavior.
Lehmann et al. show different classes of collective attention for tags in Twitterthat span a period of one day to one week [5]. Similarly, we are able to classifymost types of attention in SO into four classes, namely uniform, increasing,decreasing, and peak. Examples for all four classes are shown in Fig. 2 and arenext discussed in more detail:
Uniform: Figure 2a shows a uniform usage pattern of the topics with a relativelystable expected monthly usage value. Topics with the uniform usage ratio patternare growing as fast as the platform (Fig. 1b). While showing a stronger varianceof monthly percentages, the topic C still provides a constant expected value ofaround 2 %. The other topics stay relatively constant over the seven year timespan with around 1 % (Linux and Eclipse) or 0.5 % (Git).
Increasing: Figure 2b depicts topics with an increasing attention on the SOplatform. The two programming languages R and MATLAB gain in popularity.

Topic Shifts in StackOverflow: Ask it Like Socrates 217
Both languages, which have a strong focus on mathematics and statistics, arecommonly used in the area of data science and data analytics. Until mid 2009the number of MATLAB questions was higher than R related posts. Afterwards,the number of R questions follows a stronger growth. Notably, the number ofquestions concerning R is higher than the ones concerning C at the end of thedata period.
Decreasing: Figure 2c depicts the decrease in spreading of the topics (halvedpopularity). For instance, the number of questions about the proprietary andexpensively licensed programming framework Delphi decreases. Simultaneous,the number of questions regarding open source alternatives, such as .NET andJava, increases. The decreasing spread of question regarding SVN shows thatmore and more software development projects switch to other version controlsolutions (e.g., Git).
Peak: Figure 2d shows the spreading of discussion topics following a peak pat-tern, which behave like a mixture of increasing and decreasing pattern happeningin a short time frame. The peak attention pattern is a typical scheme for topicscovering particular versions of frameworks, platforms, etc., as shown for iOS7.However, the pattern can also appear for non-version topics such as iPad, whichwas hyped on SO in spring 2010, the time of the official release of the device.While being a major concern of developers also shortly after the release, the com-munity lost interest, such that, 2 years and 9 month later the relative frequencyof questions with this topic halved.
Topic Shifts in SO
Besides the changes of topic popularity, rather the community also producestopic shifts, i.e., temporal changes of the vocabulary used for questions asso-ciated with a specific topic.
Fig. 3. Topic shift example for tags on questions containing the term ‘graph’ (Colorfigure online)
For instance, Fig. 3 contrasts three different topics in the context of posts con-taining the term ‘graph’ in the question text. Due to the ambiguity of the term,
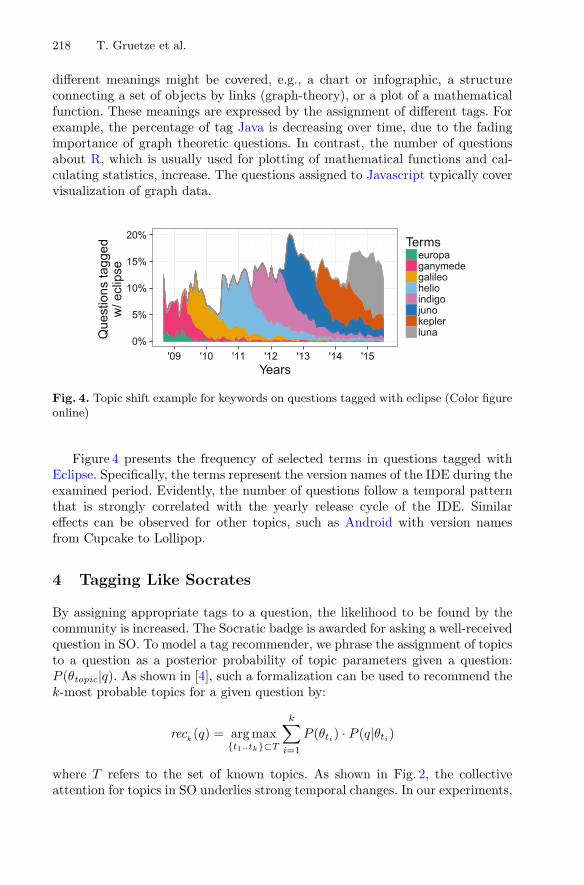
218 T. Gruetze et al.
different meanings might be covered, e.g., a chart or infographic, a structureconnecting a set of objects by links (graph-theory), or a plot of a mathematicalfunction. These meanings are expressed by the assignment of different tags. Forexample, the percentage of tag Java is decreasing over time, due to the fadingimportance of graph theoretic questions. In contrast, the number of questionsabout R, which is usually used for plotting of mathematical functions and cal-culating statistics, increase. The questions assigned to Javascript typically covervisualization of graph data.
Fig. 4. Topic shift example for keywords on questions tagged with eclipse (Color figureonline)
Figure 4 presents the frequency of selected terms in questions tagged withEclipse. Specifically, the terms represent the version names of the IDE during theexamined period. Evidently, the number of questions follow a temporal patternthat is strongly correlated with the yearly release cycle of the IDE. Similareffects can be observed for other topics, such as Android with version namesfrom Cupcake to Lollipop.
4 Tagging Like Socrates
By assigning appropriate tags to a question, the likelihood to be found by thecommunity is increased. The Socratic badge is awarded for asking a well-receivedquestion in SO. To model a tag recommender, we phrase the assignment of topicsto a question as a posterior probability of topic parameters given a question:P (θtopic|q). As shown in [4], such a formalization can be used to recommend thek-most probable topics for a given question by:
reck(q) = arg max
t1..tk⊂T
k∑
i=1
P (θti) · P (q|θti)
where T refers to the set of known topics. As shown in Fig. 2, the collectiveattention for topics in SO underlies strong temporal changes. In our experiments,

Topic Shifts in StackOverflow: Ask it Like Socrates 219
we model the prior probability P (θti) as frequency of posts with this topic fromthe past, including all recent posts. The likelihood P (q|θti) is estimated based onnouns found in the question texts for a given topic (e.g., such as the version namesfor Eclipse questions shown in Fig. 4). Note, we could have used more word classesor even all words, however, tests showed a comparable recommendation qualityfor models based on nouns as for models with all textual information whileminimizing the vocabulary size. To further facilitate the probability estimation,we make the assumption of independence between the probabilities of terms (asthe Naıve Bayes model). This plain model greatly facilitates the update of itsparameters and thus enables the efficient incorporation of current topic changes,such that the model parameters can be updated for every newly posed question.In contrast, more complex methods, such as dynamic topic models, are basedon more expensive parameter inference methods. In particular, they require atemporal partitioning of the data (i.e., the parameter estimation can be executedonly for time slices, e.g. yearly) [3].
Note, this recommender definition is rather simple and does not include fea-tures like tag co-occurrence, code snippet information, or user preferences. Asshown in previous research, such features yield a significant improvement ofthe recommendation quality [8,11]. However, due to the focus on the temporalaspects, we did not use this knowledge for the experiments and do not discussthese features here and rather focus on the improvements due to temporal pat-terns.
To measure the influence of topic shifts in SO for tag recommendations,we evaluated four different configurations of the recommender: the first modelfollows a static learn once strategy, which is based on the topic knowledge derivedfrom all posts created in the year 2010. The second model is updated annually,this yearly model recommends based on the posts of the previous calendar year(e.g., recommendations in 2011 are based on the posts of 2010). Third, the livemodel is continuously updated based on the latest SO posts. This model isbased on all posts that were created in the one year period before a question qwas submitted. Finally, we define the simple baseline that is only based on theprior probability P (θti) and thus always recommends the k most commonly usedtags for all posts independent from the question text (∀ti, tj ∈ T : P (q|θti) =P (q|θtj )). To compare the performance of all four models, we computed top-krecommendations for all questions Q from the years 2011–2015. Based on theserecommendations, we measured recall in comparison to the actual used tagsassigned to the question.
recall@k =1
|Q|∑
q∈Q
|reck(q) ∩ actTags(q)||actTags(q)|
ResultsFigure 5a shows the recall as the function of k for all four approaches. Asexpected, the baseline model performs worst. This is due to the ignorance of ques-tion contents. For k = 5 the static model was already able to recommend 39%of the actually used tags correctly. The yearly model improved this performance

220 T. Gruetze et al.
Fig. 5. Recall@k statistics for different recommendation models (Color figure online)
by 5 percent points, whereas the live model doubled these improvements andachieved a recall of 49%. This is a respectable performance given that the staticbaseline is already able to correctly identify 2 out of 5 tags given the set pos-sible set of over 40k tags. The significant increase of ten percentage points isbased on the additional temporal information and shows the potential even fora seemingly static corpus such as SO. Considering the top-10 recommendations,the live model is able to improve on recall by 10 percentage points (up to 59%),whereas the gap to the static (and yearly) model is increased by 6 (respectively5) percentage points.
To investigate the adaptation of the models with respect to topic shifts,Fig. 5b shows the recall improvement of the content based models (static, yearly,and live) in comparison to the baseline. The improvements are significant for allcompetitors, however, only the live model is able to constantly increase theimprovements for increasing k values. This underlines the superior adaptationto topic shifts due to the fast update of the model parameters.
5 Conclusion
We studied the temporal topic changes in the Q&A platform StackOverflow. Weexamined four different types of popularity patterns of topics over time to showthat indeed there are topic shifts. We showed that the likelihood for questionterms can strongly change over time for SO topics. Finally, we showed that thetag recommender that are able to incorporate these temporal changes are ableto significantly outperform their static counterparts.
In future work we will survey further Q&A platforms and compare the iden-tified temporal effects. We will investigate whether other features, such as userpreferences, code snippets, named entities, or tag co-occurrences, are chang-ing over time and can help to improve tag recommendation for new questions.Another interesting application for our findings would be trend prediction in SOand thus for the computer programming field.

Topic Shifts in StackOverflow: Ask it Like Socrates 221
Acknowledgments. This research was funded by the German Research Society, DFGgrant no. FOR 1306. We thank the StackOverflow community for sharing the valu-able knowledge targeted in this work. Finally, we wish to acknowledge the anonymousreviewers for their detailed and helpful comments to the manuscript.
References
1. Anderson, A., Huttenlocher, D., Kleinberg, J., Leskovec, J.: Discovering value fromcommunity activity on focused question answering sites: a case study of Stack Over-flow. In: Proceedings of the ACM SIGKDD Conference on Knowledge Discoveryand Data Mining, pp. 850–858 (2012)
2. Bazelli, B., Hindle, A., Stroulia, E.: On the personality traits of StackOverflowusers. In: Proceedings of the International Conference on Software Maintenance(ICSM), pp. 460–463 (2013)
3. Blei, D.M., Lafferty, J.D.: Dynamic topic models. In: Proceedings of the Interna-tional Conference on Machine Learning (ICML), pp. 113–120 (2006)
4. Gruetze, T., Yao, G., Krestel, R.: Learning temporal tagging behaviour. In: Pro-ceedings of the International Conference on World Wide Web (WWW Companion),pp. 1333–1338 (2015)
5. Lehmann, J., Goncalves, B., Ramasco, J.J., Cattuto, C.: Dynamical classes ofcollective attention in Twitter. In: Proceedings of the International Conference onWorld Wide Web (WWW), pp. 251–260 (2012)
6. Maity, S., Sahni, J.S.S., Mukherjee, A.: Analysis and prediction of question topicpopularity in community Q&A sites: a case study of Quora. In: Proceedings of theInternational AAAI Conference on Web and Social Media (ICWSM) (2015)
7. Nasehi, S.M., Sillito, J., Maurer, F., Burns, C.: What makes a good code example?A study of programming Q&A in StackOverflow. In: Proceedings of the Interna-tional Conference on Software Maintenance (ICSM), pp. 25–34 (2012)
8. Stanley, C., Byrne, M.D.: Predicting tags for StackOverflow posts. In: Proceedingsof the IEEE International Conference on (ICCM), pp. 414–419 (2013)
9. Vasilescu, B., Filkov, V., Serebrenik, A.: StackOverflow and GitHub: associationsbetween software development and crowdsourced knowledge. In: Proceedings of theInternational Conference on Social Computing (SocialCom), pp. 188–195 (2013)
10. Wang, S., Lo, D., Jiang, L.: An empirical study on developer interactions in Stack-Overflow. In: Proceedings of the Annual ACM Symposium on Applied Computing(SAC), pp. 1019–1024 (2013)
11. Wang, S., Lo, D., Vasilescu, B., Serebrenik, A.: EnTagRec: an enhanced tag recom-mendation system for software information sites. In: Proceedings of the Interna-tional Conference on Software Maintenance and Evolution (ICSME), pp. 291–300(2014)

Semantic-Syntactic Word Valence Vectorsfor Building a Taxonomy
Oleksandr Marchenko(B)
Faculty of Cybernetics, Taras Shevchenko National University of Kyiv,Glushkova ave. 4D, Kyiv 03680, Ukraine
Abstract. The paper describes the use of semantic-syntactic wordvalence vectors as context vectors in the Formal Concept Analysis forbuilding high-quality taxonomies. Research and experiments have con-firmed a significant improvement in the quality of constructed tax-onomies when in tensor models the number of dimensions is increasedwhile generating semantic-syntactic word valence vectors. The increasedarity of the tensor model gives a more accurate description of the multi-dimensional semantic and syntactic relations and allows allocating morecommutative semantic-syntactic properties of the words that are used inthe Formal Concept Analysis.
Keywords: Ontologies · Taxonomies · Formal concept analysis · Non-negative tensor factorization
1 Introduction
Taking into account that taxonomy is a fundamental hierarchical basis for design-ing ontological knowledge bases, the development of methods for automatedtaxonomy building is a relevant and extremely popular trend in computationallinguistics and artificial intelligence in general.
Formally, the task is to build a hierarchical graph from the input set of NounsN using the relation of hyponymy/hyperonymy (subclass/superclass).
Two basic classes of methods are developed for automated taxonomy build-ing via text corpora processing, namely the methods based on clustering wordswith semantic proximity measures and the methods of the set theory for word-concepts ordering. Both classes of methods work with the vector space modelthat presents words or terms as corresponding feature vectors obtained whenprocessing and analyzing a certain text corpus.
The first class of the methods is characterized by semantic proximity usageto determine the distance between vectors of words to figure out how similarthey are semantically and whether they can be placed into one cluster. To thisend, the cosine measure between vectors of words can be used. The methods ofthis class are divided, in their turn, into agglomerative (bottom-up clustering)
c© Springer International Publishing Switzerland 2016E. Metais et al. (Eds.): NLDB 2016, LNCS 9612, pp. 222–229, 2016.DOI: 10.1007/978-3-319-41754-7 19

Semantic-Syntactic Word Valence Vectors for Building a Taxonomy 223
and divisive methods (top-down clustering). The best representatives of theseapproaches are described in [1–3].
The other group, the set theory methods, performs taxonomy building byestablishing a partial order on the set of word-concepts using the relation ofinclusion among sets of features. One of the best representatives of this trendis the Formal Concept Analysis (FCA) [4]. The Formal Concept Analysis app-roach allows generating taxonomies of higher quality than hierarchies built byagglomerative/divisive clustering algorithms [5].
We propose using semantic-syntactic word valence vectors as context vectorsin the Formal Concept Analysis for building high-quality taxonomies.
The remainder of the paper is structured as follows. Section 2 contains anoverview of the Formal Concept Analysis. Section 3 presents the descriptionof a method for generating semantic-syntactic word valence vectors. Section 4describes experiments of the use of semantic-syntactic word valence vectors ascontext vectors in the Formal Concept Analysis for building high-quality tax-onomies, and demonstrates constructed taxonomies’ quality estimates calculatedin experiments. Section 5 is the conclusion of the paper.
2 The Formal Concept Analysis
The Formal Concept Analysis works with the data structure known as a contexttable K. The context table contains linguistic context data about the word usagein a certain subject area, along with a certain basic set of lexemes in the textcorpora processed and analyzed with the purpose to create the table K. To cite anexample, it can be a matrix containing data on the compatibility of an input setof Nouns N with a basic set of qualitative Adjectives. In general terms, one cansay that this method works with a table Objects×Attributes. In [5] the contextK of the FCA method is a table that stores information about the compatibilityof Noun terms with a certain set of Verbs describing Predicate−Object relation.Noun-terms are presented in the context K as vectors where non-zero elementsindicate connectivity of a Noun to the corresponding Verbs. The values areusually the frequencies of the joint appearance of Predicate − V erb × Object −Noun pairs in the text corpus. There are also options for using binary matriceswith the values 1 and 0 only.
It is worthwhile noting that in order to create the context K only the wordswith stable connections are selected, i.e. only Verbs with stable connections toat least one of the Nouns from N are selected to make a set V , i.e. a Verb canget into V if at least one frequent pair (V erb,Noun) with Predicate × Objectrelation exists in a text corpus: ∀v ∈ V ∃n ∈ N : ϑ(v, n) ≥ Th, where V is the setof Verbs, N is the set of Noun-terms, ϑ(v, n) is the frequency of co-occurrencesof (v, n) in the text corpus, Th is a threshold.
The FCA uses the partial order theory to analyze relationships betweenobjects G and their features M . The FCA singles out a feature set B fromthe formal context K, where B ⊆ M , and a bijective relation exists between Band a set of objects A ⊆ G. Such a correlated pair is called a formal concept

224 O. Marchenko
(A,B). Formal concepts are partially ordered (A1, B1) ≤ (A2, B2) ⇔ (A1 ⊆ A2)and (B2 ⊆ B1). Items o1, o2 ∈ G are conceptually clusterized if o1, o2 ⊆ A,where (A,B) is a formal concept in K.
The FCA builds a lattice of formal concepts from the binary representation ofobjects. The following two rules are applied to interpret the lattice as taxonomy:
1. One concept of taxonomy cB labeled with B is introduced for each formalconcept (A,B) if |A| ≥ 2. The concepts are arranged according to the order inthe lattice.
2. For each object o ∈ G one taxonomy concept co labeled with o is intro-duced. The concepts are arranged in such a way that co ≤ cB , where (A,B) isa formal concept and o ∈ A, and there is no formal concept (A′, B′) such that(A′, B′) ≤ (A,B) and o ∈ A′.
Among the advantages of the FCA method, one should note the quality ofthe taxonomies built. They are much better than the taxonomies constructedby the clustering methods [5]. The taxonomies obtained with the FCA methodare transparent, i.e. they are easy to interpret. The main drawback of the FCAmethod is the exponential time complexity O(2n), where n is the number ofNoun-terms that have to be organized in a taxonomy. In practice, however, theFCA demonstrates a near-linear time due to the excessive sparseness of theNoun-term vector representation.
3 Using Semantic-Syntactic Word Valence Vectors in theFCA Method
We propose to employ semantic-syntactic word valence vectors as term-contextvectors in the Formal Concept Analysis.
Semantic-syntactic word valence vectors are generated with non-negative ten-sor factorization (NTF) of words compatibility tensors. Figure 1 shows suchthree-dimensional tensor for storing the frequencies of word combinations forthe Subjects × Predicates × Objects structures derived from the analysis of alarge text corpus.
A large and sparse tensor is formed as a result of syntactic-frequency analysisof text corpus. The non-negative factorization method [6,7] is applied to thetensor to obtain a more concise and convenient presentation.
The basic idea of the method is to minimize the sum of squared differencesbetween the original tensor and its factorized model. For the three-dimensionaltensor T ∈ RD1×D2×D3 it is described by the equation:
minxi∈RD1,yi∈RD2,zi∈RD3
||T −k∑
i=1
xi yi zi||2F ,
where k is the rank of factorization and denotes the outer product of vectors.The Frobenius norm is used.
In the NTF method, a restriction of being non-negative is added, therebyturning the model into

Semantic-Syntactic Word Valence Vectors for Building a Taxonomy 225
Fig. 1. A three-dimensional tensor for storing the frequencies of word combinations forSubjects× Predicates×Objects structures.
minxi∈RD1
≥0 ,yi∈RD2≥0 ,zi∈RD3
≥0
||T −k∑
i=1
xi yi zi||2F .
The model can be represented graphically as the following illustration Fig. 2.This decomposition consists of the sum of the k outer products of vectors triples(according to the number of tensor dimensions).
Fig. 2. A graphical representation of NTF as the sum of the k outer products.
Figure 3 shows the NTF decomposition of frequency estimates of word com-patibilities for Subject × Predicate × Object triples into three matrices.
Generalized models of selectional preference and some elements of framemodel semantics (verb subcategorization frame) are extracted from text cor-pora using the NTF model for analysis of three-dimensional (S, V,O) Subject ×Predicate×Object relations. As a result, each Subject−Noun, Predicate−V erband Object − Noun gets its own vector (the size of k) from one of the matrices.The original value of tensor T for triplet (S, V,O) Tsvo can be restored from thefactorized model via calculation of the sum:
Tsvo =k∑
i=1
si ∗ vi ∗ oi

226 O. Marchenko
Fig. 3. Graphical representation of the NTF for a linguistic tensor.
Sentences are transformed into triples, e.g. the hunter shot a wolf →(hunter, shot, wolf). To calculate the frequency for the triple (hunter, shot,wolf) one needs to find the vector-subject for the word hunter, and then thevector-predicate for the word shot, and finally, the vector-object for the wordwolf . Then the frequency for the combination of these words is calculated accord-ing to the formula given above. If the score is higher than the threshold, one caninfer that such a triple is possible in the language.
Vectors from the matrices of the factorized tensor describe commutative prop-erties of words. They prescribe the links that a given word creates, i.e. withwhich lexemes and in what kind of syntactic positions these links are generated.These vectors represent both syntactic and semantic relations; therefore, thevectors are called as semantic-syntactic word valence vectors. Several tensormodels have to be tested to generate semantic-syntactic word valence vectors forNouns from the input set N . We propose to use a two-dimensional model basedon the matrix of frequencies for pairs Predicate × Object, as well as a three-dimensional model to represent triples Subject×Predicate×DirectObject, anda four-dimensional model to represent both Subject×Predicate×DirectObjectand Subject × Predicate × DirectObject × IndirectObject in text corpora.
4 Experiments
Method. As the basic algorithm for the Formal Concept Analysis, the methoddescribed in [8] was chosen. As context vectors in the FCA method, the semantic-syntactic word valence vectors for Nouns are chosen in the syntactic positions ofthe Object. To this end, the following tensors are collected and factorized:
1. a two-dimensional model is the matrix M : Predicate − DirectObject;2. a three-dimensional model is the tensor T : Subject−Predicate−DirectObject;3. a four-dimensionalmodel is the tensorP :Subject−Predicate−DirectObject−
IndirectObject.

Semantic-Syntactic Word Valence Vectors for Building a Taxonomy 227
To build the tensor, text articles from the English Wikipedia have beenselected. For each word from the input noun set N , all the articles of the EnglishWikipedia containing this word are included into the training set TSet.
Also, we should include the articles from the English Wikipedia that areconnected with the articles from the training set TSet via the category link orsome other kinds of direct links.
The training set TSet is filtered. The texts of TSet are clusterized using theLatent Semantic Analysis [9]. As the final training set, the largest cluster of textsis selected. It allows minimizing the influence of a polysemy on the model. Thelargest cluster contains texts of the correct topic domain because the maximaltopical intersection of all texts from the TSet should cover all the texts on thecorresponding topic (the topic of future taxonomy made of set N). So wordsof N inside any document of the largest cluster are mainly used with propermeanings and with appropriate contexts.
This is followed by the stage of the assembling matrix M and tensors T and P .The texts from the training set are parsed with the Stanford parser [10] and
the values of tensor elements are set. For example, if a syntactic structure ofa sentence under analysis shows that the word hunter is a Subject, the wordhunted is a Predicate, and the word boar is a Direct Object, then the valueT [i, j, k] is increased by 1. It is assumed that i is the index of the word hunter, jis the index of the word hunted, k is the index of the word boar, and T [i, j, k] =T [i, j, k] + 1. At the end of the processing, the element T [i, j, k] will contain thefrequency of the triple (hunter hunted boar) for the phrases the hunter hunteda boar in the training set.
If a particular item is absent in the triplet or quadruplet, then the missingelement is filled with the empty word . For example, the four-dimensionalmodel Subject × Predicate × DirectObject × IndirectObject for the sentencethe hunter hunted a boar has no Indirect Object and it is replaced by a sentencethe hunter hunted a boar . Where more than one element is missing in thesentence structure, no data are recorded in tensor. All elements that do notexceed a certain threshold are zeroed in order to keep only stable values and toget rid of the noise. After collecting data, the matrix and tensor factorizationsare performed. For the two-dimensional matrix model, the method of Lee-Seung[11] is employed. For the NTF of three-dimensional and four-dimensional tensors,the Parafac method is used [12]. For all the nouns from the set N the vectorsfrom the Object matrices are collected. These semantic-syntactic Noun valencevectors are used by the FCA method [8] as context vectors for constructingtaxonomies of the Noun set N .
Typically, the quality of taxonomy building algorithm is assured by the meth-ods of comparison of generated taxonomies. Usually, the comparison is made withtaxonomies that are constructed manually.
To ensure the availability of hand-crafted taxonomy the input noun set Nwas formed as shown below. As a reference taxonomy, a subnet from Word-Net [13] is taken starting from a certain node N0 as a root together with allits descendants up to the distance of 4 (sometimes 5) using relation is − a.

228 O. Marchenko
The first words of the synsets are taken from all nodes of the subnet in order toform an input set N . To calculate estimates of the structural proximity amongthe hand-crafted taxonomies and the derived taxonomies, the method describedin [5] is applied.
Results. There are three series of experiments: with the set N correspondingto N0 = transport; with the set N corresponding to N0 = food; with the set Ncorresponding to N0 = profession. The FCA method uses the following vectorsas the context:
1. as a baseline, the vectors from the incidence matrix of the words in pairsV erb−Noun (for this case taxonomies were built and evaluated as describedin [5] with the optimal value of the threshold t=0.005);
2. the semantic-syntactic word valence vectors for Noun − Objects from thetwo-dimensional factorized matrix model;
3. the semantic-syntactic word valence vectors for Noun − Objects from thethree-dimensional factorized tensor model;
4. the semantic-syntactic word valence vectors for Noun − Objects from thefour-dimensional factorized tensor model.
Each time four taxonomies T1, T2, T3, T4 are built by FCA algorithm [8] as aresult. Generated taxonomies have been examined for structural similarity tothe reference WordNet taxonomies. The estimates are presented in Table 1.
Table 1. Estimates of structural similarity of the built taxonomies to standard tax-onomies
N T1 T2 T3 T4
N0 = transport 67.39% 70.21% 76.47% 78.73%
N0 = food 65.98% 68.29% 73.41% 75.12%
N0 = profession 68.01% 70.77% 76.81% 79.37%
These estimates give the strong evidence of the sustainable advantage ofsemantic-syntactic word valence vectors over simple context vectors from theincidence matrix of words when the valence vectors are used in the Formal Con-cept Analysis method. There is a notable accuracy increase for the taxonomiesbuilt on semantic-syntactic word valence vectors when the number of tensordimensions increases. It takes place because the multidimensional tensor modelcan capture subtle sophisticated connections between predicates (V erbs) andtheir arguments (Nouns) that are unavailable for simple two-dimensional mod-els. Even the non-negative factorization of the two-dimensional matrix gives anotable improvement compared to the case when simple context vectors areused by the FCA algorithm because the Non-negative Matrix Factorization reli-ably extracts clear and stable relations from the incidence matrix. The furtherincrease of the dimension number in the tensor model allows accumulating a
Semantic-Syntactic Word Valence Vectors for Building a Taxonomy 229
larger amount of complex multidimensional semantic and syntactic data andallocating more semantic-syntactic relations that are used as attributes in theFCA method thereby improving the quality of the generated taxonomies.
5 Conclusion
The paper describes the use of semantic-syntactic word valence vectors as contextvectors in the Formal Concept Analysis method for automatic construction ofhigh-quality taxonomies. The research and experiments have confirmed a signif-icant improvement in the quality of the constructed taxonomies with increasingnumber of tensor model dimensions while generating semantic-syntactic wordvalence vectors. The tensor model arity increase gives a more accurate descrip-tion of the multidimensional semantic and syntactic relations and allows iden-tifying more commutative semantic-syntactic properties of words used in theFormal Concept Analysis for building taxonomies of a higher quality.
References
1. Caraballo, S.A.: Automatic construction of a hypernym-labeled noun hierarchyfrom text. In: Proceedings of the 37th Annual Meeting of the ACL-99, pp. 120–126(1999)
2. Hindle, D.: Noun classification from predicate-argument structures. Proceedings ofthe Annual Meeting of the ACL-90, pp. 268–275 (1990)
3. Pereira, F., Tishby, N., Lee, L.: Distributional clustering of english words. In: Pro-ceedings of the 31st Annual Meeting of the ACL-1993, pp. 183–190 (1993)
4. Ganter, B., Wille, R.: Formal Concept Analysis: Mathematical Foundations.Springer, New York (1999)
5. Cimiano, P., Hotho, A., Staab, S.: Comparing conceptual, divisive and agglomera-tive clustering for learning taxonomies from text. In: Proceedings of the EuropeanConference on Artificial Intelligence-2004, pp. 435–439 (2004)
6. Van de Cruys, T.: A non-negative tensor factorization model for selectional pref-erence induction. J. Natural Lang. Eng. 16(4), 417–437 (2010)
7. Van de Cruys, T., Rimell, L., Poibeau, T., Korhonen, A.: Multi-way tensor factor-ization for unsupervised lexical acquisition. In: Proceedings of COLING-2012, pp.2703–2720 (2012)
8. Vychodil, V.: A new algorithm for computing formal concepts. In: Proceedingsof the 19th European Meeting on Cybernetics and Systems Research, pp. 15–21(2008)
9. Deerwester, S., Dumais, S.T., Furnas, G.W., Landauer, T.K., Harshman, R.: Index-ing by latent semantic analysis. J. Am. Soc. Inform. Sci. 41(6), 391–407 (1990)
10. Stanford Parser version 3.6.0 (2015). http://nlp.stanford.edu/software/lex-parser.shtml#Download
11. Lee, D.D., Seung, H.S.: Algorithms for Non-Negative Matrix Factorization. NIPS(2000). http://hebb.mit.edu/people/seung/papers/nmfconverge.pdf
12. Cichocki, A., Zdunek, R., Phan, A.-H., Amari, S.-I.: Nonnegative Matrix and Ten-sor Factorizations: Applications to Exploratory Multi-way Data Analysis and BlindSource Separation. Wiley, Chichester (2009)
13. Miller, G., Beckwith, R., Fellbaum, C., Gross, D., Miller, K.: Introduction to Word-Net: An On-line Lexical Database. http://wordnetcode.princeton.edu/5papers.pdf

Generating Tailored Classification Schemasfor German Patents
Oliver Pimas1(B), Stefan Klampfl1, Thomas Kohl2, Roman Kern1,and Mark Kroll1
1 Know-Center GmbH Graz, Graz, Austriaopimas,sklampfl,rkern,[email protected]
2 SKF GmbH Schweinfurt, Schweinfurt, [email protected]
Abstract. Patents and patent applications are important parts of acompany’s intellectual property. Thus, companies put a lot of effort indesigning and maintaining an internal structure for organizing their ownpatent portfolios, but also in keeping track of competitor’s patent port-folios. Yet, official classification schemas offered by patent offices (i) areoften too coarse and (ii) are not mappable, for instance, to a company’sfunctions, applications, or divisions. In this work, we present a first steptowards generating tailored classification. To automate the generationprocess, we apply key term extraction and topic modelling algorithmsto 2.131 publications of German patent applications. To infer categories,we apply topic modelling to the patent collection. We evaluate the map-ping of the topics found via the Latent Dirichlet Allocation method tothe classes present in the patent collection as assigned by the domainexpert.
Keywords: Patent classification · German patents · keywordextraction · LDA
1 Introduction
Since patent applications and patents reflect a company’s know-how and value,it is important (i) to keep track of published patent applications of others, and(ii) to use it as a source for technology intelligence. Official classification such asthe International Patent Classification (IPC)1 offered by patent offices are notapplicable to functions, applications, or divisions of a company.
In this work, we present a first step towards automatically generating patentschemas tailored to a company’s needs. We approach this unsupervised learningscenario by applying keyword extraction as well as clustering techniques to 2131publications of German patent applications. First, we evaluate three keywordextraction algorithms to identify representative candidates for customized cate-gories. Based on a domain expert’s feedback, we adjust the keyword extraction,1 http://www.wipo.int/classifications/ipc/en/.
c© Springer International Publishing Switzerland 2016E. Metais et al. (Eds.): NLDB 2016, LNCS 9612, pp. 230–238, 2016.DOI: 10.1007/978-3-319-41754-7 20
Generating Tailored Classification Schemas 231
for instance, to account for characteristics of the German language. To evaluatethese adjustments, we compare rank positions of the extracted key terms and theones provided by the domain expert. Second, we use Latent Dirichlet Allocation(LDA) to identify topics within the patents. Ideally, the resulting topics reflecta company’s customized patent classes. We compare the resulting topics withthe domain expert’s class assignment. A visual inspection shows that LDA iscapable of identifying some of the expert’s classes but does not yield an optimalcoverage.
2 Key Term Extraction
Observing a domain expert classifying patents shows heavy reliance on specifictrigger words, which we call weak signals. We thus compare and evaluate threeextraction methods, integrating the domain expert’s feedback.
Our dataset is a collection of 2131 publications of German patent applica-tions, registered between 2003-01-01 and 2012-12-31. We only process the patentdescription and claim and do not exploit any information specific to this data set.As a first step towards a tailored classification schema we aimed at extractingweak signals in the form of key terms, which would then serve as candidates forcustom categories. We generated such key terms by employing and comparingthree different approaches: (i) Tf-idf, (ii) TextSentenceRank, and (iii) GriesDP.Each of these methods yields a comparable score that allows a ranking of theresulting key terms. In all approaches we restricted these terms to the stems ofcommon and proper nouns. For display purposes we associate the stems withthe most frequently occurring word form.
Tf-Idf (term frequency-inverse document frequency) is a common weightingschema used in information retrieval [9]. It reflects the importance of a word bynormalizing the occurrences of a term in a document by the number of occur-rences in the corpus. Several variants of the tf-idf measure exist; here we assignto each term t and document d a weight
w(t, d) = ft,d · log(
1 + β · N
1 + nt
)(1)
where ft,d is the raw frequency of term t in document d, N is the total numberof documents, and nt is the number of documents, the term t occurs in. βis a configurable trade-off parameter that weights the influence of the inversedocument frequency against the term frequency; here we choose β = 1.
To arrive at a global ranking of terms t, we have to aggregate these scoresin (1) over documents d. Simply choosing the maximum weight for each termover documents would often yield top-ranking terms that are very specific andoccur only in single documents. Instead, we empirically chose the 95th percentile,TF (t) = P95 w(t, d)d, where ·d denotes the distribution over documents. Inthis way, we skip the highest 5 % of weights for each term, and thus arrive atkey terms that are specific for a broader set of documents.
232 O. Pimas et al.
The TextSentenceRank algorithm [10] is a graph based ranking method tonatural language text, returning a list of relevant key terms and/or key sentencesordered by descending scores. It builds a graph where vertices correspond to sen-tences or tokens and connects them with edges weighted according to their sim-ilarity (textual similarity between sentences or textual distance between words).Furthermore, each sentence vertex is connected to the vertices corresponding tothe tokens it contains.
The score s(vi) of a vertex vi is given by
s(vi) = (1 − d) + d∑
j∈I(vi)
wij∑vk∈O(vj)
wjks(vj), (2)
where d is a parameter accounting for latent transitions between non-adjacentvertices (set to 0.85 as in [2,7]), wij is the edge weight between vi and vj , and I(v)and O(v) are the predecessors and successors of v, respectively. The scores can beobtained algorithmically by an iterative procedure, or alternatively by solving aneigenvalue problem on the weighted adjacency matrix. The TextSentenceRankalgorithm is an extension to the original TextRank algorithm [7], which couldeither compute key terms or key sentences. For the application at hand, weconcatenate all patents into a single document and extract the key terms togetherwith their scores as our ranked list of key terms.
GriesDP. The third method is the normalized dispersion measure proposed byGries in [3], which we call GriesDP :
DP (t) =1
1 − 1n
n∑
i=1
|si − vt,i|2
. (3)
It compares the relative sizes of n disjoint corpus segments si (here we choose thedocument boundaries) with the actual relative frequencies vt,i of a given term tinside these segments. The values of the normalized measure DP (t) lie between0 and 1. Small values indicate that t is distributed across the segments as onewould expect given the corpus sizes, whereas large values indicate that t occursmuch more in certain subparts of the corpus than in others. Terms with smalldispersion values can also be interpreted as corpus-specific stop words. Here, wechose the terms with the largest dispersion values as our list of key terms.
Comparison of Extraction Algorithms. Table 1 compares the top 10 keyterms generated by each of the three extraction algorithms, Tf-idf, TextSen-tenceRank, and GriesDP. The ranking is determined by the scores assigned bythe respective algorithm. Across algorithms these scores vary in terms of theirvalue range. As expected, all of the algorithms yield mostly technical terms spe-cific to the given application domain. Interestingly, however, the actual rankedlists of key terms appear to be quite different for different extraction methods.Perhaps the most apparent difference is that TextSentenceRank yields muchmore general terms, such as “Richtung” (direction) or “Beschreibung” (descrip-tion), compared to Tf-idf and GriesDP, which tend to extract words describing

Generating Tailored Classification Schemas 233
Table 1. Top 20 key terms generated by each of the three extraction algorithms rankedby the assigned score. Score values are rounded to two or three decimal places, respec-tively.
Tf-idf TextSentenceRank GriesDP
Radialkanal 223.33 radial 0.189 Axialsteg 0.994
Druckmittelubertragungselement 184.01 Außenring 0.162 Lagerscheibe 0.993
Walzlageraußenring 171.43 Walzlager 0.148 Klauenring 0.993
Dichtsteg 160.42 Walzkorper 0.137 Zwischenplatte 0.990
Ringkanaloffnung 157.27 Innenring 0.113 Funktionsring 0.989
Funktionsring 146.26 Kafigring 0.108 Rohrabschnitt 0.988
Kreisringscheibe 146.26 Beschreibung 0.102 Befestigungsschenkel 0.987
Rollenkorper 124.25 Richtung 0.100 Radialborden 0.986
Montageschiene 111.66 Ausfuhrungsform 0.099 Rampe 0.986
Distanzstuck 110.09 Lagerring 0.098 Kreisringscheibe 0.984
specific mechanical parts. GriesDP and Tf-idf share a number of terms in theirtop 20 list, although at quite different positions.
2.1 Incorporation of Expert Feedback into Extraction Metrics
To evaluate the extracted key terms as suggestions, a domain expert was askedto select around 1000 relevant terms. We found that among the top 1000terms obtained by each of the algorithms, Tf-idf yielded 52, TextSentenceR-ank matched only 1, and GriesDP extracted 7 of the terms that were marked asrelevant by the expert. This distinguishes Tf-idf as the most promising algorithmfor the application at hand.
In the following we aim at modifying this measure as to incorporate insightsobtained from the expert feedback:
1. Terms selected by the expert are on average longer than the average lengthacross all extracted key terms from the patents. Figure 1 shows that there isa considerable difference in the distributions of lengths, both in terms of thenumber of characters and the number of syllables.
2. Terms selected by the expert typically consist of compound words. Since inGerman compounds are agglutinated into single words, this is also related tothe first insight.
3. Terms selected by the expert tend to occur more in the beginning of thedocument. Figure 2 compares the distributions of relative document positionsof relevant and non-relevant phrases. It can be seen that relevant phrasesoccur more often in the first quarter and less often in the second quarter ofthe documents.

234 O. Pimas et al.
Fig. 1. Comparison of key phrase lengths in terms of characters and syllables betweenall extracted phrases (pink) and phrases marked relevant by the expert. (Color figureonline)
Fig. 2. Comparison of the distributions of relative document positions of releventphrases (blue) and non-relevant phrases (green). For display purposes, the distribu-tions were smoothed by kernel density estimation. The difference of the distributionsis shown in red. The blue and green dashed lines denote the average relative documentpositions of relevant (0.449) and non-relevant phrases (0.486), respectively. (Color figureonline)
We incorporated these insights into an modified Tf-idf metric, which com-bines the original Tf-idf metric, TF (t) (1), with additional scores in a weightedmanner. More precisely,
TFmod(t) = worig ·TF (t)+wcomp ·Scomp(t)+wrelComp ·SrelComp(t)+wloc ·Sloc(t),(4)
where Scomp, SrelComp, and Sloc are scores capturing the influence of the term’scomponents, the related compounds, and the relative location in the document,respectively. The scores are weigthed by wloc = 0.7 and worig = wcomp =wrelComp = 0.1, which were heuristically chosen. Both the scores Scomp andSrelComp take into account the composition of terms into a larger compound terms,which is a particular property of theGerman language.The component scoreScomp
of a term t computes the average Tf-idf score of its components t1, . . . , tn,
Scomp(t) =1n
n∑
i=1
TF (ti). (5)
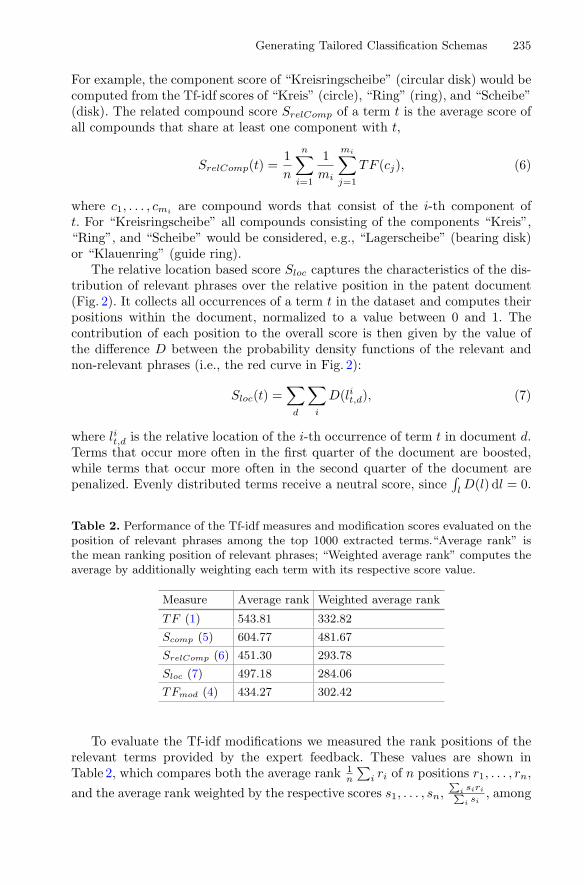
Generating Tailored Classification Schemas 235
For example, the component score of “Kreisringscheibe” (circular disk) would becomputed from the Tf-idf scores of “Kreis” (circle), “Ring” (ring), and “Scheibe”(disk). The related compound score SrelComp of a term t is the average score ofall compounds that share at least one component with t,
SrelComp(t) =1n
n∑
i=1
1mi
mi∑
j=1
TF (cj), (6)
where c1, . . . , cmiare compound words that consist of the i-th component of
t. For “Kreisringscheibe” all compounds consisting of the components “Kreis”,“Ring”, and “Scheibe” would be considered, e.g., “Lagerscheibe” (bearing disk)or “Klauenring” (guide ring).
The relative location based score Sloc captures the characteristics of the dis-tribution of relevant phrases over the relative position in the patent document(Fig. 2). It collects all occurrences of a term t in the dataset and computes theirpositions within the document, normalized to a value between 0 and 1. Thecontribution of each position to the overall score is then given by the value ofthe difference D between the probability density functions of the relevant andnon-relevant phrases (i.e., the red curve in Fig. 2):
Sloc(t) =∑
d
∑
i
D(lit,d), (7)
where lit,d is the relative location of the i-th occurrence of term t in document d.Terms that occur more often in the first quarter of the document are boosted,while terms that occur more often in the second quarter of the document arepenalized. Evenly distributed terms receive a neutral score, since
∫lD(l) dl = 0.
Table 2. Performance of the Tf-idf measures and modification scores evaluated on theposition of relevant phrases among the top 1000 extracted terms.“Average rank” isthe mean ranking position of relevant phrases; “Weighted average rank” computes theaverage by additionally weighting each term with its respective score value.
Measure Average rank Weighted average rank
TF (1) 543.81 332.82
Scomp (5) 604.77 481.67
SrelComp (6) 451.30 293.78
Sloc (7) 497.18 284.06
TFmod (4) 434.27 302.42
To evaluate the Tf-idf modifications we measured the rank positions of therelevant terms provided by the expert feedback. These values are shown inTable 2, which compares both the average rank 1
n
∑i ri of n positions r1, . . . , rn,
and the average rank weighted by the respective scores s1, . . . , sn,∑
i siri∑i si
, among

236 O. Pimas et al.
the top 1000 key terms extracted by the algorithm in question. The weightedaverage rank also accounts for differences in the assigned score values, even ifthe ranking positions are similar. It can be seen that the modified Tf-idf algo-rithm, TFmod (4), provides a considerable improvement over the standard Tf-idfmethod, TF (1), in terms of both performance measures. On average, relevantphrases are ranked more than 100 positions higher. Table 2 also evaluates theindividual scores Scomp, SrelComp, and Sloc. It indicates that the scores basedon the relative location of the phrases within a document, Sloc, and the relatedcompounds, SrelComp, provide the largest potential for improvement. On theother hand, the component score Scomp alone would not be beneficial for theranking of relevant terms. It is worth noting here, that the average rank of themodified Tf-idf measure, which combines all four other variables, is better thanthose of all of the other measures alone.
3 Category Inference
In order to automate the classification process we try to model the latent topicspresent in a patent collection. Companies often organise patents according totheir applications or function, or to fit a company’s divisions or areas. We expectsuch categories to share common concepts or ideas.
3.1 Latent Dirichlet Allocation (LDA) on Patent Collections
Following this hypothesis, we apply LDA [1], an unsupervised learning algo-rithm, that models topics as a certain probability distribution over a limitedvocabulary. We filter the vocabulary by removing stop words and only consid-ering noun phrases when computing LDA. As described in Sect. 2.1, a domainexpert selected around 1000 relevant terms from our suggestions. This expertalso assigned 63 classes to those relevant terms.
To evaluate how well the topics map this target classes, we set k = 63 andlook at the words with the highest probabilities P (w|θ) for a certain topic θ. If atopic θ most likely produces relevant terms from a single class c, θ correspondsto c.
Figure 3 shows four latent topics uncovered by LDA, each represented bythe 25 terms it most likely produces. Terms that were annotated as relevantby the expert are highlighted in different colors based on the class assigned bythe expert. Thus, extracted topics that contain relevant terms highlighted in asingle color can be mapped to the respective class. For example, topics 13 and14 can be mapped to the classes gearing and clutches, correspondingly. On theother hand, different highlighting colors within an extracted topic means that itproduced relevant terms from different classes with a high probability, thereforewe cannot map it to one of the classes provided by the expert.

Generating Tailored Classification Schemas 237
Fig. 3. Selection of 4 latent topics uncovered by LDA.
4 Related Work
Patents contain a valuable body of knowledge useful to many communities suchas industry, business or research. Not only do they document technologicaladvancements of our society, ideas expressed in patents can also reveal aca-demic as well as business trends (cf. [4]). To gain access to this knowledge,techniques and methods from many areas including natural language process-ing, information retrieval, and machine learning are being applied to patents(cf. [11]). The broad spectrum of tasks when it comes to patents include PatentRetrieval, Patent Classification, Patent Visualization, Patent Valuation, andCross-Language Mining (cf. [12]).
Key terms play an important role in the classification of patents as well.Larkey (cf. [6]), for instance, presents a patent classification system, whichemploys representative terms and phrases that are weighted by frequency andstructural information. Kim et al. (cf. [5]) focused on structural elements of apatent as well; specifically they used so-called semantic elements such as claims,purposes, or effects. Pesenhofer et al. (cf. [8]) extracted key terms from respectiveWikipedia pages, instead of the patents themselves.
5 Conclusion and Future Work
This work is inspired by a domain expert’s observation during manually assigningpatents to company related classes. We deploy three different key term extractionalgorithms to identify relevant class descriptors, improving results by takingGerman language characteristics into account. To infer a classification schema,we apply topic modelling, which provides us with a flat structure of categories.Results of this work inform the development of a patent research application forSKF2, a leading global technology provider that aims at facilitating and thusimproving in-house retrieval processes.2 http://www.skf.com/group/index.html.

238 O. Pimas et al.
Acknowledgements. The authors thank Stefan Falk for helping with the experi-ments. The Know-Center is funded within the Austrian COMET Program under theauspices of the Austrian Ministry of Transport, Innovation and Technology, the Aus-trian Ministry of Economics and Labour and by the State of Styria. COMET is man-aged by the Austrian Research Promotion Agency FFG.
References
1. Blei, D., Ng, A., Jordan, M.: Latent dirichlet allocation. J. Mach. Learn. 3,993–1022 (2003)
2. Brin, S., Page, L.: Reprint of: the anatomy of a large-scale hypertextual web searchengine. Comput. Netw. 56(18), 3825–3833 (2012)
3. Gries, S.T.: Dispersions and adjusted frequencies in corpora. Int. J. Corpus Lin-guist. 13(4), 403–437 (2008)
4. Jung, S.: Importance of using patent information. Most intermediate trainingcourse on practical intellectual property issues in business (2003)
5. Kim, J.H., Choi, K.S.: Patent document categorization based on semantic struc-tural information. Inform. Process. Manage. 43(5), 1200–1215 (2007)
6. Larkey, L.: Some issues in the automatic classification of us patents. MassachusettsUniv Amherst Department of Computer Science (1997)
7. Mihalcea, R., Tarau, P.: Textrank: bringing order into texts. In: Conference onEmpirical Methods in Natural Language Processing. Barcelona, Spain (2004)
8. Pesenhofer, A., Edler, S., Berger, H., Dittenbach, M.: Towards a patent taxonomyintegration and interaction framework. In: Proceedings of the Workshop on PatentInformation Retrieval (2008)
9. Salton, G., McGill, M.J.: Introduction to Modern Information Retrieval (1986)10. Seifert, C., Ulbrich, E., Kern, R., Granitzer, M.: Text representation for efficient
document annotation. J. Univers. Comput. Sci. 19(3), 383–405 (2013)11. Tseng, Y.H., Lin, C.J., Lin, Y.I.: Text mining techniques for patent analysis.
Inform. Process. Manage. 43(5), 1216–1247 (2007)12. Zhang, L., Li, L., Li, T.: Patent mining: a survey. SIGKDD Expl. Newslett. 16(2),
1–19 (2015)
A Platform Based ANLP Toolsfor the Construction of an Arabic
Historical Dictionary
Faten Khalfallah(&), Handi Msadak, Chafik Aloulou,and Lamia Hadrich Belguith
Faculty of Economic Sciences and Management, MIRACL, Sfax, TunisiaFaten.khalfallah105,Handi.msadak,Chafik.aloulou,
Abstract. In this paper, we provide for the linguists a method to facilitate thecreation of a standard Arabic historical dictionary in order to save the lost periodand to be up to date with other languages. In this method, we propose a platformof Automatic Natural Language Processing (ANLP) tools which permits theautomatic indexing and research from a corpus of Arabic texts. The indexation isapplied after some pretreatments: segmentation, normalization, and filtering,morphological analysis. The prototype that we’ve developed for the generationof standard Arabic historical dictionary permits to extract contexts from theentered corpus and to assign meaning from the user. The evaluation of oursystem shows that the results are reliable.
Keywords: Historical dictionary Platform ANLP Arabic Corpus Indexation Morphological analyzer Stemming
1 Introduction
The need to a better comprehension of the actual language, its culture recognition in itsperiod and a concentration to the linguistics toward the fast evolution of the languagenowadays oblige linguists to develop huge references in the different languages sup-porting the big volume of vocabularies and presenting its evolution by the time, it’s thehistorical dictionary. Fortunately, there are many linguists who recognized this problemsince a long time and tried to collect the history of their languages by developinghistorical dictionaries such the French historical dictionary and the English one. But,unfortunately, because of its complexity and semi algorithmic nature of its morphologyemploying numerous rules and constraints on inflexion, derivation and cliticization, theArabic language is not yet stored although its importance and richness. That’s why, wewill propose in this paper a solution that can help linguists to save the time alreadypassed and build their own database presenting the Arabic vocabularies from its birthand describing its evolution historically and geographically.
© Springer International Publishing Switzerland 2016E. Métais et al. (Eds.): NLDB 2016, LNCS 9612, pp. 239–248, 2016.DOI: 10.1007/978-3-319-41754-7_21
2 State of the Art
A dictionary is a reference database containing a set of words of a language or adomain of activity, generally represented under the alphabetic order. In general, adictionary indicates the root, the definition, the spelling, the sense and the syntax of theentry [1, 2]. The general structure of a dictionary can have the form of:Key = Description, where the keys are generally words from the language and thedescriptions are sets of words representing the definitions, the explanations or thecorrespondences synonym, antonym, translation, etymology) [1, 3]. There are twomain types of dictionaries: the classical and the electronic, their content is necessarilysimilar but the main difference between them is not only in the presented informationbut also in its use, the content display, and the research capacity.
In fact, Arabic dictionaries started from an early time, exactly in the year 718 andwas developed from a version to another till the present. The problem is that someentries which exist in a dictionary and don’t in another one because of the evolution ofthe period. Moreover, it is not practical for the linguists to use the separated dictionariesin order to look for the evolution of a word sense from different dictionaries. So themajority of the old dictionaries have been neglected and some entries have beendisappeared from a dictionary to another.
Historical dictionaries are available for many languages (French, English, Swedish,German,…), but unfortunately, there isn’t an Arabic one until now although the dif-ferent initiatives in different regions in the world which didn’t exceed the collect phasealthough our awareness that the fact of having a historical dictionary will be beneficialfor the most of researchers in different fields (linguistics, history, etymology…). That’swhy, as researchers, we found that it’s necessary to think about an Arabic historicaldictionary which will collect all the entries from the first appearance until the present.
The idea of historical dictionaries has started in the 19th century just after theappearance of the historical analysis method. Multiple international projects werelaunched in different countries aiming to create a historical dictionary. The mainobjective of the idea was to describe the evolution of word in language. We can take asan example the Arabic word راطق kitar which had 3 main senses from the year 39 BDtill nowadays. First, it meant “ رطملا the rain” till the year 283, then “ لبإلانمةعومجم a setof camels” till 1307 to become “ راطق train” until now.
In the following part, we will enumerate some of them.
2.1 DHLF: Historical Dictionary of the French Language
It was an etymological and historical dictionary written by Marianne Tomi, TristanHordé, Chantal Tanet and Alain Rey and edited by LE ROBERT dictionaries [4]. Itslast version appeared in 2012 containing more than 50000 entry and up to 40000 paperwhich offer a complete synthesis about the evolution of the French words. This dic-tionary is characterized by its simplicity and clearness, it is based on the dictionariesbuild by the linguists and the lexicologists in the XVII, XVIII and XIX centuries. Thisdictionary didn’t use any Automatic Natural Language Processing (ANLP) process. Itpermits just to have access to its contents in sequentially. After the access to this
240 F. Khalfallah et al.

dictionary, we noticed that it presents for each entry its morphology, the appearancedate, the origin, the sense and its evolution across the time.
2.2 DWB: German Historical Dictionary
The DWB has been the most important German dictionary since the XVI century.32 volumes were published between 1838 and 1971. It contains the history of eachword by some citations. The use of such dictionary can recognize the ancient use andthe modern use of each entry [4]. After the study of this dictionary, we noticed that itdoesn’t include automatic language processing for its creation, but it gives access toother dictionaries in its results. It displays for each entry the different senses, thedifferent papers containing the entry in addition to its date and links to search in otherdictionaries.
2.3 OED (English Historical Dictionary)
Oxford English Dictionary is a reference dictionary for the English Language which ispublished by the Oxford University. This project was launched in 1857 by the poetRichard Chenevix Trench [6] who has shown the different problems of the Englishdictionaries and announced his motivation to begin to work on a historical dictionary ina conference. The first edition of this dictionary was published in 1928 containingabout 414825 paper. This dictionary was able to be online since 1992 but there is noANLP [4, 5]. As it is described in the different previous works, the creation of ahistorical dictionary requires a long time to classify the right information in its rightplace. That’s why, as computer scientists, we decided to develop a Platform using theAutomatic Natural Language Processing tools to guide the linguists to the creation of ahistorical dictionary for the Arabic language to save the lost time and be able to updatethe dictionary easily.
3 Proposed Method
Our project consists on developing a platform of ANLP tools in order to help linguistscreate a historical dictionary of the Arabic language. Thus, we’ve been inspired fromthe different outputs of the historical dictionaries already done and we’ve noticed thatsuch a platform requires fundamental steps as follows: The corpus collection, theNatural Language Processing and the creation of the index which will facilitate theaccess to the corpus for the research. The Fig. 1 describes the proposed steps.
The Arabic language needs appropriate processing and analysis to be fullyexploited. Indexation and research are efficient as long as Arabic content has beenautomatically processed through complex stages: mining, segmentation, normalization,morphosyntactical analysis, stemming, tagging, etc. By combining power and accu-racy, this analysis enables highly structured indexing and high performance in research.The following figure resumes the proposed system tasks (Fig. 2).
A Platform Based ANLP Tools 241

3.1 Indexation
The indexation will facilitate the access to a document content. In this section, we willpresent our proposed method detailing the different pretreatments.
(A) Corpus creation
Our corpus is collected from the LDC and it is a set of heterogeneous texts fromdifferent domains (literature, poetry, prose, dictionaries, etc.). It contains 30 texts fromdifferent periods from 700 to 1300, for every period, we reserved 5 texts. These textswill be treated in order to be indexed in units, that’s why a segmentation task isnecessary.
(B) Segmentation
The segmentation [13] is a process used for the morphological treatment of the lan-guage allowing to divide a text to a set of words called tokens. It’s necessary for oursystem in order to identify the fields (author, title, date, place, …) and store the records.Since our target is to segment an Arabic text in words, we will just explain the Arabicwords limits rules. The approach consists on the analysis of the punctuation marks, thespecial characters, and spaces and a list of particles as the coordination and conjunc-tions which are considered as segmentation criteria and act as Arabic words separators.Our method permits to browse the text character by character and eliminate them.
INDEXATION RESEARCH
Corpus NLP processing Corpus Search
Fig. 1. General schema of the proposed platform
Fig. 2. System tasks
242 F. Khalfallah et al.
Moreover, this method permits to eliminate all the numbers and the non-Arabiccharacters. Unfortunately, the outputs of this step are not clean because there are a lotof words which don’t bring any interest to the indexation process, that’s why, it’snecessary to filter them.
(C) Filtering
After segmenting the texts, it is important to clean the texts by deleting all the stopwords. This step is a delicate task because Arabic is an inflected language and highlydifferentiable. And since, the stop words are non significant words and very communein multiple texts, it’s not necessary to index them or to look for them in the researchphase. The stop words (i.e. ببسب,اهيلع,ضعب,ف,مث , etc.) are generally linguistic toolsused to link or coordinate the sentences. And in order to eliminate these stop words, weused a data base in a txt file format which contains a list of non significant words. Thefiltered texts now contains multiple words having different forms but the same root,that’s why, it is really recommended to provide a morphological analysis to study thewords bare and unify them by the same descriptive.
(D) Morphological analysis
The morphological analysis consists on determining for each word, the list of possiblemorphosyntactic characteristics (category, gender, number, time, etc.) and theircanonical forms, their roots, etc. For that, a stemming phase [13] is useful beforestarting the indexing process since it represents one of the most important treatmentsfor the Arabic language, in the concept of information research which aims to findinflected forms of a word from its form represented in the document by the applicationof affixes truncation [4, 6, 12]. We have to remember that the form of Arabic words canhave four affixes categories: the enclitic, prefixes, suffixes and proclitic. Besides, anArabic word can have a more complicated if all the affixes are linked to its standardform. Therefore, we’ve identified a solution to this problem by the affixes removalapproach which is called the light stemming [7, 11] allowing a remarkable way toproduce an excellent information retrieval and allows a word to truncate at bothextremities. In fact, various versions of Light Stemmer were developed for Arabic andhave followed the same steps. The idea was to delete, first of all, the character «و»(“and”) for the light2, light3, light8 and light10 [8, 9] if the rest of the word iscomposed of 3 characters or more. Although the deletion of the character «و» isimportant, it triggers a problem because it exists a lot of commune Arabic wordsstarting by this character, thus, the length criteria here is stricter than the definitearticles. Second, remove all the definite articles in the case where it stills two or morecharacters. Finally, access the list of suffixes once in the order from right to left whileremoving all that at the end of the word if there are two or more characters. As it isdescribed previously, the light stemmers don’t delete any string which will be con-sidered as Arabic prefixes.
(E) Index generation
In the Indexation process, the analyzed words will be stored in a data structure calledinversed index which is already stored in a file system or in memory as a set of indexfiles. This index is a form of content representation which represents a relation which
A Platform Based ANLP Tools 243

links each document to the set of keywords or descriptors. In addition, it permits tofacilitate the access to the documents content [15]. In fact, we’ve represented our indexin a table which contains the term frequencies (TF) of a given word in each documentthat contains the term and the texts which have appeared. Thus, we can determine for atext the list of words that can contain, and for a word the list of texts in which it appearsfrom an IndexReader, using the term of interest.
3.2 Research
An information research system has an objective to output the most pertinent docu-ments comparing with the request. This process consists on corresponding the list ofgenerated index by an indexation system with the user request.
The research phase can be resumed by the schema presented in Fig. 3.
The research information can’t be accomplished only by the user intervention. Tobe able to do a research, the user makes a query as a single word in everyday language.The system analyzes the content of the request (single word) and converts it into part ofthe indexing language after standardized and lemmatized.
Then, it compares the term of the query with the inversed index: if the result of thecomparison returns true, the system will return the text titles containing the query word.Then, the system compares his titles with the titles of the “xml” files in the corpus andreturns the texts with their titles, authors, authors origins and period and it extracts thecontexts of this word from each text. For the extraction of these contexts, we’veproposed a method which returns the left and the right context of a word. In fact, this
Fig. 3. Research system architecture
244 F. Khalfallah et al.

method targets, first, to place the text content in a table (each word in a cell). Second, itpermits to browse the table displaying every time the wished number of apparition leftand right of the searched word.
4 Implementation and Evaluation
The aim of our application is to develop an ANLP tools platform enabling to build anArabic historical dictionary from a corpus. The objective of this dictionary is to collectthe vocabulary of the standard Arabic language and to describe its evolution (temporaland geographical aspects) which gives a reflection of civilizations and represents thewitness of the mentalities evolution.
This historical dictionary will include a set of simple entries which will be analyzedseparately. As we described in our proposed method, we need a segmentation tool tosubdivide texts into separate simple words, filtering tool to eliminate the stop wordsfrom the corpus, a morphological analyzer including a stemmer, an indexation tool tomatch between the set of texts and different useful information and a research toolallowing to search in the indexed set of texts. Apache Lucene is a suitable technologyfor nearly any application that requires full-text search, especially cross-platform.We’ve used this tool for the needed tasks since it is a high-performance, full-featuredtext search engine library written entirely in Java.
In fact, Lucene stores the input data in a data structure called inverted index, whichis already stored in the files system or in the memory as a set of index files. It allowsusers to execute some quick researches by keywords and to find documents respondinga given query. Before adding the textual data to the index, it is treated by an Arabicanalyzer which permits the conversion of textual data in fundamental units of researchcalled terms. During the analysis, the text is set to various treatments: words extraction,removal of the stop words and the punctuation signs, words stemming. For our case,we’ve used the Arabic analyzer. The text analysis is done before the indexation and thequery analysis. It converts the textual data in tokens, and these tokens are added tolucene index as terms. After finishing the indexation phase, we move to the researchphase where we examine the index to find the words then obtain the documentscontaining these words.
Our corpus of texts contains 30 texts from different periods starting from 700 to1300, for every period, we reserved 5 texts. The size of our corpus is 155 MO counting2 millions words. The index is presented in a table in which it’s displayed for everyword its stem, root, possible vowellation, Part Of Speech, number of apparition of eachword in a text and the title of the corresponding text. “The first version of our platformis composed of three main zones, the first is called The current text صنلايراجلا ” inwhich the text will be uploaded to display, the second is called “Research operation
ثحبلاةــيلمع ” which represents the research possibilities (with criteria, by entering aword to search, etc.) and the last zone which contains four parts “update texts ثيدحت
صوصنلا ”, “update senses تاملكلايناعمثيدحت ”, “words senses تاملكلايناعم ” and “searchresults ثحبلاةجيتن ”.
Our platform permits to add a new word from a new text with its relative information(sense, period and location) in the sense database, it permits also to add the tag “sense”
A Platform Based ANLP Tools 245

in the xml texts next to the corresponding word and according to its context. The usercan intervene to give a sense to the word, so that the sense data base can be updatedaccording to the treated texts. The platform permits to access to all the different positionsof the word in the corpus. So we can display the evolution of the use of the words.
To evaluate our work, we’ve chosen 100 words for testing and we’ve calculated therecall, the precision and the F-measure. The table below summarizes some of the result.
The Table 1 resumes the evaluation results of the research phase, the average of theF-measure obtained for the 100 words is equal to 90 %. The advantage of our system isin the fact of the indexation, because this step is done only one time for the enteredtexts of the corpus and will just take time when there is a corpus update. The responsetime in the research phase depends on the size of the text and of course on the computercharacteristics. The following table shows some statistics after a research done on theword “Allah هللا ”.
The Table 2 proves that the response time depends on the size of the text. Thebigger is the text size, the longer is the response time.
Table 1. System evaluation according to the pertinence
Words Doc Returned Not returned Precision Recall F-measure
بتكkataba
Pertinent 25 2 92.60 % 100 % 96.16 %Non Pertinent 0 3
اكحاضdhahikan
Pertinent 6 1 85.71 % 100 % 92.30 %Non Pertinent 0 23
همدقkadamuhu
Pertinent 27 2 93.10 % 96.45 % 94.75 %Non Pertinent 1 0
دجوWajada
Pertinent 30 0 100 % 100 % 100 %
Table 2. Response time variation
Word Texts Text size(KO)
Words numberin the text
Number ofapparition in thetext
Responsetime
هـــــــلـلا ملعيفةيفاشلافيرصتلا
97 12 428 23 0 s
نوـيـعةـمـكـحلا
125 13 392 9 0 s
مداقلاةفحت 270 30 623 151 1 sعابنالانويع 353 36 245 228 1 s
ةنزاوملاباتك 581 64 892 203 1 sءارعشلامجعم 792 90 617 763 4 sظافلأتادرفم
نآرقلا853 86 092 1 130 5 s
ماكحألعماجلانآرقلا
1 251 142 053 2 412 11 s
246 F. Khalfallah et al.

90 % of F-measure is an acceptable rate for our first system trial but we have tosearch for the different causes that didn’t let the system provide 100 %. When wefocused on the causes, we found that the main problem leading to this result is thescripts and the rich and complex morphology of the Arabic language which lack shortvowels and other diacritics that distinguish words and grammatical functions. Theselinguistic complexities result in significant recognition difficulties. There are differentflexion forms of the entry and various vowelling style of a simple root which increasesretrieval effectiveness over the use of words or stems.
5 Conclusion
Our system aims to generate automatically an Arabic historical dictionary from acorpus through ANLP tools. Various tasks are done to the entered corpus for theindexation and the research: segmentation, filtering, morphological Analysis. Oursystem still need semantic resources to assign the sense to the entries according to theirperiod. As future work, we will try to ameliorate the performance of our system usingsemantic analyzers, and grammatical rules to extract the suitable contexts. We aregoing to link our system to some electronic dictionaries from different periods todisplay for each entry its details from different sources spanning different periods.Besides, we propose to include the semantic analysis to recognize automatically foreach word its signification without the human intervention.
References
1. McEnery, T., Wilson, A.: Corpus Linguistics: An Introduction, 2nd edn. EdinburghUniversity Press, Edinburgh (2001)
2. Wehr, H.: Arabic English dictionary. In: Cowan, M. (ed.) The Hans Wehr Dictionary ofModern Written Arabic, 4th edn. Spoken Language Services, Inc., Urbana (1994)
3. AlSaid. M.: A Corpus-based historical Arabic dictionary. Ph.D. thesis in linguistics, CairoUniversity (2010)
4. Kadri, Y., Nie, J.Y.: Effective stemming for Arabic information retrieval. In: Proceedings ofthe Challenge of Arabic for NLP/MT Conference, Londres, United Kingdom (2006)
5. Trench, R.: On some deficiencies in our English dictionaries: being the substance of twopapers read before the philological society, London (1857)
6. Larkey, S.L., Ballesteros, L.: Light stemming for Arabic information retrieval. In: ArabicComputational Morphology, pp. 221–243 (2007)
7. Larkey, L., Ballesteros, S., Connell, E.M.: Improving stemming for Arabic informationretrieval light stemming and co-occurrence analysis. In: Proceedings of the 25th AnnualInternational Conference on Research and Development in Information Retrieval (SIGIR2002), Tampere, Finland, August 11–15, pp. 275–282 (2005)
8. Larkey, S.L., Ballesteros, L., Connell, E.M.: Light stemming for Arabic informationretrieval. In: Arabic Computational Morphology: Knowledge-Based and Empirical Methods(2005)
9. Souteh, Y., Bouzoubaa, K.: SAFAR platform and its morphological layer. In: Proceeding ofthe Eleventh Conference on Language Engineering ESOLEC’2011, 14–15 December, Cairo,Egypt (2011)
A Platform Based ANLP Tools 247

10. Habash, N.: Arabic natural language processing: words. In: Summer School on HumanLanguage Technology Johns Hopkins University, Baltimore, 6 July 2005
11. Larkey, L., Ballesteros, S., Connell, E.M.: Light stemming for Arabic information retrieval,Arabic computational morphology: knowledge-based and empirical methods (2005)
12. Larkey, L., Ballesteros, S., Connell, E.M.: Improving stemming for Arabic informationretrieval light stemming and co-occurrence analysis. In: Proceedings of the 25th AnnualInternational Conference on Research and Development in Information Retrieval (SIGIR2002), Tampere, Finland, pp. 275–282, 11–15 August 2002
13. Khalifa, I., Feki, Z., Farawila, A.: Arabic discourse segmentation based on rhetoricalmethods. Int. J. Electr. Comput. Sci. IJECS-IJENS 11, 10–15 (2011)
14. Semmar, N., Elkateb-Gara, F., Fluhr, C.: Using a stemmer in a natural language processingsystem to treat Arabic for cross-language information retrieval. In: International Conferenceon Machine Intelligence, Tozeur, Tunisia (2005)
15. Jacquemin, C., Daille, B., Royante, J., Polanco, X.: In vitro evaluation of a program formachine-aided indexing. Inf. Process. Manag. 38(6), 765–792 (2002)
248 F. Khalfallah et al.

Extracting Knowledge Using WikipediaSemi-structured Resources
Nazanin Firoozeh(B)
Laboratoire d’Informatique de Paris-Nord, Universite Paris 13,Pixalione SAS, Paris, France
Abstract. Automatic knowledge discovery has been an active researchfield for years. Knowledge can be extracted from source files with dif-ferent data structures and using different types of resources. In thispaper, we propose a pattern-based approach of extraction, which exploitsWikipedia semi-structured data in order to extract the implicit knowl-edge behind any unstructured text. The proposed approach first identi-fies concepts of the studied text and then extracts their correspondingcommon sense and basic knowledge. We explored the effectiveness of ourknowledge extraction model on city domain textual sources. The initialevaluation of the approach shows its good performance.
Keywords: Wikipedia semi-structured resources · Knowledge discov-ery · Common sense knowledge
1 Introduction
Knowledge discovery is the nontrivial extraction of implicit, previously unknown,and potentially useful information from data [2]. Knowledge can be obtainedfrom sources with different types of data structures: unstructured, structuredand semi-structured. While structured and semi-structured sources have pre-defined data models, unstructured data has no organization to facilitate thetask of extraction. Unstructured data files often contain a considerable amountof knowledge, which can be used in different applications of Artificial Intelligence.
In knowledge discovery, resources with different types of structures can beexploited [4]. The same as source data, resources are also in three types. Machinereadable structured resources, such as thesauri, are easy to exploit but diffi-cult to create and maintain. Due to these difficulties, they may not cover alldomains and languages. Unstructured resources, on the other side, are collec-tions of machine-unreadable multimedia content and extracting reliable knowl-edge from such resources is a very challenging task. Hence, structured resourcesextract knowledge with high accuracy but low coverage rate, while unstructuredresources cover all the domains but the knowledge extracted from such resources isless reliable. In order to make use of the positive points of each type and reduce thelimitations, in this paper we focus on semi-structured resources. Wikipedia is onec© Springer International Publishing Switzerland 2016E. Metais et al. (Eds.): NLDB 2016, LNCS 9612, pp. 249–257, 2016.DOI: 10.1007/978-3-319-41754-7 22

250 N. Firoozeh
of the major resources, which is updated regularly and contains many statementsin natural language. In this work, we exploit category names and infobox tables ofWikipedia as semi-structured resources in order to extract the implicit knowledgebehind any given unstructured text.
Two kinds of knowledge are targeted in our work: basic and common sense(CS). By basic knowledge, we mean any kind of knowledge that provides basicinformation about the studied concept. Considering Paris as an example of aconcept, information about its population, mayor, etc., can be considered asbasic knowledge. Common sense knowledge is however defined as the backgroundknowledge that human has. This type of knowledge is so obvious that is rarelyexpressed in documents. As an example, the fact that “Paris is a city” is aknowledge that majority of people know as a background knowledge.
The rest of the paper comprises the background (Sect. 2), the proposed model(Sect. 3), evaluation and results gained (Sect. 4), and conclusions and suggestionsfor future work (Sect. 5).
2 Background
Extracting knowledge from Wikipedia has been one of the interesting domainsof research and different systems have been developed for extracting knowl-edge from Wikipedia. YAGO [9] is an ontology which makes use of Wikipedia.In this project, instead of using information extraction methods, categories ofWikipedia articles are used as resources of knowledge. This system makes useof both Wikipedia articles and WordNet database [5] in order to extract facts.One limitation of YAGO is that it extracts only 14 types of relations and somerelations cannot be detected using this system. Authors also extended the sys-tem to YAGO2 [3], which is able to represent the facts along dimensions of timeand space.
In another work, WordNet database is enriched using new relations extractedfrom Wikipedia [8]. One disadvantage of this system is that it needs to go throughdefinition of each entity in Wikipedia to look for hyperlinks and to extractrelations between different concepts. This increases the time complexity of thesystem. In [7], large scale taxonomy was built from Wikipedia. In that work,semantic relations between categories are found using a connectivity networkand lexico-syntactic matching. Although this method extracts relation betweencategory names, it cannot find relation between a specific concept and its corre-sponding category names. Wikipedia articles have been also used for extractingrelations between different concepts of Wikipedia. In [10], an unsupervised app-roach is used along with linguistic analysis with web frequency information. Thegoal of using this analysis is to improve unsupervised classification performance.Unlike our approach, which focuses on semi-structured content of Wikipedia,here, unstructured parts of articles are taken into consideration.
DBpedia [1] is another knowledge extraction system, which is now availableon the World Wide Web. The goal of DBpedia is first to extract structuredinformation from Wikipedia and then to allow users to ask queries against it.

Extracting Knowledge Using Wikipedia Semi-structured Resources 251
One drawback of DBpedia is that its data can be based on several months olddata. DBpedia-live [6] solves this problem by providing a live synchronizationmethod based on the update stream of Wikipedia.
Similar to the described systems, we also make use of Wikipedia articles as arich resource of information. However, unlike YAGO, YAGO2 and the work doneby Ruiz-Casado et al. [8], the system does not use WordNet database. Hence,the complexity of the system is reduced. In addition, while the work done byPonzetto et al. [7] tries to find types of relations between different categorynames, our system finds the relations between any given concept and its relatedcategory names.
DBpedia can be considered as the closest work to our proposed approach.Comparing to DBpedia, our approach is simpler and less structured. This work ishowever an initial effort on knowledge extraction in order to propose a simple butefficient approach for extracting knowledge from Wikipedia. As will be seen later,as a future work, we aim to compare our extracted knowledge with DBpediaknowledge. Comparing the results, we will be then able to see if the proposedmethod can be considered as a complementary tool for DBpedia.
3 A Model of Extraction
Extracting a good amount of basic and common sense knowledge and using itin interactive applications is an important step in Artificial Intelligence field.In this work, we make use of Wikipedia as a resource of knowledge. AlthoughWikipedia has both unstructured and semi-structured content, we focus onlyon category names and infobox tables, which are semi-structured contents ofWikipedia.
In general, our model consists of four main steps: 1. HTML parsing, 2. con-cept extraction, 3. extracting infobox-based facts, 4. extracting category-basedfacts. It should be noted that by category-based and infobox-based facts, werespectively mean facts that are extracted from category names and infoboxtables. Following is the detailed description of each step.
HTML Parsing. The input of the system is either a URL or a plain text.In the former case, the system directly starts from “Concept Extraction” step.Having a URL as the input of the system, the HTML source code is then parsedand the content of the page is extracted. In this step, some HTML tags whichdo not bring information about the content of the page are removed. Header andFooter are examples of these uninformative HTML tags.
Concept Extraction. Having the extracted text, the system then extracts itsconcepts using both part of speech information and Wikipedia titles. In fact,we assume that each Wikipedia title corresponds to one concept in the realworld. Some concepts however have different representations. For these con-cepts, Wikipedia redirects users to the same article and shows the same page for

252 N. Firoozeh
different representations. Using the redirection feature of Wikipedia, we avoidgenerating concepts with the same meaning but different formulations. As anexample, UK and United Kingdom are redirected to the same URL in Wikipedia.Hence, only one of them is taken into consideration for further processing.
Extracting Category-Based Facts. All Wikipedia articles have a categorysection, where navigational links to other Wikipedia pages are provided. In orderto reveal the semantics encoded in category names of Wikipedia articles, first theWikitext of the Wikipedia article is extracted. Wikitext is a markup languageused for writing the content of wiki websites, such as Wikipedia. Category namesof a Wikipedia article are extracted by parsing the Wikitext obtained as theanswer of a proper query1. To avoid having uninformative category names, weignore all the categories under Wikipedia administration.
In order to extract the knowledge behind each category name, we pro-posed 23 extraction patterns. To generate the patterns, different criteria suchas type and position of the prepositions as well as occurrences of some keywordslike Type, Establishment, Disestablishment, etc., are taken into consideration.Table 1 represents the proposed extraction patterns. These patterns encode rela-tions between the studied concept and different concepts that appear in thecategory section of the article. For each category name, the system checks if itmatches any of the patterns. If so, the associated fact(s) is returned. It is impor-tant to mention that in Table 1, X refers to the studied concept, and Y andZ refer to the concepts that appear in the category names. In addition, YEARsimply indicates a year and Xs shows the plural form of X. X1, X2 and Y1, Y2also show respectively the sub-terms of X and Y.
Category-based facts are in two types; “R-specific”, which explicitly speci-fies types of relations and “R-generic”, which just indicates that the concepts arerelated without explicitly showing type of the relation. In Table 1, patterns 1 to 22generate R-specific facts, whereas R-generic facts are extracted using pattern 23.
Extracting Infobox-Based Facts. Infobox is another resource that we use forextracting knowledge. For each extracted concept, the system checks the exis-tence of an infobox template in the extracted Wikitext. The template starts with“Infobox” and ends with corresponding “”. This section is called infoboxtemplate and is used for further processing. If Wikitext of a concept does notcontain this template, we stop extracting infobox-based facts for that concept.
As not all the infobox elements produce interesting facts, we first discarduseless attributes including image, caption, logo, alt, coat, footnote, etc. We thendefine different extraction patterns as regular expressions for extracting attributenames and values. It should be noted that attributes with no informative valueare discarded.
At the end of the extraction task, the extracted category-based and infobox-based facts are written as sentences in a text file.
1 Example: http://en.Wikipedia.org/w/index.php?action=raw\&title=Paris.

Extracting Knowledge Using Wikipedia Semi-structured Resources 253
Table 1. Extraction patterns and associated facts for category names of Wikipedia
Extraction pattern Extracted fact(s)
1 Y of X Y is an attribute of X
2 Type(s) of Y X has a type of Y
3 Y in X X has Y
4 Y in Z (Y contains just letters) X is a Y in Z
X is a Y
X is in Z
5 Y of Z X is a Y of Z (Singular Y)
X is one of the Y of Z (Plural Y)
6 Y in YEAR In year YEAR, there was a Y of X
7 YEAR introductions X was introduced in YEAR
8 X in YEAR X was in YEAR
9 Y established in YEAR X has been established in YEAR
X is a Y (Y singular)
X is one of the Y (Y plural)
10 YEAR establishment(s) X has been established in YEAR
11 Y establishment(s) in Z X has been established in Y (if Y contains digit)
X is in Z
12 Y disestablished in YEAR X has been disestablished in YEAR
X was a Y (Y singular)
X was one of the Y (Y plural)
13 YEAR disestablishment(s) X has been disestablished in YEAR
14 Y disestablishment(s) in Z X has been disestablished in Y (if Y contains digit)
X was in Z
15 YX (one concept) YX is one form of X
16 Y=(Y1 Y2) &X=(X1 X2) (if Y2 = X2) X is a Y (Y is singular)
X is one of the Y (Y is plural)
17 Y by type X has a type of Y
18 Y invention X is a Y invention
19 Y format(s) Format of X is Y
20 YEAR birth X was born in YEAR
21 YEAR death X died in YEAR
22 Xs X is a subset of Xs
23 If none of the above relations X R Y (relates)
4 Evaluation and Results
Accuracy and reliability of the extracted knowledge is one of the main steps inknowledge discovery. Using incorrect knowledge in different applications decreasestheir performance. In this work, we evaluate our approach by defining three labelsthat indicate the quality of the extracted facts. The labels are correct, incorrect andambiguous. A correct fact is a fact with a correct meaning and a proper formula-tion. Incorrect fact, on the other hand, refers to the fact with an incorrect meaning.Among the extracted facts, some have correct meanings but wrong formulations.These facts are labeled as ambiguous. By differently labeling these facts, we aim

254 N. Firoozeh
at differentiating them from the incorrect ones, since we believe that as a very firststep of the future work, we can refine the system to get correct formulations forthese cases.
The initial evaluation of the approach was performed manually by scanningall the facts and finding the ratio of the correct, incorrect and ambiguous facts.To do this, 10 students were asked to label the extracted facts. The facts wereevaluated in terms of both meaning and formulation and the final label wasassigned based on the majority vote. The students were also asked to labelthe facts as basic or common sense. Similarly, the final type of knowledge wasdetermined based on the majority vote of the students.
To show the performance of the proposed approach, we took into account10 input texts either from news websites or city-related web pages. From theten input URLs, 313 concepts and 1443 facts were extracted. Having list of theextracted facts, each fact was evaluated by all the ten students. Table 2 showsexamples of the extracted facts with different evaluation labels.
Table 2. Examples of the extracted facts
Fact Label Basic/CS
Paris is a capital in Europe Correct CS
Versailles is an art museum and gallery Ambiguous –
Eiffel Tower is a Michelin Guide Incorrect –
Latitude of Paris is 48.8567 Correct Basic
Roof of Eiffel Tower is, abbr=on Incorrect –
Gini year of Spain is 2005 Ambiguous –
Figure 1 compares the average rates of accuracy, error and ambiguity for bothcategory-based and infobox-based facts and over all the evaluated examples.In the former case, the evaluation metrics are calculated over R-specific facts,since this type shows the performance of the extraction patterns. In calculations,accuracy, error, and ambiguity rates are obtained by respectively dividing thenumber of correct, incorrect, and ambiguous facts to the total number of thefacts. It should be noted that in case of extracting semantically similar facts,only one of them is taken into consideration in the evaluation phase. Accordingto Fig. 1, the average rate of accuracy for the extracted infobox-based facts ishigher than the one for category-based facts. However, difference in their errorrates is minor.
The ratio between R-specific and R-generic category-based facts is shown inFig. 2. As expected, more facts are categorized as R-generic. The reason is thatmany of the category names have no specific structure. Figure 3 also comparesthe amount of common sense and basic knowledge in both category-based andinfobox-based facts. According to the figure, infobox table is not a good resourcefor extracting common sense knowledge. This is due to the fact that Wikipedia

Extracting Knowledge Using Wikipedia Semi-structured Resources 255
has infobox tables for proper nouns such as Paris and not for general conceptssuch as shopping. As a result, the extracted facts in most cases cannot be con-sidered as general knowledge. On the other hand, category names are betterresources for extracting common sense knowledge.
Fig. 1. Comparing theaverage rates of correct,incorrect and ambiguousfacts. (Color figure online)
Fig. 2. Ratio of R-genericand R-Specific facts.
Fig. 3. Comparing typesof the extracted facts.(Color figure online)
Fig. 4. Total number of the facts extracted by each pattern over five input texts.
We also evaluated the performance of the proposed extraction patterns. Inthis step, we studied only pattern 1 to 22, which generate R-specific facts.Figure 4 shows the total number of the facts extracted using each pattern.
Performance of each pattern is also represented in Fig. 5. According to thefigure, patterns 3, 10, 17, 19, 20, and 21 have the highest accuracy rate. However,these patterns extract a few numbers of facts. Considering the patterns with highrates of extraction, i.e., patterns 4, 5 and 22, pattern 22 outperforms the othertwo patterns due to the high rate of accuracy (96.06 %). On the other side,pattern 15 cannot efficiently extract knowledge from the resources.
According to Fig. 4, no fact is extracted using patterns 11, 12, 13, and 14.In fact, these patterns extracted facts which were semantically similar to thepreviously extracted facts. However, it is important to keep these patterns, asdue to their structure, in some cases they might extract new facts.
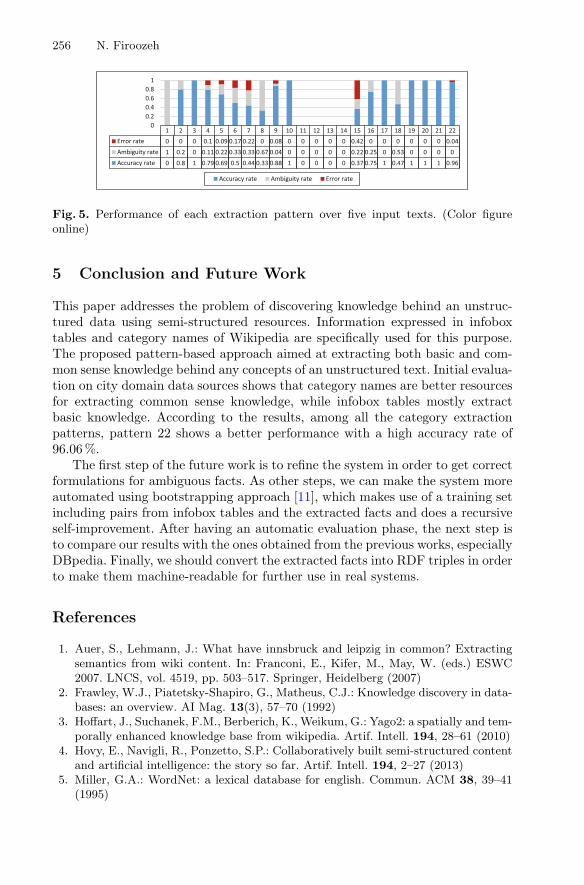
256 N. Firoozeh
Fig. 5. Performance of each extraction pattern over five input texts. (Color figureonline)
5 Conclusion and Future Work
This paper addresses the problem of discovering knowledge behind an unstruc-tured data using semi-structured resources. Information expressed in infoboxtables and category names of Wikipedia are specifically used for this purpose.The proposed pattern-based approach aimed at extracting both basic and com-mon sense knowledge behind any concepts of an unstructured text. Initial evalua-tion on city domain data sources shows that category names are better resourcesfor extracting common sense knowledge, while infobox tables mostly extractbasic knowledge. According to the results, among all the category extractionpatterns, pattern 22 shows a better performance with a high accuracy rate of96.06 %.
The first step of the future work is to refine the system in order to get correctformulations for ambiguous facts. As other steps, we can make the system moreautomated using bootstrapping approach [11], which makes use of a training setincluding pairs from infobox tables and the extracted facts and does a recursiveself-improvement. After having an automatic evaluation phase, the next step isto compare our results with the ones obtained from the previous works, especiallyDBpedia. Finally, we should convert the extracted facts into RDF triples in orderto make them machine-readable for further use in real systems.
References
1. Auer, S., Lehmann, J.: What have innsbruck and leipzig in common? Extractingsemantics from wiki content. In: Franconi, E., Kifer, M., May, W. (eds.) ESWC2007. LNCS, vol. 4519, pp. 503–517. Springer, Heidelberg (2007)
2. Frawley, W.J., Piatetsky-Shapiro, G., Matheus, C.J.: Knowledge discovery in data-bases: an overview. AI Mag. 13(3), 57–70 (1992)
3. Hoffart, J., Suchanek, F.M., Berberich, K., Weikum, G.: Yago2: a spatially and tem-porally enhanced knowledge base from wikipedia. Artif. Intell. 194, 28–61 (2010)
4. Hovy, E., Navigli, R., Ponzetto, S.P.: Collaboratively built semi-structured contentand artificial intelligence: the story so far. Artif. Intell. 194, 2–27 (2013)
5. Miller, G.A.: WordNet: a lexical database for english. Commun. ACM 38, 39–41(1995)

Extracting Knowledge Using Wikipedia Semi-structured Resources 257
6. Morsey, M., Lehmann, J., Auer, S., Stadler, C., Hellmann, S.: DBpedia and the liveextraction of structured data from wikipedia. Program Electron. Library Inform.Syst. 46, 157–181 (2012)
7. Ponzetto, S.P., Strube, M.: Deriving a large scale taxonomy from Wikipedia. In:National Conference on Artificial Intelligence, vol. 2, pp. 1440–1445 (2007)
8. Ruiz-Casado, M., Alfonseca, E., Castells, P.: Automatic extraction of semanticrelationships for wordnet by means of pattern learning from wikipedia. In: Mon-toyo, A., Munoz, R., Metais, E. (eds.) NLDB 2005. LNCS, vol. 3513, pp. 67–79.Springer, Heidelberg (2005)
9. Suchanek, F.M., Kasneci, G., Weikum, G.: Yago: A core of semantic knowledge.In: International Conference on World Wide Web, USA, pp. 697–706 (2007)
10. Yan, Y., Okazaki, N., Matsuo, Y., Yang, Z., Ishizuka, M.: Unsupervised rela-tion extraction by mining Wikipedia texts using information from the web. In:ACL/IJCNLP, USA, vol. 2, pp. 1021–1029 (2009)
11. Zhao, S.H., Betz, J.: Corroborate and learn facts from the web. In: ACM SIGKDDInternational Conference on Knowledge Discovery and Data Mining, pp. 995–1003(2007)

Mixing Crowdsourcing and GraphPropagation to Build a Sentiment Lexicon:
Feelings Are Contagious
Mathieu Lafourcade1(&), Nathalie Le Brun2, and Alain Joubert1
1 Lirmm, Université Montpellier, Montpellier, Francelafourcade,[email protected]
2 Imagin@T, 34400 Lunel, [email protected]
Abstract. This paper describes a method for building a sentiment lexicon. Itsoriginality is to combine crowdsourcing via a Game With A Purpose (GWAP)with automated propagation of sentiments through a spreading algorithm, bothusing the lexical JeuxDeMots network as data source and substratum. Wepresent the game designed to collect sentiment data, and the principles andassumptions underlying the action of the algorithm that propagates them withinthe network. Finally, we give a qualitative evaluation of the data obtained forboth the game and the spreading done by the algorithm.
Keywords: Sentiments Crowdsourcing GWAP Lexical network Spreading
1 Introduction
The ability to automatically characterize the sentiments that emerge from a text hasbecome a major issue for applications such as the analysis of political speeches, or theopinion survey in all kinds of areas, ranging from tourism to cultural offer, through theconsumer goods, education and learning, health and human services, art and culture,sport, recreation and environment. Building a lexical resource of sentiments (in whicheach term is connected to a weighted set of sentiments) is a prerequisite for this type ofstudy, whatever type of approach, statistics supervised or more linguistic one [1].Sentiments can be expressed from a predetermined closed set [2] or defined in an openway, what is potentially richer with the risk of lower accuracy [3]. For example [4] useda set of seven emotions (trust, fear, sadness, anger, surprise, disgust and joy) to buildEmolex, a polarity resource/sentiments for English obtained by crowdsourcing withAmazon Mechanical Turk (which can be problematic, see [5]). Each term of theirlexicon (about 14,000 words) is bound to zero, one or more elements of this set of 7feelings. The value “indifference” is assigned to terms that are not linked to any ofthese 7 feelings. This resource has been translated into French [6]. [7] produced a freelexical resource based on WorldNet, which is in the form of a lexicon connecting eachsynset with 3 polarity values (positive, negative, and neutral). This is not strictlyspeaking a lexicon of feelings, although the terminology often shows confusion
© Springer International Publishing Switzerland 2016E. Métais et al. (Eds.): NLDB 2016, LNCS 9612, pp. 258–266, 2016.DOI: 10.1007/978-3-319-41754-7_23
between sentiments and polarity. The detection of feelings and opinions is the subjectof numerous works: data is usually identified and extracted automatically from somecorpus, see [8–12]. We propose a different approach.
A lexical network, such as that obtained through the online game (GWAP) Jeux-DeMots (JDM) [13], includes a large set of terms linked by lexical-semantic relations.JDM project enabled not only the establishment of a lexical network in constantexpansion whose data are freely accessible, but also the validation of relations betweenterms through many side games [14]. Thus, such a resource is particularly suitable fortesting new data acquisition methods. Our hypothesis is as follows: to build a lexicalresource of sentiments/emotions, it may be advantageous to combine a GWAP (wheredata are provided by the players, like in [24] for other kinds of NLP data) with apropagation algorithm that will automatically assign feelings data to many terms of thenetwork. The data of sentiments provided by the gamers will thus be propagatedtowards the terms lacking of sentiment information. This approach is based on theimplicit idea that gamers provide good quality data [15].
In this article, we first show how one can get associations between words and theemotions they evoke, through crowdsourcing, using the Emot GWAP. We then presentBotemot, an algorithm inferring sentiments from the network. Results are quantifiedand qualitatively discussed on the basis of a comparison between the feelings proposedby the Botemot algorithm and those already present in the lexical network, which arethus considered as valid.
2 Crowdsourcing and Lexical Network
The JDM project [13, 14] combines a collection of games and contributory interfacesintended to build a large lexical-semantic network for the French. Initiated in 2007,from a set of 150,000 words without any relation between them, the network has nowabout 850,000 terms linked by more than 43 million lexical and semantic relations. Itsdevelopment results from players activity combined with algorithms that continuouslypropose new relations inferred from existing ones (never ended learning). Such astructure is suitable for inferring new information by diffusion within the network.The JDM project demonstrated that in its application context, i.e. the creation of alexical network of general knowledge and common sense, crowdsourcing via gameswas effective, either quantitatively or qualitatively.
2.1 Lexical Network: A Graph Structure
A lexical network is a graph in which nodes are lexical items, and arcs are lexical orsemantic relations between them. Structures like Wordnet [16, 17] Babelnet [18] orHowNet [19], which are built according to this model, can also be considered as suchnetworks. As far as we know, beside JDM, no other lexical network has involved alarge community of volunteer gamers [14]. In the JDM network, about an hundredtypes of binary, oriented and weighted relations are defined. A relation with a negativeweight is considered false, (for example: fly: agent/-25: ostrich) and can be considered
Mixing Crowdsourcing and Graph Propagation 259
inhibitory, because it will block the spreading of information in its vicinity during thepropagation process. Similarly, a negative relationship is considered false by theinference mechanism, even if a generic term of the concerned one satisfies the relationin question (fly : agent/>0: bird). In JDM, over 12,000 polysemous terms are refined in37,146 meanings and uses. This enlarges continuously, fed by many GWAPs and othercrowdsourcing activities, coupled with processes of inference and consistency check.The resource is freely available (http://jeuxdemots.org).
In this article, a working hypothesis is that the values of feelings associated withterms related to the target word generally verify a form of transitivity. This allows us toautomatically infer the feelings of a term if it is sufficiently provided with informationitself and if its neighbors are reasonably provided too.
2.2 Emot, a Game to Capture Feelings
The Emot game (http://www.jeuxdemots.org/emot.php) offers the player to associateone or several feelings/emotions to a given word, either by choosing one among thedisplayed feelings (e.g. love, joy, sadness, fear, …), or by entering some other(s)feeling(s) via a text field, if none of the proposals suits him. The player can also “pass”if he doesn’t know the word, or select “indifference” if it doesn’t evoke any feeling.The main appeal of the game is the possibility for a player to compare his own answerswith those of others. Moreover, regarding the proposed vocabulary, he can choosebetween two difficulty levels. Most players start with the easy level to get familiar withthe game, and then go to the next level, which is more difficult and therefore morerewarding. Each sentiment proposed by a player for a given word affects the lexicalnetwork through the insertion of a specific sentiment relation between both terms (or asmall augmentation of its weight on an open scale, if this relation already exists). Theresulting data (the set of sentiment relations) were systematically and regularly man-ually evaluated by 4 native speakers of French to ensure their validity (so as to be surethat these data were valid as they were intended to be used by our algorithm). On about1,500 contributions, 90 % were perfectly relevant, 9 % debatable, and only 1 % of thecontributions were to be rejected. The questionable contributions are almost alwaysrelated to minority opinions but possible (e.g. disgust associated with salmon). Thecases of rejection clearly correspond to errors or malicious action of trollers (shynessassociated with potato). Obtained data are freely accessible.
3 An Algorithm for Inferring Relations
Botemot is an algorithm designed to propagate some information through the network.For each selected word, Botemot proposes the feelings associated with its neighbors,i.e. those to which it is linked by certain relations. The negatively associated terms areignored. A positively associated term with sentiment(s) negatively weighted is nor-mally retained, the negative weight being subtracted from the sum of weights. Theexecution of Botemot is looped continuously together with the activity of players. Toassociate feelings with terms of the network, we apply the following procedure.
260 M. Lafourcade et al.

From a given term (T) as input, the algorithm infers a weighted list (L) of senti-ments. At the beginning, L is initialized the empty set. if the term T is not associatedwith any polarity, positive or negative, then the empty set is returned It is the same ifthe number of words associated to T is too low (<5). Otherwise, for each t associated toT, we enumerate its associated weighted list of sentiments. We add this set to L (as aweighted union). Items of L are further filtered with a tolerance factor. We choose theT term among words that are names (common or proper), verbs, adjectives or adverbs.The knowledge base from which we extract associated terms is JDM, but this could beany other lexical network. A sentiment that appears n times with an average value ofp will have a score of n * p. A sentiment term of the resulting list L might have anegative value and be kept as such. The 6 types of relation that seem useful forinferring sentiments are: associated ideas, hypernyms, characteristics, synonyms,semantic refinements, consequences. The assumption is that if two terms are connectedby one of these relations, their associated feelings are globally “contagious” and can betransmitted. For example, the following general scheme can often be checked: IfTconsequenceC and Csentiments/emotionsS, then Tsentiments/emo-tionsS. A particular example could be: If tumorconsequencedeath anddeathsentiments/emotionsfear, then tumorsentiments/emotionsfear.
The weighted union of lists is the set union of list elements in which weights ofcommon elements are combined. Botemot is applied to each of the approximately500,000 eligible terms of the network, and is part of the never ended learning loop. Fora given T term, it may return an empty list, if: (1) the term is not characterized by astrong polarity (i.e.>25 %); (2) the term T has no related term for the 6 consideredrelation types; (3) the term T has some related terms but none of them has anyassociated feelings. The polarity, as defined in the JDM project, was presented in(Lafourcade et al., 2015a) and we use it as a filter in our algorithm. Botemot propagatessentiments depending on the network topology and it is done together with the activityof players, whose contributions serve as reference values.
The threshold filtering is used to determine the most relevant part of the list L toimprove accuracy (to the detriment of the recall, see qualitative assessment). Terms ofthe list L being weighted, we calculate the average mu of their weights. Let alpha bethe tolerance factor, defined on R+. We keep only the terms the weight of which isupper to the threshold mu * alpha. The higher is alpha, the stricter the filtering. Forexample, suppose the following list L :fear: 110, excitement: 50, joy: 30, anguish:10.The average is equal to (110 + 50 + 30 + 10)/4 = 200/4 = 50. If alpha = 2, we keeponly the words whose weight is greater than or equal to 100, i.e. the set fear: 110. Ifalpha = 0.5, we keep the words the weight of which is greater than or equal to 25, i.e.the set fear: 110, excitement: 50, joy: 30. By lowering the acceptance threshold, atolerant filtering increases the proportion of proposals with low weight. Increasing therecall also increases the error rate, and lowers the accuracy. Our second filter is basedon the polarity [20] of the terms of the lexical network. In our experiments, we limitedthe action of the algorithm to the terms with positive or negative polarity higher than25 %. For these words, we selected only the sentiments polarized in the same way.Note that due to polysemy or point of view, many terms may have a mixed polarity,both negative and positive. The neutral polarity is ignored: it typically does not arousesentiments other than indifference. Upstream, we perform a filtering based on level of
Mixing Crowdsourcing and Graph Propagation 261
information (i.e. the sum of the weights of the 6 relations considered by Botemot), toavoid terms with too few associated relations. In practice, the terms with a level ofinformation less than 1000 are ignored.
4 Evaluations
About information of sentiments, the JDM lexical network, modified by our experi-ence, includes: 112,643 terms associated with at least one sentiment/emotion, includingindifference; 110,671 terms associated with at least one sentiment/emotion, exceptindifference; 566,298 relations between these terms and sentiments/emotions, i.e.approximately 5 sentiments per term.
Botemot proposed a total of 972,467 sentiments for 154,099 words. Approximately45,000 among them (30 %) had no associated feeling. About 620,000 are originalproposals (not existing in the network) and 350,000 are proposals already presentbefore our experience. Our hypothesis is the following: if a proposal of Botemot isalready among the validated sentiments for a given term, then we consider that it iscorrect, and by extrapolation, we can have confidence in the proposals of the algorithmfor the words that had no validated sentiments. One must keep in mind that Botemotdoes not know what are the feelings already validated for the term for which it tries tomake proposals. Note that Botemot succeeded in selecting 19 words with associatedsentiments for 1 which arouses only the indifference, what represents a noise about5 %. Thus, we can consider that the algorithm is relatively effective in detecting wordsfor which linkage with any sentiments (apart from indifference) is relevant.
4.1 Qualitative Assessment by Counting and Weighting
A good proposal is an already validated sentiment (positive weight). A bad proposal is aninvalidated sentiment (negative weight). A new proposal is a sentiment that has neverbeen validated or invalidated for the target word. For the evaluation, we consider theamount of information of each term, i.e. the sum of the weights of the 6 relations con-sidered by Botemot. Terms with an amount of information between 5,000 and 100,000 arethe ones to consider. Below 5,000, words have too little information to lead to correctinferences. And terms with a level of information higher to 100,000 are too few to lead toreliable statistics. The evaluation by counting (c) is only based on the criterionpresence/absence of the words, regardless of their weight. However, it seems fair toconsider that for the algorithm, regain a sentiment already present and strongly bound(high weight) is better than finding a more weakly bound sentiment (lowweight): this is anevaluation by weighting (w). So we also calculated precision (w) recall (w) and F1-score(w) by adding the weight of the words rather than their numbers, and we allocated to everygood proposal its weight in the network, while we assigned an arbitrary weight of 25 toevery new proposal. On average, for both methods, precision = 0.93, recall = 0.98, andF1-score = 0.95 (for about 350,000 proposals of sentiments).
Precision in weighting is always greater than precision in counting (it is the samefor F1-score) of about 0.03. Indeed, taking weights into account allows a much finer
262 M. Lafourcade et al.

modulation in the calculation than simply counting the number of words. The F1-score,which ranges between 94 and 98 %, validates our initial hypothesis: we can inferrelevant feelings from existing ones, and, by extrapolation, consider valid the senti-ments transmitted in this way to a word which had no validated sentiment, with amaximum error risk of 6 %.
4.2 Qualitative Assessment by Manual Validation of New Proposals
Manually checking for new feelings proposed by the algorithm was performed by 4native speakers of French on more than 500 words, and shows that 93 to 97 % of theproposed feelings are valid, thus a rejection rate from 3 % to 7 %. According to bothevaluation methods: (a) using weights in order to distinguish representative feelingsand anecdotal ones seems relevant, and (b) evaluating the inference method by com-paring the data produced with those supplied by the contributors seem to be a reliableapproach. By changing the numerator in formulas of precision and recall, we mayconsider the new proposals made by the algorithm in two ways: the optimistic point ofview would be to assume they are valid by assigning them, for counting, the value of0.5. It would increase recall and precision of 2 %; the pessimistic view would be tosuppose they are irrelevant by assigning them, for counting, the value of −0.5. It woulddecrease recall and precision of 2 % (on average, both with a tolerance of 1).
Data of sentiments provided by the players are very precise and diversified. Thisjustifies that these data are the reference for the diffusion algorithm, which is veryaccurate. There are little new proposals (10 %), but by manual verification we esti-mated that 95 % are fair and 4.5 % debatable (0.5 % false). The algorithm doesn’tpropose any sentiment of negative weight, and doesn’t propose again those invalidated,which avoids looping. The invalidated feelings are assigned a negative weight and thismakes them inhibitors in the mechanism of inference.
The algorithm seems efficient to assign sentiments to the words of the networkwhich had no information of this type, provided that these words have neighbors withsentiments data. The quality of inferred data is obviously highly dependent on thequality of data provided by the players. But as the crowdsourcing approach involves avery large number of contributors, the large majority of supplied data are correct.
4.3 Qualitative Assessment by Comparison with Emolex Lexicon
We compared the sentiments proposed by Botemot with the lexicon of [21], in theversion translated by [6]. We remind that this lexicon allocates to about 14,000 words avariable number of sentiments selected from a predetermined set of seven. This numbervaries from 0 (indifference) to 6, each sentiment being activated (value 1) or not(value 0). For 99.9 % of the words, at least one of the feelings associated in the Emolexlexicon is also part of the proposals of our algorithm. For 69 % of the words to whichno feeling is associated in Emolex our algorithm proposes at least “indifference”. TotalInclusion: 92 % (For a given word, all the feelings associated in the Emolex lexicon areamong the proposals of Botemot). Strict inclusion: 5 % (for a given word, the feelings
Mixing Crowdsourcing and Graph Propagation 263

associated in the Emolex lexicon are exactly identical to the proposals of Botemot).About twenty words from Emolex are not in the JeuxDeMots network but these aremalformed words, probably mistranslated. Regarding the strict inclusion, the result(5 %) is due to the fact that our algorithm offers many synonyms of the same feeling(e.g. fear, anxiety, apprehension whereas only the word “fear” is listed in Emolex).When for a word Botemot proposes sentiments absent from Emolex, these words are in70 % of cases synonymous with a sentiment of Emolex. In the remaining 30 %, thereare only 0.5 % of inadequate sentiments (comparison carried out on a sample of 1500words related to 8,000 sentiments). We think our approach is more adapted to reflectthe richness and diversity of feelings and collect vocabulary to designate them as shownin [22, 23].
5 Conclusion
The use of GWAPs gives good results for the lexical crowdsourcing, but we canimprove the effectiveness (in coverage) by combining the crowdsourcing with mecha-nisms of inference by diffusion. Note that such approach can be applied to any other typeof information. Here, the inference is performed by an algorithm, which “contaminates”a term of the lexical network with information gleaned from its close neighbors. Thismechanism enlarges the lexicon from a nucleus built by the gamers, which diversifiesand is growing constantly under the combined action of the gamers and the algorithm(Never Ended Learning). Thus, one can predict that the inferred feelings will becomeincreasingly accurate and relevant over time. Botemot uses as reference data the senti-ments provided by the players, who provide novelty, richness and diversity of infor-mation to infer: the algorithm cannot infer a feeling that would not be associated withany of the neighbors of the target word. It can be noticed that thanks to the redundancyof the lexical network, polysemy does not compromise inference of sentiments. But themeanings that evoke the most pronounced feelings tend to contaminate the generalmeaning. The resource that we get reflects the diversity and richness of views, evenopposite ones. The Botemot algorithm, very simply designed, produces very relevantproposals as shown by our different assessments, and the evaluation method of inferreddata, by calculating the precision and the recall can be easily and effectively transposedto any field where a resource is in permanent construction.
References
1. Brun, C.: Detecting opinions using deep syntactic analysis. In: Proceedings of RecentAdvances in Natural Language Processing, (RANLP 2011), Hissar, Bulgaria, pp. 392–398(2011)
2. Taboada, M., Brooke, J., Tofiloski, M., Voll, K., Stede, M.: Lexicon-based methods forsentiment analysis. Comput. Linguist. 37(2), 267–307 (2011)
3. Whissell, C.: The Dictionary of Affect in Language. Academic Press, Cambridge (1989)4. Saif, M., Turney, P.: Crowdsourcing a word-emotion association Lexicon. Comput. Intell.
29(3), 436–465 (2013)
264 M. Lafourcade et al.

5. Fort, K., Adda, G., Sagot, B., Mariani, J., Couillault, A.: Crowdsourcing for languageresource development: criticisms about amazon mechanical turk overpowering use. In:Vetulani, Z., Mariani, J. (eds.) LTC 2011. LNCS, vol. 8387, pp. 303–314. Springer,Heidelberg (2014). ISBN 978-3-319-08957-7
6. Abdaoui, A., Azé, J., Bringay, S., Poncelet P.: FEEL: French Extended Emotional Lexicon(2014). ISLRN: 041-639-484-224-2
7. Esuli, A., Sebastiani, F.: SentiWordNet: a publicly available lexical resource for opinionmining. In: Proceedings of LREC-06, Gênes, Italie, p. 6 (2006)
8. Kim, S.-M. Hovy, E.: Determining the sentiment of opinions. In: Proceedings of theInternational Conference on Computational Linguistics (COLING), pp. 1367–1373 (2004)
9. Kim, S.-M., Hovy, E.: Extracting opinions, opinion holders, and topics expressed in onlinenews media text. In: Proceedings of the Workshop on Sentiment and Subjectivity in Text,SST 2006, Stroudsburg, PA, USA, pp. 1–8. Association for Computational Linguistics.(2006)
10. Mudinas, A., Zhang, D., Levenem, M.: Combining lexicon and learning based approachesfor concept-level sentiment analysis. In: Proceedings of the First International Workshop onIssues of Sentiment Discovery and Opinion Mining, WISDOM 2012, pp. 5:1–5:8. ACM,New York (2012)
11. Strapparava, C., Mihalcea, R.: Learning to identify emotions in text. In: Proceedings of the2008 ACM Symposium on Applied Computing, SAC 2008, pp. 1556–1560. ACM,New York (2008)
12. Kiritchenko, S., Xiaodan, Z., Saif, M.: Sentiment analysis of short informal texts. J. Artif.Intell. Res. 50, 723–762 (2014)
13. Lafourcade, M.: Making people play for lexical acquisition. In: Proceedings of SNLP 2007,7th Symposium on Natural Language Processing, Pattaya, Thailande, p. 8, 13–15 December2007
14. Lafourcade, M., Le Brun, N., Joubert, A.: Games with a Purpose (GWAPS), p. 158.Wiley-ISTE, New York (2015). ISBN 978-1-84821-803-1
15. Simperl, E., Acosta, M., Flöck, F.: Knowledge engineering via human computation. In:Michelucci, P. (ed.) Handbook of Human Computation, pp. 131–151. Springer, New York(2013)
16. Miller, G.A.: WordNet: a lexical database for English. Commun. ACM 38(11), 39–41(1995)
17. Fellbaum, C. (ed.): WordNet: An Electronic Lexical Database. MIT Press, Cambridge(1998)
18. Navigli, R., Ponzetto, S.P.: BabelNet: building a very large multilingual semantic network.In: Proceedings of the 48th Annual Meeting of the Association for ComputationalLinguistics, pp. 216–225 (2010)
19. Dong, Z.D., Dong, Q., Hao, C.L.: Theoretical findings of HowNet. J. Chin. Inf. Proc. 21(4),3–9 (2007)
20. Lafourcade, M., Le Brun, N., Joubert, A.: Collecting and evaluating lexical polarity with agame with a purpose. In: Proceedings of International Conference on Recent Advances inNatural Language Processing (RANLP 2015), Hissar, Bulgaria, p. 9, 5–11 September 2015
21. Saif, M., Turney, P.D.: Emotions evoked by common words and phrases: using mechanicalturk to create an emotion Lexicon. In: Proceedings of the NAACL-HLT 2010 Workshop onComputational Approaches to Analysis and Generation of Emotion in Text, LA, California,pp. 26–34, June 2010
22. Ekman, P.: An argument for basic emotions. Cogn. Emot. 6, 169–200 (1992)
Mixing Crowdsourcing and Graph Propagation 265

23. Tausczik, Y.R., Pennebake, R.J.W.: The psychological meaning of words : LIWC andcomputerized text analysis methods. J. Lang. Soc. Psychol. 29, 24–54 (2010)
24. Bos, J., Nissim, M.: Uncovering noun-noun compound relations by gamification. In:Megyesi, B., (Ed.) Proceedings of the 20th Nordic Conference of Computational Linguistics(NODALIDA 2015), pp. 251–255 (2015)
266 M. Lafourcade et al.

Comparing Two Strategies for Query Expansionin a News Monitoring System
Parvaz Mahdabi(B) and Andrei Popescu-Belis
Idiap Research Institute, Martigny, Switzerlandparvaz.mahdabi,[email protected]
Abstract. In this paper, we study query expansion strategies thatimprove the relevance of retrieved documents in a news and social mediamonitoring system, which performs real-time searches based on complexqueries. We propose a two-step retrieval strategy using textual featuressuch as bi-gram word dependencies, proximity, and expansion terms.We compare two different methods for query expansion: (1) based onword co-occurrence information; (2) using semantically-related expansionterms. We evaluate our methods and compare them with the baselineversion of the system by crowdsourcing user-centric tasks. The resultsshow that word co-occurrence outperforms semantic query expansion,and improves over the baseline in terms of relevance and utility.
Keywords: Query analysis · Query expansion · Web IR and socialmedia search
1 Introduction
The information discovery paradigm has recently gained attention in the indus-try as well as in the academia [1,7]. Unlike traditional web search results,displayed for instance as “ten blue links”, an information discovery systemfinds insights that are otherwise hidden in various information sources such asWikipedia, news feeds, or social media. These insights are an alternative way ofanswering information needs, and can be directly shown to users in addition toranked lists of links to document results.
This paper studies two types of cues for query expansion, namely semanticvs. distributional ones, in order to enhance a commercial information discoverysystem. As our purpose is to compare the two types of cues, we will not advertisethe name of the initial baseline system, but provide instead a sufficient descrip-tion of it. The system facilitates access to evolving sources of information such asnews or social media, thanks to complex queries formulated by users, who alsoreceive assistance in formulating these queries. The queries are used to generateup-to-date “magazines” that are typically consulted daily by their users. Thebaseline version of the system implements a hybrid semantic search approachcombining full-text search with entity-based search to overcome the vocabularymismatch limitation of traditional keyword search.c© Springer International Publishing Switzerland 2016E. Metais et al. (Eds.): NLDB 2016, LNCS 9612, pp. 267–275, 2016.DOI: 10.1007/978-3-319-41754-7 24

268 P. Mahdabi and A. Popescu-Belis
To improve the list of documents retrieved by the system, we propose andcompare two methods for query expansion with new words or concepts, withinthe existing hybrid semantic search framework. The first method finds candidateexpansion terms from the systems’s document repository using a global analysisof the word distributions in the corpus. We follow a pseudo-relevance feedbackapproach, assuming that the initial ranked list contains relevant documents, anddrawing candidate expansion terms from this set. The second approach uses twoexternal semantic resources, DBpedia and WordNet, to find candidate expansionterms. We analyze the initial ranked list and identify search terms from thequery that did not occur in the retrieved documents. We expand these termswith synonyms from WordNet and titles of redirect pages from DBpedia.
To assess the merits of our proposals, we evaluate them over a set of queriesobtained from users of the system. We design a comparative evaluation approachwhich relies on human subjects to compare two magazines in terms of relevance,diversity, and utility to potential users. First, we validate the results obtainedfrom non-expert subjects (via crowdsourcing), by comparing them with evalu-ations of expert users. Then, using mostly non-expert users, we show that theproposed query expansion methods achieve promising results in terms of rele-vance and utility compared to the baseline, and that the distributional methodoutperforms the semantic one.
The paper is organized as follows. In Sect. 2 we present the frameworkand baseline system, describing its indexing, search and retrieval components.Section 3 presents our two-step retrieval strategy and the two query expansionmethods, and compares them with the initial system. The experimental setup ispresented in Sect. 4. Results are presented and discussed in Sect. 5.
2 A System for News and Social Media Monitoring
Query Representation. The information discovery engine underlying thisstudy helps users find relevant information to satisfy a recurring informationneed, expressed as a complex query. The results, presented as a “magazine,”are made of documents, news, or tweets. The system allows users to constructBoolean queries composed of keywords and phrases, which are represented inConjunctive Normal Form (CNF). A CNF formula is an “AND of ORs”, i.e. aBoolean conjunction of clauses, where a clause is a disjunction of literals. WhileCNF queries are mainly used by expert searchers such as librarians, lawyers,or patent searchers, our system assists general users with query constructionthrough a user-friendly interface which provides an intuitive view of AND/ORconnectives and recommends related concept names for each field.
For instance, one of the CNF complex queries considered in this paper is:“((FedEx or Parcel Post or Postage Stamp or Royal Mail or United Par-cel Services or United States Postal Service or Universal Postal Union) and
(Privatization or Private Sector or Public Sector or Postal Services)).”

Comparing Two Strategies for Query Expansion 269
Data Repository. The document collection consists of semi-structured doc-uments (obtained from Google, Yahoo News, and Twitter) with the followingfields: title, excerpt, and text. These fields are stored in the system’s index,created using the ElasticSearch toolkit (www.elastic.co). We perform minimalstemming on the words, by only removing plural and possessive forms. Uponindexing, each document also undergoes semantic annotation, which enrichesthe text documents by finding key phrases in them, then disambiguating thesephrases, and linking them to DBpedia concepts (www.dbpedia.org). The linkedconcepts, identified by their DBpedia URIs, are added to the document repre-sentation and are stored in the system’s index, on condition that the linkingconfidence value is higher than a threshold that was set experimentally. Thesesemantic annotations are used both in the baseline and in the proposed approach.
3 Search, Retrieval and Re-ranking Methods
The architecture for hybrid semantic search is represented in Fig. 1. We firstpresent below an overview of the innovations proposed in this paper, and thendescribe a new strategy for term weighting and two new query expansion meth-ods that we study.
Fig. 1. Architecture for hybrid semantic search.
Overview of the System. In the first step, the CNF query is annotated usinglabels of concepts found in DBpedia. The goal of this step is to enhance thequery by linking it to DBpedia URIs. In Step 2, the Boolean structure of thequery is used to filter documents which lexically match either the query or theconcepts associated to it. Then, this document set is ranked by calculating arelevance score. As a result, a unified ranked list is produced, which serves asan intermediate result set. In Step 3, additional expansion terms are selected,according to either of the two approaches proposed for query expansion, notedQE-CO and SQE. In Step 4, the results of Step 2 are re-ranked using the expan-sion terms selected in Step 3. Finally, the re-ranked results are presented to theuser as a ranked list or “magazine”.

270 P. Mahdabi and A. Popescu-Belis
Baseline. The baseline system only includes Step 2 from Fig. 1. In Step 2,to generate the magazine, the baseline system uses the Boolean query to filterdocuments and uses tf-idf scoring to rank documents that were found accordingto matching on concepts and unigrams.
Term and N-gram Weighting for Retrieval. The following indexing andretrieval strategies are used at Steps 2 and 4 of the proposed system. We considerboth the unigram and the bigram statistics of these fields. Documents are rankedaccording to Language Modeling with Laplacian smoothing [6]. We hereafterrefer to these enhancements as the ‘IRM’ option. Furthermore, we improve termweighting in several ways. We increase the weight of shorter fields (title andexcerpt) and we boost matches of bigrams from queries with respect to unigrams,to increase precision. We also increase the weights of query terms that appearalone inside an AND clause, to compensate the fact that these terms are notaccompanied by synonyms or semantically related terms in the query formulatedby the user. We refer to these enhancements as the ‘TW’ option.
Query ExpansionUsingWordCo-occurrence (QE-CO). The first methodfor query expansion, noted ‘QE-CO’, relies on word co-occurrence information forfinding related terms. To perform co-occurrence analysis at Step 3, we comparethe foreground model (documents belonging to the ranked list generated at Step 2for a query) with the background model (the entire dataset), and select terms thatare indicators of the foreground model (more frequently appearing in the initialranked list together with query terms, as opposed to the rest of the corpus). Vari-ous methods exist to perform this comparison and calculate term relatedness [5],such as chi-square, mutual information, and Google normalized distance [3]. Weuse here mutual information, following preliminary experiments in which we com-pared the terms obtained by each approach. We observed that the results ofthe mutual information approach contained fewer rare terms, and avoided theselection of misspellings.
Mutual information compares the joint probability that a term t appears ina document collection set with the probabilities of observing t and set indepen-dently [5]. The mutual information between U and C is calculated as follows:
I(U ;C) =∑
et∈0,1
∑
eset∈fg,fgP (U = et, C = eset) log
P (U = et, C = eset)P (U = et) P (C = eset)
where U is a random variable indicating the presence (et = 1) or absence (et = 0)of term t, and C is a random variable which represents the presence of thedocument in the foreground collection (eset = fg) or its absence (eset = fg).These probabilities are estimated using Maximum Likelihood Estimate (MLE),using counts of documents that have the respective values of et and eset.
All unigrams and bigrams appearing in the documents of the initial rankedlist for a given query are sorted according to their mutual information scores and
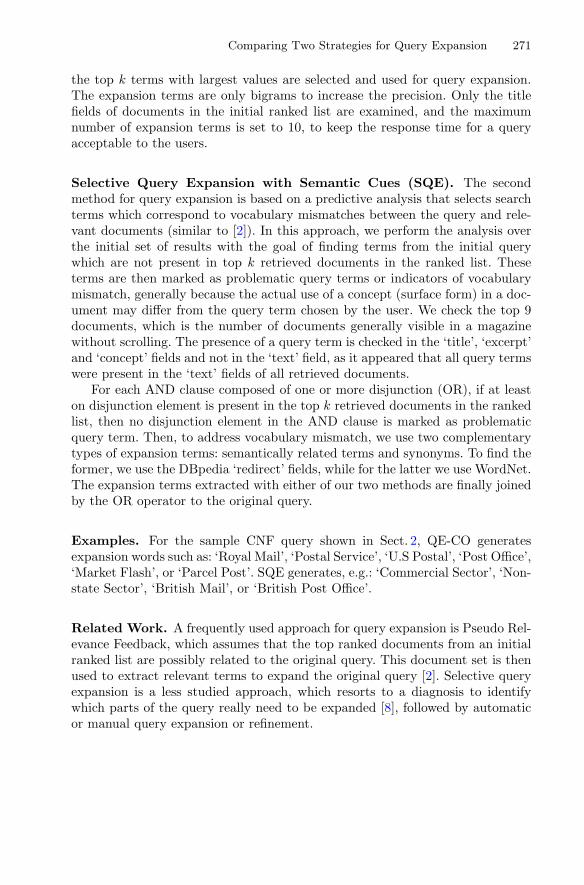
Comparing Two Strategies for Query Expansion 271
the top k terms with largest values are selected and used for query expansion.The expansion terms are only bigrams to increase the precision. Only the titlefields of documents in the initial ranked list are examined, and the maximumnumber of expansion terms is set to 10, to keep the response time for a queryacceptable to the users.
Selective Query Expansion with Semantic Cues (SQE). The secondmethod for query expansion is based on a predictive analysis that selects searchterms which correspond to vocabulary mismatches between the query and rele-vant documents (similar to [2]). In this approach, we perform the analysis overthe initial set of results with the goal of finding terms from the initial querywhich are not present in top k retrieved documents in the ranked list. Theseterms are then marked as problematic query terms or indicators of vocabularymismatch, generally because the actual use of a concept (surface form) in a doc-ument may differ from the query term chosen by the user. We check the top 9documents, which is the number of documents generally visible in a magazinewithout scrolling. The presence of a query term is checked in the ‘title’, ‘excerpt’and ‘concept’ fields and not in the ‘text’ field, as it appeared that all query termswere present in the ‘text’ fields of all retrieved documents.
For each AND clause composed of one or more disjunction (OR), if at leaston disjunction element is present in the top k retrieved documents in the rankedlist, then no disjunction element in the AND clause is marked as problematicquery term. Then, to address vocabulary mismatch, we use two complementarytypes of expansion terms: semantically related terms and synonyms. To find theformer, we use the DBpedia ‘redirect’ fields, while for the latter we use WordNet.The expansion terms extracted with either of our two methods are finally joinedby the OR operator to the original query.
Examples. For the sample CNF query shown in Sect. 2, QE-CO generatesexpansion words such as: ‘Royal Mail’, ‘Postal Service’, ‘U.S Postal’, ‘Post Office’,‘Market Flash’, or ‘Parcel Post’. SQE generates, e.g.: ‘Commercial Sector’, ‘Non-state Sector’, ‘British Mail’, or ‘British Post Office’.
Related Work. A frequently used approach for query expansion is Pseudo Rel-evance Feedback, which assumes that the top ranked documents from an initialranked list are possibly related to the original query. This document set is thenused to extract relevant terms to expand the original query [2]. Selective queryexpansion is a less studied approach, which resorts to a diagnosis to identifywhich parts of the query really need to be expanded [8], followed by automaticor manual query expansion or refinement.
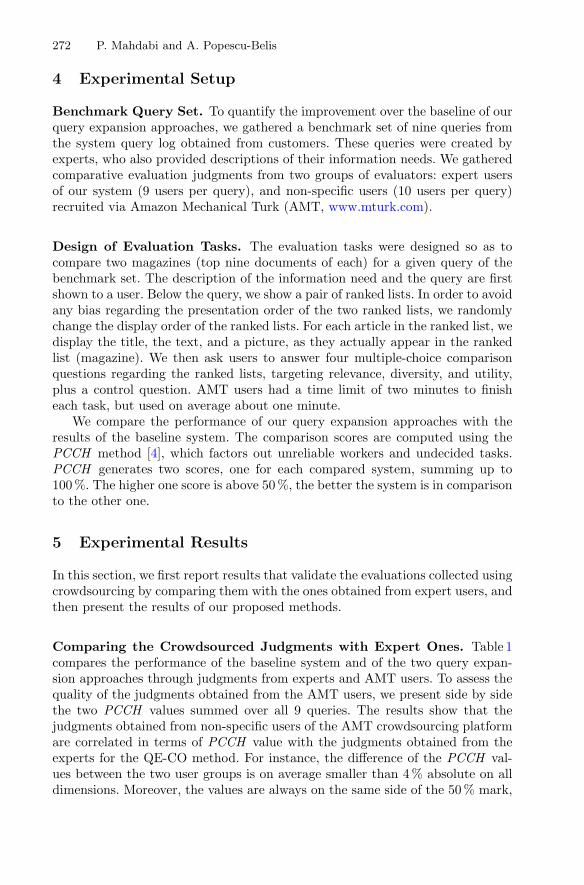
272 P. Mahdabi and A. Popescu-Belis
4 Experimental Setup
Benchmark Query Set. To quantify the improvement over the baseline of ourquery expansion approaches, we gathered a benchmark set of nine queries fromthe system query log obtained from customers. These queries were created byexperts, who also provided descriptions of their information needs. We gatheredcomparative evaluation judgments from two groups of evaluators: expert usersof our system (9 users per query), and non-specific users (10 users per query)recruited via Amazon Mechanical Turk (AMT, www.mturk.com).
Design of Evaluation Tasks. The evaluation tasks were designed so as tocompare two magazines (top nine documents of each) for a given query of thebenchmark set. The description of the information need and the query are firstshown to a user. Below the query, we show a pair of ranked lists. In order to avoidany bias regarding the presentation order of the two ranked lists, we randomlychange the display order of the ranked lists. For each article in the ranked list, wedisplay the title, the text, and a picture, as they actually appear in the rankedlist (magazine). We then ask users to answer four multiple-choice comparisonquestions regarding the ranked lists, targeting relevance, diversity, and utility,plus a control question. AMT users had a time limit of two minutes to finisheach task, but used on average about one minute.
We compare the performance of our query expansion approaches with theresults of the baseline system. The comparison scores are computed using thePCCH method [4], which factors out unreliable workers and undecided tasks.PCCH generates two scores, one for each compared system, summing up to100 %. The higher one score is above 50 %, the better the system is in comparisonto the other one.
5 Experimental Results
In this section, we first report results that validate the evaluations collected usingcrowdsourcing by comparing them with the ones obtained from expert users, andthen present the results of our proposed methods.
Comparing the Crowdsourced Judgments with Expert Ones. Table 1compares the performance of the baseline system and of the two query expan-sion approaches through judgments from experts and AMT users. To assess thequality of the judgments obtained from the AMT users, we present side by sidethe two PCCH values summed over all 9 queries. The results show that thejudgments obtained from non-specific users of the AMT crowdsourcing platformare correlated in terms of PCCH value with the judgments obtained from theexperts for the QE-CO method. For instance, the difference of the PCCH val-ues between the two user groups is on average smaller than 4 % absolute on alldimensions. Moreover, the values are always on the same side of the 50 % mark,
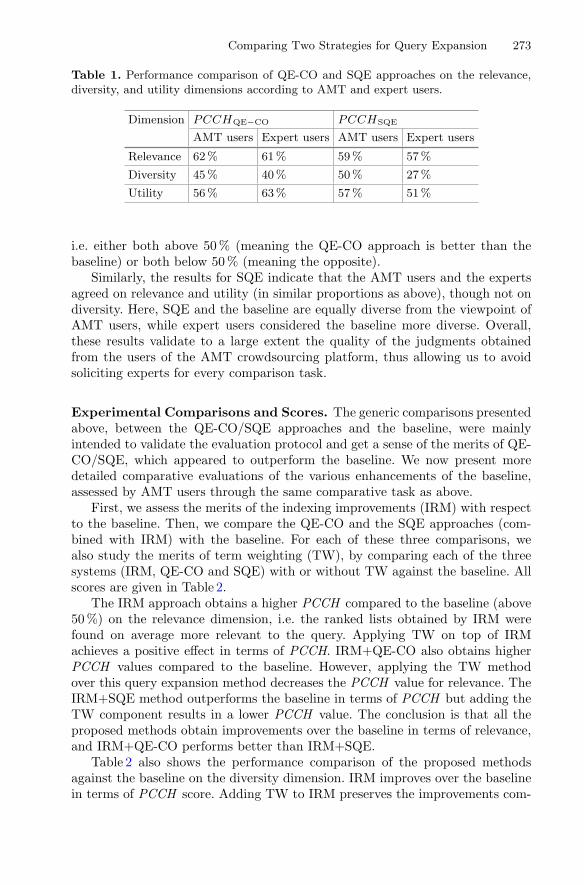
Comparing Two Strategies for Query Expansion 273
Table 1. Performance comparison of QE-CO and SQE approaches on the relevance,diversity, and utility dimensions according to AMT and expert users.
Dimension PCCHQE−CO PCCHSQE
AMT users Expert users AMT users Expert users
Relevance 62 % 61 % 59 % 57%
Diversity 45 % 40 % 50 % 27%
Utility 56 % 63 % 57 % 51%
i.e. either both above 50 % (meaning the QE-CO approach is better than thebaseline) or both below 50 % (meaning the opposite).
Similarly, the results for SQE indicate that the AMT users and the expertsagreed on relevance and utility (in similar proportions as above), though not ondiversity. Here, SQE and the baseline are equally diverse from the viewpoint ofAMT users, while expert users considered the baseline more diverse. Overall,these results validate to a large extent the quality of the judgments obtainedfrom the users of the AMT crowdsourcing platform, thus allowing us to avoidsoliciting experts for every comparison task.
Experimental Comparisons and Scores. The generic comparisons presentedabove, between the QE-CO/SQE approaches and the baseline, were mainlyintended to validate the evaluation protocol and get a sense of the merits of QE-CO/SQE, which appeared to outperform the baseline. We now present moredetailed comparative evaluations of the various enhancements of the baseline,assessed by AMT users through the same comparative task as above.
First, we assess the merits of the indexing improvements (IRM) with respectto the baseline. Then, we compare the QE-CO and the SQE approaches (com-bined with IRM) with the baseline. For each of these three comparisons, wealso study the merits of term weighting (TW), by comparing each of the threesystems (IRM, QE-CO and SQE) with or without TW against the baseline. Allscores are given in Table 2.
The IRM approach obtains a higher PCCH compared to the baseline (above50 %) on the relevance dimension, i.e. the ranked lists obtained by IRM werefound on average more relevant to the query. Applying TW on top of IRMachieves a positive effect in terms of PCCH. IRM+QE-CO also obtains higherPCCH values compared to the baseline. However, applying the TW methodover this query expansion method decreases the PCCH value for relevance. TheIRM+SQE method outperforms the baseline in terms of PCCH but adding theTW component results in a lower PCCH value. The conclusion is that all theproposed methods obtain improvements over the baseline in terms of relevance,and IRM+QE-CO performs better than IRM+SQE.
Table 2 also shows the performance comparison of the proposed methodsagainst the baseline on the diversity dimension. IRM improves over the baselinein terms of PCCH score. Adding TW to IRM preserves the improvements com-

274 P. Mahdabi and A. Popescu-Belis
pared to the baseline. IRM+QE-CO scores below the baseline (PCCH below50 %) but IRM+SQE scores similarly to the baseline. Adding the TW methodtogether with QE-CO and SQE approaches decreases the diversity of the rankedlists. A possible reason for this result could be the tendency of AMT users tojudge relevance and diversity as inversely correlated.
Table 2. Comparison of methods for relevance, diversity, and utility.
Method PCCH
Relevance Diversity Utility
IRM 58 % 58 % 63%
IRM+TW 60 % 53 % 60%
IRM+QE-CO 62 % 45 % 56%
IRM+QE-CO+TW 55 % 43 % 52%
IRM+SQE 59 % 50 % 57%
IRM+SQE+TW 53 % 40 % 53%
Table 2 further compares the performance of the proposed methods againstthe baseline on the utility dimension. IRM and both query expansion methodsincrease the perceived utility of the ranked list, as they achieve better PCCHvalues compared to the baseline. However, applying the TW method to IRM,SQE, and QE-CO impacts negatively the perceived utility of the ranked lists.From the results of Table 2, we conclude that IRM and both query expansionapproaches achieve a positive effect on improving the relevance and perceivedutility of the ranked list with respect to the baseline. However, the diversityof the ranked lists generated by the two query expansion approaches is lowercompared to the baseline, while IRM alone achieves improvements in diversity.
6 Conclusion
In this paper we considered the challenge of improving the ranking of relevantdocuments in a news and social media monitoring system. We presented a twostage process, where in the first stage an initial ranker retrieves a set of docu-ments and in the second stage a model re-ranks the first list before presentingthe results to the user. We studied two query expansion methods to improve there-ranking stage: the first one employs corpus statistics to find terms related tothe query, while the second one performs selective query expansion by predictingwhich query terms require expansion and then finding semantically related termsfrom external resources. The first method outperformed the second one based oncrowdsourced comparative judgments, and both were above the baseline systemin terms of relevance and utility.
Acknowledgments. This work was funded by the Swiss Commission for Technologyand Innovation.

Comparing Two Strategies for Query Expansion 275
References
1. Arguello, J., Diaz, F., Callan, J., Crespo, J.: Sources of evidence for vertical selec-tion. In: Proceedings of ACM SIGIR Conference on Research and Development inInformation Retrieval, pp. 315–322 (2009)
2. Cao, G., Nie, J., Gao, J., Robertson, S.: Selecting good expansion terms for pseudo-relevance feedback. In: Proceedings of ACM SIGIR Conference on Research andDevelopment in Information Retrieval (SIGIR), pp. 243–250 (2008)
3. Cilibrasi, R., Vitanyi, P.M.: The Google similarity distance. IEEE Trans. Knowl.Data Eng. 19, 370–383 (2007)
4. Habibi, M., Popescu-Belis, A.: Using crowdsourcing to compare document recom-mendation strategies for conversations. In: Workshop on Recommendation UtilityEvaluation, Held in Conjunction with ACM RecSys (2012)
5. Manning, C., Raghavan, P., Schutze, H.: Introduction to Information Retrieval.Cambridge University Press, New York (2008)
6. Ponte, J.M., Croft, B.: A language modeling approach to information retrieval.In:Proceedings of ACM SIGIR Conference on Research and Development in Informa-tion Retrieval (SIGIR), pp. 275–281 (1998)
7. Tablan, V., Bontcheva, K., Roberts, I.: Mımir: an open-source semantic searchframework for interactive information seeking and discovery. Web Semant. Sci.Serv. Agents World Wide Web 30, 52–68 (2015)
8. Zhao, L., Callan, J.: Term necessity prediction. In: Proceedings of the ACM Inter-national Conference on Information and Knowledge Management (CIKM), pp.259–268 (2010)
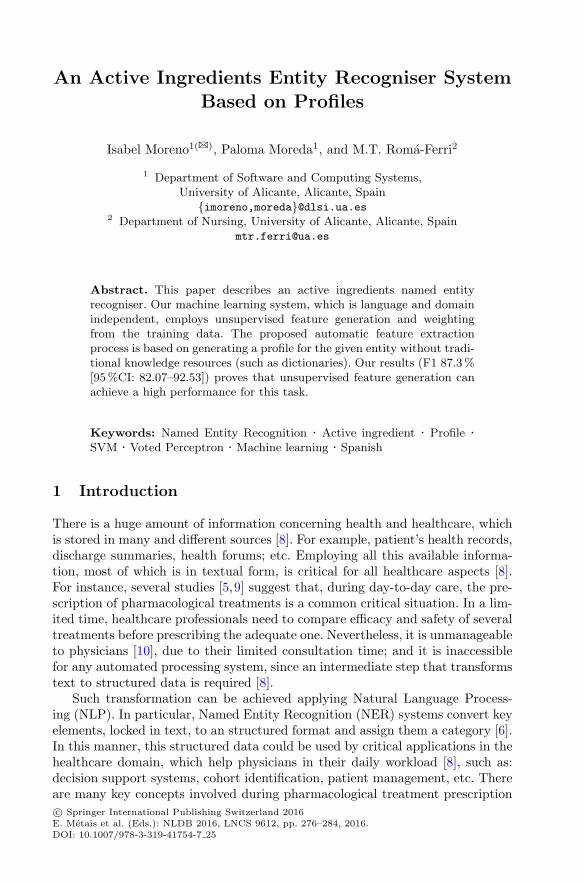
An Active Ingredients Entity Recogniser SystemBased on Profiles
Isabel Moreno1(B), Paloma Moreda1, and M.T. Roma-Ferri2
1 Department of Software and Computing Systems,University of Alicante, Alicante, Spain
imoreno,[email protected] Department of Nursing, University of Alicante, Alicante, Spain
Abstract. This paper describes an active ingredients named entityrecogniser. Our machine learning system, which is language and domainindependent, employs unsupervised feature generation and weightingfrom the training data. The proposed automatic feature extractionprocess is based on generating a profile for the given entity without tradi-tional knowledge resources (such as dictionaries). Our results (F1 87.3 %[95 %CI: 82.07–92.53]) proves that unsupervised feature generation canachieve a high performance for this task.
Keywords: Named Entity Recognition · Active ingredient · Profile ·SVM · Voted Perceptron · Machine learning · Spanish
1 Introduction
There is a huge amount of information concerning health and healthcare, whichis stored in many and different sources [8]. For example, patient’s health records,discharge summaries, health forums; etc. Employing all this available informa-tion, most of which is in textual form, is critical for all healthcare aspects [8].For instance, several studies [5,9] suggest that, during day-to-day care, the pre-scription of pharmacological treatments is a common critical situation. In a lim-ited time, healthcare professionals need to compare efficacy and safety of severaltreatments before prescribing the adequate one. Nevertheless, it is unmanageableto physicians [10], due to their limited consultation time; and it is inaccessiblefor any automated processing system, since an intermediate step that transformstext to structured data is required [8].
Such transformation can be achieved applying Natural Language Process-ing (NLP). In particular, Named Entity Recognition (NER) systems convert keyelements, locked in text, to an structured format and assign them a category [6].In this manner, this structured data could be used by critical applications in thehealthcare domain, which help physicians in their daily workload [8], such as:decision support systems, cohort identification, patient management, etc. Thereare many key concepts involved during pharmacological treatment prescriptionc© Springer International Publishing Switzerland 2016E. Metais et al. (Eds.): NLDB 2016, LNCS 9612, pp. 276–284, 2016.DOI: 10.1007/978-3-319-41754-7 25
An Active Ingredients Entity Recogniser System Based on Profiles 277
that can be eligible for being a named entity (NE). However, prescription ismainly related with active ingredients, which is the name of a substance givinga drug its effect (e.g. “paracetamol”, in English “acetaminophen”).
Taking into consideration all these aspects, our aim is to present a profile-based NER system. It identifies entities and assigns a category in a single step.Although our methodology is domain and language-independent, it is focused onidentifying whether candidates are mentions of active ingredients or not. Giventhat most efforts are concentrated in English [22], this work is evaluated overdocuments written in Spanish to enhance available resources in this language.
The remainder of the paper is structured as follows. Section 2 reviews existingapproaches for NER in this narrow field. Then, Sect. 3 describes our approach.The evaluation performed is provided in Sect. 4. Finally, Sect. 5 concludes thepaper and outlines future work.
2 Background
NER has been faced through two main approaches: hand-crafted rules or statisti-cal models. Most systems are rule-based and make extensive use of lexicons withgood results. These dictionaries were built combining several sources: (i) biome-dical knowledge resources [3,4,12,16,20,21,23]; (ii) training data [12,23,24]; (iii)unlabelled data [12]; and (iv) the web [21,23]. Given their lexicons, these systemsemploy pattern matching and regular expressions [3,12,16,23,24], join a spellchecker with an existing NER system (MedEx ) [4], combine rules from expertswith a concept recognition tool (Mgrep) [20] or integrate a dictionary-basedNER (Textalytics) and GATE gazetteers [21]. A drawback shared by these dic-tionary rule-based systems is an expensive maintenance to make them updatedfor including new instances and their variations [16].
There is a trend to employ Machine Learning (ML) algorithms [1,2,11,13,18]for NER, which generates good results with or without biomedical knowledgeresources. The algorithms more commonly used are: (i) J48 implementation ofC4.5 decision tree to identify and recognise entities independently [2]; (ii) Con-ditional Random Fields (CRF) to found and classify entities [11,13,18]; and (iii)Support Vector Machines (SVM) to categorize entities [1]. The features employedvary from domain-independent ones based on context from different levels ofanalysis (lexical, syntactical and semantic) [1,2,11,13], as well as domain-specifictools (MMTx [1], TEES [1], Chemspot [13]) and domain-specific knowledge basessuch as dictionaries [13,18], ontologies (ChEBI [11,13] and PHARE [13]) ordatabases (DrugBank [1]). These ML approaches often define their features byhand, which leads to manually redefine and adjust the features of the system.For instance, when new types of entities appear, but also if either domain orlanguage changes.
As for languages tackled, only two systems were developed for Spanish [16,21],whereas English has received more attention [1–4,11–13,18,20,23]. Thus, there isa scarcity of Spanish NER tools in this domain.
Our hypothesis is that medical NER systems can be effective out of knowledgeresources and can take advantage of an unsupervised feature generation process

278 I. Moreno et al.
from a training corpus. To this end, we experiment with one entity (active ingre-dient), two automatic feature generation spaces (sentences and sections) and oneapproach for entity recognition based on ML.
3 Method: Named Entity Recognition Through Profiles
Our methodology performs active ingredients mentions extraction using profiles.The term profile refers to a collection of unique entity descriptors that are a setof relevant concept bearing words found in a corpus [14].
The proposed approach is an adaptation for NER from the method definedin [14]. There are two main differences between their work and ours. On the onehand, while Lopes et al. [14] obtain their descriptors from a concept extractorsystem; ours are derived from nouns, verbs, adjectives and adverbs. On the otherhand, their categorization is performed by ranking possible entities using theirown similarity measure, but ours calculate similarity between profiles and entitiesthrough ML.
Our method has two main stages: (i) profile generation step, whose main goalis to build a profile for a given NE type from which to train a ML model for recog-nising such NE; and (ii) profile application step, whose aim is to recognise enti-ties from a text through a ML model. It computes similarity measures betweena profile and the candidates’ profile. Next, each phase is further described.
1. Profile generation for a NE type is an off-line process that follows thesesteps:(a) Linguistic annotation: a corpus previously annotated with this NE is
tokenized, sentence-splitted, morphologically analysed, PoS-tagged, andshallow-parsed by using Freeling [17]. Finally, noun phrases are extracted.
(b) Split the training corpus: the dataset is divided in two sets called targetand contrasting. The former set represents a fragment of the corpus capa-ble to characterize that a given NE belongs to a certain class (i.e. positiveexamples or sentences containing active ingredients). While the latter iscomposed by negative examples (i.e. sentences with named entities dif-ferent from active ingredients). According to [14], the use of contrast-ing entities (or negative examples) discovers frequent terms in all typesof entities, and thus it will allow to find common relevant descriptorsbetween all entities (both positive and negative examples).
(c) Descriptors extraction: For each set, we extract content bearing termsand their frequency, called top and common descriptors. The former con-tains descriptors from the target set, whereas the latter includes commondescriptors in both target and contrasting set. As noted above, contentbearing terms are lemmas of nouns, verbs, adjectives and adverbs thatappear in a window (i.e. 10 descriptors before and 10 after).
(d) Relevance computation: For both top and common descriptors lists, arelevance index is assigned to weight them. The term frequency, disjointcorpora frequency index [14] determines the relevance of each item from

An Active Ingredients Entity Recogniser System Based on Profiles 279
a top list applying (1), where: d is a descriptor, t is the target set, c is thecontrasting set, and occ(d, t) is the occurrences of a term d in a set t. idxtop
penalize descriptors that appear in the contrasting set, thus higher idxtop
values estimate more relevant descriptors. Similarly, to weight descriptorsfrom the commons list, the relevance common index is defined in (2).
idxtop(d, t, c) = log(1 +occ(d, t)
1 + log(1 + occ(d, c))) (1)
idxcommon(d, t, c) = log(1 + occ(d, t) − occ(d, t)1 + log(1 + occ(d, c))
) (2)
This step produces a profile of a named entity category (such as activeingredient pa), which is a top Tpa
and common Cpadescriptors lists. Each
item from these lists is a pair representing a term and its relevance index:term(i), idx(term(i), t, c). Such index is used in next steps to determinethe category of this NE and weights the relevance of each descriptor.These lists contains every extracted descriptor whose occ(d) ≥ 1.
(e) Model training : Our proposal creates ML models for computing profilesimilarity between an NE class and its candidates. Thus, in this step,a model is generated for each entity profile. Two algorithms have beenemployed: (i) SVM [19], an algorithm commonly used for classificationpurposes [1]; and (ii) Voted Perceptron (VP) [7], a simplified version ofCRF algorithm which is frequently used in NER [11,13,18]. The builtclassifiers have as features the profile of the entity, that is the Tp and Cp
lists. The value of each feature (i.e. a descriptor) is its relevance index,idxtop (1) and idxcommon (2), respectively.
2. Profile application process for recognising a NE type takes these steps:(a) Linguistic annotation: text is tokenized, sentence-splitted, morphologi-
cally analyzed, PoS-tagged, and shallow-parsed by using Freeling [17].Finally, noun phrases are annotated.
(b) Candidate detection: an active ingredient is a noun (e.g. “amoxicilina”,in English “amoxicilin”) or a set of nouns (e.g. “acido acetilsalicilico”, inEnglish “aspirin”). Thus, all extracted noun phrase are considered as acandidate, as long as they do not have numerals.
(c) Descriptors extraction: For each candidate, we extract the top and com-mon descriptors that appear in a window (i.e. 10 terms before and 10after) using the same restrictions as in the generation phase (nouns, verbs,adjectives and adverbs). Common descriptors are obtained using the con-trasting set employed for profile generation.
(d) Relevance computation: Only the top relevance index idxtop (1) is com-puted, as [14] does.
(e) Similarity computation &classification: Once an entity candidate hasfilled its profile, this one is compared against the previously generatedone to compute their similarity. It was estimated using two ML algo-rithms (i.e. SVM and VP). The classification is based on a model whosefeatures are the descriptors of the given entity (Tp and Cp).
280 I. Moreno et al.
4 Results Analysis
The aim of our experiments is to estimate similarity between the active ingre-dient profile and a candidate NE using SVM and VP algorithms. Each expe-riment preserved the remaining variables (i.e. maximum window size, linguisticannotations, relevance computation, candidate and descriptors extraction) andcomputed Recall (R), Precision (P) and F-measure (F1). This section describes:(i) baseline; (ii) evaluation set-up; (iii) evaluation results; and (iv) comparisonwith similar systems.
Baseline: Similarity between a profile and a candidate was computed setting anarbitrary threshold (i.e. 20) to the measure proposed by [14].
Evaluation Set-up: Our NER tool was evaluated against DrugSemantics cor-pus [15], a collection of 5 Spanish Summaries of Product Characteristics manu-ally annotated. It contains 670 sentences and 582 active ingredients.
This evaluation employed two spaces, sentences and sections, to investigatewhether our estimation is robust given a maximum window size but potentialbigger contexts. This implies that sentence-level tests have smaller windows. Forexample, first and final descriptors in a sentence only take into account halfof the context; whereas a descriptor in the middle of a sentence considers thecontext completely. As opposed, section-level space has a bigger window, sincefirst and final descriptors in a sentence have context descriptors from previousand following sentences until the maximum window size is reached. Given thateach space is characterised differently, distinct assessment methodologies wereused.
Evaluation at sentence-level used stratified sampling. It allows to randomlyselect each sentence based on its features to keep proportionality as in DrugSe-mantics corpus. Here, the features were: (i) lack of any NEs; (ii) contain exclu-sively other NEs; (iii) include only one active ingredient; and (iv) contain morethan one active ingredient. Four samples were created from DrugSemantics. Thesize of each sample was decided considering a 95 % Confidence Interval (CI) andan error rate of 3 % so as to ensure the representativeness of every sample fromDrugSemantics. Briefly, 2 samples were derived to provide target (125 sentences)and contrasting sets (128 sentences). The other two samples were for validation(261 sentences) and evaluation purposes (156 sentences), but only the latter wasused. These experiments generated profiles at sentence-level, regardless of thewindow size.
Evaluation at section-level was performed through a 5-fold cross-validation(i.e. 4 SPCs for training and one for evaluation). Common cross-validation wasdiscarded due to the profiles-dataset relation. Independently of the window size,this experiment generated profiles considering first and second level headings.
Evaluation Results: Results for both spaces are in Table 1. Regardless of thedimension, the more balanced results are achieved when VP estimates similar-ity between active ingredients profile and each candidate. Sentence-level tests,

An Active Ingredients Entity Recogniser System Based on Profiles 281
Table 1. Active ingredient NER through profiles evaluation
Dim Sample Similarity Recall (%) Precision (%) F-measure (%)
Sen Test BSL 24 [17.3–30.7]* 18 [11.97,24.03]* 21 [14.61,27.39]*
Sen Test SVM 84.7 [79.05–90.35]* 87 [81.72–92.28]* 85.7 [80.21–91.19]*
Sen Test VP 89.1 [84.21–93.99]* 86.1 [80.67–91.53]* 87.3 [82.07–92.53]*
Sec MAv BSL 78.4 12.6 21.2
Sec MAv SVM 81.5 84.66 82.92
Sec MAv VP 89.08 85.38 86.4
Sec Fold1 BSL 93 25 39
Sec Fold1 SVM 68.4 76.8 71.9
Sec Fold1 VP 82.4 78.5 80
Sec Fold2 BSL 71 7 13
Sec Fold2 SVM 83.2 88.3 85.6
Sec Fold2 VP 92.6 87.5 90
Sec Fold3 BSL 70 5 9
Sec Fold3 SVM 94.3 94 94.2
Sec Fold3 VP 95.3 94 94.7
Sec Fold4 BSL 81 15 26
Sec Fold4 SVM 84.6 85.6 85.1
Sec Fold4 VP 86.4 81.8 82.8
Sec Fold5 BSL 77 11 19
Sec Fold5 SVM 77 78.6 77.8
Sec Fold5 VP 88.7 85.1 86.7Acronyms, by appearance: (i) Dim: Dimension; (ii) Sen: Sentence; (iii) BSL: baseline [14];(iv) *: 95%confidence interval;(v) SVM: Support Vector Machine; (vi) VP: Voted Perceptron; and (vii) MAv:Macro average.
which provide a 95 %CI and 5 % error rate, produce the best result with VP andpresent the greater F1 (87.3 % [95 %CI: 82.07–92.53]).
State of the Art Comparison: Comparing our system results with others cannot be done directly because the training and testing samples are different.Although, to prove that our results are in line with the state of the art, Table 2lists systems described in Sect. 2 and our best result (called ‘Profile’). Our sys-tem only detects active ingredients, but we can ensure its effectiveness margin.The best ML-system [18] reported R and F1 inside our CI. Examining the bestdictionary-based systems [4,24], their results are within our 95 % CI. This posi-tive comparison is repeated for Spanish NER systems [16,21]. It should be notedthat [16,21] use lexicons, whereas wegot such results without them.

282 I. Moreno et al.
Table 2. Active ingredient NER by F1, 1st ML systems and 2nd dictionary-based
System Lang Recall(%) Precision(%) F1(%) Corpus AI entities
Sydney [18] EN 87.77 92.89 90.26 i2b2 -
Profile ES 89.1 86.1 87.3 DrugSemantics 117
WBI-NER [13] EN 85.2 73.6 79 DDIExtraction 351
UTurku [1] EN - - 78 DDIExtraction 351
LASIGE [11] EN 70 75 73 DDIExtraction 351
UMCC-DLSI [2] EN 56 20 30 DDIExtraction 351
OpenU [24] EN - - 89 i2b2 -
Vanderbilt [4] EN 87 90 88 i2b2 -
MaNER [16] ES 86 87 88 DrugSemantics 616
BME-Humboldt [23] EN 82 92 87 i2b2 -
SpanishADRTool [21] ES 80 87 83 SpanishADR 188
Acronyms: (i) AI: Active Ingredient; (ii) ES: Spanish; (iii) EN: English; (iv)Lang:Language
5 Conclusions and Future Work
This paper presented a supervised ML NER system. This proposal, which islanguage and domain independent, employs unsupervised feature generation andweighting only from training data. It was evaluated on a Spanish corpus, DrugSe-mantics [15]. Our VP classifier results (F1 87.3 % [95 %CI: 82.07–92.53]) provesour hypothesis that an active ingredient NER system can perform this tasksuccessfully without knowledge bases. As future work, we plan to enhance oursystem with other NEs relevant for day-to-day care, as well as traditional NEs.
Acknowledgments. This paper has been partially supported by the Spanish Gov-ernment (grant no. TIN2015-65100-R).
References
1. Bjorne, J., Kaewphan, S., Salakoski, T.: UTurku: drug named entity recognitionand drug-drug interaction extraction using svm classification and domain knowl-edge. In: Proceedings of the Seventh International Workshop on Semantic Evalu-ation, vol. 2, pp. 651–659 (2013)
2. Collazo, A., Ceballo, A., Puig, D.D., Gutierrez, Y., Abreu, J.I., Perez, R.,Fernandez Orqın, A., Montoyo, A., Munoz, R., Camara, F.: UMCC DLSI: Seman-tic and Lexical features for detection and classification Drugs in biomedical texts.In: Proceedings of the Seventh International Workshop on Semantic Evaluation,vol. 2, pp. 636–643 (2013). http://www.aclweb.org/anthology/S13-2106
3. Deleger, L., Grouin, C., Zweigenbaum, P.: Extracting medical information fromnarrative patient records: the case of medication-related information. J. Am. Med.Inform. Assoc. 17(5), 555–558 (2010)

An Active Ingredients Entity Recogniser System Based on Profiles 283
4. Doan, S., Bastarache, L., Klimkowski, S., Denny, J.C., Xu, H.: Integrating existingnatural language processing tools for medication extraction from discharge sum-maries. J. Am. Med. Inform. Assoc. 17(5), 528–531 (2010)
5. Ely, J.W., Osheroff, J.A., Ebell, M.H., Bergus, G.R., Levy, B.T., Chambliss, M.,Evans, E.R.: Analysis of questions asked by family doctors regarding patient care.Br. Med. J. 319, 358–361 (1999)
6. Feldman, R., Sanger, J.: The Text Mining Handbook: Advanced Approaches inAnalyzing Unstructured Data. Cambridge University Press, New York (2007)
7. Freund, Y., Schapire, R.E.: Large margin classification using the perceptron algo-rithm. Mach. Learn. 37(3), 277–296 (1999)
8. Friedman, C., Rindflesch, T.C., Corn, M.: Natural language processing: state of theart and prospects for significant progress, a workshop sponsored by the NationalLibrary of Medicine. J. Biomed. Inform. 46(5), 765–773 (2013)
9. Gonzalez-Gonzalez, A.I., Dawes, M., Sanchez-Mateos, J., Riesgo-Fuertes, R.,Escortell-Mayor, E., Sanz-Cuesta, T., Hernandez-Fernandez, T.: Information needsand information-seeking behavior of primary care physicians. Ann. Family Med.5, 345–352 (2007)
10. Gonzalez-Gonzalez, A.I., Sanchez Mateos, J., Sanz Cuesta, T., Riesgo Fuertes,R., Escortell Mayor, E., Hernandez Fernandez, T.: Estudio de las necesidades deinformacion generadas por los medicos de atencion primaria (proyecto ENIGMA)*.Atencion primaria, 38(4), 219–224 (2006)
11. Grego, T., Couto, F.M.: LASIGE : using Conditional Random Fields and ChEBIontology. In: Proceedings of the Seventh International Workshop on Semantic Eval-uation, vol. 2, pp. 660–666 (2013). http://aclweb.org/anthology/S13-2109
12. Hamon, T., Grabar, N.: Linguistic approach for identification of medication namesand related information in clinical narratives. J. Am. Med. Inform. Assoc. 17(5),549–554 (2010)
13. Huber, T., Linden, U.D., Rockt, T.: WBI-NER : The impact of domain-specificfeatures on the performance of identifying and classifying mentions of drugs. In:Proceedings of the Seventh International Workshop on Semantic Evaluation, vol.2, pp. 356–363 (2013). http://www.aclweb.org/anthology/S13-2058
14. Lopes, L., Vieira, R.: Building and applying profiles through term extraction. In:X Brazilian Symposium in Information and Human Language Technology, Natal,Brazil, pp. 91–100 (2015)
15. Moreno, I., Moreda, P., Roma-Ferri, M.: Reconocimiento de entidades nom-bradas en dominios restringidos. In: Actas del III Workshop en Tecnologıas dela Informatica, Alicante, Spain, pp. 41–57 (2012)
16. Moreno, I., Moreda, P., Roma-Ferri, M.T.: MaNER: a MedicAl named entity recog-niser. In: Biemann, C., Handschuh, S., Freitas, A., Meziane, F., Metais, E. (eds.)NLDB 2015. LNCS, vol. 9103, pp. 418–423. Springer, Heidelberg (2015)
17. Padro, L., Stanilovsky, E.: FreeLing 3.0: towards wider multilinguality. In: Pro-ceedings of the Language Resources and Evaluation Conference, Istanbul, Turkey(2012)
18. Patrick, J., Li, M.: High accuracy information extraction of medication informationfrom clinical notes: 2009 i2b2 medication extraction challenge. J. Am. Med. Inform.Assoc. 17(5), 524–527 (2010)
19. Platt, J.: Using analytic QP and sparseness to speed training of support vectormachines. In: Proceedings of the Advances in Neural Information Processing Sys-tems, vol. 11, pp. 557–563 (1999)

284 I. Moreno et al.
20. Sanchez-Cisneros, D., Aparicio Gali, F.: UEM-UC3M: An Ontology-based namedentity recognition system for biomedical texts. In: Proceedings of the Seventh Inter-national Workshop on Semantic Evaluation, vol. 2, pp. 622–627 (2013)
21. Segura-Bedmar, I., Revert, R., Martınez, P.: Detecting drugs and adverse eventsfrom Spanish health social media streams. In: Proceedings of the 5th InternationalWorkshop on Health Text Mining and Information Analysis, pp. 106–115 (2014)
22. Singh, A.: Natural language processing for less privileged languages: Where dowe come from? Where are we going? In: IJCNLP-08 Workshop on NLP for LessPrivileged Languages, Hyderabad, India, pp. 7–12 (2008)
23. Tikk, D., Solt, I.: Improving textual medication extraction using combined condi-tional random fields and rule-based systems. J. Am. Med. Inform. Assoc. 17(5),540–544 (2010)
24. Yang, H.: Automatic extraction of medication information from medical dischargesummaries. J. Am. Med. Inform. Assoc. 17(5), 545–548 (2010). http://dx.doi.org/10.1136/jamia.2010.003863

Improving the Sentiment Analysis Processof Spanish Tweets with BM25
Juan Sixto(B), Aitor Almeida, and Diego Lopez-de-Ipina
DeustoTech-Deusto Institute of Technology, Universidad de Deusto,Avenida de las Universidades 24, 48007 Bilbao, Spain
jsixto,aitor.almeida,[email protected]
Abstract. The enormous growth of user-generated information of socialnetworks has caused the need for new algorithms and methods for theirclassification. The Sentiment Analysis (SA) methods attempt to identifythe polarity of a text, using among other resources, the ranking algo-rithms. One of the most popular ranking algorithms is the Okapi BM25ranking, designed to rank documents according to their relevance on atopic. In this paper, we present an approach of sentiment analysis forSpanish Tweets based combining the BM25 ranking function with a Lin-ear Support Vector supervised model. We describe the implemented pro-cedure to adapt BM25 to the peculiarities of SA in Twitter. The resultsconfirm the potential of the BM25 algorithm to improve the sentimentanalysis tasks.
Keywords: BM25 · Linear support vector · Sentiment analysis · Termfrequency
1 Introduction
Sentiment analysis is the task of identifing and extracting the subjective infor-mation of a document or set of documents. Through the use of natural languageprocessing (NLP) mechanisms, sentiment analysis attempts to determine theopinion expressed in a document. The final purpose is to establish the attitude ofa user in a context or in relation with a specific topic. The heterogeneous sourcesof the documents studied by sentiment analysis require different approaches andcustomized techniques, according to the different features of the documents. InTwitter texts, the opinions are expressed in micro-blogging texts that may con-tain only one or two words with subjective information. This raises the need ofimplement new methods to address this problem.
A vast amount of techniques have been developed by researchers in the senti-ment analysis field during the last years. However, most of these approaches arelanguage dependent, and could not be applied to different languages due to theconsiderable differences between languages and the difficulty of establish stan-dard linguistic rules between them [8]. The existence of different lexicons anddata sets for each language increases the difficulty in the research of efficientsolutions for sentiment analysis task.c© Springer International Publishing Switzerland 2016E. Metais et al. (Eds.): NLDB 2016, LNCS 9612, pp. 285–291, 2016.DOI: 10.1007/978-3-319-41754-7 26

286 J. Sixto et al.
In this paper, we present our adaptation of the BM25 ranking function forSentiment Analysis and their latest results with a Linear Support Vector super-vised model. Our work is based on the Spanish language and is evaluated usingthe corpus of TASS 2015 workshop, composed by tweets written is Spanish. Thepaper is organized as follows: In Sect. 2, the context of this work is presented,including the Sentiment Analysis at global level task of the TASS workshop. InSect. 3, the Okapi BM25 ranking function is described, in conjuction with thecontextual adaptation process. Section 4 covers the experimental procedures, andconclusions are in Sect. 5.
2 Related Work
BM25 Okapi is a ranking function developed by Robertson et al. [14,15] closelyrelated to the standard TF-IDF (frequency-inverse document frequency) retrievalfunction. Even so, BM25 has two parametrizable variables that allow a superioroptimization of the function. In addition, the asymptotic maximum of the functionestablishes a limit for high frequency terms [16], unlike the standard TF-IDF. Alarge number of comparisons has been conducted between BM25 and other rank-ing functions like TF-IDF, Dirichlet or Pivoted normalization [5]. Also, the perfor-mance of BM25 has been evaluated with several datasets formed by Twitter-likeshort texts about product reviews [4], with certain similarities with the work pre-sented in this paper. In [21], BM25 Okapi score has been used to calculate the termsimilarity between queries and documents, similarly to [11,12].
In this paper, we use the datasets and results of the sentiment analysis taskat TASS’151 workshop [20]. This is an evaluation workshop for sentiment analy-sis focused on Spanish language, organized as a satellite event of the annualconference of the Spanish Society for Natural Language Processing (SEPLN)2.This paper is focused on the first task of the workshop that consists in perform-ing an automatic sentiment analysis to determine the global polarity of eachmessage in the provided corpus. Tweets are divided into six different polaritylabels: strong positive (P+), positive (P), neutral (NEU), negative (N), strongnegative (N+) and no sentiment tag (NONE), and form two sets, the trainingdataset with 7.219 (11 %) items and the test dataset with 60.798 (89 %) items.Additionally, the task includes a 1.000 items dataset, a subset of the test dataset,for an alternative evaluation of the performance of systems.
Due to the sentiment analysis task consisting of a classification problem, avery large selection of machine learning classification algorithms has been usedby researchers. The most frequent algorithms used in the recent years are Sup-port Vector Machine (SVM) [9,17], Logistic Regression [18], Naıve Bayes [7] andDecision Tree [19]. Anta et al. [1], present a comparative analysis of classifica-tion techniques for sentiment analysis on spanish tweets. During our work thesealgorithms and some others were tested in order to achieve the highest accuracyresults. This process are described in Sect. 4.1 Workshop on Sentiment Analysis at SEPLN Conference.2 http://www.sepln.org/.

Improving the Sentiment Analysis Process of Spanish Tweets with BM25 287
3 Okapi BM25 Ranking Function
In order to use the BM25 function as a sentiment resource, it has been necessaryto implement an adaptation of the algorithm to the concrete features of the task.Previously to the automatic training step, a terms dictionary must be generatedthrough the BM25 algorithm. This dictionary allows the system to obtain therelevance weights of each term and polarity in the corpus texts. The formula usedto implement BM25 in the system and the conceptual necessary adaptations aredefined below. The software implementation of the function has been realized inPython Programming Language, in order to be combined with the scikit-learn3
toolkit.BM25 uses term frequency (TF) and inverse document frequency (IDF) to
weight terms. The relevance of a term qi in a polarity D is calculated acordingto the Eq. 1, where f(qi,D) is the frequency of the term (TF) in the document(polarity) D. In the Okapi model, D concerns the documents used for similarityscoring. However, in our context the documents should be the six polaritiesexisting in the corpus. To do this, the complete collection of tweets in the trainingdataset must be compiled by polarity, in order to generates a single documentfor each polarity. During this step, the use of a part-of-speech tagger and atext normalization algorithm reduces the length of the dictionary and increasestheir quality. This requires the use of a similar preprocessing for the texts beforeweighting them. The variable |D| is the length of the document in words andavgdl is the average of the longitude of all documents in the collection. k1 andb ∈ [0, 1] are free parameters and their optimization is described in Sect. 4. Bothfor the D documents generation and for the ranking of tweets, a conversionprocess applies to the texts is necessary. This includes the removal of the Twitterspecial characters and the tokenization in order to be evaluated separately.
score(D,Q) =n∑
i=1
IDF (qi) · f(qi,D) · (k1 + 1)
f(qi,D) + k1 · (1 − b + b · |D|avgdl )
(1)
The inverse document frequency (IDF) equation used in BM25 is not similarto the used in standard TF-IDF algorithm, using the variation described in Eq. 2.The N value is the quantity of document that exists in the collection and n(qi)is the quantity of documents that contains the keyword (qi).
IDF (qi) = logN − n(qi) + 0.5
n(qi) + 0.5(2)
We use this ranking function over the training dataset in order to create alexical dictionary that is used to rank each tweet in the test datasets. To rankthe tweets, the dictionary weights the text to each polarity, generating a sixvalues array that it is used as feature in a automatic classifier. In this way, thealgorithm presents better results than a direct election of the highest values. Itshould be taken into consideration that the six categories are not completely3 http://scikit-learn.org/.
288 J. Sixto et al.
different categories, while the pairs (P, P+) and (N, N+) comprehend the samesentiment with different intensity. Therefore they can share terms but differingin frequency.
4 Experimental Investigation
Our proposal is to assess the precision of our adaptation of BM-25 to the SA ofspanish tweets task. In order to measure the efficiency of the algorithm, a set ofexperiments have been performed, with the TASS datasets and using the rankedweights as only lexical feature. For this work we use a LinearSVC Classifier asbase classifier, due to its good performance in similar approaches [10,17]. Theselected tests consist in classify both test datasets (1.000 and 60.798 items) inthe six polarity categories (P+, P, NEU, N, N+, NONE). The measures selectedfor the experiments are accuracy and F-score, because they are usually usedto order and compare classifier systems in state-of-art and represent well thesuccess in the task.
4.1 Results
A set of experiments have been developed in order to evaluate the best val-ues of parameters b and k1 in the task. These experiments consist on an arrayof performance tests, alternating the values of both parameters and extractingthe accuracy and F-score of each test. The optimal values are different to eachdataset, having the highest accuracy values the parameters (b = 0.6 and k1 = 35)for the 1 K dataset and (b = 0.7 and k1 = 40) for the full dataset. The completeresults of this experiments are resumed in Figs. 1 and 2. This values are clearlysuperior to the typical values, probably according to the particularities of thetask. In [16], Robertson and Zaragoza asserts that values such as 0.5 < b < 0.8and 1.2 < k1 < 2 are reasonably good in many circumstances, according to theirexperiments, a very low values for K1 in comparison with our optimal value.
Fig. 1. Accuracy of k1 = 40 (left) and b = 0.7 (right) using the full corpus.

Improving the Sentiment Analysis Process of Spanish Tweets with BM25 289
Fig. 2. Accuracy of k1 = 35 (left) and b = 0.6 (right) using the 1.000 corpus.
Table 1. Accuracy and F1-measure of studied systems using both datasets.
System Features ML Methods Accuracy F1-Measure
1k Full 1k Full
S1 Monograms Support Vector Machines 0.371 0.533 0.285 0.343
S2 Monograms Logistic Regression 0.384 0.520 0.311 0.369
S3 Bigrams Logistic Regression 0.234 0.266 0.203 0.192
S4 Trigrams Logistic Regression 0.207 0.375 0.234 0.283
S5 Bigrams+Trigrams Logistic Regression 0.354 0.517 0.314 0.333
S6 Bigrams+Trigrams Gradient Boosting 0.335 0.459 0.278 0.316
S7 S5+S6 VoteClassifier 0.334 0.475 0.302 0.323
S8 S2+S7 MajorityVote 0.367 0.533 0.383 0.349
Once the free parameters have been optimized, we studied the complementaryposibilities of the system in order to improve the results. Table 1 presents themost relevant results using monograms, bigrams or trigrams as input of theBM25 function. The studied classifiers are Support Vector Machines (SVM) [2],Logistic Regression (LR) [3] and Gradient Boosting Classifier (GBC) [6]. Also,we used a VoteClassifier in order to combine several systems and the majorityvoting scheme described in [13].
5 Conclusion and Further Works
In this paper, we have presented our approach to use the BM25 Okapi functionin the sentiment analysis of spanish tweets. We have studied the influence oftheir multiple configurations of linguistic processing on the results. Also, itsassociation with a set of automatic classifiers of contextual relevance has beenexposed. During the study of the b and k1 free parameters, has been confirmedthat the optimal values of k1 for this task is far from the typical values presentedin other research fields. Our theory is that this happens because, in contrastwith the application over large documents, tweets have a very short longitude
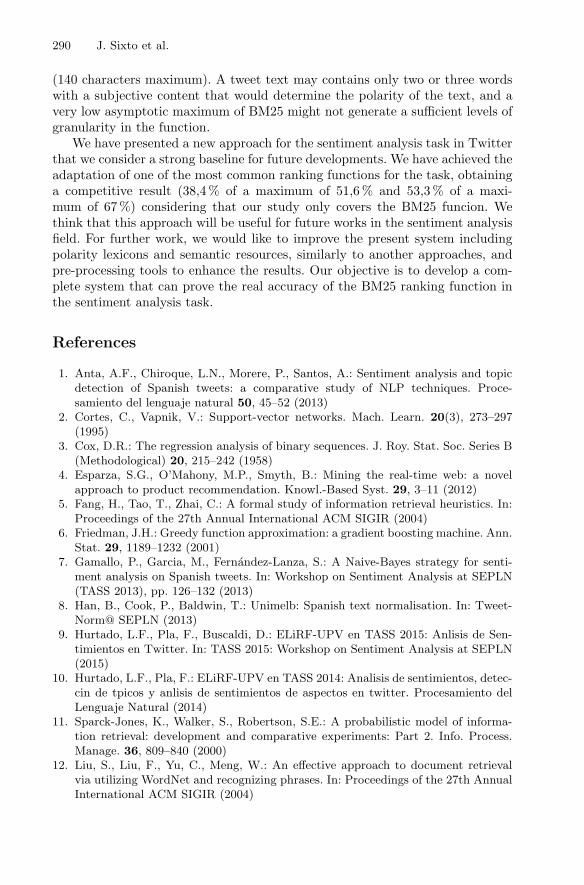
290 J. Sixto et al.
(140 characters maximum). A tweet text may contains only two or three wordswith a subjective content that would determine the polarity of the text, and avery low asymptotic maximum of BM25 might not generate a sufficient levels ofgranularity in the function.
We have presented a new approach for the sentiment analysis task in Twitterthat we consider a strong baseline for future developments. We have achieved theadaptation of one of the most common ranking functions for the task, obtaininga competitive result (38,4 % of a maximum of 51,6 % and 53,3 % of a maxi-mum of 67 %) considering that our study only covers the BM25 funcion. Wethink that this approach will be useful for future works in the sentiment analysisfield. For further work, we would like to improve the present system includingpolarity lexicons and semantic resources, similarly to another approaches, andpre-processing tools to enhance the results. Our objective is to develop a com-plete system that can prove the real accuracy of the BM25 ranking function inthe sentiment analysis task.
References
1. Anta, A.F., Chiroque, L.N., Morere, P., Santos, A.: Sentiment analysis and topicdetection of Spanish tweets: a comparative study of NLP techniques. Proce-samiento del lenguaje natural 50, 45–52 (2013)
2. Cortes, C., Vapnik, V.: Support-vector networks. Mach. Learn. 20(3), 273–297(1995)
3. Cox, D.R.: The regression analysis of binary sequences. J. Roy. Stat. Soc. Series B(Methodological) 20, 215–242 (1958)
4. Esparza, S.G., O’Mahony, M.P., Smyth, B.: Mining the real-time web: a novelapproach to product recommendation. Knowl.-Based Syst. 29, 3–11 (2012)
5. Fang, H., Tao, T., Zhai, C.: A formal study of information retrieval heuristics. In:Proceedings of the 27th Annual International ACM SIGIR (2004)
6. Friedman, J.H.: Greedy function approximation: a gradient boosting machine. Ann.Stat. 29, 1189–1232 (2001)
7. Gamallo, P., Garcia, M., Fernandez-Lanza, S.: A Naive-Bayes strategy for senti-ment analysis on Spanish tweets. In: Workshop on Sentiment Analysis at SEPLN(TASS 2013), pp. 126–132 (2013)
8. Han, B., Cook, P., Baldwin, T.: Unimelb: Spanish text normalisation. In: Tweet-Norm@ SEPLN (2013)
9. Hurtado, L.F., Pla, F., Buscaldi, D.: ELiRF-UPV en TASS 2015: Anlisis de Sen-timientos en Twitter. In: TASS 2015: Workshop on Sentiment Analysis at SEPLN(2015)
10. Hurtado, L.F., Pla, F.: ELiRF-UPV en TASS 2014: Analisis de sentimientos, detec-cin de tpicos y anlisis de sentimientos de aspectos en twitter. Procesamiento delLenguaje Natural (2014)
11. Sparck-Jones, K., Walker, S., Robertson, S.E.: A probabilistic model of informa-tion retrieval: development and comparative experiments: Part 2. Info. Process.Manage. 36, 809–840 (2000)
12. Liu, S., Liu, F., Yu, C., Meng, W.: An effective approach to document retrievalvia utilizing WordNet and recognizing phrases. In: Proceedings of the 27th AnnualInternational ACM SIGIR (2004)

Improving the Sentiment Analysis Process of Spanish Tweets with BM25 291
13. Pla, F., Hurtado, L.-F.: Sentiment analysis in twitter for Spanish. In: Metais,E., Roche, M., Teisseire, M. (eds.) NLDB 2014. LNCS, vol. 8455, pp. 208–213.Springer, Heidelberg (2014)
14. Robertson, S.E., Walker, S.: Some simple effective approximations to the 2-poissonmodel for probabilistic weighted retrieval. In: Proceedings of the 17th Annual Inter-national ACM SIGIR Conference (1994)
15. Robertson, S.E., Walker, S., Jones, S., Hancock-Beaulieu, M.M., Gatford, M.:Okapi at TREC-3. NIST SPECIAL PUBLICATION SP (1995)
16. Robertson, S., Zaragoza, H.: The Probabilistic Relevance Framework: BM25 andBeyond. Now Publishers Inc., Hanover (2009)
17. Sixto, J., Almeida, A., Lopez-de-Ipina, D.: DeustoTech Internet at TASS 2015:Sentiment analysis and polarity classification in spanish tweets. In: TASS 2015:Workshop on Sentiment Analysis at SEPLN (2015)
18. Thelwall, M., Buckley, K., Paltoglou, G.: Sentiment strength detection for thesocial web. J. Am. Soc. Inform. Sci. Technol. 63(1), 163–173 (2012)
19. Valverde, J., Tejada, J., Cuadros, E.: Comparing Supervised Learning Methods forClassifying Spanish Tweets. In: TASS 2015: Workshop on Sentiment Analysis atSEPLN, p. 87 (2015). Comit organizador
20. Villena-Roman, J., Garcıa-Morera, J., Garcıa-Cumbreras, M., Martınez-Camara,E., Martın-Valdivia, M., Urena-Lopez, L.: Overview of TASS 2015. In: TASS 2015:Workshop on Sentiment Analysis at SEPLN (2015)
21. Zhang, W., Yu, C., Meng, W.: Opinion retrieval from blogs. In: Proceedings of theSixteenth ACM Conference (2007)

Validating Learning Outcomes of an E-LearningSystem Using NLP
Eiman Aeiad(B) and Farid Meziane
School of Computing, Science and Engineering, University of Salford,Salford M5 4WT, UK
[email protected], [email protected]
Abstract. Despite the development and the wide use of E-Learning,developing an adaptive personalised E-Learning system tailored to theneeds of individual learners remains a challenge. In an early work, theauthors proposed APELS that extracts freely available resources on theweb using an ontology to model the leaning topics and optimise the infor-mation extraction process. APELS takes into consideration the leaner’sneeds and background. In this paper, we developed an approach to eval-uate the topics’ content extracted previously by APELS against a setof learning outcomes as defined by standard curricula. Our validationapproach is based on finding patterns in part of speech and grammaticaldependencies using the Stanford English Parser. As a case study, we usethe computer science field with the IEEE/ACM Computing curriculumas the standard curriculum.
Keywords: NLP · Keyword extraction · Key phrases · Dependencyrelation
1 Introduction
E-learning is a modality of learning using Information and Communication Tech-nologies (ICTs) and advanced digital media [14]. It offers education to those whocannot access face to face learning. However, the needs of individual learnershave not been addressed properly [1]. A system to address this problem wasproposed by Aeiad and Meziane [1] in the form of an E-Learning environmentthat is Adaptive and Personalised using freely available resources on the Web(the APELS System). The aim of APELS is to enable users to design their ownlearning material based on internationally recognised curricula and contents. Itis designed to first identify learners’ requirements and learning style and basedon their profile, the system uses an ontology to help in extracting the requireddomain knowledge from the Web in order to retrieve relevant information as perusers’requests. A number of modules were developed to support this process [1].The contents of the retrieved websites are then evaluated against a set of learningoutcomes as defined by standard curricula and this constitutes to the main focusof this paper. We used a set of action verbs based on Bloom’s taxonomy [2] toc© Springer International Publishing Switzerland 2016E. Metais et al. (Eds.): NLDB 2016, LNCS 9612, pp. 292–300, 2016.DOI: 10.1007/978-3-319-41754-7 27

Validating Learning Outcomes Using NLP 293
analyse the learning outcomes. Bloom’s taxonomy classifies action verbs into sixlevels representing the following cognitive skills: Remembering, Understanding,Applying, Analysing, Evaluating and Creating. For example, action verbs suchas define, describe and identify are used to measure basic levels of cognitive skillsin understanding, while action verbs such as carry out, demonstrate, solve, illus-trate, use, classify and execute are used to measure basic levels of the applyingcognitive skills. In addition, we used the Stanford Parser, an implementation ofa probabilistic parser in Java which comprises a set of libraries for Natural Lan-guage Processing (NLP) that together make a solid unit capable of processinginput text in natural language and produces part-of-speech (PoS) tagged text,context-free phrase structure grammar representation and a typed dependencyrepresentation [6]. In this paper, a case study using the IEEE/ACM ComputingCurriculum [12] will be used to illustrate the functionality of APELS.
The rest of the paper is structured as follows: the next section reviewssome related work by outlining different approaches for extracting keywords andkeyphrases. Section 3 presents a revised architecture of the APELS system andthe knowledge extraction module in details. Section 4 illustrates the functionalityof the APELS system using examples from the ACM/IEEE Computer SocietyComputer Science Curriculum. and the system evaluated. Finally, conclusionand future developments are given in Sect. 5.
2 Project Background
Personalised E-learning systems have attracted attention in the area oftechnology-based education, where their main aim is to offer to each individ-ual learner the content that suits her/his learning style, background and needs.Previously, we designed APELS that extracted information from the WWWbased on an ontology and tailored to individual learners’ profile [1]. However,the suitability of the contents of the selected websites should be evaluated toensure that they fit the learner’s needs and this will be addressed in this paper.Matching the content to learning outcomes of curricula, is very important whenassessing the suitability of the selected websites. Learning outcomes are state-ments of what a student is expected to know, understand and/or be able todemonstrate after the completion of the learning process [7]. Each learning out-come contains an action verb followed by usually a noun phrase that acts as theobject of the verb. Together, the action verbs and noun phrases are referred toas Keywords or key phrases. These are used in academic publications to give anidea about the content of the article to the reader as they are a set of represen-tative words, which express the meaning of an entire document. Various systemsare available for keywords extraction such as automatic indexing, text summa-rization, information retrieval, classification, clustering, filtering, topic detectionand tracking, information visualization, report generation, and web searches [3].Automatic Keyword Extraction methods are divided into four categories: sta-tistical methods [5], machine learning methods [13], linguistic methods [9] andhybrid methods [10].

294 E. Aeiad and F. Meziane
The APELS architecture given in Fig. 1, is a revised version of the one pro-posed in [1]. It is modified based on our experience while developing this project.APELS is based on four modules: student profile, student requirement, knowl-edge extraction and content delivery. The student profile and the student require-ment modules are similar to the ones presented in [1]. We updated the knowledgeextraction module adding the learning outcomes validation in order to evaluatethe topics’ contents against a set of learning outcomes as defined by standardcurricula and the details of this module are given in Sect. 3.
Fig. 1. Knowledge extraction module
3 The Knowledge Extraction Module
The Knowledge extraction module is responsible for the extraction of the learn-ing resources from the Web that would satisfy the learners’ needs and learn-ing outcomes. The Module comprises two phases; the Relevance phase and theRanking phase. The relevance phase uses an ontology to retrieve the relevantinformation as per users’ needs. In addition, it transforms HTML documentsto XML to provide the information in a friendly accessible format and easierfor extraction and comparison. Moreover, we implemented a process called thematching process that computes the similarity measure between the subset ofthe ontology that models the learning domain and the values element extractedfrom the websites. The website with the highest similarity is selected as the bestmatching website that satisfies the learners’ learning style.
After the matching process occurs, there is a further step that is required toevaluate that content adheres to a standard set of guidelines for studying thechosen subject. Hence, the learning outcome validation was added to ensure theselection of the most relevant websites that satisfy the learning outcomes set by
Validating Learning Outcomes Using NLP 295
standard curricula. This is the purpose of the ranking phase that is composedof two components (i) categorising learning outcomes statements and contentvalidation against learning outcomes.
3.1 Categorising Learning Outcomes Statements
The learning outcomes statements are analysed by selecting a set of action verbsbased on the Bloom’s taxonomy [2]. Each learning outcome contains an actionverb associated with the intended cognitive level of the bloom’s Taxonomy, fol-lowed by the object of the verb (specific subject material). The Stanford parseris used as the pre-processor of the input statement, which is a learning out-come. It takes the learning outcome statement, written in natural language, andmarks it with the PoS tagger, builds tree representation of the sentence from thesentence’s context-free-phrase-structure-grammar parse, and eventually builds alist of typed dependencies [6]. Here we used only the PoS tagger to analyse thelearning outcome and followed by Nouns and Verbs Extractor to classify thelearning outcomes. The PoS tagger is used to identify the nouns and verbs bytagging each word in the text (e.g. ‘drink’: verb, ‘car’: noun, ‘lucky’: adjective,‘vastly’: adverb, ‘on’: preposition etc.). It has been widely proposed by manyauthors [4,8] as the main task for analysing the text syntactically at the wordlevel. After all the words in the learning outcomes statements are tagged, Nounsand Verbs Extractor is used to extract the nouns and verbs by selecting thepattern tags of the PoS. The current pattern tags of Stanford parser is definedas follow:
define/VB and/CC describe/VB variable/NN ./.
A set of rules are used to identify the learning outcomes statement by search-ing the pattern token in the tagged verb in the action verbs dictionary that havebeen manually defined based on the Bloom’s Taxonomy. The rules that are usedto assign learning outcomes based on action verbs in bloom’s Taxonomy havethe form:
if pattern token in tagged verb belongs to Level A,then learning outcome = "A"
The six levels representing of the cognitive skills defined in Sect. 1. We asso-ciate a set of action verbs with each level which will be used to identify the level.The actions verbs associated with the Applying level for example are also givenin Sect. 1.
3.2 Content Validation Against Learning Outcomes
The evaluation of the topic’s content will be against the identified learning out-comes statements. The Stanford typed dependencies representation is used toextract a topic name, an action verb and their relationship. Moreover, we adopteda rule based linguistic method to extract key phrases and keywords from text.

296 E. Aeiad and F. Meziane
The Stanford typed dependencies representation provides a simple description ofthe grammatical relationships in a sentence, establishing relationships between“head” words and words which modify those heads (“refer”). Furthermore, theStanford dependency parser consists of three variables namely: Type dependencyname, governing of the dependency and Subordinate of the dependency.
To extract action verbs, topic names and their relationships, two types ofdictionaries are used. The action verbs dictionary that contains the action verbsthat have been manually defined based on the Bloom’s Taxonomy and the topicname synonym dictionary whose terms are retrieved from the ontology. Thesystem checks the output of a typed dependency pattern to check if the governorof the dependency is an action verb and its subordinate a topic name or if thegovernor of the dependency is a topic name and its subordinate an action verb.Moreover, we used Porter’s stemming Algorithm [11] to produce the roots of thewords. Once the Stanford parser produces the typed dependency between a pairof words, these are analyzed to get the root of the word that will be looked upin the action verb dictionary and the topic name synonyms from the ontology.The other distinctive feature of Normalisation (stemming) is to reduce the sizeof the action verbs dictionary and topic name synonym as they contain all thedifferent forms of the word.
The typed dependency parsing approach is only used to analyze the text inorder to identify the potential relationship between the action verbs and topicnames. This is not enough to fully validate the content against the learningoutcomes. Hence, we used rule based linguistic methods to filter out the keyphrases and keywords by using the linguistic features of the word (i.e., PoS tags)to determine key phrases or keyword from the text. These rules are employedto identify familiarity, usage, and assessment levels which are illustrated in thecase study section.
4 Case Study and Evaluation
4.1 Description of the Case Study
The ACM/IEEE Computer Science Society Curriculum [12] was used to illus-trate the functionality of APELS. The IEEE/ACM Body of Knowledge (BoK)is organized into a set of 18 Knowledge Areas (KAs) corresponding to typicalareas of study in computing such as Algorithms and Complexity and SoftwareEngineering. Each Knowledge Area (KA) is broken down into Knowledge Units(KUs). Each KU is divided into a set of topics which are then classified into atiered set of core topics (compulsory topics that must be taught) and electivetopics (significant depth in many of the Elective topics should be covered). Coretopics are further divided into Core-Tier1 topics and Core-Tier2 topics (Shouldalmost be covered). The software development fundamentals area for exampleis divided into 4 KUs. The Algorithm and design KU is divided into 11 Core-Tier1 topics. Learning outcomes are then defined for each class of topics. We willspecifically look at designing an advanced programming module in C++ from

Validating Learning Outcomes Using NLP 297
the IEEE/ACM fundamental Programming Concepts KU using APELS. More-over, we used the learning outcomes that have an associated level of masteryin the Bloom’s Taxonomy, which have been well explored within the ComputerScience domain based on the IEEE/ACM Computing curriculum. The level ofmastery is defined in the Familiarity, Usage and Assessment levels. Each levelhas a special set of action verbs. The linguistic rules used in APELS include:
– Rule 1: At the “Familiarity” level, the student would be expected to knowthe definition of the concept of the specific topic name in the content text.Thus this rule is utilized to extract the key phrases when the topic name isfollowed by verb “to be” expressed as “is” and “are” such as in the phrases“variable is” and “algorithms are”. In these kind of key phrases the noun“variable” does not depended on the verb to be “is”. The PoS tag is used toidentify the grammatical categories for each word in the content of the text.Then, the system will extract a noun followed by the verb “to be” by selectingthe pattern token in the tagged noun followed by the pattern’s token in thetagged verb. We first identify the token with the noun tag in the topic namesynonyms from the ontology and check if it is followed by the token with theverb tag (“is” or “are” in this case).
– Rule 2: At the “usage” level, the student is able to use or apply a concept in aconcrete way. Using a concept may include expressions made up of two wordssuch as “write program”, “use program” and “execute program”. In theseexpressions, where words such as “write”, “use” and “execute” are dependenton “program”, the system is able to recognize these expressions automaticallyfrom the text using dependency relations.
– Rule 3: Students who take courses in computer science domain will haveto apply some techniques or use some programs. Therefore, the content mayinclude examples to illustrate the use these concepts. To search whether thecontent has terms such as ”example” or ”for example”. A PoS tagger is usedto tag each word in the text. The system will then extract nouns by selectingthe pattern token in the tagged noun. Finally, the system checks if the patterntoken in the tagged noun matches with the word “example”.
– Rule 4: at the “assessment” level, we have designed a special kind of rulesbecause at this level there are two types of information that needs to beevaluated. First, the student is required to understand a specific topic and beable to use the topic in a problem solving scenario for example. In this casethe system will apply rules 1 to 3 for the specific topic. Second, the studentshould be able to select the appropriate topic among different topics, hencethe system apply again rules 1 to 3 for each topic.
4.2 Results and Evaluation
The APELS system produced a list of websites for learning the C++ languagewith the highest accuracy rating [1]. Now, the validity of these selected websiteswill be assessed by matching their content to the targeted learning outcomes as

298 E. Aeiad and F. Meziane
described by IEEE/ACM curriculum. We selected one of the outcome “Defineand describe variable” to be tested by our system. First, the system identi-fied the learning outcome in the Familiarity level because it contains the actionverbs “define” and “describe”. Hence in this case, three kinds of grammaticalpatterns are implemented for keywords and key phrases extraction as shown inTable 1. One is the potential relationship between the action verb and the topicname, second if the potential syntactic structure of the sentences includes a nounphrase followed by a verb phrase and the third pattern of the PoS includes anoun phrase. The system ranks the relevant documents using the weighted aver-age method, which is used to calculate the average value of a particular set ofoccurrence of keywords and key phrases in a document with different weights.The weighted average formula is defined as follows:
WeightAvg(x) = w1x1 + w2x2 + w3x3 + ... + wnxn
Where W = weight, x = occurrence of keywords and key phrases.
The weights are determined based on the importance of each mastery levelof the learning outcomes. The weights are chosen manually where sentence def-inition of the topic name taken from Rule 1 is worth 0.70. This is becauseunderstanding the definition of the concept is most important for the stu-dents before they do any further learning around it. For example, the learn-ing outcome “define and describe variables”, if the student does not understandthe variable concept he/she might not be able to implement it in their work.The dependency relationship between action verbs and topic name and Rule 3are both given a weighted 0.15. This is because both criteria have the sameimportance. To calculate a weighted average, each value must first be mul-tiplied by its weight. Then all of these new values must be added together.Thus, the overall calculation for the website (www.cplusplus.com/doc/tutorial/variables) would be (43 * 0.15) + (8 * 0.70) + (16 * 0.15) = 14.45. It is cru-cial that each criteria are given the correct weights based on their importance.If more weights were given to less important criteria compared to importantone, it would give inaccurate ranking for the WebPages. For example, although(www.cplusplus.com/doc/tutorial/variables) has highest dependency relation,
Table 1. Ranking of WebPages based on Weighted average
WebPages Occurences Weighted average Total
Dependency
Relation
Rule 1 Rule 3 *0.15 *0.70 *0.15
fresh2refresh.com/c-programming/c-variables 16 15 15 2.4 10.5 2.25 15.15
www.cplusplus.com/doc/tutorial/variables 43 8 16 6.45 5.6 2.4 14.45
en.wikibooks.org/wiki/C Programming/Variables 32 4 20 4.8 2.8 3 10.6
microchip.wikidot.com/tls2101:variables 37 2 3 5.55 1.4 0.45 7.4
http://www.doc.ic.ac.uk/∼wjk/C++Intro
/RobMillerL2.html
11 2 25 1.65 1.4 3.75 6.8
www.penguinprogrammer.co.uk/c-beginners
-tutorial/variables
11 3 1 1.65 2.1 0.15 3.9
Validating Learning Outcomes Using NLP 299
(fresh2refresh.com/c-programming/c-variables) ranked first because it has thehighest score for Rule 1 which is most important.
5 Conclusion and Future Work
Validating the website content against the learning outcome would add a greatvalue to the system making it more specific. In the future work, we need tofinalise the system so that the leaner will be able to adapt and modify thecontent and learning style based on the interactions of the users with the systemover a period of time. The information extracted by the system will be passedto a Planner module that will structure it into lectures/tutorials and workshopsbased on some predefined learning times.
References
1. Aeiad, E., Meziane, F.: An adaptable and personalised e-learning system basedon free web resources. In: Biemann, C., Handschuh, S., Freitas, A., Meziane, F.,Metais, E. (eds.) NLDB 2015. LNCS, vol. 9103, pp. 293–299. Springer, Heidelberg(2015)
2. Bloom, B.S., Engelhart, M.D., Furst, E.J., Hill, W.H., Krathwohl, D.R.: Taxonomyof Educational Objectives: Handbook 1, The Cognitive Domain. Allyn & Bacon,Boston (1956)
3. Bracewell, D.B., Ren, F., Kuriowa, S.: Multilingual single document keywordextraction for information retrieval. In: Proceedings of the International Confer-ence on Natural Language Processing and Knowledge Engineering, pp. 517–522.IEEE (2005)
4. Brill, E.: A simple rule-based part of speech tagger. In: Proceedings of the 3rd Con-ference on Applied Natural Language Processing, pp. 152–155. ACL, Stroudsburg(1992)
5. Cohen, J.D.: Highlights: language- and domain-independent automatic indexingterms for abstracting. J. Assoc. Inf. Sci. Technol. 46(3), 162–174 (1995)
6. De Marneffe, M.-C., Manning, C.D.: Stanford typed dependencies manual. Tech-nical report, Stanford University (2008)
7. ECTS Users’ Guide. Computer science curricula (2005). http://ec.europa.eu/education/programmes/socrates/ects/doc/guide en.pdf
8. Hepple, M.: Independence, commitment: assumptions for rapid training and exe-cution of rule-based pos taggers. In: Proceedings of the 38th Annual Meeting onAssociation for Computational Linguistics, ACL 2000, pp. 278–277. Associationfor Computational Linguistics, Stroudsburg (2000)
9. Hulth, A.: Improved automatic keyword extraction given more linguistic knowl-edge. In: Proceedings of the 2003 Conference on Empirical Methods in NLP, pp.216–223 (2003)
10. Krulwich, B., Burkey, C.: Learning user information interests through extraction ofsemantically significant phrases. In: Proceedings of the AAAI Spring Symposiumon Machine Learning in Information Access, pp. 100–112 (1996)
11. Porter, M.F.: An algorithm for suffix stripping. Program 14(3), 130–137 (1980)12. ACM/IEEE Societies. Computer science curricula (2013). http://www.acm.org/
education/CS2013-final-report.pdf

300 E. Aeiad and F. Meziane
13. Uzun, Y.: Keyword extraction using naive bayes. Technical report, Bilkent Univer-sity, Computer Science Dept., Turkey (2005)
14. Wentling, T.L., Waight, C., Strazzo, D., File, J., La Fleur, J., Kanfer, A.: Thefuture of e-learning: A corporate and an academic perspective (2000). http://learning.ncsa.uiuc.edu/papers/elearnfut.pdf

Aspects from Appraisals!! A Label Propagationwith Prior Induction Approach
Nitin Ramrakhiyani1(B), Sachin Pawar1,2, Girish K. Palshikar1,and Manoj Apte1
1 TCS Research, Tata Consultancy Services, Pune 411013, Indianitin.ramrakhiyani,sachin7.p,gk.palshikar,[email protected]
2 Department of CSE, Indian Institute of Technology Bombay,Mumbai 400076, India
Abstract. Performance appraisal (PA) is an important HumanResources exercise conducted by most organizations. The text data gen-erated during the PA process can be a source of valuable insights formanagement. As a new application area, analysis of a large PA dataset(100K sentences) of supervisor feedback text is carried out. As the firstcontribution, the paper redefines the notion of an aspect in the feedbacktext. Aspects in PA text are like activities characterized by verb-nounpairs. These activities vary dynamically from employee to employee (e.g.conduct training, improve coding) and can be challenging to identifythan the static properties of products like a camera (e.g. price, batterylife). Another important contribution of the paper is a novel enhance-ment to the Label Propagation (LP) algorithm to identify aspects fromPA text. It involves induction of a prior distribution for each node anditerative identification of new aspects starting from a seed set. Evalu-ation using a manually labelled set of 500 verb-noun pairs suggests animprovement over multiple baselines.
1 Introduction
Performance Appraisals (PA) are carried out in various organizations to mea-sure growth and productivity of employees. Apart from gauging employee per-formance, the PA process is used for employee promotions, re-numerations andrewards. In this work, PA process of a large Information Technology servicesorganization is considered. The organization has more than 300 K employees,leading to large amount of appraisal text (∼10 million sentences) getting gener-ated every year.
The organization’s PA methodology consists of three steps - (i) supervisor set-ting goals for an employee, (ii) employee recording his self-appraisal for each goaland (iii) supervisor recording his feedback. It is important to summarize suchappraisal dialogue. For summarization in the product review domain, “aspect”based analysis is carried out. Aspects are certain informative noun phrases usefulin summarization and sentiment analysis. A novel contribution of this work isthe redefinition of an aspect in PA domain which is more an activity than a singlec© Springer International Publishing Switzerland 2016E. Metais et al. (Eds.): NLDB 2016, LNCS 9612, pp. 301–309, 2016.DOI: 10.1007/978-3-319-41754-7 28

302 N. Ramrakhiyani et al.
noun phrase. As the second contribution, the Label Propagation algorithm [12]is supplemented to introduce an instance-wise prior which indicates an instance’sbelongingness to the target labels. The approach starts with a seed set and thenlearns new aspects iteratively using weakly supervised label propagation.
2 Notion of an Aspect in the PA Domain
Based on a perspective to regard a performance appraisal as a kind of “personreview”, the term “aspect” is borrowed from the domain of product review analy-sis. Observation of data from both review texts reveals a host of differences interms of writing style, sentential structure, level of sentiment and noise content.In the product review domain, aspect based analysis is well researched [7] andis used widely to derive useful information. Majority of the work in the productreview domain assumes noun phrases in the review sentences as candidates foraspects. In the PA domain, a noun phrase like training or unplanned leavealone doesn’t characterize the facets of the dynamic pair of an employee andhis work. As an example, the noun phrase training can be an important facetof an employee’s work. However, for an experienced employee it may be relatedto conducting trainings and for an amateur it may be related to attendingtrainings. For proper summarization and analysis of PA text, it is necessary todifferentiate these modifications to the noun phrase training. Based on theseobservations, it is proposed that aspects in PA text should be modelled like anactivity rather than a noun phrase. Further, the activity should be characterizedas a verb-noun pair, e.g. conduct training and attend training. Multipleexamples in Table 1 emphasize the effectiveness of this verb-noun pair notionof an aspect. It is observed that many highly frequent verb-noun pairs carrymarginal semantic content to be regarded as an aspect and in turn for summa-rization. As examples, consider verb-noun pairs like spend-time, help-projectand similar which are regularly said by supervisors. One can see that these verb-noun pairs are too generic to bring an information gain to an appraisal summaryand hence, are not accounted as aspects. It also establishes that pairs showinghigh co-occurrence are not necessarily aspects. Guidelines for tagging verb-nounpairs provided to the annotators were based on the above arguments. A verb-noun pair which describes a specific activity in a clear manner and is fit forinclusion in a summary should be tagged as an aspect and non-aspect otherwise.
Table 1. Verb-noun pairs as aspects
Verb-Noun pairs
develop--tool, create--tool, learn--tool
deliver--code, develop--code, review--code
propose--idea, suggest--idea, implement--idea, share--idea

Aspects from Appraisals!! 303
3 Prior Induction in the Label Propagation Algorithm
Given the above definition of an aspect in PA text, the task of identifyingmeaningful aspects is posed as a classification of candidate verb-noun pairsinto aspects and non-aspects. The semi-supervised graph based Label Propa-gation Algorithm [12] (LPA), is employed. It represents labelled and unlabelledinstances as nodes in a graph with edges reflecting the similarity between nodes.The label information of a node is propagated to its nearby nodes iterativelythrough the weighted edges and labels of unlabelled examples are inferred whenthe propagation converges.
Now there can be scenarios when prior domain knowledge about nodes is avail-able and can be a crucial aid in classification of the nodes. Providing a skewedlabel distribution at initiation won’t work as Zhu and Gheramani [12] proved thatthe final labels which get assigned to unlabelled nodes are independent of theirlabel distribution at initialization. As a major contribution of the paper, a noveltechnique to induce this prior knowledge is proposed which involves addition ofdummy nodes, one per label, to the graph. The initial distribution of a dummynode is skewed to hold full probability for the label it represents and zero for otherlabels. Now for a dummy node representing label lj , all unlabelled nodes and nodeslabelled lj should be connected to it. Weights of the edges connecting unlabellednodes to dummy nodes can be used to add the desired prior knowledge. To keepthis edge weight annotation generic in nature it can be constrained to behave asa prior probability distribution. So it can be ensured that the sum of weights ofedges connecting a node to the dummy nodes should be 1. For instance, in a graphwith M dummy nodes if the prior inclination to the ith label is expressed as μi,the corresponding edge weight should be the normalized value µi∑M
j=1 µj. The paper
generalizes this notion further so that the edge weight sum can also be a fixedconstant k instead of 1. This would change the corresponding edge weight in theexample to k∗µi∑M
j=1 µj. Using such a constant, helps in controlling the influence of the
prior during label propagation iterations. It is also used in the ensuing discussionon fixed and variable prior induction.
The proposed graph setup is accompanied by an assumption that a welldefined procedure (domain specific or independent) to express the prior infor-mation as a real number can always be devised. Based on the proposed premises,there can be two ways to induce the prior - fixed percentage prior induction andnode-wise variable prior induction. For a node in the modified graph, with Mdummy nodes and N other nodes, it can be inferred that the prior informa-tion from all dummy nodes to a node will be weighted by a factor k
(∑N
i=1 wi)+k.
Now under fixed percentage prior induction, it is intended to infuse the priorinformation by a fixed percentage (say q%). The constant kr for a node r withnr non-dummy neighbours, can then be expressed as a function of the totalnon-dummy edge weight incident at node r and the percentage q through thefollowing formalism.
q =kr
(∑nr
i=1 wri) + kr⇒ kr =
q ∗ (∑nr
i=1 wri)1 − q
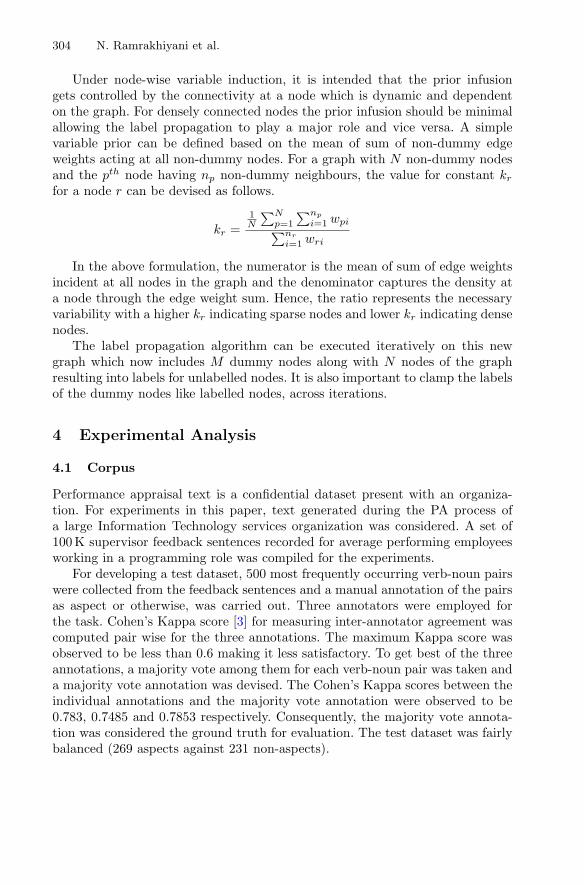
304 N. Ramrakhiyani et al.
Under node-wise variable induction, it is intended that the prior infusiongets controlled by the connectivity at a node which is dynamic and dependenton the graph. For densely connected nodes the prior infusion should be minimalallowing the label propagation to play a major role and vice versa. A simplevariable prior can be defined based on the mean of sum of non-dummy edgeweights acting at all non-dummy nodes. For a graph with N non-dummy nodesand the pth node having np non-dummy neighbours, the value for constant krfor a node r can be devised as follows.
kr =1N
∑Np=1
∑np
i=1 wpi∑nr
i=1 wri
In the above formulation, the numerator is the mean of sum of edge weightsincident at all nodes in the graph and the denominator captures the density ata node through the edge weight sum. Hence, the ratio represents the necessaryvariability with a higher kr indicating sparse nodes and lower kr indicating densenodes.
The label propagation algorithm can be executed iteratively on this newgraph which now includes M dummy nodes along with N nodes of the graphresulting into labels for unlabelled nodes. It is also important to clamp the labelsof the dummy nodes like labelled nodes, across iterations.
4 Experimental Analysis
4.1 Corpus
Performance appraisal text is a confidential dataset present with an organiza-tion. For experiments in this paper, text generated during the PA process ofa large Information Technology services organization was considered. A set of100 K supervisor feedback sentences recorded for average performing employeesworking in a programming role was compiled for the experiments.
For developing a test dataset, 500 most frequently occurring verb-noun pairswere collected from the feedback sentences and a manual annotation of the pairsas aspect or otherwise, was carried out. Three annotators were employed forthe task. Cohen’s Kappa score [3] for measuring inter-annotator agreement wascomputed pair wise for the three annotations. The maximum Kappa score wasobserved to be less than 0.6 making it less satisfactory. To get best of the threeannotations, a majority vote among them for each verb-noun pair was taken anda majority vote annotation was devised. The Cohen’s Kappa scores between theindividual annotations and the majority vote annotation were observed to be0.783, 0.7485 and 0.7853 respectively. Consequently, the majority vote annota-tion was considered the ground truth for evaluation. The test dataset was fairlybalanced (269 aspects against 231 non-aspects).

Aspects from Appraisals!! 305
4.2 Experiments
To obtain candidate verb-noun pairs, dependency parsing of each sentence wasperformed using the Stanford CoreNLP pipeline [8]. Next, the verbs and nounsconnected with relations - nsubj, dobj, iobj, nsubjpass, rcmod and xcomp1 wereextracted. These relations ensured that the verbs and nouns formed a meaningfulactivity pair. The extracted verbs and nouns are organized in the form of abipartite graph with one set of vertices consisting of the verbs and the other thenouns. The edges carry co-occurrence frequency of the enclosing nodes.
Discussion on Baselines: Three different co-occurrence based baselines areused for comparison. The first baseline is Point-wise Mutual Information(PMI) [2] of the verb-noun pair. The test set pairs are ordered according tolargest PMI first. A classification is achieved by demarcating a threshold PMIvalue above which all pairs are considered as aspects and the rest as non-aspects.The best threshold is determined empirically. As another baseline the Lexicogra-pher’s Mutual Information (LMI) [6] is computed. It multiplies the PMI with theco-occurrence frequency, hence giving priority to pairs with high co-occurrence.A product baseline which computes a score by multiplying the conditional prob-abilities P (v/n) and P (n/v) is also employed. P (v/n) is the conditional proba-bility of observing verb v in a verb-noun pair given that noun is n. A maximumlikelihood estimation is used which is the ratio of the number of times v andn occur together as a verb-noun pair to the number of times n occurs in anyverb-noun pair. A similar argument holds for P (n/v).
Experiments with Label Propagation: For experiments with the Labelpropagation algorithm, an open implementation available at [9] is used. Theverb/noun bipartite graph developed earlier is processed further. For each nounand verb, three information measures are computed. The first measure is Resnik’sInformation Content (IC) [10] which is calculated as the negative log of prob-ability of a word’s occurrence in a corpus. The second measure is the entropyof a noun/verb. The entropy is computed using probabilities of co-occurrenceof a noun (verb) with each verb (noun) in the opposite set of vertices. Thethird measure, named Specificity, is introduced to combine both the measures- IC and entropy. As shown in Eq. 1, Specificity of a verb v is formulated as amodified entropy over all nouns, incorporating a weighted probability where theweights are IC values of the nouns. Specificity of a noun can be visualized onsimilar lines. Through these measures, a relative importance of the word can beestablished and hence its belongingness to the aspect class can be characterized.These measures are regarded as verb/noun properties.
S(Vi) =|N |∑
j=1
−pij ∗ log pij where pij =|(vi, nj)| ∗ IC(nj)
∑|N |k=1 |(vi, nk)| ∗ IC(nk)
(1)
Considering the verb-noun pair notion of an aspect, a bipartite graph sep-arating the verbs and nouns is conducive to extract candidate aspects. As the1 http://nlp.stanford.edu/software/dependencies manual.pdf.
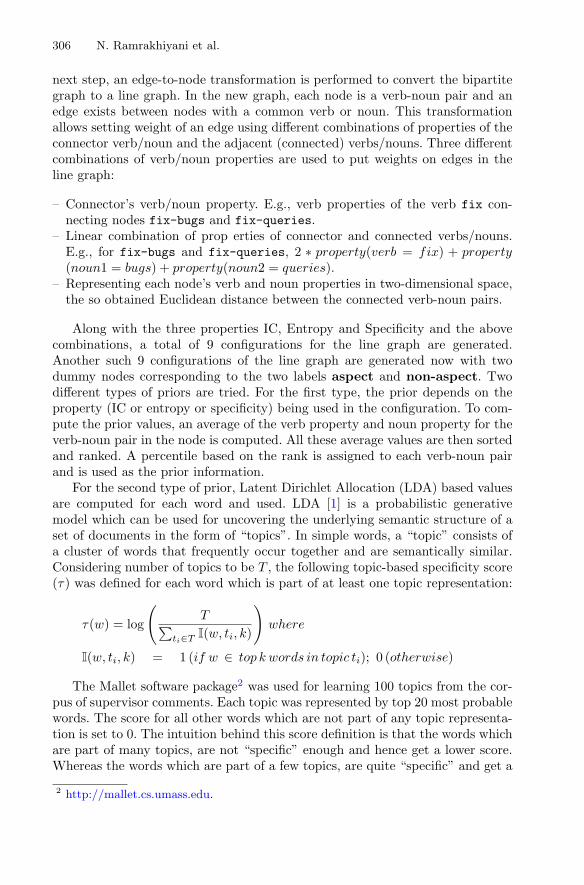
306 N. Ramrakhiyani et al.
next step, an edge-to-node transformation is performed to convert the bipartitegraph to a line graph. In the new graph, each node is a verb-noun pair and anedge exists between nodes with a common verb or noun. This transformationallows setting weight of an edge using different combinations of properties of theconnector verb/noun and the adjacent (connected) verbs/nouns. Three differentcombinations of verb/noun properties are used to put weights on edges in theline graph:
– Connector’s verb/noun property. E.g., verb properties of the verb fix con-necting nodes fix-bugs and fix-queries.
– Linear combination of prop erties of connector and connected verbs/nouns.E.g., for fix-bugs and fix-queries, 2 ∗ property(verb = fix) + property(noun1 = bugs) + property(noun2 = queries).
– Representing each node’s verb and noun properties in two-dimensional space,the so obtained Euclidean distance between the connected verb-noun pairs.
Along with the three properties IC, Entropy and Specificity and the abovecombinations, a total of 9 configurations for the line graph are generated.Another such 9 configurations of the line graph are generated now with twodummy nodes corresponding to the two labels aspect and non-aspect. Twodifferent types of priors are tried. For the first type, the prior depends on theproperty (IC or entropy or specificity) being used in the configuration. To com-pute the prior values, an average of the verb property and noun property for theverb-noun pair in the node is computed. All these average values are then sortedand ranked. A percentile based on the rank is assigned to each verb-noun pairand is used as the prior information.
For the second type of prior, Latent Dirichlet Allocation (LDA) based valuesare computed for each word and used. LDA [1] is a probabilistic generativemodel which can be used for uncovering the underlying semantic structure of aset of documents in the form of “topics”. In simple words, a “topic” consists ofa cluster of words that frequently occur together and are semantically similar.Considering number of topics to be T , the following topic-based specificity score(τ) was defined for each word which is part of at least one topic representation:
τ(w) = log
(T∑
ti∈T I(w, ti, k)
)where
I(w, ti, k) = 1 (if w ∈ top k words in topic ti); 0 (otherwise)
The Mallet software package2 was used for learning 100 topics from the cor-pus of supervisor comments. Each topic was represented by top 20 most probablewords. The score for all other words which are not part of any topic representa-tion is set to 0. The intuition behind this score definition is that the words whichare part of many topics, are not “specific” enough and hence get a lower score.Whereas the words which are part of a few topics, are quite “specific” and get a
2 http://mallet.cs.umass.edu.

Aspects from Appraisals!! 307
higher score. An average of these scores for the verb and noun in the verb-nounpair is computed and a rank based percentile score is used as the prior.
To form the seed set, 11 verb noun pairs comprising of 6 aspects and 5non-aspects were chosen randomly (ensuring agreement of all three annotators)from the annotated set of 500 verb-noun pairs. Experiments are conducted forfixed percentage prior induction by varying the percentage from 1 to 100. Addi-tionally, results based only on the prior information are also computed for eachconfiguration.
4.3 Evaluation
For evaluation, accuracy values from baseline methods and the runs of LP algo-rithm are compiled. Accuracy values are preferred over F1-measures becausein this case of two-class classification, the accuracy turns out to be the micro-averaged F1-measure for the two classes. Table 2 shows the various accuracyvalues.
It can be observed that co-occurrence baselines perform better than the nor-mal label propagation and only prior techniques. However, it is use of priorinformation in label propagation that improves the results and helps outperformthe baselines. The combined approach also proves to be better than the LPAand prior individually barring a few cases. Use of LDA information as priorboosts the accuracy further taking it as high as 76.2 % which approaches theaverage inter-annotator agreement score. Considering the case when LDA priorsare used, in most configurations the fixed percentage prior marginally outper-forms node-wise variable prior. However, it is preferable to employ the node-wisevariable prior as that doesn’t require learning/tuning of any external parameters(like q) and is completely dependent on node connections.
Table 2. Experimentation Results (% Accuracy values)
Baseline PMI LMI Product
Accuracy 0.68 0.668 0.672
Property LPA Property LPA + Property Prior LPA + LDA Prior
+ Combination prior Fixed (q%) Variable Fixed (q%) Variable
IC + Connector 60.48 59.04 64.11 (42) 70.28 75 (21) 75.1
IC + Linear Comb. 55.44 59.04 64.31 (36) 70.88 75.4 (2) 75.1
IC + Euclidean Dist. 60.48 59.04 64.71 (25) 71.08 76 (27) 75.7
E + Connector 52.82 40.16 68.15 (3) 54.21 75.6 (23) 74.1
E + Linear Comb. 53.63 40.16 67.94 (3) 54.82 75.4 (25) 74.7
E + Euclidean Dist. 59.48 40.16 68.75 (2) 52.41 75.6 (10) 74.9
S + Connector 52.62 39.76 67.14 (3) 53.82 75.4 (24) 73.7
S + Linear Comb. 53.62 39.76 67.34 (2) 53.61 75.4 (25) 74.7
S + Euclidean Dist. 60.08 39.76 69.15 (2) 54.21 76.21 (10) 76.1
LDA Prior performs at 72.69 %; E: Entropy; S: Specificity
308 N. Ramrakhiyani et al.
Analysis of Results: The strong LDA prior baseline misses several aspectswhich are correctly identified by the LPA + LDA prior setting, e.g. improve-competency, follow--ethic, conduct--kss3, complete--documentation.Further, the LDA prior incorrectly labels certain non-aspect verb-noun pairs asaspects, which the LPA + LDA Prior setting corrects, e.g. accept--comment,reduce--count, rework--effort, code--standard. It can be observed that theformer two verb-noun pairs do not provide much information but more impor-tantly, the latter two are not even proper verb-noun pairs as they are result of incor-rect POS-tagging (rework and code incorrectly tagged as verbs).
5 Related Work
Liu [7] provides a good survey of various types of aspect extraction techniques.But none of these techniques deals with “aspects” in the form of verb-noun pairs.On the contrary, Widdows [11] and Cohen et al. [4] have experimented with verb-noun pairs but not in the context of aspect extraction or summarization.
There have been some attempts to introduce “dummy” nodes in graph basedsemi-supervised learning algorithms. Zhu et al. [13] proposed an approach thatis based on a Gaussian random fields with methods for incorporating class pri-ors and output of some external classifier. Here, the general class priors at themass level are incorporated, whereas the proposed approach inducts the spe-cific class priors for each unlabelled node in the graph. They also used “dongle”nodes, connected to each unlabelled node for incorporating output of the exter-nal supervised classifier. Whereas the proposed approach only introduces limitednumber of “dummy” nodes, one for each class label and all such “dummy” nodesare connected to all the unlabelled nodes representing the prior knowledge abouttheir class assignment. Kajdanowicz et al. [5] also use “dummy” nodes, one foreach labelled node in order to preserve labels of the labelled nodes.
6 Conclusion and Future Work
The process of performance appraisals in large organizations is considered andthe problem of identifying “aspects” from supervisor feedback is explored. Thisis the first attempt to automatically extract insights from PA text sentences.Unlike the usual notion of noun phrase based aspects used in literature, a noveldefinition of aspect in PA domain in the form of verb-noun pairs is presented. Asa major contribution, a novel way of inducing prior knowledge in the label prop-agation algorithm is proposed. This is achieved by introducing “dummy” nodes(one for each class label) and connecting them to all the nodes in the graph alongwith the edge-weights commensurate with the prior knowledge. A better perfor-mance of the proposed approach is reported in comparison to various baselinemethods, basic label propagation and only prior.
In future, focus will be on exploring the effectiveness of the approach on adataset from other domains. Realizing more complex priors is another area tobe tried.3 KSS stands for Knowledge Sharing Session.

Aspects from Appraisals!! 309
References
1. Blei, D.M., Ng, A.Y., Jordan, M.I.: Latent dirichlet allocation. J. Mach. Learn.Res. 3, 993–1022 (2003)
2. Church, K.W., Hanks, P.: Word association norms, mutual information, and lexi-cography. Comput. Linguist. 16(1), 22–29 (1990)
3. Cohen, J.: A coefficient of agreement for nominal scales. Educ. Psychol. Measur.20(1), 37–46 (1960)
4. Cohen, W.W., Carvalho, V.R., Mitchell, T.M.: Learning to classify email into“speech acts”. In: EMNLP, pp. 309–316 (2004)
5. Kajdanowicz, T., Indyk, W., Kazienko, P.: Mapreduce approach to relational influ-ence propagation in complex networks. Pattern Anal. Appl. 17(4), 739–746 (2014)
6. Kilgarriff, A., Rychly, P., Smrz, P., Tugwell, D.: Itri-04-08 the sketch engine.Inform. Technol. 105, 116 (2004)
7. Liu, B.: Sentiment analysis and opinion mining. Synth. Lect. Hum. Lang. Technol.5(1), 1–167 (2012)
8. Manning, C.D., Surdeanu, M., Bauer, J., Finkel, J., Bethard, S.J., McClosky, D.:The stanford corenlp natural language processing toolkit. In: ACL: System Demos,pp. 55–60 (2014)
9. Ozaki, K.: (2011). https://github.com/smly/java-labelpropagation10. Resik, P.: Using information content to evaluate semantic similarity. In: Proceed-
ings of the 14th IJCAI, pp. 448–453 (1995)11. Widdows, D.: Semantic vector products: Some initial investigations. In: Second
AAAI Symposium on Quantum Interaction, vol. 26, p. 28 (2008)12. Zhu, X., Ghahramani, Z.: Learning from labeled and unlabeled data with label
propagation. Technical report, Citeseer (2002)13. Zhu, X., Ghahramani, Z., Lafferty, J., et al.: Semi-supervised learning using
gaussian fields and harmonic functions. ICML 3, 912–919 (2003)
Mining Hidden Knowledgefrom the Counterterrorism Dataset Using
Graph-Based Approach
Kishlay Jha(B) and Wei Jin
North Dakota State University, Fargo, ND, USAkishlay.jha,[email protected]
Abstract. Information overloaded is now a matter of fact. These enor-mous stack of information poses huge potential to discover previouslyuncharted knowledge. In this paper, we propose a graph based approachintegrated with statistical correlation measure to discover latent but valu-able information buried under huge corpora. For given two concepts, Ci
and Cj (e.g. bush and bin ladin), we find the best set of intermedi-ate concepts interlinking them by gleaning across multiple documents.We perform query enrichment on input concepts using Longest Com-mon Substring (LCSubstr) algorithm to enhance the level of granular-ity. Moreover, we use Kulczynski correlation measure to determine thestrength of interdependence between concepts and demote associationswith relatively meager statistical significance. Finally, we present ourusers with ranked paths, along with sentence level evidence to facilitatebetter interpretation of underlying context. Counterterrorism dataset isused to demonstrate the effectiveness and applicability of our technique.
1 Introduction
It is known that the rise in text data is on unprecedented scale. These hugecorpora of literature necessitate the intelligent text mining techniques whichcan explore non-apparent but meaningful information buried under them. “Thewealth of recorded knowledge is greater than sum of its parts”- a hypothesesproposed by Davies in 1989 [1] underneaths the essence of this paper. Swansonand Smalheiser [2], the pioneers of Literature based discovery (LBD) (viz. amethodology of finding new knowledge from complementary and non-interactiveset of articles) used aforementioned hypothesis as a basis to propound severalnovel hypothesis in the area of biomedicine, which were later validated by bio-scientists. They postulated a simple ABC model, where AB and BC refer todirect relationships in the literature reported explicitly wherein the goal is tofind any plausible relationship between A and C via intermediate B. Meanwhile,the pioneering contributions of Swanson and Smalheiser [3] made major stridesin LBD, it also stimulated researchers to make notable contribution in practicalareas of biomedicine, healthcare, clinical study and counterterrorism. In con-text of counterterrorism, [4] found hidden connections between concepts acrossmultiple documents using concept chain queries.c© Springer International Publishing Switzerland 2016E. Metais et al. (Eds.): NLDB 2016, LNCS 9612, pp. 310–317, 2016.DOI: 10.1007/978-3-319-41754-7 29

Mining Hidden Knowledge: Graph-Based Approach 311
Although the meticulous research in intelligent text mining algorithms haveimmensely advanced the domain of LBD, there are two questions which are largelypondered upon by information scientist working in this area of study (a) Howto find prudent and scalable correlation measures which help to determine thestrength of interdependence between concepts while taking into account the sheersize of documents? (b) How to lessen the need for manual intervention or domainknowledge required during the discovery phase? In this paper, we intend to inves-tigate into these problems by using Kulczynski correlation measure. The motiva-tion behind is - the use correlation measure propels us atleast one step towards ourgoal of presenting users with paths which are statistically meaningful and which inturn provides a rationale for discovery of hitherto unknown knowledge. To advancewith our second question, we present paths with sentence level evidence to facili-tate in understanding the scenario from multiple perspectives.
The unfortunate incident of 9/11, lead to exponential growth in documen-tation related to terrorism. Research works in this area could heavily benefitintelligence analyst to discover covert association between entities (e.g. person,organization, events) and also help them to monitor criminal activities. Relevantto this area of study, [5] combined text mining with link analysis techniques todiscover new anti-terror knowledge (i.e. they found Osama bin laden’s organiza-tion was responsible for assassination attempt of John Paul II). In our approach,we model the problem of finding hidden but precious knowledge from huge corpususing graph-based approach. We capture both unexpressed and precise knowl-edge in paths between query terms (e.g. bush and bin ladin) by eradicating theneed for any user intervention. We also perform query enrichment [Sect. 3.3.1]to add finer granularity and rank retrieved paths based on correlation measure.
The reminder of this paper is structured as follows. Section 2 discusses relatedwork. In Sect. 3, we present an overview of our approach in detail. In Sect. 4 wepresent experiments and evaluation results. And finally Sect. 5 brings conclusionand gives directions for future work.
2 Related Work
Fish Oil-Raynauds disease(FO-RD) discovery by Swanson [6] initiated the workin this area of study and was successful in attracting researchers from diversedomain. Though, Swanson’s work entrenched a role model for many text miningresearchers, it had a few setbacks. One of the major setback was the require-ment of strong domain knowledge and manual settings during various stages ofKnowledge Discovery (KD). To overcome this limitation, many LBD researchersproposed distinct techniques. [7] used a Natural Language Processing (NLP)component to extract biomedically relevant concepts and Unified Medical Lan-guage (UML) provided semantic types to eradicate spurious connections. Gordonand Dumais applied [8] their popular technique of Latent semantic indexing (LSI)to solve this problem and several other distributional approaches such as “termfrequency-inverse document frequency (tf-idf)”, “token frequency”, “record fre-quency” [9,10] were used to find bridge concepts. In retrospect, although tradi-tional techniques have heavily relied upon frequency of concept co-occurrence,

312 K. Jha and W. Jin
they seem to have ignored the nature of correlation that exists between them.In our approach, after collecting corpus level statistical information, an appro-priate correlation measure is further used to capture this nature and estimatethe strength of associations between concepts.
In the years followed, Srinivasan [11] proposed open and closed text miningalgorithm to discover new biomedical knowledge from MEDLINE1 using MESH2
terms. Her approach was a major improvement in LBD which successfully repli-cated several Swanson’s discoveries. While this model may seem lucrative, thereare nuances which should be carefully thought upon. One of them is the numberof A → B and B → C combinations which could grow exponentially large inmassive text data. To deal with such a large search space, Pratt and Yetisgen-Yildiz [12] incorporated several ordering and filtering capabilities. More recently,Xiaohua Hu [13,14] proposed semantic based association rule mining algorithmto discover new knowledge from biomedical literature. They utilized semanticknowledge (e.g. semantic types, semantic relations and semantic hierarchy) tofilter irrelevant association rules.
LBD in counteterrorism was limited till recent past. Research work in thisdomain include work of [15,16], who proposed an Unapparent Informationretreival (UIR) framework using concept chain graph (CCG) to find interest-ing associations. Our current work is motivated by [17], which in itself is basedon idea of concept graph. In this work, we have incorporated the following spe-cific points in the algorithm design (a) we perform query enrichment on inputquery terms to incorporate the comprehensive detail of available literature (b)we use Kulczynski correlation measure to promote paths with high statisticalcorrelation. To the best of our knowledge, both of the these aforementionedpoints are nascent in their application to LBD.
3 Graph Based Text Mining Model
We model the problem of finding novel knowledge from existing Knowledge Base(KB) as one of ranking paths generated between query terms from the conceptco-occurrence graph. We use an open source tool Open Calais3 and an existing IEengine Sementax [16] to extract meaningful concepts from documents. Conceptsextracted are used to create a KB, wherein, we issue queries (e.g. “bush” and“bin ladin”) to generate ranked paths utilizing correlation measure. A basicarchitecture of our method is shown in Fig. 1.
3.1 Concept Extraction
In the Concept Extraction (CE) phase, we extract meaningful information fromthe available text. Concepts or instances refer to the name of a person, place,organization, event etc. Each concept belong to one or more category. We process1 https://www.nlm.nih.gov/pubs/factsheets/medline.html.2 https://www.nlm.nih.gov/mesh.3 http://www.opencalais.com/opencalais-demo/.

Mining Hidden Knowledge: Graph-Based Approach 313
Fig. 1. Basic architecture proposed method
our entire dataset with Open Calais/Semantex [16] and map the extracted con-cepts to their respective category or semantic type. An example of conceptextraction for our dataset is shown in Table 1.
Table 1. Example of concept extraction from documents.
Category or Semantic type Concepts
Person Bin ladin, George W bush
Organization Al-qaeda, Muslim brotherhood
Position President, Emir, Messenger
Industry term Bank accounts, Oil wealth
City New York, Kabul, Boston
3.2 Knowledge Base Creation
The concepts extracted in CE phase are used to build a KB. This KB formsthe central component of our system. It is modeled as graph G (V, E), where Vrefers to a set of vertices and E is a set of edges. Each unique concept ci ∈ Vis considered a vertex and each eij ∈ E refers to a relationship between ciand cj . The relationship between concepts can be defined in several ways. Oneway is to consider the frequency of co-occurrence between concepts in a specificwindow unit (e.g. sentence, paragraph, document). In our approach, we definethe relation between concepts at sentence level. In other words, for a givendocument, we build a concept-by-concept co-occurrence frequency matrix atsentence level (viz., all concepts occurring within this window unit is consideredco-occurring with each other). By shifting the window unit across the documents,an overall co-occurrence matrix for all the concepts ci ∈ V is produced. We use

314 K. Jha and W. Jin
this co-occurrence value as an edge property (cooccurCount) for eij betweenconcepts. Altogether, we have a KB modeled in form of graph, where conceptsare the vertices and concept-concept co-occurrence frequency is the weight ofrelationship between them. We use Neo4j 4 graph database to store our KB.
3.3 Algorithm
Having built the Knowledge base (KB), now our goal is to find interesting inter-mediate terms which connect query pair in a coherent manner. For the inputquery terms, we perform query enrichment [Sect. 3.3.1] to capture the availableknowledge in comprehensive manner. We intend to highlight that while sentencelevel relation in itself is considered granular [4,5], we further add to it by per-forming query enrichment over input terms. It is also important to note thatas our graph is a concept cooccurrence graph, a path of length K=2 betweenquery pair will result in finding one intermediate concept.
3.3.1 Query Enrichment
A concept name may have several lexicographic variants. For example, a concept“bin ladin” may have variants as “bin laden”, “osama bin ladin”, “usama binladin”. Though, all these variants refer to the same person semantically, theyvary lexicographically. We may risk missing important interlinking connectionswithout incorporating them into queries pairs. Therefore, we perform Longestcommon substring(LCSubstr)5 matching to find variants of input query. UsingLCSubstr, we generate a small list of variants which are closest to the query termsand present them to our user. The user makes a final decision on which possiblevariants may be added to the query. The reason behind not fully automatingthis process is to prevent false positives from being added to the query.
3.4 Graph Traversal
In this phase, we perform graph traversal between query terms in our createdgraph (i.e. KB). The user inputs start concept (Ci), end concept (Cj), anddesired path length (K). Our system performs query enrichment over input termsfollowed by graph traversal. In graph traversal, the algorithm enumerates allpossible paths of specified length. The paths generated are ranked using Kulccorrelation measure. Finally, the user is presented ranked paths with sentencelevel evidence.
3.5 Ranking
Once we obtain the paths between enriched query pairs, we rank them usingKulczynski correlation measure. Kulczynski correlation measure for concepts Ci
and Cj is defined as:4 http://neo4j.com.5 http://en.wikipedia.org/wiki/Longest common substring problem.

Mining Hidden Knowledge: Graph-Based Approach 315
Kulczynski(Ci, Cj) =12(P (Ci|Cj) + P (Cj |Ci)) (1)
4 Experiments
For experiments, we use publicly available 9/11 commission report7 as our cor-pus. It includes executive summary, preface, thirteen chapters, appendix andnotes. Each of them is treated as a separate document. An open source toolOpen Calais and an existing IE engine Semantex is used to extract relevantconcepts from documents as described in Sect. 3.1.
4.1 Evaluation Set
Unfortunately, there is no standard goldset available for performing quantitativeevaluation in this domain. Therefore, a major task in this step was to constructour own evaluation dataset. Our goal was to calculate the precision and recall ofpaths generated by our system. Precision was calculated by manual inspection(i.e., manually reading the sentences of generated paths to check if there isa logical connection) of top N chains. For recall, we synthesize an evaluationset by selecting paths of length ranging from 1 to 4. To choose paths, we ranqueries on corpus with start and end concepts as named entities. For the selectedpairs, we manually inspected the relevant paragraphs and selected those wherethere exists a logical connection. Finally, we generated paths for these pairs asevaluation data. The parameters used to select the target paths are as follows:-
– Entity-to-Entity link: A correlation between entities.– Entity-to-Event link: If two entities participated in the same event.– Entity-to-person link: If two persons are connected by the same entity.
4.2 Evaluation Result
The above mentioned process resulted in approximately 35 query pairs as evalua-tion dataset. In our experiment, we executed each of the query pairs and selectedtop 5 paths for various path lengths. The evaluation looked at (a) Weather thetarget path was found in top 5 paths returned by system? (b) the overall pre-cision of top 5 paths for various path length. Our system obtained an overallrecall of 73.50%. Tables 2 and 3 show recall and precision, respectively for top5 paths of various lengths.
The recall parameter shows the strength and applicability of our technique.Using this methodology, we obtain a sound coverage of intermediate links withhigher precision. Also, as expected, the precision decreases with increase in pathlength (K), as paths with greater K generate more generic intermediates. Thereason for missing some truth chains (Paths) is - our technique does not take
7 http://govinfo.library.unt.edu/911/report/911Report.pdf.

316 K. Jha and W. Jin
Table 2. Recall on test data
Path Length (K) Paths found in top 5 Total Paths
1 10 13
2 5 7
3 8 11
4 2 3
Table 3. Precision on test data
Path Length (K) Precision
1 1
2 0.88
3 0.80
4 0.78
into account the anaphors (he, she, his, her) of persons names. Additionally,although our query enrichment technique finds lexicographic variants of inputterms, it does not capture the semantically related terms. We are looking furtherinto these issues.
5 Conclusions
In this paper, we propose a graph based approach amalgamated with correla-tion measure to discover new knowledge from existing knowledge base by siftingacross multiple documents. We conclude that, query enrichment over input termsalong with sentence level association between concepts helped us achieve finergranularity required for plausible hypothesis generation. The incorporated corre-lation measure successfully identifies significant relationships between conceptsand ranks them high. In addition to generation of ranked paths, we present userswith relevant sentence extracted from multiple documents to assist for furtherinvestigation.
In further research, in addition to the specific points raised in the paper,we are researching on alternative correlation measures which could incorporatemore context in the discovery process to produce more meaningful correlations.We also intend to extend concept chain queries to concept graph queries wherethree or more concepts are involved. This will enable users to quickly generatehypotheses graph specific to a corpus.
Acknowledgments. This work was supported by National Science Foundation grantIIS-1452898.
Mining Hidden Knowledge: Graph-Based Approach 317
References
1. Davies, R.: The creation of new knowledge by information retrieval and classifica-tion. J. Documentation 45(4), 273–301 (1989)
2. Swanson, D.R., Smalheiser, N.R.: Implicit text linkage between medline records;using arrowsmith as an aid to scientific discovery. Libr. Trends 48, 48–59 (1999)
3. Swanson, D.R., Smalheiser, N.R.: An interactive system for finding complementaryliteratures. Artif. Intell. 91, 183–203 (1997)
4. Jin, W., Srihari, R.K.: Knowledge discovery across documents through conceptchain queries. In: Proceedings of the 6th IEEE International Conference on DataMining Workshop on Foundation of Data Mining and Novel Techniques in HighDimensional Structural and Unstructred Data, pp. 448–452 (2006)
5. Ben-Dov, M., Wu, W., Feldman, R., Cairns, P.A., House, R.: Improving knowledgediscovery by combining text-mining and link analysis techniques. In: Proceedingsof the SIAM International Conference on Data Mining (2004)
6. Swanson, D.: Fish oil, raynauds syndrome, and undiscovered public knowledge.Perspect. Biol. Med. 30, 7–18 (1986)
7. Weeber, M., Klein, H., Berg, L., Vos, R.: Using concepts in literature-based dis-covery: simulating swansons raynaud-fish oil and migraine-magnesium discoveries.J. Am. Soc. Inf. Sci. 52(7), 548–557 (2001)
8. Gordon, M., Dumais, S.: Using latent semantic indexing for literature based dis-covery. JASIS 49(8), 674–685 (1998)
9. Lindsay, R., Gordon, M.: Literature-based discovery by lexical statistics. JASIS50(7), 574–587 (1999)
10. Gordon, M., Lindsay, R.: Toward discovery support systems: a replication, re-examination, and extension of swansons work on literature based discovery of aconnection between raynauds and fish oil. JASIS 47(2), 116–128 (1996)
11. Srinivasan, P.: Text mining: generating hypotheses from medline. JASIS 55(5),396–413 (2004)
12. Yetisgen-Yildiz, M., Pratt, W.: Using statistical and knowledge-based approachesfor literature-based discovery. J. Biomed. Inf. 39(6), 600–611 (2006)
13. Hu, X., Zhang, X., Yoo, I., Wang, X., Feng, J.: Mining hidden connections amongbiomedical concepts from disjoint biomedical literature sets through semantic-based association rule. Int. J. Intell. Syst. 25, 207–223 (2010)
14. Hu, X., Zhang, X., Yoo, I., Zhang, Y.: A semantic approach for mining hiddenlinks from complementary and non-interactive biomedical literature. In: SDM, pp.200–209 (2006)
15. Srihari, R., Lamkhede, S., Bhasin, A.: Unapparent information revelation: a con-cept chain graph approach. In: Proceedings of the ACM Conference on Informationand Knowledge Management, pp. 200–209 (2005a)
16. Srihari, R.K., Li, W., Niu, C., Cornell, T.: infoxtract: a customizable intermediatelevel information extraction engine. J. Nat. Lang. Eng. 14(01), 33–69 (2008)
17. Jin, W., Srihari, R.K., Ho, H.H.: A text mining model for hypothesis generation.In: 19th IEEE International Conference on Tools with Artificial Intelligence 2007,ICTAI 2007, vol. 2, pp. 156–162. IEEE (2007)

An Empirical Assessment of CitationInformation in Scientific Summarization
Francesco Ronzano(B) and Horacio Saggion
Natural Language Processing Group, Universitat Pompeu Fabra,Barcelona, Spain
francesco.ronzano,[email protected]
Abstract. Considering the recent substantial growth of the publica-tion rate of scientific results, nowadays the availability of effective andautomated techniques to summarize scientific articles is of utmost impor-tance. In this paper we investigate if and how we can exploit the citationsof an article in order to better identify its relevant excerpts. By relying onthe BioSumm2014 dataset, we evaluate the variation in performance ofextractive summarization approaches when we consider the citations toextend or select the contents of an article to summarize. We compute themaximum ROUGE-2 scores that can be obtained when we summarize apaper by considering its contents together with its citations. We showthat the inclusion of citation-related information brings to the generationof better summaries.
Keywords: Citation-based summarization · Scientific text mining ·Summary evaluation
1 Introduction: Citation-Based Summarization
A new scientific article is published every 20 s and such publication rate is goingto increase during then next decade [1]. Considering this trend, everyone canagree that any person who has to deal with scientific publications, includingresearchers, editors, reviewers, is flooded by a huge amount of information.Keeping track of recent advances has become an extremely difficult and timeconsuming activity.
New and improved approaches to select and organize contents of interestfrom the huge amount of scientific papers that are accessible on-line could helpto solve or at least reduce this problem. In this context, automated summariza-tion techniques play a central role. By exploiting these techniques, it is possibleto identify the set of excerpts of a text that better recap its contents, thus
This work is (partly) supported by the Spanish Ministry of Economy and Compet-itiveness under the Maria de Maeztu Units of Excellence Programme (MDM-2015-0502) and by the European Project Dr. Inventor (FP7-ICT-2013.8.1 - Grant no:611383).
c© Springer International Publishing Switzerland 2016E. Metais et al. (Eds.): NLDB 2016, LNCS 9612, pp. 318–325, 2016.DOI: 10.1007/978-3-319-41754-7 30

An Empirical Assessment of Citation Information 319
substantially reducing the effort needed to organize and evaluate scientific infor-mation. Current approaches to summarize scientific literature usually extendexisting document summarization techniques [2] by taking advantage of distinc-tive traits of scientific publications. Citations represent by far the feature ofscientific articles that has been more often exploited in order to improve thequality of automatically generated summaries.
When a paper is cited, the part of the citing article that explains the reason ofthe citation is usually referred to as citation context or citance [3]. Each citanceincludes the sentence where the citation occurs (citing sentence) or part of itand possibly one or more surrounding sentences. To automatically identify thecitation context different approaches have been proposed relying on the depen-dency tree of the citing sentence [6], on classifiers like Support Vector Machinesor on sequence taggers, including Conditional Random Fields [7,8].
Several analyses aim at characterizing what type of information about apaper is provided by its citances. [5] analyze a corpus of open access articlesfrom PubMed Central1 and notice that there is a small but quantifiable differ-ence between the informative content of the abstract of a paper and the infor-mation provided by its set of citances. [9] prove the utility of citances to improvethe quality of multi-document summaries: graph-based summarization method-ologies are evaluated over two topic-homogeneous collections of papers from theACL Anthology2.
Distinct approaches have been proposed to exploit citances so as to selectthe set of clues or sentences that better summarize a paper. Starting from anarticle, [10] build a similarity graph to clusters sentences concerning the sametopic and explore different selection strategies to choose from each cluster theones to include in the summary [11]. Exploit the citances of a paper to build alanguage model that, in turn, is used to select the most influential sentences. [13]show that the citation information improves sensibly the quality of a summary byrelying on different summarization approaches and exploiting the BioSumm2014dataset. In [4] the contents of a paper are summarized by extracting relevantkeyphrases (n-grams) from the collection of citances of the considered paper.A background language model is built by gathering several papers of the samedomain of the one to summarize. The summary includes the sentences with thelowest keyphrase overlap with the background language model. [6] rely on thecitances of an article to improve the diversity and readability of its automaticallygenerated summary.
We investigate to what extent the citances of a paper are useful to createan improved summary of its contents. In particular we analyze how the con-tents of different parts of a paper, including abstract, body and citances, con-tribute to maximize a widespread summary evaluation metric, ROUGE-2. Tothis purpose we exploit the Biomedical Summarization Dataset (BioSumm2014),released in the context of the Biomedical Summarization Track of the Text
1 http://www.ncbi.nlm.nih.gov/pubmed.2 https://aclweb.org/anthology/.
320 F. Ronzano and H. Saggion
Analysis Conference 20143. The BioSumm2014 dataset consists of 20 collectionsof annotated papers, each one including a reference article and 10 citing articles.Section 2 provides a detailed description of the BioSumm2014 dataset and thecitation-related manually annotated information that it includes. In Sect. 2 wealso briefly describe the pre-processing steps we perform over the contents of theBioSumm2014 dataset to support further data analyses. In Sect. 3 we presentand discuss how the maximum ROUGE-2 of a summary of a paper varies if weconsider its citances to automatically build its summary. In Sect. 4 we provideour conclusions, outlining future venues of research.
2 The BioSumm2014 Dataset
The BioSumm2014 dataset has been released in the context of the BiomedicalSummarization Trak (Text Analysis Conference 2014) to provide a manuallyannotated corpus of scientific publications useful to investigate several aspectsof citations. All the experiments presented in the following Sections of this paperrely on this dataset.
The BioSumm2014 dataset includes 20 collections of scientific publicationsdealing with the bio-molecular, pharmaceutical and medical domains, indexedby PubMed Central. Each collection consists of one cited paper (also referred toas Reference Paper) and 10 Citing Papers. Every Citing Paper of each collectioncites one or more times the corresponding Reference Paper (see Fig. 1). Eachcitation of each Citing Paper has been manually annotated by four annotatorswho were asked to identify:
– the context of the citation (i.e. citance), consisting of one to three text spansand including the related in-line citation marker ([1] , (Rossi et al., 2010), etc.);
– the citing spans, that are one to three text spans in the Reference Paper thatmost accurately reflect the citance, thus representing the part of the ReferencePaper that contains the reason why such paper has been cited by the CitingPaper.
In each Reference Paper we can identify the following parts (see Fig. 1): theabstract, the body and, for each citation of a Citing Paper from the same collec-tion, four citing spans, each one identified by a different annotator. On average,one third of the sentences the body of each Reference Paper intersects one ormore citing spans. In addition, for each collection of papers, each annotator pro-vided a summary of the Reference Paper having an approximate length of 250words and including the opinions expressed by the related citations. In the Bio-Summ2014 dataset, for each citation of a Reference Paper, different citances havebeen identified by distinct annotators in the related Citing Paper. We associateto each citation, a global citance span. The global citance span represents theunion of the citance text spans identified by the four human annotators for thatparticular citation. All the experiment we discuss in the next Section are based
3 http://www.nist.gov/tac/2014/BiomedSumm/.

An Empirical Assessment of Citation Information 321
Fig. 1. Structure of the BioSumm2014 dataset.
on the manual annotations of the citation contexts and the citing spans. Theautomatic identification of these text spans is out of the scope of the experimentspresented in this paper.
2.1 Pre-processing BioSumm2014 Papers
To enable the execution of the experiments described in this paper, we importedthe articles of the BioSumm2014 dataset together with their stand-off anno-tations into the text engineering framework GATE4. Then, we performed thefollowing set of pre-processing steps on the textual contents of each article (bothReference and Citing Papers):- Custom sentence splitting: we customized GATE regular-expressionsentence-splitter in order to properly identify sentence boundaries in the scien-tific texts included the in the BioSumm2014 dataset. We added rules to correctlydeal with abbreviations that are characteristic of scientific literature (Fig., Sect.,etc.);- Tokenization and POS-tagging: we exploited GATE English Tokenizer andPOS-tagger to perform these actions on the texts;- Sentence sanitization: we filtered out incorrectly annotated sentences, rely-ing on a set of rules and heuristics. For instance, we excluded sentences withno verbal tokens or short sentences, with less than 4 tokens (excluding punctu-ation). These sentences often represent headers or captions;
4 https://gate.ac.uk/.
322 F. Ronzano and H. Saggion
- Sentence TF-IDF vector calculation: we determined the TF-IDF vectorassociated to each sentence, where the IDF values are computed over all thepapers of the related collection (10 Citing Papers and one Reference Paper). Weremoved stop-words to compute TF-IDF vectors.
3 ROUGE-2 Maximization Analysis
The ROUGE metrics [12] represent one of the most adopted sets of measuresthat aim at evaluating the quality of an automatically generated summary(also referred to as candidate summary) with respect to one or more referencesummaries, usually created by humans. Summary evaluation results based onROUGE metrics are proven to have a high correlation with human judgements.In our experiments we rely on ROUGE-2, one of the measures of the ROUGEfamily of metrics. ROUGE-2 quantifies the bi-gram recall between a candidatesummary and a set of reference summaries: higher is the ROUGE-2 value, higheris the similarity of the candidate summary with the reference ones in terms ofshared bi-grams.
In this Section we evaluate the contribution of different portions of Bio-Summ2014 papers (abstracts, body, citing spans, etc.) with respect to the vari-ations of ROUGE-2. Specifically, we compute the maximum ROUGE-2 that canbe obtained when we produce a summary of 250 words by picking sentencesthat belong to distinct portions of the papers. We truncate the contents of thesummaries to evaluate to their 250th word.
Relying on the sentence detection output (see pre-processing Subsect. 2.1),we are able to divide the sentences of the papers of each collection into thefollowing groups:
– ABSTRACT: sentences that belong to the abstract of the Reference Paper;– BODY: sentences of the body of the Reference Paper;– CITING SPANS: sentences of the body of the Reference Paper that inter-
sect totally or partially a citing span (abstract sentences intersecting a citingspan are not included in this group);
– CITATION CONTEXT: sentences that intersect at least one global citancespan in a Citing Paper (i.e. sentences that belong to the context of the citationsof the Reference Paper).
In each collection of papers, for each combination of the previous groups ofsentences, we determine the subset of sentences (up to 250 words) that maxi-mizes the ROUGE-2, by considering two types of reference summaries:- ABST SUMM: the abstract of the Reference Paper;- GS SUMM: the four 250-words summaries written by BioSumm2014 anno-tators.
In Tables 1 and 2 we show the average value (across the 20 collections) ofthe maximized ROUGE-2, when we generate a 250-words summary by choosingsentences from different groups.
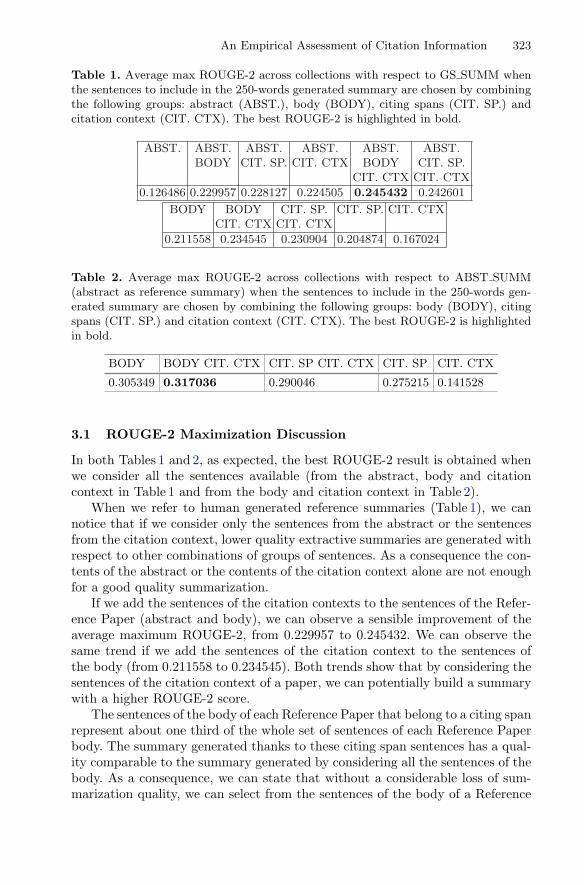
An Empirical Assessment of Citation Information 323
Table 1. Average max ROUGE-2 across collections with respect to GS SUMM whenthe sentences to include in the 250-words generated summary are chosen by combiningthe following groups: abstract (ABST.), body (BODY), citing spans (CIT. SP.) andcitation context (CIT. CTX). The best ROUGE-2 is highlighted in bold.
ABST. ABST. ABST. ABST. ABST. ABST.BODY CIT. SP. CIT. CTX BODY CIT. SP.
CIT. CTX CIT. CTX
0.126486 0.229957 0.228127 0.224505 0.245432 0.242601
BODY BODY CIT. SP. CIT. SP. CIT. CTXCIT. CTX CIT. CTX
0.211558 0.234545 0.230904 0.204874 0.167024
Table 2. Average max ROUGE-2 across collections with respect to ABST SUMM(abstract as reference summary) when the sentences to include in the 250-words gen-erated summary are chosen by combining the following groups: body (BODY), citingspans (CIT. SP.) and citation context (CIT. CTX). The best ROUGE-2 is highlightedin bold.
BODY BODY CIT. CTX CIT. SP CIT. CTX CIT. SP CIT. CTX
0.305349 0.317036 0.290046 0.275215 0.141528
3.1 ROUGE-2 Maximization Discussion
In both Tables 1 and 2, as expected, the best ROUGE-2 result is obtained whenwe consider all the sentences available (from the abstract, body and citationcontext in Table 1 and from the body and citation context in Table 2).
When we refer to human generated reference summaries (Table 1), we cannotice that if we consider only the sentences from the abstract or the sentencesfrom the citation context, lower quality extractive summaries are generated withrespect to other combinations of groups of sentences. As a consequence the con-tents of the abstract or the contents of the citation context alone are not enoughfor a good quality summarization.
If we add the sentences of the citation contexts to the sentences of the Refer-ence Paper (abstract and body), we can observe a sensible improvement of theaverage maximum ROUGE-2, from 0.229957 to 0.245432. We can observe thesame trend if we add the sentences of the citation context to the sentences ofthe body (from 0.211558 to 0.234545). Both trends show that by considering thesentences of the citation context of a paper, we can potentially build a summarywith a higher ROUGE-2 score.
The sentences of the body of each Reference Paper that belong to a citing spanrepresent about one third of the whole set of sentences of each Reference Paperbody. The summary generated thanks to these citing span sentences has a qual-ity comparable to the summary generated by considering all the sentences of thebody. As a consequence, we can state that without a considerable loss of sum-marization quality, we can select from the sentences of the body of a Reference
324 F. Ronzano and H. Saggion
Paper, the ones that most accurately reflect the contents of its citation contextsand then generate an extractive summary from this subset of sentences. This selec-tion would act as a filter, thus considerably reducing the number of candidate sen-tence to evaluate when generating a summary of the Reference Paper.
When our reference summary is the abstract of the Reference Paper (Table 2),we can note that the sentences of the citation contexts alone do not constitutethe best choice to summarize the paper (citation context column, avg. maxROUGE-2 equal to 0.141528). Moreover, as previously observed with humangenerated reference summaries, if we add to the sentences of the body of thepaper, the sentences of the citation context, the average maximum ROUGE-2improves (from 0.305349 - only body - to 0.317036 - body and citation context).These fact confirms the usefulness of citation context sentences to generate bettersummaries of a paper.
4 Conclusions and Future Work
Nowadays, the growing publication rate of scientific results is more and morestressing the importance of effective approaches to easily structure and sum-marize the contents of articles. We have investigated how the citations of anarticle can contribute to generate a better summary. To this purpose we reliedon the BioSumm2014 dataset that includes 20 manually annotated collections,each one made of one cited paper and 10 other papers that cite the first one. Weevaluated how different parts of each cited paper (abstract, body, citing spans)together with its citation context contribute to the generation of a summary.We adopted the following approach: by considering any possible combination ofparts of the cited paper and its citation context, we computed the maximumROUGE-2 score achievable. As a result, we noted that the maximum ROUGE-2score achievable sensibly increases when we exploit the sentences from the cita-tion context to generate a summary by considering as reference summaries bothhuman generated summaries and the abstract.
In general, we have to notice that when we want to generate a citation-basedsummary of a paper, we need to gather and process the set of articles that citethe paper. Currently this process requires a considerable effort and the contentsof all the citing articles are not always available. As a consequence, besides theimprovement of the quality of the summary, when we consider citation-basedsummarization we have also to take into account the efforts needed in order tocollect the citation related information concerning a paper.
As venues for future research we would like to validate the set of experimentspresented in this paper with scientific publications from different domains. Itwould be interesting to perform a detailed evaluation of the consistency anddiversity of the information included in automatically generated summaries,since the contents of a paper are often repeated or paraphrased by its citationcontexts. Moreover, we would like to investigate into details to what extent dif-ferent summarization approaches in different domains generate better summarieswhen we consider citation contexts as well as other kinds of information from
An Empirical Assessment of Citation Information 325
citing papers. We would also perform more extensive analyses by contemplating,besides the ROUGE-2 score, alternative summary evaluation metrics.
References
1. AAAS Science Magazine: Communication in Science Pressures and Predators. Sci-ence 342(6154), 58–59 (2013). doi:10.1126/science.342.6154.58
2. Gupta, V., Lehal, G.S.: A survey of text summarization extractive techniques. J.Emerg. Technol. Web Intell. 2(3), 258–268 (2010)
3. Nakov, P.I., Schwartz, A.S., Hearst, M.: Citances: citation sentences for semanticanalysis of bioscience text. In: Proceedings of the SIGIR 2004 Workshop on Searchand Discovery in Bioinformatics, pp. 81–88 (2004)
4. Qazvinian, V., Radev, D.R., Ozgur, A.: Citation summarization through keyphraseextraction. In: Proceedings of the 23rd International Conference on ComputationalLinguistics, pp. 895–903. Association for Computational Linguistics (2010)
5. Elkiss, A., Shen, S., Fader, A., Erkan, G., States, D., Radev, D.: Blind men andelephants: what do citation summaries tell us about a research article? J. Am. Soc.Inf. Sci. Technol. 59(1), 51–62 (2008)
6. Abu-Jbara, A., Radev, D.: Coherent citation-based summarization of scientificpapers. In: Proceedings of the 49th Annual Meeting of the Association for Com-putational Linguistics: Human Language Technologies, vol. 1, pp. 500–509. Asso-ciation for Computational Linguistics (2011)
7. Abu-Jbara, A., Radev, D.: Reference scope identification in citing sentences. In:Proceedings of the 2012 Conference of the North American Chapter of the Asso-ciation for Computational Linguistics: Human Language Technologies, pp. 80–90.Association for Computational Linguistics (2012)
8. Qazvinian, V., Radev, D.R.: Identifying non-explicit citing sentences for citation-based summarization. In: Proceedings of the 48th Annual Meeting of the Associ-ation for Computational Linguistics, pp. 555–564. Association for ComputationalLinguistics (2010)
9. Mohammad, S., Dorr, B., Egan, M., Hassan, A., Muthukrishan, P., Qazvinian, V.,Radev, D., Zajic, D.: Using citations to generate surveys of scientific paradigms.In: Proceedings of Human Language Technologies: The 2009 Annual Conferenceof the North American Chapter of the Association for Computational Linguistics,pp. 584–592. Association for Computational Linguistics (2009)
10. Qazvinian, V., Radev, D.R., Mohammad, S., Dorr, B.J., Zajic, D.M., Whidby, M.,Moon, T.: Generating extractive summaries of scientific paradigms. J. Artif. Intell.Res. (JAIR) 46, 165–201 (2013)
11. Mei, Q., Zhai, C.: Generating impact-based summaries for scientific literature. In:ACL 2008, pp. 816–824 (2008)
12. Lin, C.Y.: Rouge: a package for automatic evaluation of summaries. In: Text Sum-marization Branches Out: Proceedings of the ACL 2004 Workshop, vol. 8 (2004)
13. Cohan, A., Goharian, N.: Scientific article summarization using citation-contextand articles discourse structure. In: Empirical Methods in Natural LanguageProcessing (2015)

PIRAT: A Personalized Information RetrievalSystem in Arabic Texts Based on a Hybrid
Representation of a User Profile
Houssem Safi(&), Maher Jaoua(&), and Lamia Hadrich Belguith(&)
MIRACL Laboratory, Faculty of Economics and Management of Sfax,ANLP Research Group, Sfax, Tunisia
Maher.Jaoua,[email protected]
Abstract. The work presented in this paper aims at developing a PersonalizedInformation Retrieval system in Arabic Texts (“PIRAT”) based on the user’spreferences/interests. For this reason, we proposed a user’s modeling and apersonalized matching method document-query. The proposed user’s modelingis based on a hybrid representation of the user profile. In this approach, weintroduce an algorithm which automatically builds a hierarchical user profile thatrepresents his implicit personal interests and domain. It is to represent theinterests and the domain with a conceptual network of nodes linked togetherthrough relationships respecting the linking topology defined in the domain ofhierarchies and ontologies (hyperonymy, hyponymy, and synonymy). Then, weaddress the problem of unavailable language resources by building (i) a largeArabic text corpus entitled “WCAT” and (ii) Building our own Arabic queriescorpus entitled “AQC2” in order to evaluate the suggested PIRAT system andAXON system. The results of this evaluation are promising.
Keywords: Information retrieval Personalization User profile Ontology
1 Introduction
Personalization is an effort to uncover most relevant documents using informationabout the user’s target, domain of interest, browsing history, query context etc., thatgives higher value to the user from the large set of results [1]. However, in certainlanguages, the linguistic tools, such as the case of Arabic language are not developedenough. In fact, there is a lack of resources and automated tools to deal with thislanguage. In addition, the Arabic language is distinguishable from the Western ones asit is a flexible and derivative language. First, unlike the Indo-European languages suchas English and French, stemming in Arabic is more difficult, due mainly to the fact thatArabic is an agglutinative and derivational language. Indeed, in Arabic, there are manymore affixes than in English, which leads to a large number of word forms. Besides, asa property of words in Semitic language, Arabic stem has an additional internalstructure consisting of two parts, namely a “root” and a “pattern”. The root is usually asequence of three consonants and has some abstract meanings, while the pattern is atemplate that defines the placement of each root letter among vowels and possibly other
© Springer International Publishing Switzerland 2016E. Métais et al. (Eds.): NLDB 2016, LNCS 9612, pp. 326–334, 2016.DOI: 10.1007/978-3-319-41754-7_31

consonants. For example, the word ( ناباتكلا ) “AlkitabAn”, meaning the two books, has aroot composed of the letters k, t, and b; and its pattern is “Root1+i+Root2+a+Root3” [2].
It is emphasized that the present work is an extension of previous studies [4, 5].Indeed, we integrated the stemmer MADAMIRA instead of the analyzer Alkhalil.Then, we proposed a personalized matching method document query. Moreover, wehave implemented these methods to produce a system entitled “PIRAT” based ondynamic ontology profile as an extension of the AXON system [5]. Finally, we per-formed an evaluation of PIRAT system on a large and closed corpus of documents,about 30550 items. The results are very encouraging.
In the second section, we present a brief overview of the Personalized InformationRetrieval (PIR). In the third section, we present in detail the proposed user’s modeling.In the forth section, we will see in detail the integration of the user profile in theproposed method of PIR. In the last section, we provide a description of the PIRATsystem as well as an evaluation of our own evaluation corpus.
2 Personalized Retrieval Information
Any information about the user or his profile, his preferences, his main interests, hisinformation needs and his research environment are consequently supposed to berelevant and usable by the system of personalization [6]. There are mainly tree types ofrepresentation of user’s profile [5]: Set, Semantics and Multidimensional. Theupgrading of the user profile means the adaptation to changes in interest centers that theusers describe, and therefore their information needs over time. There are two types ofthe user’s needs: short-term profile and long-term profile. For more details of theoverview on the user’s modeling, it is worth referring to the work of [5].
A personalized web search is usually achieved in practice by incorporating theuser’s profile in one of the three main retrieval steps: query refinement, documentretrieval and document re-ranking.
In this context, the works on IRS and query expansion for Arabic texts are notmuch known. First, the system of [8] adopts the notion of schema as a basis forlemmatize words and substitutes it with its lemmas in the operations of indexing andsearch. Then, the studies carried out done in [9] showed that manual reformulationreweighting of query terms leads to improved performance (recall and precision) of SRIArabic. For their experiment, [9] used a corpora of 242 documents and a set of ninequeries. Additionally, the work of [10] on the query expansion by terms from a the-saurus shows an improvement in the recall of the Arab SRI. We note that the corpusused is the Koran. On the other hand, the works of [11] show that the use of a thesaurus(i.e. Wikipedia) improves significantly (18 %) the performance of an Arab SRI. [11]also showed that the use of an indexation based on the roots is more efficient than theuse of schemes for Arabic texts. Moreover, the works of [3] on the query expansionusing ontology of the legal field and WordNet provided significant improvements in theperformance of IRS. The works of [7] used a reformulation based on an externalresource (Arabic WordNet and DSA). The results of comparison between the use of
PIRAT: A Personalized Information Retrieval System in Arabic 327

Arabic WordNet and DSA are in favor of the first. The evaluation corpora for this workconsists of a set of 50 keyword queries.
It should be noted that the works already mentioned, and despite the fact that someof them have proven their performance, they also have some limitations. Indeed, someworks used an ontology or semantic resource for a specific field such as the case of theworks of [3, 10]. In addition, in other works, we see the non-exploitation of conceptualrelationships ontology. Finally, there is a lack of studies about the contribution of eachsemantic relationship used in the enrichment process for some query expansion systemsfor the Arabic language as the case of the works of [3, 7].
According to the state of the art of IRS and QE, we notice that the contribution ofthis work is distinguished from that of the work cited above by (i) the coupling betweenthe user profile information and the one contained in ontology is an interestingapproach that should be developed (ii) integrating the user profile in all levels of theRIP process.
3 Suggested Modeling User
The proposed user’s modeling is based on a hybrid representation of the user profile, anexplicit and implicit construction of the profile as well as an updating the short and thelong term user profile. In this approach, we introduce an algorithm which automaticallybuilds a hierarchical user profile that represents his implicit personal interests anddomain. It is to represent the interests and the domain with a conceptual network ofnodes linked together through relationships respecting the link topology defined indomain of hierarchies and ontologies. The model proposed is based on the notion ofhyperonymy, hyponymy, and synonymy for a more realistic representation of the user.In what follows, we present the proposed approach.
3.1 Hybrid Representation of the User Profile
The representation of the user profile in our method is based on a hybrid approach(combination of the set-approach and conceptual approach). Thus, the proposedmodeling approach is based on two models: static Model and dynamic model. Theproposed static model of the user profile (User Profile set-representation) is based ondimensions that can be the user’s demographic attributes (identity, personal data),professional attributes (employer, address and type), behavioral attributes and centersof interest attributes. The proposed approach is to consider a multidimensional way ofmodeling the interest in the user profile by integrating a technical term weighted by theformula in TF * IDF [3, 4]. However, the dynamic model (Profile semantic repre-sentation) also presents the centers of interest and the domain of user in the form ofsemantic representation. Indeed, the profile is presented as a hierarchy of personalconcepts based on the knowledge contained in the ontologies Arabic Wordnet1
(AWN) and Amine Arabic Wordnet2(Amine AWN). The construction of user’s domain
1 http://wwww.globalwordnet.org/AWN/AWNBrowser.html.2 http://amine-platform.sourceforge.net.
328 H. Safi et al.

and centers of interest tree is based on the extraction of semantic relationships found inontologies (AWN and Amine AWN).
3.2 Initial Building of Profile
This stage occurs in order to avoid cold start and primarily to prompt the user to fill outpersonal information form related to him. Then, the system builds a hierarchy ofconcepts based on the user’s domain already indicated and his/her interests. Thetreatment is to build, from Arabic WordNet Amine and Arabic WordNet ontologies, atree containing all the information on the domain and interests of the concerned person.This step includes the user’s registration and the building of the domain tree that will bethe subject of the following two sections.
The Registration. The user is invited to fill in a registration form containing hispersonal information, such as his/her domain and interests. This is an explicit acqui-sition approach of the user’s data. Indeed, the profile is composed of three categories(i) personal data (the name, first name, login, password, etc.), (ii) professional Data (theuser’s profession and the field) and (iii) interest centers (the preferences).
Construction of the Profile as a Hierarchy of Concept. Building a hierarchy ofconcepts is based on the semantic relationships found in the ontology in question. Thisstep is based on the extraction of concepts from Amine AWN ontology and AWNontology that are in semantic relationships with the field in question and with eachcenter of interest. For a given field it is to extract for each concept the synonym (s), thehyperonymy (s) and hyponymy (s) if they exist in the ontologies. The hierarchy ofconcepts below corresponds to a sub-tree of the field (economy) “ داصتقإ ” (Fig. 1).
3.3 Updating the User Profile
The proposed approach manages to update the short-term, long-term profile or both atthe same time in terms of the time dimension. The capture of changes in the interestcenters is visualized by adding a search history (query and search results) in theshort-term profile. Indeed, the proposed approach defines a personalization score basedon building and updating of a user profile from its relevance judgments. Besides, eachuser’s request will be added to his short-term profile. In addition, we calculate theformula tf * idf of each term of each document is considered to be relevant or very
Fig. 1. Example of a hierarchy extracted from the AWN ontology for (economy) “ داصتقإ ” field
PIRAT: A Personalized Information Retrieval System in Arabic 329

relevant by the user. Then, we add the first three terms with the highest tf * idf in theshort-term user profile.
Thus, updating is considered by the recent information classification visualized orcreated by the user in the ontology concepts. This contributes to the accumulation ofthe weight of the initial concepts of the profile or activation of new concepts to beconsidered in the representation of the profile.
In fact, the approach proposed attributes an initial weight to each concept of thehierarchy that is going to be updated based on the user’s relevance judgments. Thus,the user profile is nodes set which compound is (i) interest score S Cð Þ to the concept cinitialized to 1, (ii) when updating the profile from the user’s relevance judgments, eachinterest score S Cð Þ is incremented in relation to a score of updating which depends onthe similarity Simðdi; cÞ of the document selected by the user and the concept c. Thescore c. updating c:evolution of concept c is estimated as follows:
c:evolution ¼ IS Cð Þ:Simðdi; cÞ ð1Þ
The highest score of concept c has spread to the entire nearest neighbor of conceptsc based on the weight of the relationship between these two concepts. The operation isperformed iteratively.
The proposed approach of an updating long-term profile is to add or modify acontext implicitly formed of a pair of concepts associated with a user’s query. Theidentification of a similar context to the query profile implies its combination with thelatter and the possible updating of the final representation in the long-term profile. If nocontext of all the already learned contexts matches the context of the query beingevaluated, a new context is added to the long term profile. Similarly, the long-termprofile can also be updated by the user by explicitly modifying the field.
4 Proposed Methods for AXON and PIRAT
The proposed reformulation method distinguishes five implemented steps. For moredetails about this method, one could refer to the work of [3, 5]. In the stemming phase,the Alkhalil stemmer was used. However, the latter does not provide a good result sinceits lexical database is poor and it does not give the lemma of a given term in its currentversion. To our knowledge, MADAMIRA3 is the only available light stemmer whichperforms morphological analysis and disambiguation of Arabic. For this reason, weused it to apply a light stemming on each query. Light stemming aims at reducingwords to their lemma forms. For example, if the query is “ ةيثارولاضارمألا ” (the geneticdiseases) then the pretreated query is “ ضرميثارو ” (genetic disease).
The personalized matching method consists of two steps, namely thedocument-query matching step by integrating the user profile in calculating the rele-vance score, and the user’s relevance feedback step which consists in updating theshort-term as well as long-term profile.
3 http://nlp.ldeo.columbia.edu/madamira/#locale=ar.
330 H. Safi et al.

4.1 Document-Query Matching Step
By exploiting the body of indexed documents and the enriched query according to theprofile, matching will take place. In this step, matching is composed of two phases,namely the classical matching and personalized matching. The classic matching is doneby computing a similarity function between document “d” and query “q” RSV (d, q).Indeed, this matching based on the search tool offered by Lucene for indexing adocument corpus and research documents and their correspondence with the query. Thecorrespondence between the query and the documents is made by operating the indexand display of the search results.
In personalized matching step, the user remains an inescapable component therebyobtaining a new relevance function RSV ðD;Q;UÞ where D, Q and U represent adocument, a user and a query. It is therefore appropriate to replace the RSV function ofLucene with another function which takes the user into account. Thus, the personal-ization technique is to include the user profile in computing the document relevance.This function is calculated as follows:
RSV D;Q;Uð Þ ¼ RSV D;Qð Þ þ RSV D; Uð Þ ð2Þ
4.2 User’s Relevence Feedback
This phase is considered to be an explicit user’s feedback. It is very helpful in theproposed evaluation process. Furthermore, its output serves as an input to the proposedreranking method using the learning technique (this method will be described in otherstudies). Thus, the user is asked to evaluate the documents deemed relevant by anindexing tool (Lucene) to the query entered by the user. According to his/her needs andinterests, the user can choose the level of importance of each document by assigning apercentage of 20 % (Not relevant) 40 % (a little relevant), 60 % (Medium relevant),80 % (relevant) or 100 % (very relevant). The chosen documents and their relevancelevels will be saved in the short-term user profile.
4.3 Updating the Short Term and Long Term Profile
Updating the short-term user profile is to enrich its representation on the basis ofcorrelated queries. Likewise, updating the long-term profile is based on the assumptionof recurrence of needed information during research sessions. Indeed, the most con-sulted profile in the short term is regarded as a long-term profile (see Sect. 3.3).
5 Experimentation and Discussion of Results
We implemented a personalized matching Arabic text query system entitled “PIRAT”.To evaluate this system, we used the search engine “Lucene4”. The later is capableof processing large volumes of documents with its power and speed due to indexing.
4 https://lucene.apache.org/.
PIRAT: A Personalized Information Retrieval System in Arabic 331

In our system, we used the 4.0.0 version of lucene to index a corpus of documents,analyze the queries, search for the documents and present document results.
5.1 Arabic Corpora: WCAT and AQC
Given that the Arabic language resources are very rare or even unavailable, we havecreated a large Arabic text corpus entitled WCAT (Wikipedia Corpus for Arabic Text).This corpus is segmented into 30550 text article, extracted from Wikipedia5, in order toevaluate PIRAT system. This corpus contains texts dealing with topics related to the“natural sciences” domain. Moreover, each article has one or more categories related tothe root category of “natural sciences”. We generated 7200 sub-categories from the“natural sciences” category. The study and the treatment of Wikipedia categories canonly be performed by a manual procedure. In what follows, we will give some featuresof the WCAT (Table 1).
We have used Lucene tool to index our corpus. In this phase, the indexing step ofthe corpus consists in word stemming, removing stop words, indexing and extractingkey words of each document in the corpus. A list of keywords thus allows defining thethemes represented in a document, that is to say, we will calculate the TF*IDF of eachterm of the document to extract first five keywords with the highest TF*IDF for eachdocument. These terms will be used later to update the short-term user profile.
We built also our own Arabic queries corpus entitled “AQC”. This corpus iscomposed of 100 queries submitted by 5 different users. The AQC dealing with topicsrelated to the “natural sciences” domain. An Arabic query corpus consists of 20,301words or 93,021 characters and 1.16 megabyte size. Thus, the evaluation corpus of oursystem contains different types of queries suggested by various users.
5.2 PIRAT System and the Discussion of the Evaluation Results
Given that there are no custom access standard assessment frameworks to PIR, par-ticularly suitable for short-term personalization, we proposed context-oriented assess-ment frameworks based on simulation collections of TREC campaign by simulateduser profiles and search sessions. We have exploited these evaluation frameworks tovalidate our contribution. We have also experimentally compared our “PIRAT” con-tribution to “AXON” method.
Table 1. Features of WCAT
Size of corpus Average size of an item Size of items Num. of words Language
100 MB 5 KB 5 KB 21492628 Arabic
5 The Wikipedia account 236,019 items in 02/12/2015.
332 H. Safi et al.
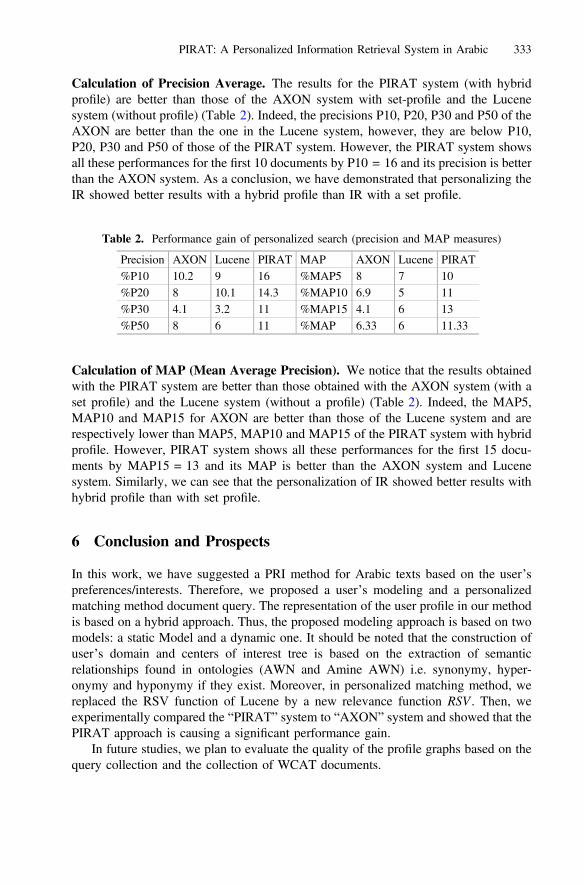
Calculation of Precision Average. The results for the PIRAT system (with hybridprofile) are better than those of the AXON system with set-profile and the Lucenesystem (without profile) (Table 2). Indeed, the precisions P10, P20, P30 and P50 of theAXON are better than the one in the Lucene system, however, they are below P10,P20, P30 and P50 of those of the PIRAT system. However, the PIRAT system showsall these performances for the first 10 documents by P10 = 16 and its precision is betterthan the AXON system. As a conclusion, we have demonstrated that personalizing theIR showed better results with a hybrid profile than IR with a set profile.
Calculation of MAP (Mean Average Precision). We notice that the results obtainedwith the PIRAT system are better than those obtained with the AXON system (with aset profile) and the Lucene system (without a profile) (Table 2). Indeed, the MAP5,MAP10 and MAP15 for AXON are better than those of the Lucene system and arerespectively lower than MAP5, MAP10 and MAP15 of the PIRAT system with hybridprofile. However, PIRAT system shows all these performances for the first 15 docu-ments by MAP15 = 13 and its MAP is better than the AXON system and Lucenesystem. Similarly, we can see that the personalization of IR showed better results withhybrid profile than with set profile.
6 Conclusion and Prospects
In this work, we have suggested a PRI method for Arabic texts based on the user’spreferences/interests. Therefore, we proposed a user’s modeling and a personalizedmatching method document query. The representation of the user profile in our methodis based on a hybrid approach. Thus, the proposed modeling approach is based on twomodels: a static Model and a dynamic one. It should be noted that the construction ofuser’s domain and centers of interest tree is based on the extraction of semanticrelationships found in ontologies (AWN and Amine AWN) i.e. synonymy, hyper-onymy and hyponymy if they exist. Moreover, in personalized matching method, wereplaced the RSV function of Lucene by a new relevance function RSV . Then, weexperimentally compared the “PIRAT” system to “AXON” system and showed that thePIRAT approach is causing a significant performance gain.
In future studies, we plan to evaluate the quality of the profile graphs based on thequery collection and the collection of WCAT documents.
Table 2. Performance gain of personalized search (precision and MAP measures)
Precision AXON Lucene PIRAT MAP AXON Lucene PIRAT%P10 10.2 9 16 %MAP5 8 7 10%P20 8 10.1 14.3 %MAP10 6.9 5 11%P30 4.1 3.2 11 %MAP15 4.1 6 13%P50 8 6 11 %MAP 6.33 6 11.33
PIRAT: A Personalized Information Retrieval System in Arabic 333

References
1. Jenifer, K., Yogesh Prabhu, M., Gunasekaran, N.: A survey on web personalization webapproaches for efficient information retrieval on user interests. J. Recent Res. Eng. Technol.2(6) (2015). ISSN: 2349–2260
2. Heintz, I.: Arabic language modeling with stem-derived morphemes for automatic speechrecognition. Ph.D. dissertation, The Ohio State University, USA (2010)
3. Zaidi, S., Laskri, M.: Expansion de la requête Arabe sur le réseau internet. In:Barmajiat CSLA, Alger (2007)
4. Safi, H., Jaoua, M., Belguith, L.: AXON: a personalized retrieval information system inArabic texts based on linguistic features. In: 6th International Conference on SIIE 2015,Hammamet, Tunisia, 12–14 February 2015
5. Safi, H., Jaoua, M., Belguith, L.: Intégration du profil utilisateur basé sur les ontologies dansla reformulation des requêtes Arabes. In: 2ème Colloque CEC-TAL, 23–25 Mars, Sousse,Tunisie (2015)
6. Akhila, G.S., Prasanth, R.S.: A survey on personalized web search. Int. J. Adv. Res. TrendsEng. Technol. (IJARTET) II(Special Issue VI), February 2015
7. Abderrahim, M.-A.: Utilisation des ressources externes pour la reformulation des requêtesdans un système de recherche d’information. Prague Bull. Math. Linguist. 99, 87–99 (2013)
8. Bessou, S., Saadi, A., Touahria, M.: Vers une recherche d’information plus intelligenteapplication à la langue arabe. In: Actes of SIIE 2008, Hammamet, Tunisia (2008)
9. Kanaan, G.R., Al-Shalabi, R., Abu-Alrub, M., Rawashdeh, M.: Relevance feedback:experimenting with a simple Arabic information retrieval system with evaluation. Int.J. Appl. Sci. Comput. 12(2) (2005)
10. Hammo, B., Azzam, S., Mahmoud, E.-H.: Effectiveness of query expansion in searching theHoly Quran. In: Proceedings of CITALA 2007, vol. 7, pp. 18–19, Morroco (2007)
11. Xu, Y., Jones, G.J.F., Wang, B.: Query dependent pseudorelevance feedback based onwikipedia. In: Proceedings of the Annual International SIGIR Conference on Research andDevelopment in Information Retrieval, SIGIR 2009, pp. 59–66. ACM (2009)
334 H. Safi et al.

YATS: Yet Another Text Simplifier
Daniel Ferres, Montserrat Marimon, Horacio Saggion(B),and Ahmed AbuRa’ed
TALN - DTIC, Universitat Pompeu Fabra, Barcelona, Spaindaniel.ferres,montserrat.marimon,horacio.saggion,
Abstract. We present a text simplifier for English that has been builtwith open source software and has both lexical and syntactic simplifica-tion capabilities. The lexical simplifier uses a vector space model app-roach to obtain the most appropriate sense of a given word in a givencontext and word frequency simplicity measures to rank synonyms.The syntactic simplifier uses linguistically-motivated rule-based syntac-tic analysis and generation techniques that rely on part-of-speech tagsand syntactic dependency information. Experimental results show goodperformance of the lexical simplification component when comparedto a hard-to-beat baseline, good syntactic simplification accuracy, andaccording to human assessment, improvements over the best reportedresults in the literature for a system with same architecture as YATS.
1 Introduction
Automatic text simplification is a research field which studies methods to sim-plify textual content. Text simplification methods should facilitate or at leastspeed up the adaptation of textual material, making accessible information forall a reality. The growing interest in text simplification is evidenced by the num-ber of languages and users which are targeted by researchers around the globe.In automatic text simplification, the algorithms can involve either or both lexi-cal and syntactic simplifications. Lexical simplification is the task of identifyingand substituting complex words for simpler ones in given contexts. Syntacticsimplification is the task of reducing the grammatical complexity of a sentencewhile keeping the original information and meaning. An example involving bothlexical and syntactic simplifications is given in (1), where the passive voice ischanged into active and complex words are substituted for simpler synonyms.
(1) a. The poem was composed by the renowned artist.b. The famous artist wrote the poem.
In this paper we present YATS, a state-of-the-art text simplifier for Englishthat has been built with the aim to improve text readability and understandabil-ity in order to help people with intellectual disabilities. The system, however,is highly adaptable and the resources used can easily be changed to meet theneeds of people with special demands.1
1 http://taln.upf.edu/pages/yats.
c© Springer International Publishing Switzerland 2016E. Metais et al. (Eds.): NLDB 2016, LNCS 9612, pp. 335–342, 2016.DOI: 10.1007/978-3-319-41754-7 32

336 D. Ferres et al.
2 Related Work
Early work on text simplification relied on hand-crafted rules to perform syntac-tic simplifications. Chandrasekar et al. [4] developed a linear pattern-matchinghand-crafted rule system that simplified a few specific constructions, namelyrelative clauses, appositions, and coordinated clauses. Then, Siddharthan [11]described a rule-based system that performed syntactic simplifications in threephases: (1) analysis, which used chunking and PoS tagging, followed by pattern-matching, (2) transformation, which applied a few rules for dis-embeddingrelative clauses, splitting conjoined clauses and making new sentences out ofappositives, and (3) regeneration, which fixed mistakes by generating referringexpressions, selecting determiners, and preserving discourse structure to improvetext cohesion. More recent hand-crafted systems made use of transfer rules thatoperated on the output of a parser: Siddharthan [12] applied transformationrules to a typed dependency representation produced by the Stanford parser.This is the approach that has been mostly followed in non-English projects [9].
Coster and Kauchak [5] and Wubben et al. [15] used monolingual translationfrom English Wikipedia (EW) to Simple English Wikipedia (SEW) and theyapplied phrase based Machine Translation to the text simplification augmentedwith a phrasal deletion model [5] and a post-hoc reranking procedure that rankedthe output [15]. Siddharthan and Angrosh [13] presented a hybrid system thatcombined manually written synchronous grammars for syntactic simplificationswith an automatically acquired synchronous grammar for lexicalized constructs.
Work on lexical simplification began in the PSET project [6]. The authorsused WordNet to identify synonyms and calculated their relative difficulty usingKucera-Francis frequencies. Biran et al. [1] used word frequencies in EW andSEW to calculate their difficulty, and Yatskar et al. [16] used SEW edit historiesto identify the simplify operations.
3 Lexical Simplification in YATS
The lexical simplifier based on [2,8] is composed of the following phases (exe-cuted sequentially): (i) Document analysis, (ii) Complex words detection, (iii)Word Sense Disambiguation (WSD), (iv) Synonyms ranking, and (v) Languagerealization. The document analysis phase extracts the linguistic features from thedocuments. It uses the GATE2 NLP API and its ANNIE pipeline to perform:tokenization, sentence splitting, part-of-speech (PoS) tagging, lemmatization,named entity recognition and classification, and co-reference resolution.
The complex word detection phase identifies a word as complex when thefrequency count of the word in a given psycholinguistic database is in a rangedetermined by two threshold values (i.e. w is complex if min ≤ wfrequency ≤max). The two psycholinguistic resources that can be used separately in ourlexical simplification system are: Age-of-Acquisition norms3 and Kucera-Francis4
frequency counts.2 http://gate.ac.uk.3 http://crr.ugent.be/archives/806.4 http://www.psych.rl.ac.uk/kf.wds.

YATS: Yet Another Text Simplifier 337
The WSD phase selects the most appropriate word replacement out of a listof “synonyms”. The WSD algorithm used is based on the Vector Space Model[14] approach for lexical semantics which has been previously used in LexicalSimplification [1]. The WSD algorithm uses a word vector model derived froma large text collection from which a word vector for each word in WordNet-3.15 is created by collecting co-occurring word lemmas of the word in N-windowcontexts (only nouns, verbs, adjectives, and adverbs) together with their fre-quencies. Then, a common vector is computed for each of the word senses of agiven target word (lemma and PoS). These word sense vectors are created byadding the vectors of all synonyms in each sense in WordNet. When a complexword is detected the WSD algorithm computes the cosine distance between thecontext vector computed from the words of the complex word context (at sen-tence or document level) and the word vectors of each sense from the model.The word sense selected is the one with the lowest cosine distance (i.e. greatercosine value) between its word vector in the model and the context vector ofthe complex word in the sentence or document to simplify. The data structureproduced following this procedure has 63,649 target words and 87,792 entries.The plain text of the Simple English Wikipedia (99,943 documents6) has beenextracted using the WikiExtractor7 tool. The FreeLing 3.18 NLP API has beenused to analyze and extract the lemmas and the PoS tags. These lemmas wereextracted from a 11-word window (5 lemmas are extracted to each side of thetarget words). We rank synonyms in the selected sense by their simplicity andfind the simplest and most appropriate synonym word for the given context. Thesimplicity measure implemented is word frequency (i.e. more frequent is simpler)[3]. Several frequency lists were compiled for YATS, however for the experimentsto be described here the Simple English Wikipedia frequency list was used.
The language realization phase generates the correct inflected forms of theselected synonym word substitutes in the contexts. The SimpleNLG Java API9
is used with its default lexicon to perform this task considering the context andthe PoS tag of the complex word.
3.1 Intrinsic Evaluation of the YATS Lexical Simplifier
Horn et al. [7] have produced a dataset for evaluation of lexical simplificationsystems containing 500 examples. Each example contains a sentence and a targetword, randomly sampled from alignments between sentences in pairs of articlesfrom English Wikipedia and Simple English Wikipedia produced by [5]. FiftyMechanical Turkers10 provided simplifications (i.e. lexical substitutes) for eachsentence in the dataset. Moreover, counts for the lexical substitutes proposed
5 http://wordnet.princeton.edu/.6 simplewiki-20140204 dump version.7 http://github.com/attardi/wikiextractor.8 http://nlp.cs.upc.edu/freeling/.9 http://github.com/simplenlg/simplenlg.
10 https://www.mturk.com.

338 D. Ferres et al.
were obtained so as to produce a frequency-based rank for the set of replace-ments. One example of the evaluation dataset is shown below:
Sentence: A haunted house is defined as a house that is believed to be acenter for supernatural occurrences or paranormal phenomena.Replacements: events (24); happenings (12); activities (2); things (2);accidents (1); activity (1); acts (1); beings (1); event (1); happening (1);instances (1); times (1); situations (1)
The example shows: (i) a sentence where the target word to simplify is under-lined (i.e. occurrences) and (ii) its possible replacements, together with the num-ber of annotators selecting the replacement (e.g. the word events was chosen 24times as simpler synonym for occurrences). We have carried out a hard intrinsicevaluation of the lexical simplification system using the above dataset. We haveused the YATS lexical simplifier to select the most appropriate and simpler syn-onym of each target word in the dataset. Note that this is not a real applicationscenario of our lexical simplifier, since we already know which target word tosimplify and therefore the task is somehow simpler. As a baseline we used twoapproaches: (i) the system proposed by [3] and replicated in [10] which sim-ply selects the most frequent synonym of the target word ignoring the possiblepolysemy of the target word (i.e. no WSD), and (ii) the rules induced by thesystem proposed by [16] which are freely available (see Sect. 2). The frequency-based baseline uses the same resources as YATS, that is, WordNet for findingsynonyms, and same file for lemma frequencies used in YATS.
In order to carry out the evaluation some transformations have to be appliedto the dataset: (i) all replacements have to be lemmatized and counts mergedfor replacements with the same lemma (e.g. in the example above activitiesand activity have to be collapsed under activity with count 1 + 2 = 3); (ii) forevaluating both YATS and the frequency-based baseline only replacements (i.e.lemmas) appearing as synonyms of the target word are considered (e.g. in theexample above occurrence has only 3 possible synonyms in our lexical resource:happening, presence, and event, therefore all other listed replacements will notbe considered since they can not be produced by the considered system). We uselexical simplification accuracy as a metric defined for a sentence S, target wordT , a set of weighted replacements Replacements(S, T ) of T in S, and Syno: thesynonym chosen by the system, as follows:
Lex Simp Acc(S, T, Syno) =
∑R∈Replacements(S,T ) Match(R,Syno,Rn)
∑R∈Replacements(S,T ) Rn
where Rn is the number of annotators who have chosen R as replacement,Match(R,Syno, Rn) is Rn if R = Syno and 0 otherwise. That is, the system winsas many points as annotators have chosen Syno as replacement. The denomina-tor of the formula is a normalization factor which indicates how many annota-tors have provided replacements for the target word. As an example, if for theinstance above a system selects “event” as a substitute of “occurrences”, then

YATS: Yet Another Text Simplifier 339
it will obtain 24 (=23+1)points. Given k pairs of sentences and target words< S, T >, the overall lexical simplification accuracy of a system will be its aver-age lexical simplification accuracy. The results of evaluating the three systems:YATS, frequency-based baseline, and rules are shown in Table 1. We also includethe maximum possible lexical simplification accuracy a system could obtain (i.e.an oracle).
Table 1. Average lexical simplification accuracy of three systems and an oracle on theHorn et al.’s lexical simplification dataset [7].
System Oracle YATS Frequency Rules
Lex.Simp.Acc. 0.81 0.21 0.19 0.11
Results indicate a good performance of the YATS system, overtaking botha hard to beat baseline and rule-based system which rules were induced fromcorpora. Moreover, YATS provided valid replacements for 146 sentences while thefrequency-based baseline provided 141 replacements and the rule-based systemonly 71.
4 Syntactic Simplification in YATS
The syntactic simplification is organized as a two-phase process: document analy-sis and sentence generation. The document analysis phase uses three mainresources to identify complex syntactic structures: (i) the GATE/ANNIE analy-sis pipeline used for lexical simplification; this step performs tokenization, sen-tence splitting and NE recognition, (ii) the Mate Tools dependency parser11,12
which adds a dependency labels to sentence tokens, and (iii) a set of GATEJAPE (Java Annotation Patterns Engine) grammars which detect and label thedifferent kind of syntactic phenomena appearing in the sentences.
JAPE Rules were manually developed in an iterative process by usingdependency-parsed sentences from Wikipedia. The process resulted in a set ofrules able to recognize and analyze the different kinds of syntactic phenomenaappearing in the sentences (described below). These rules rely on dependencytrees, which allow a broad coverage of common syntactic simplifications with asmall hand-crafted rules. Given the complex problem at hand, it is not enough toperform pattern matching and annotation of the matched elements, also the dif-ferent annotations matched instantiating the pattern have to be properly anno-tated and related to each other. Each syntactic phenomena dealt with in thesystem has a dedicated grammar (i.e. a set of rules). The complete rule-basedsystem is composed of the following sets of rules (applied in priority order whenseveral syntactic phenomena are detected): (i) appositives (1 rule), (ii) relative11 http://code.google.com/archive/p/mate-tools/.12 It uses the Mate Tools’ PoS tagger and lemmatizer before parsing.

340 D. Ferres et al.
clauses (17 rules), (iii) coordination of sentences and verb phrases (10 rules),(iv) coordinated correlatives (4 rules), (v) passive constructions (14 rules), (vi)adverbial clauses (12 rules), and (vii) subordination (i.e. concession, cause, etc.)(8 rules). The system recursively simplifies sentences until no more simplifica-tions can be applied.
The sentence generation phase uses the information provided by the analysisstage to generate simple structures. It applies a set of rules which are specific foreach phenomenon. These rules perform the common simplification operations,namely sentence splitting, reordering of words or phrases, word substitutions,verbal tense adaptions, personal pronouns transformations, and capitalizationand de-capitalization of some words.
4.1 Intrinsic Evaluation of the YATS Syntactic Simplifier
We have carried out an intrinsic evaluation of the rule-based systems in terms ofprecision. We have collected 100 sentence examples (not used for system devel-opment) per syntactic phenomena we target. Each grammar was then applied tothe set of sentences the grammar was covering so as to analyze the performanceof the rules on unseen examples. Results are presented on Table 2.
Most rules are rather precise, except perhaps those dealing with coordinationwhich is a very difficult phenomena to recognize given its ambiguity. An analysisof the errors showed us that the JAPE rules produced errors due to the lackof coverage of certain structures, e.g. coordination of anchors, coordination ofantecedents, or coordination of main verbs taking a subordinated clause. Someof the errors produced by the dependency parser were: the parser PoS taggerassigned a wrong PoS tag, the parser assigned a wrong function (e.g. the anchorwas identified with a wrong token, the relative pronoun got a wrong function) ora wrong dependency (e.g. the subordinated clause depended on a wrong head,the parser did not identify all the dependents of a head or it assigned a wrongtoken dependency), and the parser analyzed a syntactic structure wrongly.
Table 2. Evaluation of the JAPE grammars. The first column lists the syntactic phe-nomena, the second column indicates the number of sentences used which contained thesought syntactic phenomena, the third column indicates the percent of the grammarfired, the fourth column indicates the precision of the grammar, the fifth column is thepercent of wrong grammar applications, and finally the last column is the percent oftimes the grammar did not fire.
Grammar #sents %fired %right %wrong %ignored
Appositions 100 100% 79% 21 % 0 %
Relative Clauses 100 93% 79% 14 % 7 %
Coordination 100 62% 56% 6 % 38%
Subordination 100 97% 72% 25 % 3 %
Passives 100 91% 85% 6 % 9 %
Total 500 89% 74.2 % 14.4 % 11.4 %

YATS: Yet Another Text Simplifier 341
5 Human Evaluation of YATS
We performed manual evaluation relying on eight English proficient humanjudges,13 who assessed our system w.r.t. fluency, adequacy, and simplicity, usingthe evaluation set used by Siddharthan and Angrosh [13], from which we ran-domly selected 25 sentences. Participants were presented with the source sen-tence from the English Wikipedia (EW) followed by three simplified versionsfrom Simple English Wikipedia (SEW) (i.e. a sentence from SEW aligned to thesentence in EW), the system developed by Siddharthan and Angrosh [13], andYATS, in a randomized order, and they were asked to rate each of the simplifiedversion w.r.t. the extend to which it was grammatical (fluency), the extend towhich it had the same meaning as the complex sentence (adequacy), and theextend to which it was simpler than the complex and thus easier to understand(simplicity). We used a five point rating scale (high numbers indicate betterperformance). Table 3 shows the results for the complete data set. Our systemachieved the same mean score for simplicity as Siddharthan and Angrosh’s [13],and is slightly better at fluency and adequacy, though not statistically significant.
Table 3. Average results of the human evaluation with eight human judges.
System Fluency Adequacy Simplicity
Simple English Wikipedia (Human) 4.58 3.76 3.93
Siddharthan and Angrosh [13] (Automatic) 3.73 3.70 2.86
YATS (Automatic) 3.98 4.02 2.86
6 Conclusion
In this paper we have presented YATS, a text simplifier for English with lexi-cal and syntactic simplification capabilities. The lexical simplifier uses a vectorspace model approach to obtain the most appropriate sense of a given wordin a given context and word frequency simplicity measures to rank synonyms.We have shown that our lexical simplifier outperforms a hard-to-beat baselineprocedure based on frequency and a rule-based system highly cited in the liter-ature. The syntactic simplifier, which is linguistically motivated and based onpeer-reviewed work, uses rule-based syntactic analysis and generation techniquesthat rely on part-of-speech tags and dependency trees. Experimental results ofhuman assessment of the system output showed improvements over the bestreported results in the literature. Future research includes: (a) experiments tobetter assess the performance of the system (e.g. lexical simplification in otheravailable datasets), (b) improve the coverage of the syntactic simplifier by re-training the parser, (c) extending the scope of the lexical simplifier relying onmore advanced vector representations (e.g. embeddings), and (d) porting thesystem to other languages.13 None of them developed the simplifier.

342 D. Ferres et al.
Acknowledgments. We are grateful to three anonymous reviewers for their use-ful comments, to the participants in our human evaluation experiments, and toA. Siddharthan for sharing his dataset. This work was funded by the ABLE-TO-INCLUDE project (European Commission CIP Grant No. 621055). Horacio Saggion is(partly) supported by the Spanish MINECO Ministry (MDM-2015-0502).
References
1. Biran, O., Brody, S., Elhadad, N.: Putting it simply: a context-aware approach tolexical simplification. In: Proceedings of the ACL 2011, pp. 496–501 (2011)
2. Bott, S., Rello, L., Drndarevic, B., Saggion, H.: Can Spanish be simpler? LexSiS:lexical simplification for Spanish. In: Proceedings of the COLING 2012, Mumbai,India, pp. 357–374 (2012)
3. Carroll, J., Minnen, G., Canning, Y., Devlin, S., Tait, J.: Practical simplificationof English newspaper text to assist aphasic readers. In: Proceedings of the AAAI1998 Workshop on Integrating AI and Assistive Technology, pp. 7–10 (1998)
4. Chandrasekar, R., Doran, C., Srinivas, B.: Motivations and methods for text sim-plification. In: Proceedings of the COLING 1996, pp. 1041–1044 (1996)
5. Coster, W., Kauchak, D.: Learning to simplify sentences using wikipedia. In:Proceedings of ACL 2011 Workshop on Monolingual Text-To-Text Generation,Portland, Oregon, USA, pp. 1–9 (2011)
6. Devlin, S., Tait, J.: The use of a psycholinguistic database in the simplification oftext for aphasic readers. In: Linguistic Databases, pp. 161–173 (1998)
7. Horn, C., Manduca, C., Kauchak, D.: Learning a lexical simplifier using Wikipedia.In: Proceedings of ACL 2014, pp. 458–463 (2014)
8. Saggion, H., Bott, S., Rello, L.: Simplifying words in context. Experiments withtwo lexical resources in Spanish. Comput. Speech Lang. 35, 200–218 (2016)
9. Saggion, H., Stajner, S., Bott, S., Mille, S., Rello, L., Drndarevic, B.: Making itsimplext: implementation and evaluation of a text simplification system for spanish.TACCESS 6(4), 14 (2015)
10. Shardlow, M.: Out in the open: finding and categorising errors in the lexical sim-plification pipeline. In: Proceedings of LREC 2014, Reykjavik, Iceland (2014)
11. Siddharthan, A.: Syntactic simplification and text cohesion. In: Proceedings of theLEC 2002, pp. 64–71 (2002)
12. Siddharthan, A.: Text simplification using typed dependencies: a comparision of therobustness of different generation strategies. In: Proceedings of the 13th EuropeanWorkshop on Natural Language Generation, Nancy, France (2011)
13. Siddharthan, A., Angrosh, M.: Hybrid text simplification using synchronous depen-dency grammars with hand-written and automatically harvested rules. In: Proceed-ings of the EACL 2014, Gothenburg, Sweden (2014)
14. Turney, P.D., Pantel, P.: From frequency to meaning: vector space models of seman-tics. J. Artif. Int. Res. 37(1), 141–188 (2010)
15. Wubben, S., Bosch, A., Krahmer, E.: Sentence simplification by monolingualmachine translation. In: Proceedings of ACL 2012, pp. 1015–1024 (2012)
16. Yatskar, M., Pang, B., Danescu-Niculescu-Mizil, C., Lee, L.: For the sake of sim-plicity: unsupervised extraction of lexical simplifications from Wikipedia. In: Pro-ceedings of HLT-NAACL 2010 (2010)

Are Deep Learning Approaches Suitablefor Natural Language Processing?
S. Alshahrani(&) and E. Kapetanios
Cognitive Computing Research Group, Computer Science Department,University of Westminster, London, UK
Abstract. In recent years, Deep Learning (DL) techniques have gained muchattention from Artificial Intelligence (AI) and Natural Language Processing(NLP) research communities because these approaches can often learn featuresfrom data without the need for human design or engineering interventions. Inaddition, DL approaches have achieved some remarkable results. In this paper,we have surveyed major recent contributions that use DL techniques for NLPtasks. All these reviewed topics have been limited to show contributions to textunderstanding, such as sentence modelling, sentiment classification, semanticrole labelling, question answering, etc. We provide an overview of deep learningarchitectures based on Artificial Neural Networks (ANNs), ConvolutionalNeural Networks (CNNs), Long Short-Term Memory (LSTM), and RecursiveNeural Networks (RNNs).
Keywords: Deep learning Natural language processing Artificial neuralnetworks Convolutional neural networks Long short-term memory Recursive neural networks
1 Introduction
Machine Learning (ML) is a robust AI tool, which has shown its usefulness in our dailylives, for example, with technologies used in search engines, image understanding,predictive analytics, transforming speech to text and matching relevant text. All MLapproaches can be roughly classified as supervised, unsupervised and semi-supervised.
Building a machine-learning system with features extraction requires specificdomain expertise in order to design a classifier model for transforming the raw data intointernal representation inputs or vectors. These methods are called representationlearning (RL), in which the model automatically feeds in raw data to detect the neededrepresentation.
In particular, the ability to precisely represent words, phrases, sentences (statementor question) or paragraphs, and the relational classifications between them, is essentialto language understanding. Deep learning approaches are similar to RL methods usingmultiple levels of representational processing [1].
Deep Learning (DL) involves multiple data processing layers, which allow themachine to learn from data, through various levels of abstraction, for a specific task
© Springer International Publishing Switzerland 2016E. Métais et al. (Eds.): NLDB 2016, LNCS 9612, pp. 343–349, 2016.DOI: 10.1007/978-3-319-41754-7_33
without human interference or previously captured knowledge. Therefore, one couldclassify DL as unsupervised ML approach. Investigating the suitability of DLapproaches for NLP tasks has gained much attention from the ML and NLP researchcommunities, as they have achieved good results in solving bottleneck problems [1].These techniques have had great success in different NLP tasks, from low level(character level) to high level (sentence level) analysis, for instance, sentence mod-elling [12], Semantic Role Labelling [4], Named Entity Recognition [19], QuestionAnswering [15], text categorization [11], opinion expression [8], and MachineTranslation [9].
The focus of this paper is on DL approaches that are used for NLP tasks. ANNs arediscussed in Sect. 2 below, while CNNs are considered in Sect. 3. Section 4 discussesthe suitability of these techniques for NLP and the implications for future research. Wethen conclude with a brief overview in Sect. 5.
2 Artificial Neural Networks Approaches
A standard neural network consists of many connected units called neurons, eachgenerating a sequence of real-valued activations. Neurons are activated by previousneurons in the circuit, via weighted connections. Each link transforms chains ofcomputational sequences between neurons in a non-linear way. ANNs are robustlearning models that are about precisely assigning weights across many levels. Theyare broadly divided into two types of ANN architectures that can be feed-forwardnetworks (FF-NNs), Recurrent Neural Networks (RNNs) and Recursive Neural Net-works [10]. FF-NNs architecture consists of fully connected network layers. The RNNsmodel, on the other hand, consist of a fully linked circle of neurons connected for thepurpose of back-propagation algorithm implementation.
FF-NNs applied to NLP tasks consider syntax features as part of semantic analysis[26]. ANN learning models have been proposed that can be applied to different naturallanguage tasks, such as semantic role labelling and Named Entity Recognition [23].The advantage of these approaches is to avoid the need for prior knowledge and taskspecific engineering interventions. FF-NNs models have achieved an efficientperformance in tagging systems with low computational requirements [4]. A Neural-Image-QA approach has been proposed, which combines NLP and image representa-tion for a textual question answering system regarding images [16]. However, thissystem has shown incorrect answers regarding the size of the objects in an image, andalso with spatial reasoning questions, such as “which is the largest object?”. In anotherstudy [28], a novel approach was proposed to match queries with candidate answers(sentences) depending on their semantic meaning, by combing distributed representa-tions and deep learning without the need for features engineering or linguistic expertise.State-of-the-art neural network-based distributional models have achieved a high per-formance in various natural NLP tasks; for instance, document classification [13] andEntity Disambiguation and Recognition [23]. Another FF-NNS approach is theANNABEL model [7], which aspires to simulate the human brain and to become ableto process verbal and non-verbal natural language without prior knowledge. This workis based on a large-scale neural architecture which acts as the central executive and
344 S. Alshahrani and E. Kapetanios

interacts with humans through a conversational interface. The lack of control overinformation flow through memory inspired the ANNABEL team to build their mentalaction to control the Short-Tern Memory system.
2.1 Recurrent Neural Network Approaches
The RNNs model fully links neurons in a circle of connections for the purpose ofback-propagation algorithm implementation. Recurrent Neural Networks have been rec-ommended for processing sequences [10], while Recursive Neural Networks are collec-tions of recurrent networks that can address trees [6]. Another application uses RecurrentNeural Networks for question answering systems about paragraphs [15], and a NeuralResponding Machine (NRM) has been proposed for a Short-Text Conversation generator,which is based on neural networks [21]. In addition, Recurrent Neural Networks modelsoffered state-of-the-art performance for sentiment classification [13], target-dependentsentiment classification [25] and question answering [15]. Adaptive Recurrent NeuralNetwork (AdaRNN) is introduced for sentiment classification in Twitter promotions basedon the context and syntactic relationships between words [2]. Furthermore, RecurrentNeural Networks are used for the prediction of opinion expression [8].
3 Convolutional Neural Networks Architecture
CNNs evolved in the field of vision research, where the first use was for performingimage classification learning to detect the edges of an image from its raw pixels, in thefirst layer, and then using the edges to identify simple shapes located in the secondlayer. These shapes are then used to identify higher-level features such as facial shapesin the higher layers of the network [27].
Applying a non-linear function over a sequence of words, by sliding a window overthe sentences, is the key advantage of using CNNs architecture for NLP tasks [57]. Thisfunction, which is also called a ‘filter’, mutates the input (k-word window) into ad-dimensional vector that consists of the significant characteristic of the words in thewindow. Then, a pooling operation is applied to integrate the vectors, resulting fromthe different channels, into a single n-dimensional vector. This is done by consideringthe maximum value or the average value for each level across the different windows tocapture the important features, or at least the positions of these features. For example,Fig. 1 gives an illustration of the CNNs’ structure where each filter executes convo-lution on the input, in this case a sentence matrix, and then produces feature maps,hence it showing two possible outputs. This example is used in the sentence classifi-cation model.
Most NLP classification tasks use CNN models and pioneering work has been doneusing these methods for semantic-role labelling [3], sentiment and question-typeclassification [14], text understanding from the basic character level [57] and textcategorization [11]. A further use of CNNs is in the visual question-answering model,known as mQA model, which is able to answer a question about image contents [5].This model comprises of four parts: a Long Short-Term Memory (LSTM) to extract thequery representation, a CNN, another LSTM for processing the context of the answers,
Are Deep Learning Approaches Suitable 345

and a process part for generating the answer, which can collect the information fromthe first three parts in order to provide answers. This can be in the form of a word, aphrase or a sentence. A new convolutional latent semantic approach for vector repre-sentation learning [22] uses CNNs to deal with ambiguity problems in semanticclustering for short text. However, this model can work appropriately for long text aswell [25]. CNNs are proposed for sentiment analysis of short texts that learn features ofthe text from low levels (characters) to high levels (sentences) to classify sentences inpositive or negative prediction analysis. However, this approach can be used for dif-ferent sentence sizes [18]. The Dynamic CNN (DCNN) is embraced for semanticsentence modelling which includes extracting features from sentences. DCNN istrained by selectively weighting functions between linked network layers [12].
4 Discussion and Future Research
DL approaches are used for a variety of NLP tasks, as shown in Table 1. This gives anoverview of different NLP tasks using NN, CNN and RNN (Recurrent Neural Net-work) approaches for NLP tasks related to semantic and context analysis. The RNNs
Fig. 1. Model of three filter division sizes (2, 3 and 4) of CNNs architecture for sentenceclassification. (Source: Zhang and Wallace (2015)). (Color figure online)
346 S. Alshahrani and E. Kapetanios

model can achieve a competitive performance in NLP tasks with sequence input; but, ifthe problem deals with sparsity in its input, this can be solved using CNNs. The CNNimplementation is most commonly used in NLP classification tasks, such as sentimentclassification, question answering, and sentence selection. CNNs have achievedstate-of-the-art performance in solving data sparsity problems in large structures ofNLP tasks.
In addition, DL learning techniques provide an enhanced performance for NLPtasks due to their ability to its distinguishing features. Firstly, they use powerful per-formance, provided by advanced CPUs, to improve training processes which areimplemented in current deep learning techniques, for NLP tasks. Secondly, they pro-vide functional evidence in terms of representation, as convolutional filters can auto-matically learn the term representations without requiring prior knowledge.Furthermore, RNNs deal with sequence inputs, and we therefore expect models whichuse these methods to have a large impact on natural language understanding over thenext couple of years.
Conversely, conventional deep learning approaches that may be very appropriatefor processing of raw pixels in images cannot work properly for text processing, due tothe need for more features and data in the hidden layer parameters [24].
Popular word-embedding models are GloVe (Global Vectors for word represen-tation) [17], Word2vec [20], and embedding algorithms, such as dynamically sizedcontext windows [4]. Word2vec is an open-source Google text processing tool pub-lished in 2013. This approach is used for word representation. Word2vec relies upontwo algorithms, skip-grams and continuous bag of words (CBOW). The skip-grammodel process the current input word using a linear classifier to predict surroundingwords in a specific scope, whereas CBOW is a trained model for understandingambiguous words, based on their context [20]. GloVe is a vector representationword-learning method.
Table 1. Gives an overview of different NLP tasks using DL approaches for for NLP tasksrelated to semantic and context analysis.
Text understanding task ANNs CNNs RNNs
Sentence classification
Named entity recognition(NER)
Text categorization
Semantic role labelling
Semantic clustering
Short-text conversation
Question answering
Sentiment analysis
Paraphrase detection
Document classification
Topic categorization
Opinion expression prediction
Are Deep Learning Approaches Suitable 347
GloVe works by computing the large word co-occurrence matrix in memory, and isdependent on matrix factorization algorithms, making it a good model for optimization.In contrast, Word2Vec goes through sentences directly, treating each co-occurrenceseparately. The advantage of these approaches (word-embedding) can be combinedwith other deep learning models to enhance performance for NLP tasks. In addition, agradient-based method can be used in NN training, which helps to reduce error over atraining set.
In addition, further research may explore the suitability of DL for ConversationalUser Interfaces and/or for dynamic Question Answering, particularly for graph basedpattern search and recognition, over Linked Open Data.
5 Conclusion
In this paper, we have presented an overview of the deep learning based approach tonatural language processing tasks. Different studies are included in this review, cov-ering various NLP tasks that implemented ANNs, CNNs, RNNs and LSTM. Theseapproaches can be combined with other deep learning models to develop improvedperformance for NLP tasks. The advantage of using these approaches is to avoid theneed for prior knowledge and human engineering interventions. The key conclusionfrom this overview is that deep learning approaches are ideal for solving data sparsityproblems in large structures, while CNNs have the advantage of fast performance andalso providing functional evidence for representational learning and feature extraction.
We have not discussed statistical surveys or performance comparisons relating todeep learning techniques used for NLP tasks. This should be explored comprehensivelyas part of future research.
References
1. Ba, L., Caurana, R.: Do Deep Nets Really Need to be Deep? 521(7553) 1–6 (2013). arXivpreprint arXiv:1312.6184
2. Dong, L., Wei, F., Tan, C., Tang, D., Zhou, M., Xu, K.: Adaptive recursive neural networkfor target-dependent Twitter sentiment classification. In: ACL-2014, pp. 49–54 (2014)
3. Collobert, R., Weston, J.: Fast semantic extraction using a novel neural network architecture.In: Proceedings of the 45th Annual Meeting of the ACL, pp. 560–567 (2007)
4. Collobert, R., Weston, J., Bottou, L., Karlen, M., Kavukcuglu, K., Kuksa, P.: Naturallanguage processing (almost) from scratch. J. Mach. Learn. Res. 12, 2493–2537 (2011)
5. Gao, H., Mao, J., Zhou, J., Huang, Z., Wang, L., Xu, W.: Are you talking to a machine?Dataset and methods for multilingual image question answering. In: Arxiv, pp. 1–10 (2015)
6. Goller, C., Kuchler, A.: Learning task-dependent distributed representations bybackpropagation through structure. In: Proceedings of the ICNN 1996, pp. 347–352.IEEE (1996)
7. Golosio, B., Cangelosi, A., Gamotina, O., Masala, G.L.: A cognitive neural architecture ableto learn and communicate through natural language. PLoS ONE 10(11), e0140866 (2015)
8. Irsoy, O., Cardie, C.: Opinion mining with deep recurrent neural networks. In:EMNLP-2014, pp. 720–728 (2014)
348 S. Alshahrani and E. Kapetanios

9. Jean, S., Cho, K., Memisevic, R., Bengio, Y.: On using very large target vocabulary forneural machine translation. In: Proceedings of the ACL-IJCNLP (2015)
10. Elman, J.L.: Finding structure in time. Cogn. Sci. 14(2), 179–211 (1990)11. Johnson, R., Zhang, T.: Semi-supervised Convolutional Neural Networks for Text
Categorization via Region Embedding, pp. 1–12 (2015)12. Kalchbrenner, N., Grefenstette, E., Blunsom, P.: A convolutional neural network for
modelling sentences. In: Proceedings of the 52nd Annual Meeting of the Association forComputational Linguistics, ACL 2014, 22–27 June 2014, Baltimore, MD, USA, vol. 1,pp. 655–665 (2014). Long Papers
13. Hermann, K.M., Blunsom, P.: Multilingual models for compositional distributionalsemantics. In Proceedings of ACL (2014)
14. Kim, Y.: Convolutional neural networks for sentence classification. In: Proceedings of the2014 Conference on Empirical Methods in Natural Language Processing (EMNLP 2014),pp. 1746–1751 (2014)
15. Iyyer, M., Boyd-Graber, J., Claudino, L., Socher, R., Daumé III, H.: A neural network forfactoid question answering over paragraphs. In: EMNLP (2014)
16. Malinowski, M., Rohrbach, M., Fritz, M.: Ask your neurons: a neural-based approach toanswering questions about images. In: IEEE International Conference on Computer Vision,pp. 1–9 (2015)
17. Pennington, J., Socher, R., Manning, C.D.: GloVe: global vectors for word representation.In: EMNLP (2014)
18. dos Santos, C.N., Gatti, M.: Deep convolutional neural networks for sentiment analysis ofshort texts. In: COLING-2014, pp. 69–78 (2014)
19. dos Santos, C.N., Guimarães, V.: Boosting named entity recognition with neural characterembeddings. In: ACL 2014, pp. 25–33 (2015)
20. Schmidhuber, J.: Deep learning in neural networks: an overview. Neural Netw. 61, 85–117(2015)
21. Shang, L., Lu, Z., Li, H.: Neural responding machine for short-text conversation. In:ACL-2015, pp. 1577–1586 (2015)
22. Shen, Y., He, X., Gao, J., Deng, L., Mesnil, G.: A latent semantic model with convolutional-pooling structure for information retrieval. In: Proceedings of the 23rd ACM InternationalConference on Conference on Information and Knowledge Management - CIKM 2014,pp. 101–110 (2014)
23. Sun, Y., Lin, L., Tang, D., Yang, N., Ji, Z., Wang, X.: Modelling mention, context and entitywith neural networks for entity disambiguation. In: IJCAI, pp. 1333–1339 (2015)
24. Mikolov, T., Corrado, G., Chen, K., Dean, J.: Efficient estimation of word representations invector space. In: Proceedings of the International Conference on Learning Representations(ICLR 2013) (2013)
25. Wang, P., Xu, J., Xu, B., Liu, C., Zhang, H., Wang, F., Hao, H.: Semantic clustering andconvolutional neural network for short text categorization. In: Proceedings of the ACL 2015,pp. 352–357 (2015)
26. Weston, J., America, N.E.C.L., Way, I.: A unified architecture for natural languageprocessing: deep neural networks with multitask learning. In: ICML 2008, pp. 160–167(2008)
27. LeCun, Y., Bengio, Y.: Convolutional networks for images, speech, and time-series.pp. 255–258. MIT Press (1995)
28. Yu, L., Hermann, K.M., Blunsom, P., Pulman, S.: Deep learning for answer sentenceselection. In: NIPS Deep Learning Workshop, 9 p. (2014)
29. Zhang, X., LeCun, Y.: Text Understanding from Scratch (2015)
Are Deep Learning Approaches Suitable 349
An Approach to Analyse a Hashtag-BasedTopic Thread in Twitter
Ekaterina Shabunina(B), Stefania Marrara, and Gabriella Pasi
Dipartimento di Informatica Sistemistica e Comunicazione,Universita degli Studi di Milano-Bicocca, Viale Sarca 336, 20126 Milan, Italy
ekaterina.shabunina,stefania.marrara,[email protected]
Abstract. In last years, the spread of social Web has promoted a stronginterest in analyzing how information related to a given topic diffuses.Nevertheless, this is still quite an unexplored field in the literature. Inthis paper we propose a general approach that makes use of a set ofNatural Language Processing (NLP) techniques to analyse some of themost important features of information related to a topic. The domainof this study is Twitter, since here topics are easily identified by meansof hashtags. In particular, our aim is to analyse the possible change overtime of the content sub-topicality and sentiment in the tracked tweets,and bring out their relationships with the users’ demographic features.
Keywords: Corpus analysis · Natural language processing techniques ·Twitter · Information demographic · User generated content analysis
1 Introduction
In last years, with the spread of social media the analysis of how content relatedto a given topic is spread through the Web constitutes an interesting researchissue. In particular, Twitter is a microblogging platform where the discussionaround a given topic can be easily identified and tracked by means of the so-called hashtags (e.g., #HeForShe). The assumption at the basis of this paperis that a hashtag is representative of an eccentric topic, as outlined in [4]. Thisallows to easily crawl a thread of tweets, which can offer a good repository toperform various kinds of analysis, related to different characteristics of boththe content and the users generating it. Analyses of this kind can give severalinteresting insights on how a certain topic diffuses among users also dependeingon users’ characteristics.
The objective of this paper is to propose a tool that, based on a set of standardNLP techniques, allows to analyse some of the most important characteristicsof the Twitter topics and their contributing users. In particular, the aim of theproposed approach is to monitor over time the content sub-topicality and senti-ment in the tracked tweets, and its relation with demographics such as genderand age. Differently to the well studied phenomenon of information diffusion, inour work we aim to study the evolution of content on a given Twitter topic in alimited timeframe.c© Springer International Publishing Switzerland 2016E. Metais et al. (Eds.): NLDB 2016, LNCS 9612, pp. 350–358, 2016.DOI: 10.1007/978-3-319-41754-7 34

An Approach to Analyse a Hashtag-Based Topic Thread in Twitter 351
The paper is organised as follows: in Sect. 2 we present the context of thecurrent study. In Sect. 3 we introduce the approach proposed in the current work,followed by the application of our approach on a specific topic in Sect. 4. Finally,Sect. 5 concludes the paper.
2 Related Work
In this section we shortly review the literature that shares some common back-ground with the approach proposed in this paper.
Several research works focus on the study of the demographics of the socialnetwork users who generate the information spread. In [5] the gender of theTwitter users is detected through a comparison of the first word of the self-reported name in the user’s profile to the list of the most popular names reportedby the USA Social Security Administration. In the research conducted in [1] thetweets from reporters of 51 US newspapers have been analyzed for the genderratio in the quotes. The result reported in [1] is in line with most previousworks on this topic, which present that women are less likely to be used asquoted sources overall. Additionally, in [7] it has been discovered that blogs aremore likely to quote the source without introducing any changes, in contrast toprofessional journalists.
Another research line analyzes hashtags, their diffusion and the character-istics of their spread [4]. In [6,8] the authors outline that different topics havedistinct patterns of information spread.
The spread of units of information or concepts on the Web, known as Infor-mation Propagation, has been widely studied as a modelling and predictionproblem [2] or as function of the influence among nodes of a network [8]. Unlikethe aim of our work, these approaches do not focus on the evolution of the con-tent itself but rather on the evolution of the network of users. However, in [3]the authors point out the importance of the content of a piece of informationwhen predicting its propagation.
In this paper we claim that the analysis of the user generated content overtime is an important research issue. To this aim we propose a simple approachwith a related tool that can easily support a few basic kinds of analysis relatedto both users and tweets. The proposed approach is presented in Sect. 3.
3 The Proposed Approach
In this section we describe the proposed approach for analysing some character-istics of the evolution of a topic (identified by a hashtag in Twitter) in a giventime interval.
3.1 The Twitter Topic Analysis Questions
In this section we propose a set of questions that can be used as guidelines forthe analysis of any stream of tweets associated with a topic:

352 E. Shabunina et al.
1. What is the main sentiment along the tweets stream? Does it change overtime and w.r.t. user gender or age?
2. How are the users who contributed to the analysed topic divided w.r.t. theirtopics of interests?
3. Who are the main contributors to the tweets stream? Are they private usersor corporates?
4. Does the topic have a goal? If so, are the statistics of the analysis in line withthe main purpose of the topic creation?
5. What are the characteristics (e.g. gender, age, etc.) of the leading quotedsources?
The above questions can be more specifically tailored to the topic underconsideration. To answer the above questions, we propose a combined usage ofopen source NLP tools and a module that we have developed to perform somespecific statistical analyses; we refer to this combination as the Analysis Tool.
The tool, presented in Sect. 3.2, works with a set of sentiment and demo-graphic dimensions aimed at gathering the analysis statistics. The considereddimensions are:
– the gender, male or female, of the user;– the age of the user, to identify if the topic touched the diverse groups of the
Twitter population;– the user sentiment;– the tweet sentiment;– the main topic of interest of each user (e.g., Arts, Business...), to identify
the interests of the users who posted in the analysed topic;– the quoted sources (via the analysis of retweets), to detect the trusted voice
of the crowd and the dominant contributors to the spread of information;– sub-topicality (via terms frequency and jointly used hashtags), to analyse
changes in the information carried by the given hashtag.
Fig. 1. The tool for analysing the content evolution of a stream of tweets associatedwith a given hashtag.
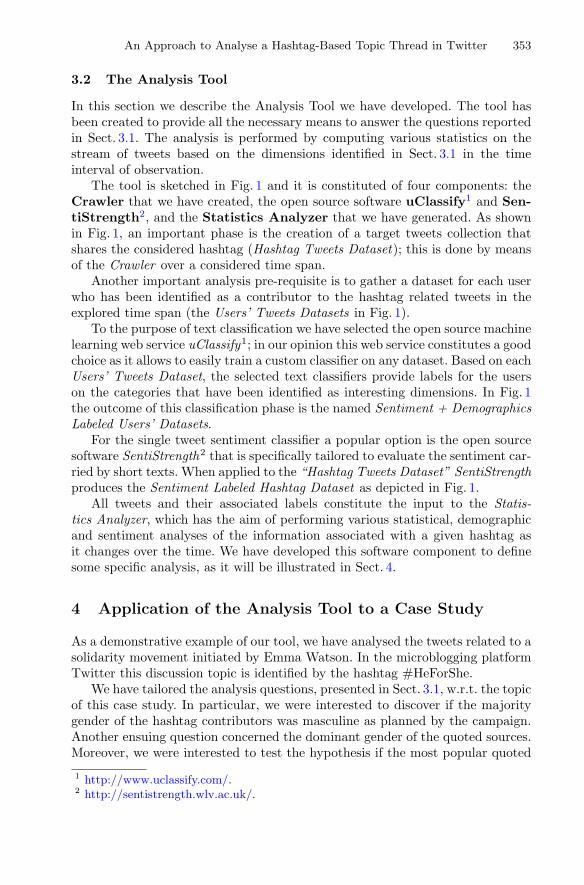
An Approach to Analyse a Hashtag-Based Topic Thread in Twitter 353
3.2 The Analysis Tool
In this section we describe the Analysis Tool we have developed. The tool hasbeen created to provide all the necessary means to answer the questions reportedin Sect. 3.1. The analysis is performed by computing various statistics on thestream of tweets based on the dimensions identified in Sect. 3.1 in the timeinterval of observation.
The tool is sketched in Fig. 1 and it is constituted of four components: theCrawler that we have created, the open source software uClassify1 and Sen-tiStrength2, and the Statistics Analyzer that we have generated. As shownin Fig. 1, an important phase is the creation of a target tweets collection thatshares the considered hashtag (Hashtag Tweets Dataset); this is done by meansof the Crawler over a considered time span.
Another important analysis pre-requisite is to gather a dataset for each userwho has been identified as a contributor to the hashtag related tweets in theexplored time span (the Users’ Tweets Datasets in Fig. 1).
To the purpose of text classification we have selected the open source machinelearning web service uClassify1; in our opinion this web service constitutes a goodchoice as it allows to easily train a custom classifier on any dataset. Based on eachUsers’ Tweets Dataset, the selected text classifiers provide labels for the userson the categories that have been identified as interesting dimensions. In Fig. 1the outcome of this classification phase is the named Sentiment + DemographicsLabeled Users’ Datasets.
For the single tweet sentiment classifier a popular option is the open sourcesoftware SentiStrength2 that is specifically tailored to evaluate the sentiment car-ried by short texts. When applied to the “Hashtag Tweets Dataset” SentiStrengthproduces the Sentiment Labeled Hashtag Dataset as depicted in Fig. 1.
All tweets and their associated labels constitute the input to the Statis-tics Analyzer, which has the aim of performing various statistical, demographicand sentiment analyses of the information associated with a given hashtag asit changes over the time. We have developed this software component to definesome specific analysis, as it will be illustrated in Sect. 4.
4 Application of the Analysis Tool to a Case Study
As a demonstrative example of our tool, we have analysed the tweets related to asolidarity movement initiated by Emma Watson. In the microblogging platformTwitter this discussion topic is identified by the hashtag #HeForShe.
We have tailored the analysis questions, presented in Sect. 3.1, w.r.t. the topicof this case study. In particular, we were interested to discover if the majoritygender of the hashtag contributors was masculine as planned by the campaign.Another ensuing question concerned the dominant gender of the quoted sources.Moreover, we were interested to test the hypothesis if the most popular quoted
1 http://www.uclassify.com/.2 http://sentistrength.wlv.ac.uk/.

354 E. Shabunina et al.
sources belonged to celebrities rather than common people. The next questionwas related to the dominant age groups of the contributors to the promotionof gender equality. Lastly we explored the expectation that the dominant senti-ment of the tweets stream was positive, based upon the noble intentions of thecampaign.
4.1 Dataset Description
The tweets collection was generated using the Twitter Search API 1.1 on aweekly basis. The tweets associated with the considered hashtag, i.e., #HeFor-She, were crawled, limited to those in English. Our dataset covers one month ofTwitter microblogs, containing the hashtag #HeForShe, crawled from March 08to April 08, 2015. In total it consists of 72.932 tweets, posted by 53.700 distinctusers. The retweets were included in the dataset since they comprise a Twit-ter mechanism to favor the propagation of information found interesting by theusers; this constitutes an important information to the purpose of our analy-ses. Only tweets from users with protected accounts were eliminated from thisdataset (about 1, 5% of the initial dataset). These users were deleted since theirtweets are protected, thus not allowing their classification. In addition to themain dataset, we have gathered 50.445 collections of the last tweets belongingto the users who contributed to the discussion under the #HeForShe hashtag.
All tweets datasets were fed to the text classifiers of uClassify and to thesentiment classifier SentiStrength to generate labels on five categories: Gender,Age Groups, User Sentiment, Tweet Sentiment and Topic. The geographic dis-tribution of the tweets was not considered in the analysis due to the extremesparseness of the geographic information in the tweets and in the users’ accounts.
4.2 Results of the Performed Analyses
In this section we present the results of the performed analysis with our tool.
Demographic. A first issue we addressed was to verify if the peculiarity ofthe hashtag (campaign) served its purpose. Although this hashtag was createdfor men to participate in the gender equality fight, only 18% of all tweets andonly 17% of all retweets were spread by men. This gender domination trend wasconsistent throughout the whole time period under study at a daily granularity.
Additionally, it was interesting to compare the retweets and tweets amountson a daily scale. Over the investigated time period, 71.829 tweets were posted onthe gender equality campaign in Twitter. Out of these, 57.520 tweets were actu-ally “retweets”, and consequently only 14.309 were “original tweets” containingnew content. This explains the identical oscillation pattern on a daily basis ofthe retweets number and the “all posts” one, observable in Fig. 2.
Looking at the age distribution per each gender group in Fig. 3, we foundthat for women the strong majority of users (57, 8%) was classified to the “13–17 years old” group persistently along the 32 studied days. While, interestingly,
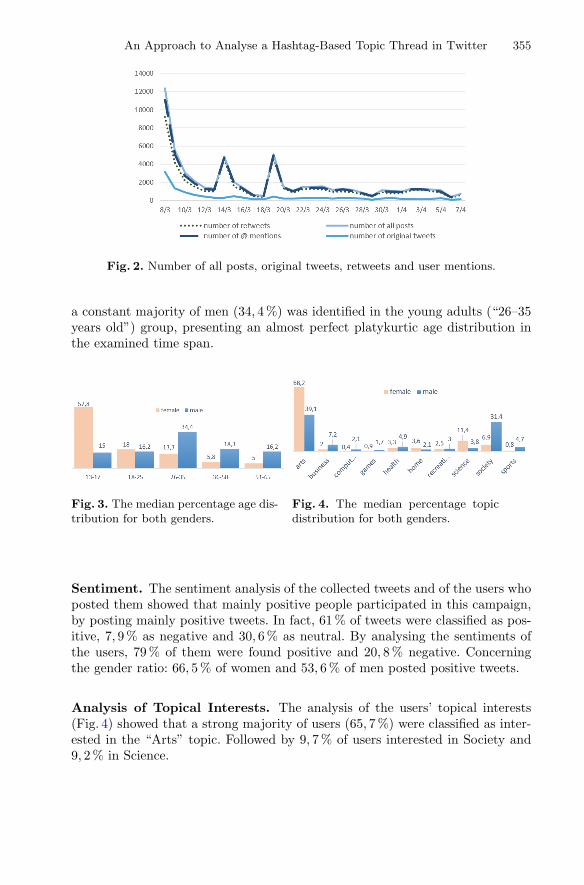
An Approach to Analyse a Hashtag-Based Topic Thread in Twitter 355
Fig. 2. Number of all posts, original tweets, retweets and user mentions.
a constant majority of men (34, 4%) was identified in the young adults (“26–35years old”) group, presenting an almost perfect platykurtic age distribution inthe examined time span.
Fig. 3. The median percentage age dis-tribution for both genders.
Fig. 4. The median percentage topicdistribution for both genders.
Sentiment. The sentiment analysis of the collected tweets and of the users whoposted them showed that mainly positive people participated in this campaign,by posting mainly positive tweets. In fact, 61% of tweets were classified as pos-itive, 7, 9% as negative and 30, 6% as neutral. By analysing the sentiments ofthe users, 79% of them were found positive and 20, 8% negative. Concerningthe gender ratio: 66, 5% of women and 53, 6% of men posted positive tweets.
Analysis of Topical Interests. The analysis of the users’ topical interests(Fig. 4) showed that a strong majority of users (65, 7%) were classified as inter-ested in the “Arts” topic. Followed by 9, 7% of users interested in Society and9, 2% in Science.
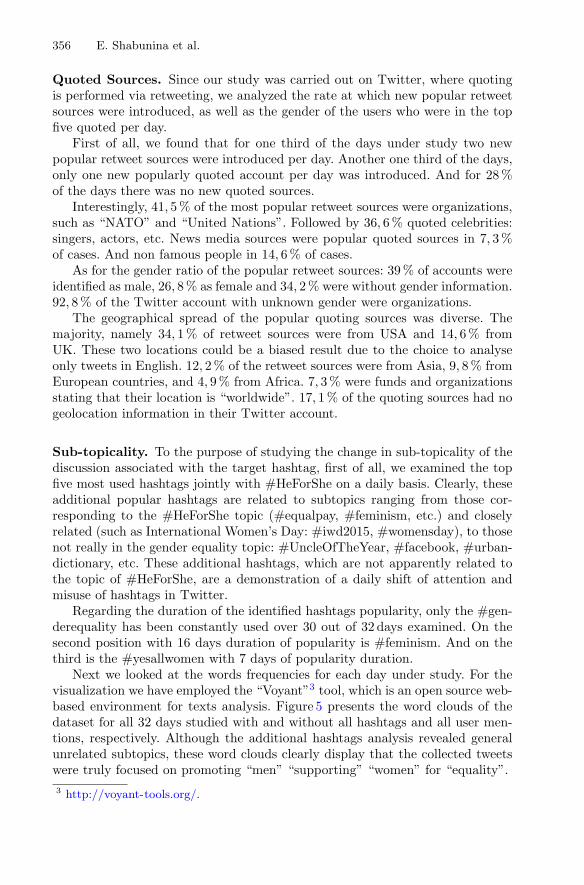
356 E. Shabunina et al.
Quoted Sources. Since our study was carried out on Twitter, where quotingis performed via retweeting, we analyzed the rate at which new popular retweetsources were introduced, as well as the gender of the users who were in the topfive quoted per day.
First of all, we found that for one third of the days under study two newpopular retweet sources were introduced per day. Another one third of the days,only one new popularly quoted account per day was introduced. And for 28%of the days there was no new quoted sources.
Interestingly, 41, 5% of the most popular retweet sources were organizations,such as “NATO” and “United Nations”. Followed by 36, 6% quoted celebrities:singers, actors, etc. News media sources were popular quoted sources in 7, 3%of cases. And non famous people in 14, 6% of cases.
As for the gender ratio of the popular retweet sources: 39% of accounts wereidentified as male, 26, 8% as female and 34, 2% were without gender information.92, 8% of the Twitter account with unknown gender were organizations.
The geographical spread of the popular quoting sources was diverse. Themajority, namely 34, 1% of retweet sources were from USA and 14, 6% fromUK. These two locations could be a biased result due to the choice to analyseonly tweets in English. 12, 2% of the retweet sources were from Asia, 9, 8% fromEuropean countries, and 4, 9% from Africa. 7, 3% were funds and organizationsstating that their location is “worldwide”. 17, 1% of the quoting sources had nogeolocation information in their Twitter account.
Sub-topicality. To the purpose of studying the change in sub-topicality of thediscussion associated with the target hashtag, first of all, we examined the topfive most used hashtags jointly with #HeForShe on a daily basis. Clearly, theseadditional popular hashtags are related to subtopics ranging from those cor-responding to the #HeForShe topic (#equalpay, #feminism, etc.) and closelyrelated (such as International Women’s Day: #iwd2015, #womensday), to thosenot really in the gender equality topic: #UncleOfTheYear, #facebook, #urban-dictionary, etc. These additional hashtags, which are not apparently related tothe topic of #HeForShe, are a demonstration of a daily shift of attention andmisuse of hashtags in Twitter.
Regarding the duration of the identified hashtags popularity, only the #gen-derequality has been constantly used over 30 out of 32 days examined. On thesecond position with 16 days duration of popularity is #feminism. And on thethird is the #yesallwomen with 7 days of popularity duration.
Next we looked at the words frequencies for each day under study. For thevisualization we have employed the “Voyant”3 tool, which is an open source web-based environment for texts analysis. Figure 5 presents the word clouds of thedataset for all 32 days studied with and without all hashtags and all user men-tions, respectively. Although the additional hashtags analysis revealed generalunrelated subtopics, these word clouds clearly display that the collected tweetswere truly focused on promoting “men” “supporting” “women” for “equality”.3 http://voyant-tools.org/.
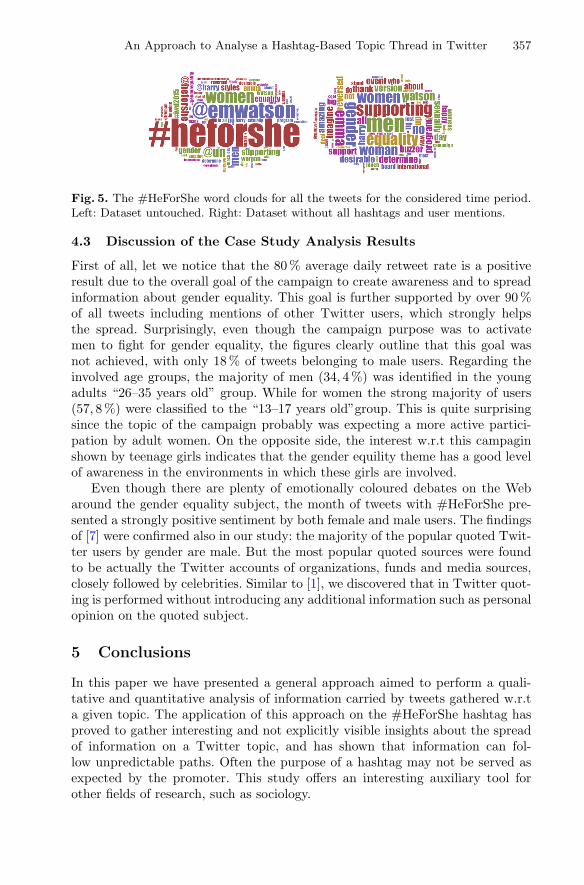
An Approach to Analyse a Hashtag-Based Topic Thread in Twitter 357
Fig. 5. The #HeForShe word clouds for all the tweets for the considered time period.Left: Dataset untouched. Right: Dataset without all hashtags and user mentions.
4.3 Discussion of the Case Study Analysis Results
First of all, let we notice that the 80% average daily retweet rate is a positiveresult due to the overall goal of the campaign to create awareness and to spreadinformation about gender equality. This goal is further supported by over 90%of all tweets including mentions of other Twitter users, which strongly helpsthe spread. Surprisingly, even though the campaign purpose was to activatemen to fight for gender equality, the figures clearly outline that this goal wasnot achieved, with only 18% of tweets belonging to male users. Regarding theinvolved age groups, the majority of men (34, 4%) was identified in the youngadults “26–35 years old” group. While for women the strong majority of users(57, 8%) were classified to the “13–17 years old”group. This is quite surprisingsince the topic of the campaign probably was expecting a more active partici-pation by adult women. On the opposite side, the interest w.r.t this campaginshown by teenage girls indicates that the gender equility theme has a good levelof awareness in the environments in which these girls are involved.
Even though there are plenty of emotionally coloured debates on the Webaround the gender equality subject, the month of tweets with #HeForShe pre-sented a strongly positive sentiment by both female and male users. The findingsof [7] were confirmed also in our study: the majority of the popular quoted Twit-ter users by gender are male. But the most popular quoted sources were foundto be actually the Twitter accounts of organizations, funds and media sources,closely followed by celebrities. Similar to [1], we discovered that in Twitter quot-ing is performed without introducing any additional information such as personalopinion on the quoted subject.
5 Conclusions
In this paper we have presented a general approach aimed to perform a quali-tative and quantitative analysis of information carried by tweets gathered w.r.ta given topic. The application of this approach on the #HeForShe hashtag hasproved to gather interesting and not explicitly visible insights about the spreadof information on a Twitter topic, and has shown that information can fol-low unpredictable paths. Often the purpose of a hashtag may not be served asexpected by the promoter. This study offers an interesting auxiliary tool forother fields of research, such as sociology.
358 E. Shabunina et al.
References
1. Artwick, C.G.: News sourcing and gender on twitter. Journalism 15(8), 1111–1127(2014)
2. Cheng, J., Adamic, L., Dow, P.A., Kleinberg, J.M., Leskovec, J.: Can cascades bepredicted? In: Proceedings of the 23rd International Conference on World WideWeb, WWW 2014, pp. 925–936. ACM, New York (2014)
3. Lagnier, C., Denoyer, L., Gaussier, E., Gallinari, P.: Predicting information diffusionin social networks using content and user’s profiles. In: Serdyukov, P., Braslavski,P., Kuznetsov, S.O., Kamps, J., Ruger, S., Agichtein, E., Segalovich, I., Yilmaz, E.(eds.) ECIR 2013. LNCS, vol. 7814, pp. 74–85. Springer, Heidelberg (2013)
4. Lin, Y.-R., Margolin, D., Keegan, B., Baronchelli, A., Lazer, D.: #bigbirds neverdie: Understanding social dynamics of emergent hashtags (2013)
5. Mislove, A., Lehmann, S., Ahn, Y., Onnela, J., Rosenquist, J.N.: Understanding thedemographics of twitter users. In: ICWSM (2011)
6. Romero, D.M., Meeder, B., Kleinberg, J.: Differences in the mechanics of informa-tion diffusion across topics: Idioms, political hashtags, and complex contagion ontwitter. In: Proceedings of the 20th International Conference on World Wide Web,WWW 2011, pp. 695–704. ACM, New York (2011)
7. Simmons, M.P., Adamic, L.A., Adar, E.: Memes online: Extracted, subtracted,injected, and recollected. In: Proceedings of the Fifth International AAAI Con-ference on Weblogs and Social Media (2011)
8. Yang, J., Leskovec, J.: Modeling information diffusion in implicit networks. In: Pro-ceedings of the IEEE International Conference on Data Mining, ICDM 2010, pp.599–608. IEEE Computer Society, Washington (2010)

Identification of Occupation Mentionsin Clinical Narratives
Azad Dehghan1,2,3(&), Tom Liptrot1, Daniel Tibble1,Matthew Barker-Hewitt1, and Goran Nenadic2,3
1 The Christie NHS Foundation Trust, Manchester, [email protected]
2 School of Computer Science, The University of Manchester, Manchester, [email protected]
3 Health e-Research Centre (HeRC), Manchester, UK
Abstract. A patient’s occupation is an important variable used for diseasesurveillance and modeling, but such information is often only available infree-text clinical narratives. We have developed a large occupation dictionarythat is used as part of both knowledge- (dictionary and rules) and data-driven(machine-learning) methods for the identification of occupation mentions. Wehave evaluated the approaches on both public and non-public clinical datasets.A machine-learning method using linear chain conditional random fields trainedon minimalistic set of features achieved up to 88 % F1-measure (token-level),with the occupation feature derived from the knowledge-driven method showinga notable positive impact across the datasets (up to additional 32 % F1-measure).
Keywords: Information extraction Natural language processing Namedentity recognition Lexical resource Occupation Profession
1 Introduction
The identification of occupation mentions in free-text has been highlighted as importantnamed entity recognition (NER) task for many applications [1]. This is particularlyimportant in the clinical domain, where patient’s profession is important for diseasemodeling and surveillance, but yet only available in free-text narratives (clinical notes,discharge letters, etc.). Occupation information is also considered as personal identi-fiable information and therefore important to capture in practical applications such asautomated de-identification of clinical documents. However, identification of occupa-tion mentions is a challenging task – a recent community challenge demonstrated thatstate-of-the-art NER approaches could merely achieve up to 69 % F1-measure [2, 3].
In this paper we evaluate two approaches (knowledge- and data-driven) to occu-pation NER, which rely on a large lexical Occupation dictionary that we have engi-neered semi-automatically. This novel and freely available lexical resource is one of themain contributions of this paper.
© Springer International Publishing Switzerland 2016E. Métais et al. (Eds.): NLDB 2016, LNCS 9612, pp. 359–365, 2016.DOI: 10.1007/978-3-319-41754-7_35

2 Methods
2.1 Data
Two datasets (see Table 1) from different institutions and countries were used:
(1) clinical narrative notes and correspondence from the Christie NHS FoundationTrust, United Kingdom (henceforth referred to as the Christie dataset); and (2) clinicalnarratives from the Partners HealthCare obtained via the Informatics for IntegratedBiology and the Bedside (i2b2)1, United States (henceforth referred to as the i2b2dataset) [2].
The i2b2 and Christie datasets were annotated using multiple annotators with anentity level Inter Annotation Agreement (IAA) of 71.4 % and 76.6 % F1-measurerespectively. The training datasets were used for development sets by splitting theminto validation-training and validation-test sets, and the held-out sets were used forevaluation.
2.2 Natural Language Processing Methods
We have developed both knowledge- (dictionary and rules) and data-driven(machine-learning) methods. Figure 1 provides an outline of the workflow and itscomponents in our methodology, which are explained below.
Pre-processing. The data was pre-processed with GATE [4] and OpenNLP2 to pro-vide tokenization, sentence splitting, part-of-speech (POS), and shallow parsing orchunking.
Knowledge-Driven Method. This component is made up of a dictionary and a ruletagger, that are used in combination to identify occupation mentions in text.
Dictionary Tagger. This component uses a large-scale dictionary of Occupations thatcontains 19,148 lexical entries. This dictionary has been semi-automatically generatedand curated from electronic patient records (The Christie NHS Foundation Trust) andother data sources retrieved from the Office for National Statistics (ONS) in the United
Table 1. Datasets summary.
Dataset Document count Label count(occupation)
Training Held-out Training Held-out
Christie 780 520 486 234i2b2 790 514 265 179
1 https://www.i2b2.org.2 https://opennlp.apache.org/.
360 A. Dehghan et al.

Kingdom [5]. This component uses the dictionary with case insensitive and longestmatch to tag occupation mentions in text.
Rule Tagger. This component includes a set of zoning rules to restrict or reinforce thedictionary tagger to relevant sub-sections and specific contexts. For example, a con-siderable number of occupation mentions tend to be preceded by specific contextualclues such as “social history”, “works as”, “job as” or “occupation”.
Data-Driven Method. This method uses the preceding components (pre-processingand knowledge-driven) to extract features that are subsequently used by the CRF taggerto tag token sequences that most probable contain occupation mentions.
Feature Extraction. This step extracts the relevant features for the CRF tagger. Wederived 31 features from previous work in clinical NER [6, 7] and by usingforward/backward feature selection strategies. Specifically, the following token levelfeatures were used:
• Lexical features (a total of 4 features) include (a) the word/token itself, (b) its stem(using Porter’s stemmer [8]), (c) POS, and (d) chunking information.
• Orthographic features (2 features) include tokens’ characteristics such as (e) wordtype (i.e., word, number, punctuation, or symbol) and (f) casing (i.e., upper initial,all capital, all lower case, or mixed capitalization).
Fig. 1. Occupation NER architecture
Identification of Occupation Mentions in Clinical Narratives 361
• Contextual (lexical and orthographic) features (24 features) for all aforementionedfeature types (a, b, c, d, e, and f) are used: for each token, a context window of twotokens before and two tokens after are considered.
• Semantic feature (1 feature) is a binary attribute indicating if a given token wastagged (as an occupation mention) by the knowledge-driven component (dictionary-and rule-taggers).
CRF Tagger. A state-of-the-art sequence labeling algorithm, linear chain conditionalrandom field (CRF, [9]), was trained for each dataset separately with the above featureset to predict occupation mentions in textual data. The data was modeled at the tokenlevel using the Beginning, Inside, Outside (BIO) token level representation schema. Inaddition, the L2 regularization algorithm was adopted together with the defaultparameters (C = 1.00 and ETA = 0.001).3
3 Results and Discussion
Evaluation. We used standard evaluation metrics (precision (P), recall (R), F1-measure(F)) and two approaches defined by different matching strategies: token level matchingthat requires at least one token of the gold standard span and the predicted/tagged span tomatch; and entity level matching that requires an exact match of the gold standard spanwith the predicted/tagged span.
The results on the held-out test datasets are given in Table 2. The best results wereachieved using the data-driven methodology. Specifically, on the i2b2 dataset, ourmethod achieved 70 % and 76 %, and on the Christie 81 % and 88 % F (entity andtoken level respectively). Our experiments indicate that the data-driven method seems tobe particularly useful for entity level extraction. Overall, better results were achieved onthe Christie dataset. This was expected given how the lexical resource was sourced and adifference in label distribution across datasets (more mentions in the Christie dataset).Yet, the results on the i2b2 data are better than previously published work [2, 3].
The dictionary tagger without zoning rules performed worst (Table 2). Theseresults highlight the importance of the rules to optimize the performance of the dic-tionary tagger. However, more interestingly, the dictionary tagger on its own achievedthe highest recall: 96.09 % and 88.68 % (token level) on the i2b2 and Christie datasetsrespectively. The high recalls achieved across the two different datasets indicate that thedeveloped dictionary has an extensive coverage. The lower recall on the Christiedataset may partly be explained by the fact that some occupation mentions such asretirement and unemployment were captured by the rule tagger and were not includedin the dictionary.
When comparing data- versus knowledge-driven methods, we note that the tokenlevel evaluation shows small difference (e.g. 1.10 % on the i2b2 data), while thedifferences in entity level evaluation, as expected, are larger (e.g. 6.56 % for the i2b2
3 CRF implementation used: https://taku910.github.io/crfpp/.
362 A. Dehghan et al.

dataset). Given the high recall provided by the dictionary tagger, we hypothesize thatthe entity level results can be further improved using post-processing strategiesexplored in e.g., [6, 7].
Table 3 shows the evaluation on the held-out datasets when the semantic feature(generated by the knowledge-driven method) is removed from the CRF taggers. Thegains of using the knowledge-driven component are 22.63 % and 32.39 % (entitylevel) and 14.28 % and 20.95 % (token level) for the Christie and i2b2 data respec-tively, indicating a notable impact and illustrating the potential of hybrid approaches.
Moreover, the results on the validation-test datasets (Table 4) show that ourmethods generalized well as there are no significant differences between the results onthe validation-test and held-out test sets. Notably, there are small differences (con-sidering F) between data- and knowledge-driven methods when comparing token level
Table 2. Results on the held-out datasets.
Dataset Method Token levelmatching
Entity levelmatching
P% R% F% P% R% F%
Christie Data-driven 95.96 80.75 87.70 88.34 74.34 80.74Christie Knowledge-driven 93.39 80.00 86.18 83.26 71.32 76.83Christie Dictionary tagger 29.27 88.68 44.01 20.05 60.75 30.15i2b2 Data-driven 96.55 62.57 75.93 88.79 57.54 69.83i2b2 Knowledge-driven 95.65 61.45 74.83 80.87 51.96 63.27i2b2 Dictionary tagger 28.76 96.09 44.27 28.09 93.85 43.24
Table 3. Results on held-out dataset with no knowledge-driven features.
Dataset Method Token levelmatching
Entity levelmatching
P% R% F% P% R% F%
Christie DD no KD feature 91.06 61.51 73.42 72.07 48.68 58.11i2b2 DD no KD feature 95.83 38.55 54.98 65.28 26.26 37.45
(Data-driven (DD), Knowledge-driven (KD)).
Table 4. Results on the validation-test datasets.
Dataset Method Token levelmatching
Entity levelmatching
P% R% F% P% R% F%
Christie Data-driven 96.84 82.26 88.95 91.77 77.96 84.30Christie Knowledge-driven 96.25 82.80 89.02 87.50 75.27 80.92i2b2 Data-driven 98.21 64.71 78.01 83.93 55.29 66.67i2b2 Knowledge-driven 100.0 64.71 78.57 81.82 52.94 64.29
Identification of Occupation Mentions in Clinical Narratives 363
evaluation for the Christie (0.07 %) and i2b2 (0.56 %) datasets with advantage toknowledge-driven methods. This is largely consistent with the held-out test sets (seeTable 2) where the smallest differences between methods are also observed in the tokenlevel results: the Christie data (1.52 %) and i2b2 data (1.10 %) with advantage to thedata-driven methods. The small differences observed and the variable method advan-tage indicate that the results are inconclusive and further experiments using statisticalsignificance testing would be appropriate to determine whether there is a real differenceobserved between the methods.
4 Conclusion
In this paper we have evaluated knowledge- and data-driven approaches to identifyoccupation mentions in clinical narratives. The results show that using a large dic-tionary as part of a data-driven pipeline enables state-of-the-art performance in iden-tifying occupation mentions in free-text clinical narratives. Notably, the automatedmethods presented in this paper were comparable to human benchmarks. We proposethat future work focuses on boundary adjustment and post-processing strategies inorder to improve entity level performance (e.g., [6, 7, 10]). In addition, using two-passrecognition [6] may also improve results by capturing occupation mentions that lackthe specific contextual clues modeled.
The methods and data sources presented herein are available online at: https://github.com/christie-nhs-data-science/occupation-ner.
Acknowledgement. We would like to thank Bob Seymour from ONS for his help with findingrelevant resources.
References
1. Stubbs, A., Kotfila, C., Uzuner, O.: Automated systems for the de-identification oflongitudinal clinical narratives: overview of 2014 i2b2/UTHealth shared task track 1.J. Biomed. Inform. 58(Suppl.), S11–S19 (2015). ISSN: 1532-0464, http://dx.doi.org/10.1016/j.jbi.2015.06.007
2. Stubbs, A., Uzuner, O.: Annotating longitudinal clinical narratives for de-identification: the2014 i2b2/UTHealth corpus. J. Biomed. Inform. 58(Suppl.), S20–S29 (2015). ISSN:1532-0464, http://dx.doi.org/10.1016/j.jbi.2015.07.020
3. Yang, H., Garibaldi, J.M.: Automatic detection of protected health information from clinicnarratives. J. Biomed. Inform. 58(Suppl.), S30–S38 (2015). ISSN: 1532-0464, http://dx.doi.org/10.1016/j.jbi.2015.06.015
4. Cunningham, H., Tablan, V., Roberts, A., Bontcheva, K.: Getting more out of biomedicaldocuments with GATE’s full lifecycle open source text analytics. Comput. Biol. 9(2),e1002854 (2013). doi:10.1371/journal.pcbi.1002854
5. Office for National Statistics (ONS), the Standard Occupational Classification (SOC) 2010Index. http://www.ons.gov.uk/ons/search/index.html?newquery=soc2010. Accessed 7 Dec2015
364 A. Dehghan et al.

6. Dehghan, A., Kovacevic, A., Karystianis, G., Keane, J.A., Nenadic, G.: Combiningknowledge- and data-driven methods for de-identification of clinical narratives. J. Biomed.Inform. 58(Suppl.), S53–S59 (2015). ISSN: 1532-0464, http://dx.doi.org/10.1016/j.jbi.2015.06.029
7. Dehghan, A.: Temporal ordering of clinical events (2015). arXiv:1504.036598. Porter, F.M.: An algorithm for suffix stripping. Program 14(3), 130–137 (1980)9. Lafferty, J.D., McCallum, A., Pereira, F.C.N.: Conditional random fields: probabilistic
models for segmenting and labeling sequence data. In: Proceedings of the EighteenthInternational Conference on Machine Learning, pp. 282–289 (2001)
10. Dehghan, A., Keane, J.A., Nenadic, G.: Challenges in clinical named entity recognition fordecision support. In: 2013 IEEE International Conference on Systems, Man, andCybernetics, Manchester, pp. 947–951 (2013). doi:10.1109/SMC.2013.166
Identification of Occupation Mentions in Clinical Narratives 365
Multi-objective Word Sense InductionUsing Content and Interlink Connections
Sudipta Acharya1(B), Asif Ekbal1, Sriparna Saha1,Prabhakaran Santhanam1, Jose G. Moreno2, and Gael Dias3
1 Indian Institute of Technology Patna, Patna, [email protected]
2 LIMSI, CNRS, Universite Paris-Saclay, 91405 Orsay, France3 University of Caen Lower Normandy, Caen, France
Abstract. In this paper, we propose a multi-objective optimizationbased clustering approach to address the word sense induction problemby leveraging the advantages of document-content and their structures inthe Web. Recent works attempt to tackle this problem from the perspec-tive of content analysis framework. However, in this paper, we show thatcontents and hyperlinks existing in the Web are important and comple-mentary sources of information. Our strategy is based on the adaptationof a simulated annealing algorithm to take into account second-ordersimilarity measures as well as structural information obtained with apageRank based similarity kernel. Exhaustive results on the benchmarkdatasets show that our proposed approach attains better accuracy com-pared to the content based or hyperlink strategy encouraging the com-bination of these sources.
1 Introduction
Word Sense Induction (WSI) is a crucial problem in Natural Language Process-ing (NLP), which has drawn significant attention to the researchers during thepast few years. WSI concerns the automatic identification of the senses of aknown word, which is an expected capability of modern information retrievalsystems. In recent times, there are few research works that address this problemby analyzing Web contents and exploring interesting ideas to extract knowledgefrom external resources. One important work is proposed in [6], which showsthat increased performance may be obtained for Web Search Results Clustering(SRC) when word similarities are calculated over the Google Web1T corpus.The authors propose a comparative evaluation of WSI systems by the use of anend-user application such as SRC. The key idea behind SRC system is to returnsome meaningful labeled clusters from a set of snippets retrieved from a searchengine for a given query. So far, most of the works have focused on the discoveryof relevant and informative clusters [4] in which the results are organized bytopics in such a way as WSI.
In this paper, we present a strategy for WSI based on content and linkanalyses over Web collections through the use of a Multi-Objective Optimizationc© Springer International Publishing Switzerland 2016E. Metais et al. (Eds.): NLDB 2016, LNCS 9612, pp. 366–375, 2016.DOI: 10.1007/978-3-319-41754-7 36

Multi-objective Word Sense Induction 367
(MOO) technique [5]. The underlying idea is grounded on the hypothesis thatword senses are related to the distribution of words on Web pages and the waythat they are linked together. In other words, Web pages containing the sameword meaning should share some similar content-based and link-based values.This study supposes that (1) word distribution is different for each sense, (2)links over the Web express knowledge complementary to content and (3) webdomains provide an unique meaning of a word, thus extrapolating the “one senseper discourse” paradigm [7].
Our proposal addresses the WSI problem using a MOO framework that hasa different perspective compared to Single Objective Optimization (SOO). InSOO, we concentrate in optimizing only a single objective function, whereasMOO deals with the issue of simultaneously optimizing more than one objectivefunction. Here, we first pose the problem of WSI within the framework of MOO,and thereafter solve this using a simulated annealing based MOO techniquecalled AMOSA [3]. Specifically, we are interested in optimizing the similarity ofa cluster of documents in terms of both their content and interlink similarity.The combination of these sources is not straightforward, and this calls for theuse of MOO techniques.
The main contributions of this paper are summarized as follows. First, wepropose a new MOO algorithm for WSI which automatically determines thenumber of senses. Next, we propose an evaluation of alternative sources as a com-bination to improve existing solutions to the WSI problem. Evaluation resultsshow that our MOO based clustering algorithm performs better compared tothe hyperlink-based techniques, and very closely compared to approaches withstrong content-based solutions when evaluated using WSI measures.
2 Related Works
As far as our knowledge goes, no existing methodology for WSI uses the hyper-link information and content information in an unified setting. The populartechniques either use one or the other sources of information. Content-basedtechniques such as [6] are based on the use of word distributions over the hugecollections of n-grams mapped to a graph where the nodes are the words (sensecandidates) and the arcs are calculated based on the frequencies in which twowords are found together. Once the graph is built the words are grouped togetherbased on simple graph patterns such as curvature clustering or balanced max-imum spanning tree clustering, where each obtained cluster represents a sense.Similarly, [8] proposes the use of extra frequency information extracted fromWikipedia and forms groups using a variation of the well known latent dirich-let allocation (LDA) algorithm. Each topic obtained by LDA is considered asa cluster. In contrast, hyperlink-based techniques are quite rare. In [11] authorshave proposed a technique exclusively based on hyperlink information. Thereare works where similarity between documents is calculated using a Jensen-Shannon kernel [9] and then clustering is performed by the use of a classicalspectral clustering algorithm. Each cluster represents a sense in the solution.
368 S. Acharya et al.
Both approaches manage to adequately discover the word senses in the docu-ments. However, reported results show a superiority of content-based techniquesover hyperlink-based techniques.
In the field of application of MOO, as far as we know, within text applica-tions, [12] is the first work, which formulates text clustering as a MOO problem.In particular, they express desired properties of frequent itemset clustering interms of multiple conflicting objective functions. The optimization is solved bya genetic algorithm and the result is a set of Pareto-optimal solutions. But,towards solution of WSI problem, according to best of our knowledge, this is thevery first attempt that utilises MOO based clustering approach.
3 Combining Content and Hyperlink Approacheswith a MOO
Most of the existing SRC techniques are based on a single criterion which reflectsa single measure of goodness of a partitioning. However, one single source ofinformation may not fit all problems. In particular, [2] have shown the utilityof hyperlink information to cluster Web documents, whereas [11] have showntheir applicability to the WSI problem. Manifestly, both SRC and WSI havebeen addressed by the analysis of document contents. Moreover, an effectivecombination of these two has not been yet proposed. Hence, it may becomenecessary to simultaneously optimize several cluster quality measures which cancapture different content-based or hyperlink-based characteristics. In order toachieve this, MOO can be an ideal platform and therefore we pose the prob-lem of finding word senses within this framework. Therefore, the application ofsophisticated MOO techniques seems appropriate and natural.
Content Compactness based on SCP/PMI Measure: This type of indicesmeasures the proximity among the various elements of the cluster. One of thecommonly used measures for compactness is the variance. Documents are kepttogether if the distribution of words is similar. This measurement is based oneither Symmetric Conditional Probability (SCP ) or Pointwise Mutual Informa-tion (PMI), defined on Sect. 4.2.
Content Separability based on SCP/PMI Measure: This particular typeof indices is used in order to differentiate between two clusters. Distance betweentwo cluster centroids is a commonly used measure of separability. This measureis easy to compute and can detect hyperspherical-shaped clusters well. Word-distribution between senses must be as different as possible. This measurementis also based on computing either SCP or PMI.
Hyperlink Compactness: Well-connected Web documents must belong to thesame sense cluster.
Hyperlink Separability: The number of interlinks between senses must be assmall as possible.

Multi-objective Word Sense Induction 369
4 MOO Based Clustering for WSI
In order to perform MOO based clustering we adapt Archived multi-objectivesimulated annealing (AMOSA) [3] as the underlying optimization strategy. Itincorporates the concept of an archive where the non-dominated solutions seenso far are stored. Steps of the proposed approach are described in the followingsections. For better understanding we also show the various steps of our proposedalgorithm in Fig. 1.
4.1 Archive Initialization
As we follow an endogenous approach, only the information returned by a searchengine is used. In particular, we only deal with web snippets and each one isrepresented as a word feature vector. So, our proposed clustering technique startsits execution after initializing the archive with some random solutions as archivemembers. Here, a particular solution refers to a complete assignment of websnippets (or data points) in several clusters. So, the first step is to represent asolution compatible with AMOSA, which represents each individual solution asa string. In order to encode the clustering problem in the form of a string, acenter-based representation is used. Note that the use of a string representationfacilitates the definition of individuals and mutation functions [3].
Let us assume that the archive member i represents the centroids of Ki
clusters and the number of tokens in a centroid is p1, then the archive memberhas length li where li = p×Ki. To initialize the number of centroids Ki encodedin the string i, a random value between 2 and Kmax is chosen and each of theKi centroids is initialized by randomly generated token from the vocabulary.
4.2 Content-Based Similarity Measure
In order to compute the similarity between two Web documents (word vec-tors) we have used two well known content-based similarity metrics, theSCP (W1,W2) = P (W1,W2)
2
P (W1)×P (W2)and PMI(W1,W2) = log( P (W1,W2)
P (W1)×P (W2)).
Start
Input pre−processing(pre−processed SemEval13 WSI
data)
String representation
archive initialization&
Compute membership using
any one of 4 versions of experiment for
Form Pareto optimal
Search operator mutation
* SCP(for 2nd and 3rd version of experiment)
* PMI(for 1st and 4th version of experiment)SetIter=0
T=T+alpha
front
Initialize temparature T=TminTmin=minimum temparatureN=total number of iterations
* SCP(for 2nd and 3rd version of experiment)* PMI(for 1st and 4th version of experiment)
Compute objective functions based on
each encoded solution
Temparature<=Tmin
Iter<NIter=Iter+1
Choose final solutionfrom Pareto optimal front
according to F1/JI/RI/ARI
Stop
Yes
No
NoYes
Fig. 1. Flowchart of proposed methodology
1 A centroid is represented by a p word feature vector (w1k, w
2k, w
3k, . . . , w
pk).
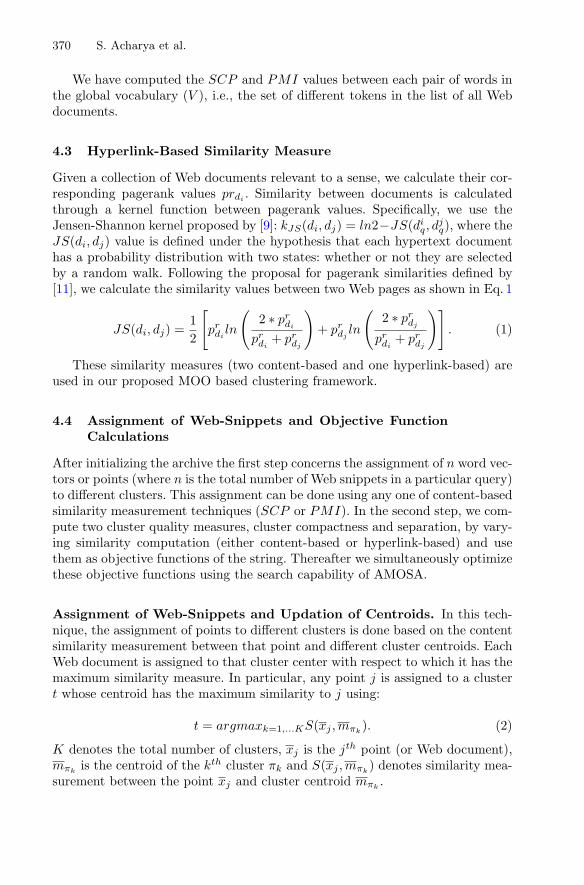
370 S. Acharya et al.
We have computed the SCP and PMI values between each pair of words inthe global vocabulary (V ), i.e., the set of different tokens in the list of all Webdocuments.
4.3 Hyperlink-Based Similarity Measure
Given a collection of Web documents relevant to a sense, we calculate their cor-responding pagerank values prdi
. Similarity between documents is calculatedthrough a kernel function between pagerank values. Specifically, we use theJensen-Shannon kernel proposed by [9]: kJS(di, dj) = ln2−JS(di
q, djq), where the
JS(di, dj) value is defined under the hypothesis that each hypertext documenthas a probability distribution with two states: whether or not they are selectedby a random walk. Following the proposal for pagerank similarities defined by[11], we calculate the similarity values between two Web pages as shown in Eq. 1
JS(di, dj) =12
[pr
diln
(2 ∗ pr
di
prdi
+ prdj
)+ pr
djln
(2 ∗ pr
dj
prdi
+ prdj
)]. (1)
These similarity measures (two content-based and one hyperlink-based) areused in our proposed MOO based clustering framework.
4.4 Assignment of Web-Snippets and Objective FunctionCalculations
After initializing the archive the first step concerns the assignment of n word vec-tors or points (where n is the total number of Web snippets in a particular query)to different clusters. This assignment can be done using any one of content-basedsimilarity measurement techniques (SCP or PMI). In the second step, we com-pute two cluster quality measures, cluster compactness and separation, by vary-ing similarity computation (either content-based or hyperlink-based) and usethem as objective functions of the string. Thereafter we simultaneously optimizethese objective functions using the search capability of AMOSA.
Assignment of Web-Snippets and Updation of Centroids. In this tech-nique, the assignment of points to different clusters is done based on the contentsimilarity measurement between that point and different cluster centroids. EachWeb document is assigned to that cluster center with respect to which it has themaximum similarity measure. In particular, any point j is assigned to a clustert whose centroid has the maximum similarity to j using:
t = argmaxk=1,...KS(xj ,mπk). (2)
K denotes the total number of clusters, xj is the jth point (or Web document),mπk
is the centroid of the kth cluster πk and S(xj ,mπk) denotes similarity mea-
surement between the point xj and cluster centroid mπk.

Multi-objective Word Sense Induction 371
One possible way to compute the similarity between two word vectors isdefined by Eq. 3, which is inspired by [1]2.
S(di, dj) =‖di‖∑
k=1
‖dj‖∑
l=1
SCP (Wik,Wjl) (3)
Here ‖di‖ and ‖dj‖ respectively denote, total number of words in word vectors di
and dj . After assigning all Web snippets to different clusters, the cluster centroidsencoded in that string are updated. For each cluster, p number of words fromglobal vocabulary which are most similar to other documents of that particularcluster are chosen to form new centroid of that cluster.
Objective Functions. In order to compute the goodness of the partitioningencoded in a particular string, cluster compactness and separability are usuallyused as the objective functions in MOO clustering. The objective functions quan-tify two intrinsic properties of the partitioning. First, compactness is defined inEq. 4 and it is maximized.
COM =K∑
k=1
∑
xi∈πk
S(xi,mπk) (4)
Here mπkis the cluster centroid of the kth cluster consisting of p words
(wπk1 , ....., wπk
p ), K is the number of clusters encoded in that particular stringand S(xi,mπk
) value is computed using Eq. 3. In Eq. 3, SCP can be replaced byPMI. Also cluster compactness can be measured using hyperlink similarity asgiven in Eq. 1. The compactness using hyperlink similarity is computed by thefollowing equation:
COM =K∑
k=1
∑xi,xj∈πk
JS(xi, xj)
|πk| (5)
Hence, total three different versions of cluster compactness can be computedby varying the similarity measures. Note that if words in a particular clusterare very similar to the cluster centroid and documents are highly interconnectedthen the corresponding COM value would be maximized. Also for hyperlinksimilarity based compactness if all the documents of any particular cluster arehighly interconnected to each other then also corresponding COM gets maxi-mized. Here our target is to form good clusters whose compactness in terms ofsimilarity should be maximum.
The second objective function is the cluster separation which measures thedissimilarity between two given clusters. Purpose of any clustering algorithmis to obtain compact similar typed clusters which are dissimilar to each other.Here we have computed the summation of similarities between different pairs
2 SCP could be replaced by PMI.
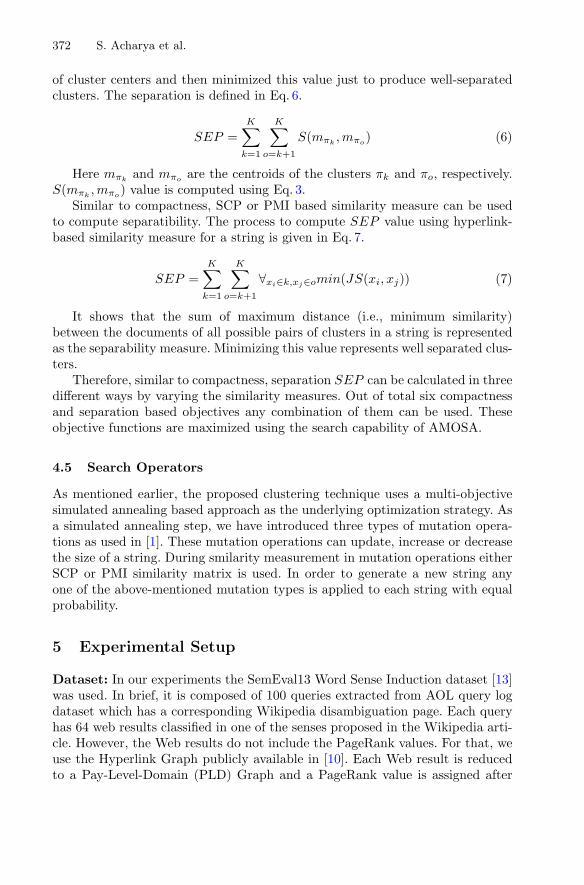
372 S. Acharya et al.
of cluster centers and then minimized this value just to produce well-separatedclusters. The separation is defined in Eq. 6.
SEP =K∑
k=1
K∑
o=k+1
S(mπk,mπo
) (6)
Here mπkand mπo
are the centroids of the clusters πk and πo, respectively.S(mπk
,mπo) value is computed using Eq. 3.
Similar to compactness, SCP or PMI based similarity measure can be usedto compute separatibility. The process to compute SEP value using hyperlink-based similarity measure for a string is given in Eq. 7.
SEP =K∑
k=1
K∑
o=k+1
∀xi∈k,xj∈omin(JS(xi, xj)) (7)
It shows that the sum of maximum distance (i.e., minimum similarity)between the documents of all possible pairs of clusters in a string is representedas the separability measure. Minimizing this value represents well separated clus-ters.
Therefore, similar to compactness, separation SEP can be calculated in threedifferent ways by varying the similarity measures. Out of total six compactnessand separation based objectives any combination of them can be used. Theseobjective functions are maximized using the search capability of AMOSA.
4.5 Search Operators
As mentioned earlier, the proposed clustering technique uses a multi-objectivesimulated annealing based approach as the underlying optimization strategy. Asa simulated annealing step, we have introduced three types of mutation opera-tions as used in [1]. These mutation operations can update, increase or decreasethe size of a string. During smilarity measurement in mutation operations eitherSCP or PMI similarity matrix is used. In order to generate a new string anyone of the above-mentioned mutation types is applied to each string with equalprobability.
5 Experimental Setup
Dataset: In our experiments the SemEval13 Word Sense Induction dataset [13]was used. In brief, it is composed of 100 queries extracted from AOL query logdataset which has a corresponding Wikipedia disambiguation page. Each queryhas 64 web results classified in one of the senses proposed in the Wikipedia arti-cle. However, the Web results do not include the PageRank values. For that, weuse the Hyperlink Graph publicly available in [10]. Each Web result is reducedto a Pay-Level-Domain (PLD) Graph and a PageRank value is assigned after
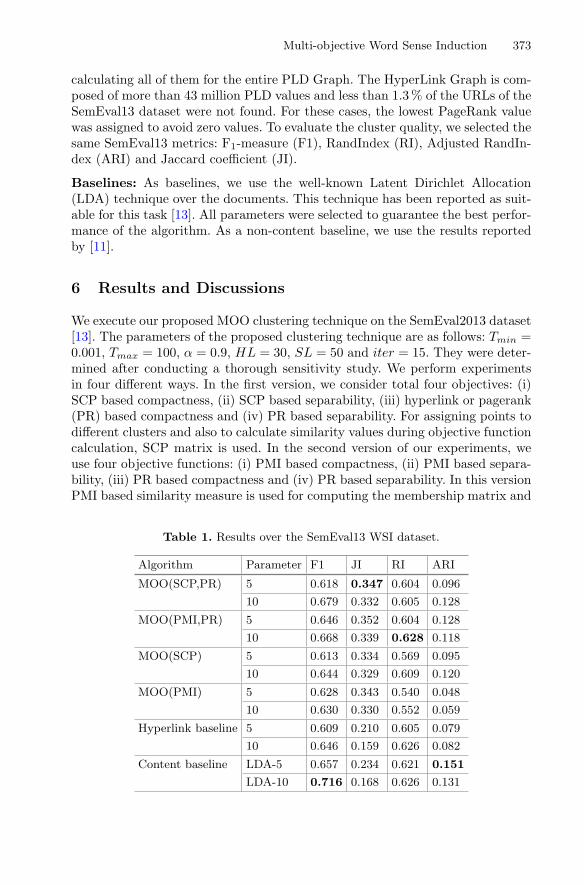
Multi-objective Word Sense Induction 373
calculating all of them for the entire PLD Graph. The HyperLink Graph is com-posed of more than 43 million PLD values and less than 1.3 % of the URLs of theSemEval13 dataset were not found. For these cases, the lowest PageRank valuewas assigned to avoid zero values. To evaluate the cluster quality, we selected thesame SemEval13 metrics: F1-measure (F1), RandIndex (RI), Adjusted RandIn-dex (ARI) and Jaccard coefficient (JI).
Baselines: As baselines, we use the well-known Latent Dirichlet Allocation(LDA) technique over the documents. This technique has been reported as suit-able for this task [13]. All parameters were selected to guarantee the best perfor-mance of the algorithm. As a non-content baseline, we use the results reportedby [11].
6 Results and Discussions
We execute our proposed MOO clustering technique on the SemEval2013 dataset[13]. The parameters of the proposed clustering technique are as follows: Tmin =0.001, Tmax = 100, α = 0.9, HL = 30, SL = 50 and iter = 15. They were deter-mined after conducting a thorough sensitivity study. We perform experimentsin four different ways. In the first version, we consider total four objectives: (i)SCP based compactness, (ii) SCP based separability, (iii) hyperlink or pagerank(PR) based compactness and (iv) PR based separability. For assigning points todifferent clusters and also to calculate similarity values during objective functioncalculation, SCP matrix is used. In the second version of our experiments, weuse four objective functions: (i) PMI based compactness, (ii) PMI based separa-bility, (iii) PR based compactness and (iv) PR based separability. In this versionPMI based similarity measure is used for computing the membership matrix and
Table 1. Results over the SemEval13 WSI dataset.
Algorithm Parameter F1 JI RI ARI
MOO(SCP,PR) 5 0.618 0.347 0.604 0.096
10 0.679 0.332 0.605 0.128
MOO(PMI,PR) 5 0.646 0.352 0.604 0.128
10 0.668 0.339 0.628 0.118
MOO(SCP) 5 0.613 0.334 0.569 0.095
10 0.644 0.329 0.609 0.120
MOO(PMI) 5 0.628 0.343 0.540 0.048
10 0.630 0.330 0.552 0.059
Hyperlink baseline 5 0.609 0.210 0.605 0.079
10 0.646 0.159 0.626 0.082
Content baseline LDA-5 0.657 0.234 0.621 0.151
LDA-10 0.716 0.168 0.626 0.131

374 S. Acharya et al.
objective functions. In the third version, we use two objective functions: (i) SCPbased compactness and (ii) SCP based separability. In the fourth version we usetwo objective functions: (i) PMI based compactness (ii) PMI based separability.
Results are reported in Table 1. In the table second column (parameter) rep-resents the number of clusters in corresponding version of our experiments. Fromthe results it is evident that for all the validity metrices the first version performsbetter compared to the third version. It implies that inclusion of hyperlink infor-mation makes the clustering algorithm more efficient. Similarly, second versionperforms better than the fourth version in all aspects. Results also show thatboth the first two versions of the proposed algorithm (using SCP and PMIbased similarity measures, respectively) perform better compared to the app-roach reported in [11], where only hyperlink information was used. However, thesimilar situation was not observed when the results of the proposed approach arecompared with the content-based baseline. It is important to note that LDA is astrong baseline, and our algorithm shows slight under-performance for F1 (5 %)and RI (0.01 %). It is more significant for ARI (15 %) and on the other hand,MOO outperforms LDA by 30 % in terms of JI. Clearly, the use of content hashelped in the sense identification, but fails to contribute to their maximum as itis obtained by the use of LDA. Moreover as mentioned in [3], selecting appropri-ate combination of parameters is very important for the good performance of aparticular MOO based approach. Thus a proper sensitivity study is required toconduct to choose the correct values of parameters. In the current approach thesame set of parameters as used in [1] is used. But as the targeted task is morecomplex compared to [1], it will be more interesting to conduct the sensibilityanalysis further.
7 Conclusion
In this paper, we have formulated the problem of WSI within the framework ofMOO that combines atypical mixed sources of information. Our proposed app-roach differs from related work as clustering is performed over multiple objectivefunctions that take into account document content and hyperlink connections.As far as we know, this is the first attempt towards this research direction inWSI studies.
In particular, we proposed the use of similarity metrics based on the frequen-cies of words in documents (SCP and PMI) to evaluate the content similarityand the use of a Jensen-Shannon kernel function based on PageRank to computethe Web pages interconnectivity. Four cluster indices are proposed to guide theoptimization process. Results show that the combination of these two differentsources outperforms clustering techniques that relay on just one.
References
1. Acharya, S., Saha, S., Moreno, J.G., Dias, G.: Multi-objective search results clus-tering. In: Proceedings of COLING 2014, the 25th International Conference onComputational Linguistics, pp. 99–108 (2014)

Multi-objective Word Sense Induction 375
2. Avrachenkov, K., Dobrynin, V., Nemirovsky, D., Pham, S., Smirnova, E.: Pagerankbased clustering of hypertext document collections. In: Proceedings of the 31stAnnual International Conference on Research and Development in InformationRetrieval (SIGIR), pp. 873–874 (2008)
3. Bandyopadhyay, S., Saha, S., Maulik, U., Deb, K.: A simulated annealing-basedmultiobjective optimization algorithm: amosa. IEEE Trans. Evol. Comput. 12,269–283 (2008)
4. Carpineto, C., Osinski, S., Romano, G., Weiss, D.: A survey of web clusteringengines. ACM Comput. Surv. 41(3), 1–38 (2009)
5. Deb, K.: Multi-objective Optimization Using Evolutionary Algorithms. Wiley, NewYork (2009)
6. Di Marco, A., Navigli, R.: Clustering and diversifying web search results withgraph-based word sense induction. Comput. Linguist. 39(4), 1–43 (2013)
7. Gale, W., Church, K., Yarowsky, D.: One sense per discourse. In: Proceedings ofthe Workshop on Speech and Natural Language (HLT), pp. 233–237 (1992)
8. Lau, J.H., Cook, P., Baldwin, T.: Unimelb: topic modelling-based word sense induc-tion for web snippet clustering. In: Proceedings of the 7th International Workshopon Semantic Evaluation (SemEval 2013), June 2013
9. Martins, A., Smith, N., Xing, E., Aguiar, P., Figueiredo, M.: Nonextensive infor-mation theoretic kernels on measures. J. Mach. Learn. Res. 10, 935–975 (2009)
10. Meusel, R., Vigna, S., Lehmberg, O., Bizer, C.: Graph structure in the web - revis-ited. In: Proceedings of the International World Wide Web Conference (WWW),pp. 1–8 (2014)
11. Moreno, J.G., Dias, G.: Pagerank-based word sense induction within web searchresults clustering. In: Proceedings of the 14th ACM/IEEE-CS Joint Conference onDigital Libraries, pp. 465–466 (2014)
12. Morik, K., Kaspari, A., Wurst, M., Skirzynsk, M.: Multi-objective frequent termsetclustering. Knowl. Inf. Syst. 30(3), 715–738 (2012)
13. Navigli, R., Vannella, D.: Semeval-2013 task 11: word sense induction & disam-biguation within an end-user application. In: Proceedings of the InternationalWorkshop on Semantic Evaluation (SEMEVAL), pp. 1–9 (2013)
Re-expressing Business Processes Informationfrom Corporate Documents into
Controlled Language
Bell Manrique-Losada1, Carlos M. Zapata-Jaramillo2,and Diego A. Burgos3(&)
1 Universidad de Medellín, Medellin, [email protected]
2 Universidad Nacional de Colombia, Medellin, [email protected]
3 Wake Forest University, Winston-Salem, [email protected]
Abstract. In this paper, we propose a top-down approach for convertingbusiness processes information from corporate documents into controlled lan-guage. This proposal is achieved with a multi-level methodology. We firstcharacterize document structure by using rhetorical analysis to determine rele-vant sections for information extraction. Then, a verb-centered event analysis isperformed to start defining the typical patterns featured by business processesinformation. Lastly, morpho-syntactic and dependency parsing is carried out forextracting this information. This multi-level knowledge is used to define rulesfor converting the extracted sentences into a controlled language, which isintended to be used in software requirements elicitation.
Keywords: Business processes Controlled language Rhetorical analysis Information extraction
1 Introduction
Business knowledge and stakeholder needs regarding the development of a softwareproduct are analyzed and specified by means of requirements elicitation1. Traditionally,requirements elicitation has been carried out by human analysts by using interviews,observations, questionnaires, etc. Sometimes, the information obtained is converted bythe analyst to a controlled language, which is used in further stages of the softwareimplementation. This approach to requirements analysis, however, increase costs andimply a certain degree of subjectivity [1]. Alternatively, human analysts elicitrequirements by hand from corporate documents. In this paper, we propose amulti-level methodology for automatically obtaining information about business
1 This work has been partly funded by the University of Medellin’s Research Vice-provost’s Office,Wake Forest University, and National University of Colombia, under the project: “Defining aSpecific-Domain Controlled Language: Linguistic and Transformational Bases from CorporateDocuments in Natural Language”.
© Springer International Publishing Switzerland 2016E. Métais et al. (Eds.): NLDB 2016, LNCS 9612, pp. 376–383, 2016.DOI: 10.1007/978-3-319-41754-7_37

processes from corporate documents in English. A business process can be defined asan action in a corporate environment. This action—represented in a text by verbs ordeverbal nouns—generally involves an agent and an object. The way process com-ponents relate to each other will be described in Sect. 3.
The methodology proposed here spans from rhetorical analysis to semantic andmorpho-syntactic parsing. The rhetorical analysis determines the sections were infor-mation about business processes prevail. Then, a verb-centered event analysis definesthe typical patterns of such information. Lastly, a morpho-syntactic and dependencyparsing is combined with previous levels for extracting information satisfying suchpatterns. This multi-level knowledge is used to define rules for converting the extractedsentences into a controlled language2 for the requirements elicitation process.
This paper is structured as follows. In Sect. 2 we review related key concepts andwork on knowledge extraction and acquisition. In Sect. 3 we present our proposal. InSect. 4 we describe how evaluation was carried out, and Sect. 5 draws some conclu-sions on the present work.
2 Related Work
Related to semi-structured document processing, we found the following contributions:the RARE project [3] is focused on parsing texts based on a semantic network assistedby a thesaurus. Concerning requirement texts, Cleland-Huang et al. [4] work ondetection of viewpoints. Bajwa et al. [5] propose mapping business rules to semanticvocabulary. Meth et al. [6] focus on providing automated and knowledge based supportfor the elicitation process. These approaches are based on structured or semi-structureddocuments, but no experiments were developed for technical documents. Young andAntón [7] propose the identification of requirements by analyzing the commitments,privileges, and rights conveyed within online policy documents. The usage of corporais a suitable means for describing and analyzing texts, as Wang [8] promotes for usingclassification rules based on set theory and corpus. In knowledge engineering, Dinesshet al. [9] propose the validation of regulations from organizational procedure texts byusing formalizations. These authors depart from our approach in that they define thestakeholder behavior by means of phrases previously created. Several approaches foridentifying domain knowledge from documents have been proposed including thefollowing: techniques for formalizing business process from organizational domains[10], software design [11], and knowledge mapping [12]. Likewise, some techniquesand methods for knowledge representation in requirement analysis and elicitation basedon work processes specification are presented [13]. Most of the aforementioned studiesreport techniques to represent domain knowledge, and more particularly, for designingscenario maps and objective diagrams. From the knowledge engineering perspective,we find useful techniques to be used in the requirements elicitation process—such asbusiness process modeling, semantic nets, and knowledge diagrams—to facilitatedomain understanding.
2 A controlled natural language is a sub-language of the corresponding natural language [2].
Re-expressing Business Processes Information 377
3 Re-expressing Business Processes Information
3.1 Rhetorical Analysis
Rhetorical analysis (RA) is concerned with discourse construction, prioritizing on thecommunicative purpose of each genre [14]. Rhetoric supports discourse from itsintentional and instrumental perspective. RA is a discursive approach to carry out thestructural analysis of a document. From RA, document analysis is discussed in terms ofrhetorical moves, which refer to the functional parts or sections of a document cor-responding to a specific genre. This approach for studying a particular genre comprisesthe analysis of a text and its description in terms of rhetorical structure sections (i.e.,moves). The particular configuration of the text surface is defined in terms of levels oftext organization, also known as rhetorical discourse organization. The macro unitsidentified by genre analysis can be characterized as moves (i.e., documentmacro-sections) and steps (i.e., sections), which are larger than clauses, complexclauses, and sentences. Also, macro units possess some unity grounded in a commonfunction or meaning.
We define the rhetorical organizational model (ROM) in this study as follows. Thecorpus construction starts by collecting possible technical documents on themacro-genre circulating on the web. We broadly explore four types of technical doc-uments, and collect and analyze a corpus of Standard Operating Procedures—SOP—for this case study. A SOP is a constitutive document of a quality system describing aset of recurring operations for illustrating how corporate policies are effectivelyimplemented. We selected a sample of 32 documents from the corpus corresponding to64 % of the total population. This is the minimum percentage statistically randomized,calculated with the Z-test of proportions. Then, we conducted the rhetorical analysisbased on this sample. The preprocessing carried out on the corpus consisted in tok-enization, keyword and stop-word identification, and creation of word frequency lists,among others. The corpus contains 9,252 word types and 167,905 tokens. No refer-ences were found in the literature regarding SOP models, so we follow Burdiles [15]and use an inductive method for defining a preliminary model of this kind of document:(i) We randomly select four sample documents from the corpus; (ii) We develop anincremental construction of a preliminary model from a by-hand review of the docu-ment structure and superstructure, in order to identify the common organization units(i.e., moves) in the sample; (iii) Incrementally, we define rhetorical moves as functionalsections of a genre [16], and according to the macro-move concept from Parodi [17], sothat each macro-move serves a communicative purpose and all macro-moves shape theoverall organization of the text; (iv) By analyzing the functional organization of thedocument, we identify macro-purposes, which comprise a set of more specific moves;(v) We define a preliminary model as a set of functional and structural features, whichresults from the identification of recurrent moves. In the reference model, we considerthe most frequent moves, which comprise three macro-moves containing in turn 19moves—showing more specific functional units—as we show in Table 1 (detailedmoves are described by Manrique [18]).
378 B. Manrique-Losada et al.
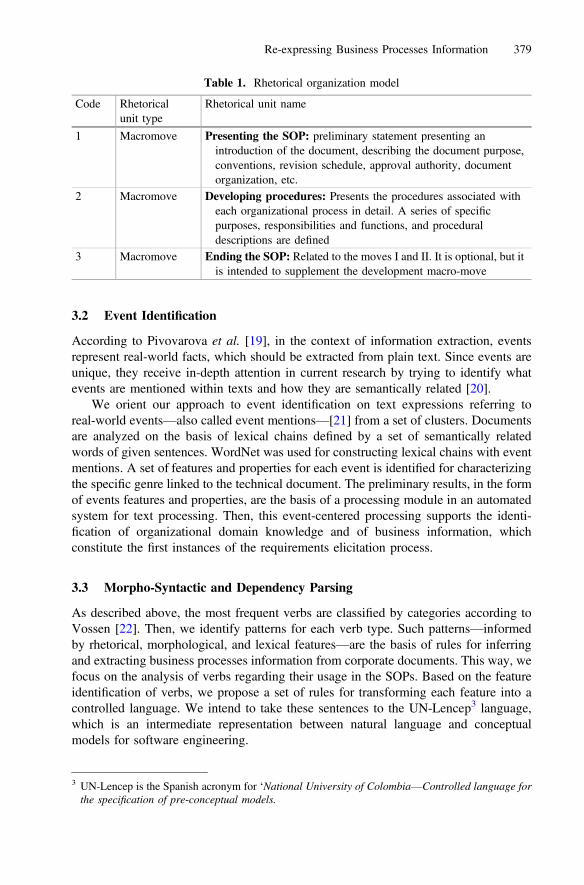
3.2 Event Identification
According to Pivovarova et al. [19], in the context of information extraction, eventsrepresent real-world facts, which should be extracted from plain text. Since events areunique, they receive in-depth attention in current research by trying to identify whatevents are mentioned within texts and how they are semantically related [20].
We orient our approach to event identification on text expressions referring toreal-world events—also called event mentions—[21] from a set of clusters. Documentsare analyzed on the basis of lexical chains defined by a set of semantically relatedwords of given sentences. WordNet was used for constructing lexical chains with eventmentions. A set of features and properties for each event is identified for characterizingthe specific genre linked to the technical document. The preliminary results, in the formof events features and properties, are the basis of a processing module in an automatedsystem for text processing. Then, this event-centered processing supports the identi-fication of organizational domain knowledge and of business information, whichconstitute the first instances of the requirements elicitation process.
3.3 Morpho-Syntactic and Dependency Parsing
As described above, the most frequent verbs are classified by categories according toVossen [22]. Then, we identify patterns for each verb type. Such patterns—informedby rhetorical, morphological, and lexical features—are the basis of rules for inferringand extracting business processes information from corporate documents. This way, wefocus on the analysis of verbs regarding their usage in the SOPs. Based on the featureidentification of verbs, we propose a set of rules for transforming each feature into acontrolled language. We intend to take these sentences to the UN-Lencep3 language,which is an intermediate representation between natural language and conceptualmodels for software engineering.
Table 1. Rhetorical organization model
Code Rhetoricalunit type
Rhetorical unit name
1 Macromove Presenting the SOP: preliminary statement presenting anintroduction of the document, describing the document purpose,conventions, revision schedule, approval authority, documentorganization, etc.
2 Macromove Developing procedures: Presents the procedures associated witheach organizational process in detail. A series of specificpurposes, responsibilities and functions, and proceduraldescriptions are defined
3 Macromove Ending the SOP: Related to the moves I and II. It is optional, but itis intended to supplement the development macro-move
3 UN-Lencep is the Spanish acronym for ‘National University of Colombia—Controlled language forthe specification of pre-conceptual models.
Re-expressing Business Processes Information 379

In Table 2 we present the rules defined for such mapping. Each mapping rule isassigned to one category (first column), expressed in terms of its pattern in the SOP [IfPattern] and the generated expression in UN-Lencep [then (!) Expression]. Addition-ally, in the second row of each attribute (features conditioning each element of the pattern)we related the tags (e.g., syntactic or semantic tag—synt—, function tag—func—, etc.)assigned by the parser4. In the third row of each rule, we included an example of a phrasematching the pattern and the resulting expression in UN-Lencep.
The output expression in the rules shows what the parser and the semantic pro-cessor generate in the application of each rule (where the pattern matches the sentence).The parser applies multiple rules to the same sentence, so the output can be comple-mented by successive rules. Since most of the relevant verbs are either copulative ortransitive, we initialize the information extraction process with the macro-rules below,which summarize the rules in Table 2.
Table 2. Rules for sentence re-expression in controlled language
aThis rule corresponds to document related features, e.g., when an agent is stated early in thedocument and a list of duties for him/her is presented later with a verb in the infinitive form.
4 We used Freeling (http://nlp.lsi.upc.edu/freeling/) for dependency parsing.
380 B. Manrique-Losada et al.

– Copulative verbs: Subject + copulative verb + attribute– Transitive verbs: (including those that take a prepositional complement): Sub-
ject + verb chunk + noun chunk or prepositional chunk– Transitive verbs: Subject + verb chunk + THAT clause
4 Evaluation
4.1 Rhetorical Organization Model
We determined that rhetorical moves are crucial for writing/analyzing a SOP, as a partof the methodology based on corpus linguistics. We pursue the evaluation activities asfollows: (i) Selecting the experts for the evaluation of the reference model;(ii) Designing a template and an instruction guide for the evaluation; (iii) Filling in theevaluation by selected experts; (iv) Analyzing and filtering the results of the evaluation,based on an inter-rater reliability analysis. Thus, we generate a new version of themodel for the subsequent analysis, comprising only the moves considered mandatoryby the experts, and the adjustments and changes by move in the necessary cases.
4.2 Sentences in Controlled Language
We compared the sentences in controlled language that an expert generates on the onehand, and the ones generated by our prototype on the other hand. We perform apreliminary assessment in terms of the potential business process sentences beingextracted, the number of relevant business process sentences extracted by the expertand by the prototype, and the number of irrelevant business process sentencesextracted. We measured precision (P) and recall (R) [23]. When comparing the generalresults between an expert and our prototype (85 vs. 77.5) compared to the potentialsentences (n = 127), we obtained: R = 0.9118 and P = 0.939.
We computed the harmonic mean of P and R (i.e., the F-measure) to determineefficiency. Usually beta is 0.5, by weighting precision and recall as equally important.In this way, the F-measure obtained by the prototype performance—regarding the idealor potential relations—is 0.739, but regarding the expert mapping it is 0.925. Theevaluation results in terms of precision, recall, and F-measure are shown in Table 3.
When the number of retrieved documents grows, recall increases since it is sortedaccording to relevance. The human output variable ‘Mapping Time’ directly dependson the expertise level and the familiarity with the mapping rules. The first run of themapping took 45 min and the second one 30 min. It can be expected that the mapping
Table 3. Results of extracted controlled sentences (expert vs. prototype vs. potential)
Exp. vs. pot. Prot. vs. exp. Prot. vs. pot.
Recall 0,66929134 0,91176471 0,61023622Precision 0,94444444 0,93939394 0,93939394F-measure 0,78341014 0,92537313 0,7398568
Re-expressing Business Processes Information 381
time decreases with periodical training of experts. However, this will not get close tothe prototype mapping time (between 40 and 100 s).
5 Conclusions
In this paper we proposed a methodology for re-expressing business processes infor-mation from corporate documents into a controlled language. This approach aims atextracting knowledge from business-related technical documents. Our approach isbased on a rhetorical analysis of discourse and natural language processing(NLP) methods, which take each document as input. We are promoting the relevantrole of elicitation techniques based on document analysis as sources of domainknowledge and business information within the requirements elicitation process.
We describe how business process information from corporate documents ispotentially useful for identifying domain knowledge following an elicitation techniquebased on document analysis. We follow a multi-level processing methodology com-prising: rhetorical analysis, verb-centered event analysis, and morpho-syntactic anddependency parsing. All together, these processes identify and extract sentences from anatural language document to be translated into a controlled language.
By analyzing the processing results yielded by the prototype, some importantfindings arise: the linguistic quality of the input document affects processing perfor-mance; a refinement of the regular expressions for pre-processing is needed (regardingthe treatment of lists, bullets, and non-textual elements in the source text, amongothers); design of new complex processing rules should be considered, e.g., compoundadjectives, complex noun phrases, past participles with gerund, modal structures, andphrasal verbs with long predicates. The evaluation of the prototype was presented in theform of percentage of correctness, i.e., precision and recall.
As future work, we are interested in: (i) increasing the kind and the number ofdocuments in the corpus and refining the study of lexical and semantic features;(ii) considering statistical association measures for reinforcing term identification andpattern extraction in the context of knowledge acquisition; (iii) validating extensivelythe processing methodology; and (iv) systematically addressing the challenges andlimitations posed by the task such as text ambiguities and implicit agents.
References
1. Manrique-Losada, B., Burgos, D.A., Zapata-Jaramillo, C.M.: Exploring MWEs forknowledge acquisition from corporate technical documents. In: 9th Workshop onMultiword Expressions -MWE 2013, NAACL 2013, Atlanta, July 2013
2. Fuchs, N.E., Schwitter, R.: Specifying logic programs in controlled natural language.Technical report IFI 95.17, University of Zurich (1995)
3. Cybulski, J.L., Reed, K.: Requirements classification and reuse: crossing domainboundaries. In: Frakes, W.B. (ed.) ICSR 2000. LNCS, vol. 1844, pp. 190–210. Springer,Heidelberg (2000)
382 B. Manrique-Losada et al.

4. Cleland-Huang, J., Marrero, W., Berenbach, B.: Goal-centric traceability: using virtualplumblines to maintain critical systemic qualities. Trans. Soft. Eng. 34, 685–699 (2008)
5. Bajwa, I.S., Lee, M., Bordbar, B.: SBVR business rules generation from natural languagespecification. In: AAAI Spring Symposium, pp. 2–8. AAAI, San Francisco (2011)
6. Meth, H., Li, Y., Maedche, A. Mueller, B.: Advancing task elicitation systems–anexperimental evaluation of design principles. In: Proceedings of 33rd InternationalConference on Information Systems, pp. 54–68. AISEL, Florida (2012)
7. Young, J.D., Antón, A.I.: A method for identifying software requirements based on policycommitments. In: 18th International Requirements engineering Conference, pp. 47–56.IEEE, Sydney (2010)
8. Wang, F.H.: On acquiring classification knowledge from noisy data based on rough set.Expert Syst. Appl. 29(1), 49–64 (2005)
9. Dinesh, N., Joshi, A., Lee, I. Webber, B.: Extracting formal specifications from naturallanguage regulatory documents. In: ICoS-5, Buxton (2006)
10. Vegega, C., Amatriain, H., Pytel, P., Pollo, F., Britos, P., García, R.: Formalización deDominios de Negocio basada en Técnicas de Ingeniería del Conocimiento para Proyectos deExplotación de Información. In: Proceedings of IX JIISIC, pp. 79–86. PUCP, Lima (2012)
11. Aysolmaz, B., Demirors, O.: Modeling business processes to generate artifacts for softwaredevelopment: a methodology. In: Proceedings of the 6th International Workshop onModeling in Software Engineering, pp. 7–12. ACM, New York (2014)
12. Hao, J., Yan, Y., Gong, L., Wang, G., Lin, J.: Knowledge map-based method for domainknowledge browsing. Decis. Support Syst. 61, 106–114 (2014)
13. Tavares, V., Santoro, F.M., Borges, M.R.S.: A context-based model for knowledgemanagement embodied in work processes. Inf. Sci. 179, 2538–2554 (2009)
14. Azaustre, A., Casas, J.: Manual de retórica española. Ariel, Barcelona (1997)15. Burdiles, G.A.: Descripción de la organización retórica del género caso clínico de la
medicina a partir del corpus CCM-2009. Ph.D. thesis in Applied Linguistics. PontificiaUniversidad Católica de Valparaíso, Chile (2011)
16. Swales, J.M.: Research Genres: Explorations and Applications. Univ. Press, Cambridge(2004)
17. Parodi, G.: Lingüística de corpus: una introducción al ámbito. Revista de Lingüística Teóricay Aplicada 46(1), 93–119 (2008)
18. Manrique-Losada, B.: A formalization for mapping discourses from business-basedtechnical documents into controlled language texts for requirements elicitation. Ph.D.thesis, Universidad Nacional de Colombia (2014)
19. Pivovarova, L., Huttunen, S., Yangarber, R.: Event representation across genre. In:Proceedings of 1st Workshop on EVENTS: Definition, Detection, Coreference, andRepresentation, pp. 29–37 (2013)
20. Do, Q.X., Chan, Y.S., Roth, D.: Minimally supervised event causality identification. In:EMNLP 2011 (2011)
21. Bejan, C.A., Harabagiu, S.: Unsupervised Event Coreference Resolution. ComputationalLinguistics 40(2) (2013)
22. Vossen, P. (ed.): EuroWordNet General Document. Version 3. University of Amsterdam,Amsterdam (2002)
23. Chaowicharat, E., Naruedomkul, K.: Co-ocurrence-based error correction approach to wordsegmentation. In: Boonthum-Denecke, C., McCarthy, P.M., Lamkin, T. (eds.) Cross-Disciplinary Advances in Applied Natural Language Processing. Issues and Approaches,pp. 354–364. Information Sciences Reference Publishers (2012)
Re-expressing Business Processes Information 383

Using Semantic Frames for AutomaticAnnotation of Regulatory Texts
Kartik Asooja(B), Georgeta Bordea, and Paul Buitelaar
Insight Centre, National University of Ireland, Galway, Irelandkartik.asooja,georgeta.bordea,[email protected]
Abstract. The global legislation system is being actively updated, espe-cially after the financial crisis of 2007–2008. This results in a significantamount of work load for the different industries, in order to cope upwith the volume, velocity, variety, and complexity of the regulations inorder to be compliant. So far, this is mainly being handled manually bythe regulatory experts in the industries. In this paper, we explore thespace of providing automatic assistance to experts in compliance verifi-cation pipeline. This work specifically focuses on performing automaticsemantic annotations of the regulatory documents with a set of prede-fined categories. This is achieved by using text classification approachesusing linguistically motivated features.
1 Introduction
There are fundamental challenges in terms of Governance, Risk and Compliancethat the financial industry is facing nowadays. This is mainly due to the con-stantly changing regulations, which leads to an increased need for experts toperform compliance verification for regulatory legislation. This further increasesthe already high costs in terms of time and manual effort required in this process.In recent years, the automation of some of the tasks associated with complianceverification using recent advances in artificial intelligence is more and more seenas a solution to this problem [1,6].
An important stage in the compliance verification pipeline discussed byAsooja et al. [1] is the semantic annotation of the text sections in the regu-latory documents. This requires a semantic framework consisting of generic anddomain specific regulatory semantics. This work focuses on a text classificationapproach for automatic semantic annotation of the regulation documents. Suchannotations would enable intelligent querying over the regulatory documents. Inour context, we define these semantic annotations as pre-defined concepts fromSubject Matter Experts (SMEs), like Enforcement or Obligation. This paperdescribes an approach for semantic annotation of regulations in the financialdomain, which uses multi-label and multi-class text classification for taggingdomain specific concepts and generic concepts respectively. Our main contri-butions in this work can be summarized as: (1) Gathering a larger dataset ofannotated regulations compared to previous work, (2) Using semantic frames asfeatures for automatic annotation.c© Springer International Publishing Switzerland 2016E. Metais et al. (Eds.): NLDB 2016, LNCS 9612, pp. 384–391, 2016.DOI: 10.1007/978-3-319-41754-7 38

Using Semantic Frames for Automatic Annotation of Regulatory Texts 385
2 Related Work
Most of the works targeting related text classification problems around regula-tory texts revolve around the classification of generic concepts or modalities likeProhibition and Obligation [3,7,8]. First steps towards addressing the problemof annotating regulations with domain specific concept types are taken in Asoojaet al. [1]. They focus mostly on shallow features such as n-grams and manuallyidentified cue-phrases. We follow the problem definition as defined by them, andfurther propose additional semantics based features including semantic featuresfrom FrameNet [2] for the categorization of regulatory text. In addition to this,we also extend the dataset with more instances and modality classes, thus show-ing also an evaluation over modality classification.
3 Task Description
We perform automatic classification of regulatory text into different domain spe-cific concepts like Customer Due Diligence, as well as generic concepts e.g. modal-ities like Prohibition or Obligation [1]. We utilize a multi-class classification forclassifying a text into generic concepts (3 classes as shown in Table 2). We fur-ther classify each text into domain specific concepts using multi-label classifica-tion, since each text unit can represent more than one domain specific categories.The decision of using a multi-class classifier for generic concepts and a multi-labelclassifier for domain specific concepts is taken by the SMEs considering the size ofthe text unit, which can be aligned to a particular XML tag “P2” in the UK reg-ulation document [1]. In our case, the domain is Anti Money Laundering (AML),and the identified 9 domain specific class labels are listed in Table 1.
Dataset: We extend the available dataset consisting of only domain specificconcepts related to Anti Money Laundering (AML), with more domain specificclass labels and generic class labels e.g. Prohibition, Obligation. These annota-tions are performed by the SMEs. We annotated 10 UK acts and 1 US act thatrelate to AML. Only the sections concerned with AML have been annotated.Following list enumerates the exact regulation documents that were annotated:
– Anti Money Laundering (AML): UK AML (1993, 2001, 2003, 2007), USBank Secrecy Act Chapter X.
– Crime: Crime and Courts Act 2013, The Proceeds of Crime Act 2002 - Busi-ness in the Regulated Sector and Supervisory Authorities Order (2003, 2007),Serious Organised Crime and Police Act 2005
– Terrorism: Terrorism Act 2000, The Terrorism Act 2000 - Business in theRegulated Sector and Supervisory Authorities Order (2003, 2007)
Table 1 shows the different AML class labels and their distribution over the dif-ferent regulation types in the domain specific multi-label dataset. In the newannotations, as compared to the existing ones [1], we merged the classes Cus-tomer Identification and Verification (CIV) and Customer Due Diligence (CDD),
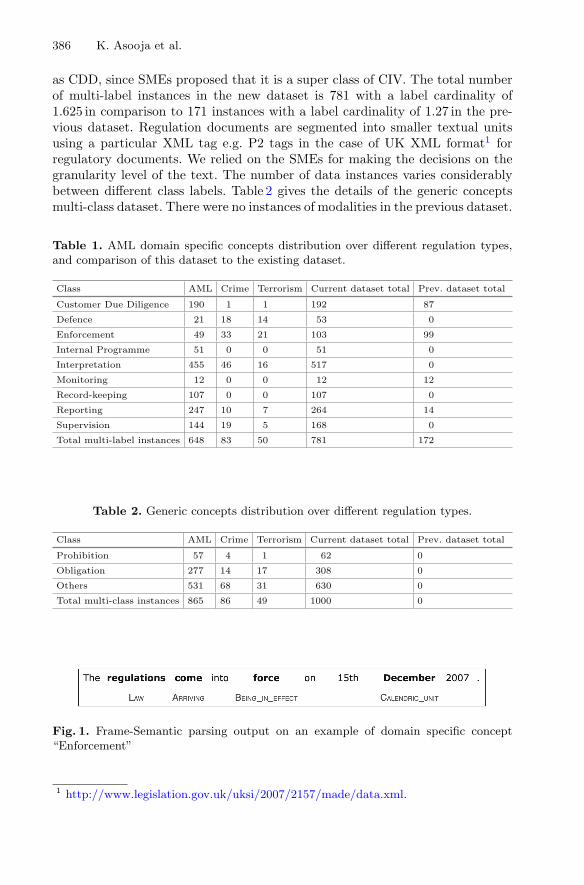
386 K. Asooja et al.
as CDD, since SMEs proposed that it is a super class of CIV. The total numberof multi-label instances in the new dataset is 781 with a label cardinality of1.625 in comparison to 171 instances with a label cardinality of 1.27 in the pre-vious dataset. Regulation documents are segmented into smaller textual unitsusing a particular XML tag e.g. P2 tags in the case of UK XML format1 forregulatory documents. We relied on the SMEs for making the decisions on thegranularity level of the text. The number of data instances varies considerablybetween different class labels. Table 2 gives the details of the generic conceptsmulti-class dataset. There were no instances of modalities in the previous dataset.
Table 1. AML domain specific concepts distribution over different regulation types,and comparison of this dataset to the existing dataset.
Class AML Crime Terrorism Current dataset total Prev. dataset total
Customer Due Diligence 190 1 1 192 87
Defence 21 18 14 53 0
Enforcement 49 33 21 103 99
Internal Programme 51 0 0 51 0
Interpretation 455 46 16 517 0
Monitoring 12 0 0 12 12
Record-keeping 107 0 0 107 0
Reporting 247 10 7 264 14
Supervision 144 19 5 168 0
Total multi-label instances 648 83 50 781 172
Table 2. Generic concepts distribution over different regulation types.
Class AML Crime Terrorism Current dataset total Prev. dataset total
Prohibition 57 4 1 62 0
Obligation 277 14 17 308 0
Others 531 68 31 630 0
Total multi-class instances 865 86 49 1000 0
Fig. 1. Frame-Semantic parsing output on an example of domain specific concept“Enforcement”
1 http://www.legislation.gov.uk/uksi/2007/2157/made/data.xml.
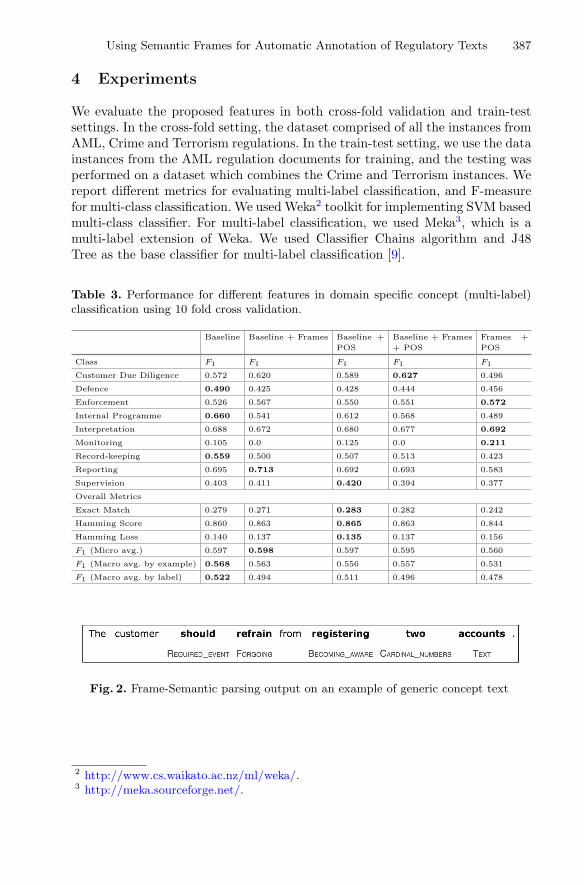
Using Semantic Frames for Automatic Annotation of Regulatory Texts 387
4 Experiments
We evaluate the proposed features in both cross-fold validation and train-testsettings. In the cross-fold setting, the dataset comprised of all the instances fromAML, Crime and Terrorism regulations. In the train-test setting, we use the datainstances from the AML regulation documents for training, and the testing wasperformed on a dataset which combines the Crime and Terrorism instances. Wereport different metrics for evaluating multi-label classification, and F-measurefor multi-class classification. We used Weka2 toolkit for implementing SVM basedmulti-class classifier. For multi-label classification, we used Meka3, which is amulti-label extension of Weka. We used Classifier Chains algorithm and J48Tree as the base classifier for multi-label classification [9].
Table 3. Performance for different features in domain specific concept (multi-label)classification using 10 fold cross validation.
Baseline Baseline + Frames Baseline +
POS
Baseline + Frames
+ POS
Frames +
POS
Class F1 F1 F1 F1 F1
Customer Due Diligence 0.572 0.620 0.589 0.627 0.496
Defence 0.490 0.425 0.428 0.444 0.456
Enforcement 0.526 0.567 0.550 0.551 0.572
Internal Programme 0.660 0.541 0.612 0.568 0.489
Interpretation 0.688 0.672 0.680 0.677 0.692
Monitoring 0.105 0.0 0.125 0.0 0.211
Record-keeping 0.559 0.500 0.507 0.513 0.423
Reporting 0.695 0.713 0.692 0.693 0.583
Supervision 0.403 0.411 0.420 0.394 0.377
Overall Metrics
Exact Match 0.279 0.271 0.283 0.282 0.242
Hamming Score 0.860 0.863 0.865 0.863 0.844
Hamming Loss 0.140 0.137 0.135 0.137 0.156
F1 (Micro avg.) 0.597 0.598 0.597 0.595 0.560
F1 (Macro avg. by example) 0.568 0.563 0.556 0.557 0.531
F1 (Macro avg. by label) 0.522 0.494 0.511 0.496 0.478
Fig. 2. Frame-Semantic parsing output on an example of generic concept text
2 http://www.cs.waikato.ac.nz/ml/weka/.3 http://meka.sourceforge.net/.
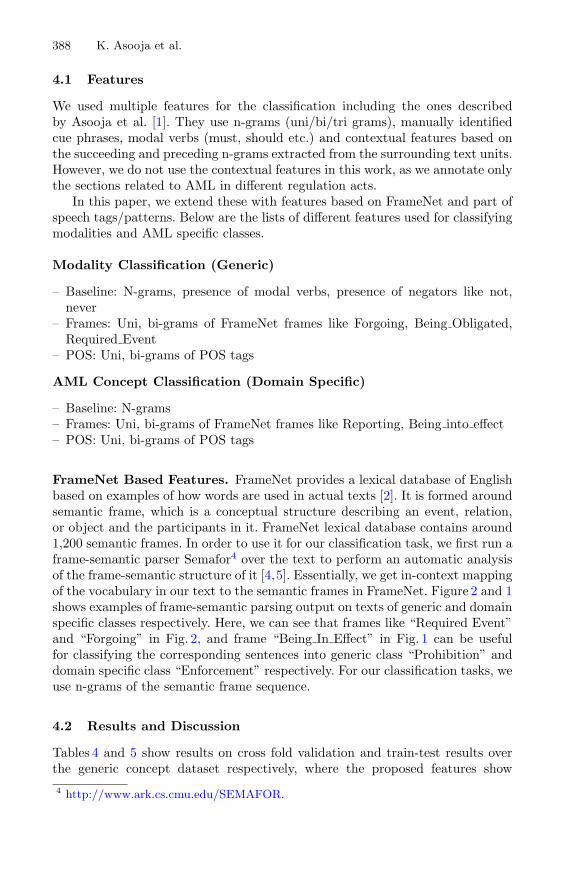
388 K. Asooja et al.
4.1 Features
We used multiple features for the classification including the ones describedby Asooja et al. [1]. They use n-grams (uni/bi/tri grams), manually identifiedcue phrases, modal verbs (must, should etc.) and contextual features based onthe succeeding and preceding n-grams extracted from the surrounding text units.However, we do not use the contextual features in this work, as we annotate onlythe sections related to AML in different regulation acts.
In this paper, we extend these with features based on FrameNet and part ofspeech tags/patterns. Below are the lists of different features used for classifyingmodalities and AML specific classes.
Modality Classification (Generic)
– Baseline: N-grams, presence of modal verbs, presence of negators like not,never
– Frames: Uni, bi-grams of FrameNet frames like Forgoing, Being Obligated,Required Event
– POS: Uni, bi-grams of POS tags
AML Concept Classification (Domain Specific)
– Baseline: N-grams– Frames: Uni, bi-grams of FrameNet frames like Reporting, Being into effect– POS: Uni, bi-grams of POS tags
FrameNet Based Features. FrameNet provides a lexical database of Englishbased on examples of how words are used in actual texts [2]. It is formed aroundsemantic frame, which is a conceptual structure describing an event, relation,or object and the participants in it. FrameNet lexical database contains around1,200 semantic frames. In order to use it for our classification task, we first run aframe-semantic parser Semafor4 over the text to perform an automatic analysisof the frame-semantic structure of it [4,5]. Essentially, we get in-context mappingof the vocabulary in our text to the semantic frames in FrameNet. Figure 2 and 1shows examples of frame-semantic parsing output on texts of generic and domainspecific classes respectively. Here, we can see that frames like “Required Event”and “Forgoing” in Fig. 2, and frame “Being In Effect” in Fig. 1 can be usefulfor classifying the corresponding sentences into generic class “Prohibition” anddomain specific class “Enforcement” respectively. For our classification tasks, weuse n-grams of the semantic frame sequence.
4.2 Results and Discussion
Tables 4 and 5 show results on cross fold validation and train-test results overthe generic concept dataset respectively, where the proposed features show
4 http://www.ark.cs.cmu.edu/SEMAFOR.

Using Semantic Frames for Automatic Annotation of Regulatory Texts 389
Table 4. F1 for different features in generic concept (multi-class) classification using10 fold cross validation.
Baseline (n-grams Baseline Baseline Baseline Frames
+ modal verbs + negators) + Frames + POS + Frames + POS + POS
Class F1 F1 F1 F1 F1
Obligation 0.796 0.813 0.804 0.806 0.780
Prohibition 0.494 0.483 0.447 0.442 0.522
Others 0.903 0.911 0.906 0.910 0.891
Weighted Avg. F1 0.844 0.854 0.846 0.849 0.834
Table 5. F1 of different features in generic concept (multi-class) classification in traintest setting, where train dataset is AML, and test dataset is Crime + Terrorism
Baseline (n-grams Baseline Baseline Baseline Frames
+ modal verbs + negators) + Frames + POS + Frames + POS + POS
Class F1 F1 F1 F1 F1
Obligation 0.535 0.541 0.562 0.571 0.523
Prohibition 0.0 0.0 0.0 0.0 0.0
Others 0.760 0.767 0.761 0.791 0.739
Overall Metrics
Weighted Avg. F1 0.680 0.686 0.687 0.712 0.662
considerable improvement over baseline. Tables 3 and 6 show results on crossfold validation and train-test results only over the domain specific (AML) con-cept dataset respectively, where no clear trend is visible. Baseline performs betterin some of the metrics. In general, cross fold setting results in both the casesproduce higher scores than the train-test settings. This can be due to the pos-sibility of data bias, as the dataset also contains different year versions of thesame regulations, which brings in the possibility of repetition of some of the textsections in the dataset.
Also, the evaluations here may be very sensitive towards the change in the datasamples, because of their very small size. Change of predictions for a few instancesin the datasets can result in high deviations in the results. In short, the size anddistribution of dataset is the main concern presently. Since the annotations are per-formed by SMEs, the data preparation process is slow and expensive.

390 K. Asooja et al.
Table 6. Performance of different features in domain specific concept (multi-label)classification in train test setting, where train dataset is AML, and test dataset isCrime + Terrorism. Here, NI denotes no instances of that class in the test instances.
Baseline Baseline Baseline Baseline + Frames Frames
+ Frames + POS + POS + POS
Class F1 F1 F1 F1 F1
Customer Due Diligence 0.057 0.049 0.0 0.055 NaN
Defence 0.0 0.0 0.0 0.0 0.0
Enforcement 0.089 0.213 0.057 0.160 0.164
Internal Programme NI NI NI NI NI
Interpretation 0.562 0.520 0.504 0.496 0.547
Monitoring NI NI NI NI NI
Record-keeping NI NI NI NI NI
Reporting 0.185 0.196 0.154 0.211 0.182
Supervision 0.047 0.091 0.140 0.182 0.043
Overall Metrics
Exact Match 0.090 0.090 0.060 0.068 0.068
Hamming Score 0.752 0.742 0.736 0.744 0.743
Hamming Loss 0.248 0.258 0.264 0.256 0.257
F1 (Micro avg.) 0.237 0.244 0.202 0.234 0.234
F1 (Macro avg. by example) 0.230 0.232 0.190 0.213 0.221
F1 (Macro avg. by label) 0.105 0.119 0.095 0.122 0.104
5 Conclusion
This paper discusses the use of semantic features to complement shallow features,providing an increase in performance especially in the generic classes. We planto further extend and improve the dataset by using multiple annotators, andapplying the approach to different domains than AML.
Acknowledgement. This work has been funded in part by a research grant fromScience Foundation Ireland (SFI) under Grant Number SFI/12/RC/2289 (INSIGHT)and by Enterprise Ireland (EI) as part of the project Financial Services Governance,Risk and Compliance Technology Centre (GRCTC), University College Cork, Ireland.

Using Semantic Frames for Automatic Annotation of Regulatory Texts 391
References
1. Asooja, K., Bordea, G., Vulcu, G., O’Brien, L., Espinoza, A., Abi-Lahoud, E.,Buitelaar, P., Butler, T.: Semantic annotation of finance regulatory text usingmultilabel classification (2015)
2. Baker, C.F., Fillmore, C.J., Lowe, J.B.: The berkeley framenet project. In: Proceed-ings of the 36th Annual Meeting of the Association for Computational Linguisticsand 17th International Conference on Computational Linguistics - vol. 1, ACL 1998,Stroudsburg, PA, USA, pp. 86–90. Association for Computational Linguistics (1998)
3. Buabuchachart, A., Metcalf, K., Charness, N., Morgenstern, L.: Classification ofregulatory paragraphs by discourse structure, reference structure, and regulationtype (2013)
4. Chen, D., Schneider, N., Das, D., Smith, N.A.: Semafor: Frame argument resolu-tion with log-linear models. In: Proceedings of the 5th International Workshop onSemantic Evaluation, pp. 264–267. Association for Computational Linguistics (2010)
5. Das, D., Chen, D., Martins, A.F., Schneider, N., Smith, N.A.: Frame-semantic pars-ing. Comput. Linguist. 40(1), 9–56 (2014)
6. Elgammal, A., Butler, T.: Towards a framework for semantically-enabled compliancemanagement in fiancial services. In: Toumani, F., et al. (eds.) ICSOC 2014. LNCS,vol. 8954, pp. 171–184. Springer, Heidelberg (2015)
7. Francesconi, E., Passerini, A.: Automatic classification of provisions in legislativetexts. Artif. Intell. Law 15(1), 1–17 (2007)
8. Morgenstern, L.: Toward automated international law compliance monitoring(tailcm). Technical report, Intelligence Advanced Research Projects Activity(IARPA) (2014)
9. Read, J., Pfahringer, B., Holmes, G., Frank, E.: Classifier chains for multi-labelclassification. Mach. Learn. 85(3), 333–359 (2011)

Automatic Evaluation of a Summary’s LinguisticQuality
Samira Ellouze(B), Maher Jaoua, and Lamia Hadrich Belguith
ANLP Research Group, MIRACL Laboratory, University of Sfax, Sfax, [email protected], maher.jaoua,[email protected]
Abstract. The Evaluation of a summary’s linguistic quality is a diffi-cult task because several linguistic aspects (e.g. grammaticality, coher-ence, etc.) must be verified to ensure the well formedness of a text’ssummary. In this paper, we report the result of combining “AdaptedROUGE” scores and linguistic quality features to assess linguistic qual-ity. We build and evaluate models for predicting the manual linguisticquality score using linear regression. We construct models for evaluat-ing the quality of each text summary (summary level evaluation) and ofeach summarizing system (system level evaluation). We assess the perfor-mance of a summarizing system using the quality of a set of summariesgenerated by the system. All models are evaluated using the Pearsoncorrelation and the Root mean squared error.
Keywords: Automatic summary evaluation · Linguistic quality · Linearregression model · Machine learning
1 Introduction
The evaluation of a summary is an important and necessary task to improve theresults of automatic summarization systems. It quantifies the informative and lin-guistic quality of a summary. There have been many studies in the field of auto-matic evaluation of summaries. Most of those studies focus on the evaluation ofthe content of a summary such as ROUGE [17], AutoSummENG [9], SIMetrix [16].But, the fact that an automatic summarypreserves the important ideas of the inputtext, is not enough; it should also have a good linguistic quality.
In the Text Analysis Conference (TAC, successor of Document Understand-ing Conference [DUC]), the linguistic quality (i.e. readability) of a summary wasevaluated manually over the years. It should be noted that manual evaluation isa hard and expensive task. So there is a particular need to establish an automaticmethod for evaluating the linguistic quality of a summary. To urge researchers toautomatically evaluate the linguistic quality of a summary, the TAC conferenceproposed, in the 2011 session, a new goal to the task of automatic evaluation oftext summaries consisting in evaluating the participated metrics for their abil-ity to measure the linguistic quality of a summary. In this conference linguisticquality evaluation involves five properties (cited in Sect. 2) which should all bec© Springer International Publishing Switzerland 2016E. Metais et al. (Eds.): NLDB 2016, LNCS 9612, pp. 392–400, 2016.DOI: 10.1007/978-3-319-41754-7 39
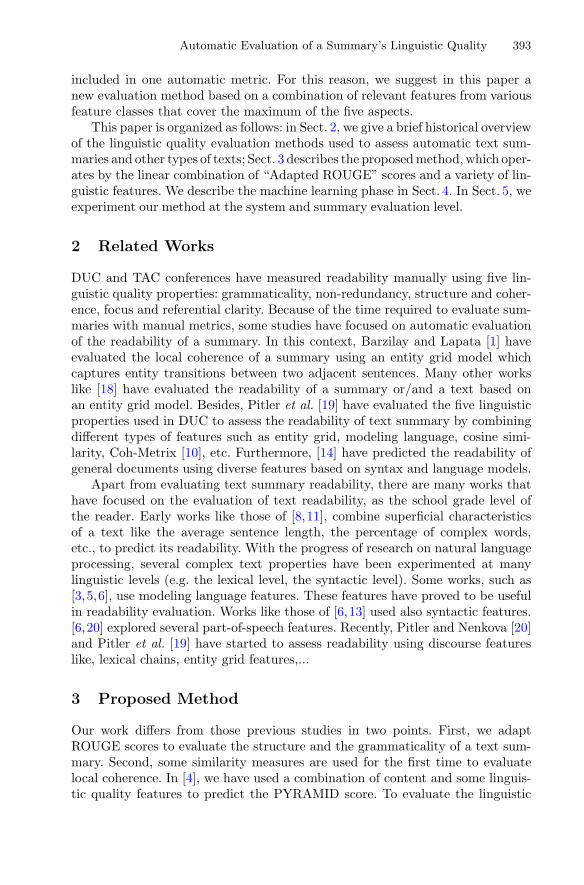
Automatic Evaluation of a Summary’s Linguistic Quality 393
included in one automatic metric. For this reason, we suggest in this paper anew evaluation method based on a combination of relevant features from variousfeature classes that cover the maximum of the five aspects.
This paper is organized as follows: in Sect. 2, we give a brief historical overviewof the linguistic quality evaluation methods used to assess automatic text sum-maries and other types of texts; Sect. 3 describes the proposed method, which oper-ates by the linear combination of “Adapted ROUGE” scores and a variety of lin-guistic features. We describe the machine learning phase in Sect. 4. In Sect. 5, weexperiment our method at the system and summary evaluation level.
2 Related Works
DUC and TAC conferences have measured readability manually using five lin-guistic quality properties: grammaticality, non-redundancy, structure and coher-ence, focus and referential clarity. Because of the time required to evaluate sum-maries with manual metrics, some studies have focused on automatic evaluationof the readability of a summary. In this context, Barzilay and Lapata [1] haveevaluated the local coherence of a summary using an entity grid model whichcaptures entity transitions between two adjacent sentences. Many other workslike [18] have evaluated the readability of a summary or/and a text based onan entity grid model. Besides, Pitler et al. [19] have evaluated the five linguisticproperties used in DUC to assess the readability of text summary by combiningdifferent types of features such as entity grid, modeling language, cosine simi-larity, Coh-Metrix [10], etc. Furthermore, [14] have predicted the readability ofgeneral documents using diverse features based on syntax and language models.
Apart from evaluating text summary readability, there are many works thathave focused on the evaluation of text readability, as the school grade level ofthe reader. Early works like those of [8,11], combine superficial characteristicsof a text like the average sentence length, the percentage of complex words,etc., to predict its readability. With the progress of research on natural languageprocessing, several complex text properties have been experimented at manylinguistic levels (e.g. the lexical level, the syntactic level). Some works, such as[3,5,6], use modeling language features. These features have proved to be usefulin readability evaluation. Works like those of [6,13] used also syntactic features.[6,20] explored several part-of-speech features. Recently, Pitler and Nenkova [20]and Pitler et al. [19] have started to assess readability using discourse featureslike, lexical chains, entity grid features,...
3 Proposed Method
Our work differs from those previous studies in two points. First, we adaptROUGE scores to evaluate the structure and the grammaticality of a text sum-mary. Second, some similarity measures are used for the first time to evaluatelocal coherence. In [4], we have used a combination of content and some linguis-tic quality features to predict the PYRAMID score. To evaluate the linguistic

394 S. Ellouze et al.
quality, we have combined adapted content scores and many linguistic featuresthat have an impact on the linguistic quality into one model. This model predictsthe manual linguistic quality score which is given by human judges in the TACconference. To build this model, we need to perform a machine learning phase.
4 Machine Learning Phase
4.1 Features’ Extraction
The goal of this phase is to transform the text summary input into numeric fea-tures matrix. The literature explores various linguistic indicators of the linguisticquality of a text. We divided those indicators into several classes of features.
Adapted ROUGE scores: ROUGE scores measure the content of a text sum-mary based on the calculation of the recall of words’ N-grams between a candi-date summary (CS) and one or more reference summaries (RSs). According to [2],ROUGE variants, which take into account large contexts, may capture the linguis-tic qualities of the summary such as some grammatical phenomena. In addition, acandidate summary is built by selecting a subset of existing words, phrases, or sen-tences from source documents. So, to evaluate linguistic quality with ROUGE, it ismore suitable to compare CS with source documents, than with RSs. For this rea-son, we adapt ROUGE scores by replacing RSs with one document that containsall source documents. Then, instead of calculating recall for the original ROUGE,we calculating the precision of words overlap between a candidate summary andall source documents. So, for instance, “Adapted ROUGE-N” scores have the fol-lowing formula:
Ad R − N =
∑gramnεCandidatSummary Countmatch(gramn)∑
gramnεCandidatSummary Count(gramn)(1)
where n represents the length of n-grams, Counmatch(gramn) represents themaximum number of n-grams co-occurring in a candidate summary and a setof source documents. We have adapted the following ROUGE variants: Ad-R-2,Ad-R-3, Ad-R-4, Ad-R-5, Ad-R-L, Ad-R-S4 and Ad-R-W.
Traditional readability measures use some simple characteristics of docu-ments like the average sentence length and the average number of syllables perword. In this study, we use as features the following set of most used traditionalreadability measures: FOG [11], Flesch Reading Ease [8], Flesch-Kincaid [15]and Automated Readability Index [21].
Shallow features: In fact, a text containing difficult words and long sen-tences will be more difficult to read and to understand. For this reason, weused as features the average number of syllables per word, the average num-ber (NB) of characters per word, the average NB of words per sentence.Moreover, we noticed that many system summaries include very long sen-tences with a few sentences. This is why we calculate, for each summary,

Automatic Evaluation of a Summary’s Linguistic Quality 395
the NB of sentences, the NB of characters and the NB of words. These fea-tures are respectively equal to − log2(NbSentences), − log2(NbCharacters) and− log2(NbWords).
Language modeling features: We use Language modeling features under theassumption that a text containing difficult words that are not frequently used bypeople will be less readable and vice versa. In our work, we have trained threelanguage models over the Open American National Corpus. We used the SRIlanguage modeling toolkit [22] to calculate for each summary the log probabilityand two measures of perplexity for unigrams, bigrams and trigrams models.
Part-of-speech Features: We divide Part-of-speech features into functionwords and content words. Features extracted from function words can tell usabout the cohesion of a text. Indeed, according to Halliday and Hasan [12], thecohesion concept includes phenomena which allow a link between sentences orphrases. Since many functional words include link tools (e.g. while, and), wehave decided to calculate for each summary the following features: the totalNB, the average NB per sentence and the density of four categories of functionwords: determiners, conjunctions, prepositions and subordinating conjunctions,and personal pronouns. We have also calculated the same features as functionwords to four categories of content words: adjectives, nouns, verbs and adverbs.
Syntactic Features: In general, a summary can be unreadable due to ungram-matical language or unusual linguistic structures that may be expressed in thesyntactic properties of the summary. We implement the following syntactic fea-tures: total number and average number per sentence of four phrases (i.e. nounphrases, verbal phrases, prepositional phrases and clauses). Furthermore, we addtwo other features: the average tree parse height of a summary and the averagenumber of dependency relation per sentence in a summary.
Entity-based features: Feng et al. [6] hypothesize that the comprehension ofa text is related to the number of entities presented in it. To extract entities weuse the Stanford NER [7]. Based on the extracted named entities, we implementfor three features: NB of named entities, density of named entities and averageNB of named entities per sentence.
Local coherence features: We assess the local coherence of a text by measur-ing the topic continuity between two adjacent sentences in a summary. To mea-sure this continuity, we determine the similarity between adjacent sentences usingLevenshtein distance, Cosine similarity, Jaccard Coefficient, Pearson’s correla-tion, Kullback-Leibler divergence, Jensen Shannon divergence, Dice coefficientand words overlap. For each measure, local coherence is defined as:
Cohr =∑(n−1)
i=1 SIM(i,i+1)
n − 1(2)
where n is the NB of sentences in a summary and SIM(i,i+1) is a similaritymeasure between sentence i and sentence i+1. This equation can be an indicator

396 S. Ellouze et al.
for continuity as well as an indicator for redundancy. As mentioned in [19], somerepetition between two adjacent sentences is a good indicator of continuity whilemuch repetition leads to redundant sentences.
4.2 Training and Validation
Before training our data, we select the relevant features to build our learningmodel using the “Wrapper subset evaluator” method implemented in the Wekaplatform. The input of the training phase is a feature Matrix, which containsselected features, and a manual readability score vector. In this phase, we build apredictive model (called “ranker”) of the manual linguistic quality (readability)score. This manual score is given by human judges in the TAC conference ona scale ranging from 1(very poor) to 5(very good). We have tried to predictlinguistic quality using several regression algorithms that are integrated in Wekaenvironment. We notice that the best result is obtained by the linear regressionfunction that estimates readability using the following equation:
y = w0 + w1x1 + w2x2 + ... + wnxn (3)
where y is the predictive value, n is the number of features, x1...xn are the fea-ture values, w1...wn are the feature weights and w0 is a constant. We used linearregression to find the linear combination that maximizes the correlation betweenthe used features and the linguistic quality score. So the problem of linear regres-sion is expressed as a set of features and their corresponding readability scores.Then, we determine a vector w of length n+1 maximizing the correlation as:
w = argmaxρ(w0 +n∑
j=1
aijwj , bi) (4)
where aij is the value of the jth feature for entry i; bi is the readability score forentry i; and ρ is the Pearson correlation. We used the least squares method tominimize the sum of squared deviations between the readability score and thepredicted readability score. Then, the equation of minimization is:
min
m∑
i=1
(yi − yi)2 (5)
To validate our model, we use the cross-validation method (with 10 folds).
5 Experiments
We Experiment our method in system level evaluation as well as in summarylevel evaluation. In our experiment we employ TAC2008’s corpus, which con-tains 48 collections and 58 systems. For each collection, there are two sets of10 documents: set (A) and set (B). Each system produces an initial summaryconstructed using only the first set of documents which chronologically precedes

Automatic Evaluation of a Summary’s Linguistic Quality 397
the second document set and an update summary built from the second set.In order to compare the baselines, the ranker and each set of features to themanual readability score, the Pearson correlation coefficient is computed. Sincecorrelation ignores the size of errors made by wrong predictions, we decide torecite the “Root Mean Squared Error” (RMSE) which can be interpreted asthe average deviation in readability scores between the predicted and the actualvalues.
5.1 System Level Evaluation
In this level, we measure the overall performance of a summarizing system bycomputing the average score for a system over the entire set of its producedsummaries. Table 1 shows the correlation and the RMSE for each baseline, eachclass of features and ranker in both tasks on the system level evaluation. Ininitial summary task, the ranker out performs all the other experiments with acorrelation of 0.8603 and an RMSE of 0.1994. This model has a strong correlationwith manual readability score and a low RMSE. Added to that, we notice thatthe correlation of the “Adapted ROUGE” scores features class outperforms allother classes. In general, the majority of baselines has a weak correlation withlinguistic quality.
In the update summary, as seen in Table 1, the best correlation and the lowestRMSE are between the ranker and the manual readability score. The modeling
Table 1. Pearson Correlation with Readability Score and RMSE (between brackets)in Both Tasks of System Level Evaluation (p− value < 2.2e− 16)
Features Initial summary Update summary
Baseline
Gunning Fog Index −0.4815(0.4026) −0.3407(0.4907)
Flesch Reading Ease −0.1584(0.399) −0.0723(0.4850)
Flesch-Kincaid Index −0.1679(0.4000) −0.4058(0.4910)
Automated Readability Index −0.1340(0.4005) −0.2402(0.4878)
Our experiments
Ad-ROUGE scores class 0.6481(0.2981) 0.6221(0.3727)
Traditional readability measures class −0.2876(0.4113) 0.2830(0.4625)
Shallow features class 0.2051(0.3844) 0.1119(0.4814)
Language modeling features class 0.4642(0.3466) 0.7025(0.3382)
Part-of-speech class 0.2482(0.3908) 0.3987(0.4799)
Syntactic Features class 0.5008(0.3401) 0.4745(0.4261)
Named entity based features class 0.2782(0.3793) −0.1271(0.5102)
local coherence features class 0.2906(0.4101) 0.3819(0.4514)
Ranker 0.8603(0.1994) 0.8485(0.2121)

398 S. Ellouze et al.
language class is the best class in predicting the readability score. The “daptedROUGE” scores class has also a good correlation with the manual readabilityscore.
5.2 Summary Level Evaluation
Now, we investigate the predictive power of the used features at summary levelevaluation in which we take, for each Summarizer system, each produced sum-mary in a separate entry. The summary level evaluation is more difficult and theresults of the correlation coefficient are lower compared to those in the systemlevel evaluation. At this level, Table 2 shows that ranker gives the best corre-lation and the lowest RMSE on both tasks. Besides, the “Adapted ROUGE”scores class is the best class in predicting the manual readability score, in bothtasks. Furthermore, the use of selected features in the ranker gives a better cor-relation compared to a single class of features, but this correlation remains lowcompared with the system level evaluation.
Table 2. Pearson Correlation with Readability Score and RMSE (between brackets)in both Tasks of Summary Level Evaluation (p− value < 2.2e− 16)
Features Initial summary Update summary
Baseline
Gunning Fog Index −0.0729(1.0607) 0.0284(1.0910)
Flesch Reading Ease −0.0614(1.0614) 0.0284(1.0910)
Flesch-Kincaid Index −0.0729(1.0607) 0.0291(1.0909)
Automated Readability Index −0.0234(1.0609) 0.0496(1.0900)
Our experiments
Ad-ROUGE scores class 0.2771(1.0186) 0.3124(1.0365)
Traditional readability measures class 0.0150(1.0606) 0.1195(1.0835)
Shallow features class 0.1719(1.0444) 0.1961(1.0701)
LM features class 0.2093(1.0368) 0.1821(1.0740)
Part-of-speech class 0.2402(1.0295) 0.1478(1.0807)
Syntactic Features class 0.1927(1.0405) 0.1837(1.0731)
Named entity based features class 0.0635(1.0581) 0,0700(1.0887)
Local coherence features class 0.0996(1.0551) 0.0406(1.0907)
Ranker 0.4323(0.9562) 0.4209(0.9908)
6 Conclusion
We have presented a method for summary readability evaluation. To predictreadability score, we have combined “Adapted ROUGE” scores and a variety

Automatic Evaluation of a Summary’s Linguistic Quality 399
of linguistic features. The combination of features is performed using a linearregression method.
To evaluate our method, we have compared the correlation of ranker, ofeach class of features and of baselines, with the manual readability scores. Wehave evaluated our method in two levels of granularity: the system level and thesummary level and in two evaluation tasks: the initial summary task and theupdate summary task. On both levels and in both tasks, our method has providedgood performance compared to baselines. For both levels and both tasks, all builtmodels use Adapted content features such as Ad-ROUGE-3, Ad-ROUGE-4,etc.This confirms the hypothesis of [2] which indicates that the integration of contentscores which take into account large context may captivate some grammaticalphenomena.
References
1. Barzilay, R., Lapata, M.: Modeling local coherence: an entity-based approach.Comput. Linguist. 34(1), 1–34 (2008)
2. Conroy, J.M., Dang, H.T.: Mind the gap: dangers of divorcing evaluations of sum-mary content from linguistic quality. In: Proceedings of the International Confer-ence on Computational Linguistics, pp. 145–152 (2008)
3. Dell’Orletta, F., Wieling, M., Cimino, A., Venturi, G., Montemagni, S.: Assessingthe readability of sentences: which corpora and features? In: Workshop on Innov-ative Use of NLP for Building Educational Applications, pp. 163–173 (2014)
4. Ellouze, S., Jaoua, M., Belguith, L.H.: An evaluation summary method based ona combination of content and linguistic metrics. In: Proceedings of RANLP Con-ference, pp. 245–251 (2013)
5. Falkenjack, J., Muhlenbock, K.H., Jonsson, A.: Features indicating readability inSwedish text. In: Proceedings of NoDaLiDa Conference, pp. 27–40 (2013)
6. Feng, L., Jansche, M., Huenerfauth, M., Elhadad, N.: A comparison of features forautomatic readability assessment. In: Proceedings of COLING, pp. 276–284 (2010)
7. Finkel, J.R., Grenager, T., Manning, C.: Incorporating non-local information intoinformation extraction systems by gibbs sampling. In: Proceedings of the Associ-ation for Computational Linguistics Conference, pp. 363–370 (2005)
8. Flesch, R.F.: How to Test Readability. Harper & Brothers, New York (1951)9. Giannakopoulos, G., Karkaletsis, V., Vouros, G., Stamatopoulos, P.: Summa-
rization system evaluation revisited: N-gram graphs. ACM Trans. Speech Lang.Process. J. 5(3), 1–39 (2008)
10. Graesser, A.C., Mcnamara, D.S., Louwerse, M.M., Cai, Z.: Coh-Metrix: Analysis oftext on cohesion and language. Behav. Res. Methods Instrum. Comput. J. 36(2),193–202 (2004)
11. Gunning, R.: The techniques of clear writing. McGraw-Hill, New York (1952)12. Halliday, M.A.K., Hasan, R.: Cohesion in English. Longman, London (1976)13. Islam, Z., Mehler, A.: Automatic readability classification of crowd-sourced data
based on linguistic and information-theoretic features. Computacin Sistemas J.17(2), 113–123 (2013)
14. Kate, R.J., Luo, X., Patwardhan, S., Franz, M., Florian, R., Mooney, R.J., Roukos,S., Welty, C.: Learning to predict readability using diverse linguistic features. In:Proceedings of Coling Conference, pp. 546–554 (2010)
400 S. Ellouze et al.
15. Kincaid, J.P., Fishburne, Jr., R.P., Rogers, R.L., Chissom, B.S.: Derivation of newreadability formulas for Navy enlisted personnel. Research Branch Report 8–75,U.S. Naval Air Station, Memphis (1975)
16. Louis, A., Nenkova, A.: Automatically assessing machine summary contentwithouta gold standard. Comput. Linguist. J. 39(2), 267–300 (2013)
17. Lin, C.Y.: Rouge: a package for automatic evaluation of summaries, text summa-rization branches out. In: Proceedings of the ACL-04 Workshop, pp. 74–81 (2004)
18. Lin, Z., Liu, C., Ng, H.T., Kan, M.Y.: Combining coherence models and machinetranslation evaluation metrics for summarization evaluation. In: Proceedings ofAssociation for Computational Linguistics, pp. 1006–1014 (2012)
19. Pitler, E., Louis, A., Nenkova, A.: Automatic evaluation of linguistic quality inmulti-document summarization. In: Proceedings of ACL, pp. 544–554 (2010)
20. Pitler, E., Nenkova, A.: Revisiting readability: a unified framework for predictingtext quality. In: Proceedings of the EMNLP Conference, pp. 186–195 (2008)
21. Smith, E., Senter, R.: Automated readability index. AMRL-TR. Aerospace MedicalResearch Laboratories (6570th), 1 (1967)
22. Stolcke, A.: SRILM - an extensible language modeling toolkit. In: Proceedingsof International Conference on Spoken Language Processing, vol. 2, pp. 901–904(2002)

Poster Papers

Extracting Formal Models from Normative Texts
John J. Camilleri1(B), Normunds Gruzitis2(B), and Gerardo Schneider1
1 CSE, Chalmers University of Technology and University of Gothenburg,Gothenburg, Sweden
john.j.camilleri,[email protected] IMCS, University of Latvia, Riga, Latvia
Abstract. Normative texts are documents based on the deontic notionsof obligation, permission, and prohibition. Our goal is model such textsusing the C-O Diagram formalism, making them amenable to formalanalysis, in particular verifying that a text satisfies properties concerningcausality of actions and timing constraints. We present an experimental,semi-automatic aid to bridge the gap between a normative text and itsformal representation. Our approach uses dependency trees combinedwith our own rules and heuristics for extracting the relevant components.The resulting tabular data can then be converted into a C-O Diagram.
Keywords: Information extraction · Normative texts · C-O diagrams
1 Introduction
Normative texts are concerned with what must be done, may be done, or shouldnot be done (deontic norms). This class of documents includes contracts, termsof services and regulations. Our aim is to be able to query such documents,by first modelling them in the deontic-based C-O Diagram [4] formal language.Models in this formalism can be automatically converted into networks of timedautomata [1], which are amenable to verification. There is, however, a largegap between the natural language texts as written by humans, and the formalrepresentation used for automated analysis. The task of modelling a text iscompletely manual, requiring a good knowledge of both the domain and theformalism. In this paper we present a method which helps to bridge this gap, byautomatically extracting a partial model using NLP techniques.
We present here our technique for processing normative texts written in nat-ural language and building partial models from them by analysing their syntac-tic structure and extracting relevant information. Our method uses dependencystructures obtained from a general-purpose statistical parser, namely the Stan-ford parser [3], which are then processed using custom rules and heuristics thatwe have specified based on a small development corpus in order to produce atable of predicate candidates. This can be seen as a specific information extrac-tion task. While this method may only produce a partial model which requiresfurther post-editing by the user, we aim to save the most tedious work so thatthe user (knowledge engineer) can focus better on formalisation details.c© Springer International Publishing Switzerland 2016E. Metais et al. (Eds.): NLDB 2016, LNCS 9612, pp. 403–408, 2016.DOI: 10.1007/978-3-319-41754-7 40
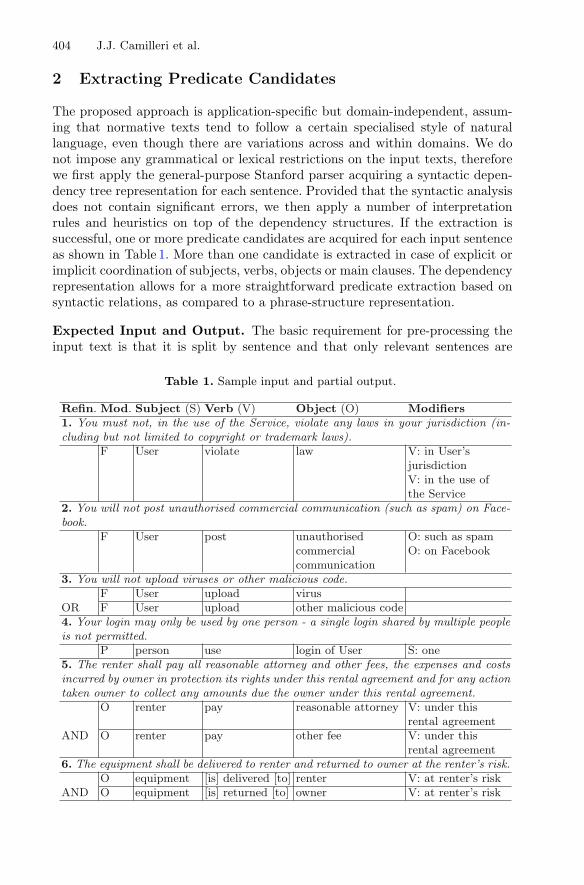
404 J.J. Camilleri et al.
2 Extracting Predicate Candidates
The proposed approach is application-specific but domain-independent, assum-ing that normative texts tend to follow a certain specialised style of naturallanguage, even though there are variations across and within domains. We donot impose any grammatical or lexical restrictions on the input texts, thereforewe first apply the general-purpose Stanford parser acquiring a syntactic depen-dency tree representation for each sentence. Provided that the syntactic analysisdoes not contain significant errors, we then apply a number of interpretationrules and heuristics on top of the dependency structures. If the extraction issuccessful, one or more predicate candidates are acquired for each input sentenceas shown in Table 1. More than one candidate is extracted in case of explicit orimplicit coordination of subjects, verbs, objects or main clauses. The dependencyrepresentation allows for a more straightforward predicate extraction based onsyntactic relations, as compared to a phrase-structure representation.
Expected Input and Output. The basic requirement for pre-processing theinput text is that it is split by sentence and that only relevant sentences are
Table 1. Sample input and partial output.
Refin. Mod. Subject (S) Verb (V) Object (O) Modifiers1. You must not, in the use of the Service, violate any laws in your jurisdiction (in-cluding but not limited to copyright or trademark laws).
F User violate law V: in User’sjurisdictionV: in the use ofthe Service
2. You will not post unauthorised commercial communication (such as spam) on Face-book.
F User post unauthorisedcommercialcommunication
O: such as spamO: on Facebook
3. You will not upload viruses or other malicious code.F User upload virus
OR F User upload other malicious code4. Your login may only be used by one person - a single login shared by multiple peopleis not permitted.
P person use login of User S: one5. The renter shall pay all reasonable attorney and other fees, the expenses and costsincurred by owner in protection its rights under this rental agreement and for any actiontaken owner to collect any amounts due the owner under this rental agreement.
O renter pay reasonable attorney V: under thisrental agreement
AND O renter pay other fee V: under thisrental agreement
6. The equipment shall be delivered to renter and returned to owner at the renter’s risk.O equipment [is] delivered [to] renter V: at renter’s risk
AND O equipment [is] returned [to] owner V: at renter’s risk
Extracting Formal Models from Normative Texts 405
included. In this experiment, we have manually selected the relevant sentences,ignoring (sub)titles, introductory notes etc. Automatic analysis of the documentstructure is a separate issue. We also expect that sentences do not contain gram-matical errors that would considerably affect the syntactic analysis and thus theoutput of our tool.
The output is a table where each row corresponds to a C-O Diagram box(clause), containing fields for: Subject: the agent of the clause; Verb: the verbalcomponent of an action; Object: the object component of an action; Modality:obligation (O), permission (P), prohibition (F), or declaration (D) for clauseswhich only state facts; Refinement: whether a clause should be attached to thepreceding clause by conjunction (AND), choice (OR) or sequence (SEQ); Time:adverbial modifiers indicating temporality; Adverbials: other adverbial phrasesthat modify the action; Conditions: phrases indicating conditions on agents,actions or objects; Notes: other phrases providing additional information (e.g.relative clauses), indicating the head word they attach to.
Values of the Subject, Verb and Object fields undergo certain normalisationand formatting: head words are lemmatised; Saxon genitives are converted to of-constructions if contextually possible; the preposition “to” is explicitly added toindirect objects; prepositions of prepositional objects are included in the Verbfield as part of the predicate name, as well as the copula if the predicate isexpressed by a participle, adjective or noun; articles are omitted.
A complete document in this format can be converted automatically into aC-O Diagram model. Our tool however does not necessarily produce a completetable, in that fields may be left blank when we cannot determine what to use.There is also the question of what is considered correct output. It may also bethe case that certain clauses can be encoded in multiple ways, and, while allfields may be filled, the user may find it more desirable to change the encoding.
Rules. We make a distinction between rules and heuristics that are appliedon top of the Stanford dependencies. Rules are everything that explicitly followfrom the dependency relations and part-of-speech tags. For example, the headof the subject noun phrase (NP) is labelled by nsubj, and the head of thedirect object NP—by dobj; fields Subject and Object of the output table canbe straightforwardly populated by the respective phrases (as in Table 1).
We also count as lexicalised rules cases when the decision can be obviouslymade by considering both the dependency label and the head word. For example,modal verbs and other auxiliaries of the main verb are labelled as aux butwords like “may” and “must” clearly indicate the respective modality (P andO). Auxiliaries can be combined with other modifiers, for example, the modifier“not” (neg) which indicates prohibition. In such cases, the rule is that obligationoverrides permission, and prohibition overrides both obligation and permission.
In order to provide concise values for the Subject and Object fields, relativeclauses (rcmod), verbal modifiers (vmod) and prepositional modifiers (prep) thatmodify heads of the subject and object NPs are separated in the Notes field. Adver-bialmodifiers (advmod), prepositionalmodifiers and adverbial clauses (advcl) thatmodify the main verb are separated, by default, in the Adverbials field.
406 J.J. Camilleri et al.
If the main clause is expressed in the passive voice, and the agent is mentioned(expressed by the preposition “by”), the resulting predicate is converted to theactive voice (as shown by the fourth example in Table 1).
Heuristics. In addition to the obvious extraction rules, we apply a number ofheuristic rules based on the development examples and our intuition about theapplication domains and the language of normative texts.
First of all, auxiliaries are compared and classified against extended lists ofkeywords. For example, the modal verb “can” most likely indicates permissionwhile “shall” and “will” indicate obligation. In addition to auxiliaries, we con-sider the predicate itself (expressed by a verb, adjective or noun). For example,words like “responsible” and “require” most likely express obligation.
For prepositional phrases (PP) which are direct dependants of Verb, we firstcheck if they reliably indicate a temporal modifier and thus should be put inthe Time field. The list of such prepositions include “after”, “before”, “during”etc. If the preposition is ambiguous, the head of the NP is checked if it bears ameaning of time. There is a relatively open list of such keywords, including “day”,“week”, “month” etc. Due to PP-attachment errors that syntactic parsers oftenmake, if a PP is attached to Object, and it has the above mentioned indicatorsof a temporal meaning, the phrase is put in the Verb-dependent Time field.
Similarly, we check the markers (mark) of adverbial clauses if they indicatetime (“while”, “when” etc.) or a condition (e.g. “if”), as well as values of simpleadverbial modifiers, looking for “always”, “immediately”, “before” etc. Adverbialmodifiers are also checked against a list of irrelevant adverbs used for emphasis(e.g. “very”) or as gluing words (e.g. “however”, “also”).
Subject and Object are checked for attributes: if it is modified by a number,the modifier is treated as a condition and is separated in the respective field.
If there is no direct object in the sentence, or, in the case of the passive voice,no agent expressed by a prepositional phrase (using the preposition “by”), thefirst PP governed by Verb is treated as a prepositional object and thus is includedin the Object field.
Additionally, anaphoric references by personal pronouns are detected, nor-malised and tagged (e.g. “we”, “our” and “us” are all rewritten as “<we>”). Inthe case of terms of services, for instance, pronouns “we” and “you” are oftenused to refer to the service and the user respectively. The tool can be customisedto do such a simple but effective anaphora resolution (see Table 1).
3 Experiments
In order to test the potential and feasibility of the proposed approach, we haveselected four normative texts from three different domains: (1) PhD regulationsfrom Chalmers University; (2) Rental agreement from RSO, Inc.; (3) Terms ofservice for GitHub; and (4) Terms of service for Facebook. In the developmentstage, we considered first 10 sentences of each document, based on which the rules
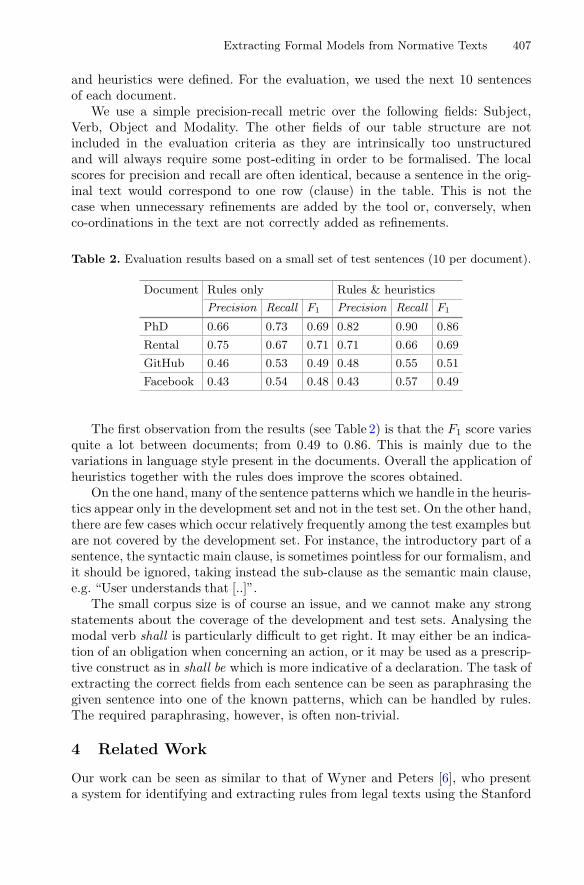
Extracting Formal Models from Normative Texts 407
and heuristics were defined. For the evaluation, we used the next 10 sentencesof each document.
We use a simple precision-recall metric over the following fields: Subject,Verb, Object and Modality. The other fields of our table structure are notincluded in the evaluation criteria as they are intrinsically too unstructuredand will always require some post-editing in order to be formalised. The localscores for precision and recall are often identical, because a sentence in the orig-inal text would correspond to one row (clause) in the table. This is not thecase when unnecessary refinements are added by the tool or, conversely, whenco-ordinations in the text are not correctly added as refinements.
Table 2. Evaluation results based on a small set of test sentences (10 per document).
Document Rules only Rules & heuristics
Precision Recall F1 Precision Recall F1
PhD 0.66 0.73 0.69 0.82 0.90 0.86
Rental 0.75 0.67 0.71 0.71 0.66 0.69
GitHub 0.46 0.53 0.49 0.48 0.55 0.51
Facebook 0.43 0.54 0.48 0.43 0.57 0.49
The first observation from the results (see Table 2) is that the F1 score variesquite a lot between documents; from 0.49 to 0.86. This is mainly due to thevariations in language style present in the documents. Overall the application ofheuristics together with the rules does improve the scores obtained.
On the one hand, many of the sentence patterns which we handle in the heuris-tics appear only in the development set and not in the test set. On the other hand,there are few cases which occur relatively frequently among the test examples butare not covered by the development set. For instance, the introductory part of asentence, the syntactic main clause, is sometimes pointless for our formalism, andit should be ignored, taking instead the sub-clause as the semantic main clause,e.g. “User understands that [..]”.
The small corpus size is of course an issue, and we cannot make any strongstatements about the coverage of the development and test sets. Analysing themodal verb shall is particularly difficult to get right. It may either be an indica-tion of an obligation when concerning an action, or it may be used as a prescrip-tive construct as in shall be which is more indicative of a declaration. The task ofextracting the correct fields from each sentence can be seen as paraphrasing thegiven sentence into one of the known patterns, which can be handled by rules.The required paraphrasing, however, is often non-trivial.
4 Related Work
Our work can be seen as similar to that of Wyner and Peters [6], who presenta system for identifying and extracting rules from legal texts using the Stanford

408 J.J. Camilleri et al.
parser and other NLP tools within the GATE system. Their approach is some-what more general, producing as output an annotated version of the originaltext. Ours is a more specific application of such techniques, in that we have awell-defined output format which guided the design of our extraction tool, whichincludes in particular the ability to define clauses using refinement.
Mercatali et al. [5] tackle the automatic translation of textual representationsof laws to a formal model, in their case UML. This underlying formalism is ofcourse different, where they are mainly interested in the hierarchical structureof the documents rather than the norms themselves. Their method does not usedependency or phrase-structure trees but shallow syntactic chunks.
Cheng et al. [2] also describe a system for extracting structured informationfor texts in a specific legal domain. Their method combines surface-level methodslike tagging and named entity recognition (NER) with semantic analysis ruleswhich were hand-crafted for their domain and output data format.
5 Conclusion
Our main goal is to perform formal analyses of normative texts through modelchecking. In this paper we have briefly described how we can help to bridge thegap between natural language texts and their formal representations. Thoughthe results reported here are indicative at best (due to the small test corpus), theapplication of our technique to the case studies we have considered has definitelyhelped increase the efficiency of their “encoding” into C-O Diagrams. Futureplans include extending the heuristics, comparing the use of other parsers, andapplying our technique to larger case studies.
Acknowledgements. This research has been supported by the Swedish ResearchCouncil under Grant No. 2012-5746 and partially supported by the Latvian StateResearch Programme NexIT.
References
1. Alur, R., Dill, D.L.: A theory of timed automata. Theoret. Comput. Sci. 126(2),183–235 (1994)
2. Cheng, T.T., Cua, J., Tan, M., Yao, K., Roxas, R.: Information extraction fromlegal documents. In: SNLP 2009, pp. 157–162, October 2009
3. Klein, D., Manning, C.D.: Accurate unlexicalized parsing. In: ACL 2003,pp. 423–430 (2003)
4. Martinez, E., Cambronero, E., Diaz, G., Schneider, G.: A model for visual specifi-cation of e-Contracts. In: SCC 2010, pp. 1–8. IEEE Comp. Soc. (2010)
5. Mercatali, P., Romano, F., Boschi, L., Spinicci, E.: Automatic translation fromtextual representations of laws to formal models through UML. In: JURIX 2005,pp. 71–80. IOS Press (2005)
6. Wyner, A., Peters, W.: On rule extraction from regulations. In: Atkinson, K. (ed.)JURIX 2011, pp. 113–122. IOS Press, Amsterdam (2011)

Sentiment Analysis in Arabic
Sanjeera Siddiqui1(&), Azza Abdel Monem2, and Khaled Shaalan1,3
1 British University in Dubai, Block 11, 1st and 2nd Floor,Dubai International Academic City, Dubai, UAE
[email protected], [email protected] Faculty of Computer and Information Sciences, Ain Shams University,
Abbassia, 11566 Cairo, [email protected]
3 School of Informatics, University of Edinburgh, Edinburgh, UK
Abstract. The tasks that falls under the errands that takes after Natural Lan-guage Processing approaches includes Named Entity Recognition, InformationRetrieval, Machine Translation, and so on. Wherein Sentiment Analysis utilizesNatural Language Processing as one of the way to locate the subjective contentshowing negative, positive or impartial (neutral) extremity (polarity). Due to theexpanded utilization of online networking sites like Facebook, Instagram,Twitter, Sentiment Analysis has increased colossal statures. Examination ofsentiments helps organizations, government and other association to extempo-rize their items and administration in view of the audits or remarks. This paperintroduces an Innovative methodology that investigates the part of lexicalizationfor Arabic Sentiment examination. The system was put in place with twoprinciples rules– “equivalent to” and “within the text” rules. The outcomessubsequently accomplished with these rules methodology gave 89.6 % accuracywhen tried on baseline dataset, and 50.1 % exactness on OCA, the seconddataset. A further examination shows 19.5 % in system1 increase in accuracywhen compared with baseline dataset.
Keywords: Sentiment analysis Opinion mining Rule-based approach Arabic natural language processing
1 Introduction
Web, additionally termed as World Wide Web, contains heaps of data. Web furnishesindividuals with an open space to impart their insights or assumptions, their encounters,and their inclinations on a substance or product. The aim of Sentiment Analysis is toperceive the content with assessments and mastermind them in a way adjusting to theextremity (polarity), which incorporates: negative, positive or unbiased (neutral).Sentiments takes the organizations to tremendous statures [6, 7]. Dialects talked byindividuals identifies with their way of life and what they talk, thus distinctive dialectsare talked or learnt in better places, which contrast in components also in qualities.Arabic Natural dialect handling is moving a large portion of the scientist’s outlook toArabic, because of the expansion utilization of Arabic dialect by people and theexpanded web Arabic clients. Arabic dialect holds one of the main ten position in the
© Springer International Publishing Switzerland 2016E. Métais et al. (Eds.): NLDB 2016, LNCS 9612, pp. 409–414, 2016.DOI: 10.1007/978-3-319-41754-7_41
overall utilized dialects. Arabic Natural dialect handling in sentiment investigation istaking gigantic consideration because of the inaccessibility of assets. This requires aneed to develop the work in Arabic Sentiment Analysis.
The rest of this paper is organized as follows. Related work is covered in Sect. 2,Data collection is covered in Sect. 3 followed by system implementation in Sect. 4.Section 5 covers results and lastly Sect. 6 depicts conclusion.
2 Related Work
Shoukry and Refea [7] took after a corpus-based methodology, accomplished anaccuracy of 72.6 %. Positive, negative and unbiased polarity characterization done byAbdullah et al. [1] displayed a dictionary and sentiment examination tool with anaccuracy of 70.05 % on tweeter dataset and 63.75 % on Yahoo Maktoob dataset.
In order to take a shot at Sentiment Analysis, the key parameter is the dataset. Lateendeavors by Shaalan [5] outlined the significance of crowdsourcing as an extremelyeffective system for clarifying dataset. SVM classifier accomplished 72.6 % accuracyon twitter dataset of 1000 tweets [2, 7].
Feldman [4] worked at record level opinion investigation utilizing a consolidatedmethodology comprising of a vocabulary and Machine Learning approach withK-Nearest Neighbors and Maximum Entropy on a blended area corpus includinginstruction, legislative issues and games achieved an F-measure of 80.29 %.
Aldayel and Azmi [2] utilizing a half and half approach that is Lexical and SupportVector Machine classifier created 84.01 % precision. El-Halees [3] accomplished79.90 % precision with Hybrid methodology containing lexical, entropy and K-closestneighbor.
3 Data Collection
Collection of data is vital to perform sentiment analysis. In the field of sentimentanalysis, the key underlying data used is the opinion or sentiment data for checking thepolarity and lexicon for building the rules or for machine learning classifiers. Lexiconsused in this paper is an extension of lexicon shared by [1]. These lexicons containsnamed entities, adjectives, randomly paced and most importantly words whichappeared to be common in both positive and negative reviews. New addition to thelexicon created in this paper includes one word tweet or review in the appropriatelexicon list.
Hence we add Abdullah et al.’s [1] dictionaries with the expansion of words fromthe dataset which were found to seem more than once. Taking into account theattentiveness of reiteration of these words and their situation, they were incorporatedinto both the rundown that is sure and negative records. For instance, “ بتاك ” (Writer)was rehashed in both negative and positive surveys. Henceforth, it was incorporatedinto positive and negative dictionary.
410 S. Siddiqui et al.

4 Implementation of Arabic Sentiment Analysis
The spreadsheet guideline (rule) based framework proposed in this section includedthree key stages to show the outcomes in the wake of handling. The principal stage is toenter the tweet. The second stage incorporates rules centered check wherein the enteredsubjective statement is gone through an arrangement of standards rules which includes“equal to” and “within the text rules”, examining for the tweet extremity either negativeor positive. The third stage is to transform the content into “Red” color demonstratingcontent is positive or “Green” showing content is negative. Figure 1 delineates thereview of the framework proposed in this paper.
The methodology followed in this paper is guideline (rule) based, we allude(Shaalan 2010) for an audit about the importance of the principle based methodologyand how it is utilized to apply distinctive NLP assignments or tasks. Parcel of exam-ination till date included pre-handling or pre-processing as the real steps. In thisexposition, with the very utilization of fitting standards the pre-preparing step wascompletely wiped out for the dataset, there were no changes done to the dataset. Thetenet (rule) based methodology incorporate examples to gaze the entered tweet in thedictionary which in this case is the lexicon.
Methodology for the Formation of Rules. The very presence of the strategy that wehave proposed in this paper, has enlivened a completely new methods, in order toaddress the basic and undealt issues with the lexicon based methodology. Both theextremity (polarity) dictionaries and extremity (polarity) opinions are scrutinized. Thispaper only focusses on positive and negative polarity examination.
The methodology in this research covers many crucial areas found to be missing inthe literature review that we conducted. Firstly, the rules are not confined to searchwithin text. Secondly, rules are not excluding common words found in both positiveand negative lexicon and lastly, the proposed rule-based system covers all the direc-tions where the word has been found to have a huge impact.
Input: Tweet
Processing:
Check through a set of rules
Output:
→
→
Tweet turns “RED COLOUR ” positive or
Tweet turns “GREEN COLOUR” negative.
Fig. 1. Overview of the system proposed
Sentiment Analysis in Arabic 411
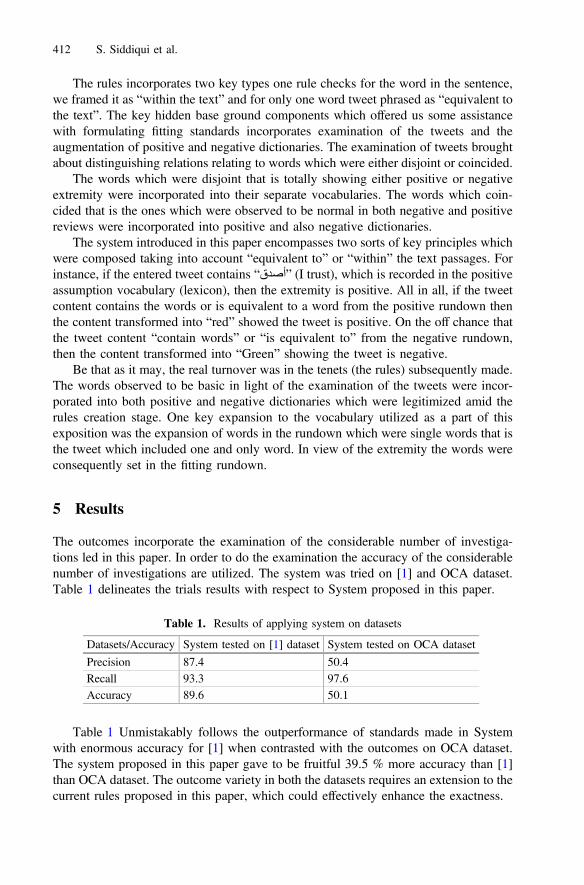
The rules incorporates two key types one rule checks for the word in the sentence,we framed it as “within the text” and for only one word tweet phrased as “equivalent tothe text”. The key hidden base ground components which offered us some assistancewith formulating fitting standards incorporates examination of the tweets and theaugmentation of positive and negative dictionaries. The examination of tweets broughtabout distinguishing relations relating to words which were either disjoint or coincided.
The words which were disjoint that is totally showing either positive or negativeextremity were incorporated into their separate vocabularies. The words which coin-cided that is the ones which were observed to be normal in both negative and positivereviews were incorporated into positive and also negative dictionaries.
The system introduced in this paper encompasses two sorts of key principles whichwere composed taking into account “equivalent to” or “within” the text passages. Forinstance, if the entered tweet contains “ قدصأ ” (I trust), which is recorded in the positiveassumption vocabulary (lexicon), then the extremity is positive. All in all, if the tweetcontent contains the words or is equivalent to a word from the positive rundown thenthe content transformed into “red” showed the tweet is positive. On the off chance thatthe tweet content “contain words” or “is equivalent to” from the negative rundown,then the content transformed into “Green” showing the tweet is negative.
Be that as it may, the real turnover was in the tenets (the rules) subsequently made.The words observed to be basic in light of the examination of the tweets were incor-porated into both positive and negative dictionaries which were legitimized amid therules creation stage. One key expansion to the vocabulary utilized as a part of thisexposition was the expansion of words in the rundown which were single words that isthe tweet which included one and only word. In view of the extremity the words wereconsequently set in the fitting rundown.
5 Results
The outcomes incorporate the examination of the considerable number of investiga-tions led in this paper. In order to do the examination the accuracy of the considerablenumber of investigations are utilized. The system was tried on [1] and OCA dataset.Table 1 delineates the trials results with respect to System proposed in this paper.
Table 1 Unmistakably follows the outperformance of standards made in Systemwith enormous accuracy for [1] when contrasted with the outcomes on OCA dataset.The system proposed in this paper gave to be fruitful 39.5 % more accuracy than [1]than OCA dataset. The outcome variety in both the datasets requires an extension to thecurrent rules proposed in this paper, which could effectively enhance the exactness.
Table 1. Results of applying system on datasets
Datasets/Accuracy System tested on [1] dataset System tested on OCA dataset
Precision 87.4 50.4Recall 93.3 97.6Accuracy 89.6 50.1
412 S. Siddiqui et al.

This inquiry is exceptionally very much replied with a basic correlation of oursystem with guideline (rule) fastening approach results with Abdullah et al.’s [1]lexicon based methodology results. As the dataset utilized as a part of this paper istaken from Abdullah et al. [1], we have looked at our outcome with this dataset. Ourproposed framework (rule based) beat their outcomes with 17.35 % increment inexactness when tried on System 1.
On contrasting our technique and Abdullah et al. [1] presented some key incre-ments. Abdullah et al. [1] concentrated on augmenting the dictionaries which was onlyexpansion of new words to the rundown even irrelevant to the test set, has abandonedthem with no change in accuracy. Consequently, the analyses outflanked when con-trasted with the outcomes reported in [1]. Table 2 delineates the correlation of the testsdirected in this paper with [1].
This section exhibited the system developed. System incorporated the rules whichsecured “within the text” and “equivalent to” standards.
6 Conclusion
This paper delineated how Sentiment Analysis has discovered its presence with theextremely propelled developments in online data. The key fundamental parameter seenis the sharing of audits on any setting and how this effect the clients to take choices onnumerous things right from purchasing a motion picture ticket to purchasing a propertyto numerous propelled operations.
Revealing insight into how a word in one assessment represents positive extremityand how the same word could bring about to make the sentence negative when utilizedas a part of an alternate setting. Sentiment Analysis is observed to be exceptionallyhelpful in measuring the effect of an item or administration, through the surveys orreviews that the general population have shared on it. This paper beats the vocabulary(lexicon) building process through the proper arrangement of words too not barring thebasic words found in both the tweets for the dictionaries. Sentiment Analysis, throughthe organized set guidelines (rules) and through the right utilization of various rulesincluding “contains content” and “equivalent to”.
The reasonable noteworthiness in results in a manner acquired through the stan-dards made makes the rules based methodology the most alluring methodology. Thegreater part of the scientists have concentrated just on Lexicon based yield. Our yield isnew to the sentiment investigation period. The yield was exhibited through theadjustment in shade of entered tweet to “Red” for positive tweets and “Green” fornegative tweets with the use of two rules, which obtained 19.5 % increase in resultswhen compared to Abdullah et al. [1] but resulted in only 50 % accuracy for OCAdataset. This calls for a need to extend this rule based system to be improvised and
Table 2. Results correlation with [1]
Rule-based vs lexicon-based approaches Accuracy
System proposed 89.6 %Abdullah et al. [1] 70.05 %
Sentiment Analysis in Arabic 413

enhanced to be fitted into the context of any dataset. In spite of the fact that thisframework (system) was just cantered around positive and negative tweets.
As a key errand for further creating and upgrading this proposed framework, wewould be anticipating enhance the current proposed framework to cover more rules,subjectivity order and in this way show impartial(neutral) extremity also.
References
1. Abdulla, N.A., Ahmed, N.A., Shehab, M.A., Al-Ayyoub, M., Al-Kabi, M.N., Al-rifai, S.:Towards improving the lexicon-based approach for arabic sentiment analysis. Int. J. Inf.Technol. Web Eng. (IJITWE) 9(3), 55–71 (2014)
2. Aldayel, H.K., Azmi, A.M.: Arabic tweets sentiment analysis – a hybrid scheme. J. Inf. Sci.0165551515610513 (2015)
3. El-Halees, A.: Arabic opinion mining using combined classification approach (2011)4. Feldman, R.: Techniques and applications for sentiment analysis. Commun. ACM 56(4),
82–89 (2013)5. Shaalan, K.: A survey of arabic named entity recognition and classification. Comput. Linguist.
40(2), 469–510 (2014). MIT Press, USA6. Shoukry, A., Rafea, A.: Preprocessing Egyptian dialect tweets for sentiment mining. In: 4th
Workshop on Computational Approaches to Arabic Script-Based Languages, pp. 47–56(2012)
7. Shoukry, A., Rafea, A.: Sentence-level Arabic sentiment analysis. In: 2012 InternationalConference on Collaboration Technologies and Systems (CTS), pp. 546–550. IEEE, May2012
414 S. Siddiqui et al.

Automatic Creation of Ontology Using a LexicalDatabase: An Application for the Energy Sector
Alexandra Moreira1, Jugurta Lisboa Filho1,and Alcione de Paiva Oliveira1,2(B)
1 Departamento de Informatica, Universidade Federal de Vicosa, Vicosa, [email protected], [email protected], [email protected] The University of Sheffield, Western Bank, Sheffield S10 2TN, UK
Abstract. The development of ontologies is a task that demands under-standing of a domain and use of computational tools to develop them.One of the main difficulties is to establish the appropriate meaning ofeach term. There are several lexical bases that can help in this task, butthe problem is how doing this automatically. This paper presents a tech-nique for the automatic ontology development based on lexical databasesavailable on the Web. The intention is that the whole process is to takeplace with a minimum of human intervention. The technique was ableto generate the correct hierarchy for 64 % of the terms in a case studyfor the electricity sector. The tool was applied in the electrical powerdomain, but the goal is that the tool can be used for any domain.
Keywords: Ontology creation · Lexical database · Information extrac-tion
1 Introduction
Ontologies, in the computational sense, are resources for the representation andretrieval of information. It is a resource often used when one wants to add seman-tics to a syntactic construct. However, as stated by Sanchez and Moreno [9], theconstruction of ontologies is a task that demands a lot of time and a thoroughknowledge of the domain. The attribution of meaning to the terms of the domainfor the composition of the ontology can be difficult due to the ambiguity inher-ent in natural language. One possible way that can facilitate the assignmentof meaning to the terms of a domain is to make use of lexical databases andontologies available on the web. Many researchers have already put much effortinto the construction of these resources and they are mature enough to be use-ful for semantic attribution tasks. Among the lexical resources and ontologiesavailable on the Web we can mention the FrameNet [1], the WordNet [4], andsumo ontology [8]. As those resources are available in digital format, accessiblethrough a computer network, it would be interesting if a computer system could
A. de Paiva Oliveira—The author receives a grant from capes, process n.0449/15-6.
c© Springer International Publishing Switzerland 2016E. Metais et al. (Eds.): NLDB 2016, LNCS 9612, pp. 415–420, 2016.DOI: 10.1007/978-3-319-41754-7 42
416 A. Moreira et al.
be built to make use of those resources. In this paper, we describe a computersystem named AutOnGen (AUTomatic ONtology GENnerator), that makes useof these resources to attribute meaning to terms of a domain and to build upan ontology. The system generates the ontology fully automatically, however,the ontology generated should be later examined by an expert to carry outadjustments. The system was applied to the construction of an ontology for thesector of production and supply of electric power. This paper is organized as fol-lows: the next section presents the work previously developed that are related tothis research; Sect. 3 describes the proposed system; Sect. 4 presents the resultsobtained; and Sect. 5 presents the final remarks.
2 Related Works
Igor et al. [5] created a glossary automatically for the field of Geology. Theyextracted terms from a corpus composed of 140 specific texts in the field ofGeology. Each term receives a definition obtained from Wikipedia sites and fromglossaries for the relevant terms. In addition to the difference of the applicationdomain, a distinction of our work in relation to the proposal of [5] is that wepropose to build an ontology and not just a glossary.
Dahab et al. [2] have developed a system named TextOntoEx that constructsontology from natural domain text using a semantic pattern-based approach.According to the authors, TextOntoEx analyses natural domain text to extractcandidate relations and then maps them into a meaning representation to facil-itate the construction of the ontology. They applied it in a case study of agri-cultural domain. The method is not fully automatic, and they do not use a toplevel ontology.
Ruiz-Casado et al. [7] presented a procedure for automatically enriching theWordNet with relationships extracted from Wikipedia. In this case, the pointthat most differentiates this work of ours is the fact they didn’t create an ontologyfor a particular domain but rather enriched a general ontology.
3 The Proposed System
The AutOnGen (AUTomatic ONtology GENnerator) was developed in Pythonlanguage and uses the framework NLTK1. It also relies heavily on tools used toprocess natural language as POS tagger and machine translation and lexical andsemantic bases, in this case the Wordnet 3.0 [4] and the SUMO ontology [8]. Wewill now explain each module of the system, as well as the decisions adopted. TheFig. 1 illustrates the modules of the system and their interactions. The systementry is a list of selected terms of the domain. The selection of terms is a key stepin the construction of ontology, however, this is not the focus of this paper. Butit is essential that all the terms are relate to a specific domain. In the case of ourproject the list was generated automatically by the Exterm2 software and formedby the Brazilian Portuguese language terms related to the electricity sector.1 http://www.nltk.org/.2 The article describing the software is being evaluated for publication.

Automatic Creation of Ontology Using a Lexical Database 417
Fig. 1. Diagram showing the AutOnGen system modules. The rectangles are the inputand output data and the ellipses denote the functions performed.
3.1 The Translation Module
At this point one can note the first critical decision in the system design. As the listof the terms is in Brazilian Portuguese then it would be expected the use of Por-tuguese lexical resources. However, in the light of scarce lexical resources for thePortuguese language, it was chosen to use lexical resources in English. For exam-ple, the current Brazilian WordNet version contains only verbs (3713 synsets) andthe present work deals with nouns [3]. On the other hand, the American Word-Net has a much broader lexical coverage, with 82115 synsets for nouns and 13767synsets for verbs, not to mention the synsets classes for other classes of words3.For this reason, the first step in the system is the translation of the terms of thelist for the English language. To perform the translation it was used the libtrans-late4 library that works as a facade to web-based translation services such as BabelFish, Google Language Tools and SYSTRAN. We decided to use only the GoogleLanguage Tools once it produced better results in our preliminary tests. As theGoogle tool is based on statistics generated by an immense ngrams database, inorder to increase the quality of the translation, each term submitted for transla-tion was attached to another term, called domain anchor. Domain anchor is an adhoc attempt to establish the context of translation. It ensure, for instance, that theterm “acordo” be translated as “agreement” and not “wake up” by simply addingthe term “negocios” (business) as domain anchor. The choice of the term that willserve as the domain anchor must be done carefully in order to help characterizethe domain. Despite the employment of this feature we have not yet measured theeffectiveness of such a technique. After translation the term is analyzed by a POStagger.
3.2 POS Tagging and Hypernym Finding
The translated terms are annotated according to their syntactic class withthe goal to determine the core lexeme of the noun phrase. This is done becausethe next step in the process is to obtain the head of the term and, after that,3 http://wordnet.princeton.edu/wordnet/man/wnstats.7WN.html.4 http://www.nongnu.org/libtranslate/.

418 A. Moreira et al.
the hypernym of the term by querying the Wordnet. In the case of compoundterms, when the WordNet does not find the hypernym of a compound term, thesystem uses the hypernym of the head lexeme of the compound term. The ruleused for the selection of the head word of a compound term is the following: If thecomposite term does not have prepositions or conjunctions, it will be selectedthe last nominal of the compound term, otherwise it will be selected the lastnominal occurring before the preposition or the conjunction. For instance, inthe case of the compound term “the distribution system usage charge” that hasthe following POS annotation(‘the’,‘DT’), (‘distribution’,‘NN’), (‘system’,‘NN’),(‘usage’,‘NN’), (‘charge’,‘NN’)
it would be selected as head term the word “charge”. This rule for head selectionof a compound word in Germanic languages, was proposed by [10], and is calledThe Right-hand Head Rule (RHHR): the head of a compound word is the right-hand member of that compound.
The biggest challenge in this step is to get the correct hypernym. Wordnet canreturn several senses to the lexeme and it’s hard for the system to choose the cor-rect one automatically. The choice of generic sense is made by the get hypernymmodule. This module works as follows: when the WordNet returns more than oneterm candidate for being the hypernym, the module queries the google ngramsdatabase5 to verify which term has the highest probability of being the hypernymterm. The query is done building for each term a bigram formed by concatena-tion of the hypernym term with hyponym term. Thus, for the term “business”and the hypernym candidate term “group” is formed the compound term “groupbusiness”. The underlying hypothesis of this technique is that the construction<noum noum>, where the second term modifies or qualifies the first, it is a com-mon linguistic construction in the English language. This type of compound wascalled subsumptive compound by Marchand [6]. Once obtained the hypernymthe system moves to the step of obtaining the class hierarchy.
3.3 Getting the Hierarchy and Generating the Ontology
After obtaining the hypernym, obtaining the remainder of the class hierarchy isa relatively simple step, since we rely on SUMO ontology-related technologies.This is done by means of successive queries to SUMO’s website, where in eachquery is retrieved the superclass of the current class, until the system returns totop class (Entity). Thus a query with the term “power company” would have toreturn the following class hierarchy:Business→ Organization→ Agent→ Object→ Physical→ Entity
The final step of the system is generating the ontology. Ontology generationis another straightforward step in the process. This step gets the list of translatedterms and the class hierarchy of each term and issues a file in the owl format.The Fig. 2 displays a small segment of a generated ontology for the electricalenergy sector.5 https://books.google.com/ngrams.

Automatic Creation of Ontology Using a Lexical Database 419
Fig. 2. A generated ontology sample.
4 Results
As stated previously, the system was applied to a list of terms extracted froma corpus related to the electricity sector. The list was generated automaticallyby the Exterm tool. Exterm extracted 4114 terms from which we randomlyselected 100 terms for testing. The output of the system was analyzed to verifythe system performance. The results were: 64 % of all terms were consideredcorrectly classified; 16 % of all items were framed in a wrong sense, but somehowrelated; 17 % of all items were framed in a totally wrong sense (spurius); and 3 %of all items were not found in the WordNet database. A related framing is, forinstance, to state that Relationship agent is a type of Relation when the correctwould be to state that it is a type of Agent. A spurius framing is, for instance,to state that electricity is a type of EmotionalState when the correct would beto state that it is a type of Energy. All the terms have been translated correctly.
Examining the results presented certain conclusions can be drawn. Only threeitems in a hundred were not found in WordNet, which attests to its wide lexicalcoverage. Other lexical bases were attempted, such as DBpedia and FrameNet,but failed to obtain the same performance. The reasons for the wrong framingfall into two categories: (1) the term has multiple senses and the system chosethe incorrect sense to the domain; or (2) there is no appropriate option to framethe term.
5 Conclusions
A system for automatic generation of ontologies from a list of terms over adomain and from a top level ontology was presented. The ontology generatedcan benefit from all the definitions and relationships designed for the SUMOontology, but the system does not generate relationships between the terms of thedomain. Thus, it’s not captured relationships as power company has shareholder.This problem must be addressed in future versions.
The system was applied to a list of terms extracted from the electrical powerdomain. The generated ontology had 64 percent of its terms correctly classified

420 A. Moreira et al.
and the ontology expressed in OWL language could be readily edited by varioustools available. The database version of WordNet used by the system is 3.0.
The critical point of the process is the proper selection of the hypernym forthe term translated. Is planned for inclusion in the next version of the system,a more suitable technique for selecting the best hypernym of a word among theoptions returned by WordNet. Probably, the use of a domain oriented corpuswould produce better results, but that will be tested in a next version.
Acknowledgments. This research is supported in part by the funding agenciesCEMIG, FAPEMIG, CNPq, and CAPES.
References
1. Baker, C.F., Fillmore, C.J., Lowe, J.B.: The berkeley framenet project. In: Pro-ceedings of the 17th International Conference on Computational Linguistics, vol. 1.Association for Computational Linguistics (1998)
2. Dahab, M.Y., Hassan, H.A., Rafea, A.: TextOntoEx: automatic ontology construc-tion from natural english text. Expert Syst. Appl. 34(2), 1474–1480 (2008)
3. Dias-da-Silva, B.C.: The WordNet.Br: an exercise of human language technologyresearch. In: Proceedings of the Third International WordNet Conference GWC,pp. 22–26 (2006)
4. Fellbaum, C.: A semantic network of English verbs. WordNet Electron. LexicalDatabase 3, 153–178 (1998)
5. Wendt, I.d.S., et al.: Gerao automatica de glossarios de termos especıficos de umcorpus de Geologia. In: ONTOBRAS, 3. Anais, Florianopolis (2010)
6. Marchand, H.: The Categories and Types of Present-Day English Word-formation:A Synchronic-Diachronic Approach, 2nd edn. Munchen, Beck (1969)
7. Ruiz-Casado, M., Alfonseca, E., Castells, P.: Automatic extraction of semanticrelationships for WordNet by means of pattern learning from wikipedia. In:Montoyo, A., Munoz, R., Metais, E. (eds.) NLDB 2005. LNCS, vol. 3513, pp.67–79. Springer, Heidelberg (2005)
8. Pease, A., Niles, I., Li, J.: The suggested upper merged ontology: a large ontologyfor the semantic web and its applications. In: Working Notes of the AAAI-2002Workshop on Ontologies and the Semantic Web, Edmonton, Canada (2002)
9. Sanchez, D., Moreno, A.: Creating ontologies from web documents. In: RecentAdvances in Artificial Intelligence Research and Development, vol. 113, pp. 11–18.IOS Press (2004)
10. Williams, E.: On the notions of lexically related and head of a word. Linguist. Inq.12, 245–274 (1981)
Computer-Generated Text Detection UsingMachine Learning: A Systematic Review
Daria Beresneva(&)
Moscow Institute of Physics and Technology,Russian Academy of National Economy and Public Administration,
Anti-Plagiat Research, Moscow, [email protected]
Abstract. Computer-generated text or artificial text nowadays is in abundanceon the web, ranging from basic random word salads to web scraping. In thispaper, we present a short version of systematic review of some existing auto-mated methods aimed at distinguishing natural texts from artificially generatedones. The methods were chosen by certain criteria. We further provide a sum-mary of the methods considered. Comparisons, whenever possible, use commonevaluation measures, and control for differences in experimental set-up.
Keywords: Artificial content Generated text Fake content detection
1 Introduction
The biggest part of artificial content is generated for nourishing fake web sites designedto offset search engine indexes: at the scale of a search engine, usage of automaticallygenerated texts render such sites harder to detect than using copies of existing pages.Artificial content can contain text (word salad) as well as data plots, flow charts, andcitations. The examples of automatically generated content include text translated by anautomated tool without human review or curation before publishing; text generatedthrough automated processes, such as Markov chains; text generated using automatedsynonymizing or obfuscation techniques.
The aim of this paper is to review existing methods of artificial text detection. Wesurvey these efforts, their results and their limitations. In spite of recent advances inevaluation methodology, many uncertainties remain as to the effectiveness oftext-generating filtering techniques and as to the validity of artificial text discoveringmethods. This is a short version of review according to poster publication rules.
The rest of this paper is organized following systematic review guidelines. Section 2presents the methods selected and their short description. A comparison of the methodsis available in Sect. 3. Section 4 recaps our main findings and discusses various possibleextensions of this work.
© Springer International Publishing Switzerland 2016E. Métais et al. (Eds.): NLDB 2016, LNCS 9612, pp. 421–426, 2016.DOI: 10.1007/978-3-319-41754-7_43

2 The Methods of Artificial Text Detection
As said before, the way of artificial content detection depends on the method by whichit was generated. Let us consider various existing features, that authors use for clas-sification. The information about results and datasets used for each method is given inthe summary table.
2.1 Frequency Counting Method
To discover whether a text is automatically generated by machine translation(MT) system or is written/translated by human, the paper [1] uses the correlations ofneighboring words in the text.
According to the author’s hypothesis, the artificial text, the word’s pair distribution(means the number of rare for language pairs) should be broken with function of“compatibility” of words with numbers i and j on the functions (means the number ofrare for language pairs are longer than the standard and the number of frequent pairs) isunderstated.
2.2 Linguistic Features Method
One more way of machine translation detection [2] uses not only a statistical, but alsolinguistic characteristics of the text.
For each sentence, 46 linguistic features were automatically extracted by per-forming a syntactic parse. The features fall into two broad categories:
(1) Perplexity features extracted using the CMU-Cambridge Statistical LanguageModeling Toolkit [8]
(2) Linguistic features felt into several subcategories: branching properties of theparse, function word density, constituent length, and other miscellaneous features.
2.3 The Method of Phrase Analysis
The method [6] involves the use of a set of computationally inexpensive features toautomatically detect low-quality Web-text translated by statistical machine translationsystems. The method uses only monolingual text as input; therefore, it is applicable forrefining data produced by a variety of Web-mining activities.
The authors define features to capture a MT phrase salad by examining local anddistant phrases. These features evaluate fluency, grammaticality, and completeness ofnon-contiguous phrases in a sentence. Features extracted from human-generated textrepresent the similarity to human-generated text; features extracted from machine-translated text depict the similarity to machine-translated text. By contrasting thesefeature weights, one can effectively capture phrase salads in the sentence.
422 D. Beresneva

2.4 Artificial Content Detection Using Lexicographic Features
By and large, the lexicographic characteristics can be used not only in machine trans-lation detection, but in general case (patchwork, word stuffing or Markovian generators,etc.) as well. The method described in [6] uses feature set (a thorough presentation ofthese indices is given in [10]) to train the algorithm [5]. Here are some of them:
• the ratio of words that are found in an English dictionary;• the ratio between number of tokens (i.e. the number of running words) and number
of types (size of vocabulary), which measures the richness or diversity of thevocabulary;
• the v2 score between the observed word frequency distribution and the distributionpredicted by the Zipf law;
• Honore’s, Sichel’s, and Simpson’s scores;
2.5 Perplexity-Based Filtering
This method is based on conventional n-gram language models.A language model is entirely defined by the set of conditional probabilities
pðwjhÞ, h 2 H, where h denotes the n − 1 words long history (sequence of n-grams)of w, and H is the set of all sequences of length n − 1 over a fixed vocabulary.
A standard way to estimate how well a language model p predicts a text T ¼w1. . .wN is to compute its perplexity over T, where the perplexity is defined as:
PPðpTÞ ¼ 2HðT ;pÞ ¼ 21
N
PNi¼1
log2pðwijhiÞ ð1Þ
Here, the perplexities are computed with the SRILM Toolkit [18].
2.6 A Fake Content Detector Based on Relative Entropy
This method seeks to detect Marcovian generators, patchworks and word stuffing, andit uses a short-range information between words [14]. Language model pruning can beperformed using conditional probability estimates [15] or relative entropy betweenn-gram distributions [16].
The given entropy-based detector uses a similar strategy to score n-grams accordingto the semantic relation between their first and last words. This is done by findinguseful n-grams, means n-grams that can help detect artificial text.
Let p(|h) denote an n-gram language model, h′ - the truncated history, that is thesuffix of length n − 2 of h. For each history h, the Kullback-Leibler (KL) divergencebetween the conditional distributions p(|h) and p(|h′) ([17]) is calculated. Then thepenalty score assigned to an n-gram (h, w), which represents a progressive penalty fornot respecting the strongest relationship between the first word of the history h and apossible successor: argmax PKL(h, v) is computed. The total score S(T) of a text T iscomputed by averaging the scores of all its n-grams with known histories.
Computer-Generated Text Detection Using Machine Learning 423
2.7 Method of Hidden Style Similarity
The method [3] identifies automatically generated texts on the Internet using a (hidden)style similarity measure based on extra-textual features in HTML source code.
The first step is to extract the content by removing any alphanumeric character fromthe HTML documents and keeping into account the remaining characters usingn-grams.
The second step is to model the “style” of the documents by converting the contentinto a model suitable for comparison.
The similarity measure of the texts is computed using Jaccard index.For similarity clustering is used the technique called fingerprinting: the fingerprint
of a document D is stored as a sorted list of m integers.
2.8 SciDetect Method
The next approach [21] was invented to detect documents automatically generatedusing the software SCIGen, MathGen, PropGen and PhysGen. For this, the distancesbetween a text and others (inter-textual distances) are computed. Then these distancesare used to determine which texts, within a large set, are closer to each other and maythus be grouped together. Inter-textual distance depends on four factors: genre, author,subject and epoch.
As the authors don’t provide any numerical results of the method’s work, we haveimplemented the method using the source Java code provided by SciDetect developers.
3 Choosing a Method
Every artificial content is generated for a specific purpose. Here we focus only on fakescientific paper for academic publishing or increase in the percentage of originality ofthe article.
It is important to recognize the aim of fake content for its subsequent detection.Various generation strategies require different approaches to find it. For example,algorithms for detecting word salad are clearly possible and are not particularly difficultto implement. A statistical approach based on Zipf’s law of word frequency haspotential in detecting simple word salad, as do grammar checking and the use of naturallanguage processing. Statistical Markovian analysis, where short phrases are used todetermine if they can occur in normal English sentences, is another statistical approachthat would be effective against completely random phrasing but might be fooled bydissociated press methods. Combining linguistic and statistical features can improvethe result of experiment. By contrast, texts generated with stochastic language modelsappear much harder to detect.
One also needs to estimate the data capacity. Text corpuses are taken depending onthe aim of the experiment and capabilities of getting them. Like a generation strategy,every data capacity needs different approach. For instance, small trainings samplespermit to use such indexes as Jaccard or Dice [5] to count the similarity measure ordistance between documents. For big datasets, one can use some linguistics features
424 D. Beresneva
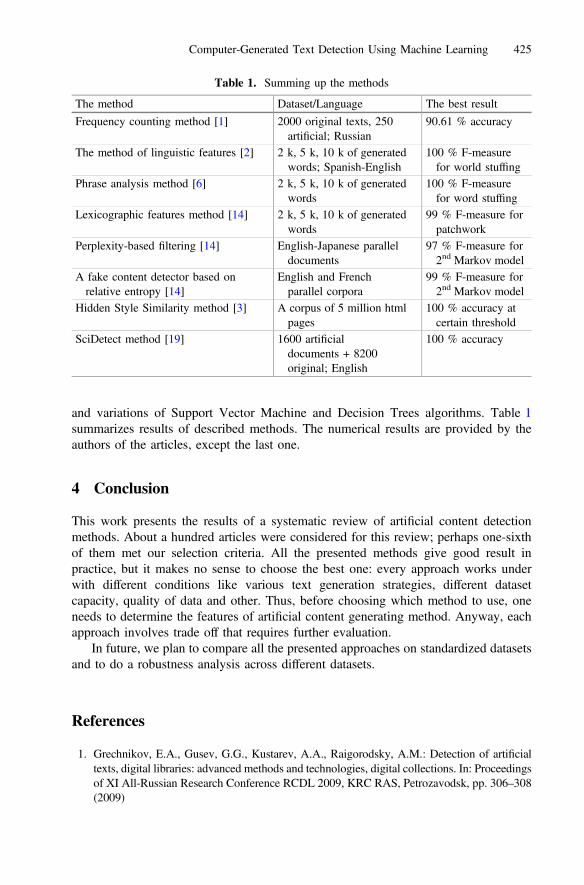
and variations of Support Vector Machine and Decision Trees algorithms. Table 1summarizes results of described methods. The numerical results are provided by theauthors of the articles, except the last one.
4 Conclusion
This work presents the results of a systematic review of artificial content detectionmethods. About a hundred articles were considered for this review; perhaps one-sixthof them met our selection criteria. All the presented methods give good result inpractice, but it makes no sense to choose the best one: every approach works underwith different conditions like various text generation strategies, different datasetcapacity, quality of data and other. Thus, before choosing which method to use, oneneeds to determine the features of artificial content generating method. Anyway, eachapproach involves trade off that requires further evaluation.
In future, we plan to compare all the presented approaches on standardized datasetsand to do a robustness analysis across different datasets.
References
1. Grechnikov, E.A., Gusev, G.G., Kustarev, A.A., Raigorodsky, A.M.: Detection of artificialtexts, digital libraries: advanced methods and technologies, digital collections. In: Proceedingsof XI All-Russian Research Conference RCDL 2009, KRC RAS, Petrozavodsk, pp. 306–308(2009)
Table 1. Summing up the methods
The method Dataset/Language The best result
Frequency counting method [1] 2000 original texts, 250artificial; Russian
90.61 % accuracy
The method of linguistic features [2] 2 k, 5 k, 10 k of generatedwords; Spanish-English
100 % F-measurefor world stuffing
Phrase analysis method [6] 2 k, 5 k, 10 k of generatedwords
100 % F-measurefor word stuffing
Lexicographic features method [14] 2 k, 5 k, 10 k of generatedwords
99 % F-measure forpatchwork
Perplexity-based filtering [14] English-Japanese paralleldocuments
97 % F-measure for2nd Markov model
A fake content detector based onrelative entropy [14]
English and Frenchparallel corpora
99 % F-measure for2nd Markov model
Hidden Style Similarity method [3] A corpus of 5 million htmlpages
100 % accuracy atcertain threshold
SciDetect method [19] 1600 artificialdocuments + 8200original; English
100 % accuracy
Computer-Generated Text Detection Using Machine Learning 425
2. Corston-Oliver, S., Gamon, M., Brockett, C.: A machine learning approach to the automaticevaluation of machine translation. In: Proceeding of 39th Annual Meeting on Association forComputational Linguistics, ACL 2001, pp. 148–155 (2001)
3. Urvoy, T., Lavergne, T., Filoche, P.: Tracking web spam with hidden style similarity. In:AIRWEB 2006, Seattle, Washington, USA, 10 August 2006
4. Witten, I.H., Frank, E.: Data Mining: Practical Machine Learning Tools and Techniqueswith Java Implementations. Morgan Kaufmann Publishers, Burlington (2011)
5. Arase, Y., Zhou, M.: Machine translation detection from monolingual web-text. In:Proceedings of 51st Annual Meeting of the Association for Computational Linguistics,Sofia, Bulgaria, pp. 1597–1607, 4–9 August 2013
6. Baayen, R.H.: Word Frequency Distributions. Kluwer Academic Publishers, Amsterdam(2001)
7. Clarkson, P., Rosenfeld, R.: Statistical language modeling using the CMU-Cambridgetoolkit. In: Proceedings of Eurospeech 1997, pp. 2707–2710 (1997)
8. Chickering, D.M., Heckerman, D., Meek, C.: A Bayesian approach to learning Bayesiannetworks with local structure. In: Geiger, D., Shenoy, P.P. (eds.) Proceedings of 13thConference on Uncertainty in Artificial Intelligence, pp. 80–89 (1997)
9. Vapnik, V.N.: The Nature of Statistical Learning Theory. Springer, New York (1995)10. Chen, S.F., Goodman, J.T.: An empirical study of smoothing techniques for language
modeling. In: Proceedings of 34th Annual Meeting of the Association for ComputationalLinguistics (ACL), Santa Cruz, pp. 310–318 (1996)
11. Honore, A.: Some simple measures of richness of vocabulary. Assoc. Lit. Linguist. Comput.Bull. 7(2), 172–177 (1979)
12. Sichel, H.: On a distribution law for word frequencies. J. Am. Stat. Assoc. 70, 542–547(1975)
13. Lavergne, T., Urvoy, T., Yvon, F.: Detecting fake content with relative entropy scoring. In:PAN 2008 (2008)
14. Seymore, K., Rosenfeld, R.: Scalable backoff language models. In: ICSLP 1996,Philadelphia, PA, vol. 1, pp. 232–235 (1996)
15. Stolcke, A.: Entropy-based pruning of backoff language models (1998)16. Manning, C.D., Schutze, H.: Foundations of Statistical Natural Language Processing.
The MIT Press, Cambridge (1999)17. Gyongyi, Z., Garcia-Molina, H.: Web spam taxonomy. In: 1st International Workshop on
Adversarial Information Retrieval on the Web (AIRWeb 2005) (2005)18. Heymann, P., Koutrika, G., Garcia-Molina, H.: Fighting spam on social web sites: a survey
of approaches and future challenges. IEEE Mag. Internet Comput. 11(6), 36–45 (2007)19. Labbé, C., Labbé, D.: Duplicate and fake publications in the scientific literature: how many
SCIgen papers in computer science? Scientometrics, Akadémiai Kiadó, p. 10 (2012)
426 D. Beresneva
Sentiment Analysis for German Facebook Pages
Florian Steinbauer1 and Mark Kroll2(B)
1 University of Technology, Graz, [email protected] Know-Center GmbH Graz, Graz, Austria
Abstract. Social media monitoring has become an important means forbusiness analytics and trend detection, for instance, analyzing the senti-ment towards a certain product or decision. While a lot of work has beendedicated to analyze sentiment for English texts, much less effort hasbeen put into providing accurate sentiment classification for the Germanlanguage. In this paper, we analyze three established classifiers for theGerman language with respect to Facebook posts. We then present ourown hierarchical approach to classify sentiment and evaluate it using adata set of ∼640 Facebook posts from corporate as well as governmentalFacebook pages. We compare our approach to three sentiment classifiersfor German, i.e. AlchemyAPI, Semantria and SentiStrength. With anaccuracy of 70%, our approach performs better than the other classi-fiers. In an application scenario, we demonstrate our classifier’s abilityto monitor changes in sentiment with respect to the refugee crisis.
Keywords: Sentiment analysis · German · Facebook posts
1 Introduction
Monitoring social media represents one means for companies to gain access toknowledge about, for instance, competitors, products as well as markets. Face-book, for instance, has more than 1.39 billion active users, 4.5 billion likes arecreated and on average 4.75 billion items are shared daily1; thus containing largeamounts of potentially valuable information. As a consequence, social mediamonitoring tools have been gaining attention to handle this kind of (personal)information including the analysis of general opinions and sentiments, for exam-ple, towards a certain product or decision. While a lot of work has been dedicatedto analyze sentiment for English texts, much less effort has been put into pro-viding accurate sentiment classification for the German language.
In this paper, we implement a hierarchical classifier to analyze sentiment inGerman Facebook posts and compare its performance to three sentiment clas-sifiers for German, i.e. AlchemyAPI, Semantria and SentiStrength. We evaluate
1 http://blog.wishpond.com/post/115675435109/40-up-to-date-facebook-facts-and-stats.
c© Springer International Publishing Switzerland 2016E. Metais et al. (Eds.): NLDB 2016, LNCS 9612, pp. 427–432, 2016.DOI: 10.1007/978-3-319-41754-7 44

428 F. Steinbauer and M. Kroll
our approach using a data set of ∼640 Facebook posts from Facebook pages.Our algorithm achieves an accuracy of 70 % which is higher compared to theother three libraries. In an application scenario we classify posts from Austrianand German Facebook pages and try to find notable examples in the timelineof shitstorms, events that trigger a negative outcry on social media platforms onthe internet; in our case concerning the refugee crisis.
2 Related Work
While a lot of work has been dedicated to analyze sentiment for English texts,much less effort has been put into providing accurate sentiment classification forthe German language. The interest group on German sentiment analysis IGGSA,formed by academic and industrial members, has published some 16 papers onthe topic. Momtazi [4], for instance, compared different methods of sentimentdetection on a corpus of German lifestyle documents pulled from Facebook,Blogs, Amazon and Youtube comments and received results of 69 % for posi-tive and 71 % for negative documents using a rule-based method, outperformingNaive Bayes, SVM and Decision Trees. Kasper and Vela [2] analyze sentimentin German hotel reviews to facilitate decision making processes for customers aswell as to serve as a quality control tool for hotel managers.
There is work which particularly addresses sentiment analysis/detection withrespect to Facebook. Ortigosa et al. [6] presented SentBuk which classifies Span-ish Facebook messages according to their polarity. SentBuk uses a hybrid app-roach combining lexical-based and machine-learning techniques and achievesaccuracy values up to ∼83.3 %. Neri et al. [5] studied ∼1000 Facebook poststo compare the public sentiment towards Rai, the Italian public broadcastingservice, vs. La7, a private competitor. Troussas et al. [8] experimented with sev-eral classification models on English posts; in their experiments the Naive Bayesclassifier achieved the highest accuracy with 77 %. In [1], He et al. demonstratedthe usefulness of social media monitoring by applying natural language process-ing to Twitter and Facebook content to compare pizza chains.
3 German Sentiment Analysis
3.1 Existing Libraries
In this section, we provide an overview of three existing libraries for Germansentiment analysis, i.e. AlchemyAPI, Semantria and SentiStrength.
AlchemyAPI provides a palette of text processing and computer vision ser-vices since mid 2009 and added German sentiment analysis in 2012. AlchemyAPIcombines linguistic and statistical analysis techniques, using the first on morestructured documents as news articles and press releases and the latter on moreunstructured dirty documents as Twitter tweets and Facebook posts. An eval-uation by Meehan et al. [3] showed a 86 % accuracy level, based on a corpus of

Sentiment Analysis for German Facebook Pages 429
5370 English tweets. Although these results appear promising, we were unableto reproduce these accuracy levels using our data set (38 % accuracy).
Semantria-a company owned by Lexalytics-is a web service similar to Alche-myAPI. Applying Semantria to our Facebook data set gives us an overall accu-racy score of ∼50 %. Semantria thus achieves a higher accuracy on our data setthan AlchemyAPI. We observe that Semantria has some difficulties with shortpieces of text. To give some negative examples, “Da hilft wohl nur Boykott”(then boycott it is going to be) and “Eure Mozarella Sticks konnten auch nichtmehr winziger sein :-(” (your mozarella sticks couldn’t be tinier :-( ) are bothrated positively although they convey negative sentiment.
The SentiStrength algorithm is based on a lexical approach created byThelwall et al. in 2010 [7]. The algorithm achieves up to 69.6 % accuracy forpositive and 71 % accuracy for negative German documents [4]. It is designed toextract sentiment out of short passages of text, like twitter status updates, forumentries or Facebook posts. One of the specific features of the SentiStrength clas-sifier is its lack of any linguistic processing, i.e. it does neither use part-of-speechinformation nor any kind of stemming or morphological analysis. SentiStrengthhas problems with German negation words. It only checks for negation wordsright before opinionated verbs, while all other positions are ignored, for instance,“Ich liebe[+3] dieses Lied nicht” (I don’t love this song) results in the positiverating (3,−1) because nicht (not) is not used for rating.
3.2 A Hierarchical Approach to German Sentiment Analysis
Experimental Setup. Facebook provides a REST API to fetch posts written byusers and posted publicly to a specific page. Collecting a one year span, roughlyfrom the 10th of September 2014 until the 11th of September 2015, results invarying numbers of posts per page. Following companies and their brands wereimported and used in our German Facebook data set:
Facebook page #Posts Facebook page #Posts
McDonalds Deutschland 8942 SPAR Osterreich 792
OBB 4092 derStandard.at 685
BurgerKing Deutschland 3210 Peek & Cloppenburg Deutschland 456
McDonalds Osterreich 2193 Bipa 450
Billa 1620 Peek & Cloppenburg Osterreich 283
DM Drogeriemarkt Osterreich 1407 OEAMTC 212
Kronen Zeitung 1227 BurgerKing Osterreich 194
Data Annotation. Four human annotators rated a set of ∼100 posts (7 docu-ments per crawled Facebook page) while the remaining ∼600 posts were ratedby one of the authors. All raters annotated each post positive (0 to 10) as well asnegative (0 to 10) allowing a post to contain both polarities. 62.7 % of all ratings
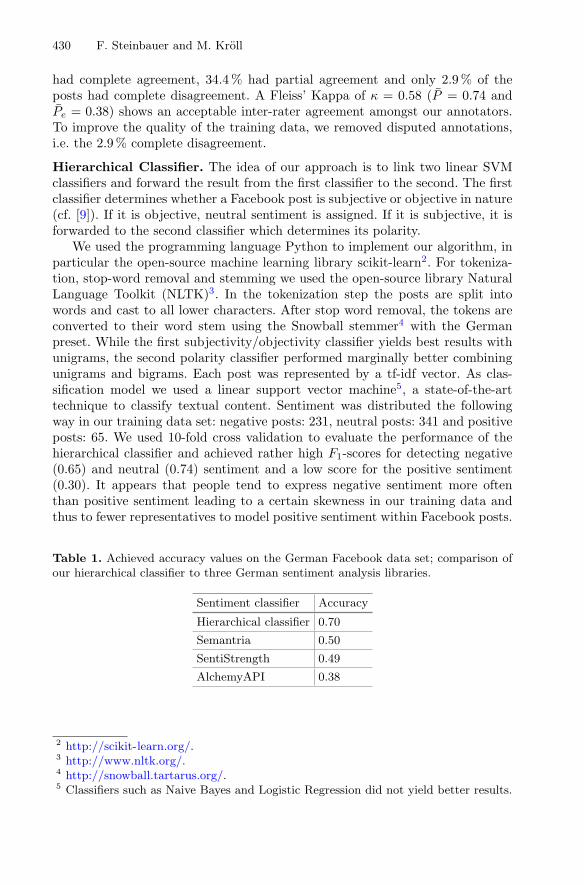
430 F. Steinbauer and M. Kroll
had complete agreement, 34.4 % had partial agreement and only 2.9 % of theposts had complete disagreement. A Fleiss’ Kappa of κ = 0.58 (P = 0.74 andPe = 0.38) shows an acceptable inter-rater agreement amongst our annotators.To improve the quality of the training data, we removed disputed annotations,i.e. the 2.9 % complete disagreement.
Hierarchical Classifier. The idea of our approach is to link two linear SVMclassifiers and forward the result from the first classifier to the second. The firstclassifier determines whether a Facebook post is subjective or objective in nature(cf. [9]). If it is objective, neutral sentiment is assigned. If it is subjective, it isforwarded to the second classifier which determines its polarity.
We used the programming language Python to implement our algorithm, inparticular the open-source machine learning library scikit-learn2. For tokeniza-tion, stop-word removal and stemming we used the open-source library NaturalLanguage Toolkit (NLTK)3. In the tokenization step the posts are split intowords and cast to all lower characters. After stop word removal, the tokens areconverted to their word stem using the Snowball stemmer4 with the Germanpreset. While the first subjectivity/objectivity classifier yields best results withunigrams, the second polarity classifier performed marginally better combiningunigrams and bigrams. Each post was represented by a tf-idf vector. As clas-sification model we used a linear support vector machine5, a state-of-the-arttechnique to classify textual content. Sentiment was distributed the followingway in our training data set: negative posts: 231, neutral posts: 341 and positiveposts: 65. We used 10-fold cross validation to evaluate the performance of thehierarchical classifier and achieved rather high F1-scores for detecting negative(0.65) and neutral (0.74) sentiment and a low score for the positive sentiment(0.30). It appears that people tend to express negative sentiment more oftenthan positive sentiment leading to a certain skewness in our training data andthus to fewer representatives to model positive sentiment within Facebook posts.
Table 1. Achieved accuracy values on the German Facebook data set; comparison ofour hierarchical classifier to three German sentiment analysis libraries.
Sentiment classifier Accuracy
Hierarchical classifier 0.70
Semantria 0.50
SentiStrength 0.49
AlchemyAPI 0.38
2 http://scikit-learn.org/.3 http://www.nltk.org/.4 http://snowball.tartarus.org/.5 Classifiers such as Naive Bayes and Logistic Regression did not yield better results.

Sentiment Analysis for German Facebook Pages 431
We compared our hierarchical classifier6 to the three other sentiment analy-sis libraries with respect to their accuracy values. As illustrated in Table 1, ourhierarchical approach to German sentiment analysis achieved the highest accu-racy values. We used the publicly available version of the compared libries, i.e.we did not train them with respect to the Facebook domain - the most likelyexplanation for the lower accuracy values. In addition, we believe that separatingopinionated from neutral posts also contributes to the higher accuracy.
4 Application Scenario
Social media monitoring represents a prominent proving ground for natural lan-guage processing techniques including sentiment analysis. In this section we showour algorithm’s potential to analyze German Facebook entries posted by gov-ernmental or economic sources. In the following, we will examine changes insentiment for the impact of the refugee crisis on Austrian railway operators. Inmid summer of 2015 the influx of refugees via the western Balkan route hit apeek of up to 8.500 daily transiting refugees. One of the stops on this routewas Vienna to change trains. In this timespan the atmosphere toward refugeeswas very positive, which is also reflected in the posts to the federal Austrianrailway company OBB shown at the top of Fig. 1. The private railway operatorWestbahn did not get involved in the affair and received close to none feedback
Fig. 1. Sentiment chart displaying classified posts containing the keywords Fluchtling(refugee), Krise (crisis), Westbahnhof (west station) for the Facebook pages unsereOBB(top) and WESTbahn GmbH (bottom) from Aug. 27 2015 until Nov. 10 2015. (Colorfigure online)
6 Experiments with a single layer classifier (same settings) led to an accuracy of 0.68 %.

432 F. Steinbauer and M. Kroll
on their Facebook page until they demanded compensation on 21th of Octoberfor the losses due to the refugee crisis. This motion had a very bad resonance inpress and sparked a public outcry yielding 48 negative posts that day. Many ofthese posts accuse the company that they tried to make profit from the crisis.
5 Conclusion
In this paper, we implemented a hierarchical sentiment classifier which checkswhether a post contains sentiment and if so, a subsequent classifier predicts itspolarity. We evaluated our classifier using a set of ∼ 640 Facebook posts resultingin 70.0 % accuracy which achieves better results than three established librariesfor German such as AlchemyAPI, Semantria and SentiStrength. To make thealgorithm accessible, we implemented a CLI7 where users can enter a Facebookpage id and a sentiment chart for a desired time span will be plotted.
Acknowledgements. This work is funded by the KIRAS program of the AustrianResearch Promotion Agency (FFG) (project nr. 840824). The Know-Center is fundedwithin the Austrian COMET Program under the auspices of the Austrian Ministry ofTransport, Innovation and Technology, the Austrian Ministry of Economics and Labourand by the State of Styria. COMET is managed by the Austrian Research PromotionAgency FFG.
References
1. He, W., Zha, S., Li, L.: Social media competitive analysis and text mining: a casestudy in the pizza industry. J. Inf. Manag. 33(3), 464 (2013)
2. Kasper, W., Vela, M.: Sentiment analysis for hotel reviews. In: Proceedings of theComputational Linguistics-Applications Conference (2011)
3. Meehan, K., Lunney, T., Curran, K., McCaughey, A.: Context-aware intelligent rec-ommendation system for tourism. In: IEEE International Conference on PervasiveComputing and Communications Workshops (2013)
4. Momtazi, S.: Fine-grained German sentiment analysis on social media. In: Proceed-ings of the 8th Conference on Language Resources and Evaluation (2012)
5. Neri, F., Aliprandi, C., Capeci, F., Cuadros, M., By, T.: Sentiment analysis on socialmedia. In: Advances in Social Networks Analysis and Mining (2012)
6. Ortigosa, A., Martın, J.M., Carro, R.M.: Sentiment analysis in facebook and itsapplication to e-learning. Comput. Human Behav. 31, 527 (2014)
7. Thelwall, M., Buckley, K., Paltoglou, G., Cai, D., Kappas, A.: Sentiment in shortstrength detection informal text. J. Am. Soc. Inf. Sci. Technol. 61(12), 2544 (2010)
8. Troussas, C., Virvou, M., Espinosa, K., Llaguno, K., Caro, J.: 4th InternationalConference on Information, Intelligence, Systems and Applications (2013)
9. Wiebe, J., Wilson, T.: Learning to disambiguate potentially subjective expressions.In: Proceedings of the 6th Conference on Natural Language Learning (2002)
7 The application can be downloaded from the project GitHub repostory https://github.com/fsteinbauer/nldb16-sentiment-analysis.
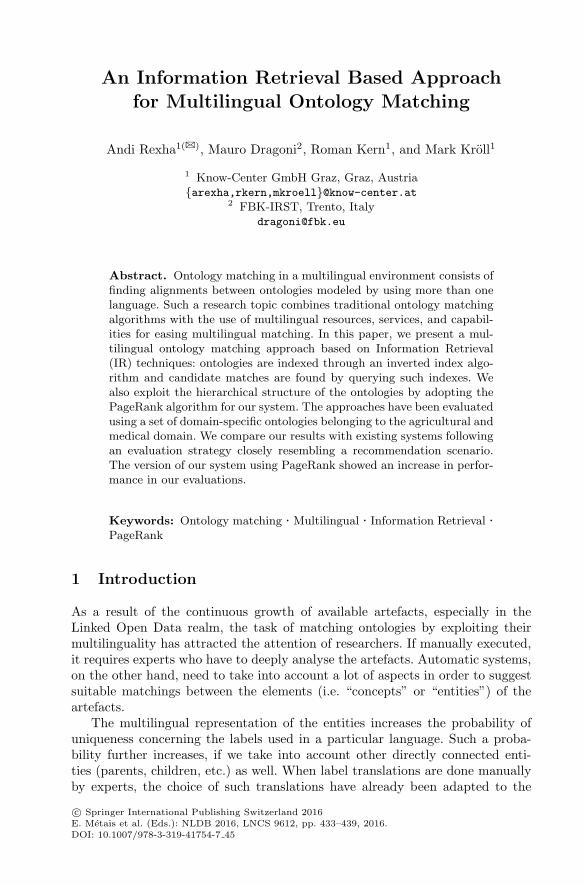
An Information Retrieval Based Approachfor Multilingual Ontology Matching
Andi Rexha1(B), Mauro Dragoni2, Roman Kern1, and Mark Kroll1
1 Know-Center GmbH Graz, Graz, Austriaarexha,rkern,[email protected]
2 FBK-IRST, Trento, [email protected]
Abstract. Ontology matching in a multilingual environment consists offinding alignments between ontologies modeled by using more than onelanguage. Such a research topic combines traditional ontology matchingalgorithms with the use of multilingual resources, services, and capabil-ities for easing multilingual matching. In this paper, we present a mul-tilingual ontology matching approach based on Information Retrieval(IR) techniques: ontologies are indexed through an inverted index algo-rithm and candidate matches are found by querying such indexes. Wealso exploit the hierarchical structure of the ontologies by adopting thePageRank algorithm for our system. The approaches have been evaluatedusing a set of domain-specific ontologies belonging to the agricultural andmedical domain. We compare our results with existing systems followingan evaluation strategy closely resembling a recommendation scenario.The version of our system using PageRank showed an increase in perfor-mance in our evaluations.
Keywords: Ontology matching · Multilingual · Information Retrieval ·PageRank
1 Introduction
As a result of the continuous growth of available artefacts, especially in theLinked Open Data realm, the task of matching ontologies by exploiting theirmultilinguality has attracted the attention of researchers. If manually executed,it requires experts who have to deeply analyse the artefacts. Automatic systems,on the other hand, need to take into account a lot of aspects in order to suggestsuitable matchings between the elements (i.e. “concepts” or “entities”) of theartefacts.
The multilingual representation of the entities increases the probability ofuniqueness concerning the labels used in a particular language. Such a proba-bility further increases, if we take into account other directly connected enti-ties (parents, children, etc.) as well. When label translations are done manuallyby experts, the choice of such translations have already been adapted to the
c© Springer International Publishing Switzerland 2016E. Metais et al. (Eds.): NLDB 2016, LNCS 9612, pp. 433–439, 2016.DOI: 10.1007/978-3-319-41754-7 45
434 A. Rexha et al.
modelled domain. In this paper, we present an approach, inspired by the afore-mentioned principles, for finding matchings between ontologies in a multilingualsetting. Such an approach has been implemented within a system based on theuse of Information Retrieval techniques adopting a structured representation ofeach entity for finding candidate matchings.
We evaluate our approach on a set of domain-specific ontologies belongingto the medical and agricultural domains. Furthermore, we investigate the role ofhierarchical information in the ontology matching task by applying the PageR-ank algorithm [9].
2 Related Work
Literature on ontology matching & alignment is very large and many systemsand algorithms have been proposed (cf. [1,4]). However, research on ontologymatching taking into account multilinguality is quite recent. In [15], the authorsquantify the effects on different matching algorithms by discussing several learn-ing matching functions. They show the effectiveness of the approach using a smallset of manually aligned concepts from two ontologies. WordNet [6] was one ofthe first artefacts used for research in multilingual matching (cf. [2]) togetherwith several projects focusing on the creation of WordNet versions for differentlanguages. The two most important ones have probably been EuroWordNet [16]and MultiWordNet [7] whose tasks consist of building language-specific Word-Nets while keeping them aligned.
In [3], the authors constructed a Chinese-English lexicon and evaluated it inmultilingual applications such as machine translation and cross-language infor-mation retrieval (CLIR). Another application of multilingual ontology matchingfor CLIR was described in [17]. Approaches based on the use of informationretrieval techniques have not been widely explored even if they demonstratedtheir suitability for the ontology matching task. IROM [14] and LOM [11] imple-ment a search & retrieve approach for defining mappings between ontologies.With respect to our approach, the IROM system does not take into accountmultilinguality or disambiguation capabilities for trying to reduce errors dur-ing the indexing operation. In conrast, LOM defines mappings by observing theontologies in only one direction, from a source ontology Os to a target ontologyOt, without refining these results by considering the contrary workflow.
Recently, ontology matching platforms have been developed and made acces-sible from external services. In [13], the authors describe an API for multilingualmatching and implement two different matching strategies: (i) a direct matchingbetween two ontologies, and (ii) a strategy based on composition of alignments.In [5], the authors discuss several approaches for ontology matching by examin-ing similarities, differences, and identification of weaknesses. In addition to that,they propose a new architecture for a multilingual ontology matching service.

An IR Based Approach for Multilingual Ontology Matching 435
3 An IR-Based Approach for Multilingual OntologyMatching
We define a matching as a set of correspondences or mappings between entitiesasserting that a certain relation holds between these two entities. Formally, giventwo artifacts A1 and A2, a matching M between A1 and A2 is a set of 5-tuple:〈id, e1, e2, R, c〉 such that id is a unique identifier of a single matching, e1 and e2are entities of A1 and A2 respectively, R is the matching relation between e1 ande2 (for example, equivalence (≡), more general (⊇), or disjointness (⊥)), and cis a confidence measure, typically in the [0, 1] range. In this work, we focus onthe equivalence relation.
Our proposed approach takes inspiration by techniques used in the field ofInformation Retrieval and the process is split into three phases: in the firstone, we create an index storing structured representation of all entities for eachontology involved in the matching operation. In the second phase, the indicesbuilt in the previous phase are exploited by performing queries. The structuredrepresentation of each entity stored in an index is extracted and converted intoa query. Such a query is then invoked on the index containing the ontology to bematched and the top ranked result is then used for defining the mapping. Thethird phase uses the previously provided matches to build a weighted connectedgraph between the two considered ontologies. We try to overcome the locality ofthe second step by using the well known voting algorithm PageRank.
Availability of Multilingualism. As introduced in Sect. 1, our approach exploitsontology multilinguality for defining new mappings. Although it makes use of thepresence of multiple languages within an ontology, it also works for monolingualor bilingual ontologies. This is an important property, as many of the existingontologies are currently limited to just one or two languages.
Representation of Information. The main source of information for the matchingis the textual information: the “label” associated with each concept describedin an ontology, where with the term “label” we mean a string identifying theconcept associated with its language tag (i.e. “concept label@lang code”). Basedon this information we are able to make string-based operations, which are botheffective and semantically sensible.
Index Construction. For each entity defined in the ontology we have a set ofpairs “label-language”, or, in presence of synonyms, we may have more pairsfor the same language. Such labels are tokenized, stemmed1, and normalized byusing Natural Language Processing libraries2. Each token then is used as anindex term with reference to the corresponding ontology entity [12].
1 The list of supported languages is available in the Lucene analyser documentation.2 We used the text processors included in the Lucene (http://lucene.apache.org)library. In case of unavailability of libraries for a particular language, the originallabel is indexed as it is without being processed.

436 A. Rexha et al.
Matches Definition. Once all indices have been created, the matching operationbetween two ontologies is done by querying them. Given two ontologies, O1 andO2, the matching operation is done by performing the following seven steps:
1. For each entity stored in index of O1, its structured representation is trans-formed into a query that is then invoked on the index containing the struc-tured representation of O2. The top ranked candidate matching (i.e. the firstquery result) is temporarily stored associated with its confidence score.
2. The same procedure is performed for entities contained in the index of O2,where their structured representation is used for querying the index contain-ing the structured representation of O1.
3. For each matching AO1 → BO2 built by querying O2 with information comingfrom O1, we also verify if BO2 → AO1 holds.
4. If a matching CO2 → AO1 exists, we save the matching between AO1 andthe entity having the higher confidence score. If further entities from O2 arecandidate matchings for AO1 , the highest confidence score is considered.
5. Otherwise if, by querying O1 using structured representation stored in O2,AO1 is not mapped with any concept, the matching AO1 → BO2 is maintainedand saved in the final output.
6. The same process is repeated using the results obtained by querying O1 aswell as using structured representations of O2.
7. Each found candidate with lower confidence score than a threshold (0.5), isignored.
As mentioned above, each query is created from the structured representationof entities stored in the indices. Once the query is built, a search operation onthe related index is performed which returns for each match a score calculatedfrom the following formula:
score(Rc1 , Rc2) = coord(Rc1 , Rc2) ·∑
x∈Rc1
tf(x ∈ Rc2) · idf(x)2, (1)
where Rc1 and Rc2 are respectively the representations of concepts definedin the source and in the target ontologies, tf() and idf() are the standard “termfrequency” and “inverse document frequency” functions used in IR [12], andcoord(Rc1 , Rc2) represents the number of labels defined in the representation ofc1 occurring in the representation of c2.
PageRank. To improve the matching concepts, we exploit the hierarchical struc-ture of the ontologies/artifacts by using PageRank. In doing so, we aim to favorthe correct matches and to penalize the mismatches. Given two ontologies O1
and O2, we conduct the following six steps to build the graph to be capable ofapplying the PageRank algorithm:
1. Each concept and individual of an ontology is represented as a vertex of thenew graph.
2. Each hierarchical information (isA, broader, narrower, etc.) is represented astwo directed edges in the graph. Each edge has a unitary weight.

An IR Based Approach for Multilingual Ontology Matching 437
3. Once the candidate matching is calculated by the Inverted Index, we createa new vertex and two edges with each of the matching candidates.
4. We weight each edge of the matching with the result given from the InvertedIndex.
5. After creating the weighted graph, we apply the PageRank algorithm andextract the voting results from the voting vertices.
6. We rank the matching vertices in order to select the ones with the highestvalue (the correct candidate for our algorithm).
4 Evaluation
We evaluate our approach with two different setups and use the following ontolo-gies that do provide multilingual labels: Agrovoc, Eurovoc, and Gemet that belongto the agriculture and environment domains, and MeSH, SNOMED, and MDRthat belong to the medical one3. In the first setup, we evaluate our algorithmas a recommender system for matching concepts/individuals of ontologies. Wecompare the effectiveness of our indexing system with two state-of-the-art multi-lingual ontology matching algorithms only on the matching concepts/individuals.In particular, we consider the “WeSeE” [10] and the “YAM++ 2013” [8]4 sys-tems, since these are the only ones implementing a multilingual ontology matchingstrategy. In the second setup, we evaluate the overall performance as an ontologymatching system by using only the indexing approach. Finally, we estimate theimpact of the PageRank algorithm applied to the hierarchy of the ontology.
Results. Table 1 shows the performance (expressed as F1-measure) of the solelyindexing approach compared to the other systems. From the table we can seethat our system outperforms “YAM++ 2013” and performs similar to “WeSeE”.We believe that this is due to the use of external resources (search the web andusing automatic translation of the labels) in contrast to our system which usesonly the available labels.
In Table 2, on the left side we present the overall performance of the systemevaluated on all the concepts/individuals. On the right side, we evaluate thesystem after the application of the PageRank algorithm and filter the matches.
The results show that the application of the PageRank algorithm has animpact of almost 10 % on the F1-measure of all the matchings. Another aspectto highlight is that in most of the cases the recall is much higher than theprecision. We believe that this is due to the indexing approach. We filter theresults of the query based on a threshold that could include a lot of noise andnot existing matches, namely decreasing the precision of the system.
3 The ontologies, their indexed version, and gold standard can be found at https://db.tt/p959AWhO.
4 The 2012 version of the YAM++ system yields the same results as the 2013 version.
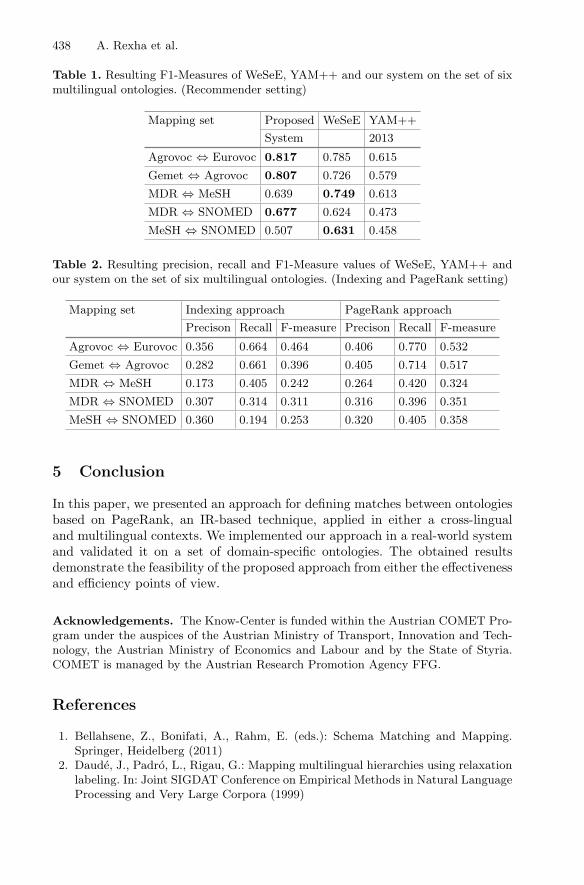
438 A. Rexha et al.
Table 1. Resulting F1-Measures of WeSeE, YAM++ and our system on the set of sixmultilingual ontologies. (Recommender setting)
Mapping set Proposed WeSeE YAM++
System 2013
Agrovoc ⇔ Eurovoc 0.817 0.785 0.615
Gemet ⇔ Agrovoc 0.807 0.726 0.579
MDR ⇔ MeSH 0.639 0.749 0.613
MDR ⇔ SNOMED 0.677 0.624 0.473
MeSH ⇔ SNOMED 0.507 0.631 0.458
Table 2. Resulting precision, recall and F1-Measure values of WeSeE, YAM++ andour system on the set of six multilingual ontologies. (Indexing and PageRank setting)
Mapping set Indexing approach PageRank approach
Precison Recall F-measure Precison Recall F-measure
Agrovoc ⇔ Eurovoc 0.356 0.664 0.464 0.406 0.770 0.532
Gemet ⇔ Agrovoc 0.282 0.661 0.396 0.405 0.714 0.517
MDR ⇔ MeSH 0.173 0.405 0.242 0.264 0.420 0.324
MDR ⇔ SNOMED 0.307 0.314 0.311 0.316 0.396 0.351
MeSH ⇔ SNOMED 0.360 0.194 0.253 0.320 0.405 0.358
5 Conclusion
In this paper, we presented an approach for defining matches between ontologiesbased on PageRank, an IR-based technique, applied in either a cross-lingualand multilingual contexts. We implemented our approach in a real-world systemand validated it on a set of domain-specific ontologies. The obtained resultsdemonstrate the feasibility of the proposed approach from either the effectivenessand efficiency points of view.
Acknowledgements. The Know-Center is funded within the Austrian COMET Pro-gram under the auspices of the Austrian Ministry of Transport, Innovation and Tech-nology, the Austrian Ministry of Economics and Labour and by the State of Styria.COMET is managed by the Austrian Research Promotion Agency FFG.
References
1. Bellahsene, Z., Bonifati, A., Rahm, E. (eds.): Schema Matching and Mapping.Springer, Heidelberg (2011)
2. Daude, J., Padro, L., Rigau, G.: Mapping multilingual hierarchies using relaxationlabeling. In: Joint SIGDAT Conference on Empirical Methods in Natural LanguageProcessing and Very Large Corpora (1999)
An IR Based Approach for Multilingual Ontology Matching 439
3. Dorr, B.J., Levow, G.-A., Lin, D.: Building a Chinese-English mapping betweenverb concepts for multilingual applications. In: White, J.S. (ed.) AMTA 2000.LNCS (LNAI), vol. 1934, pp. 1–12. Springer, Heidelberg (2000)
4. Euzenat, J., Shvaiko, P.: Ontology Matching. Springer, Heidelberg (2007)5. al Feel, H.T., Schafermeier, R., Paschke, A.: An inter-lingual reference approach
for multi-lingual ontology matching. Int. J. Comput. Sci. (2013)6. Fellbaum, C.: WordNet: An Electronic Lexical Database. Bradford Books,
Cambridge (1998)7. Magnini, B., Strapparava, C., Ciravegna, F., Pianta, E.: Multilingual lexical knowl-
edge bases: applied wordnet prospects. In: Proceedings of the International Work-shop on the Future of the Dictionary (1994)
8. Ngo, D., Bellahsene, Z.: YAM++ results for OAEI 2013. In: Workshop on OntologyMatching (OM) (2013)
9. Page, L., Brin, S., Motwani, R., Winograd, T.: The pagerank citation ranking:Bringing order to the web. Technical report, Stanford InfoLab (1999)
10. Paulheim, H.: Wesee-match results for OEAI 2012. In: Workshop on OntologyMatching (OM) (2012)
11. Pirro, G., Talia, D.: LOM: a linguistic ontology matcher based on informationretrieval. J. Inf. Sci. 34(6), 845 (2008)
12. van Rijsbergen, C.J.: Information Retrieval. Butterworth, Oxford (1979)13. dos Santos, C.T., Quaresma, P., Vieira, R.: An API for multi-lingual ontology
matching. In: Proceedings of the International Conference on Language Resourcesand Evaluation (2010)
14. Mousselly-Sergieh, H., Unland, R.: IROM: information retrieval-based ontologymatching. In: Declerck, T., Granitzer, M., Grzegorzek, M., Romanelli, M., Ruger,S., Sintek, M. (eds.) SAMT 2010. LNCS, vol. 6725, pp. 127–142. Springer,Heidelberg (2011)
15. Spohr, D., Hollink, L., Cimiano, P.: A machine learning approach to multilingualand cross-lingual ontology matching. In: Aroyo, L., Welty, C., Alani, H., Taylor, J.,Bernstein, A., Kagal, L., Noy, N., Blomqvist, E. (eds.) ISWC 2011, Part I. LNCS,vol. 7031, pp. 665–680. Springer, Heidelberg (2011)
16. Vossen, P.: Introduction to EuroWordNet. Comput. Humanit. 32(2–3), 73 (1998)17. Zhang, L., Wu, G., Xu, Y., Li, W., Zhong, Y.: Multilingual collection retrieving via
ontology alignment. In: Proceedings of International Conference on Asian DigitalLibraries (2004)
Automatic Text Summarization with a ReducedVocabulary Using Continuous Space Vectors
Elvys Linhares Pontes1(B), Stephane Huet1, Juan-Manuel Torres-Moreno1,2,and Andrea Carneiro Linhares3
1 LIA, Universite d’Avignon et des Pays de Vaucluse, Avignon, [email protected]
2 Ecole Polytechnique de Montreal, Montreal, Canada3 Universidade Federal do Ceara, Sobral, CE, Brazil
Abstract. In this paper, we propose a new method that uses contin-uous vectors to map words to a reduced vocabulary, in the context ofAutomatic Text Summarization (ATS). This method is evaluated on theMultiLing corpus by the ROUGE evaluation measures with four ATSsystems. Our experiments show that the reduced vocabulary improvesthe performance of state-of-the-art systems.
Keywords: Word embedding · Text summarization · Vocabularyreduction
1 Introduction
Nowadays, the amount of daily generated information is so large that it cannotbe manually analyzed. Automatic Text Summarization (ATS) aims at producinga condensed text document retaining the most important information from oneor more documents; it can facilitate the search for reference texts and acceleratetheir understanding.
Different methodologies based on graphs, optimization, word frequency orword co-occurrence have been used to automatically create summaries [12]. Inthe last years, Continuous Space Vectors (CSVs) have been employed in severalstudies to evaluate the similarity between sentences and to improve the summaryquality [1,5,10]. In this paper, we introduce a novel use of CSVs for summariza-tion. The method searches for similar words in the continuous space and regardsthem as identical, which reduces the size of vocabulary. Then, it computes met-rics in this vocabulary space seen as a discrete space, in order to select the mostrelevance sentences.
After a brief reminder on the implementation of neural networks to buildCSVs in Sect. 2, Sects. 3 and 4 describe the previous works that used CSVs forsummarization and our method respectively. In Sect. 5, we present the evaluation
E.L. Pontes and J.-M. Torres-Moreno — This work was partially financed by theEuropean Project CHISTERA-AMIS ANR-15-CHR2-0001.
c© Springer International Publishing Switzerland 2016E. Metais et al. (Eds.): NLDB 2016, LNCS 9612, pp. 440–446, 2016.DOI: 10.1007/978-3-319-41754-7 46

Summarization with a Reduced Vocabulary Using Continuous Space Vectors 441
of the proposed approach with four ATS systems. Our results show that thereduced vocabulary in a discrete space improves the performance of the state-of-the-art. Section 6 concludes with a summary and future work.
2 Neural Networks and Continuous Space Vectors
Artificial Neural Networks (ANNs) have been successfully applied in diverse Nat-ural Language Processing applications, such as language modeling [3,8], speechrecognition or automatic translation. An ANN is a system that interconnectsneurons and organizes them in input, hidden and output layers. The interestof these models has recently been renewed with the use of deep learning whichupdates the weights of the hidden layers to build complex representations.
Mikolov et al. [8] developed a successful approach with the so-called Skip-gram model to build continuous word representations, i.e., word embeddings.Their model aims at predicting a word, basing its decision on other words inthe same sentence. It uses a window to limit the number of words used; e.g. fora window of 5, the system classifies the word w from the 5 words before andthe 5 words after it. Given a sequence of training words w1, w2, w3, ..., wN , theobjective of the Skip-gram model is to maximize the average log probability:
1N
N∑
t=1
∑
−c≤j≤c,j =0
log p(wt+j | wt) (1)
where c is the window size and N is the number of words in the training set.
3 Related Work
Several works have used word embeddings to measure sentence similarity, whichis central to select sentences for text summarization. Kageback et al. [5] usedcontinuous vectors as semantically aware representations of sentences (phraseembeddings) to calculate the similarity, and compared the performance of dif-ferent types of CSVs for summarization. Balikas and Amini [1] also analyzedvarious word embedding representations to summarize texts in English, Frenchand Greek languages. They proposed an autoencoder model to learn a languageindependent representation for multilingual sentences and determine the sim-ilarity between sentences. Phung and De Vine [10] used word embeddings tocalculate the sentence similarity measures for the PageRank system to select themost significant sentences. They compare this PageRank version with other sys-tems based on TF-IDF and different variants of Maximum Marginal Relevance(MMR).
Our methodology differs from the previously described methods because wereduce the vocabulary using a CSV-based similarity between words. This firststep allows us to calculate more accurately the similarity and the relevance ofsentences in a discrete space.
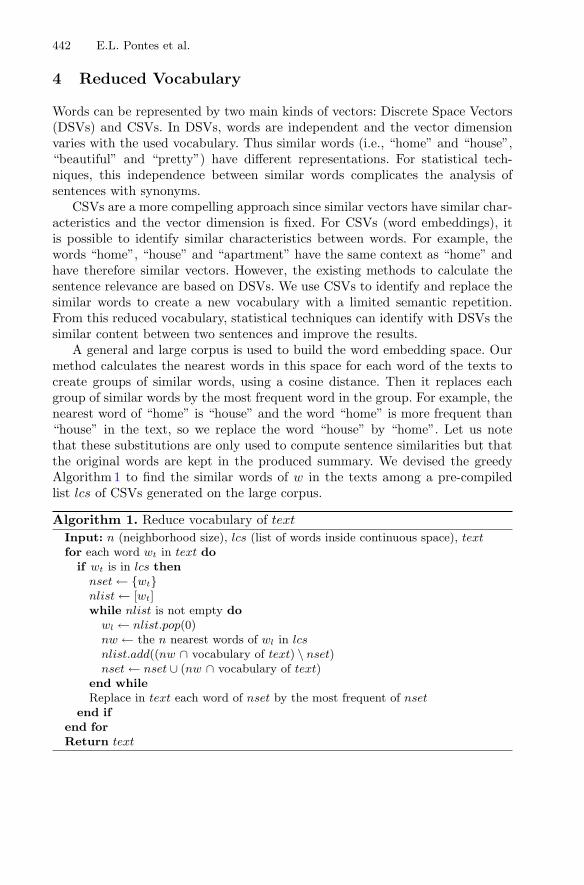
442 E.L. Pontes et al.
4 Reduced Vocabulary
Words can be represented by two main kinds of vectors: Discrete Space Vectors(DSVs) and CSVs. In DSVs, words are independent and the vector dimensionvaries with the used vocabulary. Thus similar words (i.e., “home” and “house”,“beautiful” and “pretty”) have different representations. For statistical tech-niques, this independence between similar words complicates the analysis ofsentences with synonyms.
CSVs are a more compelling approach since similar vectors have similar char-acteristics and the vector dimension is fixed. For CSVs (word embeddings), itis possible to identify similar characteristics between words. For example, thewords “home”, “house” and “apartment” have the same context as “home” andhave therefore similar vectors. However, the existing methods to calculate thesentence relevance are based on DSVs. We use CSVs to identify and replace thesimilar words to create a new vocabulary with a limited semantic repetition.From this reduced vocabulary, statistical techniques can identify with DSVs thesimilar content between two sentences and improve the results.
A general and large corpus is used to build the word embedding space. Ourmethod calculates the nearest words in this space for each word of the texts tocreate groups of similar words, using a cosine distance. Then it replaces eachgroup of similar words by the most frequent word in the group. For example, thenearest word of “home” is “house” and the word “home” is more frequent than“house” in the text, so we replace the word “house” by “home”. Let us notethat these substitutions are only used to compute sentence similarities but thatthe original words are kept in the produced summary. We devised the greedyAlgorithm 1 to find the similar words of w in the texts among a pre-compiledlist lcs of CSVs generated on the large corpus.
Algorithm 1. Reduce vocabulary of textInput: n (neighborhood size), lcs (list of words inside continuous space), textfor each word wt in text do
if wt is in lcs thennset ← wtnlist ← [wt]while nlist is not empty do
wl ← nlist.pop(0)nw ← the n nearest words of wl in lcsnlist.add((nw ∩ vocabulary of text) \ nset)nset ← nset ∪ (nw ∩ vocabulary of text)
end whileReplace in text each word of nset by the most frequent of nset
end ifend forReturn text

Summarization with a Reduced Vocabulary Using Continuous Space Vectors 443
5 Experiments and Results
The reduced vocabulary approach was evaluated with four different systems. Thefirst simple system (named “base”) generates an extract with the sentences thatare the most similar to the document. The second system (MMR) produces asummary based on the relevance and the redundancy of the sentences [2]. Withthe objective of analyzing different methodologies to calculate the relevance andthe similarity of sentences (e.g. word co-occurrence, TF-ISF1...), we use twoother systems: Sasi [11] and TextRank [7].
Pontes et al. [11] use Graph theory to create multi-document summaries byextraction. Their so-called Sasi system models a text as a graph whose verticesrepresent sentences and edges connect two similar sentences. Their approachemploys TF-ISF to rank sentences and creates a stable set of the graph. Thesummary is made of the sentences belonging to this stable set.
TextRank [7] is an algorithm based on graphs to measure the sentence rel-evance. The system creates a weighted graph associated with the text. Twosentences can be seen as a process of recommendation to refer to other sentencesin the text based on a shared common content. The system uses the Pageranksystem to stabilize the graph. After the ranking algorithm is run on the graph,the top ranked sentences are selected for inclusion in the summary.
We used for our experiments the 2011 MultiLing corpus [4] to analyze thesummary quality in the English and French languages. Each corpus has 10 topics,each containing 10 texts. We concatenated the 10 texts of each topic to convertmultiple documents into a single text. There are between 2 and 3 summariescreated by human (reference summaries) for each topic. We took the LDC Giga-word corpus (5th edition for English, 3rd edition for French) and the word2vecpackage2 to create the word embedding representation, the vector dimensionparameter having been set to 300. We varied the window size between 1 and 8words to create a dictionary of word embeddings. A neighborhood of between 1and 3 words in the continuous space was considered to reduce the vocabulary(parameter n of Algorithm 1). Finally, the summaries produced by each systemhave up to 100 words.
The compression rate using the Algorithm 1 depends on the number n of thenearest words used. Table 1 reports the average compression ratio for each corpusin the word embedding space for three values of n. For the English language,a good compression happens using 1 or 2 nearest words, while the vocabularycompression for the French language is not so high because the French Gigawordcorpus is smaller (925M words) than the English Gigaword corpus (more than4.2G words). Consequently, a higher number of words of the text vocabulary arenot in the dictionary of French word embeddings.
In order to evaluate the quality of the summaries, we use the ROUGE sys-tem3, which is based on the intersection of the n-grams of a candidate summary1 Term Frequency - Inverse Sentence Frequency.2 Site: https://code.google.com/archive/p/word2vec/.3 The options for running ROUGE 1.5.5 are -a -n 2 -x -m -2 4 -u -c 95 -r 1000 -f A -p
0.5 -t 0.
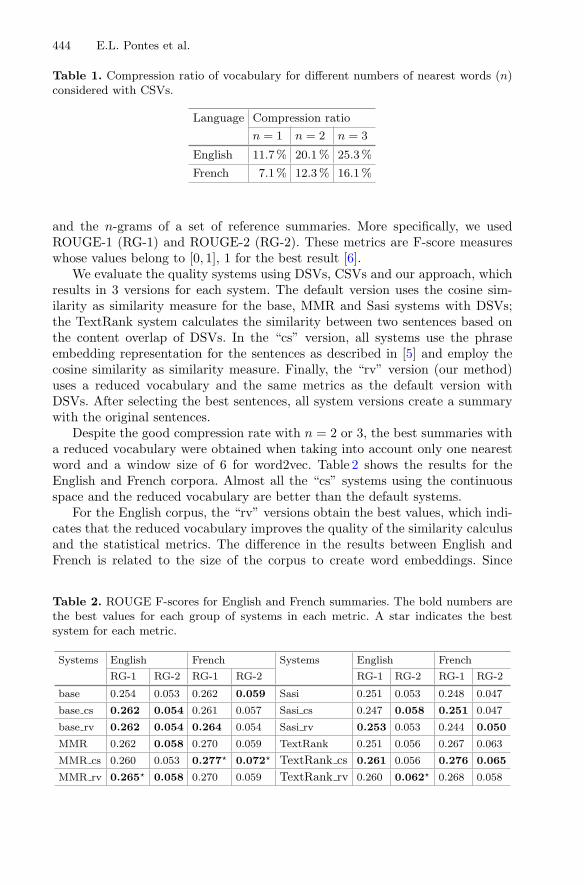
444 E.L. Pontes et al.
Table 1. Compression ratio of vocabulary for different numbers of nearest words (n)considered with CSVs.
Language Compression ratio
n = 1 n = 2 n = 3
English 11.7 % 20.1 % 25.3 %
French 7.1 % 12.3 % 16.1 %
and the n-grams of a set of reference summaries. More specifically, we usedROUGE-1 (RG-1) and ROUGE-2 (RG-2). These metrics are F-score measureswhose values belong to [0, 1], 1 for the best result [6].
We evaluate the quality systems using DSVs, CSVs and our approach, whichresults in 3 versions for each system. The default version uses the cosine sim-ilarity as similarity measure for the base, MMR and Sasi systems with DSVs;the TextRank system calculates the similarity between two sentences based onthe content overlap of DSVs. In the “cs” version, all systems use the phraseembedding representation for the sentences as described in [5] and employ thecosine similarity as similarity measure. Finally, the “rv” version (our method)uses a reduced vocabulary and the same metrics as the default version withDSVs. After selecting the best sentences, all system versions create a summarywith the original sentences.
Despite the good compression rate with n = 2 or 3, the best summaries witha reduced vocabulary were obtained when taking into account only one nearestword and a window size of 6 for word2vec. Table 2 shows the results for theEnglish and French corpora. Almost all the “cs” systems using the continuousspace and the reduced vocabulary are better than the default systems.
For the English corpus, the “rv” versions obtain the best values, which indi-cates that the reduced vocabulary improves the quality of the similarity calculusand the statistical metrics. The difference in the results between English andFrench is related to the size of the corpus to create word embeddings. Since
Table 2. ROUGE F-scores for English and French summaries. The bold numbers arethe best values for each group of systems in each metric. A star indicates the bestsystem for each metric.
Systems English French Systems English French
RG-1 RG-2 RG-1 RG-2 RG-1 RG-2 RG-1 RG-2
base 0.254 0.053 0.262 0.059 Sasi 0.251 0.053 0.248 0.047
base cs 0.262 0.054 0.261 0.057 Sasi cs 0.247 0.058 0.251 0.047
base rv 0.262 0.054 0.264 0.054 Sasi rv 0.253 0.053 0.244 0.050
MMR 0.262 0.058 0.270 0.059 TextRank 0.251 0.056 0.267 0.063
MMR cs 0.260 0.053 0.277 0.072 TextRank cs 0.261 0.056 0.276 0.065
MMR rv 0.265 0.058 0.270 0.059 TextRank rv 0.260 0.062 0.268 0.058

Summarization with a Reduced Vocabulary Using Continuous Space Vectors 445
the French training corpus is not as big, the precision of the semantic wordrelationships is not accurate enough and the closest word may not be similar.Furthermore, the French word embedding dictionary is smaller than for English.Consequently, the “rv” version sometimes does not find the true similar wordsin the continuous space and the reduced vocabulary may be incorrect. The “cs”version mitigates the problem with the small vocabulary because this versiononly analyzes the words of the text that exist in the continuous space. Thus the“cs” version produces better summaries for almost all systems.
6 Conclusion
We analyzed the summary quality of different systems using Discrete SpaceVectors and Continuous Space Vectors. Reducing the text vocabulary with aCSV-based similarity using a big training corpus produced better results thanthe methods described in [5] for English, but lower for French.
As future work, we will increase the French training corpus to extend thedictionary of word embeddings, and use other methodologies to create continuousspace vectors, such as [3,9]. Furthermore, new methods have still to be devisedto fully exploit CSVs to calculate the sentence relevance.
References
1. Balikas, G., Amini, M.R.: Learning language-independent sentence representationsfor multi-lingual, multi-document summarization. In: 17eme Conference Francoph-one sur l’Apprentissage Automatique (CAp) (2015)
2. Carbonell, J., Goldstein, J.: The use of MMR, diversity-based reranking for reorder-ing documents and producing summaries. In: SIGIR, pp. 335–336 (1998)
3. Collobert, R., Weston, J.: A unified architecture for natural language processing:deep neural networks with multitask learning. In: ICML, pp. 160–167 (2008)
4. Giannakopoulos, G., El-Haj, M., Favre, B., Litvak, M., Steinberger, J., Varma, V.:TAC2011 multiling pilot overview. In: TAC (2011)
5. Kageback, M., Mogren, O., Tahmasebi, N., Dubhashi, D.: Extractive summariza-tion using continuous vector space models. In: 2nd EACL Workshop on ContinuousVector Space Models and their Compositionality (CVSC), pp. 31–39 (2014)
6. Lin, C.Y.: ROUGE: a package for automatic evaluation of summaries. In: ACLWorkshop on Text Summarization Branches Out (2004)
7. Mihalcea, R., Tarau, P.: Textrank: bringing order into texts. In: EMNLP, pp. 404–411 (2004)
8. Mikolov, T., Sutskever, I., Chen, K., Corrado, G.S., Dean, J.: Distributed represen-tations of words and phrases and their compositionality. In: NIPS, pp. 3111–3119(2013)
9. Pennington, J., Socher, R., Manning, C.: Glove: Global vectors for word represen-tation. In: Proceedings of the 2014 Conference on Empirical Methods in NaturalLanguage Processing (EMNLP), pp. 1532–1543. Association for ComputationalLinguistics, Doha, October 2014
10. Phung, V., De Vine, L.: A study on the use of word embeddings and pagerankfor vietnamese text summarization. In: 20th Australasian Document ComputingSymposium, pp. 7:1–7:8 (2015)

446 E.L. Pontes et al.
11. Pontes, E.L., Linhares, A.C., Torres-Moreno, J.M.: Sasi: sumarizador automaticode documentos baseado no problema do subconjunto independente de vertices. In:XLVI Simposio Brasileiro de Pesquisa Operacional (2014)
12. Torres-Moreno, J.M.: Automatic Text Summarization. Wiley, Hoboken (2014)

A Platform for the Conceptualization of ArabicTexts Dedicated to the Design of the UML
Class Diagram
Kheira Zineb Bousmaha1(&), Mustapha Kamel Rahmouni1,Belkacem Kouninef2, and Lamia Hadrich Belguith3
1 LRIIR, Department of Computer Science,University of Oran 1, Ahmed Ben Bella, Oran, Algeria
[email protected], [email protected] National Institute of Telecommunication and Information and Communication
Technology of Oran (INTTIC), Oran, [email protected]
3 MIRACL, Faculty of Economics and Management of Sfax (FSEGS),Department of Computer Science, University of Sfax, Sfax, Tunisia
Abstract. In many fields using information systems (IS), knowledge is oftenrepresented by UML models, in particular, by including class diagrams. Thisformalism has the advantage of being controlled by a large community andtherefore the perfect means of exchange. The desire to use an automated toolthat formalizes the intellectual process of the expert from an IS specificationtexts seems interesting. Our problem is devoted to the presentation of a newstrategy that allows us to move from an informal to a semi-formal representationmodel, which is the UML class diagram. This issue is not new. It has arousedgreat interest for a long time. The originality of our work is that these texts are inArabic.
1 Introduction
The specification of an IS is a mutual work done between the client, who is the onlyone to really know the problem and the designers who need to be helped to express itclearly. These needs have to be simple and specified in a language that can beunderstood by different sides of the project. The development of semi-formal modelslike UML and its derivatives from requirements specification can be long and tedious.Its automation leads to many challenges in different scientific fields such as require-ments engineering, knowledge representation, the automatic processing of language,information extraction and knowledge engineering.
Several works are been interested to theses researches in the past [1, 2] and recently[3–5]. Also, many studies have focused on automating and semi automating thisprocess to extract a UML model from natural language text [4–7]. The approachesproposed use most of time NLP (Natural Language Processing) techniques. The lack offormal semantics which hampers the UML language can lead to serious modeling
© Springer International Publishing Switzerland 2016E. Métais et al. (Eds.): NLDB 2016, LNCS 9612, pp. 447–452, 2016.DOI: 10.1007/978-3-319-41754-7_47

problems that generate contradictions in the developed models [3]. This motivatedmore work on the transition from UML to formal languages such as B [8], VDM [1],VDM++ [9], Z [10], Maude [11].
We propose in this paper a platform for the conceptualization of the texts ofspecification of an information system, dedicated to the design of the UML classdiagram based on hybrid approaches that encompass both linguistic and statisticalapproaches.
The original contribution of our work is the fact that the specification texts are inArabic. The Arabic language is especially challenging because of its complex linguisticstructures. It has rich and complex morphological, grammatical, and semantic aspectssince it is a highly inflectional and derivational language that includes root, prefixes,suffixes, and clitics. Particles are used to complete the meaning of verbs and nouns.Different words, with different meanings and pronunciations, often differ only by theirdiacritics. Besides the classical phenomena that exist in Latin languages, there arespecific difficulties in the Arabic language that generate problems in its different pro-cess tasks, such as the agglutination, the free order language, the absence of shortvowels which cause artificial syntactic and semantic ambiguities and complicate thegrammar construction and other issues [12].
The rest of this paper is organized as follows; we present our platform approach andits different models in Sect. 2. Then we show the experiments we conducted and the firstversion results obtained and finally some perspectives for this work are given in Sect. 3.
2 The AL2UML Platform
The strategy we propose can be illustrated by the Fig. 1. The texts constitute thefoundation of modeling. From them, it is possible to extract a linguistic model thatcontains the elements that are expressed in the texts. The conceptual plan correspondsto a result of the modeling whose automation is done through the linguistic model; butmoving from the latter to the conceptual model can only be done by making significantmodeling choices, which pertain to both the granularity of the desired description andthe objectives of the modeling. The passage from the conceptual model represented byUML class diagram to the event_B model is in progress. Our ambition is to develop anIDM platform (model-driven engineering) dedicated to this purpose that will allow tolink conduct the modeling activities and the formal validation of the functional model.
2.1 The Linguistic Model
To establish the linguistic model and proceed to the pretreatment of the texts ofspecification, we have designed a tool Alkhalil+ [12], it does a considerable amount oftasks on MSA1, Segmentation2, tokenization, morphological analysis3, lemmatization,
1 Modern Standard Arabic.2 STAR split the text into sentences we use 147 rules established by linguistics.3 Alkhalil Morpho Sys, Version 1.3, Un Open Source http://sourceforge.net/projects/alkhalil/.
448 K.Z. Bousmaha et al.

part of-speech (POS) tagging4, disambiguation and diacritisation5. The experimentshave carried a disambiguation rate that is above 85 %. The output is an XML filecontaining the information that is necessary for the conceptual model. We haveestablished 6 typology of verbs, for example Class of verb of State: includes the verbsthat means an hyponymy. Example: عرفتت,أزجتت,مسقنت .
2.2 The Conceptual Model: Architecture and Approach
As shown in Fig. 2, the proposed approach starts by extracting terms with the formulatf.idf and compound terms with a hybrid method which combine linguistic patternswith a statistical method based on the mutual information (MI) [13].
The second step is the design of the chunker. We have established a list of cate-gories of chunks that were necessary for the classification of the sentences in order toextract the meaning. Only the chunks pertinent, supposed describe the structuraldescription of the future IS are selected and which roles are attributed to them. Weeliminate the treatment of temporal and behavioral syntagms types. Then we proceed tothe classification of these sentences according to sentences patterns that we havealready determined. The extracted information is then represented by a semantic net-work and a set of design patterns as well as heuristics containing the know-how andexperience of the design experts are applied, which leads to generating the corre-sponding class diagram.
2.2.1 The Semantics AnalysisOur approach begins with the assignment of roles to the various components used inthe sentence. Then, we proceed to a classification of its sentences into patterns ofsentences. A semantic network is generated as Output in order to represent the whole ofthe extracted information.
Fig. 1. The models of the platform AL2UML
4 We implemented a set of grammar rules as a set of ATN (augmented transition network).5 We apply a method based on decision theory.
A Platform for the Conceptualization of Arabic Texts Dedicated 449

The Verbal sentence processing: it is recognized by the presence of a verbal chunk(VP). The VP is recognized by the identification of a verb, verbal noun, active par-ticiple, passive participle or the particle .’ل‘ We look for the verb class and therecognition of the semantic relations that link the different chunks to the verb, in orderto assign suitable roles (Ci) to the different words and chunks composing this sentence.We have identified 12 roles, these roles are inspired and adapted from the semantic ofthe casual theory of Fillmore. We have defined for each class of verb a role assignmentalgorithm.
The Nominal Sentence processing: The relationship is deduced by a prepositionalchunk. It may even be implicit, in this case, we look for a pivot element (the subject ofthe action) in the nominal chunk, identified by its pos tag and by its position in thischunk. We have established algorithms that assign roles for each chunk of the sentence.Usually, the nominal sentence describes either an association relationship or aninheritance relationship.
The sentence pattern: The Sentences patterns allow us to stereotype the sentences; wehave classified them according to 9 schemas (plans). This classification allows us todetermine a first interpretation of the specification text.
Fig. 2. Architecture of conceptual model
450 K.Z. Bousmaha et al.
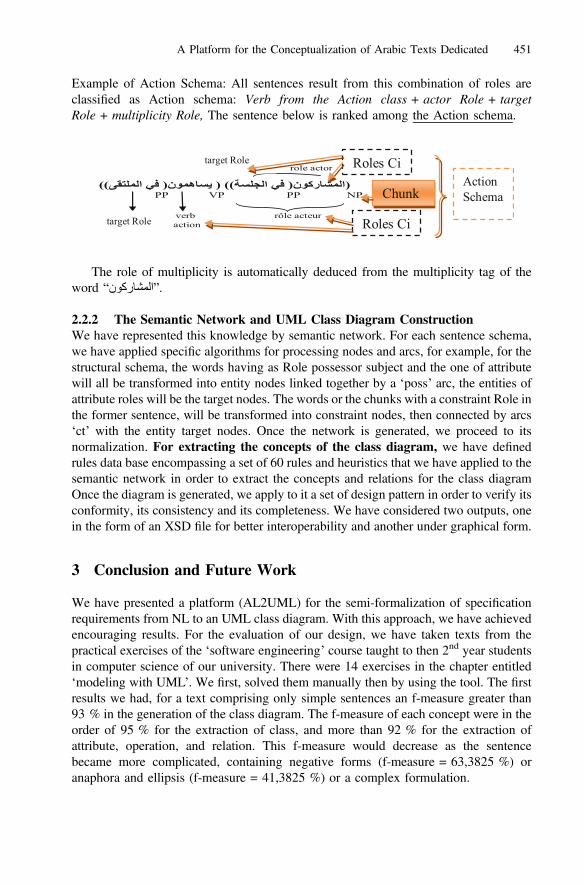
Example of Action Schema: All sentences result from this combination of roles areclassified as Action schema: Verb from the Action class + actor Role + targetRole + multiplicity Role, The sentence below is ranked among the Action schema.
The role of multiplicity is automatically deduced from the multiplicity tag of theword “ نوكراشملا ”.
2.2.2 The Semantic Network and UML Class Diagram ConstructionWe have represented this knowledge by semantic network. For each sentence schema,we have applied specific algorithms for processing nodes and arcs, for example, for thestructural schema, the words having as Role possessor subject and the one of attributewill all be transformed into entity nodes linked together by a ‘poss’ arc, the entities ofattribute roles will be the target nodes. The words or the chunks with a constraint Role inthe former sentence, will be transformed into constraint nodes, then connected by arcs‘ct’ with the entity target nodes. Once the network is generated, we proceed to itsnormalization. For extracting the concepts of the class diagram, we have definedrules data base encompassing a set of 60 rules and heuristics that we have applied to thesemantic network in order to extract the concepts and relations for the class diagramOnce the diagram is generated, we apply to it a set of design pattern in order to verify itsconformity, its consistency and its completeness. We have considered two outputs, onein the form of an XSD file for better interoperability and another under graphical form.
3 Conclusion and Future Work
We have presented a platform (AL2UML) for the semi-formalization of specificationrequirements from NL to an UML class diagram. With this approach, we have achievedencouraging results. For the evaluation of our design, we have taken texts from thepractical exercises of the ‘software engineering’ course taught to then 2nd year studentsin computer science of our university. There were 14 exercises in the chapter entitled‘modeling with UML’. We first, solved them manually then by using the tool. The firstresults we had, for a text comprising only simple sentences an f-measure greater than93 % in the generation of the class diagram. The f-measure of each concept were in theorder of 95 % for the extraction of class, and more than 92 % for the extraction ofattribute, operation, and relation. This f-measure would decrease as the sentencebecame more complicated, containing negative forms (f-measure = 63,3825 %) oranaphora and ellipsis (f-measure = 41,3825 %) or a complex formulation.
A Platform for the Conceptualization of Arabic Texts Dedicated 451

As an extension, first we plan to take into account the treatment of the complexsentence, the anaphora and ellipsis, the synonymy by using Ontology AWN for thelater. Second, we intent to complete the UML model by the OCL constraint expressionlanguage for processing constraints. Finally, we have to address the lack of formalsemantics which penalizes UML in the developed models for a transition to Event_Bformal language.
References
1. Meziane, F.: From english to formal specifications. Thesis, University of Salford, UK (1994)2. Fougères, A., Trigano, P.: Rédaction de spécifications formelles: Élaboration à partir des
spécifications écrites en langage naturel. Cahiers Romans de Sciences Cognitives 1(8), 29–36 (1997)
3. Sadoun, D.: Des spécifications en langage naturel aux spécifications formelles via uneontologie comme modéle pivot. Thesis, Université de Paris Sud (2014)
4. Landhäußer, M., Körner, S.J., Tichy, W.F.: From requirements to UML models and backhow automatic processing of text can support requirements engineering. Softw. Qual. J.22(1), 1–29 (2013)
5. Bajwa, I.S., Bordbar, B., Lee, M., Anastasakis, K.: Nl2alloy: a tool to generate alloy from nlconstraints. J. Digital Inf. Manag. 10(6), 365–372 (2012)
6. Ilieva, M., Boley, H.: Representing textual requirements as graphical natural language forUML diagram generation. In: SEKE 2008, pp. 478–483 (2008)
7. Meziane, F., Vadera, S.: Obtaining E-R diagrams semi-automatically from natural languagespecifications (2010)
8. Mammar A., Laleau, R.: An automatic generation of B specifications from well-definedUML notations for database applications. In: International Symposium on ProgrammingSystems, Alger, Algérie (2001)
9. Mit, E.: Developing VDM++ operations from UML diagrams. Thesis, School of Computing,Science and Engineering, University of Salford, UK (2007)
10. Shroff, M., France, R.: Towards a formalization of UML class structures in Z. In:Proceedings of the 21th International Computer Software and Applications Conference–COMPSAC 1997. IEEE (1997)
11. Mokhati, F., Badri, M.: Generating Maude specifications from UML use case diagrams.J. Object Technol. 8(2), 119–136 (2009)
12. Bousmaha, K.Z., Rahmouni, M.K., Kouninef, B., Belguith-Hadrich, L.: A hybrid approachfor the morpho-lexical disambiguation of Arabic: Alkhalil+. J. Inf. Process. Syst. Jips (2016)(à paraitre)
13. Church, K., Hanks, P.: Word association norms, mutual information, and lexicography.Comput. Linguist. 16(1), 22–29 (1989). mars
452 K.Z. Bousmaha et al.

Reversing the Polarity with Emoticons
Phoey Lee Teh1(&), Paul Rayson2, Irina Pak1, Scott Piao2,and Seow Mei Yeng1
1 Department of Computing and Information Systems, Sunway University,Bandar Sunway, Malaysia
[email protected], [email protected],
[email protected] School of Computing and Communications,
Lancaster University, Lancaster, UKp.rayson,[email protected]
Abstract. Technology advancement in social media software allows users toinclude elements of visual communication in textual settings. Emoticons are widelyused as visual representations of emotion and body expressions. However, theassignment of values to the “emoticons” in current sentiment analysis tools is still at avery early stage. This paper presents our experiments in which we study the impactof positive and negative emoticons on the classifications by fifteen different senti-ment tools. The “smiley” :) and the “sad” emoticon :( and raw-text are compared toverify the degrees of sentiment polarity levels. Questionnaires were used to collecthuman ratings of the positive and negative values of a set of sample comments thatendwith these emoticons.Our results show that emoticons used in sentences are ableto reverse the polarity of their true sentiment values.
Keywords: Sentiment Emoticons Polarity Emotion Social media
1 Introduction
An emoticon is a symbol which includes “emotion” and “icon” [1]. Mobile and online textmessaging platforms often include emoticons. It also known as “Emoji” or “Facemarks”. Inthis paper, we study the effect of positive and negative emoticons by testing fifteen differentsentiment tools in order to investigate the impact of the emoticons on the sentiment clas-sification of the short messages by different sentiment analysis tools. In addition, wesimulated 30 comments, similar to the comparison of sentiment tools, with each simulatedcomment containing “smiley” , “sad” emoticon , and without emoticon. We collectedthe opinion of “like” and “dislike” values for different variations of text in order to examinethe impact of emoticon on the polarity of the text. Overall, our evaluation results show thatemoticons are able to reverse polarity of the sentiment values.
2 Related Work
There have been some publications studying the behavioral usage of emoticons in textmessaging, social media and the art of communication from social workplace. Forexample, Zhang et al. [2] stated that emoticons are strongly associated with subjectivity
© Springer International Publishing Switzerland 2016E. Métais et al. (Eds.): NLDB 2016, LNCS 9612, pp. 453–458, 2016.DOI: 10.1007/978-3-319-41754-7_48

and sentiment, and they are increasingly used to directly express a user’s feelings,emotions and moods in microblog platforms. Yamamoto [3] verified the multidimen-sional sentiment of tweet messages by examining the role of the emoticon. Derks et al.[4] observed 150 secondary school students and studied the frequency of emoticonsused to represent non-verbal face-to-face expressions. Ted et al. [5] studied the effect ofemotions on emotional interpretation of messages in the workplace. Garrison et al. [6]studied the emoticons used in instant messaging. Tossell et al. [7] studied the emoti-cons used in text messaging sent from smart phones, particularly focusing on thegender difference in using emoticons. Another study by Reyes and Rosso [8] stated thatemoticons are one of the features which are related to identifying irony within text.
3 Data and Experiment
In our earlier study [9] we showed that sentiment tools should consider the number ofexclamation marks when detecting sentiment. In that study, we tested different numbersof exclamation marks, and our experiment showed that different numbers of excla-mation marks have an impact on sentiment value of the text. We further argued thatemoticons have a significant value for identifying the sentiment of comments onproducts based on testing of fifteen existing sentiment analysis tools. In this paper, weemploy a similar method to explore the fifteen sentiment tools (Table 2) for positiveand negative emoticons to investigate if the scores of polarity show any difference. Werecorded the scores of: (1) unformatted text (e.g.: I like it), (2) comments that end withpositive emoticon (e.g.: I like it :-)), and (3) comments that end with negative emoticon(e.g.: I like it :-(). We focus our experiment on these three types of comments, whichcan help to reveal the impact of the positive and negative emoticons. The impact isobserved by comparing sentiment scores for three different types of comment.
Furthermore, we explore whether or not the emoticons affect the sentiment valuesof the comments assigned by human raters by conducting a survey. The data ofcomments on products used for the questionnaire survey were collected from onlineretails sites such as Ebay, Amazon and Lazada. Altogether, our corpus consisted of1,041 raw comments were collected covering 10 different types of products, including(1) Beauty and Health, (2) Camera, (3) Computer, (4) Consumer Electronics,(5) Fashion, (6) Home appliance, (7) Jewellery and Watch, (8) Mobiles and Tables,(9) Sport goods, and (10) Toys and Kids. All of the collected comments were analyzedwith Lancaster University UCREL’s Wmatrix system to identify the emotional wordsthat have the high frequencies of occurrence. Based on this, we manually categorizedand extracted emotional words. Next, we designed the questionnaire with these 30comments, using a 7- point Likert-type scale, where we repeated the questions to eachof the listed comments. We collected the opinions of “like” and “dislike” values fordifferent variations of text, employing similar approach to that which we used incomparing the sentiment tools. For example, three variants of the comment “I love it”were generated: (a) “I love it”, (b) “I love it ”, and (c) “I love it ”, then respondentswere asked to express their opinions at the levels of “like” and “dislike” about them. Asa result, we collected rating data from 500 respondents. Figure 1 presents the fifteenstrongest positive and negative comments with emotional words.
454 P.L. Teh et al.

4 Evaluation Results
The human rating data of the sentiment of comments of the 500 respondents werecomputed and analysed. Seven-point scale is used for both positive and negativecomments, in which the mid-point of 4 represents neutral sentiment.
Figure 1 illustrates the mean scores with a chart. The four grey lines in the chart,denoted by M1, M2, M3 and M4, represent respectively the positive texts with positiveemoticon, positive texts with negative emoticon, negative texts with positive emoticon,and negative texts with negative emoticon (see Table 1). Those comments on theX-axis are those simulated with both positive and negative emotions at the end ofthe messages that were given to the 500 respondents to assign sentiment values on the“like” and “dislike” scale.
With the neutral line N (see the red line) of the sentiment scale point 4 as thebenchmark, the M1 line indicates that the mean sentiment rating scores of all the com-ments fall under the range of “slightly like” to “like” scales (corresponding to thenumerical range of 4.22–5.24 points). In contrast, the whole M2 line falls below theneutral line N towards the “dislike” scale. This is an interesting and unexpected result,because M2 consists of positive texts but some of them have manual sentiment ratingsthat are even lower than the line M3 which consists of negative texts. On the other hand,line M3 appears as the second top level (although below line N) for many comments in
Fig. 1. Like and Dislike scores for positive and negative comments that end with emoticons(Color figure online)
Reversing the Polarity with Emoticons 455

the range of 3.2 to 5.11 sentiment scale points. For instance, the message “I hate it”ending with a smiley has a score of 3.2 and “I can afford it” ending with smiley has ascore of 5.11. We categorize line M3 as “sarcastic” line since it mixes negative com-ments with the positive emoticon.
With respect to lines M3 and M4 in Fig. 1, which illustrate the negative comments,emoticons seem to reduce the overall values of “like” and “dislike” from range 2.3–5.11 to 2.36–3.74. Here again, changing emoticons appears to significantly affect theoverall sentiment value of expressions. Overall, line M3 shows that negative commentswith positive emoticons appear to have a higher positive overall rating compared to thepositive comments with negative emoticons (line M2). Our observation leads to thefollowing tentative conclusions:
(a) Negative emoticons can have an important impact on the overall sentiment of thepositive comments and can potentially alter the sentiment.
(b) Various types of emoticons form an important factor that should be considered bythe sentiment analysis tools.
We extracted scores for an example phrase “I like it” from fifteen freely availableonline sentiment analysis tools, as shown by Table 2. Our checking of the resultsshows that 9 out of the 15 tools include the value of expression of emoticons in theirsentiment polarity classification process, which affects the positive or negative senti-ments of the comments compared to the original text-only messages without smileys.For example, in our experiment Twitter Sentiment Analyzer, Lexalytics, SentimentAnalysis Engine, Sentiment Search Engine etc. produced negative sentiment scores forthis message. These results also support our claim regarding the importance ofemoticons for sentiment analysis. It is interesting that both Sentiment Analysis Engineand Sentiment Search Engine classified the message “I like it :-(” as totally negativewhen a negative emoticon was used. It shows that most of the sentiment tools includedin our study consider emoticons as a relevant factor when determining the sentimentpolarity of the text. However, they appear not to take account of the positive/negativeinteractions between text and emoticons, which we have highlighted in this study.
Table 1. Description of the lines
Line Comment polarity Emoticon used
M1 Positive PositiveM2 Positive NegativeM3 Negative PositiveM4 Negative Negative
456 P.L. Teh et al.
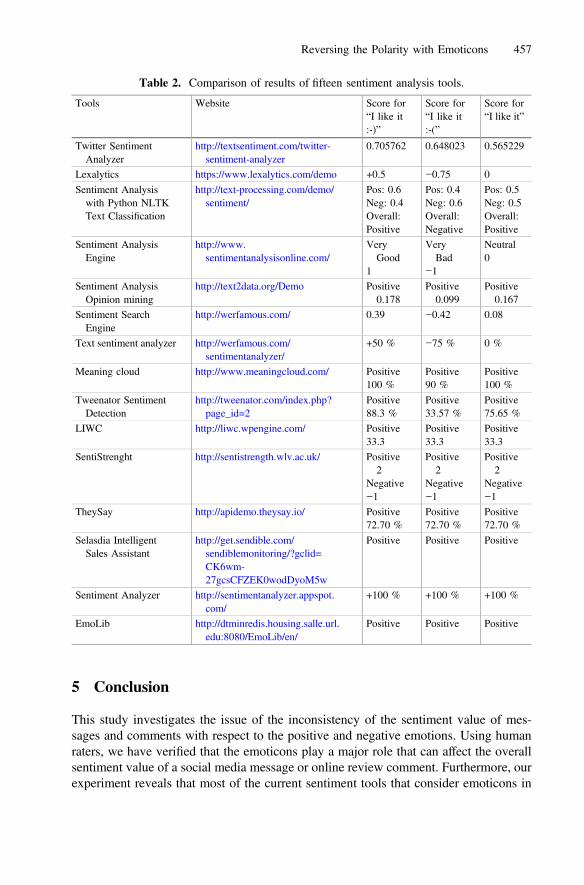
5 Conclusion
This study investigates the issue of the inconsistency of the sentiment value of mes-sages and comments with respect to the positive and negative emotions. Using humanraters, we have verified that the emoticons play a major role that can affect the overallsentiment value of a social media message or online review comment. Furthermore, ourexperiment reveals that most of the current sentiment tools that consider emoticons in
Table 2. Comparison of results of fifteen sentiment analysis tools.
Tools Website Score for“I like it:-)”
Score for“I like it:-(”
Score for“I like it”
Twitter SentimentAnalyzer
http://textsentiment.com/twitter-sentiment-analyzer
0.705762 0.648023 0.565229
Lexalytics https://www.lexalytics.com/demo +0.5 −0.75 0
Sentiment Analysiswith Python NLTKText Classification
http://text-processing.com/demo/sentiment/
Pos: 0.6Neg: 0.4Overall:Positive
Pos: 0.4Neg: 0.6Overall:Negative
Pos: 0.5Neg: 0.5Overall:Positive
Sentiment AnalysisEngine
http://www.sentimentanalysisonline.com/
VeryGood
1
VeryBad
−1
Neutral0
Sentiment AnalysisOpinion mining
http://text2data.org/Demo Positive0.178
Positive0.099
Positive0.167
Sentiment SearchEngine
http://werfamous.com/ 0.39 −0.42 0.08
Text sentiment analyzer http://werfamous.com/sentimentanalyzer/
+50 % −75 % 0 %
Meaning cloud http://www.meaningcloud.com/ Positive100 %
Positive90 %
Positive100 %
Tweenator SentimentDetection
http://tweenator.com/index.php?page_id=2
Positive88.3 %
Positive33.57 %
Positive75.65 %
LIWC http://liwc.wpengine.com/ Positive33.3
Positive33.3
Positive33.3
SentiStrenght http://sentistrength.wlv.ac.uk/ Positive2
Negative−1
Positive2
Negative−1
Positive2
Negative−1
TheySay http://apidemo.theysay.io/ Positive72.70 %
Positive72.70 %
Positive72.70 %
Selasdia IntelligentSales Assistant
http://get.sendible.com/sendiblemonitoring/?gclid=CK6wm-27gcsCFZEK0wodDyoM5w
Positive Positive Positive
Sentiment Analyzer http://sentimentanalyzer.appspot.com/
+100 % +100 % +100 %
EmoLib http://dtminredis.housing.salle.url.edu:8080/EmoLib/en/
Positive Positive Positive
Reversing the Polarity with Emoticons 457
their sentiment polarity classifications do not consider the interaction betweenconflicting positive/negative sentiment values of textual contents and emoticons whenassessing the overall sentiment. In light of our experimental results, we propose thatcurrent sentiment tools should be improved by considering all these factors in theirclassification algorithms.
References
1. Kim, J., Lee, M.: Pictogram generator from Korean sentences using emoticon and saliencymap. In: HAI 2015 Proceedings of the 3rd International Conference on Human-AgentInteraction, pp. 259–262. ACM, New York (2015). ©2015
2. Zhang, L., Pei, S., Deng, L., Han, Y., Zhao, J., Hong, F.: Microblog sentiment analysis basedon emoticon networks model. In: Proceedings of the Fifth International Conference onInternet Multimedia Computing and Service - ICIMCS 2013, pp. 134–138. ACM, New York(2013). ©2013
3. Yamamoto, Y.: Role of emoticons for multidimensional sentiment analysis of Twitter. In: The14th IIWAS, pp. 107–115. ACM, New York (2013). ©2014
4. Derks, D., Bos, A.E.R., Von Grumbkow, J.: Emoticons and social interaction on the internet:the importance of social context. Comput. Hum. Behav. 23(1), 842–849 (2007)
5. Ted, T., Wu, L., Lu, H., Tao, Y.: Computers in human behavior the effect of emoticons insimplex and complex task-oriented communication: an empirical study of instant messaging.Comput. Hum. Behav. 26(5), 889–895 (2010)
6. Garrison, A., Remley, D., Thomas, P., Wierszewski, E.: Conventional faces: emoticons ininstant messaging discourse. Comput. Compos. 28(2), 112–125 (2011)
7. Tossell, C.C., Kortum, P., Shepard, C., Barg-Walkow, L.H., Rahmati, A., Zhong, L.: Alongitudinal study of emoticon use in text messaging from smartphones. Comput. Hum.Behav. 28(2), 659–663 (2012)
8. Reyes, A., Rosso, P.: On the difficulty of automatically detecting irony: beyond a simple caseof negation. Knowl. Inf. Syst. 40, 595–614 (2014)
9. Teh, P.L., Rayson, P., Piao, S., Pak, I.: Sentiment analysis tools should take account of thenumber of exclamation marks!!! In: The 17th IIWAS, pp. 4–9. ACM, New York (2015).©2015
458 P.L. Teh et al.

Spatial-Temporal Representation and ReasoningAbout Objects and Regions
Aldjia Aider1(B), Fatiha Mamache1, and Fatma-Zohra Belkredim2
1 Laboratoire RIIMA, Departement d’Informatique,Faculte d’Electronique et d’Informatique, USTHB,
BP 32 El Alia, Bab-Ezouar, Alger, Algerialaider,[email protected]
2 LMA Laboratoire de Mathematiques et Applications,Departement de Mathematiques, Faculte de Sciences,Universite Hassiba Benbouali Chlef, Chlef, Algeria
Abstract. There are many Artificial Intelligence application thatrequire reasoning involving spatial and temporal concepts. We propose aspatio-temporal formalism to represent the relationship between objectsand regions. The formalism is based on a first order language augmentedwith operators which main aim is to facilitate the representation ofspatial-temporal objects positions. This temporal logic allows to studythe evolution of relative positions between entities during time. The tra-jectory of an object in areas is represented by equivalence classes ofobjects positions in present, past and future.
Keywords: Artificial intelligence · Knowledge representation · Tempo-ral reasoning · Spatial-temporal logic · Qualitative spatial reasoning
1 Introduction
Artificial Intelligence Applications increasingly need representation and reason-ing about space and time. In this paper, we propose a formalism to enrich Gal-ton’s work [1]. The aim of this language is to represent objects position in futureand past. In our proposal, the first order logic is extended to include oper-ators to represent the position of an object in the past, present and future.These operators allow the identification of the object’s trajectory and simplifiesits spatial-temporal representation. The set of time-elements when an object ispresent in an area is represented by an equivalence class of a time-element whenthe object was in this area for the first time. The remaining of the paper isorganized as follows. In Sect. 2, we review some related works and present ourlanguage by defining its notations and terminologies to represent positions ofobjects. Section 3 is devoted to the definition of the spatial-temporal relation-ships between objects and regions. In Sect. 4, we present a deductive system andthe semantics of the SPT L logic. We conclude and identify future developmentsin Sect. 5.c© Springer International Publishing Switzerland 2016E. Metais et al. (Eds.): NLDB 2016, LNCS 9612, pp. 459–464, 2016.DOI: 10.1007/978-3-319-41754-7 49

460 A. Aider et al.
2 Related Work
Several formalism were proposed including spatial qualitative reasoning. The for-malisms suggested are characterized by spatial entities as well as relationshipsbetween them. Within the framework of space theory based on areas, Galton[1,2] was the first to consider the movement of object from a qualitative pointof view on a more general theory of time and action, whiah is different fromthe way it is defined before [3]. Galton does not distinguish between future andpast. We propose a language which main aim is to facilitate the representationof the space-time positions of the objects in the future and the past. Galton [1,2]combined spatial theory with temporal theory, inspired by actions modeling for-malism, more precisely by actions theory and Allen’s time [3]. Using Mamache’sformalism [4] to deal with this kind of situations, we present a logical formal-ism based on a first order language extended with special operators in order torepresent spatial-temporal positions of objects.
3 Spatial-Temporal Reasoning About Objects andRegions
Within the framework of the formalization of a symbolic approach for Spatial-Temporal Reasoning, and inspired by Allen [3], McDermott [6] and Aider andMamache [4,5] works, we propose a spatial-temporal formalism to reason aboutobjects, regions and time.
3.1 Language, Notation and Terminology
We introduce the following language which is a first order language with equality:
• Connectors: ¬,∨,∧and ⊃.• Two signs of quantification noted ∃ and ∀.• A symbol of equality, which we will note ≡ to distinguish it from the sign =.• A countable infinite collection of propositional variable.• A set of operational signs or symbols functional.• Three unary temporal operators: Pk (past), Fk (future), and P0 (present).• The expressions are the symbol strings on this alphabet.• The set of the formulas noted Φ is by definition the smallest set of expressions
which checks the following conditions:– Φ contains the propositional variables.– A set of elements called symbols of individuals.– If A and B are elements of Φ it is the same for ¬A and A ⊃ B.– If A is an element of Φit is the same for Pk A, FkA and P0A.
The language, equally contains:
• A set of elements called symbols of individuals.• A set of operative signs or functional symbols.• A set of relational signs or symbols of predicates.
As Galton [7], the predicate pos is used to express that an object o is in aregion r.

Spatial-Temporal Representation and Reasoning About Objects and Regions 461
3.2 Atemporal Representation
Definition 1. An object o is an atemporal object if its position does not dependon time.
Let o be an atemporal object and r a region. To express that the object o isin the region r, we use the predicate “pos”. We can generalize for m objects:
Let o1, o2, ..., om m atemporal expressions of object type and r a region.To express that the objects o1, o2, .., om are in the region r, we use the pred-
icate pos defined by:
pos(o1, o2, ..., om; r) ≡ pos(o1; r) ∧ ... ∧ pos(om; r).
Example 1. pos(plane,HouariBoumedieneAirport)means that the plane is in Houari Boumediene Airport.
Example 2. pos(Algeria, Tunisia,Morocco;Africa):means Algeria, Tunisia and Morocco are in Africa.
3.3 Temporal Representation
Definition 2. We call time-element an interval or a point of time [8,9].Let I be a set of intervals, P a set of points of time and T the union of I and
P then every object o is in an area r during a time-element t.If the position of o in the area is instantaneous then t is a point of time and
if it is so t is an interval.If an object o would be (in the future) in an area r at a time-element t, we
give the following definition:
Definition 3. Let o be an object type, r a region and (t1, t2, . . . , tm) elementsof time.
1. The formula pos(o.t; r) expresses that the object o will be in the region r atthe element of time t.
2. The formula pos(t.o; r) expresses that the object o was in the region r at theelement of time t.
3. The formula pos(o.t1, o.t2, . . . , o.tm; r) expresses that the object o will be inthe region r at the different elements of time t1, t2, . . . , tm.
4. The formula pos(t1.o, t2.o, . . . , tm.o; r) expresses that the object o was in theregion r at the different elements of time t1, t2, . . . , tm.
Example 3. 1. pos (plane.15: 00; Algiers) means: The plane will arrive at Algiersat 15 : 00.
2. pos (15: 00.plane; Algiers) means: The plane was in Algiers at 15 : 00.
Example 4. 1. pos (plane.15: 00; plane.18 : 00; plane.23 : 00; Algiers) means Theplane will be in Algiers at 15: 00, 18: 00 and 23: 00.
2. pos (15: 00.plane; 18 : 00.plane; 23 : 00.plane; Algiers), means: The plane wasin Algiers at 15: 00, 18: 00 and 23: 00.

462 A. Aider et al.
Definition 4. Let T be a nonempty set of time-elements, O a set of objects andR a set of regions. We define a set Pos(O.T,R) as the set of elements pos(o.t; r).
Pos(O.T,R) = pos(o.t, r), o ∈ O, r ∈ R, t ∈ T/ will be in r at t.
To represent the fact that o1, o2, . . . , om will be in an area r respectively att1, t2, . . . , tm we use the notation:
pos(o1.t1, o2.t2, . . . , om.tm; r).
Definition 5. Let Pos(T.O,R) be the set of elements pos(t.o; r).
Pos(T.o,R) = pos(t.o, r), o ∈ O, r ∈ R, t ∈ T/owill be in r at t.
To represent the fact that o1, o2, . . . , om will be in an area r respectively att1, t2, . . . , tm we use the notation
pos(t1.o1, t2.o2, . . . , tm.om; r).
Definition 6. A Trajectory Tj , in line with Kayser and Mokhtari [10] andMamache [4] is a succession of time-elements tj representing an evolution ofthe universe defined by the position of an object in an area of the universe.
4 Spatial-Temporal Relationships Between Objectsand Regions
In our approach, we establish a relation between objects, areas and time whenthese objects are in these areas. To express this, we enrich our language by newoperators. The notion of time (past, present and future) is represented by aninteger k such as:
1. k > 0 represents the future. Fk(pos(o; rk)) expresses the position of the objecto in the area rk in the future and,
2. k < 0 represents the past. Pk(pos(o; rk)) expresses the position of the objecto in the area rk in the past.
If the object o would be in the future in different areas r1, r2, . . . , rm, we note:
F1(pos(o; r1)), F2(pos(o; r2)), . . . , Fm(pos(o; rm))
m is the number of areas where the object o would be in the future. If the objecto was in different areas r′
1, r′2, . . . , r
′s:
P−1(pos(o; r′1), P−2(pos(o; r′
2)), . . . , P−s(pos(o; r′s)),
s is the number of areas where the object o was in the past.The operator Fk allows us to determine all positions of the object o in the
future and the operator Pk in the past (ramification).

Spatial-Temporal Representation and Reasoning About Objects and Regions 463
4.1 SPTL Spatial-Temporal Logic to Reason About Objects andRegions
We propose a spatial-temporal logic SPT L to reason on the objects and regions.
Deductive System. The axioms of the spatial-temporal logic SPT L are axiomsof propositional logic [11]. The rules of deduction are:
1. The modus ponens [11].2. Temporal generalization: If pos(o; r) is a theorem, Fk(pos(o; r)), Pk(pos(o; r))
and P0(pos(o; r)) are also theorems.
The theorems of SPT L are by definition all the formulas deductible from theaxioms by using the rules of deduction. In particular all the theorems of propo-sitional calculus are theorems.
Semantic of SPTL. In the semantic of propositional calculus [10], an assign-ment of values of truth V is an application that for each propositional variableassociates a value of truth. An assignment of value of truth describes a stateof the world. In the case of SPT L, we choose as propositional variables thepositions of an object o in an area r at a time-element t.
Definition 7. Let P(T) be the set of the parts of T and V the valuationdefined by:
V : Pos(O,R) → P (T ) → 0, 1pos(o; r)) → T ′ = t/o is in r at t
the valuation of pos(o, r) = 1 if T ′ = ∅ and pos(o, r) = 0 if T = ∅
4.2 Representation of the Movement When an Object is inDifferent Regions at Different Time-Elements
We note Pos(o,R) the set of positions of an object o.
Definition 8. We define the application V t : Pos(o,R) → P (T ) as follows:If o is in ri at ti, then Vt(pos(o; ri)) = ti
Definition 9. Let Rt a binary relation defined on the set Pos(o;R) as follows:(pos(o; ri)Rtpos(o; rj) ⇔ Vt(pos(o; ri)) = Vt(pos(o; rj))
Proposition 1. Rt is a relation of equivalence as defined in the following diagram:
P (O,R)−→Vt P (T )
s ↓ ↑ i
P (O,R)/Rt
−→Vt ImVt
Pos(o,R)/Rt = pos(o, r) ∈ Pos(o;R) is the set of equivalence classesof elements of Pos(o;R) and pos(o, r) = pos(o, ri) ∈ Pos(o,R)/pos(o, ri)Rtpos(o, ; r) is the class of equivalence of pos(o; r). It contains all positionspos(o, rj) of the object o in different areas rj (movement). Vt associates to anyelement of Pos(o,R) a time-element ti and Vt(pos(o, ri)) = ti. The set of thetime-elements when an object o is in different areas ri or the movement of theobject o is represented by the equivalence class of a position pos(o, ri) when o isin these areas, it is the representative of the class.

464 A. Aider et al.
5 Conclusion and Perspectives
In this paper, we introduced a formalism based on a first order language ex-tended with operators to represent spatial-temporal positions of objects in thepast, present and future that makes the possibility to determine the Trajectory ofthis object. Also, we proposed an arborescent spatial-temporal logic to describea state of the world. Our formalism can be used in the management of air, seaand rail transport in real time. Pieces of information will be centralized andthe formalism will be the reference allowing rapid access. Furthermore it can beapplied to moving objects as Animals, Humans or Robots.
References
1. Galton, A.: A critical examination of Allen’s theory of action and time. J. Artif.Intell. 42(2–3), 159–188 (1990)
2. Galton, A.: On the notions of specification and implementation. R. Inst. Philos.Suppl. 34, 111–136 (1993)
3. Allen, J.: Towards a general theory of actions and time. J. Artif. Intell. 23, 123–154(1984)
4. Mamache, F.: A temporal logic for reasoning about actions. Int. J. Open Probl.Comput. Sci. Math. 4(1), 97–112 (2011)
5. Aider, A., Mamache, F.: Objects, regions and spatio-temporal logic. Asian J. Math.Comput. Res. 9(1), 77–91 (2016)
6. McDermott, D.: A temporal logic for reasoning about processes and plans. ProcessCogn. Sci. 6, 101–155 (1989)
7. Galton, A.: Spatial and temporal knowledge representation. Earth Sci. Inf. 2(3),169–187 (2009)
8. Birstouge, H., Ligozat, G.: Outils logiques pour le traitement du temps de la lin-guistique l’intelligence Artificielle. Masson, Paris (1989)
9. Knight, B., My, J., Peng, T.: Representing temporal relationships between eventsand their ef-fects. In: Proceedings of the International Fourth Temporal Workshopone Representation and Reasoning, pp. 148–152. IEEE Computer Society Press(1997)
10. Kayser, D., Mokhtari, A.: Time in a causal theory. Ann. Math. Artif. Intell. 22(1–2), 117–138 (1998)
11. Kleene, S.C.: Mathematical logic. Collection U (1971)
Bias Based Navigation for News Articlesand Media
Anish Anil Patankar and Joy Bose(&)
Samsung R&D Institute, Bangalore, Indiaanish.p,[email protected]
Abstract. In existing news related services, readers cannot decide if there isanother side of a news story, unless they actually come across an article rep-resenting a different perspective. However, it is possible to determine the bias ina given article using NLP related tools. In this paper we determine the bias inmedia content such as news articles, and use this determined bias in two ways.First, we generate the topic/bias index for one or more news articles, positioningeach article within the index for a given topic or attribute. We then provide auser interface to display how much bias is present in the currently read article,along with a slider to enable the reader to change the bias. Upon the userchanging the bias value, the system loads a different news article on the sametopic with a different bias. The system can be extended for a variety of mediasuch as songs, provided the lyrics are known. We test our system on a few newsarticles on different topics, reconfirming the detected bias manually.
Keywords: News Media consumption Clustering Natural languageprocessing Classification Sentiment analysis Bias Topic modelling
1 Introduction
There are positive and negative aspects of any event, and news articles from differentsources covering the same event are typically not free from bias. Users cannot possiblybrowse and read all articles on a given topic from all sources. A related problem is:while reading a news article, readers have no way of determining if, and how much biasis present in the article. A study on social media users [1] found that people of polarizedpolitical orientations, such as liberal and conservative, generally only interact withothers of a similar orientation and not with the differing groups. This shows that it isdifficult for a user to come across articles that do not correspond closely to their alreadyexisting point of view.
In this paper we provide a system comprising of a web service to determine the biasin a given news article in real time by identifying the topic of the article, analyzing thewords in an article for positive, negative or neutral connotations and determining a biasscore as a ratio of the number of positive or negative words with the total number ofwords. This calculated bias score is displayed in the web browser using a suitable userinterface, giving the user a chance to be aware of the bias of the currently read articleand change it if they wish. The cloud server stores a list of articles on the same or
© Springer International Publishing Switzerland 2016E. Métais et al. (Eds.): NLDB 2016, LNCS 9612, pp. 465–470, 2016.DOI: 10.1007/978-3-319-41754-7_50
similar topics sorted by bias, which is used by the web service to provide a slider basedinterface. The user is able to view a different article on a given topic by choosing adifferent bias value on the slider.
2 Related Work
Slider user interfaces which provide a user a means to choose and personalize howmuch content related to a given topic they wish to read, are already available. Examplesinclude the interface used by Google news [2]. Yahoo’s Social Sentiment Slider [3] is awidget that provides a means to ask users relevant questions regarding how they feelabout a given content, by sliding a cursor across a scale. However, a slider userinterface that lets a user control the bias or sentiment related to a given article is notavailable at present.
A number of Twitter related tools and other works [4–6] are available that enableone to analyze or visualize the sentiment of tweets on a given topic or brand, using textmining. Similarly, methods using text mining to detect bias in news articles have beensurveyed by Balyaeva [7]. Gupta [8] and Chu et al. [9] among others have analyzedonline news articles to evaluate the present bias.
None of the above related work mentions any solutions to enable the user to selectnews articles based on the bias of the article related to a given topic. This is what we areproposing in this paper.
3 System Overview
Our overall system comprises a server component and the client user device such as amobile phone with a web browser. On the client device, a web browser extensioncalculates the bias and topic of the already loaded article and then queries the server tofind related articles with a different bias. The server returns the URL of the relatedarticles to the web browser on the client device, which then loads the URL like anyother webpage.
The server maintains a list of news articles on given topics, maintaining a databaseof URLs of articles on similar topics, along with the bias score for each article. The webbrowser extension on the client loads the related article URLs obtained from the server,displays them on the user device, and runs the user interface which displays the biasscore for each article.
The system can alternatively be implemented wholly on the user device to calculateand display the bias score of the currently loaded article. However, the computationload and memory requirement in this case would be larger and slow down the devicesignificantly. For this reason, a server based solution is preferable.
We use two methods for detection of bias, which are listed below.
466 A.A. Patankar and J. Bose
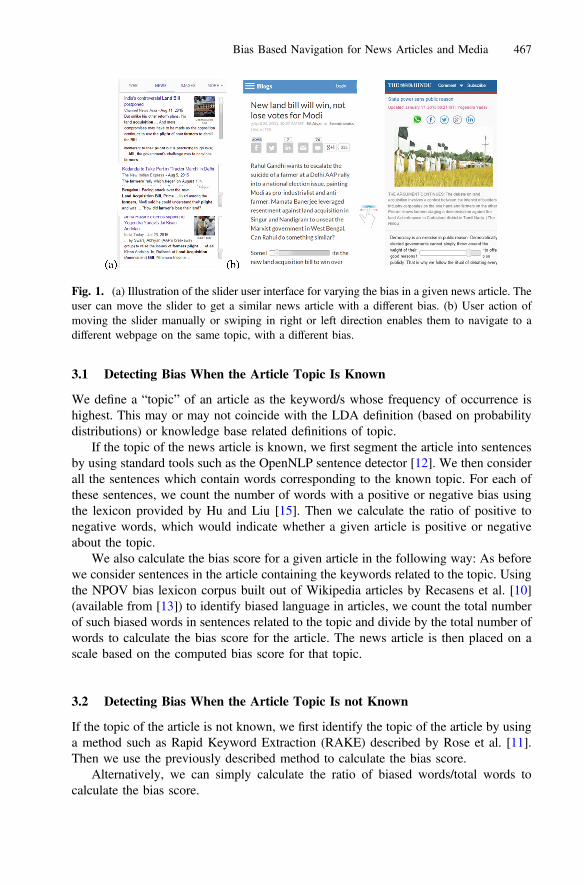
3.1 Detecting Bias When the Article Topic Is Known
We define a “topic” of an article as the keyword/s whose frequency of occurrence ishighest. This may or may not coincide with the LDA definition (based on probabilitydistributions) or knowledge base related definitions of topic.
If the topic of the news article is known, we first segment the article into sentencesby using standard tools such as the OpenNLP sentence detector [12]. We then considerall the sentences which contain words corresponding to the known topic. For each ofthese sentences, we count the number of words with a positive or negative bias usingthe lexicon provided by Hu and Liu [15]. Then we calculate the ratio of positive tonegative words, which would indicate whether a given article is positive or negativeabout the topic.
We also calculate the bias score for a given article in the following way: As beforewe consider sentences in the article containing the keywords related to the topic. Usingthe NPOV bias lexicon corpus built out of Wikipedia articles by Recasens et al. [10](available from [13]) to identify biased language in articles, we count the total numberof such biased words in sentences related to the topic and divide by the total number ofwords to calculate the bias score for the article. The news article is then placed on ascale based on the computed bias score for that topic.
3.2 Detecting Bias When the Article Topic Is not Known
If the topic of the article is not known, we first identify the topic of the article by usinga method such as Rapid Keyword Extraction (RAKE) described by Rose et al. [11].Then we use the previously described method to calculate the bias score.
Alternatively, we can simply calculate the ratio of biased words/total words tocalculate the bias score.
Fig. 1. (a) Illustration of the slider user interface for varying the bias in a given news article. Theuser can move the slider to get a similar news article with a different bias. (b) User action ofmoving the slider manually or swiping in right or left direction enables them to navigate to adifferent webpage on the same topic, with a different bias.
Bias Based Navigation for News Articles and Media 467

3.3 Working with Sentiment Instead of Bias
An alternative method is to use the identified positive or negative sentiment in a givenarticle rather than the bias, using a tool such as SentiWordNet [14]. We use theSentiWordNet data for training to construct an LDA model. We then input the newsarticle as a bag of words to the trained LDA model, which then splits the words intotwo clusters, one for positive and one for negative words. We then calculate an overallscore (between 0 and 1) for the news article. This method has the advantage ofinforming to the user how much a given article is positive or negative, rather than justindicate the bias. The user can then change the sentiment manually using the availableuser interfaces for the purpose and access another article on the same topic with adifferent sentiment. However, in this paper we have experimented with just the biasrather than the sentiment.
4 Experimental Setup with News Articles
For this experiment, we used 3 articles each, taken from popular news sources, ontopics of contemporary relevance: Bernie Sanders and Donald Trump, prominentdemocrat and republican candidates for the US presidential nomination. We determinedthe bias score for each of these articles and tested the score using the previouslydescribed method, confirming the obtained relative bias score by asking 5 knowl-edgeable users aged 25–35 to rank the given articles for bias.
For the liberal democrat candidate (Sanders), we sourced a neutral article fromWikipedia, a positive article from a liberal website and a negative article from aconservative website (and reverse for the republican conservative candidate Trump).
The Tables 1 and 2 show the results of our test. In case of Trump, the bias score islower for the neutral (Wikipedia) article than for the pro and anti articles, which is asexpected. The same holds in case of pro-Bernie and anti-Bernie articles, although thedifference is much less pronounced in this case. Since the biased and unbiased articlesare correctly distinguished, it is feasible to separate them on the slider interface as wedescribed earlier.
Table 1. Bias results for Donald Trump Related articles
Article Bias score Bias words Total words Ratio of positive/negative words
Pro Trump (a) 0.163 34 208 3.2Anti-Trump (b) 0.142 82 579 0.81Neutral (c) 0.107 303 2822 0.84
Sources (a) http://www.breitbart.com/big-government/2016/02/09/donald-trump-vows-to-be-the-greatest-jobs-president-god-ever-created (b) https://www.wsws.org/en/articles/2015/12/10/pers-d10.html (c) https://en.wikipedia.org/wiki/Donald_Trump
468 A.A. Patankar and J. Bose

5 Use Cases and Applications
Our system, with a little modification, can also be used in a number of other use casessuch as other media (songs, TV channels etc. with a given bias or sentiment related to agiven topic) or product reviews (a method such as mentioned in Hu and Liu [15] can beused for the purpose). In each of these use cases, a similar method to the one describedearlier in the case of news articles would be used.
6 Conclusion and Future Work
In this paper, we have described a slider based interface for navigating between newsarticles with a given bias. This would enable the user to be aware of and also controlthe amount of bias present in the news article they are currently reading. This new andinteresting interface would lead to higher user engagement with news articles and othermedia. This can potentially change the way news content is accessed by users, andprevent users from being manipulated by bias in media.
In future we seek to improve the accuracy of the system, implement it for music andother use cases and use the (positive or negative) sentiment of the article rather than justbias. We also seek to extend the proposed algorithm to cover sub-topics within a newsarticle.
References
1. Smith, M.A., Rainie, L., Shneiderman, B., Himelboim, I.: Mapping Twitter topic networks:from polarized crowds to community clusters. Pew Research Centre, vol. 20 (2014)
2. Google News Help: Personalizing Google News (2016). https://support.google.com/news/answer/1146405?hl=en
3. Yahoo Advertising Solutions: Introducing Yahoo!’s New Social Sentiment Slider. YahooNews (2011). http://news.yahoo.com/blogs/advertising/introducing-yahoo-social-sentiment-slider-185414337.html
4. Tweet Sentiment Visualization App. http://www.csc.ncsu.edu/faculty/healey/tweet_viz/tweet_app/
5. Sentiment140. http://www.sentiment140.com
Table 2. Bias results for Bernie Sanders related articles
Article Bias score Bias words Total words Ratio of positive/negative words
Pro Bernie (a) 0.145 94 648 0.93Anti-Bernie (b) 0.168 117 694 0.94Neutral (c) 0.134 232 1733 1.08
Sources (a) http://www.alternet.org/election-2016/6-awesome-things-about-bernie-sanders-you-might-not-know (b) https://mises.org/library/economics-bernie-sanders (c) https://en.wikipedia.org/wiki/Bernie_Sanders
Bias Based Navigation for News Articles and Media 469
6. Agarwal, A., Xie, B., Vovsha, I., Rambow, O., Passonneau, R.: Sentiment analysis ofTwitter data. In: Proceedings of Workshop on Language in Social Media (LSM 2011),Portland, Oregon, pp. 30–38. Association for Computational Linguistics, 23 June 2011
7. Balyaeva, J.: Learning how to detect news bias. Departmental Seminar, University ofLjubjana (2015)
8. Gupta, S.: Finding bias in political news and blog websites. Project report (2009). http://snap.stanford.edu/class/cs224w-2010/proj2009/report_Sonal_Gupta.pdf
9. Chu, A., Shi, K., Wong, C.: Prediction of average and perceived polarity in online journalism.Project report (2014). http://cs229.stanford.edu/proj2014/Albert%20Chu,%20Kensen%20Shi,%20Catherine%20Wong,%20Prediction%20of%20Average%20and%20Perceived%20Polarity%20in%20Online%20Journalism.pdf
10. Recasens, M., Danescu-Niculescu-Mizil, C., Jurafsky, D.: Linguistic models for analyzingand detecting biased language. In: Proceedings of ACL (2013)
11. Rose, S., Engel, D., Cramer, N., Cowley, W.: Automatic keyword extraction from individualdocuments. In: Text Mining: Applications and Theory, pp. 1–20. Wiley, New York (2010)
12. OpenNLP Sentence Detector. http://opennlp.apache.org/documentation/1.6.0/manual/opennlp.html#tools.sentdetect
13. Cristian Danescu-Niculescu-Mizil: Biased Language. http://www.cs.cornell.edu/*cristian/Biased_language.html
14. Esuli, A., Sebastiani, F.: SENTIWORDNET: a publicly available lexical resource foropinion mining. In: Proceedings of 5th International Conference on Language Resources andEvaluation (LREC-2006), Genoa, Italy. European Language Resources Association (ELRA)(2006). http://www.lrec-conf.org/proceedings/lrec2006/pdf/384_pdf.pdf
15. Hu, M., Liu, B.: Mining and summarizing customer reviews. In: Proceedings ofACM SIGKDD International Conference on Knowledge Discovery and Data Mining (KDD2004), Seattle, Washington, USA, 22–25 August 2004
470 A.A. Patankar and J. Bose
Learning to Rank Entity Relatedness ThroughEmbedding-Based Features
Pierpaolo Basile, Annalina Caputo(B), Gaetano Rossiello,and Giovanni Semeraro
Department of Computer Science, University of Bari Aldo Moro, Bari, Italypierpaolo.basile,annalina.caputo,gaetano.rossiello,
Abstract. This paper describes the effect of introducing embedding-based features in a learning to rank approach to entity relatedness. Wedefine several features that exploit word- and link-embedding approachesby relying on both links and the content that appear in Wikipedia arti-cles. These features are combined with other state-of-the-art relatednessmeasures by using a learning to rank framework. In the evaluation, wereport the performance of each feature individually. Moreover, we investi-gate the contribution of each feature to the ranking function by analysingthe output of a feature selection algorithm. The results of this analy-sis prove that features based on word and link embeddings are able toincrease the performance of the learning to rank algorithm.
1 Introduction
Entity relatedness tries to capture the strength of the relationship that tiestogether named entities or concepts. As a measure of semantic relatedness, itplays a key role in many computational tasks that require semantic processingof natural language, like question answering and information retrieval, text reuse,entity suggestion and recommendation, and it is at the core of several naturallanguage processing algorithms for entity linking [2,4,8].
Over the past few years, many relatedness measures have been proposedwhich exploit Wikipedia in order to collect useful information about entities andtheir relationships. Each article in Wikipedia can be regarded as an entity or aconcept of the real world. Then, the textual content of Wikipedia articles, theirhyperlink graph, the hierarchical organization of content through categories alloffer a rich amount of freely available information that has been harnessed toextract and weight entities and their relations.
Most of the methods that exploited Wikipedia for entity relatedness havefocused on one single aspect at time, although every aspect of the Wikipediacontent provides evidence of different kinds of relatedness. And in particulargraph-theoretic methods have showed their capability in measuring relatednessboth for computing semantic similarity [8] and for entity linking [7]. Moreover,the combination of such measures proved to be very effective in a learning to
c© Springer International Publishing Switzerland 2016E. Metais et al. (Eds.): NLDB 2016, LNCS 9612, pp. 471–477, 2016.DOI: 10.1007/978-3-319-41754-7 51

472 P. Basile et al.
rank framework [2]. Learning to rank for entity relatedness models the prob-lem of ranking entities most related to a given target as a learning task [2,9].This problem has some similarities with learning to rank in information retrievalwhere, trained over a set of features describing query-document pairs, the algo-rithm learns to rank documents according to their relevance to a given query. Inthe context of entity relatedness, the query is a target entity and the algorithmlearns to rank entities on the basis of their relatedness to the target [2].
This paper introduces a new set of features based on the embedding of infor-mation about either the graph structure or the content of Wikipedia articlesinto a low-dimensional space. These embeddings are able to grasp the latentrelationships that exist between words or links. For this reason, the resultingspaces contribute more to the learning of the ranking function than traditionalvector spaces which exploit the same information.
2 Methodology
In this paper we investigate the problem of entity relatedness: given two enti-ties ei and ej we want to define a function r(ei, ej) able to predict their degreeof relatedness. We model this problem taking into account several relatednessmeasures and combining them into a learning to rank framework following theapproach proposed in [2]. The idea is that each feature is able to grasp a particu-lar aspect of relatedness and we want to investigate the use of measures based onembeddings. All proposed measures rely on Wikipedia. More specifically, eachpage p of Wikipedia corresponds to an entity, which can be represented by threeaspects: (1) In(p), the set of links that point to p; (2) Out(p), the set of pagespointed by p and 3) the content of p.
We expand the initial set of 27 features in [2] based only on In(p) andOut(p) by introducing three relatedness measures based on word/link embed-dings. These embedding-based features exploit the word2vec [6] tool which imple-ments a revised method of the Neural Network Language Model by using alog-linear approach. We build three separate corpora that take into account theWikipedia page content:
Abstract (a). Each document in this corpus is the abstract of a Wikipediapage extracted from DBpedia. Since abstracts are the first paragraph of aWikipedia page, which usually gives a definition of that concept, the ideabehind this approach is to build a corpus of entities’ definitions.
Entity (e). Each document is the list of entities that occur in the sameWikipedia page. The occurrence of an entity in a Wikipedia page is iden-tified by the manual link that the editor of the page has associated with theentity anchor text. It is important to underline that the list of entities reflectstheir order of occurrence in the page.
Entity&Word (e&w). Each document is the list of both words and entitiesoccurring in each Wikipedia page. Also, in this case the words/entities orderis preserved. The idea behind this corpus is to learn embeddings taking intoaccount both words and entities.

Learning to Rank Entity Relatedness Through Embedding-Based Features 473
For each corpus we build a vector space using word2vec with the skip-grammodel. We build a total of three vector spaces: W2Va, W2Ve, and W2Ve&w. InW2Ve and W2Ve&w spaces we have a vector for each Wikipage page (entity). Wecan compute the relatedness between two entities as the cosine similarity betweentheir corresponding vector representations. In the W2Va space, we adopt a differ-ent strategy to compute the entity vector since this space represents only words.We retrieve the abstract of each entity and build an abstract vector that is thesum of the word vectors occurring in the abstract. Then the relatedness betweentwo entities is computed as the cosine similarity between their correspondingabstract vectors. In order to compare the proposed encoding-based features, wedefine two additional measures that compute the relatedness in a standard vec-tor space of links. These measures are inspired by [1], where the semantics of anentity is represented by its distribution in the high dimensional concept spacederived from Wikipedia. For each type of link (In(p) and Out(p)) we build avector space where each entity is represented through a vector whose dimensionsare the link counts (ingoing and outgoing, respectively). Then, given two entitiesei and ej , we define the following features:
1. vsmin(ei, ej): is defined as the cosine similarity between In(ei) and In(ej).This measure is equivalent to the one proposed in [1];
2. vsmout(ei, ej): is defined as the cosine similarity between Out(ei) and Out(ej).
Table 1 summarizes all the features exploited by our approach, where learningto rank and feature selection are performed using the same approach in [2].
Table 1. List of features exploited by our approach.
id Description
1-27 Features proposed in [2] exploiting some statistical aspects: probability, jointprobability, conditional probability, entropy, Kullback-Leibler (KL) diver-gence, and co-citation
28 Cosine similarity computed in the space built on the corpus of Wikipedia pageabstracts (W2Va)
29 Cosine similarity computed in the space built on the corpus of entities occur-ring in the Wikipedia pages (W2Ve)
30 Cosine similarity between the entity vectors computed in the space builton the corpus of both entities and words occurring in the Wikipedia pages(W2Ve&w)
31 Cosine similarity between In(ei) and In(ej) (vsmin(ei, ej))
32 Cosine similarity between Out(ei) and Out(ej) (vsmout(ei, ej))
3 Evaluation
We evaluate the performance of the proposed features within a learning to rankapproach to the problem of entity relatedness. The goal of the evaluation is

474 P. Basile et al.
twofold: (1) prove the effectiveness of the proposed relatedness measures basedon embeddings; (2) provide a deep feature analysis by relying on the featureselection algorithm described in [2].
We adopt the same dataset proposed by [2], which was extracted from asubset of the CoNNL 2003 entity recognition task [5]. However, since we use adifferent version of Wikipedia, we remove from the dataset all Wikipedia pagesthat are no longer available. After this step the dataset consists of 957,622 pairsof entities for training, 361,984 pairs for validation, and 295,886 for testing. Weset different parameters for each vector space as summarized in Table 2, where wereport the vector dimension (Dim.), the number of vectors in the space and themin-count parameter1. All other word2vec parameters are set to default values.We rely on the Wikipedia dump released on 13th January 2016. The dump wasprocessed using the Java Wikipedia Library (JWPL) of the DKPro project2. Allthe other components are developed in Java and Python by the authors.
Table 2. Settings about word embedding.
Space Dim #vectors Min-count
W2Va 200 227,239 5
W2Ve&w 300 4,856,978 10
W2Ve 200 4,527,966 1
We use the RankLib library3 to perform learning to rank by adopting Lamb-daMART algorithm and setting nDCG at 10 (n@10) as the measure to optimizein the learning step. We use default values for all the other LambdaMART para-meters. We adopt this setting in order to make our approach comparable withthe one proposed by [2].
We first evaluate the performance of the learning to rank algorithm when theproposed features are combined to traditional link-based ones. We performed tworuns: (1) we adopt only the state-of-the-art features introduced in [2] in orderto compute a baseline (we refer to this group of features as SOA) and (2) weexploit all the features proposed in our methodology in addition to SOA (werefer to this second group as ALL). SOA achieves a n@10 value of 0.8050, whileALL obtains a n@10 value of 0.8187, which results in a 1.702% of increment.
The second step of the evaluation is to assess the performance of each singlefeature. Results of this evaluation are reported in Table 3, in decreasing orderof n@10 values. The table shows also the id and a short description for eachfeature, while in boldface are reported the measures introduced in this paper.Among the embedding-based features the most promising is the W2Ve&w, whileW2Va, which is the only feature that exploits the page content, provides quite
1 Words that appear less than min-count are discarded.2 Available on line: https://dkpro.github.io/dkpro-jwpl/.3 Available on-line: https://sourceforge.net/p/lemur/wiki/RankLib/.

Learning to Rank Entity Relatedness Through Embedding-Based Features 475
Table 3. Performance of each featureevaluated in isolation.
Id n@10 Description
21 0.7215 joint probability
14 0.2844 KL divergence between e2 and e1
2 0.4622 probability of e2
29 0.5471 W2Ve
4 0.4622 entropy of e2
26 0.6046 χ2 using out links
30 0.5879 W2Ve&w
24 0.6884 χ2 using in links
28 0.4916 W2Va
25 0.6668 χ2 using both in and out links
16 0.5974 co-citation using both in and out links
17 0.5807 co-citation using out links
19 0.6327 Jaccard index using both in and out links
20 0.6071 Jaccard index using out links
23 0.6564 Avg. friend
27 0.4197 Point-wise mutual information (PMI)
32 0.5938 V SMout
5 0.5333 conditional probability of e1 given e2
12 0.5315 Friend between e2 and e1
18 0.6651 Jaccard index using in links
6 0.7213 conditional probability of e2 given e1
15 0.6419 co-citation using in links
11 0.6450 Friend between e1 and e2
13 0.2343 KL divergence between e1 and e2
31 0.5028 V SMin
10 0.3766 probability that e2 is linked to e1
8 0.4216 exists a link between e2 and e1
7 0.4906 exists a link between e1 and e2
9 0.4906 probability that e1 is linked to e2
22 0.4244 exists a bi-direct. link between e1 and e2
1 0.1120 probability of e1
3 0.1120 entropy of e1
Table 4. Results of theapplication of the featureselection strategy.
Id n@10 %ΔALL %ΔSOA
21 0.6443 -21.30 -20.04
14 0.6657 -18.69 -17.39
2 0.6855 -16.27 -14.93
29 0.7595 -7.23 -5.75
4 0.7672 -6.29 -4.79
26 0.779 -4.85 -3.33
30 0.786 -3.99 -2.46
24 0.7913 -3.35 -1.80
28 0.7927 -3.18 -1.63
25 0.7929 -3.15 -1.60
16 0.8079 -1.32 0.26
17 0.8079 -1.32 0.26
19 0.8107 -0.98 0.61
20 0.81 -1.06 0.52
23 0.8147 -0.49 1.10
27 0.8138 -0.60 0.99
32 0.8158 -0.35 1.24
5 0.8172 -0.18 1.41
12 0.8169 -0.22 1.38
18 0.8155 -0.39 1.20
6 0.816 -0.33 1.27
15 0.8177 -0.12 1.48
11 0.8161 -0.32 1.28
13 0.8159 -0.34 1.25
31 0.8183 -0.05 1.55
10 0.8173 -0.17 1.43
8 0.8173 -0.17 1.43
7 0.8173 -0.17 1.43
9 0.8175 -0.15 1.45
22 0.8175 -0.15 1.45
1 0.8169 -0.22 1.38
3 0.8187 0.00 1.60
poor performance. Finally, in order to better understand the contribution ofeach feature to the learning to rank algorithm, we perform a feature selectionapproach as described in [2]. This algorithm introduces one feature at a time bystarting from the first feature in the rank reported in Table 3. The remainingfeatures are selected according to the greedy algorithm proposed in [3].
Table 4 shows the n@10 values obtained by the learning to rank algorithmapplied to the features filtered with this selection strategy. The last two columnsin the table report the difference in percentage with respect to the model that

476 P. Basile et al.
includes all the features (ALL) and the model based only on the features pro-posed in [2] (SOA). The analysis of the results highlights some important out-comes:
1. The use of only the top eleven features is able to outperform the modelpropose in [2] (the first horizontal line in Table 4 marks this first group offeatures).
2. All the embedding-based features belong to the top eleven features selectedby the algorithm (reported in boldface in Table 4).
3. The most relevant improvement (about 9%) is obtained by introducing thefeature with id 29 based on link (i.e. entity) embeddings.
The W2Ve&w feature (id 30), which combines content (words) with entities,provides an interesting contribution to the performance of the algorithm.
4 Conclusions
This work proposed a new set of features based on word and link embeddings ina learning to rank framework for entity relatedness. We exploited the content ofWikipedia pages to build embeddings able to capture different kinds of related-ness. Measures based on these models have been evaluated in combination withother state-of-the-art features and vector space models built upon the Wikipedialink structure. We observed that all the embedding-based features boosted theperformance of the learning to rank algorithm, and they appeared between thetop ranked ones that were able to give the overall better performance.
Acknowledgments. This work is supported by the IBM Faculty Award “Deep Learn-ing to boost Cognitive Question Answering” and the project “Multilingual Entity Lik-ing” funded by the Apulia Region under the program FutureInResearch. The Titan XGPU used for this research was donated by the NVIDIA Corporation.
References
1. Aggarwal, N., Buitelaar, P.: Wikipedia-based distributional semantics for entityrelatedness. In: 2014 AAAI Fall Symposium Series (2014)
2. Ceccarelli, D., Lucchese, C., Orlando, S., Perego, R., Trani, S.: Learning relatednessmeasures for entity linking. In: CIKM, pp. 139–148 (2013)
3. Geng, X., Liu, T.Y., Qin, T., Li, H.: Feature selection for ranking. In: SIGIR, pp.407–414 (2007)
4. Hoffart, J., Seufert, S., Nguyen, D.B., Theobald, M., Weikum, G.: Kore: keyphraseoverlap relatedness for entity disambiguation. In: CIKM, pp. 545–554 (2012)
5. Hoffart, J., Yosef, M.A., Bordino, I., Furstenau, H., Pinkal, M., Spaniol, M., Taneva,B., Thater, S., Weikum, G.: Robust disambiguation of named entities in text. In:EMNLP, pp. 782–792 (2011)
6. Mikolov, T., Chen, K., Corrado, G., Dean, J.: Efficient estimation of word represen-tations in vector space (2013). arXiv:1301.3781

Learning to Rank Entity Relatedness Through Embedding-Based Features 477
7. Milne, D., Witten, I.H.: Learning to link with Wikipedia. In: CIKM, pp. 509–518(2008)
8. Witten, I., Milne, D.: An effective, low-cost measure of semantic relatedness obtainedfrom Wikipedia links. In: WIKIAI, pp. 25–30 (2008)
9. Zheng, Z., Li, F., Huang, M., Zhu, X.: Learning to link entities with knowledgebase. In: Human Language Technologies: The 2010 Annual Conference of the NorthAmerican Chapter of the Association for Computational Linguistics (2010)

Arabic Quranic Search ToolBased on Ontology
Mohammad Alqahtani(&) and Eric Atwell
School of Computing, University of Leeds, Leeds, UKscmmal,[email protected]
Abstract. This paper reviews and classifies most of the common types ofsearch techniques that have been applied on the Holy Quran. Then, it addressesthe limitations of these methods. Additionally, this paper surveys most existingQuranic ontologies and what are their deficiencies. Finally, it explains a newsearch tool called: a semantic search tool for Al-Quran based on Qur’anicontologies. This tool will overcome all limitations in the existing Quranic searchapplications.
Keywords: Holy Quran Information Retrieval (IR) Natural LanguageProcessing (NLP) Ontology Semantic search
1 Introduction
The Holy Quran (Al Quran) is sacred Arabic text [1]. Al Quran contains about 79,000words forming 114 chapters [1]. The techniques used to retrieve information from AlQuran can be classified into two types: a semantic-based and a keyword-based tech-nique. The semantic-based technique is a concept-based search tool that retrievesresults based on word meaning, or concept match, whereas the keyword-based tech-nique returns results based on letters matching word(s) queries [2]. The majority ofQuranic search tools employ the keyword search technique.
The existing Quranic semantic search techniques are: an ontology-based [3], asynonyms-set [4] and a cross-language information retrieval (CLIR) technique [5]. Theontology-based approach searches for the concept(s) matching a user words query.Then, this technique returns verses related to these concept(s). The synonyms-settechnique produces all synonyms of the query words using WordNet. After that, it findsall Quranic verses matching these words’ synonyms. CLIR translates words of an inputquery to another language and then retrieves verses that contain words matching thetranslated words.
Several deficiencies exist with the Quranic verses (Ayat) retrieved for a query usingthe existing keyword search techniques. These problems are: irrelevant verses areretrieved, relevant verses are not retrieved or the order of retrieved verses is not ranked[4]. The keyword-based technique’s limitations include misunderstanding the exactmeaning of input words forming a query and neglecting some theories of informationretrieval [6].
© Springer International Publishing Switzerland 2016E. Métais et al. (Eds.): NLDB 2016, LNCS 9612, pp. 478–485, 2016.DOI: 10.1007/978-3-319-41754-7_52

Moreover, current Quranic semantic search techniques have some limitations aboutfinding requested information. This is because these semantic searches use uncom-pleted Holy Quran ontology. Additionally, these concepts have different scopes andformats [7].
This paper is organized as follows. Section 2 is Literature review containing areview of the structure of the Holy Quran, Quranic search applications, previousresearch on Quranic search tools and existing ontologies of Al Quran. Section 3describes the methodology of Arabic Quranic Search Tool Based on Ontology. Finally,Sect. 4 concludes the critical points in this paper.
2 Literature Review
2.1 Structure of the Holy Quran
Challenging points regarding the natural structure of the Holy Quran exist whenapplying NLP technologies. First, a concept could be mentioned in different verses. Forexample, the concept of the Hell ( راــنلا ) is discussed in various chapters and verses.Additionally, one verse may contain many themes. For example, verse 40 of Chapter78 contains only seven words describing five different concepts such as Allah, Humans,chastisement, person and, the Judgment day [6]. Another unique style of the Quran isthat one concept is mentioned using different words, depending on the context. Forexample, Muhammad ( دمحم ) is the same as Ahmad ( دمحأ ), and Mozzammil ( لمزم ).Additionally, a term may also refer to entirely different things, depending on thecontext: for example, L-jannat might refer to a heaven or a garden. Additionally,two different words may have the same letters but have different diacritics. Forexample, ‘ ةنجلا ’ represents two distinct words: means paradise, and meansghosts (see Table 1).
Finally, the text of the Holy Quran is written in the classical Arabic language,which is slightly different from the modern Arabic language. This will cause a gapbetween the query and retrieved verses.
Table 1. Search results of ةنجلا based on concepts
Arabic pronunciation English meaning Arabic word No. of verses
L-jannat Paradise ةنجلا 109aṣḥābu L-jannat Companions of paradise ةنجلاباحصا 14L-jannat Garden ةنجلا 14Jinnat Ghost 10Junnat cover 2
Arabic Quranic Search Tool Based on Ontology 479

2.2 Quranic Search Applications
Desktop and Web applications have been developed to retrieve knowledge from AlQuran. The majority of these applications use keyword search techniques. However,some researchers have proposed frameworks for a Quranic semantic search tool basedon concepts.
Khazain-ul-Hidayat [8], and Zakr [9] are free desktop applications that enable userto read, listen to and search the Quran in many different languages. These applicationsare mainly designed to be aid tools for teaching the Quran. A user can search Al Quranby querying a word or by entering a verse number. When the user queries a word, theresults will include all verses containing any forms of this query word based on thestem of query words. For example, if the query word is ‘ ركذ ’, then the retrieved verseswill contain other forms of ‘ ركذ ’, such as ‘ نوركاذلا’,‘ةركذت’,‘ركذا’,‘ةركذت ’, and ‘ ىركذ ’.
Almonagib alqurany ( ينارقلابقنملا ) [10], Islam web [11], Tanzil [12], QuranicArabic Corpus (QAC) [13], KSU Quran [15], The Quran [16] and the Noble Quran[14] are online Web applications that enable users to read, listen to and search Al Quranin different languages. Users can select a specific chapter, verse or word. In the case ofsearching by a word, these applications will return all verses that have words belongingto the same root of the query word.
Semantic Quran [17] is an online search tool application that allows a user to searchverses based on concepts. In this application, each verse has a set of tags that areconcepts. Additionally, not all verses are completely tagged. Therefore, the user canparticipate in tagging any verse. The idea behind this application is that many verses inthe Holy Quran relate to certain concepts even though these verses do not have anycommon words.
2.3 Conducted Research on Quranic Search Tools
A lot of computational research has been carried out on Al Quran. The followingreview is about the IR and semantic search research.
[18] proposed a new Arabic question-answering system in the domain of Al Quran.The system prompts users to enter an Arabic question about Al Quran. Then, thissystem retrieves relevant Quranic verses with their Arabic descriptions from IbnKathir’s book. This system uses 1,217 Quranic concepts integrated from the QuranicArabic Corpus Ontology [13] and Quranic Topic Ontology [19]. It is claimed thatretrieved results’ accuracy can reach 65 % using the top result. This system has threephases for answering a question: question analysis using the ‘Morphological Analysisand Disambiguation of Arabic’ tool (MADA) [20], IR using ‘explicit analysisapproach’ [21] and answer extraction. This proposed system does not recommend asolution for if the question terms do not match any concepts from the QuranicOntology.
[22] suggested a Quranic semantic search tool by developing a simple domain ofontology for the animals mentioned in Al Quran. This paper concludes that the existingArabic WordNet is not sufficient for finding synonyms for query words to increase
480 M. Alqahtani and E. Atwell

one’s chances of retrieving information from a document, and based on this, it issuggested to develop Arabic WordNet for the Al Quran words.
[23] proposed a semantic search system for retrieving Quranic verses based on theenhanced ontology done by [13].
[24] recommended a semantic search for Al Quran based on CLIR. This researchcreated a bilingual ontology: the English and Malay languages. This ontology is basedon the ontology developed by [13]. They did this to experiment on this ontology fortwo translations of Al Quran. In the Malay translation, 5,999 verses are assigned to theconcepts, and 237 verses do not relate to any concepts. In the English translation, theyfound 5,695 verses related to concepts in this ontology. On the other hand, 541 doc-uments are not allocated to any concepts.
[25] has developed a tool called “Qurany” for searching the Quranic text in bothArabic and English. In this project, 6,236 HTML pages were created in which eachHTML page contains one verse, its eight different English translations and the topic ofthis verse in both Arabic and English. The project’s main idea is searching Al Quran’seight translations using the keyword search. This will enhance this tool’s precision.Regarding [25], most of the available search tools on the Web use one Englishtranslation in the search process, with average recall and precision values of 54 % and48 %, respectively.
In conclusion, all of the above research on Quranic semantic search are proposedframeworks for developing a semantic tool to search Al Quran. Moreover, no onlinetools for Quranic semantic search are currently up-to-date.
2.4 Research on Ontology of the Holy Quran
[26] developed a Semantic Quran dataset in an RDF format representing 42 different AlQuran translations. This dataset was built by merging data from two differentsemi-structured sources: the Tanzil project and the Quranic Arabic Corpus. Thisontology has 7,718 links to DBpedia, 18,655 links to Wiktionary and 15,741,399triples.
[22] developed an ontology for Al Quran in the scope of the animals found in AlQuran. The ontology provides 167 links to animals in Al Quran based on informationfound in “the Hewanat Al-Quran” book ( نارقلاتاناويح ).
[27] rebuilt the existing ontology created by [15] using the Protégée tool andManchester OWL. He increased the number of relationships from 350 to about 650based on Al Quran, the Hadith and some online Islamic resource.
[25] has developed a tree of nearly 1,100 nodes representing Quranic abstractconcepts. These concepts are linked to all verses of Al Quran. She used existingQuranic topics from the Islamic scholarly book called “Mushaf Al Tajweed” ( فحصم
ديوجتلا ). These concepts in the index have an aggregation relationship; the hierarchy ofconcepts is non-reflexive, non-symmetric and transitive.
[13] extracted 300 concepts and 350 relations from Al Quran using predicate logic.The relationship types connecting concepts are Part-of and IS-A. The ontology is basedon a famous Al Quran discerption book called “Tafsir Ibn Kathir” ( ريسفت نبا ريثك ) [28].
Arabic Quranic Search Tool Based on Ontology 481
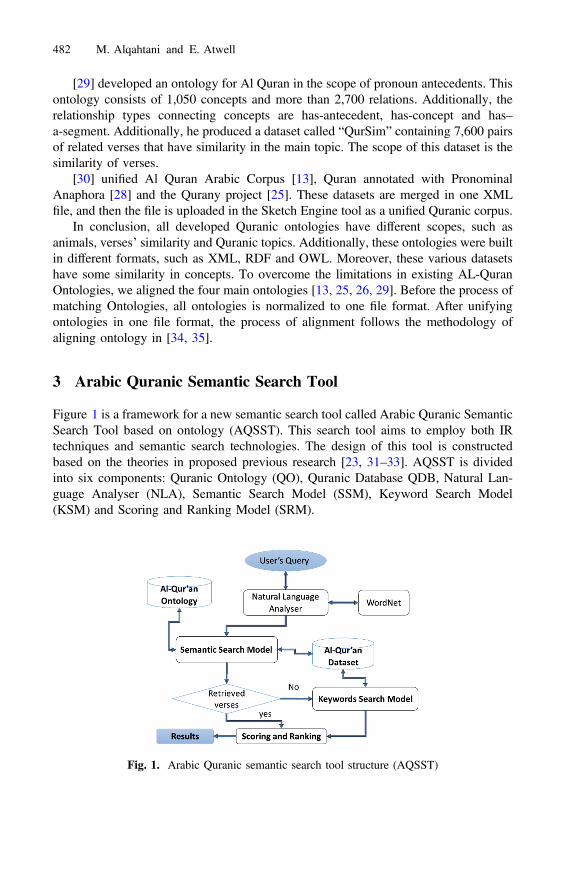
[29] developed an ontology for Al Quran in the scope of pronoun antecedents. Thisontology consists of 1,050 concepts and more than 2,700 relations. Additionally, therelationship types connecting concepts are has-antecedent, has-concept and has–a-segment. Additionally, he produced a dataset called “QurSim” containing 7,600 pairsof related verses that have similarity in the main topic. The scope of this dataset is thesimilarity of verses.
[30] unified Al Quran Arabic Corpus [13], Quran annotated with PronominalAnaphora [28] and the Qurany project [25]. These datasets are merged in one XMLfile, and then the file is uploaded in the Sketch Engine tool as a unified Quranic corpus.
In conclusion, all developed Quranic ontologies have different scopes, such asanimals, verses’ similarity and Quranic topics. Additionally, these ontologies were builtin different formats, such as XML, RDF and OWL. Moreover, these various datasetshave some similarity in concepts. To overcome the limitations in existing AL-QuranOntologies, we aligned the four main ontologies [13, 25, 26, 29]. Before the process ofmatching Ontologies, all ontologies is normalized to one file format. After unifyingontologies in one file format, the process of alignment follows the methodology ofaligning ontology in [34, 35].
3 Arabic Quranic Semantic Search Tool
Figure 1 is a framework for a new semantic search tool called Arabic Quranic SemanticSearch Tool based on ontology (AQSST). This search tool aims to employ both IRtechniques and semantic search technologies. The design of this tool is constructedbased on the theories in proposed previous research [23, 31–33]. AQSST is dividedinto six components: Quranic Ontology (QO), Quranic Database QDB, Natural Lan-guage Analyser (NLA), Semantic Search Model (SSM), Keyword Search Model(KSM) and Scoring and Ranking Model (SRM).
Fig. 1. Arabic Quranic semantic search tool structure (AQSST)
482 M. Alqahtani and E. Atwell
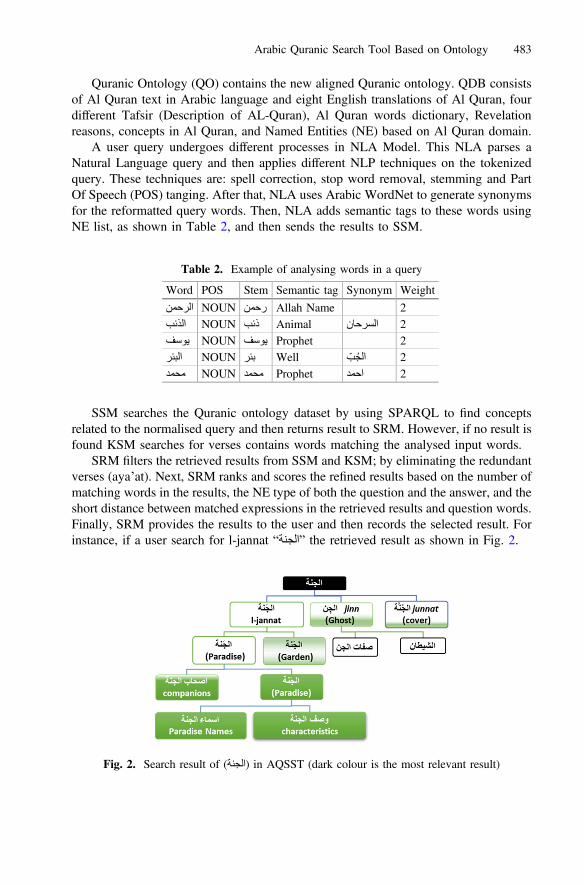
Quranic Ontology (QO) contains the new aligned Quranic ontology. QDB consistsof Al Quran text in Arabic language and eight English translations of Al Quran, fourdifferent Tafsir (Description of AL-Quran), Al Quran words dictionary, Revelationreasons, concepts in Al Quran, and Named Entities (NE) based on Al Quran domain.
A user query undergoes different processes in NLA Model. This NLA parses aNatural Language query and then applies different NLP techniques on the tokenizedquery. These techniques are: spell correction, stop word removal, stemming and PartOf Speech (POS) tanging. After that, NLA uses Arabic WordNet to generate synonymsfor the reformatted query words. Then, NLA adds semantic tags to these words usingNE list, as shown in Table 2, and then sends the results to SSM.
SSM searches the Quranic ontology dataset by using SPARQL to find conceptsrelated to the normalised query and then returns result to SRM. However, if no result isfound KSM searches for verses contains words matching the analysed input words.
SRM filters the retrieved results from SSM and KSM; by eliminating the redundantverses (aya’at). Next, SRM ranks and scores the refined results based on the number ofmatching words in the results, the NE type of both the question and the answer, and theshort distance between matched expressions in the retrieved results and question words.Finally, SRM provides the results to the user and then records the selected result. Forinstance, if a user search for l-jannat “ ةنجلا ” the retrieved result as shown in Fig. 2.
Table 2. Example of analysing words in a query
Word POS Stem Semantic tag Synonym Weight
نمحرلا NOUN نمحر Allah Name 2بئذلا NOUN بئذ Animal ناحرسلا 2فسوي NOUN فسوي Prophet 2
رئبلا NOUN رئب Well بجلا 2دمحم NOUN دمحم Prophet دمحا 2
Fig. 2. Search result of ( ةنجلا ) in AQSST (dark colour is the most relevant result)
Arabic Quranic Search Tool Based on Ontology 483
4 Conclusion
This paper summarises the search techniques used in existing search tools for ALQuran. Additionally, this paper studied the previous research have been conducted onAl Quran search methods and Al Ontologies. Depending on this study, many chal-lenges have been found.
Firstly, Limitations of existing Al Quran search tools for retrieving all requestedinformation. These search tools do not prompt users to search by concepts, phrases,sentences, questions or topics. Most search tools do not analyse the query texts byapplying NLP techniques, such as parsing and spell check.
Secondly, absence of accurate and comprehensive resources for Islamic ontology.Existing Quranic datasets have different scopes and formats; and not follow ontologystandards. Additionally, some Quranic ontologies are not available for usage.
The NER of the Arabic language is mostly focused on the modern Arabic language.Additionally, no well-formatted NER lists exist that are specialised for Quranic text,such as prophets’ names, Allah’s names, animals, times, religion, and etc. The Arabiclanguage is an inflected language with complicated orthography.
Finally, all these limitations are highly considered in the design of the ArabicSemantic Quranic search tools.
References
1. Atwell, E., Brierley, C., Dukes, K., Sawalha, M., Sharaf, A.-B.: An artificial intelligenceapproach to Arabic and Islamic content on the internet. In: Proceedings of NITS 3rdNational Information Technology Symposium (2011)
2. Sudeepthi, G., Anuradha, G., Babu, M.S.P.: A survey on semantic web search engine. Int.J. Comput. Sci. 9(2), (2012)
3. Yauri, A.R., Kadir, R.A., Azman, A., Murad, M.A.A.: Quranic verse extraction base onconcepts using OWL-DL ontology. Res. J. Appl. Sci. Eng. Technol. 6(23), 4492–4498(2013)
4. Shoaib, M., Yasin, M.N., Hikmat, U.K., Saeed, M.I., Khiyal, M.S.H.: Relational WordNetmodel for semantic search in Holy Quran. In: International Conference on EmergingTechnologies, ICET 2009, pp. 29–34 (2009)
5. Yunus, M.A., Zainuddin, R., Abdullah, N.: Semantic query for Quran documents results. In:2010 IEEE Conference on Open Systems (ICOS), pp. 1–5 (2010)
6. Raza, S.A., Rehan, M., Farooq, A., Ahsan, S.M., Khan, M.S.: An essential framework forconcept based evolutionary Quranic search engine (CEQSE). Science International 26.1(2014)
7. Alrehaili, S.M., Atwell, E.: Computational ontologies for semantic tagging of the Quran: asurvey of past approaches. In: Proceedings of LREC (2014)
8. Khazain-ul-Hidayat. http://www.khazainulhidayat.com/9. Zakr. http://zekr.org/10. Almonagib alqurany. http://www.holyquran.net/search/sindex.php11. Islam Web. http://quran.al-islam.com/12. Zarrabi-Zadeh, H.: Tanzil (2007). http://tanzil.net/13. Dukes, K.: Statistical Parsing by Machine Learning from a Classical Arabic Treebank.
School of Computing, University of Leeds (2013)
484 M. Alqahtani and E. Atwell

14. Noble Quran. http://quran.com/15. KSU Quran. http://quran.ksu.edu.sa/16. The Quran. http://al-quran.info/17. Semantic Quran. http://semquran.com/18. Abdelnasser, H., Mohamed, R., Ragab, M., Mohamed, A., Farouk, B., El-Makky, N., Torki,
M.: Al-Bayan: an Arabic question answering system for the Holy Quran. In: ANLP 2014,p. 57 (2014)
19. Abbas, N.H.: Quran ‘search for a concept’ tool and website. Diss. University of Leeds(School of Computing) (2009)
20. Habash, N., Rambow, O., Roth, R.: MADA+ TOKAN: a toolkit for Arabic tokenization,diacritization, morphological disambiguation, POS tagging, stemming and lemmatization.In: Proceedings of the 2nd International Conference on Arabic Language Resources andTools (MEDAR), Cairo, Egypt, pp. 102–109 (2009)
21. Gabrilovich, E., Markovitch, S.: Computing semantic relatedness using Wikipedia-basedexplicit semantic analysis. IJCAI 7, 1606–1611 (2007)
22. Khan, H.U., Saqlain, S.M., Shoaib, M., Sher, M.: Ontology based semantic search in HolyQuran. Int. J. Future Comput. Commun. 2(6), 570–575 (2013)
23. Yauri, A.R.: Automated Semantic Query Formulation for Quranic Verse Retrieval. PutraMalaysia, Malaysia (2014)
24. Yahya, Z., Abdullah, M.T., Azman, A., Kadir, R.A.: Query translation using conceptssimilarity based on Quran ontology for cross-language information retrieval. J. Comput. Sci.9(7), 889–897 (2013)
25. Abbas, N.: Quran ‘search for a concept’ tool and website. Unpublished dissertation,University of Leeds (2009)
26. Sherif, M.A., Ngonga Ngomo A.-C.: Semantic Quran a multilingual resource fornatural-language processing. Semant. Web J. 6, 339–345 (2009)
27. Yauri, A.R., Kadir, R.A., Azman, A., Murad, M.A.A.: Ontology semantic approach toextraction of knowledge from Holy Quran. In: 2013 5th International Conference onComputer Science and Information Technology (CSIT), pp. 19–23 (2013)
28. Abdul-Rahman, M.S.: Tafsir Ibn Kathir Juz’ 1 (Part 1): Al-Fatihah 1 to Al-Baqarah 141, 2ndedn. MSA Publication Limited, London (2009)
29. Sharaf, A.-B.M., Atwell, E.: QurAna: corpus of the Quran annotated with pronominalAnaphora. In: LREC, pp. 130–137 (2012)
30. Aldhubayi, L.: Unified Quranic Annotations and Ontologies. University of Leeds, Leeds,UK (2012)
31. Mony, M., Rao, J.M., Potey, M.M.: Semantic search based on ontology alignment forinformation retrieval. Int. J. Comput. Appl. 107(10), (2014)
32. Al-Yahya, M., Al-Khalifa, H., Bahanshal, A., Al-Odah, I., Al-Helwah, N.: An ontologicalmodel for representing semantic lexicons: an application on time nouns in the holy Quran.Arab. J. Sci. Eng. 35(2), 21 (2010)
33. Ou, S., Pekar, V., Orasan, C., Spurk, C., Negri, M.: Development and alignment of adomain-specific ontology for question answering. In: LREC (2008)
34. Doan, A., Madhavan, J., Dhamankar, R., Domingos, P., Halevy, A.: [GLUE] learning tomatch ontologies on the semantic web. VLDB J. Int. J. Very Large Data Bases 12(4), 303–319 (2003)
35. Taye, M., Alalwan, N.: Ontology alignment technique for improving semantic integration.In: Proceedings in the Fourth International Conference on Advances in Semantic Processing,Florence, Italy, pp. 13–18 (2010)
Arabic Quranic Search Tool Based on Ontology 485
Author Index
Abdel Monem, Azza 409AbuRa’ed, Ahmed 335Acharya, Sudipta 366Aeiad, Eiman 292Aider, Aldjia 459Alexandrov, Mikhail 115Almeida, Aitor 285Aloulou, Chafik 239Alqahtani, Mohammad 478Alshahrani, S. 343Amami, Maha 200Apte, Manoj 301Arcan, Mihael 60Asooja, Kartik 384Atwell, Eric 478
Barker-Hewitt, Matthew 359Basile, Pierpaolo 471Bäumer, Frederik Simon 37Bayomi, Mostafa 187Belguith, Lamia Hadrich 239, 326, 392, 447Belkredim, Fatma-Zohra 459Beresneva, Daria 421Bordea, Georgeta 384Bose, Joy 465Bousmaha, Kheira Zineb 447Buey, María G. 140Buitelaar, Paul 60, 384Burgos, Diego A. 376
Cabrera-Diego, Luis Adrián 91Cabrio, Elena 74Camilleri, John J. 403Caputo, Annalina 471Casado-Rubio, José-Luis 140Chanda, Parnab Kumar 175Chatterji, Sanjay 175Crofts, Gillian 3
Danilova, Vera 115de Paiva Oliveira, Alcione 415Dehghan, Azad 359Dekker, Rommert 48Dias, Gaël 15, 366
Dragoni, Mauro 60, 433Durette, Barthélémy 91
Ekbal, Asif 366Ellouze, Samira 392
Faiz, Rim 127, 200Ferrés, Daniel 335Filho, Jugurta Lisboa 415Firoozeh, Nazanin 249Frasincar, Flavius 48
Gandon, Fabien 74Garrido, Angel L. 140Geierhos, Michaela 37Ghorab, M. Rami 187Gregson, Cassie 162Gruetze, Toni 213Gruzitis, Normunds 403
Hernandez, Robert 162Huet, Stéphane 440
Jagwani, Bhavi Bhagwan 175Jaoua, Maher 326, 392Jayasena, S. 15Jha, Kishlay 310Jin, Wei 310Joubert, Alain 258
Kapetanios, E. 343Kedad, Zoubida 102Kern, Roman 230, 433Khalfallah, Faten 239Klampfl, Stefan 230Kohl, Thomas 230Kouninef, Belkacem 447Krestel, Ralf 213Kröll, Mark 230, 427, 433
Lafourcade, Mathieu 258Lavin, Peter 187Lawless, Séamus 187
Le Brun, Nathalie 258Levacher, Killian 187Linhares, Andréa Carneiro 440Liptrot, Tom 359Lopes, Stéphane 102Lopez, Cédric 74López-de-Ipiña, Diego 285
Mahdabi, Parvaz 267Mamache, Fatiha 459Manrique-Losada, Bell 376Marchenko, Oleksandr 222Marimon, Montserrat 335Marrara, Stefania 350McDaniel, Melinda 24Megala, U. 15Meziane, Farid 3, 292Milosevic, Nikola 162Mittal, Vibhor 175Mokanarangan, T. 15Moreda, Paloma 276Moreira, Alexandra 415Moreno, Isabel 276Moreno, Jose G. 366Msadak, Handi 239Muñoz, Gema 140
Nabhan, Ahmed Ragab 152Naumann, Felix 213Nenadic, Goran 162, 359Nilusija, N. 15Nooralahzadeh, Farhad 74Nugier, Sylvaine 102
O’Connor, Alexander 187Othman, Nouha 127Ouksili, Hanane 102
Pak, Irina 453Palshikar, Girish K. 301Pasi, Gabriella 200, 350Patankar, Anish Anil 465Pawar, Sachin 301Piao, Scott 453
Pimas, Oliver 230Pontes, Elvys Linhares 440Popescu-Belis, Andrei 267Popova, Svetlana 115Pranavan, T. 15
Rahmouni, Mustapha Kamel 447Ramrakhiyani, Nitin 301Ranathunga, S. 15Rayson, Paul 453Rexha, Andi 433Romá-Ferri, M.T. 276Ronzano, Francesco 318Rossiello, Gaetano 471
Safi, Houssem 326Saggion, Horacio 318, 335Saha, Sriparna 366Santhanam, Prabhakaran 366Schneider, Gerardo 403Schouten, Kim 48Segond, Frédérique 74Semeraro, Giovanni 471Shaalan, Khaled 152, 409Shabunina, Ekaterina 350Siddiqui, Sanjeera 409Sixto, Juan 285Steinbauer, Florian 427Stella, Fabio 200Storey, Veda C. 24Sugumaran, Vijayan 24
Teh, Phoey Lee 453Tibble, Daniel 359Torres-Moreno, Juan-Manuel 91, 440
Varshney, Nitish 175
Yeng, Seow Mei 453
Zapata-Jaramillo, Carlos M. 376Zulkarnain, Nur Zareen 3
488 Author Index