baselines for natural language processing tasks based on
TRANSCRIPT
Appl. Comput. Math., V.11, N.2, 2012, pp.180-199
BASELINES FOR NATURAL LANGUAGE PROCESSING TASKSBASED ON SOFT CARDINALITY SPECTRA
SERGIO JIMENEZ1, ALEXANDER GELBUKH2
Abstract. Soft-cardinality spectra (SC spectra) is a new method of approximation for textstrings in linear time, which divides text strings into character q-grams of different sizes. Themethod allows simultaneous use of weighting at term and q-gram levels. SC spectra in combina-tion with resemblance coefficients allows the construction of a family of text similarity functionsthat only use the surface information of the texts and weights obtained in the same text collec-tion. These similarity measures can be used in various tasks of natural language processing asbaseline for other methods that exploit the hidden syntactic and/or semantic structure usingresources based on knowledge, inference of large corpora. The proposed method was evaluatedon 22 data sets to address the tasks of information retrieval, entity matching, paraphrase andtextual entailment recognition. The results raised the bar near to the best published results inthe used data sets. We claim that any method that uses any resource or information external toa particular data set should outperform our method. We found that our method is an effectiveand challenging baseline for the evaluated tasks.
Keywords: text similarity, soft cardinality, SC spectra, q-grams, NLP baselines, entity resolu-tion, information retrieval, paraphrase recognition, textual entailment recognition
AMS Subject Classification: 68T50, 68P20
1. Introduction
The assessment of similarity is the ability to balance commonalities and differences betweentwo objects to produce a similarity judgment. People and most animals have this intrinsic capac-ity, which makes this an important requirement for artificial intelligence systems. Although, thecomputational exact comparison of any two object representations is trivial, approximate com-parison has to deal with issues such as noise, nuance and ambiguity. Therefore, the agreementof computer-generated and human similarity judgments is a challenge for artificial intelligencesystems.
In natural language processing, text similarity functions are basic components in many par-ticular tasks [26] namely, textual entailment, question answering, summarization, paraphrasing,semantic text similarity assessment, entity resolution, information retrieval, text classification,text clustering, etc. For instance, the entity resolution task consists of finding co-referentialnames in a couple of lists of names, dealing with misspellings, homonyms, initialisms, aliases,typos, and other issues. A text similarity function can be used to obtain a ranking of the mostsimilar pairs as candidates to be the same entity. The results above a threshold are evaluatedagainst a gold standard built with human judgments.
Similarly, many information retrieval approaches aim to reproduce the human relevance judg-ments building similarity functions that compare queries and documents using similarity scoresas evidence of relevance. In paraphrase and textual entailment recognition, text similarity
1Universidad Nacional de Colombia, Ciudad Universitaria, ed. 453, of. 220, Bogota, Colombia,e-mail: [email protected].
2Centro de Investigacion en Computacion (CIC), Instituto Politecnico Nacional (IPN), Av. Juan Dios Batizs/n, casi esq. Av. Mendizabal, Col. Nueva Industrial Vallejo, CP 07738, DF, Mexico,e-mail: [email protected] received 07/06/2012.
180
S. JIMENEZ, A. GELBUKH: BASELINES FOR NLP TASKS ... 181
functions have been used to compare pairs of texts to determine whether a particular pair issemantically similar enough to be a valid paraphrase or entailment pair. In this paper, we ex-plore the usefulness of a new text similarity function in the following tasks: entity resolution (orname matching), information retrieval, paraphrase and textual entailment recognition.
The current text comparison methods can be classified by the level of granularity in which thetexts are divided for comparison. For example, characters are used as comparison unit in thefamily of methods derived from the edit distance [28]. The granularity gradually decreases inthe methods based on q-grams of characters [25]. Q-grams, also known as kmers or n-grams, areconsecutive substrings of length q that overlap q − 1 characters. Even coarser, methods such asthe vector space model (VSM) [38] and the resemblance coefficients applied to text [39] make useof the terms (i.e., words or symbols) as subdivision unit. The methods that have achieved thebest performance on the task of entity resolution are those that combine term-level comparisonswith comparisons of character or q-gram level. Some examples of these hybrid approaches arethe Monge-Elkan measure [32], SoftTFIDF [8], fuzzy match similarity [5], meta-Levenshtein [33]and the soft cardinality (SC) [22]. The method proposed in this paper combines informationfrom several text subdivisions ranging from characters, q-grams to terms levels in a new approachbased on the idea of soft cardinality.
Text similarity functions can also be classified by the information used to calculate theirsimilarity scores. The simplest approach is to use static similarity functions, which only usethe information contained in the surface of the pair of texts that are being compared, e.g.edit distance(A,B) [28]. The adaptive similarity functions are the next category, because inaddition to the information used by the static ones they use the entire collection of text beingcompared. For instance, the function cosine tf idf(A,B,collection) [38] requires the entire textcollection (as third parameter) to obtain the tf-idf weights of the terms in texts A and B. Ingeneral, adaptive similarity functions recombine information of the text collection to producethe similarity score for any pair of texts. The third category is the semantic similarity functions,which make use of any additional resources based on large corpora, knowledge or combinationsof them, e.g. POS-taggers, parsers, dictionaries, thesaurus, semantic networks (e.g. WordNet,ontologies), structured corpus (e.g. Wikipedia), annotated corpus (e.g. BNC1, NY Times cor-pus), unlabeled corpus, parallel corpus (e.g. English-French Canadian Parliament hansards), theWeb, etc. For instance, the weighted bilingual dictionary proposed in [40] can be used to lever-age a similarity function that compares texts in two different languages with statistics gatheredin large corpora. Other approaches that reveal from scratch the latent semantic structure of atext collection (e.g. LSA [16]) are a specialization of the adaptive similarity functions. However,these approaches are not being considered in this paper.
Given the amount of information and knowledge used by each one of the previous categoriesit is expected that each stage could be used as a baseline for the next. For example, if a staticfunction outperforms an adaptive function in a particular task, it makes no sense to use thelatter. Similarly, the semantic similarity functions should outperform static and adaptive onesto justify the use of their resources, which are generally complex in time and storage space. Themethod proposed in this paper can be whether static or adaptive depending on the used weightingscheme. We used a static version for the entity resolution (ER) and information retrieval (IR)tasks, and we compared its results against other adaptive approaches. The proposed staticapproach reached performances close to that of the adaptive approaches, and in some casesbetter results. For paraphrase and textual entailment recognition we used an adaptive versionand its results were compared against other semantic methods. In this scenario, our methodachieved performances close to the best results already published, and in some cases better thanmany semantic approaches.
The proposed method is based on the soft cardinality [22]. The soft cardinality is a set-based method for comparing objects that softens the rigid count of elements that makes the
1British National Corpus
182 APPL. COMPUT. MATH., V.11, N.2, 2012
classical set cardinality by considering the similarities among elements. The definition of the softcardinality requires the calculation of 2m intersections for a set with m elements. An approach toapproximate the soft cardinality using only m2 computations of an auxiliary similarity measurethat compares pairs of elements is proposed in [22]. The soft cardinality can be used to comparetexts considering texts as sets of terms.
In this paper, we propose a new method for approximating the soft cardinality that, unlikethe current approach, does not require any auxiliary similarity measure. Furthermore, the newmethod allows the simultaneous comparison of unigrams (i.e., characters), bigrams or trigramsby combining any range of them. We call these combinations soft-cardinality spectra (or SCspectra for shorter). SC spectra can be computed in linear time allowing the use of soft cardi-nality with relatively large texts that are used in applications such as information retrieval.
We tested SC-spectra with 11 entity resolution data sets [8], 9 classical information retrievalcollections [2], the MSR paraphrase corpus [15] and the RTE-3 textual entailment data set [18].The proposed approach overcame all baselines and provided quite good results compared toother baselines and methods.
The remainder of this paper is organized as follows: Section 2 describes the cosine TF-IDFand softTFIDF measures. Section 3 briefly summarizes the soft cardinality method for textcomparison. The proposed soft-cardinality spectra (SC spectra) method is presented in Section4. Section 5 describes how to build similarity functions using the proposed cardinality. InSection 6, the proposed method is experimentally evaluated and a brief discussion is providedfor each tested task. Related work is presented in Section 7. Finally, conclusions are drawn inSection 8.
2. Cosine TF-IDF and softTFIDF
The cosine TF-IDF measure [38] was proposed almost three decades ago and today is stillconsidered an effective method for text comparison. For using this measure a pair of texts A andB are represented as vectors in a space indexed by the vocabulary of A∩B. The values on eachdimension of the vectors are the weights that determine the relative importance of the terms.These weights are obtained by combining evidence from the text (i.e. tf term frequency) andfrom the entire collection (i.e. idf inverse document frequency). Tf-idf weights are calculatedusing the following expressions:
idf (ai) = log(
M
mai
)(2.1)
tfidf(D, ai) = tf(D, ai)× idf(ai), (2.2)
where M is the number of texts in the data set, mai is the number of texts where the termai occurs and tf(D, ai) is the count of the term ai in the document D. The similarity scorebetween two texts is obtained by the cosine of the angle between both vectors:
TFIDF (A,B) =∑
t∈A∩B
(tfidf (A, t)
K(A)× tfidf (B, t)
K(B)
), (2.3)
where K(A) is a normalization factor K(A) =√∑
t′∈A tfidf (A, t′)2. This notation allows abetter comparison with the softTFIDF measure [8]. SoftTFIDF addresses the problem of terminterdependence by extending the set of terms that contributes to the commonalities from theterms in A∩B to those pairs of terms that surpassed a threshold θ of similarity provided by anauxiliary similarity function sim (ta, tb):
S. JIMENEZ, A. GELBUKH: BASELINES FOR NLP TASKS ... 183
softTFIDF (A,B, θ) =∑
ta ∈ Atb ∈ B
sim(ta, tb) > θ
(tfidf (A, ta)
K(A)× tfidf (B, t)
K(B)× sim (ta, tb)
)(2.4)
The auxiliary similarity function sim (ta, tb) can be any measure fulfilling the postulate ofidentity (i.e. sim (t, t) = 1) and alternatively other metric-space postulates such as symmetry,triangle inequality, and positiveness. In [8] the Jaro-Winkler measure [44] was used as auxiliarysimilarity function with a threshold θ = 0.9.
3. Soft cardinality for text comparison
The classical set cardinality is a function of a set that counts the number of different elementsin that set. When a text is represented as a bag of words, the cardinality of the bag is thesize of the vocabulary of terms, i.e. the number of different terms used. The cardinality canbe used with resemblance coefficients to provide similarity measures that compare pairs of sets.Examples of these measures are Jaccard (|A∩B|/|A∪B), Dice (2|A∩B|/(|A|+ |B|)) and cosine(|A∩B|/
√|A||B|) coefficients. The effect of the cardinality function in these measures is to count
the number of common elements and to compress the repeated elements in a single instance.Based on an information-theoretical definition of similarity proposed in [29], a compressiondistance [7], which explicitly takes advantage of this feature, was shown to be useful in textapplications.
However, the compression provided by classical set cardinality is rigid. That is, while onlyidentical elements in a set are counted once, two nearly identical elements are counted twice.The soft cardinality addresses this issue taking into account the similarities between the elementsof the set. The intuition of the soft cardinality is as follows: the elements that have similaritieswith other elements contribute less to the total cardinality than unique elements. Therefore, thesoft cardinality takes into account not only the elements that are identical but also the elementsthat are similar.
3.1. Definition of soft cardinality. The soft cardinality of a set is the cardinality of theunion of its elements treated (themselves) as sets. Thus, for a set A =
{a1, a2, . . . , a|A|
}, the
soft cardinality of A is:|A|′ =
∣∣∣⋃|A|i=1ai
∣∣∣ (3.1)
This set-based definition allows to provide the following expressions:
|A ∪B|′=∣∣∣(⋃|A|
i=1ai
)∪(⋃|B|
i=1bi
)∣∣∣|A ∩B|
′= |A|
′+ |B|
′− |A ∪B|
′
Given that the elements ai of the set A are also sets, they have their own “sub”-elements(i.e. the elements of the elements) and cardinalities. These cardinalities are the number ofdifferent “sub”-elements in any ai element, making trivial the computation of |A|
′. However, the
cardinality of each element |ai| can also be associated with the relative weight (or importance) ofai in A. Besides, the cardinality of the intersections among the elements ai of the set A can alsobe provided by information sources different from the common “sub”-elements of the elementsai.
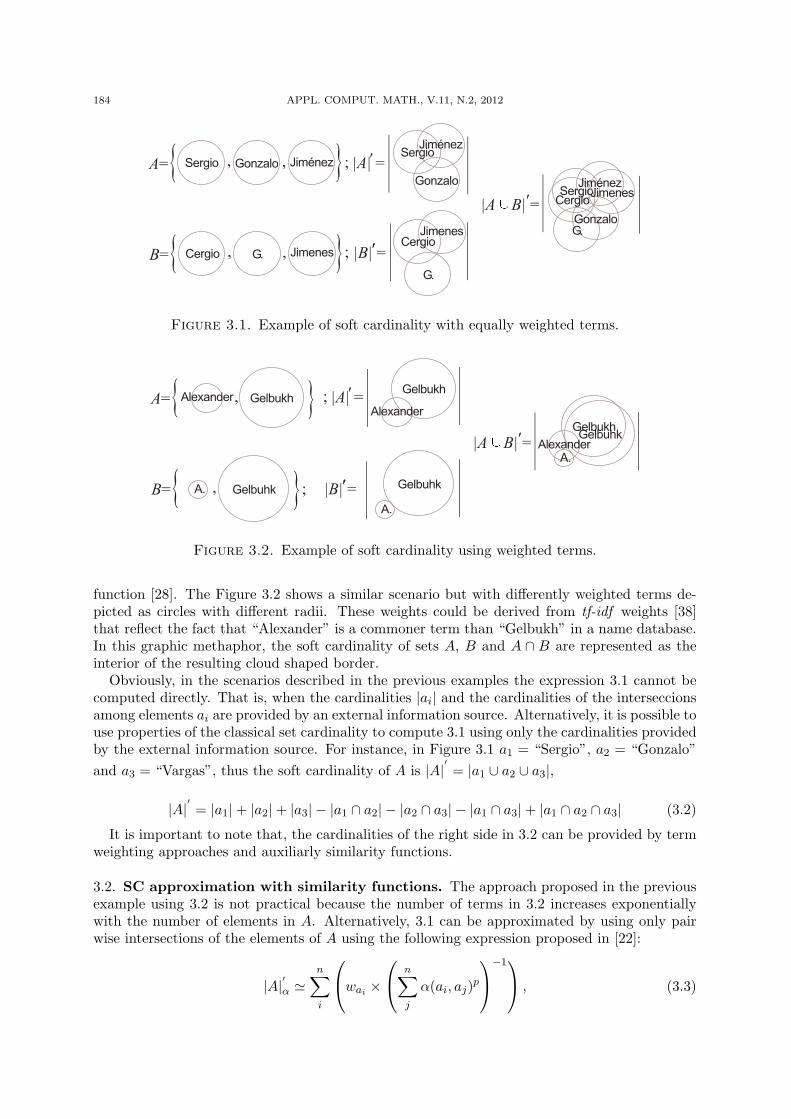
Let us consider the example depicted in Figure 3.1 in which two Spanish proper names arerepresented as sets A and B. The term elements ai, bj , and the intersections are represented asVenn diagrams. In this example, all elements are equally weighted and the represented inter-sections could be derivated from any information source such an edit-distance-based similarity
184 APPL. COMPUT. MATH., V.11, N.2, 2012
Sergio
Cergio
Gonzalo
G.
Jiménez
Gonzalo
Jiménez
Jimenes
G.
G.Jimenes
A= |A| =
|A B| =
|B| =B=
, ;
;,
,
,
{
{
} ||
||
||
}
'
'
Sergio
Sergio
Cergio
Cergio
'
'Gonzalo
JimenesJiménez
Figure 3.1. Example of soft cardinality with equally weighted terms.
Alexander
A.
A.
GelbukhGelbukh
GelbuhkGelbuhk
A= |A| =
|A B| =
|B| =B=
, ;
;,
{
{
} ||
||
||
}
'
''
'
Alexander
GelbukhGelbuhk
Alexander
A.
Figure 3.2. Example of soft cardinality using weighted terms.
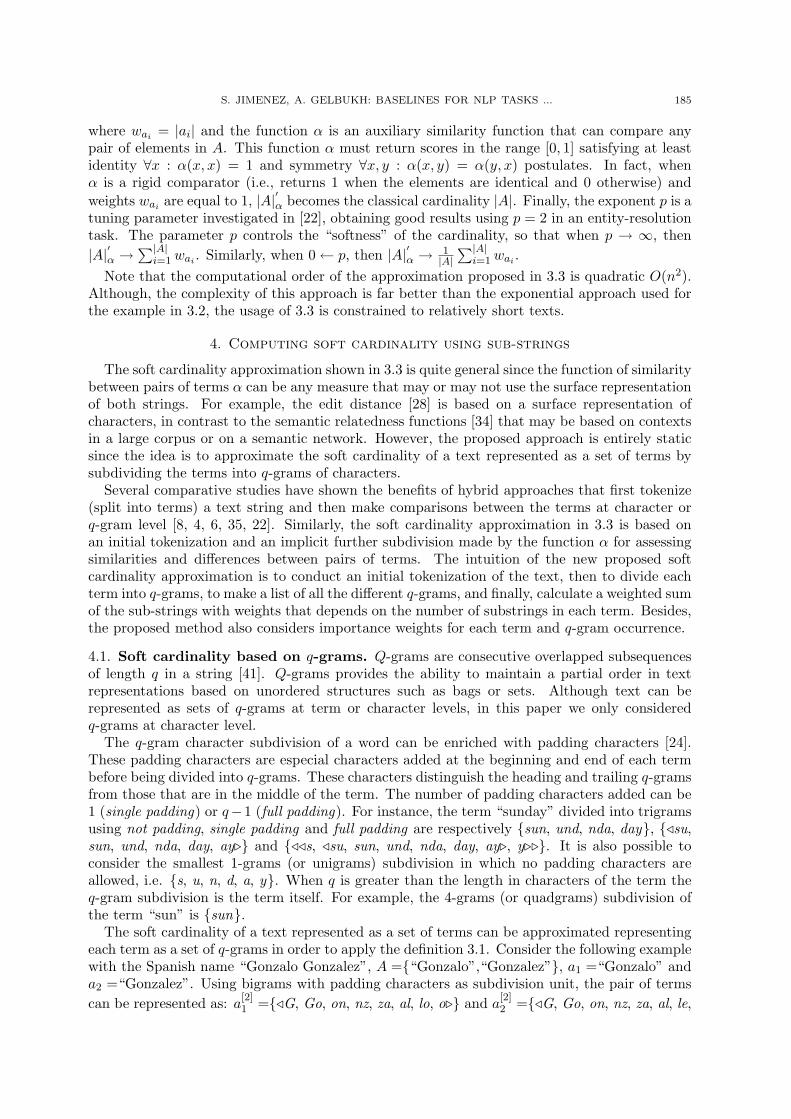
function [28]. The Figure 3.2 shows a similar scenario but with differently weighted terms de-picted as circles with different radii. These weights could be derived from tf-idf weights [38]that reflect the fact that “Alexander” is a commoner term than “Gelbukh” in a name database.In this graphic methaphor, the soft cardinality of sets A, B and A ∩ B are represented as theinterior of the resulting cloud shaped border.
Obviously, in the scenarios described in the previous examples the expression 3.1 cannot becomputed directly. That is, when the cardinalities |ai| and the cardinalities of the interseccionsamong elements ai are provided by an external information source. Alternatively, it is possible touse properties of the classical set cardinality to compute 3.1 using only the cardinalities providedby the external information source. For instance, in Figure 3.1 a1 = “Sergio”, a2 = “Gonzalo”and a3 = “Vargas”, thus the soft cardinality of A is |A|
′= |a1 ∪ a2 ∪ a3|,
|A|′= |a1|+ |a2|+ |a3| − |a1 ∩ a2| − |a2 ∩ a3| − |a1 ∩ a3|+ |a1 ∩ a2 ∩ a3| (3.2)
It is important to note that, the cardinalities of the right side in 3.2 can be provided by termweighting approaches and auxiliarly similarity functions.
3.2. SC approximation with similarity functions. The approach proposed in the previousexample using 3.2 is not practical because the number of terms in 3.2 increases exponentiallywith the number of elements in A. Alternatively, 3.1 can be approximated by using only pairwise intersections of the elements of A using the following expression proposed in [22]:
|A|′α 'n∑i
wai ×
n∑j
α(ai, aj)p
−1 , (3.3)
S. JIMENEZ, A. GELBUKH: BASELINES FOR NLP TASKS ... 185
where wai = |ai| and the function α is an auxiliary similarity function that can compare anypair of elements in A. This function α must return scores in the range [0, 1] satisfying at leastidentity ∀x : α(x, x) = 1 and symmetry ∀x, y : α(x, y) = α(y, x) postulates. In fact, whenα is a rigid comparator (i.e., returns 1 when the elements are identical and 0 otherwise) andweights wai are equal to 1, |A|′α becomes the classical cardinality |A|. Finally, the exponent p is atuning parameter investigated in [22], obtaining good results using p = 2 in an entity-resolutiontask. The parameter p controls the “softness” of the cardinality, so that when p → ∞, then|A|′α →
∑|A|i=1 wai . Similarly, when 0← p, then |A|′α → 1
|A|∑|A|
i=1 wai .Note that the computational order of the approximation proposed in 3.3 is quadratic O(n2).
Although, the complexity of this approach is far better than the exponential approach used forthe example in 3.2, the usage of 3.3 is constrained to relatively short texts.
4. Computing soft cardinality using sub-strings
The soft cardinality approximation shown in 3.3 is quite general since the function of similaritybetween pairs of terms α can be any measure that may or may not use the surface representationof both strings. For example, the edit distance [28] is based on a surface representation ofcharacters, in contrast to the semantic relatedness functions [34] that may be based on contextsin a large corpus or on a semantic network. However, the proposed approach is entirely staticsince the idea is to approximate the soft cardinality of a text represented as a set of terms bysubdividing the terms into q-grams of characters.
Several comparative studies have shown the benefits of hybrid approaches that first tokenize(split into terms) a text string and then make comparisons between the terms at character orq-gram level [8, 4, 6, 35, 22]. Similarly, the soft cardinality approximation in 3.3 is based onan initial tokenization and an implicit further subdivision made by the function α for assessingsimilarities and differences between pairs of terms. The intuition of the new proposed softcardinality approximation is to conduct an initial tokenization of the text, then to divide eachterm into q-grams, to make a list of all the different q-grams, and finally, calculate a weighted sumof the sub-strings with weights that depends on the number of substrings in each term. Besides,the proposed method also considers importance weights for each term and q-gram occurrence.
4.1. Soft cardinality based on q-grams. Q-grams are consecutive overlapped subsequencesof length q in a string [41]. Q-grams provides the ability to maintain a partial order in textrepresentations based on unordered structures such as bags or sets. Although text can berepresented as sets of q-grams at term or character levels, in this paper we only consideredq-grams at character level.
The q-gram character subdivision of a word can be enriched with padding characters [24].These padding characters are especial characters added at the beginning and end of each termbefore being divided into q-grams. These characters distinguish the heading and trailing q-gramsfrom those that are in the middle of the term. The number of padding characters added can be1 (single padding) or q−1 (full padding). For instance, the term “sunday” divided into trigramsusing not padding, single padding and full padding are respectively {sun, und, nda, day}, {/su,sun, und, nda, day, ay.} and {//s, /su, sun, und, nda, day, ay., y..}. It is also possible toconsider the smallest 1-grams (or unigrams) subdivision in which no padding characters areallowed, i.e. {s, u, n, d, a, y}. When q is greater than the length in characters of the term theq-gram subdivision is the term itself. For example, the 4-grams (or quadgrams) subdivision ofthe term “sun” is {sun}.
The soft cardinality of a text represented as a set of terms can be approximated representingeach term as a set of q-grams in order to apply the definition 3.1. Consider the following examplewith the Spanish name “Gonzalo Gonzalez”, A ={“Gonzalo”,“Gonzalez”}, a1 =“Gonzalo” anda2 =“Gonzalez”. Using bigrams with padding characters as subdivision unit, the pair of termscan be represented as: a
[2]1 ={/G, Go, on, nz, za, al, lo, o.} and a
[2]2 ={/G, Go, on, nz, za, al, le,
186 APPL. COMPUT. MATH., V.11, N.2, 2012
ez, z.}. The exponent in square brackets means the size q of the q-gram subdivision. Let A[2]
be the set with all different bigrams A[2] = a[2]1 ∪ a
[2]2 ={/G, Go, on, nz, za, al, lo, o., le, ez, z.},
and its classical cardinality is∣∣A[2]
∣∣ = ∣∣∣a[2]1 ∪ a
[2]2
∣∣∣ = 11. Similarly,∣∣∣a[2]
1 \ a[2]2
∣∣∣ = 2,∣∣∣a[2]
2 \ a[2]1
∣∣∣ = 3
and∣∣∣a[2]
1 ∩ a[2]2
∣∣∣ = 6.
Similar to |A|, which provides an integer count of the number of terms in A, |A|′provides a
real number that represent the “soft” count of the number of terms in A. In our running example|A|
′must be a number in between 1.0 and 2.0. Thus, each one of the elements of A[2] adds a
contribution to the total soft cardinality of A. The cardinality of A[2] represents the number ofbigrams in A, in order to make it represent the “soft” number of terms in A the cardinalitiesof the bigrams in A[2] need to be adjusted. Now, let us denote A
[2]i as a bigram such that
A[2]j ∈ A[2]. The cardinalities of the non-common bigrams between a
[2]1 and a
[2]2 are adjusted by∣∣∣A[2]
j
∣∣∣ = 1∣∣∣a[2]1
∣∣∣ ;∀A[2]j ∈
(a
[2]1 \ a
[2]2
)and
∣∣∣A[2]j
∣∣∣ = 1∣∣∣a[2]2
∣∣∣ ;∀A[2]j ∈
(a
[2]2 \ a
[2]1
), that is the contribution
of each bigram is inverse to the number of bigrams in the term. Similarly, the cardinality of thecommon bigrams is adjusted by the average
∣∣∣A[2]j
∣∣∣ = 0.5× 1∣∣∣a[2]1
∣∣∣ +0.5× 1∣∣∣a[2]2
∣∣∣ ;∀A[2]j ∈
(a
[2]1 ∪ a
[2]2
).
In our example, 1∣∣∣a[2]1
∣∣∣ = 0.125, 1∣∣∣a[2]2
∣∣∣ = 0.111 and 0.5 × 1∣∣∣a[2]1
∣∣∣ + 0.5 × 1∣∣∣a[2]1
∣∣∣ = 0.118. Finally,
given that there are 6 common bigrams between a[2]1 and a
[2]2 , 2 bigrams exclusively in a
[2]1 and 3
bigrams exclusively in a[2]2 , the final soft cardinality for this example is |A|′ ' 0.118×6+0.125×
2 + 0.111× 3 = 1.292. The soft cardinality of A reflects the fact that a1 and a2 are very similarin contrast to the classical cardinality that obtains |A| = 2
4.2. Soft cardinality q-spectrum. In the previous example we obtained an approximationof the soft cardinality using a partition of bigrams. The soft cardinality of any text stringrepresented as a set of terms A can be approximated by the partition A[q] =
⋃|A|i=1a
[q]i of A in
q-grams, where a[q]i is the partition of i-th term in A into q-grams. Clearly, each one of the
q-grams A[q]j in A[q] can occur in various terms ai in A. The indices i satisfying A
[q]j ∈ a
[q]i
indexes all the terms ai in A where the q-gram A[q]j occurs. The number of terms in A in which
the q-gram A[q]j occurs is denoted by KAj . The contribution of a particular q-gram A
[q]j to the
total soft cardinality is the arithmetic average of the weights 1∣∣∣a[q]i
∣∣∣ for each one of its occurrences
in the text. The expression for the q-spectrum soft cardinality is:
|A|′[q] '|A[q]|∑j=1
1KAj
×∑
i:A[q]j ∈a
[q]i
1∣∣∣a[q]i
∣∣∣ (4.1)
The approximation |A|′[q] obtained from the 4.1 using q-grams is the soft cardinality (SC)q-spectrum of A. Note that this cardinality expression depends only on the information in theset A, so any similarity measure derived from 4.1 is a static measure.
The soft cardinality of a text provides a “soft” count of the number or terms in the textequally weighting all terms. However, it is already known that in a particular text some of itsterms convey more information than others (see Section 2). The term weights obtained with 2.2can also be integrated to the SC q-spectrum expression as follows:
S. JIMENEZ, A. GELBUKH: BASELINES FOR NLP TASKS ... 187
|A|′[q] '|A[q]|∑j=1
1KAj
×∑
i:A[q]j ∈a
[q]i
tfidf(A, ai)∣∣∣a[q]i
∣∣∣ (4.2)
Note that tf-idf weights used in 4.2 are obtained from statistics gathered from the entirecollection of texts being compared. Thus, any similarity measure derived of the use of 4.2 is anadaptive measure.
Furthermore, the idea of weighting can also be also applied at q-gram level to discriminatesubstrings according with the amount of information that each q-gram conveys. This amountof information can be associated with the frequency of the q-gram in a large corpus or in aparticular text collection. For instance, in the English language the character bigram “th” isconsiderably more frequent than the bigram “xy”. Thus, the former conveys less informationthan the latter. We adopt a weighting scheme similar to that used in 2.1 for idf to weightq-grams based on the frequency of occurrence. Thus, the weight for a particular q-gram A
[q]j is:
qidf(A[q]j ) = log
N
nA
[q]j
, (4.3)
where N is the total number of terms (words) in the collection of texts and nA
[q]j
is the number
of terms in which the q-gram A[q]j occurs. Considering that the number of q-grams per term may
be significatively less than the number of terms per document, the effect of repeated q-grams ina term is low, so we do not consider tf -like weights at q-gram level. As idf , qidf weights canalso be integrated to the SC q-spectrum expression as follows:
|A|′[q] '|A[q]|∑j=1
1KAj
×∑
i:A[q]j ∈a
[q]i
tfidf(A, ai)× qidf(A[q]j )∣∣∣a[q]
i
∣∣∣ (4.4)
The similarity measures derived from the use of 4.4 are adaptive measures, but their adap-tiveness is made simultaneously at term and q-gram levels.
The inner expressiontfidf(A,ai)×qidf(A
[q]j )∣∣∣a[q]
i
∣∣∣ in 4.4 is the weight associated with each q-gram in
each term in the text A. This weighting expression depends on the weight of the term given thetext collection (i.e. term weights tfidf(A, ai)), the weight of the q-gram given the term collection(i.e. q-gram weights qidf(A[q]
j )) and on the number of q-grams in the term (i.e. context q-gram
weights 1/∣∣∣a[q]
i
∣∣∣). The expression in 4.4 first averages the q-gram weights for repeated occurrencesof all q-grams in the text and next it makes the sum of those averages. Clearly, the term andq-gram weighting functions tfidf() and qidf() can be replaced by any weighting mechanism.
In the experimental evaluation provided in Section 6 different combinations of term and q-gram weighting mechanisms will be tested for different natural language processing tasks.
4.3. Soft-cardinality spectra. A partition of q-grams allows the construction of similaritymeasures with its associated soft cardinality q-spectrum. The most fine-grained substring par-tition corresponds to q = 1 (i.e. characters or unigrams) and the coarsest is the partition intoterms. While partitions such as unigrams, bigrams and trigrams are used in tasks such as en-tity resolution, the partition into terms is preferred for information retrieval, text classificationand other tasks. Intuitively, the finer partitions seem to be suitable for short texts and termpartitions seem to be more suitable for long texts.
However, as it was shown in [43, 23] the more convenient partitions for text comparison rangedfrom trigrams to heptagrams depending on the used similarity function and on the data set. It
188 APPL. COMPUT. MATH., V.11, N.2, 2012
was also shown that in general the performance of the similarity function decreases considerablywhen q < 3 or q > 7. Although their experimental results suggested that there is a single valueof q for maximum performance for any pair {similarity function, data set}, there is not a methodto unsupervisedly determine such optimal value of q.
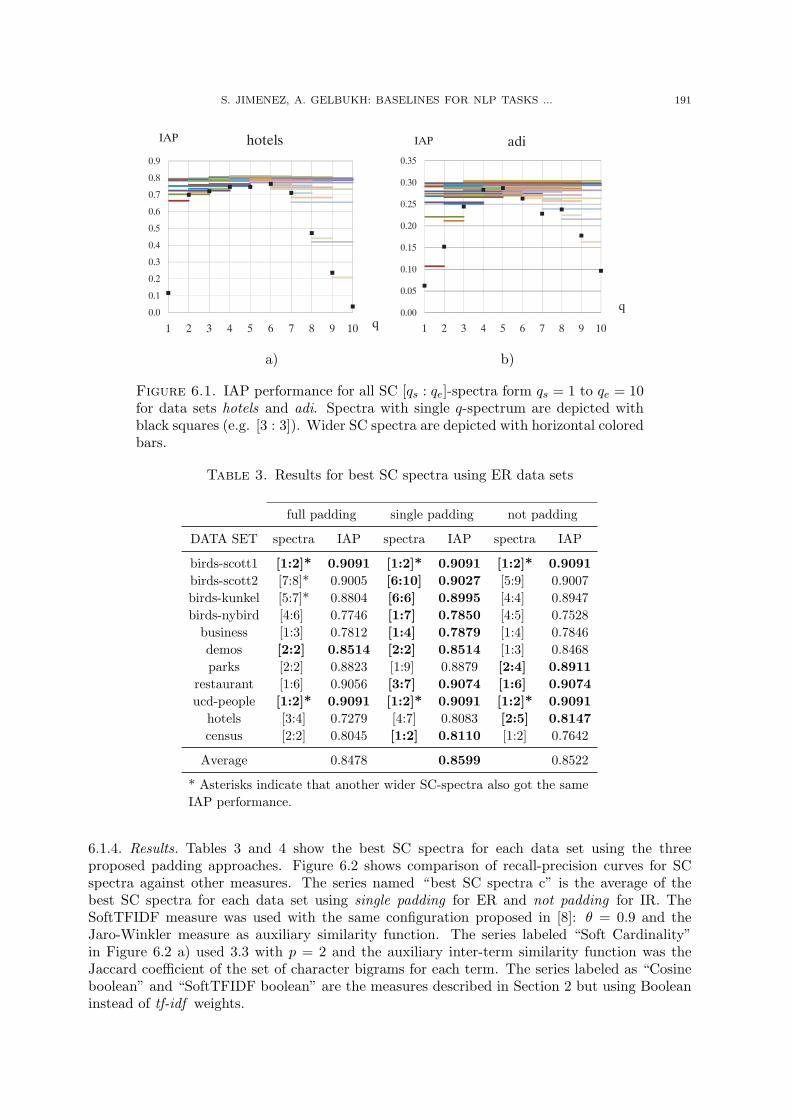
The proposed method aims to combine a series of partitions with different q in order toobtain an aggregate score close to the optimum selection of q. For instance, in Figure 6.1 b) theperformance of a particular similarity measure in the IR collection ADI is shown for differentq-gram partition sizes. It is difficult to unsupervisedly determine that pentagrams (i.e. q = 5) isthe best partition size to use. Nevertheless, it is possible to guess a range such as q1 = 2, q2 = 8just by considering the features of the documents and the similarity to other reference collections.Moreover, the aggregation of different text representations derived from various q-gram sizes canprovide a better final performance in the task taking into account the fundamental reasons whyensemble models may work better than the single ones, that is statistical, computational andrepresentational reasons (see [13]).
As we mentioned, the combination of several contiguous partition granularities can be usefulfor comparing texts in a particular dataset. Since each SC q-spectrum provides a measure ofthe compressed amount of terms in a text, several SC q-spectrum can be averaged or added toget a combined measure. SC [qs : qe]-spectra is defined as the aggregation of a series of severalq-spectrum from qs to qe, having qs ≤ qe. For example, the SC [2 : 4]-spectra uses simultaneouslybigrams, trigrams and quadgrams to get an approximation the soft cardinality of a bag of words.Thus, the SC spectra expression is:
|A|′[qs:qe]=
e∑i=s
|A|′[qi]. (4.5)
5. Building text similarity functions
Once the SC spectra function is provided, text similarity functions can be constructed re-placing the classical set cardinality by SC spectra in resemblance coefficients. Resemblancecoefficients are binary similarity measures that compare two sets A and B by the ratio betweenthe cardinality of the commonalities (i.e. |A ∩B|) and the aggregation of the cardinalities ofthe two sets, e.g. Jaccard [20] and Dice [12] coefficients. The aggregation of |A| and |B| can bemade using the generalized mean, which control the aggregation by a parameter p. We call thisresemblance coefficient as the generalized mean coefficient :
SIM(A,B) =|A ∩B|
(0.5× |A|p + 0.5× |B|p)1p
(5.1)
This coefficient can also be considered as a derivation for similarity of the Minkowski distanceD(x, y) = (|x1 − y1|p + |x2 − y2|p)
1p ; note that vertical lines in this expression denotes absolute
values rather than cardinalities. The generalized mean coefficient is similar to the coefficientproposed in [21] because it models the asymmetric selection of the referent for comparison. Thatis, when −∞ ← p and p → ∞ the denominator in 1 becomes min (|A| , |B|) and max (|A| , |B|)respectively. Different values of p in 5.1 produce a family of resemblance coefficients some valuesof p correspond to some already known coefficients (see Table 1).
Several text similarity functions can be proposed using the generalized mean coefficient andthe SC spectra function proposed in Section 4. For instance, using p = −1 in 5.1 (i.e. harmoniccoefficient) and SC spectra the following expression can be obtained:
sim(A,B) = 1 +12×
(|A|′[qs:qe]
|B|′[qs:qe]
+|B|′[qs:qe]
|A|′[qs:qe]
−|A ∪B|′[qs:qe]
|A|′[qs:qe]
−|A ∪B|′[qs:qe]
|B|′[qs:qe]
). (5.2)
In the following evaluation section several text similarity functions obtained using different pvalues were tested.
S. JIMENEZ, A. GELBUKH: BASELINES FOR NLP TASKS ... 189
Table 1. Different instances of the generalized mean coefficient.
p Name Expression1 Dice coefficient 2×|A∩B|
|A|+|B|p→ 0 cosine coefficient |A∩B|√
|A|×|B|
2 quadratic coefficient |A∩B|√0.5×(|A|2+|B|2)
−∞← p overlap coefficient |A∩B|min(|A|,|B|)
−1 harmonic coefficient |A∩B|×(|A|+|B|)2×|A|×|B|
Table 2. Naming convention for the weighting schemes used in experiments.
Convention name Expression Type Levelnone 1 static n/a
c 1∣∣∣a[q]i
∣∣∣ static character q-grams
idf idf(ai) adaptive termsqidf qidf(A[q]
j ) adaptive character q-gramsc.idf idf(ai)∣∣∣a[q]
i
∣∣∣ adaptive character q-grams & terms
c.qidfqidf(A
[q]j )∣∣∣a[q]
i
∣∣∣ adaptive character q-grams
idf.qidf idf(ai)× qidf(A[q]j ) adaptive character q-grams & terms
c.idf.qidfidf(ai)×qidf(A
[q]j )∣∣∣a[q]
i
∣∣∣ adaptive character q-grams & terms
6. Experimental evaluation
The proposed experiments aim to evaluate the text similarity functions based on SC spectraas baselines for several natural processing tasks, namely: information retrieval (IR) and entityresolution (ER) in subsection 6.1, paraphrase and textual entailment recognition in subsection6.2. In addition, the experiments also intend to address the following issues: (i) to determinewhich of the different q-gram padding approaches are better suited for different tasks, (ii) todetermine the suitability of the different weighting schemes at term and q-gram level, (iv) to de-termine whether the SC spectra aggregation is more convenient than individual SC q-spectrum,and (v) to compare the soft-cardinality spectra approach versus other approaches.
The different weighting schemes in the inner expression in 4.4 used in all experiments arelisted using the naming convention given in Table 2.
6.1. Information retrieval and entity resolution. The classical information retrieval taskis to find a ranked list of relevant documents for a set of queries (or information needs). Theentity resolution task consists of given a pair of relations containing entities, finding all entitypairs that refer the same object. The entities are commonly represented as names or namesextended with addresses and other information.
Information retrieval and entity resolution tasks usually involve large collections of documentsand databases. Furthermore, using a naive approach these tasks involve the evaluation of a textsimilarity measure on the Cartesian product on the sets of queries and documents, or on thepair entity relations to be reconciled. Therefore, the use of semantic measures is restricted dueto the considerable amount of resources that these measures require. The common practice isto use adaptive measures such as cosine TF-IDF. Besides, a static similarity measures such asthe cosine similarity using Boolean weights is considered a baseline for these tasks.
190 APPL. COMPUT. MATH., V.11, N.2, 2012
6.1.1. Data sets . For the experimental evaluation, two groups of data sets were used for entityresolution and information retrieval tasks. The first group, called ER, consists of 11 data setscollected from different sources by the secondstring framework2 creators. The second group,called IR, is composed of 9 “classical” collections described in [2]3. Each data set consists oftwo series of texts and a gold-standard relation that associates pairs from both sets. The goldstandard in all data sets was obtained from human judgments excluding census data set, whichwas built making random edit operations into a list of people names. In the ER data sets, thegold-standard relationship means identity equivalence and in IR data sets, it means relevancebetween a query and a document.
Texts in all data sets were divided into terms (i.e., tokenized) with a simple approach usingas separator the space bar, punctuation characters, parenthesis and others special characterssuch as slash, hyphen, currency, tab, etc. Characters in all data sets were converted to theirlowercase equivalents. Besides, no stop words removal or stemming was used either at ER or IRdata sets.
6.1.2. Performance measure. The quality of the similarity function proposed in 5.2 can be mea-sured quantitatively using various existing performance metrics for ER and IR tasks. We pre-ferred to use interpolated average precision (IAP) because it is a performance measure that hasbeen used at both tasks (see [2] for a detailed description). IAP allows to measure the two-waysclassification performance (match vs. not-match and relevant vs. not relevant) of a ranked list oftext pairs. While in IR, IAP reports the average measured in a different rank for each query, inER a single rank for each data set is used. The reason for this is that the entity pairs in ER aretexts of the same type, differently to the IR task where texts are whether queries or documents.Thus, while in IR it makes sense to evaluate the retrieved documents for each particular query;in ER it is more important to evaluate the ability of the similarity measure to separate theentire dataset into two groups of correct and incorrect pairs. In order to provide a consistentevaluation measure we used a single rank for both IR and ER tasks.
The ranking of text pairs is provided by ordering them from most to least similar using thesimilarity score obtained using the text similarity function to be evaluated. Precision at theposition i in such ranking is precision(i) = c(i)
i , where c(i) is the number of correct pairs rankedbefore position i. Recall at the position i is recall(i) = c(i)
m , where m is the total number ofcorrect pairs. Interpolated precision at recall r is maxi (precision(i)), where max is taken overall ranks i such that recall(i) ≥ r. Values of interpolated precision are obtained at eleven evenlyseparated recall points: 0.0, 0.1, ..., 1.0. The obtained values can be used to plot a recall-precision curve such as those shown in Figure 6.2. Finally, interpolated average precision (IAP)is the area under the resulting recall-precision curve that can be obtained averaging the eleveninterpolated precision values.
6.1.3. Experiments. For the experiments, 55 similarity functions were constructed with all pos-sible SC spectra using q-spectrum ranging q from 1 to 10 in combination with 5.2. The weightingmechanism used in all experiments was weighting by local context, i.e. c in Table 2. Therefore,all the used measures based on SC spectra in this subsection were static measures.
Each similarity measure obtained was evaluated using all text pairs throughout the Cartesianproduct between both text sets in the 18 data sets. In addition, the following three paddingapproaches were tested: single padding, full padding and not padding.
For each one of the 2,970 (55 SC [qs : qe]-spectra by 18 data sets by 3 padding approaches)experiments carried out the IAP performance measure was calculated. Figure 6.1 shows asample of the results for two data sets (hotels and adi) using single padding and not paddingconfigurations respectively.
2http://secondstring.sourceforge.net/3http://people.ischool.berkeley.edu/˜hearst/irbook/
S. JIMENEZ, A. GELBUKH: BASELINES FOR NLP TASKS ... 191
0.0
0.1
0.2
0.3
0.4
0.5
0.6
0.7
0.8
0.9
1 2 3 4 5 6 7 8 9 10
IAP
q
hotels
0.00
0.05
0.10
0.15
0.20
0.25
0.30
0.35
1 2 3 4 5 6 7 8 9 10
IAP
q
adi
a) b)
Figure 6.1. IAP performance for all SC [qs : qe]-spectra form qs = 1 to qe = 10for data sets hotels and adi. Spectra with single q-spectrum are depicted withblack squares (e.g. [3 : 3]). Wider SC spectra are depicted with horizontal coloredbars.
Table 3. Results for best SC spectra using ER data sets
full padding single padding not padding
DATA SET spectra IAP spectra IAP spectra IAP
birds-scott1 [1:2]* 0.9091 [1:2]* 0.9091 [1:2]* 0.9091birds-scott2 [7:8]* 0.9005 [6:10] 0.9027 [5:9] 0.9007birds-kunkel [5:7]* 0.8804 [6:6] 0.8995 [4:4] 0.8947birds-nybird [4:6] 0.7746 [1:7] 0.7850 [4:5] 0.7528
business [1:3] 0.7812 [1:4] 0.7879 [1:4] 0.7846demos [2:2] 0.8514 [2:2] 0.8514 [1:3] 0.8468parks [2:2] 0.8823 [1:9] 0.8879 [2:4] 0.8911
restaurant [1:6] 0.9056 [3:7] 0.9074 [1:6] 0.9074ucd-people [1:2]* 0.9091 [1:2]* 0.9091 [1:2]* 0.9091
hotels [3:4] 0.7279 [4:7] 0.8083 [2:5] 0.8147census [2:2] 0.8045 [1:2] 0.8110 [1:2] 0.7642
Average 0.8478 0.8599 0.8522
* Asterisks indicate that another wider SC-spectra also got the sameIAP performance.
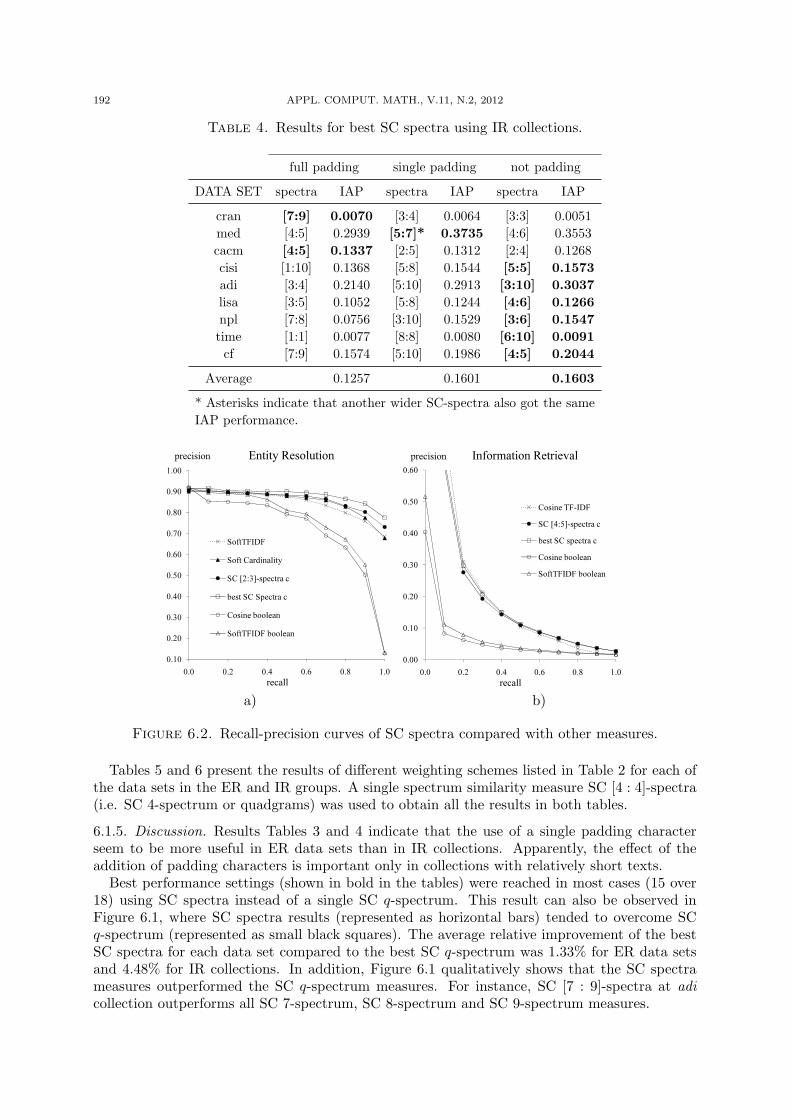
6.1.4. Results. Tables 3 and 4 show the best SC spectra for each data set using the threeproposed padding approaches. Figure 6.2 shows comparison of recall-precision curves for SCspectra against other measures. The series named “ best SC spectra c” is the average of thebest SC spectra for each data set using single padding for ER and not padding for IR. TheSoftTFIDF measure was used with the same configuration proposed in [8]: θ = 0.9 and theJaro-Winkler measure as auxiliary similarity function. The series labeled “Soft Cardinality”in Figure 6.2 a) used 3.3 with p = 2 and the auxiliary inter-term similarity function was theJaccard coefficient of the set of character bigrams for each term. The series labeled as “Cosineboolean” and “SoftTFIDF boolean” are the measures described in Section 2 but using Booleaninstead of tf-idf weights.
192 APPL. COMPUT. MATH., V.11, N.2, 2012
Table 4. Results for best SC spectra using IR collections.
full padding single padding not padding
DATA SET spectra IAP spectra IAP spectra IAP
cran [7:9] 0.0070 [3:4] 0.0064 [3:3] 0.0051med [4:5] 0.2939 [5:7]* 0.3735 [4:6] 0.3553cacm [4:5] 0.1337 [2:5] 0.1312 [2:4] 0.1268cisi [1:10] 0.1368 [5:8] 0.1544 [5:5] 0.1573adi [3:4] 0.2140 [5:10] 0.2913 [3:10] 0.3037lisa [3:5] 0.1052 [5:8] 0.1244 [4:6] 0.1266npl [7:8] 0.0756 [3:10] 0.1529 [3:6] 0.1547time [1:1] 0.0077 [8:8] 0.0080 [6:10] 0.0091cf [7:9] 0.1574 [5:10] 0.1986 [4:5] 0.2044
Average 0.1257 0.1601 0.1603
* Asterisks indicate that another wider SC-spectra also got the sameIAP performance.
0.50
0.60
0.70
0.80
0.90
1.00precision Entity Resolution
SoftTFIDFSoft CardinalitySC [2:3]-spectra c
0.10
0.20
0.30
0.40
0.0 0.2 0.4 0.6 0.8 1.0recall
best SC Spectra cCosine booleanSoftTFIDF boolean
0.30
0.40
0.50
0.60precision Information Retrieval
Cosine TF-IDFSC [4:5]-spectra cbest SC spectra cCosine booleanSoftTFIDF boolean
0.00
0.10
0.20
0.0 0.2 0.4 0.6 0.8 1.0recall
a) b)
Figure 6.2. Recall-precision curves of SC spectra compared with other measures.
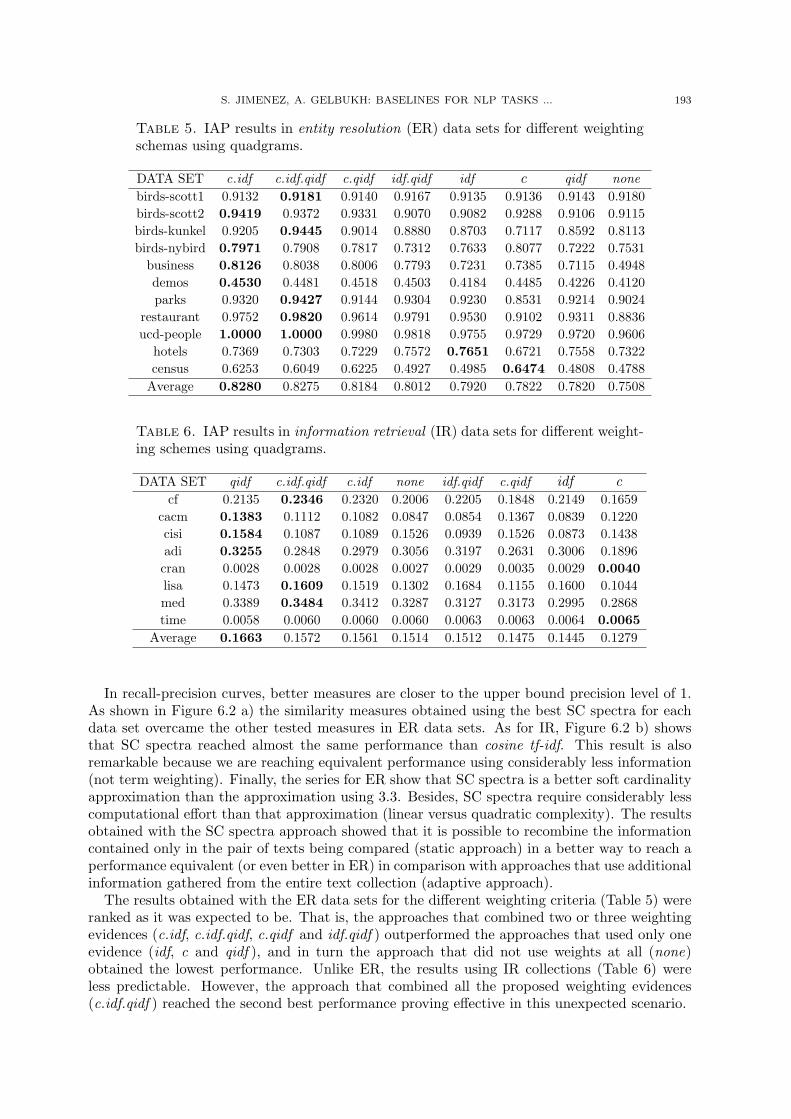
Tables 5 and 6 present the results of different weighting schemes listed in Table 2 for each ofthe data sets in the ER and IR groups. A single spectrum similarity measure SC [4 : 4]-spectra(i.e. SC 4-spectrum or quadgrams) was used to obtain all the results in both tables.
6.1.5. Discussion. Results Tables 3 and 4 indicate that the use of a single padding characterseem to be more useful in ER data sets than in IR collections. Apparently, the effect of theaddition of padding characters is important only in collections with relatively short texts.
Best performance settings (shown in bold in the tables) were reached in most cases (15 over18) using SC spectra instead of a single SC q-spectrum. This result can also be observed inFigure 6.1, where SC spectra results (represented as horizontal bars) tended to overcome SCq-spectrum (represented as small black squares). The average relative improvement of the bestSC spectra for each data set compared to the best SC q-spectrum was 1.33% for ER data setsand 4.48% for IR collections. In addition, Figure 6.1 qualitatively shows that the SC spectrameasures outperformed the SC q-spectrum measures. For instance, SC [7 : 9]-spectra at adicollection outperforms all SC 7-spectrum, SC 8-spectrum and SC 9-spectrum measures.
S. JIMENEZ, A. GELBUKH: BASELINES FOR NLP TASKS ... 193
Table 5. IAP results in entity resolution (ER) data sets for different weightingschemas using quadgrams.
DATA SET c.idf c.idf.qidf c.qidf idf.qidf idf c qidf nonebirds-scott1 0.9132 0.9181 0.9140 0.9167 0.9135 0.9136 0.9143 0.9180birds-scott2 0.9419 0.9372 0.9331 0.9070 0.9082 0.9288 0.9106 0.9115birds-kunkel 0.9205 0.9445 0.9014 0.8880 0.8703 0.7117 0.8592 0.8113birds-nybird 0.7971 0.7908 0.7817 0.7312 0.7633 0.8077 0.7222 0.7531
business 0.8126 0.8038 0.8006 0.7793 0.7231 0.7385 0.7115 0.4948demos 0.4530 0.4481 0.4518 0.4503 0.4184 0.4485 0.4226 0.4120parks 0.9320 0.9427 0.9144 0.9304 0.9230 0.8531 0.9214 0.9024
restaurant 0.9752 0.9820 0.9614 0.9791 0.9530 0.9102 0.9311 0.8836ucd-people 1.0000 1.0000 0.9980 0.9818 0.9755 0.9729 0.9720 0.9606
hotels 0.7369 0.7303 0.7229 0.7572 0.7651 0.6721 0.7558 0.7322census 0.6253 0.6049 0.6225 0.4927 0.4985 0.6474 0.4808 0.4788
Average 0.8280 0.8275 0.8184 0.8012 0.7920 0.7822 0.7820 0.7508
Table 6. IAP results in information retrieval (IR) data sets for different weight-ing schemes using quadgrams.
DATA SET qidf c.idf.qidf c.idf none idf.qidf c.qidf idf ccf 0.2135 0.2346 0.2320 0.2006 0.2205 0.1848 0.2149 0.1659
cacm 0.1383 0.1112 0.1082 0.0847 0.0854 0.1367 0.0839 0.1220cisi 0.1584 0.1087 0.1089 0.1526 0.0939 0.1526 0.0873 0.1438adi 0.3255 0.2848 0.2979 0.3056 0.3197 0.2631 0.3006 0.1896cran 0.0028 0.0028 0.0028 0.0027 0.0029 0.0035 0.0029 0.0040lisa 0.1473 0.1609 0.1519 0.1302 0.1684 0.1155 0.1600 0.1044med 0.3389 0.3484 0.3412 0.3287 0.3127 0.3173 0.2995 0.2868time 0.0058 0.0060 0.0060 0.0060 0.0063 0.0063 0.0064 0.0065
Average 0.1663 0.1572 0.1561 0.1514 0.1512 0.1475 0.1445 0.1279
In recall-precision curves, better measures are closer to the upper bound precision level of 1.As shown in Figure 6.2 a) the similarity measures obtained using the best SC spectra for eachdata set overcame the other tested measures in ER data sets. As for IR, Figure 6.2 b) showsthat SC spectra reached almost the same performance than cosine tf-idf. This result is alsoremarkable because we are reaching equivalent performance using considerably less information(not term weighting). Finally, the series for ER show that SC spectra is a better soft cardinalityapproximation than the approximation using 3.3. Besides, SC spectra require considerably lesscomputational effort than that approximation (linear versus quadratic complexity). The resultsobtained with the SC spectra approach showed that it is possible to recombine the informationcontained only in the pair of texts being compared (static approach) in a better way to reach aperformance equivalent (or even better in ER) in comparison with approaches that use additionalinformation gathered from the entire text collection (adaptive approach).
The results obtained with the ER data sets for the different weighting criteria (Table 5) wereranked as it was expected to be. That is, the approaches that combined two or three weightingevidences (c.idf, c.idf.qidf, c.qidf and idf.qidf ) outperformed the approaches that used only oneevidence (idf, c and qidf ), and in turn the approach that did not use weights at all (none)obtained the lowest performance. Unlike ER, the results using IR collections (Table 6) wereless predictable. However, the approach that combined all the proposed weighting evidences(c.idf.qidf ) reached the second best performance proving effective in this unexpected scenario.
194 APPL. COMPUT. MATH., V.11, N.2, 2012
6.2. Paraphrase and textual entailment recognition. Paraphrase and textual entailmentrecognition are tasks in which a pair of text passages is considered and it is necessary to decidewhether one text is a paraphrase of the other, or if one text is entailed by the other. Whileparaphrasing is a symmetrical task, in the textual entailment task one the texts is labeled as“T” (the entailing text) and the other as “H” (the entailed text). Thus, “T” entails “H” if ahuman reading “T” would infer that “H” is probably true. Each text pair is provided with agold standard obtained from human judgments.
Given that those tasks require a higher “understanding” of the text that may require infor-mation not included in the surface text information, the methods that deal with those tasksgenerally use semantic approaches. For these tasks, static and adaptive approaches are con-sidered as baselines because they cannot reveal any underlying semantic structure hidden inthe text. Semantic methods aim to reveal that structure using an assortment of resources thatexploit statistical evidence (e.g. large corpora) and/or knowledge (e.g. parsers, semantic net-works).
To evaluate the baseline role of the measures outlined in Section 2 and the SC spectra ap-proach, we used standard data sets for the tasks and compared our results against the resultsalready published.
6.2.1. Data sets. The data sets selected for evaluation were the Microsoft Research ParaphraseCorpus [15] (MSR paraphrase) and the RTE-3 data set [18] from the third PASCAL recognizingtextual entailment challenge (2007). Both data sets have been extensively studied and dozensof papers have reported results using them. See [15, 18] for a comprehensive description of thedata sets. We used the test partition of the RTE-3 to allow comparison of performance with theresults published in [18].
Both data sets were preprocessed by tokenizing, lowercase character conversion and stemmingusing the Porter stemmer [36]. Besides, q-gram partitions were obtained using not paddingbecause this approach is the simplest and it obtained the best results for the IR task, whosetext type (documents) is similar to those used in paraphrase and textual entailment.
6.2.2. Performance measure. The similarity scores provided a ranking of text pairs where higherscores were considered as valid paraphrases and entailments. Accuracy, precision, recall andF-measure [2] standard metrics were calculated at each position on the ranking using a goldstandard. The results are reported on the ranking position with the best F-measure (i.e. F1-score). The main performance measure for comparison was accuracy, i.e. the number or correctpredictions over the total number of predictions.
6.2.3. Experiments. The used q-gram partition in all experiments was SC [1 : 4]-spectra usingnot padding approach. The generalized mean coefficient 5.1 was used as similarity measure andthe parameter p was adjusted to obtain the best performance. That is, p = 10 for paraphraseand p = −1.5 for textual entailment. We present the results only for the idf weighting schemefor SC spectra because this approach slightly outperformed the tf-idf weights in all experiments.
We also tested two additional adaptive baselines such as softTFIDF and cosine TF-IDF.SoftTFIDF had the same configuration used in the previous subsection, but using the thresholdθ = 0.7, which was the threshold with the best results.
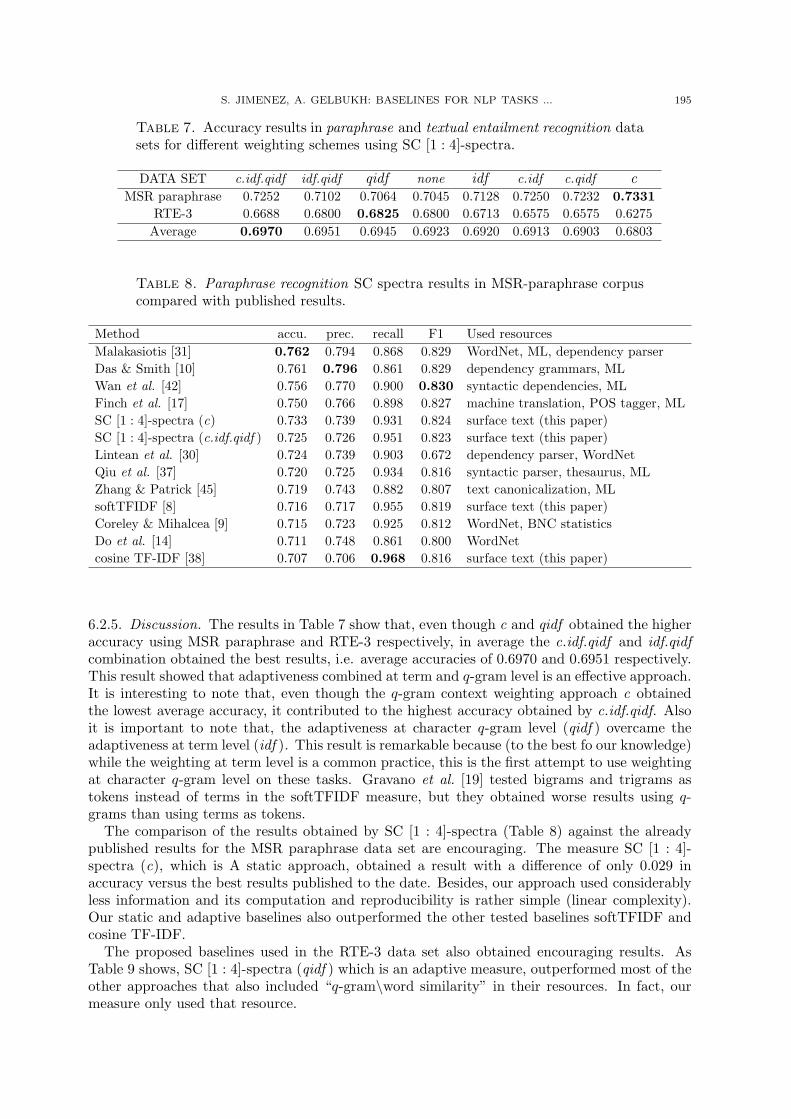
6.2.4. Results. Table 7 shows the accuracies obtained for the different weighting schemas listedin Table 2. Table 8 shows a sorted summary of the published results for the MSR paraphrasecorpus (extracted in part from [1]) including the best results obtained using SC [1 : 4]-spectra,softTFIDF and cosine TF-IDF.
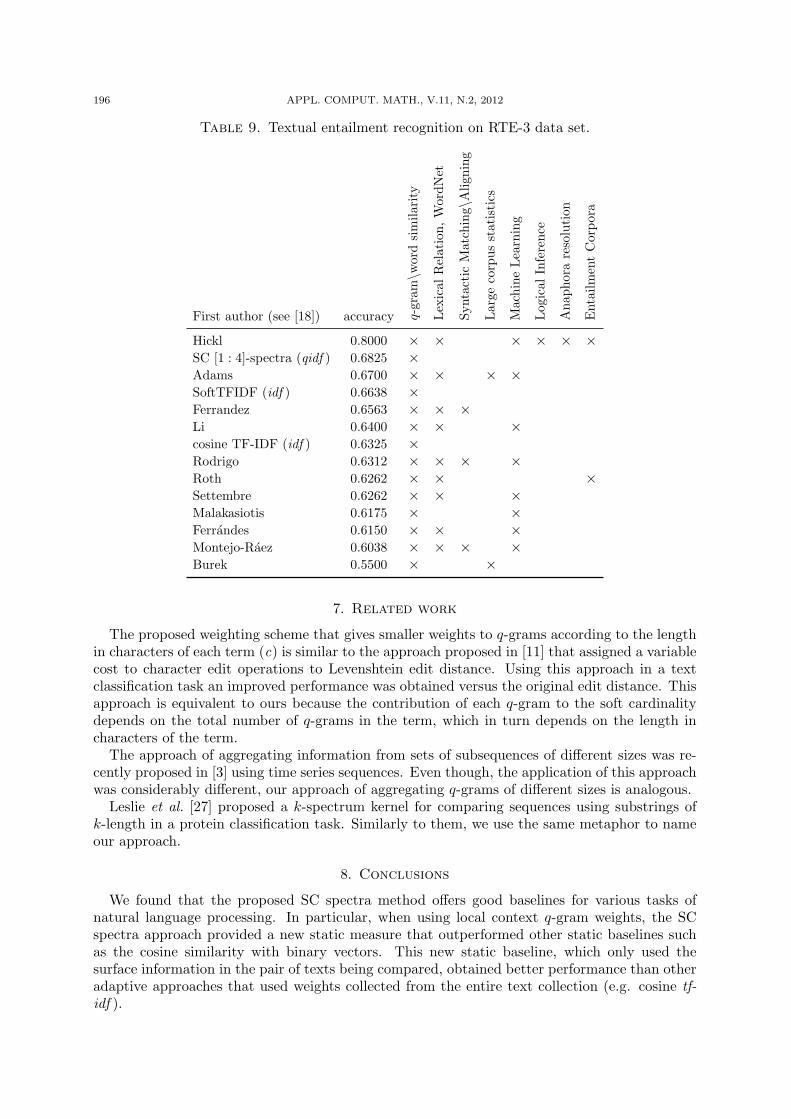
Table 9 shows a summary (extracted from [18]) of the accuracies and resources used to ob-tain each listed result. The table shows only the participating systems in the third PASCALrecognizing textual entailment challenge (2007) that included in the used resources a similaritymeasures based on q-grams or words.
S. JIMENEZ, A. GELBUKH: BASELINES FOR NLP TASKS ... 195
Table 7. Accuracy results in paraphrase and textual entailment recognition datasets for different weighting schemes using SC [1 : 4]-spectra.
DATA SET c.idf.qidf idf.qidf qidf none idf c.idf c.qidf cMSR paraphrase 0.7252 0.7102 0.7064 0.7045 0.7128 0.7250 0.7232 0.7331
RTE-3 0.6688 0.6800 0.6825 0.6800 0.6713 0.6575 0.6575 0.6275Average 0.6970 0.6951 0.6945 0.6923 0.6920 0.6913 0.6903 0.6803
Table 8. Paraphrase recognition SC spectra results in MSR-paraphrase corpuscompared with published results.
Method accu. prec. recall F1 Used resourcesMalakasiotis [31] 0.762 0.794 0.868 0.829 WordNet, ML, dependency parserDas & Smith [10] 0.761 0.796 0.861 0.829 dependency grammars, MLWan et al. [42] 0.756 0.770 0.900 0.830 syntactic dependencies, MLFinch et al. [17] 0.750 0.766 0.898 0.827 machine translation, POS tagger, MLSC [1 : 4]-spectra (c) 0.733 0.739 0.931 0.824 surface text (this paper)SC [1 : 4]-spectra (c.idf.qidf ) 0.725 0.726 0.951 0.823 surface text (this paper)Lintean et al. [30] 0.724 0.739 0.903 0.672 dependency parser, WordNetQiu et al. [37] 0.720 0.725 0.934 0.816 syntactic parser, thesaurus, MLZhang & Patrick [45] 0.719 0.743 0.882 0.807 text canonicalization, MLsoftTFIDF [8] 0.716 0.717 0.955 0.819 surface text (this paper)Coreley & Mihalcea [9] 0.715 0.723 0.925 0.812 WordNet, BNC statisticsDo et al. [14] 0.711 0.748 0.861 0.800 WordNetcosine TF-IDF [38] 0.707 0.706 0.968 0.816 surface text (this paper)
6.2.5. Discussion. The results in Table 7 show that, even though c and qidf obtained the higheraccuracy using MSR paraphrase and RTE-3 respectively, in average the c.idf.qidf and idf.qidfcombination obtained the best results, i.e. average accuracies of 0.6970 and 0.6951 respectively.This result showed that adaptiveness combined at term and q-gram level is an effective approach.It is interesting to note that, even though the q-gram context weighting approach c obtainedthe lowest average accuracy, it contributed to the highest accuracy obtained by c.idf.qidf. Alsoit is important to note that, the adaptiveness at character q-gram level (qidf ) overcame theadaptiveness at term level (idf ). This result is remarkable because (to the best fo our knowledge)while the weighting at term level is a common practice, this is the first attempt to use weightingat character q-gram level on these tasks. Gravano et al. [19] tested bigrams and trigrams astokens instead of terms in the softTFIDF measure, but they obtained worse results using q-grams than using terms as tokens.
The comparison of the results obtained by SC [1 : 4]-spectra (Table 8) against the alreadypublished results for the MSR paraphrase data set are encouraging. The measure SC [1 : 4]-spectra (c), which is A static approach, obtained a result with a difference of only 0.029 inaccuracy versus the best results published to the date. Besides, our approach used considerablyless information and its computation and reproducibility is rather simple (linear complexity).Our static and adaptive baselines also outperformed the other tested baselines softTFIDF andcosine TF-IDF.
The proposed baselines used in the RTE-3 data set also obtained encouraging results. AsTable 9 shows, SC [1 : 4]-spectra (qidf ) which is an adaptive measure, outperformed most of theother approaches that also included “q-gram\word similarity” in their resources. In fact, ourmeasure only used that resource.
196 APPL. COMPUT. MATH., V.11, N.2, 2012
Table 9. Textual entailment recognition on RTE-3 data set.
First author (see [18]) accuracy q-gr
am\w
ord
sim
ilari
ty
Lex
ical
Rel
atio
n,W
ordN
et
Synt
acti
cM
atch
ing\
Alig
ning
Lar
geco
rpus
stat
isti
cs
Mac
hine
Lea
rnin
g
Log
ical
Infe
renc
e
Ana
phor
are
solu
tion
Ent
ailm
ent
Cor
pora
Hickl 0.8000 × × × × × ×SC [1 : 4]-spectra (qidf ) 0.6825 ×Adams 0.6700 × × × ×SoftTFIDF (idf ) 0.6638 ×Ferrandez 0.6563 × × ×Li 0.6400 × × ×cosine TF-IDF (idf ) 0.6325 ×Rodrigo 0.6312 × × × ×Roth 0.6262 × × ×Settembre 0.6262 × × ×Malakasiotis 0.6175 × ×Ferrandes 0.6150 × × ×Montejo-Raez 0.6038 × × × ×Burek 0.5500 × ×
7. Related work
The proposed weighting scheme that gives smaller weights to q-grams according to the lengthin characters of each term (c) is similar to the approach proposed in [11] that assigned a variablecost to character edit operations to Levenshtein edit distance. Using this approach in a textclassification task an improved performance was obtained versus the original edit distance. Thisapproach is equivalent to ours because the contribution of each q-gram to the soft cardinalitydepends on the total number of q-grams in the term, which in turn depends on the length incharacters of the term.
The approach of aggregating information from sets of subsequences of different sizes was re-cently proposed in [3] using time series sequences. Even though, the application of this approachwas considerably different, our approach of aggregating q-grams of different sizes is analogous.
Leslie et al. [27] proposed a k-spectrum kernel for comparing sequences using substrings ofk-length in a protein classification task. Similarly to them, we use the same metaphor to nameour approach.
8. Conclusions
We found that the proposed SC spectra method offers good baselines for various tasks ofnatural language processing. In particular, when using local context q-gram weights, the SCspectra approach provided a new static measure that outperformed other static baselines suchas the cosine similarity with binary vectors. This new static baseline, which only used thesurface information in the pair of texts being compared, obtained better performance than otheradaptive approaches that used weights collected from the entire text collection (e.g. cosine tf-idf ).
S. JIMENEZ, A. GELBUKH: BASELINES FOR NLP TASKS ... 197
For the paraphrase and textual entailment recognition tasks, which involve semantics, weproposed a SC spectra adaptive baseline. This new text similarity measure used a weightingmechanism at character q-gram level based on a combination of evidence from: i) the localcontext of the q-gram, ii) the idf weight of the term in which the q-gram occurred, and iii)idf -like weights at q-gram level. This combined weighting scheme obtained better results inboth tasks when compared with weighting approaches based on single evidence. In addition,the proposed adaptive measure was a fairly good baseline for other semantic measures thatused additional linguistic resources based on knowledge and/or large corpora. The proposedbaseline reached performances close to the best published results while outperformed manyother semantic approaches.
We have shown that the soft cardinality spectra (SC spectra) approach has the necessarycharacteristics to be a good baseline method: simplicity, speed (linear complexity in the lengthof the text being compared) and performance.
Acknowledgements
This research was funded in part by the Systems and Industrial Engineering Department,the Office of Student Wellfare of the National University of Colombia, Bogota, and throughta grant from the Colombian Department for Science, Technology and Innovation Colciencias,project 110152128465. The second author acknowledges support from Mexican Government(SNI, COFAA-IPN, SIP 20121823, CONACYT 50206-H) and CONACYT–DST India project122030 2011–2014 “Answer Validation through Textual Entailment”.
References
[1] Ion Androutsopoulos and Prodromos Malakasiotis. A survey of paraphrasing and textual entailment methods.J. Artif. Int. Res., 38(1):135–187, May 2010.
[2] Ricardo Baeza-Yates and Berthier Ribeiro-Neto. Modern Information Retrieval. Addison Wesley & ACMPress, 1999.
[3] Ildar Batyrshin, Raul Herrera-Avelar, Leonid Sheremetov, and Aleksandra Panova. Moving approximationtransform and local trend associations in time series data bases. In Ildar Batyrshin, Janusz Kacprzyk, LeonidSheremetov, and Lotfi Zadeh, editors, Perception-based Data Mining and Decision Making in Economicsand Finance, volume 36 of Studies in Computational Intelligence, pages 55–83. Springer Berlin / Heidelberg,2007.
[4] Mikhail Bilenko, Raymond Mooney, William Cohen, Pradeep Ravikumar, and Stephen Fienberg. Adaptivename matching in information integration. IEEE Intelligent Systems, 18(5):16–23, 2003.
[5] Surajit Chaudhuri, Kris Ganjam, Venkatesh Ganti, and Rajeev Motwani. Robust and efficient fuzzy matchfor online data cleaning. In Proceedings of the 2003 ACM SIGMOD international conference on managementof data, pages 313–324, San Diego, California, 2003. ACM.
[6] Peter Christen. A comparison of personal name matching: Techniques and practical issues. In Data MiningWorkshops, International Conference on, pages 290–294, Los Alamitos, CA, USA, 2006. IEEE ComputerSociety.
[7] Rudi Cilibrasi and Paul Vitanyi. Clustering by compression. IEEE Transactions on Information Theory,pages 1523–1545, 2005.
[8] William W Cohen, Pradeep Ravikumar, and Stephen E Fienberg. A comparison of string distance metrics forName-Matching tasks. In Proceedings of the IJCAI2003 Workshop on Information Integration on the WebIIWeb03, pages 73–78, August 2003.
[9] Courtney Corley and Rada Mihalcea. Measuring the semantic similarity of texts. In Proceedings of theACL Workshop on Empirical Modeling of Semantic Equivalence and Entailment, EMSEE ’05, pages 13–18,Stroudsburg, PA, USA, 2005. Association for Computational Linguistics.
[10] Dipanjan Das and Noah A. Smith. Paraphrase identification as probabilistic quasi-synchronous recognition.In Proceedings of the Joint Conference of the 47th Annual Meeting of the ACL and the 4th International JointConference on Natural Language Processing of the AFNLP: Volume 1 - Volume 1, ACL ’09, page 468–476,Stroudsburg, PA, USA, 2009. Association for Computational Linguistics.
[11] Colin de la Higuera and Luisa Mico. A contextual normalised edit distance. In 2008 IEEE 24th InternationalConference on Data Engineering Workshop, pages 354–361, Cancun, Mexico, 2008.
[12] Lee R. Dice. Measures of the amount of ecologic association between species. Ecology, pages 297–302, 1945.
198 APPL. COMPUT. MATH., V.11, N.2, 2012
[13] Thomas Dietterich. Ensemble methods in machine learning. In Multiple Classifier Systems, volume 1857 ofLecture Notes in Computer Science, pages 1–15. Springer Berlin / Heidelberg, 2000.
[14] Quang Xuan Do, Dan Roth, Mark Sammons, Yuancheng Tu, and V. G. Vinod Vydiswaran. Robust, light-weight approaches to compute lexical similarity. Technical report, 2010.
[15] Bill Dolan, Chris Quirk, and Chris Brockett. Unsupervised construction of large paraphrase corpora: exploit-ing massively parallel news sources. In Proceedings of the 20th international conference on ComputationalLinguistics, COLING ’04, Stroudsburg, PA, USA, 2004. Association for Computational Linguistics.
[16] Susan Duma. Latent semantic analysis. ARIST Review of Information Science and Technology, 2004.[17] Andrew Finch, Young-Sook Hwang, and Eiichiro Sumita. Using machine translation evaluation techniques
to determine sentence-level semantic equivalence. In Proceedings of the 3rd Int. Workshop on Paraphrasing,Jeju Island, Korea, 2005.
[18] Danilo Giampiccolo, Bernardo Magnini, Ido Dagan, and Bill Dolan. The third PASCAL recognizing textualentailment challenge. In Proceedings of the ACL-PASCAL Workshop on Textual Entailment and Paraphras-ing, RTE ’07, pages 1–9, Stroudsburg, PA, USA, 2007. Association for Computational Linguistics.
[19] L. Gravano, Panagiotis G. Ipeirotis, Nick Koudas, and Divesh Srivastava. Text joins in a RDBMS for webdata integration. 2003.
[20] Paul Jaccard. Etude comparative de la distribution florare dans une portion des alpes et des jura. Bulletinde la Societe Vaudoise des Sciences Naturelles, pages 547–579, 1901.
[21] Sergio Jimenez, Claudia Becerra, and Alexander Gelbukh. Soft cardinality: A parameterized similarity func-tion for text comparison. In In Proceedings of the 6th International Workshop on Semantic Evaluation (Se-mEval 2012), in conjunction with the First Joint Conference on Lexical and Computational Semantics (*SEM2012), Montreal, Canada, 2012.
[22] Sergio Jimenez, Fabio Gonzalez, and Alexander Gelbukh. Text comparison using soft cardinality. In EdgarChavez and Stefano Lonardi, editors, String Processing and Information Retrieval, volume 6393 of LNCS,pages 297–302. Springer Berlin Heidelberg, Berlin, Heidelberg, 2010.
[23] Sergio Jimenez Vargas and Alexander Gelbukh. SC spectra: A Linear-Time soft cardinality approximationfor text comparison. In Advances in Soft Computing, volume 7095 of Lecture Notes in Computer Science,pages 213–224. Springer Berlin / Heidelberg, 2011.
[24] H. Keskustalo, A. Pirkola, K. Visala, and E. Leppanen. Non-adjacent digrams improve matching of cross-lingual spelling variants. In LNCS 2857, pages 252–265, Manaus, Brazil, 2003.
[25] Karen Kukich. Techniques for automatically correcting words in text. ACM Computing Surveys, 24:377–439,December 1992.
[26] Yulia Ledeneva and Grigori Sidorov. Recent advances in computational linguistics. Informatica. InternationalJournal of Computing and Informatics, 34(1):3–18, 2010.
[27] Christina Leslie, Eleazar Eskin, and William Stafford Noble. The spectrum kernel: A string kernel for SVMprotein classification. In Biocomputing 2002 - Proceedings of the Pacific Symposium, pages 564–575, Kauai,Hawaii, USA, 2001.
[28] Vladimir I. Levenshtein. Binary codes capable of correcting deletions, insertions, and reversals. Soviet PhysicsDoklady, 10(8):707–710, 1966.
[29] Dekang Lin. An Information-Theoretic definition of similarity. In Proceedings of the Fifteenth InternationalConference on Machine Learning, pages 296–304. Morgan Kaufmann Publishers Inc., 1998.
[30] Mihai Lintean and Vasile Rus. Paraphrase identification using weighted dependencies and word semantics.In Proceedings of the Twenty-Second International FLAIRS Conference, 2009.
[31] Prodromos Malakasiotis. Paraphrase recognition using machine learning to combine similarity measures. InProceedings of the ACL-IJCNLP 2009 Student Research Workshop, ACLstudent ’09, pages 27–35, Strouds-burg, PA, USA, 2009. Association for Computational Linguistics.
[32] Alvaro E. Monge and Charles Elkan. The field matching problem: Algorithms and applications. In Proceedingof the 2nd International Conference on Knowledge Discovery and Data Mining (KDD-96), pages 267–270,Portland, OR, 1996.
[33] Erwan Moreau, Francois Yvon, and Olivier Cappe. Robust similarity measures for named entities matching.In Proceedings of the 22nd International Conference on Computational Linguistics - Volume 1, pages 593–600,Manchester, United Kingdom, 2008. Association for Computational Linguistics.
[34] Ted Pedersen, Siddharth Patwardhan, and Jason Michelizzi. WordNet::Similarity: measuring the relatednessof concepts. In Proceedings HLT-NAACL–Demonstration Papers, Stroudsburg, PA, USA, 2004. Associationfor Computational Linguistics.
[35] Jakub Piskorski and Marcin Sydow. Usability of string distance metrics for name matching tasks in polish.2008.
[36] Martin Porter. An algorithm for suffix stripping. Program, 3(14):130–137, October 1980.
S. JIMENEZ, A. GELBUKH: BASELINES FOR NLP TASKS ... 199
[37] Long Qiu, Min-Yen Kan, and Tat-Seng Chua. Paraphrase recognition via dissimilarity significance classifica-tion. In Proceedings of the 2006 Conference on Empirical Methods in Natural Language Processing, EMNLP’06, page 18–26, Stroudsburg, PA, USA, 2006. Association for Computational Linguistics.
[38] Gerard Salton, Andrew K. C. Wong, and Chung-Shu Yang. A vector space model for automatic indexing.Commun. ACM, 18(11):613–620, 1975.
[39] B Sarker. The resemblance coefficients in group technology: A survey and comparative study of relationalmetrics. Computers & Industrial Engineering, 30(1):103–116, January 1996.
[40] Grigori Sidorov, Alberto Barron-Cedeno, and Paolo Rosso. English-Spanish large statistical dictionary ofinflectional forms. In Proceedings of the Seventh International Conference on Language Resources and Evalu-ation (LREC’10), pages 277–281, Valletta, Malta, 2010. European Language Resources Association (ELRA).
[41] Julian R. Ullmann. A binary N-Gram technique for automatic correction of substitution, deletion, insertionand reversal errors in words. The Computer Journal, 20(2):141–147, January 1977.
[42] Stephen Wan, Mark Dras, Robert Dale, and Cecile Paris. Using Dependency-Based features to take thepara-farce out of paraphrase. In Proceedings of the Australasian Language Technology Workshop, Sydney,Australia, 2006.
[43] S. J Westerman, T. Cribbin, and J. Collins. Human assessments of document similarity. Journal of theAmerican Society for Information Science and Technology, 61(8):1535–1542, April 2010.
[44] William E Winkler. The state of record linkage and current research problems. Statistical Research Division,U.S. Census Bureau, 1999.
[45] Yitao Zhang and Jon Patrick. Paraphrase identification by text canonicalization. In Proceedings of the Aus-tralasian Language Technology Workshop, Sydney, Australia, 2005.
Sergio Jimenez was graduated from the Depart-ment of Systems and Computer Engineering inthe National University of Colombia (UniversidadNacional de Colombia), Bogota in 1993. After acareer of 12 years in software development andIT (information technology) marketing industry,he returned to his alma mater in 2006 to pur-sue a Masters in Systems Engineering and Com-puting obtaining a cum ladue master’s degree in2009. Since 2010, he has been PhD candidate atthe Universidad Nacional de Colombia, Bogota,Colombia.
Alexander Gelbukh received a PhD degree(Computer Science) from the All-Russian In-stitute of Scientific and Technical Information(VINITI) in 1995. Since 1997 he is a ResearchProfessor and Head of the Natural Language andText Processing Laboratory of the Center forComputing Research of the National PolytechnicInstitute (IPN), Mexico, since 1998 he is a Na-tional Researcher of Mexico, currently with ex-cellence level 2, and since 2000 he is an mem-ber of the Mexican Academy of Sciences. He isauthor of more than 400 publications, and edi-tor of more than 50 books and special issues ofjournals, in the areas of computational linguis-tics and artificial intelligence. See more detailson www.Gelbukh.com.