nasa technical note - dtic
TRANSCRIPT
NASA TECHNICAL NOTE
CM Reproduced From Besi Available Copy
I NASA TN D-2640
e r,:>
in fc ■; ü ilj
59^8 a
DISTRIBUTION STATEMENT A Approved for Public Release
Distribution Unlimited
EFFECT OF COMPONENT DIFFERENTIAL HARDNESSES ON ROLLING-CONTACT FATIGUE AND LOAD CAPACITY
by Erwin V. Zaretsky, Richard J. Parker,
and William J. Anderson
Lewis Research Center
Cleveland, Ohio 20010907 010 NATIONAL AERONAUTICS AND SPACE ADMINISTRATION • WASHINGTON, D. C. • MARCH 1965
NASA TN D-2640
EFFECT OF COMPONENT DIFFERENTIAL HARDNESSES ON
ROLLING-CONTACT FATIGUE AND LOAD CAPACITY
By Erwin V. Zaretsky, Richard J. Parker, and William J. Anderson
Lewis Research Center Cleveland, Ohio
NATIONAL AERONAUTICS AND SPACE ADMINISTRATION
For sale by the Office of Technical Services, Department of Commerce,
Washington, D.C. 20230 -- Price $1-00
EFFECT OF COMPONENT DIFFERENTIAL HARDNESSES ON
ROLLING-CONTACT FATIGUE AND LOAD CAPACITY
by Erwin V. Zaretsky, Richard J. Parker, and William J. Anderson
Lewis Research Center
SUMMARY
( The I The five-ball fatigue tester was used to study the effect of component hardness combinations on the fatigue life of rolling elements subjected to re- peated stresses applied in rolling contact. SAE*52100 steel balls j/from the ^'^ . , same heat of material were tempered to a range of Rockwell C hardnesses from bP^(:f:te^i) 59.7 to 66.4. Groups of balls having average Rockwell C hardnesses of 60.5, "TiUxf 63.2, and 65.2 were used as upper test balls and run with lower test balls of ^P-a., nominal Rockwell C hardnesses of 60, 62, 63, 65, and 66. Nominal test condi- tions included an average race temperature of 150° F, 800,000-psi maximum (Hertz) compressive stress, and a highly purified naphthenic mineral oil lubri- cant. . The fatigue life results were compared with component hardness combina- tions, plastic deformation of the upper test ball, retained austenite, grain size, and contact temperature. The following results were obtained.
In general, for a specific upper test ball hardness, the rolling-contact fatigue life and the load-carrying capacity of the test system increased with increasing lower test ball hardness to an intermediate hardness where a peak life was attained. For further increases in hardness of the lower balls, sys- tem life and capacity decreased. The peak life hardness combination occurred for each of the three lots of upper test balls where the hardness of the lower test balls was approximately one to two Rockwell C hardness points greater than the upper test ball. The improvement in load capacity at the intermediate hardness where a peak life was observed was as much as 130 percent greater than that of the lowest hardness.
There was no apparent correlation between fatigue life and material prop- erties such as retained austenite and grain size. Additionally, no correlation existed between the resistance to plastic deformation between elements of dif- ferent hardnesses and fatigue life. Further, no correlation existed between the rolling-element fatigue life and the temperatures measured at the edge of the contact zone for each hardness combination.
Only minor differences in the metallographic structure were observed in the test specimens over the hardness range considered. The softer balls tended to have more and larger fine (precipitated) carbides and greater definition of/
fo.t««|rfll",
tempered martensite. The amount of retained austenite decreased with lower hardness (higher tempering temperatures). * , ^
—4 '' ' ,\ '' INTRODUCTION
Aerospace applications demand high reliability for rolling elements such as gears, cams, and rolling-element hearings. Much research has been directed toward increasing the fatigue life of rolling-element bearings and gears. Fa- tigue testing has been conducted with bench-type component testers as well as with full-scale bearings and gears. A general conclusion drawn from much of these data is that material hardness plays an important role in determining rolling-contact fatigue life.
It is reported in reference 1 that fatigue life increased with increasing hardness for four groups of AISI M-50 steel balls having Rockwell C hardnesses of 56 to 63.5 run in a one-ball fatigue tester at 400° F. Further research (refs. 2 to 4) indicated that life increased with increasing hardness for l/2- inch-diameter ball specimens of four materials, AISI M-l, AISI M-50, Halmo, and WB-49 tested in the NASA spin rig and five-ball fatigue testers. No maximum fatigue life or load capacity at intermediate hardness values was observed. These results were substantiated with bearings made of SAE 52100 having Rock- well C hardnesses up to 63; for these bearings, fatigue life increased with increasing hardness (ref. 5). These findings, however, were contrary to the conclusions reached in reference 6 wherein a maximum fatigue life was predicted at an intermediate hardness level for AISI M-50.
It was found in references 7 and 8 that plastic deformation can reduce the contact stress as much as 10 percent at theoretical maximum Hertz stress levels between 600,000 and 800,000 psi in the five-ball fatigue tester. Therefore, where plastic deformation does occur under rolling contact, the calculated Hertz stress may only be approximate (refs. 7 and 9). Material hardness or re- sistance to plastic deformation has a two-fold effect on fatigue life: as hardness is decreased, fatigue life decreases because of an inherent decrease in material strength, but at the same time resistance to plastic deformation and, thus, the contact stress decrease. This latter effect would increase fa- tigue life. The two effects are, therefore, acting in opposition to each other.
I The research reported herein was undertaken to experimentally determine: (l) whether a maximum system fatigue life does exist at some optimum component hardness combination, (2) whether a relation exists among contact temperature, component hardness, and fatigue life, (3) whether a relation exists among plastic deformation, relative hardness of system components, and fatigue life, and (4) whether metallurgical factors, such as retained austenite and grain size, affect fatigue life. J ■/, , / -c.-—
Tests were conducted in the five-ball fatigue tester with upper test balls having average Rockwell C hardnesses of 60.5, 63.2, and 65.2 and lower test balls from five separate groups of 59.7 to 66.4 (Rockwell C). The lower test balls were positioned by a separator in an outer race having a Rockwell C hard- ness of 62 to 63. The system was considered failed if a fatigue spall occurred

on any of these components. Test conditions were a maximum initial Hertz stress of 800,000 psi, a shaft speed of 10,000 rpm, a contact angle of 30°, and a race temperature of 150° to 165° F with a highly refined naphthenic mineral oil as the lubricant. All experimental results were obtained with a single batch of material and lubricant.
BACKGROUND
The references relating material hardness to rolling-contact fatigue life are limited in number. Deformation and wear tests reported in references 2 to 4 indicate that resistance to permanent plastic deformation increases with increasing hardness. Since fatigue life is a function of hardness, it was thus concluded that a qualitative correlation exists between fatigue life and resis- tance to plastic deformation. Many factors, however, that contribute to pene- tration hardness may not necessarily contribute to the resistance to plastic deformation under rolling contact. The factors that can affect penetration hardness are among others: (l) the amount of carbon in solid solution, (2) the dispersion of carbide phases, (3) the amount of retained austenite, (4) the amount of bainite, (5) the strain caused by volume changes when austenite transforms to martensite, and (6) the amount and type of new phases forming. Items (l) to (4) can be controlled to a great extent by heat treatment. If mechanoelastic martensitic transformation is assumed, however, items (5) and (6) are, in most cases, a function of the contact stress due to the hardness indentor or to the two "geometries in contact.
It has been indicated by some investigators that for a given hardness in bearing steels, the amount of plastic deformation increases as the amount of retained austenite increases (refs. 10 and ll). A correlation was found be- tween the amount of plastic deformation and retained austenite in SAE 52100 bearing steel, which was kept at a relatively constant hardness; this material was given different heat treatments to vary its retained austenite content from 0 to 20 percent (ref. 10). Additionally, it was reported in references 2 and 11 that the resistance to plastic deformation appears to be a direct func- tion of hardness for a given material. The contact stress at which the onset of plastic deformation occurs, however, appears to be related to the amount of retained austenite present. As was reported in reference 11 for SAE 52100 steel ball specimens having Rockwell C hardnesses of 58 to 64, the stress at which plastic deformation initiates was increased'from 160,000 to 373,000 psi as the retained austenite content decreases from 18.4 to 3.9 percent (ref. 11).
It has been shown that where the amount of bainite is varied from 10 to 20 percent, increased resistance to permanent plastic deformation as well as increased fatigue life occurs (private communication from E. N. Bamberger, General Electric Company, Cincinnati, Ohio). As the amount of bainite is in- creased from 20 to 40 percent, fatigue life and the resistance to permanent plastic deformation decreases. These results, as do those reported in refer- ences 2 to 4, indicate a correlation between fatigue life and the resistance of the material to plastic deformation. Since the variation in heat treatment or hardness will affect nearly all material variables to different degrees, it is very difficult to measure the effect of only one variable when the others can-
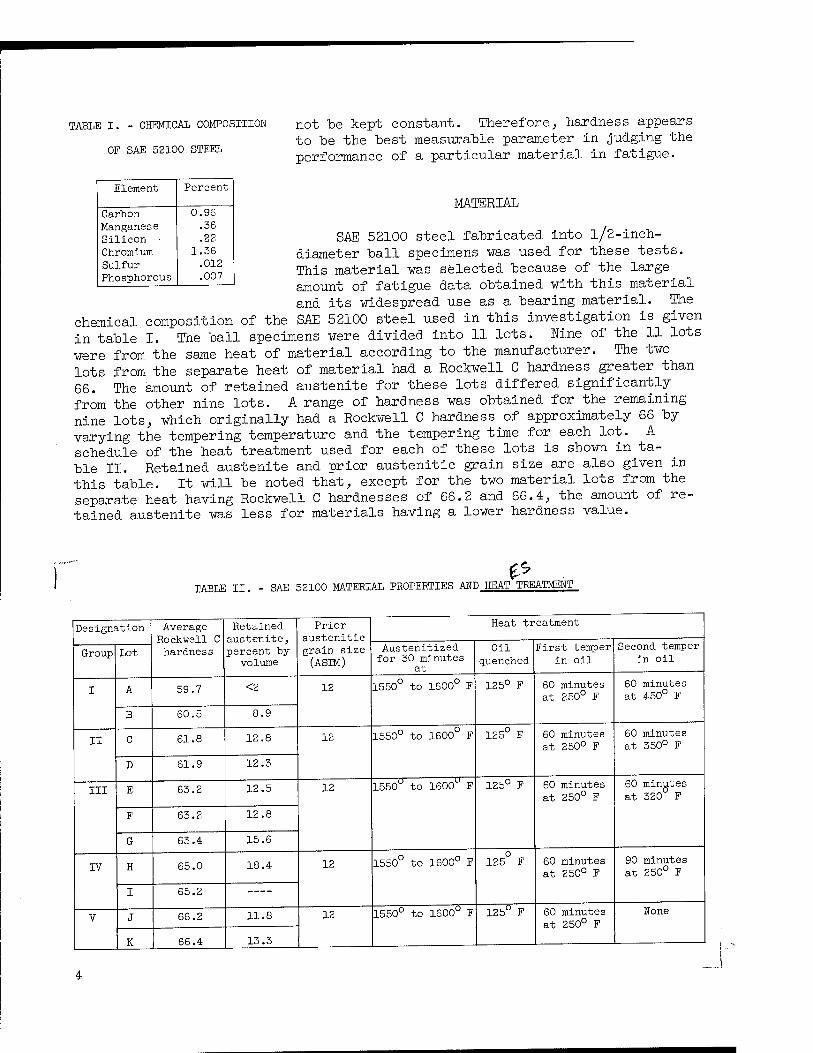
TABLE I. - CHEMICAL COMPOSITION
OF SAE 52100 STEEL
Element Percent
Carbon 0.96 Manganese .36 Silicon • .22 Chromium 1.36 Sulfur .012 Phosphorous .007
not be kept constant. Therefore,, hardness appears to be the best measurable parameter in judging the performance of a particular material in fatigue.
MATERIAL
SAE 52100 steel fabricated into l/2-inch- diameter ball specimens was used for these tests. This material was selected because of the large amount of fatigue data obtained with this material and its widespread use as a bearing material. The
chemical.composition of the SAE 52100 steel used in this investigation is given in table I. The ball specimens were divided into 11 lots. Nine of the 11 lots were from the same heat of material according to the manufacturer. The two lots from the separate heat of material had a Rockwell C hardness greater than 66. The amount of retained austenite for these lots differed significantly from the other nine lots. A range of hardness was obtained for the remaining nine lots, which originally had a Rockwell C hardness of approximately 66 by varying the tempering temperature and the tempering time for each lot. A schedule of the heat treatment used for each of these lots is shown in ta- ble II. Retained austenite and prior austenitic grain size are also given in this table. It will be noted that, except for the two material lots from the separate heat having Rockwell C hardnesses of 66.2 and 66.4, the amount of re- tained austenite was less for materials having a lower hardness value.
£5 TABLE II. - SAE 52100 MATERIAL PROPERTIES AMD HEAT TREATMENT
Designation Average Rockwell C hardness
Retained austenite, percent by
volume
Prior austenitic grain size (ASTM)
Heat treatment
Group Lot Austenitized for 30 minutes
at
Oil quenched
First temper in oil
Second temper in oil
I A 59.7 <2 12 1550° to 1600° F 125° F 60 minutes at 250° F
60 minutes at 450° F
B 60.5 8.9
II C 61.8 12.8 12 1550° to 1600° F 125° F 60 minutes at 250° F
60 minutes at 350° F
D 61.9 12.3
III E 63.2 12.5 12 1550° to 1600° F 125° F 60 minutes at 250° F
60 minutes at 320 F
F 63.2 12.8
G 63.4 15.6
IV H 65.0 18.4 12 1550° to 1600° F 0
125 F 60 minutes at 250° F
90 minutes at 250° F
I 65.2
V J 66.2 11.8 12 1550° to 1600u F 125° F 60 minutes at 250° F
None
K 66.4 13.3
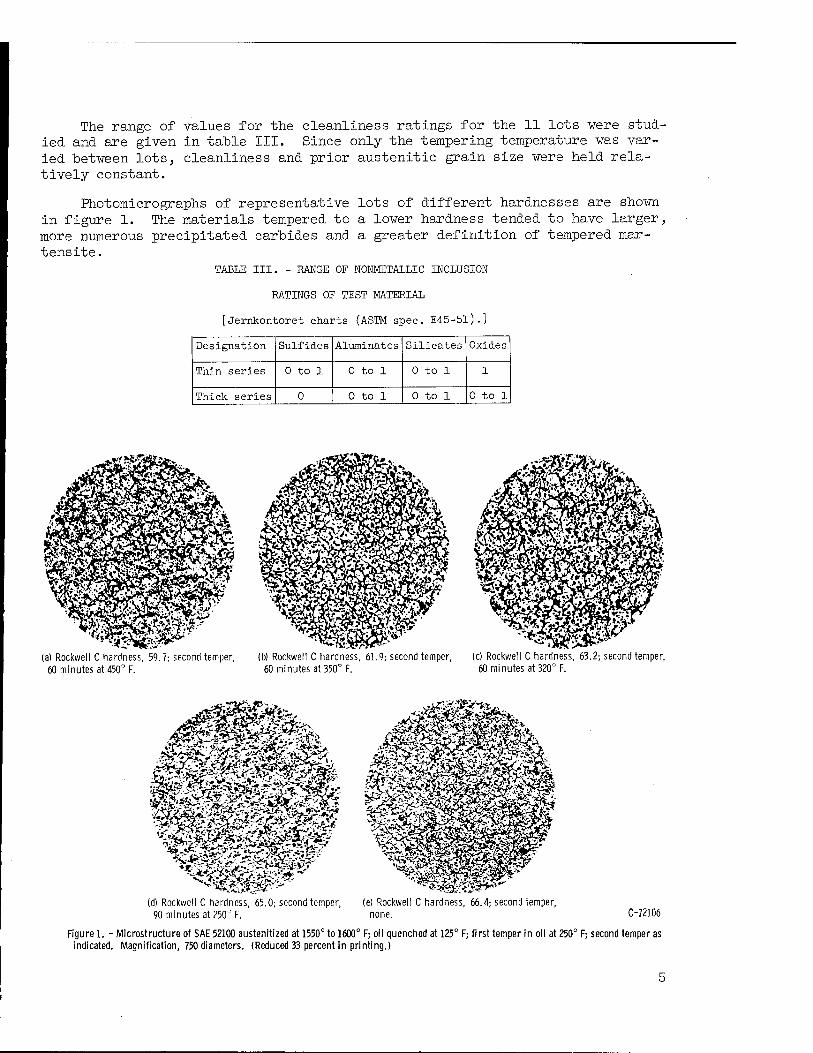
The range of values for the cleanliness ratings for the 11 lots were stud- ied and are given in table III. Since only the tempering temperature was var- ied between lots, cleanliness and prior austenitic grain size were held rela- tively constant.
Photomicrographs of representative lots of different hardnesses are shown in figure 1. The materials tempered to a lower hardness tended to have larger, more numerous precipitated carbides and a greater definition of tempered mar- tensite.
TABLE III. - RANGE OF NONMETALLIC INCLUSION
RATINGS OF TEST MATERIAL
[Jernkontoret charts (ASTM spec. E45-51).]
Designation Sulfides Aluminates Silicates Oxides
Thin series 0 to 1 0 to 1 0 to 1 1
Thick series 0 0 to 1 0 to 1 0 to 1
(a) Rockwell C hardness, 59.7; second temper, 60 minutes at 450° F.
(b) Rockwell C hardness, 61.9; second temper, (c) Rockwell C hardness, 63.2; second temper, 60 minutes at 350° F. 60 minutes at 320° F.
mmm? (d) Rockwell C hardness, 65.0; second temper,
90 minutes at 250° F. (e) Rockwell C hardness, 66.4; second temper,
none. C-72106
Figure 1. - Microstructure of SAE 52100 austenitized at 1550° to 1600° F; oil quenched at 125° F; first temper in oil at 250° F; second temper as indicated. Magnification, 750 diameters. (Reduced 33 percent in printing.)
APPARATUS
Five-Ball Fatigue Tester
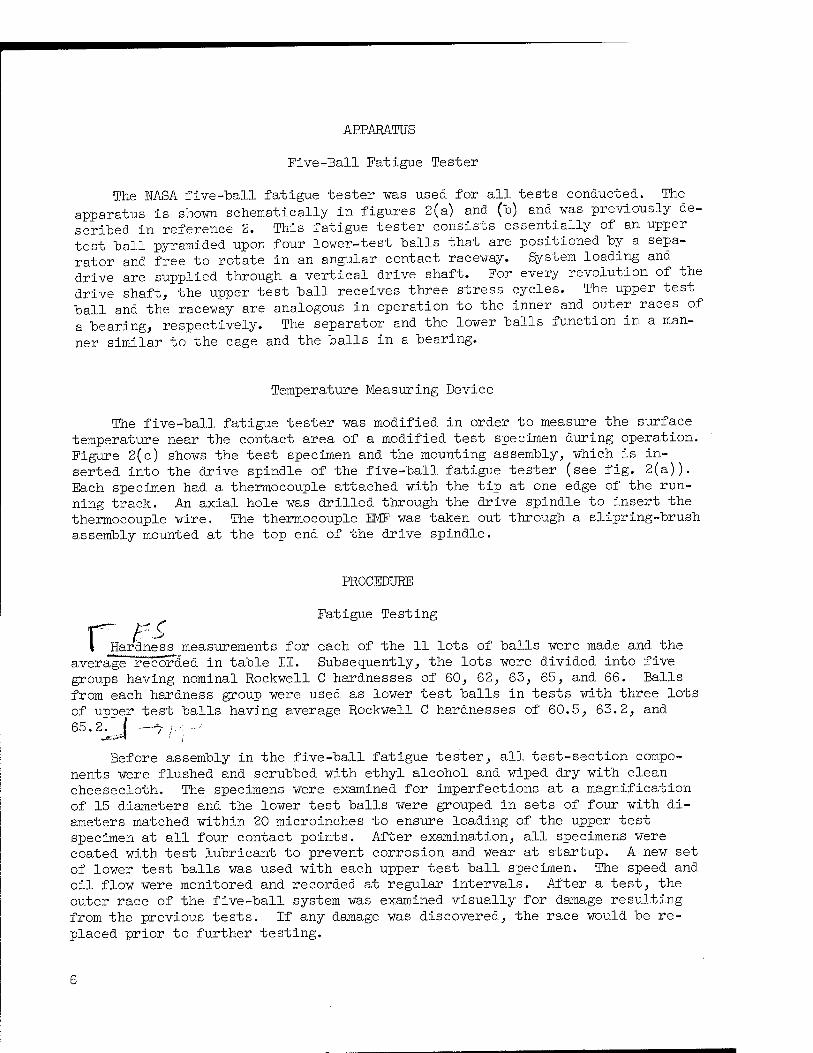
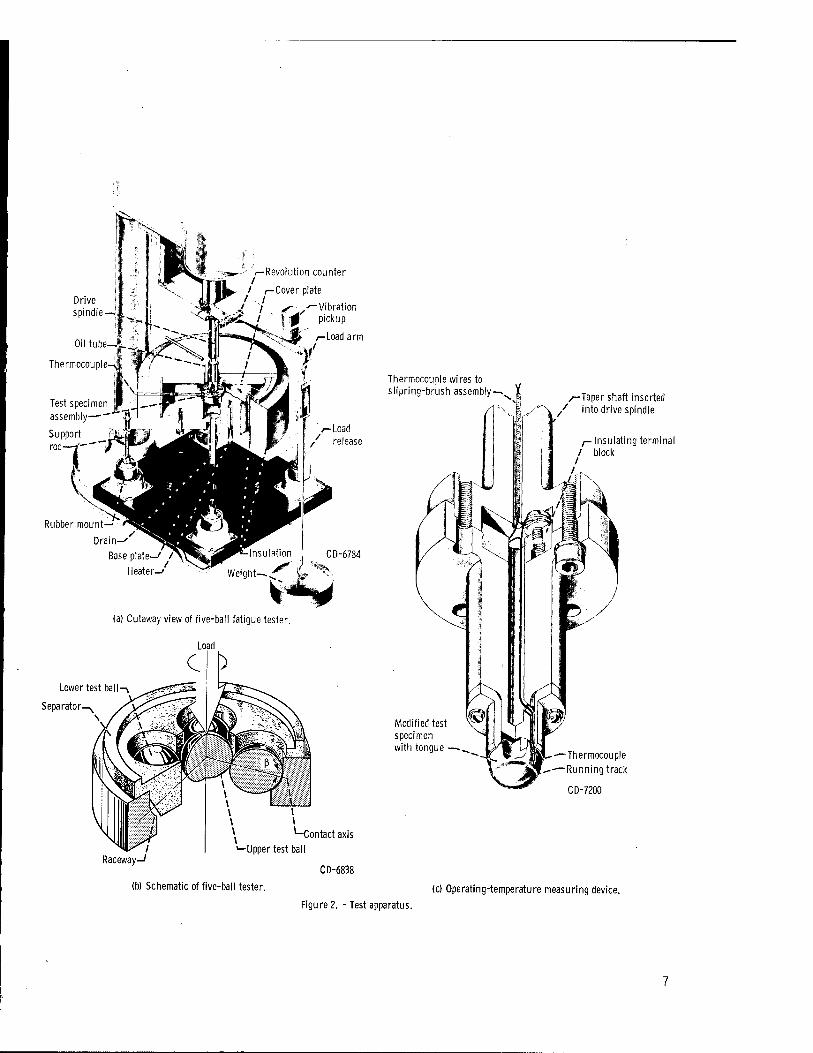
The NASA five-ball fatigue tester was used for all tests conducted. The apparatus is shown schematically in figures 2(a) and (b) and was previously de- scribed in reference 2. This fatigue tester consists essentially of an upper test hall pyramided upon four lower-test halls that are positioned by a sepa- rator and free to rotate in an angular contact raceway. System loading and drive are supplied through a vertical drive shaft. For every revolution of the drive shaft, the upper test ball receives three stress cycles. The upper test ball and the raceway are analogous in operation to the inner and outer races of a bearing, respectively. The separator and the lower balls function in a man- ner similar to the cage and the balls in a bearing.
Temperature Measuring Device
The five-ball fatigue tester was modified in order to measure the surface temperature near the contact area of a modified test specimen during operation. Figure 2(c) shows the test specimen and the mounting assembly, which is in- serted into the drive spindle of the five-ball fatigue tester (see fig. 2(a)). Each specimen had a thermocouple attached with the tip at one edge of the run- ning track. An axial hole was drilled through the drive spindle to insert the thermocouple wire. The thermocouple EMF was taken out through a slipring-brush assembly mounted at the top end of the drive spindle.
c
PROCEDURE
Fatigue Testing
t Hardness measurements for each of the 11 lots of balls were made and the averäge~recorded in table II. Subsequently, the lots were divided into five groups having nominal Rockwell C hardnesses of 60, 62, 63, 65, and 66. Balls from each hardness group were used as lower test balls in tests with three lots of upper test balls having average Rockwell C hardnesses of 60.5, 63.2, and 65.2. ] -^j-,:,-'
Before assembly in the five-ball fatigue tester, all test-section compo- nents were flushed and scrubbed with ethyl alcohol and wiped dry with clean cheesecloth. The specimens were examined for imperfections at a magnification of 15 diameters and the lower test balls were grouped in sets of four with di- ameters matched within 20 microinches to ensure loading of the upper test specimen at all four contact points. After examination, all specimens were coated with test lubricant to prevent corrosion and wear at startup. A new set of lower test balls was used with each upper test ball specimen. The speed and oil flow were monitored and recorded at regular intervals. After a test, the outer race of the five-ball system was examined visually for damage resulting from the previous tests. If any damage was discovered, the race would be re- placed prior to further testing.
Drive spindle—'
Oil tube-4
Thermocouple
Test specimen assembly-—"*"■"&
-Revolution counter
/ r-Cover plate
&*<l. IP Picku
Rubber mount
Vibration P
Load arm
Load release
Base plate-/ /
Heater—'
(a) Cutaway view of five-ball fatigue tester.
CD-6784
Load
c )
Lower test ball-\ sS *f^T~~^^
Separator^ /
■\t£&W' . /VIK^ .,~ ^ii'-^Jo
iü »f^y m L_n
N \^iiiiiip ill
WKß t I '—Contact axis
Raceway-/ »-Upper test ball
CD-6838
(b) Schemat 'c of five -ball tester.
Thermocouple wires to slipring-brush assembly-^ J
/-Taper shaft inserted \ / into drive spindle
lating terminal
Modified test specimen with tongue —
rmocouple
track
CD-7200
(c) Operating-temperature measuring device.
Figure 2. - Test apparatus.
, Fatigue tests were conducted in the five-ball fatigue tester at a maximum Hertz stress of 800,000 psi, a drive.shaft speed of 10,000 rpm, and a contact angle of 30° (indicated by ß in fig. 2("b))> The race temperature stabilized at 150° to 165° F with no heat added. The stress developed in the contact area was calculated by using the Hertz formulas given in reference 12^]
Method of Presenting Fatigue Results
(Total running time for each specimen (or test system) was recorded and converted into total stress cycles. The statistical methods of reference 13 for analyzing rolling-contact fatigue data were used to obtain a log-log plot of the reciprocal of the probability of survival as a function of the log of stress cycles to failure (Weibull coordinates). For convenience, the ordinate is graduated in statistical percent of specimens failed. From these plots the number of stress cycles necessary to fail any given portion of the specimen group may be determined. Where high reliability is of paramount importance, the main interest is in early failures. For comparison purposes the 10-percent life on the Weibull plot was used. The 10-percent life is the number^of stress cycles within which 10 percent of the specimens can be expected to fail) this 10-percent life is equivalent to a 90 percent probability of survivalJ| The _,,,; (p failure index given with each plot indicates the number of specimens! of those tested.
*iled! out
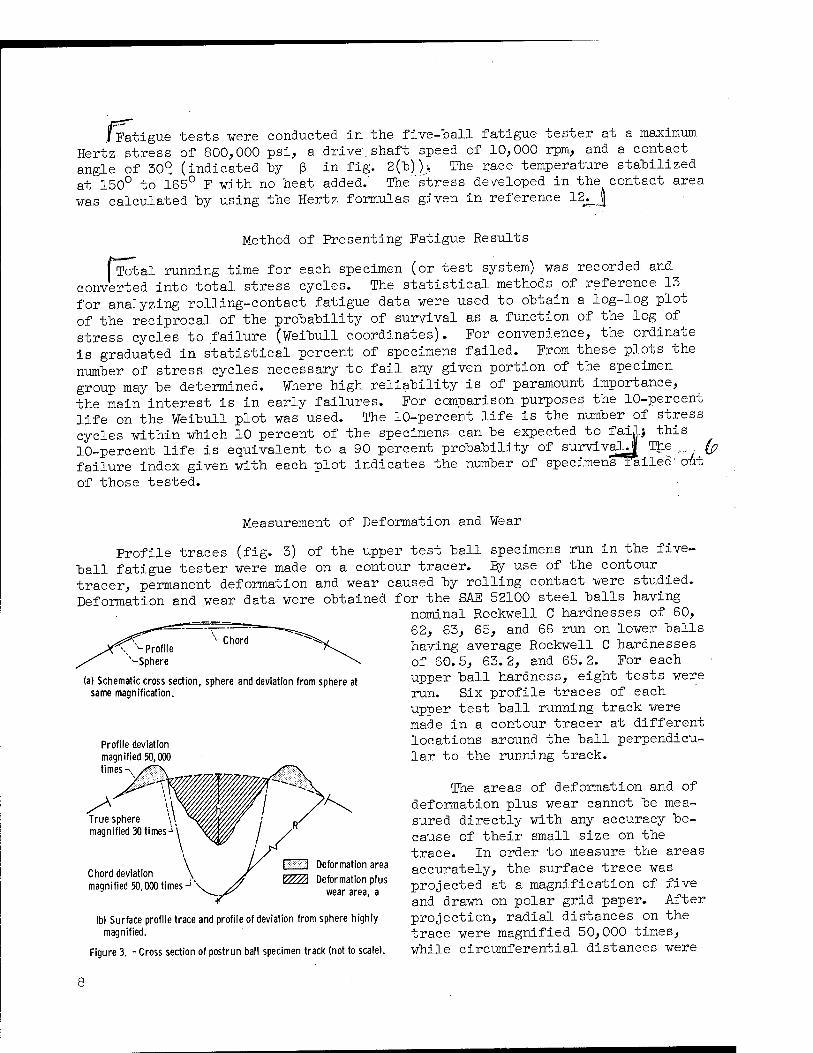
Measurement of Deformation and Wear
Profile traces (fig. 3) of the upper test ball specimens run in the five- ball fatigue tester were made on a contour tracer. By use of the contour tracer, permanent deformation and wear caused by rolling contact were studied. Deformation and wear data were obtained for the SAE 52100 steel balls having
nominal Rockwell C hardnesses of 60, ~ 62, 63, 65, and 66 run on lower balls
having average Rockwell C hardnesses of 60.5, 63.2, and 65.2. For each upper ball hardness, eight tests were run. Six profile traces of each upper test ball running track were made in a contour tracer at different locations around the ball perpendicu- lar to the running track.
The areas of deformation and of deformation plus wear cannot be mea- sured directly with any accuracy be- cause of their small size on the trace. In order to measure the areas accurately, the surface trace was projected at a magnification of five and drawn on polar grid paper. After projection, radial distances on the trace were magnified 50,000 times, while circumferential distances were
(a) Schematic cross section, sphere and deviation from sphere at same magnification.
Profile deviation magnified 50,000 times-
True sphere magnified 30 times
Chord deviation \ magnified 50,000 times -"'
Deformation area ZffZR Deformation plus
wear area, a
(b) Surface profile trace and profile of deviation from sphere highly magnified.
Figure 3. - Cross section of postrun ball specimen track (not to scale).
magnified 30 times. The surface trace -would then look as shown schematically in figure 3(h). The areas of deformation and of deformation plus wear were measured from these traces hy use of a planimeter. The wear area is the dif- ference hetween these two areas (area of deformation plus wear minus area of deformation). The depth of the track h was also measured.
RESULTS AMD DISCUSSION
Life Results
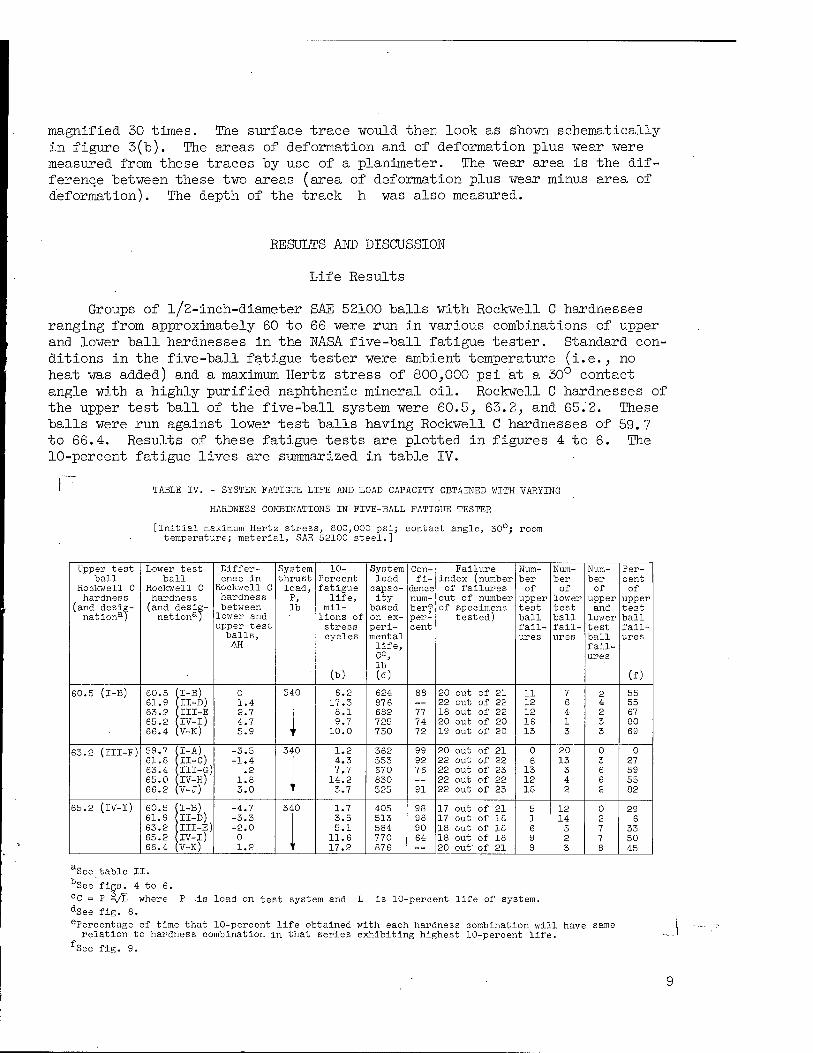
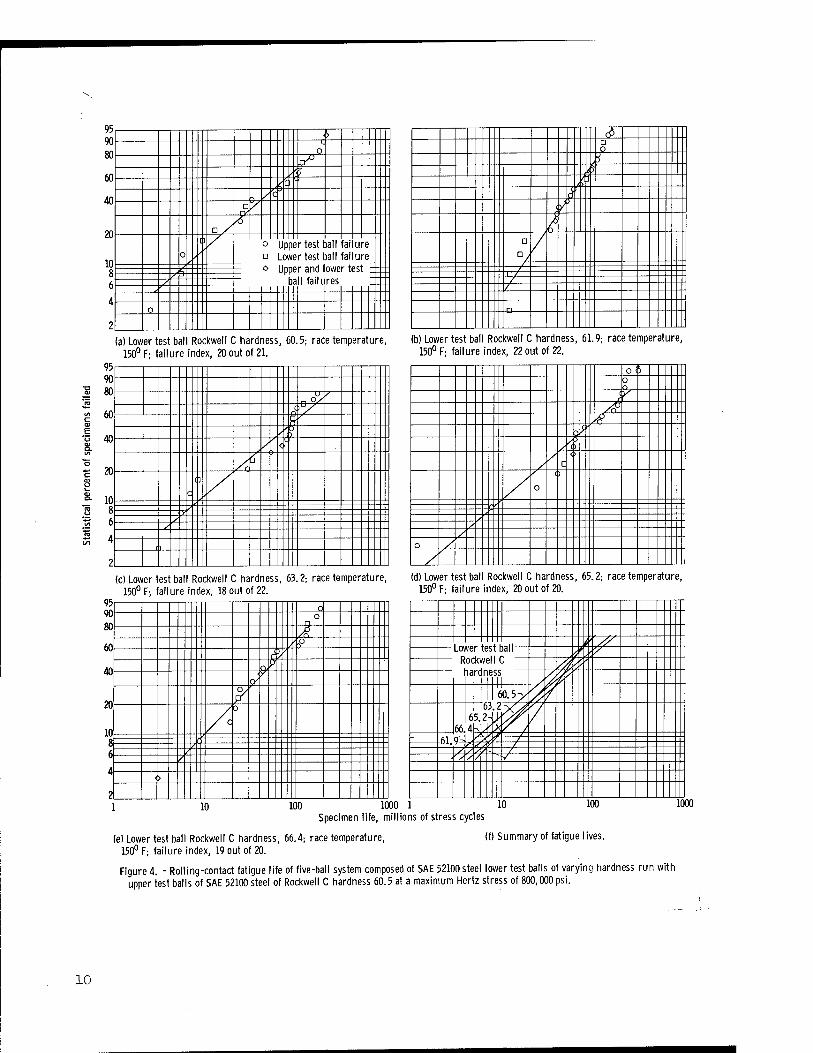
Groups of l/2-inch-diameter SAE 52100 halls with Rockwell C hardnesses ranging from approximately 60 to 66 were run in various combinations of upper and lower hall hardnesses in the NASA five-hall fatigue tester. Standard con- ditions in the five-hall fatigue tester were ambient temperature (i.e., no heat was added) and a maximum Hertz stress of 800,000 psi at a 30° contact angle with a highly purified naphthehic mineral oil. Rockwell C hardnesses of the upper test ball of the five-ball system were 60.5, 63.2, and 65.2. These balls were run against lower test balls having Rockwell C hardnesses of 59. 7 to 66.4. Results of these fatigue tests are plotted in figures 4 to 6. The 10-percent fatigue lives are summarized in table IV.
' TABLE IV. - SYSTEM FATIGUE LIFE AND LOAD CAPACITY OBTAINED WITH VARYING
HARDNESS COMBINATIONS IN FIVE-BALL FATIGUE TESTER
[Initial maximum Hertz stress, 800,000 psi; contact angle, 30°; room temperature; material, SAE 52100 steel.]
Upper test Lower test Differ- System 10- System Con- Failure Num- Num- Num- Per- ball ball ence in thrust Percent load fi- index (number ber ber ber cent
Rockwell C Rockwell C Rockwell C load, fatigue capac- dence of failures of of of of hardness hardness hardness P, life, ity num- out of number upper lower upper upper
(and desig- nation^
(and desig- nation3;
between lb mil- based ber® of specimens test test and test lower and lions of on ex- per- tested) ball ball lower ball upper test stress peri- cent fail- fail- test fail- balls, cycles mental ures ures ball ures AH
(D)
life, cc, lb (d)
fail- ures
(f)
60.5 (I-B) 60.5 (I-B) 0 340 6.2 624 88 20 out of 21 11 7 2 55 61.9 (II-D) 1.4 17.3 876 — 22 out of 22 12 6 4 55 63.2 (III-E 2.7 8.1 682 77 18 out of 22 12 4 2 67 65.2 (IV-I) 4.7 9.7 725 74 20 out of 20 16 1 3 80 66.4 (V-K) 5.9 ' ' 10.0 730 72 19 out of 20 13 3 3 69
63.2 (III-F) 59.7 (I-A) -3.5 340 1.2 362 99 20 out of 21 0 20 0 0 61.8 (II-C) -1.4 4.3 553 92 22 out of 22 6 13 3 27 63.4 (III-G) .2 7.7 670 76 22 out of 23 13 3 6 59 65.0 (IV-H) 1.8 14.2 830 — 22 out of 22 12 4 6 55 66.2 (V-J) 3.0 i f 3.7 525 91 22 out of 23 18 2 2 82
65.2 (IV-I) 60.5 (I-B) -4.7 340 1.7 405 98 17 out of 21 5 12 0 29 61.9 (II-D) -3.3 3.5 513 98 17 out of 18 1 14 2 6 63.2 (III-E) -2.0 5.1 584 90 18 out of 18 6 5 7 33 65.2 (IV-I) 0 11.6 770 64 18 out of 18 9 2 7 50 66.4 (V-K) 1.2 ' \ 17.2 876 — 20 out of 21 9 3 8 45
aSee table II. bSee figs. 4 to 6. °C = P VL where P -is load on test system and L is 10-percent life of system. dSee fig. 8. Percentage of time that 10-percent life obtained with each hardness combination will have same relation to hardness combination in that series exhibiting highest 10-percent life.
fSee fig. 9.
•g
e 'o
5
> 0
A> / i v
/c D
C /
o
11 / o Upper test ball fai □ Lower test ball fai
ure ure
o Upper and lower test -:: 7" 3"
y ball failures f '
o
4 D 0 j
A* i] $ / /
D n ,
---jLY—
(a) Lower test ball Rockwell C hardness, 60.5; race temperature, (b) Lower test ball Rockwell C hardness, 61.9; race temperature, 150° F; failure index, 20 out of 21. 150° F; failure index, 22 out of 22.
95 r 90-
60-
40-
* 20-
10- 8:
6-
4-
OÖ ü 0, u.
n °/ Cl/ Ar .rr
5 < (1
/ / <•
c
i: / / o
<)
— ,2 --' ' / / /
0
(c) Lower test ball Rockwell C hardness, 63.2; race temperature, (d) Lower test ball Rockwell C hardness, 65.2; race temperature, 150° F; failure index, 18 out of 22. 150° F; failure index, 20 out of 20.
95 90
80
o o
rj £
60 A° r°/
40
20
in
o,
/a
f.
4 ■ >
2
r // Luwer K
Rockwf
st ball ,-y II C '{// ' laran
I ess
V y
n 1 60.5^"
66
6 65.2 4K,j
3.2-y^ '/
61 V >* ~i~ ^z| * / / - / ' / // ■■■/
10 100 1000 1 Specimen life, millions of stress cycles
10 100 1000
(f) Summary of fatigue lives. (e) Lower test ball Rockwell C hardness, 66.4; race temperature, 150° F; failure index, 19 out of 20.
Figure 4. - Rolling-contact fatigue life of five-ball system composed of SAE 52100 steel lower test balls of varying hardness run with upper test balls of SAE 52100 steel of Rockwell C hardness 60.5 at a maximum Hertz stress of 800,000 psi.
10
95 90 3_ 6
80 D
60 " ^ [p
40 §' c 1 /
o .
20
10
□ Lower test ball fail ur i
c J
1
o Uf per a ball f
nd lower t ailure
est
8 6 A
2
1 : 6
< Cl
..f.7 . nc r/
/u
12
n
(a) Lower test ball Rockwell C hardness, 59.7; race temperature, 155° F; failure index, 20 out of 21.
(b) Lower test ball Rockwell C hardness, 61.8; race temperature, 150° F; failure index, 22 out of 22.
Z 20
8. 10
O 6 0
<> 8 J{
*'' />. t A /° D/
/o
ii" /
=00.5 7
(c) Lower test ball Rockwell C hardness, 63.4; race temperature, 165° F; failure index, 22 out of 23.
(d) Lower test ball Rockwell C hardness, 65.0; race temperature, 150° F; failure index, 22out of 22.
o 0
. 0
°A a U/
0,
/ /
10 100 1000 1 Specimen life, millions of stress cycles
1 r t «t ha | Rockwell C
/ / 1 1 <?'
59.W p]6
' / 6 2-Y* *63. 4
/- 65.0
10 100
(f) Summary of fatigue lives.
1000
(e) Lower test ball Rockwell C hardness, 66.2; race temperature, 155° F; failure index, 22 out of 8.
Figure 5. - Rolling-contact fatigue life of five-ball system composed of SAE 52100 steel lower test balls of varying hardness run with upper test balls of SAE 52100 steel of Rockwell C hardness 63.2 at a maximum Hertz stress of 800,000 psi.
11
, -, / / \
D °- 7
C "/ [ s
3 • o Upper test ball failure □ Lower test ball failure o Upper and lower test
ball failure 0
s
P
< >
□ n /
13
C
L
(a) Lower test ball Rockwell C hardness, 60.5; race temperature, 150° F; failure index, 17 out of 21.
(b) Lower test ball Rockwell C hardness, 61.9; race temperature, 145° F; failure index, 17 out of 18.
8.
° 20
S. 10 ro 8 S 6
£ 4
r, * .Ä < 0
-e / ^ k
4 * 0/ 7>
o/ ^ /% D
[]
rrTT r-— /
Ü
95
(c) Lower test ball Rockwell C hardness 150° F; failure index, 18 out of 18.
63.2; race temperature,
6 90 o 80
/* 60 ■§ ,= ° 40 ' 5
,vd
20
10
D / 0
--2j /
8 —-*- 6 / / 4
o
?
(d) Lower test ball Rockwell C hardness, 65.2; race temperature, 150° F; failure index, 18 out of 18.
L ertes t ball / / ' ,','
hardne "V
ss AS
9-
A /
61 \K / / 63. P1 k t-6
65. 6.1
2
—- ■y— - -- A -f—
10 100 1000 1 10 Specimen life, millions of stress cycles
100 1000
(e) Lower test ball Rockwell C hardness, 66.4; race temperature, 150° F; failure index, 20 out of 21.
(f) Summary of fatigue lives.
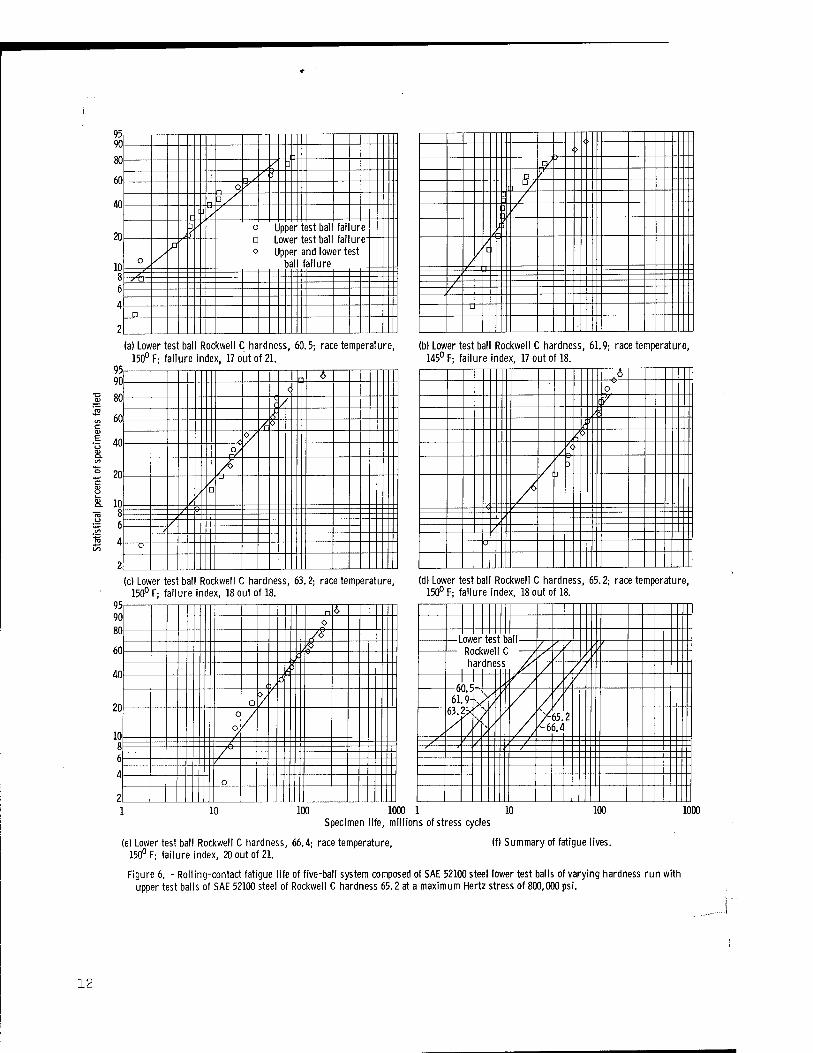
Figure 6. - Rolling-contact fatigue life of five-ball system composed of SAE 52100 steel lower test balls of varying hardness run with upper test balls of SAE 52100 steel of Rockwell C hardness 65.2 at a maximum Hertz stress of 800,000 psi.
12
20
•S 10
/u
A. • Upper test ball
0/ Rockwell C
0/ 0
hardness
60.5 c
< 63.2 65.2
/& / Soft »r lower >alls Harder lower balls
1-4-3-2-1012345 Difference in Rockwell C hardness between lower test balls and upper test ball
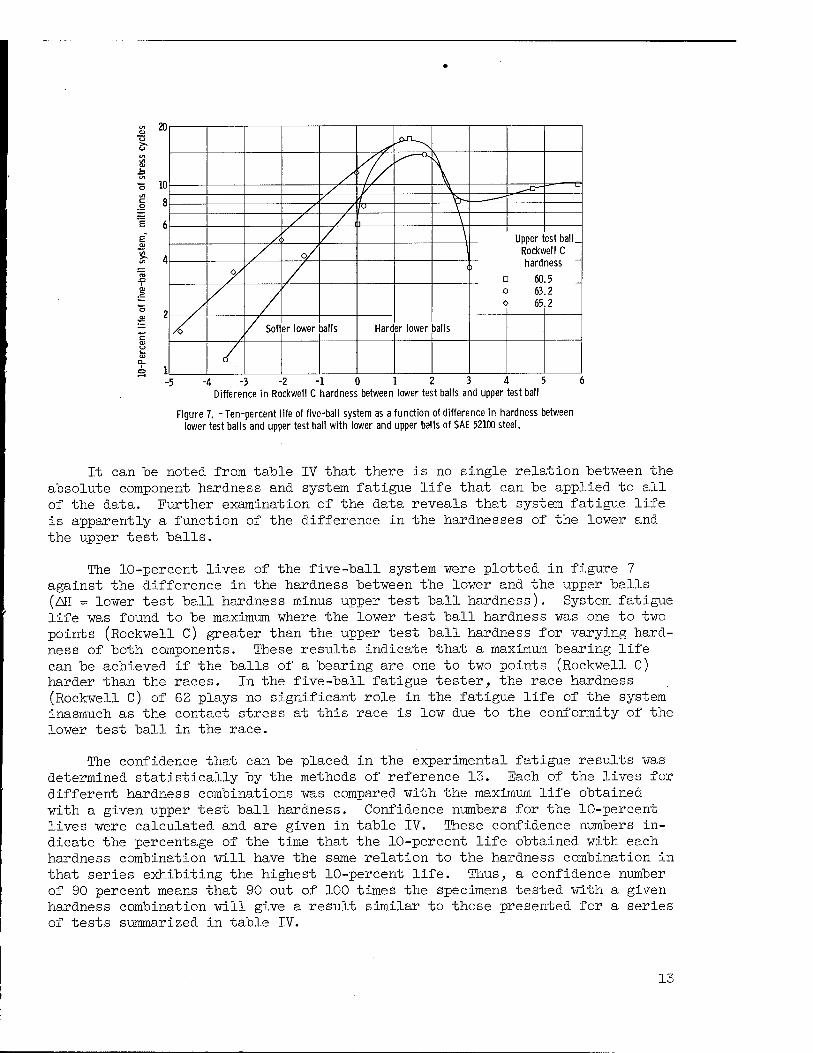
Figure 7. -Ten-percent life of five-ball system as a function of difference in hardness between lower test balls and upper test ball with lower and upper balls of SAE 52100 steel.
It can be noted from table IV that there is no single relation between the absolute component hardness and system fatigue life that can be applied to all of the data. Further examination of the data reveals that system fatigue life is apparently a function of the difference in the hardnesses of the lower and the upper test balls.
The 10-percent lives of the five-ball system were plotted in figure 7 against the difference in the hardness between the lower and the upper balls (AH = lower test ball hardness minus upper test ball hardness). System fatigue life was found to be maximum where the lower test ball hardness was one to two points (Rockwell C) greater than the upper test ball hardness for varying hard- ness of both components. These results indicate that a maximum bearing life can be achieved if the balls of a bearing are one to two points (Rockwell C) harder than the races. In the five-ball fatigue tester, the race hardness (Rockwell C) of 62 plays no significant role in the fatigue life of the system inasmuch as the contact stress at this race is low due to the conformity of the lower test ball in the race.
The confidence that can be placed in the experimental fatigue results was determined statistically by the methods of reference 13. Each of the lives for different hardness combinations was compared with the maximum life obtained with a given upper test ball hardness. Confidence numbers for the 10-percent lives were calculated and are given in table IV. These confidence numbers in- dicate the percentage of the time that the 10-percent life obtained with each hardness combination will have the same relation to the hardness combination in that series exhibiting the highest 10-percent life. Thus, a confidence number of 90 percent means that 90 out of 100 times the specimens tested with a given hardness combination will give a result similar to those presented for a series of tests summarized in table IV.
13
5-4-3-2-10 1 2 3 4 5 Difference in Rockwell C hardness between lower test balls and upper test ball
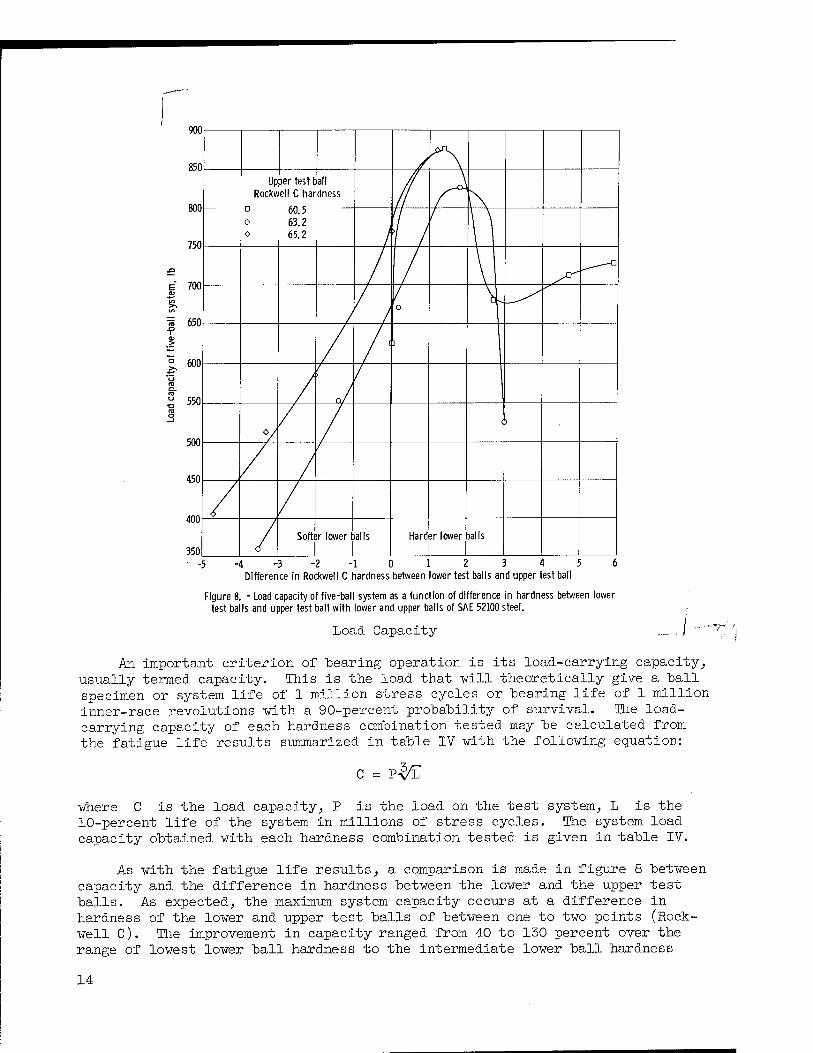
Figure 8. - Load capacity of five-ball system as a function of difference in hardness between lower test balls and upper test ball with lower and upper balls of SAE 52100 steel.
Load Capacity i An important criterion of "bearing operation is its load-carrying capacity,
usually termed capacity. This is the load that -will theoretically give a hall specimen or system life of 1 million stress cycles or bearing life of 1 million inner-race revolutions with a 90-percent probability of survival. The load- carrying capacity of each hardness combination tested may be calculated from the fatigue life results summarized in table IV with the following equation:
C = P-^L
where C is the load capacity, P is the load on the test system, L is the 10-percent life of the system in millions of stress cycles. The system load capacity obtained with each hardness combination tested is given in table IV.
As with the fatigue life results, a comparison is made in figure 8 between capacity and the difference in hardness between the lower and the upper test balls. As expected, the maximum system capacity occurs at a difference in hardness of the lower and upper test balls of between one to two points (Rock- well C). The improvement in capacity ranged from 40 to 130 percent over the range of lowest lower ball hardness to the intermediate lower ball hardness
14
where a peak life occurred. At hardness combinations where the lower test halls were more than two points (Rockwell C) greater than the upper test hall, load capacity dropped off markedly. The increase in relative capacity with in- creasing hardness correlated with previous published fatigue data for ball specimens (refs. 2 to 4) up to the hardness combination where the maximum sys- tem capacity occurred.
Effect of Component Hardness on Fatigue Location
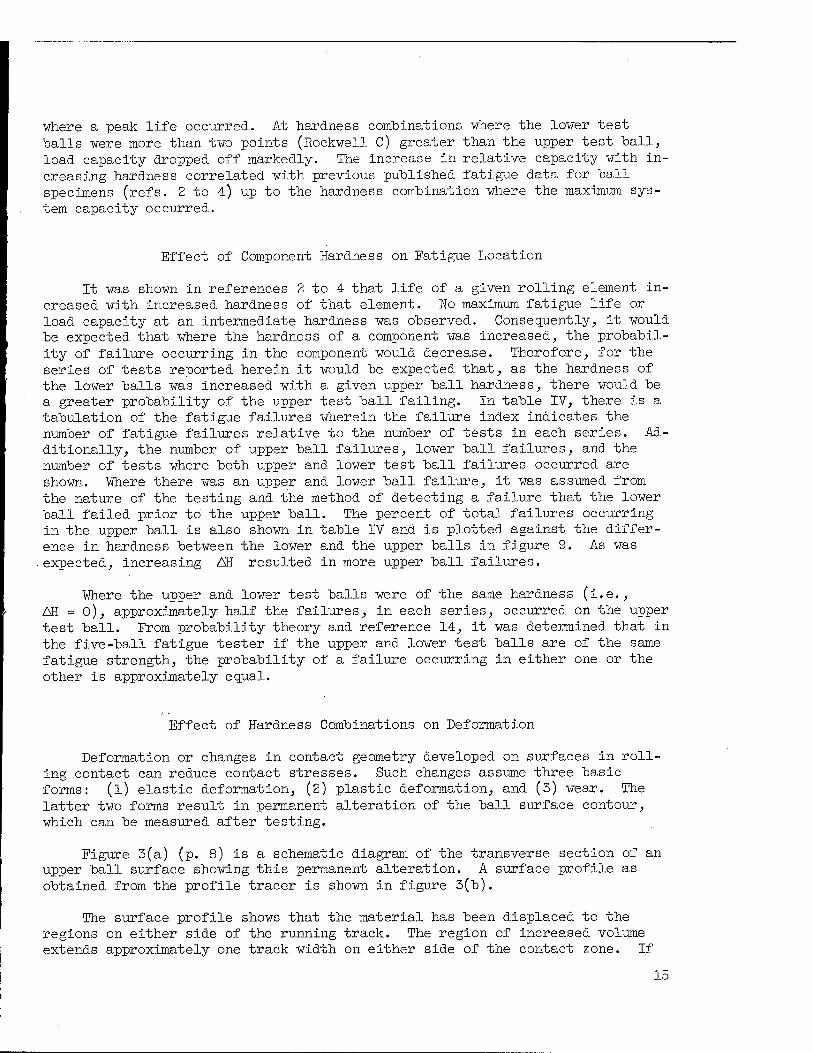
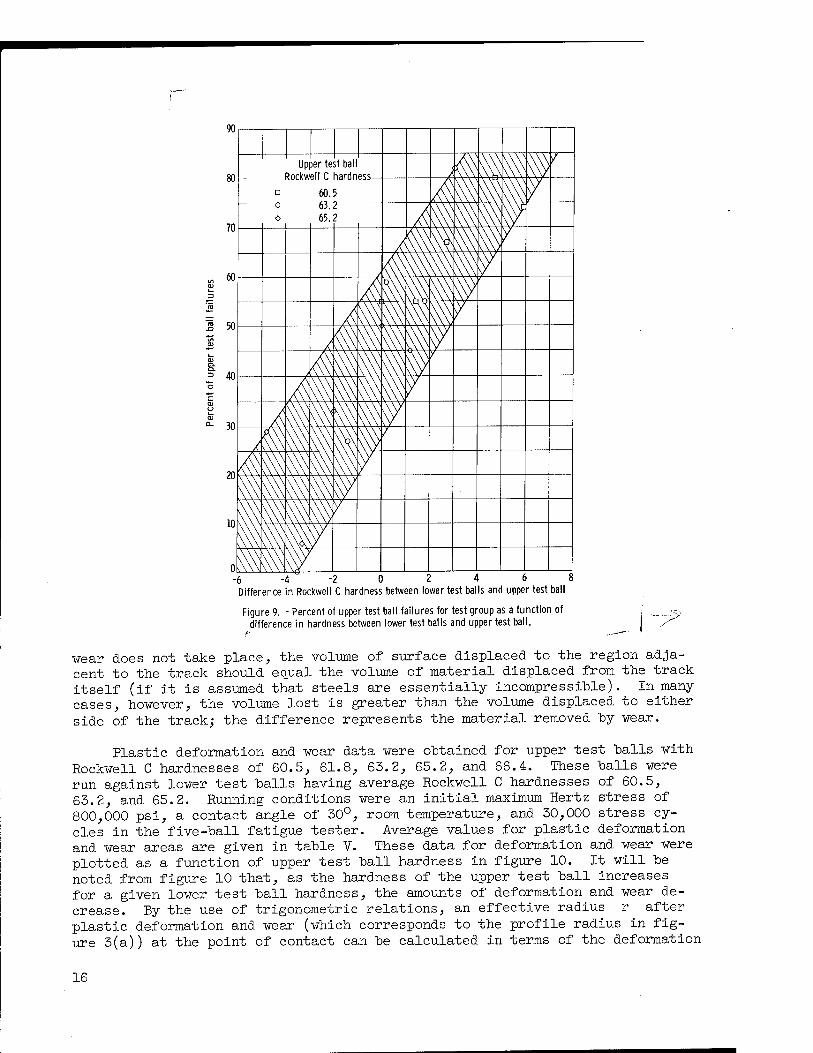
It was shown in references 2 to 4 that life of a given rolling element in- creased with increased hardness of that element. Wo maximum fatigue life or load capacity at an intermediate hardness was observed. Consequently, it would be expected that where the hardness of a component was increased, the probabil- ity of failure occurring in the component would decrease. Therefore, for the series of tests reported herein it would be expected that, as the hardness of the lower balls was increased with a given upper ball hardness, there would be a greater probability of the upper test ball failing. In table IV, there is a tabulation of the fatigue failures wherein the failure index indicates the number of fatigue failures relative to the number of tests in each series. Ad- ditionally, the number of upper ball failures, lower ball failures, and the number of tests where both upper and lower test ball failures occurred are shown. Where there was an upper and lower ball failure, it was assumed from the nature of the testing and the method of detecting a failure that the lower ball failed prior to the upper ball. The percent of total failures occurring in the upper ball is also shown in table IV and is plotted against the differ- ence in hardness between the lower and the upper balls in figure 9. As was expected, increasing AH resulted in more upper ball failures.
Where the upper and lower test balls were of the same hardness (i.e., AH = 0), approximately half the failures, in each series, occurred on the upper test ball. From probability theory and reference 14, it was determined that in the five-ball fatigue tester if the upper and lower test balls are of the same fatigue strength, the probability of a failure occurring in either one or the other is approximately equal.
Effect of Hardness Combinations on Deformation
Deformation or changes in contact geometry developed on surfaces in roll- ing contact can reduce contact stresses. Such changes assume three basic forms: (l) elastic deformation, (2) plastic deformation, and (3) wear. The latter two forms result in permanent alteration of the ball surface contour, which can be measured after testing.
Figure 3(a) (p. 8) is a schematic diagram of the transverse section of an upper ball surface showing this permanent alteration. A surface profile as obtained from the profile tracer is shown in figure 3(b).
The surface profile shows that the material has been displaced to the regions on either side of the running track. The region of increased volume extends approximately one track width on either side of the contact zone. If
15
-6 -4 " -2 0 2 4 6 I Difference in Rockwell C hardness between lower test balls and upper test ball
Figure 9. - Percent of upper test ball failures for test group as a function of difference in hardness between lower test balls and upper test ball.
wear does not take place, the volume of surface displaced to the region adja- cent to the track should equal the volume of material displaced from the track itself (if it is assumed that steels are essentially incompressible). In many- cases, however, the volume lost is greater than the volume displaced to either side of the track; the difference represents the material removed "by wear.
Plastic deformation and wear data were obtained for upper test balls with Rockwell C hardnesses of 60.5, 61.8, 63.2, 65.2, and 66.4. These balls were run against lower test balls having average Rockwell C hardnesses of 60.5, 63.2, and 65.2. Running conditions were an initial maximum Hertz stress of 800,000 psi, a contact angle of 30°, room temperature, and 30,000 stress cy- cles in the five-ball fatigue tester. Average values for plastic deformation and wear areas are given in table V. These data for deformation and wear were plotted as a function of upper test ball hardness in figure 10. It will be noted from figure 10 that, as the hardness of the upper test ball increases for a given lower test ball hardness, the amounts of deformation and wear de- crease. By the use of trigonometric relations, an effective radius r after plastic deformation and wear (which corresponds to the profile radius in fig- ure 3(a)) at the point of contact can be calculated in terms of the deformation
16
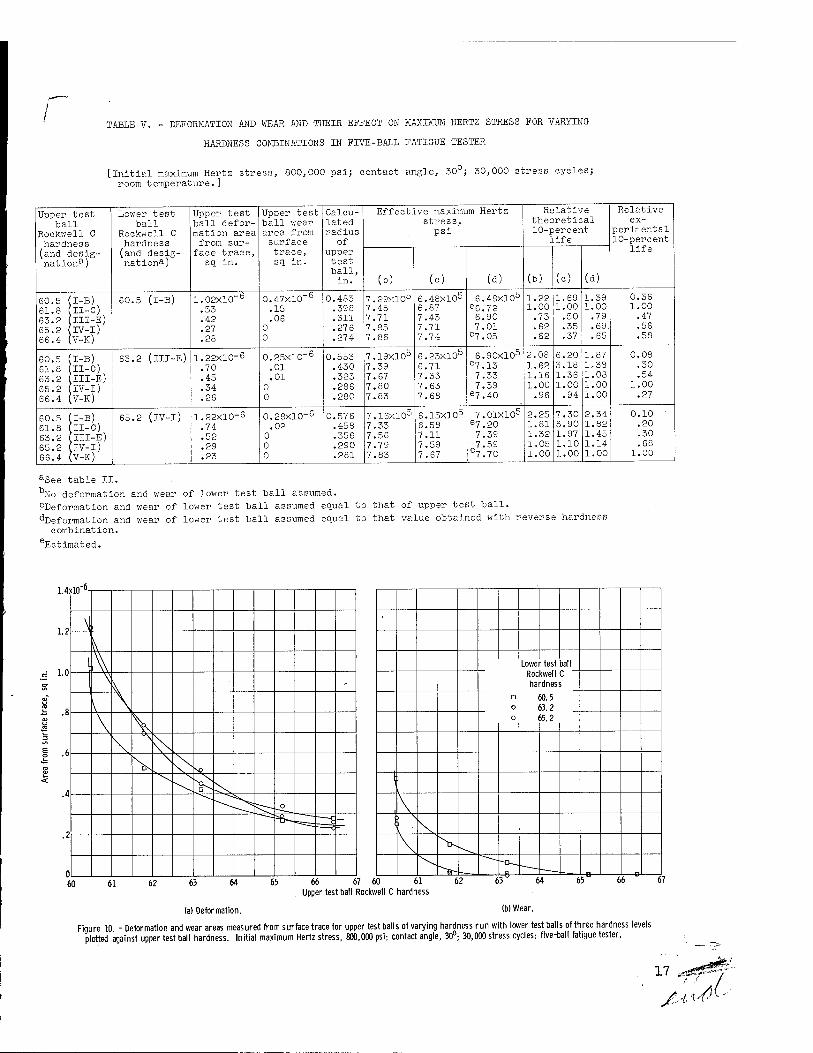
TABLE V. - DEFORMATION AND WEAR AND THEIR EFFECT ON MAXIMUM HERTZ STRESS FOR VARYING
HARDNESS COMBINATIONS IN FIVE-BALL FATIGUE TESTER
[Initial maximum Hertz stress, 800,000 psl; contact angle, 30°; 30,000 stress cycles; room temperature.]
Upper test Lower test Upper test Upper test Calcu- Effective maximum Hertz Relative Relative
ball ball ball defor- ball wear lated stress, theoretical ex-
Rockwell C Rockwell C mation area area from radius psl 10-percent perimental
hardness (and desig-
hardness (and desig-
from sur- face trace,
surface trace,
of upper
life 10-percent life
nationa) nation&) sq In. sq In. test ball, In. (b) (c) (d) lb) (cj UJ
60.5 (I-B) 60.5 (I-B) 1.02X10"6 0.47X10"6 0.483 7.29X10⁵ 6.48X10⁵ 6.48X10⁵ 1.22 1.69 1.39 0.36
61.8 (iI-C) .53 .15 .398 7.45 6.87 e6.72 1.00 1.00 1.00 1.00
63.2 (III-E) .42 .06 .311 7.71 7.43 6.90 .73 .50 .79 .47
65.2 (IV-I) .27 0 .276 7.85 7.71 7.01 .62 .35 .69 .56
66.4 (V-K) .28 0 .274 7.86 7.74 e7.05 .62 .37 .65 .58
60.5 (I-B) 63.2 (III-E) 1.22X10"6 0.25X10"6 0.553 7.19X10⁵ 6.23X10⁵ 6.90X10⁵ 2.08 6.20 1.87 0.08
61.8 (II-C) .70 .01 .430 7.39 6.71 e7.13 1.62 3.18 1.38 .30
63.2 (iII-E) .45 .01 .323 7.67 7.33 7.33 1.16 1.36 1.08 .54
65.2 (lV-1) .34 0 .286 7.80 7.63 7.39 1.00 1.00 1.00 1.00
66.4 (V-K) .26 0 .280 7.83 7.68 e7.40 .96 .94 1.00 .27
60.5 (I-B) 65.2 (IV-I) 1.22X10"6 0.28X10"6 0.576 7.16X10⁵ 6.15X10⁵ 7.01X10⁵ 2.25 7.30 2.34 0.10
61.8 (II-C) .74 .02 .458 7.33 6.58 e7.20 1.81 3.90 1.82 .20
63.2 (III-E) .52 0 .356 7.56 7.11 7.39 1.32 1.97 1.45 .30
65.2 (IV-l) .29 0 .290 7.79 7.59 7.59 1.05 1.10 1.14 .68
66.4 (V-K) .23 0 .281 7.83 7.67 e7.70 1.00 1.00 1.00 1.00
aSee table II. %o deformation and wear of lower test ball assumed. PDeformatlon and wear of lower test ball assumed equal to that of upper test ball. dDeformatlon and wear of lower test ball assumed equal to that value obtained with reverse hardness
combination. eEstimated.
1.4) 10~6-
1.2 \j » ] ^ w \ \ -
.8 \
V .6
u\ \
V ^ -*
.4 .Q""
0
.2
n
Lower test ball Rockwell C hardness
60.5 63.2 65.2
60 61 62 65 66 67 60 61 Upper test ball Rockwell C hardness
(a) Deformation. (b) Wear.
Figure 10 - Deformation and wear areas measured from surface trace for upper test balls of varying hardness run with lower test balls of three hardness levels plotted against upper test ball hardness. Initial maximum Hertz stress, 800,000 psi; contact angle, 30°; 30,000 stress cycles; five-ball fatigue tester.
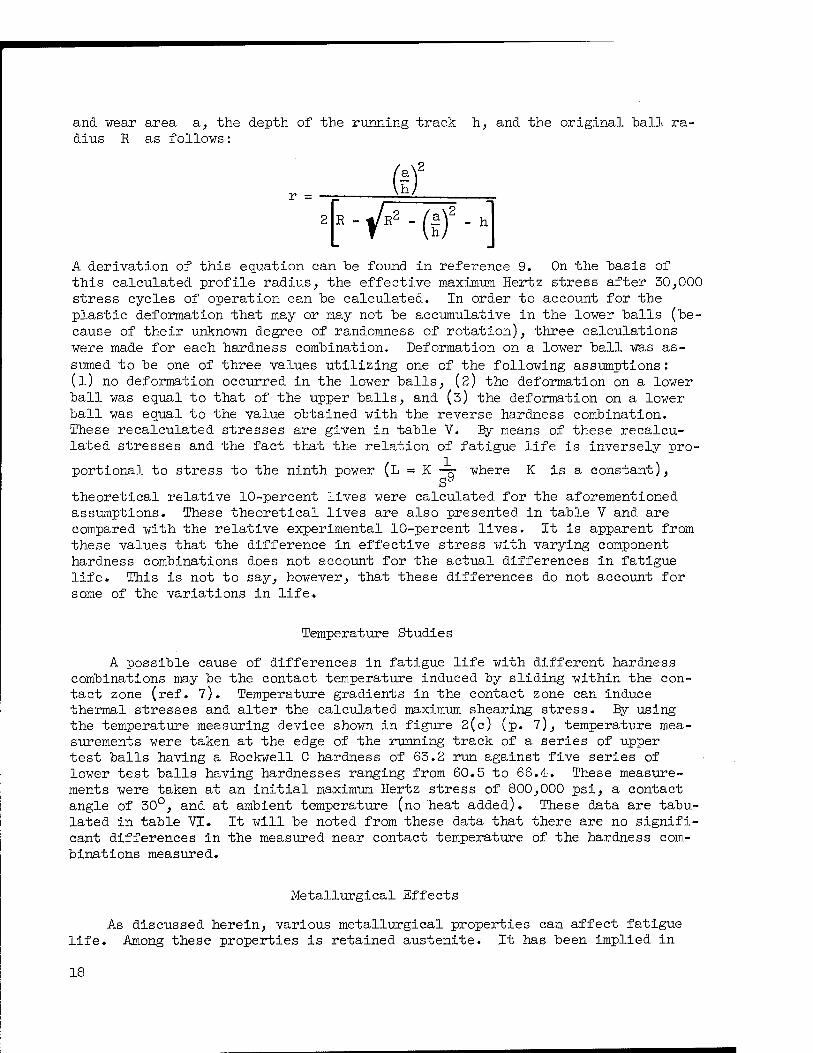
and wear area a, the depth of the running track h, and the original ball ra- dius R as follows:
(f)E
2[E-|^ff-] A derivation of this equation can be found in reference 9. On the basis of this calculated profile radius, the effective maximum Hertz stress after 30,000 stress cycles of operation can be calculated. In order to account for the plastic deformation that may or may not be accumulative in the lower balls (be- cause of their unknown degree of randomness of rotation), three calculations were made for each hardness combination. Deformation on a lower ball was as- sumed to be one of three values utilizing one of the following assumptions : (l) no deformation occurred in the lower balls, (2) the deformation on a lower ball was equal to that of the upper balls, and (3) the deformation on a lover ball was equal to the value obtained with the reverse hardness combination. These recalculated stresses are given in table V. By means of these recalcu- lated stresses and the fact that the relation of fatigue life is inversely pro-
portional to stress to the ninth power (L = K —jr where K is a constant),
theoretical relative 10-percent lives were calculated for the aforementioned assumptions. These theoretical lives are also presented in table V and are compared with the relative experimental 10-percent lives. It is apparent from these values that the difference in effective stress with varying component hardness combinations does not account for the actual differences in fatigue life. This is not to say, however, that these differences do not account for some of the variations in life.
Temperature Studies
A possible cause of differences in fatigue life with different hardness combinations may be the contact temperature induced by sliding within the con- tact zone (ref. 7). Temperature gradients in the contact zone can induce thermal stresses and alter the calculated maximum shearing stress. By using the temperature measuring device shown in figure 2(c) (p. 7), temperature mea- surements were taken at the edge of the running track of a series of upper test balls having a Rockwell C hardness of 63.2 run against five series of lower test balls having hardnesses ranging from 60.5 to 66.4. These measure- ments were taken at an initial maximum Hertz stress of 800,000 psi, a contact angle of 30°, and at ambient temperature (no heat added). These data are tabu- lated in table VI. It will be noted from these data that there are no signifi- cant differences in the measured near contact temperature of the hardness com- binations measured.
Metallurgical Effects
As discussed herein, various metallurgical properties can affect fatigue life. Among these properties is retained austenite. It has been implied in
18
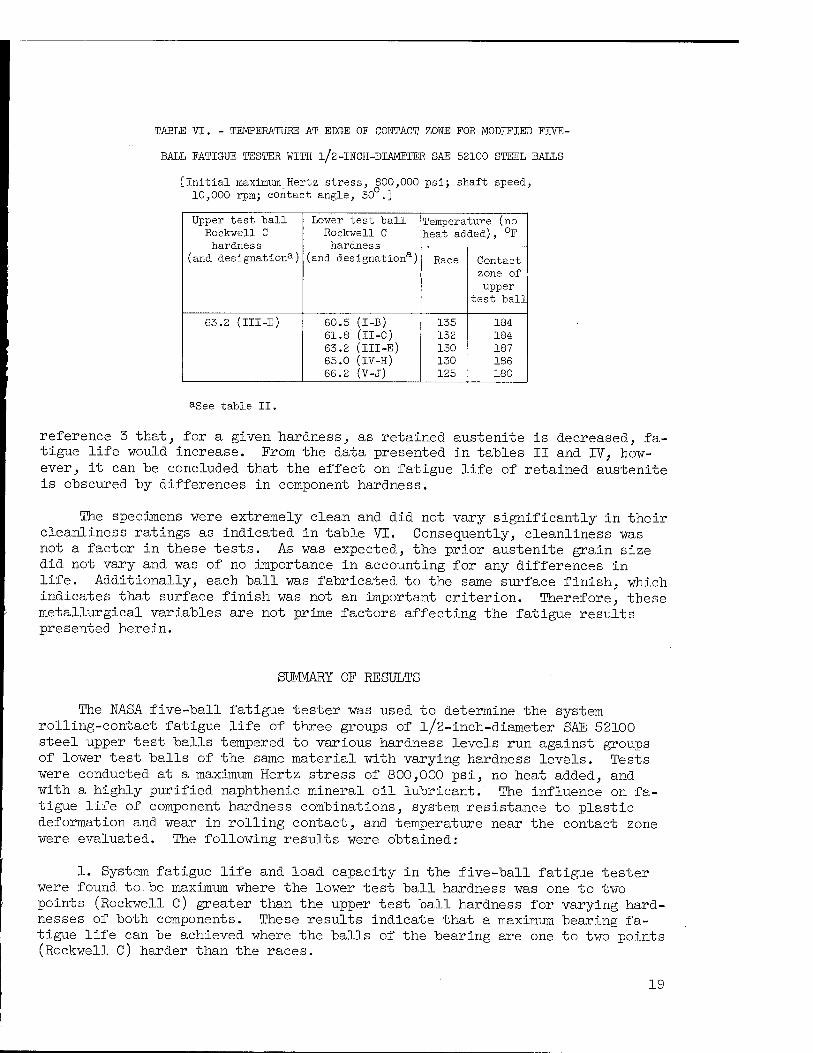
TABLE VI. - TEMPERATURE AT EDGE OF CONTACT ZONE FOR MODIFIED FIVE-
BALL FATIGUE TESTER WITH 1/2-INCH-DIAMETER SAE 52100 STEEL BALLS
[Initial maximum Hertz stress, 800,000 psij shaft speed, 10,000 rpm; contact angle, 30°.]
Upper test hall Rockwell C hardness
(and designation8-)
Lower test hall Rockwell C hardness
(and designationa)
Temperature (no heat added), °F
Race Contact zone of upper
test ball
63.2 (III-E) 60.5 (I-B) 61.8 (II-C) 63.2 (III-E) 65.0 (IV-H) 66.2 (V-J)
135 132 130 130 125
184 184 187 186 180
»See table II.
reference 3 that, for a given hardness, as retained austenite is decreased, fa- tigue life would increase. From the data presented in tables II and IV, how- ever, it can be concluded that the effect on fatigue life of retained austenite is obscured by differences in component hardness.
The specimens were extremely clean and did not vary significantly in their cleanliness ratings as indicated in table VI. Consequently, cleanliness was not a factor in these tests. As was expected, the prior austenite grain size did not vary and was of no importance in accounting for any differences in life. Additionally, each ball was fabricated to the same surface finish, which indicates that surface finish was not an important criterion. Therefore, these metallurgical variables are not prime factors affecting the fatigue results presented herein.
SUMMARY OF RESULTS
The NASA five-ball fatigue tester was used to determine the system rolling-contact fatigue life of three groups of l/2-inch-diameter SAE 52100 steel upper test balls tempered to various hardness levels run against groups of lower test balls of the same material with varying hardness levels. Tests were conducted at a maximum Hertz stress of 800,000 psi, no heat added, and with a highly purified naphthenic mineral oil lubricant. The influence on fa- tigue life of component hardness combinations, system resistance to plastic deformation and wear in rolling contact, and temperature near the contact zone were evaluated. The following results were obtained:
1. System fatigue life and load capacity in the five-ball fatigue tester were found to be maximum where the lower test ball hardness was one to two points (Rockwell C) greater than the upper test ball hardness for varying hard- nesses of both components. These results indicate that a maximum bearing fa- tigue life can be achieved where the balls of the bearing are one to two points (Rockwell C) harder than the races.
19
2. Differences in plastic deformation and wear for different hardness combinations could not account for measured differences in fatigue life.
3. The measured near contact temperatures based on data obtained with five hardness combinations were not significantly different indicating that any thermal effect on fatigue life could not account for differences in life.
4. Only minor differences in metallurgical structure were observed for the various hardness levels considered. Percent retained austenite decreased with higher tempering temperature (lower hardness). Any apparent correlation that existing between fatigue life and retained austenite was obscured by differ- ences in hardness.
Lewis Research Center National Aeronautics and Space Administration
Cleveland, Ohio, October 23, 1964
REFERENCES
1. Jackson, E. G.: Rolling Contact Fatigue Evaluation of Bearing Materials and Lubricants. Trans. ASLE, vol. 2, no. 1, 1959, pp. 121-128.
2. Carter, Thomas L., Zaretsky, Erwin V., and Anderson, William J.: Effect of Hardness and Other Mechanical Properties on Rolling-Contact Fatigue Life of Four High-Temperature Bearing Steels. NASA TN D-270, 1960.
3. Zaretsky, E. V., and Anderson, w. J.: Relation Between Rolling-Contact Fa- tigue Life and Mechanical Properties for Several Aircraft Bearing Steels. Trans. ASTM, vol. 60, 1960, pp. 627-649.
4. Zaretsky, Erwin V., and Anderson, William J.: Rolling-Contact Fatigue Studies with Four Tool Steels and a Crystallized Glass Ceramic. Jour. Basic Eng. (Trans. ASME), ser. D, vol. 83, no. 4, Dec. 1961, pp. 603-612.
5. Irwin, Arthur S.: Effect of Bearing Temperatures on Capacities of Bearings of Various Materials. Paper Presented at Third Spring Lubrication Sympo- sium, ASME, New York (N.Y.), Mar. 14-15, 1960.
6. Baughman, R. A.: Effect of Hardness, Surface Finish, and Grain Size on Rolling-Contact Fatigue Life of M-50 Bearing Steel. Jour. Basic Eng. (Trans. ASME), ser. D, vol. 82, no. 2, June 1960, pp. 287-294.
7. Zaretsky, E. V., Anderson, W. J., and Parker, R. J.: The Effect of Contact Angle on Rolling-Contact Fatigue and Bearing Load Capacity. ASLE Trans., vol. 5, no. 1, Apr. 1962, pp. 210-219.
8. Zaretsky, E. V., Sibley, L. B., and Anderson, W. J.: The Role of Elasto- hydrodynamic Lubrication in Rolling-Contact Fatigue. Jour. Basic Eng. (Trans. ASME), ser. D, vol. 85, no. 3, Aug. 1963, pp. 439-450.
20
9. Zaretsky, Erwin V., Anderson, William J., and Parker, Richard J.: Effect of Nine Lubricants on Rolling-Contact Fatigue Life» NASA TN D-1404, 1962.
10. Martin, J. A.: Plastic Indentation Resistance as a Function of Retained Austenite in Rolling-Element Bearing Steel. ASLE Irans., vol. 5, no. 2, Nov. 1962, pp. 341-346.
11. Drutowski, R. C, and Mikus, E. B. : The Effect of Ball Bearing Steel Structure on Rolling Friction and Contact Plastic Deformation. Jour. Basic Eng. (Trans. ASME), ser. D, vol. 82, no. 2, June 1960, pp. 302-308.
12. Jones, A. B.: New Departure-Analysis of Stresses and Deflections. Vols. I and II. New Departure, Div. General Motors Corp., Bristol (Conn.), 1946.
13. Johnson, Leonard G.: The Statistical Treatment of Fatigue Experiments. GMR-202, Res. Labs., General Motors Corp., Apr. 1959.
14. Lundberg, G., and Palmgren, A.: Dynamic Capacity of Rolling Bearings. Acta Polytech., Mech. Eng. Ser., vol. 1, no. 3, 1947.
NASA-Langley, 1965 E-2021 21
"The aeronautical and space activities of the United States shall be conducted so as to contribute . . . to the expansion of human knowl- edge of phenomena in the atmosphere and space. The Administration shall provide for the widest practicable and appropriate dissemination of information concerning its activities and the results thereof."
—NATIONAL AERONAUTICS AND SPACE ACT OF 1958
NASA SCIENTIFIC AND TECHNICAL PUBLICATIONS
TECHNICAL REPORTS: Scientific and technical information considered important, complete, and a lasting contribution to existing knowledge.
TECHNICAL NOTES: Information less broad in scope but nevertheless of importance as a contribution to existing knowledge.
TECHNICAL MEMORANDUMS: Information receiving limited distri- bution because of preliminary data, security classification, or other reasons.
CONTRACTOR REPORTS: Technical information generated in con- nection with a NASA contra« or grant and released under NASA auspices.
TECHNICAL TRANSLATIONS: Information published in a foreign language considered to merit NASA distribution in English.
TECHNICAL REPRINTS: Information derived from NASA activities and initially published in the form of journal articles.
SPECIAL PUBLICATIONS: Information derived from or of value to NASA activities but not necessarily reporting the results of individual NASA-programmed scientific efforts. Publications include conference proceedings, monographs, data compilations, handbooks, sourcebooks, and special bibliographies.
Details on the availability of these publications may be obtained from:
SCIENTIFIC AND TECHNICAL INFORMATION DIVISION
NATIONAL AERONAUTICS AND SPACE ADMINISTRATION
Washington, D.C. 20546