nanobiosensors for contaminants detection in water josé
TRANSCRIPT

ADVERTIMENT. Lʼaccés als continguts dʼaquesta tesi queda condicionat a lʼacceptació de les condicions dʼúsestablertes per la següent llicència Creative Commons: http://cat.creativecommons.org/?page_id=184
ADVERTENCIA. El acceso a los contenidos de esta tesis queda condicionado a la aceptación de las condiciones de usoestablecidas por la siguiente licencia Creative Commons: http://es.creativecommons.org/blog/licencias/
WARNING. The access to the contents of this doctoral thesis it is limited to the acceptance of the use conditions setby the following Creative Commons license: https://creativecommons.org/licenses/?lang=en
Nanobiosensors for contaminants
detection in water
José Francisco Bergua Canudo
Ph.D. Thesis
Ph.D. in Biotechnology
Directors
ICREA Prof. Dr. Arben Merkoçi
Dr. Ruslan Álvarez

The present work entitled “Nanobiosensors for contaminants detection in waters”, presented by
José Francisco Bergua Canudo to obtain the degree of doctor in biotechnology by Universitat
Autònoma de Barcelona, was performed at the Nanobioelectronics and Biosensors Group at the
Institut Catalá de Nanociencia i Nanotecnologia (ICN2), under the supervision of Prof. Arben
Merkoçi, ICREA Professor and Group Leader, and Dr. Ruslan Álvarez.
The author
José Francisco Bergua Canudo
The Supervisors
Prof. Dr. Arben Merkoçi Dr. Ruslan Álvarez
The present Thesis was performed also under the doctoral program studies “Doctorado en
Biotecnología” at the Faculty of Biosciences, Universitat Autònoma de Barcelona, under the
tutorship of Professor Jordi Joan Cairó.
The University Tutor
Prof. Jordi Joan Cairó Badillo
Bellaterra, July 2020


PREFACE
The research work accomplished during this thesis resulted three manuscripts that are submitted
to international peer-reviewed scientific journals:
The state-of-the-art studies have resulted in a review publication under preparation:
“Water pollutants and their detection using optical biosensors”. José Francisco Bergua, Ruslan
Álvarez-Diduk, Arben Merkoçi. To be submitted in 2020.
The experimental work performed conducted to two articles not yet published, and one
article in preparation:
“Improved Aliivibrio fischeri based-toxicity assay: graphene-oxide as a sensitivity booster with a
mobile-phone application”. José Francisco Bergua, Liming Hu, Celia Fuentes, Ruslan Álvarez-
Diduk, Abdelrahim H.A. Hassan, Claudio Parolo, Arben Merkoçi. Submitted to Analytical
Chemistry in 2020.
“Improved Aliivibrio fischeri based-toxicity assay: graphene-oxide as a sensitivity booster with a
mobile-phone application”. José Francisco Bergua, Ruslan Álvarez-Diduk, Liming Hu, Abdelrahim
H.A. Hassan, Arben Merkoçi. Submitted to Journal of Hazardous Materials in 2020.
“Portable platform for optical biosensing applications”. José Francisco Bergua, Ruslan Álvarez-
Diduk, Liming Hu, Andrea Idili, Claudio Parolo, Arben Merkoçi. To be submitted in 2020.
PREFACE
Additionally, the collaborations performed within the Ph.D. thesis resulted in several other
publications non-related to this thesis:
“Tutorial: Design and fabrication of nanoparticle-based lateral flow immunoassays”. Claudio
Parolo, Amadeo Sena-Torralba, José Francisco Bergua, Enric Calucho, Celia Fuentes-Chust, Liming
Hu, Lourdes Rivas, Ruslan Álvarez-Diduk, Emily P. Nguyen, Stefano Cinti, Daniel Quesada-
González, Arben Merkoçi. Nature Protocols. Recently accepted in 2020.
“Lateral flow assay modified with time-delay wax barriers as a sensitivity and signal enhancement
strategy”. Amadeo Sena-Torralba, Duy Ba Ngo, Claudio Parolo, Liming Hu, Ruslan Álvarez-Diduk,
José Francisco Bergua, Giulio Rosati, Werasak Surareungchai, Arben Merkoçi. Biosensors &
Bioelectronics. Submitted in 2020.
“Validity of a single antibody-based lateral flow immunoassay depending on graphene oxide for
highly sensitive determination of E. coli O157:H7 in minced beef and river water”. Abdel-Rahim
H. A. Hassan, José Francisco Bergua, Eden Morales-Narváez, Arben Merkoçi. Food Chemistry,
2019, 297 (124965), 1-10.
“Low-cost strategy for the development of a rapid electrochemical assay for bacteria detection
based on AuAg Nanoshells”. Lorenzo Russo, Juan Leva Bueno, José Francisco Bergua, Monica
Constantini, Marco Giannetto, Víctor Puntes, Alfredo de la Escosura Muñiz, Arben Merkoçi. ACS
Omega, 2018, 3 (12), 18849-18856.
“Straightforward immunosensing platform based on graphene oxide-decorated nanopaper: a
highly sensitive and fast biosensing approach”. Nopchulee Cheeveewattanagul, Eden Morales-
Narváez, Abdel-Rahin H. A. Hassan, José Francisco Bergua, Arben Merkoçi. Advanced Functional
Materials, 2017, 27 (1702741), 1-8.

AGRADECIMIENTOS
En esta sección, me gustaría agradecer el apoyo a toda la gente que ha sido importante
para mí durante la tesis, y que de una forma u otra han ayudado a que hoy esté escribiendo estas
palabras.
Primero, me gustaría agradecer a mi familia todo el apoyo recibido durante estos cuatro
años. Por estar siempre al pie del cañón en los buenos momentos y en los más duros, y por todo
el cariño y la fuerza que siempre me habéis dado. Gracias papá por las horas interminables de
teléfono escuchando experimentos que ni siquiera entendías. Gracias mamá por la energía
positiva, los abrazos y los besos infinitos al volver a casa cada mes. Gracias Virgi por cuidarme,
por todos los consejos desde la distancia, y por aportar siempre esa visión más realista que tu
hermano a menudo necesita. Gracias yaya, gracias simplemente por estar allí, porque lo que más
me motivaba para volver a Huesca cada mes era verte la sonrisa dibujada en la cara al verme
aparecer en la residencia. Gracias también a mi tía Ana Salas por todos los ánimos, los consejos
y la fuerza prestada, sobre todo durante el confinamiento y la escritura de la tesis. Tampoco me
quiero olvidar de mi tía Elena y de mi prima Andrea, siempre dispuestas a reírse conmigo sea cual
sea la situación a la que nos enfrentemos. Finalmente, gracias al resto de tíos y primos, que de
alguna forma también me han ayudado a conseguir este objetivo.
Segundo, me gustaría agradecer a toda la gente que forma o ha formado parte del grupo
Nanobioelectronics & Biosensors (NB2) y con la que he trabajado estos años. Como directores de
mi tesis, me gustaría también agradecerles el apoyo y la supervisión a Arben Merkoçi y a Ruslan
Álvarez. Gracias Arben, por aceptarme en el grupo para realizar el trabajo de fin de máster, más
tarde por ofrecerme hacer el doctorado en el grupo, y finalmente por todas las oportunidades y
los consejos prestados durante estos cinco años en el grupo. Gracias Ruslan, porque tú mejor que
nadie sabes que si he llegado hasta aquí y he conseguido acabar esta tesis, en gran parte, es
gracias a ti. Me llevo muy buenos momentos, muchas risas y aprendizajes, alguna bronca y,
además, me llevo a un buen amigo también.
Como supervisores y personas de gran ayuda durante mi estancia en el ICN2, me gustaría
nombrar a algunas personas. Daniel Quesada, gracias por ser como un padre para mí desde que
entré en el grupo a realizar el TFM. Por las horas interminables de laboratorio que hemos pasado
juntos, por todos los viajes y actividades que hemos realizado, y en general por tu apoyo, tu
ACKNOWLEDGMENTS
comprensión y tu amistad todos estos años. Para mí has sido un referente durante la tesis. Me
gustaría también agradecer a Anna Puig todas las risas y la paciencia mostradas todo este tiempo,
porque gracias a ella también hoy puedo depositar esta tesis. Por otro lado, quiero agradecer a
Alfredo de la Escosura todo el apoyo y los consejos prestados durante el tiempo que coincidimos
en el grupo. Y por supuesto, también por organizar los partidos de fútbol en el SAF y por los
divertidos piques futbolísticos entre Huesca y Oviedo.
A continuación, me gustaría agradecer a los grandes amigos que he hecho en el grupo NB2
durante el doctorado. Amadeo Sena, gracias por estos cinco años que hemos vivido juntos, codo
con codo. Porque hemos seguido caminos paralelos y nosotros mejor que nadie podemos
entender el esfuerzo que hemos realizado. Me llevo a un grandísimo amigo, un muy buen
compañero de laboratorio, y un más que aceptable goleador en los partidillos de fútbol que
jugábamos. Quiero destacar la estancia que disfrutamos en Taiwán durante dos de los mejores
meses de mi vida, todo el apoyo mutuo y las risas y risas que hemos compartido durante todo
este tiempo. Enric Calucho, gracias también por tu amistad y tus ganas de ayudar siempre, dentro
y fuera del laboratorio. Hemos compartido muchas y muy buenas experiencias, destacando
algunos conciertos, incluyendo al mejor: Bob Dylan. Celia Fuentes, gracias por todo. Porque si ha
habido alguien que me ha entendido y ha estado al pie del cañón desde que llegó al ICN2, has
sido tú. Gracias por ser tan buena alumna, tan buena amiga, y por la alegría que siempre
transmites cuando trabajamos juntos. Por otro lado, una parte de mí se ha enamorado de China,
su lengua y su cultura durante el doctorado, y eso es en gran medida gracias a Liming, Qiuyue y
Lei. Gracias por los buenísimos momentos disfrutados en la oficina y en las actividades que
realizábamos fuera del trabajo. En especial, gracias a Liming por trabajar tan estrechamente y
por enseñarme tantas cosas desde que aterrizó en el grupo.
También hay otros miembros del grupo a los que me gustaría mostrar mi agradecimiento.
Claudio Parolo, gracias por el buen rollo, todo el trabajo, y los consejos durante este tiempo.
Andrea Idili, gracias también por tus consejos y por el enorme apoyo y toda la fuerza mostrada
para sacar adelante cualquier proyecto que se nos pusiera por delante. Lourdes Rivas, gracias por
tu apoyo, tus recomendaciones, y todas tus ganas de ayudar durante el doctorado. Por último,
AGRADECIMIENTOS
gracias también al resto de miembros del grupo NB2, algunos de los cuales también me han
ayudado mucho, pero a los que no puedo nombrar uno por uno.
Siguiente, me gustaría también recordar a algunos antiguos miembros del grupo que me
han marcado enormemente durante el doctorado. Gracias a Liu Jie (Emma), Nopchulee y Hassan
por los grandes momentos que hemos compartido y por todas vuestras enseñanzas durante los
primeros años de mi doctorado. También me gustaría acordarme de Marc Balsells, compañero
inseparable de piscina y gran apoyo durante su estancia en el grupo. Además, no puedo
olvidarme de Marc Botifoll, primer estudiante que tuve como supervisor. Gracias por tu esfuerzo,
tus ganas de aprender, y en general por tu amistad y lo fácil que me pusiste tu supervisión.
Gracias también a Xin Yi por toda tu alegría, y por los indescriptibles momentos embarazosos que
vivimos en la oficina. En general, también me gustaría agradecer a los miembros del proyecto
europeo INTCATCH la oportunidad de colaborar en un proyecto tan importante y todas las
experiencias que me llevo al haber trabajado en numerosos países.
Tercero, me gustaría acordarme de otros grandes amigos que he hecho durante mi estancia
en el ICN2, fuera del grupo NB2. Gracias a Javier Muro por su amistad, por todas las cosas que
hemos vivido juntos y por siempre estar allí cuando lo he necesitado. Gracias especialmente a
Alba Mingorance, por toda su alegría, sus abrazos, sus consejos, y, en definitiva, por todo su gran
apoyo durante estos años. Gracias a Li Zhi por su enorme empatía y por sus ganas de disfrutar de
la vida con una alegría de la que es imposible no contagiarse. Gracias a Cristina Peláez también
por su alegría, las noches de cine, y los viajes y cenas que hemos compartido. Gracias a Pau Güell
por su amistad y por todas las conversaciones que hemos compartido en el tren desde y hacia el
ICN2 durante los últimos años de la tesis. Por último, gracias a José Cruz por todos los buenos
momentos y las risas compartidas durante el doctorado.
No me quiero olvidar tampoco de mis compañeros del grupo de “Toxics” en la facultad de
ingeniería, en especial de Teresa Vincent, y de otras personas del ICN2 que me han ayudado
enormemente y han hecho mi estancia durante el doctorado mucho más agradable: Marcos
Rosado y Belén Ballesteros del servicio de microscopía, Marta en recepción, y las siempre
amables trabajadoras de la limpieza del ICN2.
ACKNOWLEDGMENTS
Cuarto, me gustaría agradecer muchas cosas a la gente maravillosa con la que he vivido
estos años en Barcelona y en Cerdanyola. Primero, a Sonia Borao, amiga inseparable de la carrera
en Zaragoza y compañera de piso durante dos de los mejores años de mi vida en Barcelona. Por
las sesiones de jogging por el paseo marítimo, los conciertos, las cenas y las birras en restaurantes
y bares de toda la ciudad. Pero básicamente, porque siempre ha estado junto a mí desde el
principio y hasta el final de esta etapa. También me gustaría acordarme de las compañeras de
piso Ana Malešević e Irene Díaz, por las noches compartidas en el piso viendo series y por los
guateques musicales de guitarra y armónica que montábamos en el salón. Me gustaría
acordarme especialmente de Laura Paúl, amiga desde la infancia y compañera de piso durante
mi primer año en Cerdanyola. Porque a pesar de que no fue un año fácil, todo su apoyo y su
cariño siempre han sido un aliciente constante. Por supuesto, quería agradecer a Damian
Dąbrowski su amistad y todos los buenos momentos que hemos disfrutado en el piso de
Cerdanyola durante tres años: cenas, películas, excursiones por el mundo y mucho más. También
a Lorraine Stack, persona con un corazón enorme, por toda su alegría y sus continuas ganas de
ayudar durante el año que coincidimos viviendo juntos.
Quinto, quiero acordarme de las personas maravillosas que he conocido en Barcelona estos
años. Gracias a Fabián y a Maxi por su amistad, sus ganas de fiesta, y en definitiva por abrirme
un nuevo mundo que no conocía hasta mi llegada a Barcelona. Gracias también a Pedro Jiménez
y a Luca Barone por todas sus enseñanzas y su amistad desde que nos conocimos. Por último,
también me gustaría acordarme de Pili y Alejandro, profesores de armónica, con los que he
descubierto una faceta musical que ignoraba, y que me han hecho encontrar y disfrutar de una
pasión que no conocía antes de llegar a Barcelona.
Sexto, quiero recordar sin duda unos de los mejores momentos de la tesis y a algunas de
las personas que conocí en aquel entonces. Porque la estancia en Taiwán fue inolvidable en
muchos sentidos, pero en gran parte gracias a Amadeo, Verónica y Héctor. Gracias especialmente,
de nuevo a Amadeo, y a Verónica por su empatía, su alegría, y por todo el apoyo y las experiencias
que disfrutamos enormemente en la isla. Gracias también a Luca Mastrosimone, a Lily y a Helena
por los muchos buenos momentos vividos en Taiwán.
AGRADECIMIENTOS
De forma rápida me gustaría acordarme también de los que considero mis mejores amigos
fuera de Barcelona y de los que he recibido apoyo constante todos estos años. Gracias a la ya
mencionada anteriormente Laura Paúl, pero también a Chema Navarro, a Inés Mármol, a Pedro
Martínez, a Rubén López y a Javier Usón. Gracias a todos por acompañarme estos años desde la
distancia y por vuestra amistad, que sin duda ha ayudado enormemente para poder terminar
esta tesis.
Por último, gracias a una persona muy especial que conozco desde hace poco pero que sin
duda ha supuesto un gran apoyo los últimos meses de la tesis. Gracias Marc por tu comprensión
y por tu cariño constante, especialmente durante el periodo de confinamiento. Gracias por todo
lo que me has dado estos meses y espero que me sigas dando en el futuro.
Gracias a ti, lector, a todos los partícipes de estos agradecimientos y a cualquier persona
que de forma directa o indirecta me haya ayudado estos años. Gracias a todos.

ACKNOWLEDGMENTS


ACKNOWLEDGMENTS FOR FINANCIAL AND LONGISTIC SUPPORT
“Detection of PTHrP using magneto sandwich
immunoassay”
Work done by ICN group as a contribution to the project:
“Evaluation of the calcium sensing receptor as a potential new tumor suppressor gene and therapeutic target in neuroblastoma”.
SUMMARY
Water pollution is one of the major problems humankind is facing nowadays. On the one
hand, the presence of chemicals (i.e. pesticides and heavy metals) coming from agriculture and
industrial runoffs impairs the water quality. On the other hand, farming and urban areas produce
huge quantities of dung and wastewaters that result in altered water microbiological status and
may lead to waterborne outbreaks. In this regard, biosensing offers great opportunities for
tracking in situ chemical and microbiological pollutants in water to prevent and reduce the
associated environmental and health issues.
General aspects and experimental results are exposed in this thesis, starting from a general
introduction that covers the description of a broad range of chemical and biological water
pollutants, to a variety of biosensing techniques used to detect and quantify those pollutants.
The experimental section focuses on the detection of Escherichia coli by a colorimetric lateral
flow immunoassay (LFIA) as a fecal indicator and two environmentally persistent pesticides
through a bioluminescent toxicity biosensor as chemical pollutants. Furthermore, a versatile and
portable platform is thoroughly described to perform colorimetric, fluorescent, and
bioluminescent assays for environmental and other applications.
As aforementioned, E. coli is considered the main fecal indicator for water quality
assessment. Nowadays, standard E. coli detection methods are laboratory-based and time-
consuming. For this reason, the development of a colorimetric AuNPs-based LFIA for general E.
coli detection is reported in this thesis. The proposed system can detect three different strains of
E. coli, while discerning from Salmonella spp, in tap, river, and sewage in 10 minutes. In addition,
the implementation of a filtration system allows for preconcentrating E. coli and increasing the
sensitivity in two orders of magnitude. Eventually, a gram-negative bacterium, similar in shape
and size to E. coli, is used as a novel characterization system to study the microfluidics within
different lateral flow materials.
Nowadays, pesticides are widely used worldwide mainly for agricultural applications.
However, some pesticides are highly toxic to non-target organisms and remain for years in the
soil and water. As two examples, tributyltin (TBT) and pentachlorophenol were broadly used in
the EU for many years. For this reason, a toxicity biosensor based on the bioluminescent
bacterium Aliivibrio fischeri is used to detect TBT and pentachlorophenol in water samples and is
SUMMARY
reported in this thesis. The proposed system relies on a standard 96-wells plate, an opaque box,
and a smartphone to carry out the toxicity measurements. Besides, the addition of graphene-
oxide as a growth enhancer allows for reducing the growing time of the bacteria and enhancing
the sensitivity of the biosensor.
Third, a universal portable platform has been used to perform optical bioassays. This
versatile platform allows for performing colorimetric, fluorescent, and bioluminescent assays.
More in detail, the platform has been used to develop a colorimetric ELISA test to detect SARS-
CoV-2 and human immunoglobulin G. Besides, it allows for studying the aggregation state of
nanoparticles, which are critical elements in many optical bioassays. On the other hand, the
detection of fluorophores such as quantum dots (QDs) and fluorescein is possible through the
installation of a UV-led and a series of optical filters that allow for exciting the samples and
filtering out the background signals for optimal imaging. In addition, bioluminescent assays can
also be carried out for toxicity assessment of water samples by simply adjusting the smartphone
camera settings and the dark conditions within the platform. Last, but not least, the platform
allows for growing bacteria cultures under agitation and controlled temperature conditions, as
well as monitoring bacterial growth through a new method to estimate turbidity changes within
the media.
Finally, the general conclusions are exposed including some opinions and
recommendations for further continuation of the research in the field
RESUMEN
La contaminación del agua es uno de los principales problemas a los que la humanidad se
enfrenta hoy en día. Por un lado, la presencia de productos químicos (ej. pesticidas y metales
pesados) provenientes de la agricultura y de los vertidos industriales alteran la calidad del agua.
Por otro lado, tanto la ganadería como las ciudades producen grandes cantidades de estiércol y
aguas de desecho, lo que conlleva alteraciones del estado microbiológico del agua y puede
provocar brotes de enfermedades infecciosas. En este sentido, los biosensores ofrecen grandes
oportunidades para monitorizar in situ los contaminantes químicos y microbiológicos, lo que
ayuda a prevenir y reducir los problemas medioambientales y de salud pública asociados.
En esta tesis se exponen los aspectos generales y resultados experimentales, comenzando
por una introducción general que cubre la descripción de un amplio rango de contaminantes
químicos y biológicos del agua, así como una gran variedad de biosensores utilizados para
detectar y cuantificar dichos contaminantes. La sección experimental se centra en la detección
de Escherichia coli como indicador fecal del agua a través de un inmunoensayo colorimétrico de
tipo flujo lateral (LFIA, por sus siglas en inglés: “lateral flow immunoassays”). A su vez, se incluye
la detección de dos pesticidas altamente persistentes en el medioambiente a través de un
biosensor de toxicidad bioluminescente. Además, se describe en profundidad una plataforma
portátil y versátil que puede llevar a cabo ensayos colorimétricos, fluorescentes y
bioluminescentes orientados a aplicaciones medioambientales y de otros tipos.
Mencionado ya anteriormente, E. coli se considera el principal indicador de contaminación
fecal del agua. Hoy en día, los métodos estándar de detección de E. coli en agua son
extremadamente lentos y requieren de instalaciones especializadas para llevarse a cabo. Por esta
razón, en esta tesis se expone el desarrollo de un biosensor de flujo lateral basado en
nanopartículas de oro (AuNPs) para la detección de la especie E. coli como indicador fecal. El
sistema propuesto es capaz de detectar hasta tres cepas diferentes de E. coli, discerniendo de
Salmonella spp., en agua de grifo, de río y de una planta depuradora. Además, la implementación
de un sistema de filtración adicional permite preconcentrar E. coli, y a su vez incrementar la
sensibilidad del sensor en dos órdenes de magnitud. Finalmente, una bacteria gram-negativa,
similar en forma y tamaño a E. coli, se usa como un sistema novedoso de caracterización para
estudiar la microfluídicia dentro de las diferentes partes del sensor de flujo lateral.
RESUMEN
Hoy en día, los pesticidas se usan de forma generalizada a través del mundo,
principalmente en aplicaciones relacionadas con la agricultura. Sin embargo, algunos pesticidas
son altamente tóxicos y no selectivos, permaneciendo durante años en el suelo y en las aguas.
Como dos ejemplos, el tributilo de estaño (TBT) y el pentaclorofenol fueron ampliamente
utilizados en la Unión Europea durante muchos años. Por esta razón, se expone en esta tesis el
desarrollo de un biosensor basado en la bacteria bioluminescente Aliivibrio fischeri para detectar
TBT y pentaclorofenol en muestras de agua. El sistema propuesto se basa en la combinación de
una placa de 96 pocillos, una caja opaca, y un teléfono móvil para realizar las medidas de
toxicidad. Además, la adición de óxido de grafeno (GO) actúa como un potenciador del
crecimiento bacteriano, permitiendo reducir el tiempo de crecimiento de la bacteria e
incrementando la sensibilidad del biosensor.
Tercero, se ha desarrollado una plataforma universal portátil para realizar bioensayos
ópticos; en concreto, ensayos colorimétricos, fluorescentes y bioluminescentes. Más en detalle,
la plataforma se ha utilizado para desarrollar test de ELISA colorimétricos para detectar SARS-
CoV-2 y anticuerpos humanos isotipo G. Además, permite estudiar el estado de agregación de
nanopartículas, que son elementos cruciales en la mayoría ensayos ópticos. Por otra parte, es
posible detectar fluoróforos como quantum dots (QDs) y fluoresceína a través de la instalación
de un led ultravioleta y una serie de filtros ópticos que permiten excitar las muestras y filtrar las
señales de ruido de fondo para obtener imágenes de gran calidad. Asimismo, también se pueden
llevar a cabo ensayos bioluminescentes para la evaluación de la toxicidad del agua, simplemente
ajustado los parámetros de la cámara del teléfono móvil y las condiciones de oscuridad dentro
de la plataforma. Por último, pero no menos importante, la plataforma permite crecer cultivos
bacterianos en condiciones de agitación y temperatura controladas, así como monitorear el
crecimiento bacteriano a través de un nuevo método que permite estimar cambios de turbidez
en el medio de cultivo.
Por último, se exponen las conclusiones generales y futuras propuestas.
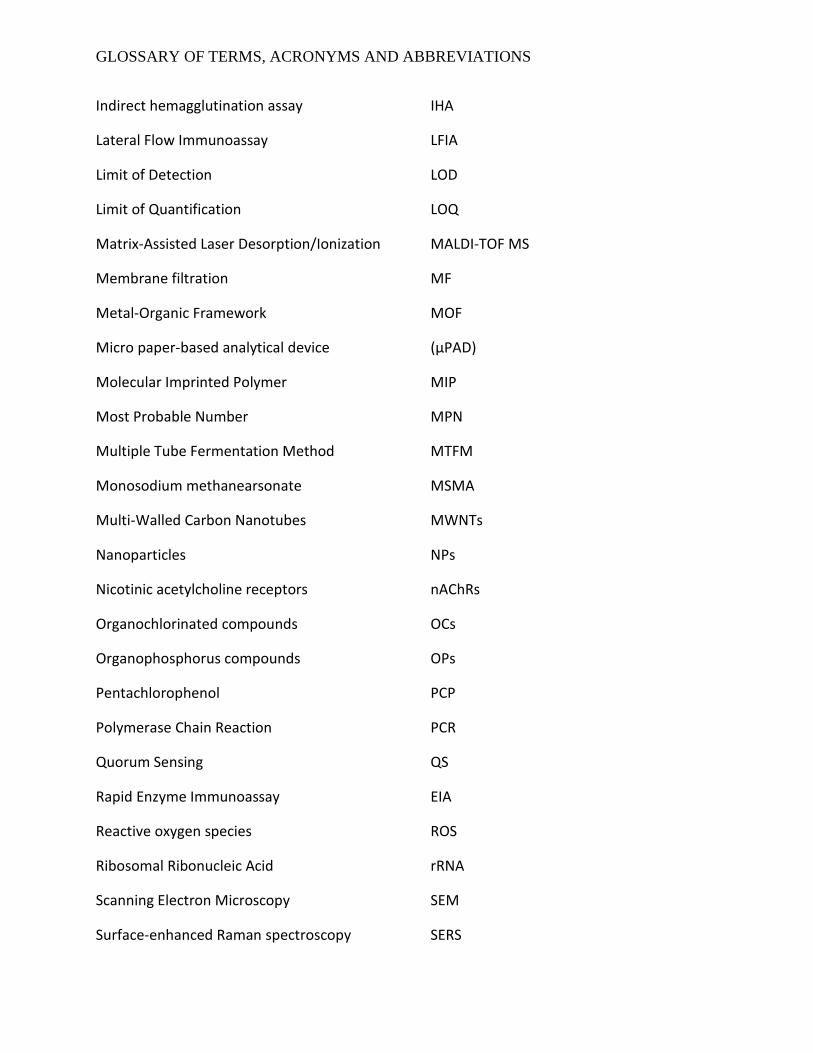
GLOSSARY OF TERMS, ACRONYMS AND ABBREVIATIONS
4-methylumbelliferyl-β-d-galactoside
Acetylcholinesterase
Aliivibrio fischeri
Butyrylcholinesterase
Dichlorodiphenyltrichloroethane
Deoxyribonucleic acid
Dissolved oxygen
Enteroaggregative E. coli
European Food Safety Authority
Enterohemorrhagic E. coli
Enteroinvasive E. coli
Enterotoxigenic E. coli
Enterovirulent E. coli
European Environmental Agency
Enzyme-Linked Immunosorbent Assay
European Union
Food and Agriculture Organization of the
United Nations
Förster resonance energy transfer
Gamma-Aminobutyric acid
Gas-Chromatography/Mass-Spectrometry
Glutamate-Chloride
High-Performance Liquid Chromatography
Hierarchical Cluster Analysis
Indoxyl β-D-glucuronide
MUGal
AChE
AF
BChE
DDT
DNA
DO
EAggEC
EFSA
EHEC
EIEC
ETEC
EEC
EEA
ELISA
EU
FAO
FRET
GABA
GC/MS
GluCl
HPLC
HCA
IBDG
GLOSSARY OF TERMS, ACRONYMS AND ABBREVIATIONS
Indirect hemagglutination assay
Lateral Flow Immunoassay
Limit of Detection
Limit of Quantification
Matrix-Assisted Laser Desorption/Ionization
Membrane filtration
Metal-Organic Framework
Micro paper-based analytical device
Molecular Imprinted Polymer
Most Probable Number
Multiple Tube Fermentation Method
Monosodium methanearsonate
Multi-Walled Carbon Nanotubes
Nanoparticles
Nicotinic acetylcholine receptors
Organochlorinated compounds
Organophosphorus compounds
Pentachlorophenol
Polymerase Chain Reaction
Quorum Sensing
Rapid Enzyme Immunoassay
Reactive oxygen species
Ribosomal Ribonucleic Acid
Scanning Electron Microscopy
Surface-enhanced Raman spectroscopy
IHA
LFIA
LOD
LOQ
MALDI-TOF MS
MF
MOF
(µPAD)
MIP
MPN
MTFM
MSMA
MWNTs
NPs
nAChRs
OCs
OPs
PCP
PCR
QS
EIA
ROS
rRNA
SEM
SERS

GLOSSARY OF TERMS, ACRONYMS AND ABBREVIATIONS
Surface Plasmon Resonance
Shige toxin-producing E. coli
Transmission Electron Microscopy
Tributyltin
Upconverting Nanoparticles
SPR
STEC
TEM
TBT
UCNPs

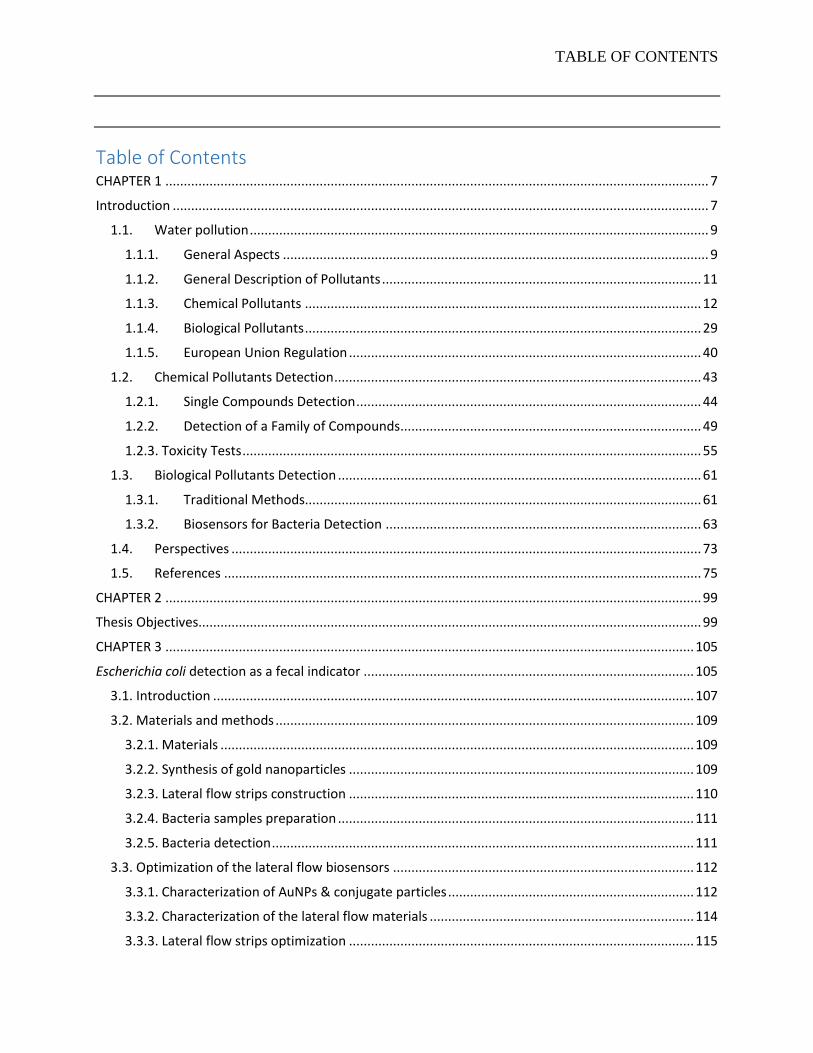
TABLE OF CONTENTS
Table of Contents CHAPTER 1 .................................................................................................................................................... 7
Introduction .................................................................................................................................................. 7
1.1. Water pollution ............................................................................................................................. 9
1.1.1. General Aspects .................................................................................................................... 9
1.1.2. General Description of Pollutants ....................................................................................... 11
1.1.3. Chemical Pollutants ............................................................................................................ 12
1.1.4. Biological Pollutants ............................................................................................................ 29
1.1.5. European Union Regulation ................................................................................................ 40
1.2. Chemical Pollutants Detection .................................................................................................... 43
1.2.1. Single Compounds Detection .............................................................................................. 44
1.2.2. Detection of a Family of Compounds .................................................................................. 49
1.2.3. Toxicity Tests ............................................................................................................................. 55
1.3. Biological Pollutants Detection ................................................................................................... 61
1.3.1. Traditional Methods............................................................................................................ 61
1.3.2. Biosensors for Bacteria Detection ...................................................................................... 63
1.4. Perspectives ................................................................................................................................ 73
1.5. References .................................................................................................................................. 75
CHAPTER 2 .................................................................................................................................................. 99
Thesis Objectives......................................................................................................................................... 99
CHAPTER 3 ................................................................................................................................................ 105
Escherichia coli detection as a fecal indicator .......................................................................................... 105
3.1. Introduction ................................................................................................................................... 107
3.2. Materials and methods .................................................................................................................. 109
3.2.1. Materials ................................................................................................................................. 109
3.2.2. Synthesis of gold nanoparticles .............................................................................................. 109
3.2.3. Lateral flow strips construction .............................................................................................. 110
3.2.4. Bacteria samples preparation ................................................................................................. 111
3.2.5. Bacteria detection ................................................................................................................... 111
3.3. Optimization of the lateral flow biosensors .................................................................................. 112
3.3.1. Characterization of AuNPs & conjugate particles ................................................................... 112
3.3.2. Characterization of the lateral flow materials ........................................................................ 114
3.3.3. Lateral flow strips optimization .............................................................................................. 115

TABLE OF CONTENTS
3.4. Characterization of the lateral flow biosensors ............................................................................. 116
3.4.1. Sensitivity, selectivity and reproducibility .............................................................................. 116
3.4.2. Analysis with real samples ...................................................................................................... 118
3.5. Conclusions .................................................................................................................................... 121
3.6. References ..................................................................................................................................... 122
CHAPTER 4 ................................................................................................................................................ 129
Water Toxicity Assessment ....................................................................................................................... 129
4.1. Introduction ................................................................................................................................... 131
4.2. Materials and methods .................................................................................................................. 133
4.2.1. Materials ................................................................................................................................. 133
4.2.2. Bacteria culture and storage ................................................................................................... 133
4.2.3. Toxicity assays ......................................................................................................................... 134
4.3. Bioluminescence enhancement, stability, and quorum sensing characterization ........................ 134
4.3.1. Bioluminescence enhancement using agar media ................................................................. 134
4.3.2. Bioluminescence enhancement using graphene-oxide .......................................................... 136
4.3.3. Stability enhancement by lyophilization ................................................................................. 137
4.3.4. Characterization of the quorum-sensing system .................................................................... 138
4.4. Toxicity assays and sensitivity enhancement using graphene-oxide ............................................. 141
4.4.1. Optimization of the toxicity assay conditions ......................................................................... 141
4.4.2. Smartphone-based toxicity assays .......................................................................................... 142
4.4.3. Sensitivity enhancement of the toxicity assays using graphene oxide (GO) .......................... 144
4.5. Conclusions .................................................................................................................................... 146
4.6. References ..................................................................................................................................... 147
CHAPTER 5 ................................................................................................................................................ 153
Portable Platform for Environmental Applications ................................................................................... 153
5.1. Introduction ................................................................................................................................... 155
5.2. Materials & methods ..................................................................................................................... 157
5.2.1. Materials ................................................................................................................................. 157
5.2.2. Colorimetric ELISA tests .......................................................................................................... 158
5.2.3. Gold aggregation tests (GAT) .................................................................................................. 158
5.2.4. Fluorescent assays .................................................................................................................. 158
5.2.5. Bioluminescent assays ............................................................................................................ 159
5.2.6. Elementary analysis with ImageJ ............................................................................................ 159
5.2.7. Complex analysis with ImageJ ................................................................................................. 159
5.2.8. Bacteria culture and drug screening ....................................................................................... 160

TABLE OF CONTENTS
5.3. Characterization of the optical system .......................................................................................... 160
5.4. Colorimetric assays ........................................................................................................................ 162
5.4.1. Colorimetric ELISA test ............................................................................................................ 162
5.4.2. Gold Aggregation Test ............................................................................................................. 164
5.5. Bioluminescent assays ................................................................................................................... 165
5.6. Fluorescent assays ......................................................................................................................... 167
5.6.1. Fluorophores characterization ................................................................................................ 167
5.6.2. Fluorescent ELISA test ............................................................................................................. 169
5.7. Bacterial growth & drug screening ................................................................................................ 170
5.7.1. Bacterial growth & turbidity measurements .......................................................................... 170
5.7.2. Drug screening ........................................................................................................................ 172
5.5. Conclusions .................................................................................................................................... 173
5.6. References ..................................................................................................................................... 174
CHAPTER 6 ................................................................................................................................................ 177
Concluding Remarks.................................................................................................................................. 177
6.1. Escherichia coli detection as a fecal indicator ............................................................................... 179
6.2. Water toxicity assessment ............................................................................................................. 180
6.3. Portable platform for environmental applications ........................................................................ 181
ANNEXES ................................................................................................................................................... 183


THESIS OVERVIEW


3
THESIS OVERVIEW
Water pollution threatens both environment and human health all over the world. The
number and variety of water pollutants are huge, making their detection and water quality
assessment though and complicated. Overall, chemical and microbiological pollution are the
main cause of water pollution worldwide. Therefore, this thesis is focused on the development
of portable platforms and biosensors for water quality monitoring, especially related to fecal
contamination and chemical pollution.
General aspects and experimental results related to the present Ph.D. Thesis are divided
into six chapters, including the introduction, thesis objectives, results and discussions, and
general conclusions.
Chapter 1, entitled “Introduction”, presents the description of chemical pollutants, mainly
focused on pesticides but also including heavy metals and petroleum; as well as the description
of waterborne pathogens, mainly focused on bacteria but also including viruses and other
parasites. Next, a legal frame regarding water quality in the EU is presented, as well as more
general aspects related to the regulations in other countries. In the following section, biosensors
targeting pesticides are presented, from single compounds detection to a family of compounds,
and more general toxicity biosensors. At last, biosensors targeting bacteria are presented, as well
as the different bioreceptors and transducers employed in these biosensors.
Chapter 2, entitled “Objectives of the thesis”, presents the different objectives of the Ph.D.
Thesis. The main objective was to study and develop portable and easy-to-use platforms for
chemical and microbiological analysis of water samples.
Chapter 3, entitled “Escherichia coli detection as a fecal indicator”, reports the design,
development, and optimization of a lateral flow biosensor for the detection of E. coli in water
samples as a way to assess water fecal contamination. Besides, a new methodology is presented
to characterize the microfluidics of bacteria cells within the lateral flow materials.
Chapter 4, entitled “Water toxicity assessment”, reports the development and optimization
of a bioluminescent toxicity biosensor based on the bacteria Aliivibrio fischeri. The quorum-
sensing effect that triggers the bioluminescence is studied and characterized, and a new platform
based on the growth of A. fischeri onto a solid substrate is presented as a strategy to enhance
THESIS OVERVIEW
4
bacterial bioluminescence. Besides, the use of graphene oxide (GO) as a biocompatible material
to promote bacterial growth and enhance the system’s sensitivity is described. Eventually, a
smartphone is used to perform the toxicity measurements, enabling to move from the laboratory
analysis to the field.
Chapter 5, entitled “Portable platform for optical biosensing applications”, reports the
design, fabrication, and use of a portable platform to perform colorimetric, fluorescent,
bioluminescent, and turbidimetric assays. All the components of the platform have been installed
to optimize the performance of a variety of bioassays that allow for biomarkers’ and
environmental monitoring. This chapter includes a detailed description of these bioassays,
highlighting the performance with the portable platform and a smartphone and the envisaged
real applications.
Concluding remarks of the present Thesis in addition to future perspectives regarding the results
and research fields explored are enclosed in Chapter 6.
CHAPTER 1. INTRODUCTION
CHAPTER 1 .................................................................................................... Error! Bookmark not defined.
Introduction ................................................................................................. Error! Bookmark not defined.
1.1. Water pollution ................................................................. Error! Bookmark not defined.
1.1.1. General Aspects ......................................................... Error! Bookmark not defined.
1.1.2. General Description of Pollutants .............................. Error! Bookmark not defined.
1.1.3. Chemical Pollutants ................................................... Error! Bookmark not defined.
1.1.4. Biological Pollutants ................................................... Error! Bookmark not defined.
1.1.5. European Union Regulation ....................................... Error! Bookmark not defined.
1.2. Chemical Pollutants Detection .......................................... Error! Bookmark not defined.
1.2.1. Single Compounds Detection ..................................... Error! Bookmark not defined.
1.2.2. Detection of a Family of Compounds ........................ Error! Bookmark not defined.
1.2.3. Toxicity Tests .................................................................. Error! Bookmark not defined.
1.3. Biological Pollutants Detection ......................................... Error! Bookmark not defined.
1.3.1. Traditional Methods .................................................. Error! Bookmark not defined.
1.3.2. Biosensors for Bacteria Detection ............................. Error! Bookmark not defined.
1.4. Perspectives ...................................................................... Error! Bookmark not defined.
1.5. References ......................................................................... Error! Bookmark not defined.


CHAPTER 1
7
CHAPTER 1
Introduction

9
CHAPTER 1
1.1. Water pollution
1.1.1. General Aspects
Water is the most essential resource for life. It covers 71% of the Earth’s surface and it
constitutes the fluids of most living organisms. These living organisms use water mainly for
drinking, but for some of them, it is also their living media. Humans also use water for several
other activities such as cooking, cultivating crops, farming, and washing.
Since the 19th century, with the arrival of the Industrial Revolution, new chemicals started
to be produced and poured uncontrollably in water bodies. Moreover, new technological
advances and improvements in sanitary conditions boosted life-expectancy, increasing the world
population and the need for bigger cities and farming lands. Altogether, these circumstances
have led to a dramatic increase in both water demand and pollution, threatening access to good-
quality water all over the world. As an example, global water demand has raised almost 600%
from 1900 to 2015 (Figure 1.1a)1. If water use keeps growing at this rate, it is estimated that
around 50% of the world population will be living in water-stressed areas by 2050, with limited
access to safe water sources2. Currently, most of the world water demand is due to agriculture
and farming (≈ 70%), but there are important variations among different geographical areas
(Figure 1.1b)3. The remaining global water consumption is carried out by the industries (≈ 20%),
and by the urban areas (≈ 10%).
Water pollution arises when pollutants reach water bodies (i.e. rivers, lakes, seas, oceans
and groundwater sources). Pollutants are substances introduced in the environment that cause
adverse effects to specific living beings or the overall ecosystem. Water pollution can be chemical,
biological, and physical. On the one hand, chemical pollution generally comes from the industrial
and agricultural sectors and includes organic and inorganic substances such as pesticides and
heavy metals. On the other hand, microbiological pollution is caused by microorganisms such as
bacteria, viruses, and protozoa. Eventually, physical pollution arises as some physicochemical
parameters of the water are impaired, such as temperature, pH, conductivity, and dissolved
oxygen content.
INTRODUCTION
10
Main waste products produced by agriculture and farming are pesticides, dung, and other
biological traces. These waste products may pollute the ecosystem through filtration in
underground-water reservoirs or direct grooving to the rivers, lakes, seas, and oceans. Therefore,
since agriculture and farming are human activities with the highest water demand worldwide,
water quality is severely threatened by chemical and biological pollution. For example, in the
European Union (EU), only 18% of the inner water bodies can be considered to have good or high
quality (Figure 1.1c)4. On the other hand, almost 40% of the inner water bodies are considered
to have poor or bad quality and are inappropriate for human consumption.
Consumption of unsafe water, polluted with chemicals and mainly with microorganisms,
can lead to several diseases, some of which may be fatal, such as dysentery or cholera. More than
2 billion people in the world drink unsafe water contaminated with feces, and around 0.8 million
people die every year as a consequence5. More than 98% of these deaths caused by waterborne
outbreaks are produced in Africa and south-east Asia, being India and Nigeria the two countries
with the highest number of deaths related to the consumption of unsafe water (Figure 1.1d)6.
In summary, water pollution threatens water quality worldwide. Nowadays, agriculture and
farming entail the highest pollution sources of water bodies. Since more than 2 billion people
drink unsafe water causing almost 1 million deaths per year, it is crucial to know and detect the
main pollutants found in water. Consequently, this control would allow for decreasing the
personal and economical burdens associated with waterborne outbreaks and chronic related
diseases.

11
CHAPTER 1
1.1.2. General Description of Pollutants
Water pollution occurs when wastewater bodies containing pollutants get in contact with
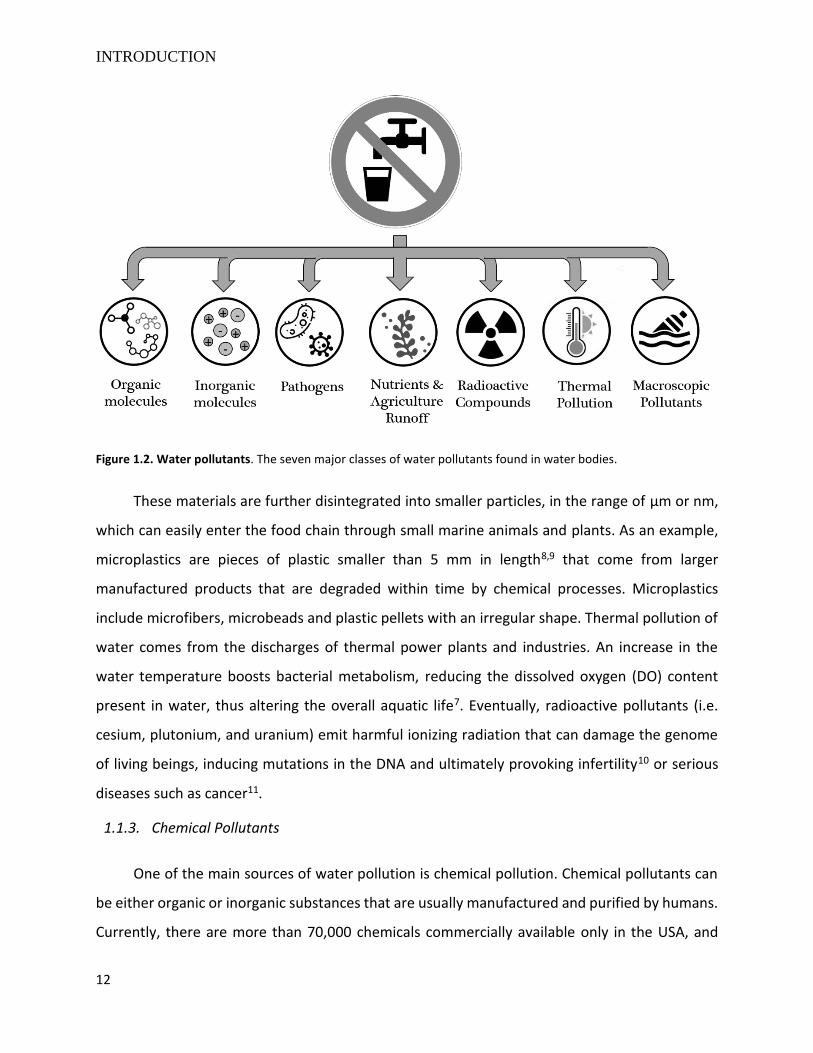
cleaner water bodies. There exist many water pollutants that can be classified into seven major
categories: organic compounds, inorganic compounds, pathogens, nutrients, and agriculture
runoff, radioactive pollutants, thermal pollution and macroscopic pollutants7 (Figure 1.2).
Organic and inorganic compounds can, in turn, be included in a larger category of chemical
pollutants, whereas pathogens can be considered as biological pollutants. These two main
categories are explained more in detail in the following sections. Besides, radioactive pollutants,
thermal pollution, and macroscopic pollutants can be classified as physical pollutants. Some
examples of macroscopic pollutants include plastics, large metallic pieces and other types of trash.
Figure 1.1. Water use, pollution, and related outbreaks. (A) Global water demand from 1900 to 2015 (Food and
Agriculture Organization of the United Nations [FAO]). (B) Water use by sector (agriculture and farming, industry
and urban areas) in the five continents and worldwide (2010, AQUASTAT). (C) Water quality of inner water bodies in
the EU (2018, European Environmental Agency [EEA]). (D) Human deaths caused by waterborne diseases showing
the top-ten countries with the highest mortality numbers (2016, AQUASTAT).
INTRODUCTION
12
Figure 1.2. Water pollutants. The seven major classes of water pollutants found in water bodies.
These materials are further disintegrated into smaller particles, in the range of µm or nm,
which can easily enter the food chain through small marine animals and plants. As an example,
microplastics are pieces of plastic smaller than 5 mm in length8,9 that come from larger
manufactured products that are degraded within time by chemical processes. Microplastics
include microfibers, microbeads and plastic pellets with an irregular shape. Thermal pollution of
water comes from the discharges of thermal power plants and industries. An increase in the
water temperature boosts bacterial metabolism, reducing the dissolved oxygen (DO) content
present in water, thus altering the overall aquatic life7. Eventually, radioactive pollutants (i.e.
cesium, plutonium, and uranium) emit harmful ionizing radiation that can damage the genome
of living beings, inducing mutations in the DNA and ultimately provoking infertility10 or serious
diseases such as cancer11.
1.1.3. Chemical Pollutants
One of the main sources of water pollution is chemical pollution. Chemical pollutants can
be either organic or inorganic substances that are usually manufactured and purified by humans.
Currently, there are more than 70,000 chemicals commercially available only in the USA, and
13
CHAPTER 1
around 100 million registered worldwide12,13. Some examples of chemical pollutants are
pesticides, petroleum and its derivatives, and heavy metals.
1.1.3.1. Pesticides
Pesticides are chemical compounds used to control pests (i.e. to prevent, contain, reduce
or kill a harmful organism) in order to protect plants or animals from disease. Pesticides may be
also used to keep water reserves, prevent epidemic and pandemic spreads, improve animal
welfare, promote industrial processes and preserve home material. In any case, pesticides are
toxic compounds intended to interfere with or modify fundamental physiological mechanisms on
living organisms. In this regard, the major problem pesticides pose is the lack of selectivity against
the target organisms14–16. For instance, broad-spectrum pesticides kill indiscriminately a great
variety of organisms (i.e. insects), speeding up the ecosystem unbalance. Besides, several
pesticide wastes can accumulate for years in soil and water, increasing the probability of contact
with non-target animals, plants and, even humans. The first synthesized man-made pesticide was
dichlorodiphenyltrichloroethane (DDT)17, an insecticide synthesized in 1874 and which
properties were elucidated in 1939. After the Second World War, the use of pesticides
widespread all over the world, mainly due to the development of chemical industries and
intensive farming.
Pesticides can be classified according to different criteria, such as their specific target,
physical state, danger level, intended use or chemical constitution. For example, pesticides may
be used to control insects and mites (insecticides), fungi (fungicides), weeds (herbicides), bacteria
(bactericides), rodents (rodenticides), worms (nematicides) and mollusks (molluscicides)18.
Regarding the physical state, pesticides can be found in the form of gas, spray, powder, solid,
liquid or tablets. Besides, the acute toxicity can be used to classify pesticides, from extremely
dangerous to non-dangerous compounds, including three different intermediate categories
(highly dangerous, dangerous and slightly dangerous)18.
Pesticides can also be classified according to their final use. They are ubiquitous: agriculture
uses up to 85% of the total pesticides produced worldwide, and up to 10% is used in public health
to control vector-transmitted diseases (i.e. malaria) and eliminate illegal drug cultivations17. On
the other hand, pesticides are useful to prevent weed growth in natural water reserves and to
INTRODUCTION
14
avoid bacterial and fungi growth within the machines in the industry. Besides, home care
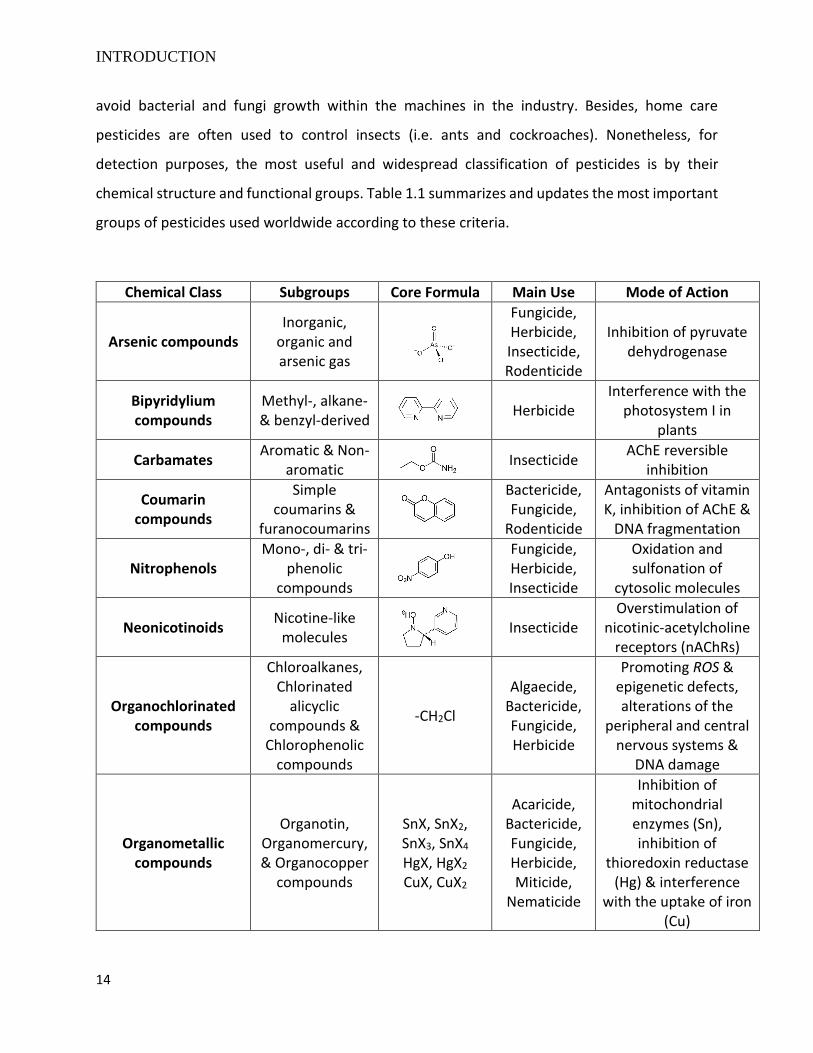
pesticides are often used to control insects (i.e. ants and cockroaches). Nonetheless, for
detection purposes, the most useful and widespread classification of pesticides is by their
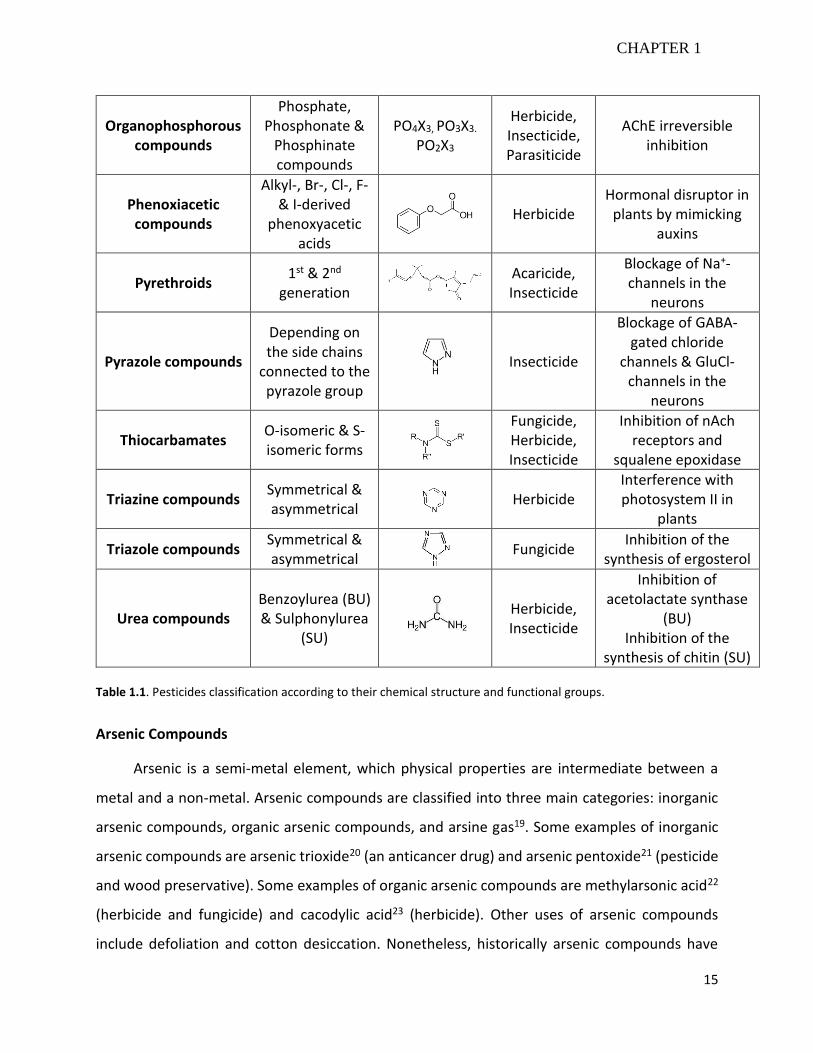
chemical structure and functional groups. Table 1.1 summarizes and updates the most important
groups of pesticides used worldwide according to these criteria.
Chemical Class Subgroups Core Formula Main Use Mode of Action
Arsenic compounds Inorganic,
organic and arsenic gas
Fungicide, Herbicide, Insecticide, Rodenticide
Inhibition of pyruvate dehydrogenase
Bipyridylium compounds
Methyl-, alkane- & benzyl-derived
Herbicide Interference with the
photosystem I in plants
Carbamates Aromatic & Non-
aromatic Insecticide
AChE reversible inhibition
Coumarin compounds
Simple coumarins &
furanocoumarins
Bactericide, Fungicide,
Rodenticide
Antagonists of vitamin K, inhibition of AChE &
DNA fragmentation
Nitrophenols Mono-, di- & tri-
phenolic compounds
Fungicide, Herbicide, Insecticide
Oxidation and sulfonation of
cytosolic molecules
Neonicotinoids Nicotine-like
molecules
Insecticide
Overstimulation of nicotinic-acetylcholine
receptors (nAChRs)
Organochlorinated compounds
Chloroalkanes, Chlorinated
alicyclic compounds &
Chlorophenolic compounds
-CH2Cl
Algaecide, Bactericide, Fungicide, Herbicide
Promoting ROS & epigenetic defects, alterations of the
peripheral and central nervous systems &
DNA damage
Organometallic compounds
Organotin, Organomercury, & Organocopper
compounds
SnX, SnX2, SnX3, SnX4
HgX, HgX2
CuX, CuX2
Acaricide, Bactericide, Fungicide, Herbicide, Miticide,
Nematicide
Inhibition of mitochondrial enzymes (Sn), inhibition of
thioredoxin reductase (Hg) & interference
with the uptake of iron (Cu)
15
CHAPTER 1
Organophosphorous compounds
Phosphate, Phosphonate &
Phosphinate compounds
PO4X3, PO3X3.
PO2X3
Herbicide, Insecticide, Parasiticide
AChE irreversible inhibition
Phenoxiacetic compounds
Alkyl-, Br-, Cl-, F- & I-derived
phenoxyacetic acids
Herbicide
Hormonal disruptor in plants by mimicking
auxins
Pyrethroids 1st & 2nd
generation Acaricide,
Insecticide
Blockage of Na+-channels in the
neurons
Pyrazole compounds
Depending on the side chains
connected to the pyrazole group
Insecticide
Blockage of GABA-gated chloride
channels & GluCl-channels in the
neurons
Thiocarbamates O-isomeric & S-isomeric forms
Fungicide, Herbicide, Insecticide
Inhibition of nAch receptors and
squalene epoxidase
Triazine compounds Symmetrical & asymmetrical
Herbicide Interference with photosystem II in
plants
Triazole compounds Symmetrical & asymmetrical
Fungicide Inhibition of the
synthesis of ergosterol
Urea compounds Benzoylurea (BU) & Sulphonylurea
(SU)
Herbicide, Insecticide
Inhibition of acetolactate synthase
(BU) Inhibition of the
synthesis of chitin (SU)
Table 1.1. Pesticides classification according to their chemical structure and functional groups.
Arsenic Compounds
Arsenic is a semi-metal element, which physical properties are intermediate between a
metal and a non-metal. Arsenic compounds are classified into three main categories: inorganic
arsenic compounds, organic arsenic compounds, and arsine gas19. Some examples of inorganic
arsenic compounds are arsenic trioxide20 (an anticancer drug) and arsenic pentoxide21 (pesticide
and wood preservative). Some examples of organic arsenic compounds are methylarsonic acid22
(herbicide and fungicide) and cacodylic acid23 (herbicide). Other uses of arsenic compounds
include defoliation and cotton desiccation. Nonetheless, historically arsenic compounds have
INTRODUCTION
16
mainly been used as pesticides for agricultural applications. Inorganic arsenic compounds were
banned in the USA since 199324, and organic arsenic compounds were later on banned in 200925,
except for monosodium methanearsonate (MSMA).
Arsenic compounds have been used as fungicides, herbicides, insecticides, and rodenticides.
These compounds inhibit the enzyme pyruvate dehydrogenase26 located in the matrix of the
mitochondria, preventing the use of thiamine (vitamin B1), leading to the production of reactive
oxygen species (ROS), and finally triggering cellular apoptosis27. Arsenic compounds are highly
toxic for humans and the intake routes can be by inhalation and ingestion24. Acute toxicity
induces vomiting, encephalopathy, and diarrhea28. Chronic exposure often leads to tumors,
cancer, and heart disease24.
Bipyridinium Compounds
Bipyridinium compounds are chemicals consisting of two pyridyl rings (C5N4H). Bipyridinium
compounds are classified according to the regioisomery of the bipyridine group and the chemical
groups connected to the pyridyl rings (i.e. methyl, formyl and cyano groups)29. The main use of
bipyridinium compounds is as non-selective herbicides to kill grasses and weeds30. These
herbicides interfere with the electron transfer process carried out by the iron-sulfur protein
ferredoxin, located in the photosynthetic photosystem I of the plants, triggering the formation
of ROS, causing lipid peroxidation and oxidative stress, and finally leading to cellular apoptosis31.
Intoxication with bipyridinium compounds leads to liver, kidney and lungs damage32. Paraquat is
the most widely used herbicide of this category. Bipyridinium compounds are also used as
electrochemical labels and catalysts (i.e. 2,2’-Bipyridine)33.
Carbamate Compounds
Carbamate compounds are organic compounds derived from carbamic acid (NH2COOH).
Carbamate compounds are classified as aromatic or non-aromatic carbamates34. The main use of
carbamate compounds is as insecticides, but they are also used to synthesize polyurethane
polymers. Carbamates inhibit reversibly the enzyme acetylcholinesterase (AChE), which catalyzes
the breakdown of the acetylcholine neurotransmisor35. There are three main isoforms of AChE36,
which can be found both in invertebrate and vertebrate animals. In this regard, insects are the
17
CHAPTER 1
main target of carbamate pesticides, but due to the presence of AChE also in the nerves and
muscles of mammal animals and humans, poisoning and toxic effects are not rare to occur.
Toxicity triggered by carbamate pesticides may lead to central nervous system alterations such
as paralysis and asphyxiation in the most severe cases37. Carbaryl is one of the most commonly
used carbamate insecticides worldwide since it is less toxic to humans than other carbamate
pesticides such as carbofuran38. Regarding alternative uses, carbamate compounds are also used
to develop anxiolytic and muscle relaxing drugs (i.e. pyridostigmine)39.
Coumarin Compounds
Coumarin compounds are aromatic organic chemicals derived from coumarin (C9H6O2).
Coumarin compounds are classified as simple coumarins or furanocoumarins, as well as
according to the chemical groups found on the side chains out of the coumarin aromatic rings40.
Coumarin compounds have several applications, highlighting those related to the medicine (i.e.
warfarin, anticoagulant)41 and the control of pests (i.e. brodifacoum, rodenticide)42. As pesticides,
coumarin compounds may behave as rodenticides, fungicides, and bactericides43. On the one
hand, most coumarin compounds block the regeneration and recycling of vitamin K44, leading to
uncontrolled bleeding and hemorrhage in mice and rats. On the other hand, some coumarin
compounds have also been reported to inhibit AChE and trigger DNA fragmentation43. Coumarin
compounds are normally not toxic to humans at the concentrations used to kill rodents, but
overexposure to higher doses may lead to hepatoxicity and internal hemorrhage in susceptible
groups of human population45.
Nitrophenol Derivatives
Nitrophenol derivatives are organic compounds derived from nitrophenol (HOC6H5-x[NO2]x).
Nitrophenol has, in turn, three isomeric forms: o-nitrophenol, m-nitrophenol, and p-nitrophenol.
The phenolic ring can also be connected to two or three NO2 groups, yielding di- and tri-
nitrophenols46,47. Nitrophenolic compounds can be directly used as herbicides, fungicides, and
insecticides; or used as intermediates in the synthesis of more complex pesticides48,49. They
trigger biological oxidations and cytosolic sulfonation of small molecules in the cytoplasm,
leading to oxidative stress and cellular apoptosis50. Some nitrophenol derivatives are also used
as pigments and chemicals for rubber and leather treatments51. Regarding the toxicological
INTRODUCTION
18
effects on humans, nitrophenols are poisonous compounds that may cause eye, skin and
respiratory tract irritation. In contact with internal organs, nitrophenol leads to the formation of
methemoglobin and subsequent cyanosis, confusion, and unconsciousness52,53.
Neonicotinoids
Neonicotinoids are structural analogs of nicotine. Nicotine is a bicyclic compound
containing a pyridine cycle (5 C atoms and 1 N atom) and a pyrrolidine cycle (4 C atoms and 1 N
atom). In this regard, neonicotinoids mimic nicotine biochemical activity by binding to the
nicotinic acetylcholine receptors (nAChRs) and triggering their overstimulation54. While nAChRs’
low activation causes nervous stimulation, excessive activation causes paralysis and ultimately
death. Neonicotinoids are mainly used as insecticides because nAChRs are present in the central
nervous system of insects54,55. These receptors can also be found in the central and peripheral
nervous systems of mammals, whereby the selectivity of neonicotinoids lies in the structural
differences of the nAChRs present in insects and mammals56,57. Nonetheless, neonicotinoids are
highly toxic to a broad range of insects, including honeybees55,58, having a dramatic impact on
the ecosystem's biodiversity. Besides, side effects can also occur in humans, including infertility,
hepatoxicity, neurotoxicity, and genotoxicity55. Some examples of neonicotinoids are
acetamiprid, imidacloprid and thiamethoxam59.
Organochlorinated Compounds
Organochlorinated compounds (OCs) are organic compounds containing at least one
covalently bonded atom of chlorine. OCs are classified according to the chemical structure
(chloroalkanes, chlorinated alicyclic compounds, and chlorophenolic compounds) and to the
number of chlorine atoms present in the molecule (mono-, di-, tri-, tetra- and
pentachlorophenol)60. OCs are used as algaecides, bactericides, fungicides, and herbicides61,62.
Depending on their specific chemical structure, OCs cause a great variety of damages at the
biochemical and cellular levels, inducing different toxic effects. For example, trichloroacetic
compounds trigger epigenetic alterations in the DNA and oxidative stress63. On the other hand,
DDT-like compounds (dichlorodiphenyltrichloroethane) cause hyperexcitability on the peripheral
nervous system64,65, whereas chlorinated cyclodienes trigger a widespread depression of the
19
CHAPTER 1
nervous system66,67. Finally, chlorophenols directly damage DNA by inducing mutations and
structural alterations of the DNA double strand68.
OCs are also commonly used as disinfectants68 (chlorophenolic compounds), electrical
insulators and heat transfer agents69 (polychlorinated biphenyls), flame retardants70
(chloroalkanes) and substrates for the fabrication of plastics71 (vinyl chloride). Some examples of
organochlorinated pesticides include trichloroacetic acid72 (herbicide), pentachlorophenol61
(algaecide, fungicide, herbicide, and insecticide) and endosulfan73 (chlorinated cyclodiene;
acaricide and insecticide). OCs pose a risk for human health since some of them have proven to
be carcinogenic and cause severe renal and neurological defects61,74.
Organometallic Compounds
Organometallic compounds are organic compounds containing at least one covalently
bonded atom of metal. In the case of organometallic pesticides, tin (Sn), mercury (Hg) and copper
(Cu) are the most used metallic atoms. There exist a great variety of organometallic pesticides
with different biological effects, including acaricides, bactericides, fungicides, herbicides,
miticides and nematicides75–78. Tin-based organometallic compounds are classified as organotin
halides, organotin hydrides, organotin oxides, organotin hydroxides, and stannanes79. Tributyltin
(TBT) is an organotin compound commonly used as an anti-fouling paint and as an ingredient in
some disinfectants80,81. Mercury-based organometallic compounds are classified as elemental
mercury, inorganic mercury compounds, and organic mercury compounds78,82. Thiomersal
(ethyl(2-mercaptobenzoato-(2-)-O,S) mercurate(1-)sodium, IUPAC name) is an organomercury
compound formerly used as a bactericide83. Copper-based organometallic compounds include a
pool of copper-based organic and inorganic compounds such as copper sulfate, copper oxide,
and copper octanoate84,85. Copper sulfate is used as an algaecide and as an herbicide84,86.
Tin-organometallic pesticides inhibit the ATPase activity and destroy the pH gradient in the
mitochondria. Besides, they cause microtubule disassembly and disruption, and inhibition of
several enzymes, including cytochrome P-450, leading to cellular apoptosis87. Mercury-
organometallic pesticides inhibit selenoenzymes (i.e. thioredoxin reductase), leading to oxidative
stress and cellular apoptosis88. Copper-organometallic pesticides interfere with the uptake of
iron and other nutrients essential for the plants and fungi’s metabolism, as well as induce
INTRODUCTION
20
oxidative stress77,89,90. Other uses of organometallic compounds include catalysts (Sn-
compounds)91, sensing devices (Hg-compounds)92 and coloring agents (Cu-compounds)93.
Organometallic compounds are toxic to humans at different levels depending on their chemical
structure and the intake route. The toxic effects might include bronchitis and endocrine
disruption for Sn-compounds94, central nervous system alterations (i.e. Minamata disease)95 and
kidney toxicity for Hg-compounds, and skin and respiratory irritation for Cu-compounds96.
Organophosphorus Compounds
Organophosphorus compounds (OPs) are organic compounds containing at least one
covalently bonded atom of phosphorus. OPs are classified according to the chemical valence of
the phosphorus element: phosphorus (III) and phosphorus (V), as well as the chemical structure
of the entire molecule (i.e. phosphates, phosphonates, phosphorothioates, phosphoramidites,
etc.)97. OP pesticides are mainly used as anthelmintics, ectoparasiticides, herbicides, and
insecticides98. OPs covalently bind to AChE and inhibit it irreversibly, behaving as neurotoxins
that lead to muscle spasms and ultimately death97,99. Parathion, malathion, and diazinon are
some examples of OP pesticides100. Other OPs are used as flame-retardants (i.e. triphenyl
phosphate)101. OPs can be toxic for humans through inhalation, ingestion and dermal absorption,
and toxic effects can be acute or chronic. In this regard, OPs have been classified as possible
carcinogens102, and acute toxicity leads to neurotoxic effects, even at low levels of exposure97.
Phenoxiacetic Compounds
Phenoxiacetic compounds stem from phenoxiacetic acid. They are classified according to
the functional groups bonded to the aromatic ring of the molecule, which can be alkyl and
halogen groups (F, Cl, Br and I)103. Phenoxiacetic compounds are used as herbicides because they
behave as hormonal disruptors in plants. More specifically, phenoxiacetic compounds mimic the
structure of auxins, a class of plant hormones that play a critical role in plant growth and
development104,105. These herbicides induce an unsustainable growth of the plants, finally leading
to plants’ death. An example could be 2,4-dichlorophenoxyacetic acid, a herbicide used to control
weeds106. Other phenoxiacetic compounds are used as flavoring ingredients (i.e. phenoxiacetic
acid)107 and antidiabetic drugs (i.e. rosiglitazone)108. Phenoxiacetic compounds are safe for
21
CHAPTER 1
humans at low doses, but high doses may produce acute toxic effects such as eye irritation109,
while chronic toxicity might lead to the formation of tumors and cancer development106.
Pyrazole Compounds
Pyrazole compounds are organic compounds derived from pyrazole, a heterocycle
containing three atoms of carbon and two atoms of nitrogen (C3H4N2). Pyrazole compounds are
classified according to the side chains connected to the pyrazole group (i.e. alkyl, phenyl). For
example, fipronil is a pyrazole compound connected to four different chemical groups (amino,
carbonitrile, halogenic phenol, and halogenic sulfinyl groups) that induces oxidative stress and
widespread damage to lipids, DNA and intracellular proteins110. Pyrazole compounds are mainly
used as insecticides, but some of them also have bactericide, fungicide, and herbicide activity111.
Their insecticide activity comes from the blockage of the γ-aminobutyric acid-gated chloride
(GABA) channels and glutamate-activated chloride (GluCl) channels present in insects112.
Whereas GluCl channels are only present in protostome invertebrates113 (i.e. arthropods,
annelids, and mollusks), GABA-gated chloride channels are also in present in humans. Therefore,
the selectivity of pyrazole insecticides arises from their more specific and stronger binding to the
insect GABA-gated chloride channels. Other pyrazole compounds (i.e. chlorfenapyr and
tebufenpyrad)114,115 inhibit the complex I enzymes found in the mitochondria, disrupting the
production of intracellular ATP, and finally leading to cellular death. Pyrazole insecticides may
produce acute neurotoxic effects in humans (i.e. headache, tremors, and convulsions), and
tumors and cancer upon chronic exposure116. Eventually, some pyrazole compounds are used as
therapeutic drugs due to their analgesic and anti-inflammatory activity111.
Pyrethroids
Pyrethroids are organic compounds analogs of pyrethrins, natural organic compounds
produced by the plant Tanacetum cinerariifolium117. Pyrethroids consist of a molecule of
chrysanthemic acid whose side chains can be alkyl, halogen, cycloalkyl and aromatic groups.
Pyrethroids are classified according to their chemical nature, or the time they were synthesized
(1st, 2nd, 3rd and 4th generation)117. They are mainly used as acaricides and insecticides. Bifenthrin
is an example of a pyrethroid insecticide118. Pyrethroids behave as excitotoxins, preventing the
closure of the voltage-gated sodium channels in the neurons65. Consequently, the nerves cannot
INTRODUCTION
22
repolarize, paralyzing the organism and leading to death. The voltage-gated sodium channels are
found both in insects and mammals, but most mammals can break down pyrethroid molecules
at low doses117. However, cats are especially susceptible to pyrethroids since they lack the
enzyme glucuronidase, which helps to detoxify the pyrethroids in the liver119,120. In this regard,
pyrethroids have proven to be less toxic for humans than OPs and carbamate compounds,
causing respiratory irritation if inhaled, but they are strongly toxic for honeybees and a wide
range of aquatic organisms28,117,119.
Thiocarbamates
Thiocarbamates are organic sulfur-compounds derived from carbamic acid.
Thiocarbamates are classified according to the isomeric form of the thiocarbamate ester as O-
isomers or S-isomers. Thiocarbamates are widely used in agriculture as fungicides, herbicides,
and insecticides, but they are also used as biocides for household care products and several
industrial applications. Some examples are tolnaftate (fungicide)121, benthiocarb (herbicide)122
and cartap (insecticide)123. On the one hand, fungicide thiocarbamates inhibit the enzyme
squalene exposidase121, hindering the synthesis of ergosterol, an essential compound in the
fungal cellular membranes. On the other hand, herbicide thiocarbamates induce oxidative stress
in plants through the formation of sulfoxide compounds124. Lastly, insecticide thiocarbamates are
ion channel blockers of the nAChR123. Thiocarbamates show generally low toxicity to mammals,
including humans, being skin and eyes irritation the most common side effects observed upon
exposition. Nonetheless, some specific thiocarbamates might produce nausea, dizziness, ataxia
and even convulsions84.
Triazine and Triazole Compounds
Triazine and triazole compounds are nitrogen-containing organic heterocycles whose
molecular formula is C3H3N3 and C2H3N3, respectively. Triazine and triazole compounds are
classified according to the different isomeric and tautomeric forms of the heterocycles. While
triazine compounds are fundamentally used as herbicides125, triazole compounds are more
commonly used as fungicides. Some examples of triazine compounds include atrazine and
simazine126, and some examples of triazole compounds include ketoconazole and
tebuconazole127,128. On the one hand, triazine compounds interfere with the photosynthetic
23
CHAPTER 1
system of the plants through the inhibition of the plastoquinone-binding protein of photosystem
II, located on the thylakoid membrane of chloroplasts84. Consequently, the electron transport
process is interrupted, resulting in the plant’s death. On the other hand, triazole compounds
inhibit the enzyme lanosterol 14α-demethylase, preventing the conversion of lanosterol to
ergosterol129, thereby harming the fungal cellular membrane integrity. Triazine compounds have
generally low toxicity to mammals. However, some triazine compounds are skin irritators and
might provoke irritability, anorexia, and hypothermia after ingestion, among other symptoms84.
Additionally, triazole compounds may inhibit the enzyme aromatase130, essential for the
biosynthesis of estrogens, behaving as endocrinal disruptors. Regarding other uses, triazine
compounds are often used as chemical reagents in organic synthesis131, and triazole compounds
are used as antifungal drugs to treat fungal infections.
Urea Compounds
Urea compounds are organic chemical compounds derived from urea (CO[NH2]2). Urea-
based pesticides encompass three major categories known as benzoylureas, phenylureas, and
sulfonylureas132. Benzoylureas are chemical derivatives of benzoylurea (C8H8N2O2) that act as
insect growth regulators by inhibiting the biosynthesis of chitin133, the primary component of
insects’ exoskeleton. Diflubenzuron is an example of benzoylurea insecticide133. Phenylureas are
chemical derivatives of phenylurea (C8H10N2O) that inhibit the plastoquinone-binding protein of
the photosystem II in plants and algae, interrupting the electron transport chain, and finally
leading to the plant’s death134. Diuron is probably the most commonly used phenylurea
worldwide135. Sulfonylureas are chemical derivatives of sulfonylurea (CH2NO3S) containing two
additional side-chains composed of a variety of different chemical groups. They are classified as
1st, 2nd and 3rd generation sulfonylureas. Sulfonylureas are mainly used as herbicides due to their
ability to inhibit the acetolactate synthase136, an enzyme present in plants and some
microorganisms involved in the biosynthesis of the amino acids valine, isoleucine and leucine. An
example is flazasulfuron, a sulfonylurea herbicide used to prevent the growth of pre-emergent
plants and kill post-emergent plants in a matter of days137. Some other sulfonylureas are used as
antidiabetic drugs to treat diabetes mellitus type 2 (i.e. glimepiride) by stimulating the secretion
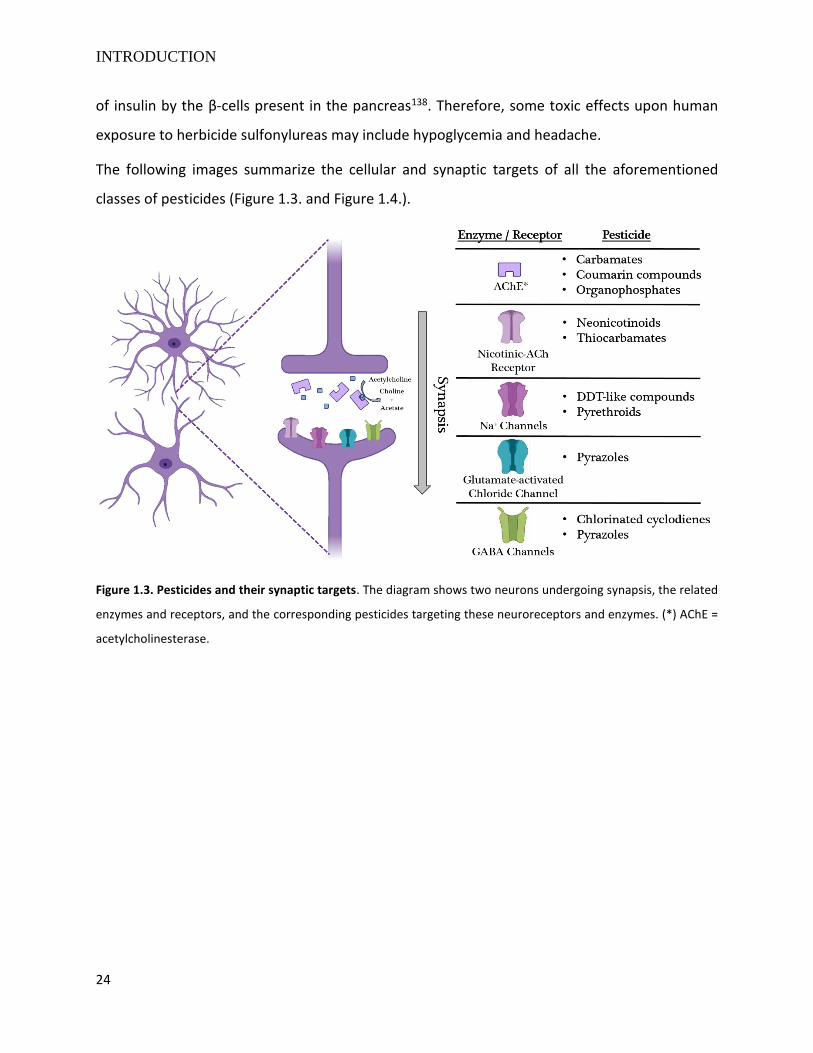
INTRODUCTION
24
of insulin by the β-cells present in the pancreas138. Therefore, some toxic effects upon human
exposure to herbicide sulfonylureas may include hypoglycemia and headache.
The following images summarize the cellular and synaptic targets of all the aforementioned
classes of pesticides (Figure 1.3. and Figure 1.4.).
Figure 1.3. Pesticides and their synaptic targets. The diagram shows two neurons undergoing synapsis, the related
enzymes and receptors, and the corresponding pesticides targeting these neuroreceptors and enzymes. (*) AChE =
acetylcholinesterase.
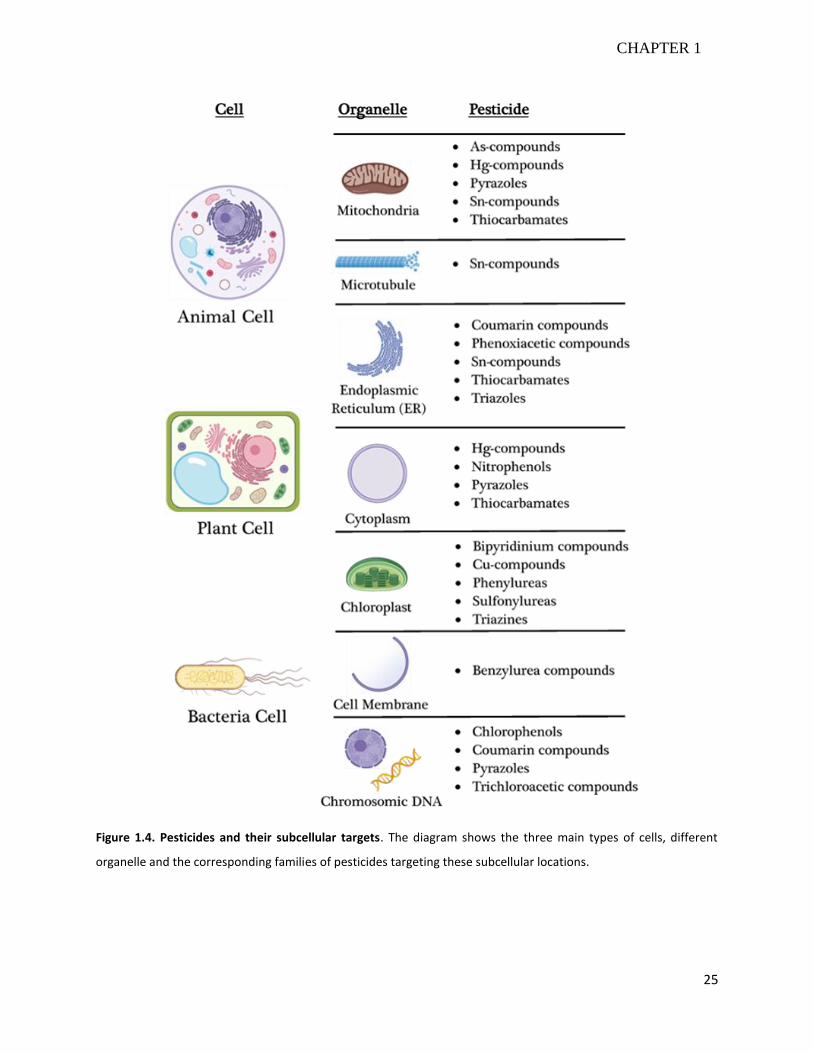
25
CHAPTER 1
Figure 1.4. Pesticides and their subcellular targets. The diagram shows the three main types of cells, different
organelle and the corresponding families of pesticides targeting these subcellular locations.
INTRODUCTION
26
1.1.3.2. Heavy Metals and Petroleum
Heavy Metals
Heavy metals are metallic elements with specific properties such as high density (3.5-7
g·cm-3) and high atomic weight. Water pollution with heavy metals often arises from mining and
other industrial activities. The most common heavy metals found in waters are arsenic (As),
cadmium (Cd), chromium (Cr), copper (Cu), nickel (Ni), lead (Pb), mercury (Hg), thallium (Tl) and
zinc (Zn)139. These heavy metals are not biodegradable, and though some of them are essential
for humans’ metabolism at low concentrations, higher concentrations often cause toxicity.
The following list summarizes the uses of these heavy metals, the pollution inputs of them into
the water bodies, and their toxic effects on the environment and human’s health:
• Arsenic: Arsenic compounds have historically been used as healing agents to treat several
diseases such as leukemia and psoriasis27. More recently, roxarsone and arsanilic acid
were still being used as feed additives for swine and poultry in some countries, including
the US and Australia24. Pollution inputs often come from industrial processes and natural
geological sources leaching into water bodies (i.e. aquifers)27. Arsenic pollution is a
relevant issue in Bangladesh and West Bengal (India)27. Arsenic is not only a carcinogen
but also a powerful poison, whose acute ingestion usually leads to death within one to
four days.
• Cadmium: Cadmium is a habitual element found in paints, batteries and some plastics.
Therefore, the main pollution inputs come from non-recycled batteries and industrial
wastewaters. Cadmium is strongly toxic for humans, even at low concentrations139.
Cadmium is considered a carcinogen since it can inhibit the enzymes involved in DNA
reparation, as well as other ROS (Reactive Oxygen Species) detoxifying enzymes (i.e.
catalase and superoxide dismutase)140. As an example, the itai-itai disease is a cadmium-
poisoning related disease141.
• Chromium: Chromium is used to produce stainless steel, manufacture paper, and tan
leather cloths. It enters the ecosystem mainly through industrial wastewaters. Chromium
inhibits the enzymes catalase and glutathione reductase, thereby increasing the
27
CHAPTER 1
concentration of intracellular ROS, leading to lipid peroxidation and cell membrane’s
damage140. Chromium can produce irritation through inhalation, ingestion or even by skin
contact, leading to more serious symptoms such as hemorrhagic gastroenteritis and acute
renal deficiency142.
• Copper: Copper is an essential element (micronutrient) that is required by most living
beings (plants, animals and some microorganisms). It constitutes a key cofactor for some
metalloenzymes and is involved in the formation of red blood cells139,143. Copper has been
used since the prehistory for the construction of rudimentary tools, until nowadays for
the production of wires and other electrical components139. Nonetheless, the intake of
high concentrations of copper by drinking polluted waters leads to stomach and kidney
problems in humans139,144. Furthermore, copper is extremely toxic to several aquatic
organisms, even when found at low concentrations in water139,145.
• Nickel: Nickel is a metallic element mainly found in volcanic rocks, and is used in diverse
industrial applications such as the production of stainless steel, coins, and batteries139,146.
Nickel is also necessary for the synthesis of red blood cells in humans, but it becomes toxic
at high doses and longer exposure times139. It has been hypothesized that Ni atoms may
replace Mg atoms in the double-strand DNA, enhancing chromatin condensation and
triggering DNA methylation, resulting in important epigenetic modifications63. Nickel
poisoning leads to liver toxicity, heart damage, and even cancer139,146.
• Lead: Lead is used for the production of bullets, ship ballasts, and scuba diving weight
belts. The plumbing pipes systems are the main sources of pollution of drinking water
with lead, especially in old houses built in the first half of the 20th century. Lead atoms are
highly toxic because they hinder the hemoglobin synthesis and disrupt the central
nervous system139. Besides, lead also produces chlorosis and bleaching in plants exposed
to Pb-polluted waters139.
• Mercury: Mercury is used for the manufacture of thermometers, barometers, dental
amalgams, and fluorescent lamps. Industrial wastewaters are the main mercury inputs in
natural water bodies. Mercury can be inhaled or ingested, damaging severely the red
blood cells by inducing ROS production83. Mercury is known to be mutagenic and cause
INTRODUCTION
28
neurologic disabilities78,139. For example, Minamata disease is a neurological disorder
caused by mercury poisoning95.
• Thallium: Thallium is a rare metallic element used as an infrared optical material, as a
photoresistor, and for nuclear medicine scanning. Thallium pollution of waters is not
common. Upon ingestion, Tl+ ions mimic K+ ions, entering the cells through the potassium
ionic channels. Once inside the cell, Tl+ ions interact with sulfur ligands (i.e. cysteine),
interfering with many cellular processes (i.e. regulation of oxidative stress and
glutathione metabolism)147. The symptoms provoked by thallium poisoning are complex
and nonspecific, including anxiety and delirium, which might lead to coma and death148.
• Zinc: Zinc has several applications in the industry, highlighting the galvanization of steel
and iron-made pieces and the fabrication of alloys such as bronze and brass. Zinc is also
an essential micronutrient for plants and humans, which deficiency causes immunological
depression, diarrhea, and psychological disorders149,150. In this regard, zinc is required for
the correct working of many intracellular enzymes and transcription factors149,151.
Nevertheless, high concentrations of zinc in water provoke phytotoxic effects and
muscular disorders in humans after ingestion139. In this regard, several human activities
such as mining, coal combustion, and steel processing might release traces of zinc into
the soil and the rivers, rising the zinc concentration above the safety levels152.
Petroleum
Petroleum is a natural hydrocarbon found beneath the Earth’s surface that is used to
produce a huge variety of products such as gasoline, plastics, asphalt, and kerosene. Therefore,
it is primarily used as a source of energy for transport, heating, and lighting. Petroleum is formed
after a large number of dead organisms are buried under sedimentary rocks undergoing intense
heat and pressure153.
Nowadays, humankind has a strong dependence on petroleum to produce energy and
several manufactured products. However, petroleum sources underneath the Earth's surface are
limited. Petroleum itself has limited toxicity on humans, mainly irritation after skin contact154.
The ingestion of petroleum may lead to mild symptoms, such as nausea and diarrhea154.
29
CHAPTER 1
On the other hand, petroleum-derived oils pose a severe risk to marine life, and ultimately
to humans as well155. Some oils derived from petroleum, together with some additives they
contain, can reach the lungs by aspiration, leading to acute pneumonitis. Besides, a huge amount
of petroleum-derived products and oils are transported by sea in freighter ships. When any of
these ships break down, tons of a complex mixture of hydrocarbons together with additives (i.e.
sulfur and nitrogen compounds), are released into the water155. Consequences are catastrophic.
Some examples are Gulf War oil spill (the Persian Gulf, 1991, ˃ 1.5·106 tons)156, Ixtoc I oil spill (the
Gulf of Mexico, 1979, ˃ 4.5·105 tons)157 and Atlantic Empress/Aegean Captain oil spill (the
Caribbean Sea, 1979, ˃ 2.5·105 tons)158.
Several oil spills have also taken place around the Spanish coasts, being the Prestige oil spill
occurred in November 2002, the most recent. The tank of the ship burst after a storm, releasing
more than 63,000 tons of heavy fuel oil into de Atlantic sea, near the Galician coast. As a result,
more than 1,000 km of coastline was covered by fuel, thousands of animals died, and
environmental-related problems lasted for years159.
1.1.4. Biological Pollutants
Pathogens are disease-causing microorganisms. Some of these microorganisms can be
transmitted by water, producing waterborne outbreaks and serious diseases. Waterborne
pathogens can be either bacteria, viruses, protozoa, algae or worms (Figure 1.5). Therefore,
water disinfection is required to achieve drinkable water standards and the optimal treatment of
wastewaters.
1.1.4.1. Bacteria
Bacteria are prokaryotic cells that can be free-living or interact with animals and humans
either through symbiotic or parasitic relationships. Our own body has more bacteria cells than
human cells, mainly living in the guts but also all over the skin, in our nose, mouth, throat,
stomach, and genitals160. Water is also a common ecosystem for bacteria, and their presence is
almost inevitable. Therefore, the parameter that indicates whether a specific source of water is
drinkable or not, is not the presence of bacteria but their concentration (CFU/mL). Besides, many
different bacteria species can be found in water, making the detection and quantification of all
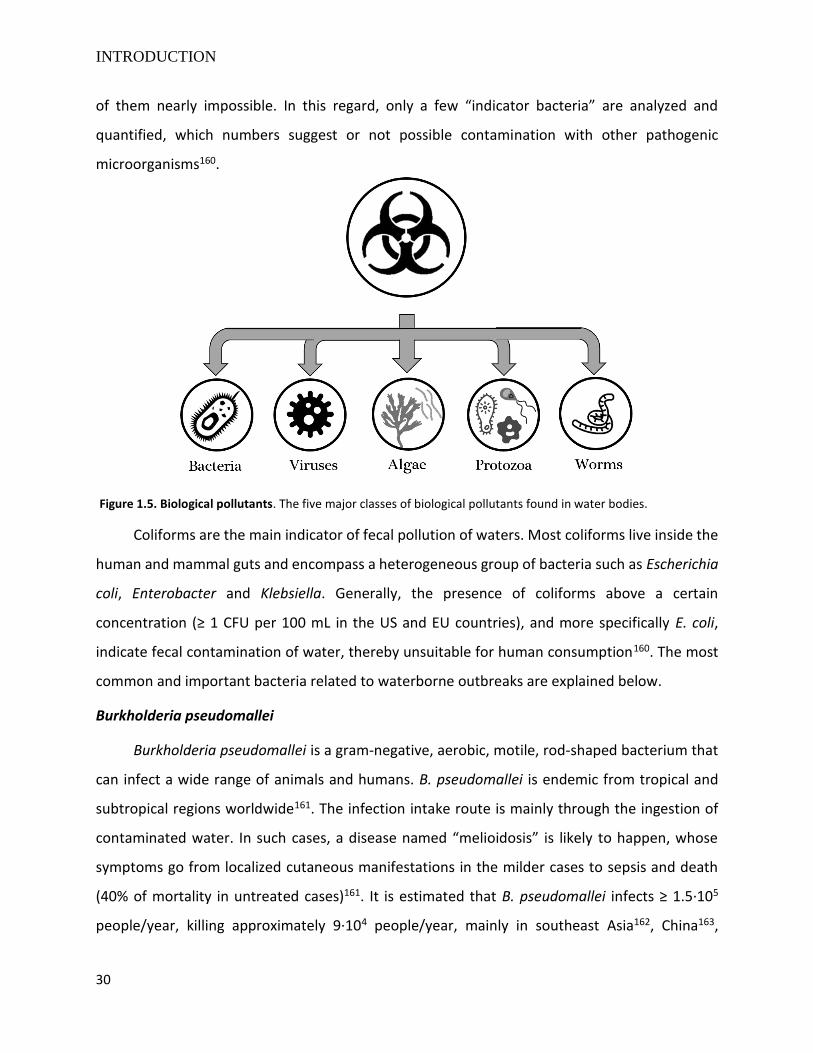
INTRODUCTION
30
of them nearly impossible. In this regard, only a few “indicator bacteria” are analyzed and
quantified, which numbers suggest or not possible contamination with other pathogenic
microorganisms160.
Figure 1.5. Biological pollutants. The five major classes of biological pollutants found in water bodies.
Coliforms are the main indicator of fecal pollution of waters. Most coliforms live inside the
human and mammal guts and encompass a heterogeneous group of bacteria such as Escherichia
coli, Enterobacter and Klebsiella. Generally, the presence of coliforms above a certain
concentration (≥ 1 CFU per 100 mL in the US and EU countries), and more specifically E. coli,
indicate fecal contamination of water, thereby unsuitable for human consumption160. The most
common and important bacteria related to waterborne outbreaks are explained below.
Burkholderia pseudomallei
Burkholderia pseudomallei is a gram-negative, aerobic, motile, rod-shaped bacterium that
can infect a wide range of animals and humans. B. pseudomallei is endemic from tropical and
subtropical regions worldwide161. The infection intake route is mainly through the ingestion of
contaminated water. In such cases, a disease named “melioidosis” is likely to happen, whose
symptoms go from localized cutaneous manifestations in the milder cases to sepsis and death
(40% of mortality in untreated cases)161. It is estimated that B. pseudomallei infects ≥ 1.5·105
people/year, killing approximately 9·104 people/year, mainly in southeast Asia162, China163,
31
CHAPTER 1
Taiwan164, and northern Australia162. Diagnosis and identification of B. pseudomallei can be
carried out by culture on blood and MacConkey agar, 16S rRNA sequencing, PCR, serological
diagnosis (i.e. IHA or ELISA), metabolic profiling, and more recently by MALDI-TOF MS165.
Campylobacter jejuni & Campylobacter coli
Campylobacter spp. is a genus of gram-negative, microaerophilic, motile, rod and spiral-
shaped bacteria that can be transmitted by ingestion of contaminated food and water, as well as
by fecal-oral route from infected animals or people166. Campylobacter jejuni and Campylobacter
coli are the two main pathogenic species of this genus of bacteria. Campylobacter spp. provokes
around 2 million infections only in the US every year166, and is considered to be the most frequent
cause of gastroenteritis worldwide167. Campylobacteriosis causes high fever (≥ 40 ºC), nausea,
stomachache, and bloody diarrhea. Most people overcome the disease after 7-10 days, but the
infection reappears in around 25% of the cases166. Detection of C. jejuni is mainly made by
immunological tests and bacterial growth on selective media166.
Clostridium botulinum
Clostridium botulinum is a gram-positive, anaerobic, motile and rod-shaped bacterium. C.
botulinum typically lives in water and can form endospores that enable the bacteria to survive at
high temperatures and salinity conditions168. C. botulinum produces the botulinum neurotoxin,
which can be ingested together with the bacteria through contaminated food and water, causing
botulism. This neurotoxin blocks the release of acetylcholine, paralyzing the muscles, and
consequently may lead to death because of respiratory failure169. The ingestion of only a few
nanograms of the botulinum neurotoxin can kill a person170. Diagnosis of C. botulinum toxin is
carried out by ELISA tests with digoxigenin-labeled antibodies, the so-called “mouse lethality
bioassay”, and quantitative PCR171.
Escherichia coli
Escherichia coli is a gram-negative, facultative anaerobe, motile and rod-shaped bacterium.
Most E. coli strains are considered normal microbiota in humans’ and mammals’ guts. However,
there are specific strains of E. coli considered pathogenic, referred to as enterovirulent E. coli
(EEC). For example, the strain O104:H4 belongs to a pathogenic group named Shiga toxin-
INTRODUCTION
32
producing E. coli (STEC), which produces Shiga toxins that trigger inflammation in the intestines,
followed by bloody diarrhea172,173. Other strains of E. coli, named enterotoxigenic E. coli (ETEC)
cause the traveler’s diarrhea. Infection occurs upon the ingestion of contaminated food or water.
ETEC cells attach to the intestinal lining, secreting enterotoxins that cause watery diarrhea174. On
the other hand, enterohemorrhagic E. coli (EHEC) strains cause hemolytic-uremic syndrome (i.e.
O157:H7), characterized by acute kidney failure and low red blood cells and platelets levels172.
Finally, enteroinvasive E. coli (EIEC) and enteroaggregative E. coli (EAggEC) invade the intestinal
walls, causing either acute or chronic diarrhea, especially in children172,175. Diagnosis of EEC
infections is carried out by bacteria culture and isolation on growing media, ELISA tests, and
multiplex PCR174,175.
Legionella spp.
Legionella spp. is a genus of gram-negative, aerobic, motile and rod-shaped bacteria. There
exist around 50 species of Legionella, among which L. pneumophila is well known to cause
legionellosis. Legionellosis can, in turn, appear as Legionnaire’s disease (atypical pneumonia) or
Pontiac fever (mild upper respiratory infection)176. There is no human to human transmission of
these bacteria but through inhalation of water droplets from contaminated sources (water
cooling towers, air-conditioning cooling systems, and fountains)177. Once inside the body,
Legionella infects alveolar macrophages, in the lungs, usually leading to pneumonia176.
Nonetheless, this disease tends to affect more immunocompromised hosts, thereby water
quality monitoring inside hospitals is extremely important to prevent outbreaks. The mortality
rate is less than 5% in healthy patients with antibiotics treatment but raises to 60% for
nosocomial infections178. Legionella is detected by culture on buffered charcoal yeast extract agar
since it requires cysteine and iron to grow166,176. The incubation process is slow and may take up
to 10 days to have a definitive result176, whereby immunological tests or even PCR are commonly
used to speed up the process179.
Non-tuberculous mycobacteria
Non-tuberculous Mycobacteria are those species of Mycobacterium that do not cause
tuberculosis or leprosy. The bacteria belonging to this group are considered to be opportunistic
pathogens, and often cause pulmonary diseases other than tuberculosis, but also lymphadenitis,
33
CHAPTER 1
skin disease, and other affections180. Mycobacterium bacteria are ubiquitous and can be found in
water, soil, and animals. Non-tuberculosis Mycobacterium can colonize indoor water systems,
natural water sources, pools, and pipes. Therefore, these bacteria can be transmitted through
contaminated water and droplets180. The overall mortality rate caused by non-tuberculosis
Mycobacteria is around 10%181. Diagnosis is made by radiographic evidence of the lungs, culture
growth on Löwenstein-Jensen medium (3-4 weeks) and 16S ribosomal RNA sequencing182.
Pseudomonas aeruginosa
Pseudomonas aeruginosa is a gram-negative, facultative anaerobe, motile and rod-shaped
bacterium. It is considered as an opportunistic pathogen for humans, meaning that P. aeruginosa
usually causes disease when the host is immunocompromised, has an altered microbiota or the
integumentary barriers are damaged. Therefore, most P. aeruginosa infections are nosocomial
infections that can cause a variety of different symptoms depending on the intake route (i.e.
folliculitis, otitis, pneumonia, and bacteremia)183. P. aeruginosa can be transmitted not only by
contaminated water but also by contaminated tools, through skin contact, inhalation, and
ingestion. It is a worldwide distributed bacteria that can broadly survive in non-optimal
environments, including distilled water and soil184. Diagnosis includes culture growing on
MacConkey agar, biochemical tests (oxidase +) and pigment production (pyocyanin)185.
Salmonella spp.
Salmonella spp. is a genus of gram-negative, facultative anaerobe, motile and rod-shaped
bacteria that encompass 3 different species: S. enterica, S. bongori and S. subterranean.
Salmonella enterica is further divided into six subspecies and several serotypes according to three
cellular surface antigens: O antigen (cellular wall), H antigen (flagella), and Vi antigens (bacterial
capsule)186. Subspecies of S. enterica are enteropathogenic bacteria that cause salmonellosis
(acute gastroenteritis). The transmission of Salmonella is produced by the ingestion of
contaminated water and food (mainly raw meat and dairy products)186. After infection,
Salmonella colonizes the small and large intestines, provoking diarrhea and stomach cramps. It
is estimated that around 100 million cases of salmonellosis occur worldwide every year, causing
more than 150,000 deaths per year187. Salmonella spp. detection is carried out by culturing
bacteria in growth media containing ferrous sulfate and real-time PCR188,189.
INTRODUCTION
34
Salmonella typhi
Salmonella typhi is a species of Salmonella spp. responsible for the disease called typhoid
fever. The main symptoms after infection are headache, abdominal pain, and vomiting, whereas
diarrhea is not common. Typhoid fever can be transmitted by eating or drinking contaminated
food and water with feces of infected people190. Without appropriate treatment, typhoid fever
has a mortality rate of 10-30%191. Diagnosis is made by culturing bacteria (i.e. bismuth sulfite
agar), performing immunological tests (i.e. Widal test, Typhidot, and Tubex test)192–194 or
detecting bacteria’s DNA in biological samples (i.e. blood and feces)195.
Shigella spp.
Shigella spp. is a genus of gram-negative, facultative anaerobe, motile and rod-shaped
bacteria. There are four species of Shigella spp: S. dysenteriae, S. flexneri, S. boydii, and S. sonnei.
Shigella, in turn, classified into serotypes and serogroups166. Shigellosis is produced after the
ingestion of water polluted with Shigella spp. In this case, bacterial cells invade the epithelium of
the colon, inducing inflammation and killing the invaded cells196. As a result, diarrhea and
dysentery (bloody diarrhea) are expected to occur. More specifically, S. dysenteriae strains
secrete an enterotoxin that often leads to the hemolytic-uremic syndrome196. The mortality rate
of shigellosis was around 10-15% at the end of the 20th century, but since then it is steadily
decreasing197. Diagnosis and identification of Shigella spp. are made by agglutination tests using
adsorbed rabbit antisera196.
Vibrio cholerae
Vibrio cholerae is a gram-negative, facultative anaerobe, a halophilic, motile, comma-
shaped bacterium that is typically transmitted due to the ingestion of contaminated water160.
Cholera is the waterborne disease provoked by V. cholerae. It is an endemic disease in many
developing countries in Africa, South America and Southeast Asia160. It is estimated that between
1.3 and 4 million cases of cholera occur every year worldwide198. In this regard, there are two
strains of V. cholerae of special importance due to their virulence and widespread distribution:
O1 (Indonesia) and O139 (India and Bangladesh)160. After the ingestion of contaminated water,
V. cholerae attaches to the epithelial cells in the small intestine, thrives and secrete an
35
CHAPTER 1
enterotoxin that causes strong diarrhea and dehydration (≥ 20 liters/day)160. Without the intake
of liquids and the appropriate electrolytes, death is certain. The mortality rate is around 50-60%
in the non-treated cases199. Diagnosis and detection of V. cholerae cells are normally made by
microscopic observation of comma-shaped bacteria in the aqueous feces of sick people160.
Yersinia enterocolitica
Yersinia enterocolitica is a gram-negative, facultative anaerobe, motile, rod-shaped
bacterium that is transmitted by the ingestion of contaminated water and food. Pathogenicity of
Y. enterocolitica relies on the virulence factors that the bacteria might express depending on
certain chromosomal and plasmid genes200. Infection with Y. enterocolitica leads to yersiniosis,
causing acute diarrhea and other digestive symptoms. The gravest condition of the infection by
Y. enterocolitica is the enteric fever, a potentially lethal disease166. Y. enterocolitica provokes
almost 90,000 infections per year only in the US166. Diagnosis and detection of Y. enterocolitica
cells are made by imaging studies (i.e. computed tomography scan), ELISA tests (detection of
human IgG, IgA, and IgM against Yersinia), PCR and immunofluorescence assays201.
1.1.4.2. Viruses, Protozoa and other Parasites
Not only bacteria but also viruses, protozoa, algae, and helminths can cause waterborne
outbreaks. Viruses are the smallest known parasites that can replicate inside their host cells.
Protozoa are unicellular eukaryotic cells that can be either free-living or parasitic. Algae are
photosynthetic eukaryotic organisms that can be either unicellular or pluricellular, some of which
produce toxins. Finally, helminths, more commonly known as parasitic worms, are large
macroparasites (> mm). The following list summarizes some of these microorganisms and
parasites202:
• Enteroviruses: Enteroviruses are those viruses able to infect the human intestinal tract.
Enteroviruses do not produce any symptoms in many cases, but mild intestinal symptoms
are not rare. They represent almost 40% of all waterborne outbreaks produced by viruses
in the US202. Enteroviruses can be detected using reverse transcriptase PCR (RT-PCR),
serological methods (i.e. IgM and IgG detection by ELISA tests), and virus typing (genome
sequencing)203.
INTRODUCTION
36
• Hepatitis A (HAV) and E (HEV) viruses: These viruses can be transmitted by contaminated
water and food with feces, infecting the liver and causing hepatitis. Their prevalence is
very common in developing countries. The hepatitis A virus is resistant to inactivation by
heat and has a worldwide distribution, whereas the hepatitis E virus is more common in
tropical countries and is responsible for the highest number of cases of hepatitis204.
Diagnosis of hepatitis A is made by serological testing of IgM, IgA and IgG anti-HAV since
the symptoms may be similar to other hepatitis viruses205, whereas the diagnosis of
hepatitis E is made by detection of IgM and IgG anti-HEV and detection of HEV RNA206.
• Other viruses: This group encompasses norovirus, rotavirus, astrovirus & adenovirus.
Noroviruses were first discovered in the late 1960s in the US, and are known to cause
vomiting and diarrhea202. Rotaviruses often cause gastroenteritis in children and elderly
people, especially in developing countries, causing thousands of deaths in Africa, Latin
America, and Asia. On the other hand, astroviruses are known to be the major cause of
acute diarrhea in children207. Eventually, adenoviruses are transmitted by contaminated
water and are resistant to adverse chemical and pH conditions. Among different
infections, adenoviruses can cause ear infection, conjunctivitis, tonsillitis, bronchiolitis,
and also gastroenteritis in some cases208. These viruses can be detected by rapid enzyme
immunoassays (EIA), ELISA tests and immunochromatographic assays209,210.
• Giardia lamblia: Giardia lamblia is a unicellular flagellated protozoan that causes enteritis.
It can infect not only humans but also dogs, cats, cattle and other livestock. It is
transmitted by the fecal-oral route through contaminated water in the form of cysts (an
inactive and more resistant form of the parasite). G. lamblia causes around 280 million
cases of enteritis worldwide, especially in developing countries, leading to diarrhea,
bloating and abdominal pain. G. lamblia infections are diagnosed by microscopic
identification, fluorescent immunoassays, and PCR211.
• Cryptosporidium: Cryptosporidium is a parasitic protozoan that causes watery diarrhea in
humans. Infection is produced by the intake of contaminated water and food sources. The
related disease is particularly serious in immunocompromised hosts, which cases can be
fatal. Currently, there are nine Cryptosporidium species known to be able to infect
37
CHAPTER 1
humans212. This parasite undergoes a complex life cycle, in part of which it adheres to the
cells in the intestinal epithelium and access to the host cell cytoplasm, feeding off its
nutrients212. Diagnosis often includes seeking antigens or oocysts in stool samples by
bright-field stain visualization, immunofluorescent assays, ELISA tests, and
immunochromatographic assays212.
• Other protozoa: This group encompasses Naegleria fowleri, Entamoeba histolytica,
Toxoplasma gondii & Cyclospora cayetanensis. Naegleria fowleri is a free-living amoeba
that can become pathogenic, causing a lethal brain infection called naegleriasis. The
infection starts after the ingestion of contaminated water, mainly from hot springs, ponds,
lakes and swimming pools213. Entamoeba histolytica is another amoeba that can be
transmitted by sexual or fecal-oral routes, mainly in tropical and subtropical areas.
Infection with E. histolytica might be asymptomatic or cause fulminant dysentery214.
Toxoplasma gondii is a parasitic protozoan that undergoes a complex life cycle, first
infecting cats, from which infects humans and other mammals afterward. Ingestion of
contaminated food and water leads to toxoplasmosis, especially problematic for pregnant
women. Typical symptoms of toxoplasmosis are fever, headache and muscle pain215.
Eventually, Cyclospora cayetanensis is also a parasite that can infect humans, causing
cyclosporiasis. Cyclosporiasis is an endemic disease in some tropical countries that causes
nausea, fatigue, abdominal pain and diarrhea. Diagnosis of these protozoa involves
cerebral spin fluid analysis by magnetic resonance imaging for Naegleria, and serological
tests (i.e. ELISA tests), PCR and microscopic observation for Entamoeba, Toxoplasma and
Cyclospora213–216.
• Microcystis: Microcystis spp. is a genus of freshwater cyanobacteria. Among the different
species of Microcystis, M. aeruginosa is responsible for the production of harmful algal
blooms and several neurotoxins (lipopolysaccharides) and hepatotoxins (microcystins),
thereby causing water contamination and health and economic burdens worldwide.
Microcystins are not only produced by M. aeruginosa but alto by other cyanobacteria.
These toxins are non-ribosomal cyclic heptapeptides that inhibit the intracellular Ser/Thr
phosphatases in terrestrial mammals after drinking contaminated water217. Microcystins
INTRODUCTION
38
detection is usually made by liquid chromatography coupled with tandem mass
spectrometry, while the algae themselves can be tracked by PCR218,219.
• Anabaena: Anabaena spp. is a genus of cyanobacteria that includes some species that
produce some of the most toxic cyanotoxins (i.e. anatoxin-a). Anabaena’s cyanotoxins
bind to nAchR by mimicking acetylcholine. These toxins typically cause acute
neurotoxicity, leading to loss of coordination, convulsions, and death by respiratory
paralysis. The intake route of cyanotoxins is through the ingestion of contaminated
water220. Detection of cyanotoxins includes ELISA tests, protein phosphatase inhibition
assays, HPLC combined with mass spectrometry, liquid chromatography, PCR, and
microarrays221.
• Ascaris lumbricoides: A. lumbricoides is a parasitic nematode that infects humans causing
intestinal and respiratory problems222. It is estimated that worldwide more than 1.3
billion people are infected with A. lumbricoides, out of which around 15% develop
symptoms. Female worms can produce over 200,000 eggs per day, many of which are
excreted through the feces. Infection occurs after the ingestion of contaminated food and
water with eggs222. Diagnosis is mainly carried out by the floatation concentration Faust
method222.
• Other helminths: This group encompasses Trichuris trichiura, Necator americanus, Taenia
spp. and Schistosoma mansoni. Trichuris trichiura is a parasitic helminth that causes
trichuriasis after the ingestion of contaminated food or water. As a consequence, the
worm colonizes the large intestine, producing diarrhea and anemia223. Necator
americanus is another parasitic helminth that can penetrate throughout the healthy skin,
invading different organs until it settles down in the intestines, where it feeds off the
host’s blood. This infection causes iron-deficiency anemia, diarrhea, and abdominal pain.
It is estimated that N. americanus infects around 10% of the world’s population224. On the
other hand, Taenia spp. is also a parasitic helminth that can infect humans, causing
taeniasis. Two main species of Taenia infect humans: T. saginata and T. solium. Symptoms
are not usually more serious than weight loss or abdominal pain. However, if the parasites
reach the ventricles, heart problems may arise225. Finally, Schistosoma mansoni is a
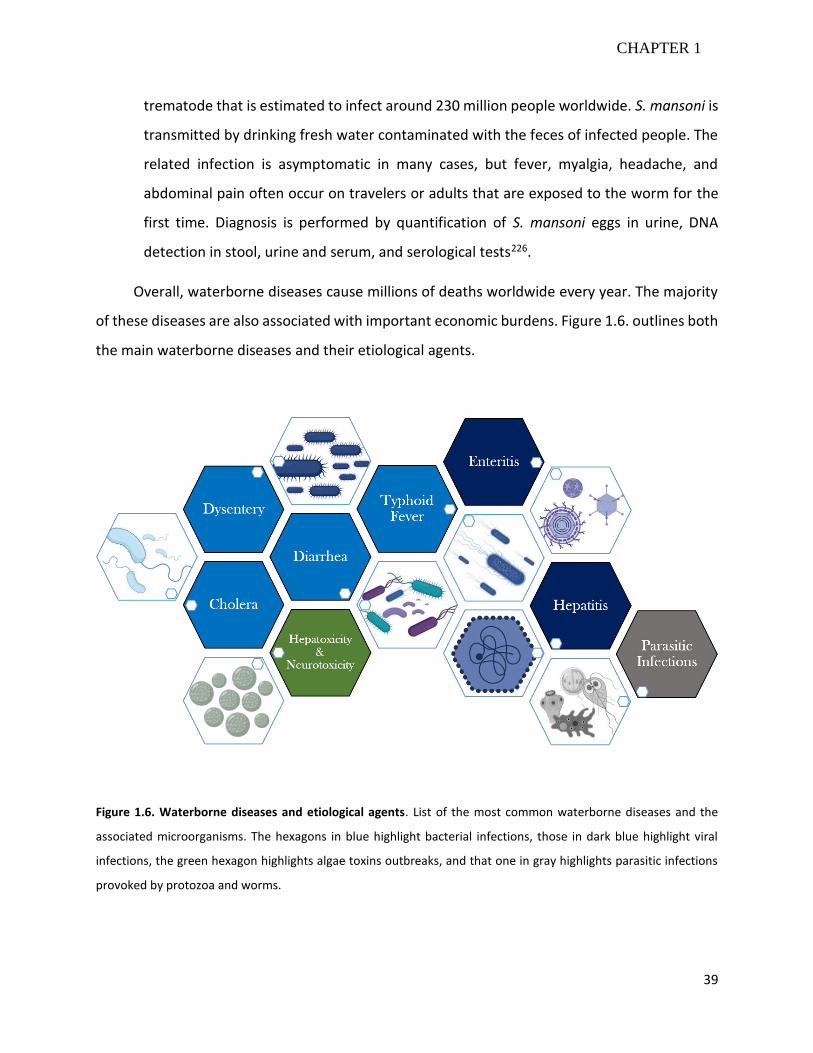
39
CHAPTER 1
trematode that is estimated to infect around 230 million people worldwide. S. mansoni is
transmitted by drinking fresh water contaminated with the feces of infected people. The
related infection is asymptomatic in many cases, but fever, myalgia, headache, and
abdominal pain often occur on travelers or adults that are exposed to the worm for the
first time. Diagnosis is performed by quantification of S. mansoni eggs in urine, DNA
detection in stool, urine and serum, and serological tests226.
Overall, waterborne diseases cause millions of deaths worldwide every year. The majority
of these diseases are also associated with important economic burdens. Figure 1.6. outlines both
the main waterborne diseases and their etiological agents.
Figure 1.6. Waterborne diseases and etiological agents. List of the most common waterborne diseases and the
associated microorganisms. The hexagons in blue highlight bacterial infections, those in dark blue highlight viral
infections, the green hexagon highlights algae toxins outbreaks, and that one in gray highlights parasitic infections
provoked by protozoa and worms.
INTRODUCTION
40
1.1.5. European Union Regulation
European Union (EU) has launched several directives and regulations in the last years
regarding the control of pollutants and contaminants in water. Directive 2013/39/EU states that
“Chemical pollution of surface water poses a threat to the aquatic environment, […], and also
poses a threat to human health. As a matter of priority, the causes of pollution should be
identified […]”.227 Therefore, it is clear that legislation is required to limit and monitor water
pollutants in drinking water.
The Drinking Water Directive was first established in the EU in 1998 and is regularly updated.
Currently, all Member States are required to monitor a total of 48 parameters, divided into 2
microbiological parameters (E. coli and Enterococci), 26 chemical parameters (i.e. arsenic, lead,
nickel, and some pesticides), and 20 indicator parameters to assess the organoleptic quality of
the water (i.e. color and odor), physicochemical parameters (i.e. temperature and pH), and
minimum required concentrations (i.e. alkalinity and hardness). The concentration thresholds of
all these parameters are usually in compliance with the WHO guidelines228,229.
The last update of this document was performed in 2018 and adds naturally present but
harmful compounds to the list such as uranium; emerging contaminants such as perfluorinated
compounds, and endocrine disruptors, such as bisphenol A and β-estradiol228. Besides,
microplastics have been included as an issue of emerging concern, new microbiological
parameters have been set to avoid the formation of bacterial biofilms, the uses of lead and
chromium have been tightly restricted, and the limits for some emerging chemicals have been
cut down.
Nowadays there still exist enormous challenges to achieve optimal water quality
monitoring. First, new techniques to evaluate the toxicity of water are required in combination
with the more traditional methods used to measure individual substances81. Second, the
appearance of new chemical pollutants pushes the legislation to move forward faster to tackle
their release into the water bodies. Third, more efforts are required to reduce both sewage
pollution and industrial pollution of rivers and seas. Finally, securing sustainable management of
water remains one of the key challenges in the EU81.
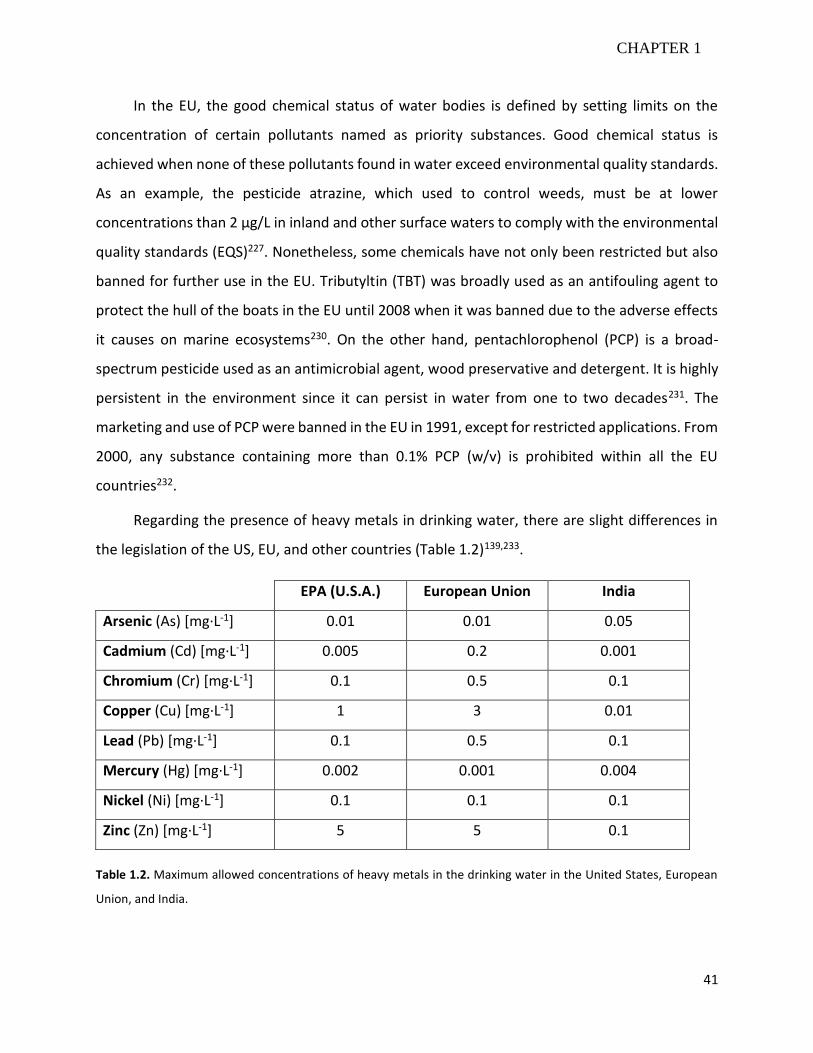
41
CHAPTER 1
In the EU, the good chemical status of water bodies is defined by setting limits on the
concentration of certain pollutants named as priority substances. Good chemical status is
achieved when none of these pollutants found in water exceed environmental quality standards.
As an example, the pesticide atrazine, which used to control weeds, must be at lower
concentrations than 2 µg/L in inland and other surface waters to comply with the environmental
quality standards (EQS)227. Nonetheless, some chemicals have not only been restricted but also
banned for further use in the EU. Tributyltin (TBT) was broadly used as an antifouling agent to
protect the hull of the boats in the EU until 2008 when it was banned due to the adverse effects
it causes on marine ecosystems230. On the other hand, pentachlorophenol (PCP) is a broad-
spectrum pesticide used as an antimicrobial agent, wood preservative and detergent. It is highly
persistent in the environment since it can persist in water from one to two decades231. The
marketing and use of PCP were banned in the EU in 1991, except for restricted applications. From
2000, any substance containing more than 0.1% PCP (w/v) is prohibited within all the EU
countries232.
Regarding the presence of heavy metals in drinking water, there are slight differences in
the legislation of the US, EU, and other countries (Table 1.2)139,233.
Table 1.2. Maximum allowed concentrations of heavy metals in the drinking water in the United States, European
Union, and India.
EPA (U.S.A.) European Union India
Arsenic (As) [mg·L-1] 0.01 0.01 0.05
Cadmium (Cd) [mg·L-1] 0.005 0.2 0.001
Chromium (Cr) [mg·L-1] 0.1 0.5 0.1
Copper (Cu) [mg·L-1] 1 3 0.01
Lead (Pb) [mg·L-1] 0.1 0.5 0.1
Mercury (Hg) [mg·L-1] 0.002 0.001 0.004
Nickel (Ni) [mg·L-1] 0.1 0.1 0.1
Zinc (Zn) [mg·L-1] 5 5 0.1
INTRODUCTION
42
On the other hand, microbiological pollution often comes from the contamination of
drinking water with sewage waters. In this regard, microbiological indicators ease the assessment
of the water quality without the need for detecting and quantifying all the different pathogenic
microorganisms that can be found in water. An ideal indicator should be universally present in
the feces of humans and warm-blooded animals, easy to detect and enumerate, not able to grow
in natural water bodies and be removed similarly to waterborne pathogens after water treatment
to track the effectiveness of these water treatments229. In this regard, the EU Directive
80/778/EEC recommends fecal coliforms, total coliforms, and fecal streptococci as the
microbiological indicators for water fecal pollution229:
• Coliforms are gram-negative, non-spore forming, oxidase negative, rod-shaped
facultative anaerobic bacteria that can ferment lactose at 36 ºC within 24-48 h229.
• Fecal coliforms are coliforms that can ferment lactose at 44.5 ºC within 24 hours229.
• Fecal streptococci are gram-positive, catalase-negative cocci that possess the Lancefield
group D antigen, and can grow on selective media for Enterococcus and bile aesculin agar
at 45 ºC229.
According to the EU directive 98/83/EC, E. coli and fecal streptococci are required to be
absent in 100 mL of water to consider it as drinking water234. Nevertheless, it is estimated that
up to 90% of the water samples contaminated with feces are overlooked because some
pathogens do not correlate very well with coliform bacteria, some indicators might be stressed
or injured during an inadequate water treatment thereby making them unable to grow and
multiply in the laboratory, and some viruses and parasites are also more resistant to conventional
water treatment methods than indicator bacteria229. For this reason, the legislation in the EU
concerning the microbiological quality of drinking water added in 2018 Clostridium perfringens
and somatic coliphages to the pre-existing list.
In this regard, European countries have achieved outstanding success in water treatment
and sanitation, reducing waterborne outbreaks during the last decades. However, the European
Food Safety Authority (EFSA) reported in 2013 more than 5,000 waterborne and foodborne
outbreaks in the EU countries, including Iceland, Norway, Liechtenstein and Switzerland as well235.
By analyzing the timeline between 2009 and 2013, there are significant differences in the trend
43
CHAPTER 1
of some water- and foodborne diseases in this group of countries. Whereas the cases of
salmonellosis and yersiniosis decreased, the cases of listeriosis and verotoxigenic E. coli (VTEC)
increased235. In any case, salmonellosis still hogs the highest number of water- and foodborne
outbreaks in the EU, involving more than 37% of the total cases, followed by bacterial toxins
(25%), and viral infections (10%)235.
1.2. Chemical Pollutants Detection
This section is mainly focused on the detection of pesticides as chemical pollutants,
avoiding details on the detection systems harnessed to detect heavy metals and petroleum
derivatives since they are not the main topic of this thesis.
Traditional methods used to detect pesticides are high-performance liquid
chromatography (HPLC) and gas chromatography/mass spectrometry (GC/MS). Both methods
usually offer high sensitivity, but at the cost of expensive and complex machines and facilities,
requiring well-qualified personnel and the extraction of large volumes of water28. Therefore, due
to the rising concern about the water quality worldwide, as well as the limited budget and
resources that are available in many countries, governments and regulatory organizations need
cheaper, faster, easier-to-use and standardized sensing platforms to detect and quantify a great
number of chemical pollutants.
The research field for pesticides detection has stood out in recent years. Both new
materials and nanomaterials, as well as novel recognition elements and detection devices, have
been exploited to achieve higher specificity, selectivity, and simplicity. For example, for the first
time, NiCo2S4 reticulated hollow spheres and PtPd nanoflowers have been used for the
electrochemical detection of organophosphorus compounds with incredibly low detection limits
(LOD around 10-14 g/mL)236,237, taking the advantage of their favorable nanostructures and
electroconductive properties. Besides, new optical detection approaches have also arisen for
highly specific detection of different isomers of aromatic compounds using β-cyclodextrin-
functionalized silver nanoparticles (AgNPs)238. However, not only new nanomaterials with better
sensitivity and selectivity but also innovative detection systems have evolved for the last years.
As an example, the use of pixelated dielectric metasurfaces for selective molecular barcode
INTRODUCTION
44
imaging of several chemical compounds, including glyphosate, one of the most used pesticides
worldwide239. Besides, new biosensors using carbon dots (CDs)240,241, graphene-based
devices242,243, and Europium-based metal-organic frameworks (EuMOFs)244 with improved
properties have been recently reported. Finally, not only single nanomaterials but also combined
nanomaterial-organic molecules sensing systems have been designed for detection purposes: Eu-
allyl-3-carboxycoumarin244 and rhodamine-Ag/Au bimetallic nanoparticles245 are only two
examples.
In recent years, smartphone-based techniques have also experienced a large development
through their integration into sensing devices, enabling faster and more accurate in-situ
detection methods246,247. Moreover, the use of aptamers has provided new tools to develop both
new optical and electrochemical immunosensors, boosting pesticides detection sensitivity248–251.
Eventually, new enzymes, with better properties (i.e. stability and sensitivity) have also been used
as substitutes of the commonly used acetylcholinesterase (AChE) for organophosphorus and
carbamates detection252.
1.2.1. Single Compounds Detection
Overall, pesticides biosensors can be either classified by the recognition principle (i.e.
immunoassay, enzymatic inhibition, non-specific chemical interactions, molecularly imprinted
polymers [MIPs], etc.) or the (nano)materials used to construct the biosensor (AuNPs, QDs, CDs,
bimetallic NPs, microwires, etc.). In particular, optical sensing systems aimed to detect pesticides
can be classified according to the detection techniques as colorimetric, fluorescent, luminescent
and surface-enhanced Raman spectroscopy (SERS) biosensors.
Nowadays, many colorimetric sensors rely on ratiometric changes that boost the dynamic
range of measurements and reduce the errors caused by changes in the environment253.
Ratiometric outputs can be achieved by combining different nanomaterials, such as infrared dyes,
dual-metal nanoparticles, upconverting nanoparticles, bio-capped nanoparticles, and sensor
arrays based on cross-responsive elements246,250,254,255.
Weerathunge et al. employed tyrosine-capped silver nanoparticles as nanozymes,
mimicking the enzymatic activity of peroxidase to detect the organophosphate (OP) pesticide
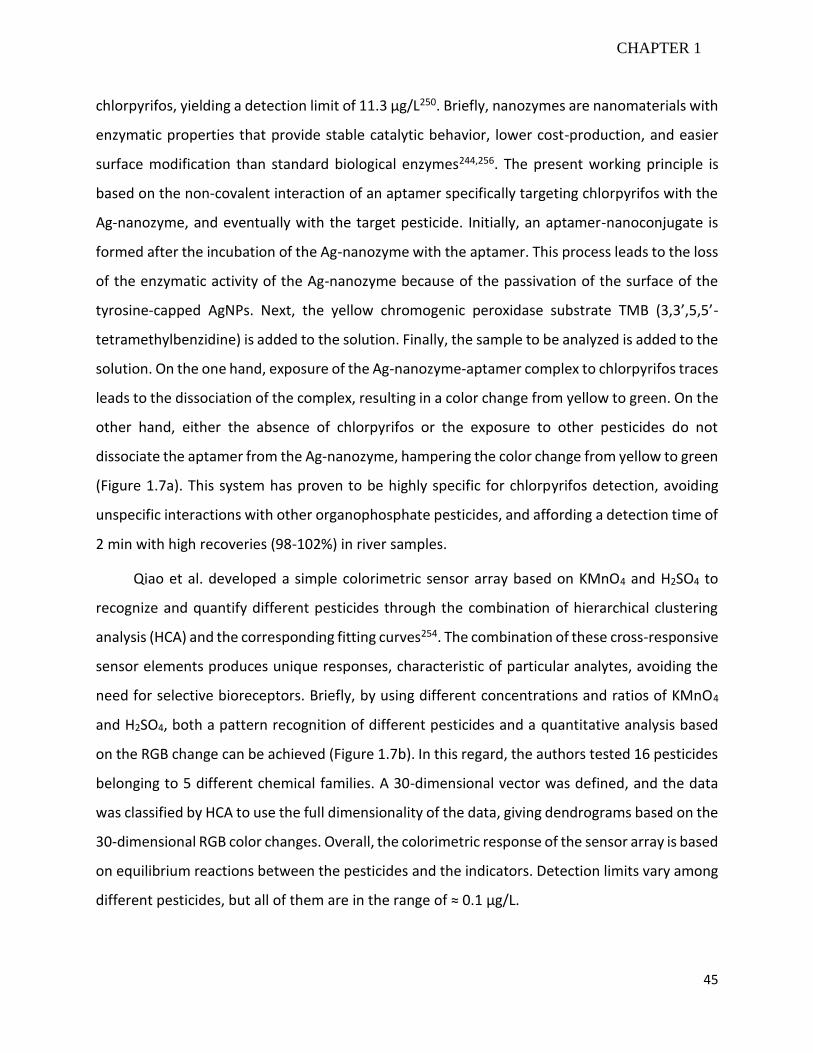
45
CHAPTER 1
chlorpyrifos, yielding a detection limit of 11.3 µg/L250. Briefly, nanozymes are nanomaterials with
enzymatic properties that provide stable catalytic behavior, lower cost-production, and easier
surface modification than standard biological enzymes244,256. The present working principle is
based on the non-covalent interaction of an aptamer specifically targeting chlorpyrifos with the
Ag-nanozyme, and eventually with the target pesticide. Initially, an aptamer-nanoconjugate is
formed after the incubation of the Ag-nanozyme with the aptamer. This process leads to the loss
of the enzymatic activity of the Ag-nanozyme because of the passivation of the surface of the
tyrosine-capped AgNPs. Next, the yellow chromogenic peroxidase substrate TMB (3,3’,5,5’-
tetramethylbenzidine) is added to the solution. Finally, the sample to be analyzed is added to the
solution. On the one hand, exposure of the Ag-nanozyme-aptamer complex to chlorpyrifos traces
leads to the dissociation of the complex, resulting in a color change from yellow to green. On the
other hand, either the absence of chlorpyrifos or the exposure to other pesticides do not
dissociate the aptamer from the Ag-nanozyme, hampering the color change from yellow to green
(Figure 1.7a). This system has proven to be highly specific for chlorpyrifos detection, avoiding
unspecific interactions with other organophosphate pesticides, and affording a detection time of
2 min with high recoveries (98-102%) in river samples.
Qiao et al. developed a simple colorimetric sensor array based on KMnO4 and H2SO4 to
recognize and quantify different pesticides through the combination of hierarchical clustering
analysis (HCA) and the corresponding fitting curves254. The combination of these cross-responsive
sensor elements produces unique responses, characteristic of particular analytes, avoiding the
need for selective bioreceptors. Briefly, by using different concentrations and ratios of KMnO4
and H2SO4, both a pattern recognition of different pesticides and a quantitative analysis based
on the RGB change can be achieved (Figure 1.7b). In this regard, the authors tested 16 pesticides
belonging to 5 different chemical families. A 30-dimensional vector was defined, and the data
was classified by HCA to use the full dimensionality of the data, giving dendrograms based on the
30-dimensional RGB color changes. Overall, the colorimetric response of the sensor array is based
on equilibrium reactions between the pesticides and the indicators. Detection limits vary among
different pesticides, but all of them are in the range of ≈ 0.1 µg/L.
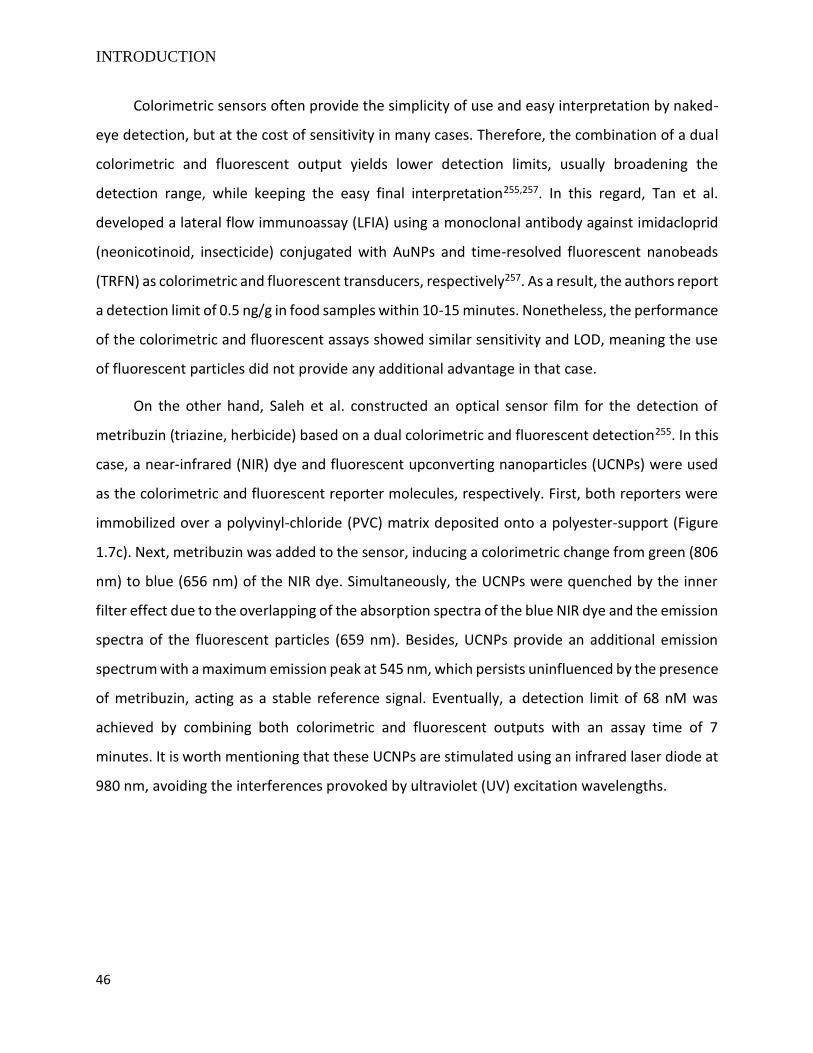
INTRODUCTION
46
Colorimetric sensors often provide the simplicity of use and easy interpretation by naked-
eye detection, but at the cost of sensitivity in many cases. Therefore, the combination of a dual
colorimetric and fluorescent output yields lower detection limits, usually broadening the
detection range, while keeping the easy final interpretation255,257. In this regard, Tan et al.
developed a lateral flow immunoassay (LFIA) using a monoclonal antibody against imidacloprid
(neonicotinoid, insecticide) conjugated with AuNPs and time-resolved fluorescent nanobeads
(TRFN) as colorimetric and fluorescent transducers, respectively257. As a result, the authors report
a detection limit of 0.5 ng/g in food samples within 10-15 minutes. Nonetheless, the performance
of the colorimetric and fluorescent assays showed similar sensitivity and LOD, meaning the use
of fluorescent particles did not provide any additional advantage in that case.
On the other hand, Saleh et al. constructed an optical sensor film for the detection of
metribuzin (triazine, herbicide) based on a dual colorimetric and fluorescent detection255. In this
case, a near-infrared (NIR) dye and fluorescent upconverting nanoparticles (UCNPs) were used
as the colorimetric and fluorescent reporter molecules, respectively. First, both reporters were
immobilized over a polyvinyl-chloride (PVC) matrix deposited onto a polyester-support (Figure
1.7c). Next, metribuzin was added to the sensor, inducing a colorimetric change from green (806
nm) to blue (656 nm) of the NIR dye. Simultaneously, the UCNPs were quenched by the inner
filter effect due to the overlapping of the absorption spectra of the blue NIR dye and the emission
spectra of the fluorescent particles (659 nm). Besides, UCNPs provide an additional emission
spectrum with a maximum emission peak at 545 nm, which persists uninfluenced by the presence
of metribuzin, acting as a stable reference signal. Eventually, a detection limit of 68 nM was
achieved by combining both colorimetric and fluorescent outputs with an assay time of 7
minutes. It is worth mentioning that these UCNPs are stimulated using an infrared laser diode at
980 nm, avoiding the interferences provoked by ultraviolet (UV) excitation wavelengths.
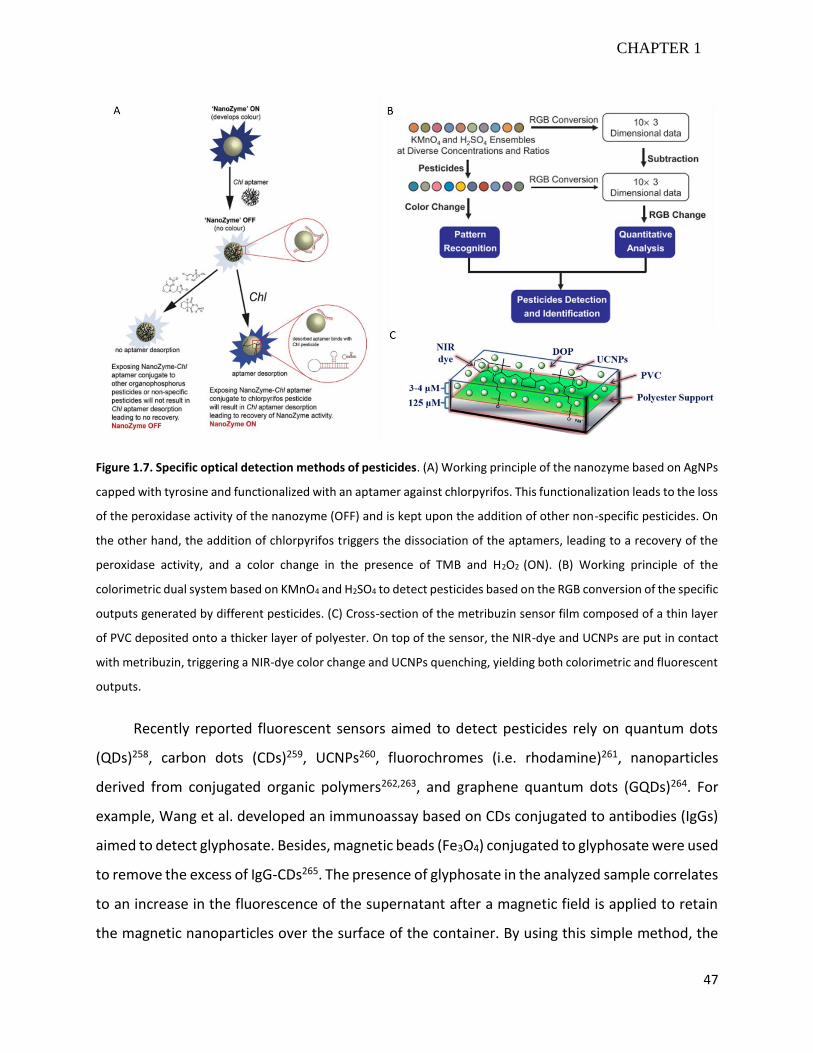
47
CHAPTER 1
Figure 1.7. Specific optical detection methods of pesticides. (A) Working principle of the nanozyme based on AgNPs
capped with tyrosine and functionalized with an aptamer against chlorpyrifos. This functionalization leads to the loss
of the peroxidase activity of the nanozyme (OFF) and is kept upon the addition of other non-specific pesticides. On
the other hand, the addition of chlorpyrifos triggers the dissociation of the aptamers, leading to a recovery of the
peroxidase activity, and a color change in the presence of TMB and H2O2 (ON). (B) Working principle of the
colorimetric dual system based on KMnO4 and H2SO4 to detect pesticides based on the RGB conversion of the specific
outputs generated by different pesticides. (C) Cross-section of the metribuzin sensor film composed of a thin layer
of PVC deposited onto a thicker layer of polyester. On top of the sensor, the NIR-dye and UCNPs are put in contact
with metribuzin, triggering a NIR-dye color change and UCNPs quenching, yielding both colorimetric and fluorescent
outputs.
Recently reported fluorescent sensors aimed to detect pesticides rely on quantum dots
(QDs)258, carbon dots (CDs)259, UCNPs260, fluorochromes (i.e. rhodamine)261, nanoparticles
derived from conjugated organic polymers262,263, and graphene quantum dots (GQDs)264. For
example, Wang et al. developed an immunoassay based on CDs conjugated to antibodies (IgGs)
aimed to detect glyphosate. Besides, magnetic beads (Fe3O4) conjugated to glyphosate were used
to remove the excess of IgG-CDs265. The presence of glyphosate in the analyzed sample correlates
to an increase in the fluorescence of the supernatant after a magnetic field is applied to retain
the magnetic nanoparticles over the surface of the container. By using this simple method, the
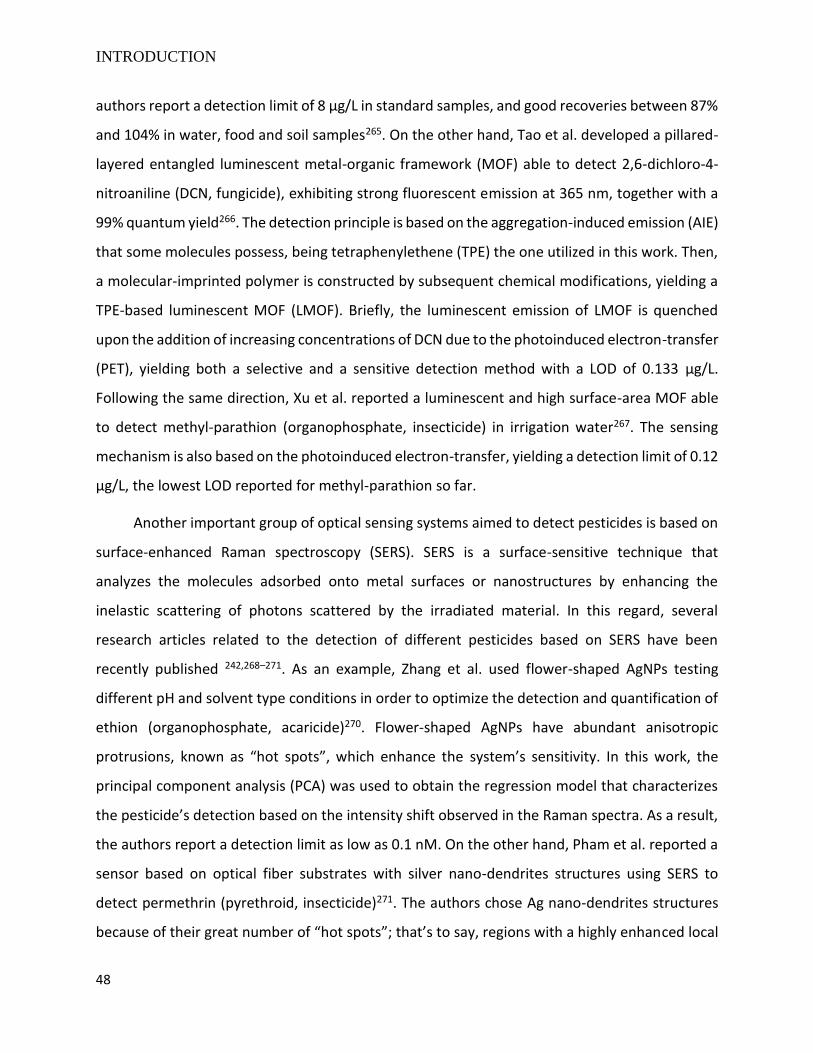
INTRODUCTION
48
authors report a detection limit of 8 µg/L in standard samples, and good recoveries between 87%
and 104% in water, food and soil samples265. On the other hand, Tao et al. developed a pillared-
layered entangled luminescent metal-organic framework (MOF) able to detect 2,6-dichloro-4-
nitroaniline (DCN, fungicide), exhibiting strong fluorescent emission at 365 nm, together with a
99% quantum yield266. The detection principle is based on the aggregation-induced emission (AIE)
that some molecules possess, being tetraphenylethene (TPE) the one utilized in this work. Then,
a molecular-imprinted polymer is constructed by subsequent chemical modifications, yielding a
TPE-based luminescent MOF (LMOF). Briefly, the luminescent emission of LMOF is quenched
upon the addition of increasing concentrations of DCN due to the photoinduced electron-transfer
(PET), yielding both a selective and a sensitive detection method with a LOD of 0.133 µg/L.
Following the same direction, Xu et al. reported a luminescent and high surface-area MOF able
to detect methyl-parathion (organophosphate, insecticide) in irrigation water267. The sensing
mechanism is also based on the photoinduced electron-transfer, yielding a detection limit of 0.12
µg/L, the lowest LOD reported for methyl-parathion so far.
Another important group of optical sensing systems aimed to detect pesticides is based on
surface-enhanced Raman spectroscopy (SERS). SERS is a surface-sensitive technique that
analyzes the molecules adsorbed onto metal surfaces or nanostructures by enhancing the
inelastic scattering of photons scattered by the irradiated material. In this regard, several
research articles related to the detection of different pesticides based on SERS have been
recently published 242,268–271. As an example, Zhang et al. used flower-shaped AgNPs testing
different pH and solvent type conditions in order to optimize the detection and quantification of
ethion (organophosphate, acaricide)270. Flower-shaped AgNPs have abundant anisotropic
protrusions, known as “hot spots”, which enhance the system’s sensitivity. In this work, the
principal component analysis (PCA) was used to obtain the regression model that characterizes
the pesticide’s detection based on the intensity shift observed in the Raman spectra. As a result,
the authors report a detection limit as low as 0.1 nM. On the other hand, Pham et al. reported a
sensor based on optical fiber substrates with silver nano-dendrites structures using SERS to
detect permethrin (pyrethroid, insecticide)271. The authors chose Ag nano-dendrites structures
because of their great number of “hot spots”; that’s to say, regions with a highly enhanced local
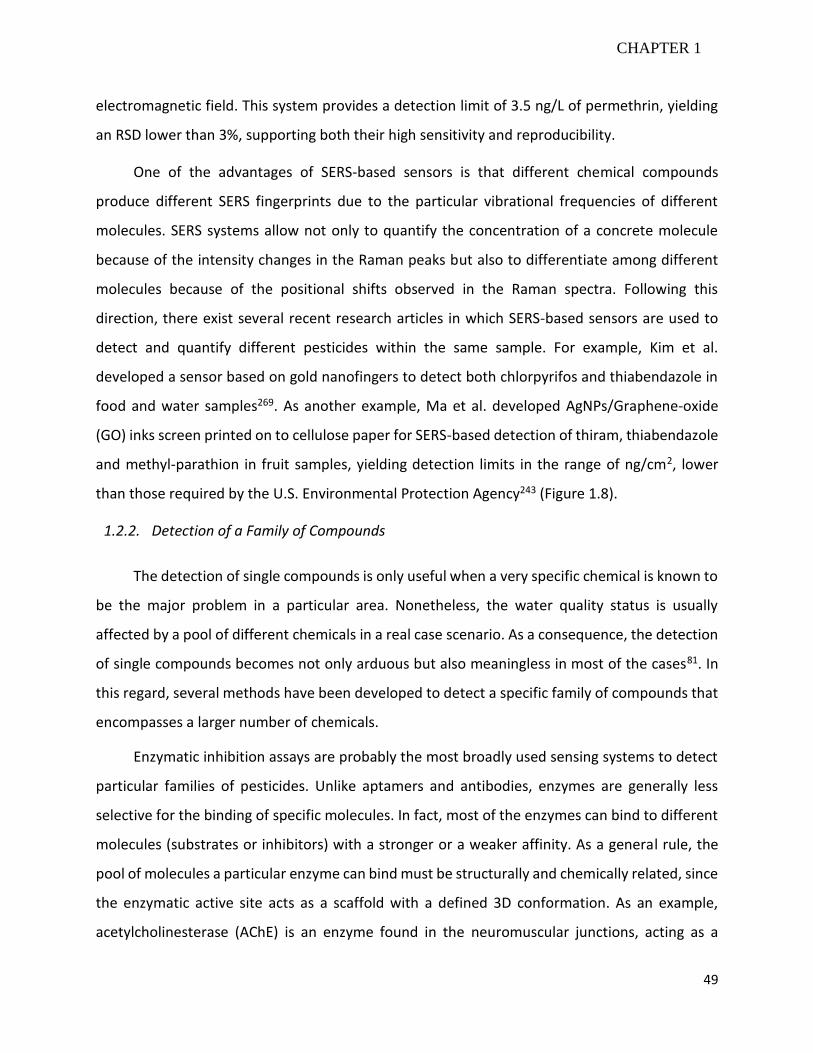
49
CHAPTER 1
electromagnetic field. This system provides a detection limit of 3.5 ng/L of permethrin, yielding
an RSD lower than 3%, supporting both their high sensitivity and reproducibility.
One of the advantages of SERS-based sensors is that different chemical compounds
produce different SERS fingerprints due to the particular vibrational frequencies of different
molecules. SERS systems allow not only to quantify the concentration of a concrete molecule
because of the intensity changes in the Raman peaks but also to differentiate among different
molecules because of the positional shifts observed in the Raman spectra. Following this
direction, there exist several recent research articles in which SERS-based sensors are used to
detect and quantify different pesticides within the same sample. For example, Kim et al.
developed a sensor based on gold nanofingers to detect both chlorpyrifos and thiabendazole in
food and water samples269. As another example, Ma et al. developed AgNPs/Graphene-oxide
(GO) inks screen printed on to cellulose paper for SERS-based detection of thiram, thiabendazole
and methyl-parathion in fruit samples, yielding detection limits in the range of ng/cm2, lower
than those required by the U.S. Environmental Protection Agency243 (Figure 1.8).
1.2.2. Detection of a Family of Compounds
The detection of single compounds is only useful when a very specific chemical is known to
be the major problem in a particular area. Nonetheless, the water quality status is usually
affected by a pool of different chemicals in a real case scenario. As a consequence, the detection
of single compounds becomes not only arduous but also meaningless in most of the cases81. In
this regard, several methods have been developed to detect a specific family of compounds that
encompasses a larger number of chemicals.
Enzymatic inhibition assays are probably the most broadly used sensing systems to detect
particular families of pesticides. Unlike aptamers and antibodies, enzymes are generally less
selective for the binding of specific molecules. In fact, most of the enzymes can bind to different
molecules (substrates or inhibitors) with a stronger or a weaker affinity. As a general rule, the
pool of molecules a particular enzyme can bind must be structurally and chemically related, since
the enzymatic active site acts as a scaffold with a defined 3D conformation. As an example,
acetylcholinesterase (AChE) is an enzyme found in the neuromuscular junctions, acting as a
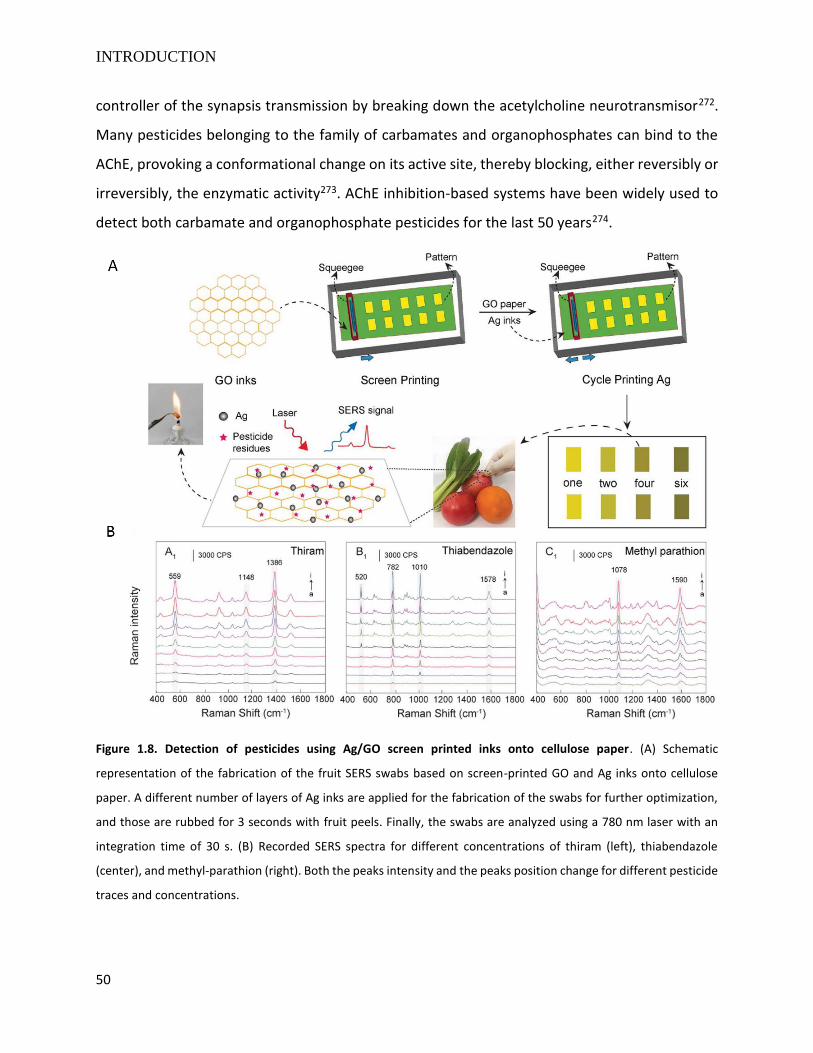
INTRODUCTION
50
controller of the synapsis transmission by breaking down the acetylcholine neurotransmisor272.
Many pesticides belonging to the family of carbamates and organophosphates can bind to the
AChE, provoking a conformational change on its active site, thereby blocking, either reversibly or
irreversibly, the enzymatic activity273. AChE inhibition-based systems have been widely used to
detect both carbamate and organophosphate pesticides for the last 50 years274.
Figure 1.8. Detection of pesticides using Ag/GO screen printed inks onto cellulose paper. (A) Schematic
representation of the fabrication of the fruit SERS swabs based on screen-printed GO and Ag inks onto cellulose
paper. A different number of layers of Ag inks are applied for the fabrication of the swabs for further optimization,
and those are rubbed for 3 seconds with fruit peels. Finally, the swabs are analyzed using a 780 nm laser with an
integration time of 30 s. (B) Recorded SERS spectra for different concentrations of thiram (left), thiabendazole
(center), and methyl-parathion (right). Both the peaks intensity and the peaks position change for different pesticide
traces and concentrations.
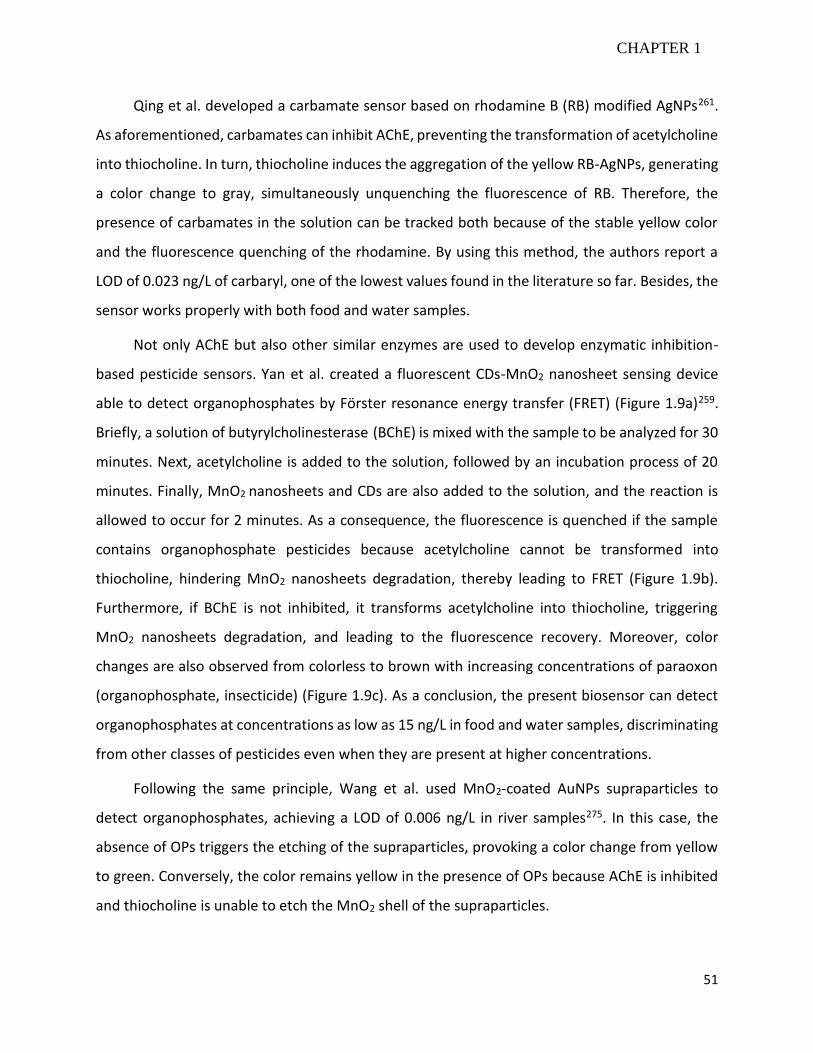
51
CHAPTER 1
Qing et al. developed a carbamate sensor based on rhodamine B (RB) modified AgNPs261.
As aforementioned, carbamates can inhibit AChE, preventing the transformation of acetylcholine
into thiocholine. In turn, thiocholine induces the aggregation of the yellow RB-AgNPs, generating
a color change to gray, simultaneously unquenching the fluorescence of RB. Therefore, the
presence of carbamates in the solution can be tracked both because of the stable yellow color
and the fluorescence quenching of the rhodamine. By using this method, the authors report a
LOD of 0.023 ng/L of carbaryl, one of the lowest values found in the literature so far. Besides, the
sensor works properly with both food and water samples.
Not only AChE but also other similar enzymes are used to develop enzymatic inhibition-
based pesticide sensors. Yan et al. created a fluorescent CDs-MnO2 nanosheet sensing device
able to detect organophosphates by Förster resonance energy transfer (FRET) (Figure 1.9a)259.
Briefly, a solution of butyrylcholinesterase (BChE) is mixed with the sample to be analyzed for 30
minutes. Next, acetylcholine is added to the solution, followed by an incubation process of 20
minutes. Finally, MnO2 nanosheets and CDs are also added to the solution, and the reaction is
allowed to occur for 2 minutes. As a consequence, the fluorescence is quenched if the sample
contains organophosphate pesticides because acetylcholine cannot be transformed into
thiocholine, hindering MnO2 nanosheets degradation, thereby leading to FRET (Figure 1.9b).
Furthermore, if BChE is not inhibited, it transforms acetylcholine into thiocholine, triggering
MnO2 nanosheets degradation, and leading to the fluorescence recovery. Moreover, color
changes are also observed from colorless to brown with increasing concentrations of paraoxon
(organophosphate, insecticide) (Figure 1.9c). As a conclusion, the present biosensor can detect
organophosphates at concentrations as low as 15 ng/L in food and water samples, discriminating
from other classes of pesticides even when they are present at higher concentrations.
Following the same principle, Wang et al. used MnO2-coated AuNPs supraparticles to
detect organophosphates, achieving a LOD of 0.006 ng/L in river samples275. In this case, the
absence of OPs triggers the etching of the supraparticles, provoking a color change from yellow
to green. Conversely, the color remains yellow in the presence of OPs because AChE is inhibited
and thiocholine is unable to etch the MnO2 shell of the supraparticles.
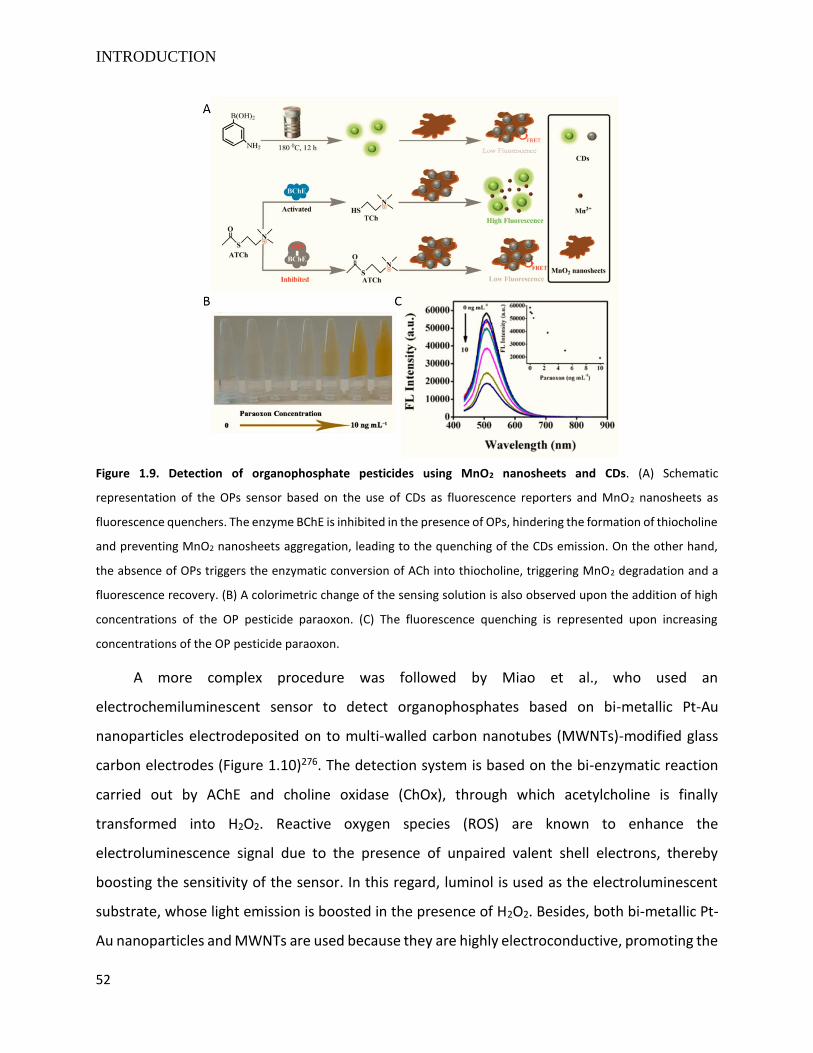
INTRODUCTION
52
A more complex procedure was followed by Miao et al., who used an
electrochemiluminescent sensor to detect organophosphates based on bi-metallic Pt-Au
nanoparticles electrodeposited on to multi-walled carbon nanotubes (MWNTs)-modified glass
carbon electrodes (Figure 1.10)276. The detection system is based on the bi-enzymatic reaction
carried out by AChE and choline oxidase (ChOx), through which acetylcholine is finally
transformed into H2O2. Reactive oxygen species (ROS) are known to enhance the
electroluminescence signal due to the presence of unpaired valent shell electrons, thereby
boosting the sensitivity of the sensor. In this regard, luminol is used as the electroluminescent
substrate, whose light emission is boosted in the presence of H2O2. Besides, both bi-metallic Pt-
Au nanoparticles and MWNTs are used because they are highly electroconductive, promoting the
Figure 1.9. Detection of organophosphate pesticides using MnO2 nanosheets and CDs. (A) Schematic
representation of the OPs sensor based on the use of CDs as fluorescence reporters and MnO2 nanosheets as
fluorescence quenchers. The enzyme BChE is inhibited in the presence of OPs, hindering the formation of thiocholine
and preventing MnO2 nanosheets aggregation, leading to the quenching of the CDs emission. On the other hand,
the absence of OPs triggers the enzymatic conversion of ACh into thiocholine, triggering MnO2 degradation and a
fluorescence recovery. (B) A colorimetric change of the sensing solution is also observed upon the addition of high
concentrations of the OP pesticide paraoxon. (C) The fluorescence quenching is represented upon increasing
concentrations of the OP pesticide paraoxon.
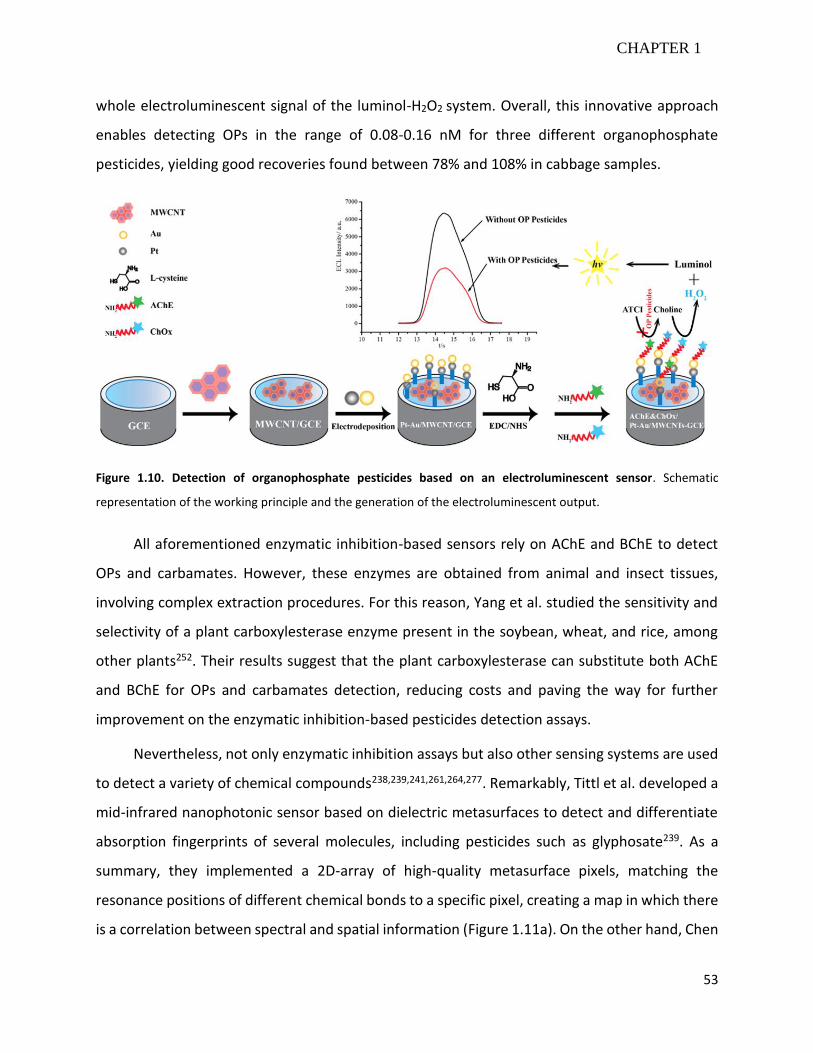
53
CHAPTER 1
whole electroluminescent signal of the luminol-H2O2 system. Overall, this innovative approach
enables detecting OPs in the range of 0.08-0.16 nM for three different organophosphate
pesticides, yielding good recoveries found between 78% and 108% in cabbage samples.
Figure 1.10. Detection of organophosphate pesticides based on an electroluminescent sensor. Schematic
representation of the working principle and the generation of the electroluminescent output.
All aforementioned enzymatic inhibition-based sensors rely on AChE and BChE to detect
OPs and carbamates. However, these enzymes are obtained from animal and insect tissues,
involving complex extraction procedures. For this reason, Yang et al. studied the sensitivity and
selectivity of a plant carboxylesterase enzyme present in the soybean, wheat, and rice, among
other plants252. Their results suggest that the plant carboxylesterase can substitute both AChE
and BChE for OPs and carbamates detection, reducing costs and paving the way for further
improvement on the enzymatic inhibition-based pesticides detection assays.
Nevertheless, not only enzymatic inhibition assays but also other sensing systems are used
to detect a variety of chemical compounds238,239,241,261,264,277. Remarkably, Tittl et al. developed a
mid-infrared nanophotonic sensor based on dielectric metasurfaces to detect and differentiate
absorption fingerprints of several molecules, including pesticides such as glyphosate239. As a
summary, they implemented a 2D-array of high-quality metasurface pixels, matching the
resonance positions of different chemical bonds to a specific pixel, creating a map in which there
is a correlation between spectral and spatial information (Figure 1.11a). On the other hand, Chen
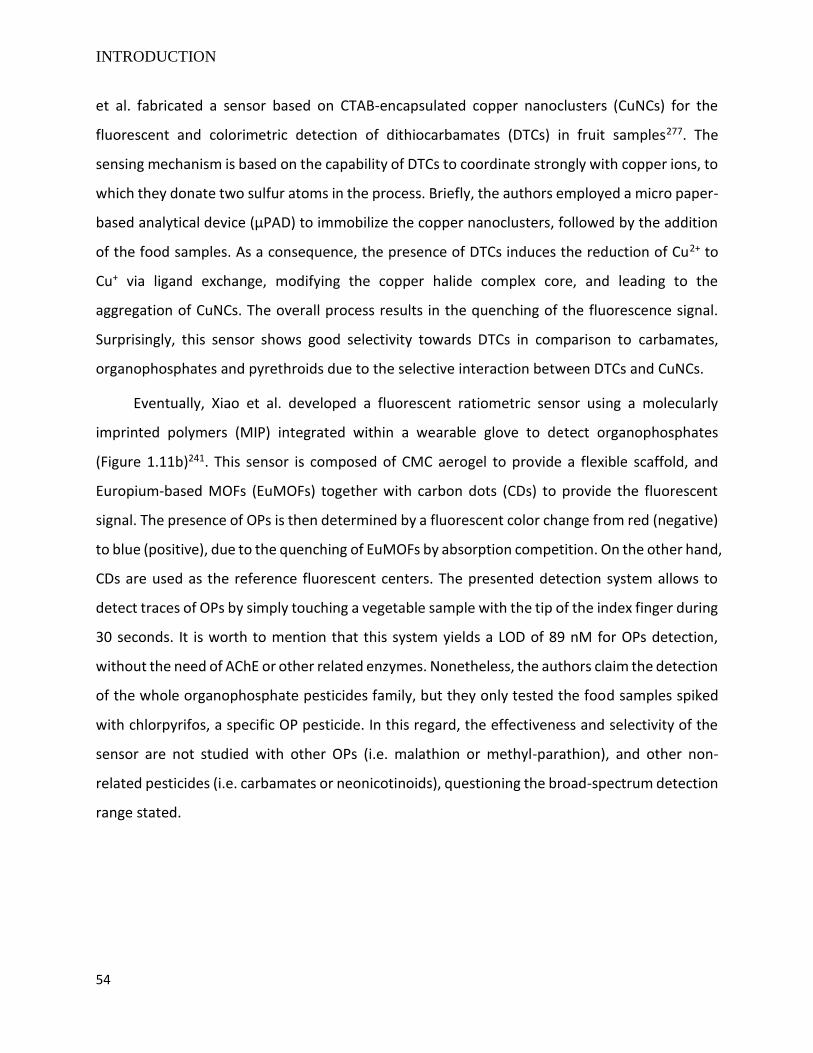
INTRODUCTION
54
et al. fabricated a sensor based on CTAB-encapsulated copper nanoclusters (CuNCs) for the
fluorescent and colorimetric detection of dithiocarbamates (DTCs) in fruit samples277. The
sensing mechanism is based on the capability of DTCs to coordinate strongly with copper ions, to
which they donate two sulfur atoms in the process. Briefly, the authors employed a micro paper-
based analytical device (µPAD) to immobilize the copper nanoclusters, followed by the addition
of the food samples. As a consequence, the presence of DTCs induces the reduction of Cu2+ to
Cu+ via ligand exchange, modifying the copper halide complex core, and leading to the
aggregation of CuNCs. The overall process results in the quenching of the fluorescence signal.
Surprisingly, this sensor shows good selectivity towards DTCs in comparison to carbamates,
organophosphates and pyrethroids due to the selective interaction between DTCs and CuNCs.
Eventually, Xiao et al. developed a fluorescent ratiometric sensor using a molecularly
imprinted polymers (MIP) integrated within a wearable glove to detect organophosphates
(Figure 1.11b)241. This sensor is composed of CMC aerogel to provide a flexible scaffold, and
Europium-based MOFs (EuMOFs) together with carbon dots (CDs) to provide the fluorescent
signal. The presence of OPs is then determined by a fluorescent color change from red (negative)
to blue (positive), due to the quenching of EuMOFs by absorption competition. On the other hand,
CDs are used as the reference fluorescent centers. The presented detection system allows to
detect traces of OPs by simply touching a vegetable sample with the tip of the index finger during
30 seconds. It is worth to mention that this system yields a LOD of 89 nM for OPs detection,
without the need of AChE or other related enzymes. Nonetheless, the authors claim the detection
of the whole organophosphate pesticides family, but they only tested the food samples spiked
with chlorpyrifos, a specific OP pesticide. In this regard, the effectiveness and selectivity of the
sensor are not studied with other OPs (i.e. malathion or methyl-parathion), and other non-
related pesticides (i.e. carbamates or neonicotinoids), questioning the broad-spectrum detection
range stated.
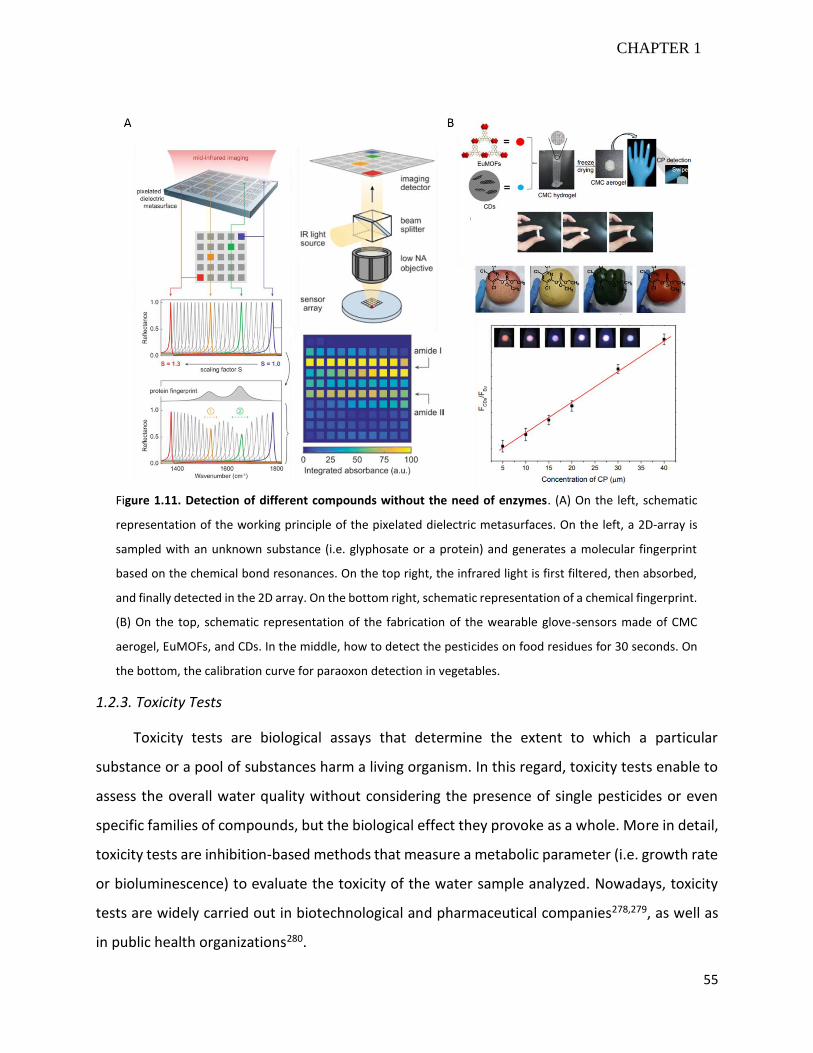
55
CHAPTER 1
1.2.3. Toxicity Tests
Toxicity tests are biological assays that determine the extent to which a particular
substance or a pool of substances harm a living organism. In this regard, toxicity tests enable to
assess the overall water quality without considering the presence of single pesticides or even
specific families of compounds, but the biological effect they provoke as a whole. More in detail,
toxicity tests are inhibition-based methods that measure a metabolic parameter (i.e. growth rate
or bioluminescence) to evaluate the toxicity of the water sample analyzed. Nowadays, toxicity
tests are widely carried out in biotechnological and pharmaceutical companies278,279, as well as
in public health organizations280.
Figure 1.11. Detection of different compounds without the need of enzymes. (A) On the left, schematic
representation of the working principle of the pixelated dielectric metasurfaces. On the left, a 2D-array is
sampled with an unknown substance (i.e. glyphosate or a protein) and generates a molecular fingerprint
based on the chemical bond resonances. On the top right, the infrared light is first filtered, then absorbed,
and finally detected in the 2D array. On the bottom right, schematic representation of a chemical fingerprint.
(B) On the top, schematic representation of the fabrication of the wearable glove-sensors made of CMC
aerogel, EuMOFs, and CDs. In the middle, how to detect the pesticides on food residues for 30 seconds. On
the bottom, the calibration curve for paraoxon detection in vegetables.
INTRODUCTION
56
Common organisms used to detect and monitor pollutants in water are Aliivibrio fischeri,
Daphnia magna, Dreissena mussels, zebrafish, and mammal cells281,282. On the one hand,
Microtox ® is a well-known technology used to assess the toxicity of water samples by tracking
the bioluminescence inhibition of the bacteria Aliivibrio fischeri in the presence of toxic
compounds283. On the other hand, CellTiterGlo ® is a toxicity assay-based technology that
quantifies the concentration of ATP, enabling to monitor the metabolic state of the cells282.
Besides, other toxicity models based on animals such as rats and fish pose ethical issues on
experimentation. Albeit these methods are well-standardized and worldwide employed, they are
expensive, and often lack stability, robustness, and simplicity, involving several-step processes.
For example, the commercially available Microtox 500 ® costs around 20,000 € and requires
several preparation steps before testing the sample; whereas CellTiterGlo ® requires a lysing
agent to extract the intracellular ATP, introducing several undesired components in the reaction,
thus affecting the overall performance of the toxicity detection system282,284.
In recent years, several researchers have been working on the development of simpler-to-
use and sensitive toxicity-based biosensors for water quality assessment282,285–287. As an example,
Pujol-Vila et al. used E. coli cells trapped within paper matrices to detect copper as a toxic agent287.
The paper matrices (paper discs) serve themselves not only as carriers but also act as fluidic
elements, avoiding the use of external pumps. Moreover, the authors claim to store the bacteria
stable for at least 1 month at -20 ºC. Regarding the toxicity assays, ferricyanide is used as the
substrate, whose reduction is determined by optical reflectometry, image analysis, and visual
inspection. In the presence of copper, ferricyanide reduction capacity is hindered, thereby
decreasing the gray color of the sample. Among all the aforementioned techniques, optical
reflectometry (∆Abs420) yields the most sensitive results, with an EC50 value of 3.9 mg/L, similar
to those previously reported in the literature.
One of the drawbacks most of the toxicity inhibition assays face is the stability of the
organisms that, in turn, disrupt the reproducibility within different batches and shorten the
working life of these sensing platforms. In this regard, Ben-Yoav et al. developed a bacterial
biofilm-based sensor integrated within a microchip to stabilize and keep reproducibility while
preserving simplicity (Figure 1.12a)285. Briefly, the authors use a genetically modified strain of E.
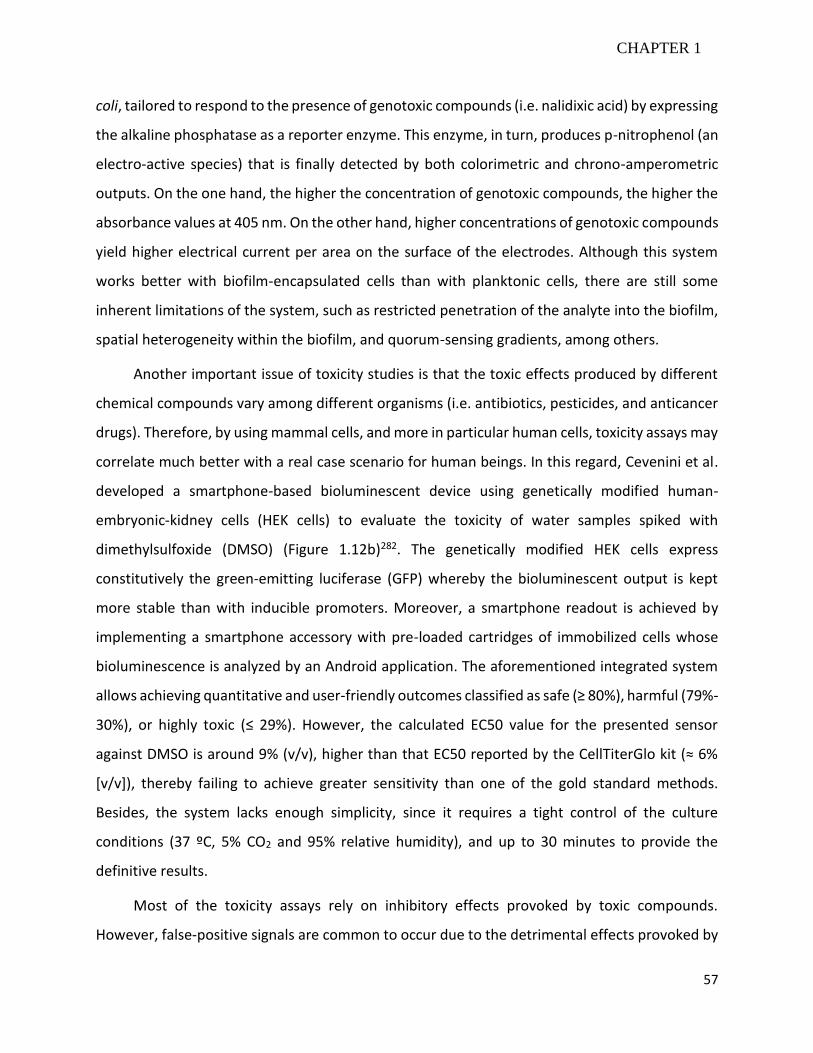
57
CHAPTER 1
coli, tailored to respond to the presence of genotoxic compounds (i.e. nalidixic acid) by expressing
the alkaline phosphatase as a reporter enzyme. This enzyme, in turn, produces p-nitrophenol (an
electro-active species) that is finally detected by both colorimetric and chrono-amperometric
outputs. On the one hand, the higher the concentration of genotoxic compounds, the higher the
absorbance values at 405 nm. On the other hand, higher concentrations of genotoxic compounds
yield higher electrical current per area on the surface of the electrodes. Although this system
works better with biofilm-encapsulated cells than with planktonic cells, there are still some
inherent limitations of the system, such as restricted penetration of the analyte into the biofilm,
spatial heterogeneity within the biofilm, and quorum-sensing gradients, among others.
Another important issue of toxicity studies is that the toxic effects produced by different
chemical compounds vary among different organisms (i.e. antibiotics, pesticides, and anticancer
drugs). Therefore, by using mammal cells, and more in particular human cells, toxicity assays may
correlate much better with a real case scenario for human beings. In this regard, Cevenini et al.
developed a smartphone-based bioluminescent device using genetically modified human-
embryonic-kidney cells (HEK cells) to evaluate the toxicity of water samples spiked with
dimethylsulfoxide (DMSO) (Figure 1.12b)282. The genetically modified HEK cells express
constitutively the green-emitting luciferase (GFP) whereby the bioluminescent output is kept
more stable than with inducible promoters. Moreover, a smartphone readout is achieved by
implementing a smartphone accessory with pre-loaded cartridges of immobilized cells whose
bioluminescence is analyzed by an Android application. The aforementioned integrated system
allows achieving quantitative and user-friendly outcomes classified as safe (≥ 80%), harmful (79%-
30%), or highly toxic (≤ 29%). However, the calculated EC50 value for the presented sensor
against DMSO is around 9% (v/v), higher than that EC50 reported by the CellTiterGlo kit (≈ 6%
[v/v]), thereby failing to achieve greater sensitivity than one of the gold standard methods.
Besides, the system lacks enough simplicity, since it requires a tight control of the culture
conditions (37 ºC, 5% CO2 and 95% relative humidity), and up to 30 minutes to provide the
definitive results.
Most of the toxicity assays rely on inhibitory effects provoked by toxic compounds.
However, false-positive signals are common to occur due to the detrimental effects provoked by
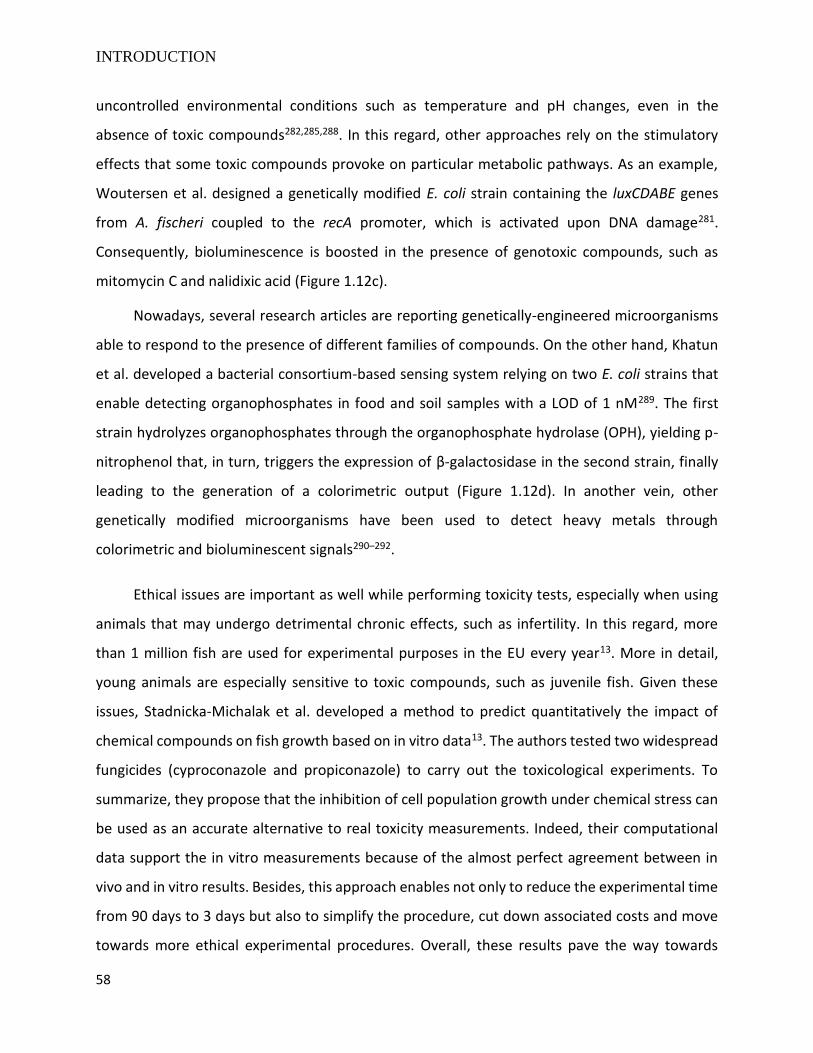
INTRODUCTION
58
uncontrolled environmental conditions such as temperature and pH changes, even in the
absence of toxic compounds282,285,288. In this regard, other approaches rely on the stimulatory
effects that some toxic compounds provoke on particular metabolic pathways. As an example,
Woutersen et al. designed a genetically modified E. coli strain containing the luxCDABE genes
from A. fischeri coupled to the recA promoter, which is activated upon DNA damage281.
Consequently, bioluminescence is boosted in the presence of genotoxic compounds, such as
mitomycin C and nalidixic acid (Figure 1.12c).
Nowadays, several research articles are reporting genetically-engineered microorganisms
able to respond to the presence of different families of compounds. On the other hand, Khatun
et al. developed a bacterial consortium-based sensing system relying on two E. coli strains that
enable detecting organophosphates in food and soil samples with a LOD of 1 nM289. The first
strain hydrolyzes organophosphates through the organophosphate hydrolase (OPH), yielding p-
nitrophenol that, in turn, triggers the expression of β-galactosidase in the second strain, finally
leading to the generation of a colorimetric output (Figure 1.12d). In another vein, other
genetically modified microorganisms have been used to detect heavy metals through
colorimetric and bioluminescent signals290–292.
Ethical issues are important as well while performing toxicity tests, especially when using
animals that may undergo detrimental chronic effects, such as infertility. In this regard, more
than 1 million fish are used for experimental purposes in the EU every year13. More in detail,
young animals are especially sensitive to toxic compounds, such as juvenile fish. Given these
issues, Stadnicka-Michalak et al. developed a method to predict quantitatively the impact of
chemical compounds on fish growth based on in vitro data13. The authors tested two widespread
fungicides (cyproconazole and propiconazole) to carry out the toxicological experiments. To
summarize, they propose that the inhibition of cell population growth under chemical stress can
be used as an accurate alternative to real toxicity measurements. Indeed, their computational
data support the in vitro measurements because of the almost perfect agreement between in
vivo and in vitro results. Besides, this approach enables not only to reduce the experimental time
from 90 days to 3 days but also to simplify the procedure, cut down associated costs and move
towards more ethical experimental procedures. Overall, these results pave the way towards
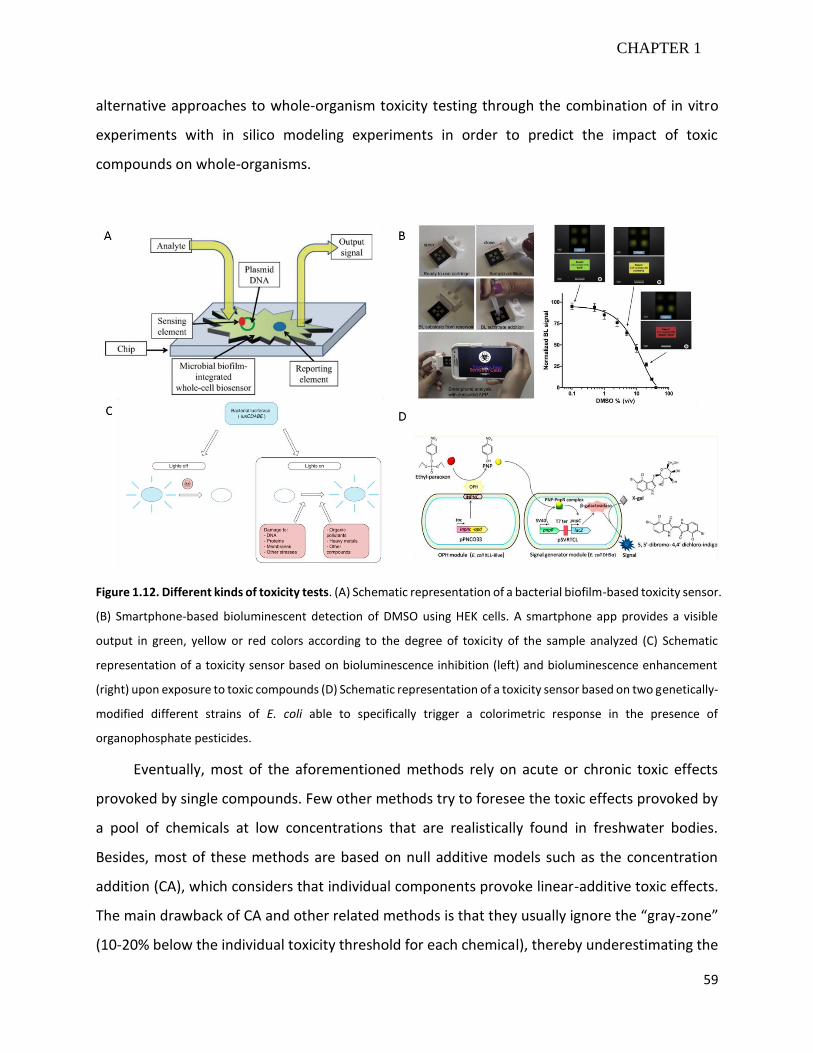
59
CHAPTER 1
alternative approaches to whole-organism toxicity testing through the combination of in vitro
experiments with in silico modeling experiments in order to predict the impact of toxic
compounds on whole-organisms.
Figure 1.12. Different kinds of toxicity tests. (A) Schematic representation of a bacterial biofilm-based toxicity sensor.
(B) Smartphone-based bioluminescent detection of DMSO using HEK cells. A smartphone app provides a visible
output in green, yellow or red colors according to the degree of toxicity of the sample analyzed (C) Schematic
representation of a toxicity sensor based on bioluminescence inhibition (left) and bioluminescence enhancement
(right) upon exposure to toxic compounds (D) Schematic representation of a toxicity sensor based on two genetically-
modified different strains of E. coli able to specifically trigger a colorimetric response in the presence of
organophosphate pesticides.
Eventually, most of the aforementioned methods rely on acute or chronic toxic effects
provoked by single compounds. Few other methods try to foresee the toxic effects provoked by
a pool of chemicals at low concentrations that are realistically found in freshwater bodies.
Besides, most of these methods are based on null additive models such as the concentration
addition (CA), which considers that individual components provoke linear-additive toxic effects.
The main drawback of CA and other related methods is that they usually ignore the “gray-zone”
(10-20% below the individual toxicity threshold for each chemical), thereby underestimating the
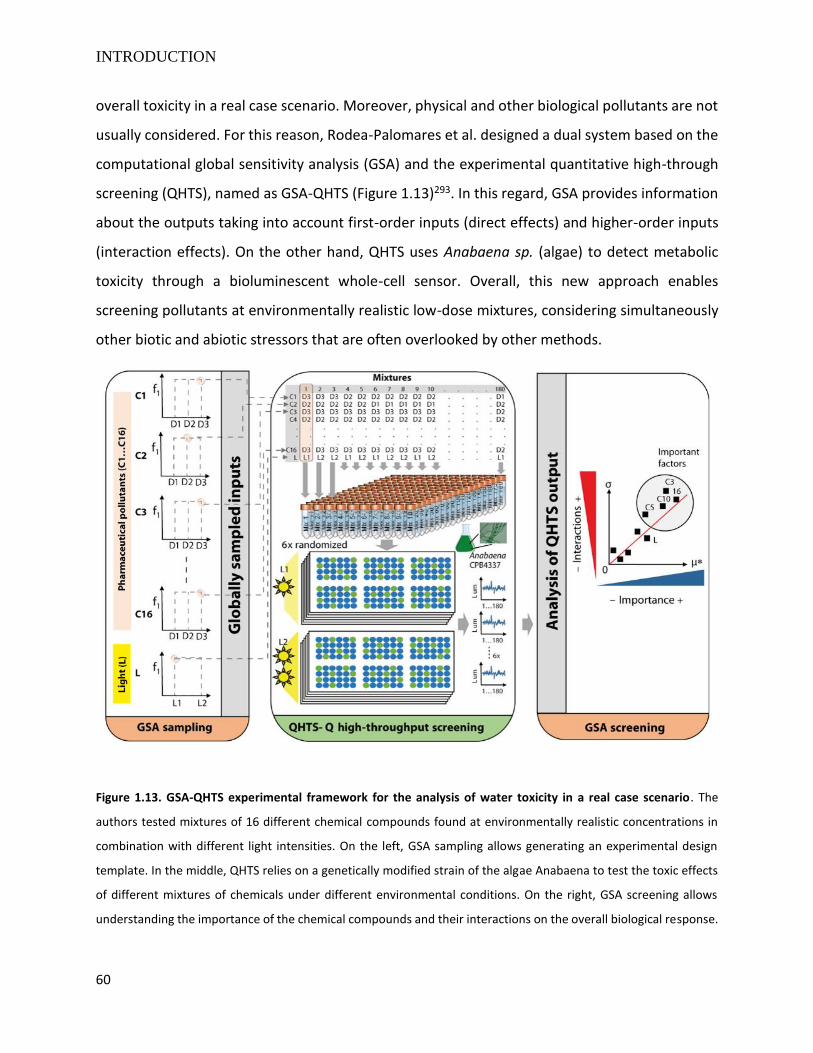
INTRODUCTION
60
overall toxicity in a real case scenario. Moreover, physical and other biological pollutants are not
usually considered. For this reason, Rodea-Palomares et al. designed a dual system based on the
computational global sensitivity analysis (GSA) and the experimental quantitative high-through
screening (QHTS), named as GSA-QHTS (Figure 1.13)293. In this regard, GSA provides information
about the outputs taking into account first-order inputs (direct effects) and higher-order inputs
(interaction effects). On the other hand, QHTS uses Anabaena sp. (algae) to detect metabolic
toxicity through a bioluminescent whole-cell sensor. Overall, this new approach enables
screening pollutants at environmentally realistic low-dose mixtures, considering simultaneously
other biotic and abiotic stressors that are often overlooked by other methods.
Figure 1.13. GSA-QHTS experimental framework for the analysis of water toxicity in a real case scenario. The
authors tested mixtures of 16 different chemical compounds found at environmentally realistic concentrations in
combination with different light intensities. On the left, GSA sampling allows generating an experimental design
template. In the middle, QHTS relies on a genetically modified strain of the algae Anabaena to test the toxic effects
of different mixtures of chemicals under different environmental conditions. On the right, GSA screening allows
understanding the importance of the chemical compounds and their interactions on the overall biological response.
61
CHAPTER 1
1.3. Biological Pollutants Detection
This section is mainly focused on the detection of bacteria as biological pollutants, avoiding
details on the detection systems harnessed to detect viruses and other parasites since they are
not the main topic of this thesis.
According to a recent study performed in 2020, fecal contamination of waters gets a
foothold as the main source of water pollution in the EU (85% of polluting activity), followed by
agriculture (70%), farm waste and oil tanks (50%), residential area (40%), and transport (35%)294.
In this regard, water fecal contamination often leads to waterborne outbreaks caused by
pathogenic microorganisms. However, pathogens’ detection requires the analysis of large
volumes of water since pathogens are usually present at low numbers within the water bodies.
Therefore, as aforementioned, the detection of indicator microorganisms is not only preferred
but also more practical when assessing water fecal contamination295. Coliform bacteria are the
best indicator microorganisms (Escherichia, Citrobacter, Enterobacter, and Klebsiella). Among all
these bacteria, Escherichia coli is the perfect indicator microorganism of water fecal
contamination because it is always present in the guts of warm-blooded animals166.
1.3.1. Traditional Methods
Currently, there are two universal methods used for the counting of E. coli in water samples:
membrane filtration (MF) and multiple tube fermentation method (MTFM). On the one hand, MF
uses a small pore-sized membrane to filter the water and trap the bacteria onto its surface. Next,
the membrane is placed over an agar plate containing a selective growth media that only allows
for coliforms’ growth. However, this method is time-consuming and highly susceptible to the
presence of other microorganisms. On the other hand, MTFM uses a mixture of bacterial growth
media together with the water sample to be analyzed, in which bacteria are allowed to grow,
normally within 16-24 hours, and detected by optical density (OD). This method does not require
a filtration process but does require an enrichment process and a long incubation time to provide
the definitive results. In this regard, the most probable number (MPN) analysis helps to narrow
down the real concentration range of bacteria found in the water samples295.
INTRODUCTION
62
Although not used as a gold standard to detect water fecal contamination, microscopy
techniques also allow detecting and identifying bacteria and bigger pathogens. Several sorts of
microscopy, including bright- and dark-field microscopy, phase contrast microscopy, differential
contrast microscopy, fluorescence microscopy, laser scanning, transmission electron microscopy
(TEM) and scanning electron microscopy (SEM) are used to identify and characterize bacteria
according to their morphology and structural differences (i.e. Gram stain)296. Nonetheless, these
techniques often ignore the presence of small pathogens and are not very specific.
More recently, new bacterial detection systems appeared, such as enzymatic assays (i.e.
Colilert), immunological assays (i.e. ELISA and agglutination tests), and nucleic acid-based assays
(i.e. PCR and loop-mediated isothermal amplification [LAMP]). On the one hand, enzymatic
assays rely on the ability of specific bacteria to metabolize particular compounds: 4-
methylumbelliferyl-β-d-galactoside (MUGal) for coliforms, and indoxyl β-D-glucuronide (IBDG)
specifically for E. coli. However, they also require a long incubation time to provide definitive
results (18-22 hours)166. On the other hand, immunological assays rely on antibodies that bind
selectively to specific analytes. In this regard, ELISA tests are considered as a gold standard for
clinical diagnosis and quantification of protein biomarkers and microorganisms. Nonetheless,
ELISA tests are time-consuming, involving several steps (i.e. sample labeling with fluorescent
reagents) and requiring well-trained personnel. Eventually, nucleic acid-based assays are usually
more sensitive than enzymatic and immunological assays because of an additional amplification
step that allows detecting few copies of specific genes found in particular bacteria. However,
most of these methods often require an in-depth target selection, rely on expensive enzymes
and devices (i.e. thermocyclers), and need several steps to perform the DNA amplification296.
Overall, traditional methods for bacteria detection have several drawbacks: some
techniques require specialized equipment and trained personnel, whereas in other cases the lack
of sensitivity and specificity is the major problem. For instance, microscopy techniques are often
quick but not specific. On the other hand, growth culture techniques require one to several days
to be completed. Next, biochemical assays, such as the analytical profile index (API), detect the
presence of particular enzymes due to colorimetric changes, giving a unique colorimetric profile
for specific bacteria species, but also last one day to provide the definitive results. Finally, genetic
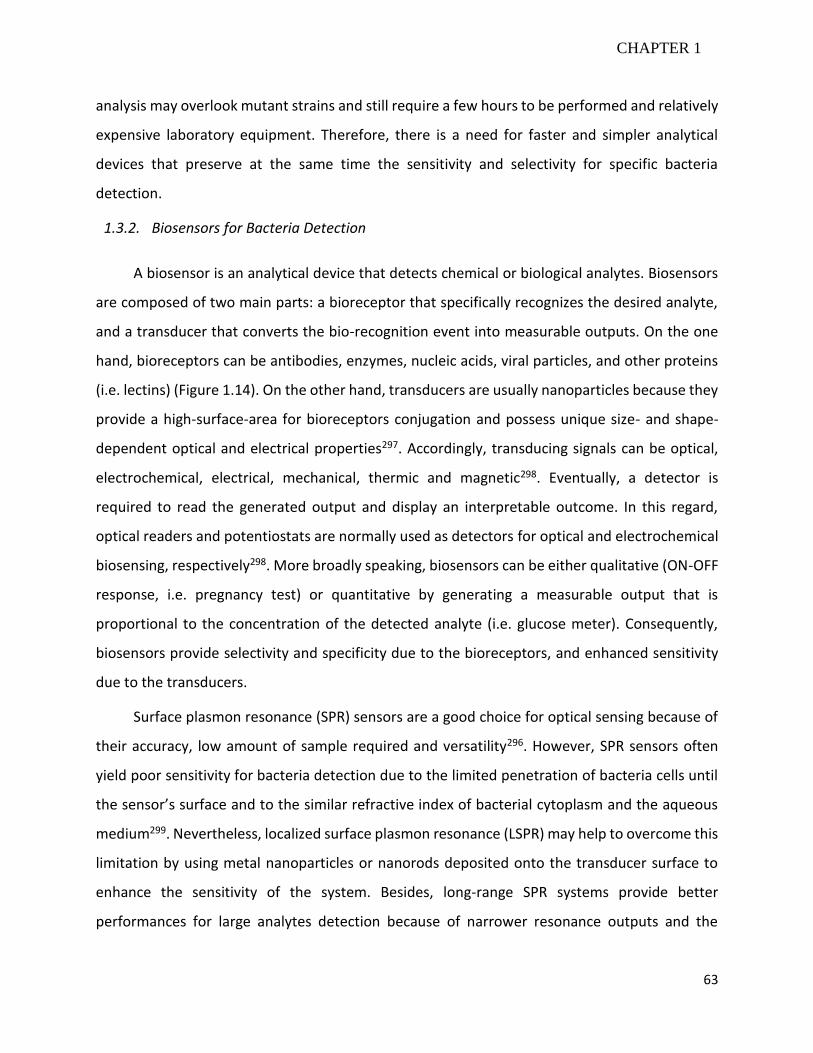
63
CHAPTER 1
analysis may overlook mutant strains and still require a few hours to be performed and relatively
expensive laboratory equipment. Therefore, there is a need for faster and simpler analytical
devices that preserve at the same time the sensitivity and selectivity for specific bacteria
detection.
1.3.2. Biosensors for Bacteria Detection
A biosensor is an analytical device that detects chemical or biological analytes. Biosensors
are composed of two main parts: a bioreceptor that specifically recognizes the desired analyte,
and a transducer that converts the bio-recognition event into measurable outputs. On the one
hand, bioreceptors can be antibodies, enzymes, nucleic acids, viral particles, and other proteins
(i.e. lectins) (Figure 1.14). On the other hand, transducers are usually nanoparticles because they
provide a high-surface-area for bioreceptors conjugation and possess unique size- and shape-
dependent optical and electrical properties297. Accordingly, transducing signals can be optical,
electrochemical, electrical, mechanical, thermic and magnetic298. Eventually, a detector is
required to read the generated output and display an interpretable outcome. In this regard,
optical readers and potentiostats are normally used as detectors for optical and electrochemical
biosensing, respectively298. More broadly speaking, biosensors can be either qualitative (ON-OFF
response, i.e. pregnancy test) or quantitative by generating a measurable output that is
proportional to the concentration of the detected analyte (i.e. glucose meter). Consequently,
biosensors provide selectivity and specificity due to the bioreceptors, and enhanced sensitivity
due to the transducers.
Surface plasmon resonance (SPR) sensors are a good choice for optical sensing because of
their accuracy, low amount of sample required and versatility296. However, SPR sensors often
yield poor sensitivity for bacteria detection due to the limited penetration of bacteria cells until
the sensor’s surface and to the similar refractive index of bacterial cytoplasm and the aqueous
medium299. Nevertheless, localized surface plasmon resonance (LSPR) may help to overcome this
limitation by using metal nanoparticles or nanorods deposited onto the transducer surface to
enhance the sensitivity of the system. Besides, long-range SPR systems provide better
performances for large analytes detection because of narrower resonance outputs and the
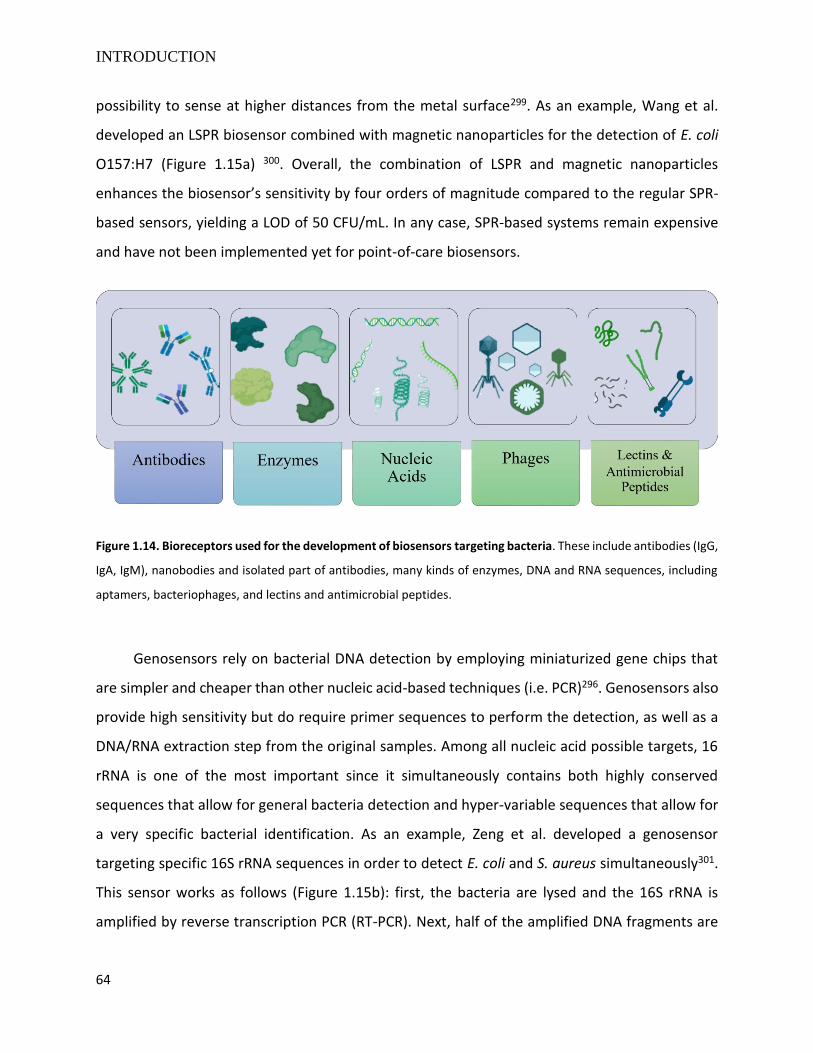
INTRODUCTION
64
possibility to sense at higher distances from the metal surface299. As an example, Wang et al.
developed an LSPR biosensor combined with magnetic nanoparticles for the detection of E. coli
O157:H7 (Figure 1.15a) 300. Overall, the combination of LSPR and magnetic nanoparticles
enhances the biosensor’s sensitivity by four orders of magnitude compared to the regular SPR-
based sensors, yielding a LOD of 50 CFU/mL. In any case, SPR-based systems remain expensive
and have not been implemented yet for point-of-care biosensors.
Figure 1.14. Bioreceptors used for the development of biosensors targeting bacteria. These include antibodies (IgG,
IgA, IgM), nanobodies and isolated part of antibodies, many kinds of enzymes, DNA and RNA sequences, including
aptamers, bacteriophages, and lectins and antimicrobial peptides.
Genosensors rely on bacterial DNA detection by employing miniaturized gene chips that
are simpler and cheaper than other nucleic acid-based techniques (i.e. PCR)296. Genosensors also
provide high sensitivity but do require primer sequences to perform the detection, as well as a
DNA/RNA extraction step from the original samples. Among all nucleic acid possible targets, 16
rRNA is one of the most important since it simultaneously contains both highly conserved
sequences that allow for general bacteria detection and hyper-variable sequences that allow for
a very specific bacterial identification. As an example, Zeng et al. developed a genosensor
targeting specific 16S rRNA sequences in order to detect E. coli and S. aureus simultaneously301.
This sensor works as follows (Figure 1.15b): first, the bacteria are lysed and the 16S rRNA is
amplified by reverse transcription PCR (RT-PCR). Next, half of the amplified DNA fragments are
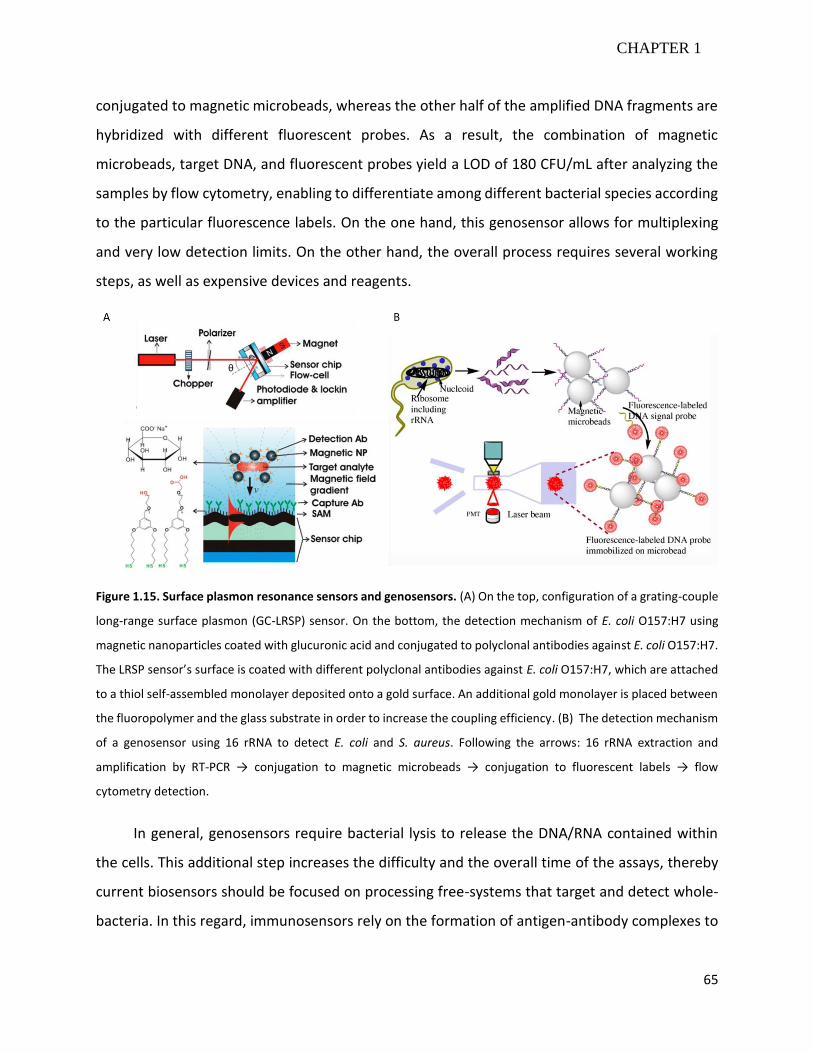
65
CHAPTER 1
conjugated to magnetic microbeads, whereas the other half of the amplified DNA fragments are
hybridized with different fluorescent probes. As a result, the combination of magnetic
microbeads, target DNA, and fluorescent probes yield a LOD of 180 CFU/mL after analyzing the
samples by flow cytometry, enabling to differentiate among different bacterial species according
to the particular fluorescence labels. On the one hand, this genosensor allows for multiplexing
and very low detection limits. On the other hand, the overall process requires several working
steps, as well as expensive devices and reagents.
Figure 1.15. Surface plasmon resonance sensors and genosensors. (A) On the top, configuration of a grating-couple
long-range surface plasmon (GC-LRSP) sensor. On the bottom, the detection mechanism of E. coli O157:H7 using
magnetic nanoparticles coated with glucuronic acid and conjugated to polyclonal antibodies against E. coli O157:H7.
The LRSP sensor’s surface is coated with different polyclonal antibodies against E. coli O157:H7, which are attached
to a thiol self-assembled monolayer deposited onto a gold surface. An additional gold monolayer is placed between
the fluoropolymer and the glass substrate in order to increase the coupling efficiency. (B) The detection mechanism
of a genosensor using 16 rRNA to detect E. coli and S. aureus. Following the arrows: 16 rRNA extraction and
amplification by RT-PCR → conjugation to magnetic microbeads → conjugation to fluorescent labels → flow
cytometry detection.
In general, genosensors require bacterial lysis to release the DNA/RNA contained within
the cells. This additional step increases the difficulty and the overall time of the assays, thereby
current biosensors should be focused on processing free-systems that target and detect whole-
bacteria. In this regard, immunosensors rely on the formation of antigen-antibody complexes to
INTRODUCTION
66
detect bacteria and other microorganisms. In most of the cases, antibodies target specific surface
epitopes present on the cell wall of bacteria cells, mainly proteins, glycoproteins,
lipopolysaccharides, and peptidoglycan299. On the one hand, surface epitope targeting avoids the
need for bacteria lysis or any other additional steps that may interfere with the detection process.
However, immunosensors are also more susceptible to nonspecific interactions due to the
presence of many surface epitopes in any kind of microorganism. On the other hand, bacteria
detection and quantification through immunosensors cannot be correlated to other standard
techniques such a growth culture or PCR. While growth culture gives an idea of the number of
viable bacteria cells present in the sample, PCR gives an idea of the number of specific DNA/RNA
sequences found in a particular sample. In this regard, PCR might estimate both viable and dead
bacteria cells by targeting genetic sequences whose presence is independent of the cellular
metabolic state. These differences complicate immunosensors validation and the estimation of
bacteria concentration since a single bacterium or even broken pieces of bacterial cell walls could
yield multiple antigen-antibody interactions.
The sensitivity and selectivity of the immunosensors strongly depend on the bioreceptor
used to capture the bacteria cells. For example, polyclonal antibodies enable to target a pool of
different unknown epitopes, thereby broadening the detection range of the immunosensors.
Conversely, monoclonal antibodies are more specific since they target single epitopes, yielding
higher sensitivity but ramping up the overall cost. Furthermore, lectins target bacterial cell wall
glycoproteins with high selectivity and often represent a valid alternative for whole-bacteria
detection. Eventually, bacteriophages, also known as phages, have also been used to develop
biosensors aimed to detect bacteria. Phages are viruses that infect and replicate within bacteria
and archaea. The main advantages of bacteria-targeting biosensors based on phages are the high
specificity and robustness, as well as the low reagent cost, and the possibility to tune the
selection of phages for different bacterial species296. Besides, phages can also be used to kill non-
target bacteria, allowing the growth and thereby the detection of only the target bacteria302.
Lateral flow immunoassays (LFIA) are excellent immunosensors for in-situ bacteria
detection since they are portable, stable in a wide range of conditions, commercially available
and tunable to yield different degrees of sensitivity. LFIA started to be developed in the early
67
CHAPTER 1
1980s and can be present in sandwich format or competitive format, being the latter mainly used
for the detection of small molecules with one antigenic determinant. On the contrary, LFIA based
on the sandwich format has been widely used for the detection of different bacteria (i.e.
Campylobacter, Clostridium, E. coli, Pseudomonas, Salmonella, Vibrio, etc.)303–308. The majority of
these LFIA aim to target pathogenic strains of E. coli (i.e. E. coli O157) and Salmonella in food
samples309.
Most LFIA targeting bacteria rely on the use of antibodies, but others rely on antimicrobial
peptides or nucleic acids as bioreceptors. In this regard, nucleic acids can target oligonucleotides,
protein surface antigens or even whole-bacteria309. Aptamers present several advantages over
polyclonal antibodies: low immunogenicity, controllable selectivity, and better stability310.
Besides, aptamers can be easily tagged with reporter fluorescent molecules. On the other hand,
aptamers present short half-life, low specificity in some cases and are quickly exposed to serum
degradation when testing biological samples.
Regarding the LFIA transducers, AuNPs, QDs, carbon NPs, fluorescent dyes, up-converting
emitters, and magnetic beads have been used, among others302. On the one hand, AuNPs are
easy and cheap to synthesize. Moreover, the versatility of AuNPs’ synthesis allows for tunable
size and shape, which yield size-dependent electronic and optical properties. AuNPs are also
considered highly biocompatible. Besides, AuNPs possess quenching ability, useful to develop
dual colorimetric-fluorescent assays. Eventually, AuNPs interact strongly with thiol groups that
may be present in antibodies and SH-modified aptamers for an optimal bioconjugation310. On the
other hand, QDs are fluorescent nanometric semiconductor particles with special optical and
electronic properties. In general, QDs possess high quantum yield, with broad absorption spectra
and narrow emission spectra. Moreover, QDs present low photobleaching and high resistance to
harsh chemical degradation310.
As an example, Schenk et al. developed an AuNPs-based LFIA for the detection of
Salmonella lipopolysaccharides (LPS) by structuring four channels within a single LFS (Figure
1.16a)311. Interestingly, the authors can detect the LPS of two different species of Salmonella (S.
enteritidis and S. Typhimurium), and avoid the well-known “Hook effect” by adding an
intermediate spot of LPS between the test dots and the control dots in the nitrocellulose pad. In
INTRODUCTION
68
another example, Wang et al. developed a fluorescent LFIA based on magnetic-core@dual
quantum dot-shell nanoparticles (Fe3O4@DQDs) for the detection of Streptococcus pneumonia
(Figure 1.16b)312. Their new synthesis of Fe3O4@DQDs through polyethyleneimine (PEI)-
mediated layer-by-layer yields better fluorescent properties and more stability than the
conventional synthesis methods. On the one hand, the QDs allows for a strong fluorescent signal
upon excitation at 365 nm. On the other hand, the Fe3O4 particles allow for the separation and
pre-concentration of the target bacteria. Eventually, the authors report a LOD of 8 CFU/mL, with
good a detection range from 10 to 107 CFU/mL, yielding good specificity and selectivity in blood
and serum samples.
The combination of more than one signal transducer often yields better sensitivity than the
use of single nanoparticles within the LFIA. For example, Chen et al. developed an LFIA system
based on two different sized AuNPs (28 and 45 nm) to detect E. coli O157:H7 (Figure 1.16c)313.
This procedure requires a first step performed in solution, in which the bacteria are incubated
with 28 nm AuNPs conjugated with monoclonal antibodies anti-E. coli O157:H7. Next, this
solution is loaded onto the sample pad and flows across the conjugate pad, where 45 nm AuNPs
are immobilized. The antibodies conjugated to the 45 nm AuNPs recognize and capture the
antibodies conjugated to the 28 nm AuNPs, forming a bigger complex of bacteria-28 nm AuNPs-
45 nm AuNPs. Eventually, the antibodies printed on the test line capture the bacteria and the
two kinds of AuNPs, boosting the sensitivity of the overall system until ≈ 103 CFU/mL, at least two
to three orders of magnitude better than the standard colorimetric LFS targeting whole-
bacteria302,314.
Bu et al. developed an even simpler method based on colorimetric LFIA targeting
Salmonella enteritidis using a single monoclonal antibody (Figure 1.16d)315. Briefly, the authors
stain the bacteria cells in solution with crystal violet for 1 minute, which is one of the two main
dyes used for the conventional Gram stain. Next, the stained samples are loaded onto the sample
pad of the LFS and flow throughout the LFS until the bacteria reach the monoclonal antibodies
immobilized within the test line (TL), generating a strong violet line in case of a positive signal.
This system avoids the use of conjugate particles and the first-target antibody since the color
generation comes from the bacteria stain, and all specificity relies on the monoclonal antibodies
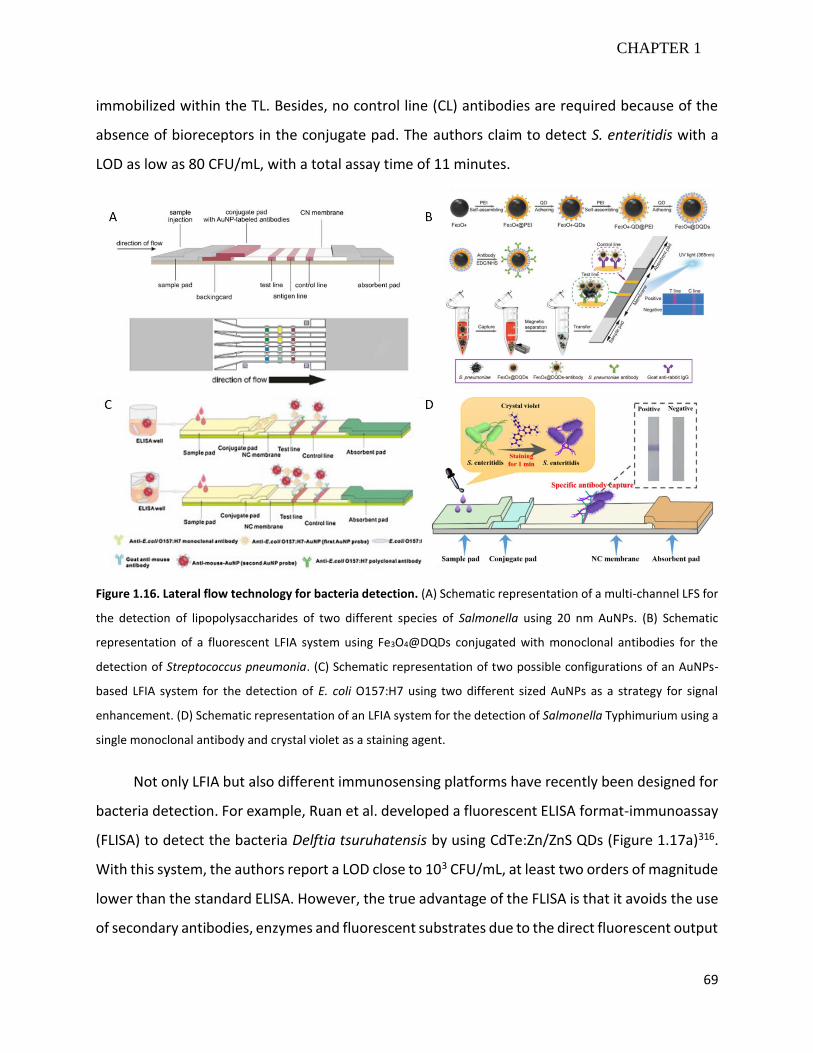
69
CHAPTER 1
immobilized within the TL. Besides, no control line (CL) antibodies are required because of the
absence of bioreceptors in the conjugate pad. The authors claim to detect S. enteritidis with a
LOD as low as 80 CFU/mL, with a total assay time of 11 minutes.
Figure 1.16. Lateral flow technology for bacteria detection. (A) Schematic representation of a multi-channel LFS for
the detection of lipopolysaccharides of two different species of Salmonella using 20 nm AuNPs. (B) Schematic
representation of a fluorescent LFIA system using Fe3O4@DQDs conjugated with monoclonal antibodies for the
detection of Streptococcus pneumonia. (C) Schematic representation of two possible configurations of an AuNPs-
based LFIA system for the detection of E. coli O157:H7 using two different sized AuNPs as a strategy for signal
enhancement. (D) Schematic representation of an LFIA system for the detection of Salmonella Typhimurium using a
single monoclonal antibody and crystal violet as a staining agent.
Not only LFIA but also different immunosensing platforms have recently been designed for
bacteria detection. For example, Ruan et al. developed a fluorescent ELISA format-immunoassay
(FLISA) to detect the bacteria Delftia tsuruhatensis by using CdTe:Zn/ZnS QDs (Figure 1.17a)316.
With this system, the authors report a LOD close to 103 CFU/mL, at least two orders of magnitude
lower than the standard ELISA. However, the true advantage of the FLISA is that it avoids the use
of secondary antibodies, enzymes and fluorescent substrates due to the direct fluorescent output
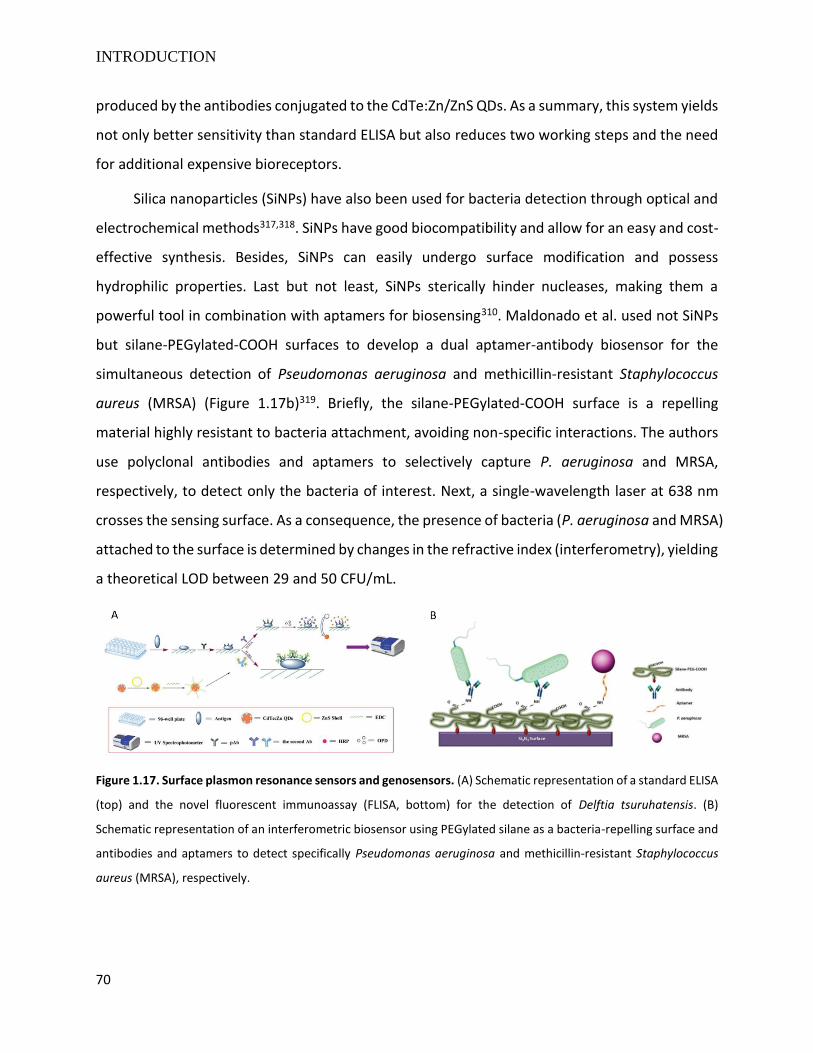
INTRODUCTION
70
produced by the antibodies conjugated to the CdTe:Zn/ZnS QDs. As a summary, this system yields
not only better sensitivity than standard ELISA but also reduces two working steps and the need
for additional expensive bioreceptors.
Silica nanoparticles (SiNPs) have also been used for bacteria detection through optical and
electrochemical methods317,318. SiNPs have good biocompatibility and allow for an easy and cost-
effective synthesis. Besides, SiNPs can easily undergo surface modification and possess
hydrophilic properties. Last but not least, SiNPs sterically hinder nucleases, making them a
powerful tool in combination with aptamers for biosensing310. Maldonado et al. used not SiNPs
but silane-PEGylated-COOH surfaces to develop a dual aptamer-antibody biosensor for the
simultaneous detection of Pseudomonas aeruginosa and methicillin-resistant Staphylococcus
aureus (MRSA) (Figure 1.17b)319. Briefly, the silane-PEGylated-COOH surface is a repelling
material highly resistant to bacteria attachment, avoiding non-specific interactions. The authors
use polyclonal antibodies and aptamers to selectively capture P. aeruginosa and MRSA,
respectively, to detect only the bacteria of interest. Next, a single-wavelength laser at 638 nm
crosses the sensing surface. As a consequence, the presence of bacteria (P. aeruginosa and MRSA)
attached to the surface is determined by changes in the refractive index (interferometry), yielding
a theoretical LOD between 29 and 50 CFU/mL.
Figure 1.17. Surface plasmon resonance sensors and genosensors. (A) Schematic representation of a standard ELISA
(top) and the novel fluorescent immunoassay (FLISA, bottom) for the detection of Delftia tsuruhatensis. (B)
Schematic representation of an interferometric biosensor using PEGylated silane as a bacteria-repelling surface and
antibodies and aptamers to detect specifically Pseudomonas aeruginosa and methicillin-resistant Staphylococcus
aureus (MRSA), respectively.
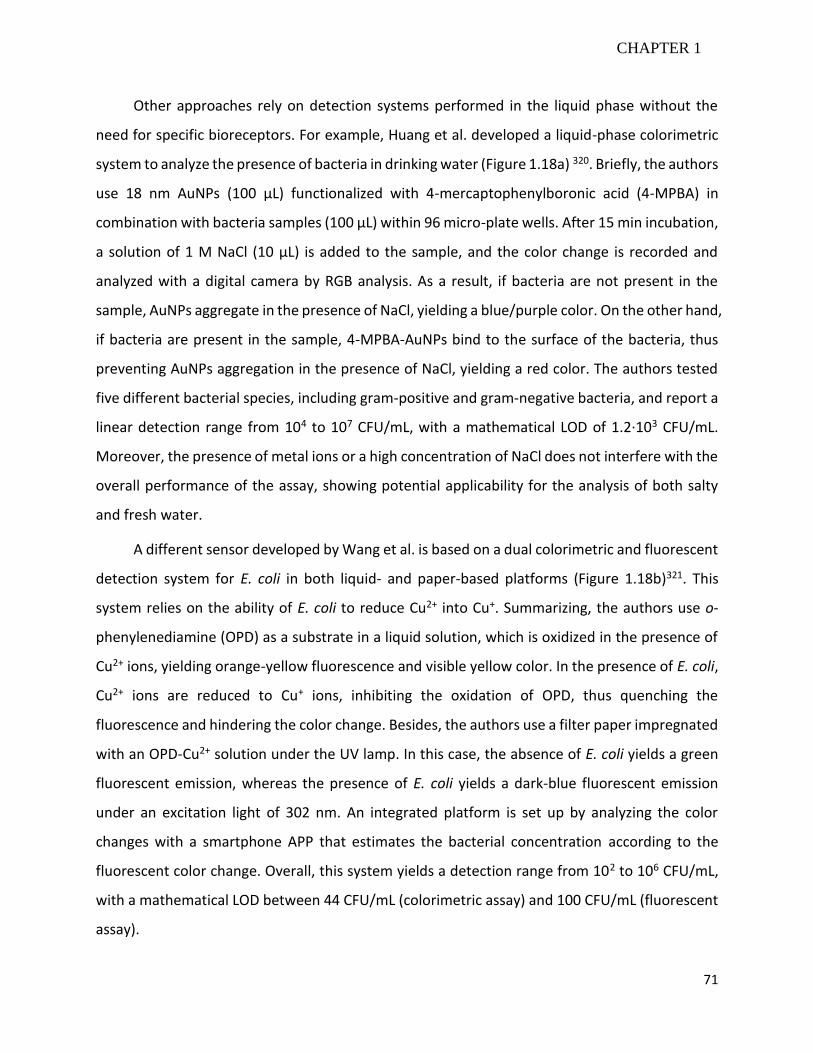
71
CHAPTER 1
Other approaches rely on detection systems performed in the liquid phase without the
need for specific bioreceptors. For example, Huang et al. developed a liquid-phase colorimetric
system to analyze the presence of bacteria in drinking water (Figure 1.18a) 320. Briefly, the authors
use 18 nm AuNPs (100 µL) functionalized with 4-mercaptophenylboronic acid (4-MPBA) in
combination with bacteria samples (100 µL) within 96 micro-plate wells. After 15 min incubation,
a solution of 1 M NaCl (10 µL) is added to the sample, and the color change is recorded and
analyzed with a digital camera by RGB analysis. As a result, if bacteria are not present in the
sample, AuNPs aggregate in the presence of NaCl, yielding a blue/purple color. On the other hand,
if bacteria are present in the sample, 4-MPBA-AuNPs bind to the surface of the bacteria, thus
preventing AuNPs aggregation in the presence of NaCl, yielding a red color. The authors tested
five different bacterial species, including gram-positive and gram-negative bacteria, and report a
linear detection range from 104 to 107 CFU/mL, with a mathematical LOD of 1.2·103 CFU/mL.
Moreover, the presence of metal ions or a high concentration of NaCl does not interfere with the
overall performance of the assay, showing potential applicability for the analysis of both salty
and fresh water.
A different sensor developed by Wang et al. is based on a dual colorimetric and fluorescent
detection system for E. coli in both liquid- and paper-based platforms (Figure 1.18b)321. This
system relies on the ability of E. coli to reduce Cu2+ into Cu+. Summarizing, the authors use o-
phenylenediamine (OPD) as a substrate in a liquid solution, which is oxidized in the presence of
Cu2+ ions, yielding orange-yellow fluorescence and visible yellow color. In the presence of E. coli,
Cu2+ ions are reduced to Cu+ ions, inhibiting the oxidation of OPD, thus quenching the
fluorescence and hindering the color change. Besides, the authors use a filter paper impregnated
with an OPD-Cu2+ solution under the UV lamp. In this case, the absence of E. coli yields a green
fluorescent emission, whereas the presence of E. coli yields a dark-blue fluorescent emission
under an excitation light of 302 nm. An integrated platform is set up by analyzing the color
changes with a smartphone APP that estimates the bacterial concentration according to the
fluorescent color change. Overall, this system yields a detection range from 102 to 106 CFU/mL,
with a mathematical LOD between 44 CFU/mL (colorimetric assay) and 100 CFU/mL (fluorescent
assay).
INTRODUCTION
72
Furthermore, metal nanoclusters (NCs) are composed of few atoms of one or several metal
elements with a total size smaller than 2 nm (i.e. AuNCs, AgNCs, CuNCs). As an example, AuNCs
do not show the SPR properties that AuNPs do, but instead AuNCs show fluorescence and
enhanced catalytic behavior. Metal NCs can be used for the detection of bacteria by label-free
methods based on, for example, differential response to pH changes, agglomeration of NCs in
the presence of bacteria, or fluorescence recovery of NCs upon Cu2+ reduction by bacteria322. On
the other hand, metal NCs can also be used for bacteria detection through the recognition of
molecular motifs by conjugation to small molecules, covering of bigger biomolecules such as
enzymes, undergoing magnetic enrichment, or by FRET mechanism in the presence of
Figure 1.18. (A) Detection of E. coli by copper reduction. On the top, the presence of E. coli reduces Cu2+ to Cu+,
turning off the fluorescence emitted by o-phenylenediamine (OPD). On the bottom, the presence of E. coli hinders
the colorimetric change of OPD (colorless) to the oxidized OPD (yellow) (B) Detection of total bacteria in water
through a colorimetric test based on the aggregation of 4-mercaptophenylboronic acid (MPBA)-coated AuNPs in the
presence of NaCl (1 M). On the one hand, the absence of bacteria induces the aggregation of the MPBA-AuNPs,
switching the solution color from red to blue. On the other hand, the presence of bacteria prevents the aggregation
of the MPBA-AuNPs because they bind to the surface of the bacterial cell wall, thereby the solution color remains
red.
73
CHAPTER 1
appropriate quenchers (i.e. AuNPs)322. Besides, the combination of metal NCs with particular
proteins or antibiotics allows for the detection of different bacterial species by constructing
sensing arrays. In this regard, metal NCs can attach to bacteria without the need for specific
bioreceptors, but their modification allows for higher specificity. As a clear advantage, metal NCs
do no need the covalent modification many fluorophores require and can be used for the
detection of antibiotic-resistant bacteria when coupled to certain antibiotics.
Eventually, micromechanical sensors usually depend on an antigen-antibody interaction
that causes a mass change upon bacteria’s attachment. These sensors provide high sensitivity
and fast response time without the need for sample processing. Quartz crystal microbalance
(QCM) and microcantilever sensors are the two main examples of micromechanical sensors296.
On the one hand, QCM sensors are label-free piezoelectric biosensors that can detect resonance
frequency changes, yielding very low detection limits. On the other hand, microcantilever sensors
rely on functionalized bioreceptors that oscillate at a particular resonance frequency after the
analyte recognition. As a clear advantage, microcantilever sensors normally allow for label-free
and real-time measurements. As an example, Salam et al. developed a QCM sensor coupled to a
microfluidic system for the detection of Salmonella Typhimurium323. The authors use a gold
sensor chip containing two antibodies immobilized onto its surface: a monoclonal antibody
against Salmonella and an anti-mouse IgG antibody used as a controls spot. Therefore, the
attachment of Salmonella cells alters the sensor frequency directly proportionally to the bacteria
concentration. Importantly, this QCM sensor provides good selectivity against other bacteria
because of the presence of monoclonal antibodies against Salmonella, as well as improved
sensitivity when using a sandwich immunoassay with antibody conjugated AuNPs (LOD = 10-20
CFU/mL). Similarly, other authors have reported microcantilever sensors to detect whole-
bacteria, such as Bacillus anthracis, E. coli O157:H7, and Salmonella Typhimurium324.
1.4. Perspectives
Water pollution is one of the main challenges humankind is facing nowadays. In particular,
agriculture and farming are the two main activities that introduce the highest quantities of
wastewater into the environment worldwide. Consequently, as agriculture uses a myriad of
pesticides to control pests and boost crops’ growth, and farming generates large quantities of
INTRODUCTION
74
dung, pesticides and fecal microorganisms are the most important water pollutants to be
monitored.
In this regard, the detection of pesticides in water can be addressed through several
perspectives, from specific compounds detection to the determination of the overall toxicity
caused by a complex pool of different pesticides. The detection of specific compounds often
yields high specificity and sensitivity through a wide variety of nanomaterials and approaches (i.e.
MIPs and selective chemical reactions). On the other hand, the use of enzymes as bioreceptors
allows detecting a family of structurally related pesticides that usually inhibit the catalytic activity
of the enzyme. Eventually, toxicity biosensors allow for the evaluation of the overall toxicity of a
water sample, without considering the identity and concentration of specific compounds. In a
real case scenario, this last approach provides the most reliable information because water
pollution often comprises different pollution inputs pouring a variety of pesticides in water that,
in turn, are found at variable concentrations.
On the other hand, fecal contamination of water requires the detection of particular fecal
indicators since the number of pathogens that can be found in wastewaters is large (i.e. bacteria,
viruses, and parasites). So far, fecal coliforms, and more specifically Escherichia coli, are the best
candidates as indicators of water fecal contamination. However, it is worth to mention that either
the presence or absence of E. coli in water cannot completely foresee the presence of certain
pathogens, such as some viruses and parasites.
Bacteria gold-standard detection methods have traditionally been growth culture, colony
counting, and microscopy techniques. More recently, enzymatic assays, immunoassays, and PCR
appeared, yielding better sensitivity and specificity but at the expense of cost and simplicity. In
this context, biosensing has evolved as a promising alternative for bacteria detection, and
especially for fecal bacteria detection in water. Genosensors, immunosensors, and enzymatic
sensors are probably the most widely studied, each of them relying on nucleic acids, antibodies
or aptamers, and enzymes as bioreceptors, respectively. A great variety of transducers is also
used to boost the sensitivity of these biosensors, such as metal nanoparticles, nanoclusters, and
quantum dots. Nowadays, lateral flow immunoassays (LFIA) represent one of the most appealing
biosensing approaches because of their simplicity, portability, easy interpretation, and lack of
75
CHAPTER 1
multiple and complex steps. Nonetheless, LFIA still has some drawbacks such as the lack of
sensitivity, specificity and stability in certain cases due to the inherent characteristics of
antibodies.
As a general conclusion, more efforts should be driven for the development of more
sensitive, stable, and reliable toxicity biosensors, since they provide the broadest and most
relevant information regarding the chemical pollution of waters. Besides, research should be
focused on the development of inexpensive, small, easy-to-operate, and with little or no sample
preparation bacterial biosensors, while boosting their sensitivity and stability for water fecal
contamination determination.
1.5. References
1. Ritchie H, Roser M. Water Use and Stress. Our World in Data. https://ourworldindata.org/water-use-stress.
Published in 2015.
2. Burek P, Satoh Y, Fischer G, et al. Water Futures and Solution.; 2016.
3. Food and Agriculture Organization of the United Nations. AQUASTAT - FAO’s Global Information System on
Water and Agriculture. AQUASTAT. http://www.fao.org/aquastat/en/overview/methodology/water-use.
Published in 2010.
4. European Environmental Agency. European Waters - Assessment of Status and Pressures.; 2018.
doi:10.4324/9780203938607
5. World Health Organization. Drinking-water. https://www.who.int/news-room/fact-sheets/detail/drinking-
water. Published in 2019.
6. The global distribution of deaths from unsafe water. Our World in Data. https://ourworldindata.org/water-
access#the-global-distribution-of-deaths-from-unsafe-water. Published in 2016.
7. Ghangrekar MM, Chatterjee P. Water pollutants classification and its effects on the environment. In: Carbon
Nanotubes for Clean Water. ; 2018:11-26. doi:10.1007/978-3-319-95603-9_2
8. Eerkes-Medrano D, Thompson R. Occurrence, Fate, and Effect of Microplastics in Freshwater Systems.
Elsevier Inc.; 2018. doi:10.1016/b978-0-12-813747-5.00004-7
9. Ngo PL, Pramanik BK, Shah K, Roychand R. Pathway, classification and removal efficiency of microplastics in
wastewater treatment plants. Environ Pollut. 2019;255:1-8. doi:10.1016/j.envpol.2019.113326
10. Fuller N, Smith JT, Ford AT. Impacts of ionizing radiation on sperm quality, DNA integrity and post-fertilisation
development in marine and freshwater crustaceans. Ecotoxicol Environ Saf. 2019;186(109764):1-9.
INTRODUCTION
76
doi:10.1016/j.ecoenv.2019.109764
11. Little JB. Principal Cellular and Tissue Effects of Radiation. In: Cancer Medicine. 6th Edition. 6th ed. ; 2003.
12. Environmental Protection Agency. Toxic Substances Control Act Inventory. https://www.epa.gov/tsca-
inventory/how-access-tsca-inventory. Published in 2016.
13. Stadnicka-Michalak J, Schirmer K, Ashauer R. Toxicology across scales: Cell population growth in vitro
predicts reduced fish growth. Sci Adv. 2015;1:1-8. doi:10.1126/sciadv.1500302
14. Hill MP, Macfadyen S, Nash MA. Broad spectrum pesticide application alters natural enemy communities
and may facilitate secondary pest outbreaks. PeerJ. 2017;5:1-24. doi:10.7717/peerj.4179
15. Zeilinger AR, Olson DM, Andow DA. Competitive release and outbreaks of non-target pests associated with
transgenic Bt cotton. Ecol Appl. 2016;26(4):1047-1054. doi:10.1890/15-1314
16. Collier R, Jukes A, Daniel C, Hommes M. Ecological selectivity of pesticides and pesticide application methods.
Integr Prot F Veg. 2016;118:94-98.
17. Ramírez JA, Lacasaña M. Plaguicidas: clasificación, uso, toxicología y medición de la exposición. Arch
Prevención Riesgos Laborales. 2001;4(2):67-75.
18. Bartual-Sánchez J, Berenguer-Subils MJ. Pesticidas: Clasificación y Riesgos Principales.; 1985.
19. World Health Organization. Arsenic, Metals, Fibres and Dusts. Vol 100.; 2012. https://www.iarc.fr/.
20. Davison K, Mann KK, Miller WH. Arsenic Trioxide: Mechanisms of Action. Semin Hematol. 2002;39(2):3-7.
doi:10.1053/shem.2002.33610
21. National Center for Biotechnology Information. Arsenic pentoxide. PubChem Database,.
https://pubchem.ncbi.nlm.nih.gov/compound/Arsenic-pentoxide. Published 2019.
22. National Center for Biotechnology Information. Methylarsonic acid. PubChem Database,.
https://pubchem.ncbi.nlm.nih.gov/compound/Methylarsonic-acid. Published 2019.
23. National Center for Biotechnology Information. Cacodylic acid. PubChem Database,.
https://pubchem.ncbi.nlm.nih.gov/compound/Cacodylic-acid. Published 2019.
24. World Health Organization. Arsenic, Metals, Fibres and Dusts. IARC Monogr. 2012;100(C):41-93.
25. Environmental Protection Agency. Organic Arsenicals: Product Cancellation Order and Amendments to
Terminate Uses. Fed Regist. 2009;74(188):50187-50194. doi:10.1016/0196-335x(80)90058-8
26. Samikkannu T, Chen CH, Yih LH, et al. Reactive Oxygen Species Are Involved in Arsenic Trioxide Inhibition of
Pyruvate Dehydrogenase Activity. Chem Res Toxicol. 2003;16(3):409-414. doi:10.1021/tx025615j
27. Ratnaike RN. Acute and chronic arsenic toxicity. Postgrad Med J. 2003;79:391-396.
doi:10.1136/pmj.79.933.391
77
CHAPTER 1
28. Aragay G, Pino F, Merkoçi A. Nanomaterials for Sensing and Destroying Pesticides. Chem Rev.
2012;112:5317-5338. doi:10.1021/cr300020c
29. Smith AP, Fraser CL. Bipyridine Ligands. In: Comprehensive Coordination Chemistry II. ; 2003:1-23.
doi:10.1016/B0-08-043748-6/01103-8
30. Rao VS. Transgenic Herbicide Resistance in Plants. (Press C, ed.).; 2014.
31. Qian H, Chen W, Sun L, Jin Y, Liu W, Fu Z. Inhibitory effects of paraquat on photosynthesis and the response
to oxidative stress in Chlorella vulgaris. Ecotoxicology. 2009;18:537-543. doi:10.1007/s10646-009-0311-8
32. Viales-López G. Intoxicación por Paraquat. Med Leg Costa Rica. 2014;31(2):1-7.
https://www.scielo.sa.cr/scielo.php?script=sci_arttext&pid=S1409-
00152014000200009%0Ahttp://www.scielo.sa.cr/pdf/mlcr/v31n2/art09v31n2.pdf.
33. Constable EC. A Journey From Solution Self-Assembly to Designed Interfacial Assembly. Vol 71. 1st ed. Elsevier
Inc.; 2018. doi:10.1016/bs.adioch.2017.11.005
34. Ghosh AK, Brindisi M. Organic Carbamates in Drug Design and Medicinal Chemistry. J Med Chem.
2015;58:2895-2940. doi:10.1021/jm501371s
35. Fukuto TR. Mechanism of Action of Organophosphorus and Carbamate Insecticides. Environ Health Perspect.
1990;87:245-254. doi:10.1289/ehp.9087245
36. Schegg KM, Futamachi KJ, Peacock JH. Characterization of Acetylcholinesterase Isoforms in Septal and
Hippocampal Cultures and Cocultures. Dev Brain Res. 1986;30:221-230. doi:10.1016/0165-3806(86)90112-4
37. Silberman J, Taylor A. Carbamate Toxicity.; 2019.
38. Mladenović M, Arsić BB, Stanković N, et al. The Targeted Pesticides as Acetylcholinesterase Inhibitors:
Comprehensive Cross-Organism Molecular Modelling Studies Performed to Anticipate the Pharmacology of
Harmfulness to Humans In Vitro. Molecules. 2018;23:1-37. doi:10.3390/molecules23092192
39. National Center for Biotechnology Information. Pyridostigmine. PubChem Database,.
https://pubchem.ncbi.nlm.nih.gov/compound/Pyridostigmine. Published 2019.
40. Bruneton J. Principles of herbal pharmacology. In: Principles and Practice of Phytotherapy. ; 2013:17-82.
doi:10.1016/b978-0-443-06992-5.00002-5
41. National Center for Biotechnology Information. Warfarin. PubChem Database,.
https://pubchem.ncbi.nlm.nih.gov/compound/Warfarin. Published 2019.
42. National Center for Biotechnology Information. Brodifacoum. PubChem Database,.
https://pubchem.ncbi.nlm.nih.gov/compound/54680676. Published 2019.
43. Poumale-Poumale HM, Hamm R, Zang Y, Shiono Y, Kuete V. Coumarins and Related Compounds from the
Medicinal Plants of Africa.; 2013. doi:10.1016/B978-0-12-405927-6.00008-4
INTRODUCTION
78
44. van Sittert NJ, Tuinman CP. Coumarin derivatives (rodenticides). Toxicology. 1994;91(10):71-76.
doi:10.1016/0300-483X(94)90243-7
45. Abraham K, Wöhrlin F, Lindtner O, Heinemeyer G, Lampen A. Toxicology and risk assessment of coumarin:
Focus on human data. Mol Nutr Food Res. 2010;54:228-239. doi:10.1002/mnfr.200900281
46. National Center for Biotechnology Information. Picric acid. PubChem Database,.
https://pubchem.ncbi.nlm.nih.gov/compound/6954. Published 2019.
47. Booth G. Nitro Compounds, Aromatic. In: Ullmann’s Encyclopedia of Industrial Chemistry. Vol 24. ; 2006:301-
349. doi:10.1002/14356007.a17
48. Schwarzenbach RP, Stierli R, Folsom BR, Zeyer J. Compound Properties Relevant for Assessing the
Environmental Partitioning of Nitrophenols. Environ Sci Technol. 1988;22:83-92. doi:10.1021/es00166a009
49. National Center for Biotechnology Information. 2-nitrophenol. PubChem Database,.
https://pubchem.ncbi.nlm.nih.gov/compound/2-Nitrophenol. Published 2019.
50. National Center for Biotechnology Information. 4-Nitrophenol. PubChem Database,.
https://pubchem.ncbi.nlm.nih.gov/compound/4-Nitrophenol. Published 2019.
51. Koul B, Taak P. Biotechnological Strategies for Effective Remediation of Polluted Soils. Springer International
Publishing; 2018.
52. Sigma-Aldrich. Ficha de Datos de Seguridad: 4-Nitrofenol.; 2019.
53. Lee CH, Kim SH, Kwon DH, Jang KH, Chung YH, Moon JD. Two Cases of Methemoglobinemia Induced by the
Exposure to Nitrobenzene and Aniline. Ann Occup Environ Med. 2013;25(31):1-7. doi:10.1186/2052-4374-
25-31
54. Moffat C, Buckland ST, Samson AJ, et al. Neonicotinoids target distinct nicotinic acetylcholine receptors and
neurons, leading to differential risks to bumblebees. Sci Rep. 2016;6:1-10. doi:10.1038/srep24764
55. Han W, Tian Y, Shen X. Human exposure to neonicotinoid insecticides and the evaluation of their potential
toxicity: An overview. Chemosphere. 2018;192:59-65. doi:10.1016/j.chemosphere.2017.10.149
56. Taillebois E, Cartereau A, Jones AK, Thany SH. Neonicotinoid insecticides mode of action on insect nicotinic
acetylcholine receptors using binding studies. Pestic Biochem Physiol. 2015;151:59-66.
57. Cartereau A, Martin C, Thany SH. Neonicotinoid insecticides differently modulate acetycholine-induced
currents on mammalian α7 nicotinic acetylcholine receptors. Br J Pharmacol. 2018;175:1987-1998.
doi:10.1111/bph.14018
58. Zhang E, Nieh JC. The neonicotinoid imidacloprid impairs honey bee aversive learning of simulated predation.
J Exp Biol. 2015;218:3199-3205. doi:10.1242/jeb.127472
59. Amirzade N, Izadi H, Jalali MA, Zohdi H. Evaluation of three neonicotinoid insecticides against the common
79
CHAPTER 1
pistachio psylla, Agonoscena pistaciae, and its natural enemies. J Insect Sci. 2014;14(35):1-8.
doi:10.1673/031.014.35
60. Gribble GW. The Natural Production of Chlorinated Compounds. Environ Sci Technol. 1994;28(7):310-319.
doi:10.1021/es00056a712
61. Jayaraj R, Megha P, Sreedev P. Organochlorine pesticides, their toxic effects on living organisms and their
fate in the environment. Interdiscip Toxicol. 2016;9(3-4):90-100. doi:10.1515/intox-2016-0012
62. Ul’yanovskii N V., Kosyakov DS, Varsegov IS, Popov MS, Lebedev AT. Identification of novel disinfection
byproducts in pool water: Chlorination of the algaecide benzalkonium chloride. Chemosphere. 2020;239:1-
9. doi:10.1016/j.chemosphere.2019.124801
63. Baccarelli A, Bollati V. Epigenetics and environmental chemicals. Curr Opin Pediatr. 2009;21(2):243-251.
doi:10.1016/j.immuni.2010.12.017
64. Van Wendel De Joode B, Wesseling C, Kromhout H, Monge P, García M, Mergler D. Chronic nervous-system
effects of long-term occupational exposure to DDT. Lancet. 2001;357:1014-1016. doi:10.1016/S0140-
6736(00)04249-5
65. Raymond-Delpech V, Matsuda K, Sattelle BM, Rauh JJ, Sattelle DB. Ion channels: molecular targets of
neuroactive insecticides. Invertebr Neurosci. 2005;5:119-133. doi:10.1007/s10158-005-0004-9
66. Gant DB, Eldefrawi ME, Eldefrawi AT. Cyclodiene Insecticides Inhibit GABA Receptor-Regulated Chloride
Transport. Toxicol Appl Pharmacol. 1987;88:313-321. doi:10.1016/0041-008X(87)90206-7
67. Khan MAQ, Stanton RH, Sutherland DJ, Rosen JD, Maitra N. Toxicity-metabolism relationship of the
photoisomers of certain chlorinated cyclodiene insecticide chemicals. Arch Environ Contam Toxicol.
1973;1(2):159-169.
68. Igbinosa EO, Odjadjare EE, Chigor VN, et al. Toxicological Profile of Chlorophenols and Their Derivatives in
the Environment: The Public Health Perspective. Sci World J. 2013;460215:1-11. doi:10.1084/jem.184.2.585
69. Rossberg M& L, Wilhelm & Pfleiderer G, Tögel A, et al. Chlorinated Hydrocarbons.; 2006.
70. de Boer J. Chlorinated Parafilms. In: The Handbook of Environmental Chemistry. ; 2010:1-198.
71. Allsopp MW, Vianello G. Poly (Vinyl Chloride). In: Ullmann’s Encyclopedia of Industrial Chemistry. ; 2012:411-
467. doi:10.1002/14356007.a21
72. International Agency for Research on Cancer. Trichloroethylene, tetrachloroethylene, and some other
chlorinated agents. In: IARC Monographs. Vol 106. ; 2012:1-514.
73. Alva S, Damodar D, D’Souza A, D’Souza UJA. Endosulfan induced early pathological changes in vital organs of
rat: A biochemical approach. Indian J Pharmacol. 2012;44(4):512-516. doi:10.4103/0253-7613.99335
74. Mclean D, Pearce N, Langseth H, et al. Cancer Mortality in Workers Exposed to Organochlorine Compounds
INTRODUCTION
80
in the Pulp and Paper Industry: An International Collaborative Study. Environ Health Perspect.
2006;114(7):1007-1012. doi:10.1289/ehp.8588
75. Fickova M, Macho L, Brtko J. A comparison of the effects of tributyltin chloride and triphenyltinchloride on
cell proliferation, proapoptotic p53, Bax, and antiapoptoticBcl-2 protein levels in human breast cancer MCF-
7 cell line. Toxicol Vitr. 2015;29:727-731.
76. Dong-po X, Di-an F, Chang-sheng Z, Shu-lun J, Hao-yuan H. Effect of tributyltin chloride (TBT-Cl) exposure on
expression of HSP90β1 in the river pufferfish (Takifugu obscurus): Evidences for its immunologicfunction
involving in exploring process. Gene. 2018;666:9-17.
77. Lamichhane JR, Osdaghi E, Behlau F, Köhl J, Jones JB, Aubertot JN. Thirteen decades of antimicrobial copper
compounds applied in agriculture. A review. Agron Sustain Dev. 2018;38(28):1-18. doi:10.1007/s13593-018-
0503-9
78. Rosenfeld PE, Feng LGH. Mercury, BPA, and Pesticides in Food. In: Risks of Hazardous Wastes. ; 2011:223-
235. doi:10.1016/b978-1-4377-7842-7.00017-9
79. Sigma-Aldrich. Organotin. Official Webpage of Merck. https://www.sigmaaldrich.com/chemistry/chemistry-
products.html?TablePage=16246425. Published 2020.
80. Snoeij NJ, Penninks AH, Seinen W. Biological activity of organotin compounds-An overview. Environ Res.
1987;44:335-353. doi:10.1016/S0013-9351(87)80242-6
81. Whalley C, Mohaupt V. Chemicals in European Waters.; 2018. doi:10.2800/265080 European
82. Arrhenius E, Löfroth G, Ramel C. Mercury Compounds.; 2000. doi:10.1126/science.176.4039.1072
83. U.S. Department of Health and Human Services. Toxicological Profile for Mercury.; 1999.
doi:10.1201/9781420061888_ch109
84. Gupta RC, Crissman JW. Agricultural Chemicals. In: Haschek and Rousseaux’s Handbook of Toxicologic
Pathology. Third Edit. Elsevier; 2013:1349-1372. doi:10.1016/B978-0-12-415759-0.00042-X
85. Abrahamian P, Jones JB, Vallad GE. Efficacy of copper and copper alternatives for management of bacterial
spot on tomato under transplant and field production. Crop Prot. 2019;126:1-9.
doi:10.1016/j.cropro.2019.104919
86. Wagner JL, Townsend AK, Velzis AE, Paul EA. Temperature and toxicity of the copper herbicide (NautiqueTM)
to freshwater fish in field and laboratory trials. Cogent Environ Sci. 2017;3:1-12.
doi:10.1080/23311843.2017.1339386
87. Doull J, Ecobichon D, Gammon D, Hodgson E, Reiter L, Ross J. Chapter 57: Pesticides Affecting Oxidative
Phosphorylation. In: Handbook of Pesticide Toxicology. ; 2001:1214-1215.
88. Branco V, Godinho-Santos A, Gonçalves J, Lu J, Holmgren A, Carvalho C. Mitochondrial thioredoxin reductase
81
CHAPTER 1
inhibition, selenium status,and Nrf-2 activation are determinant factors modulating the toxicityof mercury
compounds. Free Radic Biol Med. 2014;73:95-105.
89. Arnal N, Astiz M, de Alainz MJT, Marra CA. Clinical parameters and biomarkers of oxidative stress in
agricultural workers who applied copper-based pesticides. Ecotoxicol Environ Saf. 2011;74:1779-1786.
90. Husak V. Copper and Copper-Containing Pesticides: Metabolism, Toxicity and Oxidative Stress. J Vasyl
Stefanyk Precarpathian Natl Univ. 2015;2(1):38-50. doi:10.15330/jpnu.2.1.38-50
91. Ferreira AB, Lemos Cardoso A, da Silva MJ. Tin-Catalyzed Esterification and Transesterification Reactions: A
Review. ISRN Renew Energy. 2012;2012:1-13. doi:10.5402/2012/142857
92. Dakappa PH, Bhat GK, Bolumbu G, Rao SB, Adappa S, Mahabala C. Comparison of Conventional Mercury
Thermometer and Continuous TherCom® Temperature Recording in Hospitalized Patients. J Clin Diagnostic
Res. 2016;10(9):43-46. doi:10.7860/JCDR/2016/21617.8586
93. Viera I, Pérez-Gálvez A, Roca M. Green natural colorants. Molecules. 2019;24(154):1-17.
doi:10.3390/molecules24010154
94. Nakanishi T. Endocrine disruption induced by organotin compounds; organotins function as a powerful
agonist for nuclear receptors rather than an aromatase inhibitor. J Toxicol Sci. 2008;33(3):269-276.
doi:10.2131/jts.33.269
95. Harada M. Minamata Disease: Methylmercury Poisoning in Japan Caused by Environmental Pollution. Crit
Rev Toxicol. 1995;25(1):1-24. doi:10.3109/10408449509089885
96. Hostynek JJ, Maibach HI. Skin irritation potential of copper compounds. Toxicol Mech Methods. 2004;14:205-
213. doi:10.1080/15376520490446365
97. Gupta RC. Classification and Uses of Organophosphates and Carbamates. In: Toxicology of Organophosphate
and Carbamate Compounds. ; 2006:5-24.
98. Muhammad G, Rashid I, Firyal S. Practical Aspects of Treatment of Organophosphate and Carbamate
Insecticide Poisoning in Animals. Matrix Sci Pharma. 2017;1(1):10-11. doi:10.26480/msp.01.2017.10.11
99. Horsak RD, Bedient PB, Hamilton MC, Thomas F Ben. Pesticides. In: Environmental Forensics. ; 2005:144-163.
doi:10.1016/B978-0-12-507751-4.50030-6
100. Videira RA, Antunes-Madeira MC, Lopes VICF, Madeira VMC. Changes induced by malathion,
methylparathion and parathion on membrane lipid physicochemical properties correlate with their toxicity.
Biochim Biophys Acta. 2001;1511:360-368.
101. Wade MG, Kawata A, Rigden M, Caldwell D, Holloway AC. Toxicity of Flame Retardant Isopropylated
Triphenyl Phosphate: Liver, Adrenal, and Metabolic Effects. Int J Toxicol. 2019;38(4):279-290.
doi:10.1177/1091581819851502
INTRODUCTION
82
102. Lerro CC, Koutros S, Andreotti G, et al. Organophosphate insecticide use and cancer incidence among
spouses of pesticide applicators in the Agricultural Health Study. Environ Med. 2015;72(10):736-744.
doi:10.1136/oemed-2014-102798.Organophosphate
103. Wang X, Zhao T, Yang B, et al. Synthesis and biological evaluation of phenoxyacetic acid derivatives as novel
free fatty aid receptor 1 agonists. Bioorg Med Chem. 2015;23:132-140.
104. Parry G, Delbarre A, Marchant A, et al. Novel auxin transport inhibitors phenocopy the auxin influx carrier
mutation aux1. Plant J. 2001;25(4):399-406. doi:10.1046/j.1365-313X.2001.00970.x
105. Torii KU, Hagihara S, Uchida N, Takahashi K. Harnessing synthetic chemistry to probe and hijack auxin
signaling. New Phytol. 2018;220:417-424. doi:10.1111/nph.15337
106. Benbrahim-Tallaa L, Voubard V, Brown R, et al. Carcinogenicity of lindane, DDT, and 2,4-
dichlorophenoxyacetic acid. Lancet Oncol. 2015;16:891-892. doi:10.1016/S1470-2045(15)00081-9
107. National Center for Biotechnology Information. Phenoxyacetic Acid. PubChem Database,.
https://pubchem.ncbi.nlm.nih.gov/compound/Phenoxyacetic-acid. Published 2020.
108. Morrow RL, Carney G, Wright JM, Bassett K, Sutherland J, Dormuth CR. Impact of rosiglitazone meta-analysis
on use of glucose-lowering medications. Open Med. 2010;4(1):50-59.
109. Chemical Industry Press. Chapter 1: Introduction. In: Analytical Methods for Food Safety by Mass
Spectrometry. ; 2018:1-9. doi:10.1016/B978-0-12-814167-0.00001-6
110. Wang X, Aránzazu-Martínez M, Wu Q, et al. Fipronil insecticide toxicology: oxidative stress and metabolism.
Crit Rev Toxicol. 2016;46(10):876-899. doi:10.1080/10408444.2016.1223014
111. Venância Faria J, Fazolin Vegi P, Carvalho Miguita AG, Silva dos Santos M, Boechat N, Rolim Bernardino AM.
Recently reported biological activities of pyrazole compounds. Bioorganic Med Chem. 2017;25:5891-5903.
doi:10.1016/j.bmc.2017.09.035
112. Loretta CM, Nicholson RA, Casida JE. Action of Phenylpyrazole Insecticides at the GABA-Gated Chloride
Channels. Pestic Biochem Physiol. 1993;46:47-54.
113. Wolstenholme AJ. Glutamate-gated chloride channels. J Biol Chem. 2012;287(48):40232-40238.
doi:10.1074/jbc.R112.406280
114. Raghavendra K, Barik TK, Sharma P, et al. Chlorfenapyr: a new insecticide with novel mode of action can
control pyrethroid resistant malaria vectors. Malar J. 2011;10(16):1-7. doi:10.1186/1475-2875-10-16
115. Sherer TB, Richardson JR, Testa CM, et al. Mechanism of toxicity of pesticides acting at complex I: relevance
to environmental etiologies of Parkinson’s disease. J Neurochem. 2007;100:1469-1479. doi:10.1111/j.1471-
4159.2006.04333.x
116. Page SW. CHAPTER 10. Antiparasitic Drugs. In: Small Animal Clinical Pharmacology. Second Edi. Elsevier Ltd;
83
CHAPTER 1
2013:228-229. doi:10.1039/9781849736862-00095
117. Pérez-Fernández V, García MÁ, Marina ML. Characteristics and enantiomeric analysis of chiral pyrethroids. J
Chromatogr A. 2010;1217:968-989. doi:10.1016/j.chroma.2009.10.069
118. National Center for Biotechnology Information. Bifenthrin. PubChem Database,.
https://pubchem.ncbi.nlm.nih.gov/compound/Bifenthrin. Published 2020.
119. Chrustek A, Hołyńska-Iwan I, Dziembowska I, et al. Current Research on the Safety of Pyrethroids Used as
Insecticides. Med. 2018;54(61):1-15. doi:10.3390/medicina54040061
120. Fyfe JC, Kurzhals RL, Lassaline ME, et al. Molecular Basis of Feline β-Glucuronidase Deficiency: An Animal
Model of Mucopolysaccharidosis VII. Genomics. 1999;58:121-128.
121. Ryder NS, Frank I, Dupont MC. Ergosterol Biosynthesis Inhibition by the Thiocarbamate Antifungal Agents
Tolnaftate and Tolciclate. Antimicrob Agents Chemother. 1986;29(5):858-860. doi:10.1128/AAC.29.5.858
122. National Center for Biotechnology Information. Thiobencarb. PubChem Database,.
https://pubchem.ncbi.nlm.nih.gov/compound/Thiobencarb. Published 2020.
123. Lee S-J, Caboni P, Tomizawa M, Casida JE. Cartap Hydrolysis Relative to Its Action at the Insect Nicotinic
Channel. J Agric Food Chem. 2004;52:95-98. doi:10.1021/jf0306340
124. Xie J, Potter A, Xie W, Lync C, Seefeldt T. Evaluation of a dithiocarbamate derivative as a model of thiol
oxidative stress in H9c2 rat cardiomyocites. Free Radic Biol Med. 2014;70:214-222.
125. LeBaron HM, McFarland JE, Burnside OC. Chapter 1. In: The Triazine Herbicides: A Milestone in the
Development of Weed Control Technology. Elsevier B.V.; 2016:1-12. doi:10.1016/B978-044451167-6.50004-
0
126. Barchanska H, Baranowska I. Procedures for Analysis of Atrazine and Simazine in Environmental Matrices. In:
Reviews of Environmental Contamination and Toxicology. Vol 200. ; 2009:53-81. doi:10.1007/978-1-4419-
0028-9
127. National Center for Biotechnology Information. Metconazole. PubChem Database,.
128. National Center for Biotechnology Information. Tebuconazole. PubChem Database,.
129. Sagatova AA, Keniya M V., Wilson RK, Monk BC, Tyndall JDA. Structural Insights into Binding of the Antifungal
Drug Fluconazole to Saccharomyces cerevisiae Lanosterol 14α-Demethylase. Antimicrob Agents Chemother.
2015;59(8):4982-4989. doi:10.1128/AAC.00925-15
130. Iyer P, Makris S. Developmental and Reproductive Toxicology of Pesticides. In: Hayes’ Handbook of Pesticide
Toxicology. ; 2010:381-441. doi:10.1007/978-3-030-24436-1_17
131. Tappe H, Helmling W, Mischke P, et al. Reactive Dyes. In: Ullmann’s Encyclopedia of Industrial Chemistry. ;
2012:277-289. doi:10.1002/14356007.a22
INTRODUCTION
84
132. Morais S, Correia M, Domingues V, Delerue-Matos C. Urea Pesticides. In: Pesticides - Strategies for Pesticides
Analysis. ; 2011:241-262. doi:10.5772/13126
133. Sun R, Liu C, Zhang H, Wang Q. Benzoylurea Chitin Synthesis Inhibitors. J Agric Food Chem. 2015;63:6847-
6865. doi:10.1021/acs.jafc.5b02460
134. Bowyer J, Hilton M, Whitelegge J, et al. Molecular Modelling Studies on the Binding of Phenylurea Inhibitors
to the D1 Protein of Photosystem II. Zeitschrift fur Naturforsch - Sect C J Biosci. 1990;45(c):379-387.
doi:10.1515/znc-1990-0512
135. Kumar KS, Choo K-S, Yea SS, Seo Y, Han T. Effects of the Phenylurea Herbicide Diuron on the Physiology of
Saccharina japonica Aresch. Toxicol Environ Health Sci. 2010;2(3):188-199. doi:10.1007/BF03216505
136. Pang SS, Guddat LW, Duggleby RG. Molecular Basis of Sulfonylurea Herbicide Inhibition of Acetohydroxyacid
Synthase. J Biol Chem. 2003;278(9):7639-7644. doi:10.1074/jbc.M211648200
137. Magné C, Saladin G, Clément C. Transient effect of the herbicide flazasulfuron on carbohydrate physiology
in Vitis vinifera L. Chemosphere. 2006;62:650-657.
138. Sola D, Rossi L, Schianca GPC, et al. Sulfonylureas and their use in clinical practice. Arch Med Sci.
2015;11(4):840-848. doi:10.5114/aoms.2015.53304
139. Gautam RK, Sharma SK, Mahiya S, Chattopadhyaya MC. Contamination of Heavy Metals in Aquatic Media:
Transport, Toxicity and Technologies for Remediation. In: Heavy Metals In Water. ; 2014:1-24.
doi:10.1039/9781782620174-00001
140. Gumpu MB, Sethuraman S, Krishnan UM, Rayappan JBB. A review on detection of heavy metal ions in water
- An electrochemical approach. Sensors Actuators, B Chem. 2015;213:515-533.
doi:10.1016/j.snb.2015.02.122
141. Nishijo M, Nakagawa H, Suwazono Y, Nogawa K, Kido T. Causes of death in patients with Itai-itai disease
suffering from severe chronic cadmium poisoning: a nested case-control analysis of a follow-up study in
Japan. BMJ Open. 2017;7:1-7. doi:10.1136/bmjopen-2016-015694
142. Baruthio F. Toxic Effects of Chromium and Its Compounds. Biol Trace Elem Res. 1992;32:145-153.
doi:10.1007/BF02784599
143. SK Jain DW. Copper deficiency anemia: altered red blood cell lipids and viscosity in rats. Am J Clin Nutr.
1988;48(3):637-640.
144. Festa RA, Thiele DJ. Copper: an Essential Metal in Biology. Curr Biol. 2011;21:1-14.
doi:10.1016/j.cub.2011.09.040.Copper
145. Nor YM. Ecotoxicity of copper to aquatic biota: A review. Environ Res. 1987;43:274-282. doi:10.1016/S0013-
9351(87)80078-6
85
CHAPTER 1
146. Das KK, Reddy RC, Bagoji IB, et al. Primary concept of nickel toxicity - an overview. J Basic Clin Physiol
Pharmacol. 2019;30(2):141-152. doi:10.1515/jbcpp-2017-0171
147. Shyng S, Valiyaveetil F, Whorton M. Thallium Flux Assay for Measuring the Activity of Monovalent Cation
Channels and Transporters.; 2017.
148. Cvjetko P, Cvjetko I, Pavlica M. Thallium toxicity in humans. Arh Hig Rada Toksikol. 2010;61:111-119.
doi:10.2478/10004-1254-61-2010-1976
149. Sharma A, Patni B, Shankhdhar D, Shankhdhar SC. Zinc - An Indispensable Micronutrient. Physiol Mol Biol
Plants. 2013;19(1):11-20. doi:10.1007/s12298-012-0139-1
150. Prasad AS. Discovery of Human Zinc Deficiency: Its Impact on Human Health and Disease. Am Soc Nutr.
2013;4:176-190. doi:10.3945/an.112.003210.176
151. Cherasse Y, Urade Y. Dietary Zinc Acts as a Sleep Modulator. Int J Mol Sci. 2017;18:1-12.
doi:10.3390/ijms18112334
152. Lenntech. Zinc - Zn. Lenntech BV (website). https://www.lenntech.es/. Published 2020.
153. Cyprian Eneh O. A Review on Petroleum: Source, Uses, Processing, Products and the Environment. J Appl Sci.
2011;11(12):2084-2091.
154. Henry JA. Composition and toxicity of petroleum products and their additives. Hum Exp Toxicol. 1998;17:111-
123. doi:10.1191/096032798678908350
155. The National Academies Press. Oil in the Sea III: Inputs, Fates, and Effects.; 2003.
156. Michel J. 1991 Gulf War Oil Spill (Chapter 37). In: Oil Spill Science and Technollgy. ; 2011:1127-1132.
157. Egawhary E. How big is the Deepwater Horizon oil spill? BBC News.
http://news.bbc.co.uk/2/hi/uk_news/magazine/8664684.stm.
158. Chang SE, Stone J, Demes K, Piscitelli M. Consequences of oil spills: A review and framework for informing
planning. Ecol Soc. 2014;19(2):1-25. doi:10.5751/ES-06406-190226
159. Penela-Arenaz M, Bellas J, Vázquez E. Effects of the prestige oil spill on the biota of NW Spain: 5 years of
learning. Adv Mar Biol. 2010;56:365-396. doi:10.1016/S0065-2881(09)56005-1
160. Madigan MT, Martinko JM, Dunlap P V., Clark DP. Tratamiento de aguas residuales, potabilización de aguas
y enfermedades microianas transmitidas por el agua. In: Brock, Biología de Los Microorganismos. 12th ed. ;
2009:1142-1160.
161. Joost Wiersinga W, Virk HS, Torres AG, et al. Melioidosis. Nat Rev Dis Prim. 2018;4:1-49.
doi:10.1038/nrdp.2017.107
162. Cheng AC, Currie BJ. Melioidosis: Epidemiology, Pathophysiology, and Management. Clin Microbiol Rev.
2005;18(2):383-416. doi:10.1128/CMR.18.2.383
INTRODUCTION
86
163. Yang S. Melioidosis research in China. Acta Trop. 2000;77(2):157-165.
164. Chen YS, Lin HH, Mu JJ, et al. Distribution of Melioidosis Cases and Viable Burkholderia pseudomallei in Soil:
Evidence for Emerging Melioidosis in Taiwan. J Clin Microbiol. 2010;48(4):1432-1434.
doi:10.1128/JCM.01720-09
165. Lau SKP, Sridhar S, Ho CC, et al. Laboratory diagnosis of melioidosis: Past, present and future. Exp Biol Med.
2015;240:742-751. doi:10.1177/1535370215583801
166. Madigan M, Martinko J, Dunlap P, Clark D. Brock Biología de los Microorganismos. In: Brock. Biología de Los
Microorganismos. 12th ed. Madrid, Spain; 2009:935-936.
167. World Health Organization. Campylobacter.
168. World Health Organization. Botulismo. https://www.who.int/es/news-room/fact-sheets/detail/botulism.
Published 2018.
169. Carter AT, Peck MW. Genomes, neurotoxins and biology of Clostridium botulinum Group I and Group II. Res
Microbiol. 2015;166:303-317. doi:10.1016/j.resmic.2014.10.010
170. Kumar Dhaked R, Kumar Singh M, Singh P, Gupta P. Botulinum toxin: Bioweapon & magic drug. Indian J Med
Res. 2010;132(5):489-503.
171. Thirunavukkarasu N, Johnson E, Pillai S, et al. Botulinum Neurotoxin Detection Methods for Public Health
Response and Surveillance. Front Bioeng Biotechnol. 2018;6(80):1-12. doi:10.3389/fbioe.2018.00080
172. Hunt JM. Shiga toxin-producing escherichia coli (STEC). Clin Lab Med. 2010;30(1):21-45.
doi:10.1016/j.cll.2009.11.001
173. Navarro-Garcia F. Escherichia coli O104:H4 Pathogenesis: an Enteroaggregative E. coli/Shiga Toxin-Producing
E. coli Explosive Cocktail of High Virulence. Microbiol Spectr. 2014;2(6):1-19.
doi:10.1128/microbiolspec.ehec-0008-2013
174. Evans DJ, Evans DG. Chapter 25: Escherichia coli in Diarrheal Disease. In: Medical Microbiology. ; 1996.
175. Rich C, Alfidja A, Sirot J, Joly B, Forestier C. Identification of Human Enterovirulent Escherichia coli Strains by
Multiplex PCR. J Clin Lab Anal. 2001;15:100-103. doi:10.1002/jcla.9
176. Wang C, Chuai X, Liang M. Legionella feeleii: pneumonia or Pontiac fever? Bacterial virulence traits and host
immune response. Med Microbiol Immunol. 2019;208:25-32. doi:10.1007/s00430-018-0571-0
177. Crook B, Willerton L, Smith D, et al. Legionella risk in evaporative cooling systems and underlying causes of
associated breaches in health and safety compliance. Int J Hyg Environ Health. 2020;224:1-7.
178. Marrie TJ, Haldane D, Bezanson G. Nosocomial Legionnaires’ disease: Clinical and radiographic patterns. Can
J Infect Dis. 1992;3(5):253-260. doi:10.1155/1992/582736
179. Avni T, Bieber A, Green H, Steinmetz T, Leibovici L, Paul M. Diagnostic Accuracy of PCR Alone and Compared
87
CHAPTER 1
to Urinary Antigen Testing for Detection of Legionella spp.: A Systematic Review. J Clin Microbiol.
2016;54(2):401-411. doi:10.1128/JCM.02675-15
180. Pryangani Adikaram C. Chapter 13: Overview of Non Tuberculosis Mycobacterial Lung Diseases. In:
Mycobacterium - Research and Development. ; 2018:258-286. doi:10.5772/intechopen.73542
181. Gommans EPAT, Even P, Linssen CFM, et al. Risk factors for mortality in patients with pulmonary infections
with non-tuberculous mycobacteria: A retrospective cohort study. Respir Med. 2015;109:137-145.
doi:10.1016/j.rmed.2014.10.013
182. Simon A, Onya O, Mazza-Stalder J, Nicod L, Gilbert G, Katia J. Added diagnostic value of 16S rRNA gene pan-
mycobacterial PCR for nontuberculous mycobacterial infections: a 10-year retrospective study. Eur J Clin
Microbiol Infect Dis. 2019;38:1873-1881. doi:10.1007/s10096-019-03621-z
183. Bush LM, Pérez MT. Pseudomonas and Related Infections. MSD Manual Professional Version.
184. Instituto Nacional de Seguridad e Higiene en el Trabajo. Pseudomona Aeruginosa.; 2016.
doi:https://doi.org/10.1101/269001
185. Hall S, McDermott C, Anoopkumar-Dukie S, et al. Cellular effects of Pyocyanin, a Secreted Virulence Factor
of Pseudomonas aeruginosa. Toxins (Basel). 2016;8(236):1-14. doi:10.3390/toxins8080236
186. Bishop R, Erdman MM, Fields P, Fullerton K, Jackson K, Mahon B. National Enteric Disease Surveillance:
Salmonella Surveillance Overview. Centers Dis Control Prev. 2011;(July):1-12.
187. The Center for Food Security & Public Health. Salmonellosis.; 2013.
188. Hoorfar J, Ahrens P, Radstrom P. Automated 5’ nuclease PCR assay for identification of Salmonella enterica.
J Clin Microbiol. 2000;38(9):3429-3435.
189. Cudjoe KS, Krona R, Crøn B, Olsen E. Use of ferrous sulphate and immunomagnetic separation to recover
Salmonella enteritidis from raw eggs. Int J Food Microbiol. 1994;23:149-158.
190. Akullian A, Ng’eno E, Matheson A, et al. Environmental Transmission of Typhoid Fever in a Urban Slum. PLoS
Negl Trop Dis. 2015;9(12):1-14.
191. Buckle GC, Walker CLF, Black RE. Typhoid fever and paratyphoid fever: Systematic review to estimate global
morbidity and mortality for 2010. J Glob Health. 2012;2(1):1-9. doi:10.7189/jogh.02.010401
192. Mawazo A, Bwire GM, Matee MIN. Performance of Widal test and stool culture in the diagnosis of typhoid
fever among suspected patients in Dar es Salaam, Tanzania. BMC Res Notes. 2019;12(319):1-5.
doi:10.1186/s13104-019-4340-y
193. Krishna S, Desai S, Anjana V, Paranthaaman R. Typhidot (IgM) as a reliable and rapid diagnostic test for
typhoid fever. Ann Trop Med Public Heal. 2011;4(1):42-44.
194. Bakr W, El Attar L, Ashour M, El Tokhy A. TUBEX Test Versus Widal Test In The Diagnosis Of Typhoid Fever in
INTRODUCTION
88
Kafr El-Shekh, Egypt. J Egypt Public Heal Assoc. 2010;85(5-6):285-296.
195. Goay YX, Chin KL, Tan CLL, et al. Identification of Five Novel Salmonella Typhi-Specific Genes as Markers for
Diagnosis of Typhoid Fever Using Single-Gene Target PCR Assays. Biomed Res Int. 2016;2016:1-9.
doi:10.1155/2016/8905675
196. Hale TL, Keusch GT. Chapter 22: Shigella. In: Medical Microbiology. 4th ed. ; 1996.
197. Bennish M, Wojtyniak B. Mortality due to shigellosis: community and hospital data. Rev Infect Dis.
1991;13(4):245-251.
198. World Health Organization. Cholera.
199. Todar K. Vibrio cholerae and Asiatic Cholera. Online Textbook of Bacteriology.
200. Drummond N, Murphy BP, Ringwood T, Prentice MB, Buckley JF, Fanning S. Yersinia Enterocolitica: A Brief
Review of the Issues Relating to the Zoonotic Pathogen, Public Health Challenges, and the Pork Production
Chain. Foodborne Pathog Dis. 2012;9(3):179-191. doi:10.1089/fpd.2011.0938
201. Aziz M, Waheed A. Yersinia Enterocolitica. StarPearls.
202. Gerba CP, Pepper IL. Microbial Contaminants. In: Environmental and Pollution Science. 3rd ed. Elsevier Inc.;
2019:191-217. doi:10.1016/b978-0-12-814719-1.00013-6
203. Harvala H, Broberg E, Benschop K, et al. Recommendations for enterovirus diagnostics and characterisation
within and beyond Europe. J Clin Virol. 2018;101:11-17. doi:10.1016/j.jcv.2018.01.008
204. Arora D, Jindal N, Shukla RK, Bansal R. Water Borne Hepatitis A and Hepatitis E in Malwa Region of Punjab,
India. J Clin Diagnostic Res. 2013;7(10):2163-2166. doi:10.7860/JCDR/2013/5966.3459
205. Nainan O V, Xia G, Vaughan G, Margolis HS. Diagnosis of Hepatitis A Virus Infection: a Molecular Approach.
Clin Microbiol Rev. 2014;19(1):63-79. doi:10.1128/CMR.19.1.63
206. Aggarwal R. Diagnosis of hepatitis E. Nat Rev Gastroenterol Hepatol. 2012;(January 2013):1-10.
doi:10.1038/nrgastro.2012.187
207. Jeong HS, Jeong A, Cheon DS. Epidemiology of astrovirus infection in children. Korean J Pediatr.
2012;55(3):77-82. doi:10.3345/kjp.2012.55.3.77
208. Qiu F zhou, Shen X xin, Li G xia, et al. Adenovirus associated with acute diarrhea: a case-control study. BMC
Infect Dis. 2018;18(450):1-7. doi:10.1186/s12879-018-3340-1
209. Tran A, Talmud D, Lejeune B, et al. Prevalence of Rotavirus, Adenovirus, Norovirus, and Astrovirus Infections
and Coinfections among Hospitalized Children in Northern France. J Clin Microbiol. 2010;48(5):1943-1946.
doi:10.1128/JCM.02181-09
210. CerTest Biotec. Rotavirus + Adenovirus + Astrovirus + Norovirus.
https://www.certest.es/es/products/rotavirus-adenovirus-astrovirus-norovirus-2/. Published 2020.
89
CHAPTER 1
211. Rumsey P, Waseem M. Giardia Lamblia Enteritis.; 2019.
212. Leitch GJ, He Q. Cryptosporidiosis-an overview. J Biomed Res. 2011;25(1):1-16. doi:10.1016/S1674-
8301(11)60001-8
213. Grace E, Asbill S, Virga K. Naegleria fowleri: Pathogenesis, Diagnosis, and Treatment Options. Antimicrob
Agents Chemother. 2015;59(11):6677-6681. doi:10.1080/21678707.2019.1571904
214. Showler AJ, Boggild AK. Entamoeba histolytica. Can Med Assoc J. 2013;185(12):1064.
doi:10.1503/cmaj.121576
215. Montoya JG, Liesenfield O. Toxoplasmosis. Lancet. 2004;363:1965-1976.
216. Ortega YR, Sanchez R. Update on Cyclospora cayetanensis, a Food-Borne and Waterborne Parasite. Clin
Microbiol Rev. 2010;23(1):218-234. doi:10.1128/CMR.00026-09
217. Qu J, Shen L, Zhao M, et al. Determination of the Role of Microcystis aeruginosa in Toxin Generation Based
on Phosphoproteomic Profiles. Toxins (Basel). 2018;10:1-14. doi:10.3390/toxins10070304
218. van der Merwe D, Sebbag L, Nietfeld JC, Aubel MT, Foss A, Carney E. Investigation of a Microcystis aeruginosa
cyanobacterial freshwater harmful algal bloom associated with acute microcystin toxicosis in a dog. J Vet
Diagnostic Investig. 2012;24(4):679-687. doi:10.1177/1040638712445768
219. Chiu YT, Chen YH, Wang TS, Yen HK, Lin TF. A qPCR-Based Tool to Diagnose the Presence of Harmful
Cyanobacteria and Cyanotoxins in Drinking Water Sources. Int J Environ Res Public Health. 2017;14(547):1-
17. doi:10.3390/ijerph14050547
220. Haddad SP, Jonathan BM, Taylor, Raegyn TB, et al. Determination of microcystins, nodularin, anatoxin-a,
cylindrospermopsin, and saxitoxin in water and fish tissue using isotope dilution liquid chromatography
tandem mass spectrometry. J Chromatogr A. 2019;1599:66-74.
221. United States Environmental Protection Agency. Detection Methods for Cyanotoxins.
https://www.epa.gov/ground-water-and-drinking-water/detection-methods-cyanotoxins. Published 2017.
222. Hagel I, Giusti T. Ascaris lumbricoides: An Overview of Therapeutic Targets. Infect Disord - Drug Targets.
2010;10:349-367. doi:10.2174/187152610793180876
223. Manz KM, Clowes P, Kroidl I, et al. Trichuris trichiura infection and its relation to environmental factors in
Mbeya region, Tanzania: A cross-sectional, population-based study. PLoS One. 2017;12(4):1-16.
doi:10.1371/journal.pone.0175137
224. Chauhan VM, Scurr DJ, Christie T, Telford G, Aylott JW, Pritchard DI. The physicochemical fingerprint of
Necator americanus. PLoS Negl Trop Dis. 2017;11(12):1-19. doi:10.1371/journal.pntd.0005971
225. Symeonidou I, Arsenopoulos K, Tzilves D, Soba B, Gabriël S, Papadopoulos E. Human taeniasis/cysticercosis:
A potentially emerging parasitic disease in Europe. Ann Gastroenterol. 2018;31(4):406-412.
INTRODUCTION
90
doi:10.20524/aog.2018.0260
226. Colley DG, Bustinduy AL, Evan Secor W, King CH. Human schistosomiasis. Lancet. 2014;383(9936):2253-2264.
doi:10.19173/irrodl.v8i3.463
227. The European Parlament and the Council of the European Union. Directive 2013/39/EU.; 2013.
doi:http://eur-lex.europa.eu/legal-content/EN/TXT/?uri=celex:32013L0039
228. Laaninen T. Revision of the Drinking Water Directive. Vol 625.; 2019.
229. Bernasconi C, Daverio E, Ghiani M. Microbiology Dimension in EU Water Directives.; 2003.
230. Gipperth L. The legal design of the international and European Union ban on tributyltin antifouling paint:
Direct and indirect effects. J Environ Manage. 2009;90(SUPPL. 1):86-95. doi:10.1016/j.jenvman.2008.08.013
231. Bettinetti R, Kopp-Schneider A, Vignati DAL. The European water-based environmental quality standard for
pentachlorophenol is NOT protective of benthic organisms. Sci Total Environ. 2018;613-614:39-45.
doi:10.1016/j.scitotenv.2017.09.055
232. OSPAR Commission. Pentachlorophenol.; 2001.
233. Environmental Protection Agency (EPA). Chemical Contaminant Rules.; 2020.
https://www.epa.gov/dwreginfo/chemical-contaminant-rules.
234. World Health Organization. Drinking Water Parameter Cooperation Project.; 2017.
http://ec.europa.eu/environment/water/water-
drink/pdf/20171215_EC_project_report_final_corrected.pdf.
235. Food Safety European Authority. The European Union summary report on trends and sources of zoonoses,
zoonotic agents and food-borne outbreaks in 2013. 2015;13(1). doi:10.2903/j.efsa.2015.3991
236. Ma L, Zhou L, He Y, et al. Mesoporous Bimetallic PtPd Nanoflowers as a Platform to Enhance Electrocatalytic
Activity of Acetylcholinesterase for Organophosphate Pesticide Detection. Electroanalysis. 2018;30(8):1801-
1810. doi:10.1002/elan.201700845
237. Peng L, Dong S, Wei W, Yuan X, Huang T. Synthesis of reticulated hollow spheres structure NiCo2S4 and its
application in organophosphate pesticides biosensor. Biosens Bioelectron. 2017;92:563-569.
doi:10.1016/j.bios.2016.10.059
238. Chen X, Parker SG, Zou G, Su W, Zhang Q. β-Cyclodextrin-Functionalized Silver Nanoparticles for the Naked
Eye Detection of Aromatic Isomers. ACS Nano. 2010;4(11):6387-6394. doi:10.1021/nn1016605
239. Tittl A, Leitis A, Liu M, et al. Imaging-based molecular barcoding with pixelated dielectric metasurfaces.
Science (80- ). 2018;360:1105-1109. doi:10.1126/science.aas9768
240. Lin B, Yan Y, Guo M, et al. Modification-free carbon dots as turn-on fluorescence probe for detection of
organophosphorus pesticides. Food Chem. 2018;245(378):1176-1182. doi:10.1016/j.foodchem.2017.11.038
91
CHAPTER 1
241. Xu XY, Yan B, Lian X. Wearable glove sensor for non-invasive organophosphorus pesticide detection based
on a double-signal fluorescence strategy. Nanoscale. 2018;10:13722-13729. doi:10.1039/c8nr03352h
242. Kant R. Surface plasmon resonance based fiber–optic nanosensor for the pesticide fenitrothion utilizing
Ta2O5 nanostructures sequestered onto a reduced graphene oxide matrix. Microchim Acta. 2020;187(8):1-
11. doi:10.1007/s00604-019-4002-8
243. Ma Y, Wang Y, Luo Y, et al. Rapid and sensitive on-site detection of pesticide residues in fruits and vegetables
using screen-printed paper-based SERS swabs. Anal Methods. 2018;10:4655-4664. doi:10.1039/c8ay01698d
244. Azab HA, Khairy GM, Kamel RM. Time-resolved fluorescence sensing of pesticides chlorpyrifos, crotoxyphos
and endosulfan by the luminescent Eu(III)-8-allyl-3-carboxycoumarin probe. Spectrochim Acta - Part A Mol
Biomol Spectrosc. 2015;148:114-124. doi:10.1016/j.saa.2015.03.098
245. Luo Q, Lai J, Qiu P, Wang X. An ultrasensitive fluorescent sensor for organophosphorus pesticides detection
based on RB-Ag/Au bimetallic nanoparticles. Sensors Actuators, B Chem. 2018;263:517-523.
doi:10.1016/j.snb.2018.02.101
246. Guo J, Wong JXH, Cui C, Li X, Yu HZ. A smartphone-readable barcode assay for the detection and quantitation
of pesticide residues. Analyst. 2015;140(16):5518-5525. doi:10.1039/c5an00874c
247. Zhao Y, Yang M, Fu Q, et al. A Nanozyme- and Ambient Light-Based Smartphone Platform for Simultaneous
Detection of Dual Biomarkers from Exposure to Organophosphorus Pesticides. Anal Chem. 2018;90:7391-
7398. doi:10.1021/acs.analchem.8b00837
248. Tang T, Deng J, Zhang M, Shi G, Zhou T. Quantum dot-DNA aptamer conjugates coupled with capillary
electrophoresis: A universal strategy for ratiometric detection of organophosphorus pesticides. Talanta.
2016;146:55-61. doi:10.1016/j.talanta.2015.08.023
249. Wang J, Wu Y, Zhou P, et al. A novel fluorescent aptasensor for ultrasensitive and selective detection of
acetamiprid pesticide based on the inner filter effect between gold nanoparticles and carbon dots. Analyst.
2018;143(21):5151-5160. doi:10.1039/c8an01166d
250. Weerathunge P, Behera BK, Zihara S, et al. Dynamic interactions between peroxidase-mimic silver
NanoZymes and chlorpyrifos-specific aptamers enable highly-specific pesticide sensing in river water. Anal
Chim Acta. 2019;1083:157-165. doi:10.1016/j.aca.2019.07.066
251. Pang S, Labuza TP, He L. Development of a single aptamer-based surface enhanced Raman scattering method
for rapid detection of multiple pesticides. Analyst. 2014;139:1895-1901. doi:10.1039/c3an02263c
252. Yang X, Dai J, Zhao S, et al. Identification and characterization of a novel carboxylesterase from Phaseolus
vulgaris for detection of organophosphate and carbamates pesticides. J Sci Food Agric. 2018;98:5095-5104.
doi:10.1002/jsfa.9048
253. Tang X, Zhu Z, Liu R, Tang Y. A novel ratiometric and colorimetric fluorescent probe for hypochlorite based
INTRODUCTION
92
on cyanobiphenyl and its applications. Spectrochim Acta Part A Mol Biomol Spectrosc. 2019;219:576-581.
254. Qiao L, Qian S, Wang Y, Lin H. A colorimetric sensor array based on sulfuric acid assisted KMnO4 fading for
the detection and identification of pesticides. Talanta. 2018;181:305-310.
doi:10.1016/j.talanta.2018.01.029
255. Saleh SM, Alminderej FM, Ali R, Abdallah OI. Optical sensor film for metribuzin pesticide detection.
Spectrochim Acta Part A Mol Biomol Spectrosc. 2020;229(117971):1-9. doi:10.1016/j.saa.2019.117971
256. Wang Q, Wei H, Zhang Z, Wang E, Dong S. Nanozyme: An emerging alternative to natural enzyme for
biosensing and immunoassay. rends Anal Chem. 2018;105:218-224. doi:10.1016/j.trac.2018.05.012
257. Tan G, Zhao Y, Wang M, Chen X, Wang B, Li QX. Ultrasensitive quantitation of imidacloprid in vegetables by
colloidal gold and time-resolved fluorescent nanobead traced lateral flow immunoassays. Food Chem.
2020;311(126055):1-7. doi:10.1016/j.foodchem.2019.126055
258. Nsibande SA, Forbes PBC. Development of a quantum dot molecularly imprinted polymer sensor for
fluorescence detection of atrazine. Luminescence. 2019;34(5):480-488. doi:10.1002/bio.3620
259. Yan X, Song Y, Zhu C, et al. MnO2 Nanosheet-Carbon Dots Sensing Platform for Sensitive Detection of
Organophosphorus Pesticides. Anal Chem. 2018;90:2618-2624. doi:10.1021/acs.analchem.7b04193
260. Wang P, Li H, Hassan MM, Guo Z, Zhang ZZ, Chen Q. Fabricating an Acetylcholinesterase Modulated UCNPs-
Cu2+ Fluorescence Biosensor for Ultrasensitive Detection of Organophosphorus Pesticides-Diazinon in Food.
J Agric Food Chem. 2019;67:4071-4079. doi:10.1021/acs.jafc.8b07201
261. Luo QJ, Li YX, Zhang MQ, Qiu P, Deng YH. A highly sensitive, dual-signal assay based on rhodamine B covered
silver nanoparticles for carbamate pesticides. Chinese Chem Lett. 2017;28(2):345-349.
doi:10.1016/j.cclet.2016.10.024
262. Talbert W, Jones D, Morimoto J, Levine M. Turn-on detection of pesticides: Via reversible fluorescence
enhancement of conjugated polymer nanoparticles and thin films. New J Chem. 2016;40(9):7273-7277.
doi:10.1039/c6nj00690f
263. Azab HA, Khairy GM, Kamel RM. Time-resolved fluorescence sensing of pesticides chlorpyrifos, crotoxyphos
and endosulfan by the luminescent Eu(III)-8-allyl-3-carboxycoumarin probe. Spectrochim Acta Part A Mol
Biomol Spectrosc. 2015;148:114-124. doi:10.1016/j.saa.2015.03.098
264. Gao L, Ju L, Cui H. Chemiluminescent and fluorescent dual-signal graphene quantum dots and their
application in pesticide sensing arrays. J Mater Chem C. 2017;5(31):7753-7758. doi:10.1039/c7tc01658a
265. Wang D, Lin B, Cao Y, Guo M, Yu Y. A Highly Selective and Sensitive Fluorescence Detection Method of
Glyphosate Based on an Immune Reaction Strategy of Carbon Dot Labeled Antibody and Antigen Magnetic
Beads. J Agric Food Chem. 2016;64:6042-6050. doi:10.1021/acs.jafc.6b01088
93
CHAPTER 1
266. Tao CL, Chen B, Liu XG, et al. A highly luminescent entangled metal-organic framework based on pyridine-
substituted tetraphenylethene for efficient pesticide detection. Chem Commun. 2017;53:9975-9978.
doi:10.1039/c7cc05031c
267. Xu X, Guo Y, Wang X, et al. Sensitive detection of pesticides by a highly luminescent metal-organic framework.
Sensors Actuators, B Chem. 2018;260:339-345. doi:10.1016/j.snb.2018.01.075
268. Zhang Y, Wang Z, Wu L, Pei Y, Chen P, Cui Y. Rapid simultaneous detection of multi-pesticide residues on
apple using SERS technique. Analyst. 2014;139(20):5148-5154. doi:10.1039/c4an00771a
269. Kim A, Barcelo SJ, Li Z. SERS-based pesticide detection by using nanofinger sensors. Nanotechnology.
2015;26:1-7. doi:10.1088/0957-4484/26/1/015502
270. Zhang D, Liang P, Yu Z, et al. The effect of solvent environment toward optimization of SERS sensors for
pesticides detection from chemical enhancement aspects. Sensors Actuators, B Chem. 2018;256:721-728.
doi:10.1016/j.snb.2017.09.209
271. Pham TB, Hoang THC, Pham VH, et al. Detection of Permethrin pesticide using silver nano-dendrites SERS on
optical fibre fabricated by laser-assisted photochemical method. Sci Rep. 2019;9(12590):1-10.
doi:10.1038/s41598-019-49077-1
272. Trang A, Khandhar PB. Physiology. Acetylcholinesterase.; 2019.
273. Braitberg G. Acute Intoxication and Poisoning. In: Critical Care Nephrology: Third Edition. Third Edit. ;
2019:574-588. doi:10.1016/B978-0-323-44942-7.00098-4
274. Abou-Donia MB, Menzel DB. Fish brain cholinesterase: Its inhibition by carbamates and automatic assay.
Comp Biochem Physiol. 1967;21(1):99-104.
275. Wang S, Ye Z, Wang X, Xiao L. Etching of Single-MnO2-Coated Gold Nanoparticles for the Colorimetric
Detection of Organophosphorus Pesticides. ACS Appl Nano Mater. 2019;2:6646-6654.
doi:10.1021/acsanm.9b01517
276. Miao SS, Wu MS, Ma LY, He XJ, Yang H. Electrochemiluminescence biosensor for determination of
organophosphorous pesticides based on bimetallic Pt-Au/multi-walled carbon nanotubes modified
electrode. Talanta. 2016;158:142-151. doi:10.1016/j.talanta.2016.05.030
277. Chen S, Wang Y, Feng L. Specific detection and discrimination of dithiocarbamates using CTAB-encapsulated
fluorescent copper nanoclusters. Talanta. 2020;210(120627):1-7. doi:10.1016/j.talanta.2019.120627
278. Pharmamar. Pharmamar. http://pharmamar.com/sobre-pharmamar/. Published 2020.
279. Lovšin Barle E, Looser R, Černe M, Bechter R. The value of acute toxicity testing of pharmaceuticals for
estimation of human response. Regul Toxicol Pharmacol. 2012;62:412-418. doi:10.1016/j.yrtph.2012.01.005
280. Parasuraman S. Toxicological screening. J Pharmacol Pharmacother. 2011;2(2):74-79. doi:10.4103/0976-
INTRODUCTION
94
500X.81895
281. Woutersen M, van Der Gaag B, Boakye AA, et al. Development and validation of an on-linewater toxicity
sensor with immobilized luminescent bacteria for on-line surface water monitoring. Sensors. 2017;17:1-14.
doi:10.3390/s17112682
282. Cevenini L, Calabretta MM, Tarantino G, Michelini E, Roda A. Smartphone-interfaced 3D printed toxicity
biosensor integrating bioluminescent “sentinel cells.” Sensors Actuators, B Chem. 2016;225:249-257.
doi:10.1016/j.snb.2015.11.017
283. Bennet J, Cubbage J. Review and Evaluation of MicrotoxTest for Freshwater Sediments.; 1992.
https://fortress.wa.gov/ecy/publications/publications/92e04.pdf.
284. Ponsoda NA. Diseño y puesta a punto de un método para la determinación de la toxicidad en efluentes
líquidos. 2016.
285. Ben-Yoav H, Amzel T, Biran A, et al. Bacterial biofilm-based water toxicity sensor. Sensors Actuators B Chem.
2011;158:366-371. doi:10.1016/j.snb.2011.06.037
286. Liu J, Morales-Narváez E, Orozco J, Vincent T, Zhong G, Merkoçi A. Bioluminescent Nanopaper for the Fast
Screening of Toxic Substances. Nano Res. 2017:1-19.
287. Pujol-Vila F, Vigués N, Guerrero-Navarro A, et al. Paper-based chromatic toxicity bioassay by analysis of
bacterial ferricyanide reduction. Anal Chim Acta. 2016;910:60-67. doi:10.1016/j.aca.2016.01.006
288. Scheerer S, Gomez F, Lloyd D. Bioluminescence of Vibrio fischeri in continuous culture: Optimal conditions
for stability and intensity of photoemission. J Microbiol Methods. 2006;67:321-329.
doi:10.1016/j.mimet.2006.04.010
289. Khatun MA, Hoque MA, Zhang Y, et al. Bacterial Consortium-Based Sensing System for Detecting
Organophosphorus Pesticides. Anal Chem. 2018;90:10577-10584. doi:10.1021/acs.analchem.8b02709
290. Sharma P, Asad S, Ali A. Bioluminescent bioreporter for assessment of arsenic contamination in water
samples of India. J Biosci. 2013;38(2):251-258. doi:10.1007/s12038-013-9305-z
291. Joe MH, Lee KH, Lim SY, et al. Pigment-based whole-cell biosensor system for cadmium detection using
genetically engineered Deinococcus radiodurans. Bioprocess Biosyst Eng. 2012;35:265-272.
doi:10.1007/s00449-011-0610-3
292. de Mora K, Joshi N, Balint BL, Ward FB, Elfick A, French CE. A pH-based biosensor for detection of arsenic in
drinking water. Anal Bioanal Chem. 2011;400(4):1031-1039. doi:10.1007/s00216-011-4815-8
293. Rodea-Palomares I, Gonzalez-Pleiter M, Gonzalo S, et al. Hidden drivers of low-dose pharmaceutical
pollutant mixtures revealed by the novel GSA-QHTS screening method. Sci Adv. 2016;2:1-12.
doi:10.1126/sciadv.1601272
95
CHAPTER 1
294. Gunnarsdottir MJ, Gardarsson SM, Figueras MJ, et al. Water safety plan enhancements with improved
drinking water quality detection techniques. Sci Total Environ. 2020;698:1-11.
doi:10.1016/j.scitotenv.2019.134185
295. Bannister E. Evaluation of methodology for detection and quantification of coliform bacteria and their
survival in soil and water. 2010.
296. Mobed A, Baradaran B, de la Guardia M, et al. Advances in detection of fastidious bacteria: From microscopic
observation to molecular biosensors. Trends Anal Chem. 2019;113:157-171. doi:10.1016/j.trac.2019.02.012
297. Holzinger M, Le Goff A, Cosnier S. Nanomaterials for biosensing applications: a review. Front Chem. 2014;2:1-
10. doi:10.3389/fchem.2014.00063
298. Bhalla N, Jolly P, Formisano N, Estrela P. Introduction to biosensors. Essays Biochem. 2016;60:1-8.
doi:10.1042/EBC20150001
299. Ahmed A, Rushworth J V., Hirst NA, Millner PA. Biosensors for Whole-Cell Bacterial Detection. Clin Microbiol
Rev. 2014;27(3):631-646. doi:10.1128/CMR.00120-13
300. Wang Y, Knoll W, Dostalek J. Bacterial Pathogen Surface Plasmon Resonance Biosensor Advanced by Long
Range Surface Plasmons and Magnetic Nanoparticle Assays. Anal Chem. 2012;84:8345-8350.
doi:10.1021/ac301904x
301. Zeng Y, Zhang D, Qi P. Combination of a flow cytometric bead system with 16S rRNA-targeted oligonucleotide
probes for bacteria detection. Anal Bioanal Chem. 2019;411:2161-2168. doi:10.1007/s00216-019-01651-2
302. Singh J, Sharma S, Nara S. Evaluation of gold nanoparticle based lateral flow assays for diagnosis of
enterobacteriaceae members in food and water. Food Chem. 2015;170:470-483.
doi:10.1016/j.foodchem.2014.08.092
303. Song C, Liu J, Li J, Liu Q. Dual FITC lateral flow immunoassay for sensitive detection of Escherichia coli
O157:H7 in food samples. Biosens Bioelectron. 2016;85:734-739. doi:10.1016/j.bios.2016.05.057
304. Hwang J, Kwon D, Lee S, Jeon S. Detection of Salmonella bacteria in milk using gold-coated magnetic
nanoparticle clusters and lateral flow filters. RSC Adv. 2016;6:48445-48448. doi:10.1039/c6ra05446c
305. Zhao Y, Wang H, Zhang P, et al. Rapid multiplex detection of 10 foodborne pathogens with an up-converting
phosphor technology-based 10-channel lateral flow assay. Sci Rep. 2016;6:1-8. doi:10.1038/srep21342
306. Carroll KC, Mizusawa M. Laboratory Tests for the Diagnosis of Clostridium difficile. Clin Colon Rectal Surg.
2020;33(02):73-81.
307. Poonlapdecha W, Seetang-Nun Y, Wonglumsom W, et al. Antibody-conjugated ferromagnetic nanoparticles
with lateral flow test strip assay for rapid detection of Campylobacter jejuni in poultry samples. Int J Food
Microbiol. 2018;286:6-14. doi:10.1016/j.ijfoodmicro.2018.07.009
INTRODUCTION
96
308. Zhao F, Niu L, Nong J, et al. Rapid and sensitive detection of Pseudomonas aeruginosa using multiple cross
displacement amplification and gold nanoparticle-based lateral flow biosensor visualization. FEMS Microbiol
Lett. 2018;365:1-6. doi:10.1093/femsle/fny147
309. Shan S, Lai W, Xiong Y, Wei H, Xu H. Novel Strategies To Enhance Lateral Flow Immunoassay Sensitivity for
Detecting Foodborne Pathogens. J Agric Food Chem. 2015;63:745-753. doi:10.1021/jf5046415
310. Jo H, Ban C. Aptamer-nanoparticle complexes as powerful diagnostic and therapeutic tools. Exp Mol Med.
2016;48(5):e230. doi:10.1038/emm.2016.44
311. Schenk F, Weber P, Vogler J, Hecht L, Dietzel A, Gauglitz G. Development of a paper-based lateral flow
immunoassay for simultaneous detection of lipopolysaccharides of Salmonella serovars. Anal Bioanal Chem.
2018;410:863-868. doi:10.1007/s00216-017-0643-9
312. Wang C, Shen W, Rong Z, et al. Layer-by-layer assembly of magnetic-core dual quantum dot-shell
nanocomposites for fluorescence lateral flow detection of bacteria. Nanoscale. 2020;12:795-807.
doi:10.1039/c9nr08509b
313. Chen M, Yu Z, Liu D, et al. Dual gold nanoparticle lateflow immunoassay for sensitive detection of Escherichia
coli O157:H7. Anal Chim Acta. 2015;876:71-76. doi:10.1016/j.aca.2015.03.023
314. Çam D, Öktem HA. Optimizations needed for lateral flow assay for rapid detection of pathogenic E. Coli.
Turkish J Biol. 2017;41:954-968. doi:10.3906/biy-1705-50
315. Bu T, Huang Q, Yan L, et al. Applicability of biological dye tracer in strip biosensor for ultrasensitive detection
of pathogenic bacteria. Food Chem. 2019;274:816-821. doi:10.1016/j.foodchem.2018.09.066
316. Ruan Y, Xu H, Yu J, Chen Q, Gu L, Guo A. A fluorescence immunoassay based on CdTe : Zn/ZnS quantum dots
for the rapid detection of bacteria, taking: Delftia tsuruhatensis CM’13 as an example. RSC Adv.
2019;10:1042-1049. doi:10.1039/c9ra08651j
317. Bonnet R, Farre C, Valera L, et al. Highly labeled methylene blue-ds DNA silica nanoparticles for signal
enhancement of immunoassays: application to the sensitive detection of bacteria in human platelet
concentrates. Analyst. 2018;143:2293-2303.
318. Borsa BA, Guna BG, Hernandez FJ, et al. Staphylococcus aureus detection in blood samples by silica
nanoparticle-oligonucleotides conjugates. Biosens Bioelectron. 2016;86(15):27-32.
319. Maldonado J, Estévez MC, Fernández-Gavela A, González-López JJ, González-Guerrero AB, Lechuga LM.
Label-free detection of nosocomial bacteria using a nanophotonic interferometric biosensor. Analyst.
2020;145:497-506. doi:10.1039/c9an01485c
320. Huang J, Sun J, Warden AR, Ding X. Colorimetric and photographic detection of bacteria in drinking water by
using 4-mercaptophenylboronic acid functionalized AuNPs. Food Control. 2020;108:1-7.
doi:10.1016/j.foodcont.2019.106885
97
CHAPTER 1
321. Wang C, Gao X, Wang S, Liu Y. A smartphone-integrated paper sensing system for fluorescent and
colorimetric dual-channel detection of foodborne pathogenic bacteria. Anal Bioanal Chem. 2020;412:611-
620. doi:10.1007/s00216-019-02208-z
322. Li D, Kumari B, Makabenta JM, Gupta A, Rotello V. Effective detection of bacteria using metal nanoclusters.
Nanoscale. 2019;11:22172-22181. doi:10.1039/c9nr08510f
323. Salam F, Uludag Y, Tothill I. Real-time and sensitive detection of Salmonella Typhimurium using an
automated quartz crystal microbalance (QCM) instrument with nanoparticles amplification. Talanta.
2013;115:761-767.
324. Buchapudi KR, Huang X, Yang X, Ji H-F, Thundat T. Microcantilever biosensors for chemicals and bioorganisms.
Analyst. 2011;139:1539-1556.


CHAPTER 2
99
CHAPTER 2
Thesis Objectives

CHAPTER 2
101
Objectives of the Thesis
The main objective of the present thesis is to develop portable biosensors for water quality
monitoring. These sensors aim to tackle microbiological and chemical pollution through the
detection of the bacterium E. coli as a fecal indicator and the pesticides pentachlorophenol and
tributyltin (TBT). Besides, an innovative platform is presented as a sensing device for
environmental and health-related applications.
More in detail, the objectives of the thesis can be summarized as follows:
- The design, fabrication, characterization, and optimization of a colorimetric lateral flow
biosensor for the detection of E. coli using gold nanoparticles (AuNPs) and antibodies for
a fast, cheap, and simple determination of water fecal contamination.
- The design, fabrication, characterization, and optimization of a bioluminescent toxicity-
based biosensor for the assessment of water toxicity and the detection of two particular
pesticides (TBT and pentachlorophenol).
- The design, fabrication, and development of a new smartphone-based portable analytical
device for optical biosensing (i.e. colorimetric, fluorescent and bioluminescent) of
environmental pollution and other related applications.

CHAPTER 3. ESCHERICHIA COLI DETECTION AS A FECAL INDICATOR
CHAPTER 3........................................................................................ Error! Bookmark not defined.
Escherichia coli detection as a fecal indicator ................................. Error! Bookmark not defined.
3.1. Introduction ........................................................................... Error! Bookmark not defined.
3.2. Materials and methods ......................................................... Error! Bookmark not defined.
3.2.1. Materials ......................................................................... Error! Bookmark not defined.
3.2.2. Synthesis of gold nanoparticles ...................................... Error! Bookmark not defined.
3.2.3. Lateral flow strips construction ...................................... Error! Bookmark not defined.
3.2.4. Bacteria samples preparation ........................................ Error! Bookmark not defined.
3.2.5. Bacteria detection .......................................................... Error! Bookmark not defined.
3.3. Optimization of the lateral flow biosensors .......................... Error! Bookmark not defined.
3.3.1. Characterization of AuNPs & conjugate particles .......... Error! Bookmark not defined.
3.3.2. Characterization of the lateral flow materials ............... Error! Bookmark not defined.
3.3.3. Lateral flow strips optimization ...................................... Error! Bookmark not defined.
3.4. Characterization of the lateral flow biosensors .................... Error! Bookmark not defined.
3.4.1. Sensitivity, selectivity and reproducibility ...................... Error! Bookmark not defined.
3.4.2. Analysis with real samples .............................................. Error! Bookmark not defined.
3.5. Conclusions ............................................................................ Error! Bookmark not defined.
3.6. References ............................................................................. Error! Bookmark not defined.

CHAPTER 3
105
CHAPTER 3
Escherichia coli detection as a fecal
indicator

CHAPTER 3
107
This chapter summarizes the design, construction, development, and optimization of a
colorimetric lateral flow biosensor based on polyclonal antibodies conjugated to gold
nanoparticles for the detection of the fecal indicator Escherichia coli. The chapter is divided into
i) a short introduction to set out the topic and the current needs, as well as the presented
proposal; ii) materials and methods; iii) the experimental results related to the optimization of
the lateral flow biosensors; iv) the characterization of the sensitivity, selectivity, reproducibility,
and working with real samples of the lateral flow biosensors; v) the conclusions of the chapter,
and vi) the references.
3.1. Introduction
Water safety and quality are fundamental to human development and well-being. In recent
years, water pollution has arisen as one of the main challenges humankind is facing globally.
Drinking polluted water leads to waterborne illnesses that are connected to a substantial disease
burden. Worldwide, about 2.2 billion people use drinking water sources polluted with feces,
causing more than 800.000 deaths globally, according to the estimates of the World Health
Organization (WHO)1. In this regard, the United Nations (UN) states as one major objective for
2030 “worldwide clean water and sanitation”2. Currently, it is well accepted that fecal bacteria
coming from sewage treatment plants, farm effluents, and flooding are the main indicators of
water microbial pollution3. Among all fecal indicators, Escherichia coli (E. coli) is the best indicator
for water microbial pollution because of two main reasons: first, E. coli is the most abundant
bacteria in mammal digestive systems; and second, E. coli is more easily detected than other
waterborne pathogens3.
In this regard, according to the EU standards, drinking water must contain less than 1 CFU
of E. coli per 100 mL4. Nonetheless, sewage waters usually reach levels of thousands of fecal
coliforms per 100 mL, thereby fecal contamination endangers water quality standards5. Currently,
the gold standard techniques for E. coli detection in water are bacterial culturing (i.e. membrane
filtration and defined substrate method) and DNA-based methods (i.e. qPCR)6. Nonetheless,
these techniques suffer from important drawbacks, namely, they are time-consuming,
ESCHERICHIA COLI DETECTION AS A FECAL INDICATOR
108
complicated, relatively expensive and require well-trained personnel and highly equipped
laboratories.
Lateral flow strips (LFS) are paper-based sensors that enable a fast (from 5 to 15 minutes)7
and easy interpretation of the results. Besides, LFS typically require low sample volumes, are one-
step assay, have long shelf-life, and demand relatively short development time8. Most LFS rely on
colorimetric reporters to indicate the presence of the analyte of interest in the analyzed sample9–
12. Among all of these labels, gold nanoparticles (AuNPs) are usually chosen because of their easy
and versatile synthesis, long shelf-life13, intense red color, and easy conjugation to different
biomolecules (i.e. antibodies, DNA and aptamers, etc.)14–18 making them powerful transducers
for optical biosensing. Other LFS rely on fluorescent (i.e. upconverting nanoparticles and quantum
dots) and Raman reporters that boost sensitivity at the cost of simplicity and naked-eye
detection19–21. Nowadays, several AuNPs-based LFS products to detect bacteria are already
available in the market22–25. LFS specifically targeting bacteria usually rely on monoclonal
antibodies (mAb) to boost the sensitivity and selectivity of the assays26–29. Typically, these mAb-
AuNPs-based LFS present LOD between 105 and 106 CFU/mL30–32. Furthermore, most of these LFS
aim to target pathogenic strains of E. coli and Salmonella in food samples, but few of them do it
for water analysis33. In this regard, one of the main challenges in detecting fecal pollution of
waters is the countless number of different E. coli strains possibly found depending on the sewage
water pollution inputs (i.e. cities or farms). Consequently, the detection of certain E. coli strains
using monoclonal antibodies would thus neglect the overall water microbial pollution. The
required broader detection range needs the use of polyclonal antibodies (pAb) instead of
monoclonal antibodies, usually at the cost of sensitivity and selectivity of the system. However,
pAb are cheaper to produce and possess higher stability than mAb34, making pAb more affordable
for massive production and scaling worldwide.
Herein, we have developed AuNPs-pAb-based LFS with an easily interpretable colorimetric
output to detect several strains of E. coli species. The optimization of the lateral flow materials,
AuNPs, and antibodies allow detecting E. coli at 104 CFU/mL in 25 minutes in combination with a
simple filtration system. More in detail, we present a novel bioluminescent characterization

CHAPTER 3
109
method to study the microfluidics of bacteria within the lateral flow materials. Other parameters
such as selectivity and reproducibility have also been studied. Eventually, the proposed system
proves to work properly with river and sewage samples, yielding always recoveries above 80%.
3.2. Materials and methods
3.2.1. Materials
Polyclonal anti-E. coli antibody (PA1-7213, ThermoFisher) and polyclonal anti-rabbit
antibody (ab6702 & ab6720, Abcam) were purchased. HAuCl4, sodium citrate, bovine serum
albumin (BSA), sodium dodecyl sulfate (SDS), sucrose, Tween-20, drying pearls, trizma salts,
phosphate salts, borate salts, tryptic soy agar (TSA) and tryptic soy broth (TSB) were purchased
from Sigma-Aldrich. Commercial 60 & 80 nm AuNPs were purchased from nanoComposix. Lateral
flow strips were made of nitrocellulose (HF170, HF140, HF125 & SS40, from Advanced
Microdevices; CN95 & CN150, from Sartorius), glass fiber (CN14 & CN17, GE Healthcare),
cellulose (GE Healthcare) and laminated cards as a scaffold (Millipore). TEM grids (carbon film
300 MESH Copper grids CF300-CU) were purchased from Electron Microscopy Sciences.
Lyophilized E. coli cells (strain B) were purchased from Sigma-Aldrich. Other E. coli strains
(ATCC11775, ATCC11303, ATCC25922) & Salmonella Typhimurium (strain ATCC14028) were
purchased from the ATCC collection and the company LGC.
3.2.2. Synthesis of gold nanoparticles
A 150 mL solution of 2.2 mM sodium citrate in MilliQ water was heated up to 135 ºC. After
boiling, one mL of 25 mM HAuCl4 was added to the solution, and the solution color changed to
light red/dark pink after 10 minutes. Next, the temperature was lowered down to 90 ºC, and then
one mL of 60 mM sodium citrate was added to the solution. After 2 minutes, one mL of 25 mM
HAuCl4 was added to the solution and the reaction was allowed to last for 30 minutes. These last
two steps were repeated 2 times and 5 times to obtain 20 nm and 40 nm AuNPs, respectively. In
the last step, either 20 nm or 40 nm AuNPs were cooled down and carefully stored at +4 ºC for
further use.
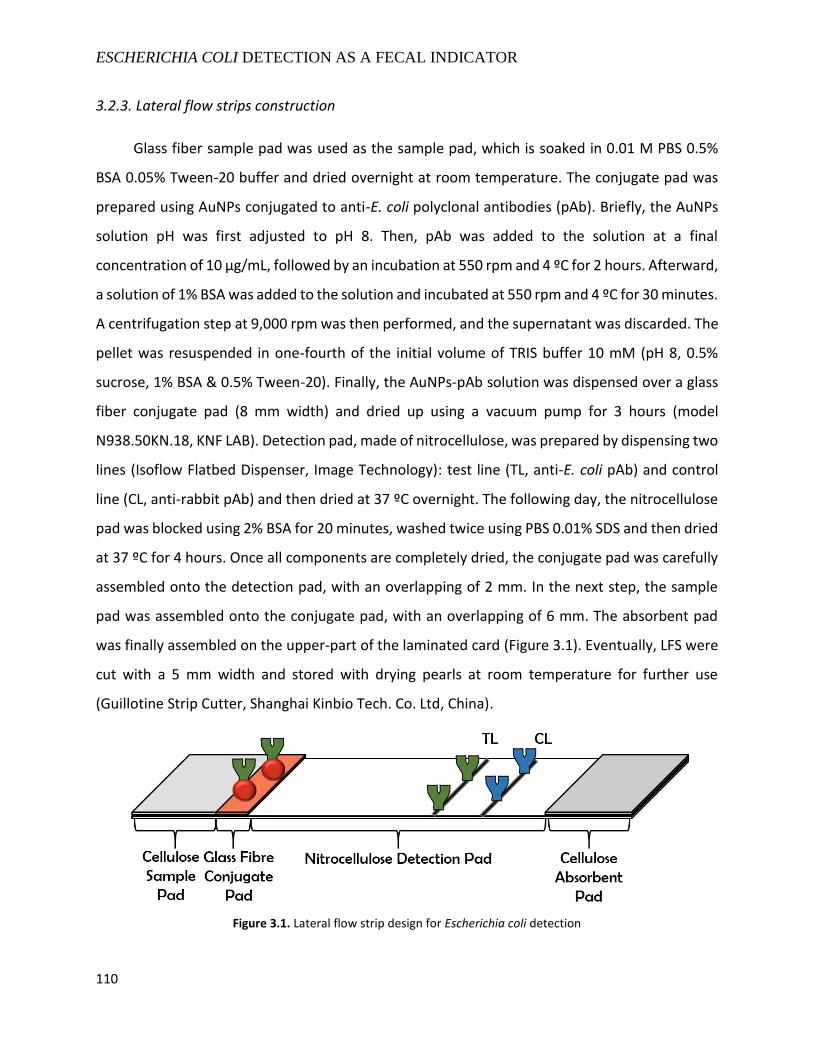
ESCHERICHIA COLI DETECTION AS A FECAL INDICATOR
110
3.2.3. Lateral flow strips construction
Glass fiber sample pad was used as the sample pad, which is soaked in 0.01 M PBS 0.5%
BSA 0.05% Tween-20 buffer and dried overnight at room temperature. The conjugate pad was
prepared using AuNPs conjugated to anti-E. coli polyclonal antibodies (pAb). Briefly, the AuNPs
solution pH was first adjusted to pH 8. Then, pAb was added to the solution at a final
concentration of 10 µg/mL, followed by an incubation at 550 rpm and 4 ºC for 2 hours. Afterward,
a solution of 1% BSA was added to the solution and incubated at 550 rpm and 4 ºC for 30 minutes.
A centrifugation step at 9,000 rpm was then performed, and the supernatant was discarded. The
pellet was resuspended in one-fourth of the initial volume of TRIS buffer 10 mM (pH 8, 0.5%
sucrose, 1% BSA & 0.5% Tween-20). Finally, the AuNPs-pAb solution was dispensed over a glass
fiber conjugate pad (8 mm width) and dried up using a vacuum pump for 3 hours (model
N938.50KN.18, KNF LAB). Detection pad, made of nitrocellulose, was prepared by dispensing two
lines (Isoflow Flatbed Dispenser, Image Technology): test line (TL, anti-E. coli pAb) and control
line (CL, anti-rabbit pAb) and then dried at 37 ºC overnight. The following day, the nitrocellulose
pad was blocked using 2% BSA for 20 minutes, washed twice using PBS 0.01% SDS and then dried
at 37 ºC for 4 hours. Once all components are completely dried, the conjugate pad was carefully
assembled onto the detection pad, with an overlapping of 2 mm. In the next step, the sample
pad was assembled onto the conjugate pad, with an overlapping of 6 mm. The absorbent pad
was finally assembled on the upper-part of the laminated card (Figure 3.1). Eventually, LFS were
cut with a 5 mm width and stored with drying pearls at room temperature for further use
(Guillotine Strip Cutter, Shanghai Kinbio Tech. Co. Ltd, China).
Figure 3.1. Lateral flow strip design for Escherichia coli detection
CHAPTER 3
111
3.2.4. Bacteria samples preparation
Different concentrations of lyophilized E. coli were prepared in tap, river and sewage
waters by adjusting OD600 to the reference values provided by Agilent Genomics. Whereas, for
the other living strains of E. coli and Salmonella, bacterial cultures were first grown in TSB
cultures. TSA plates were then incubated overnight at 37 ºC with 5 µL of the grown TSB cultures.
Afterward, some colonies were picked up and added to filtered water. Optical density at 600 nm
was measured, and bacterial solutions were diluted to obtain the closest OD600 value equivalent
to 109 CFU/mL. Finally, bacteria were heat-killed at +65 ºC for 20 min before use on the strips.
3.2.5. Bacteria detection
Ten-fold decimal dilutions of different E. coli and Salmonella strains were prepared in
various water samples from the original bacterial concentration. A volume of 150 µL of different
E. coli concentrations was carefully dispensed on the sample pad of the LFS. After 10 minutes,
one (CL) or two (TL & CL) lines appeared on the detection pad and the results were recorded with
a lateral flow strips reader (SkanEasy, Skannex). The redder the TL, the greater the concentration
of E. coli in the water sample. To perform the selectivity tests, the same volume and
concentrations of different strains of E. coli and Salmonella were added to the LFS and the color
intensity of both TL and CL was recorded after 10 minutes. The comparison was made using three
different strains of E. coli, Salmonella and E. coli + Salmonella tested in the same batch of LFS. R-
statistical program was used to evaluate the response of the LFS to different strains of E. coli35.
Reproducibility tests were carried out using three different batches of LFS produced on different
days. Inter-assay and intra-assay relative standard deviation (RSD) were calculated comparing
the outputs of the three batches of LFS and testing triplicates of different concentrations of
bacteria (106, 107, 108 CFU/mL). In another vein, filtration of water samples in the laboratory was
carried out using a peristaltic pump and a microfluidic system using 0.25 µm pore-size filters
(Perimax 12 SPETEC, GmbH). On the other hand, filtration in the river was performed with a
portable boat that collected and filtered the water while sailing. In both cases, when the filtration
was over, the filters were collected, immersed in a smaller amount of clean water (i.e. 1-2 mL),
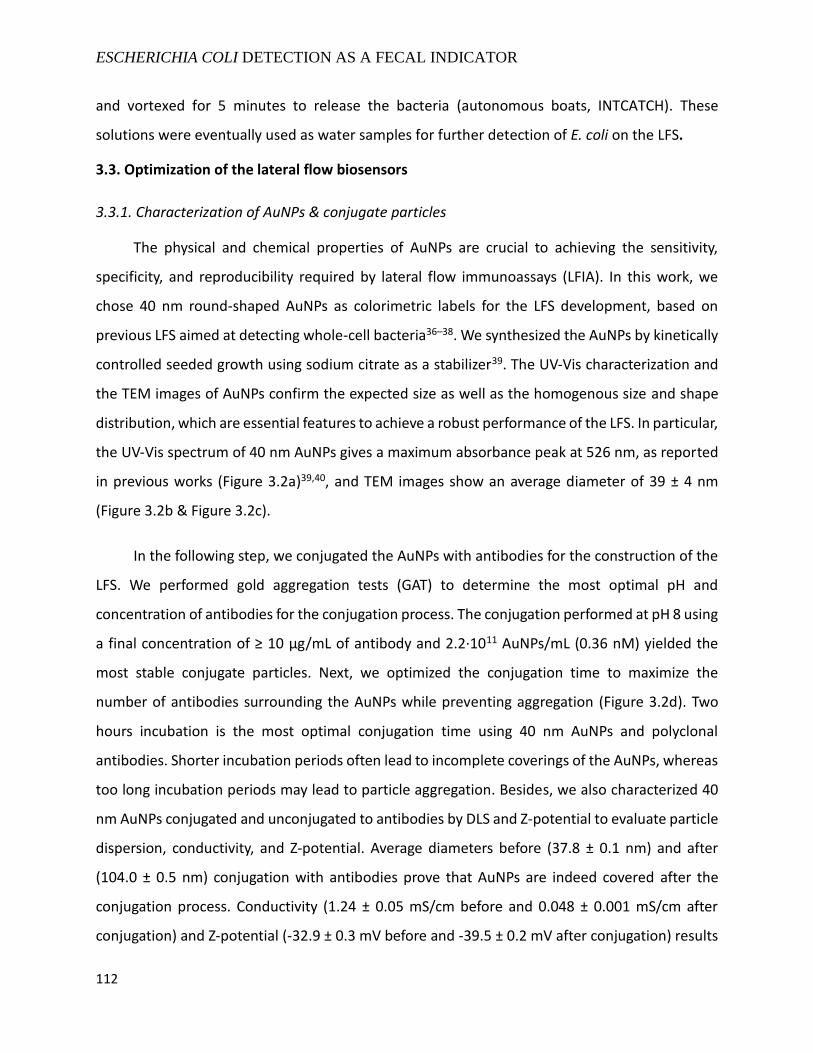
ESCHERICHIA COLI DETECTION AS A FECAL INDICATOR
112
and vortexed for 5 minutes to release the bacteria (autonomous boats, INTCATCH). These
solutions were eventually used as water samples for further detection of E. coli on the LFS.
3.3. Optimization of the lateral flow biosensors
3.3.1. Characterization of AuNPs & conjugate particles
The physical and chemical properties of AuNPs are crucial to achieving the sensitivity,
specificity, and reproducibility required by lateral flow immunoassays (LFIA). In this work, we
chose 40 nm round-shaped AuNPs as colorimetric labels for the LFS development, based on
previous LFS aimed at detecting whole-cell bacteria36–38. We synthesized the AuNPs by kinetically
controlled seeded growth using sodium citrate as a stabilizer39. The UV-Vis characterization and
the TEM images of AuNPs confirm the expected size as well as the homogenous size and shape
distribution, which are essential features to achieve a robust performance of the LFS. In particular,
the UV-Vis spectrum of 40 nm AuNPs gives a maximum absorbance peak at 526 nm, as reported
in previous works (Figure 3.2a)39,40, and TEM images show an average diameter of 39 ± 4 nm
(Figure 3.2b & Figure 3.2c).
In the following step, we conjugated the AuNPs with antibodies for the construction of the
LFS. We performed gold aggregation tests (GAT) to determine the most optimal pH and
concentration of antibodies for the conjugation process. The conjugation performed at pH 8 using
a final concentration of ≥ 10 µg/mL of antibody and 2.2·1011 AuNPs/mL (0.36 nM) yielded the
most stable conjugate particles. Next, we optimized the conjugation time to maximize the
number of antibodies surrounding the AuNPs while preventing aggregation (Figure 3.2d). Two
hours incubation is the most optimal conjugation time using 40 nm AuNPs and polyclonal
antibodies. Shorter incubation periods often lead to incomplete coverings of the AuNPs, whereas
too long incubation periods may lead to particle aggregation. Besides, we also characterized 40
nm AuNPs conjugated and unconjugated to antibodies by DLS and Z-potential to evaluate particle
dispersion, conductivity, and Z-potential. Average diameters before (37.8 ± 0.1 nm) and after
(104.0 ± 0.5 nm) conjugation with antibodies prove that AuNPs are indeed covered after the
conjugation process. Conductivity (1.24 ± 0.05 mS/cm before and 0.048 ± 0.001 mS/cm after
conjugation) and Z-potential (-32.9 ± 0.3 mV before and -39.5 ± 0.2 mV after conjugation) results
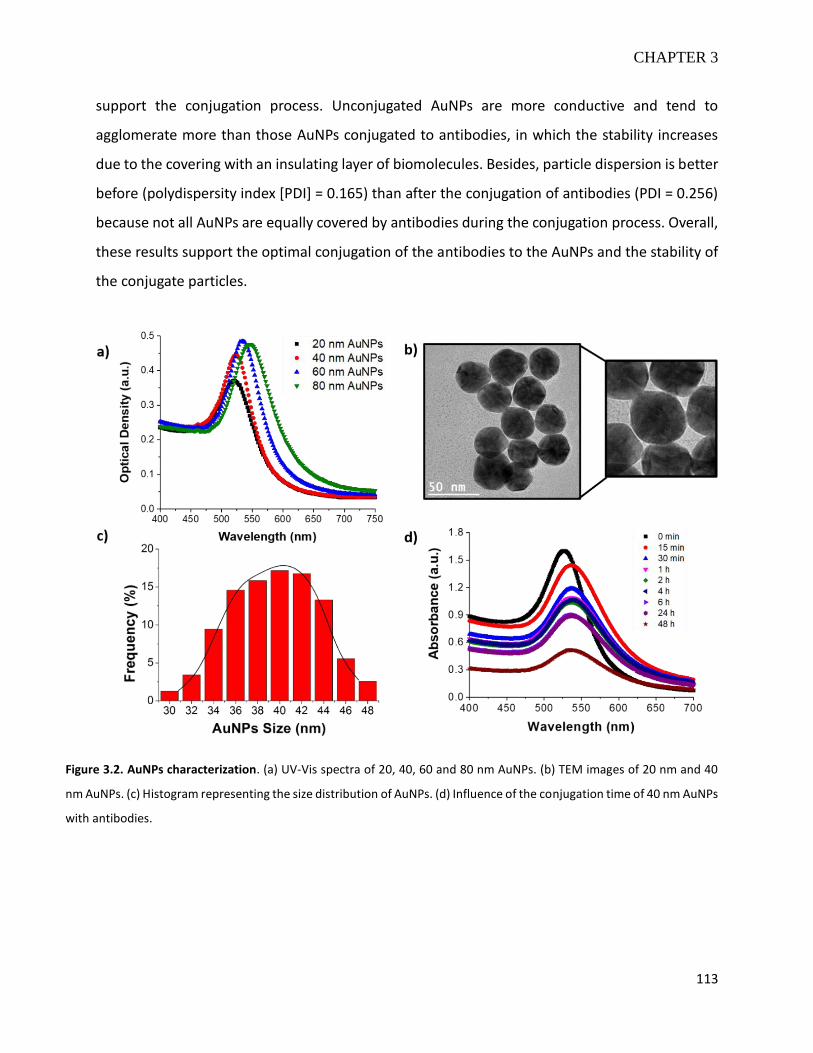
CHAPTER 3
113
support the conjugation process. Unconjugated AuNPs are more conductive and tend to
agglomerate more than those AuNPs conjugated to antibodies, in which the stability increases
due to the covering with an insulating layer of biomolecules. Besides, particle dispersion is better
before (polydispersity index [PDI] = 0.165) than after the conjugation of antibodies (PDI = 0.256)
because not all AuNPs are equally covered by antibodies during the conjugation process. Overall,
these results support the optimal conjugation of the antibodies to the AuNPs and the stability of
the conjugate particles.
Figure 3.2. AuNPs characterization. (a) UV-Vis spectra of 20, 40, 60 and 80 nm AuNPs. (b) TEM images of 20 nm and 40
nm AuNPs. (c) Histogram representing the size distribution of AuNPs. (d) Influence of the conjugation time of 40 nm AuNPs
with antibodies.
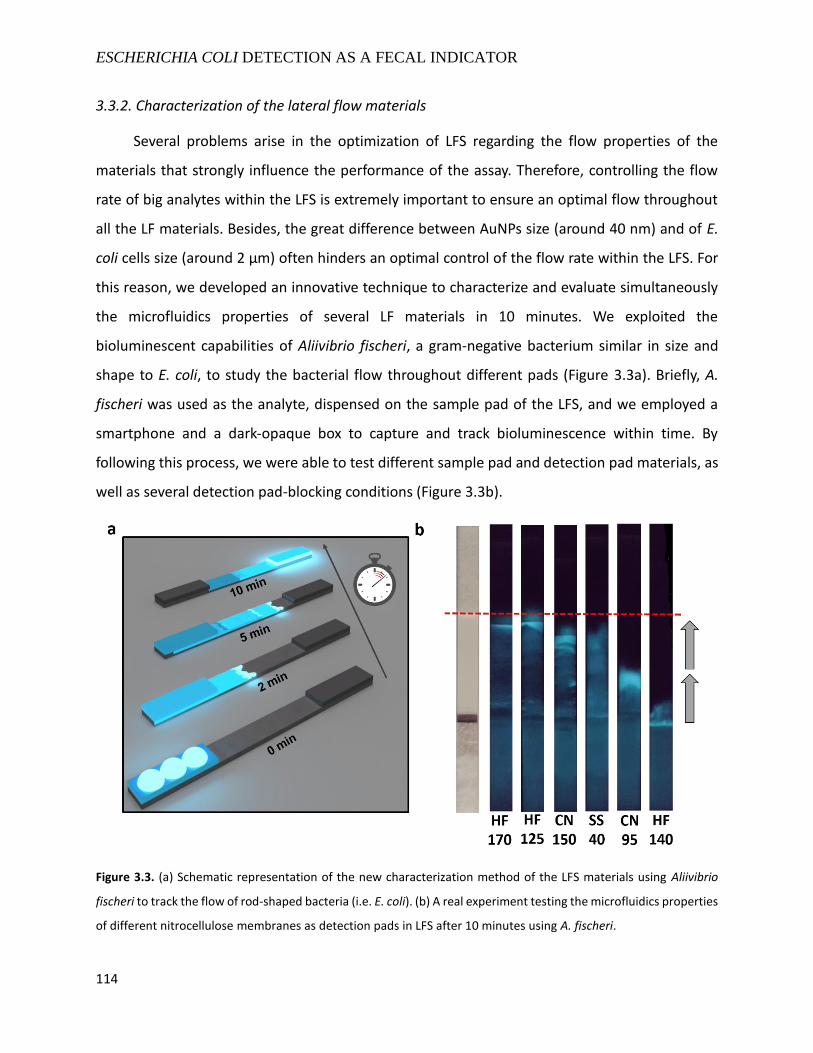
ESCHERICHIA COLI DETECTION AS A FECAL INDICATOR
114
3.3.2. Characterization of the lateral flow materials
Several problems arise in the optimization of LFS regarding the flow properties of the
materials that strongly influence the performance of the assay. Therefore, controlling the flow
rate of big analytes within the LFS is extremely important to ensure an optimal flow throughout
all the LF materials. Besides, the great difference between AuNPs size (around 40 nm) and of E.
coli cells size (around 2 µm) often hinders an optimal control of the flow rate within the LFS. For
this reason, we developed an innovative technique to characterize and evaluate simultaneously
the microfluidics properties of several LF materials in 10 minutes. We exploited the
bioluminescent capabilities of Aliivibrio fischeri, a gram-negative bacterium similar in size and
shape to E. coli, to study the bacterial flow throughout different pads (Figure 3.3a). Briefly, A.
fischeri was used as the analyte, dispensed on the sample pad of the LFS, and we employed a
smartphone and a dark-opaque box to capture and track bioluminescence within time. By
following this process, we were able to test different sample pad and detection pad materials, as
well as several detection pad-blocking conditions (Figure 3.3b).
Figure 3.3. (a) Schematic representation of the new characterization method of the LFS materials using Aliivibrio
fischeri to track the flow of rod-shaped bacteria (i.e. E. coli). (b) A real experiment testing the microfluidics properties
of different nitrocellulose membranes as detection pads in LFS after 10 minutes using A. fischeri.
CHAPTER 3
115
3.3.3. Lateral flow strips optimization
We optimized the LFS in terms of the selection of antibodies, the AuNPs size, the type of
nitrocellulose membrane, the blocking of the nitrocellulose membrane, the concentration of
antibody conjugated to AuNPs and the concentration of antibody immobilized on the test line by
testing different E. coli concentrations in tap water. First, we tested four different antibodies
within the conjugated pad and the test line, selecting those that provided the highest sensitivity
(Figure 3.4a). Second, we analyzed the effect of AuNPs size as conjugate particles by using 20 and
nm, 40 nm AuNPs, 60 nm, and 80 nm AuNPs conjugated to anti-E. coli antibodies (Figure 3.4b).
We observed that 40 nm AuNPs provide higher sensitivity than the rest of the AuNPs. In fact, LOD
improves from 107 CFU/mL to 106 CFU/mL when using 40 nm AuNPs instead of 20 nm, 60 nm,
and 80 nm AuNPs. This LOD concords with other AuNPs-based LFS developed for whole-cell
bacteria detection10,30,41,42. Besides, 40 nm AuNPs have stronger color than 20 nm AuNPs, while
bigger AuNPs are less stable and may hinder antibody-antigen interactions43.
Third and according to the previous results (Figure 3.3b), we selected the four-nitrocellulose
pads that yielded an appropriate flow of bacteria to fabricate LFS and test LFIA performance
(Figure 3.4c). Nitrocellulose HF170 provides the highest sensitivity, but also produces the
strongest false-positive signals on the test line. Therefore, we studied different blocking
conditions on the nitrocellulose pad HF170 to reduce this background signal. We selected BSA as
the blocking agent to lessen the unspecific interaction of the antibodies conjugated to the 40 nm
AuNPs and the antibodies immobilized within the TL. We tested different BSA concentrations,
among which 2% BSA (w/v) yields the best performance, reducing the background signal while
not affecting the overall sensitivity of the LFS (Figure 3.4d).
Next, we optimized the concentration of antibodies conjugated to the 40 nm AuNPs. We
tested different anti-E. coli antibody concentrations (5, 10, 20 to 30 µg/mL) (Figure 3.4e) based
on the previous gold aggregation test results. Using too low antibody concentration decreases
the sensitivity of the LFS, whereas using too high antibody concentration increases the intensity
of the false-positive signals. As a result, a concentration of 10 µg/mL of the antibody provides the
bests results. Finally, we optimized the concentration of antibodies immobilized on the test line
by comparing the sensitivity of the LFS using three different antibody concentrations (0.5, 1, 2
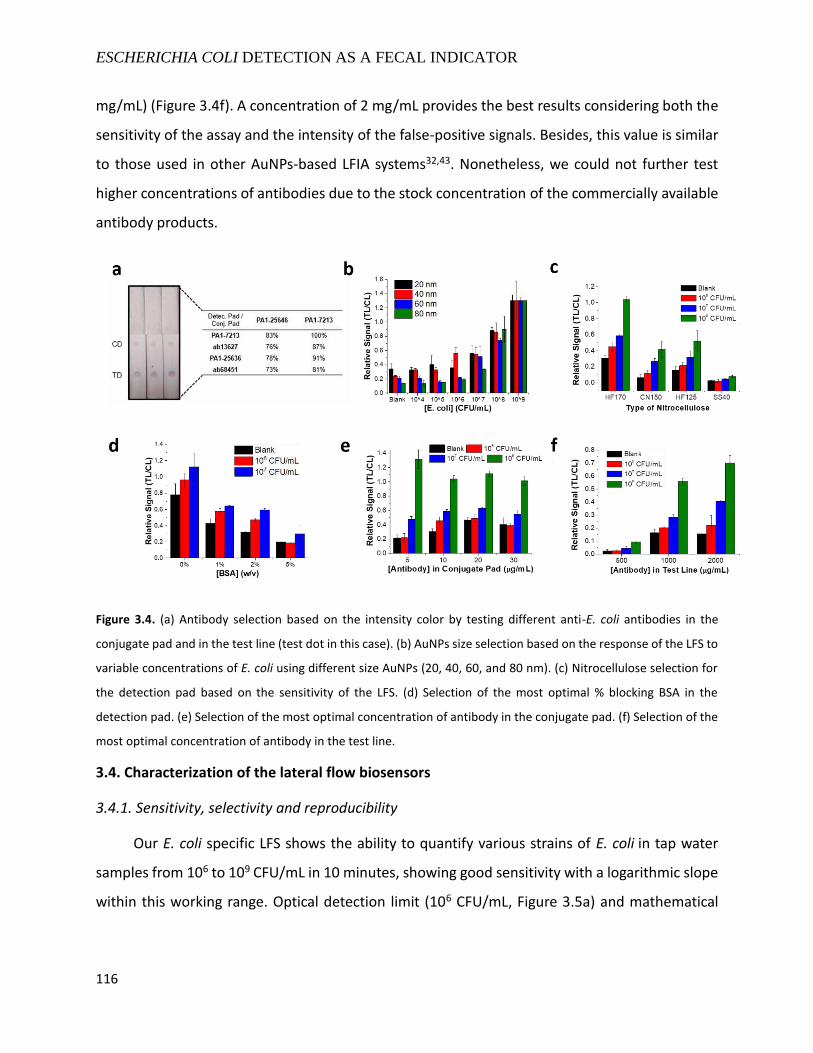
ESCHERICHIA COLI DETECTION AS A FECAL INDICATOR
116
mg/mL) (Figure 3.4f). A concentration of 2 mg/mL provides the best results considering both the
sensitivity of the assay and the intensity of the false-positive signals. Besides, this value is similar
to those used in other AuNPs-based LFIA systems32,43. Nonetheless, we could not further test
higher concentrations of antibodies due to the stock concentration of the commercially available
antibody products.
Figure 3.4. (a) Antibody selection based on the intensity color by testing different anti-E. coli antibodies in the
conjugate pad and in the test line (test dot in this case). (b) AuNPs size selection based on the response of the LFS to
variable concentrations of E. coli using different size AuNPs (20, 40, 60, and 80 nm). (c) Nitrocellulose selection for
the detection pad based on the sensitivity of the LFS. (d) Selection of the most optimal % blocking BSA in the
detection pad. (e) Selection of the most optimal concentration of antibody in the conjugate pad. (f) Selection of the
most optimal concentration of antibody in the test line.
3.4. Characterization of the lateral flow biosensors
3.4.1. Sensitivity, selectivity and reproducibility
Our E. coli specific LFS shows the ability to quantify various strains of E. coli in tap water
samples from 106 to 109 CFU/mL in 10 minutes, showing good sensitivity with a logarithmic slope
within this working range. Optical detection limit (106 CFU/mL, Figure 3.5a) and mathematical
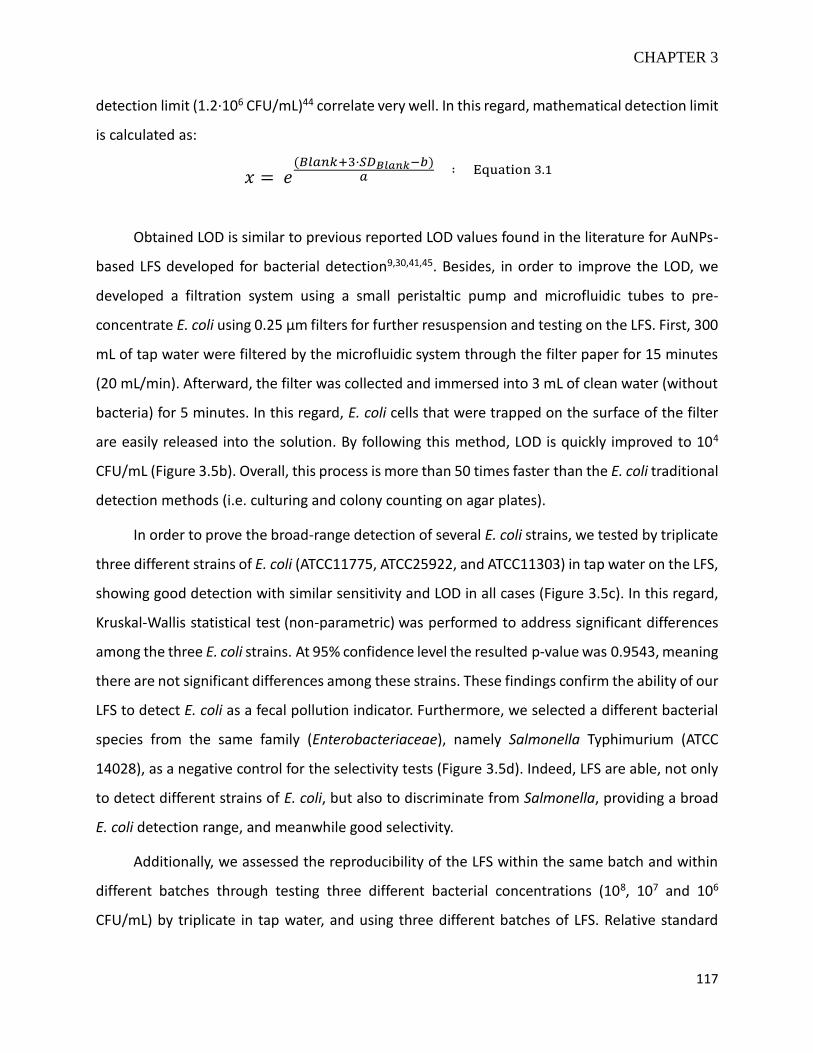
CHAPTER 3
117
detection limit (1.2·106 CFU/mL)44 correlate very well. In this regard, mathematical detection limit
is calculated as:
𝑥 = 𝑒(𝐵𝑙𝑎𝑛𝑘+3·𝑆𝐷𝐵𝑙𝑎𝑛𝑘−𝑏)
𝑎 ∶ Equation 3.1
Obtained LOD is similar to previous reported LOD values found in the literature for AuNPs-
based LFS developed for bacterial detection9,30,41,45. Besides, in order to improve the LOD, we
developed a filtration system using a small peristaltic pump and microfluidic tubes to pre-
concentrate E. coli using 0.25 µm filters for further resuspension and testing on the LFS. First, 300
mL of tap water were filtered by the microfluidic system through the filter paper for 15 minutes
(20 mL/min). Afterward, the filter was collected and immersed into 3 mL of clean water (without
bacteria) for 5 minutes. In this regard, E. coli cells that were trapped on the surface of the filter
are easily released into the solution. By following this method, LOD is quickly improved to 104
CFU/mL (Figure 3.5b). Overall, this process is more than 50 times faster than the E. coli traditional
detection methods (i.e. culturing and colony counting on agar plates).
In order to prove the broad-range detection of several E. coli strains, we tested by triplicate
three different strains of E. coli (ATCC11775, ATCC25922, and ATCC11303) in tap water on the LFS,
showing good detection with similar sensitivity and LOD in all cases (Figure 3.5c). In this regard,
Kruskal-Wallis statistical test (non-parametric) was performed to address significant differences
among the three E. coli strains. At 95% confidence level the resulted p-value was 0.9543, meaning
there are not significant differences among these strains. These findings confirm the ability of our
LFS to detect E. coli as a fecal pollution indicator. Furthermore, we selected a different bacterial
species from the same family (Enterobacteriaceae), namely Salmonella Typhimurium (ATCC
14028), as a negative control for the selectivity tests (Figure 3.5d). Indeed, LFS are able, not only
to detect different strains of E. coli, but also to discriminate from Salmonella, providing a broad
E. coli detection range, and meanwhile good selectivity.
Additionally, we assessed the reproducibility of the LFS within the same batch and within
different batches through testing three different bacterial concentrations (108, 107 and 106
CFU/mL) by triplicate in tap water, and using three different batches of LFS. Relative standard
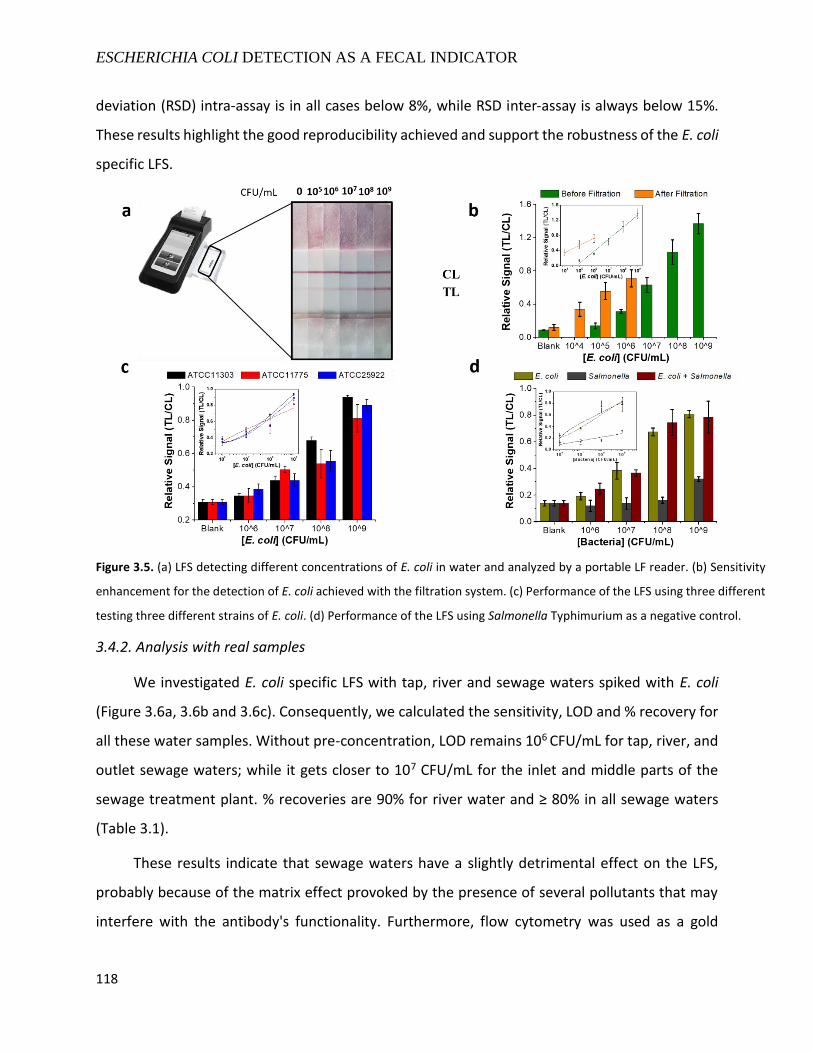
ESCHERICHIA COLI DETECTION AS A FECAL INDICATOR
118
deviation (RSD) intra-assay is in all cases below 8%, while RSD inter-assay is always below 15%.
These results highlight the good reproducibility achieved and support the robustness of the E. coli
specific LFS.
3.4.2. Analysis with real samples
We investigated E. coli specific LFS with tap, river and sewage waters spiked with E. coli
(Figure 3.6a, 3.6b and 3.6c). Consequently, we calculated the sensitivity, LOD and % recovery for
all these water samples. Without pre-concentration, LOD remains 106 CFU/mL for tap, river, and
outlet sewage waters; while it gets closer to 107 CFU/mL for the inlet and middle parts of the
sewage treatment plant. % recoveries are 90% for river water and ≥ 80% in all sewage waters
(Table 3.1).
These results indicate that sewage waters have a slightly detrimental effect on the LFS,
probably because of the matrix effect provoked by the presence of several pollutants that may
interfere with the antibody's functionality. Furthermore, flow cytometry was used as a gold
Figure 3.5. (a) LFS detecting different concentrations of E. coli in water and analyzed by a portable LF reader. (b) Sensitivity
enhancement for the detection of E. coli achieved with the filtration system. (c) Performance of the LFS using three different
testing three different strains of E. coli. (d) Performance of the LFS using Salmonella Typhimurium as a negative control.
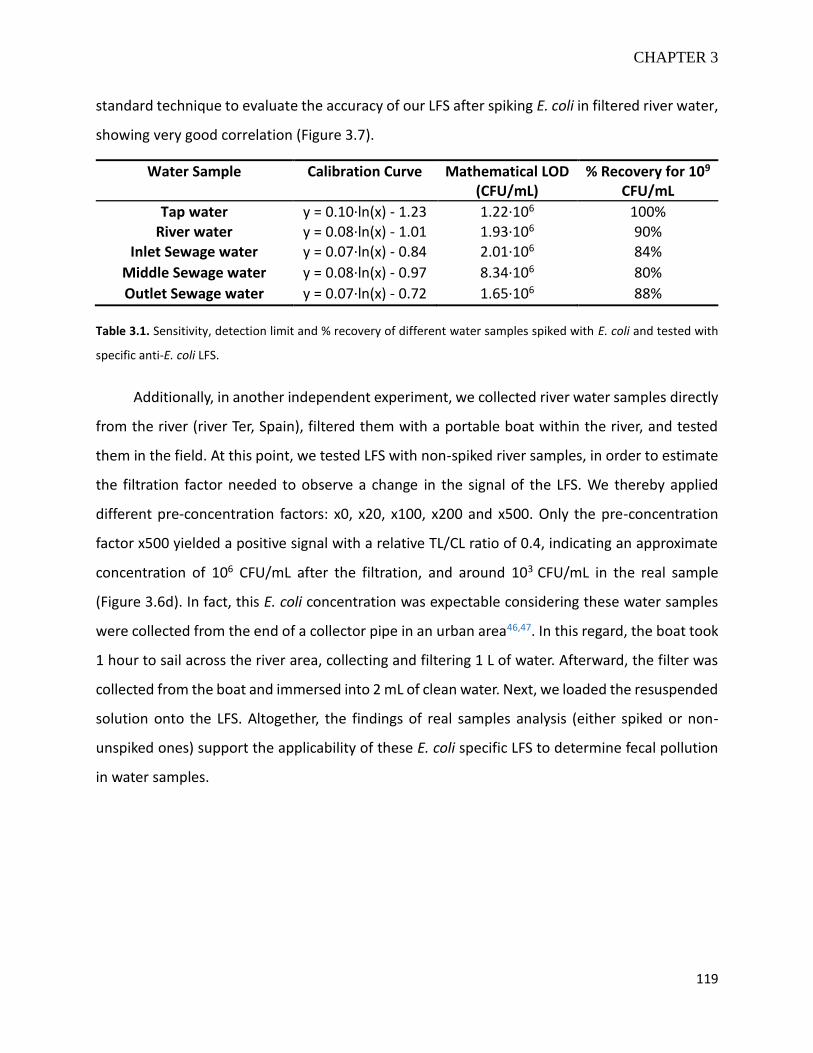
CHAPTER 3
119
standard technique to evaluate the accuracy of our LFS after spiking E. coli in filtered river water,
showing very good correlation (Figure 3.7).
Water Sample Calibration Curve Mathematical LOD (CFU/mL)
% Recovery for 109 CFU/mL
Tap water y = 0.10·ln(x) - 1.23 1.22·106 100% River water y = 0.08·ln(x) - 1.01 1.93·106 90%
Inlet Sewage water y = 0.07·ln(x) - 0.84 2.01·106 84%
Middle Sewage water y = 0.08·ln(x) - 0.97 8.34·106 80%
Outlet Sewage water y = 0.07·ln(x) - 0.72 1.65·106 88%
Table 3.1. Sensitivity, detection limit and % recovery of different water samples spiked with E. coli and tested with
specific anti-E. coli LFS.
Additionally, in another independent experiment, we collected river water samples directly
from the river (river Ter, Spain), filtered them with a portable boat within the river, and tested
them in the field. At this point, we tested LFS with non-spiked river samples, in order to estimate
the filtration factor needed to observe a change in the signal of the LFS. We thereby applied
different pre-concentration factors: x0, x20, x100, x200 and x500. Only the pre-concentration
factor x500 yielded a positive signal with a relative TL/CL ratio of 0.4, indicating an approximate
concentration of 106 CFU/mL after the filtration, and around 103 CFU/mL in the real sample
(Figure 3.6d). In fact, this E. coli concentration was expectable considering these water samples
were collected from the end of a collector pipe in an urban area46,47. In this regard, the boat took
1 hour to sail across the river area, collecting and filtering 1 L of water. Afterward, the filter was
collected from the boat and immersed into 2 mL of clean water. Next, we loaded the resuspended
solution onto the LFS. Altogether, the findings of real samples analysis (either spiked or non-
unspiked ones) support the applicability of these E. coli specific LFS to determine fecal pollution
in water samples.
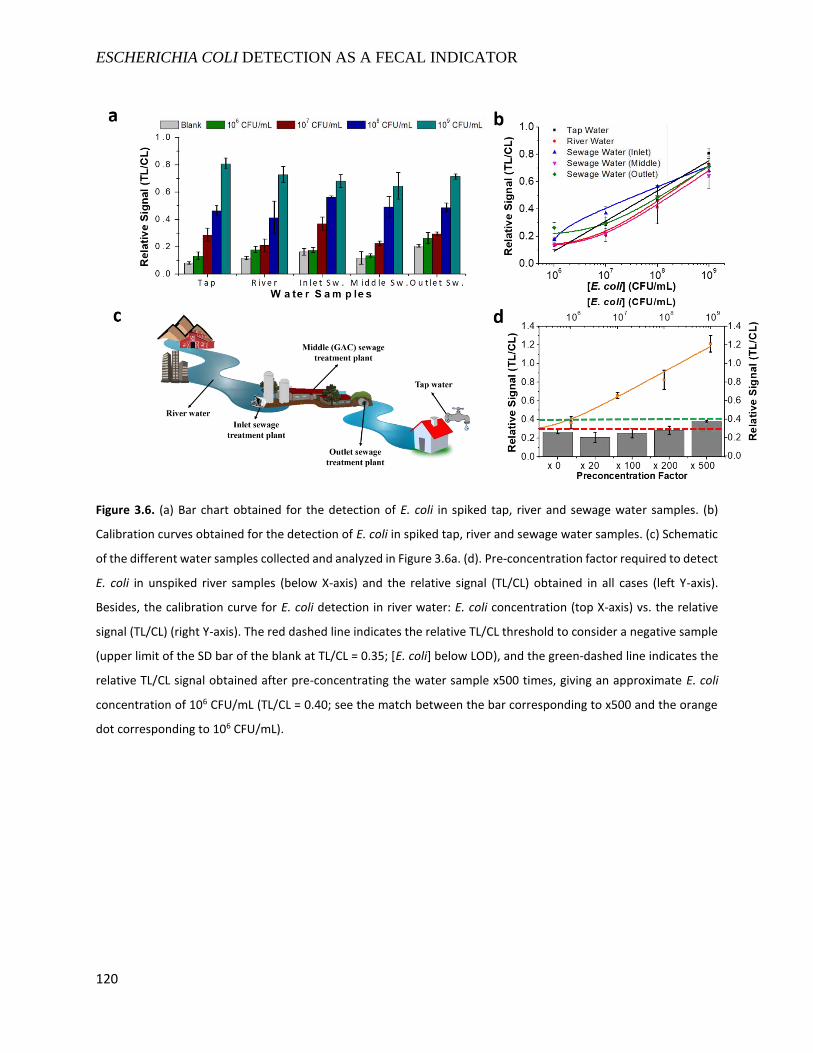
ESCHERICHIA COLI DETECTION AS A FECAL INDICATOR
120
Figure 3.6. (a) Bar chart obtained for the detection of E. coli in spiked tap, river and sewage water samples. (b)
Calibration curves obtained for the detection of E. coli in spiked tap, river and sewage water samples. (c) Schematic
of the different water samples collected and analyzed in Figure 3.6a. (d). Pre-concentration factor required to detect
E. coli in unspiked river samples (below X-axis) and the relative signal (TL/CL) obtained in all cases (left Y-axis).
Besides, the calibration curve for E. coli detection in river water: E. coli concentration (top X-axis) vs. the relative
signal (TL/CL) (right Y-axis). The red dashed line indicates the relative TL/CL threshold to consider a negative sample
(upper limit of the SD bar of the blank at TL/CL = 0.35; [E. coli] below LOD), and the green-dashed line indicates the
relative TL/CL signal obtained after pre-concentrating the water sample x500 times, giving an approximate E. coli
concentration of 106 CFU/mL (TL/CL = 0.40; see the match between the bar corresponding to x500 and the orange
dot corresponding to 106 CFU/mL).
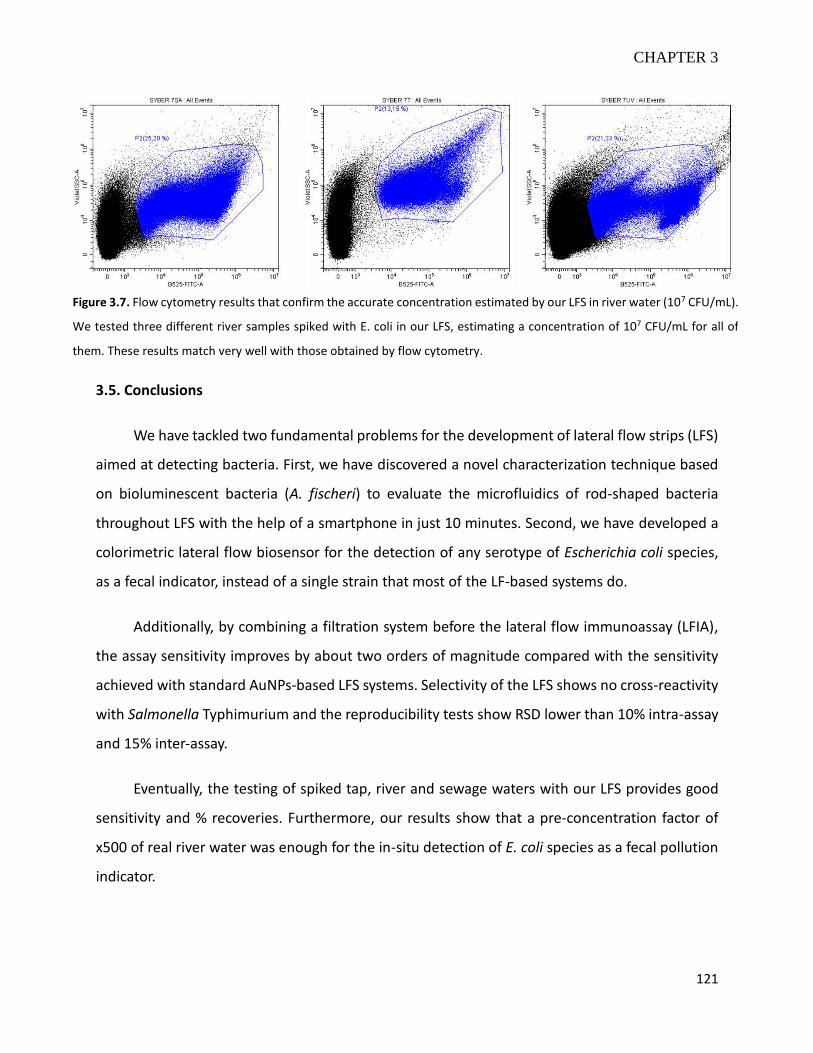
CHAPTER 3
121
3.5. Conclusions
We have tackled two fundamental problems for the development of lateral flow strips (LFS)
aimed at detecting bacteria. First, we have discovered a novel characterization technique based
on bioluminescent bacteria (A. fischeri) to evaluate the microfluidics of rod-shaped bacteria
throughout LFS with the help of a smartphone in just 10 minutes. Second, we have developed a
colorimetric lateral flow biosensor for the detection of any serotype of Escherichia coli species,
as a fecal indicator, instead of a single strain that most of the LF-based systems do.
Additionally, by combining a filtration system before the lateral flow immunoassay (LFIA),
the assay sensitivity improves by about two orders of magnitude compared with the sensitivity
achieved with standard AuNPs-based LFS systems. Selectivity of the LFS shows no cross-reactivity
with Salmonella Typhimurium and the reproducibility tests show RSD lower than 10% intra-assay
and 15% inter-assay.
Eventually, the testing of spiked tap, river and sewage waters with our LFS provides good
sensitivity and % recoveries. Furthermore, our results show that a pre-concentration factor of
x500 of real river water was enough for the in-situ detection of E. coli species as a fecal pollution
indicator.
Figure 3.7. Flow cytometry results that confirm the accurate concentration estimated by our LFS in river water (107 CFU/mL).
We tested three different river samples spiked with E. coli in our LFS, estimating a concentration of 107 CFU/mL for all of
them. These results match very well with those obtained by flow cytometry.
ESCHERICHIA COLI DETECTION AS A FECAL INDICATOR
122
3.6. References
1. World Health Organization. Drinking-water. https://www.who.int/news-room/fact-sheets/detail/drinking-
water. Published 2019.
2. Garcia-Armisen T, Prats J, Servais P. Comparison of culturable fecal coliforms and Escherichia coli
enumeration in freshwaters. Can J Microbiol. 2007;53(6):798-801. doi:10.1139/W07-033
3. Environmental Protection Agency (EPA). Recreational Water Quality Criteria. 2011:1-63.
4. Bernasconi C, Daverio E, Ghiani M. Microbiology Dimension in EU Water Directives.; 2003.
5. Hendricks R, Pool EJ. The effectiveness of sewage treatment processes to remove faecal pathogens and
antibiotic residues. J Environ Sci Heal Part A. 2012;47:289-297. doi:10.1080/10934529.2012.637432
6. Hassan AHA, Bergua JF, Morales-Narváez E, Merkoçi A. Validity of a single antibody-based lateral flow
immunoassay depending on graphene oxide for highly sensitive determination of E. coli O157:H7 in minced
beef and river water. Food Chem. 2019;297(124965):1-10. doi:10.1016/j.foodchem.2019.124965
7. Koczula KM, Gallotta A. Lateral flow assays. Essays Biochem. 2016;60:111-120. doi:10.1042/EBC20150012
8. Quesada-González D, Merkoçi A. Nanoparticle-based lateral flow biosensors. Biosens Bioelectron.
2015;73:47-63. doi:10.1016/j.bios.2015.05.050
9. Song C, Liu C, Wu S, et al. Development of a lateral flow colloidal gold immunoassay strip for the
simultaneous detection of Shigella boydii and Escherichia coli O157: H7 in bread, milk and jelly samples. Food
Control. 2016;59:345-351. doi:10.1016/j.foodcont.2015.06.012
10. Bu T, Huang Q, Yan L, et al. Applicability of biological dye tracer in strip biosensor for ultrasensitive detection
of pathogenic bacteria. Food Chem. 2019;274:816-821. doi:10.1016/j.foodchem.2018.09.066
11. Quesada-González D, Sena-Torralba A, Wicaksono WP, de la Escosura-Muñiz A, Ivandini TA, Merkoçi A.
Iridium oxide (IV) nanoparticle-based lateral flow immunoassay. Biosens Bioelectron. 2019;132:132-135.
doi:10.1016/j.bios.2019.02.049
12. Gupta A, Moyano DF, Parnsubsakul A, et al. Ultra-stable and Biofunctionalizable Gold Nanoparticles. ACS
Appl Mater Interfaces. 2018;8(22):14096-14101. doi:10.1021/acsami.6b02548.
13. Ciaurriz P, Fernández F, Tellechea E, Moran JF, Asensio AC. Comparison of four functionalization methods of
gold nanoparticles for enhancing the enzyme-linked immunosorbent assay (ELISA). Beilstein J Nanotechnol.
2017;8:244-253. doi:10.3762/bjnano.8.27
14. Jazayeri MH, Amani H, Pourfatollah AA, Pazoki-Toroudi H, Sedighimoghaddam B. Various methods of gold
nanoparticles (GNPs) conjugation to antibodies. Sens Bio-Sensing Res. 2016;9:17-22.
doi:10.1016/j.sbsr.2016.04.002

CHAPTER 3
123
15. Gan H, Wu J, Ju H. Proximity hybridization-induced on particle DNA walker for ultrasensitive protein
detection. Anal Chim Acta. 2019;1074:142-149. doi:10.1016/j.aca.2019.05.013
16. Quesada-González D, Jairo GA, Blake RC, Blake DA, Merkoçi A. Uranium (VI) detection in groundwater using
a gold nanoparticle/paper-based lateral flow device. Sci Rep. 2018;8(16157):1-8. doi:10.1038/s41598-018-
34610-5
17. Shayesteh OH, Ghavami R. Two colorimetric ampicillin sensing schemes based on the interaction of aptamers
with gold nanoparticles. Microchim Acta. 2019;186(485):1-10. doi:10.1007/s00604-019-3524-4
18. Zhu L, Li S, Shao X, et al. Colorimetric detection and typing of E. coli lipopolysaccharides based on a dual
aptamer-functionalized gold nanoparticle probe. Microchim Acta. 2019;186(111):1-6. doi:10.1007/s00604-
018-3212-9
19. Morales-Narváez E, Naghdi T, Zor E, Merkoçi A. Photoluminescent Lateral-Flow Immunoassay Revealed by
Graphene Oxide: Highly Sensitive Paper-Based Pathogen Detection. Anal Chem. 2015;87(16):8573-8577.
doi:10.1021/acs.analchem.5b02383
20. Gong Y, Zheng Y, Jin B, et al. A portable and universal upconversion nanoparticle-based lateral flow assay
platform for point-of-care testing. Talanta. 2019;201:126-133. doi:10.1016/j.talanta.2019.03.105
21. Wang R, Kim K, Choi N, et al. Highly sensitive detection of high-risk bacterial pathogens using SERS-based
lateral flow assay strips. Sensors Actuators, B Chem. 2018;270:72-79. doi:10.1016/j.snb.2018.04.162
22. Romer Labs C. RapidChek. https://www.romerlabs.com/shop/inter_en/test-kits/lateral-flow-devices/.
23. Merk Millipore C. Singlepath. http://www.merckmillipore.com/ES/es/search/singlepath/.
24. Noack Group C. Reveal 2.0. https://www.noackgroup.com/product/reveal-2-0-for-e-coli-o157h7-lateral-
flow-strip-test/.
25. BioControl C. VIP Gold. http://www.biocontrolsys.com/assets/uploads/14050855166-vip-gold-ehec-dfu-
rev-01.pdf.
26. Hnasko R, Lin A V., McGarvey JA. Rapid Detection of Staphylococcal Enterotoxin-B by Lateral Flow Assay.
Monoclon Antib Immunodiagn Immunother. 2019;38(5):209-212. doi:10.1089/mab.2019.0028
27. Wang J, Zhou J, Chen Y, et al. Rapid one-step enzyme immunoassay and lateral flow
immunochromatographic assay for colistin in animal feed and food. J Anim Sci Biotechnol. 2019;10(82):1-10.
doi:10.1186/s40104-019-0389-7
28. Khlebtsov BN, Bratashov DN, Byzova NA, Dzantiev BB, Khlebtsov NG. SERS-based lateral flow immunoassay
of troponin I by using gap-enhanced Raman tags. Nano Res. 2019;12(2):413-420. doi:10.1007/s12274-018-
2232-4
29. Bu T, Jia P, Liu J, et al. Diversely positive-charged gold nanoparticles based biosensor: A label-free and
ESCHERICHIA COLI DETECTION AS A FECAL INDICATOR
124
sensitive tool for foodborne pathogen detection. Food Chem X. 2019;3(100052):1-8.
doi:10.1016/j.fochx.2019.100052
30. Moongkarndi P, Rodpai E, Kanarat S. Evaluation of an immunochromatographic assay for rapid detection of
Salmonella enterica serovars Typhimurium and Enteritidis. J Vet Diagnostic Investig. 2011;23(4):797-801.
doi:10.1177/1040638711408063
31. Qi H, Zhong Z, Zhou H-X, et al. A rapid and highly sensitive protocol for the detection of Escherichia coli
O157:H7 based on immunochromatography assay combined with the enrichment technique of
immunomagnetic nanoparticles. Int J Nanomedicine. 2011;6:3033-3039. doi:10.2147/ijn.s25684
32. Wang J, Katani R, Li L, et al. Rapid detection of Escherichia coli O157 and shiga toxins by lateral flow
immunoassays. Toxins (Basel). 2016;8(92):1-10. doi:10.3390/toxins8040092
33. Singh J, Sharma S, Nara S. Evaluation of gold nanoparticle based lateral flow assays for diagnosis of
enterobacteriaceae members in food and water. Food Chem. 2015;170:470-483.
34. Pacific Immunology C. Polyclonal vs. Monoclonal Antibodies.
https://www.pacificimmunology.com/resources/antibody-introduction/polyclonal-vs-monoclonal-
antibodies/. Published 2019.
35. R Foundation for Statistical Computing. R Core Team: A language and environment for statistical computing.
2017. https://www.r-project.org/.
36. Chen W, Zhang J, Lu G, et al. Development of an immunochromatographic lateral flow device for rapid
diagnosis of Vibrio cholerae O1 serotype Ogawa. Clin Biochem. 2014;47:448-454.
doi:10.1016/j.clinbiochem.2013.12.022
37. Yee C, Yong G, Lim A, et al. Dry-reagent gold nanoparticle-based lateral flow biosensor for the simultaneous
detection of Vibrio cholerae serogroups O1 and O139. J Microbiol Methods. 2011;86(3):277-282.
doi:10.1016/j.mimet.2011.04.020
38. Liu C, Yeung C, Chen P, Yeh M, Hou S. Salmonella detection using 16S ribosomal DNA / RNA probe-gold
nanoparticles and lateral flow immunoassay. Food Chem. 2013;141(3):2526-2532.
doi:10.1016/j.foodchem.2013.05.089
39. Bast NG, Comenge J, Puntes V. Kinetically Controlled Seeded Growth Synthesis of Citrate-Stabilized Gold
Nanoparticles of up to 200 nm: Size Focusing versus Ostwald Ripening. Langmuir. 2011;27:11098-11105.
40. Bald I. Effect of Adsorption Kinetics on Dissociation of DNA-Nucleobases on Gold Nanoparticles under Pulsed
Laser Illumination Effect of adsorption kinetics on dissociation of. Phys Chem Chem Phys. 2017;19:10796-
10803. doi:10.1039/C6CP08433H
41. Preechakasedkit P, Pinwattana K, Dungchai W, et al. Development of a one-step immunochromatographic
strip test using gold nanoparticles for the rapid detection of Salmonella typhi in human serum. Biosens
CHAPTER 3
125
Bioelectron. 2012;31(1):562-566. doi:10.1016/j.bios.2011.10.031
42. Wang W, Liu L, Song S, et al. Identification and quantification of eight Listeria monocytogene serotypes from
Listeria spp. using a gold nanoparticle-based lateral flow assay. Microchim Acta. 2017;184:715-724.
doi:10.1007/s00604-016-2028-8
43. Gong Y, Hu J, Choi JR, et al. Improved LFIAs for highly sensitive detection of BNP at point-of-care. Int J
Nanomedicine. 2017;12:4455-4466. doi:10.2147/IJN.S135735
44. Armbruster DA, Pry T. Limit of Blank, Limit of Detection and Limit of Quantitation. Clin Biochem. 2008;29:S49-
S52.
http://www.ncbi.nlm.nih.gov/pubmed/18852857%0Ahttp://www.pubmedcentral.nih.gov/articlerender.fc
gi?artid=PMC2556583.
45. Park J, Shin JH, Park J. Pressed Paper-Based Dipstick for Detection of Foodborne Pathogens with Multistep
Reactions. Anal Biochem. 2016;88:3781-3788. doi:10.1021/acs.analchem.5b04743
46. Ofred JM, Robinson HM, Lughano JMK, Anita F, Anders D. Removal of Escherichia coli in treated wastewater
used for food production in Morogoro, Tanzania. African J Microbiol Res. 2016;10(33):1344-1350.
doi:10.5897/ajmr2016.8156
47. Cirelli GL, Consoli S, Juanicó M. Modelling Escherichia coli concentration in a wastewater reservoir using an
operational parameter MRT%FE and first order kinetics. J Environ Manage. 2009;90:604-614.
doi:10.1016/j.jenvman.2007.12.015


CHAPTER 4. WATER TOXICITY ASSESSMENT
CHAPTER 4........................................................................................ Error! Bookmark not defined.
Water Toxicity Assessment .............................................................. Error! Bookmark not defined.
4.1. Introduction ........................................................................... Error! Bookmark not defined.
4.2. Materials and methods ......................................................... Error! Bookmark not defined.
4.2.1. Materials ......................................................................... Error! Bookmark not defined.
4.2.2. Bacteria culture and storage .......................................... Error! Bookmark not defined.
4.2.3. Toxicity assays ................................................................ Error! Bookmark not defined.
4.3. Bioluminescence enhancement, stability, and quorum sensing characterization ....... Error! Bookmark not defined.
4.3.1. Bioluminescence enhancement using agar media ......... Error! Bookmark not defined.
4.3.2. Bioluminescence enhancement using graphene-oxide . Error! Bookmark not defined.
4.3.3. Stability enhancement by lyophilization ........................ Error! Bookmark not defined.
4.3.4. Characterization of the quorum-sensing system ........... Error! Bookmark not defined.
4.4. Toxicity assays and sensitivity enhancement using graphene-oxide ... Error! Bookmark not defined.
4.4.1. Optimization of the toxicity assay conditions ................ Error! Bookmark not defined.
4.4.2. Smartphone-based toxicity assays ................................. Error! Bookmark not defined.
4.4.3. Sensitivity enhancement of the toxicity assays using graphene oxide (GO) ......... Error! Bookmark not defined.
4.5. Conclusions ............................................................................ Error! Bookmark not defined.
4.6. References ............................................................................. Error! Bookmark not defined.


CHAPTER 4
129
CHAPTER 4
Water Toxicity Assessment

CHAPTER 4
131
This chapter summarizes the development and optimization of a bioluminescent
biosensor based on Aliivibrio fischeri for water toxicity assessment. The chapter is divided into
i) a short introduction to set out the topic and the current needs, as well as the presented
proposal; ii) materials and methods; iii) the experimental results related to the
bioluminescence enhancement, study of stability, and quorum sensing characterization; iv)
the performance of the toxicity assays and the sensitivity enhancement using graphene-oxide;
v) the conclusions of the chapter, and vi) the references.
4.1. Introduction
Aliivibrio fischeri (A. fischeri) is a bioluminescent bacterium found in marine waters
around the world. Its bioluminescence relies on a biochemical reaction in which light is
produced by the enzymatic oxidation of long-chain aldehydes, carried out by the luciferase
enzyme1–3. Genetic expression of A. fischeri bioluminescent luciferase is triggered by the
quorum-sensing system4,5, which switches on/off genetic expression according to the cellular
density6–8. Quorum sensing can be considered as a chemical-based inter-cellular
communication system, where the bioluminescence production is an indicator of the health
state of the bacterial population. On the other hand, many toxic compounds are known to
interfere with different enzymatic processes in living organisms9–12. Since any enzymatic
inhibition will decrease cellular fitness and bioluminescence is directly related to A. fischeri
metabolic activity, any toxic compounds to the bacteria present in the media will unleash
bioluminescence reduction. Therefore, the presence of toxic compounds in water samples can
be analyzed according to the bioluminescence output of A. fischeri13–18.
In this regard, both enzymatic and microbial luciferase-based toxicity sensors have been
developed19–22. Nonetheless, there are important differences between enzymatic and
microbial sensors: while enzymatic sensors generally provide higher sensitivity and shorter
detection time19,20, microbial sensors are often much cheaper, more resistant to pH and
temperature changes, self-renewable and do not require extraction and purification steps21–
24. An important constraint of enzymatic luciferase-based sensors is that they only rely on
those compounds able to inhibit the luciferase activity25. However, A. fischeri-based sensors
rely on any compounds able to interfere with any important metabolic pathway of the
WATER TOXICITY ASSESSMENT
132
bacteria, broadening the number of possible compounds to be detected. The first
commercialized microbial-based toxicity-test-kit, called Microtox, was developed by Azur
Environmental in 197926. Since then, several products based on the bioluminescent A. fischeri
system have been launched to the market27–29. However, sensitivity and stability are often two
major problems of these technologies30,31. In addition, most microbial bioluminescent-based
sensors require long-response times and provide limited bioluminescent outputs, often
hindering real usefulness for in-situ analysis18,22,32.
To overcome some of these limitations, researchers have been trying to enhance
bioluminescence and bacterial growth in quorum sensing-based systems. In this regard,
bacterial growth and the bioluminescent output can be enhanced by using molecular biology
tools and relying on very sensitive devices to capture the emitted light20,32–37. For example,
bacterial growth can be promoted by adding immiscible oxygenated oils38, organic chemical
compounds39, graphene-oxide40 (GO), and nanopaper41 to the media. In fact, GO has been
reported to be either a biocompatible40,42,43 or an antimicrobial/cytotoxic nanomaterial44–48.
On the one hand, some authors reported that GO behaves as a bacterial growth enhancer by
promoting cell attachment and proliferation40,49. On the other hand, other authors reported
GO toxicity, triggering the generation of reactive oxygen species (ROS) and the subsequent
cellular death45,50. Nonetheless, in most of these cases, one or a few bacterial species are
tested with an uncertain GO purity and a limited concentration range40.
There is thereby a need to enhance the sensitivity, provide greater stability, and move
to a more cost-effective approach for in-situ water toxicity analysis. Herein we study and
characterize A. fischeri’s quorum-sensing system, and boost their bioluminescence and
stability by growing the bacteria on solid media. Besides, we achieve more sensitive detection
of toxic compounds by combining A. fischeri with graphene oxide in a liquid medium. Finally,
we were able to demonstrate applicability for in the field analysis by using a smartphone
camera to detect and analyze the bioluminescence outputs.
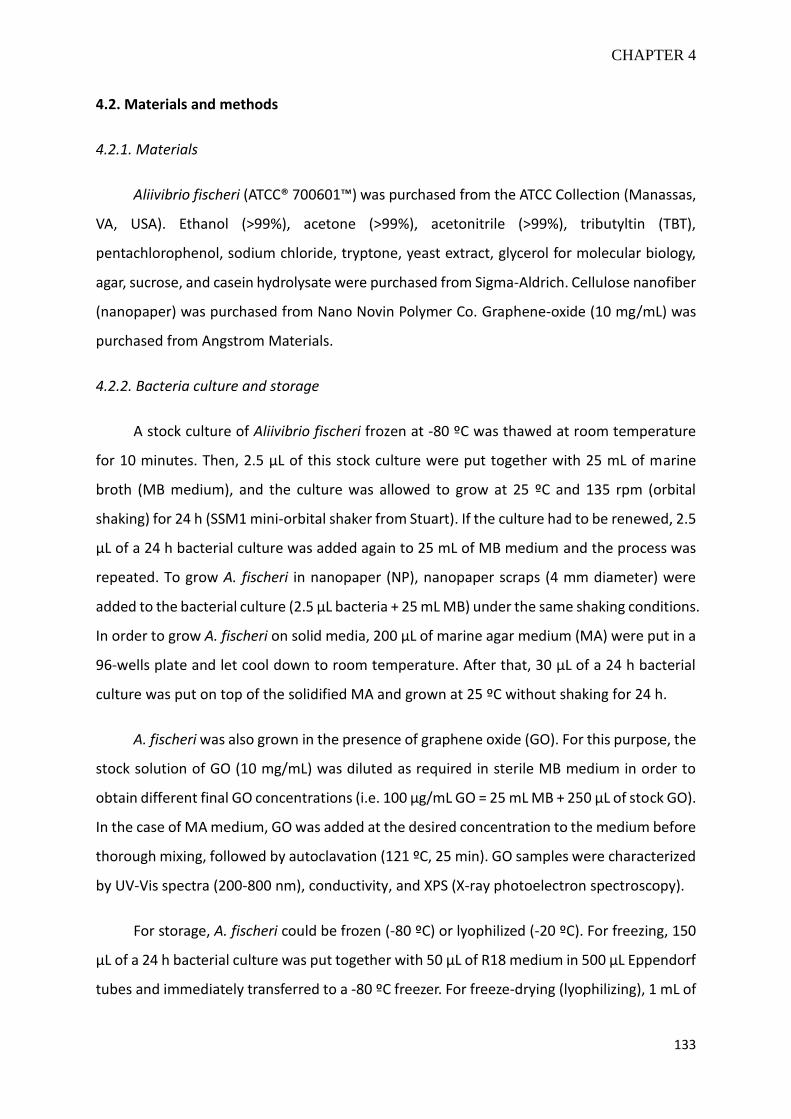
CHAPTER 4
133
4.2. Materials and methods
4.2.1. Materials
Aliivibrio fischeri (ATCC® 700601™) was purchased from the ATCC Collection (Manassas,
VA, USA). Ethanol (>99%), acetone (>99%), acetonitrile (>99%), tributyltin (TBT),
pentachlorophenol, sodium chloride, tryptone, yeast extract, glycerol for molecular biology,
agar, sucrose, and casein hydrolysate were purchased from Sigma-Aldrich. Cellulose nanofiber
(nanopaper) was purchased from Nano Novin Polymer Co. Graphene-oxide (10 mg/mL) was
purchased from Angstrom Materials.
4.2.2. Bacteria culture and storage
A stock culture of Aliivibrio fischeri frozen at -80 ºC was thawed at room temperature
for 10 minutes. Then, 2.5 µL of this stock culture were put together with 25 mL of marine
broth (MB medium), and the culture was allowed to grow at 25 ºC and 135 rpm (orbital
shaking) for 24 h (SSM1 mini-orbital shaker from Stuart). If the culture had to be renewed, 2.5
µL of a 24 h bacterial culture was added again to 25 mL of MB medium and the process was
repeated. To grow A. fischeri in nanopaper (NP), nanopaper scraps (4 mm diameter) were
added to the bacterial culture (2.5 µL bacteria + 25 mL MB) under the same shaking conditions.
In order to grow A. fischeri on solid media, 200 µL of marine agar medium (MA) were put in a
96-wells plate and let cool down to room temperature. After that, 30 µL of a 24 h bacterial
culture was put on top of the solidified MA and grown at 25 ºC without shaking for 24 h.
A. fischeri was also grown in the presence of graphene oxide (GO). For this purpose, the
stock solution of GO (10 mg/mL) was diluted as required in sterile MB medium in order to
obtain different final GO concentrations (i.e. 100 µg/mL GO = 25 mL MB + 250 µL of stock GO).
In the case of MA medium, GO was added at the desired concentration to the medium before
thorough mixing, followed by autoclavation (121 ºC, 25 min). GO samples were characterized
by UV-Vis spectra (200-800 nm), conductivity, and XPS (X-ray photoelectron spectroscopy).
For storage, A. fischeri could be frozen (-80 ºC) or lyophilized (-20 ºC). For freezing, 150
µL of a 24 h bacterial culture was put together with 50 µL of R18 medium in 500 µL Eppendorf
tubes and immediately transferred to a -80 ºC freezer. For freeze-drying (lyophilizing), 1 mL of
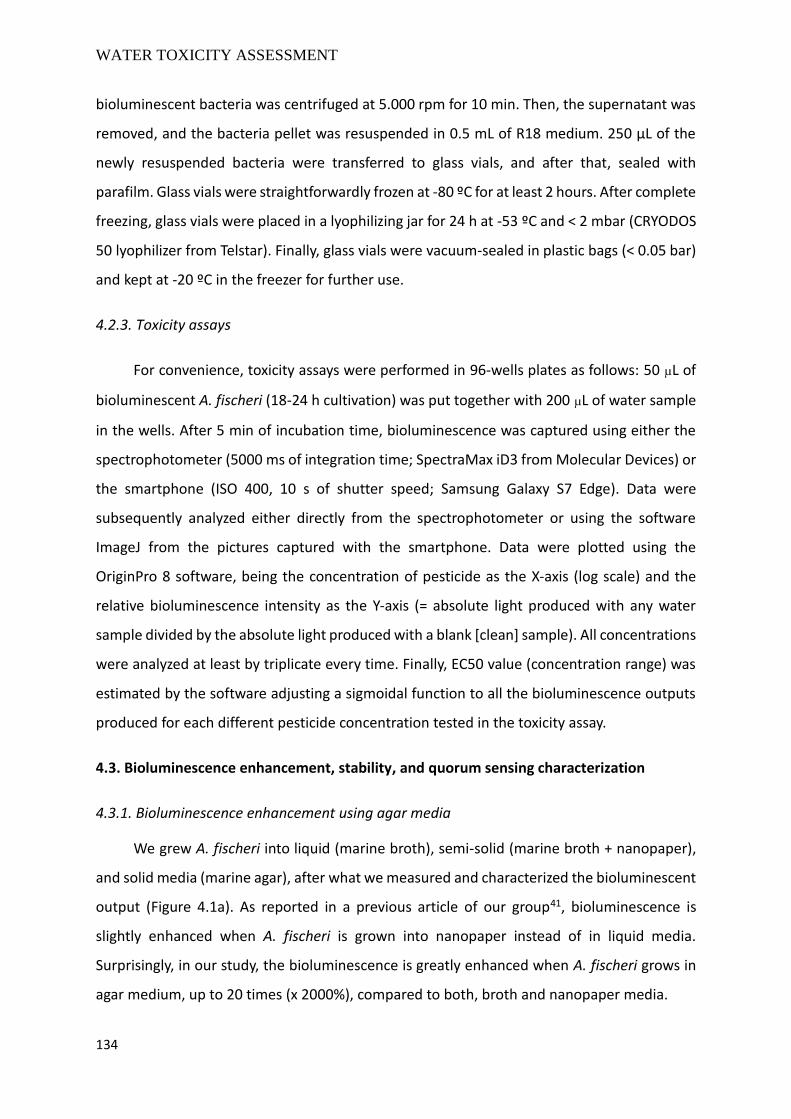
WATER TOXICITY ASSESSMENT
134
bioluminescent bacteria was centrifuged at 5.000 rpm for 10 min. Then, the supernatant was
removed, and the bacteria pellet was resuspended in 0.5 mL of R18 medium. 250 µL of the
newly resuspended bacteria were transferred to glass vials, and after that, sealed with
parafilm. Glass vials were straightforwardly frozen at -80 ºC for at least 2 hours. After complete
freezing, glass vials were placed in a lyophilizing jar for 24 h at -53 ºC and < 2 mbar (CRYODOS
50 lyophilizer from Telstar). Finally, glass vials were vacuum-sealed in plastic bags (< 0.05 bar)
and kept at -20 ºC in the freezer for further use.
4.2.3. Toxicity assays
For convenience, toxicity assays were performed in 96-wells plates as follows: 50 µL of
bioluminescent A. fischeri (18-24 h cultivation) was put together with 200 µL of water sample
in the wells. After 5 min of incubation time, bioluminescence was captured using either the
spectrophotometer (5000 ms of integration time; SpectraMax iD3 from Molecular Devices) or
the smartphone (ISO 400, 10 s of shutter speed; Samsung Galaxy S7 Edge). Data were
subsequently analyzed either directly from the spectrophotometer or using the software
ImageJ from the pictures captured with the smartphone. Data were plotted using the
OriginPro 8 software, being the concentration of pesticide as the X-axis (log scale) and the
relative bioluminescence intensity as the Y-axis (= absolute light produced with any water
sample divided by the absolute light produced with a blank [clean] sample). All concentrations
were analyzed at least by triplicate every time. Finally, EC50 value (concentration range) was
estimated by the software adjusting a sigmoidal function to all the bioluminescence outputs
produced for each different pesticide concentration tested in the toxicity assay.
4.3. Bioluminescence enhancement, stability, and quorum sensing characterization
4.3.1. Bioluminescence enhancement using agar media
We grew A. fischeri into liquid (marine broth), semi-solid (marine broth + nanopaper),
and solid media (marine agar), after what we measured and characterized the bioluminescent
output (Figure 4.1a). As reported in a previous article of our group41, bioluminescence is
slightly enhanced when A. fischeri is grown into nanopaper instead of in liquid media.
Surprisingly, in our study, the bioluminescence is greatly enhanced when A. fischeri grows in
agar medium, up to 20 times (x 2000%), compared to both, broth and nanopaper media.
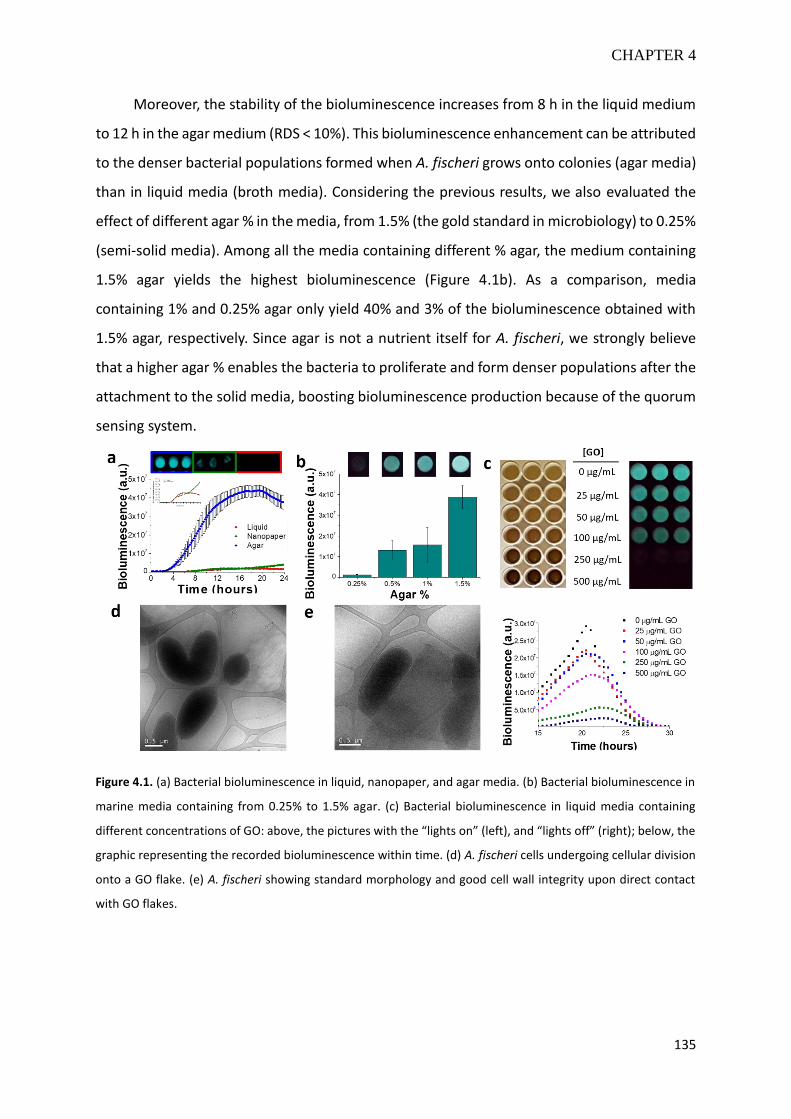
CHAPTER 4
135
Moreover, the stability of the bioluminescence increases from 8 h in the liquid medium
to 12 h in the agar medium (RDS < 10%). This bioluminescence enhancement can be attributed
to the denser bacterial populations formed when A. fischeri grows onto colonies (agar media)
than in liquid media (broth media). Considering the previous results, we also evaluated the
effect of different agar % in the media, from 1.5% (the gold standard in microbiology) to 0.25%
(semi-solid media). Among all the media containing different % agar, the medium containing
1.5% agar yields the highest bioluminescence (Figure 4.1b). As a comparison, media
containing 1% and 0.25% agar only yield 40% and 3% of the bioluminescence obtained with
1.5% agar, respectively. Since agar is not a nutrient itself for A. fischeri, we strongly believe
that a higher agar % enables the bacteria to proliferate and form denser populations after the
attachment to the solid media, boosting bioluminescence production because of the quorum
sensing system.
Figure 4.1. (a) Bacterial bioluminescence in liquid, nanopaper, and agar media. (b) Bacterial bioluminescence in
marine media containing from 0.25% to 1.5% agar. (c) Bacterial bioluminescence in liquid media containing
different concentrations of GO: above, the pictures with the “lights on” (left), and “lights off” (right); below, the
graphic representing the recorded bioluminescence within time. (d) A. fischeri cells undergoing cellular division
onto a GO flake. (e) A. fischeri showing standard morphology and good cell wall integrity upon direct contact
with GO flakes.
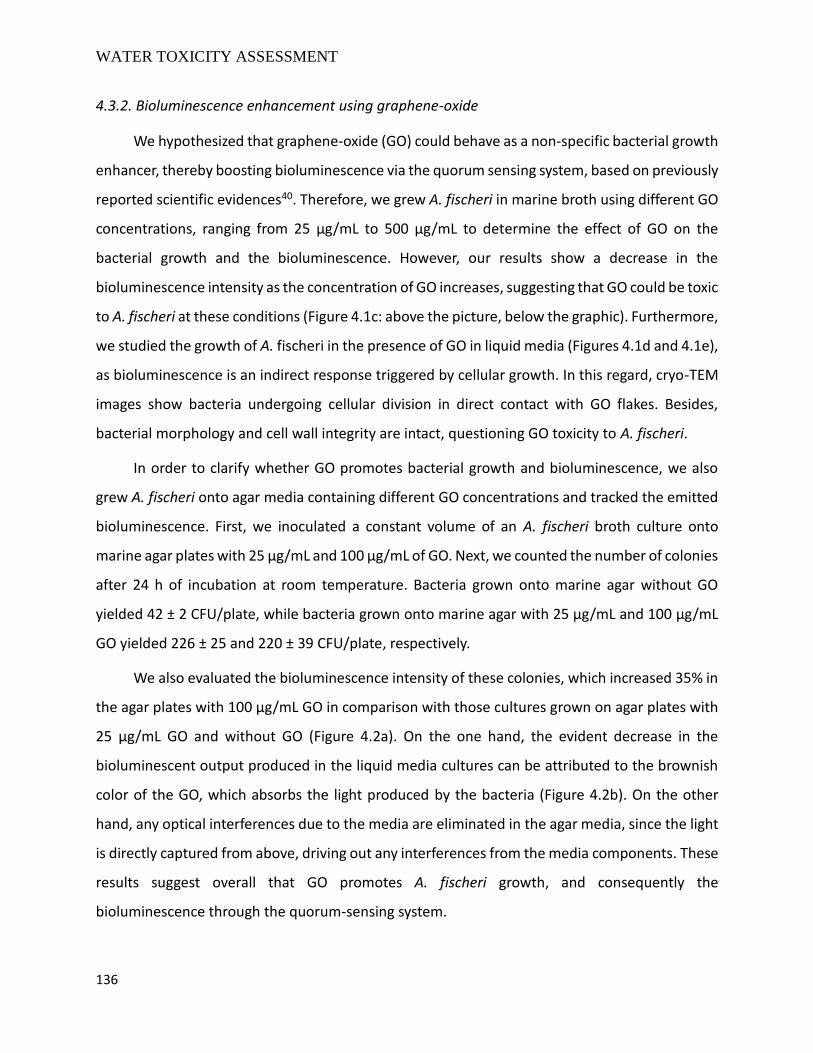
WATER TOXICITY ASSESSMENT
136
4.3.2. Bioluminescence enhancement using graphene-oxide
We hypothesized that graphene-oxide (GO) could behave as a non-specific bacterial growth
enhancer, thereby boosting bioluminescence via the quorum sensing system, based on previously
reported scientific evidences40. Therefore, we grew A. fischeri in marine broth using different GO
concentrations, ranging from 25 µg/mL to 500 µg/mL to determine the effect of GO on the
bacterial growth and the bioluminescence. However, our results show a decrease in the
bioluminescence intensity as the concentration of GO increases, suggesting that GO could be toxic
to A. fischeri at these conditions (Figure 4.1c: above the picture, below the graphic). Furthermore,
we studied the growth of A. fischeri in the presence of GO in liquid media (Figures 4.1d and 4.1e),
as bioluminescence is an indirect response triggered by cellular growth. In this regard, cryo-TEM
images show bacteria undergoing cellular division in direct contact with GO flakes. Besides,
bacterial morphology and cell wall integrity are intact, questioning GO toxicity to A. fischeri.
In order to clarify whether GO promotes bacterial growth and bioluminescence, we also
grew A. fischeri onto agar media containing different GO concentrations and tracked the emitted
bioluminescence. First, we inoculated a constant volume of an A. fischeri broth culture onto
marine agar plates with 25 µg/mL and 100 µg/mL of GO. Next, we counted the number of colonies
after 24 h of incubation at room temperature. Bacteria grown onto marine agar without GO
yielded 42 ± 2 CFU/plate, while bacteria grown onto marine agar with 25 µg/mL and 100 µg/mL
GO yielded 226 ± 25 and 220 ± 39 CFU/plate, respectively.
We also evaluated the bioluminescence intensity of these colonies, which increased 35% in
the agar plates with 100 µg/mL GO in comparison with those cultures grown on agar plates with
25 µg/mL GO and without GO (Figure 4.2a). On the one hand, the evident decrease in the
bioluminescent output produced in the liquid media cultures can be attributed to the brownish
color of the GO, which absorbs the light produced by the bacteria (Figure 4.2b). On the other
hand, any optical interferences due to the media are eliminated in the agar media, since the light
is directly captured from above, driving out any interferences from the media components. These
results suggest overall that GO promotes A. fischeri growth, and consequently the
bioluminescence through the quorum-sensing system.
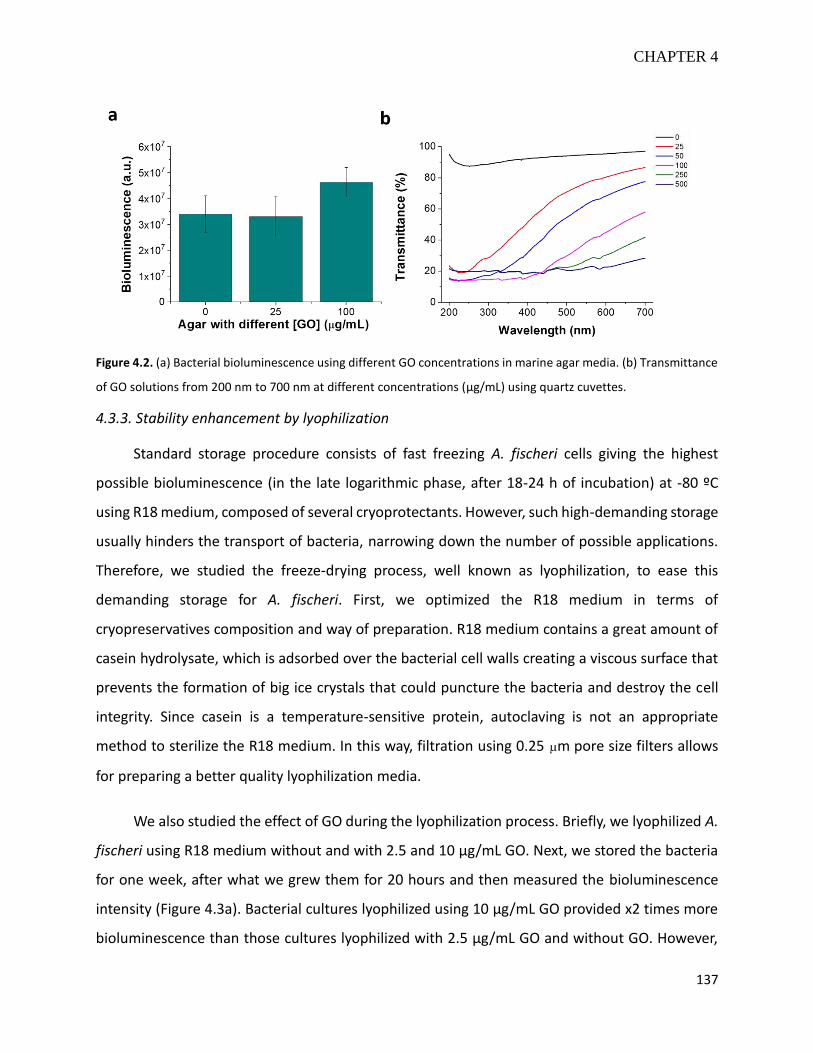
CHAPTER 4
137
Figure 4.2. (a) Bacterial bioluminescence using different GO concentrations in marine agar media. (b) Transmittance
of GO solutions from 200 nm to 700 nm at different concentrations (µg/mL) using quartz cuvettes.
4.3.3. Stability enhancement by lyophilization
Standard storage procedure consists of fast freezing A. fischeri cells giving the highest
possible bioluminescence (in the late logarithmic phase, after 18-24 h of incubation) at -80 ºC
using R18 medium, composed of several cryoprotectants. However, such high-demanding storage
usually hinders the transport of bacteria, narrowing down the number of possible applications.
Therefore, we studied the freeze-drying process, well known as lyophilization, to ease this
demanding storage for A. fischeri. First, we optimized the R18 medium in terms of
cryopreservatives composition and way of preparation. R18 medium contains a great amount of
casein hydrolysate, which is adsorbed over the bacterial cell walls creating a viscous surface that
prevents the formation of big ice crystals that could puncture the bacteria and destroy the cell
integrity. Since casein is a temperature-sensitive protein, autoclaving is not an appropriate
method to sterilize the R18 medium. In this way, filtration using 0.25 µm pore size filters allows
for preparing a better quality lyophilization media.
We also studied the effect of GO during the lyophilization process. Briefly, we lyophilized A.
fischeri using R18 medium without and with 2.5 and 10 µg/mL GO. Next, we stored the bacteria
for one week, after what we grew them for 20 hours and then measured the bioluminescence
intensity (Figure 4.3a). Bacterial cultures lyophilized using 10 µg/mL GO provided x2 times more
bioluminescence than those cultures lyophilized with 2.5 µg/mL GO and without GO. However,

WATER TOXICITY ASSESSMENT
138
control cultures to which we also added 2.5 and 10 µg/mL GO after the lyophilization for bacterial
growth provided a similar response. Then, we concluded that GO has not a strong influence on
bacterial survival rate during the lyophilization process but only acts as a growth enhancer after
rehydration.
Besides, we evaluated the influence of the storage temperature. In this regard, we
compared the bioluminescence of bacterial cultures previously frozen at -80 ºC and those
lyophilized cultures stored for one month at -20 ºC, +4ºC and +25ºC. As a result, A. fischeri
cultures stored at -20 ºC with R18 medium and 10 µg/mL GO provided as much bioluminescence
as those stored at -80 ºC by just freezing (Figure 4.3b). Nevertheless, bacterial cultures stored at
+4 ºC and +25 ºC were not viable in any of the aforementioned cases, despite we successfully
achieved milder storage with an absolute difference of 60 ºC by simply freeze-drying A. fischeri
cultures in filtered modified R18 medium containing 10 µg/mL of GO.
Figure 4.3. (a) Bacterial bioluminescence after lyophilization, rehydration and growth for 20 hours by using R18
medium prepared by either autoclavation or filtration, and either containing (10 µg/mL) or not GO. (b) Bacterial
bioluminescence after storage, rehydration, and growth for 20 hours by using fast freezing (-80 ºC) or lyophilization
(-20 ºC, +4 ºC, and +25 ºC).
4.3.4. Characterization of the quorum-sensing system
We evaluated the bioluminescence trend in time in a batch culture of A. fischeri incubated
at 25 ºC (room temperature) and 135 rpm (orbital shaking) (Figure 4.4a). Maximum
bioluminescence is achieved in the timeframe between 18 h and 24 h of cultivation; after this
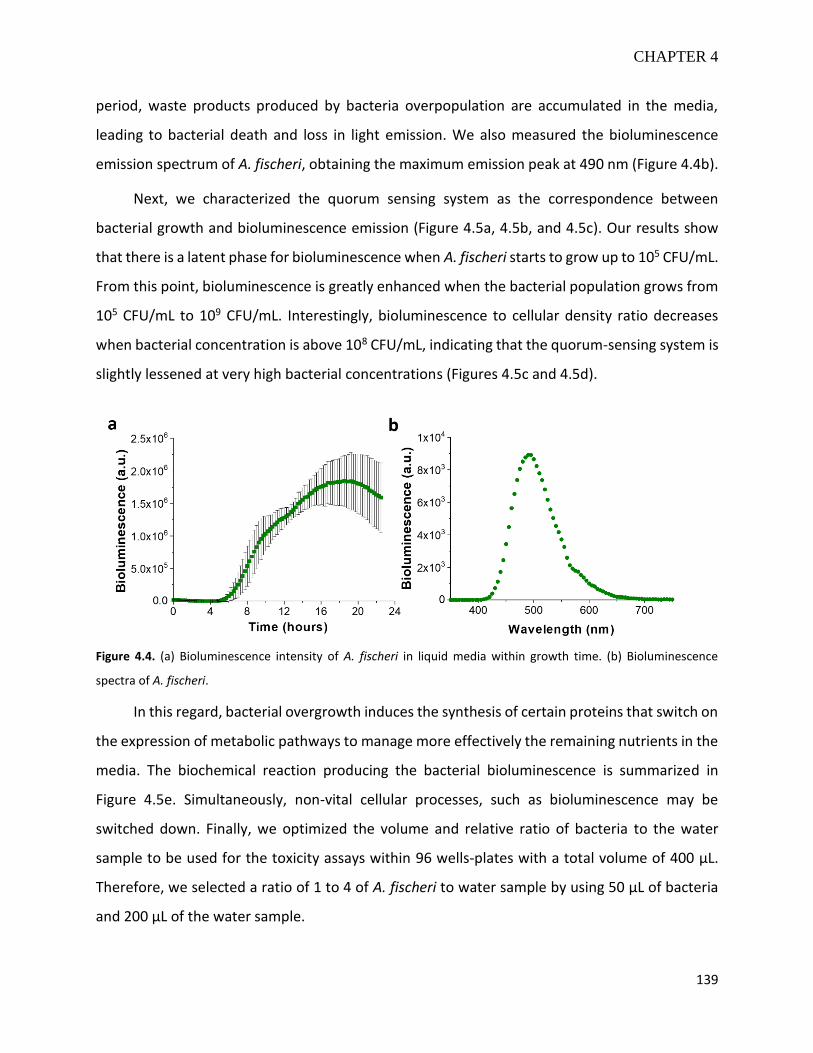
CHAPTER 4
139
period, waste products produced by bacteria overpopulation are accumulated in the media,
leading to bacterial death and loss in light emission. We also measured the bioluminescence
emission spectrum of A. fischeri, obtaining the maximum emission peak at 490 nm (Figure 4.4b).
Next, we characterized the quorum sensing system as the correspondence between
bacterial growth and bioluminescence emission (Figure 4.5a, 4.5b, and 4.5c). Our results show
that there is a latent phase for bioluminescence when A. fischeri starts to grow up to 105 CFU/mL.
From this point, bioluminescence is greatly enhanced when the bacterial population grows from
105 CFU/mL to 109 CFU/mL. Interestingly, bioluminescence to cellular density ratio decreases
when bacterial concentration is above 108 CFU/mL, indicating that the quorum-sensing system is
slightly lessened at very high bacterial concentrations (Figures 4.5c and 4.5d).
Figure 4.4. (a) Bioluminescence intensity of A. fischeri in liquid media within growth time. (b) Bioluminescence
spectra of A. fischeri.
In this regard, bacterial overgrowth induces the synthesis of certain proteins that switch on
the expression of metabolic pathways to manage more effectively the remaining nutrients in the
media. The biochemical reaction producing the bacterial bioluminescence is summarized in
Figure 4.5e. Simultaneously, non-vital cellular processes, such as bioluminescence may be
switched down. Finally, we optimized the volume and relative ratio of bacteria to the water
sample to be used for the toxicity assays within 96 wells-plates with a total volume of 400 µL.
Therefore, we selected a ratio of 1 to 4 of A. fischeri to water sample by using 50 µL of bacteria
and 200 µL of the water sample.
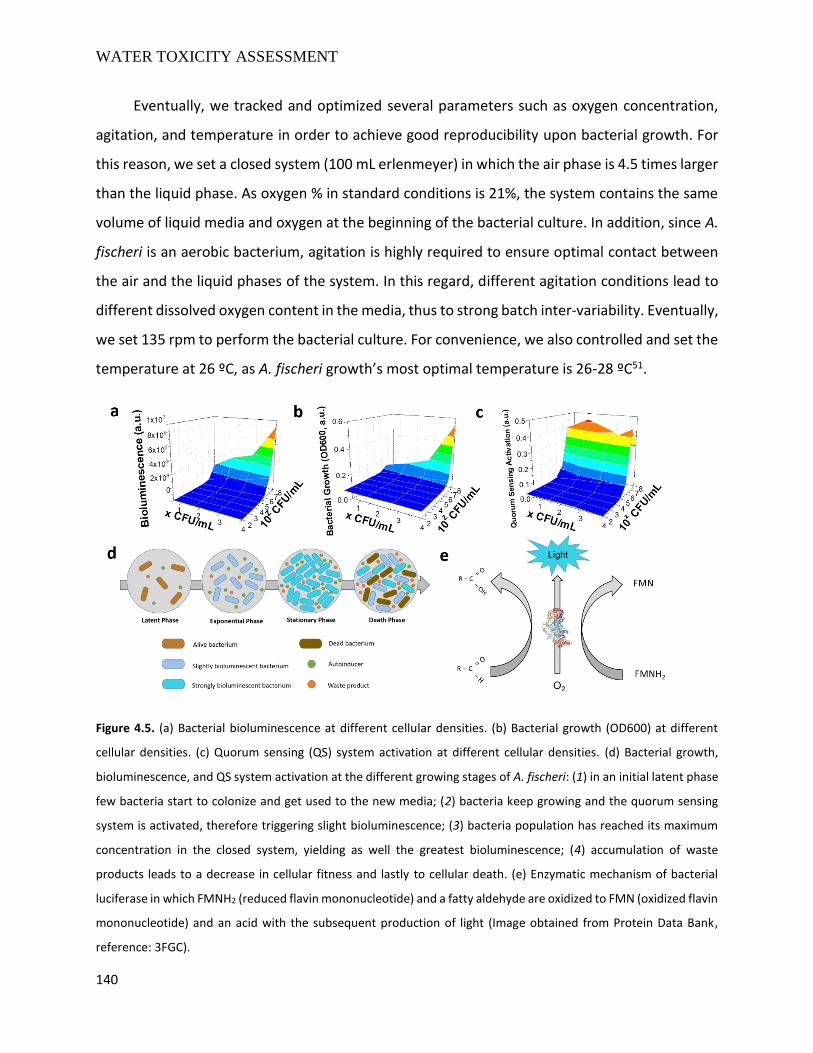
WATER TOXICITY ASSESSMENT
140
Eventually, we tracked and optimized several parameters such as oxygen concentration,
agitation, and temperature in order to achieve good reproducibility upon bacterial growth. For
this reason, we set a closed system (100 mL erlenmeyer) in which the air phase is 4.5 times larger
than the liquid phase. As oxygen % in standard conditions is 21%, the system contains the same
volume of liquid media and oxygen at the beginning of the bacterial culture. In addition, since A.
fischeri is an aerobic bacterium, agitation is highly required to ensure optimal contact between
the air and the liquid phases of the system. In this regard, different agitation conditions lead to
different dissolved oxygen content in the media, thus to strong batch inter-variability. Eventually,
we set 135 rpm to perform the bacterial culture. For convenience, we also controlled and set the
temperature at 26 ºC, as A. fischeri growth’s most optimal temperature is 26-28 ºC51.
Figure 4.5. (a) Bacterial bioluminescence at different cellular densities. (b) Bacterial growth (OD600) at different
cellular densities. (c) Quorum sensing (QS) system activation at different cellular densities. (d) Bacterial growth,
bioluminescence, and QS system activation at the different growing stages of A. fischeri: (1) in an initial latent phase
few bacteria start to colonize and get used to the new media; (2) bacteria keep growing and the quorum sensing
system is activated, therefore triggering slight bioluminescence; (3) bacteria population has reached its maximum
concentration in the closed system, yielding as well the greatest bioluminescence; (4) accumulation of waste
products leads to a decrease in cellular fitness and lastly to cellular death. (e) Enzymatic mechanism of bacterial
luciferase in which FMNH2 (reduced flavin mononucleotide) and a fatty aldehyde are oxidized to FMN (oxidized flavin
mononucleotide) and an acid with the subsequent production of light (Image obtained from Protein Data Bank,
reference: 3FGC).
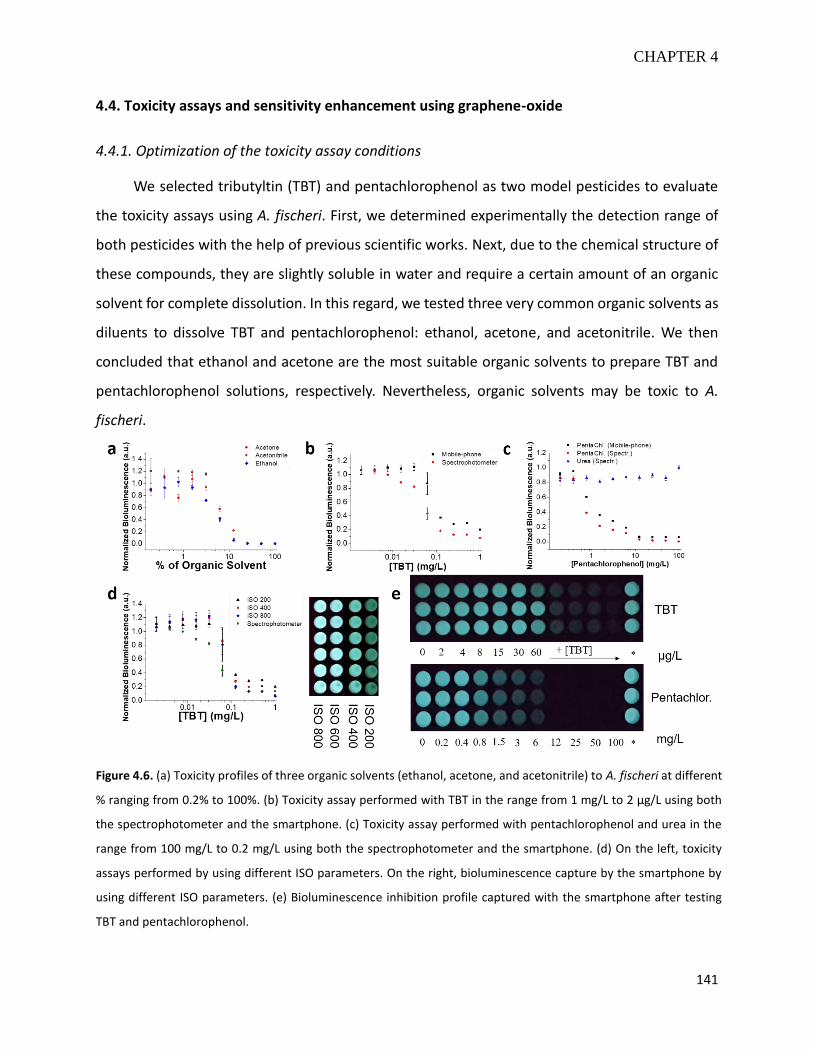
CHAPTER 4
141
4.4. Toxicity assays and sensitivity enhancement using graphene-oxide
4.4.1. Optimization of the toxicity assay conditions
We selected tributyltin (TBT) and pentachlorophenol as two model pesticides to evaluate
the toxicity assays using A. fischeri. First, we determined experimentally the detection range of
both pesticides with the help of previous scientific works. Next, due to the chemical structure of
these compounds, they are slightly soluble in water and require a certain amount of an organic
solvent for complete dissolution. In this regard, we tested three very common organic solvents as
diluents to dissolve TBT and pentachlorophenol: ethanol, acetone, and acetonitrile. We then
concluded that ethanol and acetone are the most suitable organic solvents to prepare TBT and
pentachlorophenol solutions, respectively. Nevertheless, organic solvents may be toxic to A.
fischeri.
Figure 4.6. (a) Toxicity profiles of three organic solvents (ethanol, acetone, and acetonitrile) to A. fischeri at different
% ranging from 0.2% to 100%. (b) Toxicity assay performed with TBT in the range from 1 mg/L to 2 µg/L using both
the spectrophotometer and the smartphone. (c) Toxicity assay performed with pentachlorophenol and urea in the
range from 100 mg/L to 0.2 mg/L using both the spectrophotometer and the smartphone. (d) On the left, toxicity
assays performed by using different ISO parameters. On the right, bioluminescence capture by the smartphone by
using different ISO parameters. (e) Bioluminescence inhibition profile captured with the smartphone after testing
TBT and pentachlorophenol.
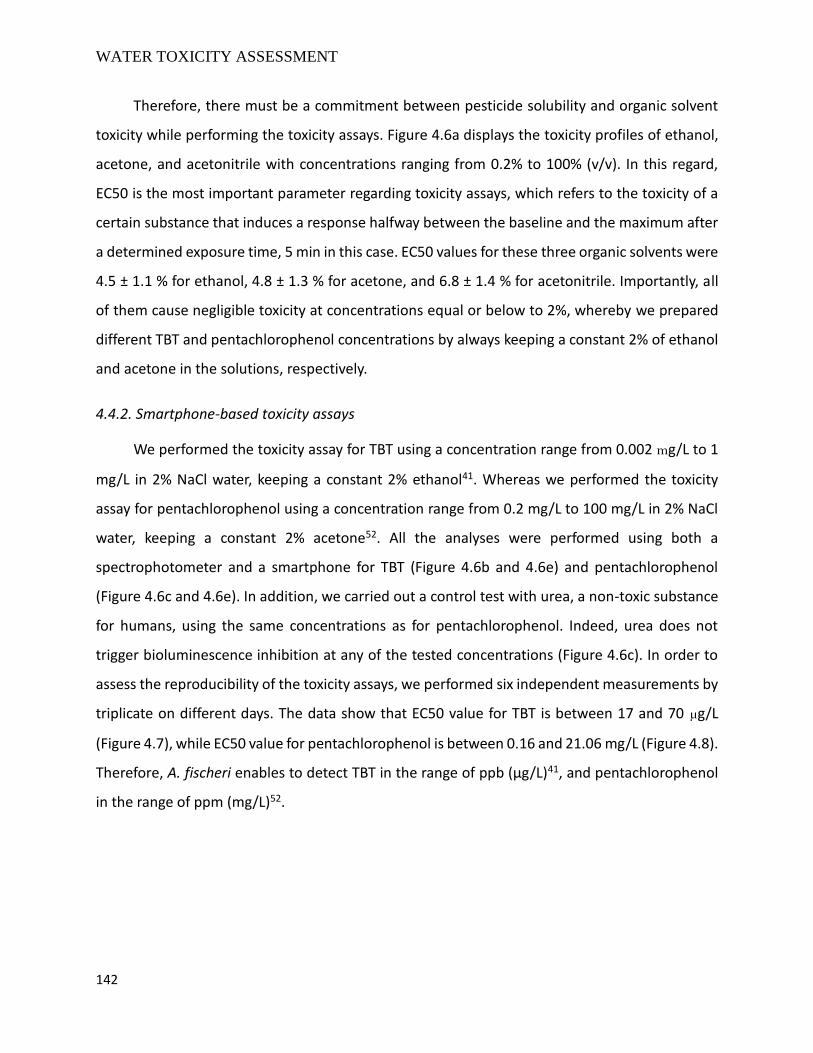
WATER TOXICITY ASSESSMENT
142
Therefore, there must be a commitment between pesticide solubility and organic solvent
toxicity while performing the toxicity assays. Figure 4.6a displays the toxicity profiles of ethanol,
acetone, and acetonitrile with concentrations ranging from 0.2% to 100% (v/v). In this regard,
EC50 is the most important parameter regarding toxicity assays, which refers to the toxicity of a
certain substance that induces a response halfway between the baseline and the maximum after
a determined exposure time, 5 min in this case. EC50 values for these three organic solvents were
4.5 ± 1.1 % for ethanol, 4.8 ± 1.3 % for acetone, and 6.8 ± 1.4 % for acetonitrile. Importantly, all
of them cause negligible toxicity at concentrations equal or below to 2%, whereby we prepared
different TBT and pentachlorophenol concentrations by always keeping a constant 2% of ethanol
and acetone in the solutions, respectively.
4.4.2. Smartphone-based toxicity assays
We performed the toxicity assay for TBT using a concentration range from 0.002 mg/L to 1
mg/L in 2% NaCl water, keeping a constant 2% ethanol41. Whereas we performed the toxicity
assay for pentachlorophenol using a concentration range from 0.2 mg/L to 100 mg/L in 2% NaCl
water, keeping a constant 2% acetone52. All the analyses were performed using both a
spectrophotometer and a smartphone for TBT (Figure 4.6b and 4.6e) and pentachlorophenol
(Figure 4.6c and 4.6e). In addition, we carried out a control test with urea, a non-toxic substance
for humans, using the same concentrations as for pentachlorophenol. Indeed, urea does not
trigger bioluminescence inhibition at any of the tested concentrations (Figure 4.6c). In order to
assess the reproducibility of the toxicity assays, we performed six independent measurements by
triplicate on different days. The data show that EC50 value for TBT is between 17 and 70 µg/L
(Figure 4.7), while EC50 value for pentachlorophenol is between 0.16 and 21.06 mg/L (Figure 4.8).
Therefore, A. fischeri enables to detect TBT in the range of ppb (µg/L)41, and pentachlorophenol
in the range of ppm (mg/L)52.
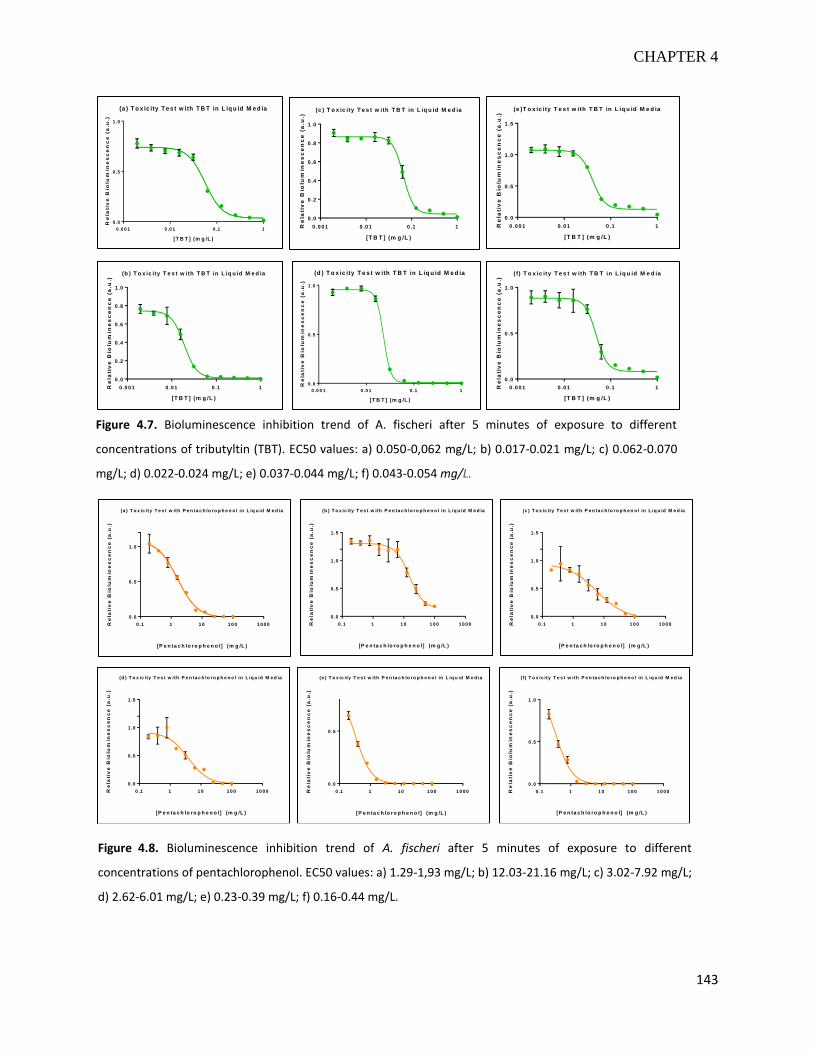
CHAPTER 4
143
0 .0 0 1 0 .0 1 0 .1 1
0 .0
0 .5
1 .0
(a ) T o x ic ity T e s t w ith T B T in L iq u id M e d ia
[T B T ] (m g /L )
Re
lativ
e B
iolu
min
es
ce
nc
e (
a.u
.)
0 .0 0 1 0 .0 1 0 .1 1
0 .0
0 .2
0 .4
0 .6
0 .8
1 .0
(b ) T o x ic ity T e s t w ith T B T in L iq u id M e d ia
[T B T ] (m g /L )
Re
lati
ve
Bio
lum
ine
sc
en
ce
(a
.u.)
0 .0 0 1 0 .0 1 0 .1 1
0 .0
0 .2
0 .4
0 .6
0 .8
1 .0
(c ) T o x ic ity T e s t w ith T B T in L iq u id M e d ia
[T B T ] (m g /L )
Re
lati
ve
Bio
lum
ine
sc
en
ce
(a
.u.)
0 .0 0 1 0 .0 1 0 .1 1
0 .0
0 .5
1 .0
(d ) T o x ic ity T e s t w ith T B T in L iq u id M e d ia
[T B T ] (m g /L )
Re
lati
ve
Bio
lum
ine
sc
en
ce
(a
.u.)
0 .0 0 1 0 .0 1 0 .1 1
0 .0
0 .5
1 .0
1 .5
(e )T o x ic ity T e s t w ith T B T in L iq u id M e d ia
[T B T ] (m g /L )
Re
lati
ve
Bio
lum
ine
sc
en
ce
(a
.u.)
0 .0 0 1 0 .0 1 0 .1 1
0 .0
0 .5
1 .0
( f) T o x ic ity T e s t w ith T B T in L iq u id M e d ia
[T B T ] (m g /L )
Re
lati
ve
Bio
lum
ine
sc
en
ce
(a
.u.)
0 .1 1 1 0 1 0 0 1 0 0 0
0 .0
0 .5
1 .0
(a ) T o x ic ity T e s t w ith P e n ta c h lo ro p h e n o l in L iq u id M e d ia
[P e n ta c h lo ro p h e n o l] (m g /L )
Re
lati
ve
Bio
lum
ine
sc
en
ce
(a
.u.)
0 .1 1 1 0 1 0 0 1 0 0 0
0 .0
0 .5
1 .0
1 .5
(b ) T o x ic ity T e s t w ith P e n ta c h lo ro p h e n o l in L iq u id M e d ia
[P e n ta c h lo ro p h e n o l] (m g /L )
Re
lati
ve
Bio
lum
ine
sc
en
ce
(a
.u.)
0 .1 1 1 0 1 0 0 1 0 0 0
0 .0
0 .5
1 .0
1 .5
(c ) T o x ic ity T e s t w ith P e n ta c h lo ro p h e n o l in L iq u id M e d ia
[P e n ta c h lo ro p h e n o l] (m g /L )
Re
lati
ve
Bio
lum
ine
sc
en
ce
(a
.u.)
0 .1 1 1 0 1 0 0 1 0 0 0
0 .0
0 .5
1 .0
1 .5
(d ) T o x ic ity T e s t w ith P e n ta c h lo ro p h e n o l in L iq u id M e d ia
[P e n ta c h lo ro p h e n o l] (m g /L )
Re
lati
ve
Bio
lum
ine
sc
en
ce
(a
.u.)
0 .1 1 1 0 1 0 0 1 0 0 0
0 .0
0 .5
(e ) T o x ic ity T e s t w ith P e n ta c h lo ro p h e n o l in L iq u id M e d ia
[P e n ta c h lo ro p h e n o l] (m g /L )
Re
lati
ve
Bio
lum
ine
sc
en
ce
(a
.u.)
0 .1 1 1 0 1 0 0 1 0 0 0
0 .0
0 .5
1 .0
(f ) T o x ic ity T e s t w ith P e n ta c h lo ro p h e n o l in L iq u id M e d ia
[P e n ta c h lo ro p h e n o l] (m g /L )
Re
lati
ve
Bio
lum
ine
sc
en
ce
(a
.u.)
Figure 4.7. Bioluminescence inhibition trend of A. fischeri after 5 minutes of exposure to different
concentrations of tributyltin (TBT). EC50 values: a) 0.050-0,062 mg/L; b) 0.017-0.021 mg/L; c) 0.062-0.070
mg/L; d) 0.022-0.024 mg/L; e) 0.037-0.044 mg/L; f) 0.043-0.054 mg/L.
Figure 4.8. Bioluminescence inhibition trend of A. fischeri after 5 minutes of exposure to different
concentrations of pentachlorophenol. EC50 values: a) 1.29-1,93 mg/L; b) 12.03-21.16 mg/L; c) 3.02-7.92 mg/L;
d) 2.62-6.01 mg/L; e) 0.23-0.39 mg/L; f) 0.16-0.44 mg/L.
WATER TOXICITY ASSESSMENT
144
The detection system used to perform the measurements can strongly influence the
sensitivity of the detection and quantification of both pesticides. In this regard, we analyzed and
compared the sensitivity achieved by a spectrophotometer with a luminometer function and a
smartphone using TBT as the model analyte. First, we performed the measurements with the
spectrophotometer by setting 5 seconds of integration time and 1 mm of reading height. Second,
we evaluated different smartphone ISO values to understand how this parameter could influence
the sensitivity of the toxicity assays (Figure 4.6d). Then, we analyzed the pictures in raw image
format (without processing) using the smartphone application Image J by setting the shutter
speed as 10 seconds and the aperture like f/1.7. with manual focus.
The bioluminescence inhibition profiles show a lower EC50 value obtained with the
spectrophotometer (0.047 mg/L) than those EC50 values obtained with the smartphone, no
matter using which ISO values (0.112 mg/L for ISO 800, 0.106 mg/L for ISO 400 and 0.101 mg/L
for ISO 200). We expected these results because spectrophotometers are highly sensitive devices,
specifically designed to detect slight changes in an optical signal. Interestingly, there were not
strong differences among the different ISO values studied, being ISO 200 the setting that
provided the lowest EC50 value after the spectrophotometer. Again, we expected this result
because lower ISO values allow for a lower amount of light captured by the smartphone.
Nevertheless, we selected ISO 400 to perform the smartphone analysis for two main reasons.
First, ISO 800 provides the brightest outputs but makes often difficult to discern between
different low concentrations of pesticides due to the high amount of grain (“noise”); and second,
ISO 200 provides the lowest EC50 value but the darkest pictures at the same time, with poor
contrast, thus leading to a greater variability among different batches of the bioluminescent
bacteria.
4.4.3. Sensitivity enhancement of the toxicity assays using graphene oxide (GO)
We studied the influence of GO on the toxicity assays sensitivity by adding different GO
concentrations before the bacterial growth, and then we performed the toxicity assays with TBT
and pentachlorophenol as stated in section 4.4.2. Figures 4.9a and 4.9d show the results obtained
from three independent toxicity assays carried out with TBT and A. fischeri grown under different
CHAPTER 4
145
GO concentrations. Besides, Table 4.1 summarizes the EC50 values obtained in this experiment,
being the bacterial culture grown with 100 µg/mL GO the most sensitive one, followed by 25
µg/mL GO, and eventually by that bacterial culture without GO. This slight increase in the
sensitivity could reflect a synergic toxic effect between the pesticides (TBT in the shown case)
and GO, but it clashes with the fact that GO promotes A. fischeri growth. Furthermore, as
aforementioned, GO shields bacterial bioluminescence in liquid media due to its blackness
(Figure 4.2b).
[GO] (µg/mL) EC50 before equalizing initial
biolum. (mg/L) EC50 after equalizing initial
biolum. (mg/L)
0 0.18-0.62 0.06-0.12
25 0.08-0.18 0.08-0.18
100 0.05-0.12 0.04-0.10
Table 4.1. EC50 values for the toxicity assays carried out with TBT using different GO concentrations: 0, 25 and 100
µg/mL, before (left) and after (right) balancing the initial bioluminescence of the three bacterial cultures.
In the following experiment, we carried out the toxicity assays under similar conditions but
diluting the most bioluminescent bacterial cultures with 2% NaCl to balance the initial
bioluminescence (RSD < 10%) of those cultures grown with and without GO (Figure 4.9b). The
results show this time that all three EC50 values are much more similar (Table 4.1). Therefore,
GO has not a direct influence, neither positive nor negative, on the toxicity caused by either TBT
or pentachlorophenol. Besides, since GO promotes the growth of A. fischeri at these
concentrations, the greater sensitivity (lower EC50) obtained in those bacterial cultures grown
with a higher concentration of GO can be indirectly attributed to the darker outputs produced by
the bacterial cultures grown under these conditions (Figure 4.9c).
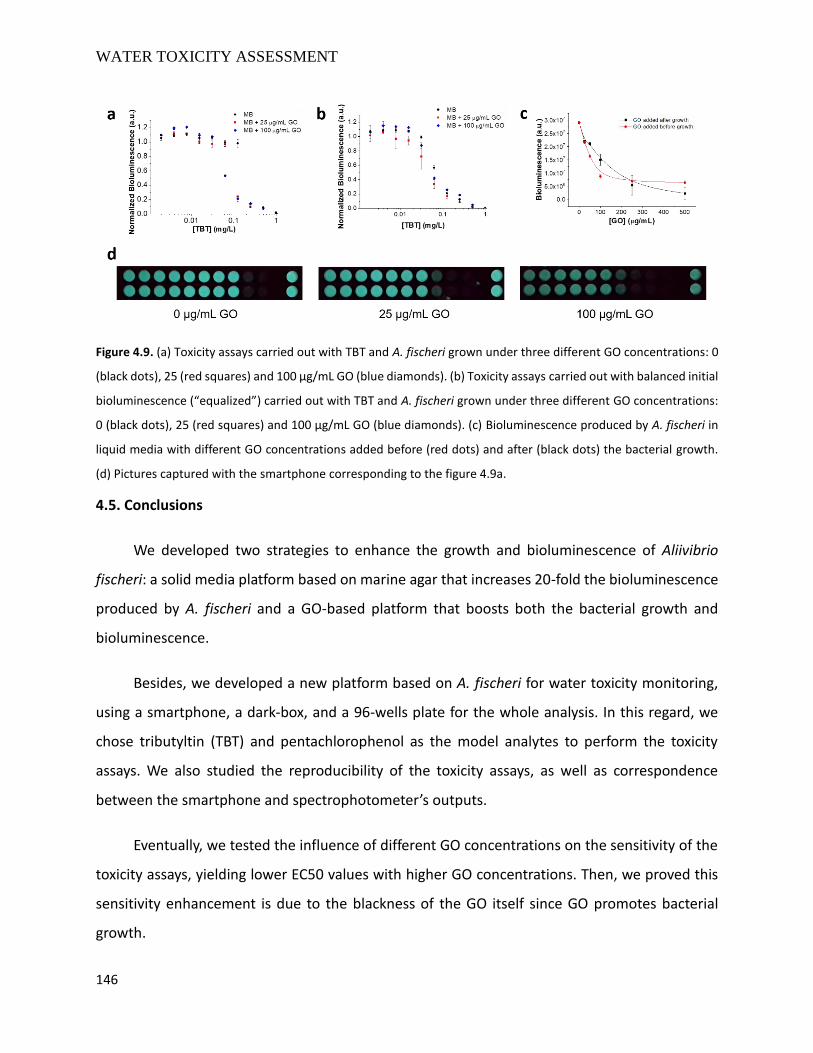
WATER TOXICITY ASSESSMENT
146
Figure 4.9. (a) Toxicity assays carried out with TBT and A. fischeri grown under three different GO concentrations: 0
(black dots), 25 (red squares) and 100 µg/mL GO (blue diamonds). (b) Toxicity assays carried out with balanced initial
bioluminescence (“equalized”) carried out with TBT and A. fischeri grown under three different GO concentrations:
0 (black dots), 25 (red squares) and 100 µg/mL GO (blue diamonds). (c) Bioluminescence produced by A. fischeri in
liquid media with different GO concentrations added before (red dots) and after (black dots) the bacterial growth.
(d) Pictures captured with the smartphone corresponding to the figure 4.9a.
4.5. Conclusions
We developed two strategies to enhance the growth and bioluminescence of Aliivibrio
fischeri: a solid media platform based on marine agar that increases 20-fold the bioluminescence
produced by A. fischeri and a GO-based platform that boosts both the bacterial growth and
bioluminescence.
Besides, we developed a new platform based on A. fischeri for water toxicity monitoring,
using a smartphone, a dark-box, and a 96-wells plate for the whole analysis. In this regard, we
chose tributyltin (TBT) and pentachlorophenol as the model analytes to perform the toxicity
assays. We also studied the reproducibility of the toxicity assays, as well as correspondence
between the smartphone and spectrophotometer’s outputs.
Eventually, we tested the influence of different GO concentrations on the sensitivity of the
toxicity assays, yielding lower EC50 values with higher GO concentrations. Then, we proved this
sensitivity enhancement is due to the blackness of the GO itself since GO promotes bacterial
growth.
CHAPTER 4
147
4.6. References
1. Nunes-Halldorson VDS, Duran NL. Bioluminescent bacteria: Lux genes as environmental biosensors. Brazilian
J Microbiol. 2003;34(2):91-96.
2. Boettcher KJ, Ruby EG. Depressed Light Emission by symbiotic by Vibrio fischeri of the Sepiolid Squid
Euprymma scolopes. J Bacteriol. 1990;172(7):3701–3706.
3. Brooks JF, Gyllborg MC, Cronin DC, et al. Global discovery of colonization determinants in the squid symbiont
Vibrio fischeri. Proc Natl Acad Sci. 2014;111(48):17284-17289.
4. Visick KL, Foster J, Doino J, McFall-Ngai M, Ruby EG. Vibrio fischeri lux genes play an important role in
colonization and development of the host light organ. J Bacteriol. 2000;182(16):4578-4586.
5. Science B, Microbiology U, Lupp OAC, et al. The Vibrio fischeri quorum-sensing systems ain and lux
sequentially induce luminescence gene expression and are important for persistence in the squid host. Mol
Microbiol. 2003;50:319-331.
6. Miyashiro T, Ruby EG. Shedding light on bioluminescence regulation in Vibrio fischeri. Mol Microbiol.
2013;84(5):795-806.
7. Lupp C, Ruby EG. Vibrio fischeri Uses Two Quorum-Sensing Systems for the Regulation of Early and Late
Colonization Factors. J Bacteriol. 2005;187(11):3620-3629.
8. Ray VA, Visick KL. LuxU Connects Quorum Sensing to Biofilm Formation in Vibrio fischeri. Mol Microbiol.
2012;86(4):954-970.
9. Khaled A, Pelkonen O. The inhibition of major human hepatic cytochrome P450 enzymes by 18 pesticides:
Comparison of the N-in-one and single substrate approaches. Toxicol Vitr. 2012;27:1584-1588.
10. Hodgson E, Wallace AD. Human Metabolic Interactions of Pesticides: Inhibition, Induction, and Activation.
ACS Symp Ser. 2012;1099:115-132.
11. Mesnage R, Seralini G-E. Toxicity of Pesticides on Health and Environment. Vol 6.; 2018.
12. Singh S, Kumar V, Chauhan A, et al. Toxicity, degradation and analysis of the herbicide atrazine. Environ Chem
Lett. 2018;16(1):211-237.
13. Jarque S, Masner P, Klánová J, Prokeš R, Bláha L. Bioluminescent Vibrio fischeri Assays in the Assessment of
Seasonal and Spatial Patterns in Toxicity of Contaminated River Sediments. Front Microbiol. 2016;7(NOV):1-
11.
14. Tingting X, Close D, Smartt A, Ripp S, Sayler G. Detection of Organic Compounds with Whole-Cell
Bioluminescent Bioassays. Adv Biochem Eng Biotechnol. 2014:111-151.
15. Mortimer M, Kasemets K, Heinlaan M, Kurvet I, Kahru A. High throughput kinetic Vibrio fischeri
WATER TOXICITY ASSESSMENT
148
bioluminescence inhibition assay for study of toxic effects of nanoparticles. Toxicol Vitr. 2008;22(5):1412-
1417.
16. Lopes I, Ribeiro R, Antunes FE, et al. Toxicity and genotoxicity of organic and inorganic nanoparticles to the
bacteria Vibrio fischeri and Salmonella typhimurium. Ecotoxicology. 2012;21(3):637-648.
17. Hernando MD, De Vettori S, Martínez Bueno MJ, Fernández-Alba AR. Toxicity evaluation with Vibrio fischeri
test of organic chemicals used in aquaculture. Chemosphere. 2007;68:724-730.
18. Menz J, Schneider M, Kümmerer K. Toxicity testing with luminescent bacteria - Characterization of an
automated method for the combined assessment of acute and chronic effects. Chemosphere.
2013;93(6):990-996.
19. Četkauskaite A, Pessala P, Södergren A. Elemental Sulfur: Toxicity In Vivo and In Vitro to Bacterial Luciferase,
In Vitro Yeast Alcohol Dehydrogenase, and Bovine Liver Catalase. Environ Toxicol. 2004;19(4):372-386.
20. Cevenini L, Calabretta MM, Lopreside A, et al. Exploiting NanoLuc luciferase for smartphone-based
bioluminescence cell biosensor for (anti)-inflammatory activity and toxicity. Anal Bioanal Chem.
2016;408(30):8859-8868.
21. van der Meer JR, Belkin S. Where microbiology meets microengineering: design and applications of reporter
bacteria. Nat Rev Microbiol. 2010;8(7):511-522.
22. van De Merwe JP, Leusch FDL. A sensitive and high throughput bacterial luminescence assay for assessing
aquatic toxicity - The BLT-Screen. Environ Sci Process Impacts. 2015;17(5):947-955.
23. Stoytcheva M. Enzyme vs. Bacterial Electrochemical Sensors for Organophosphorus Pesticides Quantification.
In: Intelligent and Biosensors. Vol 11. ; 2016:218-230.
24. Roda A, Cevenini L, Michelini E, Branchini BR. A portable bioluminescence engineered cell-based biosensor
for on-site applications. Biosens Bioelectron. 2011;26(8):3647-3653.
25. Leitão JMM, Esteves da Silva JCG. Firefly luciferase inhibition. J Photochem Photobiol B Biol. 2010;101(1):1-
8.
26. Bulich A. Use of Luminescent Bacteria for Determining Toxicity in Aquatic Environments. Aquat Toxicol.
1979:98-106.
27. ModernWater. https://www.modernwater.com/contact.
28. Orbit Technologies Pvt. Ltd. http://www.orbitindia.com/.
29. AquaTox Research Inc. http://www.aquatoxresearch.com/contactmain.php.
30. Munkittrick KR, Power EA, Sergy GA. The Relative Sensitivity of Microtox®, Daphnid, Rainbow Trout, and
Fathead Minnow Acute Lethality Tests. Environ Toxicol Water Qual. 1991;6(1):35-62.
31. Shen K, Shen C, Lu Y, et al. Hormesis response of marine and freshwater luminescent bacteria to metal
CHAPTER 4
149
exposure. Biol Res. 2009;42(2):183-187.
32. Gregor C, Gwosch KC, Sahl SJ, Hell SW. Strongly enhanced bacterial bioluminescence with the ilux operon
for single-cell imaging. Proc Natl Acad Sci. 2018;115(5):962-967.
33. Shimada T, Tanaka K. Use of a Bacterial Luciferase Monitoring System To Estimate Real-Time Dynamics of
Intracellular Metabolism in Escherichia coli. Appl Environ Microbiol. 2016;82(19):5960-5968.
34. Álvarez-Diduk R, Orozco J, Merkoçi A. Paper strip-embedded graphene quantum dots: a screening device
with a smartphone readout. Sci Rep. 2017;7(1):1-9.
35. Quesada-González D, Merkoçi A. Mobile phone-based biosensing: An emerging “diagnostic and
communication” technology. Biosens Bioelectron. 2017;92:549-562.
36. Wang B, Barahona M, Buck M. Engineering modular and tunable genetic amplifiers for scaling transcriptional
signals in cascaded gene networks. Nucleic Acids Res. 2014;42(14):9484-9492.
37. Wang B, Barahona M, Buck M. A modular cell-based biosensor using engineered genetic logic circuits to
detect and integrate multiple environmental signals. Biosens Bioelectron. 2013;40(1):368-376.
38. Sklodowska K, Jakiela S. Enhancement of bacterial growth with the help of immiscible oxygenated oils. RSC
Adv. 2017;7(65):40990-40995.
39. O’Donnell PM, Aviles H, Lyte M, Sonnenfeld G. Enhancement of In Vitro Growth of Pathogenic Bacteria by
Norepinephrine: Importance of Inoculum Density and Role of Transferrin. Appl Environ Microbiol.
2006;72(7):5097-5099.
40. Ruiz ON, Fernando KAS, Wang B, et al. Graphene Oxide: A Nonspecific Enhancer of Cellular Growth. ACS
Nano. 2011;5(10):8100-8107.
41. Liu J, Morales-Narváez E, Orozco J, Vincent T, Zhong G, Merkoçi A. Bioluminescent Nanopaper for the Fast
Screening of Toxic Substances. Nano Res. 2017:1-19.
42. Jiao J, Cheng F, Zhang X, et al. Preparation of Graphene Oxide and Its Mechanism in Promoting Tomato Roots
Growth. J Nanosci Nanotechnol. 2016;16(4):4216-4223.
43. Das MR, Sarma RK, Saikia R, Kale VS, Shelke M V., Sengupta P. Synthesis of silver nanoparticles in an aqueous
suspension of graphene oxide sheets and its antimicrobial activity. Colloids Surfaces B Biointerfaces.
2011;83(1):16-22.
44. Wang K, Ruan J, Song H, et al. Biocompatibility of Graphene Oxide. Nanoscale Res Lett. 2011;6(1):1-8.
45. Gurunathan S, Han JW, Abdal Dayem A, Eppakayala V, Kim JH. Oxidative stress-mediated antibacterial
activity of graphene oxide and reduced graphene oxide in Pseudomonas aeruginosa. Int J Nanomedicine.
2012;7:5901-5914.
46. Di Giulio M, Zappacosta R, Di Lodovico S, et al. Antimicrobial and Antibiofilm Efficacy of Graphene Oxide
WATER TOXICITY ASSESSMENT
150
against Chronic Wound Microorganisms. Antimicrob Agents Chemother. 2018;62(7):1-9.
47. Chen J, Peng H, Wang X, Shao F, Yuan Z, Han H. Graphene oxide exhibits broad-spectrum antimicrobial
activity against bacterial phytopathogens and fungal conidia by intertwining and membrane perturbation.
Nanoscale. 2014;6(3):1879-1889.
48. Mokkapati VRSS, Pandit S, Kim J, et al. Bacterial response to graphene oxide and reduced graphene oxide
integrated in agar plates. R Soc Open Sci. 2018;5(11).
49. Xue J, BinAhmed S, Wang Z, Karp NG, Stottrup BL, Romero-Vargas Castrillón S. Bacterial Adhesion to
Graphene Oxide (GO)-Functionalized Interfaces Is Determined by Hydrophobicity and GO Sheet Spatial
Orientation. Environ Sci Technol Lett. 2018;5(1):14-19.
50. Pelin M, Fusco L, Martín C, et al. Graphene and graphene oxide induce ROS production in human HaCaT skin
keratinocytes: the role of xanthine oxidase and NADH dehydrogenase. Nanoscale. 2018;10(25):11820-11830.
51. Soto W, Gutierrez J, Remmenga MD, Nishiguchi MK. Salinity and Temperature Effects on Physiological
Responses of Vibrio fischeri from Diverse Ecological Niches. Microb Ecol. 2009;57(1):1-21.
52. Froehner K, Meyer W, Grimme LH. Time-dependent toxicity in the long-term inhibition assay with Vibrio
fischeri. Chemosphere. 2002;46:987-997.
CHAPTER 5. PORTABLE PLATFORM FOR ENVIRONMENTAL APPLICATIONS
CHAPTER 5................................................................................................................................... 153
Portable Platform for Environmental Applications .................................................................... 153
5.1. Introduction ...................................................................................................................... 155
5.2. Materials & methods ........................................................................................................ 157
5.2.1. Materials .................................................................................................................... 157
5.2.2. Colorimetric ELISA tests ............................................................................................. 158
5.2.3. Gold aggregation tests (GAT) .................................................................................... 158
5.2.4. Fluorescent assays ..................................................................................................... 158
5.2.5. Bioluminescent assays ............................................................................................... 159
5.2.6. Elementary analysis with ImageJ ............................................................................... 159
5.2.7. Complex analysis with ImageJ ................................................................................... 159
5.2.8. Bacteria culture and drug screening ......................................................................... 160
5.3. Characterization of the optical system ............................................................................ 160
5.4. Colorimetric assays........................................................................................................... 162
5.4.1. Colorimetric ELISA test .............................................................................................. 162
5.4.2. Gold Aggregation Test ............................................................................................... 164
5.5. Bioluminescent assays...................................................................................................... 165
5.6. Fluorescent assays ............................................................................................................ 167
5.6.1. Fluorophores characterization .................................................................................. 167
5.6.2. Fluorescent ELISA test ............................................................................................... 169
5.7. Bacterial growth & drug screening .................................................................................. 170
5.7.1. Bacterial growth & turbidity measurements ............................................................ 170
5.7.2. Drug screening ........................................................................................................... 172
5.5. Conclusions ....................................................................................................................... 173
5.6. References ........................................................................................................................ 174

CHAPTER 5
153
CHAPTER 5
Portable Platform for Environmental
Applications

154
CHAPTER 5
155
5.1. Introduction
The human population is growing exponentially worldwide and in 2030 is predicted to
break the barrier of 8.5 billion people1. This rapid growth has a positive effect on industrialization
and medicine development, but at the same time, it is opening a lot of concerns2. For example,
the adoption of the current lifestyle by all these people will have a tremendous impact on the
environment, affecting the social and healthcare systems3–5. Possible scenarios could be a
shortage of food, an increase in environmental pollution, and rapid depletion of natural
freshwater reservoirs4. Besides, the recent COVID-19 outbreak has highlighted the accelerated
spread rate of infectious diseases in the form of epidemics and pandemics6. In these predicted
scenarios, bioanalytical sciences could play an important role in tackling these issues. For
example, the development of user-friendly, low-cost, portable-devices able to detect
biologically, environmentally, and clinically relevant targets could facilitate the monitoring of
environmental pollution, infectious diseases, and their transmission and diagnosis7–9. At the
same time, these devices could open new perspectives for developing countries, which are the
most exposed to these events and cannot prevent such issues using the classical laboratory-
based methods (techniques which are very sensitive but highly-expensive, non-portable, and
require to be used by specialized personnel inside laboratory facilities)10,11. Therefore, the
development of integrated, low-cost, portable, and easier-to-use bioanalytical platforms able to
be exploited for a broad number of applications is becoming an important topic in the analytical
sciences10,12.
An ideal bioanalytical platform should be lightweight, self-powered, and cost-effective, as
well as allow for wireless communication and fast analysis while keeping the accuracy and
sensitivity of the laboratory-based techniques13. In this regard, the main purpose of developing
bioanalytical portable platforms is to substitute laboratory-based platforms that need to be used
by trained personnel inside laboratory facilities, especially in developing countries with
increasing population and limited access to sophisticated screening devices. Overall, portable
platforms should display analytical performance comparable to the standard techniques used in
the laboratories14,15. Inspired by these designing concepts, recently, several studies have
demonstrated the development of portable sensing devices. For example, the smartwatches
allow nowadays for the monitoring of a myriad of parameters, such as the heart-rate, the blood
pressure, and the sleep cycle16. However, the bottleneck of these devices is that they can display
a limited number of applications for relevant target monitoring.
In recent years, smartphone-based portable platforms have been developed for
environmental monitoring, disease diagnosis, and forensic applications9,13,17–19. Besides portable
PORTABLE PLATFORM FOR ENVIRONMENTAL APPLICATIONS
156
platforms, smartphones allow for imaging and data processing, making them powerful tools for
optical sensing applications20. For instance, the development of a smartphone-microplate
reader integrated within a 3D-printed optomechanical scaffold for diagnosis of viral diseases13.
This platform relies on the colorimetric detection of the antibodies present in the serum of
patients previously infected by herpes, mumps, and measles viruses. The authors use blue-
emitting LEDs to illuminate the microplate wells and optical fibers to transmit the individual
outputs from each well to an external lens. Eventually, a smartphone is used to capture an image
integrating all the outputs transmitted by the optical fibers. Remarkably, this device allows for
portability (small dimensions and self-powered by batteries) and fast monitoring (1 min to
integrate the results). However, this system hinders alternative detection methods such as those
based on fluorescence and bioluminescence. Besides, the optical fibers are used to maximize
the number of wells read with a single photo, reducing the area per well that is read by the
smartphone. Other researchers report the development of smartphone-spectrophotometer
devices, for example, for the kinetics measurement of enzymatic reactions by attachment of a
microcuvette to a self-made housing21. Furthermore, the development of a smartphone
application allows for decomposing the pixels into RGB and hue values, which are further
converted to the corresponding wavelengths by an algorithm, showing similar results to those
provided by laboratory-based spectrophotometers22. On the other hand, other smartphone-
based portable platforms rely on fluorescent detection of clinical biomarkers23,24. For instance,
a 3D-designed scaffold attached to a smartphone to read lateral flow strips (LFS) used to detect
hormones24. Eventually, other works report the detection of bacteria cells using smartphones
and portable platforms25,26. For instance, the use of an enzyme-aptamer dual system allows for
performing a dot-blot assay for assessment of Mycobacterium tuberculosis growth in 5 hours
with a limit of quantification of 104 CFU/mL25. Despite these achievements, most of these
smartphone-based platforms only allow for specific detection methods (i.e. either colorimetric
or fluorescent) and constrained reaction chambers (i.e. specific microcuvette or LFS with
controlled dimensions).
Herein, we report the design, construction, and testing of an automated portable
platform, similar in size and shape to a shoebox, with integrated optical, mechanical, and
electrical components that allow for optical sensing of environmental pollutants and disease
biomarkers. In this regard, we have provided the portable platform with tools to perform
colorimetric, fluorescent, bioluminescent, and turbidimetric assays. Besides, we have adapted
the portable platform to measure ELISA plates since they are the most widely used analytical
platforms nowadays. First, we have tested the colorimetric detection of disease biomarkers by
CHAPTER 5
157
carrying out ELISA tests with the help of a light source and a smartphone to capture the images
with the platform. We have also performed a gold aggregation test (GAT) with interest to
evaluate the state of nanoparticles, which are the main components of many optical biosensors.
Next, we have performed a bioluminescent assay to detect pesticides within the portable
platform thanks to the opacity of the device and the professional mode of a smartphone camera.
Besides, we have installed UV-LEDs and optical filters to perform fluorescent assays and allow
the detection of different fluorophores, such as quantum dots (QDs) and fluorescein. Eventually,
we have developed a new method to determine the turbidity of the media that converts the
portable platform into a drug-screening device for the detection of antibiotic-resistance bacteria.
Altogether, this work highlights the development of a versatile and automatized device
controlled by a smartphone that allows for performing a variety of optical detection techniques
with a myriad of sensing applications.
5.2. Materials & methods
5.2.1. Materials
Aliivibrio fischeri (ATCC® 700601™) was purchased from the ATCC Collection (Manassas,
VA, USA). E. coli (ATCC11303, ATCC25922) were purchased from the ATCC collection and the
company LGC. AuNPs of 40 nm size were synthesized by kinetic seed growth27. COVID-19
nucleoprotein and anti-COVID-19 nucleoprotein polyclonal antibody (anti-COVID-19 NP pAb)
were purchased from Abyntek (Derio, Spain). Anti-COVID-19 NP monoclonal antibody (anti-
COVID-19 NP mAb) was purchased from Fisher Scientific (Hampton, NH, USA). Human IgG, anti-
human IgG, anti-human IgG-biotin, and tetramethylbenzidine (TMB) were purchased from
Sigma-Aldrich (St. Luis, MO, USA). Streptavidin-horseradish peroxidase (HRP) and anti-mouse
IgG-HRP were purchased from Abcam (Cambridge, UK). Red and green quantum dots (QDs) were
purchased from Serviquimia (Tarragona, Spain). Blue carbon dots were synthesized by
hydrothermal synthesis. Quantum dots conjugated to streptavidin were purchased from Fisher
Scientific (Hampton, NH, USA). Fluorescein and pentachlorophenol were purchased from Sigma-
Aldrich (St. Luis, MO, USA). Kanamycin, ampicillin, and amoxicillin were purchased from Sigma-
Aldrich (St. Luis, MO, USA). White and black ELISA plates with transparent bottom wells were
purchased from FisherScientific (Hampton, NH, USA). Transparent ELISA plates were purchased
from FisherScientific (Hampton, NH, USA).
Optical lens (LA1540 and LA1576) and optical filters (bandpass 370nm FB370-10, longpass
400nm FEL0400) were purchased from Thorlabs (Newton, NJ, USA). White LED (C535A-WJN
5mm) and UV LED (KTDS-3534UV365B 1.95W 265nm) were purchased from Farnell as well as
the Peltier module, heatsink, and fans (Leeds, UK). A smartphone Huawei P20 Lite was used to
PORTABLE PLATFORM FOR ENVIRONMENTAL APPLICATIONS
158
perform the optical analysis with the platform. SpectraMax iD3 (San José, CA, USA) was used to
perform additional optical measurements. Bacteria were cultivated either within the portable
platform while performing optical measurements within SpectraMax iD3, or by using a 37 ºC
microbiological incubator (Single 184L incubator, FisherScientific, MA, USA).
5.2.2. Colorimetric ELISA tests
ELISA wells were first coated with capture antibodies against the COVID-19 nucleoprotein
and human-IgG (16 h, 4 ºC). Then, a washing step with washing buffer (PBST; 0.01 M PBS, pH
7.4, 0.05% Tween-20) was performed, followed by a blocking step with 3% BSA in PBS (2h, 37
ºC), and an additional washing step with PBST. Next, different concentrations of nucleoprotein
(from 1 ng/mL to 1 µg/mL) and human-IgG (from 1 ng/mL to 1 µg/mL) were added (1 h, 25 ºC),
the ELISA wells were washed with PBST, and the detection antibodies were added (1 h, 25 ºC),
using the PBST to wash the microwells again. In the following step, anti-mouse IgG (HRP) or
streptavidin-HRP were added for 1 h of incubation at 25 ºC. Eventually, the last washing step
was performed, and the colorimetric revealing agent (tetramethylbenzidine, TMB) was added
to yield the final results.
5.2.3. Gold aggregation tests (GAT)
40 nm AuNPs were blocked with a solution of BSA at different concentrations (0%, 0.005%,
0.05%, 0.1%, and 1%) for 20 min (550 rpm, 25 ºC). Then, 80 µL of these blocked AuNPs were
added to the microplate wells together with 20 µL of 10% NaCl. The solutions were incubated
for 3 minutes and the colorimetric outputs were recorded either with the spectrophotometer
or with the smartphone within the portable platform by using white LEDs to illuminate the
samples. Then, the pictures were analyzed with the software ImageJ and the results were
compared with those obtained with the spectrophotometer to estimate the AuNPs aggregation
state and the correlation between both detection methods.
5.2.4. Fluorescent assays
The concentration of different QDs (red, green, and blue) was first adjusted to obtain
similar fluorescent output intensities. Next, different QDs were put together to obtain different
fluorescent colors (i.e. cyan, yellow, and pink). The fluorescent emission spectra were recorded
with the spectrophotometer and pictures were captured with the smartphone and the portable
platform using a UV-LED to excite the QDs at 365 nm. Besides, red QDs were prepared at
different concentrations from 300 nM to 0.001 nM in order to detect and quantify them with
the spectrophotometer and the portable platform. Briefly, 50 µL of different concentrations of
red QDs were added to 96-wells plates, and pictures were taken by using different smartphone
CHAPTER 5
159
settings (from ISO 200 to ISO 3200, integration time from 1/30 s to 5 s). The pictures captured
with the smartphone were afterward analyzed using the software ImageJ. Besides, fluorescein
was also detected as another common fluorophore using the portable platform. Different
concentrations of fluorescein were prepared and quantified using both the spectrophotometer
and the portable platform. The same UV-LED was used to excite the fluorescein (365 nm) and
the outputs were recorded by the smartphone and afterward analyzed by ImageJ. The brighter
the image, the higher concentration of fluorescein. Eventually, a fluorescent ELISA test was
performed by immobilizing different concentrations of biotinylated-antibodies (100, 200, 500,
and 2000 ng/mL) on the ELISA wells and using streptavidin-QDs as the revealing agents (10 nM,
5 nM, 2.5 nM, and 1 nM).
5.2.5. Bioluminescent assays
A. fischeri was grown in marine broth (MB) at 25 ºC for 20 hours. Bacteria concentration
and bioluminescence were recorded and the experiments were only performed when cellular
density was higher than 108 CFU/mL and bioluminescence was higher than 106 dimensionless
units (spectrophotometer). Next, 50 µL of bacteria and 50 µL of the sample were put together
within the microplate wells and incubated under agitation for 5 minutes. Eventually, individual
pictures from each well were captured with the smartphone using ISO 1000 and different
integration times. The pictures captured with the smartphone were afterward analyzed using
the software ImageJ.
5.2.6. Elementary analysis with ImageJ
The pictures were uploaded to the software ImageJ and the optical outputs were selected
with a circular shape that spans the whole microplate well. In this way, the analysis is not biased
by a partial selection of the area of the well. The intensity of the optical output is then recorded,
as well as the background signal within the same picture outside the microplate well. Next, the
background signal is subtracted to the output obtained within the well. This process is repeated
for the different samples analyzed during the same experiment. In the following step, all the
numeric values are divided by the highest value (brightest output) in order to normalize the data
(between 0 and 1). Finally, the data are graphically represented for an appropriate
interpretation of the results.
5.2.7. Complex analysis with ImageJ
On the one hand, the intensity of the red color of the AuNPs was analyzed by ImageJ to
estimate AuNPs’ aggregation state. First, the pictures were uploaded to ImageJ. Then, the
PORTABLE PLATFORM FOR ENVIRONMENTAL APPLICATIONS
160
following command was used to treat the images: Image → Color → Split Channels → Green
Channel. As green color (540 nm) is complementary to red, and AuNPs yield red color, splitting
the green channel allows for a B&W output in which the redder the original image, the blacker
the processed image. In this regard, ImageJ can easily analyze the brightness of the picture
according to the intensity of the red color in the original image, which is directly proportional to
the blackness in the processed image.
On the other hand, the intensity of the yellow color yielded by the revealing reagent in
the colorimetric ELISA tests is analyzed as follows: Image → Adjust → Color Threshold. At this
point, three scrolling bars pop up that allows for a complex analysis of the uploaded images.
First, the hue threshold must be framed between 35 and 45, which corresponds to the range in
which the yellow color is found. Next, the saturation and brightness of the pictures must be
adjusted in order to obtain the highest contrast between different color intensities. The overall
process yields B&W images that can be easily analyzed by ImageJ, being the original yellowest
pictures the blackest pictures after the images processing.
5.2.8. Bacteria culture and drug screening
A. fischeri was grown in marine broth (MB) at 25 ºC either in an orbital agitator or within
the portable platform (20 h cultivation). The two strains of E. coli were cultured in tryptic soy
broth (TSB) at 37 ºC either in an incubator or within the portable platform (18 h cultivation).
Bacterial cultures were then adjusted to an OD600 = 0.2 (≈ 1.6·108 CFU/mL) by adding growth
media and different concentrations of antibiotics. Next, 50 µL of antibiotics was added together
with 50 µL of bacteria within the ELISA wells, followed by an incubation step performed at 25 ºC
with shaking for A. fischeri, and at 37 ºC without shaking for E. coli. Eventually, bacterial growth
was estimated and compared by using the spectrophotometer to measure the OD600 and the
smartphone to analyze the turbidity of the media. In order to increase the contrast between the
growth media and the media containing a high concentration of bacteria, a dark spot of wax
printed over a white paper was placed centered below the ELISA wells. Briefly, this new method
allows for increasing the contrast between those samples containing low concentrations of
bacteria (darker spot, light not reflected) and high concentrations of bacteria (whiter spot, light
reflected by the presence of particles [bacteria cells] within the media), boosting the sensitivity
of the detection of bacterial growth within the portable platform.
5.3. Characterization of the optical system
Our portable platform consists of a physical scaffold that contains all the electronic,
mechanical, and optical components required to perform the optical tests (Figures 5.1a and
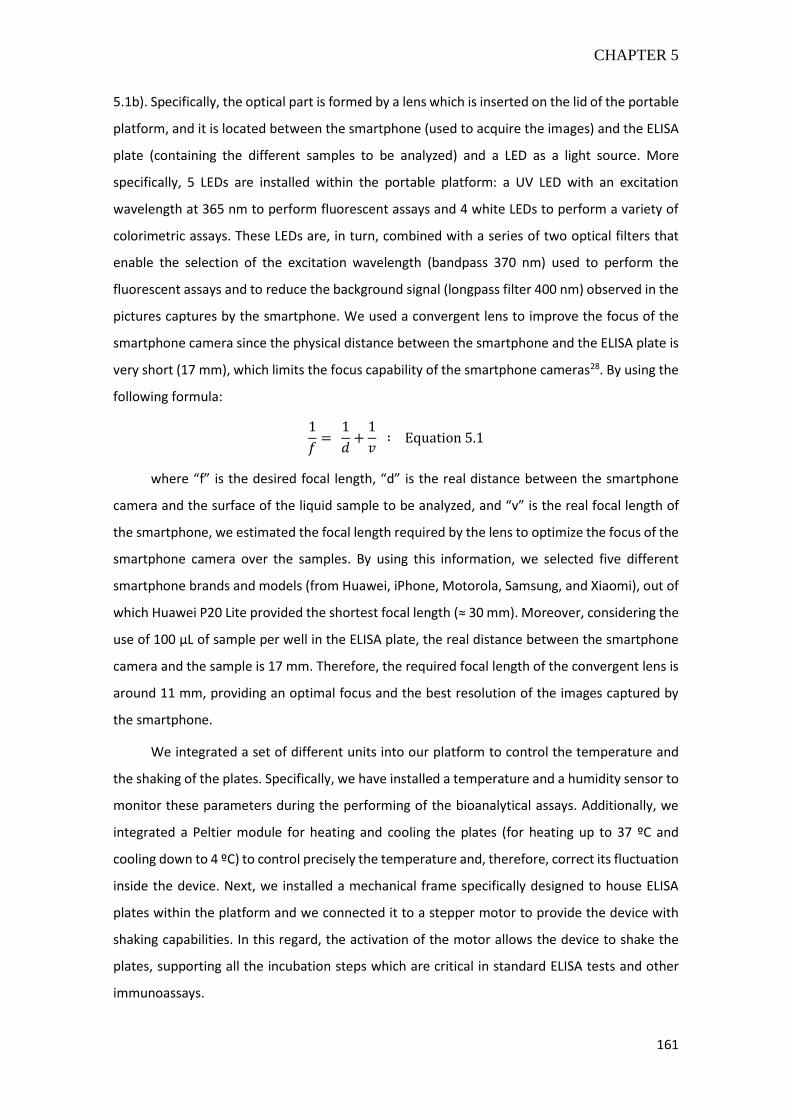
CHAPTER 5
161
5.1b). Specifically, the optical part is formed by a lens which is inserted on the lid of the portable
platform, and it is located between the smartphone (used to acquire the images) and the ELISA
plate (containing the different samples to be analyzed) and a LED as a light source. More
specifically, 5 LEDs are installed within the portable platform: a UV LED with an excitation
wavelength at 365 nm to perform fluorescent assays and 4 white LEDs to perform a variety of
colorimetric assays. These LEDs are, in turn, combined with a series of two optical filters that
enable the selection of the excitation wavelength (bandpass 370 nm) used to perform the
fluorescent assays and to reduce the background signal (longpass filter 400 nm) observed in the
pictures captures by the smartphone. We used a convergent lens to improve the focus of the
smartphone camera since the physical distance between the smartphone and the ELISA plate is
very short (17 mm), which limits the focus capability of the smartphone cameras28. By using the
following formula:
1
𝑓=
1
𝑑+
1
𝑣 ∶ Equation 5.1
where “f” is the desired focal length, “d” is the real distance between the smartphone
camera and the surface of the liquid sample to be analyzed, and “v” is the real focal length of
the smartphone, we estimated the focal length required by the lens to optimize the focus of the
smartphone camera over the samples. By using this information, we selected five different
smartphone brands and models (from Huawei, iPhone, Motorola, Samsung, and Xiaomi), out of
which Huawei P20 Lite provided the shortest focal length (≈ 30 mm). Moreover, considering the
use of 100 µL of sample per well in the ELISA plate, the real distance between the smartphone
camera and the sample is 17 mm. Therefore, the required focal length of the convergent lens is
around 11 mm, providing an optimal focus and the best resolution of the images captured by
the smartphone.
We integrated a set of different units into our platform to control the temperature and
the shaking of the plates. Specifically, we have installed a temperature and a humidity sensor to
monitor these parameters during the performing of the bioanalytical assays. Additionally, we
integrated a Peltier module for heating and cooling the plates (for heating up to 37 ºC and
cooling down to 4 ºC) to control precisely the temperature and, therefore, correct its fluctuation
inside the device. Next, we installed a mechanical frame specifically designed to house ELISA
plates within the platform and we connected it to a stepper motor to provide the device with
shaking capabilities. In this regard, the activation of the motor allows the device to shake the
plates, supporting all the incubation steps which are critical in standard ELISA tests and other
immunoassays.
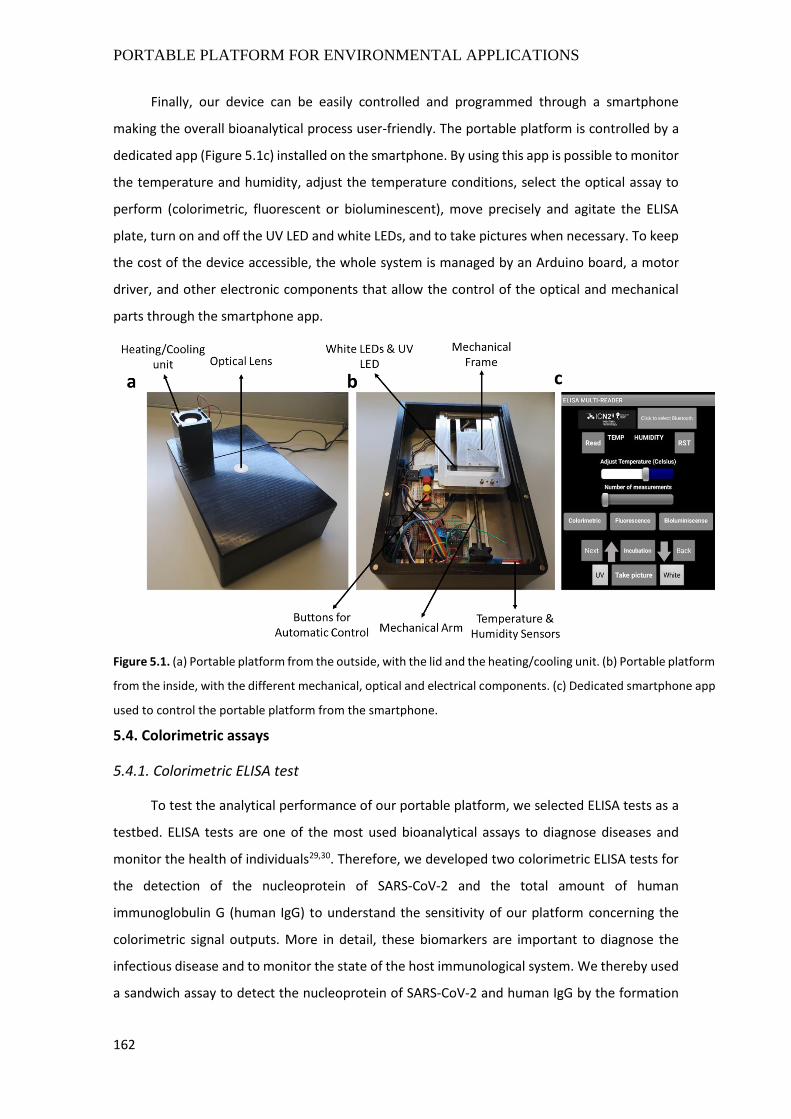
PORTABLE PLATFORM FOR ENVIRONMENTAL APPLICATIONS
162
Finally, our device can be easily controlled and programmed through a smartphone
making the overall bioanalytical process user-friendly. The portable platform is controlled by a
dedicated app (Figure 5.1c) installed on the smartphone. By using this app is possible to monitor
the temperature and humidity, adjust the temperature conditions, select the optical assay to
perform (colorimetric, fluorescent or bioluminescent), move precisely and agitate the ELISA
plate, turn on and off the UV LED and white LEDs, and to take pictures when necessary. To keep
the cost of the device accessible, the whole system is managed by an Arduino board, a motor
driver, and other electronic components that allow the control of the optical and mechanical
parts through the smartphone app.
5.4. Colorimetric assays
5.4.1. Colorimetric ELISA test
To test the analytical performance of our portable platform, we selected ELISA tests as a
testbed. ELISA tests are one of the most used bioanalytical assays to diagnose diseases and
monitor the health of individuals29,30. Therefore, we developed two colorimetric ELISA tests for
the detection of the nucleoprotein of SARS-CoV-2 and the total amount of human
immunoglobulin G (human IgG) to understand the sensitivity of our platform concerning the
colorimetric signal outputs. More in detail, these biomarkers are important to diagnose the
infectious disease and to monitor the state of the host immunological system. We thereby used
a sandwich assay to detect the nucleoprotein of SARS-CoV-2 and human IgG by the formation
Figure 5.1. (a) Portable platform from the outside, with the lid and the heating/cooling unit. (b) Portable platform
from the inside, with the different mechanical, optical and electrical components. (c) Dedicated smartphone app
used to control the portable platform from the smartphone.
CHAPTER 5
163
of immunocomplexes, which are further detected by a third antibody conjugated with an
enzyme. Eventually, the presence of the enzymatic substrate triggers the enzymatic reaction
which leads to the formation of a colored product.
The selection of appropriate ELISA plates is crucial to achieving the most optimal
performance of the assays. We thereby selected white ELISA plates with transparent bottom
wells because white color avoids “light cross-contamination” from well-to-well but preserves an
optimal illumination of all the samples. Based on our previous expertise, we tested a wide
concentration range of the analytes, from 1 ng/mL to 1 µg/mL. Then, we placed the ELISA plates
in the supporting frame and we closed the lid. At this point, we deposited the smartphone on
the lid, which is well-aligned with the lens, to acquire the image of the well. Furthermore, by
using a second smartphone, we can control the device moving the plate from well to well,
allowing us to collect the signal outputs from all the wells of the plate.
The results yield a pale to yellow colorimetric output: the more yellow, the higher
concentration of the analyte within the sample. These results were read and quantified with the
spectrophotometer and the portable platform using the smartphone camera (Figure 5.2a).
Nonetheless, whereas the spectrophotometer can select and specifically read the yellow optical
signal of the wells, the smartphone camera only captures the images but cannot directly quantify
their color intensity. We thereby used ImageJ as an optical software to analyze the pictures
yielded after the ELISA tests. Briefly, precise control of the analysis conditions (see section 5.2.7)
allows for transforming the yellow to pale gradient into a white to black gradient, which can be
easily analyzed by ImageJ (Figure 5.2b). We then plotted and compared the results obtained by
the spectrophotometer and the portable platform (Figures 5.2c and 5.2d). On the one hand,
there is a clear correlation between the results obtained by both methods, with a better
correlation for the detection of the SARS-CoV-2 nucleoprotein (optical LOD = 3 ng/mL for the
spectrophotometer and 10 ng/mL for the portable platform). On the other hand, the RSD among
the different replicates for the same concentration of the analytes are higher with the portable
platform than with the spectrophotometer, especially at low concentrations of human-IgG.
These results can be expected by considering slight changes in the illumination given for
different wells within the portable platform. That’s to say, these slight illumination variations
amplify the real differences among the replicates due to the later analytical treatment
performed with ImageJ. Nonetheless, the obtained results support that the portable platform
can be used to perform and read colorimetric ELISA tests, showing great potential for other
related applications.
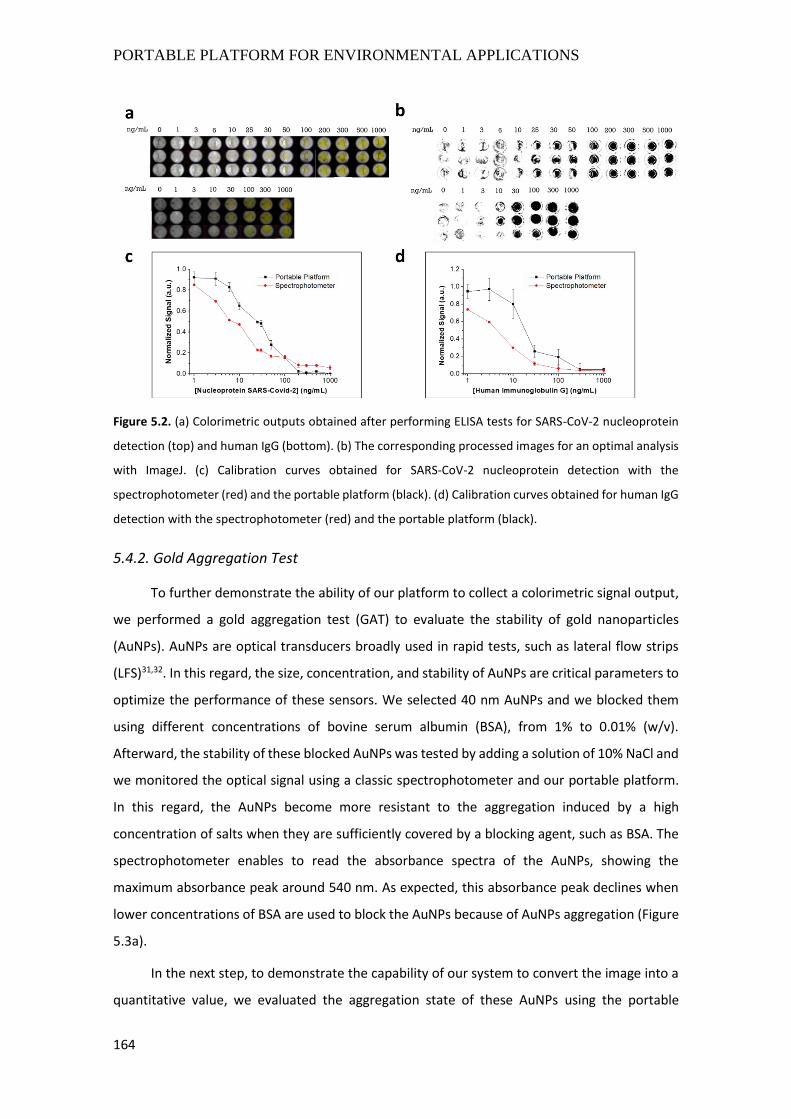
PORTABLE PLATFORM FOR ENVIRONMENTAL APPLICATIONS
164
Figure 5.2. (a) Colorimetric outputs obtained after performing ELISA tests for SARS-CoV-2 nucleoprotein
detection (top) and human IgG (bottom). (b) The corresponding processed images for an optimal analysis
with ImageJ. (c) Calibration curves obtained for SARS-CoV-2 nucleoprotein detection with the
spectrophotometer (red) and the portable platform (black). (d) Calibration curves obtained for human IgG
detection with the spectrophotometer (red) and the portable platform (black).
5.4.2. Gold Aggregation Test
To further demonstrate the ability of our platform to collect a colorimetric signal output,
we performed a gold aggregation test (GAT) to evaluate the stability of gold nanoparticles
(AuNPs). AuNPs are optical transducers broadly used in rapid tests, such as lateral flow strips
(LFS)31,32. In this regard, the size, concentration, and stability of AuNPs are critical parameters to
optimize the performance of these sensors. We selected 40 nm AuNPs and we blocked them
using different concentrations of bovine serum albumin (BSA), from 1% to 0.01% (w/v).
Afterward, the stability of these blocked AuNPs was tested by adding a solution of 10% NaCl and
we monitored the optical signal using a classic spectrophotometer and our portable platform.
In this regard, the AuNPs become more resistant to the aggregation induced by a high
concentration of salts when they are sufficiently covered by a blocking agent, such as BSA. The
spectrophotometer enables to read the absorbance spectra of the AuNPs, showing the
maximum absorbance peak around 540 nm. As expected, this absorbance peak declines when
lower concentrations of BSA are used to block the AuNPs because of AuNPs aggregation (Figure
5.3a).
In the next step, to demonstrate the capability of our system to convert the image into a
quantitative value, we evaluated the aggregation state of these AuNPs using the portable
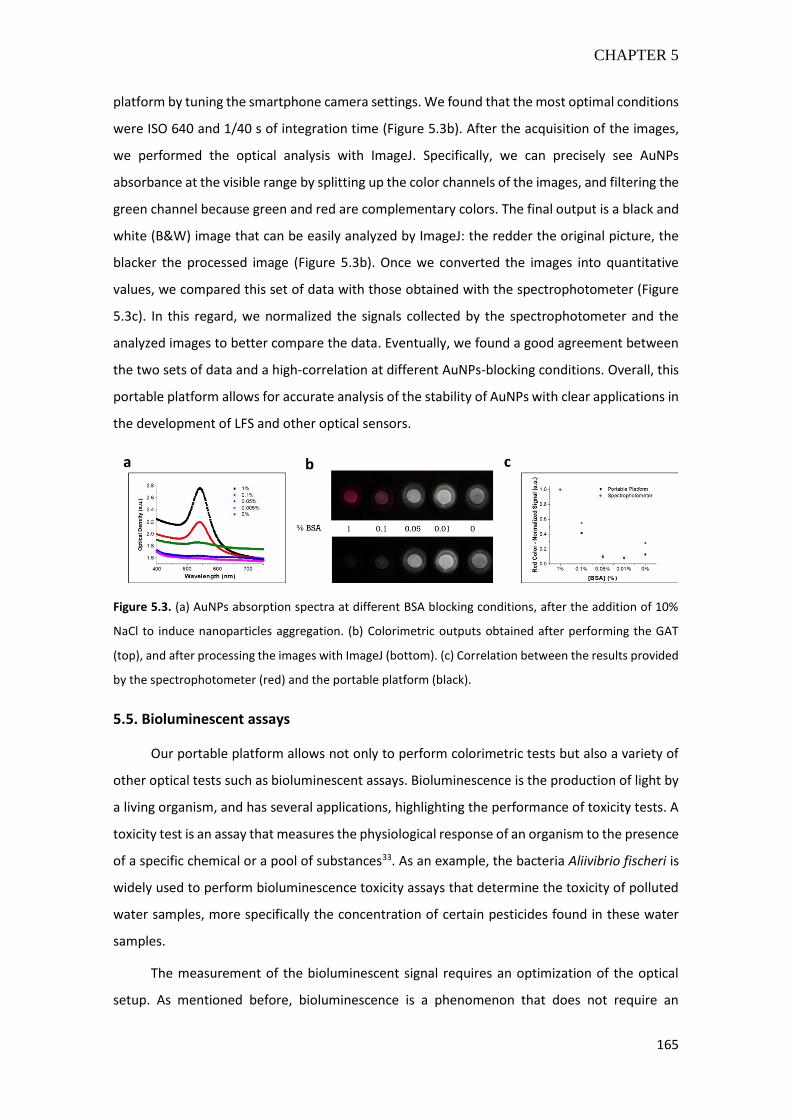
CHAPTER 5
165
platform by tuning the smartphone camera settings. We found that the most optimal conditions
were ISO 640 and 1/40 s of integration time (Figure 5.3b). After the acquisition of the images,
we performed the optical analysis with ImageJ. Specifically, we can precisely see AuNPs
absorbance at the visible range by splitting up the color channels of the images, and filtering the
green channel because green and red are complementary colors. The final output is a black and
white (B&W) image that can be easily analyzed by ImageJ: the redder the original picture, the
blacker the processed image (Figure 5.3b). Once we converted the images into quantitative
values, we compared this set of data with those obtained with the spectrophotometer (Figure
5.3c). In this regard, we normalized the signals collected by the spectrophotometer and the
analyzed images to better compare the data. Eventually, we found a good agreement between
the two sets of data and a high-correlation at different AuNPs-blocking conditions. Overall, this
portable platform allows for accurate analysis of the stability of AuNPs with clear applications in
the development of LFS and other optical sensors.
Figure 5.3. (a) AuNPs absorption spectra at different BSA blocking conditions, after the addition of 10%
NaCl to induce nanoparticles aggregation. (b) Colorimetric outputs obtained after performing the GAT
(top), and after processing the images with ImageJ (bottom). (c) Correlation between the results provided
by the spectrophotometer (red) and the portable platform (black).
5.5. Bioluminescent assays
Our portable platform allows not only to perform colorimetric tests but also a variety of
other optical tests such as bioluminescent assays. Bioluminescence is the production of light by
a living organism, and has several applications, highlighting the performance of toxicity tests. A
toxicity test is an assay that measures the physiological response of an organism to the presence
of a specific chemical or a pool of substances33. As an example, the bacteria Aliivibrio fischeri is
widely used to perform bioluminescence toxicity assays that determine the toxicity of polluted
water samples, more specifically the concentration of certain pesticides found in these water
samples.
The measurement of the bioluminescent signal requires an optimization of the optical
setup. As mentioned before, bioluminescence is a phenomenon that does not require an
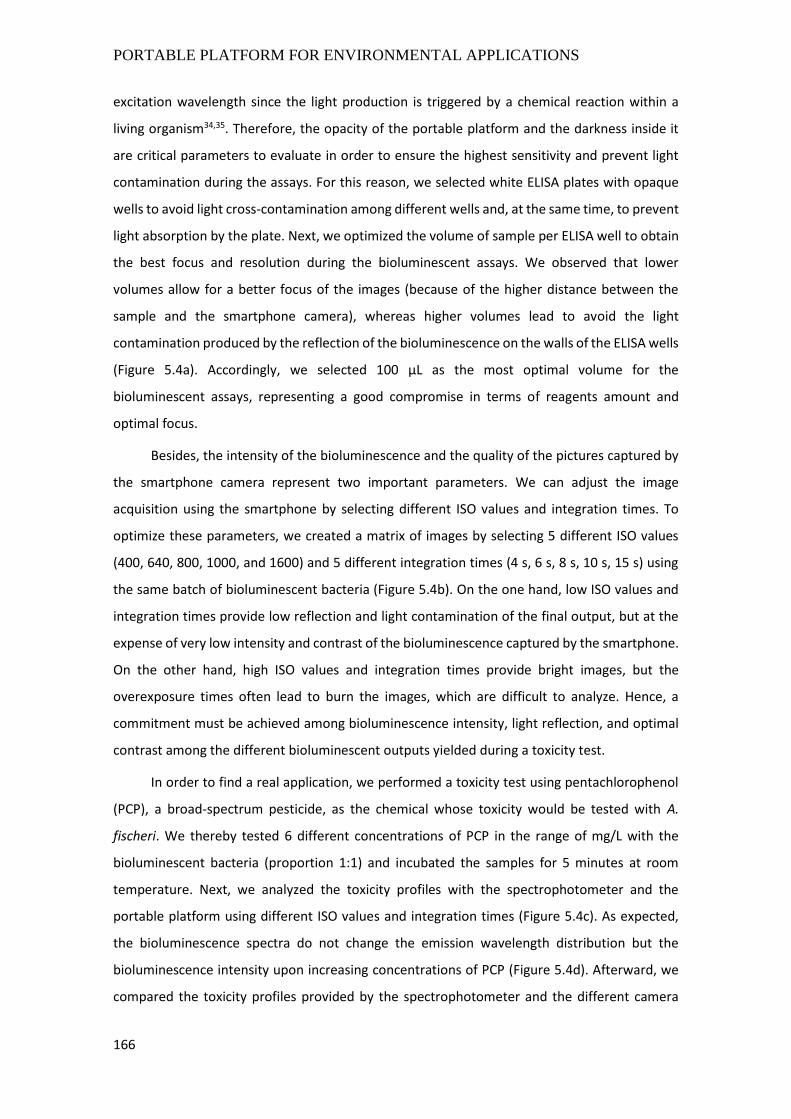
PORTABLE PLATFORM FOR ENVIRONMENTAL APPLICATIONS
166
excitation wavelength since the light production is triggered by a chemical reaction within a
living organism34,35. Therefore, the opacity of the portable platform and the darkness inside it
are critical parameters to evaluate in order to ensure the highest sensitivity and prevent light
contamination during the assays. For this reason, we selected white ELISA plates with opaque
wells to avoid light cross-contamination among different wells and, at the same time, to prevent
light absorption by the plate. Next, we optimized the volume of sample per ELISA well to obtain
the best focus and resolution during the bioluminescent assays. We observed that lower
volumes allow for a better focus of the images (because of the higher distance between the
sample and the smartphone camera), whereas higher volumes lead to avoid the light
contamination produced by the reflection of the bioluminescence on the walls of the ELISA wells
(Figure 5.4a). Accordingly, we selected 100 µL as the most optimal volume for the
bioluminescent assays, representing a good compromise in terms of reagents amount and
optimal focus.
Besides, the intensity of the bioluminescence and the quality of the pictures captured by
the smartphone camera represent two important parameters. We can adjust the image
acquisition using the smartphone by selecting different ISO values and integration times. To
optimize these parameters, we created a matrix of images by selecting 5 different ISO values
(400, 640, 800, 1000, and 1600) and 5 different integration times (4 s, 6 s, 8 s, 10 s, 15 s) using
the same batch of bioluminescent bacteria (Figure 5.4b). On the one hand, low ISO values and
integration times provide low reflection and light contamination of the final output, but at the
expense of very low intensity and contrast of the bioluminescence captured by the smartphone.
On the other hand, high ISO values and integration times provide bright images, but the
overexposure times often lead to burn the images, which are difficult to analyze. Hence, a
commitment must be achieved among bioluminescence intensity, light reflection, and optimal
contrast among the different bioluminescent outputs yielded during a toxicity test.
In order to find a real application, we performed a toxicity test using pentachlorophenol
(PCP), a broad-spectrum pesticide, as the chemical whose toxicity would be tested with A.
fischeri. We thereby tested 6 different concentrations of PCP in the range of mg/L with the
bioluminescent bacteria (proportion 1:1) and incubated the samples for 5 minutes at room
temperature. Next, we analyzed the toxicity profiles with the spectrophotometer and the
portable platform using different ISO values and integration times (Figure 5.4c). As expected,
the bioluminescence spectra do not change the emission wavelength distribution but the
bioluminescence intensity upon increasing concentrations of PCP (Figure 5.4d). Afterward, we
compared the toxicity profiles provided by the spectrophotometer and the different camera
CHAPTER 5
167
settings tested with the portable platform (Figure 5.4e). The analysis of the images captured by
the smartphone was performed with ImageJ without any further image treatment. In this regard,
ISO 400 and 4 s of integration time yield better sensitivity than the spectrophotometer, whereas
increasing ISO values and integration times allow for brighter images but lower sensitivity.
Overall, the toxicity tests performed with the portable platform give reliable results, comparable
to those obtained with the spectrophotometer, and enable to tune the detection range of PCP
by selecting the most appropriate smartphone camera settings.
Figure 5.4. (a) Different volumes of bioluminescent bacteria tested within the portable platform. (b)
Different smartphone parameters tested to capture the bioluminescence of A. fischeri within the portable
platform. (c) Different smartphone parameters tested to analyze the toxicity profile of pentachlorophenol
with A. fischeri within the portable platform. (d) Bioluminescence spectra of A. fischeri upon increasing
concentrations of PCP. (e) Toxicity profiles of PCP with A. fischeri by using the spectrophotometer and
different smartphone settings within the portable platform.
5.6. Fluorescent assays
5.6.1. Fluorophores characterization
To further demonstrate the versatility of the platform, we performed fluorescent assays
with several fluorophores broadly used for biosensing applications (i.e. quantum dots [QDs] and
fluorescein)36–39. As previously described, we installed a UV led that emits at 365 nm to excite
the fluorophores used for the fluorescent assays and an appropriate filter to reduce the signal
background produced by the excitation source. In this case, the opacity within the portable
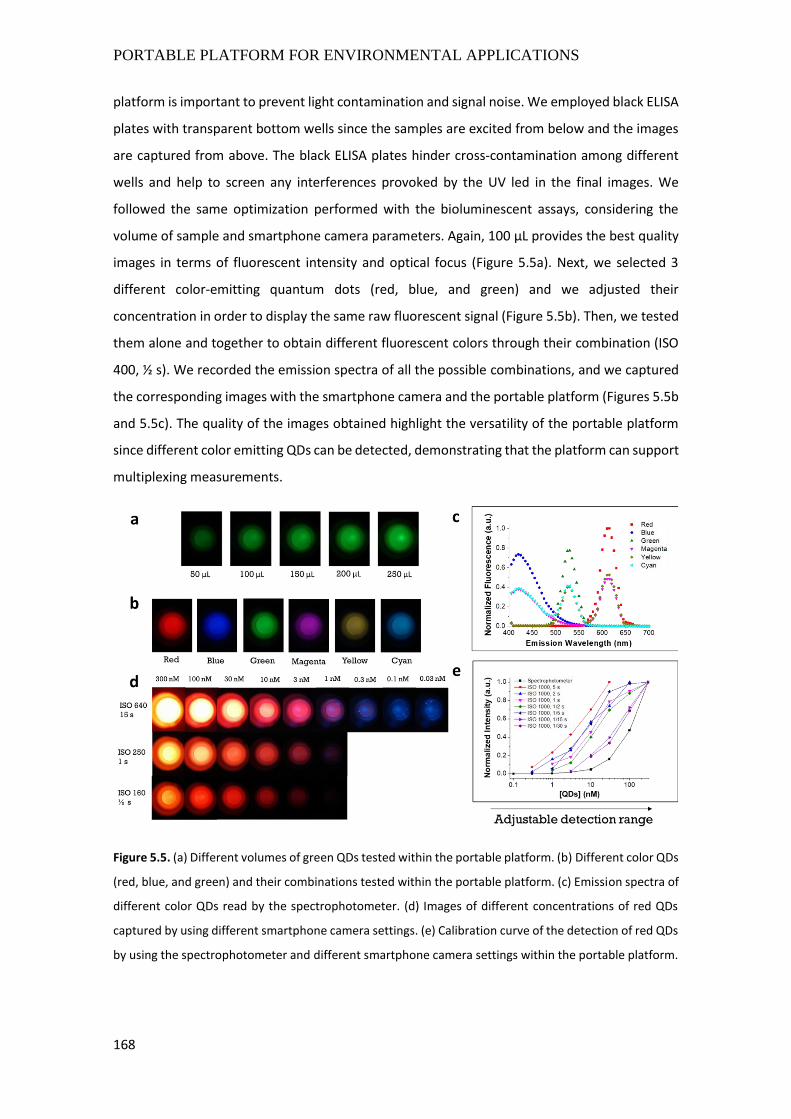
PORTABLE PLATFORM FOR ENVIRONMENTAL APPLICATIONS
168
platform is important to prevent light contamination and signal noise. We employed black ELISA
plates with transparent bottom wells since the samples are excited from below and the images
are captured from above. The black ELISA plates hinder cross-contamination among different
wells and help to screen any interferences provoked by the UV led in the final images. We
followed the same optimization performed with the bioluminescent assays, considering the
volume of sample and smartphone camera parameters. Again, 100 µL provides the best quality
images in terms of fluorescent intensity and optical focus (Figure 5.5a). Next, we selected 3
different color-emitting quantum dots (red, blue, and green) and we adjusted their
concentration in order to display the same raw fluorescent signal (Figure 5.5b). Then, we tested
them alone and together to obtain different fluorescent colors through their combination (ISO
400, ½ s). We recorded the emission spectra of all the possible combinations, and we captured
the corresponding images with the smartphone camera and the portable platform (Figures 5.5b
and 5.5c). The quality of the images obtained highlight the versatility of the portable platform
since different color emitting QDs can be detected, demonstrating that the platform can support
multiplexing measurements.
Figure 5.5. (a) Different volumes of green QDs tested within the portable platform. (b) Different color QDs
(red, blue, and green) and their combinations tested within the portable platform. (c) Emission spectra of
different color QDs read by the spectrophotometer. (d) Images of different concentrations of red QDs
captured by using different smartphone camera settings. (e) Calibration curve of the detection of red QDs
by using the spectrophotometer and different smartphone camera settings within the portable platform.
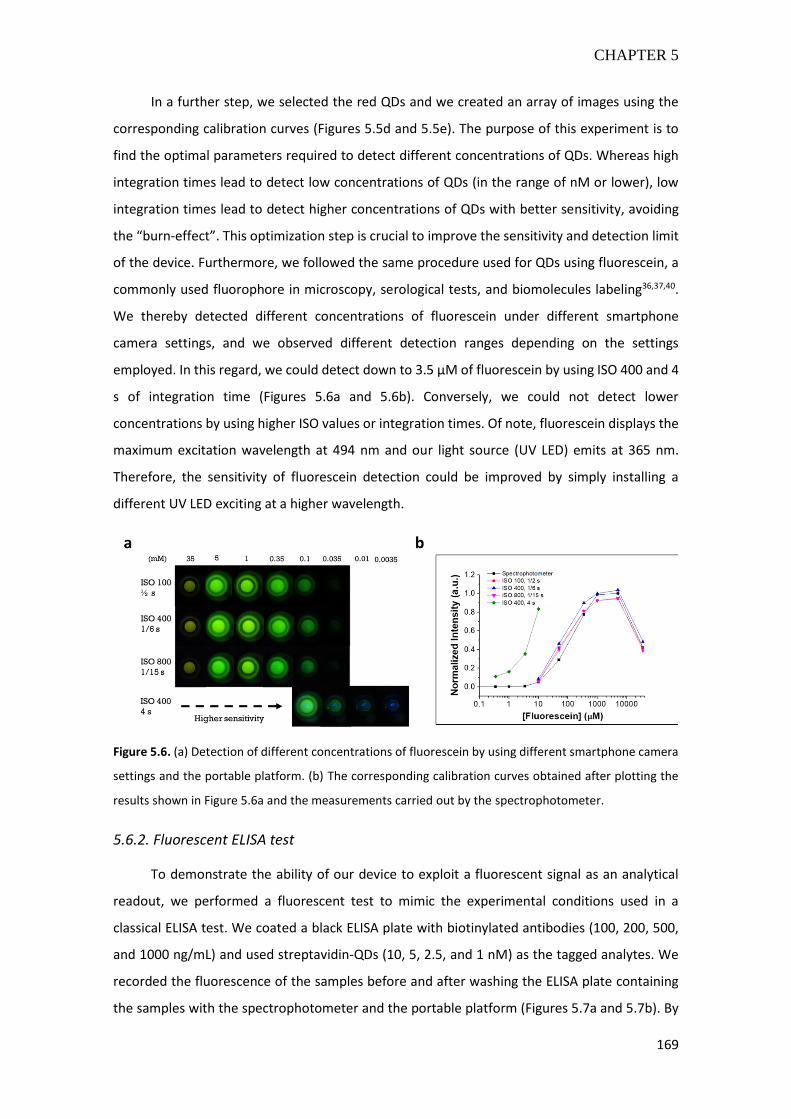
CHAPTER 5
169
In a further step, we selected the red QDs and we created an array of images using the
corresponding calibration curves (Figures 5.5d and 5.5e). The purpose of this experiment is to
find the optimal parameters required to detect different concentrations of QDs. Whereas high
integration times lead to detect low concentrations of QDs (in the range of nM or lower), low
integration times lead to detect higher concentrations of QDs with better sensitivity, avoiding
the “burn-effect”. This optimization step is crucial to improve the sensitivity and detection limit
of the device. Furthermore, we followed the same procedure used for QDs using fluorescein, a
commonly used fluorophore in microscopy, serological tests, and biomolecules labeling36,37,40.
We thereby detected different concentrations of fluorescein under different smartphone
camera settings, and we observed different detection ranges depending on the settings
employed. In this regard, we could detect down to 3.5 µM of fluorescein by using ISO 400 and 4
s of integration time (Figures 5.6a and 5.6b). Conversely, we could not detect lower
concentrations by using higher ISO values or integration times. Of note, fluorescein displays the
maximum excitation wavelength at 494 nm and our light source (UV LED) emits at 365 nm.
Therefore, the sensitivity of fluorescein detection could be improved by simply installing a
different UV LED exciting at a higher wavelength.
Figure 5.6. (a) Detection of different concentrations of fluorescein by using different smartphone camera
settings and the portable platform. (b) The corresponding calibration curves obtained after plotting the
results shown in Figure 5.6a and the measurements carried out by the spectrophotometer.
5.6.2. Fluorescent ELISA test
To demonstrate the ability of our device to exploit a fluorescent signal as an analytical
readout, we performed a fluorescent test to mimic the experimental conditions used in a
classical ELISA test. We coated a black ELISA plate with biotinylated antibodies (100, 200, 500,
and 1000 ng/mL) and used streptavidin-QDs (10, 5, 2.5, and 1 nM) as the tagged analytes. We
recorded the fluorescence of the samples before and after washing the ELISA plate containing
the samples with the spectrophotometer and the portable platform (Figures 5.7a and 5.7b). By
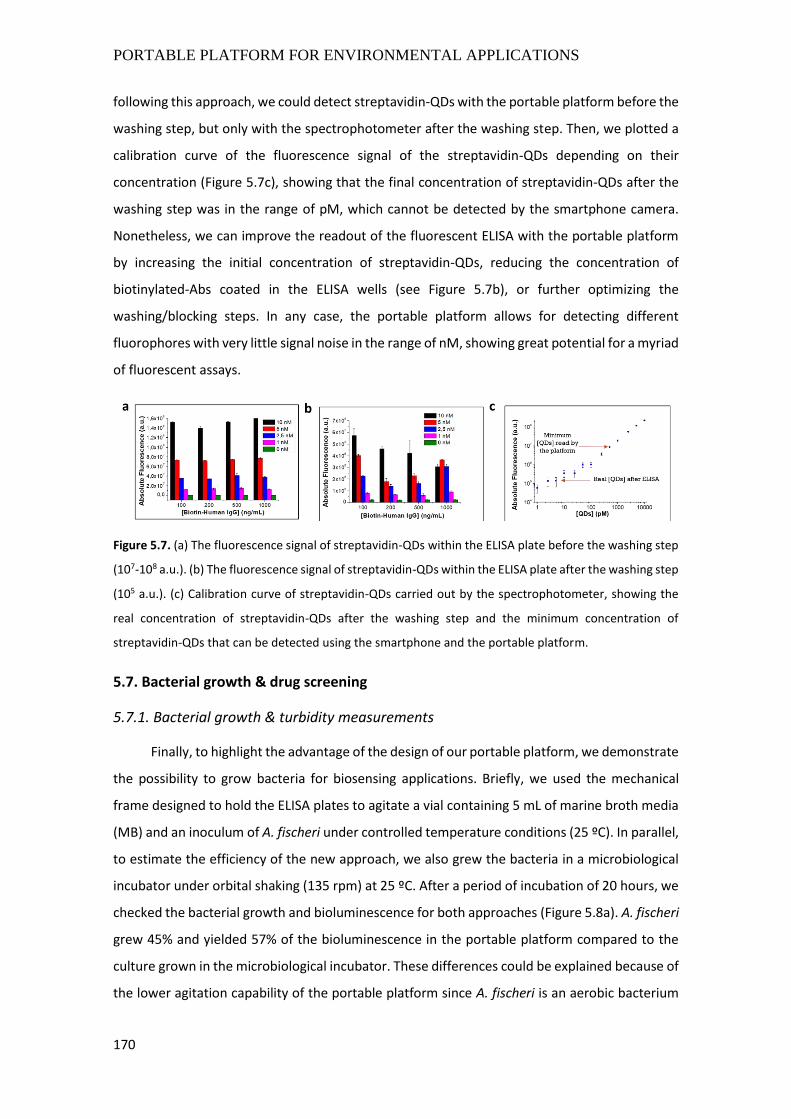
PORTABLE PLATFORM FOR ENVIRONMENTAL APPLICATIONS
170
following this approach, we could detect streptavidin-QDs with the portable platform before the
washing step, but only with the spectrophotometer after the washing step. Then, we plotted a
calibration curve of the fluorescence signal of the streptavidin-QDs depending on their
concentration (Figure 5.7c), showing that the final concentration of streptavidin-QDs after the
washing step was in the range of pM, which cannot be detected by the smartphone camera.
Nonetheless, we can improve the readout of the fluorescent ELISA with the portable platform
by increasing the initial concentration of streptavidin-QDs, reducing the concentration of
biotinylated-Abs coated in the ELISA wells (see Figure 5.7b), or further optimizing the
washing/blocking steps. In any case, the portable platform allows for detecting different
fluorophores with very little signal noise in the range of nM, showing great potential for a myriad
of fluorescent assays.
Figure 5.7. (a) The fluorescence signal of streptavidin-QDs within the ELISA plate before the washing step
(107-108 a.u.). (b) The fluorescence signal of streptavidin-QDs within the ELISA plate after the washing step
(105 a.u.). (c) Calibration curve of streptavidin-QDs carried out by the spectrophotometer, showing the
real concentration of streptavidin-QDs after the washing step and the minimum concentration of
streptavidin-QDs that can be detected using the smartphone and the portable platform.
5.7. Bacterial growth & drug screening
5.7.1. Bacterial growth & turbidity measurements
Finally, to highlight the advantage of the design of our portable platform, we demonstrate
the possibility to grow bacteria for biosensing applications. Briefly, we used the mechanical
frame designed to hold the ELISA plates to agitate a vial containing 5 mL of marine broth media
(MB) and an inoculum of A. fischeri under controlled temperature conditions (25 ºC). In parallel,
to estimate the efficiency of the new approach, we also grew the bacteria in a microbiological
incubator under orbital shaking (135 rpm) at 25 ºC. After a period of incubation of 20 hours, we
checked the bacterial growth and bioluminescence for both approaches (Figure 5.8a). A. fischeri
grew 45% and yielded 57% of the bioluminescence in the portable platform compared to the
culture grown in the microbiological incubator. These differences could be explained because of
the lower agitation capability of the portable platform since A. fischeri is an aerobic bacterium
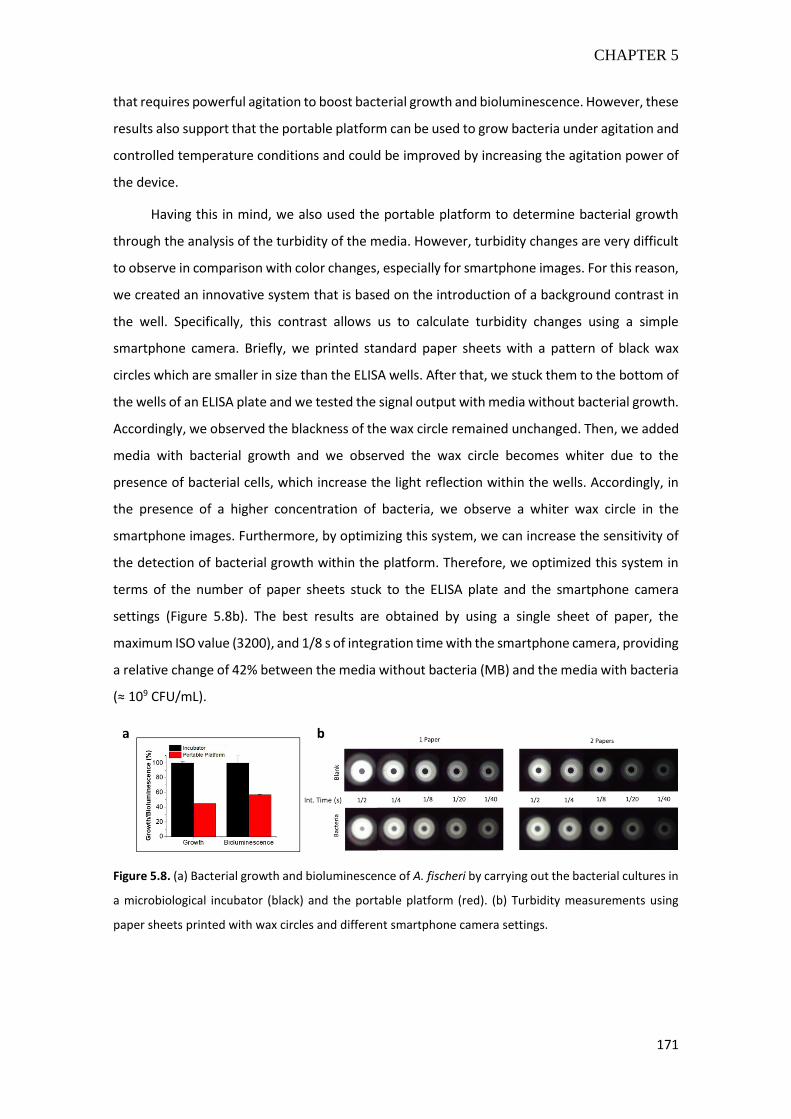
CHAPTER 5
171
that requires powerful agitation to boost bacterial growth and bioluminescence. However, these
results also support that the portable platform can be used to grow bacteria under agitation and
controlled temperature conditions and could be improved by increasing the agitation power of
the device.
Having this in mind, we also used the portable platform to determine bacterial growth
through the analysis of the turbidity of the media. However, turbidity changes are very difficult
to observe in comparison with color changes, especially for smartphone images. For this reason,
we created an innovative system that is based on the introduction of a background contrast in
the well. Specifically, this contrast allows us to calculate turbidity changes using a simple
smartphone camera. Briefly, we printed standard paper sheets with a pattern of black wax
circles which are smaller in size than the ELISA wells. After that, we stuck them to the bottom of
the wells of an ELISA plate and we tested the signal output with media without bacterial growth.
Accordingly, we observed the blackness of the wax circle remained unchanged. Then, we added
media with bacterial growth and we observed the wax circle becomes whiter due to the
presence of bacterial cells, which increase the light reflection within the wells. Accordingly, in
the presence of a higher concentration of bacteria, we observe a whiter wax circle in the
smartphone images. Furthermore, by optimizing this system, we can increase the sensitivity of
the detection of bacterial growth within the platform. Therefore, we optimized this system in
terms of the number of paper sheets stuck to the ELISA plate and the smartphone camera
settings (Figure 5.8b). The best results are obtained by using a single sheet of paper, the
maximum ISO value (3200), and 1/8 s of integration time with the smartphone camera, providing
a relative change of 42% between the media without bacteria (MB) and the media with bacteria
(≈ 109 CFU/mL).
Figure 5.8. (a) Bacterial growth and bioluminescence of A. fischeri by carrying out the bacterial cultures in
a microbiological incubator (black) and the portable platform (red). (b) Turbidity measurements using
paper sheets printed with wax circles and different smartphone camera settings.
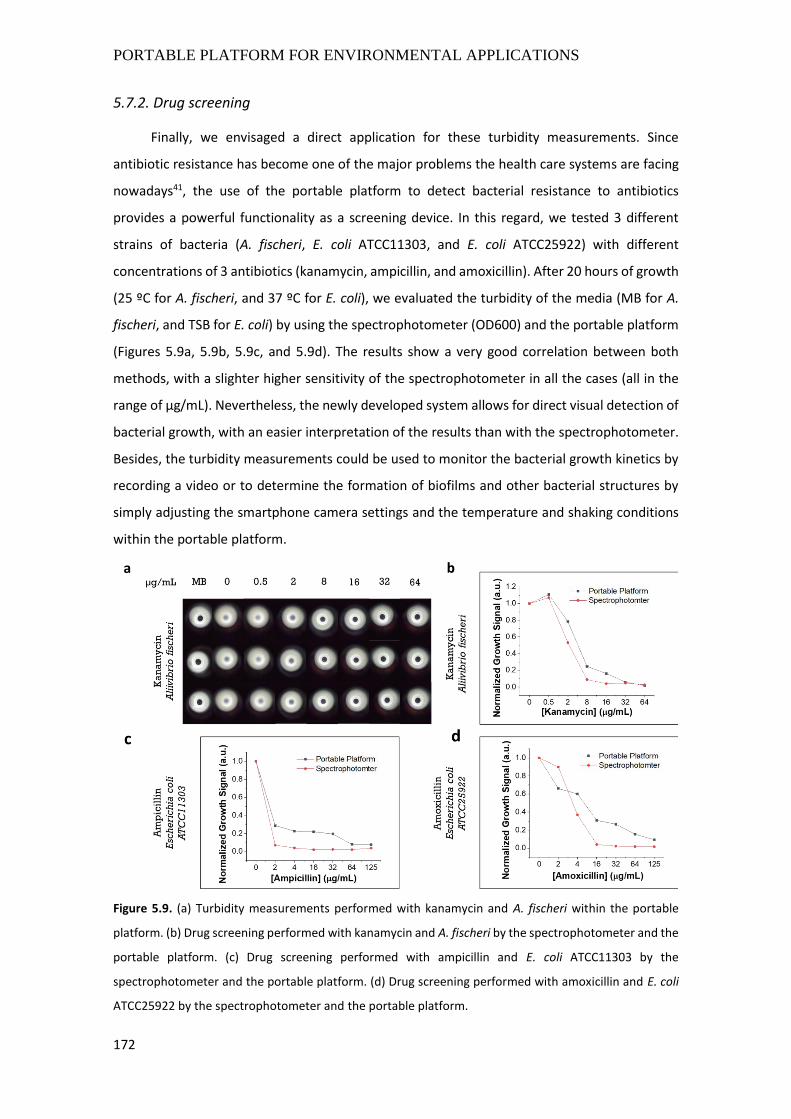
PORTABLE PLATFORM FOR ENVIRONMENTAL APPLICATIONS
172
5.7.2. Drug screening
Finally, we envisaged a direct application for these turbidity measurements. Since
antibiotic resistance has become one of the major problems the health care systems are facing
nowadays41, the use of the portable platform to detect bacterial resistance to antibiotics
provides a powerful functionality as a screening device. In this regard, we tested 3 different
strains of bacteria (A. fischeri, E. coli ATCC11303, and E. coli ATCC25922) with different
concentrations of 3 antibiotics (kanamycin, ampicillin, and amoxicillin). After 20 hours of growth
(25 ºC for A. fischeri, and 37 ºC for E. coli), we evaluated the turbidity of the media (MB for A.
fischeri, and TSB for E. coli) by using the spectrophotometer (OD600) and the portable platform
(Figures 5.9a, 5.9b, 5.9c, and 5.9d). The results show a very good correlation between both
methods, with a slighter higher sensitivity of the spectrophotometer in all the cases (all in the
range of µg/mL). Nevertheless, the newly developed system allows for direct visual detection of
bacterial growth, with an easier interpretation of the results than with the spectrophotometer.
Besides, the turbidity measurements could be used to monitor the bacterial growth kinetics by
recording a video or to determine the formation of biofilms and other bacterial structures by
simply adjusting the smartphone camera settings and the temperature and shaking conditions
within the portable platform.
Figure 5.9. (a) Turbidity measurements performed with kanamycin and A. fischeri within the portable
platform. (b) Drug screening performed with kanamycin and A. fischeri by the spectrophotometer and the
portable platform. (c) Drug screening performed with ampicillin and E. coli ATCC11303 by the
spectrophotometer and the portable platform. (d) Drug screening performed with amoxicillin and E. coli
ATCC25922 by the spectrophotometer and the portable platform.
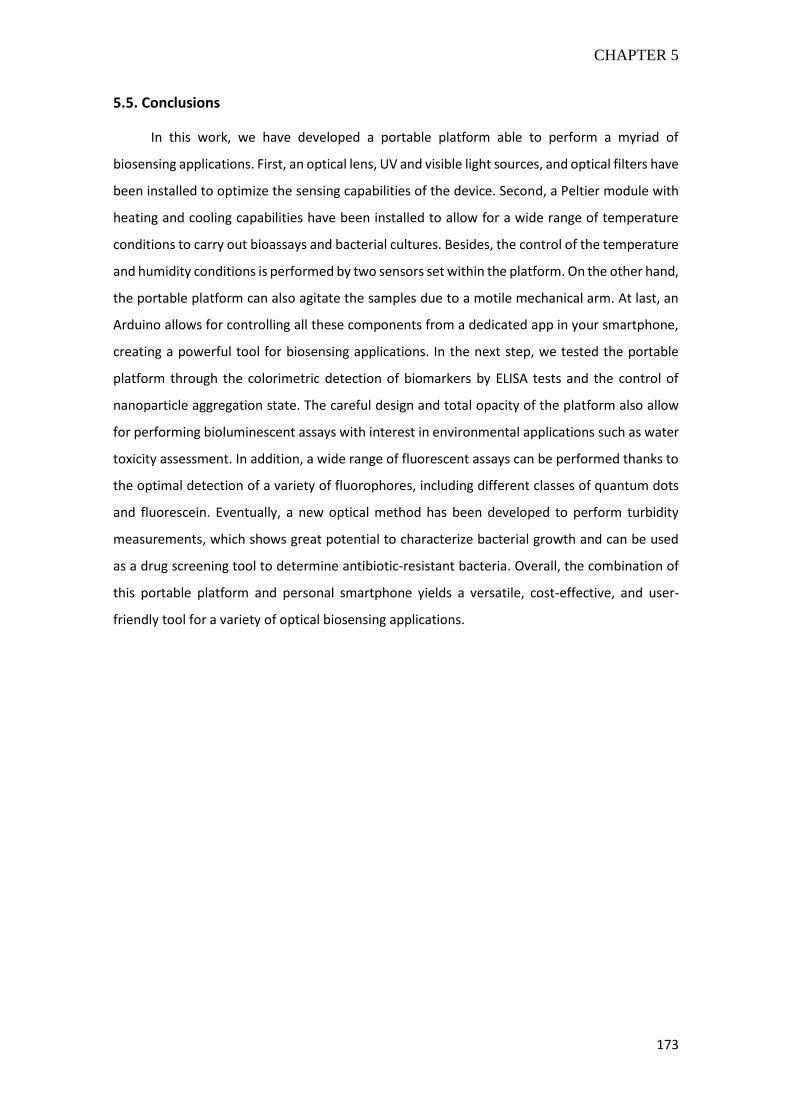
CHAPTER 5
173
5.5. Conclusions
In this work, we have developed a portable platform able to perform a myriad of
biosensing applications. First, an optical lens, UV and visible light sources, and optical filters have
been installed to optimize the sensing capabilities of the device. Second, a Peltier module with
heating and cooling capabilities have been installed to allow for a wide range of temperature
conditions to carry out bioassays and bacterial cultures. Besides, the control of the temperature
and humidity conditions is performed by two sensors set within the platform. On the other hand,
the portable platform can also agitate the samples due to a motile mechanical arm. At last, an
Arduino allows for controlling all these components from a dedicated app in your smartphone,
creating a powerful tool for biosensing applications. In the next step, we tested the portable
platform through the colorimetric detection of biomarkers by ELISA tests and the control of
nanoparticle aggregation state. The careful design and total opacity of the platform also allow
for performing bioluminescent assays with interest in environmental applications such as water
toxicity assessment. In addition, a wide range of fluorescent assays can be performed thanks to
the optimal detection of a variety of fluorophores, including different classes of quantum dots
and fluorescein. Eventually, a new optical method has been developed to perform turbidity
measurements, which shows great potential to characterize bacterial growth and can be used
as a drug screening tool to determine antibiotic-resistant bacteria. Overall, the combination of
this portable platform and personal smartphone yields a versatile, cost-effective, and user-
friendly tool for a variety of optical biosensing applications.
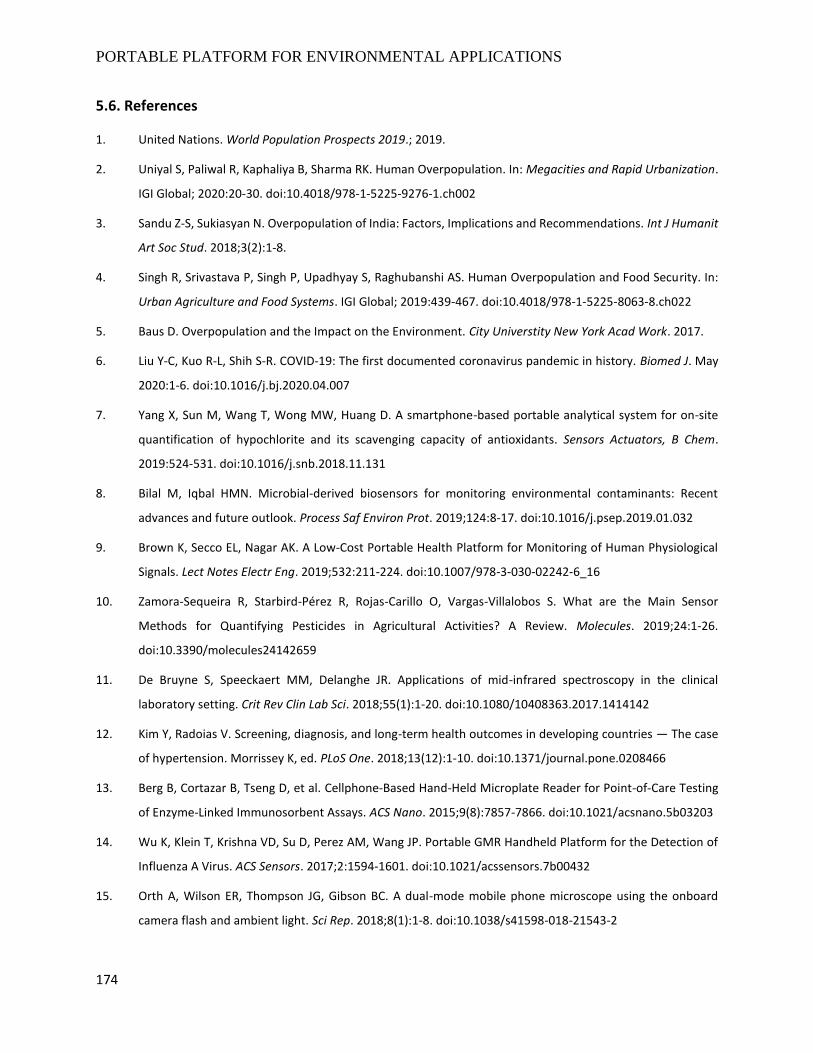
PORTABLE PLATFORM FOR ENVIRONMENTAL APPLICATIONS
174
5.6. References
1. United Nations. World Population Prospects 2019.; 2019.
2. Uniyal S, Paliwal R, Kaphaliya B, Sharma RK. Human Overpopulation. In: Megacities and Rapid Urbanization.
IGI Global; 2020:20-30. doi:10.4018/978-1-5225-9276-1.ch002
3. Sandu Z-S, Sukiasyan N. Overpopulation of India: Factors, Implications and Recommendations. Int J Humanit
Art Soc Stud. 2018;3(2):1-8.
4. Singh R, Srivastava P, Singh P, Upadhyay S, Raghubanshi AS. Human Overpopulation and Food Security. In:
Urban Agriculture and Food Systems. IGI Global; 2019:439-467. doi:10.4018/978-1-5225-8063-8.ch022
5. Baus D. Overpopulation and the Impact on the Environment. City Universtity New York Acad Work. 2017.
6. Liu Y-C, Kuo R-L, Shih S-R. COVID-19: The first documented coronavirus pandemic in history. Biomed J. May
2020:1-6. doi:10.1016/j.bj.2020.04.007
7. Yang X, Sun M, Wang T, Wong MW, Huang D. A smartphone-based portable analytical system for on-site
quantification of hypochlorite and its scavenging capacity of antioxidants. Sensors Actuators, B Chem.
2019:524-531. doi:10.1016/j.snb.2018.11.131
8. Bilal M, Iqbal HMN. Microbial-derived biosensors for monitoring environmental contaminants: Recent
advances and future outlook. Process Saf Environ Prot. 2019;124:8-17. doi:10.1016/j.psep.2019.01.032
9. Brown K, Secco EL, Nagar AK. A Low-Cost Portable Health Platform for Monitoring of Human Physiological
Signals. Lect Notes Electr Eng. 2019;532:211-224. doi:10.1007/978-3-030-02242-6_16
10. Zamora-Sequeira R, Starbird-Pérez R, Rojas-Carillo O, Vargas-Villalobos S. What are the Main Sensor
Methods for Quantifying Pesticides in Agricultural Activities? A Review. Molecules. 2019;24:1-26.
doi:10.3390/molecules24142659
11. De Bruyne S, Speeckaert MM, Delanghe JR. Applications of mid-infrared spectroscopy in the clinical
laboratory setting. Crit Rev Clin Lab Sci. 2018;55(1):1-20. doi:10.1080/10408363.2017.1414142
12. Kim Y, Radoias V. Screening, diagnosis, and long-term health outcomes in developing countries — The case
of hypertension. Morrissey K, ed. PLoS One. 2018;13(12):1-10. doi:10.1371/journal.pone.0208466
13. Berg B, Cortazar B, Tseng D, et al. Cellphone-Based Hand-Held Microplate Reader for Point-of-Care Testing
of Enzyme-Linked Immunosorbent Assays. ACS Nano. 2015;9(8):7857-7866. doi:10.1021/acsnano.5b03203
14. Wu K, Klein T, Krishna VD, Su D, Perez AM, Wang JP. Portable GMR Handheld Platform for the Detection of
Influenza A Virus. ACS Sensors. 2017;2:1594-1601. doi:10.1021/acssensors.7b00432
15. Orth A, Wilson ER, Thompson JG, Gibson BC. A dual-mode mobile phone microscope using the onboard
camera flash and ambient light. Sci Rep. 2018;8(1):1-8. doi:10.1038/s41598-018-21543-2
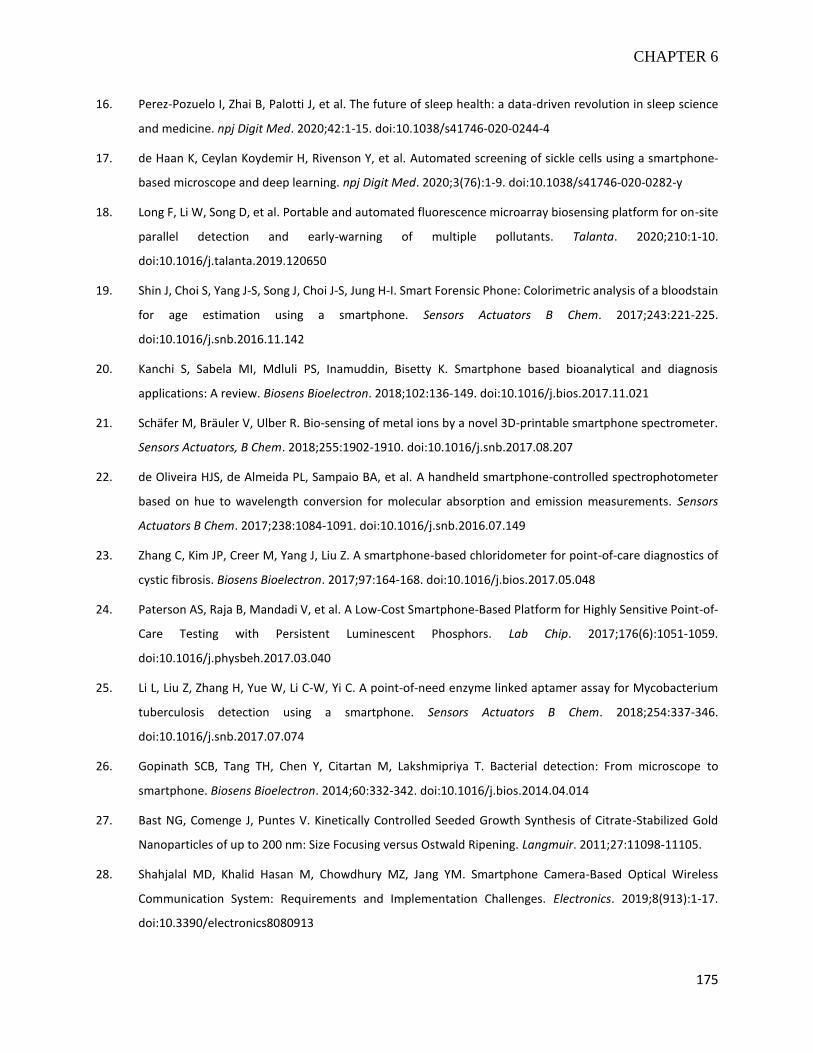
CHAPTER 6
175
16. Perez-Pozuelo I, Zhai B, Palotti J, et al. The future of sleep health: a data-driven revolution in sleep science
and medicine. npj Digit Med. 2020;42:1-15. doi:10.1038/s41746-020-0244-4
17. de Haan K, Ceylan Koydemir H, Rivenson Y, et al. Automated screening of sickle cells using a smartphone-
based microscope and deep learning. npj Digit Med. 2020;3(76):1-9. doi:10.1038/s41746-020-0282-y
18. Long F, Li W, Song D, et al. Portable and automated fluorescence microarray biosensing platform for on-site
parallel detection and early-warning of multiple pollutants. Talanta. 2020;210:1-10.
doi:10.1016/j.talanta.2019.120650
19. Shin J, Choi S, Yang J-S, Song J, Choi J-S, Jung H-I. Smart Forensic Phone: Colorimetric analysis of a bloodstain
for age estimation using a smartphone. Sensors Actuators B Chem. 2017;243:221-225.
doi:10.1016/j.snb.2016.11.142
20. Kanchi S, Sabela MI, Mdluli PS, Inamuddin, Bisetty K. Smartphone based bioanalytical and diagnosis
applications: A review. Biosens Bioelectron. 2018;102:136-149. doi:10.1016/j.bios.2017.11.021
21. Schäfer M, Bräuler V, Ulber R. Bio-sensing of metal ions by a novel 3D-printable smartphone spectrometer.
Sensors Actuators, B Chem. 2018;255:1902-1910. doi:10.1016/j.snb.2017.08.207
22. de Oliveira HJS, de Almeida PL, Sampaio BA, et al. A handheld smartphone-controlled spectrophotometer
based on hue to wavelength conversion for molecular absorption and emission measurements. Sensors
Actuators B Chem. 2017;238:1084-1091. doi:10.1016/j.snb.2016.07.149
23. Zhang C, Kim JP, Creer M, Yang J, Liu Z. A smartphone-based chloridometer for point-of-care diagnostics of
cystic fibrosis. Biosens Bioelectron. 2017;97:164-168. doi:10.1016/j.bios.2017.05.048
24. Paterson AS, Raja B, Mandadi V, et al. A Low-Cost Smartphone-Based Platform for Highly Sensitive Point-of-
Care Testing with Persistent Luminescent Phosphors. Lab Chip. 2017;176(6):1051-1059.
doi:10.1016/j.physbeh.2017.03.040
25. Li L, Liu Z, Zhang H, Yue W, Li C-W, Yi C. A point-of-need enzyme linked aptamer assay for Mycobacterium
tuberculosis detection using a smartphone. Sensors Actuators B Chem. 2018;254:337-346.
doi:10.1016/j.snb.2017.07.074
26. Gopinath SCB, Tang TH, Chen Y, Citartan M, Lakshmipriya T. Bacterial detection: From microscope to
smartphone. Biosens Bioelectron. 2014;60:332-342. doi:10.1016/j.bios.2014.04.014
27. Bast NG, Comenge J, Puntes V. Kinetically Controlled Seeded Growth Synthesis of Citrate-Stabilized Gold
Nanoparticles of up to 200 nm: Size Focusing versus Ostwald Ripening. Langmuir. 2011;27:11098-11105.
28. Shahjalal MD, Khalid Hasan M, Chowdhury MZ, Jang YM. Smartphone Camera-Based Optical Wireless
Communication System: Requirements and Implementation Challenges. Electronics. 2019;8(913):1-17.
doi:10.3390/electronics8080913
PORTABLE PLATFORM FOR ENVIRONMENTAL APPLICATIONS
176
29. ThermoFisher Scientific. ELISA (Enzyme-Linked Immunosorbent Assay).
https://www.thermofisher.com/es/es/home/life-science/protein-biology/protein-assays-
analysis/elisa.html. Published 2020.
30. Zhdanov A, Keefe J, Franco-Waite L, Konnaiyan KR, Pyayt A. Mobile phone based ELISA (MELISA). Biosens
Bioelectron. 2018;103:138-142. doi:10.1016/j.bios.2017.12.033
31. Quesada-González D, Merkoçi A. Nanomaterial-based devices for point-of-care diagnostic applications.
Chem Soc Rev. 2018;47(13):4697-4709. doi:10.1039/c7cs00837f
32. Quesada-González D, Merkoçi A. Nanoparticle-based lateral flow biosensors. Biosens Bioelectron.
2015;73:47-63. doi:10.1016/j.bios.2015.05.050
33. Kress N. Actual Impacts of Seawater Desalination on the Marine Environment Reported Since 2001. In:
Marine Impacts of Seawater Desalination. ; 2019:81-133.
34. Strack R. Harnessing fungal bioluminescence. Nat Methods. 2019;16(2):140. doi:10.1038/s41592-019-0311-
4
35. Miyashiro T, Ruby EG. Shedding light on bioluminescence regulation in Vibrio fischeri. Mol Microbiol.
2013;84(5):795-806.
36. Zhao X, Lu C, Yang S, Zhang J. Bioconjugation of aptamer to fluorescent trimethyl chitosan nanoparticles for
bacterial detection. Mater Lett. 2020;264:1-3. doi:10.1016/j.matlet.2020.127330
37. Luka G, Samiei E, Dehghani S, Johnson T, Najjaran H, Hoorfar M. Label-free Capacitive Biosensor for Detection
of Cryptosporidium. Sensors. 2019;19(258):1-9. doi:10.3390/s19020258
38. Sheng E, Lu Y, Tan Y, Xiao Y, Li Z, Dai Z. Ratiometric Fluorescent Quantum Dot-Based Biosensor for
Chlorothalonil Detection via an Inner-Filter Effect. Anal Chem. 2020;92:4364-4370.
doi:10.1021/acs.analchem.9b05199
39. Ma F, Jiang S, Zhang C yang. SiRNA-directed self-assembled quantum dot biosensor for simultaneous
detection of multiple microRNAs at the single-particle level. Biosens Bioelectron. 2020;157:1-7.
doi:10.1016/j.bios.2020.112177
40. Shen J, Li Y, Gu H, Xia F, Zuo X. Recent development of sandwich assay based on the nanobiotechnologies
for proteins, nucleic acids, small molecules, and ions. Chem Rev. 2014;114(15):7631-7677.
doi:10.1021/cr300248x
41. World Health Organization. Antibiotic resistance. https://www.who.int/news-room/fact-
sheets/detail/antibiotic-resistance. Published 2020.

CHAPTER 6
177
CHAPTER 6
Concluding Remarks

CHAPTER 6
179
The study of different optical approaches (colorimetric, fluorescent, and bioluminescent)
implemented into portable sensing devices for the detection of chemical and microbial analytes
related to water pollution has been achieved within this work.
Considering the objectives previously described in Chapter 2, along with the obtained
results presented from Chapter 3 to Chapter 5, the following specific conclusions on this Ph.D.
Thesis can be given:
6.1. Escherichia coli detection as a fecal indicator
Lateral flow strips (LFS) have been designed to capture E. coli through polyclonal antibodies
conjugated to 40 nm-AuNPs in a direct assay. First, lateral flow materials have been tested and
optimized for the optimal flow of bacteria based on the flow of A. fischeri, a gram-negative
bioluminescent bacterium similar in size and shape to E. coli. This approach is new and has not
been previously reported in the literature. Second, AuNPs have been carefully synthesized and
characterized to achieve an optimal size distribution (UV-Vis spectroscopy, TEM, DLS, and Z-
potential). Third, LFS have been optimized in terms of the selection of antibodies, different size
AuNPs, different concentration of antibodies both in the conjugate pad and in the test line,
detection pad materials, and blocking conditions of the detection pad. Fourth, the optimized LFS
can detect different strains of E. coli and neglect the presence of other related bacteria such as
Salmonella, showing great potential for the determination of fecal contamination. Fifth, a
filtration system allows for improving the sensitivity of the LFS by two orders of magnitude in just
15 minutes. Last, these LFS show great reproducibility and good performance with real samples
(i.e. river and sewage waters), yielding recoveries always above 80%.
Briefly, the presented platform can detect E. coli species in different water samples at
concentrations ≤ 104 CFU/mL within 25 minutes. Besides, the sensitivity of the system can be
further improved by incrementing both the filtration time and the amount of water filtered.
Nonetheless, these values are still far from those recommended by WHO regarding drinking
quality standards (≤ 0 CFU E. coli/100 mL). On the other hand, the system has proven to detect
E. coli in a real case scenario at concentrations between 103-104 CFU/mL at the end of an urban
area drainpipe, showing potential for use in particular locations subjected to continuous sewage
discharges.
CONCLUSIONS
180
6.2. Water toxicity assessment
A bioluminescent toxicity biosensor based on the bacterium Aliivibrio fischeri has been
developed for water toxicity assessment. This system relies on the well-known and commercially
available Microtox technology. A. fischeri produces bioluminescence according to the number of
bacteria alive present in the media, a regulation metabolic mechanism known as quorum sensing.
First, bioluminescence has been boosted by growing the bacteria into a specific liquid medium
that allows capturing the light with a standard smartphone and a 96-wells plate. Second,
bioluminescence can be further improved by growing the bacteria onto agar medium, but the
formation of biofilms avoids an appropriate performance of the toxicity assays. Third, two
pesticides (tributyltin [TBT] and pentachlorophenol) have been spiked at different concentrations
and successfully detected with the smartphone, showing a good correlation with those results
obtained with a more sensitive luminometer. Fourth, graphene oxide (GO) was used as a non-
specific growth enhancer to reduce the growing time of A. fischeri and speed up the whole
process. This biocompatibility has been proven by cryo-TEM images that allow watching bacteria
thriving in direct contact with GO flakes. Besides, GO can improve the system’s sensitivity by
screening bioluminescence at a particular concentration range. Overall, the system delves into
the quorum-sensing mechanism to boost the bioluminescence of A. fischeri and also enhances
the sensitivity of the water toxicity biosensor.
Briefly, the sensitivity achieved with A. fischeri is still low to detect the maximum allowable
concentrations of TBT and pentachlorophenol in water samples according to the EU directives.
Nonetheless, toxicity biosensors are useful to assess the overall water toxicity; that’s to say, the
presence of different chemical products at variable concentrations. In this regard, it is difficult to
evaluate the usefulness of this system to assess water toxicity. In any case, Microtox technology,
based on lyophilized A. fischeri and an ultra-sensitive luminometer, is widely used worldwide,
supporting the applicability of our approach. Further improvements should be focused on
improving the stability of the bacteria when stored and transported, and the stability of the
bioluminescence within time and from batch-to-batch to achieve more reproducible results.
CHAPTER 6
181
6.3. Portable platform for environmental applications
A portable platform has been developed in combination with a smartphone to perform a
variety of different optical assays with several applications in the environmental and health-
related fields. The portable platform consists of several components divided into optical,
mechanical, and electrical categories. First, an optical lens allows for an optimal focus of the
smartphone camera over the samples to be analyzed. Besides, UV and visible light LEDs allow for
performing fluorescent and colorimetric assays, respectively. The use of optical filters enables to
filter out any background signal produced by the LEDs in the final images. Second, a temperature
controlling unit allows for heating and cooling down the samples from 4 ºC to 37 ºC according to
the specific needs of the assay. Besides, temperature and humidity sensors have been installed
to monitor the conditions within the platform. A mechanical arm has also been installed for
agitation of the samples, boosting the capabilities of the platform. Third, all the components are
electrically connected within the platform and controlled by an Arduino that is led by a dedicated
smartphone app. In this regard, all the components of the portable platform are controlled from
your smartphone. Fourth, the integration of all these components allows for performing a great
variety of optical assays with several biosensing applications.
Briefly, colorimetric, bioluminescent, fluorescent, and turbidimetric assays have been
performed within the portable platform. Two kinds of colorimetric assays have been tested, ELISA
tests for the detection of the nucleoprotein of SARS-CoV-2 and human immunoglobulin G and
gold aggregation tests for the determination of the nanoparticle aggregation state. These assays
can be performed within the platform, the measurements are carried out by the smartphone and
the optical analysis is made by the software ImageJ, after careful optimization of the curing of
the images. Next, a bioluminescent assay is performed within the platform for the determination
of the toxicity of the pesticide pentachlorophenol within water samples. The total opacity of the
platform and the tuning of the smartphone camera parameters allow for very sensitive detection
of the bioluminescence, comparable to that obtained with the spectrophotometer. In the next
step, the detection of fluorescence particles (quantum dots and fluorescein) is carried out in the
range from µM to nM thanks to the UV LED and the optical filters installed within the platform.
In this regard, the portable platform allows for visualizing different fluorescent colors and
CONCLUSIONS
182
detecting different concentration range by controlling the smartphone camera settings. We also
envisaged an application for the detection of these fluorophores by developing a fluorescent
ELISA test. However, the final concentration of QDs after the ELISA test was in the range of pM
and could only be detected by the spectrophotometer. On the other hand, we took advantage of
the shaking capabilities of the portable platform to grow aerobic bacteria within the device.
Eventually, a new method to determine turbidimetric changes was developed to evaluate
bacterial growth, with applications in the detection of antibiotic-resistant bacteria. Different
bacterial strains and species were tested with different antibiotics and the growth inhibition
profiles were generated with the smartphone and the portable platform, showing great
correlation with the spectrophotometer measurements.

ANNEXES
183
ANNEXES

ANNEXES
185
As annexes are attached the 2 following published articles:
“Validity of a single antibody-based lateral flow immunoassay depending on graphene oxide for
highly sensitive determination of E. coli O157:H7 in minced beef and river water”. Abdel-Rahim
H. A. Hassan, José Francisco Bergua, Eden Morales-Narváez, Arben Merkoçi. Food Chemistry,
2019, 297 (124965), 1-10.
“Low-cost strategy for the development of a rapid electrochemical assay for bacteria detection
based on AuAg Nanoshells”. Lorenzo Russo, Juan Leva Bueno, José Francisco Bergua, Monica
Constantini, Marco Giannetto, Víctor Puntes, Alfredo de la Escosura Muñiz, Arben Merkoçi. ACS
Omega, 2018, 3 (12), 18849-18856.
“Straightforward immunosensing platform based on graphene oxide-decorated nanopaper: a
highly sensitive and fast biosensing approach”. Nopchulee Cheeveewattanagul, Eden Morales-
Narváez, Abdel-Rahin H. A. Hassan, José Francisco Bergua, Arben Merkoçi. Advanced Functional
Materials, 2017, 27 (1702741), 1-8.
Also, the following posters presented at different congresses:
Jie Liu, José Francisco Bergua, Eden Morales-Narváez, Jahir Orozco, Ruslan Álvarez-Diduk, Teresa
Vincent, Guohua Zhong, Arben Merkoçi. “Fast Screening of Toxic sSbstances using
Bioluminescent Nanopaper” – Presented at Globaqua, Barcelona (2017), and also at International
Congress of Analytical Nanoscience and Nanotechnology (IX NyNA) (2019).
José Francisco Bergua, Chun-Jen Huang. “Improvement of Lateral Flow Strips Performance for
Bacteria Detection” – Presented at Ministry of Science and Technology of Taiwan (MOST) (2018).

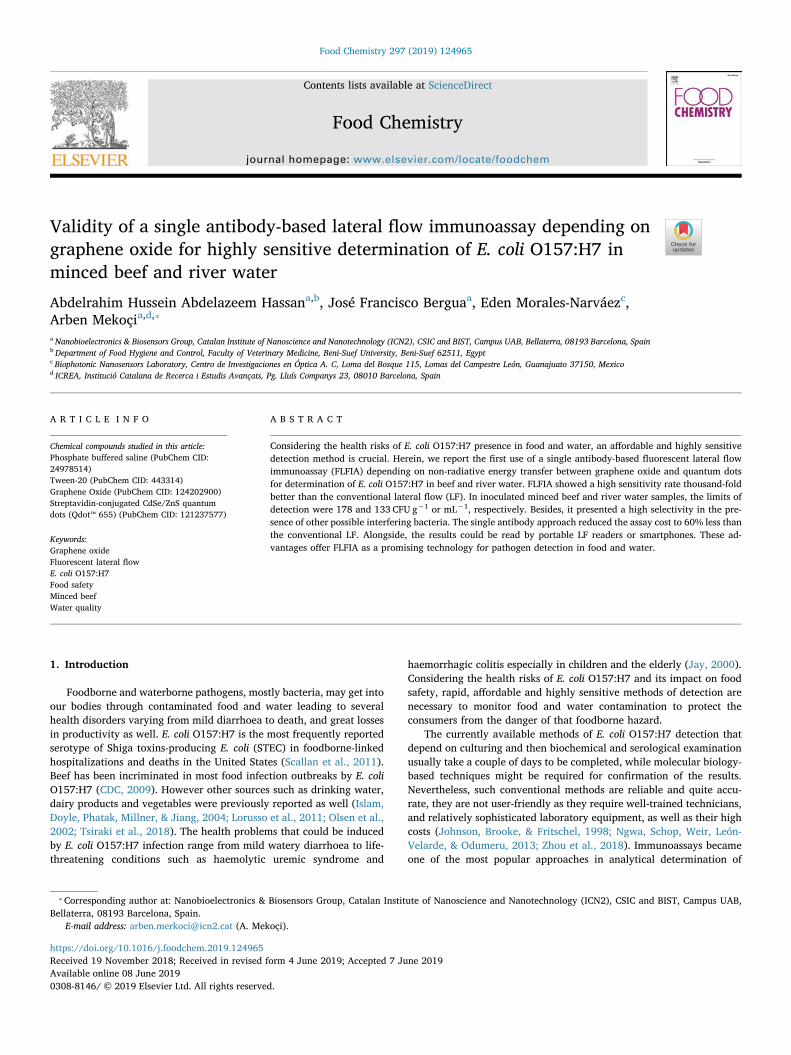
Contents lists available at ScienceDirect
Food Chemistry
journal homepage: www.elsevier.com/locate/foodchem
Validity of a single antibody-based lateral flow immunoassay depending ongraphene oxide for highly sensitive determination of E. coli O157:H7 inminced beef and river water
Abdelrahim Hussein Abdelazeem Hassana,b, José Francisco Berguaa, Eden Morales-Narváezc,Arben Mekoçia,d,⁎
aNanobioelectronics & Biosensors Group, Catalan Institute of Nanoscience and Nanotechnology (ICN2), CSIC and BIST, Campus UAB, Bellaterra, 08193 Barcelona, SpainbDepartment of Food Hygiene and Control, Faculty of Veterinary Medicine, Beni-Suef University, Beni-Suef 62511, Egyptc Biophotonic Nanosensors Laboratory, Centro de Investigaciones en Óptica A. C, Loma del Bosque 115, Lomas del Campestre León, Guanajuato 37150, Mexicod ICREA, Institució Catalana de Recerca i Estudis Avançats, Pg. Lluís Companys 23, 08010 Barcelona, Spain
A R T I C L E I N F O
Chemical compounds studied in this article:Phosphate buffered saline (PubChem CID:24978514)Tween-20 (PubChem CID: 443314)Graphene Oxide (PubChem CID: 124202900)Streptavidin-conjugated CdSe/ZnS quantumdots (Qdot™ 655) (PubChem CID: 121237577)
Keywords:Graphene oxideFluorescent lateral flowE. coli O157:H7Food safetyMinced beefWater quality
A B S T R A C T
Considering the health risks of E. coli O157:H7 presence in food and water, an affordable and highly sensitivedetection method is crucial. Herein, we report the first use of a single antibody-based fluorescent lateral flowimmunoassay (FLFIA) depending on non-radiative energy transfer between graphene oxide and quantum dotsfor determination of E. coli O157:H7 in beef and river water. FLFIA showed a high sensitivity rate thousand-foldbetter than the conventional lateral flow (LF). In inoculated minced beef and river water samples, the limits ofdetection were 178 and 133 CFU g−1 or mL−1, respectively. Besides, it presented a high selectivity in the pre-sence of other possible interfering bacteria. The single antibody approach reduced the assay cost to 60% less thanthe conventional LF. Alongside, the results could be read by portable LF readers or smartphones. These ad-vantages offer FLFIA as a promising technology for pathogen detection in food and water.
1. Introduction
Foodborne and waterborne pathogens, mostly bacteria, may get intoour bodies through contaminated food and water leading to severalhealth disorders varying from mild diarrhoea to death, and great lossesin productivity as well. E. coli O157:H7 is the most frequently reportedserotype of Shiga toxins-producing E. coli (STEC) in foodborne-linkedhospitalizations and deaths in the United States (Scallan et al., 2011).Beef has been incriminated in most food infection outbreaks by E. coliO157:H7 (CDC, 2009). However other sources such as drinking water,dairy products and vegetables were previously reported as well (Islam,Doyle, Phatak, Millner, & Jiang, 2004; Lorusso et al., 2011; Olsen et al.,2002; Tsiraki et al., 2018). The health problems that could be inducedby E. coli O157:H7 infection range from mild watery diarrhoea to life-threatening conditions such as haemolytic uremic syndrome and
haemorrhagic colitis especially in children and the elderly (Jay, 2000).Considering the health risks of E. coli O157:H7 and its impact on foodsafety, rapid, affordable and highly sensitive methods of detection arenecessary to monitor food and water contamination to protect theconsumers from the danger of that foodborne hazard.
The currently available methods of E. coli O157:H7 detection thatdepend on culturing and then biochemical and serological examinationusually take a couple of days to be completed, while molecular biology-based techniques might be required for confirmation of the results.Nevertheless, such conventional methods are reliable and quite accu-rate, they are not user-friendly as they require well-trained technicians,and relatively sophisticated laboratory equipment, as well as their highcosts (Johnson, Brooke, & Fritschel, 1998; Ngwa, Schop, Weir, León-Velarde, & Odumeru, 2013; Zhou et al., 2018). Immunoassays becameone of the most popular approaches in analytical determination of
https://doi.org/10.1016/j.foodchem.2019.124965Received 19 November 2018; Received in revised form 4 June 2019; Accepted 7 June 2019
⁎ Corresponding author at: Nanobioelectronics & Biosensors Group, Catalan Institute of Nanoscience and Nanotechnology (ICN2), CSIC and BIST, Campus UAB,Bellaterra, 08193 Barcelona, Spain.
E-mail address: [email protected] (A. Mekoçi).
Food Chemistry 297 (2019) 124965
Available online 08 June 20190308-8146/ © 2019 Elsevier Ltd. All rights reserved.
T
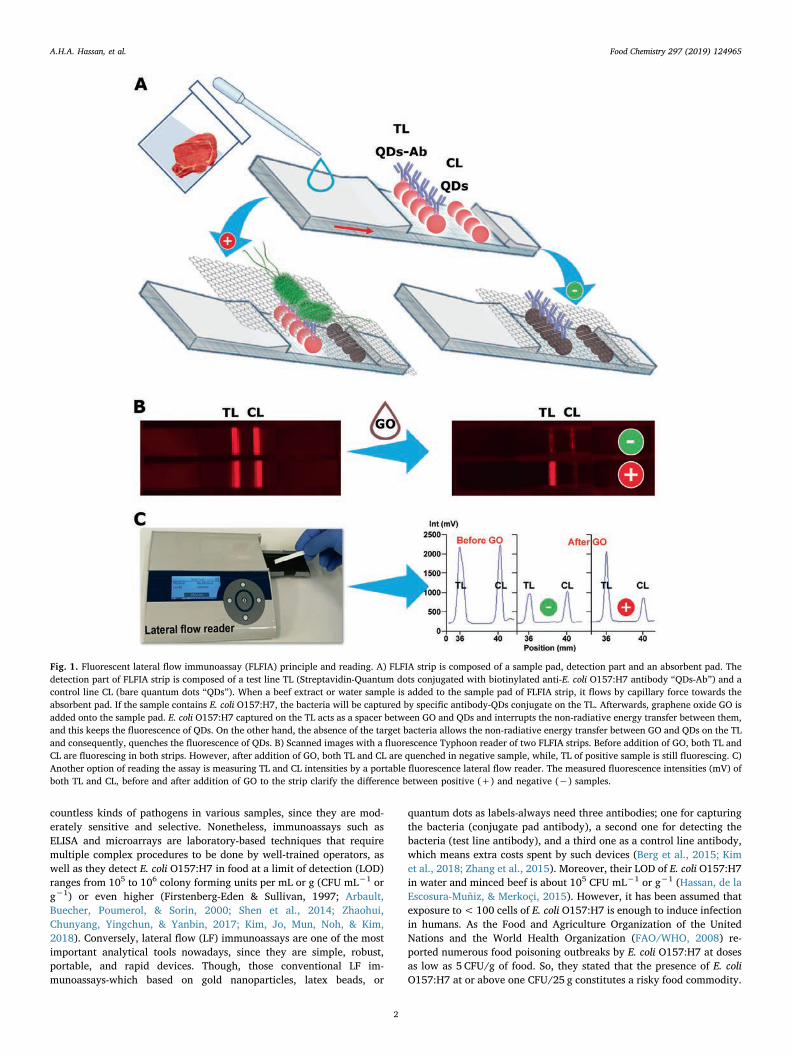
countless kinds of pathogens in various samples, since they are mod-erately sensitive and selective. Nonetheless, immunoassays such asELISA and microarrays are laboratory-based techniques that requiremultiple complex procedures to be done by well-trained operators, aswell as they detect E. coli O157:H7 in food at a limit of detection (LOD)ranges from 105 to 106 colony forming units per mL or g (CFU mL−1 org−1) or even higher (Firstenberg-Eden & Sullivan, 1997; Arbault,Buecher, Poumerol, & Sorin, 2000; Shen et al., 2014; Zhaohui,Chunyang, Yingchun, & Yanbin, 2017; Kim, Jo, Mun, Noh, & Kim,2018). Conversely, lateral flow (LF) immunoassays are one of the mostimportant analytical tools nowadays, since they are simple, robust,portable, and rapid devices. Though, those conventional LF im-munoassays-which based on gold nanoparticles, latex beads, or
quantum dots as labels-always need three antibodies; one for capturingthe bacteria (conjugate pad antibody), a second one for detecting thebacteria (test line antibody), and a third one as a control line antibody,which means extra costs spent by such devices (Berg et al., 2015; Kimet al., 2018; Zhang et al., 2015). Moreover, their LOD of E. coli O157:H7in water and minced beef is about 105 CFU mL−1 or g−1 (Hassan, de laEscosura-Muñiz, & Merkoçi, 2015). However, it has been assumed thatexposure to< 100 cells of E. coli O157:H7 is enough to induce infectionin humans. As the Food and Agriculture Organization of the UnitedNations and the World Health Organization (FAO/WHO, 2008) re-ported numerous food poisoning outbreaks by E. coli O157:H7 at dosesas low as 5 CFU/g of food. So, they stated that the presence of E. coliO157:H7 at or above one CFU/25 g constitutes a risky food commodity.
Fig. 1. Fluorescent lateral flow immunoassay (FLFIA) principle and reading. A) FLFIA strip is composed of a sample pad, detection part and an absorbent pad. Thedetection part of FLFIA strip is composed of a test line TL (Streptavidin-Quantum dots conjugated with biotinylated anti-E. coli O157:H7 antibody “QDs-Ab”) and acontrol line CL (bare quantum dots “QDs”). When a beef extract or water sample is added to the sample pad of FLFIA strip, it flows by capillary force towards theabsorbent pad. If the sample contains E. coli O157:H7, the bacteria will be captured by specific antibody-QDs conjugate on the TL. Afterwards, graphene oxide GO isadded onto the sample pad. E. coli O157:H7 captured on the TL acts as a spacer between GO and QDs and interrupts the non-radiative energy transfer between them,and this keeps the fluorescence of QDs. On the other hand, the absence of the target bacteria allows the non-radiative energy transfer between GO and QDs on the TLand consequently, quenches the fluorescence of QDs. B) Scanned images with a fluorescence Typhoon reader of two FLFIA strips. Before addition of GO, both TL andCL are fluorescing in both strips. However, after addition of GO, both TL and CL are quenched in negative sample, while, TL of positive sample is still fluorescing. C)Another option of reading the assay is measuring TL and CL intensities by a portable fluorescence lateral flow reader. The measured fluorescence intensities (mV) ofboth TL and CL, before and after addition of GO to the strip clarify the difference between positive (+) and negative (−) samples.
A.H.A. Hassan, et al. Food Chemistry 297 (2019) 124965
2
Accordingly, the detection of this dangerous pathogen by conventionalLF assays might result valueless in particularly demanding contexts.Consequently, the food and environment hygienists are in need to an-other simple, portable and rapid device that must be affordable, highlysensitive, and highly specific for rapid in-situ determination of E. coliO157:H7 in complex food matrices under the field conditions.
Our group has been studying the quenching capabilities of grapheneoxide (GO) based on the fluorescence resonance energy transfer (FRET),and its interaction with photoexcited quantum dots (QDs)(Cheeveewattanagul et al., 2017; Morales-Narváez & Merkoçi, 2012;Morales-Narváez, Hassan, & Merkoçi, 2013; Morales-Narváez, Naghdi,Zor, & Merkoçi, 2015; Zamora-Gálvez, Morales-Narváez, Romero, &Merkoçi, 2018). We had previously patented a highly sensitive pa-thogen-detection device for the sensing of E. coli in a standard buffer(Merkoçi & Morales-Narváez, 2015; Morales-Narváez et al., 2013).However, using a traditional glass slide-based microarray system as abiosensing platform was quite expensive and not suitable for port-ability. Therefore, paper-based lateral-flow assay was another low-costoption in another study done by our group (Morales‐Narváez et al.,2015). While, that study was limited to the detection of general E. coliin buffer and bottled water by using QDs/anti-E. coli antibody. Al-though, assessment of the validity of this GO-based LF immunoassay fordetection of pathogenic E. coli O157:H7 in real samples of highlycomplex matrices such as minced beef and river water is another hottopic worthy to be investigated, since those samples are the main sourceof human infections by that pathogen.
Herein, we report the first exploit of FRET-based quenching prop-erties of GO, and their interaction with QDs for development of afluorescent lateral flow immunoassay (FLFIA) for determination of thehighly pathogenic E. coli O157:H7 in minced beef and river water. Thedetection part of that strip has two lines; a test line (TL) which com-posed of CdSe@ZnS QDs/anti-E. coli O157:H7 antibody that works as afluorescent probe and a control line (CL) that composed of only bareQDs. GO is added to the LF strip as a quencher for the fluorescent QDsafter adding the sample to divulge the presence of bacteria. If thesample does not have E. coli O157:H7, the test line will be efficientlyquenched when adding GO by FRET, since the distance between QDs/Abs (donor) and GO (acceptor) is few nanometres (Gaudreau et al.,2013; Lin et al., 2013). On the other hand, if the sample has E. coliO157:H7, it will be selectively captured by the specific QDs/Abs probeon the test line, then after adding GO, resonance energy transfer ishindered or minimally occurs since the distance between GO and QDsexceeds to more than 20 nm by the bacteria interference (Gaudreauet al., 2013; Lin et al., 2013). Consequently, the fluorescence of QDs onthe test line is maintained, and its intensity is correlational to theconcentration of the E. coli O157:H7 in the sample. Instead, the controlline QDs will be always quenched by GO because this line has not anyantibodies to the target pathogen. The principle and reading of FLFIA isfully illustrated in Fig. 1.
2. Materials and methods
2.1. Reagents and equipment
All commercial reagents were of analytical grade and they werehandled according to the safety data sheets provided by the suppliers.Goat polyclonal Anti-Escherichia coli O157:H7 antibody (conjugatedwith biotin) (LS-C525826-100) was purchased from LifeSpanBioSciences (Seattle, WA, USA), and streptavidin-conjugated CdSe/ZnSquantum dots 655 (QDs) (Cat. No. Q10121MP) were obtained from LifeTechnologies (Carlsbad, CA, USA). Phosphate buffered saline (PBS)(PubChem CID: 24978514), bovine serum albumin (BSA), and Tween-20 (PubChem CID: 443314) were purchased from Sigma-Aldrich(Madrid, Spain). Graphene oxide (GO) was bought from AngstronMaterials (Ohio, U.S.A.). Escherichia coli O157:H7 (CECT 4783, E. coliO157:H7) and Salmonella enterica subsp. enterica serovar Typhimurium
LT2 (CECT 722T, S. Typhimurium) strains were obtained from theColección Española de Cultivos Tipo (CECT, Valencia, Spain). TS-100Thermo-Shaker (Biosan, Riga, Latvia) was used as a stirrer for mod-ification of QDs with antibodies. Laminated cards (HF000MC100), ni-trocellulose membranes (SHF1800425), and cellulose fibre(CFSP001700) that were used for fabricating FLFIA strips were pur-chased from Millipore (Billerica, MA, USA). An IsoFlow reagent dis-pensing system (Imagene Technology, Hanover, NH, USA) was used fordispensing the TL and CL onto the nitrocellulose membrane. A Dahle533 guillotine (Dahle, Peterborough, NH, USA) was used to cut theFLFIA strips into 6mm width. JP Selecta 2000210 oven from JP selecta(Barcelona, Spain) was used to dry the strips. A portable ESEQuantlateral flow reader with its software LF-Studio Version 3.3.6 fromQiagen GmbH (Stockach, Germany) were used to measure the in-tensities of the TL and CL of FLFIA strips. As well as, fluorescent imagesof FLFIA strips were produced using a Typhoon 9410 Variable ModeImager (GE, Freiburg, Germany). The intensities of the lines of thosefluorescent images were measured using ImageJ 1.46r (WayneRasband, National Institutes of Health, Bethesda, MD, USA). PBS(10mM, pH 7.4) with 0.5% (v/v) Tween-20 containing 1% of BSAfraction V (w/v) was employed as a standard buffer for preparation ofbacterial inocula. While, PBS (10mM, pH 7.4) with 0.05% (v/v) Tween-20 was used as a washing buffer. All aqueous solutions were freshlyprepared in Milli-Q water produced using a Milli-Q system(>18.2MΩcm−1) purchased from Millipore (Billerica, MA, USA).Scanning Electron Microscopy (SEM) images were obtained by aMagellan 400L High-Resolution SEM (FEI, Hillsboro, OR, USA).
2.2. Preparation of minced beef extract and bacterial inocula
Minced beef was purchased from a local retail market in Barcelonaand analysed by the standard culturing method for the presence of E.coli O157 (ISO 4:1665, 2001). Only negative samples of beef and waterwere selected to be inoculated with bacteria. Twenty-five g of E. coliO157-free minced beef were homogenized in a sterile stomacher bagwith 225mL of sterile PBS (10mM, pH 7.4) using a stomacher (LabBlender 400, Seward, UK) for 3min. Then the filtrate was used as adiluent for preparation of bacterial suspensions.
For preparation of bacterial inocula, freeze-dried cultures of E. coliO157:H7 and Salmonella Typhimurium were revived in a sterile tryp-tone soy broth (TSB, Oxoid Ltd., UK) and incubated at 37 °C for about24 h, then transferred onto sterile tryptone soy agar (TSA, Oxoid Ltd.,UK) plates for another 24 h at 37 °C. Stock cultures of both strains werekept on TSA slope tubes for future use. Bacterial cell suspensions wereprepared directly from bacterial colonies of TSA plates, during thelogarithmic phase, in sterile standard buffer and river water to obtain abacterial load of 1.5× 10⁸ CFU mL−1 according to McFarland stan-dards (McFarland, 1907) using Densimat densitometer (Biomerieux,Brazil). Afterwards, ten-fold decimal bacterial dilutions (10–108 CFUmL−1) were prepared from the original one. Finally, heat killing of thebacteria was done by putting the bacterial suspension in tightly sealedtubes to be placed in a water bath at 80 °C for 15min to stop bacterialreplication. Regarding minced beef, a suitable volume of heat-killedbacterial suspension in a sterile standard buffer (1.5× 10⁸ CFU mL−1)was used to prepare ten-fold decimal dilutions of E. coli O157:H7 inminced beef homogenate (10–108 CFU g−1). The prepared bacterialdilutions were stored at 4 °C until being used for the assay within twoweeks in case of standard buffer and river water. Whereas inoculatedminced beef was used without delay to avoid sample deterioration.
2.3. Fabrication of FLFIA
The proposed lateral flow strips were prepared as follows: (a) as-sembling of the nitrocellulose membrane on the laminated card. (b)Dispensing the QDs/anti-E. coli O157:H7 as a TL and bare QDs as a CLusing an IsoFlow reagent dispensing system on the nitrocellulose
A.H.A. Hassan, et al. Food Chemistry 297 (2019) 124965
3
membrane. For TL, we used a conjugate composed of 4 nM streptavidin-quantum dots 655 and 300 µg/mL biotinylated anti-E. coli O157:H7polyclonal antibody in standard buffer. The conjugate was preparedthrough mixing them at 650 rpm/4 °C/30min. Whereas for CL, we usedonly 4 nM of streptavidin-quantum dots 655. After line dispensing, thedetection pad was kept overnight inside a tightly closed container in thefridge at 4 °C temperature. In the second day, the nitrocellulose mem-brane (2.5× 20 cm) was homogenously treated with 5mL of standardbuffer, then kept in the fridge for 15min before drying in the oven at37 °C for about 3 h. (c) Some pieces of cellulose sample and absorbentpads (≈20 cm each) were saturated sequentially with Milli-Q water,and standard buffer, then they were kept in the oven at 37 °C forovernight until complete dryness. (d) Afterwards, assembling thesample and absorbent pads on the same laminated card. (e) Ultimately,cutting the assembled card using a clean guillotine into strips of 6mmin width. The strips were kept in a tightly closed plastic container withsome drying pearls in the fridge until use for bacteria determination.
2.4. Using FLFIA for E. coli O157:H7 detection in standard buffer
In order to use the prepared FLFIA strips for detection and quanti-fication of E. coli O157:H7 in various samples, the initial photo-luminescence intensities (I1) of both TL and CL were measured using aportable lateral flow reader (Fig. 1C). Then 100 µL of previously pre-pared E. coli O157:H7 suspension of various concentrations in standardbuffer was added onto the sample pad of the fabricated strip, the stripswere left for about 15min until complete flow of the sample to theabsorbent pad. Afterwards, 100 µL of PBS with 0.05% tween 20 (v/v)was dispensed on the sample pad as a washing buffer, to remove anykind of intervention. Then, they were left at room temperature foraround 10min until complete flow of the washing buffer. Subsequently,100 µL of aqueous solution of graphene oxide (GO) 150 µgmL−1 con-tains 0.1% Tween-20 (v/v) was dispensed on the sample pad, for re-vealing the presence of bacteria. A final step of dryness was done beforereading the final photoluminescence intensities (I2) of both lines usingthe LF reader. The ratio of the final intensity to the initial one (I2/I1) ofthe test line (RTL) was used as an estimation for the concentration of thetarget bacteria in the sample.
2.5. Validation of FLFIA in real samples
To evaluate the overall performance of the proposed assay in realsamples, artificially inoculated minced beef and river water with serialconcentrations of E. coli O157:H7 (0, 50, 102, 103, 104, 105, and 106)CFU g−1/mL−1 were used. The same abovementioned procedure usedwith standard buffer was conducted with real samples as well.Calibration curves were created for each sample type at decimal con-centrations of bacteria. The linear regression and coefficient of de-termination (R2) were calculated for both minced beef and river water.
Furthermore, spike and recovery experiment was conducted todistinguish how much the complex matrix of real sample could affectthe performance of our FLFIA. Two concentrations of E. coli O157:H7(103 and 104 CFU mL−1 or g−1) were spiked in each of standard buffer,minced beef, and river water. At least 3 replicates were used in eachconcentration. The average RTL of spiked minced beef and river waterwas compared to that of standard buffer at the same concentration toestimate the recovery percentage according to the following equation;recovery %= RTL of real sample/RTL of standard buffer.
As well as, the specificity of FLFIA against non-specific pathogenwas tested. Salmonella enterica subsp. enterica serovar Typhimurium (S.Typhimurium), a Gram-negative pathogen from the sameEnterobacteriaceae family of E. coli O157:H7, was used to conduct thespecificity test. In this experiment, we evaluated the response of FLFIAto the presence of S. Typhimurium either alone or in a mixture with E.coli O157:H7, as well as it was compared with blank buffer. Blank(0 CFUmL−1), single S. Typhimurium (104 CFU mL−1), single E. coli
O157:H7 (102 and 104 CFU mL−1), and two mixtures of both bacterialspecies (E. coli O157:H7 102+ S. Typhimurium 104 and E. coli O157:H7104+ S. Typhimurium 102 CFU mL−1) were prepared in standardbuffer to conduct such experiment.
Additionally, the reproducibility of the assay was evaluated by es-timating the variation coefficient through calculating the relativestandard deviation (RSD %) along different batches of FLFIA strips usedthroughout the study.
3. Results and discussion
3.1. Optimization of fluorescence and quenching process
Since the currently available conventional LF immunoassays basedon gold nanoparticles or latex beads used for E. coli O157:H7 detectionin various food and water samples are of high costs (≈ 0.30 USD/teststrip) and low sensitivity (≈105 CFU mL−1 or g−1) (Han et al., 2018;Hassan et al., 2015; Karakus & Salih, 2013; Luo et al., 2017), the foodand water monitoring may require another simple, portable, affordableand highly sensitive device. Herein, we designed a novel fluorescentlateral flow immunoassay based on the interaction between photo-excited molecules and quencher. We exploited streptavidin functiona-lized CdSe@ZnS QDs, of an approximate diameter of 14 ± 2 nm and amaximum emission wavelength at≈665 nm, as donors of non-radiativeenergy that makes them a powerful fluorescence agent. As well as, weused GO sheets in the form of water-based dispersion of an averagelateral dimension range of 500 nm, an average thickness of approxi-mately 1.1 nm and C/O ratio of about one unit (according to manu-facturer‘s data), as acceptors for the non-radiative energy leading tohighly effectual quenching of fluorescence (Morales-Narváez et al.,2013). SEM images illustrated in Fig. 2C and C1 show GO sheets inwater suspension surrounding to E. coli O157:H7 cells. In addition,Fig. 2C2 shows bare GO suspension of the same concentration. Since thedistance between the QDs and GO is very crucial for non-radiativeenergy transfer between them as Lin et al. (2013) recorded thatquenching is not strongly observable at distances greater than 20 nm, sohere the target bacteria (≈0.5×2 µm size) acts as a spacer betweenthe donor and the acceptor hindering the photons transfer and keepingthe fluorescence of QDs. Fig. 2D shows a SEM micrograph of QDs-Abconjugates are capturing to bacterial cells of E coli O157:H7.
To get the most suitable photoluminescence, different concentra-tions of QDs (1.5, 3, 4, 6, 8, 9, and 10 nM) were dispensed on ni-trocellulose membranes and their intensities were measured by a por-table LF reader (data not shown). The LF reader used in this study hasan excitation wavelength of 365 nm, and an emission filter of about670 nm. Hence, 4 nM was chosen as the appropriate concentration thatgives about 80% of the dynamic range of the reader (Fig. 1C). Ad-ditionally, since the concentration of the acceptor molecules shouldaffect the rate of photons transfer from the donor to the acceptor, so,different concentrations of GO suspension in Milli-Q water (60, 70, 80,100, 150 and 200 µgmL−1) with two concentrations of Tween-20 (0.05and 0.1%) were investigated to optimize the most suitable quenchingconditions. The presence of Tween-20 in the GO suspension aids theprocess of GO flow through the nitrocellulose. A hundred µL of eachconcentration was added onto a blank strip, the TL and CL intensitieswere measured before and after addition of GO. The degree ofquenching (I2/I1) was calculated by dividing the final intensity (I2) bythe initial one (I1). GO 150 and 200 µgmL−1 with 0.1% Tween-20 (v/v)achieved the highest quenching rates (I2/I1 ≈0.3–0.4) (Fig. 3A).However, GO 150 µgmL−1 with 0.1% Tween-20 (v/v) was preferredbecause it achieved the most reliable results afterwards, in terms ofsteady performance and error rate. In conclusion, 4 nM QDs and GO150 μgmL−1 with Tween-20 (0.1% v/v) were the most appropriatecondition for proper photoluminescence and quenching of blank strips.
Since bacterial cells are much bigger (≈0.5×2.0 µm, Fig. 2A) thanother analytes like proteins, a nitrocellulose membrane with big pore
A.H.A. Hassan, et al. Food Chemistry 297 (2019) 124965
4
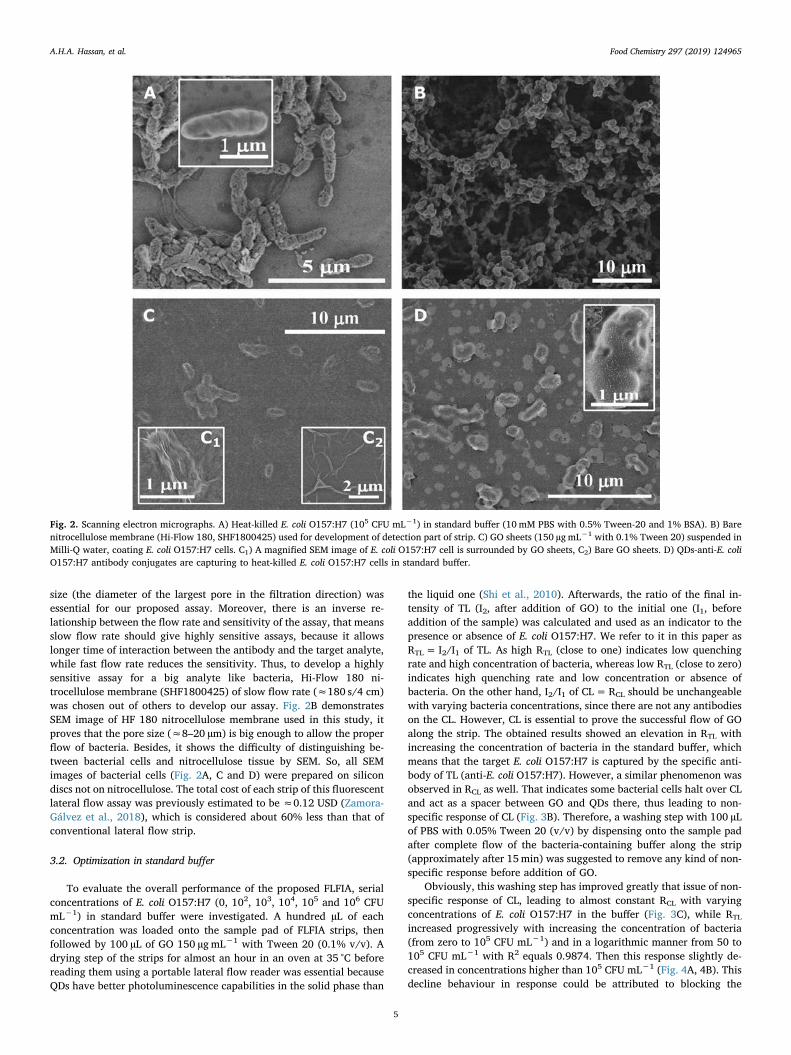
size (the diameter of the largest pore in the filtration direction) wasessential for our proposed assay. Moreover, there is an inverse re-lationship between the flow rate and sensitivity of the assay, that meansslow flow rate should give highly sensitive assays, because it allowslonger time of interaction between the antibody and the target analyte,while fast flow rate reduces the sensitivity. Thus, to develop a highlysensitive assay for a big analyte like bacteria, Hi-Flow 180 ni-trocellulose membrane (SHF1800425) of slow flow rate (≈180 s/4 cm)was chosen out of others to develop our assay. Fig. 2B demonstratesSEM image of HF 180 nitrocellulose membrane used in this study, itproves that the pore size (≈8–20 µm) is big enough to allow the properflow of bacteria. Besides, it shows the difficulty of distinguishing be-tween bacterial cells and nitrocellulose tissue by SEM. So, all SEMimages of bacterial cells (Fig. 2A, C and D) were prepared on silicondiscs not on nitrocellulose. The total cost of each strip of this fluorescentlateral flow assay was previously estimated to be ≈0.12 USD (Zamora-Gálvez et al., 2018), which is considered about 60% less than that ofconventional lateral flow strip.
3.2. Optimization in standard buffer
To evaluate the overall performance of the proposed FLFIA, serialconcentrations of E. coli O157:H7 (0, 102, 103, 104, 105 and 106 CFUmL−1) in standard buffer were investigated. A hundred µL of eachconcentration was loaded onto the sample pad of FLFIA strips, thenfollowed by 100 µL of GO 150 µgmL−1 with Tween 20 (0.1% v/v). Adrying step of the strips for almost an hour in an oven at 35 °C beforereading them using a portable lateral flow reader was essential becauseQDs have better photoluminescence capabilities in the solid phase than
the liquid one (Shi et al., 2010). Afterwards, the ratio of the final in-tensity of TL (I2, after addition of GO) to the initial one (I1, beforeaddition of the sample) was calculated and used as an indicator to thepresence or absence of E. coli O157:H7. We refer to it in this paper asRTL= I2/I1 of TL. As high RTL (close to one) indicates low quenchingrate and high concentration of bacteria, whereas low RTL (close to zero)indicates high quenching rate and low concentration or absence ofbacteria. On the other hand, I2/I1 of CL=RCL should be unchangeablewith varying bacteria concentrations, since there are not any antibodieson the CL. However, CL is essential to prove the successful flow of GOalong the strip. The obtained results showed an elevation in RTL withincreasing the concentration of bacteria in the standard buffer, whichmeans that the target E. coli O157:H7 is captured by the specific anti-body of TL (anti-E. coli O157:H7). However, a similar phenomenon wasobserved in RCL as well. That indicates some bacterial cells halt over CLand act as a spacer between GO and QDs there, thus leading to non-specific response of CL (Fig. 3B). Therefore, a washing step with 100 µLof PBS with 0.05% Tween 20 (v/v) by dispensing onto the sample padafter complete flow of the bacteria-containing buffer along the strip(approximately after 15min) was suggested to remove any kind of non-specific response before addition of GO.
Obviously, this washing step has improved greatly that issue of non-specific response of CL, leading to almost constant RCL with varyingconcentrations of E. coli O157:H7 in the buffer (Fig. 3C), while RTL
increased progressively with increasing the concentration of bacteria(from zero to 105 CFU mL−1) and in a logarithmic manner from 50 to105 CFU mL−1 with R2 equals 0.9874. Then this response slightly de-creased in concentrations higher than 105 CFU mL−1 (Fig. 4A, 4B). Thisdecline behaviour in response could be attributed to blocking the
Fig. 2. Scanning electron micrographs. A) Heat-killed E. coli O157:H7 (105 CFU mL−1) in standard buffer (10 mM PBS with 0.5% Tween-20 and 1% BSA). B) Barenitrocellulose membrane (Hi-Flow 180, SHF1800425) used for development of detection part of strip. C) GO sheets (150 µgmL−1 with 0.1% Tween 20) suspended inMilli-Q water, coating E. coli O157:H7 cells. C1) A magnified SEM image of E. coli O157:H7 cell is surrounded by GO sheets, C2) Bare GO sheets. D) QDs-anti-E. coliO157:H7 antibody conjugates are capturing to heat-killed E. coli O157:H7 cells in standard buffer.
A.H.A. Hassan, et al. Food Chemistry 297 (2019) 124965
5

Fig. 3. A) Optimization of the quenching process of QDs. Different concentra-tions of graphene oxide (GO) suspension in Milli-Q water with Tween-20 wereinvestigated to achieve the optimum quenching conditions of both test line (TL)and control line (CL) by measuring the ratio of the final intensity to the initialone (I2/I1) of lines. It shows that GO 150 and 200 μgmL−1 with 0.1% Tween-20are the most quenching conditions. B) and C) The significance of using awashing buffer after sample loading to remove nonspecific reaction. B) Withoutwashing step, the initial optimization process exhibited a nonspecific accumu-lation of the bacterial cells on the CL. The I2/I1 of CL is increasing with bacterialconcentration like the TL. C) Conversely, with a washing step, nearly constantI2/I1 of control lines were obtained regardless the bacterial concentrations inthe sample. The error bars represent the standard deviation of at least 3
(caption on next page)
A.H.A. Hassan, et al. Food Chemistry 297 (2019) 124965
6
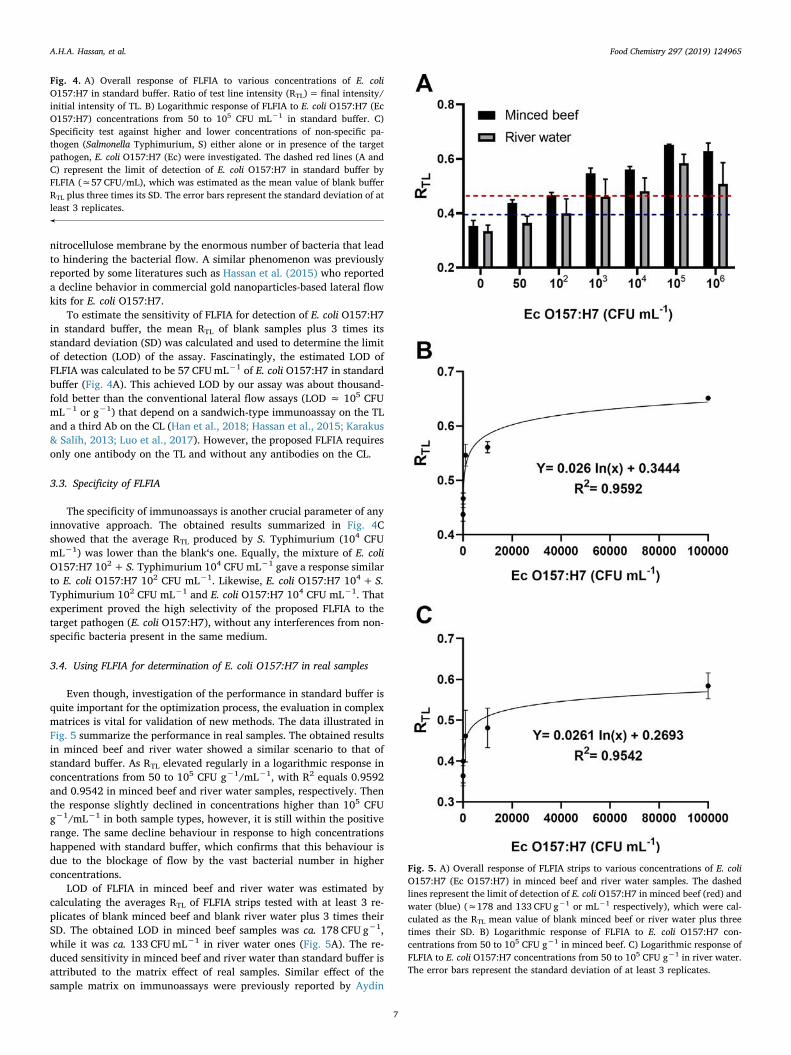
nitrocellulose membrane by the enormous number of bacteria that leadto hindering the bacterial flow. A similar phenomenon was previouslyreported by some literatures such as Hassan et al. (2015) who reporteda decline behavior in commercial gold nanoparticles-based lateral flowkits for E. coli O157:H7.
To estimate the sensitivity of FLFIA for detection of E. coli O157:H7in standard buffer, the mean RTL of blank samples plus 3 times itsstandard deviation (SD) was calculated and used to determine the limitof detection (LOD) of the assay. Fascinatingly, the estimated LOD ofFLFIA was calculated to be 57 CFUmL−1 of E. coli O157:H7 in standardbuffer (Fig. 4A). This achieved LOD by our assay was about thousand-fold better than the conventional lateral flow assays (LOD ≈ 105 CFUmL−1 or g−1) that depend on a sandwich-type immunoassay on the TLand a third Ab on the CL (Han et al., 2018; Hassan et al., 2015; Karakus& Salih, 2013; Luo et al., 2017). However, the proposed FLFIA requiresonly one antibody on the TL and without any antibodies on the CL.
3.3. Specificity of FLFIA
The specificity of immunoassays is another crucial parameter of anyinnovative approach. The obtained results summarized in Fig. 4Cshowed that the average RTL produced by S. Typhimurium (104 CFUmL−1) was lower than the blank‘s one. Equally, the mixture of E. coliO157:H7 102+ S. Typhimurium 104 CFU mL−1 gave a response similarto E. coli O157:H7 102 CFU mL−1. Likewise, E. coli O157:H7 104+ S.Typhimurium 102 CFU mL−1 and E. coli O157:H7 104 CFU mL−1. Thatexperiment proved the high selectivity of the proposed FLFIA to thetarget pathogen (E. coli O157:H7), without any interferences from non-specific bacteria present in the same medium.
3.4. Using FLFIA for determination of E. coli O157:H7 in real samples
Even though, investigation of the performance in standard buffer isquite important for the optimization process, the evaluation in complexmatrices is vital for validation of new methods. The data illustrated inFig. 5 summarize the performance in real samples. The obtained resultsin minced beef and river water showed a similar scenario to that ofstandard buffer. As RTL elevated regularly in a logarithmic response inconcentrations from 50 to 105 CFU g−1/mL−1, with R2 equals 0.9592and 0.9542 in minced beef and river water samples, respectively. Thenthe response slightly declined in concentrations higher than 105 CFUg−1/mL−1 in both sample types, however, it is still within the positiverange. The same decline behaviour in response to high concentrationshappened with standard buffer, which confirms that this behaviour isdue to the blockage of flow by the vast bacterial number in higherconcentrations.
LOD of FLFIA in minced beef and river water was estimated bycalculating the averages RTL of FLFIA strips tested with at least 3 re-plicates of blank minced beef and blank river water plus 3 times theirSD. The obtained LOD in minced beef samples was ca. 178 CFU g−1,while it was ca. 133 CFUmL−1 in river water ones (Fig. 5A). The re-duced sensitivity in minced beef and river water than standard buffer isattributed to the matrix effect of real samples. Similar effect of thesample matrix on immunoassays were previously reported by Aydin
Fig. 4. A) Overall response of FLFIA to various concentrations of E. coliO157:H7 in standard buffer. Ratio of test line intensity (RTL)= final intensity/initial intensity of TL. B) Logarithmic response of FLFIA to E. coli O157:H7 (EcO157:H7) concentrations from 50 to 105 CFU mL−1 in standard buffer. C)Specificity test against higher and lower concentrations of non-specific pa-thogen (Salmonella Typhimurium, S) either alone or in presence of the targetpathogen, E. coli O157:H7 (Ec) were investigated. The dashed red lines (A andC) represent the limit of detection of E. coli O157:H7 in standard buffer byFLFIA (≈57 CFU/mL), which was estimated as the mean value of blank bufferRTL plus three times its SD. The error bars represent the standard deviation of atleast 3 replicates.
Fig. 5. A) Overall response of FLFIA strips to various concentrations of E. coliO157:H7 (Ec O157:H7) in minced beef and river water samples. The dashedlines represent the limit of detection of E. coli O157:H7 in minced beef (red) andwater (blue) (≈178 and 133 CFU g−1 or mL−1 respectively), which were cal-culated as the RTL mean value of blank minced beef or river water plus threetimes their SD. B) Logarithmic response of FLFIA to E. coli O157:H7 con-centrations from 50 to 105 CFU g−1 in minced beef. C) Logarithmic response ofFLFIA to E. coli O157:H7 concentrations from 50 to 105 CFU g−1 in river water.The error bars represent the standard deviation of at least 3 replicates.
A.H.A. Hassan, et al. Food Chemistry 297 (2019) 124965
7
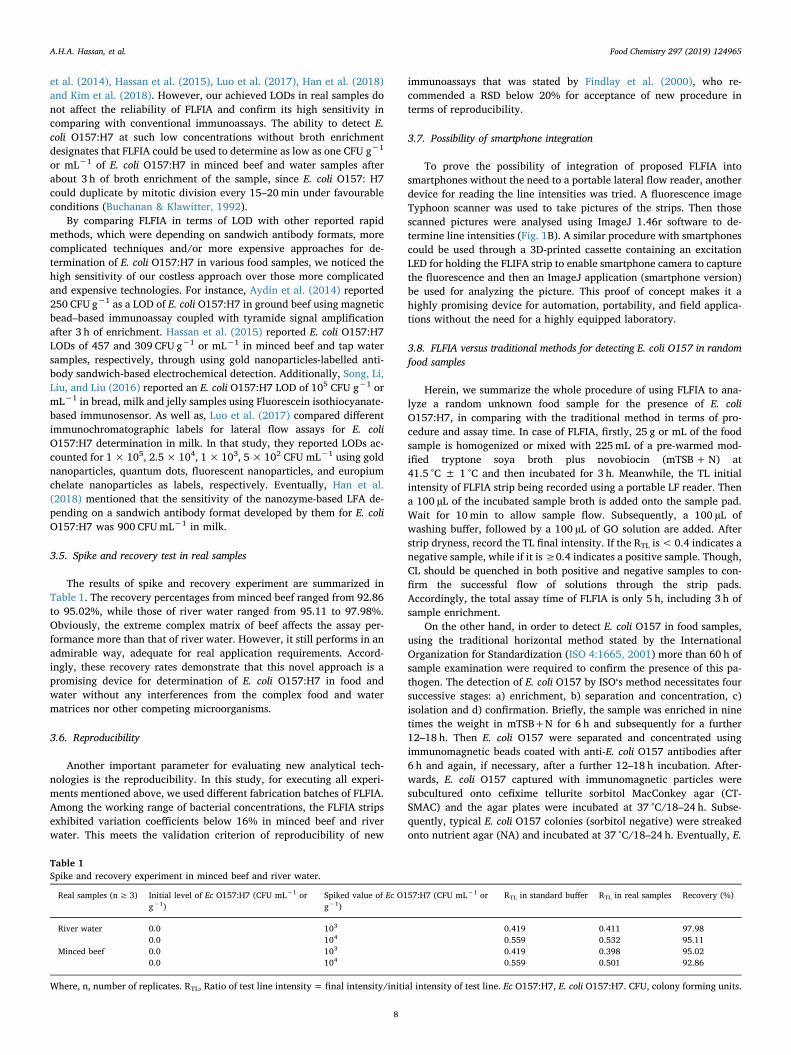
et al. (2014), Hassan et al. (2015), Luo et al. (2017), Han et al. (2018)and Kim et al. (2018). However, our achieved LODs in real samples donot affect the reliability of FLFIA and confirm its high sensitivity incomparing with conventional immunoassays. The ability to detect E.coli O157:H7 at such low concentrations without broth enrichmentdesignates that FLFIA could be used to determine as low as one CFU g−1
or mL−1 of E. coli O157:H7 in minced beef and water samples afterabout 3 h of broth enrichment of the sample, since E. coli O157: H7could duplicate by mitotic division every 15–20min under favourableconditions (Buchanan & Klawitter, 1992).
By comparing FLFIA in terms of LOD with other reported rapidmethods, which were depending on sandwich antibody formats, morecomplicated techniques and/or more expensive approaches for de-termination of E. coli O157:H7 in various food samples, we noticed thehigh sensitivity of our costless approach over those more complicatedand expensive technologies. For instance, Aydin et al. (2014) reported250 CFU g−1 as a LOD of E. coli O157:H7 in ground beef using magneticbead–based immunoassay coupled with tyramide signal amplificationafter 3 h of enrichment. Hassan et al. (2015) reported E. coli O157:H7LODs of 457 and 309 CFU g−1 or mL−1 in minced beef and tap watersamples, respectively, through using gold nanoparticles-labelled anti-body sandwich-based electrochemical detection. Additionally, Song, Li,Liu, and Liu (2016) reported an E. coli O157:H7 LOD of 105 CFU g−1 ormL−1 in bread, milk and jelly samples using Fluorescein isothiocyanate-based immunosensor. As well as, Luo et al. (2017) compared differentimmunochromatographic labels for lateral flow assays for E. coliO157:H7 determination in milk. In that study, they reported LODs ac-counted for 1×10⁵, 2.5× 10⁴, 1×10³, 5×10² CFU mL−1 using goldnanoparticles, quantum dots, fluorescent nanoparticles, and europiumchelate nanoparticles as labels, respectively. Eventually, Han et al.(2018) mentioned that the sensitivity of the nanozyme-based LFA de-pending on a sandwich antibody format developed by them for E. coliO157:H7 was 900 CFUmL−1 in milk.
3.5. Spike and recovery test in real samples
The results of spike and recovery experiment are summarized inTable 1. The recovery percentages from minced beef ranged from 92.86to 95.02%, while those of river water ranged from 95.11 to 97.98%.Obviously, the extreme complex matrix of beef affects the assay per-formance more than that of river water. However, it still performs in anadmirable way, adequate for real application requirements. Accord-ingly, these recovery rates demonstrate that this novel approach is apromising device for determination of E. coli O157:H7 in food andwater without any interferences from the complex food and watermatrices nor other competing microorganisms.
3.6. Reproducibility
Another important parameter for evaluating new analytical tech-nologies is the reproducibility. In this study, for executing all experi-ments mentioned above, we used different fabrication batches of FLFIA.Among the working range of bacterial concentrations, the FLFIA stripsexhibited variation coefficients below 16% in minced beef and riverwater. This meets the validation criterion of reproducibility of new
immunoassays that was stated by Findlay et al. (2000), who re-commended a RSD below 20% for acceptance of new procedure interms of reproducibility.
3.7. Possibility of smartphone integration
To prove the possibility of integration of proposed FLFIA intosmartphones without the need to a portable lateral flow reader, anotherdevice for reading the line intensities was tried. A fluorescence imageTyphoon scanner was used to take pictures of the strips. Then thosescanned pictures were analysed using ImageJ 1.46r software to de-termine line intensities (Fig. 1B). A similar procedure with smartphonescould be used through a 3D-printed cassette containing an excitationLED for holding the FLIFA strip to enable smartphone camera to capturethe fluorescence and then an ImageJ application (smartphone version)be used for analyzing the picture. This proof of concept makes it ahighly promising device for automation, portability, and field applica-tions without the need for a highly equipped laboratory.
3.8. FLFIA versus traditional methods for detecting E. coli O157 in randomfood samples
Herein, we summarize the whole procedure of using FLFIA to ana-lyze a random unknown food sample for the presence of E. coliO157:H7, in comparing with the traditional method in terms of pro-cedure and assay time. In case of FLFIA, firstly, 25 g or mL of the foodsample is homogenized or mixed with 225mL of a pre-warmed mod-ified tryptone soya broth plus novobiocin (mTSB+N) at41.5 °C ± 1 °C and then incubated for 3 h. Meanwhile, the TL initialintensity of FLFIA strip being recorded using a portable LF reader. Thena 100 µL of the incubated sample broth is added onto the sample pad.Wait for 10min to allow sample flow. Subsequently, a 100 µL ofwashing buffer, followed by a 100 µL of GO solution are added. Afterstrip dryness, record the TL final intensity. If the RTL is< 0.4 indicates anegative sample, while if it is≥0.4 indicates a positive sample. Though,CL should be quenched in both positive and negative samples to con-firm the successful flow of solutions through the strip pads.Accordingly, the total assay time of FLFIA is only 5 h, including 3 h ofsample enrichment.
On the other hand, in order to detect E. coli O157 in food samples,using the traditional horizontal method stated by the InternationalOrganization for Standardization (ISO 4:1665, 2001) more than 60 h ofsample examination were required to confirm the presence of this pa-thogen. The detection of E. coli O157 by ISO‘s method necessitates foursuccessive stages: a) enrichment, b) separation and concentration, c)isolation and d) confirmation. Briefly, the sample was enriched in ninetimes the weight in mTSB+N for 6 h and subsequently for a further12–18 h. Then E. coli O157 were separated and concentrated usingimmunomagnetic beads coated with anti-E. coli O157 antibodies after6 h and again, if necessary, after a further 12–18 h incubation. After-wards, E. coli O157 captured with immunomagnetic particles weresubcultured onto cefixime tellurite sorbitol MacConkey agar (CT-SMAC) and the agar plates were incubated at 37 °C/18–24 h. Subse-quently, typical E. coli O157 colonies (sorbitol negative) were streakedonto nutrient agar (NA) and incubated at 37 °C/18–24 h. Eventually, E.
Table 1Spike and recovery experiment in minced beef and river water.
Real samples (n≥ 3) Initial level of Ec O157:H7 (CFU mL−1 org−1)
Spiked value of Ec O157:H7 (CFU mL−1 org−1)
RTL in standard buffer RTL in real samples Recovery (%)
River water 0.0 103 0.419 0.411 97.980.0 104 0.559 0.532 95.11
Minced beef 0.0 103 0.419 0.398 95.020.0 104 0.559 0.501 92.86
Where, n, number of replicates. RTL, Ratio of test line intensity= final intensity/initial intensity of test line. Ec O157:H7, E. coli O157:H7. CFU, colony forming units.
A.H.A. Hassan, et al. Food Chemistry 297 (2019) 124965
8
coli O157 on NA was confirmed by indole production and agglutinationwith E. coli O157 antiserum. Thus, the traditional method is laborious,time consuming and of high cost, as well as, it requires well-trainedoperators and highly equipped facilities. That confirms the advantagesof FLFIA over standard traditional methods.
4. Conclusions
In conclusion, we exclusively developed a fluorescent lateral flowimmunoassay based on quantum dots as donors of non-radiative energyand graphene oxide as an acceptor for such energy. We used only asingle antibody on the test line to capture the target pathogen, whichreduced the total assay cost per strip to be 60% less than the conven-tional LF. This study is the first report of using that principle for E. coliO157:H7 detection in minced beef and river water. FLFIA achievedoutstanding LODs of E. coli O157:H7 (≈133 and 178 CFUmL−1 or g−1
in river water and mined beef, respectively). Theoretically, this in-dicates the possibility of detecting as low as one CFU mL−1 or g−1 of E.coli O157:H7 after about 3 h of food sample enrichment in a suitablebroth. The detection of E. coli O157:H7 by FLFIA in beef complex matrixdesignates the ability of their using for other food commodities, as wellas for other similar bacterial species with changing the antibody. Aportable lateral flow reader was used for reading and quantifying theresults. Alongside, analysing the images with ImageJ software wasproved to be an alternative way for reading the results with smart-phones. FLFIA showed numerous advantages in comparing with thestandard traditional method of E. coli O157 detection, as well as againstother previously reported rapid methods.
Declaration of Competing Interest
The authors declare that there is no any conflict of interest in thiswork.
Acknowledgements
A.H.A. Hassan gratefully acknowledges the financial support fromthe Science and Technology Development Fund (STDF), Egypt (Grant25347). E. M.-N. acknowledges the financial support from CONACYT(Mexico, Grant 293523) and National System of Researchers,CONACYT (Mexico, Grant 74314). ICN2 is supported by the SeveroOchoa program from Spanish MINECO (Grant Nos. SEV-2017-0706 andMAT2017) and by CERCA Programme/Generalitat de Catalunya.
References
Arbault, P., Buecher, V., Poumerol, S., & Sorin, M. L. (2000). Study of an ELISA methodfor the detection of E. coli O157 in food. Progress in biotechnology: Vol. 17, (pp. 359–368). Elsevier https://doi.org/10.1016/S0921-0423(00)80093-3.
Aydin, M., Herzig, G. P., Jeong, K. C., Dunigan, S., Shah, P., & Ahn, S. (2014). Rapid andsensitive detection of Escherichia coli O157: H7 in milk and ground beef using mag-netic bead-based immunoassay coupled with tyramide signal amplification. Journal ofFood Protection, 77(1), 100–105. https://doi.org/10.4315/0362-028X.JFP-13-274.
Berg, B., Cortazar, B., Tseng, D., Ozkan, H., Feng, S., Wei, Q., ... Di Carlo, D. (2015).Cellphone-based hand-held microplate reader for point-of-care testing of enzyme-linked immunosorbent assays. ACS Nano, 9, 7857–7866. https://doi.org/10.1021/acsnano.5b03203.
Buchanan, R. L., & Klawitter, L. A. (1992). The effect of incubation temperature, initialpH, and sodium chloride on the growth kinetics of Escherichia coli O157:H7. FoodMicrobiology, 9, 185–196. https://doi.org/10.1016/0740-0020(92)80046-7.
CDC, Centers for Disease Control and Prevention (2009). Reports of E. coli OutbreakInvestigations from 2006-2009, CDC, USA. URL https://www.cdc.gov/ecoli/2006-2009-outbreaks.html. Accessed 03.06.2019.
Cheeveewattanagul, N., Morales-Narváez, E., Hassan, A.-R. H., Bergua, J. F.,Surareungchai, W., Somasundrum, M., & Merkoçi, A. (2017). Straightforward im-munosensing platform based on graphene oxide-decorated nanopaper: A highlysensitive and fast biosensing approach. Advanced Functional Materials, 27(38),1702741. https://doi.org/10.1002/adfm.201702741.
Findlay, J. W. A., Smith, W. C., Lee, J. W., Nordblom, G. D., Das, I., DeSilva, B. S., &Bowsher, R. R. (2000). Validation of immunoassays for bioanalysis: A pharmaceuticalindustry perspective. Journal of pharmaceutical and biomedical analysis, 21(6),
1249–1273. https://doi.org/10.1016/S0731-7085(99)00244-7.Food and Agriculture Organization of the United Nations/World Health Organization
(FAO/WHO, 2008). Shiga toxin-producing Escherichia coli (STEC) and food: attri-bution, characterization, and monitoring (Report). Microbiological risk assessmentseries 31, Rome. Available on: www.fao.org/publications. Accessed 03.06.2019.
Gaudreau, L., Tielrooij, K. J., Prawiroatmodjo, G. E. D. K., Osmond, J., de Abajo, F. G., &Koppens, F. H. L. (2013). Universal distance-scaling of nonradiative energy transferto graphene. Nano Letters, 13(5), 2030–2035. https://doi.org/10.1021/nl400176b.
Han, J., Zhang, L., Hu, L., Xing, K., Lu, X., Huang, Y., ... Chen, T. (2018). Nanozyme-basedlateral flow assay for the sensitive detection of Escherichia coli O157: H7 in milk.Journal of Dairy Science, 101, 5570–5779. https://doi.org/10.3168/jds.2018-14429.
Hassan, A.-R. H. A.-A., de la Escosura-Muñiz, A., & Merkoçi, A. (2015). Highly sensitiveand rapid determination of Escherichia coli O157: H7 in minced beef and water usingelectrocatalytic gold nanoparticle tags. Biosensors and Bioelectronics, 67, 511–515.https://doi.org/10.1016/j.bios.2014.09.019.
Islam, M., Doyle, M. P., Phatak, S. C., Millner, P., & Jiang, X. (2004). Persistence ofenterohemorrhagic Escherichia coli 0157:H7 in soil and on leaf lettuce and parsleygrown in fields treated with contaminated manure composts or irrigation water.Journal of Food Protection, 67, 1365–1370.
ISO 16654:2001. Microbiology of food and animal feeding stuffs – Horizontal method forthe detection of Escherichia coli O157. URL https://www.iso.org/standard/29821.html. Accessed 03.06.2019.
Jay, J. (2000). Microorganisms in foodsModern food microbiology (6 ed.). New York: VanNostrand Reinhold.
Johnson, J., Brooke, C., & Fritschel, S. (1998). Comparison of the BAX for screening/E.coli O157: H7 method with conventional methods for detection of extremely lowlevels of Escherichia coli O157: H7 in ground beef. Applied EnvironmentalMicrobiology, 64, 4390–4395.
Karakus, C., & Salih, B. A. J. (2013). Comparison of lateral flow immunoassays (LFIA) forthe diagnosis of Helicobacter pylori infection. Journal of Immunological Methods, 396,8–14. https://doi.org/10.1016/j.jim.2013.08.010.
Kim, S. U., Jo, E.-J., Mun, H., Noh, Y., & Kim, M.-G. (2018). Ultrasensitive detection ofEscherichia coli O157:H7 by immunomagnetic separation and selective filtration withnitroblue tetrazolium/5-bromo-4-chloro-3-indolyl phosphate signal amplification.Journal of Agricultural and Food Chemistry, 66, 4941–4947. https://doi.org/10.1021/acs.jafc.8b00973.
Lin, T. N., Huang, L. T., Shu, G. W., Yuan, C. T., Shen, J. L., Lin, C. A. J., ... Kuo, H. C.(2013). Distance dependence of energy transfer from InGaN quantum wells to gra-phene oxide. Optics letters, 38(15), 2897–2899. https://doi.org/10.1364/OL.38.002897.
Lorusso, V., Dambrosio, A., Quaglia, N. C., Parisi, A., Lasalandra, G., Mula, G., ...Normanno, G. (2011). Development of a multiplex PCR for rapid detection of ver-ocytotoxin-producing Escherichia coli O26 in raw milk and ground beef. Journal ofFood Protection, 74, 13–17. https://doi.org/10.4315/0362-028X.JFP-10-201.
Luo, K., Hu, L., Guo, Q., Wu, C., Wu, S., Liu, D., ... Lai, W. (2017). Comparison of 4 label-based immunochromatographic assays for the detection of Escherichia coli O157: H7in milk. Journal of Dairy Science, 100, 5176–5187. https://doi.org/10.3168/jds.2017-12554.
McFarland, J. (1907). Nephelometer: An instrument for estimating the number of bacteriain suspensions used for calculating the opsonic index and for vaccines. Journal ofAmerican Medical Association, 14, 1176–1178. https://doi.org/10.1001/jama.1907.25320140022001f.
Merkoçi, A., & Morales-Narváez, E. (2015). Sensitive qualitative bioassay using grapheneoxide as analyte revealing agent. European Patent No. EP13188693.9.
Morales-Narváez, E., & Merkoçi, A. (2012). Graphene oxide as an optical biosensingplatform. Advanced Materials, 24, 3298–3308. https://doi.org/10.1002/adma.201200373.
Morales-Narváez, E., Hassan, A. R., & Merkoçi, A. (2013). Graphene oxide as a pathogen-revealing agent: Sensing with a digital-like response. Angewandte Chemie InternationalEdition, 52(51), 13779–13783. https://doi.org/10.1002/anie.201307740.
Morales-Narváez, E., Naghdi, T., Zor, E., & Merkoçi, A. (2015). Photoluminescent lateral-flow immunoassay revealed by graphene oxide: Highly sensitive paper-based pa-thogen detection. Analytical Chemistry, 87(16), 8573–8577. https://doi.org/10.1021/acs.analchem.5b02383.
Ngwa, G. A., Schop, R., Weir, S., León-Velarde, C. G., & Odumeru, J. A. (2013). Detectionand enumeration of E. coli O157:H7 in water samples by culture and molecularmethods. Journal of Microbiological Methods, 355(92), 164–172. https://doi.org/10.1016/j.mimet.2012.11.018.
Olsen, S. J., Miller, G., Kennedy, M., Higgins, C., Walford, J., McKee, G., ... Mead, P.(2002). A waterborne outbreak of Escherichia coli O157:H7 infections and hemolyticuremic syndrome: Implications for rural water systems. Emerging Infectious Diseases, 8,370–375. https://doi.org/10.3201/eid0804.000218.
Scallan, E., Hoekstra, R. M., Angulo, F. J., Tauxe, R. V., Widdowson, M. A., Roy, S. L., ...Griffin, P. M. (2011). Foodbome illness acquired in the United States – Major pa-thogens. Emerging Infectious Diseases, 17, 7–15. https://doi.org/10.3201/eid1701.P11101.
Shen, Z., Hou, N., Jin, M., Qiu, Z., Wang, J., Zhang, B., ... Li, J. (2014). A novel enzyme-linked immunosorbent assay for detection of Escherichia coli O157:H7 using im-munomagnetic and beacon gold nanoparticles. Gut Pathogens, 6, 14. https://doi.org/10.1186/1757-4749-6-14.
Shi, X., Meng, X., Sun, L., Liu, J., Zheng, J., Gai, H., ... Yeung, E. S. (2010). Observingphotophysical properties of quantum dots in air at the single molecule level:Advantages in microarray applications. Lab on a Chip, 10(21), 2844–2847. https://doi.org/10.1039/c005258b.
Song, C., Li, J., Liu, J., & Liu, Q. (2016). Simple sensitive rapid detection of Escherichia coliO157: H7 in food samples by label-free immunofluorescence strip sensor. Talanta,
A.H.A. Hassan, et al. Food Chemistry 297 (2019) 124965
9

156, 42–47. https://doi.org/10.1016/j.talanta.2016.04.054.Tsiraki, M. I., Yehia, H. M., Elobeid, T., Osaili, T., Sakkas, H., & Savvaidis, I. N. (2018).
Viability of and Escherichia coli O157: H7 and Listeria monocytogenes in a delicatessenappetizer (yogurt-based) salad as affected by citrus extract (Citrox©) and storagetemperature. Food Microbiology, 69, 11–17. https://doi.org/10.1016/j.fm.2017.07.014.
Zamora-Gálvez, A., Morales-Narváez, E., Romero, J., & Merkoçi, A. (2018).Photoluminescent lateral flow based on non-radiative energy transfer for proteindetection in human serum. Biosensors and Bioelectronics, 100, 208–213. https://doi.org/10.1016/j.bios.2017.09.013.
Zhang, L., Huang, Y., Wang, J., Rong, Y., Lai, W., Zhang, J., & Chen, T. (2015).
Hierarchical flowerlike gold nanoparticles labeled immunochromatography test stripfor highly sensitive detection of Escherichia coli O157: H7. Langmuir, 31, 5537–5544.https://doi.org/10.1021/acs.langmuir.5b00592.
Zhaohui, Q., Chunyang, L., Yingchun, Fu., & Yanbin, L. (2017). Rapid and sensitive de-tection of E. coli O157:H7 based on antimicrobial peptide functionalized magneticnanoparticles and urease catalyzed signal amplification. Analytical Methods, 9,5204–5210. https://doi.org/10.1039/c7ay01643c.
Zhou, C., Zou, H., Li, M., Sun, C., Ren, D., & Li, Y. (2018). Fiber optic surface plasmonresonance sensor for detection of E. coli O157: H7 based on antimicrobial peptidesand AgNPs-rGO. Biosensors and Bioelectronics, 117, 347–353. https://doi.org/10.1016/j.bios.2018.06.005.
A.H.A. Hassan, et al. Food Chemistry 297 (2019) 124965
10
Low-Cost Strategy for the Development of a Rapid ElectrochemicalAssay for Bacteria Detection Based on AuAg NanoshellsLorenzo Russo,†,‡ Juan Leva Bueno,† Jose Francisco Bergua,†,‡ Monica Costantini,§ Marco Giannetto,§
Victor Puntes,†,∥,⊥ Alfredo de la Escosura-Muniz,† and Arben Merkoci*,†,‡,∥
†Catalan Institute of Nanoscience and Nanotechnology (ICN2), CSIC and The Barcelona Institute of Science and Technology,Campus UAB, Bellaterra, 08193 Barcelona, Spain‡Universitat Autonoma de Barcelona (UAB), Campus UAB, Bellaterra, 08193 Barcelona, Spain§Department of Chemistry, Life Sciences and Environmental Sustainability, University of Parma, Parco Area delle Scienze 17/A,43124 Parma, Italy∥Vall d’Hebron Institut de Recerca (VHIR), 08035 Barcelona, Spain⊥Institucio Catalana de Recerca i Estudis Avancats (ICREA), P. Lluís Companys 23, 08010 Barcelona, Spain
*S Supporting Information
ABSTRACT: A low-cost strategy for the simple and rapiddetection of bacterial cells in biological matrixes is presentedherein. Escherichia coli and Salmonella typhimurium werechosen as model bacteria for the development of anelectrochemical assay based on hollow AuAg nanoshells(NSs). By taking advantage of their electrocatalytic propertiesfor the in situ generation of the electrochemical signal withoutthe need of any other kind of reagent, substrate, or redoxenzyme, high sensitivities (down to 102 CFU/mL) wereachieved. Moreover, the recognition and discrimination of themodel bacterial cells in the sample matrix was possible by relying solely on nonspecific affinity interactions between their cellwalls and AuAg NSs surface, avoiding the use of expensive and fragile biological receptor. Compared to traditional, laboratory-based analytical tests available, this assay provides a promising proof-of-concept alternative that allows to obtain goodsensitivities and selectivity in very short times in addition to the low cost.
■ INTRODUCTION
Bacterial resistance to antimicrobials is considered widely themost urgent health issue the world is facing in the comingyears.1 Nowadays, the choice to prescribe antibiotics is rarelybased on definitive diagnoses, which generally requirelaboratory-based analytical test (i.e., polymerase chain reaction(PCR), traditional plate counting), often consisting of days-long procedure characterized by high costs and the need forhighly trained and skilled personnel. Effective, rapid, low-costdiagnostic tools are needed for guiding optimal use ofantibiotics in human and animal medicine and, also in theform of point-of-care (POC) devices. Such tools should beeasily integrated into clinical, pharmacy, and veterinarypractices as high-throughput screening methods for the earlydiscrimination between bacterial and viral infections.2 In thiscontext, nanotechnology has proven to be extremely successfulin providing innovative and advantageous solutions toovercome the conventional in vitro diagnostic intrinsiclimitations through the rational design of advanced nanoma-terials with suitable properties and functionalities.3−6 Amongthem, nanomaterials with unique electrochemical and electro-catalytic properties have been introduced as signal-amplifica-
tion carriers or direct signal-generating elements to increasesensitivities and enhance analytic performances.7−9
The cost of diagnostics technologies is on the other handone of the fundamental global health aspects to be consideredfor accessing the market with competitive and sustainableproducts.10 Indeed, recognition elements found on the fewPOC electrochemical biosensors available consist fundamen-tally of biomolecules (i.e., enzymes, nucleic acids, antibodies),which represent one of the largest fraction of the totalproduction cost.11 Besides their unmatched specificity andselectivity, several drawbacks, such as high production cost andhigh susceptibility to environmental conditions (i.e., pH,temperature, metal cations, fouling agents, metabolites) canlimit their applicability, especially when integrated into POCdevices.12 Exploiting instead the catalytic properties ofelectroactive nanomaterials presents a number of advantages,such as a lower production cost and engineering, ease of massproduction, and a higher stability both in working conditionsand long-term storage.13−15
Received: September 20, 2018Accepted: December 3, 2018Published: December 31, 2018
Article
http://pubs.acs.org/journal/acsodfCite This: ACS Omega 2018, 3, 18849−18856
© 2018 American Chemical Society 18849 DOI: 10.1021/acsomega.8b02458ACS Omega 2018, 3, 18849−18856
This is an open access article published under an ACS AuthorChoice License, which permitscopying and redistribution of the article or any adaptations for non-commercial purposes.
Dow
nloa
ded
via
UN
IV A
UT
ON
OM
A D
E B
AR
CE
LO
NA
on
Nov
embe
r 22
, 201
9 at
10:
25:4
3 (U
TC
).Se
e ht
tps:
//pub
s.ac
s.or
g/sh
arin
ggui
delin
es f
or o
ptio
ns o
n ho
w to
legi
timat
ely
shar
e pu
blis
hed
artic
les.
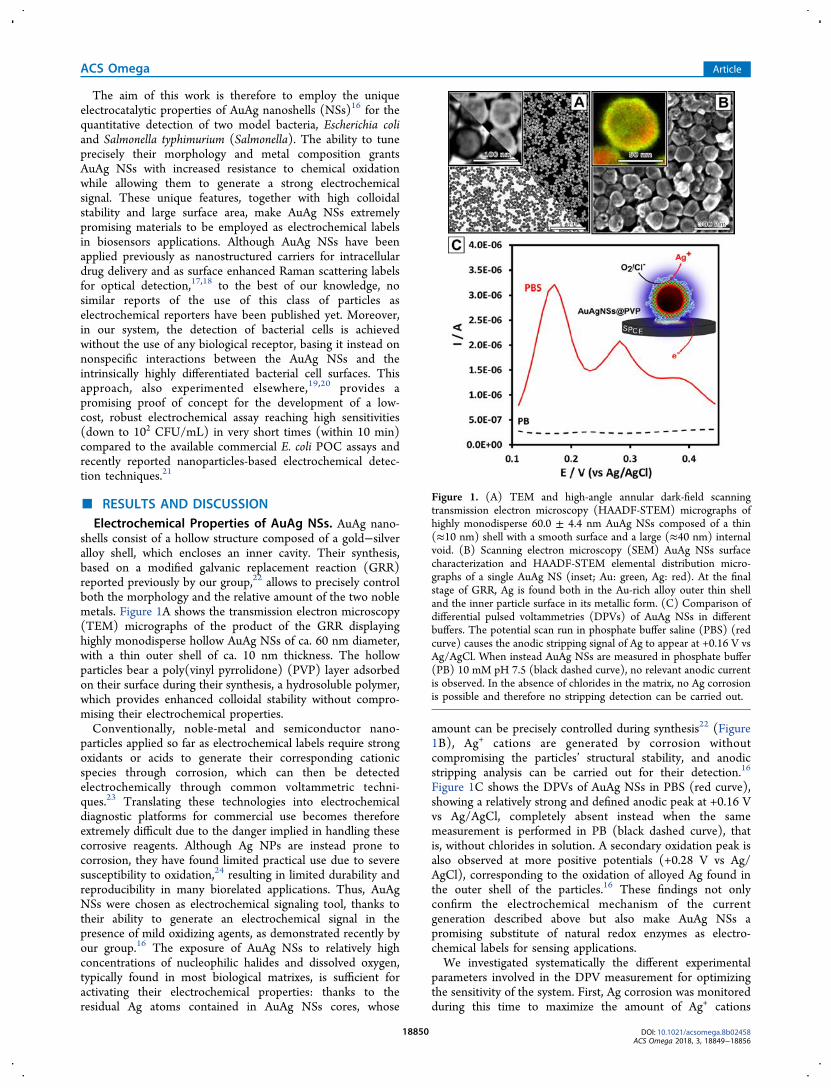
The aim of this work is therefore to employ the uniqueelectrocatalytic properties of AuAg nanoshells (NSs)16 for thequantitative detection of two model bacteria, Escherichia coliand Salmonella typhimurium (Salmonella). The ability to tuneprecisely their morphology and metal composition grantsAuAg NSs with increased resistance to chemical oxidationwhile allowing them to generate a strong electrochemicalsignal. These unique features, together with high colloidalstability and large surface area, make AuAg NSs extremelypromising materials to be employed as electrochemical labelsin biosensors applications. Although AuAg NSs have beenapplied previously as nanostructured carriers for intracellulardrug delivery and as surface enhanced Raman scattering labelsfor optical detection,17,18 to the best of our knowledge, nosimilar reports of the use of this class of particles aselectrochemical reporters have been published yet. Moreover,in our system, the detection of bacterial cells is achievedwithout the use of any biological receptor, basing it instead onnonspecific interactions between the AuAg NSs and theintrinsically highly differentiated bacterial cell surfaces. Thisapproach, also experimented elsewhere,19,20 provides apromising proof of concept for the development of a low-cost, robust electrochemical assay reaching high sensitivities(down to 102 CFU/mL) in very short times (within 10 min)compared to the available commercial E. coli POC assays andrecently reported nanoparticles-based electrochemical detec-tion techniques.21
■ RESULTS AND DISCUSSIONElectrochemical Properties of AuAg NSs. AuAg nano-
shells consist of a hollow structure composed of a gold−silveralloy shell, which encloses an inner cavity. Their synthesis,based on a modified galvanic replacement reaction (GRR)reported previously by our group,22 allows to precisely controlboth the morphology and the relative amount of the two noblemetals. Figure 1A shows the transmission electron microscopy(TEM) micrographs of the product of the GRR displayinghighly monodisperse hollow AuAg NSs of ca. 60 nm diameter,with a thin outer shell of ca. 10 nm thickness. The hollowparticles bear a poly(vinyl pyrrolidone) (PVP) layer adsorbedon their surface during their synthesis, a hydrosoluble polymer,which provides enhanced colloidal stability without compro-mising their electrochemical properties.Conventionally, noble-metal and semiconductor nano-
particles applied so far as electrochemical labels require strongoxidants or acids to generate their corresponding cationicspecies through corrosion, which can then be detectedelectrochemically through common voltammetric techni-ques.23 Translating these technologies into electrochemicaldiagnostic platforms for commercial use becomes thereforeextremely difficult due to the danger implied in handling thesecorrosive reagents. Although Ag NPs are instead prone tocorrosion, they have found limited practical use due to severesusceptibility to oxidation,24 resulting in limited durability andreproducibility in many biorelated applications. Thus, AuAgNSs were chosen as electrochemical signaling tool, thanks totheir ability to generate an electrochemical signal in thepresence of mild oxidizing agents, as demonstrated recently byour group.16 The exposure of AuAg NSs to relatively highconcentrations of nucleophilic halides and dissolved oxygen,typically found in most biological matrixes, is sufficient foractivating their electrochemical properties: thanks to theresidual Ag atoms contained in AuAg NSs cores, whose
amount can be precisely controlled during synthesis22 (Figure1B), Ag+ cations are generated by corrosion withoutcompromising the particles’ structural stability, and anodicstripping analysis can be carried out for their detection.16
Figure 1C shows the DPVs of AuAg NSs in PBS (red curve),showing a relatively strong and defined anodic peak at +0.16 Vvs Ag/AgCl, completely absent instead when the samemeasurement is performed in PB (black dashed curve), thatis, without chlorides in solution. A secondary oxidation peak isalso observed at more positive potentials (+0.28 V vs Ag/AgCl), corresponding to the oxidation of alloyed Ag found inthe outer shell of the particles.16 These findings not onlyconfirm the electrochemical mechanism of the currentgeneration described above but also make AuAg NSs apromising substitute of natural redox enzymes as electro-chemical labels for sensing applications.We investigated systematically the different experimental
parameters involved in the DPV measurement for optimizingthe sensitivity of the system. First, Ag corrosion was monitoredduring this time to maximize the amount of Ag+ cations
Figure 1. (A) TEM and high-angle annular dark-field scanningtransmission electron microscopy (HAADF-STEM) micrographs ofhighly monodisperse 60.0 ± 4.4 nm AuAg NSs composed of a thin(≈10 nm) shell with a smooth surface and a large (≈40 nm) internalvoid. (B) Scanning electron microscopy (SEM) AuAg NSs surfacecharacterization and HAADF-STEM elemental distribution micro-graphs of a single AuAg NS (inset; Au: green, Ag: red). At the finalstage of GRR, Ag is found both in the Au-rich alloy outer thin shelland the inner particle surface in its metallic form. (C) Comparison ofdifferential pulsed voltammetries (DPVs) of AuAg NSs in differentbuffers. The potential scan run in phosphate buffer saline (PBS) (redcurve) causes the anodic stripping signal of Ag to appear at +0.16 V vsAg/AgCl. When instead AuAg NSs are measured in phosphate buffer(PB) 10 mM pH 7.5 (black dashed curve), no relevant anodic currentis observed. In the absence of chlorides in the matrix, no Ag corrosionis possible and therefore no stripping detection can be carried out.
ACS Omega Article
DOI: 10.1021/acsomega.8b02458ACS Omega 2018, 3, 18849−18856
18850
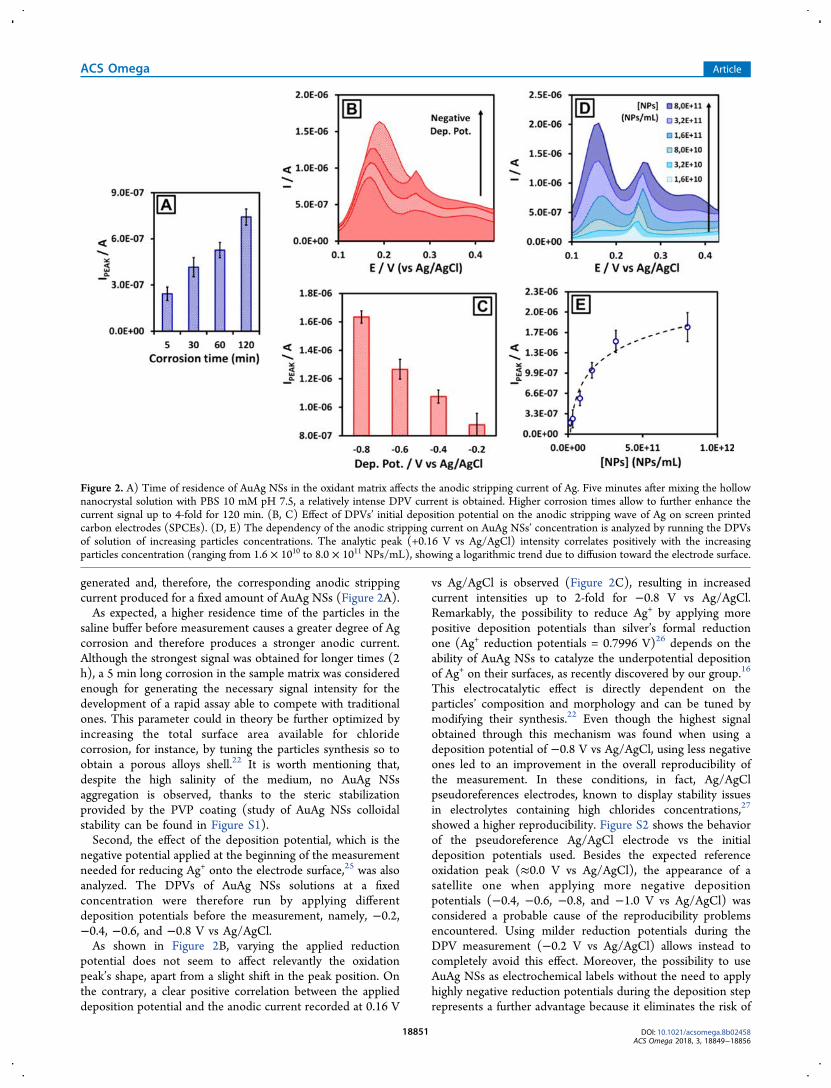
generated and, therefore, the corresponding anodic strippingcurrent produced for a fixed amount of AuAg NSs (Figure 2A).As expected, a higher residence time of the particles in the
saline buffer before measurement causes a greater degree of Agcorrosion and therefore produces a stronger anodic current.Although the strongest signal was obtained for longer times (2h), a 5 min long corrosion in the sample matrix was consideredenough for generating the necessary signal intensity for thedevelopment of a rapid assay able to compete with traditionalones. This parameter could in theory be further optimized byincreasing the total surface area available for chloridecorrosion, for instance, by tuning the particles synthesis so toobtain a porous alloys shell.22 It is worth mentioning that,despite the high salinity of the medium, no AuAg NSsaggregation is observed, thanks to the steric stabilizationprovided by the PVP coating (study of AuAg NSs colloidalstability can be found in Figure S1).Second, the effect of the deposition potential, which is the
negative potential applied at the beginning of the measurementneeded for reducing Ag+ onto the electrode surface,25 was alsoanalyzed. The DPVs of AuAg NSs solutions at a fixedconcentration were therefore run by applying differentdeposition potentials before the measurement, namely, −0.2,−0.4, −0.6, and −0.8 V vs Ag/AgCl.As shown in Figure 2B, varying the applied reduction
potential does not seem to affect relevantly the oxidationpeak’s shape, apart from a slight shift in the peak position. Onthe contrary, a clear positive correlation between the applieddeposition potential and the anodic current recorded at 0.16 V
vs Ag/AgCl is observed (Figure 2C), resulting in increasedcurrent intensities up to 2-fold for −0.8 V vs Ag/AgCl.Remarkably, the possibility to reduce Ag+ by applying morepositive deposition potentials than silver’s formal reductionone (Ag+ reduction potentials = 0.7996 V)26 depends on theability of AuAg NSs to catalyze the underpotential depositionof Ag+ on their surfaces, as recently discovered by our group.16
This electrocatalytic effect is directly dependent on theparticles’ composition and morphology and can be tuned bymodifying their synthesis.22 Even though the highest signalobtained through this mechanism was found when using adeposition potential of −0.8 V vs Ag/AgCl, using less negativeones led to an improvement in the overall reproducibility ofthe measurement. In these conditions, in fact, Ag/AgClpseudoreferences electrodes, known to display stability issuesin electrolytes containing high chlorides concentrations,27
showed a higher reproducibility. Figure S2 shows the behaviorof the pseudoreference Ag/AgCl electrode vs the initialdeposition potentials used. Besides the expected referenceoxidation peak (≈0.0 V vs Ag/AgCl), the appearance of asatellite one when applying more negative depositionpotentials (−0.4, −0.6, −0.8, and −1.0 V vs Ag/AgCl) wasconsidered a probable cause of the reproducibility problemsencountered. Using milder reduction potentials during theDPV measurement (−0.2 V vs Ag/AgCl) allows instead tocompletely avoid this effect. Moreover, the possibility to useAuAg NSs as electrochemical labels without the need to applyhighly negative reduction potentials during the deposition steprepresents a further advantage because it eliminates the risk of
Figure 2. A) Time of residence of AuAg NSs in the oxidant matrix affects the anodic stripping current of Ag. Five minutes after mixing the hollownanocrystal solution with PBS 10 mM pH 7.5, a relatively intense DPV current is obtained. Higher corrosion times allow to further enhance thecurrent signal up to 4-fold for 120 min. (B, C) Effect of DPVs’ initial deposition potential on the anodic stripping wave of Ag on screen printedcarbon electrodes (SPCEs). (D, E) The dependency of the anodic stripping current on AuAg NSs’ concentration is analyzed by running the DPVsof solution of increasing particles concentrations. The analytic peak (+0.16 V vs Ag/AgCl) intensity correlates positively with the increasingparticles concentration (ranging from 1.6 × 10¹⁰ to 8.0 × 10¹¹ NPs/mL), showing a logarithmic trend due to diffusion toward the electrode surface.
ACS Omega Article
DOI: 10.1021/acsomega.8b02458ACS Omega 2018, 3, 18849−18856
18851
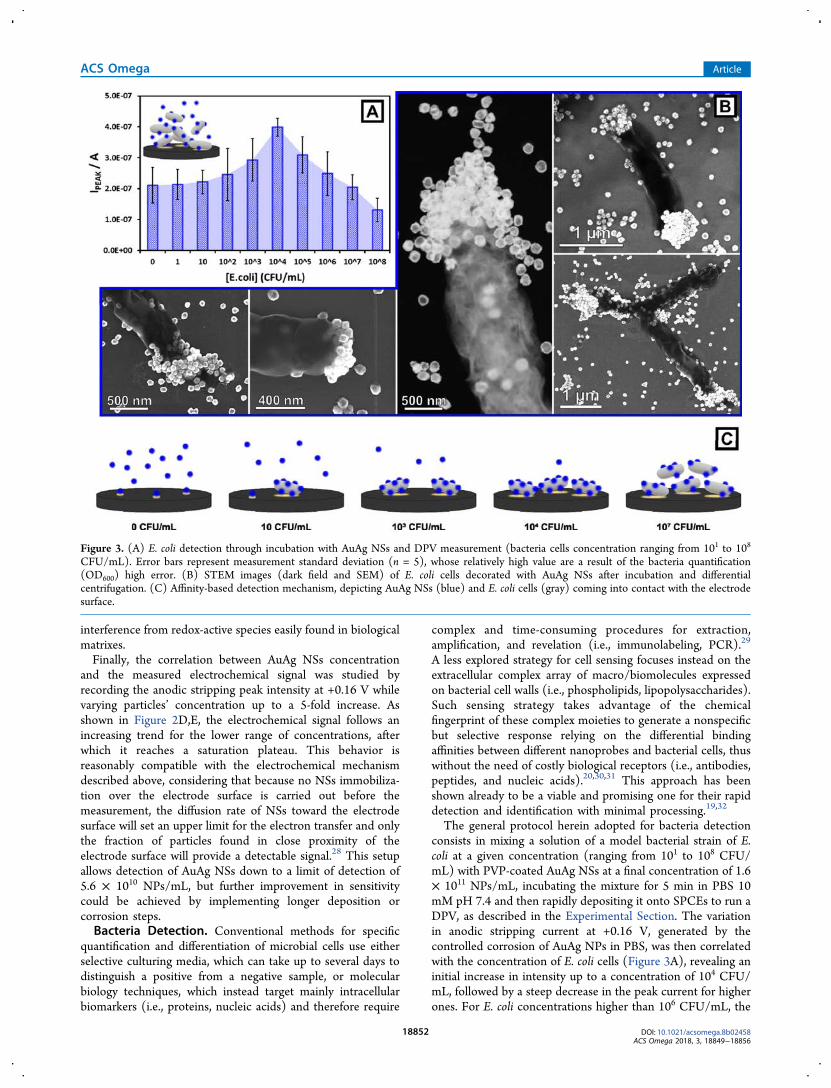
interference from redox-active species easily found in biologicalmatrixes.Finally, the correlation between AuAg NSs concentration
and the measured electrochemical signal was studied byrecording the anodic stripping peak intensity at +0.16 V whilevarying particles’ concentration up to a 5-fold increase. Asshown in Figure 2D,E, the electrochemical signal follows anincreasing trend for the lower range of concentrations, afterwhich it reaches a saturation plateau. This behavior isreasonably compatible with the electrochemical mechanismdescribed above, considering that because no NSs immobiliza-tion over the electrode surface is carried out before themeasurement, the diffusion rate of NSs toward the electrodesurface will set an upper limit for the electron transfer and onlythe fraction of particles found in close proximity of theelectrode surface will provide a detectable signal.28 This setupallows detection of AuAg NSs down to a limit of detection of5.6 × 1010 NPs/mL, but further improvement in sensitivitycould be achieved by implementing longer deposition orcorrosion steps.Bacteria Detection. Conventional methods for specific
quantification and differentiation of microbial cells use eitherselective culturing media, which can take up to several days todistinguish a positive from a negative sample, or molecularbiology techniques, which instead target mainly intracellularbiomarkers (i.e., proteins, nucleic acids) and therefore require
complex and time-consuming procedures for extraction,amplification, and revelation (i.e., immunolabeling, PCR).29
A less explored strategy for cell sensing focuses instead on theextracellular complex array of macro/biomolecules expressedon bacterial cell walls (i.e., phospholipids, lipopolysaccharides).Such sensing strategy takes advantage of the chemicalfingerprint of these complex moieties to generate a nonspecificbut selective response relying on the differential bindingaffinities between different nanoprobes and bacterial cells, thuswithout the need of costly biological receptors (i.e., antibodies,peptides, and nucleic acids).20,30,31 This approach has beenshown already to be a viable and promising one for their rapiddetection and identification with minimal processing.19,32
The general protocol herein adopted for bacteria detectionconsists in mixing a solution of a model bacterial strain of E.coli at a given concentration (ranging from 101 to 108 CFU/mL) with PVP-coated AuAg NSs at a final concentration of 1.6× 10¹¹ NPs/mL, incubating the mixture for 5 min in PBS 10mM pH 7.4 and then rapidly depositing it onto SPCEs to run aDPV, as described in the Experimental Section. The variationin anodic stripping current at +0.16 V, generated by thecontrolled corrosion of AuAg NPs in PBS, was then correlatedwith the concentration of E. coli cells (Figure 3A), revealing aninitial increase in intensity up to a concentration of 104 CFU/mL, followed by a steep decrease in the peak current for higherones. For E. coli concentrations higher than 106 CFU/mL, the
Figure 3. (A) E. coli detection through incubation with AuAg NSs and DPV measurement (bacteria cells concentration ranging from 101 to 108
CFU/mL). Error bars represent measurement standard deviation (n = 5), whose relatively high value are a result of the bacteria quantification(OD600) high error. (B) STEM images (dark field and SEM) of E. coli cells decorated with AuAg NSs after incubation and differentialcentrifugation. (C) Affinity-based detection mechanism, depicting AuAg NSs (blue) and E. coli cells (gray) coming into contact with the electrodesurface.
ACS Omega Article
DOI: 10.1021/acsomega.8b02458ACS Omega 2018, 3, 18849−18856
18852
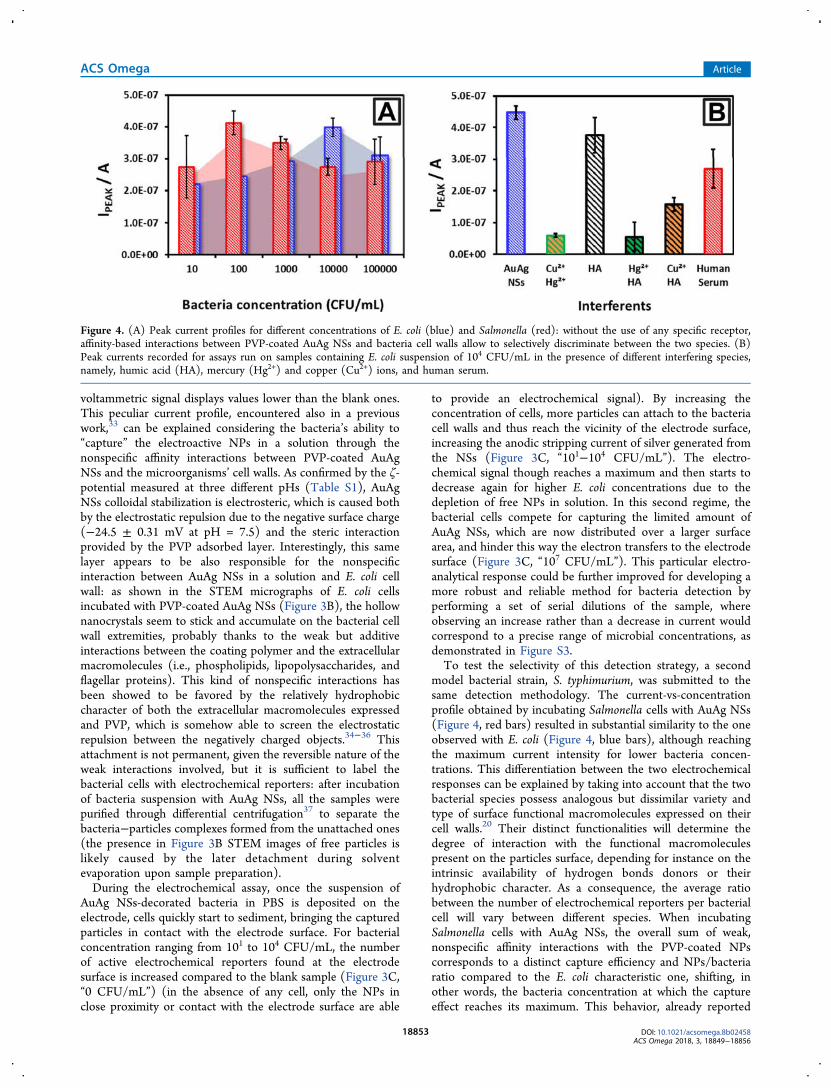
voltammetric signal displays values lower than the blank ones.This peculiar current profile, encountered also in a previouswork,33 can be explained considering the bacteria’s ability to“capture” the electroactive NPs in a solution through thenonspecific affinity interactions between PVP-coated AuAgNSs and the microorganisms’ cell walls. As confirmed by the ζ-potential measured at three different pHs (Table S1), AuAgNSs colloidal stabilization is electrosteric, which is caused bothby the electrostatic repulsion due to the negative surface charge(−24.5 ± 0.31 mV at pH = 7.5) and the steric interactionprovided by the PVP adsorbed layer. Interestingly, this samelayer appears to be also responsible for the nonspecificinteraction between AuAg NSs in a solution and E. coli cellwall: as shown in the STEM micrographs of E. coli cellsincubated with PVP-coated AuAg NSs (Figure 3B), the hollownanocrystals seem to stick and accumulate on the bacterial cellwall extremities, probably thanks to the weak but additiveinteractions between the coating polymer and the extracellularmacromolecules (i.e., phospholipids, lipopolysaccharides, andflagellar proteins). This kind of nonspecific interactions hasbeen showed to be favored by the relatively hydrophobiccharacter of both the extracellular macromolecules expressedand PVP, which is somehow able to screen the electrostaticrepulsion between the negatively charged objects.34−36 Thisattachment is not permanent, given the reversible nature of theweak interactions involved, but it is sufficient to label thebacterial cells with electrochemical reporters: after incubationof bacteria suspension with AuAg NSs, all the samples werepurified through differential centrifugation37 to separate thebacteria−particles complexes formed from the unattached ones(the presence in Figure 3B STEM images of free particles islikely caused by the later detachment during solventevaporation upon sample preparation).During the electrochemical assay, once the suspension of
AuAg NSs-decorated bacteria in PBS is deposited on theelectrode, cells quickly start to sediment, bringing the capturedparticles in contact with the electrode surface. For bacterialconcentration ranging from 101 to 104 CFU/mL, the numberof active electrochemical reporters found at the electrodesurface is increased compared to the blank sample (Figure 3C,“0 CFU/mL”) (in the absence of any cell, only the NPs inclose proximity or contact with the electrode surface are able
to provide an electrochemical signal). By increasing theconcentration of cells, more particles can attach to the bacteriacell walls and thus reach the vicinity of the electrode surface,increasing the anodic stripping current of silver generated fromthe NSs (Figure 3C, “101−104 CFU/mL”). The electro-chemical signal though reaches a maximum and then starts todecrease again for higher E. coli concentrations due to thedepletion of free NPs in solution. In this second regime, thebacterial cells compete for capturing the limited amount ofAuAg NSs, which are now distributed over a larger surfacearea, and hinder this way the electron transfers to the electrodesurface (Figure 3C, “107 CFU/mL”). This particular electro-analytical response could be further improved for developing amore robust and reliable method for bacteria detection byperforming a set of serial dilutions of the sample, whereobserving an increase rather than a decrease in current wouldcorrespond to a precise range of microbial concentrations, asdemonstrated in Figure S3.To test the selectivity of this detection strategy, a second
model bacterial strain, S. typhimurium, was submitted to thesame detection methodology. The current-vs-concentrationprofile obtained by incubating Salmonella cells with AuAg NSs(Figure 4, red bars) resulted in substantial similarity to the oneobserved with E. coli (Figure 4, blue bars), although reachingthe maximum current intensity for lower bacteria concen-trations. This differentiation between the two electrochemicalresponses can be explained by taking into account that the twobacterial species possess analogous but dissimilar variety andtype of surface functional macromolecules expressed on theircell walls.20 Their distinct functionalities will determine thedegree of interaction with the functional macromoleculespresent on the particles surface, depending for instance on theintrinsic availability of hydrogen bonds donors or theirhydrophobic character. As a consequence, the average ratiobetween the number of electrochemical reporters per bacterialcell will vary between different species. When incubatingSalmonella cells with AuAg NSs, the overall sum of weak,nonspecific affinity interactions with the PVP-coated NPscorresponds to a distinct capture efficiency and NPs/bacteriaratio compared to the E. coli characteristic one, shifting, inother words, the bacteria concentration at which the captureeffect reaches its maximum. This behavior, already reported
Figure 4. (A) Peak current profiles for different concentrations of E. coli (blue) and Salmonella (red): without the use of any specific receptor,affinity-based interactions between PVP-coated AuAg NSs and bacteria cell walls allow to selectively discriminate between the two species. (B)Peak currents recorded for assays run on samples containing E. coli suspension of 104 CFU/mL in the presence of different interfering species,namely, humic acid (HA), mercury (Hg2+) and copper (Cu2+) ions, and human serum.
ACS Omega Article
DOI: 10.1021/acsomega.8b02458ACS Omega 2018, 3, 18849−18856
18853
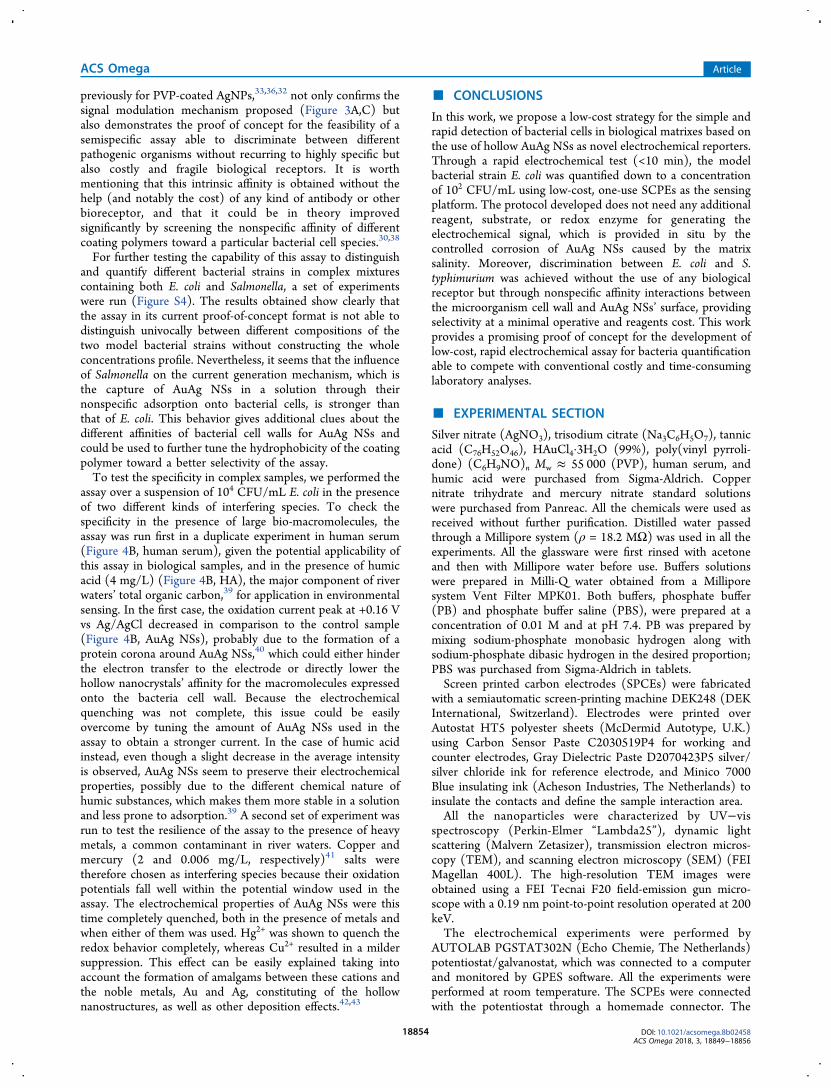
previously for PVP-coated AgNPs,33,36,32 not only confirms thesignal modulation mechanism proposed (Figure 3A,C) butalso demonstrates the proof of concept for the feasibility of asemispecific assay able to discriminate between differentpathogenic organisms without recurring to highly specific butalso costly and fragile biological receptors. It is worthmentioning that this intrinsic affinity is obtained without thehelp (and notably the cost) of any kind of antibody or otherbioreceptor, and that it could be in theory improvedsignificantly by screening the nonspecific affinity of differentcoating polymers toward a particular bacterial cell species.30,38
For further testing the capability of this assay to distinguishand quantify different bacterial strains in complex mixturescontaining both E. coli and Salmonella, a set of experimentswere run (Figure S4). The results obtained show clearly thatthe assay in its current proof-of-concept format is not able todistinguish univocally between different compositions of thetwo model bacterial strains without constructing the wholeconcentrations profile. Nevertheless, it seems that the influenceof Salmonella on the current generation mechanism, which isthe capture of AuAg NSs in a solution through theirnonspecific adsorption onto bacterial cells, is stronger thanthat of E. coli. This behavior gives additional clues about thedifferent affinities of bacterial cell walls for AuAg NSs andcould be used to further tune the hydrophobicity of the coatingpolymer toward a better selectivity of the assay.To test the specificity in complex samples, we performed the
assay over a suspension of 104 CFU/mL E. coli in the presenceof two different kinds of interfering species. To check thespecificity in the presence of large bio-macromolecules, theassay was run first in a duplicate experiment in human serum(Figure 4B, human serum), given the potential applicability ofthis assay in biological samples, and in the presence of humicacid (4 mg/L) (Figure 4B, HA), the major component of riverwaters’ total organic carbon,39 for application in environmentalsensing. In the first case, the oxidation current peak at +0.16 Vvs Ag/AgCl decreased in comparison to the control sample(Figure 4B, AuAg NSs), probably due to the formation of aprotein corona around AuAg NSs,40 which could either hinderthe electron transfer to the electrode or directly lower thehollow nanocrystals’ affinity for the macromolecules expressedonto the bacteria cell wall. Because the electrochemicalquenching was not complete, this issue could be easilyovercome by tuning the amount of AuAg NSs used in theassay to obtain a stronger current. In the case of humic acidinstead, even though a slight decrease in the average intensityis observed, AuAg NSs seem to preserve their electrochemicalproperties, possibly due to the different chemical nature ofhumic substances, which makes them more stable in a solutionand less prone to adsorption.39 A second set of experiment wasrun to test the resilience of the assay to the presence of heavymetals, a common contaminant in river waters. Copper andmercury (2 and 0.006 mg/L, respectively)41 salts weretherefore chosen as interfering species because their oxidationpotentials fall well within the potential window used in theassay. The electrochemical properties of AuAg NSs were thistime completely quenched, both in the presence of metals andwhen either of them was used. Hg2+ was shown to quench theredox behavior completely, whereas Cu2+ resulted in a mildersuppression. This effect can be easily explained taking intoaccount the formation of amalgams between these cations andthe noble metals, Au and Ag, constituting of the hollownanostructures, as well as other deposition effects.42,43
■ CONCLUSIONS
In this work, we propose a low-cost strategy for the simple andrapid detection of bacterial cells in biological matrixes based onthe use of hollow AuAg NSs as novel electrochemical reporters.Through a rapid electrochemical test (<10 min), the modelbacterial strain E. coli was quantified down to a concentrationof 102 CFU/mL using low-cost, one-use SCPEs as the sensingplatform. The protocol developed does not need any additionalreagent, substrate, or redox enzyme for generating theelectrochemical signal, which is provided in situ by thecontrolled corrosion of AuAg NSs caused by the matrixsalinity. Moreover, discrimination between E. coli and S.typhimurium was achieved without the use of any biologicalreceptor but through nonspecific affinity interactions betweenthe microorganism cell wall and AuAg NSs’ surface, providingselectivity at a minimal operative and reagents cost. This workprovides a promising proof of concept for the development oflow-cost, rapid electrochemical assay for bacteria quantificationable to compete with conventional costly and time-consuminglaboratory analyses.
■ EXPERIMENTAL SECTION
Silver nitrate (AgNO3), trisodium citrate (Na3C6H5O7), tannicacid (C76H52O46), HAuCl4·3H2O (99%), poly(vinyl pyrroli-done) (C6H9NO)n Mw ≈ 55 000 (PVP), human serum, andhumic acid were purchased from Sigma-Aldrich. Coppernitrate trihydrate and mercury nitrate standard solutionswere purchased from Panreac. All the chemicals were used asreceived without further purification. Distilled water passedthrough a Millipore system (ρ = 18.2 MΩ) was used in all theexperiments. All the glassware were first rinsed with acetoneand then with Millipore water before use. Buffers solutionswere prepared in Milli-Q water obtained from a Milliporesystem Vent Filter MPK01. Both buffers, phosphate buffer(PB) and phosphate buffer saline (PBS), were prepared at aconcentration of 0.01 M and at pH 7.4. PB was prepared bymixing sodium-phosphate monobasic hydrogen along withsodium-phosphate dibasic hydrogen in the desired proportion;PBS was purchased from Sigma-Aldrich in tablets.Screen printed carbon electrodes (SPCEs) were fabricated
with a semiautomatic screen-printing machine DEK248 (DEKInternational, Switzerland). Electrodes were printed overAutostat HT5 polyester sheets (McDermid Autotype, U.K.)using Carbon Sensor Paste C2030519P4 for working andcounter electrodes, Gray Dielectric Paste D2070423P5 silver/silver chloride ink for reference electrode, and Minico 7000Blue insulating ink (Acheson Industries, The Netherlands) toinsulate the contacts and define the sample interaction area.All the nanoparticles were characterized by UV−vis
spectroscopy (Perkin-Elmer “Lambda25”), dynamic lightscattering (Malvern Zetasizer), transmission electron micros-copy (TEM), and scanning electron microscopy (SEM) (FEIMagellan 400L). The high-resolution TEM images wereobtained using a FEI Tecnai F20 field-emission gun micro-scope with a 0.19 nm point-to-point resolution operated at 200keV.The electrochemical experiments were performed by
AUTOLAB PGSTAT302N (Echo Chemie, The Netherlands)potentiostat/galvanostat, which was connected to a computerand monitored by GPES software. All the experiments wereperformed at room temperature. The SCPEs were connectedwith the potentiostat through a homemade connector. The
ACS Omega Article
DOI: 10.1021/acsomega.8b02458ACS Omega 2018, 3, 18849−18856
18854
general protocol for the electrochemical measurements ofnanoparticles (NPs)-containing samples is as follows: 10 μL ofAuAg NSs suspension at a nominal concentration of 1.6 × 10¹¹
NPs/mL, unless specified otherwise, were transferred into aplastic 1.5 mL Eppendorf tube containing 50 μL of a bacteriasuspension in PBS 10 mM pH 7.4 with a given bacteria colonyforming units (CFU)/mL. After incubation in the saline matrixfor a given time and under stirring at 600 rpm in athermoshaker at 25 °C, 50 μL of the mixture was displacedonto the SPCE so as to cover the three electrodes. Differentialpulsed voltammetry (DPV) was run: after applying a fixeddeposition negative potential for 60 s, voltage was scannedbetween −0.05 and +0.4 V with 0.01 V step potential. Cyclicvoltammetries were recorded in the same conditions scanningfrom −0.8 to +0.3 V at 100 mV/s scan rate with 0.005 V steppotential.E. coli O157:H7 (CECT 4783) and Salmonella enterica
subsp. enterica serovar Typhimurium LT2 (CECT 722 T)strains were obtained from “Coleccion Espanola de CultivosTipo” (CECT). E. coli stock cultures were kept in trypticasesoy agar (TSA) sloped tubes at 4 °C and stored in theseconditions no longer than 2 months. To start up the culture,some E. coli colonies were transferred from TSA to trypticasesoy broth tubes at 37 °C for 24 h for bacterial growth. Nextday, a small fraction of the new grown bacterial culture wastaken with a loop (≈1 μL) and carried to a TSA plate. Again,bacteria were allowed to grow at 37 °C for 24 h. Finally, a glasstube was filled up with 0.01 M PBS and some colonies wereintroduced into the tube. Bacteria solution was vortexed andOD was measured using McFarland standards: a value of 0.5indicated a bacterial density of around 1.5 × 10⁸ CFU/mL. E.coli living cells were eventually subjected to a sharptemperature increase (80 °C) for 20 min to kill withoutcompromising the outer cell wall structure. The same processwas carried out for Salmonella strain.
■ ASSOCIATED CONTENT*S Supporting InformationThe Supporting Information is available free of charge on theACS Publications website at DOI: 10.1021/acsome-ga.8b02458.
Stability study for AuAg NSs; stability study for Ag/AgCl pseudoreference electrode; Z-potential of AuAgNSs; dilution method for electrochemical assay; multi-component samples analysis (PDF)
■ AUTHOR INFORMATIONCorresponding Author*E-mail: [email protected] Merkoci: 0000-0003-2486-8085NotesThe authors declare no competing financial interest.
■ ACKNOWLEDGMENTSThis work was carried out within the “Doctorat en Quimica”PhD programme of Universitat Autonoma de Barcelona,supported by the Spanish MINECO (MAT2015-70725-R) andfrom the Catalan Agencia de Gestio d’Ajuts Universitaris i deRecerca (AGAUR) (2017-SGR-143). Financial support fromthe HISENTS (685817) Project financed by the European
Community under H20202 Capacities Programme is gratefullyacknowledged. It was also funded by the CERCA Program/Generalitat de Catalunya. ICN2 acknowledges the support ofthe Spanish MINECO through the Severo Ochoa Centers ofExcellence Program under Grant SEV2201320295.
■ REFERENCES(1) World Health Organization. Global Action Plan on AntimicrobialResistance; WHO Press, 2015; pp 1−28.(2) Drain, P. K.; Hyle, E. P.; Noubary, F.; Freedberg, K. A.; Wilson,D.; Bishai, W. R.; Rodriguez, W.; Bassett, I. V. Diagnostic Point-of-Care Tests in Resource-Limited Settings. Lancet Infect. Dis. 2014, 14,239−249.(3) Huang, X.; Liu, Y.; Yung, B.; Xiong, Y.; Chen, X. Nano-technology-Enhanced No-Wash Biosensors for In Vitro Diagnostics ofCancer. ACS Nano 2017, 11, 5238−5292.(4) Lee, W. G.; Kim, Y.-G.; Chung, B. G.; Demirci, U.;Khademhosseini, A. Nano/Microfluidics for Diagnosis of InfectiousDiseases in Developing Countries. Adv. Drug Delivery Rev. 2010, 62,449−457.(5) Polavarapu, L.; Liz-Marzan, L. M. Towards Low-Cost FlexibleSubstrates for Nanoplasmonic Sensing. Phys. Chem. Chem. Phys. 2013,15, 5288−5300.(6) Bulbul, G.; Hayat, A.; Andreescu, S. Portable Nanoparticle-BasedSensors for Food Safety Assessment. Sensors 2015, 15, 30736−30758.(7) Qiu, H.-J.; Li, X.; Xu, H.-T.; Zhang, H.-J.; Wang, Y. NanoporousMetal as a Platform for Electrochemical and Optical Sensing. J. Mater.Chem. C 2014, 2, 9788−9799.(8) Ambrosi, A.; Merkoci, A.; de la Escosura-Muniz, A. Electro-chemical Analysis with Nanoparticle-Based Biosystems. TrAC, TrendsAnal. Chem. 2008, 27, 568−584.(9) Kelley, S. O.; Mirkin, C. A.; Walt, D. R.; Ismagilov, R. F.; Toner,M.; Sargent, E. H. Advancing the Speed, Sensitivity and Accuracy ofBiomolecular Detection Using Multi-Length-Scale Engineering. Nat.Nanotechnol. 2014, 9, 969−980.(10) Huckle, D. Point-of-Care Diagnostics: Will the Hurdles BeOvercome This Time? Expert Rev. Med. Devices 2006, 3, 421−426.(11) El Harrad, L.; Bourais, I.; Mohammadi, H.; Amine, A. RecentAdvances in Electrochemical Biosensors Based on Enzyme Inhibitionfor Clinical and Pharmaceutical Applications. Sensors 2018, 18, 164.(12) Rocchitta, G.; Spanu, A.; Babudieri, S.; Latte, G.; Madeddu, G.;Galleri, G.; Nuvoli, S.; Bagella, P.; Demartis, M. I.; Fiore, V.; et al.Enzyme Biosensors for Biomedical Applications: Strategies forSafeguarding Analytical Performances in Biological Fluids. Sensors2016, 16, 780.(13) Kotov, N. A. Inorganic Nanoparticles as Protein Mimics. Science2010, 330, 188−189.(14) Cheng, H.; Lin, S.; Muhammad, F.; Lin, Y. W.; Wei, H.Rationally Modulate the Oxidase-like Activity of Nanoceria for Self-Regulated Bioassays. ACS Sens. 2016, 1, 1336−1343.(15) Wang, C.; Chen, W.; Chang, H. Enzyme Mimics of Au/AgNanoparticles for Fluorescent Detection of Acetylcholine. Anal. Chem.2012, 84, 9706−9712.(16) Russo, L.; Puntes, V.; Merkoci, A. Tunable Electrochemistry ofGold-Silver Alloy Nanoshells. Nano Res. 2018, 6336.(17) Wang, Y.; Salehi, M.; Schutz, M.; Schlucker, S. FemtogramDetection of Cytokines in a Direct Dot-Blot Assay Using SERSMicrospectroscopy and Hydrophilically Stabilized Au-Ag Nanoshells.Chem. Commun. 2014, 50, 2711−2714.(18) Jang, H.; Kim, D. E.; Min, D. H. Self-Assembled MonolayerMediated Surface Environment Modif icat ion of Poly-(Vinylpyrrolidone)-Coated Hollow Au-Ag Nanoshells for EnhancedLoading of Hydrophobic Drug and Efficient Multimodal Therapy.ACS Appl. Mater. Interfaces 2015, 7, 12789−12796.(19) Miranda, O. R.; Li, X.; Garcia-Gonzalez, L.; Zhu, Z. J.; Yan, B.;Bunz, U. H. F.; Rotello, V. M. Colorimetric Bacteria Sensing Using aSupramolecular Enzyme-Nanoparticle Biosensor. J. Am. Chem. Soc.2011, 133, 9650−9653.
ACS Omega Article
DOI: 10.1021/acsomega.8b02458ACS Omega 2018, 3, 18849−18856
18855
(20) Chen, J.; Andler, S. M.; Goddard, J. M.; Nugen, S. R.; Rotello,V. M. Integrating Recognition Elements with Nanomaterials forBacteria Sensing. Chem. Soc. Rev. 2017, 46, 1272−1283.(21) Chen, J.; Jiang, Z.; Ackerman, J. D.; Yazdani, M.; Hou, S.;Nugen, S. R.; Rotello, V. M. Electrochemical Nanoparticle−enzymeSensors for Screening Bacterial Contamination in Drinking Water.Analyst 2015, 140, 4991−4996.(22) Russo, L.; Merkoci, F.; Patarroyo, J.; Piella, J.; Merkoci, A.;Bastus, N. G.; Puntes, V. Time- and Size-Resolved PlasmonicEvolution with Nm Resolution of Galvanic Replacement Reactionin AuAg Nanoshells Synthesis. Chem. Mater. 2018, 30, 5098−5107.(23) Wan, Y.; Zhou, Y.-G.; Poudineh, M.; Safaei, T. S.; Mohamadi,R. M.; Sargent, E. H.; Kelley, S. O. Highly Specific ElectrochemicalAnalysis of Cancer Cells Using Multi-Nanoparticle Labeling. Angew.Chem., Int. Ed. 2014, 53, 13145−13149.(24) Zheng, Y.; Zeng, J.; Ruditskiy, A.; Liu, M.; Xia, Y. OxidativeEtching and Its Role in Manipulating the Nucleation and Growth ofNoble-Metal Nanocrystals. Chem. Mater. 2014, 26, 22−33.(25) Cloake, S. J.; Toh, H. S.; Lee, P. T.; Salter, C.; Johnston, C.;Compton, R. G. Anodic Stripping Voltammetry of Silver Nano-particles: Aggregation Leads to Incomplete Stripping. ChemistryOpen2015, 4, 22−26.(26) Douglas, F.; Yanez, R.; Ros, J.; Marín, S.; De La Escosura-Muniz, A.; Alegret, S.; Merkoc i, A. Silver, Gold and theCorresponding Core Shell Nanoparticles: Synthesis and Character-ization. J. Nanopart. Res. 2008, 10, 97−106.(27) Toh, H. S.; Batchelor-McAuley, C.; Tschulik, K.; Compton, R.G. Electrochemical Detection of Chloride Levels in Sweat UsingSilver Nanoparticles: A Basis for the Preliminary Screening for CysticFibrosis. Analyst 2013, 138, 4292−4297.(28) Kleijn, S. E. F.; Lai, S. C. S.; Koper, M. T. M.; Unwin, P. R.Electrochemistry of Nanoparticles. Angew. Chem., Int. Ed. 2014, 53,3558−3586.(29) Tamerat, N.; Muktar, Y. Application of Molecular DiagnosticTechniques for the Detection of E. coli O157:H7: A Review. J. Vet. Sci.Technol. 2016, 7, 362.(30) Jiang, Z.; Le, N. D. B.; Gupta, A.; Rotello, V. M. Cell Surface-Based Sensing with Metallic Nanoparticles. Chem. Soc. Rev. 2015, 44,4264−4274.(31) Feng, Z. V.; Gunsolus, I. L.; Qiu, T. A.; Hurley, K. R.; Nyberg,L. H.; Frew, H.; Johnson, K. P.; Vartanian, A. M.; Jacob, L. M.; Lohse,S. E.; et al. Impacts of Gold Nanoparticle Charge and Ligand Type onSurface Binding and Toxicity to Gram-Negative and Gram-PositiveBacteria. Chem. Sci. 2015, 6, 5186−5196.(32) Sepunaru, L.; Tschulik, K.; Batchelor-McAuley, C.; Gavish, R.;Compton, R. G. Electrochemical Detection of Single E. coli BacteriaLabeled with Silver Nanoparticles. Biomater. Sci. 2015, 3, 816−820.(33) Hassan, A. R. H. A. A.; de la Escosura-Muniz, A.; Merkoci, A.Highly Sensitive and Rapid Determination of Escherichia coli O157:H7 in Minced Beef and Water Using Electrocatalytic GoldNanoparticle Tags. Biosens. Bioelectron. 2015, 67, 511−515.(34) El Badawy, A. M.; Silva, R. G.; Morris, B.; Scheckel, K. G.;Suidan, M. T.; Tolaymat, T. M. Surface Charge-Dependent Toxicityof Silver Nanoparticles. Environ. Sci. Technol. 2011, 45, 283−287.(35) Song, J. E.; Phenrat, T.; Marinakos, S.; Xiao, Y.; Liu, J.;Wiesner, M. R.; Tilton, R. D.; Lowry, G. V. Hydrophobic InteractionsIncrease Attachment of Gum Arabic- and PVP-Coated Ag Nano-particles to Hydrophobic Surfaces. Environ. Sci. Technol. 2011, 45,5988−5995.(36) Bondarenko, O.; Ivask, A.; Kakinen, A.; Kurvet, I.; Kahru, A.Particle-Cell Contact Enhances Antibacterial Activity of SilverNanoparticles. PLoS One 2013, 8, No. e64060.(37) Sousa, C.; Sequeira, D.; Kolen’Ko, Y. V.; Pinto, I. M.;Petrovykh, D. Y. Analytical Protocols for Separation and ElectronMicroscopy of Nanoparticles Interacting with Bacterial Cells. Anal.Chem. 2015, 87, 4641−4648.(38) MacKenzie, D. A.; Sherratt, A. R.; Chigrinova, M.; Kell, A. J.;Pezacki, J. P. Bioorthogonal Labelling of Living Bacteria Using
Unnatural Amino Acids Containing Nitrones and a NitroneDerivative of Vancomycin. Chem. Commun. 2015, 51, 12501−12504.(39) Frimmel, F. Aquatic Humic Substances. In Biopolymers, Volume1: Lignin, Humic Substances and Coal; Wiley-VCH, 2001; pp 301−310.(40) Barbero, F.; Russo, L.; Vitali, M.; Piella, J.; Salvo, I.; Borrajo, M.L.; Busquets-Fite, M.; Grandori, R.; Bastus, N. G.; Casals, E.; et al.Formation of the Protein Corona: The Interface between Nano-particles and the Immune System. Semin. Immunol. 2017, 34, 52−60.(41) Gorchev, H. G.; Ozolins, G. WHO Guidelines for Drinking-Water Quality. WHO Chron. 1984, 38, 104−108.(42) Li, L.; Feng, D.; Fang, X.; Han, X.; Zhang, Y. Visual Sensing ofHg2+ Using Unmodified Au@Ag Core−shell Nanoparticles. J.Nanostructure Chem. 2014, 4, 117.(43) Price, S. W. T.; Speed, J. D.; Kannan, P.; Russell, A. E. Exploringthe First Steps in Core − Shell Electrocatalyst Preparation: In SituCharacterization of Cu and Pd Shells on Supported Au Nanoparticles2011, 133, 19448−19458.
ACS Omega Article
DOI: 10.1021/acsomega.8b02458ACS Omega 2018, 3, 18849−18856
18856
FULL PAPERwww.afm-journal.de
© 2017 WILEY-VCH Verlag GmbH & Co. KGaA, Weinheim1702741 (1 of 8)
Straightforward Immunosensing Platform Based on Graphene Oxide-Decorated Nanopaper: A Highly Sensitive and Fast Biosensing ApproachNopchulee Cheeveewattanagul, Eden Morales-Narváez, Abdel-Rahim H. A. Hassan, José Francisco Bergua, Werasak Surareungchai, Mithran Somasundrum, and Arben Merkoçi*
Immunoassays are nowadays a crucial tool for diagnostics and drug devel-opment. However, they often involve time-consuming procedures and need at least two antibodies in charge of the capture and detection processes, respectively. This study reports a nanocomposite based on graphene oxide-coated nanopaper (GONAP) facilitating an advantageous immunosensing platform using a single antibody and without the need for washing steps. The hydrophilic, porous, and photoluminescence-quenching character of GONAP allows for the adsorption and quenching of photoluminescent quantum dots nanocrystals complexed with antibodies (Ab-QDs), enabling a ready-to-use immunosensing platform. The photoluminescence is recovered upon immuno-complex (antibody-antigen) formation which embraces a series of interactions (hydrogen bonding, electrostatic, hydrophobic, and Van der Waals interactions) that trigger desorption of the antigen-Ab-QD complex from GONAP surface. However, the antigen is then attached onto the GONAP surface by electrostatic interactions leading to a spacer (greater than ≈20 nm) between Ab-QDs and GONAP and thus hindering nonradiative energy transfer. It is demonstrated that this simple—yet highly sensitive—platform represents a virtually universal immunosensing approach by using small-sized and big-sized targets as model analytes, those are, human-IgG protein and Escherichia coli bacteria. In addi-tion, the assay is proved effective in real matrices analysis, including human serum, poultry meat, and river water. GONAP opens the way to conceptually new paper-based devices for immunosensing, which are amenable to point of care applications and automated diagnostics.
DOI: 10.1002/adfm.201702741
1. Introduction
Immunoassays capitalize on the selectivity and sensitivity of antibody–antigen inter-actions so as to capture and detect analytes in biological or environmental samples.[1] Being highly specific techniques, immu-noassays are the most extensively used detection approaches for the analytical determination of clinically relevant bio-markers.[2,3] They are also important drug screening platforms and prominent proteomic tools.[4,5] Consequently, they are a corner-stone in diagnostics and biological research. In fact, there are dif-ferent configurations (direct, indirect, sandwich, competitive) and various tech-nologies exploiting immunoassays such as microarray, lateral flow, and enzyme-linked immunosorbent assay.[1] Neverthe-less, they often require time-consuming labors (e.g., multiple washing steps) and/or at least two antibodies in charge of the capture and detection of the analyte, respectively. In addition, most of them are not particularly easy-to-use or ame-nable to portability.[6] Given this paucity,
Immunoassays
N. Cheeveewattanagul, Dr. E. Morales-Narváez, Dr. A.-R. H. A. Hassan, J. F. Bergua, Prof. A. MerkoçiNanobioelectronics and Biosensor GroupCatalan Institute of Nanoscience and Nanotechnology (ICN2)CSIC and BISTCampus UAB, Bellaterra, 08193 Barcelona, SpainE-mail: [email protected]. Cheeveewattanagul, Dr. W. SurareungchaiDivision of BiotechnologySchool of Bioresources and TechnologyKing Mongkut’s University of Technology ThonburiBangkhuntien Campus, Bangkok 10150, ThailandDr. E. Morales-NarváezBiophotonic Nanosensors LaboratoryCentro de Investigaciones en Óptica A. CLoma del Bosque 115, Lomas del CampestreLeón, Guanajuato 37150, MexicoDr. A.-R. H. A. HassanFood Hygiene DepartmentFaculty of Veterinary MedicineBeni-Suef UniversityBeni-Suef 62511, Egypt
Dr. W. SurareungchaiNanoscience & Nanotechnology Graduate ProgramKing Mongkut’s University of Technology ThonburiBangkhuntien Campus, Bangkok 10150, ThailandDr. M. SomasundrumBiochemical Engineering and Pilot Plant Research and Development UnitNational Center for Genetic Engineering and BiotechnologyNational Science and Technology Development Agency at King Mongkut’s University of Technology Thonburi (Bangkhuntien Campus)Bangkok 10150, ThailandProf. A. MerkoçiICREA – Institució Catalana de Recerca i Estudis AvancatsBarcelona 08010, Spain
The ORCID identification number(s) for the author(s) of this article can be found under https://doi.org/10.1002/adfm.201702741.
Adv. Funct. Mater. 2017, 27, 1702741
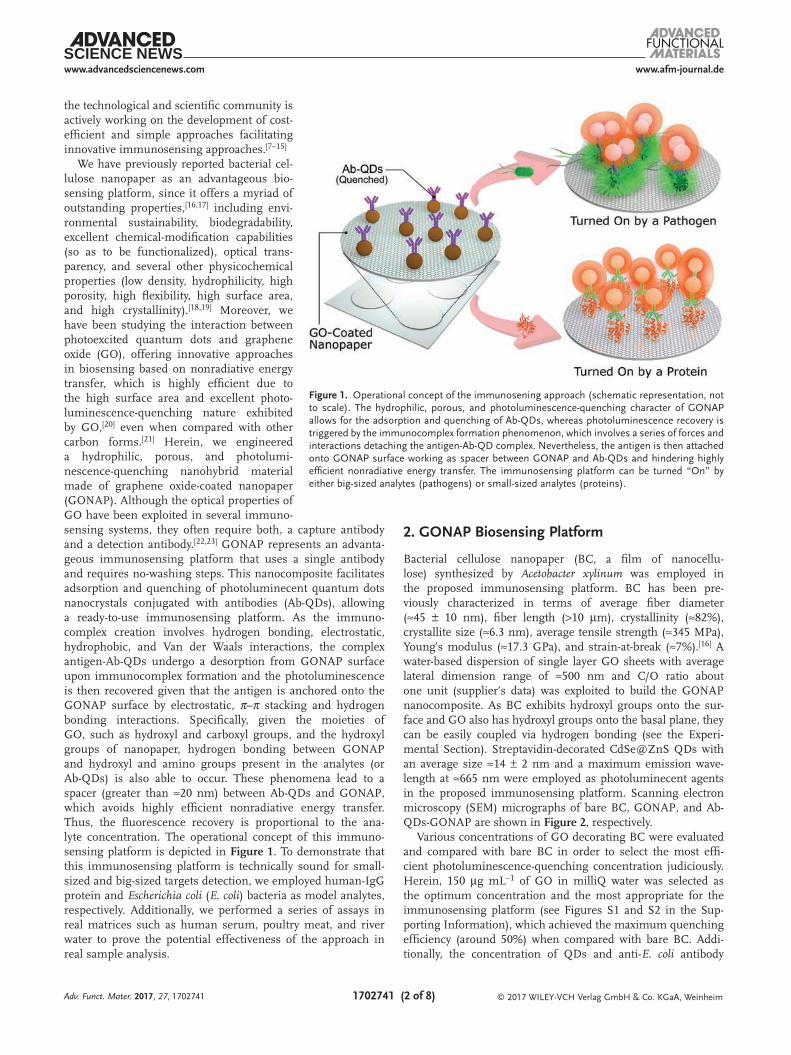
www.afm-journal.dewww.advancedsciencenews.com
1702741 (2 of 8) © 2017 WILEY-VCH Verlag GmbH & Co. KGaA, Weinheim
the technological and scientific community is actively working on the development of cost-efficient and simple approaches facilitating innovative immunosensing approaches.[7–15]
We have previously reported bacterial cel-lulose nanopaper as an advantageous bio-sensing platform, since it offers a myriad of outstanding properties,[16,17] including envi-ronmental sustainability, biodegradability, excellent chemical-modification capabilities (so as to be functionalized), optical trans-parency, and several other physicochemical properties (low density, hydrophilicity, high porosity, high flexibility, high surface area, and high crystallinity).[18,19] Moreover, we have been studying the interaction between photoexcited quantum dots and graphene oxide (GO), offering innovative approaches in biosensing based on nonradiative energy transfer, which is highly efficient due to the high surface area and excellent photo-luminescence-quenching nature exhibited by GO,[20] even when compared with other carbon forms.[21] Herein, we engineered a hydrophilic, porous, and photolumi-nescence-quenching nanohybrid material made of graphene oxide-coated nanopaper (GONAP). Although the optical properties of GO have been exploited in several immuno-sensing systems, they often require both, a capture antibody and a detection antibody.[22,23] GONAP represents an advanta-geous immunosensing platform that uses a single antibody and requires no-washing steps. This nanocomposite facilitates adsorption and quenching of photoluminecent quantum dots nanocrystals conjugated with antibodies (Ab-QDs), allowing a ready-to-use immunosensing platform. As the immuno-complex creation involves hydrogen bonding, electrostatic, hydrophobic, and Van der Waals interactions, the complex antigen-Ab-QDs undergo a desorption from GONAP surface upon immunocomplex formation and the photoluminescence is then recovered given that the antigen is anchored onto the GONAP surface by electrostatic, π–π stacking and hydrogen bonding interactions. Specifically, given the moieties of GO, such as hydroxyl and carboxyl groups, and the hydroxyl groups of nanopaper, hydrogen bonding between GONAP and hydroxyl and amino groups present in the analytes (or Ab-QDs) is also able to occur. These phenomena lead to a spacer (greater than ≈20 nm) between Ab-QDs and GONAP, which avoids highly efficient nonradiative energy transfer. Thus, the fluorescence recovery is proportional to the ana-lyte concentration. The operational concept of this immuno-sensing platform is depicted in Figure 1. To demonstrate that this immunosensing platform is technically sound for small-sized and big-sized targets detection, we employed human-IgG protein and Escherichia coli (E. coli) bacteria as model analytes, respectively. Additionally, we performed a series of assays in real matrices such as human serum, poultry meat, and river water to prove the potential effectiveness of the approach in real sample analysis.
2. GONAP Biosensing Platform
Bacterial cellulose nanopaper (BC, a film of nanocellu-lose) synthesized by Acetobacter xylinum was employed in the proposed immunosensing platform. BC has been pre-viously characterized in terms of average fiber diameter (≈45 ± 10 nm), fiber length (>10 µm), crystallinity (≈82%), crystallite size (≈6.3 nm), average tensile strength (≈345 MPa), Young’s modulus (≈17.3 GPa), and strain-at-break (≈7%).[16] A water-based dispersion of single layer GO sheets with average lateral dimension range of ≈500 nm and C/O ratio about one unit (supplier’s data) was exploited to build the GONAP nanocomposite. As BC exhibits hydroxyl groups onto the sur-face and GO also has hydroxyl groups onto the basal plane, they can be easily coupled via hydrogen bonding (see the Experi-mental Section). Streptavidin-decorated CdSe@ZnS QDs with an average size ≈14 ± 2 nm and a maximum emission wave-length at ≈665 nm were employed as photoluminecent agents in the proposed immunosensing platform. Scanning electron microscopy (SEM) micrographs of bare BC, GONAP, and Ab-QDs-GONAP are shown in Figure 2, respectively.
Various concentrations of GO decorating BC were evaluated and compared with bare BC in order to select the most effi-cient photoluminescence-quenching concentration judiciously. Herein, 150 µg mL−1 of GO in milliQ water was selected as the optimum concentration and the most appropriate for the immunosensing platform (see Figures S1 and S2 in the Sup-porting Information), which achieved the maximum quenching efficiency (around 50%) when compared with bare BC. Addi-tionally, the concentration of QDs and anti-E. coli antibody
Adv. Funct. Mater. 2017, 27, 1702741
Figure 1. Operational concept of the immunosening approach (schematic representation, not to scale). The hydrophilic, porous, and photoluminescence-quenching character of GONAP allows for the adsorption and quenching of Ab-QDs, whereas photoluminescence recovery is triggered by the immunocomplex formation phenomenon, which involves a series of forces and interactions detaching the antigen-Ab-QD complex. Nevertheless, the antigen is then attached onto GONAP surface working as spacer between GONAP and Ab-QDs and hindering highly efficient nonradiative energy transfer. The immunosensing platform can be turned “On” by either big-sized analytes (pathogens) or small-sized analytes (proteins).

www.afm-journal.dewww.advancedsciencenews.com
1702741 (3 of 8) © 2017 WILEY-VCH Verlag GmbH & Co. KGaA, Weinheim
and the incubation time for the immunoreaction were care-fully selected based on the most sensitive response, taking the analysis of the blank sample as reference. It was found that the optimum concentrations of QDs and Ab are 100 × 10−9 m and 0.9 mg mL−1, respectively. Consequently, [GO] ≈ 150 µg mL−1, [QDs] ≈ 100 × 10−9 m, and [anti-E. coli Ab] ≈ 0.9 mg mL−1 were employed for sensitive detection of foodborne pathogen (E. coli O157:H7). Moreover, the optimum incubation time was 30 min for capturing the target bacteria by the specific Ab. The same aforementioned optimization procedures were carried out for protein detection, whereas the optimum concentrations were ≈100 µg mL−1, 100 × 10−9 m, and 0.2 mg mL−1 for GO, QDs, and antihuman IgG Ab, respectively, for protein detection, while an optimum incubation period of 2 h was found the most appro-priate for protein detection (see Figure S5 in the Supporting Information). It is well known that the suitable incubation time for any immunoreaction strongly depends on the analyte size,[24] thus there is a significant difference between E. coli and protein detection in this parameter (E. coli size ≈ 0.5 × 1.5 µm, human IgG size ≈ 12 nm). Although the size of these analytes is completely different, the biosensing mechanism is driven by the same aforementioned principle that eventually leads to a spacer between photoexcited QDs and GONAP (greater than ≈20 nm), hindering a highly efficient nonradiative energy transfer phenomenon. Thus, the proposed biosensing system is able to detect both small-sized and big-sized analytes as demon-strated below.
2.1. GONAP for Pathogen Detection
The performance of the proposed immunosensing platform as a pathogen detection device was evaluated by using ten-fold serial concentrations of E. coli O157:H7 (10–106 Colony Forming Unit “CFU” mL−1) in a standard buffer. Blank sample (buffer containing zero bacteria) was studied to distinguish between the presence and the absence of the target analyte. The photoluminescence intensity ratios (F1/F0) of the test and the blank spots were estimated in dimensionless units by dividing the final photoluminescence intensity (F1) into the initial photo-luminescence intensity (F0) of the same GONAP spot, which determine the presence or absence of the target pathogen. Fur-thermore, the F1/F0 ratio allows for the measurement of tiny amounts of the analyte circumventing analytical problems due to the original intensity of F0, which can be considered the
background signal. Given the operational concept of the immu-nosensing platform, the photoluminescence of the test spots is expected to increase upon addition of the pathogen, whereas that of the blank spots is expected to be relatively constant or decrease slightly due to the removal of the excess of some Ab-QD complexes after the contact with the liquid sample. Figure 3a shows how the F1/F0 ratio of the analyzed blank sample was around 0.8, while serial dilutions of E. coli obtained a F1/F0 ratio greater than this value. The proposed immuno-sensing platform showed a highly sensitive response to the presence of the target bacteria with a wide detection range, from 10 to 106 CFU mL−1, where the F1/F0 ratio increased gradually with E. coli concentration at the range from 10 to 105 CFU mL−1 with a full saturation of the system at 106 CFU mL−1. As experimental evidences, Figure 3b shows images of the photo luminescent performance of GONAP immuno-sensing platform targeting E. coli and Figure 3c displays a SEM micrograph of the platform after adding the target bacteria. Moreover, from that logarithmic response, the estimated detec-tion limit of E. coli in standard buffer was about 55 CFU mL−1, which has been calculated by the mean value F1/F0 ratio of the blank plus three times its standard deviation, see Figure S10A in the Supporting Information (threshold line).
In order to investigate the effect of washing steps on GONAP immunosensing platform, a series of assays was carried out via GONAP immunosensing platform and washing steps were per-formed using 100 µL of PBST followed by 100 µL milli-Q water. After discarding the washing solution, a fluctuating response in the F1/F0 ratio with serial E. coli concentrations has been observed. This could be attributed to the weak attaching forces between GONAP and the complex antigen-Ab-QDs.[25] This fluctuating response is shown in Figure S4 in the Supporting Information. Importantly, we discovered that the overall optimal performance of the proposed immnosensing platform does not require washing steps.
2.1.1. GONAP Specificity in Pathogen Detection
We also explored the specificity of GONAP immunosensing plat-form targeting E. coli in the presence of another nontarget bacte-rial strain form the same “Enterobacteriaceae family.” Salmonella typhimurium was selected as a nonspecific pathogen for con-ducting this experiment. Different concentrations of the target and nontarget bacteria were simultaneously analyzed in standard
Adv. Funct. Mater. 2017, 27, 1702741
Figure 2. Scanning-electron micrographs of GONAP platform. a) Bare bacterial cellulose nanopaper. b) GONAP. c) Ab-QDs on GONAP.
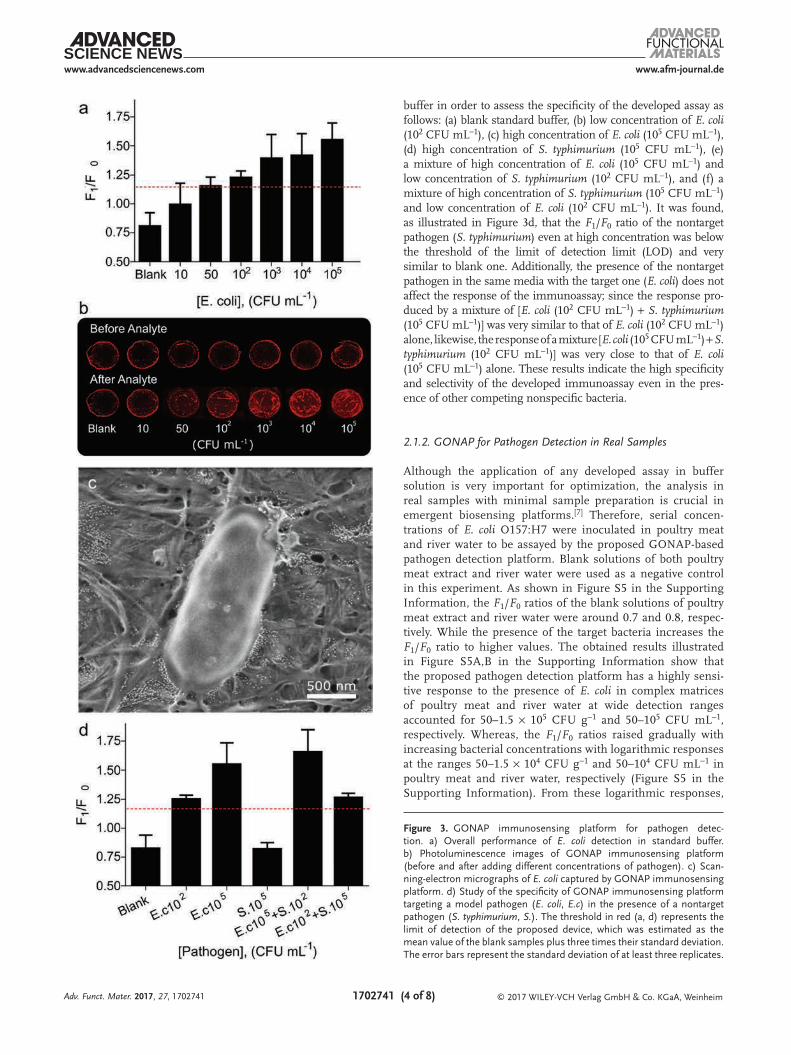
www.afm-journal.dewww.advancedsciencenews.com
1702741 (4 of 8) © 2017 WILEY-VCH Verlag GmbH & Co. KGaA, Weinheim
buffer in order to assess the specificity of the developed assay as follows: (a) blank standard buffer, (b) low concentration of E. coli (102 CFU mL−1), (c) high concentration of E. coli (105 CFU mL−1), (d) high concentration of S. typhimurium (105 CFU mL−1), (e) a mixture of high concentration of E. coli (105 CFU mL−1) and low concentration of S. typhimurium (102 CFU mL−1), and (f) a mixture of high concentration of S. typhimurium (105 CFU mL−1) and low concentration of E. coli (102 CFU mL−1). It was found, as illustrated in Figure 3d, that the F1/F0 ratio of the nontarget pathogen (S. typhimurium) even at high concentration was below the threshold of the limit of detection limit (LOD) and very similar to blank one. Additionally, the presence of the nontarget pathogen in the same media with the target one (E. coli) does not affect the response of the immunoassay; since the response pro-duced by a mixture of [E. coli (102 CFU mL−1) + S. typhimurium (105 CFU mL−1)] was very similar to that of E. coli (102 CFU mL−1) alone, likewise, the response of a mixture [E. coli (105 CFU mL−1) + S. typhimurium (102 CFU mL−1)] was very close to that of E. coli (105 CFU mL−1) alone. These results indicate the high specificity and selectivity of the developed immunoassay even in the pres-ence of other competing nonspecific bacteria.
2.1.2. GONAP for Pathogen Detection in Real Samples
Although the application of any developed assay in buffer solution is very important for optimization, the analysis in real samples with minimal sample preparation is crucial in emergent biosensing platforms.[7] Therefore, serial concen-trations of E. coli O157:H7 were inoculated in poultry meat and river water to be assayed by the proposed GONAP-based pathogen detection platform. Blank solutions of both poultry meat extract and river water were used as a negative control in this experiment. As shown in Figure S5 in the Supporting Information, the F1/F0 ratios of the blank solutions of poultry meat extract and river water were around 0.7 and 0.8, respec-tively. While the presence of the target bacteria increases the F1/F0 ratio to higher values. The obtained results illustrated in Figure S5A,B in the Supporting Information show that the proposed pathogen detection platform has a highly sensi-tive response to the presence of E. coli in complex matrices of poultry meat and river water at wide detection ranges accounted for 50–1.5 × 10⁵ CFU g−1 and 50–105 CFU mL−1, respectively. Whereas, the F1/F0 ratios raised gradually with increasing bacterial concentrations with logarithmic responses at the ranges 50–1.5 × 10⁴ CFU g−1 and 50–104 CFU mL−1 in poultry meat and river water, respectively (Figure S5 in the Supporting Information). From these logarithmic responses,
Adv. Funct. Mater. 2017, 27, 1702741
Figure 3. GONAP immunosensing platform for pathogen detec-tion. a) Overall performance of E. coli detection in standard buffer. b) Photoluminescence images of GONAP immunosensing platform (before and after adding different concentrations of pathogen). c) Scan-ning-electron micrographs of E. coli captured by GONAP immunosensing platform. d) Study of the specificity of GONAP immunosensing platform targeting a model pathogen (E. coli, E.c) in the presence of a nontarget pathogen (S. typhimurium, S.). The threshold in red (a, d) represents the limit of detection of the proposed device, which was estimated as the mean value of the blank samples plus three times their standard deviation. The error bars represent the standard deviation of at least three replicates.
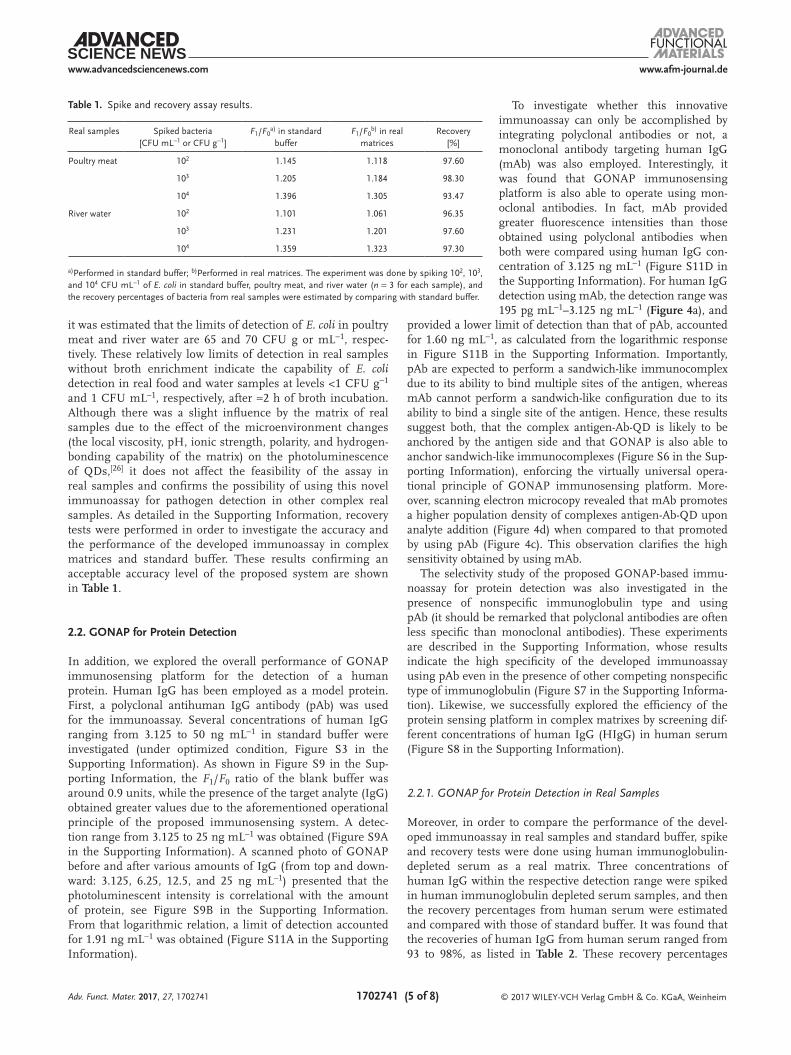
www.afm-journal.dewww.advancedsciencenews.com
1702741 (5 of 8) © 2017 WILEY-VCH Verlag GmbH & Co. KGaA, Weinheim
it was estimated that the limits of detection of E. coli in poultry meat and river water are 65 and 70 CFU g or mL−1, respec-tively. These relatively low limits of detection in real samples without broth enrichment indicate the capability of E. coli detection in real food and water samples at levels <1 CFU g−1 and 1 CFU mL−1, respectively, after ≈2 h of broth incubation. Although there was a slight influence by the matrix of real samples due to the effect of the microenvironment changes (the local viscosity, pH, ionic strength, polarity, and hydrogen-bonding capability of the matrix) on the photoluminescence of QDs,[26] it does not affect the feasibility of the assay in real samples and confirms the possibility of using this novel immunoassay for pathogen detection in other complex real samples. As detailed in the Supporting Information, recovery tests were performed in order to investigate the accuracy and the performance of the developed immunoassay in complex matrices and standard buffer. These results confirming an acceptable accuracy level of the proposed system are shown in Table 1.
2.2. GONAP for Protein Detection
In addition, we explored the overall performance of GONAP immunosensing platform for the detection of a human protein. Human IgG has been employed as a model protein. First, a polyclonal antihuman IgG antibody (pAb) was used for the immunoassay. Several concentrations of human IgG ranging from 3.125 to 50 ng mL−1 in standard buffer were investigated (under optimized condition, Figure S3 in the Supporting Information). As shown in Figure S9 in the Sup-porting Information, the F1/F0 ratio of the blank buffer was around 0.9 units, while the presence of the target analyte (IgG) obtained greater values due to the aforementioned operational principle of the proposed immunosensing system. A detec-tion range from 3.125 to 25 ng mL−1 was obtained (Figure S9A in the Supporting Information). A scanned photo of GONAP before and after various amounts of IgG (from top and down-ward: 3.125, 6.25, 12.5, and 25 ng mL−1) presented that the photoluminescent intensity is correlational with the amount of protein, see Figure S9B in the Supporting Information. From that logarithmic relation, a limit of detection accounted for 1.91 ng mL−1 was obtained (Figure S11A in the Supporting Information).
To investigate whether this innovative immunoassay can only be accomplished by integrating polyclonal antibodies or not, a monoclonal antibody targeting human IgG (mAb) was also employed. Interestingly, it was found that GONAP immunosensing platform is also able to operate using mon-oclonal antibodies. In fact, mAb provided greater fluorescence intensities than those obtained using poly clonal antibodies when both were compared using human IgG con-centration of 3.125 ng mL−1 (Figure S11D in the Supporting Information). For human IgG detection using mAb, the detection range was 195 pg mL−1–3.125 ng mL−1 (Figure 4a), and
provided a lower limit of detection than that of pAb, accounted for 1.60 ng mL−1, as calculated from the logarithmic response in Figure S11B in the Supporting Information. Importantly, pAb are expected to perform a sandwich-like immunocomplex due to its ability to bind multiple sites of the antigen, whereas mAb cannot perform a sandwich-like configuration due to its ability to bind a single site of the antigen. Hence, these results suggest both, that the complex antigen-Ab-QD is likely to be anchored by the antigen side and that GONAP is also able to anchor sandwich-like immunocomplexes (Figure S6 in the Sup-porting Information), enforcing the virtually universal opera-tional principle of GONAP immunosensing platform. More-over, scanning electron microcopy revealed that mAb promotes a higher population density of complexes antigen-Ab-QD upon analyte addition (Figure 4d) when compared to that promoted by using pAb (Figure 4c). This observation clarifies the high sensitivity obtained by using mAb.
The selectivity study of the proposed GONAP-based immu-noassay for protein detection was also investigated in the presence of nonspecific immunoglobulin type and using pAb (it should be remarked that polyclonal antibodies are often less specific than monoclonal antibodies). These experiments are described in the Supporting Information, whose results indicate the high specificity of the developed immunoassay using pAb even in the presence of other competing nonspecific type of immunoglobulin (Figure S7 in the Supporting Informa-tion). Likewise, we successfully explored the efficiency of the protein sensing platform in complex matrixes by screening dif-ferent concentrations of human IgG (HIgG) in human serum (Figure S8 in the Supporting Information).
2.2.1. GONAP for Protein Detection in Real Samples
Moreover, in order to compare the performance of the devel-oped immunoassay in real samples and standard buffer, spike and recovery tests were done using human immunoglobulin-depleted serum as a real matrix. Three concentrations of human IgG within the respective detection range were spiked in human immunoglobulin depleted serum samples, and then the recovery percentages from human serum were estimated and compared with those of standard buffer. It was found that the recoveries of human IgG from human serum ranged from 93 to 98%, as listed in Table 2. These recovery percentages
Adv. Funct. Mater. 2017, 27, 1702741
Table 1. Spike and recovery assay results.
Real samples Spiked bacteria [CFU mL−1 or CFU g−1]
F1/F0a) in standard buffer
F1/F0b) in real
matricesRecovery
[%]
Poultry meat 102 1.145 1.118 97.60
103 1.205 1.184 98.30
104 1.396 1.305 93.47
River water 102 1.101 1.061 96.35
103 1.231 1.201 97.60
104 1.359 1.323 97.30
a)Performed in standard buffer; b)Performed in real matrices. The experiment was done by spiking 102, 103, and 104 CFU mL−1 of E. coli in standard buffer, poultry meat, and river water (n = 3 for each sample), and the recovery percentages of bacteria from real samples were estimated by comparing with standard buffer.
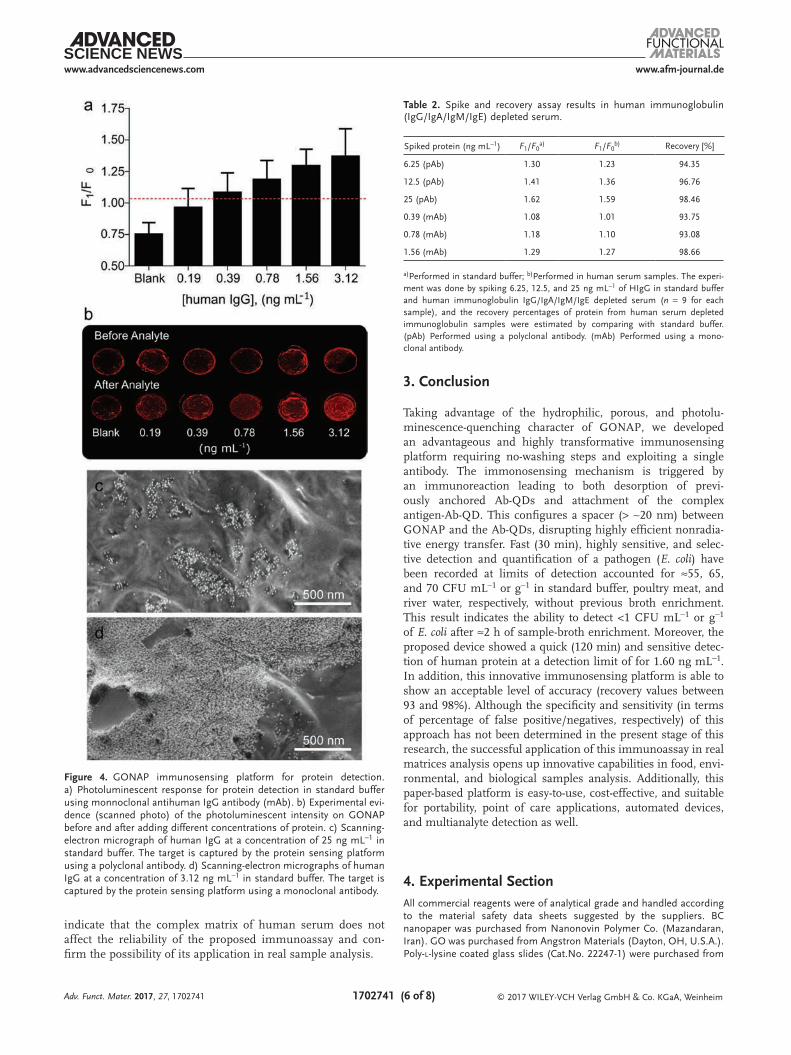
www.afm-journal.dewww.advancedsciencenews.com
1702741 (6 of 8) © 2017 WILEY-VCH Verlag GmbH & Co. KGaA, Weinheim
indicate that the complex matrix of human serum does not affect the reliability of the proposed immunoassay and con-firm the possibility of its application in real sample analysis.
3. Conclusion
Taking advantage of the hydrophilic, porous, and photolu-minescence-quenching character of GONAP, we developed an advantageous and highly transformative immunosensing platform requiring no-washing steps and exploiting a single antibody. The immonosensing mechanism is triggered by an immunoreaction leading to both desorption of previ-ously anchored Ab-QDs and attachment of the complex antigen-Ab-QD. This configures a spacer (> ∼20 nm) between GONAP and the Ab-QDs, disrupting highly efficient nonradia-tive energy transfer. Fast (30 min), highly sensitive, and selec-tive detection and quantification of a pathogen (E. coli) have been recorded at limits of detection accounted for ≈55, 65, and 70 CFU mL−1 or g−1 in standard buffer, poultry meat, and river water, respectively, without previous broth enrichment. This result indicates the ability to detect <1 CFU mL−1 or g−1 of E. coli after ≈2 h of sample-broth enrichment. Moreover, the proposed device showed a quick (120 min) and sensitive detec-tion of human protein at a detection limit of for 1.60 ng mL−1. In addition, this innovative immunosensing platform is able to show an acceptable level of accuracy (recovery values between 93 and 98%). Although the specificity and sensitivity (in terms of percentage of false positive/negatives, respectively) of this approach has not been determined in the present stage of this research, the successful application of this immunoassay in real matrices analysis opens up innovative capabilities in food, envi-ronmental, and biological samples analysis. Additionally, this paper-based platform is easy-to-use, cost-effective, and suitable for portability, point of care applications, automated devices, and multianalyte detection as well.
4. Experimental SectionAll commercial reagents were of analytical grade and handled according to the material safety data sheets suggested by the suppliers. BC nanopaper was purchased from Nanonovin Polymer Co. (Mazandaran, Iran). GO was purchased from Angstron Materials (Dayton, OH, U.S.A.). Poly-l-lysine coated glass slides (Cat.No. 22247-1) were purchased from
Adv. Funct. Mater. 2017, 27, 1702741
Figure 4. GONAP immunosensing platform for protein detection. a) Photoluminescent response for protein detection in standard buffer using monnoclonal antihuman IgG antibody (mAb). b) Experimental evi-dence (scanned photo) of the photoluminescent intensity on GONAP before and after adding different concentrations of protein. c) Scanning-electron micrograph of human IgG at a concentration of 25 ng mL−1 in standard buffer. The target is captured by the protein sensing platform using a polyclonal antibody. d) Scanning-electron micrographs of human IgG at a concentration of 3.12 ng mL−1 in standard buffer. The target is captured by the protein sensing platform using a monoclonal antibody.
Table 2. Spike and recovery assay results in human immunoglobulin (IgG/IgA/IgM/IgE) depleted serum.
Spiked protein (ng mL−1) F1/F0a) F1/F0
b) Recovery [%]
6.25 (pAb) 1.30 1.23 94.35
12.5 (pAb) 1.41 1.36 96.76
25 (pAb) 1.62 1.59 98.46
0.39 (mAb) 1.08 1.01 93.75
0.78 (mAb) 1.18 1.10 93.08
1.56 (mAb) 1.29 1.27 98.66
a)Performed in standard buffer; b)Performed in human serum samples. The experi-ment was done by spiking 6.25, 12.5, and 25 ng mL−1 of HIgG in standard buffer and human immunoglobulin IgG/IgA/IgM/IgE depleted serum (n = 9 for each sample), and the recovery percentages of protein from human serum depleted immunoglobulin samples were estimated by comparing with standard buffer. (pAb) Performed using a polyclonal antibody. (mAb) Performed using a mono-clonal antibody.
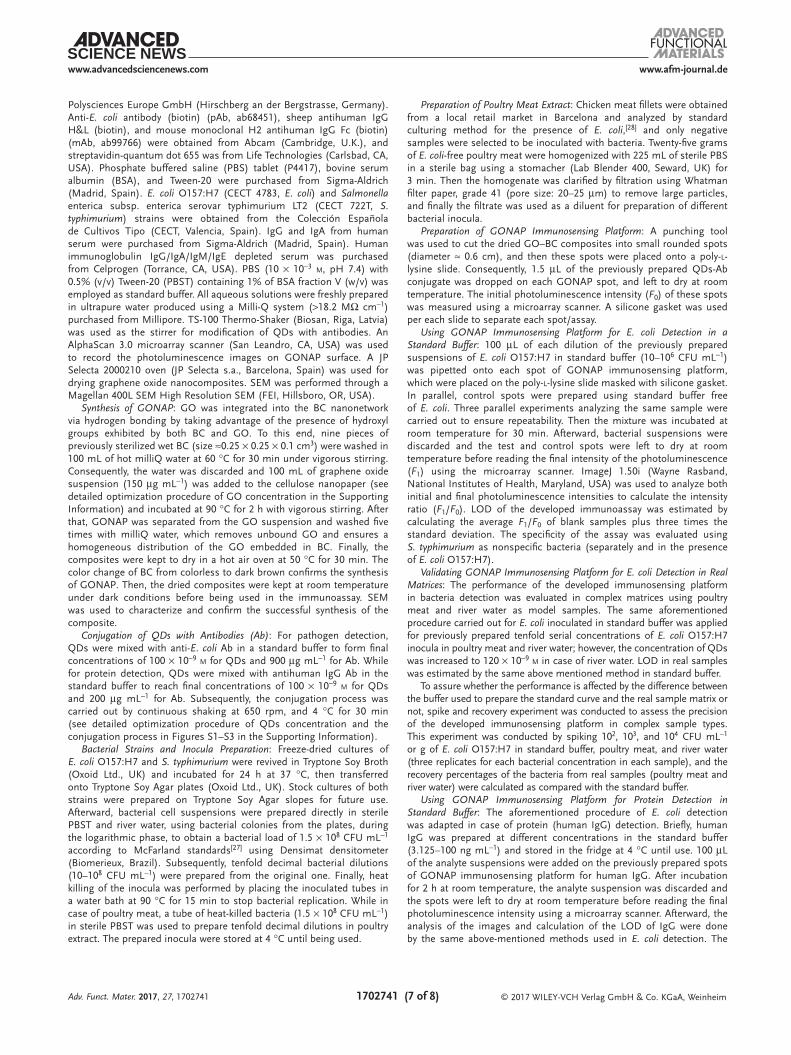
www.afm-journal.dewww.advancedsciencenews.com
1702741 (7 of 8) © 2017 WILEY-VCH Verlag GmbH & Co. KGaA, Weinheim
Polysciences Europe GmbH (Hirschberg an der Bergstrasse, Germany). Anti-E. coli antibody (biotin) (pAb, ab68451), sheep antihuman IgG H&L (biotin), and mouse monoclonal H2 antihuman IgG Fc (biotin) (mAb, ab99766) were obtained from Abcam (Cambridge, U.K.), and streptavidin-quantum dot 655 was from Life Technologies (Carlsbad, CA, USA). Phosphate buffered saline (PBS) tablet (P4417), bovine serum albumin (BSA), and Tween-20 were purchased from Sigma-Aldrich (Madrid, Spain). E. coli O157:H7 (CECT 4783, E. coli) and Salmonella enterica subsp. enterica serovar typhimurium LT2 (CECT 722T, S. typhimurium) strains were obtained from the Colección Española de Cultivos Tipo (CECT, Valencia, Spain). IgG and IgA from human serum were purchased from Sigma-Aldrich (Madrid, Spain). Human immunoglobulin IgG/IgA/IgM/IgE depleted serum was purchased from Celprogen (Torrance, CA, USA). PBS (10 × 10−3 m, pH 7.4) with 0.5% (v/v) Tween-20 (PBST) containing 1% of BSA fraction V (w/v) was employed as standard buffer. All aqueous solutions were freshly prepared in ultrapure water produced using a Milli-Q system (>18.2 MΩ cm−1) purchased from Millipore. TS-100 Thermo-Shaker (Biosan, Riga, Latvia) was used as the stirrer for modification of QDs with antibodies. An AlphaScan 3.0 microarray scanner (San Leandro, CA, USA) was used to record the photoluminescence images on GONAP surface. A JP Selecta 2000210 oven (JP Selecta s.a., Barcelona, Spain) was used for drying graphene oxide nanocomposites. SEM was performed through a Magellan 400L SEM High Resolution SEM (FEI, Hillsboro, OR, USA).
Synthesis of GONAP: GO was integrated into the BC nanonetwork via hydrogen bonding by taking advantage of the presence of hydroxyl groups exhibited by both BC and GO. To this end, nine pieces of previously sterilized wet BC (size ≈0.25 × 0.25 × 0.1 cm3) were washed in 100 mL of hot milliQ water at 60 °C for 30 min under vigorous stirring. Consequently, the water was discarded and 100 mL of graphene oxide suspension (150 µg mL−1) was added to the cellulose nanopaper (see detailed optimization procedure of GO concentration in the Supporting Information) and incubated at 90 °C for 2 h with vigorous stirring. After that, GONAP was separated from the GO suspension and washed five times with milliQ water, which removes unbound GO and ensures a homogeneous distribution of the GO embedded in BC. Finally, the composites were kept to dry in a hot air oven at 50 °C for 30 min. The color change of BC from colorless to dark brown confirms the synthesis of GONAP. Then, the dried composites were kept at room temperature under dark conditions before being used in the immunoassay. SEM was used to characterize and confirm the successful synthesis of the composite.
Conjugation of QDs with Antibodies (Ab): For pathogen detection, QDs were mixed with anti-E. coli Ab in a standard buffer to form final concentrations of 100 × 10−9 m for QDs and 900 µg mL−1 for Ab. While for protein detection, QDs were mixed with antihuman IgG Ab in the standard buffer to reach final concentrations of 100 × 10−9 m for QDs and 200 µg mL−1 for Ab. Subsequently, the conjugation process was carried out by continuous shaking at 650 rpm, and 4 °C for 30 min (see detailed optimization procedure of QDs concentration and the conjugation process in Figures S1–S3 in the Supporting Information).
Bacterial Strains and Inocula Preparation: Freeze-dried cultures of E. coli O157:H7 and S. typhimurium were revived in Tryptone Soy Broth (Oxoid Ltd., UK) and incubated for 24 h at 37 °C, then transferred onto Tryptone Soy Agar plates (Oxoid Ltd., UK). Stock cultures of both strains were prepared on Tryptone Soy Agar slopes for future use. Afterward, bacterial cell suspensions were prepared directly in sterile PBST and river water, using bacterial colonies from the plates, during the logarithmic phase, to obtain a bacterial load of 1.5 × 10⁸ CFU mL−1 according to McFarland standards[27] using Densimat densitometer (Biomerieux, Brazil). Subsequently, tenfold decimal bacterial dilutions (10–108 CFU mL−1) were prepared from the original one. Finally, heat killing of the inocula was performed by placing the inoculated tubes in a water bath at 90 °C for 15 min to stop bacterial replication. While in case of poultry meat, a tube of heat-killed bacteria (1.5 × 10⁸ CFU mL−1) in sterile PBST was used to prepare tenfold decimal dilutions in poultry extract. The prepared inocula were stored at 4 °C until being used.
Preparation of Poultry Meat Extract: Chicken meat fillets were obtained from a local retail market in Barcelona and analyzed by standard culturing method for the presence of E. coli,[28] and only negative samples were selected to be inoculated with bacteria. Twenty-five grams of E. coli-free poultry meat were homogenized with 225 mL of sterile PBS in a sterile bag using a stomacher (Lab Blender 400, Seward, UK) for 3 min. Then the homogenate was clarified by filtration using Whatman filter paper, grade 41 (pore size: 20–25 µm) to remove large particles, and finally the filtrate was used as a diluent for preparation of different bacterial inocula.
Preparation of GONAP Immunosensing Platform: A punching tool was used to cut the dried GO–BC composites into small rounded spots (diameter ≈ 0.6 cm), and then these spots were placed onto a poly-l-lysine slide. Consequently, 1.5 µL of the previously prepared QDs-Ab conjugate was dropped on each GONAP spot, and left to dry at room temperature. The initial photoluminescence intensity (F0) of these spots was measured using a microarray scanner. A silicone gasket was used per each slide to separate each spot/assay.
Using GONAP Immunosensing Platform for E. coli Detection in a Standard Buffer: 100 µL of each dilution of the previously prepared suspensions of E. coli O157:H7 in standard buffer (10–106 CFU mL−1) was pipetted onto each spot of GONAP immunosensing platform, which were placed on the poly-l-lysine slide masked with silicone gasket. In parallel, control spots were prepared using standard buffer free of E. coli. Three parallel experiments analyzing the same sample were carried out to ensure repeatability. Then the mixture was incubated at room temperature for 30 min. Afterward, bacterial suspensions were discarded and the test and control spots were left to dry at room temperature before reading the final intensity of the photoluminescence (F1) using the microarray scanner. ImageJ 1.50i (Wayne Rasband, National Institutes of Health, Maryland, USA) was used to analyze both initial and final photoluminescence intensities to calculate the intensity ratio (F1/F0). LOD of the developed immunoassay was estimated by calculating the average F1/F0 of blank samples plus three times the standard deviation. The specificity of the assay was evaluated using S. typhimurium as nonspecific bacteria (separately and in the presence of E. coli O157:H7).
Validating GONAP Immunosensing Platform for E. coli Detection in Real Matrices: The performance of the developed immunosensing platform in bacteria detection was evaluated in complex matrices using poultry meat and river water as model samples. The same aforementioned procedure carried out for E. coli inoculated in standard buffer was applied for previously prepared tenfold serial concentrations of E. coli O157:H7 inocula in poultry meat and river water; however, the concentration of QDs was increased to 120 × 10−9 m in case of river water. LOD in real samples was estimated by the same above mentioned method in standard buffer.
To assure whether the performance is affected by the difference between the buffer used to prepare the standard curve and the real sample matrix or not, spike and recovery experiment was conducted to assess the precision of the developed immunosensing platform in complex sample types. This experiment was conducted by spiking 102, 103, and 104 CFU mL−1 or g of E. coli O157:H7 in standard buffer, poultry meat, and river water (three replicates for each bacterial concentration in each sample), and the recovery percentages of the bacteria from real samples (poultry meat and river water) were calculated as compared with the standard buffer.
Using GONAP Immunosensing Platform for Protein Detection in Standard Buffer: The aforementioned procedure of E. coli detection was adapted in case of protein (human IgG) detection. Briefly, human IgG was prepared at different concentrations in the standard buffer (3.125–100 ng mL−1) and stored in the fridge at 4 °C until use. 100 µL of the analyte suspensions were added on the previously prepared spots of GONAP immunosensing platform for human IgG. After incubation for 2 h at room temperature, the analyte suspension was discarded and the spots were left to dry at room temperature before reading the final photoluminescence intensity using a microarray scanner. Afterward, the analysis of the images and calculation of the LOD of IgG were done by the same above-mentioned methods used in E. coli detection. The
Adv. Funct. Mater. 2017, 27, 1702741
www.afm-journal.dewww.advancedsciencenews.com
1702741 (8 of 8) © 2017 WILEY-VCH Verlag GmbH & Co. KGaA, WeinheimAdv. Funct. Mater. 2017, 27, 1702741
specificity of the assay was evaluated using human IgA as a nontarget protein (separately and in a mixture with human IgG).
Validating GONAP Immunosensing Platform for Protein Detection in Human Serum: The performance of the developed immunosensing platform for protein detection was evaluated in complex real matrices using human immunoglobulin-depleted serum as a real matrix. The same aforementioned procedure carried out with human IgG inoculated in standard buffer was conducted for various concentrations of human IgG (7–700 ng mL−1) in human immunoglobulin-depleted serum. The LOD of human IgG in human serum was estimated by the same abovementioned method in E. coli detection. Similar to E. coli detection procedures, a spike and recovery test was conducted for IgG by spiking 6.25, 12.5, and 25 ng mL−1 of IgG in both standard buffer and human immunoglobulin-depleted serum (at least three replicates for each protein concentration) and the recovery percentages of protein from human serum were calculated as compared with standard buffer.
Supporting InformationSupporting Information is available from the Wiley Online Library or from the author.
AcknowledgementsN.C. and E.M.-N. contributed equally to this work. This study was funded by the CERCA programme/Generalitat de Catalunya. The Nanobioelectronics and Biosensors Group acknowledges the support from H2020-EU (INTCATCH Project, Ref. 689341) and the Generalitat de Catalunya (Grant 2014 SGR 260). ICN2 acknowledges support from the Severo Ochoa Program (MINECO, Grant SEV-2013-0295). N.C. acknowledges the Royal Golden Jubilee Project of the Thailand Research Fund, in cooperation with the King Mongkut’s University of Technology Thonburi for the Ph.D. scholarship (PHD/0109/2553).
Conflict of InterestThe authors declare no conflict of interest.
Keywordsbiophotonics, diagnostics, immunoassays, nanocomposites, optical biosensors, paper-based devices
Received: May 22, 2017Revised: June 27, 2017
Published online: August 11, 2017
[1] D. Wild, in The Immunoassay Handbook, 4th ed., Elsevier, Oxford, 2013, pp. 7–10.
[2] M. C. Brown, in Lateral Flow Immunoassay (Eds: R. Wong, H. Tse), Humana Press, Totowa, NJ, 2009, pp. 1–16.
[3] Y. Wang, R. Vaidyanathan, M. J. A. Shiddiky, M. Trau, ACS Nano 2015, 9, 6354.
[4] I. Wright, J. E. Van Eyk, Clin. Chem. 2016, 63, 245.[5] A. G. Paulovich, J. R. Whiteaker, Nat. Biotechnol. 2016, 34, 1033.[6] B. Berg, B. Cortazar, D. Tseng, H. Ozkan, S. Feng, Q. Wei,
R. Y.-L. Chan, J. Burbano, Q. Farooqui, M. Lewinski, D. Di Carlo, O. B. Garner, A. Ozcan, ACS Nano 2015, 9, 7857.
[7] A. P. F. Turner, Chem. Soc. Rev. 2013, 42, 3184.[8] R. de la Rica, M. M. Stevens, Nat. Nanotechnol. 2012, 7, 821.[9] Y. Song, W. Wei, X. Qu, Adv. Mater. 2011, 23, 4215.
[10] Y. Zhang, Y. Guo, Y. Xianyu, W. Chen, Y. Zhao, X. Jiang, Adv. Mater. 2013, 25, 3802.
[11] E. Morales-Narváez, L. Baptista-Pires, A. Zamora-Gálvez, A. Merkoçi, Adv. Mater. 2017, 29, 1604905.
[12] E. Waltz, Nat. Biotechnol. 2017, 35, 11.[13] K. Yamada, T. G. Henares, K. Suzuki, D. Citterio, Angew. Chem. Int.
Ed. 2015, 54, 5294.[14] C. S. Jeon, I. Hwang, T. D. Chung, Adv. Funct. Mater. 2013, 23, 1484.[15] Y. Zhu, K. Kekalo, C. NDong, Y.-Y. Huang, F. Shubitidze, K. E. Griswold,
I. Baker, J. X. J. Zhang, Adv. Funct. Mater. 2016, 26, 3953.[16] E. Morales-Narváez, H. Golmohammadi, T. Naghdi, H. Yousefi,
U. Kostiv, D. Horák, N. Pourreza, A. Merkoçi, ACS Nano 2015, 9, 7296.
[17] B. Heli, E. Morales-Narváez, H. Golmohammadi, A. Ajji, A. Merkoçi, Nanoscale 2016, 8, 7984.
[18] D. Klemm, F. Kramer, S. Moritz, T. Lindström, M. Ankerfors, D. Gray, A. Dorris, Angew. Chem. Int. Ed. 2011, 50, 5438.
[19] H. Golmohammadi, E. Morales-Narváez, T. Naghdi, A. Merkoçi, Chem. Mater. 2017, 29, 5426.
[20] E. Morales-Narváez, A.-R. Hassan, A. Merkoçi, Angew. Chem. Int. Ed. 2013, 52, 13779.
[21] E. Morales-Narváez, B. Pérez-López, L. B. Pires, A. Merkoçi, Carbon 2012, 50, 2987.
[22] M. Liu, H. Zhao, X. Quan, S. Chen, X. Fan, Chem. Commun. 2010, 46, 7909.
[23] J. H. T. Luong, S. K. Vashist,Biosens. Bioelectron. 2017, 89, 293.[24] E. P. Diamandis, T. K. Christopoulos, Immunoassay, Academic
Press, San Deigo, 1996.[25] J.-L. Chen, X.-P. Yan, K. Meng, S.-F. Wang, Anal. Chem. 2011, 83, 8787.[26] U. Resch-Genger, M. Grabolle, S. Cavaliere-Jaricot, R. Nitschke,
T. Nann, Nat. Methods 2008, 5, 763.[27] J. McFarland, JAMA, J. Am. Med. Assoc. 1907, XLIX, 1176.[28] ISO 7251:2005: Microbiology of food and animal feeding stuffs—
Horizontal method for the detection and enumeration of presump-tive Escherichia coli—Most probable number technique.
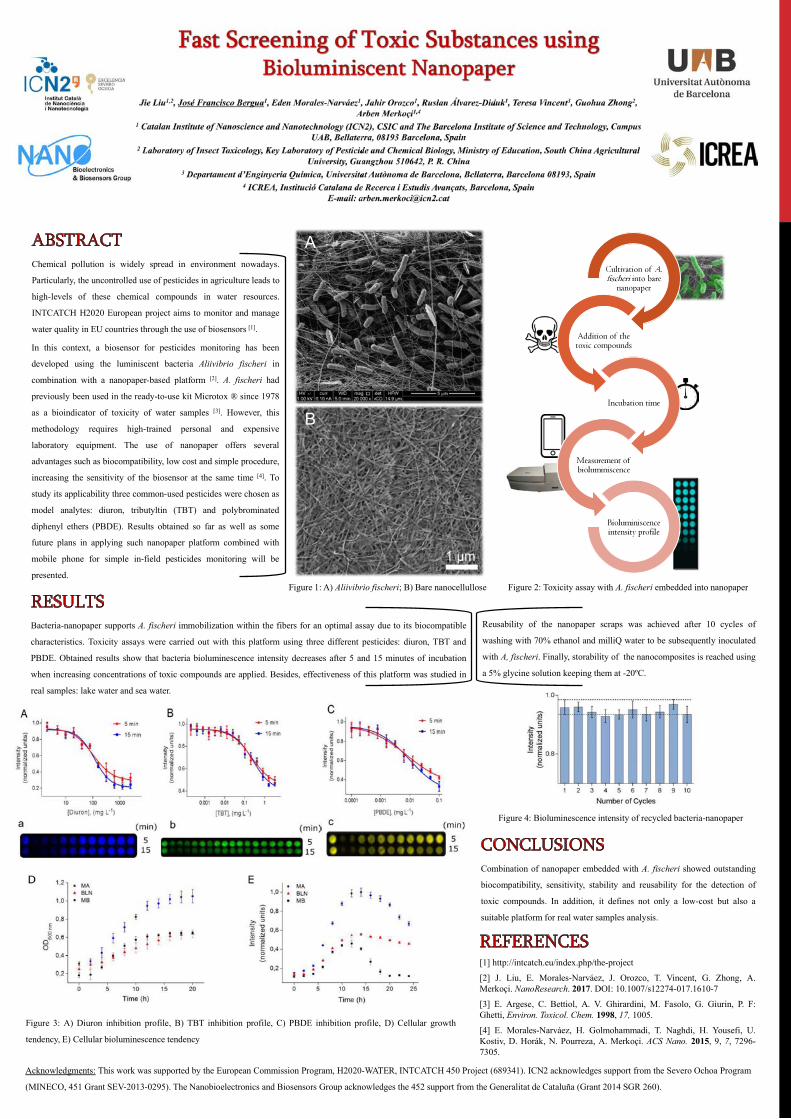
Bacteria-nanopaper supports A. fischeri immobilization within the fibers for an optimal assay due to its biocompatible
characteristics. Toxicity assays were carried out with this platform using three different pesticides: diuron, TBT and
PBDE. Obtained results show that bacteria bioluminescence intensity decreases after 5 and 15 minutes of incubation
when increasing concentrations of toxic compounds are applied. Besides, effectiveness of this platform was studied in
real samples: lake water and sea water.
A
B
Figure 1: A) Aliivibrio fischeri; B) Bare nanocellullose Figure 2: Toxicity assay with A. fischeri embedded into nanopaper
Chemical pollution is widely spread in environment nowadays.
Particularly, the uncontrolled use of pesticides in agriculture leads to
high-levels of these chemical compounds in water resources.
INTCATCH H2020 European project aims to monitor and manage
water quality in EU countries through the use of biosensors [1].
In this context, a biosensor for pesticides monitoring has been
developed using the luminiscent bacteria Aliivibrio fischeri in
combination with a nanopaper-based platform [2]. A. fischeri had
previously been used in the ready-to-use kit Microtox ® since 1978
as a bioindicator of toxicity of water samples [3]. However, this
methodology requires high-trained personal and expensive
laboratory equipment. The use of nanopaper offers several
advantages such as biocompatibility, low cost and simple procedure,
increasing the sensitivity of the biosensor at the same time [4]. To
study its applicability three common-used pesticides were chosen as
model analytes: diuron, tributyltin (TBT) and polybrominated
diphenyl ethers (PBDE). Results obtained so far as well as some
future plans in applying such nanopaper platform combined with
mobile phone for simple in-field pesticides monitoring will be
presented.
Reusability of the nanopaper scraps was achieved after 10 cycles of
washing with 70% ethanol and milliQ water to be subsequently inoculated
with A, fischeri. Finally, storability of the nanocomposites is reached using
a 5% glycine solution keeping them at -20ºC.
Figure 3: A) Diuron inhibition profile, B) TBT inhibition profile, C) PBDE inhibition profile, D) Cellular growth
tendency, E) Cellular bioluminescence tendency
Figure 4: Bioluminescence intensity of recycled bacteria-nanopaper
Combination of nanopaper embedded with A. fischeri showed outstanding
biocompatibility, sensitivity, stability and reusability for the detection of
toxic compounds. In addition, it defines not only a low-cost but also a
suitable platform for real water samples analysis.
[1] http://intcatch.eu/index.php/the-project
[2] J. Liu, E. Morales-Narváez, J. Orozco, T. Vincent, G. Zhong, A. Merkoçi. NanoResearch. 2017. DOI: 10.1007/s12274-017.1610-7
[3] E. Argese, C. Bettiol, A. V. Ghirardini, M. Fasolo, G. Giurin, P. F: Ghetti, Environ. Toxicol. Chem. 1998, 17, 1005.
[4] E. Morales-Narváez, H. Golmohammadi, T. Naghdi, H. Yousefi, U. Kostiv, D. Horák, N. Pourreza, A. Merkoçi. ACS Nano. 2015, 9, 7, 7296-7305.
Acknowledgments: This work was supported by the European Commission Program, H2020-WATER, INTCATCH 450 Project (689341). ICN2 acknowledges support from the Severo Ochoa Program
(MINECO, 451 Grant SEV-2013-0295). The Nanobioelectronics and Biosensors Group acknowledges the 452 support from the Generalitat de Cataluña (Grant 2014 SGR 260).

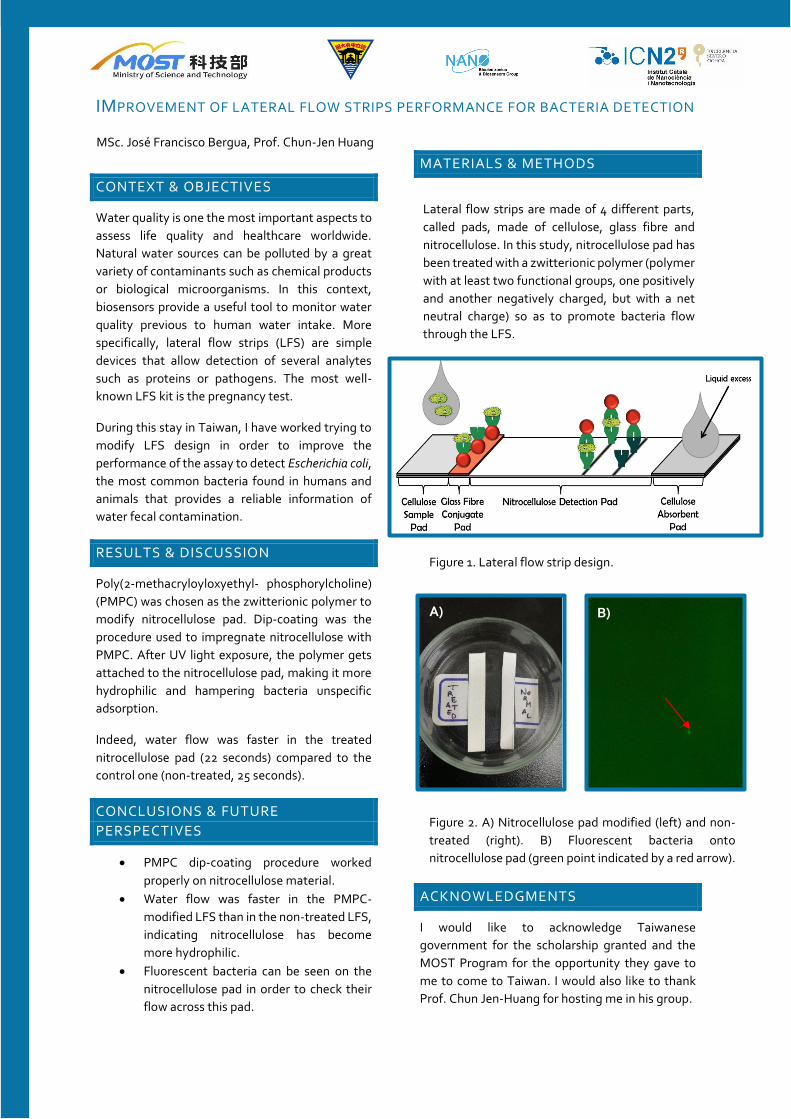
IMPROVEMENT OF LATERAL FLOW STRIPS PERFORMANCE FOR BACTERIA DETECTION
CONTEXT & OBJECTIVES
Water quality is one the most important aspects to
assess life quality and healthcare worldwide.
Natural water sources can be polluted by a great
variety of contaminants such as chemical products
or biological microorganisms. In this context,
biosensors provide a useful tool to monitor water
quality previous to human water intake. More
specifically, lateral flow strips (LFS) are simple
devices that allow detection of several analytes
such as proteins or pathogens. The most well-
known LFS kit is the pregnancy test.
During this stay in Taiwan, I have worked trying to
modify LFS design in order to improve the
performance of the assay to detect Escherichia coli,
the most common bacteria found in humans and
animals that provides a reliable information of
water fecal contamination.
RESULTS & DISCUSSION
Poly(2-methacryloyloxyethyl- phosphorylcholine)
(PMPC) was chosen as the zwitterionic polymer to
modify nitrocellulose pad. Dip-coating was the
procedure used to impregnate nitrocellulose with
PMPC. After UV light exposure, the polymer gets
attached to the nitrocellulose pad, making it more
hydrophilic and hampering bacteria unspecific
adsorption.
Indeed, water flow was faster in the treated
nitrocellulose pad (22 seconds) compared to the
control one (non-treated, 25 seconds).
CONCLUSIONS & FUTURE
PERSPECTIVES
• PMPC dip-coating procedure worked
properly on nitrocellulose material.
• Water flow was faster in the PMPC-
modified LFS than in the non-treated LFS,
indicating nitrocellulose has become
more hydrophilic.
• Fluorescent bacteria can be seen on the
nitrocellulose pad in order to check their
flow across this pad.
MATERIALS & METHODS
ACKNOWLEDGMENTS
I would like to acknowledge Taiwanese
government for the scholarship granted and the
MOST Program for the opportunity they gave to
me to come to Taiwan. I would also like to thank
Prof. Chun Jen-Huang for hosting me in his group.
Lateral flow strips are made of 4 different parts,
called pads, made of cellulose, glass fibre and
nitrocellulose. In this study, nitrocellulose pad has
been treated with a zwitterionic polymer (polymer
with at least two functional groups, one positively
and another negatively charged, but with a net
neutral charge) so as to promote bacteria flow
through the LFS.
MSc. José Francisco Bergua, Prof. Chun-Jen Huang
Figure 1. Lateral flow strip design.
Figure 2. A) Nitrocellulose pad modified (left) and non-
treated (right). B) Fluorescent bacteria onto
nitrocellulose pad (green point indicated by a red arrow).
A) B)
