multivariate erosion risk assessment of lateritic badlands of birbhum (west bengal, india): a case...
TRANSCRIPT
Multivariate erosion risk assessment of lateritic badlandsof Birbhum (West Bengal, India): A case study
Sandipan Ghosh∗ and Kamala Bhattacharya
Post-Graduate Dept. of Geography, The University of Burdwan, Burdwan 713 104, West Bengal, India.∗Corresponding author. e-mail: [email protected]
Each geomorphic hazard involves a degree of risk which incorporates quantification of the probabilitythat a hazard will be harmful. At present, the categorization of sub-watersheds into erosion risk is con-sidered as the fundamental step to conserve the soil loss. Development of badlands over the laterites ofBirbhum district is an indicative of excessive soil loss in the monsoonal wet-dry type of climate. Slopeerosion and channel erosion have generated huge amount of sediment from the small watersheds dur-ing intense monsoonal rainfall (June–September). The adjoining areas of Rampurhat I Block, Birbhum(West Bengal) and Shikaripara Block, Dumka (Jharkhand) have lost the lateritic soil cover at a rate of20–40 ton/ha/year (Sarkar et al. 2005). In order to estimate the progressive removal of soil particles fromthe gully-catchments of the above-mentioned area, different morphometric parameters, soil parameters,hydrologic parameters and empirical models are employed. Side by side, the study is carried out to cate-gorize the gully-catchments into different magnitude of erosion risk using several multivariate statisticaltechniques.
1. Introduction
Fluvial erosion is the composite result of severalhydro-geomorphic processes (e.g., overland flow,rill and gully erosion) whereby debris, soil and rockmaterials are loosened or dissolved and removedfrom any part of the earth’s surface (Kirkby 1969a;Stoddart 1969). In general, ‘soil erosion’ is a two-phase process consisting of the detachment ofindividual particles from soil mass (by rainsplasherosion) and their transport by erosion agentssuch as running water (overland flow). When suf-ficient energy is no longer available to transportthe particles, deposition occurs (Morgan 2005). Soilerosion is a function of erosivity (i.e., potential abil-ity of falling raindrops to detach soil particles) anderodibility (i.e., the degree to which soil particles issusceptible to erosion by water) (Hudson 1984). Asthe raindrops, rills and gullies are the chief agents
of catchment erosion or suspended sediment yield;the early phase of soil erosion study should incorpo-rate the quantitative basin-oriented or catchment-oriented approach (Chorley 1969; Jha and Paudel2010). Then to control the erosion or to take ero-sion protection measures, the fundamental step isto assess the present severity or risk of catchmenterosion through the hydro-geomorphic quantita-tive expressions and thematic maps. A geomor-phic hazard, like soil erosion, involves a degreeof risk, the elements at risk being land property,loss of top-soil, soil infertility and the environment(Bell 1999; Blinkov and Kostadinov 2010). ‘Risk’involves quantification of the probability that ahazard will be harmful and the tolerable degree ofrisk depends upon what is being risked, soil con-servation being much more important than landutilization (Bell 1999). ‘The assessment of ero-sion hazard’ is a specialized form of land resource
Keywords. Erosion risk; soil erosion; sediment yield; multivariate analysis; GIS.
J. Earth Syst. Sci. 121, No. 6, December 2012, pp. 1441–1454c© Indian Academy of Sciences 1441
1442 Sandipan Ghosh and Kamala Bhattacharya
evaluation, aiming categorization or ranking ofland areas and catchments of the study area intoregions of low to high erosion risk zones based onselected hydrologic, geomorphic and soil parame-ters (Sarkar et al. 2005). Side by side, analyzing theregional climatic pattern, rainfall erosivity, over-land flow and using several multivariate statisticaltechniques, we have identified sequentially thoseinfluencing parameters or factors which enhancesignificantly the catchment erosional processes ofarea under study and at last we have prepared thecatchments’ priority for soil conservation (in termsof controlling the factors of soil erosion).
2. Methodology
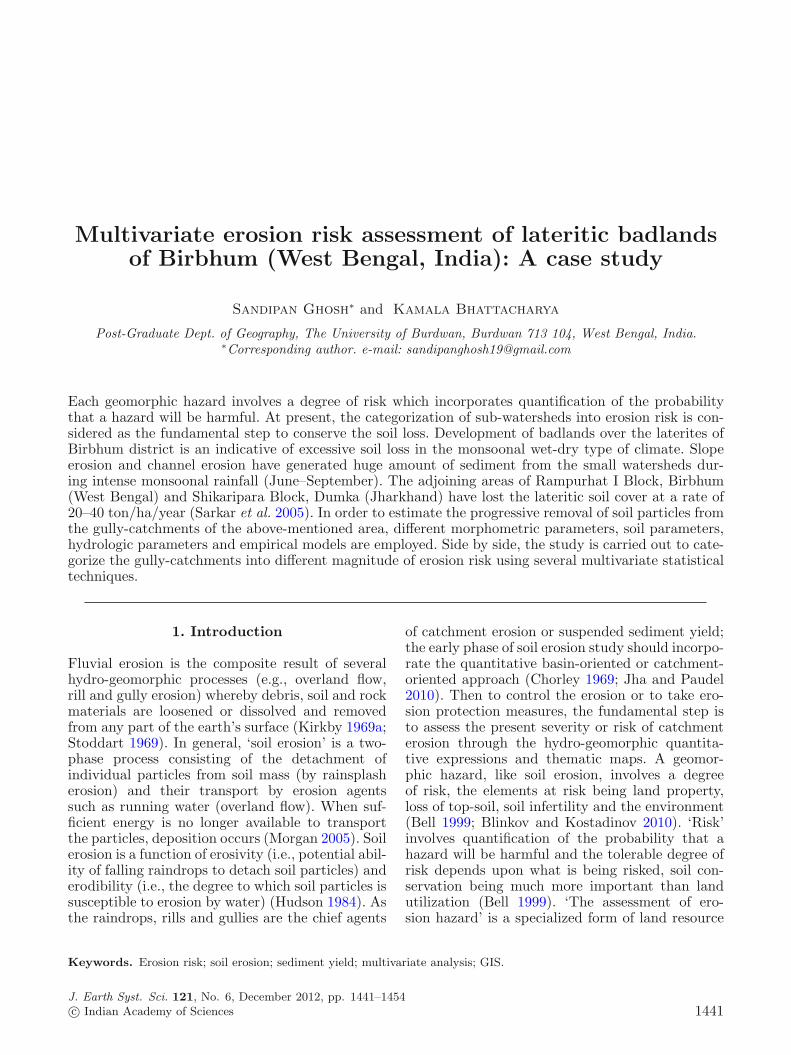
Erosion risk assessment always demands an inter-disciplinary approach connecting the disciplines ofhydrology, geomorphology and pedology (Gerrard1981; Jha and Kapat 2009). It stresses predom-inantly on the quantitative method, incorporat-ing the statistical and mathematical equations toanalyse phenomena. The present study includesthree principal processes – empirical observations,recording of data and quantitative interpretation.The adopted methodology is clearly represented ina flowchart (figure 1). The ultimate aim of thisstudy is to recognize those catchments of gullieswhere the soil productivity, land uses and land cov-ers are threatened by excessive soil loss by water.
To reach that goal the following objectives aretaken into consideration:
• Understanding the geo-environmental settingsof the study area which influence both rainfallerosivity and soil erodibility;
• Analyzing statistically the relations of hydro-geomorphic parameters with erosion of selectedcatchments;
• Multivariate analysis of those parameters toidentify the dominant or principal parametersand relative clustering of catchments in terms ofcomponents’ scores; and
• Classifying the sample catchments from low tohigh erosion risk and mapping the potentialerosivity and soil erosion of the study area.
Here the catchments or drainage basins of 2ndand 3rd order and slope facets are taken as an idealgeomorphic unit. The study area is subdividedinto 17 catchments for the detailed erosional study.In the pre-field session, topographical sheet (72P/12/NE, 1979), District Resource Map of Birb-hum District (Geological Survey of India 2001),climatic data of India Meteorological Departmentand Irrigation and Waterways Department of WestBengal, satellite images (LANDSAT and IRS),SRTM data (2006), numerous literatures, bulletinsand reports are collected. The spatial informationis stored in Geographic Information System (GIS)and the thematic maps are prepared using GISsoftware (ArcGIS 9.2 and 21st Century GIS). The
Figure 1. Flow chart of methodology adopted in this study.
Erosion risk assessment of lateritic badlands of Birbhum 1443
different statistical analysis (e.g., linear and curvi-linear regression, correlation, principal componentanalysis, cluster analysis and multiple regressions)is done in Microsoft Excel 2003 and SPSS 14.0softwares.
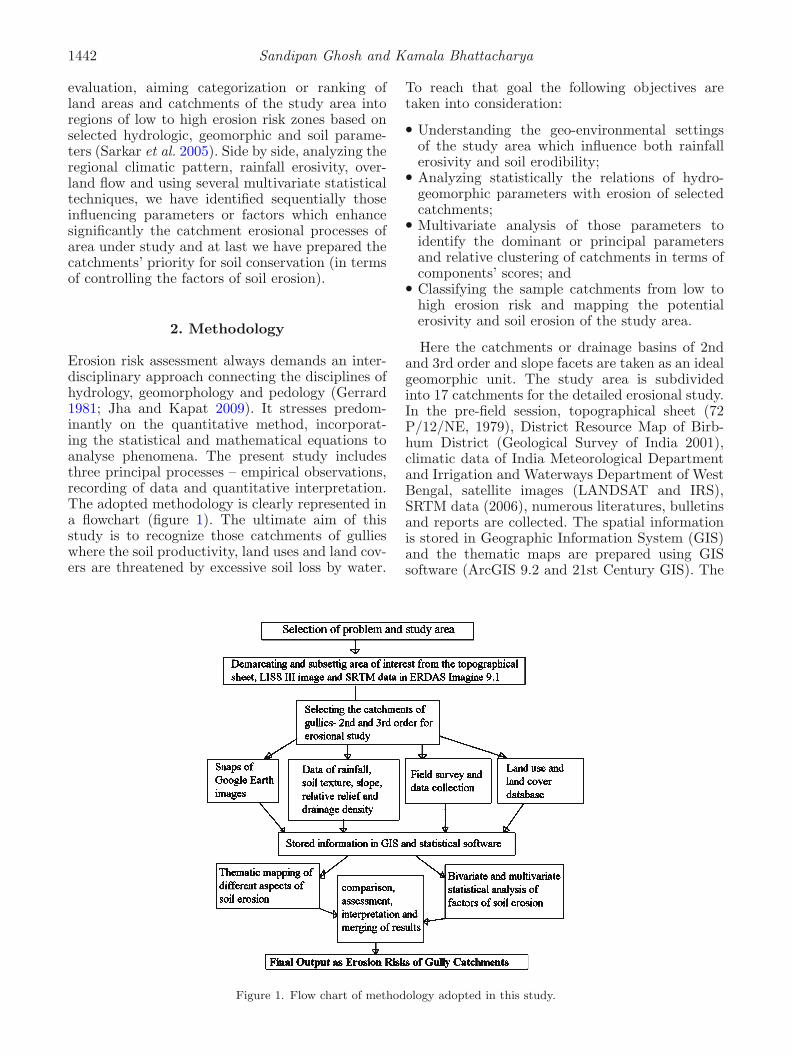
The selected study area (65.84 km2) is situ-ated between the adjoining area of westernRampurhat, I Block of Birbhum district, WestBengal and eastern Shikaripara Block of Dumkadistrict, Jharkhand. The study area is locatedat 5 km west of Rampurhat railway station,near Baramasia bus-stop. The latitudinal exten-sion ranges from 24◦10′N to 24◦13′N and longi-tudinal extension ranges from 87◦39′E to 87◦45′E
(figure 2). It is the lateritic elevated interfluveportion (mean relief of 56 metre) of Brahmani(north) and Dwarka (south) rivers. The lateritesand lateritic soils of Cainozoic Era are found hereover Rajmahal Trap–Basalt of Jurassic to Creta-ceous Period (Hundy and Banerjee 1967; Sarkaret al. 2007). The detrital laterites are occurred herein loose concretions as gravels and pebbles andthese are generally derived from weathered primaryhigh-level laterites by fluvial processes and aredeposited far from their source of origin (RajmahalHighlands). Laterites are generally underlain bylithomergic clays which is more prone to tunnelerosion (soil piping) (Jha and Kapat 2009).
Figure 2. Location map of the study area.
1444 Sandipan Ghosh and Kamala Bhattacharya
3. Severity of soil erosion androle of climatic variables
The movement of water on catchment occurs intwo ways to enhance soil loss (Abrahams 1964;Morisawa 1985):
(1) Rainfall on the surface of a watershed can beremoved by infiltration into the soil or rock, bysheet flow over the surface/or by flow througha system of rills, gullies or stream channels; and
(2) The sub-surface water may remove material insolution or suspension as it flows, resulting ina subsurface system of ‘pipes’. Piping (or sap-ping) may eventually result in open rills orgullies when the roofs of these tunnels collapse.
Based on the topographical sheet (1979), IRS 1DLISS III image (2001), Google Earth (2007) andfield survey (2010), the current geographical areaof forest, degraded lateritic land and stone quarry-ing are 3.95, 16.23 and 2.9 km2, respectively. Fromthe recurrent field investigations, following impor-tant facts regarding magnitude of erosion risk havecome into light.
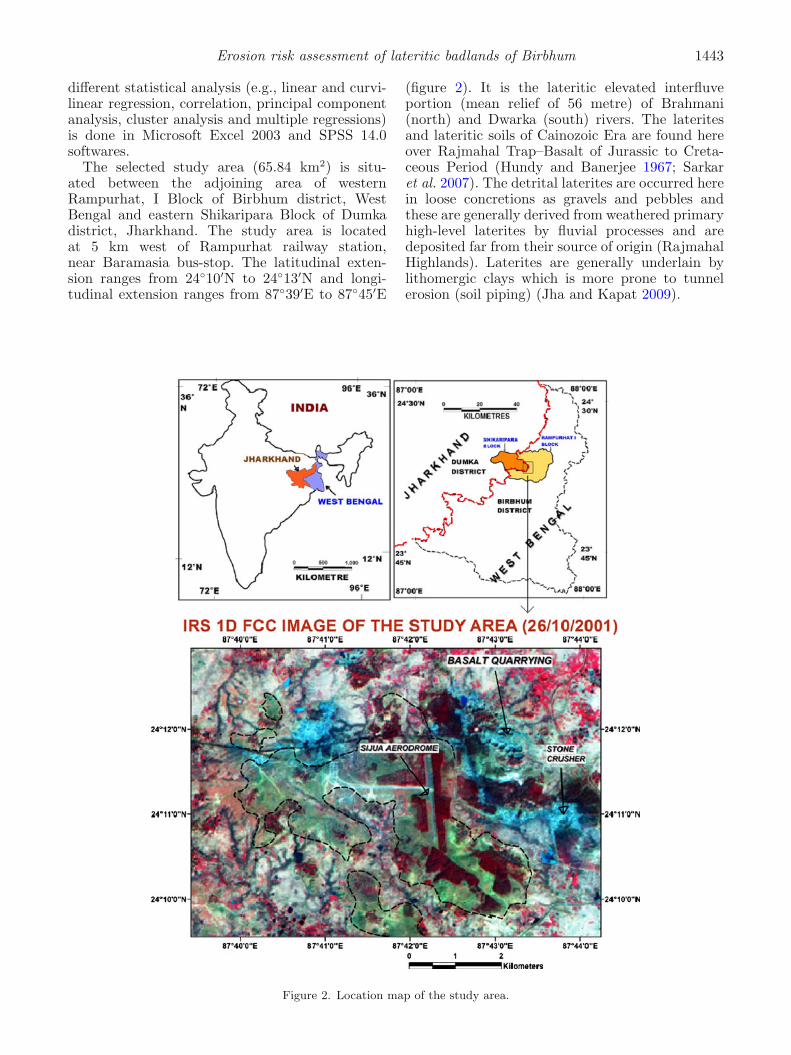
(i) The severity of erosion can be understood bythe appearances of numerous rills and gullies,exposure of tree roots, pedestal erosion, pin-nacle erosion, bare soil cover, barren wasteland, tunnels and surface crusting (figure 3);
(ii) Monsoonal wet-dry type of climate has highseasonal regime which influences laterisationand soil loss (McFarlane 1976);
(iii) Due to high erodibility of lateritic soil(20–40 t/ha/y), deforestation, morum andstone quarrying, low water holding capacity(<50 mm/m), low clay content (<25%) andorganic carbon (<1.5%) of soil favour surfaceand sub-surface erosion;
(iv) Rainsplash erosion is more effective in theupstream deforested area of catchment thanoverland flow;
(v) Horton overland flow and saturation overlandflow both occur in heavy showers of summerthunderstorms and monsoon and it trans-ports downslope clay and silt from topsoil andleave the coarse sand and gravels in upslope(Kirkby 1969b);
(vi) Breaks in vegetation cover, bareness of soil,local irregularities on slope, surface run-off,etc. develop rills and gullies at some distancefrom the water divide and the system of rillsbecomes true drainage net by abstraction andmicropiracy (Parsons 2005);
(vii) Diversion of the overland flow into large rillincreases its erosive and grading ability andthat rill may become enlarged enough to becalled as a gully. Though gully heads are
formed by saturation overland flow, collaps-ing of tunnels and soil slumping; and
(viii) Such a gully in turn develops rills on its valleywalls which by the processes of micropiracy andcross-grading become tributaries (figure 3a).
Figure 3. Photographs showing (a) rill and inter-rill ero-sion, (b) gully erosion and (c) tunnel erosion on laterites atwestern part of Bhatina village, Rampurhat.
Erosion risk assessment of lateritic badlands of Birbhum 1445
Table 1. Summary of land sculpturing activities in different seasons.
Climatic phenomena Effects on landform and soil loss
1. Seasonal variation of temperature Encourage various processes weathering, like block disintegration,
(about 15◦–19◦C) formation of cracks and joints
2. High temperature range Lowering soil moisture and ground water table, loosening of soil
(max. 45◦C and min. 9◦C) particles, drying up of surface soils, reduction in soil cohesiveness
3. Seasonal rainfall (from mid-June Weathered products are removed or accumulated to yield
to 1st week of September) ferruginous soils, laterisation process becomes active
4. Short phases of heavy downpour Development of badland topography – rainsplash erosion, sheet erosion,
within monsoon season rill and gully erosion, gully piping, mass wasting at gully headwall
and sidewall, bareness of soil cover
Source: Sen et al. (2004), p. 213.
The climate of the study area has been identi-fied as sub-humid and sub-tropical monsoon type,receiving mean annual rainfall of 1420–1437 mm.According to the scheme of Chorley et al. (1984),the study area is identified as ‘Tropical Wet-DrySavanna Morphogenetic Region’ where the chiefdominant pedo-geomorphic processes are mod-maxchemical weathering, moderate physical weather-ing, mod-max mass wasting, max pluvial erosion,mod-max fluvial processes (sheet wash, rain-splash, rill and gully erosion-badlands), and lat-erisation (Cooke and Doornkamp 1987). Themonsoonal and cyclonic rainfall (maximum inten-sity of 21.51–25.51 mm/hr) is the most force-ful climatic variable operative in this typical lat-eritic badland, causing excessive erosion throughrainsplash, overland flow and sub-surface flow.
According to Sen et al. (2004), there are two sea-sonal stages of annual soil erosion (table 1). (1)Surface preparation stage of winter (December–February) and summer (March–May) and (2) theactive surface erosion stage (mid June–October).
4. Catchment-wise annual rainfall erosivityand aggressiveness
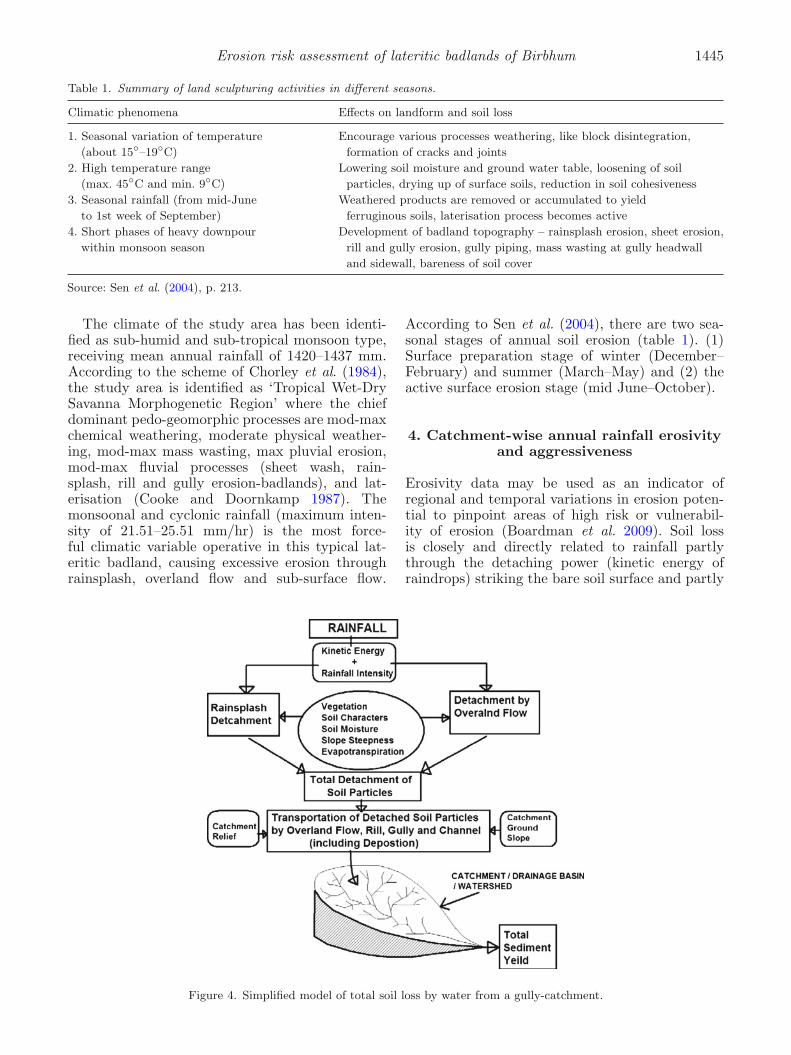
Erosivity data may be used as an indicator ofregional and temporal variations in erosion poten-tial to pinpoint areas of high risk or vulnerabil-ity of erosion (Boardman et al. 2009). Soil lossis closely and directly related to rainfall partlythrough the detaching power (kinetic energy ofraindrops) striking the bare soil surface and partly
Figure 4. Simplified model of total soil loss by water from a gully-catchment.
1446 Sandipan Ghosh and Kamala Bhattacharya
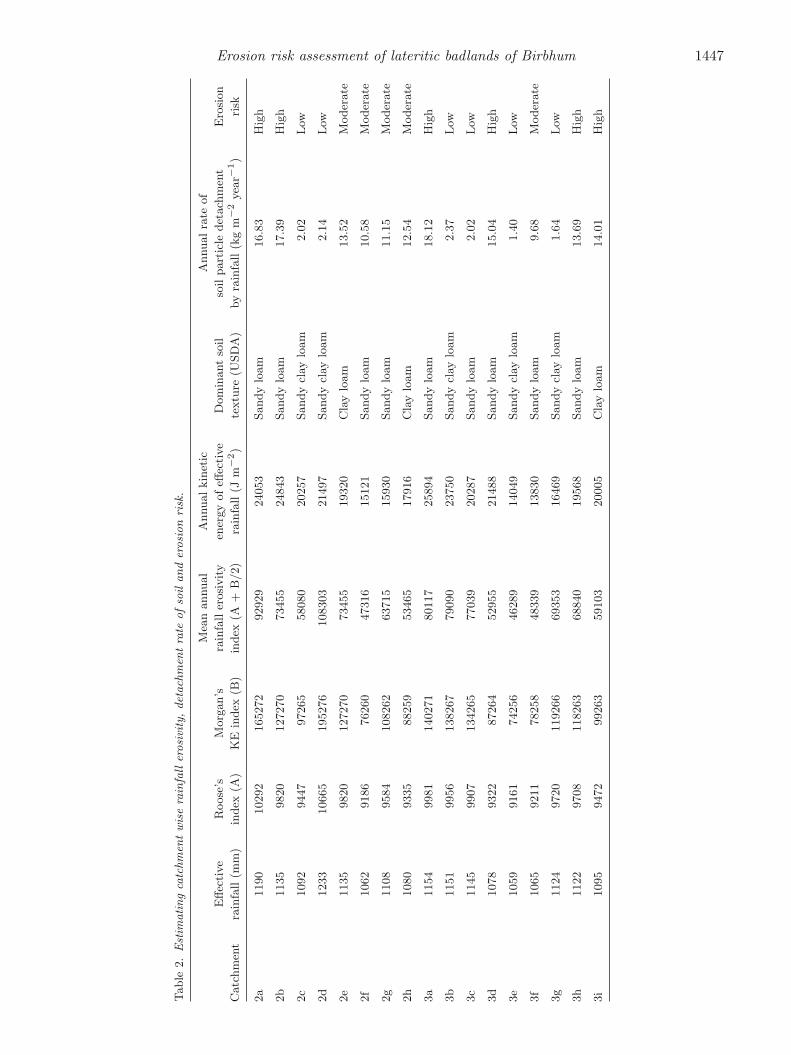
through the contribution of rain to surface andsubsurface run-off (Morgan 2005). Due to low-cohesiveness of lateritic soil and prolonged dry-ness of topsoil (November–May), the study areais much more vulnerable to rainsplash erosionthan overland flow in intensified monsoonal show-ers. In inter-rill areas, the dominant mechanism ofsediment detachment is that of raindrop impact(Parsons 2005). The whole system of soil loss of awatershed is provided as model in figure 4. To esti-mate the annual rainfall erosivity we have takenthe average value of Roose’s rainfall erosivity index(1975) and Morgan’s mean annual rainfall erosivity(1974). To quantify the potential rainfall erosivity,we have employed the effective rainfall which is theactual portion of rainfall over surface after rainfallinterception by vegetation. After getting the rain-fall erosivity value, annual rainfall detachment ofcatchments (table 2) is derived by the formula ofMorgan (2001). The expressions are as follows:
From (Morgan 2005), mean annual rainfall (inmm) = R and effective rainfall (P ) = R (1 − A)where A is the proportion of rainfall interception(0–1) by vegetation.
From Roose (1975), mean annual rainfall erosionindex in mg mm ha−1h−1.
From Morgan (1974), mean annual rainfall ero-sivity (KE>25)
I30 (75 mm h−1 – maximum value recommendedby Wischmeier and Smith 1978).
From Morgan (2001), rainfall detachment rate(kg m−2 year −1) = K KE 10−3, where K is thesoil detachability index (g J−1).
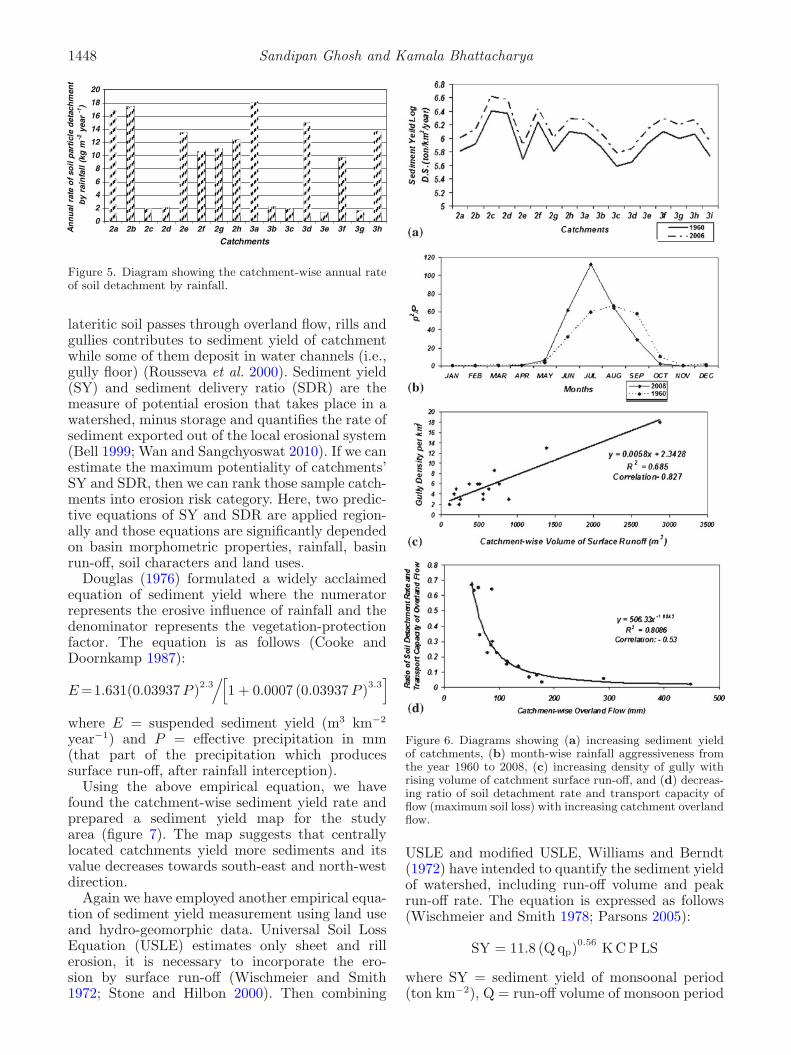
The result suggests that 2nd order catchments of2a, 2b, 2e, 2f, 2g, 2h and 3rd order catchments of3a, 3d and 3h are very much susceptible to splasherosion (figure 5). Alongside, the annual rainfalldetachment rate of soil particles ranges from 1.40to 18.12 kg m−2 year−1. Again we have found thatthe catchments of loamy and clay loam soils aremore prone to rainfall detachment.
Rainfall aggressiveness index (potentiality ofrainfall to yield sediment from a watershed) is∑
p2/P (Arnolds 1980; modified form of Fournierindex 1960), where p is the monthly rainfall (mm)and P is annual rainfall (mm) (Morgan 2005;Parsons 2005). The high value of
∑p2/P 232.14
and 277.33 for the years 1960 and 2008, respec-tively denotes a strong seasonal climatic regimewith a dry season during which the plant coverdecays (Morgan 2005). According to Douglas(1976), the prediction of erosion rates still rely onclimatic parameters, few of which are more sat-isfactory than Fournier’s (1960) general empiricalequation embodying p2/P , basin relief (H) andbasin area (S) (Cooke and Doornkamp 1987). Thetemporal variation (1960–2006) suggests that there
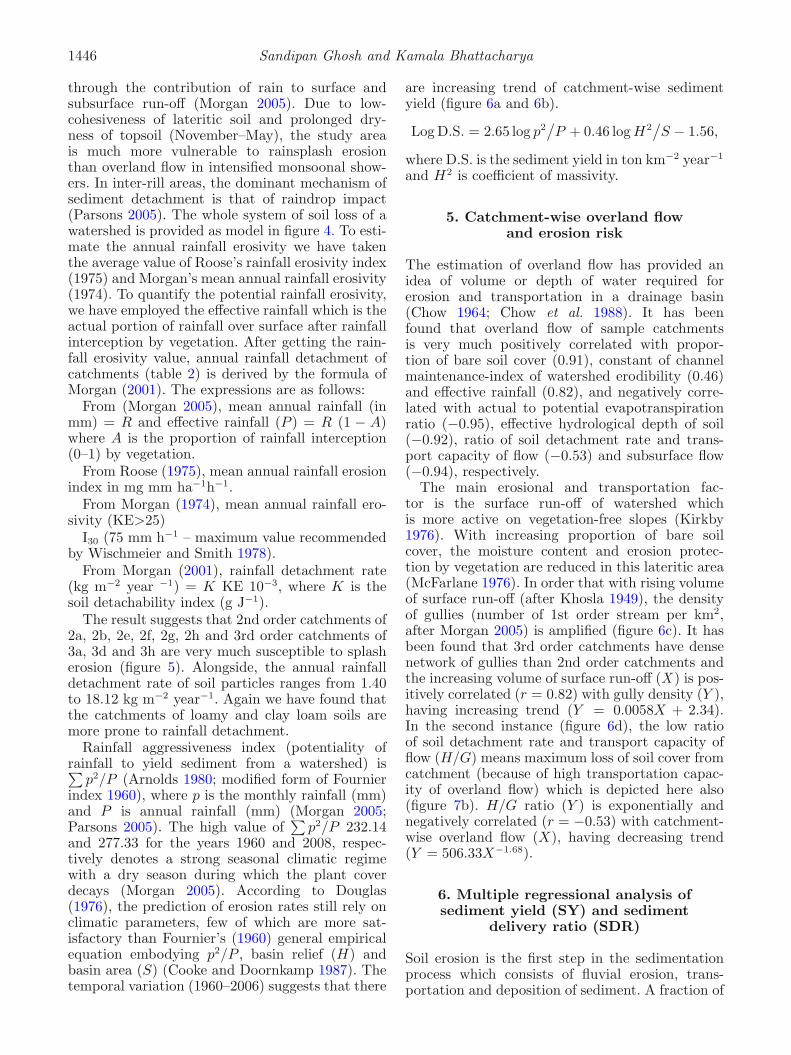
are increasing trend of catchment-wise sedimentyield (figure 6a and 6b).
Log D.S. = 2.65 log p2/P + 0.46 log H2
/S − 1.56,
where D.S. is the sediment yield in ton km−2 year−1
and H2 is coefficient of massivity.
5. Catchment-wise overland flowand erosion risk
The estimation of overland flow has provided anidea of volume or depth of water required forerosion and transportation in a drainage basin(Chow 1964; Chow et al. 1988). It has beenfound that overland flow of sample catchmentsis very much positively correlated with propor-tion of bare soil cover (0.91), constant of channelmaintenance-index of watershed erodibility (0.46)and effective rainfall (0.82), and negatively corre-lated with actual to potential evapotranspirationratio (−0.95), effective hydrological depth of soil(−0.92), ratio of soil detachment rate and trans-port capacity of flow (−0.53) and subsurface flow(−0.94), respectively.
The main erosional and transportation fac-tor is the surface run-off of watershed whichis more active on vegetation-free slopes (Kirkby1976). With increasing proportion of bare soilcover, the moisture content and erosion protec-tion by vegetation are reduced in this lateritic area(McFarlane 1976). In order that with rising volumeof surface run-off (after Khosla 1949), the densityof gullies (number of 1st order stream per km2,after Morgan 2005) is amplified (figure 6c). It hasbeen found that 3rd order catchments have densenetwork of gullies than 2nd order catchments andthe increasing volume of surface run-off (X ) is pos-itively correlated (r = 0.82) with gully density (Y ),having increasing trend (Y = 0.0058X + 2.34).In the second instance (figure 6d), the low ratioof soil detachment rate and transport capacity offlow (H/G) means maximum loss of soil cover fromcatchment (because of high transportation capac-ity of overland flow) which is depicted here also(figure 7b). H/G ratio (Y ) is exponentially andnegatively correlated (r = −0.53) with catchment-wise overland flow (X), having decreasing trend(Y = 506.33X−1.68).
6. Multiple regressional analysis ofsediment yield (SY) and sediment
delivery ratio (SDR)
Soil erosion is the first step in the sedimentationprocess which consists of fluvial erosion, trans-portation and deposition of sediment. A fraction of
Erosion risk assessment of lateritic badlands of Birbhum 1447
Table
2.
Est
imating
catc
hm
entwis
era
infa
ller
osi
vity
,det
ach
men
tra
teofso
iland
erosi
on
risk
.
Mea
nannual
Annualkin
etic
Annualra
teof
Effec
tive
Roose
’sM
org
an’s
rain
fall
erosi
vity
ener
gy
ofeff
ecti
ve
Dom
inant
soil
soil
part
icle
det
ach
men
tE
rosi
on
Catc
hm
ent
rain
fall
(mm
)in
dex
(A)
KE
index
(B)
index
(A+
B/2)
rain
fall
(Jm
−2)
textu
re(U
SD
A)
by
rain
fall
(kg
m−
2yea
r−1)
risk
2a
1190
10292
165272
92929
24053
Sandy
loam
16.8
3H
igh
2b
1135
9820
127270
73455
24843
Sandy
loam
17.3
9H
igh
2c
1092
9447
97265
58080
20257
Sandy
clay
loam
2.0
2Low
2d
1233
10665
195276
108303
21497
Sandy
clay
loam
2.1
4Low
2e
1135
9820
127270
73455
19320
Cla
ylo
am
13.5
2M
oder
ate
2f
1062
9186
76260
47316
15121
Sandy
loam
10.5
8M
oder
ate
2g
1108
9584
108262
63715
15930
Sandy
loam
11.1
5M
oder
ate
2h
1080
9335
88259
53465
17916
Cla
ylo
am
12.5
4M
oder
ate
3a
1154
9981
140271
80117
25894
Sandy
loam
18.1
2H
igh
3b
1151
9956
138267
79090
23750
Sandy
clay
loam
2.3
7Low
3c
1145
9907
134265
77039
20287
Sandy
loam
2.0
2Low
3d
1078
9322
87264
52955
21488
Sandy
loam
15.0
4H
igh
3e
1059
9161
74256
46289
14049
Sandy
clay
loam
1.4
0Low
3f
1065
9211
78258
48339
13830
Sandy
loam
9.6
8M
oder
ate
3g
1124
9720
119266
69353
16469
Sandy
clay
loam
1.6
4Low
3h
1122
9708
118263
68840
19568
Sandy
loam
13.6
9H
igh
3i
1095
9472
99263
59103
20005
Cla
ylo
am
14.0
1H
igh
1448 Sandipan Ghosh and Kamala Bhattacharya
0
2
4
6
8
10
12
14
16
18
20
2a
Catchments
An
nu
al r
ate
of
soil
par
ticl
e d
etac
hm
ent
by
rain
fall
(kg
m-2
yea
r -1
)
2b 2c 2d 2e 2f 2g 2h 3a 3b 3c 3d 3e 3f 3g 3h
Figure 5. Diagram showing the catchment-wise annual rateof soil detachment by rainfall.
lateritic soil passes through overland flow, rills andgullies contributes to sediment yield of catchmentwhile some of them deposit in water channels (i.e.,gully floor) (Rousseva et al. 2000). Sediment yield(SY) and sediment delivery ratio (SDR) are themeasure of potential erosion that takes place in awatershed, minus storage and quantifies the rate ofsediment exported out of the local erosional system(Bell 1999; Wan and Sangchyoswat 2010). If we canestimate the maximum potentiality of catchments’SY and SDR, then we can rank those sample catch-ments into erosion risk category. Here, two predic-tive equations of SY and SDR are applied region-ally and those equations are significantly dependedon basin morphometric properties, rainfall, basinrun-off, soil characters and land uses.
Douglas (1976) formulated a widely acclaimedequation of sediment yield where the numeratorrepresents the erosive influence of rainfall and thedenominator represents the vegetation-protectionfactor. The equation is as follows (Cooke andDoornkamp 1987):
E =1.631(0.03937 P )2.3/[
1 + 0.0007 (0.03937 P )3.3]
where E = suspended sediment yield (m3 km−2
year−1) and P = effective precipitation in mm(that part of the precipitation which producessurface run-off, after rainfall interception).
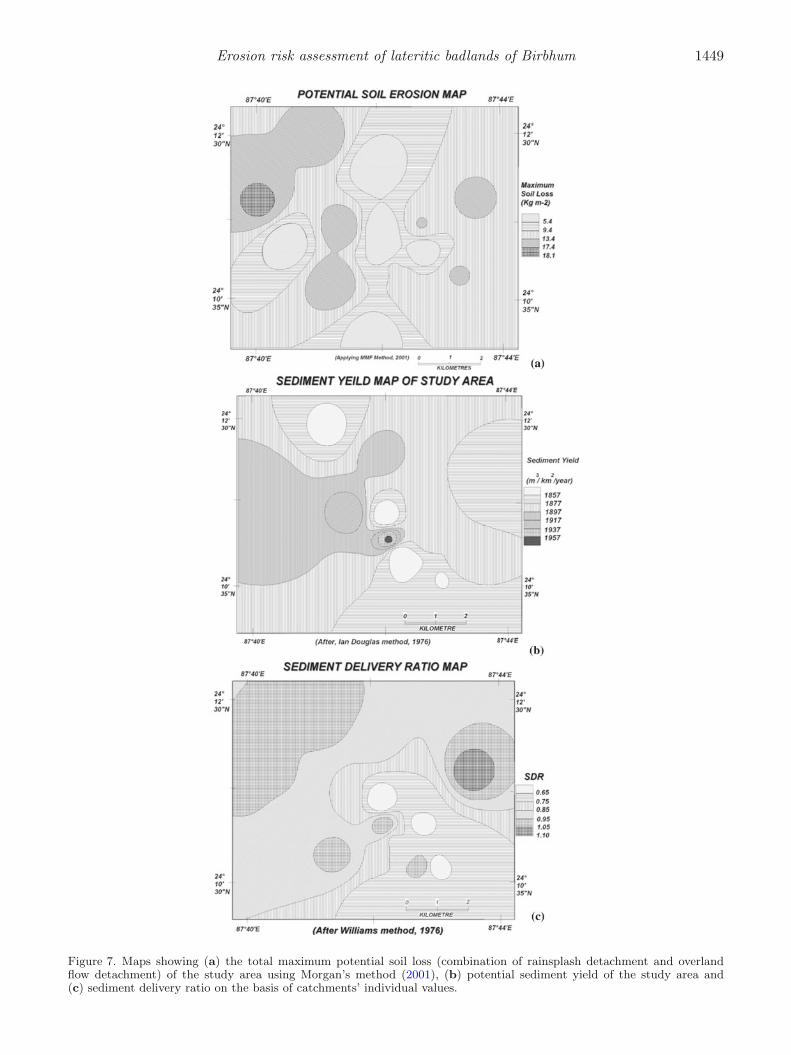
Using the above empirical equation, we havefound the catchment-wise sediment yield rate andprepared a sediment yield map for the studyarea (figure 7). The map suggests that centrallylocated catchments yield more sediments and itsvalue decreases towards south-east and north-westdirection.
Again we have employed another empirical equa-tion of sediment yield measurement using land useand hydro-geomorphic data. Universal Soil LossEquation (USLE) estimates only sheet and rillerosion, it is necessary to incorporate the ero-sion by surface run-off (Wischmeier and Smith1972; Stone and Hilbon 2000). Then combining
Figure 6. Diagrams showing (a) increasing sediment yieldof catchments, (b) month-wise rainfall aggressiveness fromthe year 1960 to 2008, (c) increasing density of gully withrising volume of catchment surface run-off, and (d) decreas-ing ratio of soil detachment rate and transport capacity offlow (maximum soil loss) with increasing catchment overlandflow.
USLE and modified USLE, Williams and Berndt(1972) have intended to quantify the sediment yieldof watershed, including run-off volume and peakrun-off rate. The equation is expressed as follows(Wischmeier and Smith 1978; Parsons 2005):
SY = 11.8 (Q qp)0.56 K C P LS
where SY = sediment yield of monsoonal period(ton km−2), Q = run-off volume of monsoon period
Erosion risk assessment of lateritic badlands of Birbhum 1449
Figure 7. Maps showing (a) the total maximum potential soil loss (combination of rainsplash detachment and overlandflow detachment) of the study area using Morgan’s method (2001), (b) potential sediment yield of the study area and(c) sediment delivery ratio on the basis of catchments’ individual values.
1450 Sandipan Ghosh and Kamala Bhattacharya
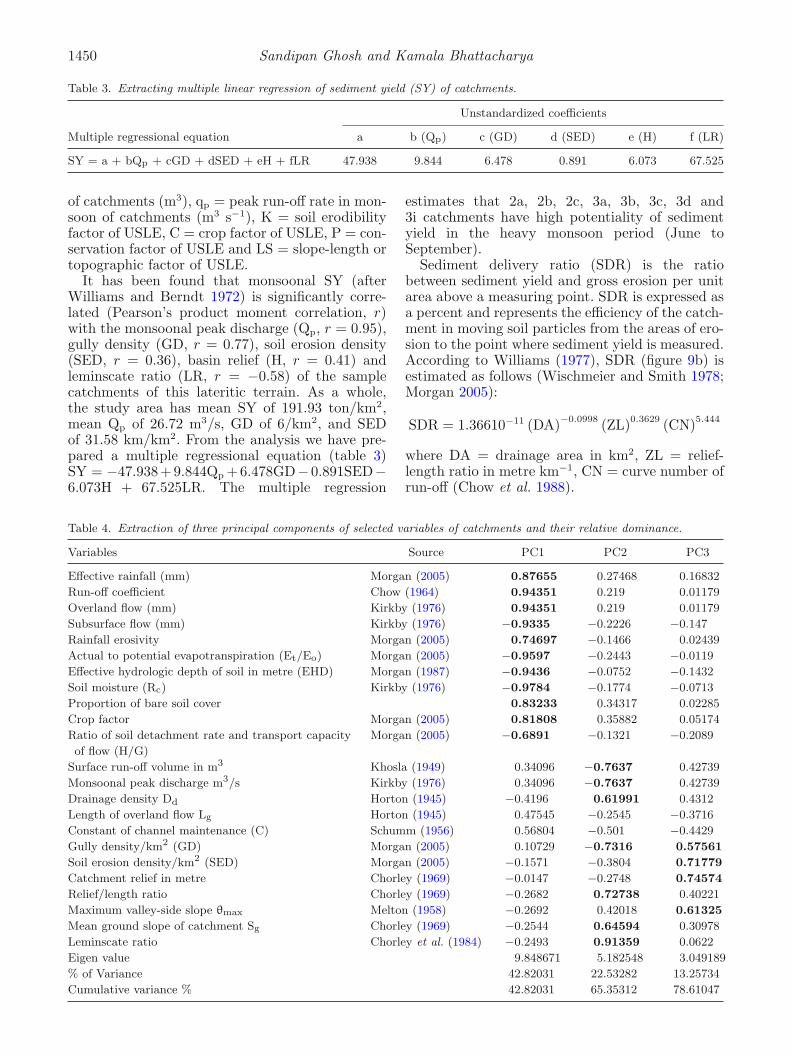
Table 3. Extracting multiple linear regression of sediment yield (SY) of catchments.
Unstandardized coefficients
Multiple regressional equation a b (Qp) c (GD) d (SED) e (H) f (LR)
SY = a + bQp + cGD + dSED + eH + fLR 47.938 9.844 6.478 0.891 6.073 67.525
of catchments (m3), qp = peak run-off rate in mon-soon of catchments (m3 s−1), K = soil erodibilityfactor of USLE, C = crop factor of USLE, P = con-servation factor of USLE and LS = slope-length ortopographic factor of USLE.
It has been found that monsoonal SY (afterWilliams and Berndt 1972) is significantly corre-lated (Pearson’s product moment correlation, r)with the monsoonal peak discharge (Qp, r = 0.95),gully density (GD, r = 0.77), soil erosion density(SED, r = 0.36), basin relief (H, r = 0.41) andleminscate ratio (LR, r = −0.58) of the samplecatchments of this lateritic terrain. As a whole,the study area has mean SY of 191.93 ton/km2,mean Qp of 26.72 m3/s, GD of 6/km2, and SEDof 31.58 km/km2. From the analysis we have pre-pared a multiple regressional equation (table 3)SY = −47.938+9.844Qp +6.478GD−0.891SED−6.073H + 67.525LR. The multiple regression
estimates that 2a, 2b, 2c, 3a, 3b, 3c, 3d and3i catchments have high potentiality of sedimentyield in the heavy monsoon period (June toSeptember).
Sediment delivery ratio (SDR) is the ratiobetween sediment yield and gross erosion per unitarea above a measuring point. SDR is expressed asa percent and represents the efficiency of the catch-ment in moving soil particles from the areas of ero-sion to the point where sediment yield is measured.According to Williams (1977), SDR (figure 9b) isestimated as follows (Wischmeier and Smith 1978;Morgan 2005):
SDR = 1.36610−11 (DA)−0.0998 (ZL)0.3629 (CN)5.444
where DA = drainage area in km2, ZL = relief-length ratio in metre km−1, CN = curve number ofrun-off (Chow et al. 1988).
Table 4. Extraction of three principal components of selected variables of catchments and their relative dominance.
Variables Source PC1 PC2 PC3
Effective rainfall (mm) Morgan (2005) 0.87655 0.27468 0.16832
Run-off coefficient Chow (1964) 0.94351 0.219 0.01179
Overland flow (mm) Kirkby (1976) 0.94351 0.219 0.01179
Subsurface flow (mm) Kirkby (1976) −0.9335 −0.2226 −0.147
Rainfall erosivity Morgan (2005) 0.74697 −0.1466 0.02439
Actual to potential evapotranspiration (Et/Eo) Morgan (2005) −0.9597 −0.2443 −0.0119
Effective hydrologic depth of soil in metre (EHD) Morgan (1987) −0.9436 −0.0752 −0.1432
Soil moisture (Rc) Kirkby (1976) −0.9784 −0.1774 −0.0713
Proportion of bare soil cover 0.83233 0.34317 0.02285
Crop factor Morgan (2005) 0.81808 0.35882 0.05174
Ratio of soil detachment rate and transport capacity Morgan (2005) −0.6891 −0.1321 −0.2089
of flow (H/G)
Surface run-off volume in m3 Khosla (1949) 0.34096 −0.7637 0.42739
Monsoonal peak discharge m3/s Kirkby (1976) 0.34096 −0.7637 0.42739
Drainage density Dd Horton (1945) −0.4196 0.61991 0.4312
Length of overland flow Lg Horton (1945) 0.47545 −0.2545 −0.3716
Constant of channel maintenance (C) Schumm (1956) 0.56804 −0.501 −0.4429
Gully density/km2 (GD) Morgan (2005) 0.10729 −0.7316 0.57561
Soil erosion density/km2 (SED) Morgan (2005) −0.1571 −0.3804 0.71779
Catchment relief in metre Chorley (1969) −0.0147 −0.2748 0.74574
Relief/length ratio Chorley (1969) −0.2682 0.72738 0.40221
Maximum valley-side slope θmax Melton (1958) −0.2692 0.42018 0.61325
Mean ground slope of catchment Sg Chorley (1969) −0.2544 0.64594 0.30978
Leminscate ratio Chorley et al. (1984) −0.2493 0.91359 0.0622
Eigen value 9.848671 5.182548 3.049189
% of Variance 42.82031 22.53282 13.25734
Cumulative variance % 42.82031 65.35312 78.61047
Erosion risk assessment of lateritic badlands of Birbhum 1451
From the sediment delivery ratio map (figure 7),we have found that the delivery of sediment isdecreasing from north-west to south-east directionwhereas western and central portions of the studyarea have generated maximum sediment yield.From the result it can be predicted that 2nd ordercatchments of 2a, 2b 2d and 3rd order catchmentsof 3a, 3b, 3c, 3d and 3i have generated high valueof SDR (0.85–1.10) in respect of hydro-geomorphicparameters. So those areas of catchments shouldbe protected from soil detachment and sedimenttransportation.
7. Factor analysis and categorizationof erosion risk
In multivariate analysis of geomorphic phenomena,often volumes of data having many variables areanalysed amidst the problem of multidimension-ality. Multidimensionality is signified by a con-dition wherein groups of variables often movetogether and one reason for this is that more thanone variable may be measuring the same driv-ing principle governing the behaviour of the sys-tem (Singh 2007). According to Kothari (2009),the factor analysis is a multivariate technique tofind out something more fundamental among inter-dependent variables or latent which creates thecommonality.
Though rainfall detachment and detachment byoverland flow are the main source of sedimentyield of catchment, both of them are controlledby numerous climatic, hydro-geomorphic and
pedologic variables of catchment (Shrestha 1997;Boardman et al. 2009). So to reduce the num-ber of variables into few factors or componentsand to detect structure in the inter-relationshipsamong variables we have employed principal com-ponent analysis (PCA) which is a method of factoranalysis. The principal components (PC) as wholeform an orthogonal basis for the space of the data(Gregory 1977; Singh 2007). Considering 20 vari-ables of 17 sub-catchments (2nd and 3rd orders),we have extracted the principal components in sucha fashion that first PC accounts for the largestamount of total variation in the data (table 4). Theimportance of each component is expressed by itseigen values. The higher the eigen value, the moreimportant is the component because of the largestnumber of inter-correlated dominant parameters(Singh 2007; Kothari 2009). Transforming the firstand second PC into prinsscores and then intoZ-scores, we have standardized and categorizedthe sample catchments into susceptibility of fluvialerosion in relation to dominant hydro-geomorphicvariables (Doornkamp and King 1971; Gregory1977). Alongside, discriminate analysis is used tounderstand the association and separation of thecatchments from each other based on Z-scores.The main purpose of discriminate analysis is tocluster the groups of catchments which are dis-criminated from other groups based on scores oferosion risk.
We have chosen 20 important variables whichinter-relatedly contribute their negative and pos-itive effects on the whole system of catchmentdenudation. Extracting three principal components
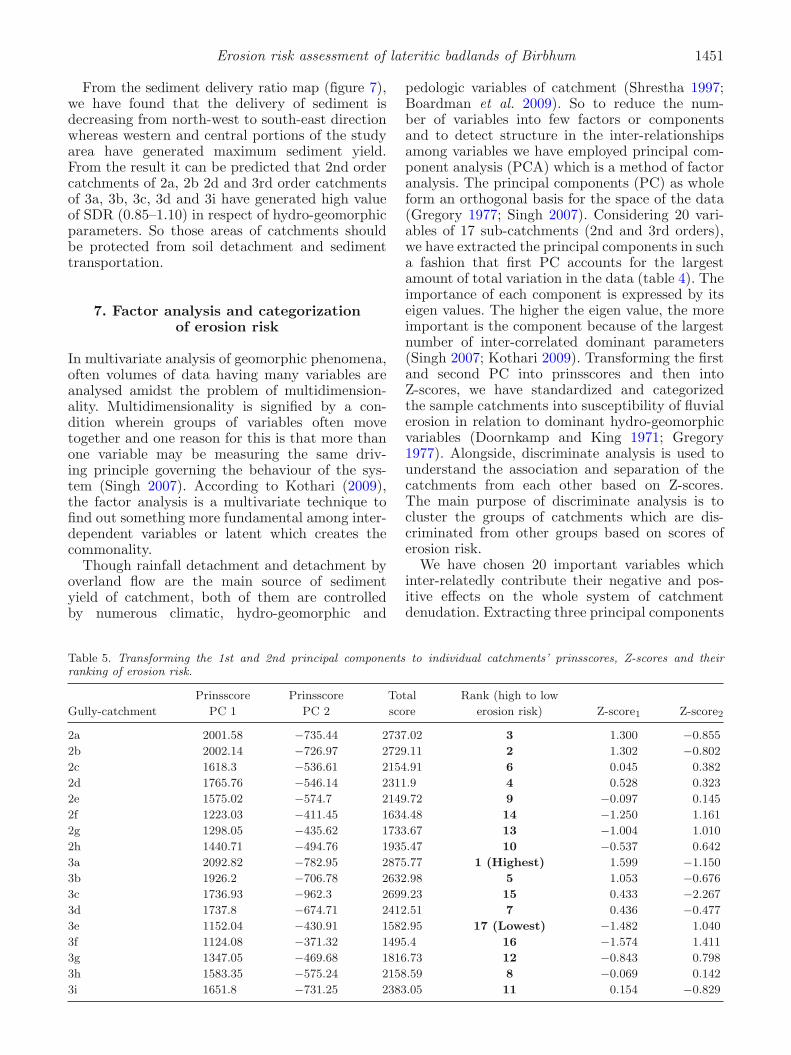
Table 5. Transforming the 1st and 2nd principal components to individual catchments’ prinsscores, Z-scores and theirranking of erosion risk.
Prinsscore Prinsscore Total Rank (high to low
Gully-catchment PC 1 PC 2 score erosion risk) Z-score1 Z-score2
2a 2001.58 −735.44 2737.02 3 1.300 −0.855
2b 2002.14 −726.97 2729.11 2 1.302 −0.802
2c 1618.3 −536.61 2154.91 6 0.045 0.382
2d 1765.76 −546.14 2311.9 4 0.528 0.323
2e 1575.02 −574.7 2149.72 9 −0.097 0.145
2f 1223.03 −411.45 1634.48 14 −1.250 1.161
2g 1298.05 −435.62 1733.67 13 −1.004 1.010
2h 1440.71 −494.76 1935.47 10 −0.537 0.642
3a 2092.82 −782.95 2875.77 1 (Highest) 1.599 −1.150
3b 1926.2 −706.78 2632.98 5 1.053 −0.676
3c 1736.93 −962.3 2699.23 15 0.433 −2.267
3d 1737.8 −674.71 2412.51 7 0.436 −0.477
3e 1152.04 −430.91 1582.95 17 (Lowest) −1.482 1.040
3f 1124.08 −371.32 1495.4 16 −1.574 1.411
3g 1347.05 −469.68 1816.73 12 −0.843 0.798
3h 1583.35 −575.24 2158.59 8 −0.069 0.142
3i 1651.8 −731.25 2383.05 11 0.154 −0.829
1452 Sandipan Ghosh and Kamala Bhattacharya
we have cumulatively explained 78.61% of totalvariance, having three eigen values 9.84, 5.18 and3.04, respectively. The three principal componentsuniquely dominated the system are as follows:
• PC 1: Mainly climatic and hydrologic variablesdrive strongly the denudation system of catch-ments; effective rainfall, run-off coefficient, over-land flow, rainfall erosivity, bare soil coverand crop factor positively influence the system;whereas sub-surface flow, Et/Eo, EHD, Rc andH/G negatively influence the system.
• PC 2: Mainly geomorphic variables, viz., lemin-scate ratio, catchment ground slope, relief/lengthratio and gully density drive system; though run-off volume and monsoonal peak discharge havean effect in the motion of system.
• PC 3: Again geomorphic variables, viz., gullydensity, SED, catchment relief and θmax drive thedenudation system positively.
Based on the summation of prinsscores of PC1and PC2, we have ranked the gully-catchments
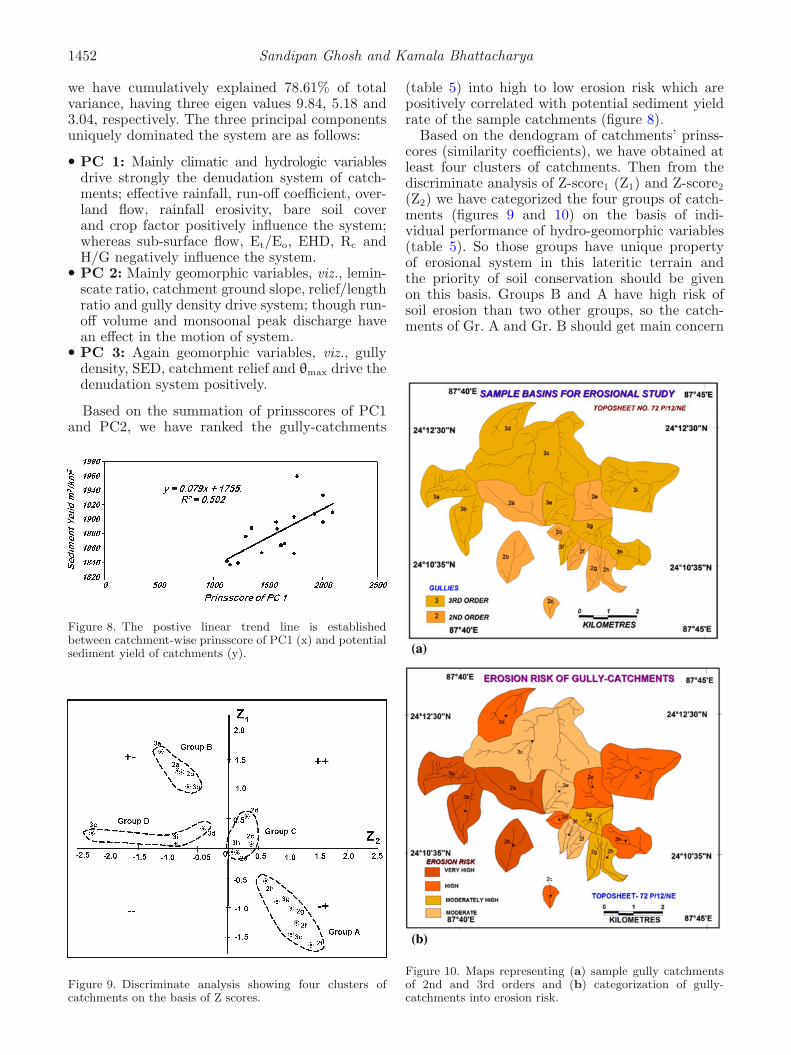
Figure 8. The postive linear trend line is establishedbetween catchment-wise prinsscore of PC1 (x) and potentialsediment yield of catchments (y).
Figure 9. Discriminate analysis showing four clusters ofcatchments on the basis of Z scores.
(table 5) into high to low erosion risk which arepositively correlated with potential sediment yieldrate of the sample catchments (figure 8).
Based on the dendogram of catchments’ prinss-cores (similarity coefficients), we have obtained atleast four clusters of catchments. Then from thediscriminate analysis of Z-score1 (Z1) and Z-score2
(Z2) we have categorized the four groups of catch-ments (figures 9 and 10) on the basis of indi-vidual performance of hydro-geomorphic variables(table 5). So those groups have unique propertyof erosional system in this lateritic terrain andthe priority of soil conservation should be givenon this basis. Groups B and A have high risk ofsoil erosion than two other groups, so the catch-ments of Gr. A and Gr. B should get main concern
Figure 10. Maps representing (a) sample gully catchmentsof 2nd and 3rd orders and (b) categorization of gully-catchments into erosion risk.
Erosion risk assessment of lateritic badlands of Birbhum 1453
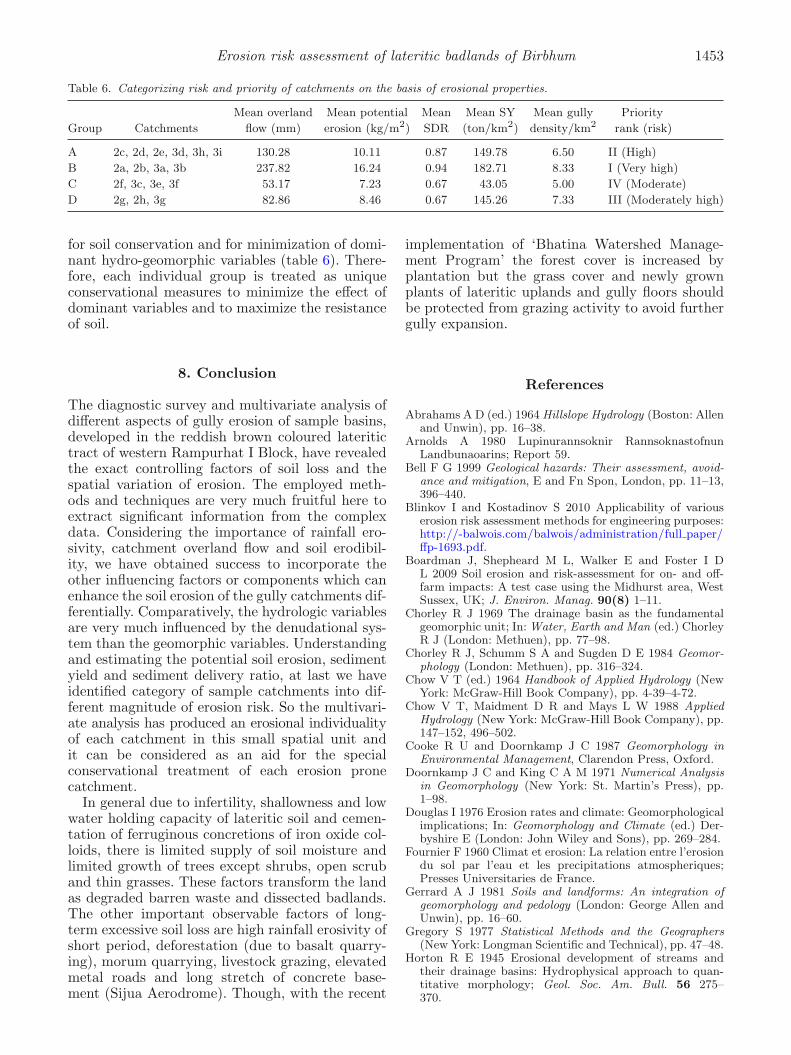
Table 6. Categorizing risk and priority of catchments on the basis of erosional properties.
Mean overland Mean potential Mean Mean SY Mean gully Priority
Group Catchments flow (mm) erosion (kg/m2) SDR (ton/km2) density/km2 rank (risk)
A 2c, 2d, 2e, 3d, 3h, 3i 130.28 10.11 0.87 149.78 6.50 II (High)
B 2a, 2b, 3a, 3b 237.82 16.24 0.94 182.71 8.33 I (Very high)
C 2f, 3c, 3e, 3f 53.17 7.23 0.67 43.05 5.00 IV (Moderate)
D 2g, 2h, 3g 82.86 8.46 0.67 145.26 7.33 III (Moderately high)
for soil conservation and for minimization of domi-nant hydro-geomorphic variables (table 6). There-fore, each individual group is treated as uniqueconservational measures to minimize the effect ofdominant variables and to maximize the resistanceof soil.
8. Conclusion
The diagnostic survey and multivariate analysis ofdifferent aspects of gully erosion of sample basins,developed in the reddish brown coloured lateritictract of western Rampurhat I Block, have revealedthe exact controlling factors of soil loss and thespatial variation of erosion. The employed meth-ods and techniques are very much fruitful here toextract significant information from the complexdata. Considering the importance of rainfall ero-sivity, catchment overland flow and soil erodibil-ity, we have obtained success to incorporate theother influencing factors or components which canenhance the soil erosion of the gully catchments dif-ferentially. Comparatively, the hydrologic variablesare very much influenced by the denudational sys-tem than the geomorphic variables. Understandingand estimating the potential soil erosion, sedimentyield and sediment delivery ratio, at last we haveidentified category of sample catchments into dif-ferent magnitude of erosion risk. So the multivari-ate analysis has produced an erosional individualityof each catchment in this small spatial unit andit can be considered as an aid for the specialconservational treatment of each erosion pronecatchment.
In general due to infertility, shallowness and lowwater holding capacity of lateritic soil and cemen-tation of ferruginous concretions of iron oxide col-loids, there is limited supply of soil moisture andlimited growth of trees except shrubs, open scruband thin grasses. These factors transform the landas degraded barren waste and dissected badlands.The other important observable factors of long-term excessive soil loss are high rainfall erosivity ofshort period, deforestation (due to basalt quarry-ing), morum quarrying, livestock grazing, elevatedmetal roads and long stretch of concrete base-ment (Sijua Aerodrome). Though, with the recent
implementation of ‘Bhatina Watershed Manage-ment Program’ the forest cover is increased byplantation but the grass cover and newly grownplants of lateritic uplands and gully floors shouldbe protected from grazing activity to avoid furthergully expansion.
References
Abrahams A D (ed.) 1964 Hillslope Hydrology (Boston: Allenand Unwin), pp. 16–38.
Arnolds A 1980 Lupinurannsoknir RannsoknastofnunLandbunaoarins; Report 59.
Bell F G 1999 Geological hazards: Their assessment, avoid-ance and mitigation, E and Fn Spon, London, pp. 11–13,396–440.
Blinkov I and Kostadinov S 2010 Applicability of variouserosion risk assessment methods for engineering purposes:http://-balwois.com/balwois/administration/full paper/ffp-1693.pdf.
Boardman J, Shepheard M L, Walker E and Foster I DL 2009 Soil erosion and risk-assessment for on- and off-farm impacts: A test case using the Midhurst area, WestSussex, UK; J. Environ. Manag. 90(8) 1–11.
Chorley R J 1969 The drainage basin as the fundamentalgeomorphic unit; In: Water, Earth and Man (ed.) ChorleyR J (London: Methuen), pp. 77–98.
Chorley R J, Schumm S A and Sugden D E 1984 Geomor-phology (London: Methuen), pp. 316–324.
Chow V T (ed.) 1964 Handbook of Applied Hydrology (NewYork: McGraw-Hill Book Company), pp. 4-39–4-72.
Chow V T, Maidment D R and Mays L W 1988 AppliedHydrology (New York: McGraw-Hill Book Company), pp.147–152, 496–502.
Cooke R U and Doornkamp J C 1987 Geomorphology inEnvironmental Management, Clarendon Press, Oxford.
Doornkamp J C and King C A M 1971 Numerical Analysisin Geomorphology (New York: St. Martin’s Press), pp.1–98.
Douglas I 1976 Erosion rates and climate: Geomorphologicalimplications; In: Geomorphology and Climate (ed.) Der-byshire E (London: John Wiley and Sons), pp. 269–284.
Fournier F 1960 Climat et erosion: La relation entre l’erosiondu sol par l’eau et les precipitations atmospheriques;Presses Universitaries de France.
Gerrard A J 1981 Soils and landforms: An integration ofgeomorphology and pedology (London: George Allen andUnwin), pp. 16–60.
Gregory S 1977 Statistical Methods and the Geographers(New York: Longman Scientific and Technical), pp. 47–48.
Horton R E 1945 Erosional development of streams andtheir drainage basins: Hydrophysical approach to quan-titative morphology; Geol. Soc. Am. Bull. 56 275–370.
1454 Sandipan Ghosh and Kamala Bhattacharya
Hudson N 1984 Soil Conservation; (London: English Lan-guage Book Society), pp. 62–87, 113–127.
Hundy A and Banerjee S 1967 Geology and mineralresources of West Bengal; Memoirs of the GSI, Delhi 9744–54.
Jha M K and Paudel R C 2010 Erosion predictions byempirical models in a mountainous watershed in Nepal;J. Spatial Hydrol. 10(1) 89–102.
Jha V C and Kapat S 2009 Rill and gully erosion risk oflateritic terrain in south-western Birbhum District, WestBengal, India; Sociedade & Natureza, Uberlandia 21(2)141–158.
Khosla A N 1949 Analysis and utilization of data forthe appraisal of water resources; The Central Board ofIrrigation and Power Journal, Delhi 6(4) 410–422.
Kothari C R 2009 Research Methodology (New Delhi: NewAge International Publishers), pp. 315–340.
Kirkby M J 1969a Erosion by water on hillslopes; In: Water,Earth and Man (ed.) Chorley R J (London: Methuen),pp. 229–238.
Kirkby M J 1969b Infiltration, through flow and over-land flow; In: Water, Earth and Man (ed.) Chorley R J(London: Methuen), pp. 215–226.
Kirkby M J 1976 Hydrological slope models: The influence ofclimate; In: Geomorphology and Climate (ed.) DerbyshireE (London: John Wiley and Sons), pp. 247–266.
McFarlane M J 1976 Laterite and Landscape (London:Academic Press), pp. 91–108.
Melton M A 1958 Geometric properties of mature drainagesystems and their representation in an E4 phase space;J. Geol. 66 35–54.
Morgan R P C 1974 Estimating regional variations in soilerosion hazard in Peninsular Malaysia; Malay NatureJournal 28 94–106.
Morgan R P C 1987 A system approach to conservationtillage; Experimental Agriculture 23(1) 107.
Morgan R P C 2001 A simple approach to soil loss predic-tion: A revised Morgan–Morgan-Finney Model; Catena44 305–322.
Morgan R P C 2005 Soil Erosion and Conservation (Malden:Blackwell Publishing), pp. 67–157.
Morisawa M 1985 Rivers: Form and processes; Longman,London.
Parsons A J 2005 Erosion and sediment transport by wateron hillslopes; In: Encyclopedia of Hydrological Sciences(ed.) Anderson M G (New York: John Wiley and SonsLtd), pp. 1199–1205.
Roose E J 1975 Natural mulch or chemical conditioners forreducing soil erosion in humid tropical area; Soil ScienceSociety of Civil Engineers 98 2087–2098.
Rousseva S, Lazarov A, Stefanova V and Malinov I2000 Soil Erosion Risk Assessments in Bulgaria;http://-balwois.com/balwois/administration/full paper/ffp-608.pdf.
Sarkar D, Dutta D, Nayak D C and Gajbhiye K S et al.2005 Soil erosion of West Bengal; National Bureau ofSoil Survey and Land Use Planning, NBSS Publ. 117,Nagpur.
Sarkar D, Dutta D, Nayak D C and Gajbhiye K S 2007Optimizing land use of Birbhum District (West Bengal)soil resource assessment; National Bureau of Soil Surveyand Land Use Planning, NBSS Publ., Nagpur, 130 1–33.
Schumm S A 1956 Evolution of drainage systems and slopesin badlands at Perth Amboy; Geol. Soc. Am. Bull. 67597–646.
Sen J, Sen S and Bandyopadhyay S 2004 Geomorphologicalinvestigation of badlands: A case study at Garhbeta, WestMedinipur District, West Bengal, India; In: Geomorphol-ogy and Environment (eds) Singh S, Sharma H S and DeS K (Kolkata: ACB Publication), pp. 204–234.
Shrestha D P 1997 Assessment of soil erosion in the NepaleseHimalaya: A case study in Likhu Khola Valley, MiddeleMountain Region; Oxford & IBH Publishing Co. Pvt. Ltd,Land Husbandry 2(1) 59–80.
Singh K 2007 Quantitative Social Research Methods; SagePublications, Los Angeles, pp. 202–213.
Stoddart D R 1969 World erosion and sedimentation; In:Water, Earth and Man (ed.) Chorley R J (London:Methuen), pp. 43–63.
Stone R P and Hilbon D 2000 Universal Soil Loss Equa-tion; Factsheet, Ministry of Agriculture, Food and RuralAffairs, Ontario.
Wan Z and Sangchyoswat C 2010 Soil erosion risk assess-ment using GIS and Farmer’s Perception: A casestudy in dry zone area of central region of Myanmar;http://www.mcc.cmu.ac.th/Seminar/pdf/1534.pdf.
Williams J R and Berndt H D 1972 Sediment yield computedwith universal equation; Proc. Am. Soc. Civil Engineers98 2087–2098.
Williams J R 1977 Sediment delivery ratios determined withsediment and runoff models; Int. Assoc. Hydrol. Sci. Publ.122 168–179.
Wischmeier W H and Smith D D 1972 Predicting rainfall–erosion losses from cropland and east of the RockyMountains, USDA; Agriculture Handbook No. 282,Washington, pp. 1–43.
Wischmeier W H and Smith D D 1978 Predictingrainfall-erosion losses: A guide to conservation plan-ning, USDA; Agriculture Handbook No. 537, Washington,pp. 1–32.
MS received 10 September 2011; revised 25 April 2012; accepted 28 April 2012