elemental weathering fluxes and saprolite production rate in a central african lateritic terrain...
TRANSCRIPT

Available online at www.sciencedirect.com
www.elsevier.com/locate/gca
Geochimica et Cosmochimica Acta 99 (2012) 243–270
Elemental weathering fluxes and saprolite production rate ina Central African lateritic terrain (Nsimi, South Cameroon)
Jean-Jacques Braun a,b,⇑, Jean-Christophe Marechal c, Jean Riotte a,b,Jean-Loup Boeglin b, Jean-Pierre Bedimo Bedimo d, Jules Remy Ndam Ngoupayou e,
Brunot Nyeck e, Henri Robain f, M. Sekhar a,g, Stephane Audry b, Jerome Viers b
a Indo-French Cell for Water Sciences, IISc–IRD Joint International Laboratory, IISc, Bangalore 560012, Indiab GET-OMP, UMR 5563 CNRS/Univ. P. Sabatier/IRD, 14 Avenue E. Belin, F-31400 Toulouse, France
c BRGM-Service Eau, 1039, Rue de Pinville, 34000 Montpellier, Franced Institut de Recherche Geologique et Miniere, Centre de Recherche Hydrologique, BP 4110 Yaounde, Cameroon
e Department of Earth Sciences, University of Yaounde I, BP 512 Yaounde, Cameroonf BIOEMCO UMR 7618 UPMC – CNRS – INRA – ENS – ENSCP – INA-PG Campus Jussieu, Tour 46/56, 2eme etage,
4, Place Jussieu 75252 Paris Cedex 05, Franceg Civil Engineering Department, IISc, Bangalore 560012, India
Received 13 June 2011; accepted in revised form 13 September 2012; available online 27 September 2012
Abstract
The comparison between contemporary and long-term weathering has been carried out in the Small ExperimentalWatershed (SEW) of Nsimi, South Cameroon in order to quantify the export fluxes of major and trace elements and the res-idence time of the lateritic weathering cover. We focus on the hillside system composed of a thick lateritic weathering covertopped by a soil layer. This study is built on the recent improvements of the hillside hydrological functioning and on the anal-yses of major and trace elements.
The mass balance calculation at the weathering horizon scale performed with the parent rock as reference indicates (i)strong depletion profiles for alkalis (Na, K, Rb) and alkaline earths (Mg, Ca, Sr, Ba), (ii) moderate depletion profiles forSi, P, Cd, Cu, Zn, Ni and Co, (iii) depletion/enrichment profiles for Al, Ga, Ge, Sn, Pb, LREE, HREE, Y, U, Fe, V, Cr,Mn. It is noteworthy that (i) Mn and Ce are not significantly redistributed according to oxidative processes as it is the casefor Fe, V and Cr, and (ii) Ge is fractionated compared to silica with enrichment in Fe-rich horizons. The calculations per-formed for the topsoil with iron crust as parent material reference reveal that the degradation of the iron crust is accompaniedby the loss of most of the constituting elements, among which are those specifically accumulated as the redox sensitive ele-ments (Fe, V, Cr) and iron oxide related elements like Th.
The overall current elemental fluxes from the hillside system at the springs and the seepage zones are extremely low due tothe inert lateritic mineralogy. Ninety-four percent of the whole Na flux generated from the hillside corrected from atmosphericdeposits (77 mol/ha/yr) represents the current weathering rates of plagioclase (oligoclase) in the system, the other remaining6% may be attributed to the dissolution of hornblende. The silica hillside flux is 300 mol/ha/yr and can be mostly attributed tothe plagioclase and kaolinite dissolution. Al and Ga are exported from the lateritic regolith and maybe due to the dissolutionof kaolinite crystals. Compared to the other immobile elements (Zr, Hf, Nb and Th), Ti is significantly exported. Amongredox-sensitive elements (Fe, V, Cr, Mn, Ce), only Ce and Mn are exported out of the hillside system. The other elements(Fe, V, Cr) are likely able to be mobilized but over a short distance only. Rb, Sr, Ba, Ni, Cu, Zn are affected by export
0016-7037/$ - see front matter � 2012 Elsevier Ltd. All rights reserved.
http://dx.doi.org/10.1016/j.gca.2012.09.024
⇑ Corresponding author at: Indo-French Cell for Water Sciences, IISc–IRD Joint International Laboratory, IISc, Bangalore 560012, India.Fax: +91 80 360 02 23.
E-mail address: [email protected] (J.-J. Braun).

244 J.-J. Braun et al. / Geochimica et Cosmochimica Acta 99 (2012) 243–270
processes. LREE and Y are exported but in very low amounts (in the range from lmol/ha/yr to mmol/ha/yr) while HREEand U are exported in negligible quantities.
A first attempt is carried out to compare the mature ridge top profile from Nsimi SEW with the immature ridge top weath-ering profile from the Mule Hole SEW (South India), developed on similar granodioritic basement, in order to get deeperinsight into (i) the contemporary saprolite production rates and (ii) the combined effect of precipitation (in terms of MeanAnnual Rainfall, MAR) and evapotranspiration on the aggressiveness of the draining solutions. Considering (i) the contem-porary Na flux as representative of the dissolution of plagioclase crystals and conservative during saprolitization processesand (ii) steady state of the inter-annual recharge (R) over a 10 years period, the current saprolite production rates (rr) areof 22 mm/kyr for Mule Hole SEW and 2 mm/kyr for Nsimi SEW, respectively. Even with a very low R/MAR ratio (0.04)compared to Nsimi, the chemical weathering at Mule Hole is active and related to the groundwater exports. At Mule Hole,plagioclase crystals are still present in the saprolite and the soil cover leading to a diffuse weathering front. The high Nsimi R/MAR ratio (0.2) allows the solution to be still aggressive with respect to the plagioclase and other weatherable minerals at thebedrock interface resulting in their complete breakdown in a few centimetres (sharp weathering front) leading to a maturesaprolite.
For the Nsimi SEW, if we consider (i) the low contemporary saprolite production rate (2 mm/kyr), (ii) the Miocene age(average 15 Myr) of the South Cameron Plateau landscape and (ii) the limited movement of Africa continent since Eocene,the long term saprolite production rate should have remained in its lower range, from 2 to 10 m/Myr. This suggests that, forthick weathering profiles the migration of the weathering front into the bedrock occurs at a relatively uniform rate regardlessof present-day climatic conditions. Climate variation leading to the alternation of setup of savanna or humid forest will havean effect on physical erosion rather than chemical erosion for such deep weathering profiles.� 2012 Elsevier Ltd. All rights reserved.
1. INTRODUCTION
Chemical weathering in the Critical Zone can be ad-dressed from two perspectives (White, 2008; Brantley andWhite, 2009; Brantley and Lebedeva, 2011). This can beeither on a geologic time scale based on solid-state elemen-tal, isotopic and mineralogical changes in weathering prod-ucts relative to the parent rock or on a contemporary timescale based on the present day solute compositions andfluxes. However, combining both approaches offers a pow-erful method of improving the quantitative modelling ofdynamics within the Critical Zone (i.e. saprolite and soilproduction rates, cycling of carbon, nutrients and poten-tially toxic element migration). Such studies are particularlycrucial in our ever-changing environment and especially inthose systems affected by both climate variations and hu-man activities (Velbel, 1993; Riebe et al., 2003; Andersonet al., 2008, 2007; Brantley, 2007, 2008, 2010; Godderiset al., 2009).
Lateritic terrains cover most of the shield landscapes inthe humid Tropics. They have to be considered as both pal-aeoclimatic records and feed-through reactors and repre-sentative of optimal conditions for chemical weathering(Kisakurek et al., 2004; Braun et al., 2005; West et al.,2005; Anderson et al., 2007; Wimpenny et al., 2007). Insuch regions, (Godderis et al., 2008) determined that silicateweathering in the warm humid tropical belt is five times lesssensitive to continental runoff than in mid-latitude temper-ate climate due to the shield effect of the deep matureweathering profiles. However, the integrated effects ofintrinsic changes in mineral properties and abundances, aswell as extrinsic long-term changes in climate and vegeta-tion, soil permeability and topography, commonly onlyreach maturity over periods of tens of thousands to millionsof years (Nahon, 1991; Tardy, 1993; Thomas, 1994; Tardy
and Roquin, 1998). Moreover, most of these lateritic covershave developed in those regions where prevailing transport-limited conditions have been favourable to deep and pro-longed chemical weathering (Nash and McLaren, 2007;Retallack, 2010; Tardy and Roquin, 1998; Widdowson,2003, 2007).
Despite the heterogeneous structures and textures ob-served in these widespread lateritic covers, their mineralog-ical composition is predictably monotonous consistingchiefly of the secondary minerals, kaolinite, gibbsite, goe-thite, and hematite (Schellmann, 1986; Aleva, 1994). Stud-ies of U/Th disequilibrium (Dequincey et al., 2002;Chabaux et al., 2003) and radiation-induced defects in kao-linite (Balan et al., 2005) suggest that each horizon of thelateritic profile behaves independently, reflecting the super-imposition of further remobilization effects upon older for-mation steps. Although the petrology, mineralogy andgeochemistry of lateritic profiles developed on silicate rockshave been extensively studied, the quantification of thechemical fluxes within the regolith and, hence, the saproliteand soil production rates remain poorly constrained. Mostof the attempts in the Tropics have been carried out withstream chemistry, which may be significantly influencedby processes occurring in the hyporeic zones (e.g. swamp,alluvial valley) (Edmond et al., 1995; Boeglin and Probst,1998).
In tectonically quiescent shield areas, uplift is minimumand the only variation of base level is likely to have resultedfrom eustatic variation such as that resulting from the ad-vance and retreat of ice sheets in mid and boreal latitudes.Thus, in general, the balance between erosion and weather-ing rates has been in favour of deepening of the regolith bychemical weathering, rather than one of regional erosivestripping. In addition, successive periods of high and lowferruginisation (leading to the formation of different gener-

J.-J. Braun et al. / Geochimica et Cosmochimica Acta 99 (2012) 243–270 245
ations of iron crust) have resulted from climate changes(Tardy and Roquin, 1998; Retallack, 2010).
The ‘small experimental watershed’ (SEW) of Nsimi hasbeen previously described (Braun et al., 2005) and is consid-ered representative of the lateritic tropical environment ofthe South Cameroon plateau which is itself typified of mul-ticonvex landform developed on granitic terrains (Migon,2006, 2009; Thomas, 1994). The South Cameroon Plateauhas remained at equatorial latitudes since Eocene(46 ± 8 Myr) as a consequence of the limited movementof Africa continent (Parrish et al., 1982) and so the tropicalpaleo-climatic conditions are unlikely to have altered signif-icantly during this prolonged period.
The Nsimi SEW has been under investigation forhydrology and biogeochemistry for the last 15 years. It isdeveloped on a granito-gneissic basement and may be con-sidered as two geomorphologically-controlled systems: (i) ahillside lateritic system and (ii) a hydromorphic swamp sys-tem. The mineralogy and geochemistry of the solid phases(i.e. lateritic products) and the water chemistry have beenextensively studied within both systems (Viers et al., 1997;Oliva et al., 1999; Braun et al., 2005). The contribution ofphytoliths to the suspended load of biogenic silica was alsoinvestigated (Cary et al., 2005), whilst isotopic fractionationof Nd, Fe and Zn in the different reservoirs of the systemwere discussed by (Viers and Wasserburg, 2004; Vierset al., 2007; Poitrasson et al., 2008). To date, quantitativeflux studies have only focused on the organic-rich waterdraining the swamp system and contemporary fluxes formajor (Ca, Na, Mg, K, Fe, Al, Ti) and for selected trace ele-ments (Th, Zr) were assessed at the outlet of the SEW(Braun et al., 2005). These studies showed that the organ-ic-rich surface waters enhanced the mobilisation and trans-fer of Al and Fe and even the highly charged transitionmetals such as Th, Ti and Zr (Braun et al., 2005). However,the specific contribution of the hillside lateritic system tothe chemical weathering fluxes remains poorly understood,especially for trace elements.
Building on the long-term hydrological and geochemicalmonitoring of the Nsimi SEW, (Marechal et al., 2011a) re-cently described the main hydrological processes; here theChloride Mass Balance (CMB) was used to compute on ayearly basis the hillslope groundwater discharge to theswamp zone while the contributions of various sourcewaters to two short storm events of a few hours durationwere determined by end-member mixing analysis. The cur-rent study is based upon these earlier assessments, howeverhere we refine the contemporary fluxes for major and traceelements in the hillside lateritic system and determine theircontribution to the outlet flux. These contemporary fluxesare then compared with the mass balance calculation ele-mental gain/loss in a hill-top weathering profile.
In order to refine the elemental transfers in lateritic cov-ers developed on silicate basement and to get deeper insightinto (i) the contemporary saprolite production rates and (ii)the combined effect of precipitation and evapotranspirationon the aggressiveness of the draining solutions, a first at-tempt has been carried out both on the studied mature pro-file of the Nsimi SEW and with the immature ridge topweathering profile from the Mule Hole SEW (South India),
developed on a similar granodioritic basement (Descloitreset al., 2007; Braun et al., 2009; Marechal et al., 2009; Ruizet al., 2010; Violette et al., 2010; Soumya et al., 2011; Mare-chal et al., 2011b). Finally, taking into account the resultsof the present study and the known history of the SouthCameroon landscape, we infer the average saprolite pro-duction rate on a long term basis.
2. SETTINGS
The landform of the South Cameroon Plateau, now at amean elevation of 700 m, namely “Interior Erosion Sur-face”, corresponds to the dismantling of an old iron crustundergoing more humid climatic conditions (Bilong et al.,1992; Beauvais, 1999; Bitom et al., 2004). This multiconvexlandform is composed of rather closely spaced hilly com-partments, typically of few hundred metres in diameter,separated by flat swampy valleys of variable stretch from50 to 500 m width (Bitom et al., 2004). The hills are coveredby thick weathering formation capped by ferruginous softnodular layers containing fragments of iron crust, overlaidby soft clayey topsoil. The topsoil is the substratum of therain forest and diverse crops and its fragility has beenclearly pointed out. The age of the erosion surface has beenassessed by different authors (Segalen, 1967; Fritsch, 1978;Morin, 1989) based on relative geomorphic data and spanfrom Eocene to Quaternary (Tardy and Roquin, 1998).However, (Tardy and Roquin, 1998) suggested that theage of the erosion surface is likely Miocene based on furtherstudies (Morin, 1989).
The Nyong river basin is located in the tropical rainfor-est zone between the latitude 2�480N and 4�320N (Fig. 1),primarily on the South Cameroon Plateau. The NsimiSEW (3�100N–11�510E) belongs to the Upper Nyong riverbasin and an extended description of this 60 ha watershedis given in (Braun et al., 2005). The Nsimi SEW presentsthe contemporary weathering conditions for a matureweathering cover under humid climate with the alternationof two rainy and dry seasons throughout the hydrologicalyear. Over the period from 1994 to 2010, the MAR is1640 ± 260 mm/yr with a coefficient of variation of 16%(data from http://bvet.omp.obs-mip.fr). The rainforest veg-etation induces an Actual EvapoTranspiration (AET) of1270 mm/yr (76.5% of the MAR). The vegetation coveron the hillsides limits the erosion.
The parent rock of the Nsimi SEW is composed of twointermingled granitoid rocks: a gray blue granodiorite anda leucocratic monzogranite. Numerous quartz seams cross-cut the granitoid body. The mineralogy of the granodioriteis composed of quartz, oligoclase, hornblende, K-feldspar,biotite, magnetite and titano-magnetite. Accessories (lessthan 1%) are zircon, monazite and apatite. The mineralogyof the granite is composed of quartz, K-feldspar, albite,biotite and accessories as epidote, magnetite, ilmenite,titanite and zircon.
The hillside weathering cover is composed of a thick var-iegated saprolite superimposed by lateritic horizons (i.e.mottled clay, carapace and iron crust) topped by a softclayey topsoil. The presence of the crosscutting quartzseams within the horizons undergoing lateritization pro-
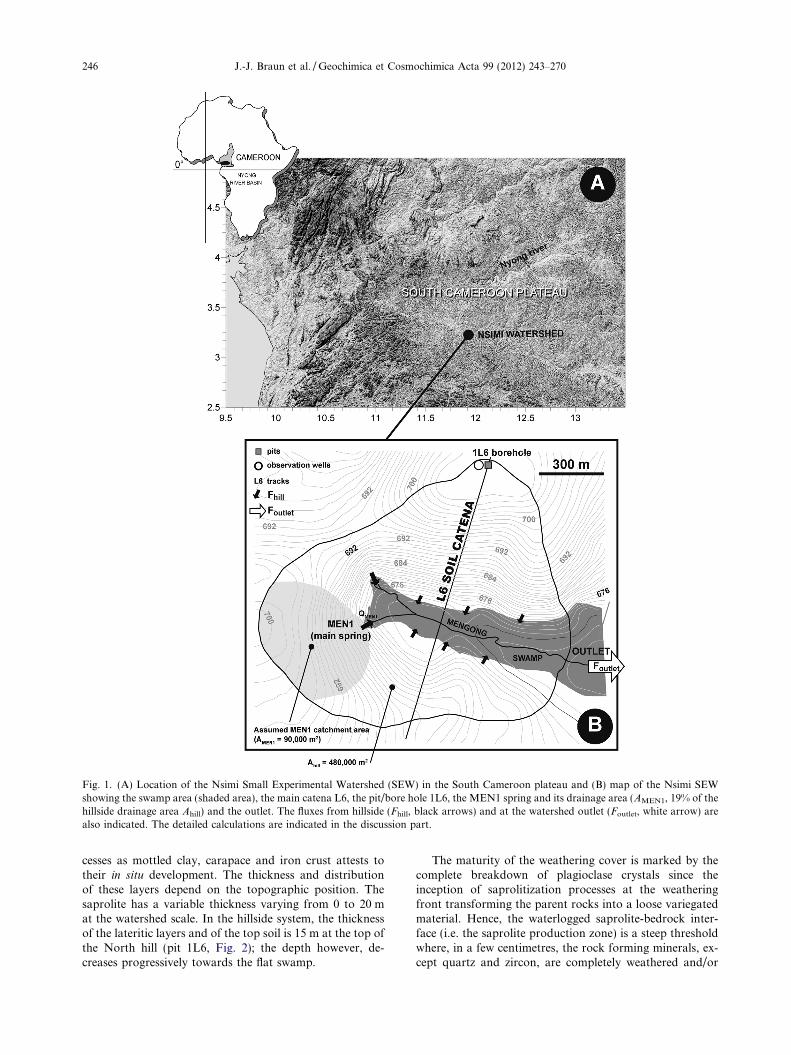
Fig. 1. (A) Location of the Nsimi Small Experimental Watershed (SEW) in the South Cameroon plateau and (B) map of the Nsimi SEWshowing the swamp area (shaded area), the main catena L6, the pit/bore hole 1L6, the MEN1 spring and its drainage area (AMEN1, 19% of thehillside drainage area Ahill) and the outlet. The fluxes from hillside (Fhill, black arrows) and at the watershed outlet (Foutlet, white arrow) arealso indicated. The detailed calculations are indicated in the discussion part.
246 J.-J. Braun et al. / Geochimica et Cosmochimica Acta 99 (2012) 243–270
cesses as mottled clay, carapace and iron crust attests totheir in situ development. The thickness and distributionof these layers depend on the topographic position. Thesaprolite has a variable thickness varying from 0 to 20 mat the watershed scale. In the hillside system, the thicknessof the lateritic layers and of the top soil is 15 m at the top ofthe North hill (pit 1L6, Fig. 2); the depth however, de-creases progressively towards the flat swamp.
The maturity of the weathering cover is marked by thecomplete breakdown of plagioclase crystals since theinception of saprolitization processes at the weatheringfront transforming the parent rocks into a loose variegatedmaterial. Hence, the waterlogged saprolite-bedrock inter-face (i.e. the saprolite production zone) is a steep thresholdwhere, in a few centimetres, the rock forming minerals, ex-cept quartz and zircon, are completely weathered and/or

620
640
660
680
700
720
0 100 200 300 400 500 600 700 800 900
FAULTED ZONE
HYDROMORPHIC SWAMP SYSTEM
MENGONG BROOK
GROUNDWATER TABLE(AVERAGE LEVEL)
ALT
ITU
DE
(m)
NORTH
SOUTH
BOREHOLE1L6
HILLSIDE LATERITIC SYSTEM
HILLSIDE LATERITIC SYSTEM
PARENT ROCKS
SAPROLITE
MOTTLED CLAY AND DURICRUST
SOFT CLAYEY TOPSOIL
HILLSIDE LATERITICSYSTEM
HYDROMORPHIC SOIL COVER
PARENT ROCKS
SAPROLITE
HYDROMORPHICSWAMP SYSTEM
0
2
4
6
8
10
18
16
14
12
22
20
36
34
38
32
ROOTPENETRATION
ΔWT
SAPROLITE
FERRUGINOUSNODULAR HORIZON
MOTTLEDCLAY
HORIZON
TOPSOIL
BOREHOLE1L6
depth (m)
Seepageor spring zone
PARENT ROCK
fluctuation zoneof the groundwater table
A
B
L6 SOIL CATENA
Rhill
Qhill
Qbase
Fig. 2. (A) Cross section of the catena L6 showing the distribution of the weathered materials within both hillside and swamp systems and (B)profile 1L6 (adapted from Braun et al., 2005).The hillside recharge Rhill, the discharge Qhill and Qbase are also indicated.
J.-J. Braun et al. / Geochimica et Cosmochimica Acta 99 (2012) 243–270 247
248 J.-J. Braun et al. / Geochimica et Cosmochimica Acta 99 (2012) 243–270
pseudomorphosed by secondary clays (Fe oxides or oxihy-droxides), illite and 1:1 clay minerals (e.g. kaolinite). In theupper part of the saprolite, the ferruginization process leadsto iron segregation, mottling and nodules. Local glaebuliza-tion process leads to the hardening of saprolite remnants byiron oxides. The coalescence of the indurate phases leadsprogressively to the development of the carapace horizondue to the water table fluctuations at the expense of themottled clay horizon. It becomes a continuous ferruginousindurate network crossed by soft bleached whitish seams,with boundaries that are coloured by iron oxides and oxy-hydroxides. The carapace is assimilated to the plinthite andpetroplinthite horizons defined in (USDA, 1999). Withinthe upper two-thirds of the slope, a nodular ferruginoushorizon overlays the carapace. It is composed of iron crustrelicts as indurate ferruginous boulders, nodules, and peb-bles varying in size from a millimetre to a few centimetresand surrounded by a red clayey sandy matrix. Towardsthe foot of the slope, the thickness of this horizon decreasesand progressively transforms itself into another ferruginouscarapace with a vesicular network that continuesdownslope.
A soft clayey porous topsoil horizon overlays the diverseferruginous horizons. The boundary between this softclayey topsoil and the underlying layers is undulating andclear. A thin organo-mineral horizon (3 cm thick), depletedin clays and covered by a thin litter, tops the soft clayeyhorizon. The roots of the hillside vegetation are essentiallyconcentrated in this topsoil, which has a depth of 5–6 mfrom the top of the soil catena. The faunal activity (e.g. ter-mites and worms) is intense.
For the purpose of this study, we selected the profile 1L6located at the sub-horizontal top of the North hillside at analtitude of 705 m. The level compared to the Mengongbrook, which flows at 678.5 m in altitude, is of 26.5 m. Thisweathering lateritic profile is supposed to be the mostevolved at the watershed scale, in other words, having keptthe longest saprolite/soil history. Above the fractured bed-rock, it is composed of 21 m of variegated saprolite (SAP),3 m of mottled clay horizon (MCH), 7 m of iron crust (IC)and 5 m of topsoil (TOP).
At the hillside system scale, the groundwater flowsthrough the fractured bedrock, the entire saprolite, andpartly through the mottled clay horizon. The water tablefluctuates up to one third of the latest horizon. Withinthe top ridge profile 1L6, the thickness of the vadose zoneis limited to the first 15 m and the groundwater tablefloods the entire saprolite with a maximum water tablefluctuation of about 3 m. A part of this groundwaterdraining the hillside emerges at springs in the watershedhead and at specific seepage points all around the hill-side/swamp boundaries and then is conveyed to thestream. The mean discharge rate of the main spring(spring MEN1) was measured at 0.87 l/s, which corre-sponds to 46 mm/yr related to the watershed surface area.The swamp system covers 20% of the watershed. Throughthe water-year, the swamp is flooded and constitutes aseepage zone, the extent of which depends on the seasonaldistribution of the rain.
3. MATERIAL AND METHODOLOGY
3.1. Water sampling and analyses
Water samples analysed for trace elements were col-lected monthly from August 1994 to January 1997 at themain spring (MEN1) and at the outlet of the Mengongbrook. An additional sampling was carried out in 2011for throughfall and litter leachates for major element anal-yses. Litter leachates were obtained by leaving samplingplastic bags below litter traps during rain events in May,June, July and September 2011.
The water samples were filtered on-site with celluloseacetate 0.45 lm membranes using a polycarbonate Milli-pore filtration unit. Samples were then stored in acidwashed Nalgene� polypropylene bottles, either acidifiedwith ultrapure 15 N HNO3 for major cation and trace ele-ment analyses or non-acidified for major anion analyses.Measurements of conductivity, pH, alkalinity and watertemperature were carried out on-site. Major cations (Ca,Mg, K, Na) and anions (Cl, SO4, NO3) were determinedby Ion Chromatography at the Institut de Physique duGlobe, Paris (IPGP) and Geoscience Environnement Tou-louse (GET). Dissolved trace element concentrations weremeasured by ICP-MS (Elan 6000) at GET. Usual incerti-tude was 5% and detection limit up to 1 ng/L for the heavi-est elements. Aqueous silica concentrations were measuredboth by standard colorimetry (molybdate blue method) andby ICP-MS. The international standard SLRS-3 was usedas a reference.
3.2. Sampling, analytical procedures of parental rock and
regolith
Due to the presence of the groundwater table at 15 mdepth in 1L6, it was not possible to collect preserved sapro-lite samples. A mechanic auger was used to drill up to theparent rock and collect a saprolite composite sample. Par-ent rock samples were collected from drilling core at adepth of 36 m and in the streambed on track L5 (Braunet al., 2005). A handmade pit was dug up to the groundwa-ter table to access the weathered materials.
The parent rock density was determined with a Goguel�
densimeter. Bulk soil samples of about 2 kg were collected,each 50 cm from the surface towards the groundwater table.Corresponding samples were also collected in soft soapplastic boxes to preserve the soil structure. On these sam-ples, bulk density (qw) was obtained by the paraffin methodand grain densities (qg) by the air pycnometer method(three replicates). Porosity was calculated using the equa-tion U = 1 � [qw/qg], where U is the symbol of porosity.The bulk density measurements were carried out on thebulk ferruginous nodular horizon samples. The proportionof nodules/matrix was quantified for the bulk mass balancecalculation.
Thin sections of rocks and soils were observed by opticalmicroscopy as well as by SEM coupled with EDS. Micro-probe analyses of the rock forming minerals were carriedout on hand picked separates with CAMECA SX50 at Lab-

J.-J. Braun et al. / Geochimica et Cosmochimica Acta 99 (2012) 243–270 249
oratoire des Mecanismes de Transfert en Geologie(LMTG), Toulouse (France).
Powder samples were obtained with an automatic agatemortar. Crystalline phases in the randomly oriented sam-ples of weathered materials were analysed by X-ray diffrac-tion using a copper source with a Siemens XRDdiffractometer at IRD, Bondy, France. The radiationlengths k were 1.54060 and 1.54443 A. The 2h range was120� with steps of 0.03�.
Major and 40 trace elements from rocks and weatheredmaterials were analysed by ICP-AES and ICP-MS at theSARM (Centre de Recherche Petrographique et Geochimi-que-CNRS, Vand�uvre-les-Nancy) after LiBO2 fusion andHNO3 dissolution. The data set for major elements, Th andZr in the profile 1L6 is already displayed in (Braun et al.,2005).
The detection limits (in wt.%) are 0.8 for SiO2, 0.3 forAl2O3, 0.1 for Fe2O3, 0.03 for MnO, 0.4 for MgO, 0.5 forCaO, 0.08 for Na2O, 0.05 for K2O, 0.09 for TiO2 and 0.2for P2O5. The detection limit of the Loss on Ignition(LoI), the measure of volatile H2O, CO2, F, Cl and S, isfound to be 0.02 wt.%. The error for trace elements is lessthan 5%.
4. RESULTS
For both parent rocks and weathered products, Table 1displays the trace element composition along with otherchemical and physical data already published (Braunet al., 2005) and included for convenience (major elements,Th, Zr, grain size fractions, bulk and grain densities). Fig. 3presents the depth-profiles for selected elements: redox sen-sitive (V, Cr, Fe, Mn), potentially immobile (Th, Zr, Nb,Ti), potentially mobile as alkaline (Na, K, Rb), alkalineearths (Ca, Mg, Sr, Ba), REEs, Y, U, Si, Ge, Ga, Al andheavy metals (Co, Cu, Zn, Ni). The first striking point isthe tremendous depletion in the incipient stage of the sap-rolitization of Na Ca, and Mg compared to all other ele-ments and especially compared to the other alkaline andalkaline earth as K, Rb, Ba and Sr. There is an enrichmenttrend in the in situ weathering products for Ge, Si, Ga, Al,V, Cr, Fe, Ta, Hf, Th, Zr, U while a depletion trend forLREE, HREE, Y and Mn. For Co, Ni, Cu and Zn, thetrend is less obvious. A significant threshold is observedfor almost all the elements between the top of the iron crustand overlying topsoil. The shift is positive for Ti, K, Si, Al,Rb, Sr, Ba, HREE, LREE, Y, Mn, Ta, Hf, Nb, Zr, and Snand negative for Th, Fe, V, Cr, Pb Ga, U and Ge.
Table 2 sums up the composition of trace elements (sta-tistics and Volume Weight Mean, VWM) for (i) the springwater MEN1, representative of the water from the springsand seepage zones at the watershed scale, and (ii) the outletwater. Fig. 4 displays the composite bedrock normalisedpattern for the Mengong spring and outlet waters. Forthe displayed elements the fractionation is higher in theswamp system than in the hillside system. The redox sensi-tive elements (except Mn and Ce) and potential immobileelements (except Ti) are below the detection limit in the hill-side system while they are present in significant amount inthe swamp system. Among alkaline and alkaline earths,
K, Rb, Sr, Ba are less fractionated then Ca, Na and Mgin both swamp and hillside systems.
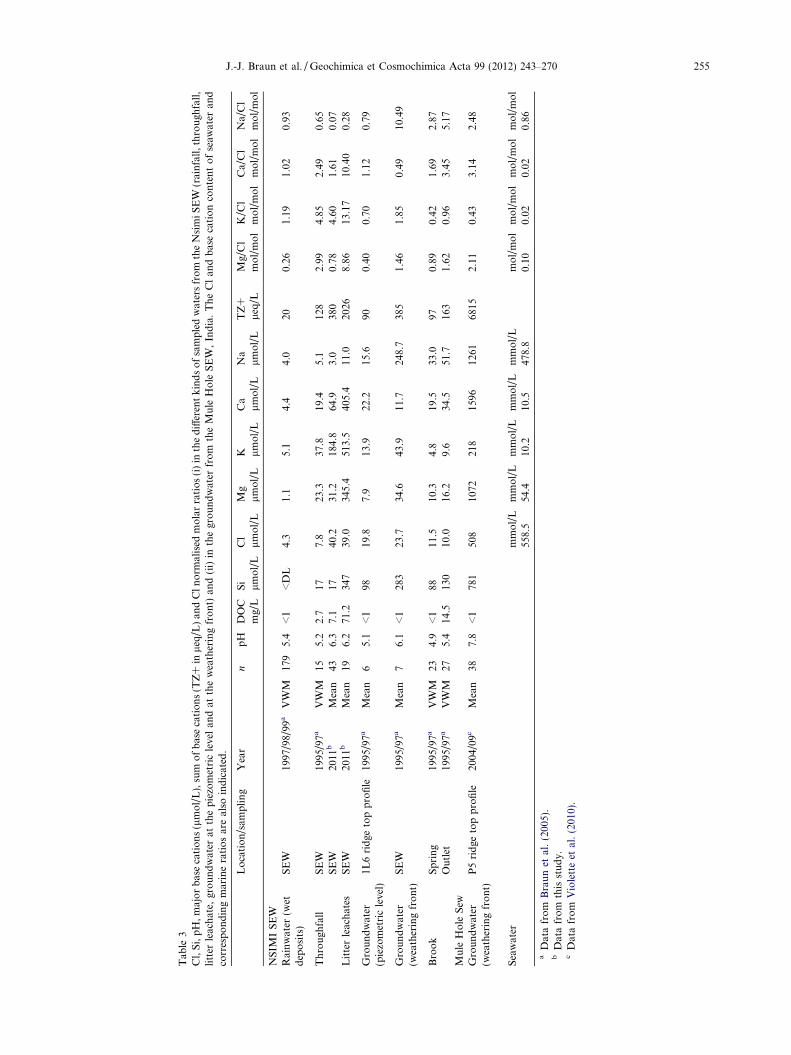
In order to compare the signatures of the different kindof waters from the Nsimi SEW (rainfall, troughfall, litterleachates, groundwater at piezometric level and weatheringfront, brook –MEN1 spring and outlet–), Table 3 sums uppH, silica, major base cations, sum of base cations (TZ+)and Cl contents compiled and this study (Braun et al.,2005). In addition, the chemistry of groundwater sampledin the ridge top well P5 from the Mule Hole SEW (Violetteet al., 2010) is also reported for further comparisons be-tween both ecosystems. The respective Cl-normalised molarratios are also mentionned along with the seawater compo-sition and the marine cyclic salt ratios. At Nsimi, the rain-falls collected from 1997 to 1999 are particularly diluted(TZ+ �20 leq/L) with a low average Na content of4 lmol/L and with other base cation contents less than5 lmol/L. The Na/Cl ratio (0.93) is not significantly differ-ent from the seawater ratio (0.86) given the incertitudelinked to these low concentrations. The Si and DOC (dis-solved organic carbon) contents are below the detectionlimit. The throughfalls collected from 1995 to 1997 and2011 exhibit an average Na contents from 2.8 to5.1 lmol/L, similar to the rainfalls, whilst the other majorcations (Ca, Mg, K) are in higher concentrations (TZ+from 128 to 380 leq/L) dominated by K with contents from38 to 168 lmol/L. The elevated K contents are associatedwith high Cl contents (up to 40 lmol/L) leading to Na/Clratio below the marine ratio (0.07–0.65). In the throughfallthe average Si contents are low (17 lmol/L) and the DOCcontents range between 2.7 and 7.1 mg/L. The waters col-lected below the litter traps in 2011 exhibit the highest basecation concentrations of the sampled pools with TZ+ of2030 leq/L. The average Na content is low (11 lmol/L)but twice those of rainfalls, certainly due to moderate evap-oration processes. With a concentration of 513 lmol/L, Kis the dominant cation associated with high Mg and Cacontents (345 lmol/L and 405 lmol/L, respectively). TheCl content is similar to those of the 2011’s troughfall sam-pling with 39 lmol/L, leading to a Na/Cl ratio of 0.28. BothSi and DOC contents are significantly high with 347 lmol/L and 71 mg/L, respectively. The chemistry of throughfallsand litter leachates indicates that K, Ca, Mg, Si and Cl aresignificantly cycled by the vegetation at the seasonnal scale.The hillside groundwater shows a positive concentrationgradient in terms of major base cations and protons fromthe topmost part of the water table (TZ+ � 90 leq/L;pH � 5.0) towards the bedrock/saprolite weathering front(TZ+ � 400 leq/L; pH � 6.0). The topmost groundwateris saturated with respect to quartz and kaolinite with Sicontent of 100 lmol/L and it is extremely diluted in Na,Ca, Mg and K. At the weathering front the Na and Si con-tents increase significantly to 250 lmol/L and to 280 lmol/L, respectively. The Cl, Ca, Mg and K contents are in thesame range at the top ridge piezometric level and at theweathering front. The water at the weathering front fromNsimi remains significantly diluted (400 leq/L) comparedto that from Mule Hole (6815 leq/L) (Violette et al.,2010). It has to be noticed that the entire hillside groundwa-ter is DOC free (DOC < 1 mg/L, detection limit).

Tab
le1
Ch
emic
alco
mp
osi
tio
no
fth
em
ain
ho
rizo
ns
of
pit
1L6
(hil
lsid
esy
stem
).
So
ftcl
ayey
top
soil
(TO
P)
Iro
ncr
ust
Mo
ttle
dcl
ayh
or.
(MC
H)
Sap
roli
te
(SA
P)
Gra
nit
eG
ran
od
iori
teC
om
po
site
par
ent
rock
0.30
0.70
Dep
thcm
2050
100
150
200
250
300
350
400
450
500
550
600
650
700
750
800
850
900
950
1000
1050
1100
1200
1250
1300
1350
1400
1400
–362
0
Gra
vel
frac
tio
n
%0.
00.
00.
00.
00.
00.
00.
00.
00.
00.
071
.468
.667
.467
.773
.046
.068
.158
.436
.232
.957
.435
.033
.452
.57.
60.
08.
80.
0
San
d
frac
tio
n
%51
.022
.825
.030
.030
.630
.928
.127
.121
.134
.27.
010
.98.
98.
59.
025
.012
.611
.828
.425
.614
.021
.020
.429
.238
.039
.939
.442
.2
Lo
am
frac
tio
n
%2.
12.
08.
98.
00.
06.
11.
916
.216
.43.
91.
15.
31.
21.
31.
15.
22.
43.
87.
36.
37.
311
.68.
710
.517
.018
.226
.734
.7
Cla
y
frac
tio
n
%47
.075
.265
.962
.069
.463
.070
.056
.162
.462
.020
.515
.222
.423
.017
.023
.817
.025
.528
.135
.221
.332
.437
.57.
837
.441
.925
.123
.1
q b1.
241.
331.
221.
261.
191.
251.
211.
271.
261.
271.
861.
881.
841.
791.
961.
771.
871.
761.
781.
371.
391.
621.
481.
171.
271.
321.
321.
271.
502.
652.
652.
65
q g2.
672.
682.
712.
702.
702.
682.
682.
682.
682.
702.
852.
862.
872.
842.
882.
803.
042.
922.
822.
832.
872.
772.
802.
782.
802.
812.
822.
662.
652.
652.
652.
65
U0.
540.
500.
550.
530.
560.
540.
550.
530.
530.
530.
350.
340.
360.
370.
320.
370.
380.
400.
370.
520.
520.
420.
470.
580.
550.
530.
530.
520.
430.
000.
000.
00
SiO
2w
t%67
.55
56.9
356
.98
57.1
752
.19
57.1
255
.60
54.6
555
.50
52.2
529
.89
31.5
434
.26
34.0
428
.88
40.7
541
.46
39.9
045
.68
44.7
440
.65
48.1
247
.99
51.5
251
.84
57.0
750
.90
53.7
661
.09
74.4
663
.02
66.4
5
Al 2
O3
wt%
15.0
022
.26
22.6
122
.55
25.9
722
.85
23.2
523
.87
23.7
924
.77
19.4
119
.26
20.9
320
.69
19.7
421
.37
19.9
719
.71
27.8
723
.76
20.8
424
.51
23.2
025
.09
24.3
519
.27
21.4
725
.71
22.1
313
.57
14.7
214
.38
Fe 2
O3
wt%
5.58
7.68
8.04
8.02
8.97
7.86
8.13
8.51
8.48
9.36
38.6
436
.66
33.4
234
.22
39.5
725
.31
27.7
029
.13
12.0
017
.34
27.1
315
.68
16.3
511
.11
11.8
112
.72
13.7
58.
476.
540.
875.
814.
33
Mn
Ow
t%0.
030.
030.
030.
030.
040.
040.
030.
030.
030.
040.
020.
020.
010.
020.
020.
010.
010.
010.
020.
020.
020.
020.
030.
020.
040.
060.
040.
030.
030.
000.
100.
07
MgO
wt%
0.08
0.03
0.08
0.07
0.12
0.04
0.09
0.09
0.05
0.04
0.11
0.05
0.10
0.13
0.09
0.13
0.12
0.11
0.20
0.16
0.18
0.16
0.16
0.11
0.17
0.27
0.18
0.16
0.23
0.13
3.49
2.48
CaO
wt%
0.02
0.00
0.00
0.07
0.00
0.00
0.00
0.00
0.00
0.00
0.00
0.00
0.00
0.00
0.00
0.00
0.00
0.00
0.00
0.00
0.00
0.00
0.00
0.00
0.04
0.00
0.00
0.00
0.01
0.98
5.58
4.20
Na 2
Ow
t%0.
000.
000.
000.
000.
000.
000.
000.
000.
000.
000.
000.
000.
000.
000.
000.
000.
000.
000.
000.
000.
000.
000.
000.
000.
000.
000.
000.
000.
003.
364.
484.
14
K2O
wt%
0.10
0.15
0.13
0.13
0.15
0.18
0.12
0.12
0.14
0.26
0.10
0.10
0.11
0.12
0.13
0.39
0.25
0.29
0.64
0.61
0.45
0.53
0.39
0.44
0.55
0.99
0.85
0.63
0.74
5.10
0.88
2.15
TiO
2w
t%0.
911.
061.
071.
111.
271.
121.
131.
151.
161.
200.
580.
630.
540.
680.
660.
580.
620.
580.
670.
860.
620.
770.
870.
831.
171.
541.
520.
960.
590.
050.
470.
34
P2O
5w
t%0.
090.
150.
090.
080.
100.
150.
080.
080.
080.
140.
060.
180.
060.
070.
070.
190.
070.
050.
090.
180.
120.
090.
090.
090.
100.
060.
190.
090.
140.
030.
240.
18
LO
Iw
t%10
.47
11.8
110
.83
10.6
011
.64
10.8
611
.40
11.3
410
.60
11.8
611
.22
11.4
410
.45
10.4
810
.05
11.1
89.
859.
5712
.68
11.7
610
.04
10.3
610
.77
10.4
29.
777.
9410
.40
10.0
58.
531.
150.
550.
73
To
tal
wt%
99.8
210
0.08
99.8
499
.82
100.
4510
0.19
99.8
299
.83
99.8
299
.90
100.
0599
.87
99.8
810
0.48
99.2
299
.89
100.
0599
.38
99.8
499
.44
100.
0610
0.23
99.8
599
.63
99.8
499
.90
99.2
899
.85
100.
0399
.32
Vlg
/g89
123
128
127
140
137
124
130
133
163
631
628
508
590
653
364
404
426
202
238
456
242
244
146
166
198
248
132
878.
8510
9.01
78.9
7
Cr
lg/g
8510
229
411
111
412
710
711
312
525
674
566
746
275
164
023
928
739
722
137
731
810
911
453
5968
8945
404.
5316
1.97
114.
73
Co
lg/g
3.1
4.1
4.6
4.1
4.8
4.5
4.4
4.6
4.4
5.4
3.7
3.3
2.3
4.2
4.1
2.5
2.7
3.1
3.3
3.7
2.7
3.8
3.7
4.4
5.8
6.9
7.9
4.5
5.4
0.97
19.0
413
.62
Ni
lg/g
2334
3833
3935
3535
3442
2320
1725
2918
1820
2122
1721
2318
2320
2719
162.
848
.334
.6
Cu
lg/g
1621
2421
2224
1918
1625
3930
1436
1919
1014
1019
1212
1416
1918
2516
1341
.40
6.56
17.0
1
Zn
lg/g
169
5258
5663
5956
5653
6052
4129
5040
2930
3537
3835
4250
4160
5565
4339
10.6
080
.97
59.8
6
Ga
lg/g
2232
3133
3634
3134
3438
4444
4145
5142
3638
3838
3736
3632
4251
5034
2716
.40
19.7
218
.73
Ge
lg/g
1.1
1.4
1.3
1.3
1.4
1.7
1.3
1.4
1.5
1.6
1.7
2.0
2.2
1.8
2.4
1.4
1.5
1.6
1.0
1.1
1.7
1.3
1.3
1.3
1.2
1.1
1.3
1.0
0.9
0.98
0.68
Rb
lg/g
10.7
13.0
13.3
13.4
14.9
14.3
13.9
12.6
12.1
12.8
4.0
4.4
4.4
4.9
4.0
11.1
6.7
6.5
15.6
12.3
9.4
11.2
8.6
7.5
8.0
12.1
12.1
8.8
10.1
162.
009.
3455
.14
Sr
lg/g
2022
2222
2723
2325
2426
1114
1512
1323
3027
1822
7245
4671
6142
6671
9623
1.0
777.
761
3.7
Zr
lg/g
359
390
350
394
431
429
400
398
353
443
272
405
235
245
271
220
238
225
245
288
223
309
282
280
395
537
411
302
198
7012
010
5
Nb
lg/g
1923
2324
2724
2525
2527
1112
1110
109
109
1214
1012
139
1315
1310
51
43
Cd
lg/g
0.18
0.25
0.19
0.20
0.27
0.27
0.24
0.14
0.13
0.16
0.25
0.19
0.10
0.21
0.21
0.08
0.08
0.10
0.07
0.21
0.12
0.19
0.21
0.18
0.21
0.39
0.23
0.23
0.14
0.17
0.18
0.18
Sn
lg/g
2.03
2.81
2.83
2.71
2.85
2.87
2.95
3.04
2.81
3.18
1.76
1.67
1.69
1.85
2.39
1.36
1.63
1.41
1.51
1.89
1.44
1.65
1.76
1.39
1.87
2.50
1.88
1.65
0.87
0.53
1.14
0.95
Ba
lg/g
53.5
65.4
63.6
66.2
74.1
70.0
71.2
75.0
73.2
86.3
39.3
41.2
47.8
53.6
76.1
193.
415
0.9
144.
631
9.6
281.
122
4.0
232.
623
3.1
292.
242
0.0
617.
058
3.3
418.
445
0.8
1083
.076
6.7
861.
6
La
lg/g
16.8
23.5
26.0
25.9
30.2
28.0
28.2
30.2
28.1
29.9
15.6
15.5
16.3
13.2
14.5
25.4
26.5
25.6
17.8
21.3
59.6
38.2
41.7
72.5
85.0
66.1
86.4
72.2
79.7
9.1
45.1
34.3
Ce
lg/g
30.3
49.5
55.7
54.6
64.6
59.2
59.9
58.2
50.9
53.7
23.7
24.0
22.9
22.8
23.0
52.7
44.9
43.5
28.7
36.0
102.
764
.371
.812
5.9
145.
911
2.9
154.
612
5.6
146.
812
.698
.572
.8
Pr
lg/g
2.9
4.2
5.1
4.7
5.6
5.0
5.2
5.5
5.2
5.3
2.7
2.6
2.8
2.4
2.5
4.8
4.8
4.6
3.1
3.7
11.4
6.6
7.8
13.7
14.8
11.4
15.8
13.2
16.1
1.0
11.5
8.3
Nd
lg/g
9.7
14.9
17.6
16.4
19.0
17.5
18.3
18.7
18.3
18.3
9.7
9.0
9.2
8.6
8.1
14.9
15.8
15.6
9.8
12.1
36.4
21.7
26.1
44.3
46.5
36.4
48.6
43.4
56.5
3.2
43.3
31.3
Sm
lg/g
1.65
2.51
3.13
2.86
3.23
2.91
3.27
3.12
2.98
3.05
1.71
1.39
1.31
1.44
1.33
2.04
2.27
2.26
1.53
1.93
5.16
3.21
3.62
5.76
5.82
4.24
6.20
5.27
7.49
0.42
7.16
5.14
250 J.-J. Braun et al. / Geochimica et Cosmochimica Acta 99 (2012) 243–270

Eu
lg/g
0.38
0.56
0.66
0.62
0.67
0.65
0.68
0.70
0.63
0.66
0.41
0.34
0.36
0.35
0.30
0.55
0.60
0.56
0.39
0.46
1.29
0.78
0.83
1.38
1.35
0.92
1.42
1.27
1.97
0.58
1.59
1.29
Gd
lg/g
1.39
2.15
2.24
2.32
2.77
2.34
2.36
2.38
2.25
2.39
1.15
1.10
0.93
1.14
0.93
1.39
1.61
1.56
0.93
1.38
3.14
2.04
2.52
3.50
3.65
2.46
3.58
3.26
4.80
0.36
4.82
3.48
Tb
lg/g
0.21
0.30
0.34
0.29
0.41
0.34
0.37
0.38
0.35
0.33
0.19
0.16
0.15
0.17
0.13
0.18
0.19
0.19
0.16
0.18
0.39
0.29
0.33
0.44
0.43
0.32
0.46
0.44
0.65
0.03
0.62
0.44
Dy
lg/g
1.37
1.55
2.09
2.11
2.18
2.12
2.17
2.03
2.03
2.15
0.97
0.85
0.77
0.97
0.75
0.96
1.08
1.10
0.83
0.96
1.87
1.47
1.66
2.08
2.01
1.48
2.28
1.87
2.97
0.18
2.92
2.09
Ho
lg/g
0.28
0.34
0.41
0.39
0.46
0.38
0.44
0.45
0.42
0.46
0.20
0.19
0.15
0.19
0.13
0.16
0.18
0.17
0.17
0.20
0.27
0.24
0.25
0.28
0.31
0.23
0.27
0.25
0.43
0.03
0.48
0.35
Er
lg/g
0.86
0.98
1.21
1.21
1.31
1.14
1.27
1.36
1.18
1.29
0.57
0.52
0.42
0.58
0.41
0.43
0.50
0.53
0.48
0.55
0.68
0.68
0.75
0.80
0.86
0.62
0.74
0.71
1.13
0.06
1.35
0.96
Tm
lg/g
0.13
0.18
0.18
0.19
0.26
0.19
0.22
0.21
0.21
0.21
0.10
0.08
0.07
0.09
0.07
0.08
0.09
0.08
0.08
0.10
0.09
0.09
0.10
0.09
0.10
0.09
0.10
0.07
0.12
0.01
0.19
0.13
Yb
lg/g
0.95
1.22
1.34
1.29
1.65
1.24
1.39
1.37
1.26
1.42
0.58
0.56
0.45
0.71
0.45
0.46
0.50
0.45
0.56
0.63
0.57
0.60
0.65
0.61
0.64
0.58
0.67
0.51
0.79
0.08
1.21
0.87
Lu
lg/g
0.17
0.18
0.23
0.24
0.25
0.21
0.23
0.23
0.23
0.20
0.10
0.10
0.07
0.10
0.08
0.07
0.08
0.08
0.09
0.09
0.09
0.11
0.11
0.09
0.11
0.11
0.11
0.09
0.11
0.02
0.18
0.13
Ylg
/g8.
310
.611
.311
.513
.813
.012
.412
.512
.213
.55.
45.
24.
45.
13.
83.
74.
94.
44.
85.
56.
06.
26.
96.
26.
35.
46.
56.
310
.91
1511
Hf
lg/g
8.88
9.44
8.74
10.0
110
.19
9.81
9.71
9.80
8.55
10.0
66.
108.
465.
105.
516.
075.
595.
645.
385.
596.
574.
986.
876.
286.
579.
2612
.50
8.97
6.78
4.52
2.64
2.91
2.83
Ta
lg/g
1.49
1.78
1.76
1.82
1.95
1.72
1.87
1.89
1.86
1.93
0.75
0.78
0.68
0.71
0.63
0.65
0.74
0.69
0.83
0.96
0.66
0.71
0.87
0.61
0.79
0.87
0.68
0.66
0.35
0.04
0.35
0.26
Wlg
/g0.
851.
111.
261.
161.
201.
081.
141.
191.
191.
200.
630.
660.
580.
690.
580.
490.
460.
480.
530.
640.
430.
450.
510.
240.
240.
180.
170.
130.
270.
210.
050.
10
Pb
lg/g
13.0
16.3
16.7
17.3
18.4
15.7
16.9
16.6
16.2
16.6
23.5
20.8
20.0
26.2
31.4
29.2
20.5
25.0
13.4
17.5
26.7
19.8
20.9
18.3
18.9
15.3
23.4
16.5
17.7
22.6
07.
5312
.05
Th
lg/g
12.9
16.5
18.0
18.0
19.5
16.2
17.8
18.8
18.1
18.8
30.9
27.9
23.6
30.6
47.4
36.0
34.7
34.5
16.3
27.8
47.5
40.0
37.3
28.4
38.3
50.5
40.7
26.6
16.1
4.3
6.9
6.1
Ulg
/g1.
92.
22.
52.
62.
82.
42.
52.
72.
42.
62.
52.
11.
92.
42.
42.
52.
32.
32.
72.
92.
51.
81.
91.
61.
92.
02.
41.
41.
61.
80.
71.
1
Gra
insi
zed
istr
ibu
tio
n,
bu
lkan
dgr
ain
den
siti
esan
dm
ajo
rel
emen
ts(i
nw
t.%
)ar
efr
om
Bra
un
etal
.(2
005)
.T
race
elem
ent
con
ten
ts(i
np
pm
)ar
efr
om
this
stu
dy
and
(* )tr
ace
elem
ents
alre
ady
men
tio
ned
in(B
rau
net
al.,
2005
).T
OP
,so
ftcl
ayey
top
soil
;IC
,ir
on
cru
st;
MC
H,
mo
ttle
dcl
ayh
ori
zon
;S
AP
:sa
pro
lite
.
J.-J. Braun et al. / Geochimica et Cosmochimica Acta 99 (2012) 243–270 251
5. DISCUSSION
The first section of the discussion will address the ele-mental distribution within the constitutive minerals of bothparent rocks and weathering products, which is an indis-pensable preamble to trace the origin of the long-termand contemporary chemical weathering fluxes. The secondsection will focus on the quantification of the solid-stateelemental and mineralogical changes within in situ weath-ered materials and topsoil using appropriate immobile ele-ment and parental references. The third section will dealwith the origin and the quantification of the contemporaryelemental fluxes and the saprolite production rate. Com-parisons will be carried out in terms of both hydrologicalregime and aggressiveness of the pore water with a ridgetop immature weathering profile from Mule Hole SEW,South India. We will finally merge both long-term trans-formation and contemporary chemical fluxes within theNsimi SEW profile to infer the long-term trajectory ofthe lateritic tropical terrain of South Cameroon.
5.1. Elemental distribution in bedrock and weathering
products
The modal abundances presented in (Braun et al., 2005)for both parent rock end members (granodiorite and gran-ite) and weathering products were refined following themethod proposed in (Braun et al., 2009) to better appraisethe elemental contribution of the constitutive minerals anderrors. In the parent rocks, assuming that apatite controls100% of P2O5, its modal abundance is first determined;then the proportion of Ca linked to apatite is deductedfrom the bulk analysis. To estimate the modal abundanceswith the apatite-corrected bulk analysis, we apply a linearinverse method using least squares criterion (Tarantolaand Valette, 1982). The solution and error is given byEqs. (47) and (48) in (Tarantola and Valette, 1982):
x ¼ ðAT :C�1yoyo:AÞ�1:AT :C�1
yoyo:yo
Cxx ¼ ðAT :C�1yoyo:AÞ�1
where y0 is the chemical composition vector of the rock, A
is the matrix of the main mineral compositions and x the a
posteriori solution (modal abundance vector), C�1y0y0
is theinverse of the covariance matrix and Cxx is the a posteriori
error covariance of the solution. The residuals are calcu-lated by y0 � y, where y ¼ A:x. The minerals selected inthe matrix A are quartz, biotite, K-feldspar, oligoclase,hornblende, magnetite, epidote for the graniodiorite andquartz, biotite, K-feldspar, albite, titanomagnetite and epi-dote for the granite. Both bulk compositions (+/�r), cal-culated modal abundances and their errors, estimatedbulk compositions (y) and associated residuals, and theestimated contributions from each mineral to the wholerock are summed up in Table 4 for the parent rock endmembers and the composite rock and in Table 5 for theweathering products.
In the composite parent rock, the distribution of majorelements in the primary minerals is, in decreasing order:

1 10 100 1000
0 <= 0.1 1 10 100
TiO2(wt%)
Fe2O3(wt%)
Al2O3(wt%)
SiO2(wt%)
Na2O(wt%)
K2O(wt%)
CaO(wt%)
MgO(wt%)
1 10 100 1000
1 10 100 1000 0.1 1 10 100
0100200300400500600700800900
10001100120013001400
3600
topsoil
iron crust
mottledclay
saprolite
element (wt% or ppm)BOREHOLE1L6
parentrock
depth (cm)
0100200300400500600700800900
10001100120013001400
3600
0100200300400500600700800900
10001100120013001400
3600
0100200300400500600700800900
10001100120013001400
3600
element (wt% or ppm)
0.01 0.1 1 10 100 1000
0.01 0.1 1 10 100 1000
0.1 1 10 100
Ta(ppm)
Hf(ppm)
Nb(ppm)
Th(ppm)
Zr(ppm)
K2O(wt%)
Cr(ppm)
V(ppm)
MnO(wt%)
Fe2O3(wt%)
U(ppm)
Th(ppm)
Ce(ppm)
Y(ppm)
HREE(ppm)
LREE-Ce(ppm)
Rb(ppm)
Ba(ppm)
Sr(ppm)
A
HG
FE
DC
B
Zn(ppm)
Co(ppm)
Ni(ppm)
Cu(ppm)
SiO2(wt%)
Al2O3(wt%)
Ge(ppm)
Ga(ppm)
Fig. 3. (A–H) Depth profiles of major elements (in wt.%) and trace elements (in ppm) in the profile 1L6.
252 J.-J. Braun et al. / Geochimica et Cosmochimica Acta 99 (2012) 243–270

Table 2Statistics of the composition in trace elements and Volume Weight Mean (VWM) for (i) the MEN1 spring waters and (ii) the outlet watersfrom the Mengong brook, Nsimi SEW.
Springaveragen = 23
±1r Min Max VWM Outletaveragen = 27
±1r Min Max VWM
Rb lmol/L 0.004 0.001 0.001 0.005 0.003 0.009 0.007 0.003 0.028 0.009Sr lmol/L 0.065 0.009 0.029 0.074 0.064 0.216 0.045 0.095 0.284 0.205Ba lmol/L 0.084 0.016 0.033 0.116 0.084 0.172 0.066 0.074 0.425 0.178
Al lmol/L 0.706 0.434 0.139 1.589 0.569 11.633 4.214 4.918 18.658 11.726Ga lmol/L 0.005 0.001 0.002 0.006 0.005 0.009 0.004 0.001 0.024 0.010
Si (*) lmol/L 92 10 67 111 91 128 14 94 146 129
Ti (*) lmol/L 0.006 0.005 <DL 0.019 0.006 0.041 0.038 0.009 0.158 0.039Zr (*) lmol/L <DL <DL <DL <DL 0.004662 0.002054 0.000853 0.007908 0.003813Hf lmol/L <DL <DL <DL <DL 0.000077 0.000034 0.000013 0.000141 0.000060Nb lmol/L <DL <DL <DL <DL 0.000060 0.000047 0.000007 0.000173 0.000092
V lmol/L <DL <DL <DL <DL 0.028 0.014 0.008 0.065 0.025Cr lmol/L <DL <DL <DL <DL 0.037 0.007 0.026 0.055 0.034Mn lmol/L 0.087 0.022 0.025 0.117 0.085 0.235 0.140 0.014 0.596 0.217Fe lmol/L <DL <DL <DL <DL 6.747 2.539 2.862 11.015 6.728
Co lmol/L 0.003 0.001 0.001 0.005 0.003 0.005 0.002 0.001 0.010 0.005Ni lmol/L 0.011 0.011 0.004 0.060 0.011 0.030 0.021 0.007 0.094 0.028Cu lmol/L 0.004 0.005 <DL 0.021 0.004 0.017 0.007 0.003 0.028 0.015Zn lmol/L 0.035 0.019 <DL 0.068 0.027 0.094 0.079 0.016 0.274 0.057
La lmol/L 0.000628 0.000486 0.000099 0.002290 0.000536 0.001909 0.000711 0.000551 0.003339 0.002018Ce lmol/L 0.000822 0.000484 0.000122 0.001616 0.000723 0.004392 0.001566 0.001314 0.006943 0.004594Pr lmol/L 0.000104 0.000058 0.000018 0.000212 0.000092 0.000515 0.000181 0.000171 0.000837 0.000531Nd lmol/L 0.000406 0.000230 0.000029 0.000956 0.000343 0.002052 0.000690 0.000737 0.003121 0.002105Sm lmol/L 0.000079 0.000048 <DL 0.000175 0.000086 0.000442 0.000183 0.000059 0.000796 0.000422Eu lmol/L 0.000012 0.000016 <DL 0.000042 0.000007 0.000091 0.000042 0.000033 0.000178 0.000092Gd lmol/L 0.000044 0.000048 <DL 0.000143 0.000033 0.000300 0.000122 0.000097 0.000550 0.000304Tb lmol/L 0.000003 0.000006 <DL 0.000026 0.000001 0.000042 0.000018 0.000012 0.000070 0.000040Dy lmol/L 0.000020 0.000033 <DL 0.000104 0.000008 0.000256 0.000081 0.000106 0.000411 0.000266Ho lmol/L <DL <DL <DL <DL 0.000048 0.000014 0.000017 0.000073 0.000048Er lmol/L <DL <DL <DL <DL 0.000131 0.000046 0.000061 0.000233 0.000135Tm lmol/L <DL <DL <DL <DL 0.000017 0.000008 0.000006 0.000031 0.000012Yb lmol/L 0.000003 0.000007 <DL 0.000030 0.000004 0.000128 0.000044 0.000045 0.000193 0.000127Lu lmol/L <DL <DL <DL <DL 0.000018 0.000006 0.000009 0.000029 0.000015Y lmol/L 0.000560 0.000337 0.000088 0.001178 0.000459 0.002492 0.000800 0.000766 0.004077 0.002615
Th (*) lmol/L <DL <DL <DL <DL 0.00044 0.00016 0.00011 0.00071 0.000437U lmol/L <DL <DL <DL <DL 0.00007 0.00002 0.00003 0.00013 0.000069
Data from Braun et al. (2005) (*).
J.-J. Braun et al. / Geochimica et Cosmochimica Acta 99 (2012) 243–270 253
� For Si: quartz (36%), oligoclase (31%), hornblende(13%), K-feldspar (9%), albite (8%), epidote (3%) andbiotite (2%).� For Na: oligoclase (64%), albite (29%), hornblende (6%)
and K-feldspar (1%).� For K: K-feldspar (50%), hornblende (24%), biotite
(16%), oligoclase (10%) and albite (0.2%).� For Ca: epidote (36%), hornblende (31%), oligoclase
(24%), albite (6%), apatite (4%) and biotite (0.3%).� For Mg: hornblende (66%) and biotite (34%).
From XRD patterns and thin section SEM observationsof the weathered materials, the residual mineral phases arequartz (SiO2) and zircon (ZrSiO4). The secondary mineralassemblage is composed of clays (goethite, haematite,
anatase) and clay minerals (illite, kaolinite). Gibbsite is ab-sent on the bulk XRD patterns meaning that, if present, thecontent are less than 5%. To assess the repartition of ele-ments in the weathered materials, the mineral compositionsused in the matrix for the linear inverse method come fromthe Mineralogy Database website (http://webmineral.com/). The quartz proportion in the composite bedrock is24%, which accounts for 38% of the Si content. In thein situ weathered materials, the proportion significantly in-creases up to 32.8% (53.7% of Si) in the saprolite and thendecreases to 23.1% (43.6% of Si) in the mottled clay and to12.4% (31.6% of Si) in the iron crust, respectively. In thetopsoil, the quartz proportion is 24.4% accounting for44% of the Si content. The zircon proportion in the com-posite bedrock is 180 mg/kg and accounts for 100% of Zr

1.0E-08
1.0E-07
1.0E-06
1.0E-05
1.0E-04
1.0E-03
Na K Mg Ca Rb Sr Ba Si Al Ga V Cr FeMn Co Ni Cu Zn Ti Zr Nb Hf Th U La Ce Pr Nd Sm Eu Gd Tb Dy Ho Er Tm Yb Lu Y
ELEM
ENT w
ater
/ EL
EMEN
T com
posi
te p
aren
t roc
k
SPRINGMENGONG
OUTLETMENGONG
Fig. 4. Parent rock normalised patterns for the water at the Mengong outlet (white squares and dark gray shade) and for the water at thespring MEN1 (dark circles and light grey shade). The shaded areas represent the standard deviation to the mean for the waters.
254 J.-J. Braun et al. / Geochimica et Cosmochimica Acta 99 (2012) 243–270
based on the fact that the Zr content is only attributed tozircon crystals. Zircon grains are significantly accumulatedin the saprolite (480 mg/kg), the mottled clay (890 mg/kg),the iron crust (620 mg/kg) and the topsoil (920 mg/kg).With amounts from 50% to 60%, kaolinite (Al2Si2O5(OH)4)is the most abundant mineral in the weathered materialsand accounts for 38–64% of the SiO2 content and for 92–98% of the Al2O3 content. The proportion of iron oxidesand oxihydroxides, only assessed with goethite (FeOOH)in the mineral matrix, is low in the saprolite (6.5%) andreaches its maximum in the iron crust (29.4%). Goethite ac-counts for more than 98% of Fe of the weathered materials.Illite (K0.6(H3O)0.4Al1.3Mg0.3Fe2+
0.1Si3.5O10(OH)2�(H2O))could only be detected on the XRD patterns of saproliteand mottled clay samples. However the proportions wereassessed in all the weathered horizons assuming that illiteaccounts for 100% of the K content in the weathered mate-rials. The saprolite and mottled clay contain 9.5% and 8.9%of illite, respectively. The proportions decrease in the ironcrust with 4.1% and in the topsoil with 2.2%. The Ti con-tents are attributed to the presence of anatase in the weath-ered materials, whose estimated proportions tend toincrease in the mottled clay (1.2%), the iron crust (0.7%)and the topsoil (1.1%) compared to the saprolite (0.6%).
5.2. Long-term elemental fluxes in the weathering lateritic
profile
The mass balance equation set is based on the principleof mass conservation (Brimhall et al., 1991; Oh and Rich-ter, 2005). For a chemical element j:
V wqwCj;w
100¼
V pqpCj;p
100þ mj;flux
where the subscripts p and w refer to the parent and weath-ered materials, respectively. V is volume in cm3, q is bulkdensity in g/cm3 and Cj is chemical concentration of anyelement j in weight percent (wt.%). The mj,flux representsthe mass of an element j moving in or out of the system.The mj,flux is positive if the element j is accumulated inthe system and negative if j is leached from the system.
The volumetric strain (e) or volume change is calculatedfrom the density ratios q and conservative element concen-trations Ci in the regolith by:
ei;w ¼qpCi;p
qwCi;w� 1
Positive values of ei,w indicate expansion, negative onesindicate collapse and values around zero, isovolumicweathering.
The addition or subtraction of a chemical element j,either by solute migration or mechanical translocation, isquantified by the open-system mass fraction transport func-tion (sj,w):
sj;w ¼qwCj;w
qpCj;p
!ðei;w þ 1Þ � 1
Because the calculation of sj,w takes into account bothresidual enrichment and deformation, a positive value forsj,w reflects a true mass gain in element j of the weatheredrock compared to the parent rock and a negative value indi-cates a mass loss. If sj,w = 0, the element is immobile duringweathering with respect to the volume of regolith consid-ered. Moreover, quantification of the overall mass transfersduring both saprolitization and soil processes can be ap-proached by the estimation of the chemical component
Tab
le3
Cl,
Si,
pH
,m
ajo
rb
ase
cati
on
s(l
mo
l/L
),su
mo
fb
ase
cati
on
s(T
Z+
inl
eq/L
)an
dC
ln
orm
alis
edm
ola
rra
tio
s(i
)in
the
diff
eren
tk
ind
so
fsa
mp
led
wat
ers
fro
mth
eN
sim
iS
EW
(rai
nfa
ll,
thro
ugh
fall
,li
tter
leac
hat
e,gr
ou
nd
wat
erat
the
pie
zom
etri
cle
vel
and
atth
ew
eath
erin
gfr
on
t)an
d(i
i)in
the
gro
un
dw
ater
fro
mth
eM
ule
Ho
leS
EW
,In
dia
.T
he
Cl
and
bas
eca
tio
nco
nte
nt
of
seaw
ater
and
corr
esp
on
din
gm
arin
era
tio
sar
eal
soin
dic
ated
.
Lo
cati
on
/sam
pli
ng
Yea
rn
pH
DO
CS
iC
lM
gK
Ca
Na
TZ
+M
g/C
lK
/Cl
Ca/
Cl
Na/
Cl
mg/
Llm
ol/
Ll
mo
l/L
lm
ol/
Ll
mo
l/L
lm
ol/
Ll
mo
l/L
leq
/Lm
ol/
mo
lm
ol/
mo
lm
ol/
mo
lm
ol/
mo
l
NS
IMI
SE
WR
ain
wat
er(w
etd
epo
sits
)S
EW
1997
/98/
99a
VW
M17
95.
4<
1<
DL
4.3
1.1
5.1
4.4
4.0
200.
261.
191.
020.
93
Th
rou
ghfa
llS
EW
1995
/97a
VW
M15
5.2
2.7
177.
823
.337
.819
.45.
112
82.
994.
852.
490.
65S
EW
2011
bM
ean
436.
37.
117
40.2
31.2
184.
864
.93.
038
00.
784.
601.
610.
07L
itte
rle
ach
ates
SE
W20
11b
Mea
n19
6.2
71.2
347
39.0
345.
451
3.5
405.
411
.020
268.
8613
.17
10.4
00.
28
Gro
un
dw
ater
(pie
zom
etri
cle
vel)
1L6
rid
geto
pp
rofi
le19
95/9
7aM
ean
65.
1<
198
19.8
7.9
13.9
22.2
15.6
900.
400.
701.
120.
79
Gro
un
dw
ater
(wea
ther
ing
fro
nt)
SE
W19
95/9
7aM
ean
76.
1<
128
323
.734
.643
.911
.724
8.7
385
1.46
1.85
0.49
10.4
9
Bro
ok
Sp
rin
g19
95/9
7aV
WM
234.
9<
188
11.5
10.3
4.8
19.5
33.0
970.
890.
421.
692.
87O
utl
et19
95/9
7aV
WM
275.
414
.513
010
.016
.29.
634
.551
.716
31.
620.
963.
455.
17M
ule
Ho
leS
ewG
rou
nd
wat
er(w
eath
erin
gfr
on
t)P
5ri
dge
top
pro
file
2004
/09c
Mea
n38
7.8
<1
781
508
1072
218
1596
1261
6815
2.11
0.43
3.14
2.48
Sea
wat
erm
mo
l/L
mm
ol/
Lm
mo
l/L
mm
ol/
Lm
mo
l/L
mo
l/m
ol
mo
l/m
ol
mo
l/m
ol
mo
l/m
ol
558.
554
.410
.210
.547
8.8
0.10
0.02
0.02
0.86
aD
ata
fro
mB
rau
net
al.
(200
5).
bD
ata
fro
mth
isst
ud
y.c
Dat
afr
om
Vio
lett
eet
al.
(201
0).
J.-J. Braun et al. / Geochimica et Cosmochimica Acta 99 (2012) 243–270 255

Tab
le4
Ave
rage
com
po
siti
on
,re
fin
edm
od
alab
un
dan
ces
and
erro
rsan
dco
ntr
ibu
tio
nto
the
wh
ole
rock
of
each
min
eral
of
the
bed
rock
end
mem
ber
san
dfo
rth
eco
mp
osi
teb
edro
ck.
Als
om
enti
on
edis
the
aver
age
anal
ysis
of
thre
esa
mp
les
fro
mth
eo
utc
rop
of
the
L5
cate
na.
Th
eb
old
valu
esco
rres
po
nd
toth
ees
tim
ates
of
the
mo
dal
abu
nd
ance
sfr
om
Bra
un
etal
.(2
005)
SiO
2A
l 2O
3F
e 2O
3M
nO
MgO
CaO
Na 2
OK
2O
TiO
2P
2O
5L
OI
tota
lw
t%w
t%w
t%w
t%w
t%w
t%w
t%w
t%w
t%w
t%w
t%w
t%
Gra
no
dio
rite
end
-mem
ber
Bu
lkan
alys
is**
62.8
014
.58
5.97
0.07
3.51
5.61
4.63
0.83
0.46
0.29
0.89
99.6
4B
ore
ho
le1L
6D
etec
tio
nli
mit
0.80
0.30
0.10
0.03
0.40
0.50
0.08
0.05
0.09
0.20
0.02
Est
imat
e62
.80
14.1
95.
970.
063.
706.
574.
310.
830.
500.
290.
6699
.89
Res
idu
als
0.00
0.39
0.00
0.01
�0.
19�
0.96
0.32
0.00�
0.04
0.00
0.23
Mo
dal
abu
nd
ance
Min
eral
con
trib
uti
on
toth
ew
ho
lero
ckco
mp
osi
tio
n
Co
nst
itu
tive
min
eral
form
ula
**
av.
(%)
±(*
*)
SiO
2A
l 2O
3F
e 2O
3M
nO
MgO
CaO
Na 2
OK
2O
TiO
2P
2O
5L
oI
Oli
gocl
ase
(Na 0
.75,C
a 0.2
4,K
0.0
2)(
Si 2
.76A
l 1.2
3)O
844
.3±
2.1
50
44.0
72.6
0.0
0.0
0.0
33.6
90.8
13.8
00
0.0
Ho
rnb
len
de
(Na 0
.27K
0.2
1) 0
.48(C
a 1.8
3N
a 0.1
7) 2
(Mg 3
.05
Fe2
+1.2
9F
e3+
0.1
9A
l 0.2
5T
i 0.1
9M
n0.0
3) 5
(Si 6
.66A
l 1.3
3) 8
O22(O
H1.7
7F
0.2
3) 2
25.0
±1.
42
418
.116
.156
.391
.994
.344
.48.
833
.686
075
.3
Qu
artz
Si0
220
.3±
3.4
19
32.3
0.0
0.0
0.0
0.0
0.0
0.0
0.0
00
0.0
Ep
ido
te(C
a 2.0
6F
e 0.9
2M
n0.0
1) 3
(Si 3
.13A
l 2.1
9) 5
.32O
13(O
H)
4.6
±1.
3N
D2.
87.
20.
18.
10.
016
.20.
00.
00
013
.8T
itan
om
agn
etit
eF
e2+
2(F
e3+
Ti)
O4
2.4
±0.
33
0.0
0.0
39.5
0.0
0.0
0.0
0.0
0.0
00
0.0
K-f
eld
spar
(K0.9
2N
a 0.0
7B
a 0.0
1)(
Si 2
.97A
l 1.0
5)O
81.
9±
0.5
21.
92.
50.
00.
00.
00.
00.
335
.00
00.
0B
ioti
te(K
1.8
5B
a 0.0
2) 1
.88(M
g 3.1
3F
e 1.8
4T
i 0.5
2,
Al 0
.06M
n0.0
2) 5
.57
(Si 5
.56A
l 2.4
4) 8
O20(O
H3.4
0F
0.6
0) 4
1.5
±0.
72
0.9
1.5
4.1
0.0
5.7
0.0
0.0
17.6
140
9.1
Ap
atit
eC
a 10[P
O4] 5
,98[S
iO4] 0
,02F
1,8
0C
l 0,0
2O
H0,0
80.
7±
0.2
0.7
0.0
0.0
0.0
0.0
0.0
5.8
0.0
0.0
010
01.
8
Gra
nit
een
d-m
emb
erB
ulk
anal
ysis
**
74.4
613
.57
0.87
<D
L<
DL
0.98
3.36
5.10
<D
L<
DL
1.15
99.6
9L
5o
utc
rop
Det
ecti
on
lim
it0.
800.
300.
100.
030.
400.
500.
080.
050.
090.
200.
02
Est
imat
e74
.46
12.8
21.
680.
021.
000.
943.
465.
220.
270.
000.
3610
0.23
Res
idu
als
0.00
0.75
�0.
81�
0.02�
1.00
0.04�
0.10�
0.12�
0.27
0.00
0.79
Mo
dal
abu
nd
ance
Min
eral
con
trib
uti
on
toth
ew
ho
lero
ckco
mp
osi
tio
n
Co
nst
itu
tive
min
eral
form
ula
**
av.
(%)
±(*
*)
SiO
2A
l 2O
3F
e 2O
3M
nO
MgO
CaO
Na 2
OK
2O
TiO
2P
2O
5L
oI
Gra
nit
een
d-m
emb
erQ
uar
tzS
i02
32.6
±3.
92
943
.80.
00.
00.
00.
00.
00.
00.
00.
00
0.0
Alb
ite
(Na 0
.93,C
a 0.0
6,K
0.0
1)(
Si 2
.93A
l 1.0
8)O
829
.0±
1.4
34
26.6
44.8
0.0
0.0
0.0
18.4
96.4
0.6
0.0
00.
0K
-fel
dsp
ar(K
0.9
7,N
a 0.0
4)(
Si 2
.98A
l 1.0
1)O
827
.9±
1.5
33
24.2
40.4
0.0
0.0
0.0
0.0
3.6
86.1
0.0
00.
0B
ioti
teK
1.7
9(M
g 2.8
6F
e 2.1
4T
i 0.3
5A
l 0.3
4M
n0.0
2) 5
.57
(Si 5
.55A
l 2.4
5) 8
O20(O
H3.6
0F
0.4
0) 2
7.4
±0.
62
3.7
9.1
74.1
80.7
100.
01.
10.
013
.410
0.0
081
.9
Ep
ido
te(C
a 2.0
6F
e 0.9
2M
n0.0
1) 3
(Si 3
.13A
l 2.1
9) 5
.32O
13(O
H)
3.3
±0.
2N
D1.
75.
725
.919
.30.
080
.50.
00.
00.
00
18.1
Tit
ano
mag
net
ite
Fe2
+2(F
e3+
Ti)
O4
0.0
±0.
21
0.0
0.0
0.0
0.0
0.0
0.0
0.0
0.0
0.0
00.
0
Co
mp
osi
teb
edro
ckB
ulk
anal
ysis
(0.3�
Gra
nit
e+
0.7�
Gra
no
dio
rite
)66
.30
14.2
84.
440.
052.
464.
224.
252.
110.
320.
200.
9799
.60
L5
ou
tcro
p(a
vera
ge)
Bu
lkan
alys
is*
68.2
316
.03
3.13
0.03
1.17
3.36
4.57
1.77
0.36
0.14
0.75
99.5
5
256 J.-J. Braun et al. / Geochimica et Cosmochimica Acta 99 (2012) 243–270

3sa
mp
les
of
5k
gea
chS
tan
dar
dd
evia
tio
n1.
940.
490.
670.
000.
260.
090.
100.
170.
080.
030.
270.
02
Mo
dal
abu
nd
ance
Min
eral
con
trib
uti
on
toth
ew
ho
lero
ckco
mp
osi
tio
n
Co
nst
itu
tive
min
eral
form
ula
**
av.
(%)
SiO
2A
l 2O
3F
e 2O
3M
nO
MgO
CaO
Na 2
OK
2O
TiO
2P
2O
5L
oI
Oli
gocl
ase
31.0
30.8
50.8
0.0
0.0
0.0
23.5
63.6
9.7
0.0
0.0
0.0
Qu
artz
24.0
35.8
0.0
0.0
0.0
0.0
0.0
0.0
0.0
0.0
0.0
0.0
Ho
rnb
len
de
17.5
12.6
11.3
39.4
64.3
66.0
31.1
6.2
23.5
60.2
0.0
52.7
K-f
eld
spar
9.7
8.6
13.9
0.0
0.0
0.0
0.0
1.3
50.3
0.0
0.0
0.0
Alb
ite
8.7
8.0
13.4
0.0
0.0
0.0
5.5
28.9
0.2
0.0
0.0
0.0
Ep
ido
te4.
22.
46.
87.
811
.50.
035
.50.
00.
00.
00.
015
.1B
ioti
te3.
31.
73.
825
.124
.234
.00.
30.
016
.339
.70.
030
.9T
itan
om
agn
etit
e1.
60.
00.
027
.60.
00.
00.
00.
00.
00.
00.
00.
0A
pat
ite
0.5
0.0
0.0
0.0
0.0
0.0
4.1
0.0
0.0
0.0
100.
01.
2
*T
his
stu
dy.
**
Dat
afr
om
Bra
un
etal
.(2
005)
.
J.-J. Braun et al. / Geochimica et Cosmochimica Acta 99 (2012) 243–270 257
transfer. The total mass of any mobile element j (DMj)transferred through the weathering system with thicknessz (cm), expressed in mol/ha, is given by:
DMj ðmol=haÞ ¼ 106qpCj;p
Z z
0
sj;wdZ
Mass balance requires precise verifications regardingthe determination of the parent material compositionprior to the chemical weathering onset and the choiceof an inert element, which should be very insolubleand resistant to weathering dissolution loss. The calcula-tions were carried out (i) with the composite parent rockas reference (70% of granodiorite and 30% of granite,see estimate in (Braun et al., 2005)) for the averagecompositions of the overlying horizons including topsoiland (ii) with the iron crust as reference of the parentalmaterial for the topsoil samples. Then, the elementscan be sorted out according to their mass transfer pro-files: immobile, depletion, depletion-enrichment, additionand biogenic profiles (Brantley et al., 2007; Brantley andLebedeva, 2011).
5.2.1. Selection of the inert element, bulk density of the
saprolite and strain in the weathering profile
The extremely low Zr contents in the hillside ground-water, always below the ICPMS detection limit (3 pmol/L), suggest that (i) the zircon grains are stable in theweathering lateritic profile and (ii) their current behav-iour is strictly inert during saprolitization and ferralitiza-tion (Braun et al., 2005; Delattre et al., 2007). Thesefindings could justify the use of Zr as inert elementfor iso-element mass balance calculations in the hillsidelateritic weathering profile only. However, due to heter-ogeneity in the distribution of zircon grains at the sam-ple scale in the in situ weathering layers, an averagecomposition for each horizon is used for the mass bal-ance calculation. For instance the variegated saprolitecomposition is an average of the composition of sixsamples sampled by drilling between 1500 and 2420 cmin depth.
The mass balance calculation for the saprolite requiresestimating its average bulk density. One way to estimatethe average saprolite bulk density is to assume its isovolu-metric weathering. If so, eZr,w equals to 0 and then qsapro-
lite = qp(CZr,parent/CZr,saprolite). The calculated average bulkdensity of the saprolite is 1.61 g/cm3.
The depth profile of the volume strain factor eZr,w, indi-cates an average collapse of 35% and 33% in the mottledclay and iron crust, respectively. This collapse increases inthe topsoil to 43%.
The other highly charged transition elements, potentiallyinert, include Ti, Hf, Th and Nb (see references in (Braunet al., 1998; Brantley and White, 2009). Fig. 5 displaysthe sj,w for these elements compared to eZr,w. The behaviourof Hf rather matches that of Zr, both elements being mainlyassociated in zircon crystals in granitoids. Ti exhibits amoderate depletion profile with losses reaching 20%. Nband Th have an erratic behaviour due to either local heter-ogeneity in the distribution of bearing minerals or to redis-tribution with adsorption (e.g. Th on iron oxides).

258 J.-J. Braun et al. / Geochimica et Cosmochimica Acta 99 (2012) 243–270
5.3. Elemental mass transfer profiles within the in situweathered horizons
Table 6 reports the average open-system mass transportfractions sj,w, their standard deviations and elemental gainsand losses (in 106 mol/ha or mol/ha) for each horizon of theprofile 1L6 calculated with average compositions.
Alkalis (Na, K, Rb), alkaline earths (Mg, Ca, Sr, Ba),silica, P, Cd, Cu, Zn, Ni and Co show depletion profileswith depletion at the top, grading to parent concentrationat depth. Alkalis (Na, K, Rb) and alkaline earths (Mg,Ca, Sr, Ba) exhibit losses with sj,Zr ranging from �0.8 to�1.0. This indicates the complete breakdown of oligoclase,K-feldspar and hornblende crystals. Silica is moderately de-pleted in the saprolite (sSi,Zr �0.5) and more significantlydepleted in the upper horizons with sSi,Zr down to �0.8. Sil-ica in the weathered materials is mainly controlled byquartz and kaolinite. The quartz content estimates and er-rors obtained from the linear inverse method (Tables 3and 4) used to calculate the open-system mass transportfractions (sQuartz,Zr) in the different layers of the profileare showed in Fig. 6. Quartz loss in the saprolite reaches30% and increases significantly in mottled clay, iron crustand topsoil with loss up to 70–80%, with nonetheless largeerror bars. Some other elements as P, Cd, Cu, Zn, Ni andCo show depletion profiles with significant losses in thewhole weathering profile (sx,Zr �0.8/�0.6).
Al, Ga, Ge, Pb, Fe, V, Cr, U, REE and Y exhibit deple-tion–enrichment profiles with enrichment at various depthsresulting from precipitation or translocation and a return toparent concentration at greater depth. The losses are mod-erate for Al, Ga, Ge and Pb in the whole weathering profile(minimum sx,Zr �0.60/�0.05). Redistribution of Al, Ga andPb at depth occurs in both ferruginous nodular horizon andsaprolite. Ge is fractionated compared to Si with relativeenrichment in Fe-rich horizon compared to saprolite andin mottled clay horizon and in topsoil (sGe,Zr = �0.05)(Fig. 7). Among redox-sensitive elements, Fe, V and Crshow significant accumulation in the ferruginous nodularhorizon with sx,Zr of + 1.5, +1.2, +0.4, respectively. Theyare depleted in the saprolite, the mottled clay horizon andtopsoil, moderately for Fe and V and more significantlyfor Cr (Fig. 8). Mn and Ce, two other important redox-sen-sitive elements, do not show significant redistributionlinked to oxidative processes. Mn is lost all over the weath-ering profile (�0.9) and slightly less in the topsoil (�0.7).The Ce mass transfer does not differ from those of its neigh-bours La and Pr (Fig. 8). The LREE show an accumulationzone in the saprolite. Fig. 9 displays the REE fractionationaccording to the average open-system mass transport frac-tion for each horizon. The average loss of LREE is moder-ate in saprolite (�0.1), with even a slight accumulation ofLa, Ce and Pr (e.g. sLa,Zr = +0.2). The LREE losses signif-icantly increase in the above horizons to �0.8. The losses ofHREE+Y are higher than those of LREE in saprolite(range from �0.6 to �0.2) and keep increasing in the mot-tled clay horizon and the iron crust (�0.8), then decreaseslightly in topsoil (�0.7). U is depleted in the entire weath-ering profile with redistribution features in the iron crust.
5.4. Elemental mass transfer profiles within the topsoil
The loose clayey topsoil of lateritic weathering covers isknown to be the place of intense biological activity and tobe able to incorporate dusts from atmospheric inputs(Brimhall et al., 1988). It is considered as the current soilprofile developing at the expense of the underlying ironcrust (Tardy, 1993; Beauvais, 2009). Three possibilities havebeen proposed to explain the origin of the topsoil ((Tardy,1993) and reference therein) particularly difficult to deci-pher due to the apparent homogeneity of the materials: (i)an autochthonous origin, exclusively derived from the deg-radation of the underlying iron crust material, (ii) an allo-chthonous origin by colluvionment and rework ofmaterial constituting the slope of the landscape and (iii) amixed origin with material coming from deeper horizonsfrom the same profile by input of fine mineral particlesbrought by the termite activity.
The studied topsoil, from 0 to 4.5 m, homogeneous intexture (soft clayey) and structure (micro-aggregated),exhibits a steep threshold for most of the chemical elementsat its transition with the underlying iron crust (i.e. soil pro-duction zone, see Fig. 3). The open-system mass transportfractions sj,w were calculated with the average iron crustcomposition taken as parent material. The transfer profilesare shown in Fig. 10. It has to be noticed that, except K, themajor alkaline and alkaline earth contents, are below theICPAES detection limit within both the parent iron crustand in the topsoil. If we consider a margin of error of±0.2 for both eZr,w and sj,Zr, the depth profiles indicate that:
� The topsoil has likely undergone an isovolumetricweathering compared to the underlying iron crust(Fig. 10A).� Apart from the organo-mineral first centimetres, Si, Rb,
Ni, Co and Zn are quite conservative in the topsoil.� The topsoil is depleted in redox sensitive elements (Fe,
V, Cr), Ba, K, Sr, Ge, Ga, Al, Co, Cu, U, REE (La)and Th. The losses are quite constant for each elementthrough the soil profile, with sj,Zr not exceeding �0.8,and with, for most of them, an enrichment at 1 m depthfollowed by a depletion in the uppermost part of thetopsoil.
These calculations indicate that the degradation of theiron crust is accompanied by the loss of most of the ele-ments especially those accumulated in the iron crust asthe redox sensitive elements (Fe, V, Cr) and Th.
5.5. Contemporary elemental fluxes in the hillside lateritic
system
5.5.1. Origin of the contemporary fluxes in the hillside spring
and seepage
On the watershed, the diluted meteoric water brings, invariable amounts, elements originating from sea salt aero-sols (mainly Na and Cl), terrigeneous particles, biogenicemissions from the vegetal cover and possible anthropo-genic inputs. Passing through the hillside rainforest cover,

Tab
le5
Ave
rage
com
po
siti
on
,m
od
alab
un
dan
ces
and
con
trib
uti
on
toth
ew
ho
lero
cko
fea
chm
iner
alo
fth
esa
pro
lite
,th
em
ott
led
clay
,th
eir
on
cru
stan
dth
eto
pso
il.
Min
eral
ogy
isd
eriv
edfr
om
the
resu
lts
of
XR
Dan
alys
esp
erfo
rmed
on
wea
ther
ing
pro
du
cts.
Th
eca
lcu
lati
on
use
dth
eore
tica
lst
ruct
ura
lfo
rmu
la.
SiO
2A
l 2O
3F
e 2O
3M
nO
MgO
CaO
Na 2
OK
2O
TiO
2P
2O
5Z
rO2
LO
Iw
t%w
t%w
t%w
t%w
t%w
t%w
t%w
t%w
t%w
t%w
t%w
t%
To
pso
ilD
epth
:0–
500
cm55
.38
23.5
58.
340.
03<
DL
<D
L<
DL
0.15
1.14
0.11
0.05
411
.22
So
ftcl
ayey
ho
rizo
n1.
991.
210.
550.
030.
400.
500.
080.
040.
060.
030.
004
0.50
Est
imat
e55
.38
25.6
88.
480.
000.
070.
000.
000.
161.
140.
000.
054
10.1
6R
esid
ual
s0.
00�
2.13
�0.
140.
03�
0.07
0.00
0.00
�0.
010.
000.
110.
000
1.05
Co
nst
itu
tive
min
eral
form
ula
Mo
de
(%)
±M
iner
alco
ntr
ibu
tio
nto
the
wh
ole
rock
com
po
siti
on
(%)
Qu
artz
SiO
224
.42.
344
.00.
00.
0<
DL
0.0
<D
L<
DL
0.0
0.0
<D
L0.
00.
0Il
lite
K0.6
(H3O
) 0.4
Al 1
.3M
g 0.3
Fe2
+0.1
Si 3
.5O
10(O
H) 2�(H
2O
)2.
20.
62.
11.
50.
2<
DL
100.
0<
DL
<D
L10
0.0
0.0
<D
L0.
02.
6K
aoli
nit
eA
l 2S
i 2O
5(O
H) 4
64.1
2.4
53.9
98.5
0.0
<D
L0.
0<
DL
<D
L0.
00.
0<
DL
0.0
88.0
Go
eth
ite
FeO
OH
9.4
0.6
0.0
0.0
99.8
<D
L0.
0<
DL
<D
L0.
00.
0<
DL
0.0
9.4
An
atas
eT
iO2
1.1
0.1
0.0
0.0
0.0
<D
L0.
0<
DL
<D
L0.
010
0.0
<D
L0.
00.
0Z
irco
nZ
rSiO
40.
092
0.00
80.
053
0.0
0.0
<D
L0.
0<
DL
<D
L0.
00.
0<
DL
100
0.0
Iro
ncr
ust
Dep
th:
500–
1400
cm39
.07
21.6
427
.16
<D
L<
DL
<D
L<
DL
0.32
0.67
0.10
0.03
610
.76
Fer
rugi
no
us
no
du
lar
ho
rizo
n6.
722.
539.
340.
030.
400.
500.
080.
200.
100.
050.
007
0.87
Est
imat
e39
.07
21.4
726
.43
0.00
0.13
0.00
0.00
0.30
0.67
0.00
0.03
610
.82
Res
idu
als
0.00
0.17
0.73
0.00
�0.
130.
000.
000.
020.
000.
100.
000�
0.06
Mo
de
(%)
±M
iner
alco
ntr
ibu
tio
nto
the
wh
ole
rock
com
po
siti
on
(%)
Qu
artz
12.4
7.2
31.6
0.0
0.0
<D
L0.
0<
DL
<D
L0.
00.
0<
DL
0.0
0.0
Illi
te4.
12.
75.
73.
30.
1<
DL
100.
0<
DL
<D
L10
0.0
0.0
<D
L0.
04.
6K
aoli
nit
e52
.65.
662
.696
.70.
0<
DL
0.0
<D
L<
DL
0.0
0.0
<D
L0.
067
.9G
oet
hit
e/h
emat
ite
29.4
8.0
0.0
0.0
99.9
<D
L0.
0<
DL
<D
L0.
00.
0<
DL
0.0
27.5
An
atas
e0.
70.
10.
00.
00.
0<
DL
0.0
<D
L<
DL
0.0
100.
0<
DL
0.0
0.0
Zir
con
0.06
20.
012
0.05
00.
00.
0<
DL
0.0
<D
L<
DL
0.0
0.0
<D
L10
00.
0
Mo
ttle
dcl
ayh
ori
zon
Dep
th:
1400
–160
0cm
53.0
223
.18
11.5
7<
DL
<D
L<
DL
<D
L0.
691.
200.
100.
052
9.72
2.50
2.72
2.00
0.03
0.40
0.50
0.08
0.22
0.32
0.05
0.01
41.
03
Est
imat
e53
.02
22.7
811
.50
0.00
0.28
0.00
0.00
0.65
1.20
0.00
0.05
29.
88R
esid
ual
s0.
000.
400.
070.
00�
0.28
0.00
0.00
0.04
0.00
0.10
0.00
0�
0.16
Mo
de
(%)
±M
iner
alco
ntr
ibu
tio
nto
the
wh
ole
rock
com
po
siti
on
(%)
Qu
artz
23.1
3.5
43.6
0.0
0.0
<D
L0.
0<
DL
<D
L0.
00.
0<
DL
0.0
0.0
Illi
te8.
93.
09.
16.
70.
6<
DL
100.
0<
DL
<D
L10
0.0
0.0
<D
L0.
010
.9K
aoli
nit
e53
.85.
447
.393
.30.
0<
DL
0.0
<D
L<
DL
0.0
0.0
<D
L0.
076
.1G
oet
hit
e/h
emat
ite
12.7
2.2
0.0
0.0
99.4
<D
L0.
0<
DL
<D
L0.
00.
0<
DL
0.0
13.1
An
atas
e1.
20.
30.
00.
00.
0<
DL
0.0
<D
L<
DL
0.0
100.
0<
DL
0.0
0.0
Zir
con
0.08
90.
024
0.05
30.
00.
0<
DL
0.0
<D
L<
DL
0.0
0.0
<D
L10
00.
0
Sap
roli
teD
epth
:16
00–3
620
cm61
.09
22.1
36.
54<
DL
<D
L<
DL
<D
L0.
740.
590.
140.
025
8.53
J.-J. Braun et al. / Geochimica et Cosmochimica Acta 99 (2012) 243–270 259

2.21
1.73
2.55
0.03
0.40
0.50
0.08
0.17
0.09
0.03
0.00
70.
49
Est
imat
e61
.09
21.2
35.
910.
000.
300.
000.
000.
690.
590.
000.
025
8.74
Res
idu
als
0.00
0.90
0.62
0.00
�0.
300.
000.
000.
040.
000.
140.
000�
0.21
Mo
de
(%)
±M
iner
alco
ntr
ibu
tio
nto
the
wh
ole
rock
com
po
siti
on
(%)
Qu
artz
32.8
2.7
53.7
0.0
0.0
<D
L0.
0<
DL
<D
L0.
00.
0<
DL
0.0
0.0
Illi
te9.
52.
38.
47.
61.
3<
DL
100.
0<
DL
<D
L10
0.0
0.0
<D
L0.
013
.1K
aoli
nit
e49
.63.
337
.892
.40.
0<
DL
0.0
<D
L<
DL
0.0
0.0
<D
L0.
079
.3G
oet
hit
e/h
emat
ite
6.5
2.7
0.0
0.0
98.7
<D
L0.
0<
DL
<D
L0.
00.
0<
DL
0.0
7.5
An
atas
e0.
60.
10.
00.
00.
0<
DL
0.0
<D
L<
DL
0.0
100.
0<
DL
0.0
0.0
Zir
con
0.04
20.
012
0.02
20.
00.
0<
DL
0.0
<D
L<
DL
0.0
0.0
<D
L10
00.
0
aD
ata
fro
mB
rau
net
al.
(200
5).
Fig. 5. Open-system mass transport fractions (sj,w) for potentialother immobile elements (Hf, Nb, Th and Ti) versus volumetricstrain (eZr,w).
260 J.-J. Braun et al. / Geochimica et Cosmochimica Acta 99 (2012) 243–270
the meteoric water incorporates elements from leaf recre-tion (i.e. dominant in the throughfall signature) and vegeta-tion decay (i.e. dominant in the litter leachate signature).Compared to rainfall, the water signature before infiltrationinto the ground is thus characterised by (i) high DOC con-tents (ii) significant enrichment in Si, K, Ca, Mg and Cl and(iii) declining Na/Cl ratios attesting to Cl inputs by vegeta-tion if we consider Na as conservative and originating onlyfrom sea salts (see Table 3). When this water migratesthrough the vadose zone towards the topmost part of the1L6 groundwater table, (i) the DOC content drastically fallsunder the detection limit (<1 mg/L), (ii) the Si, Mg, Ca, Kand Cl enrichment is no more observed and (iii) the Na/Clratio is close to the marine ratio. Along with evaporationprocesses, that means that the infiltrating water likelyundergoes several coupled processes affecting its chemistryas ion exchange, vegetation uptake and organic matter min-eralisation by soil meso and microfauna. As per the ratherinert nature of the lateritic vadose zone mainly composed ofquartz, kaolinite and Fe-oxides and oxyhydroxides, we canconsidered that vegetation uptake and mineralisation dom-inate the base cation exchange processes. Except for Si forwhich the concentration reflects the equilibrium with phaseslike quartz and kaolinite, the topmost part of the ground-water has a signature of slightly concentrated rainwaterby evaporation (5�) and slightly enriched with elementscoming from the cycling through vegetation (Ca, Mg, K)with Ca/Cl, Mg/Cl and K/Cl are of 1.1, 0.4 and 0.7, respec-tively. Towards the weathering front the influence of chem-ical weathering contribution becomes significant asindicated by the increase of the Cl-normalised ratios (Ca/Cl = 4.7; Mg/Cl = 1.5; K/Cl = 1.9; Na/Cl = 10.5) and thesilica content (280 lmol/L).
The spring and seepage water may be considered as amixing between (i) recharge water from the vadose zone,whose composition reflects the interaction with the vegeta-tion cover and rain fall and (ii) water having interacted withprimary weatherable minerals (mafic minerals, plagioclase,feldspars . . .) at deeper levels towards the weathering front(chemical weathering sensu stricto). At MEN1, the wateris slightly acidic (pH � 4.5), free of suspended matter(<0.1 mg/L, detection limit) and free of dissolved organic

Tab
le6
Ave
rage
op
en-s
yste
mm
ass
tran
spo
rtfr
acti
on
s(s
j,w
),st
and
ard
dev
iati
on
san
del
emen
tal
gain
san
dlo
sses
(in
106
mo
l/h
ao
rm
ol/
ha)
for
each
ho
rizo
no
fth
ere
goli
than
dfo
rth
ew
ho
lere
goli
tho
fp
it1L
6.T
he
bo
ldva
lues
corr
esp
on
dto
the
valu
esab
ove
0fr
oth
em
ass
bal
ance
calc
ula
tio
nm
ean
ing
aga
info
rth
eco
nce
rned
elem
ent
wh
ich
are
gain
ed.
SA
PM
CH
ICT
op
soil
SA
PM
CH
ICT
op
soil
s x,Z
r±
rs x
,Zr
±r
s x,Z
r±
rs x
,Zr
±r
Dep
th(c
m)
1400
–362
012
00–1
400
500–
1200
0–50
0N
a�
1.00
±0.
14�
1.00
±0.
00�
1.00
±0.
00�
1.00
±0.
00N
a10
6.m
ol/
ha
�78
7�
106
�23
0�
160
K�
0.82
±0.
11�
0.91
±0.
01�
0.94
±0.
04�
0.98
±0.
00K
106.m
ol/
ha
�21
9�
33�
74�
53R
b�
0.90
±0.
13�
0.95
±0.
01�
0.94
±0.
03�
0.94
±0.
00R
b10
6.m
ol/
ha
�0.
34�
0.05
�0.
10�
0.07
Mg
�0.
95±
0.13
�0.
98±
0.00
�0.
98±
0.01
�0.
99±
0.00
Mg
106.m
ol/
ha
�34
5�
48�
104
�73
Ca
�1.
00±
0.14
�1.
00±
0.00
�1.
00±
0.00
�1.
00±
0.00
Ca
106.m
ol/
ha
�44
0�
60�
129
�89
Sr
�0.
92±
0.13
�0.
97±
0.01
�0.
98±
0.01
�0.
99±
0.00
Sr
106.m
ol/
ha
�3.
78�
0.54
�1.
18�
0.83
Ba
�0.
72±
0.10
�0.
85±
0.02
�0.
93±
0.05
�0.
98±
0.00
Ba
106.m
ol/
ha
�2.
66�
0.43
�1.
00�
0.73
Al
�0.
18±
0.03
�0.
53±
0.15
�0.
39±
0.11
�0.
58±
0.05
Al
106.m
ol/
ha
�30
1�
111
�19
0�
192
Ga
�0.
24±
0.03
�0.
38±
0.05
�0.
13±
0.15
�0.
54±
0.05
Ga
mo
l/h
a�
3833
1�
8062
�58
62�
1702
8S
n�
0.51
±0.
07�
0.46
±0.
03�
0.29
±0.
12�
0.22
±0.
07S
nm
ol/
ha
�24
35�
295
�39
8�
197
Pb
�0.
22±
0.03
�0.
56±
0.11
�0.
23±
0.22
�0.
64±
0.03
Pb
mo
l/h
a�
7520
�24
84�
2308
�43
97
Si
�0.
51±
0.07
�0.
77±
0.05
�0.
76±
0.05
�0.
77±
0.03
Si
106.m
ol/
ha
�33
27�
669
�14
50�
1024
Ge
�0.
32±
0.05
�0.
51±
0.13
�0.
05±
0.27
�0.
46±
0.05
Ge
mo
l/h
a�
1785
�35
1�
75�
506
La
0.24
±0.0
3�
0.36
±0.
14�
0.69
±0.
18�
0.79
±0.
03L
am
ol/
ha
3428
0�
6530
�29
490
�23
164
Ce
0.0
7±
0.0
1�
0.47
±0.
12�
0.75
±0.
15�
0.80
±0.
03C
em
ol/
ha
2229
2�
1873
0�
6753
6�
4944
7P
r0
.03
±0.0
0�
0.52
±0.
12�
0.77
±0.
14�
0.84
±0.
02P
rm
ol/
ha
874
�23
39�
7854
�59
12N
d�
0.04
±0.
01�
0.59
±0.
10�
0.80
±0.
12�
0.86
±0.
02N
dm
ol/
ha
�49
19�
9860
�29
887
�22
027
Sm
�0.
23±
0.03
�0.
69±
0.09
�0.
82±
0.10
�0.
85±
0.02
Sm
mo
l/h
a�
4541
�18
27�
4833
�34
53E
u�
0.19
±0.
03�
0.71
±0.
09�
0.82
±0.
10�
0.87
±0.
02E
um
ol/
ha
�92
8�
466
�12
00�
877
Gd
�0.
27±
0.04
�0.
72±
0.08
�0.
82±
0.09
�0.
83±
0.02
Gd
mo
l/h
a�
3483
�12
44�
3131
�21
74T
b�
0.22
±0.
03�
0.72
±0.
08�
0.81
±0.
08�
0.80
±0.
03T
bm
ol/
ha
�35
7�
157
�38
6�
264
Dy
�0.
25±
0.03
�0.
73±
0.08
�0.
79±
0.08
�0.
75±
0.03
Dy
mo
l/h
a�
1870
�73
0�
1748
�11
40H
o�
0.34
±0.
05�
0.78
±0.
06�
0.77
±0.
05�
0.69
±0.
04H
om
ol/
ha
�42
1�
127
�27
9�
170
Er
�0.
37±
0.05
�0.
77±
0.06
�0.
77±
0.05
�0.
67±
0.04
Er
mo
l/h
a�
1267
�34
8�
764
�45
7T
m�
0.52
±0.
07�
0.81
±0.
04�
0.74
±0.
04�
0.61
±0.
06T
mm
ol/
ha
�24
3�
51�
102
�57
Yb
�0.
52±
0.07
�0.
80±
0.04
�0.
75±
0.04
�0.
60±
0.04
Yb
mo
l/h
a�
1545
�31
7�
647
�35
6L
u�
0.56
±0.
08�
0.78
±0.
04�
0.72
±0.
04�
0.55
±0.
06L
um
ol/
ha
�24
3�
45�
92�
47Y
�0.
45±
0.06
�0.
83±
0.04
�0.
81±
0.04
�0.
70±
0.03
Ym
ol/
ha
�31
647
�78
01�
1656
7�
9887
Th
0.4
0±
0.0
60
.65
±0
.08
1.2
2±
0.6
9�
0.24
±0.
08T
hm
ol/
ha
6170
1390
5549
�71
2U
�0.
18±
0.02
�0.
51±
0.08
�0.
11±
0.19
�0.
38±
0.06
Um
ol/
ha
�46
1�
175
�81
�19
6
Ti
�0.
08±
0.01
�0.
04±
0.09
�0.
22±
0.11
�0.
13±
0.06
Ti
106.m
ol/
ha
�2.
1�
0.2
�1.
7�
0.6
Zr
0.0
0±
0.0
00
.00
±0
.00
0.0
0±
0.0
00
.00
±0
.00
Hf
�0.
15±
0.02
�0.
15±
0.02
�0.
16±
0.04
�0.
10±
0.03
Hf
mo
l/h
a�
1393
�18
3�
426
�19
6N
b�
0.11
±0.
020
.01
±0
.06
0.3
6±
0.1
50
.97
±0
.14
Nb
mo
l/h
a�
2266
6321
5841
65T
a�
0.27
±0.
04�
0.21
±0.
100
.17
±0.1
70
.89
±0
.15
Ta
mo
l/h
a�
225
�21
4115
2
Fe
�0.
20±
0.03
�0.
25±
0.13
1.5
4±
0.8
8�
0.50
±0.
05F
e10
6.m
ol/
ha
�63
�9
144
�32
J.-J. Braun et al. / Geochimica et Cosmochimica Acta 99 (2012) 243–270 261
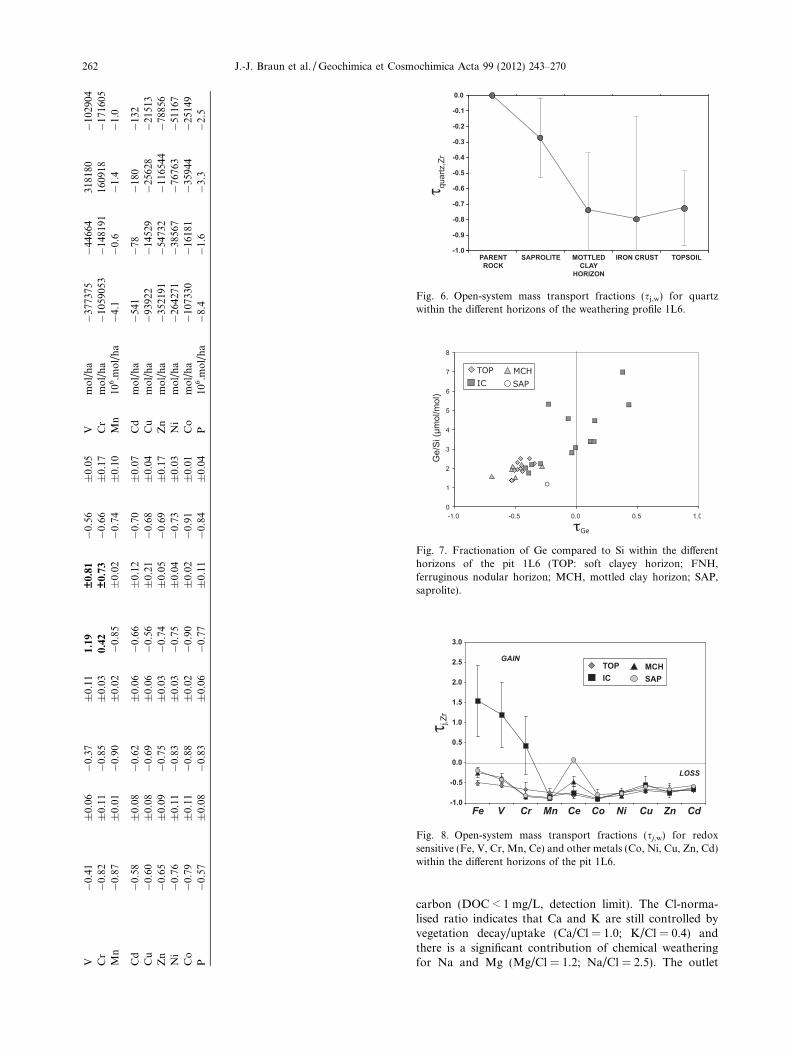
V�
0.41
±0.
06�
0.37
±0.
111
.19
±0.8
1�
0.56
±0.
05V
mo
l/h
a�
3773
75�
4466
431
8180
�10
2904
Cr
�0.
82±
0.11
�0.
85±
0.03
0.4
2±
0.7
3�
0.66
±0.
17C
rm
ol/
ha
�10
5905
3�
1481
9116
0918
�17
1605
Mn
�0.
87±
0.01
�0.
90±
0.02
�0.
85±
0.02
�0.
74±
0.10
Mn
106.m
ol/
ha
�4.
1�
0.6
�1.
4�
1.0
Cd
�0.
58±
0.08
�0.
62±
0.06
�0.
66±
0.12
�0.
70±
0.07
Cd
mo
l/h
a�
541
�78
�18
0�
132
Cu
�0.
60±
0.08
�0.
69±
0.06
�0.
56±
0.21
�0.
68±
0.04
Cu
mo
l/h
a�
9392
2�
1452
9�
2562
8�
2151
3Z
n�
0.65
±0.
09�
0.75
±0.
03�
0.74
±0.
05�
0.69
±0.
17Z
nm
ol/
ha
�35
2191
�54
732
�11
6544
�78
856
Ni
�0.
76±
0.11
�0.
83±
0.03
�0.
75±
0.04
�0.
73±
0.03
Ni
mo
l/h
a�
2642
71�
3856
7�
7676
3�
5116
7C
o�
0.79
±0.
11�
0.88
±0.
02�
0.90
±0.
02�
0.91
±0.
01C
om
ol/
ha
�10
7330
�16
181
�35
944
�25
149
P�
0.57
±0.
08�
0.83
±0.
06�
0.77
±0.
11�
0.84
±0.
04P
106.m
ol/
ha
�8.
4�
1.6
�3.
3�
2.5
Fig. 7. Fractionation of Ge compared to Si within the differenthorizons of the pit 1L6 (TOP: soft clayey horizon; FNH,ferruginous nodular horizon; MCH, mottled clay horizon; SAP,saprolite).
-1.0
-0.9
-0.8
-0.7
-0.6
-0.5
-0.4
-0.3
-0.2
-0.1
0.0
TOPSOILIRON CRUSTMOTTLEDCLAY
HORIZON
SAPROLITEPARENTROCK
τ quar
tz,Z
r
Fig. 6. Open-system mass transport fractions (sj,w) for quartzwithin the different horizons of the weathering profile 1L6.
-1.0
-0.5
0.0
0.5
1.0
1.5
2.0
2.5
3.0
Fe V Cr Mn Ce Co Ni Cu Zn Cd
TOPIC
MCHSAP
GAIN
LOSS
τ j,Zr
Fig. 8. Open-system mass transport fractions (sj,w) for redoxsensitive (Fe, V, Cr, Mn, Ce) and other metals (Co, Ni, Cu, Zn, Cd)within the different horizons of the pit 1L6.
262 J.-J. Braun et al. / Geochimica et Cosmochimica Acta 99 (2012) 243–270
carbon (DOC < 1 mg/L, detection limit). The Cl-norma-lised ratio indicates that Ca and K are still controlled byvegetation decay/uptake (Ca/Cl = 1.0; K/Cl = 0.4) andthere is a significant contribution of chemical weatheringfor Na and Mg (Mg/Cl = 1.2; Na/Cl = 2.5). The outlet

-1.0
-0.8
-0.6
-0.4
-0.2
0.0
0.2
0.4
La Ce Pr Nd Sm Eu Gd Tb Dy Ho Er Tm Yb Lu Y U
TOP MCHSAP
τ j,Zr
GAIN
LOSS
IC
Fig. 9. Open-system mass transport fractions (sj,w) for REE, Y andU within the different horizons of the pit 1L6.
J.-J. Braun et al. / Geochimica et Cosmochimica Acta 99 (2012) 243–270 263
water may be considered as the mixing between spring andseepage water, organic-rich overland flow water, rainwater
0
100
200
300
400
500
-1.0 -0.8 -0.6 -0.4 -0.2 0.0 0.2 0.4 0.6 0.8 1.0
K Rb
εZr
Al
Ga
SiGe
-1
-1.0 -0.8 -0.6 -0.4 -0.2 0.0 0.2 0.4 0.6 0.8 1.0 -1
100
200
300
400
500
100
200
300
400
500
loss gain
collapse dilation
± σ
A
E
C
Sr
Ba
Fig. 10. Depth profiles for the volumetric strain (eZr,w) (A) and for tracmaterial reference.
and swamp groundwater. Unfortunately, the analyses oftrace metals are not available for the topmost groundwater;hence further studies are needed to assess their origin in thefluxes (i.e. chemical weathering versus vegetation uptake/decay).
5.5.2. Determination of the recharge rate on the hillside
system and quantification of the contemporary elemental
fluxes
The methodology used to determine the discharge of thegroundwater in the swamp area from the hillside regolith isthe Chloride Mass Balance (CMB) and is discussed in(Marechal et al., 2011a). This method is based on theassumption that chlorine is conservative in the watershed,i.e. the Cl input from atmospheric wet deposits is equal tothe Cl output in groundwater and stream, at a yearly to plu-riannual basis. In the Nsimi watershed, the substratum isfree of Cl-bearing minerals including evaporites and, duringthe time of the study, the watershed was carefully preserved
Fe
V
Cr
La
Th U
Cu
Co
Zn
.0 -0.8 -0.6 -0.4 -0.2 0.0 0.2 0.4 0.6 0.8 1.0
.0 -0.8 -0.6 -0.4 -0.2 0.0 0.2 0.4 0.6 0.8 1.0
loss gain
loss gain
D
B
F
e elements (B–F) in the topsoil horizon with iron crust as a parent

264 J.-J. Braun et al. / Geochimica et Cosmochimica Acta 99 (2012) 243–270
and prevented from burning and clearing. The Na/Cl ratioin throughfalls varies from 0.07 to 0.65 (Table 3). This indi-cates that Cl is partly cycled through the vegetation at therainy season scale, which is consistent with the nutrient sta-tus of Cl for plants (see review of (White and Broadley,2001)). To avoid this effect of seasonal Cl cycling, theCMB was carried out on a pluriannual scale from 1994 to1997, over three hydrological years.
Neglecting overland flow on the hillside, the CMB forhillside system is computed as:
P ½Cl�p ¼ Rhill½Cl�hill
with P is the precipitation amount, [Cl]P the volumeweighted mean (VWM) chloride content in the precipita-tion, Rhill the recharge rate on the hillside (related to thehillside surface area), [Cl]hill the volume weighted mean(VWM) chloride content of hillside/weathering covergroundwater. A part of this water flows to the springsand seepages (Qhill) while the other part flows to the swamp(Qbase). The water budget of hillside/weathering cover aqui-fer system, if a steady assumption is made (meaning that, atthe water year level, there is no variation of the water tablelevel), (Fig. 2) is:
Rhill ¼ Qhill þ Qbase
with Qhill the total discharge rate of springs and seepage atthe bottom of hillside (mm/yr) and Qbase the groundwaterdeep flow from the hillside weathering cover aquifer tothe swamp aquifer (mm/yr).
The CMB has been used for the 1994–1998 period forthe spring (Marechal et al., 2011a,b). According to thetypes of raingauges, the error is usually 5% on rainfallamount measurements. The runoff at the outlet has beenmeasured using a Thalimedes OTT� station which is gener-ally known to generate an error of 10% on discharge rates.The analytical error associated with the Ionic Chromato-graph equipment used for chloride content measurementis ±5%.
The spring MEN1 is the main outlet of the bedrockaquifer in the Nsimi watershed. In this highly rechargedsystem, the water table constitutes a subdued replica ofthe topography. Its catchment can be adjusted to the headof the surface watershed, with a surface area of aboutAMEN1 = 90,000 m2 (Fig. 1 B). Assuming that other springsand seepage points equally drain the rest of the bedrock/regolith aquifer located below the hillside, we obtain:
QMENI
Qhill
¼ AMENI
Ahill
with Ahill (m2) the surface area of hillsides and QMEN1 thedischarge rate at the spring MEN1 (mm/yr). This equationallows calculating the yearly contribution of bedrock aqui-fer to the streamflow, Qhill = 305 ± 53 mm/yr.
Assuming that the chloride content in the regolith/bed-rock aquifer is equal to spring MEN1 chloride content, thisleads to Rhill = 332 mm/yr. Then Qbase is determined (Qba-
se = 27 ± 34 mm/yr). All the flow rates are related to hill-side surface area. Out of the Rhill of 332 mm/yr about90% flows to the springs/brook and 10% flows to the
swamp as base flow. This recharge rate represents 20% ofthe rainfall.
The elemental fluxes for the hillside zone (Fj,hill) are as-sessed by:
F j;hillðmol=ha=yrÞ ¼ Cj;MEN1ðlmol=LÞ:Rhillðmm=yrÞ=100
where Fj,hill is the flux of element j in the hillside system,Cj,MEN1 is the VWM of element j in the spring MEN1and Rhill is the recharge rate in the hillside system(332 mm/yr, (Marechal et al., 2011a))
The elemental fluxes at the outlet (Fj,outlet) is assessed by:
F j;outlet ðmol=ha=yrÞ ¼ Cj;outlet ðlmol=LÞ:Routlet ðmm=yrÞ=100
where Fj,outlet is the flux of element j at the outlet, Cj,outlet isthe VWM of element j at the outlet and Routlet is the surfacerunoff at the watershed scale (378 mm/yr, (Braun et al.,2005)). The elemental fluxes for the hillside zone (Fj,hill)and at the outlet (Fj,outlet) are reported in Table 7.
The elemental contributions of the swamp to the outletflux (in%) is calculated by:
%F swamp ¼ 100½F j;outlet ðmol=ha=yrÞSoutlet ðhaÞ
� F j;hill ðmol=ha=yrÞ Shill ðhaÞ�=
½F j;outlet ðmol=ha=yrÞSoutlet ðhaÞ�
with Soutlet = 60 ha and Shill = 48 ha, the respective surfaceareas for the whole watershed and the hillside system. Theresults are reported in Table 7.
Overall, the elemental fluxes are extremely low at thehillside lateritic system level. Out of the 77 mol/ha/yr ofNa flux, corrected from atmospheric deposits, 72 mol/ha/yr may be attributed to the current weathering rates of pla-gioclase crystals (oligoclase/albite, 94% of the compositeparent rock) and the remaining 5 mol/ha/yr to the break-down of hornblende (6% of the composite parent rock).The silica hillside flux is 300 mol/ha/yr and can be attrib-uted to plagioclase dissolution, and maybe to a lesser extentto kaolinite dissolution. Al and Ga are exported from thelateritic weathering cover due to the dissolution of plagio-clase and kaolinite crystals. Compared to other immobileelements (Zr, Hf, Nb and Th), Ti is significantly exported.Among redox-sensitive elements (Fe, V, Cr, Mn, Ce), onlyCe and Mn are exported out of the hillside system meaningthat the water is mildly oxidising, less than in other studiedprofiles where CeO2 precipitates (Braun et al., 1998). Theother elements (Fe, V, Cr) are likely able to be mobilisedbut over a short distance only, they are not exported outof the hillside system. Rb, Sr, Ba, Ni, Cu, Zn are affectedby export processes. LREE and Y are exported but in verylow amounts (in the lmol/ha/yr to mmol/ha/yr range)while HREE and U are quite immobile.
The elemental export by the stream can be sorted out bybeing: (i) Primarily controlled by the swamp(80 6 %Fswamp 6 100%) as Th, Zr, U, LREE, HREE + Y,Cu, Fe, Cr, V, Zr, Hf, Nb, Ti and Al, (ii) significantly con-trolled (60 6 %Fswamp 6 80%) as Na, Rb, Sr, Mn, Ni, K,Ca, Ba, Zn and Ga and (ii) moderately controlled(%Fswamp 6 60%) as Mg, Co and Si.

Table 7Contemporary elemental fluxes for the hillside zone (Fj,hill) and at the outlet (Fj,outlet) and the elemental contributions of the swamp to theoutlet flux (%Fj,swamp) are also reported. The calculation are carried out with (#) Rhill = 332 ± 61 mm/yr, (##) Routlet = 378 ± 38 mm/yr, (§)Na* with ClVWM = 11.5 lmol/L; (§§) Na* with ClVWM = 10.8 lmol/L.
#Fhill ±1r ##Foutlet ±1r %Fswamp
§ §§
Mg mol/ha/yr 34 ±7 61 ±6 44K mol/ha/yr 16 ±3 36 ±4 56Ca mol/ha/yr 65 ±13 130 ±13 50Na* mol/ha/yr 77 ±15 195 ±20 61
Rb mol/ha/yr 0.011 ±0.00 0.032 ±0.00 64Sr mol/ha/yr 0.213 ±0.04 0.776 ±0.08 73Ba mol/ha/yr 0.279 ±0.06 0.672 ±0.07 58
Al mol/ha/yr 1.890 ±0.38 44.324 ±4.46 96Ga mol/ha/yr 0.015 ±0.00 0.037 ±0.00 59
Si mol/ha/yr 303 ±60.60 486 ±49 38
Ti mol/ha/yr 0.020 ±0.004 0.148 ±0.015 87Zr mol/ha/yr <DL 0.01441 0.00145 100Hf mol/ha/yr <DL 0.00023 0.00002 100Nb mol/ha/yr <DL 0.00035 0.00003 100
V mol/ha/yr <DL 0.096 ±0.010 100Cr mol/ha/yr <DL 0.127 ±0.013 100Mn mol/ha/yr 0.283 ±0.057 0.820 ±0.082 66Fe mol/ha/yr <DL 25 3 100
Co mol/ha/yr 0.011 ±0.002 0.018 ±0.002 40Ni mol/ha/yr 0.038 ±0.008 0.107 ±0.011 65Cu mol/ha/yr 0.012 ±0.002 0.057 ±0.006 79Zn mol/ha/yr 0.089 ±0.018 0.217 ±0.022 59
La mol/ha/yr 0.001781 ±0.000356 0.007628 ±0.000767 77Ce mol/ha/yr 0.002401 ±0.000480 0.017364 ±0.001746 86Pr mol/ha/yr 0.000305 ±0.000061 0.002007 ±0.000202 85Nd mol/ha/yr 0.001139 ±0.000228 0.007955 ±0.000800 86Sm mol/ha/yr 0.000285 ±0.000057 0.001594 ±0.000160 82Eu mol/ha/yr 0.000023 ±0.000005 0.000347 ±0.000035 93Gd mol/ha/yr 0.000109 ±0.000022 0.001148 ±0.000115 90Tb mol/ha/yr 0.000004 ±0.000001 0.000150 ±0.000015 97Dy mol/ha/yr 0.000026 ±0.000005 0.001007 ±0.000101 97Ho mol/ha/yr <DL 0.000181 ±0.000018 100Er mol/ha/yr <DL 0.000509 ±0.000051 100Tm mol/ha/yr <DL 0.000045 ±0.000005 100Yb mol/ha/yr 0.000014 ±0.000003 0.000478 ±0.000048 97Lu mol/ha/yr <DL 0.000057 ±0.000006 100Y mol/ha/yr 0.001525 ±0.000305 0.009884 ±0.000994 85
Th mol/ha/yr <DL 0.001651 ±0.000166 100U mol/ha/yr <DL 0.000260 ±0.000026 100
J.-J. Braun et al. / Geochimica et Cosmochimica Acta 99 (2012) 243–270 265
5.5.3. Assessment of the contemporary saprolite production
rate and aggressiveness of the draining waters with respect to
the primary mineral weathering assemblage
The amount and timing of the water flux determines therate of chemical weathering reactions (i.e. acid–base, ion ex-change, redox and mineral transformation reactions) andhence the trajectory of the evolution of the weathering cov-er (Berner, 1978; Chadwick and Chorover, 2001; Lin, 2010).The aggressiveness of the draining waters with respect toprimary and/or secondary minerals will depend on theirsaturation index, which indicates the saturation of the solu-tion with respect to a given secondary mineral either in the
waterlogged part of the regolith or in the vadose zone. Thesaturation index will tend to increase with increasing rate ofprecursor mineral dissolution but will decrease as increas-ing water flux (i.e. recharge) leaches solutes. Precipitationand evapo-transpiration are hence critical determinants ofrecharge/discharge of groundwater and weathering reac-tions (Chadwick and Chorover, 2001).
In order to get a deeper insight into the dynamics of thelateritic terrains in humid Tropics and how the chemicalweathering proceeds in such an environment with respectto (i) the combined effect of precipitation and evapotranspi-ration on the aggressiveness of the draining solutions at the
266 J.-J. Braun et al. / Geochimica et Cosmochimica Acta 99 (2012) 243–270
weathering front and (ii) the contemporary saprolite pro-duction rates, we propose to compare the 1L6 profile fromNsimi SEW to the BH5 monitored ridge top weatheringprofile from Mule Hole SEW, South India. Both profileshave developed on granito-gneissic Precambrian base-ments, mainly granodioritic in composition, with dominantplagioclase/albite phases. Thanks to the thorough geo-chemical, mineralogical and hydrological studies and usingthe CMB approach (see previous section), we were able toassess the water recharge (Rhill) and the chemical weather-ing fluxes in both ridge top profiles (Soumya et al., 2009;Marechal et al., 2011a,b).
The Mule Hole SEW presents the contemporary weath-ering conditions for an immature weathering cover undersub-humid climate with one rainy season of limited exten-sion (three months) per hydrological year (Braun et al.,2009; Marechal et al., 2009; Soumya et al., 2009; Ruizet al., 2010). Over a period of 40 years, the MAR is1280 ± 380 mm/yr with a coefficient of variation of 30%(Javeed et al., 2009; Javeed, 2010). The dry deciduous forestvegetation induces an elevated AET of 1100 mm/yr (85% ofMAR) (Marechal et al., 2009; Ruiz et al., 2010). The re-charge (Rhill) is 45 mm/yr out of which 100% of the solutesare discharged through the groundwater as underflow fromthe watershed. The superficial soil horizons still contain pla-gioclase crystals indicating the immaturity of the weather-ing cover. The vadose zone thickness extent to up to 36 mwithin the top ridge profile (BH5) (Braun et al., 2009)and the groundwater flows mainly in the fractured rockaquifer, leaving the saprolite aquifer unsaturated most ofthe time. The groundwater has a quite stable compositionthroughout the year with TZ+ of 7000 leq/L and silicacontent of 780 lmol/L (Violette et al., 2010). The erosionprocesses are highly active on the hillside (Barbiero et al.,2007).
At Nsimi, the coefficient of variation of annual rain islow (16%) and hence the coefficient of variation of rechargeis also low. Moreover the recharge is relatively uniform in-tra-year due to the distribution within a year with two rainyseasons. This results in a uniform discharge of the porewater each year and hence leads to a uniform developmentof a mature saprolite horizon with a sharp weatheringfront. At Mule Hole, the coefficient of variation of annualrainfall is significantly higher (30%, (Javeed et al., 2009;Javeed, 2010)) and hence the coefficient of variation of an-nual recharge is also higher than at Nsimi. Further the rain-fall within a year is predominantly concentrated in threemonths, which results in a time limited water–rock interac-tion and leading to non-uniformly developed weatheringfront (gradually decreasing maturation of the profile) inthe saprolite. Since the weathering front is not a sharpthreshold unlike at Nsimi, the pore water can be concen-trated to a higher level during its pathway to the fracturedrock. As the pore water appearing above the fractured zoneis already highly concentrated due to the continuousbreakdown of primary minerals, in the case of Mule Hole,there is less opportunity for chemical weathering in thefractured zone. Hence in comparison with Nsimi, there isa significant retardation of the development of saprolitehorizon.
We can consider, on a decadal time frame both at thepristine forested watersheds of Nsimi and Mule Hole, thatthe mean annual groundwater discharge is equal to themean annual recharge (Rhill = Qhill). So, the estimatedgroundwater discharge at Mule Hole (45 mm/yr) is approx-imatively six times lower than at Nsimi (332 mm/yr). Eventhough the groundwater discharge at Mule Hole is smallerthan at Nsimi, the pore water concentration from the frac-tured zone at Mule Hole is 12 times higher than at Nsimiweathering front, which results in a higher mass of elementsbeing leached at Mule Hole. Considering (i) Na as represen-tative of the dissolution of plagioclase crystals and conser-vative during saprolitization processes and (ii) steady stateof the inter-annual recharge for a 10 years period, the cur-rent saprolite production rates (rT, in mm/kyr) can be as-sessed by:
rT ¼F Na;hillside
ðX Na;parentrock � X Na;saproliteÞ
where FNa,hillside is the flux of sodium leached from theweathering profile (in g/m2/yr) (FNa,hillside = Rhill[Na]ground-
waternoutput with Rhill is the recharge and [Na]groundwaternoutput
the concentration of Na in the groundwater discharge fromthe system corrected from atmospheric deposit inputs).XNa,saprolite and XNa,saprolite are the fraction of sodium (i)in the parent rock and (ii) content remaining in the saprolite(in g/m3), respectively. XNa,saprolite tends towards zero whenplagioclase crystals are completely broken down and Naleached away from the saprolite (e.g. case of Nsimi). Theresulting saprolite production rates are 22 mm/kyr at MuleHole and 2 mm/kyr at Nsimi meaning that even with highdischarge, the importance of the maturity of the weatheringcover coupled with the hydrological functionning remains afundamental forcing for the solute export, chemical weath-ering and the shape of the weathering front.
5.6. Implication on the long-term evolution of lateritic
terrains in the humid Tropics
The multiconvex landform of the Interior Surface of theSouth Cameroun Plateau, whose elevation is between 600and 800 m, is supposed to originate from the dismantlingof an old iron crust formerly developed in contrasted drierclimatic conditions. Field works and remote sensing ap-proaches in the upper Nyong basin, (Bitom et al., 2004)suggest that the conjunction of climatic variations and for-est dynamics as well as the hydrostatic level fluctuation andthe lateritic heritages in the weathering cover have con-trolled the landform evolution in the current rainforest zoneof Africa. The dense secondary hydrographic network mayhave incised previous landforms while the hydrostatic levelremained stable or even migrated upwards. This has led tovertical downward decay of the lateritic weathering cover.However, the South Cameroon Plateau was not always cov-ered with rainforest and had heavy rainfall. Paleohydrolog-ical and paleoclimatological investigations covering the last10,000 yr interglacial period (Holocene) have pointed outthat the region has undergone alternating wet and droughtperiods leading, for the rainforest, to either its expansionduring wet intervals or its contraction during drought

J.-J. Braun et al. / Geochimica et Cosmochimica Acta 99 (2012) 243–270 267
periods with set up of savanna (Ngomanda et al., 2007,2009). The long term precipitation changes in monsoon re-gime during the past 20,000 yrs in Central Africa are mostlyrelated to changes in ocean circulation and sea surface tem-perature patterns, which are important to modulate atmo-spheric moisture transport (Schefusz et al., 2005; Weldeabet al., 2005). The influence on this alternating regime on along term period (i.e. P1 Myr) would have influenced thebalance between both weathering and erosion processes,hence denudation processes, but not enough to strip offthe landforms as it has occurred in the sub-humid and aridpart in South India (i.e. the Kabini River basin, case ofMule Hole SEW) (Gunnell, 1998; Gunnell et al., 2003;Braun et al., 2009).
The only existing information about the age of the Inte-rior Surface, South Cameroon Plateau, are found in thesynthesis of (Tardy and Roquin, 1998). The authors, basedon previous attempts of relative dating of the erosion sur-faces of Central Africa (Segalen, 1967; Fritsch, 1978; Mor-in, 1989) proposed a plausible Miocene age (7–20 Myr).
In order to assess the saprolite residence time and theaverage saprolite production rate (i.e. the migration rateof the weathering front into the fresh bedrock, see also (Vel-bel, 1985; Pavich, 1989; Price et al., 2008)) over long periodof time (i.e. PMyr), we have adapted the method from(Dosseto et al., 2008) coupled with the relative estimatesof age of the Interior Surface of the South Cameroon Pla-teau given in (Tardy and Roquin, 1998) to be applied to theNa leaching rate.
The saprolite residence time ssaprolite is given by:
ssaprolite ¼hsaprolite
esaprolite
with ssaprolite (in Myr) is the saprolite residence time, hsapro-
lite is the height of the saprolite (in m) and esaprolite is thesaprolite production rate (in m/Myr). ssaprolite is then usedin the expression allowing to calculate the average flux ofNa leached out of the profile over long period:
�F Na;saprolite ¼DMNa;saprolite
ssaprolite
¼ DMNa; saprolite � esaprolite
hsaprolite
where �F Na;saprolite corresponds to the average flux of Na pro-duced during the formation of the saprolite and DMNa,sap-
rolite the total mass of Na transferred from the saprolite.If we assume that the saprolite production rate might oscil-late between 2 and 25 m/Myr, range generally admitted forshield landscapes in humid Tropics (i.e. transport-limitedenvironment, (Thomas, 2006)), for a saprolite thickness of22.2 m (1L6, Nsimi), the average Na flux FNa,saprolite
F_{Na,saprolite} would vary from 70 to 890 mol/ha/yrfor residence times ssaprolite oscillating from 11 to 0.8Myr, respectively. If we consider (i) the contemporary Naflux being in the lower range FNa,hillside = 77 ± 15 mol/ha/yr; rT = 2 mm/kyr), (ii) the Miocene age (average 15 Myr)of the South Cameron Plateau landscape and (iii) the lim-ited movement of Africa continent (Parrish et al., 1982)leading to its Central part has remained at equatorial lati-tudes since Eocene (46 ± 8 Myr), the saprolite productionrate should have remain in the lower range, from 2 to10 m/Myr. We therefore agree with the statement of
(Dosseto et al., 2008) based on U-Th method, who sug-gested that, for thick weathering profiles, although the ex-tent of weathering strongly differs between temperate andtropical climates, the migration of the weathering front intothe bedrock occurs at a relatively uniform rate regardless ofpresent-day climatic conditions. Climate variation leadingto the alternation of setup of savanna or humid forest willhave an effect on physical erosion rather than chemical ero-sion for such deep weathering profiles.
6. CONCLUSION
The assessment of past and present chemical weatheringfluxes for major and trace elements of the Nsimi hillsideweathering cover indicates that:
� The mass balance calculation integrating the gain or lossof elements over the weathering profile history exhibits(i) strong depletion profiles for alkalis (Na, K, Rb)and alkaline earths (Mg, Ca, Sr, Ba), (ii) moderatedepletion profiles for Si, P, Cd, Cu, Zn, Ni and Co,(iii) depletion/enrichment profiles for Al, Ga, Ge, Sn,Pb, LREE, HREE, Y, U, Fe, V, Cr, Mn. It is notewor-thy that (i) Mn and Ce are not significantly redistributedaccording to oxidative processes as it is the case for Fe,V and Cr, and (ii) Ge is fractionated compared to silicawith enrichment in Fe-rich horizons. In the topsoil, themass balance calculations performed with the iron crustcomposition as parent material reference indicate thatthe degradation is accompanied by the loss of most ofthe elements especially those accumulated in the ironcrust as the redox sensitive elements (Fe, V, Cr) and Th.� The loss of Na is mostly attributed to plagioclase break-
down (94%) and to a lesser extend to hornblende (6%).The loss of Si is mainly due to plagioclase/feldspar crys-tal dissolution (47.4%) and ferromagnesian minerals(17.2%). The K loss is attributed to the dissolution ofK-feldspar (60%) and hornblende (40%). The Ca is pro-vided by the dissolution of epidote and hornblende(>60%) and to a lesser extend to plagioclase (30%) whilstapatite contributes for 4% only. For Mg, the main con-tributors to the weathering solution are hornblende andbiotite with 66% and 34%, respectively.� The current elemental fluxes from the hillside system are
extremely low due to both high recharge and the inertlateritic materials. Out of the 77 mol/ha/yr of Na lea-ched by chemical weathering, 72 mol/ha/yr and 5 mol/ha/yr can be attributed to the breakdown of plagiocalse(oligoclase, albite) and hornblende, respectively. Silica isthe most important species to be exported out of thewatershed with 300 mol/ha/yr, attributed to plagioclaseand kaolinite dissolution. Al (FAl,hill = 2 mol/ha/yr)and Ga (FGa,hill = 15 mmol/ha/yr) are exported fromthe lateritic weathering profile likely due to the dissolu-tion of kaolinite crystals. Immobile elements at the hill-side scale encompasses HREE, U, Th, Zr, Hf, Nb. Ti ismobile with export flux of 20 mmol/ha/yr. Amongredox-sensitive elements (Fe, V, Cr, Mn, Ce), only Ce(FCe,hill = 2 mmol/ha/yr) and Mn (FMn,hill = 280 mmol/ha/yr) are exported out of the hillside system. Rb, Ni,

268 J.-J. Braun et al. / Geochimica et Cosmochimica Acta 99 (2012) 243–270
Cu, Zn are exported in the range of 10 to 100 mmol/ha/yr, Ba and Sr in the range 200–300 mmol/ha/yr. LREEand Y are exported but in very low amounts (in thelmol/ha/yr to mmol/ha/yr range) without Cefractionation.� The element export by the stream can be sorted out by
being (1) primarily controlled by the swamp(80 6 %Fswamp 6 100%) as Th, Zr, U, LREE,HREE + Y, Cu, Fe, Cr, V, Zr, Hf, Nb, Ti and Al (2) sig-nificantly controlled (60 6 %Fswamp 6 80%) as Na, Rb,Sr, Mn, Ni, K, Ca, Ba, Zn and Ga (3) moderately con-trolled (%Fswamp 6 60%) as Mg, Co and Si.� The comparison of water budget and pore water compo-
sition within the mature ridge top weathering profiles ofNsimi and that immature of Mule Hole indicates that, atNsimi, even with high discharge, the importance of thematurity of the weathering cover coupled with thehydrological functioning remains a fundamental forcingfor the solute export, hence chemical weathering and theshape of the weathering front with a saprolite produc-tion rate of 2 mm/kyr (against 22 mm/kyr at Mule Hole)and a sharp weathering front.� On a long-term basis (>1 Myr), the assessment of the
saprolite production rate infers that the chemical weath-ering has hardly changed for this deep mature coverdeveloped on shield granito-gneissic rocks.
ACKNOWLEDGEMENTS
In Cameroon, the multidisciplinary research carried on theNsimi watershed began in 1994 under the control of IRD andIRGM-CRH (Institut de Recherche Geologique et Miniere/Centrede Recherche Hydrologique, Yaounde, Cameroon). Apart from thespecific support from the French Institute of Research for Develop-ment (IRD), our project benefited from funding from the NationalPrograms PROSE/PEGI (Programme Sol Erosion/ProgrammeEnvironnement Geosphere Intertropicale) and PNSE (ProgrammeNational Sol-Erosion) dedicated to a better understanding of thehumid tropical ecosystems These programs were funded both byIRD and INSU/CNRS (Institut National des Sciences de l’Uni-vers/Centre National de la Recherche Scientifique). In India, themultidisciplinary research carried on the Mule Hole watershed be-gan in 2002 under the aegis of the IFCWS (Indo-French Cell for-Water Sciences), joint laboratory IISc/IRD. Apart from thespecific support from the French Institute of Research for Develop-ment (IRD), the Embassy of France in India and the Indian Insti-tute of Science, our project benefited from the funding from IRDand INSU/CNRS (Institut National des Sciences de l’Univers/Cen-tre National de la Recherche Scientifique) through the French pro-grammes ECCO-PNRH (Ecosphere Continentale: Processus etModelisation — Programme National Recherche Hydrologique),EC2CO (Ecosphere Continentale et Cotiere) and ACI-Eau. It isalso funded by the Indo-French programme IFCPAR (Indo-French Center for the Promotion of Advanced ResearchW-3000).We thank the Karnataka Forest Department and the staff of theBandipur National Park for all the facilities and support they pro-vided. The long term monitoring on both Nsimi and Mule HoleSEW is supported by the project SOERE BVET (Service Observa-tion Recherche en Environnement – Basins Versants Experiment-aux Tropicaux; http://bvet.omp.obs-mip.fr). The SEWs are alsopart of the SOERE French Resources for the Exploration of theCritical Zone (Reseau des Bassins Versants, http://www.allenvi.fr).
We thank Mathieu Zang, Mathurin Amougou, Patrice Messi,Claude Akono of the Nsimi village and Justin Nlozoa (IRGM-CRH) for the care that they took in setting up of the watershedand maintaining it. We are grateful to Michel Valladon and Ber-nard Reynier for their assistance during the ICP-MS measure-ments, Philippe De Perceval for microprobe analyses and C.Lagane for the major element analyses at GET (Geoscience Envi-ronnement Toulouse). Professor Shyamala Mani is acknowledgedfor her help with English copyediting.
Thanks to S.L. Brantley and S. Carretier for stimulating discus-sions about the development of weathering fronts in the CriticalZone.
We wish to express our sincere gratitude to J.R. Price, M. Wid-dowson and an anonymous reviewer for providing thorough andvaluable reviews.
Dr. S. Krishnaswami is thanked for his editorial handling ofthis paper.
REFERENCES
Aleva G. J. J. (1994) Laterites. In Concepts, Geology, Morphology
and Chemistry. ISRIC, Wageningen.
Anderson S. P., Bales R. C. and Duffy C. J. (2008) Critical zoneobservatories: building a network to advance interdisciplinarystudy of Earth surface processes. Mineral. Mag. 72, 7–10.
Anderson S. P., von Blanckenburg F. and White A. F. (2007)Physical and chemical controls on the critical zone. Elements 3,
315–319.
Balan E., Allard T., Fritsch E., Selo M., Falgueres C., Chabaux F.,Pierret M.-C. and Calas G. (2005) Formation and evolution oflateritic profiles in the middle Amazon basin: insights fromradiation-induced defects in kaolinite. Geochim. Cosmochim.
Acta 69, 2193–2204.
Barbiero L., Parate H. R., Descloitres M., Bost A., Furian S.,Mohan Kumar M. S., Kumar C. and Braun J.-J. (2007) Using astructural approach to identify relationships between soil anderosion in a non-anthropic forested area, South India. Catena
70, 313–329.
Beauvais A. (1999) Geochemical mass balance of lateritizationprocesses and climatic change signatures in weathering profilesoverlain by ferricretes in Central Africa. Geochim. Cosmochim.
Acta 63, 3939–3957.
Beauvais A. (2009) Ferricrete biochemical degradation on therainforest–savannas boundary of Central African Republic.Geoderma 150, 379–388.
Berner R. A. (1978) Rate control of mineral dissolution under earthsurface conditions. Am. J. Sci. 278, 1235–1252.
Bilong P., Eno Belinga S. M. and Volkoff B. (1992) Sequenced’evolution des paysages cuirasses et des sols ferrallitiques enzones forestieres tropicales d’Afrique Centrale: place des sols ahorizons d’argiles tachetees. C. R. Acad. Sci. Paris 314, 109–
115.
Bitom D., Volkoff B., Beauvais A., Seyler F. and Ndjigui P.-D.(2004) Role des heritages lateritiques et du niveau des nappesdans l’evolution des modeles et es sols en zone intertropicaleforestiere humide. C. R. Acad. Sci. Paris 336, 1161–1170.
Boeglin J. L. and Probst J. L. (1998) Physical and chemicalweathering rates and CO2 comsumption in a tropical lateriticenvironment: the upper Niger Basin. Chem. Geol. 148, 137–156.
Brantley S. L. and Lebedeva M. (2011) Learning to read thechemistry of regolith to understand the critical zone. Annu. Rev.
Earth Planet. Sci. 39, 387–416.
Brantley S. L. (2008) Understanding soil time – perspectives –geology. Science 321, 1454–1455.

J.-J. Braun et al. / Geochimica et Cosmochimica Acta 99 (2012) 243–270 269
Brantley S. L. (2010) Rock to regolith – focus news and views. Nat.
Geosci. 3, 305–306.
Brantley S. L., Goldhaber M. B. and Ragnarsdottir K. V. (2007)Crossing disciplines and scales to understand the critical zone.Elements 3, 307–314.
Brantley S. L. and White A. F. (2009) Approaches to modelingweathered regolith. In Reviews in Mineralogy and Geochemistry.
Mineralogical Society of America, pp. 435–484.
Braun J.-J., Descloitres M., Riotte J., Fleury S., BarbiEro L.,Boeglin J.-L., Violette A., Lacarce E., Ruiz L., Sekhar M.,Mohan Kumar M. S., Subramanian S. and DuprE B. (2009)Regolith mass balance inferred from combined mineralogical,geochemical and geophysical studies: Mule Hole gneissicwatershed, South India. Geochim. Cosmochim. Acta 73, 935–
961.
Braun J.-J., Ndam Ngoupayou J. R., Viers J., Dupre B.,Bedimo Bedimo J. P., Boeglin J. L., Robain H., Nyeck B.,Freydier R., Sigha Nkamdjou L., Rouiller J. and Muller J.-P. (2005) Present weathering rates in a humid tropicalwatershed: Nsimi site (South Cameroon). Geochim. Cosmo-
chim. Acta 69, 357–387.
Braun J.-J., Viers J., Dupre B., Polve M., Ndam J. and Muller J.-P.(1998) Solid/Liquid REE fractionation in the lateritic system ofGoyoum, East Cameroon: the implication for the presentdynamics of the soil covers of the humid tropical regions.Geochim. Cosmochim. Acta 62, 273–299.
Brimhall G. H., Lewis C. J., Ague J. J., Dietrich W. E., Hampel J.,Teague T. and Rix P. (1988) Metal enrichment in bauxites bydeposition of chemically mature aeolian dust. Nature 333, 819–
824.
Brimhall G. H., Lewis C. J., Ford C., Bratt J., Taylor G. andWarin O. (1991) Quantitative geochemical approach topedogenesis: importance of parent material reduction, volu-metric expansion and eolian influx in laterization. Geoderma
51, 51–91.
Cary L., Alexandre A., Meunier J.-D., Boeglin J.-L. and Braun J. J.(2005) Contribution of phytoliths to the suspended load ofbiogenic silica in the Nyong basin rivers (Cameroon). Biogeo-
chemistry 74, 101–114.
Chabaux F., Dequincey O., Leveque J.-J., Leprun J.-C., Clauer N.,Riotte J. and Paquet H. (2003) Tracing and dating recentchemical transfers in weathering profiles by trace-elementgeochemistry and 238U–234U–230Th disequilibria: the exam-ple of the Kaya lateritic toposequence (Burkina-Faso). C. R.
Geosci. 335, 1219–1231.
Chadwick O. A. and Chorover J. (2001) The chemistry ofpedogenic thresholds. Geoderma 100, 321–353.
Delattre S., Utsunomiya S., Ewing R., Boeglin J. L., Braun J.-J.,Balan E. and Calas G. (2007) Dissolution of radiation-damagedzircon in lateritic soils. Am. Mineral. 92, 1978–1989.
Dequincey O., Chabaux F., Clauer N., Sigmarsson O., Liewig N.and Leprun J. C. (2002) Chemical mobilizations in laterites:evidence from trace elements and 238U–234U–230Th disequi-libria. Geochim. Cosmochim. Acta 66, 1197–1210.
Descloitres M., Ruiz L., Sekhar M., Legchenko A., Braun J J.,Mohan Kumar M. S. and Subramanian S. (2007) Character-ization of seasonal local recharge using electrical resistivitytomography and magnetic resonance sounding. Hydrol. Pro-
cess. 22, 384–394.
Dosseto A., Turner S. P. and Chappell J. (2008) The evolution ofweathering profiles through time: new insights from uranium-series isotopes. Earth Planet. Sci. Lett. 274, 359–371.
Edmond J. M., Palmer M. R., Measures C. I., Grant B. andStallard R. F. (1995) The fluvial geochemistry and denudationrate of the Guayana Shield in Venezuela, Colombia and Brazil.Geochim. Cosmochim. Acta 59, 3301–3325.
Fritsch, P., 1978. Chronologie relative des formations cuirassees etanalyses geographiques des facteurs du cuirassement au Came-roun. Trav. Doc. CEGET, Bordeaux, Bordeaux, pp. 115–132.
Godderis Y., Donnadieu Y., Tombozafy M. and Dessert C. (2008)Shield effect on continental weathering: implication for climaticevolution of the Earth at the geological timescale. Geoderma
145, 439–448.
Godderis Y., Roelandt C., Schott J., Pierret M.-C. and Franc�ois L.M. (2009) Towards an integrated model of weathering, climate,and biospheric processes (ed. M. S. o. America). Reviews inMineralogy & Geochemistry, pp. 411–434.
Gunnell Y. (1998) Present, past and potential denudation rates: isthere a link? Tentative evidence from fission-track data, riversediment loads and terrain analysis in the South Indian shield.Geomorphology 25, 135–153.
Gunnell Y., Gallagher K., Carter A., Widdowson M. and HurfordA. J. (2003) Denudation history of the continental margin ofwestern peninsular India since the early Mesozoic - reconcilingapatite fission-track data with geomorphology*1. Earth Planet.
Sci. Lett. 215, 187–201.
Javeed, Y., 2010. Analysis of groundwater dynamics in semi-aridregions: effect of rainfall variability and pumping, Ph.D., CivilEngineering. Indian Institute of Science, Bangalore, India.
Javeed Y., Sekhar M., Bandyopadhyay S. and Mangiarotti S.(2009) EOF and SSA analyses of hydrological time series toassess effects of climatic variability and land use effects: a casestudy in the Kabini river basin in south India. IAHS publication
329, 167–177.
Kisakurek B., Widdowson M. and James R. H. (2004) Behaviourof Li isotopes during continental weathering: the Bidar lateriteprofile, India. Chem. Geol. 212, 27–44.
Lin H. (2010) Earth’s Critical Zone and hydropedology: concepts,characteristics and advances. Hydrol. Earth Syst. Sci. 14, 25–45.
Marechal J. C., Braun J. J., Riotte J., Bedimo Bedimo J.-P. andBoeglin J. L. (2011a) Hydrologic processes of a rainforestheadwater swamp from natural chemical tracing in Nsimiwatershed, Cameroon. Hydrol. Process.. http://dx.doi.org/10.1002/hyp.7989.
Marechal J. C., Riotte J., Lagane C., Subramanian S., Kumar C.,Ruiz L., Audry S., Varma M. R. R. and Braun J. J. (2011b)Deep groundwater flow as the main pathway for chemicaloutputs in a small headwater watershed. Appl. Geochem. 26,
S94–S96.
Marechal J. C., Varma M. R. R., Riotte J., Vouillamoz J. M.,Kumar M. S. M., Ruiz L., Sekhar M. and Braun J. J. (2009)Indirect and direct recharges in a tropical forested watershed:Mule Hole, India. J. Hydrol. 364, 272–284.
Migon P. (2006) Granite Landscapes of the World. OxfordUniversity Press.
Migon P. (2009) Are any granite landscape distinctive of the humidtropics? Reconsidering multiconvex topographies. Singap. J.
Trop. Geogr. 30, 327–342.
Morin, S., 1989. Hautes terres et bassins de l’Ouest Cameroun.Etude geomorphologique, Dpt. Geography. Univ. BordeauxIII, p. 1190.
Nahon D. (1991) Introduction to the Petrology of Soil and Chemical
Weathering. John Wiley and Sons, New York, 313p..Nash D. J. and McLaren S. J. (2007) Geochemical Sediments and
Landscapes. Blackwell, Oxford.Ngomanda A., Jolly D., Bentaleb I., Chepstow-Lusty A., Makaya
M. v., Maley J., Fontugne M., Oslisly R. and Rabenkogo N.(2007) Lowland rainforest response to hydrological changesduring the last 1500 years in Gabon, Western EquatorialAfrica. Quatern. Res. 67, 411–425.
Ngomanda A., Neumann K., Schweizer A. and Maley J. (2009)Seasonality change and the third millennium BP rainforest

270 J.-J. Braun et al. / Geochimica et Cosmochimica Acta 99 (2012) 243–270
crisis in southern Cameroon (Central Africa). Quatern. Res. 71,
307–318.
Oh N.-H. and Richter D. D. (2005) Elemental translocation andloss from three highly weathered soil-bedrock profiles in thesoutheastern United States. Geoderma 126, 5–25.
Oliva P., Viers J., Dupre B., Fortune J. P., Martin F., Braun J. J.,Nahon D. and Robain H. (1999) The effect of organic matter onchemical weathering: study of a small tropical watershed: nsimi-zoetele site, cameroon. Geochim. Cosmochim. Acta 63, 4013–
4035.
Parrish J. T., Ziegler A. M. and Scotese C. R. (1982) Rainfallpatterns and the distribution of coals and evaporites in theMesozoic and Cenozoic. Pal. Pal. Pal. 40, 67–101.
Pavich M. J. (1989) Regolith residence time and the concept ofsurface age of the Piedmont “Peneplain”. Geomorphology 2,
181–196.
Poitrasson F., Viers J., Martin F. and Braun J.-J. (2008) Limitediron isotope variations in recent lateritic soils from Nsimi,Cameroon: implications for the global Fe geochemical cycle.Chem. Geol. 253, 54–63.
Price J. R., Heitmann N., Hull J. and Szymanski D. (2008) Long-term average mineral weathering rates from watershed geo-chemical mass balance methods: using mineral modal abun-dances to solve more equations in more unknowns. Chem. Geol.
254, 36–51.
Retallack G. L. (2010) Lateritization and bauxitization Events.Econ. Geol. 105, 655–667.
Riebe C. S., Kirchner J. W. and Finkel R. C. (2003) Long-termrates of chemical weathering and physical erosion fromcosmogenic nuclides and geochemical mass balance. Geochim.
Cosmochim. Acta 67, 4411–4427.
Ruiz L., Varma M. R. R., Kumar M. S. M., Sekhar M., MarechalJ. C., Descloitres M., Riotte J., Kumar S., Kumar C. and BraunJ. J. (2010) Water balance modelling in a tropical watershedunder deciduous forest (Mule Hole, India): regolith matricstorage buffers the groundwater recharge process. J. Hydrol.
380, 460–472.
Schefusz E., Schouten S. and Schneider R. R. (2005) Climaticcontrols on central African hydrology during the past20,000[thinsp]years. Nature 437, 1003–1006.
Schellmann W. (1986) A new definition of laterite. In Lateritisation
Processes (ed. P. K. Banerjiee). Memoir of the Geological
Survey of India, pp. 1–7.
Segalen P. (1967) Les sols et la geomorphologie du Cameroun. Cah.
ORSTOM, Serie Pedol. 5(2), 137–188.
Soumya B. S., Sekhar M., Riotte J., Audry S., Lagane C. andBraun J. J. (2011) Inverse models to analyze the spatiotemporalvariations of chemical weathering fluxes in a granito-gneissicwatershed: Mule Hole, South India. Geoderma 165, 12–24.
Soumya B. S., Sekhar M., Riotte J. and Braun J. J. (2009) Non-linear regression model for spatial variation in precipitationchemistry for South India. Atmos. Environ. 43, 1147–1152.
Tarantola A. and Valette B. (1982) Generalized nonlinear inverseproblems solved using the least squares criterion. Rev. Geophys.
Space Phys. 20, 219–232.
Tardy Y. (1993) Petrologie des laterites et des sols tropicaux.Masson, Paris.
Tardy, Y., Roquin, C., 1998. Derive des continents – Paleoclimatset alterations tropicales. BRGM Editions, Orleans.
Thomas M. F. (1994) Geomorphology in the tropics. A study of
weathering and denudation in low latitudes. John Wiley & Sons.Thomas M. F. (2006) Lessons from the tropics for a global
geomorphology. Singap. J. Trop. Geogr. 27, 11–127.
USDA, 1999. Soil Taxonomy: A Basic System of Soil Classificationfor Making and Interpreting Soil Surveys – Soil Survey Staff.USDA NRCS, Washington, USA.
Velbel M. A. (1985) Geochemical mass balances and weatheringrates in forested watershed of the southern Blue Ridge. Am. J.
Sci. 285, 904–930.
Velbel M. A. (1993) Temperature dependence of silicate weatheringin nature: how strong a negative feedback on long-termaccumulation of atmospheric CO2 and global greenhousewarming? Geology 21, 1059–1062.
Viers J., Dupre B., Polve M., Schott J., Dandurand J. L. and BraunJ. J. (1997) Chemical weathering in the drainage basin of atropical watershed (Nsimi-Zoetele site, Cameroon): comparisonbetween organic poor and organic rich waters. Chem. Geology
140, 181–206.
Viers J., Oliva P., Nonell A., Gelabert A., Sonke J. E., Freydier R.,Gainville R. and Dupre B. (2007) Evidence of Zn isotopicfractionation in a soil–plant system of a pristine tropicalwatershed (Nsimi, Cameroon). Chem. Geol. 239, 124–137.
Viers J. and Wasserburg G. J. (2004) Behavior of Sm and Nd in alateritic soil profile. Geochim. Cosmochim. Acta 68, 2043–2054.
Violette A., Godderis Y., Marechal J. C., Riotte J., Oliva P.,Kumar M. S. M., Sekhar M. and Braun J. J. (2010) Modellingthe chemical weathering fluxes at the watershed scale in theTropics (Mule Hole, South India): relative contribution of thesmectite/kaolinite assemblage versus primary minerals. Chem.
Geol. 277, 42–60.
Weldeab S., Schneider R. R., Kolling M. and Wefer G. (2005)Holocene African droughts relate to eastern equatorial Atlanticcooling. Geology 33, 981–984.
West A. J., Galy A. and Bickle M. (2005) Tectonic and climaticcontrols on silicate weathering. Earth Planet. Sci. Lett. 235,
211–228.
White, A.F., 2008. Quantitative Approaches to CharacterizingNatural Chemical Weathering Rates. In Kinetics of Water-Rock Interaction (eds. S. L. Brantley, J. D. Kubicki and A.F.White). Springer, New York, pp. 469–543.
White P. J. and Broadley M. R. (2001) Chloride in soils and itsuptake and movement within the plant: a review. Ann. Bot. 88,
967–988.
Widdowson M. (2003) Ferricrete. In Encyclopedia of Geomorphol-
ogy (ed. A. S. Goudie). Routledge, London, pp. 365–367.
Widdowson M. (2007) Laterite and ferricrete. In Geochemical
Sediments and Landscapes (eds. D. J. Nash and S. J. McLaren).Blackwell Publishing Ltd., p. 488pp..
Wimpenny J., Gannoun A., Burton K. W., Widdowson M., JamesR. H. and Gıslason S. R. (2007) Rhenium and osmium isotopeand elemental behaviour accompanying laterite formation inthe Deccan region of India. Earth Planet. Sci. Lett. 261, 239–
258.
Associate editor: S. Krishnaswami