multiferroicity in la1/2nd1/2feo3 nanoparticles
TRANSCRIPT
lable at ScienceDirect
Solid State Sciences 37 (2014) 55e63
Contents lists avai
Solid State Sciences
journal homepage: www.elsevier .com/locate/ssscie
Multiferroicity in La1/2Nd1/2FeO3 nanoparticles
Sadhan Chanda a, *, Sujoy Saha a, Alo Dutta a, A.S. Mahapatra b, P.K. Chakrabarti b,Uday Kumar c, T.P. Sinha a
a Department of Physics, Bose Institute, 93/1, Acharya Prafulla Chandra Road, Kolkata 700009, West Bengal, Indiab Solid State Research Laboratory, Department of Physics, Burdwan University, Burdwan 713104, Indiac Department of Physical Science, Indian Institute of Science Education and Research, Kolkata, Mohanpur 741252, India
a r t i c l e i n f o
Article history:Received 23 April 2014Received in revised form25 July 2014Accepted 13 August 2014Available online 27 August 2014
Keywords:NanostructuresSolegel chemistryAntiferromagneticImpedance spectroscopyDielectric propertiesMultiferroicity
* Corresponding author. Tel.: þ91 033 23031191; faE-mail addresses: [email protected],
(S. Chanda).
http://dx.doi.org/10.1016/j.solidstatesciences.2014.08.01293-2558/© 2014 Elsevier Masson SAS. All rights res
a b s t r a c t
Nano-sized La1/2Nd1/2FeO3 (LNF) powder is synthesized by the solegel citrate method. The Rietveldrefinement of the X-ray diffraction profile of the sample at room temperature (303 K) shows theorthorhombic phase with Pbnm symmetry. The particle size is obtained by transmission electron mi-croscope. The antiferromagnetic nature of the sample is explained using zero field cooled and fieldcooled magnetisation and the corresponding hysteresis loop. A signature of weak ferromagnetic phase isobserved in LNF at low temperature which is explained on the basis of spin glass like behaviour of surfacespins. The dielectric relaxation of the sample has been investigated using impedance spectroscopy in thefrequency range from 42 Hz to 1 MHz and in the temperature range from 303 K to 513 K. The ColeeColemodel is used to analyse the dielectric relaxation of LNF. The frequency dependent conductivity spectrafollow the power law. The magneto capacitance measurement of the sample confirms its multiferroicbehaviour.
© 2014 Elsevier Masson SAS. All rights reserved.
1. Introduction
Multiferroicity in perovskite oxides has been investigatedextensively in recent years due to their potential application insolid oxide fuel cells, non-volatile magnetic memory devices andultrasensitive magnetic read-heads of modern hard disk drives[1e4]. Among these multiferroic perovskites, the rare-earthorthoferrites, RFeO3 (R ¼ rare earth) have been investigated fortheir usefulness in a wide variety of applications such as in gassensors [5,6] and photo-catalysis [7]. They have also been poten-tially used for data storage applications due to their antiferro-magnetic properties with N�eel temperature ranging from 620 K to740 K [8]. The high value of the local internal electric field producesthe spontaneous polarization leading to the on-set of ferroelectricordering, and the interaction between Fe-cations via oxygen anioninduces super-exchange interaction leading to the on-set of mag-netic ordering in the same system [9].
The studies of the rare earth transition metal oxides haverevealed many fascinating aspects. Among all the rare earthorthoferrites, the LaFeO3 is an orthorhombically (Pbnm) distorted
x: þ91 033 [email protected]
06erved.
antiferromagnetic (AFM) material having the highest Neel tem-perature, TN ¼ 740 K [10]. It has been widely investigated to char-acterise the verities of properties such as multiferrocity [11],exchange bias [12], colossal dielectric response [13] etc. Some at-tempts have been made to increase the value of the magnetizationby doping Al3þ and Sb3þ at La3þ in LaFeO3 [14,15]. Wu et al. haveinvestigated the hysteresis and magnetic behaviour of RFeO3(R ¼ La, Nd) nanocrystalline powder [16]. NdFeO3 has an ortho-rhombically distorted perovskite-type structure with space groupPbnm. In NdFeO3, there exists three major magnetic interactions(FeeFe, NdeFe and NdeNd) [17]. These competing interactionsdetermine their interesting magnetic properties and lead to anumber of applications.
In this work, a single phase nano-sized La1/2Nd1/2FeO3 (LNF)powder is prepared by solegel citrate method and its structural,dielectric, magnetic and multiferroic properties are investigated.La3þ has nomagnetic moment while Nd3þ hasmagnetic moment of~3.3e3.7 mB. Nd3þ ion is chosen for two way improvement of themultiferroic behaviour of LaFeO3: (i) the enhancement of themagnetisation for the nanoparticles and (ii) the increment of theelectrical properties by increasing the value of the dielectric con-stant and decreasing the dielectric loss. To the best of our knowl-edge, no report on the structure, magnetic and dielectric propertiesand/or the multiferroic behaviour of Nd3þ doped LaFeO3 is found inthe literature.
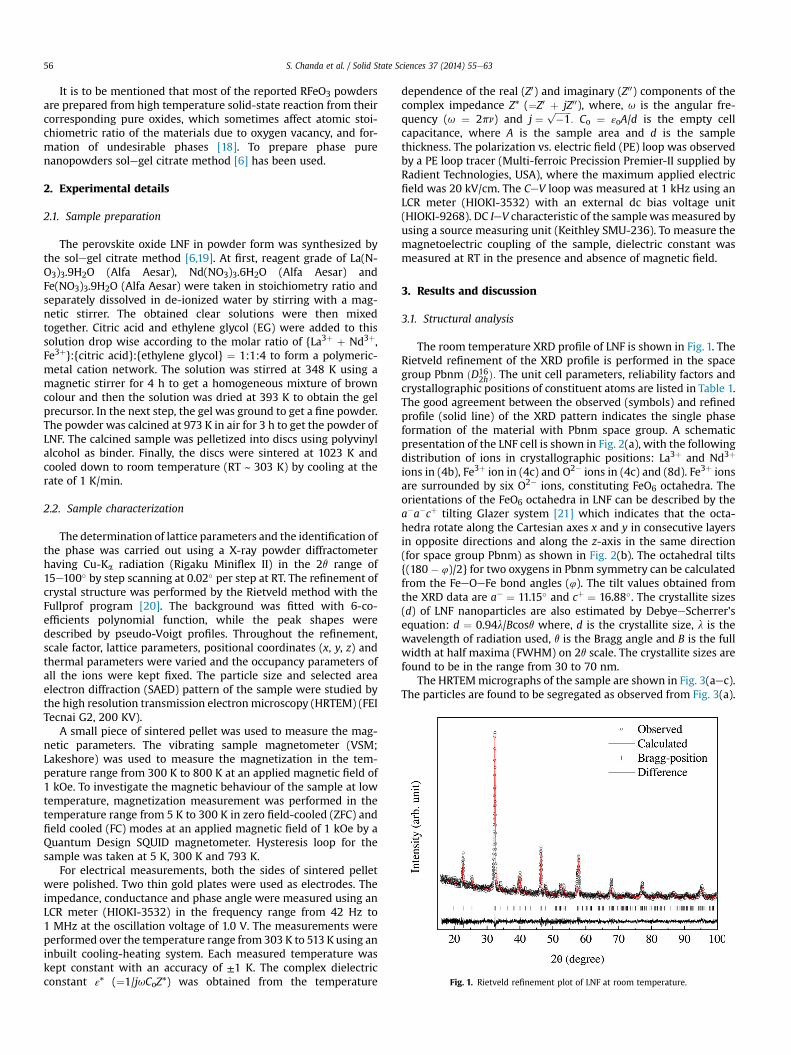
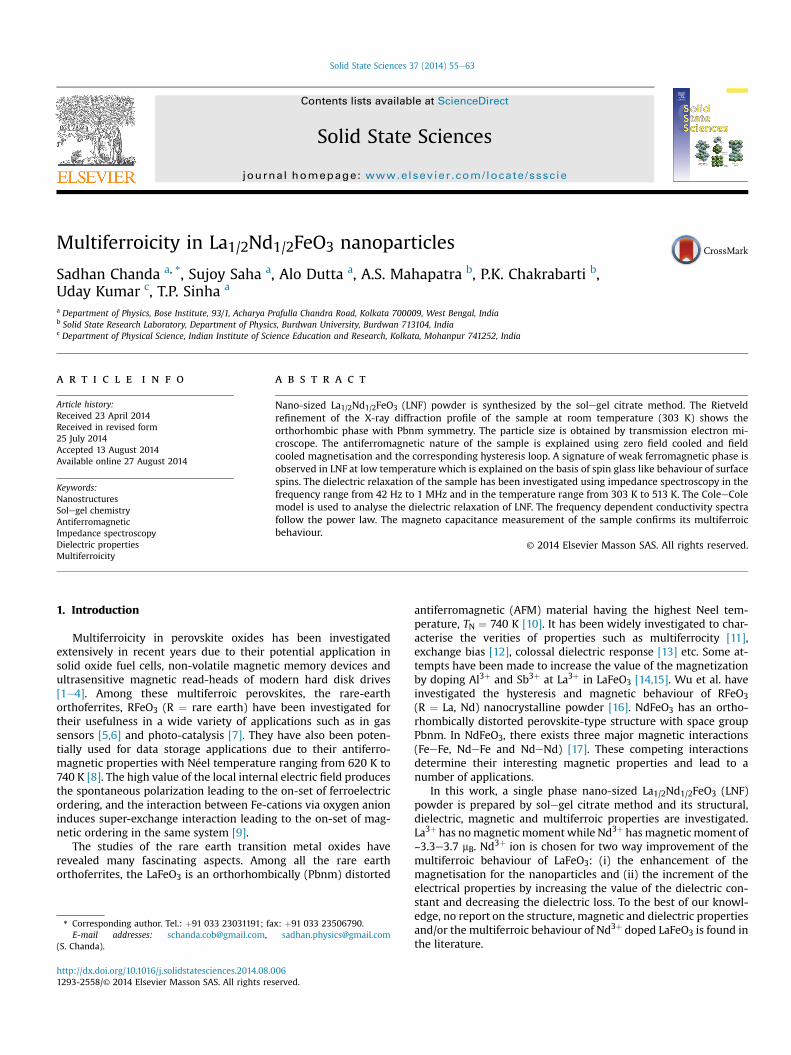
Fig. 1. Rietveld refinement plot of LNF at room temperature.
S. Chanda et al. / Solid State Sciences 37 (2014) 55e6356
It is to be mentioned that most of the reported RFeO3 powdersare prepared from high temperature solid-state reaction from theircorresponding pure oxides, which sometimes affect atomic stoi-chiometric ratio of the materials due to oxygen vacancy, and for-mation of undesirable phases [18]. To prepare phase purenanopowders solegel citrate method [6] has been used.
2. Experimental details
2.1. Sample preparation
The perovskite oxide LNF in powder form was synthesized bythe solegel citrate method [6,19]. At first, reagent grade of La(N-O3)3.9H2O (Alfa Aesar), Nd(NO3)3.6H2O (Alfa Aesar) andFe(NO3)3.9H2O (Alfa Aesar) were taken in stoichiometry ratio andseparately dissolved in de-ionized water by stirring with a mag-netic stirrer. The obtained clear solutions were then mixedtogether. Citric acid and ethylene glycol (EG) were added to thissolution drop wise according to the molar ratio of {La3þ þ Nd3þ,Fe3þ}:{citric acid}:{ethylene glycol} ¼ 1:1:4 to form a polymeric-metal cation network. The solution was stirred at 348 K using amagnetic stirrer for 4 h to get a homogeneous mixture of browncolour and then the solution was dried at 393 K to obtain the gelprecursor. In the next step, the gel was ground to get a fine powder.The powder was calcined at 973 K in air for 3 h to get the powder ofLNF. The calcined sample was pelletized into discs using polyvinylalcohol as binder. Finally, the discs were sintered at 1023 K andcooled down to room temperature (RT ~ 303 K) by cooling at therate of 1 K/min.
2.2. Sample characterization
The determination of lattice parameters and the identification ofthe phase was carried out using a X-ray powder diffractometerhaving Cu-Ka radiation (Rigaku Miniflex II) in the 2q range of15e100� by step scanning at 0.02� per step at RT. The refinement ofcrystal structure was performed by the Rietveld method with theFullprof program [20]. The background was fitted with 6-co-efficients polynomial function, while the peak shapes weredescribed by pseudo-Voigt profiles. Throughout the refinement,scale factor, lattice parameters, positional coordinates (x, y, z) andthermal parameters were varied and the occupancy parameters ofall the ions were kept fixed. The particle size and selected areaelectron diffraction (SAED) pattern of the sample were studied bythe high resolution transmission electronmicroscopy (HRTEM) (FEITecnai G2, 200 KV).
A small piece of sintered pellet was used to measure the mag-netic parameters. The vibrating sample magnetometer (VSM;Lakeshore) was used to measure the magnetization in the tem-perature range from 300 K to 800 K at an applied magnetic field of1 kOe. To investigate the magnetic behaviour of the sample at lowtemperature, magnetization measurement was performed in thetemperature range from 5 K to 300 K in zero field-cooled (ZFC) andfield cooled (FC) modes at an applied magnetic field of 1 kOe by aQuantum Design SQUID magnetometer. Hysteresis loop for thesample was taken at 5 K, 300 K and 793 K.
For electrical measurements, both the sides of sintered pelletwere polished. Two thin gold plates were used as electrodes. Theimpedance, conductance and phase angle were measured using anLCR meter (HIOKI-3532) in the frequency range from 42 Hz to1 MHz at the oscillation voltage of 1.0 V. The measurements wereperformed over the temperature range from 303 K to 513 K using aninbuilt cooling-heating system. Each measured temperature waskept constant with an accuracy of ±1 K. The complex dielectricconstant ε* (¼1/juCoZ*) was obtained from the temperature
dependence of the real (Z0) and imaginary (Z00) components of thecomplex impedance Z* (¼Z0 þ jZ00), where, u is the angular fre-quency (u ¼ 2pn) and j ¼
ffiffiffiffiffiffiffi�1
p: Co ¼ εoA/d is the empty cell
capacitance, where A is the sample area and d is the samplethickness. The polarization vs. electric field (PE) loop was observedby a PE loop tracer (Multi-ferroic Precission Premier-II supplied byRadient Technologies, USA), where the maximum applied electricfield was 20 kV/cm. The CeV loop was measured at 1 kHz using anLCR meter (HIOKI-3532) with an external dc bias voltage unit(HIOKI-9268). DC IeV characteristic of the samplewasmeasured byusing a source measuring unit (Keithley SMU-236). To measure themagnetoelectric coupling of the sample, dielectric constant wasmeasured at RT in the presence and absence of magnetic field.
3. Results and discussion
3.1. Structural analysis
The room temperature XRD profile of LNF is shown in Fig. 1. TheRietveld refinement of the XRD profile is performed in the spacegroup Pbnm ðD16
2hÞ: The unit cell parameters, reliability factors andcrystallographic positions of constituent atoms are listed in Table 1.The good agreement between the observed (symbols) and refinedprofile (solid line) of the XRD pattern indicates the single phaseformation of the material with Pbnm space group. A schematicpresentation of the LNF cell is shown in Fig. 2(a), with the followingdistribution of ions in crystallographic positions: La3þ and Nd3þ
ions in (4b), Fe3þ ion in (4c) and O2� ions in (4c) and (8d). Fe3þ ionsare surrounded by six O2� ions, constituting FeO6 octahedra. Theorientations of the FeO6 octahedra in LNF can be described by thea�a�cþ tilting Glazer system [21] which indicates that the octa-hedra rotate along the Cartesian axes x and y in consecutive layersin opposite directions and along the z-axis in the same direction(for space group Pbnm) as shown in Fig. 2(b). The octahedral tilts{(180 � 4)/2} for two oxygens in Pbnm symmetry can be calculatedfrom the FeeOeFe bond angles (4). The tilt values obtained fromthe XRD data are a� ¼ 11.15� and cþ ¼ 16.88�. The crystallite sizes(d) of LNF nanoparticles are also estimated by DebyeeScherrer'sequation: d ¼ 0.94l/Bcosq where, d is the crystallite size, l is thewavelength of radiation used, q is the Bragg angle and B is the fullwidth at half maxima (FWHM) on 2q scale. The crystallite sizes arefound to be in the range from 30 to 70 nm.
The HRTEMmicrographs of the sample are shown in Fig. 3(aec).The particles are found to be segregated as observed from Fig. 3(a).

Table 1Structural parameters for LNF as obtained from Rietveld analysis of XRD pattern.
Atoms Site x y z Biso (Å2) Bond length (Å)
La/Nd 4c 0.504(1) 0.5367(4) 0.2500 0.45 FeeO1 (x2) ¼ 2.022Fe 4b 0.0000 0.5000 0.0000 0.35 FeeO2 (x2) ¼ 2.056OI 4c 0.403(7) �0.010(5) 0.25 0.69 FeeO2 (x2) ¼ 1.946OII 8d 0.781(6) 0.204(5) �0.037(2) 0.48<FeeOIeFe> ¼ 149.52�
<FeeOIIeFe> ¼ 155.74�
Cell parameters: a ¼ 5.5013(4) Å, b ¼ 5.5664(4) Å, c ¼ 7.8057(6) Å.Reliability factors: Rp ¼ 4.99, Rwp ¼ 6.32, Rexp ¼ 5.44, c2 ¼ 1.30.
S. Chanda et al. / Solid State Sciences 37 (2014) 55e63 57
The sizes of the particles are estimated to be in the range from 40 to75 nm. Fig. 3(b) indicates the homogeneous orientation of thelattice planes with interplanar spacing of 0.27 nmwhich correlateswith the d spacing value of (112) plane of the system. The SAEDpattern (Fig. 3(c)) shows bright spots indicating that particles arewell crystalline in nature.
3.2. Magnetic properties
Fig. 4(a) shows the temperature dependence of magnetization(M) of the sample from 300 to 800 K under an applied magneticfield of 1 kOe. The value of M decreases slowly with the increase oftemperature and shows an antiferromagnetic to paramagnetictransition at 728 K (¼N�eel temperature, TN). Fig. 4(b) shows theM�H curves of LNF at 300 K and 793 K. The lack of the saturation ofthe magnetization at 300 K supports the antiferromagneticbehaviour of LNF. Above TN, a paramagnetic region is observedwhich is justified by linear nature of M�H loop at 793 K. The ZFCand FC magnetizations of the sample are shown in the temperaturerange from 5 K to 300 K in Fig. 4(c). It is observed that themagnetization (M) first increases slowly with the decrease oftemperature and then increases sharply below 35 K. The ZFCmagnetic hysteresis loop of LNF at 5 K is shown in Fig. 4(d). Theobserved linear MeH loop at 5 K (Fig. 4(d)) indicates the presenceof a predominate AFM interaction. Moreover, a weak FM
Fig. 2. (a) Schematic presentation of the LNF orthorhombic unit cell. The Fe atoms are locateOII oxygen atoms located in the planes parallel to xy plane. (b) A view looking down the z
component is also observed in the loop. The sharp increase ofmagnetization below 35 K (Fig. 4(c)) may be due to the weak FMnature of the material. Orthoferrite LNF has two magnetic sub-lattices (Fe3þ and Nd3þ) which are coupled through a negativeexchange interaction [22,23]. The iron sublattice is ordered into aslightly canted antiferromagnetic structure with a weak ferro-magnetic moment which is perpendicular to the antiferromagneticaxis [24], while the magnetic moments of Nd ions have negativetemperature coefficient. Below 35 K, themagnitude of Ndmomentsis larger than that of Fe cations and ferromagnetic-like situationwhich is also revealed by ZFC curve may occur [25]. However, themoments of Nd ions decrease with increasing temperature whichinduces monotonical drop in magnetization up to 35 K. Thereafter,the antiferromagnetism of Fe sublattice becomes prominent.
In the inset of Fig. 4(d) the expansion of small regionbetween �2.5 and 2.5 kOe of the hysteresis loop is shown. It can beseen that the values of coercivity HC1 (¼�880 Oe) and HC2(¼þ620 Oe) are not equal. This indicates the presence of an ex-change bias in LNF. The strength of exchange bias effect can beunderstood in terms of exchange field HE which is defined as [26]:
HE ¼ �HC1 þ HC2
2; (1)
where HC1 and HC2 are the left and right side field values respec-tively when magnetization becomes zero in hysteresis loop. Thevalue of HE for LNF is found to be 130 Oe. The presence of exchangebias effect and the observed open hysteresis loop (shown in theinset of Fig. 4(c)) even at high field 30 kOe is a signature of un-compensated surface spins. Due to the large surface/volume ratio innanoparticles, the effect of surface disorder is large which may giverise to spin glass like behaviour of surface spins. In principle, thespin glass like behaviour of the surface spins in nanoparticlescomes due to the magnetic frustrations and disorder, which isdifferent from the geometrical frustration occurring in systemswith special symmetries and no disorder in spin [27].
Besides the magnetic frustrations and disorder of the surfacespins, the exchange bias anisotropy in LNF (observed from the
d at the centres of the FeO6 octahedra. The OI oxygen atoms located along z axis and theaxis of two adjacent layers of octahedral for LNF (a�a�cþ tilt system).

Fig. 3. (a) The transmission electron microscopy (TEM) image of particles, (b) itscorresponding high resolution-TEM (HR-TEM) image and (c) selected area electrondiffraction (SAED) pattern.
S. Chanda et al. / Solid State Sciences 37 (2014) 55e6358
presence of an asymmetry in the remanence magnetization) can beexplained by the deviation of the surface spins from the collineararrangement of the core spins due to spin canting which leads tothe uncompensated surface spins. This effect enhances the weakFM interaction. The enhanced FM coupling facilitates the formationof ferromagnetic interaction between the surface spins in LNFnanoparticles. The positive value of HE also supports the ferro-magnetic nature of surface spins [12]. Thus, the LNF nanoparticlescan be supposed to be composed of an AFM core and FM spin glasslike surface shell.
3.3. Dielectric relaxation
The angular frequency u (¼2pn) dependence of the real (ε0) andimaginary (ε00) parts of complex dielectric constant (ε*) for LNF areshown in Fig. 5 as a function of temperature. The step-like decrease
in ε0 (in Fig. 5(a)) and the respective relaxation peaks in ε
00 (asshown in Fig. 5(b)) may be ascribed to the dipole polarization effect,which appears at radio-frequency range. The polarization mecha-nism in the material depends solely on the two effects, the fre-quency of applied electric field and temperature. At fixedtemperature, if an alternating field is applied then the polarizationmay fully develop at sufficiently low applied frequencies (the po-larization and the field are in phase) but when the frequency of theapplied field is very high, the field is reversed before the polari-zation has responded and no response will be the result. Themagnitude of the polarization thus drops off as the frequency isincreased. At low temperature, the electric dipoles freeze throughthe relaxation process and there exists decay in polarization withrespect to the applied electric field, which is responsible for thesharp decrease in ε'. When the temperature is high, the rate ofpolarization formed is quick, and thus the relaxation occurs in highfrequency as shown in Fig. 5(b) for LNF. At high temperature, ε'increases in the low frequency range (<1 kHz) which may be due tospace charge polarization. Usually, the space charge (interfacial)polarization occurs when mobile charge carriers are impeded by aphysical barrier (i.e. grain boundary and/or electrode-specimeninterface) that inhibits charge migration. The charges then pile upat the barrier, producing a localized polarization within grains[28,29]. With increasing temperature, the density of chargescontributing to the space charge polarization becomes sufficientlylarge. The range of frequency for such polarizationmay extend from10�3 Hz to a few kilocycle range, producing a large ε
0.It seems clear that the width of the loss peaks in Fig. 5(b) cannot
be accounted for in terms of a monodispersive relaxation processbut points towards the possibility of a distribution of relaxationtimes which indicates the non-Debye type relaxation. One of themost convenient ways of checking the polydispersive nature of thedielectric relaxation is through ColeeCole model where the com-plex dielectric constant is known to be described by the empiricalrelation [30].
ε* ¼ ε∞ þ εs � ε∞
1þ ðjutÞ1�a(2)
where εs � ε∞ is the dielectric strength, t is the mean relaxationtime and a is the ColeeCole parameter varies in between 0 and 1.For an ideal Debye relaxation, a ¼ 0 and a > 0 signifies that therelaxation has a distribution of relaxation times, which gives abroader peak shape than a Debye peak. Moreover, when the elec-trical conductivity is dominated at the low frequency range for thesample, a contribution term by electrical conduction is generallyadded to the relaxation equation. The modified ColeeCole equationincorporating the conductivity term is given as [29,31]
ε* ¼ ε∞ þ εs � ε∞
1þ ðjutÞ1�a� j
s*
εous (2a)
where s* (¼s1 þ js2) is the complex conductivity. From the aboverelation, the complex permittivity can be decomposed into the realand imaginary parts
ε
0 ¼ ε∞ þ�εs � ε∞
�n1þ ðutÞ1�a sin
�ap=2
�o
1þ 2ðutÞ1�a sin�ap=2
�þ ðutÞ2�2a
þ s2
εous (3)
and
ε
00 ¼ ðεs � ε∞ÞðutÞ1�a cosðap=2Þ1þ 2ðutÞ1�a sin
�ap=2
�þ ðutÞ2�2a
þ s1
εous (4)

Fig. 4. (a) Temperature dependence of the magnetization of LNF measured at 1 kOe from RT to 800 K, (b) Hysteresis curves at RT and 793 K, (c) Temperature dependence of themagnetization of LNF after ZFC and FC measured at 1 kOe from 5 K to RT, (d) Hysteresis curve at 5 K.
S. Chanda et al. / Solid State Sciences 37 (2014) 55e63 59
Here s1 is the conductivity due to the free charge carriers (dcconductivity) and s2 is the conductivity due to the space charges(localized charges) and s is a dimensionless exponent (0 < s < 1).Equations (3) and (4) show the contributions of conductivity to thedielectric constant (ε0) and dielectric loss (ε00). The first term ofEquation (4) is the part of the dielectric relaxation loss due topermanent dipole orientation or other motions which do notinvolve long-range displacement of mobile charge carriers, whilethe second term is the part of the losses associated with long-rangemigration of carrier response. The above equations indicate that thelocalized charge carriers at defect sites and interfaces (s2) havelarge contribution to the dielectric permittivity, whereas the freecharge carrier (s1) contributes to the dielectric loss.
The experimental data for both ε0 and ε
00 have been fittedwell byusing Equations (3) and (4) in the temperature range from 393 K to453 K over the entire range of frequencies as shown by the solidlines in Fig. 5(a) and (b) respectively. Thus, it can be concluded thatthe two main factors, dipolar and conductivity relaxations areresponsible for the dielectric relaxation in LNF. All the parametersused in the fitting of Fig. 5 are listed in Table 2. It is also important tomention that the values of s tend to increase (s / 1) withincreasing temperature, indicating that the carrier polarizationmechanism is weakly dispersive at higher temperature, whichmight be attributed to some barrier height extracted.
To get an idea about the type of relaxation response in thesematerials, it is necessary to find out the activation energy ofrelaxation process. At a temperature T, themost probable relaxationtime corresponding to the peak position in ε
00 vs. log u is propor-tional to exp(�Ea/kBT) (Arrhenius law). The linear fit of the exper-imental data as shown by the solid line in the inset of Fig. 5(b) givesthe activation energy of 0.32 eV. Such a value of activation energyindicates that the conduction mechanism in the samples may bedue to the polaron hopping based on the electron carriers. Inhopping process, the electron disorders its surroundings, by mov-ing its neighbouring atoms from their equilibrium positionscausing structural defects in the B perovskite sites of the system.
Fig. 6 shows the complex impedance plane plots of the materialat different temperatures. At each temperature, impedance plane
plots show two semicircular arcs, a larger one at low frequency anda smaller one at the higher frequency side. The smaller arcs aremagnified and shown in the inset of Fig. 6(b) for the material. Thetwo semicircular arcs in well resolved condition have been shownin the inset of Fig. 6(b) for the temperature 423 K. The appearanceof two arcs in impedance plane plots at each temperature indicatesthe presences of two types of relaxation phenomena with twodifferent relaxation times. Both the semicircular arcs have beenfound to be depressed with their centre below the real axis indi-cating the heterogeneity and deviation from the ideal behaviour[32].
In order to correlate the electrical properties of LNF with itsmicrostructure, an equivalent circuit model consisting of two par-allel RQ circuits connected in series (as shown in the inset ofFig. 6(a)) has been employed to interpret the nature of impedanceplane plots [33]. Here R and Q are the resistance and the constantphase element for grain interiors (Rg, Qg) and grain boundaries (Rgb,Qgb) respectively. The constant phase element (CPE) is used toexplain the non-ideal behaviour of the capacitancewhichmay haveits origin in the presence of more than one relaxation process withapproximately similar relaxation times. The capacitance from theconcept of the CPE is given by the following relation, C¼ Q1/nR(1�n)/
n, where the parameter n estimates the deviation from idealcapacitive behaviour, n is zero for pure resistive behaviour and isunity for capacitive one. The high resistive nature of grain-boundaries may be attributed due to the presence of danglingbonds and non-stoichiometric distribution of oxygen on the grainboundaries, which can act as carrier traps and form the barrier layerfor charge transport. The capacitance of this region also becomeshigh because of the inverse proportionality between the capaci-tance and the thickness (d) of the grain-boundary layer (C f 1/d).The response of grain boundaries, due to their higher resistance andcapacitance, lies at lower frequencies compared to the response ofgrains. So, we can conclude that the larger (low frequency) andsmaller (high frequency) semicircular arcs are due to grainboundary and grain interior respectively. The fitted parameters Rg,,Rgb, Cg, Cgb, ng and ngb are listed in Table 3 for the material. Thedecrease in the resistance of grains and grain boundaries may be

Fig. 5. Frequency (angular) dependence of ε0 (a) and ε00 (b) at various temperatures for
LNF. Solid lines are the fitting of experimental data using Eqs. (3) and (4). Inset is theArrhenius plot of most probable relaxation time where the symbols are the experi-mental data points and the solid line is the least-squares straight-line fit.
S. Chanda et al. / Solid State Sciences 37 (2014) 55e6360
due to the thermal activation of the localized charges. Two types ofthermal activations, i.e., carrier density in the case of band con-duction and carrier mobility in case of hopping, are responsible forthe reduction in the resistance with temperature.
In order to understand the effect of the conductivity on thedielectric properties of the nanoceramic, the frequency depen-dence of ac conductivity has been characterized over the temper-ature from 303 K to 513 K. The angular frequency dependent s (inFig. 7) shows two plateaus, one at low frequency and other at highfrequency region. Although at low temperature two plateaus areobserved, at high temperature the plateaus are moved to the highfrequency side and the high frequency plateau has gone out fromthe experimental investigation range. The low-frequency plateaurepresents the total conductivity whereas the high-frequencyplateau represents the contribution of grains to the total conduc-tivity. The presence of both the high and low-frequency plateaus inconductivity spectra suggests that the two processes are contrib-uting to the bulk conduction behaviour in LNF. One of these pro-cesses relaxes in the high-frequency region and the contribution ofthe other process appears as a plateau in the high-frequency region.The total conductivity at a given temperature can be expressed bythe power law [34]
Table 2Fitting parameters of modified ColeeCole equation obtained using Eqs. (3) and (4).
Temp (K) Dε ¼ (εs � ε∞) a s umax (10
393 133 0.12 0.59 45423 133 0.10 0.59 85453 143 0.10 0.59 150
sðuÞ ¼ sð0Þ þ Aun (5)
where s(0) is the dc conductivity and A depends on temperatureand exponent n is temperature and material dependent. The termAun denotes the frequency dependence and characterizes alldispersion phenomena. The exponent n has been found to behavein a variety of forms as a constant, decreasing and increasing withtemperature, but always varying within 0 < n < 1. However, ingeneral, the frequency dependence of conductivity does not followthe simple power law as given above but well described by thedouble power law given as [35]
sðuÞ ¼ sð0Þ þ A1un1 þ A2u
n2 (6)
The experimental data in high temperature side are fitted bysingle power law with single n value for a temperature whereas thedata in low temperature region are fitted with double power lawwith two n values as shown by the solid lines in Fig. 7. The exponentn in the lower frequency region is found to be in the range of 1.5e2and increases with increase of temperature. In the high-frequencyregion the values of n are found to be in between 0.3 and 0.4. Thelower and higher frequency regions represent the non-diffusingand localized diffusing modes respectively, and based on this the-ory Ishii et al. [36] have predicted that the exponent n is greaterthan 1 and tends to attain 2 with increasing temperature in lowerfrequency region whereas it is less than 1 in the higher frequencyregion.
Fig. 8(a) illustrates the room temperature ferroelectric hystere-sis loop (PE) of the sample observed at 100 Hz frequency fordifferent applied electric field. The tendency of saturation increaseswith the increase of maximum applied electric field. The values ofmaximum polarization (Ps), remanent polarization (Pr) and theelectric coercivity (Ec) are found to be 0.17 mC/cm2, 0.029 mC/cm2
and 2.46 kV/cm, respectively. The observed loop indicates theferroelectric ordering of dipole moment configuration due tospontaneous polarization of the sample. We have also recorded thePE loops of the sample at RT by changing the time window ofmeasurements i.e., the frequency of the measuring system whichare shown in Fig. 8(b). The value of maximum polarization of thesample decreases with the increase of frequency and the shape ofhysteresis loops changes with frequency. This change in the shapeand polarization is quite likely due to the change of ferroelectricresponse of the sample with the variation of measuring timewindow.
The ferroelectric behaviour of LNF at RT is also confirmed by itscapacitanceevoltage (CeV) characteristic as shown in Fig. 9. The''butterfly'' nature of the CeV curve suggests a weak ferroelectricbehaviour at room temperature. This nature is also observed forother multiferroic material [37]. The hysteretic currentevoltage(IeV) characteristic of LNF at RT as shown in the inset of Fig. 9(which is found to be asymmetric with respect to the polarity ofapplied voltage) may be due to the ferroelectric resistive switchingeffect [38]. The observed IeV characteristic supports the weakferroelectric behaviour of LNF at RT.
In order to demonstrate the coupling between electric andmagnetic polarizations in LNF nanoceramics, we have carried outthe in-situ measurement of changes in capacitance with the
4 rad s�1) s1 (10�7 S m�1) s2 (10�7 S m�1) Ea (eV)
4.6 0.25 0.320.6 0.30.9 0.35
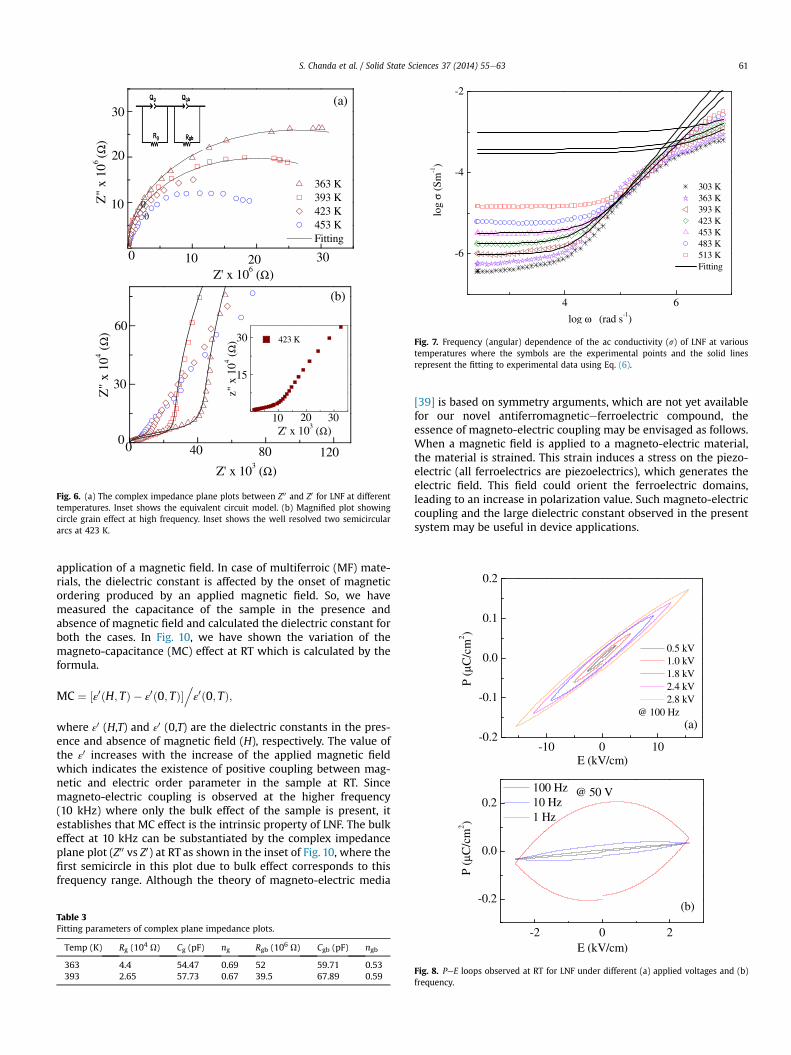
Fig. 6. (a) The complex impedance plane plots between Z00 and Z0 for LNF at differenttemperatures. Inset shows the equivalent circuit model. (b) Magnified plot showingcircle grain effect at high frequency. Inset shows the well resolved two semicirculararcs at 423 K.
Fig. 7. Frequency (angular) dependence of the ac conductivity (s) of LNF at varioustemperatures where the symbols are the experimental points and the solid linesrepresent the fitting to experimental data using Eq. (6).
S. Chanda et al. / Solid State Sciences 37 (2014) 55e63 61
application of a magnetic field. In case of multiferroic (MF) mate-rials, the dielectric constant is affected by the onset of magneticordering produced by an applied magnetic field. So, we havemeasured the capacitance of the sample in the presence andabsence of magnetic field and calculated the dielectric constant forboth the cases. In Fig. 10, we have shown the variation of themagneto-capacitance (MC) effect at RT which is calculated by theformula.
MC ¼ ε0 H; Tð Þ � ε
0 0; Tð Þ½ �.ε0 0; Tð Þ;
where ε0 (H,T) and ε
0 (0,T) are the dielectric constants in the pres-ence and absence of magnetic field (H), respectively. The value ofthe ε
0 increases with the increase of the applied magnetic fieldwhich indicates the existence of positive coupling between mag-netic and electric order parameter in the sample at RT. Sincemagneto-electric coupling is observed at the higher frequency(10 kHz) where only the bulk effect of the sample is present, itestablishes that MC effect is the intrinsic property of LNF. The bulkeffect at 10 kHz can be substantiated by the complex impedanceplane plot (Z00 vs Z0) at RT as shown in the inset of Fig. 10, where thefirst semicircle in this plot due to bulk effect corresponds to thisfrequency range. Although the theory of magneto-electric media
Table 3Fitting parameters of complex plane impedance plots.
Temp (K) Rg (104 U) Cg (pF) ng Rgb (106 U) Cgb (pF) ngb
363 4.4 54.47 0.69 52 59.71 0.53393 2.65 57.73 0.67 39.5 67.89 0.59
[39] is based on symmetry arguments, which are not yet availablefor our novel antiferromagneticeferroelectric compound, theessence of magneto-electric coupling may be envisaged as follows.When a magnetic field is applied to a magneto-electric material,the material is strained. This strain induces a stress on the piezo-electric (all ferroelectrics are piezoelectrics), which generates theelectric field. This field could orient the ferroelectric domains,leading to an increase in polarization value. Such magneto-electriccoupling and the large dielectric constant observed in the presentsystem may be useful in device applications.
Fig. 8. PeE loops observed at RT for LNF under different (a) applied voltages and (b)frequency.

Fig. 9. CeV characteristics acquired at 1 kHz at RT. The ac probing signal was 1 V. Insetshows dc IeV characteristics.
Fig. 10. Variation of MC (@10 kHz) with magnetic field at RT of LNF. Inset shows thecomplex impedance plane plot between Z00 and Z0 for LNF at RT.
S. Chanda et al. / Solid State Sciences 37 (2014) 55e6362
It is to be mentioned that the value of magnetization of0.64 � 10�4 emu/g/Oe at RT of LNF nanoparticle is found to be morethan that of LaFeO3 (0.3 � 10�4 emu/g/Oe) [16] and NdFeO3
(0.45 � 10�4 emu/g/Oe) [16] nanoparticle samples. The enhancedvalue of magnetization in LNF may be due to the presence of threemajor magnetic interactions (FeeFe, NdeFe and NdeNd) whereasfor LaFeO3 only FeeFe interaction contributes to the magnetization.The coercive field for LNF is found to be ~880 Oe which is very high(6 times) if compared with LaFeO3 (~137 Oe) [16]. The dielectricconstant (ε0) has been increased in LNF with respect to that ofLaFeO3. ε0 is found to be ~80 and 105 at 105 Hz at RT for LaFeO3 [13]and LNF respectively. The ac conductivity (s) increases from2.36 � 10�3 U�1 m�1 for the LaFeO3 to 4.21 �10�3 U�1 m�1 for theLNF at T ¼ 553 K and at frequency 1 MHz [15]. Thus the sample LNFmay be concluded to be a novel single phase multiferroic material.
4. Conclusions
The multiferroic behaviour of nano-sized La1/2Nd1/2FeO3 pow-der, synthesized by the solegel citrate method, has been investi-gated. The Rietveld refinement of the X-ray diffraction profile of thesample at room temperature shows the orthorhombic phase withPbnm symmetry. The particle size is obtained by transmission
electronmicroscope and found to be ranging from 40 to 75 nm. Thezero field-cooled and field cooled magnetizations of the sample aremeasured from 5 K to 800 K in an applied magnetic field of 1 kOe. Asignature of weak ferromagnetic phase observed in LNF isexplained on the basis of spin glass like behaviour of surface spins.Ferroelectric hysteresis loop observed at room temperature in-dicates the presence of ferroelectric ordering in LNF. The dielectricrelaxation of the sample has been investigated using impedancespectroscopy in the frequency range from42Hz to 1MHz and in thetemperature range from 303 K to 513 K. The ColeeCole model isused to analyse the dielectric relaxation of LNF. The frequencydependent conductivity spectra follow the power law. Theobserved magneto capacitance of the sample confirms its multi-ferroic behaviour. The sample LNF is concluded to be a novel singlephase multiferroic material.
Acknowledgements
Sujoy Saha acknowledges the financial support provided by theUGC New Delhi in the form of JRF. Alo Dutta thanks the Departmentof Science and Technology of India for providing the financialsupport through DST Fast Track Project under grant no. SR/FTP/PS-032/2010. The authors acknowledge Dr. P. Singha Deo of S. N. BoseNational Center for Basic Sciences for taking TEM micrographs.
References
[1] K.F. Wang, J.M. Liu, Z.F. Ren, Adv. Phys. 58 (2009) 321.[2] T. Hibino, S. Wang, S. Kakimoto, M. Sano, Solid State Ionics 127 (2000) 89.[3] A. Moser, C.T. Rettner, M.E. Best, E.E. Fullerton, D. Weller, M. Parker,
M.F. Doerner, IEEE Trans. Magn. 36 (2000) 2137.[4] S.S.P. Parkin, K.P. Roche, M.G. Samant, P.M. Rice, R.B. Beyers, R.E. Scheuerlein,
E.J. O'Sullivan, S.L. Brown, J. Bucchigano, D.W. Abraham, Yu Lu, M. Rooks,P.L. Trouilloud, R.A. Wanner, W.J. Gallagher, J. Appl. Phys. 85 (1999) 5828.
[5] M. Siemons, U. Simon, Sens. Actuators B 126 (2007) 18.[6] T.G. Ho, T.D. Ha, Q.N. Pham, H.T. Giang, T.A.T. Do, N.T. Nguyen, Adv. Nat. Sci.
Nanosci. Nanotechnol. 2 (2011) 015012.[7] X. Niu, H. Li, G. Liu, J. Mol. Catal. A 232 (2005) 89.[8] Landolt-B€ornstein, in: H.P.J. Wijn (Ed.), Numerical Data and Functional Re-
lationships in Science and Technology Group III, vol. 27f3, Springer, Berlin,1994.
[9] G.A. Smolenkii, V.A. Bokov, J. Appl. Phys. 35 (1964) 915e918.[10] M.A. Ahmed, R. Seoudi, S.I. El-Dek, J. Mol. Struct. 754 (2005) 41.[11] S. Acharya, J. Mondal, S. Ghosh, S.K. Roy, P.K. Chakrabarti, Mater. Lett. 64
(2010) 415.[12] Hossein Ahmadvand, Hadi Salamati, Parviz Kameli, Asok Poddar,
Mehmet Acet, Khalil Zakeri, J. Phys. D Appl. Phys. 43 (2010) 245002.[13] M. Idrees, M. Nadeem, M. Atif, M. Siddique, M. Mehmood, M.M. Hassan, Acta
Mater. 59 (2011) 1338.[14] S. Acharya, P.K. Chakrabarti, Solid State Commun. 150 (2010) 1234.[15] M.A. Ahmed, M. Solyman Selim, M.M. Arman, Mater. Chem. Phys. 129 (2011)
705.[16] Anhua Wu, Hui Shen, Jun Xu, Linwen Jiang, Liqing Luo, Shujuan Yuan,
Shixun Cao, Huaijin Zhang, J. Sol-Gel Sci. Technol. 59 (2011) 158.[17] J. Bartolom�e, E. Palacios, M.D. Kuz'min, F. Bartolom�e, I. Sosnowska,
R. Przeniosło, R. Sonntag, M.M. Lukina, Phys. Rev. B 55 (1997) 11432.[18] V. Buscaglia, F. Caracciolo, C. Bottino, M. Leoni, P. Nanni, Acta Mater. 45 (1997)
1213.[19] Sujoy Saha, Sadhan Chanda, Alo Dutta, T.P. Sinha, J. Sol-Gel Sci. Technol. 69
(2014) 553.[20] J. Rodriguez - Carvajal, Phys. B 192 (1993) 55.[21] A.M. Glazer, Acta Crystallogr. B 28 (1972) 3384.[22] M.A. Ahmed, S.I. El-Dek, Mater. Lett. 60 (2006) 1437.[23] Y. Zhang, H. Zhang, J. Yin, H. Zhang, J. Chen, W. Wang, G. Wu, J. Magn. Magn.
Mater. 322 (2010) 2251.[24] D. Treves, J. Appl. Phys. 36 (1965) 1033.[25] F. Bartolom�e, M.D. Kuz'min, J. Bartolom�e, J. Blasco, J. García, F. Sapi~na, Solid
State Commun. 91 (1994) 177.[26] J. Nogues, Ivan K. Schuller, J. Magn. Magn. Mater. 192 (1999) 203.[27] A.P. Ramirez, Ann. Rev. Mater. Sci. 24 (1994) 453.[28] L.L. Hence, J.K. West, Principles of Electronic Ceramics, Wiley, New York, 1990.[29] P. Thongbai, S. Tangwancharoen, T. Yamwong, S. Maensiri, J. Phys. Condens.
Matter 20 (2008) 395227.[30] K.S. Cole, R.H. Cole, J. Chem. Phys. 9 (1941) 342.[31] D. Ming, J.M. Reau, J. Ravez, J. Gitae, P. Hagenmuller, J. Solid State Chem. 116
(1995) 185.

S. Chanda et al. / Solid State Sciences 37 (2014) 55e63 63
[32] E. Barsoukov, J.R. Macdonald, Impedance Spectroscopy Theory, Experimentsand Applications, Wiley, New York, 2005.
[33] M. Younas, M. Nadeem, M. Atif, R. Grossinger, J. Appl. Phys. 109 (2011)093704.
[34] A.K. Jonscher, Universal Relaxation Law, Chelsea Dielectrics Press, London,1996.
[35] S. Mahboob, G. Prasad, G.S. Kumar, Bull. Mater. Sci. 29 (2006) 35.
[36] T. Ishii, T. Abe, H. Shirai, Solid State Commun. 127 (2003) 737.[37] C.R. Serrao, A.K. Kundu, S.B. Krupanidhi, U.V. Waghmare, C.N.R. Rao, Phys. Rev.
B 72 (220101(R)) (2005).[38] Atsushi Tsurumaki, Hiroyuki Yamada, Akihito Sawa, Adv. Funct. Mater. 22
(2012) 1040e1047.[39] T.H. O'Dell, The Electrodynamics of Magneto-electric Media, North-Holland,
Amsterdam, 1970.