multi-project baselines for evaluation of industrial energy-efficiency and electric power projects
TRANSCRIPT

eScholarship provides open access, scholarly publishingservices to the University of California and delivers a dynamicresearch platform to scholars worldwide.
Lawrence Berkeley National LaboratoryLawrence Berkeley National Laboratory
Title:Multi-Project Baselines for Evaluation of Industrial Energy-Efficiency and Electric Power Projects
Author:Sathaye, JayantPrice, LynnWorrell, ErnstRuth, MichaelSchaeffer, R.Macedo Costa, M.Yanjia, W.Roy, J.Das, S.Winkler, H.Spalding-Fecher, R.Afrane-Okese, Y.Davidson, O.
Publication Date:08-30-2001
Permalink:http://escholarship.org/uc/item/060392mn
Keywords:baselines industrial energy efficiency electric power greenhouse gas emissions climate changeprojects case studies
Copyright Information:All rights reserved unless otherwise indicated. Contact the author or original publisher for anynecessary permissions. eScholarship is not the copyright owner for deposited works. Learn moreat http://www.escholarship.org/help_copyright.html#reuse

LBNL-48242
Multi-Project Baselines for Evaluation of
Industrial Energy-Efficiency and Electric Power Projects
Jayant Sathaye, Lynn Price, Ernst Worrell, and Michael Ruth Energy Analysis Department
Environmental Energy Technologies Division Lawrence Berkeley National Laboratory
Berkeley, CA 94720 USA
Prepared for the U.S. Environmental Protection Agency Market Policy Branch
Clean Air Markets Division Office of Atmospheric Programs
Washington, DC
Maurice LeFranc, Project Manager
2001
This work was supported by the U.S. Environmental Protection Agency through the U.S. Department of Energy under Contract No. DE-AC03-76SF00098.


i
Multi-Project Baselines for Evaluation of Industrial Energy-Efficiency and Electric Power Projects
Table of Contents
LBNL-48242 Multi-Project Baselines For Evaluation Of Industrial Energy-Efficiency And Electric Power Projects
LBNL-48242A The Impact Of Multi-Project Baselines On CDM Projects In The Cement Industry In Brazil
LBNL-48242B Multi-Project Baselines For CDM Projects: Case Study For The Cement Industry In China
LBNL-48242C Potential Multi-Project Baselines in the Power Sector in the Eastern Region of India
LBNL-48242D Potential Multi-Project Baselines In The Power Sector In South Africa

ii

iii
LBNL-48242
Multi-Project Baselines for Evaluation of Industrial Energy-Efficiency and Electric Power Projects
Jayant Sathaye, Lynn Price, Ernst Worrell, Michael Ruth Lawrence Berkeley National Laboratory
2001

iv

v
LBNL-48242
Multi-Project Baselines For Evaluation Of Industrial Energy-Efficiency And Electric Power Projects
Table of Contents 1 Introduction…………………………………………………………………….. 12 Rationale For Use Of Multi-Project Baselines…………………………………. 13 Multi-Project Baselines for Evaluation of Industrial Energy-Efficiency
Projects…………………………………………………………………………..
34 Multi-Project Baselines For Evaluation Of Electric Power Projects…………… 145 Findings………………………………………………………………………… 226 Conclusions And Recommendations For Further Research……………………. 26

vi

vii
LBNL-48242
Multi-Project Baselines for Evaluation of Industrial Energy-Efficiency and Electric Power Projects
Jayant Sathaye, Lynn Price, Ernst Worrell, Michael Ruth Lawrence Berkeley National Laboratory
Roberto Schaeffer and Marcio Macedo Costa
Federal University of Rio de Janeiro
Wang Yanjia US/China Energy and Environment Technology Center, Tsinghua University, Beijing
Joyashree Roy and Sharmistha Das
Jadavpur University, Calcutta
Harald Winkler, Randall Spalding-Fecher, Y. Afrane-Okese, Ogunlade Davidson Energy Development Research Center, University of Cape Town
December 2001

viii

ix
Multi-Project Baselines for Evaluation of Industrial Energy-Efficiency and Electric Power Projects
Jayant Sathaye, Lynn Price, Ernst Worrell, Michael Ruth Lawrence Berkeley National Laboratory
Abstract
Calculating greenhouse gas emissions reductions from projects requires construction of a hypothetical baseline that approximates emissions levels without the project. This paper describes a standardized multi-project baseline methodology for industrial energy-efficiency and electric power projects. The multi-project baseline methodology is illustrated with four case studies. Two case studies, for Brazil and China, focus on energy-efficiency projects in the cement sector. The other two case studies focus on electric power sector projects in India and South Africa. From the four case studies, it is clear that the most difficult aspect of setting multi-project baselines is determining the appropriate criteria in terms of baseline plants, baseline breadth, and baseline stringency in order to balance the desire to encourage no- or low-carbon projects while maintaining environmental integrity. Overall, we found that it is important to fully evaluate the variety of potential baselines in order to make informed decisions regarding which plants to include in the baseline, what type of baseline to use, and what level of stringency to use. Further research is required to fully understand the ramifications of the various choices in constructing and using these baselines. Keywords: baselines, industrial energy efficiency, electric power, greenhouse gas emissions, climate change projects, case studies

x

1
1. Introduction
Calculating greenhouse gas (GHG) emissions reductions from projects requires construction of a hypothetical baseline that approximates emissions levels without the project. Such baselines can be project-specific, multi-project, or a hybrid of the two (Ellis and Bosi, 1999). Project-specific baselines are determined on a project-by-project basis using specific measurements or assumptions. Multi-project baselines use existing or estimated emissions levels from a defined set of actual or projected projects to derive a baseline level. The hybrid approach combines project-specific and standardized parameters to derive a baseline (Ellis and Bosi, 1999). This paper describes a standardized multi-project baseline methodology for industrial energy-efficiency and electric power projects. For the purposes of this paper, we assume that the proposed projects have already passed an additionality test and have been accepted as qualified projects. Additionality tests are designed to ensure that a proposed project will result in actual GHG emissions reductions that would not have occurred in the absence of the project. The multi-project baselines described in this paper are then used for estimating the number of carbon emission reduction (CER) units that is earned from a project. The multi-project baseline methodology is illustrated with four case studies. Two case studies, for Brazil and China, focus on energy-efficiency projects in the cement sector. The other two case studies focus on electric power sector projects in India and South Africa.
2. Rationale for Use of Multi-Project Baselines
The rationale for exploring the use of multi-project baselines as an alternative to project-specific baselines is to seek a balance between ensuring environmental integrity and minimizing transaction costs while encouraging emissions reduction projects. Project-by-project baselines may have higher transaction costs than multi-project baselines, reducing the number of projects that attract investment. Experience with other project evaluations has shown that construction of project-specific baselines is time-consuming, costly, and can be highly uncertain1. Thus, the concept of standardized baselines across many projects, for particular sectors or given technologies, has emerged. These multi-project baselines can be used as an alternative to project-specific baselines depending upon the preference of the developer and/or the host country government. The aim of this paper is to explore alternative options for multi-project baselines. Project-specific baselines can be static or dynamic. Static baselines are set at the time of project approval and remain unchanged for the duration of the project, while dynamic baselines may be revised during the course of the project should new information about the baseline conditions require a re-examination of the original baseline. Multi-project baselines too could be adjusted in a similar manner if the original baseline were to undergo an unexpected change.
1 Specifically, projects related to the Activities Implemented Jointly (AIJ) pilot phase were initiated at the first United Nations Framework Convention on Climate Change (UNFCCC) Conference of the Parties to test the impact of implementing emissions reductions projects in some countries (developing countries or countries with economies in transition). An evaluation of a number World Bank-managed Prototype Carbon Fund projects found that the costs associated with preparing a project-specific baseline study and presenting a case for environmental additionality are about US$20,000 per project (World Bank, 2000). Uncertainty related to calculation of emissions reductions using project-specific baselines has been estimated to range from ± 35% to ±60% for demand-side, heat supply, cogeneration, and electricity supply projects (Parkinson et al., 2001).

2
Establishing a baseline for a particular activity, sector and/or region potentially simplifies the calculation of emissions reductions. Baselines need to be simple enough to be practical in developing countries. Three key decisions2 are required to calculate multi-project baselines: Choosing Baseline Plants: The first decision is which set of plants to include in the multi-project baseline. For each plant, the essential data are the fuel input (in GJ per year) and the product output (in tonnes/year for industrial projects) or electrical output (in TWh/year for power projects). Combining this information with the calorific value of the fuel and its carbon content, we can calculate the carbon (C) intensity. The carbon intensity is measured in mass of carbon per unit of product output or energy produced, e.g. in units of kg C/tonne or kg C/kWh. This carbon intensity value is the key element for constructing the emissions baselines. Once the multi-project baselines are constructed using the calculated carbon intensity levels, project CERs are determined by multiplying the difference between the project’s carbon intensity level and that of the chosen baseline level by the project’s annual production. One approach for constructing multi-project baselines is to use carbon intensity values for recently-constructed plants to calculate the baseline, assuming that these represent the best available technology. An advantage of this approach is that the data for such plants are observable. Another approach is to use a “forward-looking” baseline that includes near-future plants, making assumptions about which plants would most likely be built. A forward-looking baseline has the advantage that it can consider new, more efficient technologies. Arguably this type of baseline is more realistic regarding what new technologies are likely to be used. In this sense, a “forward-looking” baseline is likely to be methodologically more accurate while one based on “recently-constructed” units is likely to have more accurate data. A concern is that forward-looking baselines are open to “gaming” in which countries have an incentive to choose a baseline with high carbon intensity, so that projects will be able to earn more credits. Gaming can be avoided to some extent by including factors that are difficult to change, for example requiring the projection to be based on published government or utility plans. Setting regional baselines also makes gaming more difficult, as would a system of international review (Meyers, 2000). To the extent that gaming cannot be avoided, there is a trade-off between this risk and the risk of free riders against a backward-looking baseline that does not promote the best available technology. Fuel-switching is a complicating issue regarding the choice of either recently-built or forward-looking baselines. If lower-carbon fuels are available and have not yet been fully utilized, then a baseline using recently-built, more carbon-intensive, plants or a forward-looking baseline that captures this opportunity could provide larger emissions credits for lower carbon projects. Also, if the current trend in the country is to fuel-switch away from lower carbon fuels and future plans reflect this trend, then a recently-built baseline could also be the best choice in terms of providing larger credits for lower-carbon projects. Choosing Baseline Breadth: The second issue is which set of plants should be used for comparison to the proposed project. For example, does a proposed gas plant need to perform better than the average power station in the whole sector, the average fossil-fueled plant or better than other gas-fired plants? Obviously, the fuel-specific comparison only works if there is at least 2 These three decisions are analyzed here. Lazarus et al. (1999) note another methodological issue – the degree of aggregation, which we do not address.

3
one plant or unit in the baseline using the same fuel as the project. The decision whether to compare the proposed project to other plants using the same fuel (“fuel-specific”), to all fossil fuel-fired plants (“all fossil”), or to the entire sector (“sector-wide”) will need to be made based on country-specific conditions. The choice of an appropriate baseline may also be technology specific. Thus for a proposed coal project one might use a mix of baseload plants, while a mix of peaking units (plants that are only operated during peak demand periods) might be a more appropriate multi-project baseline for a solar PV unit. Choosing Baseline Stringency: The third decision to make when constructing multi-project baselines is whether to compare potential projects against average, better-than-average or best plants. Once the carbon intensity of the baseline plants is calculated, increasingly stringent benchmarks can be constructed: average, weighted average, 25th percentile, 10th percentile, or best plant. The choice of stringency level will determine the amount of CERs a project will earn by comparing the actual performance of the project to the chosen multi-project baseline level. The choice of this stringency level will need to balance the desire to encourage GHG emissions reduction projects with the desire ensure that CERs are only granted for additional emissions reductions. In addition to being used to determine CERs, multi-project baselines can also be used to test for additionality. Additionality raises the question of whether a proposed project would have been undertaken as part of the baseline activity anyway. Institutional, financial, and technological additionality tests in order to check for environmental additionality have been proposed. A financial test would check to see whether a proposed project meets investment criteria when carbon benefits are included, but not otherwise. Institutional additionality requires the establishment of new institutions. Technological additionality is the demonstration of new technology that is specific to the proposed project. Multi-project baselines can also provide an indication of whether a project appears to be additional by comparing the proposed project to one of the more stringent benchmarks, such as best plant or the 10th percentile level. Projects that perform better than these stringent levels could be assumed to result in GHG emissions reductions that would not have otherwise occurred.
3. Multi-Project Baselines for Evaluation of Industrial Energy-Efficiency Projects
The industrial sector clearly dominates global total primary energy use, using an estimated 130.8 EJ, or over 40%, in 1995 (Price et al., 1998). Carbon dioxide (CO2) emissions associated with this energy use were 2370 MtC, about 43% of global CO2 emissions from energy use (Price et al. 1999). The largest growth in industry-related CO2 emissions has been seen in developing countries as these countries construct roads, buildings, and other infrastructure-related structures that require large amounts of energy-intensive industrial commodities such as steel, aluminum, and cement (Price et al., 1999). LBNL has developed a “process-step” multi-project baseline methodology for energy-intensive industrial sectors in which the important energy-consuming production steps in an industry are assigned a value based on actual performance of existing plants. In this section, we explain the use of this methodology in the cement sector and present two case studies in which five baseline energy-consumption levels (average, weighted average, 25th percentile, 10th percentile, and best plant) are tested.

4
Process-Step Multi-Project Baselines for Cement Energy-Efficiency Projects3
Almost 3% of global energy-related CO2 emissions and over 6% of global industrial energy-related CO2 emissions are from the manufacture of cement. In addition, cement manufacture also contributes an almost equal amount of CO2 from process emissions due to the calcining process (see below) (Hendricks et al., 1999). Global cement production grew at a rapid rate of 3.6% per year between 1971 and 1995, dominated by growth in developing countries (Hendricks et al., 1999). Cement production is an energy-intensive process in which a combination of raw materials is chemically altered through intense heat to form a compound with binding properties. The main steps in cement production are illustrated in Figure 1.
Quarrying & Mining
MaterialsPreparing Kiln Fuels
Crushing & Drying Additives
(gypsum, fly ash, etc.)
raw materials fuels prepared additives
Grinding & Homogenizing
Materialsprepared materials
Clinker Production (Pyro-processing)
clinker Finish Grinding
cement
system boundary for benchmark analysis
Bagging and Transport
Figure 1: The Cement Production Process
Raw materials, including limestone, chalk, and clay, are mined or quarried, usually at a site close to the cement mill. These materials are then ground to a fine powder in the proper proportions needed for the cement. These can be ground as a dry mixture or combined with water to form a slurry. The addition of water at this stage has important implications for the production process and for the energy demands during production. Production is often categorized as dry process and wet process. Additionally, equipment can be added to remove some water from the slurry after grinding; the process is then called semi-wet or semi-dry. This mixture of raw materials enters the clinker production (or pyro-processing) stage. During this stage the mixture is passed through a kiln (and possibly a preheater system) and exposed to increasingly intense heat, up to 1400 degrees Celcius. This process drives off all moisture, dissociates CO2 from calcium carbonate, and transforms the raw materials into new compounds. The output from this process, called clinker, must be cooled rapidly to prevent further chemical changes. Finally the clinker is blended with certain additives and ground into a fine powder to make cement. Following this cement grinding step, the cement is bagged and transported for sale, or transported in bulk. In cement making, about half of the carbon dioxide emissions result from energy use and the other half are from the decomposition of calcium carbonate during clinker production (calcining) (Hendriks, et al., 1999). The most energy-intensive stage of the cement production process is clinker production, which accounts for up to 90 percent of the total energy use. The grinding of 3 Based on Ruth et al., 2000.

5
raw materials and of the cement mixture both are electricity-intensive steps and account for much of the remaining energy use in cement production. Because these three steps are the most energy-intensive and have seen the most technological advancements over time, they are the process steps used for setting the multi-project baselines, as shown by the system boundary in Figure 1. Setting this system boundary in an important step. The most energy-intensive steps should be included inside the benchmark, while steps that do not now consume much energy or which have extremely difficult or inconsistent data requirements can be left outside the boundary. For our evaluation, we include the three steps indicated in the diagram and evaluate electricity use at the grinding stages and combustible fuel use in the clinker production stage.4 To establish an evaluation tool for cement production that addresses the three stages identified above and uses a benchmarking approach, it is necessary to establish benchmark performance values for each of the three stages. Then a project can be compared against the benchmark to determine the projected level of carbon dioxide reduction the project will accomplish. The formula for calculating carbon emission reductions at a cement plant is given below. This formula takes into account only energy use at the three key process stages: raw material preparation, clinker production, and cement grinding. A benchmark value is used at each stage to measure the carbon emissions avoided.
( ) ( ) ( )[ ])()()()()()()( tGtXbtMtXbqtKtXbqmtC GGMMeKKf
ff −⋅+−⋅⋅+−⋅⋅=∑ (1)
clinker production raw materials cement grinding C(t) = carbon dioxide emission reduction at the plant in year t (tonnes CO2) Carbon contents: mf = percentage of fuel f in total primary fuel use for year t (%) qf = carbon content of fuel f (tonnes CO2/GJ) qe = carbon content of electricity (tonnes CO2/kWh) Outputs: XM(t) = output of raw material at the plant in year t (tonnes) XK(t) = output of clinker at the plant in year t (tonnes) XG(t) = output of ground cement at the plant in year t (tonnes) Energy Use: M(t) = total plant electricity use for raw materials preparation in year t (kWh) K(t) = total plant energy use for clinker production in year t (GJ) G(t) = total plant electricity use for cement grinding in year t (kWh) Benchmarks: bM = energy benchmark for raw material production (kWh/tonne raw material) bK = energy benchmark for clinker production (GJ/tonne clinker) bG = energy benchmark for cement production (kWh/tonne cement) In the cement production process, CO2 emissions can be grouped as “energy-related”, referring to emissions that result from the combustion of fossil fuel, and “process-related”, referring to the emissions from the decomposition of calcium carbonate. Process-related emissions are not 4 A more detailed or comprehensive analysis may yield a different analysis boundary. For example, if more detail is desired, the use of electricity to rotate the kiln could be included. Also, if projects that introduce a greater proportion of additives in cement are included in the analysis, the additive preparation step could be included. Our boundary is intended as an illustrative example.

6
accounted for in Equation (1) because they are not a matter of efficiency or performance; instead they are related to the total amount of clinker produced and not to the technology used. These emissions can be reduced on a per tonne of cement basis by decreasing the amount of clinker per tonne of cement (the clinker-to-cement ratio). This is referred to as “blended cement”. This aspect has been left out of Equation (1) because it presents some difficult issues. For now, the calculation is neutral to the clinker-to-cement ratio. Determining the value to assign as benchmarks for the above equation is not a simple task. Cement production is highly competitive and efficient equipment is the norm. It is plausible to consider setting benchmarks for the cement process steps from: (1) average annual performance data from individual plants across the industry, (2) actual performance data from recently constructed plants, or (3) documented best technology information. While the first of these options would allow us to generate a trend of energy performance at newly added facilities over time, and therefore might indicate a future trend for plants, data availability may make this a difficult approach. Following this approach requires performance data at each process step for each plant in a country, as well as information on the vintage or age of each component. This may be difficult to obtain. Furthermore, there may not be enough plants built in a given region, or the plants in a region may be too old, for a reasonable trend to be observed. It is easier to compile a reliable dataset for the other two options. For example, when new plants are constructed, the manufacturer often gives a “guaranteed” value for the performance of the kiln, and the manufacturer will compensate the facility owner if the value is not met. Thus, actual performance data from recent plants may be available because plant owners are monitoring actual kiln production compared to guaranteed values. Documentation on the best available technologies for all processes is obtainable from cement associations, such as Cembureau, the European Cement Association, and may be the most simple method for establishing benchmark values.
3.2. Case Studies
Energy analysts at the Federal University of Rio de Janeiro, Brazil and Tsinghua University, China worked with LBNL staff to test the process-step multi-project baseline approach using data on cement production from each country. Descriptions of the cement industry and the results of the country-specific evaluations of the methodology provided below are excerpted from the individual reports (Schaeffer and Costa, 2001; Wang, 2001).
3.2.1 Brazil5
Cement production has grown steadily in Brazil in the past three decades. Just five years ago, in 1995, Brazil was the thirteenth largest cement producer in the world (SNIC, 1996). In 1996, the country was already the eighth largest producer, the seventh in 1997 and the sixth in 1998 (SNIC, 1999). In 1998, the country had a total production/consumption of 40 Mt of cement (or 250 t of cement/capita), out of a world production of 1,536 Mt of cement (SNIC, 1999). That year, 41 different companies, with 59 producing plants (with 11 grinding-only plants), were in operation in Brazil. Due to its extremely high energy intensity and large volumes of production involved, cement manufacture in Brazil accounted for 7%, 4% and 5% of total energy use in the industrial sector in 1970, 1995 and 1999, respectively. In terms of carbon emissions from energy use, cement manufacture accounted for 7% of total industrial emissions in the country in 1994 (MME, 2000). 5 Based on Schaeffer and Costa, 2001.

7
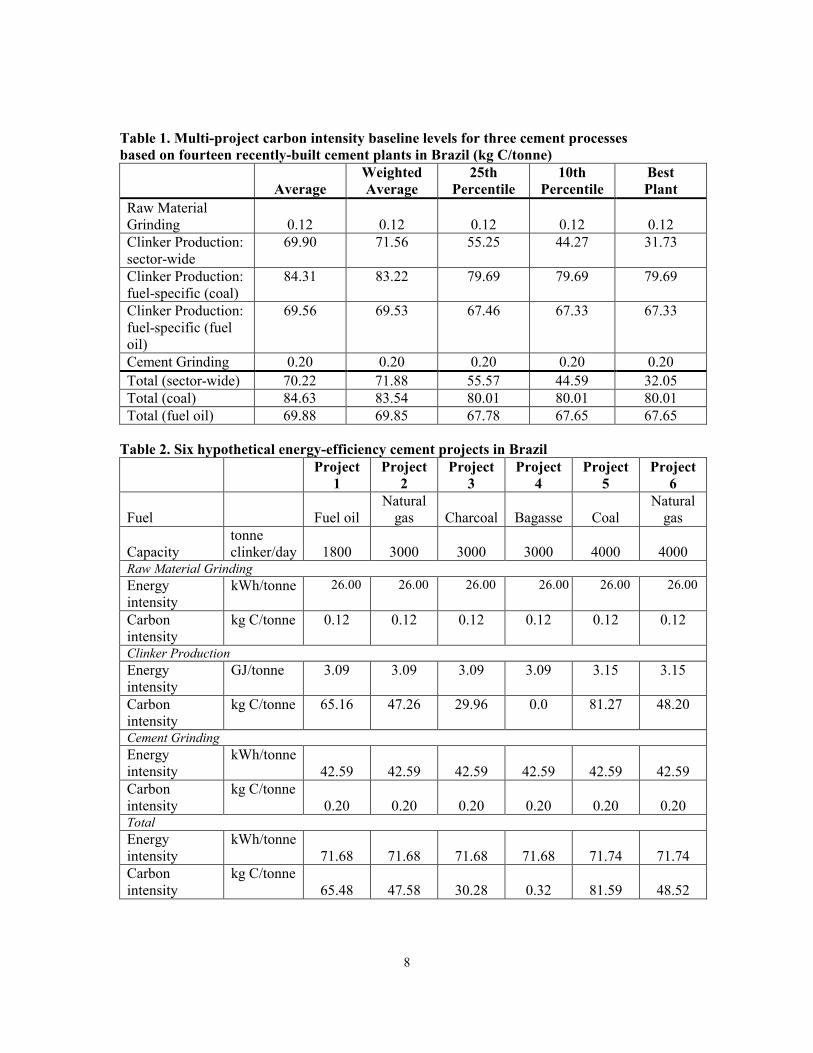
In this study, baselines are set using data for fourteen relatively new cement plants in the country, five of which are oil-fueled, four are coal-fueled and five are multi-fueled.6 The main criterion used for choosing these plants was to build a baseline composed only of highly energy-efficient clinker production units. These fourteen plants are the most recently built and the most modern plants in operation in the country today. A baseline that included plants under construction or planned plants is not considered because such information is currently not available in Brazil. Baselines for the raw material production and the cement grinding stages require information on electricity consumption on a plant-by-plant level. However, such information is not currently available in Brazil and estimated values of 26 kWh/tonne (0.12 kgC/tonne) for raw material production and 42.6 kWh/tonne (0.2 kgC/tonne) for cement grinding were used for setting the baselines for these two process steps. These estimates are based on total electricity consumption, 116 kWh/tonne cement, in the Brazilian cement sector in 1995, applying shares for each step in typical portland cement plants in Brazil (dry process). However, carbon emissions derived from electricity generation are extremely low in Brazil due to the fact that about 95% of all electricity generated and consumed in the country has a hydroelectric origin. Thus, electricity savings technologies are not considered in this study and the estimates for electricity consumption are illustrative only. Table 1 provides the carbon intensity multi-project baseline levels for the fourteen recently-built cement plants in Brazil. The carbon intensities are given for sector-wide and fuel-specific baselines. Table 2 presents information on six hypothetical energy-efficiency cement projects. Project 1 refers to a plant using 100% fuel oil with the “best plant” specific energy consumption (SEC) of 3.09 GJ/tonne clinker and carbon intensity of 65.16 kg C/tonne clinker, both for clinker production only. Projects 2 to 4 refer to plants with the “best plant” SECs of 3.09 GJ/t clinker and using 100% of a different fuel each (natural gas, charcoal and bagasse). These plants have carbon intensities of 47.26 kg C/tonne, 29.96 kg C/tonne, and 0.0 kg C/tonne, respectively. Projects 5 and 6 refer to plants using 100% coal and 100% natural gas, respectively, both with SECs of 3.15 GJ/t clinker. The carbon intensities of these two plants are 81.27 kg C/tonne and 48.20 kg C/tonne, respectively. When compared to the sector-wide baseline, only the two renewable energy projects (3 and 4) have carbon intensities below the best plant baseline level (see Figure 2)7. The two natural gas projects (2 and 6) fall between the 10th and 25th percentiles, the fuel oil project (1) falls below the average baseline value and the coal plant (5) exceeds all baseline carbon intensity values.
6 The multi-project baseline energy and carbon (from energy use only) intensities of cement manufacture are based on data from 1995, the last year for which information on fuel energy consumption is available on a plant-by-plant basis. 7 Figure based on Ellis, 2000.
8
Table 1. Multi-project carbon intensity baseline levels for three cement processes based on fourteen recently-built cement plants in Brazil (kg C/tonne)
Average
Weighted Average
25th Percentile
10th Percentile
Best Plant
Raw Material Grinding 0.12 0.12 0.12 0.12 0.12 Clinker Production: sector-wide
69.90 71.56 55.25 44.27 31.73
Clinker Production: fuel-specific (coal)
84.31 83.22 79.69 79.69 79.69
Clinker Production: fuel-specific (fuel oil)
69.56 69.53 67.46 67.33 67.33
Cement Grinding 0.20 0.20 0.20 0.20 0.20 Total (sector-wide) 70.22 71.88 55.57 44.59 32.05 Total (coal) 84.63 83.54 80.01 80.01 80.01 Total (fuel oil) 69.88 69.85 67.78 67.65 67.65
Table 2. Six hypothetical energy-efficiency cement projects in Brazil Project
1 Project
2 Project
3 Project
4 Project
5 Project
6 Fuel
Fuel oil
Natural gas
Charcoal
Bagasse
Coal
Natural gas
Capacity
tonne clinker/day
1800
3000
3000
3000
4000
4000
Raw Material Grinding Energy intensity
kWh/tonne 26.00 26.00 26.00 26.00 26.00 26.00
Carbon intensity
kg C/tonne 0.12 0.12 0.12 0.12 0.12 0.12
Clinker Production Energy intensity
GJ/tonne 3.09 3.09 3.09 3.09 3.15 3.15
Carbon intensity
kg C/tonne 65.16 47.26 29.96 0.0 81.27 48.20
Cement Grinding Energy intensity
kWh/tonne42.59 42.59 42.59 42.59 42.59 42.59
Carbon intensity
kg C/tonne 0.20 0.20 0.20 0.20 0.20 0.20
Total Energy intensity
kWh/tonne71.68 71.68 71.68 71.68 71.74 71.74
Carbon intensity
kg C/tonne 65.48 47.58 30.28 0.32 81.59 48.52

9
Carbon intensity (kg C/tonne)
0 10 20 30 40 50 60 70 80 90
Project #1 - fuel oil
Project #2 - natural gas
Project #3 - charcoal
Project #4 - bagasse
Project #5 - coal
Project #6 - natural gas
Weighted Average
Average
25th Percentile
10th Percentile
Best Plant
Figure 2. Carbon intensity of six hypothetical energy-efficiency cement projects in Brazil compared to the multi-project sector-wide baseline
Project #1 - fuel oil
Project #5 - coal
0 10 20 30 40 50 60 70 80 90
Carbon intensity (kg C/tonne)
Average
Weighted Average
Weighted Average
Average
25th Percentile
10th Percentile
Best Plant
25th Percentile
10th Percentile
Best Plant
Figure 3. Carbon intensity of two hypothetical energy-efficiency cement projects in Brazil compared to the fuel-specific baselines (Project 1 compared to fuel oil; Project 5 compared to coal)
10
Along with being compared to baselines calculated based on all fuels used in the sector, energy-efficiency projects can also be compared to fuel-specific baselines. In this case, the two fuel-specific baselines are for projects 1 (fuel oil) and 5 (coal) (see Figure 3). The carbon intensity of project 1 is lower than all the fuel-specific baseline values, including that for the best plant, because the plant’s specific energy consumption (3.09 MJ/kg clinker) is equal to the SEC of the most efficient cement plant in Brazil and is thus lower than the SEC of any other fuel-oil cement plant. Only when evaluated using an all-fuel baseline is it obvious that project 1 (as shown in Figure 2), despite its high level of energy efficiency, cannot compete in terms of carbon emissions with less energy-efficient cement plants fueled with natural gas, charcoal, and bagasse. The carbon intensity of project 5, on the other hand, is lower than the average and weighted average baseline values of the coal-specific baseline, but exceeds the other three baseline values (Figure 3).
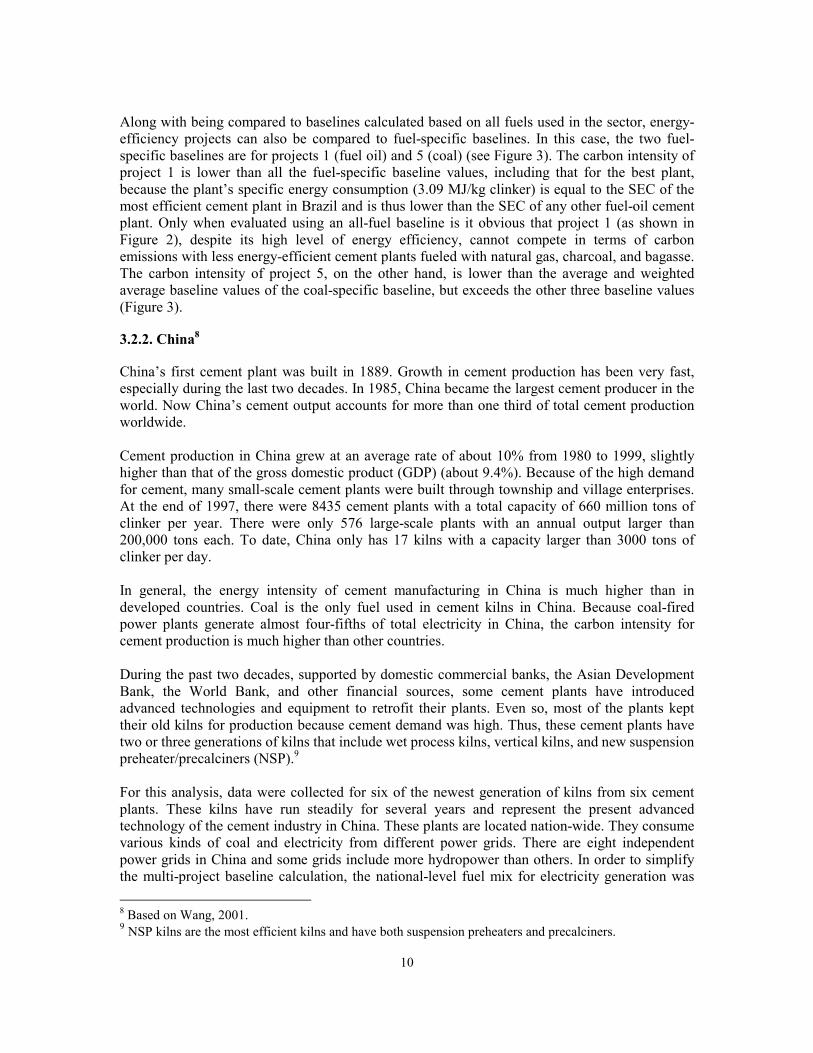
3.2.2. China8
China’s first cement plant was built in 1889. Growth in cement production has been very fast, especially during the last two decades. In 1985, China became the largest cement producer in the world. Now China’s cement output accounts for more than one third of total cement production worldwide. Cement production in China grew at an average rate of about 10% from 1980 to 1999, slightly higher than that of the gross domestic product (GDP) (about 9.4%). Because of the high demand for cement, many small-scale cement plants were built through township and village enterprises. At the end of 1997, there were 8435 cement plants with a total capacity of 660 million tons of clinker per year. There were only 576 large-scale plants with an annual output larger than 200,000 tons each. To date, China only has 17 kilns with a capacity larger than 3000 tons of clinker per day. In general, the energy intensity of cement manufacturing in China is much higher than in developed countries. Coal is the only fuel used in cement kilns in China. Because coal-fired power plants generate almost four-fifths of total electricity in China, the carbon intensity for cement production is much higher than other countries. During the past two decades, supported by domestic commercial banks, the Asian Development Bank, the World Bank, and other financial sources, some cement plants have introduced advanced technologies and equipment to retrofit their plants. Even so, most of the plants kept their old kilns for production because cement demand was high. Thus, these cement plants have two or three generations of kilns that include wet process kilns, vertical kilns, and new suspension preheater/precalciners (NSP).9 For this analysis, data were collected for six of the newest generation of kilns from six cement plants. These kilns have run steadily for several years and represent the present advanced technology of the cement industry in China. These plants are located nation-wide. They consume various kinds of coal and electricity from different power grids. There are eight independent power grids in China and some grids include more hydropower than others. In order to simplify the multi-project baseline calculation, the national-level fuel mix for electricity generation was 8 Based on Wang, 2001. 9 NSP kilns are the most efficient kilns and have both suspension preheaters and precalciners.

11
used to calculate the carbon content of electricity for this analysis. The electricity carbon content in China is much higher than those countries that use more hydro and low carbon content fossil fuel such as natural gas and fuel oil for power generation, since China’s electricity sector is based primarily on the use of fossil fuel (82.4%) with a smaller contribution of hydro (16.4%) and nuclear power (1.2%) (Fridley et al., 2001).
Table 3. Multi-project carbon intensity baseline levels for three cement processes based on six recently-built cement kilns in China (kg C/tonne)
Average Weighted Average
25th Percentile
10th Percentile
Best Plant
Raw Material Grinding 15.76 15.71 15.17 15.07 15.07 Clinker Production 87.47 85.92 79.22 78.22 78.22 Cement Grinding 8.78 8.72 7.36 7.33 7.33
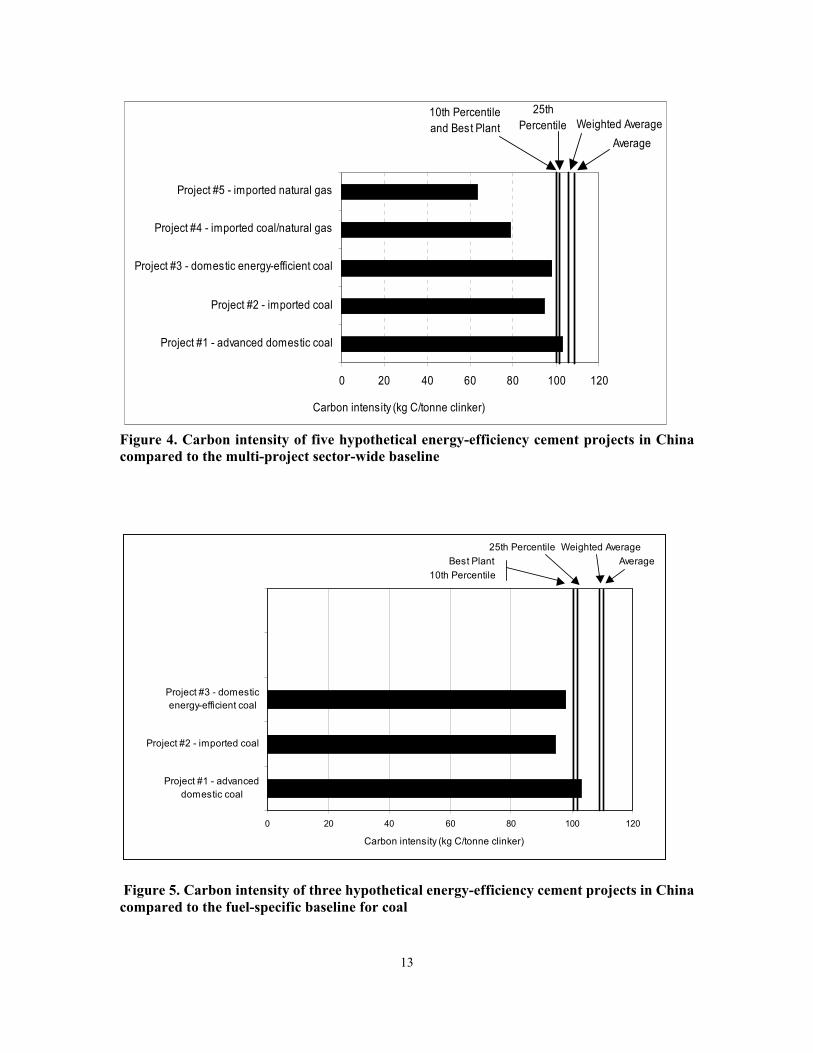
Total 112.01 110.35 101.75 100.62 100.62 Table 3 provides the carbon intensity multi-project baseline levels for the six cement kilns. All the values apply to all three types of baselines (sector-wide, all-fossil, and fuel-specific) because Chinese cement kilns use coal exclusively. Table 4 presents information on five hypothetical cement projects. Project 1 is based on the use of advanced domestic technology using coal as the main fuel. Project 2 also uses coal, but is based on imported technology and has a larger capacity. Project 3 uses energy-efficient technology for the grinding stages and uses coal for the clinker production. Project 4 is based on imported technology using a mix of 50% coal and 50% natural gas. Finally, Project 5 relies on imported technology using exclusively natural gas as a fuel. Present domestic advanced technology, as represented by Project 1, is only better than the average and weighted average benchmarks (see Figure 4). Domestic advanced technology with additional electricity-efficiency improvements, as represented by Project 3, is better than all of the benchmarks from a total plant point of view, although the carbon reduction of clinker production is lower than the better-than-average benchmarks. This means that electricity efficiency is an important reduction measure because of the reliance on coal as the main source for power generation. This conclusion is made based on the nation-wide power source mix; for some areas where more hydropower is used for electricity production, there may be no carbon reduction benefits through electricity-efficiency improvement. Imported advanced technology using coal as a fuel source, as represented by Project 2, is better than all of the benchmarks due to the improved energy efficiency in all three process stages. Fuel switching away from coal, as represented by Project 4 (50% coal and 50% natural gas) and Project 5 (100% natural gas), gives the largest carbon emissions reductions. Only the first three projects can be compared to a fuel-specific baseline, in this case coal. All three of these projects have lower carbon intensities than the average and weighted average fuel-specific baselines. Project 1, which represents present domestic advanced technology using coal as the primary fuel, has a higher carbon intensity than the 25th percentile, 10th percentile, and best plant baselines. Projects 2 and 3, which are based on imported and energy-efficient domestic technologies, respectively, both have lower carbon intensities than the 25th percentile, 10th percentile, and best plant baselines.

12
Table 4. Five hypothetical energy-efficiency cement projects in China Project 1 Project 2 Project 3 Project 4 Project 5 Technology Advanced
domestic Imported Domestic energy-efficient
Imported Imported
Fuel Coal Coal Coal
50% coal 50% natural
gas
Natural gas
Capacity tonne/day 4000 7200 4000 7200 7200 Raw Material Grinding Energy intensity kWh/tonne 64.00 46.00 46.10 46.00 46.00
Carbon intensity kg C/tonne 14.46 10.40 10.42 10.40 10.40
Clinker Production Energy intensity GJ/tonne 3.13 3.00 3.13 3.00 3.00
Carbon intensity kg C/tonne 80.75 77.40 80.75 61.65 45.90
Cement Grinding Energy intensity kWh/tonne 35.00 30.00 30.10 30.00 30.00
Carbon intensity kg C/tonne 7.91 6.78 6.80 6.78 6.78
Total Energy intensity kWh/tonne 102.13 79.00 79.33 79.00 79.00
Carbon intensity kg C/tonne 103.12 94.58 97.97 78.83 63.08
13
Carbon intensity (kg C/tonne clinker)
0 20 40 60 80 100 120
Project #1 - advanced domestic coal
Project #2 - imported coal
Project #3 - domestic energy-efficient coal
Project #4 - imported coal/natural gas
Project #5 - imported natural gas
Weighted AverageAverage
25th Percentile
10th Percentile and Best Plant
Figure 4. Carbon intensity of five hypothetical energy-efficiency cement projects in China compared to the multi-project sector-wide baseline
Carbon intensity (kg C/tonne clinker)
0 20 40 60 80 100 120
Project #1 - advanceddomestic coal
Project #2 - imported coal
Project #3 - domesticenergy-efficient coal
Best Plant10th Percentile
25th Percentile Weighted AverageAverage
Figure 5. Carbon intensity of three hypothetical energy-efficiency cement projects in China compared to the fuel-specific baseline for coal

14
4. Multi-Project Baselines for Evaluation of Electric Power Projects
In 1995, global electricity generation was 13,200 TWh and accounted for carbon dioxide emissions of over 2 GtC, or about one-third of global CO2 emissions (IEA, 1998). Coal is clearly the primary fuel for electricity generation. In 1995, coal represented 44% of the fuel input for generating electricity and was responsible for 70% of electricity-related carbon dioxide emissions (IEA, 1998). Electricity is also generated using oil, natural gas, nuclear power, hydroelectric power, and various renewable energy sources. LBNL has developed a standardized method for establishing a multi-project baseline for a power system. In this section, we explain the use of this methodology and present two case studies in which five baseline carbon intensity levels (average, weighted average, 25th percentile, 10th percentile, and best plant) are tested.
4.1 Calculating Multi-Project Baselines for Electric Power Projects
Multi-project baselines for electric power projects can be calculated based on recently constructed or planned electric generation facilities in a country. Estimation of the CO2 emissions that are avoided by projects that supply electricity to the grid requires a baseline that represents what would have happened in the absence of the project. Estimating the effect of projects hinges upon finding the type of power plants whose construction or use would be avoided by the projects, and the carbon emissions avoided by their reduced operation. Establishing a multi-project baseline for the power system can provide project developers with factors that they could use in calculating the CERs expected from a project and the actual CERS to be claimed after the project is completed. A multi-project baseline based on a mix of planned new capacity or the dominant type of existing capacity and can be expressed in terms of kg C per kWh avoided. To calculate the baseline, data on annual electricity output (TWh/yr) and annual energy use (GJ/yr) are gathered for each plant in the reference scenario. The carbon intensity of each plant in the reference scenario is calculated by dividing the total annual carbon emissions by annual electricity output: Carbon intensity [tC/MWh] = total fossil fuel usage [TJ] * fuel carbon content [tC/TJ] (2) Annual electricity generation [MWh] Country-specific values for the fuel carbon content (or emissions factor) can be used. Alternatively, IPCC values may be used as a default.
4.2 Case Studies
4.2.1 India10
The Indian power generation sector uses a wide diversity of energy supply sources including coal, oil, natural gas, hydro, nuclear, wind, solar, and biomass. Coal-based thermal generation dominates the electricity sector in India. Over the last 25 to 30 years, the capacity share of large hydro has declined, while that of nuclear power is growing slowly.
10 Based on Roy and Das, 2001.

15
Currently, thermal plants account for 72.9% of the total power generation, while hydro and nuclear power plants contribute 15.2% and 2.5%, respectively. The average age of the thermal power stations in India is 30 years. The abundance of coal (India’s coal reserve is estimated to be 2000 billion tonnes) coupled with short construction periods of 3 to 4 years for smaller thermal plants with capacity below 250 MW, and between 6 to 7 years for plants above 250 MW capacity have encouraged the dependency on the thermal power in the country. The plant load factor (PLF) is very low in India (average is approximately 65%). Thermal efficiency of the plants varies across plants due to the varying grades of coal used and vintages of plants. The coal use factor ranges from 0.53 kg/kWh to 0.88 kg/kWh. The use of high ash content coal reduces the efficiency of the thermal power plants. The high dependency of coal implies India’s electricity industry has relatively high CO2 emissions. In addition, some methane (CH4) is released during coal mining, production of coal, and production of natural gas. With 237 million metric tons of carbon released from the consumption and flaring of fossil fuels in 1997, India ranked fifth in total CO2 emissions in the world behind the United States, China, Russia and Japan (U.S. Energy Information Administration, 1999). Thus, increased power generation in India to satisfy the growing demand for electricity will continue to increase GHG emissions significantly. For ease of operation of the power system, the electricity distribution network in India is divided into several regions: north, west, south, east and north-eastern region. We focus on the eastern region in this analysis. The eastern region covers three states –West Bengal, Bihar and Orissa. Though public, private, and government-owned public sector undertakings (PSUs)11 are all engaged in power generation, transmission and distribution, the power industry in this region is dominated by the PSUs. Total installed capacity in this region is 16,973 MW which is 15% of the total installed capacity of the country. Six PSUs in this region own 57% of the total regional power generation capacity, public sector owns 29% and the remaining 14% of generation capacity is owned by the Calcutta Electric Supply Corporation (CESC), the only private licensee in this region. Like other regions, the regional power grid in the eastern region, governed by the Eastern Regional Electricity Board (EREB), facilitates flows of power from surplus areas to deficit areas and assists the optimum utilization of the power available in the country. Total consumption in this region in 1999-2000 was 46,165 megawatt hours (MWh). Regional electricity generating capacity is based on three primary resources: coal, oil and hydro. The coal reserve of eastern region is the highest (90%) in India. The availability of coal encouraged the establishment of thermal power stations in this region at a greater rate. By 2000, there were 25 thermal power plants with 44 major units in the eastern region. Besides coal-based power stations, the eastern region also has 15 hydroelectric power stations and four high speed diesel oil (HSDO)-based gas turbines. Capacity expansion in the eastern region is continuing and a large expansion has been planned over the next decade covering tenth and eleventh Five-Year Plan periods starting from 2003. Twenty-five units (including conventional and non conventional fuel based) with total capacity of 4283 MW (25% of the total existing capacity) began operation since 1994. Of these, 81% are thermal with coal as the primary fuel source, 15% (6.5 MW) are hydro and the remainder (1 MW) are renewable sources such as solar and wind to meet the off grid supply. The future expansion plan of the next decade proposes to construct 26 power stations with a total capacity of 24,313 MW. 11 Public sector undertakings are characterised by more than 50% share holding by the government.

16
Table 5. Multi-project carbon intensity baseline levels for “recent past” electricity plants in India (kg C/kWh)
Average Weighted Average
25th Percentile
10th Percentile
Best Plant
All-fossil 0.390 0.345 0.241 0.217 0.217
Sector-wide 0.280 0.341 0.228 0.192 0.000 Table 5 provides the carbon intensity multi-project baseline levels for the “recent past” baseline for all-fossil generation and for sector-wide generation. These include 13 power plants built since 1995. There are no plants that use only one type of fuel. All thermal plants use both coal and oil. Although coal-fired plants use coal as primary fuel, they do keep provision for use of oil as a supplementary fuel for either starting the system or supplement the primary fuel in case of coal supply shortage or availability of coal racks. For hydro, we assume that the carbon intensity is zero. The fossil fuel-specific carbon intensity is identical for the 10th percentile and the best plant because several of the coal units included in the baseline have identical performance. The zero carbon intensity for the sector-wide category reflects the inclusion of hydro and solar energy based power generation that it is zero-emitting.
Table 6. Five hypothetical electricity generation projects in India Project 1 Project 2 Project 3 Project 4 Project 5 Fuel Hydro Hydro 99% coal
1% oil 99% coal
1% oil Renewabl
e Capacity (MW) 1020 1710 1000 500 6 Annual generation
(TWh)
4.468
7.490
6.132
3.504
0.006
Carbon intensity kg C/kWh 0.000 0.000 0.220 0.220 0.000
Table 6 presents information on five hypothetical power generation projects. Projects 1 and 2 are large hydroelectric plants with capacities of 1020 MW and 1710 MW, respectively. Projects 3 and 4 are planned as private sector and public sector projects with capacities of 500 and 1000 MW, respectively. They have been planned to be more efficient and to use better quality coal and less oil input. Project 5 represents plans under the renewable energy development agency for decentralized off-grid supply of power of 6 MW of generating capacity. Both hydroelectric projects 1 and 2, and the renewable project 5, clearly perform at the best plant level, better than all of the other baseline levels for either the sector-wide or the all-fossil baselines (see Figures 6 and 7). The thermal plants (projects 3 and 4) perform better than the weighted average and 25th percentile when using either the sector-wide or the all-fossil baseline, but the CO2 intensity reduction relative to the 25th percentile is greatest when using the all-fossil baseline. Neither of the thermal-based projects reduce CO2 emissions when the 10th percentile or best plant baseline is used since these include renewable-based projects in the sector-wide baseline and a “best plant” project with a carbon intensity of 0.217 kg C/kWh in the all-fossil baseline.

17
0 0.05 0.1 0.15 0.2 0.25 0.3 0.35 0.4
Project #1 - hydro
Project #2 - hydro
Project #3 - coal/oil
Project #4 - coal/oil
Project #5 - renewable
Carbon intensity (kg C/kWh)
Best Plant 10th Percentile 25th Percentile Weighted Average
Figure 6. Carbon intensity of five hypothetical electric power projects in India compared to the multi-project sector-wide baselines
0 0.05 0.1 0.15 0.2 0.25 0.3 0.35 0.4
Project #1 - hydro
Project #2 - hydro
Project #3 - coal/oil
Project #4 - coal/oil
Project #5 - renewable
Carbon intensity (kg C/kWh)
Best Plant10th Percentile 25th Percentile
Weighted Average
Figure 7. Carbon intensity of five hypothetical electric power projects in India compared to the all-fossil (and fuel-specific) baseline

18
4.2.2 South Africa12
The electricity supply industry in South Africa is almost entirely owned by the public sector – either through the state-owned company, Eskom, or through municipal distributors. Generation and transmission are dominated by Eskom. There are a few self-producers, some of which sell to neighboring communities. Eskom owns 92% of all generation capacity in South Africa, municipalities own 6% and private generators only 2%. The total quantity of electricity generated in South Africa in 1999 was 190 TWh (NER 1999). Eskom accounted for 96% of this total. South Africa’s electricity generating technology is based largely on coal-fired power stations, mostly owned and operated by Eskom and largely concentrated near and to the east of Johannesburg – close to the main coal resources as well as the country’s major demand center. At the end of 1999, there were 49 power stations in operation in the country, of which 20 are coal-fired, accounting for 90 per cent of the total capacity of 43,142 MW (excluding capacity in reserve and under construction). Three of Eskom’s older coal stations are currently in reserve (“mothballed”) because of excess capacity, and these would add an additional 3,556 MW. The only non-coal stations of significance are the Koeberg nuclear power station (4% of operational capacity) and three pumped storage facilities (4% of operational capacity) (NER, 1999). South Africa is known for being one of the world’s low-cost producers of electricity. At the beginning of 1997, Eskom, the electric utility had the lowest industrial electricity tariffs in the world. At 2 US cents/kWh, South Africa was followed closely by only New Zealand at 2.5 US cents/kWh (SANEA 1998). The average age of Eskom’s operational power stations is 14 years (weighted by capacity) – this figure is heavily influenced by several large stations constructed in the 1980s. Eskom’s coal-fired power stations generally exhibit high thermal efficiencies for conventional pulverised fuel technology. Average efficiencies have consistently been over 34 %, despite the use of low quality (high ash) coal and the use of dry-cooled technology on two newer plants, which is generally slightly less efficient than wet-cooled stations. The weighted average heat content for existing coal-fired power stations is low at 21.3 GJ/t (coal) compared to the IPCC default value of 29.3; carbon content is relatively high at 28.2 tC/TJ compared to the IPCC factor of 25.8 (IPCC 1995). Eskom’s moth-balled stations are 30 years old on average and would typically have lower than average thermal efficiencies. The high dependence on coal means that South Africa’s electricity industry has relatively high GHG emissions of 159 Mt of CO2 equivalent in 1998. This is mainly from coal combustion, but includes some methane emissions from coal mines. Overall, South Africa produces 0.96 kg of GHG per kWh produced by coal fired power stations. Using observed data from recent plants reduces gaming, and is probably desirable for baselines in many electricity sectors. However, in South Africa, deriving baselines based on recently built plants does not work because only one power station, Majuba, has been constructed in the last seven years13. At Majuba, four units have been constructed from 1996-1999, and two more are being constructed during 2000 and 2001. If one uses the “recent plant” approach, one therefore compares the proposed projects to the performance of a single power station. The slower growth in demand in South Africa in recent years creates some inertia against changes in the capacity mix (Lazarus 1999). Opportunities to change the capacity mix towards low-carbon technologies are constrained by the existence of excess capacity and moth-balled coal stations. These arguments are specific to the power sector in South Africa, and do not imply that other developing countries might not choose recent plant baselines. 12 Based on Winkler, et al., 2000. 13 The last previous plant was Kendal, whose units were commissioned from 1988-1993 (Eskom 1996).

19
Table 7. Six near future electricity generation projects in South Africa used for development of a near future baseline Plant 1 Plant 2 Plant 3 Plant 4 Plant 5 Plant 6 Fuel New
Coal New Coal
Moth-balled Coal
Moth-balled Coal
Natural gas
Imported hydro
Capacity (MW) 713 713 570 870 736 400 Annual generation (TWh) 3.78 3.78 3.02 4.61 4.13 1.84
Carbon intensity kg C/kWh 0.295 0.295 0.338 0.338 0.100 0.000
In this analysis, we have therefore chosen a baseline that includes six “near future” plants. Table 7 presents information on these plants, which include the two new units of Majuba, the recommissioning of two units in moth-balled power stations, a new natural gas plant and imported hydroelectric power (Eskom, 1996; Eskom, 1998; Eskom, 1999; NER, 1999). Given the directions set by Eskom’s Sixth Integrated Electricity Plan, one could reasonably expect these units to come on line between 2000 and 2005 (Eskom, 1998).
Table 8. Multi-project carbon intensity baseline levels for “recent past” electricity plants in South Africa (kg C/kWh)
Weighted Average
25th Percentile
10th Percentile
Best Plant
Fuel-specific: coal 0.316 0.295 0.295 0.295 Fuel-specific: natural gas (1 plant only) 0.100 0.100 0.100 0.100
All-fossil 0.270 0.128 0.100 0.100 Sector-wide 0.247 0.065 0.013 0.000 Table 8 provides the multi-project sector-wide, all-fossil, and fuel-specific carbon intensity baseline levels based on “near future” plants. The benchmarks get more stringent from left to right, as expected. However, the coal-specific carbon intensity is identical whether one uses the 25th percentile, 10th percentile or best plant. This is because several of the coal units included in the baseline have identical performance. Natural gas has much lower carbon intensity than coal – and this constitutes the best plant and 10th percentile for the “all fossil” comparison. The zero carbon intensity for the best plant sector-wide reflects the inclusion of imported hydro and the assumption that it is zero-emitting. For coal-based generation, the baseline generally gets more stringent as one moves from fuel-specific to all fossil and sector-wide comparisons. This is because the all-fossil comparison adds in natural gas, and the sector adds the imported hydro, bringing down the weighted average carbon intensity. Natural gas does not follow this trend since the fuel-specific carbon intensity is lower than the all-fossil or sector-wide intensity, which include more carbon-intensive coal. In this example, the weighted average and percentiles for gas are based on one plant only. While it may be more mathematically correct to base such measures on more than the one gas plant included here, the value of the single plant is included across all baselines since that is what one would compare the project against.

20
Table 9 presents information on five hypothetical electricity generation projects. Project 1 is based on importing gas from the Kudu Gas fields for three units of 368 MW each (Roggen 2000). New gas-fired power plants are substantially less carbon-intensive than coal-fired plants. Project 2 is based on plans for the Darling wind farm to install 5 MW for production of electricity for the grid (Asamoah 2000). Project 3 is based on the use of more efficient, super-critical coal plants. Project 4 is based on an Eskom initiative to install 18 million compact fluorescent lights (CFLs) to reduce energy demand in the residential sector (Eskom 2000). Rather than increasing supply, this project aims to reduce demand for electricity, and thus avoid emissions. By including an energy efficiency option, it is possible to measure demand- as well as supply-side options against one multi-project baseline. Project 5 is based on Off-grid Solar Home Systems. The aim of the programme to use off-grid solar home systems to electrify rural areas unlikely to receive grid electricity. The project has a target market of 350,000 households (Qase 2000). In comparing this programme to the multi-project baseline, one implicitly assumes that it will displace electricity, whereas it is more likely that paraffin or diesel will be displaced. The difference in emissions reductions is substantial, with a typical 50Wp system displacing around 230 kg CO2 per system per year when compared to traditional fuel use, but only about 40-80 kg CO2 per system per year compared to grid electricity (Ybema et al. 2000). Based on international experience, the value for diesel generates would be expected to lie between these two. For this reason, it seems appropriate to use different benchmarks for off-grid projects and grid-connected ones.
Table 9. Five hypothetical electricity generation projects in South Africa Project 1 Project 2 Project 3 Project 4 Project 5 Fuel/Project Natural
gas Wind Coal CFLs Off-grid solar
Capacity (MW) 368 5 1,974 1,080 * 17.5 Annual generation (TWh) 2.07 0.00876 10.46 4.00 * 0.02555
Carbon intensity kg C/kWh 0.100 0.000 0.216 0.000 0.000
* Avoided capacity and generation. Sources: Roggen (2000),Karottki and Banks (2000); Howells (1999), Eskom (2000), Qase (2000). The two renewable electricity generation projects (2 and 5) and the electricity demand reduction project (4) all perform at or below the best plant level and better than all of the other baseline levels for the sector-wide, all-fossil, and fuel-specific baselines (see Figures 8-10). Fossil fuel projects struggle to beat the baseline if anything other than fossil fuels is included. Project 3, the efficient coal plant, only performs better than the weighted average for both the sector-wide and all-fossil baselines, but is significantly better than all baseline levels when compared to the coal-specific baseline level. Project 1, the new natural gas plant, looks best compared to fossil fuels only, since this is only coal in South Africa. The fuel-specific comparison for gas shows equal performance, since units of new gas were included in the baseline. The implication of this is that new gas projects would have to do better than ones included in the “near future” baseline.

21
0 0.05 0.1 0.15 0.2 0.25 0.3
Project #1 - natural gas
Project #2 - wind
Project #3 - coal
Project #4 - CFLs
Project #5 - off-grid solar
Carbon intensity (kg C/kWh)
Best Plant 10th Percentile 25th Percentile Weighted Average
Figure 8. Carbon intensity of five hypothetical electric power projects in South Africa compared to the sector-wide baseline
0 0.05 0.1 0.15 0.2 0.25 0.3
Project #1 - natural gas
Project #2 - wind
Project #3 - coal
Project #4 - CFLs
Project #5 - off-grid solar
Carbon intensity (kg C/kWh)
Best Plant10th Percentile
25th Percentile Weighted Average
Figure 9. Carbon intensity of five hypothetical electric power projects in South Africa compared to the all-fossil baseline

22
0 0.05 0.1 0.15 0.2 0.25 0.3 0.35
Project #1 - natural gas
Project #2 - wind
Project #3 - coal
Project #4 - CFLs
Project #5 - off-grid solar
Carbon intensity (kg C/kWh)
Best Plant10th Percentile25th Percentile
Weighted Average
Best Plant10th Percentile25th Percentile
Weighted Average
Figure 10. Carbon intensity of two hypothetical electric power projects in South Africa compared to the fuel-specific baseline
5. Findings
5.1 Methodology
5.1.1 Choosing Baseline Plants
A multi-project baseline can include either recently-constructed plants or plants that will be constructed in the near future. Of the four case studies presented in this paper, three (Brazil, China, and India) used data for recently-constructed plants, while one (South Africa) found that such an approach was inappropriate because of the small number of recent plants and significant changes in fuel mix of new, marginal plants. For the Brazilian case study, baselines were set from fourteen relatively new cement plants. These plants were chosen because they were both the most recently built and the most modern. A forward-looking baseline would be difficult to construct for Brazil’s cement sector because data on plants under construction and/or planned are not currently available. A baseline that included all plants, including older plants, would certainly differ from the one presented here, but the difference would not be substantial: the SEC for clinker production averaged 3.30 MJ/kg clinker for the baseline while the SEC for clinker production would average 3.60 MJ/kg clinker for a baseline constructed considering all the dry process plants in operation in Brazil. For China, the baseline was established using data for six recently-built cement kilns. Due to the wide variation in technology levels seen in Chinese cement kilns, it is difficult to generalize about which kilns should be included in the construction of a baseline. Domestically-available technologies are adopted by cement plants that do not have the financial means to invest in international advanced technologies. Even so, these plants can operate as well or better than other

23
plants due to variations in management and engineering ability among plant operators. Typically, plants that receive either foreign assistance or official key project status have the funding to adopt international advanced technologies. Which kilns should be used for establishing a multi-project baseline in China is an important topic for further research. An issue that arose in the Chinese evaluation was that some cement plants run several kilns, each with different efficiencies. For example, one plant selected for the baseline calculation runs four kilns: one vertical kiln, two wet process kilns and one NSP kiln. The performance and energy efficiency of these kilns are quite different. The general data from the plant usually presents the average performance, which hides the significant differences in efficiency. Thus, it is important that specific kiln-based data be collected for the baseline calculations. Recently-built electric generation plants were chosen for construction of the Indian (eastern regional) baseline. Over the last five years thirteen power plants, accounting for approximately 33% of total generating capacity, have been constructed. These recent plants reflect a wide variety in fuel types, including coal, high speed diesel oil, wind, solar, and hydro. Both the government sector and the public sector have installed new generation capacity. The installed capacity varies from 0.5 MW to 1000 MW. The near future plants are also of the similar variety both in terms of fuels and capacity and ownership pattern. Therefore, the performance of the recently-built and operating plants has been selected to construct the baseline. In South Africa, it was not possible to construct a baseline of recently-built plants since only one power plant has been constructed in the last seven years. To use historical data, one would have to go back some 20 years or so to get a reasonable representative baseline. That would defeat the purpose of recent plant baselines, which is to include marginal, relatively efficient technologies. For this analysis, a baseline looking at six “near future” plants and units was used. Since these are future plants, the baseline itself is a projection, determined by the underlying assumptions. The South African analysis included a comparison of the near future baseline with a recent plant baseline that used only the one recently-built plant. This comparison found that projects generally do better with the less stringent recent plant baseline since it is “easier to beat” than the harder near-future baseline, especially for the sector-wide comparison. Thus, the four case studies show that it is more difficult to find information on near-future plants for the cement industry than for the electric power sector, where plans for capacity additions are more commonly available. The South African case study found that using recently-built plants for baseline construction could result in less stringent baselines than those based on near-future plants, assuming that the near-future plants are less carbon intensive than those recently built. However, if the planned near-future plants are more carbon intensive, as in the case of Brazil’s electricity sector for example, then a baseline using recently-built plants would be more stringent. Ultimately, the decision regarding which type of baseline to use will be determined by the host country government following analysis of the country-specific conditions.
5.1.2 Choosing Baseline Breadth
Once the baseline plants have been chosen and the baseline has been constructed, a proposed project can be compared to the baseline’s sector-wide, all-fossil, or fuel-specific carbon intensity values. In general, the case studies show that larger CERs will be realized if an all-fossil or fuel-specific baseline is used (assuming the fuel-specific baseline is based on fossil-fuel plants) because the baselines only include other fossil-fuel plants and a new fossil-fuel plant can have significant reduction in carbon intensity when compared to other fossil-fuel plants. For example,

24
the hypothetical coal-fired plant in India (Project 3) that has a carbon intensity of 0.220 kg C/kWh, has carbon savings that are greater for the all-fossil baseline when compared to the sector-wide baseline (see Table 10). Similar results were seen in the Brazil and South Africa case studies. There was no difference between the sector-wide and all-fossil or fuel-specific baselines for China because only coal-fired cement kilns have been constructed to date.
Table 10. Comparison of Carbon Savings from a Hypothetical Coal-Fired Plant with a Carbon Intensity of 0.220 kg C/kWh in India Using All-Fossil and Sector-wide Baselines (kg C/kWh). Weighted
Average 25th
Percentile 10th
Percentile Best Plant
Baseline: All Fossil 0.345 0.241 0.217 0.217 Carbon Savings 0.126 0.021 -0.003 -0.003 Baseline: Sector-wide 0.341 0.228 0.192 0.0 Carbon Savings 0.122 0.008 -0.027 -0.220
In the South African context, even the sector-wide baseline provides a strong incentive to invest in low-carbon technologies. The actual electricity displaced by these projects will include the coal, gas and hydro-power that would likely come on line from 2000 to 2005. The projects will not only displace coal power. Hence any fossil-fuel projects that want to attract investment have to compete with gas and hydro, as do renewables. More efficient coal plants could still be developed if a weighted average benchmark is used, but the emissions reductions would be relatively small. While the purpose of the analysis is to compare baselines, rather than potential projects, we cannot avoid the issue of fossil-fuel projects. New coal would only be eligible under less stringent baselines.
5.1.3 Choosing Baseline Stringency
Once the baseline has been calculated and the breadth is chosen, then the proposed project can be evaluated based on increasingly strict baseline levels ranging from the average to the weighted average, 25th percentile, 10th percentile and best plant. The average and weighted average baselines allow the largest number of CERs and reflect the projected mix of the sector. The best plant and 10th percentile benchmarks are more restrictive, in that even renewable energy projects show only a marginal improvement in carbon intensity and many plants do not qualify for any credit at all. The 25th percentile benchmark is an intermediate choice that would still help to provide incentives to introduce advanced technologies and low- or no-carbon projects. As mentioned above, however, it can be argued that since the project has already passed some sort of additionality criteria, it is difficult to expect it to be significantly better than the weighted average plant in the multi-project baseline.
5.2 Other Issues
5.2.1 Data
One question that comes up often regarding multi-project baselines is the degree of difficulty of getting the data for different plants. In the case of Brazil, the most recent data on energy consumption for cement production are for 1995 and even so these data are not complete: no electricity consumption data on a plant-by-plant basis are available. Even so, the data available are good enough for setting the most appropriate multi-project baselines and reference values for multi-project emissions factors for the cement industry in Brazil as an alternative to project-specific baselines. Also, although the use of kiln-specific data vs. plant-specific data might be

25
preferable in some cases, in Brazil there are no significant differences in energy efficiency between kilns at the same plant. There is no database for the cement industry in China related to energy consumption. There are two indicators currently used to measure the energy consumption or efficiency in cement plants in China. They are specific fuel consumption for clinker production and integrated electricity consumption for cement production. If the methodology developed by LNBL is used in China, data would have to be collected for annual clinker and cement production for a plant or kiln, annual energy use of specific fuels for clinker production, and annual electricity use for the entire cement production process. It is very difficult to get data related to electricity consumption divided to different stages. Also, there is an absence of electricity consumption for kilns in the methodology.
5.2.2 Fuel Switching
Fuel switching to lower carbon fuels for either electricity generation or use in industrial processes is an option in countries or regions that have access to these fuels. However, fuel switching may not be an option in cases where natural gas or hydro is not available, where the use of these fuels is already widespread, or where other specific conditions, such as the move away from hydro in some SADC countries to mitigate the risks of drought, drive decisions. For the Brazil case study, it was found that the widespread potential availability of low-or-zero net carbon emissions alternative fuels in most regions of the country (charcoal and sugarcane bagasse mainly) make fuel switching, rather than energy-efficiency improvements, the most effective carbon-savings option for energy-related cement projects. While increasing the energy efficiency of cement manufacture plants in Brazil can reduce, in theory, on average, carbon emissions from cement production by less than 20% at most (assuming an average SEC for clinker production of 3.6 MJ/kg clinker in the country and a “best-of-all” plant with a SEC for clinker production of 2.88 MJ/kg of clinker), fuel switching can reduce carbon emissions by up to 100% (in the case of new cement plants fueled with 100%-renewable biomass, such as increasingly-renewable charcoal and already zero-net-carbon emissions sugarcane bagasse). Although it is clear that using low-carbon fuel for kilns and power generation can increase CO2 reductions in China, the issue is how to develop low-carbon resources and markets. For example, after the west–to-east natural gas project is completed, 12 billion cubic meters of natural gas will be supplied to Shanghai, but the price of natural gas is projected to be higher than in most developed countries and higher than industries are willing to pay for natural gas. Overcoming such barriers to promote natural gas utilization is currently a challenge in China.
5.2.3 Process Emissions and Blended Cement
The cement industry is one of the few sectors that emits CO2 not only from energy consumption but also from the production process. The emissions from the production process are almost equal to those from energy consumption. Improving energy efficiency can only solve part of problem. Reductions in cement utilization or in the clinker consumption for cement production are effective measures for CO2 reduction. For example, some kinds of slag from the metallurgical industry have special characteristics that can blend with clinker to produce cement and improve the quality of cement. According to a rough estimate for China, if the cement output target is 600 million tons per year in the next two decades, 1% more slag will be used for cement production than is currently used and as a result 0.8 MtC of CO2 will be reduced from clinker production process.

26
Potential project types in the cement sector can be divided into the broad categories of energy related and non-energy related. Energy-related cement projects include increasing the energy efficiency of cement manufacture, changes in the production process, and changing the input fuels to less carbon-intensive energy carriers (including less-carbon-intensive carriers for electricity production). Non-energy related cement projects include process CO2 emissions, which can also be significantly reduced with the blending of clinker with increasing proportions of other products. This possibility, which was not examined here either but that could also be accounted for using this same methodology and the multi-project baseline model, should be also pursued in future research efforts.
6. Conclusions and Recommendations for Further Research
From the four case studies, it is clear that the most difficult aspect of setting multi-project baselines is determining the appropriate criteria in terms of baseline plants, baseline breadth, and baseline stringency in order to balance the desire to encourage no- or low-carbon projects while maintaining environmental integrity. For Brazil, 14 recently-constructed cement plants were used to calculate the baseline. The results of the case study led the authors to conclude that, in principle, the “best plant” approach seems to be the best model for future cement plants in Brazil. That approach would not be too restrictive and, as such, would help reduce carbon emissions from energy use in the cement industry to a minimum, and, at the same time, help Brazil to get access to the most modern technology in the sector, with possible spin-offs to other industrial sectors as well. However, in some situations the “best-plant multi-project-baseline approach” may not generate enough credits to encourage potential investors-to-be on cement projects in Brazil. In summary, the results support the argument that, for the cement industry in Brazil at least, multi-project baselines based on “10th percentile” or “best plant” seem to be the most appropriate criteria for setting future baselines, by no means being too restrictive. This conclusion can be drawn in Brazil because of the opportunity to switch from fossil-fuel-based cement production to low-carbon bagasse and charcoal-based plants. The multi-project baseline for cement plants in China was calculated using data from six recently-constructed kilns. In order to surpass expected energy efficiency levels of new cement plants in China, future projects must adopt imported advanced technologies that can beat all benchmarks according to the baselines established in this research. The project adopting advanced domestic technology only receives credit against the average and weighed average baselines. Data from kilns with advanced domestic technology level should be used for the baseline calculation in order to ensure that the project benefits the host country in terms of technology, capital and information transfer. Overall, based on the small sample size used in this evaluation, the Chinese case study led to the conclusion that in general a 10th percentile baseline eliminates the advanced domestic coal-based kilns, while providing increasing credits to domestic energy-efficient coal, imported coal, imported 50% coal/50% natural gas, and imported natural gas cement kilns, in that order. At the same time, such a baseline can identify the present advanced technology of the host country and assist in realizing technology transfer. Recently-constructed electric power plants in the Eastern region were used to calculate the multi-project baseline for India. Using this baseline to assess a number of hypothetical plants, the case study authors concluded that in India the sector-wide baseline appears to make the most sense, because the projects will displace not only coal power by any inefficient and carbon-intensive

27
plant. Hence any fossil-fuel projects that want to attract investments have to compete with hydro and renewables. This approach assumes that one is aiming to ensure environmental integrity. The South Africa case study authors constructed a multi-project baseline using six plants planned for construction in the near future. The authors concluded that one option would be to use a sector-wide, 25th percentile baseline for all projects in the electricity generation sector. Another option is to choose different baselines for projects with different attributes. The advantage of a single baseline is that it is simple, and treats all technologies equally. For the electricity sector, it can include both supply and demand side options. The attraction of different baselines for different projects is that they can more accurately reflect what the project displaces and reduce free rider credits. A project-specific approach promises more accuracy in “getting the reductions right”, but has higher costs. Overall, these case studies show that it is important to fully evaluate the variety of potential baselines in order to make informed decisions regarding which plants to include in the baseline, what type of baseline to use (sector-wide, all-fossil, fuel-specific), and what level of stringency to use. The case studies presented in this paper represent an initial effort to develop and test the concept of multi-project baselines. Further research is required to fully understand the ramifications of the various choices in constructing and using these baselines. As such, we provide the following list of recommendations for additional research:
Establishing criteria to determine which plants (or more specifically which kilns in the case of cement and which units in the case of power stations with units that differ significantly from one another) are used for establishing multi-project baselines.
Comparing the use of recently-built to near-future baselines for specific proposed projects in a country.
Evaluating non-energy-related cement projects that address reducing process CO2 emissions.
Improving data quality, e.g. actual coal consumption per power unit in the power stations rather than average consumption reported.
Considering different types of power stations being displaced, e.g. base-load and peak-load.
Using the plant-specific calorific value and carbon content of the fuels. Introducing some dynamics over time to the static analysis presented here. Calculating baselines for privately-owned and publicly-owned plants separately since the
latter may be financially subsidized in some manner by the government. Analyzing the impact of matching projects with the load profile that they would displace. Analyzing the impact of using differentiated baselines where, for example, small-scale
renewable and energy efficiency projects are automatically accepted and their savings are calculated against a sector-wide baseline in contrast to new fossil fuel projects which would be expected to meet a more stringent baseline (e.g. 10th percentile).
Extending the analyses to larger geographical area (e.g. extend the South African analysis to the Southern African Development Community).
Making more detailed comparison of multi-project against project-specific baseline, applied to specific projects, which may require additional project-specific studies.
Determining the cost and amount of time required for constructing multi-project baselines
Reducing the amount of subjectivity in constructing multi-project baselines.

28
Acknowledgments
This work was supported by the U.S. Environmental Protection Agency Office of Air and Radiation / Office of Atmospheric Programs through the U.S. Department of Energy under Contract No. DE-AC03-76SF00098. The authors would like to thank Ed Vine (LBNL) for his constructive comments on the paper, Amol Phadke (LBNL) for his review of the India case study, and Jane Ellis (OECD) for her thoughtful comments on the Brazilian case study.
References
Asamoah, Joe, 2000. Darling demonstrates the power of wind, African Energy Journal, vol 2 no 4., pp. 32-35 Ellis, J. and Bosi, M., 1999. Options for Project Emissions Baselines. OECD and IEA Information Paper. Paris: Organization for Economic Co-operation and Development and International Energy Agency. Ellis, J., 2000. An Initial View on Methodologies for Emission Baselines: Cement Case Study. OECD and IEA Information Paper. Paris: Organization for Economic Co-operation and Development. Eskom, 1996. Statistical Yearbook, Electricity Supply Commission. Sandton, South Africa: Eskom. Eskom, 1998a. Annual Report 1998. Sandton, South Africa: Eskom. Eskom, 1998b. IEP6: Integrated Electricity Plan for the Period 1997 – 2016. Sandton, South Africa: Eskom. Eskom 1999. Environmental Report 1999. Sandton, South Africa: Eskom. Eskom, 2000. Efficient Lighting Initiative. Sandton, South Africa: Eskom. Fridley, D., Sinton, J., Lehman, B., Lewis, J., Zhou, F., Li, J., Lin, J., 2001. China Energy Databook. Version 5.0. Berkeley, CA: Lawrence Berkeley National Laboratory. Hendriks,C.A., Worrell, E., Price, L., Martin, N., Ozawa Meida, L. 1999. Greenhouse Gases from Cement Production. IEA Greenhouse Gas R&D Programme. Report #PH3/7. Utrecht, The Netherlands: Ecofys. Howells, Mark, 1999. Baseline and Greenhouse Gas Mitigation Options for Bulk Energy Supply, South African Country Study on Climate Change, Draft, Energy Research Institute, University of Cape Town. International Energy Agency, 1998. World Energy Outlook – 1998 Update. Paris: IEA/OECD. Karottki, Rene, and Doug Banks, 2000. Power and profit? Electrifying rural South Africa, Renewable Energy World Jan 2000, pp. 51-59.

29
Lazarus, M., Kartha, S., Ruth, M., Bernow, S., and Dunmire, C., 1999. Evaluation of Benchmarking as an Approach for Establishing Clean Development Mechanism Baselines, Boston: Tellus Institute. Meyers, Steve, 2000. Determining Baselines and Additionality for the Clean Development Mechanism: Are Simplified Methods Viable? Forthcoming, Lawrence Berkeley National Laboratory. MME (Ministério de Minas e Energia), 2000. Balanço Energético Nacional 1999, Brasília, Brazil:MME. NER (National Electricity Regulator), 1999. Electricity Supply Statistics for South Africa 1999. Johannesburg: NER. Parkinson, S., Begg, K., Bailey, P., and Jackson, T., 2001. “Accounting for Flexibility Against Uncertain Baselines: Lessons from Case Studies in the Easter European Energy Sector,” Climate Policy 1(2001): 55-73. Price, L., Michaelis, L., Worrell, E., and Khrushch, M., 1998. “Sectoral Trends and Driving Forces of Global Energy Use and Greenhouse Gas Emissions,” Mitigation and Adaptation Strategies for Global Change 3: 263-319. Price, L., Worrell, E., and Khrushch, M., 1999. Sector Trends and Driving Forces of Global Energy Use and Greenhouse Gas Emissions: Focus on Industry and Buildings. LBNL-43746. Berkeley, CA: Lawrence Berkeley National Laboratory. Qase, Nomawethu, 2000. Too little too late: Understanding rural community reactions to Solar Home Systems in South Africa, conference paper presented East African Power Industry Convention, Kampala, 16-19 October 2000. Roggen, Wouter, 2000. Personal communication, Athlone Power Station Manager. Roy, J. and Das, S., 2001. Potential Multi-project Baselines for Power Sector in the Eastern Region of India. Ruth, M., Worrell, E., and Price, L., 2000. Evaluating Clean Development Mechanism Projects in the Cement Industry Using a Process-Step Benchmarking Approach. LBNL-45346. Berkeley, CA: Lawrence Berkeley National Laboratory. SANEA, 1998. South Africa Energy Profile. Sandton, South Africa: South African National Energy Association. Schaeffer, R. and Costa, M. M., 2001. The Impact of Multi-project Baselines on CDM Projects in the Cement Industry in Brazil. SNIC, 1996. Sindicato Nacional da Indústria do Cimento. SNIC, Rio de Janeiro, Brazil. SNIC, 1999. Sindicato Nacional da Indústria do Cimento. SNIC, Rio de Janeiro, Brazil. U.S. Energy Information Administration, 1999. India: Environmental Issues. November. http://www.eia.doe.gov/emeu/cabs/indiaenv.html

30
Wang, Y., 2001. Multi-Project Baselines for CDM Projects: Case Study for the Cement Industry in China. Winkler, H., Spalding-Fecher, R., Afrane-Okese, Y., and Davidson, O., 2000. Potential Multi-project Baselines in the Power Sector in South Africa. Cape Town, SA: University of Cape Town, Energy & Development Research Centre. World Bank Prototype Carbon Fund, 2000. Learning from the Implementation of the Prototype Carbon Fund. Washington, DC: World Bank. Ybema, J R, Cloin, J, Nieuwenhout, F D J, Hunt, A C & Kaufman, S L 2000. Towards a streamlined CDM process for Solar Home Systems: Case studies in selected countries. Petten, Netherlands, ECN.