multi-omics approach to study the growth efficiency and amino acid metabolism in lactococcus lactis...
TRANSCRIPT
RESEARCH Open Access
Multi-omics approach to study the growthefficiency and amino acid metabolism inLactococcus lactis at various specific growth ratesPetri-Jaan Lahtvee1,2, Kaarel Adamberg2,3, Liisa Arike2,3, Ranno Nahku1,2, Kadri Aller1,2, Raivo Vilu1,2*
Abstract
Background: Lactococcus lactis is recognised as a safe (GRAS) microorganism and has hence gained interest innumerous biotechnological approaches. As it is fastidious for several amino acids, optimization of processes whichinvolve this organism requires a thorough understanding of its metabolic regulations during multisubstrate growth.
Results: Using glucose limited continuous cultivations, specific growth rate dependent metabolism of L. lactisincluding utilization of amino acids was studied based on extracellular metabolome, global transcriptome andproteome analysis. A new growth medium was designed with reduced amino acid concentrations to increaseprecision of measurements of consumption of amino acids. Consumption patterns were calculated for all 20 aminoacids and measured carbon balance showed good fit of the data at all growth rates studied. It was observed thatmetabolism of L. lactis became more efficient with rising specific growth rate in the range 0.10 - 0.60 h-1, indicatedby 30% increase in biomass yield based on glucose consumption, 50% increase in efficiency of nitrogen use forbiomass synthesis, and 40% reduction in energy spilling. The latter was realized by decrease in the overall productformation and higher efficiency of incorporation of amino acids into biomass. L. lactis global transcriptome andproteome profiles showed good correlation supporting the general idea of transcription level control of bacterialmetabolism, but the data indicated that substrate transport systems together with lower part of glycolysis in L.lactis were presumably under allosteric control.
Conclusions: The current study demonstrates advantages of the usage of strictly controlled continuous cultivationmethods combined with multi-omics approach for quantitative understanding of amino acid and energymetabolism of L. lactis which is a valuable new knowledge for development of balanced growth media, genemanipulations for desired product formation etc. Moreover, collected dataset is an excellent input for developingmetabolic models.
BackgroundLactococcus (L.) lactis is the most intensively studiedlactic acid bacterium and it has a great industrial impor-tance. In addition to its wide usage in the dairy industry,L. lactis subsp. lactis IL1403 was the first lactic acidbacterium whose genome was sequenced [1], and it isextensively used for production of different metabolicproducts and recombinant proteins [reviews in [2-4]].As this bacterium is generally recognised as safe(GRAS), there has been increasing interest in its use as
a live vector for mucosal delivery of therapeutic pro-teins, including nasal and gastrointestinal vaccines [5,6].However, there exists a remarkable lack of knowledgeabout the peculiarities of L. lactis metabolic regulation,especially regarding amino acid metabolism. There areseveral defined media designed for L. lactis [7-9], how-ever, these are unbalanced and concentrations of indivi-dual amino acids are quite high, making theirconsumption measurements inaccurate as utilization bythe cells is small compared to the total content. Lack ofreliable information on consumption patterns and regu-lation of amino acid metabolism hinders design ofcheaper balanced complex media and optimization ofbioprocesses.
* Correspondence: [email protected] University of Technology, Department of Chemistry, Akadeemia tee15, 12618 Tallinn, EstoniaFull list of author information is available at the end of the article
Lahtvee et al. Microbial Cell Factories 2011, 10:12http://www.microbialcellfactories.com/content/10/1/12
© 2011 Lahtvee et al; licensee BioMed Central Ltd. This is an Open Access article distributed under the terms of the Creative CommonsAttribution License (http://creativecommons.org/licenses/by/2.0), which permits unrestricted use, distribution, and reproduction inany medium, provided the original work is properly cited.

Systems biology approaches where ‘omics’ methodsare combined with advanced cultivation methods, com-putational and mathematical models form a solid plat-form for elucidating quantitative peculiarities ofmetabolism and its regulation in microorganisms. Tran-scriptome and proteome expression in L. lactis havebeen measured and compared several times in variousphases of batch cultivations [10,11]. A multi-omicsstudy where L. lactis was cultivated at steady state con-ditions was carried out by Dressaire et al. [12,13]. Theycharacterized L. lactis at the transcriptome level in iso-leucine limited chemostat cultures, calculated translationefficiencies based on proteome and transcriptome levels,and showed that energy costs associated with proteinturnover in cells are bigger at low growth rates in com-parison with higher ones.To provide more comprehensive knowledge about
amino acid metabolism in L. lactis we developed a newmedium, which allowed studying quantitative patternsof amino acid consumption. To further link amino acidmetabolism with the overall physiological state of cells,growth rate dependent trancriptomes, proteomes andextracellular metabolomes were measured and studiedtogether with carbon, nitrogen and ATP, redox balanceanalyses. L. lactis was cultivated in accelerostat (A-stat)continuous cultures as this method allows acquisition ofvast amount of data on quasi steady state growing cellsand precise determination of growth characteristics,especially investigation of dependences of growth char-acteristics on residual concentrations of growth limitingsubstrate (e.g. glucose) which determines the specificgrowth rate of cells (μ).
ResultsL. lactis growth characteristicsL. lactis was cultivated in A-stat culture where afterstabilisation in chemostat at dilution rate 0.10 h-1, speci-fic growth rate (μ) was smoothly increased until themaximal μ (μmax) was reached at 0.59 ± 0.02 h-1 (aver-age value of five independent experiments ± standarddeviation; Figure 1). To obtain higher precision in thedetermination of amino acid consumption patterns, con-centrations of most amino acids in the growth mediumwere reduced ca 3 times compared to the chemicallydefined medium (CDM) [14], exceptions being arginineand glutamine, whose concentrations were increased inthe medium to avoid amino group shortage during thegrowth (see Methods). The residual glucose concentra-tion remained below detection limit (<0.1 mM) betweenμ 0.10 h-1 and 0.59 ± 0.02 h-1 in all five independentexperiments. It is important to note that constant pro-tein content (45 ± 2% of cell dry weight) and constantamino acid composition of the protein fraction wasobserved in the full range of μ from 0.10 to 0.55 h-1
(Additional file 1, Table S1). RNA content increasedfrom 6.5 ± 1.0% to 9.5 ± 1.5% in cell dry weight inbetween the latter μ values. The biomass yield perconsumed carbon (YXC) increased from 0.13 ± 0.00 to0.17 ± 0.01 C-molbiomass C-molcarbon
-1 when μ wasraised from 0.20 ± 0.02 h-1 to 0.52 ± 0.04 h-1 (Addi-tional file 2, Table S1). It was realized by decrease ofby-product formation per biomass from 89.6 to 62.3mmol gdw-1 (sum of Ylact, Yace and Yeth, Additional file2, Table S1). Corresponding yield of these by-products(lactate, acetate, ethanol) per consumed glucosedecreased from 2.05 to 1.88 molproducts molglc
-1, withlactate yield per consumed glucose Ylg = 1.83 ± 0.03mollact molglc
-1 remaining constant. As by-product for-mation exceeded maximal possible yield (2 mol mol-1)per consumed glucose at growth rates below 0.4 h-1
(Additional file 1, Table S2) it indicated that part of theamino acids should have been catabolised to pyruvateand eventually to by-products. The overall consumptionof amino acids decreased from 12.5 ± 0.5 mmol gdw-1
to 9.3 ± 0.3 mmol gdw-1 with increasing μ (Additionalfile 2, Figure S1), exceeding two to three times thatrequired for synthesis of proteins in biomass (4.2 ± 0.1mmol gdw-1, Additional file 1, Table S1), and constitut-ing always 21 ± 1% (52 to 39 C-mmol gdw-1) of all thetotal carbon utilised by cells throughout the μ rangestudied.For proof of principle, a chemostat experiment was
carried out at a dilution rate of 0.45 h-1 and the dataobtained were compared with the data obtained at thesame μ value in A-stat experiments. The measured sub-strate and product yields in chemostat culture hadvalues in the range of presented standard deviations forA-stat data (Additional file 2, Table S2) which shows
Figure 1 Typical A-stat cultivation, where dilution ratedependent metabolism of L. lactis is illustrated. D - dilution rate(h-1); X - biomass concentration (g (dry cellular weight) L-1); μ -specific growth rate (h-1); lact, form, glc, eth, ace - lactate, formate,glucose, ethanol, acetate concentration in bioreactor, respectively(mM). D, μ and X are monitored constantly; metaboliteconcentrations are measured with a frequency of approximately0.01 h-1.
Lahtvee et al. Microbial Cell Factories 2011, 10:12http://www.microbialcellfactories.com/content/10/1/12
Page 2 of 12
that quasi steady state data from A-stat is comparable tochemostat.
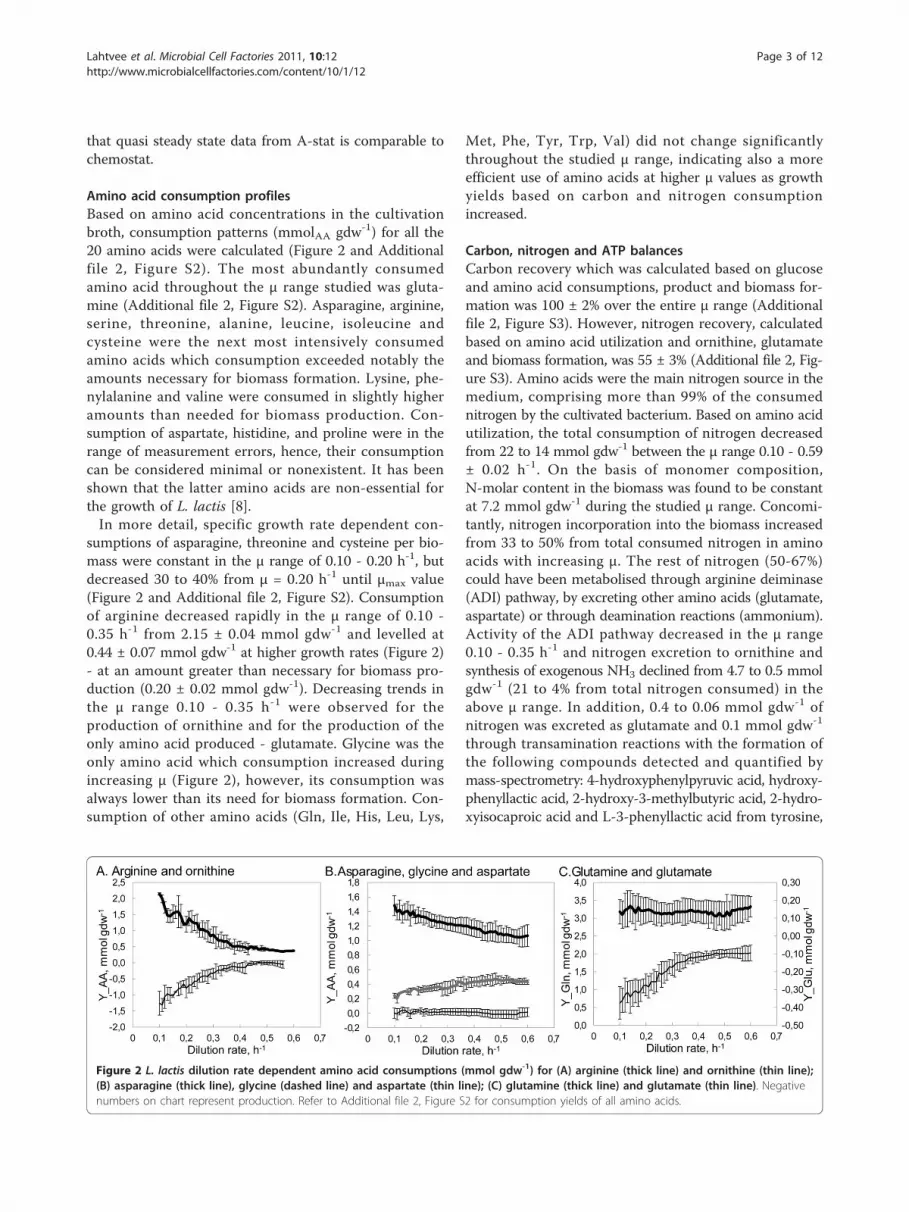
Amino acid consumption profilesBased on amino acid concentrations in the cultivationbroth, consumption patterns (mmolAA gdw-1) for all the20 amino acids were calculated (Figure 2 and Additionalfile 2, Figure S2). The most abundantly consumedamino acid throughout the μ range studied was gluta-mine (Additional file 2, Figure S2). Asparagine, arginine,serine, threonine, alanine, leucine, isoleucine andcysteine were the next most intensively consumedamino acids which consumption exceeded notably theamounts necessary for biomass formation. Lysine, phe-nylalanine and valine were consumed in slightly higheramounts than needed for biomass production. Con-sumption of aspartate, histidine, and proline were in therange of measurement errors, hence, their consumptioncan be considered minimal or nonexistent. It has beenshown that the latter amino acids are non-essential forthe growth of L. lactis [8].In more detail, specific growth rate dependent con-
sumptions of asparagine, threonine and cysteine per bio-mass were constant in the μ range of 0.10 - 0.20 h-1, butdecreased 30 to 40% from μ = 0.20 h-1 until μmax value(Figure 2 and Additional file 2, Figure S2). Consumptionof arginine decreased rapidly in the μ range of 0.10 -0.35 h-1 from 2.15 ± 0.04 mmol gdw-1 and levelled at0.44 ± 0.07 mmol gdw-1 at higher growth rates (Figure 2)- at an amount greater than necessary for biomass pro-duction (0.20 ± 0.02 mmol gdw-1). Decreasing trends inthe μ range 0.10 - 0.35 h-1 were observed for theproduction of ornithine and for the production of theonly amino acid produced - glutamate. Glycine was theonly amino acid which consumption increased duringincreasing μ (Figure 2), however, its consumption wasalways lower than its need for biomass formation. Con-sumption of other amino acids (Gln, Ile, His, Leu, Lys,
Met, Phe, Tyr, Trp, Val) did not change significantlythroughout the studied μ range, indicating also a moreefficient use of amino acids at higher μ values as growthyields based on carbon and nitrogen consumptionincreased.
Carbon, nitrogen and ATP balancesCarbon recovery which was calculated based on glucoseand amino acid consumptions, product and biomass for-mation was 100 ± 2% over the entire μ range (Additionalfile 2, Figure S3). However, nitrogen recovery, calculatedbased on amino acid utilization and ornithine, glutamateand biomass formation, was 55 ± 3% (Additional file 2, Fig-ure S3). Amino acids were the main nitrogen source in themedium, comprising more than 99% of the consumednitrogen by the cultivated bacterium. Based on amino acidutilization, the total consumption of nitrogen decreasedfrom 22 to 14 mmol gdw-1 between the μ range 0.10 - 0.59± 0.02 h-1. On the basis of monomer composition,N-molar content in the biomass was found to be constantat 7.2 mmol gdw-1 during the studied μ range. Concomi-tantly, nitrogen incorporation into the biomass increasedfrom 33 to 50% from total consumed nitrogen in aminoacids with increasing μ. The rest of nitrogen (50-67%)could have been metabolised through arginine deiminase(ADI) pathway, by excreting other amino acids (glutamate,aspartate) or through deamination reactions (ammonium).Activity of the ADI pathway decreased in the μ range0.10 - 0.35 h-1 and nitrogen excretion to ornithine andsynthesis of exogenous NH3 declined from 4.7 to 0.5 mmolgdw-1 (21 to 4% from total nitrogen consumed) in theabove μ range. In addition, 0.4 to 0.06 mmol gdw-1 ofnitrogen was excreted as glutamate and 0.1 mmol gdw-1
through transamination reactions with the formation ofthe following compounds detected and quantified bymass-spectrometry: 4-hydroxyphenylpyruvic acid, hydroxy-phenyllactic acid, 2-hydroxy-3-methylbutyric acid, 2-hydro-xyisocaproic acid and L-3-phenyllactic acid from tyrosine,
Figure 2 L. lactis dilution rate dependent amino acid consumptions (mmol gdw-1) for (A) arginine (thick line) and ornithine (thin line);(B) asparagine (thick line), glycine (dashed line) and aspartate (thin line); (C) glutamine (thick line) and glutamate (thin line). Negativenumbers on chart represent production. Refer to Additional file 2, Figure S2 for consumption yields of all amino acids.
Lahtvee et al. Microbial Cell Factories 2011, 10:12http://www.microbialcellfactories.com/content/10/1/12
Page 3 of 12
phenylalanine or branched chain amino acids (data notshown). The left-over of consumed nitrogen was 9.5 - 6.6mmol gdw-1 (contributing 44 - 48% from total nitrogen)in the μ range of 0.1 - 0.6 h-1. This nitrogen must havebeen excreted as NH3 if the excess of consumed aminoacids not incorporated into protein fraction of biomasswould have been converted to pyruvate. The latterassumption is supported by the fact that the carbon wasfully recovered during the growth. Reduction of carbonand nitrogen wasting led to the increase of the biomassyields based on carbon (including glucose and aminoacids) and nitrogen consumption 1.3 and 1.5 times,respectively (from 0.12 to 0.15 C-mol C-mol-1 and from0.33 to 0.50 N-mol N-mol-1), in parallel with the increaseof μ from 0.10 to 0.59 ± 0.02 h-1.Based on biomass monomer composition and the stoi-
chiometry of ATP, NAD(P)H and central metabolites formonomer production, μ dependent ATP and NAD(P)Hbalance calculations were carried out (Additional file 1,Tables S3-S5). Calculations indicated that more ATP wasproduced than necessary for biomass formation. Presum-ably the ATP synthesized in excess was wasted in futilecycles. Calculated energy spilling was constant at 60mmol ATP gdw-1 in the range of the μ 0.10 - 0.15 h-1
and decreased afterwards to 36 mmol gdw-1 at μmax, indi-cating that the metabolism was the most efficient nearμmax conditions (Additional file 1, Table S5). Similarlycalculated NAD(P)H misbalance (spilling) decreasedfrom 3.5 mmol gdw-1 at low growth rates to 0 mmolgdw-1 at specific growth rate >0.45 h-1 (Additional file 1,Table S5). However, latter improvement of balance isinside the range of errors of lactate measurements (aslactate dehydrogenase is the main NAD regenerationreaction in lactic acid bacteria). Therefore a conclusionthat redox balance was maintained throughout thestudied growth conditions should be drawn.
Transcriptome and proteome responseTranscriptomes and proteomes at four different quasisteady state μ values (0.17, 0.24, 0.44, 0.52 h-1) were com-pared to steady state μ = 0.10 h-1 (additional info in Meth-ods). Changes in gene and protein expression levels forthe most relevant reactions between μ 0.52 and 0.10 h-1
are illustrated on Figure 3 and 4; a full list of measuredgene and protein expression changes at various μ valuescan be found in Additional file 3. In this section we discusschanges of mRNA and protein expressions significant withP value ≤ 0.05 for μ 0.52 ± 0.03 h-1 vs. 0.10 h-1.Mannose uptake genes ptnAB, which are responsible
for glucose transport in L. lactis, and ptsI were up-regulated 2.1 to 4.3-fold at the transcriptome level athigher growth rates (above 0.44 h-1). However, corre-sponding enzymes did not show any remarkable changein the same growth rate range as measured in the
proteome. Transporter genes for additional sugars (notpresent in our medium) like galactose (by galE) and cel-lobiose (by ptcABC and yidB) were 1.8 to 2.9-folddown-regulated at higher specific growth rates at thetranscriptome level, whereas a 2.2- to 2.8-fold repressionof PtcAB was measured for proteome. This down-regu-lation is known to be the consequence of carbon catabo-lite repression which is extensively studied also in otherbacteria like E. coli and B. subtilis [15,16].Expression in the upper part of glycolysis did not
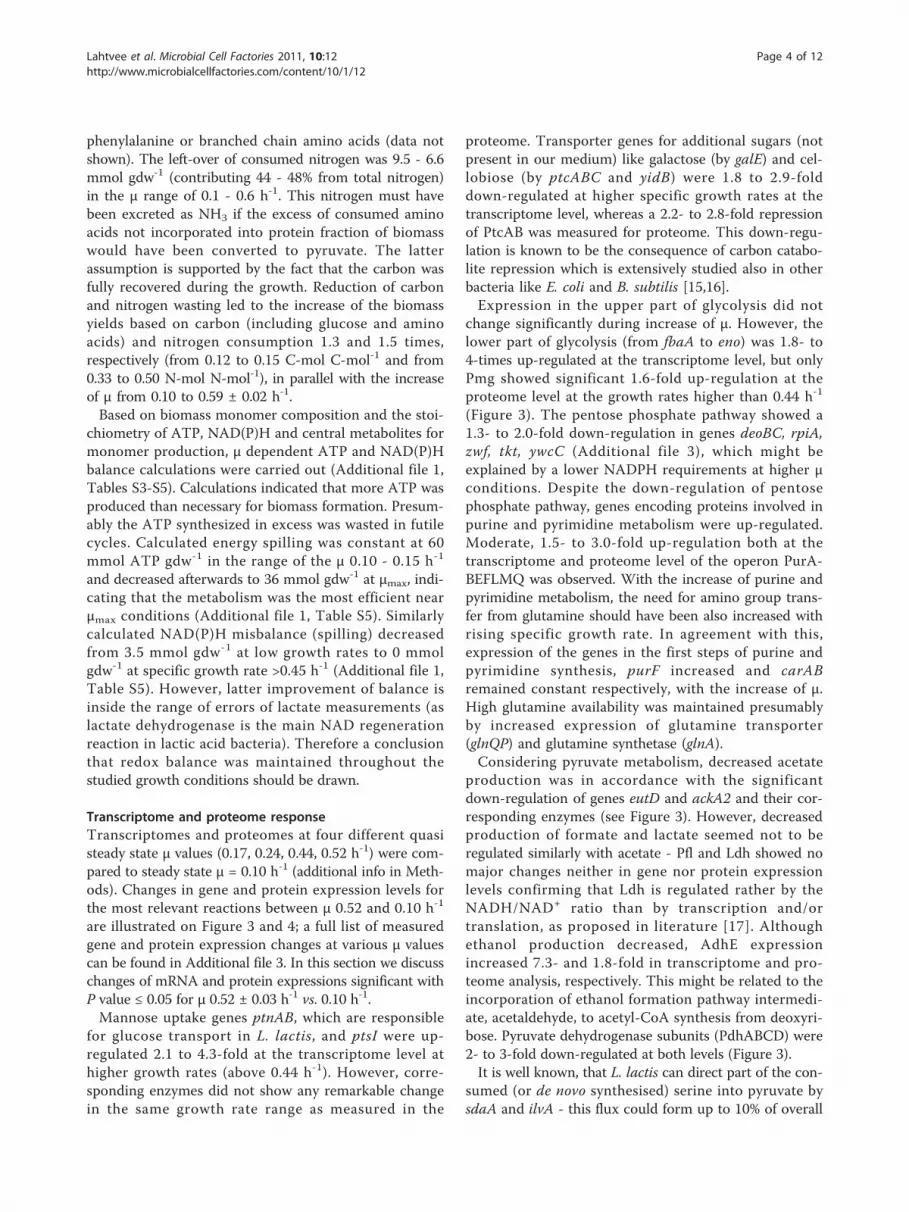
change significantly during increase of μ. However, thelower part of glycolysis (from fbaA to eno) was 1.8- to4-times up-regulated at the transcriptome level, but onlyPmg showed significant 1.6-fold up-regulation at theproteome level at the growth rates higher than 0.44 h-1
(Figure 3). The pentose phosphate pathway showed a1.3- to 2.0-fold down-regulation in genes deoBC, rpiA,zwf, tkt, ywcC (Additional file 3), which might beexplained by a lower NADPH requirements at higher μconditions. Despite the down-regulation of pentosephosphate pathway, genes encoding proteins involved inpurine and pyrimidine metabolism were up-regulated.Moderate, 1.5- to 3.0-fold up-regulation both at thetranscriptome and proteome level of the operon PurA-BEFLMQ was observed. With the increase of purine andpyrimidine metabolism, the need for amino group trans-fer from glutamine should have been also increased withrising specific growth rate. In agreement with this,expression of the genes in the first steps of purine andpyrimidine synthesis, purF increased and carABremained constant respectively, with the increase of μ.High glutamine availability was maintained presumablyby increased expression of glutamine transporter(glnQP) and glutamine synthetase (glnA).Considering pyruvate metabolism, decreased acetate
production was in accordance with the significantdown-regulation of genes eutD and ackA2 and their cor-responding enzymes (see Figure 3). However, decreasedproduction of formate and lactate seemed not to beregulated similarly with acetate - Pfl and Ldh showed nomajor changes neither in gene nor protein expressionlevels confirming that Ldh is regulated rather by theNADH/NAD+ ratio than by transcription and/ortranslation, as proposed in literature [17]. Althoughethanol production decreased, AdhE expressionincreased 7.3- and 1.8-fold in transcriptome and pro-teome analysis, respectively. This might be related to theincorporation of ethanol formation pathway intermedi-ate, acetaldehyde, to acetyl-CoA synthesis from deoxyri-bose. Pyruvate dehydrogenase subunits (PdhABCD) were2- to 3-fold down-regulated at both levels (Figure 3).It is well known, that L. lactis can direct part of the con-
sumed (or de novo synthesised) serine into pyruvate bysdaA and ilvA - this flux could form up to 10% of overall
Lahtvee et al. Microbial Cell Factories 2011, 10:12http://www.microbialcellfactories.com/content/10/1/12
Page 4 of 12
pyruvate flux [18]. In the current study, these noted geneswere 1.4- to 2.2-fold up-regulated comparing μ = 0.50 toμ = 0.10 h-1. In concordance with the sharp decrease ofarginine consumption from μ 0.10 h-1 up to μ 0.35 h-1, the2.3- to 4.5-fold decrease in protein expression of ArcAB,which converts arginine to ornithine, was observed duringthe increase of μ (Figure 4).
DiscussionCarbon balance and growth efficiencyGrowth conditions have a strong influence on specificgrowth rate (μ), macromolecular composition of biomass
(i.e. ribosomal content) and cell size of microorganisms[18,19]. In this study, a gradual change to more efficientcarbon metabolism with the increase of μ was observedfor L. lactis (Figure 1). The first shift in L. lactis metabo-lism took place at μ 0.20 ± 0.02 h-1, when biomass yield(YXC) per consumed carbon started to increase. Thirtypercent increase with the increase of μ from 0.10 to 0.60h-1 was achieved by reduction of fermentation by-productssynthesis (acetate, formate, ethanol). Concomitantly to theincrease of biomass yield, calculated ATP balance showeddecreased energy spilling. It has been postulated thathigher energy spilling at lower μ conditions could be
Figure 3 Overview of central carbon metabolism in L. lactis at various specific growth rates (μ). Black and capitalised metabolites weremeasured extracellular. Measured metabolites in boxes/ellipses were consumed/produced, respectively. Red/green/white background representsdecrease/increase/no change, respectively, in metabolite consumption or production with increasing μ. Red arrows indicate decrease, greenarrows increase and black arrows no significant change in transcriptome and proteome expressions when μ 0.5 h-1 is compared with μ 0.1 h-1.Orange arrows represent increase only at transcriptome level with increasing μ. Arrowheads indicate the assumed reaction directions. Morespecific protein expression fold changes are illustrated on chart.
Lahtvee et al. Microbial Cell Factories 2011, 10:12http://www.microbialcellfactories.com/content/10/1/12
Page 5 of 12
caused by greater costs of turnover of macromolecules andsensory molecules, establishment of ion gradients acrossthe cell membrane etc [20]. Dressaire et al. [12] calculatedthe degradation rates for proteins and found that proteinmedian half-lives were ca 10-fold shorter at μ = 0.10 h-1
than at μmax. As ATP is consumed during protein degra-dation [21] this non-growth related expenditure mightform a higher proportion of the total energy synthesized atlower μ conditions than at higher growth rates.
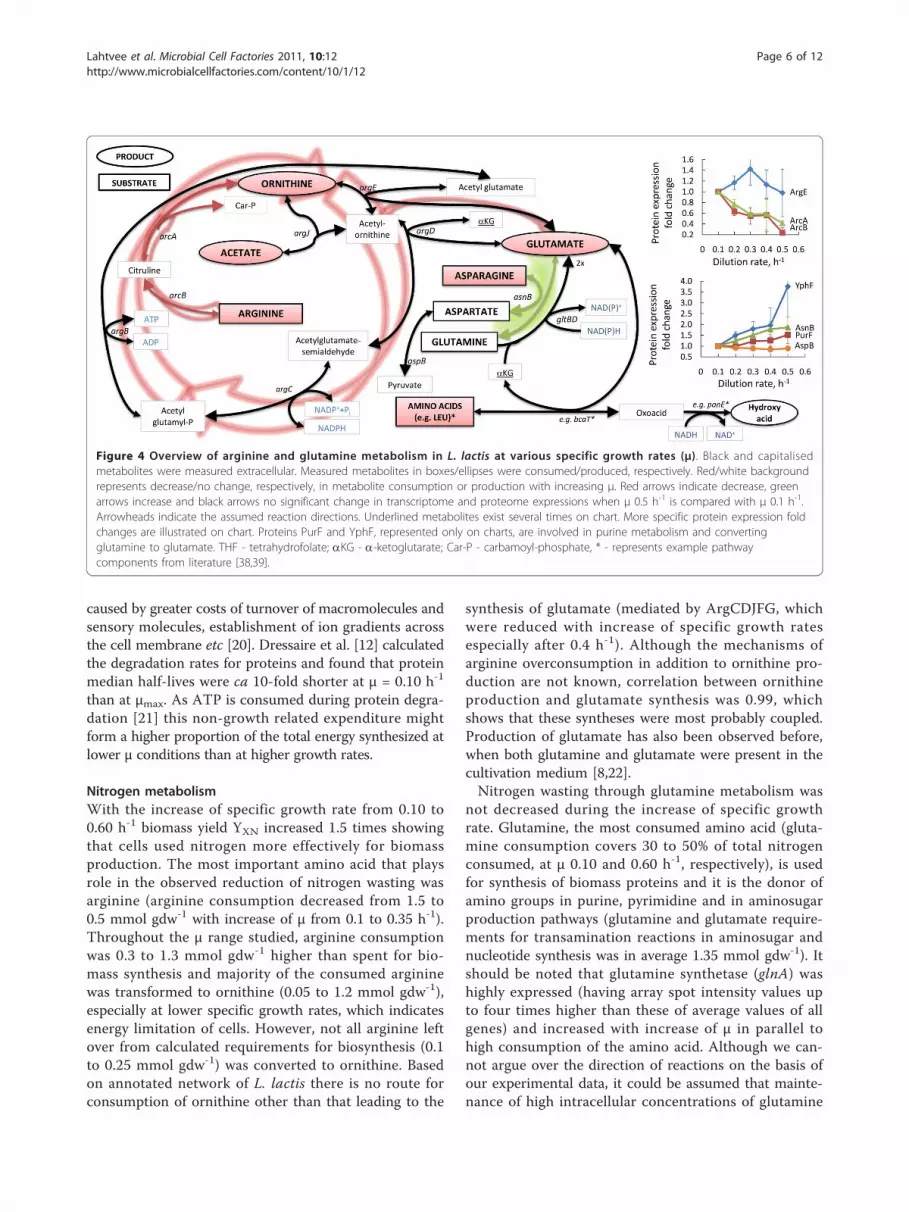
Nitrogen metabolismWith the increase of specific growth rate from 0.10 to0.60 h-1 biomass yield YXN increased 1.5 times showingthat cells used nitrogen more effectively for biomassproduction. The most important amino acid that playsrole in the observed reduction of nitrogen wasting wasarginine (arginine consumption decreased from 1.5 to0.5 mmol gdw-1 with increase of μ from 0.1 to 0.35 h-1).Throughout the μ range studied, arginine consumptionwas 0.3 to 1.3 mmol gdw-1 higher than spent for bio-mass synthesis and majority of the consumed argininewas transformed to ornithine (0.05 to 1.2 mmol gdw-1),especially at lower specific growth rates, which indicatesenergy limitation of cells. However, not all arginine leftover from calculated requirements for biosynthesis (0.1to 0.25 mmol gdw-1) was converted to ornithine. Basedon annotated network of L. lactis there is no route forconsumption of ornithine other than that leading to the
synthesis of glutamate (mediated by ArgCDJFG, whichwere reduced with increase of specific growth ratesespecially after 0.4 h-1). Although the mechanisms ofarginine overconsumption in addition to ornithine pro-duction are not known, correlation between ornithineproduction and glutamate synthesis was 0.99, whichshows that these syntheses were most probably coupled.Production of glutamate has also been observed before,when both glutamine and glutamate were present in thecultivation medium [8,22].Nitrogen wasting through glutamine metabolism was
not decreased during the increase of specific growthrate. Glutamine, the most consumed amino acid (gluta-mine consumption covers 30 to 50% of total nitrogenconsumed, at μ 0.10 and 0.60 h-1, respectively), is usedfor synthesis of biomass proteins and it is the donor ofamino groups in purine, pyrimidine and in aminosugarproduction pathways (glutamine and glutamate require-ments for transamination reactions in aminosugar andnucleotide synthesis was in average 1.35 mmol gdw-1). Itshould be noted that glutamine synthetase (glnA) washighly expressed (having array spot intensity values upto four times higher than these of average values of allgenes) and increased with increase of μ in parallel tohigh consumption of the amino acid. Although we can-not argue over the direction of reactions on the basis ofour experimental data, it could be assumed that mainte-nance of high intracellular concentrations of glutamine
Figure 4 Overview of arginine and glutamine metabolism in L. lactis at various specific growth rates (μ). Black and capitalisedmetabolites were measured extracellular. Measured metabolites in boxes/ellipses were consumed/produced, respectively. Red/white backgroundrepresents decrease/no change, respectively, in metabolite consumption or production with increasing μ. Red arrows indicate decrease, greenarrows increase and black arrows no significant change in transcriptome and proteome expressions when μ 0.5 h-1 is compared with μ 0.1 h-1.Arrowheads indicate the assumed reaction directions. Underlined metabolites exist several times on chart. More specific protein expression foldchanges are illustrated on chart. Proteins PurF and YphF, represented only on charts, are involved in purine metabolism and convertingglutamine to glutamate. THF - tetrahydrofolate; aKG - a-ketoglutarate; Car-P - carbamoyl-phosphate, * - represents example pathwaycomponents from literature [38,39].
Lahtvee et al. Microbial Cell Factories 2011, 10:12http://www.microbialcellfactories.com/content/10/1/12
Page 6 of 12

in the cells in the result of intense synthesis and con-sumption flows might be necessary to keep the transferof amino group effective.The third biggest part of nitrogen wasting could be
associated with the consumption of asparagine, whichwas reduced from 1.4 to 1.1 mmol gdw-1 with increaseof μ from 0.10 to 0.60 h-1. Asparagine and aspartate(which was not consumed and therefore should havebeen produced from asparagine) are required for synth-eses of nucleotides (in average 0.35 mmol gdw-1) andproteins (in average 0.4 mmol gdw-1). It was shown that0.35 to 0.65 mmol gdw-1 of asparagine was not used forbiosynthesis. Asparagine can be metabolised throughasparaginase (ansB) - however its expression was in therange of threshold values in the mRNA array and corre-sponding protein was not detected. Instead of that thehigh expression (array spot intensity values up to seventimes higher than these of average values of all genes) ofasparagine synthetase (asnB), which expression evenincreased with increase of specific growth rate wasobserved. Similarly to glutamine it could be assumedthat overconsumption of asparagine and high expressionof the relevant synthesis genes might be necessary tokeep the transfer of amino group effective. Energeticallytransport of asparagine in L. lactis is much more effi-cient than aspartate [23], moreover, asparagine is prob-ably preferentially directed towards the production ofaspartate [24,25]. Surplus of aspartate in its turn can bedirected into pyruvate by AspB (Figure 4).The role of other amino acids (other than glutamine,
arginine and aspartate) in nitrogen wasting can be con-sidered minimal as over-consumptions (amounts greaterthan necessary for biomass production) of these aminoacids were below 0.2 mmol gdw-1 (cysteine, serine,threonine) or 0.1 mmol gdw-1 (all other not mentionedabove).
Omics comparisonGood correlation with a Pearson coefficient up to 0.69was observed between 600 measured protein and geneexpression data (Figure 5). An interesting phenomenonwas seen at μ values 0.52 ± 0.03 h-1 and 0.42 ± 0.02 h-1
compared to 0.10 h-1: a large amount of genes up-regulated at the transcriptome level showed only smallor no change at the proteome level (Figure 5). The vastmajority of members in this group were related toribosomal subunits (74% from all detected ribosomalproteins), as well as lower glycolysis (FbaA, GapB, Pgk,Eno) and amino acid or peptide transport (BusAB,GlnPQ, GltPS, OptCD, PepCPX, PtnABD, PtsHI).Up-regulation at the transcriptome level and no signifi-cant change at proteome level during anaerobic growthof L. lactis in lower part of glycolysis have also beennoticed before [11,12]. Despite the relatively good
Figure 5 L. lactis transcriptome and proteome correlation atvarious specific growth rates. “R” value on chart representsPearson coefficient. Six hundred proteins, with a standard deviationless than 30% and their corresponding genes are indicated on agraph.
Lahtvee et al. Microbial Cell Factories 2011, 10:12http://www.microbialcellfactories.com/content/10/1/12
Page 7 of 12
correlation between the transcriptomic and proteomicdata, several important regulations were observed onlyat trancriptome level. The data obtained indicatedimportance of taking into account the possibility ofallosteric regulation, and carrying out measurements offluxome in addition to transcriptome and proteome tofully characterize regulation of metabolic pathways.By scanning the entire range of specific growth rates
using A-stat experiments, it is possible to continuouslymonitor the steady state metabolism using on-line sen-sors or frequently collected samples for at-line analyses.Reproducibility of growth characteristics in A-stat werecompared with chemostat at μ 0.45 h-1. All measuredsubstrate consumption and product formation yields(including amino acids) remained within mentionedstandard deviation ranges indicating the accordance ofquasi steady state and steady state data (Additional file2, Table S2). Recently, similar comparisons at the globaltranscriptome level were conducted with E. coli achiev-ing very good correlation with a Pearson coefficientup to 0.96 [26]. In both studies, it was shown that theA-stat cultivation technique allows precise monitoringthe sequence of metabolic switch points.
ConclusionsDistinct ratios of glucose and amino acids in the growthmedia are very important for biomass yield optimizationas carbon and nitrogen metabolism are tightly coupledin L. lactis. High biomass yields are crucial for produ-cing vaccines using microorganisms and nutrient limita-tions can strongly affect achieving the desired results.As was shown in this study, some amino acids wereconsumed in large amounts (glutamine, asparagine, argi-nine) and more efficient growth might not be achievedby insufficient supply of these compounds. There havebeen several attempts to optimize the media for lacto-cocci using a single omission technique [7,8], however, asystematic approach taking into account that amino acidrequirements depend on environmental conditions (e.g.at various μ values) has not yet been fully realized as itis difficult using only batch cultivation. The currentwork combining systematic continuous cultivationapproach with omics methods is therefore of high valuefor better media design, as well as for understandingprinciples of metabolism of the bacteria.Using steady state cultivation methods and a systems
biology approach for characterisation of L. lactis meta-bolism, it was possible to demonstrate a shift to moreefficient metabolism at higher growth rates by increasingthe biomass yield, change towards homolactic fermenta-tion, and decreasing the flux through alternative energygeneration pathways with lower efficiency than glycolysise.g. acetate formation and the ADI pathway.
This study demonstrates the necessity of using strictlycontrolled continuous cultivation methods in combina-tion with a multi-omics approach and element balancecalculations to gain quantitative understanding of theregulation of complex global metabolic networks, impor-tant for strain dependent media optimisation or thedesign of efficient producer cells. However, questionsabout rationale of 2-3 times over-consumption of aminoacids by cells and principles of properly balanced mediaremain to be answered in full in the future studies.
MethodsMicroorganism and mediumThe strain used throughout these experiments Lactococcuslactis subsp. lactis IL1403 was kindly provided by Dr. Ogierfrom INRA (Jouy-en-Josas, France). Inoculum was preparedusing a lyophilized stock culture stored at -80°C which waspre-grown twice on the cultivation medium. Chemicallydefined medium with a reduced amino acid concentrationswere developed especially for better detection of aminoacids. Media contained 70% GIBCO™ F-12 Nutrient Mix-ture (Invitrogen Corporation, Carlsbad, CA) and 30% modi-fied CDM (composition in [27]). This combination gave thebest trade-off for growth yield and maximal growth rate.Composition of the final medium was as follows (mg L-1):limiting substrate D-Glucose - 3500; L-Alanine - 78;L-Arginine - 185; L-Asparagine - 74; L-Aspartic acid - 72;L-Cysteine - 64; L-Glutamic acid - 70; L-Glutamine - 132;Glycine - 58; L-Histidine - 60; L-Isoleucine - 102;L-Leucine - 207; L-Lysine - 158; L-Methionine - 41;L-Phenylalanine - 86; L-Proline - 92; L-Serine - 163; L-Threonine - 76; L-Trypthophan - 16; L-Tyrosine - 29;L-Valine - 107; Biotin - 0.305; Choline chloride - 9.8;D-Pantothenate - 0.65; Folic Acid - 1.21; Niacinamide -0.325; Pyridoxine hydrochloride - 0.642; Riboflavin - 0.326;Thiamine hydrochloride - 0.51; Vitamin B12 - 0.98; i-Ino-sitol - 12.6; CaCl2 - 28; CuSO4 × 5H2O - 0.272; FeSO4 ×7H2O - 0.71; MgCl2 - 58; KCl - 157; NaCl - 5580; Na2PO4
- 99; ZnSO4 × 7H2O - 1; Hypoxanthine-Na - 3; LinoleicAcid - 0.1; Lipoic Acid - 0.1; Phenol Red - 0.8; Putrescine ×2HCl - 0.1; Na-Pyruvate - 77; Thymidine - 0.5.
A-stat cultivationsA-stat cultivations were carried out in a 1 L Biobundlebioreactor (Applikon, Schiedam, the Netherlands) con-trolled by an ADI1030 biocontroller (Applikon) and acultivation control program “BioXpert NT” (Applikon)(detailed description in [28], with an addition of anin situ OD sensor (model TruCell2; Finesse, San Jose,CA)). Cultivations were carried out under anaerobicconditions (N2-environment) with an agitation speed of300 rpm at 34°C and pH 6.4. Five parallel A-stat experi-ments were carried out where after a batch phase,
Lahtvee et al. Microbial Cell Factories 2011, 10:12http://www.microbialcellfactories.com/content/10/1/12
Page 8 of 12

constant dilution rate (D = 0.1 h-1) was initiated. Cul-ture was stabilised until constant optical density andtitration rate, pumping through at least 5 volumes ofmedium. After achieving steady state conditions, accel-eration of dilution rate (a = 0.01 h-2) was started. Addi-tionally, a steady state chemostat experiment wascarried out at a dilution rate of 0.45 h-1 and results werecompared with data collected from the A-stat experi-ment at the same dilution rate. Average yield and meta-bolic switch point values with their standard deviationswere calculated based on five independent experiments,additionally taking into account chemostat experimentvalues at a dilution rate of 0.45 h-1.
Analytical methods and growth characteristicsBiomass was constantly monitored by measuring the opti-cal density at 600 nm; biomass dry weight was determinedgravimetrically. Biomass correlation constant K was0.372 ± 0.005 and was not specific growth rate dependent.Levels of glucose, lactate, formate, acetate and ethanol inthe culture medium were measured with liquid chromato-graphy (Alliance 2795 system, Waters Corp., Milford,MA), using a BioRad HPX-87H column (Hercules, CA)with isocratic elution of 5 mM H2SO4 at a flow rate of 0.6mL min-1 and at 35°C. A refractive index detector (model2414; Waters Corp.) was used for detection and quantifi-cation of substances. The detection limit for the analyticalmethod was 0.1 mM. Samples from culture medium werecentrifuged (14,000 × g, 4 min); supernatants were col-lected and analyzed immediately or stored at -20°C untilanalysis. Free amino acid concentrations were determinedfrom the same sample (analysing frequency ca 0.02 h-1)with an amino acid analyzer (Acquity UPLC; WatersCorp.) according to the manufacturer’s instructions.Empower software (Waters Corp.) was used for the dataprocessing. For measuring amino acid concentrations inprotein content, biomass was hydrolysed with 6 M HClfor 20 h at 120°C. From hydrolyte, amino acids were deter-mined as free amino acids described above. Protein con-tent from biomass dry cell weight was calculated based onamino acid analysis and, additionally, measured using theLowry method [29], where bovine serum albumin wasused as a standard. For measurement of DNA content inbiomass genomic DNA was extracted and measured usinginstructions of RTP® Bacteria DNA Mini Kit (Invitec, Ger-many). Detailed protocol for fatty acid quantification isdescribed in [30]. Growth characteristics μ, YXS, YSubstrate,YProduct were calculated as described previously [27,28].For consumption calculations, measured medium concen-trations were used.
Carbon, nitrogen and ATP balance calculationsFor carbon balance calculations C-molar concentrationsof measured substrates, products and biomass were used
(biomass C-molar concentration with a value 0.03625C-mol gdw-1 was calculated based on monomer compo-sition). For nitrogen balance calculations N-molaramino acid consumptions, production of ornithine andglutamate, ADI pathway activity and biomass composi-tion (0.00725 N-mol gdw-1) were taken into account.For calculations of ATP and NAD(P)H balance mea-
sured biomass, amino acid, RNA, DNA and fatty acidcontents were used. Other necessary data were adaptedfrom literature [31]. Stoichiometry of ATP, NAD(P)Hand central metabolites for monomer production weretaken from the Kyoto Encyclopaedia of Genes and Gen-omes database http://www.kegg.jp/, with an assumptionthat amino acids were not synthesized. Specific calcula-tions are presented in Additional file 1.
Gene expression profilingAgilent’s DNA microarrays (Santa Clara, CA) weredesigned in eArray web portal in 8 × 15K format, con-taining 7 unique probes per target https://earray.chem.agilent.com/earray/. Target sequences for 2234 geneswere downloaded from Kyoto Encyclopaedia of Genesand Genomes ftp://ftp.genome.jp/pub/kegg/genes/organ-isms/lla/l.lactis.nuc.For microarray analysis, steady state chemostat culture
of L. lactis IL1403 was used as reference (D = 0.10 h-1).Subsequent quasi steady state points from A-stat experi-ment at specific growth rates 0.52 ± 0.03; 0.42 ± 0.02;0.29 ± 0.01 h1 in biological duplicates and 0.17 h-1 werecompared to the reference sample. Transcript changewas considered significant if the P value between parallelexperiments was less than 0.05.Total RNA was extracted and quantified, cDNA
synthesised and labelled as described previously [27],with minor modification: 11 μg of total RNA was usedfor cDNA synthesis. Hybridization, slide washing andscanning was performed using standard Agilent’sreagents and hardware http://www.chem.agilent.com.Gene expression data was analyzed as described before[27], except global lowess normalization was used. Spotswith intensities lower than 100 units in both channelsand outliers among technical replicates (according [32])were filtered. After filtering, seven technical replicatesshowed average standard deviation <10%. Gene (andprotein) expression measurement results are shown inAdditional file 3. DNA microarray data is also availableat NCBI Gene Expression Omnibus (Reference series:GSE26536).
Protein expression profilingFor protein expression analysis, the steady state chemo-stat culture of L. lactis IL1403 was used as reference(μ = 0.10 h-1). Quasi steady state points at μ = 0.20 ±0.01, 0.30 ± 0.02, 0.42 ± 0.01 and 0.50 ± 0.01 h-1 were
Lahtvee et al. Microbial Cell Factories 2011, 10:12http://www.microbialcellfactories.com/content/10/1/12
Page 9 of 12
compared with the reference sample. Three biologicalreplicates were analysed.Samples intended for proteome analysis were col-
lected, washed with PBS (0.137 M NaCl, 2.7 mM KCl,10.0 mM Na2HPO4, 1.4 mM KH2PO4), flash frozen inliquid nitrogen and stored at -80°C prior to proteinextraction.Proteins were extracted in ice-cold SDS-buffer
(100 mM Tris-HCl (pH 6.5), 1% SDS (w/v)). Cells weredisrupted as a result of agitating the suspension withglass-beads at 4°C for 30 minutes. After centrifugationfor 30 min at 4°C, the supernatant was collected and theprotein concentration was determined by 2D Quant kit(Amersham Biosciences, Buckinghamshire, UK) and pro-tein samples were stored at -80°C until further analysis.Aliquots of 100 μg cloroform/MeOH chloroform pre-
cipitated proteins from each sample were processed forlabeling with iTRAQ 4plex reagents (Applied Biosys-tems, Foster City, CA) according to manufacturer’sinstructions. Briefly, precipitated proteins were dissolvedin 0.5 M triethylammonium bicarbonate (TEAB) and0.1% SDS, disulfide bonds were reduced in 5 mMTris-(2-carboxyethyl) phosphine (TCEP) for 1 h at 60°C,followed by blocking cycteine residues in 10 mM methylmethanethiosulfonate (MMTS) for 30 min at room tem-perature, before digestion with trypsin (1:40, enzyme toprotein ratio) overnight at 37°C. For labeling, eachiTRAQ reagent was dissolved in 70 μl of ethanol andadded to the respective peptide mixture. After 1 h incu-bation at room temperature the reactions were stoppedby adding 100 μl milliQ water and incubating for 30min. All four samples were mixed together and ethanolwas removed by drying in a vacuum concentrator(Model 5301, Eppendorf, Cambridgeshire, UK).The combined peptide mixtures were separated into 10
fractions with a cation exchange cartridge system(Applied Biosystems, Foster City, CA) by differentKH2PO4 concentrations (10-1000 mM) and cleaned byStageTips [33]. All fractions were analyzed twice byLC-MS/MS using an Agilent 1200 series nanoflow system(Agilent Technologies, Santa Clara, CA) connected to aThermo Scientific LTQ Orbitrap mass-spectrometer(Thermo Electron, San Jose, CA) equipped with a nanoe-lectrospray ion source (Proxeon, Odense, Denmark).Purified peptides were dissolved in 0.5% formic acid andloaded on self-packed fused silica emitter (150 mm ×0.075 mm; Proxeon) packed with Repropur-Sil C18-AQ 3μm particles (Dr. Maisch, Germany) using a flow rate of0.7 μl min-1. Peptides were separated with a 180 min gra-dient from 3 - 40% B (A: 0.1% formic acid, B: 0.1% formicacid/80% acetonitrile) using a flow-rate of 200 nl min-1
and sprayed directly into LTQ Orbitrap mass-spectrometer operated at 180°C capillary temperatureand 2.4 kV spray voltage.
Mass spectrometry method combined HCD and CIDspectrums as described in Köcher et al. [34]. Briefly, fullmass spectra were acquired in profile mode, with massrange from m/z 300 to 1800 at resolving power of60000 (FWHM). Up to four data-dependent MS/MSscans with CID and four scans with HCD tandem massspectrometry experiment triggered from the same pre-cursor ion were acquired in centroid mode for eachFTMS full-scan spectrum. CID was carried out with atarget signal value of 10 000 in the linear ion trap, colli-sion energy of 35%, Q value of 0.25 and an activationtime of 30 ms. HCD-generated ions were detected inthe Orbitrap using the target signal value of 10 000, col-lision energy of 35% and an activation time of 40 ms.Each fragmented ion was dynamically excluded for 60s.Raw files were extracted to .mgf files by MM File
Conversion Tools http://searcher.rrc.uic.edu/cgi-bin/mm-cgi/downloads.py. Each .mgf file was converted to aQuantMerge file [34]. All files from the same samplewere merged together. Data generated was searchedagainst L. lactis IL1403 NCBI database (22092009) byMassMatrix search tool [35]. A reversed decoy databasewas used for false positives detection. In all cases, a pep-tide mass tolerance of 5 ppm was used and fragment ionmasses were searched with a 0.6 Da mass window. Twomissed cleavage sites for trypsin were allowed. Beta-methylthiolation of a cysteine was set as a fixed modifi-cation and oxidation of methionine as a variable modifi-cation. Quantification was set as iTRAQ andquantification statistics as arithmetic mean. Only pro-teins with confidence intervals of more than 95% wereallowed for further data analysis (Additional file 3). Pro-teomic analysis raw data is available at the PRIDE data-base [36]http://www.ebi.ac.uk/pride under accessionnumbers 13105-13162 (username: review17185, pass-word: wyd*b6_6). The data was converted using PRIDEConverter http://code.google.com/p/pride-converter[37].Protein expression change was considered significant ifthe P value between parallel experiments was less than0.05.
Additional material
Additional file 1: Specific growth rate dependent ATP and NAD(P)Hbalance calculations for A-stat experiments with Lactococcus lactissubsp. lactis IL1403.
Additional file 2: Supplementary figures and tables.
Additional file 3: Specific growth rate dependent mRNA andprotein expression changes from A-stat experiments withLactococcus lactis subsp. lactis IL1403. The expression fold change isgiven accordingly: sample at respective specific growth rate (quasi steadystate) is divided by steady state chemostat sample (0.10 h-1). Averagelog2 gene and protein expression changes were calculated from “n”number of parallel A-stat experiments. In gene expression analysis spotswith intensities lower than 100 units in both channels and outliersamong technical replicates (according Rorabacher, 1991) were filtered. In
Lahtvee et al. Microbial Cell Factories 2011, 10:12http://www.microbialcellfactories.com/content/10/1/12
Page 10 of 12
protein expression analysis, proteins identified with a confidence intervalmore the 95% and appearances in all mentioned parallels are presented.
AcknowledgementsThe authors would like to thank Lauri Peil (University of Tartu) and ElinaPelonen (Turku University of Applied Sciences and Åbo Akademi) for theirhelp in carrying out ‘omics analysis. The financial support for this researchwas provided by the European Regional Development Fund projectEU29994, and Ministry of Education, Estonia, through the grantSF0140090s08.
Author details1Tallinn University of Technology, Department of Chemistry, Akadeemia tee15, 12618 Tallinn, Estonia. 2Competence Center of Food and FermentationTechnologies, Akadeemia tee 15b, 12618 Tallinn, Estonia. 3Tallinn Universityof Technology, Department of Food Processing, Ehitajate tee 5, 19086Tallinn, Estonia.
Authors’ contributionsPJL, KAd, RV designed experiments and conceived the project. PJL, KAlcarried out experiments. PJL, RN, LA, KAl contributed in analytics and dataanalysis. KAd was responsible for mathematical calculations. PJL drafted themanuscript. KAd helped drafting the manuscript. RV, RN, LA edited themanuscript. All authors read and approved the final manuscript.
Competing interestsThe authors declare that they have no competing interests.
Received: 13 July 2010 Accepted: 24 February 2011Published: 24 February 2011
References1. Bolotin A, Wincker P, Mauger S, Jaillon O, Malarme K, Weissenbach J,
Ehrlich SD, Sorokin A: The complete genome sequence of the lactic acidbacterium Lactococcus lactis ssp. lactis IL1403. Genome Research 2001,11:731-53.
2. Hugenholtz J, Sybesma W, Groot MN, Wisselink W, Ladero V, Burgess K, vanSinderen D, Piard JC, Eggink G, Smid EJ, Savoy G, Sesma F, Jansen T, Hols P,Kleerebezem M: Metabolic engineering of lactic acid bacteria for theproduction of nutraceuticals. Antonie Van Leeuwenhoek 2002, 82:217-35.
3. Kleerebezem M, Boels IC, Groot MN, Mierau I, Sybesma W, Hugenholtz J:Metabolic engineering of Lactococcus lactis: the impact of genomics andmetabolic modelling. J Biotechnol 2002, 98:199-213.
4. Hugenholtz J: The lactic acid bacterium as a cell factory for foodingredient production. Intern Dairy J 2008, 18:466-75.
5. Morello E, Bermúdez-Humarán LG, Llull D, Solé V, Miraglio N, Langella P,Poquet I: Lactococcus lactis, an efficient cell factory for recombinantprotein production and secretion. J Mol Microbiol Biotechnol 2008,14:48-58.
6. Bermúdez-Humarán LG: Lactococcus lactis as a live vector for mucosaldelivery of therapeutic proteins. Human Vaccines 2009, 5:264-7.
7. Jensen PR, Hammer K: Minimal Requirements for Exponential Growth ofLactococcus lactis. Appl Environ Microbiol 1993, 59:4363-6.
8. Novak L, Cocaign-Bousquet M, Lindley N, Loubiere P: Metabolism andenergetics of Lactococcus lactis during growth in complex or syntheticmedia. Appl Environ Microbiol 1997, 63:2665-70.
9. Zhang G, Block DE: Using highly efficient nonlinear experimental designmethods for optimization of Lactococcus lactis fermentation inchemically defined media. Biotechnol Prog 2009, 25:1587-97.
10. Larsen N, Boye M, Siegumfeldt H, Jakobsen M: Differential expression ofproteins and genes in the lag phase of Lactococcus lactis subsp. lactisgrown in synthetic medium and reconstituted skim milk. Appl EnvirMicrobiol 2006, 72:1173-9.
11. Mazzoli R, Pessione E, Dufour M, Laroute V, Giuffrida M, Giunta C, Cocaign-Bousquet M, Loubière P: Glutamate-induced metabolic changes inLactococcus lactis NCDO 2118 during GABA production: combinedtranscriptomic and proteomic analysis. Amino Acids 2010, 3:727-37.
12. Dressaire C, Redon E, Milhem H, Besse P, Loubière P, Cocaign-Bousquet M:Growth rate regulated genes and their wide involvement in theLactococcus lactis stress responses. BMC Genomics 2008, 9:343.
13. Dressaire C, Gitton C, Loubière P, Monnet V, Queinnec I, Cocaign-Bousquet M: Transcriptome and proteome exploration to modeltranslation efficiency and protein stability in Lactococcus lactis. PLoSComput Biol 2009, 5:12.
14. Poolman B, Konings WN: Relation of growth of Streptococcus lactis andStreptococcus cremoris to amino acid transport. J Bacteriol 1988,170:700-707.
15. Görke B, Stülke J: Carbon catabolite repression in bacteria: many ways tomake the most out of nutrients. Nat Rev Microbiol 2008, 6:613-24.
16. Titgemeyer F, Hillen W: Global control of sugar metabolism: a gram-positive solution. Antonie Van Leeuwenhoek 2002, 82:59-71.
17. Garrigues C, Loubiere P, Lindley ND, Cocaign-Bousquet M: Control of theshift from homolactic acid to mixed-acid fermentation in Lactococcuslactis: predominant role of the NADH/NAD+ ratio. J Bacteriol 1997,179:5282-7.
18. Novak L, Loubiere P: The metabolic network of Lactococcus lactis:Distribution of 14C-labeled substrates between catabolic and anabolicpathways. J Bacteriol 2000, 182:1136-1143.
19. Molenaar D, van Berlo R, de Ridder D, Teusink B: Shifts in growthstrategies reflect tradeoffs in cellular economics. Mol Syst Biol 2009, 5:323.
20. Russell JB: The energy spilling reactions of bacteria and other organisms.J Mol Microbiol Biotechnol 2007, 13:1-11.
21. Ogura T, Wilkinson AJ: AAA+ superfamily ATPases: common structure -diverse function. Gen Cells 2001, 6:575-597.
22. Smid EJ, Konings WN: Relationship between utilization of proline andproline-containing peptides and growth of Lactococcus lactis. J Bacteriol1990, 172:5286-92.
23. Benthin S, Villadsen J: Amino acid utilization by Lactococcus lactis subsp.cremoris FD1 during growth on yeast extract or casein peptone. J ApplMicrobiol 1996, 80:65-72.
24. Lapujade P, Cocaign-Bousquet M, Loubiere P: Glutamate biosynthesis inLactococcus lactis subsp. lactis NCDO 2118. Appl Envir Microbiol 1998,64:2485-9.
25. Konings WN, Poolman B, Driessen AJ: Bioenergetics and solute transportin lactococci. Crit Rev Microbiol 1989, 16:419-76.
26. Valgepea K, Adamberg K, Nahku R, Lahtvee PJ, Arike L, Vilu R: Systemsbiology approach reveals that overflow metabolism of acetate inEscherichia coli is triggered by carbon catabolite repression of acetyl-CoA synthetase. BMC Syst Biol 2010, 4:166.
27. Lahtvee PJ, Valgepea K, Nahku R, Abner K, Adamberg K, Vilu R: Steady stategrowth space study of Lactococcus lactis in D-stat cultures. Antonie VanLeeuwenhoek 2009, 96:487-96.
28. Adamberg K, Lahtvee PJ, Valgepea K, Abner K, Vilu R: Quasi steady stategrowth of Lactococcus lactis in glucose-limited acceleration stat (A-stat)cultures. Antonie van Leeuwenhoek 2009, 95:219-26.
29. Lowry OH, Rosebrough NJ, Farr AL, Randall RJ: Protein measurement withthe Folin phenol reagent. J Biol Chem 1951, 193:265-75.
30. Špitsmeister M, Admaberg K, Vilu R: UPLC/MS based method forquantitative determination of fatty acid composition in Gram-negativeand Gram-positive bacteria. J Microbiol Methods 2010, 82:288-95.
31. Oliveira A, Nielsen J, Forster J: Modeling Lactococcus lactis using agenome-scale flux model. BMC Microbiol 2005, 5:39.
32. Rorabacher DB: Statistical treatment for rejection of deviant values:critical values of Dixon’s “Q” parameter and related subrange ratios atthe 95% confidence level. Analyt Chem 1991, 63:139-146.
33. Rappsilber J, Mann M, Ishihama Y: Protocol for micro-purification,enrichment, pre-fractionation and storage of peptides for proteomicsusing StageTips. Nat Prot 2007, 2:1896-906.
34. Köcher T, Pichler P, Schutzbier M, Stingl C, Kaul A, Teucher N, Hasenfuss G,Penninger JM, Mechtler K: High precision quantitative proteomics usingiTRAQ on an LTQ Orbitrap: a new mass spectrometric methodcombining the benefits of all. J Prot Research 2009, 8:4743-52.
35. Xu H, Freitas MA: MassMatrix: a database search program for rapidcharacterization of proteins and peptides from tandem massspectrometry data. Proteom 2009, 9:1548-55.
36. Martens L, Hermjakob H, Jones P, Adamski M, Taylor C, States D, Gevaert K,Vandekerckhove J, Apweiler R: PRIDE: the proteomics identificationsdatabase. Proteomics 2005, 5:3537-3545.
Lahtvee et al. Microbial Cell Factories 2011, 10:12http://www.microbialcellfactories.com/content/10/1/12
Page 11 of 12

37. Barsnes H, Vizcaíno JA, Eidhammer I, Martens L: PRIDE Converter: makingproteomics data-sharing easy. Nat Biotechnol 2009, 27:598-599.
38. Ganesan B, Dobrowolski P, Weimer BC: Identification of the leucine-to-2-methylbutyric acid catabolic pathway of Lactococcus lactis. Appl EnvironMicrobiol 2006, 72:4264-73.
39. Chambellon E, Rijnen L, Lorquet F, Gitton C, van Hylckama Vlieg JET,Wouters JA, Yvon M: The D-2-hydroxyacid dehydrogenase incorrectlyannotated PanE is the sole reduction system for branched-chain 2-ketoacids in Lactococcus lactis. J Bacteriol 2009, 191:873-81.
doi:10.1186/1475-2859-10-12Cite this article as: Lahtvee et al.: Multi-omics approach to study thegrowth efficiency and amino acid metabolism in Lactococcus lactis atvarious specific growth rates. Microbial Cell Factories 2011 10:12.
Submit your next manuscript to BioMed Centraland take full advantage of:
• Convenient online submission
• Thorough peer review
• No space constraints or color figure charges
• Immediate publication on acceptance
• Inclusion in PubMed, CAS, Scopus and Google Scholar
• Research which is freely available for redistribution
Submit your manuscript at www.biomedcentral.com/submit
Lahtvee et al. Microbial Cell Factories 2011, 10:12http://www.microbialcellfactories.com/content/10/1/12
Page 12 of 12