metabolic modeling and omics-integrative
TRANSCRIPT
University of Nebraska - Lincoln University of Nebraska - Lincoln
DigitalCommons@University of Nebraska - Lincoln DigitalCommons@University of Nebraska - Lincoln
Chemical & Biomolecular Engineering Theses, Dissertations, & Student Research
Chemical and Biomolecular Engineering, Department of
Summer 7-27-2021
METABOLIC MODELING AND OMICS-INTEGRATIVE ANALYSIS OF METABOLIC MODELING AND OMICS-INTEGRATIVE ANALYSIS OF
SINGLE AND MULTI-ORGANISM SYSTEMS: DISCOVERY AND SINGLE AND MULTI-ORGANISM SYSTEMS: DISCOVERY AND
REDESIGN REDESIGN
Mohammad Mazharul Islam University of Nebraska-Lincoln, [email protected]
Follow this and additional works at: https://digitalcommons.unl.edu/chemengtheses
Part of the Biochemical and Biomolecular Engineering Commons
Islam, Mohammad Mazharul, "METABOLIC MODELING AND OMICS-INTEGRATIVE ANALYSIS OF SINGLE AND MULTI-ORGANISM SYSTEMS: DISCOVERY AND REDESIGN" (2021). Chemical & Biomolecular Engineering Theses, Dissertations, & Student Research. 36. https://digitalcommons.unl.edu/chemengtheses/36
This Article is brought to you for free and open access by the Chemical and Biomolecular Engineering, Department of at DigitalCommons@University of Nebraska - Lincoln. It has been accepted for inclusion in Chemical & Biomolecular Engineering Theses, Dissertations, & Student Research by an authorized administrator of DigitalCommons@University of Nebraska - Lincoln.
METABOLIC MODELING AND OMICS-INTEGRATIVE ANALYSIS OF
SINGLE AND MULTI-ORGANISM SYSTEMS: DISCOVERY AND REDESIGN
by
Mohammad Mazharul Islam
A DISSERTATION
Presented to the Faculty of
The Graduate College at the University of Nebraska
In Partial Fulfillment of Requirements
For the Degree of Doctor of Philosophy
Major: Chemical & Biomolecular Engineering
Under the Supervision of Professor Rajib Saha
Lincoln, Nebraska
June, 2021
METABOLIC MODELING AND OMICS-INTEGRATIVE ANALYSIS OF
SINGLE AND MULTI-ORGANISM SYSTEMS: DISCOVERY AND REDESIGN
Mohammad Mazharul Islam, Ph.D.
University of Nebraska, 2021
Advisor: Rajib Saha
Computations and modeling have emerged as indispensable tools that drive the process of
understanding, discovery, and redesign of biological systems. With the accelerating pace of
genome sequencing and annotation information generation, the development of computational
pipelines for the rapid reconstruction of high-quality genome-scale metabolic networks has
received significant attention. These models provide a rich tapestry for computational tools to
quantitatively assess the metabolic phenotypes for various systems-level studies and to develop
engineering interventions at the DNA, RNA, or enzymatic level by careful tuning in the
biophysical modeling frameworks. in silico genome-scale metabolic modeling algorithms based
on the concept of optimization, along with the incorporation of multi-level omics information,
provides a diverse array of toolboxes for new discovery in the metabolism of living organisms
(which includes single-cell microbes, plants, animals, and microbial ecosystems) and allows for
the reprogramming of metabolism for desired output(s). Throughout my doctoral research, I used
genome-scale metabolic models and omics-integrative analysis tools to study how microbes,
plants, animal, and microbial ecosystems respond or adapt to diverse environmental cues, and
how to leverage the knowledge gleaned from that to answer important biological questions. Each
chapter in this dissertation will provide a detailed description of the methodology, results, and
conclusions from one specific research project. The research works presented in this dissertation
represent important foundational advance in Systems Biology and are crucial for sustainable
development in food, pharmaceuticals and bioproduction of the future.

i
DEDICATION
To Seefat Farzin, a beloved wife and a good human being.
ii
ACKNOWLEDGEMENTS
This dissertation has been made possible because of several important people in my
academic and personal life, to whom I am greatly indebted.
First and foremost, I would like to express my deepest gratitude to Professor Rajib Saha,
my research advisor. He is not only an excellent mentor but also an extraordinary human being,
which have played a key role in my graduate journey. Our relationship goes back a long way,
even before I officially started my PhD at University of Nebraska-Lincoln. During my MS studies
at the Pennsylvania State University and during my doctoral admission process, his help and
guidance was insurmountable. Throughout my doctoral research, Professor Saha has provided me
with novel ideas, necessary pointers, important discussions, constructive feedback, and due
appreciation for my work. He has been the most accessible resource during my PhD. He has been
patient with the progress of my projects, ingenious during brainstorming ideas, reasonable during
constructing logical arguments and hypotheses, and understanding during difficult times. Besides
being a great academic advisor, Professor Saha has supported my professional and personal
development in numerous ways.
I would like to thank my dissertation committee members and collaborators. Professors
Vinai C. Thomas, Samodha Fernando, and Harkamal Walia have provided useful insight, primary
experimental results, and much needed guidance throughout the different research projects I have
undertaken. I also acknowledge their research group members who generated the experimental
datasets and performed analyses for many of the projects, especially Dr. Jong-Sam Ahn from
Professor Thomas’ research group and Ms. Jaspreet Sandhu from Professor Walia’s research
group. Professor Alexandrov has provided very thoughtful feedback and suggestions during the
iii
review of my progress and my comprehensive examinations, which were critical in shaping the
overall outcome of the dissertation.
I would like to acknowledge all the members of the Systems and Synthetic Biology
(SSBio) laboratory. They have engaged in long brainstorming sessions on research ideas and
troubleshooting of programming and computing challenges, reviewed my work as well as
manuscripts, shared their insight on career development, and participated in fun social activities
with me throughout my doctoral journey. It felt like a family with them being around.
Specifically, I am grateful to Dr. Cheryl Immethun, Dr. Wheaton Schroeder, Adil Al-Siyabi,
Dianna Long, Brandi Brown, Mark Kathol, and Niaz Chowdhury. In addition, I thank all the
undergraduate student researchers who have worked with me in different projects over the years,
especially Matthew Van Beek, Andrea Goertzen, Tony Le, and Shardhat R. Daggumati.
I hereby acknowledge the funding entities that have supported my work: the University
of Nebraska Faculty Startup Grant; Nebraska Systems Science Initiative Seed Grant; University
of Nebraska Collaboration Initiative Grant; University of Nebraska Animal Nutrition, Growth
and Lactation Grant; Effective Mitigation Strategies for Antimicrobial Resistance Grant; US
Department of Agriculture (USDA); National Institute of Food and Agriculture (NIFA);
National Institute of Health (NIH); National Institute of Allergy and Infectious Diseases (NIAID);
University of Nebraska-Lincoln Research Council Interdisciplinary Grant; and National
Science Foundation. I also thank the faculties and staff of the department of Chemical and
Biomolecular Engineering at University of Nebraska-Lincoln for their help and support.
Thanks go out to my teachers, mentors, and colleagues at the University of Nebraska-
Lincoln, the Pennsylvania State University, and Bangladesh University of Engineering and
Technology. They have instilled technical and non-technical knowledge and wisdom that made

iv
me successful as a researcher. Specifically, I would like to thank the following individuals:
Professor Costas D. Maranas, my MS advisor at the Pennsylvania State University, for
supervising my research in metabolic modeling of microbial communities; Professor Tareq
Daher, my instructor of STEM Teaching at University of Nebraska-Lincoln, for teaching me the
tools of evidence-based teaching; Dr. Lisa Rohde, Associate Director of Teaching & Research
Development at University of Nebraska-Lincoln, for guiding me during my CIRTL certification
process; and Professor Sirajul Haque Khan at Bangladesh University of Engineering and
Technology, for first kindling the fire of optimization of chemical and biological systems through
his graduate course.
I would also like to acknowledge the inspiration I have drawn from several individuals:
Dr. Clifford Paul Stoll, Dr. Jorge Gabriel Cham (PhD comics), Mr. Randall Patrick Munroe
(xkcd), Cartoonists Mr. Gavin Aung Than (Zen Pencils) and Mr. Matthew Boyd Inman (The
Oatmeal), and Dr. Isaac Asimov. Their creative muse and talent have helped me persevere,
advance, think, and act wisely in numerous occasions.
My heartiest gratitude goes to my beloved wife, Seefat Farzin. She has supported my
strenuous doctoral journey with patience, encouragement, and love. Being a partner in all the joys
and sorrows of my life, she has been my biggest source of motivation. During this demanding
career path of mine, she has made countless sacrifices and still stood by me with her beautiful
smile all day long. Without her on my side, this journey would have been very difficult to pursue.
My parents, Md Zahidul Islam and Maleka Pervin, have provided mental support and
inspiration throughout my graduate studies. Having their elder son some few thousand miles
away from home, it was not an easy affair for them. They missed me physically every moment of
the past few years and kept inspiring me despite all my shortfalls in carrying out my

v
responsibilities towards them. My brother, Mr. Mohammad Manzurul Islam, has been a playful
sibling all along, and I thank him for putting his trust and confidence in me in the times of need.
Along with them, I thank all my friends and family back in Bangladesh for all their support.
My friends in Lincoln, Nebraska have been helpful and supporting of my research. I had
the privilege to work with and be friends with people from not only the USA and Bangladesh but
also from all over the world. I am greatly thankful to them for their continuous companionship
and encouragement.
This list can only acknowledge a tiny fraction of the people whose direct and indirect
support have been instrumental to my work. I express my sincere gratitude to all.
vi
PREFACE
Some of the content discussed in Chapter 2 has been published in npj Systems Biology and
Applications (Islam, M. M., S. C. Fernando, and R. Saha, “Metabolic Modeling Elucidates
Metabolic Transactions in the Rumen Microbiome and the Metabolic Shifts upon virome
Interactions”, Frontiers in Microbiology, 2019, 10: 2412). Used with permission.
Some of the content discussed in Chapter 3 has been published in Computational and Structural
Biotechnology Journal (Islam, M. M., J. K. Sandhu, H. Walia, and R. Saha, “Transcriptomic
data-driven discovery of global regulatory features in developing rice seeds under heat stress”,
Computational and Structural Biotechnology Journal, 2020, 18:2556-2567). Used with
permission.
Some of the content discussed in Chapter 4 has been published in Frontiers in Microbiology
(Islam, M. M., S. C. Fernando, and R. Saha, “Metabolic Modeling Elucidates Metabolic
Transactions in the Rumen Microbiome and the Metabolic Shifts upon virome Interactions”,
Frontiers in Microbiology, 2019, 10: 2412). Used with permission.
Some of the content discussed in Chapter 5 has been published in PeerJ (Islam, M. M., Le, T.,
Daggumati, S. R., and R. Saha, “Investigation of microbial community interactions between lake
Washington methanotrophs using genome-scale metabolic modeling”, PeerJ, 2020, 8:e9464).
Used with permission.

vii
Some of the content discussed in Chapter 6 is expected to be included in a manuscript that is
currently in preparation for publication under the lead of Rajib Saha (Islam, M. M., Goertzen, A.,
and R. Saha, “Exploring the metabolic landscape of pancreatic ductal adenocarcinoma cells
using genome-scale metabolic modeling”, (in preparation for submission to refereed journal).
viii
TABLE OF CONTENTS
Introduction ...................................................................................................................................... 1
1.1. Understanding metabolism: the role of Systems Biology .................................................... 1
1.2. Metabolic model development and analysis ......................................................................... 2
1.3. Curation and refinement of genome-scale metabolic models .............................................. 4
1.4. Computational modeling of single- and multi-cellular organisms ....................................... 5
1.5. Metabolic modeling of microbial communities .................................................................... 6
1.6. Integration of multi-level omics’ datasets into genome-scale metabolic models ................. 9
1.7. Computational resources .................................................................................................... 10
1.8. Dissertation Objectives ....................................................................................................... 11
Genome-Scale Metabolic Reconstruction and Multi-omics Analysis of Human Pathogen
Staphylococcus aureus ................................................................................................................... 13
2.1. Background ......................................................................................................................... 14
2.2. Preliminary model reconstruction utilizing the existing knowledge base .......................... 17
2.3. Model curation .................................................................................................................... 18
2.4. Evaluation of growth profiles of mutants in NTML ........................................................... 21
2.5. Gene essentiality analyses .................................................................................................. 23
2.6. Using GrowMatch to resolve Growth and No-growth inconsistencies .............................. 25
2.7. Model validation and refinement: Incorporation of regulation .......................................... 27
2.8. Model validation and refinement: Growth phenotypes study ............................................ 28
2.9. Model validation and refinement: Metabolite excretion profiles of mutants ..................... 31
ix
2.10. Model validation and refinement: Carbon catabolism capacity ....................................... 38
2.11. Conclusions ...................................................................................................................... 38
Transcriptomics-guided Discovery of Global Regulatory Mechanisms During Heat Stress on
Developing Rice Seeds .................................................................................................................. 41
3.1. Introduction ........................................................................................................................ 42
3.2. Data collection .................................................................................................................... 47
3.3. Differential gene expression under heat stress ................................................................... 48
3.4. Co-expression network and clustering behavior ................................................................ 52
3.5. Application of MiReN optimization framework to identify minimal regulatory networks 54
3.6. MiReN-predicted regulatory influences of known regulators in rice ................................. 56
3.7. MiReN-predicted de novo regulatory influences on stress-responsive rice transcription
factors ........................................................................................................................................ 60
3.8. Conclusions ........................................................................................................................ 64
Microbiome-Virome Interaction in Bovine Rumen: The Role of Viral Auxiliary Metabolic Genes
in Modulating Microbial Community Dynamics ........................................................................... 68
4.1. Background ......................................................................................................................... 69
4.2. Model reconstructions and curations .................................................................................. 74
4.3. Community formation and simulation ................................................................................ 77
4.4. Identification of unknown interactions and bridging of network gaps ............................... 79
4.5. Identification of viral auxiliary metabolic genes ................................................................ 84
4.6. Viral auxiliary metabolic genes and shifts in flux distributions in the metabolic models .. 84
4.7. Variability of the metabolic fluxes under different community objective functions ......... 89
x
4.8. Conclusions ........................................................................................................................ 92
Microbial Community Dynamics in a Freshwater Lake Methanotrophic Ecosystem .................. 94
5.1. Background ......................................................................................................................... 95
5.2. Metabolic model reconstruction and curation .................................................................... 99
5.3. Community model formation ........................................................................................... 102
5.4. Formaldehyde Inhibition Constraint ................................................................................. 102
5.5. Community dynamics under variable environmental conditions ..................................... 103
5.6. Dynamic shifts in metabolism under sediment incubated microcosm and synthetic co-
culture composition ................................................................................................................. 112
5.7. Conclusions ...................................................................................................................... 115
Divergent Metabolic Landscape of Pancreatic Ductal Adenocarcinoma .................................... 116
6.1. Background ....................................................................................................................... 116
6.2. Transcriptomic data processing ........................................................................................ 122
6.3. Preliminary pancreas metabolic reconstruction and curation ........................................... 124
6.4. Metabolic models of PDAC and healthy pancreas cell .................................................... 127
6.5. Unique metabolic traits in PDAC ..................................................................................... 129
6.6. Conclusions ...................................................................................................................... 134
Conclusions and Future Perspectives ........................................................................................... 135
Appendix A .................................................................................................................................. 195
Appendix B .................................................................................................................................. 198
Appendix C .................................................................................................................................. 207
Appendix D .................................................................................................................................. 213

xi
Appendix E .................................................................................................................................. 216
Appendix F ................................................................................................................................... 220
Appendix G .................................................................................................................................. 225
xii
LIST OF FIGURES
2.1 Overall view of the iSA863 model reconstruction 22
2.2 Growth-no growth (G-NG) prediction matrices 27
2.3 Refinements in the central metabolic pathway of the model iSA863 showing
correction of reaction directionality, additions, and deletions.
30
2.4 Growth curve for the mutants in (A) CDMG and (B) CDM media. 34
2.5 Shifts in flux space for eight mutants in the central carbon and nitrogen
metabolic pathway.
36
3.1 Step-by-step workflow to identify stress responsive genes of interest and the
potential regulator candidates to be analyzed using the MiReN framework.
46
3.2 Transcriptomic experimental design of control and stressed samples of
developing rice seed.
48
3.3 Enrichment of genes related to cellular processes differentially enriched under
stress condition.
50
3.4 MiReN-predicted and experimentally identified regulatory networks for (A)
Slender Rice 1, (B) Immune receptor XA21 (C) Kinesin motor-domain
containing proteins KIN12C and STD1, and (D) WD-repeat containing protein
OsWD40.
58
3.5 Minimal regulatory networks involving the MADS-Box M-type (A), MYB (B),
and bZIP (C) genes in control and stress conditions.
63
4.1 Initial community simulation results showing the interactions between the
bacterial and archaeal members.
78
4.2 Workflow for identifying possible interspecies interactions from Gapfill
suggestions.
80
xiii
4.3 Identified de novo interactions in the community. 83
4.4 Changes in flux space after viral AMGs were added to the metabolic models. 87
4.5 Shifts in metabolism and inter-species interactions after the inclusion of viral
auxiliary metabolic genes.
88
4.6 Variability in metabolic fluxes under different community objective functions 90
5.1 Community dynamics showing the fluxes of key shared metabolites and biomass
in the community model.
104
5.2 The community composition and total biomass under varying Methane and
Oxygen conditions.
106
5.3 Central carbon metabolism fluxes in Methylobacter (A) and Methylomonas (B)
under high nutrient condition
107
5.4 Central carbon metabolism fluxes in Methylobacter (A) and Methylomonas (B)
under Oxygen limited condition.
108
5.5 Central carbon metabolism fluxes in Methylobacter (A) and Methylomonas (B)
under Nitrogen limited condition.
109
5.6 Central carbon metabolism fluxes in Methylobacter (A) and Methylomonas (B)
under Carbon limited condition.
111
5.7 Flux distribution for select metabolites in Methylobacter and Methylomonas
under A) Lake Washington sediment-incubated microcosm conditions and B)
synthetic co-culture conditions.
113
6.1 Schematic of the workflow for generating healthy pancreas and PDAC model
and elucidating the metabolic divergence in PDAC.
121
6.2 Model statistics for the healthy pancreas and the PDAC models. 128
6.3 Significantly upregulated and downregulated pathways in PDAC cell
metabolism
129
xiv
6.4 Distinct metabolic features of PDAC cell. 131
A.1 Example of fixing cycles involving duplicate reactions. 195
A.2 Example of fixing cycles involving lumped reactions. 196
A.3 Example of fixing cycles involving non-specific cofactors. 197
B.1 The methodology to determine gene-essentiality. 202
G.1 Significantly upregulated and downregulated pathways in PDAC cell
metabolism.
225
xv
LIST OF TABLES
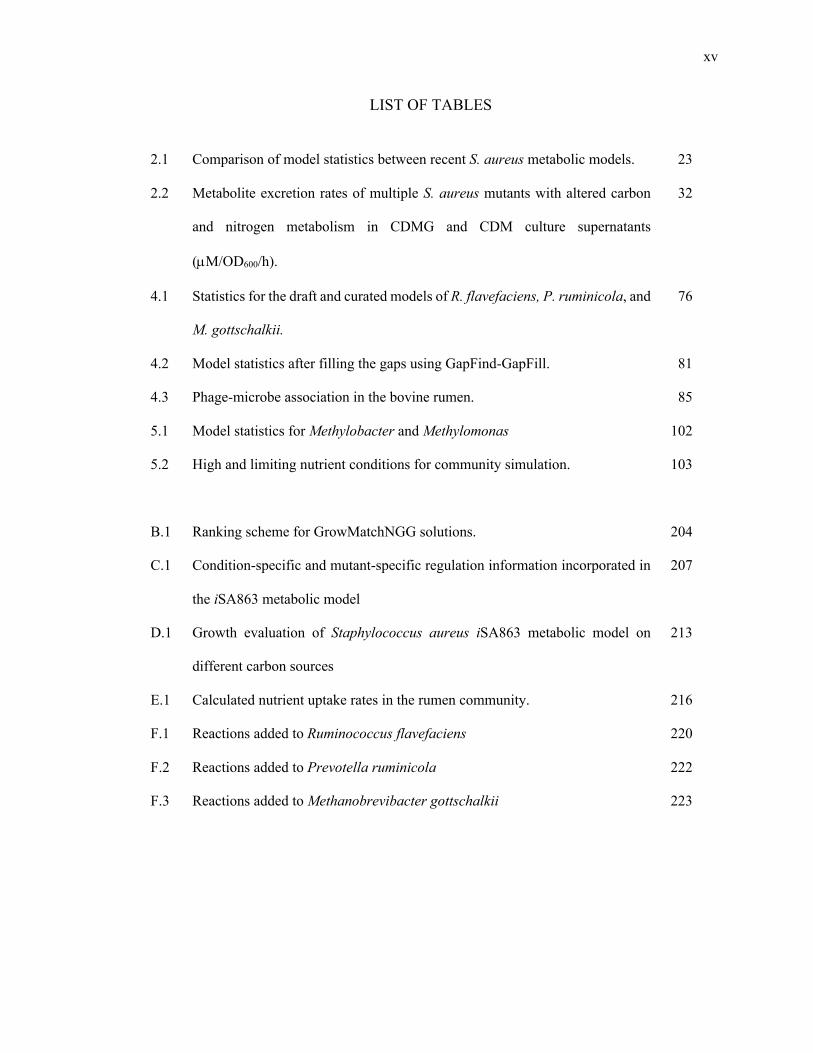
2.1 Comparison of model statistics between recent S. aureus metabolic models. 23
2.2 Metabolite excretion rates of multiple S. aureus mutants with altered carbon
and nitrogen metabolism in CDMG and CDM culture supernatants
(µM/OD600/h).
32
4.1 Statistics for the draft and curated models of R. flavefaciens, P. ruminicola, and
M. gottschalkii.
76
4.2 Model statistics after filling the gaps using GapFind-GapFill. 81
4.3 Phage-microbe association in the bovine rumen. 85
5.1 Model statistics for Methylobacter and Methylomonas 102
5.2 High and limiting nutrient conditions for community simulation. 103
B.1 Ranking scheme for GrowMatchNGG solutions. 204
C.1 Condition-specific and mutant-specific regulation information incorporated in
the iSA863 metabolic model
207
D.1 Growth evaluation of Staphylococcus aureus iSA863 metabolic model on
different carbon sources
213
E.1 Calculated nutrient uptake rates in the rumen community. 216
F.1 Reactions added to Ruminococcus flavefaciens 220
F.2 Reactions added to Prevotella ruminicola 222
F.3 Reactions added to Methanobrevibacter gottschalkii 223
1
Chapter 1
Introduction
Computation and modeling have emerged as indispensable tools that drive the process of
understanding, discovery, and redesign of biological systems. Nowadays, we use computations to
reconstruct models of metabolism that account for stoichiometry, regulation, kinetics and
increasingly every macromolecular species present. The plasticity of living systems inherited
through evolution enables biotechnologists to steer metabolism to many different directions
ranging from strain development for chemicals and materials production, drug targeting in
pathogens, prediction of enzyme functions, pan-reactome analysis, tailoring metabolism through
omics’ data integration, modeling interactions among multiple cells or organisms, and
understanding human diseases. A growing number of computational tools relying on
mathematical optimization frameworks have emerged, benefiting from the rapid advancements in
the reconstruction of genome‐scale metabolic models of microbes, plants, animals, and microbial
ecosystems. These tools and models together allow us to address the challenges of identifying and
quantifying the genetic and environmental interventions and minimizing the counteractions of the
organisms in response to them. These large models together with constraint-based methods
represent a key foundational advance in Systems Biology and metabolic engineering and are
crucial for sustainable development in food, pharmaceuticals and bioproduction of the future.
1.1. Understanding metabolism: the role of Systems Biology
Systems biology is the use of computational and mathematics tools, modeling, and analysis for
holistic understanding and design of biological systems. It is a method of generating hypotheses
in silico, utilizing mathematics and knowledge of the biological system which may be
investigated in vivo through synthetic biology or other more traditional methods. Systems biology
2
has evolved as a scientific discipline in which computational and mathematical modeling is used
to study the complete system, as opposed to molecular biology, which focuses on subsystems
often studied via in vitro experiments. Another characteristic of systems biology is that it involves
quantitative analysis, unlike the largely qualitative; nature of molecular biology that focuses on
hypothesis testing, which is used to determine whether a given model describing the system is
true or false. Despite the different approaches, systems biology is highly dependent on the
extensive biological information that has been acquired through molecular biology, and systems
biology studies often result in the generation of hypotheses that require confirmation using a
reductionist approach. Due to the high connectivity in metabolism, it is often necessary to use
explicit and detailed mathematical models for the analyses in Systems Biology.
1.2. Metabolic model development and analysis
At the heart of the most Systems biology tools and analysis methods is the Metabolic Model,
which has provided a more rigorous method of metabolic investigation. A metabolic network
model captures the inter-conversion of metabolites through chemical transformations catalyzed
by enzymes by assembling gene annotation and biological information from existing
knowledgebases such as KEGG1, BRENDA2, ModelSeed3, KBase4, and Biocyc5. To this end, a
metabolic model describes reaction stoichiometry and directionality, gene to protein to reaction
associations (GPRs), organelle-specific reaction localization, transporter/exchange reaction
information, transcriptional/translational regulation, and biomass composition 6. By defining the
metabolic space, genome-scale metabolic models (GSMs) can assess allowable cellular
phenotypes; explore the metabolic potentials and restrictions under specific environmental and/or
genetic conditions 7-10. In order to have detailed blueprints for biological systems, a genome-scale
metabolic model needs to be carefully reconstructed from available genome annotation and
biological data, checked for elemental and charge balance, tested for its completeness, and filled
in for any remaining network gaps before utilizing it to answer important biological questions.
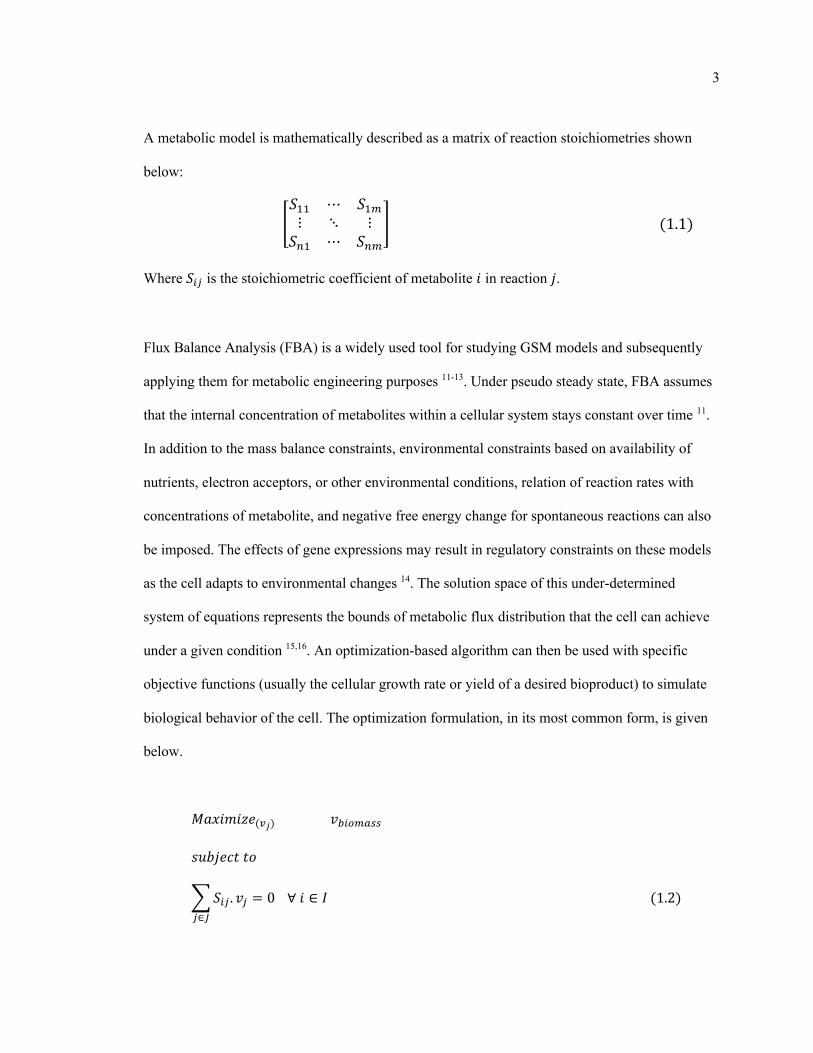
3
A metabolic model is mathematically described as a matrix of reaction stoichiometries shown
below:
!𝑆!! ⋯ 𝑆!"⋮ ⋱ ⋮𝑆#! ⋯ 𝑆#"
& (1.1)
Where 𝑆!" is the stoichiometric coefficient of metabolite 𝑖 in reaction 𝑗.
Flux Balance Analysis (FBA) is a widely used tool for studying GSM models and subsequently
applying them for metabolic engineering purposes 11-13. Under pseudo steady state, FBA assumes
that the internal concentration of metabolites within a cellular system stays constant over time 11.
In addition to the mass balance constraints, environmental constraints based on availability of
nutrients, electron acceptors, or other environmental conditions, relation of reaction rates with
concentrations of metabolite, and negative free energy change for spontaneous reactions can also
be imposed. The effects of gene expressions may result in regulatory constraints on these models
as the cell adapts to environmental changes 14. The solution space of this under-determined
system of equations represents the bounds of metabolic flux distribution that the cell can achieve
under a given condition 15,16. An optimization-based algorithm can then be used with specific
objective functions (usually the cellular growth rate or yield of a desired bioproduct) to simulate
biological behavior of the cell. The optimization formulation, in its most common form, is given
below.
𝑀𝑎𝑥𝑖𝑚𝑖𝑧𝑒($!)𝑣&!'()**
𝑠𝑢𝑏𝑗𝑒𝑐𝑡𝑡𝑜
2𝑆!" . 𝑣" = 0"∈,
∀𝑖 ∈ 𝐼(1.2)
4
𝐿𝐵" ≤ 𝑣" ≤ 𝑈𝐵" ∀𝑗 ∈ 𝐽(1.3)
Here, I and J are the sets of metabolites and reactions in the metabolic model, respectively. Sij is
the stoichiometric coefficient of metabolite i in reaction j and vj is the flux value of reaction j.
Parameters LBj and UBj denote the minimum and maximum allowable fluxes for reaction j,
respectively. vbiomass is the flux of the biomass reaction which mimics the cellular growth yield.
1.3. Curation and refinement of genome-scale metabolic models
Various automated tools for GSM reconstruction such as KBase4 and ModelSeed3 have been
developed that can effectively generate draft models as a starting point for GSM reconstructions.
The draft models often need to be used cautiously and carefully curated however, since the often
have several issues such as: 1) chemical or charge imbalance in reaction stoichiometries, 2) many
reactions are often disconnected from the metabolic network, 3) some reactions are included in
models with little to no evidence, 4) draft models often contain thermodynamically infeasible
cycles (TICs) or reaction loops, and 5) draft models are often overly generic and missing
metabolic functions unique to an organism, family, or other taxonomic group.
Correcting reaction imbalances: For balancing the reactions imbalanced in protons, the reactions
in the draft model are subjected to addition/deletion of one or multiple protons on either the
reactant or the product side. For the remaining imbalanced reactions, the reaction stoichiometry is
checked and corrected in order to ensure that the atoms on both sides of the reactions balance out.
Identifying and eliminating thermodynamically Infeasible Cycles: One of the limitations of
constraint-based genome-scale models is that the mass balance constraints only describe the net
accumulation or consumption of metabolites, without restricting the individual reaction fluxes.
While biochemical conversion cycles like TCA cycle or urea cycle are ubiquitous in a metabolic
5
network model, there can be cycles which do not consume or produce any metabolite. Therefore,
the overall thermodynamic driving force of these cycles are zero, implying that no net flux can
flow around this cycle 17. To identify Thermodynamically Infeasible Cycles in our model, all the
nutrient uptakes to the cell are turned off and an optimization formulation called Flux Variability
Analysis (FVA) is used, which maximizes and minimizes each of the reaction fluxes subject to
mass balance constraints 18. The reaction fluxes which hit either the lower bound or upper bound
are defined as unbounded reactions and were grouped together as a linear combination of the null
basis of their stoichiometric matrix. To eliminate the cycles, either duplicate reactions are
removed, lumped reaction are turned off, or reactions are selectively turned on/off based on
available cofactor specificity information. The mathematical formulation of Flux Variability
Analysis (FVA) is given below. vapp-obj, threshold. is a predetermined threshold value of the
appropriate objective flux vapp-obj to ensure that the feasible flux space satisfy the targeted value.
𝑀𝑎𝑥𝑖𝑚𝑖𝑧𝑒/𝑚𝑖𝑛𝑖𝑚𝑖𝑧𝑒($!)𝑣"
𝑠𝑢𝑏𝑗𝑒𝑐𝑡𝑡𝑜
2𝑆!" . 𝑣" = 0"∈,
∀𝑖 ∈ 𝐼(1.4)
𝐿𝐵" ≤ 𝑣" ≤ 𝑈𝐵" ∀𝑗 ∈ 𝐽(1.5)
𝑣&!'()** = 𝑣)--.'&",0123*1'45 (1.6)
1.4. Computational modeling of single- and multi-cellular organisms
Since the first GSM for Haemophilus influenzae was reported in 199919, significant advances
have been made to develop and simulate GSMs for an increasing number of organisms across
bacteria, archaea, and eukarya. With the rapid evolution of genome sequencing and omics
analysis techniques, the quality and application scopes of GSMs have also expanded accordingly,
and together they have contributed to better understanding of metabolism in various organisms.
6
Starting with GSMs of model organisms, including Escherichia coli20 and Saccharomyces
cerevisiae21, GSMs of various microorganisms and also multicellular organisms, such as
humans22 and plant cells23-25, have been reconstructed. Among the single cellular prokaryotic
organisms, in addition to the metabolic reconstructions of model organisms, the reconstruction of
non-model organisms has also gained much momentum due to their unique metabolic capabilities
that can be useful for biotechnological advancements. As the most representative eukaryotic
microorganism, S. cerevisiae was the first eukaryotic organism to have its GEM reconstructed 21.
Since then, the GEMs for this microorganism have been updated by several different research
groups26-28. Global plant models (by considering the entire plant as one single unit) are available
for arabidopsis 29, maize 7, sorghum 23, sugarcane 23, rapeseed 30, and rice 31. These models in
essence analyze the physiology and/or metabolism of these plants. In addition, tissue-specific
models of plant seed 32, leaf 33, as well as different tissue types in human34-37, have been
reconstructed.
Such progress in the reconstruction of GSMs has made it possible to construct a wide range of
metabolic studies by generating model-driven hypotheses and implementing various context-
specific simulations38. Relevant applications that have benefited from advances in the use of
GSMs include, but are not limited to, strain development to produce bio-based chemicals and
materials, drug targeting in pathogens, the prediction of enzyme functions, pan-reactome analysis,
modeling interactions among multiple cells or organisms, and understanding human diseases.
1.5. Metabolic modeling of microbial communities
Microorganisms, in nature, exist and function in diverse, robust, integrated, and interactive
consortia instead of living in isolation. The interactions among the members of such a community
in the form of unidirectional and/or bidirectional exchange of biochemical cues and their
temporal variations (due to environmental perturbations) result in one or more population(s).
7
These populations can get benefited from a thorough cooperation or negatively affected (e.g.,
competition for limiting resources). They can even have a combination of both 39-43 and, thereby,
change community composition, structure, function, and stability 44-47. Like the eukaryotic
modeling efforts, there have been a growing number of metabolic modeling frameworks to
understand and elucidate the inter-species interactions in simple microbial communities and their
dynamics 44,47-53. In some of these efforts the metabolic networks of the different microorganisms
are treated as separate compartments similar to eukaryotic metabolic models, and the exchange of
metabolites are accommodated using a separate compartment 47-49,54,55. A number of other
approaches including elementary mode analysis, evolutionary game theory, nonlinear dynamics,
and stochastic processes 56-62 have been attempted to model such communities. All these methods
are based on optimization problems with a single objective function, and therefore, are not able to
capture the multi-level nature of decision making in microbial communities.
To capture the trade-offs between species-level fitness and community level objective in
microbial communities, Zomorrodi and Maranas have introduced OptCom 39 with a multi-level
and multi-objective optimization formulation. OptCom postulates a separate biomass
maximization problem for each community member as the inner problems. The inter-species
interactions are modeled by using inter-organism flow constraints in the outer problem imposing
a flux balance constraint in the extracellular environment for each metabolite shared by the
community members. The objective function of the outer problem represents a community-level
fitness criterion (e.g., maximization of community biomass), or surrogates a desired
bioengineering objective. OptCom can include any type of interactions (positive, negative or
combinations thereof) and also accommodate any number of microbial species (or guilds) in its
framework. As a case study, OptCom has been applied to quantify the syntrophic associations in
two-species microbial systems, assess the optimality level of growth in phototrophic microbial
8
mats, and elucidate the inter-species metabolite and electron transfer in a synthetic microbial
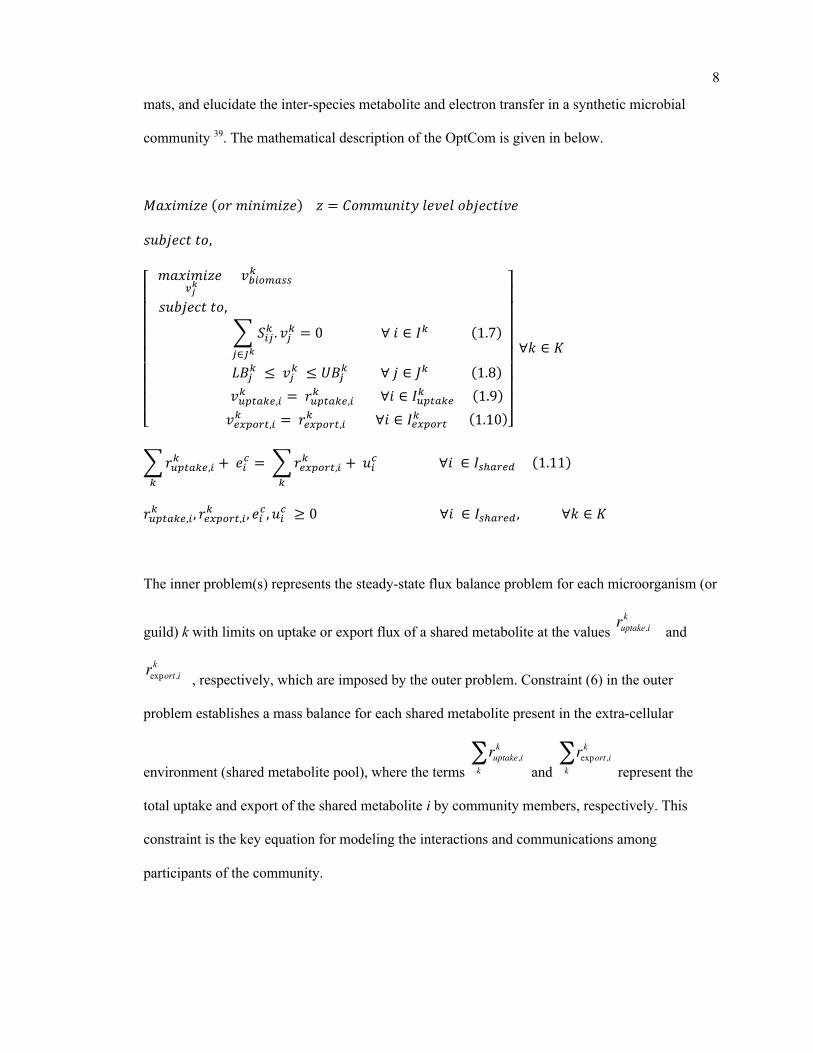
community 39. The mathematical description of the OptCom is given in below.
𝑀𝑎𝑥𝑖𝑚𝑖𝑧𝑒(𝑜𝑟𝑚𝑖𝑛𝑖𝑚𝑖𝑧𝑒)𝑧 = 𝐶𝑜𝑚𝑚𝑢𝑛𝑖𝑡𝑦𝑙𝑒𝑣𝑒𝑙𝑜𝑏𝑗𝑒𝑐𝑡𝑖𝑣𝑒
𝑠𝑢𝑏𝑗𝑒𝑐𝑡𝑡𝑜,
⎣⎢⎢⎢⎢⎢⎢⎢⎢⎡ 𝑚𝑎𝑥𝑖𝑚𝑖𝑧𝑒$!
"𝑣&!'()**6
𝑠𝑢𝑏𝑗𝑒𝑐𝑡𝑡𝑜,
2 𝑆!"6 . 𝑣"6 = 0∀𝑖 ∈ 𝐼6 (1.7)"∈,"
𝐿𝐵"6 ≤ 𝑣"6 ≤ 𝑈𝐵"6 ∀𝑗 ∈ 𝐽6 (1.8)𝑣7-0)63,!6 =𝑟7-0)63,!6 ∀𝑖 ∈ 𝐼7-0)636 (1.9)𝑣39-'20,!6 =𝑟39-'20,!6 ∀𝑖 ∈ 𝐼39-'206 (1.10)⎦
⎥⎥⎥⎥⎥⎥⎥⎥⎤
∀𝑘 ∈ 𝐾
2𝑟7-0)63,!6 +𝑒!:
6
=2𝑟39-'20,!6 +𝑢!: ∀𝑖 ∈ 𝐼*1)235 (1.11)6
𝑟7-0)63,!6 , 𝑟39-'20,!6 , 𝑒!: , 𝑢!: ≥ 0∀𝑖 ∈ 𝐼*1)235 ,∀𝑘 ∈ 𝐾
The inner problem(s) represents the steady-state flux balance problem for each microorganism (or
guild) k with limits on uptake or export flux of a shared metabolite at the values and
, respectively, which are imposed by the outer problem. Constraint (6) in the outer
problem establishes a mass balance for each shared metabolite present in the extra-cellular
environment (shared metabolite pool), where the terms and represent the
total uptake and export of the shared metabolite i by community members, respectively. This
constraint is the key equation for modeling the interactions and communications among
participants of the community.
ruptake,ik
rexport,ik
ruptake,ik
k∑ rexport,i
k
k∑
9
1.6. Integration of multi-level omics’ datasets into genome-scale metabolic models
Since genome-scale metabolic models are capable of efficient mapping of the genotype to the
phenotype 26,38,63-66, integrating multi-level omics data with these models enhances their predictive
power and allows for a systems-level study of the metabolic reprogramming happening in living
organisms under various genetic and environmental perturbations or diseases. The availability of
high-throughput experimental techniques, often referred to as omics techniques, has made it
possible to begin to address the general question of how metabolic fluxes are controlled at the
transcriptional, translational, and posttranslational levels and/or at the level of metabolite–enzyme
interactions. Analysis of omics data is traditionally performed using statistical and clustering
methods, but these analytical methods are inherently naïve with respect to the underlying biology.
Using biological networks for integrative analysis has made it possible to identify parts of large
networks that are coregulated.
Although expression levels of genes are not a direct representation of enzyme activities, as
posttranscriptional modifications determine the ultimate cellular protein concentrations and
activity, a number of applications have shown that they provide important cues for the magnitude
of reaction rates 67-73. These studies include the famous work of Shlomi et al.73, who identified
distinct metabolic activity in human cancer tissues using tissue-specific metabolic models. Most
approaches for integrating omics data to regulate or customize genome-scale metabolic models
can be broadly classified into two categories: (a) the switch approach (e.g. GIMME74, iMAT75
etc.): on/off reaction fluxes based on threshold expression levels, and, (b) the valve approach (e.g.
e-Flux76, PROM77 etc.): regulate reaction fluxes based on relative gene/protein expressions. In the
absence of detailed mechanistic information about transcription and enzyme activity (or reaction
flux), these frameworks provide a ‘first-guess’ estimate for correlating genotype with phenotype.
While these methods have been shown to provide accurate and detailed predictions of flux
distributions for specific systems, they do not perform consistently across different conditions and
10
organisms. Therefore, a more broadly applicable computational approach that does not heavily
rely on context-specific knowledge and assumptions is desirable. Nonetheless, these frameworks
have been widely used to generate context-specific metabolic models of living systems,
especially eukaryotic organisms 34,75.
1.7. Computational resources
The following computational and software resources were used in the studies described in this
dissertation:
Metabolic modeling and analyses: The General Algebraic Modeling System (GAMS)78 version
24.7.4 was used to run constraint-based modeling algorithms, including FBA, FVA, OptFill,
GapFind-GapFill, Growmatch, pFBA, MiReN, on the models. The models were parsed from
Systems Biology Markup Language (SBML) documents using standard programming languages
(i.e., Python) to generate the input files required by GAMS. GAMS was run on a high-
performance cluster computing system at the Holland Computing Center of the University of
Nebraska-Lincoln. The COBRA Toolbox79,80 version 3.0 in Matlab version 9.6.0.1174912
(R2019a) was used to run iMAT75, identify essential reactions and reaction imbalances, and run
FBA and FVA on some of the models. For exporting the metabolic models to Systems Biology
Markup Language (SBML), Python and COBRA toolbox were used.
Omics’ analyses: The DESeq algorithm in R software package “Bioconductor” was used for
differential gene expression analysis 81. DESeq employs negative binomial distribution and a
shrinkage estimator for the distribution’s variance methods to test for differential expression 81.
The raw read counts were used to calculate the fold change and the log2(foldchange) of the genes.
Unless otherwise specified, genes with a log2 (foldchange) value of 1 or higher were considered
overexpressed and genes with a log2 (foldchange) value of -1 or lower were considered
11
underexpressed, while satisfying an adjusted p-value of <0.05 82. GO functional enrichment
analysis was performed to identify significantly enriched biological processes and molecular
functions in different conditions or mutants.
Co-expression networks were created based on the correlation coefficients calculated in Matlab
version 2018b (Mathworks Inc.) using the Pearson Correlation method with an adjusted p value
of <0.05. Genes with a conservative absolute value of Pearson’s correlation coefficient (usually
>0.9) were considered to be present in the coexpression network to obtain a set of coexpressed
genes with very high correlation 83.
Network visualization was performed in Cytoscape 84 version 3.5.x on a linux-based high-
performance cluster computing system using Prefuse Force Directed Layout (http://prefuse.org/)
and yFiles Organic Layout (http://www.yworks.com/) with automatic edge bundling and manual
repositioning. DyNet toolbox in Cytoscape was used to show the changes in node presence,
connections and node and edge attributes (e.g., expression value or regulation coefficient).
All the developed computer codes, model files, and scripts are available at a public github
repository at https://github.com/ssbio under GNU General Public License v3.0.
1.8. Dissertation Objectives
The goal of this dissertation is to provide a comprehensive description of my doctoral research,
primarily focused on genome-scale metabolic modeling and omics-integrated analysis of
microbial, plant, animal, and microbial ecosystem metabolism. During my PhD, I established a
foundation in metabolic model development and analysis, which is the rapid advancing field in
Systems Biology. I sought to bring engineering skills to my studies of living organisms. I have
developed and implemented novel algorithms, tools, and protocols for modeling and analyzing
12
microbial and plant systems as well as for redesigning their metabolism to achieve desired
outputs. My research efforts that contribute to the development of this dissertation are
i) Development and analysis of a genome-scale metabolic model for analysis of
Staphylococcus aureus physiology under diverse environmental and genetic
perturbations, discussed in Chapter 2;
ii) Understanding the effects of heat stress on rice seed development using optimization-
based analysis of transcriptomic data, discussed in Chapter 3;
iii) Elucidating the role of viral auxiliary metabolic genes in modulating microbial
interactions in bovine rumen, discussed in Chapter 4;
iv) Modeling the methane-recycling community metabolism in freshwater lakes,
discussed in Chapter 5; and
v) Divergent metabolic landscape of Pancreatic Ductal Adenocarcinoma cells, discussed
in Chapter 6.
13
Chapter 2
Genome-Scale Metabolic Reconstruction and Multi-omics Analysis of
Human Pathogen Staphylococcus aureus
Staphylococcus aureus is a metabolically versatile pathogen that colonizes nearly all organs of
the human body. Despite decades of advances in clinical care, the high incidence of
staphylococcal infection remains a major public health concern. However, very few studies have
addressed these interrelationships from a systems-biology perspective, primarily due to the lack
of an accurate in silico metabolic model and technical know-how. To this end, I have
reconstructed and experimentally validated an updated and enhanced genome-scale metabolic
model of S. aureus USA300_FPR3757. The model combined genome annotation data, reaction
stoichiometry, and regulation information from biochemical databases and previous strain-
specific models. Reactions in the model were checked and fixed to ensure chemical balance and
thermodynamic consistency. To further refine the model, growth assessment of 1920 non-
essential mutants from the Nebraska Transposon Mutant Library was performed and metabolite
excretion profiles of important mutants in carbon and nitrogen metabolism were determined. The
growth and no-growth inconsistencies between the model predictions and in vivo essentiality data
were resolved using extensive manual curation based on optimization-based reconciliation
algorithms. Upon intensive curation and refinements, the model contains 863 metabolic genes,
1379 metabolites (including 1159 unique metabolites), and 1545 reactions including transport and
exchange reactions. To improve the accuracy and predictability of the model to environmental
changes, condition-specific regulation information curated from the existing knowledgebase was
incorporated. These critical additions improved the model performance significantly in capturing
gene essentiality, substrate utilization, and metabolite production capabilities and increased the
ability to generate model-based discoveries of therapeutic significance. Use of this highly curated
14
model will enhance the functional utility of omics data and, therefore, serve as a resource to
support future investigations of S. aureus and to augment staphylococcal research worldwide.
2.1. Background
S. aureus is a versatile human pathogen that has emerged as one of the most successful infectious
agents of recent times, affecting approximately 20% of the world’s population 85-87. The incidence
of methicillin resistance at low fitness cost has significantly contributed to the rise in community-
associated methicillin resistant S. aureus (CA-MRSA) infections, which significantly limits the
therapeutic options and increase rates of mortality, morbidity and costs associated with its
treatment 85,88,89. This threat to human health has resulted in a steady rise in interest and focus on
understanding how staphylococcal metabolism relates to antibiotic resistance and pathogenesis. A
number of studies have attempted to explore the metabolic aspects of antimicrobial functionality
of MRSA, including nitric oxide metabolism, oxidative stress, carbon overflow metabolism,
redox imbalance etc. 90-95. While previous efforts have been made to understand the regulatory
networks for the antibiotic mechanism of action to S. aureus, genetic perturbations can also play a
major role in understanding the effectiveness of antibiotic killing and inhibition functions. A
complete mechanistic understanding of staphylococcal metabolism is still missing, making the
identification of systematic therapeutic targets challenging. Some key questions in this regard are
still unanswered, including i) what are the core carbon and nitrogen metabolic pathways that are
crucial for staphylococcal growth and survival; ii) how specific mutations alter the metabolic
landscape, growth rate and survival of S. aureus; and iii) would a systems-level metabolic model
be able to accurately predict growth and metabolite changes that occur within defined mutants?
The increase in knowledge of macromolecular structures, availability of numerous biochemical
database resources, advances in high-throughput genome sequencing, and increase in
computational efficiency have accelerated the use of in silico methods for metabolic model
15
development and analysis, strain design, therapeutic target discovery, and drug development35,96-
100. There have been a number of attempts to reconstruct the metabolism of multiple strains of S.
aureus using semi-automated methods 101-105. However, the absence of organism-specific
metabolic functions and the inclusion of genes without any specified reactions still limit the
utility of these models. These models need to be continually refined and updated to accurately
predict biological phenotypes by addressing these issues as well as by reducing metabolic
network gaps, elemental imbalance, and missing physiological information. Since the predictive
genome-scale metabolic models of several microorganisms were useful in performing in silico
gene essentiality and synthetic lethality analyses and yielded promising results in pinpointing
metabolic bottlenecks and potential drug targets98,106-109, the potential for accurately modeling S.
aureus metabolism is immense. To this end, Seif et al recently developed an updated genome-
scale model of S. aureus strain JE2, incorporated 3D protein structures, evaluated gene
essentiality predictions against experimental physiological data, and assessed flux distributions in
different media types 104. Their model was informed by multilevel omics data and a significant
step toward deciphering the metabolic differences of this organism under different environmental
conditions. Given the vast knowledgebase of experimental data, incorporation of the latest strain-
specific annotation information, addition of condition-specific and mutant-specific regulations,
and removal of spurious functions could result in a refined and more utilitarian metabolic model
for S. aureus USA300_FPR3757.
Several other studies have been dedicated to elucidating the metabolic aspects of staphylococcal
virulence and to pinpoint the key metabolic “hubs” in carbon and nitrogen metabolism 95,110-115.
However, a majority of these studies were focused on specific segments of staphylococcal
metabolism and overlooked a system-wide inter-dependence that drives fitness, metabolic
robustness, virulence, and antimicrobial resistance. Hence, a holistic approach of in silico
genome-scale modeling and in vivo experimentation is crucial for gaining an improved
16
mechanistic understanding of staphylococcal metabolism and, thereby, facilitating the
development of novel therapeutic strategies to combat staphylococcal infections.
In this study, a comprehensive genome-scale metabolic model of S. aureus USA300_FPR3757,
namely iSA863, was reconstructed using annotation information from biochemical databases3,4
and previous strain-specific models 3,102,103 and validated through experimental observations and
published phenotypic data. Strain USA300 FPR3757 is one of the common MRSA strains with
available genome annotation (GenBank accession number NC_007793.1) and is closely related to
the strain JE2 (with only 11 SNPs between these strains)116. The Nebraska Transposon Mutant
Library (NTML)117 was developed for JE2; however, the S. aureus USA300 FPR3757
chromosomal genome sequence was used to map transpositions of bursa aurealis into the
genome of S. aureus JE2, since the annotated genome sequence of strain JE2 was not available at
that time. Therefore, the modeling framework took advantage of the existing knowledgebase. The
model underwent extensive manual curation to ensure chemical and charge balance,
thermodynamic consistency, and biomass precursors production. To test and inform the model,
the fitness level of 1920 mutants from NTML117 was assessed and the metabolite excretion
profiles of eight important mutants distributed across several pathways of the carbon and nitrogen
metabolism were measured. The growth phenotyping results of the NTML mutants were utilized
via GrowMatch procedure118 to reconcile in silico vs. in vivo growth inconsistencies. Upon
incorporating conditional regulations in the model gleaned from existing ‘omics’ datasets113,119,120,
the predictive capability of the model in terms of gene essentiality and metabolite excretions in
different environmental conditions was further improved. Furthermore, the growth predictions
from the model on 69 different carbon sources were validated against existing growth
experiment104. Overall, this model is extensively tested by multiple available and newly
developed experimental datasets on staphylococcal metabolism and subsequently refined to pave
a way forward to advance system-wide analysis of fitness and virulence.
17
2.2. Preliminary model reconstruction utilizing the existing knowledge base
A collection of 1511 metabolic reactions obtained from a consensus of recently published strain-
specific models 102,103 was assembled into a preliminary model of S. aureus. Out of 842 genes in
the latest strain-specific USA300_FPR3757_uid58555 model by Bosi et al.102, 109 did not have
any reactions associated with them, which were not included in our model at this stage. Checking
reactions from the S. aureus N315 model iSB619103 against the annotations of strain
USA300_FPR3757 in the KEGG database1 resulted in the inclusion of seven unique reactions to
the preliminary model. In addition, every reaction in the model was verified for correct gene
annotations in the NCBI, KEGG, and UniProt databases and published resources1,102,104,121-123 to
amend the model with 90 metabolic reactions and annotate 75 reactions with correct Gene-
Protein-Reaction (GPR) rules.
These amendments resulted in a preliminary model that contained 858 metabolic genes catalyzing
1608 reactions involving 1499 metabolites. This model included reactions for central carbon
metabolism, secondary biosynthesis pathway, energy and cofactor metabolism, lipid synthesis,
elongation and degradation, nucleotide metabolism, amino acid biosynthesis and degradation.
The protocol outlined by Thiele et al 2010124 was followed when developing the biomass
equation according to experimental measurements of macromolecular composition105 and
transcriptomic data125 and the biomass compositions by previous models 102-104. Biomass
precursors that do not have either experimental measurements or any literature evidence of
synthesis in S. aureus were excluded. For example, S. aureus lacks an identifiable polyamine
biosynthetic pathway and therefore cannot produce putrescine111,126. In addition,
phosphatidylethanolamine is not produced in S. aureus127,128. Therefore, these components are not
included in the biomass equation.
18
Flux balance analysis (FBA)12,15,129 was employed during model testing, validation, and analyzing
flux distributions at different stages of the study. For performing FBA, the reconstruction was
represented in a mathematical form of stoichiometric coefficients (known as stoichiometric
matrix or S-matrix), where each column represents a metabolite, and each row signifies a
reaction. In addition to the mass balance constraints 11, environmental constraints based on
nutrient availability, the relational constraint of reaction rates with concentrations of metabolites,
and thermodynamic constraints were imposed as necessary. The effects of gene expressions were
incorporated as regulatory constraints on the model as the cell adapted to change in media or gene
knockouts14. The non-growth-associated ATP maintenance demand was estimated to be 5.00
mmol/gDCW.hr in CDM media and 7.91 mmol/gDCW.hr in CDMG media in this study,
according to the established protocol in absence of chemostat growth data124. In CDMG media,
glucose uptake rate was limited to 10 mmol/gDW.hr with other nutrients set to be in excess (see
Supplementary Data 9 for details). In CDM media, glucose uptake rate was set to zero.
2.3. Model curation
The preliminary reconstruction underwent extensive manual curation steps, as outlined below:
Rectification of reaction imbalances: To ensure that each of the reactions in the model is
chemically balanced, the metabolite formula and the stoichiometry of the reactions were checked
against biochemical databases 1,3,130,131. In total, 197 reactions (excluding the biomass reaction,
demand, sink, and exchange reactions) were found to be imbalanced in terms of proton, carbon,
nitrogen, oxygen or sulfur. Most of these reactions (i.e.,182 reactions) were fixed for proton
imbalance and four reactions were fixed for imbalance in other elements. For balancing the
reactions imbalanced in protons, the protonation state consistent with the reaction set in the
preliminary model was checked and additions/deletions of one or multiple protons or water on
either the reactant or the product side were performed. For the other elements, correct
19
stoichiometry was incorporated into the S-matrix. Nonetheless, a few mass- and charge-
imbalanced reactions remained in the model, primarily due to the presence of macromolecules
with unspecified “R”-groups and gaps in knowledge about correct reaction mechanisms. These
remaining reaction imbalances are common in published genome-scale metabolic models132 and
given that the overall stoichiometry of the reactions involving these macromolecules is correct,
these imbalances do not significantly affect the performance of the model.
Identification and elimination of thermodynamically Infeasible Cycles: One of the limitations of
constraint-based genome-scale models is that the mass balance constraints only describe the net
accumulation or consumption of metabolites, without restricting the individual reaction fluxes.
Therefore, they have an inherent tendency to ignore the loop low for electric circuits which states
that there can be no flow through a closed loop in any network at steady state 17. While
biochemical conversion cycles like TCA cycle or urea cycle are ubiquitous in a metabolic
network model, there can be cycles which do not have any net consumption or production of any
metabolite. Therefore, the overall thermodynamic driving force of these cycles are zero, implying
that no net flux can flow around these cycles 17. It is important to identify and eliminate these
Thermodynamically Infeasible Cycles (TICs) to achieve sensible and realistic metabolic flux
distributions.
To identify Thermodynamically Infeasible Cycles in the model, all the nutrient uptakes to the cell
were turned off and an optimization formulation called Flux Variability Analysis (FVA) was
used18. FVA maximizes and minimizes each of the reaction fluxes subject to mass balance,
environmental, and any artificial (i.e., biomass threshold) constraints 18. The reaction fluxes
which hit either the lower bounds or upper bounds are defined as unbounded reactions and were
grouped as a linear combination of the null basis of their stoichiometric matrix. These groups are
indicative of possible thermodynamically infeasible cycles133.
20
The preliminary model had 291 reaction fluxes unnecessarily hitting the upper or lower bounds
during a Flux Variability Analysis (FVA) when no nutrients were provided. Also, the inconsistent
dissipation of ATP and other cofactors, which was persistent in earlier models102, also existed in
the preliminary reconstruction. These two phenomena are observed when the reaction network
contains thermodynamically infeasible cycles17. To eliminate the cycles, duplicate reactions were
removed, lumped reaction were turned off or reactions were selectively turned on/off based on
available cofactor specificity information (see Appendix A for details). In total, 42 reactions were
made irreversible, and four reactions were reversed in directionality either when thermodynamic
information and literature evidence were available, or the restrictions assumed did not conflict
with any literature evidence but resolved an infeasible cycle (details in Appendix A).
Furthermore, 72 reactions were turned off either due to their improper annotations or to remove
lumped or duplicate reactions from the model. For example, the irreversible duplicates for several
reactions including acetolactate synthase, aconitase, phosphoribosylaminoimidazole carboxylase,
alcohol- NAD oxidoreductase, arginine deiminase, D-ribitol-5-phosphate NAD 2-oxidoreductase,
glycerate dehydrogenase, methionine synthase, and ribokinase were removed. Also, based on
available cofactor specificity information134,135, reactions such as cytidine kinase (GTP), glycerol-
3-phosphate dehydrogenase (NAD), guanylate kinase (GMP:dATP), and homoserine
dehydrogenase (NADH) were turned off to ensure correct cofactor usage in these reactions.
Reactions involved in polyamine synthesis and degradation were removed due to the lack of
convincing evidence of polyamine metabolism in S. aureus USA300_FPR3757 111,126. After these
manual curation steps, the number of unbounded reactions (reaction fluxes hitting either the upper
or the lower bound without any nutrient uptake) was reduced to seven. At this step, the model
was checked for erroneous generation of energetic cofactors and confirmed that it could not
21
produce unlimited amount of them without any nutrient input, as described by Zomorrodi and
Maranas133 and followed in previous modeling studies by us7,8,33,136,137 and other groups138,139.
Gapfilling: The annotation of S. aureus USA300_FPR3757 genome in the KEGG database was
next used to bridge several network gaps in the model. At this stage, the model contained 528
blocked reactions compared to 784 in the preliminary reconstruction. While this was a significant
improvement, the model still contained a greater number of blocked reactions than other similar-
sized models104. The blocked reactions were not removed at the current stage because they
contained proper gene annotation information but either their terminal dead-end metabolite was
beyond the scope of the model or no convincing evidence (e.g., high-score annotations) for filling
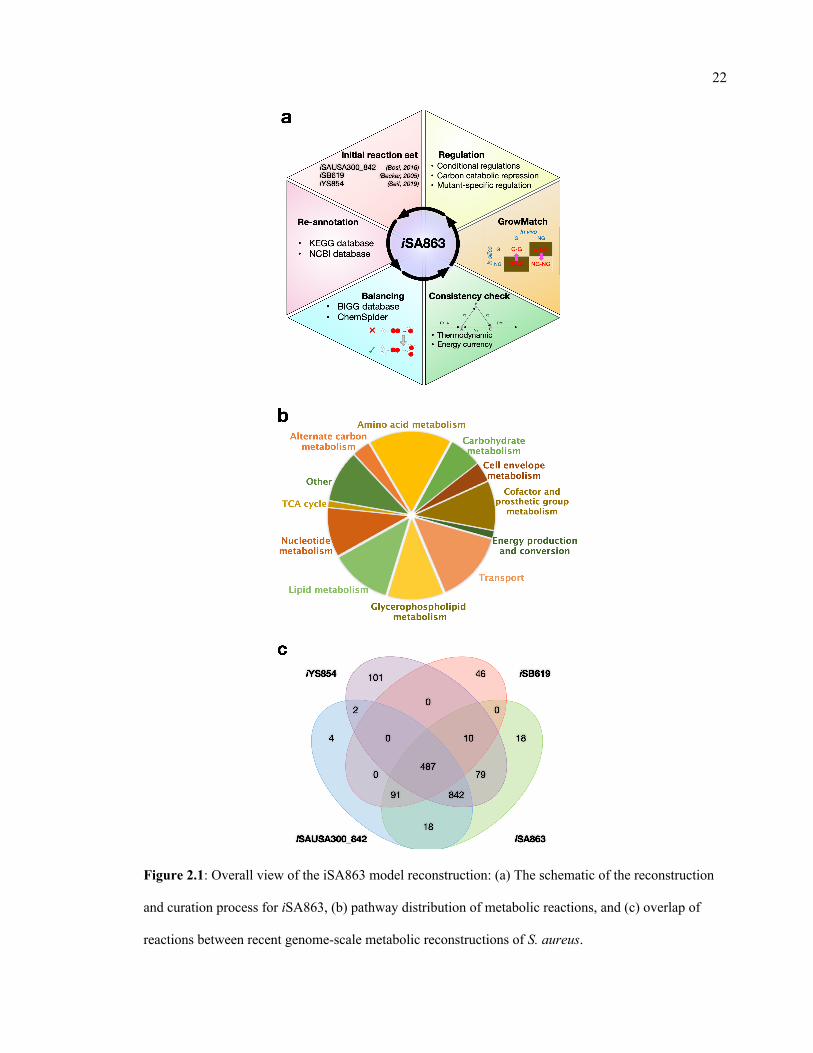
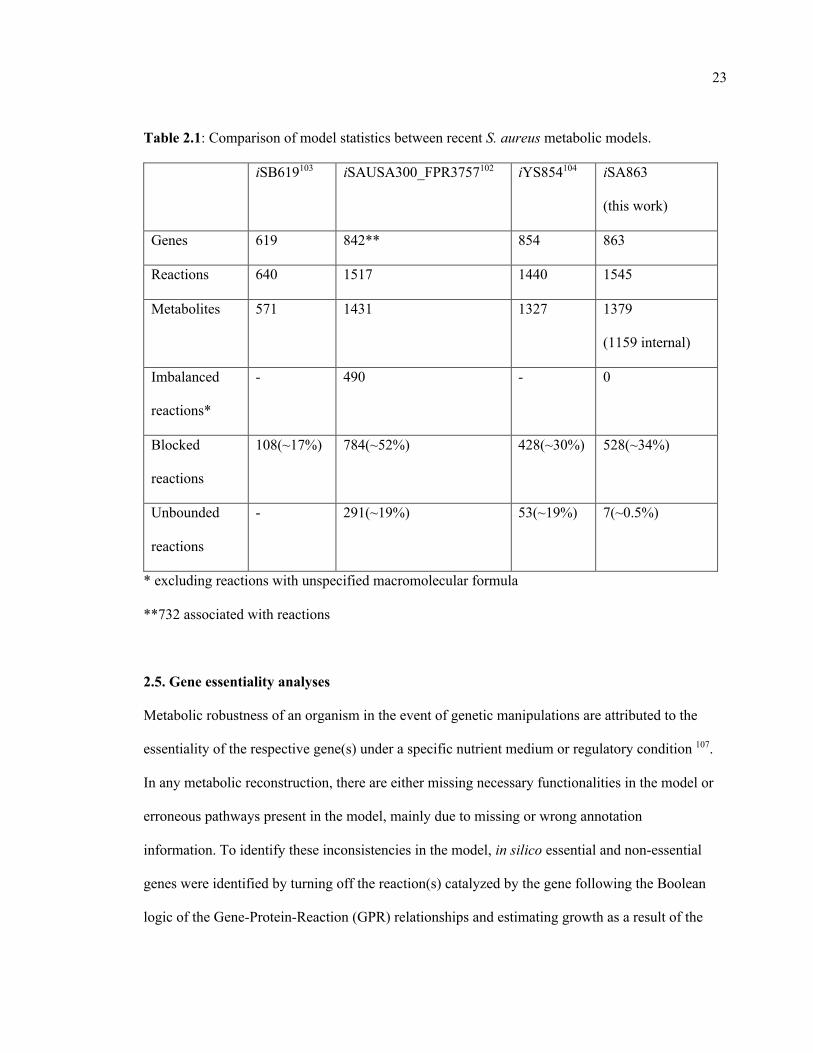
the gap was available. The model reconstruction process, pathway distribution, and overlap of
reactions with other S. aureus models are shown in Figure 2.1 and the comparative model
statistics are presented in Table 2.1.
2.4. Evaluation of growth profiles of mutants in NTML
Pre-cultures of wild-type and isogenic transposon mutant strains from the NTML library were
grown overnight aerobically in 384-well plates containing 100 μL of Tryptic Soy Broth (TSB)/
well with 14 mM glucose. The overnight cultures (1 μL) were seeded into a fresh 384-well plate
containing TSB (100 μL/ well) using a solid 384 pin tool (V & P Scientific) and cultured for 24 h
at 37°C under maximum agitation in a TECAN microplate reader. Preculture ODs were not
specifically standardized due to the large number of mutants in this collection. Growth was
monitored by recording the optical density (OD600) of cultures for 24 h at 30-minute intervals.
The area under the growth curve (AUC) was calculated as a measure of growth for each strain
and used for comparative analyses.
22
Figure 2.1: Overall view of the iSA863 model reconstruction: (a) The schematic of the reconstruction
and curation process for iSA863, (b) pathway distribution of metabolic reactions, and (c) overlap of
reactions between recent genome-scale metabolic reconstructions of S. aureus.
23
Table 2.1: Comparison of model statistics between recent S. aureus metabolic models.
iSB619103 iSAUSA300_FPR3757102 iYS854104 iSA863
(this work)
Genes 619 842** 854 863
Reactions 640 1517 1440 1545
Metabolites 571 1431 1327 1379
(1159 internal)
Imbalanced
reactions*
- 490 - 0
Blocked
reactions
108(~17%) 784(~52%) 428(~30%) 528(~34%)
Unbounded
reactions
- 291(~19%) 53(~19%) 7(~0.5%)
* excluding reactions with unspecified macromolecular formula
**732 associated with reactions
2.5. Gene essentiality analyses
Metabolic robustness of an organism in the event of genetic manipulations are attributed to the
essentiality of the respective gene(s) under a specific nutrient medium or regulatory condition 107.
In any metabolic reconstruction, there are either missing necessary functionalities in the model or
erroneous pathways present in the model, mainly due to missing or wrong annotation
information. To identify these inconsistencies in the model, in silico essential and non-essential
genes were identified by turning off the reaction(s) catalyzed by the gene following the Boolean
logic of the Gene-Protein-Reaction (GPR) relationships and estimating growth as a result of the
24
deletion. Isozymes (i.e., proteins/genes with an “OR” relationship) for essential reactions are not
considered as essential, and for reaction catalyzed by protein with multiple subunits (i.e.,
proteins/genes with an “AND” relationship), each gene responsible for each subunit is considered
essential. A mutant was classified as lethal if its growth rate is below a preset threshold. Essential
genes with the threshold values of 1%, 10%, 25% and 50% of the wild-type growth rate were
estimated. A 1% or 10% threshold did not have any difference on the number of essential genes
and following conventions8,118 used in the community, the 10% threshold was used in this study.
Our growth evaluation experiment revealed varying degrees of growth inhibition of the NTML
mutants compared to the wild-type strain and identified subtle disagreements in gene essentiality
predictions of other studies101,140-144. Therefore, the true set of essential genes required further
scrutiny, which is why, as a conservative estimate, I used a consensus set of essential genes by
utilizing the existing knowledge base and our own experimental findings 101,140-144, as explained in
detail in the Appendix B. Most of the essential genes were determined by randomly inserting
transposons into S. aureus and excluding mutations that remained after growing the cells 140,141,143.
Genes reported to be essential in any sources were considered essential unless there was evidence
suggesting otherwise 101,140-144. There were three types of positive evidence. First, mutants
obtained from Nebraska’s Transposon Mutant Library 117,145 were not considered essential unless
it was found to be domain-essential 140. This is because the transposon may have inserted in a
non-essential part of the gene, allowing a partially functional protein to be formed. Second, if the
gene was found to be essential at only 43⁰C, then it is evident that the gene was incorrectly found
to be essential in literature because of a high-temperature plasmid curing step in the processes
used in the other literature sources 140. Third, if the gene was found to be essential using a
promoterless transposon insert, but not with promoter-containing methodologies, then the gene is
upstream of an essential gene, and other sources found it to be essential due to polar effects that
25
disrupt expression 140. The step-by-step methodology used in determining core essential gene set
is illustrated in Appendix B.
Out of the consensus set of the essential genes, 167 metabolic genes that are present in the
iSA863 metabolic model were considered for further model refinements. The results of the in
silico growth estimation were compared with these experimental evidences, and the genes were
classified based on the matches and mismatches between in silico and in vivo results. Correct
model predictions for non-essential and essential genes are denoted by GG and NGNG, while
wrong model predictions for non-essential and essential genes are denoted by NGG and GNG,
respectively. GNG inconsistencies imply that the metabolic model erroneously contains reactions
that complement for the lost gene function. In contrast, NGG inconsistencies are generally
indicative of missing or poor annotations in the model.
2.6. Using GrowMatch to resolve Growth and No-growth inconsistencies
To resolve the growth and no-growth inconsistencies in the model, an automated procedure called
GrowMatch was used118. Correct model predictions for non-essential and essential genes were
denoted by GG and NGNG, while wrong model predictions for non-essential and essential genes
were denoted by NGG and GNG, respectively in which the first of the two terms (“G” or “NG”)
corresponds to in silico and the second term refers to in vivo observations. GrowMatch tries to
reconcile GNG predictions by suppressing spurious functionalities that were mistakenly included
in the model and NGG predictions by adding missing functionalities to the model while
maintaining the already identified correct growth and no-growth predictions 118. Every suggested
GrowMatch modification was filtered for the resolution of conflict following the procedure of
Henry et al. in 2009 146.
26
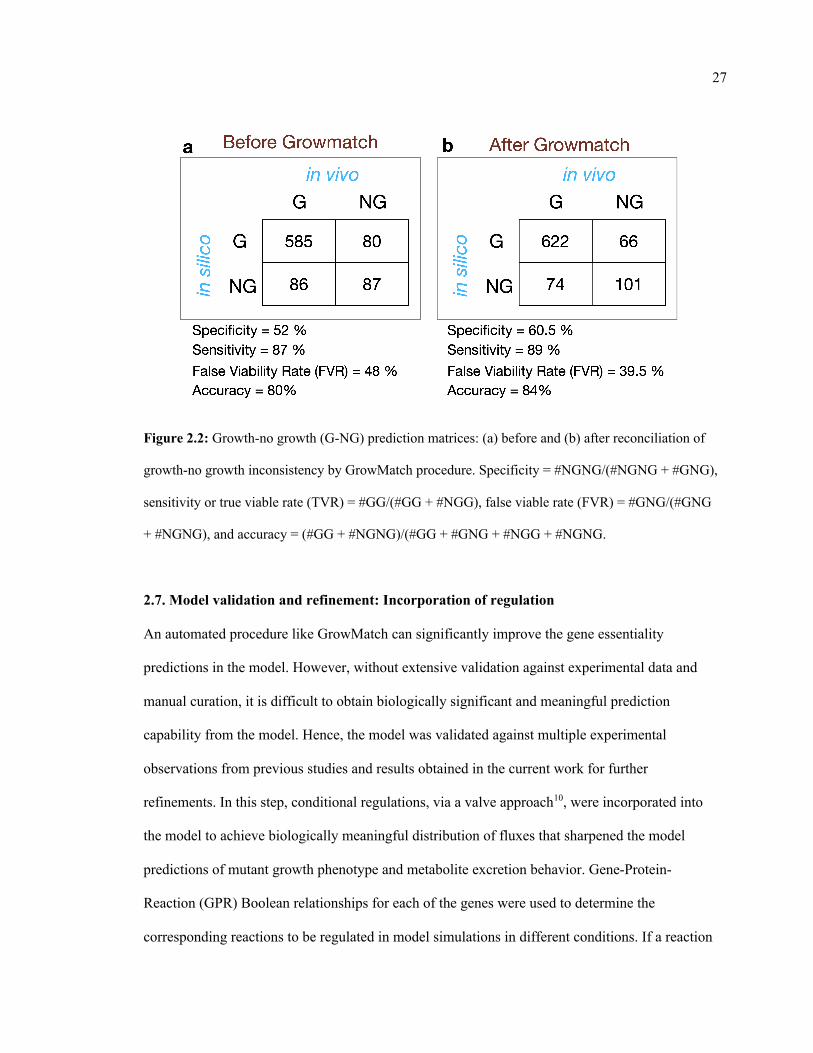
The overall impact of applying Growmatch is shown in Figure 2.2 (a: before Growmatch and b:
after). The specificity increased from 52% to 60.5%, the sensitivity increased from 87% to 89%,
the false viability rate decreased from 48% to 39.5%, and the accuracy increased from 80% to
84%. In comparison, the specificity, sensitivity, false viability rate, and accuracy of iYS854104
could be calculated to be 50.6%, 93.2%, 49.4%, and 85%, respectively. To resolve the NGG
inconsistencies, metabolic reactions were added from highly-curated metabolic models20,146 as
well as the Modelseed database3. A total of five reactions were added to the model and three
reactions were allowed to go in the reverse direction based on literature evidence or
thermodynamic information, which reduced the number of NGGs by 12. It should be noted here
that while Growmatch could suggest multiple solutions to fix an NGG inconsistency, every
suggestion needs to be manually scrutinized and filtered out if it does not have strong literature
suggestion indicating a possible gap in the genome annotation or worsens the thermodynamic
infeasibility in the model. Model predictions of essential genes were further improved upon the
removal of spurious reactions and genes. To this end, six reactions that did not have either any
gene associated with them (orphan reactions) or proper gene annotations, were removed from the
model, resulting in an 8% reduction in GNGs. 81 of the GrowMatch predicted resolution
strategies were not accepted because they resulted in conflicts with correct growth (GG) and no-
growth (NGNG) predictions in the model.
It was observed that the majority of the GNG inconsistencies fall in the category of metal
ion/proton antiporters and amino-acid-tRNA ligases, which indicates that non-s. aureus-specific
and/or incorrectly annotated reactions might be present in the network. It should be noted that
attempting to reconcile every GNG and NGG inconsistency is out of scope of this work and not
tractable with the existing knowledgebase. Since Growmatch solutions are only preliminary in
silico suggestions, these gene functions need to be further verified by experimentation to enrich
our knowledge about the correct genome annotation and regulatory effects.
27
Figure 2.2: Growth-no growth (G-NG) prediction matrices: (a) before and (b) after reconciliation of
growth-no growth inconsistency by GrowMatch procedure. Specificity = #NGNG/(#NGNG + #GNG),
sensitivity or true viable rate (TVR) = #GG/(#GG + #NGG), false viable rate (FVR) = #GNG/(#GNG
+ #NGNG), and accuracy = (#GG + #NGNG)/(#GG + #GNG + #NGG + #NGNG.
2.7. Model validation and refinement: Incorporation of regulation
An automated procedure like GrowMatch can significantly improve the gene essentiality
predictions in the model. However, without extensive validation against experimental data and
manual curation, it is difficult to obtain biologically significant and meaningful prediction
capability from the model. Hence, the model was validated against multiple experimental
observations from previous studies and results obtained in the current work for further
refinements. In this step, conditional regulations, via a valve approach10, were incorporated into
the model to achieve biologically meaningful distribution of fluxes that sharpened the model
predictions of mutant growth phenotype and metabolite excretion behavior. Gene-Protein-
Reaction (GPR) Boolean relationships for each of the genes were used to determine the
corresponding reactions to be regulated in model simulations in different conditions. If a reaction
28
in catalyzed by multiple isozymes, the reaction was only suppressed if all the isozymes were
downregulated in a certain condition. For a reaction catalyzed by multiple subunit proteins, it was
suppressed if any of the genes responsible for a subunit was downregulated. To simulate the
condition-specific and mutant-specific repressions, the allowable flux ranges were limited to a
fraction of their maximum wild-type flux range. To assess the effect of the level of repression, I
performed a sensitivity analysis using repression effect simulating 10%, 25%, 50% and 90% of
maximum wild-type flux space. The full list of regulations can be found in Appendix C.
A major regulatory system that was incorporated in the model was the carbon catabolite
repression, which is a well-studied global regulatory process in low-GC Gram-positive bacteria in
the presence of a preferred carbon source (e.g., glucose) that induces the repression of genes
involved in the metabolism of alternative carbon sources (e.g., amino acids) 113,120. In addition,
SrrAB and Rex-dependent transcriptional regulation are prominent driving forces of metabolic
flux through respiratory metabolism that was integrated into the model147-149. Furthermore,
mutant-specific repression of respiration, histidine and ornithine metabolism, and pyruvate
metabolism were imposed on the model for the menD mutant119.
2.8. Model validation and refinement: Growth phenotypes study
The essentiality predictions for 29 amino acid catabolic pathway genes in the model was
validated against the mutant growth phenotypes evaluated in a previous study112. The mutants
were grown in a chemically defined medium (CDM) supplemented with 18 amino acids but
lacking glucose. That study112 found that 11 of the mutations did not cause any growth defect,
while 11 mutations caused intermediate growth defect and seven mutations were lethal. The
model failed to recapitulate growth phenotype for nine (ald1/ald2- aldehyde dehydrogenase,
aspA- aspartate aminotransferase, gltA- citrate synthase, sdhA- succinate dehydrogenase,
sdaAA/sdaAB- serine dehydratase, ansA- asparaginase, arcA1/arcA2- arginine deiminase, and
29
rocF- arginase) out of the 29 mutants, which warranted further investigation and refinements in
the relevant pathways in the model. The gudB mutant did not appear to be an essential gene in the
model simulation because other genes including D-alanine transaminase (dat) and aspartate
transaminase (aspA) could convert glutamate to alpha-ketoglutarate. Based on information about
kinetic limitation on alanine uptake150 and the experimentally measured uptake values reported by
Seif et al104, a tighter constraint on alanine uptake of 0.4 mmol/gDW.hr was imposed in the
model, which resulted in a correct prediction of the essentiality of the gudB gene. The essentiality
of sucC and sucA genes was ensured in the model by rectifying the direction of the alternate
pathway consisting of succinyldiaminopimelate transaminase (dapE) and tetrahydrodipicolinate
succinylase (dapD). In addition to that, the TCA cycle reactions converting citrate to succinyl-
CoA were constrained to allow flux towards the forward direction only. Two of the gaps in the
histidine transport pathway and proline catabolism were filled during the refinement process to
allow for utilization of these alternate carbon sources in the absence of glucose. Ornithine-
putrescine antiport, lactate dehydrogenase (ferricytochrome), malic enzyme (NADP), and
succinyldiaminopimelate transaminase were removed from the model due to the lack of evidence
in S. aureus. Upon these refinements, the model was able to correctly predict 24 (out of 29) of the
mutant phenotypes, except gltA, acnA, icd, fumC, and rocF mutants. In comparison, the previous
S. aureus model iYS854 failed to predict the growth phenotype for gudB, ald1, ald2, pyc, argD
and gltA mutants104. The model refinements in the central metabolic pathway in terms of
correction of reaction directionality, additions, and deletions are shown in Figure 2.3.
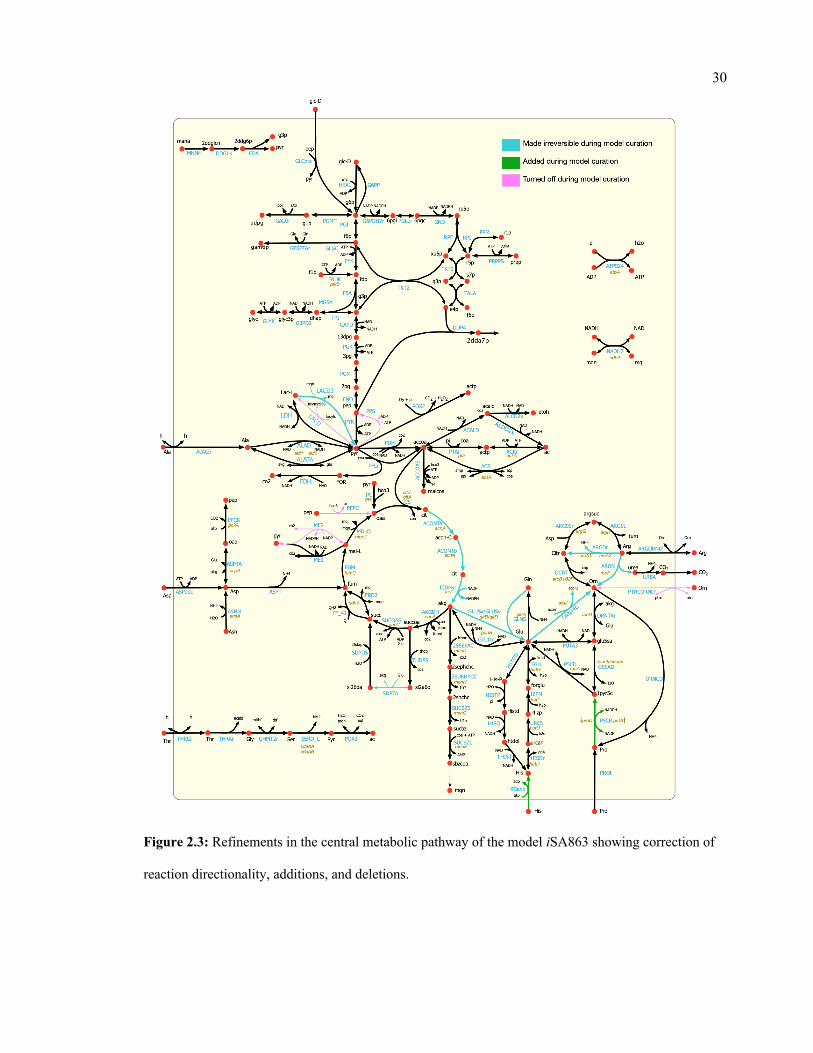
30
Figure 2.3: Refinements in the central metabolic pathway of the model iSA863 showing correction of
reaction directionality, additions, and deletions.
31
2.9. Model validation and refinement: Metabolite excretion profiles of mutants
In addition to the model refinements mentioned in the preceding section, we determined the
metabolite excretion profiles of eight mutants during exponential growth (Table 2.2) in CDM and
CDMG (CDM media with added glucose) media. The mutants considered were pyc (pyruvate
carboxylase), citZ (citrate synthase), sucA (2-oxoglutarate dehydrogenase), ackA (acetate kinase),
gudB (glutamate dehydrogenase), ndhA (NADH dehydrogenase), menD (menaquinone
biosynthesis protein), and atpA (a subunit of ATPase). These mutants were selected for their
potential in carbon and nitrogen redirection in the cell that affect glycolysis, TCA cycle,
gluconeogenesis, Electron Transport Chain (ETC), cellular redox potential, overflow metabolism,
and fitness, as was evident by the growth inhibition of these mutants in our experiment.
Chemically Defined Media (CDM) was prepared as previously described by Hussain, Hastings
and White151 with minor modifications to amino acid content. Amino acids were diluted to final
concentrations in the media from working stocks, as described by Vitko and Richardson152.
Briefly, the media contained the following components: Na2HPO4.2H2O, 10 g/L; KH2PO4, 3
g/L; MgSO4.7H2O, 0.5 g/L; Biotin, 0.1 mg/L; Nicotinic acid, 2 mg/L; D-Pantothenic Acid Ca
salt, 2 mg/L; Pyridoxal, 4 mg/L; Pyridoxamine dihydrochloride, 4 mg/L; Riboflavin, 2 mg/L;
Thiamin hydrochloride, 2 mg/L; Adenine sulfate, 20 mg/L; Guanine hydrochloride, 20 mg/L;
CaCl2.6H2O, 10 mg/L; MnSO4, 5 mg/L; (NH4)2SO4. FeSO4.6H2O, 6 mg/L. The individual
amino acids were diluted 100-fold into CDM from stock solutions prepared as follows: L-
Aspartic acid, 15 g/L in 1N HCl; L- Alanine 10 g/L in dH2O; L- Arginine, 10 g/L in 1N HCl; L-
Cystine, 5 g/L in 1N HCl; G1ycine, 10 g/L in dH2O; L-Glutamic acid, 15 g/L in 1N HCl; L-
Histidine, 10 g/L in 1N HCl; L-Isoleucine, 15 g/L in 1M NH4OH; L-Lysine, 10 g/L in 1N HCl;
L-Leucine, 15 g/L in 1N HCl; L-Methionine, 10 g/L in 1N HCl; L-Phenylalanine, 10 g/L in 1M
NH4OH; L-Proline, 15 g/L in dH2O; L-Serine, 10 g/L in dH2O; L-Threonine, 15 g/L in dH2O;
L-Tryptophan, 10 g/L in 1N HCl; L-Tyrosine, 10 g/L in 1N HCl; L-Valine, 15 g/L in dH2O. 10
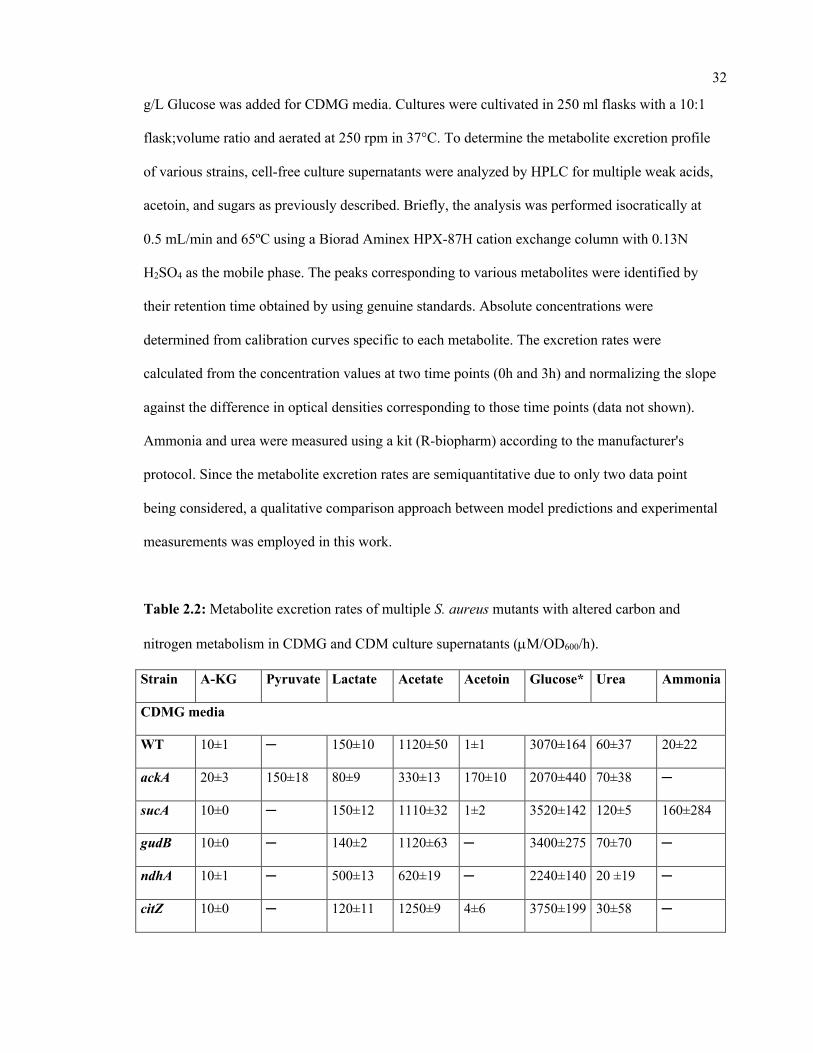
32
g/L Glucose was added for CDMG media. Cultures were cultivated in 250 ml flasks with a 10:1
flask;volume ratio and aerated at 250 rpm in 37°C. To determine the metabolite excretion profile
of various strains, cell-free culture supernatants were analyzed by HPLC for multiple weak acids,
acetoin, and sugars as previously described. Briefly, the analysis was performed isocratically at
0.5 mL/min and 65ºC using a Biorad Aminex HPX-87H cation exchange column with 0.13N
H2SO4 as the mobile phase. The peaks corresponding to various metabolites were identified by
their retention time obtained by using genuine standards. Absolute concentrations were
determined from calibration curves specific to each metabolite. The excretion rates were
calculated from the concentration values at two time points (0h and 3h) and normalizing the slope
against the difference in optical densities corresponding to those time points (data not shown).
Ammonia and urea were measured using a kit (R-biopharm) according to the manufacturer's
protocol. Since the metabolite excretion rates are semiquantitative due to only two data point
being considered, a qualitative comparison approach between model predictions and experimental
measurements was employed in this work.
Table 2.2: Metabolite excretion rates of multiple S. aureus mutants with altered carbon and
nitrogen metabolism in CDMG and CDM culture supernatants (µM/OD600/h).
Strain A-KG Pyruvate Lactate Acetate Acetoin Glucose* Urea Ammonia
CDMG media
WT 10±1 ─ 150±10 1120±50 1±1 3070±164 60±37 20±22
ackA 20±3 150±18 80±9 330±13 170±10 2070±440 70±38 ─
sucA 10±0 ─ 150±12 1110±32 1±2 3520±142 120±5 160±284
gudB 10±0 ─ 140±2 1120±63 ─ 3400±275 70±70 ─
ndhA 10±1 ─ 500±13 620±19 ─ 2240±140 20 ±19 ─
citZ 10±0 ─ 120±11 1250±9 4±6 3750±199 30±58 ─
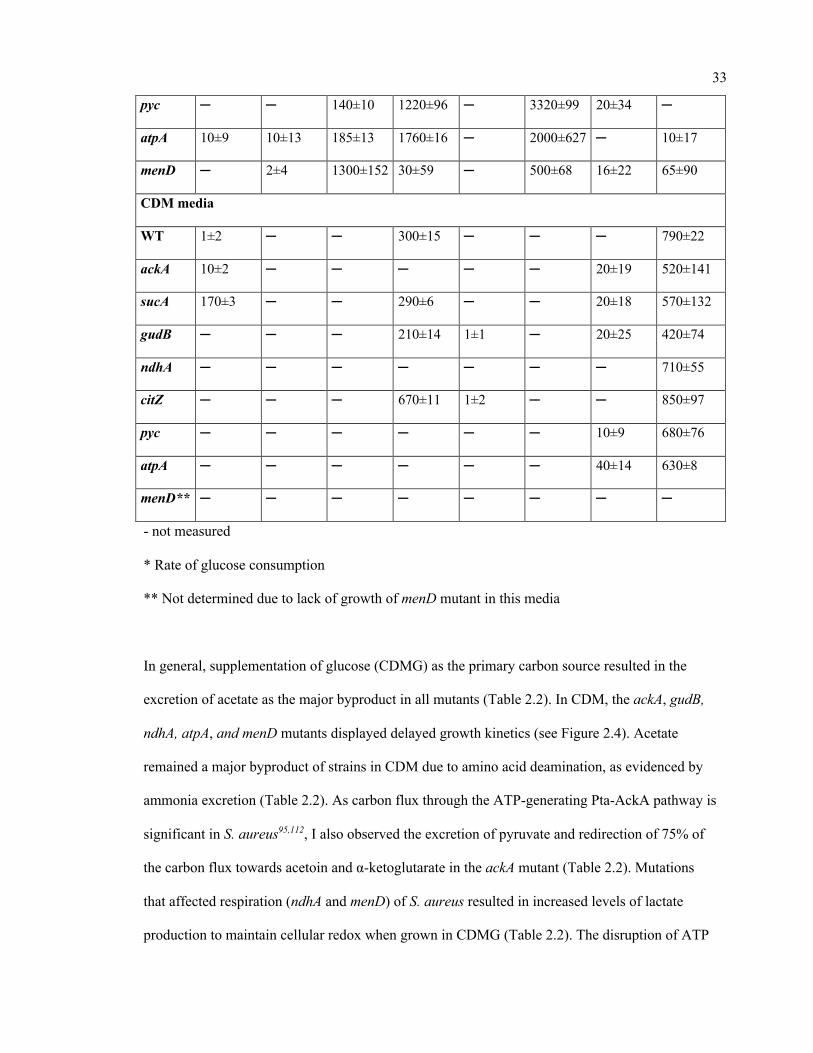
33
pyc ─ ─ 140±10 1220±96 ─ 3320±99 20±34 ─
atpA 10±9 10±13 185±13 1760±16 ─ 2000±627 ─ 10±17
menD ─ 2±4 1300±152 30±59 ─ 500±68 16±22 65±90
CDM media
WT 1±2 ─ ─ 300±15 ─ ─ ─ 790±22
ackA 10±2 ─ ─ ─ ─ ─ 20±19 520±141
sucA 170±3 ─ ─ 290±6 ─ ─ 20±18 570±132
gudB ─ ─ ─ 210±14 1±1 ─ 20±25 420±74
ndhA ─ ─ ─ ─ ─ ─ ─ 710±55
citZ ─ ─ ─ 670±11 1±2 ─ ─ 850±97
pyc ─ ─ ─ ─ ─ ─ 10±9 680±76
atpA ─ ─ ─ ─ ─ ─ 40±14 630±8
menD** ─ ─ ─ ─ ─ ─ ─ ─
- not measured
* Rate of glucose consumption
** Not determined due to lack of growth of menD mutant in this media
In general, supplementation of glucose (CDMG) as the primary carbon source resulted in the
excretion of acetate as the major byproduct in all mutants (Table 2.2). In CDM, the ackA, gudB,
ndhA, atpA, and menD mutants displayed delayed growth kinetics (see Figure 2.4). Acetate
remained a major byproduct of strains in CDM due to amino acid deamination, as evidenced by
ammonia excretion (Table 2.2). As carbon flux through the ATP-generating Pta-AckA pathway is
significant in S. aureus95,112, I also observed the excretion of pyruvate and redirection of 75% of
the carbon flux towards acetoin and α-ketoglutarate in the ackA mutant (Table 2.2). Mutations
that affected respiration (ndhA and menD) of S. aureus resulted in increased levels of lactate
production to maintain cellular redox when grown in CDMG (Table 2.2). The disruption of ATP
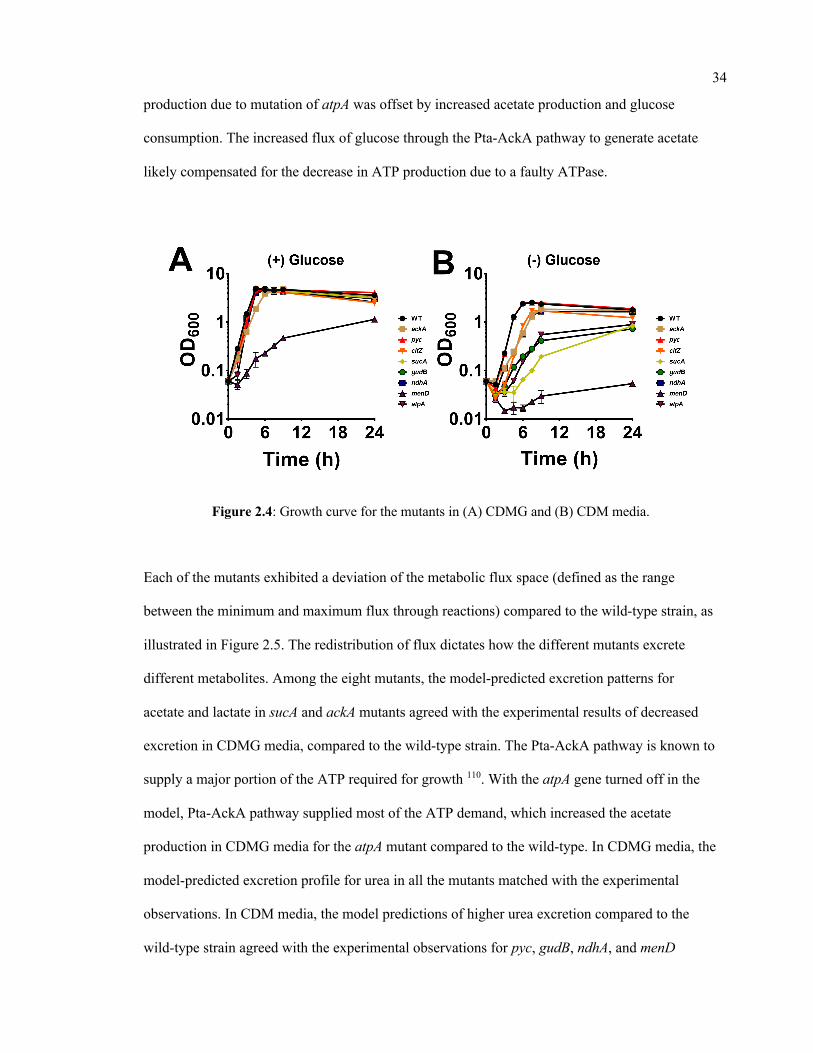
34
production due to mutation of atpA was offset by increased acetate production and glucose
consumption. The increased flux of glucose through the Pta-AckA pathway to generate acetate
likely compensated for the decrease in ATP production due to a faulty ATPase.
Figure 2.4: Growth curve for the mutants in (A) CDMG and (B) CDM media.
Each of the mutants exhibited a deviation of the metabolic flux space (defined as the range
between the minimum and maximum flux through reactions) compared to the wild-type strain, as
illustrated in Figure 2.5. The redistribution of flux dictates how the different mutants excrete
different metabolites. Among the eight mutants, the model-predicted excretion patterns for
acetate and lactate in sucA and ackA mutants agreed with the experimental results of decreased
excretion in CDMG media, compared to the wild-type strain. The Pta-AckA pathway is known to
supply a major portion of the ATP required for growth 110. With the atpA gene turned off in the
model, Pta-AckA pathway supplied most of the ATP demand, which increased the acetate
production in CDMG media for the atpA mutant compared to the wild-type. In CDMG media, the
model-predicted excretion profile for urea in all the mutants matched with the experimental
observations. In CDM media, the model predictions of higher urea excretion compared to the
wild-type strain agreed with the experimental observations for pyc, gudB, ndhA, and menD
35
mutants. Similar to the experimental results, excretion of ammonia was predicted by the model in
all mutants when glucose was absent (CDM media). These correct predictions can be attributed to
the deamination of the amino acids consumed in CDM media when the cell adapts to amino acids
due to CcpA-mediated control of amino acid metabolism. The Rex and SrrAB repression on
central carbon metabolism allowed the model to correctly simulate the oxygen deprivation in the
model, which, in turn, resulted in correct predictions of decreased acetate excretion by the ndhA
mutant in both CDM and CDMG media. Rex and SrrAB-mediated repression of pyruvate formate
lyase (PFLr), alcohol dehydrogenase (ACALD, ALDD2x), and other pathways downstream of
pyruvate shifted carbon flux away from the acetate production. At the same time, the flux space
for lactate dehydrogenase (LDH) widened, which allowed for more lactate excretion in the
CDMG media. Mutant-specific regulations and refinements also improved the model’s predictive
capacity for menD and pyc mutants. Incorporation of condition-specific and mutant-specific
regulations were important to capture the biologically meaningful phenotypic behavior, which is
evident from the observation that the unregulated model could only predict approximately 10 out
of 24 cases in CDMG and 16 out of 24 cases in CDM media, while incorporation of those
regulations resulted in 18 out of 24 correct predictions in CDMG and 20 out of 24 correct
predictions in CDM media.
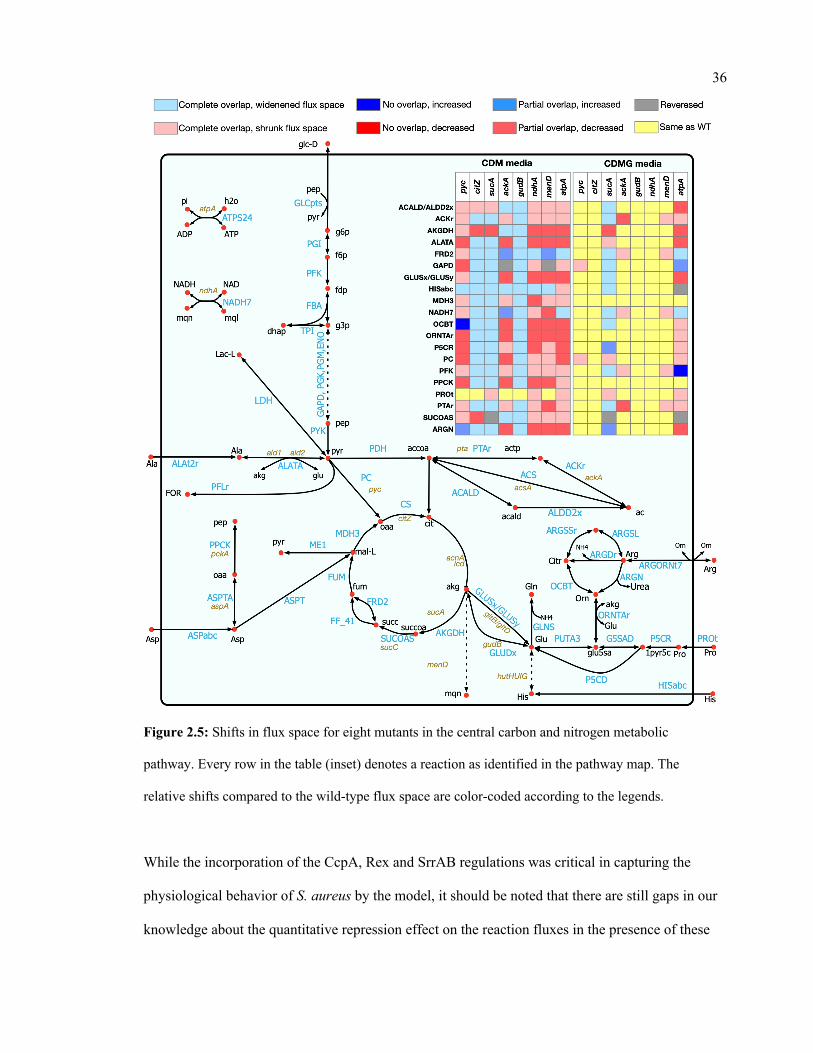
36
Figure 2.5: Shifts in flux space for eight mutants in the central carbon and nitrogen metabolic
pathway. Every row in the table (inset) denotes a reaction as identified in the pathway map. The
relative shifts compared to the wild-type flux space are color-coded according to the legends.
While the incorporation of the CcpA, Rex and SrrAB regulations was critical in capturing the
physiological behavior of S. aureus by the model, it should be noted that there are still gaps in our
knowledge about the quantitative repression effect on the reaction fluxes in the presence of these
37
regulators. To explore the quantitative effect of repression on the mutant phenotypes, different
levels of repression (10%, 25%, 50% and 90% of the maximum wild-type flux space) was
imposed on the model and metabolite excretion behavior was observed (data not shown). The
different levels of repression showed varied degrees of agreement with experimental observation,
with the 50% of the wild-type cutoff preforming the best overall. However, there were specific
cases when the 50% cutoff was not highly predictive. For example, in CDMG media, ammonia
production was not predicted in the menD, atpA, and sucA mutants by the model with a 50%
cutoff, which was observed experimentally. Upon further investigation, it was observed that
relaxing the repressions (to 90% of the wild-type flux space), the discrepancies were removed. In
addition, a stronger repression effect (10%-25% of wild-type) on the reactions downstream of
pyruvate redirected a portion of the carbon flux to acetolactate and resulted in acetoin excretion,
which was not observed with a more relaxed (50%-90% of wild-type) repression effect. In
CDMG media, the citZ mutant correctly predicted the excretion pattern of acetate because, with
the reduced flux space for the TCA cycle reactions, more carbon could be directed to the Pta-
AckA pathway. However, in the CDM media, when amino acids were the primary source of
carbon, deletion of the citZ gene did change the model predicted flux space in the Pta-AckA
pathway, and hence could not capture the decrease in acetate excretion rate. The reason for these
inconsistencies could be either the lack of a complete understanding of the regulatory processes
that affects the relationship between amino acid catabolism, urea cycle, TCA cycle and pyruvate
metabolism or the inherent non-linearity that exists between gene expressions and flux levels in
some cases (i.e., a limitation of any regulation-incorporating methods in a metabolic model10),
and therefore, warrant further investigation.
38
2.10. Model validation and refinement: Carbon catabolism capacity
In order to further test the accuracy of the model, the growth predictive capability of the model
was validated against a recent study of carbon source utilization by S. aureus strain USA300-
TCH1516 by Seif et al.104. Out of the 69 carbon sources tested, the authors observed growth on
53 metabolites and no growth on 16 metabolites in their BIOLOG experiment. Our model
correctly predicted growth on 41 and no-growth on 12 of the carbon sources, and falsely
predicted growth on four and no-growth on 12 carbon sources (see Appendix D for details). In
comparison, iYS854 correctly predicted growth on 42 and no-growth on five of the carbon
sources, and falsely predicted growth on 11 and no-growth on 11 carbon sources. Overall, our
model achieved a specificity of 75%, a precision of 91%, and an accuracy of 77%, which in
general are either at par with or better than previously developed models104 and further
demonstrates the improved predictive capability of this new model.
2.11. Conclusions
In the current study, an updated and comprehensive genome-scale metabolic model of the
methicillin-resistant human pathogen S. aureus USA300_FPR3757 was reconstructed from the
previous strain specific models 102-104, amended using annotations based on KEGG database1, and
refined and validated based on published and new experimental results. Strain USA300 FPR3757
is one of the common MRSA strains with available genome annotation (GenBank accession
number NC_007793.1) and is closely related to the strain JE2 116. While the Nebraska Transposon
Mutant Library117 was developed for JE2, the S. aureus USA300 FPR3757 chromosomal genome
sequence was used to map transpositions of bursa aurealis into the genome of S. aureus JE2,
since the annotated genome sequence of strain JE2 was not available at that time. Therefore, I
chose to utilize the existing knowledgebase. Reactions were examined and fixed to ensure
chemical and charge balance and thermodynamic consistencies. The extensive manual curation
performed on the preliminary reconstruction resulted in improved prediction capabilities and
39
successful capture of experimentally observed metabolic traits. All these demonstrate the
necessity of exhaustive manual scrutiny and rectification of automated reconstructions. Further
experimental results from gene essentiality, mutant growth and metabolite excretion studies
enabled high-resolution model refinements to further enhance the predictive capabilities of the
model. The final genome-scale metabolic reconstruction (iSA863) is therefore a product of the
series of automated and manual curation steps.
S. aureus remains a significant threat to human health, which drives a growing number of studies
towards understanding how staphylococcal metabolism relates to antibiotic resistance and
pathogenesis. Very few studies have addressed these interrelationships from a systems biology
perspective, which requires a predictive in silico metabolic model capable of capturing the
biochemical features of the pathogen. This work addresses these gaps through the development of
a detailed metabolic model informed not only from existing resources, such as the NTML, in
silico genome sequences, annotation databases, and theoretical metabolic stoichiometry but also
from our own experimental studies on mutant fitness, gene essentiality, and metabolite excretion
profile. The results presented in this work demonstrate the predictive capacity of the new
genome-scale metabolic reconstruction of S. aureusUSA300_FPR3757, iSA863, in different
environments, utilizing different substrates, and with perturbed genetic contents, which paves the
way for a mechanistic understanding of S. aureus metabolism. This latest genome-scale model of
S. aureus demonstrates high performance in capturing gene essentiality, mutant phenotype and
substrate utilization behavior observed in experiments. However, the accuracy and prediction
capability, as well as the ability to generate model-based drug-target discoveries, can be further
enhanced by incorporating extensively vetted flux measurements, quantitative proteomics, and
kinetic measurements of metabolic intermediates. The development of a more accurate systems-
level metabolic model for S. aureus will have a tremendous impact on future scientific
discoveries and will be a valuable resource shared among the staphylococcal research community

40
for the identification and implementation of intervention strategies that are successful against a
wide range of pathogenic strains.
41
Chapter 3
Transcriptomics-guided Discovery of Global Regulatory Mechanisms
During Heat Stress on Developing Rice Seeds
Abiotic stressors such as cold, heat, drought, salt and high concentrations of heavy metals
significantly affect the plant vigor and crop yields. In order to adapt to these stress conditions,
plants use a suite of strategies such as changing the levels of relative abundance of stress
responsive genes and/or proteins that ultimately lead to the large-scale changes in the levels of
gene expressions (i.e., transcriptome), protein abundances (i.e., proteome), and metabolite levels
(i.e., metabolome) 153. However, the information flow as part of a response to environmental cue
is not essentially linear. In other words, due to posttranslational mechanism and complex gene to
protein associations (among many other factors), expression patterns at the transcript as well as
protein levels and metabolite abundances do not always correlate. This constitutes a challenge to
understand and then utilize the mechanisms involved in stress tolerance response in plants for
crop improvement. Therefore, there is a clear need for a comprehensive systems-level effort to
elucidate the phenotypic differences and/or plasticity of rice under these stressful conditions.
Such information can be useful for developing biomarkers for breeding stress tolerant rice
germplasm.
To elucidate the extent and directional hierarchy of gene regulation in rice seeds under heat stress,
I developed and implemented a robust multi-level optimization-based algorithm called Minimal
Regulatory Network identifier (MiReN). MiReN could predict the minimal regulatory
relationship between a gene and its potential regulators from our temporal transcriptomic dataset.
MiReN predictions for global regulators including stress-responsive gene Slender Rice 1 (SLR1)
and disease resistance gene XA21 were validated with published literature. It also predicted novel
42
regulatory influences of other major regulators such as Kinesin-like proteins KIN12C and STD1,
and WD repeat-containing protein WD40. Out of the 228 stress-responsive transcription factors
identified, I predicted de novo regulatory influences on three major groups (MADS-box M-type,
MYB, and bZIP) and investigated their physiological impacts during stress. Overall, MiReN
results can facilitate new experimental studies to enhance our understanding of global regulatory
mechanisms triggered during heat stress, which can potentially accelerate the development of
stress-tolerant cultivars.
3.1. Introduction
Rice (Oryza sativa) is the primary food crop for more than half of the human population. Rice has
a highly mature genomics and genetic toolbox with multiple high-quality finished genomes, 3000
rice resequenced genomes, and efficient genetic engineering and gene editing protocols. Rice
yield, nutrient content, and cooking quality are highly sensitive to abiotic stresses. This is
particularly true for high temperatures during reproductive development when the grains are
transitioning through rapid development and grain weight accumulation 154-158. This poses a
serious threat to global food security with the increasing atmospheric temperature. Therefore,
there is a clear need for a comprehensive effort to elucidate the phenotypic differences and/or
plasticity of rice under these stressful conditions. Such information can be useful for developing
biomarkers for breeding stress tolerant rice germplasm. Since rice shares extensive synteny and
collinearity with other grasses and monocot crops 159-161, fundamental discoveries in rice can also
be leveraged for improving other major monocot crops of high economic importance such as
maize, wheat and sorghum, as well as candidate energy crops such as switchgrass 162. However,
due to the complex nature of protein translation, folding, and degradation, complex formation,
posttranslational modification, allosteric regulation, and substrate availability, the expression
patterns at the transcript as well as protein levels and metabolite abundances do not always
correlate linearly 163. This becomes even more complicated since the time frame for imposition of
43
abiotic stresses can vary widely, thus creating stress-specific response thresholds at cellular and
whole-plant level. Heat stress typically can occur more rapidly relative to some of the other
stressors such as drought and nutrient deficiency, and therefore, mitigates some of the temporal
challenges.
A number of studies focused on identifying heat stress-responsive genes and understanding the
molecular mechanisms underlying these responses as well as the cellular consequence of these
stress responses 164-166. With the fast progress in molecular biology, significant research effort was
geared towards uncovering the adaptive and/or defensive mechanisms at the molecular level in
plants in stressed conditions 167,168. Moreover, the elucidation of the topology of genetic
regulatory networks using high-throughput omics data is a pressing challenge driving numerous
research efforts 169. For example, Cooper et al. focused on developing a network of genes
associated with developmental and stress responses by identifying and localizing genes to stress-
tolerance trait genetic loci 170. Dasika et al. developed an optimization-based framework to infer
time delays in gene regulatory networks from expression data 171. Chen et al. developed BNArray
172, an algorithm implemented in R environment, which statistically evaluates potential high-
scoring Bayesian network sets and directed, dense coherent significant sub-networks from
microarray data.
A small number of global regulatory genes/proteins usually play a central role in integrating the
regulatory architecture of both prokaryotes and eukaryotes and modulates the transcriptional
responses to environmental stressors 173-176. Although previous studies have explored the co-
expression patterns of stress-responsive genes, they do not address the hierarchy in regulatory
relationships and the role of the major regulatory players. Also, the elucidation of directional
hierarchy and the parsimonious nature of the regulatory relationships have not been explicitly
addressed yet. Extracting these features requires a careful systems-level analysis of the temporal
44
gene expression profiles. Some recent studies attempted to address this knowledge gap. Zhang et
al. proposed Context Based Dependency Network (CBDN), a method for reconstructing directed
gene regulatory network 177 by evaluating the magnitude of changes in expression dependencies
between genes. To identify major transcriptional regulators in rice involved in the metabolic
adjustments necessary for adaptation to drought, Mohanty et al. used correlative analysis of the
patterns of differential spatio-temporal expression profile and cis-element enrichment in leaf,
root, and young panicle of rice plants subjected to drought stress during tillering, booting, and
panicle elongation stages 178. In a subsequent work, they identified that crosstalk between a
number of key transcription factors and different phytohormones is responsible for survival of an
alcohol dehydrogenase 1 (ADH1)-deficient rice mutant under complete submergence 179. Mueller
et al. developed an optimization-based algorithm to identify the regulatory influence networks for
cyanobacterial strains, namely Synechocystis PCC 6803 and Cyanothece ATCC 51142 180. While
these studies focused on identifying the regulatory effect of known global regulators, a data-
driven systematic approach to decipher the molecular mechanisms that drive the expression
pattern of these major regulatory players is yet to be developed. Moreover, the overwhelming
abundance of multi-level omics data presents a challenge to interpret and incorporate the
information into any system-level study of metabolism in an efficient fashion 181,182. A reasonably
robust and minimal model that incorporates the necessary and sufficient set of regulatory
influences grounded on experimental data will be critical. Therefore, a clustering-based method to
identify global regulators and to define a minimal network involving the global regulators has the
potential to capture the emergent biological shifts and stress response mechanisms while being
computationally tractable and efficient.
I attempted to elucidate the heat stress response mechanism in developing rice seeds. The step-
by-step workflow is presented in Figure 3.1. To this end, I used differential gene expression
analysis on our temporal transcriptomic dataset collected from developing rice seeds under
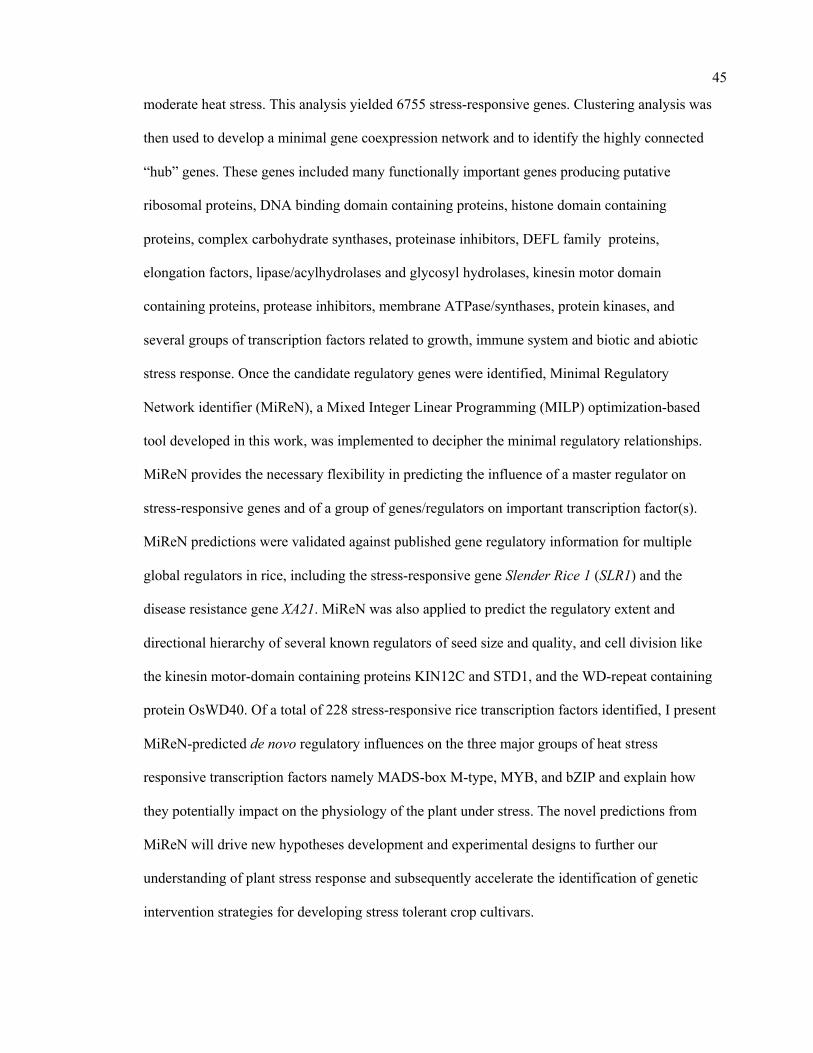
45
moderate heat stress. This analysis yielded 6755 stress-responsive genes. Clustering analysis was
then used to develop a minimal gene coexpression network and to identify the highly connected
“hub” genes. These genes included many functionally important genes producing putative
ribosomal proteins, DNA binding domain containing proteins, histone domain containing
proteins, complex carbohydrate synthases, proteinase inhibitors, DEFL family proteins,
elongation factors, lipase/acylhydrolases and glycosyl hydrolases, kinesin motor domain
containing proteins, protease inhibitors, membrane ATPase/synthases, protein kinases, and
several groups of transcription factors related to growth, immune system and biotic and abiotic
stress response. Once the candidate regulatory genes were identified, Minimal Regulatory
Network identifier (MiReN), a Mixed Integer Linear Programming (MILP) optimization-based
tool developed in this work, was implemented to decipher the minimal regulatory relationships.
MiReN provides the necessary flexibility in predicting the influence of a master regulator on
stress-responsive genes and of a group of genes/regulators on important transcription factor(s).
MiReN predictions were validated against published gene regulatory information for multiple
global regulators in rice, including the stress-responsive gene Slender Rice 1 (SLR1) and the
disease resistance gene XA21. MiReN was also applied to predict the regulatory extent and
directional hierarchy of several known regulators of seed size and quality, and cell division like
the kinesin motor-domain containing proteins KIN12C and STD1, and the WD-repeat containing
protein OsWD40. Of a total of 228 stress-responsive rice transcription factors identified, I present
MiReN-predicted de novo regulatory influences on the three major groups of heat stress
responsive transcription factors namely MADS-box M-type, MYB, and bZIP and explain how
they potentially impact on the physiology of the plant under stress. The novel predictions from
MiReN will drive new hypotheses development and experimental designs to further our
understanding of plant stress response and subsequently accelerate the identification of genetic
intervention strategies for developing stress tolerant crop cultivars.
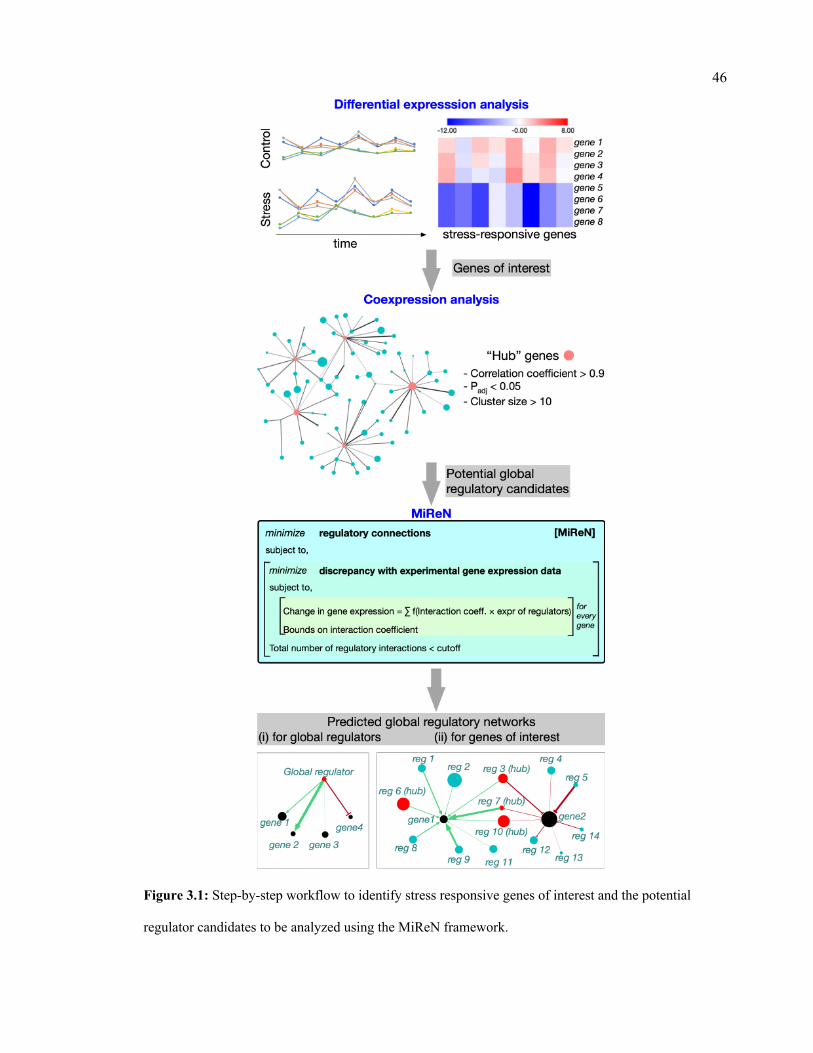
46
Figure 3.1: Step-by-step workflow to identify stress responsive genes of interest and the potential
regulator candidates to be analyzed using the MiReN framework.
47
3.2. Data collection
Rice (Oryza sativa) cv. ‘Kitaake’ plants were grown in 4-inch square pots under optimum
greenhouse conditions (16-h-light/8-h-dark cycle at 28°C/ 25°C) until flowering. At flowering,
uniformly looking plants were moved to in percival growth chambers maintained at control
conditions (28/25 °C, 16/8 h light/dark). The spikelets were marked at time of fertilization on two
consecutive days and plants were maintained at control growth chamber conditions. To
investigate the transcriptional responses of rice early seed development under heat stress, we
exposed the plants to moderate heat stress (35°C). Previous studies show that exposure to short-
term moderate heat stress (35°C) during early seed development reduces the seed size at maturity
183. Therefore, we selected 35°C for simulating the moderate heat stress.
When the marked seeds/spikelets reached to 36 hours after fertilization (HAF) and 12 HAF, half
of plants were moved to stress chamber (35 °C). The developing seeds without husk were
collected from control and stress plants at time points indicated in Figure 3.2. The time points
were decided with an idea to capture early (i.e. within few hours after imposing the stress) heat
stress responses. Two biological replicates were collected for each of control and stress time-
point. For each sample, developing seeds were pooled from 2-3 plants. Total RNA isolated using
RNAeasy mini-elute kit (Qiagen) was sequenced using illumina-sequencing single end 100 bp
reads. RNA-seq analysis including trimming low-quality reads, read alignment and read counting
was performed as described in Chen et al., 2016 183. Trimmomatic was used to remove low
quality reads and trimmed reads were aligned to rice MSU (v 7.0) genome using TopHat 184,185.
To get number of reads per gene, HTSeq-count was used in “union” resolution mode 186.
48
Figure 3.2: Transcriptomic experimental design of control and stressed samples of developing rice
seed. The collected time points in Hours After Fertilization (HAF) are indicated at the bottom. The
temperature profile for the control and stress samples are indicated by blue and red lines, respectively.
For each control and stress samples at every time points, two biological replicates (indicated by “R”)
were collected.
For RT-qPCR, a 20 ul reverse transcription reaction was performed to synthesize cDNA (iScript
cDNA Synthesis kit, Invitrogen). RT-PCR was performed using OsFIE1 and OsMADS87 specific
primers (IQ SYBR Green Supermix, Bio-Rad). Relative expression was calculated using Delta-
Delta-Cq method 187.
3.3. Differential gene expression under heat stress
Differential gene expression analysis was used to identify the stress responsive genes from the
transcriptomic data as the first step of the data analysis (see Figure 3.1). The Reads Per Kilobase
of transcript, per Million mapped reads (RPKM) values were filtered with a cutoff of 20 reads
(maximum among all conditions and time points). In addition, the genes with a standard deviation
in gene expression levels (normalized read count values) less than 2% across all data points were
discarded from the analysis. The DESeq algorithm in R software package “Bioconductor” was
used for differential gene expression analysis 81. DESeq employs negative binomial distribution
and a shrinkage estimator for the distribution’s variance methods to test for differential
expression 81. The average of the raw read counts from two replicates were used to calculate the
49
fold change and the log2(foldchange) of the genes. Genes with a log2 (foldchange) value of 1 or
higher were considered overexpressed and genes with a log2 (foldchange) value of -1 or lower
were considered underexpressed, while satisfying an adjusted p-value of <0.05 82. GO functional
enrichment analysis was performed to identify significantly enriched biological processes and
molecular functions in stress condition. The GO analysis was carried out by AgriGO software
with FDR ≤ 0.05 based on biological process (BP), molecular function (MF) and cellular
component (CC) GO terms 188,189. Heatmap of gene set enrichment was developed in Morpheus
(https://software.broadinstitute.org/morpheus/) using the z-score of differential enrichment for
each GO term in the stressed sample compared to the control sample at every time point.
Differential gene expression analysis yielded a total of 3441 significantly differentially expressed
genes of interest. Parametric Gene Set Enrichment Analysis identified 39 Gene Ontology (GO)
terms related to cellular processes that are significantly differentially enriched in the stressed
samples (shown in Figure 3.3). Genes involved in photosynthesis, precursor metabolite synthesis,
energy metabolism, regulation of cellular components, and response to stress and abiotic stimulus
were consistently upregulated under heat stress across all time points. On the other hand, genes
related to protein translation, macromolecule synthesis, signaling processes, flowering,
reproduction, growth and organismal development, transport, cell cycle, and metabolic processes
involving proteins and nucleic acids showed significant downregulation in stressed condition.
This set of stress-responsive genes defines the genes of interest for de novo identification of their
global regulars using the MiReN algorithm.
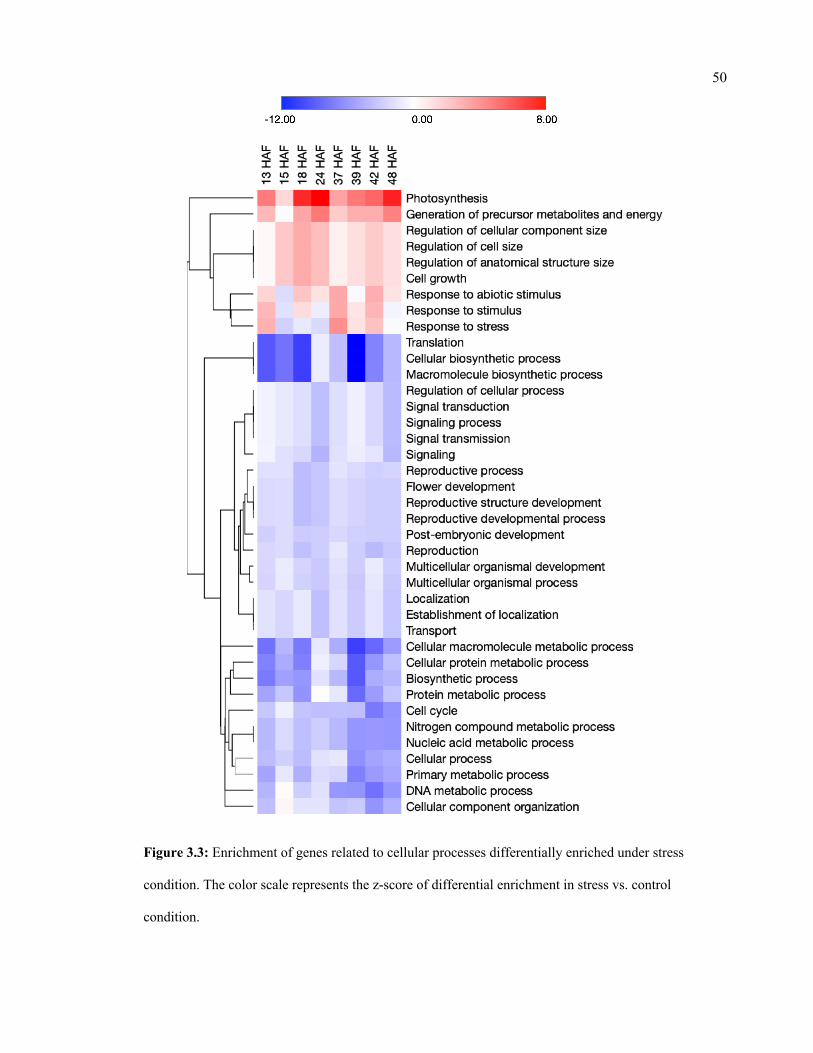
50
Figure 3.3: Enrichment of genes related to cellular processes differentially enriched under stress
condition. The color scale represents the z-score of differential enrichment in stress vs. control
condition.
51
The differential gene expression analysis and the coexpression analysis were used as
preprocessing tools leading to the MiReN framework. The genes with high clustering coefficients
in the coexpression network were used as the candidate global regulators in MiReN, while the
genes identified from the differential expression analysis are the target genes for which I predict
the global regulatory influences. We also verified the expression patterns of two known rice seed
regulators, OsFIE1 (LOC_Os08g04290) and OsMADS87 (LOC_Os03g38610) by real-time
quantitative PCR for control samples. From the differential gene expression analysis, I observed
that biological processes including photosynthesis, precursor metabolite synthesis, energy
metabolism, regulation of cellular components, and response to stress and abiotic stimulus were
consistently upregulated under heat stress. These upregulations support prior observation that
moderate heat stress during early seed development improved seed germination rate and
advanced seedling establishment, suggesting that short-term episodes of elevated temperature
play a positive role in enhancing seed performance 190,191. The early heat stress response in rice
seed also triggers protection mechanisms against cell or tissue damage from exposure to high
temperatures 192,193. For example, Heat Shock Factor (HSF) genes were observed to be
differentially overexpressed in our study, similar to the observations in other plant species in prior
studies 194-198. This facilitates the acquisition of an autonomous thermo-tolerance caused by a
moderate/sub-lethal heat stress to overcome subsequent exposure to higher temperatures 199-201.
On the other hand, genes related to protein translation, macromolecule synthesis. signaling
processes, flowering, reproduction, growth and organismal development, transport, cell cycle, and
metabolic processes involving proteins and nucleic acids showed significant down-regulation in
the stressed condition. Many of the genes in the pathways from starch metabolism (especially
those encoding the subunits of starch synthase) were observed to be downregulated at high
temperature, which can potentially result in poor grain quality and reduced size and weight, as
suggested by previous studies 202-205. A number of genes involved in the biosynthesis of
52
Gibberellic acid (for example OsGA2OX3, OsCPS2, and OsCPS4) showed reduced expression
level under heat stress, which is consistent with previous reports 191. The repression of Gibberellic
acid production can have drastic effects on development of the seed and the plant overall. Our
results indicate a consistent repression of the genes producing 14-3-3 proteins under heat stress,
which function as signal regulators and modulate nitrate reductase under limiting carbon and
nitrogen conditions and play a crucial role in the modulation of ATPase/synthase complex and
plasma membrane expansion 206,207 in stressed conditions. The repression of 14-3-3 proteins in
turn relaxes the regulation on ATPase production, as evident from the upregulation of membrane
ATPase/synthase observed in heat stress from our results. Many of the genes that were found to
be significantly heat-responsive in our study were also associated with responses to other abiotic
stresses such as drought, salt, cold, and submergence, as found in other studies 164,208. For
example, genes for salt stress responsive proteins (Salt stress root protein RS1,
LOC_Os01g13210; DREPP plasma membrane polypeptide family protein, LOC_Os02g18410),
abscisic acid-responsive proteins (LOC_Os11g06720), wound/stress protein (LOC_Os02g51710)
and zinc finger A20 and AN1 domain-containing stress-associated proteins (LOC_Os06g41010)
were identified as heat-sensitive in this study. In addition, six universal stress protein-producing
genes were differentially expressed in our study, which indicates that there is significant overlap
of responses under multiple different abiotic stresses.
3.4. Co-expression network and clustering behavior
I next sought to examine the co-expression patterns of the 3441 stress-responsive genes to
develop gene coexpression networks in control and stress conditions, with the goal to identify the
highly coexpressed “hub” genes which can be considered as putative global regulators for many
stress-responsive genes. I used a threshold of >0.9 on the Pearson’s correlation coefficient with
an adjusted p-value of <0.05 for development of the coexpression networks.
53
Based on the cluster size, a total of 267 genes in control condition and 409 genes in stress
condition were identified as “hub” genes. These highly connected genes are used in the MiReN
framework as the potential global regulatory players for the target genes of interest identified in
the previous section. These “hub” genes included previously identified MADS-box genes 183 as
well as a large number of genes with putative functions. The most dominant groups of hub genes
were responsible for the production of putative ribosomal proteins, DNA binding domain
containing proteins, histone domain containing proteins, complex carbohydrate synthases,
proteinase inhibitors, DEFL family proteins, elongation factors, lipase/acylhydrolases and
glycosyl hydrolases, kinesin motor domain containing proteins, protease inhibitors, membrane
ATPase/synthases, protein kinases, and several groups of transcription factors related to growth,
immune system and biotic and abiotic stress response. Overall, the major cluster uniquely
identified in stress condition includes genes for brassinosteroid signaling, calmodulin-dependent
protein kinases, histone domain containing proteins, cyclin-dependent kinases, endonuclease,
elongation factors, kinesin motor domain containing proteins, F-box domain containing proteins,
ribosomal proteins L4, L5, L7/L12, L29 and S13p/ S18e, and WD repeat-containing proteins.
The co-expression and clustering analysis provided important insights about the interactions
within the groups of differentially expressed genes during the early developmental stage of rice
seed under heat stress. For example, one major cluster uniquely detected in the coexpression
network in stress condition involved the “hub” genes that are responsible for brassinosteroid
insensitive 1-associated kinase 1 (OsI-BAK1), which is associated with grain filling and seed
development in rice 209. The brassinosteroid class of steroid hormones regulates plant
development and physiology, including controlling division, elongation and differentiation of
various cell types 210. BR-mediated signaling has been demonstrated to play a role in the
adaptation to biotic stresses such as insect and microbial attack, and abiotic stresses such as
drought, temperature changes, and salinity via crosstalk with other hormones such as ABA, GA,
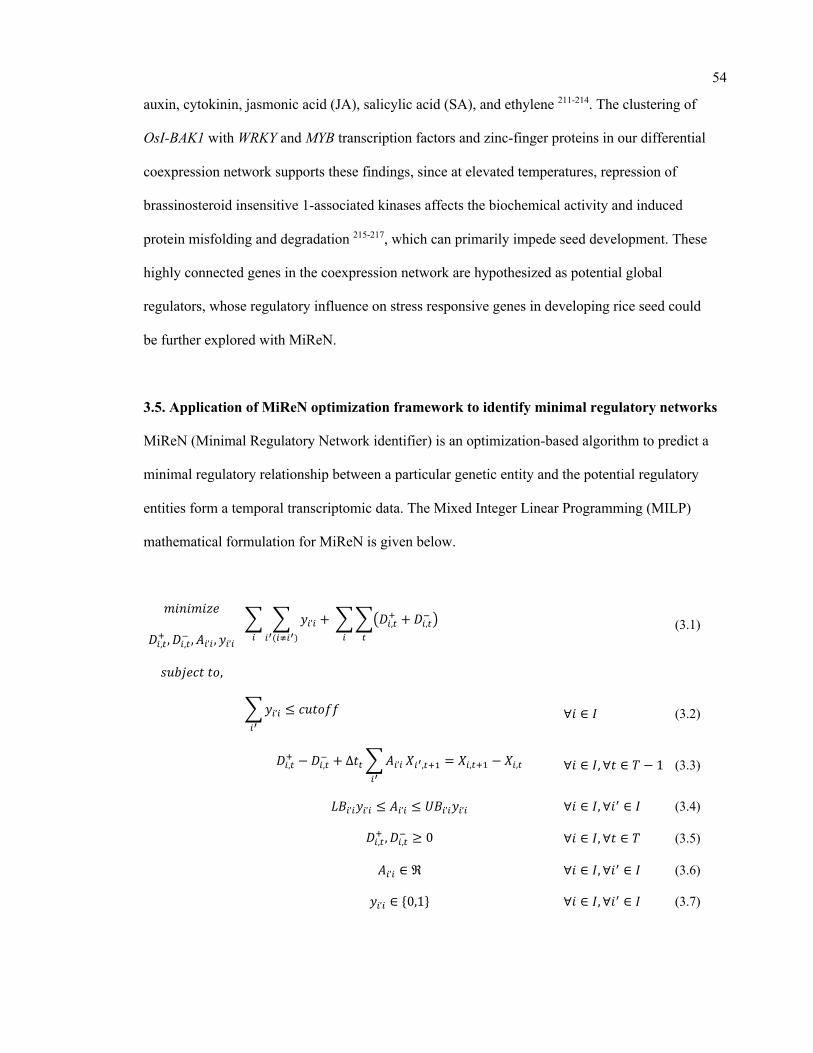
54
auxin, cytokinin, jasmonic acid (JA), salicylic acid (SA), and ethylene 211-214. The clustering of
OsI-BAK1 with WRKY and MYB transcription factors and zinc-finger proteins in our differential
coexpression network supports these findings, since at elevated temperatures, repression of
brassinosteroid insensitive 1-associated kinases affects the biochemical activity and induced
protein misfolding and degradation 215-217, which can primarily impede seed development. These
highly connected genes in the coexpression network are hypothesized as potential global
regulators, whose regulatory influence on stress responsive genes in developing rice seed could
be further explored with MiReN.
3.5. Application of MiReN optimization framework to identify minimal regulatory networks
MiReN (Minimal Regulatory Network identifier) is an optimization-based algorithm to predict a
minimal regulatory relationship between a particular genetic entity and the potential regulatory
entities form a temporal transcriptomic data. The Mixed Integer Linear Programming (MILP)
mathematical formulation for MiReN is given below.
𝑚𝑖𝑛𝑖𝑚𝑖𝑧𝑒
𝐷!,#$ , 𝐷!,#% , 𝐴!’! , 𝑦!’! + + 𝑦!’!
!!(!(!!)!
+++-𝐷!,#$ +𝐷!,#% .#!
(3.1)
𝑠𝑢𝑏𝑗𝑒𝑐𝑡𝑡𝑜,
+𝑦!’! ≤ 𝑐𝑢𝑡𝑜𝑓𝑓!!
∀𝑖 ∈ 𝐼 (3.2)
𝐷!,#$ −𝐷!,#% + ∆𝑡#+𝐴!’!!!
𝑋!!,#$* = 𝑋!,#$* − 𝑋!,# ∀𝑖 ∈ 𝐼, ∀𝑡 ∈ 𝑇 − 1 (3.3)
𝐿𝐵!’!𝑦!’! ≤ 𝐴!’! ≤ 𝑈𝐵!’!𝑦!’! ∀𝑖 ∈ 𝐼, ∀𝑖+ ∈ 𝐼 (3.4)
𝐷!,#$ , 𝐷!,#% ≥ 0 ∀𝑖 ∈ 𝐼, ∀𝑡 ∈ 𝑇 (3.5)
𝐴!’! ∈ ℜ ∀𝑖 ∈ 𝐼, ∀𝑖+ ∈ 𝐼 (3.6)
𝑦!’! ∈ {0,1} ∀𝑖 ∈ 𝐼, ∀𝑖+ ∈ 𝐼 (3.7)
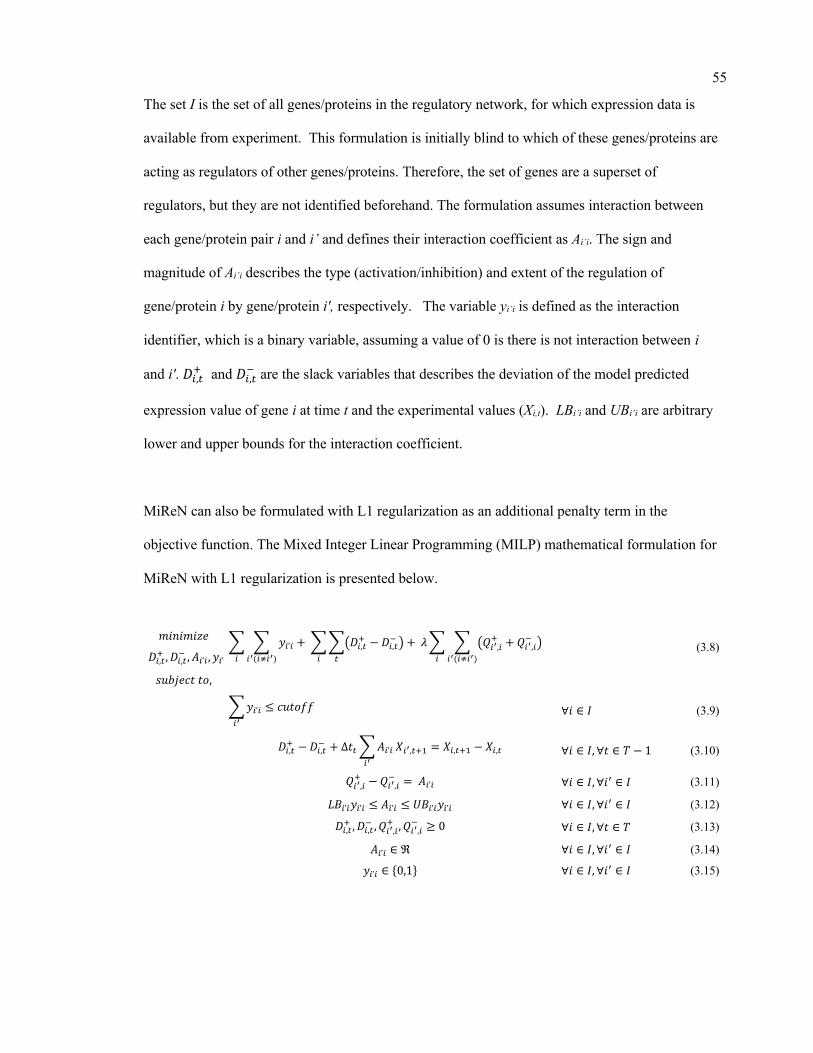
55
The set I is the set of all genes/proteins in the regulatory network, for which expression data is
available from experiment. This formulation is initially blind to which of these genes/proteins are
acting as regulators of other genes/proteins. Therefore, the set of genes are a superset of
regulators, but they are not identified beforehand. The formulation assumes interaction between
each gene/protein pair i and i’ and defines their interaction coefficient as Ai’i. The sign and
magnitude of Ai’i describes the type (activation/inhibition) and extent of the regulation of
gene/protein i by gene/protein i', respectively. The variable yi’i is defined as the interaction
identifier, which is a binary variable, assuming a value of 0 is there is not interaction between i
and i'. 𝐷!,0; and 𝐷!,0. are the slack variables that describes the deviation of the model predicted
expression value of gene i at time t and the experimental values (Xi,t). LBi’i and UBi’i are arbitrary
lower and upper bounds for the interaction coefficient.
MiReN can also be formulated with L1 regularization as an additional penalty term in the
objective function. The Mixed Integer Linear Programming (MILP) mathematical formulation for
MiReN with L1 regularization is presented below.
𝑚𝑖𝑛𝑖𝑚𝑖𝑧𝑒
𝐷#,%& , 𝐷#,%' , 𝐴#’# , 𝑦#’# + + 𝑦#’#
#!(#*#!)#
+++-𝐷#,%& −𝐷#,%' / + 𝜆+ + -𝑄#!,#& +𝑄#!,#
' /#!(#*#!)#
%#
(3.8)
𝑠𝑢𝑏𝑗𝑒𝑐𝑡𝑡𝑜,
+𝑦#’# ≤ 𝑐𝑢𝑡𝑜𝑓𝑓#!
∀𝑖 ∈ 𝐼 (3.9)
𝐷#,%& −𝐷#,%' + ∆𝑡%+𝐴#’##!
𝑋#!,%&, = 𝑋#,%&, − 𝑋#,% ∀𝑖 ∈ 𝐼, ∀𝑡 ∈ 𝑇 − 1 (3.10)
𝑄#!,#& −𝑄#!,#
' =𝐴#’# ∀𝑖 ∈ 𝐼, ∀𝑖- ∈ 𝐼 (3.11)
𝐿𝐵#’#𝑦#’# ≤ 𝐴#’# ≤ 𝑈𝐵#’#𝑦#’# ∀𝑖 ∈ 𝐼, ∀𝑖- ∈ 𝐼 (3.12)
𝐷#,%& , 𝐷#,%' , 𝑄#!,#& , 𝑄#!,#
' ≥ 0 ∀𝑖 ∈ 𝐼, ∀𝑡 ∈ 𝑇 (3.13)
𝐴#’# ∈ ℜ ∀𝑖 ∈ 𝐼, ∀𝑖- ∈ 𝐼 (3.14)
𝑦#’# ∈ {0,1} ∀𝑖 ∈ 𝐼, ∀𝑖- ∈ 𝐼 (3.15)
56
Here, the objective function minimizes the number of regulatory connections to a gene (first
term), the deviation from experimental gene expression profile (second term), and the L1-norm of
the interaction coefficient variable (third term, with 𝜆 being the weight on the penalty term).
While it possible that multiple different combinations of highly impactful regulators on a set of
genes can yield different networks, the MiReN framework with L0 regularization imposes a
strong penalty and avoids the issue. From paired sample statistical analysis of a sample case
(results in Supplemental information 6) with low (0.001), medium (1.0), and high (1000) values
of the penalization in L1 regularized formulation of MiReN, a significant change in the values of
the regulation coefficients was not observed compared to the L0 formulation.
3.6. MiReN-predicted regulatory influences of known regulators in rice
MiReN-predicted regulatory networks for some of the known regulators (e.g., Slender Rice 1,
SLR1 and the disease resistance gene XA21) were validated to test the performance of the
optimization framework in predicting regulations correctly.
MiReN predicted negative interaction coefficients for each of the genes in the GA-responsive
gene family (Figure 3.4 A), as identified by Jan and Komatsu 2006 218, which implies a repressive
action. The Slender Rice 1 (SLR1) gene and the corresponding Rice DELLA protein SLR1 are
responsible for the repression of several Gibberellic acid response genes in rice 218,219. These
genes play crucial roles in controlling plant height 220,221, regulates stomatal development and
patterning 222, modules the elongation of pedicels and/or secondary branches 223,224, and
sometimes enhances the resistance to insects 225 in rice. The slr1-1 mutant is a constitutive
gibberellin (GA) response phenotype that elongates as if saturated with GAs 226. It should be
noted that the SLR1 gene and the SLR1-repressed GA pathway have circadian regulation, which is
also demonstrated by the expression pattern of 39 genes over the course of the day (starting from
sunrise to sunset) and transcription factors regulated by SLR1 in our dataset. For example, the
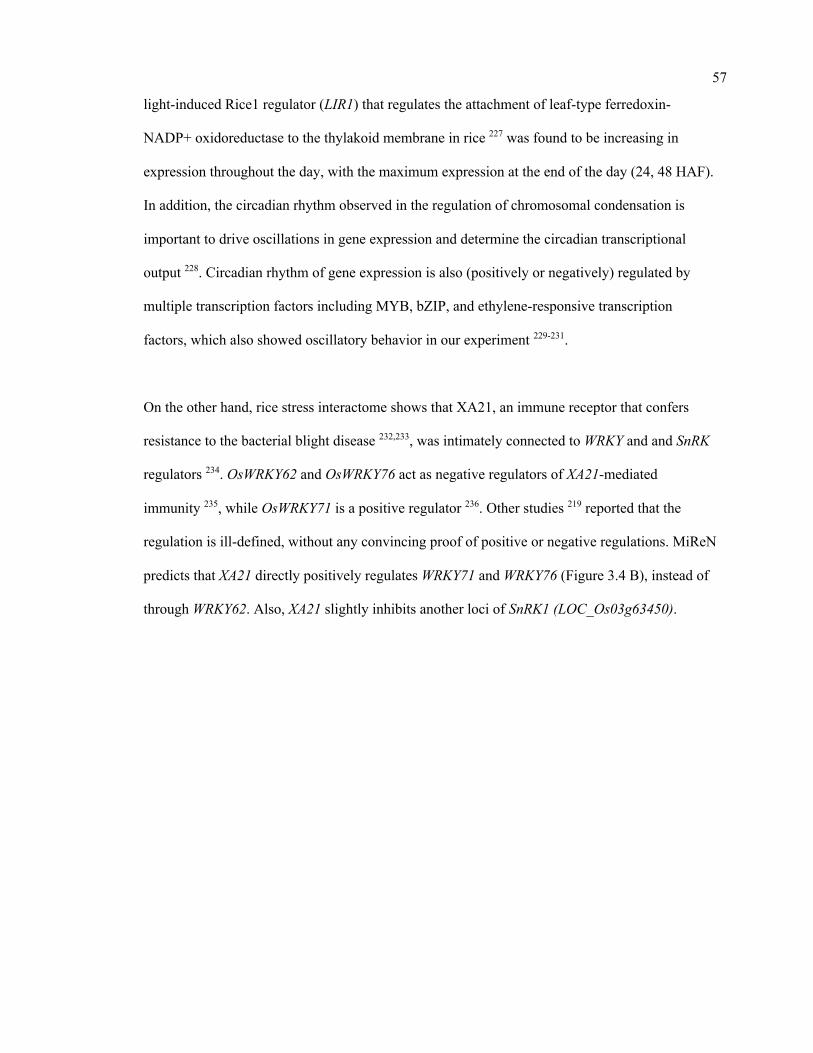
57
light-induced Rice1 regulator (LIR1) that regulates the attachment of leaf-type ferredoxin-
NADP+ oxidoreductase to the thylakoid membrane in rice 227 was found to be increasing in
expression throughout the day, with the maximum expression at the end of the day (24, 48 HAF).
In addition, the circadian rhythm observed in the regulation of chromosomal condensation is
important to drive oscillations in gene expression and determine the circadian transcriptional
output 228. Circadian rhythm of gene expression is also (positively or negatively) regulated by
multiple transcription factors including MYB, bZIP, and ethylene-responsive transcription
factors, which also showed oscillatory behavior in our experiment 229-231.
On the other hand, rice stress interactome shows that XA21, an immune receptor that confers
resistance to the bacterial blight disease 232,233, was intimately connected to WRKY and and SnRK
regulators 234. OsWRKY62 and OsWRKY76 act as negative regulators of XA21-mediated
immunity 235, while OsWRKY71 is a positive regulator 236. Other studies 219 reported that the
regulation is ill-defined, without any convincing proof of positive or negative regulations. MiReN
predicts that XA21 directly positively regulates WRKY71 and WRKY76 (Figure 3.4 B), instead of
through WRKY62. Also, XA21 slightly inhibits another loci of SnRK1 (LOC_Os03g63450).
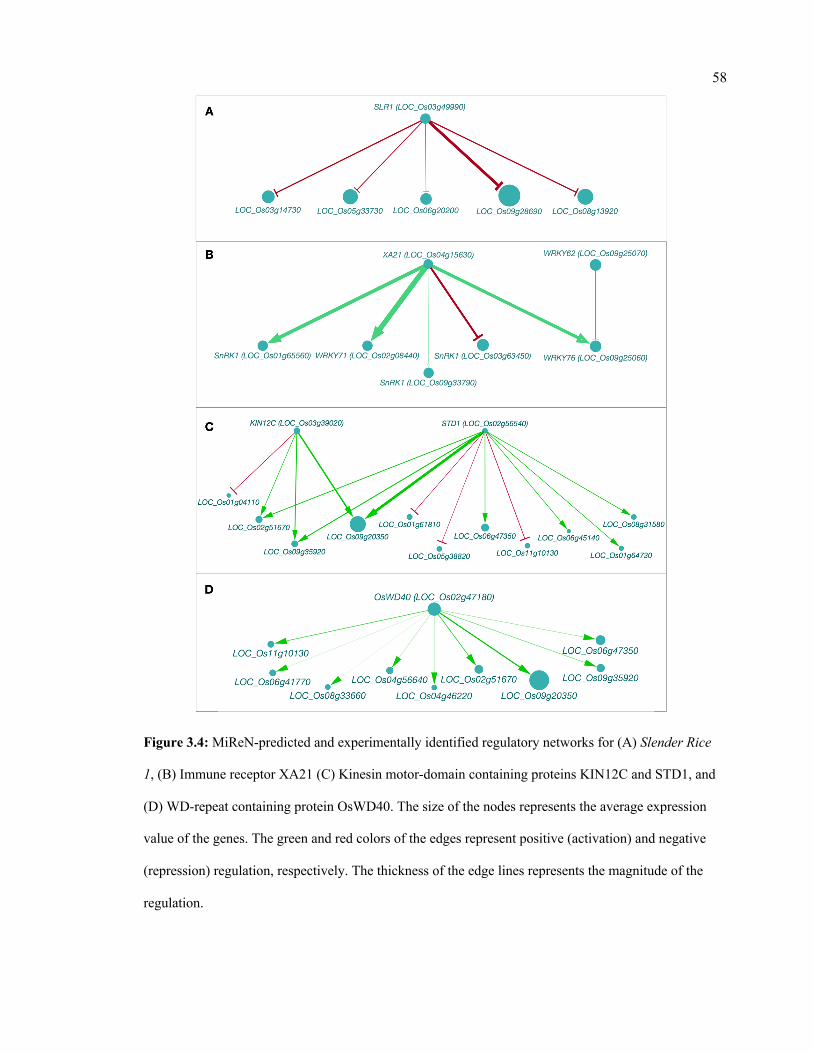
58
Figure 3.4: MiReN-predicted and experimentally identified regulatory networks for (A) Slender Rice
1, (B) Immune receptor XA21 (C) Kinesin motor-domain containing proteins KIN12C and STD1, and
(D) WD-repeat containing protein OsWD40. The size of the nodes represents the average expression
value of the genes. The green and red colors of the edges represent positive (activation) and negative
(repression) regulation, respectively. The thickness of the edge lines represents the magnitude of the
regulation.
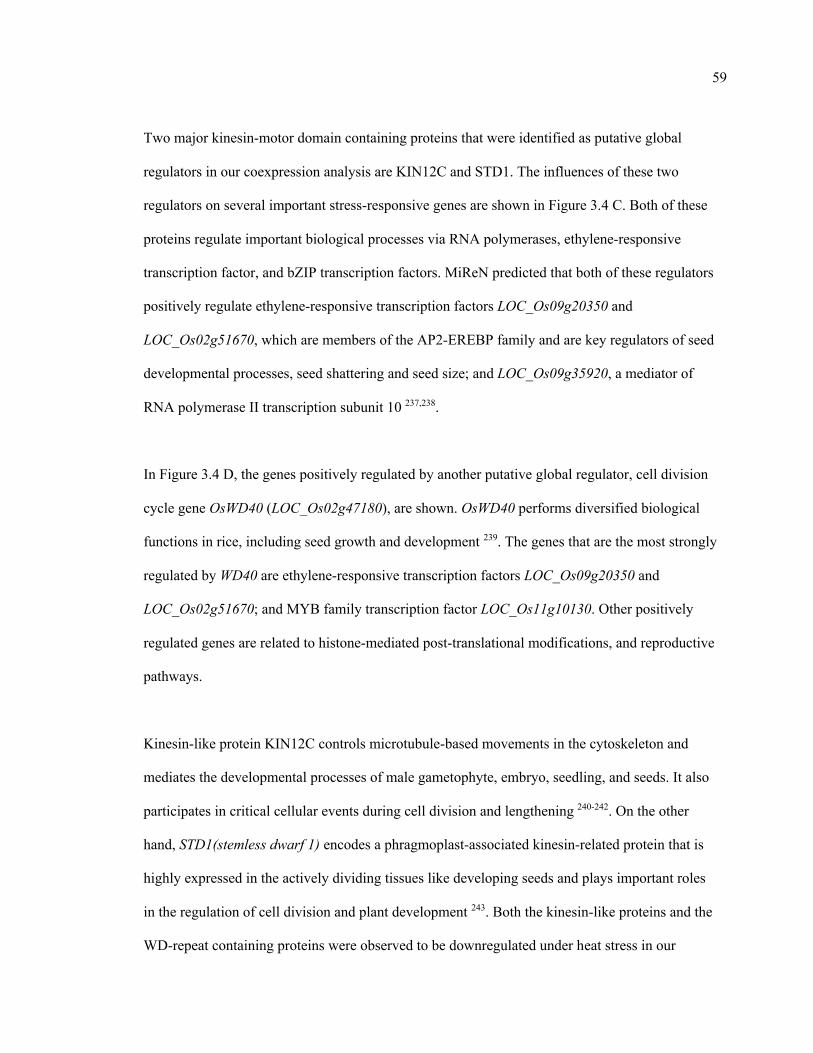
59
Two major kinesin-motor domain containing proteins that were identified as putative global
regulators in our coexpression analysis are KIN12C and STD1. The influences of these two
regulators on several important stress-responsive genes are shown in Figure 3.4 C. Both of these
proteins regulate important biological processes via RNA polymerases, ethylene-responsive
transcription factor, and bZIP transcription factors. MiReN predicted that both of these regulators
positively regulate ethylene-responsive transcription factors LOC_Os09g20350 and
LOC_Os02g51670, which are members of the AP2-EREBP family and are key regulators of seed
developmental processes, seed shattering and seed size; and LOC_Os09g35920, a mediator of
RNA polymerase II transcription subunit 10 237,238.
In Figure 3.4 D, the genes positively regulated by another putative global regulator, cell division
cycle gene OsWD40 (LOC_Os02g47180), are shown. OsWD40 performs diversified biological
functions in rice, including seed growth and development 239. The genes that are the most strongly
regulated by WD40 are ethylene-responsive transcription factors LOC_Os09g20350 and
LOC_Os02g51670; and MYB family transcription factor LOC_Os11g10130. Other positively
regulated genes are related to histone-mediated post-translational modifications, and reproductive
pathways.
Kinesin-like protein KIN12C controls microtubule-based movements in the cytoskeleton and
mediates the developmental processes of male gametophyte, embryo, seedling, and seeds. It also
participates in critical cellular events during cell division and lengthening 240-242. On the other
hand, STD1(stemless dwarf 1) encodes a phragmoplast-associated kinesin-related protein that is
highly expressed in the actively dividing tissues like developing seeds and plays important roles
in the regulation of cell division and plant development 243. Both the kinesin-like proteins and the
WD-repeat containing proteins were observed to be downregulated under heat stress in our
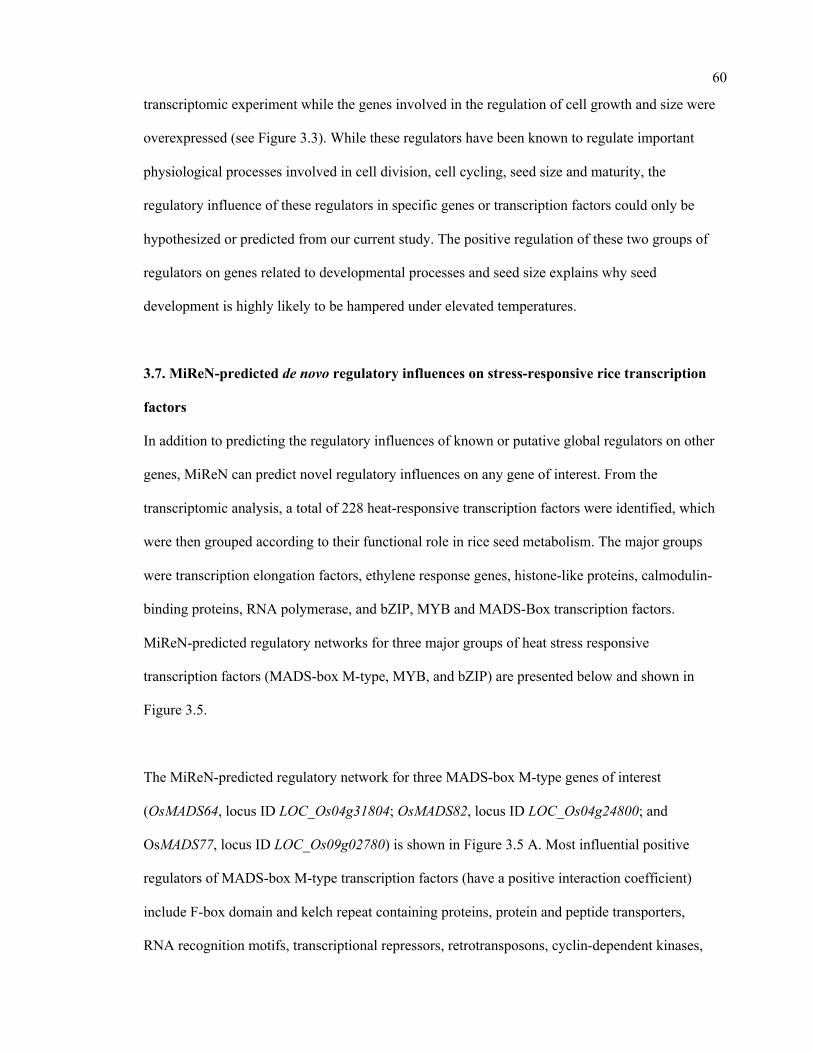
60
transcriptomic experiment while the genes involved in the regulation of cell growth and size were
overexpressed (see Figure 3.3). While these regulators have been known to regulate important
physiological processes involved in cell division, cell cycling, seed size and maturity, the
regulatory influence of these regulators in specific genes or transcription factors could only be
hypothesized or predicted from our current study. The positive regulation of these two groups of
regulators on genes related to developmental processes and seed size explains why seed
development is highly likely to be hampered under elevated temperatures.
3.7. MiReN-predicted de novo regulatory influences on stress-responsive rice transcription
factors
In addition to predicting the regulatory influences of known or putative global regulators on other
genes, MiReN can predict novel regulatory influences on any gene of interest. From the
transcriptomic analysis, a total of 228 heat-responsive transcription factors were identified, which
were then grouped according to their functional role in rice seed metabolism. The major groups
were transcription elongation factors, ethylene response genes, histone-like proteins, calmodulin-
binding proteins, RNA polymerase, and bZIP, MYB and MADS-Box transcription factors.
MiReN-predicted regulatory networks for three major groups of heat stress responsive
transcription factors (MADS-box M-type, MYB, and bZIP) are presented below and shown in
Figure 3.5.
The MiReN-predicted regulatory network for three MADS-box M-type genes of interest
(OsMADS64, locus ID LOC_Os04g31804; OsMADS82, locus ID LOC_Os04g24800; and
OsMADS77, locus ID LOC_Os09g02780) is shown in Figure 3.5 A. Most influential positive
regulators of MADS-box M-type transcription factors (have a positive interaction coefficient)
include F-box domain and kelch repeat containing proteins, protein and peptide transporters,
RNA recognition motifs, transcriptional repressors, retrotransposons, cyclin-dependent kinases,
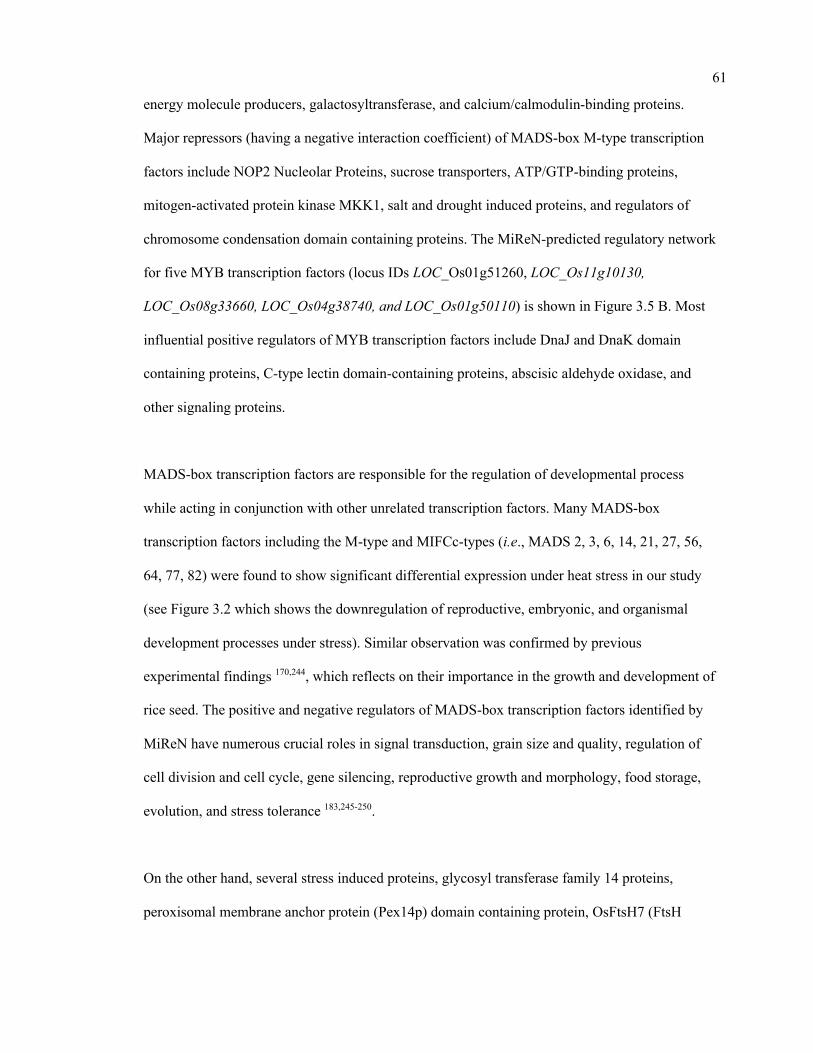
61
energy molecule producers, galactosyltransferase, and calcium/calmodulin-binding proteins.
Major repressors (having a negative interaction coefficient) of MADS-box M-type transcription
factors include NOP2 Nucleolar Proteins, sucrose transporters, ATP/GTP-binding proteins,
mitogen-activated protein kinase MKK1, salt and drought induced proteins, and regulators of
chromosome condensation domain containing proteins. The MiReN-predicted regulatory network
for five MYB transcription factors (locus IDs LOC_Os01g51260, LOC_Os11g10130,
LOC_Os08g33660, LOC_Os04g38740, and LOC_Os01g50110) is shown in Figure 3.5 B. Most
influential positive regulators of MYB transcription factors include DnaJ and DnaK domain
containing proteins, C-type lectin domain-containing proteins, abscisic aldehyde oxidase, and
other signaling proteins.
MADS-box transcription factors are responsible for the regulation of developmental process
while acting in conjunction with other unrelated transcription factors. Many MADS-box
transcription factors including the M-type and MIFCc-types (i.e., MADS 2, 3, 6, 14, 21, 27, 56,
64, 77, 82) were found to show significant differential expression under heat stress in our study
(see Figure 3.2 which shows the downregulation of reproductive, embryonic, and organismal
development processes under stress). Similar observation was confirmed by previous
experimental findings 170,244, which reflects on their importance in the growth and development of
rice seed. The positive and negative regulators of MADS-box transcription factors identified by
MiReN have numerous crucial roles in signal transduction, grain size and quality, regulation of
cell division and cell cycle, gene silencing, reproductive growth and morphology, food storage,
evolution, and stress tolerance 183,245-250.
On the other hand, several stress induced proteins, glycosyl transferase family 14 proteins,
peroxisomal membrane anchor protein (Pex14p) domain containing protein, OsFtsH7 (FtsH
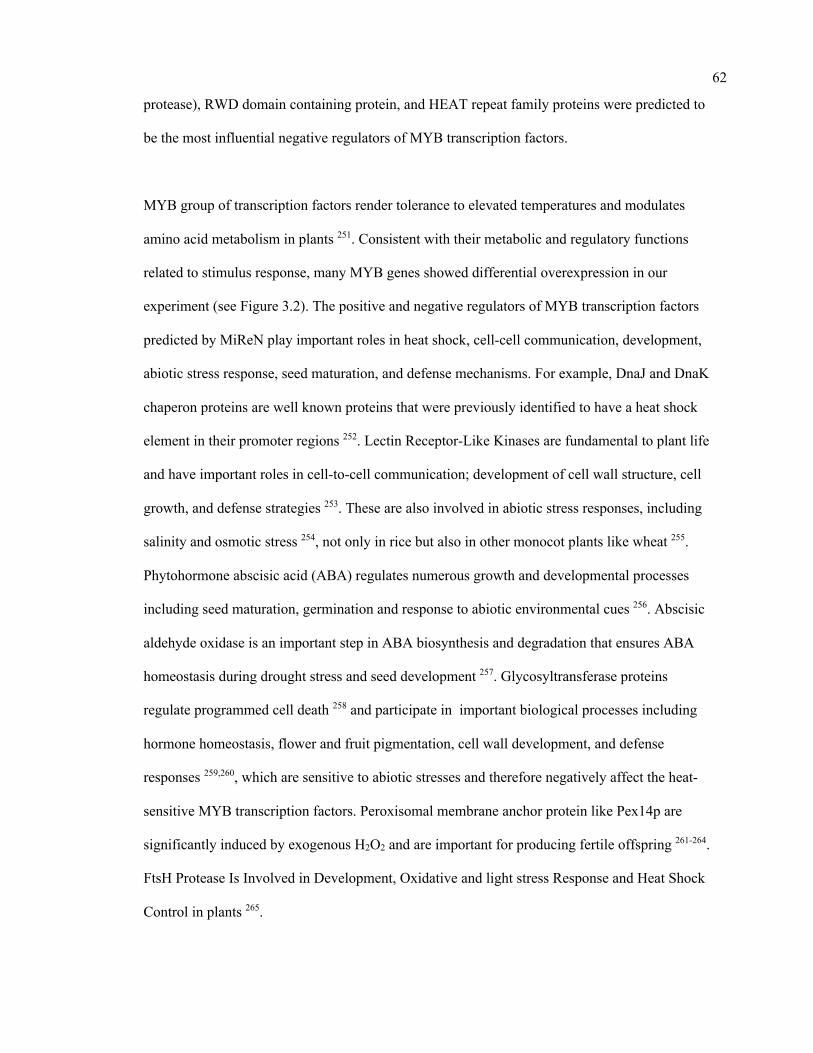
62
protease), RWD domain containing protein, and HEAT repeat family proteins were predicted to
be the most influential negative regulators of MYB transcription factors.
MYB group of transcription factors render tolerance to elevated temperatures and modulates
amino acid metabolism in plants 251. Consistent with their metabolic and regulatory functions
related to stimulus response, many MYB genes showed differential overexpression in our
experiment (see Figure 3.2). The positive and negative regulators of MYB transcription factors
predicted by MiReN play important roles in heat shock, cell-cell communication, development,
abiotic stress response, seed maturation, and defense mechanisms. For example, DnaJ and DnaK
chaperon proteins are well known proteins that were previously identified to have a heat shock
element in their promoter regions 252. Lectin Receptor-Like Kinases are fundamental to plant life
and have important roles in cell-to-cell communication; development of cell wall structure, cell
growth, and defense strategies 253. These are also involved in abiotic stress responses, including
salinity and osmotic stress 254, not only in rice but also in other monocot plants like wheat 255.
Phytohormone abscisic acid (ABA) regulates numerous growth and developmental processes
including seed maturation, germination and response to abiotic environmental cues 256. Abscisic
aldehyde oxidase is an important step in ABA biosynthesis and degradation that ensures ABA
homeostasis during drought stress and seed development 257. Glycosyltransferase proteins
regulate programmed cell death 258 and participate in important biological processes including
hormone homeostasis, flower and fruit pigmentation, cell wall development, and defense
responses 259,260, which are sensitive to abiotic stresses and therefore negatively affect the heat-
sensitive MYB transcription factors. Peroxisomal membrane anchor protein like Pex14p are
significantly induced by exogenous H2O2 and are important for producing fertile offspring 261-264.
FtsH Protease Is Involved in Development, Oxidative and light stress Response and Heat Shock
Control in plants 265.
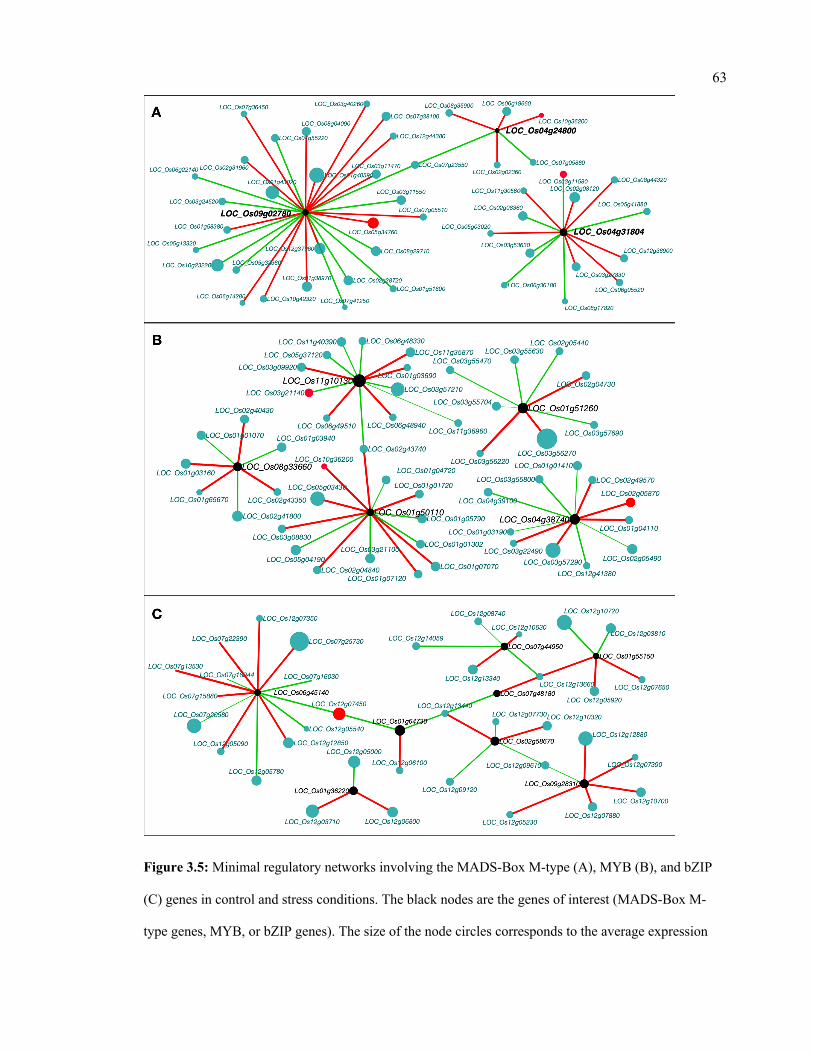
63
Figure 3.5: Minimal regulatory networks involving the MADS-Box M-type (A), MYB (B), and bZIP
(C) genes in control and stress conditions. The black nodes are the genes of interest (MADS-Box M-
type genes, MYB, or bZIP genes). The size of the node circles corresponds to the average expression
64
value of the genes. The edge colors are green for positive regulation and red for negative regulation;
the width of the edges correspond to the magnitude of the regulation coefficient. The “hub” genes
identified in this work are highlighted as red nodes.
Transcription factors in the bZIP group are mostly regulated by proteins involved in nuclear
localization, transcription, DNA repair, RNA processing, epigenetic regulation
(LOC_Os02g05660, LOC_Os07g43316, LOC_Os02g05470), phosphatase and decarboxylase
proteins (see Figure 3.5 C). bZIP transcription factors regulate a number of plant processes such
as seed development, light signaling, floral induction and flower development, biotic and abiotic
stresses, ABA signaling, and hormonal response 266-269. These are regulated by a number of
proteins involved in DNA and RNA metabolism. For example, one of the most influential
positive regulators, the DEAD-box RNA helicase family proteins, control RNA metabolism and a
range of cellular functions including response to abiotic stresses 270. SAP domain-containing
proteins regulate stress signaling by modulating the expression of endogenous stress-related
genes 271. Therefore, it is expected that while subjected to elevated temperatures, these regulators
would activate the stress-responsive pathways in seed, which is also evident from the
upregulation of stress-responsive biological process (see Figure 3.2). On the other hand, small
GTPases were predicted to be a repressor of bZIP genes, which are key regulator do cellular
transformation and are involved in controlling cell growth and shape and 272. Although a positive
or negative regulatory mechanism is not identified in literature, MiReN results show strong
repression of the bZIP family by these proteins.
3.8. Conclusions
Temperature is one of the primary drivers of growth and development for crops 273. However,
crop yield and grain quality at maturation is adversely affected by heat stress during early
developmental stage. Our results indicate a genome-wide modulation of gene expression when
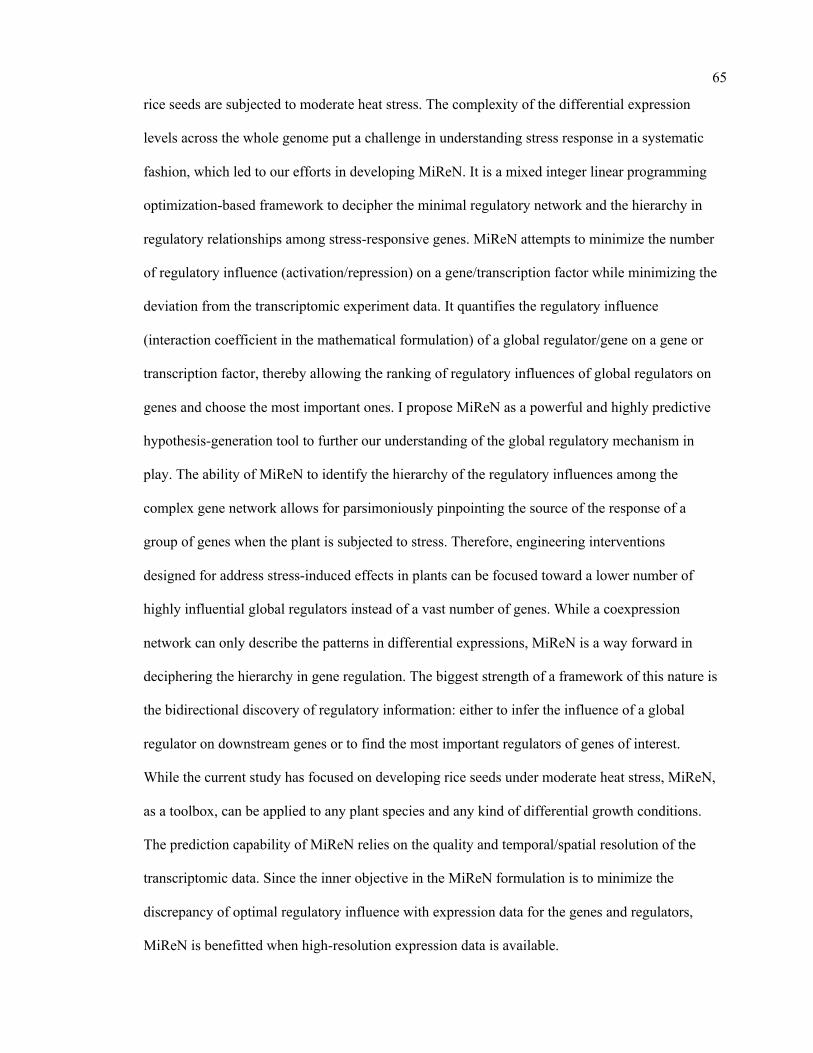
65
rice seeds are subjected to moderate heat stress. The complexity of the differential expression
levels across the whole genome put a challenge in understanding stress response in a systematic
fashion, which led to our efforts in developing MiReN. It is a mixed integer linear programming
optimization-based framework to decipher the minimal regulatory network and the hierarchy in
regulatory relationships among stress-responsive genes. MiReN attempts to minimize the number
of regulatory influence (activation/repression) on a gene/transcription factor while minimizing the
deviation from the transcriptomic experiment data. It quantifies the regulatory influence
(interaction coefficient in the mathematical formulation) of a global regulator/gene on a gene or
transcription factor, thereby allowing the ranking of regulatory influences of global regulators on
genes and choose the most important ones. I propose MiReN as a powerful and highly predictive
hypothesis-generation tool to further our understanding of the global regulatory mechanism in
play. The ability of MiReN to identify the hierarchy of the regulatory influences among the
complex gene network allows for parsimoniously pinpointing the source of the response of a
group of genes when the plant is subjected to stress. Therefore, engineering interventions
designed for address stress-induced effects in plants can be focused toward a lower number of
highly influential global regulators instead of a vast number of genes. While a coexpression
network can only describe the patterns in differential expressions, MiReN is a way forward in
deciphering the hierarchy in gene regulation. The biggest strength of a framework of this nature is
the bidirectional discovery of regulatory information: either to infer the influence of a global
regulator on downstream genes or to find the most important regulators of genes of interest.
While the current study has focused on developing rice seeds under moderate heat stress, MiReN,
as a toolbox, can be applied to any plant species and any kind of differential growth conditions.
The prediction capability of MiReN relies on the quality and temporal/spatial resolution of the
transcriptomic data. Since the inner objective in the MiReN formulation is to minimize the
discrepancy of optimal regulatory influence with expression data for the genes and regulators,
MiReN is benefitted when high-resolution expression data is available.
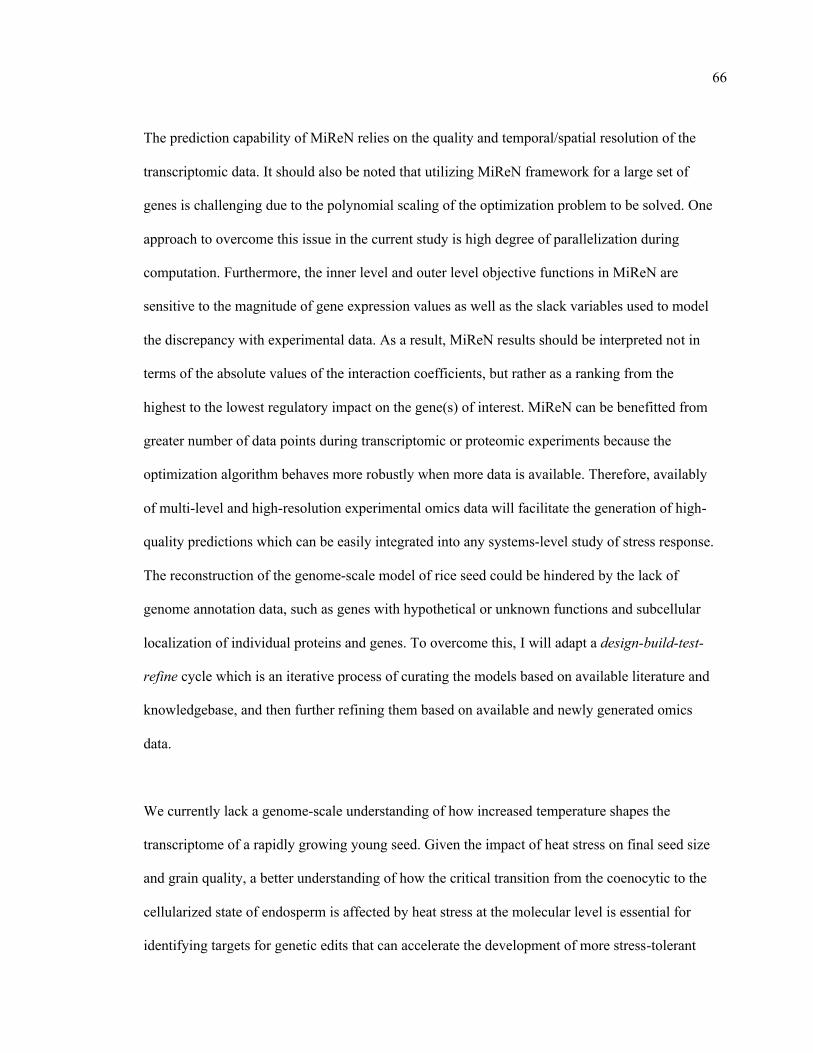
66
The prediction capability of MiReN relies on the quality and temporal/spatial resolution of the
transcriptomic data. It should also be noted that utilizing MiReN framework for a large set of
genes is challenging due to the polynomial scaling of the optimization problem to be solved. One
approach to overcome this issue in the current study is high degree of parallelization during
computation. Furthermore, the inner level and outer level objective functions in MiReN are
sensitive to the magnitude of gene expression values as well as the slack variables used to model
the discrepancy with experimental data. As a result, MiReN results should be interpreted not in
terms of the absolute values of the interaction coefficients, but rather as a ranking from the
highest to the lowest regulatory impact on the gene(s) of interest. MiReN can be benefitted from
greater number of data points during transcriptomic or proteomic experiments because the
optimization algorithm behaves more robustly when more data is available. Therefore, availably
of multi-level and high-resolution experimental omics data will facilitate the generation of high-
quality predictions which can be easily integrated into any systems-level study of stress response.
The reconstruction of the genome-scale model of rice seed could be hindered by the lack of
genome annotation data, such as genes with hypothetical or unknown functions and subcellular
localization of individual proteins and genes. To overcome this, I will adapt a design-build-test-
refine cycle which is an iterative process of curating the models based on available literature and
knowledgebase, and then further refining them based on available and newly generated omics
data.
We currently lack a genome-scale understanding of how increased temperature shapes the
transcriptome of a rapidly growing young seed. Given the impact of heat stress on final seed size
and grain quality, a better understanding of how the critical transition from the coenocytic to the
cellularized state of endosperm is affected by heat stress at the molecular level is essential for
identifying targets for genetic edits that can accelerate the development of more stress-tolerant
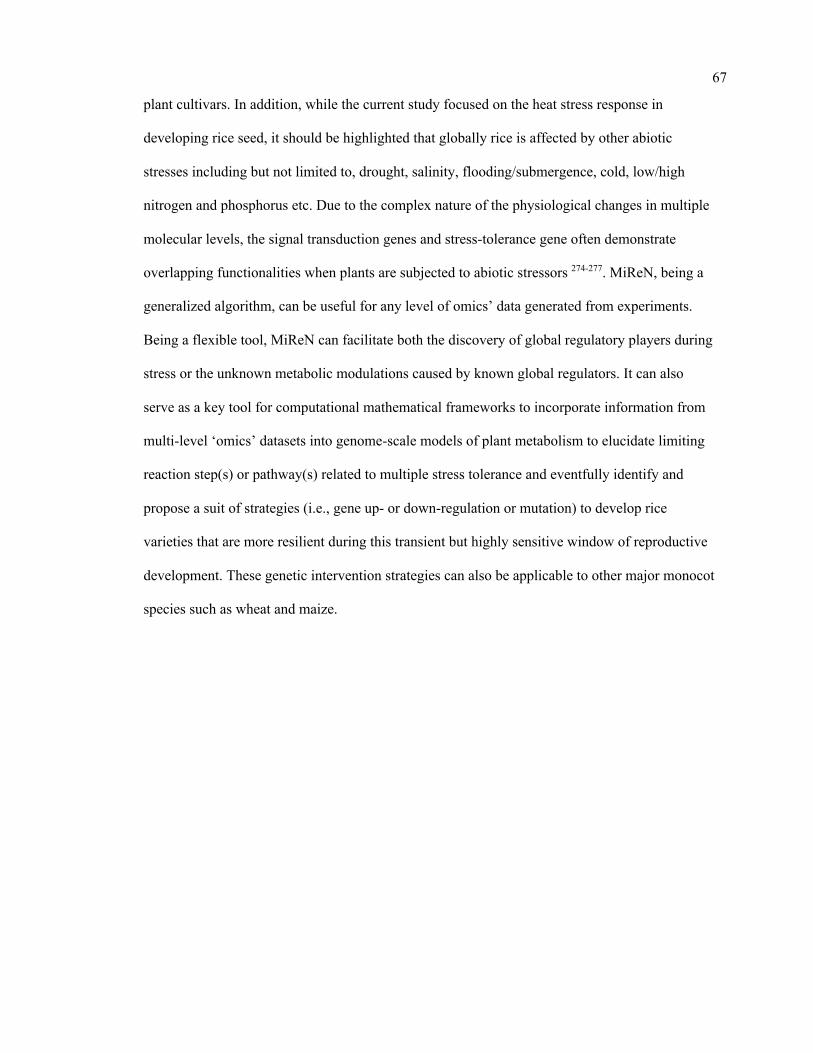
67
plant cultivars. In addition, while the current study focused on the heat stress response in
developing rice seed, it should be highlighted that globally rice is affected by other abiotic
stresses including but not limited to, drought, salinity, flooding/submergence, cold, low/high
nitrogen and phosphorus etc. Due to the complex nature of the physiological changes in multiple
molecular levels, the signal transduction genes and stress-tolerance gene often demonstrate
overlapping functionalities when plants are subjected to abiotic stressors 274-277. MiReN, being a
generalized algorithm, can be useful for any level of omics’ data generated from experiments.
Being a flexible tool, MiReN can facilitate both the discovery of global regulatory players during
stress or the unknown metabolic modulations caused by known global regulators. It can also
serve as a key tool for computational mathematical frameworks to incorporate information from
multi-level ‘omics’ datasets into genome-scale models of plant metabolism to elucidate limiting
reaction step(s) or pathway(s) related to multiple stress tolerance and eventfully identify and
propose a suit of strategies (i.e., gene up- or down-regulation or mutation) to develop rice
varieties that are more resilient during this transient but highly sensitive window of reproductive
development. These genetic intervention strategies can also be applicable to other major monocot
species such as wheat and maize.
68
Chapter 4
Microbiome-Virome Interaction in Bovine Rumen: The Role of
Viral Auxiliary Metabolic Genes in Modulating Microbial Community Dynamics
The complex microbial ecosystem within the bovine rumen plays a crucial role in host nutrition,
health, and environmental impact. However, little is known about the interactions between the
functional entities within the system, which dictates the community structure and functional
dynamics and host physiology. With the advancements in high-throughput sequencing and
mathematical modeling, in silico genome-scale metabolic analysis promises to expand our
understanding of the metabolic interplay in the community. In an attempt to understand the
interactions between microbial species and the phages inside rumen, a genome-scale metabolic
modeling approach was utilized by using key members in the rumen microbiome (a bacteroidete,
a firmicute, and an archaeon) and the viral phages associated with them. Individual microbial host
models were integrated into a community model using multi-level mathematical frameworks. An
elaborate and heuristics-based computational procedure was employed to predict previously
unknown interactions involving the transfer of fatty acids, vitamins, coenzymes, amino acids, and
sugars among the community members. While some of these interactions could be inferred by the
available multi-omic datasets, our proposed method provides a systemic understanding of why
the interactions occur and how these affect the dynamics in a complex microbial ecosystem. To
elucidate the functional role of the virome on the microbiome, local alignment search was used to
identify the metabolic functions of the viruses associated with the hosts. The incorporation of
these functions demonstrated the role of viral auxiliary metabolic genes in relaxing the metabolic
bottlenecks in the microbial hosts and complementing the inter-species interactions. Finally, a
comparative statistical analysis of different biologically significant community fitness criteria
identified the variation in flux space and robustness of metabolic capacities of the community
69
members. Our elucidation of metabolite exchange among the three members of the rumen
microbiome shows how their genomic differences and interactions with the viral strains shape up
a highly sophisticated metabolic interplay and explains how such interactions across kingdoms
can cause metabolic and compositional shifts in the community and affect the health, nutrition,
and pathophysiology of the ruminant animal.
4.1. Background
Within the ruminant species, the microbial community has co-evolved with its host and has
helped the host animal obtain energy from low quality fiber rich diets 278-280. The feed ingested by
the ruminant animal undergoes extensive microbial digestion and fermentation in the cattle
rumen, producing a range of short chain fatty acids (SCFAs) and energy for the host, and also
releases methane, hydrogen, and carbon di-oxide to the atmosphere 281. This anaerobic
environment is densely (>1010-1011 cells/g of contents) populated by diverse and interdependent
species of Bacteria, Protozoa, Fungi, Archaea and Viruses, which are involved in breakdown of
complex carbohydrates and polymers from plants, hydrogen transfer, and inter-species transaction
of fermentation products and of oligomers and monomers 282-285. Among the major bacterial
players are the phyla Bacteroidetes and Firmicutes, with an abundance of 21% and 12% of the
bacterial population in the rumen, respectively 280. Majority of the Bacteroidetes (specifically P.
ruminicola and P. bryantii) have a significant role in breakdown of starch and xylan
polysaccharides and in the metabolism of proteins and peptides 285-287. Additionally, Firmicutes
including Butyrivibrio fibrisolvens, Ruminococcus flavefaciens, Ruminococcus albas,
Eubacterium cellulosolvens etc. play an essential role in the metabolism of cellulose 280,285.
Archaea are also abundant (approximately 40%) within the rumen and many of them (including
Methanobrevibacter gottschalkii, Methanobrevibacter ruminantium, Methanosarcina barkeri,
Methanosarcina mazeii etc.) are involved in methanogenesis 280,288-290. These methanogens are
responsible for the release of methane and other gases in the atmosphere while consuming
70
SCFAs, carbon di-oxide, and hydrogen from other microbes including Bacteroidetes or
Firmicutes. The stability and diversity of the rumen microbiome is critical for the animals’ health,
nutrition, immunity, and survival. Prior studies concluded that disruption in the community
composition by sudden administration of grain or glucose to a ruminant animal previously on a
dried forage ration often leads to the damage of the rumen tissues and death of the animal within
a short period (approximately 18 hours) due to an explosive growth of the Firmicute
Streptococcus bovis and Lactobacillus spp., and accumulation of lactic acid 282,291,292, thus causing
lactic acidosis. In addition, methane production in cattle correlates with rumen methanogenic
Archaea and bacterial community structure and dietary composition 289,293. Hence, rumen
microbial community remains one of the most interesting and poorly explored natural
ecosystems.
The complex interactions between bacterial host and viral phages associated with them drive the
ecological dynamics and behavior in many natural systems 294. Viral modifications of microbial
and cyanobacterial 295,296 metabolism was identified in a substantial number of natural systems
including marine ecosystem, infectious human diseases, aquifer sediments, and animal gut
ecosystems 297-305. Viruses affect intestinal and ruminal microbial ecosystems in cattle through a
myriad of processes including cell lysis, energy production, reproduction, and reprogramming of
microbial metabolism via Auxiliary Metabolic Genes or AMGs 306,307. Studies in recent years
have demonstrated that viral AMGs augment the breakdown of complex plant carbohydrates and
boost energy production and harvest, while accelerating viral replication inside the host 308.
However, a complete understanding of the complex virome-microbiome interaction and the roles
of AMGs in the metabolic reprogramming of the host is still in its infancy.
Although advancements in high-throughput sequencing provide access to the vast diversity and
makeup of the complex rumen microbial ecosystem, our understanding of the factors that shape
71
rumen microbial communities and interactions among them is lacking. Little is known about the
processes shaping the distribution of rumen viruses or the modulation of microbe-driven
processes in the rumen. In addition, the study of the rumen ecosystem suffers due to the lack of
truly selective media or unique end products, which renders rapid identification of the community
composition and metabolic states nearly impossible 283,309,310. The study of ruminal ecology is
further complicated by the observation that approximately 75% of the ruminal bacteria are tightly
attached to feed particles or are found in biofilms 283 and cannot be analyzed by only studying
fecal contents. On the other hand, many of the virome-microbiome interactions studies appear to
be focused on interactions between infectious human viruses and bacteria in an effort to
understand respiratory infectious diseases 311-315. A recent study of virus-bacterial interactions in
the rumen identified approximately 28,000 viral sequences present in the rumen, which found that
the majority of viruses belong to a diversity of viral families including Siphoviridae, Myoviridae,
and Podoviridae interacting with host bacterial phyla such as Firmicutes and proteobacteria 306.
While a clear understanding of complex biological systems is often challenging, explicit
mathematical relation-based modeling promises in silico evaluation and analysis of the biological
phenomena. With the gradual increase in computational capacity and the abundance of in silico
genome-scale metabolic reconstruction tools, metabolic network models combined with
constraint-based analysis provide a host of methods to explore, make discovery and hypotheses,
and redesign biological systems at a genome-level 3,11,124,129,131,133,316-325. Genome-scale metabolic
modeling offers the opportunity not only to map the metabolic landscape of single organisms but
also to explore microbe-microbe and phage-microbe interactions. A number of computational
tools were developed to model the interactions and dynamics in multi-species microbial
communities in the past years 39,47,53,326-338. For modeling of multi-species communities, extensive
experimental data on different omics’ level and a significant knowledge of the inter-species
interactions are needed. However, the knowledge-base for microbe-microbe as well as host-
72
microbe interactions is still very poor, and carrying out experiments for studying inter-species
interactions appears to be challenging 339. Thus, a combined computational-experimental
approach can accelerate new discoveries in the realm of microbe-microbe and microbe-host
metabolic interactions. Despite the limitations of current in silico reconstructed host-microbe
interaction models, such efforts are of utmost importance because they allow for a detailed
metabolic resolution of the complex relationships within microbial communities and with their
host. Recently, Heinken and co-workers reconstructed and analyzed the first integrated
stoichiometric model of murine and Bacteroides thetaiotaomicron metabolism and demonstrated
the beneficial interaction of the host and the commensal microbes in the gut 340. There have been
several efforts to reconstruct individual and integrated community models of human gut microbes
in recent years, using representative species from dominant classes of microorganisms 340,341.
However, a genome-scale metabolic analysis of the complex community in the rumen was never
attempted before.
I developed a simplified and representative rumen community metabolic model with
Ruminococcus flavefaciens, Prevotella ruminicola, and Methanobrevibacter gottschalkii as
representative organisms from the three major functional guilds in the rumen ecosystem (i.e.,
Firmicutes, Bacteroidetes, and Archaea, respectively) mentioned above. These three organisms
are responsible for fiber digestion, starch and protein digestion, and methane production,
respectively. These species were chosen because of their high abundance levels in the rumen, co-
abundance reported in previous studies, and the availability of genome annotation
280,283,285,287,309,342-346. I reconstructed the draft models for these species by using the ModelSEED
database 3, and then performed extensive manual curation, including chemical and charge-
balancing, eliminating thermodynamically infeasible cycles, and ensuring network connectivity.
The curated models of R. flavefaciens (467 genes, 1033 metabolites, 1015 reactions), P.
ruminicola (546 genes, 1069 metabolites, 1088 reactions), and M. gottschalkii (319 genes, 900
73
metabolites, 847 reactions) were integrated into a community model using a multi-level
optimization framework 39,334. The community model was used to estimate metabolite secretion
profiles and community compositions. To enrich our understanding of the inter-species
interactions in the ecosystem, I employed a detailed and comprehensive heuristic procedure that
utilized existing GapFind-GapFill tools 347 and a subsequent series of knowledgebase-driven
validations. I identified 22 novel interactions involving the transfer of fatty acids, vitamins,
coenzymes, amino acids, and sugars among the community members. In addition, I bridged the
network gaps in the pentose phosphate pathway, amino acid synthesis and utilization, nucleotide
synthesis and degradation, purine metabolism, glycerophospholipid metabolism, and starch
metabolism in the metabolic models of these organisms. To elucidate the functional role of the
virome on the microbial ecosystem, I used local alignment search and identified metabolic
functions of the viruses associated with the community members that drive nucleotide synthesis,
reducing power generation, the reprogramming of the bacterial carbon metabolism to pentose
phosphate pathway and folate biosynthesis, and viral replication. The identified functions of viral
AMGs were incorporated into the model as additional metabolic functions. The addition of viral
functionalities resulted in significant changes in bacterial metabolism, including relaxing
metabolic bottleneck in the models, complementing microbe-microbe interactions, utilizing
nutrients more efficiently and energy harvest by the host. I validated the results based on meta-
transcriptomics, meta-proteomics and metabolomics studies on the rumen published recently 348-
351. Overall, these findings support the hypothesis that viral AMGs play a crucial role in
enhancing host fitness and robustness. I also studied the effect of using different community-level
objective functions (i.e., growth, short-chain fatty acids production, plant feed utilization,
greenhouse gas release, and small sugar molecule production) on the metabolic capacity of the
community members. I found that the flux ranges of the microbial species are robust irrespective
of the choice of a community objective. Hence, maximizing the community biomass is a rational
choice since a stable community in the rumen needs to survive and grow at a reasonable rate to
74
perform its necessary role in host nutrition and pathophysiology despite constant washout events
like fecal secretion.
4.2. Model reconstructions and curations
The initial draft genome-scale metabolic reconstructions of P. ruminicola, R. flavefaciens, and M.
gottschalkii were created and downloaded from the ModelSEED biochemical database (in
September 2017). The models included reactions for central carbon metabolism, secondary
biosynthesis pathway, energy and cofactor metabolism, lipid synthesis, elongation and
degradation, nucleotide metabolism, amino acid biosynthesis and degradation. Flux Balance
Analysis (FBA) was employed during model testing, validation, and analyzing flux distributions
at different stages of our work 12,15,129.
The draft reconstructions contained network gaps and 3-25% of reactions with chemical
imbalances. One of them (R. flavefaciens) had thermodynamically inconsistent production of
redox cofactors, which warranted an extensive manual curation to be performed on the models
(see methods section for details). The manual curation steps ensured that there is no chemical or
charge imbalance present in the models. The numbers of reactions that carries unrealistically high
fluxes without any nutrient uptake (thus defined as reactions with unbounded fluxes) also
decreased substantially (79% for R. flavefaciens, 79% for P. ruminicola, and 50% for M.
gottschalkii). The rest of the unbounded reactions from the nucleotide degradation pathways were
not fixed since they do not critically affect the biological significance of the models and are
usually common in existing metabolic models 352. The initial manual curation process
reconnected a number of blocked reactions in the models, which will be addressed in the
subsequent sections.
75
Correcting reaction imbalances: For balancing the reactions imbalanced in protons, I checked for
the protonation state consistent with the reaction set in the draft model and performed
addition/deletion of one or multiple protons on either the reactant or the product side. For the
remaining imbalanced reactions, I corrected the reaction stoichiometry in order to ensure that the
atoms on both sides of the reactions balance out.
Identifying and eliminating thermodynamically Infeasible Cycles: One of the limitations of
constraint-based genome-scale models is that the mass balance constraints only describe the net
accumulation or consumption of metabolites, without restricting the individual reaction fluxes.
While biochemical conversion cycles like TCA cycle or urea cycle are ubiquitous in a metabolic
network model, there can be cycles which do not consume or produce any metabolite. Therefore,
the overall thermodynamic driving force of these cycles are zero, implying that no net flux can
flow around this cycle 17. To identify Thermodynamically Infeasible Cycles in our model, I
turned off all the nutrient uptakes to the cell and used an optimization formulation called Flux
Variability Analysis (FVA) which maximizes and minimizes each of the reaction fluxes subject
to mass balance constraints 18. The reaction fluxes which hit either the lower bound or upper
bound are defined as unbounded reactions and were grouped together as a linear combination of
the null basis of their stoichiometric matrix. To eliminate the cycles, I either removed duplicate
reactions, turned off lumped reaction or selectively turned reactions on/off based on available
cofactor specificity information.
Ensuring known metabolic functions: Each of the three metabolic models were checked for the
capacity to produce biomass and metabolites they were known to produce 280,285,287,290,353-355. To
ensure these metabolic functionalities, the reactions missing in metabolic pathways were
systematically identified and added manually from biochemical databases 1,3,356 after an extensive
search for each of the missing enzyme activities in related organisms such as Ruminococcus
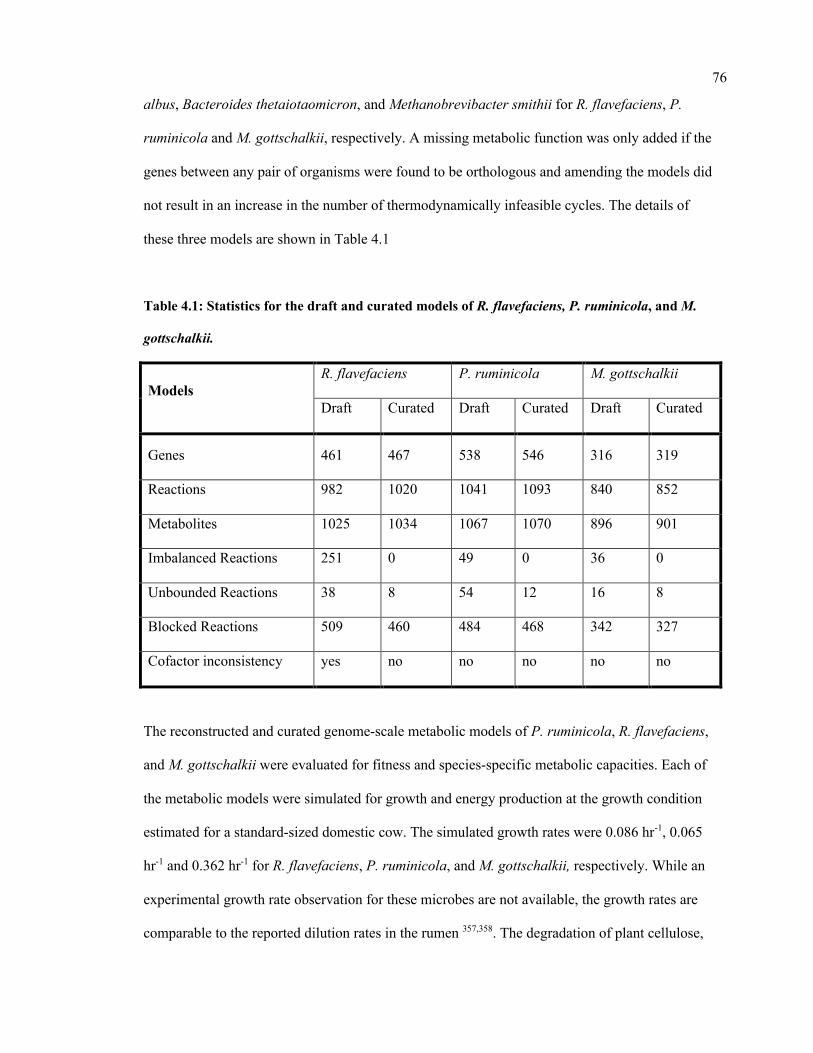
76
albus, Bacteroides thetaiotaomicron, and Methanobrevibacter smithii for R. flavefaciens, P.
ruminicola and M. gottschalkii, respectively. A missing metabolic function was only added if the
genes between any pair of organisms were found to be orthologous and amending the models did
not result in an increase in the number of thermodynamically infeasible cycles. The details of
these three models are shown in Table 4.1
Table 4.1: Statistics for the draft and curated models of R. flavefaciens, P. ruminicola, and M.
gottschalkii.
Models R. flavefaciens P. ruminicola M. gottschalkii
Draft Curated Draft Curated Draft Curated
Genes 461 467 538 546 316 319
Reactions 982 1020 1041 1093 840 852
Metabolites 1025 1034 1067 1070 896 901
Imbalanced Reactions 251 0 49 0 36 0
Unbounded Reactions 38 8 54 12 16 8
Blocked Reactions 509 460 484 468 342 327
Cofactor inconsistency yes no no no no no
The reconstructed and curated genome-scale metabolic models of P. ruminicola, R. flavefaciens,
and M. gottschalkii were evaluated for fitness and species-specific metabolic capacities. Each of
the metabolic models were simulated for growth and energy production at the growth condition
estimated for a standard-sized domestic cow. The simulated growth rates were 0.086 hr-1, 0.065
hr-1 and 0.362 hr-1 for R. flavefaciens, P. ruminicola, and M. gottschalkii, respectively. While an
experimental growth rate observation for these microbes are not available, the growth rates are
comparable to the reported dilution rates in the rumen 357,358. The degradation of plant cellulose,
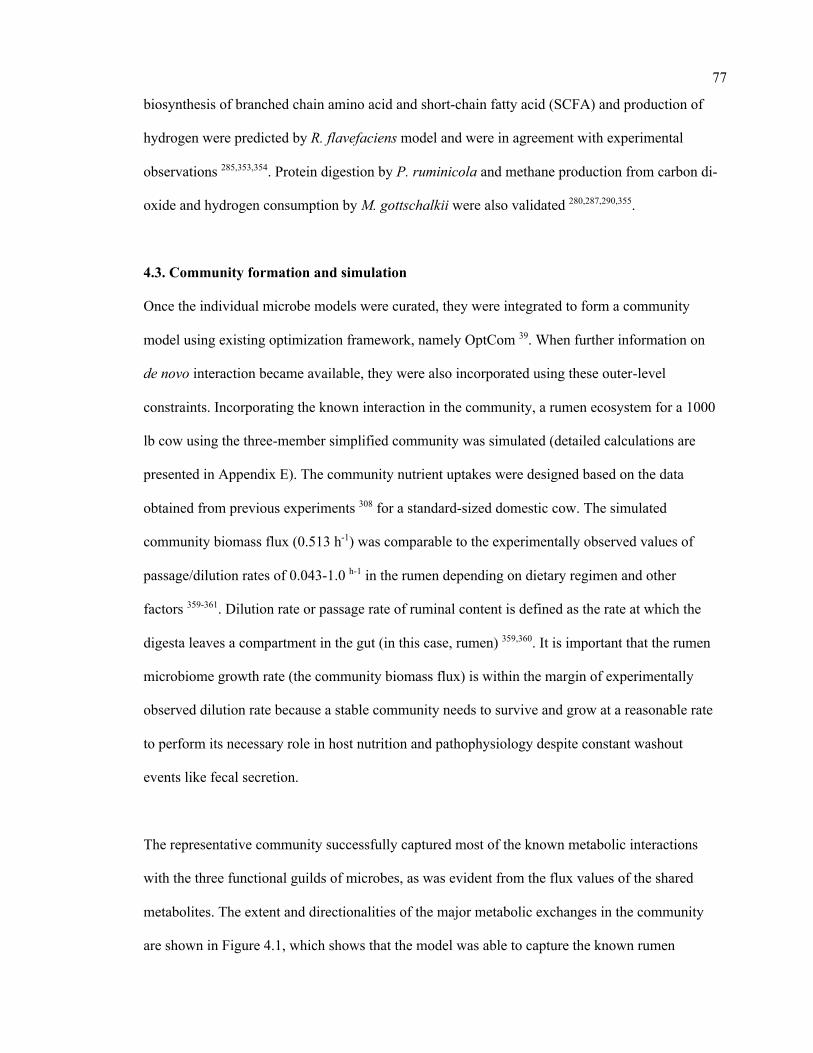
77
biosynthesis of branched chain amino acid and short-chain fatty acid (SCFA) and production of
hydrogen were predicted by R. flavefaciens model and were in agreement with experimental
observations 285,353,354. Protein digestion by P. ruminicola and methane production from carbon di-
oxide and hydrogen consumption by M. gottschalkii were also validated 280,287,290,355.
4.3. Community formation and simulation
Once the individual microbe models were curated, they were integrated to form a community
model using existing optimization framework, namely OptCom 39. When further information on
de novo interaction became available, they were also incorporated using these outer-level
constraints. Incorporating the known interaction in the community, a rumen ecosystem for a 1000
lb cow using the three-member simplified community was simulated (detailed calculations are
presented in Appendix E). The community nutrient uptakes were designed based on the data
obtained from previous experiments 308 for a standard-sized domestic cow. The simulated
community biomass flux (0.513 h-1) was comparable to the experimentally observed values of
passage/dilution rates of 0.043-1.0 h-1 in the rumen depending on dietary regimen and other
factors 359-361. Dilution rate or passage rate of ruminal content is defined as the rate at which the
digesta leaves a compartment in the gut (in this case, rumen) 359,360. It is important that the rumen
microbiome growth rate (the community biomass flux) is within the margin of experimentally
observed dilution rate because a stable community needs to survive and grow at a reasonable rate
to perform its necessary role in host nutrition and pathophysiology despite constant washout
events like fecal secretion.
The representative community successfully captured most of the known metabolic interactions
with the three functional guilds of microbes, as was evident from the flux values of the shared
metabolites. The extent and directionalities of the major metabolic exchanges in the community
are shown in Figure 4.1, which shows that the model was able to capture the known rumen
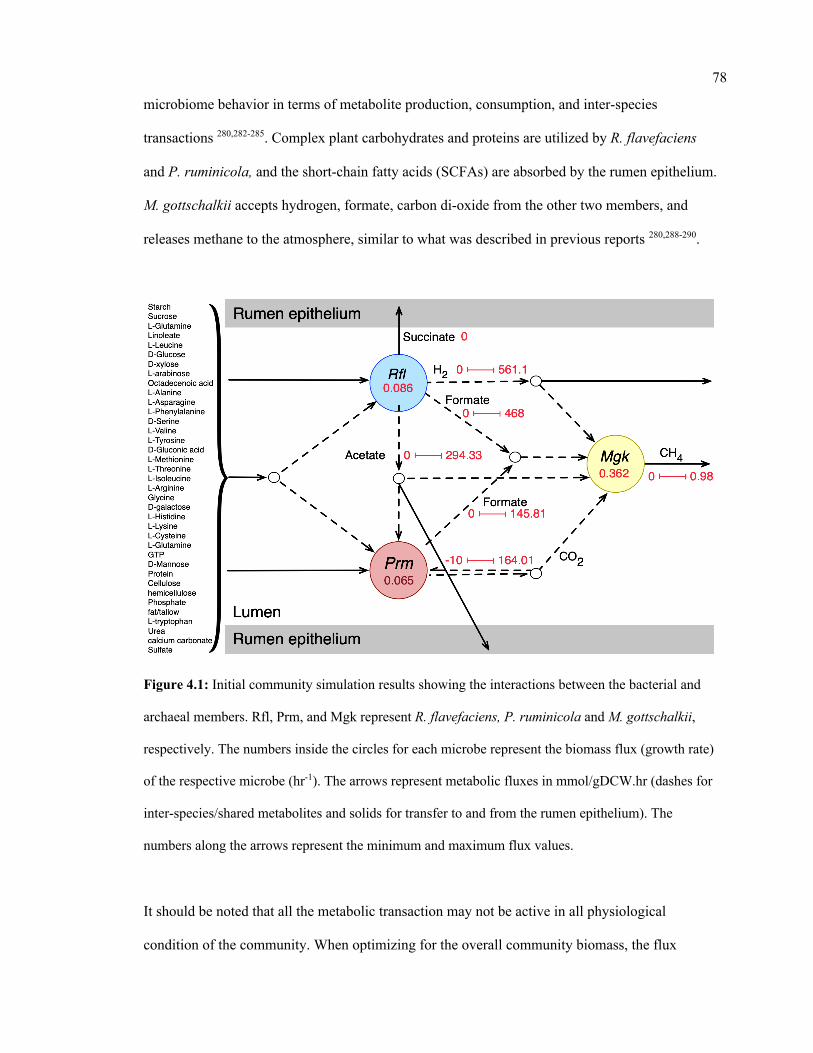
78
microbiome behavior in terms of metabolite production, consumption, and inter-species
transactions 280,282-285. Complex plant carbohydrates and proteins are utilized by R. flavefaciens
and P. ruminicola, and the short-chain fatty acids (SCFAs) are absorbed by the rumen epithelium.
M. gottschalkii accepts hydrogen, formate, carbon di-oxide from the other two members, and
releases methane to the atmosphere, similar to what was described in previous reports 280,288-290.
Figure 4.1: Initial community simulation results showing the interactions between the bacterial and
archaeal members. Rfl, Prm, and Mgk represent R. flavefaciens, P. ruminicola and M. gottschalkii,
respectively. The numbers inside the circles for each microbe represent the biomass flux (growth rate)
of the respective microbe (hr-1). The arrows represent metabolic fluxes in mmol/gDCW.hr (dashes for
inter-species/shared metabolites and solids for transfer to and from the rumen epithelium). The
numbers along the arrows represent the minimum and maximum flux values.
It should be noted that all the metabolic transaction may not be active in all physiological
condition of the community. When optimizing for the overall community biomass, the flux
79
distribution is shaped in a way that optimizes the production of biomass and not for other carbon
molecules like short-chain fatty acids or small sugars. At the same time, when optimizing for
other community objectives like production of SCFAs, some of the inactive fluxes including
these metabolic transactions can become active. For example, even though the production of
succinate and propionate by R. flavefaciens and P. ruminicola were validated, the maximization
of community biomass did not drive the production of those SCFAs for growth. It should be
noted that despite both P. ruminicola and M. gottschalkii being known and tested in silico for
carbon di-oxide production in rumen, the community simulated showed that only P. ruminicola
produced all the carbon di-oxide that was released from the rumen. This shows that metabolic
exchanges can have separate dynamics based on community fitness criteria set during the
optimization process.
4.4. Identification of unknown interactions and bridging of network gaps
One of the key limitations of any genome-scale reconstruction is the presence of gaps in the
resultant metabolic network. These gaps occur when there are dead-end metabolites in the model,
meaning that the consumption and/or production reactions for a particular metabolite are absent
in the model. Any such gaps from a specific model could be reconciled by borrowing the required
metabolic functionalities from the models of neighboring organism. For each of the metabolic
models in the rumen community, a set of Mixed-integer Linear Programming (MILP)
optimization procedures (named GapFind and GapFill) were used to identify and eliminate
network gaps in these reconstructions 347.
The broad range of metabolic capabilities of different microorganisms in the rumen ecosystem is
indicative of numerous inter-species interactions at metabolic, signaling, and regulatory levels.
While the major functions of Bacteroides, Firmicutes and Archaea, and the interplay between
them is commonly known 279,280,308,362-366, the current knowledge is only partial. To identify the
80
unknown inter-species interactions in the community, a protocol was developed that takes each
suggestion from the GapFill algorithm and performs a series of tests (shown in Figure 4.2) to
categorize the results as unacceptable, possible inter-species interactions, or acceptable solutions
to bridge network gaps.
Figure 4.2: Workflow for identifying possible interspecies interactions from Gapfill suggestions.
The overarching idea of the procedure developed is that complementation of the metabolic
functions among community members gives rise to inter-species interactions. The metabolites
that cannot be produced or consumed in a network are called the problem metabolites. For the
problem metabolites in each of the member species in the community, I performed three separate
sets of gap filling procedures. Two of them used the two other community members as the source
database, and one used the Modelseed biochemical database 3 as the source database (current as
of February 2018). For each of the gap filling solutions, if it was from the Modelseed database, it
was tested for possible transport mechanisms 367, likelihood based on presence in taxonomically
related organisms (with prioritizing organisms in the same lower taxonomic levels), and whether
the solution created thermodynamically infeasible cycles, and finally that solution was either
accepted or rejected. Similarly, for a gap filling suggestion coming from another member in the
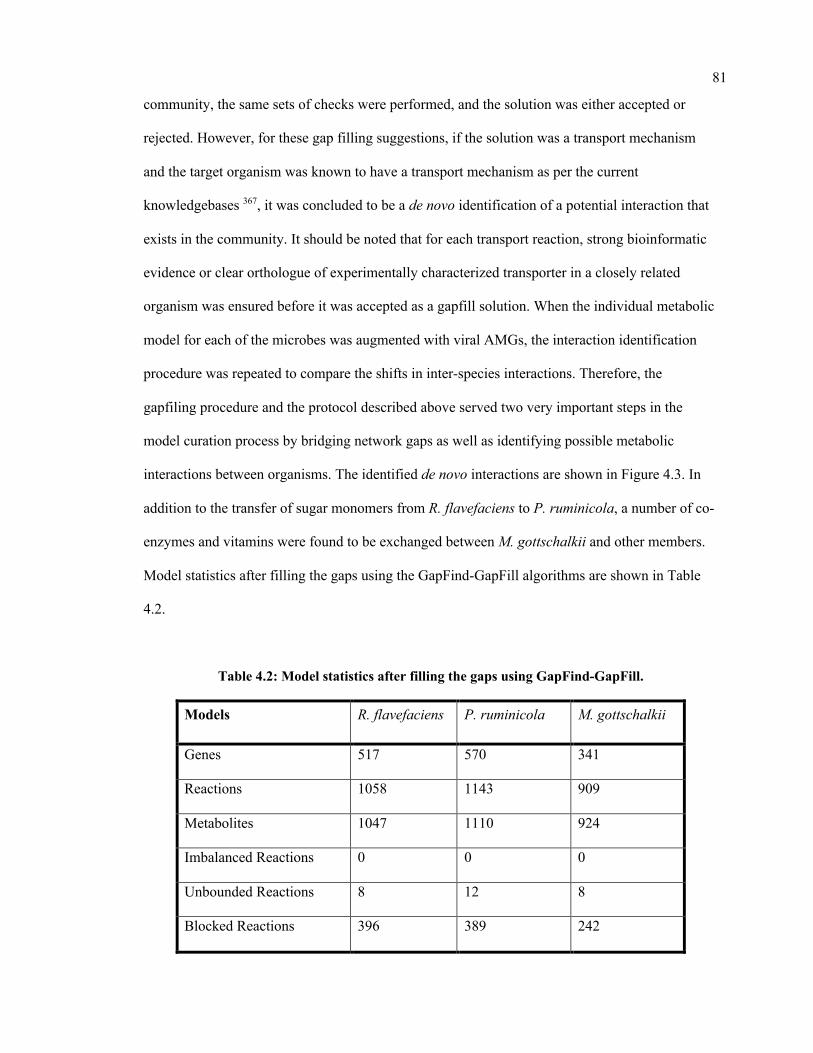
81
community, the same sets of checks were performed, and the solution was either accepted or
rejected. However, for these gap filling suggestions, if the solution was a transport mechanism
and the target organism was known to have a transport mechanism as per the current
knowledgebases 367, it was concluded to be a de novo identification of a potential interaction that
exists in the community. It should be noted that for each transport reaction, strong bioinformatic
evidence or clear orthologue of experimentally characterized transporter in a closely related
organism was ensured before it was accepted as a gapfill solution. When the individual metabolic
model for each of the microbes was augmented with viral AMGs, the interaction identification
procedure was repeated to compare the shifts in inter-species interactions. Therefore, the
gapfiling procedure and the protocol described above served two very important steps in the
model curation process by bridging network gaps as well as identifying possible metabolic
interactions between organisms. The identified de novo interactions are shown in Figure 4.3. In
addition to the transfer of sugar monomers from R. flavefaciens to P. ruminicola, a number of co-
enzymes and vitamins were found to be exchanged between M. gottschalkii and other members.
Model statistics after filling the gaps using the GapFind-GapFill algorithms are shown in Table
4.2.
Table 4.2: Model statistics after filling the gaps using GapFind-GapFill.
Models R. flavefaciens P. ruminicola M. gottschalkii
Genes 517 570 341
Reactions 1058 1143 909
Metabolites 1047 1110 924
Imbalanced Reactions 0 0 0
Unbounded Reactions 8 12 8
Blocked Reactions 396 389 242
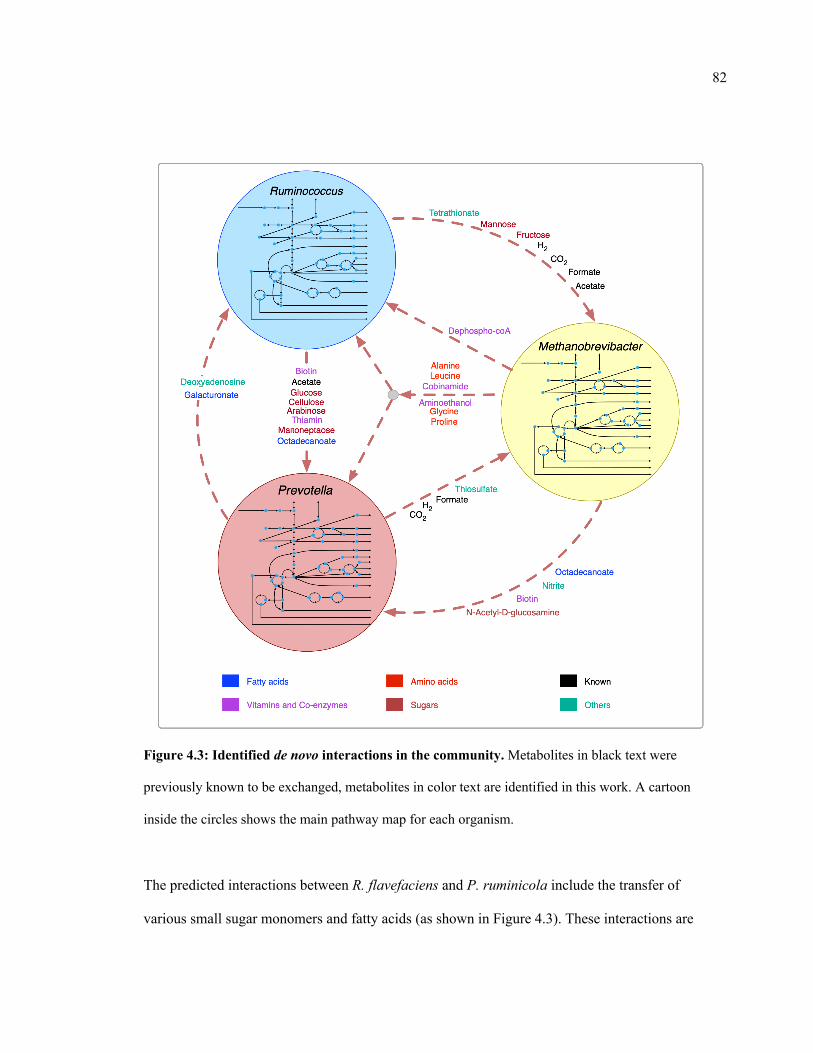
82
Figure 4.3: Identified de novo interactions in the community. Metabolites in black text were
previously known to be exchanged, metabolites in color text are identified in this work. A cartoon
inside the circles shows the main pathway map for each organism.
The predicted interactions between R. flavefaciens and P. ruminicola include the transfer of
various small sugar monomers and fatty acids (as shown in Figure 4.3). These interactions are
83
highly warranted given the metabolic functions each of these organisms perform 362,368. Both of
these cellulolytic organisms contribute towards breakdown of complex plant material and the
production of SCFAs and small sugar molecules for the host and other members in the
community. Several NMR and GC-MS based metabolomic analyses of the ruminal fluid showed
the secretion of glucose, mannose, acetate, formate, and maltoheptaose in the rumen 348,349, which
match our observations. These interactions build mutualistic and commensal relationships in the
rumen ecosystem. Prevotella is also known for its proteolytic functions and high dipeptidyl
peptidase activity 362, which was demonstrated by the consumption and degradation of amino
acids in the community simulation. This observation agrees with the meta-transcriptomic analysis
by Li and Guan 350, where they found downregulated amino acid synthesis and upregulated
alanine, aspartate and glutamate catabolism in Prevotella, and the metabolomic study by Wang et
al. 351, where a co-occurrence network analysis among the microbiota and metabolites showed
positive correlation between Prevotella and several amino acids. Li and Guan 350 also observed
downregulated fatty acids synthesis pathway in Prevotella, which can be complemented by the
uptake of fatty acids like octadecanoate produced by R. flavefaciens and M. gottschalkii.
Prevotella also lacks the capability of glycan degradation 350, which provides the explanation for
our in silico observation that glycans are degraded by R. flavefaciens and then the degradation
products are taken up by Prevotella. Methanobrevibacter acts as a sulfate reducer and a
hydrogenotroph 354,362,369,370, which can be attributed to its consumption of thiosulfate, formate,
and hydrogen. The consumption of hydrogen by Methanobrevibacter may potentially facilitate
the extraction of energy from nutrients and increase digestion efficiency by redirecting the
ruminal fermentation towards more oxidized end products 371. Previous studies have inferred an
absence of Glycosaminoglycan degradation functions in M. gottschalkii 350, which explains our
observation of acetyl glucosamine secretion by M. gottschalkii and subsequent consumption by P.
ruminicola. At the same time, the role of Methanobrevibacter in supplying a number of important
amino acids, vitamins and co-enzymes to the other organisms was observed, which was not
84
reported before the current study. These roles suggest that Methanobrevibacter is a major player
in the rumen ecosystem and warrants further studies on its role in specificity and efficiency of
bacterial digestion in rumen.
4.5. Identification of viral auxiliary metabolic genes
In addition to the syntrophic, mutualistic, and competitive microbial interactions, viruses impact
microbial populations through cell lysis and reprogramming of host metabolism by Auxiliary
Metabolic genes (AMGs). Most of the bacterial species in the cattle rumen have their own
associated viruses 306,307,372. To identify the viral AMGs, the viruses/phages associated with each
of the community members were searched for. Miller et al 306 suggested 13 different phages
associated with R. flavefaciens, P. ruminicola and M. gottschalkii. A local alignment search
(BLAST) of the viral proteomes downloaded from several databases 122,356,373-376 to The National
Center for Biotechnology Information (NCBI) non-redundant proteins sequence database 377 was
performed. The search yielded more than 3000 candidate proteins, which were filtered for
expectancy values (<10-34). The list of viruses associated with the host microbes are presented in
Table 4.3.
4.6. Viral auxiliary metabolic genes and shifts in flux distributions in the metabolic models
Upon filtering more than 3000 candidate proteins from BLAST search results for high bit score
and expectancy values (<10-34), the models of R. flavefaciens, P. ruminicola, and M. gottschalkii
were amended with 29, 26, and 18 metabolic reactions, respectively. For a detailed result of the
alignment search see Appendix F. The reactions included additional metabolic functions and also
novel metabolic capacities in the existing models. The addition of Auxiliary Metabolic Genes
(AMGs) from the viruses associated with each of the host community members had profound
impact on shifting and relaxing the flux ranges of key rate-limiting steps in the host organisms,
termed as “metabolic bottlenecks”. Up to 11% of reaction in all three of the models had
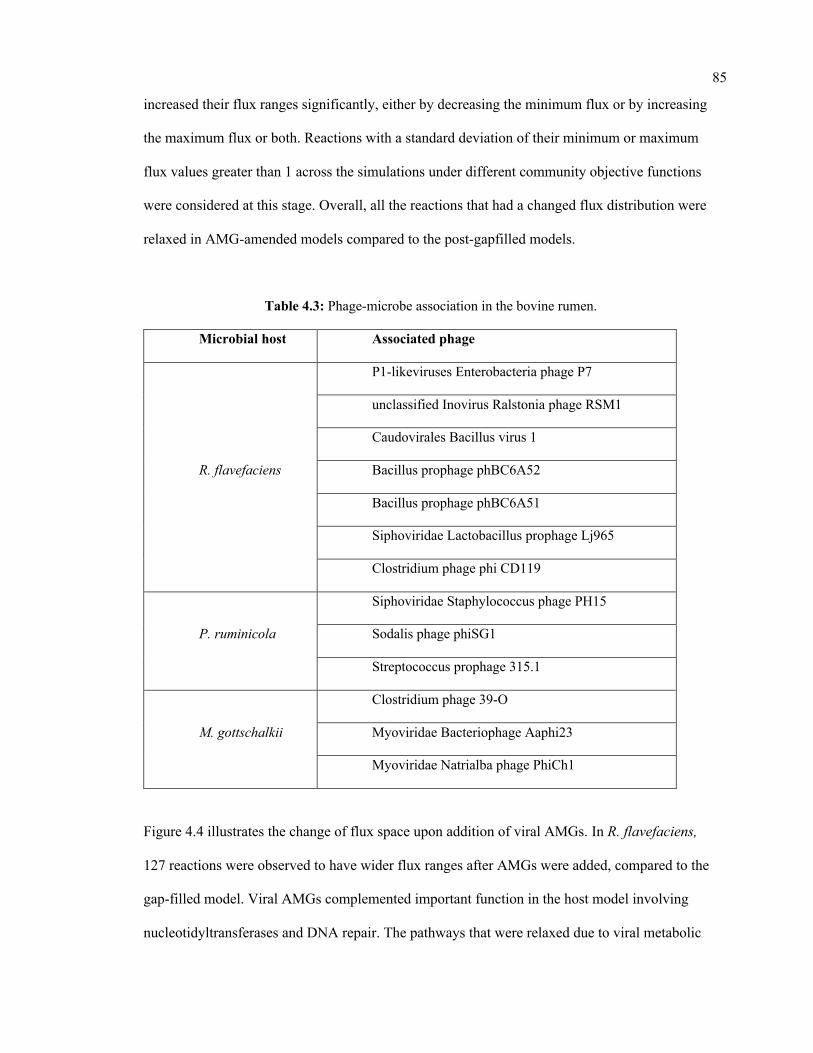
85
increased their flux ranges significantly, either by decreasing the minimum flux or by increasing
the maximum flux or both. Reactions with a standard deviation of their minimum or maximum
flux values greater than 1 across the simulations under different community objective functions
were considered at this stage. Overall, all the reactions that had a changed flux distribution were
relaxed in AMG-amended models compared to the post-gapfilled models.
Table 4.3: Phage-microbe association in the bovine rumen.
Microbial host Associated phage
R. flavefaciens
P1-likeviruses Enterobacteria phage P7
unclassified Inovirus Ralstonia phage RSM1
Caudovirales Bacillus virus 1
Bacillus prophage phBC6A52
Bacillus prophage phBC6A51
Siphoviridae Lactobacillus prophage Lj965
Clostridium phage phi CD119
P. ruminicola
Siphoviridae Staphylococcus phage PH15
Sodalis phage phiSG1
Streptococcus prophage 315.1
M. gottschalkii
Clostridium phage 39-O
Myoviridae Bacteriophage Aaphi23
Myoviridae Natrialba phage PhiCh1
Figure 4.4 illustrates the change of flux space upon addition of viral AMGs. In R. flavefaciens,
127 reactions were observed to have wider flux ranges after AMGs were added, compared to the
gap-filled model. Viral AMGs complemented important function in the host model involving
nucleotidyltransferases and DNA repair. The pathways that were relaxed due to viral metabolic
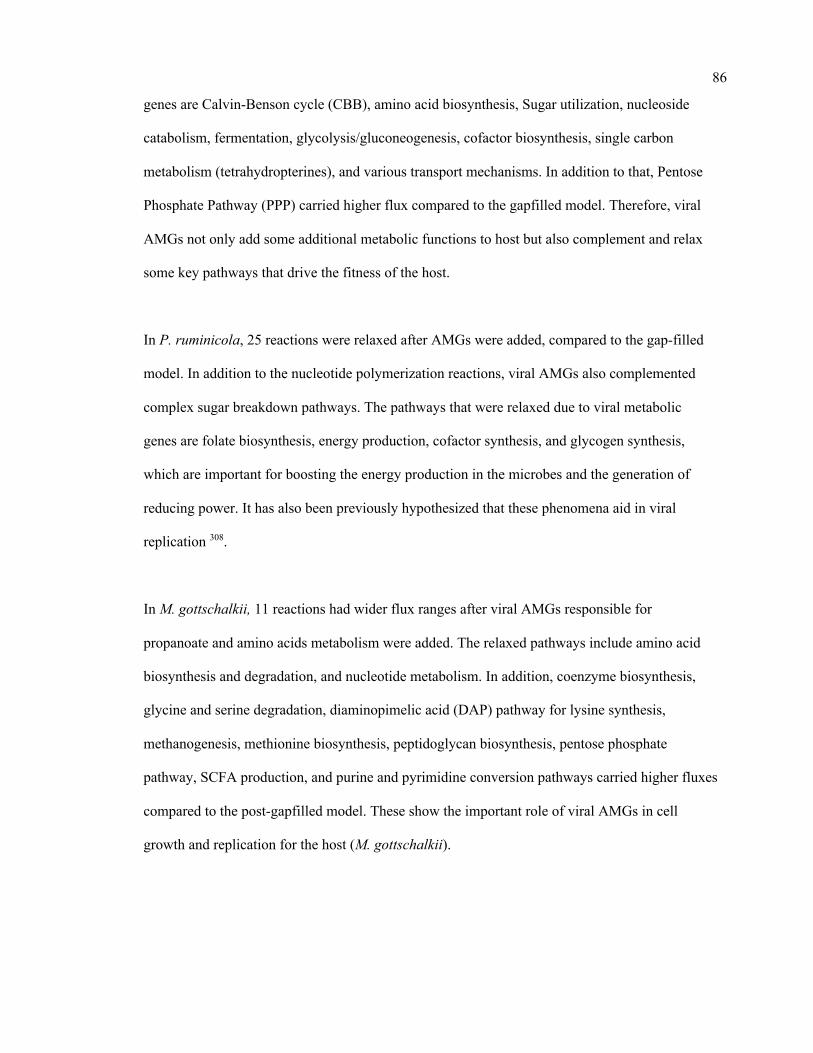
86
genes are Calvin-Benson cycle (CBB), amino acid biosynthesis, Sugar utilization, nucleoside
catabolism, fermentation, glycolysis/gluconeogenesis, cofactor biosynthesis, single carbon
metabolism (tetrahydropterines), and various transport mechanisms. In addition to that, Pentose
Phosphate Pathway (PPP) carried higher flux compared to the gapfilled model. Therefore, viral
AMGs not only add some additional metabolic functions to host but also complement and relax
some key pathways that drive the fitness of the host.
In P. ruminicola, 25 reactions were relaxed after AMGs were added, compared to the gap-filled
model. In addition to the nucleotide polymerization reactions, viral AMGs also complemented
complex sugar breakdown pathways. The pathways that were relaxed due to viral metabolic
genes are folate biosynthesis, energy production, cofactor synthesis, and glycogen synthesis,
which are important for boosting the energy production in the microbes and the generation of
reducing power. It has also been previously hypothesized that these phenomena aid in viral
replication 308.
In M. gottschalkii, 11 reactions had wider flux ranges after viral AMGs responsible for
propanoate and amino acids metabolism were added. The relaxed pathways include amino acid
biosynthesis and degradation, and nucleotide metabolism. In addition, coenzyme biosynthesis,
glycine and serine degradation, diaminopimelic acid (DAP) pathway for lysine synthesis,
methanogenesis, methionine biosynthesis, peptidoglycan biosynthesis, pentose phosphate
pathway, SCFA production, and purine and pyrimidine conversion pathways carried higher fluxes
compared to the post-gapfilled model. These show the important role of viral AMGs in cell
growth and replication for the host (M. gottschalkii).
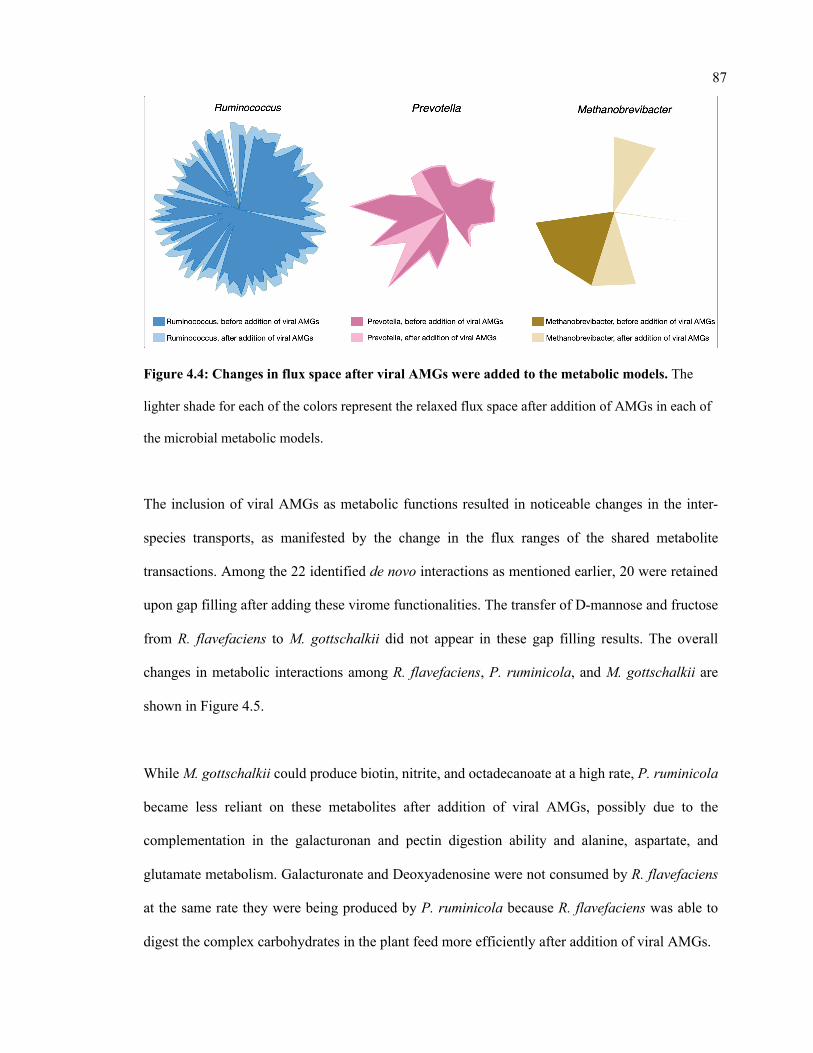
87
Figure 4.4: Changes in flux space after viral AMGs were added to the metabolic models. The
lighter shade for each of the colors represent the relaxed flux space after addition of AMGs in each of
the microbial metabolic models.
The inclusion of viral AMGs as metabolic functions resulted in noticeable changes in the inter-
species transports, as manifested by the change in the flux ranges of the shared metabolite
transactions. Among the 22 identified de novo interactions as mentioned earlier, 20 were retained
upon gap filling after adding these virome functionalities. The transfer of D-mannose and fructose
from R. flavefaciens to M. gottschalkii did not appear in these gap filling results. The overall
changes in metabolic interactions among R. flavefaciens, P. ruminicola, and M. gottschalkii are
shown in Figure 4.5.
While M. gottschalkii could produce biotin, nitrite, and octadecanoate at a high rate, P. ruminicola
became less reliant on these metabolites after addition of viral AMGs, possibly due to the
complementation in the galacturonan and pectin digestion ability and alanine, aspartate, and
glutamate metabolism. Galacturonate and Deoxyadenosine were not consumed by R. flavefaciens
at the same rate they were being produced by P. ruminicola because R. flavefaciens was able to
digest the complex carbohydrates in the plant feed more efficiently after addition of viral AMGs.
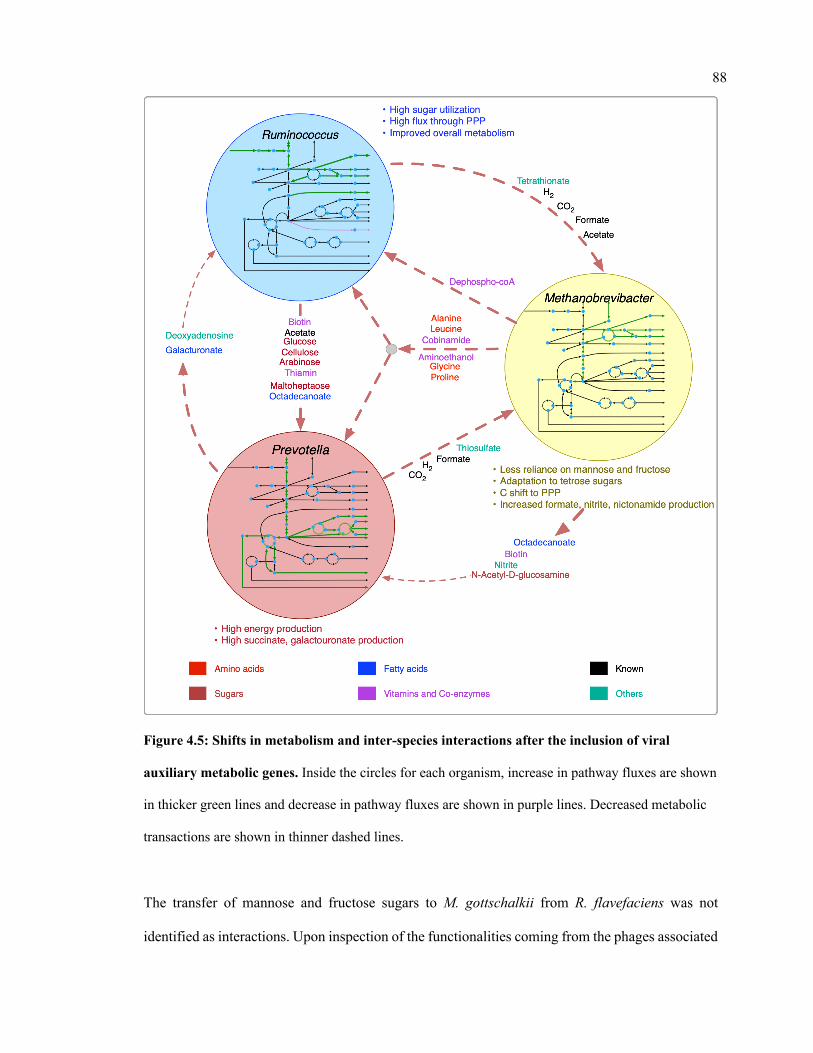
88
Figure 4.5: Shifts in metabolism and inter-species interactions after the inclusion of viral
auxiliary metabolic genes. Inside the circles for each organism, increase in pathway fluxes are shown
in thicker green lines and decrease in pathway fluxes are shown in purple lines. Decreased metabolic
transactions are shown in thinner dashed lines.
The transfer of mannose and fructose sugars to M. gottschalkii from R. flavefaciens was not
identified as interactions. Upon inspection of the functionalities coming from the phages associated

89
with M. gottschalkii, it became apparent that the D-glyceraldehyde-3-phosphate glycolaldehyde
transferase and D-mannose-6-phosphate aldose-ketose-isomerase system that drive the conversion
between fructose and mannose became unnecessary in the presence of virome functionalities in the
models. At the same time, the phosphofructokinase/sedoheptulokinase (EC 2.7.1.14) enzymes,
including Sedoheptulose 1,7-bisphosphate D-glyceraldehyde-3-phosphate-lyase and
ATP:Sedoheptulose 7-phosphate 1-phosphotransferase could shift the carbon flux from glycolysis
(via fructose-6-phosphate) to Pentose Phosphate pathway through tetrose sugars and therefore
facilitate the adaptation of M. gottschalkii even without the support of sugars from R. flavefaciens.
The ability to maintain species fitness without these interactions leads to better community fitness
in situations when these interactions are threatened (e.g., antibiotic treatment).
4.7. Variability of the metabolic fluxes under different community objective functions
The metabolic spaces of the community members were assessed under different community
objective functions after viral AMGs were added to the host models. To simulate different
functions of the rumen microbial community, i.e., i) growth, ii) SCFA production, iii) feed
utilization, iv) methane and carbon-di-oxide release, and v) small sugar molecule production, the
appropriate community-level objective functions were chosen and optimized (see Figure 4.6 A
for details). Statistical analysis was performed to investigate the deviation of flux ranges under
these five objective functions. Approximately 44%, 18%, and 6% of the reactions from R.
flavefaciens, P. ruminicola, and M. gottschalkii models, respectively, had non-zero standard
deviation among their flux ranges in these conditions. However, under these five objective
functions, the variation of flux distributions across the three community members was very small
(with average standard deviation of 0.0001 and the range between 0 and 0.68). As representatives
of the corresponding flux ranges, Figure 4.6 B, 4.6 C, and 4.6 D show the density functions of the
standard deviations of the exchange fluxes (i.e., both uptakes and imports) from all of the three
community members.
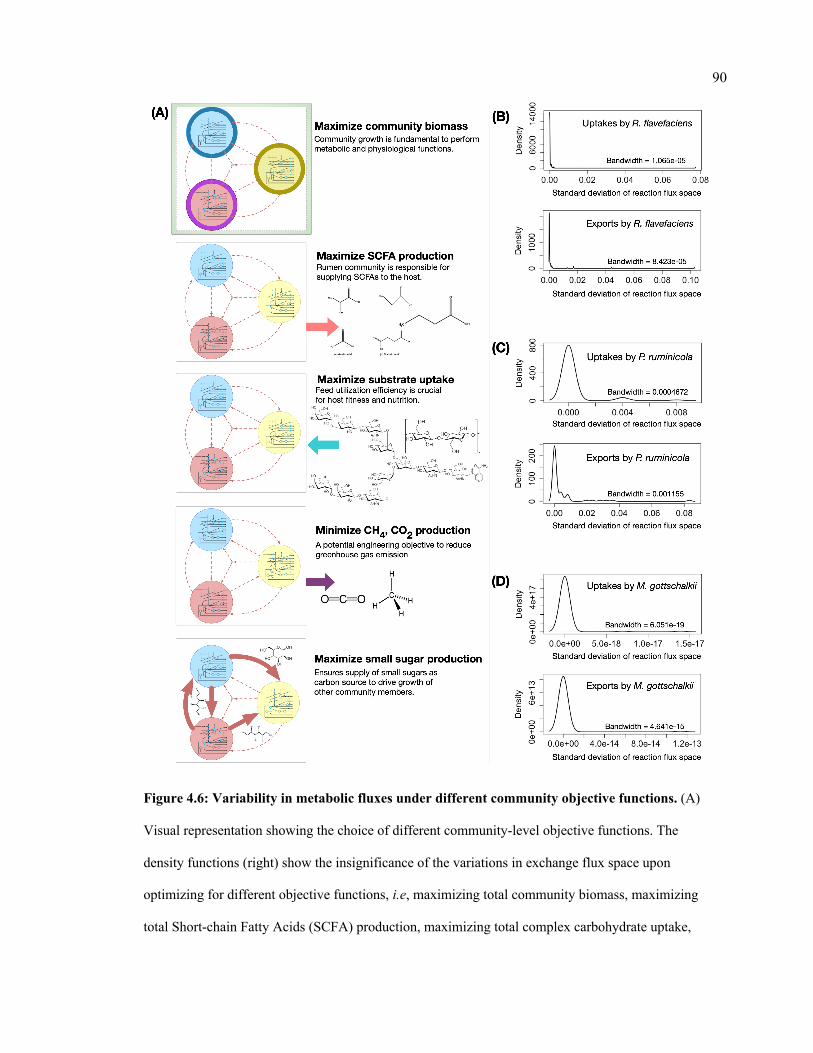
90
Figure 4.6: Variability in metabolic fluxes under different community objective functions. (A)
Visual representation showing the choice of different community-level objective functions. The
density functions (right) show the insignificance of the variations in exchange flux space upon
optimizing for different objective functions, i.e, maximizing total community biomass, maximizing
total Short-chain Fatty Acids (SCFA) production, maximizing total complex carbohydrate uptake,
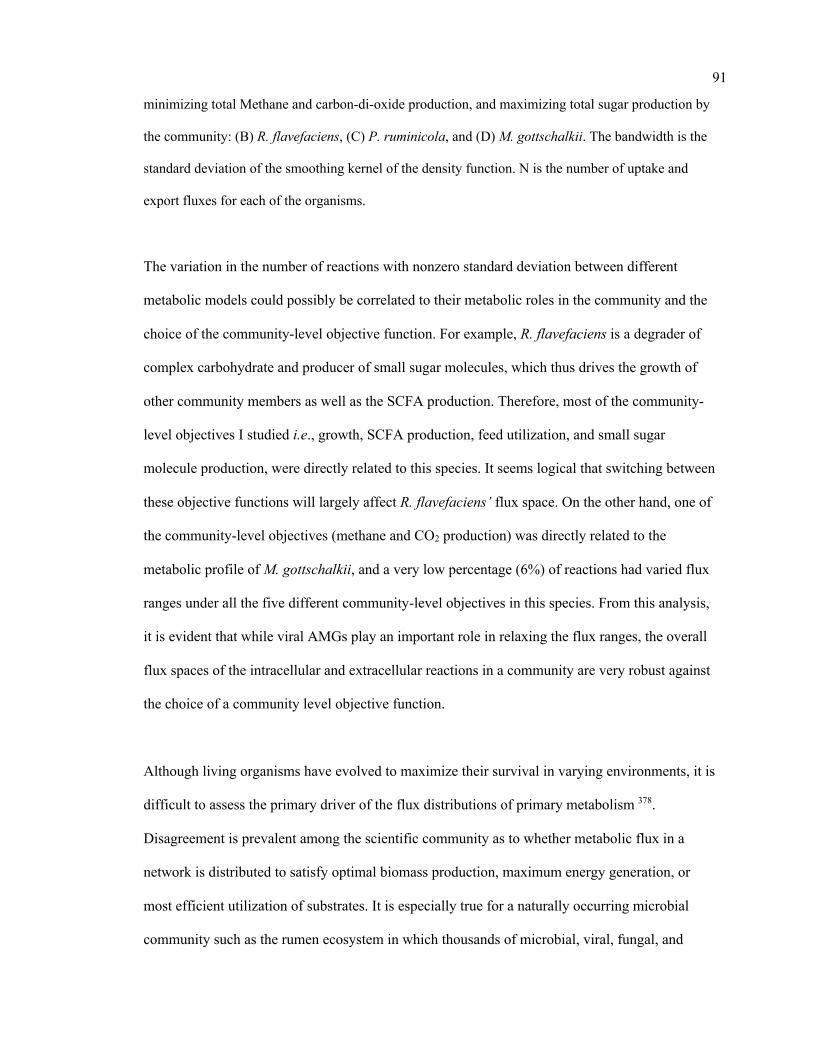
91
minimizing total Methane and carbon-di-oxide production, and maximizing total sugar production by
the community: (B) R. flavefaciens, (C) P. ruminicola, and (D) M. gottschalkii. The bandwidth is the
standard deviation of the smoothing kernel of the density function. N is the number of uptake and
export fluxes for each of the organisms.
The variation in the number of reactions with nonzero standard deviation between different
metabolic models could possibly be correlated to their metabolic roles in the community and the
choice of the community-level objective function. For example, R. flavefaciens is a degrader of
complex carbohydrate and producer of small sugar molecules, which thus drives the growth of
other community members as well as the SCFA production. Therefore, most of the community-
level objectives I studied i.e., growth, SCFA production, feed utilization, and small sugar
molecule production, were directly related to this species. It seems logical that switching between
these objective functions will largely affect R. flavefaciens’ flux space. On the other hand, one of
the community-level objectives (methane and CO2 production) was directly related to the
metabolic profile of M. gottschalkii, and a very low percentage (6%) of reactions had varied flux
ranges under all the five different community-level objectives in this species. From this analysis,
it is evident that while viral AMGs play an important role in relaxing the flux ranges, the overall
flux spaces of the intracellular and extracellular reactions in a community are very robust against
the choice of a community level objective function.
Although living organisms have evolved to maximize their survival in varying environments, it is
difficult to assess the primary driver of the flux distributions of primary metabolism 378.
Disagreement is prevalent among the scientific community as to whether metabolic flux in a
network is distributed to satisfy optimal biomass production, maximum energy generation, or
most efficient utilization of substrates. It is especially true for a naturally occurring microbial
community such as the rumen ecosystem in which thousands of microbial, viral, fungal, and
92
archaeal species co-evolved with different metabolic functions and interplay among one another.
Therefore, maximizing community biomass may not always be the best choice for an objective
function. However, choosing the best community objective is not as straightforward as it seems.
With that in mind, the variation of flux ranges under different community objective functions was
studied. From Figure 4.4, it is observed that the choice of a community objective has negligible
effect while simulating the possible metabolic capacities (flux space) of the community members.
While there have been attempts at optimizing a number of different objective functions for
prokaryotic microorganisms, optimizing for growth often seems realistic for both eukaryotic and
prokaryotic organisms 378. Due to the lack of knowledge about the overall goal of the rumen
community, maximizing community biomass is a logical choice, given that a stable community in
the rumen needs to survive and grow at a reasonable rate to perform its necessary role in host
nutrition and pathophysiology despite constant washout events like fecal secretion.
4.8. Conclusions
My rumen community metabolic model serves to discover unidentified metabolite transactions
and answer key ecological questions of ruminant nutrition through virome-microbiome
interactions, while promising to address important biological aspects of ruminant nutrition and
greenhouse emission. The development of additional bioinformatics tools, advancement in high-
throughput sequencing technologies and cultivation-independent ‘omics’ approaches may drive
further development of new mathematical frameworks for analyzing rumen ecosystems. In vitro
cell culture systems and in situ experimentation of simplified microbial, viral, and fungal
communities in gnotobiotic bovine rumen to capture spatiotemporal community dynamics will
enhance our analyzing power to a greater extent. Therefore, what I need is a combination of
computational and experimental efforts to enrich the current knowledgebase regarding in situ
metabolic and taxonomic profiling, species identification and characterization, annotation, and

93
advanced tools to accommodate for large-scale data analysis and integration, which will
accelerate further efforts in deciphering the complexity of this ecosystem.
94
Chapter 5
Microbial Community Dynamics in a Freshwater Lake
Methanotrophic Ecosystem
The role of methane in global warming has become paramount to the environment and the human
society, especially in the past few decades. Aerobic methane oxidation in freshwater lakes around
the world is a key metabolic process that significantly affects the carbon cycle by acting as a
major sink of methane. Methane cycling microbial communities in these freshwater lakes play an
important role in the global methane cycle, which is why the characterization of these
communities is critical to understand and manipulate their behavior. Methanotrophs are a major
player in these communities and are able to oxidize methane as their primary carbon source.
Lake Washington is a freshwater lake characterized by a methane-oxygen countergradient that
contains a methane cycling microbial community and provides a wonderful opportunity to study
the methane cycling with up to 20% of the organic carbon being released as methane through
decomposition and consuming up to 10% of the dissolved oxygen in the lake water.
Methanotrophs are a major part of this community involved in assimilating methane from lake
water. Two significant methanotrophic species in this community are Methylobacter
and Methylomonas. In this work, these methanotrophs are computationally studied via developing
highly curated genome-scale metabolic models. Each model was then integrated to form a
community model with a multi-level optimization framework. The competitive and mutualistic
metabolic interactions among Methylobacter and Methylomonas were also characterized. The
community model was next tested under carbon, oxygen, and nitrogen limited conditions in
addition to a nutrient-rich condition to observe the systematic shifts in the internal metabolic
pathways and extracellular metabolite exchanges. Each condition showed variations in the
95
methane oxidation pathway, pyruvate metabolism, and the TCA cycle as well as the excretion of
formaldehyde and carbon di-oxide in the community. Finally, the community model was
simulated under fixed ratios of these two members to reflect the opposing behavior in the two-
member synthetic community and in sediment-incubated communities. The community
simulations predicted a noticeable switch in intracellular carbon metabolism and formaldehyde
transfer between community members in sediment-incubated vs. synthetic condition. These
results predict the response of a simplified methane cycling microbial community from Lake
Washington to varying environments and also provide an insight into the difference of dynamics
in sediment-incubated microcosm community and synthetic co-cultures. Overall, this study lays
the ground for in silico systems-level studies of freshwater lake ecosystems, which can drive
future efforts of understanding, engineering, and modifying these communities for dealing with
global warming issues.
5.1. Background
The accelerated rise in worldwide average temperature in recent years is posing a serious threat to
the environment, terrestrial ecosystems, human health, economy, and the ultimate survival of the
planet earth. About 20 percent of global warming is caused by methane and it is expected to be 86
times more potent than carbon di-oxide in warming the earth over the next two decades 379. The
impacts of the rapid increase in atmospheric methane380 are compounded as higher temperatures
are associated with an increase in methane production from wetlands and lakes. Aerobic
methanotrophs are mostly gram-negative Proteobacteria that are an integral part of the global
carbon cycle 381. They exist in diverse environments such as wetlands, lakes, and the tundra and
use the enzyme methane monooxygenase (MMO) to oxidize methane as their sole source of
carbon 381. Methane-oxidizing Verrucomicrobia found in geothermal acidic environments are also
involved in methane oxidation while solely using carbon dioxide in the Calvin cycle 382-384. The
anaerobic methanotrophic archaea are also an important sink of methane that couple methane
96
oxidation with sulfate reduction mediated by sulfate-reducing bacteria 385. Thus, methanotrophs
act as the primary biological sink for methane 381, consuming up to 90 percent of the methane
produced in soil/sediments in addition to the atmospheric methane.
Lake Washington is a freshwater lake characterized by a methane-cycling community where
methanotrophs are one of the important functional microbial groups involved in methane
oxidation 386. It contains a steep vertical counter-gradient of methane and oxygen, and is
separated into oxic and anoxic layers where methane production and consumption occur,
respectively 386. Hence, it can be a model system to better understand methane-cycling
communities in lakes and their role in the global methane cycle. Understanding the metabolic
interactions in these communities will aid in developing methods to reduce the amount of
methane emitted from lakes. A diverse array of microbes exist in the Lake Washington
community, where Proteobacteria comprise 33% of the community and includes a major subtype
of methanotrophs, Methylococcaceae at a 10% abundance level 387. The genus Methylobacter is
the most dominant player in Methylococcaceae group at 47.7%, while other major players include
Crenothrix, Methylomonas, and Methylomicrobium at 30.0%, 10.8%, and 7.4%, respectively 387.
Other members include cyanobacteria, bacteriodetes, acidobacteria, and chloroflexi 387.
Understanding the physiological dynamics and interactions in natural methane-cycling
communities, such as the Lake Washington, are crucial to addressing problems concerning
methane’s role in global warming and leveraging methanotrophs’ possible functions in
bioremediation and bioproduction. Omics-based techniques and high-throughput sequencing can
elucidate important features of the community such as taxonomic information, community
composition, and presence of functionally important genes. However, it is difficult to assign
functionality to members of the community and decipher the roles of individual players due to the
complexity of the community and the data involved 388. On the other hand, synthetic communities
97
were proven to be efficient models to provide insight into metabolic capabilities and interactions.
Simple representative community structures can be made to lower complexity, achieve more
consistent results, and efficiently elucidate inter-species interactions. Certain Lake Washington
community members are easier to cultivate in a laboratory setting than other members. For
instance, Methylomonas and Methylosinus species previously shown ease of cultivation in the
laboratory 389. However, Methylobacter species were difficult to isolate and demonstrated poor
growth compared to Methylomonas and Methylosinus 386. A synthetic community comprising 50
different Lake Washington microbes belonging to 10 methanotrophic, 36 methylotrophic, and 4
non-methanotrophic heterobacteria showed that Methylobacter was outperformed by
Methylomonas in the community 386. Similar results about the dominance of Methylomonas in
pure cultures and in standard conditions were observed in their later experiments 390. These
observations were inconsistent with previous stable isotope probing studies that found
Methylobacter is the dominant Methylococcaceae species among microbes from Lake
Washington when grown on methane 387,391. These inconsistencies indicate that the complexities
of biological systems often make it challenging to understand the functions and interactions
within and among organisms in synthetic communities via in vitro and in vivo studies. In that
regard, in silico evaluation and analysis utilizing mathematical relation-based modeling allow for
a high-resolution understanding of the biological processes in a microbial community. However,
while there have been multiple studies in recent years involved in the model development of
various methanotrophs 392-397, an integrated community level analysis of freshwater methane
utilizing ecosystems have not been performed yet.
In this work, we developed a simplified community metabolic model with two representative and
functionally important strains of Lake Washington, namely, Methylobacter tundripaludum
21/22 (hereafter, Methylobacter) and Methylomonas sp. LW13 (hereafter, Methylomonas) as
representative organisms of the methane-oxidizing microbes in the Lake Washington ecosystem.
98
These species were chosen because of their availability in Lake Washington sediments, the ability
to mitigate common pollutants, and produce desirable biological products, and the availability of
genome-annotation. Draft models of these species were reconstructed followed by careful
curation to ensure proper representation of the species. Metabolic pathways and individual
reactions that are fundamental to the growth of these organisms such as the ribulose
monophosphate pathway, pentose phosphate pathway, methane metabolism, amino acid synthesis
and utilization, serine cycle, and Coenzyme B12 biosynthesis were manually scrutinized and then
integrated into the models. The metabolites exchanged by the two species models were
established by referring to literature and known transporter information 3,398-407. The curated
models of Methylobacter (704 genes, 1329 metabolites, and 1404 reactions) and Methylomonas
(658 genes, 1378 metabolites, and 1391 reactions) were then utilized to develop a community
model using a multi-level optimization framework, which was used to estimate biologically
feasible metabolite secretion profiles and community compositions 39,334. The community was
placed under carbon, oxygen, and nitrogen-limiting as well as nutrient-rich environments to study
the changes in intracellular carbon and nitrogen metabolism and metabolite excretion profiles.
The community composition of carbon-limited environments predicted a shift in the carbon
metabolism of both species. The community also demonstrates conservative metabolism under
oxygen and carbon-limited environments and produce less carbon-di-oxide. Under these
conditions, the mutualistic behavior involving formaldehyde transfer between Methylobacter and
Methylomonas is rarely observed. Our results also indicate metabolic reprogramming in TCA
cycle and pyruvate metabolism, which can help generate new hypotheses for in vivo experiments.
I also simulated the observed binary compositions in a sediment-incubated community and a
synthetic co-culture to predict the changes in intra- and extracellular metabolic fluxes. Overall,
our results enhance the mechanistic understanding of the Lake Washington methane-cycling
community, which can drive further engineering efforts for efficient rerouting of carbon and
nitrogen as well as mitigation of methane emission from freshwater ecosystems globally.
99
5.2. Metabolic model reconstruction and curation
The draft genome-scale metabolic models of Methylobacter and Methylomonas were developed
and downloaded using the ModelSEED database 3. The models included reactions for
glycolysis/gluconeogenesis, citrate cycle, pentose phosphate pathway, steroid biosynthesis,
nucleotide metabolism, and various amino acid biosynthesis. The biomass composition from
recently published methanotroph model Methylomicrobium buryatense strain 5G(B1)392 was
adopted in this study with slight modification in the lipid macromolecular stoichiometry to
account for different lipid macromolecules in the models. Non-growth associated ATP
maintenance flux was set to 21.6 mmol/gDCW.hr according to calculated values in the closely
related organism Methylomicrobium alcaliphilum by Akberdin et al393. All of the three modes of
electron transfer during Methane oxidation (redox arm, direct coupling and uphill electron
transfer) have been included in the models, since they are all possible and there is no definitive
conclusion of which organism prefers what mode of methane oxidation. Automated draft
reconstructions are limited as many reaction networks possess gaps due to missing reactions and
blocked reactions. These are defined as reactions that lack production/consumption of its
reactants/products. Major metabolic pathways were added based upon the literature of each
organism 391,408. Gaps were filled by referencing genetically related organisms to find missing
metabolic capabilities. The presence of these possible reactions in the models were validated by
cross referencing the relevant amino acid sequences between the reference organism and our
models via pBlast. The reactions were then checked for the formation of thermodynamically
infeasible cycles before being accepted.
Draft models for both Methylobacter and Methylomonas underwent an extensive manual curation
process, including chemical and charge-balancing, elimination of thermodynamically infeasible
cycles, and ensuring network connectivity. Reactions in the draft model reaction set imbalanced
in protons were checked with their appropriate protonation states and corrected by adding and
100
deleting proton(s) on either side of the reaction equation. The remaining imbalanced reactions
were stoichiometrically inaccurate and required the atoms on both sides of the reaction equation
to be balanced. The metabolites consumed and produced by models were established by referring
to literature and known transporter information 3,398-407.
Genome annotations of methanotrophs indicate that formaldehyde assimilation can happen
through the oxidative Pentose Phosphate Pathway as well as the formaldehyde/formate
dehydrogenases and the tetrahydrofolate-associated pathways 409,410. However, there have been
extensive evidence that the Ribulose Monophosphate (RuMP) cycle is the major route for
formaldehyde assimilation 411-413. Also, multiple studies indicate that formaldehyde assimilation
through the Serine cycle is insignificant 392,411,412. Based on transcriptomic data and metabolic flux
measurements392,411, I restricted the distribution of formaldehyde assimilation between the RuMP
cycle and the tetrahydrofolate-associated pathways. In addition, the oxygen stoichiometry in
pathways related to direct coupling methane oxidation and the coupling with cytochrome c
oxidase have been set (1 mol Oxygen/mol pyrroloquinoline quinone and 0.5 mol Oxygen/mol
Cytochrome c) according to literature 392,395,411,414.
While applying mass balance constraints to genome-scale metabolic models can display the net
accumulation and consumption of metabolites within each microbial model, it fails to account for
the regulation of reaction fluxes. The limitation of this constraint is better elucidated when
focusing on reaction cycles that do not consume and produce metabolites. Because of the absence
of metabolite consumption and production, the overall thermodynamic driving force of the cycles
become zero and the cycle is incapable of supporting any net flux, and thus deemed
thermodynamically and biologically infeasible. Reactions whose fluxes reached the defined lower
and upper bounds were determined to be unbounded reactions, group together based on
stoichiometry, and systematically corrected. These cycles were eliminated by removing duplicate
101
reactions, turning off lumped reactions, fixing reaction directionality, or selectively turning
reactions on or off based on cofactor specificities found from literature.
Both metabolic models were checked for the ability to produce biomass and metabolites they
were known to produce 391,408. The metabolic functionalities of the models were ensured by
identifying and manually adding reactions from biochemical databases, such as KEGG 407 and
Uniprot 402, to each model. Fully developed models of related organisms such as Methylococcus
capsulatus and Methanomonas methanica for both Methylobacter and Methylomonas were
utilized in help pinpoint absent enzymatic activity within our models. The addition of these
reactions was confirmed using the bioinformatic algorithm, BLAST, which compares the genes of
our organisms and related organisms and determines whether they are found to be orthologous. It
was then tested whether these reactions would increase the number of thermodynamically
infeasible cycles and promote for further curation of the models.
The manual curation process ensures that there is no chemical and charge imbalance present in
either of the models and there is no reaction with unrealistically high fluxes without any nutrient
uptake. The manual curation also reconnects a significant number of blocked metabolites to the
network in both models (i.e., 107 metabolites for Methylobacter and 109 metabolites for
Methylomonas). This enhancement of network connectivity is performed using available
literature pertaining to major metabolic pathways that are known to be present in both the
microbes 391,408. The draft models were lacking some reactions in the important metabolic
pathways i.e., the methane oxidation, pentose phosphate pathway, nitrogen fixation, cofactor, and
amino acid production, which are curated at this stage. The model statistics are shown in Table
5.1.
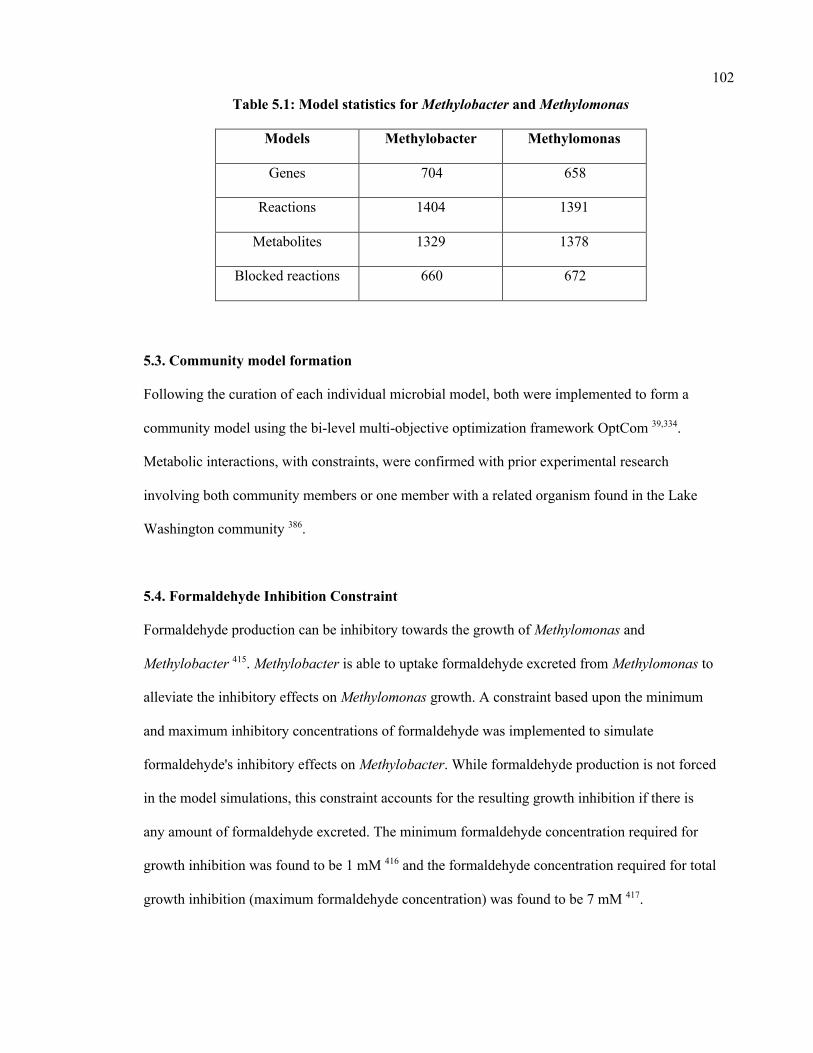
102
Table 5.1: Model statistics for Methylobacter and Methylomonas
Models Methylobacter Methylomonas
Genes 704 658
Reactions 1404 1391
Metabolites 1329 1378
Blocked reactions 660 672
5.3. Community model formation
Following the curation of each individual microbial model, both were implemented to form a
community model using the bi-level multi-objective optimization framework OptCom 39,334.
Metabolic interactions, with constraints, were confirmed with prior experimental research
involving both community members or one member with a related organism found in the Lake
Washington community 386.
5.4. Formaldehyde Inhibition Constraint
Formaldehyde production can be inhibitory towards the growth of Methylomonas and
Methylobacter 415. Methylobacter is able to uptake formaldehyde excreted from Methylomonas to
alleviate the inhibitory effects on Methylomonas growth. A constraint based upon the minimum
and maximum inhibitory concentrations of formaldehyde was implemented to simulate
formaldehyde's inhibitory effects on Methylobacter. While formaldehyde production is not forced
in the model simulations, this constraint accounts for the resulting growth inhibition if there is
any amount of formaldehyde excreted. The minimum formaldehyde concentration required for
growth inhibition was found to be 1 mM 416 and the formaldehyde concentration required for total
growth inhibition (maximum formaldehyde concentration) was found to be 7 mM 417.
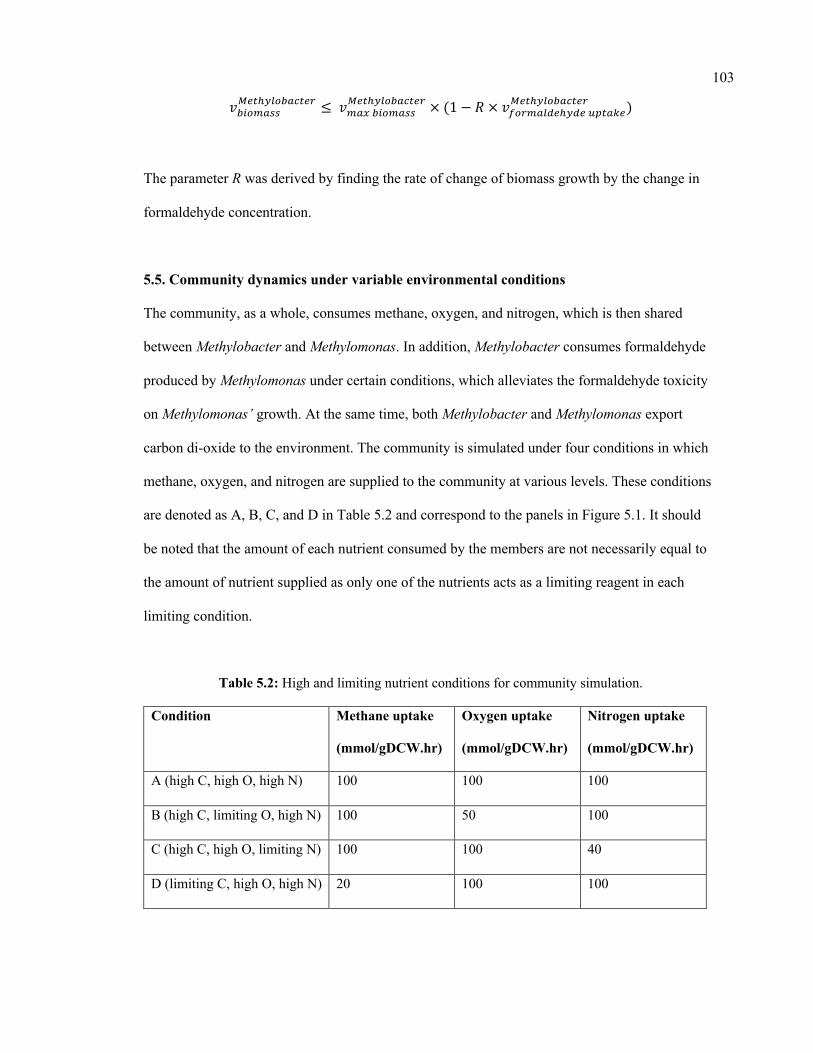
103
𝑣&!'()**<301=4'&):032 ≤𝑣()9&!'()**
<301=4'&):032 × (1 − 𝑅 × 𝑣>'2()4531=537-0)63<301=4'&):032 )
The parameter R was derived by finding the rate of change of biomass growth by the change in
formaldehyde concentration.
5.5. Community dynamics under variable environmental conditions
The community, as a whole, consumes methane, oxygen, and nitrogen, which is then shared
between Methylobacter and Methylomonas. In addition, Methylobacter consumes formaldehyde
produced by Methylomonas under certain conditions, which alleviates the formaldehyde toxicity
on Methylomonas’ growth. At the same time, both Methylobacter and Methylomonas export
carbon di-oxide to the environment. The community is simulated under four conditions in which
methane, oxygen, and nitrogen are supplied to the community at various levels. These conditions
are denoted as A, B, C, and D in Table 5.2 and correspond to the panels in Figure 5.1. It should
be noted that the amount of each nutrient consumed by the members are not necessarily equal to
the amount of nutrient supplied as only one of the nutrients acts as a limiting reagent in each
limiting condition.
Table 5.2: High and limiting nutrient conditions for community simulation.
Condition Methane uptake
(mmol/gDCW.hr)
Oxygen uptake
(mmol/gDCW.hr)
Nitrogen uptake
(mmol/gDCW.hr)
A (high C, high O, high N) 100 100 100
B (high C, limiting O, high N) 100 50 100
C (high C, high O, limiting N) 100 100 40
D (limiting C, high O, high N) 20 100 100
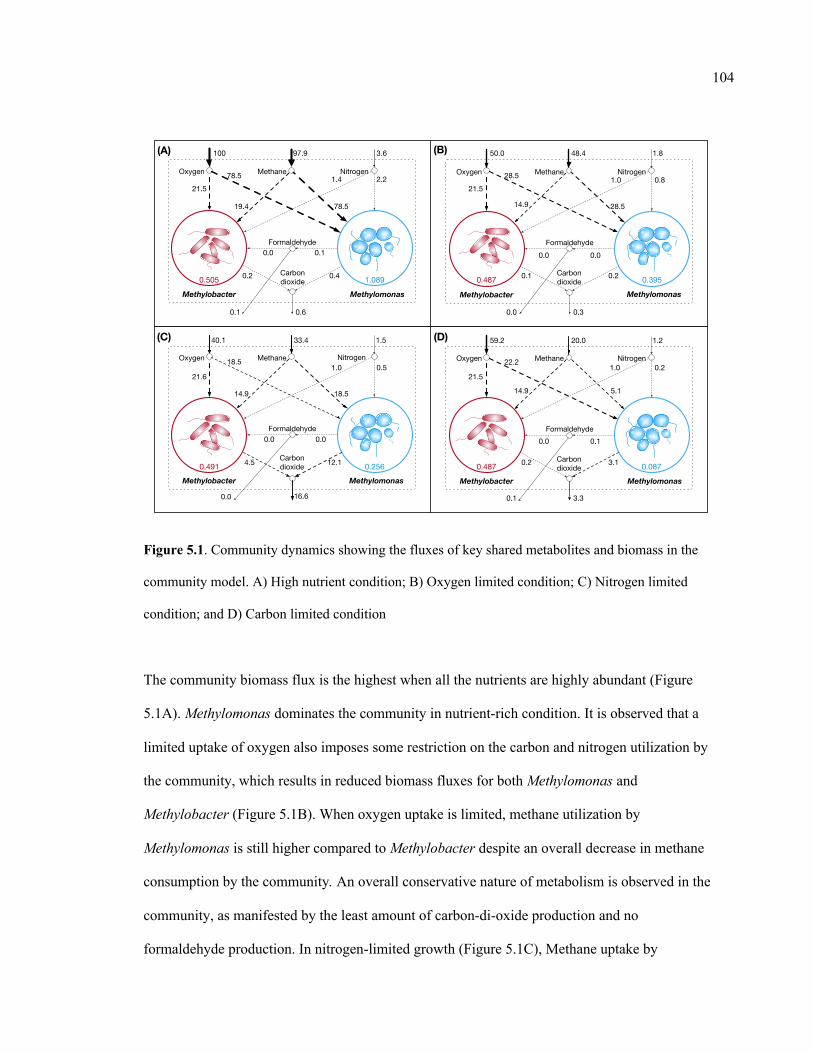
104
Figure 5.1. Community dynamics showing the fluxes of key shared metabolites and biomass in the
community model. A) High nutrient condition; B) Oxygen limited condition; C) Nitrogen limited
condition; and D) Carbon limited condition
The community biomass flux is the highest when all the nutrients are highly abundant (Figure
5.1A). Methylomonas dominates the community in nutrient-rich condition. It is observed that a
limited uptake of oxygen also imposes some restriction on the carbon and nitrogen utilization by
the community, which results in reduced biomass fluxes for both Methylomonas and
Methylobacter (Figure 5.1B). When oxygen uptake is limited, methane utilization by
Methylomonas is still higher compared to Methylobacter despite an overall decrease in methane
consumption by the community. An overall conservative nature of metabolism is observed in the
community, as manifested by the least amount of carbon-di-oxide production and no
formaldehyde production. In nitrogen-limited growth (Figure 5.1C), Methane uptake by
Oxygen Methane Nitrogen
Carbon dioxide
Formaldehyde
Methylobacter Methylomonas
Oxygen Methane Nitrogen
Carbon dioxide
Formaldehyde
Methylobacter Methylomonas
Oxygen Methane Nitrogen
Carbon dioxide
Formaldehyde
Methylobacter Methylomonas
Oxygen Methane Nitrogen
Carbon dioxide
Formaldehyde
Methylobacter Methylomonas
(A) (B)
(C) (D) 59.2
50.0100
40.1
78.5 28.5
22.218.5
5.1
28.578.5
18.5
0.2
0.82.2
0.5
0.10.0
0.1
0.00.0
0.0
0.10.0
0.1
0.00.0
0.0 3.3
3.1
0.20.4
12.14.5 0.2
0.10.2
0.30.6
16.6
21.5
21.521.5
21.6
14.9
14.919.4
14.9
20.0
48.497.9
33.4
1.0
1.01.4
1.0
1.2
1.83.6
1.5
0.487
0.4870.505
0.491 0.087
0.3951.089
0.256
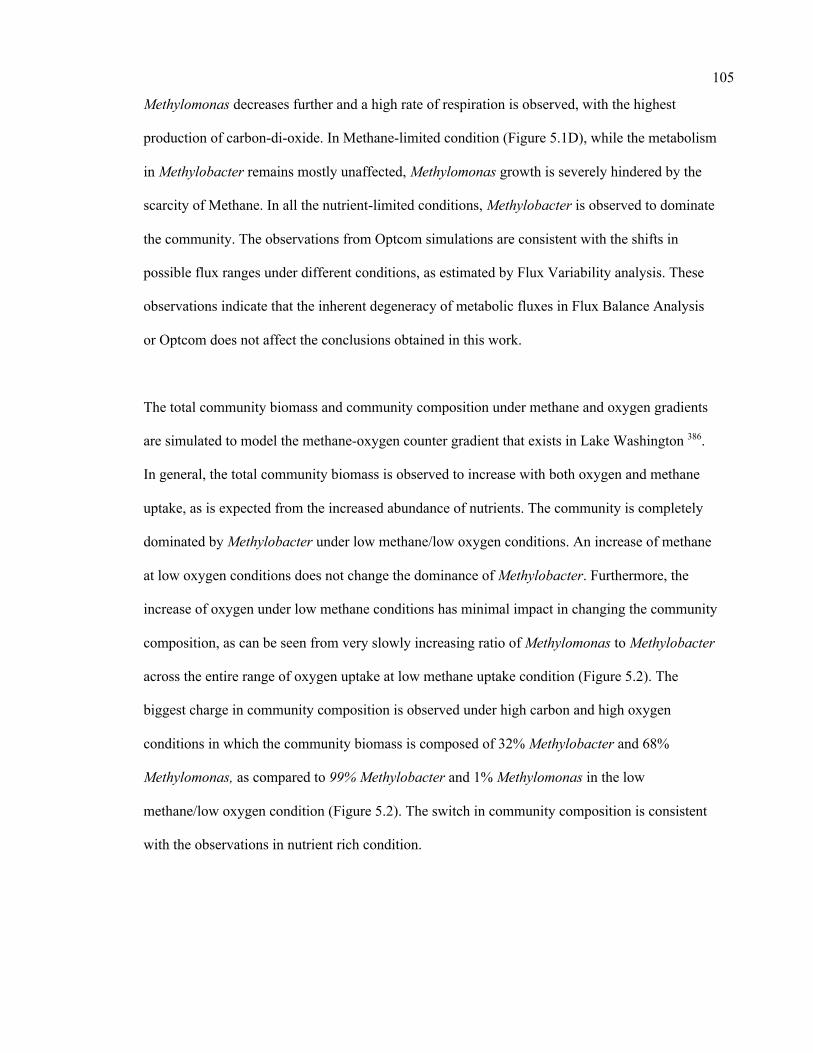
105
Methylomonas decreases further and a high rate of respiration is observed, with the highest
production of carbon-di-oxide. In Methane-limited condition (Figure 5.1D), while the metabolism
in Methylobacter remains mostly unaffected, Methylomonas growth is severely hindered by the
scarcity of Methane. In all the nutrient-limited conditions, Methylobacter is observed to dominate
the community. The observations from Optcom simulations are consistent with the shifts in
possible flux ranges under different conditions, as estimated by Flux Variability analysis. These
observations indicate that the inherent degeneracy of metabolic fluxes in Flux Balance Analysis
or Optcom does not affect the conclusions obtained in this work.
The total community biomass and community composition under methane and oxygen gradients
are simulated to model the methane-oxygen counter gradient that exists in Lake Washington 386.
In general, the total community biomass is observed to increase with both oxygen and methane
uptake, as is expected from the increased abundance of nutrients. The community is completely
dominated by Methylobacter under low methane/low oxygen conditions. An increase of methane
at low oxygen conditions does not change the dominance of Methylobacter. Furthermore, the
increase of oxygen under low methane conditions has minimal impact in changing the community
composition, as can be seen from very slowly increasing ratio of Methylomonas to Methylobacter
across the entire range of oxygen uptake at low methane uptake condition (Figure 5.2). The
biggest charge in community composition is observed under high carbon and high oxygen
conditions in which the community biomass is composed of 32% Methylobacter and 68%
Methylomonas, as compared to 99% Methylobacter and 1% Methylomonas in the low
methane/low oxygen condition (Figure 5.2). The switch in community composition is consistent
with the observations in nutrient rich condition.
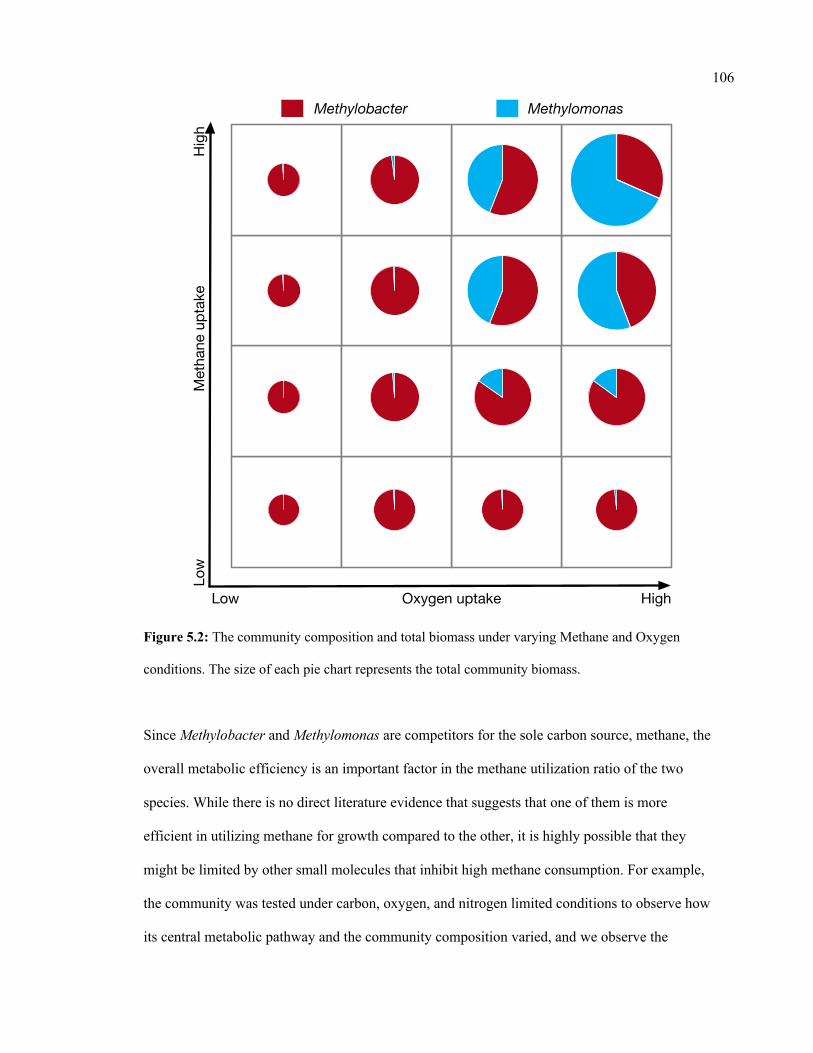
106
Figure 5.2: The community composition and total biomass under varying Methane and Oxygen
conditions. The size of each pie chart represents the total community biomass.
Since Methylobacter and Methylomonas are competitors for the sole carbon source, methane, the
overall metabolic efficiency is an important factor in the methane utilization ratio of the two
species. While there is no direct literature evidence that suggests that one of them is more
efficient in utilizing methane for growth compared to the other, it is highly possible that they
might be limited by other small molecules that inhibit high methane consumption. For example,
the community was tested under carbon, oxygen, and nitrogen limited conditions to observe how
its central metabolic pathway and the community composition varied, and we observe the
Oxygen uptake
Met
hane
upt
ake
Low
Hig
h
Low High
Methylobacter Methylomonas
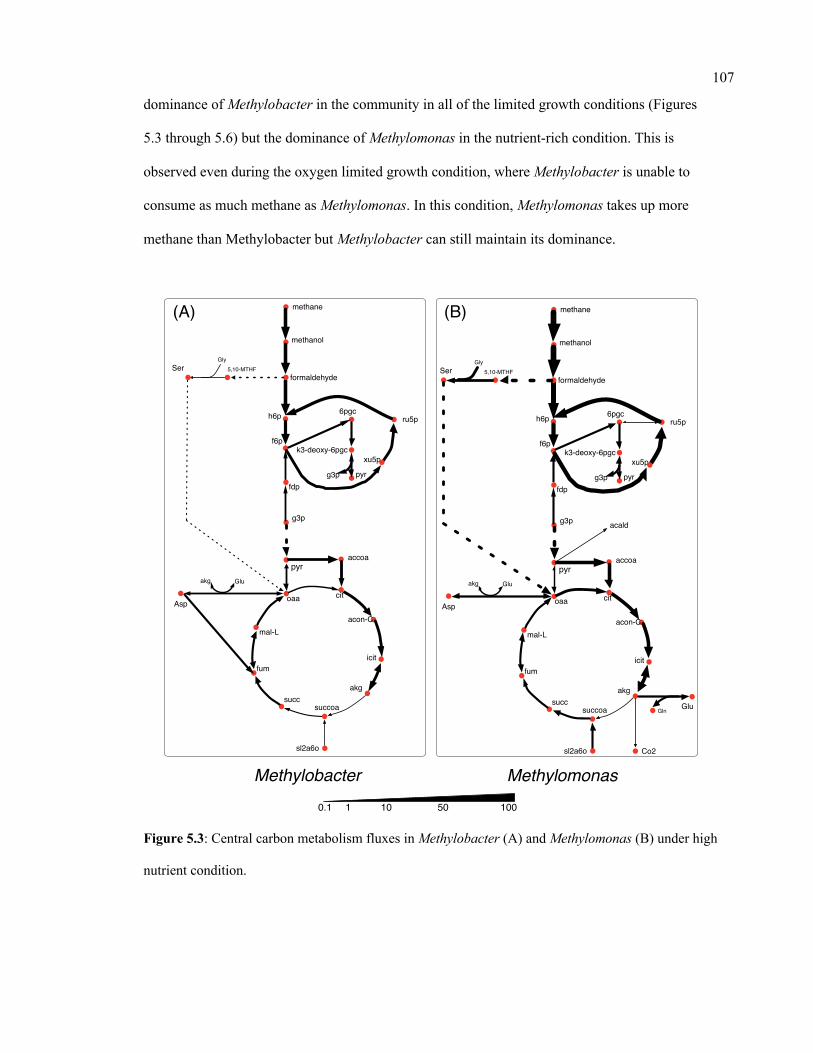
107
dominance of Methylobacter in the community in all of the limited growth conditions (Figures
5.3 through 5.6) but the dominance of Methylomonas in the nutrient-rich condition. This is
observed even during the oxygen limited growth condition, where Methylobacter is unable to
consume as much methane as Methylomonas. In this condition, Methylomonas takes up more
methane than Methylobacter but Methylobacter can still maintain its dominance.
Figure 5.3: Central carbon metabolism fluxes in Methylobacter (A) and Methylomonas (B) under high
nutrient condition.
accoa
g3p
oaa
mal-L
pyr
h6p
f6p
xu5p
6pgcru5p
cit
acon-C
akg
fum
succsuccoa
fdp
formaldehyde
icit
Asp
akg Glu
sl2a6o
methanol
methane
5,10-MTHFSerGly
k3-deoxy-6pgc
g3p pyr
Methylobacter
accoa
g3p
oaa
mal-L
pyr
h6p
f6p
xu5p
6pgcru5p
cit
acon-C
akg
fum
succsuccoa
fdp
formaldehyde
icit
GluGln
Asp
akg Glu
sl2a6o
methanol
methane
5,10-MTHFSerGly
k3-deoxy-6pgc
g3p pyr
Co2
acald
Methylomonas
(A) (B)
0.1 1 10 50 100
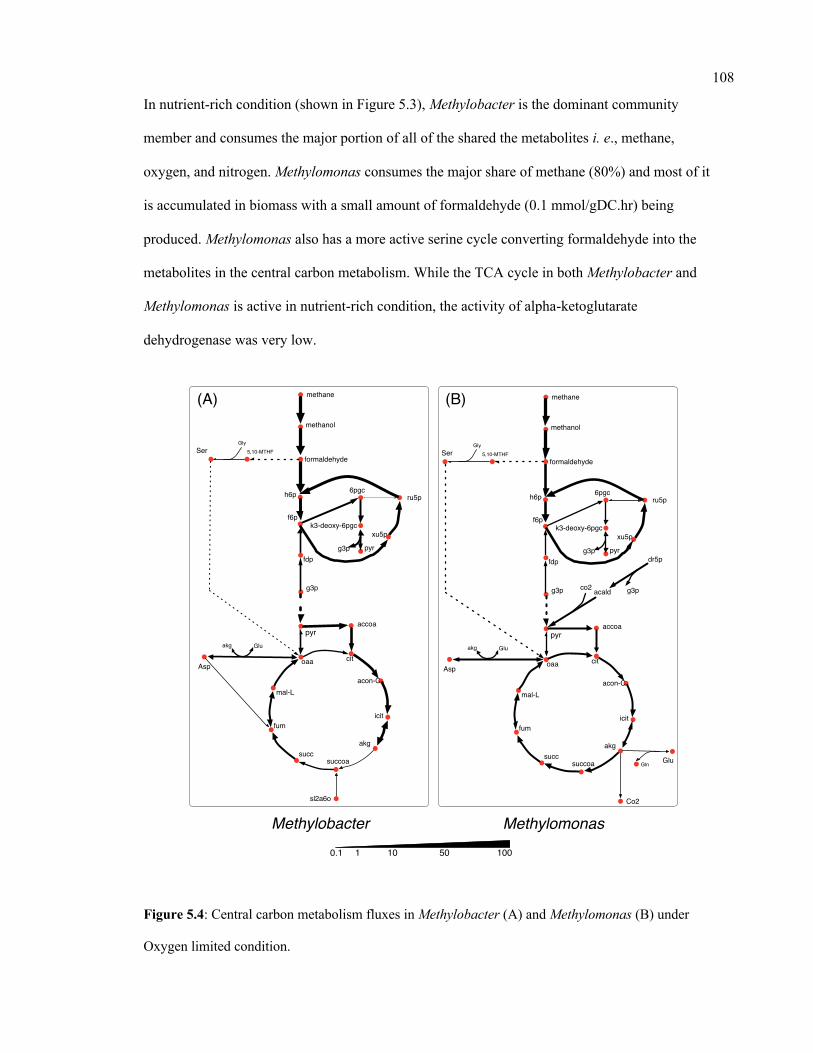
108
In nutrient-rich condition (shown in Figure 5.3), Methylobacter is the dominant community
member and consumes the major portion of all of the shared the metabolites i. e., methane,
oxygen, and nitrogen. Methylomonas consumes the major share of methane (80%) and most of it
is accumulated in biomass with a small amount of formaldehyde (0.1 mmol/gDC.hr) being
produced. Methylomonas also has a more active serine cycle converting formaldehyde into the
metabolites in the central carbon metabolism. While the TCA cycle in both Methylobacter and
Methylomonas is active in nutrient-rich condition, the activity of alpha-ketoglutarate
dehydrogenase was very low.
Figure 5.4: Central carbon metabolism fluxes in Methylobacter (A) and Methylomonas (B) under
Oxygen limited condition.
accoa
g3p
oaa
mal-L
pyr
h6p
f6p
xu5p
6pgcru5p
cit
acon-C
akg
fum
succsuccoa
fdp
formaldehyde
icit
Asp
akg Glu
sl2a6o
methanol
methane
5,10-MTHFSerGly
k3-deoxy-6pgc
g3p pyr
Methylobacter
accoa
g3p
oaa
mal-L
pyr
h6p
f6p
xu5p
6pgcru5p
cit
acon-C
akg
fum
succsuccoa
fdp
formaldehyde
icit
GluGln
Asp
akg Glu
methanol
methane
5,10-MTHFSerGly
k3-deoxy-6pgc
g3p pyr
Co2
acald
Methylomonas
(A) (B)
0.1 1 10 50 100
dr5p
g3pco2
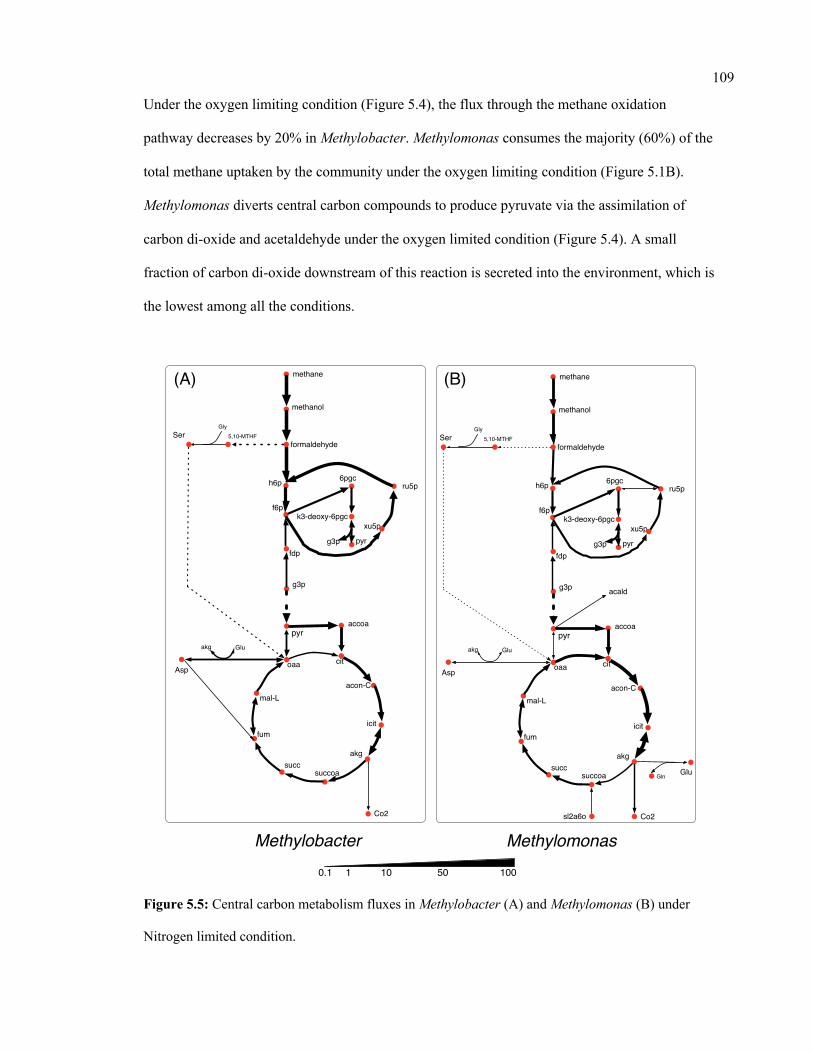
109
Under the oxygen limiting condition (Figure 5.4), the flux through the methane oxidation
pathway decreases by 20% in Methylobacter. Methylomonas consumes the majority (60%) of the
total methane uptaken by the community under the oxygen limiting condition (Figure 5.1B).
Methylomonas diverts central carbon compounds to produce pyruvate via the assimilation of
carbon di-oxide and acetaldehyde under the oxygen limited condition (Figure 5.4). A small
fraction of carbon di-oxide downstream of this reaction is secreted into the environment, which is
the lowest among all the conditions.
Figure 5.5: Central carbon metabolism fluxes in Methylobacter (A) and Methylomonas (B) under
Nitrogen limited condition.
accoa
g3p
oaa
mal-L
pyr
h6p
f6p
xu5p
6pgcru5p
cit
acon-C
akg
fum
succsuccoa
fdp
formaldehyde
icit
Asp
akg Glu
methanol
methane
5,10-MTHFSerGly
k3-deoxy-6pgc
g3p pyr
Methylobacter
accoa
g3p
oaa
mal-L
pyr
h6p
f6p
xu5p
6pgcru5p
cit
acon-C
akg
fum
succsuccoa
fdp
formaldehyde
icit
GluGln
Asp
akg Glu
sl2a6o
methanol
methane
5,10-MTHFSerGly
k3-deoxy-6pgc
g3p pyr
Co2
acald
Methylomonas
(A) (B)
0.1 1 10 50 100
Co2

110
The methane oxidizing pathway and TCA cycle reactions in Methylobacter do not show any
significant change in nitrogen limited condition (Figure 5.5A). Methylobacter excretes more
carbon di-oxide than nutrient-rich condition while consuming more oxygen than Methylomonas.
On the other hand, the activity of the methane oxidation pathway of Methylomonas decreases (the
lowest in any non-carbon limiting conditions). Furthermore, succinyl-CoA in Methylomonas is
produced from alpha-ketoglutarate in the TCA cycle, similar to oxygen limited conditions (Figure
5.5B). Methylomonas, similar to Methylobacter, also excretes significantly high amount of
carbon-di-oxide in nitrogen-limited condition.
In the carbon limited growth condition, Methylomonas takes up very small amount of methane,
while Methylobacter takes up most of the methane supplied to the community (Figure 5.6). The
central metabolism of Methylobacter is not altered under this carbon limited condition (Figure
5.6A). However, in Methylomonas, carbon di-oxide is scavenged by assimilating
succinyldihydrolipoamide and carbon di-oxide to succinyl-CoA (Figure 5.6B). This reaction is
inactive in the oxygen limiting condition. Methylomonas also displays minimal activity in its
serine cycle under carbon limiting condition.
Each of the nutrient limited conditions shows variable differences within the methane oxidation
pathway, the serine cycle, and the TCA cycle. While, based on the simulation, we did not observe
a noticeable flux through the serine cycle in either Methylomonas or Methylobacter in all
nutrient-limited conditions, it was significantly active in Methylomonas in nutrient rich condition.
In oxygen limiting condition, the community was also observed to conserve as much resource as
possible. For example, while Methylomonas excretes some amount of carbon dioxide in all
conditions, it routes most of it back to central carbon metabolism through the direction reversal of
pyruvate decarboxylase. Although there is currently no experimental studies pointing to this
phenomenon, studies in other organisms suggest a high oxygen sensitivity of this enzyme 418.
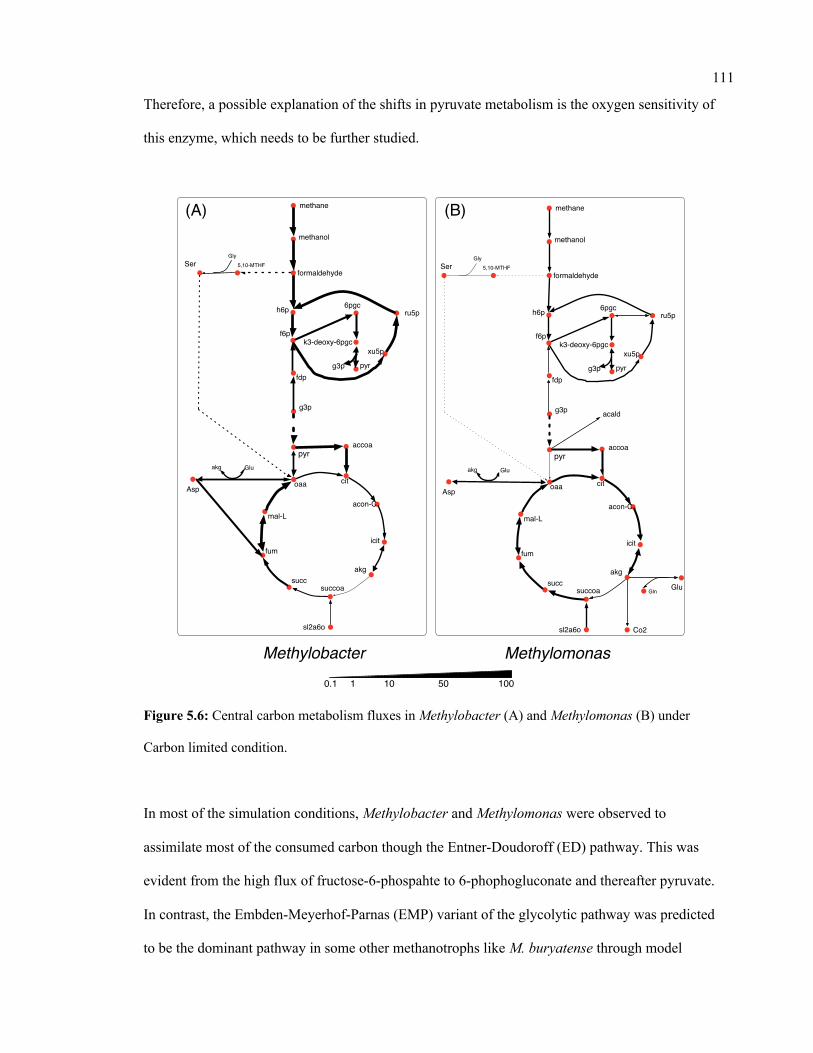
111
Therefore, a possible explanation of the shifts in pyruvate metabolism is the oxygen sensitivity of
this enzyme, which needs to be further studied.
Figure 5.6: Central carbon metabolism fluxes in Methylobacter (A) and Methylomonas (B) under
Carbon limited condition.
In most of the simulation conditions, Methylobacter and Methylomonas were observed to
assimilate most of the consumed carbon though the Entner-Doudoroff (ED) pathway. This was
evident from the high flux of fructose-6-phospahte to 6-phophogluconate and thereafter pyruvate.
In contrast, the Embden-Meyerhof-Parnas (EMP) variant of the glycolytic pathway was predicted
to be the dominant pathway in some other methanotrophs like M. buryatense through model
accoa
g3p
oaa
mal-L
pyr
h6p
f6p
xu5p
6pgcru5p
cit
acon-C
akg
fum
succsuccoa
fdp
formaldehyde
icit
Asp
akg Glu
sl2a6o
methanol
methane
5,10-MTHFSerGly
k3-deoxy-6pgc
g3p pyr
Methylobacter
accoa
g3p
oaa
mal-L
pyr
h6p
f6p
xu5p
6pgcru5p
cit
acon-C
akg
fum
succsuccoa
fdp
formaldehyde
icit
GluGln
Asp
akg Glu
sl2a6o
methanol
methane
5,10-MTHFSerGly
k3-deoxy-6pgc
g3p pyr
Co2
acald
Methylomonas
(A) (B)
0.1 1 10 50 100
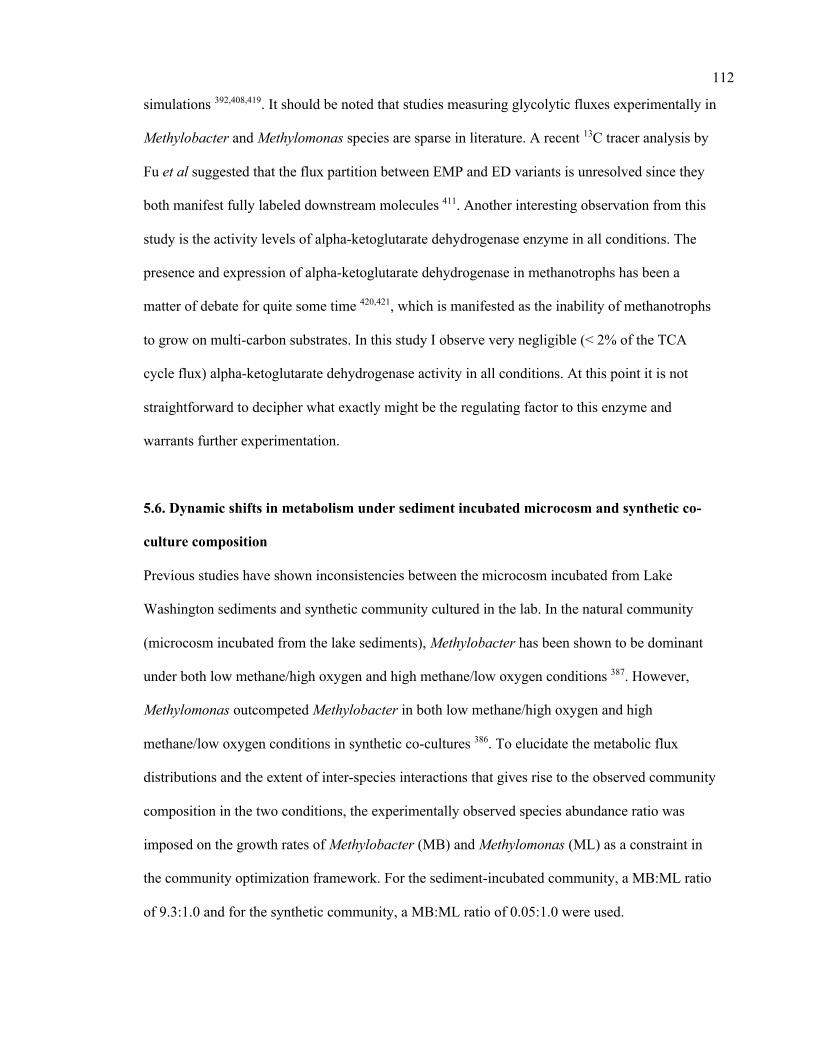
112
simulations 392,408,419. It should be noted that studies measuring glycolytic fluxes experimentally in
Methylobacter and Methylomonas species are sparse in literature. A recent 13C tracer analysis by
Fu et al suggested that the flux partition between EMP and ED variants is unresolved since they
both manifest fully labeled downstream molecules 411. Another interesting observation from this
study is the activity levels of alpha-ketoglutarate dehydrogenase enzyme in all conditions. The
presence and expression of alpha-ketoglutarate dehydrogenase in methanotrophs has been a
matter of debate for quite some time 420,421, which is manifested as the inability of methanotrophs
to grow on multi-carbon substrates. In this study I observe very negligible (< 2% of the TCA
cycle flux) alpha-ketoglutarate dehydrogenase activity in all conditions. At this point it is not
straightforward to decipher what exactly might be the regulating factor to this enzyme and
warrants further experimentation.
5.6. Dynamic shifts in metabolism under sediment incubated microcosm and synthetic co-
culture composition
Previous studies have shown inconsistencies between the microcosm incubated from Lake
Washington sediments and synthetic community cultured in the lab. In the natural community
(microcosm incubated from the lake sediments), Methylobacter has been shown to be dominant
under both low methane/high oxygen and high methane/low oxygen conditions 387. However,
Methylomonas outcompeted Methylobacter in both low methane/high oxygen and high
methane/low oxygen conditions in synthetic co-cultures 386. To elucidate the metabolic flux
distributions and the extent of inter-species interactions that gives rise to the observed community
composition in the two conditions, the experimentally observed species abundance ratio was
imposed on the growth rates of Methylobacter (MB) and Methylomonas (ML) as a constraint in
the community optimization framework. For the sediment-incubated community, a MB:ML ratio
of 9.3:1.0 and for the synthetic community, a MB:ML ratio of 0.05:1.0 were used.
113
Figure 5.7: Flux distribution for select metabolites in Methylobacter and Methylomonas under A)
Lake Washington sediment-incubated microcosm conditions and B) synthetic co-culture conditions.
The vast majority of reactions in Methylomonas has lower flux values in the sediment-incubated
community compared to the synthetic community (Figure 5.7). This occurs because
Methylomonas constitutes a smaller portion of the total community biomass in the sediment-
incubated community. There are alternate pathways to produce pyruvate which has increased flux
(Figure 5.7A). These pathways produce pyruvate by assimilating carbon di-oxide and
acetaldehyde and by the assimilation of cysteine and mercaptopyruvate. However, Methylomonas
produces less pyruvate overall even with the increased flux in these pathways, since other
pyruvate producing pathways decrease in flux. Primarily, the flux through L-serine and ammonia
assimilation to produce pyruvate is high in the synthetic condition but decreases in sediment-
incubated condition. Under sediment-incubated conditions, Methylobacter uses methane as its
primary carbon source and does not consume any formaldehyde produced by Methylomonas. On
the other hand, Methylobacter takes up some of the secreted formaldehyde from Methylomonas as
a carbon source in addition to Methane under the synthetic condition (Figure 5.7B).
These observed changes in community composition as oxygen and carbon levels change are more
consistent with behaviors in sediment samples than synthetic co-cultures 386. Methylobacter is
able to utilize methane to produce biomass at a more efficient level than Methylomonas.
Oxygen Methane Nitrogen
Carbon dioxide
Formaldehyde
Methylobacter Methylomonas
Oxygen Methane Nitrogen
Carbon dioxide
Formaldehyde
Methylobacter Methylomonas
(A) (B) 66.737.5
2.8 63.8
44.62.8
2.80.1
4.90.3
4.6
0.10.0
0.1
13.81.6 0.00.1
13.81.7
2.934.7
1.919.4
46.522.2
0.21.1
3.01.2
0.054 1.3470.505 0.067
F6P
pyr
Ser
Mer-pyr
F6P
pyr
Ser
Mer-pyrBiomass Biomass
0.10.8
1.2
0.3
0.34.9
3.4
14.2
0.7
0.813.81.6
114
However, when the synthetic co-culture condition is imposed on the species abundance ratio, i.e.,
favoring Methylomonas biomass, Methylobacter takes up formaldehyde produced by
Methylomonas in addition to methane consumption, which allows it to bypass the oxygen-
intensive reaction of oxidizing methane to methanol to some degree. This commensal relationship
helps Methylobacter to enhance its biomass even when the uptake of the original carbon source
(methane) is low while protecting Methylomonas from the toxicity and growth inhibitory effects
of formaldehyde 416,417. In our optimization formulation, the inhibitory formaldehyde constraint
placed on Methylobacter makes the consumption of formaldehyde detrimental towards biomass
production, but it can simultaneously act as a carbon source and compensates for its inhibitory
effects. This is contradictory to what was observed in the co-culture experiments 386. Similar to
formaldehyde, methanol export was also not observed in the simulations although some previous
studies have reported ethanol production422,423. This lack of excretion of intermediate carbon
molecules is often observed in steady-state Flux Balance Analysis models without any enzyme
kinetic information, where pathways upstream of biomass consumes most of the intermediates.
However, it should be noted that, the synthetic co-culture experiments reported in literature
involved other community members, whose metabolic interactions with Methylobacter and
Methylomonas are not well characterized to date. Some studies have indicated co-operative
relationships between Methylobacter and other microbial species from Methylophilaceae family
387, which might potentially impact that community dynamics in synthetic co-cultures. Moreover,
despite the dominance of Methylomonas in the synthetic community at a species level, further
assessment of community composition at a higher taxonomic level indicated a consistency with
naturally observed composition 386. I hypothesize that this discrepancy is possible, given that
there is high functional redundancy present in Lake Washington community, similar to any
naturally occurring microbial ecosystem.
115
5.7. Conclusions
In this work, we attempted to enhance our mechanistic understanding of the dynamics in the
methane cycling Lake Washington community through genome-scale metabolic modeling of the
representative and functionally important community members, Methylobacter tundripaludum
21/22 and Methylomonas sp LW13. The understanding of this community behavior will be a
foundation for future studies that aim at the long-term goal of creating a complex synthetic
community capable of carrying out certain desired functions through the consumption of
methane, thus mitigating the harmful effects of methane release in the atmosphere. One should be
aware of the fact that the in silico results need to be further tested and confirmed through relevant
experiments before any engineering strategies can be successfully employed. The community
metabolic model, in that regard, should be expanded to include other major players of the Lake
Washington community, i.e., members of Bacteroidetes and Proteobacteria phyla. Including
these organisms in our community metabolic model will enable us to explain currently
unidentified inter-species metabolite exchanges/interactions that play important role in the
cycling of methane as well as other nutrients.
116
Chapter 6
Divergent Metabolic Landscape of Pancreatic Ductal Adenocarcinoma
Pancreatic ductal adenocarcinoma (PDAC) is a major research focus due to its high therapy
resistance and difficult prognosis. PDAC cells adapt their metabolism efficiently to the particular
environment to which they are exposed, including utilizing diverse fuel sources depending on
their availability. Since traditional experimental techniques appear exhaustive in the search for a
viable therapeutic strategy against PDAC, in this study, a highly curated and omics-informed
genome-scale metabolic model of PDAC was reconstructed using patient-specific transcriptomic
data. From the analysis of the model-predicted metabolic changes, several new metabolic
functions were explored as potential therapeutic targets against PDAC in addition to the already
known metabolic hallmarks of pancreatic cancer. In particular, significant downregulation in the
peroxisomal fatty acid beta oxidation pathway reactions, flux modulation in the carnitine shuttle
system, and upregulation in the reactive oxygen species detoxification pathway reactions can
potentially direct new therapeutic approaches.
6.1. Background
Pancreatic ductal adenocarcinoma (PDAC), with poor prognosis, resistance to radio- and
chemotherapy, and a five-year survival rate of only 8.2% is the most prevalent form of pancreatic
cancer and the third-leading cause of cancer-related morbidity in the USA424. Its poor prognosis
can be attributed to its complicated and multifactorial nature, especially the lack of early
diagnostic markers as well as its ability to quickly metastasize to surrounding organs425-427.
Additionally, high rates of glycolysis and lactate secretion are observed in PDAC cells, fulfilling
the biosynthetic demands for rapid tumor growth424. The combined action of regulatory T cells
(Treg), myeloid-derived suppressor cells (MDSCs), and macrophages blocks theCD8+ T cell
117
duties in tumor recognition and clearance and, ultimately, results in PDAC cells manifesting
extensive immune suppression425.
PDAC microenvironment is greatly dominated by the presence of dense fibroblast stromal cells.
In addition to creating an acidic extracellular environment, the dense stroma surrounding the
tumor reduces oxygen diffusion into pancreas cells, resulting in hypoxia. In response to the
reduced oxygen uptake, the tumor cells undergo metabolic reprogramming to favor Warburg
effect metabolism12, which involves increased rates of glycolysis. Because cancer cells are
characterized by unregulated growth, much of the cellular metabolism is hijacked to maximize
the potential to generate biomass. Since PDAC cells are forced to live within a particularly severe
microenvironment characterized by relative hypovascularity, hypoxia, and nutrient deprivation,
these must possess biochemical flexibility in order to adapt to austere conditions. Rewired
glucose, amino acid, and lipid metabolism and metabolic crosstalk within the tumor
microenvironment contribute to unlimited pancreatic tumor progression. The metabolic
alterations of pancreatic cancer are mediated by multiple factors. These cells survive and thrive
mainly in three ways: (1) Reprogramming intracellular energy metabolism of nutrients, including
glucose, amino acids, and lipids; (2) Improving nutrient acquisition by scavenging and recycling;
(3) Conducting metabolic crosstalk with other components within the microenvironment428. In
addition, the metabolic reprogramming involved in pancreatic cancer resistance is also closely
related to chemotherapy, radiotherapy and immunotherapy, and results in a poor prognosis. Thus,
investigations of metabolism not only benefit the understanding of carcinogenesis and cancer
progression but also provide new insights for treatments against pancreatic cancer. A better
understanding of the metabolic dependencies required by PDAC to survive and thrive within a
harsh metabolic milieu could reveal specific metabolic vulnerabilities.
118
Systemic chemotherapy is presently the most frequently adopted treatment strategy for PDAC.
However, chemotherapy treatments often show limited success due to intrinsic and acquired
chemoresistance429,430. While many previous studies have predicted potential biomarkers for
therapeutic purposes, including the ribonucleotide reductase catalytic subunits M1/2 (RRM1/2),
an enzyme catalyzing the reduction of ribonucleotides, or the human equilibrative nucleoside
transporter 1 (hENT1), a transmembrane protein, the treatment with drugs (i.e., gemcitabine and
other combinatorial drugs) often failed 431-435. The hypoxic microenvironment is also resistive to
radiation dosage, reducing the efficacy of radiotherapy. In addition, the overexpression of key
regulators of the DNA damage response (e.g., RAD51 in PDAC) has been reported to contribute
to the accelerated repair of DNA damage [128, 129]. Several genes have been reported to be
frequently mutated in PDAC (i.e., KRAS, CDKN2A, TP53, and SMAD4)436,437 and, therefore,
received increased attention as potential drug targets 438-442. However, successful therapeutic
strategies are yet to be developed 443-445. The downstream events of metabolic reprogramming are
considered as prominent hallmarks of PDAC446. Therefore, tackling this aggressive cancer
through establishing a clear understanding of its metabolism has been a critical challenge to the
scientific and medical communities. Since the underlying mechanism of these drug-resistive
metabolic traits are only poorly understood, it warrants the use of novel computational techniques
to understand the metabolic landscape of tumor progression and further compliment the going
experimental efforts.
The increase in knowledge of macromolecular structures, availability of numerous biochemical
database resources, advances in high-throughput genome sequencing, and increase in
computational efficiency have accelerated the use of in silico methods for metabolic model
development and analysis, biomarkers/therapeutic target discovery, and drug development35,96-100.
These models provide a systems-level approach to studying the metabolism of tumor cells based
on conservation of mass under pseudo-steady state condition. Since genome-scale metabolic
119
models are capable of efficient mapping of the genotype to the phenotype 26,38,63-66, integrating
multi-level omics data with these models enhances their predictive power and allows for a
systems-level study of the metabolic reprogramming happening in living organisms under various
genetic and environmental perturbations or diseases. Applications of the genome-scale metabolic
modeling to cancer includes network comparison between healthy and cancerous cells, gene
essentiality and robustness studies, integrative analysis of omics data, and identifying reporter
pathways and reporter metabolites 71,447-450. For example, Turanli et. al used metabolic modeling
to pinpoint drugs that could effectively hinder growth of prostate cancer448. Similarly, Katzir, et.
al mapped the reactions and pathways in breast cancer cells using a human metabolic model and
various "omics" datasets451. Pancreatic cell and pancreatic cancer metabolism have been modeled
before as a part of reconstructing draft models of several human cell types aimed at identification
of anticancer drug through personalized genome-scale metabolic models 34,35. Although a pan-
cancer analysis of the metabolic reconstructions of ~4000 tumors were attempted recently 452, the
models generated were tasked with only finding the origin of the cancer-specific genes and
reactions, and were not essentially curated and refined to achieve a high level of predictability.
Kinetic modeling of the pancreatic tumor proliferation was also attempted, by modeling the
glycolysis, glutaminolysis, tricarboxylic acid cycle, and the pentose phosphate pathway to find
enzyme knockout or metabolic inhibitions suppressing the tumor growth 453. While these studies
have advanced our understanding of the metabolic landscape of pancreatic ductal
adenocarcinoma or cancer in general, there is still necessity of a highly curated and predictive
genome-scale metabolic model in order to have a system-level understanding of the metabolic
changes.
To understand the PDAC-associated metabolic reprogramming that involves changes in the
metabolic reaction fluxes and metabolite levels, genome-scale metabolic reconstructions of the
healthy human pancreas and the PDAC cells encompassing the genes, metabolites, and reactions,
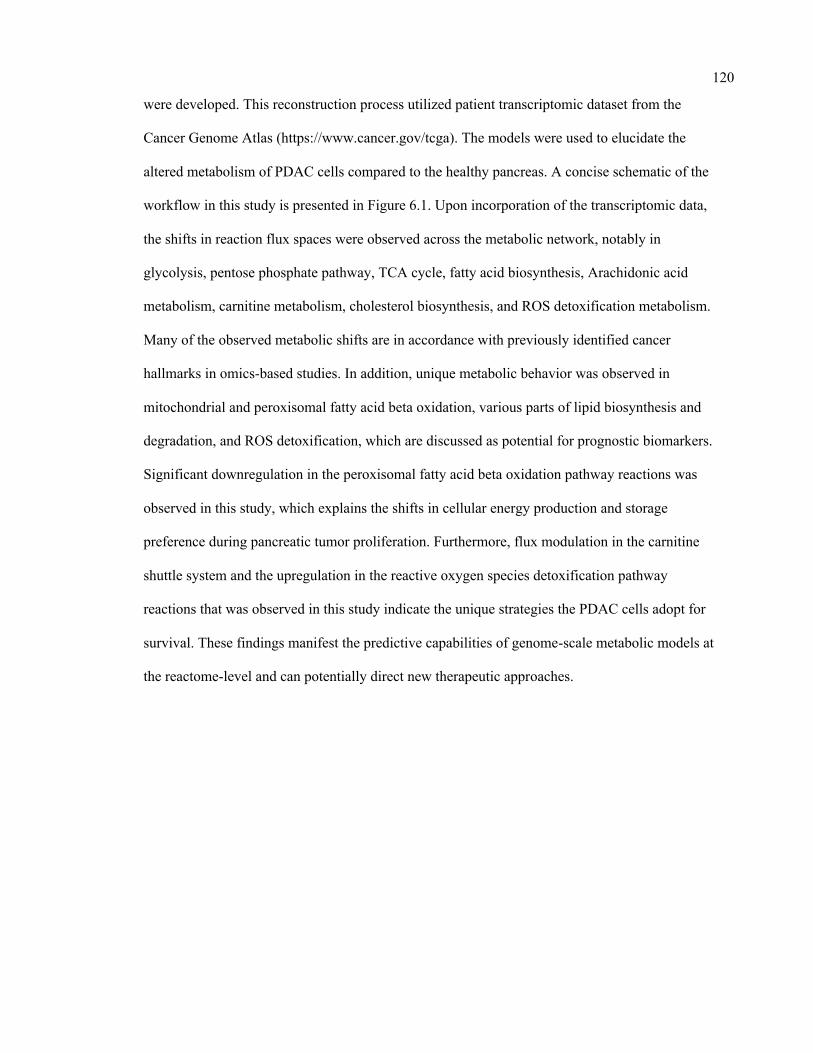
120
were developed. This reconstruction process utilized patient transcriptomic dataset from the
Cancer Genome Atlas (https://www.cancer.gov/tcga). The models were used to elucidate the
altered metabolism of PDAC cells compared to the healthy pancreas. A concise schematic of the
workflow in this study is presented in Figure 6.1. Upon incorporation of the transcriptomic data,
the shifts in reaction flux spaces were observed across the metabolic network, notably in
glycolysis, pentose phosphate pathway, TCA cycle, fatty acid biosynthesis, Arachidonic acid
metabolism, carnitine metabolism, cholesterol biosynthesis, and ROS detoxification metabolism.
Many of the observed metabolic shifts are in accordance with previously identified cancer
hallmarks in omics-based studies. In addition, unique metabolic behavior was observed in
mitochondrial and peroxisomal fatty acid beta oxidation, various parts of lipid biosynthesis and
degradation, and ROS detoxification, which are discussed as potential for prognostic biomarkers.
Significant downregulation in the peroxisomal fatty acid beta oxidation pathway reactions was
observed in this study, which explains the shifts in cellular energy production and storage
preference during pancreatic tumor proliferation. Furthermore, flux modulation in the carnitine
shuttle system and the upregulation in the reactive oxygen species detoxification pathway
reactions that was observed in this study indicate the unique strategies the PDAC cells adopt for
survival. These findings manifest the predictive capabilities of genome-scale metabolic models at
the reactome-level and can potentially direct new therapeutic approaches.
121
Figure 6.1: Schematic of the workflow for generating healthy pancreas and PDAC model and
elucidating the metabolic divergence in PDAC.
coa
coa
Human1 Global human metabolic model
TCGA-PAAD cohort Quantified transcripotmic data
Healthy pancreas metabolic model
PDAC metabolic model
Healthy
PDAC patients
iMAT for customizing metabolic model
Flux space comaprison
0% 20% 40% 60% 80% 100%
Acylglycerides metabolism
Alanine, aspartate and glutamate metaboli sm
Aminoacyl-tRNA biosynthesis
Arachidonic acid metabolism
Artificial reactions
Beta oxidat ion of di-unsaturated fatty acids (n-6) (mitochondrial)
Beta oxidat ion of even-chain fatty acids (mitochondrial )
Beta oxidat ion of odd-chain fatty acids (mitochondrial)
Beta oxidat ion of unsaturated fatty acids (n-7) (mitochondrial)
Beta oxidat ion of unsaturated fatty acids (n-7) (peroxisomal)
Beta oxidat ion of unsaturated fatty acids (n-9) (mitochondrial)
Bile acid recycling
Biopterin metaboli sm
C5-branched dibasic acid metabol ism
Carnitine shuttle (cytosolic)
Carnitine shuttle (mitochondrial)
Carnitine shuttle (peroxisomal)
Cholesterol biosynthesis 1 (Bloch pathway)
Cholesterol biosynthesis 2
Cholesterol biosynthesis 3 (Kandustch-Russell pathway)
Chondroitin / heparan sulfate biosynthesis
Estrogen metabolism
Ether lipid metabolism
Fatty acid activation (cytosolic)
Fatty acid activation (endoplasmic reticular)
Fatty acid biosynthesis (unsaturated)
Fatty acid elongation (even-chain)
Fatty acid elongation (odd-chain)
Formation and hydrolysis of cholesterol esters
Glycerolipid metabolism
Glycolysis / Gluconeogenesis
Heme degradation
Keratan sulfate biosynthesis
Keratan sulfate degradation
Leukotriene metabolism
Linoleate metabolism
Metabolism of xenobiotics by cytochrome P450
N-glycan metabolism
Nucleotide metaboli sm
O-glycan metabol ism
Omega-3 fatty acid metabolism
Omega-6 fatty acid metabolism
Oxidative phosphorylation
Pentose phosphate pathway
Prostaglandin biosynthesis
Protein modification
Retinol metabol ism
ROS detoxification
Tricarboxylic acid cycle and glyoxylate/dicarboxylate metabolism
Vitamin B12 metabolism
Vitamin D metabolism
Vitamin E metaboli sm
percentage expanded
0%20%40%60%80%100%
Acylglycerides metabolism
Alanine, aspartate and glutamate metaboli sm
Aminoacyl-tRNA biosynthesis
Arachidonic acid metabolism
Artificial reactions
Beta oxidat ion of di-unsaturated fatty acids (n-6) (mitochondrial)
Beta oxidat ion of even-chain fatty acids (mitochondrial )
Beta oxidat ion of odd-chain fatty acids (mitochondrial)
Beta oxidat ion of unsaturated fatty acids (n-7) (mitochondrial)
Beta oxidat ion of unsaturated fatty acids (n-7) (peroxisomal)
Beta oxidat ion of unsaturated fatty acids (n-9) (mitochondrial)
Bile acid recycling
Biopterin metaboli sm
C5-branched dibasic acid metabol ism
Carnitine shuttle (cytosolic)
Carnitine shuttle (mitochondrial)
Carnitine shuttle (peroxisomal)
Cholesterol biosynthesis 1 (Bloch pathway)
Cholesterol biosynthesis 2
Cholesterol biosynthesis 3 (Kandustch-Russell pathway)
Chondroitin / heparan sulfate biosynthesis
Estrogen metabolism
Ether lipid metabolism
Fatty acid activation (cytosolic)
Fatty acid activation (endoplasmic reticular)
Fatty acid biosynthesis (unsaturated)
Fatty acid elongation (even-chain)
Fatty acid elongation (odd-chain)
Formation and hydrolysis of cholesterol esters
Glycerolipid metabolism
Glycolysis / Gluconeogenesis
Heme degradation
Keratan sulfate biosynthesis
Keratan sulfate degradation
Leukotriene metabolism
Linoleate metabolism
Metabolism of xenobiotics by cytochrome P450
N-glycan metabolism
Nucleotide metaboli sm
O-glycan metabol ism
Omega-3 fatty acid metabolism
Omega-6 fatty acid metabolism
Oxidative phosphorylation
Pentose phosphate pathway
Prostaglandin biosynthesis
Protein modification
Retinol metabol ism
ROS detoxification
Tricarboxylic acid cycle and glyoxylate/dicarboxylate metabolism
Vitamin B12 metabolism
Vitamin D metabolism
Vitamin E metaboli sm
percentage shrunk
Metabolic shifts in PDAC Potential targets
coa
Consensus pancreas reconstruction
Expr
essi
on d
ata
from
Tiss
ue-s
peci
fic re
cons
truc
tion
Hea
lthy
and
PDAC
mod
els
Mod
le-b
ased
infe
renc
e
21 3
122
6.2. Transcriptomic data processing
Transcriptomic data of 18 individuals (16 PDAC, 2 healthy normal) was obtained from the
Cancer genome atlas ICGC data portal (https://www.cancer.gov/tcga). The Fragments Per
Kilobase of transcript per Million mapped reads were used as the input of differential gene
expression analysis. The transcriptomic data included FPKM information for 60,483 genes for
each of the samples. The FPKM values were filtered to exclude the genes with zero expression
values throughout samples. The DESeq algorithm in R software package “Bioconductor” was
used for differential gene expression analysis 81. DESeq employs negative binomial distribution
and a shrinkage estimator for the distribution’s variance methods to test for differential
expression 81. Genes with a log2 (foldchange) value of 2 or higher were considered overexpressed
and genes with a log2 (foldchange) value of -2 or lower were considered underexpressed, while
satisfying an adjusted p-value of <0.05 82. Heatmap was generated using Morpheus
(https://software.broadinstitute.org/morpheus) from the Broad Institute.
Differential gene expression analysis of the metabolic genes within the transcriptomic dataset
from TCGA revealed 102 significantly differentially expressed genes, among which 53 showed
significant upregulation and 49 showed repression in PDAC cells compare to healthy pancreatic
cells. Genes involved in glycolysis/gluconeogenesis, fatty acid and cholesterol biosynthesis,
tRNA synthesis, Arachidonic acid metabolism, protein kinases, glutathione metabolism, RNA
polymerase, DNA repair, mitochondrial beta oxidation, cytosolic carnitine metabolism,
leukotriene and linoleate metabolism, and estrogen metabolism were consistently upregulated in
all PDAC samples. On the other hand, genes related acylgylyceride metabolism, peroxisomal beta
oxidation, mitochondrial and peroxisomal carnitine metabolism, several peroxidases, chondroitin,
keratan, and heparan sulfate biosynthesis, glycerolipid metabolism, and different types of vitamin
metabolism, including vitamins B12, D, and E, showed significant downregulation in PDAC.
123
Lipogenic enzymes, especially ATP citrate lyase (ACLY) was overexpressed in PDAC, which
have been reported in many previous studies as well 454,455. The growth of PDAC cells was
previously shown to be inhibited by the interference of ACLY activity in a xenograft tumor
model 456. At the initial step of de novo lipid synthesis, ATP-citrate lyase (ACLY) converts
citrate to acetyl-CoA, which is then channeled to cytoplasm. Acetyl-CoA and malonyl-CoA are
coupled to acyl-carrier protein (ACP) domain of fatty acid synthase (FASN) and the downstream
genes to synthesize mono- and poly-unsaturated as well as saturated fatty acids 457. Acetyl-CoA is
also converted to cholesterol and cholesterol ester. This observation agrees with the elevated
expression of HMG-CoA (3-hydroxy-3-methylglutaryl-Coenzym-A) reductase and LDLR (low
density lipoprotein receptor) in a mouse model with PDAC 458.
Reduction in Reaction Oxygen Species (ROS) levels by superoxide dismutase (SOD1) and
peroxidases (GPX2, GPX3, TPO, MPO) is partly responsible for acquired chemoresistance of
PDAC cells. In this study, the expression of SOD1, GPX2, GPX3, TPO, and MPO was found to
be upregulated in PDAC cells. ROS stimulates other pro-growth pathways early on in cancer
progression (e.g., PI3K signaling) 459. The generation of genetic mutations by ROS may also play
a tumor-promoting role in cancer development. Chemotherapy adds to ROS levels in the PDA
microenvironment, which further compounds the oxidative perils routinely faced by these
malignant cells 460. Thus, as the dangers of ROS mount, adverse consequences and toxicities
associated with ROS start to exceed any pro-survival benefits favoring tumor growth. Therefore,
enhanced antioxidant defense mechanisms though these genes become paramount to PDAC cells
for survival 461.
In the next section, the generation of a tissue-specific metabolic reconstruction of Human
pancreas will be described.
124
6.3. Preliminary pancreas metabolic reconstruction and curation
A genome-scale metabolic model of a pancreatic cell describing reaction stoichiometry,
directionality, and gene-protein-reaction (GPR) association was built by mapping these
transcriptomic datasets to the latest global human metabolic model, Human1462. The latest global
human metabolic reconstruction, Human1462, is an extensively curated, genome-scale model of
human metabolism. It unified two previous and parallel model reconstruction lineages by the
Systems Biology community, namely the Recon22,463,464 and the Human Metabolic Reaction
(HMR)36,37 series using an open-source version-controlled repository. In addition to curating the
aggregated reconstruction, Human1 addressed issue with duplication, reaction reversibility, mass
and energy conservation, imbalance, and constructed a new generic human biomass reaction
based on various tissue and cell composition data sources. This standardized model allowed us to
conveniently integrate omics data to develop a pancreas-specific metabolic reconstruction. This
global human model contains 13,417 reactions, 10,135 metabolites, and 3,628 genes, as of the
github repository downloaded in December 2020.
The transcriptomic data used to customize the global human model to a pancreatic reconstruction
was obtained from the Cancer Genome Atlas (TCGA) database (https://www.cancer.gov/tcga).
The Cancer Genome Atlas contains genomic, epigenomic, transcriptomic, and proteomic data on
33 cancer types in human, and is publicly available for the scientific research community. To
obtain a representative set of transcriptomic data on both healthy and cancerous pancreas cells, 18
samples from the TCGA-PAAD project were used. The transcriptomic data contained FPKM
values for 60483 genes in the human pancreas. Since the TCGA dataset accounted for a
numerical expression value of every single of the 60483 genes across all the samples without any
unique genes in the samples, the dataset was filtered for genes with no read count across samples.
After that, 50392 genes remained, out of which 3628 metabolic genes overlapped with the genes
in the Human1 metabolic reconstruction462. Differential gene expression analysis of the metabolic
125
genes within the transcriptomic dataset from TCGA revealed 102 significantly differentially
expressed genes, among which 53 showed significant upregulation and 49 showed repression in
PDAC cells compare to healthy pancreatic cells. Genes involved in glycolysis/gluconeogenesis,
fatty acid and cholesterol biosynthesis, tRNA synthesis, Arachidonic acid metabolism, protein
kinases, glutathione metabolism, RNA polymerase, DNA repair, mitochondrial beta oxidation,
cytosolic carnitine metabolism, leukotriene and linoleate metabolism, and estrogen metabolism
were consistently upregulated in all PDAC samples. On the other hand, genes related
acylgylyceride metabolism, peroxisomal beta oxidation, mitochondrial and peroxisomal carnitine
metabolism, several peroxidases, chondroitin, keratan, and heparan sulfate biosynthesis,
glycerolipid metabolism, and different types of vitamin metabolism, including vitamins B12, D,
and E, showed significant downregulation in PDAC.
This tissue-specific pancreas metabolic reconstruction was obtained from the Human1 model
using the FPKM values for the 3628 metabolic genes in the TCGA dataset and using the
Integrative Metabolic Analysis Tool (iMAT)75. First, the reactions from the Human1 model were
assigned artificial “expression values” (see Zur et al, 201075 for details) based on their associated
gene and its corresponding expression values in the TCGA data. These expression values were
then grouped into 3 categories: highly expressed, moderately expressed, and lowly expressed.
Expression values greater than half a standard deviation above the mean were considered highly
expressed and assigned a value of 1. Expression values less than half a standard deviation below
the mean were considered lowly expressed and assigned a value of -1. Expression values that fell
within a half a standard deviation of the mean were considered moderately expressed and
assigned a value of 0. The expression for the Human1 biomass reaction was manually set to 1 so
the biomass equation and all the other necessary reactions producing biomass precursors are
included in the model. The iMAT algorithm75 then generated a model using the reaction
expression information and reactions in the Human1 model.
126
The preliminary pancreas metabolic reconstruction contained 3,628 genes, catalyzing 7,076
reactions, involving 4,415 metabolites located in 8 intracellular compartments (Cytosol,
Mitochondria, Inner mitochondria, Golgi apparatus, Lysosome, Nucleus, Peroxisome, and
Endoplasmic reticulum). The reactions are distributed across 133 different pathways, the largest
of which include transport reactions, exchange/demand reactions, fatty acid oxidation, and
peptide metabolism. The consensus model was curated through the classic design-build-test-
refine cycle124 to accurately reflect the metabolic capabilities of a pancreatic cell. Three reactions
contained imbalances either in their stoichiometries or molecular formulas, and these imbalances
were rectified. For reactions with imbalances caused by stoichiometric inaccuracies, changes
were made to the stoichiometric coefficient matrix of the model. For reactions whose imbalances
were due to incorrect molecular formulas, fixes were applied to the metabolic formula of the
reactions. This reconstruction was used as a baseline for generating the healthy and cancerous
genome-scale pancreas metabolic model.
Flux Variability Analysis18 found that the 1444 reactions across 54 pathways could occur an
unreasonably high rate not supported by thermodynamics, which are named unbounded reactions.
The pathways contributing the largest number of unbounded reactions were transport, fatty acid
oxidation, nucleotide metabolism, and drug metabolism. The thermodynamically infeasible cycles
comprising these unbounded reactions were identified using OptFill465. OptFill identifies TICs
through iteratively identifying the smallest number of reactions with nonzero flux for which the
sum of their fluxes is 0. All uptakes are turned off for OptFill so that all reactions carrying high
flux are involved in a TIC. These cycles were eliminated by i) removing duplicate reactions from
the model(s), ii) restricting reaction directionality if there is literature evidence of thermodynamic
information, iii) removing erroneous reactions, and iv) using correct cofactors in reactions (for
example NAD vs NADP) if that information is available. 932 reactions were modified in total.
127
609 reactions were turned off because they were duplicates of other reactions or lumped
reactions. 23 reactions that were initially irreversible were made reversible if there was literature
evidence indicating their reversibility. 286 reactions that were initially reversible were made
irreversible in the forward direction, and 14 initially reversible directions were made irreversible
in the backward direction. When turning reactions off to fix cycles, it was ensured that all
essential reactions remained active in the model.
6.4. Metabolic models of PDAC and healthy pancreas cell
The healthy pancreas and PDAC models were reconstructed from the consensus metabolic
reconstruction of the pancreas. The Integrative Metabolic Analysis tool (iMAT)75 was used to
customize the model according to the gene expression values and corresponding ranking of the
reactions in both healthy and PDAC cells. The healthy cell model contains 3,628 genes,
catalyzing 6,384 reactions, across 129 pathways, involving 4,703 metabolites, while the PDAC
cell model contains 3,628 genes, catalyzing 5,872 reactions, across 127 pathways, involving
4,381 metabolites. In both of the models, the pathways involving the largest number of internal
reactions include fatty acid oxidation, cholesterol formation, peptide metabolism, and transport
reactions.
Figure 6.2 shows further details of the two models. While there are 5180 reactions overlap
between the healthy and PDAC models, they have 1204 and 692 unique metabolic reactions,
respectively (see Figure 6.2 A and 6.2 B). The unique reactions are distributed across divergent
pathways in these two models (Figure 6.2 C). The PDAC model distinctly shows better
completeness of the Acyl-CoA hydrolysis, leukotriene metabolism, and starch and sucrose
metabolism. On the other hand, many pathways have a more complete presence in the healthy
cell model, including amino acid metabolism, structural carbohydrates (heparan and keratan
sulfate) degradation, glycan metabolism, bile acid synthesis, and TCA cycle. While the more
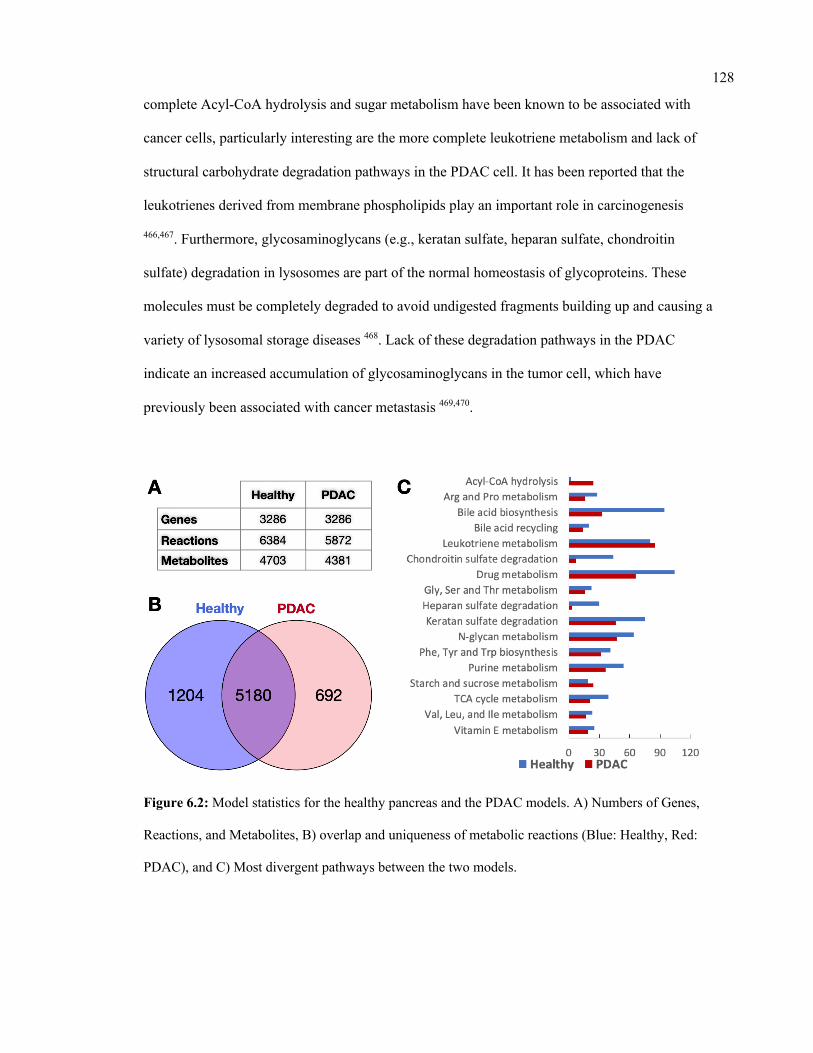
128
complete Acyl-CoA hydrolysis and sugar metabolism have been known to be associated with
cancer cells, particularly interesting are the more complete leukotriene metabolism and lack of
structural carbohydrate degradation pathways in the PDAC cell. It has been reported that the
leukotrienes derived from membrane phospholipids play an important role in carcinogenesis
466,467. Furthermore, glycosaminoglycans (e.g., keratan sulfate, heparan sulfate, chondroitin
sulfate) degradation in lysosomes are part of the normal homeostasis of glycoproteins. These
molecules must be completely degraded to avoid undigested fragments building up and causing a
variety of lysosomal storage diseases 468. Lack of these degradation pathways in the PDAC
indicate an increased accumulation of glycosaminoglycans in the tumor cell, which have
previously been associated with cancer metastasis 469,470.
Figure 6.2: Model statistics for the healthy pancreas and the PDAC models. A) Numbers of Genes,
Reactions, and Metabolites, B) overlap and uniqueness of metabolic reactions (Blue: Healthy, Red:
PDAC), and C) Most divergent pathways between the two models.
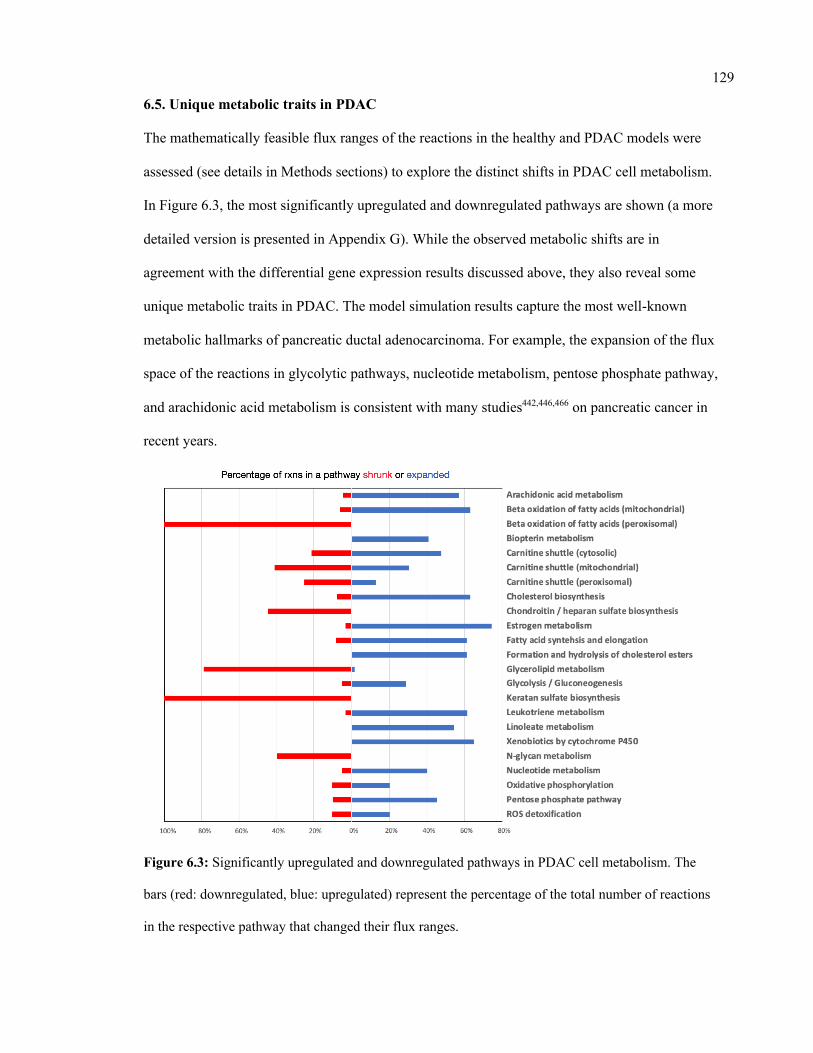
129
6.5. Unique metabolic traits in PDAC
The mathematically feasible flux ranges of the reactions in the healthy and PDAC models were
assessed (see details in Methods sections) to explore the distinct shifts in PDAC cell metabolism.
In Figure 6.3, the most significantly upregulated and downregulated pathways are shown (a more
detailed version is presented in Appendix G). While the observed metabolic shifts are in
agreement with the differential gene expression results discussed above, they also reveal some
unique metabolic traits in PDAC. The model simulation results capture the most well-known
metabolic hallmarks of pancreatic ductal adenocarcinoma. For example, the expansion of the flux
space of the reactions in glycolytic pathways, nucleotide metabolism, pentose phosphate pathway,
and arachidonic acid metabolism is consistent with many studies442,446,466 on pancreatic cancer in
recent years.
Figure 6.3: Significantly upregulated and downregulated pathways in PDAC cell metabolism. The
bars (red: downregulated, blue: upregulated) represent the percentage of the total number of reactions
in the respective pathway that changed their flux ranges.
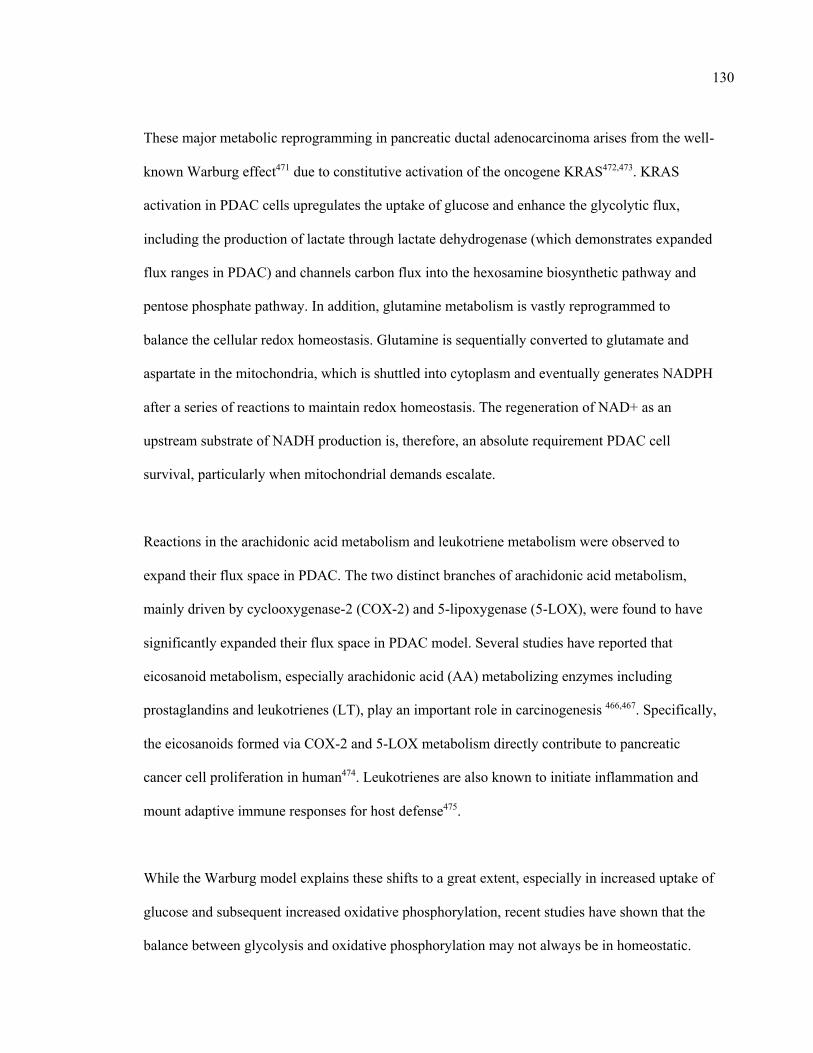
130
These major metabolic reprogramming in pancreatic ductal adenocarcinoma arises from the well-
known Warburg effect471 due to constitutive activation of the oncogene KRAS472,473. KRAS
activation in PDAC cells upregulates the uptake of glucose and enhance the glycolytic flux,
including the production of lactate through lactate dehydrogenase (which demonstrates expanded
flux ranges in PDAC) and channels carbon flux into the hexosamine biosynthetic pathway and
pentose phosphate pathway. In addition, glutamine metabolism is vastly reprogrammed to
balance the cellular redox homeostasis. Glutamine is sequentially converted to glutamate and
aspartate in the mitochondria, which is shuttled into cytoplasm and eventually generates NADPH
after a series of reactions to maintain redox homeostasis. The regeneration of NAD+ as an
upstream substrate of NADH production is, therefore, an absolute requirement PDAC cell
survival, particularly when mitochondrial demands escalate.
Reactions in the arachidonic acid metabolism and leukotriene metabolism were observed to
expand their flux space in PDAC. The two distinct branches of arachidonic acid metabolism,
mainly driven by cyclooxygenase-2 (COX-2) and 5-lipoxygenase (5-LOX), were found to have
significantly expanded their flux space in PDAC model. Several studies have reported that
eicosanoid metabolism, especially arachidonic acid (AA) metabolizing enzymes including
prostaglandins and leukotrienes (LT), play an important role in carcinogenesis 466,467. Specifically,
the eicosanoids formed via COX-2 and 5-LOX metabolism directly contribute to pancreatic
cancer cell proliferation in human474. Leukotrienes are also known to initiate inflammation and
mount adaptive immune responses for host defense475.
While the Warburg model explains these shifts to a great extent, especially in increased uptake of
glucose and subsequent increased oxidative phosphorylation, recent studies have shown that the
balance between glycolysis and oxidative phosphorylation may not always be in homeostatic.
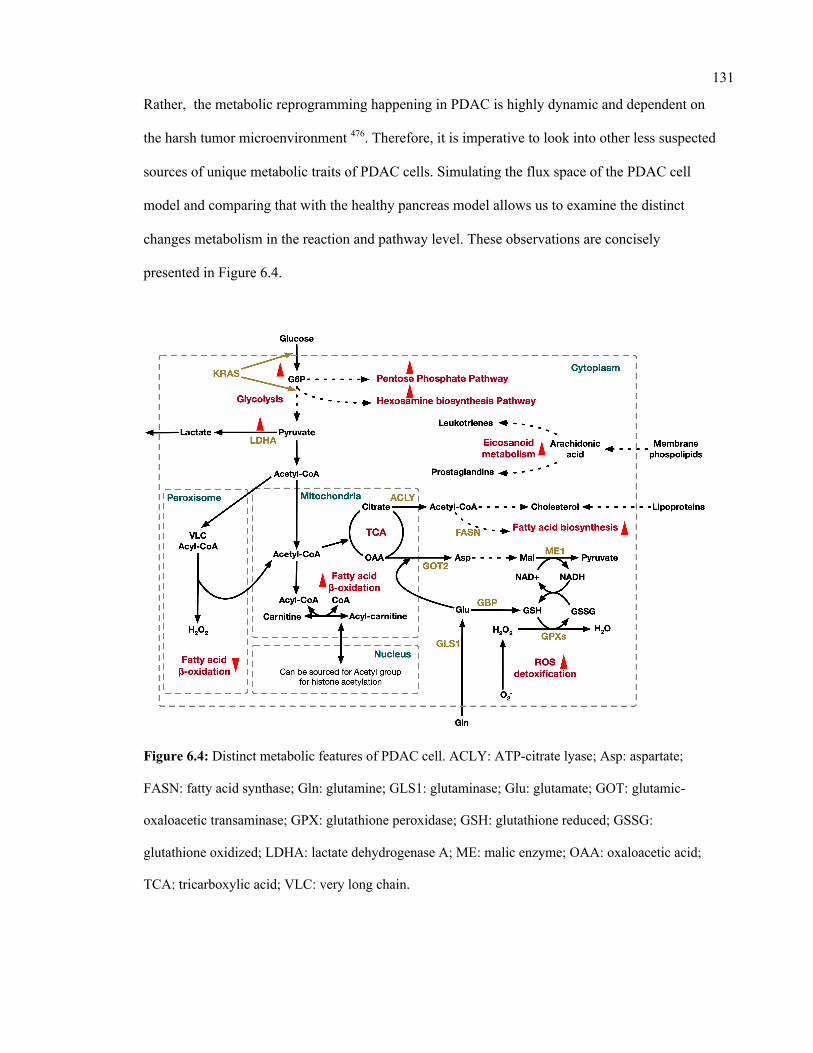
131
Rather, the metabolic reprogramming happening in PDAC is highly dynamic and dependent on
the harsh tumor microenvironment 476. Therefore, it is imperative to look into other less suspected
sources of unique metabolic traits of PDAC cells. Simulating the flux space of the PDAC cell
model and comparing that with the healthy pancreas model allows us to examine the distinct
changes metabolism in the reaction and pathway level. These observations are concisely
presented in Figure 6.4.
Figure 6.4: Distinct metabolic features of PDAC cell. ACLY: ATP-citrate lyase; Asp: aspartate;
FASN: fatty acid synthase; Gln: glutamine; GLS1: glutaminase; Glu: glutamate; GOT: glutamic-
oxaloacetic transaminase; GPX: glutathione peroxidase; GSH: glutathione reduced; GSSG:
glutathione oxidized; LDHA: lactate dehydrogenase A; ME: malic enzyme; OAA: oxaloacetic acid;
TCA: tricarboxylic acid; VLC: very long chain.
132
Increased abundance of acetyl-CoA and upregulated mitochondrial carnitine metabolism result in
more carnitine and acyl-carnitine (mostly acetyl-carnitine) in the mitochondria. Carnitine can be
transported to the cytosol and accumulated in biomass. Recent findings have suggested that
carnitine shuttle could be considered as a gridlock to trigger the metabolic flexibility of cancer
cells 477,478. Carnitine shuttle system is involved in the bidirectional transport of acyl moieties
between cytosol to mitochondria, thus playing a fundamental role in tuning the switch between
the glucose and fatty acid metabolism. This is crucial for the mitochondrial fatty acid beta-
oxidation and maintaining normal mitochondrial function (balancing the conjugated and free CoA
ratio) 479. Higher burning of long-chain fatty acids produces increased energy for the cell to
survive 480. The available acetyl-CoA can be fed into the TCA cycle to produce more energy or
acetyl-carnitine can be repurposed in the nucleus to recycle acetyl group for histone acetylation
481. Thus, the carnitine shuttle system plays a significant role in tumor by supplying both energetic
and biosynthetic demand for cancer cells481.
While the mitochondrial beta oxidation pathway reactions primarily showed an expansion in flux
space, all of the reactions in the peroxisomal beta oxidation pathway shrunk their flux space. This
is an interesting feature of pancreatic ductal adenocarcinoma, since peroxisomal beta oxidation
pathway was found to be upregulated in some cancer types 482 and downregulated in others 483-485.
The primary differences between fatty acid beta oxidation in mitochondria and peroxisome is the
chain length at which fatty acids are synthesized and the associated product. Mitochondria
catalyze the beta oxidation of the majority of the short to long-chain fatty acids, and primarily
generate energy, while peroxisomes are involved in the beta oxidation of very-long-chain fatty
acids and generate H2O2 in the process 486. This means that while mitochondrial beta-oxidation is
governed by the energy demands of the cells, peroxisomal beta-oxidation does not. Peroxisomal
beta-oxidation is mostly involved in biosynthesis of very-long-chain fatty acids and do not
produce energy, while the mitochondrial pathway is related to mostly catabolism and is coupled
133
to ATP production 487. Therefore, it is expected that the rapidly proliferating and energy-
demanding tumor cells will favor the more energy-efficient mitochondrial pathways instead of the
less required very-long-chain fatty acid-producing peroxisomal pathways. Furthermore, the
reduction of the peroxide byproduct by downregulating the peroxisomal beta oxidation pathways
reduces the oxidative stress, which helps the cancer cell to survive.
Lipid metabolism is essential for cancer progression since it provides the necessary building
blocks for cell membrane formation and produces signaling molecules and substrates for the
posttranslational modification of proteins. However, the role of fatty acids in pancreatic cancer is
complicated and still not very well understood. In PDAC, I observe that reactions participating in
de novo fatty acid biosynthesis, fatty acids elongation, and cholesterol biosynthesis pathways are
upregulated, including citrate synthase, ATP citrate lyase, fatty acid synthase, and coenzyme A
reductase. Overexpression of these lipogenic enzymes in PDAC have been reported in some
previous studies as well 454,455. At the initial step of de novo lipid synthesis, ATP-citrate lyase
(ACLY) converts citrate to acetyl-CoA, which is then channeled to cytoplasm. Acetyl-CoA and
malonyl-CoA are coupled to acyl-carrier protein domain of fatty acid synthase (FASN) and the
downstream genes to synthesize mono- and poly-unsaturated as well as saturated fatty acids 457.
Acetyl-CoA is also converted to cholesterol and cholesterol ester. This observation agrees with
the elevated expression of HMG-CoA (3-hydroxy-3-methylglutaryl-Coenzym-A) reductase and
LDLR (low density lipoprotein receptor) in a mouse model with PDAC 458. In addition to higher
intercellular lipid synthesis, uptake of extracellular lipids is also increased in PDAC. This
indicates an increased demand of nutrients for rapid proliferation that the PDAC cells have to
meet for survival.
Lactate dehydrogenase (LDHA) enzyme has shown a reversal of direction and increase in flux
space in PDAC compared to healthy pancreas cell model, in the direction of lactate production.
134
The overexpression of LDHA in pancreatic cancer and its ability to induce pancreatic cancer cell
growth have been reported by Rong et al. in 2013 488. In addition, they showed that knocking
down the LDHA in the pancreatic cancer cells significantly inhibited the cell growth revealing the
oncogenic trait of LDHA and its association with poor prognosis 488. LDHA overexpression and
its association with the poor survival outcome have also been reported 489. Although a complete
mechanistic insight behind the causal effect of upregulation of LDHA could not be established
yet, it potentially serves as an independent prognostic marker of PDAC.
6.6. Conclusions
To adapt severely metabolic constraints, PDAC cells rely on specific metabolic reprogramming,
thus offering innovative therapeutic strategies in the future. In this study, I attempted to identify a
few poorly explored metabolic traits of PDAC cells, which can potentially complement the
ongoing effort of finding novel therapeutic targets against pancreatic cancer. While many aspects
of the pancreatic tumor progression have been studied with help of transcriptomics, proteomics,
and metabolomics, this metabolic model-based study helps unravel the reactome layer of
biochemical features that are associated with PDAC. This systems-level metabolic analysis is
useful in assessing the genome-scale changes in metabolism under tumor progression, and
therefore can unravel previously unknown mechanistic insights into cancer cell proliferation.
Nonetheless, pancreatic cancer is largely an untreatable disease due to the presence of several
intrinsic or acquired chemoresistance mechanisms that still remain to be properly understood. A
better understanding of the metabolic dependencies needed to survive harsh conditions will
uncover metabolic vulnerabilities and guide alternative therapeutic strategies.
135
Chapter 7
Conclusions and Future Perspectives
In this dissertation, I have detailed the approach, methodology, results, and comprehensive
discussion on my doctoral research. While each of the chapters highlight a specific research
project, the overall theme of my research outlined here is the metabolic modeling and omics-
integrated analysis of living systems.
The primary research section of this dissertation starts with Chapter 2, which discusses my
collaborative project on genome-scale metabolic modeling and analysis of Staphylococcal
metabolism under genetic and environmental perturbations. Despite decades of advancements in
medical research, S. aureus remains a significant threat to human health, which drives a growing
number of studies towards understanding how staphylococcal metabolism relates to antibiotic
resistance and pathogenesis. Very few studies have addressed these interrelationships from a
systems biology perspective, which requires a predictive in silico metabolic model capable of
capturing the biochemical features of the pathogen. This work addresses these gaps through the
development of a detailed metabolic model informed not only from existing resources, such as
the NTML, in silico genome sequences, annotation databases, and theoretical metabolic
stoichiometry but also from our own experimental studies on mutant fitness, gene essentiality,
and metabolite excretion profile. The results presented in this Chapter 2 demonstrate the
predictive capacity of the new genome-scale metabolic reconstruction of S. aureus
USA300_FPR3757, iSA863, in different environments, utilizing different substrates, and with
perturbed genetic contents, which paves the way for a mechanistic understanding of S. aureus
metabolism. This latest genome-scale model of S. aureus demonstrates high performance in
capturing gene essentiality, mutant phenotype and substrate utilization behavior observed in
136
experiments. This model will be a valuable resource shared among the staphylococcal research
community for the identification and implementation of intervention strategies that are successful
against a wide range of pathogenic strains.
Chapter 3 highlights my work on understanding heat stress response in rice seed during the
developmental stage, leveraging my newly developed multi-level optimization tool called
MiReN. MiReN, being a generalized algorithm, can be useful for any level of omics’ data
generated from experiments. Being a flexible tool, MiReN can facilitate both the discovery of
global regulatory players during stress or the unknown metabolic modulations caused by known
global regulators. It can also serve as a key tool for computational mathematical frameworks to
incorporate information from multi-level ‘omics’ datasets into genome-scale models of plant
metabolism to elucidate limiting reaction step(s) or pathway(s) related to multiple stress tolerance
and eventfully identify and propose a suit of strategies (i.e., gene up- or down-regulation or
mutation) to develop rice varieties that are more resilient during this transient but highly sensitive
window of reproductive development.
Optimization-based genome-scale metabolic modeling and analysis of microbial ecosystems has
been my priority research area in recent years137,325,334. My research on domestic rumen
microbiome-virome interaction studied the role of rumen virome to modulate the inter-species
interactions in the microbial and archaeal community. My latest project on the Methane recycling
community in Lake Washington assess the shifts in inter-species metabolite flow and intercellular
flux distributions at different substrate gradients in freshwater lake systems. The algorithms and
frameworks developed for these projects are general to microbial ecosystems of any scale and
involving any type of interactions, i.e., mutualism, syntrophy, commensalism, competition, and
parasitism. These systems-level approaches could dramatically improve our understanding of
individual bacterial taxa within communities and their modes of interactions.
137
I developed a simplified and representative rumen community metabolic model with
representative organisms from the three major functional guilds in the rumen ecosystem, which is
discussed in Chapter 4. I employed a detailed and comprehensive heuristic procedure and
identified 22 novel interactions involving the transfer of fatty acids, vitamins, coenzymes, amino
acids, and sugars among the community members. To elucidate the functional role of the virome
on the microbial ecosystem, I used local alignment search and identified metabolic functions of
the viruses associated with the community members that drive nucleotide synthesis, reducing
power generation, the reprogramming of the bacterial carbon metabolism to pentose phosphate
pathway and folate biosynthesis, and viral replication. The addition of viral AMG functionalities
resulted in significant changes in bacterial metabolism, including relaxing metabolic bottleneck in
the models, complementing microbe-microbe interactions, utilizing nutrients more efficiently and
energy harvest by the host. Overall, these findings support the hypothesis that viral AMGs play a
crucial role in enhancing host fitness and robustness. I also studied the effect of using different
community-level objective functions (i.e., growth, short-chain fatty acids production, plant feed
utilization, greenhouse gas release, and small sugar molecule production) on the metabolic
capacity of the community members.
In chapter 5, I attempted to enhance our mechanistic understanding of the dynamics in the
methane cycling Lake Washington community through genome-scale metabolic modeling of the
representative and functionally important community members, Methylobacter tundripaludum
21/22 and Methylomonas sp LW13. The community metabolic model, in that regard, should be
expanded to include other major players of the Lake Washington community, i.e., members of
Bacteroidetes and Proteobacteria phyla. The understanding of this community behavior will be a
foundation for future studies that aim at the long-term goal of creating a complex synthetic
community capable of carrying out certain desired functions through the consumption of
methane, thus mitigating the harmful effects of methane release in the atmosphere.
138
To adapt to severe metabolic constraints, Pancreatic Ductal Adenocarcinoma (PDAC) cells rely
on specific metabolic reprogramming, thus offering innovative therapeutic strategies in the future.
In the study described in Chapter 6, I attempted to identify a few poorly explored metabolic traits
of PDAC cells, which can potentially complement the ongoing effort of finding novel therapeutic
targets against pancreatic cancer. While many aspects of the pancreatic tumor progression have
been studied with help of transcriptomics, proteomics, and metabolomics, this metabolic model-
based study helps unravel the reactome layer of biochemical features that are associated with
PDAC. This systems-level metabolic analysis is useful in assessing the genome-scale changes in
metabolism under tumor progression, and therefore can unravel previously unknown mechanistic
insights into cancer cell proliferation.
Expanding upon my doctoral research expertise in Systems Biology, I plan to establish a multi-
disciplinary collaborative research that not only will address critical and time-sensitive health,
energy, environment, socio-economic issues but also will contribute to the fundamental
advancement of science to lead the future human civilization. I will develop efficient
mathematical algorithms, software tools, and comprehensive knowledgebase for microbial
ecosystems with functionally important roles in biogeochemistry, biotechnology and human
health. My future research will potentially take multiple trajectories: i) microbial ecosystems
dynamics at scale; ii) harnessing the metabolic and biotechnological potential from nature; and
iii) systems biomedicine: resolving the multifactorial nature of complex diseases. My research
will lead the global effort in understanding the microbial ecosystem dynamics across numerous
systems on earth and will pave a foundation in the in silico metabolic engineering efforts to
leverage these complex systems for our benefit. Being a generalized set of mathematical and
computational frameworks, my tools will be translatable to other systems across multiple
disciplines. The expansion of a microbial biobank to preserve the earth’s metabolic capabilities

139
will enable us to survive during a time of altered agricultural and medical practices and climate
change. My research in Systems Biomedicine will deepen our understanding of the diseases that
we, as humankind, have been challenged for centuries, which can be translated to other complex
disease mechanisms and computationally predict unique and personalized therapeutics. In a word,
the discovery and redesign of biological systems for improving our understanding of the natural
and synthetic biological processes and strategize the engineering efforts of these processes for the
benefit and survival of mankind will be the overarching theme of my future research.
140
References
1 Kanehisa, M. & Goto, S. KEGG: Kyoto Encyclopedia of Genes and Genomes. Nucleic
acids research 28, 27-30, doi:DOI 10.1093/nar/28.1.27 (2000).
2 Placzek, S. et al. BRENDA in 2017: new perspectives and new tools in BRENDA.
Nucleic acids research 45, D380-D388, doi:10.1093/nar/gkw952 (2017).
3 Henry, C. S. et al. High-throughput generation, optimization and analysis of genome-
scale metabolic models. Nature biotechnology 28, 977-982, doi:10.1038/nbt.1672 (2010).
4 Arkin, A. P. et al. KBase: The United States Department of Energy Systems Biology
Knowledgebase. Nature biotechnology 36, 566-569, doi:10.1038/nbt.4163 (2018).
5 Caspi, R. et al. The MetaCyc database of metabolic pathways and enzymes and the
BioCyc collection of Pathway/Genome Databases. Nucleic acids research 42, D459-471,
doi:10.1093/nar/gkt1103 (2014).
6 Kumar, A., Suthers, P. F. & Maranas, C. D. MetRxn: a knowledgebase of metabolites
and reactions spanning metabolic models and databases. BMC bioinformatics 13, 6,
doi:10.1186/1471-2105-13-6 (2012).
7 Saha, R., Suthers, P. F. & Maranas, C. D. Zea mays iRS1563: a comprehensive genome-
scale metabolic reconstruction of maize metabolism. PloS one 6, e21784,
doi:10.1371/journal.pone.0021784 (2011).
8 Saha, R. et al. Reconstruction and comparison of the metabolic potential of cyanobacteria
Cyanothece sp. ATCC 51142 and Synechocystis sp. PCC 6803. PloS one 7, e48285,
doi:10.1371/journal.pone.0048285 (2012).
9 Saha, R., Chowdhury, A. & Maranas, C. D. Recent advances in the reconstruction of
metabolic models and integration of omics data. Curr Opin Biotech 29, 39-45, doi:DOI
10.1016/j.copbio.2014.02.011 (2014).
141
10 Saha, R., Chowdhury, A. & Maranas, C. D. Recent advances in the reconstruction of
metabolic models and integration of omics data. Curr Opin Biotechnol 29, 39-45,
doi:10.1016/j.copbio.2014.02.011 (2014).
11 Orth, J. D., Thiele, I. & Palsson, B. O. What is flux balance analysis? Nat Biotech 28,
245-248,
doi:http://www.nature.com/nbt/journal/v28/n3/abs/nbt.1614.html#supplementary-
information (2010).
12 Oberhardt, M. A., Chavali, A. K. & Papin, J. A. Flux balance analysis: interrogating
genome-scale metabolic networks. Methods Mol Biol 500, 61-80, doi:10.1007/978-1-
59745-525-1_3 (2009).
13 Varma, A. & Palsson, B. O. Stoichiometric flux balance models quantitatively predict
growth and metabolic by-product secretion in wild-type Escherichia coli W3110. Applied
and Environmental Microbiology 60, 3724-3731 (1994).
14 Terzer, M., Maynard, N. D., Covert, M. W. & Stelling, J. Genome-scale metabolic
networks. Wiley interdisciplinary reviews. Systems biology and medicine 1, 285-297,
doi:10.1002/wsbm.37 (2009).
15 Varma, A. & Palsson, B. O. Metabolic Capabilities of Escherichia coli: I. Synthesis of
Biosynthetic Precursors and Cofactors. Journal of theoretical biology 165, 477-502,
doi:http://dx.doi.org/10.1006/jtbi.1993.1202 (1993).
16 Varma, A. & Palsson, B. O. Metabolic flux balancing: basic concepts, scientific and
practical use. Nat. Biotechnol. 12, 994-998 (1994).
17 Schellenberger, J., Lewis, N. E. & Palsson, B. O. Elimination of thermodynamically
infeasible loops in steady-state metabolic models. Biophysical journal 100, 544-553,
doi:10.1016/j.bpj.2010.12.3707 (2011).
142
18 Mahadevan, R. & Schilling, C. H. The effects of alternate optimal solutions in constraint-
based genome-scale metabolic models. Metab Eng 5, doi:10.1016/j.ymben.2003.09.002
(2003).
19 Edwards, J. S. & Palsson, B. O. Systems properties of the Haemophilus influenzae Rd
metabolic genotype. J Biol Chem 274, 17410-17416, doi:10.1074/jbc.274.25.17410
(1999).
20 Feist, A. M. et al. A genome-scale metabolic reconstruction for Escherichia coli K-12
MG1655 that accounts for 1260 ORFs and thermodynamic information. Mol Syst Biol 3,
121, doi:10.1038/msb4100155 (2007).
21 Forster, J., Famili, I., Fu, P., Palsson, B. O. & Nielsen, J. Genome-scale reconstruction of
the Saccharomyces cerevisiae metabolic network. Genome Res 13, 244-253,
doi:10.1101/gr.234503 (2003).
22 Duarte, N. C. et al. Global reconstruction of the human metabolic network based on
genomic and bibliomic data. Proc Natl Acad Sci U S A 104, 1777-1782,
doi:10.1073/pnas.0610772104 (2007).
23 Dal'Molin, C. G., Quek, L. E., Palfreyman, R. W., Brumbley, S. M. & Nielsen, L. K.
C4GEM, a genome-scale metabolic model to study C4 plant metabolism. Plant Physiol
154, 1871-1885, doi:10.1104/pp.110.166488 (2010).
24 Dal'molin, C. G., Quek, L. E., Palfreyman, R. W. & Nielsen, L. K. Plant genome-scale
modeling and implementation. Methods Mol Biol 1090, 317-332, doi:10.1007/978-1-
62703-688-7_19 (2014).
25 de Oliveira Dal’Molin, C. G. & Nielsen, L. K. Plant genome-scale metabolic
reconstruction and modelling. Current Opinion in Biotechnology 24, 271-277,
doi:http://dx.doi.org/10.1016/j.copbio.2012.08.007 (2013).
143
26 Castillo, S., Patil, K. R. & Jouhten, P. in Yeasts in Biotechnology and Human Health:
Physiological Genomic Approaches (ed Isabel Sá-Correia) 111-133 (Springer
International Publishing, 2019).
27 Herrgard, M. J. et al. A consensus yeast metabolic network reconstruction obtained from
a community approach to systems biology. Nature biotechnology 26, 1155-1160,
doi:10.1038/nbt1492 (2008).
28 van Winden, W. A. et al. Metabolic-flux analysis of Saccharomyces cerevisiae
CEN.PK113-7D based on mass isotopomer measurements of (13)C-labeled primary
metabolites. FEMS yeast research 5, 559-568, doi:10.1016/j.femsyr.2004.10.007 (2005).
29 de Oliveira Dal'Molin, C. G., Quek, L. E., Palfreyman, R. W., Brumbley, S. M. &
Nielsen, L. K. AraGEM, a genome-scale reconstruction of the primary metabolic network
in Arabidopsis. Plant Physiol 152, 579-589, doi:10.1104/pp.109.148817 (2010).
30 Pilalis, E., Chatziioannou, A., Thomasset, B. & Kolisis, F. An In Silico
Compartmentalized Metabolic Model of Brassica Napus Enables the Systemic Study of
Regulatory Aspects of Plant Central Metabolism. Biotechnology and bioengineering 108,
1673-1682, doi:10.1002/bit.23107 (2011).
31 Poolman, M. G., Kundu, S., Shaw, R. & Fell, D. A. Responses to light intensity in a
genome-scale model of rice metabolism. Plant Physiol 162, 1060-1072,
doi:10.1104/pp.113.216762 (2013).
32 Grafahrend-Belau, E., Schreiber, F., Koschutzki, D. & Junker, B. H. Flux balance
analysis of barley seeds: a computational approach to study systemic properties of central
metabolism. Plant Physiol 149, 585-598, doi:10.1104/pp.108.129635 (2009).
33 Simons, M. et al. Assessing the metabolic impact of nitrogen availability using a
compartmentalized maize leaf genome-scale model. Plant Physiol 166, 1659-1674,
doi:10.1104/pp.114.245787 (2014).
144
34 Agren, R. et al. Reconstruction of genome-scale active metabolic networks for 69 human
cell types and 16 cancer types using INIT. PLoS computational biology 8, e1002518,
doi:10.1371/journal.pcbi.1002518 (2012).
35 Agren, R. et al. Identification of anticancer drugs for hepatocellular carcinoma through
personalized genome-scale metabolic modeling. Mol Syst Biol 10, 721,
doi:10.1002/msb.145122 (2014).
36 Mardinoglu, A. et al. Integration of clinical data with a genome-scale metabolic model of
the human adipocyte. Mol Syst Biol 9, 649, doi:10.1038/msb.2013.5 (2013).
37 Mardinoglu, A. et al. Genome-scale metabolic modelling of hepatocytes reveals serine
deficiency in patients with non-alcoholic fatty liver disease. Nature communications 5,
3083, doi:10.1038/ncomms4083 (2014).
38 Lewis, N. E., Nagarajan, H. & Palsson, B. O. Constraining the metabolic genotype-
phenotype relationship using a phylogeny of in silico methods. Nat Rev Microbiol 10,
291-305, doi:10.1038/nrmicro2737 (2012).
39 Zomorrodi, A. R. & Maranas, C. D. OptCom: a multi-level optimization framework for
the metabolic modeling and analysis of microbial communities. PLoS computational
biology 8, e1002363, doi:10.1371/journal.pcbi.1002363 (2012).
40 Shrestha, U. T. Microbial Association-Microbial Interaction,
<http://upendrats.blogspot.com/2009/08/microbial-association-microbial.html> (2009).
41 Hansen, S. K., Rainey, P. B., Haagensen, J. A. J. & Molin, S. Evolution of species
interactions in a biofilm community. Nature 445, 533-536, doi:Doi 10.1038/Nature05514
(2007).
42 Xavier, J. B. Social interaction in synthetic and natural microbial communities.
Molecular systems biology 7, doi:Artn 483
Doi 10.1038/Msb.2011.16 (2011).
145
43 Fuhrman, J. A. Microbial community structure and its functional implications. Nature
459, 193-199, doi:Doi 10.1038/Nature08058 (2009).
44 Wintermute, E. H. & Silver, P. A. Emergent cooperation in microbial metabolism. Mol
Syst Biol 6, 407, doi:10.1038/msb.2010.66 (2010).
45 Minty, J. J. et al. Design and characterization of synthetic fungal-bacterial consortia for
direct production of isobutanol from cellulosic biomass. Proc Natl Acad Sci U S A 110,
14592-14597, doi:10.1073/pnas.1218447110 (2013).
46 Wintermute, E. H. & Silver, P. A. Dynamics in the mixed microbial concourse. Genes
Dev 24, 2603-2614, doi:10.1101/gad.1985210 (2010).
47 Stolyar, S. et al. Metabolic modeling of a mutualistic microbial community. Mol Syst
Biol 3, 92, doi:10.1038/msb4100131 (2007).
48 Bizukojc, M., Dietz, D., Sun, J. & Zeng, A. P. Metabolic modelling of syntrophic-like
growth of a 1,3-propanediol producer, Clostridium butyricum, and a methanogenic
archeon, Methanosarcina mazei, under anaerobic conditions. Bioprocess and biosystems
engineering 33, 507-523, doi:10.1007/s00449-009-0359-0 (2010).
49 Lewis, N. E. et al. Large-scale in silico modeling of metabolic interactions between cell
types in the human brain. Nature biotechnology 28, 1279-1285, doi:10.1038/nbt.1711
(2010).
50 Eleftheria Tzamali, P. P., Ioannis G. Tollis and Martin Reczko. Computational
Identification of Bacterial Communities. International Journal of Biological,
Biomolecular, Agricultural, Food and Biotechnological Engineering 3, 185-192 (2009).
51 Nagarajan, H. et al. Characterization and modelling of interspecies electron transfer
mechanisms and microbial community dynamics of a syntrophic association. Nature
communications 4, 2809, doi:10.1038/ncomms3809 (2013).
52 Ibarra, R. U., Fu, P., Palsson, B. O., DiTonno, J. R. & Edwards, J. S. Quantitative
analysis of Escherichia coli metabolic phenotypes within the context of phenotypic phase
146
planes. Journal of molecular microbiology and biotechnology 6, 101-108, doi:76740
(2003).
53 Tzamali, E., Poirazi, P., Tollis, I. G. & Reczko, M. A computational exploration of
bacterial metabolic diversity identifying metabolic interactions and growth-efficient
strain communities. Bmc Syst Biol 5, doi:Artn 167
Doi 10.1186/1752-0509-5-167 (2011).
54 Mo, M. L., Jamshidi, N. & Palsson, B. O. A genome-scale, constraint-based approach to
systems biology of human metabolism. Molecular bioSystems 3, 598-603,
doi:10.1039/b705597h (2007).
55 Wahrheit, J., Nicolae, A. & Heinzle, E. Eukaryotic metabolism: measuring compartment
fluxes. Biotechnology journal 6, 1071-1085, doi:10.1002/biot.201100032 (2011).
56 Borenstein, E. & Feldman, M. W. Topological signatures of species interactions in
metabolic networks. Journal of computational biology : a journal of computational
molecular cell biology 16, 191-200, doi:10.1089/cmb.2008.06TT (2009).
57 Freilich, S. et al. Metabolic-network-driven analysis of bacterial ecological strategies.
Genome Biol 10, R61, doi:10.1186/gb-2009-10-6-r61 (2009).
58 Lehmann, L. & Keller, L. The evolution of cooperation and altruism--a general
framework and a classification of models. Journal of evolutionary biology 19, 1365-
1376, doi:10.1111/j.1420-9101.2006.01119.x (2006).
59 Nadell, C. D., Foster, K. R. & Xavier, J. B. Emergence of spatial structure in cell groups
and the evolution of cooperation. PLoS computational biology 6, e1000716,
doi:10.1371/journal.pcbi.1000716 (2010).
60 Shou, W., Ram, S. & Vilar, J. M. Synthetic cooperation in engineered yeast populations.
Proc Natl Acad Sci U S A 104, 1877-1882, doi:10.1073/pnas.0610575104 (2007).
61 Vallino, J. J. Modeling microbial consortiums as distributed metabolic networks. The
Biological bulletin 204, 174-179 (2003).
147
62 Frey, E. Evolutionary game theory: Theoretical concepts and applications to microbial
communities. Physica A: Statistical Mechanics and its Applications 389, 4265-4298
(2010).
63 Bernstein, D. B., Sulheim, S., Almaas, E. & Segrè, D. Addressing uncertainty in genome-
scale metabolic model reconstruction and analysis. Genome Biology 22, 64,
doi:10.1186/s13059-021-02289-z (2021).
64 Cardoso, J. G. R., Andersen, M. R., Herrgård, M. J. & Sonnenschein, N. Analysis of
Genetic Variation and Potential Applications in Genome-Scale Metabolic Modeling.
Frontiers in Bioengineering and Biotechnology 3, doi:10.3389/fbioe.2015.00013 (2015).
65 Matthews, M. L. & Marshall-Colón, A. Multiscale plant modeling: from genome to
phenome and beyond. Emerging Topics in Life Sciences, doi:10.1042/ETLS20200276
(2021).
66 O'Brien, E. J., Monk, J. M. & Palsson, B. O. Using Genome-scale Models to Predict
Biological Capabilities. Cell 161, 971-987, doi:10.1016/j.cell.2015.05.019 (2015).
67 Akesson, M., Forster, J. & Nielsen, J. Integration of gene expression data into genome-
scale metabolic models. Metab Eng 6, 285-293, doi:10.1016/j.ymben.2003.12.002
(2004).
68 Blazier, A. S. & Papin, J. A. Integration of expression data in genome-scale metabolic
network reconstructions. Frontiers in physiology 3, 299, doi:10.3389/fphys.2012.00299
(2012).
69 Covert, M. W., Knight, E. M., Reed, J. L., Herrgard, M. J. & Palsson, B. O. Integrating
high-throughput and computational data elucidates bacterial networks. Nature 429, 92-
96, doi:10.1038/nature02456 (2004).
70 Hyduke, D. R., Lewis, N. E. & Palsson, B. O. Analysis of omics data with genome-scale
models of metabolism. Molecular bioSystems 9, 167-174, doi:10.1039/c2mb25453k
(2013).
148
71 Jerby, L. & Ruppin, E. Predicting drug targets and biomarkers of cancer via genome-
scale metabolic modeling. Clinical cancer research : an official journal of the American
Association for Cancer Research 18, 5572-5584, doi:10.1158/1078-0432.CCR-12-1856
(2012).
72 Lee, D. et al. Improving metabolic flux predictions using absolute gene expression data.
Bmc Syst Biol 6, 73, doi:10.1186/1752-0509-6-73 (2012).
73 Shlomi, T., Cabili, M. N., Herrgard, M. J., Palsson, B. O. & Ruppin, E. Network-based
prediction of human tissue-specific metabolism. Nature biotechnology 26, 1003-1010,
doi:10.1038/nbt.1487 (2008).
74 Becker, S. A. & Palsson, B. O. Context-specific metabolic networks are consistent with
experiments. PLoS computational biology 4, e1000082,
doi:10.1371/journal.pcbi.1000082 (2008).
75 Zur, H., Ruppin, E. & Shlomi, T. iMAT: an integrative metabolic analysis tool.
Bioinformatics 26, 3140-3142, doi:10.1093/bioinformatics/btq602 (2010).
76 Colijn, C. et al. Interpreting expression data with metabolic flux models: predicting
Mycobacterium tuberculosis mycolic acid production. PLoS computational biology 5,
e1000489, doi:10.1371/journal.pcbi.1000489 (2009).
77 Chandrasekaran, S. & Price, N. D. Probabilistic integrative modeling of genome-scale
metabolic and regulatory networks in Escherichia coli and Mycobacterium tuberculosis.
Proc Natl Acad Sci U S A 107, 17845-17850, doi:10.1073/pnas.1005139107
10.1073/pnas.1005139107. Epub 2010 Sep 27. (2010).
78 Bussieck, M. R. & Meeraus, A. General algebraic modeling system (GAMS). Appl
Optimizat 88, 137-157 (2004).
79 Becker, S. A. Quantitative prediction of cellular metabolism with constraint-based
models: The COBRA Toolbox. Nat. Protoc. 2, 727-738 (2007).
149
80 Schellenberger, J. et al. Quantitative prediction of cellular metabolism with constraint-
based models: the COBRA Toolbox v2.0. Nat Protoc 6, doi:10.1038/nprot.2011.308
(2011).
81 Anders, S. & Huber, W. Differential expression analysis for sequence count data.
Genome Biol 11, R106, doi:10.1186/gb-2010-11-10-r106 (2010).
82 Rodriguez-Esteban, R. & Jiang, X. Differential gene expression in disease: a comparison
between high-throughput studies and the literature. BMC Med Genomics 10, 59,
doi:10.1186/s12920-017-0293-y (2017).
83 Mukaka, M. M. Statistics corner: A guide to appropriate use of correlation coefficient in
medical research. Malawi Med J 24, 69-71 (2012).
84 Shannon, P. et al. Cytoscape: a software environment for integrated models of
biomolecular interaction networks. Genome Res 13, 2498-2504, doi:10.1101/gr.1239303
(2003).
85 Klevens, R. M. et al. Invasive methicillin-resistant Staphylococcus aureus infections in
the United States. JAMA : the journal of the American Medical Association 298, 1763-
1771, doi:10.1001/jama.298.15.1763 (2007).
86 Kluytmans, J., van Belkum, A. & Verbrugh, H. Nasal carriage of Staphylococcus aureus:
epidemiology, underlying mechanisms, and associated risks. Clin Microbiol Rev 10, 505-
520 (1997).
87 Diekema, D. J. et al. Survey of infections due to Staphylococcus species: frequency of
occurrence and antimicrobial susceptibility of isolates collected in the United States,
Canada, Latin America, Europe, and the Western Pacific region for the SENTRY
Antimicrobial Surveillance Program, 1997-1999. Clinical infectious diseases : an official
publication of the Infectious Diseases Society of America 32 Suppl 2, S114-132,
doi:10.1086/320184 (2001).
150
88 Simons, H. & Alcabes, P. A model for surveillance of methicillin-resistant
Staphylococcus aureus. Public Health Rep 123, 21-29 (2008).
89 Wertheim, H. F. et al. The role of nasal carriage in Staphylococcus aureus infections.
Lancet Infect Dis 5, 751-762, doi:10.1016/S1473-3099(05)70295-4 (2005).
90 Chaudhari, S. S. et al. Nitrite Derived from Endogenous Bacterial Nitric Oxide Synthase
Activity Promotes Aerobic Respiration. Mbio 8, doi:10.1128/mBio.00887-17 (2017).
91 Gusarov, I., Shatalin, K., Starodubtseva, M. & Nudler, E. Endogenous nitric oxide
protects bacteria against a wide spectrum of antibiotics. Science 325, 1380-1384,
doi:10.1126/science.1175439 (2009).
92 van Sorge, N. M. et al. Methicillin-resistant Staphylococcus aureus bacterial nitric-oxide
synthase affects antibiotic sensitivity and skin abscess development. J Biol Chem 288,
6417-6426, doi:10.1074/jbc.M112.448738 (2013).
93 Sapp, A. M. et al. Contribution of the nos-pdt operon to virulence phenotypes in
methicillin-sensitive Staphylococcus aureus. PloS one 9, e108868,
doi:10.1371/journal.pone.0108868 (2014).
94 Richardson, A. R., Libby, S. J. & Fang, F. C. A nitric oxide-inducible lactate
dehydrogenase enables Staphylococcus aureus to resist innate immunity. Science 319,
1672-1676, doi:10.1126/science.1155207 (2008).
95 Marshall, D. D., Sadykov, M. R., Thomas, V. C., Bayles, K. W. & Powers, R. Redox
Imbalance Underlies the Fitness Defect Associated with Inactivation of the Pta-AckA
Pathway in Staphylococcus aureus. Journal of proteome research 15, 1205-1212,
doi:10.1021/acs.jproteome.5b01089 (2016).
96 Raskevicius, V. et al. Genome scale metabolic models as tools for drug design and
personalized medicine. PloS one 13, e0190636, doi:10.1371/journal.pone.0190636
(2018).
151
97 Bordel, S. Constraint based modeling of metabolism allows finding metabolic cancer
hallmarks and identifying personalized therapeutic windows. Oncotarget 9, 19716-
19729, doi:10.18632/oncotarget.24805 (2018).
98 Zhang, C. & Hua, Q. Applications of Genome-Scale Metabolic Models in Biotechnology
and Systems Medicine. Frontiers in physiology 6, 413, doi:10.3389/fphys.2015.00413
(2015).
99 Dunphy, L. J. & Papin, J. A. Biomedical applications of genome-scale metabolic network
reconstructions of human pathogens. Curr Opin Biotechnol 51, 70-79,
doi:10.1016/j.copbio.2017.11.014 (2017).
100 Mienda, B. S., Salihu, R., Adamu, A. & Idris, S. Genome-scale metabolic models as
platforms for identification of novel genes as antimicrobial drug targets. Future
Microbiol 13, 455-467, doi:10.2217/fmb-2017-0195 (2018).
101 Lee, D. S. et al. Comparative genome-scale metabolic reconstruction and flux balance
analysis of multiple Staphylococcus aureus genomes identify novel antimicrobial drug
targets. J Bacteriol 191, 4015-4024, doi:10.1128/JB.01743-08 (2009).
102 Bosi, E. et al. Comparative genome-scale modelling of Staphylococcus aureus strains
identifies strain-specific metabolic capabilities linked to pathogenicity. Proc Natl Acad
Sci U S A 113, E3801-3809, doi:10.1073/pnas.1523199113 (2016).
103 Becker, S. A. & Palsson, B. O. Genome-scale reconstruction of the metabolic network in
Staphylococcus aureus N315: an initial draft to the two-dimensional annotation. BMC
microbiology 5, 8, doi:10.1186/1471-2180-5-8 (2005).
104 Seif, Y. et al. A computational knowledge-base elucidates the response of
Staphylococcus aureus to different media types. PLoS computational biology 15,
e1006644, doi:10.1371/journal.pcbi.1006644 (2019).
152
105 Heinemann, M., Kummel, A., Ruinatscha, R. & Panke, S. In silico genome-scale
reconstruction and validation of the Staphylococcus aureus metabolic network.
Biotechnology and bioengineering 92, 850-864, doi:10.1002/bit.20663 (2005).
106 Joyce, A. R. & Palsson, B. O. Predicting gene essentiality using genome-scale in silico
models. Methods Mol Biol 416, 433-457, doi:10.1007/978-1-59745-321-9_30 (2008).
107 Suthers, P. F., Zomorrodi, A. & Maranas, C. D. Genome-scale gene/reaction essentiality
and synthetic lethality analysis. Mol Syst Biol 5, 301, doi:10.1038/msb.2009.56 (2009).
108 Kim, T. Y., Kim, H. U. & Lee, S. Y. Metabolite-centric approaches for the discovery of
antibacterials using genome-scale metabolic networks. Metab Eng 12, 105-111,
doi:10.1016/j.ymben.2009.05.004 (2010).
109 Schiebel, J. et al. Staphylococcus aureus FabI: inhibition, substrate recognition, and
potential implications for in vivo essentiality. Structure 20, 802-813,
doi:10.1016/j.str.2012.03.013 (2012).
110 Sadykov, M. R. et al. Inactivation of the Pta-AckA pathway causes cell death in
Staphylococcus aureus. J Bacteriol 195, 3035-3044, doi:10.1128/JB.00042-13 (2013).
111 Harper, L. et al. Staphylococcus aureus Responds to the Central Metabolite Pyruvate To
Regulate Virulence. Mbio 9, doi:10.1128/mBio.02272-17 (2018).
112 Halsey, C. R. et al. Amino Acid Catabolism in Staphylococcus aureus and the Function
of Carbon Catabolite Repression. Mbio 8, doi:10.1128/mBio.01434-16 (2017).
113 Leiba, J. et al. A novel mode of regulation of the Staphylococcus aureus catabolite
control protein A (CcpA) mediated by Stk1 protein phosphorylation. J Biol Chem 287,
43607-43619, doi:10.1074/jbc.M112.418913 (2012).
114 Thomas, V. C. et al. A central role for carbon-overflow pathways in the modulation of
bacterial cell death. PLoS Pathog 10, e1004205, doi:10.1371/journal.ppat.1004205
(2014).
153
115 Richardson, A. R. Virulence and Metabolism. Microbiol Spectr 7,
doi:10.1128/microbiolspec.GPP3-0011-2018 (2019).
116 Kennedy, A. D. et al. Epidemic community-associated methicillin-resistant
Staphylococcus aureus: recent clonal expansion and diversification. Proc Natl Acad Sci U
S A 105, 1327-1332, doi:10.1073/pnas.0710217105 (2008).
117 Fey, P. D. et al. A genetic resource for rapid and comprehensive phenotype screening of
nonessential Staphylococcus aureus genes. Mbio 4, e00537-00512,
doi:10.1128/mBio.00537-12 (2013).
118 Kumar, V. S. & Maranas, C. D. GrowMatch: an automated method for reconciling in
silico/in vivo growth predictions. PLoS computational biology 5, e1000308,
doi:10.1371/journal.pcbi.1000308 (2009).
119 Kohler, C. et al. A defect in menadione biosynthesis induces global changes in gene
expression in Staphylococcus aureus. J Bacteriol 190, 6351-6364, doi:10.1128/JB.00505-
08 (2008).
120 Seidl, K. et al. Effect of a glucose impulse on the CcpA regulon in Staphylococcus
aureus. BMC microbiology 9, 95, doi:10.1186/1471-2180-9-95 (2009).
121 Coordinators, N. R. Database resources of the National Center for Biotechnology
Information. Nucleic acids research, doi:10.1093/nar/gkx1095 (2017).
122 UniProt, C. The Universal Protein Resource (UniProt). Nucleic acids research 35, D193-
197, doi:10.1093/nar/gkl929 (2007).
123 Fuchs, S. et al. AureoWiki The repository of the Staphylococcus aureus research and
annotation community. Int J Med Microbiol 308, 558-568,
doi:10.1016/j.ijmm.2017.11.011 (2018).
124 Thiele, I. & Palsson, B. O. A protocol for generating a high-quality genome-scale
metabolic reconstruction. Nat Protoc 5, 93-121, doi:10.1038/nprot.2009.203 (2010).
154
125 Carvalho, S. M., de Jong, A., Kloosterman, T. G., Kuipers, O. P. & Saraiva, L. M. The
Staphylococcus aureus alpha-Acetolactate Synthase ALS Confers Resistance to
Nitrosative Stress. Frontiers in microbiology 8, 1273, doi:10.3389/fmicb.2017.01273
(2017).
126 Joshi, G. S., Spontak, J. S., Klapper, D. G. & Richardson, A. R. Arginine catabolic
mobile element encoded speG abrogates the unique hypersensitivity of Staphylococcus
aureus to exogenous polyamines. Mol Microbiol 82, 9-20, doi:10.1111/j.1365-
2958.2011.07809.x (2011).
127 Oku, Y., Kurokawa, K., Ichihashi, N. & Sekimizu, K. Characterization of the
Staphylococcus aureus mprF gene, involved in lysinylation of phosphatidylglycerol.
Microbiology 150, 45-51, doi:10.1099/mic.0.26706-0 (2004).
128 Sohlenkamp, C. & Geiger, O. Bacterial membrane lipids: diversity in structures and
pathways. FEMS microbiology reviews 40, 133-159, doi:10.1093/femsre/fuv008 (2016).
129 Varma, A. & Palsson, B. O. Stoichiometric flux balance models quantitatively predict
growth and metabolic by-product secretion in wild-type Escherichia coli W3110. Appl
Environ Microbiol 60, 3724-3731 (1994).
130 Pence, H. E. & Williams, A. ChemSpider: An Online Chemical Information Resource. J
Chem Educ 87, 1123-1124, doi:10.1021/ed100697w (2010).
131 Schellenberger, J., Park, J. O., Conrad, T. M. & Palsson, B. O. BiGG: a Biochemical
Genetic and Genomic knowledgebase of large scale metabolic reconstructions. BMC
bioinformatics 11, 213, doi:10.1186/1471-2105-11-213 (2010).
132 Chan, S. H. J., Cai, J., Wang, L., Simons-Senftle, M. N. & Maranas, C. D. Standardizing
biomass reactions and ensuring complete mass balance in genome-scale metabolic
models. Bioinformatics 33, 3603-3609, doi:10.1093/bioinformatics/btx453 (2017).
133 Maranas, C. & Zomorrodi, A. Optimization methods in metabolic networks. (Wiley,
2016).
155
134 Girish, T. S., Navratna, V. & Gopal, B. Structure and nucleotide specificity of
Staphylococcus aureus dihydrodipicolinate reductase (DapB). FEBS letters 585, 2561-
2567, doi:10.1016/j.febslet.2011.07.021 (2011).
135 Lord, D. M., Baran, A. U., Wood, T. K., Peti, W. & Page, R. BdcA, a protein important
for Escherichia coli biofilm dispersal, is a short-chain dehydrogenase/reductase that binds
specifically to NADPH. PloS one 9, e105751, doi:10.1371/journal.pone.0105751 (2014).
136 Alsiyabi, A., Immethun, C. M. & Saha, R. Modeling the Interplay between
Photosynthesis, CO2 Fixation, and the Quinone Pool in a Purple Non-Sulfur Bacterium.
Sci Rep-Uk 9, 12638, doi:10.1038/s41598-019-49079-z (2019).
137 Islam, M. M., Fernando, S. C. & Saha, R. Metabolic Modeling Elucidates the
Transactions in the Rumen Microbiome and the Shifts Upon Virome Interactions.
Frontiers in microbiology 10, doi:10.3389/fmicb.2019.02412 (2019).
138 Sarkar, D., Mueller, T. J., Liu, D., Pakrasi, H. B. & Maranas, C. D. A diurnal flux
balance model of Synechocystis sp. PCC 6803 metabolism. PLoS computational biology
15, e1006692, doi:10.1371/journal.pcbi.1006692 (2019).
139 Chan, S. H. J., Wang, L., Dash, S. & Maranas, C. D. Accelerating flux balance
calculations in genome-scale metabolic models by localizing the application of loopless
constraints. Bioinformatics 34, 4248-4255, doi:10.1093/bioinformatics/bty446 (2018).
140 Santiago, M. et al. A new platform for ultra-high density Staphylococcus aureus
transposon libraries. BMC Genomics 16, 252, doi:10.1186/s12864-015-1361-3 (2015).
141 Valentino, M. D. et al. Genes contributing to Staphylococcus aureus fitness in abscess-
and infection-related ecologies. Mbio 5, e01729-01714, doi:10.1128/mBio.01729-14
(2014).
142 Forsyth, R. A. et al. A genome-wide strategy for the identification of essential genes in
Staphylococcus aureus. Molecular Microbiology 43, 1387-1400, doi:DOI
10.1046/j.1365-2958.2002.02832.x (2002).
156
143 Chaudhuri, R. R. et al. Comprehensive identification of essential Staphylococcus aureus
genes using Transposon-Mediated Differential Hybridisation (TMDH). BMC Genomics
10, 291, doi:10.1186/1471-2164-10-291 (2009).
144 Ji, Y. D. et al. Identification of critical staphylococcal genes using conditional
phenotypes generated by antisense RNA. Science 293, 2266-2269, doi:DOI
10.1126/science.1063566 (2001).
145 Bae, T., Glass, E. M., Schneewind, O. & Missiakas, D. Generating a collection of
insertion mutations in the Staphylococcus aureus genome using bursa aurealis. Methods
Mol Biol 416, 103-116, doi:10.1007/978-1-59745-321-9_7 (2008).
146 Henry, C. S., Zinner, J. F., Cohoon, M. P. & Stevens, R. L. iBsu1103: a new genome-
scale metabolic model of Bacillus subtilis based on SEED annotations. Genome Biol 10,
R69, doi:10.1186/gb-2009-10-6-r69 (2009).
147 Kinkel, T. L., Roux, C. M., Dunman, P. M. & Fang, F. C. The Staphylococcus aureus
SrrAB two-component system promotes resistance to nitrosative stress and hypoxia.
Mbio 4, e00696-00613, doi:10.1128/mBio.00696-13 (2013).
148 Pagels, M. et al. Redox sensing by a Rex-family repressor is involved in the regulation of
anaerobic gene expression in Staphylococcus aureus. Mol Microbiol 76, 1142-1161,
doi:10.1111/j.1365-2958.2010.07105.x (2010).
149 Liu, X. et al. Redox-sensing regulator Rex regulates aerobic metabolism, morphological
differentiation, and avermectin production in Streptomyces avermitilis. Sci Rep 7, 44567,
doi:10.1038/srep44567 (2017).
150 Piperno, J. R. & Oxender, D. L. Amino acid transport systems in Escherichia coli K-12. J
Biol Chem 243, 5914-5920 (1968).
151 Hussain, M., Hastings, J. G. & White, P. J. A chemically defined medium for slime
production by coagulase-negative staphylococci. Journal of medical microbiology 34,
143-147, doi:10.1099/00222615-34-3-143 (1991).
157
152 Vitko, N. P. & Richardson, A. R. Laboratory maintenance of methicillin-resistant
Staphylococcus aureus (MRSA). Curr Protoc Microbiol Chapter 9, Unit 9C 2,
doi:10.1002/9780471729259.mc09c02s28 (2013).
153 Singh, R. & Jwa, N. S. Understanding the responses of rice to environmental stress using
proteomics. Journal of proteome research 12, 4652-4669, doi:10.1021/pr400689j (2013).
154 Aghamolki, M. T. K. et al. Response of Yield and Morphological Characteristic of Rice
Cultivars to Heat Stress at Different Growth Stages. International Journal of Biological,
Biomolecular, Agricultural, Food and Biotechnological Engineering 86, 98 - 100 (2014).
155 Peng, S. et al. Rice yields decline with higher night temperature from global warming.
Proc Natl Acad Sci U S A 101, 9971-9975, doi:10.1073/pnas.0403720101 (2004).
156 Cheng, L. R. et al. Genetic Analysis of Cold Tolerance at Seedling Stage and Heat
Tolerance at Anthesis in Rice (Oryza sativa L.). J Integr Agr 11, 359-367, doi:Doi
10.1016/S2095-3119(12)60020-3 (2012).
157 Jagadish, S. V. K. et al. Genetic Analysis of Heat Tolerance at Anthesis in Rice. Crop Sci
50, 1633-1641, doi:10.2135/cropsci2009.09.0516 (2010).
158 Long, S. P. & Ort, D. R. More than taking the heat: crops and global change. Current
Opinion in Plant Biology 13, 241-248, doi:10.1016/j.pbi.2010.04.008 (2010).
159 Shimamoto, K. & Kyozuka, J. Rice as a model for comparative genomics of plants.
Annual Review of Plant Biology 53, 399-419,
doi:10.1146/annurev.arplant.53.092401.134447 (2002).
160 Flavell, R. Role of model plant species. Methods Mol Biol 513, 1-18, doi:10.1007/978-1-
59745-427-8_1 (2009).
161 Devos, K. M. & Gale, M. D. Genome relationships: the grass model in current research.
Plant Cell 12, 637-646, doi:10.1105/tpc.12.5.637 (2000).
162 Paterson, A. H., Freeling, M. & Sasaki, T. Grains of knowledge: genomics of model
cereals. Genome Res 15, 1643-1650, doi:10.1101/gr.3725905 (2005).
158
163 Hoppe, A. What mRNA Abundances Can Tell us about Metabolism. Metabolites 2, 614
(2012).
164 Jung, K. H. et al. Genome-wide Identification and Analysis of Early Heat Stress
Responsive Genes in Rice. J Plant Biol 55, 458-468, doi:10.1007/s12374-012-0271-z
(2012).
165 Jung, K. H., Gho, H. J., Nguyen, M. X., Kim, S. R. & An, G. Genome-wide expression
analysis of HSP70 family genes in rice and identification of a cytosolic HSP70 gene
highly induced under heat stress. Funct Integr Genomic 13, 391-402,
doi:10.1007/s10142-013-0331-6 (2013).
166 Kumar, M., Gho, Y. S., Jung, K. H. & Kim, S. R. Genome-Wide Identification and
Analysis of Genes, Conserved between japonica and indica Rice Cultivars, that Respond
to Low-Temperature Stress at the Vegetative Growth Stage. Frontiers in Plant Science 8,
doi:ARTN 1120
10.3389/fpls.2017.01120 (2017).
167 Yamaguchi-Shinozaki, K. & Shinozaki, K. Organization of cis-acting regulatory
elements in osmotic- and cold-stress-responsive promoters. Trends Plant Sci 10, 88-94,
doi:10.1016/j.tplants.2004.12.012 (2005).
168 Yamaguchi-Shinozaki, K. & Shinozaki, K. Transcriptional regulatory networks in
cellular responses and tolerance to dehydration and cold stresses. Annu Rev Plant Biol 57,
781-803, doi:10.1146/annurev.arplant.57.032905.105444 (2006).
169 Huynh-Thu, V. A., Irrthum, A., Wehenkel, L. & Geurts, P. Inferring regulatory networks
from expression data using tree-based methods. PloS one 5,
doi:10.1371/journal.pone.0012776 (2010).
170 Cooper, B. et al. A network of rice genes associated with stress response and seed
development. Proc Natl Acad Sci U S A 100, 4945-4950, doi:10.1073/pnas.0737574100
(2003).
159
171 Dasika, M. S., Gupta, A. & Maranas, C. D. A mixed integer linear programming (MILP)
framework for inferring time delay in gene regulatory networks. Pac Symp Biocomput,
474-485, doi:10.1142/9789812704856_0045 (2004).
172 Chen, X., Chen, M. & Ning, K. BNArray: an R package for constructing gene regulatory
networks from microarray data by using Bayesian network. Bioinformatics 22, 2952-
2954, doi:10.1093/bioinformatics/btl491 (2006).
173 Paul, L., Mishra, P. K., Blumenthal, R. M. & Matthews, R. G. Integration of regulatory
signals through involvement of multiple global regulators: control of the Escherichia coli
gltBDF operon by Lrp, IHF, Crp, and ArgR. BMC microbiology 7, 2, doi:10.1186/1471-
2180-7-2 (2007).
174 Martinez-Antonio, A. & Collado-Vides, J. Identifying global regulators in transcriptional
regulatory networks in bacteria. Current opinion in microbiology 6, 482-489 (2003).
175 Sun, C. et al. Understanding the genetic and epigenetic architecture in complex network
of rice flowering pathways. Protein Cell 5, 889-898, doi:10.1007/s13238-014-0068-6
(2014).
176 Kaur, C. et al. Analysis of global gene expression profile of rice in response to
methylglyoxal indicates its possible role as a stress signal molecule. Front Plant Sci 6,
682, doi:10.3389/fpls.2015.00682 (2015).
177 Zhang, L., Feng, X. K., Ng, Y. K. & Li, S. C. Reconstructing directed gene regulatory
network by only gene expression data. BMC Genomics 17 Suppl 4, 430,
doi:10.1186/s12864-016-2791-2 (2016).
178 Mohanty, B. et al. Identification of candidate network hubs involved in metabolic
adjustments of rice under drought stress by integrating transcriptome data and genome-
scale metabolic network. Plant Sci 242, 224-239, doi:10.1016/j.plantsci.2015.09.018
(2016).
160
179 Mohanty, B. et al. Transcriptional regulatory mechanism of alcohol dehydrogenase 1-
deficient mutant of rice for cell survival under complete submergence. Rice (N Y) 9, 51,
doi:10.1186/s12284-016-0124-3 (2016).
180 Mueller, T. J., Welsh, E. A., Pakrasi, H. B. & Maranas, C. D. Identifying Regulatory
Changes to Facilitate Nitrogen Fixation in the Nondiazotroph Synechocystis sp PCC
6803. ACS synthetic biology 5, 250-258, doi:10.1021/acssynbio.5b00202 (2016).
181 Zhou, G. & Xia, J. Using OmicsNet for Network Integration and 3D Visualization.
Current Protocols in Bioinformatics 65, e69, doi:10.1002/cpbi.69 (2019).
182 Raja, K. et al. A Review of Recent Advancement in Integrating Omics Data with
Literature Mining towards Biomedical Discoveries. Int J Genomics 2017, 6213474,
doi:10.1155/2017/6213474 (2017).
183 Chen, C. et al. Heat stress yields a unique MADS box transcription factor in determining
seed size and thermal sensitivity. Plant Physiol 171, 606-622, doi:10.1104/pp.15.01992
(2016).
184 Bolger, A. M., Lohse, M. & Usadel, B. Trimmomatic: a flexible trimmer for Illumina
sequence data. Bioinformatics 30, 2114-2120, doi:10.1093/bioinformatics/btu170 (2014).
185 Trapnell, C., Pachter, L. & Salzberg, S. L. TopHat: discovering splice junctions with
RNA-Seq. Bioinformatics 25, 1105-1111, doi:10.1093/bioinformatics/btp120 (2009).
186 Anders, S., Pyl, P. T. & Huber, W. HTSeq--a Python framework to work with high-
throughput sequencing data. Bioinformatics 31, 166-169,
doi:10.1093/bioinformatics/btu638 (2015).
187 Haimes, J. & Kelley, M. Demonstration of a ΔΔCq Calculation Method to Compute
Relative Gene Expression from qPCR Data, <https://horizondiscovery.com/-
/media/Files/Horizon/resources/Technical-manuals/delta-cq-solaris-technote.pdf> (2014).
188 Tian, T. et al. agriGO v2.0: a GO analysis toolkit for the agricultural community, 2017
update. Nucleic acids research 45, W122-W129, doi:10.1093/nar/gkx382 (2017).
161
189 Du, Z., Zhou, X., Ling, Y., Zhang, Z. & Su, Z. agriGO: a GO analysis toolkit for the
agricultural community. Nucleic acids research 38, W64-70, doi:10.1093/nar/gkq310
(2010).
190 Rerksiri, W., Zhang, X., Xiong, H. & Chen, X. Expression and promoter analysis of six
heat stress-inducible genes in rice. ScientificWorldJournal 2013, 397401,
doi:10.1155/2013/397401 (2013).
191 Begcy, K., Sandhu, J. & Walia, H. Transient Heat Stress During Early Seed Development
Primes Germination and Seedling Establishment in Rice. Front Plant Sci 9, 1768,
doi:10.3389/fpls.2018.01768 (2018).
192 Maestri, E. et al. Molecular genetics of heat tolerance and heat shock proteins in cereals.
Plant Mol Biol 48, 667-681 (2002).
193 Weerakoon, W. M. W., Maruyama, A. & Ohba, K. Impact of Humidity on Temperature-
Induced Grain Sterility in Rice (Oryza sativa L). Journal of Agronomy and Crop Science
194, 135-140, doi:10.1111/j.1439-037X.2008.00293.x (2008).
194 Nover, L. et al. Arabidopsis and the heat stress transcription factor world: how many heat
stress transcription factors do we need? Cell Stress Chaperones 6, 177-189,
doi:10.1379/1466-1268(2001)006<0177:aathst>2.0.co;2 (2001).
195 Scharf, K. D., Berberich, T., Ebersberger, I. & Nover, L. The plant heat stress
transcription factor (Hsf) family: structure, function and evolution. Biochimica et
biophysica acta 1819, 104-119, doi:10.1016/j.bbagrm.2011.10.002 (2012).
196 Lavania, D., Dhingra, A. & Grover, A. Analysis of transactivation potential of rice
(Oryza sativa L.) heat shock factors. Planta 247, 1267-1276, doi:10.1007/s00425-018-
2865-2 (2018).
197 Chauhan, H., Khurana, N., Agarwal, P. & Khurana, P. Heat shock factors in rice (Oryza
sativa L.): genome-wide expression analysis during reproductive development and abiotic
stress. Mol Genet Genomics 286, 171-187, doi:10.1007/s00438-011-0638-8 (2011).
162
198 Chauhan, H., Khurana, N., Agarwal, P., Khurana, J. P. & Khurana, P. A seed preferential
heat shock transcription factor from wheat provides abiotic stress tolerance and yield
enhancement in transgenic Arabidopsis under heat stress environment. PloS one 8,
e79577, doi:10.1371/journal.pone.0079577 (2013).
199 Burke, J. J., O'Mahony, P. J. & Oliver, M. J. Isolation of Arabidopsis mutants lacking
components of acquired thermotolerance. Plant Physiol 123, 575-588,
doi:10.1104/pp.123.2.575 (2000).
200 Larkindale, J. & Vierling, E. Core genome responses involved in acclimation to high
temperature. Plant Physiol 146, 748-761, doi:10.1104/pp.107.112060 (2008).
201 Chang, P.-F. L. et al. Induction of a cDNA clone from rice encoding a class II small heat
shock protein by heat stress, mechanical injury, and salicylic acid. Plant Science 172, 64-
75, doi:https://doi.org/10.1016/j.plantsci.2006.07.017 (2007).
202 Xu, Q., Chen, S., Yunjuan, R., Chen, S. & Liesche, J. Regulation of Sucrose Transporters
and Phloem Loading in Response to Environmental Cues. Plant Physiol 176, 930-945,
doi:10.1104/pp.17.01088 (2018).
203 Cheng, F., Zhong, L., Zhao, N., Liu, Y. & Zhang, G. Temperature induced changes in the
starch components and biosynthetic enzymes of two rice varieties. Plant Growth
Regulation 46, 87-95, doi:10.1007/s10725-005-7361-6 (2005).
204 Yamakawa, H., Hirose, T., Kuroda, M. & Yamaguchi, T. Comprehensive expression
profiling of rice grain filling-related genes under high temperature using DNA
microarray. Plant Physiol 144, 258-277, doi:10.1104/pp.107.098665 (2007).
205 Tanamachi, K. et al. Differential responses to high temperature during maturation in
heat-stress-tolerant cultivars of Japonica rice. Plant Production Science 19, 300-308,
doi:10.1080/1343943X.2016.1140007 (2016).
163
206 Baunsgaard, L. et al. The 14-3-3 proteins associate with the plant plasma membrane
H(+)-ATPase to generate a fusicoccin binding complex and a fusicoccin responsive
system. The Plant journal : for cell and molecular biology 13, 661-671 (1998).
207 Bachmann, M. et al. 14-3-3 proteins associate with the regulatory phosphorylation site of
spinach leaf nitrate reductase in an isoform-specific manner and reduce
dephosphorylation of Ser-543 by endogenous protein phosphatases. FEBS letters 398, 26-
30 (1996).
208 Priya, P. & Jain, M. RiceSRTFDB: a database of rice transcription factors containing
comprehensive expression, cis-regulatory element and mutant information to facilitate
gene function analysis. Database (Oxford) 2013, bat027, doi:10.1093/database/bat027
(2013).
209 Khew, C. Y. et al. Brassinosteroid insensitive 1-associated kinase 1 (OsI-BAK1) is
associated with grain filling and leaf development in rice. J Plant Physiol 182, 23-32,
doi:10.1016/j.jplph.2015.05.003 (2015).
210 Zhu, J. Y., Sae-Seaw, J. & Wang, Z. Y. Brassinosteroid signalling. Development 140,
1615-1620, doi:10.1242/dev.060590 (2013).
211 Hao, J., Yin, Y. & Fei, S. Z. Brassinosteroid signaling network: implications on yield and
stress tolerance. Plant Cell Rep 32, 1017-1030, doi:10.1007/s00299-013-1438-x (2013).
212 De Bruyne, L., Hofte, M. & De Vleesschauwer, D. Connecting growth and defense: the
emerging roles of brassinosteroids and gibberellins in plant innate immunity. Mol Plant
7, 943-959, doi:10.1093/mp/ssu050 (2014).
213 Lozano-Durán, R. & Zipfel, C. Trade-off between growth and immunity: role of
brassinosteroids. Trends in Plant Science 20, 12-19,
doi:https://doi.org/10.1016/j.tplants.2014.09.003 (2015).
164
214 Nolan, T., Chen, J. & Yin, Y. Cross-talk of Brassinosteroid signaling in controlling
growth and stress responses. The Biochemical journal 474, 2641-2661,
doi:10.1042/BCJ20160633 (2017).
215 Martínez, C. et al. PIF4‐induced BR synthesis is critical to diurnal and
thermomorphogenic growth. The EMBO Journal 37, e99552,
doi:10.15252/embj.201899552 (2018).
216 Zhang, X. et al. A Temperature-Sensitive Misfolded bri1-301 Receptor Requires Its
Kinase Activity to Promote Growth. Plant Physiology 178, 1704-1719,
doi:10.1104/pp.18.00452 (2018).
217 Planas-Riverola, A. et al. Brassinosteroid signaling in plant development and adaptation
to stress. Development 146, doi:10.1242/dev.151894 (2019).
218 Jan, A. & Komatsu, S. Functional Characterization of Gibberellin-Regulated Genes in
Rice Using Microarray System. Genomics, Proteomics & Bioinformatics 4, 137-144,
doi:10.1016/s1672-0229(06)60026-0 (2006).
219 Sharma, R., De Vleesschauwer, D., Sharma, M. K. & Ronald, P. C. Recent advances in
dissecting stress-regulatory crosstalk in rice. Mol Plant 6, 250-260,
doi:10.1093/mp/sss147 (2013).
220 Zhang, Y. et al. Gibberellin homeostasis and plant height control by EUI and a role for
gibberellin in root gravity responses in rice. Cell Res 18, 412-421,
doi:10.1038/cr.2008.28 (2008).
221 Ueguchi-Tanaka, M. et al. GIBBERELLIN INSENSITIVE DWARF1 encodes a soluble
receptor for gibberellin. Nature 437, 693-698, doi:10.1038/nature04028 (2005).
222 Du, H., Chang, Y., Huang, F. & Xiong, L. GID1 modulates stomatal response and
submergence tolerance involving abscisic acid and gibberellic acid signaling in rice. J
Integr Plant Biol 57, 954-968, doi:10.1111/jipb.12313 (2015).
165
223 Jan, A. et al. Characterization of a xyloglucan endotransglucosylase gene that is up-
regulated by gibberellin in rice. Plant Physiol 136, 3670-3681,
doi:10.1104/pp.104.052274 (2004).
224 Jiang, G. et al. Regulation of inflorescence branch development in rice through a novel
pathway involving the pentatricopeptide repeat protein sped1-D. Genetics 197, 1395-
1407, doi:10.1534/genetics.114.163931 (2014).
225 Chen, L., Cao, T., Zhang, J. & Lou, Y. Overexpression of OsGID1 Enhances the
Resistance of Rice to the Brown Planthopper Nilaparvata lugens. International journal of
molecular sciences 19, doi:10.3390/ijms19092744 (2018).
226 Ikeda, A. et al. slender rice, a constitutive gibberellin response mutant, is caused by a null
mutation of the SLR1 gene, an ortholog of the height-regulating gene
GAI/RGA/RHT/D8. Plant Cell 13, 999-1010 (2001).
227 Reimmann, C. & Dudler, R. Circadian rhythmicity in the expression of a novel light-
regulated rice gene. Plant Mol Biol 22, 165-170, doi:10.1007/bf00039006 (1993).
228 Pacheco-Bernal, I., Becerril-Perez, F. & Aguilar-Arnal, L. Circadian rhythms in the
three-dimensional genome: implications of chromatin interactions for cyclic
transcription. Clin Epigenetics 11, 79, doi:10.1186/s13148-019-0677-2 (2019).
229 Onai, K. & Ishiura, M. PHYTOCLOCK 1 encoding a novel GARP protein essential for
the Arabidopsis circadian clock. Genes Cells 10, 963-972, doi:10.1111/j.1365-
2443.2005.00892.x (2005).
230 Zhou, F., Sun, T. H., Zhao, L., Pan, X. W. & Lu, S. The bZIP transcription factor HY5
interacts with the promoter of the monoterpene synthase gene QH6 in modulating its
rhythmic expression. Front Plant Sci 6, 304, doi:10.3389/fpls.2015.00304 (2015).
231 Phukan, U. J., Jeena, G. S., Tripathi, V. & Shukla, R. K. Regulation of Apetala2/Ethylene
Response Factors in Plants. Front Plant Sci 8, 150, doi:10.3389/fpls.2017.00150 (2017).
166
232 Song, W. Y. et al. A receptor kinase-like protein encoded by the rice disease resistance
gene, Xa21. Science 270, 1804-1806 (1995).
233 Ronald, P. C. & Beutler, B. Plant and animal sensors of conserved microbial signatures.
Science 330, 1061-1064, doi:10.1126/science.1189468 (2010).
234 Seo, Y. S. et al. Towards establishment of a rice stress response interactome. PLoS
genetics 7, e1002020, doi:10.1371/journal.pgen.1002020 (2011).
235 Peng, Y. et al. OsWRKY62 is a negative regulator of basal and Xa21-mediated defense
against Xanthomonas oryzae pv. oryzae in rice. Mol Plant 1, 446-458,
doi:10.1093/mp/ssn024 (2008).
236 Liu, X., Bai, X., Wang, X. & Chu, C. OsWRKY71, a rice transcription factor, is involved
in rice defense response. J Plant Physiol 164, 969-979, doi:10.1016/j.jplph.2006.07.006
(2007).
237 Jiang, L. et al. The APETALA2-Like Transcription Factor SUPERNUMERARY
BRACT Controls Rice Seed Shattering and Seed Size. Plant Cell 31, 17-36,
doi:10.1105/tpc.18.00304 (2019).
238 Shigyo, M., Hasebe, M. & Ito, M. Molecular evolution of the AP2 subfamily. Gene 366,
256-265, doi:10.1016/j.gene.2005.08.009 (2006).
239 Ouyang, Y., Huang, X., Lu, Z. & Yao, J. Genomic survey, expression profile and co-
expression network analysis of OsWD40 family in rice. BMC Genomics 13, 100,
doi:10.1186/1471-2164-13-100 (2012).
240 Muller, S. & Livanos, P. Plant Kinesin-12: Localization Heterogeneity and Functional
Implications. International journal of molecular sciences 20, doi:10.3390/ijms20174213
(2019).
241 Kitagawa, K. et al. A novel kinesin 13 protein regulating rice seed length. Plant Cell
Physiol 51, 1315-1329, doi:10.1093/pcp/pcq092 (2010).
167
242 Li, J., Xu, Y. & Chong, K. The novel functions of kinesin motor proteins in plants.
Protoplasma 249 Suppl 2, S95-100, doi:10.1007/s00709-011-0357-3 (2012).
243 Fang, J. et al. Reduction of ATPase activity in the rice kinesin protein Stemless Dwarf 1
inhibits cell division and organ development. The Plant journal : for cell and molecular
biology 96, 620-634, doi:10.1111/tpj.14056 (2018).
244 Arora, R. et al. MADS-box gene family in rice: genome-wide identification, organization
and expression profiling during reproductive development and stress. BMC Genomics 8,
242, doi:10.1186/1471-2164-8-242 (2007).
245 Miyazaki, S., Sato, Y., Asano, T., Nagamura, Y. & Nonomura, K. Rice MEL2, the RNA
recognition motif (RRM) protein, binds in vitro to meiosis-expressed genes containing U-
rich RNA consensus sequences in the 3'-UTR. Plant Mol Biol 89, 293-307,
doi:10.1007/s11103-015-0369-z (2015).
246 Craig, K. L. & Tyers, M. The F-box: a new motif for ubiquitin dependent proteolysis in
cell cycle regulation and signal transduction. Prog Biophys Mol Biol 72, 299-328 (1999).
247 Hong, F. et al. Overexpression of the rFCA RNA recognition motif affects morphologies
modifications in rice (Oryza sativa L.). Biosci Rep 27, 225-234, doi:10.1007/s10540-007-
9047-y (2007).
248 Hirochika, H., Sugimoto, K., Otsuki, Y., Tsugawa, H. & Kanda, M. Retrotransposons of
rice involved in mutations induced by tissue culture. Proc Natl Acad Sci U S A 93, 7783-
7788, doi:10.1073/pnas.93.15.7783 (1996).
249 Vitte, C., Panaud, O. & Quesneville, H. LTR retrotransposons in rice (Oryza sativa, L.):
recent burst amplifications followed by rapid DNA loss. BMC Genomics 8, 218,
doi:10.1186/1471-2164-8-218 (2007).
250 Wang, F., Jing, W. & Zhang, W. The mitogen-activated protein kinase cascade MKK1-
MPK4 mediates salt signaling in rice. Plant Sci 227, 181-189,
doi:10.1016/j.plantsci.2014.08.007 (2014).
168
251 El-Kereamy, A. et al. The rice R2R3-MYB transcription factor OsMYB55 is involved in
the tolerance to high temperature and modulates amino acid metabolism. PloS one 7,
e52030, doi:10.1371/journal.pone.0052030 (2012).
252 Wilkins, O. et al. EGRINs (Environmental Gene Regulatory Influence Networks) in Rice
That Function in the Response to Water Deficit, High Temperature, and Agricultural
Environments. The Plant Cell 28, 2365-2384, doi:10.1105/tpc.16.00158 (2016).
253 Bellande, K., Bono, J. J., Savelli, B., Jamet, E. & Canut, H. Plant Lectins and Lectin
Receptor-Like Kinases: How Do They Sense the Outside? International journal of
molecular sciences 18, doi:10.3390/ijms18061164 (2017).
254 Vaid, N., Macovei, A. & Tuteja, N. Knights in action: lectin receptor-like kinases in plant
development and stress responses. Mol Plant 6, 1405-1418, doi:10.1093/mp/sst033
(2013).
255 Shumayla, Sharma, S., Pandey, A. K., Singh, K. & Upadhyay, S. K. Molecular
Characterization and Global Expression Analysis of Lectin Receptor Kinases in Bread
Wheat (Triticum aestivum). PloS one 11, e0153925, doi:10.1371/journal.pone.0153925
(2016).
256 Silveira, R. D. et al. Expression of drought tolerance genes in tropical upland rice
cultivars (Oryza sativa). Genetics and molecular research : GMR 14, 8181-8200,
doi:10.4238/2015.July.27.6 (2015).
257 Kumar, K. A. et al. Identification of genes controlling aba accumulation in rice during
drought stress and seed maturation. International Journal of Advanced Biotechnology
and Research 4, 481-487 (2013).
258 Ke, S. et al. Mutation in a putative glycosyltransferase-like gene causes programmed cell
death and early leaf senescence in rice. Rice (N Y) 12, 7, doi:10.1186/s12284-019-0266-1
(2019).
169
259 Moon, S. et al. Rice glycosyltransferase1 encodes a glycosyltransferase essential for
pollen wall formation. Plant Physiol 161, 663-675, doi:10.1104/pp.112.210948 (2013).
260 Yang, C., Vizcay-Barrena, G., Conner, K. & Wilson, Z. A. MALE STERILITY1 is
required for tapetal development and pollen wall biosynthesis. Plant Cell 19, 3530-3548,
doi:10.1105/tpc.107.054981 (2007).
261 Su, T., Li, W., Wang, P. & Ma, C. Dynamics of Peroxisome Homeostasis and Its Role in
Stress Response and Signaling in Plants. Front Plant Sci 10, 705,
doi:10.3389/fpls.2019.00705 (2019).
262 Monroe-Augustus, M. et al. Matrix proteins are inefficiently imported into Arabidopsis
peroxisomes lacking the receptor-docking peroxin PEX14. Plant Mol Biol 77, 1-15,
doi:10.1007/s11103-011-9782-0 (2011).
263 Burkhart, S. E., Lingard, M. J. & Bartel, B. Genetic dissection of peroxisome-associated
matrix protein degradation in Arabidopsis thaliana. Genetics 193, 125-141,
doi:10.1534/genetics.112.146100 (2013).
264 Kao, Y. T., Gonzalez, K. L. & Bartel, B. Peroxisome Function, Biogenesis, and
Dynamics in Plants. Plant Physiol 176, 162-177, doi:10.1104/pp.17.01050 (2018).
265 Kato, Y. & Sakamoto, W. FtsH Protease in the Thylakoid Membrane: Physiological
Functions and the Regulation of Protease Activity. Front Plant Sci 9, 855,
doi:10.3389/fpls.2018.00855 (2018).
266 Chern, M. S., Eiben, H. G. & Bustos, M. M. The developmentally regulated bZIP factor
ROM1 modulates transcription from lectin and storage protein genes in bean embryos.
The Plant journal : for cell and molecular biology 10, 135-148, doi:10.1046/j.1365-
313x.1996.10010135.x (1996).
267 Bensmihen, S., Giraudat, J. & Parcy, F. Characterization of three homologous basic
leucine zipper transcription factors (bZIP) of the ABI5 family during Arabidopsis
thaliana embryo maturation. J Exp Bot 56, 597-603, doi:10.1093/jxb/eri050 (2005).
170
268 Jakoby, M. et al. bZIP transcription factors in Arabidopsis. Trends Plant Sci 7, 106-111,
doi:10.1016/s1360-1385(01)02223-3 (2002).
269 Nijhawan, A., Jain, M., Tyagi, A. K. & Khurana, J. P. Genomic survey and gene
expression analysis of the basic leucine zipper transcription factor family in rice. Plant
Physiol 146, 333-350, doi:10.1104/pp.107.112821 (2008).
270 Macovei, A., Vaid, N., Tula, S. & Tuteja, N. A new DEAD-box helicase ATP-binding
protein (OsABP) from rice is responsive to abiotic stress. Plant Signal Behav 7, 1138-
1143, doi:10.4161/psb.21343 (2012).
271 Kothari, K. S., Dansana, P. K., Giri, J. & Tyagi, A. K. Rice Stress Associated Protein 1
(OsSAP1) Interacts with Aminotransferase (OsAMTR1) and Pathogenesis-Related 1a
Protein (OsSCP) and Regulates Abiotic Stress Responses. Front Plant Sci 7, 1057,
doi:10.3389/fpls.2016.01057 (2016).
272 McCormick, F. Ras-related proteins in signal transduction and growth control. Mol
Reprod Dev 42, 500-506, doi:10.1002/mrd.1080420419 (1995).
273 Shah, F. et al. Impact of high-temperature stress on rice plant and its traits related to
tolerance. The Journal of Agricultural Science 149, 545-556,
doi:10.1017/s0021859611000360 (2011).
274 Grennan, A. K. Abiotic stress in rice. An "omic" approach. Plant Physiol 140, 1139-
1141, doi:10.1104/pp.104.900188 (2006).
275 Narsai, R. et al. Antagonistic, overlapping and distinct responses to biotic stress in rice
(Oryza sativa) and interactions with abiotic stress. BMC Genomics 14, 93,
doi:10.1186/1471-2164-14-93 (2013).
276 Rabbani, M. A. et al. Monitoring expression profiles of rice genes under cold, drought,
and high-salinity stresses and abscisic acid application using cDNA microarray and RNA
gel-blot analyses. Plant Physiol 133, 1755-1767, doi:10.1104/pp.103.025742 (2003).
171
277 Hasegawa, P. M., Bressan, R. A., Zhu, J. K. & Bohnert, H. J. Plant Cellular and
Molecular Responses to High Salinity. Annu Rev Plant Physiol Plant Mol Biol 51, 463-
499, doi:10.1146/annurev.arplant.51.1.463 (2000).
278 Hobson, P. N. The Rumen microbial ecosystem. (Elsevier Applied Science ;
Sole distributor in the USA and Canada, Elsevier Science Pub. Co., 1988).
279 Hungate, R. E. The Rumen Microbial Ecosystem. Annual Review of Ecology and
Systematics 6, 39-66, doi:10.1146/annurev.es.06.110175.000351 (1975).
280 Henderson, G. et al. Rumen microbial community composition varies with diet and host,
but a core microbiome is found across a wide geographical range. Sci Rep 5, 14567,
doi:10.1038/srep14567 (2015).
281 Nocek, J. E. & Russell, J. B. Protein and Energy as an Integrated System. Relationship of
Ruminal Protein and Carbohydrate Availability to Microbial Synthesis and Milk
Production. Journal of dairy science 71, 2070-2107,
doi:https://doi.org/10.3168/jds.S0022-0302(88)79782-9 (1988).
282 Russell, J. B. & Rychlik, J. L. Factors That Alter Rumen Microbial Ecology. Science 292,
1119-1122, doi:10.1126/science.1058830 (2001).
283 Hungate, R. E. The rumen and its microbes. (Academic Press, 1966).
284 Bryant, M. P. & Burkey, L. A. Cultural methods and some characteristics of some of the
more numerous groups of bacteria in the bovine rumen. Journal of dairy science 36, 205-
217, doi:10.3168/jds.S0022-0302(53)91482-9 (1953).
285 Flint, H. J., Bayer, E. A., Rincon, M. T., Lamed, R. & White, B. A. Polysaccharide
utilization by gut bacteria: potential for new insights from genomic analysis. Nat Rev
Microbiol 6, 121-131, doi:10.1038/nrmicro1817 (2008).
286 Thomas, F., Hehemann, J. H., Rebuffet, E., Czjzek, M. & Michel, G. Environmental and
gut bacteroidetes: the food connection. Frontiers in microbiology 2, 93,
doi:10.3389/fmicb.2011.00093 (2011).
172
287 Wallace, R. J. et al. Peptidases of the rumen bacterium, Prevotella ruminicola. Anaerobe
3, 35-42, doi:10.1006/anae.1996.0065 (1997).
288 St-Pierre, B. & Wright, A. D. Diversity of gut methanogens in herbivorous animals.
Animal : an international journal of animal bioscience 7 Suppl 1, 49-56,
doi:10.1017/S1751731112000912 (2013).
289 Danielsson, R. et al. Methane Production in Dairy Cows Correlates with Rumen
Methanogenic and Bacterial Community Structure. Frontiers in microbiology 8, 226,
doi:10.3389/fmicb.2017.00226 (2017).
290 Seedorf, H., Kittelmann, S. & Janssen, P. H. Few highly abundant operational taxonomic
units dominate within rumen methanogenic archaeal species in New Zealand sheep and
cattle. Appl Environ Microbiol 81, 986-995, doi:10.1128/AEM.03018-14 (2015).
291 Hungate, R. E., Dougherty, R. W., Bryant, M. P. & Cello, R. M. Microbiological and
physiological changes associated with acute indigestion in sheep. Cornell Vet 42, 423-
449 (1952).
292 Owens, F. N., Secrist, D. S., Hill, W. J. & Gill, D. R. Acidosis in cattle: a review. Journal
of animal science 76, 275-286 (1998).
293 Moss, A. R., Jouany, J.-P. & Newbold, J. Methane production by ruminants: its
contribution to global warming. Ann. Zootech. 49, 231-253 (2000).
294 Lenski, R. E. in Advances in Microbial Ecology (ed K. C. Marshall) 1-44 (Springer US,
1988).
295 Thompson, L. R. et al. Phage auxiliary metabolic genes and the redirection of
cyanobacterial host carbon metabolism. Proc Natl Acad Sci U S A 108, E757-764,
doi:10.1073/pnas.1102164108 (2011).
296 Hurwitz, B. L. & U'Ren, J. M. Viral metabolic reprogramming in marine ecosystems.
Current opinion in microbiology 31, 161-168, doi:10.1016/j.mib.2016.04.002 (2016).
173
297 Pan, D. et al. Correlation between viral production and carbon mineralization under
nitrate-reducing conditions in aquifer sediment. The ISME journal 8, 1691-1703,
doi:10.1038/ismej.2014.38 (2014).
298 De Smet, J. et al. High coverage metabolomics analysis reveals phage-specific alterations
to Pseudomonas aeruginosa physiology during infection. The ISME journal 10, 1823-
1835, doi:10.1038/ismej.2016.3 (2016).
299 Suttle, C. A. Marine viruses--major players in the global ecosystem. Nat Rev Microbiol 5,
801-812, doi:10.1038/nrmicro1750 (2007).
300 Sullivan, M. B. et al. Prevalence and evolution of core photosystem II genes in marine
cyanobacterial viruses and their hosts. PLoS biology 4, e234,
doi:10.1371/journal.pbio.0040234 (2006).
301 Hurwitz, B. L., Hallam, S. J. & Sullivan, M. B. Metabolic reprogramming by viruses in
the sunlit and dark ocean. Genome Biol 14, R123, doi:10.1186/gb-2013-14-11-r123
(2013).
302 Weitz, J. S. et al. A multitrophic model to quantify the effects of marine viruses on
microbial food webs and ecosystem processes. The ISME journal 9, 1352-1364,
doi:10.1038/ismej.2014.220 (2015).
303 Crummett, L. T., Puxty, R. J., Weihe, C., Marston, M. F. & Martiny, J. B. H. The
genomic content and context of auxiliary metabolic genes in marine cyanomyoviruses.
Virology 499, 219-229, doi:10.1016/j.virol.2016.09.016 (2016).
304 Minot, S. et al. The human gut virome: inter-individual variation and dynamic response
to diet. Genome Res 21, 1616-1625, doi:10.1101/gr.122705.111 (2011).
305 Howe, A. et al. Divergent responses of viral and bacterial communities in the gut
microbiome to dietary disturbances in mice. The ISME journal 10, 1217-1227,
doi:10.1038/ismej.2015.183 (2016).
174
306 Berg Miller, M. E. et al. Phage-bacteria relationships and CRISPR elements revealed by
a metagenomic survey of the rumen microbiome. Environ Microbiol 14, 207-227,
doi:10.1111/j.1462-2920.2011.02593.x (2012).
307 Parmar, N. R., Jakhesara, S. J., Mohapatra, A. & Joshi, C. G. Rumen virome: an
assessment of viral communities and their functions in the rumen of an Indian buffalo.
Curr Sci India 111, 919-925, doi:10.18520/cs/v111/i5/919-925 (2016).
308 Anderson, C. L., Sullivan, M. B. & Fernando, S. C. Dietary energy drives the dynamic
response of bovine rumen viral communities. Microbiome 5, 155, doi:10.1186/s40168-
017-0374-3 (2017).
309 Krause, D. O. & Russell, J. B. How Many Ruminal Bacteria Are There? Journal of dairy
science 79, 1467-1475, doi:https://doi.org/10.3168/jds.S0022-0302(96)76506-2 (1996).
310 Krause, D. O. & Russell, J. B. An rRNA approach for assessing the role of obligate
amino acid-fermenting bacteria in ruminal amino acid deamination. Applied and
Environmental Microbiology 62, 815-821 (1996).
311 Bosch, A. A., Biesbroek, G., Trzcinski, K., Sanders, E. A. & Bogaert, D. Viral and
bacterial interactions in the upper respiratory tract. PLoS Pathog 9, e1003057,
doi:10.1371/journal.ppat.1003057 (2013).
312 Opatowski, L. et al. Assessing pneumococcal meningitis association with viral
respiratory infections and antibiotics: insights from statistical and mathematical models.
Proceedings. Biological sciences / The Royal Society 280, 20130519,
doi:10.1098/rspb.2013.0519 (2013).
313 Pettigrew, M. M. et al. Viral-bacterial interactions and risk of acute otitis media
complicating upper respiratory tract infection. Journal of clinical microbiology 49, 3750-
3755, doi:10.1128/JCM.01186-11 (2011).
175
314 Shrestha, S. et al. Time and dose-dependent risk of pneumococcal pneumonia following
influenza: a model for within-host interaction between influenza and Streptococcus
pneumoniae. J R Soc Interface 10, 20130233, doi:10.1098/rsif.2013.0233 (2013).
315 Levin, B. R., Stewart, F. M. & Chao, L. Resource-Limited Growth, Competition, and
Predation - a Model and Experimental Studies with Bacteria and Bacteriophage. Am Nat
111, 3-24, doi:Doi 10.1086/283134 (1977).
316 Mahadevan, R., Edwards, J. S. & Doyle, F. J., 3rd. Dynamic flux balance analysis of
diauxic growth in Escherichia coli. Biophysical journal 83, 1331-1340,
doi:10.1016/S0006-3495(02)73903-9 (2002).
317 Papin, J. A., Price, N. D. & Palsson, B. O. Extreme pathway lengths and reaction
participation in genome-scale metabolic networks. Genome Res 12, 1889-1900,
doi:10.1101/gr.327702 (2002).
318 Burgard, A. P. & Maranas, C. D. Optimization-based framework for inferring and testing
hypothesized metabolic objective functions. Biotechnology and bioengineering 82, 670-
677, doi:10.1002/bit.10617 (2003).
319 Price, N. D., Papin, J. A., Schilling, C. H. & Palsson, B. Genome-scale microbial in silico
models: the constraints-based approach. Trends Biotechnol. 21, 162-169 (2003).
320 Palsson, B. Systems biology : properties of reconstructed networks. (Cambridge
University Press, 2006).
321 Feist, A. M., Herrgard, M. J., Thiele, I., Reed, J. L. & Palsson, B. O. Reconstruction of
biochemical networks in microorganisms. Nat. Rev. Microbiol. 7, 129-143,
doi:10.1038/nrmicro1949 (2009).
322 Oberhardt, M. A., Palsson, B. Ø. & Papin, J. A. Applications of genome-scale metabolic
reconstructions. Molecular Systems Biology 5, 320-320, doi:10.1038/msb.2009.77
(2009).
176
323 Feist, A. M. & Palsson, B. O. The biomass objective function. Current opinion in
microbiology 13, 344-349, doi:http://dx.doi.org/10.1016/j.mib.2010.03.003 (2010).
324 Zomorrodi, A. R., Suthers, P. F., Ranganathan, S. & Maranas, C. D. Mathematical
optimization applications in metabolic networks. Metab Eng 14, 672-686,
doi:10.1016/j.ymben.2012.09.005 (2012).
325 Islam, M. M. & Saha, R. in Methods Mol Biol Vol. 1671 63-82 (2018).
326 Mendes-Soares, H. & Chia, N. Community metabolic modeling approaches to
understanding the gut microbiome: Bridging biochemistry and ecology. Free Radic Biol
Med 105, 102-109, doi:10.1016/j.freeradbiomed.2016.12.017 (2017).
327 Hanemaaijer, M., Olivier, B. G., Roling, W. F., Bruggeman, F. J. & Teusink, B. Model-
based quantification of metabolic interactions from dynamic microbial-community data.
PloS one 12, e0173183, doi:10.1371/journal.pone.0173183 (2017).
328 Chan, S. H. J., Simons, M. N. & Maranas, C. D. SteadyCom: Predicting microbial
abundances while ensuring community stability. PLoS computational biology 13,
e1005539, doi:10.1371/journal.pcbi.1005539 (2017).
329 Zhuang, K., Ma, E., Lovley, D. R. & Mahadevan, R. The design of long-term effective
uranium bioremediation strategy using a community metabolic model. Biotechnology and
bioengineering 109, 2475-2483, doi:10.1002/bit.24528 (2012).
330 Zhuang, K. et al. Genome-scale dynamic modeling of the competition between
Rhodoferax and Geobacter in anoxic subsurface environments. The ISME journal 5, 305-
316, doi:10.1038/ismej.2010.117 (2011).
331 Salimi, F., Zhuang, K. & Mahadevan, R. Genome-scale metabolic modeling of a
clostridial co-culture for consolidated bioprocessing. Biotechnology journal 5, 726-738,
doi:10.1002/biot.201000159 (2010).
177
332 Zomorrodi, A. R. & Segre, D. Genome-driven evolutionary game theory helps
understand the rise of metabolic interdependencies in microbial communities. Nature
communications 8, 1563, doi:10.1038/s41467-017-01407-5 (2017).
333 Mendes-Soares, H., Mundy, M., Soares, L. M. & Chia, N. MMinte: an application for
predicting metabolic interactions among the microbial species in a community. BMC
bioinformatics 17, 343, doi:10.1186/s12859-016-1230-3 (2016).
334 Zomorrodi, A. R., Islam, M. M. & Maranas, C. D. d-OptCom: Dynamic Multi-level and
Multi-objective Metabolic Modeling of Microbial Communities. ACS synthetic biology 3,
247-257, doi:10.1021/sb4001307 (2014).
335 Bordbar, A. et al. A multi-tissue type genome-scale metabolic network for analysis of
whole-body systems physiology. Bmc Syst Biol 5, 180, doi:10.1186/1752-0509-5-180
(2011).
336 Henry, C. S. et al. Microbial Community Metabolic Modeling: A Community Data-
Driven Network Reconstruction. Journal of cellular physiology 231, 2339-2345,
doi:10.1002/jcp.25428 (2016).
337 Zengler, K. & Zaramela, L. S. The social network of microorganisms - how auxotrophies
shape complex communities. Nat Rev Microbiol 16, 383-390, doi:10.1038/s41579-018-
0004-5 (2018).
338 Zuniga, C., Zaramela, L. & Zengler, K. Elucidation of complexity and prediction of
interactions in microbial communities. Microbial biotechnology 10, 1500-1522,
doi:10.1111/1751-7915.12855 (2017).
339 Fritz, J. V., Desai, M. S., Shah, P., Schneider, J. G. & Wilmes, P. From meta-omics to
causality: experimental models for human microbiome research. Microbiome 1, 14,
doi:10.1186/2049-2618-1-14 (2013).
178
340 Heinken, A., Sahoo, S., Fleming, R. M. & Thiele, I. Systems-level characterization of a
host-microbe metabolic symbiosis in the mammalian gut. Gut microbes 4, 28-40,
doi:10.4161/gmic.22370 (2013).
341 Shoaie, S. et al. Understanding the interactions between bacteria in the human gut
through metabolic modeling. Sci Rep-Uk 3, doi:Artn 2532
Doi 10.1038/Srep02532 (2013).
342 Weimer, P. J., Waghorn, G. C., Odt, C. L. & Mertens, D. R. Effect of Diet on Populations
of Three Species of Ruminal Cellulolytic Bacteria in Lactating Dairy
Cows<sup>1</sup>. Journal of dairy science 82, 122-134, doi:10.3168/jds.S0022-
0302(99)75216-1 (1999).
343 Thomas, M. et al. Metagenomic characterization of the effect of feed additives on the gut
microbiome and antibiotic resistome of feedlot cattle. Sci Rep 7, 12257,
doi:10.1038/s41598-017-12481-6 (2017).
344 Zhu, Z. et al. Community structure of the metabolically active rumen bacterial and
archaeal communities of dairy cows over the transition period. PloS one 12, e0187858,
doi:10.1371/journal.pone.0187858 (2017).
345 Tymensen, L. D. & McAllister, T. A. Community structure analysis of methanogens
associated with rumen protozoa reveals bias in universal archaeal primers. Appl Environ
Microbiol 78, 4051-4056, doi:10.1128/AEM.07994-11 (2012).
346 Janssen, P. H. & Kirs, M. Structure of the archaeal community of the rumen. Appl
Environ Microbiol 74, 3619-3625, doi:10.1128/AEM.02812-07 (2008).
347 Satish Kumar, V., Dasika, M. S. & Maranas, C. D. Optimization based automated
curation of metabolic reconstructions. BMC bioinformatics 8, 212 (2007).
348 Saleem, F. et al. A metabolomics approach to uncover the effects of grain diets on rumen
health in dairy cows. Journal of dairy science 95, 6606-6623, doi:10.3168/jds.2012-5403
(2012).
179
349 Saleem, F. et al. The Bovine Ruminal Fluid Metabolome. Metabolomics 9, 360-378,
doi:10.1007/s11306-012-0458-9 (2013).
350 Li, F. & Guan, L. L. Metatranscriptomic Profiling Reveals Linkages between the Active
Rumen Microbiome and Feed Efficiency in Beef Cattle. Appl Environ Microbiol 83,
doi:10.1128/AEM.00061-17 (2017).
351 Wang, B., Ma, M. P., Diao, Q. Y. & Tu, Y. Saponin-Induced Shifts in the Rumen
Microbiome and Metabolome of Young Cattle. Frontiers in microbiology 10, 356,
doi:10.3389/fmicb.2019.00356 (2019).
352 Fritzemeier, C. J., Hartleb, D., Szappanos, B., Papp, B. & Lercher, M. J. Erroneous
energy-generating cycles in published genome scale metabolic networks: Identification
and removal. PLoS computational biology 13, e1005494,
doi:10.1371/journal.pcbi.1005494 (2017).
353 Helaszek, C. T. & White, B. A. Cellobiose uptake and metabolism by Ruminococcus
flavefaciens. Appl Environ Microbiol 57, 64-68 (1991).
354 Zheng, Y., Kahnt, J., Kwon, I. H., Mackie, R. I. & Thauer, R. K. Hydrogen formation and
its regulation in Ruminococcus albus: involvement of an electron-bifurcating [FeFe]-
hydrogenase, of a non-electron-bifurcating [FeFe]-hydrogenase, and of a putative
hydrogen-sensing [FeFe]-hydrogenase. J Bacteriol 196, 3840-3852,
doi:10.1128/JB.02070-14 (2014).
355 Qiao, J. Y., Tan, Z. L. & Wang, M. Potential and existing mechanisms of enteric methane
production in ruminants. Sci Agr 71, 430-440 (2014).
356 Apweiler, R. et al. UniProt: the Universal Protein knowledgebase. Nucleic acids research
32, D115-119, doi:10.1093/nar/gkh131 (2004).
357 Estell, R. E., 2nd & Galyean, M. L. Relationship of rumen fluid dilution rate to rumen
fermentation and dietary characteristics of beef steers. Journal of animal science 60,
1061-1071 (1985).
180
358 Huntington, G. B., Britton, R. A. & Prior, R. L. Feed intake, rumen fluid volume and
turnover, nitrogen and mineral balance and acid-base status of wethers changed from low
to high concentrate diets. Journal of animal science 52, 1376-1387 (1981).
359 Goetsch, A. L. & Galyean, M. L. Effect of Dietary Concentrate Level on Rumen Fluid
Dilution Rate. Can J Anim Sci 62, 649-652, doi:DOI 10.4141/cjas82-076 (1982).
360 Tellier, R. C., Mathison, G. W., Okine, E. K., McCartney, D. & Soofi-Siawash, R.
Frequency of concentrate supplementation for cattle fed barley straw. 2. Ruminal dilution
rates, pH and metabolite concentrations. Can J Anim Sci 84, 467-479, doi:Doi
10.4141/A03-075 (2004).
361 Stokes, M. R., Bull, L. S. & Halteman, W. A. Rumen liquid dilution rate in dairy cows
fed once daily: effects of diet and sodium bicarbonate supplementation. Journal of dairy
science 68, 1171-1180, doi:10.3168/jds.S0022-0302(85)80944-9 (1985).
362 Nagaraja, T. G. Microbiology of the Rumen. Rumenology, 39-61, doi:10.1007/978-3-
319-30533-2_2 (2016).
363 Wolin, M. J. in Advances in Microbial Ecology: Volume 3 (ed M. Alexander) 49-77
(Springer US, 1979).
364 Liu, K. et al. The impact of diet on the composition and relative abundance of rumen
microbes in goat. Asian-Australas J Anim Sci 30, 531-537, doi:10.5713/ajas.16.0353
(2017).
365 Raizada, N., Sonakya, V., Dalhoff, R., Hausner, M. & Wilderer, P. A. Population
dynamics of rumen microbes using modern techniques in rumen enhanced solid
incubation. Water science and technology : a journal of the International Association on
Water Pollution Research 48, 113-119 (2003).
366 Flint, H. J. The rumen microbial ecosystem--some recent developments. Trends in
microbiology 5, 483-488, doi:10.1016/S0966-842X(97)01159-1 (1997).
181
367 Ren, Q., Chen, K. & Paulsen, I. T. TransportDB: a comprehensive database resource for
cytoplasmic membrane transport systems and outer membrane channels. Nucleic Acids
Res. 35, D274-D279 (2007).
368 Wallace, R. J. Rumen Microbiology, Biotechnology and Ruminant Nutrition - the
Application of Research Findings to a Complex Microbial Ecosystem. FEMS
microbiology letters 100, 529-534, doi:Doi 10.1016/0378-1097(92)90257-O (1992).
369 Samuel, B. S. & Gordon, J. I. A humanized gnotobiotic mouse model of host-archaeal-
bacterial mutualism. Proc Natl Acad Sci U S A 103, 10011-10016,
doi:10.1073/pnas.0602187103 (2006).
370 Hansen, E. E. et al. Pan-genome of the dominant human gut-associated archaeon,
Methanobrevibacter smithii, studied in twins. Proc Natl Acad Sci U S A 108 Suppl 1,
4599-4606, doi:10.1073/pnas.1000071108 (2011).
371 Armougom, F., Henry, M., Vialettes, B., Raccah, D. & Raoult, D. Monitoring bacterial
community of human gut microbiota reveals an increase in Lactobacillus in obese
patients and Methanogens in anorexic patients. PloS one 4, e7125,
doi:10.1371/journal.pone.0007125 (2009).
372 Ross, E. M., Petrovski, S., Moate, P. J. & Hayes, B. J. Metagenomics of rumen
bacteriophage from thirteen lactating dairy cattle. BMC microbiology 13, 242,
doi:10.1186/1471-2180-13-242 (2013).
373 Brister, J. R., Ako-Adjei, D., Bao, Y. & Blinkova, O. NCBI viral genomes resource.
Nucleic acids research 43, D571-577, doi:10.1093/nar/gku1207 (2015).
374 Zhou, Y., Liang, Y., Lynch, K. H., Dennis, J. J. & Wishart, D. S. PHAST: a fast phage
search tool. Nucleic acids research 39, W347-352, doi:10.1093/nar/gkr485 (2011).
375 Hubisz, M. J., Pollard, K. S. & Siepel, A. PHAST and RPHAST: phylogenetic analysis
with space/time models. Brief Bioinform 12, 41-51, doi:10.1093/bib/bbq072 (2011).
182
376 Arndt, D. et al. PHASTER: a better, faster version of the PHAST phage search tool.
Nucleic acids research 44, W16-21, doi:10.1093/nar/gkw387 (2016).
377 O'Leary, N. A. et al. Reference sequence (RefSeq) database at NCBI: current status,
taxonomic expansion, and functional annotation. Nucleic acids research 44, D733-745,
doi:10.1093/nar/gkv1189 (2016).
378 Burgard, A. P. & Maranas, C. D. Optimization-based framework for inferring and testing
hypothesized metabolic objective functions. Biotechnol. Bioeng. 82, 670-677 (2003).
379 Houghton, J. T., Jenkins, G. J. & Ephraums, J. J. Climate Change: The IPCC Scientific
Assessment (New York, USA, 1990).
380 Nisbet, E. G. et al. Very Strong Atmospheric Methane Growth in the 4 Years 2014–2017:
Implications for the Paris Agreement. Global Biogeochemical Cycles 33, 318-342,
doi:10.1029/2018GB006009 (2019).
381 Hanson, R. S. & Hanson, T. E. Methanotrophic bacteria. Microbiological reviews 60,
439-471, doi:10.1128/mr.60.2.439-471.1996 (1996).
382 Mohammadi, S. S. et al. The Acidophilic Methanotroph Methylacidimicrobium
tartarophylax 4AC Grows as Autotroph on H2 Under Microoxic Conditions. Frontiers in
microbiology 10, doi:10.3389/fmicb.2019.02352 (2019).
383 Carere, C. R. et al. Hydrogen Oxidation Influences Glycogen Accumulation in a
Verrucomicrobial Methanotroph. Frontiers in microbiology 10,
doi:10.3389/fmicb.2019.01873 (2019).
384 van Teeseling, M. C. et al. Expanding the verrucomicrobial methanotrophic world:
description of three novel species of Methylacidimicrobium gen. nov. Appl Environ
Microbiol 80, 6782-6791, doi:10.1128/AEM.01838-14 (2014).
385 Cui, M., Ma, A., Qi, H., Zhuang, X. & Zhuang, G. Anaerobic oxidation of methane: an
"active" microbial process. Microbiologyopen 4, 1-11, doi:10.1002/mbo3.232 (2015).
183
386 Yu, Z., Krause, S. M., Beck, D. A. & Chistoserdova, L. A Synthetic Ecology Perspective:
How Well Does Behavior of Model Organisms in the Laboratory Predict Microbial
Activities in Natural Habitats? Frontiers in microbiology 7, 946,
doi:10.3389/fmicb.2016.00946 (2016).
387 Beck, D. A. C. et al. A metagenomic insight into freshwater methane-utilizing
communities and evidence for cooperation between the Methylococcaceae and the
Methylophilaceae. Peerj 1, doi:ARTN e23
10.7717/peerj.23 (2013).
388 Zengler, K. & Palsson, B. O. A road map for the development of community systems
(CoSy) biology. Nat Rev Microbiol 10, 366-372, doi:10.1038/nrmicro2763 (2012).
389 Auman, A. J., Stolyar, S., Costello, A. M. & Lidstrom, M. E. Molecular characterization
of methanotrophic isolates from freshwater lake sediment. Appl Environ Microbiol 66,
5259-5266, doi:10.1128/AEM.66.12.5259-5266.2000 (2000).
390 Yu, Z., Beck, D. A. C. & Chistoserdova, L. Natural Selection in Synthetic Communities
Highlights the Roles of Methylococcaceae and Methylophilaceae and Suggests
Differential Roles for Alternative Methanol Dehydrogenases in Methane Consumption.
Frontiers in microbiology 8, 2392, doi:10.3389/fmicb.2017.02392 (2017).
391 Kalyuzhnaya, M. G. et al. High-resolution metagenomics targets specific functional types
in complex microbial communities. Nature biotechnology 26, 1029-1034,
doi:10.1038/nbt.1488 (2008).
392 de la Torre, A. et al. Genome-scale metabolic reconstructions and theoretical
investigation of methane conversion in Methylomicrobium buryatense strain 5G(B1).
Microbial cell factories 14, 188, doi:10.1186/s12934-015-0377-3 (2015).
393 Akberdin, I. R. et al. Methane utilization in Methylomicrobium alcaliphilum 20Z(R): a
systems approach. Sci Rep 8, 2512, doi:10.1038/s41598-018-20574-z (2018).
184
394 Bordel, S., Rojas, A. & Munoz, R. Reconstruction of a Genome Scale Metabolic Model
of the polyhydroxybutyrate producing methanotroph Methylocystis parvus OBBP.
Microbial cell factories 18, 104, doi:10.1186/s12934-019-1154-5 (2019).
395 Lieven, C. et al. A Genome-Scale Metabolic Model for Methylococcus capsulatus (Bath)
Suggests Reduced Efficiency Electron Transfer to the Particulate Methane
Monooxygenase. Frontiers in microbiology 9, 2947, doi:10.3389/fmicb.2018.02947
(2018).
396 Bordel, S. et al. Genome scale metabolic modeling reveals the metabolic potential of
three Type II methanotrophs of the genus Methylocystis. Metab Eng 54, 191-199,
doi:10.1016/j.ymben.2019.04.001 (2019).
397 Naizabekov, S. & Lee, Y. E. Genome-Scale Metabolic Model Reconstruction and in
Silico Investigations of Methane Metabolism in Methylosinus trichosporium OB3b.
Microorganisms 8, doi:10.3390/microorganisms8030437 (2020).
398 Elbourne, L. D., Tetu, S. G., Hassan, K. A. & Paulsen, I. T. TransportDB 2.0: a database
for exploring membrane transporters in sequenced genomes from all domains of life.
Nucleic acids research 45, D320-D324, doi:10.1093/nar/gkw1068 (2017).
399 Nguyen, N. L. et al. Genomic Insights Into the Acid Adaptation of Novel Methanotrophs
Enriched From Acidic Forest Soils. Frontiers in microbiology 9, 1982,
doi:10.3389/fmicb.2018.01982 (2018).
400 Svenning, M. M. et al. Genome sequence of the Arctic methanotroph Methylobacter
tundripaludum SV96. J Bacteriol 193, 6418-6419, doi:10.1128/JB.05380-11 (2011).
401 Wartiainen, I., Hestnes, A. G., McDonald, I. R. & Svenning, M. M. Methylobacter
tundripaludum sp. nov., a methane-oxidizing bacterium from Arctic wetland soil on the
Svalbard islands, Norway (78 degrees N). Int J Syst Evol Microbiol 56, 109-113,
doi:10.1099/ijs.0.63728-0 (2006).
185
402 UniProt Consortium, T. UniProt: the universal protein knowledgebase. Nucleic acids
research 46, 2699, doi:10.1093/nar/gky092 (2018).
403 Caspi, R. et al. The MetaCyc database of metabolic pathways and enzymes and the
BioCyc collection of pathway/genome databases. Nucleic acids research 44, D471-480,
doi:10.1093/nar/gkv1164 (2016).
404 Szklarczyk, D. et al. The STRING database in 2017: quality-controlled protein-protein
association networks, made broadly accessible. Nucleic acids research 45, D362-D368,
doi:10.1093/nar/gkw937 (2017).
405 Orata, F. D., Kits, K. D. & Stein, L. Y. Complete Genome Sequence of Methylomonas
denitrificans Strain FJG1, an Obligate Aerobic Methanotroph That Can Couple Methane
Oxidation with Denitrification. Genome Announc 6, doi:10.1128/genomeA.00276-18
(2018).
406 Boden, R. et al. Complete genome sequence of the aerobic marine methanotroph
Methylomonas methanica MC09. J Bacteriol 193, 7001-7002, doi:10.1128/JB.06267-11
(2011).
407 Kanehisa, M. KEGG for linking genomes to life and the environment. Nucleic Acids Res.
36, D480-D484 (2008).
408 Kalyuzhnaya, M. G. et al. Highly efficient methane biocatalysis revealed in a
methanotrophic bacterium. Nature communications 4, 2785, doi:10.1038/ncomms3785
(2013).
409 Khmelenina, V. N., Colin Murrell, J., Smith, T. J. & Trotsenko, Y. A. in Aerobic
Utilization of Hydrocarbons, Oils and Lipids (ed Fernando Rojo) 1-25 (Springer
International Publishing, 2018).
410 Cai, Y., Zheng, Y., Bodelier, P. L., Conrad, R. & Jia, Z. Conventional methanotrophs are
responsible for atmospheric methane oxidation in paddy soils. Nature communications 7,
11728, doi:10.1038/ncomms11728 (2016).
186
411 Fu, Y., Li, Y. & Lidstrom, M. The oxidative TCA cycle operates during methanotrophic
growth of the Type I methanotroph Methylomicrobium buryatense 5GB1. Metab Eng 42,
43-51, doi:10.1016/j.ymben.2017.05.003 (2017).
412 He, H. et al. In Vivo Rate of Formaldehyde Condensation with Tetrahydrofolate.
Metabolites 10, doi:10.3390/metabo10020065 (2020).
413 Peyraud, R. et al. Genome-scale reconstruction and system level investigation of the
metabolic network of Methylobacterium extorquens AM1. Bmc Syst Biol 5, 189,
doi:10.1186/1752-0509-5-189 (2011).
414 Sugioka, K., Nakano, M., Naito, I., Tero-Kubota, S. & Ikegami, Y. Properties of a
coenzyme, pyrroloquinoline quinone: generation of an active oxygen species during a
reduction-oxidation cycle in the presence of NAD(P)H and O2. Biochimica et biophysica
acta 964, 175-182, doi:10.1016/0304-4165(88)90164-x (1988).
415 Bussmann, I., Rahalkar, M. & Schink, B. Cultivation of methanotrophic bacteria in
opposing gradients of methane and oxygen. FEMS microbiology ecology 56, 331-344,
doi:10.1111/j.1574-6941.2006.00076.x (2006).
416 Hou, C. T., Laskin, A. I. & Patel, R. N. Growth and Polysaccharide Production by
Methylocystis parvus OBBP on Methanol. Appl Environ Microbiol 37, 800-804 (1979).
417 Costa, C., Vecherskaya, M., Dijkema, C. & Stams, A. J. The effect of oxygen on
methanol oxidation by an obligate methanotrophic bacterium studied by in vivo 13C
nuclear magnetic resonance spectroscopy. Journal of industrial microbiology &
biotechnology 26, 9-14 (2001).
418 Eram, M. S. & Ma, K. Decarboxylation of pyruvate to acetaldehyde for ethanol
production by hyperthermophiles. Biomolecules 3, 578-596, doi:10.3390/biom3030578
(2013).
187
419 He, L., Fu, Y. & Lidstrom, M. E. Quantifying Methane and Methanol Metabolism of
"Methylotuvimicrobium buryatense" 5GB1C under Substrate Limitation. mSystems 4,
doi:10.1128/mSystems.00748-19 (2019).
420 Zhao, S. J. & Hanson, R. S. Isolate 761M: a New Type I Methanotroph That Possesses a
Complete Tricarboxylic Acid Cycle. Appl Environ Microbiol 48, 1237-1242,
doi:10.1128/aem.48.6.1237-1242.1984 (1984).
421 Theisen, A. R. & Murrell, J. C. Facultative methanotrophs revisited. J Bacteriol 187,
4303-4305, doi:10.1128/JB.187.13.4303-4305.2005 (2005).
422 Zheng, Y., Huang, J., Zhao, F. & Chistoserdova, L. Physiological Effect of XoxG(4) on
Lanthanide-Dependent Methanotrophy. Mbio 9, doi:10.1128/mBio.02430-17 (2018).
423 Krause, S. M. B. et al. Lanthanide-dependent cross-feeding of methane-derived carbon is
linked by microbial community interactions. Proceedings of the National Academy of
Sciences 114, 358-363, doi:10.1073/pnas.1619871114 (2017).
424 Abrego, J. et al. GOT1-mediated anaplerotic glutamine metabolism regulates chronic
acidosis stress in pancreatic cancer cells. Cancer letters 400, 37-46,
doi:10.1016/j.canlet.2017.04.029 (2017).
425 Sarantis, P., Koustas, E., Papadimitropoulou, A., Papavassiliou, A. G. & Karamouzis, M.
V. Pancreatic ductal adenocarcinoma: Treatment hurdles, tumor microenvironment and
immunotherapy. World J Gastrointest Oncol 12, 173-181, doi:10.4251/wjgo.v12.i2.173
(2020).
426 Das, S. & Batra, S. K. Pancreatic cancer metastasis: are we being pre-EMTed? Current
pharmaceutical design 21, 1249-1255, doi:10.2174/1381612821666141211115234
(2015).
427 Hezel, A. F., Kimmelman, A. C., Stanger, B. Z., Bardeesy, N. & Depinho, R. A. Genetics
and biology of pancreatic ductal adenocarcinoma. Genes Dev 20, 1218-1249,
doi:10.1101/gad.1415606 (2006).
188
428 Koppenol, W. H., Bounds, P. L. & Dang, C. V. Otto Warburg's contributions to current
concepts of cancer metabolism. Nature reviews. Cancer 11, 325-337,
doi:10.1038/nrc3038 (2011).
429 Teague, A., Lim, K. H. & Wang-Gillam, A. Advanced pancreatic adenocarcinoma: a
review of current treatment strategies and developing therapies. Ther Adv Med Oncol 7,
68-84, doi:10.1177/1758834014564775 (2015).
430 Grasso, C., Jansen, G. & Giovannetti, E. Drug resistance in pancreatic cancer: Impact of
altered energy metabolism. Crit Rev Oncol Hematol 114, 139-152,
doi:10.1016/j.critrevonc.2017.03.026 (2017).
431 Nakano, Y. et al. Gemcitabine chemoresistance and molecular markers associated with
gemcitabine transport and metabolism in human pancreatic cancer cells. British journal
of cancer 96, 457-463, doi:10.1038/sj.bjc.6603559 (2007).
432 Nakahira, S. et al. Involvement of ribonucleotide reductase M1 subunit overexpression in
gemcitabine resistance of human pancreatic cancer. Int J Cancer 120, 1355-1363,
doi:10.1002/ijc.22390 (2007).
433 Kurata, N. et al. Predicting the chemosensitivity of pancreatic cancer cells by quantifying
the expression levels of genes associated with the metabolism of gemcitabine and 5-
fluorouracil. Int J Oncol 39, 473-482, doi:10.3892/ijo.2011.1058 (2011).
434 Valsecchi, M. E. et al. Is there a role for the quantification of RRM1 and ERCC1
expression in pancreatic ductal adenocarcinoma? BMC Cancer 12, 104,
doi:10.1186/1471-2407-12-104 (2012).
435 Duxbury, M. S. et al. RNA interference demonstrates a novel role for integrin-linked
kinase as a determinant of pancreatic adenocarcinoma cell gemcitabine chemoresistance.
Clinical cancer research : an official journal of the American Association for Cancer
Research 11, 3433-3438, doi:10.1158/1078-0432.CCR-04-1510 (2005).
189
436 Waddell, N. et al. Whole genomes redefine the mutational landscape of pancreatic
cancer. Nature 518, 495-501, doi:10.1038/nature14169 (2015).
437 Cancer Genome Atlas Research Network. Electronic address, a. a. d. h. e. & Cancer
Genome Atlas Research, N. Integrated Genomic Characterization of Pancreatic Ductal
Adenocarcinoma. Cancer Cell 32, 185-203 e113, doi:10.1016/j.ccell.2017.07.007 (2017).
438 Kastenhuber, E. R. & Lowe, S. W. Putting p53 in Context. Cell 170, 1062-1078,
doi:10.1016/j.cell.2017.08.028 (2017).
439 Cox, A. D., Fesik, S. W., Kimmelman, A. C., Luo, J. & Der, C. J. Drugging the
undruggable RAS: Mission possible? Nat Rev Drug Discov 13, 828-851,
doi:10.1038/nrd4389 (2014).
440 Moore, M. J. et al. Erlotinib plus gemcitabine compared with gemcitabine alone in
patients with advanced pancreatic cancer: a phase III trial of the National Cancer Institute
of Canada Clinical Trials Group. J Clin Oncol 25, 1960-1966,
doi:10.1200/JCO.2006.07.9525 (2007).
441 Ruess, D. A. et al. Mutant KRAS-driven cancers depend on PTPN11/SHP2 phosphatase.
Nat Med 24, 954-960, doi:10.1038/s41591-018-0024-8 (2018).
442 Eser, S. et al. Selective requirement of PI3K/PDK1 signaling for Kras oncogene-driven
pancreatic cell plasticity and cancer. Cancer Cell 23, 406-420,
doi:10.1016/j.ccr.2013.01.023 (2013).
443 Fiskus, W. et al. Pre-clinical efficacy of combined therapy with novel beta-catenin
antagonist BC2059 and histone deacetylase inhibitor against AML cells. Leukemia 29,
1267-1278, doi:10.1038/leu.2014.340 (2015).
444 Wolpin, B. M. et al. Oral mTOR inhibitor everolimus in patients with gemcitabine-
refractory metastatic pancreatic cancer. J Clin Oncol 27, 193-198,
doi:10.1200/JCO.2008.18.9514 (2009).
190
445 Javle, M. M. et al. Inhibition of the mammalian target of rapamycin (mTOR) in advanced
pancreatic cancer: results of two phase II studies. BMC Cancer 10, 368,
doi:10.1186/1471-2407-10-368 (2010).
446 Orth, M. et al. Pancreatic ductal adenocarcinoma: biological hallmarks, current status,
and future perspectives of combined modality treatment approaches. Radiat Oncol 14,
141, doi:10.1186/s13014-019-1345-6 (2019).
447 Zhang, C. et al. Elucidating the Reprograming of Colorectal Cancer Metabolism Using
Genome-Scale Metabolic Modeling. Front Oncol 9, 681, doi:10.3389/fonc.2019.00681
(2019).
448 Turanli, B. et al. Discovery of therapeutic agents for prostate cancer using genome-scale
metabolic modeling and drug repositioning. EBioMedicine 42, 386-396,
doi:10.1016/j.ebiom.2019.03.009 (2019).
449 Nilsson, A. & Nielsen, J. Genome scale metabolic modeling of cancer. Metab Eng 43,
103-112, doi:10.1016/j.ymben.2016.10.022 (2017).
450 Ghaffari, P. et al. Identifying anti-growth factors for human cancer cell lines through
genome-scale metabolic modeling. Sci Rep 5, 8183, doi:10.1038/srep08183 (2015).
451 Katzir, R. et al. The landscape of tiered regulation of breast cancer cell metabolism. Sci
Rep-Uk 9, 17760, doi:10.1038/s41598-019-54221-y (2019).
452 Gatto, F., Ferreira, R. & Nielsen, J. Pan-cancer analysis of the metabolic reaction
network. Metabolic Engineering 57, 51-62,
doi:https://doi.org/10.1016/j.ymben.2019.09.006 (2020).
453 Roy, M. & Finley, S. D. Computational Model Predicts the Effects of Targeting Cellular
Metabolism in Pancreatic Cancer. Frontiers in physiology 8,
doi:10.3389/fphys.2017.00217 (2017).
191
454 Swierczynski, J., Hebanowska, A. & Sledzinski, T. Role of abnormal lipid metabolism in
development, progression, diagnosis and therapy of pancreatic cancer. World J
Gastroenterol 20, 2279-2303, doi:10.3748/wjg.v20.i9.2279 (2014).
455 Menendez, J. A. & Lupu, R. Fatty acid synthase and the lipogenic phenotype in cancer
pathogenesis. Nature reviews. Cancer 7, 763-777, doi:10.1038/nrc2222 (2007).
456 Hatzivassiliou, G. et al. ATP citrate lyase inhibition can suppress tumor cell growth.
Cancer Cell 8, 311-321, doi:10.1016/j.ccr.2005.09.008 (2005).
457 Baenke, F., Peck, B., Miess, H. & Schulze, A. Hooked on fat: the role of lipid synthesis
in cancer metabolism and tumour development. Disease models & mechanisms 6, 1353-
1363, doi:10.1242/dmm.011338 (2013).
458 Guillaumond, F. et al. Cholesterol uptake disruption, in association with chemotherapy, is
a promising combined metabolic therapy for pancreatic adenocarcinoma. Proc Natl Acad
Sci U S A 112, 2473-2478, doi:10.1073/pnas.1421601112 (2015).
459 Sullivan, L. B. & Chandel, N. S. Mitochondrial reactive oxygen species and cancer.
Cancer & Metabolism 2, 17, doi:10.1186/2049-3002-2-17 (2014).
460 Sangeetha, P., Das, U. N., Koratkar, R. & Suryaprabha, P. Increase in free radical
generation and lipid peroxidation following chemotherapy in patients with cancer. Free
Radic Biol Med 8, 15-19, doi:10.1016/0891-5849(90)90139-a (1990).
461 Izuishi, K., Kato, K., Ogura, T., Kinoshita, T. & Esumi, H. Remarkable tolerance of
tumor cells to nutrient deprivation: possible new biochemical target for cancer therapy.
Cancer Res 60, 6201-6207 (2000).
462 Robinson, J. L. et al. An atlas of human metabolism. Science signaling 13,
doi:10.1126/scisignal.aaz1482 (2020).
463 Brunk, E. et al. Recon3D enables a three-dimensional view of gene variation in human
metabolism. Nature biotechnology 36, 272-281, doi:10.1038/nbt.4072 (2018).
192
464 Thiele, I. et al. A community-driven global reconstruction of human metabolism. Nature
biotechnology 31, 419-425, doi:10.1038/nbt.2488 (2013).
465 Schroeder, W. L. & Saha, R. OptFill: A Tool for Infeasible Cycle-Free Gapfilling of
Stoichiometric Metabolic Models. iScience 23, 100783, doi:10.1016/j.isci.2019.100783
(2020).
466 Heukamp, I. et al. Impact of polyunsaturated fatty acids on hepato-pancreatic
prostaglandin and leukotriene concentration in ductal pancreatic cancer—Is there a
correlation to tumour growth and liver metastasis? Prostaglandins, Leukotrienes and
Essential Fatty Acids 74, 223-233, doi:https://doi.org/10.1016/j.plefa.2006.01.005
(2006).
467 Roebuck, B. D. Dietary fat and the development of pancreatic cancer. Lipids 27, 804-806,
doi:10.1007/BF02535854 (1992).
468 Aronson, N. N., Jr. & Kuranda, M. J. Lysosomal degradation of Asn-linked
glycoproteins. FASEB J 3, 2615-2622, doi:10.1096/fasebj.3.14.2531691 (1989).
469 Ishiwata, T. et al. Role of lumican in cancer cells and adjacent stromal tissues in human
pancreatic cancer. Oncol Rep 18, 537-543 (2007).
470 Caterson, B. & Melrose, J. Keratan sulfate, a complex glycosaminoglycan with unique
functional capability. Glycobiology 28, 182-206, doi:10.1093/glycob/cwy003 (2018).
471 Warburg, O. On the origin of cancer cells. Science 123, 309-314,
doi:10.1126/science.123.3191.309 (1956).
472 Feldmann, G., Beaty, R., Hruban, R. H. & Maitra, A. Molecular genetics of pancreatic
intraepithelial neoplasia. J Hepatobiliary Pancreat Surg 14, 224-232,
doi:10.1007/s00534-006-1166-5 (2007).
473 Gaglio, D. et al. Oncogenic K-Ras decouples glucose and glutamine metabolism to
support cancer cell growth. Mol Syst Biol 7, 523, doi:10.1038/msb.2011.56 (2011).
193
474 Knab, L. M., Grippo, P. J. & Bentrem, D. J. Involvement of eicosanoids in the
pathogenesis of pancreatic cancer: the roles of cyclooxygenase-2 and 5-lipoxygenase.
World J Gastroenterol 20, 10729-10739, doi:10.3748/wjg.v20.i31.10729 (2014).
475 Peters-Golden, M. & Henderson, W. R. Leukotrienes. New England Journal of Medicine
357, 1841-1854, doi:10.1056/NEJMra071371 (2007).
476 Jose, C., Bellance, N. & Rossignol, R. Choosing between glycolysis and oxidative
phosphorylation: A tumor's dilemma? Biochimica et Biophysica Acta (BBA) -
Bioenergetics 1807, 552-561, doi:https://doi.org/10.1016/j.bbabio.2010.10.012 (2011).
477 Melone, M. A. B. et al. The carnitine system and cancer metabolic plasticity. Cell Death
Dis 9, 228, doi:10.1038/s41419-018-0313-7 (2018).
478 Muoio, D. M. Metabolic inflexibility: when mitochondrial indecision leads to metabolic
gridlock. Cell 159, 1253-1262, doi:10.1016/j.cell.2014.11.034 (2014).
479 Sharma, S. & Black, S. M. Carnitine Homeostasis, Mitochondrial Function, and
Cardiovascular Disease. Drug Discov Today Dis Mech 6, e31-e39,
doi:10.1016/j.ddmec.2009.02.001 (2009).
480 Longo, N., Frigeni, M. & Pasquali, M. Carnitine transport and fatty acid oxidation.
Biochimica et biophysica acta 1863, 2422-2435, doi:10.1016/j.bbamcr.2016.01.023
(2016).
481 Melone, M. A. B. et al. The carnitine system and cancer metabolic plasticity. Cell Death
& Disease 9, 228, doi:10.1038/s41419-018-0313-7 (2018).
482 Zha, S. et al. Peroxisomal branched chain fatty acid beta-oxidation pathway is
upregulated in prostate cancer. Prostate 63, 316-323, doi:10.1002/pros.20177 (2005).
483 Litwin, J. A., Beier, K., Volkl, A., Hofmann, W. J. & Fahimi, H. D.
Immunocytochemical investigation of catalase and peroxisomal lipid beta-oxidation
enzymes in human hepatocellular tumors and liver cirrhosis. Virchows Arch 435, 486-
495, doi:10.1007/s004280050432 (1999).
194
484 Lauer, C., Volkl, A., Riedl, S., Fahimi, H. D. & Beier, K. Impairment of peroxisomal
biogenesis in human colon carcinoma. Carcinogenesis 20, 985-989,
doi:10.1093/carcin/20.6.985 (1999).
485 Keller, J. M. et al. Peroxisome through cell differentiation and neoplasia. Biol Cell 77,
77-88, doi:10.1016/s0248-4900(05)80177-7 (1993).
486 and, J. K. R. & Hashimoto, T. PEROXISOMAL β-OXIDATION AND PEROXISOME
PROLIFERATOR–ACTIVATED RECEPTOR α: An Adaptive Metabolic System.
Annual Review of Nutrition 21, 193-230, doi:10.1146/annurev.nutr.21.1.193 (2001).
487 Demarquoy, J. & Le Borgne, F. Crosstalk between mitochondria and peroxisomes. World
J Biol Chem 6, 301-309, doi:10.4331/wjbc.v6.i4.301 (2015).
488 Rong, Y. et al. Lactate dehydrogenase A is overexpressed in pancreatic cancer and
promotes the growth of pancreatic cancer cells. Tumour Biol 34, 1523-1530,
doi:10.1007/s13277-013-0679-1 (2013).
489 Mohammad, G. H., Olde Damink, S. W., Malago, M., Dhar, D. K. & Pereira, S. P.
Pyruvate Kinase M2 and Lactate Dehydrogenase A Are Overexpressed in Pancreatic
Cancer and Correlate with Poor Outcome. PloS one 11, e0151635,
doi:10.1371/journal.pone.0151635 (2016).
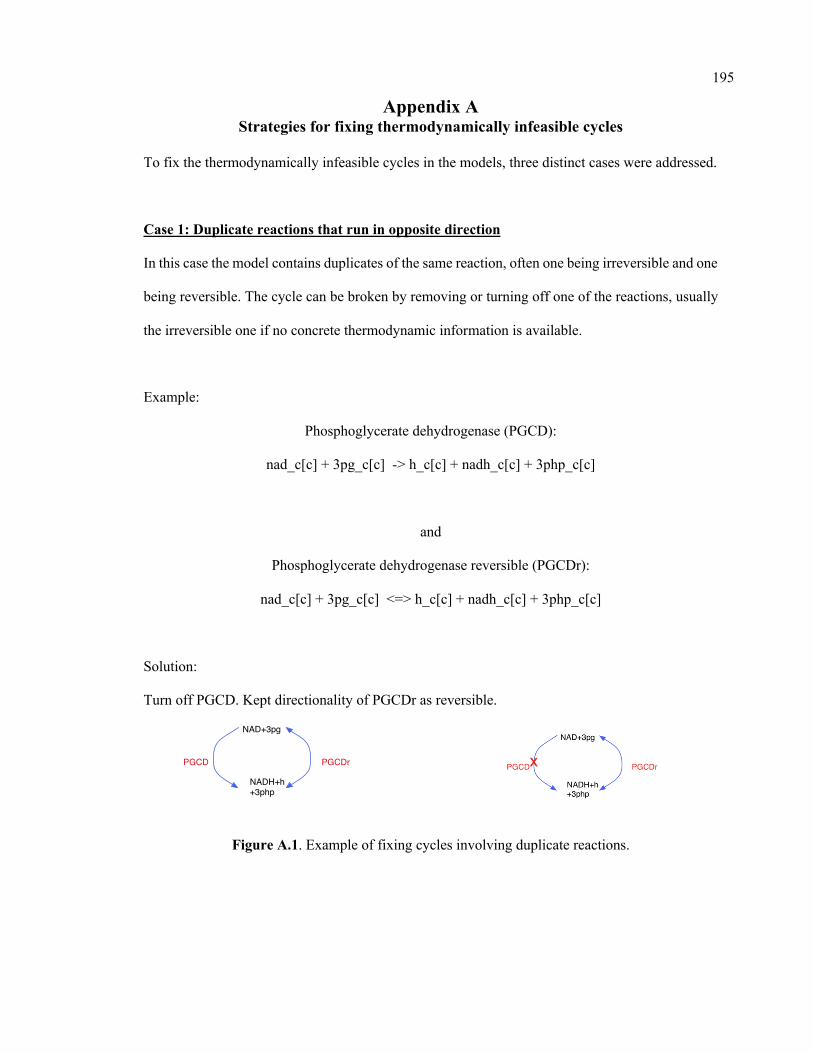
195
Appendix A Strategies for fixing thermodynamically infeasible cycles
To fix the thermodynamically infeasible cycles in the models, three distinct cases were addressed.
Case 1: Duplicate reactions that run in opposite direction
In this case the model contains duplicates of the same reaction, often one being irreversible and one
being reversible. The cycle can be broken by removing or turning off one of the reactions, usually
the irreversible one if no concrete thermodynamic information is available.
Example:
Phosphoglycerate dehydrogenase (PGCD):
nad_c[c] + 3pg_c[c] -> h_c[c] + nadh_c[c] + 3php_c[c]
and
Phosphoglycerate dehydrogenase reversible (PGCDr):
nad_c[c] + 3pg_c[c] <=> h_c[c] + nadh_c[c] + 3php_c[c]
Solution:
Turn off PGCD. Kept directionality of PGCDr as reversible.
Figure A.1. Example of fixing cycles involving duplicate reactions.
NAD+3pg
NADH+h+3php
PGCD PGCDr
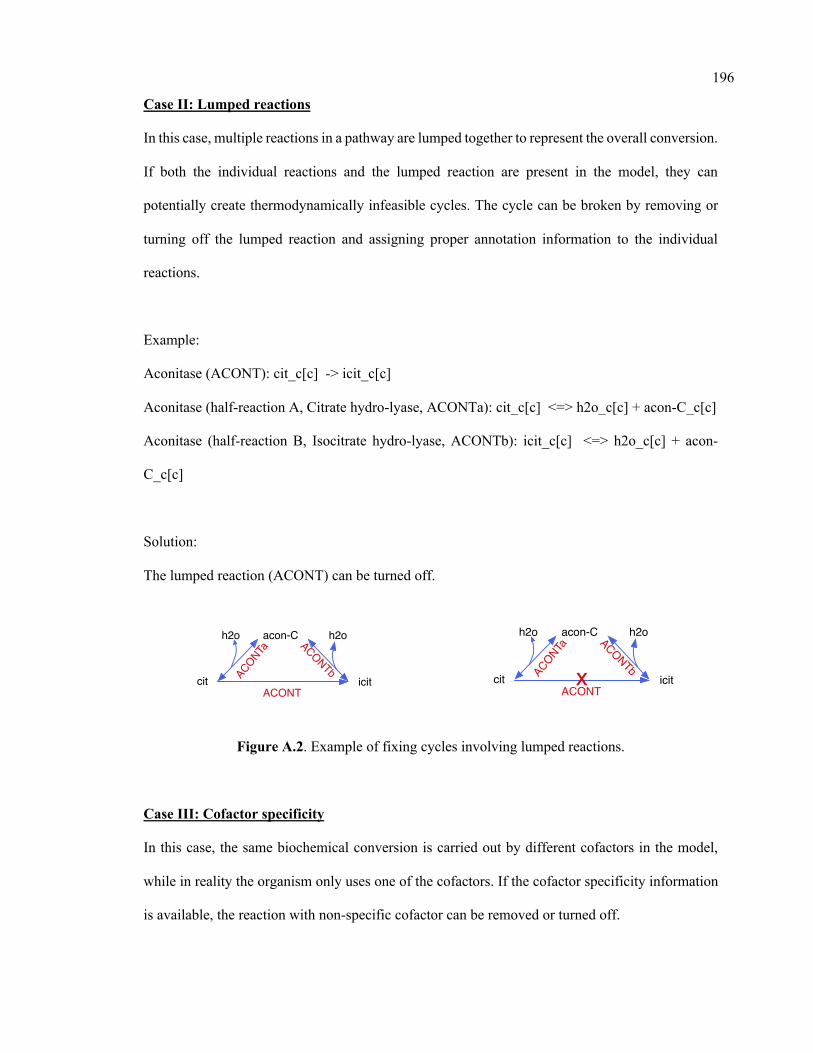
196
Case II: Lumped reactions
In this case, multiple reactions in a pathway are lumped together to represent the overall conversion.
If both the individual reactions and the lumped reaction are present in the model, they can
potentially create thermodynamically infeasible cycles. The cycle can be broken by removing or
turning off the lumped reaction and assigning proper annotation information to the individual
reactions.
Example:
Aconitase (ACONT): cit_c[c] -> icit_c[c]
Aconitase (half-reaction A, Citrate hydro-lyase, ACONTa): cit_c[c] <=> h2o_c[c] + acon-C_c[c]
Aconitase (half-reaction B, Isocitrate hydro-lyase, ACONTb): icit_c[c] <=> h2o_c[c] + acon-
C_c[c]
Solution:
The lumped reaction (ACONT) can be turned off.
Figure A.2. Example of fixing cycles involving lumped reactions.
Case III: Cofactor specificity
In this case, the same biochemical conversion is carried out by different cofactors in the model,
while in reality the organism only uses one of the cofactors. If the cofactor specificity information
is available, the reaction with non-specific cofactor can be removed or turned off.
cit icitACONT
acon-Ch2o h2o
ACONTa
ACONTbcit icit
ACONT
acon-Ch2o h2o
ACONTa
ACONTbx
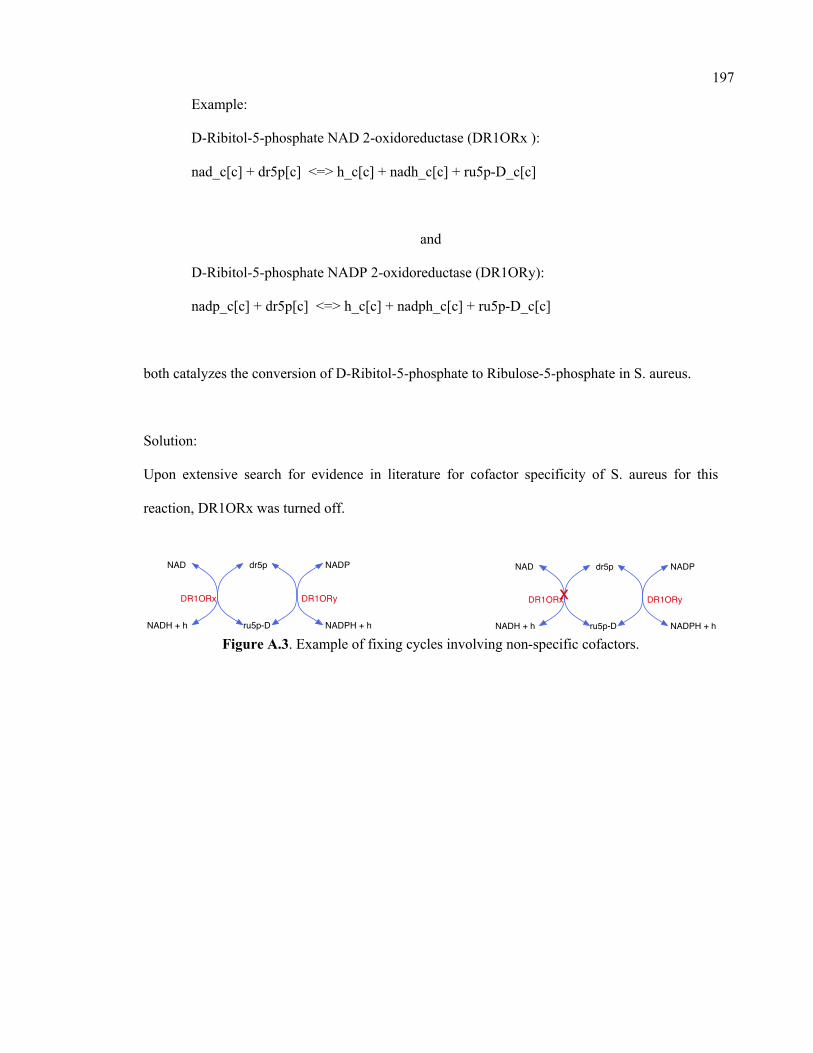
197
Example:
D-Ribitol-5-phosphate NAD 2-oxidoreductase (DR1ORx ):
nad_c[c] + dr5p[c] <=> h_c[c] + nadh_c[c] + ru5p-D_c[c]
and
D-Ribitol-5-phosphate NADP 2-oxidoreductase (DR1ORy):
nadp_c[c] + dr5p[c] <=> h_c[c] + nadph_c[c] + ru5p-D_c[c]
both catalyzes the conversion of D-Ribitol-5-phosphate to Ribulose-5-phosphate in S. aureus.
Solution:
Upon extensive search for evidence in literature for cofactor specificity of S. aureus for this
reaction, DR1ORx was turned off.
Figure A.3. Example of fixing cycles involving non-specific cofactors.
dr5p
ru5p-D
DR1ORx DR1ORy
NAD
NADH + h
NADP
NADPH + h
dr5p
ru5p-D
DR1ORx DR1ORy
NAD
NADH + h
NADP
NADPH + h
x
198
Appendix B
Consensus of in vivo essentiality information for the iSA863 metabolic model
Consensus on gene essentiality information
Valentino et. al1 hypothesized that large scale DNA sequencing combined with transposons can
determine the essentiality and fitness criticality (non-essential but important for optimal growth)
of genes. They determined gene essentiality by finding genes with fewer than 1% of the insertions
expected from a random distribution and thereafter found 319 essential genes. The study
quantified the effect of a mutation on fitness and found 106 genes that were important to fitness;
these genes were defined as genes with 1-10% of the expected insertions. The study tested the
mutants in a competitive growth environment with Brain Heart Infusion (BHI) Broth and found
420 essential genes. 30 of the 108 new essential genes were determined to be fitness
compromised from before. The study found 91.1% of the previously reported essential genes,
such as those by Chaudhuri et. al2, to be essential. This suggests that this is an effective method
for determining essential reactions. Of the remaining 8.9%, many were close to the essential
cutoff, or were very far from being essential, suggesting that the results from the previous studies
were inconsistent. One reason can be the presence of different false-positives within the different
methods; and the 1% cutoff appears to have been arbitrarily determined, and genes important to
fitness but not essential may fall within this cutoff. This work presumably incorporated true
positives that were not included in Chaudhuri et. al2 because Chaudhuri’s analysis made it hard to
detect and classify essentiality in small genes or genes with few restriction sites. In general,
Valentino was probably more accurate because they used 70,000 inserts compared to only about
350.
199
Santiago et. al 3 hypothesized that gene essentiality derived from transposon libraries can be
affected by the high temperatures used to remove the plasmid delivery vehicle. As a result,
previous methods found genes that were essential at high temperatures and/or at normal
temperatures. They used a different methodology and was able to determine essentiality at 23°C,
30°C, 37°C, and 43°C. Santiago’s list of essential genes was determined at 30°C, instead of
37°C 141. Santiago had more inserts than Valentino (690,000 compared to 70,000), and also used a
different methodology to determine essentiality, EL-ARTIST, instead of an arbitrary 1% cut-off.
The increased number of inserts and EL-ARTIST allowed Santiago to determine if a gene was
essential, had essential domains, or was non-essential. For the purpose of a metabolic model, the
domain essential genes should be considered essential because knocking out the whole gene
would kill the bacterium.
Sources of Error
There are two systematic sources of false positives in Chaudhuri et. al 2 and Valentino et. al 1.
First, transposons can be incorrectly labeled essential if a polar effect from the transposon affects
an essential gene immediately downstream. Second, the plasmid curing step requires high
temperatures during a step of the experiment. This causes heat-essential genes to be incorrectly
classified as essential genes. Santiago et. al 140 had evidence for likely false positive genes
created by the polar effect. Santiago was able to upregulate and downregulate genes with
transposons, enabling them to determine if a transposon was on an essential gene or just near an
essential gene; these transposons were referred to as “erm” and “promoter”, respectively.
However, the final data analysis uses a set of transposons referred to as “blunt” that affect only
the downstream genes. 18 of the 20 essential genes found using the blunt methodology were
found to be immediately upstream of an essential gene. Thus, genes found to be essential in the
“blunt” dataset but non-essential in the “erm” and “promoter” sets are likely false positives, even
200
if previous studies found them to be essential. Santiago et. al 3 was unique because they were
able to determine essentiality without a high temperature curing step. As a result, the study did
not incorrectly label heat-essential genes as essential at 30°C. The study performed a test at 43°C
to determine the heat-essential genes. They concluded that genes that were essential at 43°C but
not 30°C are likely false positives. Valentino and Santiago randomly added transposons and then
sequenced the junctions to determine which transposons remained after a number of generations.
The Nebraska Transposon Mutant Library (NTML) randomly generated transposon mutants and
considered a gene to be knocked out if the transposon insertion was close to the 5’ end. NTML
dataset was compared to the genes considered domain essential in Santiago et al. There appeared
to be a relationship in which the domain essential genes have lower growth than normal. The
average domain essential gene mutants have approximately 0.7 standard deviations of growth less
than other mutants. The transposon may not disrupt the essential domain, allowing the gene to
produce a slightly less functional protein. One would assume that there may be a relationship
between genes considered fitness critical in Valentino et al and the mutants with low growth in
the mutant growth test. However, after looking at the fitness critical genes in agar conditions
versus the growth in our mutant study, there appeared to be no correlation.
Conclusions
For metabolic modeling purpose, there are a few takeaways from the above discussion. First, the
true list of essential genes may require a combination of many pools of knowledge. Genes found
to be essential in any of the three data sets1-3 should be considered essential unless 1) there was a
growth mutant, 2) a gene was found to only be essential at 43°C, and 3) a gene was found
essential with the blunt promoters but not under the other two methodologies. One exception is
that domain essential genes were considered essential for the purposes of our model. This is
201
because the mutant library may have only knocked out a portion of the gene, allowing it to still
produce a functional protein. The second takeaway involves the number of fitness compromised
mutants found in Valentino et al 1 and in the current study. These generally are not found in the
in silico model; instead, the model generally shows full growth or no growth. This may suggest
that some of the upper bounds in the model are too high, and the model may compensate for lost
functionality by redirecting more flux through a pathway than possible in vivo.
Growmatch Results
In silico essential genes are found by turning off each gene individually and turning off the
reaction(s) catalyzed by the gene by following the Boolean logic of the GPR relationships. In
vivo essential genes were curated from multiple sources 1-6. Most of the essential genes were
determined by randomly inserting transposons into Staphylococcus aureus and excluding the
transposons which remained after growing the cells 1-3. An adaptation of data from two sources
using antisense RNA was also used to determine essential enzymes and thus essential genes
through the Boolean GPR relationships 4-6. The procedure for determining gene essentiality from
the pool of literature is shown in Figure F1.
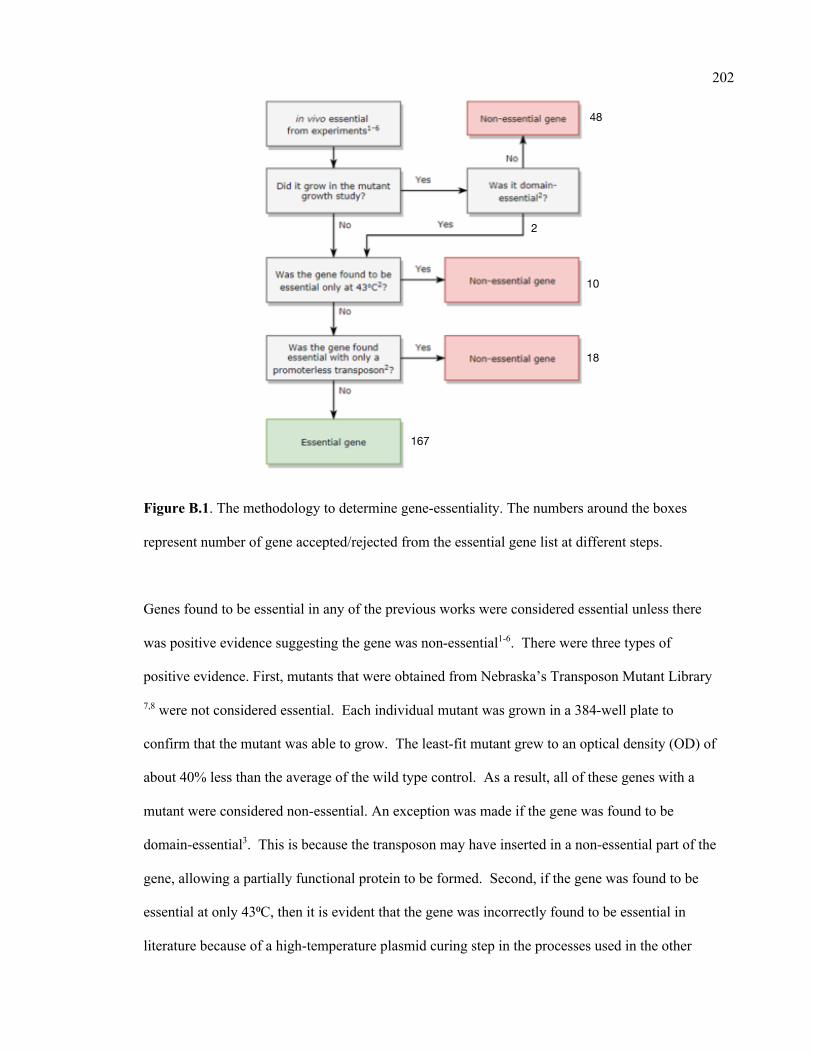
202
Figure B.1. The methodology to determine gene-essentiality. The numbers around the boxes
represent number of gene accepted/rejected from the essential gene list at different steps.
Genes found to be essential in any of the previous works were considered essential unless there
was positive evidence suggesting the gene was non-essential1-6. There were three types of
positive evidence. First, mutants that were obtained from Nebraska’s Transposon Mutant Library
7,8 were not considered essential. Each individual mutant was grown in a 384-well plate to
confirm that the mutant was able to grow. The least-fit mutant grew to an optical density (OD) of
about 40% less than the average of the wild type control. As a result, all of these genes with a
mutant were considered non-essential. An exception was made if the gene was found to be
domain-essential3. This is because the transposon may have inserted in a non-essential part of the
gene, allowing a partially functional protein to be formed. Second, if the gene was found to be
essential at only 43⁰C, then it is evident that the gene was incorrectly found to be essential in
literature because of a high-temperature plasmid curing step in the processes used in the other
167
48
2
10
18
203
literature sources3. Third, if the gene was found to be essential using a promoterless transposon
insert, but not with promoter-containing methodologies, then the gene is upstream of an essential
gene, and other sources found it to be essential due to polar effects that disrupt expression.
After determining the list of in vivo essential genes, the growth and no-growth inconsistencies
between experimental observations and the model predictions were reconciled and model
performance was improved. Reactions and genes were categorized as G or NG, meaning that
growth occurs when the gene or the corresponding reaction(s) was removed, or no growth occurs,
respectively. GGs and NGNGs mean the model agrees with experimental evidence. GNGs are
knockouts where the model predicts growth that does not occur in experiments, suggesting the
model has spurious extra functionality; NGGs are knockouts upon which the model predicts no
growth while experiments predict growth, suggesting the model lacks certain functionality.
Growmatch is an optimization-based framework used to resolve metabolic models’ growth
predictions with experimental evidence9. Growmatch consists of two algorithms:
GrowmatchNGG and GrowMatchGNG.
GrowmatchNGG:
GrowmatchNGG was used to resolve NGGs. The algorithm turns off an NGG gene, and then
maximizes growth by adding the minimal amount of reactions (minimum one to maximum four
was allowed in this work) from a database of reactions. These solutions come from three sources:
1) The backwards directions of irreversible reactions (because the reversibility of the reaction
may be uncertain) 2) Transport reactions of metabolites ( either diffusion through the cell
membrane or via a non-specific transporter), and 3) The reactions from taxonomically similar
organisms (E. coli and B. subtilis) from the BIGG database10. Growmatch suggested various
solutions (a set of one to four reactions) to solve most of the NGGs. Solutions were added one by
one and checked to ensure they do not invalidate any NGNGs or create any new
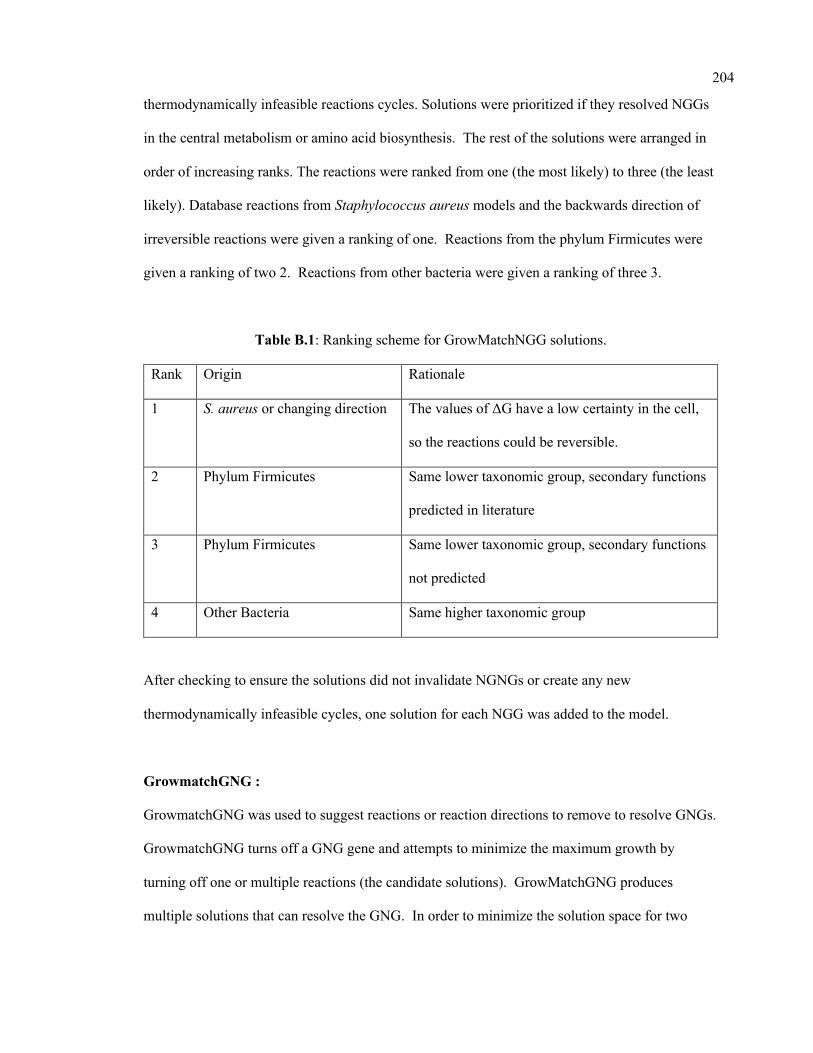
204
thermodynamically infeasible reactions cycles. Solutions were prioritized if they resolved NGGs
in the central metabolism or amino acid biosynthesis. The rest of the solutions were arranged in
order of increasing ranks. The reactions were ranked from one (the most likely) to three (the least
likely). Database reactions from Staphylococcus aureus models and the backwards direction of
irreversible reactions were given a ranking of one. Reactions from the phylum Firmicutes were
given a ranking of two 2. Reactions from other bacteria were given a ranking of three 3.
Table B.1: Ranking scheme for GrowMatchNGG solutions.
Rank Origin Rationale
1 S. aureus or changing direction The values of ΔG have a low certainty in the cell,
so the reactions could be reversible.
2 Phylum Firmicutes Same lower taxonomic group, secondary functions
predicted in literature
3 Phylum Firmicutes Same lower taxonomic group, secondary functions
not predicted
4 Other Bacteria Same higher taxonomic group
After checking to ensure the solutions did not invalidate NGNGs or create any new
thermodynamically infeasible cycles, one solution for each NGG was added to the model.
GrowmatchGNG :
GrowmatchGNG was used to suggest reactions or reaction directions to remove to resolve GNGs.
GrowmatchGNG turns off a GNG gene and attempts to minimize the maximum growth by
turning off one or multiple reactions (the candidate solutions). GrowMatchGNG produces
multiple solutions that can resolve the GNG. In order to minimize the solution space for two
205
reaction knockouts, reactions from iSB619 were not considered for removal. This was justified
because the reactions in iSB619 had a gene associated with the reaction or a rationale for each
reaction11. The solutions were pruned by ensuring they did not violate any GGs.
References:
1 Valentino, M. D. et al. Genes contributing to Staphylococcus aureus fitness in abscess-
and infection-related ecologies. Mbio 5, e01729-01714, doi:10.1128/mBio.01729-14 (2014).
2 Chaudhuri, R. R. et al. Comprehensive identification of essential Staphylococcus aureus
genes using Transposon-Mediated Differential Hybridisation (TMDH). BMC Genomics 10, 291,
doi:10.1186/1471-2164-10-291 (2009).
3 Santiago, M. et al. A new platform for ultra-high density Staphylococcus aureus
transposon libraries. BMC Genomics 16, 252, doi:10.1186/s12864-015-1361-3 (2015).
4 Lee, D. S. et al. Comparative genome-scale metabolic reconstruction and flux balance
analysis of multiple Staphylococcus aureus genomes identify novel antimicrobial drug targets. J
Bacteriol 191, 4015-4024, doi:10.1128/JB.01743-08 (2009).
5 Forsyth, R. A. et al. A genome-wide strategy for the identification of essential genes in
Staphylococcus aureus. Molecular Microbiology 43, 1387-1400, doi:DOI 10.1046/j.1365-
2958.2002.02832.x (2002).
6 Ji, Y. D. et al. Identification of critical staphylococcal genes using conditional phenotypes
generated by antisense RNA. Science 293, 2266-2269, doi:DOI 10.1126/science.1063566 (2001).
7 Fey, P. D. et al. A genetic resource for rapid and comprehensive phenotype screening of
nonessential Staphylococcus aureus genes. Mbio 4, e00537-00512, doi:10.1128/mBio.00537-12
(2013).
206
8 Bae, T., Glass, E. M., Schneewind, O. & Missiakas, D. Generating a collection of
insertion mutations in the Staphylococcus aureus genome using bursa aurealis. Methods Mol Biol
416, 103-116, doi:10.1007/978-1-59745-321-9_7 (2008).
9 Kumar, V. S. & Maranas, C. D. GrowMatch: an automated method for reconciling in
silico/in vivo growth predictions. PLoS computational biology 5, e1000308,
doi:10.1371/journal.pcbi.1000308 (2009).
10 Schellenberger, J., Park, J. O., Conrad, T. M. & Palsson, B. O. BiGG: a Biochemical
Genetic and Genomic knowledgebase of large scale metabolic reconstructions. BMC
bioinformatics 11, 213, doi:10.1186/1471-2105-11-213 (2010).
11 Becker, S. A. & Palsson, B. O. Genome-scale reconstruction of the metabolic network in
Staphylococcus aureus N315: an initial draft to the two-dimensional annotation. BMC
microbiology 5, 8, doi:10.1186/1471-2180-5-8 (2005).
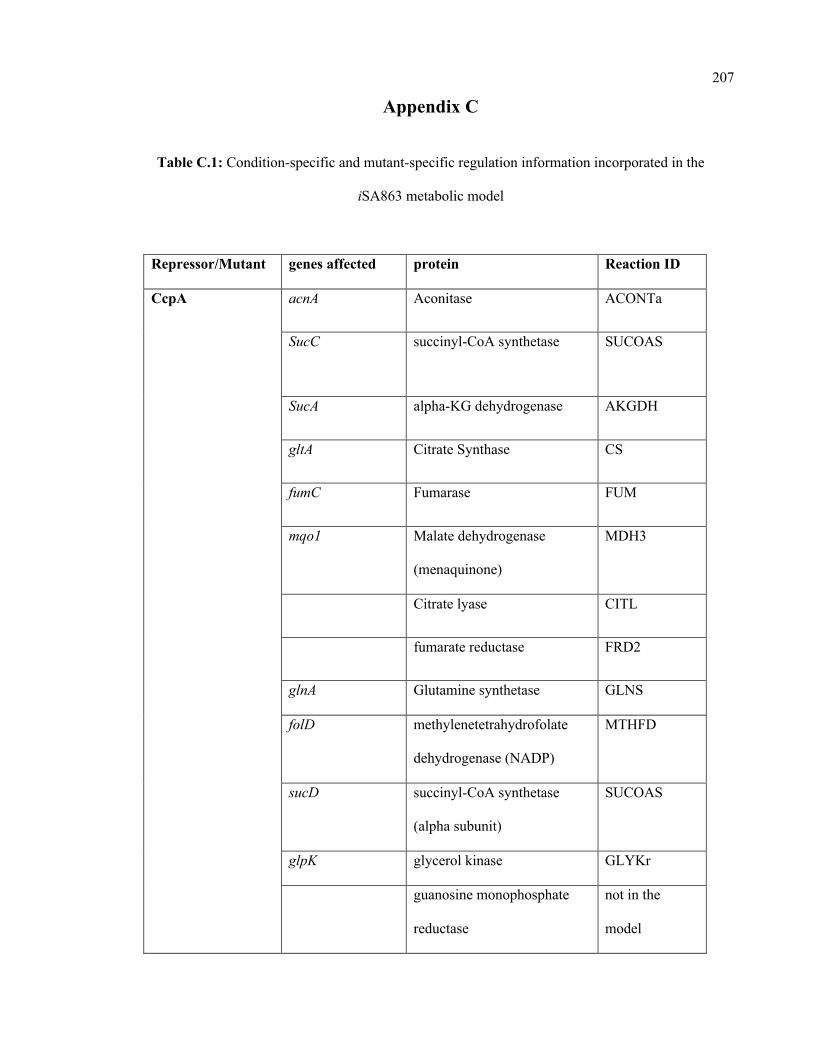
207
Appendix C
Table C.1: Condition-specific and mutant-specific regulation information incorporated in the
iSA863 metabolic model
Repressor/Mutant genes affected protein Reaction ID
CcpA acnA Aconitase ACONTa
SucC succinyl-CoA synthetase SUCOAS
SucA alpha-KG dehydrogenase AKGDH
gltA Citrate Synthase CS
fumC Fumarase FUM
mqo1 Malate dehydrogenase
(menaquinone)
MDH3
Citrate lyase CITL
fumarate reductase FRD2
glnA Glutamine synthetase GLNS
folD methylenetetrahydrofolate
dehydrogenase (NADP)
MTHFD
sucD succinyl-CoA synthetase
(alpha subunit)
SUCOAS
glpK glycerol kinase GLYKr
guanosine monophosphate
reductase
not in the
model
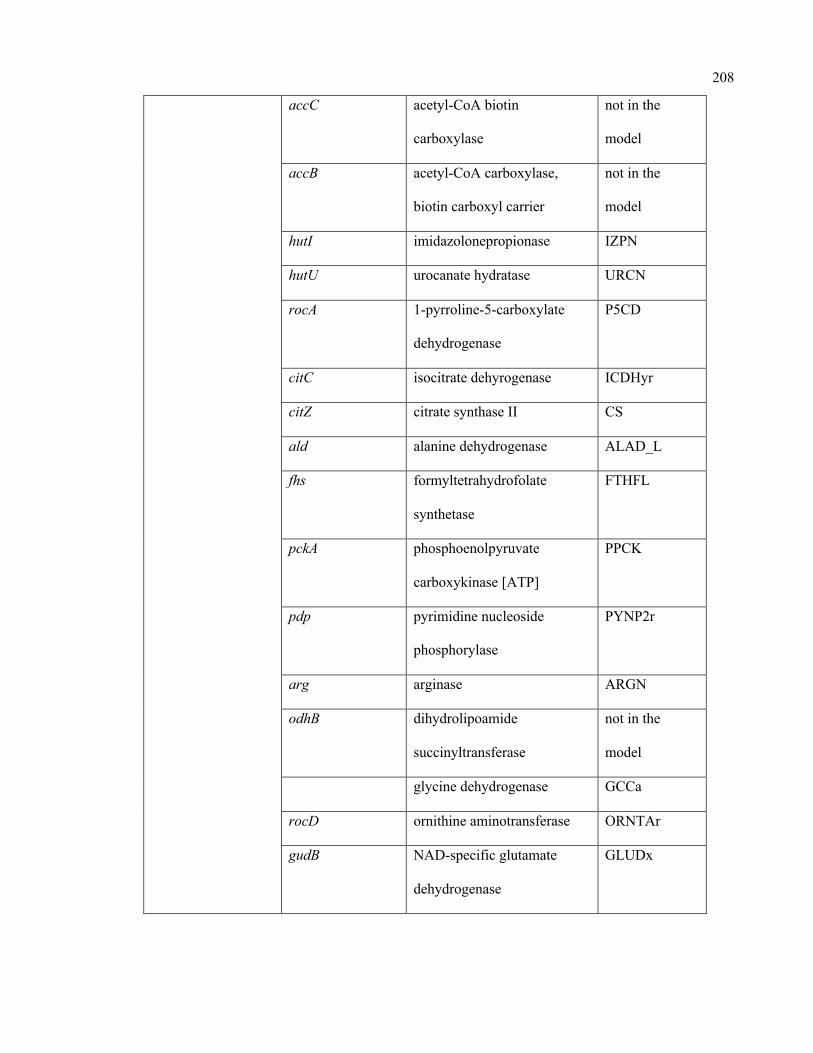
208
accC acetyl-CoA biotin
carboxylase
not in the
model
accB acetyl-CoA carboxylase,
biotin carboxyl carrier
not in the
model
hutI imidazolonepropionase IZPN
hutU urocanate hydratase URCN
rocA 1-pyrroline-5-carboxylate
dehydrogenase
P5CD
citC isocitrate dehyrogenase ICDHyr
citZ citrate synthase II CS
ald alanine dehydrogenase ALAD_L
fhs formyltetrahydrofolate
synthetase
FTHFL
pckA phosphoenolpyruvate
carboxykinase [ATP]
PPCK
pdp pyrimidine nucleoside
phosphorylase
PYNP2r
arg arginase ARGN
odhB dihydrolipoamide
succinyltransferase
not in the
model
glycine dehydrogenase GCCa
rocD ornithine aminotransferase ORNTAr
gudB NAD-specific glutamate
dehydrogenase
GLUDx
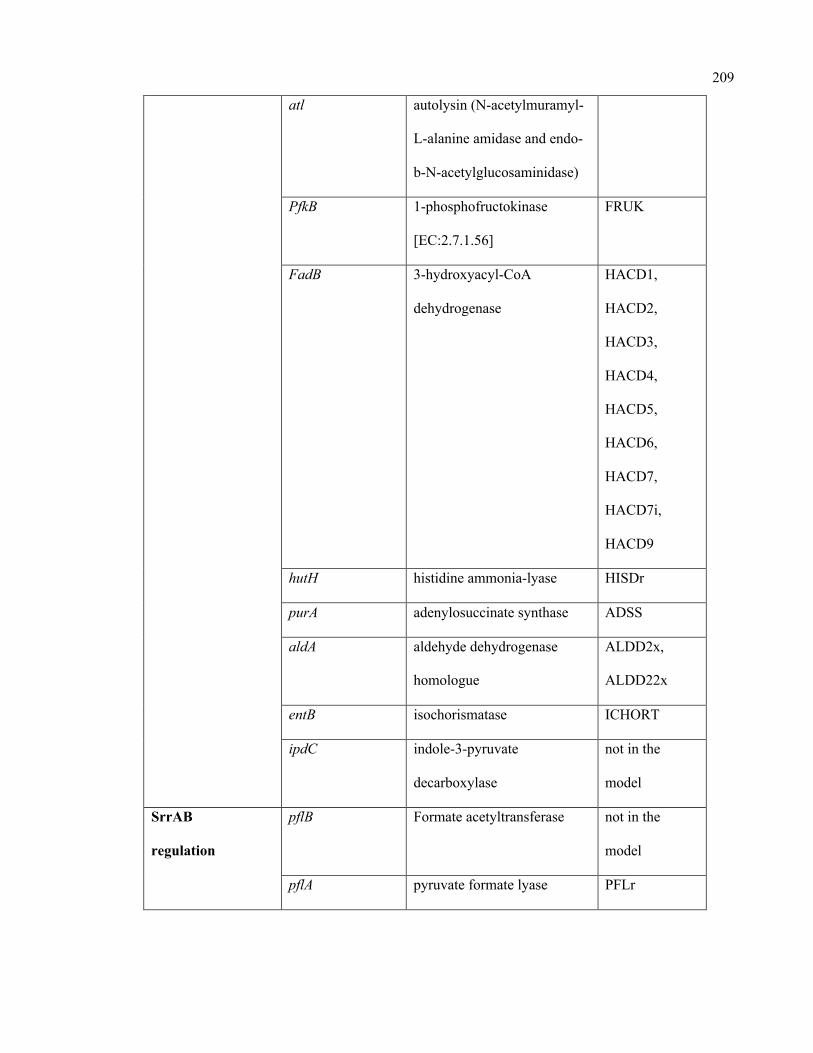
209
atl autolysin (N-acetylmuramyl-
L-alanine amidase and endo-
b-N-acetylglucosaminidase)
PfkB 1-phosphofructokinase
[EC:2.7.1.56]
FRUK
FadB 3-hydroxyacyl-CoA
dehydrogenase
HACD1,
HACD2,
HACD3,
HACD4,
HACD5,
HACD6,
HACD7,
HACD7i,
HACD9
hutH histidine ammonia-lyase HISDr
purA adenylosuccinate synthase ADSS
aldA aldehyde dehydrogenase
homologue
ALDD2x,
ALDD22x
entB isochorismatase ICHORT
ipdC indole-3-pyruvate
decarboxylase
not in the
model
SrrAB
regulation
pflB Formate acetyltransferase not in the
model
pflA pyruvate formate lyase PFLr
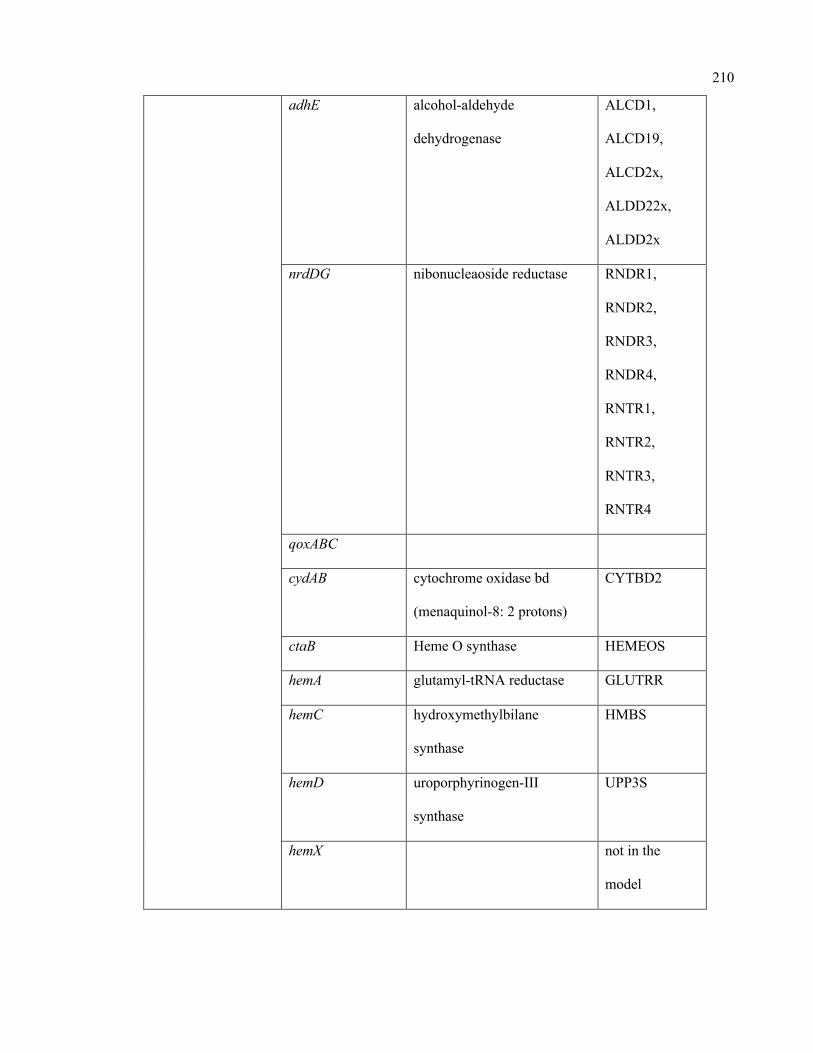
210
adhE alcohol-aldehyde
dehydrogenase
ALCD1,
ALCD19,
ALCD2x,
ALDD22x,
ALDD2x
nrdDG nibonucleaoside reductase RNDR1,
RNDR2,
RNDR3,
RNDR4,
RNTR1,
RNTR2,
RNTR3,
RNTR4
qoxABC
cydAB cytochrome oxidase bd
(menaquinol-8: 2 protons)
CYTBD2
ctaB Heme O synthase HEMEOS
hemA glutamyl-tRNA reductase GLUTRR
hemC hydroxymethylbilane
synthase
HMBS
hemD uroporphyrinogen-III
synthase
UPP3S
hemX not in the
model
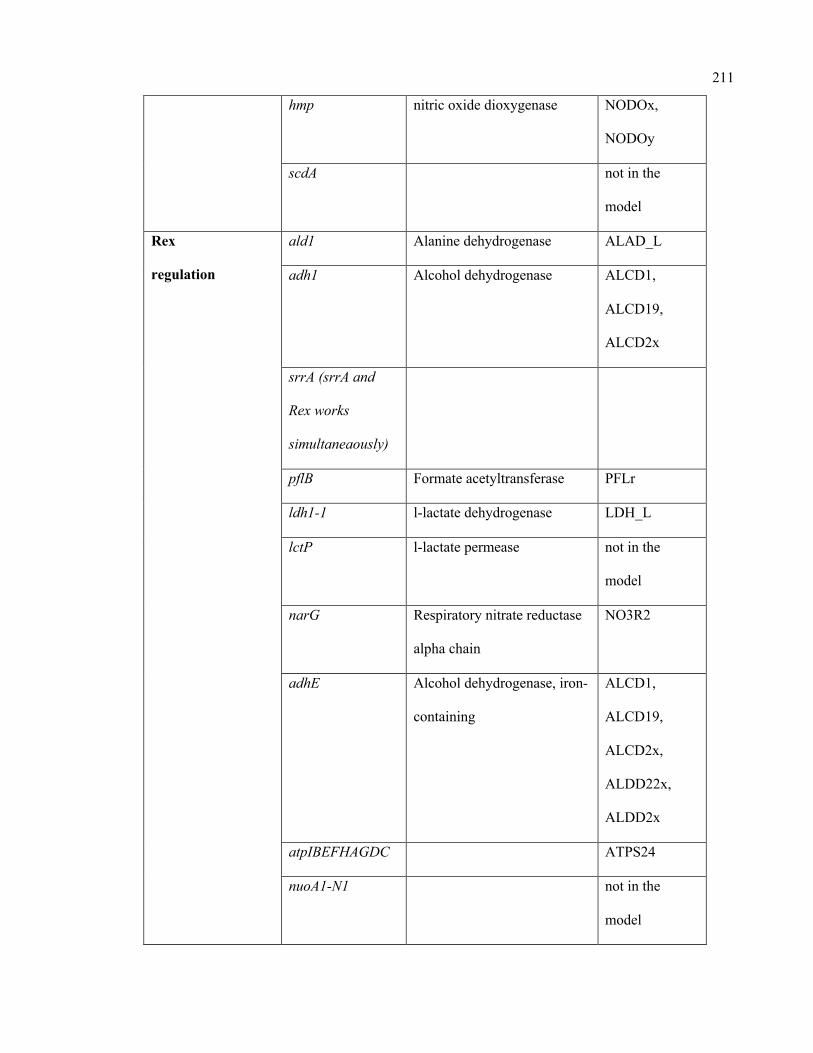
211
hmp nitric oxide dioxygenase NODOx,
NODOy
scdA not in the
model
Rex
regulation
ald1 Alanine dehydrogenase ALAD_L
adh1 Alcohol dehydrogenase ALCD1,
ALCD19,
ALCD2x
srrA (srrA and
Rex works
simultaneaously)
pflB Formate acetyltransferase PFLr
ldh1-1 l-lactate dehydrogenase LDH_L
lctP l-lactate permease not in the
model
narG Respiratory nitrate reductase
alpha chain
NO3R2
adhE Alcohol dehydrogenase, iron-
containing
ALCD1,
ALCD19,
ALCD2x,
ALDD22x,
ALDD2x
atpIBEFHAGDC ATPS24
nuoA1-N1 not in the
model
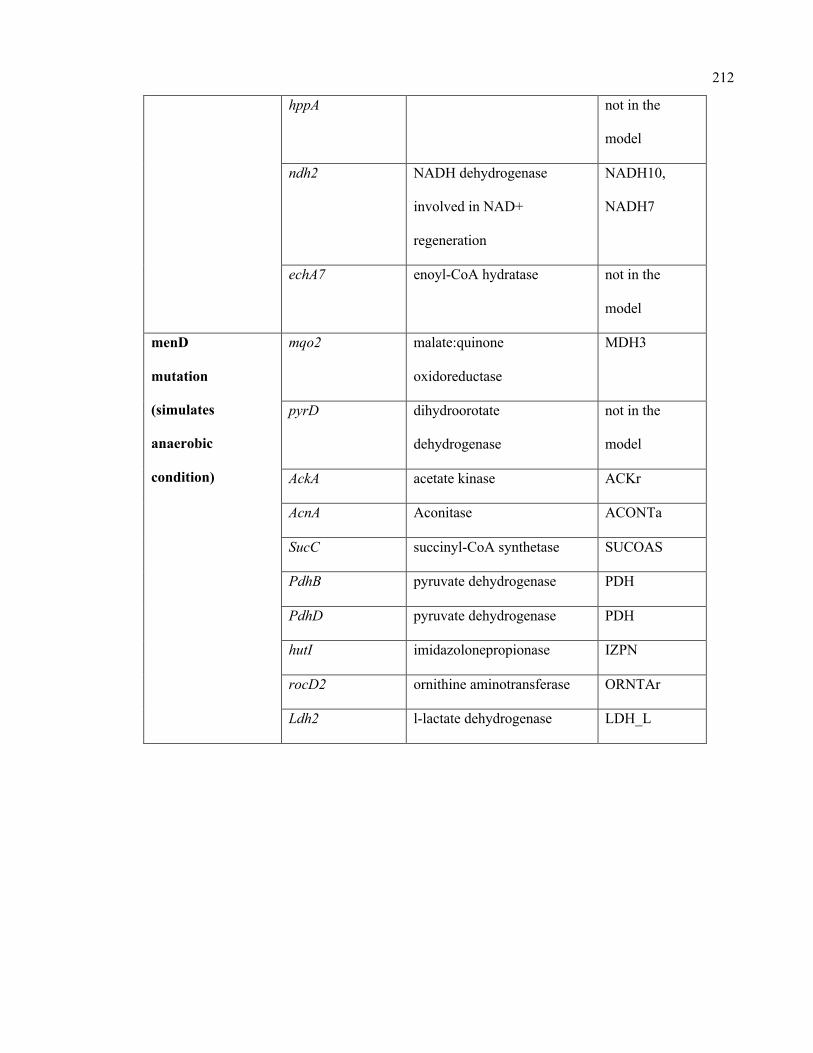
212
hppA not in the
model
ndh2 NADH dehydrogenase
involved in NAD+
regeneration
NADH10,
NADH7
echA7 enoyl-CoA hydratase not in the
model
menD
mutation
(simulates
anaerobic
condition)
mqo2 malate:quinone
oxidoreductase
MDH3
pyrD dihydroorotate
dehydrogenase
not in the
model
AckA acetate kinase ACKr
AcnA Aconitase ACONTa
SucC succinyl-CoA synthetase SUCOAS
PdhB pyruvate dehydrogenase PDH
PdhD pyruvate dehydrogenase PDH
hutI imidazolonepropionase IZPN
rocD2 ornithine aminotransferase ORNTAr
Ldh2 l-lactate dehydrogenase LDH_L
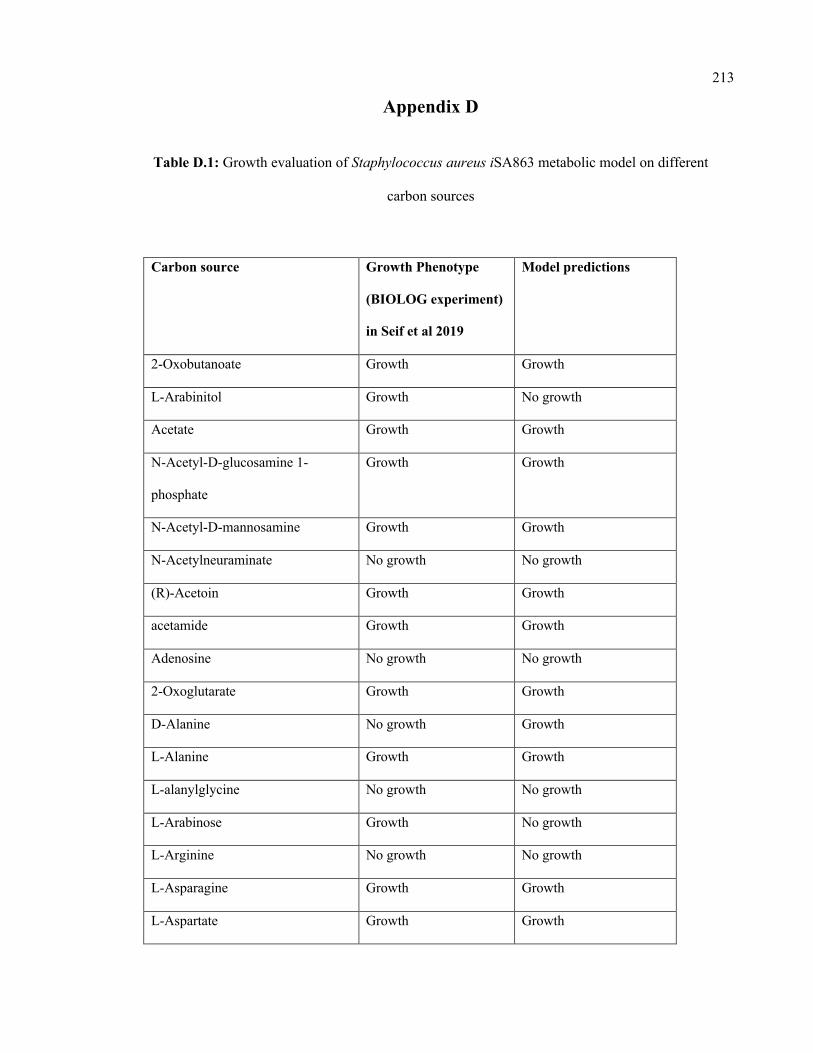
213
Appendix D
Table D.1: Growth evaluation of Staphylococcus aureus iSA863 metabolic model on different
carbon sources
Carbon source Growth Phenotype
(BIOLOG experiment)
in Seif et al 2019
Model predictions
2-Oxobutanoate Growth Growth
L-Arabinitol Growth No growth
Acetate Growth Growth
N-Acetyl-D-glucosamine 1-
phosphate
Growth Growth
N-Acetyl-D-mannosamine Growth Growth
N-Acetylneuraminate No growth No growth
(R)-Acetoin Growth Growth
acetamide Growth Growth
Adenosine No growth No growth
2-Oxoglutarate Growth Growth
D-Alanine No growth Growth
L-Alanine Growth Growth
L-alanylglycine No growth No growth
L-Arabinose Growth No growth
L-Arginine No growth No growth
L-Asparagine Growth Growth
L-Aspartate Growth Growth
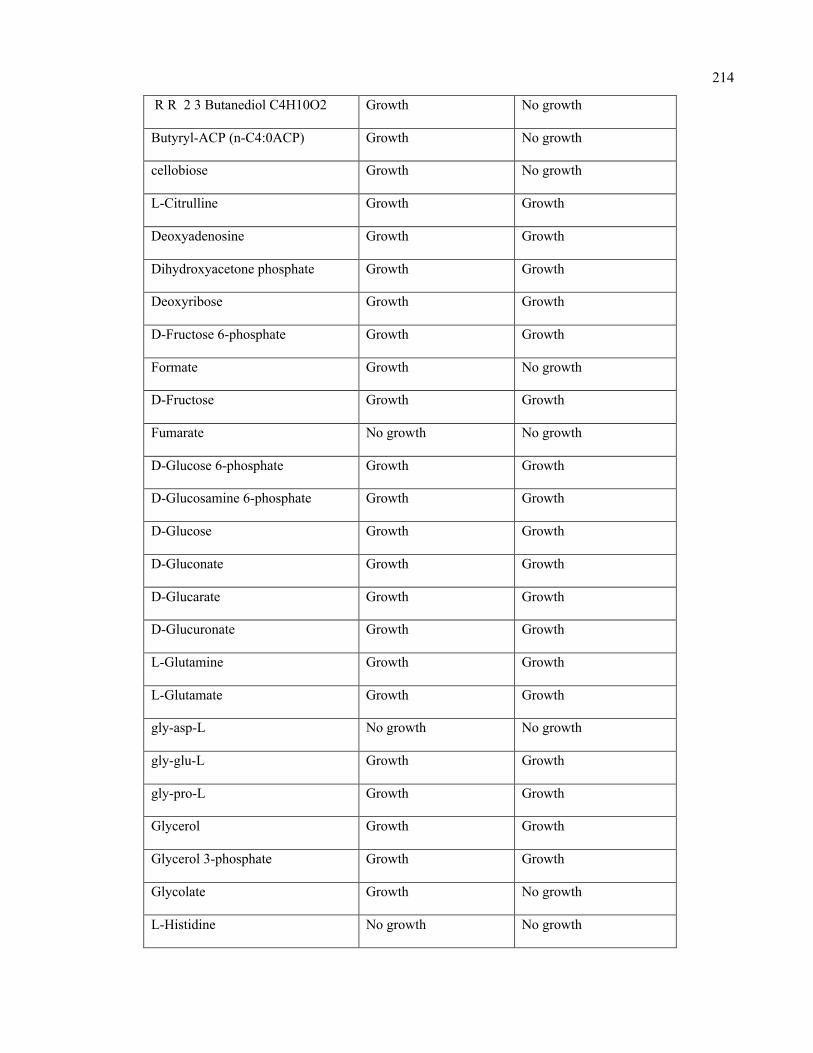
214
R R 2 3 Butanediol C4H10O2 Growth No growth
Butyryl-ACP (n-C4:0ACP) Growth No growth
cellobiose Growth No growth
L-Citrulline Growth Growth
Deoxyadenosine Growth Growth
Dihydroxyacetone phosphate Growth Growth
Deoxyribose Growth Growth
D-Fructose 6-phosphate Growth Growth
Formate Growth No growth
D-Fructose Growth Growth
Fumarate No growth No growth
D-Glucose 6-phosphate Growth Growth
D-Glucosamine 6-phosphate Growth Growth
D-Glucose Growth Growth
D-Gluconate Growth Growth
D-Glucarate Growth Growth
D-Glucuronate Growth Growth
L-Glutamine Growth Growth
L-Glutamate Growth Growth
gly-asp-L No growth No growth
gly-glu-L Growth Growth
gly-pro-L Growth Growth
Glycerol Growth Growth
Glycerol 3-phosphate Growth Growth
Glycolate Growth No growth
L-Histidine No growth No growth
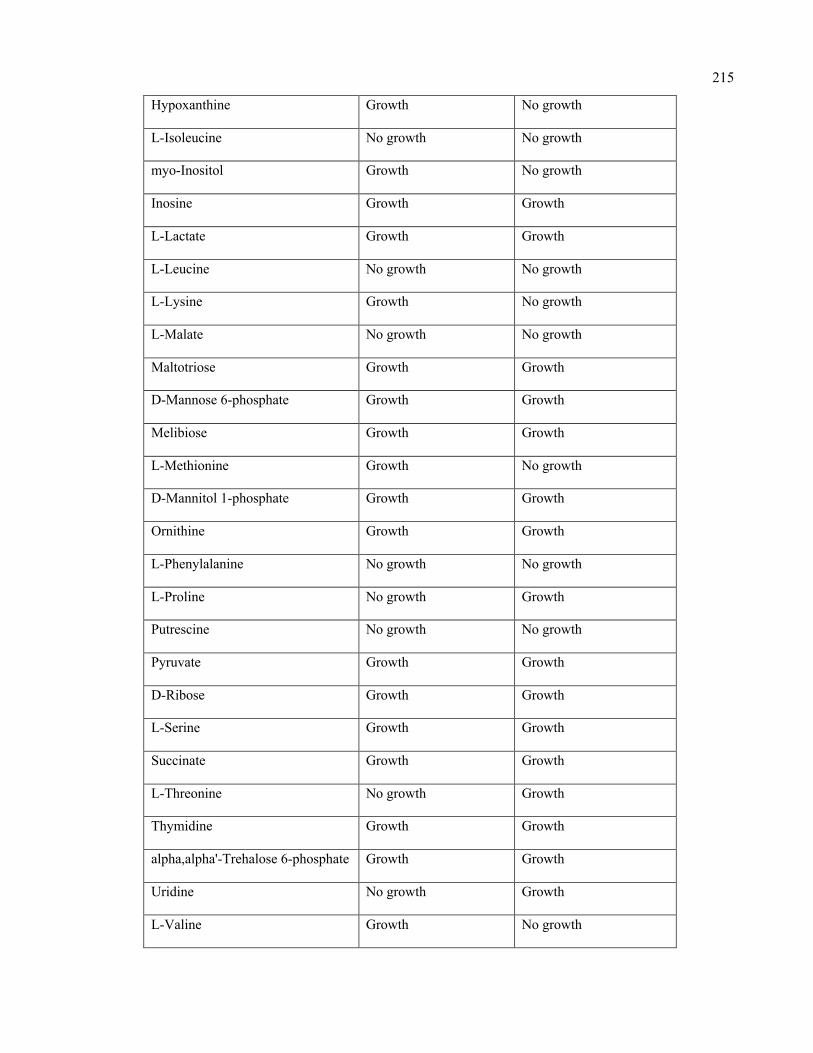
215
Hypoxanthine Growth No growth
L-Isoleucine No growth No growth
myo-Inositol Growth No growth
Inosine Growth Growth
L-Lactate Growth Growth
L-Leucine No growth No growth
L-Lysine Growth No growth
L-Malate No growth No growth
Maltotriose Growth Growth
D-Mannose 6-phosphate Growth Growth
Melibiose Growth Growth
L-Methionine Growth No growth
D-Mannitol 1-phosphate Growth Growth
Ornithine Growth Growth
L-Phenylalanine No growth No growth
L-Proline No growth Growth
Putrescine No growth No growth
Pyruvate Growth Growth
D-Ribose Growth Growth
L-Serine Growth Growth
Succinate Growth Growth
L-Threonine No growth Growth
Thymidine Growth Growth
alpha,alpha'-Trehalose 6-phosphate Growth Growth
Uridine No growth Growth
L-Valine Growth No growth
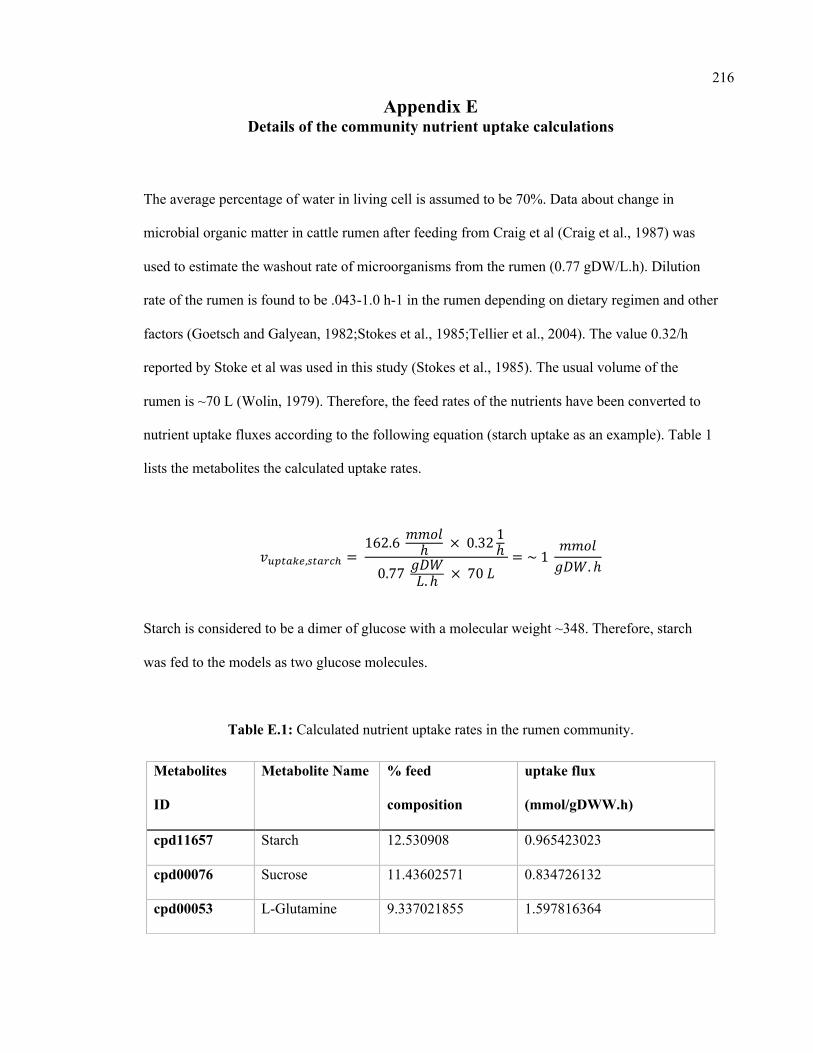
216
Appendix E Details of the community nutrient uptake calculations
The average percentage of water in living cell is assumed to be 70%. Data about change in
microbial organic matter in cattle rumen after feeding from Craig et al (Craig et al., 1987) was
used to estimate the washout rate of microorganisms from the rumen (0.77 gDW/L.h). Dilution
rate of the rumen is found to be .043-1.0 h-1 in the rumen depending on dietary regimen and other
factors (Goetsch and Galyean, 1982;Stokes et al., 1985;Tellier et al., 2004). The value 0.32/h
reported by Stoke et al was used in this study (Stokes et al., 1985). The usual volume of the
rumen is ~70 L (Wolin, 1979). Therefore, the feed rates of the nutrients have been converted to
nutrient uptake fluxes according to the following equation (starch uptake as an example). Table 1
lists the metabolites the calculated uptake rates.
𝑣7-0)63,*0)2:1 =162.6𝑚𝑚𝑜𝑙ℎ × 0.32 1ℎ
0.77 𝑔𝐷𝑊𝐿. ℎ × 70𝐿= ~1
𝑚𝑚𝑜𝑙𝑔𝐷𝑊. ℎ
Starch is considered to be a dimer of glucose with a molecular weight ~348. Therefore, starch
was fed to the models as two glucose molecules.
Table E.1: Calculated nutrient uptake rates in the rumen community.
Metabolites
ID
Metabolite Name % feed
composition
uptake flux
(mmol/gDWW.h)
cpd11657 Starch 12.530908 0.965423023
cpd00076 Sucrose 11.43602571 0.834726132
cpd00053 L-Glutamine 9.337021855 1.597816364
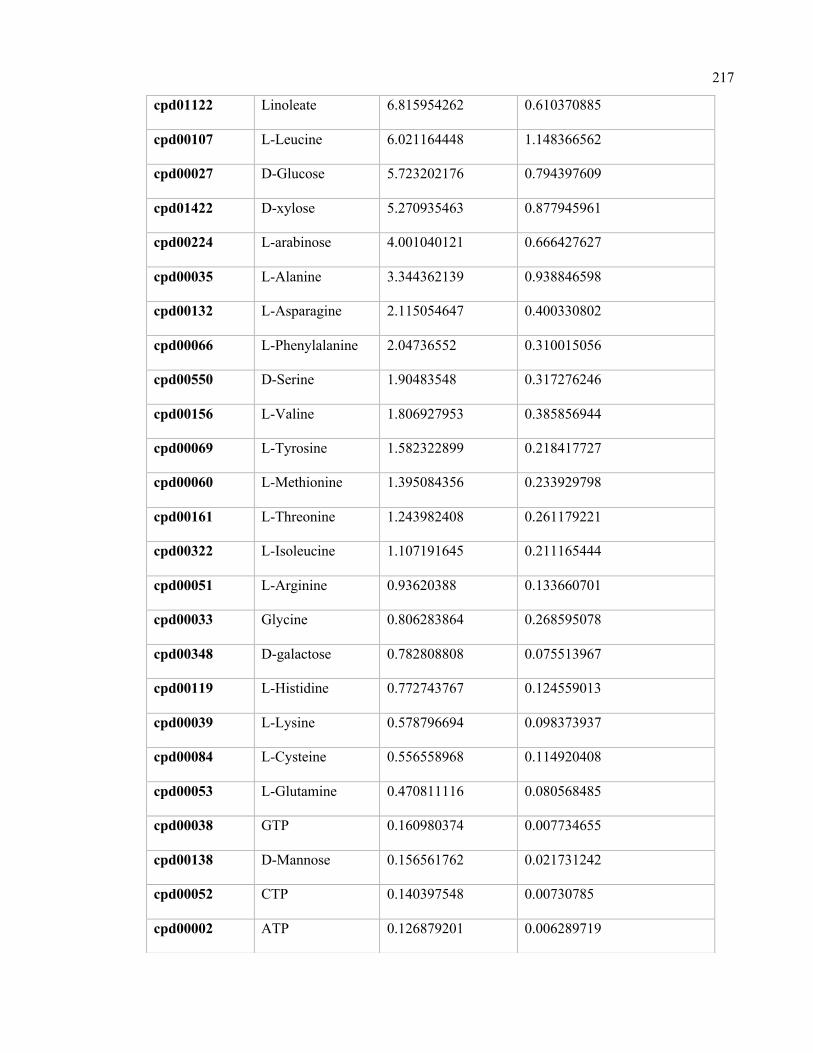
217
cpd01122 Linoleate 6.815954262 0.610370885
cpd00107 L-Leucine 6.021164448 1.148366562
cpd00027 D-Glucose 5.723202176 0.794397609
cpd01422 D-xylose 5.270935463 0.877945961
cpd00224 L-arabinose 4.001040121 0.666427627
cpd00035 L-Alanine 3.344362139 0.938846598
cpd00132 L-Asparagine 2.115054647 0.400330802
cpd00066 L-Phenylalanine 2.04736552 0.310015056
cpd00550 D-Serine 1.90483548 0.317276246
cpd00156 L-Valine 1.806927953 0.385856944
cpd00069 L-Tyrosine 1.582322899 0.218417727
cpd00060 L-Methionine 1.395084356 0.233929798
cpd00161 L-Threonine 1.243982408 0.261179221
cpd00322 L-Isoleucine 1.107191645 0.211165444
cpd00051 L-Arginine 0.93620388 0.133660701
cpd00033 Glycine 0.806283864 0.268595078
cpd00348 D-galactose 0.782808808 0.075513967
cpd00119 L-Histidine 0.772743767 0.124559013
cpd00039 L-Lysine 0.578796694 0.098373937
cpd00084 L-Cysteine 0.556558968 0.114920408
cpd00053 L-Glutamine 0.470811116 0.080568485
cpd00038 GTP 0.160980374 0.007734655
cpd00138 D-Mannose 0.156561762 0.021731242
cpd00052 CTP 0.140397548 0.00730785
cpd00002 ATP 0.126879201 0.006289719
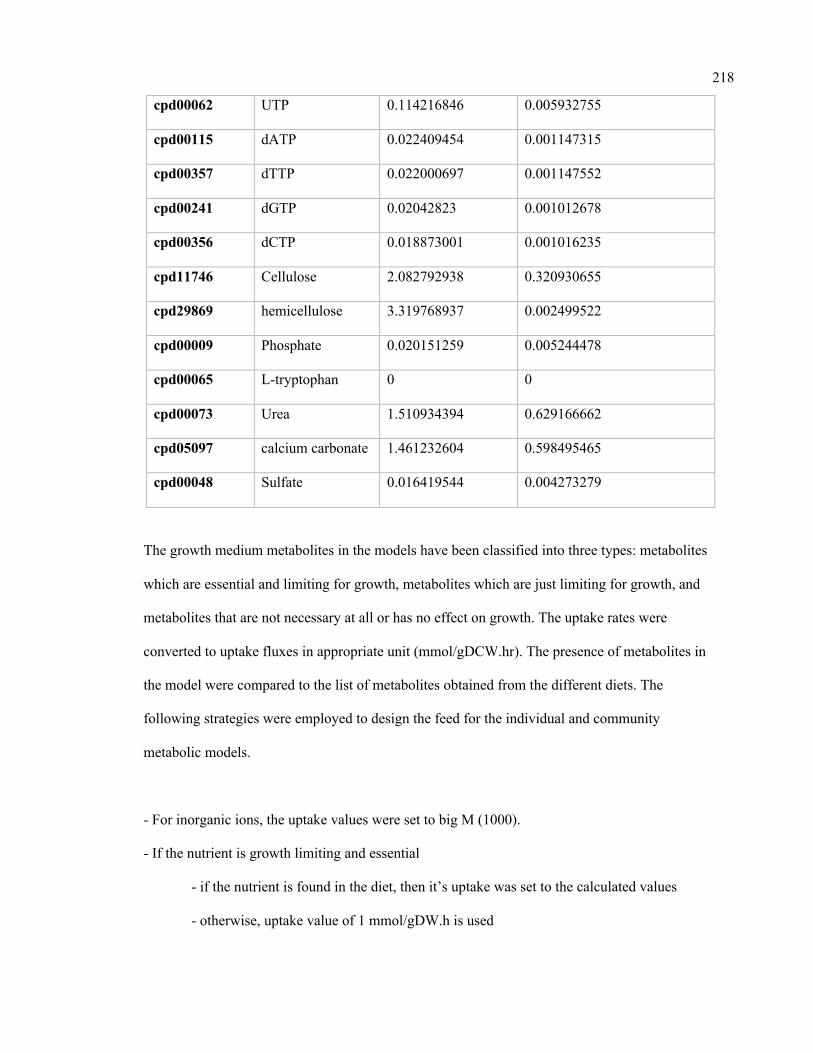
218
The growth medium metabolites in the models have been classified into three types: metabolites
which are essential and limiting for growth, metabolites which are just limiting for growth, and
metabolites that are not necessary at all or has no effect on growth. The uptake rates were
converted to uptake fluxes in appropriate unit (mmol/gDCW.hr). The presence of metabolites in
the model were compared to the list of metabolites obtained from the different diets. The
following strategies were employed to design the feed for the individual and community
metabolic models.
- For inorganic ions, the uptake values were set to big M (1000).
- If the nutrient is growth limiting and essential
- if the nutrient is found in the diet, then it’s uptake was set to the calculated values
- otherwise, uptake value of 1 mmol/gDW.h is used
cpd00062 UTP 0.114216846 0.005932755
cpd00115 dATP 0.022409454 0.001147315
cpd00357 dTTP 0.022000697 0.001147552
cpd00241 dGTP 0.02042823 0.001012678
cpd00356 dCTP 0.018873001 0.001016235
cpd11746 Cellulose 2.082792938 0.320930655
cpd29869 hemicellulose 3.319768937 0.002499522
cpd00009 Phosphate 0.020151259 0.005244478
cpd00065 L-tryptophan 0 0
cpd00073 Urea 1.510934394 0.629166662
cpd05097 calcium carbonate 1.461232604 0.598495465
cpd00048 Sulfate 0.016419544 0.004273279
219
- If the nutrient is not necessary at all
- if the nutrient is found in the diet, then it’s uptake was set to the calculated values
- otherwise, no uptake was allowed.
References:
Craig, W.M., Broderick, G.A., and Ricker, D.B. (1987). Quantitation of microorganisms
associated with the particulate phase of ruminal ingesta. J Nutr 117, 56-62.
Goetsch, A.L., and Galyean, M.L. (1982). Effect of Dietary Concentrate Level on Rumen Fluid
Dilution Rate. Canadian Journal of Animal Science 62, 649-652.
Stokes, M.R., Bull, L.S., and Halteman, W.A. (1985). Rumen liquid dilution rate in dairy cows
fed once daily: effects of diet and sodium bicarbonate supplementation. J Dairy Sci 68, 1171-
1180.
Tellier, R.C., Mathison, G.W., Okine, E.K., Mccartney, D., and Soofi-Siawash, R. (2004).
Frequency of concentrate supplementation for cattle fed barley straw. 2. Ruminal dilution rates,
pH and metabolite concentrations. Canadian Journal of Animal Science 84, 467-479.
Wolin, M.J. (1979). "The Rumen Fermentation: A Model for Microbial Interactions in Anaerobic
Ecosystems," in Advances in Microbial Ecology: Volume 3, ed. M. Alexander. (Boston, MA:
Springer US), 49-77.
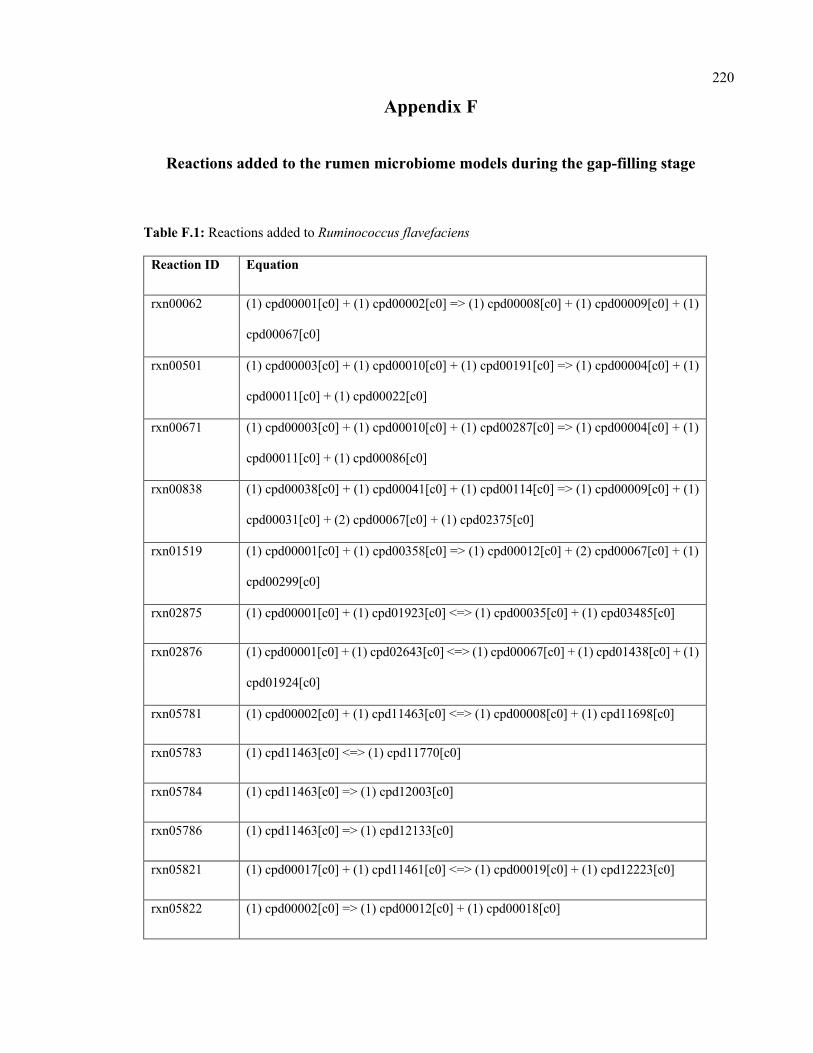
220
Appendix F
Reactions added to the rumen microbiome models during the gap-filling stage
Table F.1: Reactions added to Ruminococcus flavefaciens
Reaction ID Equation
rxn00062 (1) cpd00001[c0] + (1) cpd00002[c0] => (1) cpd00008[c0] + (1) cpd00009[c0] + (1)
cpd00067[c0]
rxn00501 (1) cpd00003[c0] + (1) cpd00010[c0] + (1) cpd00191[c0] => (1) cpd00004[c0] + (1)
cpd00011[c0] + (1) cpd00022[c0]
rxn00671 (1) cpd00003[c0] + (1) cpd00010[c0] + (1) cpd00287[c0] => (1) cpd00004[c0] + (1)
cpd00011[c0] + (1) cpd00086[c0]
rxn00838 (1) cpd00038[c0] + (1) cpd00041[c0] + (1) cpd00114[c0] => (1) cpd00009[c0] + (1)
cpd00031[c0] + (2) cpd00067[c0] + (1) cpd02375[c0]
rxn01519 (1) cpd00001[c0] + (1) cpd00358[c0] => (1) cpd00012[c0] + (2) cpd00067[c0] + (1)
cpd00299[c0]
rxn02875 (1) cpd00001[c0] + (1) cpd01923[c0] <=> (1) cpd00035[c0] + (1) cpd03485[c0]
rxn02876 (1) cpd00001[c0] + (1) cpd02643[c0] <=> (1) cpd00067[c0] + (1) cpd01438[c0] + (1)
cpd01924[c0]
rxn05781 (1) cpd00002[c0] + (1) cpd11463[c0] <=> (1) cpd00008[c0] + (1) cpd11698[c0]
rxn05783 (1) cpd11463[c0] <=> (1) cpd11770[c0]
rxn05784 (1) cpd11463[c0] => (1) cpd12003[c0]
rxn05786 (1) cpd11463[c0] => (1) cpd12133[c0]
rxn05821 (1) cpd00017[c0] + (1) cpd11461[c0] <=> (1) cpd00019[c0] + (1) cpd12223[c0]
rxn05822 (1) cpd00002[c0] => (1) cpd00012[c0] + (1) cpd00018[c0]
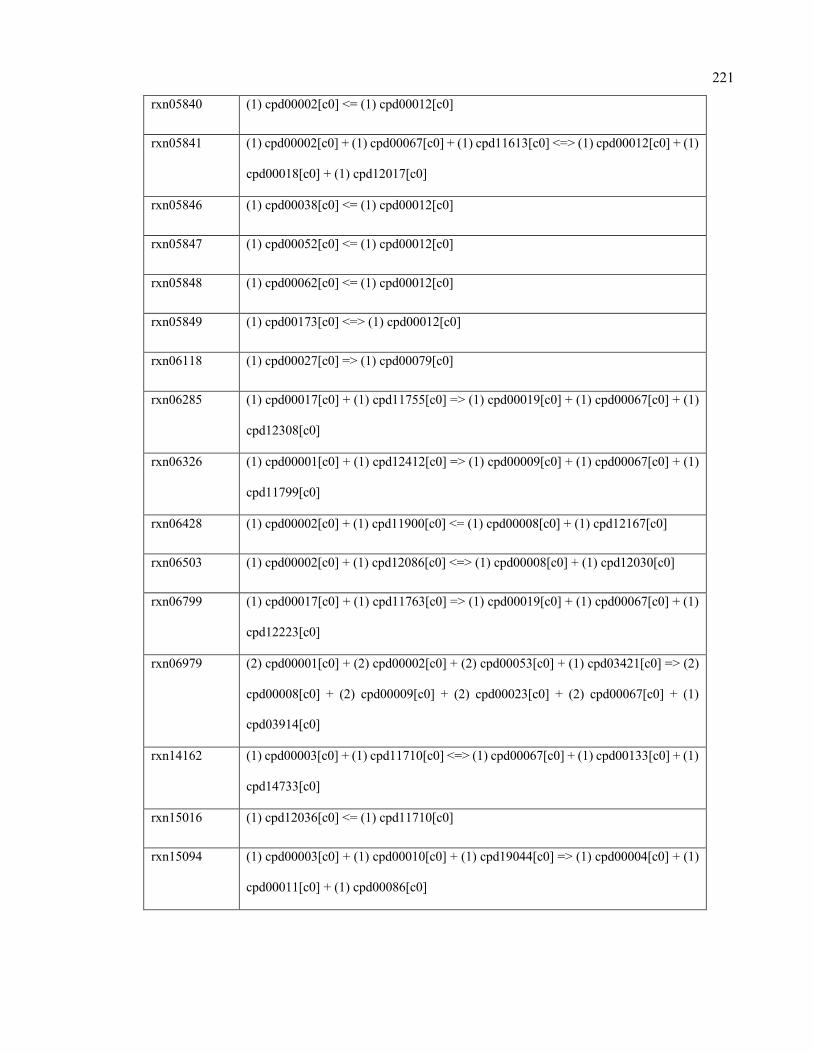
221
rxn05840 (1) cpd00002[c0] <= (1) cpd00012[c0]
rxn05841 (1) cpd00002[c0] + (1) cpd00067[c0] + (1) cpd11613[c0] <=> (1) cpd00012[c0] + (1)
cpd00018[c0] + (1) cpd12017[c0]
rxn05846 (1) cpd00038[c0] <= (1) cpd00012[c0]
rxn05847 (1) cpd00052[c0] <= (1) cpd00012[c0]
rxn05848 (1) cpd00062[c0] <= (1) cpd00012[c0]
rxn05849 (1) cpd00173[c0] <=> (1) cpd00012[c0]
rxn06118 (1) cpd00027[c0] => (1) cpd00079[c0]
rxn06285 (1) cpd00017[c0] + (1) cpd11755[c0] => (1) cpd00019[c0] + (1) cpd00067[c0] + (1)
cpd12308[c0]
rxn06326 (1) cpd00001[c0] + (1) cpd12412[c0] => (1) cpd00009[c0] + (1) cpd00067[c0] + (1)
cpd11799[c0]
rxn06428 (1) cpd00002[c0] + (1) cpd11900[c0] <= (1) cpd00008[c0] + (1) cpd12167[c0]
rxn06503 (1) cpd00002[c0] + (1) cpd12086[c0] <=> (1) cpd00008[c0] + (1) cpd12030[c0]
rxn06799 (1) cpd00017[c0] + (1) cpd11763[c0] => (1) cpd00019[c0] + (1) cpd00067[c0] + (1)
cpd12223[c0]
rxn06979 (2) cpd00001[c0] + (2) cpd00002[c0] + (2) cpd00053[c0] + (1) cpd03421[c0] => (2)
cpd00008[c0] + (2) cpd00009[c0] + (2) cpd00023[c0] + (2) cpd00067[c0] + (1)
cpd03914[c0]
rxn14162 (1) cpd00003[c0] + (1) cpd11710[c0] <=> (1) cpd00067[c0] + (1) cpd00133[c0] + (1)
cpd14733[c0]
rxn15016 (1) cpd12036[c0] <= (1) cpd11710[c0]
rxn15094 (1) cpd00003[c0] + (1) cpd00010[c0] + (1) cpd19044[c0] => (1) cpd00004[c0] + (1)
cpd00011[c0] + (1) cpd00086[c0]
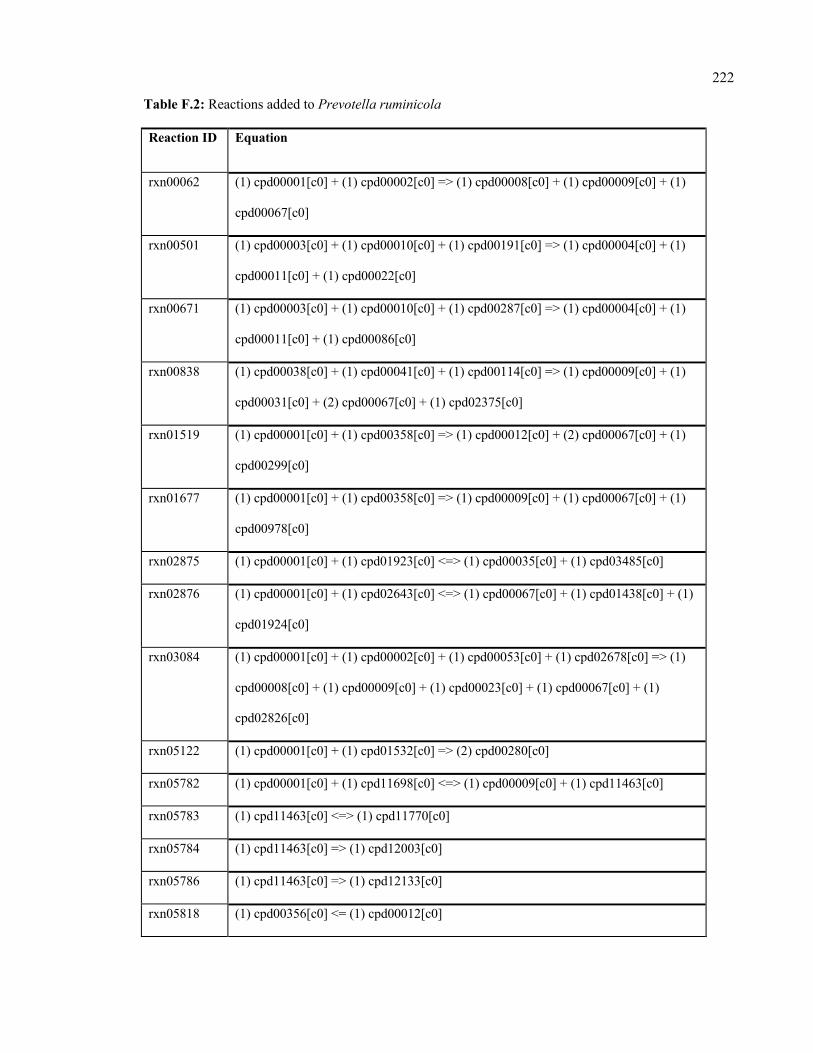
222
Table F.2: Reactions added to Prevotella ruminicola
Reaction ID Equation
rxn00062 (1) cpd00001[c0] + (1) cpd00002[c0] => (1) cpd00008[c0] + (1) cpd00009[c0] + (1)
cpd00067[c0]
rxn00501 (1) cpd00003[c0] + (1) cpd00010[c0] + (1) cpd00191[c0] => (1) cpd00004[c0] + (1)
cpd00011[c0] + (1) cpd00022[c0]
rxn00671 (1) cpd00003[c0] + (1) cpd00010[c0] + (1) cpd00287[c0] => (1) cpd00004[c0] + (1)
cpd00011[c0] + (1) cpd00086[c0]
rxn00838 (1) cpd00038[c0] + (1) cpd00041[c0] + (1) cpd00114[c0] => (1) cpd00009[c0] + (1)
cpd00031[c0] + (2) cpd00067[c0] + (1) cpd02375[c0]
rxn01519 (1) cpd00001[c0] + (1) cpd00358[c0] => (1) cpd00012[c0] + (2) cpd00067[c0] + (1)
cpd00299[c0]
rxn01677 (1) cpd00001[c0] + (1) cpd00358[c0] => (1) cpd00009[c0] + (1) cpd00067[c0] + (1)
cpd00978[c0]
rxn02875 (1) cpd00001[c0] + (1) cpd01923[c0] <=> (1) cpd00035[c0] + (1) cpd03485[c0]
rxn02876 (1) cpd00001[c0] + (1) cpd02643[c0] <=> (1) cpd00067[c0] + (1) cpd01438[c0] + (1)
cpd01924[c0]
rxn03084 (1) cpd00001[c0] + (1) cpd00002[c0] + (1) cpd00053[c0] + (1) cpd02678[c0] => (1)
cpd00008[c0] + (1) cpd00009[c0] + (1) cpd00023[c0] + (1) cpd00067[c0] + (1)
cpd02826[c0]
rxn05122 (1) cpd00001[c0] + (1) cpd01532[c0] => (2) cpd00280[c0]
rxn05782 (1) cpd00001[c0] + (1) cpd11698[c0] <=> (1) cpd00009[c0] + (1) cpd11463[c0]
rxn05783 (1) cpd11463[c0] <=> (1) cpd11770[c0]
rxn05784 (1) cpd11463[c0] => (1) cpd12003[c0]
rxn05786 (1) cpd11463[c0] => (1) cpd12133[c0]
rxn05818 (1) cpd00356[c0] <= (1) cpd00012[c0]
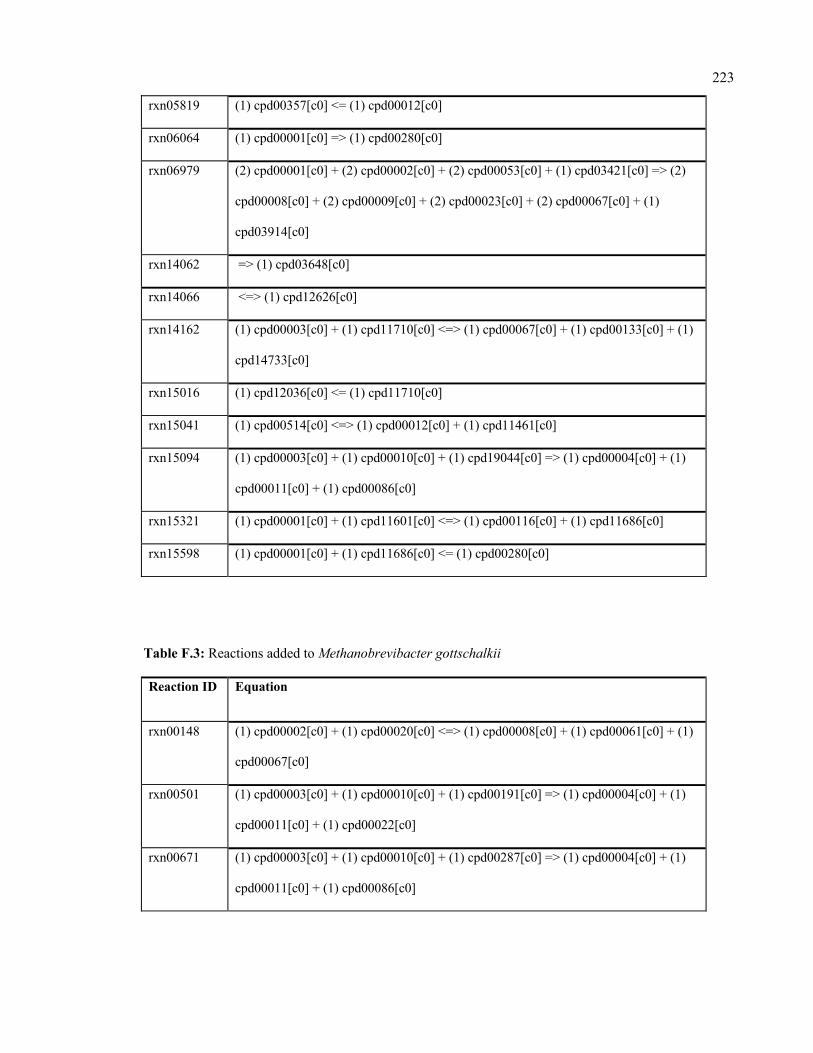
223
rxn05819 (1) cpd00357[c0] <= (1) cpd00012[c0]
rxn06064 (1) cpd00001[c0] => (1) cpd00280[c0]
rxn06979 (2) cpd00001[c0] + (2) cpd00002[c0] + (2) cpd00053[c0] + (1) cpd03421[c0] => (2)
cpd00008[c0] + (2) cpd00009[c0] + (2) cpd00023[c0] + (2) cpd00067[c0] + (1)
cpd03914[c0]
rxn14062 => (1) cpd03648[c0]
rxn14066 <=> (1) cpd12626[c0]
rxn14162 (1) cpd00003[c0] + (1) cpd11710[c0] <=> (1) cpd00067[c0] + (1) cpd00133[c0] + (1)
cpd14733[c0]
rxn15016 (1) cpd12036[c0] <= (1) cpd11710[c0]
rxn15041 (1) cpd00514[c0] <=> (1) cpd00012[c0] + (1) cpd11461[c0]
rxn15094 (1) cpd00003[c0] + (1) cpd00010[c0] + (1) cpd19044[c0] => (1) cpd00004[c0] + (1)
cpd00011[c0] + (1) cpd00086[c0]
rxn15321 (1) cpd00001[c0] + (1) cpd11601[c0] <=> (1) cpd00116[c0] + (1) cpd11686[c0]
rxn15598 (1) cpd00001[c0] + (1) cpd11686[c0] <= (1) cpd00280[c0]
Table F.3: Reactions added to Methanobrevibacter gottschalkii
Reaction ID Equation
rxn00148 (1) cpd00002[c0] + (1) cpd00020[c0] <=> (1) cpd00008[c0] + (1) cpd00061[c0] + (1)
cpd00067[c0]
rxn00501 (1) cpd00003[c0] + (1) cpd00010[c0] + (1) cpd00191[c0] => (1) cpd00004[c0] + (1)
cpd00011[c0] + (1) cpd00022[c0]
rxn00671 (1) cpd00003[c0] + (1) cpd00010[c0] + (1) cpd00287[c0] => (1) cpd00004[c0] + (1)
cpd00011[c0] + (1) cpd00086[c0]
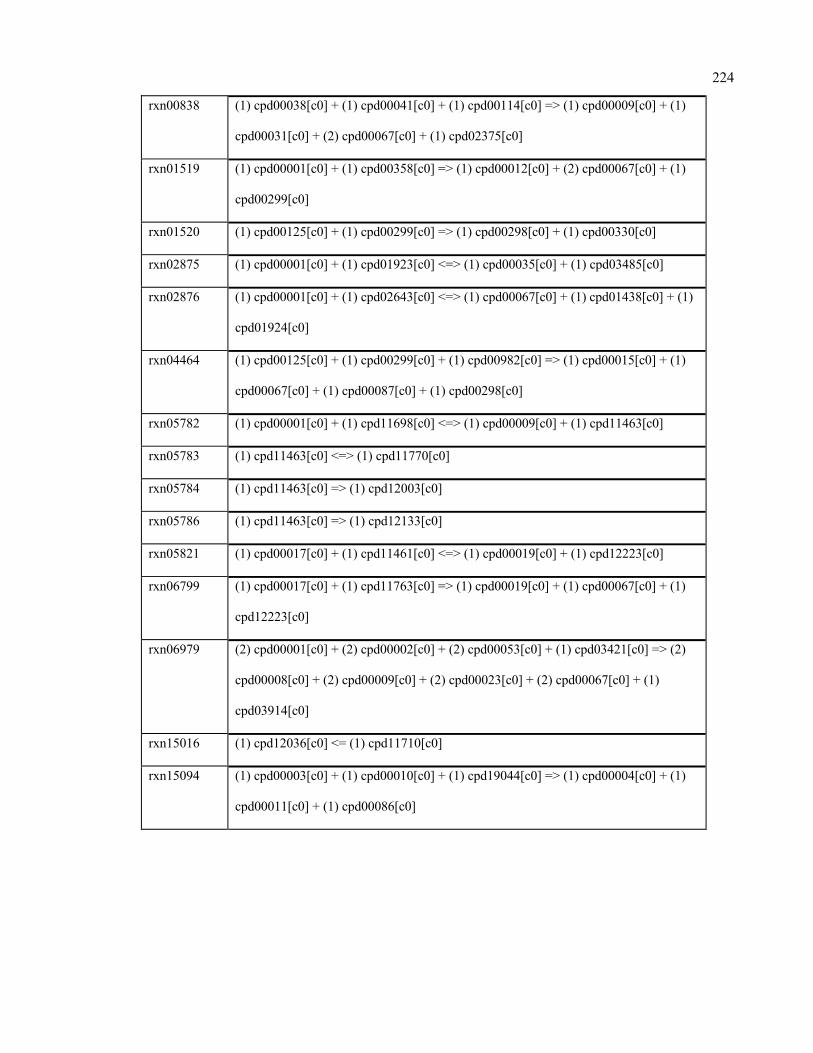
224
rxn00838 (1) cpd00038[c0] + (1) cpd00041[c0] + (1) cpd00114[c0] => (1) cpd00009[c0] + (1)
cpd00031[c0] + (2) cpd00067[c0] + (1) cpd02375[c0]
rxn01519 (1) cpd00001[c0] + (1) cpd00358[c0] => (1) cpd00012[c0] + (2) cpd00067[c0] + (1)
cpd00299[c0]
rxn01520 (1) cpd00125[c0] + (1) cpd00299[c0] => (1) cpd00298[c0] + (1) cpd00330[c0]
rxn02875 (1) cpd00001[c0] + (1) cpd01923[c0] <=> (1) cpd00035[c0] + (1) cpd03485[c0]
rxn02876 (1) cpd00001[c0] + (1) cpd02643[c0] <=> (1) cpd00067[c0] + (1) cpd01438[c0] + (1)
cpd01924[c0]
rxn04464 (1) cpd00125[c0] + (1) cpd00299[c0] + (1) cpd00982[c0] => (1) cpd00015[c0] + (1)
cpd00067[c0] + (1) cpd00087[c0] + (1) cpd00298[c0]
rxn05782 (1) cpd00001[c0] + (1) cpd11698[c0] <=> (1) cpd00009[c0] + (1) cpd11463[c0]
rxn05783 (1) cpd11463[c0] <=> (1) cpd11770[c0]
rxn05784 (1) cpd11463[c0] => (1) cpd12003[c0]
rxn05786 (1) cpd11463[c0] => (1) cpd12133[c0]
rxn05821 (1) cpd00017[c0] + (1) cpd11461[c0] <=> (1) cpd00019[c0] + (1) cpd12223[c0]
rxn06799 (1) cpd00017[c0] + (1) cpd11763[c0] => (1) cpd00019[c0] + (1) cpd00067[c0] + (1)
cpd12223[c0]
rxn06979 (2) cpd00001[c0] + (2) cpd00002[c0] + (2) cpd00053[c0] + (1) cpd03421[c0] => (2)
cpd00008[c0] + (2) cpd00009[c0] + (2) cpd00023[c0] + (2) cpd00067[c0] + (1)
cpd03914[c0]
rxn15016 (1) cpd12036[c0] <= (1) cpd11710[c0]
rxn15094 (1) cpd00003[c0] + (1) cpd00010[c0] + (1) cpd19044[c0] => (1) cpd00004[c0] + (1)
cpd00011[c0] + (1) cpd00086[c0]
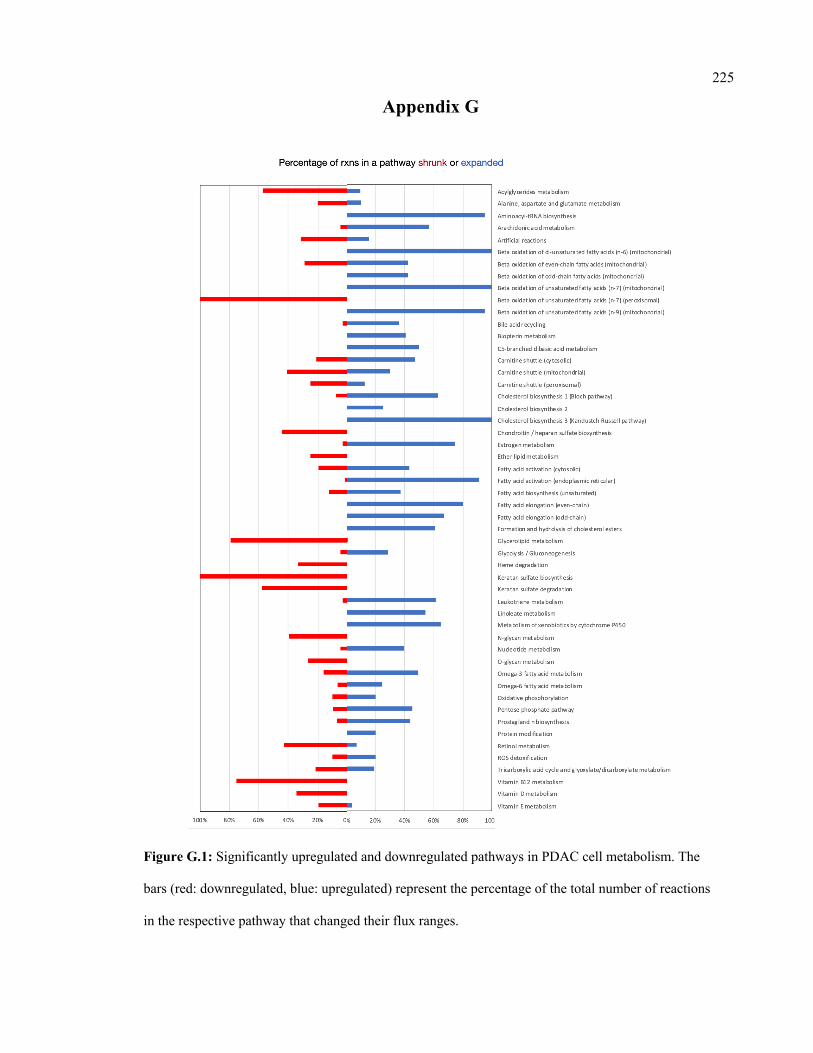
225
Appendix G
Figure G.1: Significantly upregulated and downregulated pathways in PDAC cell metabolism. The
bars (red: downregulated, blue: upregulated) represent the percentage of the total number of reactions
in the respective pathway that changed their flux ranges.