motorcycle in-depth crash study
TRANSCRIPT

Research Report AP-R489-15
Motorcycle In-depth Crash Study

Motorcycle In-depth Crash Study
Prepared by
Julie Brown, Michael Fitzharris, Matthew Baldock, Bianca Albanese, Lauren Meredith, Tom Whyte & Marijke Oomens
Publisher
Austroads Ltd. Level 9, 287 Elizabeth Street Sydney NSW 2000 Australia Phone: +61 2 8265 3300 [email protected] www.austroads.com.au
Project Manager
Alice Ma
Abstract
Motorcyclists represent an increasing proportion of road crash casualties in NSW and Australia. This study aimed to examine the:
• causal relationships between human, vehicle, road and otherenvironmental factors and motorcyclist involvement in seriousinjury crashes; and
• influence of the total system (i.e. the rider, the vehicles and thecrash site) on the nature and pattern of injuries sustained byseriously injured motorcyclists.
A case-control in-depth crash investigation approach coupled with expert multidisciplinary panel review of cases was used. Cases were motorcyclists who had been seriously or fatally injured in a crash on NSW roads. Controls were riders who had ridden, but not crashed on the same section of road where the case crash occurred.
The results indicate that riders using sports motorcycles and who are unfamiliar with their motorcycle, have a greater likelihood of being involved in serious injury crashes than riders using other motorcycle types and those very familiar with their vehicles. Protective factors identified in the case-control analysis included increasing age of the rider, and increased coverage by protective clothing. An additional protective effect was observed when the trip purpose was reported as commuting or general transport rather than for recreational purposes.
Four major themes arose in relation to crash causation and countermeasures: motorcyclists need to be seen; braking ability needs to be optimised; rider control needs to be maintained; and riders need appropriate experience.
About Austroads Austroads’ purpose is to:
• promote improved Australian and New Zealand transportoutcomes
• provide expert technical input to national policydevelopment on road and road transport issues
• promote improved practice and capability by road agencies
• promote consistency in road and road agency operations.
Austroads membership comprises the six state and two territory road transport and traffic authorities, the Commonwealth Department of Infrastructure and Regional Development, the Australian Local Government Association, and NZ Transport Agency. Austroads is governed by a Board consisting of the chief executive officer (or an alternative senior executive officer) of each of its eleven member organisations:
• Roads and Maritime Services New South Wales
• Roads Corporation Victoria
• Department of Transport and Main Roads Queensland
• Main Roads Western Australia
• Department of Planning, Transport and InfrastructureSouth Australia
• Department of State Growth Tasmania
• Department of Transport Northern Territory
• Territory and Municipal Services Directorate, AustralianCapital Territory
• Commonwealth Department of Infrastructure andRegional Development
• Australian Local Government Association
• New Zealand Transport Agency.The success of Austroads is derived from the collaboration of member organisations and others in the road industry. It aims to be the Australasian leader in providing high quality information, advice and fostering research in the road transport sector.
Keywords
Motorcycle, helmet, protective clothing, road safety, crash investigation, crash causation, crash avoidance
ISBN 978-1-925294-64-4
Austroads Project No. SS1710
Austroads Publication No. AP-R489-15
Publication date November 2015
Pages 121
© Austroads 2015 This work is copyright. Apart from any use as permitted under the Copyright Act 1968, no part may be reproduced by any process without the prior written permission of Austroads.
Acknowledgements The authors would like to thank the other members of the multi-disciplinary crash review panel; Liz de Rome (Chair), Jo Duflou, Ross Dal Nevo, Michael Griffiths, Giovanni Savino, Paul Rees, Damien Chee, Melvin Eveleigh, Ralston Fernandes, Ben Barnes, and members of the NSW Police Crash Investigation Unit. The authors also thank Mark Kazzi, Linda Pickett and Stevan Nikolin for data collection and case review assistance and Tom Gibson for supervising helmet inspections. Finally the study would not have been possible without the assistance provided by NSW Hospital trauma units; Kate Curtis, Taneal Wiseman, Tiffany Rankin, Julie Seggie, Anne McShane, Linda Gutierrez, Zsolt Balogh and Natalie Lott, and the assistance of the Motorcycle Council of NSW and the National Motorcycle Alliance.
This report has been prepared for Austroads as part of its work to promote improved Australian and New Zealand transport outcomes by providing expert technical input on road and road transport issues. Individual road agencies will determine their response to this report following consideration of their legislative or administrative arrangements, available funding, as well as local circumstances and priorities. Austroads believes this publication to be correct at the time of printing and does not accept responsibility for any consequences arising from the use of information herein. Readers should rely on their own skill and judgement to apply information to particular issues.

Motorcycle In-depth Crash Study
Austroads 2015 | page i
Summary
Motorcyclists represent an increasing proportion of road crash casualties in NSW and Australia. To develop effective countermeasures to this problem there is a need for detailed understanding of the risk factors influencing crash involvement and poor injury outcomes among motorcyclists. In-depth investigation is the best method for collecting high levels of detail about all of the potential factors in a crash. Given that the last Australian in-depth study occurred in 1997 and a number of significant motorcycle interventions have been implemented since that time (e.g., graduated licence schemes, numerous education and awareness campaigns), Australian road and transport agencies commissioned a new in-depth study of motorcycle crashes. The aims of this study were to:
1. Examine causal relationships between human, vehicle, road and other environmental factors and motorcyclist involvement in serious injury crashes; and
2. Examine the influence of the total system (i.e. the rider, the vehicles and the crash site) on the nature and pattern of injuries sustained by seriously injured motorcyclists.
A case-control in-depth investigation approach was coupled with expert multidisciplinary review of crashes to achieve these aims. Data collection occurred over a 24 month period between August 2012 and July 2014 across the greater Sydney, Hunter and Illawarra regions. These locations were selected for reasons of efficiency while still allowing inclusion of a mix of urban and rural crash locations. Case recruitment and data collection followed the protocols of the Australian National In-depth Crash Study (ANCIS). To ensure the full spectrum of serious crashes were represented, 10% of the sample involved fatal crashes. Data collected during the investigations were summarised and presented to an expert multidisciplinary Panel consisting of NeuRA researchers and engineers, a leading trauma forensic pathologist, road engineering and motorcycling experts from the NSW Centre for Road Safety, motorcycle safety research and crash investigation experts and behavioural scientists. The Panel considered factors contributing to the crash and injury outcome, as well as potential countermeasures using the Haddon matrix as a framework. Recruitment of controls relied on a method where riders nominated themselves based on previous travel through the crash location without crashing. While self-selection of controls is a potential limitation, this proved to be the most efficient possible method, and comparison of the resulting sample with the population of riders allowed any bias in the control sample to be identified. Furthermore the analysis methods controls for any differences in the composition of the samples.
The final crash sample included 102 riders, comprising 92 serious injury crashes and 10 fatal injury crashes. The 102 crashes were reviewed by the multidisciplinary Panel. A total of 336 control riders were surveyed, providing matched controls for 99 of the crashes.
The results of this study indicate that riders using sports motorcycles have greater odds of being involved in serious injury crashes than riders using other motorcycle types. Furthermore, the association between motorcycle type and crash involvement differed across age groups, with the elevated crash risk associated with sports bikes more prominent among older riders. Riding an unfamiliar motorcycle also significantly increased the odds of being in the crash sample. Another novel finding is that riders who rode the crash location daily had seven times the odds of being in the crash sample than the control sample. However, the mixed methods used in this study also identified route unfamiliarity as a contributory factor in a small number of crashes. These two concurrent findings suggest a non-linear relationship between familiarity and crash risk.

Motorcycle In-depth Crash Study
Austroads 2015 | page ii
The older the rider, the lower the odds they were in the crash sample. However older riders who were in the crash sample had significantly longer stays in hospital compared to younger riders. This indication of increased severity of outcome with older age has not been previously reported in motorcyclists. Riders who wore more protective clothing also had lower odds of being in the crash sample and this likely suggests that attitudes to riding and/or risk, associated with the use of protective clothing, may also be associated with reduced odds of crashing.
There was also a suggestion of some difference in the nature of the trip between riders who crashed (cases) and those who did not (controls). Control riders were more likely to report they had been riding in heavy traffic and in freeway type conditions prior to travelling through the crash location. Similarly, a protective effect was observed when the trip purpose was reported as commuting or general transport rather than for recreational purposes.
Most injuries sustained by the motorcyclists were minor, and involved the arms and legs. However, there were differences in the nature and pattern of injury by injury severity. While minor injury predominately involved the extremities, moderate to severe injury predominately involved the torso (the thorax, abdomen and pelvis). The most common injury sources were the roadway, another vehicle, and contact with their own motorcycle. Extremity injury resulted mainly from contact with the roadway, while more serious injuries to the thorax and abdomen resulted from contact with roadside objects, such as guardrails and fences. The motorcycle fuel tank was a common source of injury to the pelvis.
Head injury was uncommon as most riders wore helmets. However, examination of helmet performance indicated full face helmets provided better protection than open face helmets, and most impacts to the helmet or head of the rider, occurred to the front of the helmet or the face of the rider. This supports the need to extend the coverage of AS 1698.
Consistent with previous studies, riders who wore clothing specifically designed for motorcycle use were provided with effective protection against abrasions and lacerations. However, some motorcycle specific clothing failed to prevent even minor injury. Furthermore, there was little additional benefit provided from impact protectors. There is significant scope to improve the quality of motorcycle protective clothing available to Australian riders.
Using a qualitative approach four major themes emerged from the multidisciplinary Panel reviews. The benefit of the thematic approach is that it allows motorcycle safety issues to be examined from a whole system perspective. For the ‘riders need to be seen’ theme, vehicle factors related to poor bike conspicuity and blind spots in cars; human factors included drivers having inherent difficulties judging motorcycle speed, and riders travelling too close to other vehicles and taking poor lane positions; and environmental features included objects within the road environment obscuring vision of motorcycles, and treatments failing to effectively control approaches to uncontrolled intersections. For the riders ‘need to stop in time’ theme, vehicle factors related to inherent braking deficiencies; human factors related to rider speed and braking techniques; and environmental factors included obstructions to riders vision, roadway features leading to variable traffic flow and lack of appropriate road shoulders. Within the ‘maintaining control’ theme vehicle factors such as inherent instability of motorcycles and rider technique and approach speed were noted, however, road environment deficiencies were the most common. Finally for ‘rider experience’, Panel discussion highlighted the importance of experience with the motorcycle, and the match between the rider’s experience/skill level and the level of difficulty of the route being ridden.
Across the themes, recurring countermeasures that were identified included enhanced motorcycle technologies and intelligent transport technologies, the need to ride with awareness, and optimising the road environment for motorcycles and/or providing better control and guidance to road users.

Motorcycle In-depth Crash Study
Austroads 2015 | page iii
Contents
1. Introduction .................................................................................................................................. 4 1.1 Study Aims ............................................................................................................................. 5 1.2 Report Structure .................................................................................................................... 6
2. Methods ........................................................................................................................................ 7 2.1 Study Development and Ethics.............................................................................................. 7 2.2 Data Collection Methods ........................................................................................................ 7
2.2.1 In-depth crash study (cases) .............................................................................................. 7 2.2.2 Fatality study ....................................................................................................................... 10 2.2.3 Case control study .............................................................................................................. 10 2.2.4 Panel review ....................................................................................................................... 10
2.3 Analysis Methods ................................................................................................................. 11 2.3.1 Description of crash sample and injury outcomes ........................................................... 11 2.3.2 Case control study .............................................................................................................. 14 2.3.3 Rider reported environmental factors ............................................................................... 19 2.3.4 Performance of protective equipment ............................................................................... 22 2.3.5 Qualitative analysis of crash and injury causation factors and potential
countermeasures................................................................................................................ 23
3. Results ........................................................................................................................................ 24 3.1 The Crash Sample ............................................................................................................... 24
3.1.1 Discussion of the crash sample ........................................................................................ 31 3.2 Case Control Sample Comparisons .................................................................................... 32
3.2.1 General characteristics of the case and control samples ................................................ 33 3.2.2 Characteristics of the case and control samples related to the site
specific ride ......................................................................................................................... 43 3.2.3 Important points to note regarding the control sample .................................................... 46
3.3 Case Control Analysis ......................................................................................................... 48 3.3.1 Key findings ........................................................................................................................ 48 3.3.2 Description and explanation of case control analysis ...................................................... 48 3.3.3 Important points to note regarding the case control analysis .......................................... 53
3.4 Rider Reported Environmental Factors ............................................................................... 54 3.4.1 Important points to note regarding rider reported environmental factors ....................... 59
3.5 Injury Outcomes ................................................................................................................... 59 3.5.1 Important points to note regarding injury outcomes......................................................... 63
3.6 Performance of Protection Equipment ................................................................................. 64 3.6.1 Helmets ............................................................................................................................... 64 3.6.2 Protective clothing .............................................................................................................. 70
3.7 Qualitative Analysis of Crash and Injury Causation Factors and Potential Countermeasures ................................................................................................................ 81 3.7.1 Common crash types ......................................................................................................... 81 3.7.2 Crash causation.................................................................................................................. 83 3.7.3 Potential crash avoidance countermeasures ................................................................... 89 3.7.4 Summary of emerging crash causation and countermeasure themes .......................... 96

Motorcycle In-depth Crash Study
Austroads 2015 | page iv
3.7.5 Injury causation ................................................................................................................ 100 3.7.6 Injury countermeasures ................................................................................................... 101 3.7.7 Summary of emerging injury causation and countermeasure themes ......................... 103 3.7.8 Post crash factors ............................................................................................................. 105 3.7.9 Important points to note about the qualitative analysis .................................................. 105
4. Discussion ............................................................................................................................... 106 4.1 Causal relationships .......................................................................................................... 106 4.2 Nature and pattern of injury ............................................................................................... 108 4.3 Emerging crash prevention themes ................................................................................... 110 4.4 Commonalities across themes........................................................................................... 112 4.5 Protective equipment ......................................................................................................... 113 4.6 Study limitations ................................................................................................................. 113 4.7 Areas for further study ....................................................................................................... 114
References ....................................................................................................................................... 116
Tables
Table 1: Crash Description Variables.............................................................................................. 11 Table 2: Variables explored with injury outcome ............................................................................ 14 Table 3: Additional case control analysis rider characteristic variables .......................................... 14 Table 4: Additional case control analysis trip characteristic variables ............................................ 18 Table 5: variables used to explore case and control rider views on crash site ............................... 20 Table 6: Clothing designed for motorcycle use ............................................................................... 42 Table 7: Riding characteristics in the hour before the crash ........................................................... 45 Table 8: Activities on the day before the crash ............................................................................... 45 Table 9: Rider characteristics .......................................................................................................... 49 Table 10: Motorcycle characteristics ................................................................................................ 49 Table 11: Exposure/Riding characteristics ....................................................................................... 50 Table 12: Crash/Violation history ...................................................................................................... 50 Table 13: Trip Characteristics ........................................................................................................... 51 Table 14: Hour before crash ............................................................................................................. 51 Table 15: Day before crash ............................................................................................................... 51 Table 16: Step 1 conditional logistic regression ................................................................................ 52 Table 17: Step 2 conditional logistic regression ................................................................................ 52 Table 20: Case riders reporting oil/debris road surface issues may have affected handling ........... 55 Table 21: Association between injury risk factors and injury outcome ............................................. 63 Table 22 Frequency and severity of head injuries ........................................................................... 66 Table 23 Frequency and severity of neck injuries ............................................................................ 66 Table 24: Number of cases that sustained some impact damage in various zones ......................... 69 Table 25: Number of cases sustaining injury by helmet type ........................................................... 69 Table 26: Age of riders wearing clothing designed for motorcycle use ............................................ 71 Table 27: Type of motorcycle ridden by riders wearing garments designed for motorcycle use ...... 72 Table 28: Number of cases where the clothing was damaged ......................................................... 73 Table 29: Frequency of the different types of damage ..................................................................... 73 Table 30: Damage to the clothing by clothing type ........................................................................... 76

Motorcycle In-depth Crash Study
Austroads 2015 | page 2
Table 31: Damage to motorcycle specific clothing while controlling for impact speed and type ...... 77 Table 32: Extensive damage to motorcycle specific clothing while controlling for
impact speed and type ...................................................................................................... 78 Table 33: Injury to body regions covered by the different clothing items ......................................... 79 Table 34: Association between any injury and use of motorcycle specific clothing .......................... 80 Table 35: Association between any injury and use of clothing incorporating impact protection ....... 80 Table 36: Association between soft tissue injury (excluding contusions) and use of motorcycle
specific clothing ................................................................................................................. 80 Table 37: Association between soft tissue injury (excluding contusions) and use of clothing
incorporating impact protection ......................................................................................... 81 Table 38: Motorcyclists need to be seen (% given are % of all cases in sample). ........................... 97 Table 39: Enhance braking ability ..................................................................................................... 98 Table 40: Maintaining control (% given are % of all cases in sample). ............................................. 99 Table 41: Appropriate experience (% given are % of all cases in sample)..................................... 100 Table 42: Riders need good quality protective equipment .............................................................. 103 Table 43: Motorcycle design should mitigate injury to the rider ...................................................... 104 Table 44: Roadside furniture and other vehicles need to be more forgiving .................................. 104
Figures
Figure 1: Age of riders in crash sample............................................................................................ 24 Figure 2: Crash locations by country/metropolitan location ............................................................. 24 Figure 3: The geographical distribution of crashes within the crash sample. .................................. 25 Figure 4: Road types ........................................................................................................................ 25 Figure 5: Intersection types .............................................................................................................. 26 Figure 6: Distribution of speed limits at the crash locations ............................................................. 26 Figure 7: Crash types ....................................................................................................................... 27 Figure 8: DCA code description of crash types ................................................................................ 28 Figure 9: RUM code description of crash types ............................................................................... 29 Figure 10: Days of the week ............................................................................................................... 30 Figure 11: Time of day........................................................................................................................ 30 Figure 12: Number of controls per case ............................................................................................. 32 Figure 13: Age distribution ................................................................................................................. 33 Figure 14: Licence distribution ........................................................................................................... 34 Figure 15: Motorcycle Type ................................................................................................................ 35 Figure 16: Distribution of motorcycle engine capacity ........................................................................ 35 Figure 17: Rider familiarity with motorcycle being ridden ................................................................... 36 Figure 18: Kilometres clocked on motorcycle being ridden................................................................ 36 Figure 19: Average kilometres ridden per week (last 12 months) ...................................................... 37 Figure 20: Frequency of riding ........................................................................................................... 37 Figure 21: Riding days........................................................................................................................ 38 Figure 22: Frequency of riding for commuting purposes .................................................................... 38 Figure 23: Frequency of riding for leisure/pleasure ............................................................................ 39 Figure 24: Car crashes last 3 years ................................................................................................... 40 Figure 25: Reported near misses in last 12 months ........................................................................... 40

Motorcycle In-depth Crash Study
Austroads 2015 | page 3
Figure 26: Violations in last 12 months .............................................................................................. 41 Figure 27: Helmet types ..................................................................................................................... 41 Figure 28: Visor types......................................................................................................................... 42 Figure 29: Use of protective clothing .................................................................................................. 42 Figure 30: Use of ear plugs ................................................................................................................ 43 Figure 31: Trip purpose ...................................................................................................................... 43 Figure 32: Familiarity with location ..................................................................................................... 44 Figure 33: Familiarity with crash location collapsed to three categories ............................................ 44 Figure 34: Age distribution of control sample compared to age distribution of estimated
population of riders from NSW .......................................................................................... 46 Figure 35: Licence distribution of control sample compared to licence distribution of estimated
population of riders from NSW. ......................................................................................... 47 Figure 36: Variation in relationship between motorcycle type and being in crash sample by age..... 53 Figure 37: Reported road surface problems (cases and controls combined) .................................... 54 Table 18: Case riders reporting rough road surface that may have affected vehicle handling......... 55 Table 19: Case riders reporting ‘other’ road surface issues that may have affected handling ......... 55 Figure 38: Loose material ................................................................................................................... 56 Figure 39: Metal plate covering braking zone .................................................................................... 56 Figure 40: Visibility problems ............................................................................................................. 57 Figure 41: Dangerous crash location ................................................................................................. 57 Figure 42: Single vehicle crashes ...................................................................................................... 58 Figure 43: Multi vehicle crashes ......................................................................................................... 58 Figure 44: ISS distribution .................................................................................................................. 59 Figure 45: All injuries .......................................................................................................................... 60 Figure 46: AIS 3+ injuries non-fatals .................................................................................................. 60 Figure 47: Injury source – overall ....................................................................................................... 61 Figure 48: Source of injury for AIS 3+ injury (only non-fatals) ........................................................... 62 Figure 49: External damage and corresponding damage to the internal protective
liner of the helmet ............................................................................................................. 65 Figure 50: External damage and corresponding damage to the internal protective
liner of the helmet ............................................................................................................. 65 Figure 51: External damage and corresponding damage to the internal protective
liner of the helmet ............................................................................................................. 65 Figure 52: Distribution of all impact damage in all 67 inspected cases. ............................................ 67 Figure 53: Distribution of major impact damage in 20 cases with evidence of a major impact. ........ 67 Figure 54: Distribution of all damage in 26 cases where head or neck injury was sustained. ........... 68 Figure 55: Distribution of all damage in 13 cases of AIS 2+ head or neck injury. .............................. 68 Figure 56: Impact protection by region ............................................................................................... 71 Figure 57: Distribution of damage locations with respect to the AIS body regions ............................ 74 Figure 58: Distribution of damage locations according to EU13595 clothing standard zones ........... 75

Motorcycle In-depth Crash Study
Austroads 2015 | page 4
1. Introduction
Motorcyclists are the fastest growing sector of road users globally and represent an increasing proportion of road crash casualties in Australia and around the world (Rogers 2008, WHO 2009). Australian motorcycle registrations increased by 61% between 2005 and 2011, and the number of injured motorcyclists increased by 14% during that same time period (AIHW 2008, ABS 2010, ABS 2012). Nationally, motorcycle riders make up 22% of serious casualties, yet motorcycles account for just 4.2% of all registered vehicles (ABS 2012, AIHW 2013).
Risk factors for motorcycle crash involvement and injury have previously been studied using a variety of methods including the analysis of population level crash and hospital data (e.g., Mullin, Jackson et al. 2000, Wells, Mullin et al. 2004, Langley, Samaranayaka et al. 2013), survey and self-report crash data (e.g., Elliott, Baughan et al. 2007, Ozkan, Lajunen et al. 2012) and in-depth crash investigation (e.g., Hurt, Ouellet et al. 1981, Haworth, Smith et al. 1997, Kasantikul 2002, ACEM 2004). These studies have identified a number of different potential factors associated with crash and injury risk, in relation to the rider, the vehicle being ridden, other vehicles and the road environment.
Rider factors previously identified to be associated with crash risk include young rider age, less experience, being unlicensed, alcohol use, riding and braking skills, riding behaviour and attitude to riding such as behaviour and attitude to speeding, traffic violations and risk-taking (Hurt Jr, Ouellet et al. 1981, Haworth, Smith et al. 1997, Mullin, Jackson et al. 2000, ACEM 2004, Elliott, Baughan et al. 2007). Vehicle factors reported to be important to crash risk include conspicuity, and motorcycle size and type (Hurt, Ouellet et al. 1981, Wells, Mullin et al. 2004, Mattsson and Summala 2010, Teoh and Campbell 2010, Pai 2011). A number of studies have reported sports motorcycles to be associated with higher rates of death and serious injury than other types of motorcycles (Teoh and Campbell 2010, Bjornskau, Naevestad et al. 2012, Connor 2014). Some studies have also reported large capacity motorcycles to be associated with a greater crash risk (Namdaran and Elton 1988) and increased probability of serious injury or death (Kraus, Riggins et al. 1975, Quddus, Noland et al. 2002, Jou, Hensher et al. 2013, Rolison, Hewson et al. 2013) however others report no significant consistent effect between engine size and crash risk (Langley, Mullin et al. 2000, Yannis, Golias et al. 2005). The role that other vehicles on the road play in motorcycle crashes is also of interest because of the reported high frequency of crashes involving other vehicles failing to give way to motorcycles (Pai 2011). These are often discussed as ‘fail-to-see’ crashes and commonly attributed to deficits in the perceptions of other drivers (Hurt, Ouellet et al. 1981, Clarke, Ward et al. 2007). Road environment features associated with motorcycle crash risk have also been reported. These include the quality of the road surface (Haworth, Smith et al. 1997, Miggins, Lottenberg et al. 2011), aspects of the horizontal curvature of the roadway such as the radius and length of a horizontal curve and the availability and appropriateness of roadside shoulders (Hurt, Oullet et al, 1981; Schneider, Savolein et al, 2010).
For injury risk, previous studies have primarily focused on reporting the nature and distribution of injuries sustained by motorcyclists (Hurt, Ouellet et al. 1981, Ankarath, Giannoudis et al. 2002, MAIDS 2004, Fitzharris, Dandona et al. 2009, Leijdesdorff, Siegerink et al. 2012, White, Lang et al. 2013), the impact of protective equipment such as helmets (Evans and Frick 1988, Gabella, Reiner et al. 1995, Auman, Kufera et al. 2002, Houston and Richardson 2008, Croce, Zarzaur et al. 2009, Dao, Lee et al. 2012), and protective clothing (Feldkamp, Prall et al. 1977, Hurt Jr, Ouellet et al. 1981, Otte, Schroeder et al. 2002, de Rome, Ivers et al. 2011, Erdogan, Sogut et al. 2013) and more recently the interaction between roadside furniture such as guard rails and road side barriers and injury outcome (Daniello and Gabler 2011, Bambach, Grzebieta et al. 2012, Daniello and Gabler 2012).
From a Safe Systems perspective, the degree to which any one study can examine the range of potential factors is limited by the detail and validity of the data collected. In-depth investigation is the best method for collecting high levels of detail about all of the potential factors in a crash.

Motorcycle In-depth Crash Study
Austroads 2015 | page 5
Large scale in-depth studies of motorcycle crash causes have been undertaken in a number of jurisdictions around the world. These include a study of 923 cases in the US (Hurt, Ouellet et al. 1981), cases in Thailand (Kasantikul 2001, Kasantikul 2001), 921 cases across five countries in Europe (ACEM 2004, ACEM 2009) and 216 crashes in UK (Mansfield, Bunting et al. 2008). The most recent Australian in-depth investigation involved investigation of 222 motorcycle crashes in Victoria and was reported in 1997 (Haworth 1997).
The majority of data from in-depth crash investigations is presented as descriptive data but there have been a number of attempts to study motorcycle risk factors through in-depth investigation using a case-control approach (Hurt, Ouellet et al. 1981, Haworth 1997, MAIDS 2004). Case-control studies are studies that are designed to compare a group with a specific attribute, such as being involved in a crash (cases) to another group without that attribute such as those that have not been involved in a crash (controls). By making this comparison, factors that distinguish the two groups can be identified. The case-control method is an efficient way to study a variety of risk factors for crash involvement, because it requires relatively simple retrospective study of people who have been involved crashes and good statistical power can be achieved by including two or three controls for every case. However achieving a random sample of cases and controls can be difficult because collecting the necessary level of detail from people who have been involved in crashes at a population level is difficult. Similarly, it can be difficult to establish an appropriate set of controls. Controls should be similar in a number of ways to the cases but without being involved in a crash. To examine the factors associated with crash involvement while controlling for any other potential confounding difference between the two samples, it is necessary to use special statistical analyses. These conditions have not been met adequately by any of the previous attempts at in-depth case-control investigations. Nevertheless, the data generated from these studies has been rich in detail and has informed the development of strategic directions and countermeasures to motorcycle crash and injury risk.
Drawing on the findings of earlier in-depth investigations and other related studies, there have been a number of significant interventions introduced in Australia to reduce motorcycle crash and injury risk over the last few decades. These include mandatory use of helmets, graduated licensing schemes, specifically targeted road environment treatments and numerous local and population level education and awareness campaigns. As the last in-depth investigation conducted in Australia occurred in 1997, and there remains a need for a robustly conducted and analysed case-control study, Australian road and transport agencies commissioned a new in-depth case control study of motorcycle crashes.
1.1 Study Aims 1. Examine causal relationships between human, vehicle, road and other environmental factors and
motorcyclist involvement in serious injury crashes, and
2. Examine the influence of the total system (i.e. the rider, the vehicles and the crash site) on the nature and pattern of injuries sustained by seriously injured motorcyclists
A case-control in-depth crash investigation approach coupled with expert multidisciplinary panel review of cases was used to achieve the aims of the project. Cases were drawn from motorcyclists who had been seriously or fatally injured in a crash on NSW roads. Controls were riders who had ridden, but not crashed on the same section of road where the case crash occurred.
A case-control analysis was used to quantitatively examine human and vehicle risk factors for motorcycle crashes. Data collected from case and control riders was used to report features of the roadway perceived to play a role the crashes. The in-depth investigation was used to describe injury outcome and to study the performance of protective equipment used by the riders. Finally, qualitative study of the causal issues raised in the expert multidisciplinary review of cases was used to summarise the influence of the total system (i.e. the rider, vehicle and road environment) on crash involvement and injury outcome.
The outcomes of this work will be used to formulate targeted policies, programs, education and communication campaigns towards reducing the number of motorcyclists killed and injured on Australian roads.

Motorcycle In-depth Crash Study
Austroads 2015 | page 6
1.2 Report Structure
The report is structured as follows. Section 2 presents the methods for the entire body of work. Section 3 presents the results and describes the crash sample, compares the characteristics of the case and control samples, presents the results from the case-control analysis, reports the rider reported environmental factors, the injury outcomes, a quantitative analysis of the performance of the protective equipment and the qualitative analysis of the data generated by the expert panel reviews. Important notes for the reader to keep in mind when reviewing each subsection of results are also included. The final section of the report, the discussion, draws the findings of the overall study together with respect to the total system. It is important to highlight that an immense amount of data was collected for this study, and while the results and observations presented address the study aims as agreed with the project managers, the results and observations made also indicate a number of areas where further quantitative analysis may be fruitful. For this reason, the discussion section also notes areas for further study. Finally, while many of the limitations of the study are included in sub sections of the results as important notes for the reader to keep in mind, these have also been summarised as a limitations section at the end of the discussion.

Motorcycle In-depth Crash Study
Austroads 2015 | page 7
2. Methods
The study was conducted over a 24 month period between August 2012 and July 2014 across the Greater Sydney, Hunter and Illawarra regions. Case recruitment and data collection methods followed a modified version of the Australian National Crash Investigation Study (ANCIS) method. Serious injury cases were recruited from three major NSW trauma hospitals: St George Hospital, Westmead Hospital and John Hunter Hospital. Fatal injury crashes involved in-depth review of coronial records and scene investigation.
To cover the full range of the aims of this work, the case-control analysis is supplemented by a descriptive analysis of the data collected, and a qualitative analysis of the outcomes of the expert panel review of cases.
2.1 Study Development and Ethics
The development of the study instruments, including the rider interviews and inspection forms for the crash sites, protective clothing inspections and helmet inspections were finalised in collaboration with the project managers and their stakeholders.
Ethics approval for collection of data from motorcycle riders involved in crashes was obtained from the lead NSW Department of Health Ethics Committee (RPAH zone) and ratified by the University of New South Wales Human Ethics Committee. Site specific approvals (SSA) to recruit cases were obtained from each of the study hospitals. These were the South Eastern Sydney Local Health District (St George Hospital), Westmead Sydney Local Health District (Westmead Hospital) and the Hunter New England Local Health (John Hunter Hospital).
Separate ethics approval for access to and review of coronial records was obtained from the State Coroner and the Sydney South West Area Health Service (RPAH Zone) Human Research Ethics Committee. Site specific approval to conduct the review at the Department of Forensic Medicine, Glebe was also granted from the latter.
2.2 Data Collection Methods
2.2.1 In-depth crash study (cases)
Of the three major trauma hospitals that were included in the study, two were Sydney urban hospitals and one was a regional NSW hospital. Cases were collected prospectively following email notification from the trauma departments and on-site recruitment by research nurses. The motorcycle riders included in the study were aged 16 years or older and admitted to these hospitals throughout the time period August 2012 to June 2014 following involvement in a motorcycle crash (MBC). Additional inclusion criteria included a crash location within four hours drive from Randwick (Neuroscience Research Australia); at least one injury able to be coded to the Abbreviated Injury Severity (AIS) score (AAAM 2005) and therefore a minimum Injury Severity Score (ISS) of 1; no psychological or social issues warranting exclusion e.g. pre-existing mental illness, drug addiction; no known infection risk to the research team during interview process or motorcycle, clothing or helmet inspections; and ability to provide informed consent (either by the potential participant or their next of kin).

Motorcycle In-depth Crash Study
Austroads 2015 | page 8
Interviews
Once informed consent was obtained, the rider was interviewed by one of the study nurses using a structured interview pro-forma. Information collected during the interviews included: details of the crash event and awareness of the impending impact; crash location; time of day; weather and traffic conditions; trip details; clarification of vehicle/pedestrian movements, positions and the crash sequence; the rider’s perspective of contributing factors; details of the motorcycle ridden; familiarity with the road and the motorcycle ridden in the crash; use and type of protective equipment (including clothing); training, licensing and riding experience; crash and traffic violation history; alcohol, drug and medication use prior to the crash; potential fatigue factors; and rider demographics.
A separate self-report questionnaire was left with the rider to be completed and collected by the research nurse at a later time. Additional data collected in this self-report questionnaire included the mental and physical health of the rider before the crash, the prior health and well-being of the rider, attitudes to riding and self-reported riding behaviours.
During the interview, riders were also asked for their consent for the crash investigators to obtain the police report on their crash.
Medical data
Hospital medical records of the rider were accessed and reviewed by the study nurses. This included review of: ambulance records, admission record, trauma and intensive care unit (ICU) notes, integrated patient notes, operation reports, medical imaging and specialist consults. Any details of the crash or sources of injury were also recorded. Where possible, a visual examination of the patient was conducted by the research nurses to provide further details of the injuries. This was particularly important for recording details of superficial abrasions, contusions and lacerations. Age, height and weight and date of birth were also noted.
Detailed injury descriptions were recorded and injuries were coded according to the Abbreviated Injury Scale (AIS), 2008 revision. The Injury Severity Score (ISS) was also calculated by summing the squares of the AIS score of the three highest ranked injuries in three separate ISS body regions.
Helmet and clothing inspection procedures
Helmet and clothing inspections were conducted to confirm the details provided by the participant and to allow an assessment of the injury protection performance of each item. At the time of the rider interview, riders were asked for permission to access this equipment and, if possible, for the study team to retain it. For those cases where permission was granted the equipment was collected from the participant either while they were in the hospital or from their home once they were discharged. Inspections, following structured pro-formas were then carried out by biomedical engineers in the NeuRA laboratory or during a home visit. The clothing and helmets were examined for any signs of damage and damage was recorded on a detailed diagram of the helmet or clothing and related to the underlying body region. The helmets and clothing were also photographed. Helmets were examined both externally and internally for signs of impact damage and whether or not the helmet was approved to the Australian Standard AS/NZS 1698:2006 (Standards Australia 2006).
For the clothing, details collected included whether or not the garments were specifically designed for motorcycle use, the type of fabric used, whether the clothing was approved to the European Standard for motorcycle protective jackets and pants (CEN 2002). Damage to clothing was recorded by aspect, type and depth of damage for each body region location according to the injury risk zones defined in the European Standard (CEN 2002). The presence, type and location of impact protectors were also recorded as per the associated standard for protection from mechanical impacts (CEN 1998, CEN 2003). Gloves and footwear were included in the inspections and analysis.

Motorcycle In-depth Crash Study
Austroads 2015 | page 9
Vehicle inspection procedures
Motorcycles were inspected by NeuRA study engineers who had been trained in ANCIS vehicle inspection methods (Fildes, Logan et al. 2003). Inspections were conducted where ever the motorcycle was stored following the crash. Locations included participants’ homes and repairers, tow yards, auction or salvage yards, with the permission of the relevant owner/manager of the property.
Motorcycles were inspected to confirm the details of the motorcycle provided by the participant and to examine any evidence of crash damage and the most likely sources for the rider’s injuries. The inspection involved measurements of any impact locations and structural damage together with external photography. A sketch of the motorcycle deformation was also recorded.
Scene inspections
Scene locations were examined by two engineers trained in crash investigation techniques and in the ANCIS methodology following structured pro-formas. Video footage was taken from the rider’s perspective and from the opposite direction as the investigators drove through the crash location. Photography, measurements and data on environmental and road-related features were collected and were used to gain a greater understanding of the road and roadside factors involved in the crash. Photographs were taken at 25m increments up to 100m from the crash site and included:
• potential roadside hazards
• road markings and signage
• environmental conditions
• impacted objects, such as trees and fences
• evidence of the crash, such as tyre marks or gouge marks in the road surface
• police markings of the site e.g. identifying tyre marks and final location of the rider and vehicles
• parts and other debris from the motorcycle and other vehicle.
Measurements were taken on the length of tyre marks, diameters of poles and trees, height of impacting partners, lane widths and any additional dimensions that aid in understanding the role the road environment played in the crash. Detailed scene diagrams were also prepared.
Police data
For those participants who gave their consent, the researchers requested copies of their police crash reports from the NSW Police. The reports included summaries of witness statements and details of the crash obtained at the time by attending police. The reports were used to clarify details collected through interview and in-depth investigation.
Data management
All data collected was entered into a SPSS database. A second researcher checked each case record and corrected any errors, or missed variables. The circumstances surrounding the crash, the rider’s injury outcome, the vehicle/equipment, rider and environmental factors potentially contributing to the crash and the injury outcome were summarised into a structured case summary. Summaries were drafted by the crash investigator in collaboration with those conducting vehicle, equipment and scene inspections and the research nurses. The draft summary was then reviewed by another member of the investigation team and presented to a multidisciplinary expert panel (as described below). Any additional details requested by the expert Panel were then added to the summary and the summary was finalised.

Motorcycle In-depth Crash Study
Austroads 2015 | page 10
2.2.2 Fatality study
A subset of fatally injured cases was sourced retrospectively through the Institute of Forensic Medicine at Glebe. To provide an overall sample of 100 crashes that included 10% fatal crashes and represented the full spectrum of serious crashes (i.e. those that result in serious and fatal injury), as suggested by the project managers, 10 fatal crashes that occurred across the data collection area during the study period were randomly selected for inclusion.
Members of the investigation team collected data via review of records at the Sydney Coroners Court at Glebe which services the greater Sydney metropolitan area. Records viewed included Coroner’s reports, autopsy findings and police reports. Crash scenes were inspected using the same method described for the serious injury cases and injury details were coded in the same manner. Data was entered into the study case database and case summaries prepared using the template.
2.2.3 Case control study
Controls were riders who had ridden the same road where the crash occurred but had not crashed at this location. A minimum of one control per crash location was sought with an objective of collecting two or three controls per location, however there was no limit placed on the maximum numbers of controls per case. Methods for the recruitment of controls are described below.
Control recruitment and data collection procedures
Due to privacy restrictions in NSW, researchers could not use cameras to record the licence plates of motorcycles passing the crash site to obtain contact details for potential controls from the State registration database. A number of different strategies were trialled to determine the most effective way of recruiting control riders to the study. Recruiting control riders at service stations in the vicinity of crash sites was trialled initially, first with researchers as recruiters, and subsequently by engaging service station attendants with an incentive payment. Both means were unsuccessful, largely due to the very small proportion of motorcyclist customers. Brochure placement on motorcycles parked near the vicinity of a crash site proved to be a more effective means of accessing control riders and also eliminated the need for a petrol station to be nearby to a crash site. However, this was also an unsuccessful method for some crash locations.
To overcome difficulties with recruiting controls, a study website was established inviting riders to take part in the study and listing the sites for which controls were needed. The website was promoted through motorcycle community organisations and the NSW Roads and Maritimes Services website. After some trial and error, the registration process was streamlined so that riders could register on-line and receive a unique link to the survey by email. This proved to be the most successful method used. Website traffic was further enhanced by the strategy of attaching a study brochure to parked motorcycles and by advertisements placed in newspapers local to the crash locations. Interested participants were invited to visit the website to see whether they were eligible to be a control for any of the roads where case crashes had occurred.
Controls were asked to complete an online survey, which consisted of all the questions asked of the case riders in the self-report questionnaire and interviews, with the exception of questions about the crash.
2.2.4 Panel review
A multi-disciplinary expert panel was assembled, consisting of NeuRA researchers and engineers, a leading trauma forensic pathologist, road engineering and motorcycling experts from the NSW Centre for Road Safety, motorcycle safety research and crash investigation experts and behavioural scientists. The Panel met for half a day per month throughout the data collection period of the study.

Motorcycle In-depth Crash Study
Austroads 2015 | page 11
Crash investigators presented each case to the Panel using the case summary template described previously. This also included videoed drives through the crash location, and photographs of the scene, vehicle and equipment. The role of the Panel was to use their combined expertise to identify key contributory factors involved in each motorcycle crash, the most likely cause of injury, and to generate ideas about potential countermeasures using the Haddon Matrix as a framework (Haddon Jr 1972). The Haddon Matrix is a commonly used theoretical framework to examine road traffic injury causes and countermeasures. It divides the injury or crash event into three phases: the pre-crash phase; the during-crash phase and the post-crash phase; and the factors at play in each of these phases into those related to the human, the vehicle and the environment. Following the review of each case, a summary of the human, vehicle and environmental factors influencing the pre-crash, during and post-crash phases of the crash and injury outcome were formulated from the combined perspective of the multidisciplinary Panel. Potential countermeasures suggested by the Panel that might have assisted in preventing or mitigating the crash or crash outcome were also recorded. In making these suggestions panel members were instructed not to consider cost or feasibility and creativity was encouraged to facilitate broad and unlimited discussions. At the completion of the study period, all case summaries and panel review outcome matrices were submitted again to the expert Panel for final input and critique. These final summaries supported by the data obtained during the study form the basis of the qualitative analysis described below.
2.3 Analysis Methods
All data manipulation and analyses were conducted using IBM SPSS Statistics 22, with the exception of the case-control analysis which was conducted using SAS 9.4.
2.3.1 Description of crash sample and injury outcomes
Descriptive techniques were used to describe the crash sample and the injury outcomes of the riders. Variables collected, data sources and information on scales for continuous data, and categories for categorical data used to describe the crash sample are summarised in Table 1.
Table 1: Crash Description Variables
Variable Source Data Type Categories/Scale
Gender Interview Categorical Male
Female
Age Interview Continuous
Age Group Constructed Categorical 16-29 years
30-49 years
50+ years
Geographical location
Constructed Categorical Country urban
Country non-urban
Metropolitan
Road Type Scene Inspection Categorical Freeway/tollway
Major arterial
Minor arterial/sub-arterial
Collector
Local
Other

Motorcycle In-depth Crash Study
Austroads 2015 | page 12
Variable Source Data Type Categories/Scale
Intersection Type Scene Inspection Categorical 4-leg intersection
3-leg intersection
roundabout
mid-block
driveway
None
Speed limit Scene Inspection Categorical 40
50
60
70
80
90
100
Crash type Collated Investigation Categorical Multiple vehicle crash - moving vehicle
Multiple vehicle crash - fell avoiding impact
Multiple vehicle crash - loss of control
Single vehicle crash - impact stationary object
Single vehicle crash - fell avoiding impact
Single vehicle crash - loss of control
Road User Movement
Collated Investigation/DCA codes
Categorical Cross traffic
Right far
Right near
Left near
Head-on
Right through
Rear end
Right rear
Lane side swipe
Left change right
Lane change left
Left turn side swipe
U turn
Emerging from driveway
Head-on not sideswipe
Out of control
Parked

Motorcycle In-depth Crash Study
Austroads 2015 | page 13
Variable Source Data Type Categories/Scale
Road User Movement (cont)
Animal (not ridden)
Left off carriageway into object
Off carriageway to right
Right off carriageway into object
Out of control on carriageway
Off carriageway right bend
Right off bend into object
Off carriageway left bend
Other
Day of Week Medical Record Categorical Monday
Tuesday
Wednesday
Thursday
Friday
Saturday
Sunday
Time of Day Medical Record Categorical 4am
5am
6am
7am
8am
9am
10am
11am
12pm
1pm
2pm
3pm
4pm
5pm
6pm
7pm
8pm
9pm
10pm
11pm

Motorcycle In-depth Crash Study
Austroads 2015 | page 14
Descriptive techniques were used to describe injury outcome in terms of the injury severity scores (ISS); length of stay in the hospital; regions of the body injured overall and by severity of injury (using the abbreviated injury score, AIS); and the frequency of injury by injury source for all injuries, and for moderate to severe injuries. Linear regression was then used to examine the association between injury outcome and crash factors. The crash factors examined are listed in Table 2. The total number of variables that could be included in this analysis was limited by the sample size, so the variable listed in Table 2, represent those factors deemed to be most likely to influence injury outcome. Two models were constructed, one with ISS as the outcome, and one with length of stay as the outcome.
Table 2: Variables explored with injury outcome
Other variables of interest
Clothing designed for motorcycle use yes/no Binary
Rider age years Continuous
Impact speed km/h Continuous
Object impacted yes/no Binary
2.3.2 Case control study
The hypothesis being tested in the case control study was that rider and/or trip characteristics will differ between motorcyclists who are involved in a crash at a particular location and those who are not. Rider and trip characteristic variables included in this analysis were limited to those variables that were collected from both the case and control riders, and that were deemed to be potentially important based on findings from previous studies. Variables collected, data sources, and information on scales for continuous data, and categories for categorical data used in the case control analysis and not included in Table 1 are summarised in Table 3. Further variables related to the crash trip characteristics (or characteristics of the trip when the control riders rode through the crash location) are provided in Table 4.
Table 3: Additional case control analysis rider characteristic variables
Variable Source Data Type Categories/Scale
Rider Licence Interview Categorical Full/unrestricted
P2
P1
Learners
Unlicensed
Time riding on road Interview Continuous Months
Rider training Interview -Have you undertaken any rider training courses for road riding in the last 5 years?
Categorical Yes
No
Track days Interview - Do you take part in competition practice track days?
Categorical Yes
No
Club training Interview - Have you attended any rides designed for learner/provisional riders organised by motorcycle clubs
Categorical Yes
No
Off road experience
Interview-Do you ride motorcycles off-road? Categorical Yes
No

Motorcycle In-depth Crash Study
Austroads 2015 | page 15
Variable Source Data Type Categories/Scale
Car Licence Interview Categorical Bike only
Bike & Car
Other
Type of Motorcycle Interview Categorical Sports
Adventure
Standard
Cruiser
Tourer
Scooter
Type of Motorcycle Collapsed
Constructed Categorical Sports
Other
Learner approved motorcycle (LAMS)
Interview Categorical Yes
No
Don’t know/can’t remember
Engine Cubic Capacity
Interview Continuous CC
Engine Cubic capacity Large vs smaller engines
Constructed Categorical <1000cc
1000cc+
Bike ownership Interview Categorical Case/control rider
Other person
Familiarity with Bike
Interview - How familiar are you with the motorcycle? Categorical Very familiar
Familiar
Not very familiar/no previous experience
Kms ridden on bike Interview Categorical <5000kms
5000-9999kms
10,000kms or more
Length of ownership
Interview Continuous Years
Motorcycle Year of Manufacture
Interview Continuous Year of manufacture
Kms ridden each week
Interview - Over the past 12 months, on average how many kilometres of on-road riding did you ride your motorcycle each week?
Continuous Kms
Kms ridden group Constructed Categorical 100kms or less
101-400kms
>400kms

Motorcycle In-depth Crash Study
Austroads 2015 | page 16
Variable Source Data Type Categories/Scale
Hours ridden each week
Interview - Over the past 12 months, on average, how many on-road hours did you ride for each week?
Continuous Hours
Riding frequency Interview - How often do you normally ride ON ROAD? Categorical Daily
Weekly
Monthly
Other
Riding frequency collapsed
Constructed Categorical Daily
Other
Riding Days Interview -When do you normally ride ON ROAD? Categorical Mostly weekdays
Mostly weekends
Any day
Primary riding purpose - commuting
Interview - In the past 12 months, how often did you ride a motorcycle/scooter on-road for commuting purposes?
Categorical Once a month
Once a week
Daily
Never
Primary riding purpose - commuting
Constructed Categorical Daily/Sometimes
Never
Primary riding purpose - leisure
Interview - In the past 12 months, how often did you ride a motorcycle/scooter on-road for pleasure/leisure purposes?
Categorical Once a month
Once a week
Daily
Never
Primary riding purpose - leisure
Constructed Categorical Daily/Sometimes
Never
Riding association Interview - Are you a member of any type of rider organisations?
Categorical Yes
No
Crash history 12months
Interview - Have you been involved in any other on-road crashes (including minor spills) while riding a motorcycle/scooter on public roads in the last 12 months?
Categorical Yes
No
Motorcycle crashes 3 years
Interview - How many crashes have you had whilst riding a motorcycle during the past 3 years?
Continuous Number of crashes
Motorcycle crashes 3 years
Constructed Categorical Yes
No
Car crashes 3 years
Interview-Have you had any road crashes whilst driving a car during the past 3 years?
Continuous Number of crashes
Car crashes 3 years
Constructed Categorical Yes
No

Motorcycle In-depth Crash Study
Austroads 2015 | page 17
Variable Source Data Type Categories/Scale
Near misses Interview - Many riders have had the impression of only just avoiding crash (i.e. of having a near miss). How many times has this happened to you in the last 12 months whilst riding a motorcycle/scooter on a public road?
Categorical Never
1 or 2 occasions
3 to 5 occasions
more than 5 occasions
Violations Interview - Have you had any traffic violations in the past 3 years?
Categorical Yes
No
Helmet use Interview/investigation Categorical Yes
No
Helmet type Interview/investigation Categorical Full face
Flip front
Open face
Helmet type collapsed
Constructed Categorical Full face/flip front
Open face
Eye protection Constructed form interview Categorical Some form of eye protection
No eye protection
Visor Constructed from interview/investigation Categorical Clear/non-tinted
Tinted
No Visor
Jacket designed for motorcycle use
Interview/investigation Categorical Yes
No
Pants designed for motorcycle use
Interview/investigation Categorical Yes
No
Footwear designed for motorcycle use
Interview/investigation Categorical Yes
No
Gloves worn Interview/investigation Categorical Yes
No
Gloves designed for motorcycle use
Interview/investigation Categorical Yes
No
Items of protective clothing
Constructed Continuous Per piece of protective clothing
Earplugs Interview - Were you wearing earplugs, earphones or other object (?) in your ear(s)?
Categorical Yes
No

Motorcycle In-depth Crash Study
Austroads 2015 | page 18
Table 4: Additional case control analysis trip characteristic variables
Variable Source Data Type Categories/Scale
Purpose of trip Interview Categorical Commuting/transport
Recreational ride
Other
Crash trip - in hurry Interview Categorical Yes
No
Location familiarity Interview -How familiar are you with the road/area in which the crash occurred
Categorical Daily
2-3 times/week
Once a week
Once a month
Rarely
First time in area
Location familiarity collapsed Constructed Categorical Daily
Sometimes
Rarely/first time in area
Riding with others Interview Categorical Yes
No
Planned trip time Interview Continuous Minutes
Time to crash location Interview Continuous Minutes
Type of riding in hour before - near miss due to another vehicle driver/rider or own error
Constructed from interview Categorical Yes
No
Type of riding in hour before -Riding behind a slower vehicle where it was difficult to overtake
Constructed from interview Categorical Yes
No
Type of riding in hour before -Riding in heavy traffic
Constructed from interview Categorical Yes
No
Type of riding in hour before -Riding on a fast but boring section of road (e.g. motorway)
Constructed from interview Categorical Yes
No
Type of riding in hour before -Riding on a winding section of the road that was a challenge for your riding skills
Constructed from interview Categorical Yes
No
Activities day before - Long ride Constructed from interview Categorical Yes
No
Activities day before - Day Shift/Normal Work day
Constructed from interview Categorical Yes
No
Activities day before - Relaxed day at home
Constructed from interview Categorical Yes
No

Motorcycle In-depth Crash Study
Austroads 2015 | page 19
Variable Source Data Type Categories/Scale
Activities day before - Late Night Constructed from interview Categorical Yes
No
Activities day before - Worked Night Shift Constructed from interview Categorical Yes
No
Consumed Alcohol/illicit drugs in two hours prior to crash/ riding through crash location
Interview Categorical Yes
No
Taken medications in 12 hours prior to crash/ riding through crash location
Interview Categorical Yes
No
Use of electronic equipment Interview-Were you using a mobile phone or other electronic device prior to, or at the time of, the collision
Categorical Yes
No
The case/control samples were described using descriptive techniques and then conditional logistic regression, accounting for the 1: many control sample design, was used to perform the case control analysis. The outcome variable for this analysis was whether or not the rider belonged to the case or control sample.
Variables listed in Tables 3 and 4 were examined and collapsed where necessary and appropriate to ensure cell sizes contained a minimum data size of 10 per outcome (Peduzzi, Concato et al. 1996). Univariate conditional logistic regression was then used to examine the association between each variable and the outcome.
Due to the large number of potential variables to be included in the logistic regression model, model building was done in two steps. In Step 1, rider characteristic variables with a significant association (p<0.05) with the outcome were used in a backwards stepwise selection procedure with entry to the model set at p=0.25 and exit set at p=0.15. Variables remaining in the final model were seen as ‘important’ rider characteristics and were used in Step 2 of the modelling process. In Step 2, trip characteristic variables with a significant association (p<0.05) with the outcome were used together with the ‘important’ rider characteristics in a second backwards stepwise selection procedure with entry to the model also set at p=0.25 and exit set at p=0.15. The backwards selection procedure basically adds and removes potential variables through iterative steps based on changes in the significance levels of associations between the variables and the outcome until a final best fitting model is achieved.
Potential interactions between all variables included in the final model were then explored and the assumption of linearity was checked for any remaining continuous variables.
Odds ratios and 95% confidence limits for the variables included in the final model were also calculated. Odds ratios provide an indication of the strength of the association between the variables in the model and the outcome.
2.3.3 Rider reported environmental factors
In addition to the rider and trip characteristic variables examined in the case-control analysis, a number of variables related to the crash location were also collected from the case and control riders. These variables are described in Table 5 and relate to the rider’s views on the likely contribution of the road environment to the crash. Descriptive techniques were used to examine similarities and differences between the case and control riders in their perspectives of the crash location as well as the similarities and differences between single and multiple crash types.

Motorcycle In-depth Crash Study
Austroads 2015 | page 20
Table 5: Variables used to explore case and control rider views on crash site
Variable Source Data Type Categories/ Scale
Case or control Case or control rider Categorical Case
Control
Crash location number Constructed Continuous
Crash type Constructed from interview Categorical Single vehicle
Multi-vehicle
Road surface affect handling Case Rider Interview/ Control Rider Survey - In your opinion did the condition of the road surface affect vehicle handling?
Categorical Yes
No
Missing
Unknown
Road surface affect handling - Describe
Case Rider Interview/ Control Rider Survey - In your opinion did the condition of the road surface affect vehicle handling?
Categorical Rough
Camber problem
Other
Oil/debris
Slippery
Road surface condition - Dry Rider Interview/ Control Survey – What was the condition of the road surface?
Categorical Yes
No
Road surface condition - Wet Rider Interview/ Control Survey – What was the condition of the road surface?
Categorical Yes
No
Road surface condition - Damp
Rider Interview/ Control Survey – What was the condition of the road surface?
Categorical Yes
No
Road surface condition - Greasy
Rider Interview/ Control Survey – What was the condition of the road surface?
Categorical Yes
No
Road surface condition – Loose gravel
Rider Interview/ Control Survey – What was the condition of the road surface?
Categorical Yes
No
Road surface condition - Slippery
Rider Interview/ Control Survey – What was the condition of the road surface?
Categorical Yes
No
Road surface condition – Bumpy, broken or cracked
Rider Interview/ Control Survey – What was the condition of the road surface?
Categorical Yes
No
Road surface condition – Grooved or rippled surface
Rider Interview/ Control Survey – What was the condition of the road surface?
Categorical Yes
No
Road surface condition – Tar jointing compound
Rider Interview/ Control Survey – What was the condition of the road surface?
Categorical Yes
No

Motorcycle In-depth Crash Study
Austroads 2015 | page 21
Variable Source Data Type Categories/ Scale
Road surface condition – Painted road markings
Rider Interview/ Control Survey – What was the condition of the road surface?
Categorical Yes
No
Road surface condition - Potholes
Rider Interview/ Control Survey – What was the condition of the road surface?
Categorical Yes
No
Road surface condition – Temporary metal plate cover
Rider Interview/ Control Survey – What was the condition of the road surface?
Categorical Yes
No
Site Inspection - Road surface - Dry
Constructed from Site Inspection – Road Surface
Categorical Yes
No
Site inspection – Road surface - Wet
Constructed from Site Inspection – Road Surface
Categorical Yes
No
Site inspection – Road surface - Damp
Constructed from Site Inspection – Road Surface
Categorical Yes
No
Site inspection – Road surface - Greasy
Constructed from Site Inspection – Road Surface
Categorical Yes
No
Site inspection – Road surface - Slippery
Constructed from Site Inspection – Road Surface
Categorical Yes
No
Site inspection – Road surface - Muddy
Constructed from Site Inspection – Road Surface
Categorical Yes
No
Site inspection – Road surface - Oily
Constructed from Site Inspection – Road Surface
Categorical Yes
No
Site inspection – Road surface – Loose material
Constructed from Site Inspection – Road Surface
Categorical Yes
No
Site Inspection – Condition and defects - Intact
Constructed from Site Inspection – Condition and Defects
Categorical Yes
No
Site Inspection – Condition and defects - Ruts
Constructed from Site Inspection – Condition and Defects
Categorical Yes
No
Site Inspection – Condition and defects – Ripples/ridges
Constructed from Site Inspection – Condition and Defects
Categorical Yes
No
Site Inspection – Condition and defects – Pit lids/ draining grates
Constructed from Site Inspection – Condition and Defects
Categorical Yes
No
Site Inspection – Condition and defects - Worn
Constructed from Site Inspection – Condition and Defects
Categorical Yes
No
Site Inspection – Condition and defects - Potholes
Constructed from Site Inspection – Condition and Defects
Categorical Yes
No

Motorcycle In-depth Crash Study
Austroads 2015 | page 22
Variable Source Data Type Categories/ Scale
Site Inspection – Condition and defects - Bump
Constructed from Site Inspection – Condition and Defects
Categorical Yes
No
Site Inspection – Condition and defects – Pavement edge
Constructed from Site Inspection – Condition and Defects
Categorical Yes
No
Site Inspection – Condition and defects - Cracked
Constructed from Site Inspection – Condition and Defects
Categorical Yes
No
Site Inspection – Condition and defects - Spalling
Constructed from Site Inspection – Condition and Defects
Categorical Yes
No
Dangerous Crash Location Rider Interview/ Control Survey – Was there anything especially dangerous about the crash location?
Categorical Yes
No
Dangerous Crash Location – Loose material
Constructed from Rider Interview/ Control Survey – Was there anything especially dangerous about the crash location?
Categorical Yes
No
Missing
Dangerous Crash Location – Metal plate covering braking zone
Constructed from Rider Interview/ Control Survey – Was there anything especially dangerous about the crash location?
Categorical Yes
No
Missing
Dangerous Crash Location – Poor visibility
Constructed from Rider Interview/ Control Survey – Was there anything especially dangerous about the crash location?
Categorical Yes
No
Missing
Dangerous Crash Location – Complicated location
Constructed from Rider Interview/ Control Survey – Was there anything especially dangerous about the crash location?
Categorical Yes
No
Missing
Dangerous Crash Location – Other
Constructed from Rider Interview/ Control Survey – Was there anything especially dangerous about the crash location?
Categorical Yes
No
Missing
2.3.4 Performance of protective equipment
Helmets, jackets, pants, gloves, and footwear worn by the riders who were admitted to hospital were collected and/or inspected to examine the performance of the equipment in the crash.
Helmets
Damage sustained by the helmet externally and internally was described in terms of the type of damage and the location of the damage. The association between helmet damage and helmet type, and injury to the head, face and neck was then examined using descriptive techniques and logistic regression.

Motorcycle In-depth Crash Study
Austroads 2015 | page 23
Protective clothing
The protective clothing worn by the case riders was examined, and whether or not it was designed for motorcycle use and whether or not it included impact protection was noted. A preliminary descriptive examination of the use of protective clothing by rider age and bike type ridden was undertaken. The type and distribution of damage to the clothing being worn by the riders was then described. The distribution of damage was examined in terms of the body regions covered by the clothing and clothing zones as defined by EN13595-1.
For each type of clothing (i.e. garments worn on the upper body, garments worn on the lower body, gloves and footwear), logistic regression was used to examine the extent of damage by whether or not the clothing was specifically designed for motorcycle use while controlling for impact speed and object struck (as defined in Table 2).
The overall performance of motorcycle specific clothing was then examined by investigating injury outcome at each specific site of damage to the clothing. Specialised logistic regression techniques (general estimating equations accounting for clustering on case ID) were used to account for individual riders who sustained multiple damage to the clothing worn and was used to examine the association between injury outcome and whether or not the clothing was designed for motorcycle use as well as whether or not impact protection was present at the damage location while controlling for the type of damage, rider age, impact speed and object struck. Three injury outcomes were again explored; any injury, any soft tissue (external AIS 1) injury and any soft tissue injury excluding bruises.
2.3.5 Qualitative analysis of crash and injury causation factors and potential countermeasures
Data generated during the multidisciplinary expert Panels and the information included in the final case summaries were used to conduct a qualitative analysis of crash and injury causation factors and potential countermeasures.
Content analysis of the crash summaries and Panel review outcomes was conducted by a single researcher in consultation with other investigators. This involved reading and sorting of ideas thematically to (i) qualitatively describe crash types in the sample and (ii) to describe contributory factors and potential countermeasures using the Haddon Matrix as a framework. The contributory factors and potential countermeasures were explored as sets of ‘ideas’ attached to the vehicle, rider, and environmental cells of the Haddon Matrix, and emerging themes were extracted. The individual contributory factors were then linked back to each of the emerging themes and tabulated.
Finally, a retrospective count of cases falling within each of the emerging crash type and contributory themes was undertaken. Some crashes involved more than one crash type and/or contributory/countermeasure theme.
The overall results are presented thematically considering causal factors and potential countermeasures from the vehicle, rider, and environmental cells of the Haddon matrix. Thematic reporting is a common qualitative approach to reporting findings and in this instance provides a mechanism for looking at specific motorcycle safety issues from a whole system perspective.

Motorcycle In-depth Crash Study
Austroads 2015 | page 24
3. Results
3.1 The Crash Sample
The final crash sample contains details for 102 riders including 92 serious injury crashes and 10 fatal injury crashes. Most riders were male (94%), with an age ranging from 16 to 80 years with a median age of 37 years. Figure 1 illustrates the age characteristics of the crash sample.
Figure 1: Age of riders in crash sample
Figure 2: Crash locations by country/metropolitan location
Figures 2 and 3 illustrate the geographical distribution of crashes. Using the Transport for NSW definitions, 87% of the crashes occurred in metropolitan areas in Sydney, Wollongong and Newcastle, 9% in country urban areas, and 4% in country non-urban areas.
0
5
10
15
20
25
30
35
40
45
50
16-29yrs 30-49yrs 50+yrs
Freq
uenc
y
Age range (years)
0102030405060708090
100
Country urban Country non-urban Metropolitan
Freq
uenc
y
Road type
Non-fatal Fatal

Motorcycle In-depth Crash Study
Austroads 2015 | page 25
The crash distance from home for the riders involved in this sample of crashes ranged from 0.25km to 257km, with a median distance of 9.5km. Most (75%) of crashes occurred within 33km of the riders home and 25% occurred within 4km of the rider’s home.
Figure 3: The geographical distribution of crashes within the crash sample.
Figure 4: Road types
Most crashes occurred on major arterial roads (33%), local roads (26%) and minor arterial/sub-arterial roads (21%). Only 7% occurred on freeways or tollways and 12% occurred on ‘other’ roads which primarily involved roads within National Parks (Figure 4).
0
5
10
15
20
25
30
35
Per
cent
age
(%)
Road typeFatal Non-fatal

Motorcycle In-depth Crash Study
Austroads 2015 | page 26
Figure 5: Intersection types
Almost half of the crashes occurred at intersections (49%). This included 13% at 4-leg intersections and 35% at 3-leg intersections. Another 39% occurred mid-block and the remainder occurred at a driveway (3%) or on a long stretch of roadway (9%) (Figure 5).
As shown in Figure 6, most crashes occurred on roadways with a speed limit of 60km/hr, reflecting the high proportion of crashes on arterial urban roads.
Figure 6: Distribution of speed limits at the crash locations
0
5
10
15
20
25
30
35
40
45
4-legintersection
3-legintersection
Roundabout Mid-block Driveway None
Per
cent
age
(%)
Intersection class typeFatal Non-fatal
0
5
10
15
20
25
30
35
40
45
50
40 50 60 70 80 90 100
Per
cent
age
(%)
Speed limit (km/h)
Non-fatal Fatal

Motorcycle In-depth Crash Study
Austroads 2015 | page 27
Figure 7: Crash types
Multiple vehicles were involved in 61% of the crashes, where 51% of total crashes involved the motorcycle and one other vehicle or road user, 6% involved 3 vehicles and 4% involved 4 vehicles. Single vehicle crashes accounted for 39% of the sample. Among the multi-vehicle (n=62) crashes, the motorcycle impacted another moving vehicle in 89% of the crashes. Less commonly, the rider fell off while trying to avoid an impact with another vehicle (6%) or loss control due to another vehicle’s movement (6%). The single vehicle crashes primarily involved the motorcycle impacting a stationary object (45%) or loss of control of the motorcycle (43%). A smaller number occurred when the rider fell off while trying to avoid an impact with a stationary object or hazard on the roadway (12%). See Figures 7, 8 & 9.
0
10
20
30
40
50
60
Multiple vehiclecrash- Impact
moving vehicle
Multiple vehiclecrash- Fell
avoiding impact
Multiple vehiclecrash- Loss of
control
Single vehiclecrash-Impact
stationary object
Single vehiclecrash-Fell
avoiding impact
Single vehiclecrash-Loss of
control
Per
cent
age
(%)
Crash type Fatal Non-fatal

Motorcycle In-depth Crash Study
Austroads 2015 | page 28
Figure 8: DCA code description of crash types
0 2 4 6 8 10 12 14 16
Cross traffic
Right far
Right near
Left near
Head-on
Right through
Rear end
Right rear
Lane side swipe
Left change right
Lane change left
Left turn side swipe
U turn
Emerging from driveway
Head-on not sideswipe
Out of control
Parked
Aninal (not ridden)
Left off carriageway into object
Off carriageway to right
Right off carriageway into object
Out of control on carriageway
Off carriageway right bend
Right off bend into object
Off carriageway left bend
Percentage (%)
DC
A c
ode
desc
riptio
n
Non-fatal Fatal

Motorcycle In-depth Crash Study
Austroads 2015 | page 29
Figure 9: RUM code description of crash types
Figures 10 and 11 illustrate the distribution of crashes in the sample across the days of the week and the time of day. There was a relatively equal distribution of crashes across the week days with more crashes occurring on Sundays and fewer crashes occurring on Saturdays. There were slight peaks in crashes occurring during peak hour times of 7-9 am and 2-5 pm.
0 5 10 15 20
Cross traffic
Right far
Right rear
Left rear
Head on
Right through
Rear end
Left rear
Right rear
Lane side swipe
Lane change right
Lane change left
Right turn side swipe
Left turn side swipe
U turn
Leaving parking
Head on (including side swipe)
Out of control
Animal (not ridden)
Off carriageway to left
Off carriageway to right
Out of control on carriageway
Off carriageway left on right bend
Off carriageway left on right bend onto object /parked vehicle
Off carriageway right on left bend
Off carriageway left on left bend
Percentage (%)
Rum
Cod
e D
escr
iptio
n
Non-fatal Fatal

Motorcycle In-depth Crash Study
Austroads 2015 | page 30
Figure 10: Days of the week
Figure 11: Time of day
0
5
10
15
20
25
Monday Tuesday Wednesday Thursday Friday Saturday Sunday
Per
cent
age
(%)
Week day
Non-fatal Fatal
0 2 4 6 8 10 12 14
4am
5am
6am
7am
8am
9am
10am
11am
12pm
1pm
2pm
3pm
4pm
5pm
6pm
7pm
8pm
9pm
10pm
11pm
Percentage (%)
Tim
e
Non-fatal Fatal

Motorcycle In-depth Crash Study
Austroads 2015 | page 31
3.1.1 Discussion of the crash sample
Our sample of crashes involves a similar age distribution to the age distribution of serious injury motorcycle crashes in NSW in 2013 for riders aged >16 yrs. According to Transport for NSW statistics, 38% of serious injury crashes involved riders aged 17-29 (our sample 43%); 39% involved riders aged 30-49 years (our sample 34%); 23% involved riders aged 50+ years our sample 23%)(CRS 2013). The primary difference is a slightly higher percentage of younger riders in our sample which might reflect our sampling criterion of only including riders admitted to hospital following the crash if young riders tend to be in more serious crashes.
The location of crashes by country/metropolitan area is not readily available for motorcycles in NSW so we cannot comment on the representativeness of the crash location. However, in European countries, and the USA, most motorcycle crashes occur in urban locations (Hurt, Ouellet et al. 1981, ACEM 2004) and a 2001 report by the Motorcycle Riders Association of Western Australia (Pearson & Whittington, as cited by Vlahogianni, Yannis et al. 2012), reported that 70% of motorcycle injuries in Australia occur on local area roads. This suggests our sample that is highly skewed towards crashes that occurred in metropolitan areas may reflect, to some extent, motorcycle crash distribution by location across NSW.
The sample also appears to closely reflect the distribution of single and multiple vehicle motorcycle crashes. NSW statistics indicate that 40% of motorcycle crashes are single vehicle crashes, and 39% of our sample involved single vehicles crashes.
While the recruitment design of our study delivers a convenience sample, on the basis of the above comparisons, our sample is similar to the population of crashes across NSW. Therefore, the results of the analyses based on our sample can be generalisable to motorcycle crashes in NSW.

Motorcycle In-depth Crash Study
Austroads 2015 | page 32
3.2 Case Control Sample Comparisons
A total of 336 riders were recruited as controls for 99 crashes. Controls per case ranged from 1 to 22 as shown in Figure 12.
Figure 12: Number of controls per case
0 5 10 15 20 25MB001MB003MB006MB010MB013MB015MB017MB019MB022MB024MB026MB028MB030MB033MB036MB041MB043MB046MB048MB050MB052MB054MB057MB059MB061MB063MB065MB067MB069MB071MB073MB075MB077MB079MB081MB083MB086MB089MB091MB094MB097MB099MB101MB104MB106MBF03MBF05MBF08MBF10MBF23
Frequency
Cas
e N
umbe
r

Motorcycle In-depth Crash Study
Austroads 2015 | page 33
3.2.1 General characteristics of the case and control samples
For reasons of efficiency characteristics of the case and control samples are presented together as a comparison of characteristics. However, the reader should be reminded that while this section above describes the differences (and similarities) between the two groups there has been no adjustment for potential confounders, and no adjustment for the number of controls per case. Therefore the differences do not represent likely risk factors for crash involvement, but simply describe the two samples. This will be considered in the case-control analysis described in a following section
Demographics
Both the case and control samples were dominated by male riders. Among the case riders, 94% were male and 6% were females. Ignoring control riders who did not report gender (10%), 90% were males and 10% were females.
The distributions of riders by age in the case and control samples are shown in Figure 13. The cases were significantly younger than the control riders. Case riders were aged 16 to 80 years with a mean age of 37 years (SD=15 years), while control riders were aged 17 to 76 years with a mean age of 50 years (SD=14 years) (p<0.001).
Figure 13: Age distribution
Rider licencing and training
Among the case riders, 64% held full/unrestricted motorcycle licences and 36% were novice riders including 19% who were on learner licences, 13% on P1 and 3% on P2. The case rider’s licence status was significantly different than the control riders (p<0.001), with the control sample having more riders with full/unrestricted licences and less learners and P1 riders (See Figure 14).
0
1
2
3
4
5
6
7
8
0 17 20 22 24 26 28 30 32 34 36 38 40 42 44 46 48 50 52 54 56 58 60 62 64 66 68 70 72 74 76
Per
cent
age
(%)
Case number
Case Control

Motorcycle In-depth Crash Study
Austroads 2015 | page 34
Figure 14: Licence distribution
Riders were also asked to report the total time (in months) they had been riding on-road. On average, the controls had been riding for approximately twice as long as the cases (mean 249 months, SD 10 months for controls; mean 129 months SD 17 months for cases), but this was not significantly different.
Possibly related to the greater proportion of learners and P1 riders among the cases, proportionally more case riders reported being involved in rider training in the previous five years than control riders (66% of cases compared to 34% of control riders, p<0.001). Conversely, more control riders than case riders had participated in track days (25% of controls compared with 13% of cases, p<0.05). While more control riders (11%) reported participation in club training than case riders (6%), this difference did not reach significance.
There was also a significant difference in off-road experience between the two samples. More than half (62%) of the control riders reported riding off-road compared to 41% of the cases (p< 0.001).
Almost all (99%) control riders held a car licence as well as a motorcycle licence, while the comparable figure for case riders was slightly lower at 96% (p<0.04).
Motorcycle factors
There were significant differences between the motorcycles being ridden by the case and control riders. Figure 15 illustrates the types of motorcycles ridden. Just over a half of the case riders (54%) were riding sports bikes compared to only 21% of the control riders. Conversely touring bikes were more common among the controls.
0
10
20
30
40
50
60
70
80
90
100
Full/unrestricted Learners P1 P2 Unlicensed
Per
cent
age
(%)
Licence group Control Case

Motorcycle In-depth Crash Study
Austroads 2015 | page 35
Figure 15: Motorcycle Type
More control riders were riding LAMS1 bikes (77%) than case riders (56%, p < 0.001). However, on average the engine capacity was larger among control riders (Mean = 870cc, SD = 22 cc for control riders and Mean = 610 cc, SD = 43 cc for cases, p<0.02). As shown in Figure 16, there were proportionally more case riders than control riders riding motorcycles with an engine capacity <1000cc.
Figure 16: Distribution of motorcycle engine capacity
Overall control riders appeared to be more familiar with the motorcycles they rode than the case riders (p<0.001 (see Figure 17)). While most riders in both samples reported owning their bikes, there were significantly fewer riders who owned the bike they were riding among the cases (99% of controls compared with 94% of cases, p<0.012).
1 Learner Approved Motorcycle Scheme (LAMS) allows novice riders to ride only lower and moderately powered vehicles – power to weight ratio no greater than 150 kilowatts per tonne and an engine capacity no greater than 660ml. (http://roadsafety.mccofnsw.org.au/a/33.html, http://www.rms.nsw.gov.au/roads/licence/rider/)
0
10
20
30
40
50
60
Sports Adventure Commuter Cruiser Tourer
Per
cent
age
(%)
Motorcycle type
Case Control
0
5
10
15
20
25
30
35
40
0-280 281-680 681-1000 >1000
Per
cent
age
(%)
CC groupCase Control

Motorcycle In-depth Crash Study
Austroads 2015 | page 36
Figure 17: Rider familiarity with motorcycle being ridden
As shown in Figure 18, control riders reported having ridden more kilometres on their current motorcycles than the crashed riders. Comparing the proportions of riders who had ridden more or less than 10,000km on their motorcycles, among the control riders, 61% had ridden more than 10,000km compared to only 32% of the cases (p<0.001). Notably, one case rider had never previously ridden the motorcycle they crashed on, and a further two reported riding less than 100km on the motorcycle. In contrast, no control riders reported riding less than 100km on their current motorcycles.
Figure 18: Kilometres clocked on motorcycle being ridden
For those who owned the motorcycle, length of ownership varied between the two groups. Among the controls, the average length of ownership was 4.2 years (SD 3.4, range 1- 20 years) and among the cases the average length of ownership was 8.5 years (SD 6.5, range 1-24 years). However, there was no difference in the age of the motorcycles being driven by the case and control samples. The average year of manufacture was 2005 in both groups, and the range in motorcycle year of manufacture was from 1990 to 2014 in both groups.
0
10
20
30
40
50
60
70
80
90
100
Very Familiar Familiar Not very/no previous experience
Per
cent
age
(%)
Rider familiarityCase Control
0
10
20
30
40
50
60
70
<5000kms 5000-9999kms 10,000kms or more
Per
cent
age
(%)
Kilometres ridden on crashed motorcycle
Case Control

Motorcycle In-depth Crash Study
Austroads 2015 | page 37
Riding Exposure
Riders were asked to report how many kilometres, on average, they had ridden each week in the last year. As illustrated in Figure 19, there was little difference between groups.
Figure 19: Average kilometres ridden per week (last 12 months)
There was also no significant difference in reported hours of riding per week between the groups (Mean = 9 hours/week, SD =13hrs/week for the controls, Mean = 9 hours per week, SD = 6 hrs/week for the cases). For those who reported how frequently they ride, the cases appeared to report more frequent riding (see Figure 20, p <0.001) with 68% reporting that they ride daily or almost every day compared to only 47% of the controls. Note that in Figure 20, ‘other’ includes those who reported riding weekly, monthly or less frequently.
Figure 20: Frequency of riding
Riders were also asked whether or not they mostly ride on weekdays or weekends (see Figure 21). There was a significant difference in the response from the two samples (p<0.003) with case riders more likely to report riding on weekends while controls were more likely to report that they ride any day.
0
10
20
30
40
50
60
70
100km or less 101-400kms >400kms
Per
cent
age
(%)
Kilometres ridden per week
Case Control
0
10
20
30
40
50
60
70
80
Daily/Almost Daily Other
Per
cent
age
(%)
Riding frequencyCase Control

Motorcycle In-depth Crash Study
Austroads 2015 | page 38
Figure 21: Riding days
Riders were also asked about their primary purpose of riding. There were proportionally more case riders who rode daily for commuting/transport purposes (59% compared with 39%, p<0.001) but after grouping those who rode for commuting purposes daily and sometimes (see Figure 22), there was no significant difference.
Figure 22: Frequency of riding for commuting purposes
Case riders were less likely to report riding daily for leisure/recreation purposes (4% of case riders compared to 11% of control riders) and this difference remained significant when collapsed to daily/sometimes and never (see Figure 23), with 89% of the case riders reporting that they never rode for recreational purposes compared to only 4% of the control riders (p <0.001).
0
10
20
30
40
50
60
70
Any day Mostly weekdays Mostly weekends
Per
cent
age
(%)
Riding days
Case Control
0
10
20
30
40
50
60
70
80
Daily/Sometimes Never
Per
cent
age
(%)
Frequency of riding for commuting
Case Control

Motorcycle In-depth Crash Study
Austroads 2015 | page 39
Figure 23: Frequency of riding for leisure/pleasure
Association with other riders
Case riders were significantly less likely to identify as being part of any formal or informal riding organisation, with 65% reporting no involvement compared to 33% of control riders (p <0.001).
Crash and near miss history
A similar proportion of case riders reported being involved in at least one crash in the previous 12 months (12%) as control riders (13%). There was also no significant difference in motorcycle crash history over the last three years for case and control riders (19% of case riders and 21% of control riders) but case riders reported significantly more involvement in car crashes over the previous three years (13% compared with 6% of controls (p<0.01)). Figure 24 illustrates the frequency of involvement in car crashes reported by the case and control riders.
0
10
20
30
40
50
60
70
80
90
100
Daily/Sometimes Never
Per
cent
age
(%)
Frequency of riding for leisure/pleasure
Case Control

Motorcycle In-depth Crash Study
Austroads 2015 | page 40
Figure 24: Car crashes last three years
While most riders had experienced a near miss in the past 12 months, there was a non-significant trend toward case riders having a higher frequency than control riders (p<0.072) (see Figure 25).
Figure 25: Reported near misses in last 12 months
Case riders also reported more violations over the previous three years than control riders (51% compared to 38%, p<0.03) (See Figure 26).
0102030405060708090
100
0 1 2 >2
Per
cent
age
(%)
Number of car crashes in last 3 years
Case Control
0
5
10
15
20
25
30
35
40
45
Never 1 or 2 occasions 3 to 5 occasions more than 5 occasions
Per
cent
age
(%)
Reported near miss in last 12 months
Case Control

Motorcycle In-depth Crash Study
Austroads 2015 | page 41
Figure 26: Violations in last 12 months
Use of protective equipment
Helmet use was reported by almost all riders in both samples (98% of case riders and 100% of control riders who responded to this question). There was some variation in the distribution of helmet types between the two samples. Flip face helmets were more common among the controls, and open face helmets were more common among the case riders. Grouping flip face helmets with full face helmets, 83% of case riders used full face helmets compared with 92% of control riders (p<0.01, see Figure 27).
Figure 27: Helmet types
0
10
20
30
40
50
60
70
No Yes
Per
cent
age
(%)
Violation in last 12 months
Case Control
0102030405060708090
100
Full face Open face
Per
cent
age
(%)
Helmet types
Case Control

Motorcycle In-depth Crash Study
Austroads 2015 | page 42
Some form of eye protection (including visors and/or glasses) was worn by the majority of riders in both groups with only 1% of riders in both groups reporting no eye protection. However, visor use did vary between the groups (p<0.03) (see Figure 28).
Figure 28: Visor types
Significantly more control riders wore clothes designed for motorcycle use than case riders (See Table 6). Control riders also wore more items of protective clothing (see Figure 29).
Table 6: Clothing designed for motorcycle use
Cases Controls Significance
Jacket designed for motorcycle use 69 93 <0.001
Gloves worn 78 96 <0.001
Gloves designed for motorcycle use 74 96 <0.001
Pants designed for motorcycle use 33 67 <0.001
Footwear designed for motorcycle use 40 75 <0.001
Figure 29: Use of protective clothing
0
10
20
30
40
50
60
70
80
Clear/Non-Tinted Tinted None
Per
cent
gae
(%)
Visor types Case Control
0
10
20
30
40
50
60
70
No items One item Two items Three items Four items
Per
cent
age
(%)
Number of items worn Case Control

Motorcycle In-depth Crash Study
Austroads 2015 | page 43
Control riders were also significantly more likely to use earplugs (33% compared to 11%, p<0.001) (see Figure 30). Note that the question used to collect this data did not include details about the earplugs. Therefore this includes earplugs used for hearing protection as well as ear plugs used in conjunction with electronic devices.
Figure 30: Use of ear plugs
3.2.2 Characteristics of the case and control samples related to the site specific ride
Trip characteristics
For case riders, the information collected about the trip characteristics relates to the trip during which the rider crashed. For the control riders, the trip characteristics relate to features of the ride on the last time the control rider rode through the crash site. As shown in Figure 31, there were differences in the purpose of the trip between case and control riders (p<0.001). Case riders were more often riding for commuting and general transport reasons, while the control riders were more often on recreational rides. Riders were also asked if they were in a hurry the day of the crash (for cases) or when they rode through the specified location (for the controls) and there was no significant difference in responses from the two samples, with 96% of cases and 93% of controls reporting that they were not in a hurry.
Figure 31: Trip purpose
0102030405060708090
100
Yes No
Per
cent
age
(%)
Use of ear plugs
Case Control
0
10
20
30
40
50
60
70
Commuting/transport Recreational ride Other
Per
cent
age
(%)
Trip purposeCase Control

Motorcycle In-depth Crash Study
Austroads 2015 | page 44
The case riders were more familiar with the location than the control riders (p<0.001). As shown in Figure 32, half of the case riders travelled past the crash site daily compared with only 10% of the control riders.
Figure 32: Familiarity with location
Collapsing the above into those who rode through the crash location daily, sometimes (including those who rode the crash location 2-3 times a week, once a week and once a month), and rarely or first time in the area, there was a significant difference between the two samples (p<0.001) (see Figure 33).
Figure 33: Familiarity with crash location collapsed to three categories
Slightly fewer case riders than controls were riding with other riders (23% compared with 30%) but there was no significant difference. The planned trip times were longer among the case riders (Mean = 81 mins, Range =5-480 mins) than for control riders (Mean = 58 mins, Range = 10-480) but there was no significant difference. Similarly, no significance was found in the average time ridden by both groups before crossing the crash location.
0
10
20
30
40
50
60
Daily 2-3 times/week once a week Once a month rarely first time in area
Per
cent
age
(%)
Familiarity with crash locationCase Control
0
10
20
30
40
50
60
70
Daily Sometimes rarely/first time
Per
cent
age
(%)
Familiarity with crash location
Case Control

Motorcycle In-depth Crash Study
Austroads 2015 | page 45
Riders were asked about the types of riding they undertook in the hour before the crash (for case riders) or the hour before they passed through the specified location (for control riders) (See Table 7).
Table 7: Riding characteristics in the hour before the crash
Cases (%) Controls (%) Significance
A near miss due to another vehicle driver/rider or own error 5 9 0.025
Riding behind a slower vehicle where it was difficult to overtake
13 34 <0.001
Riding in heavy traffic 5 42 <0.001
Riding on a fast but boring section of road (e.g. motorway) 7 30 <0.001
Riding on a winding section of the road that was a challenge for your riding skills
11 21 0.025
Riders were asked about their activities on the day before the crash (or riding through the specified location). The control riders were significantly more likely to have reported participating in a long ride and the case riders were significantly more likely to have reported having a normal work day. However, there was no significant difference in the other activities examined (See Table 8).
Table 8: Activities on the day before the crash
Cases (%) Controls (%) Significance
Long ride 5 13 0.011
Day Shift/Normal Work day 41 52 0.001
Relaxed day at home 17 11 0.351
Late Night 4 6 0.322
Worked Night Shift 1 2 1.00
Impairment and general health
Riders were asked if they had consumed any alcohol or illicit drugs in the two hours prior to the crash (for case riders) or two hours before riding through the specified road section (for the control riders). There was no significant difference in responses of the two samples. One percent of control riders (n=5) and 2% of the case riders (n=2) reported consuming alcohol. No case rider and only one control rider (0.3%) reported consuming any illicit drugs.
Similar proportions of case (16%) and control (16%) riders reported taking medication in the 12 hours prior to the crash, or to riding through the specified section of road. Medication was defined any prescription and non-prescription medicine.
Use of electronic equipment
Case riders were asked if they were using a mobile phone or other electronic device prior to or at the time of the crash. Control riders were asked the same question with respect to the ride through the specified location. There were proportionally more control riders using some type of electronic device but the numbers were relatively small (5% of case riders compared to <1% of control riders). Of the five case riders who reported using an electronic device, two were using a hands free mobile device, two were using an IPod or similar and the fifth did not provide a description of the device.

Motorcycle In-depth Crash Study
Austroads 2015 | page 46
3.2.3 Important points to note regarding the control sample
The method of recruiting controls was limited by not being able to actively recruit riders who were observed to ride through the crash location. The final method adopted to recruit controls relied on riders self-selecting, and self-reporting that they had ridden through the crash location. This is an inherent limitation of the control sample. To examine the potential for any significant bias introduced by the control riders self-selecting, some key characteristics of the control sample have been compared to characteristics of a population referenced sample of riders across NSW.
In our control sample, 90% were male and 10% were female, compared to our population data for which 88% were male (95% confidence interval (CI) 84%-92%) and 12% were female (95% CI 8%-16%), demonstrating a close match between the control sample and the previously estimated population of riders. However as shown in Figure 34, there are some differences in age distribution, with the control sample tending to contain proportionally more riders 60 years and older than estimated to be in the population of riders in NSW.
Figure 34: Age distribution of control sample compared to age distribution of estimated population of riders from NSW
Note: Error bars on population data represent 95% confidence interval of the estimation
Similarly, comparing the proportion of riders by licence status between our control sample and the estimated population of riders in NSW (Figure 35), our sample contains more riders on unrestricted licences and fewer on learner and provisional licenses than is estimated for the NSW population of riders.
0
10
20
30
40
50
60
70
17 -20 years 21 - 25 years 26-39 years 40 - 59 years 60 or older
Per
cent
age
(%)
Age group
Control Population

Motorcycle In-depth Crash Study
Austroads 2015 | page 47
Figure 35: Licence distribution of control sample compared to licence distribution of estimated population of riders from NSW.
Note: Error bars on population data represent 95% confidence interval of the estimation
The analysis method being used in the case-control analysis will control for age and licence status and so these differences will be taken into account. However, these differences should be kept in mind when considering the simple case-control comparisons presented in the preceding section.
Differences between the control sample achieved and the estimated population also suggest the recruitment method used has not achieved a truly random sample of riders, and this limitation, together with the uncertainty regarding whether or not the control rider actually travelled through the crash location, should be kept in mind when considering the results of the case-control analysis. A final limitation to keep in mind is that the recruitment method did not consider the timing of when the control rider may have ridden through the crash location. This was eventually not specified in the inclusion criteria, so for example the control rider may have ridden through the crash location at a different time of day or day of week than the case rider. There was also no data collected about when the control rider last rode through the crash location so there may have been considerable time separations between when the crash occurred and when the control rider rode through the crash location, and/or between when the control rider rode through the crash location and when the survey was completed.
Regardless of the above limitations in the control sample, the results of the case control analysis presented in the next section reflect significant differences between the two groups that remain after controlling for potential confounders. It is also important to note the similarities between the case and control riders in terms of the measures of exposure used here. There was no significant difference in the groups in terms of the hours or kilometres ridden per week. This is important, as exposure is likely to be related to various other rider characteristics that in turn are related to rider safety.
0
10
20
30
40
50
60
70
80
90
100
Learner Provisional 1 Provisional 2 Unrestricted Not licensed
Per
cent
age
(%)
Licence Group
Control Population

Motorcycle In-depth Crash Study
Austroads 2015 | page 48
3.3 Case Control Analysis
3.3.1 Key findings
The results from the case control analysis indicate that;
• Riders of sports motorcycles were more likely to be in the crash sample than riders of other bike types, however this varies with age of rider.
• Riders who did not report being ‘very familiar with their motorcycle were more likely to be in the crash sample that riders who reported simply being familiar or not familiar with the motorcycle they were riding
• Riders who were familiar with the crash location (i.e. rode through daily) were five times more likely to be in the crash sample
• Riders who wore more protective equipment were less likely to be in the crash sample, with the odds of being in the crash sample dropping by 50% with every extra item of protective clothing worn
• For every year older, a rider was less likely to be in the crash sample than the control sample.
• Riders who reported they had been riding in heavy traffic and in freeway type conditions prior to travelling through the crash location were less likely to be in in the crash sample than in the control sample.. Riders who reported riding for commuting or transport reasons when they rode through the crash location were less likely to be in the crash sample than those who reported they were riding for recreational purposes.
3.3.2 Description and explanation of case control analysis
Tables 9 to 12 present the results of the univariate (or unadjusted) analysis of rider characteristics associated with whether or not the rider was in the case or control group. Variables marked with an asterix and shaded grey identify those variables significantly different between the two groups. The odds ratio (OR) and 95% confidence interval (CI) refer to the strength and direction of the association between the variable and the outcome (whether the rider belonged to the case or control group).
Variables with a significant association with the outcome (in crash or control sample) are highlighted with an asterix and were entered into the Step 1 conditional multivariable logistic regression with backward stepwise selection. The exceptions to this are marked with ‘+’ and include the LAMS variable, the ‘years owned variable’, the ‘commuting’ variable and the ‘recreation’ variable. The LAMS variable was not included as non-LAMS bikes were not ridden by any of the novice riders and the ‘years owned variable’ was strongly correlated with the ‘kms ridden on the bike’ variable. The ‘commuting’ and ‘recreation’ variables were strongly correlated with the variables describing the frequency of the days of the week the rider usually rides. The multivariable logistic regression model allows the association between each of these variables to be examined while ‘adjusting’ for any potential confounding by the other variables included in the model.
Tables 13 to 15 present the univariate (or unadjusted) analysis of trip characteristics. As above variables demonstrating a significant association with the outcome are highlighted with an asterix. As described below, these were added to the model identified in Step 1 of the multivariable logistic regression.

Motorcycle In-depth Crash Study
Austroads 2015 | page 49
Table 9: Rider characteristics
Variable Category p value OR 95%CI
Gender Male REFERENCE
Female 0.18 0.47 0.16 1.41
Age* <.0001 0.95 0.93 0.97
Licence* Learners/P1/P2 REFERENCE
Full/unrestricted <.0001 0.17 0.08 0.34
Months Riding* <.0001 0.996 0.994 0.998
Protective Clothing* <.0001 0.47 0.37 0.62
Rider Training* No/Not in last 5 years REFERENCE
Yes in last 5 years <.0001 3.26 1.93 5.51
Track Days Yes REFERENCE
No 0.14 1.69 0.84 3.41
Club Training Yes REFERENCE
No 0.29 1.77 0.62 5.01
Offroad Rider* No REFERENCE
Yes 0.015 0.54 0.32 0.89
Car Licence Bike Only REFERENCE
Car & Bike 0.12 0.28 0.05 1.42
Table 10: Motorcycle characteristics
Variable Category p value OR 95%CI
Bike Type* Sports REFERENCE
Other <.0001 0.22 0.13 0.39
LAMS *+ Yes REFERENCE
No 0.003 0.44 0.26 0.75
Engine Capacity* 0.04 0.999 0.999 1
Bike Familiarity * Very Familiar REFERENCE
Other 0.0001 3.58 1.88 6.82
Bike Ownership Other person REFERENCE
Own vehicle 0.10 0.14 0.01 1.47
KM on bike * <10,000kms REFERENCE
10,000kms or more <.0001 4.72 2.496 8.919
Years owned*+ <.0001 1.131 1.07 1.195
Year manufactured 0.6338 1.008 0.976 1.04
+ Not included in model

Motorcycle In-depth Crash Study
Austroads 2015 | page 50
Table 11: Exposure/Riding characteristics
Variable Category p value OR 95%CI
Kms/week 100km or less REFERENCE
101-400kms 0.1786 1.592 0.809 3.133
>400kms 0.7494 1.144 0.5 2.62
Hrs/week 0.4573 0.99 0.963 1.017
Rider Organisation* No REFERENCE
Yes <.0001 3.279 1.913 5.62
Riding Frequency Other REFERENCE
Daily/Almost Daily 0.05 0.614 0.376 1.002
Riding Days* Any day REFERENCE
Mostly weekdays 0.8811 1.083 0.379 3.095
Mostly weekends 0.002 3.874 1.639 9.156
Commuting+ Daily/Sometimes REFERENCE
Never 0.663 0.87 0.462 1.633
Recreation*+ NEVER REFERENCE
Daily/Sometimes <.0001 0.009 0.002 0.037
Table 12: Crash/Violation history
Variable Category p value OR 95%CI
Crash in last 12mth No REFERENCE
Yes 0.8595 0.934 0.441 1.981
MC crash last 3yrs No REFERENCE
Yes 0.3324 0.722 0.374 1.394
Car crash last 3yrs* (Ordinal)
0.0086 2.132 1.212 3.75
Violation last 3 years* No REFERENCE
Yes 0.0243 1.848 1.083 3.154
Near Miss 12mth Collapsed
More than 5 occasions REFERENCE
Never 0.552 0.769 0.322 1.84
1 or 2 occasions 0.0505 0.516 0.265 1.002
3 to 5 occasions 0.1358 0.545 0.245 1.21

Motorcycle In-depth Crash Study
Austroads 2015 | page 51
Table 13: Trip Characteristics
Variable Category p value OR 95%CI
In Hurry
No REFERENCE
Yes 0.4488 0.61 0.17 2.193
Riding With Others
No REFERENCE
Yes 0.7751 1.095 0.588 2.036
Familiarity*
Other REFERENCE
Daily <.0001 10.442 4.546 23.984
Pre-Crash Time 0.3437 1.001 0.999 1.003
Trip Purpose* Recreation REFERENCE
Commuting/Transport 0.0123 2.732 1.244 5.999
Other 0.1014 1.903 0.881 4.111
Table 14: Hour before crash
Variable Category p value OR 95%CI
Heavy Traffic* Yes REFERENCE
No <.0001 15.455 5.477 43.61
Near Miss Yes REFERENCE
No 0.5719 1.377 0.454 4.18
Behind slow vehicle* Yes REFERENCE
No 0.0009 3.384 1.65 6.943
Fast but boring* Yes REFERENCE
No 0.0006 4.731 1.95 11.479
Winding Road Yes REFERENCE
No 0.3737 1.448 0.64 3.276
Table 15: Day before crash
Variable Category p value OR 95%CI
Shift Change* Yes REFERENCE
No 0.0002 0.222 0.1 0.491
Worked Day shift Yes REFERENCE
No 0.0591 1.709 0.98 2.982
Long Ride* Yes REFERENCE
No 0.0439 3.071 1.031 9.146
At Home Yes REFERENCE
No 0.1525 0.588 0.284 1.217
Late Night Yes REFERENCE
No 0.2884 2.006 0.555 7.256

Motorcycle In-depth Crash Study
Austroads 2015 | page 52
The results of the Step 1 conditional logistic regression are presented in Table 16. Together with those trip characteristics variables demonstrating a significant association with the outcome (highlighted with an asterix in Tables 9-15), the variables with a significant association with the outcome in the final Step 1 model were entered into the Step 2 model (see Table 17) selection procedure. Rider age did not make it into the final Step 1 model but as this is a known important risk factor, this variable was also forced into the Step 2 variable selection procedure.
Table 16: Step 1 conditional logistic regression
Variable Category p value OR 95%CI
Bike Type* Other REFERENCE
Sports 0.0012 19.725 3.258 119.429 Bike Familiarity* Very Familiar REFERENCE
Other 0.0382 11.250 1.141 110.914 Off road riding Yes REFERENCE
No 0.0788 4.391 0.843 22.860 Protective Clothing* 0.0023 0.233 0.091 0.593
Table 17: Step 2 conditional logistic regression
Variable Category p value OR 95%CI
Bike Type* Other REFERENCE
Sports 0.0012 19.7 3.3 119.4
Bike Familiarity Very Familiar REFERENCE
Other 0.0037 10.290 2.132 49.664
Age* 0.0008 0.921 0.877 0.966
Protective clothing* 0.0083 0.497 0.296 0.835
Heavy traffic* No REFERENCE
Yes <0.001 0.026 0.004 0.162
Fast but boring* No REFERENCE
Yes 0.0015 0.075 0.015 0.370
Trip Familiarity* Other REFERENCE
Daily 0.0084 5.495 1.547 19.508
Trip Purpose* Recreation REFERENCE
Commuting/Transport* 0.0492 0.192 0.037 0.994
Other 0.8131 1.255 0.191 8.243
Potential interactions between the variables in the final model were explored and a significant interaction between age and bike type was identified. This means that the influence of motorcycle type on the outcome (i.e. being in the case or control group) varied by age.
Figure 36 illustrates the variation in the relationship between being in the crash sample by age. The increased likelihood of being in the crash sample when riding a sports motorcycle increases with age so the association between motorcycle type and crashing is most prominent among older riders.

Motorcycle In-depth Crash Study
Austroads 2015 | page 53
Figure 36: Variation in relationship between motorcycle type and being in crash sample by age
3.3.3 Important points to note regarding the case control analysis
There are a few limitations to keep in mind when considering the results of the case control analysis. The primary limitation is that the case and control samples are not random samples. For the case riders, the convenience sample does closely reflect the population of crashes across NSW in some key characteristics. For the control sample there may be some significant bias introduced by the self-selection method used during recruitment. Please refer to Section 3.2.3 for discussion of important notes regarding the control sample. For this reason we re-ran the model used to identify ‘important rider characteristics’ using data collected during a population-referenced survey of motorcycle riders across NSW, and the motorcycle type, familiarity with motorcycle and protective clothing variables remained significantly associated with the outcome i.e. being in the crash sample. This is reassuring but completing the full model selection process using the second control data set might be a worthwhile future exercise to further confirm the results in this analysis.
The model building process used in this analysis assumed the objective of finding the best fitting model from the variables selected. An alternative way to approach the case control analysis would be to start with a specific research question and then conduct an analysis while controlling for potential confounders. While the differences between the two approaches are subtle, it may also be worth considering using the case control data collected to conduct targeted testing of hypotheses formulated at the completion of this study. For example the research question might be “Do riders of sports motorcycles have a greater likelihood of being crashes?” In the alternative approach to building the model, all variables that might potentially be confounding the relationship between motorcycle type and the outcome would be forced into the model. This might also be a worthwhile exercise to confirm the observations made in this study.
A very large amount of data was collected during the in-depth investigations and control interviews and not all aspects of the data could be considered in this analysis, using the model building approach taken. Conducting further analyses with set research questions would also allow for further use of the data collected by not yet included in any analysis.
In this current analysis, cases and controls with missing data were excluded from the case-control analysis. In any future analysis consideration might also be given to finding better ways to deal with the missing data so as to not lose all data from any one case when there was only missing data for one variable of interest. Notably the data collected for fatal crashes was missing a lot of the trip specific data as there were no rider interviews conducted.
Future analyses with this data set aimed at examining specific research questions might also make better use of the data collected for the fatal crashes.
0102030405060708090
100
Control Case Control Case Control Case Control Case
25 or younger 26-39 40-59 60+
Perc
enta
ge (%
)
Age Group
Sports
Other

Motorcycle In-depth Crash Study
Austroads 2015 | page 54
3.4 Rider Reported Environmental Factors
The case and control riders were asked a series of questions about the crash location. When asked whether they believed there was an issue with the road surface at the crash location that would affect vehicle handling, 24% of the case riders and 31% of the control riders answered ‘Yes’. Crash investigators noted road surface issues in 22% of the crashes.
Case riders who answered ‘Yes’ were asked to describe the problem with the road and their responses are summarised in Figure 37.
Figure 37: Reported road surface problems (cases and controls combined)
As shown in Figure 37, the problem most commonly identified was a rough surface. A ‘rough surface’ included descriptions such as ‘bumpy’, ‘lots of corrugations’, ‘grooves in road surface’, ‘irregular surface’ and ‘ruts’. However, most of these reports came from control riders. Only three case riders (3% of crash sample) reported a rough surface as affecting vehicle handling. Two of these were single vehicle crashes and one involved multiple vehicles. As shown in Table 18, at least one control rider also observed a rough surface at two of these locations, and both of these were locations where single vehicle crashes occurred. Note no attempt to measure road roughness (using any roughness indicator such as the NAASRA Roughness Meter of the International Roughness Index was made. Instead, descriptions of the road condition made by the engineers inspecting the scene were used in Table 18.
Problems grouped as ‘other’ included descriptions such as “bouncing within my lane”, “consider greater braking distances”, “front wheel jitter and slide”, “occasional need to change line mid corner”, “poor condition”, “roadworks being undertaken”, “slight movement on bike”, “speed humps can affect the handling especially since they are damaged, not as they were made new”, “tar joining compound when damp slippery”, “tar jointing compound, tended to push the bike off it's line”, “motorcycle moved around a lot through corners”, need to use different lane due to the plate” and “care needed on some corners”. Case riders accounted for two of the riders reporting ‘other’ road surface problems, (2% of crash sample) (see Table 19). One of these involved a single vehicle crash.
0
10
20
30
40
50
60
Rough Camber problem Other OIl/debris Slippery
Per
cent
age
(%)
Road surface problems

Motorcycle In-depth Crash Study
Austroads 2015 | page 55
Table 18: Case riders reporting rough road surface that may have affected vehicle handling
Crash number
Case Control Inspection Crash type
MB058 Difficult to stop due to going in grooved surface. Could have ridden back on road.
Road is grooved from continual traffic
Potholes, Ruts & Ridges, Gravel road.
Single Vehicle
MB069 Pot hole Some crests with tar ripples affecting steering
No road surface deficits noted
Single Vehicle
MB077 Front wheel went over a bump
Bend with camber requires judgment in speed and braking
No road surface deficits noted
No road surface deficits noted
Table 19: Case riders reporting ‘other’ road surface issues that may have affected handling
Crash number
Case Control Inspection Crash type
MB050 Road surface may have affected braking
Very bumpy ride No road surface deficit noted
Multi-Vehicle
MB098 Tar jointing compound No road surface deficit noted
Ripples, ridges, damp surface
Single Vehicle
Three case riders reported that oil/debris problems may have affected handling and this included one multi-vehicle crash and two single vehicle crashes. While control riders also reported issues at two of these locations, as shown in Table 20, the descriptions did not match those of the case riders. For those two cases involving oil/diesel spills, it is not surprising that this was not observed by control riders or the crash investigators who rode through or attended the scene at a later time.
Table 20: Case riders reporting oil/debris road surface issues may have affected handling
Crash number
Case Control Inspection Crash type
MB054 Fresh diesel spill 0.5m by 50 metres
Motorcycle moved around a lot through corners; steering to avoid hazards
No deficit noted Single Vehicle
MB075 Maybe gravel Poor road surface on some bends caused me to take bad lines through some bends; road very bumpy in sections
No deficit noted Single Vehicle
MB095 Oil on road and weather conditions
No deficit noted Cracked pavement with ripples and ridges
Multi-Vehicle
Issues related to the slipperiness of the road and camber problems potentially affecting vehicle handling were not reported by any of the case riders.
Overall, 8% of the crash sample reported some issue with the road surface at the crash location that they believed may have influenced vehicle handling; however this accounted for 13% of the single vehicle crashes.

Motorcycle In-depth Crash Study
Austroads 2015 | page 56
Riders and controls were also asked whether or not they believed there to be anything particular dangerous about the crash location. Half of the control riders (50%) and just over a third of the case riders (37%) answered ‘yes’ to this question. For single vehicle crash locations, the proportions were similar with 31% of case riders and 52% of control riders reporting that they believed there was ‘something dangerous’ about the crash location. However, for the multivehicle crashes, proportionally more case riders answered ‘yes’ to this question (42% case riders and 51% of control riders).
The riders were then asked whether or not the following features were present at the location; loose material, metal plate covering braking zone, poor visibility, complicated location, or something else that was especially dangerous. Figures 38 to 41 illustrate the riders’ responses to these questions.
Figure 38: Loose material
Figure 39: Metal plate covering braking zone
0
10
20
30
40
50
60
70
80
90
Case Control
Per
cent
age
(%)
Missing Yes No
0
10
20
30
40
50
60
70
80
90
Case Control
Per
cent
age
(%)
Presence of metal plate
Missing Yes No

Motorcycle In-depth Crash Study
Austroads 2015 | page 57
Figure 40: Visibility problems
Figure 41: Dangerous crash location
As shown in Figures 38 to 41, for the case riders, the most frequently reported problem was related to the complicated nature of the location, and poor visibility at the location. The complicated nature of the location and the presence of loose material were the most commonly reported among the control riders.
0
10
20
30
40
50
60
70
80
90
Case Control
Per
cent
age
(%)
Presence of visibility problems
Missing Yes No
0
10
20
30
40
50
60
70
80
Case Control
Per
cent
age
(%)
Dangerous crash location
Missing Yes No

Motorcycle In-depth Crash Study
Austroads 2015 | page 58
Looking just at those riders who reported problems, and breaking down the crashes into single and multiple vehicle crashes, the above held true for both the single vehicle and multi-vehicle crashes. However, the proportion of riders reporting problems for the single vehicle crashes was greater than the proportion of riders reporting problems for the multiple vehicle crashes. For those riders who reported something else that was dangerous at the crash location, most of these could be categorised as a complicated traffic location, visibility issues or tight bends (Figures 42 and 43).
Figure 42: Single vehicle crashes
Figure 43: Multi vehicle crashes
0
5
10
15
20
25
Loose Material Metal Plate CoveringBraking Zone
Poor Visibility Complicated Location
Per
cent
age
(%)
Problems reported - single vehicleCase Control
0
2
4
6
8
10
12
14
16
18
Loose Material Metal Plate CoveringBraking Zone
Poor Visibility Complicated Location
Per
cent
age
(%)
Problems reported - multi vehicle Case Control

Motorcycle In-depth Crash Study
Austroads 2015 | page 59
3.4.1 Important points to note regarding rider reported environmental factors
As the case control analysis matched riders on the crash location, factors related to the crash location will not be considered in that analysis. This section describes the road environmental factors raised by the riders and compares those to observations made by the control riders and the investigators who visited the crash site. It should be kept in mind that this section takes no account of the number of controls per site, so multiple controls may report on a single site.
Overall there was close agreement between case riders, control riders and investigators in the number of sites where road surface conditions were reported to have possibly contributed to the crash (24% case riders, 22% sites reported by crash investigators, 31% of sites visited by control riders). These numbers are slightly greater than those reported in the 1997 Victorian study, where the condition of the road surface contributed to 15% of the crashes. There may however be differences in the definition of ‘contribution’ between that previous study and this one, and/or differences in the type of issues considered as road surface issues.
In comparing the issues identified by case riders, control riders and the inspection it is important to note the following. As noted previously, there was no record of the time separation between when the crash occurred and when the control rider rode through the crash location. Therefore it is possible that some of the problems with the road surface noted by case riders may have been corrected before control riders visited the crash location. Similarly, while most scene inspections occurred within two weeks of the crash, and there would unlikely have been any major changes to the crash location in that time there may have been some issues addressed.
The primary objective of this section was to present the information collected from case and control riders. Environmental contributors to crash causation are considered in more detail in the section dealing with the qualitative analysis and the overall contribution of environmental factors is discussed in more detail in section 4.0 Discussion.
3.5 Injury Outcomes
As noted in Section 2.2.1, the final case sample consists of 92 riders who were admitted to hospital and sustained at least one injury that could be coded using the Abbreviated Injury Score, and 12 fatally injured riders.
The severity of the injuries sustained by the riders overall, excluding fatal cases, is summarised by the Injury Severity Score (ISS) and the ISS distribution across the sample is shown in Figure 44. The riders’ ISS ranged from 1 to 55, with 43% of the riders sustaining minor injury (ISS <7), 22% sustaining moderate severity injury (ISS 8-13), 15% sustaining serious injury (ISS 14-20) and 20% sustaining critical injury (ISS >20).
Figure 44: ISS distribution
02468
1012141618
1 2 4 5 8 9 10 11 12 13 14 17 19 21 22 26 29 30 33 34 38 50 55
Freq
uenc
y
ISS Score

Motorcycle In-depth Crash Study
Austroads 2015 | page 60
Overall, the extremities were the most frequently injured regions, followed by the torso and the head (see Figure 45). However, for those moderate to severe injuries (AIS 3+) the thorax was the most frequently injured, followed by the abdomen then pelvis (Figure 46).
Figure 45: All injuries
Figure 46: AIS 3+ injuries non-fatals

Motorcycle In-depth Crash Study
Austroads 2015 | page 61
The most common source of injury was the roadway (including injuries from impact with the roadway and the rider sliding across the road way (46%), followed by contact with another vehicle (19%) and then the rider’s own motorcycle (15%) (see Figure 47). Overall, 5% of injuries resulted from the rider contacting a roadside object.
Figure 47: Injury source – overall
The proportion of serious (AIS 3+) injury associated with each of the identified sources of injury is shown in Figure 48. As is evident from Figure 48, while contact with roadside objects accounted for only 17% of injury overall, it commonly results in more severe injury. Conversely, while injuries occurring from contact with the rider’s own motorcycle were relatively common, these most often resulted in minor injury. However, contact with the roadway was the most common source of injury and resulted in approximately equal proportions of <AIS 3 and AIS 3+ injury.
0 5 10 15 20 25 30 35 40 45 50
Roadway
Motorcycle contact
Road furniture traffic
Road side design
Road furniture non-traffic
Crash barrier
Other vehicle
Other road user
Tree
Vegetation
Fences
Rock/ledge/bank
Wall/building
Unknown
Other
Percentage (%)
Inju
ry s
ourc
e
non-fatal fatal

Motorcycle In-depth Crash Study
Austroads 2015 | page 62
Figure 48: Source of injury for AIS 3+ injury (only non-fatals)
When controlling for risk factors commonly identified in other studies such as rider age, impact speed, whether an object was impacted and the use of protective clothing (Table 21), none of these factors were significantly associated with injury severity measured using the ISS. However a non-significant trend was observed between non-use of protective clothing and increased likelihood of increased ISS. Examining the influence of those same factors on the length of stay in hospital, length of stay significantly increased with increasing rider age.
0 20 40 60 80 100
N/A
Slid
Impact road surface
Motorcycle hit me
Road furniture traffic related
Road side design
Road furniture non traffic related
Crash barrier
Other vehicle
Other roaduser
Tree
Vegetation
Fences
Rock ledge bank
Contact with motorcycle part
Unknown
Other
Percentage (%)
Inju
ry S
ourc
e
AIS 3+ AIS 2 under

Motorcycle In-depth Crash Study
Austroads 2015 | page 63
Table 21: Association between injury risk factors and injury outcome
Outcome variable
Explanatory variable
Category Unadjusted Adjusted 95% CI
Exp(Beta) P-value Exp(Beta) P-value
Injury Severity Score (ISS)
Number of motorcycle specific clothing
n/a 1.175 0.041* 1.161 0.057 0.995-1.355
Rider age n/a 1.013 0.084 1.012 0.107 0.997-1.026
Impact speed n/a 1.005 0.284 1.006 0.180 0.997-1.016
Object impacted No Yes
Reference 1.022
0.939
Reference 1.169
0.580
0.672-2.032
Length of stay in hospital
Number of motorcycle specific clothing
n/a 1.024 0.795 0.995 0.995 0.832-1.190
Rider age n/a 1.018 0.03* 1.019 0.026* 1.002-1.036
Impact speed n/a 1.004 0.507 1.005 0.385 0.994-1.016
Object impacted No Yes
Reference 0.924
0.811
Reference 1.017
0.958
0.535-1.935
*p<0.05
3.5.1 Important points to note regarding injury outcomes
Almost all riders in the sample were using helmets, and the performance of the helmets will be presented in more detail in later sections. The high frequency of helmet use likely underlies the relatively low number of riders who sustained head injuries, given the established effectiveness of helmets (Liu, Ivers et al. 2004).
While most riders sustained relatively minor injuries, there are distinct differences in the body regions being injured, and the source of injury between minor and moderate to severe injury cases. The performance of protective clothing is examined in more detail in later sections.
Differences in injury outcome by type of injury source will be discussed in more detail in the overall discussion section presented later in the report.

Motorcycle In-depth Crash Study
Austroads 2015 | page 64
3.6 Performance of Protection Equipment
As helmets and protective clothing were not available for the fatally injured riders, this section examines the performance of helmets and protective clothing worn by the sample of seriously injured riders (n=92). This section present the results and observation, and the implications of these observations are discussed in Section 4, the overall discussion of study findings.
3.6.1 Helmets
Of the 92 cases investigated, a helmet was worn in 91 cases (99%). A full face helmet was worn in 75 cases (82.4%), an open face helmet was worn in 14 cases (15.4%), one flip front helmet (1.1%) and one unknown (1.1%) helmet was worn. In two cases (2%), the helmet was ejected from the rider’s head, both were open face helmets. The helmet was inspected and photographed in 67 cases (73%). In 15 (16%) cases, the helmet was taken with the permission of the rider and disassembled so that the internal helmet liner could be inspected.
Helmet damage type
Helmet damage was primarily identified through helmet inspections or photographs of damaged helmets provided by the rider. When an inspection was not possible, rider reports of damage obtained through the rider interview were used as evidence of damage.
Of the 91 helmets:
• 78 (86%) sustained some reported damage;
• 9 (10%) were undamaged;
• 4 (4%) condition unknown.
Scratches and abrasions to the outer shell of the helmet were the most common form of damage, present in 74 cases (81%). Cracking to the outer shell occurred in 19 cases (19%). Deformation or cracking to the internal helmet protective liner was evident in 10 cases (9%).
A major impact was defined as an impact which resulted in damage greater than superficial scratches and abrasions to the outer shell. There were 20 cases (22%) which showed evidence of a major impact.
Of the 15 cases where the liner was inspected, seven cases (47%) showed evidence of deformation or cracking of the internal protective liner. Examples of the internal liner damage are pictured in Figures 49 to 51. Of the remaining 52 helmets where the helmet was not disassembled, there was evidence of damage to the internal liner in three cases (6%). It is likely that there was unobserved damage to the internal liner in more cases.

Motorcycle In-depth Crash Study
Austroads 2015 | page 65
Figure 49: External damage and corresponding damage to the internal protective liner of the helmet
Figure 50: External damage and corresponding damage to the internal protective liner of the helmet
Figure 51: External damage and corresponding damage to the internal protective liner of the helmet
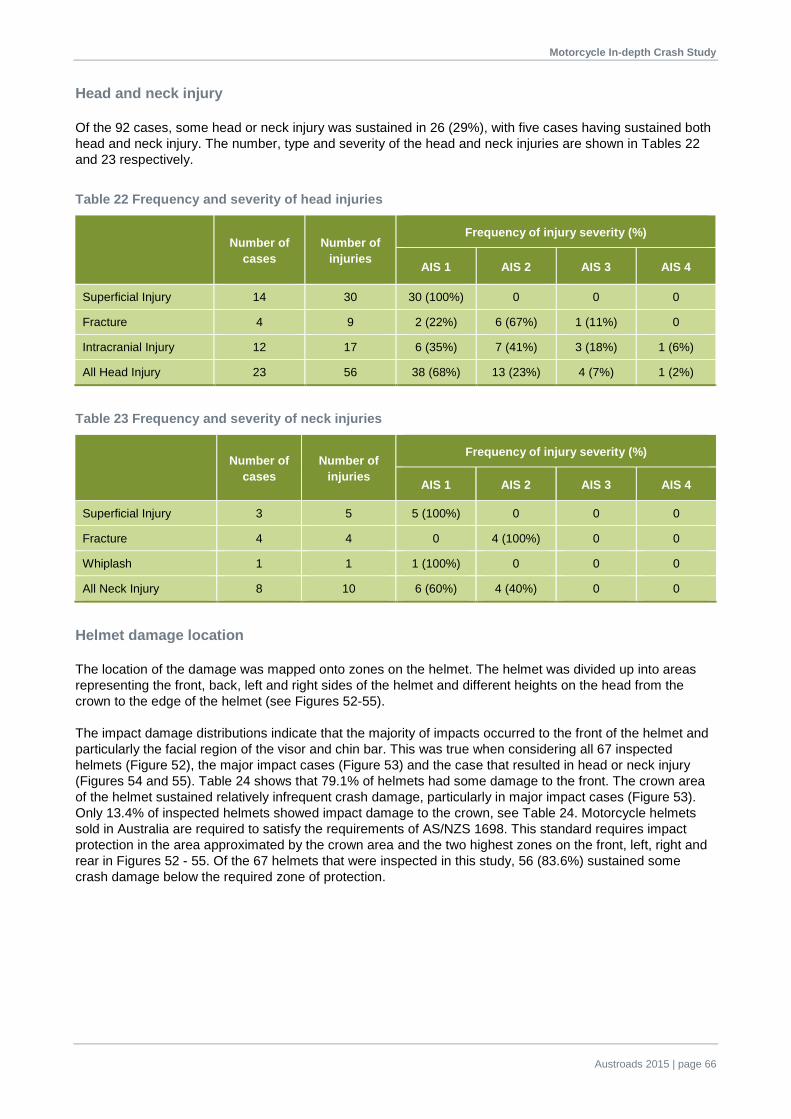
Motorcycle In-depth Crash Study
Austroads 2015 | page 66
Head and neck injury
Of the 92 cases, some head or neck injury was sustained in 26 (29%), with five cases having sustained both head and neck injury. The number, type and severity of the head and neck injuries are shown in Tables 22 and 23 respectively.
Table 22 Frequency and severity of head injuries
Number of cases
Number of injuries
Frequency of injury severity (%)
AIS 1 AIS 2 AIS 3 AIS 4
Superficial Injury 14 30 30 (100%) 0 0 0
Fracture 4 9 2 (22%) 6 (67%) 1 (11%) 0
Intracranial Injury 12 17 6 (35%) 7 (41%) 3 (18%) 1 (6%)
All Head Injury 23 56 38 (68%) 13 (23%) 4 (7%) 1 (2%)
Table 23 Frequency and severity of neck injuries
Number of cases
Number of injuries
Frequency of injury severity (%)
AIS 1 AIS 2 AIS 3 AIS 4
Superficial Injury 3 5 5 (100%) 0 0 0
Fracture 4 4 0 4 (100%) 0 0
Whiplash 1 1 1 (100%) 0 0 0
All Neck Injury 8 10 6 (60%) 4 (40%) 0 0
Helmet damage location
The location of the damage was mapped onto zones on the helmet. The helmet was divided up into areas representing the front, back, left and right sides of the helmet and different heights on the head from the crown to the edge of the helmet (see Figures 52-55).
The impact damage distributions indicate that the majority of impacts occurred to the front of the helmet and particularly the facial region of the visor and chin bar. This was true when considering all 67 inspected helmets (Figure 52), the major impact cases (Figure 53) and the case that resulted in head or neck injury (Figures 54 and 55). Table 24 shows that 79.1% of helmets had some damage to the front. The crown area of the helmet sustained relatively infrequent crash damage, particularly in major impact cases (Figure 53). Only 13.4% of inspected helmets showed impact damage to the crown, see Table 24. Motorcycle helmets sold in Australia are required to satisfy the requirements of AS/NZS 1698. This standard requires impact protection in the area approximated by the crown area and the two highest zones on the front, left, right and rear in Figures 52 - 55. Of the 67 helmets that were inspected in this study, 56 (83.6%) sustained some crash damage below the required zone of protection.

Motorcycle In-depth Crash Study
Austroads 2015 | page 67
Figure 52: Distribution of all impact damage in all 67 inspected cases.
Figure 53: Distribution of major impact damage in 20 cases with evidence of a major impact.

Motorcycle In-depth Crash Study
Austroads 2015 | page 68
Figure 54: Distribution of all damage in 26 cases where head or neck injury was sustained.
Figure 55: Distribution of all damage in 13 cases of AIS 2+ head or neck injury.

Motorcycle In-depth Crash Study
Austroads 2015 | page 69
Table 24: Number of cases that sustained some impact damage in various zones
Area of Helmet Frequency of Cases Percentage of Cases
Chin Bar 34 50.7
Visor / Facial Region 41 61.2
Frontal (above face) 19 28.4
Any frontal or face damage 53 79.1
Left 32 47.8
Right 33 49.3
Rear 40 59.7
Crown 9 13.4
Any impact below the AS 1698 test line 56 83.6
Total number of inspected helmets 67 100.0
Helmet type and injury
Table 25 shows that a significantly higher percentage of open face helmeted riders sustained a head or neck injury (p = 0.021, FET) than riders wearing full face helmets. Furthermore, there was a greater proportion of open face helmeted riders that sustained superficial head injury (50%, p < 0.001, FET) and head and dental fractures (21%, p = 0.011, FET) than full face protected riders (superficial head injury 9%, head and dental fracture 1%). However, the proportion of riders who sustained intracranial injury was similar for both full face (13%) and open face (14%) protected motorcyclists.
Table 25: Number of cases sustaining injury by helmet type
Full Face Helmet (n = 76 cases) Open Face Helmet (n = 14 cases)
p-value (FET) No. of cases
(% of cases)
OR (95% confidence
interval)
No. of cases (% of cases)
OR (95% confidence
interval)
Any Head or Neck Injury 18 (24%) 1.00 8 (57%) 4.30 (1.32-14.03) 0.021
Superficial Head Injury 7 (9%) 1.00 7 (50%) 9.86 (2.67-36.34) <0.001
Head and Dental Fracture 1 (1%) 1.00 3 (21%) 20.45 (1.95-214.48) 0.011
Intracranial Injury 10 (13%) 1.00 2 (14%) 1.10 (0.21-5.66) NS
Superficial Neck Injury 4 (5%) 1.00 1 (7%) 1.38 (0.14-13.40) NS
Cervical Vertebra fracture 4 (5%) 1.00 0 - NS
Whiplash 1 (1%) 1.00 0 - NS

Motorcycle In-depth Crash Study
Austroads 2015 | page 70
Major impacts and injury
Of the 20 cases with a major impact, 8 cases (40%) sustained a head or neck injury. These injuries consisted of:
• 2 superficial head injuries (2 = AIS 1) which occurred in 2 cases;
• 5 fractures (2 dental and 3 cervical vertebrae) (2 = AIS 1, 3 = AIS 2) which occurred in 4 cases;
• 3 intracranial head injuries (1 = AIS 1, 2 = AIS 2) which occurred in 3 cases.
There were 7 cases where intracranial injury was sustained and the helmet was inspected:
• 3 cases involved a major helmet impact resulting in 3 closed head injuries (1 = AIS 1, 2 = AIS 2);
• 4 (57%) helmets showed evidence of significant sliding, possibly inducing head rotation;
• 3 (43%) helmets had retrofit attachments to the outer shell (Bluetooth communication devices).
Devices attached to the helmet shell
Eleven (12.5%) of the crashed riders in this study had a Bluetooth headset attached to the exterior of the outer shell of the helmet. The devices allow the motorcyclist to communicate with other riders, make phone calls and listen to audio while riding and typically consist of a set of speakers and a microphone placed inside the helmet, and a small box of electronics mounted on the outside of the helmet. In one of these 11 cases, the helmet also had an attachment for a video camera device.
When an attachment to the external shell was present, 27.3% of riders sustained a diffuse type intracranial injury compared to only 7.4% of riders sustaining intracranial injury when there was no attachment. However, this difference was not statistically significant (p = 0.088, FET).
3.6.2 Protective clothing
Riders were asked what they wore on their upper body and lower body at the time of the crash. They were also asked about the use of gloves and footwear.
Jackets designed for motorcycle use were worn by 69% of the riders in the sample. Almost 80% (78%) wore gloves at the time of their crash and most of these (74% of all riders) were designed for motorcycle use. Less riders (33%) wore pants and footwear (40%) designed for motorcycle use.
Impact protection was present in 53.3% of the jackets, 54.3% of the gloves, 9.8% of the pants and 28.3% of the footwear. Impact protection in the shoulder and elbow regions was worn by more than half of the riders (n = 48), whilst just under half of the riders wore some form of back protection (42.4%, n = 39). Ten percent of riders wore impact protection in the hip region (n = 9), 12% at the knees (n = 11) and 24% at the shin (22). See Figure 56.

Motorcycle In-depth Crash Study
Austroads 2015 | page 71
Figure 56: Impact protection by region
Use of protective clothing by age and bike type
The riders who were most likely to be wearing upper garments which were designed for motorcycle use were riders aged between 30 and 49 years (38.5%). Motorcycle specific lower garments and footwear were also worn most frequently by this age group (39.4%), while gloves designed for motorcycle use were most frequently worn by riders under the age of 29. Riders of sports motorcycles were the most likely to be wearing upper garments (60%), lower garments (57.6%), gloves (54.2%) and footwear (57.1%) which were designed for motorcycle use. See Tables 26 and 27.
Table 26: Age of riders wearing clothing designed for motorcycle use
Clothing item Age range (years)
0-29 30-49 50+
Upper garment Yes No Unknown
24 (36.9) 16 (64)
0 (0)
25 (38.5)
6 (24) 1 (50)
16 (24.6)
3 (12) 1 (50)
Lower garment Yes No Unknown
12 (36.4) 28 (49.1)
0 (0)
13 (39.4) 18 (31.6)
1 (50)
8 (24.2)
11 (19.3) 1 (50)
Gloves Yes No None Unknown
23 (39) 1 (33.3)
12 (57.1) 4 (44.4)
22 (37.3) 1 (33.3) 6 (28.6) 3 (33.3)
14 (23.7) 1 (33.3) 3 (14.3) 2 (22.2)
Footwear Yes No Unknown
10 (28.6) 30 (54.5)
0 (0)
15 (42.9) 16 (29.1)
1 (50)
10 (28.6) 9 (16.4) 1 (50)
0
10
20
30
40
50
60
70
80
90
100
Shoulder Elbow Back Hip Knee Shin
Per
cent
age
(%)
IP Present No IP present Unknown

Motorcycle In-depth Crash Study
Austroads 2015 | page 72
Table 27: Type of motorcycle ridden by riders wearing garments designed for motorcycle use
Clothing item
Motorcycle type
Sports Scooter Cruiser Standard/commuter Touring/sports touring
Adventurer/ adventure tourer/
dual sport Trail
Upper garment Yes No Unknown
15 (60)
33 (50.8) 0 (0)
0 (0)
3 (12) 0 (0)
12 (18.5)
1 (4) 0 (0)
7 (10.8)
2 (8) 0 (0)
10 (15.4)
2 (8) 1 (50)
3 (4.6) 1 (4)
1 (50)
(0)
1 (4) 0 (0)
Lower garment Yes No Unknown
19 (57.6) 29 (50.9)
0 (0)
0 (0)
3 (5.3) 0 (0)
4 (12.1) 8 (15.8)
0 (0)
3 (9.1)
6 (10.5) 0 (0)
6 (18.2) 6 (10.5) 1 (50)
1 (3)
3 (5.3) 1 (50)
0 (0)
1 (1.8) 0 (0)
Gloves Yes No None Unknown
32 (54.2) 1 (33.3)
10 (47.6) 5 (55.6)
1 (1.7) 0 (0)
2 (9.5) 0 (0)
10 (16.9)
0 (0) 3 (14.3)
0 (0)
5 (8.5)
1 (33.3) 2 (9.5)
1 (11.1)
8 (13.6) 1 (33.3) 3 (14.3) 1 (11.1)
3 (5.1) 0 (0) 0 (0)
2 (22.2)
0 (0) 0 (0)
1 (4.8) 0 (0)
Footwear Yes No Unknown
20 (57.1) 28 (50.9)
0 (0)
0 (0)
3 (5.5) 0 (0)
3 (8.6)
10 (18.2) 0 (0)
5 (14.3) 4 (7.3) 0 (0)
5 (14.3) 7 (12.7) 1 (50)
2 (5.7) 2 (3.6) 1 (50)
0 (0)
1 (1.8) 0 (0)

Motorcycle In-depth Crash Study
Austroads 2015 | page 73
Inspection of protective clothing
Of the 92 cases investigated, upper garments were inspected and photographed in 58 cases (63%), 34 lower garments were inspected (37%), footwear in 43 cases (47%) and gloves in 40 cases (44%). Gloves were not worn by 19 of the participants (21%). Clothing was unable to be viewed in many cases as the clothing had been thrown out or had been sent to insurance companies for assessment. In other cases, the rider did not consent to the clothing inspection.
Type and distribution of damage to clothing
This section investigates the type of damage and the distribution of damage seen to the rider’s clothing (Table 28) as well as observing differences between clothing designed for motorcycle use and clothing not designed for motorcycle use in terms of its ability to resist damage.
Table 28: Number of cases where the clothing was damaged
Upper garments n (%)
Lower garments n (%)
Footwear n (%)
Gloves n (%)
Total Inspected Total Inspected Total Inspected Total Inspected
Damaged 60 (65) 45 (78) 61 (66) 29 (63) 43 (47) 33 (77) 35 (48) 27 (68)
Undamaged 21 (23) 13 (22) 21 (23) 17 (37) 31 (34) 10 (23) 24 (33) 13 (32)
Unknown 11 (12) 0 (0) 10 (11) 0 (0) 18 (20) 0 (0) 14 (19) 0 (0)
There were a total number of 633 damage locations identified during inspections or as noted by the participants. On average, upper garments had three specific locations of damage, while the lower garments, gloves and footwear had on average two points of damage.
Table 29 shows the different types of damage to the clothing. Abrasion damage was the most common type of damage seen to the clothing (77.3%), and this remained consistent in all of the clothing garment types. Tears were also relatively frequent (11.4%), but there was little evidence of burst (3.6%) or cut damage (1.3%).
Table 29: Frequency of the different types of damage
Damage type Upper garments n (%)
Lower garments n (%)
Gloves n (%)
Footwear n (%)
Total n (%)
Abrasion 193 (79.4) 89 (58.2) 87 (82.1) 120 (91.6) 489 (77.3)
Tear 24 (9.9) 38 (24.8) 6 (5.7) 4 (3.1) 72 (11.4)
Burst Cut Unknown
10 (4.1) 5 (2.1) 11 (4.5)
4 (2.6) 1 (0.7)
21 (13.7)
7 (6.6) 1 (0.9) 5 (4.7)
2 (1.5) 1 (0.8) 4 (3.1)
23 (3.6) 8 (1.3)
41 (6.5)
Sum 243 153 106 131 633
Extensive damage was seen to many of the garments worn by the riders involved in this investigation. Extensive damage, which was defined as a complete failure of the material, where the material worn damaged sufficiently for the rider’s skin to be exposed, occurred in 117 of the 633 locations of damage (18.5%). This was made up of 41 (16.1%) of the cases of damage to the upper garments, 56 (36.6%) cases of damage to the lower garments, 16 (11.7%) cases of damage to the gloves and 6 (4.4%) cases of damage to the footwear.

Motorcycle In-depth Crash Study
Austroads 2015 | page 74
The distribution of damage locations was mapped onto a body diagram according to the body regions on which the clothing damage occurred. This is shown in Figure 57.
Figure 57: Distribution of damage locations with respect to the AIS body regions

Motorcycle In-depth Crash Study
Austroads 2015 | page 75
Upper and lower garments
The location of the clothing damage was then mapped onto the clothing template used in the European Standard for motorcycle protective clothing EN13595-1. The damage location was unable to be mapped for 12 of the specific damage locations on the upper garments and 25 of the specific damage locations on the lower garments as the information came from the rider interview and was not specific enough to specify on which body region the damage occurred. The end result is shown in Figure 58.
Figure 58: Distribution of damage locations according to EU13595 clothing standard zones
Gloves
Most of the damage to the gloves was to the impact protectors on the knuckles and fingers (64.2%). There was only minimal damage to the anterior aspect of the gloves (14.2%), with most of the damage occurring to the back of the hands (79.2%). The location of the damage was unable to be coded for seven of the distinct impact locations due to lack of information provided by the rider during interview (6.6%).

Motorcycle In-depth Crash Study
Austroads 2015 | page 76
Footwear
Damage to the footwear occurred most frequently to the outside of the shoes (47.3%), followed by the inside of the shoes (24.4%). The toes of the shoes were also frequently damaged (13.7%) as well as on top of the foot (7.6%). There was also damage to the back of the foot in two instances (1.5%). The damage locations were unable to be coded for seven of the distinct damage points as the rider did not specify exact damage locations and the clothing was not viewed (5.3%). The damage to the footwear was located on the impact protection in 16 of the damage points (12.2%).
Clothing type and damage
The number of garments that sustained any type of damage based on whether the garment was specifically designed for motorcycle use is shown in Table 30. This excludes riders who were not wearing gloves (n=19) and riders who did not provide any detail about their garments. Controlling for impact speed and whether or not an object was impacted by the rider (Table 31), motorcycle specific clothing was not more likely to have been damaged than other clothing. Looking just at the extensive damage, where complete failure of the material occurred such that the rider’s skin was exposed (Table 32), there was also no significant difference between clothing specifically designed for motorcycle use and other clothing.
Table 30: Damage to the clothing by clothing type
Designed for motorcycle use Not designed for motorcycle use
Damaged n(%) Not Damaged n(%) Damaged n(%) Not Damaged n(%)
Upper garment 43 (73) 16 (27) 17 (77) 5 (23)
Lower garment 23 (74) 8 (26) 38 (75) 13 (25)
Gloves 29 (60) 19 (40) 1 (33) 2 (67)
Footwear 21 (68) 10 (32) 22 (51) 21 (49)
Sum 116 (69) 53 (31) 78 (66) 41 (34)

Motorcycle In-depth Crash Study
Austroads 2015 | page 77
Table 31: Damage to motorcycle specific clothing while controlling for impact speed and type
*p<0.05
Outcome variable Explanatory variable Category Univariate Multivariate
95%CI Odds ratio P-value Odds ratio P-value
Upper garments
Clothing damaged Motorcycle specific clothing Yes No
Reference 1.100
0.866
Reference 0.835
0.778
0.237-2.937
Impact speed n/a 0.962 0.003* 0.961 0.003* 0.937-0.986
Object impacted Yes No
Reference 0.851
0.800
Reference 0.831
0.794
0.207-3.335
Lower garments
Clothing damaged Motorcycle specific clothing Yes No
Reference 0.984
0.975
Reference 0.963
0.944
0.335-2.768
Impact speed n/a 0.993 0.514 0.993 0.500 0.972-1.014
Object impacted Yes No
Reference 1.549
0.451
Reference 1.663
0.418
0.485-5.697
Gloves
Clothing damaged
Motorcycle specific clothing Yes No
Reference 3.048
0.375
Reference 0.935
0.952
0.105-8.356
Impact speed n/a 0.975 0.059 0.974 0.051 0.948-1.000
Object impacted Yes No
Reference 0.982
0.980
Reference 1.116
0.886
0.252-4.946
Footwear
Clothing damaged Motorcycle specific clothing Yes No
Reference 2.561
0.060
Reference 2.633
0.060
0.960-7.221
Impact speed n/a 0.995 0.619 0.992 0.476 0.972-1.014
Object impacted Yes No
Reference 0.635
0.454
Reference 0.717
0.598
0.208-2.479

Motorcycle In-depth Crash Study
Austroads 2015 | page 78
Table 32: Extensive damage to motorcycle specific clothing while controlling for impact speed and type
Outcome variable Explanatory variable Category Univariate Multivariate
95%CI Odds ratio P-value Odds ratio P-value
Upper garments
Clothing extensive damage Motorcycle specific clothing
Yes No
Reference 0.869
0.801
Reference 0.630
0.439
0.195-2.033
Impact speed n/a 0.988 0.295 0.989 0.306 0.968-1.010
Object impacted Yes No
Reference 0.364
0.083
Reference 0.377
0.102
0.117-1.215
Lower garments
Clothing extensive damage Motorcycle specific clothing
Yes No
Reference 2.663
0.068
Reference 2.829
0.070
0.920-8.698
Impact speed n/a 1.019 0.114 1.016 0.199 0.992-1.040
Object impacted Yes No
Reference 1.207
0.788
Reference 1.213
0.794
0.284-5.185
Gloves
Clothing extensive damage Motorcycle specific clothing
Yes No
Reference 4.408
0.171
Reference 0.669
0.752
0.055-8.074
Impact speed n/a 1.008 0.609 1.008 0.614 0.977-1.039
Object impacted Yes No
Reference 0.821
0.822
Reference 0.743
0.740
0.129-4.297
Footwear
Clothing extensive damage Motorcycle specific clothing
Yes No
Reference 1.051
0.958
Reference 0.737
0.753
0.111-4.907
Impact speed n/a 1.020 0.341 1.019 0.340 0.981-1.058
Object impacted Yes No
Reference 0.348
0.274
Reference 0.351
0.287
0.051-2.409

Motorcycle In-depth Crash Study
Austroads 2015 | page 79
Clothing type and injury
This section investigates the occurrence of injuries to motorcycle riders involved in crashes based on whether motorcycle specific clothing was worn as well as whether the clothing included impact protection.
The number of riders sustaining any injury to the body regions covered by the different clothing items is shown in Table 33. Controlling for rider age, impact speed and object struck there was no significant difference in the number of riders sustaining any injury to the body regions covered by motorcycle specific or other clothing, except for gloves. Riders who wore gloves that were not designed for motorcycle use were significantly more likely to sustain injury to the hands (p = 0.002).
Table 33: Injury to body regions covered by the different clothing items
Designed for motorcycle use Not designed for motorcycle use
No. of cases (% of cases)
No. of injuries (ave no. of injuries per
injured case)
No. of cases (% of cases)
No. of injuries (ave no. of injuries per
injured case)
Upper body 56 (86.2) 214 (3.8) 21 (84) 59 (2.8)
Lower extremities and pelvis 29 (87.9) 68 (2.3) 52 (91.2) 178 (3.4)
Ankles and feet 5 (14.3) 11 (2.2) 14 (25.5) 22 (1.6)
Hands 17 (29.3) 31 (1.8) 2 (66.7) 6 (3)
Clothing damage and injury
This section investigated the injury outcome at each specific damage location to examine the association between injury and the type of clothing when there was evidence of impact.
There were 633 individual points of damage over the entire sample of riders. Injury occurred at 165 of these locations (26%). Soft tissue injuries (excluding contusions) occurred at 69 of these points of damage (11.6%).
Logistic regression using general estimating equations accounted for multiple damage locations per rider (Table 34).
Binary logistic regression analysis revealed that the main predictor of any injury occurring at the damage location was the damage type, with abrasion damage resulting in fewer injuries than other damage types. The use of impact protection or clothing designed for motorcycle use had no bearing on the injury outcome (Table 35).
When looking at the predictors of only soft tissue injuries (Tables 36 and 37), abrasion damage still resulted in a smaller likelihood of injury. Additionally, riders who did not impact with another object during the crash suffered a higher likelihood of soft tissue injuries. Motorcycle protective clothing also helped prevent injuries, with riders who were not wearing protective clothing experiencing 50% more soft tissue injuries (95% CI: 0.258-0.990). Impact protection played no role in preventing injuries.

Motorcycle In-depth Crash Study
Austroads 2015 | page 80
Table 34: Association between any injury and use of motorcycle specific clothing
Outcome variable
Explanatory variable Category
Univariate Mulitvariate 95%CI
Odds ratio p-value Odds ratio p-value
Injured at damage location
Type of damage Abrasion Other
Reference 0.394
0.004*
Reference 0.346
0.003*
0.172-0.695
Clothing designed for motorcycle use
Yes No
Reference 0.994
0.987
Reference 1.309
0.435
0.666-2.575
Rider age n/a 1.014 0.195 1.014 0.177 0.994-1.034
Impact speed n/a 0.995 0.433 0.989 0.106 0.976-1.002
Object impacted Yes No
Reference 1.208
0.585
Reference 1.298
0.431
0.679-2.483
*p<0.05
Table 35: Association between any injury and use of clothing incorporating impact protection
Outcome variable
Explanatory variable Category
Univariate Mulitvariate 95%CI
Odds ratio p-value Odds ratio p-value
Injured at damage location
Type of damage Other Abrasion
Reference 0.394
0.004*
Reference 0.365
0.006*
0.178-0.749
Impact protection Yes No
Reference 0.843
0.596
Reference 0.989
0.971
0.555-1.763
Rider age n/a 1.014 0.195 1.012 0.226 0.992-1.033
Impact speed n/a 0.995 0.433 0.990 0.115 0.977-1.003
Object impacted Yes No
Reference 1.208
0.585
Reference 1.286
0.463
0.657-2.518
Table 36: Association between soft tissue injury (excluding contusions) and use of motorcycle specific clothing
Outcome variable
Explanatory variable Category
Univariate Mulitvariate 95%CI
Odds ratio p-value Odds ratio p-value
Soft tissue injury at damage location
Type of damage Abrasion Other
Reference 0.383
0.001*
Reference 0.427
0.003*
0.242-0.754
Clothing designed for motorcycle use
Yes No
Reference 0.390
0.016*
Reference 0.505
0.047*
0.258-0.990
Rider age n/a 1.026 0.120 1.020 0.162 0.992-1.048
Impact speed n/a 0.995 0.449 0.988 0.140 0.973-1.004
Object impacted Yes No
Reference 2.435
0.009*
Reference 2.598
0.031*
1.089-6.194
*p<0.05

Motorcycle In-depth Crash Study
Austroads 2015 | page 81
Table 37: Association between soft tissue injury (excluding contusions) and use of clothing incorporating impact protection
Outcome variable
Explanatory variable Category
Univariate Mulitvariate 95%CI
Odds ratio p-value Odds ratio p-value
Soft tissue injury at damage location
Type of damage
Abrasion Other
Reference 0.383
0.001*
Reference 0.433
0.007*
0.236-0.796
Impact protection
Yes No
Reference 0.513
0.129
Reference 0.574
0.268
0.215-1.533
Rider age n/a 1.026 0.120 1.027 0.070 0.998-1.056
Impact speed n/a 0.995 0.449 0.986 0.093 0.971-1.002
Object impacted
Yes No
Reference 2.435
0.009*
Reference 2.626
0.025*
1.128-6.116
3.7 Qualitative Analysis of Crash and Injury Causation Factors and Potential Countermeasures
3.7.1 Common crash types
One hundred and two (102) crashes were reviewed by the multi-disciplinary Panel and as presented below the discussions revealed a number of common crash types which were subsequently enumerated.
Most crashes could be grouped into (i) ‘failed to see’ crashes or; (ii) rider ‘did not stop in time’; or (iii) rider made cornering error. Other less frequent but recurring crash types involved riders failing to see other vehicles, riders involved in overtaking and lane change manoeuvres, and kangaroos distracting or colliding with motorcyclists. Five crashes did not fall into any of these crash types, and a small number (2) could be categorised in more than one group.
‘Failed to see’ crashes (36%)
This type of crash describes a situation where one vehicle moves into the path of another vehicle and in this sample they can be grouped into two types. Type 1 involved aspects of the road environment potentially impacting visibility of the other vehicle (36% of failed to see crashes, 13% of all crashes). In many of these (11/13), the crash involved a car moving into the path of a motorcycle, but there were a small number (2/11) where an aspect of the environment obscured the motorcycle rider’s vision, before the motorcycle moved into the path of a car. These types of crashes occurred at controlled intersections (1/11), uncontrolled intersections (7/11) and when cars were exiting from driveways (2/11). One also involved a motorcycle exiting a driveway.
The types of features that obscured vision included roadside objects such as parked cars, roadside furniture such as telegraph poles, geography of the roadway and other vehicles travelling and/or in traffic queues on the roadway.
Type 2 did not involve aspects of the environment obscuring vision and it appears likely that these include a number of crashes where a car driver has misjudged the travel speed of the motorcyclists (4/24) with at least two drivers reporting that they saw the bike but thought they had time to make the turn. Sunlight/glare was also noted to have likely contributed to drivers turning across the path of a rider in three of these cases.

Motorcycle In-depth Crash Study
Austroads 2015 | page 82
All but one case involved a car driver turning into the path of a motorcycle (68% of the 36 failed to see crashes, 25% of all crashes). There was also one case where a motorcyclist appeared to ‘fail to see’ another vehicle and entered an intersection inappropriately (3% of failed to see crashes). These mostly occurred at intersections (with 12/19 of crashes at an uncontrolled intersection and 7/19 during filter right hand turns), but also involved car drivers making illegal U-turns and movements into and out of driveways (5). It appears likely that these include a number of crashes where a car driver has misjudged the travel speed of the motorcyclists (4/24) with at least two drivers reporting that they saw the bike but thought they had time to make the turn. Sunlight/glare was also noted to have likely contributed to drivers turning across the path of a rider in three of these cases.
Rider did not stop in time (13%)
These crashes all occurred when other vehicles on the roadway slowed or came to a stop in the motorcycle’s travel path. These sometimes occurred near lane terminations (1/13), speed zone boundaries (1/13) and controlled intersections (6/13). Two other crashes occurred away from these roadway features when vehicles stopped suddenly due to unexpected hazards on the roadway. One crash involved a motorcycle impacting a vehicle that had slowed to make a right hand turn, and two involved motorcycles impacting stationary vehicles. In one of these crashes, a motorcycle impacted a vehicle that had broken down on a bridge with no shoulder, and in another, a motorcycle impacted a vehicle parked in the left lane.
These crashes also sometimes involved lane change manoeuvres by the rider just before the impact (33%, 4/13).
The inability of motorcyclists to stop in time was also discussed frequently in regard to the ‘other vehicle failed to see crashes’ (24% of ‘failed to see’ crashes) as the rider often reported being aware of the vehicle commencing to cross its path. Including these with the ‘rider did not stop in time’ crashes described above, these accounted for 22% of all crashes in the sample.
Rider made errors in turning or cornering, or lost control while negotiating a bend (35%)
These types of crashes can be grouped into three types; those that involve riders negotiating a bend in the road (64% of these crashes, 23% of all crashes), those that involve riders negotiating a corner at an intersection (22% of these crashes, 8% of all crashes), and those where riders lost control while travelling on a relatively straight section of the road (19% of these crashes, 7% of all crashes). In some crashes (6/23) where a rider lost control on a bend, a bike or car travelling through the bend in the opposite direction negatively affected the case rider’s ability to successfully negotiate the bend. In many of these cases (5/6) the motorcycle impacted another vehicle negotiating the bend from the opposite direction. This included mostly other bikes (4/5) and all occurred along the same popular recreational riding route in southern Sydney. In one case, in a different location, the rider lost control after swerving to avoid a collision with a large vehicle negotiating the curve from the opposite direction.
In many of the crashes that involved loss of control while negotiating a bend or curve in the road (9/23), some interaction between the rider and the road environment led to the difficulties encountered. This included the rider either swerving to avoid, or coming into contact with debris such as sticks and rocks (2/9), loose gravel (3/9), potholes (2/9) and oil/diesel spills (2/9).
Interactions with the environment also featured in some of the crashes where riders lost control while negotiating an intersection turn (4/8), and where riders lost control on a straight section of road (2/7). As above these interactions involved riders swerving to avoid, or coming into contact with; debris on the road (1/6), oil on the road (1/6), loose gravel (1/6) and an animal (1/6). One rider also lost control after contact with a raised reflector and concrete median, while another lost control after traversing a tar join in the roadway.

Motorcycle In-depth Crash Study
Austroads 2015 | page 83
Crashes during overtaking and lane change manoeuvres types (13%)
Crashes involving riders performing overtaking manoeuvres (7% of all crashes) involved riders overtaking illegally (4/8, 4% of all crashes) or coming into conflict with cars attempting overtaking manoeuvres at the same time (2/8, 2% of all crashes), or features of the roadway such as median barriers (1/8, 1% of all crashes). In this latter crash the rider hit a concrete median and lost control during an overtaking manoeuvre. Crashes involving lane change manoeuvres involved riders coming into conflict with cars attempting the same manoeuvre at the same time (2/4, 2% of all crashes) suggesting an element of ‘failed to see’ in these crash types. In one crash the lane change manoeuvres were forced due to another vehicle ‘nudging out’ into the lane occupied by the motorcycle.
Crashes involving kangaroos (3%)
In this sample of 102 crashes there were three crashes involving kangaroos (3% of all crashes) entering the roadway. In two crashes the kangaroo distracted the rider, leading the rider too lose control. In another the kangaroo impacted the rider. All three occurred in areas where kangaroos are commonly sighted.
Ungrouped crashes (5%)
Two of the ungrouped crashes involved cars impacting the rear of a stationary motorcycle at a controlled intersection. The other three involved rider errors such as making a right hand turn from the left hand lane, clipping the wheel of another motorcycle during a group ride and a rider putting his leg down before coming to a stop.
3.7.2 Crash causation
Factors raised in the discussion of each case and included in the final Panel summaries are presented below using the Haddon Matrix as a framework. Therefore the factors are presented under the headings of Road Environment, Rider and Vehicle Factors. Each factor raised is presented but no attempt to quantify how many times each factor was mentioned was attempted in this qualitative review of the discussion summaries.
Road environment
The road environment, and adjacent land use played some role in many of the crashes and a number of road environment themes emerged repeatedly during the discussion of the crashes.
Uncontrolled intersections
Uncontrolled intersections played a role in many of the crashes reviewed by the expert Panel. Uncontrolled right hand turns from minor approaches onto more major roads were a feature in a number of ‘failed to see’ crashes. This type of traffic movement carries inherent difficulties in judging gap acceptance for traffic travelling in both directions. These difficulties are compounded when there are multiple lanes of traffic and/or significant volumes of traffic as gaps and entering opportunities are further limited. These types of problems were observed for both car drivers tuning into the path of motorcyclists, and motorcyclists turning into the path of other vehicles.
The roadside environment was judged to have increased the difficulty of this already inherently difficult situation in a number of crashes. Parked cars and roadside furniture (e.g. poles, fences and vegetation) blocked sight lines of some drivers or riders trying to enter intersections. The geometry of some of the minor approaches also negatively affected sight lines. Wide intersections and approach roads that made it possible to approach at high speeds and lack of effective treatments for guiding motorists to come to a complete stop for long enough were also observed to contribute to the problem in some cases.

Motorcycle In-depth Crash Study
Austroads 2015 | page 84
Controlled intersections
Controlled intersections also featured in a number of crashes. Unfiltered right hand turns were involved in a number of the ‘failed to see’ crashes. Inherent difficulties in gap judgement were noted where the turn involved crossing multiple lanes, and high volumes of traffic. A number of these cases also involved sight distances being negatively affected by traffic queues, roadside furniture and vegetation. There were also a few cases involving right hand turns on red, where drivers may have followed green lights in adjacent straight through lanes and proceeded to turn illegally.
Other problems raised around controlled intersections were the lack of hold lines which caused traffic to nudge out and disrupt the perpendicular travel lane, and vehicles stopping suddenly at amber lights. Sudden stops at amber lights were involved in a number of ‘rider could not stop in-time’ crashes and the presence of red light cameras in at least two of these intersections was noted.
The road environment also contributed to a number of cornering errors at controlled intersections. Wide approach roads and wide intersections not only allowed riders to approach the intersection at higher travel speeds, but they also encourage the rider to take a wider/larger radius turn path. Roadside furniture and vegetation was also found to reduce a rider’s view of the approach to a corner in a couple of crashes and this was thought to play a role in riders misjudging and losing control during a turn at controlled intersections.
Left hand turns
Left hand turns also contributed to a number of crashes. This included drivers making unexpected left turns from the middle lane, or moving into a left hand lane unexpectedly in order to make a left hand turn. Road environment features were noted to have been likely to have played a role in these driver movements. One of these crashes involved a bus lane that did not end far before an intersecting road and the driver may have been unaware that he could enter the left lane earlier. In other cases, parked cars were allowed relatively close to the intersection which may have forced a driver intending to turn left to move into the middle lane, leaving little time to merge back into the left. In another, the lack of lane markings giving guidance about which lanes continue in which directions were thought to have played a role. Poor visibility of side roads was also raised as a factor, with the roadside environment (e.g. roadside poles) obscuring some side roads until the driver was close to the intersection in a number of cases.
Vehicles making left hand turns were also noted to have obscured the vision of drivers of vehicles turning right from side roads, preventing motorcycles travelling behind the left turning vehicle from being seen.
Left hand turns were also noted as problematic for motorcycles because they lead to variation in travel speed, and therefore have an influence on rear end crashes where motorcycles failed to stop in time.
Cars parked on the roadway
Cars parked on the roadway potentially blocked the view of oncoming motorcycles in a number of cases and the presence of parked cars also reduced the available reaction time for the motorcyclists involved in these crashes. This was a feature of crashes involving car drivers making left and right hand turns into an intersection, as well as cars entering traffic from parking lanes. For cars entering traffic from parking lanes, a narrow parking lane, coupled with traffic travelling at a high speed, combines to reduce the driver’s potential for seeing an oncoming motorcycle. A narrow parking lane reduces sight lines and is less forgiving of errors, as the driver does not need to move very far before coming into conflict with traffic.
In properties with off-street parking, the lack of available space for cars to perform three point turns resulted in the need for vehicles to reverse onto the roadway. This hindered the ability of a car driver to see an oncoming motorcyclist in at least one crash in this series.
Parked vehicles also played a role in a number of crashes by forcing vehicles to merge into a right lane. This highlights an overall problem of competing functions of the roadway in many areas, playing some role in crash causation.

Motorcycle In-depth Crash Study
Austroads 2015 | page 85
Lane terminations
Lane terminations requiring merges in close proximity to changes in speed zone and/or uncontrolled intersections were noted to play a role in a number of ‘rider did not stop in time’ crashes.
Boundaries between speed zones
Similarly, boundaries between speed zones complicated by other factors such as traffic slowing down to turn left or corresponding with a crest in the roadway also contributed to these types of crashes. The Panel discussed the problem of differential travel speeds and variable traffic flows in these areas being coupled with situations where the rider’s vision of upstream traffic was obscured by the road topography or when travelling behind larger vehicles as being particularly problematic for riders.
High frequency lane-changing areas
High frequency lane-changing areas due to stretches of roadway with a large number of entry and exit points featured in a number of crashes within the metropolitan area. The Panel discussed the undesirable effect these areas had in promoting a high frequency of lane changing and the role this had in crash causation for crashes involving motorcycles changing lanes at the same time as cars.
Lack of shoulders or shoulders of appropriate width and/or quality
Lack of shoulders or shoulders of appropriate width and/or quality was raised as a factor in some of the ‘rider failed to stop in time’ and ‘cornering or loss of control’ crashes. For a number of the rear end crashes, the lack of an appropriate shoulder meant there was little room for a rider who could not stop in time to take evasive action. In one rear-end crash, the lack of a break down lane or shoulder resulted in a broken down vehicle in lane 1becoming an unexpected obstacle to a motorcyclist changing lanes from behind a large 4WD vehicle in lane 2.
The lack of shoulder on a dual carriageway with narrow lanes also contributed to crashes involving loss of control. In a number of these crashes, a rider or driver travelling from the opposite direction crossed into the rider’s path. The Panel noted that inappropriate shoulders coupled with limited road width reduces the escape paths available when road users are faced with the threat of being struck by another vehicle. Furthermore, poor quality and lack of sealed shoulders means vehicles in both directions tend to track too close to the centreline, increasing the likelihood of these types of crashes.
Narrow or no shoulders were also discussed as a factor that increases the spill of gravel and leaf litter/debris onto the travel lanes. Not only does this debris cause a hazard to the rider, and featured in a number of the crashes reviewed, but the lack of appropriate shoulder meant there was no room for riders to evade the debris.
When shoulders were present, the low quality of the shoulders involved in some of the rural crashes also featured as crash causation factors. Lack of sealed shoulders, and/or a high degree of gravel spillage was noted to have exacerbated a number of the run off road events reviewed.
Curves
Curves featured in many of the crashes involving cornering errors and loss of control. In addition to the issues with inappropriate shoulders noted above, a number of features were common to many of these curves. In more rural areas, low radius curves with poor sight benching on the inside of the curve exacerbated by roadside vegetation was a factor in a number of crashes. Rock cuttings were also observed at a number of sites that would further obscure the road ahead and reduce the rider’s ability to predict the road path ahead. Other misleading visual cues on road alignment such as a lack of road edge delineation also featured in a number of crashes that occurred on curves. Jagged edges of pavement on curves were observed to have a shy line effect (i.e. riders tend to shy away from or veer away from the edge of the road and therefore disrupt the rider from taking the correct line through the bend.

Motorcycle In-depth Crash Study
Austroads 2015 | page 86
The lack of appropriate and appropriately positioned curve and curve-speed advisory signs was also noted in a number of these crashes. In a few of the rural cases, inappropriate curve advisory speed/travel speed differentials were noted.
Road surfaces
Road surfaces were also discussed by the Panel as an important crash causation feature in a number of crashes involving loss of control. Roadways with a high degree of patching, pot holes, grooves and ripples contributed to loss of control either through direct loss of control when the rider made contact with these surface features or when swerving to avoid these on the roadway. These surface deficits were noted to be particularly problematic when associated with bends in the road because attempts to avoid these types of features can also disrupt the line required for the rider to successfully negotiate a curve or corner.
Longitudinal joints between asphalt and concrete that create undesirable areas of differential friction were also noted in a couple of crashes. Not only were these features discussed as a factor in loss of control crashes, they also featured in at least one crash where the Panel thought they may have created a misleading delineation effect.
Debris such as gravel and oil on the roadway featured in a few loss of control and cornering error crashes. Like deficiencies in road surfacing, these were thought not only to present a direct hazard to riders, but their presence, particularly at curves and corners, potentially disrupts a rider’s line through the corner or bend.
Roadway treatments
Roadway treatments also presented hazards to riders in a small number of crashes. In one crash, a poorly located median refuge with poor visibility was impacted by a rider during a legal and appropriate overtaking manoeuvre. In another, a rider impacted a median at night that unexpectedly appears as a road declines on a stretch of insufficiently illuminated roadway. In both cases the rider subsequently lost control. In the other, a perpendicular kerb on a traffic island located on the outside of a curve was noted to create a specific hazard for riders negotiating the curve.
Rider factors
Across the crashes, a number of rider factors were repeatedly identified as contributing or possibly contributing to the crash outcome.
Rider inexperience
Rider inexperience was noted as a factor in a number of crashes, contributing to riding errors when cornering and braking. There were also a number of cases in which the rider’s lack of experience with the bike being ridden was thought to have contributed to the crash. These cases included novice riders with new bikes, as well as more experienced riders with new bikes. In a couple of cases, the Panel noted riders who had recently graduated from provisional licenses and moved quickly to high-powered bikes. These riders’ unfamiliarity with the new bike coupled with their relative inexperience is likely to have played a role in the loss of control precipitating the crash. In one case it appeared a rider had spent little time on the road during his provisional licence and then went immediately to a high powered bike when granted his unrestricted licence.
There were also a small number of riders who had recently gained their Australian licence after holding a licence in another country. There was at least one crash in which this type of rider demonstrated inexperience in misjudging a turn.
Inexperienced riders riding in groups and demonstrating poor group riding behaviour also played a role in a number of crashes. This manifested as the riders riding too fast and too close together. There was also a common theme of inexperienced riders tackling very challenging rides. The Panel saw the problems associated with this to be in the lack of the necessary skills for tackling challenging and unfamiliar routes.

Motorcycle In-depth Crash Study
Austroads 2015 | page 87
Inappropriate speed
Inappropriate speed was often linked with rider inexperience and cornering errors, with inexperienced riders approaching bends at inappropriate speeds and failing to take the correct line through the bend. Inappropriate speeds also likely contributed to a number of the ‘failed to stop in-time’ crashes.
Travelling too close
Travelling too close to the vehicle in front was also a common theme and was linked to inappropriate travel speeds in some cases. Travelling too close to the vehicle in front not only featured in ‘failed to stop crashes’ but was discussed as a factor in a number of the ‘failed to see’ crashes. The Panel discussed the possibility that riding too close to the vehicle in front also increased the risk that the leading vehicle, particularly if it is large, would obscure the motorcycle from drivers waiting to make right or left hand turns from adjacent roads.
Errors in cornering
Errors in cornering also occurred in the absence of inappropriate speed, and while more common in crashes involving inexperienced riders, also occurred in crashes involving more experienced riders, particularly when they were riding in unfamiliar areas. Some of these cases also involved the contribution of debris or other hazards on the roadway, and some appeared to simply involve the rider not taking the right line through the corner and/or correct execution of braking.
Braking errors
Braking errors featured in a number of crashes and, like cornering errors, involved both experienced and inexperienced riders. Ineffective emergency braking was a common theme in crashes involving loss of control during cornering and when suddenly faced with an unexpected hazard. Ineffective braking was also often discussed in cases involving riders with little familiarity of the bike being ridden.
Rider fatigue
Rider fatigue was also raised as a potential contributing factor in a number of crashes involving cornering errors and riders misjudging turns. These types of crashes commonly occurred in the latter half of long rides in rural areas, and where there had been a change in rhythm in riding after a break, or in moving from rural areas to more urban areas. While no riders in this series appeared to have had blood alcohol levels over the legal limit, there were a couple of riders who had consumed some alcohol in the hours proceeding the crash, and errors in judgement were noted in these crashes that also occurred in the latter half of long rides.
Poor riding techniques
Poor riding techniques such as poor lane positioning, ineffective scanning and lane change techniques were raised as contributory factors in a number of crashes and involved all of the different crash types. Poor lane positioning was identified as contributing to a number of crashes in which motorcycle conspicuity was an issue. The Panel discussed the benefit of appropriate buffering as a measure that not only can help to avoid crashes but also as a measure that might help to increase visibility. Apparent failure to scan the roadway far enough ahead was also noted as an issue in a few of the crashes. Poor technique in looking over the shoulder when changing lanes was a factor in a couple of crashes in which the rider failed to stop in time. In one of these cases the expert Panel also raised the issue of riders making unnecessary lane changes.

Motorcycle In-depth Crash Study
Austroads 2015 | page 88
Overtaking behaviour
Overtaking behaviour of the rider was noted as a contributory factor in three of the five crashes in which a rider overtook another vehicle. In one case, a group rider attempted to overtake another rider in the same lane of travel, and in another the rider used a shoulder as an overtaking lane. In the third, a rider illegally crossed double lines to overtake a car. These behaviours were among the very few crashes in the series where an illegal or risky manoeuvre prior to the crash was deemed a contributory factor. In the other two overtaking crashes, factors other than the rider’s behaviour were involved, such as an impact with a median with poor visibility and the simultaneous attempt at overtaking of another vehicle. However, the Panel noted that a number of the overtaking crashes involved group rides and the potential impact of group riding on increasing pressure to overtake was discussed as a possible issue.
Familiarity
Familiarity with the road on which the rider was travelling was raised as a potential factor in a number of crashes. This was discussed both in terms of the riders being familiar and unfamiliar with the routes being ridden. Unfamiliarity was discussed as possible contributory factor in a number of crashes involving cornering errors. However, familiarity with the route was also raised as an issue in a number of crashes where the rider failed to stop in time. In these cases, the rider’s familiarity with the road was thought to cause the rider to accelerate prematurely for upcoming speed changes and/or change lanes while accelerating to then be faced with an unexpected slow or stationary vehicle.
Distraction
Distraction or possible distraction was noted as a possible contributory factor in a small number of cases. In one case a novice rider was potentially distracted by a companion rider who had stalled at a set of traffic lights. In another couple of cases, novice riders were riding while using an electronic music device. In another case the possibility that the rider became momentarily distracted when checking mirrors and the speedometer was raised as a possible contributory factor, although this is a usual activity related to the task of riding.
Rider vision
Rider vision may have also been compromised in a number of cases. The use of tinted visors at night by a small number of riders may have impaired their vision. Likewise, a rider wearing a dirty non-tinted visor may have had impaired vision, particularly in combination with sun glare, which could have played a role in the rider colliding with the vehicle he was following. Another rider’s vision may have been affected by the fact he wore reading glasses which were not suitable for distance vision while riding.
Vehicle factors
No vehicle maintenance issues were identified in any of the crashes reviewed. Factors related to the vehicle identified as potentially contributory to crash causation were most often related to the inherent small size of a motorcycle in ‘failed to see’ crashes, the inherent complexity of braking in motorcycles using conventional brake systems in ‘failed to stop in time’ and loss of control’ crashes, and the inherent stability issues associated with powered two wheel vehicles in ‘loss of control’ crashes.
Inexperience and unfamiliarity with the motorcycle being ridden were also discussed as factors in a number of crashes. This involved riders potentially not being familiar with the turning and braking limits of their vehicles and, in at least one case, accidental acceleration during braking. Unfamiliarity manifested in inexperienced riders riding new bikes, and experienced riders moving from one motorcycle type to another.

Motorcycle In-depth Crash Study
Austroads 2015 | page 89
Conspicuity
Conspicuity of the motorcycle was noted as a factor in many of the crashes. As discussed previously, features of the roadway, the presence of other vehicles and the lane position of the rider all contributed. The darkness of the rider’s clothing, including helmets, was also discussed as potentially compounding some of these conspicuity problems.
3.7.3 Potential crash avoidance countermeasures
The following represents a summary of the potential countermeasures discussed during the panel reviews and follows the same structure used above. Panel members were encouraged to suggest countermeasures without taking considerations such as feasibility or cost benefit into account. There was also no consideration given to whether or not the suggested countermeasures represented measures already in place in NSW or elsewhere, whether or not the measures would be acceptable to motorcycle riders, or whether or not the measures have been demonstrated to be effective or if they actually exist (e.g. potential new technologies). This allowed for broad and unlimited discussion but means the following is therefore a summary of ideas raised by Panel members and not meant as any specific recommendations. The purpose of including this in this report is to provide insight into the panel discussions.
Road environment
Uncontrolled intersections
Uncontrolled intersections might be improved by addressing the approaches to the intersection. In minor roads approaching more major roads where right hand turns are allowed, traffic calming devices to reduce speeds in the minor approach roads may be beneficial. Examples of the traffic calming devices discussed include delineation on the side road, hold lines at the intersection, and stop signs rather than give ways signs to keep vehicles at the hold line for longer and force drivers/riders to take more time making appropriate gap decisions. Wide approach roads could be further enhanced by the use of raised medians, which would not only work to further reduce approach speeds but could also be used to hold priority signage to increase the likelihood that they will be adhered to.
At intersections where right hand turns involve crossing multiple lanes of traffic, consideration could be given to left in, left out only devices (i.e. ban the right hand turn). Where crash frequency warrants, consideration could be given to the installation of traffic signals to control the intersection.
To assist motorcyclists in taking the correct line through turns at wide intersections, short length medians could be used on approach arms to reduce approach speeds and centres lines could be marked on all arms of the intersection to help guide riders through the turn.
Measures that might address issues associated with motorcycle conspicuity at intersections are addressed separately below.
Controlled intersections
Controlled intersections could be improved by addressing the risk of inadvertent turns on red right turn signals. One way to do this might be to explore the use of new phasing strategies including the use of flashing amber lights to precede the full green circle. To address issues associated with filtered right hand turns, consideration could be given to installing right hand turn indicators when the traffic volume warrants this action. Partial bans or time of day dependent bans, on filter right hand turns could also be considered. The Panel noted that the removal of right hand turns that are dependent on the accurate perception and correct judgement of drivers would be a measure that would have prevented many of the crashes in this case series.

Motorcycle In-depth Crash Study
Austroads 2015 | page 90
More generally, the Panel discussed the need for adequate all red periods at controlled intersections to ensure all vehicles can clear the intersection before the next conflicting movement starts. Ensuring the visibility of traffic signals at controlled intersections from all arms of the intersection is also important to minimise the likelihood of vehicles ‘nudging out’ into traffic travelling through the intersection.
Left hand turn
Left hand turn indents on priority roads are a potential global treatment for future intersection design, particularly if there are high volumes of turning vehicles, and would assist many of the crash types observed in this series. However, this treatment is often difficult to retrofit to existing roads due to accommodation limits introduced by verge width and width to adjacent properties. Measures discussed by the Panel that might be considered in the absence of left hand turn indents include providing adequate warning of approaching left hand turns and enhanced road marking on the approach to intersections to better guide motorists into the appropriate lane well before the intersection. Issues associated with parked vehicles and bus lanes are discussed below.
Parked cars
Parked cars introduce a number of problems for motorcyclists and the Panel noted that greater efforts are needed at the land use planning and development stages to reduce kerb side parking demands. Furthermore, where off street parking is provided in residential and commercial properties, efforts need to be made to preserve clear space to ensure vehicles can perform manoeuvres such as three point turns to prevent the need for vehicles to reverse onto roadways.
When kerb side parking is provided, the width of the parking lanes is important with wider parking lanes likely to be more forgiving by allowing car drivers the ability to move out of the space without immediately entering the traffic lane. Wider parking lanes will also allow drivers a better sight line before entering traffic.
A number of potential countermeasures to the problem of parked cars obscuring car drivers’ vision of motorcycles, and reducing reaction time for motorcyclists, were also raised. These included lowering speed limits on roads where there is a mix of parked vehicles and driveways/intersections, increasing the distance between available parking spaces and driveways/intersections, and consideration of no stopping zones immediately upstream of critical, high volume driveways and intersections. This would also benefit pedestrians on the footpath. In addition to lowering the speed limit in areas with competing functions of the roadway, where appropriate, local area traffic management devices to slow down the through vehicles could be considered.
Roadside furniture
Roadside furniture such as poles, fences and vegetation can also be problematic for motorcyclists by increasing the likelihood that they may not be seen by drivers attempting left and right hand turns into traffic. The Panel noted that relocation of utility poles is a good global treatment but in some cases it is difficult due to the lack of space between the kerb line and property boundaries. For poles supporting traffic signals at intersections consideration could be given to using mast supports for primary signals. Roadside vegetation near intersections should be well maintained with hedges pruned regularly to heights that would not impact a driver’s view of a motorcycle, or they should be removed entirely. Care also needs to be taken in selecting fencing near intersections to ensure there is no negative impact on a driver’s ability to see a motorcycle.
Care is also advised in the selection of fencing, and other road side barriers to ensure that they minimise, as much as possible, risk of injury to motorcyclists.
The Panel also noted a number of common road environment features such as median strips which, due to their placement or conspicuity, presented hazards to motorcyclists in this series. The Panel discussed the importance of ensuring road designers and those maintaining roads needing more education and awareness about such features.

Motorcycle In-depth Crash Study
Austroads 2015 | page 91
Lane terminations
Lane terminations that require merging movements in close proximity to speed zone changes and uncontrolled intersections increase the risk of rear end crashes and could be addressed by relocation of the lane termination and speed zones. In addition to moving speed zone boundaries away from lane terminations, the Panel discussed the need to ensure boundary locations are appropriate for the topography of road so that, for example, they do not occur on the departure side of a sight limiting crest or curve.
High frequency lane-changing areas
High frequency lane-changing areas could be addressed by ensuring all direction signs are clear and are provided well in advance. The advance direction signs need to provide accurate advice regarding which lane to select for different destinations and this should include distance advice. Consideration could also be given to a colour coding scheme where destinations advice is colour coded and these colours correspond to lane markings (i.e. pavement text and numbers placed in each lane).
Shoulders
Shoulders should be level and free of debris with verges that are flat and traversable. There should also be adequate rounding between the verge and any embankment, and embankments should also be traversable.
At least one crash in this series involved a motorcycle using a shoulder as an overtaking lane and the Panel discussed the need to review roadway sections near intersections where this is common practice. Where this is occurring the shoulder could be converted to become part of a left turn lane to reduce potential ambiguity.
In locations where the provision of a shoulder or breakdown lane cannot be provided, such as a high traffic volume bridge, the Panel suggested consideration be given to traffic monitoring systems that could provide early warning to motorists of any broken down vehicle ahead. Measures discussed included installing lights indicating which lane to avoid when a vehicle is broken down, flow breakdown detection technology such as in pavement speed monitoring loops and CCTVS. In the absence of such technology, it was suggested to provide emergency phones at breakdown bays.
Bus lanes
Bus lanes may encourage late merging from drivers wanting to turn left if they are unaware or unsure of when they can legally enter the lane. The Panel suggested adjusting the red coloured pavement to communicate that drivers can enter the lane within 50m if they intend to turn left and the use of appropriate dashed line marking to communicate this.
Curves
Curves featured in most of the ‘loss of control’ crashes seen in this series. Measures to better assist motorcyclists through curves on rural roads discussed by the Panel include the provision of speed advisory signs in appropriate locations on the approach to the curve. These should be coupled with advanced warning of the nature of the curve ahead rather than generic curve ahead signs. Curves should not require a significant drop in speed from the adjacent speed zone and where this currently occurs, the Panel suggested consideration be given to either realigning the curve or reducing the speed of the adjacent roadway.
The provision of good quality shoulders were also discussed as important preventive treatments for many of these crashes. Wide shoulders not only provide a more forgiving environment for errant vehicles but also allow motorcyclists to turn at wider angles further away from the centreline. On existing shoulders it is important that regular maintenance is carried out to remove debris/leaves and clear trees and other vegetation on the inside of the curve to allow a better sight bench.

Motorcycle In-depth Crash Study
Austroads 2015 | page 92
In a number of crashes, the Panel thought better delineation of the roadway and increased prominence of curve alignment markers may have helped riders better negotiate curves they crashed on. Reconfiguration of line marking so that the centre line is thicker/wider may also help to improve separation between vehicles travelling in opposite directions.
Debris
Debris on the roadway presents a significant hazard to motorcyclists. The Panel discussed the need for local government enforcement of clean up after road works, building truck spills etc. There is a need to find enhanced methods for preventing and/or mitigating oil/diesel spills to better reduce the risk to motorcyclists. This includes methods for reducing response times to emergency clean ups. The Panel suggested the public needs to be encouraged to respond quickly and call emergency services when debris, including oil/diesel is observed on the roadway.
Road surface
The road surface can also present significant hazards to motorcyclists. Pot hole patching is important and should be undertaken in a timely manner but the Panel discussed the need for pavement patching to be done with care as pavement patchwork and its interface with existing pavement may also become hazards for motorcyclists. For this reason, the Panel discussed the need to minimise sections of roadway with high degrees of patching. Where this occurs, consideration should be given to reconstruction of the pavement and improved drainage.
The Panel suggested that consideration be given to the provision of warning signs alerting riders to sections of roadway ahead where tar seal or joins in cement slab exist and cannot be corrected.
Cars turning into driveways and performing U-turns
Cars turning into driveways and performing U-turns also feature in a number of the ‘failed to see’ crashes in this series. The Panel discussed the possibility of installing double lines to separate carriageways in locations where residential driveways are frequent. To discourage illegal U turns, the Panel suggested there may be a need to provide advisory signage about the next opportunity for U turns.
Routes frequented by recreational riders
Routes frequented by recreational riders such as the Royal National Park, the old Pacific Highway and Kangaroo Valley were common and reoccurring crash sites in this relatively small case series. The expert Panel suggested that it may be beneficial to conduct motorcycle safety audits along the entire lengths of these as it would appear likely that there are a number of potential road environment treatments that might improve the overall environment for riders using these routes.
Rider factors
Appropriate experience for ride
Appropriate experience for ride was an issue commonly discussed by the Panel. The Panel suggested there was a need to encourage graduated experience for novice riders. The Panel suggested consideration be given to providing detailed advice on roads that are appropriate for the riding stage and level of practice of riders progressing through the graduated licence program. The Panel stressed the importance of novice riders having adequate experience before riding on major arterials and tackling extremely challenging routes. The Panel also suggested that more information could be provided to novice riders about what to look out for on the more common challenging rides throughout NSW. Exploration of the possible benefit of curfews or restrictions on night riding for learners was also raised.

Motorcycle In-depth Crash Study
Austroads 2015 | page 93
Familiarity with the motorcycle
Familiarity with the motorcycle being ridden was also commonly discussed and the Panel suggested that riders may need to be made more aware of potential risks associated with riding an unfamiliar motorcycle. The possible benefit of taking a graduated approach to tackling more difficult rides on a new or unfamiliar motorcycle could be communicated to riders. This includes the possible impact of moving from one motorcycle type to another (e.g. sports to cruiser) and the need to become educated on how these different motorcycle types handle differently.
The Panel also suggested that dealers could be made more aware of this issue and be more responsible with the advice they provide on new motorcycle purchases. Dealers could play a greater role in assisting the rider to become more familiar with newly purchased motorcycles. Riders could be encouraged to develop strategies for acquiring newly purchased motorcycles such as taking a buddy to ride it home. The possibility of having new bikes home delivered could also be explored.
Rider training and education
Rider training and education was also discussed as a means for communicating the above to riders, and also as a mechanism for addressing some of the rider error themes that emerged during the crash reviews. The Panel thought that more attention could be given to providing learner riders with more detailed advice on general riding behaviour as well as training in specific riding situations such as negotiating double apex turns and reverse bends. A greater emphasis may also need to be placed on the gap distance when following traffic in different traffic conditions, and appropriate speed in different traffic conditions. The Panel thought learners might benefit from more attention being given to ensuring they understand more about motorcycle stopping distances, including the effect that inappropriate speed, inattention and distraction can have on this. More emphasis on buffering and lane positioning in pre-learner training courses may also be beneficial. Improved training on accident avoidance and defensive riding, including supervised practice of emergency braking was also suggested. The Panel suggested training should place greater emphasis on the need to practice riding in familiar and non-challenging environments. The benefit of increasing training or off-road practice time prior to riding on road unsupervised should be explored. Other training and education topics discussed in the panel reviews included education regarding conspicuity of clothing, use of electronic devices, medication and rider fatigue. Furthermore, it was argued that there should be more education and awareness around protective clothing, and advice against the use of tinted visors at night and the use of dirty visors.
Learner training when transferring to a new country was identified as a potential factor in at least one crash in this series and the Panel discussed the possibility of requiring a provisional licence style competency test when transferring licence from another country.
Following distances
Following distances were discussed frequently by the Panel with respect to both ‘failed to stop in-time’ crashes and ‘failed to see’ crashes. The importance of preserving an appropriate gap for braking time should be communicated to all riders. Maintaining an appropriate gap, particularly when travelling behind larger vehicles, is also important for increasing the likelihood that a motorcycle will be seen by other vehicles waiting to enter traffic.
Braking
Braking deficiencies were common in this crash series and the Panel suggested riders need to be more aware of the braking limits of the motorcycle they ride. Riders should be encouraged to adopt the practice of covering the brake in high risk environments.

Motorcycle In-depth Crash Study
Austroads 2015 | page 94
Riding with awareness
Riding with awareness was also discussed as an important countermeasure for riders. Riders need to remain aware of their position within the traffic with respect to other vehicles because of the potential of other vehicles to act as sight barriers for other motorists as they approach intersections. Motorcyclists should also be aware of potential blind spots for drivers when travelling in adjacent lanes. Buffering could be used to not only reduce the likelihood of collisions but also to assist with conspicuity.
Rider fatigue and the effects of distraction
Rider fatigue & the effects of distraction on the motorcycling task need more exploration, particularly in regard to issues with fatigue-associated cornering errors and the impact of the use of electronic devices. In the interim, riders could be made more aware of the need to avoid using electronic devices that might limit the attentional resources available to the rider and the likely importance of taking breaks and abstaining from alcohol during long rides.
Group riding behaviour
Group riding behaviour was raised as an issue in a number of the crashes in this series, and was discussed by the Panel as an apparent particular problem among novice riders. The Panel suggested more effort is needed in communicating the risks associated with group riding, especially to novice riders. The Panel suggested consideration be given to the development of protocols for group riding.
Clothing conspicuity
Clothing conspicuity was discussed by the Panel in a number of crashes and the Panel thought the use of more conspicuous clothing by riders may be beneficial in some situations. Further research may be required on the benefits of reflective or fluorescent strips on rider clothing and if warranted, the benefits communicated to riders.
Vehicle factors
A number of technology enhancements were repeatedly raised in the panel reviews as potential countermeasures to many of the crash causation factors identified.
Enhanced brake systems
Enhanced brake systems were discussed repeatedly as a measure that might reduce the likelihood or mitigate the outcome of most crash types observed. Enhancements discussed included linked brake systems, anti-lock brake systems, electronic stability control, electronic brake force distribution and autonomous systems that can maximise braking force and/or deploy brakes automatically using advanced warning/collision detection technologies. Stability control could also assist in preventing loss of control during cornering.
Intelligent speed adaption and warning systems
Intelligent speed adaption and warning systems may also provide a great deal of benefit to motorcyclists. Linked with GPS systems it may be possible to develop a guided system to assess upcoming curvatures in the roadway and automatically adjust speed accordingly. In the absence of automatic speed adaption, it may be just as beneficial to provide feedback/warn riders when their curve approach speeds are inappropriate. Similarly, technology could be developed that could compare the line being taken by the rider to what is needed to safely negotiate the bend and feedback this information to the rider.

Motorcycle In-depth Crash Study
Austroads 2015 | page 95
Adaptive cruise control may also be beneficial for motorcyclists. In these systems a fixed distance can be maintained with vehicles that are on cruise control ahead. It does this by braking and accelerating the vehicle automatically. This type of system could also be adapted to simply provide feedback and/or warnings to keep riders at safe distance behind other vehicles.
Communication
Conspicuity aids such as enhanced lighting should be further explored as a countermeasure to ‘failed to see’ crashes but in the longer term, vehicle to vehicle (V2V) and vehicle to infrastructure (V2I) communication is likely to provide a significant benefit for motorcyclists.
Shock absorbing forks
Shock absorbing forks were raised as possible measure to correct wobble when a rider impacts debris, or some other object on the roadway.
LAMS motorcycles
The potential for LAMS motorcycles to be fitted with such enhancements depending on evidence for their effectiveness and appropriate technology becoming available was also raised. Extending LAMS or introducing an additional power rating for riders just off the provisional licence was also discussed.
Rider posture and ergonomics
Rider posture is influenced by motorcycle type and the Panel suggested that further research could examine the role of rider posture in facilitating appropriate scanning range in traffic. Review of the ergonomics of instrument panel design was also raised in response to a crash where the rider was using reading glasses to assist him to see the instrument panel.
The other vehicle
While the design of this study precluded collection of details from the other driver in those crashes involving more than one vehicle, and therefore less can be said about crash causation factors from ‘the other vehicle’s’ perspective, the Panel did discuss some issues related to car drivers in this series of crashes.
The high proportion of crashes involving failure of car drivers to notice, or judge the speed of, and estimate safe gaps to, oncoming motorcycles led to discussion of how this can best be addressed. Countermeasures for drivers included improving drivers’ awareness of the need to constantly check for motorcycles, improving their ability to judge oncoming speed and determine safe gaps for turning and the development of smart technology/advanced warning technology to alert drivers to motorcycles’ presence. More widespread implementation of existing smart sensing technologies such as autonomous braking, blind spot monitoring and reversing cameras that provide side as well as rear view may also be extremely beneficial for motorcyclists.
Sensing technology was also discussed as being an important measure for overcoming the problem of a driver’s vision being blocked by wide A pillars. The Panel noted instances in this case series where B and C pillars may have blocked a driver’s view of motorcycles when entering a traffic lane from a parked position and making an unsafe left turn from the middle lane. Sensing technologies would also be beneficial in these circumstances.

Motorcycle In-depth Crash Study
Austroads 2015 | page 96
For drivers of other vehicles, the Panel suggested measures such as reinforcing drivers’ awareness of maintaining a safe following distance in traffic, correctly securing cargo and raising awareness of legislation prohibiting turns into driveways across double lines would address some of the factors observed to play a role in the crashes within this series. The Panel noted that many road users may not be aware that in NSW motorcycles are allowed to travel in bus lanes, and/or that they are allowed to enter a bus lane within 50m of an intersection if they intend on turning at that intersection. Raising awareness of behaviour around bus lanes may be useful.
The Panel also thought consideration could be given to better education of drivers about the potential risks at uncontrolled intersections. In some cases, drivers could consider alternative route selections instead of attempting difficult and complex right hand turns across multiple lanes of traffic, and when visibility is poor due to complex road side environments. The Panel also thought car drivers could be educated about the inherent difficulties associated with correctly judging the speed of oncoming motorcycles due to the small size of these vehicles.
3.7.4 Summary of emerging crash causation and countermeasure themes
From the issues raised by the Panel a number of crash causation and countermeasure themes have emerged that cut across safer system pillars (and the Haddon Matrix). As noted in the methods, thematic analysis is a common qualitative approach to synthesising data and reporting findings. In this instance the themes provide a valuable mechanism for looking at specific motorcycle safety issues from a whole system perspective. The themes are:
• Motorcyclists need to be seen;
• Braking ability needs to be optimised;
• Rider control needs to be maintained;
• Riders need appropriate experience.
The range of crash causation and countermeasures (road environment, human and vehicle) that sit within these themes are summarised in Tables 38-41 and discussed further in Chapter 4.

Motorcycle In-depth Crash Study
Austroads 2015 | page 97
Table 38: Motorcyclists need to be seen (% given are % of all cases in sample).
Motorcyclists Need to be Seen
Crash Factors Countermeasures discussed
• Environmental features obscure motorcycles
• Parked cars, roadside furniture (i.e. poles, fences, vegetation), traffic queues, vehicles turning left (12%)
• Road geometry (21%)
• Greater efforts required to reduce kerb side parking
• Where kerb side parking occurs: - Increase distance between parking and
driveways/intersections - Consider no stopping zones upstream of high volume
driveways & intersections - Lower speed limits where mix of parking and
driveways/intersections occur - Ensure adequate width of parking lanes
• Where off-street residential/commercial parking occurs: - Preserve clear space for three point turns to prevent
reversing vehicles - Prune or remove roadside vegetation that obscures
the vision of vehicles entering intersections
• Environment features do not discourage drivers from entering uncontrolled intersections inappropriately
• Wide unmarked/inappropriately marked approaches (25%)
• Ineffective treatments (4%)
• Manage minor approaches to more major roads
• Prevent right hand turns where appropriate, or
• Minimise approach speed on minor road using traffic calming devices
• Ensure hold lines and appropriate priority signage in place
• Riders travel too close to vehicles in front, taking poor lane positions (14%)
• Encourage riders to ‘ride with awareness’
• Travel an adequate distance away from the vehicle in front (particularly large vehicles)
• Buffering can be used to improve conspicuity
• Awareness of riding in vehicle blind spots
• Awareness of sightlines being obstructed by traffic queues
• Attention to this issue in rider training
• Vehicle blind spots at the A, B & C pillars (6%) • Vehicle sensing technologies, car to car communication
• Poor conspicuity of rider and bikes (29%) • Explore effective mechanisms for enhancing conspicuity of motorcycles and motorcyclists
• Other drivers misjudge speed of motorcycles/fail to see
• Inherent difficulties with gap judgement when turning across multiple lanes of traffic (9%)
• Small size of target (4%)
• Educate drivers on difficulties in judging speed of motorcycles
• Inherent difficulties in making rights hand turn in complex traffic environments and choice of routes

Motorcycle In-depth Crash Study
Austroads 2015 | page 98
Table 39: Enhance braking ability
Enhance Braking Ability
Crash Factors Countermeasures discussed
• Environmental features cause variable flows - lane terminations in close proximity to speed
zone boundaries and uncontrolled intersections (3%);
- speed zone boundaries in close proximity to non-indented left and right hand turns (2%)
- where riders’ vision obstructed by road topography or larger vehicles (13%)
• Consider relocating lane terminations and speed zone boundaries that are in close proximity to each other
• Consider topography of road when selecting speed zone boundaries so they do not occur on departure side of a sight limiting crest or curve
• Lack of appropriate shoulder - leaves no room for evasive action (3%) - presents unexpected stationary vehicles in
traffic lanes (1%)
• Provide good quality, appropriate width shoulders
• Where break down lanes cannot be provided, consider systems to monitor traffic and warn approaching vehicles of obstacle
• Provision of downhill break down bays with emergency phones
• Riders who ride inappropriate speeds for conditions (13%)
• Braking technique deficiencies - errors by inexperienced and experienced riders
(9%) - ineffective emergency braking by
inexperienced and experienced riders (17%) - unfamiliarity with bike, and braking limits of
bike being ridden (9%) • Travelling too close to rider in front (13%)
• Ineffective riding techniques - scanning (8%) - shoulder checking (3%)
• Rider distraction (5%) • Compromised rider vision
- tinted visors at night, dirty visors, sunlight (10%)
• Raise awareness among riders of - The need to become familiar with new bikes - The need to be familiar with braking limits of their bike - The importance of maintaining appropriate distance - The importance of practice in emergency braking
• Increased attention to riders’ understanding of motorcycle stopping distances and influence of inappropriate speed, inattention, distraction
• Supervised practice of emergency braking
• Addressing brake deficiencies through enhanced brake technology
• Linked brake systems
• ABS and stability control • Electronic brake force distribution
• Autonomous systems using advanced warning/collision systems that can - Maximise brake force and/or - Deploy brakes automatically
• Potential of adding requirement of enhanced braking systems to LAMS
• Adaptive cruise control systems to control or warn riders when distance between vehicles is inappropriate
• Vehicle to vehicle communication

Motorcycle In-depth Crash Study
Austroads 2015 | page 99
Table 40: Maintaining control (% given are % of all cases in sample).
Maintaining Control
Crash Factors Countermeasures discussed
• Cornering at intersections - Inappropriate approach speeds (10%) - Wide intersections encouraging a wide radius of
turn path (1%) - Roadside furniture obscuring view of the approach
to the intersection (4%)
• Traffic management devices to reduce speeds on intersection approaches
• Guide motorcyclists through intersection turns • Ensure roadside furniture/vegetation does not obscure the
approach to the turn • Ensure road designers & those maintaining roads are
aware of potential hazards to motorcyclists
• Lack of appropriate shoulders - Makes vehicles travelling on dual carriageways
track towards centreline (4%) - Increase spillage of debris on traffic lane (9%) - Reduces room for riders to evade debris (7%) - Exacerbate run off road events (11%)
• Provide appropriate shoulders - Should be level, of adequate width and free of debris
• Curve features - Low radius curves with poor sight benching on
inside of curve (6%) - Sight bench obstructions by vegetation inside the
curve (6%) - Rock cuttings obscuring road ahead (1%) - Misleading visual cues, deficient road edge
delineation (14%) - Lack of appropriate and appropriately positioned
curve and curve speed advisory signs (10%) - Inappropriate curve speed /travel speed
differentials (4%)
• Provide measures to assist motorcyclists through curves - Appropriate speed advisory signs in appropriate
location on approach - While all curves require a rider to slow down the
change in speed required should be manageable. - Where curve alignment requires a substantial drop in
travel speed consideration should be given to dropping the speed limit on the approach or realigning the curve
- Provide advanced warning of the nature of the curve - Prune or remove vegetation on inside of curves - Attend to appropriate line marking – edge
delineation/centre line marking
• Road surface - Potholes, patching, grooves, ripples (6%) - Longitudinal joint between asphalt and concrete
(2%) - Debris such as leaves, gravels, oil (15%)
• Roadway treatments - Poorly located/poor visibility of raised concrete
medians and perpendicular kerbs (8%)
• Minimise debris - Local government enforcement of clean up after road
works/building works - Explore enhanced methods for preventing/mitigating
oil/diesel spills - Encourage & facilitate quick reporting by public
• Road surface - Pot hole patching timely and with care - Minimise need for patching - Warn riders of entering road sections with longitudinal
tar joints that can’t be corrected
• Rider techniques/factors - Inappropriate speed (15%) - Ineffective braking (36%) - Unfamiliarity with bike (10%) - Correct line through corner/curves (5%) - Appropriately powered bike for experience (9%) - Unfamiliarity with road (3%)
• Rider fatigue - Cornering errors were common among riders in
latter half of long rides (9%)
• Rider factors - Appropriate experience for difficulty of ride - Familiarity with bike and turning limits of bike - Inclusion of training in negotiating apex and reverse
bends in rider training programs - Raise awareness of potential impact of fatigue - Enhanced braking and stability systems - Shock absorbing forks - Potential of extending LAMS or introducing additional
power rating for riders just off provisional licences

Motorcycle In-depth Crash Study
Austroads 2015 | page 100
Table 41: Appropriate experience (% given are % of all cases in sample).
Appropriate Experience
Crash Factors Countermeasures discussed
• Unfamiliarity with road and bike (7%)
• Inexperience manifesting as errors and poor technique (11%)
• Rider training & education
• Encourage graduated experience • Provide advice on what to look out for on common
challenging rides throughout NSW • Greater emphasis on need for practice in familiar
non-challenging environments • Explore potential benefits of increased off road
training prior to unsupervised road riding • Increase awareness of risks with new bikes
• Purchase of new bikes • Encourage greater responsibility by dealers inform
new purchasers of need to become familiar • Encourage inexperienced riders to request more
experienced riders to ride new bikes home
• Tackling too challenging rides for experience (6%) • Route selection advice for novice riders
• Inexperience manifesting in poor group riding behaviour (5%)
• Group riding behaviour
• Address in rider training
• Develop protocols
• Buddy system • Home delivery
3.7.5 Injury causation
The primary sources of injury for the riders can be summarised as the roadway, road side furniture, the equipment used by the rider (such clothing, helmet and footwear), the motorcycle ridden by the rider, and other vehicles on the road. One rider sustained life threatening injuries from being struck by a kangaroo.
Road environment
Aspects of the road environment were noted by the Panel to be a source of injury in many of the cases reviewed.
The roadway was a frequent source of injury, with injury occurring both from the force of the impact with the roadway and as riders slid along the roadway. Abrasions from the roadway occurred primarily to the extremities of the riders, but also sometimes occurred over the torso. These types of injuries occurred both in cases where riders were wearing clothing designed for motorcycle use, and when normal street wear was worn. Impact injuries from contact with the roadway primarily involved the hands and wrists. In one case, vertebral fracture from impact with the roadway also occurred.
Road side furniture was a less common source of injury but much of the resulting injury was of a serious nature. The types of objects struck by riders included fences and walls adjacent to the roadway, roadside trees and poles, median refuges, kerbs and roadside barriers. Serious chest and abdominal injury were common features of impacts with roadside objects, and occurred in this crash sample following impact with a median refuge, the kerb, trees, poles, fences and crash barriers. Head and neck injury occurred in a small number of cases involving impacts with a fence and a crash barrier. Other impact injuries included extremity fractures from contact with a brick wall and a roadside pole, and a fractured scapular from contact with a concrete median.

Motorcycle In-depth Crash Study
Austroads 2015 | page 101
Vehicle factors
The rider’s motorcycle was also a common source of injury. Pelvic external injuries, hematoma in the groin and inguinal regional and pelvic fracture commonly occurred following contact between the rider and the fuel tank of the motorcycle. Internal injury to the bladder was also observed to occur via this mechanism. The handle bars of the motorcycle were another source of injury seen in a few cases. These included chest and abdominal injuries from contact with the handle bars as well as one case in which the handle bars of the motorcycle fractured and the broken parts caused abdominal injury. Contact with the weather shield during ejection of the rider was a source of injury for three motorcyclists. In one case the rider’s legs contacted the shield resulting in external contusions and, in another case, more serious chest injuries occurred. In one case head injury occurred following contact between the rider’s head and weather shield.
The foot pegs of the motorcycle caused significant injury in two cases. In one case a rider sustained a serious degloving injury of the lower leg and in the other fractures occurred from contact with the foot pegs when the bike fell on the rider after an impact. The bike falling onto the rider after the impact also caused leg fractures and serious chest injuries in other cases not involving the foot pegs.
One rider sustained concussion after his sliding bike made contact with his head as he also slid along the roadway.
Other vehicles were also a common source of injury. In a few cases, riders were run over by other vehicles while they lay or slid on the roadway. Other injuries occurred when the rider made direct contact with an impacting vehicle. These types of injuries included fractured leg bones, severe chest and abdominal injuries and facial injuries. One rider sustained leg fractures from contacting with another motor vehicle. Another rider sustained serious pelvic and leg injuries after being trapped under a truck.
Rider factors
The clothing worn including protective equipment was also a source of injury for some riders. One rider sustained friction injuries from the lining and chin strap of his helmet. Other riders sustained similar injuries from the lining of the clothing they were wearing. This predominantly involved clothing that had been designed for motorcycle use. One rider wearing Kevlar lined pants sustained lower leg injury after the pants tore at the knees while the rider was sliding along the roadway. One rider sustained foot injuries induced by the steel caps in the work boots he wore.
3.7.6 Injury countermeasures
While motorcyclists are vulnerable road users, review of the injuries sustained by motorcyclists and the sources of these injuries indicated a number of possible countermeasure that might assist in reducing the likelihood and severity of injury among motorcyclists. As for the section dealing with crash avoidance measures, this section represents the ideas raised by the Panel members. Feasibility, whether or not the intervention is known to be effective or the cost/benefit has not been taken into account. This merely represents a summary of the ideas discussed.
Environment factors
Roadside furniture should be designed and installed with the possibility of impact by unprotected road users such as motorcyclists in mind. While it is important to consider separating potential hazards such as trees and poles from motorcyclists using some sort of barrier, the Panel noted that it is important to consider the potential interaction between that barrier and an impacting rider. Similarly, separating traffic travelling in opposing directions might assist in reducing the likelihood of riders who come off their motorcycles being run over by other vehicles; however the crashworthiness of any barrier used to separate the traffic should also be designed and installed with the possibility of rider impacts in mind. Furthermore there are a number of advanced barrier types and advanced treatments that can be retrofitted to existing W beam guard rails.

Motorcycle In-depth Crash Study
Austroads 2015 | page 102
Increasing the distance between roadside hazards and the roadway by ensuring adequate clear zones would be an ideal solution. The benefit of increased distance is that it allows the rider more distance to decelerate before coming into contact with any other object and the slower the rider is travelling at the point of contact the better. As increasing the clear zone distance will rarely be practical there may be benefit in investigating other potential mechanisms for better controlling the deceleration of sliding riders. For example, the potential for different materials used in protective clothing to play some role in this could be investigated, and this is discussed again below.
Vehicle factors
Petrol tank design should be optimised to restrain the pelvis of riders while providing adequate control of the crash energy. Petrol tank shape and characteristics should be further investigated to better understand which parameters are most important and how these interact with riders adopting different postures due to the design of different motorcycle types. The Panel repeatedly discussed the potential role of the petrol tank in providing restraint and controlling the energy applied to the rider as well as the potential for enhanced energy absorption, including the possible inclusion of active pelvic protection in petrol tank design.
Leg protectors and the potential these might have for mitigating leg injury associated with contact with other vehicles was raised a number of times by the Panel. The potential for better designed and more forgiving foot pegs and handlebars was also discussed.
Airbags can work to restrain and control the energy transfer during an impact and the Panel also discussed the need for investigating the full potential of this technology to ameliorate rider injury.
Impact characteristics of cars for those sites that are commonly involved in impacts with motorcyclists should be further explored. The Panel noted the potential for motorcyclists to benefit from measures taken to make cars more pedestrian friendly and the further potential for extending these types of measures to those sites most commonly involved in impact with motorcyclists. The Panel also noted the negative consequences of bull bars and other similar projections for motorcyclists, and suggested that consideration be given to measures such as limiting the use of bull bars in city driving or regulating the design of bull bars to ensure a greater and more forgiving surface area in case of human contact.
Underride guards for large/high passenger vehicles such as some designs of 4WD vehicles, as well as for heavy vehicles, were also discussed as an important countermeasure for road users like motorcyclists.
Rider factors
Protective clothing for motorcyclists was commonly discussed by the Panel. It was clear from the case reviews that there was a great deal of variability in the performance of clothing being used for protective purposes by motorcyclists. The Panel noted that not only was it important to encourage the use of protective clothing through increased awareness of the potential benefits, but there was also the need to encourage the use of the best quality protective clothing including footwear. Some forms of protective clothing were observed to be protective against abrasion injury when riders slid across the roadway, but the impact protection capacity of most of the clothing observed did not appear to be effective in mitigating injuries occurring from impact with the roadway. The Panel suggested consideration be given to exploring the potential for improving the impact protection capacity of clothing designed for motorcycle use. This could include further examination of the potential benefits of airbag technology within the clothing (e.g. airbag jackets) as the Panel discussed this as a potentially important countermeasure for chest injury. The Panel noted that the current clothing designed for motorcycle use rarely incorporates any attempt to protect the chest, yet this is a commonly injured region among motorcyclists and more attention to the chest protection may therefore be beneficial.
Variability in the performance of protective clothing in crashes was observed with some garments providing very good abrasion protection and others failing to do so. The Panel noted the need to implement interventions to both encourage riders to use the best quality equipment and manufacturers to supply only equipment that will perform well.

Motorcycle In-depth Crash Study
Austroads 2015 | page 103
As noted above, while the focus of protective clothing for motorcyclists is currently on the potential to resist abrasion and impact injury, there may also be a role for protective clothing in assisting to control the deceleration of riders sliding on the road way. Reducing the velocity of sliding riders as much as possible before an impact with any roadside object would be one way to mitigate the outcome of impacts with objects on and near the road way. This might be achieved by attention to the friction between materials used in protective clothing and the road surface.
The Panel also noted the importance of helmets, and discussed the benefit of full face helmets in minimising the likelihood of facial injury. The Panel also discussed the potential for further exploration of advanced technology to provide neck protection, as injuries to the neck following head impact were common among the fatally injured riders in this sample (e.g. investigation of the potential benefits of airbags designed to protect the neck).
3.7.7 Summary of emerging injury causation and countermeasure themes
From the issues raised by the Panel a number of injury causation and countermeasure themes have emerged. This thematic analysis provides a mechanism for looking at motorcycle injury sources from a whole system perspective. The themes are:
1. Riders need good quality protective equipment;
2. Motorcycle design should mitigate injury to the rider;
3. Roadside furniture and other vehicles need to be more forgiving.
Injury causation and countermeasures within these themes are summarised in Tables 42-44.
Table 42: Riders need good quality protective equipment
Riders Need Good Quality Protective Equipment
Injury Sources & Mechanisms Countermeasures discussed
• Riders sustain injury when sliding on the roadway and from friction between the interior lining surfaces of the protective equipment and the rider’s skin
• Riders need to be encouraged to wear protective equipment (helmets, jackets, gloves, pants and footwear).
• Ensure clothing (including footwear) designed for use by motorcyclists
• Provides abrasion resistance and maintain this resistance until the sliding rider comes to a stop
• Controls the friction between the clothing and the rider’s skin
• Riders sustain injury when they impact the ground
• Enhance the impact protection capacity of protective clothing
• Examine the appropriateness of current levels of energy absorption provided by impact protectors
• Investigate technology to increase energy management, particularly for chest protection including airbags incorporated in clothing
• Riders sustain injury when they impact objects in the road environment
• Better control of the deceleration of sliding riders • Examine potential role of materials used in protective
clothing to manage deceleration • Improved energy attenuation in the chest and abdominal
regions might be achieved with airbags incorporated in clothing
• Clothing designed for motorcycle use exhibits variable performance
• Develop strategies to encourage • Riders to use best quality equipment • Manufacturers to provide best quality protective equipment

Motorcycle In-depth Crash Study
Austroads 2015 | page 104
Table 43: Motorcycle design should mitigate injury to the rider
Motorcycle Design Should Mitigate Injury to the Rider
Injury Sources & Mechanisms Countermeasures discussed
• Riders sustain pelvic injury from contact with the fuel tank
• Petrol tank design should be optimised to restrain the pelvis of the rider and manage the transfer of crash force to rider’s pelvis
• Riders sustain injury from contact with foot pegs
• Foot pegs could be designed to be more forgiving
• Riders sustain injury when they are ejected from the bike
• Airbags coupled with improved fuel tank design could be used to restrain and control rider deceleration before ejection
• Riders sustain injury when they impact other vehicles and objects while they are still on the motorcycle
• The potential benefit of well-designed leg protectors should be explored.
• Airbags on motorcycles might assist in reducing potential for direct impacts between riders and other objects
Table 44: Roadside furniture and other vehicles need to be more forgiving
Roadside Furniture and other Vehicles Need to be More Forgiving
Injury Sources & Mechanisms Countermeasures
• Riders sustain injury when they contact roadside objects after leaving the motorcycle
• The use of appropriate clear zones could reduce the risk of injury between riders and roadside objects, as the greater the distance between where the rider begins to slide and the impact, the lower the rider’s velocity at impact.
• Roadside fences and barriers should be designed to minimise the potential harm to riders
• Roadside hazards such as trees and poles that cannot be removed should be separated from potential rider impacts using appropriate motorcycle friendly barrier systems
• Rock cuttings along popular motorcycle recreational riding routes should be free from jagged projections
• Riders sustain injury when they contact other vehicles either while they are still with the motorcycle, or after being ejected from the motorcycle
• Consideration should be given to examining the frequent impact locations on vehicles involved in impacts with motorcycle riders
• Technologies being implemented to ameliorate impacts between pedestrians and passenger vehicles might also assist motorcycle riders
• Limit use of bull bars and/or manage design of bull bars to reduce risk of injury to motorcyclists
• Riders sustain injury when they slide under moving or stationary vehicles
• Underride protection, particularly for heavy vehicles and high set passenger vehicles such as 4WDs and utility vehicles, might be an important injury prevention countermeasure for motorcycles
• Riders sustain injury when they are run over by other vehicles
• Separation of lanes of traffic travelling in opposite direction by wide clear zones or appropriate barrier systems might reduce the risk of some of these run over type impacts
• Future autonomous collision prevention systems should be tuned to recognise riders on the roadway

Motorcycle In-depth Crash Study
Austroads 2015 | page 105
3.7.8 Post crash factors
The Haddon Matrix was used as a framework for discussions within the Panel reviews. As such, there was the option of discussing potential post-crash factors contributing to the severity/outcome of each crash. However, potential post-crash factors were raised in only a very few cases, and the most common of these involved injuries sustained when the bike fell onto the rider, or struck the rider as they both slid along the roadway; or when the rider was run over by another vehicle or trapped beneath another vehicle after the initial impact. These issues have been discussed in the preceding sections.
One case involved a rider involved in a single vehicle crash who also left the scene and was later taken to hospital by family members after displaying symptoms of concussion. Riders, and members of the public witnessing such events, should be made more aware of the need to call for assistance and have the health of riders assessed by medical professionals before continuing on their motorcycle.
3.7.9 Important points to note about the qualitative analysis
While this is a qualitative analysis, it uses a content analysis approach which allows some quantification of crash types and contributory factors. These will be discussed in more detail in the following overall discussion section. However, the objective of the qualitative analysis is to examine and report the discussions held during the Panel reviews. This provides an innovative mechanism for presenting factors contributing to motorcycle crashes, and ideas about potential countermeasures in a narrative form. It also provides a mechanism for demonstrating the extreme richness of data collected through in-depth investigation when the overall sample size is relatively small, and the benefits of taking a multi-factorial approach in the review of crashes. Specifically, it provides a mechanism for examining and reporting specific issues for motorcycle safety from a whole systems perspective.
In addition to providing an overview of the types of crashes, and factors contributing to motorcyclist crash involvement and injury, it is also useful for formulating future work. The ideas generated in this analysis can be used to define hypotheses for more robust analysis and/or testing in future work.
The discussion of countermeasures included in this section reflects the ideas arising during the Panel reviews.
Some of the ideas raised throughout the qualitative analysis will be revisited in the next section, which contains a discussion of the overall outcomes of the project. In the discussion, issues such as feasibility, effectiveness and acceptance by riders are considered.

Motorcycle In-depth Crash Study
Austroads 2015 | page 106
4. Discussion
The aims of this study were:
1. To examine causal relationships between human, vehicle, road and other environmental factors and motorcyclist involvement in serious injury crashes;
2. To develop an understanding of the influence of the total system (i.e. the rider, the vehicles and the crash site) on the nature and pattern of injuries sustained by seriously injured motorcyclists.
4.1 Causal relationships
Causal relationships have been studied using a case-control analysis and a qualitative review of data collected during in-depth investigation within the Haddon matrix framework. The findings from the case-control analysis are that the type of motorcycle being ridden, the rider’s familiarity with the motorcycle being ridden, the familiarity with the crash location, the rider’s use of protective equipment and the age of the rider are key indicators of motorcycle crash risk. There was also a suggestion of some difference in the nature of the trip between riders who crashed (cases) and those who did not (controls).
There has been much discussion in the literature related to crash risk and type of motorcycle being ridden. Our results indicate that riders using sports motorcycles have a greater likelihood of being involved in serious injury crashes than riders using other motorcycle types (Teoh and Campbell 2010, De Rome and Senserrick 2011, Bjornskau, Naevestad et al. 2012, Connor 2014). Sports motorcycles are more commonly ridden by younger riders (Teoh and Campbell 2010), and in NSW at least, they are the predominate motorcycle type ridden by novice riders. This is expected since most learner approved motorcycles (LAMS) fall within the category of sports motorcycle. However, in our case control analysis after adjusting for rider age we found riders of sports motorcycles were four times more likely to be in the crash cases than in the control group. However, a more nuanced finding is that the association between age and motorcycle type indicates that the association between motorcycle type and crash involvement differs across age groups (as indicated by the presence of a significant interaction between age and motorcycle type). Specifically, the elevated crash risk associated with riding sports bikes is more prominent among older riders. This detail is important because attention might otherwise be given to younger riders in this age subgroup as they are more likely to ride sports motorcycles (Teoh and Campbell 2010). It might also be that any increased risk associated with younger age or inexperience may be more important than any relationship to the type of motorcycle ridden.
It is important to note however, that it may not be the actual type of motorcycle that increases the risk per se, but rather characteristics of the rider who chooses to ride a sports motorcycle and/or the riding activities undertaken. A recent study in the Netherlands reported sports motorcycle riders exhibit less safe attitudes and behaviours than riders of other motorcycle types even after controlling for age (Bjornskau, Naevestad et al. 2012).
The case control analysis also indicates an increased likelihood of crashing when a rider rides a motorcycle they are not familiar with and this is also consistent with previous descriptive research findings (Wick, Muller et al. 1998, Paulozzi 2005, Bjornskau, Naevestad et al. 2012). However, it is a factor that has rarely been formally studied. The exception to this is a population based case control study conducted in New Zealand where familiarity with these motorcycle was found to have a strong protective effect (Mullin, Jackson et al. 2000), which aligns with our current findings. Interestingly one of the themes to emerge from the qualitative analysis was that ‘riders need appropriate experience’. This theme included unfamiliarity with motorcycle, which was identified as a likely contributory factor in a small number of crashes. As noted by the Panel in their discussion of potential countermeasures within this theme there may be a need to increase rider awareness of the risk associated with riding new motorcycles, and from moving from one type of motorcycle to another.

Motorcycle In-depth Crash Study
Austroads 2015 | page 107
Familiarity with the route being ridden was also identified as a crash factor in the case-control analysis. Notably, riders who rode the crash location daily were found to be more than seven times more likely to be in the crash sample than the control sample. While this appears to be an uncommon finding among motorcycle crash risk literature, it is consistent with road user behaviour theories that suggest familiarity might lead to automatic behaviour, reduced attention and increased reckless behaviour (Rosenbloom, Perlman et al. 2007). Similarly, car based studies have reported that car drivers are most likely to be involved in crashes in locations they travel most frequently (Blatt and Furman 1998). However, due to the fact that the control recruitment method relies on the self-report of the control rider’s actually riding through the crash location, this finding needs further confirmation. Furthermore, while the case and control riders did not demonstrate significant differences in measures of exposure such as hours ridden and kilometres ridden, it is unknown how they compared in terms of exposure to high-risk roads. It is possible that the increased odds of being involved in a crash seen with route familiarity may in fact reflect an increased exposure to high-risk environments.
Unfamiliarity with the route being ridden was also identified as a contributory factor in a small number of crashes in the qualitative analysis. This finding together with the case-control analysis, suggests there may be a non-linear relationship between familiarity and crash risk. In future analyses it would be prudent to consider both extremes of daily familiarity with a route and first time attempting a new route. Unfortunately, due to the sample size, both extremes could not be explored quantitatively in this case control analysis.
Protective factors identified in the case-control analysis included increasing age of the rider, and increased coverage by protective clothing. Age is a long established crash risk factor and the increased risk with young age is often attributed to inexperience, different attitudes to risk, over confidence and poor hazard perception (Bjornskau, Naevestad et al. 2012). Notably, variables included in the analysis specifically designed to measure experience, such as time riding, and licence status did not significantly contribute. However, in the Crash Review Panels, inexperience was highlighted as a contributory factor in about 22% of the crashes. This was seen as specifically manifesting as errors and poor riding technique, tackling rides that were too challenging for the riders level of experience, and poor group riding behaviour. These observations might provide some tangible behavioural targets for addressing the increased risks associated with young age that are related to inexperience.
While we saw the odds of being in the crash sample reduce with each additional item of protective clothing used, it is unlikely that the use of protective clothing itself provides any benefit in terms of crash avoidance. Rather, this result suggests there may be something intrinsically different, such as attitudes to riding and/or risk, associated with the use of protective clothing that is also associated with a reduced likelihood of crashing. This should be further explored as it may provide insight into the ’risky’ motorcyclist.
Finally there were also significant differences in the type of riding being undertaken by the case and control riders prior to the crash, with control riders being much more likely to report they had been riding in heavy traffic and in freeway type conditions prior to travelling through the crash location. Similarly, a protective effect was observed when the trip purpose was reported as commuting or general transport rather than for recreational purposes. These latter results align to a degree with observations made by Haworth (1997) where they reported a significant increase in risk associated with nonwork-related trips compared to work related trips. More recently Moskal, Martin et al. (2012) also identified a protective effect for commuting riding compared to recreational riding. These findings, coupled with those made by other researchers suggest further investigation of the mechanisms such as rider mindset/attitude underlying apparent links between trip type and crash risk might be worthwhile.

Motorcycle In-depth Crash Study
Austroads 2015 | page 108
4.2 Nature and pattern of injury
The influence of the total system (the rider, vehicle and crash site factors) on the nature and pattern of injuries sustained has been studied by examining the outcome of the crashes and reviewing the injury mechanisms and source of injury during the case review Panel meetings.
Most injuries sustained by the motorcyclists were minor injuries in terms of threat to life, and mostly involved the arms and legs. However, there were distinct differences in the nature and pattern of injury if minor and moderate to severe injury were considered separately. While minor injury predominately involved the extremities, moderate to severe injury predominately involved the torso (the thorax, abdomen and pelvis). This is not unexpected given the coding system, the Abbreviated Injury Score codes injury in terms of threat to life, and generally injury to the torso carries a greater threat to life that injury to the extremities. However, this does suggest that while injury to the extremities primarily involves injury to the skin, injury to the torso primarily involves injury to bones and internal organs. This is an important distinction because it means that different injury sources and therefore different countermeasures are likely to be needed for injuries deemed minor and moderate/severe based on threat to life injury coding systems.
Overall, the most common sources of injury for motorcyclists were the roadway, followed by contact with another vehicle, followed by contact with their own motorcycle. However, there were differences in the source of the injury when considering injuries of different severity, and injuries to different body regions. Injury to the extremities resulted mainly from contact with the roadway, while the more serious injuries to the thorax and abdomen resulted from contact between the rider and other objects in the roadside environment such as guardrails and fences. The rider’s motorcycle, specifically the fuel tank, was a common source of injury to the pelvis.
In our analysis of the influence of different aspects of the crash on rider outcome (see Section 3.5) we saw that none of the factors we tested that have been identified in previous studies as being important risk factors (that is the use of protective clothing, rider age, estimated impact speed and whether or not the rider struck a specific object) were associated with increased severity of injury measured in terms of threat to life. Based on the observations made during the Panel review, it may be that the specific type of object struck is the most important factor in terms of injury severity (as measured in scales based on threat to life, such as AIS and ISS). The limited sample size prevented statistical examination of the association between the specific object struck and ISS but this is something that should be considered in future work involving larger samples. In a larger sample, it would also be interesting to conduct a sub-group analysis for minor and moderate-severe injuries. Given our observations it is likely that the factors associated with the severity of the more serious injuries may be masked by the high number of minor injuries in this sample.
Using a different measure of injury outcome, we saw that rider age was significantly associated with length of stay in hospital, with older riders tending to have longer stays in hospital. This aligns well with what is known about the impact of ageing and related frailty on crash injury risk more generally, and recent reports from the literature suggesting an increased risk of fatal injury in older riders (Savolainen and Mannering 2007, Cafiso, La Cava et al. 2012, Jou, Yeh et al. 2012). This is a novel finding as nothing could be found in the literature dealing specifically with the issue of non-fatal injury and older motorcyclists, besides a recent paper about hospital costs associated with elderly motorcyclists in non-fatal collisions in Taiwan (Jou, Hensher et al. 2013). In a population-referenced survey of the rider population in NSW, approximately 13% of the rider population is estimated to be aged 60 years and over. Using that figure, and crash statistics from NSW (CRS 2013), it appears older riders might be over represented in fatal crashes, accounting for 21% of fatally injured riders in 2013, and under-represented in the other categories of crashes (6% in injury crashes, and 2% in non-casualty crashes). In our current crash sample, approximately 10% of riders were over 60. While these observations do not take exposure into account they are consistent with the emerging data from our study that older injured riders are more seriously injured.
To date, most research into crash protection for motorcyclists has focused on helmets (see Liu, Ivers et al. 2004), protective clothing and the crashworthiness of roadside barriers. Previously there has been some research into the potential of leg protectors or crash bars on motorcycles to mitigate injury to the lower extremity. More recently there has also been work examining the potential effectiveness of motorcycles and motorcycle jackets incorporating airbags.

Motorcycle In-depth Crash Study
Austroads 2015 | page 109
Helmets are known to be an effective countermeasure for head injury (Liu, Ivers et al. 2004) and almost all riders in this sample were wearing helmets. Overall, the head was a relatively infrequently injured body region, even when injuries were separated by severity. This is testament to the effectiveness of helmets. However, head and facial injury did occur among a small number of helmeted riders and this is discussed in more detail below in the sections dealing with performance of protective equipment.
The high rate of minor injury to the extremities and to the external regions (i.e. skin) of the riders seen here confirms previous reports that these are the most frequent injuries seen among motorcyclists (Hurt Jr, Ouellet et al. 1981, MAIDS 2004, de Rome, Ivers et al. 2011) and supports the use of protective clothing as a countermeasure. We did not see any overall protective effect, in terms of injury outcome measured using ISS or length of hospital stay associated with the use of protective clothing. However, as noted in more detail below we did see a protective effect against soft tissue injury and this is the most common type of injury reported to occur among motorcyclists (Hurt, 1981). Our findings that protective clothing can effectively prevent soft tissue injury align with similar previously reported work (de Rome, Ivers et al. 2011, Erdogan, Sogut et al. 2013), but are somewhat inconsistent with the findings of de Rome et al. (de Rome, Ivers et al. 2011) who reported an overall protective effect for any injury. The likely reason for these different results is the difference in the samples used. In the de Rome et al. (2011) study, cases included riders who had not been admitted to hospital, while this current study only includes riders who had been admitted which increases the likelihood of cases having more severe injuries
Our observations and discussions held during the Panel reviews support the potential for motorcycle airbag jackets as a potential crash protection measure, particularly as a countermeasure to thoracic injury. The benefit of an airbag in the jacket (rather than mounted on the motorcycle) is that the jacket goes with the rider, and therefore this type of system may be beneficial in mitigating injury associated with rider contact with road side objects. Bambach, Grzebieta et al. (2012) also noted the high incidence of thoracic injury in their study of fatal injury associated with collisions with roadside barriers. They noted the mechanism of thoracic injury in these crashes often involved the rider sliding into the barrier. To our knowledge there has been no study of the potential benefit, if any, of motorcycle jackets in mitigating injury, when the injury occurs after the rider has slid some distance.
In addition to providing the rider with protection, or possibly to increase the overall protection provided to the rider, objects located in the road side environment should be designed to be more forgiving. Bambach, Grzebieta et al. (2012) note that design standards for roadside barriers do not include any specific assessment for thoracic injury risk. Our observations support their call for this type of addition to the design standards.
An area of crash protection that has been relatively neglected to date is protection of the rider’s pelvis. In this sample we saw pelvic injury occur in just over 20% of the riders and almost all of this injury occurred following contact with the fuel tank. While there have been a number of studies in the past suggesting optimal design features of the fuel tank to mitigate pelvic injury (Hurt Jr, Ouellet et al. 1981, de Peretti, Cambas et al. 1994), these have been inconsistent and may be outdated given potential changes in motorcycle design over the last few decades. From the observations made in this current study, there appears to be significant scope for addressing pelvic injury risk through better attention to fuel tank design and this is an important area for future study.
Finally, a number of riders sustained other types of injuries from contact with their own motorcycles. While this has been noted as a source of injury in previous studies (Hurt, 1981) this may also be an area warranting future research, as it is possible that injury could be mitigated through better attention to those parts of the motorcycle acting as sources of injury. In this current study we saw injury associated with failure of motorcycle parts, such as the handle bar, and injury associated with parts of the motorcycle that could be designed to be more forgiving such as weather shields and foot pegs.

Motorcycle In-depth Crash Study
Austroads 2015 | page 110
4.3 Emerging crash prevention themes
Using a qualitative approach we have examined the most common crash types, and the factors contributing to these, and have identified a number of emerging themes. The first of these was that ‘Riders need to be seen’ and this theme applies to crashes where other vehicles failed to see or misjudged the speed of the motorcycle (36% of crashes). It also incorporates less common crashes such as those involving overtaking riders coming into conflict with cars attempting the same manoeuvre at the same time and possibly crashes where other vehicles impact the rear of stationary motorcycles.
Conspicuity is an often discussed issue for motorcycle safety. In this study we commonly saw crashes that could be described as involving another vehicle ‘failing to see’ the motorcycle (Hurt, Ouellet et al. 1981,MAIDS 2004, Pai 2011). The evidence emerging from this study form a clear distinction between these two failure types has important implications for policy and countermeasure development.
In at least two of the ‘failed to see’ crashes in our sample, there was evidence from statements taken from the other driver, that they did see the motorcycle, but thought they had time to make a turn. Motorcycles present a small target to other road users, and as noted by de Craen, Doumen et al. (2014). Previous research has demonstrated that perceptions of speed are affected by the size of the target (DeLucia 1991) and that car drivers accept smaller gaps when crossing in front of a motorcycle than crossing in front of a car (Horswill, Helman et al. 2005).
De Craen, Doumen et al. (2014) examined differences and similarities between car to car and car to motorcycle intersection crashes. They found that crashes involving drivers failing to give way to motorcycles entering intersections occur with a similar frequency to crashes involving car drivers failing to give way to other cars entering intersections. However, crashes involving cars turning across the path of a motorcycle occur more frequently than crashes involving a car turning across the path of another car. They suggest this may be related to car drivers having more difficulty judging the gap and/or speed of motorcycles than other cars. Observations from this current study support this idea. It may therefore be useful to further explore the crashes in this current sample by road user movement to examine the proportions of crashes involving cars turning across the pathway of the motorcycle as opposed to cars entering the roadway in the path of a motorcycle.
This phenomenon of other motorists apparently failing to see a motorcycle is generally attributed to characteristics of the motorcycle (such as how well it can be seen) or drivers of the other vehicle (such as their attention to and perception of motorcycles; Haworth 2012). Hence actions, and research activities to address this problem have focused on lighting systems for motorcycles (Lin and Kraus 2009, Davoodi, Hamid et al. 2011, Gould, Poulter et al. 2012, Mitsopoulos-Rubens and Lenne 2012, Pinto, Cavallo et al. 2014), visibility of clothing and helmets worn by riders (Wells, Mullin et al. 2004, Gershon, Ben-Asher et al. 2012) and education of other road users (Harrison 2005, Gershon, Ben-Asher et al. 2012).
Importantly in this study, a number of additional factors were noted as potentially contributing to conspicuity problems. These included features of the roadway, the presence of other vehicles on the road, vehicle blind spots and lane positions taken by the rider. Temporary view obstructions presumably due to traffic were also noted in the MAIDS study as a common contributor to motorcycle crashes (MAIDS 2004). These observations suggest that there may be additional or alternative measures that can be taken to address some car to motorcycle crashes that involve ‘fail to see’ through better road environment planning and use of controls, reduction of blind spots in passenger vehicle design and/or advanced rider assistance systems and increased awareness of this issue by riders. Further exploration of the contribution of these less discussed aspects of motorcycle conspicuity may be beneficial in future work.
Intelligent transport systems that assist car drivers avoid crashes are emerging in vehicle fleets, and as noted by Pai (2011) these have largely focused on the avoidance of car to car and car to pedestrian conflicts. There is significant scope for these types of systems to provide some crash avoidance benefit for car to motorcycle crashes but this is an area that has so far received relatively little attention. The recently emerging vehicle to vehicle (V2V) systems could be particularly beneficial for these ‘fail to see’ type crashes.

Motorcycle In-depth Crash Study
Austroads 2015 | page 111
The second major theme emerging from this work was that riders ‘need to stop in time’. As described by Teoh (2011) operating the brakes on a motorcycle is a much more complicated task than operating the brakes on a vehicle with four wheels, as most motorcycles have separate controls for the front and rear brakes. Furthermore, motorcycles are inherently less stable than vehicles with four wheels, and poor braking techniques can negatively affect the stability of a motorcycle. Problems with braking have been noted as frequent contributory crash factors in a number of previous studies (Hurt, Ouellet et al. 1981, MAIDS 2004, Roll 2009), and these commonly involve both under and over braking of the motorcycle (Teoh 2011). Over braking leads to the motorcycle becoming unstable and the rider subsequently having difficulty remaining upright on the bike, while under braking occurs when the rider does not brake as efficiently as they could. Fear of loss of control from over braking is one reason riders under brake (Teoh 2011). Braking systems that link front and rear brake controls, or ‘combined brake systems’ and anti-lock brake systems are countermeasures to these problems and have been shown to be effective in reducing crashes involving motorcycles (Teoh 2011, HLDI 2013, Rizzi, Strandroth et al. 2014). In this sample of 102 crashes, 8% of the motorcycles were equipped with ABS, and therefore strategies to increase the uptake of this technology into the fleet should be encouraged. There is also scope to further enhance brake technology through autonomous braking systems that could amplify brake force applied by the rider to ensure full braking capacity in emergency situations (Roll 2009, Savino, Giovannini et al. 2013). Efforts to further explore these types of enhanced technologies should be encouraged.
However, even with full braking capacity, the minimum distance over which a rider can come to a stop depends on the travel speed, and the minimum available distance will depend on the distance between the rider and the hazard. While the expert Panel noted that raising awareness and educating riders of the importance of appropriate travel speeds and following distances, greater gains may be achieved through technology based countermeasures that provide feedback to riders to assist them in making these decisions. More exploration of the potential for vehicle to vehicle communication to provide a mechanism for this sort of feedback may be warranted.
Advanced rider assistance systems were also discussed as a potential countermeasure to the third major theme that emerged from this work – ‘maintaining control’. This theme relates to problems encountered by riders during cornering and/or negotiating curves or bends in the road. While a number of previous studies have highlighted the frequency of these types of crashes (Hurt, Ouellet et al. 1981, MAIDS 2004) there has been relatively little study of potential countermeasures. These studies have been limited to investigation of concepts for potential advanced rider assistance systems that provide some assistance to the rider while negotiating curves (Biral, Da Lio et al. 2010, Huth, Biral et al. 2012); exploration of the impact of rider experience on how riders negotiate bends ( Crundall et al. 2012) and road marking approaches to guide motorcyclists through curves (Debell 2007, Winkelbauer 2014).
The fourth major theme that emerged from the current study related to ‘rider experience’. Similar to the issue of conspicuity, there has been much discussion of the role rider inexperience might play in motorcycle crash risk and most attention has focused on the rider’s experience in terms of how many years a person has been riding. However, the Panel discussion highlighted the riders experience with the motorcycle, and the match between the rider’s experience/ skill level and the level of difficulty of the route being ridden is also important. While matching the choice of route with the skill of the rider is something that may be discussed in rider training, there may be a need to develop a more formal approach to this, such as developing guides for novice riders.

Motorcycle In-depth Crash Study
Austroads 2015 | page 112
4.4 Commonalities across themes
The Panel review discussions identified several focus areas for countermeasure development. These include education and awareness of riders, enhanced rider assistance technologies and road and roadside treatments.
Many of the countermeasures targeting the rider which the Panel discussed relate to educating drivers and raising awareness. Many of these ideas are already included in publications designed for this purpose such as the NSW Motorcycle Rider’s Handbook. It would be worthwhile to review such publications alongside the findings of this study with a view to potential enhancement of the information included. For example there may be scope to increase the importance of appropriate route selection based on rider experience and skill level. Furthermore, many of the rider issues identified highlight the importance of riders riding with awareness and this supports the principles encapsulated in the current NSW ‘Ride to Live’ campaign.
Rider training is another measure that aims to educate and raise awareness. Compulsory training for motorcycling during licensing exists in some Australian states, and it may also be worthwhile ensuring that these programs incorporate the types of information suggested during the Panel reviews. The types of information discussed during the Panel reviews focused on specific riding skills and behaviours but did not include specific consideration of the potential role of education in addressing attitudes that might affect crash risk. This gap may need further consideration in future examinations of potential countermeasures. However, it is unknown how effective these types of programs are at actually educating and raising awareness of the specific issues relevant to crash avoidance and/or changing rider behaviour. There is no robust evidence that pre-licensing or post-crash training has any effect on crash risk (Kardamanidis, Martiniuk et al. 2010). While this may be due to problems with the methods used to study effectiveness previously (Kardamanidis, Martiniuk et al. 2010) it may also be due to inherent problems with measures that target education and awareness when the appropriate target might be the actual determinants of rider behaviour. Changing awareness alone does not necessarily result in a change in behaviour.
While education and awareness are important components of multi-faceted road safety interventions, they are rarely effective on their own. Conversely, countermeasures that target crash avoidance but do not require any behaviour change can be very effective on their own. Most effective road safety interventions have relied on engineering solutions or strong enforcement, whereas interventions relying on education alone have rarely been shown to be effective (Fildes 2005). Across the different crash types and emerging themes, Panel discussions raised many recurring suggestions about enhanced motorcycle technologies as potential crash countermeasures. While there has been intensive exploration of new crash avoidance and advanced driver assistance technologies for four wheeled vehicles, there has been relatively less attention given to exploring the use of these technologies for improving motorcycle safety (Pai 2011). The observations made during reviews of this sample of crashes suggest there may be significant benefits for motorcyclists from many of the new technologies being applied to other vehicle types and further examination of this issue is encouraged.
It has been suggested that one of the main reasons for the lack of effort in studying safety assist technologies for motorcycles is the resistance to these types of developments from the riding community (Beanland and Lenne 2013). It would therefore be important to include further examination of this issue in future work examining potential benefits of new technologies targeting reductions in motorcycle crashes. For example, Beanland et al. (2013) have studied the general and system-specific factors that influence acceptability of assistive systems for motorcycles in a large European survey. They found that acceptance of rider assistance systems was generally quite low, with greater acceptances for systems that do not interfere with the riding task, or that are well-known and considered reliable. These issues must be kept in mind when designing rider assistance systems to ensure broad uptake of effective systems.
Notably, discussions related to potential vehicle factor countermeasures within the Panel reviews focussed on emerging and possible future technologies. There was little discussion of any safety features inherent in the current design of most motorcycles. A review of the influence of current motorcycle design on crash avoidance and crash protection may be warranted.

Motorcycle In-depth Crash Study
Austroads 2015 | page 113
Roadway treatments of different types were also discussed as potential countermeasures across the different crash types and crash themes. The treatments discussed generally related to optimising the road environment for motorcycles and/or providing better control and guidance to road users. The Panel reviews identified potential improvements for many of the crash sites but this was done without consideration of the costs and feasibility. Nonetheless, it was clear from the cases reviewed that detailed audits for motorcycle safety along routes frequented by motorcyclists would be beneficial, and this supports the motorcycle safety treatment programs currently in place in a number of jurisdictions across Australia. This also supports the Motorcycle Safety Audits already conducted in locations such as the Royal National Park by the NSW Roads and Maritime Services and the Centre for Road Safety.
4.5 Protective equipment
As protective equipment is the primary countermeasure currently available for motorcyclists, the performance of helmets and clothing worn by the riders in this study was studied in detail.
In examining the performance of helmets the primary objective was to investigate the types of head and neck injury that occurred to riders using helmets, and the types of loading conditions that resulted in these injuries. By doing this any scope for further improvement in helmet design might be identified.
Overall, helmets were effective in preventing head injury but significant head injury still occurred in 16 cases, regardless of helmet use. Full face helmets appeared to provide better protection than open face helmets. The majority of impacts to the helmets occurred to the front of the helmet involving the visor and chin bar, and most sustained impact damage outside of the zones requiring impact protection assessment in the Australian/New Zealand Standard. These observations support advice given to riders that full face helmets are superior to open face helmet, and also indicate there may be a need to increase the coverage of the Standard test requirements to optimise protection provided to riders. In other words, the areas of the helmet currently tested and required to demonstrate minimum levels of impact protection performance in the Australian Standard should be extended.
Similarly, investigation of the performance of clothing designed specifically for motorcycle use aimed to examine any variations in the level of protection provided by this clothing compared to normal ‘street’ clothing, as well as explore any variation in protective performance among the clothing specifically designed for motorcycle use. Clothing designed for motorcycle use performed well overall in that riders who used this clothing were generally better protected. Consistent with previous studies (de Rome, Ivers et al. 2011, Erdogan, Sogut et al. 2013), riders who wore clothing specifically designed for motorcycle use were provided with effective protection against soft tissue injury. However, there were obvious variations in the performance of clothing specifically designed for motorcycle use, with some riders who wore clothing designed for motorcycle use still sustaining even minor injuries. The failure of some motorcycle specific clothing to prevent even minor injury is disturbing given the riders have likely purchased this clothing assuming they would be provided with some protection. Furthermore, there was little additional benefit provided from impact protectors. There is a need for further examination of the quality of and standards for protective clothing being sold in Australia as motorcycle specific clothing, and more detailed examination of the energy attenuation performance of impact protectors.
4.6 Study limitations
As with all studies there are a number of limitations with the methods used that should be kept in mind when interpreting conclusions, and most of these have been mentioned in the ‘important points to note’ sections after each sub-section of the results. A summary of the limitations follow.
The in-depth crash investigation sample is biased towards more seriously injured motorcyclists because of the recruitment strategy of recruiting riders who are admitted hospital. Our sample appears to have a slightly higher proportion of younger riders than would be expected from statewide crash data and this might reflect a propensity for more serious crash outcomes among younger crash involved riders. While this also means the sample does not likely represent crashes of all severity, comparison of our sample with other crash data suggests it provides an adequate representation of metropolitan/ urban crash distribution.

Motorcycle In-depth Crash Study
Austroads 2015 | page 114
The control sample is self-selected and is matched to the case riders on the basis of the control rider self-reporting they have travelled the same section of road that the case rider crashed. Unfortunately, due to NSW privacy laws it was not possible to monitor the sections of road by camera and then contact potential controls via registration data, nor was it possible to ‘pull over’ riders as they passed the crash site. Therefore, the self-report option was the only option available. Comparing our final self-selected control sample with the population of riders in NSW, it appears our control sample may also be slightly biased towards older riders, and riders with unrestricted licences. The analysis methods used in the case control analysis adjust the results for these differences and therefore they don’t impact the final results.
As the control sample is not a truly random sample of the population of riders, this is also a limitation for the case control analysis. However, to minimise this limitation we re-ran the model used to identify ‘important rider characteristics’ in the case-control analysis using data collected during a population referenced survey of motorcycle riders across NSW, and all variables remained significantly associated with the outcome of being in the crash sample. This provides some reassurance that the non-random nature of the control sample has not had much effect on the results.
As the design of the case control study precluded examination of the influence of features of the crash site on crash risk, a section of the report included a description of potential road environment factors reported by case and control riders. In reading this section and comparing the reports from case and control riders it is important to note that there was no record of the time separation between when the crash occurred and when the control rider had last ridden through the crash location. Therefore, it is possible that some problems, particularly with the condition of the road surface, may have been different between visits. For example, some problems may not yet have occurred, and/or have been corrected. Similarly, there was a time lag between the crash occurring and the scene inspection by the researchers. While this was usually only a matter of days, in a small number of crashes this delay was longer, up to a few weeks. Therefore, this may explain some discrepancies in reports between riders and investigators. Furthermore, this section simply presents those potential road environment factors reported by case and control riders, and observed during scene inspections. Further analysis is required to draw any conclusions about the likely effect of any of these factors on the actual crash, and/or what might be drawn from differences in reports of potential road environment factors from the three different sources.
4.7 Areas for further study
This report provides an overview of the data collected and examines some aspects of the data specifically in order to address the aims of the project. While we present the key findings in this report, there is scope to examine both the ‘case’ and ‘control’ data in more detail. Areas where further analysis of the existing data set may be useful include:
• Indicators of fatigue and their contribution to motorcycle crashes
• Health and well-being factors among motorcyclists and differences in these factors between case and control riders
• Validation of the Motorcycle Rider Behaviour Questionnaire (MRBQ) using the case control data
• Examination of factors associated with specific crash types e.g. intersection crashes (49%) versus other types, crashes where the rider’s actions were the primary contributor to the crash versus other crash types and
• Further use of the case control data set to examine research questions about the influence of factors identified as important in the qualitative study
• More detailed review of the mechanisms underlying the variation in performance of protective clothing worn by motorcyclists
• Detailed review of crashes that occurred along the same route e.g. there were a number of crashes in this sample that occurred within the Royal National Park.

Motorcycle In-depth Crash Study
Austroads 2015 | page 115
Beyond the existing dataset, this project has also identified a number of areas where further research efforts would be valuable, including:
• Research into the determinants of motorcycle type choice and the relationship this might have on crash risk
• Review of existing and emerging rider assistance and brake technologies and their likely benefits for motorcyclists
• Development of an appropriate research strategy to examine conspicuity issues and potential countermeasures
• Research into the role that vehicle mounted motorcycle detection systems such as blind spot warning and forward collision warning systems could benefit motorcycle crashes
• Further exploration of the association between trip type and crash risk. This should include issues related to familiarity with route being ridden, as well as trip purpose
• Research into the determinants of protective clothing and the relationship this might have on crash risk
• Detailed examination of the characteristics of fuel tank design that are important for minimising pelvic injury among motorcyclists
• Review of crash involvement and outcome data for older motorcyclists.
Throughout the panel discussions there were numerous mentions of potential technologies that might provide assistance to riders, and technologies that might work to reduce motorcycle crash risk. However the list of potential technologies was not exhaustive. For example helmet based technologies, adaptive head lighting technologies, safety assist technologies and specific types of intelligent transport system technologies were not discussed. Further more extensive and comprehensive review of potential technologies would also be valuable.
This study included a small subset of crashes where a rider was killed. This was intentionally done so as to ensure the study sample represented the entire spectrum of serious injury crashes. However the small number of fatal crashes included precludes any examination of differences between fatal and non-fatal motorcycle crashes. It may be worthwhile to conduct a case-control analysis on a larger number of fatal crashes to examine the factors associated with these more severe crashes.
Finally, any future research projects need to identify clear and relevant outcomes that are applicable to all Australian jurisdictions.

Motorcycle In-depth Crash Study
Austroads 2015 | page 116
References
AAAM (2005). Abbreviated injury scale 2005,. T. A. Gennarelli and E. Wodzin. Barrington, Il, USA, Association for the Advancement of Automotive Medicine (AAAM).
ABS (2010). Motor vehicle census, Australia, 31 March 2009. Canberra, Australian Bureau of Statistics.
ABS (2012). Motor vehicle census, Australia, 31 January 2012. ABS Catalogue 9309.0. Canberra, Australian Bureau of Statistics.
ACEM (2004). Maids in-depth investigation of accidents involving powered two wheelers: Final report 1.2. Brussels, Association of European Motorcycle Manufacturers (ACEM): 173.
ACEM (2009). Maids in-depth investigation of accidents involving powered two wheelers: Final report 2.0. Brussels, Association of European Motorcycle Manufacturers (ACEM).
AIHW (2008). Serious injury due to land transport accidents, Australia, 2005-2006. Injury Research and Statistics Series. J. G. Berry and J. E. Harrison. Canberra, Australian Institute of Health and Welfare.
AIHW (2013). Trends in hospitalised injury, Australia 1999–00 to 2010–11. Injury Research and Statistics Series. S. Pointer. Canberra, Australian Institute of Health and Welfare. Number 86.
Ankarath, S., P. V. Giannoudis, I. Barlow, M. Bellamy, S. Matthews and R. Smith (2002). Injury patterns associated with mortality following motorcycle crashes. Injury 33(6): 473-477.
Auman, K. M., J. A. Kufera, M. F. Ballesteros, J. E. Smialek and P. C. Dischinger (2002). Autopsy study of motorcyclist fatalities: The effect of the 1992 Maryland motorcycle helmet use law. American Journal of Public Health 92(8): 1352-1355.
Bambach, M. R., R. H. Grzebieta and A. S. McIntosh (2012). Injury typology of fatal motorcycle collisions with roadside barriers in Australia and New Zealand. Accident Analysis & Prevention 49: 253-260.
Beanland, V. and M. Lenne (2013). An international study of the factors associated with the acceptability of advanced rider assistive systems for powered two-wheelers. Australasian Road Safety Research Policing Education Conference, 2013, Brisbane, Queensland, Australia.
Biral, F., M. Da Lio, R. Lot and R. Sartori (2010). An intelligent curve warning system for powered two wheel vehicles. European transport research review 2(3): 147-156.
Bjornskau, T., T. O. Naevestad and J. Akhtar (2012). Traffic safety among motorcyclists in Norway: A study of subgroups and risk factors. Accident Analysis & Prevention 49: 50-57.
Blatt, J. and S. M. Furman (1998). Residence location of drivers involved in fatal crashes. Accident Analysis & Prevention 30(6): 705-711.
Cafiso, S., G. La Cava and G. Pappalardo (2012). A logistic model for powered two-wheelers crash in Italy. Procedia-Social and Behavioral Sciences 53: 880-889.
CEN (1998). Motorcyclists' protective clothing against mechanical impact: Requirements and test methods for impact protectors. EN 1621-1:1998, European Committee for Standardisation, Brussels. EN 1621-1:1998.

Motorcycle In-depth Crash Study
Austroads 2015 | page 117
CEN (2002). Protective clothing for professional motorcycle riders: Jackets, trousers and one piece or divided suits - general requirements. EN 13595-1:2002, European Committee for Standardisation, Brussels.
CEN (2003). Motorcyclists' protective clothing against mechanical impact: Motorcyclists back protectors - requirements and test methods. EN 1621-2:2003, European Committee for Standardisation, Brussels.
Clarke, D. D., P. Ward, C. Bartle and W. Truman (2007). The role of motorcyclist and other driver behaviour in two types of serious accident in the UK. Accident Analysis & Prevention 39(5): 974-981.
Connor, S. M. (2014). Involvement of unendorsed motorcycle operators in fatal crashes in Cuyahoga County, Ohio, 2005-2011. Traffic Inj Prev 15(5): 508-512.
Croce, M. A., B. L. Zarzaur, L. J. Magnotti and T. C. Fabian (2009). Impact of motorcycle helmets and state laws on society's burden: A national study. Annals of Surgery 250(3): 390-394.
CRS (2013). Road traffic crashes in New South Wales: Statistical statement for the year ended 31 December 2013, Centre for Road safety, Transport NSW: 93.
Crundall, E., D. Crundall and A. W. Stedmon (2012). Negotiating left-hand and right-hand bends: A motorcycle simulator study to investigate experiential and behaviour differences across rider groups. PLoS ONE [Electronic Resource] 7(1): e29978.
Daniello, A. and H. C. Gabler (2011). Fatality risk in motorcycle collisions with roadside objects in the United States. Accident Analysis & Prevention 43(3): 1167-1170.
Daniello, A. and H. C. Gabler (2012). Characteristics of injuries in motorcycle-to-barrier collisions in Maryland. Transportation Research Record: Journal of the Transportation Research Board 2281(1): 92-98.
Dao, H., J. Lee, R. Kermani, C. Minshall, E. A. Eriksson, R. Gross and A. R. Doben (2012). Cervical spine injuries and helmet laws: A population-based study. The Journal of Trauma and Acute Care Surgery 72(3): 638-641; discussion 641-632.
Davoodi, S. R., H. Hamid, S. Arintono, R. Muniandy and S. F. Faezi (2011). Motorcyclist rear brake simple perception-response times in rear-end collision situations. Traffic Injury Prevention 12(2): 174-179.
de Craen, S., M. J. Doumen and Y. van Norden (2014). A different perspective on conspicuity related motorcycle crashes. Accid Anal Prev 63: 133-137.
de Peretti, F., P. M. Cambas, I. Hovorka, B. Veneau and C. Argenson (1994). Motorcycle petrol tanks and their role in severe pelvic injuries. Injury 25(4): 223-225.
de Rome, L., R. Ivers, M. Fitzharris, W. Du, N. Haworth, S. Heritier and D. Richardson (2011). Motorcycle protective clothing: Protection from injury or just the weather? Accident Analysis & Prevention 43(6): 1893-1900.
De Rome, L. and T. Senserrick (2011). Factors associated with motorcycle crashes in New South Wales, Australia, 2004 to 2008. Transportation Research Record: Journal of the Transportation Research Board 2265(1): 54-61.
Debell, C. (2007). A simple engineering solution transforms a dangerous road bend. Traffic engineering and control 48(1): 13-14.
DeLucia, P. R. (1991). Pictorial and motion-based information for depth perception. Journal of Experimental Psychology: Human Perception and Performance 17(3): 738-748.

Motorcycle In-depth Crash Study
Austroads 2015 | page 118
Elliott, M. A., C. J. Baughan and B. F. Sexton (2007). Errors and violations in relation to motorcyclists' crash risk. Accident Analysis & Prevention 39(3): 491-499.
Erdogan, M. O., O. Sogut, S. Colak, H. Ayhan, M. A. Afacan and D. Satilmis (2013). Roles of motorcycle type and protective clothing in motorcycle crash injuries. Emerg Med Int 2013: 760205.
Evans, L. and M. C. Frick (1988). Helmet effectiveness in preventing motorcycle driver and passenger fatalities. Accident Analysis & Prevention 20(6): 447-458.
Feldkamp, G., W. D. Prall, G. Buhler and K. Junghanns (1977). [Motorcycle accidents - eidemiology, clinical aspects and protective measures - a follow-up and prospective study (author's transl)]. Unfallheilkunde 80(1): 1-19.
Fildes, B., D. Logan, M. Fitzharris, J. Scully and D. Burton (2003). The Australian national crash in-depth study (ancis )– the first three years. Report No. 207: 119.
Fildes, B. P. N. (2005). Crash and injury prevention. Behavioral change: An evidence-based handbook for social and public health. T. S. Browning C J. London UK, Elsevier.
Fitzharris, M., R. Dandona, G. A. Kumar and L. Dandona (2009). Crash characteristics and patterns of injury among hospitalized motorised two-wheeled vehicle users in urban India. BMC public health 9(1): 11.
Gabella, B., K. L. Reiner, R. E. Hoffman, M. Cook and L. Stallones (1995). Relationship of helmet use and head injuries among motorcycle crash victims in El Paso County, Colorado, 1989-1990. Accident Analysis & Prevention 27(3): 363-369.
Gershon, P., N. Ben-Asher and D. Shinar (2012). Attention and search conspicuity of motorcycles as a function of their visual context. Accident Analysis & Prevention 44(1): 97-103.
Gould, M., D. R. Poulter, S. Helman and J. P. Wann (2012). Judgments of approach speed for motorcycles across different lighting levels and the effect of an improved tri-headlight configuration. Accident Analysis & Prevention 48: 341-345.
Haddon Jr, W. (1972). A logical framework for categorizing highway safety phenomena and activity. Journal of Trauma and Acute Care Surgery 12(3): 193-207.
Harrison, W. A. (2005). A demonstration of avoidance learning in turning decisions at intersections. Transportation Research Part F: Traffic Psychology and Behaviour 8(4–5): 341-354.
Haworth, N. (1997). Case-control study of motorcycle crashes.
Haworth, N. (2012). Powered two wheelers in a changing world-challenges and opportunities. Accident Analysis & Prevention 44(1): 12-18.
Haworth, N., G. Smith, I. Brumen and N. Pronk (1997). Case-control study of motorcycle crashes. CR 174. Canberra, ACT, Federal Office of Road Safety: 88.
HLDI (2013). Evaluation of motorcycle antilock braking systems, alone and in conjunction with combined control braking systems. HLDI Bulletin, Highway Loss Data Institute. 30.
Horswill, M. S., S. Helman, P. Ardiles and J. P. Wann (2005). Motorcycle accident risk could be inflated by a time to arrival illusion. Optom Vis Sci 82(8): 740-746.
Houston, D. J. and L. E. Richardson (2008). Motorcyclist fatality rates and mandatory helmet-use laws. Accident Analysis & Prevention 40(1): 200-208.

Motorcycle In-depth Crash Study
Austroads 2015 | page 119
Hurt, H., J. Ouellet and D. Thom (1981). Motorcycle accident cause factors and identification of countermeasures volume i: Technical report. Traffic Safety Center, University of Southern California, Contract No. DOT HS-5-01160.
Hurt, H. H., J. V. Ouellet and D. R. Thom (1981). Motorcycle accident cause factors and identification of countermeasures. Technical Report. University of Southern California Traffic Safety Center. Washington, DC, National Highway Traffic Safety Administration. Volume 1.
Hurt Jr, H., J. V. Ouellet and I. Wagar (1981). Effectiveness of motorcycle safety helmets and protective clothing. Proceedings: American Association for Automotive Medicine Annual Conference, Association for the Advancement of Automotive Medicine.
Huth, V., F. Biral, O. Martin and R. Lot (2012). Comparison of two warning concepts of an intelligent curve warning system for motorcyclists in a simulator study. Accident Analysis & Prevention 44(1): 118-125.
Jou, R. C., D. A. Hensher, T. Y. Chen and M. C. Chao (2013). Hospitalisation costs and duration of elderly motorcyclists' non-fatality crashes in Taiwan. International Journal of Injury Control & Safety Promotion 20(2): 158-168.
Jou, R. C., T. H. Yeh and R. S. Chen (2012). Risk factors in motorcyclist fatalities in Taiwan. Traffic Injury Prevention 13(2): 155-162.
Kardamanidis, K., A. Martiniuk, R. Q. Ivers, M. R. Stevenson and K. Thistlethwaite (2010). Motorcycle rider training for the prevention of road traffic crashes. Cochrane Database of Systematic Reviews(10): CD005240.
Kasantikul, V. (2001). Motorcycle accident causation and identification of countermeasures in Thailand, Volume 2: Up country study. Bangkok, Thailand 10330, Chulalongkorn University. September 2001.
Kasantikul, V. (2001). Motorcycle accident causation and identification of countermeasures in Thailand. Volume 1. Bangkok study. Bangkok, Thailand 10330, Chulalongkorn University.
Kasantikul, V. (2002). Motorcycle accident cause factors and identification of countermeasures in Thailand: Volume 1: Bangkok. KP Printing, Bangkok (Available from the authors as a PDF file.).
Kraus, J. F., R. S. Riggins and C. E. Franti (1975). Some epidemiologic features of motorcycle collision injuries. I. Introduction, methods and factors associated with incidence. American Journal of Epidemiology 102(1): 74-98.
Langley, J., B. Mullin, R. Jackson and R. Norton (2000). Motorcycle engine size and risk of moderate to fatal injury from a motorcycle crash. Accident Analysis & Prevention 32(5): 659-663.
Langley, J., A. Samaranayaka and D. J. Begg (2013). Age, period and cohort effects on the incidence of motorcyclist casualties in traffic crashes. Injury Prevention 19(3): 153-157.
Leijdesdorff, H. A., B. Siegerink, C. F. M. Sier, M. C. B. Reurings and I. B. Schipper (2012). Injury pattern, injury severity, and mortality in 33,495 hospital-admitted victims of motorized two-wheeled vehicle crashes in the Netherlands. Journal of trauma and acute care surgery 72(5): 1363-1368.
Lin, M. R. and J. F. Kraus (2009). A review of risk factors and patterns of motorcycle injuries. Accident Analysis & Prevention 41(4): 710-722.
Liu, B., R. Ivers, R. Norton, S. Blows and S. K. Lo (2004). Helmets for preventing injury in motorcycle riders. Cochrane Database of Systematic Reviews(2): CD004333.
MAIDS, A. (2004). In-depth investigation of accidents involving powered two-wheelers. Final report 1.2. Brussels: Association of European Motorcycle Manufacturers (ACEM).

Motorcycle In-depth Crash Study
Austroads 2015 | page 120
Mansfield, H., A. Bunting, M. Martens and R. van der Horst (2008). Analysis of the on the spot (ots) road accident database. Road Safety Research Report. London, Department for Transport. 80.
Mattsson, M. and H. Summala (2010). With power comes responsibility: Motorcycle engine power and power-to-weight ratio in relation to accident risk. Traffic Injury Prevention 11(1): 87-95.
Miggins, M., L. Lottenberg, H. Liu, L. Moldawer, P. Efron and D. Ang (2011). Mopeds and scooters: Crash outcomes in a high traffic state. Journal of Trauma-Injury Infection & Critical Care 71(1): 217-222.
Mitsopoulos-Rubens, E. and M. G. Lenne (2012). Issues in motorcycle sensory and cognitive conspicuity: The impact of motorcycle low-beam headlights and riding experience on drivers' decisions to turn across the path of a motorcycle. Accident Analysis & Prevention 49: 86-95.
Moskal, A., J. L. Martin and B. Laumon (2012). Risk factors for injury accidents among moped and motorcycle riders. Accident Analysis & Prevention 49: 5-11.
Mullin, B., R. Jackson, J. Langley and R. Norton (2000). Increasing age and experience: Are both protective against motorcycle injury? A case-control study. Injury Prevention 6(1): 32-35.
Namdaran, F. and R. A. Elton (1988). A study of reported injury accidents among novice motorcycle riders in a Scottish region. Accident Analysis & Prevention 20(2): 117-121.
Otte, D., G. Schroeder and M. Richter (2002). Possibilities for load reductions using garment leg protectors for motorcyclists -- a technical, medical and biomechanical approach. Annual Proceedings/Association for the Advancement of Automotive Medicine 46: 367-385.
Ozkan, T., T. Lajunen, B. Dogruyol, Z. Yildirim and A. Coymak (2012). Motorcycle accidents, rider behaviour, and psychological models. Accident Analysis & Prevention 49: 124-132.
Pai, C.-W. (2011). Motorcycle right-of-way accidents—a literature review. Accident Analysis & Prevention 43(3): 971-982.
Paulozzi, L. J. (2005). The role of sales of new motorcycles in a recent increase in motorcycle mortality rates. Journal of Safety Research 36(4): 361-364.
Peduzzi, P., J. Concato, E. Kemper, T. R. Holford and A. R. Feinstein (1996). A simulation study of the number of events per variable in logistic regression analysis. Journal of clinical epidemiology 49(12): 1373-1379.
Pinto, M., V. Cavallo and G. Saint-Pierre (2014). Influence of front light configuration on the visual conspicuity of motorcycles. Accident Analysis & Prevention 62: 230-237.
Quddus, M. A., R. B. Noland and H. C. Chin (2002). An analysis of motorcycle injury and vehicle damage severity using ordered probit models. Journal of Safety Research 33(4): 445-462.
Rizzi, M., J. Strandroth, A. Kullgren, C. Tingvall and B. Fildes (2014). Effectiveness of motorcycle antilock braking systems (abs) in reducing crashes, the first cross-national study. Traffic Inj Prev: 0.
Rogers, N. (2008). Trends in motorcycle fleets worldwide. OECD International Workshop on motorcycling safety, http://www.internationaltransportforum.org/jtrc/safety/Lillehammer2008. Lillehammer, Norway, OECD.
Rolison, J. J., P. J. Hewson, E. Hellier and L. Hurst (2013). Risks of high-powered motorcycles among younger adults. American Journal of Public Health 103(3): 568-571.
Roll, G., Hoffman, O., Konig, J., (2009). Effectiveness evaluation of antilock brake systems (abs) for motorcyclists in real-world accident scenarios. 23rd ESV Conference. Stugttgart, germany, NHTSA: 12.

Motorcycle In-depth Crash Study
Austroads 2015 | page 121
Rosenbloom, T., A. Perlman and A. Shahar (2007). Women drivers' behavior in well-known versus less familiar locations. Journal of safety research 38(3): 283-288.
Savino, G., F. Giovannini, N. Baldanzini, M. Pierini and M. Rizzi (2013). Assessing the potential benefits of the motorcycle autonomous emergency braking using detailed crash reconstructions. Traffic Injury Prevention 14 Suppl: S40-49.
Savolainen, P. and F. Mannering (2007). Probabilistic models of motorcyclists' injury severities in single- and multi-vehicle crashes. Accident Analysis & Prevention 39(5): 955-963.
Schneider, W. H., P. T. Savolainen and D. N. Moore (2010). Effects of horizontal curvature on single-vehicle motorcycle crashes along rural two-lane highways. Transportation Research Record: Journal of the Transportation Research Board 2194(1): 91-98.
Standards Australia (2006). As/nzs 1698:2006 protective helments for vehicle users.
Teoh, E. R. (2011). Effectiveness of antilock braking systems in reducing motorcycle fatal crash rates. Traffic Injury Prevention 12(2): 169-173.
Teoh, E. R. and M. Campbell (2010). Role of motorcycle type in fatal motorcycle crashes. Journal of Safety Research 41(6): 507-512.
Vlahogianni, E. I., G. Yannis and J. C. Golias (2012). Overview of critical risk factors in power-two-wheeler safety. Accident Analysis & Prevention 49: 12-22.
Wells, S., B. Mullin, R. Norton, J. Langley, J. Connor, R. Lay-Yee and R. Jackson (2004). Motorcycle rider conspicuity and crash related injury: Case-control study. BMJ 328(7444): 857.
White, D., J. Lang, G. Russell, K. Tetsworth, K. Harvey and N. Bellamy (2013). A comparison of injuries to moped/scooter and motorcycle riders in Queensland, Australia. Injury 44(6): 855-862.
WHO (2009). Global status report on road safety: Time for action. Geneva, World Health Organization, www.who.int/violence_injury_prevention/road_safety_status/2009: 301.
Wick, M., E. J. Muller, A. Ekkernkamp and G. Muhr (1998). The motorcyclist: Easy rider or easy victim? An analysis of motorcycle accidents in Germany. American Journal of Emergency Medicine 16(3): 320-323.
Winkelbauer, M. (2014). Riding left hand corners: Facts and measures. 10th International Motorcycle Conference, Cologne, Germany, IFZ.
Yannis, G., J. Golias and E. Papadimitriou (2005). Driver age and vehicle engine size effects on fault and severity in young motorcyclists accidents. Accident Analysis & Prevention 37(2): 327-333.

Motorcycle In-depth Crash Study
Austroads 2015 | page 122