morgan-stanley-jan-2010.pdf - educomp
TRANSCRIPT

X
XX
XX
XX
XX
1
M O R G A N S T A N L E Y R E S E A R C H
January 21, 2010 Tomorrow’s Winners
Signs of a nascent economic recovery in countries around Asia Pacific, after unprecedented financial market turmoil over the past 18 months, have provided an ideal opportunity to revisit the Tomorrow’s Winners, which we started in February 2008. In this update, following on from our last in November 2008, we examine how the companies we identified as having a compelling, long-term competitive advantage weathered the financial storm. Did they stand head-and-shoulders above their peers, or have they yet to show their full promise? Our analysts examine a range of valuation metrics that highlight the strengths of their companies’ various business models. As for previous editions, we asked our analysts to review their industries for companies they felt had a distinct competitive advantage that would drive share price performance over the long term. The companies included lead their domestic competitors and are strong enough to withstand competition from abroad. The majority operate in industries that have high barriers to entry. In addition, the companies’ expected growth rates outpace those of the markets and countries in which they operate. We have not mandated balance across countries; the selections naturally lean towards those countries where GDP growth is stronger than elsewhere in the region. Of the companies included the skew remains towards China and India. Many of these are capitalizing on major long-term trends, such as infrastructure investment and per capita consumption growth. In this issue, we are adding India-based technology solutions provider Educomp and removing Brambles and Bharti Airtel. The competitive advantages identified in early 2008 for these two companies now seem less compelling. As a reminder, Morgan Stanley’s fundamental research is usually predicated on a 12-18 month horizon. However, for the purposes of Tomorrow’s Winners, we extend the time horizon to five years. As always, we welcome feedback from our clients as we progress to future editions of Tomorrow’s Winners.

2
Tomorrow’s Winners: Valuation Metrics
M O R G A N S T A N L E Y R E S E A R C H
January 21, 2010 Tomorrow’s Winners
Perf. vs. Perf. vs. Up/down Up Down Absolute Absolute Perf. vs. Country Perf. vs. Country to LT to LT to LT perf. perf. APxJ MSCI APxJ MSCI Date Close Market Cap value bull bear (12 mths) (24 mths) (12 mths) (12 mths) (24 mths) (24 mths) Industry Name Ticker Rating Curr added price (US$ mn) LT value (%) (%) (%) (%) (%) (%) (%) (%) (%) Country Sub-Industry View Belle International 1880.HK OW HK$ 02/22/08 9.82 10,664 17.80 81 141 6 161.83 -22.75 103.46 99.11 -10.42 -2.28 China Textiles, Apparel and Footwear Attractive
China Mengniu Dairy 2319.HK OW HK$ 02/22/08 27.45 6,140 45.60 66 127 14 171.29 -3.70 112.93 108.58 8.63 16.77 China Food, Bev. & Tobacco Attractive
Educomp Solutions Ltd. EDSO.BO EW Rs 01/14/10 726.85 1,502 1,400.00 93 141 3 44.82 -24.36 -13.55 -43.77 -12.03 -8.91 India Education Services Attractive Esprit Holdings 0330.HK OW HK$ 02/22/08 54.50 8,974 92.40 70 114 -24 18.90 -54.52 -39.46 -41.33 -42.19 -32.23 Hong Kong Retail In-Line
Foxconn Technology 2354.TW OW NT$ 02/22/08 139.00 4,244 272.00 96 200 -27 81.37 -41.56 23.01 5.70 -29.23 -37.77 Taiwan Hardware Technology In-Line
Gemtek Technology 4906.TW EW NT$ 02/22/08 55.60 478 120.00 116 227 4 32.83 11.47 -25.53 -42.84 23.80 15.27 Taiwan Hardware Technology In-Line Hindustan Unilever HLL.BO UW Rs 11/03/08 257.70 12,237 514.00 99 271 -10 6.31 22.00 -52.05 -82.27 34.33 37.45 India Consumer In-Line
IDFC IDFC.BO OW Rs 02/22/08 160.00 4,514 315.00 97 156 25 126.49 -33.37 68.12 37.90 -21.04 -17.92 India Financial Services Attractive
Kingdee Int’l Software Group 0268.HK OW HK$ 11/03/08 2.05 542 3.91 91 135 -9 119.54 15.56 61.17 56.83 27.89 36.03 China Technology In-Line Larsen & Toubro LART.BO OW Rs 02/22/08 1,636.45 21,383 3,095.00 89 172 18 109.25 -19.09 50.88 20.66 -6.76 -3.64 India Construction & Infrastructure Attractive
Li & Fung Ltd 0494.HK OW HK$ 02/22/08 33.00 16,045 49.20 49 96 2 141.29 1.74 82.92 81.05 14.07 24.04 Hong Kong Consumer Attractive
Mindray MR.N OW US$ 11/03/08 37.57 2,838 70.00 86 140 33 90.15 -20.35 31.79 27.44 -8.01 0.12 China Medical Devices Attractive Pantaloon Retail PART.BO OW Rs 02/22/08 445.95 1,700 1,243.00 179 392 -38 73.28 -54.14 14.92 -15.30 -41.81 -38.69 India Retail In-Line
Reliance Industries RELI.BO OW Rs 02/22/08 1,077.75 76,716 2,989.00 177 252 25 74.47 -23.87 16.11 -14.12 -11.53 -8.41 India Oil & Gas In-Line
Shanghai Zhenhua 600320.SS EW Rmb 02/22/08 10.20 5,277 22.90 125 266 39 63.72 -47.67 5.36 1.01 -35.34 -27.20 China Capital Goods In-Line Shuanghui Investment 000895.SZ OW Rmb 02/22/08 57.95 5,144 89.20 54 81 -19 50.07 -11.76 -8.30 -12.64 0.58 8.72 China Food, Bev. & Tobacco Attractive
Tencent Holdings Ltd. 0700.HK OW HK$ 02/22/08 155.40 36,466 281.00 81 122 14 236.02 189.82 177.65 173.31 202.15 210.29 China Internet Attractive
Tingyi (Cayman Islands) 0322.HK EW HK$ 02/22/08 17.58 12,645 25.00 42 96 14 115.49 51.68 57.13 52.78 64.01 72.15 China Food, Bev. & Tobacco Attractive Woori Finance Holdings 053000.KS EW W 02/22/08 15,700 11,121 27,000 72 123 2 112.96 -26.53 54.59 53.88 -14.19 -22.70 S. Korea Financial Services Attractive
MSCI Asia exJapan 58.36 -12.33 MSCI Australia 37.04 -13.64
MSCI China 62.71 -20.47
MSCI Hong Kong 60.23 -22.30 MSCI India 88.59 -15.45
MSCI S. Korea 59.08 -3.82
MSCI Taiwan 75.67 -3.80
Closing prices as of January 20, 2010. Source: Morgan Stanley Research
Removals Perf. vs. Perf. vs. Up/down Up Down Absolute Absolute Perf. vs. Country Perf. vs. Country to LT to LT to LT perf. perf. APxJ MSCI APxJ MSCI Date Date Close value bull bear (12 mths) (24 mths) (12 mths) (12 mths) (24 mths) (24 mths) Industry Name Ticker Rating Curr added removed price LT value (%) (%) (%) (%) (%) (%) (%) (%) (%) Country Sub-Industry View
Bharti Airtel Limited BRTI.BO EW Rs 02/22/08 01/14/10 330.90 470.00 42 81 -46 -8.53 -32.49 -66.89 -97.12 -20.16 -17.04 India Telecommunications Cautious Brambles Ltd. BXB.AX EW A$ 02/22/08 01/14/10 6.77 9.65 43 85 3 -8.79 -41.16 -67.16 -45.83 -28.83 -27.52 Australia Business Services In-Line
Reliance Capital RLCP.BO EW Rs 02/22/08 11/03/08 891.95 2,350.00 163 390 85 54.73 -67.10 -3.63 -33.85 -54.76 -51.64 India Financial Services Attractive
Samsung Techwin 012450.KS OW W 02/22/08 11/03/08 79,500 106,000 33 114 -35 121.35 48.64 62.98 62.27 60.97 52.46 S. Korea Hardware Components In-Line Sobha Developers Ltd. SOBH.BO NAV Rs 02/22/08 11/03/08 306.00 495.00 62 111 -29 128.27 -73.15 69.90 39.68 -60.82 -57.70 India Property In-Line
Closing prices as of January 20, 2010. Source: Morgan Stanley Research
3
Contents
M O R G A N S T A N L E Y R E S E A R C H
January 21, 2010 Tomorrow’s Winners
Tomorrow’s Winners: Valuation Metrics .............................................................................................................................................. 2
Company Analysis
Belle International: Integration of acquisitions boosts long-term earnings growth ............................................................................ 5
Removal Bharti Airtel Ltd.: Facing pressure as incumbent ............................................................................................................ 10
Removal Brambles Ltd: The penalty of past maintenance under-spending.................................................................................... 16
China Mengniu Dairy: Industry leader to capitalize on industry growth........................................................................................... 22
Addition Educomp Solutions Ltd.: Substantial scope long term in an emerging industry ............................................................. 27
Esprit Holdings: Emerging from the storm; well placed for economic recovery .............................................................................. 33
Foxconn Technology: Diversified exposure and superior cost structure to drive profit growth ....................................................... 38
Gemtek Technology: Play on upcoming fixed-mobile convergence................................................................................................ 43
Hindustan Unilever: Long-term story intact, but some hurdles ahead ............................................................................................ 48
IDFC: Financing the infrastructure boom .......................................................................................................................................... 53
Kingdee International Software Group: Well placed for long-term growth .................................................................................... 59
Larsen & Toubro: Focus on quality ................................................................................................................................................. 64
Li & Fung Ltd: Further market share gains and operating leverage to kick in.................................................................................. 69
Mindray: Bellwether in a booming industry; realizing international ambitions................................................................................... 74
Pantaloon Retail: Leader strengthens its dominance ...................................................................................................................... 79
Reliance Industries: Capex to cash flows ....................................................................................................................................... 84
Shanghai Zhenhua Heavy Industry: New offshore business to drive growth and profitability........................................................ 89
Shuanghui Investment: Potential to unlock hidden value ............................................................................................................... 94
Tencent Holdings Ltd.: Capitalizing on the largest online park in China......................................................................................... 99
Tingyi (Cayman Islands): Sector leader with compelling growth story.......................................................................................... 104
Woori Finance Holdings: Potential privatization positives ............................................................................................................ 109
Appendix
Company Fact Sheets..................................................................................................................................................................... 116
MSCI Indices: Historical Performance............................................................................................................................................. 127
Morgan Stanley does and seeks to do business with companies covered in Morgan Stanley Research. As a result, investors should be aware that the firm may have a conflict of interest that could affect the objectivity of Morgan Stanley Research. Investors should consider Morgan Stanley Research as only a single factor in making their investment decision. For analyst certification and other important disclosures, refer to the Disclosure Section, located at the end of this report. += Analysts employed by non-U.S. affiliates are not registered with FINRA, may not be associated persons of the member and may not be subject to NASD/NYSE restrictions on communications with a subject company, public appearances and trading securities held by a research analyst account.

4
M O R G A N S T A N L E Y R E S E A R C H
January 21, 2010 Tomorrow’s Winners
5
Belle International (1880.HK, HK$9.69, Overweight, LT value HK$17.8)
M O R G A N S T A N L E Y R E S E A R C H
January 21, 2010 Tomorrow’s Winners
Integration of acquisitions boosts long-term earnings growth Ticker (Reuters/Bloomberg)Share price, close (Jan-14-2010)RatingPrice target (12-18 months)Price target (5 years) HK$17.80Average daily trading value (mn)
Return on Equity (ROE) Morgan Stanley forecast
Net Operating Profit After Tax (NOPAT) Margin
× Operating Asset Turnover
+ Return from Leverage
Source: Company data, Morgan Stanley Research estimates
US$15
1880.HK / 1880 HKHK$9.69
OverweightHK$10.00
80.3%
18.6% 19.1% 17.7% 16.9%
17.2%17.6%20.6%
0%10%20%30%40%50%60%70%80%90%
2007 2008 2009e 2010e 2011e 2012e 2013e 2014e
17.5%
13.3% 13.8%12.2%
10.7%
14.5%11.6% 11.1%
0%2%4%6%8%
10%12%14%16%18%20%
2007 2008 2009e 2010e 2011e 2012e 2013e 2014e
3.21
2.38
1.541.88
2.62
1.70
2.05
2.63
0.00
0.50
1.00
1.50
2.00
2.50
3.00
3.50
2007 2008 2009e 2010e 2011e 2012e 2013e 2014e
24.2%
-2.3%-5.2%
-11.1%
-12.0%
-6.2%-4.1%
-13.0%15%
10%
5%
0%
5%
10%
15%
20%
25%
30%
2007 2008 2009e 2010e 2011e 2012e 2013e 2014e
Morgan Stanley Asia Limited+
Dennis Tao [email protected]
Angela Moh Jessica Wang
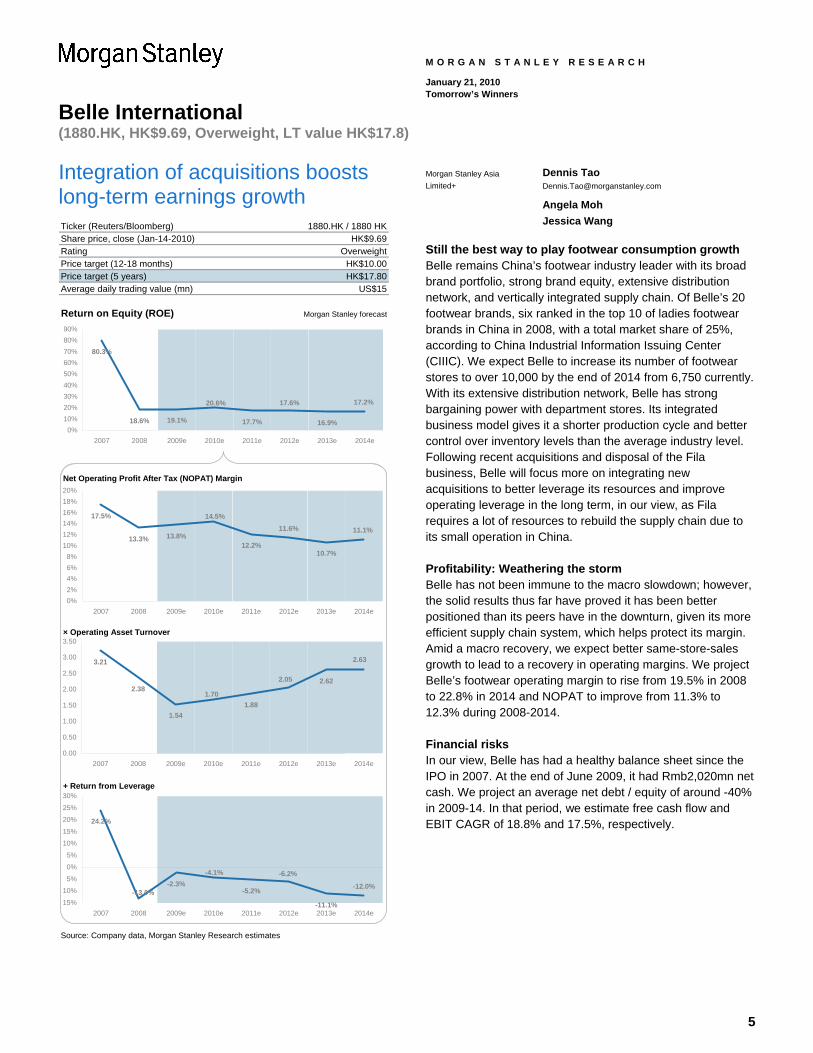
Still the best way to play footwear consumption growth Belle remains China’s footwear industry leader with its broad brand portfolio, strong brand equity, extensive distribution network, and vertically integrated supply chain. Of Belle’s 20 footwear brands, six ranked in the top 10 of ladies footwear brands in China in 2008, with a total market share of 25%, according to China Industrial Information Issuing Center (CIIIC). We expect Belle to increase its number of footwear stores to over 10,000 by the end of 2014 from 6,750 currently. With its extensive distribution network, Belle has strong bargaining power with department stores. Its integrated business model gives it a shorter production cycle and better control over inventory levels than the average industry level. Following recent acquisitions and disposal of the Fila business, Belle will focus more on integrating new acquisitions to better leverage its resources and improve operating leverage in the long term, in our view, as Fila requires a lot of resources to rebuild the supply chain due to its small operation in China.
Profitability: Weathering the storm Belle has not been immune to the macro slowdown; however, the solid results thus far have proved it has been better positioned than its peers have in the downturn, given its more efficient supply chain system, which helps protect its margin. Amid a macro recovery, we expect better same-store-sales growth to lead to a recovery in operating margins. We project Belle’s footwear operating margin to rise from 19.5% in 2008 to 22.8% in 2014 and NOPAT to improve from 11.3% to 12.3% during 2008-2014.
Financial risks In our view, Belle has had a healthy balance sheet since the IPO in 2007. At the end of June 2009, it had Rmb2,020mn net cash. We project an average net debt / equity of around -40% in 2009-14. In that period, we estimate free cash flow and EBIT CAGR of 18.8% and 17.5%, respectively.
6
Belle International (1880.HK, HK$9.69, Overweight, LT value HK$17.8)
M O R G A N S T A N L E Y R E S E A R C H
January 21, 2010 Tomorrow’s Winners
Risk-Reward: Integration of acquisitions to improve profitability
0
5
10
15
20
HK$25HK$23.70(+145%)
HK$17.80(+84%)
HK$10.40(+7%)
HK$9.69
Price Target Historical Stock Performance Current Stock Price
Jan 08 Oct 08 Jul 09 Apr 10 Jan 11 Oct 11 Jul 12 Apr 13 Jan 14 Oct 14
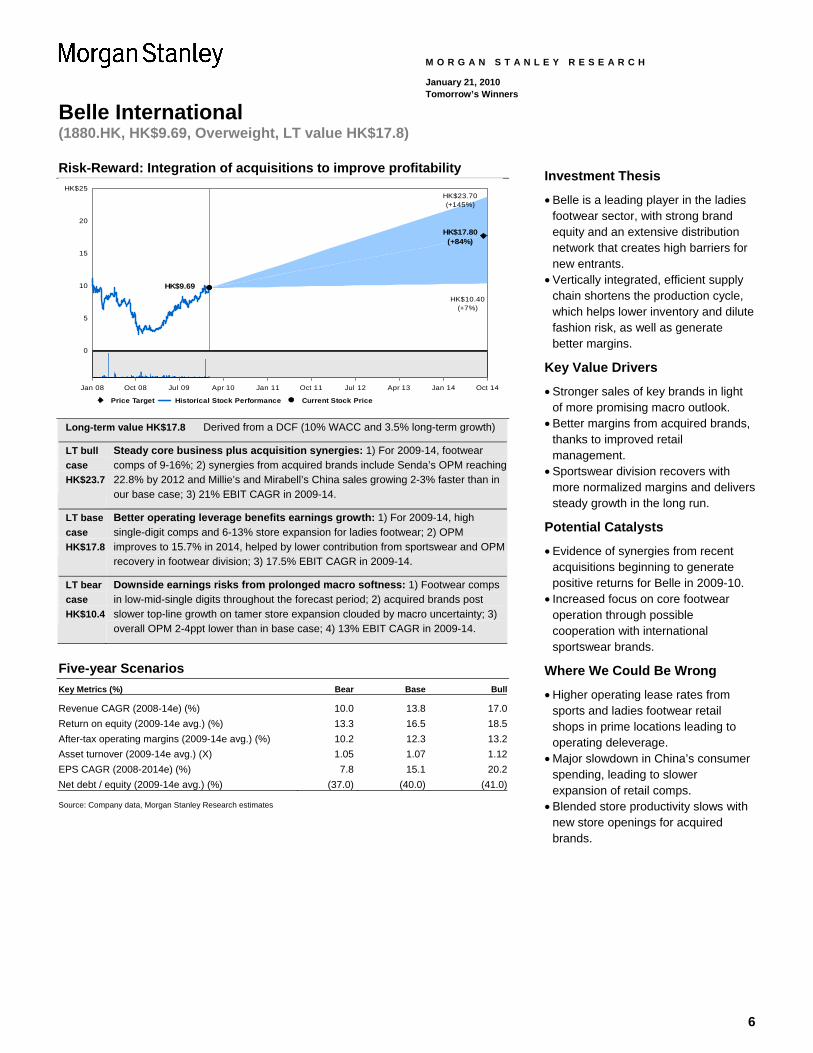
Long-term value HK$17.8 Derived from a DCF (10% WACC and 3.5% long-term growth)
LT bull case HK$23.7
Steady core business plus acquisition synergies: 1) For 2009-14, footwear comps of 9-16%; 2) synergies from acquired brands include Senda’s OPM reaching 22.8% by 2012 and Millie’s and Mirabell’s China sales growing 2-3% faster than in our base case; 3) 21% EBIT CAGR in 2009-14.
LT base case HK$17.8
Better operating leverage benefits earnings growth: 1) For 2009-14, high single-digit comps and 6-13% store expansion for ladies footwear; 2) OPM improves to 15.7% in 2014, helped by lower contribution from sportswear and OPM recovery in footwear division; 3) 17.5% EBIT CAGR in 2009-14.
LT bear case HK$10.4
Downside earnings risks from prolonged macro softness: 1) Footwear comps in low-mid-single digits throughout the forecast period; 2) acquired brands post slower top-line growth on tamer store expansion clouded by macro uncertainty; 3) overall OPM 2-4ppt lower than in base case; 4) 13% EBIT CAGR in 2009-14.
Five-year Scenarios Key Metrics (%) Bear Base Bull
Revenue CAGR (2008-14e) (%) 10.0 13.8 17.0Return on equity (2009-14e avg.) (%) 13.3 16.5 18.5After-tax operating margins (2009-14e avg.) (%) 10.2 12.3 13.2Asset turnover (2009-14e avg.) (X) 1.05 1.07 1.12EPS CAGR (2008-2014e) (%) 7.8 15.1 20.2Net debt / equity (2009-14e avg.) (%) (37.0) (40.0) (41.0) Source: Company data, Morgan Stanley Research estimates
Investment Thesis
• Belle is a leading player in the ladies footwear sector, with strong brand equity and an extensive distribution network that creates high barriers for new entrants.
• Vertically integrated, efficient supply chain shortens the production cycle, which helps lower inventory and dilute fashion risk, as well as generate better margins.
Key Value Drivers
• Stronger sales of key brands in light of more promising macro outlook.
• Better margins from acquired brands, thanks to improved retail management.
• Sportswear division recovers with more normalized margins and delivers steady growth in the long run.
Potential Catalysts
• Evidence of synergies from recent acquisitions beginning to generate positive returns for Belle in 2009-10.
• Increased focus on core footwear operation through possible cooperation with international sportswear brands.
Where We Could Be Wrong
• Higher operating lease rates from sports and ladies footwear retail shops in prime locations leading to operating deleverage.
• Major slowdown in China’s consumer spending, leading to slower expansion of retail comps.
• Blended store productivity slows with new store openings for acquired brands.
7
Belle International (1880.HK, HK$9.69, Overweight, LT value HK$17.8)
M O R G A N S T A N L E Y R E S E A R C H
January 21, 2010 Tomorrow’s Winners
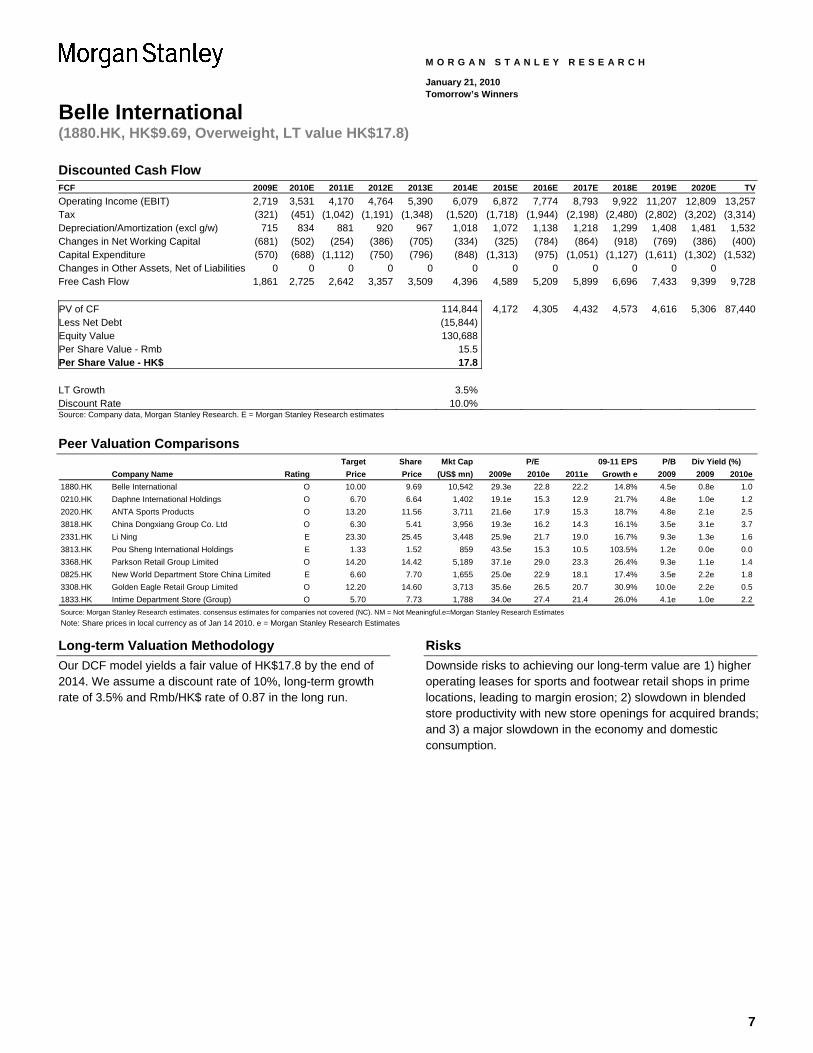
Discounted Cash Flow FCF 2009E 2010E 2011E 2012E 2013E 2014E 2015E 2016E 2017E 2018E 2019E 2020E TVOperating Income (EBIT) 2,719 3,531 4,170 4,764 5,390 6,079 6,872 7,774 8,793 9,922 11,207 12,809 13,257Tax (321) (451) (1,042) (1,191) (1,348) (1,520) (1,718) (1,944) (2,198) (2,480) (2,802) (3,202) (3,314)Depreciation/Amortization (excl g/w) 715 834 881 920 967 1,018 1,072 1,138 1,218 1,299 1,408 1,481 1,532Changes in Net Working Capital (681) (502) (254) (386) (705) (334) (325) (784) (864) (918) (769) (386) (400)Capital Expenditure (570) (688) (1,112) (750) (796) (848) (1,313) (975) (1,051) (1,127) (1,611) (1,302) (1,532)Changes in Other Assets, Net of Liabilities 0 0 0 0 0 0 0 0 0 0 0 0Free Cash Flow 1,861 2,725 2,642 3,357 3,509 4,396 4,589 5,209 5,899 6,696 7,433 9,399 9,728 PV of CF 114,844 4,172 4,305 4,432 4,573 4,616 5,306 87,440Less Net Debt (15,844) Equity Value 130,688 Per Share Value - Rmb 15.5 Per Share Value - HK$ 17.8 LT Growth 3.5% Discount Rate 10.0% Source: Company data, Morgan Stanley Research. E = Morgan Stanley Research estimates
Peer Valuation Comparisons
Target Share Mkt Cap 09-11 EPS P/BCompany Name Rating Price Price (US$ mn) 2009e 2010e 2011e Growth e 2009 2009 2010e
1880.HK Belle International O 10.00 9.69 10,542 29.3e 22.8 22.2 14.8% 4.5e 0.8e 1.00210.HK Daphne International Holdings O 6.70 6.64 1,402 19.1e 15.3 12.9 21.7% 4.8e 1.0e 1.22020.HK ANTA Sports Products O 13.20 11.56 3,711 21.6e 17.9 15.3 18.7% 4.8e 2.1e 2.53818.HK China Dongxiang Group Co. Ltd O 6.30 5.41 3,956 19.3e 16.2 14.3 16.1% 3.5e 3.1e 3.72331.HK Li Ning E 23.30 25.45 3,448 25.9e 21.7 19.0 16.7% 9.3e 1.3e 1.63813.HK Pou Sheng International Holdings E 1.33 1.52 859 43.5e 15.3 10.5 103.5% 1.2e 0.0e 0.03368.HK Parkson Retail Group Limited O 14.20 14.42 5,189 37.1e 29.0 23.3 26.4% 9.3e 1.1e 1.40825.HK New World Department Store China Limited E 6.60 7.70 1,655 25.0e 22.9 18.1 17.4% 3.5e 2.2e 1.83308.HK Golden Eagle Retail Group Limited O 12.20 14.60 3,713 35.6e 26.5 20.7 30.9% 10.0e 2.2e 0.51833.HK Intime Department Store (Group) O 5.70 7.73 1,788 34.0e 27.4 21.4 26.0% 4.1e 1.0e 2.2Source: Morgan Stanley Research estimates. consensus estimates for companies not covered (NC). NM = Not Meaningful.e=Morgan Stanley Research Estimates
P/E Div Yield (%)
Note: Share prices in local currency as of Jan 14 2010. e = Morgan Stanley Research Estimates
Long-term Valuation Methodology Our DCF model yields a fair value of HK$17.8 by the end of 2014. We assume a discount rate of 10%, long-term growth rate of 3.5% and Rmb/HK$ rate of 0.87 in the long run.
Risks Downside risks to achieving our long-term value are 1) higher operating leases for sports and footwear retail shops in prime locations, leading to margin erosion; 2) slowdown in blended store productivity with new store openings for acquired brands; and 3) a major slowdown in the economy and domestic consumption.
8
Belle International (1880.HK, HK$9.69, Overweight, LT value HK$17.8)
M O R G A N S T A N L E Y R E S E A R C H
January 21, 2010 Tomorrow’s Winners
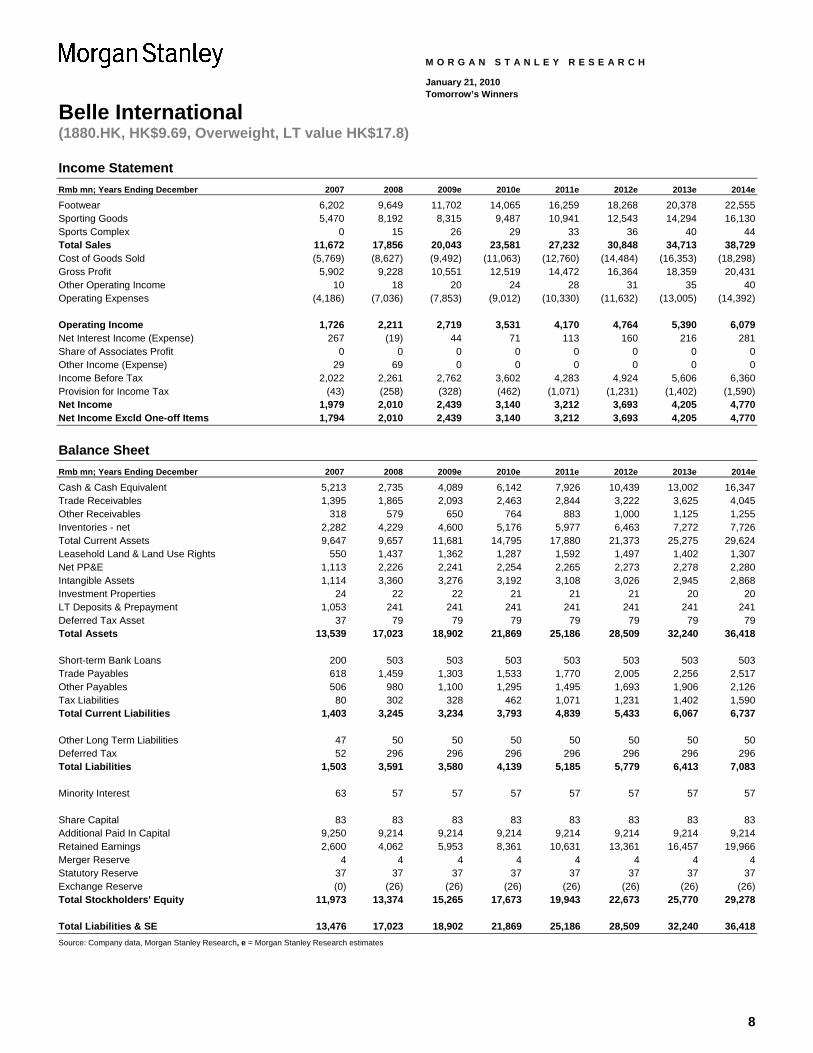
Income Statement Rmb mn; Years Ending December 2007 2008 2009e 2010e 2011e 2012e 2013e 2014e Footwear 6,202 9,649 11,702 14,065 16,259 18,268 20,378 22,555 Sporting Goods 5,470 8,192 8,315 9,487 10,941 12,543 14,294 16,130 Sports Complex 0 15 26 29 33 36 40 44 Total Sales 11,672 17,856 20,043 23,581 27,232 30,848 34,713 38,729 Cost of Goods Sold (5,769) (8,627) (9,492) (11,063) (12,760) (14,484) (16,353) (18,298) Gross Profit 5,902 9,228 10,551 12,519 14,472 16,364 18,359 20,431 Other Operating Income 10 18 20 24 28 31 35 40 Operating Expenses (4,186) (7,036) (7,853) (9,012) (10,330) (11,632) (13,005) (14,392) Operating Income 1,726 2,211 2,719 3,531 4,170 4,764 5,390 6,079 Net Interest Income (Expense) 267 (19) 44 71 113 160 216 281 Share of Associates Profit 0 0 0 0 0 0 0 0 Other Income (Expense) 29 69 0 0 0 0 0 0 Income Before Tax 2,022 2,261 2,762 3,602 4,283 4,924 5,606 6,360 Provision for Income Tax (43) (258) (328) (462) (1,071) (1,231) (1,402) (1,590) Net Income 1,979 2,010 2,439 3,140 3,212 3,693 4,205 4,770 Net Income Excld One-off Items 1,794 2,010 2,439 3,140 3,212 3,693 4,205 4,770
Balance Sheet Rmb mn; Years Ending December 2007 2008 2009e 2010e 2011e 2012e 2013e 2014e Cash & Cash Equivalent 5,213 2,735 4,089 6,142 7,926 10,439 13,002 16,347 Trade Receivables 1,395 1,865 2,093 2,463 2,844 3,222 3,625 4,045 Other Receivables 318 579 650 764 883 1,000 1,125 1,255 Inventories - net 2,282 4,229 4,600 5,176 5,977 6,463 7,272 7,726 Total Current Assets 9,647 9,657 11,681 14,795 17,880 21,373 25,275 29,624 Leasehold Land & Land Use Rights 550 1,437 1,362 1,287 1,592 1,497 1,402 1,307 Net PP&E 1,113 2,226 2,241 2,254 2,265 2,273 2,278 2,280 Intangible Assets 1,114 3,360 3,276 3,192 3,108 3,026 2,945 2,868 Investment Properties 24 22 22 21 21 21 20 20 LT Deposits & Prepayment 1,053 241 241 241 241 241 241 241 Deferred Tax Asset 37 79 79 79 79 79 79 79 Total Assets 13,539 17,023 18,902 21,869 25,186 28,509 32,240 36,418 Short-term Bank Loans 200 503 503 503 503 503 503 503 Trade Payables 618 1,459 1,303 1,533 1,770 2,005 2,256 2,517 Other Payables 506 980 1,100 1,295 1,495 1,693 1,906 2,126 Tax Liabilities 80 302 328 462 1,071 1,231 1,402 1,590 Total Current Liabilities 1,403 3,245 3,234 3,793 4,839 5,433 6,067 6,737 Other Long Term Liabilities 47 50 50 50 50 50 50 50 Deferred Tax 52 296 296 296 296 296 296 296 Total Liabilities 1,503 3,591 3,580 4,139 5,185 5,779 6,413 7,083 Minority Interest 63 57 57 57 57 57 57 57 Share Capital 83 83 83 83 83 83 83 83 Additional Paid In Capital 9,250 9,214 9,214 9,214 9,214 9,214 9,214 9,214 Retained Earnings 2,600 4,062 5,953 8,361 10,631 13,361 16,457 19,966 Merger Reserve 4 4 4 4 4 4 4 4 Statutory Reserve 37 37 37 37 37 37 37 37 Exchange Reserve (0) (26) (26) (26) (26) (26) (26) (26) Total Stockholders' Equity 11,973 13,374 15,265 17,673 19,943 22,673 25,770 29,278 Total Liabilities & SE 13,476 17,023 18,902 21,869 25,186 28,509 32,240 36,418 Source: Company data, Morgan Stanley Research, e = Morgan Stanley Research estimates
9
Belle International (1880.HK, HK$9.69, Overweight, LT value HK$17.8)
M O R G A N S T A N L E Y R E S E A R C H
January 21, 2010 Tomorrow’s Winners
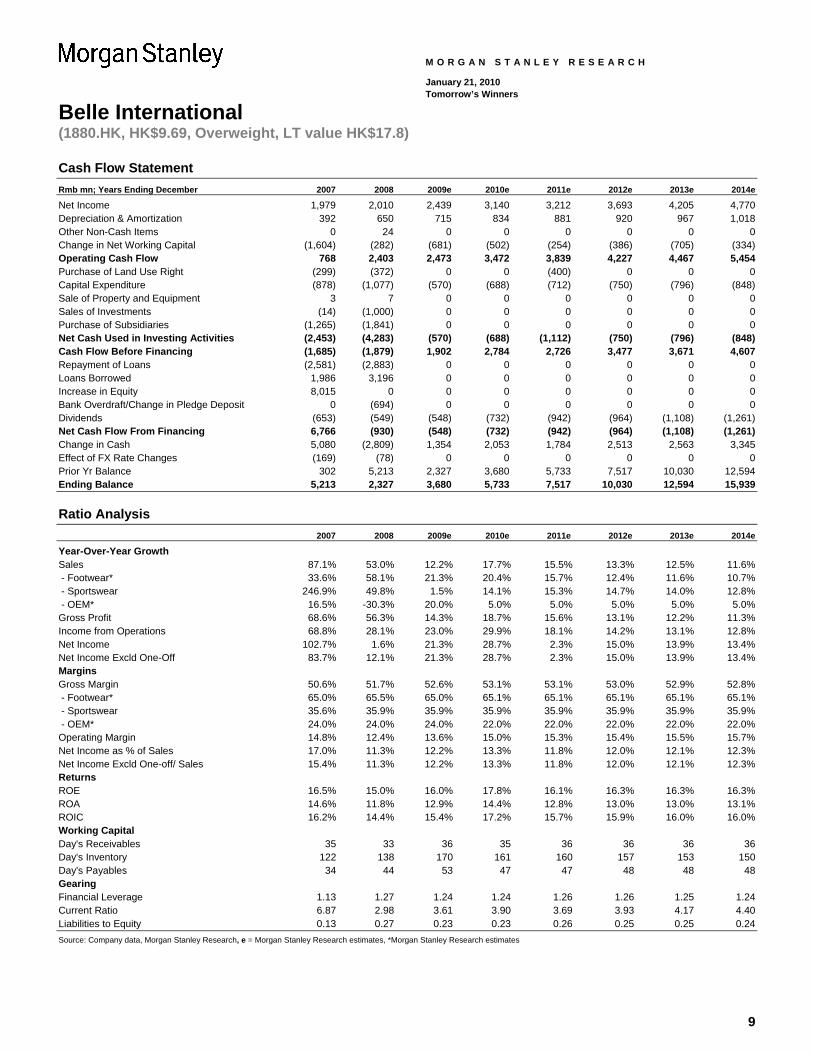
Cash Flow Statement Rmb mn; Years Ending December 2007 2008 2009e 2010e 2011e 2012e 2013e 2014e Net Income 1,979 2,010 2,439 3,140 3,212 3,693 4,205 4,770 Depreciation & Amortization 392 650 715 834 881 920 967 1,018 Other Non-Cash Items 0 24 0 0 0 0 0 0 Change in Net Working Capital (1,604) (282) (681) (502) (254) (386) (705) (334) Operating Cash Flow 768 2,403 2,473 3,472 3,839 4,227 4,467 5,454 Purchase of Land Use Right (299) (372) 0 0 (400) 0 0 0 Capital Expenditure (878) (1,077) (570) (688) (712) (750) (796) (848) Sale of Property and Equipment 3 7 0 0 0 0 0 0 Sales of Investments (14) (1,000) 0 0 0 0 0 0 Purchase of Subsidiaries (1,265) (1,841) 0 0 0 0 0 0 Net Cash Used in Investing Activities (2,453) (4,283) (570) (688) (1,112) (750) (796) (848) Cash Flow Before Financing (1,685) (1,879) 1,902 2,784 2,726 3,477 3,671 4,607 Repayment of Loans (2,581) (2,883) 0 0 0 0 0 0 Loans Borrowed 1,986 3,196 0 0 0 0 0 0 Increase in Equity 8,015 0 0 0 0 0 0 0 Bank Overdraft/Change in Pledge Deposit 0 (694) 0 0 0 0 0 0 Dividends (653) (549) (548) (732) (942) (964) (1,108) (1,261) Net Cash Flow From Financing 6,766 (930) (548) (732) (942) (964) (1,108) (1,261) Change in Cash 5,080 (2,809) 1,354 2,053 1,784 2,513 2,563 3,345 Effect of FX Rate Changes (169) (78) 0 0 0 0 0 0 Prior Yr Balance 302 5,213 2,327 3,680 5,733 7,517 10,030 12,594 Ending Balance 5,213 2,327 3,680 5,733 7,517 10,030 12,594 15,939
Ratio Analysis 2007 2008 2009e 2010e 2011e 2012e 2013e 2014e Year-Over-Year Growth Sales 87.1% 53.0% 12.2% 17.7% 15.5% 13.3% 12.5% 11.6% - Footwear* 33.6% 58.1% 21.3% 20.4% 15.7% 12.4% 11.6% 10.7% - Sportswear 246.9% 49.8% 1.5% 14.1% 15.3% 14.7% 14.0% 12.8% - OEM* 16.5% -30.3% 20.0% 5.0% 5.0% 5.0% 5.0% 5.0% Gross Profit 68.6% 56.3% 14.3% 18.7% 15.6% 13.1% 12.2% 11.3% Income from Operations 68.8% 28.1% 23.0% 29.9% 18.1% 14.2% 13.1% 12.8% Net Income 102.7% 1.6% 21.3% 28.7% 2.3% 15.0% 13.9% 13.4% Net Income Excld One-Off 83.7% 12.1% 21.3% 28.7% 2.3% 15.0% 13.9% 13.4% Margins Gross Margin 50.6% 51.7% 52.6% 53.1% 53.1% 53.0% 52.9% 52.8% - Footwear* 65.0% 65.5% 65.0% 65.1% 65.1% 65.1% 65.1% 65.1% - Sportswear 35.6% 35.9% 35.9% 35.9% 35.9% 35.9% 35.9% 35.9% - OEM* 24.0% 24.0% 24.0% 22.0% 22.0% 22.0% 22.0% 22.0% Operating Margin 14.8% 12.4% 13.6% 15.0% 15.3% 15.4% 15.5% 15.7% Net Income as % of Sales 17.0% 11.3% 12.2% 13.3% 11.8% 12.0% 12.1% 12.3% Net Income Excld One-off/ Sales 15.4% 11.3% 12.2% 13.3% 11.8% 12.0% 12.1% 12.3% Returns ROE 16.5% 15.0% 16.0% 17.8% 16.1% 16.3% 16.3% 16.3% ROA 14.6% 11.8% 12.9% 14.4% 12.8% 13.0% 13.0% 13.1% ROIC 16.2% 14.4% 15.4% 17.2% 15.7% 15.9% 16.0% 16.0% Working Capital Day's Receivables 35 33 36 35 36 36 36 36 Day's Inventory 122 138 170 161 160 157 153 150 Day's Payables 34 44 53 47 47 48 48 48 Gearing Financial Leverage 1.13 1.27 1.24 1.24 1.26 1.26 1.25 1.24 Current Ratio 6.87 2.98 3.61 3.90 3.69 3.93 4.17 4.40 Liabilities to Equity 0.13 0.27 0.23 0.23 0.26 0.25 0.25 0.24 Source: Company data, Morgan Stanley Research, e = Morgan Stanley Research estimates, *Morgan Stanley Research estimates
10
Removal Bharti Airtel Ltd. (BRTI.BO, Rs318.9, Equal-Weight, LT value Rs470)
M O R G A N S T A N L E Y R E S E A R C H
January 21, 2010 Tomorrow’s Winners
Facing pressure as incumbent Ticker (Reuters/Bloomberg)Share price (Jan 14, 2010)RatingPrice target (12-18 months)Price target (5 years) Rs470.00Average daily trading value (mn)
Return on Equity (ROE) Morgan Stanley forecast
Net Operating Profit After Tax (NOPAT) Margin
× Operating Asset Turnover
+ Return from Leverage
Source: Company data, Morgan Stanley Research estimates
US$13
BRTI.BO / BHARTI INRs318.90
Equal-WeightRs351.00
46.2%49.4%
38.1%
22.1% 19.7%
18.7%20.9%29.0%
0%
10%
20%
30%
40%
50%
60%
2007 2008 2009e 2010e 2011e 2012e 2013e 2014e
17.6%
18.7% 18.7%
16.8% 16.7%
17.4%17.0%
16.3%
15%
16%
16%
17%
17%
18%
18%
19%
19%
2007 2008 2009e 2010e 2011e 2012e 2013e 2014e
1.381.50
1.40
0.870.98
1.040.89
1.11
0.00
0.20
0.40
0.60
0.80
1.00
1.20
1.40
1.60
2007 2008 2009e 2010e 2011e 2012e 2013e 2014e
22.0%
11.9%
7.5%
3.4%0.6%
5.7%
10.9%
21.3%
0%
5%
10%
15%
20%
25%
2007 2008 2009e 2010e 2011e 2012e 2013e 2014e
Morgan Stanley India Company Private Limited+
Vinay Jaising [email protected]
Surabhi Chandna
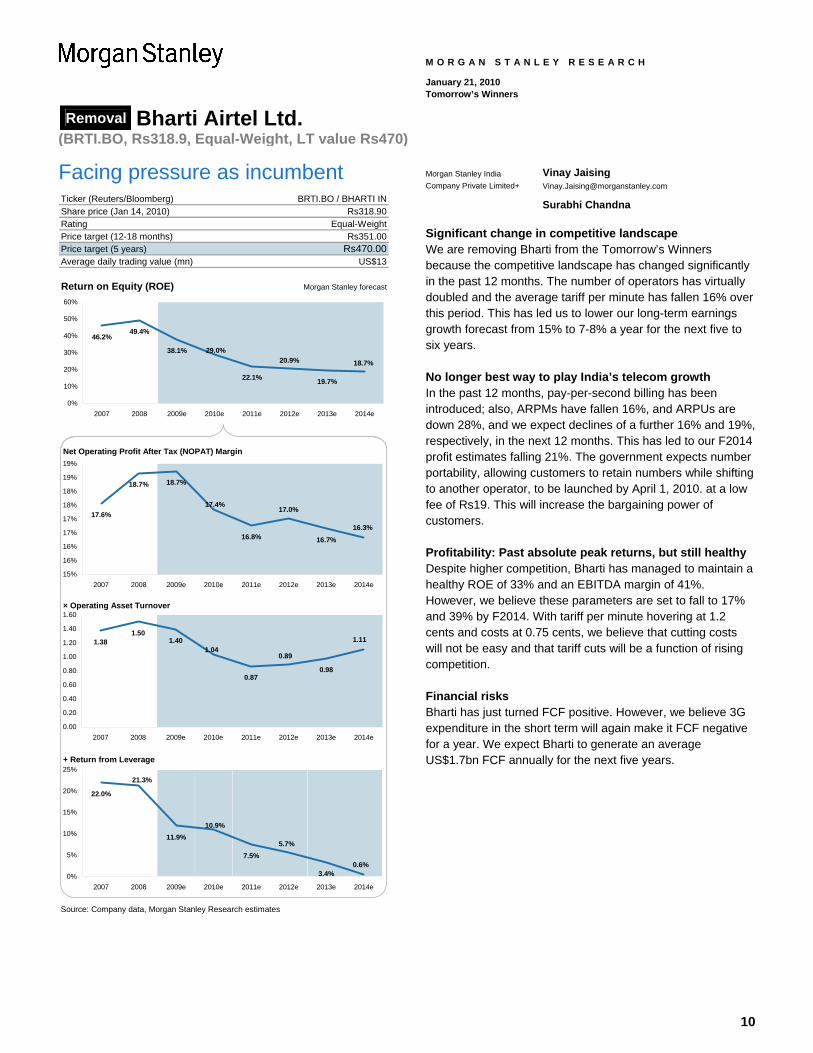
Significant change in competitive landscape We are removing Bharti from the Tomorrow’s Winners because the competitive landscape has changed significantly in the past 12 months. The number of operators has virtually doubled and the average tariff per minute has fallen 16% over this period. This has led us to lower our long-term earnings growth forecast from 15% to 7-8% a year for the next five to six years.
No longer best way to play India’s telecom growth In the past 12 months, pay-per-second billing has been introduced; also, ARPMs have fallen 16%, and ARPUs are down 28%, and we expect declines of a further 16% and 19%, respectively, in the next 12 months. This has led to our F2014 profit estimates falling 21%. The government expects number portability, allowing customers to retain numbers while shifting to another operator, to be launched by April 1, 2010. at a low fee of Rs19. This will increase the bargaining power of customers.
Profitability: Past absolute peak returns, but still healthy Despite higher competition, Bharti has managed to maintain a healthy ROE of 33% and an EBITDA margin of 41%. However, we believe these parameters are set to fall to 17% and 39% by F2014. With tariff per minute hovering at 1.2 cents and costs at 0.75 cents, we believe that cutting costs will not be easy and that tariff cuts will be a function of rising competition.
Financial risks Bharti has just turned FCF positive. However, we believe 3G expenditure in the short term will again make it FCF negative for a year. We expect Bharti to generate an average US$1.7bn FCF annually for the next five years.
11
Removal Bharti Airtel Ltd. (BRTI.BO, Rs318.9, Equal-Weight, LT value Rs470)
M O R G A N S T A N L E Y R E S E A R C H
January 21, 2010 Tomorrow’s Winners
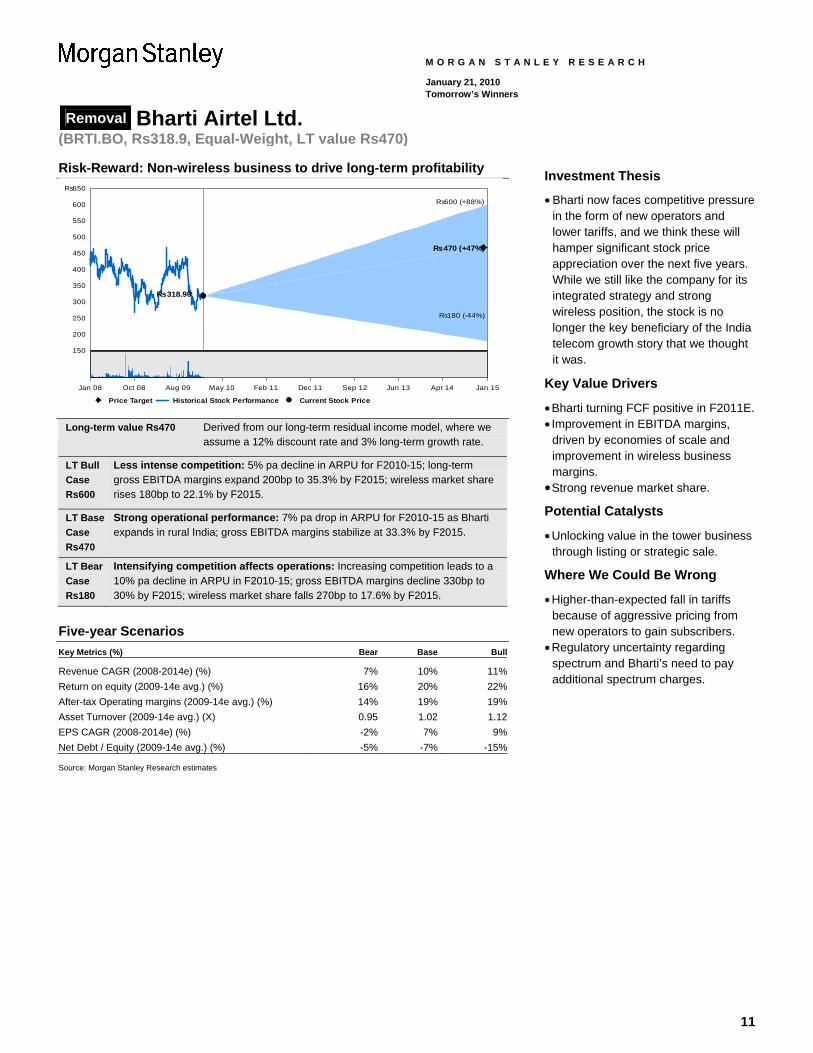
Risk-Reward: Non-wireless business to drive long-term profitability
150
200
250
300
350
400
450
500
550
600
Rs650
Rs600 (+88%)
Rs470 (+47%)
Rs180 (-44%)
Rs318.90
Price Target Historical Stock Performance Current Stock Price
Jan 08 Oct 08 Aug 09 May 10 Feb 11 Dec 11 Sep 12 Jun 13 Apr 14 Jan 15
Long-term value Rs470 Derived from our long-term residual income model, where we assume a 12% discount rate and 3% long-term growth rate.
LT Bull Case Rs600
Less intense competition: 5% pa decline in ARPU for F2010-15; long-term gross EBITDA margins expand 200bp to 35.3% by F2015; wireless market share rises 180bp to 22.1% by F2015.
LT Base Case Rs470
Strong operational performance: 7% pa drop in ARPU for F2010-15 as Bharti expands in rural India; gross EBITDA margins stabilize at 33.3% by F2015.
LT Bear Case Rs180
Intensifying competition affects operations: Increasing competition leads to a 10% pa decline in ARPU in F2010-15; gross EBITDA margins decline 330bp to 30% by F2015; wireless market share falls 270bp to 17.6% by F2015.
Five-year Scenarios Key Metrics (%) Bear Base Bull
Revenue CAGR (2008-2014e) (%) 7% 10% 11%Return on equity (2009-14e avg.) (%) 16% 20% 22%After-tax Operating margins (2009-14e avg.) (%) 14% 19% 19%Asset Turnover (2009-14e avg.) (X) 0.95 1.02 1.12EPS CAGR (2008-2014e) (%) -2% 7% 9%Net Debt / Equity (2009-14e avg.) (%) -5% -7% -15% Source: Morgan Stanley Research estimates
Investment Thesis
• Bharti now faces competitive pressure in the form of new operators and lower tariffs, and we think these will hamper significant stock price appreciation over the next five years. While we still like the company for its integrated strategy and strong wireless position, the stock is no longer the key beneficiary of the India telecom growth story that we thought it was.
Key Value Drivers
• Bharti turning FCF positive in F2011E. • Improvement in EBITDA margins,
driven by economies of scale and improvement in wireless business margins.
• Strong revenue market share.
Potential Catalysts
• Unlocking value in the tower business through listing or strategic sale.
Where We Could Be Wrong
• Higher-than-expected fall in tariffs because of aggressive pricing from new operators to gain subscribers.
• Regulatory uncertainty regarding spectrum and Bharti’s need to pay additional spectrum charges.

12
Removal Bharti Airtel Ltd. (BRTI.BO, Rs318.9, Equal-Weight, LT value Rs470)
M O R G A N S T A N L E Y R E S E A R C H
January 21, 2010 Tomorrow’s Winners
Competitive Landscape
Key Changes
• Greater intensity in tariff competition among operators;
• Increased competition with new launches;
• More new operators to increase competition further.
Bharti is one of India’s private integrated telecom operators providing wireless, enterprise, and long-distance services. Bharti has historically enjoyed a first mover advantage and its
pan-India presence had helped secure higher net adds than its competitors. Although it still has the top position in terms of subscribers, Bharti’s market share in net adds is declining because of new launches by operators such as Reliance Communications, Tata Teleservices, and Aircel, which have been giving special offers to attract customers. This has also led to steep falls in ARPMs and ARPUs in the industry.
The number of operators virtually doubled in 2009 and we expect a further four to five operators to launch services in the next 12 months – the operators could include Loop Telecom, Datacom, Stel, Swan and Sistema.
Competitive Advantage Profile of the Telecom Industry
Spectrum is no longer a constraint and new licensees can share passive and partly active infrastructure to launch services faster.
Threat of New Entrants(High)
High growth market; lowest average revenues per minute (ARPMs) in the world; lowest capex per sub.
Intensity of Rivalry(High)
Key buyers: Telecom subscribersIntroduction of number portability will lead to churn among subscribers.
Bargaining Power of Buyers(High)
Key suppliers: Equipment manufacturers Capex is on a decline around the world, increasing the attractiveness of the Indian market. Large size of contracts makes suppliers dependent on telecom operators.
Bargaining Power of Supplier(Low)
Both Data and Voice face little or no risk of substitutes since they are basic ingredients for communications today.
Threat of Substitutes(Low)
Source: Michael Porter, Morgan Stanley Research
13
Removal Bharti Airtel Ltd. (BRTI.BO, Rs318.9, Equal-Weight, LT value Rs470)
M O R G A N S T A N L E Y R E S E A R C H
January 21, 2010 Tomorrow’s Winners
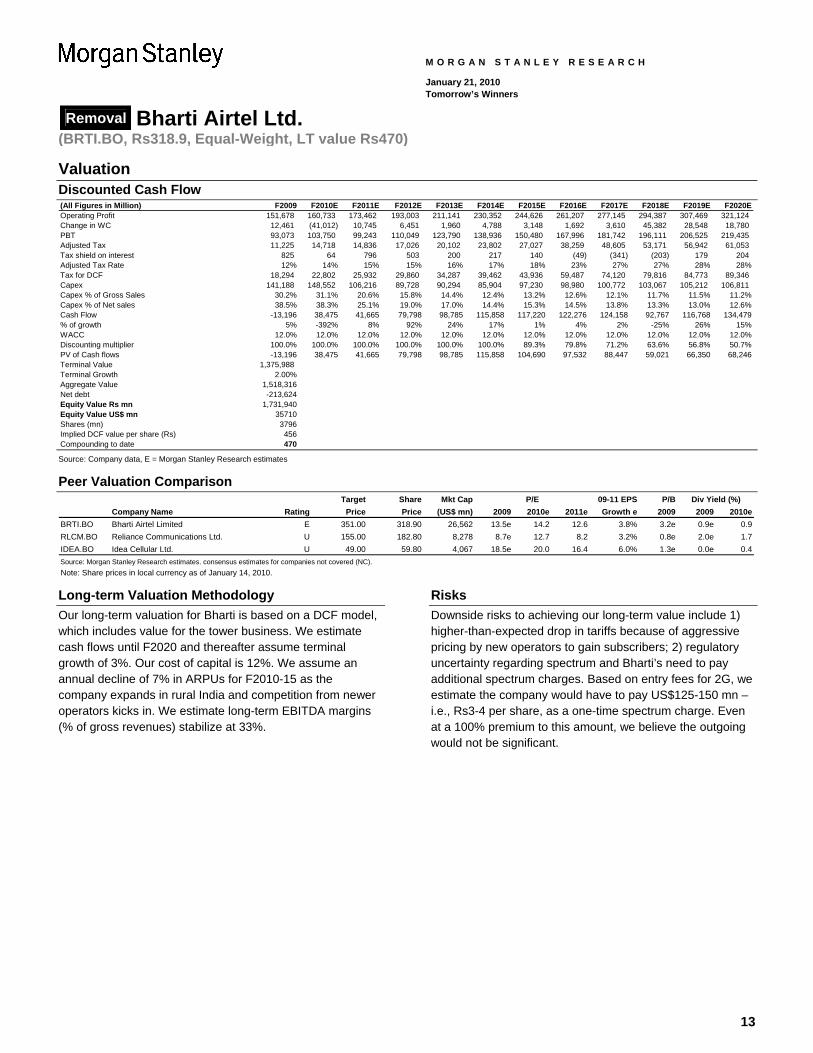
Valuation Discounted Cash Flow (All Figures in Million) F2009 F2010E F2011E F2012E F2013E F2014E F2015E F2016E F2017E F2018E F2019E F2020EOperating Profit 151,678 160,733 173,462 193,003 211,141 230,352 244,626 261,207 277,145 294,387 307,469 321,124 Change in WC 12,461 (41,012) 10,745 6,451 1,960 4,788 3,148 1,692 3,610 45,382 28,548 18,780 PBT 93,073 103,750 99,243 110,049 123,790 138,936 150,480 167,996 181,742 196,111 206,525 219,435 Adjusted Tax 11,225 14,718 14,836 17,026 20,102 23,802 27,027 38,259 48,605 53,171 56,942 61,053 Tax shield on interest 825 64 796 503 200 217 140 (49) (341) (203) 179 204 Adjusted Tax Rate 12% 14% 15% 15% 16% 17% 18% 23% 27% 27% 28% 28%Tax for DCF 18,294 22,802 25,932 29,860 34,287 39,462 43,936 59,487 74,120 79,816 84,773 89,346 Capex 141,188 148,552 106,216 89,728 90,294 85,904 97,230 98,980 100,772 103,067 105,212 106,811 Capex % of Gross Sales 30.2% 31.1% 20.6% 15.8% 14.4% 12.4% 13.2% 12.6% 12.1% 11.7% 11.5% 11.2%Capex % of Net sales 38.5% 38.3% 25.1% 19.0% 17.0% 14.4% 15.3% 14.5% 13.8% 13.3% 13.0% 12.6%Cash Flow -13,196 38,475 41,665 79,798 98,785 115,858 117,220 122,276 124,158 92,767 116,768 134,479% of growth 5% -392% 8% 92% 24% 17% 1% 4% 2% -25% 26% 15%WACC 12.0% 12.0% 12.0% 12.0% 12.0% 12.0% 12.0% 12.0% 12.0% 12.0% 12.0% 12.0%Discounting multiplier 100.0% 100.0% 100.0% 100.0% 100.0% 100.0% 89.3% 79.8% 71.2% 63.6% 56.8% 50.7%PV of Cash flows -13,196 38,475 41,665 79,798 98,785 115,858 104,690 97,532 88,447 59,021 66,350 68,246Terminal Value 1,375,988 Terminal Growth 2.00%Aggregate Value 1,518,316 1,397,215Net debt -213,624 5,513Equity Value Rs mn 1,731,940 1,391,702Equity Value US$ mn 35710 33,433 Shares (mn) 3796 3,796 Implied DCF value per share (Rs) 456 367 367 Compounding to date 470 411 2.43% 13% Source: Company data, E = Morgan Stanley Research estimates
Peer Valuation Comparison Target Share Mkt Cap 09-11 EPS P/B
Company Name Rating Price Price (US$ mn) 2009 2010e 2011e Growth e 2009 2009 2010eBRTI.BO Bharti Airtel Limited E 351.00 318.90 26,562 13.5e 14.2 12.6 3.8% 3.2e 0.9e 0.9RLCM.BO Reliance Communications Ltd. U 155.00 182.80 8,278 8.7e 12.7 8.2 3.2% 0.8e 2.0e 1.7IDEA.BO Idea Cellular Ltd. U 49.00 59.80 4,067 18.5e 20.0 16.4 6.0% 1.3e 0.0e 0.4Source: Morgan Stanley Research estimates. consensus estimates for companies not covered (NC).
P/E Div Yield (%)
Note: Share prices in local currency as of January 14, 2010.
Long-term Valuation Methodology Our long-term valuation for Bharti is based on a DCF model, which includes value for the tower business. We estimate cash flows until F2020 and thereafter assume terminal growth of 3%. Our cost of capital is 12%. We assume an annual decline of 7% in ARPUs for F2010-15 as the company expands in rural India and competition from newer operators kicks in. We estimate long-term EBITDA margins (% of gross revenues) stabilize at 33%.
Risks Downside risks to achieving our long-term value include 1) higher-than-expected drop in tariffs because of aggressive pricing by new operators to gain subscribers; 2) regulatory uncertainty regarding spectrum and Bharti’s need to pay additional spectrum charges. Based on entry fees for 2G, we estimate the company would have to pay US$125-150 mn – i.e., Rs3-4 per share, as a one-time spectrum charge. Even at a 100% premium to this amount, we believe the outgoing would not be significant.
14
Removal Bharti Airtel Ltd. (BRTI.BO, Rs318.9, Equal-Weight, LT value Rs470)
M O R G A N S T A N L E Y R E S E A R C H
January 21, 2010 Tomorrow’s Winners
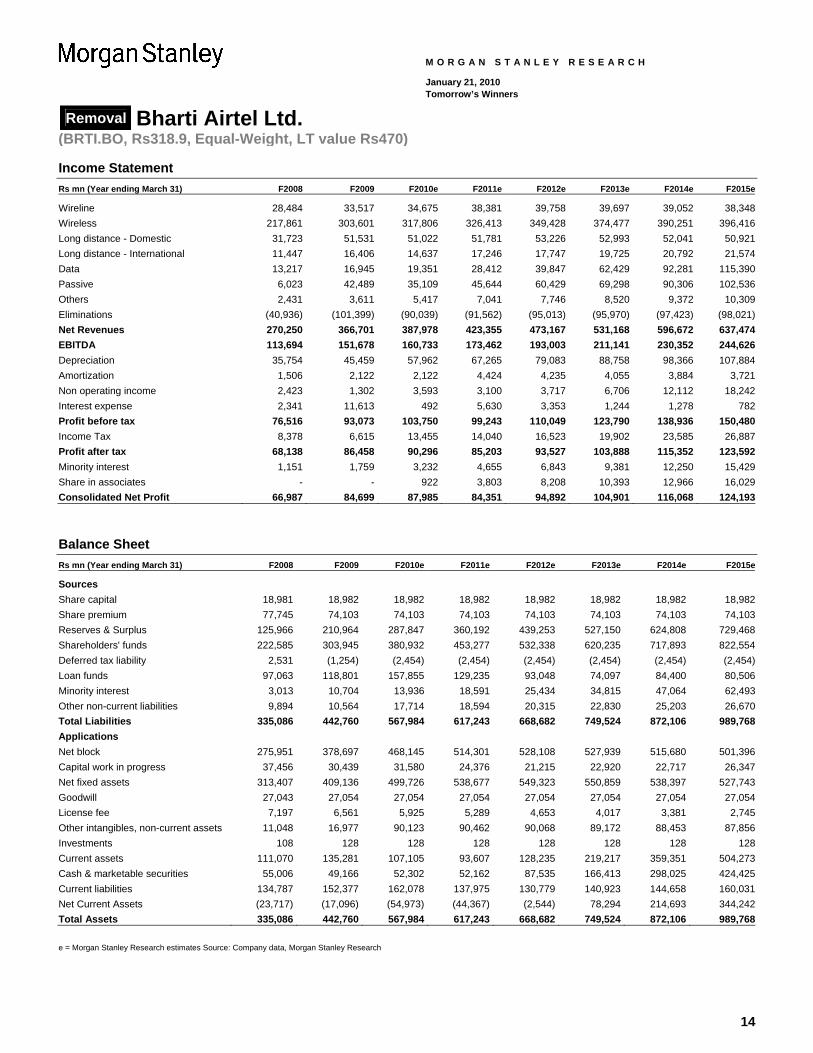
Income Statement Rs mn (Year ending March 31) F2008 F2009 F2010e F2011e F2012e F2013e F2014e F2015e
Wireline 28,484 33,517 34,675 38,381 39,758 39,697 39,052 38,348Wireless 217,861 303,601 317,806 326,413 349,428 374,477 390,251 396,416Long distance - Domestic 31,723 51,531 51,022 51,781 53,226 52,993 52,041 50,921Long distance - International 11,447 16,406 14,637 17,246 17,747 19,725 20,792 21,574Data 13,217 16,945 19,351 28,412 39,847 62,429 92,281 115,390Passive 6,023 42,489 35,109 45,644 60,429 69,298 90,306 102,536Others 2,431 3,611 5,417 7,041 7,746 8,520 9,372 10,309Eliminations (40,936) (101,399) (90,039) (91,562) (95,013) (95,970) (97,423) (98,021)Net Revenues 270,250 366,701 387,978 423,355 473,167 531,168 596,672 637,474EBITDA 113,694 151,678 160,733 173,462 193,003 211,141 230,352 244,626Depreciation 35,754 45,459 57,962 67,265 79,083 88,758 98,366 107,884Amortization 1,506 2,122 2,122 4,424 4,235 4,055 3,884 3,721Non operating income 2,423 1,302 3,593 3,100 3,717 6,706 12,112 18,242Interest expense 2,341 11,613 492 5,630 3,353 1,244 1,278 782Profit before tax 76,516 93,073 103,750 99,243 110,049 123,790 138,936 150,480Income Tax 8,378 6,615 13,455 14,040 16,523 19,902 23,585 26,887Profit after tax 68,138 86,458 90,296 85,203 93,527 103,888 115,352 123,592Minority interest 1,151 1,759 3,232 4,655 6,843 9,381 12,250 15,429Share in associates - - 922 3,803 8,208 10,393 12,966 16,029Consolidated Net Profit 66,987 84,699 87,985 84,351 94,892 104,901 116,068 124,193
Balance Sheet Rs mn (Year ending March 31) F2008 F2009 F2010e F2011e F2012e F2013e F2014e F2015e
Sources Share capital 18,981 18,982 18,982 18,982 18,982 18,982 18,982 18,982Share premium 77,745 74,103 74,103 74,103 74,103 74,103 74,103 74,103Reserves & Surplus 125,966 210,964 287,847 360,192 439,253 527,150 624,808 729,468Shareholders' funds 222,585 303,945 380,932 453,277 532,338 620,235 717,893 822,554Deferred tax liability 2,531 (1,254) (2,454) (2,454) (2,454) (2,454) (2,454) (2,454)Loan funds 97,063 118,801 157,855 129,235 93,048 74,097 84,400 80,506Minority interest 3,013 10,704 13,936 18,591 25,434 34,815 47,064 62,493Other non-current liabilities 9,894 10,564 17,714 18,594 20,315 22,830 25,203 26,670Total Liabilities 335,086 442,760 567,984 617,243 668,682 749,524 872,106 989,768Applications Net block 275,951 378,697 468,145 514,301 528,108 527,939 515,680 501,396Capital work in progress 37,456 30,439 31,580 24,376 21,215 22,920 22,717 26,347Net fixed assets 313,407 409,136 499,726 538,677 549,323 550,859 538,397 527,743Goodwill 27,043 27,054 27,054 27,054 27,054 27,054 27,054 27,054License fee 7,197 6,561 5,925 5,289 4,653 4,017 3,381 2,745Other intangibles, non-current assets 11,048 16,977 90,123 90,462 90,068 89,172 88,453 87,856Investments 108 128 128 128 128 128 128 128Current assets 111,070 135,281 107,105 93,607 128,235 219,217 359,351 504,273Cash & marketable securities 55,006 49,166 52,302 52,162 87,535 166,413 298,025 424,425Current liabilities 134,787 152,377 162,078 137,975 130,779 140,923 144,658 160,031Net Current Assets (23,717) (17,096) (54,973) (44,367) (2,544) 78,294 214,693 344,242Total Assets 335,086 442,760 567,984 617,243 668,682 749,524 872,106 989,768
e = Morgan Stanley Research estimates Source: Company data, Morgan Stanley Research
15
Removal Bharti Airtel Ltd. (BRTI.BO, Rs318.9, Equal-Weight, LT value Rs470)
M O R G A N S T A N L E Y R E S E A R C H
January 21, 2010 Tomorrow’s Winners
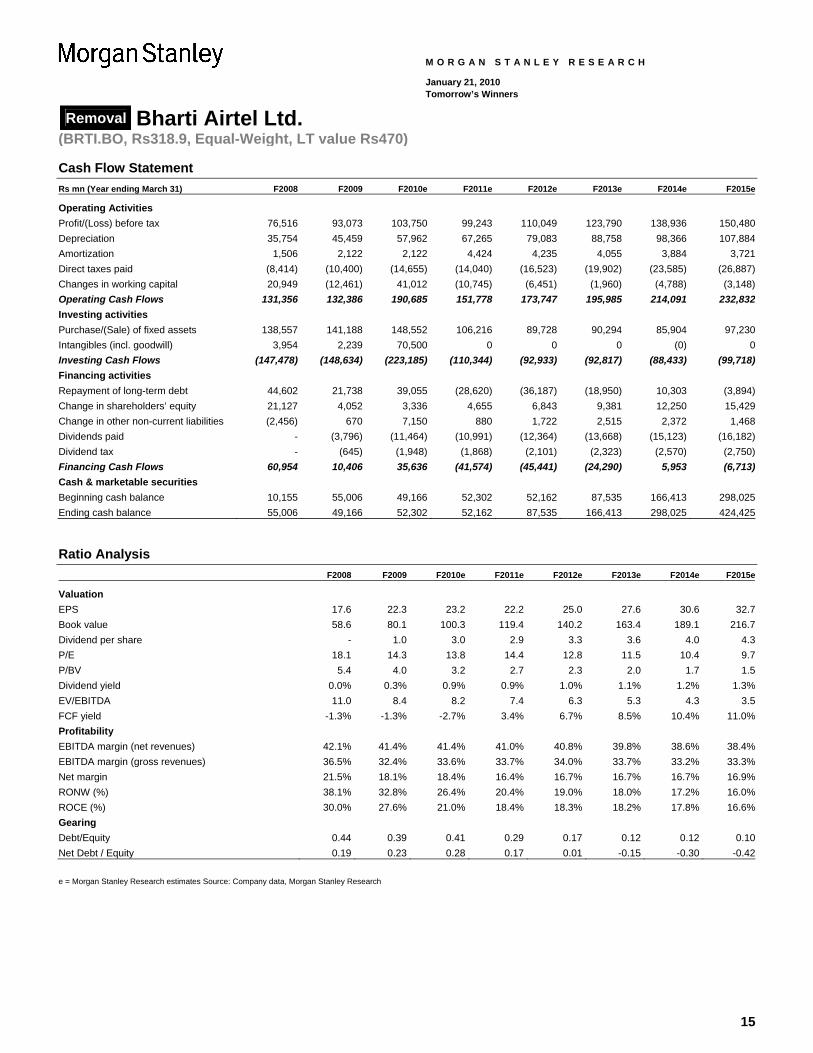
Cash Flow Statement Rs mn (Year ending March 31) F2008 F2009 F2010e F2011e F2012e F2013e F2014e F2015e
Operating Activities Profit/(Loss) before tax 76,516 93,073 103,750 99,243 110,049 123,790 138,936 150,480Depreciation 35,754 45,459 57,962 67,265 79,083 88,758 98,366 107,884Amortization 1,506 2,122 2,122 4,424 4,235 4,055 3,884 3,721Direct taxes paid (8,414) (10,400) (14,655) (14,040) (16,523) (19,902) (23,585) (26,887)Changes in working capital 20,949 (12,461) 41,012 (10,745) (6,451) (1,960) (4,788) (3,148)Operating Cash Flows 131,356 132,386 190,685 151,778 173,747 195,985 214,091 232,832Investing activities Purchase/(Sale) of fixed assets 138,557 141,188 148,552 106,216 89,728 90,294 85,904 97,230Intangibles (incl. goodwill) 3,954 2,239 70,500 0 0 0 (0) 0Investing Cash Flows (147,478) (148,634) (223,185) (110,344) (92,933) (92,817) (88,433) (99,718)Financing activities Repayment of long-term debt 44,602 21,738 39,055 (28,620) (36,187) (18,950) 10,303 (3,894)Change in shareholders’ equity 21,127 4,052 3,336 4,655 6,843 9,381 12,250 15,429Change in other non-current liabilities (2,456) 670 7,150 880 1,722 2,515 2,372 1,468Dividends paid - (3,796) (11,464) (10,991) (12,364) (13,668) (15,123) (16,182)Dividend tax - (645) (1,948) (1,868) (2,101) (2,323) (2,570) (2,750)Financing Cash Flows 60,954 10,406 35,636 (41,574) (45,441) (24,290) 5,953 (6,713)Cash & marketable securities Beginning cash balance 10,155 55,006 49,166 52,302 52,162 87,535 166,413 298,025Ending cash balance 55,006 49,166 52,302 52,162 87,535 166,413 298,025 424,425
Ratio Analysis F2008 F2009 F2010e F2011e F2012e F2013e F2014e F2015e
Valuation EPS 17.6 22.3 23.2 22.2 25.0 27.6 30.6 32.7Book value 58.6 80.1 100.3 119.4 140.2 163.4 189.1 216.7Dividend per share - 1.0 3.0 2.9 3.3 3.6 4.0 4.3P/E 18.1 14.3 13.8 14.4 12.8 11.5 10.4 9.7P/BV 5.4 4.0 3.2 2.7 2.3 2.0 1.7 1.5Dividend yield 0.0% 0.3% 0.9% 0.9% 1.0% 1.1% 1.2% 1.3%EV/EBITDA 11.0 8.4 8.2 7.4 6.3 5.3 4.3 3.5FCF yield -1.3% -1.3% -2.7% 3.4% 6.7% 8.5% 10.4% 11.0%Profitability EBITDA margin (net revenues) 42.1% 41.4% 41.4% 41.0% 40.8% 39.8% 38.6% 38.4%EBITDA margin (gross revenues) 36.5% 32.4% 33.6% 33.7% 34.0% 33.7% 33.2% 33.3%Net margin 21.5% 18.1% 18.4% 16.4% 16.7% 16.7% 16.7% 16.9%RONW (%) 38.1% 32.8% 26.4% 20.4% 19.0% 18.0% 17.2% 16.0%ROCE (%) 30.0% 27.6% 21.0% 18.4% 18.3% 18.2% 17.8% 16.6%Gearing Debt/Equity 0.44 0.39 0.41 0.29 0.17 0.12 0.12 0.10Net Debt / Equity 0.19 0.23 0.28 0.17 0.01 -0.15 -0.30 -0.42
e = Morgan Stanley Research estimates Source: Company data, Morgan Stanley Research
16
Removal Brambles Ltd (BXB.AX, A$6.96, Equal-Weight, LT value A$9.65)
M O R G A N S T A N L E Y R E S E A R C H
January 21, 2010 Tomorrow’s Winners
The penalty of past maintenance under-spending Ticker (Reuters/Bloomberg)Share price, close (Jan-14-2010)RatingPrice target (12-18 months)Price target (5 years) A$9.65Average daily trading value (mn)
Return on Equity (ROE) Morgan Stanley forecast
Net Operating Profit After Tax (NOPAT) Margin
× Operating Asset Turnover
+ Return from Leverage
Source: Company data, Morgan Stanley Research estimates
BXB.AX / BXB AUA$6.96
Equal-WeightA$6.50
US$39
19.7%
43.5%
23.1%28.5% 28.5%
28.5%31.8%31.6%
0%5%
10%15%20%25%30%35%40%45%50%
2007 2008 2009 2010e 2011e 2012e 2013e 2014e
15.8% 15.2%
10.7%
13.4%14.8%
13.1%
14.8% 14.8%
0%
2%
4%
6%
8%
10%
12%
14%
16%
18%
2007 2008 2009 2010e 2011e 2012e 2013e 2014e
0.87
1.31
1.031.11 1.09
1.17 1.09 1.09
0.00
0.20
0.40
0.60
0.80
1.00
1.20
1.40
2007 2008 2009 2010e 2011e 2012e 2013e 2014e
6.0%
12.0%13.6%
15.6%
15.6%15.6%16.3%
23.6%
0%
5%
10%
15%
20%
25%
2007 2008 2009 2010e 2011e 2012e 2013e 2014e
Morgan Stanley Australia Limited+
Philip Wensley, CFA [email protected]
Michael Rudland
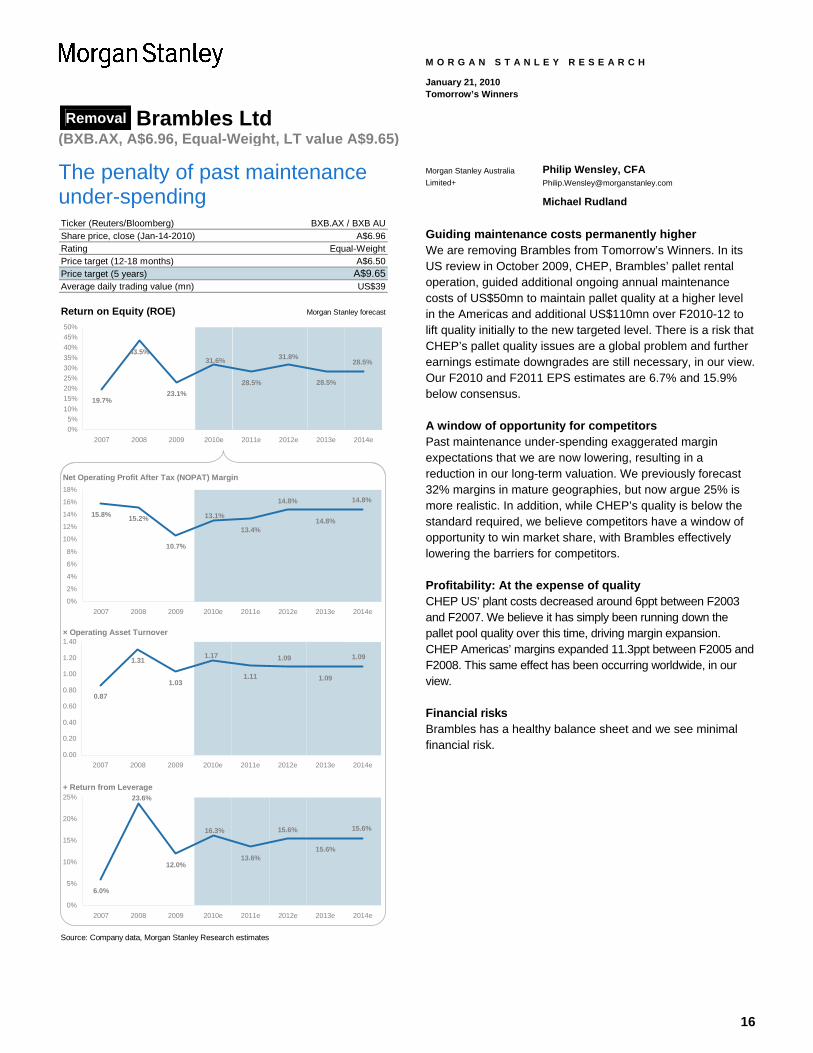
Guiding maintenance costs permanently higher We are removing Brambles from Tomorrow’s Winners. In its US review in October 2009, CHEP, Brambles’ pallet rental operation, guided additional ongoing annual maintenance costs of US$50mn to maintain pallet quality at a higher level in the Americas and additional US$110mn over F2010-12 to lift quality initially to the new targeted level. There is a risk that CHEP’s pallet quality issues are a global problem and further earnings estimate downgrades are still necessary, in our view. Our F2010 and F2011 EPS estimates are 6.7% and 15.9% below consensus.
A window of opportunity for competitors Past maintenance under-spending exaggerated margin expectations that we are now lowering, resulting in a reduction in our long-term valuation. We previously forecast 32% margins in mature geographies, but now argue 25% is more realistic. In addition, while CHEP’s quality is below the standard required, we believe competitors have a window of opportunity to win market share, with Brambles effectively lowering the barriers for competitors.
Profitability: At the expense of quality CHEP US’ plant costs decreased around 6ppt between F2003 and F2007. We believe it has simply been running down the pallet pool quality over this time, driving margin expansion. CHEP Americas’ margins expanded 11.3ppt between F2005 and F2008. This same effect has been occurring worldwide, in our view.
Financial risks Brambles has a healthy balance sheet and we see minimal financial risk.
17
Removal Brambles Ltd (BXB.AX, A$6.96, Equal-Weight, LT value A$9.65)
M O R G A N S T A N L E Y R E S E A R C H
January 21, 2010 Tomorrow’s Winners
Risk-Reward: Penalty of past under-spending on maintenance
3
4
5
6
7
8
9
10
11
12
A$13A$12.50(+80%)
A$9.65 (+39%)
A$7.00 (+1%)
A$6.96
Price Target Historical Stock Performance Current Stock Price
Jan 08 Oct 08 Aug 09 May 10 Feb 11 Dec 11 Sep 12 Jun 13 Apr 14 Jan 15
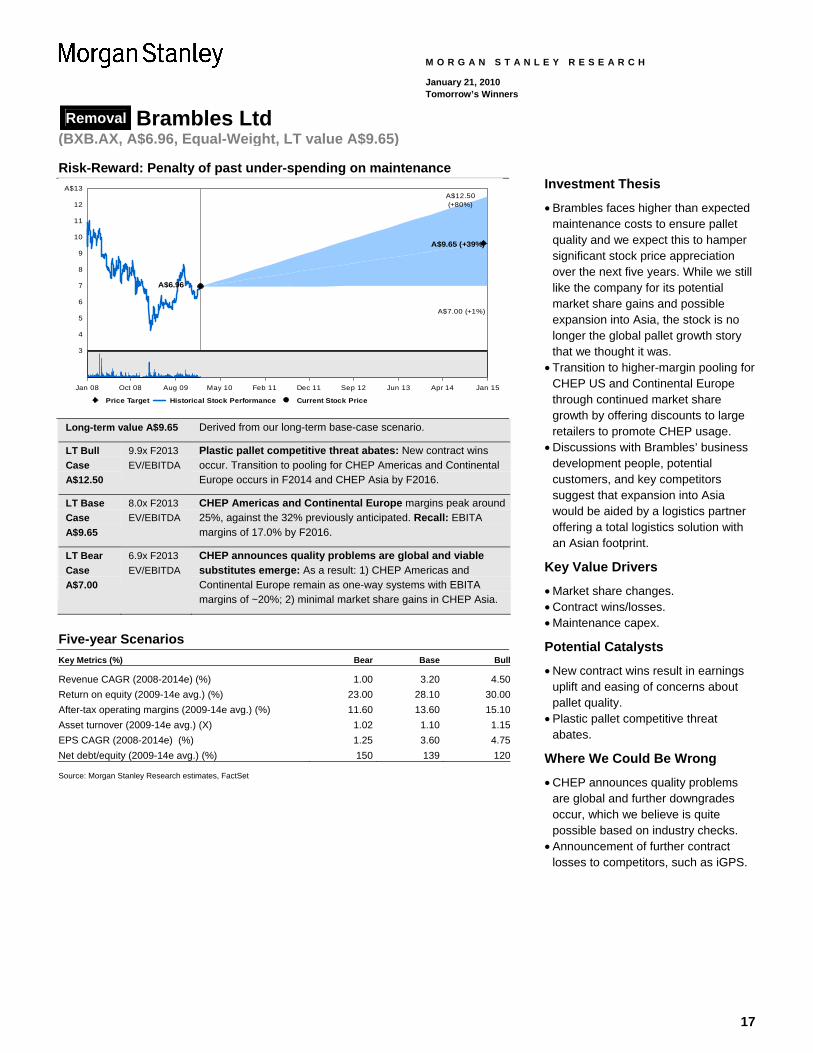
Long-term value A$9.65 Derived from our long-term base-case scenario.
LT Bull Case A$12.50
9.9x F2013 EV/EBITDA
Plastic pallet competitive threat abates: New contract wins occur. Transition to pooling for CHEP Americas and Continental Europe occurs in F2014 and CHEP Asia by F2016.
LT Base Case A$9.65
8.0x F2013 EV/EBITDA
CHEP Americas and Continental Europe margins peak around 25%, against the 32% previously anticipated. Recall: EBITA margins of 17.0% by F2016.
LT Bear Case A$7.00
6.9x F2013 EV/EBITDA
CHEP announces quality problems are global and viable substitutes emerge: As a result: 1) CHEP Americas and Continental Europe remain as one-way systems with EBITA margins of ~20%; 2) minimal market share gains in CHEP Asia.
Five-year Scenarios Key Metrics (%) Bear Base Bull
Revenue CAGR (2008-2014e) (%) 1.00 3.20 4.50Return on equity (2009-14e avg.) (%) 23.00 28.10 30.00After-tax operating margins (2009-14e avg.) (%) 11.60 13.60 15.10Asset turnover (2009-14e avg.) (X) 1.02 1.10 1.15EPS CAGR (2008-2014e) (%) 1.25 3.60 4.75Net debt/equity (2009-14e avg.) (%) 150 139 120 Source: Morgan Stanley Research estimates, FactSet
Investment Thesis
• Brambles faces higher than expected maintenance costs to ensure pallet quality and we expect this to hamper significant stock price appreciation over the next five years. While we still like the company for its potential market share gains and possible expansion into Asia, the stock is no longer the global pallet growth story that we thought it was.
• Transition to higher-margin pooling for CHEP US and Continental Europe through continued market share growth by offering discounts to large retailers to promote CHEP usage.
• Discussions with Brambles’ business development people, potential customers, and key competitors suggest that expansion into Asia would be aided by a logistics partner offering a total logistics solution with an Asian footprint.
Key Value Drivers
• Market share changes. • Contract wins/losses. • Maintenance capex.
Potential Catalysts
• New contract wins result in earnings uplift and easing of concerns about pallet quality.
• Plastic pallet competitive threat abates.
Where We Could Be Wrong
• CHEP announces quality problems are global and further downgrades occur, which we believe is quite possible based on industry checks.
• Announcement of further contract losses to competitors, such as iGPS.
18
Removal Brambles Ltd (BXB.AX, A$6.96, Equal-Weight, LT value A$9.65)
M O R G A N S T A N L E Y R E S E A R C H
January 21, 2010 Tomorrow’s Winners
Competitive Landscape
Key Changes
• CHEP released its US review in October 2009, guiding for higher-than-expected maintenance costs to maintain pallet quality.
• Past maintenance under-spending exaggerated margin expectations, which we are now lowering, resulting in a reduction in our long-term valuation.
• The increase in maintenance expense effectively lowers the barriers for competitors.
A Global Support Services Company Brambles has two key units: (1) CHEP issues, collects, repairs, and reissues more than 280mn pallets in 44 countries to assist manufacturers, distributors, and retailers to transport fast-moving consumer goods; and (2) Recall manages the secure storage, digitization, retrieval, destruction of physical and digital information for 80,000 customers in 23 countries.
On August 20, 2009, we wrote that Brambles may need to increase guidance for plant costs to maintain higher quality pallets – see Post Review Likely a Better Time to Buy. We also flagged that it may segment the pallet pool into two grades, allowing it to maybe extract some additional revenue to offset higher costs. We concluded that CHEP Americas’ margins would next peak 150bp below F2008 levels.
The two key downside surprises in the review release relative to our expectations were that management is guiding margins to peak at 360bp below F2008 levels, and that it is not anticipating (at least in the short term) any additional revenue from segmentation (we conclude it will ultimately get some).
What concerns us now is that it is not clear to us that this downgrade cycle is over yet, as we suspect CHEP’s pallet quality issues are a global problem. We acknowledge positive management changes, and operating leverage to an economic recovery (albeit less than that in Qantas and Asciano, and perhaps less than the market appreciates). But Brambles is expensive at 20.2x F2010 P/E and consensus F2010 EPS may be 7.0-8.0% too high, in our view.
Pallet Quality a Global Issue Globally, CHEP customers are dissatisfied with pallet quality, according to our checks (although this is difficult to asses because of small sample sizes). With the US Premium proportion expected to be 75% of the total, we argue that this is not really segmentation at all – all customers simply need better quality pallets than CHEP has been providing. It is certainly not an issue of needing better quality for automated facilities as nothing like 75% of the market is automated (Brambles itself has in the past argued that only ~5% of their pallets are used in automated facilities). We wonder if CHEP will ultimately move the entire US pool to one standard in line with the new US Premium specifications.
Competitive Advantage Profile of the Pallet Rental Industry
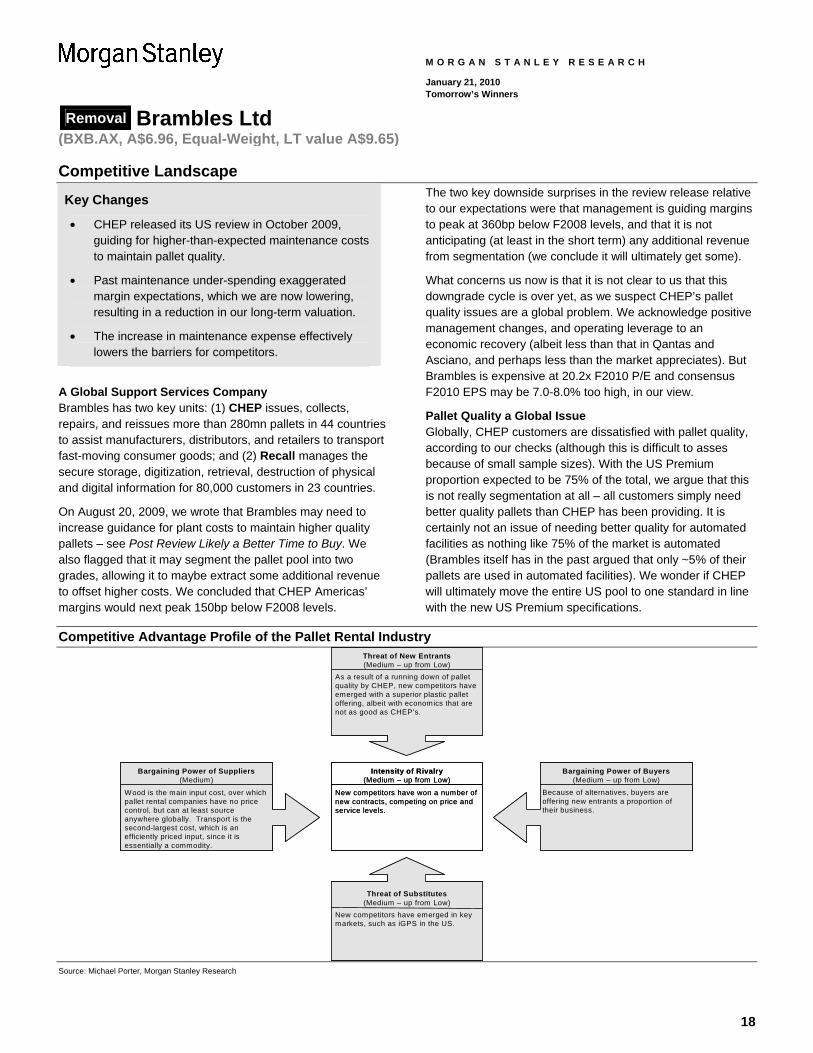
As a result of a running down of pallet quality by CHEP, new competitors have emerged with a superior plastic pallet offering, albeit with economics that are not as good as CHEP’s.
Threat of New Entrants(Medium – up from Low)
New competitors have won a number of new contracts, competing on price and service levels.
Intensity of Rivalry(Medium – up from Low)
Because of alternatives, buyers are offering new entrants a proportion of their business.
Bargaining Power of Buyers(Medium – up from Low)
Wood is the main input cost, over which pallet rental companies have no price control, but can at least source anywhere globally. Transport is the second-largest cost, which is an efficiently priced input, since it is essentially a commodity.
Bargaining Power of Suppliers(Medium)
New competitors have emerged in key markets, such as iGPS in the US.
Threat of Substitutes(Medium – up from Low)
Source: Michael Porter, Morgan Stanley Research
19
Removal Brambles Ltd (BXB.AX, A$6.96, Equal-Weight, LT value A$9.65)
M O R G A N S T A N L E Y R E S E A R C H
January 21, 2010 Tomorrow’s Winners
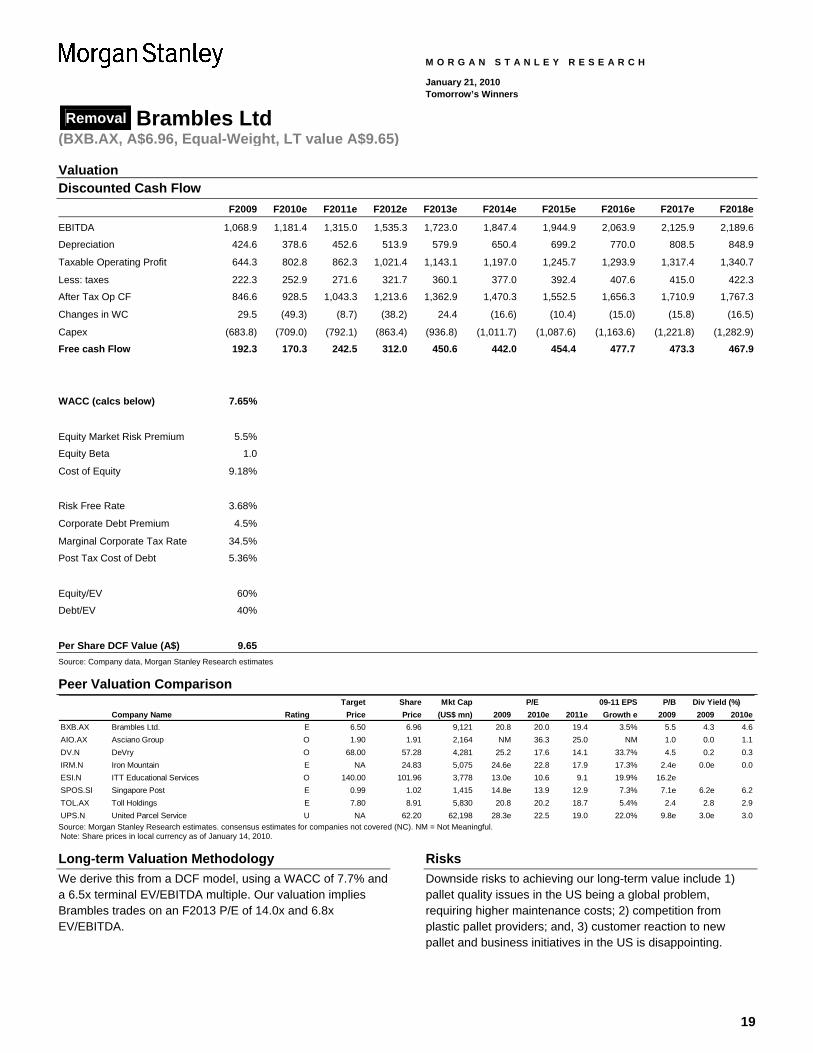
Valuation Discounted Cash Flow F2009 F2010e F2011e F2012e F2013e F2014e F2015e F2016e F2017e F2018e
EBITDA 1,068.9 1,181.4 1,315.0 1,535.3 1,723.0 1,847.4 1,944.9 2,063.9 2,125.9 2,189.6
Depreciation 424.6 378.6 452.6 513.9 579.9 650.4 699.2 770.0 808.5 848.9
Taxable Operating Profit 644.3 802.8 862.3 1,021.4 1,143.1 1,197.0 1,245.7 1,293.9 1,317.4 1,340.7
Less: taxes 222.3 252.9 271.6 321.7 360.1 377.0 392.4 407.6 415.0 422.3
After Tax Op CF 846.6 928.5 1,043.3 1,213.6 1,362.9 1,470.3 1,552.5 1,656.3 1,710.9 1,767.3
Changes in WC 29.5 (49.3) (8.7) (38.2) 24.4 (16.6) (10.4) (15.0) (15.8) (16.5)
Capex (683.8) (709.0) (792.1) (863.4) (936.8) (1,011.7) (1,087.6) (1,163.6) (1,221.8) (1,282.9)
Free cash Flow 192.3 170.3 242.5 312.0 450.6 442.0 454.4 477.7 473.3 467.9
WACC (calcs below) 7.65%
Equity Market Risk Premium 5.5%
Equity Beta 1.0
Cost of Equity 9.18%
Risk Free Rate 3.68%
Corporate Debt Premium 4.5%
Marginal Corporate Tax Rate 34.5%
Post Tax Cost of Debt 5.36%
Equity/EV 60%
Debt/EV 40%
Per Share DCF Value (A$) 9.65 Source: Company data, Morgan Stanley Research estimates
Peer Valuation Comparison Target Share Mkt Cap 09-11 EPS P/B
Company Name Rating Price Price (US$ mn) 2009 2010e 2011e Growth e 2009 2009 2010eBXB.AX Brambles Ltd. E 6.50 6.96 9,121 20.8 20.0 19.4 3.5% 5.5 4.3 4.6AIO.AX Asciano Group O 1.90 1.91 2,164 NM 36.3 25.0 NM 1.0 0.0 1.1DV.N DeVry O 68.00 57.28 4,281 25.2 17.6 14.1 33.7% 4.5 0.2 0.3IRM.N Iron Mountain E NA 24.83 5,075 24.6e 22.8 17.9 17.3% 2.4e 0.0e 0.0ESI.N ITT Educational Services O 140.00 101.96 3,778 13.0e 10.6 9.1 19.9% 16.2eSPOS.SI Singapore Post E 0.99 1.02 1,415 14.8e 13.9 12.9 7.3% 7.1e 6.2e 6.2TOL.AX Toll Holdings E 7.80 8.91 5,830 20.8 20.2 18.7 5.4% 2.4 2.8 2.9UPS.N United Parcel Service U NA 62.20 62,198 28.3e 22.5 19.0 22.0% 9.8e 3.0e 3.0
P/E Div Yield (%)
Source: Morgan Stanley Research estimates. consensus estimates for companies not covered (NC). NM = Not Meaningful. Note: Share prices in local currency as of January 14, 2010.
Long-term Valuation Methodology We derive this from a DCF model, using a WACC of 7.7% and a 6.5x terminal EV/EBITDA multiple. Our valuation implies Brambles trades on an F2013 P/E of 14.0x and 6.8x EV/EBITDA.
Risks Downside risks to achieving our long-term value include 1) pallet quality issues in the US being a global problem, requiring higher maintenance costs; 2) competition from plastic pallet providers; and, 3) customer reaction to new pallet and business initiatives in the US is disappointing.
20
Removal Brambles Ltd (BXB.AX, A$6.96, Equal-Weight, LT value A$9.65)
M O R G A N S T A N L E Y R E S E A R C H
January 21, 2010 Tomorrow’s Winners
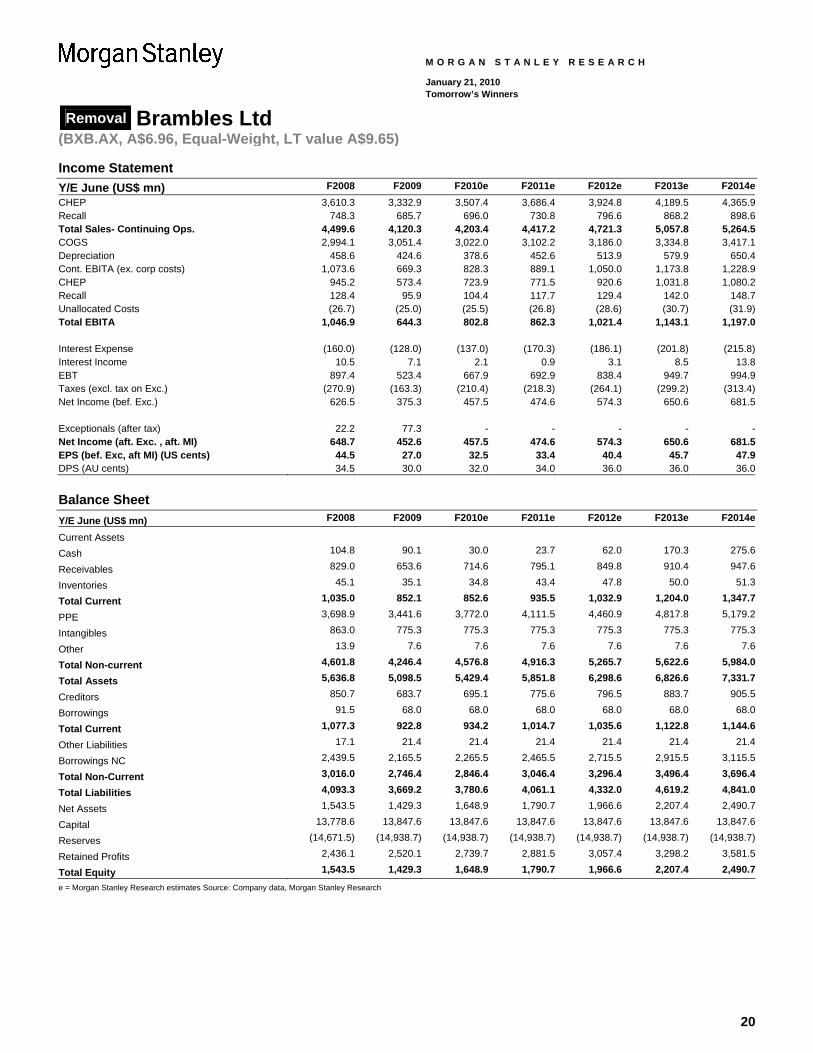
Income Statement Y/E June (US$ mn) F2008 F2009 F2010e F2011e F2012e F2013e F2014eCHEP 3,610.3 3,332.9 3,507.4 3,686.4 3,924.8 4,189.5 4,365.9Recall 748.3 685.7 696.0 730.8 796.6 868.2 898.6Total Sales- Continuing Ops. 4,499.6 4,120.3 4,203.4 4,417.2 4,721.3 5,057.8 5,264.5COGS 2,994.1 3,051.4 3,022.0 3,102.2 3,186.0 3,334.8 3,417.1Depreciation 458.6 424.6 378.6 452.6 513.9 579.9 650.4Cont. EBITA (ex. corp costs) 1,073.6 669.3 828.3 889.1 1,050.0 1,173.8 1,228.9CHEP 945.2 573.4 723.9 771.5 920.6 1,031.8 1,080.2Recall 128.4 95.9 104.4 117.7 129.4 142.0 148.7Unallocated Costs (26.7) (25.0) (25.5) (26.8) (28.6) (30.7) (31.9)Total EBITA 1,046.9 644.3 802.8 862.3 1,021.4 1,143.1 1,197.0 Interest Expense (160.0) (128.0) (137.0) (170.3) (186.1) (201.8) (215.8)Interest Income 10.5 7.1 2.1 0.9 3.1 8.5 13.8EBT 897.4 523.4 667.9 692.9 838.4 949.7 994.9Taxes (excl. tax on Exc.) (270.9) (163.3) (210.4) (218.3) (264.1) (299.2) (313.4)Net Income (bef. Exc.) 626.5 375.3 457.5 474.6 574.3 650.6 681.5 Exceptionals (after tax) 22.2 77.3 - - - - -Net Income (aft. Exc. , aft. MI) 648.7 452.6 457.5 474.6 574.3 650.6 681.5EPS (bef. Exc, aft MI) (US cents) 44.5 27.0 32.5 33.4 40.4 45.7 47.9DPS (AU cents) 34.5 30.0 32.0 34.0 36.0 36.0 36.0
Balance Sheet Y/E June (US$ mn) F2008 F2009 F2010e F2011e F2012e F2013e F2014e
Current Assets Cash 104.8 90.1 30.0 23.7 62.0 170.3 275.6
Receivables 829.0 653.6 714.6 795.1 849.8 910.4 947.6
Inventories 45.1 35.1 34.8 43.4 47.8 50.0 51.3
Total Current 1,035.0 852.1 852.6 935.5 1,032.9 1,204.0 1,347.7
PPE 3,698.9 3,441.6 3,772.0 4,111.5 4,460.9 4,817.8 5,179.2
Intangibles 863.0 775.3 775.3 775.3 775.3 775.3 775.3
Other 13.9 7.6 7.6 7.6 7.6 7.6 7.6
Total Non-current 4,601.8 4,246.4 4,576.8 4,916.3 5,265.7 5,622.6 5,984.0
Total Assets 5,636.8 5,098.5 5,429.4 5,851.8 6,298.6 6,826.6 7,331.7
Creditors 850.7 683.7 695.1 775.6 796.5 883.7 905.5
Borrowings 91.5 68.0 68.0 68.0 68.0 68.0 68.0
Total Current 1,077.3 922.8 934.2 1,014.7 1,035.6 1,122.8 1,144.6
Other Liabilities 17.1 21.4 21.4 21.4 21.4 21.4 21.4
Borrowings NC 2,439.5 2,165.5 2,265.5 2,465.5 2,715.5 2,915.5 3,115.5
Total Non-Current 3,016.0 2,746.4 2,846.4 3,046.4 3,296.4 3,496.4 3,696.4
Total Liabilities 4,093.3 3,669.2 3,780.6 4,061.1 4,332.0 4,619.2 4,841.0
Net Assets 1,543.5 1,429.3 1,648.9 1,790.7 1,966.6 2,207.4 2,490.7
Capital 13,778.6 13,847.6 13,847.6 13,847.6 13,847.6 13,847.6 13,847.6
Reserves (14,671.5) (14,938.7) (14,938.7) (14,938.7) (14,938.7) (14,938.7) (14,938.7)
Retained Profits 2,436.1 2,520.1 2,739.7 2,881.5 3,057.4 3,298.2 3,581.5
Total Equity 1,543.5 1,429.3 1,648.9 1,790.7 1,966.6 2,207.4 2,490.7
e = Morgan Stanley Research estimates Source: Company data, Morgan Stanley Research

21
Removal Brambles Ltd (BXB.AX, A$6.96, Equal-Weight, LT value A$9.65)
M O R G A N S T A N L E Y R E S E A R C H
January 21, 2010 Tomorrow’s Winners
Cash Flow Statement Y/E June (US$ mn) F2008 F2009 F2010e F2011e F2012e F2013e F2014eEBITA 1,046.9 644.3 802.8 862.3 1,021.4 1,143.1 1,197.0 Depreciation 458.6 424.6 378.6 452.6 513.9 579.9 650.4 WC Changes 66.6 29.5 (49.3) (8.7) (38.2) 24.4 (16.6)Tax (232.9) (129.2) (210.4) (218.3) (264.1) (299.2) (313.4)Interest Expense (146.4) (131.8) (137.0) (170.3) (186.1) (201.8) (215.8)Interest Earnings 9.6 8.0 2.1 0.9 3.1 8.5 13.8 Operating Cash flow 1,166.3 1,023.0 786.8 918.6 1,050.1 1,254.9 1,315.3 Capex- Maintenance (458.6) (424.6) (378.6) (452.6) (513.9) (579.9) (650.4)Capex Growth (410.8) (259.2) (330.4) (339.5) (349.5) (356.9) (361.3)Non PP&E Investments (82.7) (24.4) - - - - -Disposals 140.7 101.6 - - - - -Investing Cash flow (811.4) (606.6) (709.0) (792.1) (863.4) (936.8) (1,011.7) Ordinary and Special Dividend (444.8) (277.6) (237.9) (332.8) (398.4) (409.8) (398.3)Share Issue 38.5 0.8 - - - - -Buyback (392.0) - - - - - -Other financing Cash Flow 128.3 (8.6) - - - - -Changes in borrowings 269.7 (109.3) 100.0 200.0 250.0 200.0 200.0 Financing Cash flow (400.3) (394.7) (137.9) (132.8) (148.4) (209.8) (198.3)Effect of foreign Exchange 19.8 (36.4) - - - - -Closing Cash 104.8 90.1 30.0 23.7 62.0 170.3 275.6
Ratio Analysis Y/E June (US$ mn) F2008 F2009 F2010e F2011e F2012e F2013e F2014eCHEP AMERICAS Revenues 1,581.3 1,556.9 1,611.4 1,692.0 1,751.2 1,824.7 1,916.0 Growth % 9.9% -1.5% 3.5% 5.0% 3.5% 4.2% 5.0%EBIT 452.8 229.0 319.1 329.9 395.8 456.2 479.0 EBIT Margin % 28.6% 14.7% 19.8% 19.5% 22.6% 25.0% 25.0% EMEA Revenues 1,642.1 1,452.6 1,531.5 1,608.0 1,744.7 1,893.0 1,959.3 Growth % 12.7% -11.5% 5.4% 5.0% 8.5% 8.5% 3.5%EBIT 396.5 286.5 340.0 365.0 429.2 469.5 489.8 EBIT Margin % 24.1% 19.7% 22.2% 22.7% 24.6% 24.8% 25.0% ASIA-PACIFIC Revenues 386.9 323.4 364.5 386.4 428.9 471.8 490.6 Growth % 19.9% -16.4% 12.7% 6.0% 11.0% 10.0% 4.0%EBIT 95.9 57.9 64.9 76.5 95.6 106.1 111.4 EBIT Margin % 24.8% 17.9% 17.8% 19.8% 22.3% 22.5% 22.7% CHEP Revenues 3,610.3 3,332.9 3,507.4 3,686.4 3,924.8 4,189.5 4,365.9 Growth % 12.2% -7.7% 5.2% 5.1% 6.5% 6.7% 4.2%CHEP EBIT 945.2 573.4 723.9 771.5 920.6 1,031.8 1,080.2 EBIT Margin % 26.2% 17.2% 20.6% 20.9% 23.5% 24.6% 24.7%e = Morgan Stanley Research estimates Source: Company data, Morgan Stanley Research
22
China Mengniu Dairy (2319.HK, HK$27.25, Overweight, LT value HK$45.6)
M O R G A N S T A N L E Y R E S E A R C H
January 21, 2010 Tomorrow’s Winners
Industry leader to capitalize on industry growth Ticker (Reuters/Bloomberg)Share price, close (Jan-14-2010)RatingPrice target (12-18 months)Price target (5 years) HK$45.60Average daily trading value (mn)
Return on Equity (ROE) Morgan Stanley forecast
Net Operating Profit After Tax (NOPAT) Margin
× Operating Asset Turnover
+ Return from Leverage
Source: Company data, Morgan Stanley Research estimates
2319.HK / 2319 HKHK$27.25
OverweightHK$32.00
US$20
31.2%
-18.6%
30.7%
18.1% 17.8%
18.2%17.6%17.7%
30%
20%
10%
0%
10%
20%
30%
40%
2007 2008 2009e 2010e 2011e 2012e 2013e 2014e
5.2%
-4.0%
6.0% 5.8% 6.0%5.4%
5.8% 6.2%
6%
4%
2%
0%
2%
4%
6%
8%
2007 2008 2009e 2010e 2011e 2012e 2013e 2014e
6.06 5.70
7.12
9.01
10.508.19
9.72
11.04
0.00
2.00
4.00
6.00
8.00
10.00
12.00
2007 2008 2009e 2010e 2011e 2012e 2013e 2014e
-0.3%
-11.9%
-34.1%
-45.0%
-50.6%
-39.0%
-26.7%
3.9%
60%
50%
40%
30%
20%
10%
0%
10%
2007 2008 2009e 2010e 2011e 2012e 2013e 2014e
Morgan Stanley Asia Limited+
Angela Moh [email protected]
Penny Tu
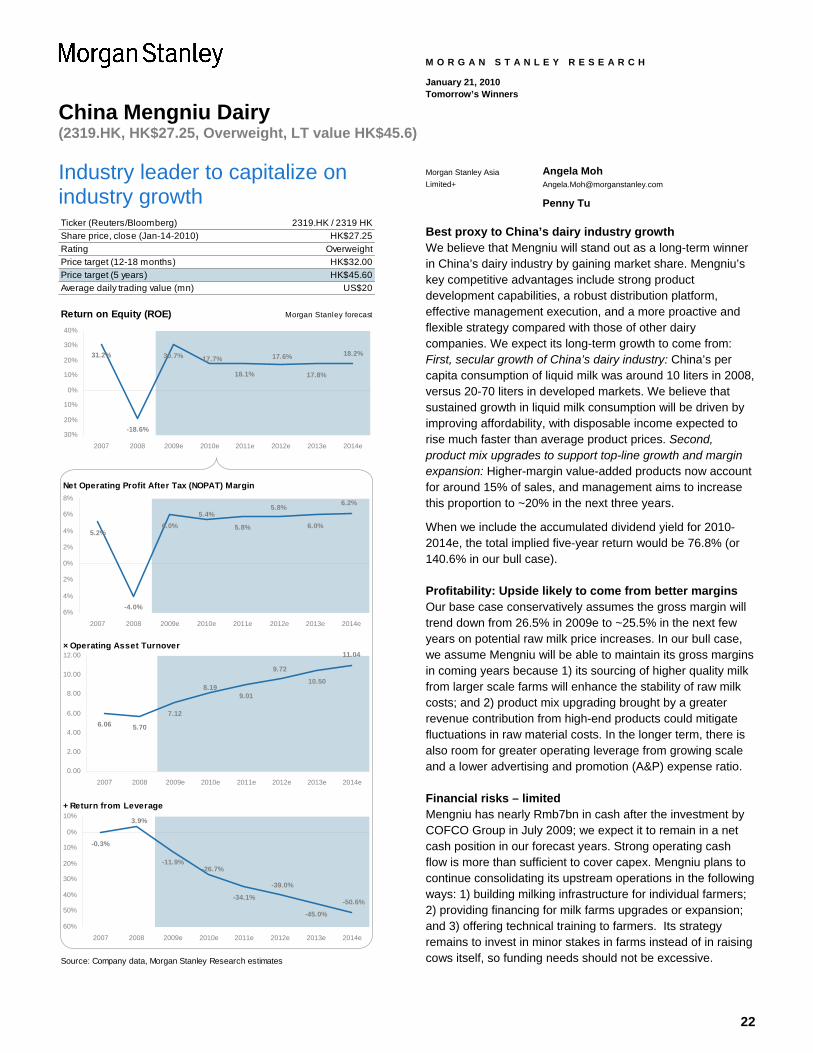
Best proxy to China’s dairy industry growth We believe that Mengniu will stand out as a long-term winner in China’s dairy industry by gaining market share. Mengniu’s key competitive advantages include strong product development capabilities, a robust distribution platform, effective management execution, and a more proactive and flexible strategy compared with those of other dairy companies. We expect its long-term growth to come from: First, secular growth of China’s dairy industry: China’s per capita consumption of liquid milk was around 10 liters in 2008, versus 20-70 liters in developed markets. We believe that sustained growth in liquid milk consumption will be driven by improving affordability, with disposable income expected to rise much faster than average product prices. Second, product mix upgrades to support top-line growth and margin expansion: Higher-margin value-added products now account for around 15% of sales, and management aims to increase this proportion to ~20% in the next three years.
When we include the accumulated dividend yield for 2010-2014e, the total implied five-year return would be 76.8% (or 140.6% in our bull case).
Profitability: Upside likely to come from better margins Our base case conservatively assumes the gross margin will trend down from 26.5% in 2009e to ~25.5% in the next few years on potential raw milk price increases. In our bull case, we assume Mengniu will be able to maintain its gross margins in coming years because 1) its sourcing of higher quality milk from larger scale farms will enhance the stability of raw milk costs; and 2) product mix upgrading brought by a greater revenue contribution from high-end products could mitigate fluctuations in raw material costs. In the longer term, there is also room for greater operating leverage from growing scale and a lower advertising and promotion (A&P) expense ratio.
Financial risks – limited Mengniu has nearly Rmb7bn in cash after the investment by COFCO Group in July 2009; we expect it to remain in a net cash position in our forecast years. Strong operating cash flow is more than sufficient to cover capex. Mengniu plans to continue consolidating its upstream operations in the following ways: 1) building milking infrastructure for individual farmers; 2) providing financing for milk farms upgrades or expansion; and 3) offering technical training to farmers. Its strategy remains to invest in minor stakes in farms instead of in raising cows itself, so funding needs should not be excessive.
23
China Mengniu Dairy (2319.HK, HK$27.25, Overweight, LT value HK$45.6)
M O R G A N S T A N L E Y R E S E A R C H
January 21, 2010 Tomorrow’s Winners
Risk-Reward: Volume growth/product mix upgrades are key drivers
0
10
20
30
40
50
60
HK$70HK$62.30(+129%)
HK$45.60(+67%)
HK$31.20(+14%)
HK$27.25
Price Target Historical Stock Performance Current Stock Price
Jan 08 Oct 08 Aug 09 May 10 Feb 11 Dec 11 Sep 12 Jun 13 Apr 14 Jan 15
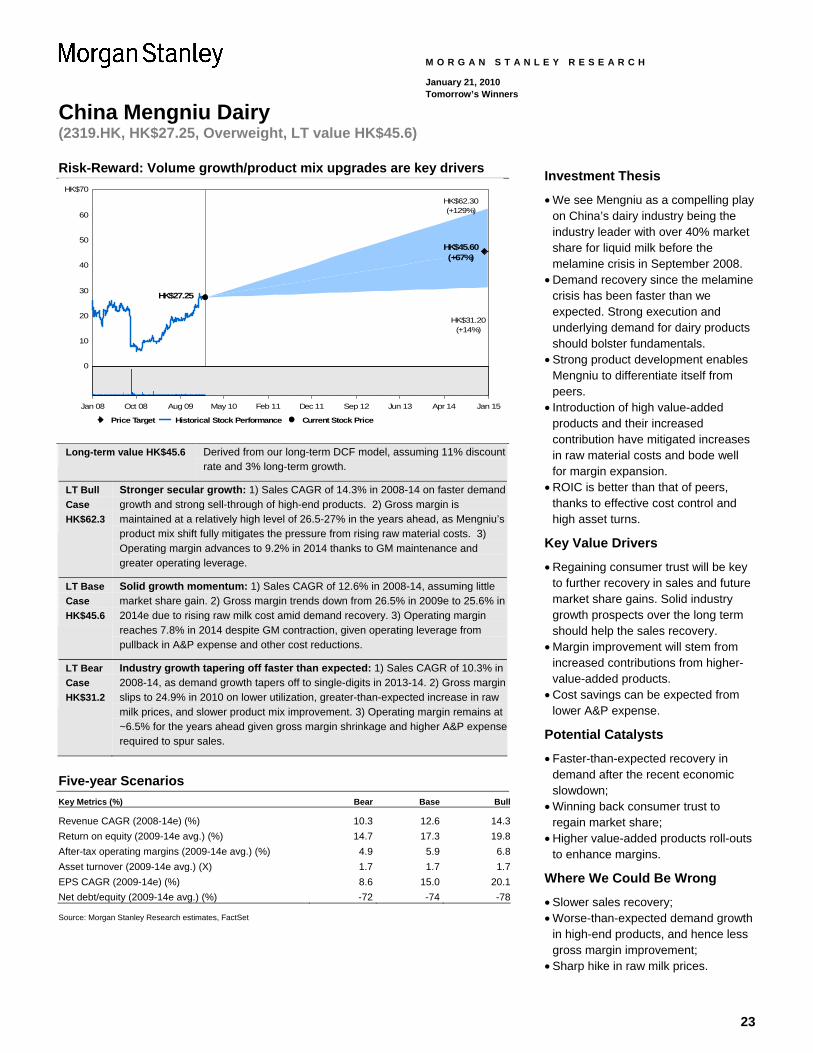
Long-term value HK$45.6 Derived from our long-term DCF model, assuming 11% discount rate and 3% long-term growth.
LT Bull Case HK$62.3
Stronger secular growth: 1) Sales CAGR of 14.3% in 2008-14 on faster demand growth and strong sell-through of high-end products. 2) Gross margin is maintained at a relatively high level of 26.5-27% in the years ahead, as Mengniu’s product mix shift fully mitigates the pressure from rising raw material costs. 3) Operating margin advances to 9.2% in 2014 thanks to GM maintenance and greater operating leverage.
LT Base Case HK$45.6
Solid growth momentum: 1) Sales CAGR of 12.6% in 2008-14, assuming little market share gain. 2) Gross margin trends down from 26.5% in 2009e to 25.6% in 2014e due to rising raw milk cost amid demand recovery. 3) Operating margin reaches 7.8% in 2014 despite GM contraction, given operating leverage from pullback in A&P expense and other cost reductions.
LT Bear Case HK$31.2
Industry growth tapering off faster than expected: 1) Sales CAGR of 10.3% in 2008-14, as demand growth tapers off to single-digits in 2013-14. 2) Gross margin slips to 24.9% in 2010 on lower utilization, greater-than-expected increase in raw milk prices, and slower product mix improvement. 3) Operating margin remains at ~6.5% for the years ahead given gross margin shrinkage and higher A&P expense required to spur sales.
Five-year Scenarios Key Metrics (%) Bear Base Bull
Revenue CAGR (2008-14e) (%) 10.3 12.6 14.3Return on equity (2009-14e avg.) (%) 14.7 17.3 19.8After-tax operating margins (2009-14e avg.) (%) 4.9 5.9 6.8Asset turnover (2009-14e avg.) (X) 1.7 1.7 1.7EPS CAGR (2009-14e) (%) 8.6 15.0 20.1Net debt/equity (2009-14e avg.) (%) -72 -74 -78 Source: Morgan Stanley Research estimates, FactSet
Investment Thesis
• We see Mengniu as a compelling play on China’s dairy industry being the industry leader with over 40% market share for liquid milk before the melamine crisis in September 2008.
• Demand recovery since the melamine crisis has been faster than we expected. Strong execution and underlying demand for dairy products should bolster fundamentals.
• Strong product development enables Mengniu to differentiate itself from peers.
• Introduction of high value-added products and their increased contribution have mitigated increases in raw material costs and bode well for margin expansion.
• ROIC is better than that of peers, thanks to effective cost control and high asset turns.
Key Value Drivers
• Regaining consumer trust will be key to further recovery in sales and future market share gains. Solid industry growth prospects over the long term should help the sales recovery.
• Margin improvement will stem from increased contributions from higher-value-added products.
• Cost savings can be expected from lower A&P expense.
Potential Catalysts
• Faster-than-expected recovery in demand after the recent economic slowdown;
• Winning back consumer trust to regain market share;
• Higher value-added products roll-outs to enhance margins.
Where We Could Be Wrong
• Slower sales recovery; • Worse-than-expected demand growth
in high-end products, and hence less gross margin improvement;
• Sharp hike in raw milk prices.
24
China Mengniu Dairy (2319.HK, HK$27.25, Overweight, LT value HK$45.6)
M O R G A N S T A N L E Y R E S E A R C H
January 21, 2010 Tomorrow’s Winners
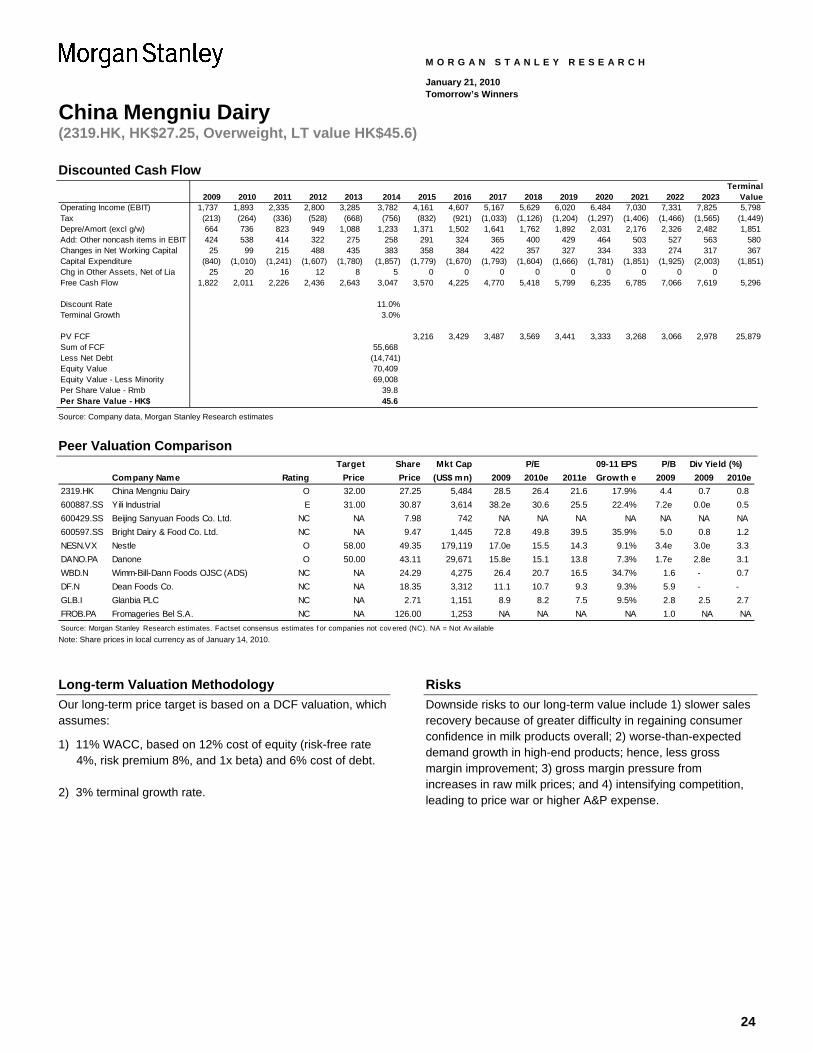
Discounted Cash Flow
2009 2010 2011 2012 2013 2014 2015 2016 2017 2018 2019 2020 2021 2022 2023Terminal
ValueOperating Income (EBIT) 1,737 1,893 2,335 2,800 3,285 3,782 4,161 4,607 5,167 5,629 6,020 6,484 7,030 7,331 7,825 5,798Tax (213) (264) (336) (528) (668) (756) (832) (921) (1,033) (1,126) (1,204) (1,297) (1,406) (1,466) (1,565) (1,449)Depre/Amort (excl g/w) 664 736 823 949 1,088 1,233 1,371 1,502 1,641 1,762 1,892 2,031 2,176 2,326 2,482 1,851Add: Other noncash items in EBIT 424 538 414 322 275 258 291 324 365 400 429 464 503 527 563 580Changes in Net Working Capital 25 99 215 488 435 383 358 384 422 357 327 334 333 274 317 367Capital Expenditure (840) (1,010) (1,241) (1,607) (1,780) (1,857) (1,779) (1,670) (1,793) (1,604) (1,666) (1,781) (1,851) (1,925) (2,003) (1,851)Chg in Other Assets, Net of Lia 25 20 16 12 8 5 0 0 0 0 0 0 0 0 0Free Cash Flow 1,822 2,011 2,226 2,436 2,643 3,047 3,570 4,225 4,770 5,418 5,799 6,235 6,785 7,066 7,619 5,296
Discount Rate 11.0%Terminal Growth 3.0%
PV FCF 3,216 3,429 3,487 3,569 3,441 3,333 3,268 3,066 2,978 25,879Sum of FCF 55,668Less Net Debt (14,741)Equity Value 70,409Equity Value - Less Minority 69,008Per Share Value - Rmb 39.8Per Share Value - HK$ 45.6 Source: Company data, Morgan Stanley Research estimates
Peer Valuation Comparison
Target Share Mkt Cap 09-11 EPS P/BCompany Name Rating Price Price (US$ mn) 2009 2010e 2011e Growth e 2009 2009 2010e
2319.HK China Mengniu Dairy O 32.00 27.25 5,484 28.5 26.4 21.6 17.9% 4.4 0.7 0.8 600887.SS Yili Industrial E 31.00 30.87 3,614 38.2e 30.6 25.5 22.4% 7.2e 0.0e 0.5600429.SS Beijing Sanyuan Foods Co. Ltd. NC NA 7.98 742 NA NA NA NA NA NA NA600597.SS Bright Dairy & Food Co. Ltd. NC NA 9.47 1,445 72.8 49.8 39.5 35.9% 5.0 0.8 1.2 NESN.VX Nestle O 58.00 49.35 179,119 17.0e 15.5 14.3 9.1% 3.4e 3.0e 3.3DANO.PA Danone O 50.00 43.11 29,671 15.8e 15.1 13.8 7.3% 1.7e 2.8e 3.1WBD.N Wimm-Bill-Dann Foods OJSC (ADS) NC NA 24.29 4,275 26.4 20.7 16.5 34.7% 1.6 - 0.7 DF.N Dean Foods Co. NC NA 18.35 3,312 11.1 10.7 9.3 9.3% 5.9 - - GLB.I Glanbia PLC NC NA 2.71 1,151 8.9 8.2 7.5 9.5% 2.8 2.5 2.7 FROB.PA Fromageries Bel S.A. NC NA 126.00 1,253 NA NA NA NA 1.0 NA NASource: Morgan Stanley Research estimates. Factset consensus estimates f or companies not cov ered (NC). NA = Not Av ailable
P/E Div Yield (%)
Note: Share prices in local currency as of January 14, 2010.
Long-term Valuation Methodology Our long-term price target is based on a DCF valuation, which assumes:
1) 11% WACC, based on 12% cost of equity (risk-free rate 4%, risk premium 8%, and 1x beta) and 6% cost of debt.
2) 3% terminal growth rate.
Risks Downside risks to our long-term value include 1) slower sales recovery because of greater difficulty in regaining consumer confidence in milk products overall; 2) worse-than-expected demand growth in high-end products; hence, less gross margin improvement; 3) gross margin pressure from increases in raw milk prices; and 4) intensifying competition, leading to price war or higher A&P expense.
25
China Mengniu Dairy (2319.HK, HK$27.25, Overweight, LT value HK$45.6)
M O R G A N S T A N L E Y R E S E A R C H
January 21, 2010 Tomorrow’s Winners
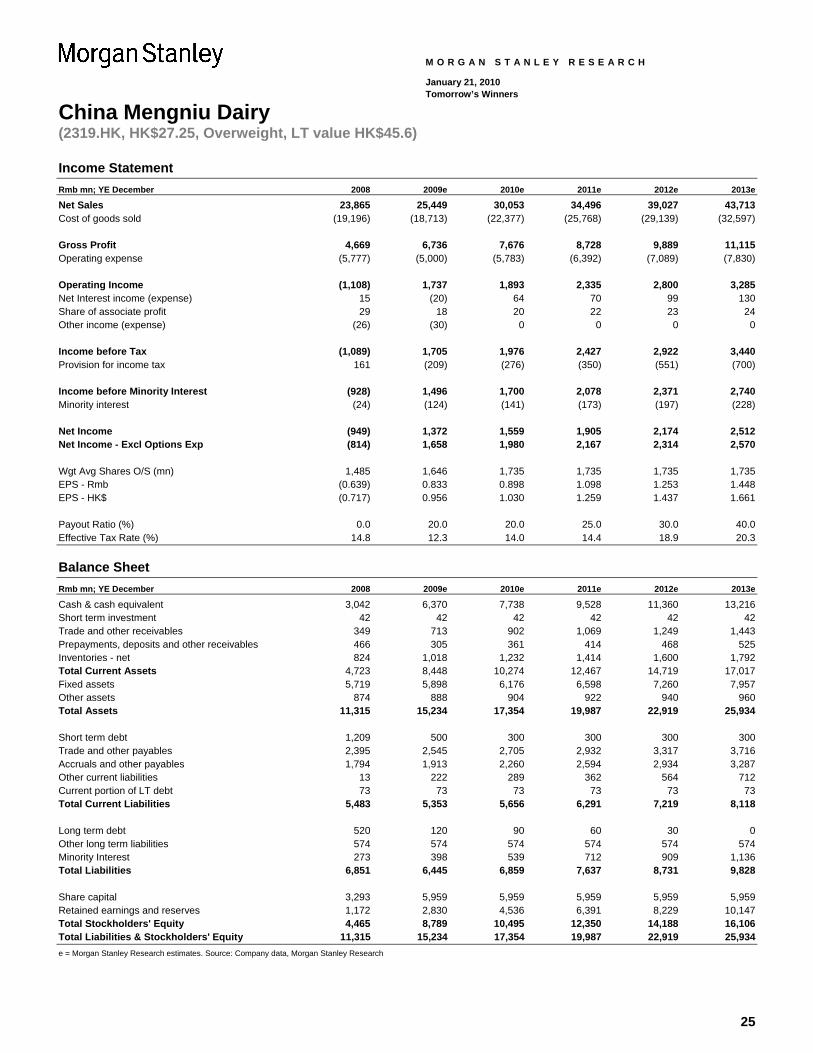
Income Statement Rmb mn; YE December 2008 2009e 2010e 2011e 2012e 2013e Net Sales 23,865 25,449 30,053 34,496 39,027 43,713 Cost of goods sold (19,196) (18,713) (22,377) (25,768) (29,139) (32,597) Gross Profit 4,669 6,736 7,676 8,728 9,889 11,115 Operating expense (5,777) (5,000) (5,783) (6,392) (7,089) (7,830) Operating Income (1,108) 1,737 1,893 2,335 2,800 3,285 Net Interest income (expense) 15 (20) 64 70 99 130 Share of associate profit 29 18 20 22 23 24 Other income (expense) (26) (30) 0 0 0 0 Income before Tax (1,089) 1,705 1,976 2,427 2,922 3,440 Provision for income tax 161 (209) (276) (350) (551) (700) Income before Minority Interest (928) 1,496 1,700 2,078 2,371 2,740 Minority interest (24) (124) (141) (173) (197) (228) Net Income (949) 1,372 1,559 1,905 2,174 2,512 Net Income - Excl Options Exp (814) 1,658 1,980 2,167 2,314 2,570 Wgt Avg Shares O/S (mn) 1,485 1,646 1,735 1,735 1,735 1,735 EPS - Rmb (0.639) 0.833 0.898 1.098 1.253 1.448 EPS - HK$ (0.717) 0.956 1.030 1.259 1.437 1.661 Payout Ratio (%) 0.0 20.0 20.0 25.0 30.0 40.0 Effective Tax Rate (%) 14.8 12.3 14.0 14.4 18.9 20.3
Balance Sheet Rmb mn; YE December 2008 2009e 2010e 2011e 2012e 2013e Cash & cash equivalent 3,042 6,370 7,738 9,528 11,360 13,216 Short term investment 42 42 42 42 42 42 Trade and other receivables 349 713 902 1,069 1,249 1,443 Prepayments, deposits and other receivables 466 305 361 414 468 525 Inventories - net 824 1,018 1,232 1,414 1,600 1,792 Total Current Assets 4,723 8,448 10,274 12,467 14,719 17,017 Fixed assets 5,719 5,898 6,176 6,598 7,260 7,957 Other assets 874 888 904 922 940 960 Total Assets 11,315 15,234 17,354 19,987 22,919 25,934 Short term debt 1,209 500 300 300 300 300 Trade and other payables 2,395 2,545 2,705 2,932 3,317 3,716 Accruals and other payables 1,794 1,913 2,260 2,594 2,934 3,287 Other current liabilities 13 222 289 362 564 712 Current portion of LT debt 73 73 73 73 73 73 Total Current Liabilities 5,483 5,353 5,656 6,291 7,219 8,118 Long term debt 520 120 90 60 30 0 Other long term liabilities 574 574 574 574 574 574 Minority Interest 273 398 539 712 909 1,136 Total Liabilities 6,851 6,445 6,859 7,637 8,731 9,828 Share capital 3,293 5,959 5,959 5,959 5,959 5,959 Retained earnings and reserves 1,172 2,830 4,536 6,391 8,229 10,147 Total Stockholders' Equity 4,465 8,789 10,495 12,350 14,188 16,106 Total Liabilities & Stockholders' Equity 11,315 15,234 17,354 19,987 22,919 25,934 e = Morgan Stanley Research estimates. Source: Company data, Morgan Stanley Research
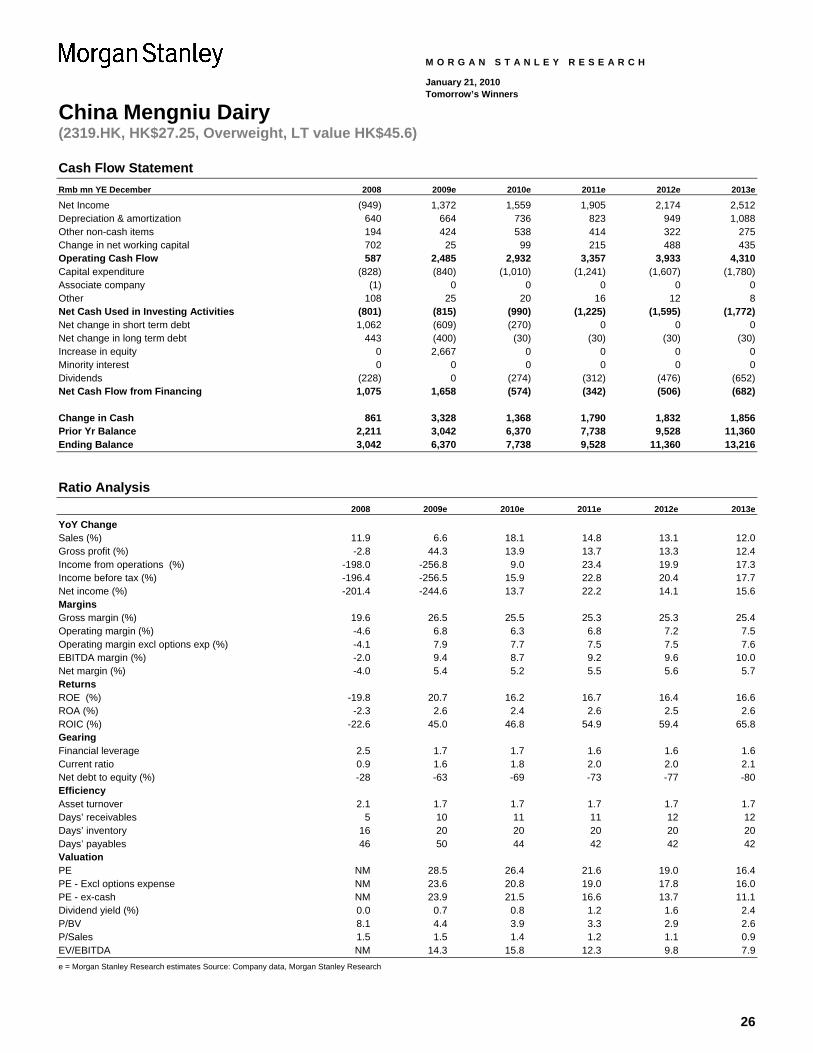
26
China Mengniu Dairy (2319.HK, HK$27.25, Overweight, LT value HK$45.6)
M O R G A N S T A N L E Y R E S E A R C H
January 21, 2010 Tomorrow’s Winners
Cash Flow Statement Rmb mn YE December 2008 2009e 2010e 2011e 2012e 2013e Net Income (949) 1,372 1,559 1,905 2,174 2,512 Depreciation & amortization 640 664 736 823 949 1,088 Other non-cash items 194 424 538 414 322 275 Change in net working capital 702 25 99 215 488 435 Operating Cash Flow 587 2,485 2,932 3,357 3,933 4,310 Capital expenditure (828) (840) (1,010) (1,241) (1,607) (1,780) Associate company (1) 0 0 0 0 0 Other 108 25 20 16 12 8 Net Cash Used in Investing Activities (801) (815) (990) (1,225) (1,595) (1,772) Net change in short term debt 1,062 (609) (270) 0 0 0 Net change in long term debt 443 (400) (30) (30) (30) (30) Increase in equity 0 2,667 0 0 0 0 Minority interest 0 0 0 0 0 0 Dividends (228) 0 (274) (312) (476) (652) Net Cash Flow from Financing 1,075 1,658 (574) (342) (506) (682) Change in Cash 861 3,328 1,368 1,790 1,832 1,856 Prior Yr Balance 2,211 3,042 6,370 7,738 9,528 11,360 Ending Balance 3,042 6,370 7,738 9,528 11,360 13,216
Ratio Analysis 2008 2009e 2010e 2011e 2012e 2013e YoY Change Sales (%) 11.9 6.6 18.1 14.8 13.1 12.0 Gross profit (%) -2.8 44.3 13.9 13.7 13.3 12.4 Income from operations (%) -198.0 -256.8 9.0 23.4 19.9 17.3 Income before tax (%) -196.4 -256.5 15.9 22.8 20.4 17.7 Net income (%) -201.4 -244.6 13.7 22.2 14.1 15.6 Margins Gross margin (%) 19.6 26.5 25.5 25.3 25.3 25.4 Operating margin (%) -4.6 6.8 6.3 6.8 7.2 7.5 Operating margin excl options exp (%) -4.1 7.9 7.7 7.5 7.5 7.6 EBITDA margin (%) -2.0 9.4 8.7 9.2 9.6 10.0 Net margin (%) -4.0 5.4 5.2 5.5 5.6 5.7 Returns ROE (%) -19.8 20.7 16.2 16.7 16.4 16.6 ROA (%) -2.3 2.6 2.4 2.6 2.5 2.6 ROIC (%) -22.6 45.0 46.8 54.9 59.4 65.8 Gearing Financial leverage 2.5 1.7 1.7 1.6 1.6 1.6 Current ratio 0.9 1.6 1.8 2.0 2.0 2.1 Net debt to equity (%) -28 -63 -69 -73 -77 -80 Efficiency Asset turnover 2.1 1.7 1.7 1.7 1.7 1.7 Days’ receivables 5 10 11 11 12 12 Days’ inventory 16 20 20 20 20 20 Days’ payables 46 50 44 42 42 42 Valuation PE NM 28.5 26.4 21.6 19.0 16.4 PE - Excl options expense NM 23.6 20.8 19.0 17.8 16.0 PE - ex-cash NM 23.9 21.5 16.6 13.7 11.1 Dividend yield (%) 0.0 0.7 0.8 1.2 1.6 2.4 P/BV 8.1 4.4 3.9 3.3 2.9 2.6 P/Sales 1.5 1.5 1.4 1.2 1.1 0.9 EV/EBITDA NM 14.3 15.8 12.3 9.8 7.9 e = Morgan Stanley Research estimates Source: Company data, Morgan Stanley Research

27
Addition Educomp Solutions Ltd. (EDSO.BO, Rs740.70, Equal-Weight, LT value Rs1,400)
M O R G A N S T A N L E Y R E S E A R C H
January 21, 2010 Tomorrow’s Winners
Substantial scope long term in an emerging industry Ticker (Reuters/Bloomberg)Share price, close (Jan-19-2010)RatingPrice target (12-18 months)Price target (5 years) Rs1,400Average daily trading value (mn)
Return on Equity (ROE) Morgan Stanley forecast
Net Operating Profit After Tax (NOPAT) Margin
× Operating Asset Turnover
+ Return from Leverage
Source: Company data, Morgan Stanley Research estimates
EDSO.BO / EDSL INRs740.70
Equal-WeightRs805.00
US$27
31.7%
61.7%
46.5%
26.6% 29.1%25.4%
27.4%29.7%
65.6%
0%
10%
20%
30%
40%
50%
60%
70%
2007 2008 2009 2010e 2011e 2012e 2013e 2014e 2015e
23.4%
22.1%22.6% 22.6%
25.1%
23.3%
21.1%
24.5% 24.5%
19%
20%
21%
22%
23%
24%
25%
26%
2007 2008 2009 2010e 2011e 2012e 2013e 2014e 2015e
2.71
2.10
1.61
1.16 1.281.47
0.89
1.201.36
0.00
0.50
1.00
1.50
2.00
2.50
3.00
2007 2008 2009 2010e 2011e 2012e 2013e 2014e 2015e
-31.7%
10.0%0.4% -3.0%
-8.7%
-5.9%0.3%
46.7%
15.3%
40%30%20%10%
0%10%20%30%40%50%60%
2007 2008 2009 2010e 2011e 2012e 2013e 2014e 2015e
Morgan Stanley India Company Private Limited+
Vipin Khare [email protected]
Gaurav Rateria
Best play on rising use of multimedia content in schools We are adding Educomp as a Tomorrow’s Winner. We think Educomp is the best way to capitalize on the growing acceptability of multimedia content for teaching in K-12 schools and the increasing share of private schools in India. Momentum in earnings growth should be the key stock driver, in our view. Educomp has the potential to increase its presence sevenfold to around 17,000 private schools by F2015, we estimate, driven by its strong competitive position and low penetration in a fast-growing market.
Key trends over the next five years First, growth in K-12 private schools: We estimate K-12 schools will continue to account for the largest proportion of students (~300mn by F2015) enrolled in India, with private schools gaining share to ~21% of all schools by F2015. Second, vocational business a big business opportunity: We estimate vocational and K-12 school revenue could reach US$100mn and US$170mn, respectively, by F2015, accounting for an aggregate 35% of company revenue, against 14% in F2010. Third, increasing penetration of SmartClass: We believe that once Educomp gains a critical mass by covering 25-30% of private schools in a city, demand could increase exponentially as the advantages become apparent and remaining schools catch up in adopting Educomp’s multimedia offerings.
Profitability: Scale should drive margin improvement We expect Educomp to generate US$800mn revenue in F2015, with SmartClass and ICT together contributing 59% of revenue and 77% of profit. The recent change in the SmartClass business model should help Educomp turn FCF positive in the coming years. We expect revenue and EBIT CAGRs of 30% and 23% in F2010-15 with EBIT margins at 33% and ROE at 25% by F2015.
Financial risks Sale of SmartClass is routed to schools through a third-party entity, Edusmart. Educomp’s cash flow depends on the success of its new securitization model. It also has an off-balance sheet liability arising from a corporate guarantee to banks. We expect the debt/equity ratio of 0.7x in F2010e to trend down as Educomp turns net cash positive. Lower profitability due to price pressure in SmartClass and longer than expected time to break even in vocational and online businesses could be a drag on ROE.
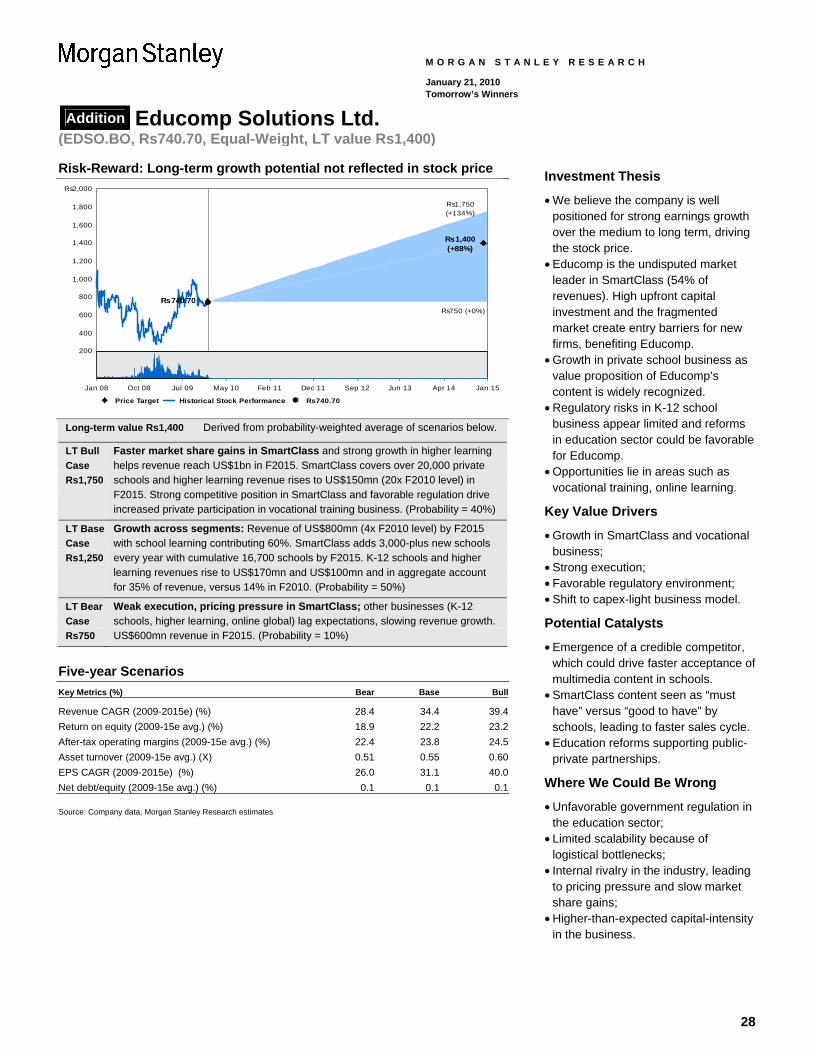
28
Addition Educomp Solutions Ltd. (EDSO.BO, Rs740.70, Equal-Weight, LT value Rs1,400)
M O R G A N S T A N L E Y R E S E A R C H
January 21, 2010 Tomorrow’s Winners
Risk-Reward: Long-term growth potential not reflected in stock price
200
400
600
800
1,000
1,200
1,400
1,600
1,800
Rs2,000
Rs1,750(+134%)
Rs1,400(+88%)
Rs750 (+0%)Rs740.70
Price Target Historical Stock Performance Rs740.70
Jan 08 Oct 08 Jul 09 May 10 Feb 11 Dec 11 Sep 12 Jun 13 Apr 14 Jan 15
Long-term value Rs1,400 Derived from probability-weighted average of scenarios below.
LT Bull Case Rs1,750
Faster market share gains in SmartClass and strong growth in higher learning helps revenue reach US$1bn in F2015. SmartClass covers over 20,000 private schools and higher learning revenue rises to US$150mn (20x F2010 level) in F2015. Strong competitive position in SmartClass and favorable regulation drive increased private participation in vocational training business. (Probability = 40%)
LT Base Case Rs1,250
Growth across segments: Revenue of US$800mn (4x F2010 level) by F2015 with school learning contributing 60%. SmartClass adds 3,000-plus new schools every year with cumulative 16,700 schools by F2015. K-12 schools and higher learning revenues rise to US$170mn and US$100mn and in aggregate account for 35% of revenue, versus 14% in F2010. (Probability = 50%)
LT Bear Case Rs750
Weak execution, pricing pressure in SmartClass; other businesses (K-12 schools, higher learning, online global) lag expectations, slowing revenue growth. US$600mn revenue in F2015. (Probability = 10%)
Five-year Scenarios Key Metrics (%) Bear Base Bull
Revenue CAGR (2009-2015e) (%) 28.4 34.4 39.4Return on equity (2009-15e avg.) (%) 18.9 22.2 23.2After-tax operating margins (2009-15e avg.) (%) 22.4 23.8 24.5Asset turnover (2009-15e avg.) (X) 0.51 0.55 0.60EPS CAGR (2009-2015e) (%) 26.0 31.1 40.0Net debt/equity (2009-15e avg.) (%) 0.1 0.1 0.1 Source: Company data, Morgan Stanley Research estimates
Investment Thesis
• We believe the company is well positioned for strong earnings growth over the medium to long term, driving the stock price.
• Educomp is the undisputed market leader in SmartClass (54% of revenues). High upfront capital investment and the fragmented market create entry barriers for new firms, benefiting Educomp.
• Growth in private school business as value proposition of Educomp’s content is widely recognized.
• Regulatory risks in K-12 school business appear limited and reforms in education sector could be favorable for Educomp.
• Opportunities lie in areas such as vocational training, online learning.
Key Value Drivers
• Growth in SmartClass and vocational business;
• Strong execution; • Favorable regulatory environment; • Shift to capex-light business model.
Potential Catalysts
• Emergence of a credible competitor, which could drive faster acceptance of multimedia content in schools.
• SmartClass content seen as “must have” versus “good to have” by schools, leading to faster sales cycle.
• Education reforms supporting public-private partnerships.
Where We Could Be Wrong
• Unfavorable government regulation in the education sector;
• Limited scalability because of logistical bottlenecks;
• Internal rivalry in the industry, leading to pricing pressure and slow market share gains;
• Higher-than-expected capital-intensity in the business.
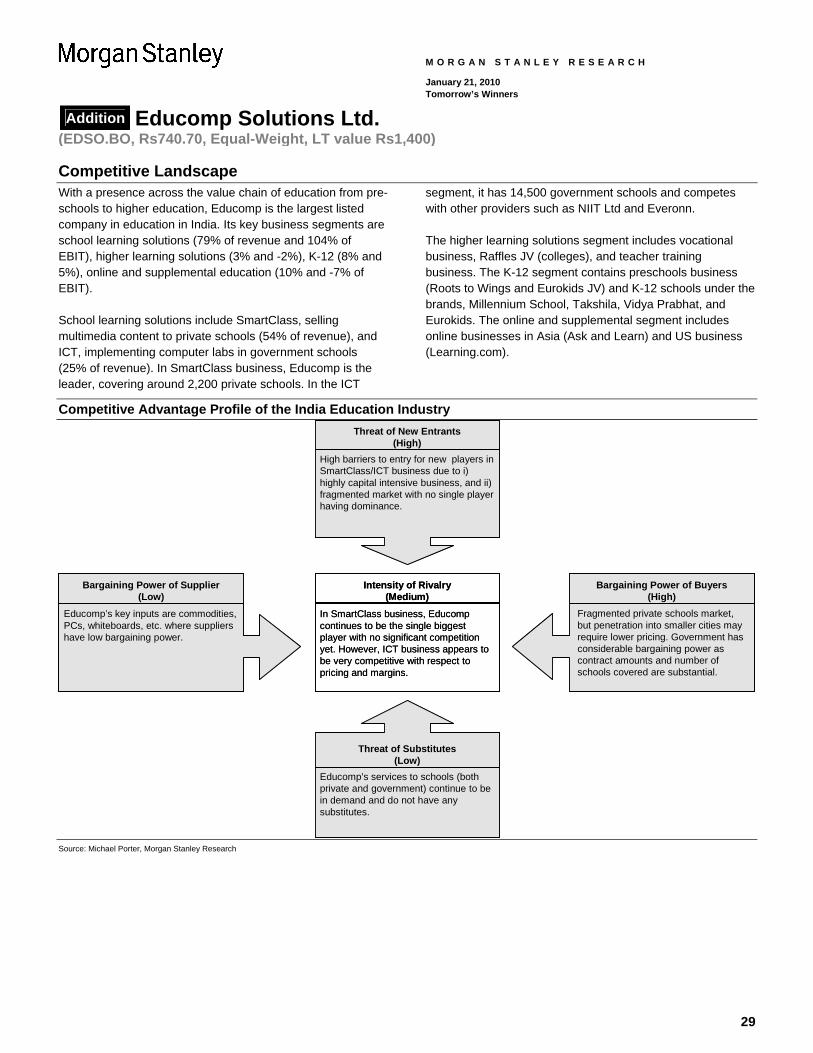
29
Addition Educomp Solutions Ltd. (EDSO.BO, Rs740.70, Equal-Weight, LT value Rs1,400)
M O R G A N S T A N L E Y R E S E A R C H
January 21, 2010 Tomorrow’s Winners
Competitive Landscape With a presence across the value chain of education from pre-schools to higher education, Educomp is the largest listed company in education in India. Its key business segments are school learning solutions (79% of revenue and 104% of EBIT), higher learning solutions (3% and -2%), K-12 (8% and 5%), online and supplemental education (10% and -7% of EBIT).
School learning solutions include SmartClass, selling multimedia content to private schools (54% of revenue), and ICT, implementing computer labs in government schools (25% of revenue). In SmartClass business, Educomp is the leader, covering around 2,200 private schools. In the ICT
segment, it has 14,500 government schools and competes with other providers such as NIIT Ltd and Everonn.
The higher learning solutions segment includes vocational business, Raffles JV (colleges), and teacher training business. The K-12 segment contains preschools business (Roots to Wings and Eurokids JV) and K-12 schools under the brands, Millennium School, Takshila, Vidya Prabhat, and Eurokids. The online and supplemental segment includes online businesses in Asia (Ask and Learn) and US business (Learning.com).
Competitive Advantage Profile of the India Education Industry
High barriers to entry for new players in SmartClass/ICT business due to i) highly capital intensive business, and ii) fragmented market with no single player having dominance.
Threat of New Entrants(High)
In SmartClass business, Educompcontinues to be the single biggest player with no significant competition yet. However, ICT business appears to be very competitive with respect to pricing and margins.
Intensity of Rivalry(Medium)
Fragmented private schools market, but penetration into smaller cities may require lower pricing. Government has considerable bargaining power as contract amounts and number of schools covered are substantial.
Bargaining Power of Buyers(High)
Educomp’s key inputs are commodities, PCs, whiteboards, etc. where suppliers have low bargaining power.
Bargaining Power of Supplier(Low)
Educomp’s services to schools (both private and government) continue to be in demand and do not have any substitutes.
Threat of Substitutes(Low)
Source: Michael Porter, Morgan Stanley Research
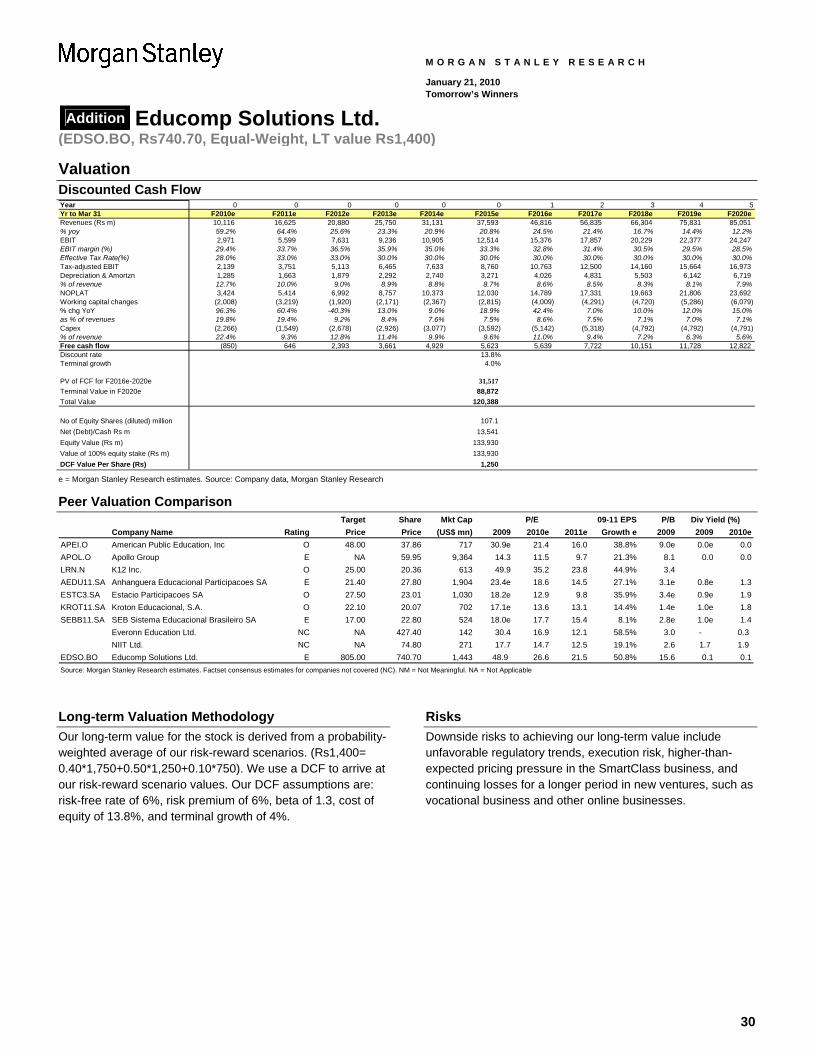
30
Addition Educomp Solutions Ltd. (EDSO.BO, Rs740.70, Equal-Weight, LT value Rs1,400)
M O R G A N S T A N L E Y R E S E A R C H
January 21, 2010 Tomorrow’s Winners
Valuation Discounted Cash Flow Year 0 0 0 0 0 0 1 2 3 4 5Yr to Mar 31 F2010e F2011e F2012e F2013e F2014e F2015e F2016e F2017e F2018e F2019e F2020e Revenues (Rs m) 10,116 16,625 20,880 25,750 31,131 37,593 46,816 56,835 66,304 75,831 85,051 % yoy 59.2% 64.4% 25.6% 23.3% 20.9% 20.8% 24.5% 21.4% 16.7% 14.4% 12.2%EBIT 2,971 5,599 7,631 9,236 10,905 12,514 15,376 17,857 20,229 22,377 24,247 EBIT margin (%) 29.4% 33.7% 36.5% 35.9% 35.0% 33.3% 32.8% 31.4% 30.5% 29.5% 28.5%Effective Tax Rate(%) 28.0% 33.0% 33.0% 30.0% 30.0% 30.0% 30.0% 30.0% 30.0% 30.0% 30.0%Tax-adjusted EBIT 2,139 3,751 5,113 6,465 7,633 8,760 10,763 12,500 14,160 15,664 16,973 Depreciation & Amortzn 1,285 1,663 1,879 2,292 2,740 3,271 4,026 4,831 5,503 6,142 6,719 % of revenue 12.7% 10.0% 9.0% 8.9% 8.8% 8.7% 8.6% 8.5% 8.3% 8.1% 7.9%NOPLAT 3,424 5,414 6,992 8,757 10,373 12,030 14,789 17,331 19,663 21,806 23,692 Working capital changes (2,008) (3,219) (1,920) (2,171) (2,367) (2,815) (4,009) (4,291) (4,720) (5,286) (6,079) % chg YoY 96.3% 60.4% -40.3% 13.0% 9.0% 18.9% 42.4% 7.0% 10.0% 12.0% 15.0%as % of revenues 19.8% 19.4% 9.2% 8.4% 7.6% 7.5% 8.6% 7.5% 7.1% 7.0% 7.1%Capex (2,266) (1,549) (2,678) (2,926) (3,077) (3,592) (5,142) (5,318) (4,792) (4,792) (4,791) % of revenue 22.4% 9.3% 12.8% 11.4% 9.9% 9.6% 11.0% 9.4% 7.2% 6.3% 5.6%Free cash flow (850) 646 2,393 3,661 4,929 5,623 5,639 7,722 10,151 11,728 12,822 Discount rate 13.8%Terminal growth 4.0%
PV of FCF for F2016e-2020e 31,517 Terminal Value in F2020e 88,872 Total Value 120,388
No of Equity Shares (diluted) million 107.1 Net (Debt)/Cash Rs m 13,541 Equity Value (Rs m) 133,930 Value of 100% equity stake (Rs m) 133,930 DCF Value Per Share (Rs) 1,250 e = Morgan Stanley Research estimates. Source: Company data, Morgan Stanley Research
Peer Valuation Comparison Target Share Mkt Cap 09-11 EPS P/B
Company Name Rating Price Price (US$ mn) 2009 2010e 2011e Growth e 2009 2009 2010eAPEI.O American Public Education, Inc O 48.00 37.86 717 30.9e 21.4 16.0 38.8% 9.0e 0.0e 0.0APOL.O Apollo Group E NA 59.95 9,364 14.3 11.5 9.7 21.3% 8.1 0.0 0.0LRN.N K12 Inc. O 25.00 20.36 613 49.9 35.2 23.8 44.9% 3.4AEDU11.SA Anhanguera Educacional Participacoes SA E 21.40 27.80 1,904 23.4e 18.6 14.5 27.1% 3.1e 0.8e 1.3ESTC3.SA Estacio Participacoes SA O 27.50 23.01 1,030 18.2e 12.9 9.8 35.9% 3.4e 0.9e 1.9KROT11.SA Kroton Educacional, S.A. O 22.10 20.07 702 17.1e 13.6 13.1 14.4% 1.4e 1.0e 1.8SEBB11.SA SEB Sistema Educacional Brasileiro SA E 17.00 22.80 524 18.0e 17.7 15.4 8.1% 2.8e 1.0e 1.4
Everonn Education Ltd. NC NA 427.40 142 30.4 16.9 12.1 58.5% 3.0 - 0.3 NIIT Ltd. NC NA 74.80 271 17.7 14.7 12.5 19.1% 2.6 1.7 1.9
EDSO.BO Educomp Solutions Ltd. E 805.00 740.70 1,443 48.9 26.6 21.5 50.8% 15.6 0.1 0.1Source: Morgan Stanley Research estimates. Factset consensus estimates for companies not covered (NC). NM = Not Meaningful. NA = Not Applicable
P/E Div Yield (%)
Long-term Valuation Methodology Our long-term value for the stock is derived from a probability-weighted average of our risk-reward scenarios. (Rs1,400= 0.40*1,750+0.50*1,250+0.10*750). We use a DCF to arrive at our risk-reward scenario values. Our DCF assumptions are: risk-free rate of 6%, risk premium of 6%, beta of 1.3, cost of equity of 13.8%, and terminal growth of 4%.
Risks Downside risks to achieving our long-term value include unfavorable regulatory trends, execution risk, higher-than-expected pricing pressure in the SmartClass business, and continuing losses for a longer period in new ventures, such as vocational business and other online businesses.
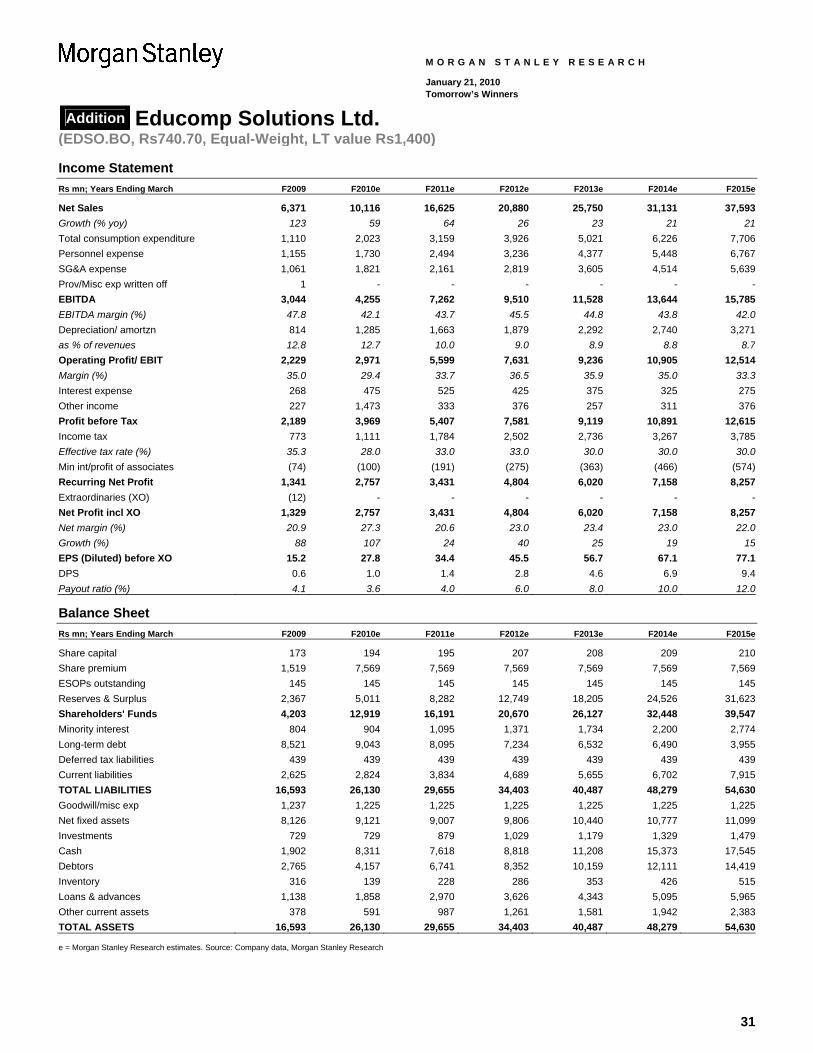
31
Addition Educomp Solutions Ltd. (EDSO.BO, Rs740.70, Equal-Weight, LT value Rs1,400)
M O R G A N S T A N L E Y R E S E A R C H
January 21, 2010 Tomorrow’s Winners
Income Statement Rs mn; Years Ending March F2009 F2010e F2011e F2012e F2013e F2014e F2015e
Net Sales 6,371 10,116 16,625 20,880 25,750 31,131 37,593Growth (% yoy) 123 59 64 26 23 21 21Total consumption expenditure 1,110 2,023 3,159 3,926 5,021 6,226 7,706Personnel expense 1,155 1,730 2,494 3,236 4,377 5,448 6,767SG&A expense 1,061 1,821 2,161 2,819 3,605 4,514 5,639Prov/Misc exp written off 1 - - - - - -EBITDA 3,044 4,255 7,262 9,510 11,528 13,644 15,785EBITDA margin (%) 47.8 42.1 43.7 45.5 44.8 43.8 42.0Depreciation/ amortzn 814 1,285 1,663 1,879 2,292 2,740 3,271as % of revenues 12.8 12.7 10.0 9.0 8.9 8.8 8.7Operating Profit/ EBIT 2,229 2,971 5,599 7,631 9,236 10,905 12,514Margin (%) 35.0 29.4 33.7 36.5 35.9 35.0 33.3Interest expense 268 475 525 425 375 325 275Other income 227 1,473 333 376 257 311 376Profit before Tax 2,189 3,969 5,407 7,581 9,119 10,891 12,615Income tax 773 1,111 1,784 2,502 2,736 3,267 3,785Effective tax rate (%) 35.3 28.0 33.0 33.0 30.0 30.0 30.0Min int/profit of associates (74) (100) (191) (275) (363) (466) (574)Recurring Net Profit 1,341 2,757 3,431 4,804 6,020 7,158 8,257Extraordinaries (XO) (12) - - - - - -Net Profit incl XO 1,329 2,757 3,431 4,804 6,020 7,158 8,257Net margin (%) 20.9 27.3 20.6 23.0 23.4 23.0 22.0Growth (%) 88 107 24 40 25 19 15EPS (Diluted) before XO 15.2 27.8 34.4 45.5 56.7 67.1 77.1DPS 0.6 1.0 1.4 2.8 4.6 6.9 9.4Payout ratio (%) 4.1 3.6 4.0 6.0 8.0 10.0 12.0
Balance Sheet Rs mn; Years Ending March F2009 F2010e F2011e F2012e F2013e F2014e F2015e
Share capital 173 194 195 207 208 209 210Share premium 1,519 7,569 7,569 7,569 7,569 7,569 7,569ESOPs outstanding 145 145 145 145 145 145 145Reserves & Surplus 2,367 5,011 8,282 12,749 18,205 24,526 31,623Shareholders' Funds 4,203 12,919 16,191 20,670 26,127 32,448 39,547Minority interest 804 904 1,095 1,371 1,734 2,200 2,774Long-term debt 8,521 9,043 8,095 7,234 6,532 6,490 3,955Deferred tax liabilities 439 439 439 439 439 439 439Current liabilities 2,625 2,824 3,834 4,689 5,655 6,702 7,915TOTAL LIABILITIES 16,593 26,130 29,655 34,403 40,487 48,279 54,630Goodwill/misc exp 1,237 1,225 1,225 1,225 1,225 1,225 1,225Net fixed assets 8,126 9,121 9,007 9,806 10,440 10,777 11,099Investments 729 729 879 1,029 1,179 1,329 1,479Cash 1,902 8,311 7,618 8,818 11,208 15,373 17,545Debtors 2,765 4,157 6,741 8,352 10,159 12,111 14,419Inventory 316 139 228 286 353 426 515Loans & advances 1,138 1,858 2,970 3,626 4,343 5,095 5,965Other current assets 378 591 987 1,261 1,581 1,942 2,383TOTAL ASSETS 16,593 26,130 29,655 34,403 40,487 48,279 54,630 e = Morgan Stanley Research estimates. Source: Company data, Morgan Stanley Research
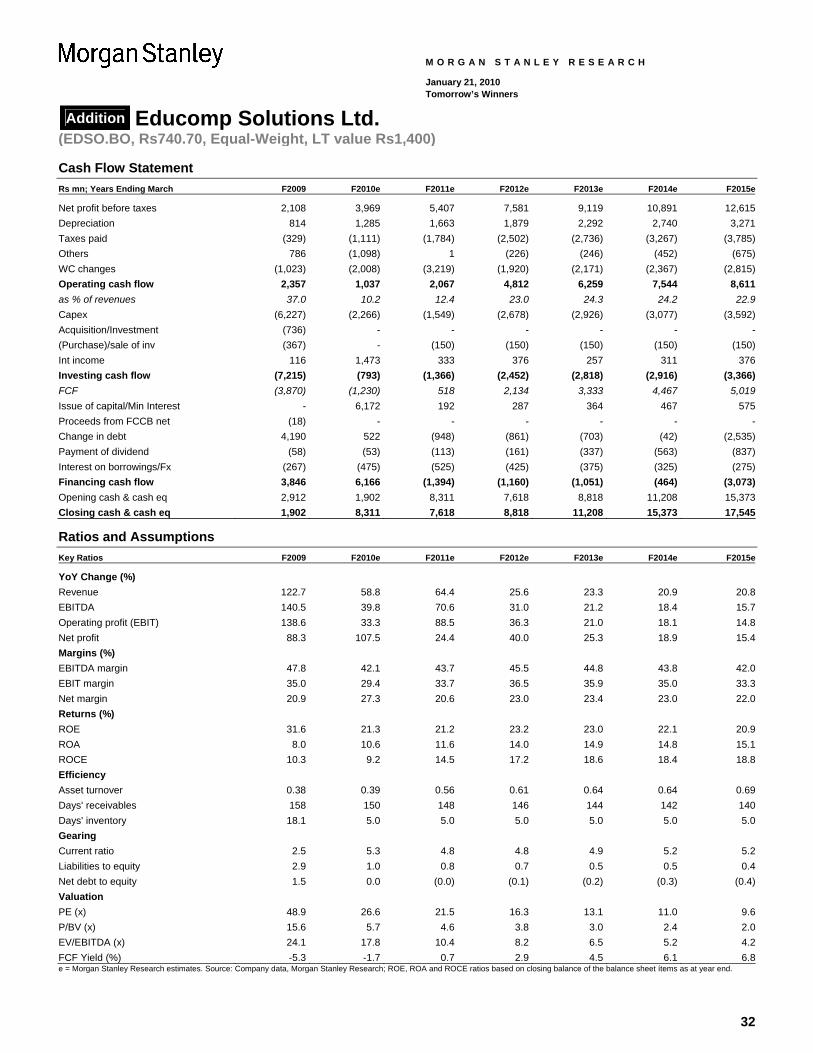
32
Addition Educomp Solutions Ltd. (EDSO.BO, Rs740.70, Equal-Weight, LT value Rs1,400)
M O R G A N S T A N L E Y R E S E A R C H
January 21, 2010 Tomorrow’s Winners
Cash Flow Statement Rs mn; Years Ending March F2009 F2010e F2011e F2012e F2013e F2014e F2015e
Net profit before taxes 2,108 3,969 5,407 7,581 9,119 10,891 12,615Depreciation 814 1,285 1,663 1,879 2,292 2,740 3,271Taxes paid (329) (1,111) (1,784) (2,502) (2,736) (3,267) (3,785)Others 786 (1,098) 1 (226) (246) (452) (675)WC changes (1,023) (2,008) (3,219) (1,920) (2,171) (2,367) (2,815)Operating cash flow 2,357 1,037 2,067 4,812 6,259 7,544 8,611as % of revenues 37.0 10.2 12.4 23.0 24.3 24.2 22.9Capex (6,227) (2,266) (1,549) (2,678) (2,926) (3,077) (3,592)Acquisition/Investment (736) - - - - - -(Purchase)/sale of inv (367) - (150) (150) (150) (150) (150)Int income 116 1,473 333 376 257 311 376Investing cash flow (7,215) (793) (1,366) (2,452) (2,818) (2,916) (3,366)FCF (3,870) (1,230) 518 2,134 3,333 4,467 5,019Issue of capital/Min Interest - 6,172 192 287 364 467 575Proceeds from FCCB net (18) - - - - - -Change in debt 4,190 522 (948) (861) (703) (42) (2,535)Payment of dividend (58) (53) (113) (161) (337) (563) (837)Interest on borrowings/Fx (267) (475) (525) (425) (375) (325) (275)Financing cash flow 3,846 6,166 (1,394) (1,160) (1,051) (464) (3,073)Opening cash & cash eq 2,912 1,902 8,311 7,618 8,818 11,208 15,373Closing cash & cash eq 1,902 8,311 7,618 8,818 11,208 15,373 17,545
Ratios and Assumptions Key Ratios F2009 F2010e F2011e F2012e F2013e F2014e F2015e
YoY Change (%) Revenue 122.7 58.8 64.4 25.6 23.3 20.9 20.8EBITDA 140.5 39.8 70.6 31.0 21.2 18.4 15.7Operating profit (EBIT) 138.6 33.3 88.5 36.3 21.0 18.1 14.8Net profit 88.3 107.5 24.4 40.0 25.3 18.9 15.4Margins (%) EBITDA margin 47.8 42.1 43.7 45.5 44.8 43.8 42.0EBIT margin 35.0 29.4 33.7 36.5 35.9 35.0 33.3Net margin 20.9 27.3 20.6 23.0 23.4 23.0 22.0Returns (%) ROE 31.6 21.3 21.2 23.2 23.0 22.1 20.9ROA 8.0 10.6 11.6 14.0 14.9 14.8 15.1ROCE 10.3 9.2 14.5 17.2 18.6 18.4 18.8Efficiency Asset turnover 0.38 0.39 0.56 0.61 0.64 0.64 0.69Days' receivables 158 150 148 146 144 142 140Days' inventory 18.1 5.0 5.0 5.0 5.0 5.0 5.0Gearing Current ratio 2.5 5.3 4.8 4.8 4.9 5.2 5.2Liabilities to equity 2.9 1.0 0.8 0.7 0.5 0.5 0.4Net debt to equity 1.5 0.0 (0.0) (0.1) (0.2) (0.3) (0.4)Valuation PE (x) 48.9 26.6 21.5 16.3 13.1 11.0 9.6P/BV (x) 15.6 5.7 4.6 3.8 3.0 2.4 2.0EV/EBITDA (x) 24.1 17.8 10.4 8.2 6.5 5.2 4.2FCF Yield (%) -5.3 -1.7 0.7 2.9 4.5 6.1 6.8e = Morgan Stanley Research estimates. Source: Company data, Morgan Stanley Research; ROE, ROA and ROCE ratios based on closing balance of the balance sheet ítems as at year end.
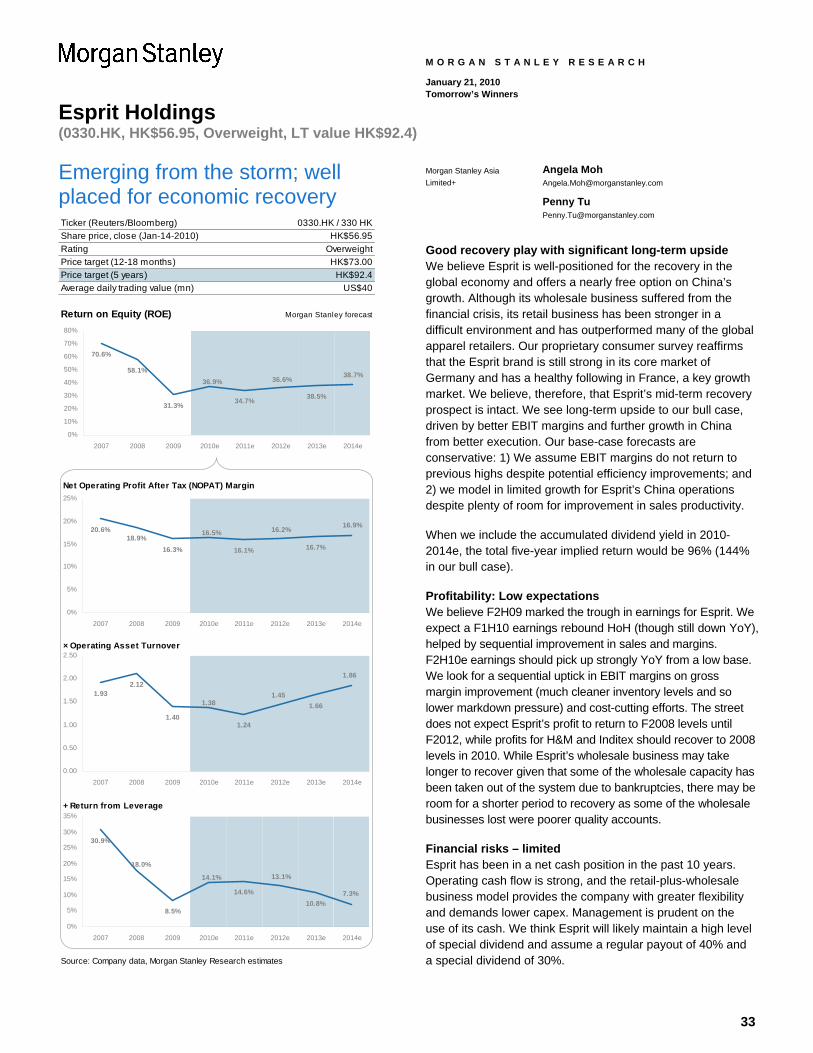
33
Esprit Holdings (0330.HK, HK$56.95, Overweight, LT value HK$92.4)
M O R G A N S T A N L E Y R E S E A R C H
January 21, 2010 Tomorrow’s Winners
Emerging from the storm; well placed for economic recovery Ticker (Reuters/Bloomberg)Share price, close (Jan-14-2010)RatingPrice target (12-18 months)Price target (5 years) HK$92.4Average daily trading value (mn)
Return on Equity (ROE) Morgan Stanley forecast
Net Operating Profit After Tax (NOPAT) Margin
× Operating Asset Turnover
+ Return from Leverage
Source: Company data, Morgan Stanley Research estimates
0330.HK / 330 HKHK$56.95
OverweightHK$73.00
US$40
70.6%
58.1%
31.3% 34.7% 38.5%
38.7%36.6%36.9%
0%
10%
20%
30%
40%
50%
60%
70%
80%
2007 2008 2009 2010e 2011e 2012e 2013e 2014e
20.6%18.9%
16.3% 16.1% 16.7%
16.5% 16.2% 16.9%
0%
5%
10%
15%
20%
25%
2007 2008 2009 2010e 2011e 2012e 2013e 2014e
1.932.12
1.401.24
1.661.381.45
1.86
0.00
0.50
1.00
1.50
2.00
2.50
2007 2008 2009 2010e 2011e 2012e 2013e 2014e
30.9%
8.5%
14.6%10.8%
7.3%
13.1%14.1%
18.0%
0%
5%
10%
15%
20%
25%
30%
35%
2007 2008 2009 2010e 2011e 2012e 2013e 2014e
Morgan Stanley Asia Limited+
Angela Moh [email protected]
Penny Tu [email protected]
Good recovery play with significant long-term upside We believe Esprit is well-positioned for the recovery in the global economy and offers a nearly free option on China’s growth. Although its wholesale business suffered from the financial crisis, its retail business has been stronger in a difficult environment and has outperformed many of the global apparel retailers. Our proprietary consumer survey reaffirms that the Esprit brand is still strong in its core market of Germany and has a healthy following in France, a key growth market. We believe, therefore, that Esprit’s mid-term recovery prospect is intact. We see long-term upside to our bull case, driven by better EBIT margins and further growth in China from better execution. Our base-case forecasts are conservative: 1) We assume EBIT margins do not return to previous highs despite potential efficiency improvements; and 2) we model in limited growth for Esprit’s China operations despite plenty of room for improvement in sales productivity.
When we include the accumulated dividend yield in 2010-2014e, the total five-year implied return would be 96% (144% in our bull case).
Profitability: Low expectations We believe F2H09 marked the trough in earnings for Esprit. We expect a F1H10 earnings rebound HoH (though still down YoY), helped by sequential improvement in sales and margins. F2H10e earnings should pick up strongly YoY from a low base. We look for a sequential uptick in EBIT margins on gross margin improvement (much cleaner inventory levels and so lower markdown pressure) and cost-cutting efforts. The street does not expect Esprit’s profit to return to F2008 levels until F2012, while profits for H&M and Inditex should recover to 2008 levels in 2010. While Esprit’s wholesale business may take longer to recover given that some of the wholesale capacity has been taken out of the system due to bankruptcies, there may be room for a shorter period to recovery as some of the wholesale businesses lost were poorer quality accounts.
Financial risks – limited Esprit has been in a net cash position in the past 10 years. Operating cash flow is strong, and the retail-plus-wholesale business model provides the company with greater flexibility and demands lower capex. Management is prudent on the use of its cash. We think Esprit will likely maintain a high level of special dividend and assume a regular payout of 40% and a special dividend of 30%.
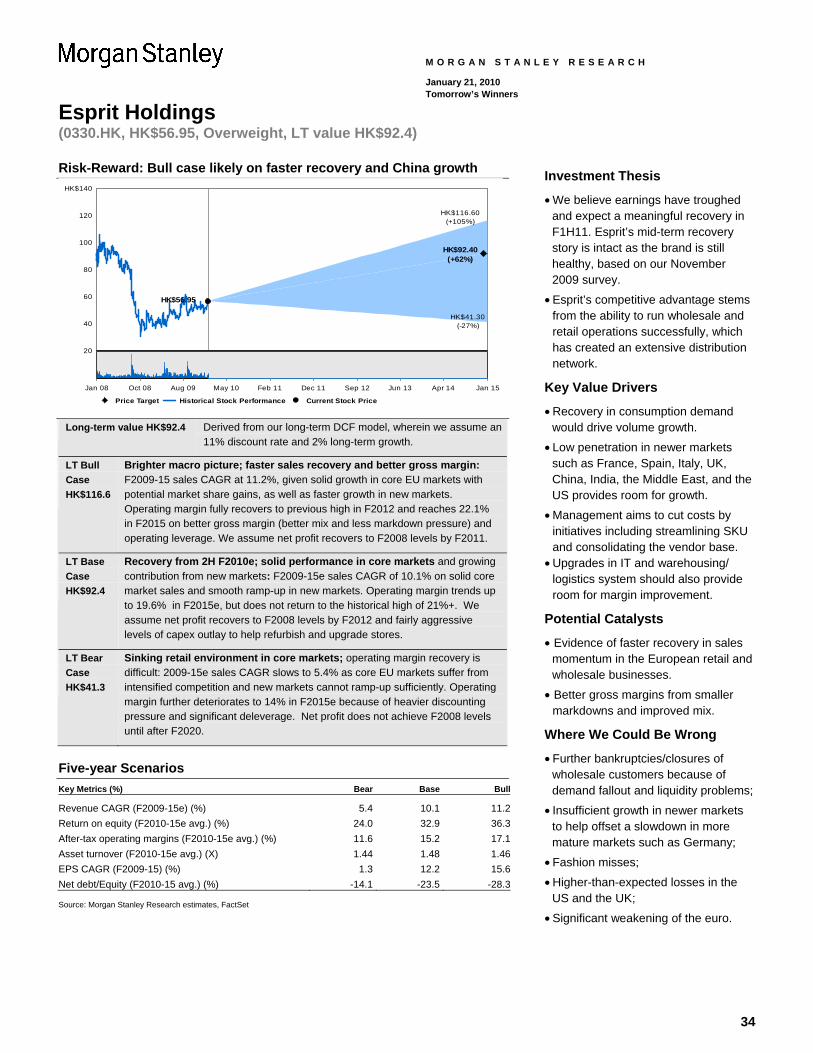
34
Esprit Holdings (0330.HK, HK$56.95, Overweight, LT value HK$92.4)
M O R G A N S T A N L E Y R E S E A R C H
January 21, 2010 Tomorrow’s Winners
Risk-Reward: Bull case likely on faster recovery and China growth
20
40
60
80
100
120
HK$140
HK$116.60(+105%)
HK$92.40(+62%)
HK$41.30(-27%)
HK$56.95
Price Target Historical Stock Performance Current Stock Price
Jan 08 Oct 08 Aug 09 May 10 Feb 11 Dec 11 Sep 12 Jun 13 Apr 14 Jan 15
Long-term value HK$92.4 Derived from our long-term DCF model, wherein we assume an 11% discount rate and 2% long-term growth.
LT Bull Case HK$116.6
Brighter macro picture; faster sales recovery and better gross margin: F2009-15 sales CAGR at 11.2%, given solid growth in core EU markets with potential market share gains, as well as faster growth in new markets. Operating margin fully recovers to previous high in F2012 and reaches 22.1% in F2015 on better gross margin (better mix and less markdown pressure) and operating leverage. We assume net profit recovers to F2008 levels by F2011.
LT Base Case HK$92.4
Recovery from 2H F2010e; solid performance in core markets and growing contribution from new markets: F2009-15e sales CAGR of 10.1% on solid core market sales and smooth ramp-up in new markets. Operating margin trends up to 19.6% in F2015e, but does not return to the historical high of 21%+. We assume net profit recovers to F2008 levels by F2012 and fairly aggressive levels of capex outlay to help refurbish and upgrade stores.
LT Bear Case HK$41.3
Sinking retail environment in core markets; operating margin recovery is difficult: 2009-15e sales CAGR slows to 5.4% as core EU markets suffer from intensified competition and new markets cannot ramp-up sufficiently. Operating margin further deteriorates to 14% in F2015e because of heavier discounting pressure and significant deleverage. Net profit does not achieve F2008 levels until after F2020.
Five-year Scenarios Key Metrics (%) Bear Base Bull
Revenue CAGR (F2009-15e) (%) 5.4 10.1 11.2Return on equity (F2010-15e avg.) (%) 24.0 32.9 36.3After-tax operating margins (F2010-15e avg.) (%) 11.6 15.2 17.1Asset turnover (F2010-15e avg.) (X) 1.44 1.48 1.46EPS CAGR (F2009-15) (%) 1.3 12.2 15.6Net debt/Equity (F2010-15 avg.) (%) -14.1 -23.5 -28.3 Source: Morgan Stanley Research estimates, FactSet
Investment Thesis
• We believe earnings have troughed and expect a meaningful recovery in F1H11. Esprit’s mid-term recovery story is intact as the brand is still healthy, based on our November 2009 survey.
• Esprit’s competitive advantage stems from the ability to run wholesale and retail operations successfully, which has created an extensive distribution network.
Key Value Drivers
• Recovery in consumption demand would drive volume growth.
• Low penetration in newer markets such as France, Spain, Italy, UK, China, India, the Middle East, and the US provides room for growth.
• Management aims to cut costs by initiatives including streamlining SKU and consolidating the vendor base.
• Upgrades in IT and warehousing/ logistics system should also provide room for margin improvement.
Potential Catalysts
• Evidence of faster recovery in sales momentum in the European retail and wholesale businesses.
• Better gross margins from smaller markdowns and improved mix.
Where We Could Be Wrong
• Further bankruptcies/closures of wholesale customers because of demand fallout and liquidity problems;
• Insufficient growth in newer markets to help offset a slowdown in more mature markets such as Germany;
• Fashion misses;
• Higher-than-expected losses in the US and the UK;
• Significant weakening of the euro.
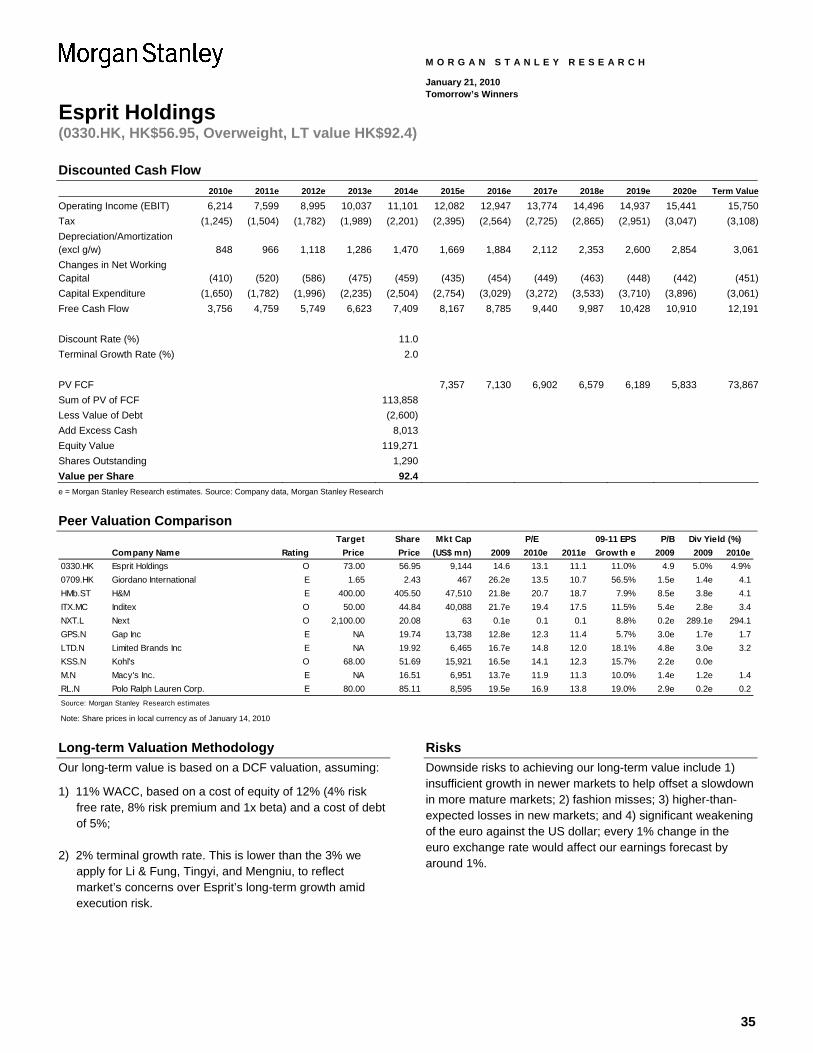
35
Esprit Holdings (0330.HK, HK$56.95, Overweight, LT value HK$92.4)
M O R G A N S T A N L E Y R E S E A R C H
January 21, 2010 Tomorrow’s Winners
Discounted Cash Flow 2010e 2011e 2012e 2013e 2014e 2015e 2016e 2017e 2018e 2019e 2020e Term Value
Operating Income (EBIT) 6,214 7,599 8,995 10,037 11,101 12,082 12,947 13,774 14,496 14,937 15,441 15,750Tax (1,245) (1,504) (1,782) (1,989) (2,201) (2,395) (2,564) (2,725) (2,865) (2,951) (3,047) (3,108)Depreciation/Amortization (excl g/w) 848 966 1,118 1,286 1,470 1,669 1,884 2,112 2,353 2,600 2,854 3,061Changes in Net Working Capital (410) (520) (586) (475) (459) (435) (454) (449) (463) (448) (442) (451)Capital Expenditure (1,650) (1,782) (1,996) (2,235) (2,504) (2,754) (3,029) (3,272) (3,533) (3,710) (3,896) (3,061)Free Cash Flow 3,756 4,759 5,749 6,623 7,409 8,167 8,785 9,440 9,987 10,428 10,910 12,191 Discount Rate (%) 11.0 Terminal Growth Rate (%) 2.0 PV FCF 7,357 7,130 6,902 6,579 6,189 5,833 73,867Sum of PV of FCF 113,858 Less Value of Debt (2,600) Add Excess Cash 8,013 Equity Value 119,271 Shares Outstanding 1,290 Value per Share 92.4 e = Morgan Stanley Research estimates. Source: Company data, Morgan Stanley Research
Peer Valuation Comparison
Target Share Mkt Cap 09-11 EPS P/BCompany Name Rating Price Price (US$ mn) 2009 2010e 2011e Growth e 2009 2009 2010e
0330.HK Esprit Holdings O 73.00 56.95 9,144 14.6 13.1 11.1 11.0% 4.9 5.0% 4.9%0709.HK Giordano International E 1.65 2.43 467 26.2e 13.5 10.7 56.5% 1.5e 1.4e 4.1HMb.ST H&M E 400.00 405.50 47,510 21.8e 20.7 18.7 7.9% 8.5e 3.8e 4.1ITX.MC Inditex O 50.00 44.84 40,088 21.7e 19.4 17.5 11.5% 5.4e 2.8e 3.4NXT.L Next O 2,100.00 20.08 63 0.1e 0.1 0.1 8.8% 0.2e 289.1e 294.1GPS.N Gap Inc E NA 19.74 13,738 12.8e 12.3 11.4 5.7% 3.0e 1.7e 1.7LTD.N Limited Brands Inc E NA 19.92 6,465 16.7e 14.8 12.0 18.1% 4.8e 3.0e 3.2KSS.N Kohl's O 68.00 51.69 15,921 16.5e 14.1 12.3 15.7% 2.2e 0.0eM.N Macy's Inc. E NA 16.51 6,951 13.7e 11.9 11.3 10.0% 1.4e 1.2e 1.4RL.N Polo Ralph Lauren Corp. E 80.00 85.11 8,595 19.5e 16.9 13.8 19.0% 2.9e 0.2e 0.2Source: Morgan Stanley Research estimates
P/E Div Yield (%)
Note: Share prices in local currency as of January 14, 2010
Long-term Valuation Methodology Our long-term value is based on a DCF valuation, assuming:
1) 11% WACC, based on a cost of equity of 12% (4% risk free rate, 8% risk premium and 1x beta) and a cost of debt of 5%;
2) 2% terminal growth rate. This is lower than the 3% we apply for Li & Fung, Tingyi, and Mengniu, to reflect market’s concerns over Esprit’s long-term growth amid execution risk.
Risks Downside risks to achieving our long-term value include 1) insufficient growth in newer markets to help offset a slowdown in more mature markets; 2) fashion misses; 3) higher-than-expected losses in new markets; and 4) significant weakening of the euro against the US dollar; every 1% change in the euro exchange rate would affect our earnings forecast by around 1%.
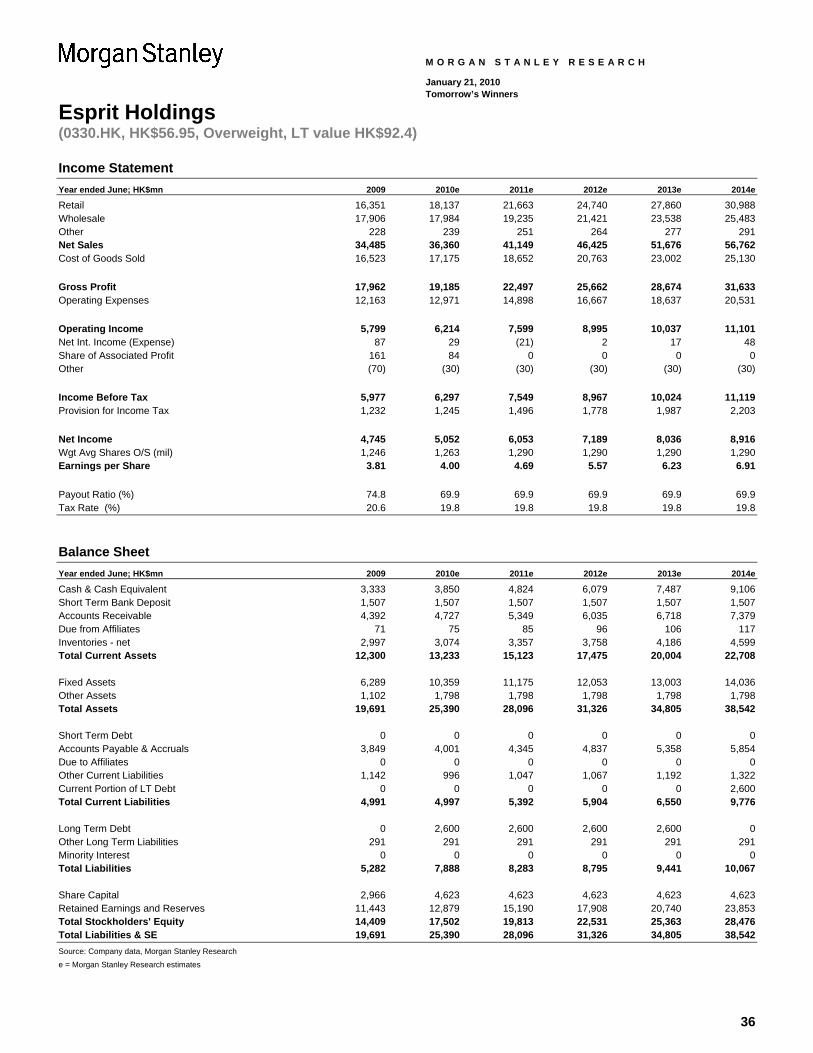
36
Esprit Holdings (0330.HK, HK$56.95, Overweight, LT value HK$92.4)
M O R G A N S T A N L E Y R E S E A R C H
January 21, 2010 Tomorrow’s Winners
Income Statement Year ended June; HK$mn 2009 2010e 2011e 2012e 2013e 2014e Retail 16,351 18,137 21,663 24,740 27,860 30,988 Wholesale 17,906 17,984 19,235 21,421 23,538 25,483 Other 228 239 251 264 277 291 Net Sales 34,485 36,360 41,149 46,425 51,676 56,762 Cost of Goods Sold 16,523 17,175 18,652 20,763 23,002 25,130 Gross Profit 17,962 19,185 22,497 25,662 28,674 31,633 Operating Expenses 12,163 12,971 14,898 16,667 18,637 20,531 Operating Income 5,799 6,214 7,599 8,995 10,037 11,101 Net Int. Income (Expense) 87 29 (21) 2 17 48 Share of Associated Profit 161 84 0 0 0 0 Other (70) (30) (30) (30) (30) (30) Income Before Tax 5,977 6,297 7,549 8,967 10,024 11,119 Provision for Income Tax 1,232 1,245 1,496 1,778 1,987 2,203 Net Income 4,745 5,052 6,053 7,189 8,036 8,916 Wgt Avg Shares O/S (mil) 1,246 1,263 1,290 1,290 1,290 1,290 Earnings per Share 3.81 4.00 4.69 5.57 6.23 6.91 Payout Ratio (%) 74.8 69.9 69.9 69.9 69.9 69.9 Tax Rate (%) 20.6 19.8 19.8 19.8 19.8 19.8
Balance Sheet Year ended June; HK$mn 2009 2010e 2011e 2012e 2013e 2014e Cash & Cash Equivalent 3,333 3,850 4,824 6,079 7,487 9,106 Short Term Bank Deposit 1,507 1,507 1,507 1,507 1,507 1,507 Accounts Receivable 4,392 4,727 5,349 6,035 6,718 7,379 Due from Affiliates 71 75 85 96 106 117 Inventories - net 2,997 3,074 3,357 3,758 4,186 4,599 Total Current Assets 12,300 13,233 15,123 17,475 20,004 22,708 Fixed Assets 6,289 10,359 11,175 12,053 13,003 14,036 Other Assets 1,102 1,798 1,798 1,798 1,798 1,798 Total Assets 19,691 25,390 28,096 31,326 34,805 38,542 Short Term Debt 0 0 0 0 0 0 Accounts Payable & Accruals 3,849 4,001 4,345 4,837 5,358 5,854 Due to Affiliates 0 0 0 0 0 0 Other Current Liabilities 1,142 996 1,047 1,067 1,192 1,322 Current Portion of LT Debt 0 0 0 0 0 2,600 Total Current Liabilities 4,991 4,997 5,392 5,904 6,550 9,776 Long Term Debt 0 2,600 2,600 2,600 2,600 0 Other Long Term Liabilities 291 291 291 291 291 291 Minority Interest 0 0 0 0 0 0 Total Liabilities 5,282 7,888 8,283 8,795 9,441 10,067 Share Capital 2,966 4,623 4,623 4,623 4,623 4,623 Retained Earnings and Reserves 11,443 12,879 15,190 17,908 20,740 23,853 Total Stockholders' Equity 14,409 17,502 19,813 22,531 25,363 28,476 Total Liabilities & SE 19,691 25,390 28,096 31,326 34,805 38,542 Source: Company data, Morgan Stanley Research
e = Morgan Stanley Research estimates
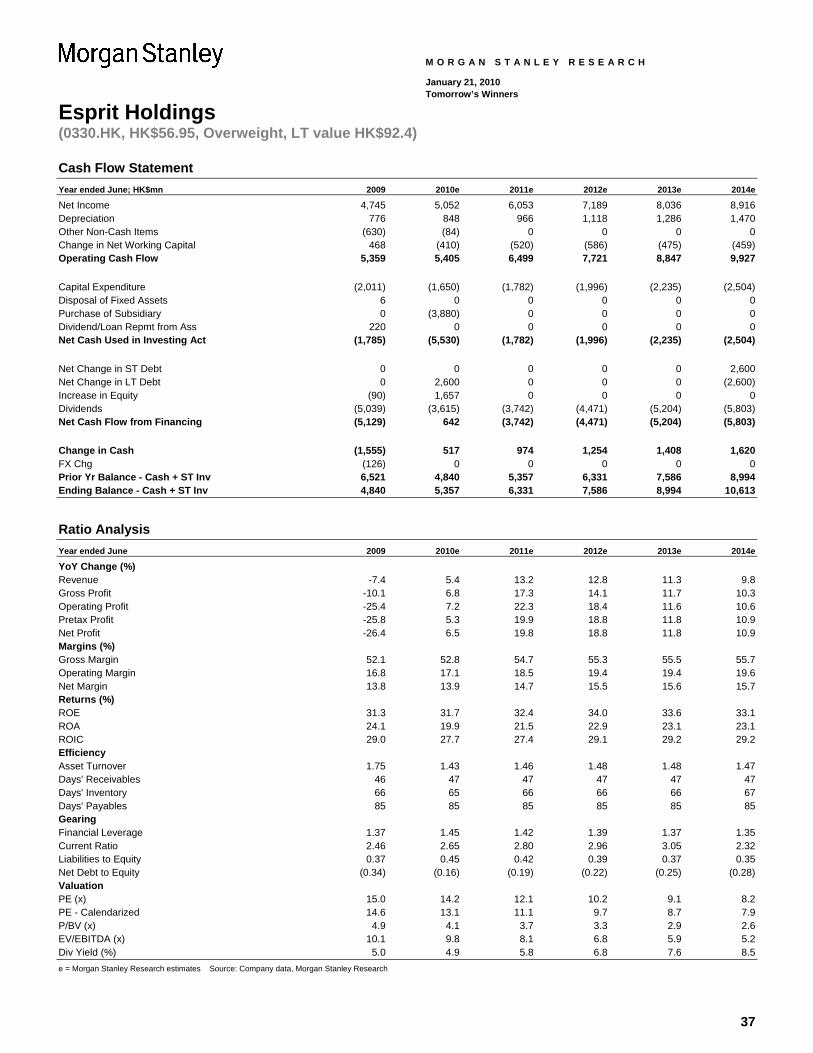
37
Esprit Holdings (0330.HK, HK$56.95, Overweight, LT value HK$92.4)
M O R G A N S T A N L E Y R E S E A R C H
January 21, 2010 Tomorrow’s Winners
Cash Flow Statement Year ended June; HK$mn 2009 2010e 2011e 2012e 2013e 2014e Net Income 4,745 5,052 6,053 7,189 8,036 8,916 Depreciation 776 848 966 1,118 1,286 1,470 Other Non-Cash Items (630) (84) 0 0 0 0 Change in Net Working Capital 468 (410) (520) (586) (475) (459) Operating Cash Flow 5,359 5,405 6,499 7,721 8,847 9,927 Capital Expenditure (2,011) (1,650) (1,782) (1,996) (2,235) (2,504) Disposal of Fixed Assets 6 0 0 0 0 0 Purchase of Subsidiary 0 (3,880) 0 0 0 0 Dividend/Loan Repmt from Ass 220 0 0 0 0 0 Net Cash Used in Investing Act (1,785) (5,530) (1,782) (1,996) (2,235) (2,504) Net Change in ST Debt 0 0 0 0 0 2,600 Net Change in LT Debt 0 2,600 0 0 0 (2,600) Increase in Equity (90) 1,657 0 0 0 0 Dividends (5,039) (3,615) (3,742) (4,471) (5,204) (5,803) Net Cash Flow from Financing (5,129) 642 (3,742) (4,471) (5,204) (5,803) Change in Cash (1,555) 517 974 1,254 1,408 1,620 FX Chg (126) 0 0 0 0 0 Prior Yr Balance - Cash + ST Inv 6,521 4,840 5,357 6,331 7,586 8,994 Ending Balance - Cash + ST Inv 4,840 5,357 6,331 7,586 8,994 10,613
Ratio Analysis Year ended June 2009 2010e 2011e 2012e 2013e 2014e YoY Change (%) Revenue -7.4 5.4 13.2 12.8 11.3 9.8 Gross Profit -10.1 6.8 17.3 14.1 11.7 10.3 Operating Profit -25.4 7.2 22.3 18.4 11.6 10.6 Pretax Profit -25.8 5.3 19.9 18.8 11.8 10.9 Net Profit -26.4 6.5 19.8 18.8 11.8 10.9 Margins (%) Gross Margin 52.1 52.8 54.7 55.3 55.5 55.7 Operating Margin 16.8 17.1 18.5 19.4 19.4 19.6 Net Margin 13.8 13.9 14.7 15.5 15.6 15.7 Returns (%) ROE 31.3 31.7 32.4 34.0 33.6 33.1 ROA 24.1 19.9 21.5 22.9 23.1 23.1 ROIC 29.0 27.7 27.4 29.1 29.2 29.2 Efficiency Asset Turnover 1.75 1.43 1.46 1.48 1.48 1.47 Days' Receivables 46 47 47 47 47 47 Days' Inventory 66 65 66 66 66 67 Days' Payables 85 85 85 85 85 85 Gearing Financial Leverage 1.37 1.45 1.42 1.39 1.37 1.35 Current Ratio 2.46 2.65 2.80 2.96 3.05 2.32 Liabilities to Equity 0.37 0.45 0.42 0.39 0.37 0.35 Net Debt to Equity (0.34) (0.16) (0.19) (0.22) (0.25) (0.28) Valuation PE (x) 15.0 14.2 12.1 10.2 9.1 8.2 PE - Calendarized 14.6 13.1 11.1 9.7 8.7 7.9 P/BV (x) 4.9 4.1 3.7 3.3 2.9 2.6 EV/EBITDA (x) 10.1 9.8 8.1 6.8 5.9 5.2 Div Yield (%) 5.0 4.9 5.8 6.8 7.6 8.5 e = Morgan Stanley Research estimates Source: Company data, Morgan Stanley Research
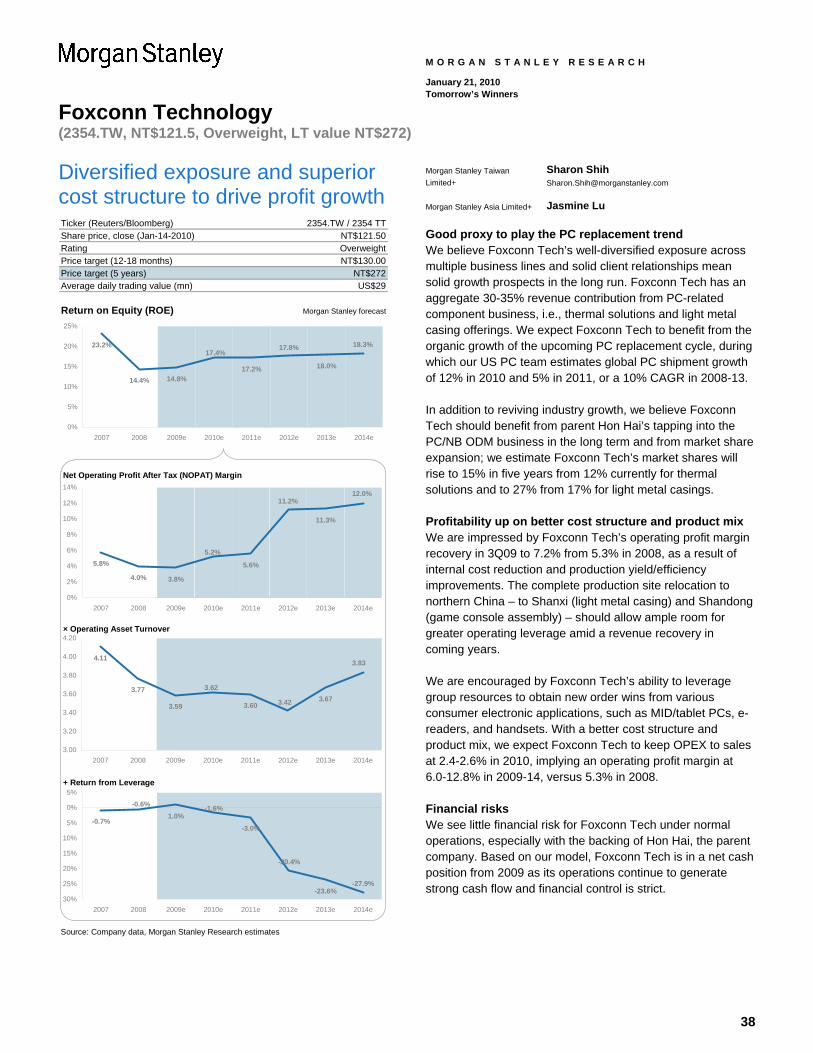
38
Foxconn Technology (2354.TW, NT$121.5, Overweight, LT value NT$272)
M O R G A N S T A N L E Y R E S E A R C H
January 21, 2010 Tomorrow’s Winners
Diversified exposure and superior cost structure to drive profit growth Ticker (Reuters/Bloomberg)Share price, close (Jan-14-2010)RatingPrice target (12-18 months)Price target (5 years) NT$272Average daily trading value (mn)
Return on Equity (ROE) Morgan Stanley forecast
Net Operating Profit After Tax (NOPAT) Margin
× Operating Asset Turnover
+ Return from Leverage
Source: Company data, Morgan Stanley Research estimates
US$29
2354.TW / 2354 TTNT$121.50OverweightNT$130.00
23.2%
14.4% 14.8%17.2% 18.0%
18.3%17.8%17.4%
0%
5%
10%
15%
20%
25%
2007 2008 2009e 2010e 2011e 2012e 2013e 2014e
5.8%
4.0% 3.8%
5.6%
11.3%
5.2%
11.2%12.0%
0%
2%
4%
6%
8%
10%
12%
14%
2007 2008 2009e 2010e 2011e 2012e 2013e 2014e
4.11
3.77
3.59 3.603.67
3.62
3.42
3.83
3.00
3.20
3.40
3.60
3.80
4.00
4.20
2007 2008 2009e 2010e 2011e 2012e 2013e 2014e
-0.7%1.0%
-3.0%
-23.6%
-0.6% -1.6%
-20.4%
-27.9%
30%
25%
20%
15%
10%
5%
0%
5%
2007 2008 2009e 2010e 2011e 2012e 2013e 2014e
Morgan Stanley Taiwan Limited+
Sharon Shih [email protected]
Morgan Stanley Asia Limited+ Jasmine Lu
Good proxy to play the PC replacement trend We believe Foxconn Tech’s well-diversified exposure across multiple business lines and solid client relationships mean solid growth prospects in the long run. Foxconn Tech has an aggregate 30-35% revenue contribution from PC-related component business, i.e., thermal solutions and light metal casing offerings. We expect Foxconn Tech to benefit from the organic growth of the upcoming PC replacement cycle, during which our US PC team estimates global PC shipment growth of 12% in 2010 and 5% in 2011, or a 10% CAGR in 2008-13.
In addition to reviving industry growth, we believe Foxconn Tech should benefit from parent Hon Hai’s tapping into the PC/NB ODM business in the long term and from market share expansion; we estimate Foxconn Tech’s market shares will rise to 15% in five years from 12% currently for thermal solutions and to 27% from 17% for light metal casings.
Profitability up on better cost structure and product mix We are impressed by Foxconn Tech’s operating profit margin recovery in 3Q09 to 7.2% from 5.3% in 2008, as a result of internal cost reduction and production yield/efficiency improvements. The complete production site relocation to northern China – to Shanxi (light metal casing) and Shandong (game console assembly) – should allow ample room for greater operating leverage amid a revenue recovery in coming years.
We are encouraged by Foxconn Tech’s ability to leverage group resources to obtain new order wins from various consumer electronic applications, such as MID/tablet PCs, e-readers, and handsets. With a better cost structure and product mix, we expect Foxconn Tech to keep OPEX to sales at 2.4-2.6% in 2010, implying an operating profit margin at 6.0-12.8% in 2009-14, versus 5.3% in 2008.
Financial risks We see little financial risk for Foxconn Tech under normal operations, especially with the backing of Hon Hai, the parent company. Based on our model, Foxconn Tech is in a net cash position from 2009 as its operations continue to generate strong cash flow and financial control is strict.
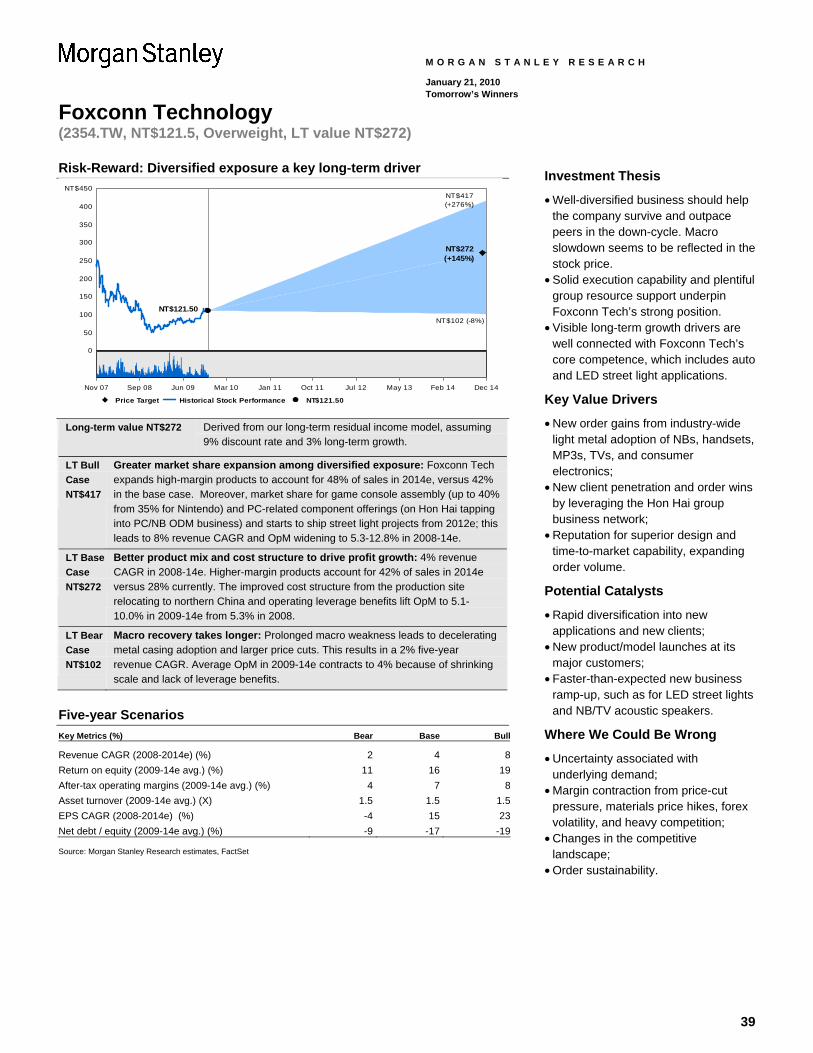
39
Foxconn Technology (2354.TW, NT$121.5, Overweight, LT value NT$272)
M O R G A N S T A N L E Y R E S E A R C H
January 21, 2010 Tomorrow’s Winners
Risk-Reward: Diversified exposure a key long-term driver
0
50
100
150
200
250
300
350
400
NT$450NT$417(+276%)
NT$272(+145%)
NT$102 (-8%)
NT$121.50
Price Target Historical Stock Performance NT$121.50
Nov 07 Sep 08 Jun 09 Mar 10 Jan 11 Oct 11 Jul 12 May 13 Feb 14 Dec 14
Long-term value NT$272 Derived from our long-term residual income model, assuming 9% discount rate and 3% long-term growth.
LT Bull Case NT$417
Greater market share expansion among diversified exposure: Foxconn Tech expands high-margin products to account for 48% of sales in 2014e, versus 42% in the base case. Moreover, market share for game console assembly (up to 40% from 35% for Nintendo) and PC-related component offerings (on Hon Hai tapping into PC/NB ODM business) and starts to ship street light projects from 2012e; this leads to 8% revenue CAGR and OpM widening to 5.3-12.8% in 2008-14e.
LT Base Case NT$272
Better product mix and cost structure to drive profit growth: 4% revenue CAGR in 2008-14e. Higher-margin products account for 42% of sales in 2014e versus 28% currently. The improved cost structure from the production site relocating to northern China and operating leverage benefits lift OpM to 5.1-10.0% in 2009-14e from 5.3% in 2008.
LT Bear Case NT$102
Macro recovery takes longer: Prolonged macro weakness leads to decelerating metal casing adoption and larger price cuts. This results in a 2% five-year revenue CAGR. Average OpM in 2009-14e contracts to 4% because of shrinking scale and lack of leverage benefits.
Five-year Scenarios Key Metrics (%) Bear Base Bull
Revenue CAGR (2008-2014e) (%) 2 4 8Return on equity (2009-14e avg.) (%) 11 16 19After-tax operating margins (2009-14e avg.) (%) 4 7 8Asset turnover (2009-14e avg.) (X) 1.5 1.5 1.5EPS CAGR (2008-2014e) (%) -4 15 23Net debt / equity (2009-14e avg.) (%) -9 -17 -19 Source: Morgan Stanley Research estimates, FactSet
Investment Thesis
• Well-diversified business should help the company survive and outpace peers in the down-cycle. Macro slowdown seems to be reflected in the stock price.
• Solid execution capability and plentiful group resource support underpin Foxconn Tech’s strong position.
• Visible long-term growth drivers are well connected with Foxconn Tech’s core competence, which includes auto and LED street light applications.
Key Value Drivers
• New order gains from industry-wide light metal adoption of NBs, handsets, MP3s, TVs, and consumer electronics;
• New client penetration and order wins by leveraging the Hon Hai group business network;
• Reputation for superior design and time-to-market capability, expanding order volume.
Potential Catalysts
• Rapid diversification into new applications and new clients;
• New product/model launches at its major customers;
• Faster-than-expected new business ramp-up, such as for LED street lights and NB/TV acoustic speakers.
Where We Could Be Wrong
• Uncertainty associated with underlying demand;
• Margin contraction from price-cut pressure, materials price hikes, forex volatility, and heavy competition;
• Changes in the competitive landscape;
• Order sustainability.
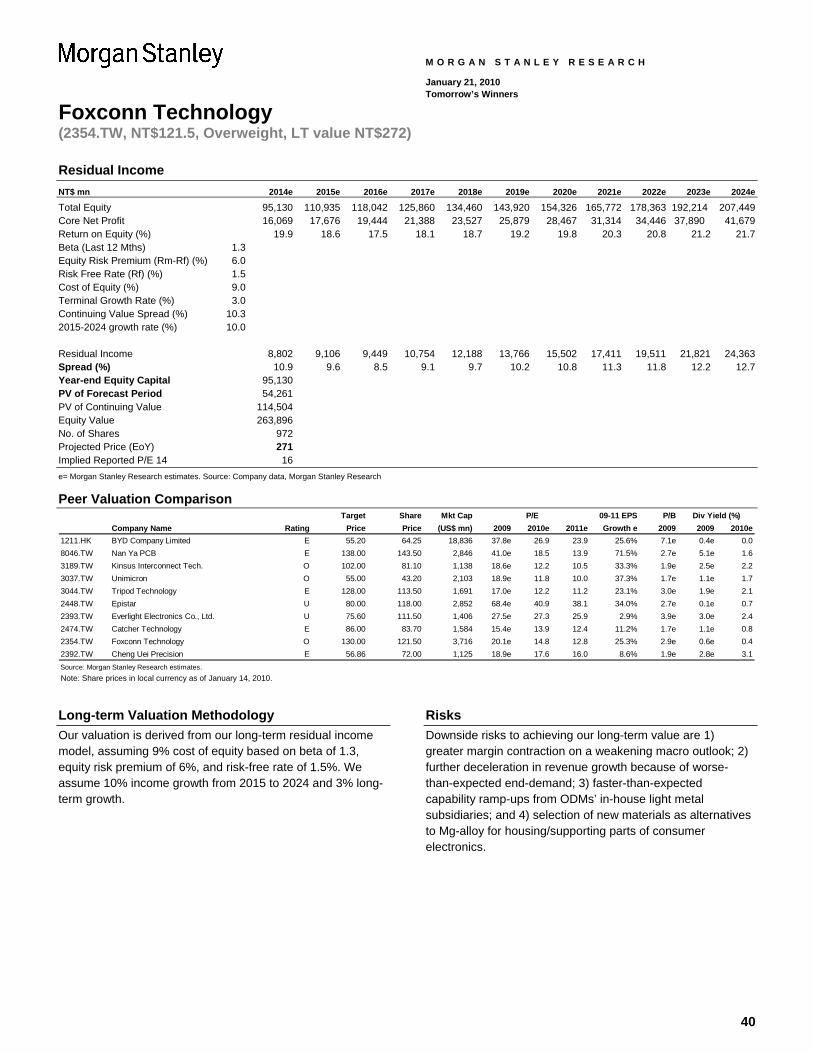
40
Foxconn Technology (2354.TW, NT$121.5, Overweight, LT value NT$272)
M O R G A N S T A N L E Y R E S E A R C H
January 21, 2010 Tomorrow’s Winners
Residual Income NT$ mn 2014e 2015e 2016e 2017e 2018e 2019e 2020e 2021e 2022e 2023e 2024e Total Equity 95,130 110,935 118,042 125,860 134,460 143,920 154,326 165,772 178,363 192,214 207,449 Core Net Profit 16,069 17,676 19,444 21,388 23,527 25,879 28,467 31,314 34,446 37,890 41,679 Return on Equity (%) 19.9 18.6 17.5 18.1 18.7 19.2 19.8 20.3 20.8 21.2 21.7 Beta (Last 12 Mths) 1.3 Equity Risk Premium (Rm-Rf) (%) 6.0 Risk Free Rate (Rf) (%) 1.5 Cost of Equity (%) 9.0 Terminal Growth Rate (%) 3.0 Continuing Value Spread (%) 10.3 2015-2024 growth rate (%) 10.0 Residual Income 8,802 9,106 9,449 10,754 12,188 13,766 15,502 17,411 19,511 21,821 24,363 Spread (%) 10.9 9.6 8.5 9.1 9.7 10.2 10.8 11.3 11.8 12.2 12.7 Year-end Equity Capital 95,130 PV of Forecast Period 54,261 PV of Continuing Value 114,504 Equity Value 263,896 No. of Shares 972 Projected Price (EoY) 271 Implied Reported P/E 14 16 e= Morgan Stanley Research estimates. Source: Company data, Morgan Stanley Research
Peer Valuation Comparison Target Share Mkt Cap 09-11 EPS P/B
Company Name Rating Price Price (US$ mn) 2009 2010e 2011e Growth e 2009 2009 2010e1211.HK BYD Company Limited E 55.20 64.25 18,836 37.8e 26.9 23.9 25.6% 7.1e 0.4e 0.08046.TW Nan Ya PCB E 138.00 143.50 2,846 41.0e 18.5 13.9 71.5% 2.7e 5.1e 1.63189.TW Kinsus Interconnect Tech. O 102.00 81.10 1,138 18.6e 12.2 10.5 33.3% 1.9e 2.5e 2.23037.TW Unimicron O 55.00 43.20 2,103 18.9e 11.8 10.0 37.3% 1.7e 1.1e 1.73044.TW Tripod Technology E 128.00 113.50 1,691 17.0e 12.2 11.2 23.1% 3.0e 1.9e 2.12448.TW Epistar U 80.00 118.00 2,852 68.4e 40.9 38.1 34.0% 2.7e 0.1e 0.72393.TW Everlight Electronics Co., Ltd. U 75.60 111.50 1,406 27.5e 27.3 25.9 2.9% 3.9e 3.0e 2.42474.TW Catcher Technology E 86.00 83.70 1,584 15.4e 13.9 12.4 11.2% 1.7e 1.1e 0.82354.TW Foxconn Technology O 130.00 121.50 3,716 20.1e 14.8 12.8 25.3% 2.9e 0.6e 0.42392.TW Cheng Uei Precision E 56.86 72.00 1,125 18.9e 17.6 16.0 8.6% 1.9e 2.8e 3.1Source: Morgan Stanley Research estimates.
P/E Div Yield (%)
Note: Share prices in local currency as of January 14, 2010.
Long-term Valuation Methodology Our valuation is derived from our long-term residual income model, assuming 9% cost of equity based on beta of 1.3, equity risk premium of 6%, and risk-free rate of 1.5%. We assume 10% income growth from 2015 to 2024 and 3% long-term growth.
Risks Downside risks to achieving our long-term value are 1) greater margin contraction on a weakening macro outlook; 2) further deceleration in revenue growth because of worse-than-expected end-demand; 3) faster-than-expected capability ramp-ups from ODMs’ in-house light metal subsidiaries; and 4) selection of new materials as alternatives to Mg-alloy for housing/supporting parts of consumer electronics.
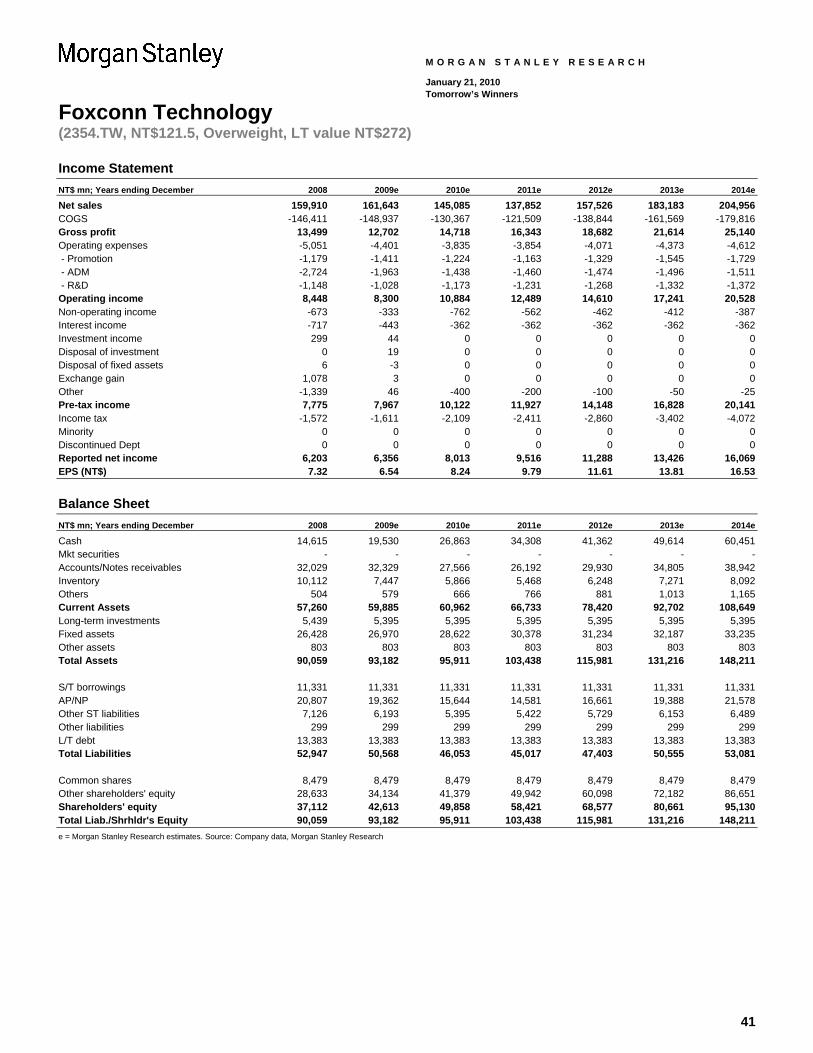
41
Foxconn Technology (2354.TW, NT$121.5, Overweight, LT value NT$272)
M O R G A N S T A N L E Y R E S E A R C H
January 21, 2010 Tomorrow’s Winners
Income Statement NT$ mn; Years ending December 2008 2009e 2010e 2011e 2012e 2013e 2014e Net sales 159,910 161,643 145,085 137,852 157,526 183,183 204,956 COGS -146,411 -148,937 -130,367 -121,509 -138,844 -161,569 -179,816 Gross profit 13,499 12,702 14,718 16,343 18,682 21,614 25,140 Operating expenses -5,051 -4,401 -3,835 -3,854 -4,071 -4,373 -4,612 - Promotion -1,179 -1,411 -1,224 -1,163 -1,329 -1,545 -1,729 - ADM -2,724 -1,963 -1,438 -1,460 -1,474 -1,496 -1,511 - R&D -1,148 -1,028 -1,173 -1,231 -1,268 -1,332 -1,372 Operating income 8,448 8,300 10,884 12,489 14,610 17,241 20,528 Non-operating income -673 -333 -762 -562 -462 -412 -387 Interest income -717 -443 -362 -362 -362 -362 -362 Investment income 299 44 0 0 0 0 0 Disposal of investment 0 19 0 0 0 0 0 Disposal of fixed assets 6 -3 0 0 0 0 0 Exchange gain 1,078 3 0 0 0 0 0 Other -1,339 46 -400 -200 -100 -50 -25 Pre-tax income 7,775 7,967 10,122 11,927 14,148 16,828 20,141 Income tax -1,572 -1,611 -2,109 -2,411 -2,860 -3,402 -4,072 Minority 0 0 0 0 0 0 0 Discontinued Dept 0 0 0 0 0 0 0 Reported net income 6,203 6,356 8,013 9,516 11,288 13,426 16,069 EPS (NT$) 7.32 6.54 8.24 9.79 11.61 13.81 16.53
Balance Sheet NT$ mn; Years ending December 2008 2009e 2010e 2011e 2012e 2013e 2014e Cash 14,615 19,530 26,863 34,308 41,362 49,614 60,451 Mkt securities - - - - - - - Accounts/Notes receivables 32,029 32,329 27,566 26,192 29,930 34,805 38,942 Inventory 10,112 7,447 5,866 5,468 6,248 7,271 8,092 Others 504 579 666 766 881 1,013 1,165 Current Assets 57,260 59,885 60,962 66,733 78,420 92,702 108,649 Long-term investments 5,439 5,395 5,395 5,395 5,395 5,395 5,395 Fixed assets 26,428 26,970 28,622 30,378 31,234 32,187 33,235 Other assets 803 803 803 803 803 803 803 Total Assets 90,059 93,182 95,911 103,438 115,981 131,216 148,211 S/T borrowings 11,331 11,331 11,331 11,331 11,331 11,331 11,331 AP/NP 20,807 19,362 15,644 14,581 16,661 19,388 21,578 Other ST liabilities 7,126 6,193 5,395 5,422 5,729 6,153 6,489 Other liabilities 299 299 299 299 299 299 299 L/T debt 13,383 13,383 13,383 13,383 13,383 13,383 13,383 Total Liabilities 52,947 50,568 46,053 45,017 47,403 50,555 53,081 Common shares 8,479 8,479 8,479 8,479 8,479 8,479 8,479 Other shareholders' equity 28,633 34,134 41,379 49,942 60,098 72,182 86,651 Shareholders' equity 37,112 42,613 49,858 58,421 68,577 80,661 95,130 Total Liab./Shrhldr's Equity 90,059 93,182 95,911 103,438 115,981 131,216 148,211 e = Morgan Stanley Research estimates. Source: Company data, Morgan Stanley Research
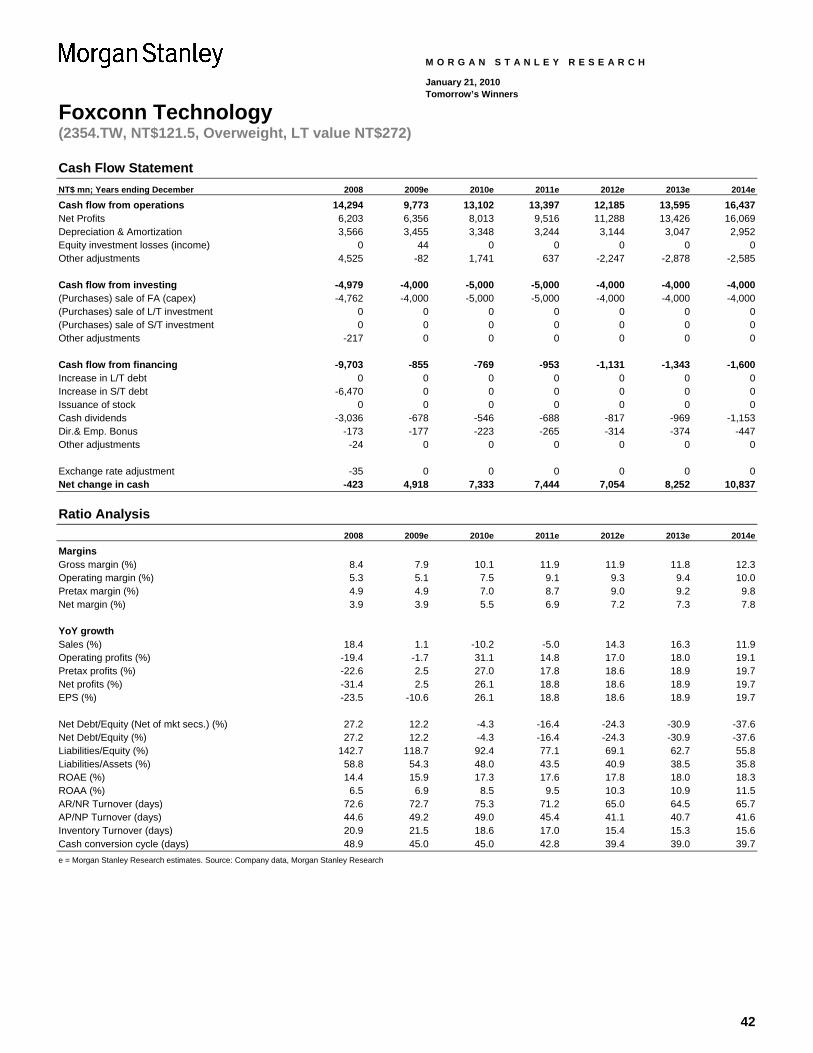
42
Foxconn Technology (2354.TW, NT$121.5, Overweight, LT value NT$272)
M O R G A N S T A N L E Y R E S E A R C H
January 21, 2010 Tomorrow’s Winners
Cash Flow Statement NT$ mn; Years ending December 2008 2009e 2010e 2011e 2012e 2013e 2014e Cash flow from operations 14,294 9,773 13,102 13,397 12,185 13,595 16,437 Net Profits 6,203 6,356 8,013 9,516 11,288 13,426 16,069 Depreciation & Amortization 3,566 3,455 3,348 3,244 3,144 3,047 2,952 Equity investment losses (income) 0 44 0 0 0 0 0 Other adjustments 4,525 -82 1,741 637 -2,247 -2,878 -2,585 Cash flow from investing -4,979 -4,000 -5,000 -5,000 -4,000 -4,000 -4,000 (Purchases) sale of FA (capex) -4,762 -4,000 -5,000 -5,000 -4,000 -4,000 -4,000 (Purchases) sale of L/T investment 0 0 0 0 0 0 0 (Purchases) sale of S/T investment 0 0 0 0 0 0 0 Other adjustments -217 0 0 0 0 0 0 Cash flow from financing -9,703 -855 -769 -953 -1,131 -1,343 -1,600 Increase in L/T debt 0 0 0 0 0 0 0 Increase in S/T debt -6,470 0 0 0 0 0 0 Issuance of stock 0 0 0 0 0 0 0 Cash dividends -3,036 -678 -546 -688 -817 -969 -1,153 Dir.& Emp. Bonus -173 -177 -223 -265 -314 -374 -447 Other adjustments -24 0 0 0 0 0 0 Exchange rate adjustment -35 0 0 0 0 0 0 Net change in cash -423 4,918 7,333 7,444 7,054 8,252 10,837
Ratio Analysis 2008 2009e 2010e 2011e 2012e 2013e 2014e Margins Gross margin (%) 8.4 7.9 10.1 11.9 11.9 11.8 12.3 Operating margin (%) 5.3 5.1 7.5 9.1 9.3 9.4 10.0 Pretax margin (%) 4.9 4.9 7.0 8.7 9.0 9.2 9.8 Net margin (%) 3.9 3.9 5.5 6.9 7.2 7.3 7.8 YoY growth Sales (%) 18.4 1.1 -10.2 -5.0 14.3 16.3 11.9 Operating profits (%) -19.4 -1.7 31.1 14.8 17.0 18.0 19.1 Pretax profits (%) -22.6 2.5 27.0 17.8 18.6 18.9 19.7 Net profits (%) -31.4 2.5 26.1 18.8 18.6 18.9 19.7 EPS (%) -23.5 -10.6 26.1 18.8 18.6 18.9 19.7 Net Debt/Equity (Net of mkt secs.) (%) 27.2 12.2 -4.3 -16.4 -24.3 -30.9 -37.6 Net Debt/Equity (%) 27.2 12.2 -4.3 -16.4 -24.3 -30.9 -37.6 Liabilities/Equity (%) 142.7 118.7 92.4 77.1 69.1 62.7 55.8 Liabilities/Assets (%) 58.8 54.3 48.0 43.5 40.9 38.5 35.8 ROAE (%) 14.4 15.9 17.3 17.6 17.8 18.0 18.3 ROAA (%) 6.5 6.9 8.5 9.5 10.3 10.9 11.5 AR/NR Turnover (days) 72.6 72.7 75.3 71.2 65.0 64.5 65.7 AP/NP Turnover (days) 44.6 49.2 49.0 45.4 41.1 40.7 41.6 Inventory Turnover (days) 20.9 21.5 18.6 17.0 15.4 15.3 15.6 Cash conversion cycle (days) 48.9 45.0 45.0 42.8 39.4 39.0 39.7 e = Morgan Stanley Research estimates. Source: Company data, Morgan Stanley Research
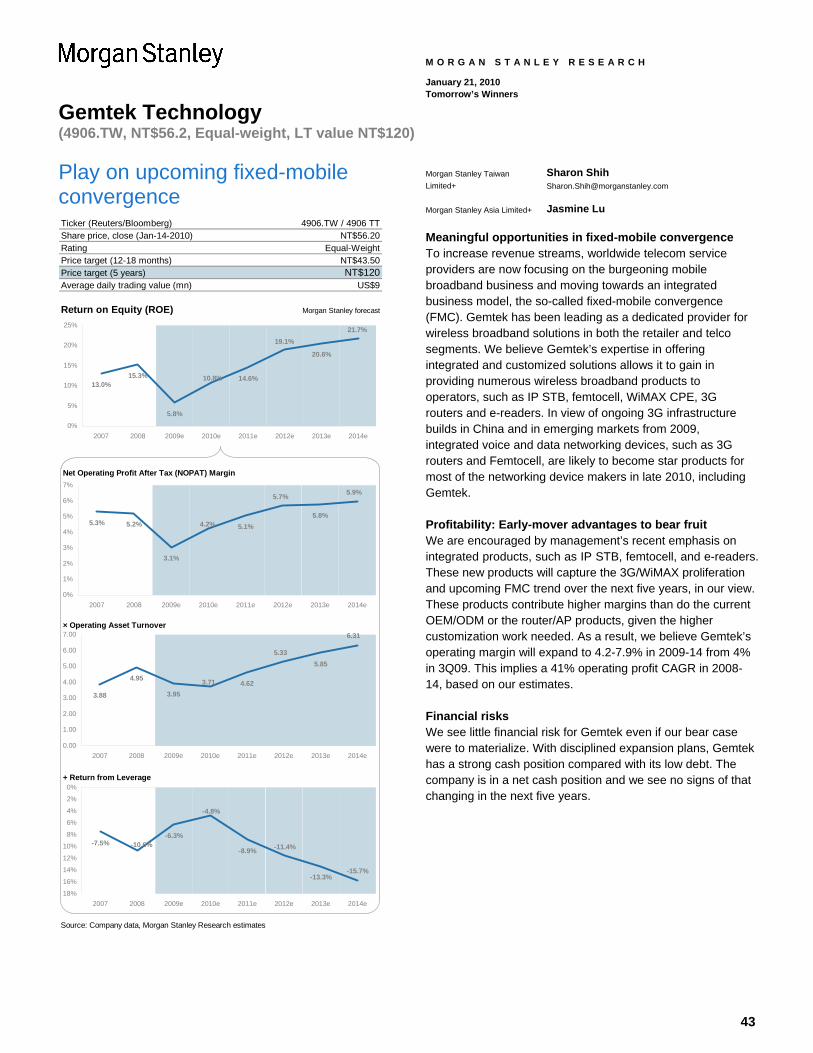
43
Gemtek Technology (4906.TW, NT$56.2, Equal-weight, LT value NT$120)
M O R G A N S T A N L E Y R E S E A R C H
January 21, 2010 Tomorrow’s Winners
Play on upcoming fixed-mobile convergence Ticker (Reuters/Bloomberg)Share price, close (Jan-14-2010)RatingPrice target (12-18 months)Price target (5 years) NT$120Average daily trading value (mn)
Return on Equity (ROE) Morgan Stanley forecast
Net Operating Profit After Tax (NOPAT) Margin
× Operating Asset Turnover
+ Return from Leverage
Source: Company data, Morgan Stanley Research estimates
US$9
4906.TW / 4906 TTNT$56.20
Equal-WeightNT$43.50
13.0%15.3%
5.8%
14.6%
20.6%
21.7%19.1%
10.8%
0%
5%
10%
15%
20%
25%
2007 2008 2009e 2010e 2011e 2012e 2013e 2014e
5.3% 5.2%
3.1%
5.1%5.8%
4.2%
5.7% 5.9%
0%
1%
2%
3%
4%
5%
6%
7%
2007 2008 2009e 2010e 2011e 2012e 2013e 2014e
3.88
4.95
3.954.62
5.85
3.71
5.33
6.31
0.00
1.00
2.00
3.00
4.00
5.00
6.00
7.00
2007 2008 2009e 2010e 2011e 2012e 2013e 2014e
-7.5%-6.3%
-8.9%
-13.3%-15.7%
-11.4%
-4.8%
-10.6%
18%
16%
14%
12%
10%
8%
6%
4%
2%
0%
2007 2008 2009e 2010e 2011e 2012e 2013e 2014e
Morgan Stanley Taiwan Limited+
Sharon Shih [email protected]
Morgan Stanley Asia Limited+ Jasmine Lu
Meaningful opportunities in fixed-mobile convergence To increase revenue streams, worldwide telecom service providers are now focusing on the burgeoning mobile broadband business and moving towards an integrated business model, the so-called fixed-mobile convergence (FMC). Gemtek has been leading as a dedicated provider for wireless broadband solutions in both the retailer and telco segments. We believe Gemtek’s expertise in offering integrated and customized solutions allows it to gain in providing numerous wireless broadband products to operators, such as IP STB, femtocell, WiMAX CPE, 3G routers and e-readers. In view of ongoing 3G infrastructure builds in China and in emerging markets from 2009, integrated voice and data networking devices, such as 3G routers and Femtocell, are likely to become star products for most of the networking device makers in late 2010, including Gemtek.
Profitability: Early-mover advantages to bear fruit We are encouraged by management’s recent emphasis on integrated products, such as IP STB, femtocell, and e-readers. These new products will capture the 3G/WiMAX proliferation and upcoming FMC trend over the next five years, in our view. These products contribute higher margins than do the current OEM/ODM or the router/AP products, given the higher customization work needed. As a result, we believe Gemtek’s operating margin will expand to 4.2-7.9% in 2009-14 from 4% in 3Q09. This implies a 41% operating profit CAGR in 2008-14, based on our estimates.
Financial risks We see little financial risk for Gemtek even if our bear case were to materialize. With disciplined expansion plans, Gemtek has a strong cash position compared with its low debt. The company is in a net cash position and we see no signs of that changing in the next five years.
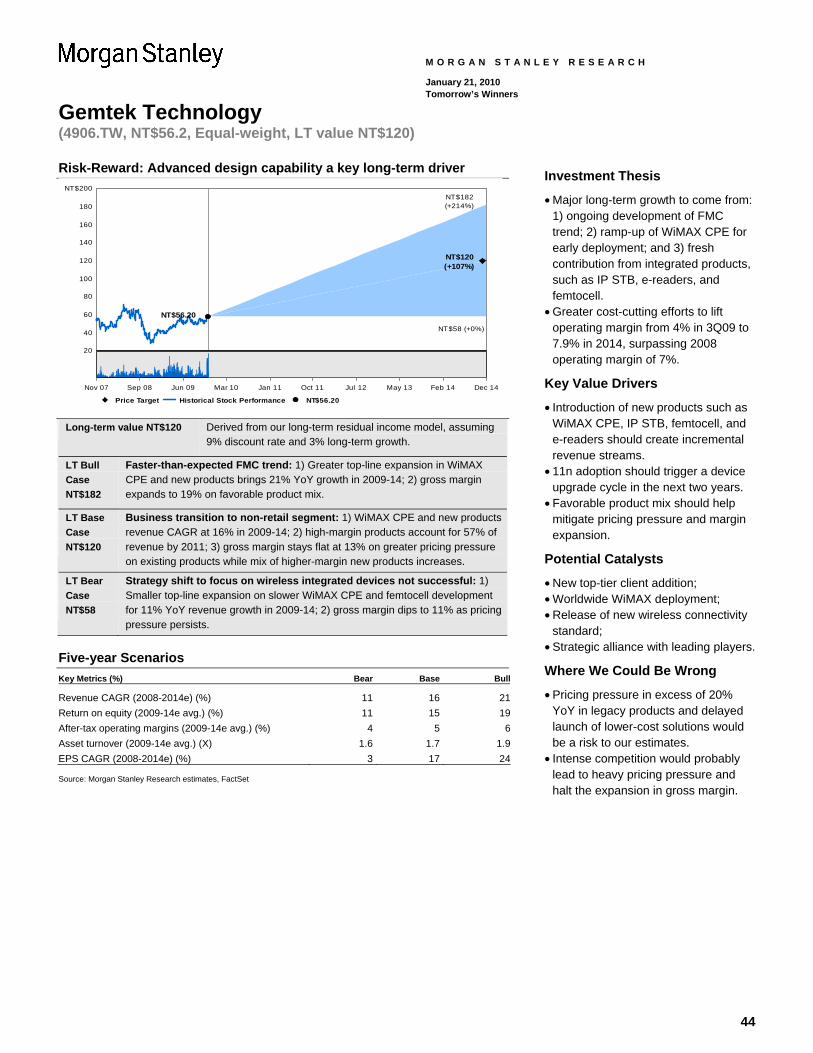
44
Gemtek Technology (4906.TW, NT$56.2, Equal-weight, LT value NT$120)
M O R G A N S T A N L E Y R E S E A R C H
January 21, 2010 Tomorrow’s Winners
Risk-Reward: Advanced design capability a key long-term driver
20
40
60
80
100
120
140
160
180
NT$200NT$182(+214%)
NT$120(+107%)
NT$58 (+0%)
NT$56.20
Price Target Historical Stock Performance NT$56.20
Nov 07 Sep 08 Jun 09 Mar 10 Jan 11 Oct 11 Jul 12 May 13 Feb 14 Dec 14
Long-term value NT$120 Derived from our long-term residual income model, assuming 9% discount rate and 3% long-term growth.
LT Bull Case NT$182
Faster-than-expected FMC trend: 1) Greater top-line expansion in WiMAX CPE and new products brings 21% YoY growth in 2009-14; 2) gross margin expands to 19% on favorable product mix.
LT Base Case NT$120
Business transition to non-retail segment: 1) WiMAX CPE and new products revenue CAGR at 16% in 2009-14; 2) high-margin products account for 57% of revenue by 2011; 3) gross margin stays flat at 13% on greater pricing pressure on existing products while mix of higher-margin new products increases.
LT Bear Case NT$58
Strategy shift to focus on wireless integrated devices not successful: 1) Smaller top-line expansion on slower WiMAX CPE and femtocell development for 11% YoY revenue growth in 2009-14; 2) gross margin dips to 11% as pricing pressure persists.
Five-year Scenarios Key Metrics (%) Bear Base Bull
Revenue CAGR (2008-2014e) (%) 11 16 21Return on equity (2009-14e avg.) (%) 11 15 19After-tax operating margins (2009-14e avg.) (%) 4 5 6Asset turnover (2009-14e avg.) (X) 1.6 1.7 1.9EPS CAGR (2008-2014e) (%) 3 17 24 Source: Morgan Stanley Research estimates, FactSet
Investment Thesis
• Major long-term growth to come from: 1) ongoing development of FMC trend; 2) ramp-up of WiMAX CPE for early deployment; and 3) fresh contribution from integrated products, such as IP STB, e-readers, and femtocell.
• Greater cost-cutting efforts to lift operating margin from 4% in 3Q09 to 7.9% in 2014, surpassing 2008 operating margin of 7%.
Key Value Drivers
• Introduction of new products such as WiMAX CPE, IP STB, femtocell, and e-readers should create incremental revenue streams.
• 11n adoption should trigger a device upgrade cycle in the next two years.
• Favorable product mix should help mitigate pricing pressure and margin expansion.
Potential Catalysts
• New top-tier client addition; • Worldwide WiMAX deployment; • Release of new wireless connectivity
standard; • Strategic alliance with leading players.
Where We Could Be Wrong
• Pricing pressure in excess of 20% YoY in legacy products and delayed launch of lower-cost solutions would be a risk to our estimates.
• Intense competition would probably lead to heavy pricing pressure and halt the expansion in gross margin.
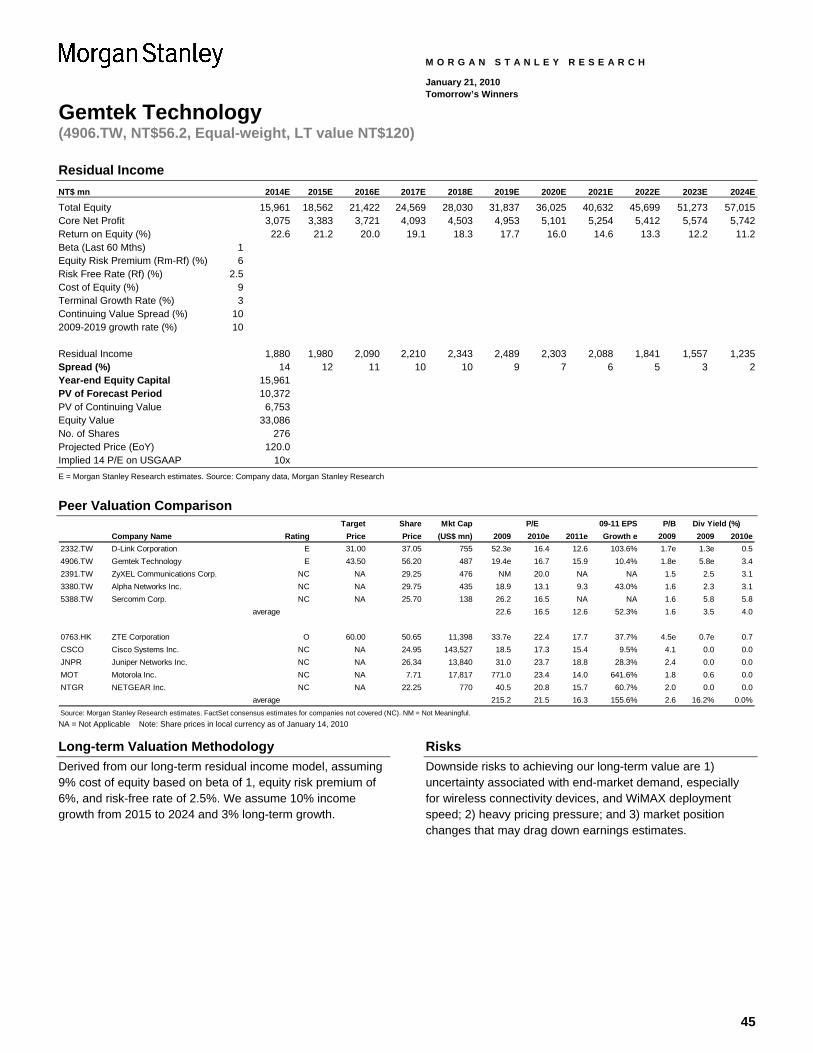
45
Gemtek Technology (4906.TW, NT$56.2, Equal-weight, LT value NT$120)
M O R G A N S T A N L E Y R E S E A R C H
January 21, 2010 Tomorrow’s Winners
Residual Income NT$ mn 2014E 2015E 2016E 2017E 2018E 2019E 2020E 2021E 2022E 2023E 2024E Total Equity 15,961 18,562 21,422 24,569 28,030 31,837 36,025 40,632 45,699 51,273 57,015 Core Net Profit 3,075 3,383 3,721 4,093 4,503 4,953 5,101 5,254 5,412 5,574 5,742 Return on Equity (%) 22.6 21.2 20.0 19.1 18.3 17.7 16.0 14.6 13.3 12.2 11.2 Beta (Last 60 Mths) 1 Equity Risk Premium (Rm-Rf) (%) 6 Risk Free Rate (Rf) (%) 2.5 Cost of Equity (%) 9 Terminal Growth Rate (%) 3 Continuing Value Spread (%) 10 2009-2019 growth rate (%) 10 Residual Income 1,880 1,980 2,090 2,210 2,343 2,489 2,303 2,088 1,841 1,557 1,235 Spread (%) 14 12 11 10 10 9 7 6 5 3 2 Year-end Equity Capital 15,961 PV of Forecast Period 10,372 PV of Continuing Value 6,753 Equity Value 33,086 No. of Shares 276 Projected Price (EoY) 120.0 Implied 14 P/E on USGAAP 10x E = Morgan Stanley Research estimates. Source: Company data, Morgan Stanley Research
Peer Valuation Comparison
Target Share Mkt Cap 09-11 EPS P/BCompany Name Rating Price Price (US$ mn) 2009 2010e 2011e Growth e 2009 2009 2010e
2332.TW D-Link Corporation E 31.00 37.05 755 52.3e 16.4 12.6 103.6% 1.7e 1.3e 0.54906.TW Gemtek Technology E 43.50 56.20 487 19.4e 16.7 15.9 10.4% 1.8e 5.8e 3.42391.TW ZyXEL Communications Corp. NC NA 29.25 476 NM 20.0 NA NA 1.5 2.5 3.13380.TW Alpha Networks Inc. NC NA 29.75 435 18.9 13.1 9.3 43.0% 1.6 2.3 3.15388.TW Sercomm Corp. NC NA 25.70 138 26.2 16.5 NA NA 1.6 5.8 5.8
average 22.6 16.5 12.6 52.3% 1.6 3.5 4.0
0763.HK ZTE Corporation O 60.00 50.65 11,398 33.7e 22.4 17.7 37.7% 4.5e 0.7e 0.7CSCO Cisco Systems Inc. NC NA 24.95 143,527 18.5 17.3 15.4 9.5% 4.1 0.0 0.0JNPR Juniper Networks Inc. NC NA 26.34 13,840 31.0 23.7 18.8 28.3% 2.4 0.0 0.0MOT Motorola Inc. NC NA 7.71 17,817 771.0 23.4 14.0 641.6% 1.8 0.6 0.0NTGR NETGEAR Inc. NC NA 22.25 770 40.5 20.8 15.7 60.7% 2.0 0.0 0.0
average 215.2 21.5 16.3 155.6% 2.6 16.2% 0.0%Source: Morgan Stanley Research estimates. FactSet consensus estimates for companies not covered (NC). NM = Not Meaningful.
P/E Div Yield (%)
NA = Not Applicable Note: Share prices in local currency as of January 14, 2010
Long-term Valuation Methodology Derived from our long-term residual income model, assuming 9% cost of equity based on beta of 1, equity risk premium of 6%, and risk-free rate of 2.5%. We assume 10% income growth from 2015 to 2024 and 3% long-term growth.
Risks Downside risks to achieving our long-term value are 1) uncertainty associated with end-market demand, especially for wireless connectivity devices, and WiMAX deployment speed; 2) heavy pricing pressure; and 3) market position changes that may drag down earnings estimates.

46
Gemtek Technology (4906.TW, NT$56.2, Equal-weight, LT value NT$120)
M O R G A N S T A N L E Y R E S E A R C H
January 21, 2010 Tomorrow’s Winners
Income Statement NT$ mn; Years Ending December 2008 2009e 2010e 2011e 2012e 2013e 2014e Net sales 21,535 17,633 23,335 28,405 36,982 44,357 51,682 COGS -18,679 -15,486 -20,428 -24,666 -32,051 -38,532 -44,873 Gross profit 2,856 2,147 2,907 3,739 4,930 5,826 6,809 Operating expenses -1,359 -1,414 -1,605 -1,830 -2,126 -2,426 -2,751 Operating income 1,497 733 1,302 1,909 2,805 3,400 4,058 Non-operating income 55 -48 16 16 16 16 16 Interest income -7 -27 -24 -24 -24 -24 -24 Investment income -67 -94 -40 -40 -40 -40 -40 Disposal of investment 90 1 0 0 0 0 0 Disposal of fixed assets -12 -2 0 0 0 0 0 Exchange gain 153 15 0 0 0 0 0 Other -102 58 80 80 80 80 80 Pre-tax income 1,551 685 1,318 1,925 2,821 3,416 4,074 Income tax -385 -182 -323 -472 -691 -837 -998 Minority -30 1 0 0 0 0 0 Net income 1,137 504 995 1,453 2,129 2,579 3,075 Reported EPS (NT$) 4.44 1.83 3.61 5.27 7.73 9.36 11.16
Balance Sheet NT$ mn; Years Ending December 2008 2009e 2010e 2011e 2012e 2013e 2014e Cash 3,206 4,243 2,860 3,763 4,108 4,813 5,820 Mkt securities 42 42 42 42 42 42 42 Accounts/Notes receivables 4,394 2,645 5,834 4,261 5,547 6,654 7,752 Inventory 1,399 1,394 2,247 2,467 3,205 3,853 4,487 Others 320 320 320 320 320 320 320 Current Assets 9,361 8,644 11,303 10,853 13,222 15,682 18,422 Long-term investments 788 881 921 961 1,001 1,041 1,081 Fixed assets 3,802 3,949 4,260 4,718 4,950 5,158 5,344 Other assets 190 190 190 190 190 190 190 Total Assets 14,141 13,664 16,674 16,722 19,363 22,071 25,037 S/T borrowings 0 0 0 0 0 0 0 AP/NP 3,960 2,323 5,107 4,193 5,449 6,550 7,628 Other ST liabilities 1,501 1,414 1,156 1,318 1,531 1,747 1,981 Other liabilities 296 296 296 296 296 296 296 L/T debt 937 937 937 937 937 937 937 Total Liabilities 6,694 4,969 7,495 6,743 8,212 9,530 10,842 Common shares 2,563 3,223 3,515 4,092 4,935 6,171 7,667 Other shareholders’ equity 10,151 10,201 10,355 11,135 11,550 12,102 12,585 Shareholders’ equity 7,447 8,695 9,179 9,978 11,151 12,541 14,195 Total Liab./Shrhldr’s Equity 14,141 13,664 16,674 16,722 19,363 22,071 25,037 e = Morgan Stanley Research estimates. Source: Company data, Morgan Stanley Research
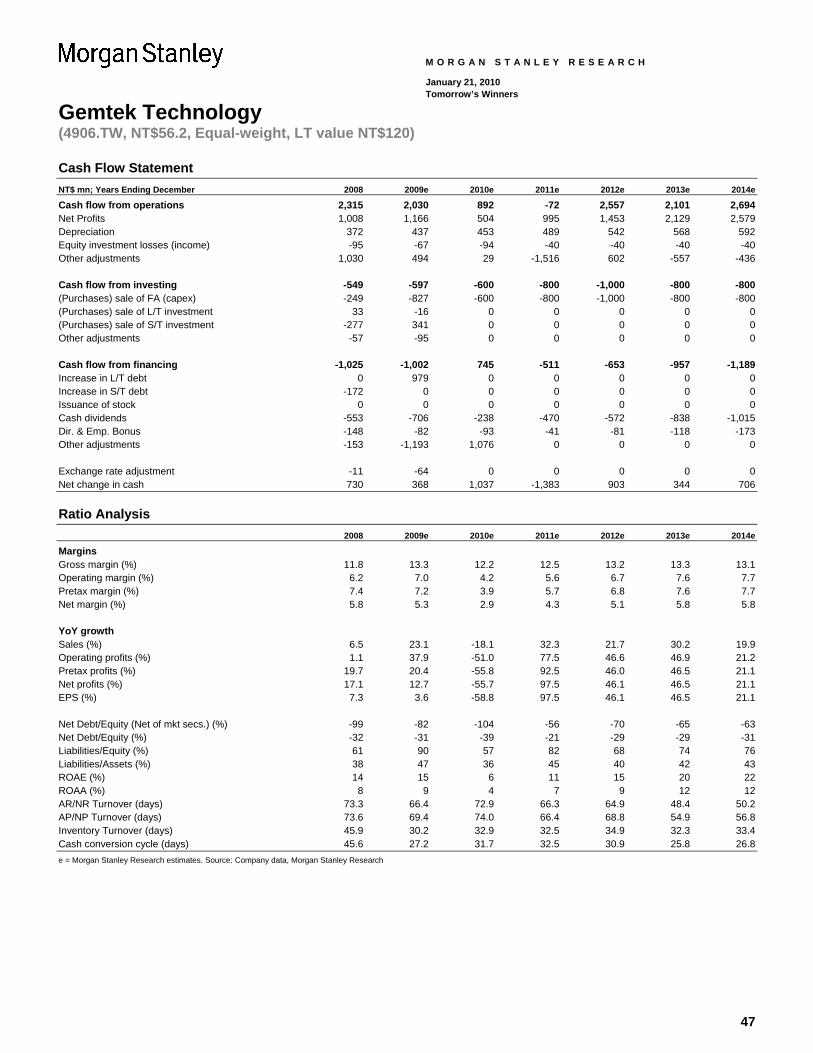
47
Gemtek Technology (4906.TW, NT$56.2, Equal-weight, LT value NT$120)
M O R G A N S T A N L E Y R E S E A R C H
January 21, 2010 Tomorrow’s Winners
Cash Flow Statement NT$ mn; Years Ending December 2008 2009e 2010e 2011e 2012e 2013e 2014e Cash flow from operations 2,315 2,030 892 -72 2,557 2,101 2,694 Net Profits 1,008 1,166 504 995 1,453 2,129 2,579 Depreciation 372 437 453 489 542 568 592 Equity investment losses (income) -95 -67 -94 -40 -40 -40 -40 Other adjustments 1,030 494 29 -1,516 602 -557 -436 Cash flow from investing -549 -597 -600 -800 -1,000 -800 -800 (Purchases) sale of FA (capex) -249 -827 -600 -800 -1,000 -800 -800 (Purchases) sale of L/T investment 33 -16 0 0 0 0 0 (Purchases) sale of S/T investment -277 341 0 0 0 0 0 Other adjustments -57 -95 0 0 0 0 0 Cash flow from financing -1,025 -1,002 745 -511 -653 -957 -1,189 Increase in L/T debt 0 979 0 0 0 0 0 Increase in S/T debt -172 0 0 0 0 0 0 Issuance of stock 0 0 0 0 0 0 0 Cash dividends -553 -706 -238 -470 -572 -838 -1,015 Dir. & Emp. Bonus -148 -82 -93 -41 -81 -118 -173 Other adjustments -153 -1,193 1,076 0 0 0 0 Exchange rate adjustment -11 -64 0 0 0 0 0 Net change in cash 730 368 1,037 -1,383 903 344 706
Ratio Analysis 2008 2009e 2010e 2011e 2012e 2013e 2014e Margins Gross margin (%) 11.8 13.3 12.2 12.5 13.2 13.3 13.1 Operating margin (%) 6.2 7.0 4.2 5.6 6.7 7.6 7.7 Pretax margin (%) 7.4 7.2 3.9 5.7 6.8 7.6 7.7 Net margin (%) 5.8 5.3 2.9 4.3 5.1 5.8 5.8 YoY growth Sales (%) 6.5 23.1 -18.1 32.3 21.7 30.2 19.9 Operating profits (%) 1.1 37.9 -51.0 77.5 46.6 46.9 21.2 Pretax profits (%) 19.7 20.4 -55.8 92.5 46.0 46.5 21.1 Net profits (%) 17.1 12.7 -55.7 97.5 46.1 46.5 21.1 EPS (%) 7.3 3.6 -58.8 97.5 46.1 46.5 21.1 Net Debt/Equity (Net of mkt secs.) (%) -99 -82 -104 -56 -70 -65 -63 Net Debt/Equity (%) -32 -31 -39 -21 -29 -29 -31 Liabilities/Equity (%) 61 90 57 82 68 74 76 Liabilities/Assets (%) 38 47 36 45 40 42 43 ROAE (%) 14 15 6 11 15 20 22 ROAA (%) 8 9 4 7 9 12 12 AR/NR Turnover (days) 73.3 66.4 72.9 66.3 64.9 48.4 50.2 AP/NP Turnover (days) 73.6 69.4 74.0 66.4 68.8 54.9 56.8 Inventory Turnover (days) 45.9 30.2 32.9 32.5 34.9 32.3 33.4 Cash conversion cycle (days) 45.6 27.2 31.7 32.5 30.9 25.8 26.8 e = Morgan Stanley Research estimates. Source: Company data, Morgan Stanley Research
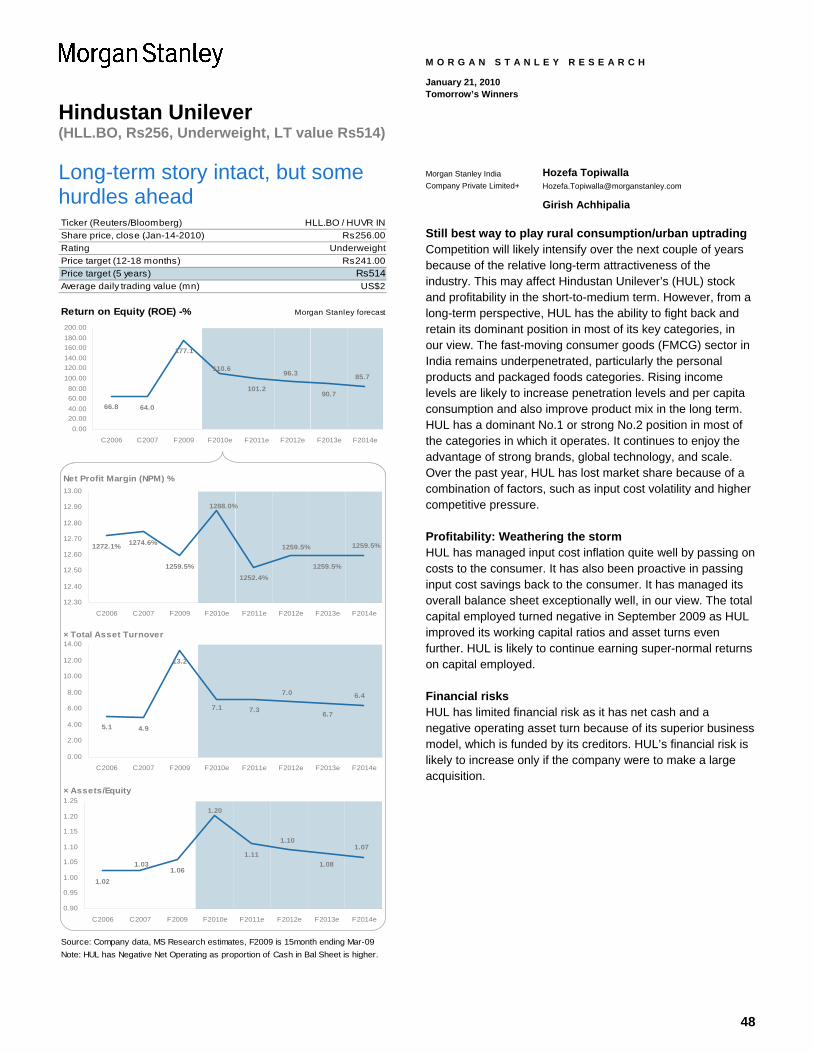
48
Hindustan Unilever (HLL.BO, Rs256, Underweight, LT value Rs514)
M O R G A N S T A N L E Y R E S E A R C H
January 21, 2010 Tomorrow’s Winners
Long-term story intact, but some hurdles ahead Ticker (Reuters/Bloomberg)Share price, close (Jan-14-2010)RatingPrice target (12-18 months)Price target (5 years) Rs514Average daily trading value (mn)
Return on Equity (ROE) -% Morgan Stanley forecast
Net Profit Margin (NPM) %
× Total Asset Turnover
× Assets/Equity
Source: Company data, MS Research estimates, F2009 is 15month ending Mar-09Note: HUL has Negative Net Operating as proportion of Cash in Bal Sheet is higher.
HLL.BO / HUVR INRs256.00
UnderweightRs241.00
US$2
66.8 64.0
101.290.7
177.1
110.6 96.3 85.7
0.0020.0040.0060.0080.00
100.00120.00140.00160.00180.00200.00
C2006 C2007 F2009 F2010e F2011e F2012e F2013e F2014e
1272.1% 1274.6%
1259.5%1252.4%
1259.5%
1288.0%
1259.5% 1259.5%
12.30
12.40
12.50
12.60
12.70
12.80
12.90
13.00
C2006 C2007 F2009 F2010e F2011e F2012e F2013e F2014e
5.1 4.9
13.2
7.3 6.77.1
7.0 6.4
0.00
2.00
4.00
6.00
8.00
10.00
12.00
14.00
C2006 C2007 F2009 F2010e F2011e F2012e F2013e F2014e
1.021.06
1.111.08
1.071.10
1.20
1.03
0.90
0.95
1.00
1.05
1.10
1.15
1.20
1.25
C2006 C2007 F2009 F2010e F2011e F2012e F2013e F2014e
Morgan Stanley India Company Private Limited+
Hozefa Topiwalla [email protected]
Girish Achhipalia
Still best way to play rural consumption/urban uptrading Competition will likely intensify over the next couple of years because of the relative long-term attractiveness of the industry. This may affect Hindustan Unilever’s (HUL) stock and profitability in the short-to-medium term. However, from a long-term perspective, HUL has the ability to fight back and retain its dominant position in most of its key categories, in our view. The fast-moving consumer goods (FMCG) sector in India remains underpenetrated, particularly the personal products and packaged foods categories. Rising income levels are likely to increase penetration levels and per capita consumption and also improve product mix in the long term. HUL has a dominant No.1 or strong No.2 position in most of the categories in which it operates. It continues to enjoy the advantage of strong brands, global technology, and scale. Over the past year, HUL has lost market share because of a combination of factors, such as input cost volatility and higher competitive pressure.
Profitability: Weathering the storm HUL has managed input cost inflation quite well by passing on costs to the consumer. It has also been proactive in passing input cost savings back to the consumer. It has managed its overall balance sheet exceptionally well, in our view. The total capital employed turned negative in September 2009 as HUL improved its working capital ratios and asset turns even further. HUL is likely to continue earning super-normal returns on capital employed.
Financial risks HUL has limited financial risk as it has net cash and a negative operating asset turn because of its superior business model, which is funded by its creditors. HUL’s financial risk is likely to increase only if the company were to make a large acquisition.
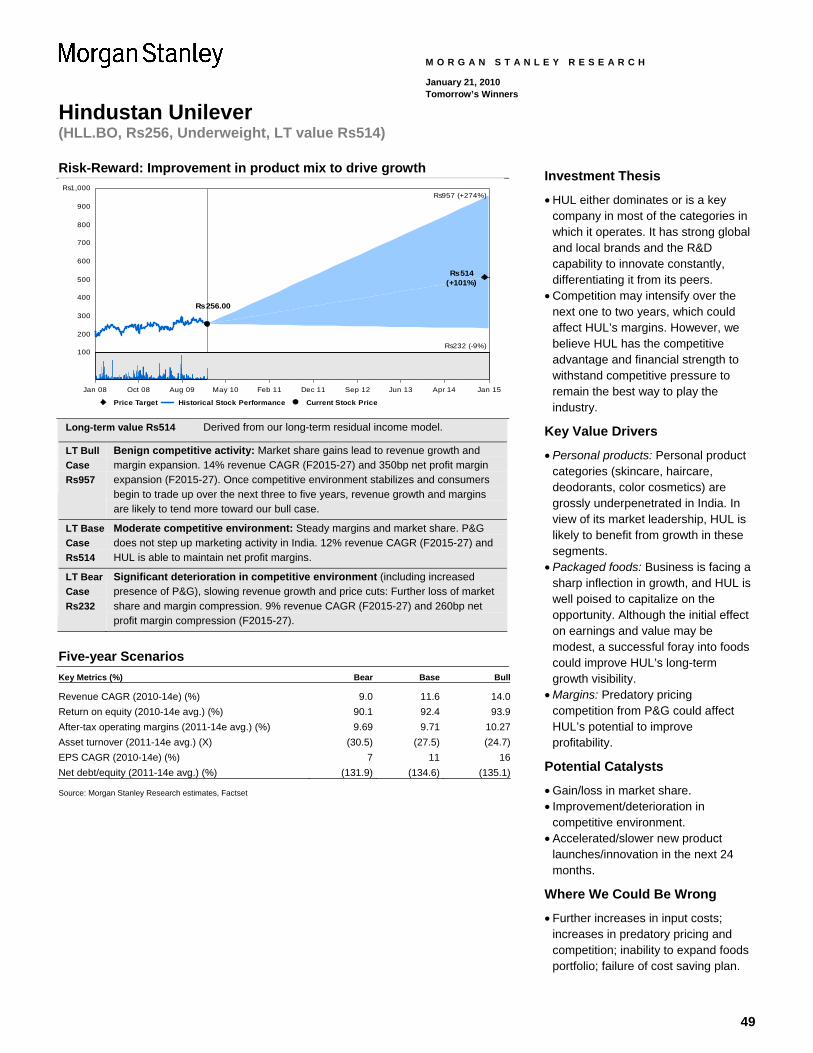
49
Hindustan Unilever (HLL.BO, Rs256, Underweight, LT value Rs514)
M O R G A N S T A N L E Y R E S E A R C H
January 21, 2010 Tomorrow’s Winners
Risk-Reward: Improvement in product mix to drive growth
100
200
300
400
500
600
700
800
900
Rs1,000Rs957 (+274%)
Rs514(+101%)
Rs232 (-9%)
Rs256.00
Price Target Historical Stock Performance Current Stock Price
Jan 08 Oct 08 Aug 09 May 10 Feb 11 Dec 11 Sep 12 Jun 13 Apr 14 Jan 15
Long-term value Rs514 Derived from our long-term residual income model.
LT Bull Case Rs957
Benign competitive activity: Market share gains lead to revenue growth and margin expansion. 14% revenue CAGR (F2015-27) and 350bp net profit margin expansion (F2015-27). Once competitive environment stabilizes and consumers begin to trade up over the next three to five years, revenue growth and margins are likely to tend more toward our bull case.
LT Base Case Rs514
Moderate competitive environment: Steady margins and market share. P&G does not step up marketing activity in India. 12% revenue CAGR (F2015-27) and HUL is able to maintain net profit margins.
LT Bear Case Rs232
Significant deterioration in competitive environment (including increased presence of P&G), slowing revenue growth and price cuts: Further loss of market share and margin compression. 9% revenue CAGR (F2015-27) and 260bp net profit margin compression (F2015-27).
Five-year Scenarios Key Metrics (%) Bear Base Bull
Revenue CAGR (2010-14e) (%) 9.0 11.6 14.0Return on equity (2010-14e avg.) (%) 90.1 92.4 93.9After-tax operating margins (2011-14e avg.) (%) 9.69 9.71 10.27Asset turnover (2011-14e avg.) (X) (30.5) (27.5) (24.7)EPS CAGR (2010-14e) (%) 7 11 16Net debt/equity (2011-14e avg.) (%) (131.9) (134.6) (135.1) Source: Morgan Stanley Research estimates, Factset
Investment Thesis
• HUL either dominates or is a key company in most of the categories in which it operates. It has strong global and local brands and the R&D capability to innovate constantly, differentiating it from its peers.
• Competition may intensify over the next one to two years, which could affect HUL’s margins. However, we believe HUL has the competitive advantage and financial strength to withstand competitive pressure to remain the best way to play the industry.
Key Value Drivers
• Personal products: Personal product categories (skincare, haircare, deodorants, color cosmetics) are grossly underpenetrated in India. In view of its market leadership, HUL is likely to benefit from growth in these segments.
• Packaged foods: Business is facing a sharp inflection in growth, and HUL is well poised to capitalize on the opportunity. Although the initial effect on earnings and value may be modest, a successful foray into foods could improve HUL’s long-term growth visibility.
• Margins: Predatory pricing competition from P&G could affect HUL’s potential to improve profitability.
Potential Catalysts
• Gain/loss in market share. • Improvement/deterioration in
competitive environment. • Accelerated/slower new product
launches/innovation in the next 24 months.
Where We Could Be Wrong
• Further increases in input costs; increases in predatory pricing and competition; inability to expand foods portfolio; failure of cost saving plan.
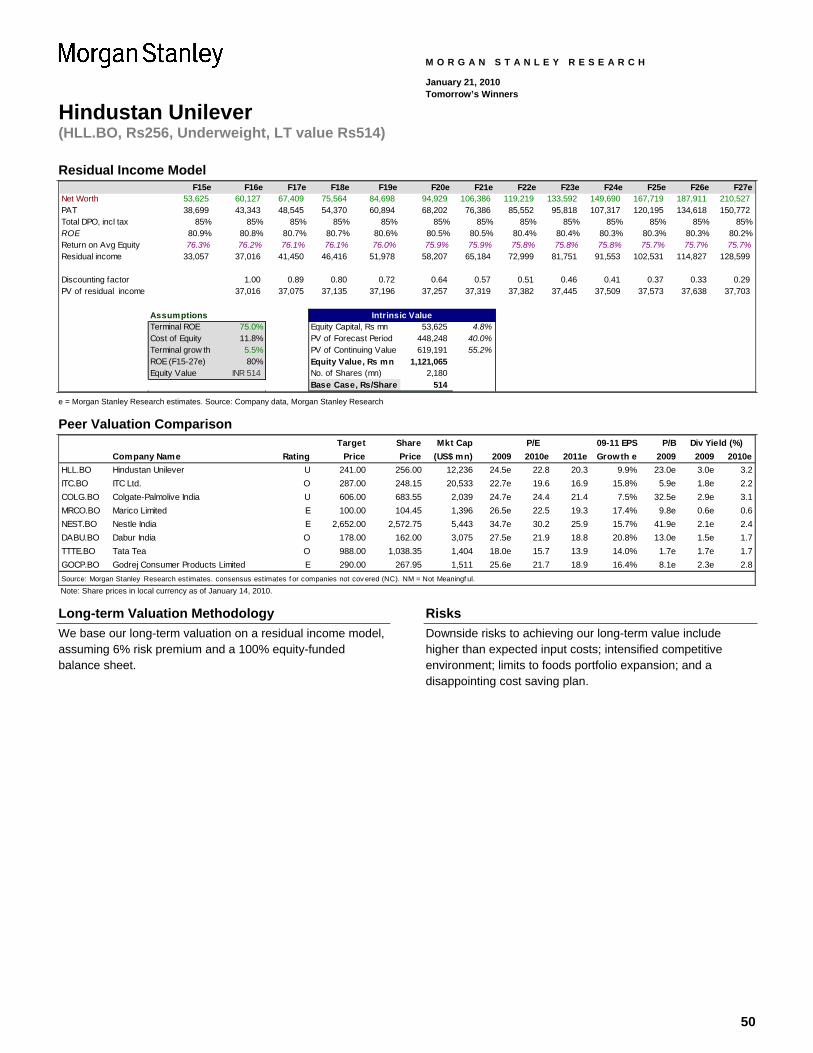
50
Hindustan Unilever (HLL.BO, Rs256, Underweight, LT value Rs514)
M O R G A N S T A N L E Y R E S E A R C H
January 21, 2010 Tomorrow’s Winners
Residual Income Model F15e F16e F17e F18e F19e F20e F21e F22e F23e F24e F25e F26e F27e
Net Worth 53,625 60,127 67,409 75,564 84,698 94,929 106,386 119,219 133,592 149,690 167,719 187,911 210,527 PAT 38,699 43,343 48,545 54,370 60,894 68,202 76,386 85,552 95,818 107,317 120,195 134,618 150,772 Total DPO, incl tax 85% 85% 85% 85% 85% 85% 85% 85% 85% 85% 85% 85% 85%ROE 80.9% 80.8% 80.7% 80.7% 80.6% 80.5% 80.5% 80.4% 80.4% 80.3% 80.3% 80.3% 80.2%Return on Avg Equity 76.3% 76.2% 76.1% 76.1% 76.0% 75.9% 75.9% 75.8% 75.8% 75.8% 75.7% 75.7% 75.7%Residual income 33,057 37,016 41,450 46,416 51,978 58,207 65,184 72,999 81,751 91,553 102,531 114,827 128,599
Discounting factor 1.00 0.89 0.80 0.72 0.64 0.57 0.51 0.46 0.41 0.37 0.33 0.29PV of residual income 37,016 37,075 37,135 37,196 37,257 37,319 37,382 37,445 37,509 37,573 37,638 37,703
AssumptionsTerminal ROE 75.0% Equity Capital, Rs mn 53,625 4.8%Cost of Equity 11.8% PV of Forecast Period 448,248 40.0%Terminal grow th 5.5% PV of Continuing Value 619,191 55.2%ROE (F15-27e) 80% Equity Value, Rs mn 1,121,065 Equity Value INR 514 No. of Shares (mn) 2,180
Base Case, Rs/Share 514
Intrinsic Value
e = Morgan Stanley Research estimates. Source: Company data, Morgan Stanley Research
Peer Valuation Comparison Target Share Mkt Cap 09-11 EPS P/B
Company Name Rating Price Price (US$ mn) 2009 2010e 2011e Growth e 2009 2009 2010eHLL.BO Hindustan Unilever U 241.00 256.00 12,236 24.5e 22.8 20.3 9.9% 23.0e 3.0e 3.2ITC.BO ITC Ltd. O 287.00 248.15 20,533 22.7e 19.6 16.9 15.8% 5.9e 1.8e 2.2COLG.BO Colgate-Palmolive India U 606.00 683.55 2,039 24.7e 24.4 21.4 7.5% 32.5e 2.9e 3.1MRCO.BO Marico Limited E 100.00 104.45 1,396 26.5e 22.5 19.3 17.4% 9.8e 0.6e 0.6NEST.BO Nestle India E 2,652.00 2,572.75 5,443 34.7e 30.2 25.9 15.7% 41.9e 2.1e 2.4DABU.BO Dabur India O 178.00 162.00 3,075 27.5e 21.9 18.8 20.8% 13.0e 1.5e 1.7TTTE.BO Tata Tea O 988.00 1,038.35 1,404 18.0e 15.7 13.9 14.0% 1.7e 1.7e 1.7GOCP.BO Godrej Consumer Products Limited E 290.00 267.95 1,511 25.6e 21.7 18.9 16.4% 8.1e 2.3e 2.8Source: Morgan Stanley Research estimates. consensus estimates f or companies not cov ered (NC). NM = Not Meaningf ul.
P/E Div Yield (%)
Note: Share prices in local currency as of January 14, 2010.
Long-term Valuation Methodology We base our long-term valuation on a residual income model, assuming 6% risk premium and a 100% equity-funded balance sheet.
Risks Downside risks to achieving our long-term value include higher than expected input costs; intensified competitive environment; limits to foods portfolio expansion; and a disappointing cost saving plan.
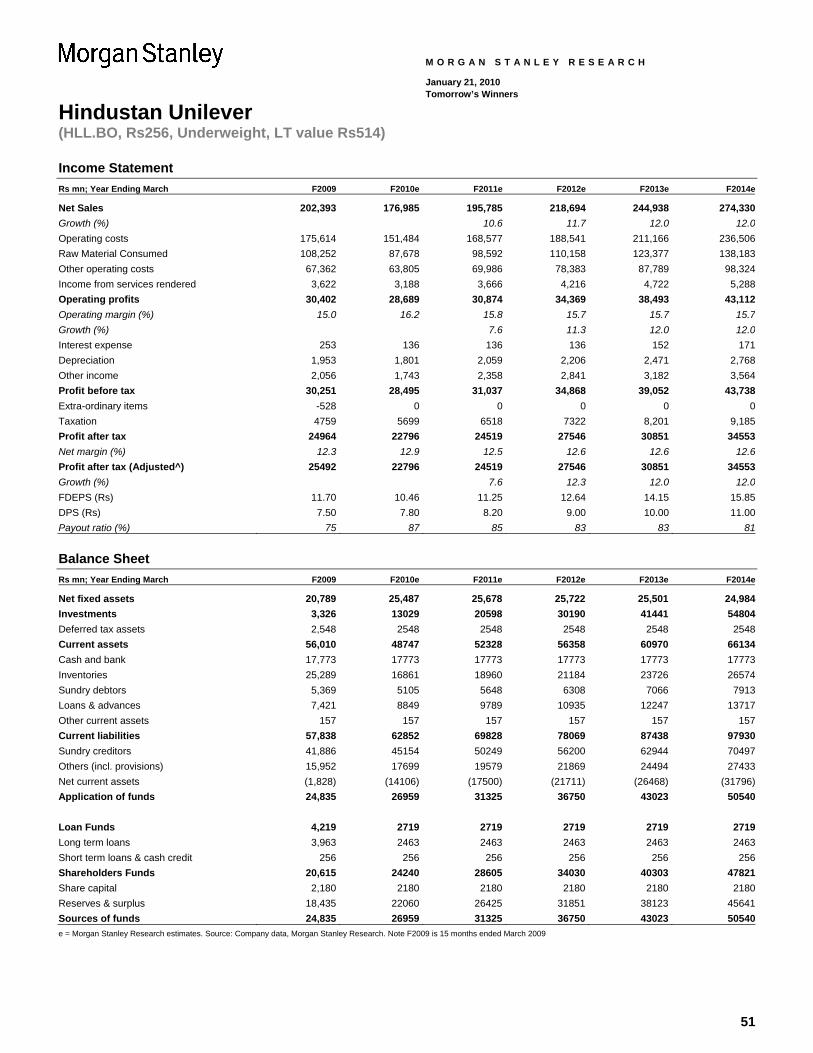
51
Hindustan Unilever (HLL.BO, Rs256, Underweight, LT value Rs514)
M O R G A N S T A N L E Y R E S E A R C H
January 21, 2010 Tomorrow’s Winners
Income Statement Rs mn; Year Ending March F2009 F2010e F2011e F2012e F2013e F2014e
Net Sales 202,393 176,985 195,785 218,694 244,938 274,330Growth (%) 10.6 11.7 12.0 12.0Operating costs 175,614 151,484 168,577 188,541 211,166 236,506Raw Material Consumed 108,252 87,678 98,592 110,158 123,377 138,183Other operating costs 67,362 63,805 69,986 78,383 87,789 98,324Income from services rendered 3,622 3,188 3,666 4,216 4,722 5,288Operating profits 30,402 28,689 30,874 34,369 38,493 43,112Operating margin (%) 15.0 16.2 15.8 15.7 15.7 15.7Growth (%) 7.6 11.3 12.0 12.0Interest expense 253 136 136 136 152 171Depreciation 1,953 1,801 2,059 2,206 2,471 2,768Other income 2,056 1,743 2,358 2,841 3,182 3,564Profit before tax 30,251 28,495 31,037 34,868 39,052 43,738Extra-ordinary items -528 0 0 0 0 0Taxation 4759 5699 6518 7322 8,201 9,185Profit after tax 24964 22796 24519 27546 30851 34553Net margin (%) 12.3 12.9 12.5 12.6 12.6 12.6Profit after tax (Adjusted^) 25492 22796 24519 27546 30851 34553Growth (%) 7.6 12.3 12.0 12.0FDEPS (Rs) 11.70 10.46 11.25 12.64 14.15 15.85DPS (Rs) 7.50 7.80 8.20 9.00 10.00 11.00Payout ratio (%) 75 87 85 83 83 81
Balance Sheet Rs mn; Year Ending March F2009 F2010e F2011e F2012e F2013e F2014e
Net fixed assets 20,789 25,487 25,678 25,722 25,501 24,984Investments 3,326 13029 20598 30190 41441 54804Deferred tax assets 2,548 2548 2548 2548 2548 2548Current assets 56,010 48747 52328 56358 60970 66134Cash and bank 17,773 17773 17773 17773 17773 17773Inventories 25,289 16861 18960 21184 23726 26574Sundry debtors 5,369 5105 5648 6308 7066 7913Loans & advances 7,421 8849 9789 10935 12247 13717Other current assets 157 157 157 157 157 157Current liabilities 57,838 62852 69828 78069 87438 97930Sundry creditors 41,886 45154 50249 56200 62944 70497Others (incl. provisions) 15,952 17699 19579 21869 24494 27433Net current assets (1,828) (14106) (17500) (21711) (26468) (31796)Application of funds 24,835 26959 31325 36750 43023 50540 Loan Funds 4,219 2719 2719 2719 2719 2719Long term loans 3,963 2463 2463 2463 2463 2463Short term loans & cash credit 256 256 256 256 256 256Shareholders Funds 20,615 24240 28605 34030 40303 47821Share capital 2,180 2180 2180 2180 2180 2180Reserves & surplus 18,435 22060 26425 31851 38123 45641Sources of funds 24,835 26959 31325 36750 43023 50540e = Morgan Stanley Research estimates. Source: Company data, Morgan Stanley Research. Note F2009 is 15 months ended March 2009
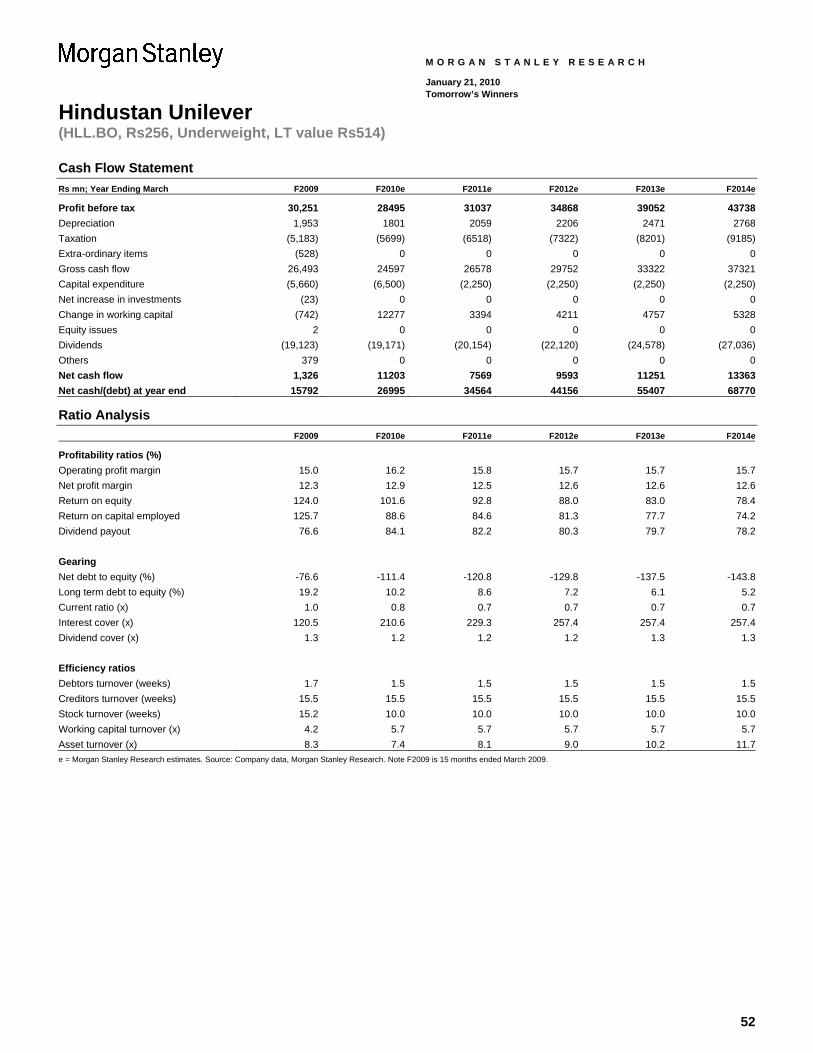
52
Hindustan Unilever (HLL.BO, Rs256, Underweight, LT value Rs514)
M O R G A N S T A N L E Y R E S E A R C H
January 21, 2010 Tomorrow’s Winners
Cash Flow Statement Rs mn; Year Ending March F2009 F2010e F2011e F2012e F2013e F2014e
Profit before tax 30,251 28495 31037 34868 39052 43738Depreciation 1,953 1801 2059 2206 2471 2768Taxation (5,183) (5699) (6518) (7322) (8201) (9185)Extra-ordinary items (528) 0 0 0 0 0Gross cash flow 26,493 24597 26578 29752 33322 37321Capital expenditure (5,660) (6,500) (2,250) (2,250) (2,250) (2,250)Net increase in investments (23) 0 0 0 0 0Change in working capital (742) 12277 3394 4211 4757 5328Equity issues 2 0 0 0 0 0Dividends (19,123) (19,171) (20,154) (22,120) (24,578) (27,036)Others 379 0 0 0 0 0Net cash flow 1,326 11203 7569 9593 11251 13363Net cash/(debt) at year end 15792 26995 34564 44156 55407 68770
Ratio Analysis F2009 F2010e F2011e F2012e F2013e F2014e
Profitability ratios (%) Operating profit margin 15.0 16.2 15.8 15.7 15.7 15.7Net profit margin 12.3 12.9 12.5 12.6 12.6 12.6Return on equity 124.0 101.6 92.8 88.0 83.0 78.4Return on capital employed 125.7 88.6 84.6 81.3 77.7 74.2Dividend payout 76.6 84.1 82.2 80.3 79.7 78.2 Gearing Net debt to equity (%) -76.6 -111.4 -120.8 -129.8 -137.5 -143.8Long term debt to equity (%) 19.2 10.2 8.6 7.2 6.1 5.2Current ratio (x) 1.0 0.8 0.7 0.7 0.7 0.7Interest cover (x) 120.5 210.6 229.3 257.4 257.4 257.4Dividend cover (x) 1.3 1.2 1.2 1.2 1.3 1.3 Efficiency ratios Debtors turnover (weeks) 1.7 1.5 1.5 1.5 1.5 1.5Creditors turnover (weeks) 15.5 15.5 15.5 15.5 15.5 15.5Stock turnover (weeks) 15.2 10.0 10.0 10.0 10.0 10.0Working capital turnover (x) 4.2 5.7 5.7 5.7 5.7 5.7Asset turnover (x) 8.3 7.4 8.1 9.0 10.2 11.7e = Morgan Stanley Research estimates. Source: Company data, Morgan Stanley Research. Note F2009 is 15 months ended March 2009.
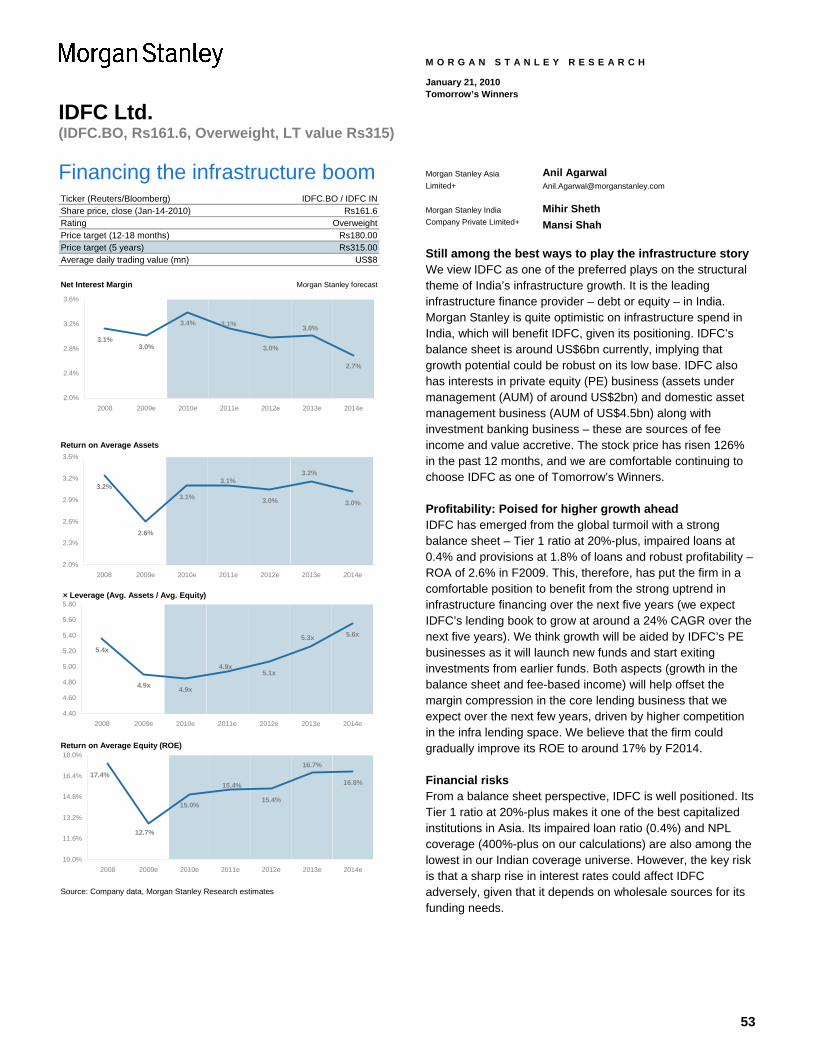
53
IDFC Ltd. (IDFC.BO, Rs161.6, Overweight, LT value Rs315)
M O R G A N S T A N L E Y R E S E A R C H
January 21, 2010 Tomorrow’s Winners
Financing the infrastructure boom Ticker (Reuters/Bloomberg)Share price, close (Jan-14-2010)RatingPrice target (12-18 months)Price target (5 years) Rs315.00Average daily trading value (mn)
Net Interest Margin Morgan Stanley forecast
Return on Average Assets
× Leverage (Avg. Assets / Avg. Equity)
Return on Average Equity (ROE)
Source: Company data, Morgan Stanley Research estimates
US$8
IDFC.BO / IDFC INRs161.6
OverweightRs180.00
3.1%3.0%
3.4%
3.0%
2.7%
3.0%3.1%
2.0%
2.4%
2.8%
3.2%
3.6%
2008 2009e 2010e 2011e 2012e 2013e 2014e
3.2%
2.6%
3.1% 3.0% 3.0%
3.1%3.2%
2.0%
2.3%
2.6%
2.9%
3.2%
3.5%
2008 2009e 2010e 2011e 2012e 2013e 2014e
5.4x
4.9x 4.9x
5.1x
5.6x
4.9x
5.3x
4.40
4.60
4.80
5.00
5.20
5.40
5.60
5.80
2008 2009e 2010e 2011e 2012e 2013e 2014e
15.0%15.4%
16.8%17.4%
16.7%
15.4%
12.7%
10.0%
11.6%
13.2%
14.8%
16.4%
18.0%
2008 2009e 2010e 2011e 2012e 2013e 2014e
Morgan Stanley Asia Limited+
Anil Agarwal [email protected]
Morgan Stanley India Company Private Limited+
Mihir Sheth Mansi Shah
Still among the best ways to play the infrastructure story We view IDFC as one of the preferred plays on the structural theme of India’s infrastructure growth. It is the leading infrastructure finance provider – debt or equity – in India. Morgan Stanley is quite optimistic on infrastructure spend in India, which will benefit IDFC, given its positioning. IDFC’s balance sheet is around US$6bn currently, implying that growth potential could be robust on its low base. IDFC also has interests in private equity (PE) business (assets under management (AUM) of around US$2bn) and domestic asset management business (AUM of US$4.5bn) along with investment banking business – these are sources of fee income and value accretive. The stock price has risen 126% in the past 12 months, and we are comfortable continuing to choose IDFC as one of Tomorrow’s Winners.
Profitability: Poised for higher growth ahead IDFC has emerged from the global turmoil with a strong balance sheet – Tier 1 ratio at 20%-plus, impaired loans at 0.4% and provisions at 1.8% of loans and robust profitability – ROA of 2.6% in F2009. This, therefore, has put the firm in a comfortable position to benefit from the strong uptrend in infrastructure financing over the next five years (we expect IDFC’s lending book to grow at around a 24% CAGR over the next five years). We think growth will be aided by IDFC’s PE businesses as it will launch new funds and start exiting investments from earlier funds. Both aspects (growth in the balance sheet and fee-based income) will help offset the margin compression in the core lending business that we expect over the next few years, driven by higher competition in the infra lending space. We believe that the firm could gradually improve its ROE to around 17% by F2014.
Financial risks From a balance sheet perspective, IDFC is well positioned. Its Tier 1 ratio at 20%-plus makes it one of the best capitalized institutions in Asia. Its impaired loan ratio (0.4%) and NPL coverage (400%-plus on our calculations) are also among the lowest in our Indian coverage universe. However, the key risk is that a sharp rise in interest rates could affect IDFC adversely, given that it depends on wholesale sources for its funding needs.
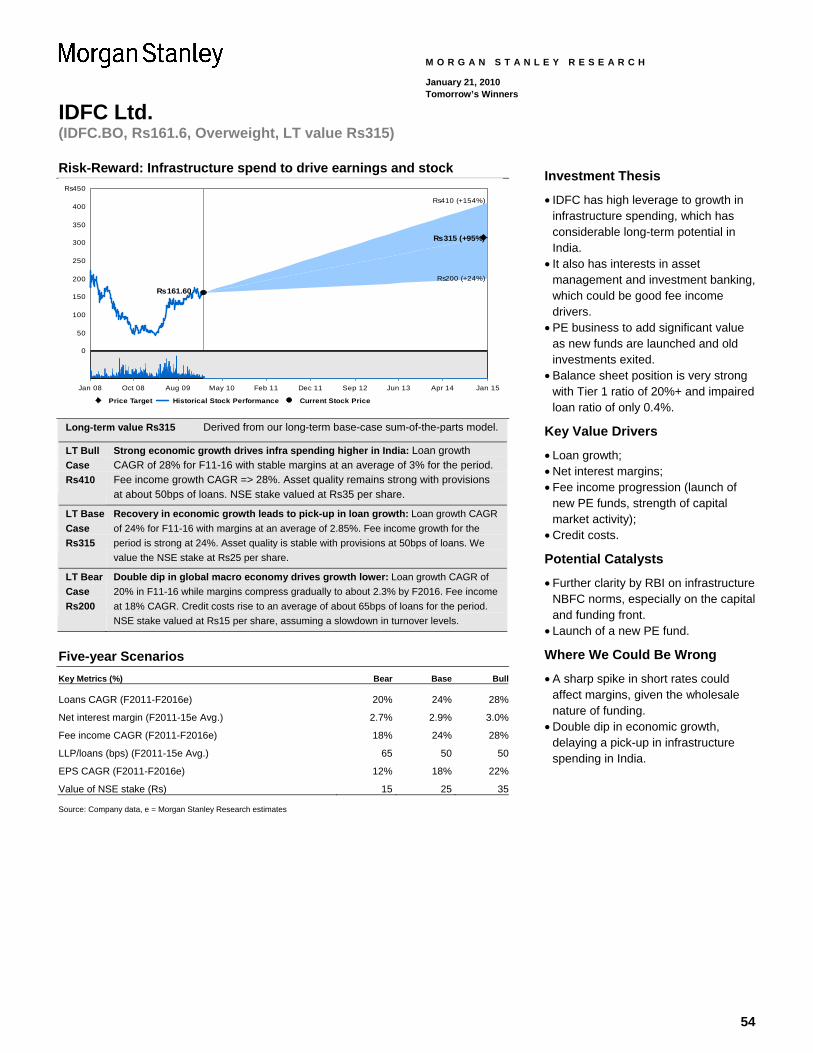
54
IDFC Ltd. (IDFC.BO, Rs161.6, Overweight, LT value Rs315)
M O R G A N S T A N L E Y R E S E A R C H
January 21, 2010 Tomorrow’s Winners
Risk-Reward: Infrastructure spend to drive earnings and stock
0
50
100
150
200
250
300
350
400
Rs450
Rs410 (+154%)
Rs315 (+95%)
Rs200 (+24%)
Rs161.60
Price Target Historical Stock Performance Current Stock Price
Jan 08 Oct 08 Aug 09 May 10 Feb 11 Dec 11 Sep 12 Jun 13 Apr 14 Jan 15
Long-term value Rs315 Derived from our long-term base-case sum-of-the-parts model.
LT Bull Case Rs410
Strong economic growth drives infra spending higher in India: Loan growth CAGR of 28% for F11-16 with stable margins at an average of 3% for the period. Fee income growth CAGR => 28%. Asset quality remains strong with provisions at about 50bps of loans. NSE stake valued at Rs35 per share.
LT Base Case Rs315
Recovery in economic growth leads to pick-up in loan growth: Loan growth CAGR of 24% for F11-16 with margins at an average of 2.85%. Fee income growth for the period is strong at 24%. Asset quality is stable with provisions at 50bps of loans. We value the NSE stake at Rs25 per share.
LT Bear Case Rs200
Double dip in global macro economy drives growth lower: Loan growth CAGR of 20% in F11-16 while margins compress gradually to about 2.3% by F2016. Fee income at 18% CAGR. Credit costs rise to an average of about 65bps of loans for the period. NSE stake valued at Rs15 per share, assuming a slowdown in turnover levels.
Five-year Scenarios Key Metrics (%) Bear Base Bull
Loans CAGR (F2011-F2016e) 20% 24% 28%
Net interest margin (F2011-15e Avg.) 2.7% 2.9% 3.0%
Fee income CAGR (F2011-F2016e) 18% 24% 28%
LLP/loans (bps) (F2011-15e Avg.) 65 50 50
EPS CAGR (F2011-F2016e) 12% 18% 22%
Value of NSE stake (Rs) 15 25 35 Source: Company data, e = Morgan Stanley Research estimates
Investment Thesis
• IDFC has high leverage to growth in infrastructure spending, which has considerable long-term potential in India.
• It also has interests in asset management and investment banking, which could be good fee income drivers.
• PE business to add significant value as new funds are launched and old investments exited.
• Balance sheet position is very strong with Tier 1 ratio of 20%+ and impaired loan ratio of only 0.4%.
Key Value Drivers
• Loan growth; • Net interest margins; • Fee income progression (launch of
new PE funds, strength of capital market activity);
• Credit costs.
Potential Catalysts
• Further clarity by RBI on infrastructure NBFC norms, especially on the capital and funding front.
• Launch of a new PE fund.
Where We Could Be Wrong
• A sharp spike in short rates could affect margins, given the wholesale nature of funding.
• Double dip in economic growth, delaying a pick-up in infrastructure spending in India.
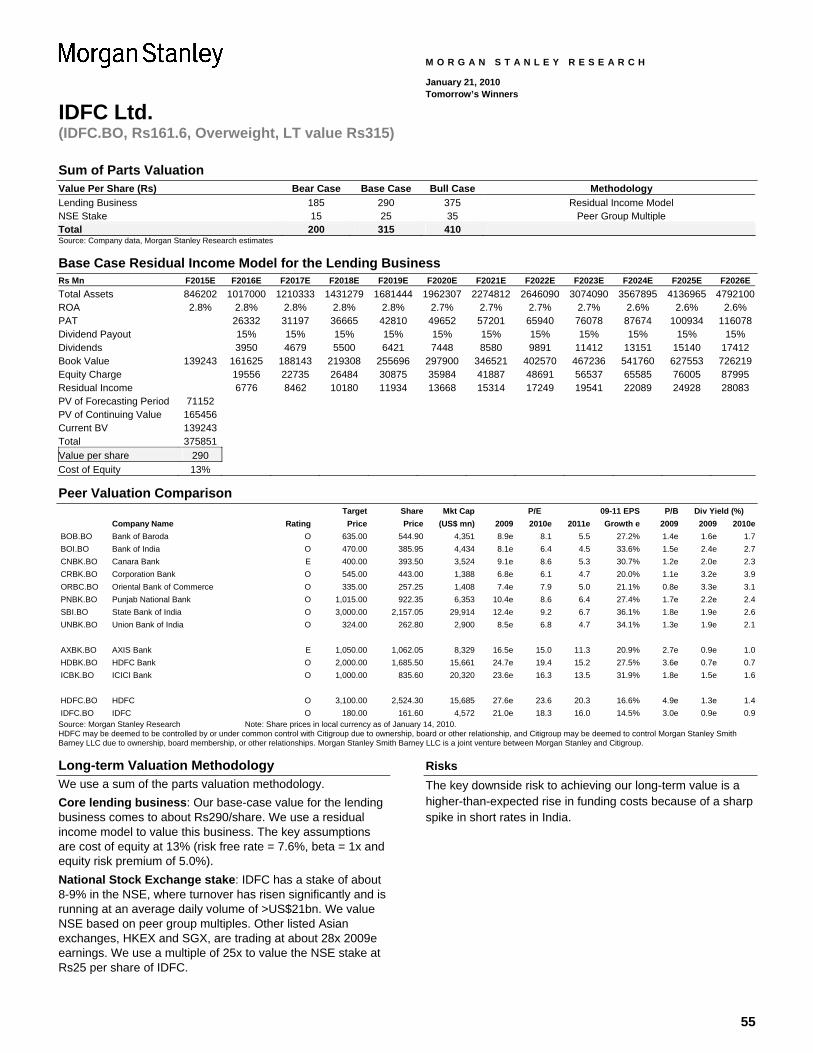
55
IDFC Ltd. (IDFC.BO, Rs161.6, Overweight, LT value Rs315)
M O R G A N S T A N L E Y R E S E A R C H
January 21, 2010 Tomorrow’s Winners
Sum of Parts Valuation Value Per Share (Rs) Bear Case Base Case Bull Case Methodology Lending Business 185 290 375 Residual Income Model NSE Stake 15 25 35 Peer Group Multiple Total 200 315 410 Source: Company data, Morgan Stanley Research estimates
Base Case Residual Income Model for the Lending Business Rs Mn F2015E F2016E F2017E F2018E F2019E F2020E F2021E F2022E F2023E F2024E F2025E F2026E Total Assets 846202 1017000 1210333 1431279 1681444 1962307 2274812 2646090 3074090 3567895 4136965 4792100ROA 2.8% 2.8% 2.8% 2.8% 2.8% 2.7% 2.7% 2.7% 2.7% 2.6% 2.6% 2.6% PAT 26332 31197 36665 42810 49652 57201 65940 76078 87674 100934 116078Dividend Payout 15% 15% 15% 15% 15% 15% 15% 15% 15% 15% 15% Dividends 3950 4679 5500 6421 7448 8580 9891 11412 13151 15140 17412 Book Value 139243 161625 188143 219308 255696 297900 346521 402570 467236 541760 627553 726219Equity Charge 19556 22735 26484 30875 35984 41887 48691 56537 65585 76005 87995 Residual Income 6776 8462 10180 11934 13668 15314 17249 19541 22089 24928 28083 PV of Forecasting Period 71152 PV of Continuing Value 165456 Current BV 139243 Total 375851 Value per share 290 Cost of Equity 13%
Peer Valuation Comparison Target Share Mkt Cap 09-11 EPS P/B
Company Name Rating Price Price (US$ mn) 2009 2010e 2011e Growth e 2009 2009 2010eBOB.BO Bank of Baroda O 635.00 544.90 4,351 8.9e 8.1 5.5 27.2% 1.4e 1.6e 1.7BOI.BO Bank of India O 470.00 385.95 4,434 8.1e 6.4 4.5 33.6% 1.5e 2.4e 2.7CNBK.BO Canara Bank E 400.00 393.50 3,524 9.1e 8.6 5.3 30.7% 1.2e 2.0e 2.3CRBK.BO Corporation Bank O 545.00 443.00 1,388 6.8e 6.1 4.7 20.0% 1.1e 3.2e 3.9ORBC.BO Oriental Bank of Commerce O 335.00 257.25 1,408 7.4e 7.9 5.0 21.1% 0.8e 3.3e 3.1PNBK.BO Punjab National Bank O 1,015.00 922.35 6,353 10.4e 8.6 6.4 27.4% 1.7e 2.2e 2.4SBI.BO State Bank of India O 3,000.00 2,157.05 29,914 12.4e 9.2 6.7 36.1% 1.8e 1.9e 2.6UNBK.BO Union Bank of India O 324.00 262.80 2,900 8.5e 6.8 4.7 34.1% 1.3e 1.9e 2.1
AXBK.BO AXIS Bank E 1,050.00 1,062.05 8,329 16.5e 15.0 11.3 20.9% 2.7e 0.9e 1.0HDBK.BO HDFC Bank O 2,000.00 1,685.50 15,661 24.7e 19.4 15.2 27.5% 3.6e 0.7e 0.7ICBK.BO ICICI Bank O 1,000.00 835.60 20,320 23.6e 16.3 13.5 31.9% 1.8e 1.5e 1.6
HDFC.BO HDFC O 3,100.00 2,524.30 15,685 27.6e 23.6 20.3 16.6% 4.9e 1.3e 1.4IDFC.BO IDFC O 180.00 161.60 4,572 21.0e 18.3 16.0 14.5% 3.0e 0.9e 0.9
P/E Div Yield (%)
Source: Morgan Stanley Research Note: Share prices in local currency as of January 14, 2010. HDFC may be deemed to be controlled by or under common control with Citigroup due to ownership, board or other relationship, and Citigroup may be deemed to control Morgan Stanley Smith Barney LLC due to ownership, board membership, or other relationships. Morgan Stanley Smith Barney LLC is a joint venture between Morgan Stanley and Citigroup.
Long-term Valuation Methodology We use a sum of the parts valuation methodology. Core lending business: Our base-case value for the lending business comes to about Rs290/share. We use a residual income model to value this business. The key assumptions are cost of equity at 13% (risk free rate = 7.6%, beta = 1x and equity risk premium of 5.0%). National Stock Exchange stake: IDFC has a stake of about 8-9% in the NSE, where turnover has risen significantly and is running at an average daily volume of >US$21bn. We value NSE based on peer group multiples. Other listed Asian exchanges, HKEX and SGX, are trading at about 28x 2009e earnings. We use a multiple of 25x to value the NSE stake at Rs25 per share of IDFC.
Risks The key downside risk to achieving our long-term value is a higher-than-expected rise in funding costs because of a sharp spike in short rates in India.
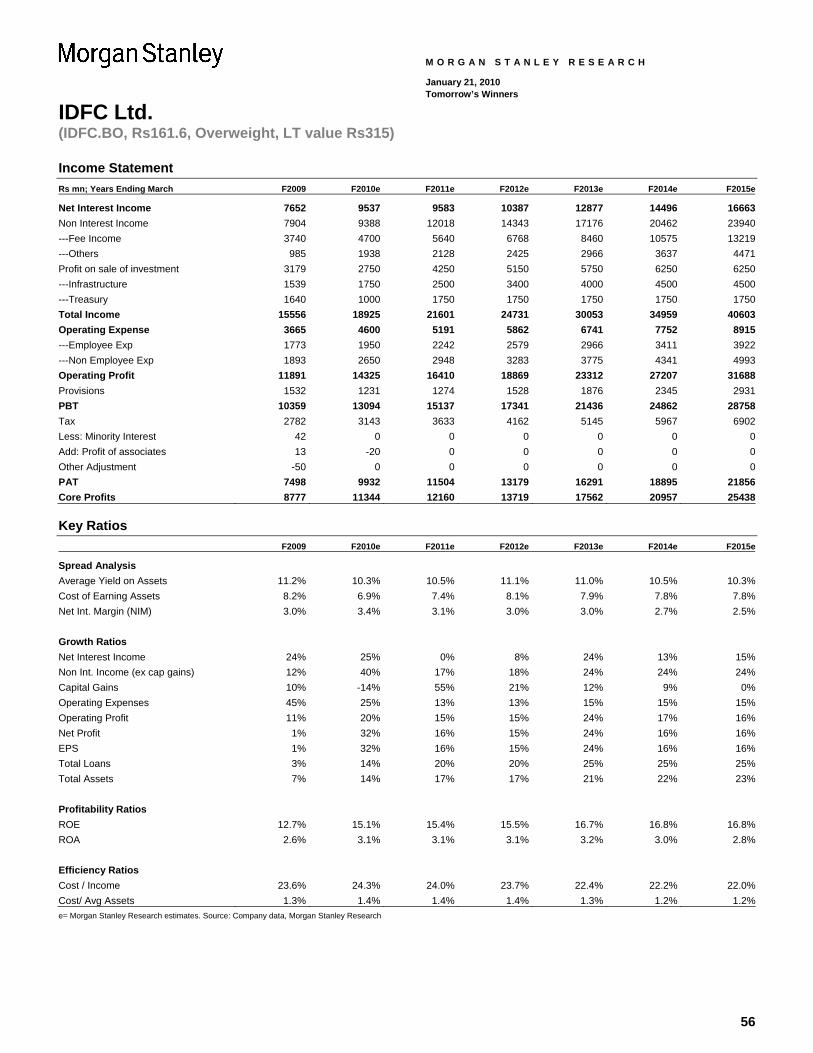
56
IDFC Ltd. (IDFC.BO, Rs161.6, Overweight, LT value Rs315)
M O R G A N S T A N L E Y R E S E A R C H
January 21, 2010 Tomorrow’s Winners
Income Statement Rs mn; Years Ending March F2009 F2010e F2011e F2012e F2013e F2014e F2015e
Net Interest Income 7652 9537 9583 10387 12877 14496 16663Non Interest Income 7904 9388 12018 14343 17176 20462 23940---Fee Income 3740 4700 5640 6768 8460 10575 13219---Others 985 1938 2128 2425 2966 3637 4471Profit on sale of investment 3179 2750 4250 5150 5750 6250 6250---Infrastructure 1539 1750 2500 3400 4000 4500 4500---Treasury 1640 1000 1750 1750 1750 1750 1750Total Income 15556 18925 21601 24731 30053 34959 40603Operating Expense 3665 4600 5191 5862 6741 7752 8915---Employee Exp 1773 1950 2242 2579 2966 3411 3922---Non Employee Exp 1893 2650 2948 3283 3775 4341 4993Operating Profit 11891 14325 16410 18869 23312 27207 31688Provisions 1532 1231 1274 1528 1876 2345 2931PBT 10359 13094 15137 17341 21436 24862 28758Tax 2782 3143 3633 4162 5145 5967 6902Less: Minority Interest 42 0 0 0 0 0 0Add: Profit of associates 13 -20 0 0 0 0 0Other Adjustment -50 0 0 0 0 0 0PAT 7498 9932 11504 13179 16291 18895 21856Core Profits 8777 11344 12160 13719 17562 20957 25438
Key Ratios F2009 F2010e F2011e F2012e F2013e F2014e F2015e
Spread Analysis Average Yield on Assets 11.2% 10.3% 10.5% 11.1% 11.0% 10.5% 10.3%Cost of Earning Assets 8.2% 6.9% 7.4% 8.1% 7.9% 7.8% 7.8%Net Int. Margin (NIM) 3.0% 3.4% 3.1% 3.0% 3.0% 2.7% 2.5% Growth Ratios Net Interest Income 24% 25% 0% 8% 24% 13% 15%Non Int. Income (ex cap gains) 12% 40% 17% 18% 24% 24% 24%Capital Gains 10% -14% 55% 21% 12% 9% 0%Operating Expenses 45% 25% 13% 13% 15% 15% 15%Operating Profit 11% 20% 15% 15% 24% 17% 16%Net Profit 1% 32% 16% 15% 24% 16% 16%EPS 1% 32% 16% 15% 24% 16% 16%Total Loans 3% 14% 20% 20% 25% 25% 25%Total Assets 7% 14% 17% 17% 21% 22% 23% Profitability Ratios ROE 12.7% 15.1% 15.4% 15.5% 16.7% 16.8% 16.8%ROA 2.6% 3.1% 3.1% 3.1% 3.2% 3.0% 2.8% Efficiency Ratios Cost / Income 23.6% 24.3% 24.0% 23.7% 22.4% 22.2% 22.0%Cost/ Avg Assets 1.3% 1.4% 1.4% 1.4% 1.3% 1.2% 1.2%e= Morgan Stanley Research estimates. Source: Company data, Morgan Stanley Research

57
IDFC Ltd. (IDFC.BO, Rs161.6, Overweight, LT value Rs315)
M O R G A N S T A N L E Y R E S E A R C H
January 21, 2010 Tomorrow’s Winners
Balance Sheet Rs mn; Years Ending March F2009 F2010e F2011e F2012e F2013e F2014e F2015e
Liabilities Capital 12953 12953 12953 12953 12953 12953 12953Reserves and Surplus 48806 56918 66602 77961 91601 107844 126290Share holders equity 61759 69871 79555 90914 104553 120797 139243Loan Funds 229546 263956 311442 367475 451961 560396 700459Subordinated debts 6500 6500 6500 6500 6500 6500 6500Minority Interest 281 281 281 281 281 281 281Total Liabilities 298090 340327 397497 464889 563014 687693 846202 Assets Infra loans 205962 235662 282270 338200 422511 527900 659637---Loans 201359 231563 277876 333451 416814 521017 651272---Debentures - Redeemable 6942 7845 9414 11297 14121 17651 22064Less: Provisions for Doubtful loans 4028 5435 6709 8237 10113 12457 15388Investments 65000 74259 93815 101468 109617 121746 139509Current Assets 21570 23753 27692 32366 39285 48082 59183Less: Current Liabilities & Provisions 9775 10765 12550 14668 17804 21791 26822Net Current Assets 11794 12988 15142 17698 21481 26291 32361Fixed Assets 4543 5225 6270 7524 9405 11756 14695Other Assets 10790 12192 14631 17557 21946 27433 34291Total Assets 298090 340327 397497 464889 563014 687693 846202Earning Assets 270369 291171 319873 375154 479657 594437 740344 Capital Ratios Tier 1 Ratio 20.0% 20.1% 19.3% 18.7% 17.5% 16.3% 15.1%Tier 2 Ratio 3.7% 3.3% 2.8% 2.4% 2.0% 1.6% 1.3%CAR 23.8% 23.5% 22.1% 21.1% 19.5% 18.0% 16.4% Asset Quality Annual LLP / Advances (bps) 79 65 50 50 50 50 50Gross NPL 780 1560 4680 9360 14040 17550 21938Net NPL 460 0 0 0 0 0 0Reserve Coverage 3710 5117 6391 7919 9795 12139 15070Gross NPL Ratio 0.4% 0.7% 1.6% 2.7% 3.2% 3.2% 3.2%Net NPL Ratio 0.2% 0.2% 0.2% 0.2% 0.2% 0.2% 0.2%Coverage Ratio 476% 328% 137% 85% 70% 69% 69%
Per Share Data and Valuations Per Share Data (Rs) F2009 F2010e F2011e F2012e F2013e F2014e F2015e
EPS 5.8 7.7 8.9 10.2 12.6 14.6 16.9Book Value 47.7 53.9 61.4 70.2 80.7 93.3 107.5Core PPP Per Share(COP) 6.8 8.8 9.4 10.6 13.6 16.2 19.6Valuations PE 27.9 21.1 18.2 15.9 12.8 11.1 9.6Price to Book 3.4 3.0 2.6 2.3 2.0 1.7 1.5P/COP 23.8 18.5 17.2 15.3 11.9 10.0 8.2e= Morgan Stanley Research estimates. Source: Company data, Morgan Stanley Research
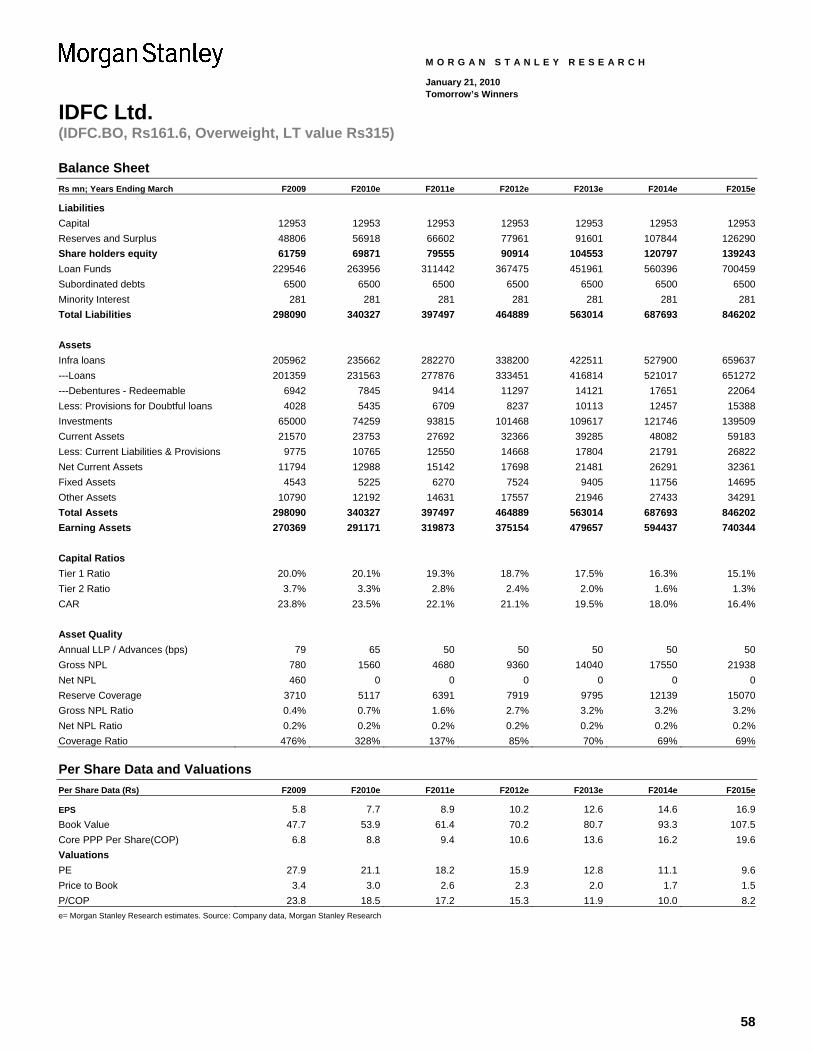
58
IDFC Ltd. (IDFC.BO, Rs161.6, Overweight, LT value Rs315)
M O R G A N S T A N L E Y R E S E A R C H
January 21, 2010 Tomorrow’s Winners
Balance Sheet Rs mn; Years Ending March F2009 F2010e F2011e F2012e F2013e F2014e F2015e
Liabilities Capital 12953 12953 12953 12953 12953 12953 12953Reserves and Surplus 48806 56918 66602 77961 91601 107844 126290Share holders equity 61759 69871 79555 90914 104553 120797 139243Loan Funds 229546 263956 311442 367475 451961 560396 700459Subordinated debts 6500 6500 6500 6500 6500 6500 6500Minority Interest 281 281 281 281 281 281 281Total Liabilities 298090 340327 397497 464889 563014 687693 846202 Assets Infra loans 205962 235662 282270 338200 422511 527900 659637---Loans 201359 231563 277876 333451 416814 521017 651272---Debentures - Redeemable 6942 7845 9414 11297 14121 17651 22064Less: Provisions for Doubtful loans 4028 5435 6709 8237 10113 12457 15388Investments 65000 74259 93815 101468 109617 121746 139509Current Assets 21570 23753 27692 32366 39285 48082 59183Less: Current Liabilities & Provisions 9775 10765 12550 14668 17804 21791 26822Net Current Assets 11794 12988 15142 17698 21481 26291 32361Fixed Assets 4543 5225 6270 7524 9405 11756 14695Other Assets 10790 12192 14631 17557 21946 27433 34291Total Assets 298090 340327 397497 464889 563014 687693 846202Earning Assets 270369 291171 319873 375154 479657 594437 740344 Capital Ratios Tier 1 Ratio 20.0% 20.1% 19.3% 18.7% 17.5% 16.3% 15.1%Tier 2 Ratio 3.7% 3.3% 2.8% 2.4% 2.0% 1.6% 1.3%CAR 23.8% 23.5% 22.1% 21.1% 19.5% 18.0% 16.4% Asset Quality Annual LLP / Advances (bps) 79 65 50 50 50 50 50Gross NPL 780 1560 4680 9360 14040 17550 21938Net NPL 460 0 0 0 0 0 0Reserve Coverage 3710 5117 6391 7919 9795 12139 15070Gross NPL Ratio 0.4% 0.7% 1.6% 2.7% 3.2% 3.2% 3.2%Net NPL Ratio 0.2% 0.2% 0.2% 0.2% 0.2% 0.2% 0.2%Coverage Ratio 476% 328% 137% 85% 70% 69% 69%
Per Share Data and Valuations Per Share Data (Rs) F2009 F2010e F2011e F2012e F2013e F2014e F2015e
EPS 5.8 7.7 8.9 10.2 12.6 14.6 16.9Book Value 47.7 53.9 61.4 70.2 80.7 93.3 107.5Core PPP Per Share(COP) 6.8 8.8 9.4 10.6 13.6 16.2 19.6Valuations PE 27.9 21.1 18.2 15.9 12.8 11.1 9.6Price to Book 3.4 3.0 2.6 2.3 2.0 1.7 1.5P/COP 23.8 18.5 17.2 15.3 11.9 10.0 8.2e= Morgan Stanley Research estimates. Source: Company data, Morgan Stanley Research
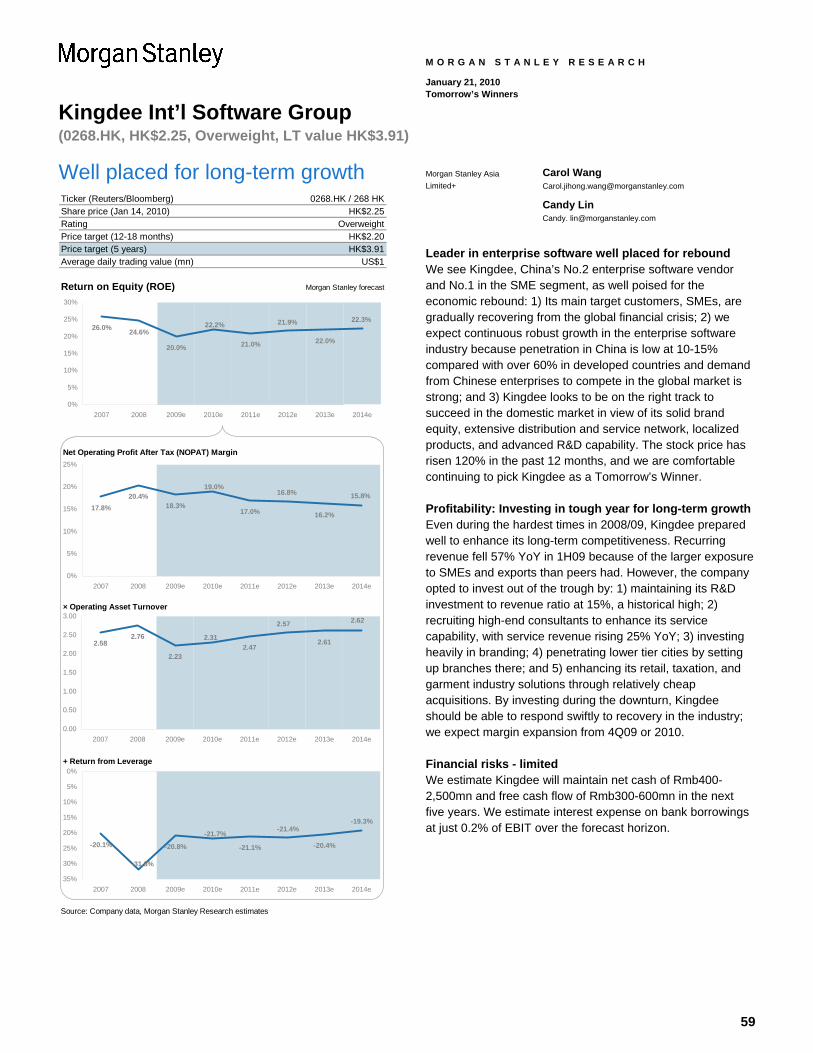
59
Kingdee Int’l Software Group (0268.HK, HK$2.25, Overweight, LT value HK$3.91)
M O R G A N S T A N L E Y R E S E A R C H
January 21, 2010 Tomorrow’s Winners
Well placed for long-term growth Ticker (Reuters/Bloomberg)Share price (Jan 14, 2010)RatingPrice target (12-18 months)Price target (5 years) HK$3.91Average daily trading value (mn)
Return on Equity (ROE) Morgan Stanley forecast
Net Operating Profit After Tax (NOPAT) Margin
× Operating Asset Turnover
+ Return from Leverage
Source: Company data, Morgan Stanley Research estimates
0268.HK / 268 HKHK$2.25
OverweightHK$2.20
US$1
26.0% 24.6%
20.0% 21.0% 22.0%
22.3%21.9%22.2%
0%
5%
10%
15%
20%
25%
30%
2007 2008 2009e 2010e 2011e 2012e 2013e 2014e
17.8%20.4%
18.3%17.0% 16.2%
19.0%16.8% 15.8%
0%
5%
10%
15%
20%
25%
2007 2008 2009e 2010e 2011e 2012e 2013e 2014e
2.582.76
2.232.47
2.612.31
2.57 2.62
0.00
0.50
1.00
1.50
2.00
2.50
3.00
2007 2008 2009e 2010e 2011e 2012e 2013e 2014e
-20.1% -20.8% -21.1% -20.4%
-19.3%-21.4%
-21.7%
-31.8%
35%
30%
25%
20%
15%
10%
5%
0%
2007 2008 2009e 2010e 2011e 2012e 2013e 2014e
Morgan Stanley Asia Limited+
Carol Wang [email protected]
Candy Lin Candy. [email protected]
Leader in enterprise software well placed for rebound We see Kingdee, China’s No.2 enterprise software vendor and No.1 in the SME segment, as well poised for the economic rebound: 1) Its main target customers, SMEs, are gradually recovering from the global financial crisis; 2) we expect continuous robust growth in the enterprise software industry because penetration in China is low at 10-15% compared with over 60% in developed countries and demand from Chinese enterprises to compete in the global market is strong; and 3) Kingdee looks to be on the right track to succeed in the domestic market in view of its solid brand equity, extensive distribution and service network, localized products, and advanced R&D capability. The stock price has risen 120% in the past 12 months, and we are comfortable continuing to pick Kingdee as a Tomorrow’s Winner.
Profitability: Investing in tough year for long-term growth Even during the hardest times in 2008/09, Kingdee prepared well to enhance its long-term competitiveness. Recurring revenue fell 57% YoY in 1H09 because of the larger exposure to SMEs and exports than peers had. However, the company opted to invest out of the trough by: 1) maintaining its R&D investment to revenue ratio at 15%, a historical high; 2) recruiting high-end consultants to enhance its service capability, with service revenue rising 25% YoY; 3) investing heavily in branding; 4) penetrating lower tier cities by setting up branches there; and 5) enhancing its retail, taxation, and garment industry solutions through relatively cheap acquisitions. By investing during the downturn, Kingdee should be able to respond swiftly to recovery in the industry; we expect margin expansion from 4Q09 or 2010.
Financial risks - limited We estimate Kingdee will maintain net cash of Rmb400-2,500mn and free cash flow of Rmb300-600mn in the next five years. We estimate interest expense on bank borrowings at just 0.2% of EBIT over the forecast horizon.
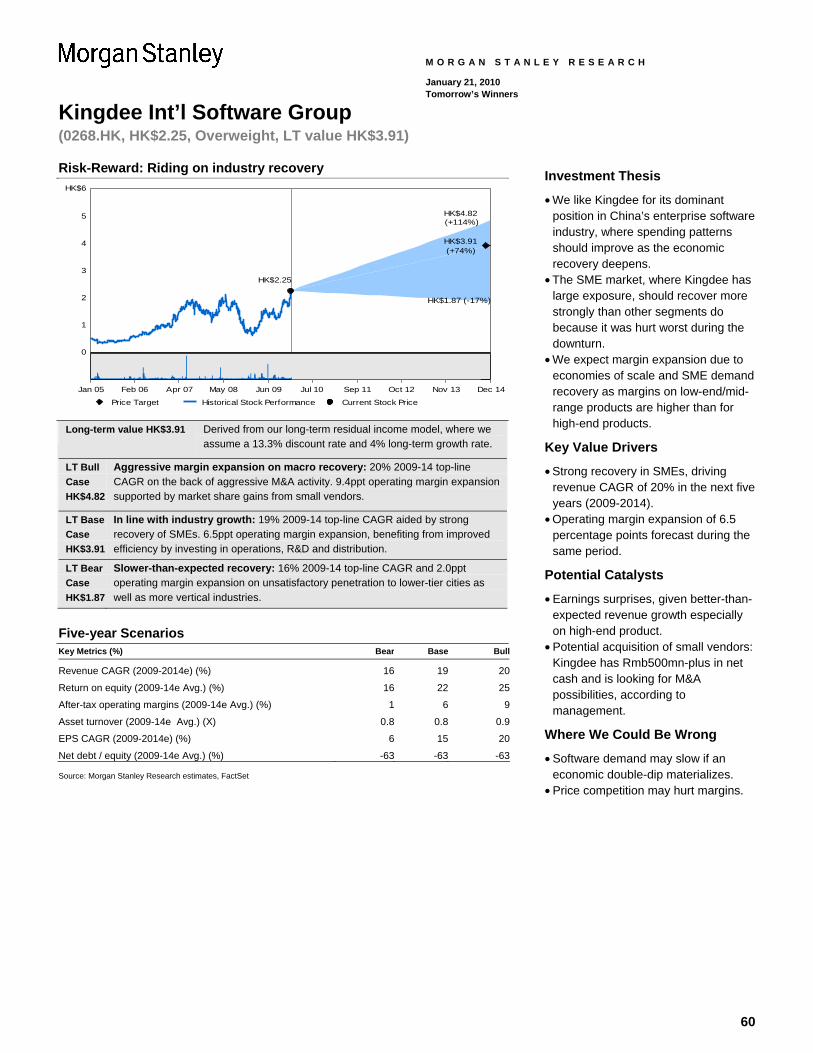
60
Kingdee Int’l Software Group (0268.HK, HK$2.25, Overweight, LT value HK$3.91)
M O R G A N S T A N L E Y R E S E A R C H
January 21, 2010 Tomorrow’s Winners
Risk-Reward: Riding on industry recovery
0
1
2
3
4
5
HK$6
HK$4.82(+114%)
HK$3.91(+74%)
HK$1.87 (-17%)
HK$2.25
Price Target Historical Stock Performance Current Stock Price
Jan 05 Feb 06 Apr 07 May 08 Jun 09 Jul 10 Sep 11 Oct 12 Nov 13 Dec 14
Long-term value HK$3.91 Derived from our long-term residual income model, where we assume a 13.3% discount rate and 4% long-term growth rate.
LT Bull Case HK$4.82
Aggressive margin expansion on macro recovery: 20% 2009-14 top-line CAGR on the back of aggressive M&A activity. 9.4ppt operating margin expansion supported by market share gains from small vendors.
LT Base Case HK$3.91
In line with industry growth: 19% 2009-14 top-line CAGR aided by strong recovery of SMEs. 6.5ppt operating margin expansion, benefiting from improved efficiency by investing in operations, R&D and distribution.
LT Bear Case HK$1.87
Slower-than-expected recovery: 16% 2009-14 top-line CAGR and 2.0ppt operating margin expansion on unsatisfactory penetration to lower-tier cities as well as more vertical industries.
Five-year Scenarios Key Metrics (%) Bear Base Bull
Revenue CAGR (2009-2014e) (%) 16 19 20
Return on equity (2009-14e Avg.) (%) 16 22 25
After-tax operating margins (2009-14e Avg.) (%) 1 6 9
Asset turnover (2009-14e Avg.) (X) 0.8 0.8 0.9
EPS CAGR (2009-2014e) (%) 6 15 20
Net debt / equity (2009-14e Avg.) (%) -63 -63 -63 Source: Morgan Stanley Research estimates, FactSet
Investment Thesis
• We like Kingdee for its dominant position in China’s enterprise software industry, where spending patterns should improve as the economic recovery deepens.
• The SME market, where Kingdee has large exposure, should recover more strongly than other segments do because it was hurt worst during the downturn.
• We expect margin expansion due to economies of scale and SME demand recovery as margins on low-end/mid-range products are higher than for high-end products.
Key Value Drivers
• Strong recovery in SMEs, driving revenue CAGR of 20% in the next five years (2009-2014).
• Operating margin expansion of 6.5 percentage points forecast during the same period.
Potential Catalysts
• Earnings surprises, given better-than-expected revenue growth especially on high-end product.
• Potential acquisition of small vendors: Kingdee has Rmb500mn-plus in net cash and is looking for M&A possibilities, according to management.
Where We Could Be Wrong
• Software demand may slow if an economic double-dip materializes.
• Price competition may hurt margins.
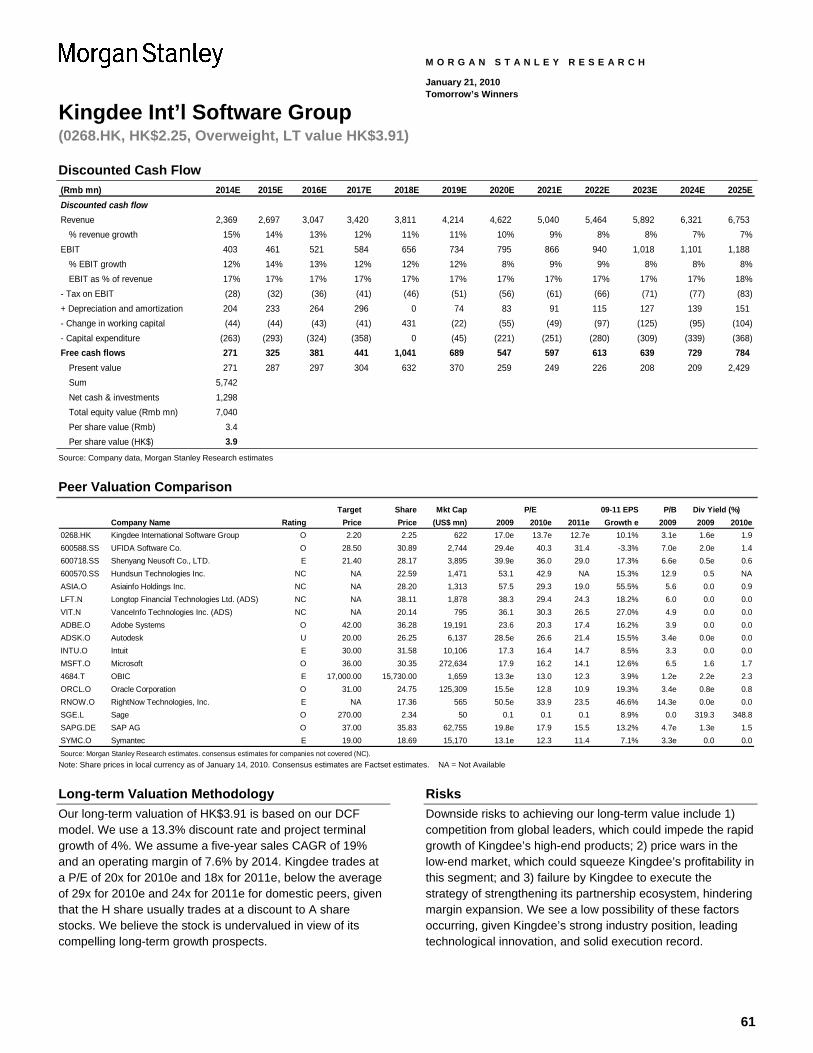
61
Kingdee Int’l Software Group (0268.HK, HK$2.25, Overweight, LT value HK$3.91)
M O R G A N S T A N L E Y R E S E A R C H
January 21, 2010 Tomorrow’s Winners
Discounted Cash Flow (Rmb mn) 2014E 2015E 2016E 2017E 2018E 2019E 2020E 2021E 2022E 2023E 2024E 2025EDiscounted cash flow Revenue 2,369 2,697 3,047 3,420 3,811 4,214 4,622 5,040 5,464 5,892 6,321 6,753
% revenue growth 15% 14% 13% 12% 11% 11% 10% 9% 8% 8% 7% 7%EBIT 403 461 521 584 656 734 795 866 940 1,018 1,101 1,188
% EBIT growth 12% 14% 13% 12% 12% 12% 8% 9% 9% 8% 8% 8%EBIT as % of revenue 17% 17% 17% 17% 17% 17% 17% 17% 17% 17% 17% 18%
- Tax on EBIT (28) (32) (36) (41) (46) (51) (56) (61) (66) (71) (77) (83)+ Depreciation and amortization 204 233 264 296 0 74 83 91 115 127 139 151- Change in working capital (44) (44) (43) (41) 431 (22) (55) (49) (97) (125) (95) (104)- Capital expenditure (263) (293) (324) (358) 0 (45) (221) (251) (280) (309) (339) (368)Free cash flows 271 325 381 441 1,041 689 547 597 613 639 729 784
Present value 271 287 297 304 632 370 259 249 226 208 209 2,429Sum 5,742Net cash & investments 1,298Total equity value (Rmb mn) 7,040Per share value (Rmb) 3.4Per share value (HK$) 3.9
Source: Company data, Morgan Stanley Research estimates
Peer Valuation Comparison
Target Share Mkt Cap 09-11 EPS P/BCompany Name Rating Price Price (US$ mn) 2009 2010e 2011e Growth e 2009 2009 2010e
0268.HK Kingdee International Software Group O 2.20 2.25 622 17.0e 13.7e 12.7e 10.1% 3.1e 1.6e 1.9600588.SS UFIDA Software Co. O 28.50 30.89 2,744 29.4e 40.3 31.4 -3.3% 7.0e 2.0e 1.4600718.SS Shenyang Neusoft Co., LTD. E 21.40 28.17 3,895 39.9e 36.0 29.0 17.3% 6.6e 0.5e 0.6600570.SS Hundsun Technologies Inc. NC NA 22.59 1,471 53.1 42.9 NA 15.3% 12.9 0.5 NAASIA.O Asiainfo Holdings Inc. NC NA 28.20 1,313 57.5 29.3 19.0 55.5% 5.6 0.0 0.9LFT.N Longtop Financial Technologies Ltd. (ADS) NC NA 38.11 1,878 38.3 29.4 24.3 18.2% 6.0 0.0 0.0VIT.N VanceInfo Technologies Inc. (ADS) NC NA 20.14 795 36.1 30.3 26.5 27.0% 4.9 0.0 0.0ADBE.O Adobe Systems O 42.00 36.28 19,191 23.6 20.3 17.4 16.2% 3.9 0.0 0.0ADSK.O Autodesk U 20.00 26.25 6,137 28.5e 26.6 21.4 15.5% 3.4e 0.0e 0.0INTU.O Intuit E 30.00 31.58 10,106 17.3 16.4 14.7 8.5% 3.3 0.0 0.0MSFT.O Microsoft O 36.00 30.35 272,634 17.9 16.2 14.1 12.6% 6.5 1.6 1.74684.T OBIC E 17,000.00 15,730.00 1,659 13.3e 13.0 12.3 3.9% 1.2e 2.2e 2.3ORCL.O Oracle Corporation O 31.00 24.75 125,309 15.5e 12.8 10.9 19.3% 3.4e 0.8e 0.8RNOW.O RightNow Technologies, Inc. E NA 17.36 565 50.5e 33.9 23.5 46.6% 14.3e 0.0e 0.0SGE.L Sage O 270.00 2.34 50 0.1 0.1 0.1 8.9% 0.0 319.3 348.8SAPG.DE SAP AG O 37.00 35.83 62,755 19.8e 17.9 15.5 13.2% 4.7e 1.3e 1.5SYMC.O Symantec E 19.00 18.69 15,170 13.1e 12.3 11.4 7.1% 3.3e 0.0 0.0Source: Morgan Stanley Research estimates. consensus estimates for companies not covered (NC).
P/E Div Yield (%)
Note: Share prices in local currency as of January 14, 2010. Consensus estimates are Factset estimates. NA = Not Available
Long-term Valuation Methodology Our long-term valuation of HK$3.91 is based on our DCF model. We use a 13.3% discount rate and project terminal growth of 4%. We assume a five-year sales CAGR of 19% and an operating margin of 7.6% by 2014. Kingdee trades at a P/E of 20x for 2010e and 18x for 2011e, below the average of 29x for 2010e and 24x for 2011e for domestic peers, given that the H share usually trades at a discount to A share stocks. We believe the stock is undervalued in view of its compelling long-term growth prospects.
Risks Downside risks to achieving our long-term value include 1) competition from global leaders, which could impede the rapid growth of Kingdee’s high-end products; 2) price wars in the low-end market, which could squeeze Kingdee’s profitability in this segment; and 3) failure by Kingdee to execute the strategy of strengthening its partnership ecosystem, hindering margin expansion. We see a low possibility of these factors occurring, given Kingdee’s strong industry position, leading technological innovation, and solid execution record.
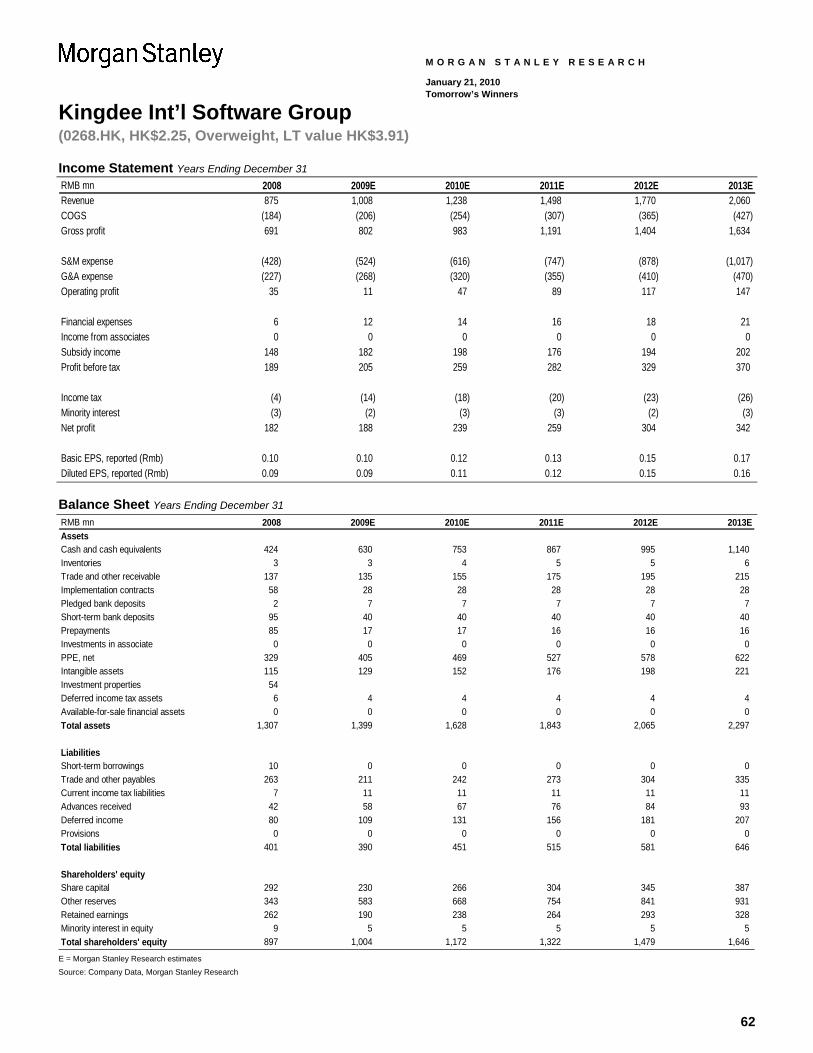
62
Kingdee Int’l Software Group (0268.HK, HK$2.25, Overweight, LT value HK$3.91)
M O R G A N S T A N L E Y R E S E A R C H
January 21, 2010 Tomorrow’s Winners
Income Statement Years Ending December 31 RMB mn 2008 2009E 2010E 2011E 2012E 2013ERevenue 875 1,008 1,238 1,498 1,770 2,060COGS (184) (206) (254) (307) (365) (427)Gross profit 691 802 983 1,191 1,404 1,634
S&M expense (428) (524) (616) (747) (878) (1,017)G&A expense (227) (268) (320) (355) (410) (470)Operating profit 35 11 47 89 117 147
Financial expenses 6 12 14 16 18 21Income from associates 0 0 0 0 0 0Subsidy income 148 182 198 176 194 202Profit before tax 189 205 259 282 329 370
Income tax (4) (14) (18) (20) (23) (26)Minority interest (3) (2) (3) (3) (2) (3)Net profit 182 188 239 259 304 342
Basic EPS, reported (Rmb) 0.10 0.10 0.12 0.13 0.15 0.17Diluted EPS, reported (Rmb) 0.09 0.09 0.11 0.12 0.15 0.16
Balance Sheet Years Ending December 31 RMB mn 2008 2009E 2010E 2011E 2012E 2013EAssetsCash and cash equivalents 424 630 753 867 995 1,140Inventories 3 3 4 5 5 6Trade and other receivable 137 135 155 175 195 215Implementation contracts 58 28 28 28 28 28Pledged bank deposits 2 7 7 7 7 7Short-term bank deposits 95 40 40 40 40 40Prepayments 85 17 17 16 16 16Investments in associate 0 0 0 0 0 0PPE, net 329 405 469 527 578 622Intangible assets 115 129 152 176 198 221Investment properties 54Deferred income tax assets 6 4 4 4 4 4Available-for-sale financial assets 0 0 0 0 0 0Total assets 1,307 1,399 1,628 1,843 2,065 2,297
LiabilitiesShort-term borrowings 10 0 0 0 0 0Trade and other payables 263 211 242 273 304 335Current income tax liabilities 7 11 11 11 11 11Advances received 42 58 67 76 84 93Deferred income 80 109 131 156 181 207Provisions 0 0 0 0 0 0Total liabilities 401 390 451 515 581 646
Shareholders' equityShare capital 292 230 266 304 345 387Other reserves 343 583 668 754 841 931Retained earnings 262 190 238 264 293 328Minority interest in equity 9 5 5 5 5 5Total shareholders' equity 897 1,004 1,172 1,322 1,479 1,646
E = Morgan Stanley Research estimates
Source: Company Data, Morgan Stanley Research
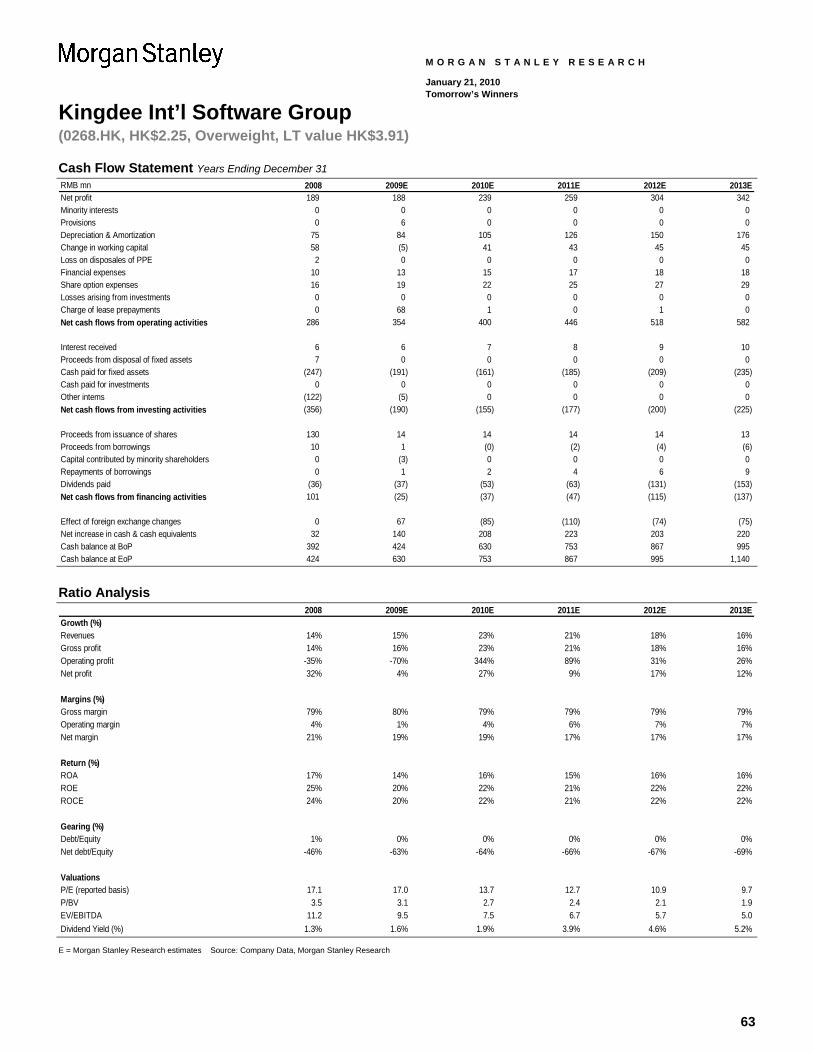
63
Kingdee Int’l Software Group (0268.HK, HK$2.25, Overweight, LT value HK$3.91)
M O R G A N S T A N L E Y R E S E A R C H
January 21, 2010 Tomorrow’s Winners
Cash Flow Statement Years Ending December 31 RMB mn 2008 2009E 2010E 2011E 2012E 2013ENet profit 189 188 239 259 304 342Minority interests 0 0 0 0 0 0Provisions 0 6 0 0 0 0Depreciation & Amortization 75 84 105 126 150 176Change in working capital 58 (5) 41 43 45 45Loss on disposales of PPE 2 0 0 0 0 0Financial expenses 10 13 15 17 18 18Share option expenses 16 19 22 25 27 29Losses arising from investments 0 0 0 0 0 0Charge of lease prepayments 0 68 1 0 1 0Net cash flows from operating activities 286 354 400 446 518 582
Interest received 6 6 7 8 9 10Proceeds from disposal of fixed assets 7 0 0 0 0 0Cash paid for fixed assets (247) (191) (161) (185) (209) (235)Cash paid for investments 0 0 0 0 0 0Other intems (122) (5) 0 0 0 0Net cash flows from investing activities (356) (190) (155) (177) (200) (225)
Proceeds from issuance of shares 130 14 14 14 14 13Proceeds from borrowings 10 1 (0) (2) (4) (6)Capital contributed by minority shareholders 0 (3) 0 0 0 0Repayments of borrowings 0 1 2 4 6 9Dividends paid (36) (37) (53) (63) (131) (153)Net cash flows from financing activities 101 (25) (37) (47) (115) (137)
Effect of foreign exchange changes 0 67 (85) (110) (74) (75)Net increase in cash & cash equivalents 32 140 208 223 203 220Cash balance at BoP 392 424 630 753 867 995Cash balance at EoP 424 630 753 867 995 1,140
Ratio Analysis 2008 2009E 2010E 2011E 2012E 2013E
Growth (%)Revenues 14% 15% 23% 21% 18% 16%Gross profit 14% 16% 23% 21% 18% 16%Operating profit -35% -70% 344% 89% 31% 26%Net profit 32% 4% 27% 9% 17% 12%
Margins (%)Gross margin 79% 80% 79% 79% 79% 79%Operating margin 4% 1% 4% 6% 7% 7%Net margin 21% 19% 19% 17% 17% 17%
Return (%)ROA 17% 14% 16% 15% 16% 16%ROE 25% 20% 22% 21% 22% 22%ROCE 24% 20% 22% 21% 22% 22%
Gearing (%)Debt/Equity 1% 0% 0% 0% 0% 0%Net debt/Equity -46% -63% -64% -66% -67% -69%
ValuationsP/E (reported basis) 17.1 17.0 13.7 12.7 10.9 9.7P/BV 3.5 3.1 2.7 2.4 2.1 1.9EV/EBITDA 11.2 9.5 7.5 6.7 5.7 5.0Dividend Yield (%) 1.3% 1.6% 1.9% 3.9% 4.6% 5.2% E = Morgan Stanley Research estimates Source: Company Data, Morgan Stanley Research
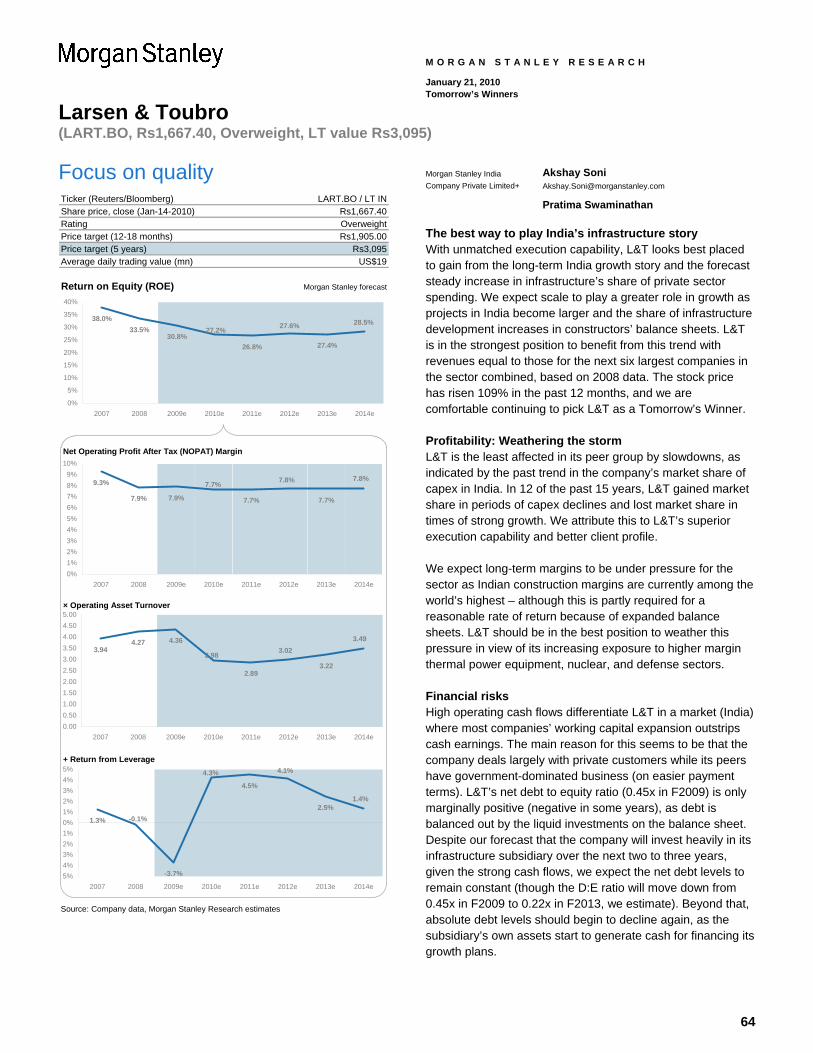
64
Larsen & Toubro (LART.BO, Rs1,667.40, Overweight, LT value Rs3,095)
M O R G A N S T A N L E Y R E S E A R C H
January 21, 2010 Tomorrow’s Winners
Focus on quality Ticker (Reuters/Bloomberg)Share price, close (Jan-14-2010)RatingPrice target (12-18 months)Price target (5 years) Rs3,095Average daily trading value (mn)
Return on Equity (ROE) Morgan Stanley forecast
Net Operating Profit After Tax (NOPAT) Margin
× Operating Asset Turnover
+ Return from Leverage
Source: Company data, Morgan Stanley Research estimates
LART.BO / LT INRs1,667.40OverweightRs1,905.00
US$19
38.0%33.5%
30.8%26.8% 27.4%
28.5%27.6%27.2%
0%
5%
10%
15%
20%
25%
30%
35%
40%
2007 2008 2009e 2010e 2011e 2012e 2013e 2014e
9.3%
7.9% 7.9% 7.7% 7.7%
7.7% 7.8% 7.8%
0%1%2%3%4%5%6%7%8%9%
10%
2007 2008 2009e 2010e 2011e 2012e 2013e 2014e
3.944.27 4.36
2.893.22
2.98 3.023.49
0.000.501.001.502.002.503.003.504.004.505.00
2007 2008 2009e 2010e 2011e 2012e 2013e 2014e
1.3%
-3.7%
4.5%
2.5%1.4%
4.1%4.3%
-0.1%
5%4%3%2%1%0%1%2%3%4%5%
2007 2008 2009e 2010e 2011e 2012e 2013e 2014e
Morgan Stanley India Company Private Limited+
Akshay Soni [email protected]
Pratima Swaminathan
The best way to play India’s infrastructure story With unmatched execution capability, L&T looks best placed to gain from the long-term India growth story and the forecast steady increase in infrastructure’s share of private sector spending. We expect scale to play a greater role in growth as projects in India become larger and the share of infrastructure development increases in constructors’ balance sheets. L&T is in the strongest position to benefit from this trend with revenues equal to those for the next six largest companies in the sector combined, based on 2008 data. The stock price has risen 109% in the past 12 months, and we are comfortable continuing to pick L&T as a Tomorrow’s Winner.
Profitability: Weathering the storm L&T is the least affected in its peer group by slowdowns, as indicated by the past trend in the company’s market share of capex in India. In 12 of the past 15 years, L&T gained market share in periods of capex declines and lost market share in times of strong growth. We attribute this to L&T’s superior execution capability and better client profile.
We expect long-term margins to be under pressure for the sector as Indian construction margins are currently among the world’s highest – although this is partly required for a reasonable rate of return because of expanded balance sheets. L&T should be in the best position to weather this pressure in view of its increasing exposure to higher margin thermal power equipment, nuclear, and defense sectors.
Financial risks High operating cash flows differentiate L&T in a market (India) where most companies’ working capital expansion outstrips cash earnings. The main reason for this seems to be that the company deals largely with private customers while its peers have government-dominated business (on easier payment terms). L&T’s net debt to equity ratio (0.45x in F2009) is only marginally positive (negative in some years), as debt is balanced out by the liquid investments on the balance sheet. Despite our forecast that the company will invest heavily in its infrastructure subsidiary over the next two to three years, given the strong cash flows, we expect the net debt levels to remain constant (though the D:E ratio will move down from 0.45x in F2009 to 0.22x in F2013, we estimate). Beyond that, absolute debt levels should begin to decline again, as the subsidiary’s own assets start to generate cash for financing its growth plans.
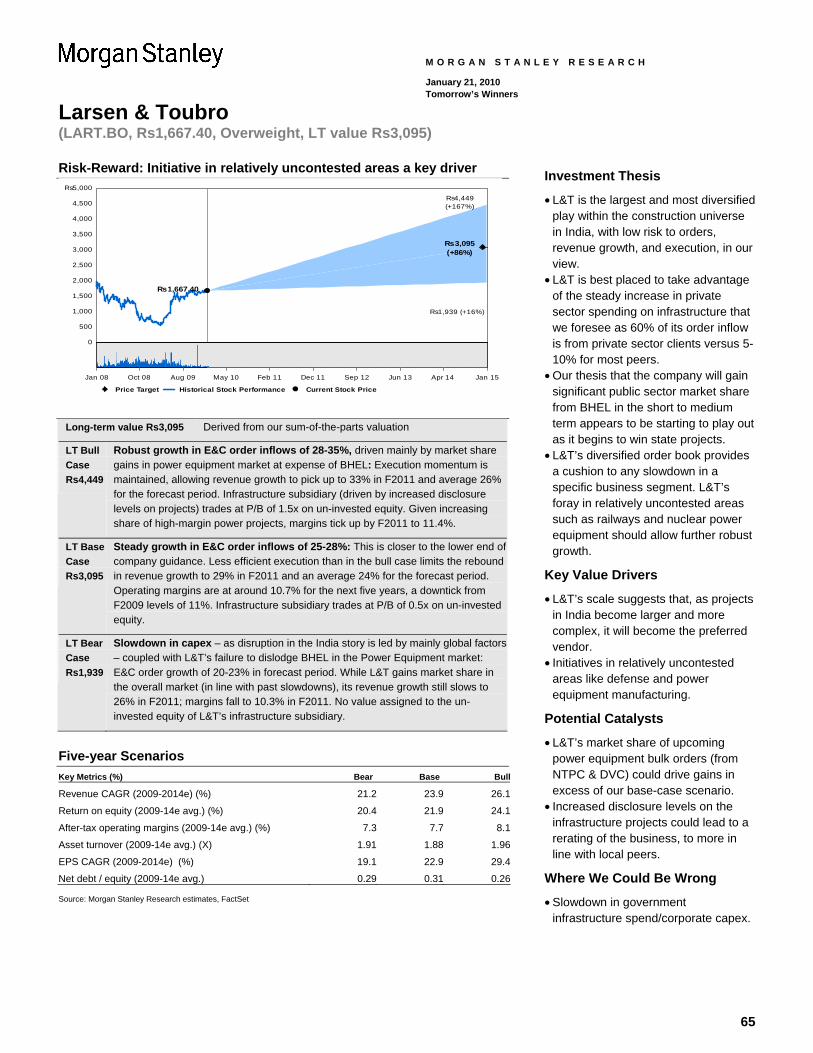
65
Larsen & Toubro (LART.BO, Rs1,667.40, Overweight, LT value Rs3,095)
M O R G A N S T A N L E Y R E S E A R C H
January 21, 2010 Tomorrow’s Winners
Risk-Reward: Initiative in relatively uncontested areas a key driver
0
500
1,000
1,500
2,000
2,500
3,000
3,500
4,000
4,500
Rs5,000Rs4,449(+167%)
Rs3,095(+86%)
Rs1,939 (+16%)
Rs1,667.40
Price Target Historical Stock Performance Current Stock Price
Jan 08 Oct 08 Aug 09 May 10 Feb 11 Dec 11 Sep 12 Jun 13 Apr 14 Jan 15
Long-term value Rs3,095 Derived from our sum-of-the-parts valuation
LT Bull Case Rs4,449
Robust growth in E&C order inflows of 28-35%, driven mainly by market share gains in power equipment market at expense of BHEL: Execution momentum is maintained, allowing revenue growth to pick up to 33% in F2011 and average 26% for the forecast period. Infrastructure subsidiary (driven by increased disclosure levels on projects) trades at P/B of 1.5x on un-invested equity. Given increasing share of high-margin power projects, margins tick up by F2011 to 11.4%.
LT Base Case Rs3,095
Steady growth in E&C order inflows of 25-28%: This is closer to the lower end of company guidance. Less efficient execution than in the bull case limits the rebound in revenue growth to 29% in F2011 and an average 24% for the forecast period. Operating margins are at around 10.7% for the next five years, a downtick from F2009 levels of 11%. Infrastructure subsidiary trades at P/B of 0.5x on un-invested equity.
LT Bear Case Rs1,939
Slowdown in capex – as disruption in the India story is led by mainly global factors – coupled with L&T’s failure to dislodge BHEL in the Power Equipment market: E&C order growth of 20-23% in forecast period. While L&T gains market share in the overall market (in line with past slowdowns), its revenue growth still slows to 26% in F2011; margins fall to 10.3% in F2011. No value assigned to the un-invested equity of L&T’s infrastructure subsidiary.
Five-year Scenarios Key Metrics (%) Bear Base Bull
Revenue CAGR (2009-2014e) (%) 21.2 23.9 26.1
Return on equity (2009-14e avg.) (%) 20.4 21.9 24.1
After-tax operating margins (2009-14e avg.) (%) 7.3 7.7 8.1
Asset turnover (2009-14e avg.) (X) 1.91 1.88 1.96
EPS CAGR (2009-2014e) (%) 19.1 22.9 29.4
Net debt / equity (2009-14e avg.) 0.29 0.31 0.26 Source: Morgan Stanley Research estimates, FactSet
Investment Thesis
• L&T is the largest and most diversified play within the construction universe in India, with low risk to orders, revenue growth, and execution, in our view.
• L&T is best placed to take advantage of the steady increase in private sector spending on infrastructure that we foresee as 60% of its order inflow is from private sector clients versus 5-10% for most peers.
• Our thesis that the company will gain significant public sector market share from BHEL in the short to medium term appears to be starting to play out as it begins to win state projects.
• L&T’s diversified order book provides a cushion to any slowdown in a specific business segment. L&T’s foray in relatively uncontested areas such as railways and nuclear power equipment should allow further robust growth.
Key Value Drivers
• L&T’s scale suggests that, as projects in India become larger and more complex, it will become the preferred vendor.
• Initiatives in relatively uncontested areas like defense and power equipment manufacturing.
Potential Catalysts
• L&T’s market share of upcoming power equipment bulk orders (from NTPC & DVC) could drive gains in excess of our base-case scenario.
• Increased disclosure levels on the infrastructure projects could lead to a rerating of the business, to more in line with local peers.
Where We Could Be Wrong
• Slowdown in government infrastructure spend/corporate capex.
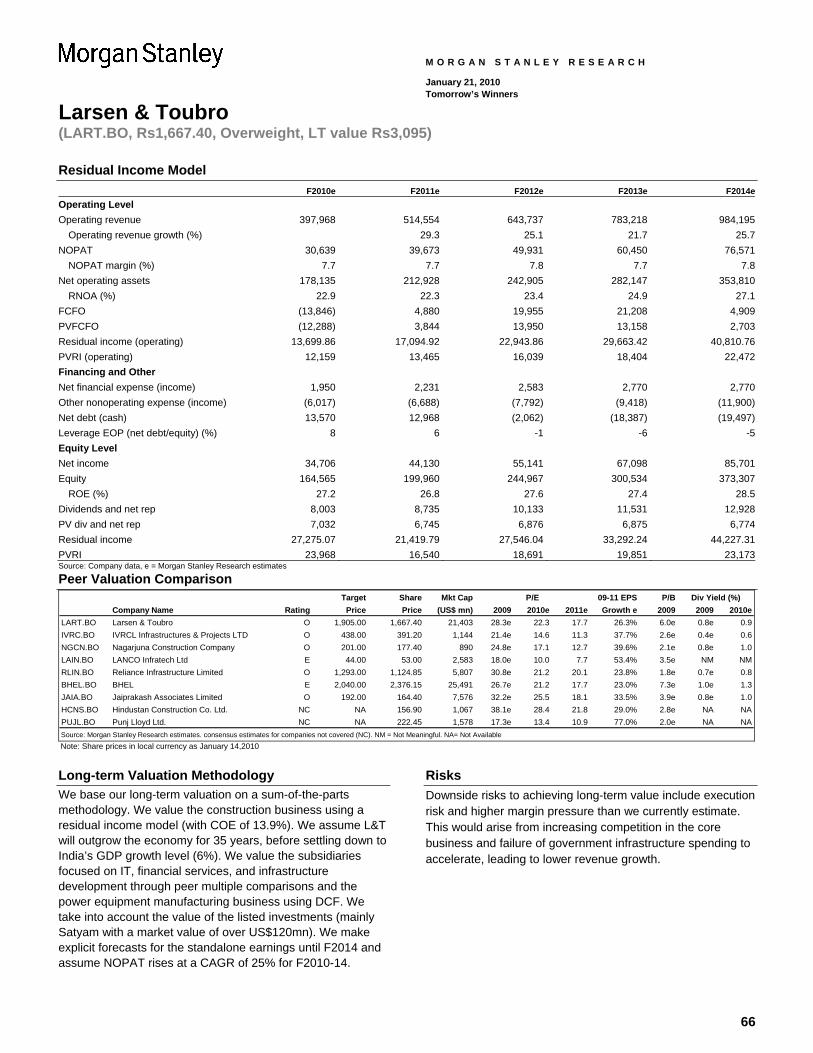
66
Larsen & Toubro (LART.BO, Rs1,667.40, Overweight, LT value Rs3,095)
M O R G A N S T A N L E Y R E S E A R C H
January 21, 2010 Tomorrow’s Winners
Residual Income Model F2010e F2011e F2012e F2013e F2014eOperating Level Operating revenue 397,968 514,554 643,737 783,218 984,195
Operating revenue growth (%) 29.3 25.1 21.7 25.7NOPAT 30,639 39,673 49,931 60,450 76,571
NOPAT margin (%) 7.7 7.7 7.8 7.7 7.8Net operating assets 178,135 212,928 242,905 282,147 353,810
RNOA (%) 22.9 22.3 23.4 24.9 27.1FCFO (13,846) 4,880 19,955 21,208 4,909PVFCFO (12,288) 3,844 13,950 13,158 2,703Residual income (operating) 13,699.86 17,094.92 22,943.86 29,663.42 40,810.76PVRI (operating) 12,159 13,465 16,039 18,404 22,472Financing and Other Net financial expense (income) 1,950 2,231 2,583 2,770 2,770Other nonoperating expense (income) (6,017) (6,688) (7,792) (9,418) (11,900)Net debt (cash) 13,570 12,968 (2,062) (18,387) (19,497)Leverage EOP (net debt/equity) (%) 8 6 -1 -6 -5Equity Level Net income 34,706 44,130 55,141 67,098 85,701Equity 164,565 199,960 244,967 300,534 373,307
ROE (%) 27.2 26.8 27.6 27.4 28.5Dividends and net rep 8,003 8,735 10,133 11,531 12,928PV div and net rep 7,032 6,745 6,876 6,875 6,774Residual income 27,275.07 21,419.79 27,546.04 33,292.24 44,227.31PVRI 23,968 16,540 18,691 19,851 23,173Source: Company data, e = Morgan Stanley Research estimates
Peer Valuation Comparison Target Share Mkt Cap 09-11 EPS P/B
Company Name Rating Price Price (US$ mn) 2009 2010e 2011e Growth e 2009 2009 2010eLART.BO Larsen & Toubro O 1,905.00 1,667.40 21,403 28.3e 22.3 17.7 26.3% 6.0e 0.8e 0.9IVRC.BO IVRCL Infrastructures & Projects LTD O 438.00 391.20 1,144 21.4e 14.6 11.3 37.7% 2.6e 0.4e 0.6NGCN.BO Nagarjuna Construction Company O 201.00 177.40 890 24.8e 17.1 12.7 39.6% 2.1e 0.8e 1.0LAIN.BO LANCO Infratech Ltd E 44.00 53.00 2,583 18.0e 10.0 7.7 53.4% 3.5e NM NMRLIN.BO Reliance Infrastructure Limited O 1,293.00 1,124.85 5,807 30.8e 21.2 20.1 23.8% 1.8e 0.7e 0.8BHEL.BO BHEL E 2,040.00 2,376.15 25,491 26.7e 21.2 17.7 23.0% 7.3e 1.0e 1.3JAIA.BO Jaiprakash Associates Limited O 192.00 164.40 7,576 32.2e 25.5 18.1 33.5% 3.9e 0.8e 1.0HCNS.BO Hindustan Construction Co. Ltd. NC NA 156.90 1,067 38.1e 28.4 21.8 29.0% 2.8e NA NAPUJL.BO Punj Lloyd Ltd. NC NA 222.45 1,578 17.3e 13.4 10.9 77.0% 2.0e NA NASource: Morgan Stanley Research estimates. consensus estimates for companies not covered (NC). NM = Not Meaningful. NA= Not Available
P/E Div Yield (%)
Note: Share prices in local currency as January 14,2010
Long-term Valuation Methodology We base our long-term valuation on a sum-of-the-parts methodology. We value the construction business using a residual income model (with COE of 13.9%). We assume L&T will outgrow the economy for 35 years, before settling down to India’s GDP growth level (6%). We value the subsidiaries focused on IT, financial services, and infrastructure development through peer multiple comparisons and the power equipment manufacturing business using DCF. We take into account the value of the listed investments (mainly Satyam with a market value of over US$120mn). We make explicit forecasts for the standalone earnings until F2014 and assume NOPAT rises at a CAGR of 25% for F2010-14.
Risks Downside risks to achieving long-term value include execution risk and higher margin pressure than we currently estimate. This would arise from increasing competition in the core business and failure of government infrastructure spending to accelerate, leading to lower revenue growth.
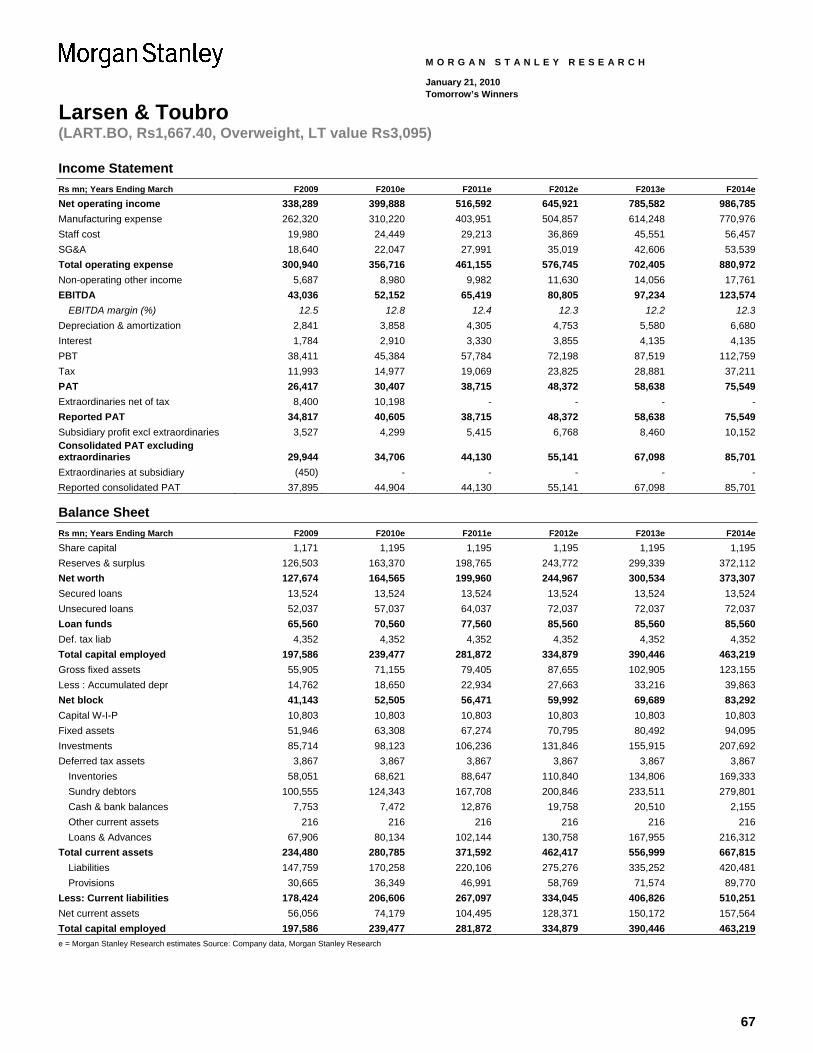
67
Larsen & Toubro (LART.BO, Rs1,667.40, Overweight, LT value Rs3,095)
M O R G A N S T A N L E Y R E S E A R C H
January 21, 2010 Tomorrow’s Winners
Income Statement Rs mn; Years Ending March F2009 F2010e F2011e F2012e F2013e F2014eNet operating income 338,289 399,888 516,592 645,921 785,582 986,785Manufacturing expense 262,320 310,220 403,951 504,857 614,248 770,976Staff cost 19,980 24,449 29,213 36,869 45,551 56,457SG&A 18,640 22,047 27,991 35,019 42,606 53,539Total operating expense 300,940 356,716 461,155 576,745 702,405 880,972Non-operating other income 5,687 8,980 9,982 11,630 14,056 17,761EBITDA 43,036 52,152 65,419 80,805 97,234 123,574
EBITDA margin (%) 12.5 12.8 12.4 12.3 12.2 12.3Depreciation & amortization 2,841 3,858 4,305 4,753 5,580 6,680Interest 1,784 2,910 3,330 3,855 4,135 4,135PBT 38,411 45,384 57,784 72,198 87,519 112,759Tax 11,993 14,977 19,069 23,825 28,881 37,211PAT 26,417 30,407 38,715 48,372 58,638 75,549Extraordinaries net of tax 8,400 10,198 - - - -Reported PAT 34,817 40,605 38,715 48,372 58,638 75,549Subsidiary profit excl extraordinaries 3,527 4,299 5,415 6,768 8,460 10,152Consolidated PAT excluding extraordinaries 29,944 34,706 44,130 55,141 67,098 85,701Extraordinaries at subsidiary (450) - - - - -Reported consolidated PAT 37,895 44,904 44,130 55,141 67,098 85,701
Balance Sheet Rs mn; Years Ending March F2009 F2010e F2011e F2012e F2013e F2014e
Share capital 1,171 1,195 1,195 1,195 1,195 1,195Reserves & surplus 126,503 163,370 198,765 243,772 299,339 372,112Net worth 127,674 164,565 199,960 244,967 300,534 373,307Secured loans 13,524 13,524 13,524 13,524 13,524 13,524Unsecured loans 52,037 57,037 64,037 72,037 72,037 72,037Loan funds 65,560 70,560 77,560 85,560 85,560 85,560Def. tax liab 4,352 4,352 4,352 4,352 4,352 4,352Total capital employed 197,586 239,477 281,872 334,879 390,446 463,219Gross fixed assets 55,905 71,155 79,405 87,655 102,905 123,155Less : Accumulated depr 14,762 18,650 22,934 27,663 33,216 39,863Net block 41,143 52,505 56,471 59,992 69,689 83,292Capital W-I-P 10,803 10,803 10,803 10,803 10,803 10,803Fixed assets 51,946 63,308 67,274 70,795 80,492 94,095Investments 85,714 98,123 106,236 131,846 155,915 207,692Deferred tax assets 3,867 3,867 3,867 3,867 3,867 3,867
Inventories 58,051 68,621 88,647 110,840 134,806 169,333Sundry debtors 100,555 124,343 167,708 200,846 233,511 279,801Cash & bank balances 7,753 7,472 12,876 19,758 20,510 2,155Other current assets 216 216 216 216 216 216Loans & Advances 67,906 80,134 102,144 130,758 167,955 216,312
Total current assets 234,480 280,785 371,592 462,417 556,999 667,815Liabilities 147,759 170,258 220,106 275,276 335,252 420,481Provisions 30,665 36,349 46,991 58,769 71,574 89,770
Less: Current liabilities 178,424 206,606 267,097 334,045 406,826 510,251Net current assets 56,056 74,179 104,495 128,371 150,172 157,564Total capital employed 197,586 239,477 281,872 334,879 390,446 463,219e = Morgan Stanley Research estimates Source: Company data, Morgan Stanley Research
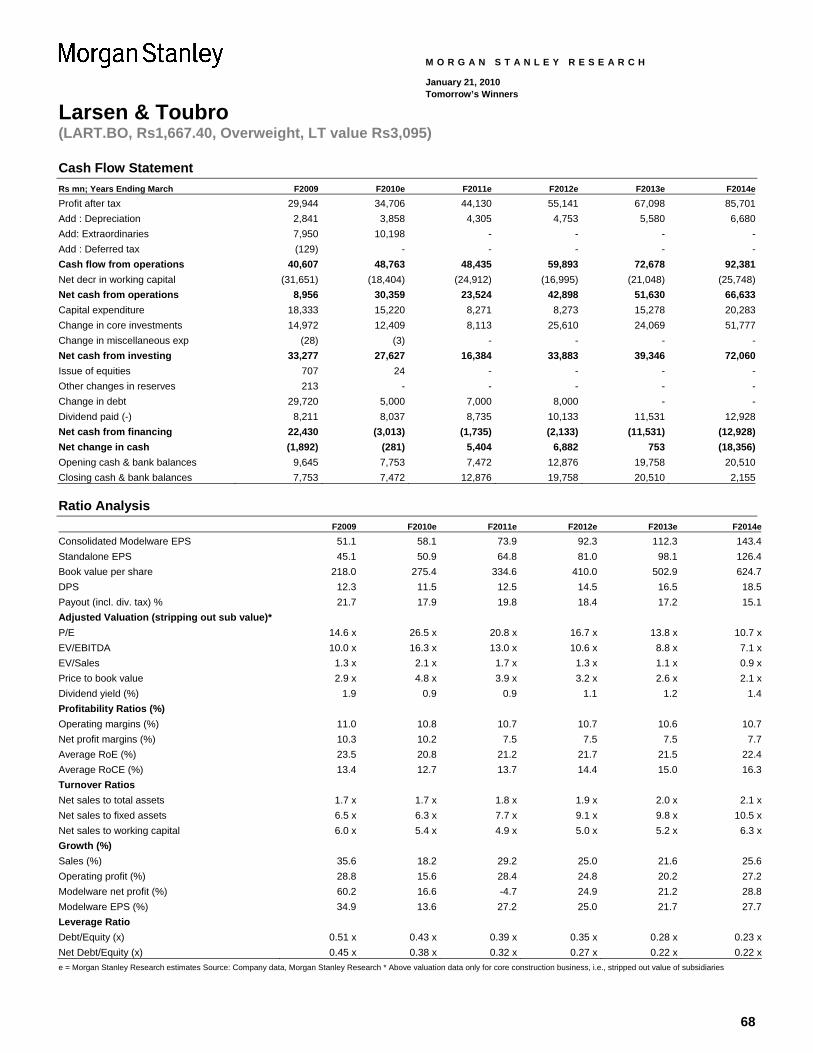
68
Larsen & Toubro (LART.BO, Rs1,667.40, Overweight, LT value Rs3,095)
M O R G A N S T A N L E Y R E S E A R C H
January 21, 2010 Tomorrow’s Winners
Cash Flow Statement Rs mn; Years Ending March F2009 F2010e F2011e F2012e F2013e F2014e
Profit after tax 29,944 34,706 44,130 55,141 67,098 85,701Add : Depreciation 2,841 3,858 4,305 4,753 5,580 6,680Add: Extraordinaries 7,950 10,198 - - - -Add : Deferred tax (129) - - - - -Cash flow from operations 40,607 48,763 48,435 59,893 72,678 92,381Net decr in working capital (31,651) (18,404) (24,912) (16,995) (21,048) (25,748)Net cash from operations 8,956 30,359 23,524 42,898 51,630 66,633Capital expenditure 18,333 15,220 8,271 8,273 15,278 20,283Change in core investments 14,972 12,409 8,113 25,610 24,069 51,777Change in miscellaneous exp (28) (3) - - - -Net cash from investing 33,277 27,627 16,384 33,883 39,346 72,060Issue of equities 707 24 - - - -Other changes in reserves 213 - - - - -Change in debt 29,720 5,000 7,000 8,000 - -Dividend paid (-) 8,211 8,037 8,735 10,133 11,531 12,928Net cash from financing 22,430 (3,013) (1,735) (2,133) (11,531) (12,928)Net change in cash (1,892) (281) 5,404 6,882 753 (18,356)Opening cash & bank balances 9,645 7,753 7,472 12,876 19,758 20,510Closing cash & bank balances 7,753 7,472 12,876 19,758 20,510 2,155
Ratio Analysis F2009 F2010e F2011e F2012e F2013e F2014e
Consolidated Modelware EPS 51.1 58.1 73.9 92.3 112.3 143.4Standalone EPS 45.1 50.9 64.8 81.0 98.1 126.4Book value per share 218.0 275.4 334.6 410.0 502.9 624.7DPS 12.3 11.5 12.5 14.5 16.5 18.5Payout (incl. div. tax) % 21.7 17.9 19.8 18.4 17.2 15.1Adjusted Valuation (stripping out sub value)* P/E 14.6 x 26.5 x 20.8 x 16.7 x 13.8 x 10.7 xEV/EBITDA 10.0 x 16.3 x 13.0 x 10.6 x 8.8 x 7.1 xEV/Sales 1.3 x 2.1 x 1.7 x 1.3 x 1.1 x 0.9 xPrice to book value 2.9 x 4.8 x 3.9 x 3.2 x 2.6 x 2.1 xDividend yield (%) 1.9 0.9 0.9 1.1 1.2 1.4Profitability Ratios (%) Operating margins (%) 11.0 10.8 10.7 10.7 10.6 10.7Net profit margins (%) 10.3 10.2 7.5 7.5 7.5 7.7Average RoE (%) 23.5 20.8 21.2 21.7 21.5 22.4Average RoCE (%) 13.4 12.7 13.7 14.4 15.0 16.3Turnover Ratios Net sales to total assets 1.7 x 1.7 x 1.8 x 1.9 x 2.0 x 2.1 xNet sales to fixed assets 6.5 x 6.3 x 7.7 x 9.1 x 9.8 x 10.5 xNet sales to working capital 6.0 x 5.4 x 4.9 x 5.0 x 5.2 x 6.3 xGrowth (%) Sales (%) 35.6 18.2 29.2 25.0 21.6 25.6Operating profit (%) 28.8 15.6 28.4 24.8 20.2 27.2Modelware net profit (%) 60.2 16.6 -4.7 24.9 21.2 28.8Modelware EPS (%) 34.9 13.6 27.2 25.0 21.7 27.7Leverage Ratio Debt/Equity (x) 0.51 x 0.43 x 0.39 x 0.35 x 0.28 x 0.23 xNet Debt/Equity (x) 0.45 x 0.38 x 0.32 x 0.27 x 0.22 x 0.22 xe = Morgan Stanley Research estimates Source: Company data, Morgan Stanley Research * Above valuation data only for core construction business, i.e., stripped out value of subsidiaries
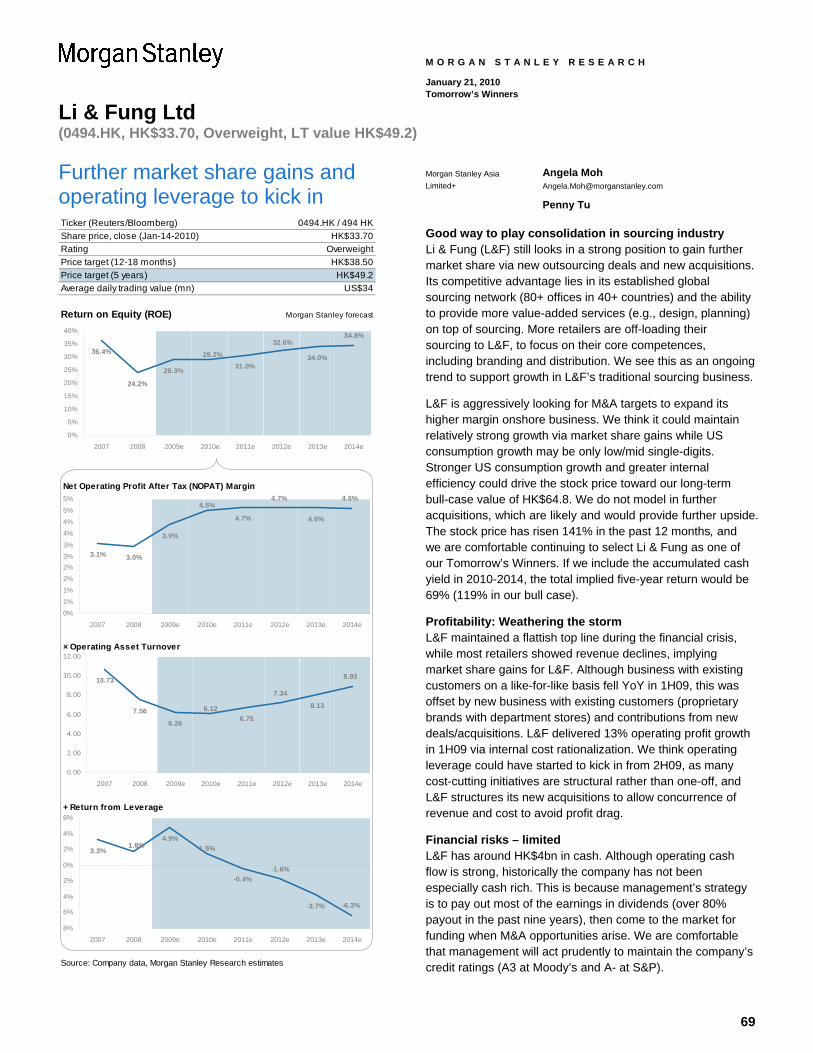
69
Li & Fung Ltd (0494.HK, HK$33.70, Overweight, LT value HK$49.2)
M O R G A N S T A N L E Y R E S E A R C H
January 21, 2010 Tomorrow’s Winners
Further market share gains and operating leverage to kick in Ticker (Reuters/Bloomberg)Share price, close (Jan-14-2010)RatingPrice target (12-18 months)Price target (5 years) HK$49.2Average daily trading value (mn)
Return on Equity (ROE) Morgan Stanley forecast
Net Operating Profit After Tax (NOPAT) Margin
× Operating Asset Turnover
+ Return from Leverage
Source: Company data, Morgan Stanley Research estimates
0494.HK / 494 HKHK$33.70
OverweightHK$38.50
US$34
36.4%
24.2%
29.3% 31.0%34.0%
34.8%32.6%
29.2%
0%
5%
10%
15%
20%
25%
30%
35%
40%
2007 2008 2009e 2010e 2011e 2012e 2013e 2014e
3.1% 3.0%
3.9%
4.7% 4.6%
4.5%4.7% 4.6%
0%1%1%
2%2%3%3%4%
4%5%5%
2007 2008 2009e 2010e 2011e 2012e 2013e 2014e
10.73
7.56
6.26 6.75
8.136.12
7.34
8.93
0.00
2.00
4.00
6.00
8.00
10.00
12.00
2007 2008 2009e 2010e 2011e 2012e 2013e 2014e
3.3%
4.9%
-0.4%
-3.7% -6.3%
-1.6%
1.5%1.8%
8%
6%
4%
2%
0%
2%
4%
6%
2007 2008 2009e 2010e 2011e 2012e 2013e 2014e
Morgan Stanley Asia Limited+
Angela Moh [email protected]
Penny Tu
Good way to play consolidation in sourcing industry Li & Fung (L&F) still looks in a strong position to gain further market share via new outsourcing deals and new acquisitions. Its competitive advantage lies in its established global sourcing network (80+ offices in 40+ countries) and the ability to provide more value-added services (e.g., design, planning) on top of sourcing. More retailers are off-loading their sourcing to L&F, to focus on their core competences, including branding and distribution. We see this as an ongoing trend to support growth in L&F’s traditional sourcing business.
L&F is aggressively looking for M&A targets to expand its higher margin onshore business. We think it could maintain relatively strong growth via market share gains while US consumption growth may be only low/mid single-digits. Stronger US consumption growth and greater internal efficiency could drive the stock price toward our long-term bull-case value of HK$64.8. We do not model in further acquisitions, which are likely and would provide further upside. The stock price has risen 141% in the past 12 months, and we are comfortable continuing to select Li & Fung as one of our Tomorrow’s Winners. If we include the accumulated cash yield in 2010-2014, the total implied five-year return would be 69% (119% in our bull case).
Profitability: Weathering the storm L&F maintained a flattish top line during the financial crisis, while most retailers showed revenue declines, implying market share gains for L&F. Although business with existing customers on a like-for-like basis fell YoY in 1H09, this was offset by new business with existing customers (proprietary brands with department stores) and contributions from new deals/acquisitions. L&F delivered 13% operating profit growth in 1H09 via internal cost rationalization. We think operating leverage could have started to kick in from 2H09, as many cost-cutting initiatives are structural rather than one-off, and L&F structures its new acquisitions to allow concurrence of revenue and cost to avoid profit drag.
Financial risks – limited L&F has around HK$4bn in cash. Although operating cash flow is strong, historically the company has not been especially cash rich. This is because management’s strategy is to pay out most of the earnings in dividends (over 80% payout in the past nine years), then come to the market for funding when M&A opportunities arise. We are comfortable that management will act prudently to maintain the company’s credit ratings (A3 at Moody’s and A- at S&P).
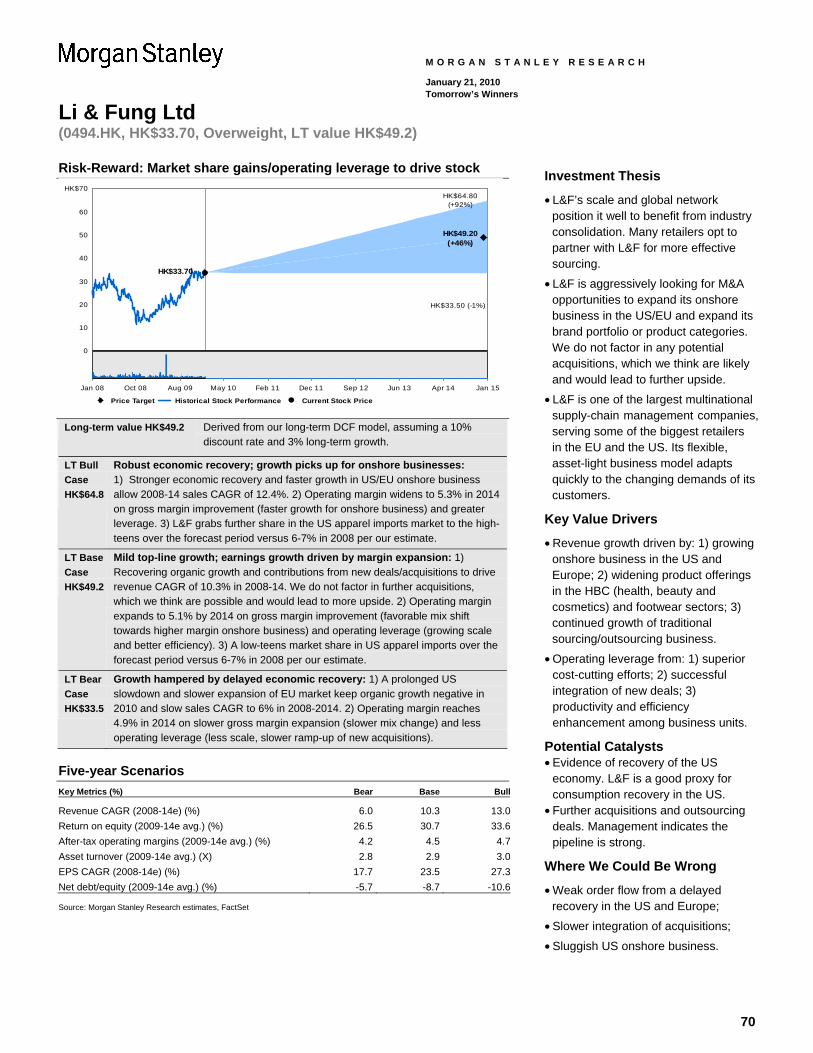
70
Li & Fung Ltd (0494.HK, HK$33.70, Overweight, LT value HK$49.2)
M O R G A N S T A N L E Y R E S E A R C H
January 21, 2010 Tomorrow’s Winners
Risk-Reward: Market share gains/operating leverage to drive stock
0
10
20
30
40
50
60
HK$70HK$64.80
(+92%)
HK$49.20(+46%)
HK$33.50 (-1%)
HK$33.70
Price Target Historical Stock Performance Current Stock Price
Jan 08 Oct 08 Aug 09 May 10 Feb 11 Dec 11 Sep 12 Jun 13 Apr 14 Jan 15
Long-term value HK$49.2 Derived from our long-term DCF model, assuming a 10% discount rate and 3% long-term growth.
LT Bull Case HK$64.8
Robust economic recovery; growth picks up for onshore businesses: 1) Stronger economic recovery and faster growth in US/EU onshore business allow 2008-14 sales CAGR of 12.4%. 2) Operating margin widens to 5.3% in 2014 on gross margin improvement (faster growth for onshore business) and greater leverage. 3) L&F grabs further share in the US apparel imports market to the high-teens over the forecast period versus 6-7% in 2008 per our estimate.
LT Base Case HK$49.2
Mild top-line growth; earnings growth driven by margin expansion: 1) Recovering organic growth and contributions from new deals/acquisitions to drive revenue CAGR of 10.3% in 2008-14. We do not factor in further acquisitions, which we think are possible and would lead to more upside. 2) Operating margin expands to 5.1% by 2014 on gross margin improvement (favorable mix shift towards higher margin onshore business) and operating leverage (growing scale and better efficiency). 3) A low-teens market share in US apparel imports over the forecast period versus 6-7% in 2008 per our estimate.
LT Bear Case HK$33.5
Growth hampered by delayed economic recovery: 1) A prolonged US slowdown and slower expansion of EU market keep organic growth negative in 2010 and slow sales CAGR to 6% in 2008-2014. 2) Operating margin reaches 4.9% in 2014 on slower gross margin expansion (slower mix change) and less operating leverage (less scale, slower ramp-up of new acquisitions).
Five-year Scenarios Key Metrics (%) Bear Base Bull
Revenue CAGR (2008-14e) (%) 6.0 10.3 13.0Return on equity (2009-14e avg.) (%) 26.5 30.7 33.6After-tax operating margins (2009-14e avg.) (%) 4.2 4.5 4.7Asset turnover (2009-14e avg.) (X) 2.8 2.9 3.0EPS CAGR (2008-14e) (%) 17.7 23.5 27.3Net debt/equity (2009-14e avg.) (%) -5.7 -8.7 -10.6 Source: Morgan Stanley Research estimates, FactSet
Investment Thesis
• L&F’s scale and global network position it well to benefit from industry consolidation. Many retailers opt to partner with L&F for more effective sourcing.
• L&F is aggressively looking for M&A opportunities to expand its onshore business in the US/EU and expand its brand portfolio or product categories. We do not factor in any potential acquisitions, which we think are likely and would lead to further upside.
• L&F is one of the largest multinational supply-chain management companies, serving some of the biggest retailers in the EU and the US. Its flexible, asset-light business model adapts quickly to the changing demands of its customers.
Key Value Drivers
• Revenue growth driven by: 1) growing onshore business in the US and Europe; 2) widening product offerings in the HBC (health, beauty and cosmetics) and footwear sectors; 3) continued growth of traditional sourcing/outsourcing business.
• Operating leverage from: 1) superior cost-cutting efforts; 2) successful integration of new deals; 3) productivity and efficiency enhancement among business units.
Potential Catalysts • Evidence of recovery of the US
economy. L&F is a good proxy for consumption recovery in the US.
• Further acquisitions and outsourcing deals. Management indicates the pipeline is strong.
Where We Could Be Wrong
• Weak order flow from a delayed recovery in the US and Europe;
• Slower integration of acquisitions;
• Sluggish US onshore business.
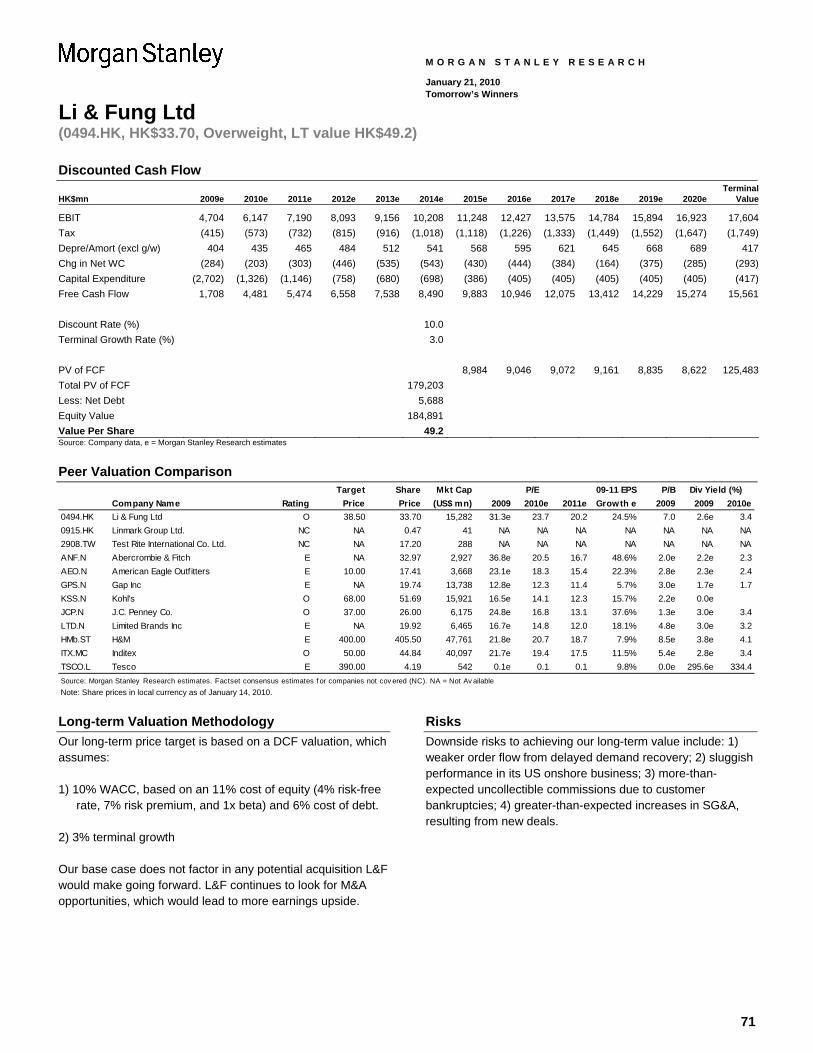
71
Li & Fung Ltd (0494.HK, HK$33.70, Overweight, LT value HK$49.2)
M O R G A N S T A N L E Y R E S E A R C H
January 21, 2010 Tomorrow’s Winners
Discounted Cash Flow
HK$mn 2009e 2010e 2011e 2012e 2013e 2014e 2015e 2016e 2017e 2018e 2019e 2020eTerminal
Value
EBIT 4,704 6,147 7,190 8,093 9,156 10,208 11,248 12,427 13,575 14,784 15,894 16,923 17,604Tax (415) (573) (732) (815) (916) (1,018) (1,118) (1,226) (1,333) (1,449) (1,552) (1,647) (1,749)Depre/Amort (excl g/w) 404 435 465 484 512 541 568 595 621 645 668 689 417Chg in Net WC (284) (203) (303) (446) (535) (543) (430) (444) (384) (164) (375) (285) (293)Capital Expenditure (2,702) (1,326) (1,146) (758) (680) (698) (386) (405) (405) (405) (405) (405) (417)Free Cash Flow 1,708 4,481 5,474 6,558 7,538 8,490 9,883 10,946 12,075 13,412 14,229 15,274 15,561 Discount Rate (%) 10.0 Terminal Growth Rate (%) 3.0 PV of FCF 8,984 9,046 9,072 9,161 8,835 8,622 125,483Total PV of FCF 179,203 Less: Net Debt 5,688 Equity Value 184,891 Value Per Share 49.2 Source: Company data, e = Morgan Stanley Research estimates
Peer Valuation Comparison
Target Share Mkt Cap 09-11 EPS P/BCompany Name Rating Price Price (US$ mn) 2009 2010e 2011e Growth e 2009 2009 2010e
0494.HK Li & Fung Ltd O 38.50 33.70 15,282 31.3e 23.7 20.2 24.5% 7.0 2.6e 3.40915.HK Linmark Group Ltd. NC NA 0.47 41 NA NA NA NA NA NA NA2908.TW Test Rite International Co. Ltd. NC NA 17.20 288 NA NA NA NA NA NA NAANF.N Abercrombie & Fitch E NA 32.97 2,927 36.8e 20.5 16.7 48.6% 2.0e 2.2e 2.3AEO.N American Eagle Outfitters E 10.00 17.41 3,668 23.1e 18.3 15.4 22.3% 2.8e 2.3e 2.4GPS.N Gap Inc E NA 19.74 13,738 12.8e 12.3 11.4 5.7% 3.0e 1.7e 1.7KSS.N Kohl's O 68.00 51.69 15,921 16.5e 14.1 12.3 15.7% 2.2e 0.0eJCP.N J.C. Penney Co. O 37.00 26.00 6,175 24.8e 16.8 13.1 37.6% 1.3e 3.0e 3.4LTD.N Limited Brands Inc E NA 19.92 6,465 16.7e 14.8 12.0 18.1% 4.8e 3.0e 3.2HMb.ST H&M E 400.00 405.50 47,761 21.8e 20.7 18.7 7.9% 8.5e 3.8e 4.1ITX.MC Inditex O 50.00 44.84 40,097 21.7e 19.4 17.5 11.5% 5.4e 2.8e 3.4TSCO.L Tesco E 390.00 4.19 542 0.1e 0.1 0.1 9.8% 0.0e 295.6e 334.4Source: Morgan Stanley Research estimates. Factset consensus estimates f or companies not cov ered (NC). NA = Not Av ailable
P/E Div Yield (%)
Note: Share prices in local currency as of January 14, 2010.
Long-term Valuation Methodology Our long-term price target is based on a DCF valuation, which assumes:
1) 10% WACC, based on an 11% cost of equity (4% risk-free rate, 7% risk premium, and 1x beta) and 6% cost of debt.
2) 3% terminal growth
Our base case does not factor in any potential acquisition L&F would make going forward. L&F continues to look for M&A opportunities, which would lead to more earnings upside.
Risks Downside risks to achieving our long-term value include: 1) weaker order flow from delayed demand recovery; 2) sluggish performance in its US onshore business; 3) more-than-expected uncollectible commissions due to customer bankruptcies; 4) greater-than-expected increases in SG&A, resulting from new deals.
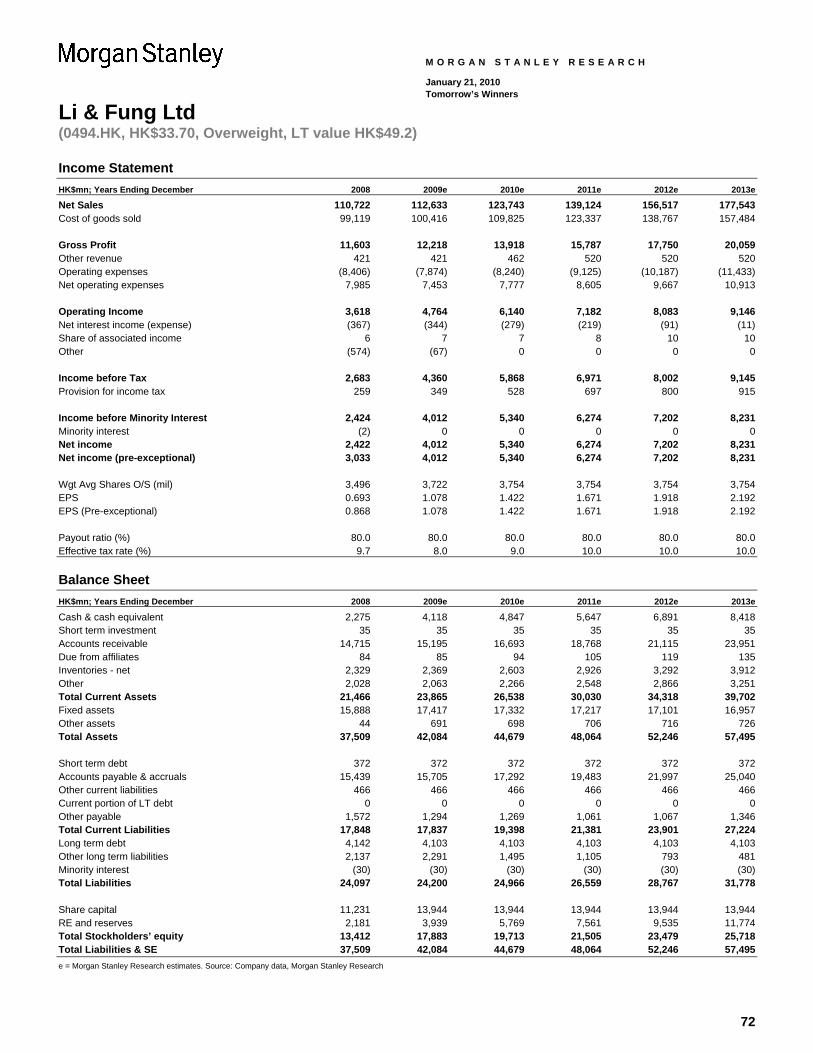
72
Li & Fung Ltd (0494.HK, HK$33.70, Overweight, LT value HK$49.2)
M O R G A N S T A N L E Y R E S E A R C H
January 21, 2010 Tomorrow’s Winners
Income Statement HK$mn; Years Ending December 2008 2009e 2010e 2011e 2012e 2013e Net Sales 110,722 112,633 123,743 139,124 156,517 177,543 Cost of goods sold 99,119 100,416 109,825 123,337 138,767 157,484 Gross Profit 11,603 12,218 13,918 15,787 17,750 20,059 Other revenue 421 421 462 520 520 520 Operating expenses (8,406) (7,874) (8,240) (9,125) (10,187) (11,433) Net operating expenses 7,985 7,453 7,777 8,605 9,667 10,913 Operating Income 3,618 4,764 6,140 7,182 8,083 9,146 Net interest income (expense) (367) (344) (279) (219) (91) (11) Share of associated income 6 7 7 8 10 10 Other (574) (67) 0 0 0 0 Income before Tax 2,683 4,360 5,868 6,971 8,002 9,145 Provision for income tax 259 349 528 697 800 915 Income before Minority Interest 2,424 4,012 5,340 6,274 7,202 8,231 Minority interest (2) 0 0 0 0 0 Net income 2,422 4,012 5,340 6,274 7,202 8,231 Net income (pre-exceptional) 3,033 4,012 5,340 6,274 7,202 8,231 Wgt Avg Shares O/S (mil) 3,496 3,722 3,754 3,754 3,754 3,754 EPS 0.693 1.078 1.422 1.671 1.918 2.192 EPS (Pre-exceptional) 0.868 1.078 1.422 1.671 1.918 2.192 Payout ratio (%) 80.0 80.0 80.0 80.0 80.0 80.0 Effective tax rate (%) 9.7 8.0 9.0 10.0 10.0 10.0
Balance Sheet HK$mn; Years Ending December 2008 2009e 2010e 2011e 2012e 2013e Cash & cash equivalent 2,275 4,118 4,847 5,647 6,891 8,418 Short term investment 35 35 35 35 35 35 Accounts receivable 14,715 15,195 16,693 18,768 21,115 23,951 Due from affiliates 84 85 94 105 119 135 Inventories - net 2,329 2,369 2,603 2,926 3,292 3,912 Other 2,028 2,063 2,266 2,548 2,866 3,251 Total Current Assets 21,466 23,865 26,538 30,030 34,318 39,702 Fixed assets 15,888 17,417 17,332 17,217 17,101 16,957 Other assets 44 691 698 706 716 726 Total Assets 37,509 42,084 44,679 48,064 52,246 57,495 Short term debt 372 372 372 372 372 372 Accounts payable & accruals 15,439 15,705 17,292 19,483 21,997 25,040 Other current liabilities 466 466 466 466 466 466 Current portion of LT debt 0 0 0 0 0 0 Other payable 1,572 1,294 1,269 1,061 1,067 1,346 Total Current Liabilities 17,848 17,837 19,398 21,381 23,901 27,224 Long term debt 4,142 4,103 4,103 4,103 4,103 4,103 Other long term liabilities 2,137 2,291 1,495 1,105 793 481 Minority interest (30) (30) (30) (30) (30) (30) Total Liabilities 24,097 24,200 24,966 26,559 28,767 31,778 Share capital 11,231 13,944 13,944 13,944 13,944 13,944 RE and reserves 2,181 3,939 5,769 7,561 9,535 11,774 Total Stockholders’ equity 13,412 17,883 19,713 21,505 23,479 25,718 Total Liabilities & SE 37,509 42,084 44,679 48,064 52,246 57,495 e = Morgan Stanley Research estimates. Source: Company data, Morgan Stanley Research
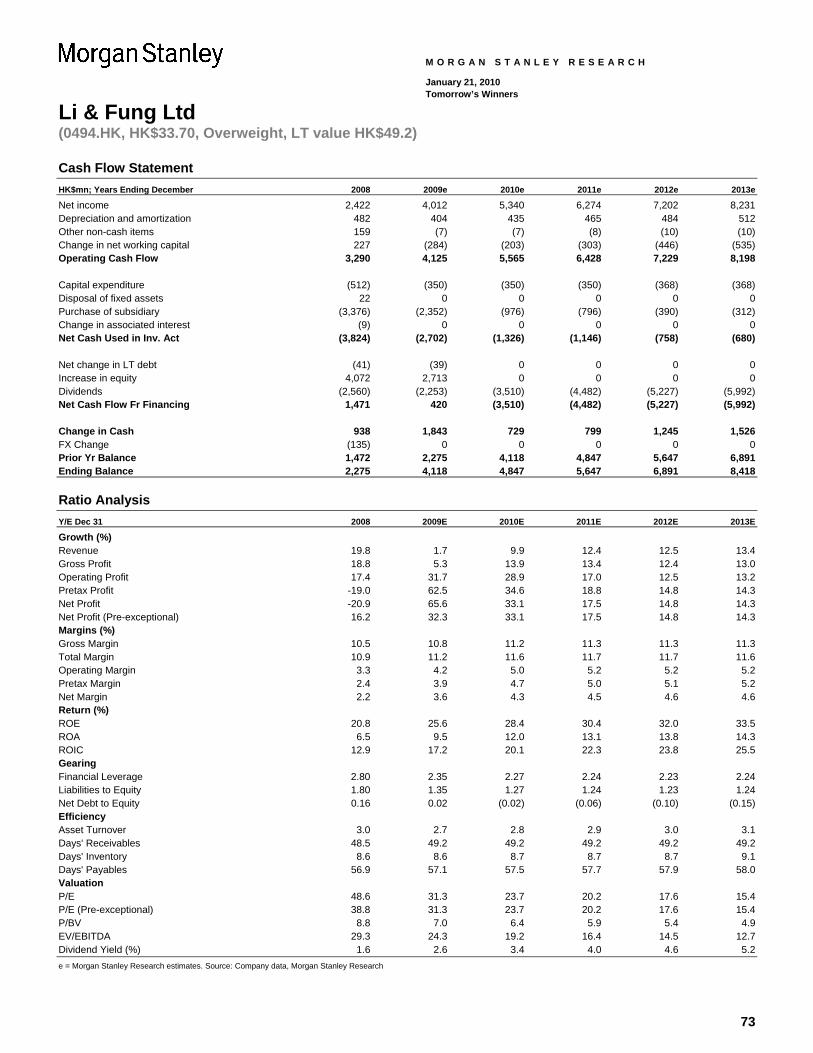
73
Li & Fung Ltd (0494.HK, HK$33.70, Overweight, LT value HK$49.2)
M O R G A N S T A N L E Y R E S E A R C H
January 21, 2010 Tomorrow’s Winners
Cash Flow Statement HK$mn; Years Ending December 2008 2009e 2010e 2011e 2012e 2013e Net income 2,422 4,012 5,340 6,274 7,202 8,231 Depreciation and amortization 482 404 435 465 484 512 Other non-cash items 159 (7) (7) (8) (10) (10) Change in net working capital 227 (284) (203) (303) (446) (535) Operating Cash Flow 3,290 4,125 5,565 6,428 7,229 8,198 Capital expenditure (512) (350) (350) (350) (368) (368) Disposal of fixed assets 22 0 0 0 0 0 Purchase of subsidiary (3,376) (2,352) (976) (796) (390) (312) Change in associated interest (9) 0 0 0 0 0 Net Cash Used in Inv. Act (3,824) (2,702) (1,326) (1,146) (758) (680) Net change in LT debt (41) (39) 0 0 0 0 Increase in equity 4,072 2,713 0 0 0 0 Dividends (2,560) (2,253) (3,510) (4,482) (5,227) (5,992) Net Cash Flow Fr Financing 1,471 420 (3,510) (4,482) (5,227) (5,992) Change in Cash 938 1,843 729 799 1,245 1,526 FX Change (135) 0 0 0 0 0 Prior Yr Balance 1,472 2,275 4,118 4,847 5,647 6,891 Ending Balance 2,275 4,118 4,847 5,647 6,891 8,418
Ratio Analysis Y/E Dec 31 2008 2009E 2010E 2011E 2012E 2013E Growth (%) Revenue 19.8 1.7 9.9 12.4 12.5 13.4 Gross Profit 18.8 5.3 13.9 13.4 12.4 13.0 Operating Profit 17.4 31.7 28.9 17.0 12.5 13.2 Pretax Profit -19.0 62.5 34.6 18.8 14.8 14.3 Net Profit -20.9 65.6 33.1 17.5 14.8 14.3 Net Profit (Pre-exceptional) 16.2 32.3 33.1 17.5 14.8 14.3 Margins (%) Gross Margin 10.5 10.8 11.2 11.3 11.3 11.3 Total Margin 10.9 11.2 11.6 11.7 11.7 11.6 Operating Margin 3.3 4.2 5.0 5.2 5.2 5.2 Pretax Margin 2.4 3.9 4.7 5.0 5.1 5.2 Net Margin 2.2 3.6 4.3 4.5 4.6 4.6 Return (%) ROE 20.8 25.6 28.4 30.4 32.0 33.5 ROA 6.5 9.5 12.0 13.1 13.8 14.3 ROIC 12.9 17.2 20.1 22.3 23.8 25.5 Gearing Financial Leverage 2.80 2.35 2.27 2.24 2.23 2.24 Liabilities to Equity 1.80 1.35 1.27 1.24 1.23 1.24 Net Debt to Equity 0.16 0.02 (0.02) (0.06) (0.10) (0.15) Efficiency Asset Turnover 3.0 2.7 2.8 2.9 3.0 3.1 Days' Receivables 48.5 49.2 49.2 49.2 49.2 49.2 Days' Inventory 8.6 8.6 8.7 8.7 8.7 9.1 Days' Payables 56.9 57.1 57.5 57.7 57.9 58.0 Valuation P/E 48.6 31.3 23.7 20.2 17.6 15.4 P/E (Pre-exceptional) 38.8 31.3 23.7 20.2 17.6 15.4 P/BV 8.8 7.0 6.4 5.9 5.4 4.9 EV/EBITDA 29.3 24.3 19.2 16.4 14.5 12.7 Dividend Yield (%) 1.6 2.6 3.4 4.0 4.6 5.2 e = Morgan Stanley Research estimates. Source: Company data, Morgan Stanley Research
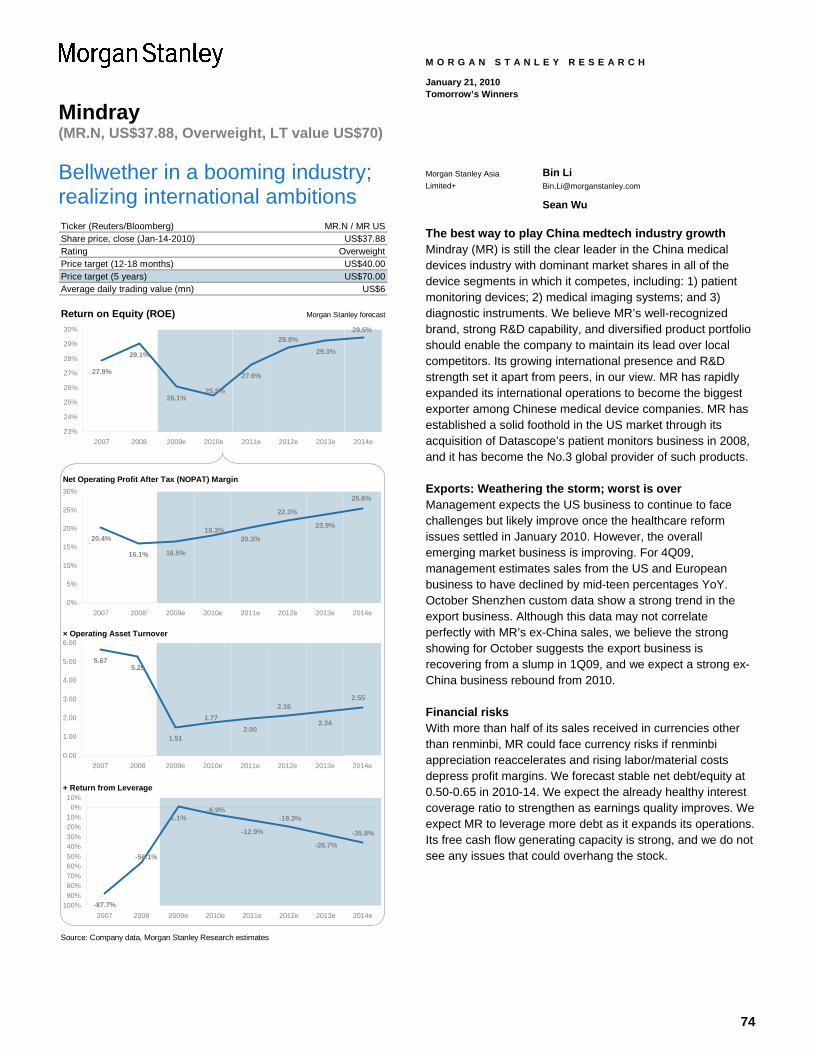
74
Mindray (MR.N, US$37.88, Overweight, LT value US$70)
M O R G A N S T A N L E Y R E S E A R C H
January 21, 2010 Tomorrow’s Winners
Bellwether in a booming industry; realizing international ambitions Ticker (Reuters/Bloomberg)Share price, close (Jan-14-2010)RatingPrice target (12-18 months)Price target (5 years) US$70.00Average daily trading value (mn)
Return on Equity (ROE) Morgan Stanley forecast
Net Operating Profit After Tax (NOPAT) Margin
× Operating Asset Turnover
+ Return from Leverage
Source: Company data, Morgan Stanley Research estimates
MR.N / MR USUS$37.88
OverweightUS$40.00
US$6
27.9%
29.1%
26.1%
27.6%
29.3%
29.5%28.8%
25.5%
23%
24%
25%
26%
27%
28%
29%
30%
2007 2008 2009e 2010e 2011e 2012e 2013e 2014e
20.4%
16.1% 16.5%
20.3%
23.9%18.3%
22.3%
25.6%
0%
5%
10%
15%
20%
25%
30%
2007 2008 2009e 2010e 2011e 2012e 2013e 2014e
5.675.29
1.512.00
2.341.77
2.162.55
0.00
1.00
2.00
3.00
4.00
5.00
6.00
2007 2008 2009e 2010e 2011e 2012e 2013e 2014e
-87.7%
1.1%
-12.9%
-26.7%-35.8%
-19.3%-6.9%
-56.1%
100%90%80%70%60%50%40%30%20%10%
0%10%
2007 2008 2009e 2010e 2011e 2012e 2013e 2014e
Morgan Stanley Asia Limited+
Bin Li [email protected]
Sean Wu
The best way to play China medtech industry growth Mindray (MR) is still the clear leader in the China medical devices industry with dominant market shares in all of the device segments in which it competes, including: 1) patient monitoring devices; 2) medical imaging systems; and 3) diagnostic instruments. We believe MR’s well-recognized brand, strong R&D capability, and diversified product portfolio should enable the company to maintain its lead over local competitors. Its growing international presence and R&D strength set it apart from peers, in our view. MR has rapidly expanded its international operations to become the biggest exporter among Chinese medical device companies. MR has established a solid foothold in the US market through its acquisition of Datascope’s patient monitors business in 2008, and it has become the No.3 global provider of such products.
Exports: Weathering the storm; worst is over Management expects the US business to continue to face challenges but likely improve once the healthcare reform issues settled in January 2010. However, the overall emerging market business is improving. For 4Q09, management estimates sales from the US and European business to have declined by mid-teen percentages YoY. October Shenzhen custom data show a strong trend in the export business. Although this data may not correlate perfectly with MR’s ex-China sales, we believe the strong showing for October suggests the export business is recovering from a slump in 1Q09, and we expect a strong ex-China business rebound from 2010.
Financial risks With more than half of its sales received in currencies other than renminbi, MR could face currency risks if renminbi appreciation reaccelerates and rising labor/material costs depress profit margins. We forecast stable net debt/equity at 0.50-0.65 in 2010-14. We expect the already healthy interest coverage ratio to strengthen as earnings quality improves. We expect MR to leverage more debt as it expands its operations. Its free cash flow generating capacity is strong, and we do not see any issues that could overhang the stock.
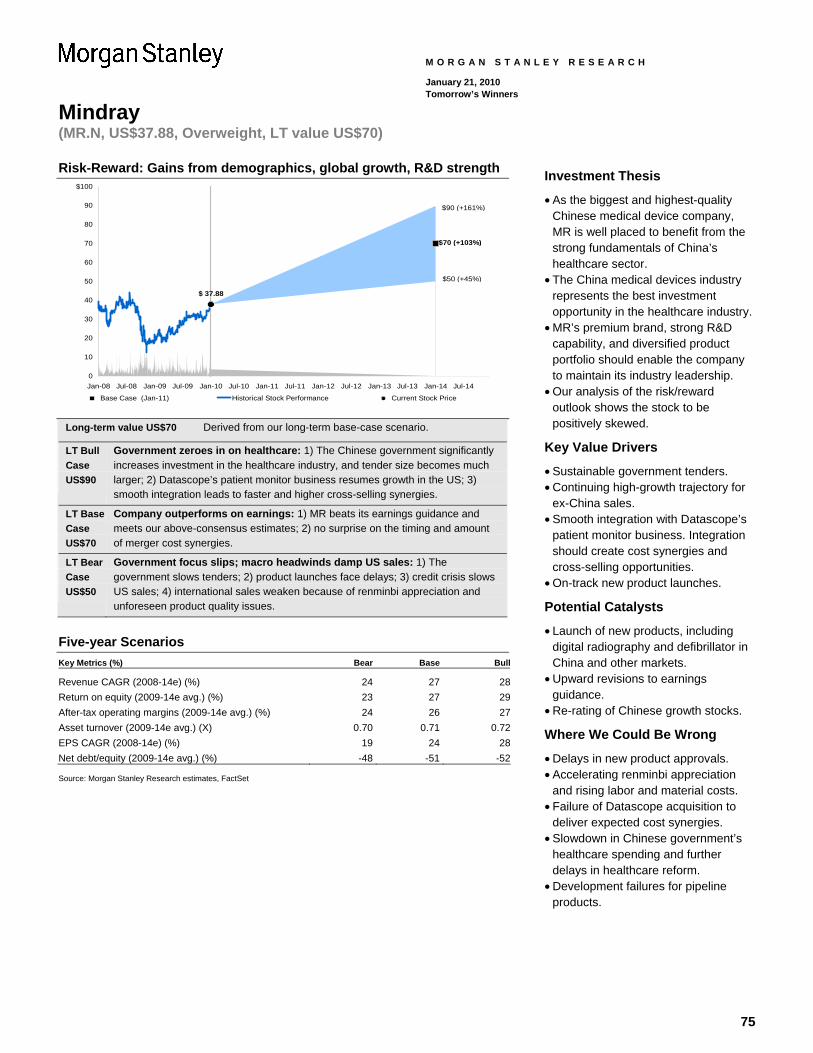
75
Mindray (MR.N, US$37.88, Overweight, LT value US$70)
M O R G A N S T A N L E Y R E S E A R C H
January 21, 2010 Tomorrow’s Winners
Risk-Reward: Gains from demographics, global growth, R&D strength
WARNINGDONOTEDIT_RRS4RL~MR.N~
$ 37.88
0
10
20
30
40
50
60
70
80
90
100
Jan-08 Jul-08 Jan-09 Jul-09 Jan-10 Jul-10 Jan-11 Jul-11 Jan-12 Jul-12 Jan-13 Jul-13 Jan-14 Jul-14
$
Base Case (Jan-11) Historical Stock Performance Current Stock Price
$90 (+161%)
$70 (+103%)
$50 (+45%)
Long-term value US$70 Derived from our long-term base-case scenario.
LT Bull Case US$90
Government zeroes in on healthcare: 1) The Chinese government significantly increases investment in the healthcare industry, and tender size becomes much larger; 2) Datascope’s patient monitor business resumes growth in the US; 3) smooth integration leads to faster and higher cross-selling synergies.
LT Base Case US$70
Company outperforms on earnings: 1) MR beats its earnings guidance and meets our above-consensus estimates; 2) no surprise on the timing and amount of merger cost synergies.
LT Bear Case US$50
Government focus slips; macro headwinds damp US sales: 1) The government slows tenders; 2) product launches face delays; 3) credit crisis slows US sales; 4) international sales weaken because of renminbi appreciation and unforeseen product quality issues.
Five-year Scenarios Key Metrics (%) Bear Base Bull
Revenue CAGR (2008-14e) (%) 24 27 28Return on equity (2009-14e avg.) (%) 23 27 29After-tax operating margins (2009-14e avg.) (%) 24 26 27Asset turnover (2009-14e avg.) (X) 0.70 0.71 0.72EPS CAGR (2008-14e) (%) 19 24 28Net debt/equity (2009-14e avg.) (%) -48 -51 -52 Source: Morgan Stanley Research estimates, FactSet
Investment Thesis
• As the biggest and highest-quality Chinese medical device company, MR is well placed to benefit from the strong fundamentals of China’s healthcare sector.
• The China medical devices industry represents the best investment opportunity in the healthcare industry.
• MR’s premium brand, strong R&D capability, and diversified product portfolio should enable the company to maintain its industry leadership.
• Our analysis of the risk/reward outlook shows the stock to be positively skewed.
Key Value Drivers
• Sustainable government tenders. • Continuing high-growth trajectory for
ex-China sales. • Smooth integration with Datascope’s
patient monitor business. Integration should create cost synergies and cross-selling opportunities.
• On-track new product launches.
Potential Catalysts
• Launch of new products, including digital radiography and defibrillator in China and other markets.
• Upward revisions to earnings guidance.
• Re-rating of Chinese growth stocks.
Where We Could Be Wrong
• Delays in new product approvals. • Accelerating renminbi appreciation
and rising labor and material costs. • Failure of Datascope acquisition to
deliver expected cost synergies. • Slowdown in Chinese government’s
healthcare spending and further delays in healthcare reform.
• Development failures for pipeline products.
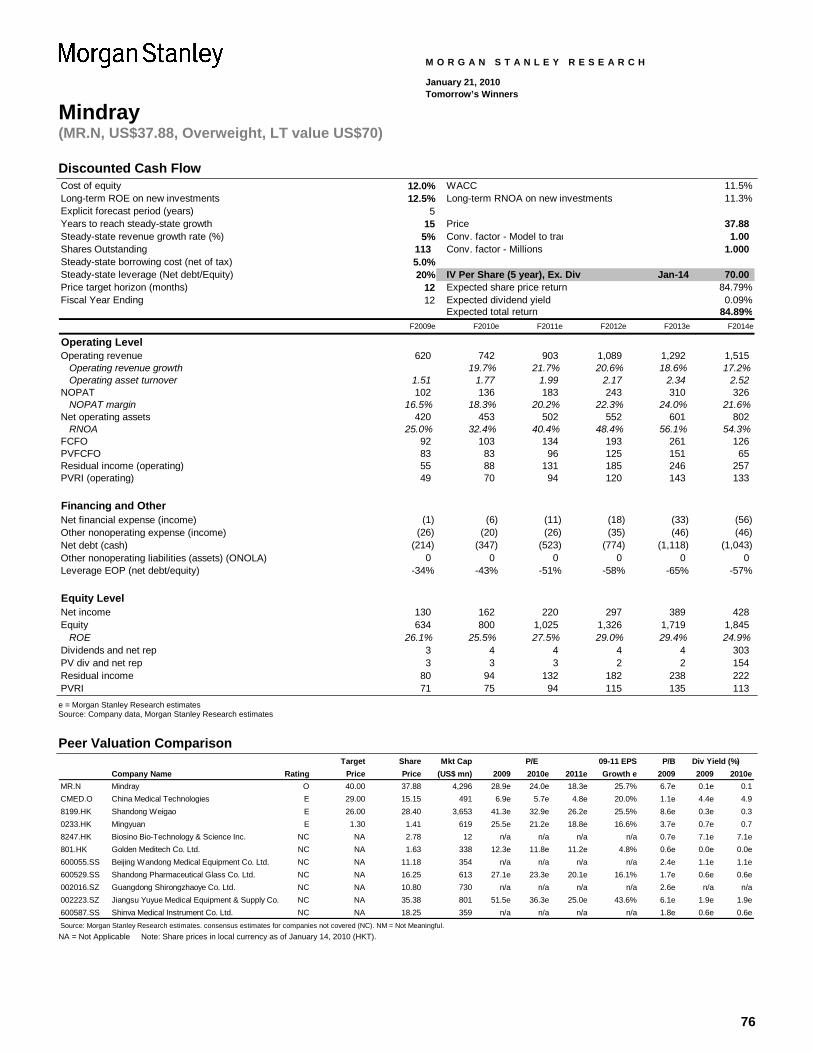
76
Mindray (MR.N, US$37.88, Overweight, LT value US$70)
M O R G A N S T A N L E Y R E S E A R C H
January 21, 2010 Tomorrow’s Winners
Discounted Cash Flow Cost of equity 12.0% WACC 0.00 11.5%Long-term ROE on new investments 12.5% Long-term RNOA on new investments 11.3%Explicit forecast period (years) 5 0.00 FALSEYears to reach steady-state growth 15 Price 0.00 37.88 Steady-state revenue growth rate (%) 5% Conv. factor - Model to trad 0.00 2013 1.00 Shares Outstanding 113 Conv. factor - Millions 0.03 1.000 Steady-state borrowing cost (net of tax) 5.0% IV per share (Current) Jan-10 22.16 Steady-state leverage (Net debt/Equity) 20% IV Per Share (5 year), Ex. Div Jan-14 70.00 Price target horizon (months) 12 Expected share price return 84.79%Fiscal Year Ending 12 Expected dividend yield 0.09%
Expected total return 84.89%F2009e F2010e F2011e F2012e F2013e F2014e
Operating LevelOperating revenue 620 742 903 1,089 1,292 1,515
Operating revenue growth 19.7% 21.7% 20.6% 18.6% 17.2%Operating asset turnover 1.51 1.77 1.99 2.17 2.34 2.52
NOPAT 102 136 183 243 310 326 NOPAT margin 16.5% 18.3% 20.2% 22.3% 24.0% 21.6%
Net operating assets 420 453 502 552 601 802 RNOA 25.0% 32.4% 40.4% 48.4% 56.1% 54.3%
FCFO 92 103 134 193 261 126 PVFCFO 83 83 96 125 151 65 Residual income (operating) 55 88 131 185 246 257 PVRI (operating) 49 70 94 120 143 133
Financing and OtherNet financial expense (income) (1) (6) (11) (18) (33) (56) Other nonoperating expense (income) (26) (20) (26) (35) (46) (46) Net debt (cash) (214) (347) (523) (774) (1,118) (1,043) Other nonoperating liabilities (assets) (ONOLA) 0 0 0 0 0 0 Leverage EOP (net debt/equity) -34% -43% -51% -58% -65% -57%
Equity LevelNet income 130 162 220 297 389 428 Equity 634 800 1,025 1,326 1,719 1,845
ROE 26.1% 25.5% 27.5% 29.0% 29.4% 24.9%Dividends and net rep 3 4 4 4 4 303 PV div and net rep 3 3 3 2 2 154 Residual income 80 94 132 182 238 222 PVRI 71 75 94 115 135 113
e = Morgan Stanley Research estimates Source: Company data, Morgan Stanley Research estimates
Peer Valuation Comparison
Target Share Mkt Cap 09-11 EPS P/BCompany Name Rating Price Price (US$ mn) 2009 2010e 2011e Growth e 2009 2009 2010e
MR.N Mindray O 40.00 37.88 4,296 28.9e 24.0e 18.3e 25.7% 6.7e 0.1e 0.1CMED.O China Medical Technologies E 29.00 15.15 491 6.9e 5.7e 4.8e 20.0% 1.1e 4.4e 4.98199.HK Shandong Weigao E 26.00 28.40 3,653 41.3e 32.9e 26.2e 25.5% 8.6e 0.3e 0.30233.HK Mingyuan E 1.30 1.41 619 25.5e 21.2e 18.8e 16.6% 3.7e 0.7e 0.78247.HK Biosino Bio-Technology & Science Inc. NC NA 2.78 12 n/a n/a n/a n/a 0.7e 7.1e 7.1e801.HK Golden Meditech Co. Ltd. NC NA 1.63 338 12.3e 11.8e 11.2e 4.8% 0.6e 0.0e 0.0e600055.SS Beijing Wandong Medical Equipment Co. Ltd. NC NA 11.18 354 n/a n/a n/a n/a 2.4e 1.1e 1.1e600529.SS Shandong Pharmaceutical Glass Co. Ltd. NC NA 16.25 613 27.1e 23.3e 20.1e 16.1% 1.7e 0.6e 0.6e002016.SZ Guangdong Shirongzhaoye Co. Ltd. NC NA 10.80 730 n/a n/a n/a n/a 2.6e n/a n/a002223.SZ Jiangsu Yuyue Medical Equipment & Supply Co. NC NA 35.38 801 51.5e 36.3e 25.0e 43.6% 6.1e 1.9e 1.9e600587.SS Shinva Medical Instrument Co. Ltd. NC NA 18.25 359 n/a n/a n/a n/a 1.8e 0.6e 0.6eSource: Morgan Stanley Research estimates. consensus estimates for companies not covered (NC). NM = Not Meaningful.
P/E Div Yield (%)
NA = Not Applicable Note: Share prices in local currency as of January 14, 2010 (HKT).
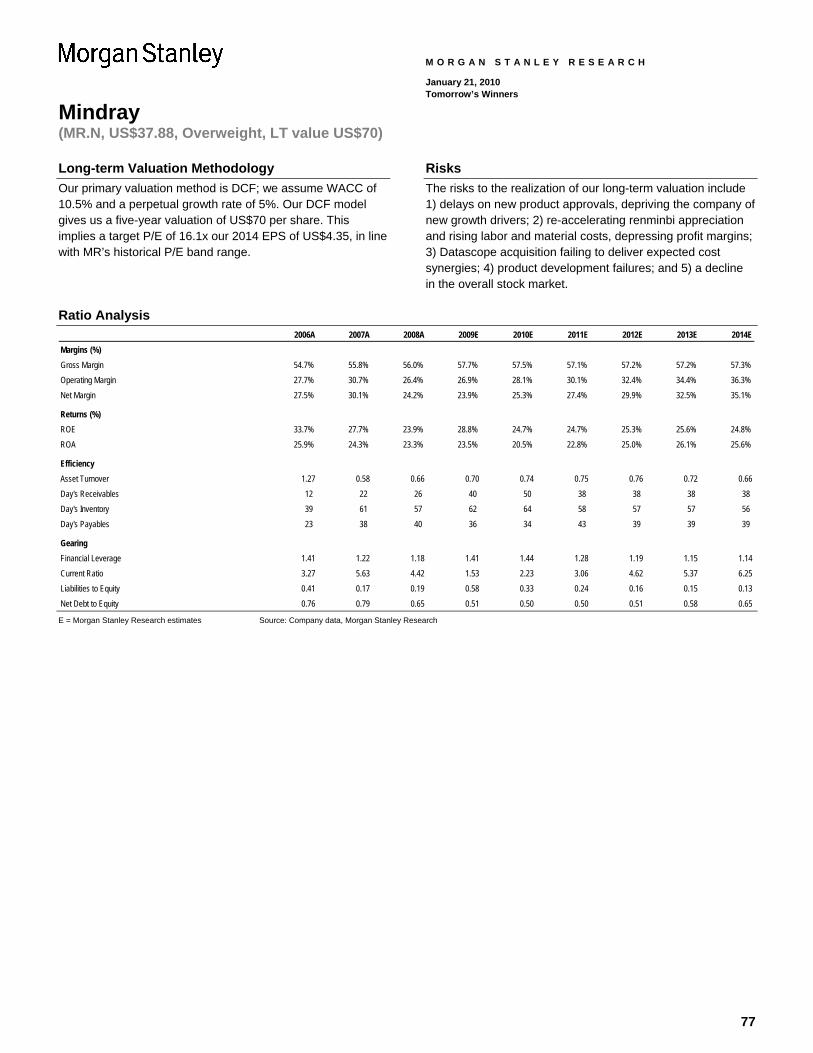
77
Mindray (MR.N, US$37.88, Overweight, LT value US$70)
M O R G A N S T A N L E Y R E S E A R C H
January 21, 2010 Tomorrow’s Winners
Long-term Valuation Methodology Our primary valuation method is DCF; we assume WACC of 10.5% and a perpetual growth rate of 5%. Our DCF model gives us a five-year valuation of US$70 per share. This implies a target P/E of 16.1x our 2014 EPS of US$4.35, in line with MR’s historical P/E band range.
Risks The risks to the realization of our long-term valuation include 1) delays on new product approvals, depriving the company of new growth drivers; 2) re-accelerating renminbi appreciation and rising labor and material costs, depressing profit margins; 3) Datascope acquisition failing to deliver expected cost synergies; 4) product development failures; and 5) a decline in the overall stock market.
Ratio Analysis 2006A 2007A 2008A 2009E 2010E 2011E 2012E 2013E 2014E
Margins (%)Gross Margin 54.7% 55.8% 56.0% 57.7% 57.5% 57.1% 57.2% 57.2% 57.3%Operating Margin 27.7% 30.7% 26.4% 26.9% 28.1% 30.1% 32.4% 34.4% 36.3%Net Margin 27.5% 30.1% 24.2% 23.9% 25.3% 27.4% 29.9% 32.5% 35.1%
Returns (%)ROE 33.7% 27.7% 23.9% 28.8% 24.7% 24.7% 25.3% 25.6% 24.8%ROA 25.9% 24.3% 23.3% 23.5% 20.5% 22.8% 25.0% 26.1% 25.6%
EfficiencyAsset Turnover 1.27 0.58 0.66 0.70 0.74 0.75 0.76 0.72 0.66Day's Receivables 12 22 26 40 50 38 38 38 38Day's Inventory 39 61 57 62 64 58 57 57 56Day's Payables 23 38 40 36 34 43 39 39 39
GearingFinancial Leverage 1.41 1.22 1.18 1.41 1.44 1.28 1.19 1.15 1.14Current Ratio 3.27 5.63 4.42 1.53 2.23 3.06 4.62 5.37 6.25Liabilities to Equity 0.41 0.17 0.19 0.58 0.33 0.24 0.16 0.15 0.13Net Debt to Equity 0.76 0.79 0.65 0.51 0.50 0.50 0.51 0.58 0.65 E = Morgan Stanley Research estimates Source: Company data, Morgan Stanley Research
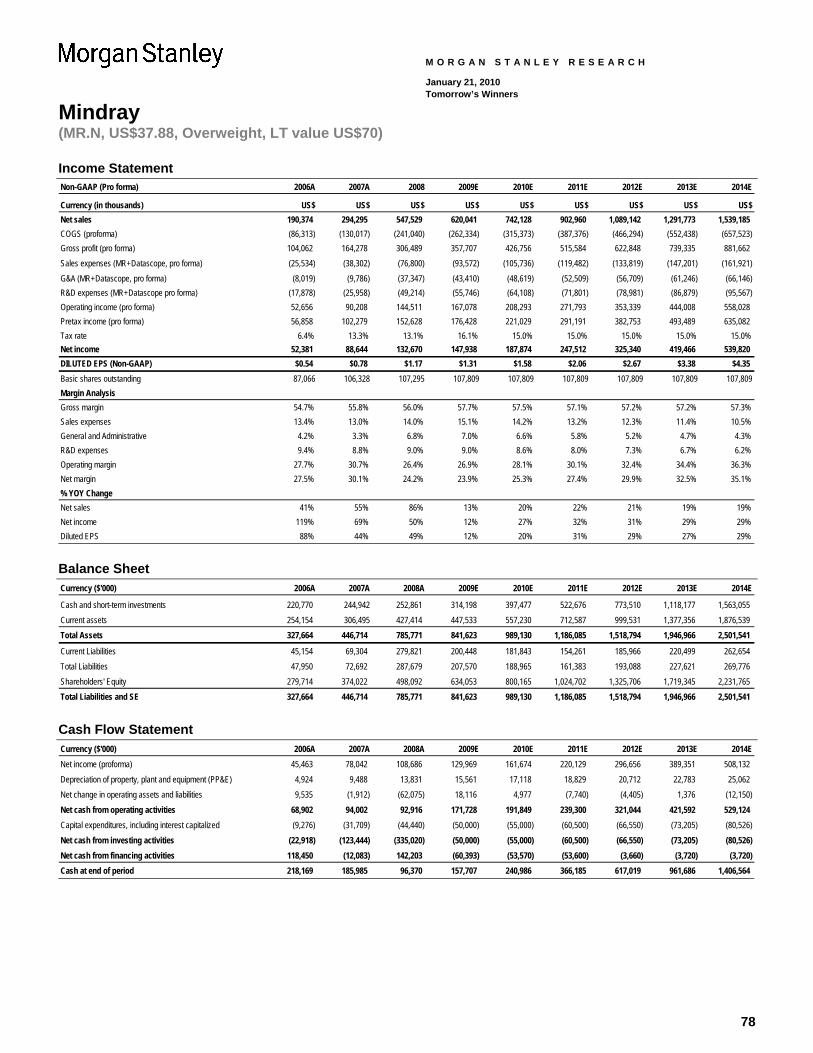
78
Mindray (MR.N, US$37.88, Overweight, LT value US$70)
M O R G A N S T A N L E Y R E S E A R C H
January 21, 2010 Tomorrow’s Winners
Income Statement Non-GAAP (Pro forma) 2006A 2007A 2008 2009E 2010E 2011E 2012E 2013E 2014E
Currency (in thousands) US$ US$ US$ US$ US$ US$ US$ US$ US$Net sales 190,374 294,295 547,529 620,041 742,128 902,960 1,089,142 1,291,773 1,539,185 COGS (proforma) (86,313) (130,017) (241,040) (262,334) (315,373) (387,376) (466,294) (552,438) (657,523) Gross profit (pro forma) 104,062 164,278 306,489 357,707 426,756 515,584 622,848 739,335 881,662 Sales expenses (MR+Datascope, pro forma) (25,534) (38,302) (76,800) (93,572) (105,736) (119,482) (133,819) (147,201) (161,921) G&A (MR+Datascope, pro forma) (8,019) (9,786) (37,347) (43,410) (48,619) (52,509) (56,709) (61,246) (66,146) R&D expenses (MR+Datascope pro forma) (17,878) (25,958) (49,214) (55,746) (64,108) (71,801) (78,981) (86,879) (95,567) Operating income (pro forma) 52,656 90,208 144,511 167,078 208,293 271,793 353,339 444,008 558,028 Pretax income (pro forma) 56,858 102,279 152,628 176,428 221,029 291,191 382,753 493,489 635,082 Tax rate 6.4% 13.3% 13.1% 16.1% 15.0% 15.0% 15.0% 15.0% 15.0%Net income 52,381 88,644 132,670 147,938 187,874 247,512 325,340 419,466 539,820 DILUTED EPS (Non-GAAP) $0.54 $0.78 $1.17 $1.31 $1.58 $2.06 $2.67 $3.38 $4.35Basic shares outstanding 87,066 106,328 107,295 107,809 107,809 107,809 107,809 107,809 107,809Margin AnalysisGross margin 54.7% 55.8% 56.0% 57.7% 57.5% 57.1% 57.2% 57.2% 57.3%Sales expenses 13.4% 13.0% 14.0% 15.1% 14.2% 13.2% 12.3% 11.4% 10.5%General and Administrative 4.2% 3.3% 6.8% 7.0% 6.6% 5.8% 5.2% 4.7% 4.3%R&D expenses 9.4% 8.8% 9.0% 9.0% 8.6% 8.0% 7.3% 6.7% 6.2%Operating margin 27.7% 30.7% 26.4% 26.9% 28.1% 30.1% 32.4% 34.4% 36.3%Net margin 27.5% 30.1% 24.2% 23.9% 25.3% 27.4% 29.9% 32.5% 35.1%% YOY ChangeNet sales 41% 55% 86% 13% 20% 22% 21% 19% 19%Net income 119% 69% 50% 12% 27% 32% 31% 29% 29%Diluted EPS 88% 44% 49% 12% 20% 31% 29% 27% 29%
Balance Sheet Currency ($'000) 2006A 2007A 2008A 2009E 2010E 2011E 2012E 2013E 2014E
Cash and short-term investments 220,770 244,942 252,861 314,198 397,477 522,676 773,510 1,118,177 1,563,055 Current assets 254,154 306,495 427,414 447,533 557,230 712,587 999,531 1,377,356 1,876,539 Total Assets 327,664 446,714 785,771 841,623 989,130 1,186,085 1,518,794 1,946,966 2,501,541
Current Liabilities 45,154 69,304 279,821 200,448 181,843 154,261 185,966 220,499 262,654 Total Liabilities 47,950 72,692 287,679 207,570 188,965 161,383 193,088 227,621 269,776 Shareholders' Equity 279,714 374,022 498,092 634,053 800,165 1,024,702 1,325,706 1,719,345 2,231,765 Total Liabilities and SE 327,664 446,714 785,771 841,623 989,130 1,186,085 1,518,794 1,946,966 2,501,541 Cash Flow Statement Currency ($'000) 2006A 2007A 2008A 2009E 2010E 2011E 2012E 2013E 2014ENet income (proforma) 45,463 78,042 108,686 129,969 161,674 220,129 296,656 389,351 508,132 Depreciation of property, plant and equipment (PP&E) 4,924 9,488 13,831 15,561 17,118 18,829 20,712 22,783 25,062 Net change in operating assets and liabilities 9,535 (1,912) (62,075) 18,116 4,977 (7,740) (4,405) 1,376 (12,150) Net cash from operating activities 68,902 94,002 92,916 171,728 191,849 239,300 321,044 421,592 529,124 Capital expenditures, including interest capitalized (9,276) (31,709) (44,440) (50,000) (55,000) (60,500) (66,550) (73,205) (80,526) Net cash from investing activities (22,918) (123,444) (335,020) (50,000) (55,000) (60,500) (66,550) (73,205) (80,526) Net cash from financing activities 118,450 (12,083) 142,203 (60,393) (53,570) (53,600) (3,660) (3,720) (3,720) Cash at end of period 218,169 185,985 96,370 157,707 240,986 366,185 617,019 961,686 1,406,564
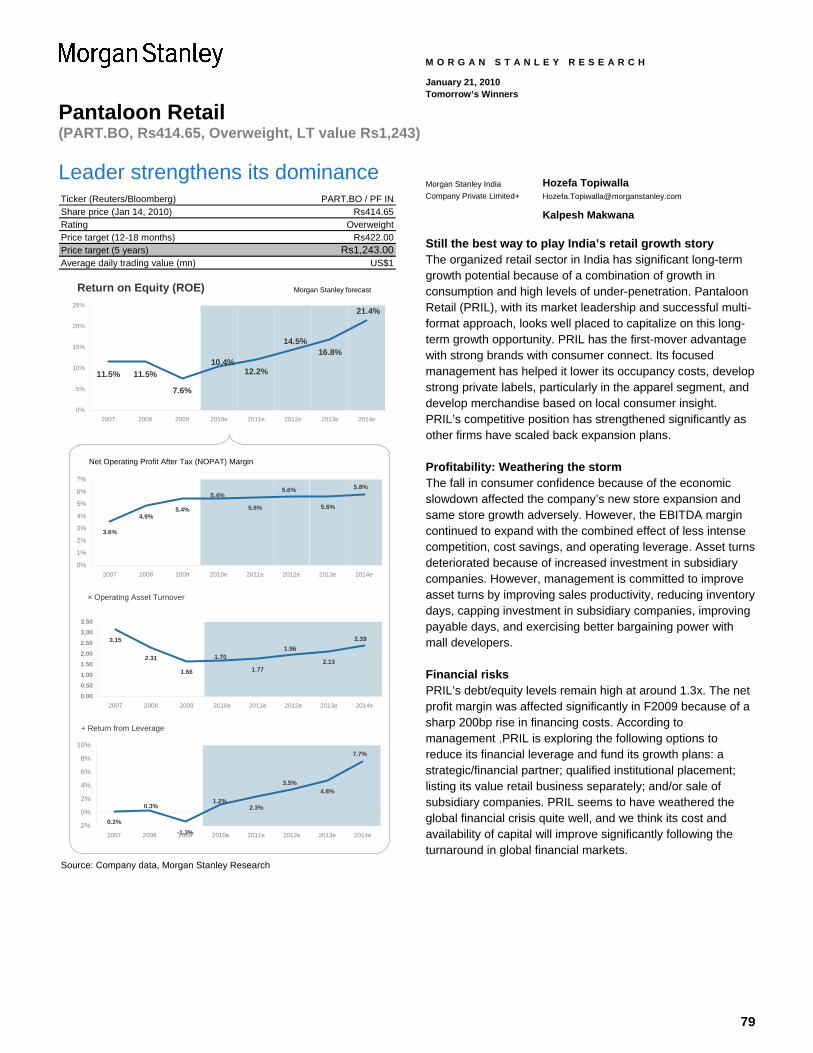
79
Pantaloon Retail (PART.BO, Rs414.65, Overweight, LT value Rs1,243)
M O R G A N S T A N L E Y R E S E A R C H
January 21, 2010 Tomorrow’s Winners
Leader strengthens its dominance Ticker (Reuters/Bloomberg)Share price (Jan 14, 2010)RatingPrice target (12-18 months)Price target (5 years) Rs1,243.00Average daily trading value (mn)
Source: Company data, Morgan Stanley Research
US$1
PART.BO / PF INRs414.65
OverweightRs422.00
Return on Equity (ROE)
11.5% 11.5%
7.6%
12.2%
16.8%
21.4%
14.5%
10.4%
0%
5%
10%
15%
20%
25%
2007 2008 2009 2010e 2011e 2012e 2013e 2014e
Morgan Stanley forecast
Net Operating Profit After Tax (NOPAT) Margin
3.6%
4.9%5.4% 5.6% 5.6%
5.4%5.6% 5.8%
0%
1%
2%
3%
4%
5%
6%
7%
2007 2008 2009 2010e 2011e 2012e 2013e 2014e
× Operating Asset Turnover
3.15
2.31
1.66 1.772.13
1.701.96
2.39
0.000.501.001.502.002.503.003.50
2007 2008 2009 2010e 2011e 2012e 2013e 2014e
+ Return from Leverage
0.2%-1.3%
2.3%
4.8%
7.7%
3.5%
1.2%0.3%
2%
0%
2%
4%
6%
8%
10%
2007 2008 2009 2010e 2011e 2012e 2013e 2014e
Morgan Stanley India Company Private Limited+
Hozefa Topiwalla [email protected]
Kalpesh Makwana
Still the best way to play India’s retail growth story The organized retail sector in India has significant long-term growth potential because of a combination of growth in consumption and high levels of under-penetration. Pantaloon Retail (PRIL), with its market leadership and successful multi-format approach, looks well placed to capitalize on this long-term growth opportunity. PRIL has the first-mover advantage with strong brands with consumer connect. Its focused management has helped it lower its occupancy costs, develop strong private labels, particularly in the apparel segment, and develop merchandise based on local consumer insight. PRIL’s competitive position has strengthened significantly as other firms have scaled back expansion plans.
Profitability: Weathering the storm The fall in consumer confidence because of the economic slowdown affected the company’s new store expansion and same store growth adversely. However, the EBITDA margin continued to expand with the combined effect of less intense competition, cost savings, and operating leverage. Asset turns deteriorated because of increased investment in subsidiary companies. However, management is committed to improve asset turns by improving sales productivity, reducing inventory days, capping investment in subsidiary companies, improving payable days, and exercising better bargaining power with mall developers.
Financial risks PRIL’s debt/equity levels remain high at around 1.3x. The net profit margin was affected significantly in F2009 because of a sharp 200bp rise in financing costs. According to management ,PRIL is exploring the following options to reduce its financial leverage and fund its growth plans: a strategic/financial partner; qualified institutional placement; listing its value retail business separately; and/or sale of subsidiary companies. PRIL seems to have weathered the global financial crisis quite well, and we think its cost and availability of capital will improve significantly following the turnaround in global financial markets.
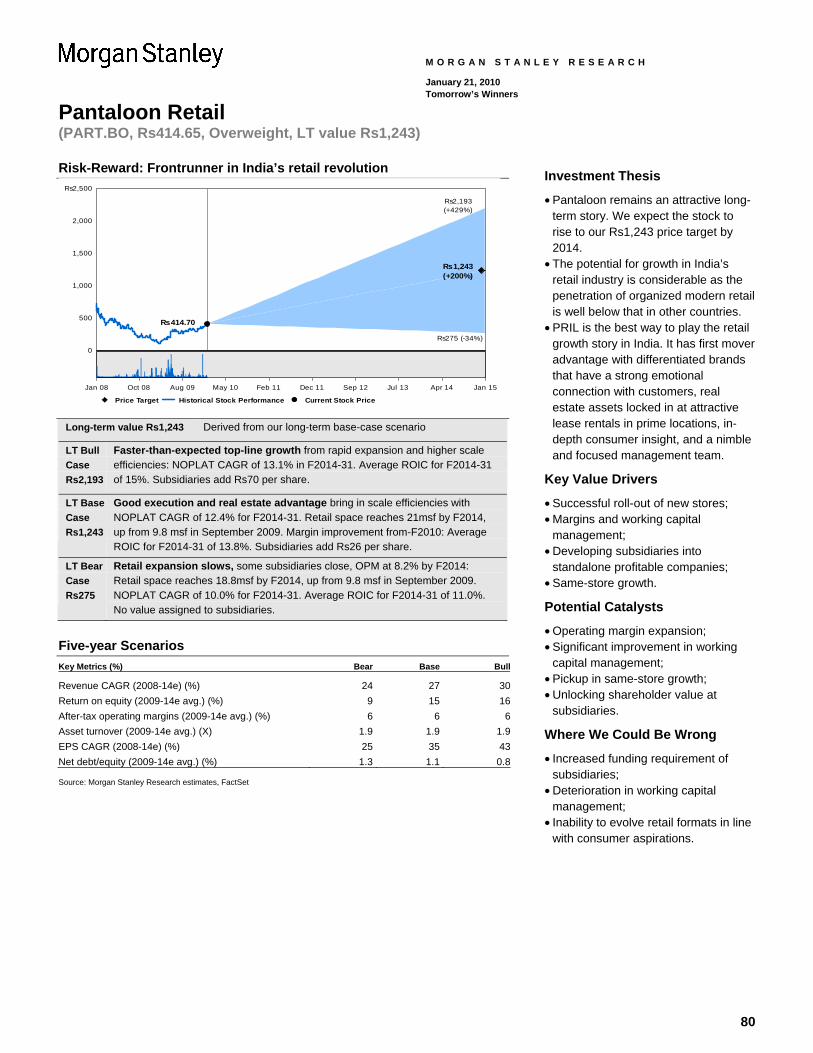
80
Pantaloon Retail (PART.BO, Rs414.65, Overweight, LT value Rs1,243)
M O R G A N S T A N L E Y R E S E A R C H
January 21, 2010 Tomorrow’s Winners
Risk-Reward: Frontrunner in India’s retail revolution
0
500
1,000
1,500
2,000
Rs2,500
Rs2,193(+429%)
Rs1,243(+200%)
Rs275 (-34%)
Rs414.70
Price Target Historical Stock Performance Current Stock Price
Jan 08 Oct 08 Aug 09 May 10 Feb 11 Dec 11 Sep 12 Jul 13 Apr 14 Jan 15
Long-term value Rs1,243 Derived from our long-term base-case scenario
LT Bull Case Rs2,193
Faster-than-expected top-line growth from rapid expansion and higher scale efficiencies: NOPLAT CAGR of 13.1% in F2014-31. Average ROIC for F2014-31 of 15%. Subsidiaries add Rs70 per share.
LT Base Case Rs1,243
Good execution and real estate advantage bring in scale efficiencies with NOPLAT CAGR of 12.4% for F2014-31. Retail space reaches 21msf by F2014, up from 9.8 msf in September 2009. Margin improvement from-F2010: Average ROIC for F2014-31 of 13.8%. Subsidiaries add Rs26 per share.
LT Bear Case Rs275
Retail expansion slows, some subsidiaries close, OPM at 8.2% by F2014: Retail space reaches 18.8msf by F2014, up from 9.8 msf in September 2009. NOPLAT CAGR of 10.0% for F2014-31. Average ROIC for F2014-31 of 11.0%. No value assigned to subsidiaries.
Five-year Scenarios Key Metrics (%) Bear Base Bull
Revenue CAGR (2008-14e) (%) 24 27 30Return on equity (2009-14e avg.) (%) 9 15 16After-tax operating margins (2009-14e avg.) (%) 6 6 6Asset turnover (2009-14e avg.) (X) 1.9 1.9 1.9EPS CAGR (2008-14e) (%) 25 35 43Net debt/equity (2009-14e avg.) (%) 1.3 1.1 0.8 Source: Morgan Stanley Research estimates, FactSet
Investment Thesis
• Pantaloon remains an attractive long-term story. We expect the stock to rise to our Rs1,243 price target by 2014.
• The potential for growth in India’s retail industry is considerable as the penetration of organized modern retail is well below that in other countries.
• PRIL is the best way to play the retail growth story in India. It has first mover advantage with differentiated brands that have a strong emotional connection with customers, real estate assets locked in at attractive lease rentals in prime locations, in-depth consumer insight, and a nimble and focused management team.
Key Value Drivers
• Successful roll-out of new stores; • Margins and working capital
management; • Developing subsidiaries into
standalone profitable companies; • Same-store growth.
Potential Catalysts
• Operating margin expansion; • Significant improvement in working
capital management; • Pickup in same-store growth; • Unlocking shareholder value at
subsidiaries.
Where We Could Be Wrong
• Increased funding requirement of subsidiaries;
• Deterioration in working capital management;
• Inability to evolve retail formats in line with consumer aspirations.
81
Pantaloon Retail (PART.BO, Rs414.65, Overweight, LT value Rs1,243)
M O R G A N S T A N L E Y R E S E A R C H
January 21, 2010 Tomorrow’s Winners
Discounted Cash Flow Free Cash Flow analysis and valuation(Year Ended 30 June) F2007 F2008 F2009 F2010e F2011e F2012e F2013e F2014eEBITDA 2,156 4,605 6,684 8,770 11,332 14,164 17,706 23,017 less Depreciation 369 834 1,401 1,868 2,257 2,749 3,346 3,942 EBIT 1,787 3,771 5,284 6,902 9,075 11,415 14,360 19,075 Tax 314 697 754 1271 1995 2622 3413 4977Other income 32 38 61 64 71 78 86 94Interest 898 1853 3182 3335 3446 4002 4693 4950Marginal tax rate 31% 35% 35% 35% 35% 35% 35% 35%Less Adjusted taxes 583 1,332 1,846 2,416 3,176 3,995 5,026 6,676 NOPLAT 1,205 2,439 3,438 4,486 5,899 7,420 9,334 12,399 Growth YoY 38.8% 102.4% 40.9% 30.5% 31.5% 25.8% 25.8% 32.8%
DCF AssumptionsGrowth rate during F2032-41E 8.0%Growth rate post F2041E 3.0%ROIC during C2032E-41E 12.5%ROIC after C2041E 12.5%WACC 10.5%No. of years in the first period 10
DCF Calculation for PRIL (standalone)Firm Value 280,038 Firm value less debt 229,038 Adjusted Firm Value 242,876 No. of shares (mn) 195.3 Firm value per share for PRIL 1,243
Source: Company data, Morgan Stanley Research. E = Morgan Stanley Research estimates.
Peer Valuation Comparisons Target Share Mkt Cap 09-11 EPS P/B
Company Name Rating Price Price (US$ mn) 2009e 2010e 2011e Growth e 2009 2010e 2011ePART.BO Pantaloon Retail O 422.00 414.70 1,632 41.4 38.1 24.3 54.1% 2.6 11.9 9.6TITN.BO Titan Industries Ltd O 1,746.00 1,517.50 1,490 16.2 30.7 24.9 21.7% 6.3 20.7 16.9SHOP.BO Shoppers Stop Ltd. NC NA 375.30 285 -33.0 50.8 29.0 NA 5.9 17.4 12.3TREN.BO Trent Ltd. NC NA 831.50 356 45.5 292.7 143.8 NA 2.7 125.4 51.6ABRL.BO Aditya Birla Nuvo Ltd. NC NA 941.00 1,939 NA NA NA NA 1.5 13.0 10.7PROV.BO Provogue (India) Ltd. NC NA 65.70 169 25.4 23.0 19.1 NA 0.9 24.9 19.3RYMD.BO Raymond NC NA 233.40 318 68.0 393.7 37.4 NA 1.2 13.8 11.7Source: Morgan Stanley Research estimates. consensus estimates for companies not covered (NC). NM = Not Meaningful.
P/E EV/EBITDA
Note: Share prices in local currency as of January 14, 2010. NA = Not Available
Long-term Valuation Methodology We derive our long-term valuation from a sum-of-the-parts valuation methodology. We value the company’s core standalone earnings by discounting future cash flows and add the estimated value for the current subsidiaries to reach our valuation. We make explicit forecasts for the standalone earnings until F2013 and assume a NOPLAT CAGR of 12.4% for F2014-31.
Risks Downside risks to achieving our long-term value include 1) execution risk; 2) heightened competitive pressure, impairing margins; 3) inability to fund growth; and 4) an unfavorable macro and political environment.

82
Pantaloon Retail (PART.BO, Rs414.65, Overweight, LT value Rs1,243)
M O R G A N S T A N L E Y R E S E A R C H
January 21, 2010 Tomorrow’s Winners
Income Statement Rs mn; Years Ending June 2009 2010e 2011e 2012e 2013e 2014e
Net sales 63,417 82,736 105,902 132,378 165,472 215,114Growth (%) 25.6 30.5 28.0 25.0 25.0 30.0Cost of goods sold 44,300 59,570 76,249 95,312 119,140 154,882Gross profit 19,118 23,166 29,653 37,066 46,332 60,232Margin (%) 30.1 28.0 28.0 28.0 28.0 28.0Employee costs 2,743 3,309 4,236 5,295 6,619 8,605General expense 9,691 11,087 14,085 17,606 22,008 28,610Total operating costs 12,433 14,396 18,321 22,901 28,627 37,215EBITDA 6,684 8,770 11,332 14,164 17,706 23,017Growth (%) 45.2 31.2 29.2 25.0 25.0 30.0Margin (%) 10.5 10.6 10.7 10.7 10.7 10.7Depreciation/ amortization 1,401 1,868 2,257 2,749 3,346 3,942Interest 3,182 3,335 3,446 4,002 4,693 4,950Other income 61 64 71 78 86 94Profit before tax 2,162 3,631 5,700 7,491 9,752 14,219Income tax 754 1,271 1,995 2,622 3,413 4,977Extra ordinary expense -3 0 0 0 0 0Net profit 1,406 2,360 3,705 4,869 6,339 9,242Growth (%) 11.6 67.9 57.0 31.4 30.2 45.8Net profit (adjusted) 1,409 2,360 3,705 4,869 6,339 9,242Net margin (%) 2.2 2.9 3.5 3.7 3.8 4.3Modelware EPS 7.4 11.2 17.5 23.1 30.0 43.8DPS 0.7 1.5 2.0 3.1 4.0 4.0
Balance Sheet Rs mn; Years Ending June 2009 2010e 2011e 2012e 2013e 2014e
Shareholders' funds 22,724 30,406 33,626 37,742 43,110 51,381Share capital 381 422 422 422 422 422Warrants 229 0 0 0 0 0Reserves & surplus 22,115 29,984 33,203 37,320 42,688 50,959Loan funds 28,504 33,249 38,249 44,249 51,000 51,000Deferred tax liabilities 1,161 1,161 1,161 1,161 1,161 1,161Total liabilities 52,389 64,816 73,035 83,152 95,271 103,542Net fixed assets 19,140 22,461 25,180 28,749 33,049 36,752Investments 8,029 8,529 9,029 9,529 10,029 10,529Long term investments 8,029 8,529 9,029 9,529 10,029 10,529Cash and cash equivalents 2,605 3,722 4,446 4,412 4,048 1,966Debtors 1,773 1,813 2,321 2,901 3,627 4,715Inventory 17,878 23,228 27,525 33,273 40,456 47,638Loans & advances 12,026 15,507 18,008 21,315 25,417 29,528Other assets 58 58 58 58 58 58Current assets 31,734 40,607 47,912 57,547 69,558 81,938Sundry creditors 8,914 9,792 12,534 15,668 19,585 25,460Others (incl. provisions) 205 710 998 1,417 1,828 2,183Current liabilities 9,119 10,502 13,532 17,085 21,412 27,643Net current assets 22,616 30,104 34,380 40,462 48,145 54,295Total Assets 52,389 64,816 73,035 83,152 95,271 103,542 e = Morgan Stanley Research estimates. Source: Company data, Morgan Stanley Research
83
Pantaloon Retail (PART.BO, Rs414.65, Overweight, LT value Rs1,243)
M O R G A N S T A N L E Y R E S E A R C H
January 21, 2010 Tomorrow’s Winners
Cash Flow Statement Rs mn; Years Ending June 2009 2010e 2011e 2012e 2013e 2014e
Net income reported 1,406 2,360 3,705 4,869 6,339 9,242Depreciation 1,401 1,868 2,257 2,749 3,346 3,942Chg in Working cap -3,917 -7,489 -4,276 -6,082 -7,683 -6,150
Net decrease in inventories -3,580 -5,350 -4,297 -5,748 -7,182 -7,182Net decrease in debtors -641 -41 -508 -580 -725 -1,088Net decrease in Other Receivables -2,438 -3,482 -2,501 -3,306 -4,103 -4,110Net increase in creditors 2,713 878 2,742 3,134 3,917 5,875Net increase in other liabilities 29 505 288 420 411 355
Change in deferred tax liabilities 483 0 0 0 0 0Cash flow from operations -628 -3,260 1,685 1,537 2,002 7,034Capital expenditure -5,252 -5,190 -4,976 -6,318 -7,645 -7,645Strategic investments -3,675 -500 -500 -500 -500 -500Cash flow from investing -8,927 -5,690 -5,476 -6,818 -8,145 -8,145Equity raised 2,988 5,686 0 0 0 0LT Debt raised 5,338 4,745 5,000 6,000 6,751 0ST debt raised 1,249 0 0 0 0 0Dividend (incl. tax) -135 -364 -486 -753 -971 -971Others Cash flow from financing 9,438 10,067 4,514 5,247 5,780 -971Net chg in cash -118 1,117 724 -34 -364 -2,083Opening cash/ mktable securities 1,211 1,093 2,210 2,934 2,900 2,537Closing cash/ mkitable securities 1,093 2,210 2,934 2,900 2,537 454Change in cash -118 1,117 724 -34 -364 -2,083
Ratio Analysis
(%) 2009 2010e 2011e 2012e 2013e 2014e
Net sales growth 25.6 30.5 28.0 25.0 25.0 30.0EBITDA growth 45.2 31.2 29.2 25.0 25.0 30.0Net profit growth 11.9 67.6 57.0 31.4 30.2 45.8EPS growth 3.0 51.1 57.0 31.4 30.2 45.8 Gross margin 30.1 28.0 28.0 28.0 28.0 28.0Operating margin 10.5 10.6 10.7 10.7 10.7 10.7EBIT margin 8.3 8.3 8.6 8.6 8.7 8.9Net margin 2.2 2.9 3.5 3.7 3.8 4.3 Return on avg equity 6.8 8.9 11.6 13.6 15.7 19.6ROE - Beg period 7.6 10.4 12.2 14.5 16.8 21.4RNOA 7.9 8.3 9.3 10.2 11.1 13.0 Sales/total assets (x) 1.2 1.3 1.5 1.6 1.7 2.1Sales/Net FA (x) 3.3 3.7 4.2 4.6 5.0 5.9 Total debt/equity 1.25 1.09 1.14 1.17 1.18 0.99Net debt/equity 1.21 1.02 1.05 1.10 1.12 0.98e = Morgan Stanley Research estimates. Source: Company data, Morgan Stanley Research
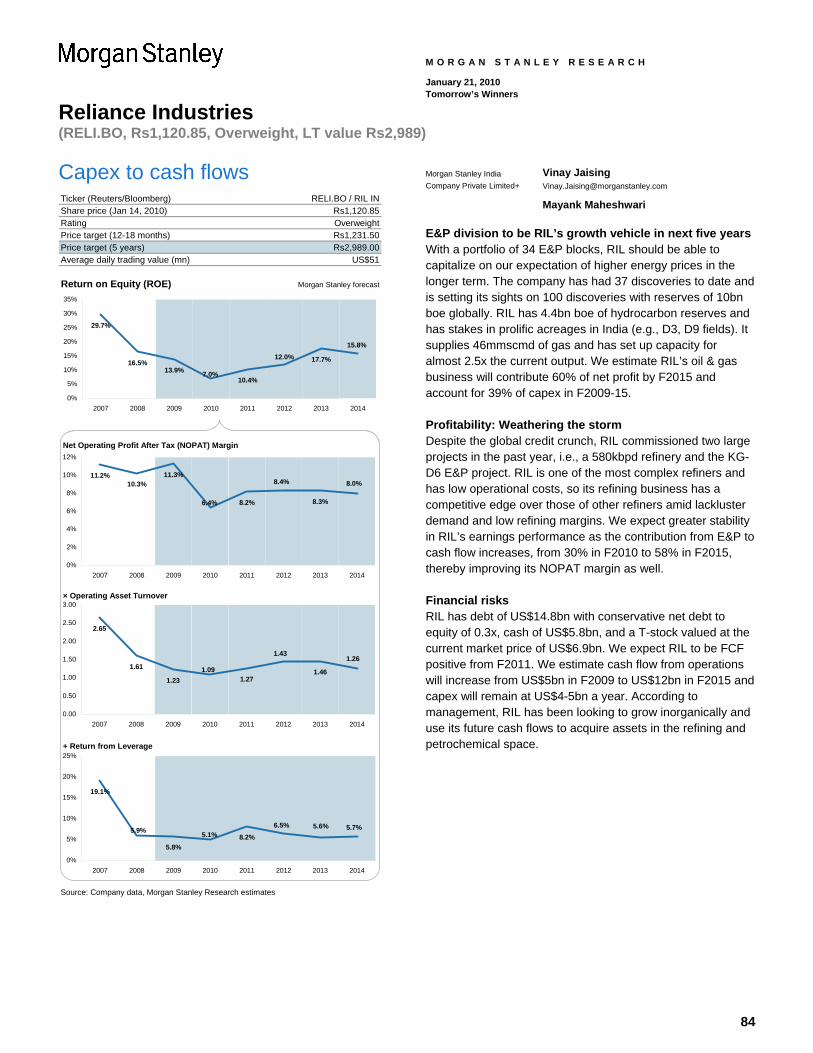
84
Reliance Industries (RELI.BO, Rs1,120.85, Overweight, LT value Rs2,989)
M O R G A N S T A N L E Y R E S E A R C H
January 21, 2010 Tomorrow’s Winners
Capex to cash flows Ticker (Reuters/Bloomberg)Share price (Jan 14, 2010)RatingPrice target (12-18 months)Price target (5 years) Rs2,989.00Average daily trading value (mn)
Return on Equity (ROE) Morgan Stanley forecast
Net Operating Profit After Tax (NOPAT) Margin
× Operating Asset Turnover
+ Return from Leverage
Source: Company data, Morgan Stanley Research estimates
RELI.BO / RIL INRs1,120.85OverweightRs1,231.50
US$51
29.7%
16.5%13.9%
10.4%
17.7%
15.8%12.0%
7.0%
0%
5%
10%
15%
20%
25%
30%
35%
2007 2008 2009 2010 2011 2012 2013 2014
11.2%10.3%
11.3%
8.2% 8.3%6.4%
8.4% 8.0%
0%
2%
4%
6%
8%
10%
12%
2007 2008 2009 2010 2011 2012 2013 2014
2.65
1.61
1.23 1.271.461.09
1.431.26
0.00
0.50
1.00
1.50
2.00
2.50
3.00
2007 2008 2009 2010 2011 2012 2013 2014
19.1%
5.8%8.2%
5.6% 5.7%6.5%5.1%5.9%
0%
5%
10%
15%
20%
25%
2007 2008 2009 2010 2011 2012 2013 2014
Morgan Stanley India Company Private Limited+
Vinay Jaising [email protected]
Mayank Maheshwari
E&P division to be RIL’s growth vehicle in next five years With a portfolio of 34 E&P blocks, RIL should be able to capitalize on our expectation of higher energy prices in the longer term. The company has had 37 discoveries to date and is setting its sights on 100 discoveries with reserves of 10bn boe globally. RIL has 4.4bn boe of hydrocarbon reserves and has stakes in prolific acreages in India (e.g., D3, D9 fields). It supplies 46mmscmd of gas and has set up capacity for almost 2.5x the current output. We estimate RIL’s oil & gas business will contribute 60% of net profit by F2015 and account for 39% of capex in F2009-15.
Profitability: Weathering the storm Despite the global credit crunch, RIL commissioned two large projects in the past year, i.e., a 580kbpd refinery and the KG-D6 E&P project. RIL is one of the most complex refiners and has low operational costs, so its refining business has a competitive edge over those of other refiners amid lackluster demand and low refining margins. We expect greater stability in RIL’s earnings performance as the contribution from E&P to cash flow increases, from 30% in F2010 to 58% in F2015, thereby improving its NOPAT margin as well.
Financial risks RIL has debt of US$14.8bn with conservative net debt to equity of 0.3x, cash of US$5.8bn, and a T-stock valued at the current market price of US$6.9bn. We expect RIL to be FCF positive from F2011. We estimate cash flow from operations will increase from US$5bn in F2009 to US$12bn in F2015 and capex will remain at US$4-5bn a year. According to management, RIL has been looking to grow inorganically and use its future cash flows to acquire assets in the refining and petrochemical space.
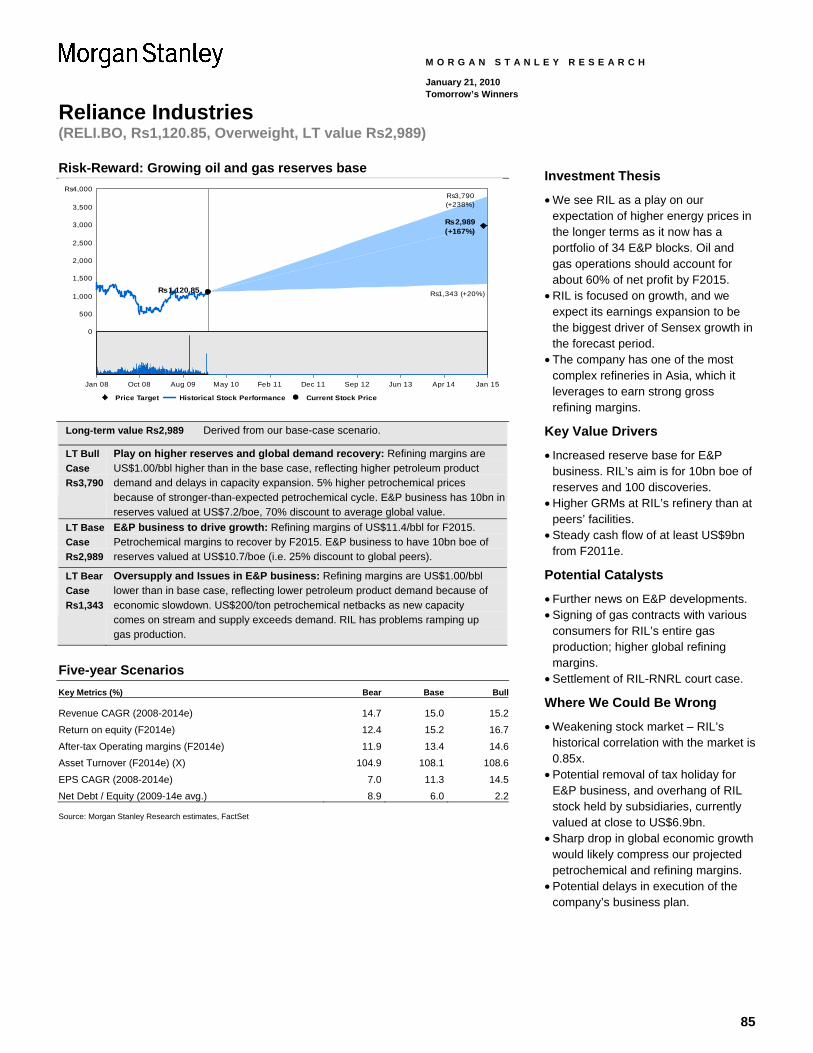
85
Reliance Industries (RELI.BO, Rs1,120.85, Overweight, LT value Rs2,989)
M O R G A N S T A N L E Y R E S E A R C H
January 21, 2010 Tomorrow’s Winners
Risk-Reward: Growing oil and gas reserves base
0
500
1,000
1,500
2,000
2,500
3,000
3,500
Rs4,000Rs3,790(+238%)
Rs2,989(+167%)
Rs1,343 (+20%)Rs1,120.85
Jan 08 Oct 08 Aug 09 May 10 Feb 11 Dec 11 Sep 12 Jun 13 Apr 14 Jan 15
Price Target Historical Stock Performance Current Stock Price
Long-term value Rs2,989 Derived from our base-case scenario.
LT Bull Case Rs3,790
Play on higher reserves and global demand recovery: Refining margins are US$1.00/bbl higher than in the base case, reflecting higher petroleum product demand and delays in capacity expansion. 5% higher petrochemical prices because of stronger-than-expected petrochemical cycle. E&P business has 10bn in reserves valued at US$7.2/boe, 70% discount to average global value.
LT Base Case Rs2,989
E&P business to drive growth: Refining margins of US$11.4/bbl for F2015. Petrochemical margins to recover by F2015. E&P business to have 10bn boe of reserves valued at US$10.7/boe (i.e. 25% discount to global peers).
LT Bear Case Rs1,343
Oversupply and Issues in E&P business: Refining margins are US$1.00/bbl lower than in base case, reflecting lower petroleum product demand because of economic slowdown. US$200/ton petrochemical netbacks as new capacity comes on stream and supply exceeds demand. RIL has problems ramping up gas production.
Five-year Scenarios Key Metrics (%) Bear Base Bull
Revenue CAGR (2008-2014e) 14.7 15.0 15.2
Return on equity (F2014e) 12.4 15.2 16.7
After-tax Operating margins (F2014e) 11.9 13.4 14.6Asset Turnover (F2014e) (X) 104.9 108.1 108.6
EPS CAGR (2008-2014e) 7.0 11.3 14.5Net Debt / Equity (2009-14e avg.) 8.9 6.0 2.2 Source: Morgan Stanley Research estimates, FactSet
Investment Thesis
• We see RIL as a play on our expectation of higher energy prices in the longer terms as it now has a portfolio of 34 E&P blocks. Oil and gas operations should account for about 60% of net profit by F2015.
• RIL is focused on growth, and we expect its earnings expansion to be the biggest driver of Sensex growth in the forecast period.
• The company has one of the most complex refineries in Asia, which it leverages to earn strong gross refining margins.
Key Value Drivers
• Increased reserve base for E&P business. RIL’s aim is for 10bn boe of reserves and 100 discoveries.
• Higher GRMs at RIL’s refinery than at peers’ facilities.
• Steady cash flow of at least US$9bn from F2011e.
Potential Catalysts
• Further news on E&P developments. • Signing of gas contracts with various
consumers for RIL’s entire gas production; higher global refining margins.
• Settlement of RIL-RNRL court case.
Where We Could Be Wrong
• Weakening stock market – RIL’s historical correlation with the market is 0.85x.
• Potential removal of tax holiday for E&P business, and overhang of RIL stock held by subsidiaries, currently valued at close to US$6.9bn.
• Sharp drop in global economic growth would likely compress our projected petrochemical and refining margins.
• Potential delays in execution of the company’s business plan.
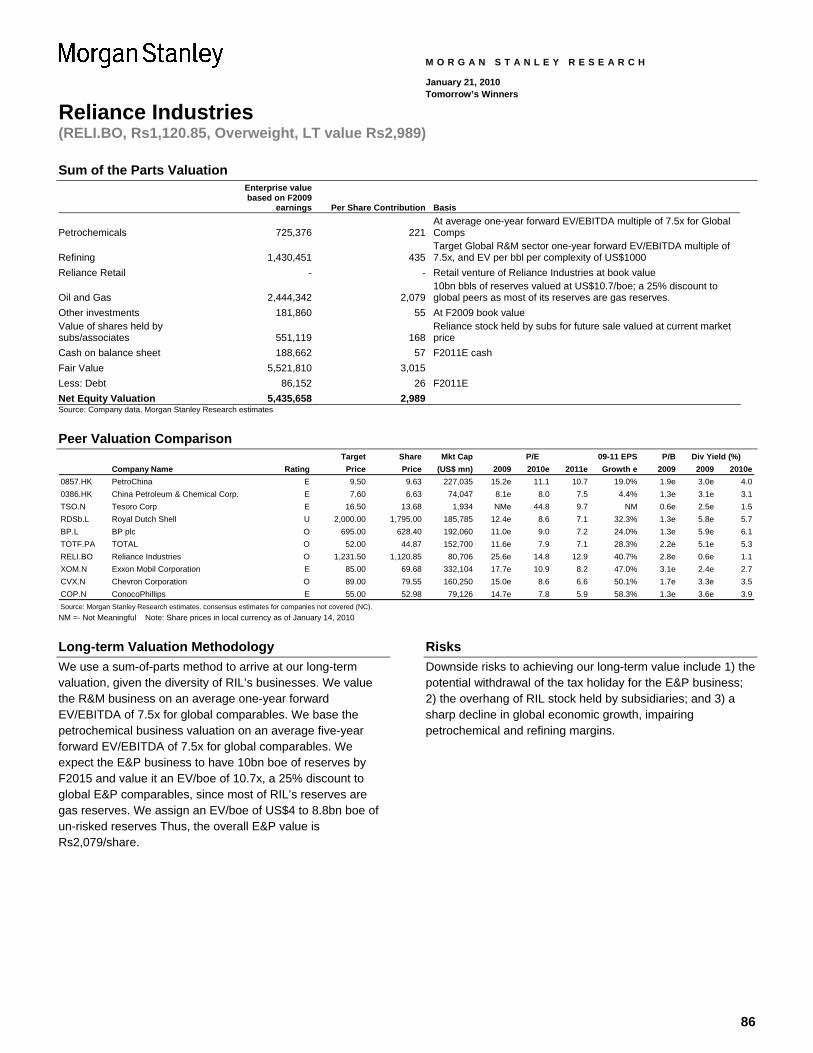
86
Reliance Industries (RELI.BO, Rs1,120.85, Overweight, LT value Rs2,989)
M O R G A N S T A N L E Y R E S E A R C H
January 21, 2010 Tomorrow’s Winners
Sum of the Parts Valuation
Enterprise value based on F2009
earnings Per Share Contribution Basis
Petrochemicals 725,376 221At average one-year forward EV/EBITDA multiple of 7.5x for Global Comps
Refining 1,430,451 435Target Global R&M sector one-year forward EV/EBITDA multiple of 7.5x, and EV per bbl per complexity of US$1000
Reliance Retail - - Retail venture of Reliance Industries at book value
Oil and Gas 2,444,342 2,07910bn bbls of reserves valued at US$10.7/boe; a 25% discount to global peers as most of its reserves are gas reserves.
Other investments 181,860 55 At F2009 book value Value of shares held by subs/associates 551,119 168
Reliance stock held by subs for future sale valued at current market price
Cash on balance sheet 188,662 57 F2011E cash Fair Value 5,521,810 3,015 Less: Debt 86,152 26 F2011E Net Equity Valuation 5,435,658 2,989 Source: Company data, Morgan Stanley Research estimates
Peer Valuation Comparison
Target Share Mkt Cap 09-11 EPS P/BCompany Name Rating Price Price (US$ mn) 2009 2010e 2011e Growth e 2009 2009 2010e
0857.HK PetroChina E 9.50 9.63 227,035 15.2e 11.1 10.7 19.0% 1.9e 3.0e 4.00386.HK China Petroleum & Chemical Corp. E 7.60 6.63 74,047 8.1e 8.0 7.5 4.4% 1.3e 3.1e 3.1TSO.N Tesoro Corp E 16.50 13.68 1,934 NMe 44.8 9.7 NM 0.6e 2.5e 1.5RDSb.L Royal Dutch Shell U 2,000.00 1,795.00 185,785 12.4e 8.6 7.1 32.3% 1.3e 5.8e 5.7BP.L BP plc O 695.00 628.40 192,060 11.0e 9.0 7.2 24.0% 1.3e 5.9e 6.1TOTF.PA TOTAL O 52.00 44.87 152,700 11.6e 7.9 7.1 28.3% 2.2e 5.1e 5.3RELI.BO Reliance Industries O 1,231.50 1,120.85 80,706 25.6e 14.8 12.9 40.7% 2.8e 0.6e 1.1XOM.N Exxon Mobil Corporation E 85.00 69.68 332,104 17.7e 10.9 8.2 47.0% 3.1e 2.4e 2.7CVX.N Chevron Corporation O 89.00 79.55 160,250 15.0e 8.6 6.6 50.1% 1.7e 3.3e 3.5COP.N ConocoPhillips E 55.00 52.98 79,126 14.7e 7.8 5.9 58.3% 1.3e 3.6e 3.9Source: Morgan Stanley Research estimates. consensus estimates for companies not covered (NC).
P/E Div Yield (%)
NM =- Not Meaningful Note: Share prices in local currency as of January 14, 2010
Long-term Valuation Methodology We use a sum-of-parts method to arrive at our long-term valuation, given the diversity of RIL’s businesses. We value the R&M business on an average one-year forward EV/EBITDA of 7.5x for global comparables. We base the petrochemical business valuation on an average five-year forward EV/EBITDA of 7.5x for global comparables. We expect the E&P business to have 10bn boe of reserves by F2015 and value it an EV/boe of 10.7x, a 25% discount to global E&P comparables, since most of RIL’s reserves are gas reserves. We assign an EV/boe of US$4 to 8.8bn boe of un-risked reserves Thus, the overall E&P value is Rs2,079/share.
Risks Downside risks to achieving our long-term value include 1) the potential withdrawal of the tax holiday for the E&P business; 2) the overhang of RIL stock held by subsidiaries; and 3) a sharp decline in global economic growth, impairing petrochemical and refining margins.
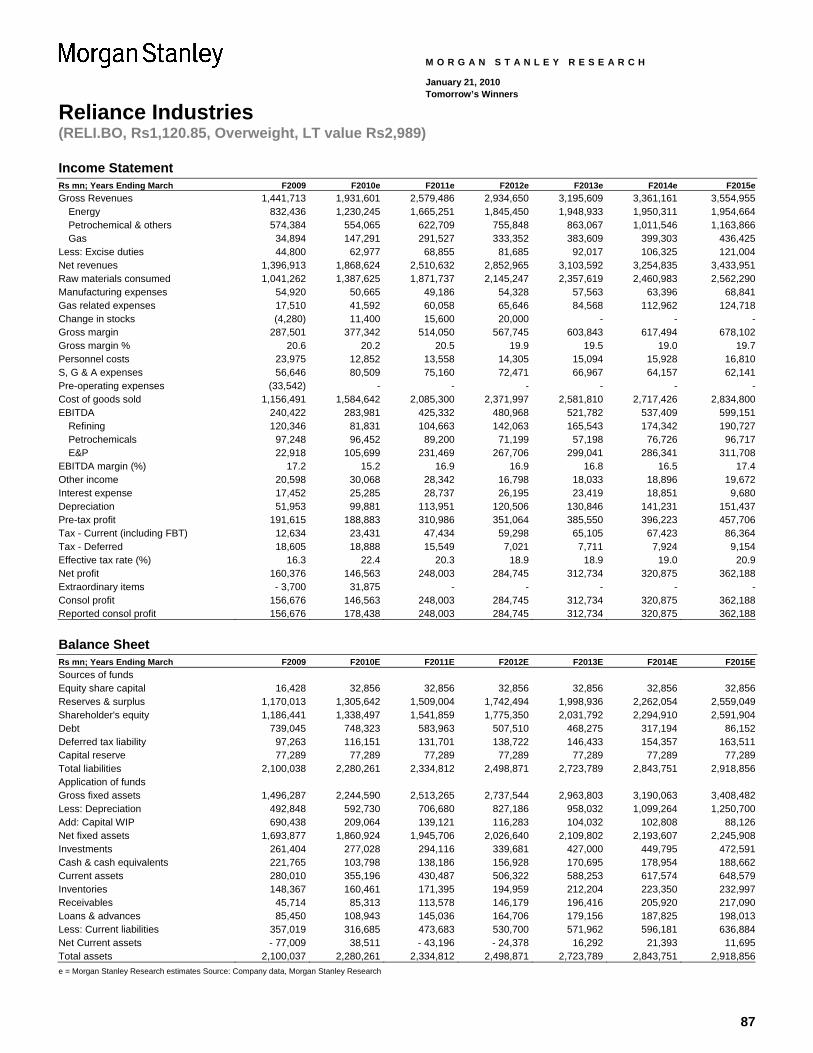
87
Reliance Industries (RELI.BO, Rs1,120.85, Overweight, LT value Rs2,989)
M O R G A N S T A N L E Y R E S E A R C H
January 21, 2010 Tomorrow’s Winners
Income Statement Rs mn; Years Ending March F2009 F2010e F2011e F2012e F2013e F2014e F2015eGross Revenues 1,441,713 1,931,601 2,579,486 2,934,650 3,195,609 3,361,161 3,554,955
Energy 832,436 1,230,245 1,665,251 1,845,450 1,948,933 1,950,311 1,954,664Petrochemical & others 574,384 554,065 622,709 755,848 863,067 1,011,546 1,163,866Gas 34,894 147,291 291,527 333,352 383,609 399,303 436,425
Less: Excise duties 44,800 62,977 68,855 81,685 92,017 106,325 121,004Net revenues 1,396,913 1,868,624 2,510,632 2,852,965 3,103,592 3,254,835 3,433,951Raw materials consumed 1,041,262 1,387,625 1,871,737 2,145,247 2,357,619 2,460,983 2,562,290Manufacturing expenses 54,920 50,665 49,186 54,328 57,563 63,396 68,841Gas related expenses 17,510 41,592 60,058 65,646 84,568 112,962 124,718Change in stocks (4,280) 11,400 15,600 20,000 - - -Gross margin 287,501 377,342 514,050 567,745 603,843 617,494 678,102Gross margin % 20.6 20.2 20.5 19.9 19.5 19.0 19.7Personnel costs 23,975 12,852 13,558 14,305 15,094 15,928 16,810S, G & A expenses 56,646 80,509 75,160 72,471 66,967 64,157 62,141Pre-operating expenses (33,542) - - - - - -Cost of goods sold 1,156,491 1,584,642 2,085,300 2,371,997 2,581,810 2,717,426 2,834,800EBITDA 240,422 283,981 425,332 480,968 521,782 537,409 599,151
Refining 120,346 81,831 104,663 142,063 165,543 174,342 190,727Petrochemicals 97,248 96,452 89,200 71,199 57,198 76,726 96,717E&P 22,918 105,699 231,469 267,706 299,041 286,341 311,708
EBITDA margin (%) 17.2 15.2 16.9 16.9 16.8 16.5 17.4Other income 20,598 30,068 28,342 16,798 18,033 18,896 19,672Interest expense 17,452 25,285 28,737 26,195 23,419 18,851 9,680Depreciation 51,953 99,881 113,951 120,506 130,846 141,231 151,437Pre-tax profit 191,615 188,883 310,986 351,064 385,550 396,223 457,706Tax - Current (including FBT) 12,634 23,431 47,434 59,298 65,105 67,423 86,364Tax - Deferred 18,605 18,888 15,549 7,021 7,711 7,924 9,154Effective tax rate (%) 16.3 22.4 20.3 18.9 18.9 19.0 20.9Net profit 160,376 146,563 248,003 284,745 312,734 320,875 362,188Extraordinary items - 3,700 31,875 - - - - -Consol profit 156,676 146,563 248,003 284,745 312,734 320,875 362,188Reported consol profit 156,676 178,438 248,003 284,745 312,734 320,875 362,188 Balance Sheet Rs mn; Years Ending March F2009 F2010E F2011E F2012E F2013E F2014E F2015ESources of funds Equity share capital 16,428 32,856 32,856 32,856 32,856 32,856 32,856Reserves & surplus 1,170,013 1,305,642 1,509,004 1,742,494 1,998,936 2,262,054 2,559,049Shareholder's equity 1,186,441 1,338,497 1,541,859 1,775,350 2,031,792 2,294,910 2,591,904Debt 739,045 748,323 583,963 507,510 468,275 317,194 86,152Deferred tax liability 97,263 116,151 131,701 138,722 146,433 154,357 163,511Capital reserve 77,289 77,289 77,289 77,289 77,289 77,289 77,289Total liabilities 2,100,038 2,280,261 2,334,812 2,498,871 2,723,789 2,843,751 2,918,856Application of funds Gross fixed assets 1,496,287 2,244,590 2,513,265 2,737,544 2,963,803 3,190,063 3,408,482Less: Depreciation 492,848 592,730 706,680 827,186 958,032 1,099,264 1,250,700Add: Capital WIP 690,438 209,064 139,121 116,283 104,032 102,808 88,126Net fixed assets 1,693,877 1,860,924 1,945,706 2,026,640 2,109,802 2,193,607 2,245,908Investments 261,404 277,028 294,116 339,681 427,000 449,795 472,591Cash & cash equivalents 221,765 103,798 138,186 156,928 170,695 178,954 188,662Current assets 280,010 355,196 430,487 506,322 588,253 617,574 648,579Inventories 148,367 160,461 171,395 194,959 212,204 223,350 232,997Receivables 45,714 85,313 113,578 146,179 196,416 205,920 217,090Loans & advances 85,450 108,943 145,036 164,706 179,156 187,825 198,013Less: Current liabilities 357,019 316,685 473,683 530,700 571,962 596,181 636,884Net Current assets - 77,009 38,511 - 43,196 - 24,378 16,292 21,393 11,695Total assets 2,100,037 2,280,261 2,334,812 2,498,871 2,723,789 2,843,751 2,918,856e = Morgan Stanley Research estimates Source: Company data, Morgan Stanley Research
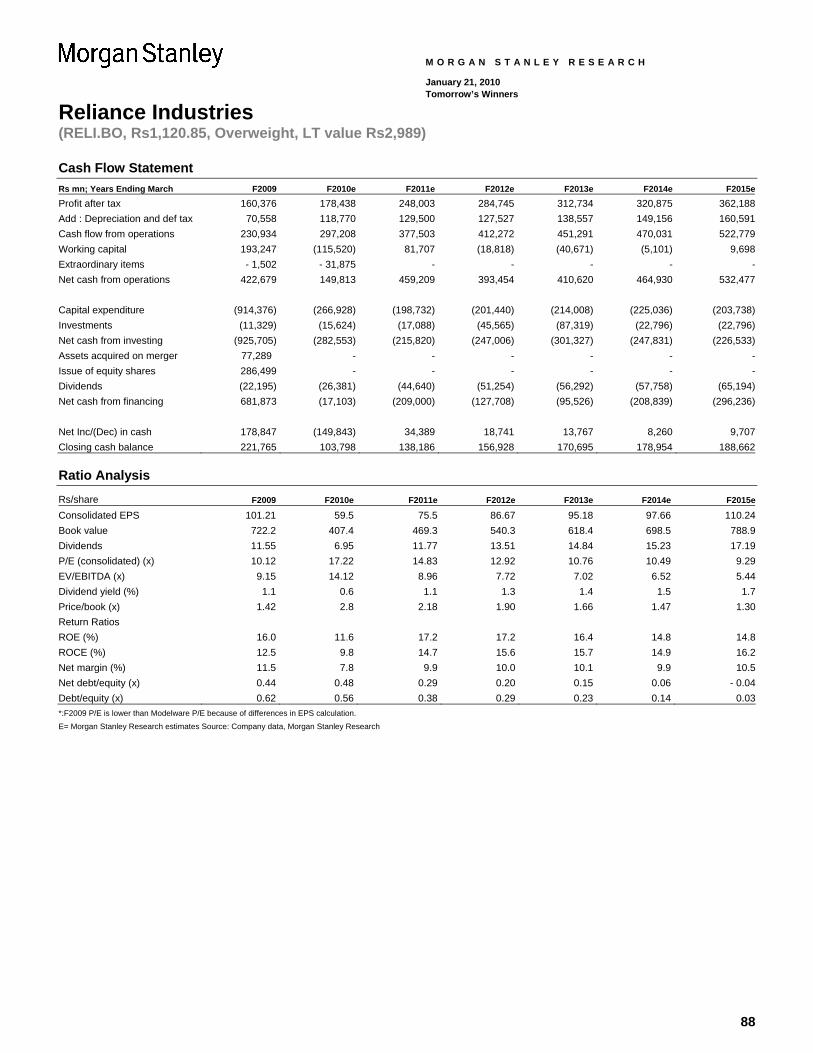
88
Reliance Industries (RELI.BO, Rs1,120.85, Overweight, LT value Rs2,989)
M O R G A N S T A N L E Y R E S E A R C H
January 21, 2010 Tomorrow’s Winners
Cash Flow Statement Rs mn; Years Ending March F2009 F2010e F2011e F2012e F2013e F2014e F2015e
Profit after tax 160,376 178,438 248,003 284,745 312,734 320,875 362,188Add : Depreciation and def tax 70,558 118,770 129,500 127,527 138,557 149,156 160,591Cash flow from operations 230,934 297,208 377,503 412,272 451,291 470,031 522,779Working capital 193,247 (115,520) 81,707 (18,818) (40,671) (5,101) 9,698Extraordinary items - 1,502 - 31,875 - - - - -Net cash from operations 422,679 149,813 459,209 393,454 410,620 464,930 532,477 Capital expenditure (914,376) (266,928) (198,732) (201,440) (214,008) (225,036) (203,738)Investments (11,329) (15,624) (17,088) (45,565) (87,319) (22,796) (22,796)Net cash from investing (925,705) (282,553) (215,820) (247,006) (301,327) (247,831) (226,533)Assets acquired on merger 77,289 - - - - - -Issue of equity shares 286,499 - - - - - -Dividends (22,195) (26,381) (44,640) (51,254) (56,292) (57,758) (65,194)Net cash from financing 681,873 (17,103) (209,000) (127,708) (95,526) (208,839) (296,236) Net Inc/(Dec) in cash 178,847 (149,843) 34,389 18,741 13,767 8,260 9,707Closing cash balance 221,765 103,798 138,186 156,928 170,695 178,954 188,662
Ratio Analysis Rs/share F2009 F2010e F2011e F2012e F2013e F2014e F2015e
Consolidated EPS 101.21 59.5 75.5 86.67 95.18 97.66 110.24Book value 722.2 407.4 469.3 540.3 618.4 698.5 788.9Dividends 11.55 6.95 11.77 13.51 14.84 15.23 17.19P/E (consolidated) (x) 10.12 17.22 14.83 12.92 10.76 10.49 9.29EV/EBITDA (x) 9.15 14.12 8.96 7.72 7.02 6.52 5.44Dividend yield (%) 1.1 0.6 1.1 1.3 1.4 1.5 1.7Price/book (x) 1.42 2.8 2.18 1.90 1.66 1.47 1.30Return Ratios ROE (%) 16.0 11.6 17.2 17.2 16.4 14.8 14.8ROCE (%) 12.5 9.8 14.7 15.6 15.7 14.9 16.2Net margin (%) 11.5 7.8 9.9 10.0 10.1 9.9 10.5Net debt/equity (x) 0.44 0.48 0.29 0.20 0.15 0.06 - 0.04Debt/equity (x) 0.62 0.56 0.38 0.29 0.23 0.14 0.03*:F2009 P/E is lower than Modelware P/E because of differences in EPS calculation. E= Morgan Stanley Research estimates Source: Company data, Morgan Stanley Research
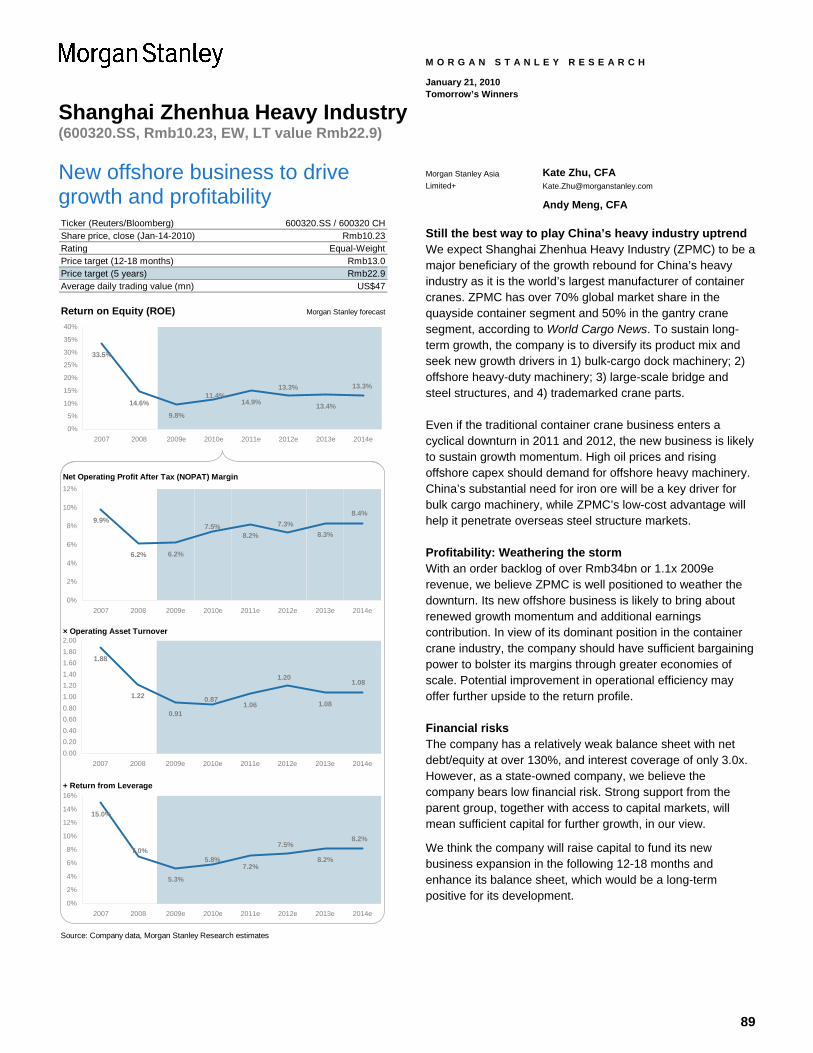
89
Shanghai Zhenhua Heavy Industry (600320.SS, Rmb10.23, EW, LT value Rmb22.9)
M O R G A N S T A N L E Y R E S E A R C H
January 21, 2010 Tomorrow’s Winners
New offshore business to drive growth and profitability Ticker (Reuters/Bloomberg)Share price, close (Jan-14-2010)RatingPrice target (12-18 months)Price target (5 years) Rmb22.9Average daily trading value (mn)
Return on Equity (ROE) Morgan Stanley forecast
Net Operating Profit After Tax (NOPAT) Margin
× Operating Asset Turnover
+ Return from Leverage
Source: Company data, Morgan Stanley Research estimates
600320.SS / 600320 CHRmb10.23
Equal-WeightRmb13.0
US$47
33.5%
14.6%
9.8%
14.9% 13.4%
13.3%13.3%11.4%
0%
5%
10%
15%
20%
25%
30%
35%
40%
2007 2008 2009e 2010e 2011e 2012e 2013e 2014e
9.9%
6.2% 6.2%
8.2% 8.3%7.5% 7.3%
8.4%
0%
2%
4%
6%
8%
10%
12%
2007 2008 2009e 2010e 2011e 2012e 2013e 2014e
1.88
1.22
0.911.06 1.080.87
1.201.08
0.000.200.400.600.801.001.201.401.601.802.00
2007 2008 2009e 2010e 2011e 2012e 2013e 2014e
15.0%
5.3%
7.2%8.2%
8.2%7.5%
5.8%7.0%
0%
2%
4%
6%
8%
10%
12%
14%
16%
2007 2008 2009e 2010e 2011e 2012e 2013e 2014e
Morgan Stanley Asia Limited+
Kate Zhu, CFA [email protected]
Andy Meng, CFA
Still the best way to play China’s heavy industry uptrend We expect Shanghai Zhenhua Heavy Industry (ZPMC) to be a major beneficiary of the growth rebound for China’s heavy industry as it is the world’s largest manufacturer of container cranes. ZPMC has over 70% global market share in the quayside container segment and 50% in the gantry crane segment, according to World Cargo News. To sustain long-term growth, the company is to diversify its product mix and seek new growth drivers in 1) bulk-cargo dock machinery; 2) offshore heavy-duty machinery; 3) large-scale bridge and steel structures, and 4) trademarked crane parts.
Even if the traditional container crane business enters a cyclical downturn in 2011 and 2012, the new business is likely to sustain growth momentum. High oil prices and rising offshore capex should demand for offshore heavy machinery. China’s substantial need for iron ore will be a key driver for bulk cargo machinery, while ZPMC’s low-cost advantage will help it penetrate overseas steel structure markets.
Profitability: Weathering the storm With an order backlog of over Rmb34bn or 1.1x 2009e revenue, we believe ZPMC is well positioned to weather the downturn. Its new offshore business is likely to bring about renewed growth momentum and additional earnings contribution. In view of its dominant position in the container crane industry, the company should have sufficient bargaining power to bolster its margins through greater economies of scale. Potential improvement in operational efficiency may offer further upside to the return profile.
Financial risks The company has a relatively weak balance sheet with net debt/equity at over 130%, and interest coverage of only 3.0x. However, as a state-owned company, we believe the company bears low financial risk. Strong support from the parent group, together with access to capital markets, will mean sufficient capital for further growth, in our view.
We think the company will raise capital to fund its new business expansion in the following 12-18 months and enhance its balance sheet, which would be a long-term positive for its development.
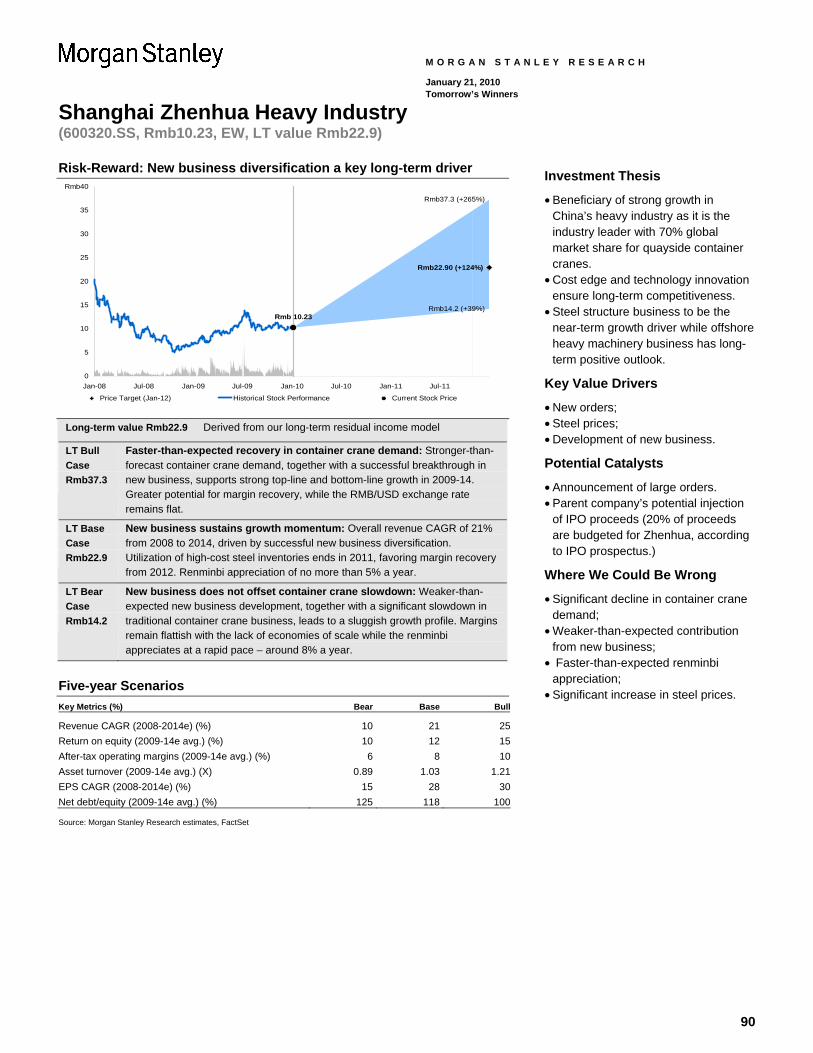
90
Shanghai Zhenhua Heavy Industry (600320.SS, Rmb10.23, EW, LT value Rmb22.9)
M O R G A N S T A N L E Y R E S E A R C H
January 21, 2010 Tomorrow’s Winners
Risk-Reward: New business diversification a key long-term driver
WARNINGDONOTEDIT_RRS4RL~600320.SS~
Rmb22.90 (+124%)
Rmb 10.23Rmb14.2 (+39%)
Rmb37.3 (+265%)
0
5
10
15
20
25
30
35
40
Jan-08 Jul-08 Jan-09 Jul-09 Jan-10 Jul-10 Jan-11 Jul-11
Rmb
Price Target (Jan-12) Historical Stock Performance Current Stock Price
Long-term value Rmb22.9 Derived from our long-term residual income model
LT Bull Case Rmb37.3
Faster-than-expected recovery in container crane demand: Stronger-than-forecast container crane demand, together with a successful breakthrough in new business, supports strong top-line and bottom-line growth in 2009-14. Greater potential for margin recovery, while the RMB/USD exchange rate remains flat.
LT Base Case Rmb22.9
New business sustains growth momentum: Overall revenue CAGR of 21% from 2008 to 2014, driven by successful new business diversification. Utilization of high-cost steel inventories ends in 2011, favoring margin recovery from 2012. Renminbi appreciation of no more than 5% a year.
LT Bear Case Rmb14.2
New business does not offset container crane slowdown: Weaker-than-expected new business development, together with a significant slowdown in traditional container crane business, leads to a sluggish growth profile. Margins remain flattish with the lack of economies of scale while the renminbi appreciates at a rapid pace – around 8% a year.
Five-year Scenarios Key Metrics (%) Bear Base Bull
Revenue CAGR (2008-2014e) (%) 10 21 25Return on equity (2009-14e avg.) (%) 10 12 15After-tax operating margins (2009-14e avg.) (%) 6 8 10Asset turnover (2009-14e avg.) (X) 0.89 1.03 1.21EPS CAGR (2008-2014e) (%) 15 28 30Net debt/equity (2009-14e avg.) (%) 125 118 100 Source: Morgan Stanley Research estimates, FactSet
Investment Thesis
• Beneficiary of strong growth in China’s heavy industry as it is the industry leader with 70% global market share for quayside container cranes.
• Cost edge and technology innovation ensure long-term competitiveness.
• Steel structure business to be the near-term growth driver while offshore heavy machinery business has long-term positive outlook.
Key Value Drivers
• New orders; • Steel prices; • Development of new business.
Potential Catalysts
• Announcement of large orders. • Parent company’s potential injection
of IPO proceeds (20% of proceeds are budgeted for Zhenhua, according to IPO prospectus.)
Where We Could Be Wrong
• Significant decline in container crane demand;
• Weaker-than-expected contribution from new business;
• Faster-than-expected renminbi appreciation;
• Significant increase in steel prices.
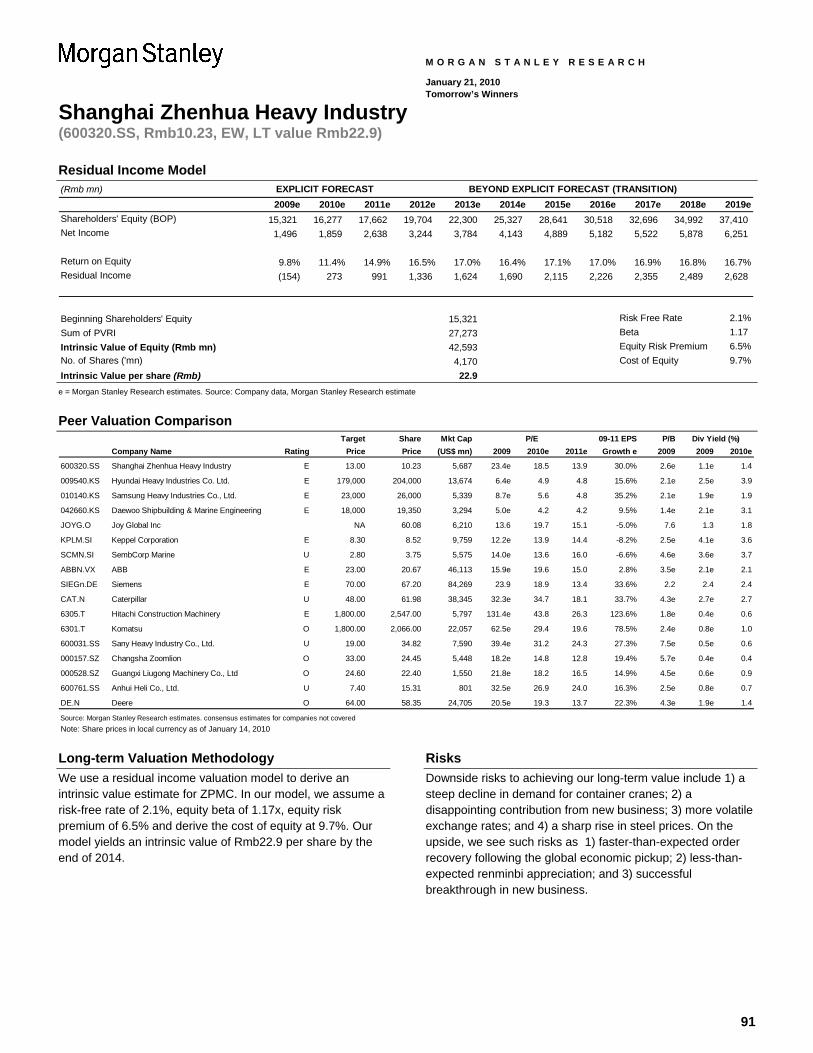
91
Shanghai Zhenhua Heavy Industry (600320.SS, Rmb10.23, EW, LT value Rmb22.9)
M O R G A N S T A N L E Y R E S E A R C H
January 21, 2010 Tomorrow’s Winners
Residual Income Model (Rmb mn)
2009e 2010e 2011e 2012e 2013e 2014e 2015e 2016e 2017e 2018e 2019eShareholders' Equity (BOP) 15,321 16,277 17,662 19,704 22,300 25,327 28,641 30,518 32,696 34,992 37,410 Net Income 1,496 1,859 2,638 3,244 3,784 4,143 4,889 5,182 5,522 5,878 6,251
Return on Equity 9.8% 11.4% 14.9% 16.5% 17.0% 16.4% 17.1% 17.0% 16.9% 16.8% 16.7%Residual Income (154) 273 991 1,336 1,624 1,690 2,115 2,226 2,355 2,489 2,628
Beginning Shareholders' Equity 15,321 Risk Free Rate 2.1%Sum of PVRI 27,273 Beta 1.17 Intrinsic Value of Equity (Rmb mn) 42,593 Equity Risk Premium 6.5%No. of Shares ('mn) 4,170 Cost of Equity 9.7%Intrinsic Value per share (Rmb) 22.9
EXPLICIT FORECAST BEYOND EXPLICIT FORECAST (TRANSITION)
e = Morgan Stanley Research estimates. Source: Company data, Morgan Stanley Research estimate
Peer Valuation Comparison
Target Share Mkt Cap 09-11 EPS P/BCompany Name Rating Price Price (US$ mn) 2009 2010e 2011e Growth e 2009 2009 2010e
600320.SS Shanghai Zhenhua Heavy Industry E 13.00 10.23 5,687 23.4e 18.5 13.9 30.0% 2.6e 1.1e 1.4
009540.KS Hyundai Heavy Industries Co. Ltd. E 179,000 204,000 13,674 6.4e 4.9 4.8 15.6% 2.1e 2.5e 3.9
010140.KS Samsung Heavy Industries Co., Ltd. E 23,000 26,000 5,339 8.7e 5.6 4.8 35.2% 2.1e 1.9e 1.9
042660.KS Daewoo Shipbuilding & Marine Engineering E 18,000 19,350 3,294 5.0e 4.2 4.2 9.5% 1.4e 2.1e 3.1
JOYG.O Joy Global Inc NA 60.08 6,210 13.6 19.7 15.1 -5.0% 7.6 1.3 1.8
KPLM.SI Keppel Corporation E 8.30 8.52 9,759 12.2e 13.9 14.4 -8.2% 2.5e 4.1e 3.6
SCMN.SI SembCorp Marine U 2.80 3.75 5,575 14.0e 13.6 16.0 -6.6% 4.6e 3.6e 3.7
ABBN.VX ABB E 23.00 20.67 46,113 15.9e 19.6 15.0 2.8% 3.5e 2.1e 2.1
SIEGn.DE Siemens E 70.00 67.20 84,269 23.9 18.9 13.4 33.6% 2.2 2.4 2.4
CAT.N Caterpillar U 48.00 61.98 38,345 32.3e 34.7 18.1 33.7% 4.3e 2.7e 2.7
6305.T Hitachi Construction Machinery E 1,800.00 2,547.00 5,797 131.4e 43.8 26.3 123.6% 1.8e 0.4e 0.6
6301.T Komatsu O 1,800.00 2,066.00 22,057 62.5e 29.4 19.6 78.5% 2.4e 0.8e 1.0
600031.SS Sany Heavy Industry Co., Ltd. U 19.00 34.82 7,590 39.4e 31.2 24.3 27.3% 7.5e 0.5e 0.6
000157.SZ Changsha Zoomlion O 33.00 24.45 5,448 18.2e 14.8 12.8 19.4% 5.7e 0.4e 0.4
000528.SZ Guangxi Liugong Machinery Co., Ltd O 24.60 22.40 1,550 21.8e 18.2 16.5 14.9% 4.5e 0.6e 0.9
600761.SS Anhui Heli Co., Ltd. U 7.40 15.31 801 32.5e 26.9 24.0 16.3% 2.5e 0.8e 0.7
DE.N Deere O 64.00 58.35 24,705 20.5e 19.3 13.7 22.3% 4.3e 1.9e 1.4
Source: Morgan Stanley Research estimates. consensus estimates for companies not covered
P/E Div Yield (%)
Note: Share prices in local currency as of January 14, 2010 Long-term Valuation Methodology We use a residual income valuation model to derive an intrinsic value estimate for ZPMC. In our model, we assume a risk-free rate of 2.1%, equity beta of 1.17x, equity risk premium of 6.5% and derive the cost of equity at 9.7%. Our model yields an intrinsic value of Rmb22.9 per share by the end of 2014.
Risks Downside risks to achieving our long-term value include 1) a steep decline in demand for container cranes; 2) a disappointing contribution from new business; 3) more volatile exchange rates; and 4) a sharp rise in steel prices. On the upside, we see such risks as 1) faster-than-expected order recovery following the global economic pickup; 2) less-than-expected renminbi appreciation; and 3) successful breakthrough in new business.
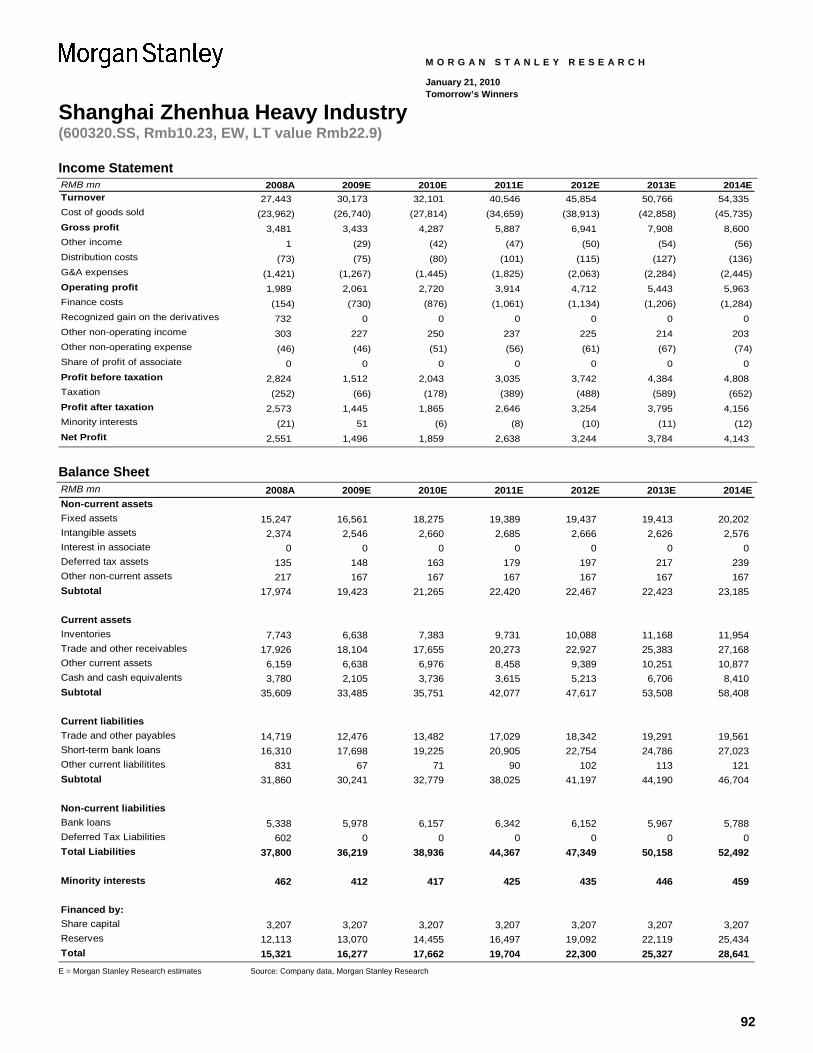
92
Shanghai Zhenhua Heavy Industry (600320.SS, Rmb10.23, EW, LT value Rmb22.9)
M O R G A N S T A N L E Y R E S E A R C H
January 21, 2010 Tomorrow’s Winners
Income Statement RMB mn 2008A 2009E 2010E 2011E 2012E 2013E 2014ETurnover 27,443 30,173 32,101 40,546 45,854 50,766 54,335Cost of goods sold (23,962) (26,740) (27,814) (34,659) (38,913) (42,858) (45,735)Gross profit 3,481 3,433 4,287 5,887 6,941 7,908 8,600 Other income 1 (29) (42) (47) (50) (54) (56)Distribution costs (73) (75) (80) (101) (115) (127) (136)G&A expenses (1,421) (1,267) (1,445) (1,825) (2,063) (2,284) (2,445)Operating profit 1,989 2,061 2,720 3,914 4,712 5,443 5,963Finance costs (154) (730) (876) (1,061) (1,134) (1,206) (1,284)Recognized gain on the derivatives 732 0 0 0 0 0 0Other non-operating income 303 227 250 237 225 214 203Other non-operating expense (46) (46) (51) (56) (61) (67) (74)Share of profit of associate 0 0 0 0 0 0 0Profit before taxation 2,824 1,512 2,043 3,035 3,742 4,384 4,808Taxation (252) (66) (178) (389) (488) (589) (652)Profit after taxation 2,573 1,445 1,865 2,646 3,254 3,795 4,156Minority interests (21) 51 (6) (8) (10) (11) (12)Net Profit 2,551 1,496 1,859 2,638 3,244 3,784 4,143
Balance Sheet RMB mn 2008A 2009E 2010E 2011E 2012E 2013E 2014ENon-current assetsFixed assets 15,247 16,561 18,275 19,389 19,437 19,413 20,202Intangible assets 2,374 2,546 2,660 2,685 2,666 2,626 2,576Interest in associate 0 0 0 0 0 0 0Deferred tax assets 135 148 163 179 197 217 239Other non-current assets 217 167 167 167 167 167 167Subtotal 17,974 19,423 21,265 22,420 22,467 22,423 23,185
Current assetsInventories 7,743 6,638 7,383 9,731 10,088 11,168 11,954Trade and other receivables 17,926 18,104 17,655 20,273 22,927 25,383 27,168Other current assets 6,159 6,638 6,976 8,458 9,389 10,251 10,877Cash and cash equivalents 3,780 2,105 3,736 3,615 5,213 6,706 8,410Subtotal 35,609 33,485 35,751 42,077 47,617 53,508 58,408
Current liabilitiesTrade and other payables 14,719 12,476 13,482 17,029 18,342 19,291 19,561Short-term bank loans 16,310 17,698 19,225 20,905 22,754 24,786 27,023Other current liabilitites 831 67 71 90 102 113 121Subtotal 31,860 30,241 32,779 38,025 41,197 44,190 46,704
Non-current liabilitiesBank loans 5,338 5,978 6,157 6,342 6,152 5,967 5,788Deferred Tax Liabilities 602 0 0 0 0 0 0Total Liabilities 37,800 36,219 38,936 44,367 47,349 50,158 52,492
Minority interests 462 412 417 425 435 446 459
Financed by:Share capital 3,207 3,207 3,207 3,207 3,207 3,207 3,207Reserves 12,113 13,070 14,455 16,497 19,092 22,119 25,434Total 15,321 16,277 17,662 19,704 22,300 25,327 28,641
E = Morgan Stanley Research estimates Source: Company data, Morgan Stanley Research
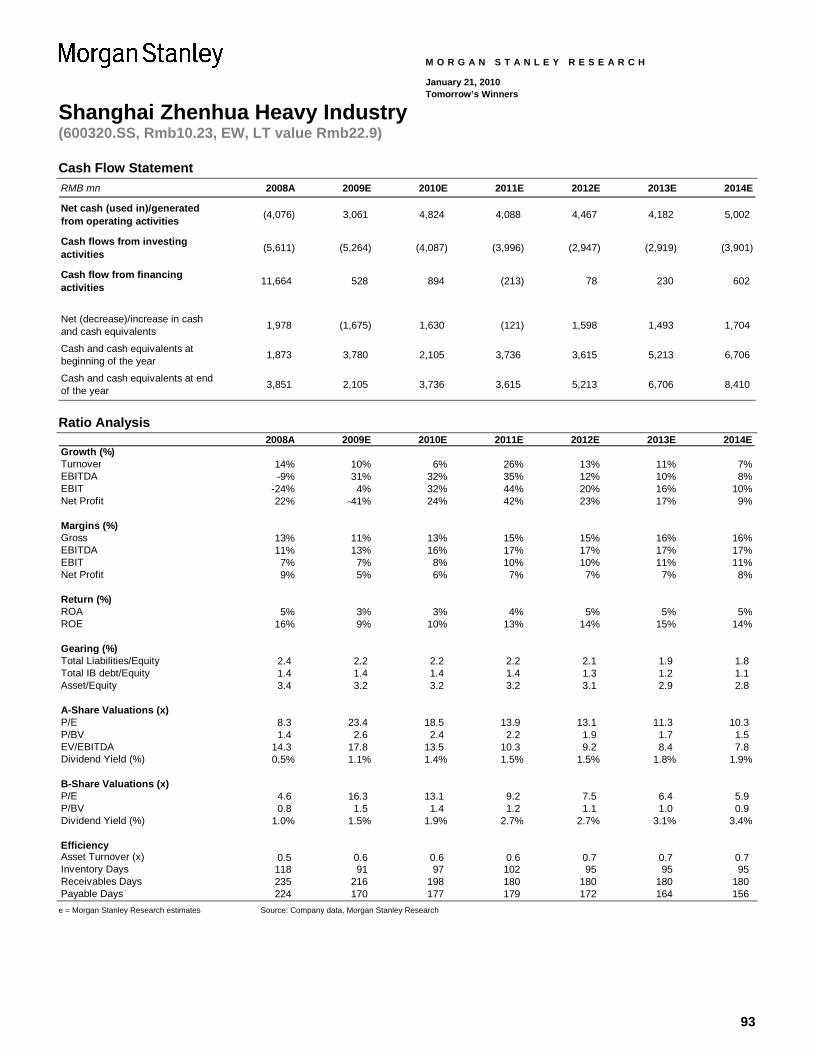
93
Shanghai Zhenhua Heavy Industry (600320.SS, Rmb10.23, EW, LT value Rmb22.9)
M O R G A N S T A N L E Y R E S E A R C H
January 21, 2010 Tomorrow’s Winners
Cash Flow Statement RMB mn 2008A 2009E 2010E 2011E 2012E 2013E 2014E
Net cash (used in)/generated from operating activities (4,076) 3,061 4,824 4,088 4,467 4,182 5,002
Cash flows from investing activities (5,611) (5,264) (4,087) (3,996) (2,947) (2,919) (3,901)
Cash flow from financing activities 11,664 528 894 (213) 78 230 602
Net (decrease)/increase in cash and cash equivalents 1,978 (1,675) 1,630 (121) 1,598 1,493 1,704
Cash and cash equivalents at beginning of the year 1,873 3,780 2,105 3,736 3,615 5,213 6,706
Cash and cash equivalents at end of the year 3,851 2,105 3,736 3,615 5,213 6,706 8,410
Ratio Analysis 2008A 2009E 2010E 2011E 2012E 2013E 2014E
Growth (%)Turnover 14% 10% 6% 26% 13% 11% 7%EBITDA -9% 31% 32% 35% 12% 10% 8%EBIT -24% 4% 32% 44% 20% 16% 10%Net Profit 22% -41% 24% 42% 23% 17% 9%
Margins (%)Gross 13% 11% 13% 15% 15% 16% 16%EBITDA 11% 13% 16% 17% 17% 17% 17%EBIT 7% 7% 8% 10% 10% 11% 11%Net Profit 9% 5% 6% 7% 7% 7% 8%
Return (%)ROA 5% 3% 3% 4% 5% 5% 5%ROE 16% 9% 10% 13% 14% 15% 14%
Gearing (%)Total Liabilities/Equity 2.4 2.2 2.2 2.2 2.1 1.9 1.8Total IB debt/Equity 1.4 1.4 1.4 1.4 1.3 1.2 1.1Asset/Equity 3.4 3.2 3.2 3.2 3.1 2.9 2.8
A-Share Valuations (x)P/E 8.3 23.4 18.5 13.9 13.1 11.3 10.3P/BV 1.4 2.6 2.4 2.2 1.9 1.7 1.5EV/EBITDA 14.3 17.8 13.5 10.3 9.2 8.4 7.8Dividend Yield (%) 0.5% 1.1% 1.4% 1.5% 1.5% 1.8% 1.9%
B-Share Valuations (x)P/E 4.6 16.3 13.1 9.2 7.5 6.4 5.9P/BV 0.8 1.5 1.4 1.2 1.1 1.0 0.9Dividend Yield (%) 1.0% 1.5% 1.9% 2.7% 2.7% 3.1% 3.4%
EfficiencyAsset Turnover (x) 0.5 0.6 0.6 0.6 0.7 0.7 0.7Inventory Days 118 91 97 102 95 95 95Receivables Days 235 216 198 180 180 180 180Payable Days 224 170 177 179 172 164 156
e = Morgan Stanley Research estimates Source: Company data, Morgan Stanley Research
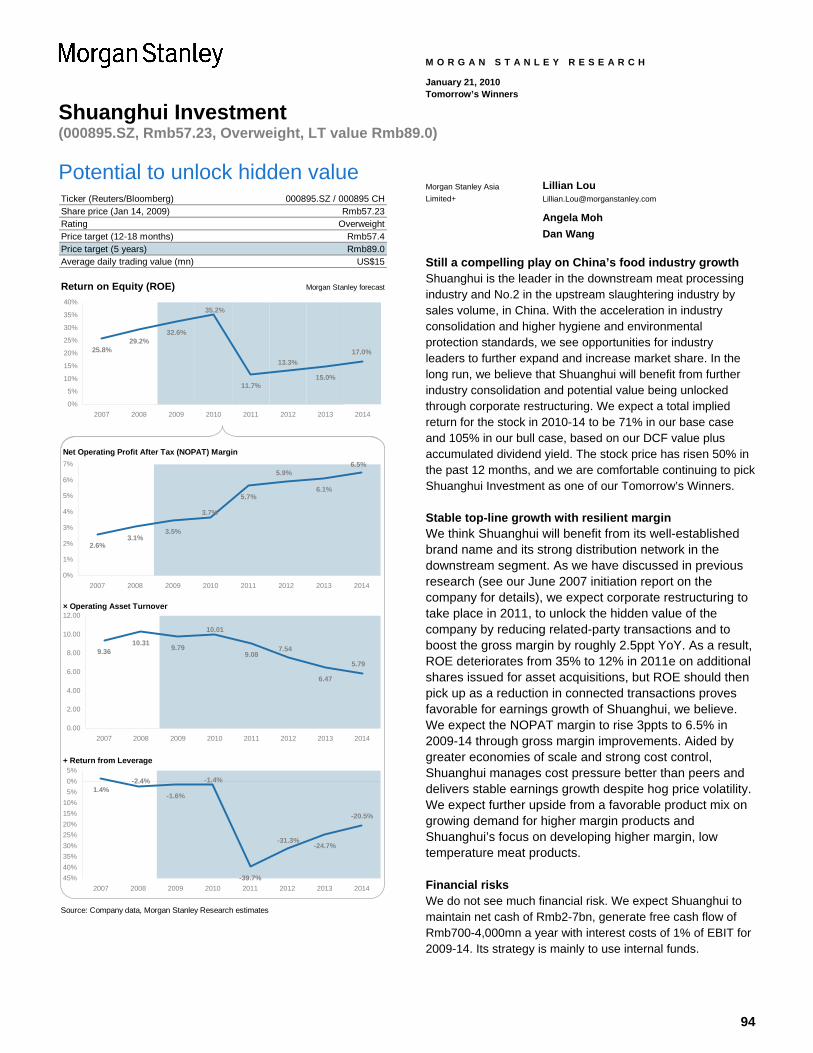
94
Shuanghui Investment (000895.SZ, Rmb57.23, Overweight, LT value Rmb89.0)
M O R G A N S T A N L E Y R E S E A R C H
January 21, 2010 Tomorrow’s Winners
Potential to unlock hidden value Ticker (Reuters/Bloomberg)Share price (Jan 14, 2009)RatingPrice target (12-18 months)Price target (5 years) Rmb89.0Average daily trading value (mn)
Return on Equity (ROE) Morgan Stanley forecast
Net Operating Profit After Tax (NOPAT) Margin
× Operating Asset Turnover
+ Return from Leverage
Source: Company data, Morgan Stanley Research estimates
000895.SZ / 000895 CHRmb57.23
OverweightRmb57.4
US$15
25.8%29.2%
32.6%
11.7%15.0%
17.0%13.3%
35.2%
0%
5%
10%
15%
20%
25%
30%
35%
40%
2007 2008 2009 2010 2011 2012 2013 2014
2.6%3.1%
3.5%
5.7%6.1%
3.7%
5.9%6.5%
0%
1%
2%
3%
4%
5%
6%
7%
2007 2008 2009 2010 2011 2012 2013 2014
9.3610.31 9.79
9.08
6.47
10.01
7.54
5.79
0.00
2.00
4.00
6.00
8.00
10.00
12.00
2007 2008 2009 2010 2011 2012 2013 2014
1.4%-1.6%
-39.7%
-24.7%
-20.5%
-31.3%
-1.4%-2.4%
45%40%35%30%25%20%15%10%5%0%5%
2007 2008 2009 2010 2011 2012 2013 2014
Morgan Stanley Asia Limited+
Lillian Lou [email protected]
Angela Moh Dan Wang
Still a compelling play on China’s food industry growth Shuanghui is the leader in the downstream meat processing industry and No.2 in the upstream slaughtering industry by sales volume, in China. With the acceleration in industry consolidation and higher hygiene and environmental protection standards, we see opportunities for industry leaders to further expand and increase market share. In the long run, we believe that Shuanghui will benefit from further industry consolidation and potential value being unlocked through corporate restructuring. We expect a total implied return for the stock in 2010-14 to be 71% in our base case and 105% in our bull case, based on our DCF value plus accumulated dividend yield. The stock price has risen 50% in the past 12 months, and we are comfortable continuing to pick Shuanghui Investment as one of our Tomorrow’s Winners.
Stable top-line growth with resilient margin We think Shuanghui will benefit from its well-established brand name and its strong distribution network in the downstream segment. As we have discussed in previous research (see our June 2007 initiation report on the company for details), we expect corporate restructuring to take place in 2011, to unlock the hidden value of the company by reducing related-party transactions and to boost the gross margin by roughly 2.5ppt YoY. As a result, ROE deteriorates from 35% to 12% in 2011e on additional shares issued for asset acquisitions, but ROE should then pick up as a reduction in connected transactions proves favorable for earnings growth of Shuanghui, we believe. We expect the NOPAT margin to rise 3ppts to 6.5% in 2009-14 through gross margin improvements. Aided by greater economies of scale and strong cost control, Shuanghui manages cost pressure better than peers and delivers stable earnings growth despite hog price volatility. We expect further upside from a favorable product mix on growing demand for higher margin products and Shuanghui’s focus on developing higher margin, low temperature meat products.
Financial risks We do not see much financial risk. We expect Shuanghui to maintain net cash of Rmb2-7bn, generate free cash flow of Rmb700-4,000mn a year with interest costs of 1% of EBIT for 2009-14. Its strategy is mainly to use internal funds.
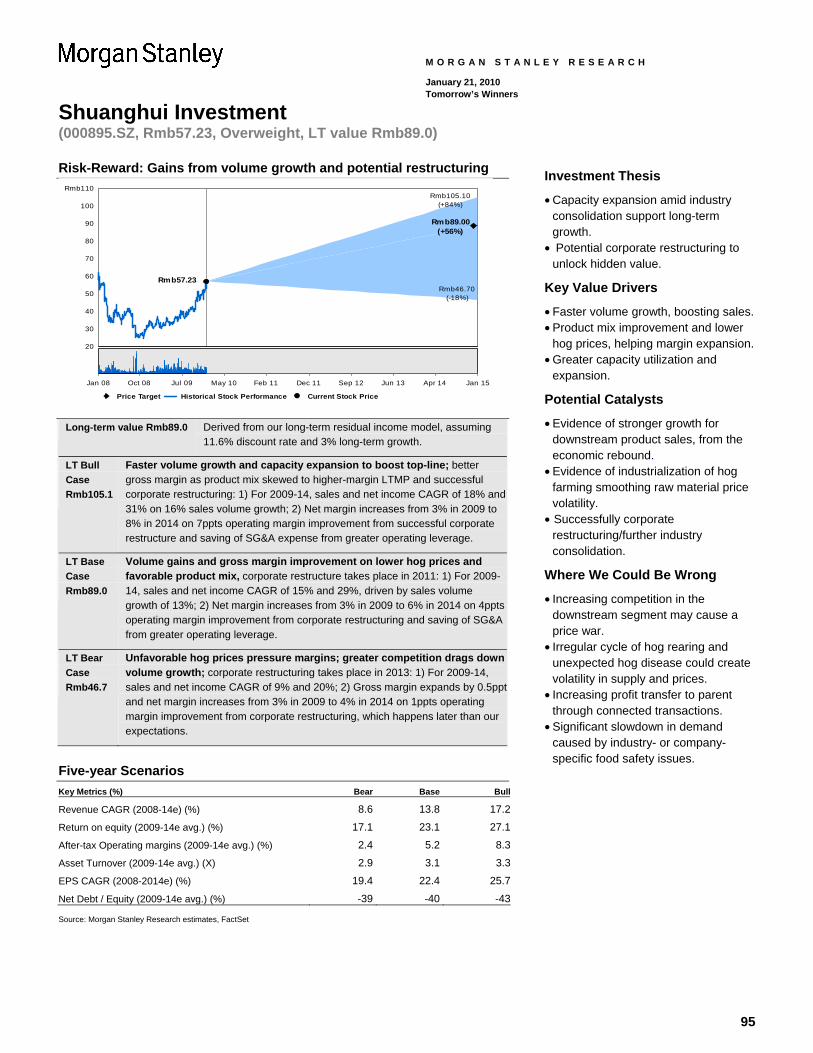
95
Shuanghui Investment (000895.SZ, Rmb57.23, Overweight, LT value Rmb89.0)
M O R G A N S T A N L E Y R E S E A R C H
January 21, 2010 Tomorrow’s Winners
Risk-Reward: Gains from volume growth and potential restructuring
20
30
40
50
60
70
80
90
100
Rmb110Rmb105.10
(+84%)
Rmb89.00(+56%)
Rmb46.70(-18%)
Rmb57.23
Price Target Historical Stock Performance Current Stock Price
Jan 08 Oct 08 Jul 09 May 10 Feb 11 Dec 11 Sep 12 Jun 13 Apr 14 Jan 15
Long-term value Rmb89.0 Derived from our long-term residual income model, assuming 11.6% discount rate and 3% long-term growth.
LT Bull Case Rmb105.1
Faster volume growth and capacity expansion to boost top-line; better gross margin as product mix skewed to higher-margin LTMP and successful corporate restructuring: 1) For 2009-14, sales and net income CAGR of 18% and 31% on 16% sales volume growth; 2) Net margin increases from 3% in 2009 to 8% in 2014 on 7ppts operating margin improvement from successful corporate restructure and saving of SG&A expense from greater operating leverage.
LT Base Case Rmb89.0
Volume gains and gross margin improvement on lower hog prices and favorable product mix, corporate restructure takes place in 2011: 1) For 2009-14, sales and net income CAGR of 15% and 29%, driven by sales volume growth of 13%; 2) Net margin increases from 3% in 2009 to 6% in 2014 on 4ppts operating margin improvement from corporate restructuring and saving of SG&A from greater operating leverage.
LT Bear Case Rmb46.7
Unfavorable hog prices pressure margins; greater competition drags down volume growth; corporate restructuring takes place in 2013: 1) For 2009-14, sales and net income CAGR of 9% and 20%; 2) Gross margin expands by 0.5ppt and net margin increases from 3% in 2009 to 4% in 2014 on 1ppts operating margin improvement from corporate restructuring, which happens later than our expectations.
Five-year Scenarios Key Metrics (%) Bear Base Bull
Revenue CAGR (2008-14e) (%) 8.6 13.8 17.2
Return on equity (2009-14e avg.) (%) 17.1 23.1 27.1
After-tax Operating margins (2009-14e avg.) (%) 2.4 5.2 8.3
Asset Turnover (2009-14e avg.) (X) 2.9 3.1 3.3
EPS CAGR (2008-2014e) (%) 19.4 22.4 25.7
Net Debt / Equity (2009-14e avg.) (%) -39 -40 -43 Source: Morgan Stanley Research estimates, FactSet
Investment Thesis
• Capacity expansion amid industry consolidation support long-term growth.
• Potential corporate restructuring to unlock hidden value.
Key Value Drivers
• Faster volume growth, boosting sales. • Product mix improvement and lower
hog prices, helping margin expansion. • Greater capacity utilization and
expansion.
Potential Catalysts
• Evidence of stronger growth for downstream product sales, from the economic rebound.
• Evidence of industrialization of hog farming smoothing raw material price volatility.
• Successfully corporate restructuring/further industry consolidation.
Where We Could Be Wrong
• Increasing competition in the downstream segment may cause a price war.
• Irregular cycle of hog rearing and unexpected hog disease could create volatility in supply and prices.
• Increasing profit transfer to parent through connected transactions.
• Significant slowdown in demand caused by industry- or company-specific food safety issues.
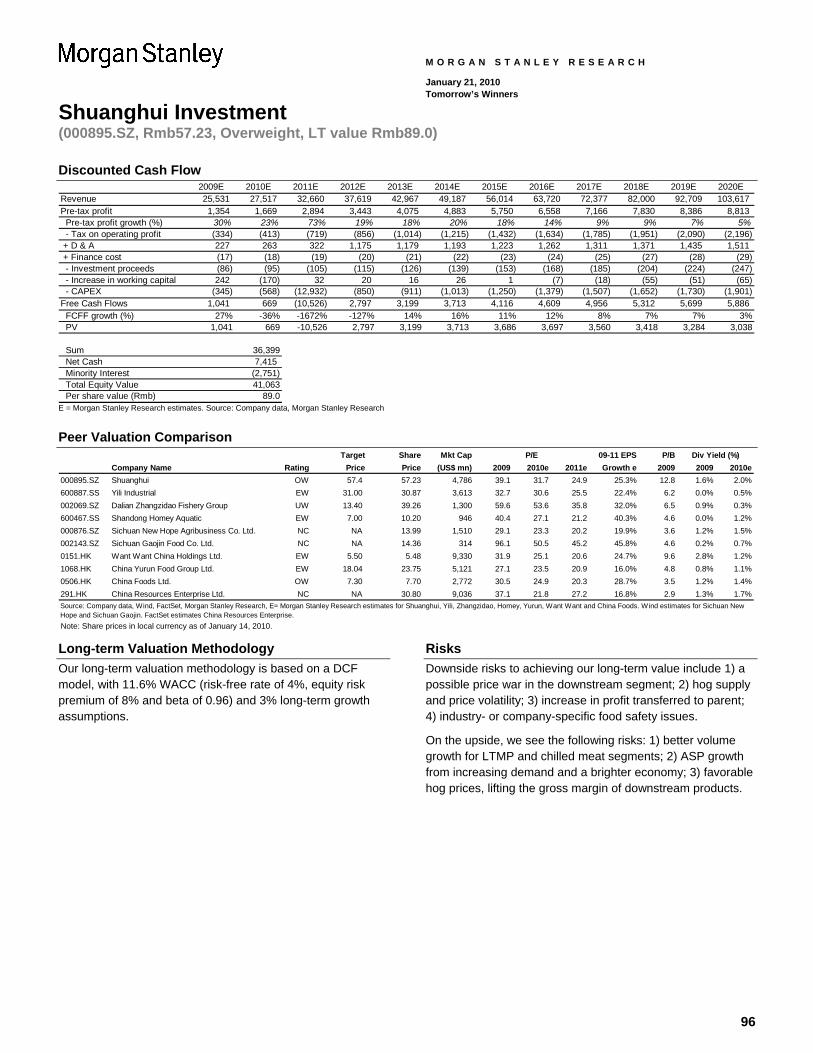
96
Shuanghui Investment (000895.SZ, Rmb57.23, Overweight, LT value Rmb89.0)
M O R G A N S T A N L E Y R E S E A R C H
January 21, 2010 Tomorrow’s Winners
Discounted Cash Flow 2009E 2010E 2011E 2012E 2013E 2014E 2015E 2016E 2017E 2018E 2019E 2020E
Revenue 25,531 27,517 32,660 37,619 42,967 49,187 56,014 63,720 72,377 82,000 92,709 103,617Pre-tax profit 1,354 1,669 2,894 3,443 4,075 4,883 5,750 6,558 7,166 7,830 8,386 8,813 Pre-tax profit growth (%) 30% 23% 73% 19% 18% 20% 18% 14% 9% 9% 7% 5% - Tax on operating profit (334) (413) (719) (856) (1,014) (1,215) (1,432) (1,634) (1,785) (1,951) (2,090) (2,196) + D & A 227 263 322 1,175 1,179 1,193 1,223 1,262 1,311 1,371 1,435 1,511 + Finance cost (17) (18) (19) (20) (21) (22) (23) (24) (25) (27) (28) (29) - Investment proceeds (86) (95) (105) (115) (126) (139) (153) (168) (185) (204) (224) (247) - Increase in working capital 242 (170) 32 20 16 26 1 (7) (18) (55) (51) (65) - CAPEX (345) (568) (12,932) (850) (911) (1,013) (1,250) (1,379) (1,507) (1,652) (1,730) (1,901)Free Cash Flows 1,041 669 (10,526) 2,797 3,199 3,713 4,116 4,609 4,956 5,312 5,699 5,886 FCFF growth (%) 27% -36% -1672% -127% 14% 16% 11% 12% 8% 7% 7% 3% PV 1,041 669 -10,526 2,797 3,199 3,713 3,686 3,697 3,560 3,418 3,284 3,038
Sum 36,399 Net Cash 7,415 Minority Interest (2,751) Total Equity Value 41,063 Per share value (Rmb) 89.0 E = Morgan Stanley Research estimates. Source: Company data, Morgan Stanley Research
Peer Valuation Comparison
Target Share Mkt Cap 09-11 EPS P/BCompany Name Rating Price Price (US$ mn) 2009 2010e 2011e Growth e 2009 2009 2010e
000895.SZ Shuanghui OW 57.4 57.23 4,786 39.1 31.7 24.9 25.3% 12.8 1.6% 2.0%600887.SS Yili Industrial EW 31.00 30.87 3,613 32.7 30.6 25.5 22.4% 6.2 0.0% 0.5%002069.SZ Dalian Zhangzidao Fishery Group UW 13.40 39.26 1,300 59.6 53.6 35.8 32.0% 6.5 0.9% 0.3%600467.SS Shandong Homey Aquatic EW 7.00 10.20 946 40.4 27.1 21.2 40.3% 4.6 0.0% 1.2%000876.SZ Sichuan New Hope Agribusiness Co. Ltd. NC NA 13.99 1,510 29.1 23.3 20.2 19.9% 3.6 1.2% 1.5%002143.SZ Sichuan Gaojin Food Co. Ltd. NC NA 14.36 314 96.1 50.5 45.2 45.8% 4.6 0.2% 0.7%0151.HK Want Want China Holdings Ltd. EW 5.50 5.48 9,330 31.9 25.1 20.6 24.7% 9.6 2.8% 1.2%1068.HK China Yurun Food Group Ltd. EW 18.04 23.75 5,121 27.1 23.5 20.9 16.0% 4.8 0.8% 1.1%0506.HK China Foods Ltd. OW 7.30 7.70 2,772 30.5 24.9 20.3 28.7% 3.5 1.2% 1.4%291.HK China Resources Enterprise Ltd. NC NA 30.80 9,036 37.1 21.8 27.2 16.8% 2.9 1.3% 1.7%
P/E Div Yield (%)
Source: Company data, Wind, FactSet, Morgan Stanley Research, E= Morgan Stanley Research estimates for Shuanghui, Yili, Zhangzidao, Homey, Yurun, Want Want and China Foods. Wind estimates for Sichuan New Hope and Sichuan Gaojin. FactSet estimates China Resources Enterprise. Note: Share prices in local currency as of January 14, 2010.
Long-term Valuation Methodology Our long-term valuation methodology is based on a DCF model, with 11.6% WACC (risk-free rate of 4%, equity risk premium of 8% and beta of 0.96) and 3% long-term growth assumptions.
Risks Downside risks to achieving our long-term value include 1) a possible price war in the downstream segment; 2) hog supply and price volatility; 3) increase in profit transferred to parent; 4) industry- or company-specific food safety issues.
On the upside, we see the following risks: 1) better volume growth for LTMP and chilled meat segments; 2) ASP growth from increasing demand and a brighter economy; 3) favorable hog prices, lifting the gross margin of downstream products.

97
Shuanghui Investment (000895.SZ, Rmb57.23, Overweight, LT value Rmb89.0)
M O R G A N S T A N L E Y R E S E A R C H
January 21, 2010 Tomorrow’s Winners
Income Statement FY-end Dec (Rmb mn) 2007 2008 2009E 2010E 2011E 2012E 2013E 2014ETurnover 21,479 25,586 27,576 32,731 37,701 43,060 49,294 56,135 High temperature meat products 7,690 8,818 11,964 12,813 13,977 15,246 16,630 18,140 Low temperature meat products 4,184 5,787 5,500 7,012 9,298 11,381 13,930 16,624 Chilled and frozen pork 8,698 9,904 8,874 11,481 12,859 14,788 17,006 19,557 Other pruducts 907 1,077 1,239 1,425 1,567 1,645 1,728 1,814 sales tax and other taxes (47) (55) (59) (71) (81) (93) (106) (121)Cost of good sold (19,596) (23,251) (24,595) (29,196) (32,711) (37,248) (42,501) (48,139) Raw meat (5,687) (7,851) (9,256) (10,518) (12,113) (13,617) (15,307) (16,955) Hog (7,887) (8,979) (7,786) (10,079) (11,289) (12,982) (14,929) (17,169) Packaging materials (2,140) (2,048) (2,505) (2,788) (3,282) (3,768) (4,338) (4,950) Other raw materials (1,530) (1,749) (1,962) (2,204) (2,604) (2,998) (3,504) (4,052) Manufacturing costs & other costs (2,352) (2,624) (3,086) (3,607) (3,422) (3,883) (4,423) (5,014)Gross Profit 1,836 2,280 2,922 3,464 4,908 5,719 6,686 7,874 Other revenue 47 49 47 56 67 81 97 102 Operating expenses (1,128) (1,329) (1,718) (1,964) (2,204) (2,492) (2,855) (3,254) Transportation expenses (395) (424) (449) (521) (621) (728) (854) (995) Promotion expenses (214) (263) (349) (377) (419) (474) (538) (605) Commissions (131) (190) (314) (347) (372) (386) (428) (487) Advertising expenses (107) (115) (248) (295) (302) (344) (394) (438) Other operating expenses (280) (337) (358) (426) (490) (560) (641) (730)Operating profit 755 1,000 1,250 1,556 2,771 3,308 3,928 4,722 Finance costs 7 14 17 18 19 20 21 22 Exceptional gain or loss 9 (31) 0 0 0 0 0 0 Associates 120 58 86 95 105 115 126 139 Pre-tax profit 891 1,041 1,354 1,669 2,894 3,443 4,075 4,883 Taxation (231) (223) (311) (384) (666) (792) (937) (1,123)Minorities (98) (119) (156) (193) (334) (398) (471) (564)Net profit 562 699 886 1,092 1,894 2,253 2,667 3,196
EPS (Rmb, diluted) 0.93 1.15 1.46 1.80 2.30 2.73 3.23 3.87 Balance Sheet FY-end Dec (Rmb mn) 2007 2008 2009E 2010E 2011E 2012E 2013E 2014ECurrent assets 2,086 2,414 3,379 3,726 4,743 6,486 8,408 10,569 Cash 897 1,281 1,856 1,916 2,702 4,148 5,724 7,513 Receivables 30 71 42 50 56 64 73 83 Inventories 1,045 968 1,366 1,622 1,817 2,069 2,361 2,674 Other current assets 114 93 113 138 168 204 249 299 Fixed assets 1,528 1,612 1,692 1,955 2,477 2,890 3,296 3,729 Capitalized expenses 0 0 0 0 0 0 0 0 Intangible assets 69 68 66 64 12,101 11,301 10,555 9,857 Long-term investments 340 362 448 543 648 763 889 1,028 Total assets 4,023 4,455 5,585 6,288 19,969 21,441 23,148 25,184 Current liabilities 1,276 1,413 2,056 2,175 2,447 2,764 3,124 3,521 Bank loans 15 0 9 9 18 18 17 15 Trade creditors 478 464 984 973 1,090 1,242 1,417 1,605 Bills payable 0 0 0 0 0 0 0 0 Other current liabilities 783 949 1,063 1,193 1,338 1,504 1,690 1,901 Long term loans 12 11 17 26 39 58 69 83 Other long-term liabilities 2 4 2 2 2 2 2 2 Total liabilities 1,290 1,429 2,075 2,202 2,487 2,823 3,195 3,606 Share capital 606 606 606 606 825 825 825 825 Reserves 1,571 1,785 2,112 2,495 15,337 16,075 16,940 18,002 Shareholders’ funds 2,177 2,391 2,718 3,101 16,163 16,900 17,765 18,827 Minorities 557 636 792 985 1,319 1,717 2,187 2,751 Shareholders' funds + minorities 4,023 4,455 5,585 6,288 19,969 21,441 23,148 25,184 W cap (inv + dtr – ctrs) 596 575 425 699 783 892 1,018 1,153 Total capital employed 2,745 3,038 3,527 4,112 17,520 18,675 20,022 21,662 Net cash/(debt) 870 1,269 1,830 1,881 2,645 4,072 5,638 7,415 E = Morgan Stanley Research estimates. Source: Company data, Morgan Stanley Research

98
Shuanghui Investment (000895.SZ, Rmb57.23, Overweight, LT value Rmb89.0)
M O R G A N S T A N L E Y R E S E A R C H
January 21, 2010 Tomorrow’s Winners
Cash Flow Statement FY-end Dec (Rmb mn) 2007 2008 2009E 2010E 2011E 2012E 2013E 2014E Pre-tax profit 891 1,041 1,354 1,669 2,894 3,443 4,075 4,883 Tax paid (231) (223) (311) (384) (666) (792) (937) (1,123) Depreciation 165 201 227 263 322 1,175 1,179 1,193 Associates’ (120) (58) (86) (95) (105) (115) (126) (139) Finance cost (7) (14) (17) (18) (19) (20) (21) (22) Change in working capital 13 210 242 (170) 32 20 16 26 Operating cash flow 711 1,157 1,409 1,266 2,459 3,711 4,186 4,818 Capex (166) (304) (345) (568) (12,932) (850) (911) (1,013) Investments (2) (4) 0 0 0 0 0 0 Disposals 28 20 40 43 50 62 73 84 Investment cash flow (140) (288) (306) (524) (12,881) (788) (839) (929) Share issues 0 0 0 0 12,041 0 0 0 Change in debt (14) (16) 15 9 22 19 10 12 Dividend paid (411) (485) (559) (709) (874) (1,516) (1,803) (2,134) Finance cost 7 14 17 18 19 20 21 22 Financing cash flow (417) (486) (527) (682) 11,208 (1,476) (1,772) (2,100)Free cash flow 545 853 1,064 698 (10,473) 2,861 3,275 3,805 Net cash flow 167 399 561 51 764 1,427 1,566 1,777 Net cash/(debt) 870 1,269 1,830 1,881 2,645 4,072 5,638 7,415 Ratio Analysis FY-end Dec Chg (%) 2007 2008 2009E 2010E 2011E 2012E 2013E 2014EGross profit 5 24 28 19 42 17 17 18 EBITDA (ex-assoc) 2 28 25 23 70 45 14 16 EBIT (ex-assoc) 3 32 25 24 78 19 19 20 Net profit 20 24 27 23 73 19 18 20 Margins (%)Gross 8.5 8.9 10.6 10.6 13.0 13.3 13.6 14.0 EBITDA (ex-assoc) 4.3 4.6 5.4 5.6 8.2 10.4 10.4 10.5 EBIT (ex-assoc) 3.5 3.9 4.5 4.8 7.4 7.7 8.0 8.4 Net profit 2.6 2.7 3.2 3.3 5.0 5.2 5.4 5.7 Return (%)ROA 14.0 15.7 15.9 17.4 9.5 10.5 11.5 12.7 ROE 25.8 29.2 32.6 35.2 11.7 13.3 15.0 17.0 RoCE 20.5 23.0 25 27 11 12 13 15 Average RoE* 26.7 30.6 35 38 20 14 15 17 Average RoA* 14.5 16.5 18 18 14 11 12 13 Gearing (%)Total liabilities/equity 59.3 59.8 76.4 71.0 15.4 16.7 18.0 19.2 Net debt/equity -40.0 -53.1 -67.3 -60.7 -16.4 -24.1 -31.7 -39.4 Asset/equity 185 186 206 203 124 127 130 134 Valuation (x)P/E 63.6 29.9 39.1 31.7 24.9 21.0 17.7 14.8 P/BV 16.4 8.7 12.8 11.2 2.9 2.8 2.7 2.5 EV/EBITDA 38.4 17.1 22.8 18.6 14.8 10.0 8.6 7.2 Dividend yield (%) 1.1 2.3 1.6 2.0 1.8 3.2 3.8 4.5 EfficiencyAsset turnover (x) 5.6 6.0 4.9 5.2 1.9 2.0 2.1 2.2 Inventory days 18.5 15.8 17.3 18.7 19.2 19.0 19.0 19.1 Receivable days 0.5 0.7 0.8 0.5 0.5 0.5 0.5 0.5 Payable days 8.9 16.6 16.6 16.6 16.6 16.6 16.6 16.6 Customer advance days 5.2 5.9 6.7 6.2 5.9 5.7 5.5 5.3 Others (%)Effective tax rate 26 21.5 23.0 23.0 23.0 23.0 23.0 23.0 Payout ratio 86 80.0 80.0 80.0 80.0 80.0 80.0 80.0 E = Morgan Stanley Research estimates. Source: Company data, Morgan Stanley Research
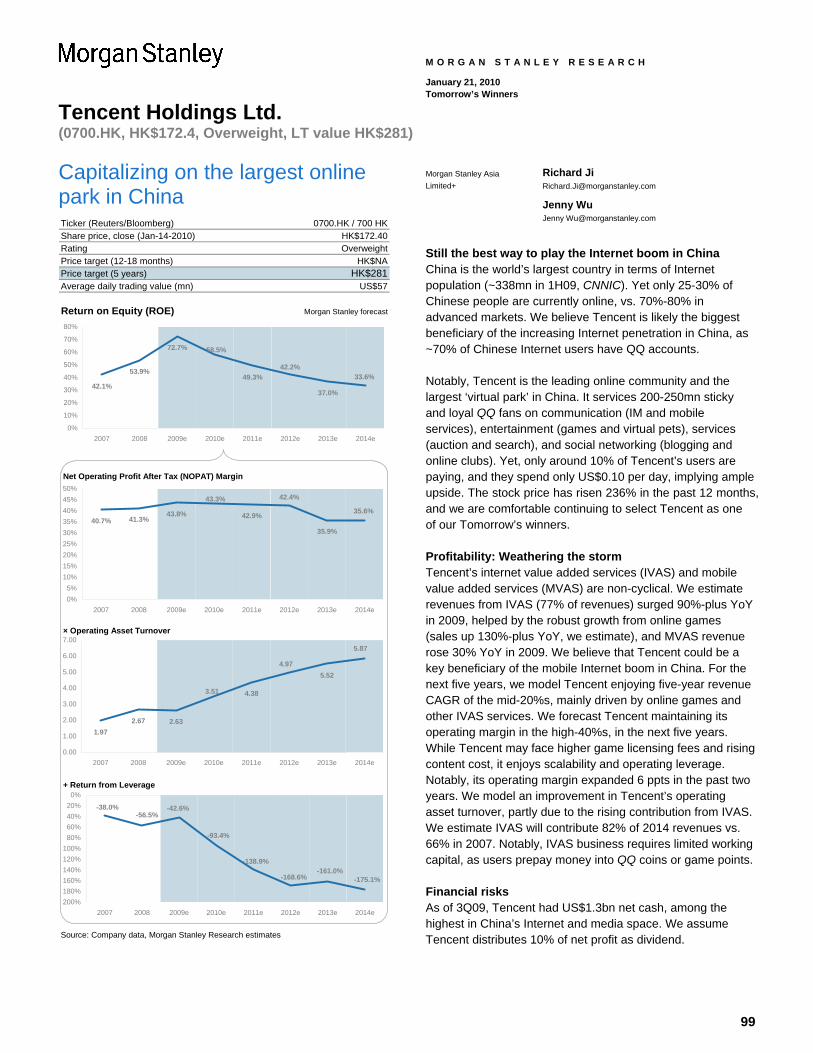
99
Tencent Holdings Ltd. (0700.HK, HK$172.4, Overweight, LT value HK$281)
M O R G A N S T A N L E Y R E S E A R C H
January 21, 2010 Tomorrow’s Winners
Capitalizing on the largest online park in China Ticker (Reuters/Bloomberg)Share price, close (Jan-14-2010)RatingPrice target (12-18 months)Price target (5 years) HK$281Average daily trading value (mn)
Return on Equity (ROE) Morgan Stanley forecast
Net Operating Profit After Tax (NOPAT) Margin
× Operating Asset Turnover
+ Return from Leverage
Source: Company data, Morgan Stanley Research estimates
US$57
0700.HK / 700 HKHK$172.40Overweight
HK$NA
42.1%
53.9%
72.7%
49.3%
37.0%
33.6%42.2%
58.5%
0%
10%
20%
30%
40%
50%
60%
70%
80%
2007 2008 2009e 2010e 2011e 2012e 2013e 2014e
40.7% 41.3%43.8% 42.9%
35.9%
43.3% 42.4%
35.6%
0%5%
10%15%20%25%30%35%40%45%50%
2007 2008 2009e 2010e 2011e 2012e 2013e 2014e
1.972.67 2.63
4.38
5.52
3.51
4.97
5.87
0.00
1.00
2.00
3.00
4.00
5.00
6.00
7.00
2007 2008 2009e 2010e 2011e 2012e 2013e 2014e
-38.0%
-138.9%
-42.6%
-161.0%-175.1%-168.6%
-93.4%
-56.5%
200%180%160%140%120%100%80%60%40%20%0%
2007 2008 2009e 2010e 2011e 2012e 2013e 2014e
Morgan Stanley Asia Limited+
Richard Ji [email protected]
Jenny Wu Jenny [email protected]
Still the best way to play the Internet boom in China China is the world’s largest country in terms of Internet population (~338mn in 1H09, CNNIC). Yet only 25-30% of Chinese people are currently online, vs. 70%-80% in advanced markets. We believe Tencent is likely the biggest beneficiary of the increasing Internet penetration in China, as ~70% of Chinese Internet users have QQ accounts.
Notably, Tencent is the leading online community and the largest ‘virtual park’ in China. It services 200-250mn sticky and loyal QQ fans on communication (IM and mobile services), entertainment (games and virtual pets), services (auction and search), and social networking (blogging and online clubs). Yet, only around 10% of Tencent’s users are paying, and they spend only US$0.10 per day, implying ample upside. The stock price has risen 236% in the past 12 months, and we are comfortable continuing to select Tencent as one of our Tomorrow’s winners.
Profitability: Weathering the storm Tencent’s internet value added services (IVAS) and mobile value added services (MVAS) are non-cyclical. We estimate revenues from IVAS (77% of revenues) surged 90%-plus YoY in 2009, helped by the robust growth from online games (sales up 130%-plus YoY, we estimate), and MVAS revenue rose 30% YoY in 2009. We believe that Tencent could be a key beneficiary of the mobile Internet boom in China. For the next five years, we model Tencent enjoying five-year revenue CAGR of the mid-20%s, mainly driven by online games and other IVAS services. We forecast Tencent maintaining its operating margin in the high-40%s, in the next five years. While Tencent may face higher game licensing fees and rising content cost, it enjoys scalability and operating leverage. Notably, its operating margin expanded 6 ppts in the past two years. We model an improvement in Tencent’s operating asset turnover, partly due to the rising contribution from IVAS. We estimate IVAS will contribute 82% of 2014 revenues vs. 66% in 2007. Notably, IVAS business requires limited working capital, as users prepay money into QQ coins or game points.
Financial risks As of 3Q09, Tencent had US$1.3bn net cash, among the highest in China’s Internet and media space. We assume Tencent distributes 10% of net profit as dividend.
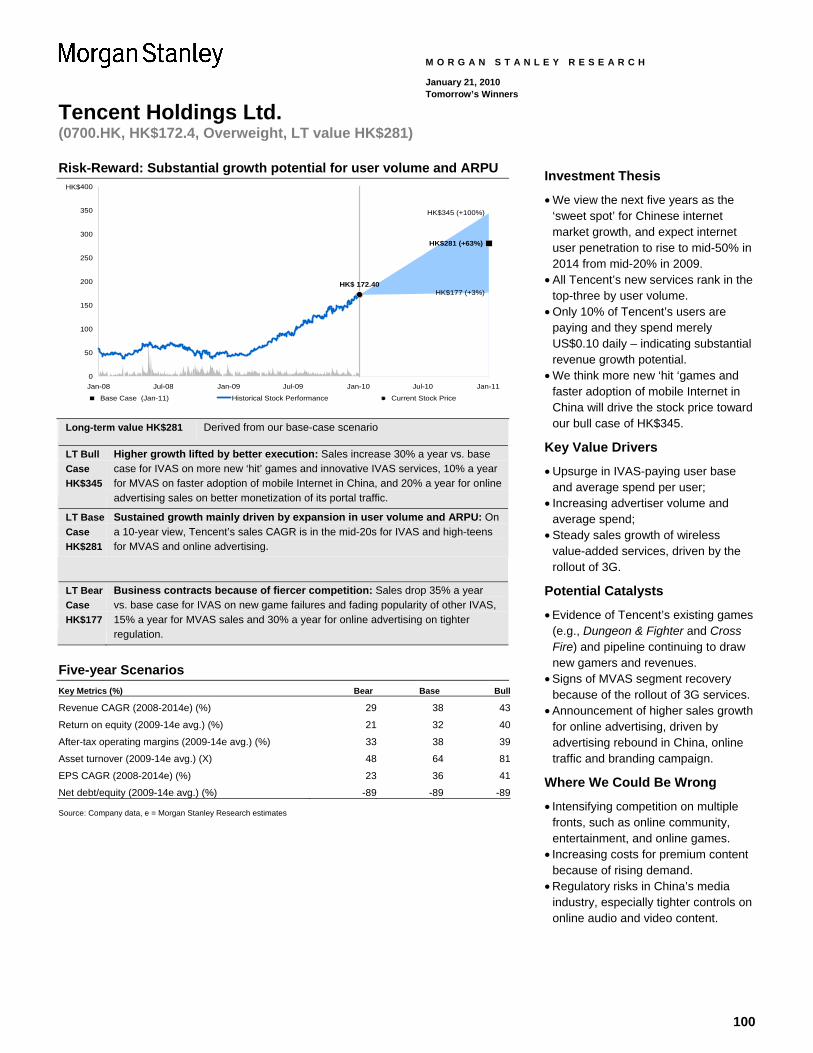
100
Tencent Holdings Ltd. (0700.HK, HK$172.4, Overweight, LT value HK$281)
M O R G A N S T A N L E Y R E S E A R C H
January 21, 2010 Tomorrow’s Winners
Risk-Reward: Substantial growth potential for user volume and ARPU
HK$281 (+63%)
HK$ 172.40HK$177 (+3%)
HK$345 (+100%)
0
50
100
150
200
250
300
350
400
Jan-08 Jul-08 Jan-09 Jul-09 Jan-10 Jul-10 Jan-11
HK$
Base Case (Jan-11) Historical Stock Performance Current Stock Price
Long-term value HK$281 Derived from our base-case scenario
LT Bull Case HK$345
Higher growth lifted by better execution: Sales increase 30% a year vs. base case for IVAS on more new ‘hit’ games and innovative IVAS services, 10% a year for MVAS on faster adoption of mobile Internet in China, and 20% a year for online advertising sales on better monetization of its portal traffic.
LT Base Case HK$281
Sustained growth mainly driven by expansion in user volume and ARPU: On a 10-year view, Tencent’s sales CAGR is in the mid-20s for IVAS and high-teens for MVAS and online advertising.
LT Bear Case HK$177
Business contracts because of fiercer competition: Sales drop 35% a year vs. base case for IVAS on new game failures and fading popularity of other IVAS, 15% a year for MVAS sales and 30% a year for online advertising on tighter regulation.
Five-year Scenarios Key Metrics (%) Bear Base Bull
Revenue CAGR (2008-2014e) (%) 29 38 43
Return on equity (2009-14e avg.) (%) 21 32 40
After-tax operating margins (2009-14e avg.) (%) 33 38 39
Asset turnover (2009-14e avg.) (X) 48 64 81
EPS CAGR (2008-2014e) (%) 23 36 41
Net debt/equity (2009-14e avg.) (%) -89 -89 -89 Source: Company data, e = Morgan Stanley Research estimates
Investment Thesis
• We view the next five years as the ‘sweet spot’ for Chinese internet market growth, and expect internet user penetration to rise to mid-50% in 2014 from mid-20% in 2009.
• All Tencent’s new services rank in the top-three by user volume.
• Only 10% of Tencent’s users are paying and they spend merely US$0.10 daily – indicating substantial revenue growth potential.
• We think more new ‘hit ‘games and faster adoption of mobile Internet in China will drive the stock price toward our bull case of HK$345.
Key Value Drivers
• Upsurge in IVAS-paying user base and average spend per user;
• Increasing advertiser volume and average spend;
• Steady sales growth of wireless value-added services, driven by the rollout of 3G.
Potential Catalysts
• Evidence of Tencent’s existing games (e.g., Dungeon & Fighter and Cross Fire) and pipeline continuing to draw new gamers and revenues.
• Signs of MVAS segment recovery because of the rollout of 3G services.
• Announcement of higher sales growth for online advertising, driven by advertising rebound in China, online traffic and branding campaign.
Where We Could Be Wrong
• Intensifying competition on multiple fronts, such as online community, entertainment, and online games.
• Increasing costs for premium content because of rising demand.
• Regulatory risks in China’s media industry, especially tighter controls on online audio and video content.

101
Tencent Holdings Ltd. (0700.HK, HK$172.4, Overweight, LT value HK$281)
M O R G A N S T A N L E Y R E S E A R C H
January 21, 2010 Tomorrow’s Winners
Discounted Cash Flow (As of end of 2014) (RmbMM) 2008 2009E 2010E 2011E 2012E 2013E 2014E 2015E 2016E 2017E 2018E 2019E
Revenue 7,155 12,263 17,253 23,328 30,728 39,445 49,090 58,512 66,673 74,571 81,983 89,481 % revenue growth 87% 71% 41% 35% 32% 28% 24% 19% 14% 12% 10% 9%
EBIT 3,246 5,964 8,386 11,382 14,882 18,883 23,279 27,409 30,830 34,305 37,510 40,826 Tax (302) (820) (1,405) (2,248) (3,386) (4,721) (5,820) (6,852) (7,707) (8,576) (9,377) (10,206) Depreciation and amortization 264 458 694 985 1,326 1,710 2,164 2,676 3,215 3,757 4,272 4,765 Working capital change 232 438 433 492 647 758 727 700 516 424 330 295 Capex (1,331) (1,271) (1,612) (2,612) (3,224) (3,963) (4,618) (5,451) (6,160) (6,838) (7,504) (8,178) Stock-based comp costs 161 289 408 552 734 955 1,201 1,451 1,678 1,892 2,097 2,303 Free cash flow 2,270 5,057 6,904 8,552 10,979 13,622 16,934 19,933 22,371 24,963 27,328 29,803 FCF conversion rate 70% 85% 82% 75% 74% 72% 73% 73% 73% 73% 73% 73%Exit value 482,964 Present value 17,958 18,157 18,253 18,002 304,303 Sum 376,672 Net cash 80,821 Net value (RmbMM) 457,493 Per share, HK$ 281
Discount rate 11%Exit growth rate 5%Exit FCF multiple 16
E = Morgan Stanley Research estimates. Source: Company data, Morgan Stanley Research
Peer Valuation Comparison
Target Share Mkt Cap 09-11 EPS P/BCompany Name Rating Price Price (US$ mn) 2009 2010e 2011e Growth e 2009 2009 2010e
1688.HK Alibaba.com Limited O NA 19.44 12,721 87.7e 53.2 38.6 50.8% 16.6e 1.0e 0.0BIDU.O Baidu.com, Inc. E NA 464.23 16,178 76.5e 56.9 44.7 30.8% 24.0e 0.0e 0.0CYOU.O Changyou E NA 34.02 1,754 12.1e 10.7 8.7 18.1% 8.0e 0.0e 0.0CTRP.O Ctrip.com O NA 73.34 5,222 53.3e 39.0 29.6 34.2% 13.5e 0.6e 0.8JOBS.O 51job, Inc O NA 18.31 508 36.2e 25.0 19.0 38.0% 2.6e 0.0e 0.0GA.N Giant Interactive O NA 7.49 1,755 13.8e 13.0 13.6 0.7% 2.1e 2.4e 2.5NTES.O Netease.com O NA 39.14 5,105 20.0e 14.6 12.4 27.0% 4.9e 0.0e 0.0PWRD.O Perfect World O NA 43.02 2,257 14.8e 11.6 10.7 17.5% 6.5e 5.0e 0.0SNDA.O Shanda Interactive Entertainment Limited O NA 54.53 3,855 17.8e 18.6 15.9 5.7% 2.3e 0.0e 0.0SINA.O Sina Corporation O NA 45.43 2,743 44.7e 26.3 21.3 44.7% 3.3e 0.0e 0.0SOHU.O Sohu.com Inc O NA 60.40 2,361 15.9e 15.3 12.7 11.7% 3.8e 0.0e 0.00700.HK Tencent Holdings Ltd. O NA 172.40 41,131 54.9e 40.7 31.3 32.6% 23.7e 0.2e 0.3Source: Morgan Stanley Research estimates. NA=Not Available
P/E Div Yield (%)
Note: Share prices in listing currency as of January 14, 2010.
Long-term Valuation Methodology DCF is our preferred methodology for valuing Tencent, as it incorporates our long-term view of the company’s operations. We assume a discount rate of 11% and a free cash flow exit multiple of 16x, at a terminal growth rate of 5%.
Risks Downside risks to achieving our long-term value include 1) intensifying competition; 2) MVAS regulation, and 3) greater government regulation over online content.

102
Tencent Holdings Ltd. (0700.HK, HK$172.4, Overweight, LT value HK$281)
M O R G A N S T A N L E Y R E S E A R C H
January 21, 2010 Tomorrow’s Winners
Income Statement (RmbMM) 2008 2009E 2010E 2011E 2012E 2013E 2014E
IVAS 4,915 9,456 13,523 18,383 24,456 31,804 40,110 MVAS 1,399 1,824 2,394 3,173 4,031 4,905 5,736 Online advertising 826 947 1,300 1,737 2,204 2,701 3,207 Other 15 36 36 36 36 36 36 Total revenues 7,155 12,263 17,253 23,328 30,728 39,445 49,090
% change Y/Y 87% 71% 41% 35% 32% 28% 24%
Cost of revenues (2,170) (3,835) (5,542) (7,572) (10,042) (12,931) (16,136) Gross profit 4,984 8,429 11,711 15,756 20,686 26,514 32,953
Gross margin (%) 70% 69% 68% 68% 67% 67% 67%% change Y/Y 84% 69% 39% 35% 31% 28% 24%
Sales and marketing (518) (527) (758) (1,049) (1,412) (1,852) (2,354) General and administrative (1,332) (2,023) (2,716) (3,571) (4,758) (6,299) (8,030) Other income/ expenses 112 85 149 246 367 520 710 Operating profits 3,246 5,964 8,386 11,382 14,882 18,883 23,279
Operating margin (%) 45% 49% 49% 49% 48% 48% 47%% change Y/Y 99% 84% 41% 36% 31% 27% 23%
Finance (costs)/ income, net (141) 13 0 0 0 0 0Pretax profits 3,105 5,977 8,386 11,382 14,882 18,883 23,279 Taxation (289) (822) (1,405) (2,248) (3,386) (4,721) (5,820) Net profits 2,785 5,101 6,924 9,074 11,434 14,096 17,390
Net margin (%) 39% 42% 40% 39% 37% 36% 35%% change Y/Y 78% 83% 36% 31% 26% 23% 23%
Fully diluted EPS (HK$) 1.70 3.16 4.36 5.68 7.11 8.72 10.68
Balance Sheet RmbMM; Years Ending Dec 2008 2009E 2010E 2011E 2012E 2013E 2014E
Cash 3,068 7,753 14,097 21,874 31,859 44,240 59,630Short term investments 2,061 2,061 2,061 2,061 2,061 2,061 2,061Accounts receivable 983 1,710 2,441 3,347 4,439 5,738 7,190Other receivables 378 649 912 1,234 1,625 2,086 2,596Inventory 5 5 5 5 5 5 5Total current assets 6,496 12,178 19,516 28,521 39,989 54,130 71,481Property and equipment 1,165 2,098 3,128 4,345 5,811 7,601 9,763Long-term investments 0 0 0 0 0 0 0Investment in associates 303 464 625 635 644 654 664Others 791 810 827 865 905 948 992Total assets 9,856 16,300 24,493 34,866 47,975 64,108 83,841
Payables and accruals 1,258 2,014 2,776 3,675 4,756 6,008 7,348Income taxes payable 47 164 281 450 677 944 1,164Other taxes payable 104 176 246 330 437 567 711Deferred revenue 682 1,312 1,877 2,551 3,394 4,414 5,567Total current liabilities 2,092 3,666 5,180 7,005 9,264 11,934 14,790Total liabilities 2,736 4,311 5,882 7,499 9,550 12,012 14,869Minority interest 98 153 210 269 332 398 467Share premium 1,155 1,155 1,155 1,155 1,155 1,155 1,155Accumulated Other Comp. Inc. 0 0 0 0 0 0 0Other reserves 5,866 10,032 16,190 24,333 34,593 47,244 62,850Total equity 7,119 11,989 18,612 27,367 38,425 52,096 68,972Liabilities plus equity 9,856 16,300 24,493 34,866 47,975 64,108 83,841
E = Morgan Stanley Research estimates, Source: Company data, Morgan Stanley Research
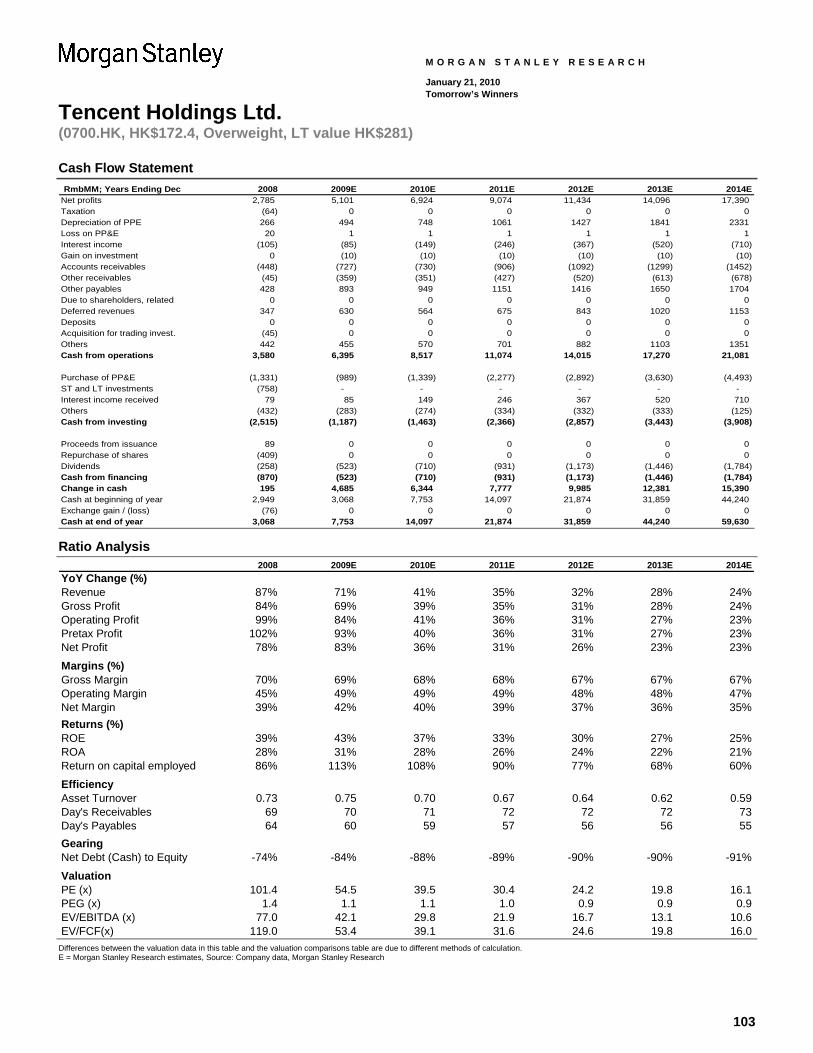
103
Tencent Holdings Ltd. (0700.HK, HK$172.4, Overweight, LT value HK$281)
M O R G A N S T A N L E Y R E S E A R C H
January 21, 2010 Tomorrow’s Winners
Cash Flow Statement RmbMM; Years Ending Dec 2008 2009E 2010E 2011E 2012E 2013E 2014E
Net profits 2,785 5,101 6,924 9,074 11,434 14,096 17,390 Taxation (64) 0 0 0 0 0 0Depreciation of PPE 266 494 748 1061 1427 1841 2331Loss on PP&E 20 1 1 1 1 1 1Interest income (105) (85) (149) (246) (367) (520) (710)Gain on investment 0 (10) (10) (10) (10) (10) (10)Accounts receivables (448) (727) (730) (906) (1092) (1299) (1452)Other receivables (45) (359) (351) (427) (520) (613) (678)Other payables 428 893 949 1151 1416 1650 1704Due to shareholders, related 0 0 0 0 0 0 0Deferred revenues 347 630 564 675 843 1020 1153Deposits 0 0 0 0 0 0 0Acquisition for trading invest. (45) 0 0 0 0 0 0Others 442 455 570 701 882 1103 1351Cash from operations 3,580 6,395 8,517 11,074 14,015 17,270 21,081
Purchase of PP&E (1,331) (989) (1,339) (2,277) (2,892) (3,630) (4,493) ST and LT investments (758) - - - - - - Interest income received 79 85 149 246 367 520 710 Others (432) (283) (274) (334) (332) (333) (125) Cash from investing (2,515) (1,187) (1,463) (2,366) (2,857) (3,443) (3,908)
Proceeds from issuance 89 0 0 0 0 0 0Repurchase of shares (409) 0 0 0 0 0 0Dividends (258) (523) (710) (931) (1,173) (1,446) (1,784) Cash from financing (870) (523) (710) (931) (1,173) (1,446) (1,784) Change in cash 195 4,685 6,344 7,777 9,985 12,381 15,390Cash at beginning of year 2,949 3,068 7,753 14,097 21,874 31,859 44,240Exchange gain / (loss) (76) 0 0 0 0 0 0Cash at end of year 3,068 7,753 14,097 21,874 31,859 44,240 59,630
Ratio Analysis 2008 2009E 2010E 2011E 2012E 2013E 2014E
YoY Change (%)Revenue 87% 71% 41% 35% 32% 28% 24%Gross Profit 84% 69% 39% 35% 31% 28% 24%Operating Profit 99% 84% 41% 36% 31% 27% 23%Pretax Profit 102% 93% 40% 36% 31% 27% 23%Net Profit 78% 83% 36% 31% 26% 23% 23%
Margins (%)Gross Margin 70% 69% 68% 68% 67% 67% 67%Operating Margin 45% 49% 49% 49% 48% 48% 47%Net Margin 39% 42% 40% 39% 37% 36% 35%Returns (%)ROE 39% 43% 37% 33% 30% 27% 25%ROA 28% 31% 28% 26% 24% 22% 21%Return on capital employed 86% 113% 108% 90% 77% 68% 60%
EfficiencyAsset Turnover 0.73 0.75 0.70 0.67 0.64 0.62 0.59Day's Receivables 69 70 71 72 72 72 73Day's Payables 64 60 59 57 56 56 55GearingNet Debt (Cash) to Equity -74% -84% -88% -89% -90% -90% -91%
ValuationPE (x) 101.4 54.5 39.5 30.4 24.2 19.8 16.1PEG (x) 1.4 1.1 1.1 1.0 0.9 0.9 0.9EV/EBITDA (x) 77.0 42.1 29.8 21.9 16.7 13.1 10.6EV/FCF(x) 119.0 53.4 39.1 31.6 24.6 19.8 16.0
Differences between the valuation data in this table and the valuation comparisons table are due to different methods of calculation. E = Morgan Stanley Research estimates, Source: Company data, Morgan Stanley Research
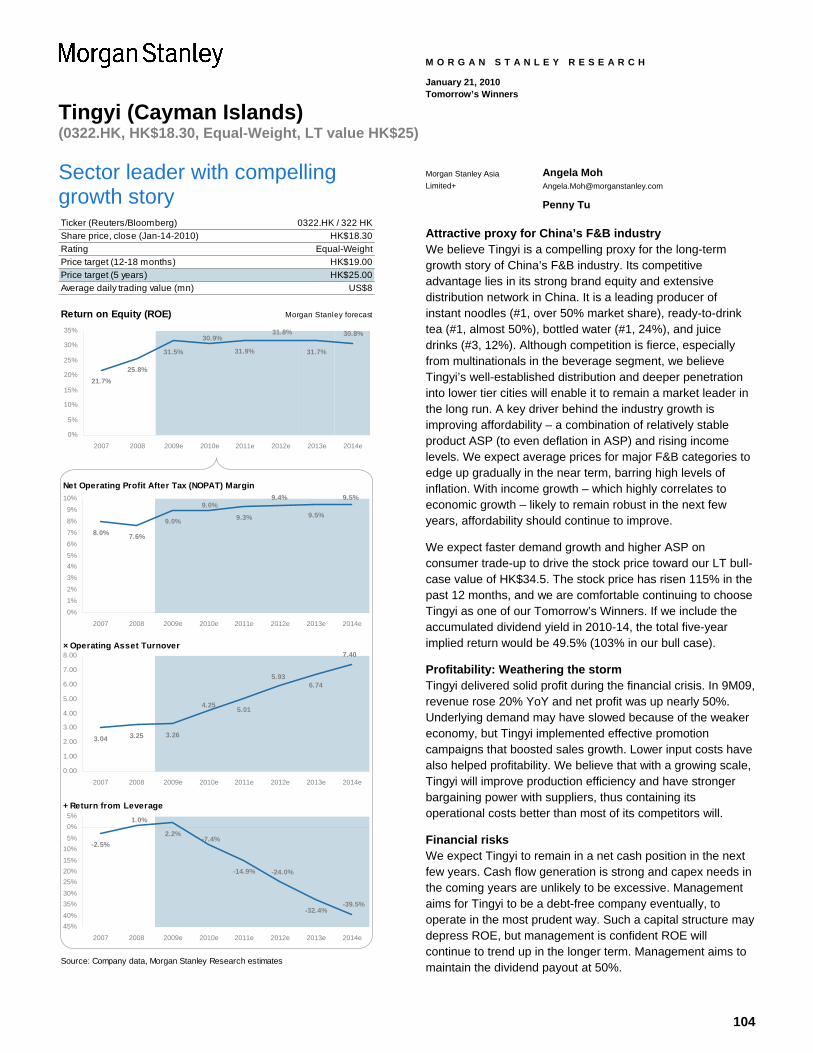
104
Tingyi (Cayman Islands) (0322.HK, HK$18.30, Equal-Weight, LT value HK$25)
M O R G A N S T A N L E Y R E S E A R C H
January 21, 2010 Tomorrow’s Winners
Sector leader with compelling growth story Ticker (Reuters/Bloomberg)Share price, close (Jan-14-2010)RatingPrice target (12-18 months)Price target (5 years) HK$25.00Average daily trading value (mn)
Return on Equity (ROE) Morgan Stanley forecast
Net Operating Profit After Tax (NOPAT) Margin
× Operating Asset Turnover
+ Return from Leverage
Source: Company data, Morgan Stanley Research estimates
0322.HK / 322 HKHK$18.30
Equal-WeightHK$19.00
US$8
21.7%25.8%
31.5% 31.9% 31.7%
30.8%31.8%30.9%
0%
5%
10%
15%
20%
25%
30%
35%
2007 2008 2009e 2010e 2011e 2012e 2013e 2014e
8.0% 7.6%
9.0% 9.3% 9.5%9.0%
9.4% 9.5%
0%
1%
2%
3%
4%5%
6%
7%
8%
9%
10%
2007 2008 2009e 2010e 2011e 2012e 2013e 2014e
3.04 3.25 3.26
5.01
6.74
4.25
5.93
7.40
0.00
1.00
2.00
3.00
4.00
5.00
6.00
7.00
8.00
2007 2008 2009e 2010e 2011e 2012e 2013e 2014e
-2.5%2.2%
-14.9%
-32.4%-39.5%
-24.0%
-7.4%
1.0%
45%40%
35%30%
25%20%15%
10%5%
0%5%
2007 2008 2009e 2010e 2011e 2012e 2013e 2014e
Morgan Stanley Asia Limited+
Angela Moh [email protected]
Penny Tu
Attractive proxy for China’s F&B industry We believe Tingyi is a compelling proxy for the long-term growth story of China’s F&B industry. Its competitive advantage lies in its strong brand equity and extensive distribution network in China. It is a leading producer of instant noodles (#1, over 50% market share), ready-to-drink tea (#1, almost 50%), bottled water (#1, 24%), and juice drinks (#3, 12%). Although competition is fierce, especially from multinationals in the beverage segment, we believe Tingyi’s well-established distribution and deeper penetration into lower tier cities will enable it to remain a market leader in the long run. A key driver behind the industry growth is improving affordability – a combination of relatively stable product ASP (to even deflation in ASP) and rising income levels. We expect average prices for major F&B categories to edge up gradually in the near term, barring high levels of inflation. With income growth – which highly correlates to economic growth – likely to remain robust in the next few years, affordability should continue to improve.
We expect faster demand growth and higher ASP on consumer trade-up to drive the stock price toward our LT bull-case value of HK$34.5. The stock price has risen 115% in the past 12 months, and we are comfortable continuing to choose Tingyi as one of our Tomorrow’s Winners. If we include the accumulated dividend yield in 2010-14, the total five-year implied return would be 49.5% (103% in our bull case).
Profitability: Weathering the storm Tingyi delivered solid profit during the financial crisis. In 9M09, revenue rose 20% YoY and net profit was up nearly 50%. Underlying demand may have slowed because of the weaker economy, but Tingyi implemented effective promotion campaigns that boosted sales growth. Lower input costs have also helped profitability. We believe that with a growing scale, Tingyi will improve production efficiency and have stronger bargaining power with suppliers, thus containing its operational costs better than most of its competitors will.
Financial risks We expect Tingyi to remain in a net cash position in the next few years. Cash flow generation is strong and capex needs in the coming years are unlikely to be excessive. Management aims for Tingyi to be a debt-free company eventually, to operate in the most prudent way. Such a capital structure may depress ROE, but management is confident ROE will continue to trend up in the longer term. Management aims to maintain the dividend payout at 50%.
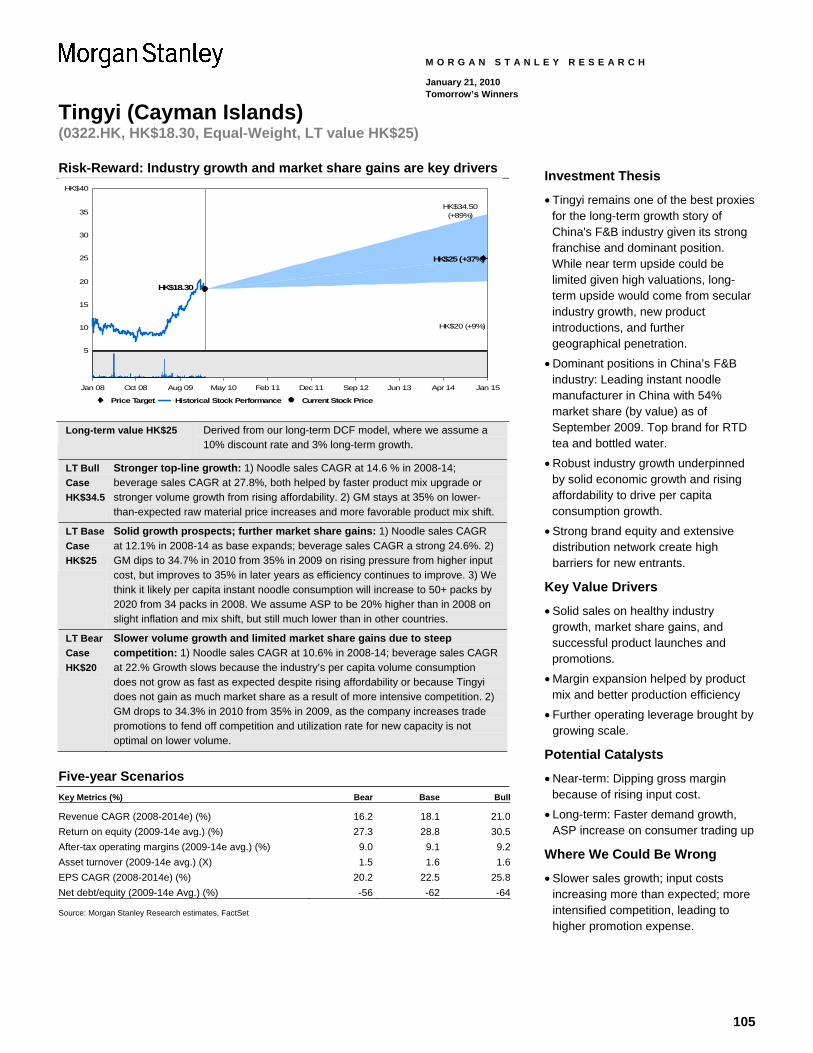
105
Tingyi (Cayman Islands) (0322.HK, HK$18.30, Equal-Weight, LT value HK$25)
M O R G A N S T A N L E Y R E S E A R C H
January 21, 2010 Tomorrow’s Winners
Risk-Reward: Industry growth and market share gains are key drivers
5
10
15
20
25
30
35
HK$40
HK$34.50(+89%)
HK$25 (+37%)
HK$20 (+9%)
HK$18.30
Price Target Historical Stock Performance Current Stock Price
Jan 08 Oct 08 Aug 09 May 10 Feb 11 Dec 11 Sep 12 Jun 13 Apr 14 Jan 15
Long-term value HK$25 Derived from our long-term DCF model, where we assume a 10% discount rate and 3% long-term growth.
LT Bull Case HK$34.5
Stronger top-line growth: 1) Noodle sales CAGR at 14.6 % in 2008-14; beverage sales CAGR at 27.8%, both helped by faster product mix upgrade or stronger volume growth from rising affordability. 2) GM stays at 35% on lower-than-expected raw material price increases and more favorable product mix shift.
LT Base Case HK$25
Solid growth prospects; further market share gains: 1) Noodle sales CAGR at 12.1% in 2008-14 as base expands; beverage sales CAGR a strong 24.6%. 2) GM dips to 34.7% in 2010 from 35% in 2009 on rising pressure from higher input cost, but improves to 35% in later years as efficiency continues to improve. 3) We think it likely per capita instant noodle consumption will increase to 50+ packs by 2020 from 34 packs in 2008. We assume ASP to be 20% higher than in 2008 on slight inflation and mix shift, but still much lower than in other countries.
LT Bear Case HK$20
Slower volume growth and limited market share gains due to steep competition: 1) Noodle sales CAGR at 10.6% in 2008-14; beverage sales CAGR at 22.% Growth slows because the industry’s per capita volume consumption does not grow as fast as expected despite rising affordability or because Tingyi does not gain as much market share as a result of more intensive competition. 2) GM drops to 34.3% in 2010 from 35% in 2009, as the company increases trade promotions to fend off competition and utilization rate for new capacity is not optimal on lower volume.
Five-year Scenarios Key Metrics (%) Bear Base Bull
Revenue CAGR (2008-2014e) (%) 16.2 18.1 21.0Return on equity (2009-14e avg.) (%) 27.3 28.8 30.5After-tax operating margins (2009-14e avg.) (%) 9.0 9.1 9.2Asset turnover (2009-14e avg.) (X) 1.5 1.6 1.6EPS CAGR (2008-2014e) (%) 20.2 22.5 25.8Net debt/equity (2009-14e Avg.) (%) -56 -62 -64 Source: Morgan Stanley Research estimates, FactSet
Investment Thesis
• Tingyi remains one of the best proxies for the long-term growth story of China's F&B industry given its strong franchise and dominant position. While near term upside could be limited given high valuations, long-term upside would come from secular industry growth, new product introductions, and further geographical penetration.
• Dominant positions in China’s F&B industry: Leading instant noodle manufacturer in China with 54% market share (by value) as of September 2009. Top brand for RTD tea and bottled water.
• Robust industry growth underpinned by solid economic growth and rising affordability to drive per capita consumption growth.
• Strong brand equity and extensive distribution network create high barriers for new entrants.
Key Value Drivers
• Solid sales on healthy industry growth, market share gains, and successful product launches and promotions.
• Margin expansion helped by product mix and better production efficiency
• Further operating leverage brought by growing scale.
Potential Catalysts
• Near-term: Dipping gross margin because of rising input cost.
• Long-term: Faster demand growth, ASP increase on consumer trading up
Where We Could Be Wrong
• Slower sales growth; input costs increasing more than expected; more intensified competition, leading to higher promotion expense.
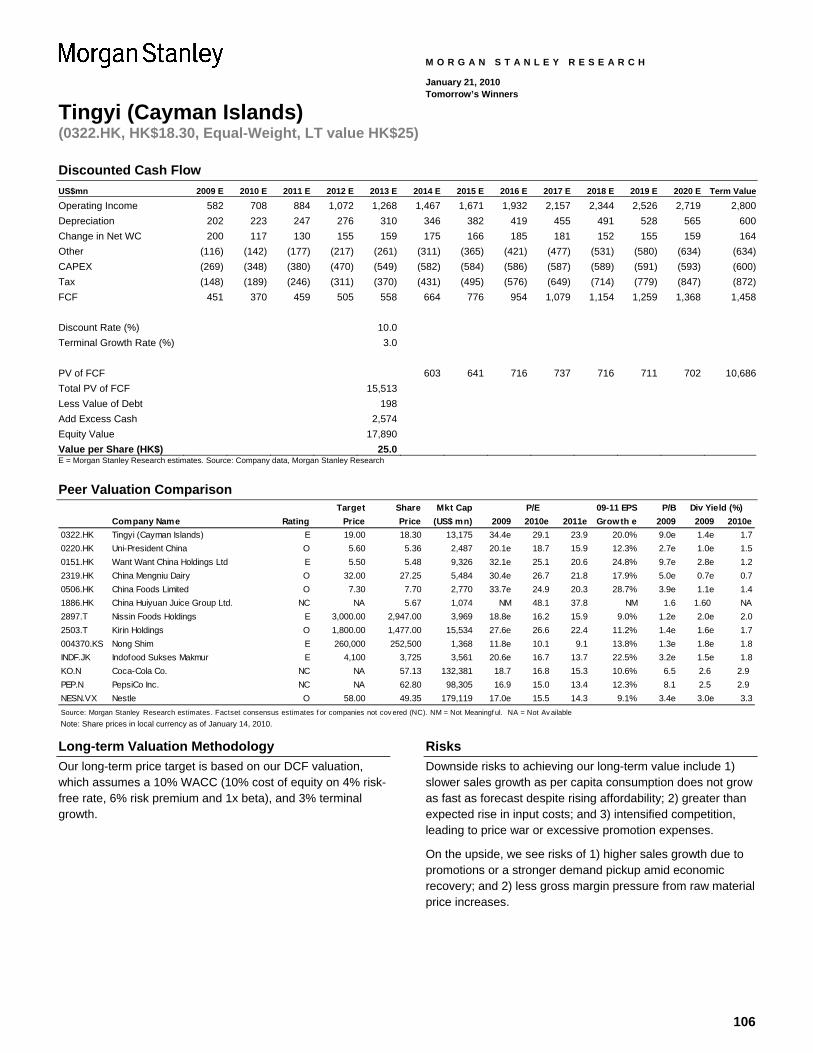
106
Tingyi (Cayman Islands) (0322.HK, HK$18.30, Equal-Weight, LT value HK$25)
M O R G A N S T A N L E Y R E S E A R C H
January 21, 2010 Tomorrow’s Winners
Discounted Cash Flow US$mn 2009 E 2010 E 2011 E 2012 E 2013 E 2014 E 2015 E 2016 E 2017 E 2018 E 2019 E 2020 E Term Value
Operating Income 582 708 884 1,072 1,268 1,467 1,671 1,932 2,157 2,344 2,526 2,719 2,800Depreciation 202 223 247 276 310 346 382 419 455 491 528 565 600Change in Net WC 200 117 130 155 159 175 166 185 181 152 155 159 164Other (116) (142) (177) (217) (261) (311) (365) (421) (477) (531) (580) (634) (634)CAPEX (269) (348) (380) (470) (549) (582) (584) (586) (587) (589) (591) (593) (600)Tax (148) (189) (246) (311) (370) (431) (495) (576) (649) (714) (779) (847) (872)FCF 451 370 459 505 558 664 776 954 1,079 1,154 1,259 1,368 1,458 Discount Rate (%) 10.0 Terminal Growth Rate (%) 3.0 PV of FCF 603 641 716 737 716 711 702 10,686Total PV of FCF 15,513 Less Value of Debt 198 Add Excess Cash 2,574 Equity Value 17,890 Value per Share (HK$) 25.0 E = Morgan Stanley Research estimates. Source: Company data, Morgan Stanley Research
Peer Valuation Comparison
Target Share Mkt Cap 09-11 EPS P/BCompany Name Rating Price Price (US$ mn) 2009 2010e 2011e Growth e 2009 2009 2010e
0322.HK Tingyi (Cayman Islands) E 19.00 18.30 13,175 34.4e 29.1 23.9 20.0% 9.0e 1.4e 1.70220.HK Uni-President China O 5.60 5.36 2,487 20.1e 18.7 15.9 12.3% 2.7e 1.0e 1.50151.HK Want Want China Holdings Ltd E 5.50 5.48 9,326 32.1e 25.1 20.6 24.8% 9.7e 2.8e 1.22319.HK China Mengniu Dairy O 32.00 27.25 5,484 30.4e 26.7 21.8 17.9% 5.0e 0.7e 0.70506.HK China Foods Limited O 7.30 7.70 2,770 33.7e 24.9 20.3 28.7% 3.9e 1.1e 1.41886.HK China Huiyuan Juice Group Ltd. NC NA 5.67 1,074 NM 48.1 37.8 NM 1.6 1.60 NA2897.T Nissin Foods Holdings E 3,000.00 2,947.00 3,969 18.8e 16.2 15.9 9.0% 1.2e 2.0e 2.02503.T Kirin Holdings O 1,800.00 1,477.00 15,534 27.6e 26.6 22.4 11.2% 1.4e 1.6e 1.7004370.KS Nong Shim E 260,000 252,500 1,368 11.8e 10.1 9.1 13.8% 1.3e 1.8e 1.8INDF.JK Indofood Sukses Makmur E 4,100 3,725 3,561 20.6e 16.7 13.7 22.5% 3.2e 1.5e 1.8KO.N Coca-Cola Co. NC NA 57.13 132,381 18.7 16.8 15.3 10.6% 6.5 2.6 2.9 PEP.N PepsiCo Inc. NC NA 62.80 98,305 16.9 15.0 13.4 12.3% 8.1 2.5 2.9 NESN.VX Nestle O 58.00 49.35 179,119 17.0e 15.5 14.3 9.1% 3.4e 3.0e 3.3Source: Morgan Stanley Research estimates. Factset consensus estimates f or companies not cov ered (NC). NM = Not Meaningf ul. NA = Not Av ailable
P/E Div Yield (%)
Note: Share prices in local currency as of January 14, 2010.
Long-term Valuation Methodology Our long-term price target is based on our DCF valuation, which assumes a 10% WACC (10% cost of equity on 4% risk-free rate, 6% risk premium and 1x beta), and 3% terminal growth.
Risks Downside risks to achieving our long-term value include 1) slower sales growth as per capita consumption does not grow as fast as forecast despite rising affordability; 2) greater than expected rise in input costs; and 3) intensified competition, leading to price war or excessive promotion expenses.
On the upside, we see risks of 1) higher sales growth due to promotions or a stronger demand pickup amid economic recovery; and 2) less gross margin pressure from raw material price increases.
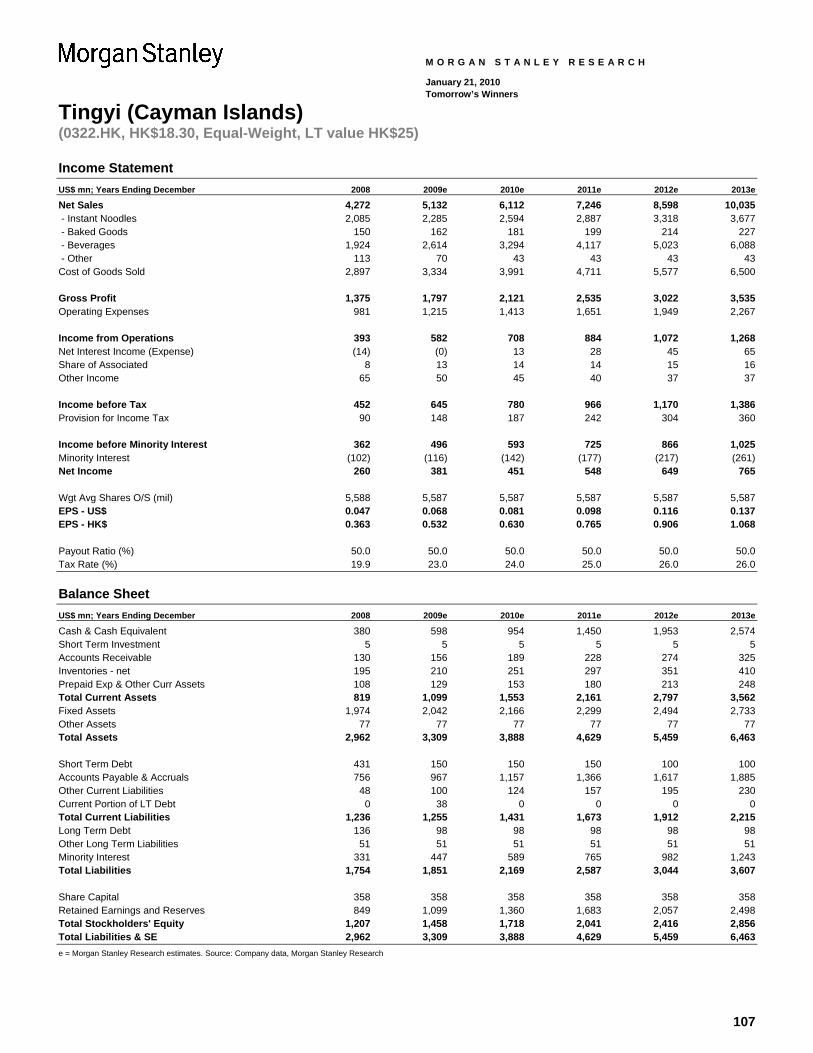
107
Tingyi (Cayman Islands) (0322.HK, HK$18.30, Equal-Weight, LT value HK$25)
M O R G A N S T A N L E Y R E S E A R C H
January 21, 2010 Tomorrow’s Winners
Income Statement US$ mn; Years Ending December 2008 2009e 2010e 2011e 2012e 2013e Net Sales 4,272 5,132 6,112 7,246 8,598 10,035 - Instant Noodles 2,085 2,285 2,594 2,887 3,318 3,677 - Baked Goods 150 162 181 199 214 227 - Beverages 1,924 2,614 3,294 4,117 5,023 6,088 - Other 113 70 43 43 43 43 Cost of Goods Sold 2,897 3,334 3,991 4,711 5,577 6,500 Gross Profit 1,375 1,797 2,121 2,535 3,022 3,535 Operating Expenses 981 1,215 1,413 1,651 1,949 2,267 Income from Operations 393 582 708 884 1,072 1,268 Net Interest Income (Expense) (14) (0) 13 28 45 65 Share of Associated 8 13 14 14 15 16 Other Income 65 50 45 40 37 37 Income before Tax 452 645 780 966 1,170 1,386 Provision for Income Tax 90 148 187 242 304 360 Income before Minority Interest 362 496 593 725 866 1,025 Minority Interest (102) (116) (142) (177) (217) (261) Net Income 260 381 451 548 649 765 Wgt Avg Shares O/S (mil) 5,588 5,587 5,587 5,587 5,587 5,587 EPS - US$ 0.047 0.068 0.081 0.098 0.116 0.137 EPS - HK$ 0.363 0.532 0.630 0.765 0.906 1.068 Payout Ratio (%) 50.0 50.0 50.0 50.0 50.0 50.0 Tax Rate (%) 19.9 23.0 24.0 25.0 26.0 26.0
Balance Sheet US$ mn; Years Ending December 2008 2009e 2010e 2011e 2012e 2013e Cash & Cash Equivalent 380 598 954 1,450 1,953 2,574 Short Term Investment 5 5 5 5 5 5 Accounts Receivable 130 156 189 228 274 325 Inventories - net 195 210 251 297 351 410 Prepaid Exp & Other Curr Assets 108 129 153 180 213 248 Total Current Assets 819 1,099 1,553 2,161 2,797 3,562 Fixed Assets 1,974 2,042 2,166 2,299 2,494 2,733 Other Assets 77 77 77 77 77 77 Total Assets 2,962 3,309 3,888 4,629 5,459 6,463 Short Term Debt 431 150 150 150 100 100 Accounts Payable & Accruals 756 967 1,157 1,366 1,617 1,885 Other Current Liabilities 48 100 124 157 195 230 Current Portion of LT Debt 0 38 0 0 0 0 Total Current Liabilities 1,236 1,255 1,431 1,673 1,912 2,215 Long Term Debt 136 98 98 98 98 98 Other Long Term Liabilities 51 51 51 51 51 51 Minority Interest 331 447 589 765 982 1,243 Total Liabilities 1,754 1,851 2,169 2,587 3,044 3,607 Share Capital 358 358 358 358 358 358 Retained Earnings and Reserves 849 1,099 1,360 1,683 2,057 2,498 Total Stockholders' Equity 1,207 1,458 1,718 2,041 2,416 2,856 Total Liabilities & SE 2,962 3,309 3,888 4,629 5,459 6,463 e = Morgan Stanley Research estimates. Source: Company data, Morgan Stanley Research
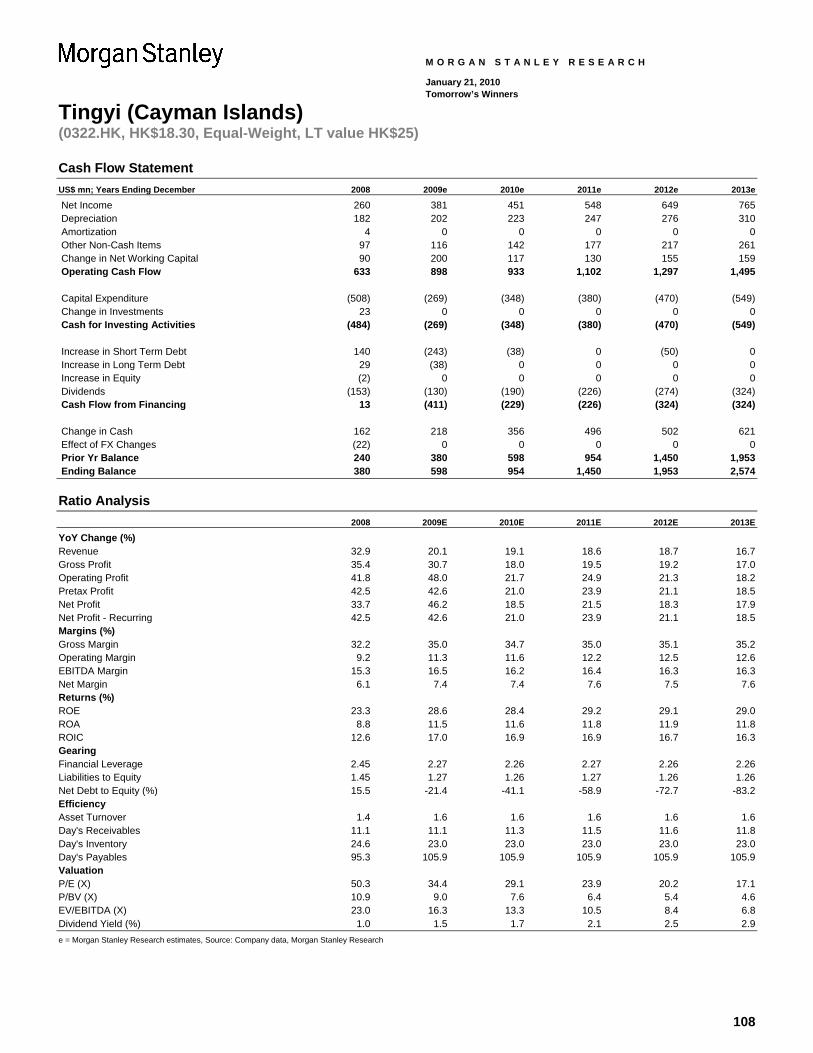
108
Tingyi (Cayman Islands) (0322.HK, HK$18.30, Equal-Weight, LT value HK$25)
M O R G A N S T A N L E Y R E S E A R C H
January 21, 2010 Tomorrow’s Winners
Cash Flow Statement US$ mn; Years Ending December 2008 2009e 2010e 2011e 2012e 2013e Net Income 260 381 451 548 649 765 Depreciation 182 202 223 247 276 310 Amortization 4 0 0 0 0 0 Other Non-Cash Items 97 116 142 177 217 261 Change in Net Working Capital 90 200 117 130 155 159 Operating Cash Flow 633 898 933 1,102 1,297 1,495 Capital Expenditure (508) (269) (348) (380) (470) (549) Change in Investments 23 0 0 0 0 0 Cash for Investing Activities (484) (269) (348) (380) (470) (549) Increase in Short Term Debt 140 (243) (38) 0 (50) 0 Increase in Long Term Debt 29 (38) 0 0 0 0 Increase in Equity (2) 0 0 0 0 0 Dividends (153) (130) (190) (226) (274) (324) Cash Flow from Financing 13 (411) (229) (226) (324) (324) Change in Cash 162 218 356 496 502 621 Effect of FX Changes (22) 0 0 0 0 0 Prior Yr Balance 240 380 598 954 1,450 1,953 Ending Balance 380 598 954 1,450 1,953 2,574
Ratio Analysis 2008 2009E 2010E 2011E 2012E 2013E YoY Change (%) Revenue 32.9 20.1 19.1 18.6 18.7 16.7 Gross Profit 35.4 30.7 18.0 19.5 19.2 17.0 Operating Profit 41.8 48.0 21.7 24.9 21.3 18.2 Pretax Profit 42.5 42.6 21.0 23.9 21.1 18.5 Net Profit 33.7 46.2 18.5 21.5 18.3 17.9 Net Profit - Recurring 42.5 42.6 21.0 23.9 21.1 18.5 Margins (%) Gross Margin 32.2 35.0 34.7 35.0 35.1 35.2 Operating Margin 9.2 11.3 11.6 12.2 12.5 12.6 EBITDA Margin 15.3 16.5 16.2 16.4 16.3 16.3 Net Margin 6.1 7.4 7.4 7.6 7.5 7.6 Returns (%) ROE 23.3 28.6 28.4 29.2 29.1 29.0 ROA 8.8 11.5 11.6 11.8 11.9 11.8 ROIC 12.6 17.0 16.9 16.9 16.7 16.3 Gearing Financial Leverage 2.45 2.27 2.26 2.27 2.26 2.26 Liabilities to Equity 1.45 1.27 1.26 1.27 1.26 1.26 Net Debt to Equity (%) 15.5 -21.4 -41.1 -58.9 -72.7 -83.2 Efficiency Asset Turnover 1.4 1.6 1.6 1.6 1.6 1.6 Day's Receivables 11.1 11.1 11.3 11.5 11.6 11.8 Day's Inventory 24.6 23.0 23.0 23.0 23.0 23.0 Day's Payables 95.3 105.9 105.9 105.9 105.9 105.9 Valuation P/E (X) 50.3 34.4 29.1 23.9 20.2 17.1 P/BV (X) 10.9 9.0 7.6 6.4 5.4 4.6 EV/EBITDA (X) 23.0 16.3 13.3 10.5 8.4 6.8 Dividend Yield (%) 1.0 1.5 1.7 2.1 2.5 2.9 e = Morgan Stanley Research estimates, Source: Company data, Morgan Stanley Research
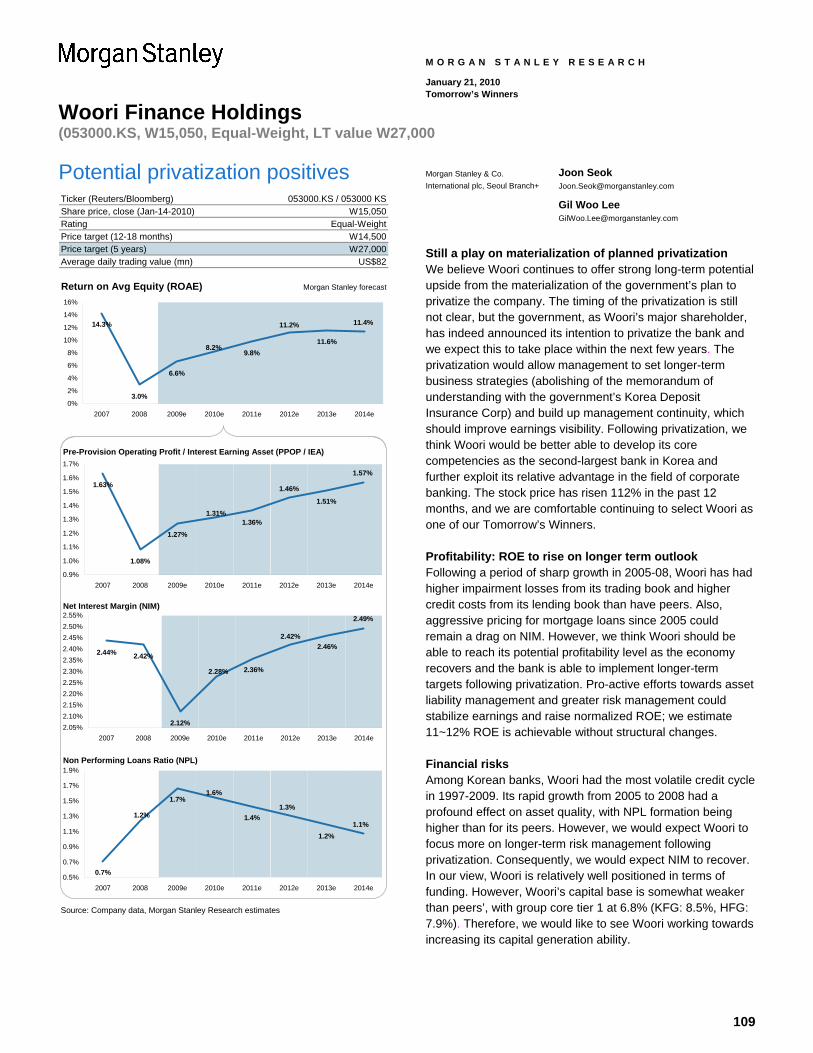
109
Woori Finance Holdings (053000.KS, W15,050, Equal-Weight, LT value W27,000
M O R G A N S T A N L E Y R E S E A R C H
January 21, 2010 Tomorrow’s Winners
Potential privatization positives Ticker (Reuters/Bloomberg)Share price, close (Jan-14-2010)RatingPrice target (12-18 months)Price target (5 years) W27,000Average daily trading value (mn)
Return on Avg Equity (ROAE) Morgan Stanley forecast
Pre-Provision Operating Profit / Interest Earning Asset (PPOP / IEA)
Net Interest Margin (NIM)
Non Performing Loans Ratio (NPL)
Source: Company data, Morgan Stanley Research estimates
US$82
053000.KS / 053000 KSW15,050
Equal-WeightW14,500
14.3%
3.0%
6.6%
9.8%11.6%
11.4%11.2%
8.2%
0%
2%
4%
6%
8%
10%
12%
14%
16%
2007 2008 2009e 2010e 2011e 2012e 2013e 2014e
1.63%
1.08%
1.27%1.36%
1.51%1.31%
1.46%
1.57%
0.9%
1.0%
1.1%
1.2%
1.3%
1.4%
1.5%
1.6%
1.7%
2007 2008 2009e 2010e 2011e 2012e 2013e 2014e
2.44% 2.42%
2.12%
2.36%
2.46%
2.28%
2.42%
2.49%
2.05%2.10%2.15%2.20%2.25%2.30%2.35%2.40%2.45%2.50%2.55%
2007 2008 2009e 2010e 2011e 2012e 2013e 2014e
0.7%
1.7%
1.4%
1.2%
1.2%
1.6%
1.3%
1.1%
0.5%
0.7%
0.9%
1.1%
1.3%
1.5%
1.7%
1.9%
2007 2008 2009e 2010e 2011e 2012e 2013e 2014e
Morgan Stanley & Co. International plc, Seoul Branch+
Joon Seok [email protected]
Gil Woo Lee [email protected]
Still a play on materialization of planned privatization We believe Woori continues to offer strong long-term potential upside from the materialization of the government’s plan to privatize the company. The timing of the privatization is still not clear, but the government, as Woori’s major shareholder, has indeed announced its intention to privatize the bank and we expect this to take place within the next few years. The privatization would allow management to set longer-term business strategies (abolishing of the memorandum of understanding with the government’s Korea Deposit Insurance Corp) and build up management continuity, which should improve earnings visibility. Following privatization, we think Woori would be better able to develop its core competencies as the second-largest bank in Korea and further exploit its relative advantage in the field of corporate banking. The stock price has risen 112% in the past 12 months, and we are comfortable continuing to select Woori as one of our Tomorrow’s Winners.
Profitability: ROE to rise on longer term outlook Following a period of sharp growth in 2005-08, Woori has had higher impairment losses from its trading book and higher credit costs from its lending book than have peers. Also, aggressive pricing for mortgage loans since 2005 could remain a drag on NIM. However, we think Woori should be able to reach its potential profitability level as the economy recovers and the bank is able to implement longer-term targets following privatization. Pro-active efforts towards asset liability management and greater risk management could stabilize earnings and raise normalized ROE; we estimate 11~12% ROE is achievable without structural changes.
Financial risks Among Korean banks, Woori had the most volatile credit cycle in 1997-2009. Its rapid growth from 2005 to 2008 had a profound effect on asset quality, with NPL formation being higher than for its peers. However, we would expect Woori to focus more on longer-term risk management following privatization. Consequently, we would expect NIM to recover. In our view, Woori is relatively well positioned in terms of funding. However, Woori’s capital base is somewhat weaker than peers’, with group core tier 1 at 6.8% (KFG: 8.5%, HFG: 7.9%). Therefore, we would like to see Woori working towards increasing its capital generation ability.
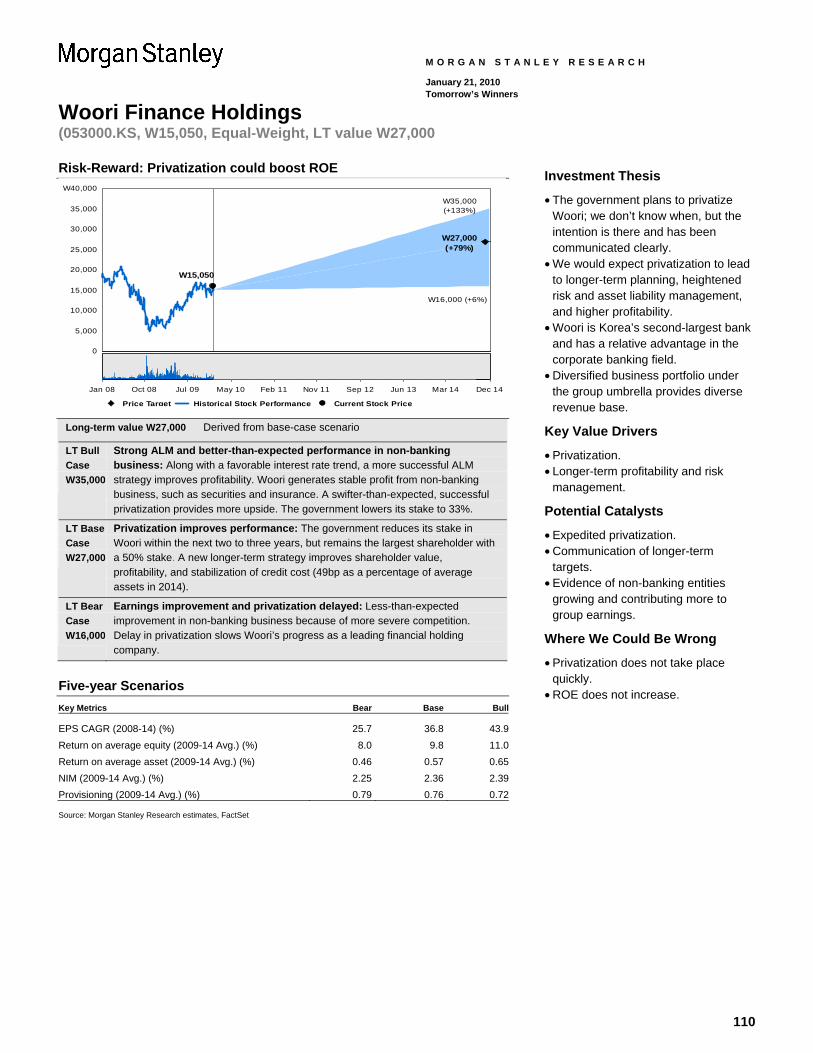
110
Woori Finance Holdings (053000.KS, W15,050, Equal-Weight, LT value W27,000
M O R G A N S T A N L E Y R E S E A R C H
January 21, 2010 Tomorrow’s Winners
Risk-Reward: Privatization could boost ROE
0
5,000
10,000
15,000
20,000
25,000
30,000
35,000
W40,000
W35,000(+133%)
W27,000(+79%)
W16,000 (+6%)
W15,050
Price Target Historical Stock Performance Current Stock Price
Jan 08 Oct 08 Jul 09 May 10 Feb 11 Nov 11 Sep 12 Jun 13 Mar 14 Dec 14
Long-term value W27,000 Derived from base-case scenario
LT Bull Case W35,000
Strong ALM and better-than-expected performance in non-banking business: Along with a favorable interest rate trend, a more successful ALM strategy improves profitability. Woori generates stable profit from non-banking business, such as securities and insurance. A swifter-than-expected, successful privatization provides more upside. The government lowers its stake to 33%.
LT Base Case W27,000
Privatization improves performance: The government reduces its stake in Woori within the next two to three years, but remains the largest shareholder with a 50% stake. A new longer-term strategy improves shareholder value, profitability, and stabilization of credit cost (49bp as a percentage of average assets in 2014).
LT Bear Case W16,000
Earnings improvement and privatization delayed: Less-than-expected improvement in non-banking business because of more severe competition. Delay in privatization slows Woori’s progress as a leading financial holding company.
Five-year Scenarios Key Metrics Bear Base Bull
EPS CAGR (2008-14) (%) 25.7 36.8 43.9Return on average equity (2009-14 Avg.) (%) 8.0 9.8 11.0Return on average asset (2009-14 Avg.) (%) 0.46 0.57 0.65NIM (2009-14 Avg.) (%) 2.25 2.36 2.39Provisioning (2009-14 Avg.) (%) 0.79 0.76 0.72 Source: Morgan Stanley Research estimates, FactSet
Investment Thesis
• The government plans to privatize Woori; we don’t know when, but the intention is there and has been communicated clearly.
• We would expect privatization to lead to longer-term planning, heightened risk and asset liability management, and higher profitability.
• Woori is Korea’s second-largest bank and has a relative advantage in the corporate banking field.
• Diversified business portfolio under the group umbrella provides diverse revenue base.
Key Value Drivers
• Privatization. • Longer-term profitability and risk
management.
Potential Catalysts
• Expedited privatization. • Communication of longer-term
targets. • Evidence of non-banking entities
growing and contributing more to group earnings.
Where We Could Be Wrong
• Privatization does not take place quickly.
• ROE does not increase.
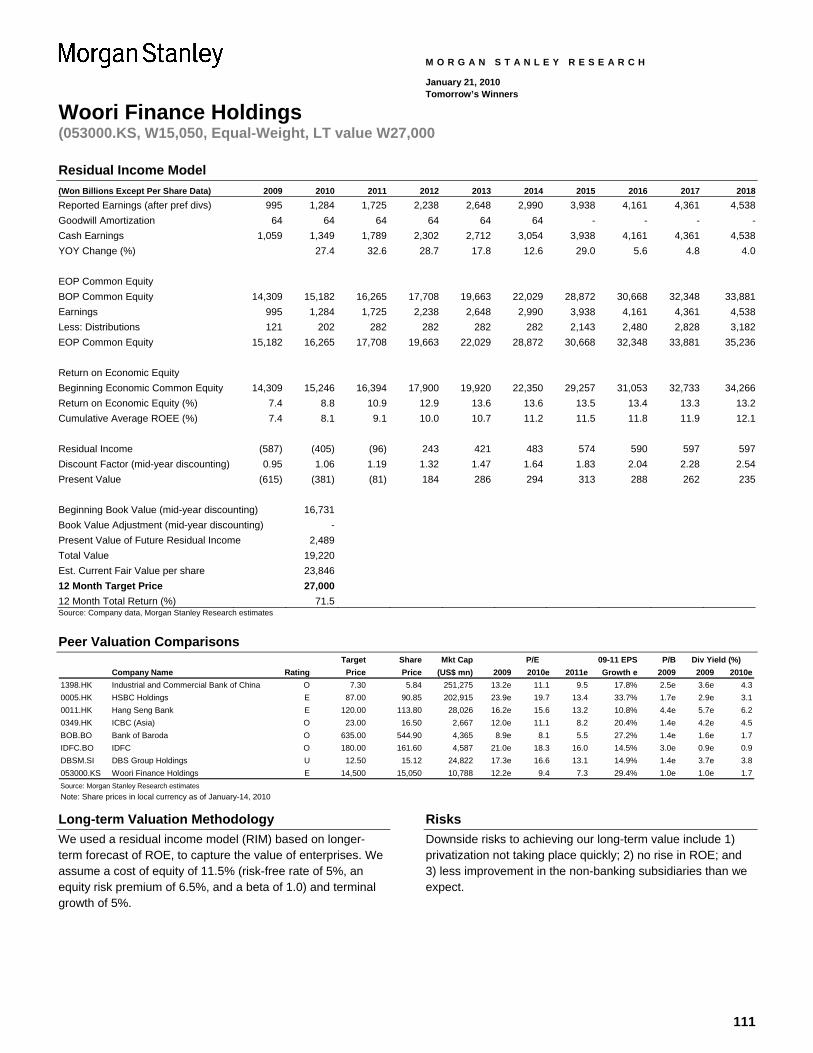
111
Woori Finance Holdings (053000.KS, W15,050, Equal-Weight, LT value W27,000
M O R G A N S T A N L E Y R E S E A R C H
January 21, 2010 Tomorrow’s Winners
Residual Income Model (Won Billions Except Per Share Data) 2009 2010 2011 2012 2013 2014 2015 2016 2017 2018Reported Earnings (after pref divs) 995 1,284 1,725 2,238 2,648 2,990 3,938 4,161 4,361 4,538Goodwill Amortization 64 64 64 64 64 64 - - - -Cash Earnings 1,059 1,349 1,789 2,302 2,712 3,054 3,938 4,161 4,361 4,538YOY Change (%) 27.4 32.6 28.7 17.8 12.6 29.0 5.6 4.8 4.0 EOP Common Equity BOP Common Equity 14,309 15,182 16,265 17,708 19,663 22,029 28,872 30,668 32,348 33,881Earnings 995 1,284 1,725 2,238 2,648 2,990 3,938 4,161 4,361 4,538Less: Distributions 121 202 282 282 282 282 2,143 2,480 2,828 3,182EOP Common Equity 15,182 16,265 17,708 19,663 22,029 28,872 30,668 32,348 33,881 35,236 Return on Economic Equity Beginning Economic Common Equity 14,309 15,246 16,394 17,900 19,920 22,350 29,257 31,053 32,733 34,266Return on Economic Equity (%) 7.4 8.8 10.9 12.9 13.6 13.6 13.5 13.4 13.3 13.2Cumulative Average ROEE (%) 7.4 8.1 9.1 10.0 10.7 11.2 11.5 11.8 11.9 12.1 Residual Income (587) (405) (96) 243 421 483 574 590 597 597Discount Factor (mid-year discounting) 0.95 1.06 1.19 1.32 1.47 1.64 1.83 2.04 2.28 2.54Present Value (615) (381) (81) 184 286 294 313 288 262 235 Beginning Book Value (mid-year discounting) 16,731 Book Value Adjustment (mid-year discounting) - Present Value of Future Residual Income 2,489 Total Value 19,220 Est. Current Fair Value per share 23,846 12 Month Target Price 27,000 12 Month Total Return (%) 71.5 Source: Company data, Morgan Stanley Research estimates
Peer Valuation Comparisons
Target Share Mkt Cap 09-11 EPS P/BCompany Name Rating Price Price (US$ mn) 2009 2010e 2011e Growth e 2009 2009 2010e
1398.HK Industrial and Commercial Bank of China O 7.30 5.84 251,275 13.2e 11.1 9.5 17.8% 2.5e 3.6e 4.30005.HK HSBC Holdings E 87.00 90.85 202,915 23.9e 19.7 13.4 33.7% 1.7e 2.9e 3.10011.HK Hang Seng Bank E 120.00 113.80 28,026 16.2e 15.6 13.2 10.8% 4.4e 5.7e 6.20349.HK ICBC (Asia) O 23.00 16.50 2,667 12.0e 11.1 8.2 20.4% 1.4e 4.2e 4.5BOB.BO Bank of Baroda O 635.00 544.90 4,365 8.9e 8.1 5.5 27.2% 1.4e 1.6e 1.7IDFC.BO IDFC O 180.00 161.60 4,587 21.0e 18.3 16.0 14.5% 3.0e 0.9e 0.9DBSM.SI DBS Group Holdings U 12.50 15.12 24,822 17.3e 16.6 13.1 14.9% 1.4e 3.7e 3.8053000.KS Woori Finance Holdings E 14,500 15,050 10,788 12.2e 9.4 7.3 29.4% 1.0e 1.0e 1.7Source: Morgan Stanley Research estimates
P/E Div Yield (%)
Note: Share prices in local currency as of January-14, 2010
Long-term Valuation Methodology We used a residual income model (RIM) based on longer-term forecast of ROE, to capture the value of enterprises. We assume a cost of equity of 11.5% (risk-free rate of 5%, an equity risk premium of 6.5%, and a beta of 1.0) and terminal growth of 5%.
Risks Downside risks to achieving our long-term value include 1) privatization not taking place quickly; 2) no rise in ROE; and 3) less improvement in the non-banking subsidiaries than we expect.
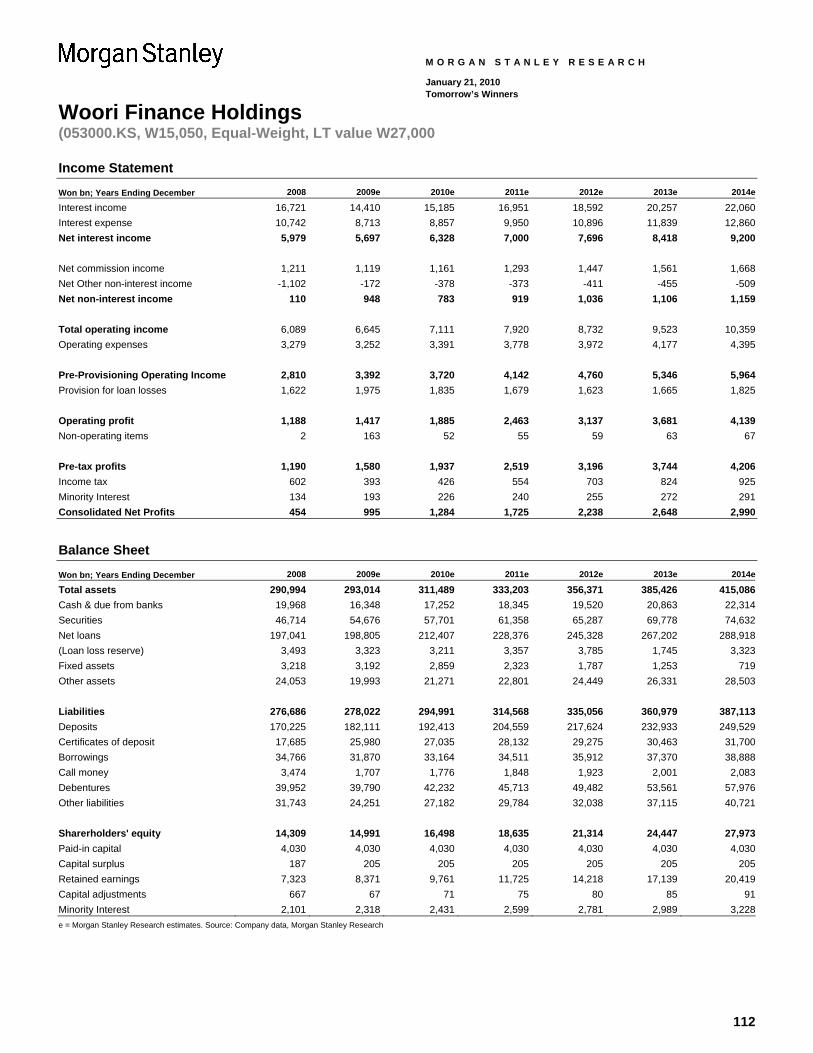
112
Woori Finance Holdings (053000.KS, W15,050, Equal-Weight, LT value W27,000
M O R G A N S T A N L E Y R E S E A R C H
January 21, 2010 Tomorrow’s Winners
Income Statement
Won bn; Years Ending December 2008 2009e 2010e 2011e 2012e 2013e 2014e
Interest income 16,721 14,410 15,185 16,951 18,592 20,257 22,060Interest expense 10,742 8,713 8,857 9,950 10,896 11,839 12,860Net interest income 5,979 5,697 6,328 7,000 7,696 8,418 9,200 Net commission income 1,211 1,119 1,161 1,293 1,447 1,561 1,668Net Other non-interest income -1,102 -172 -378 -373 -411 -455 -509Net non-interest income 110 948 783 919 1,036 1,106 1,159 Total operating income 6,089 6,645 7,111 7,920 8,732 9,523 10,359Operating expenses 3,279 3,252 3,391 3,778 3,972 4,177 4,395 Pre-Provisioning Operating Income 2,810 3,392 3,720 4,142 4,760 5,346 5,964Provision for loan losses 1,622 1,975 1,835 1,679 1,623 1,665 1,825 Operating profit 1,188 1,417 1,885 2,463 3,137 3,681 4,139Non-operating items 2 163 52 55 59 63 67 Pre-tax profits 1,190 1,580 1,937 2,519 3,196 3,744 4,206Income tax 602 393 426 554 703 824 925Minority Interest 134 193 226 240 255 272 291Consolidated Net Profits 454 995 1,284 1,725 2,238 2,648 2,990
Balance Sheet
Won bn; Years Ending December 2008 2009e 2010e 2011e 2012e 2013e 2014e
Total assets 290,994 293,014 311,489 333,203 356,371 385,426 415,086Cash & due from banks 19,968 16,348 17,252 18,345 19,520 20,863 22,314Securities 46,714 54,676 57,701 61,358 65,287 69,778 74,632Net loans 197,041 198,805 212,407 228,376 245,328 267,202 288,918(Loan loss reserve) 3,493 3,323 3,211 3,357 3,785 1,745 3,323Fixed assets 3,218 3,192 2,859 2,323 1,787 1,253 719Other assets 24,053 19,993 21,271 22,801 24,449 26,331 28,503 Liabilities 276,686 278,022 294,991 314,568 335,056 360,979 387,113Deposits 170,225 182,111 192,413 204,559 217,624 232,933 249,529Certificates of deposit 17,685 25,980 27,035 28,132 29,275 30,463 31,700Borrowings 34,766 31,870 33,164 34,511 35,912 37,370 38,888Call money 3,474 1,707 1,776 1,848 1,923 2,001 2,083Debentures 39,952 39,790 42,232 45,713 49,482 53,561 57,976Other liabilities 31,743 24,251 27,182 29,784 32,038 37,115 40,721 Sharerholders' equity 14,309 14,991 16,498 18,635 21,314 24,447 27,973Paid-in capital 4,030 4,030 4,030 4,030 4,030 4,030 4,030Capital surplus 187 205 205 205 205 205 205Retained earnings 7,323 8,371 9,761 11,725 14,218 17,139 20,419Capital adjustments 667 67 71 75 80 85 91Minority Interest 2,101 2,318 2,431 2,599 2,781 2,989 3,228e = Morgan Stanley Research estimates. Source: Company data, Morgan Stanley Research
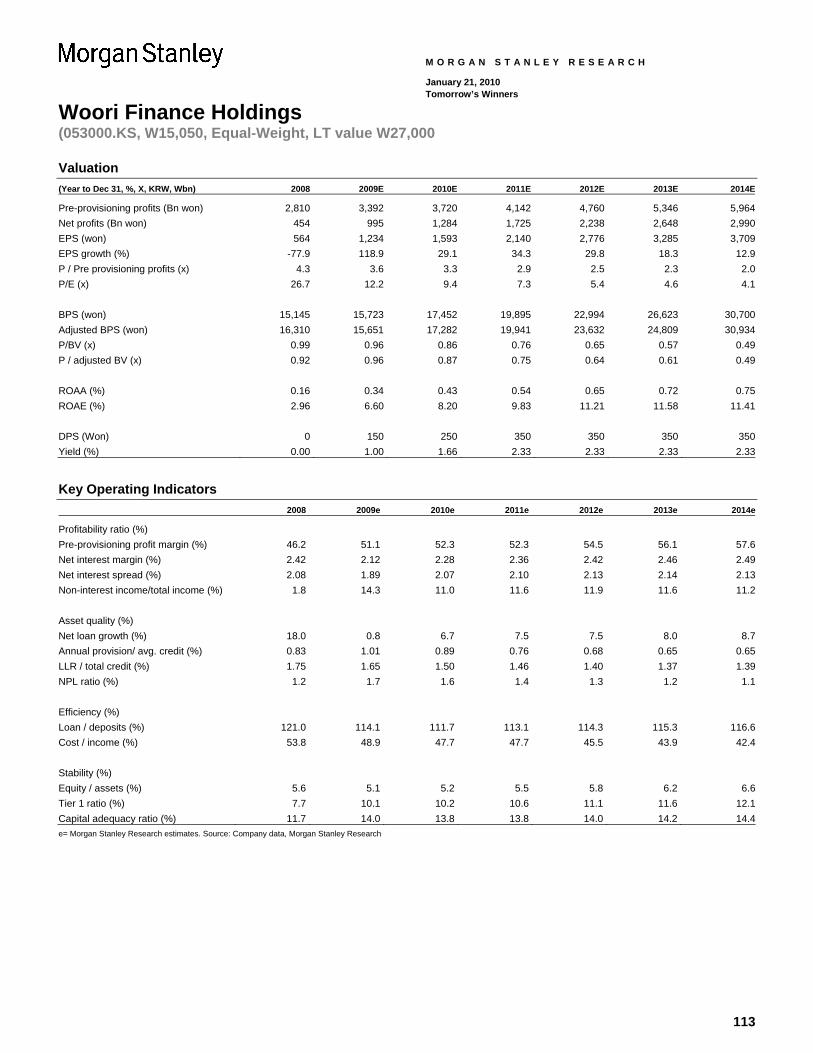
113
Woori Finance Holdings (053000.KS, W15,050, Equal-Weight, LT value W27,000
M O R G A N S T A N L E Y R E S E A R C H
January 21, 2010 Tomorrow’s Winners
Valuation (Year to Dec 31, %, X, KRW, Wbn) 2008 2009E 2010E 2011E 2012E 2013E 2014E
Pre-provisioning profits (Bn won) 2,810 3,392 3,720 4,142 4,760 5,346 5,964Net profits (Bn won) 454 995 1,284 1,725 2,238 2,648 2,990EPS (won) 564 1,234 1,593 2,140 2,776 3,285 3,709EPS growth (%) -77.9 118.9 29.1 34.3 29.8 18.3 12.9P / Pre provisioning profits (x) 4.3 3.6 3.3 2.9 2.5 2.3 2.0P/E (x) 26.7 12.2 9.4 7.3 5.4 4.6 4.1 BPS (won) 15,145 15,723 17,452 19,895 22,994 26,623 30,700Adjusted BPS (won) 16,310 15,651 17,282 19,941 23,632 24,809 30,934P/BV (x) 0.99 0.96 0.86 0.76 0.65 0.57 0.49P / adjusted BV (x) 0.92 0.96 0.87 0.75 0.64 0.61 0.49 ROAA (%) 0.16 0.34 0.43 0.54 0.65 0.72 0.75ROAE (%) 2.96 6.60 8.20 9.83 11.21 11.58 11.41 DPS (Won) 0 150 250 350 350 350 350Yield (%) 0.00 1.00 1.66 2.33 2.33 2.33 2.33
Key Operating Indicators 2008 2009e 2010e 2011e 2012e 2013e 2014e
Profitability ratio (%) Pre-provisioning profit margin (%) 46.2 51.1 52.3 52.3 54.5 56.1 57.6Net interest margin (%) 2.42 2.12 2.28 2.36 2.42 2.46 2.49Net interest spread (%) 2.08 1.89 2.07 2.10 2.13 2.14 2.13Non-interest income/total income (%) 1.8 14.3 11.0 11.6 11.9 11.6 11.2 Asset quality (%) Net loan growth (%) 18.0 0.8 6.7 7.5 7.5 8.0 8.7Annual provision/ avg. credit (%) 0.83 1.01 0.89 0.76 0.68 0.65 0.65LLR / total credit (%) 1.75 1.65 1.50 1.46 1.40 1.37 1.39NPL ratio (%) 1.2 1.7 1.6 1.4 1.3 1.2 1.1 Efficiency (%) Loan / deposits (%) 121.0 114.1 111.7 113.1 114.3 115.3 116.6Cost / income (%) 53.8 48.9 47.7 47.7 45.5 43.9 42.4 Stability (%) Equity / assets (%) 5.6 5.1 5.2 5.5 5.8 6.2 6.6Tier 1 ratio (%) 7.7 10.1 10.2 10.6 11.1 11.6 12.1Capital adequacy ratio (%) 11.7 14.0 13.8 13.8 14.0 14.2 14.4e= Morgan Stanley Research estimates. Source: Company data, Morgan Stanley Research

114
M O R G A N S T A N L E Y R E S E A R C H
January 21, 2010 Tomorrow’s Winners

115
M O R G A N S T A N L E Y R E S E A R C H
January 21, 2010 Tomorrow’s Winners
Appendix
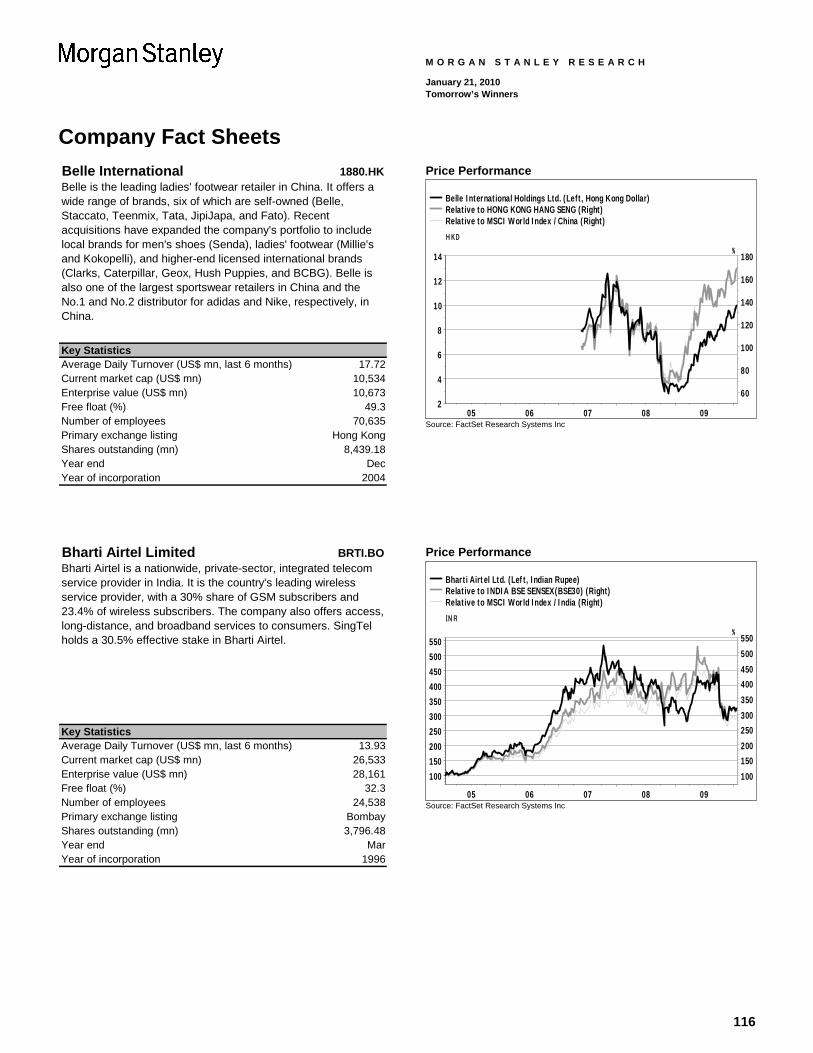
116
Company Fact Sheets
M O R G A N S T A N L E Y R E S E A R C H
January 21, 2010 Tomorrow’s Winners
Belle International 1880.HK
Key StatisticsAverage Daily Turnover (US$ mn, last 6 months) 17.72 Current market cap (US$ mn) 10,534Enterprise value (US$ mn) 10,673Free float (%) 49.3Number of employees 70,635Primary exchange listing Hong KongShares outstanding (mn) 8,439.18 Year end DecYear of incorporation 2004
Belle is the leading ladies' footwear retailer in China. It offers a wide range of brands, six of which are self-owned (Belle, Staccato, Teenmix, Tata, JipiJapa, and Fato). Recent acquisitions have expanded the company's portfolio to include local brands for men's shoes (Senda), ladies' footwear (Millie's and Kokopelli), and higher-end licensed international brands (Clarks, Caterpillar, Geox, Hush Puppies, and BCBG). Belle is also one of the largest sportswear retailers in China and the No.1 and No.2 distributor for adidas and Nike, respectively, in China.
Price Performance
05 06 07 08 092
4
6
8
10
12
14%
60
80
100
120
140
160
180
H KD
Belle International Holdings Ltd. (Left, Hong Kong Dollar)Relative to HONG KONG HANG SENG (Right)Relative to MSCI World Index /China (Right)
Source: FactSet Research Systems Inc
Bharti Airtel Limited BRTI.BO
Key StatisticsAverage Daily Turnover (US$ mn, last 6 months) 13.93 Current market cap (US$ mn) 26,533Enterprise value (US$ mn) 28,161Free float (%) 32.3Number of employees 24,538Primary exchange listing BombayShares outstanding (mn) 3,796.48 Year end MarYear of incorporation 1996
Bharti Airtel is a nationwide, private-sector, integrated telecom service provider in India. It is the country's leading wireless service provider, with a 30% share of GSM subscribers and 23.4% of wireless subscribers. The company also offers access, long-distance, and broadband services to consumers. SingTel holds a 30.5% effective stake in Bharti Airtel.
Price Performance
05 06 07 08 09
100150200250300350400450500550
%
100
150200
250300
350
400450
500
550
IN R
Bharti Airtel Ltd. (Left, Indian Rupee)Relative to INDIA BSE SENSEX(BSE30) (Right)Relative to MSCI World Index /India (Right)
Source: FactSet Research Systems Inc
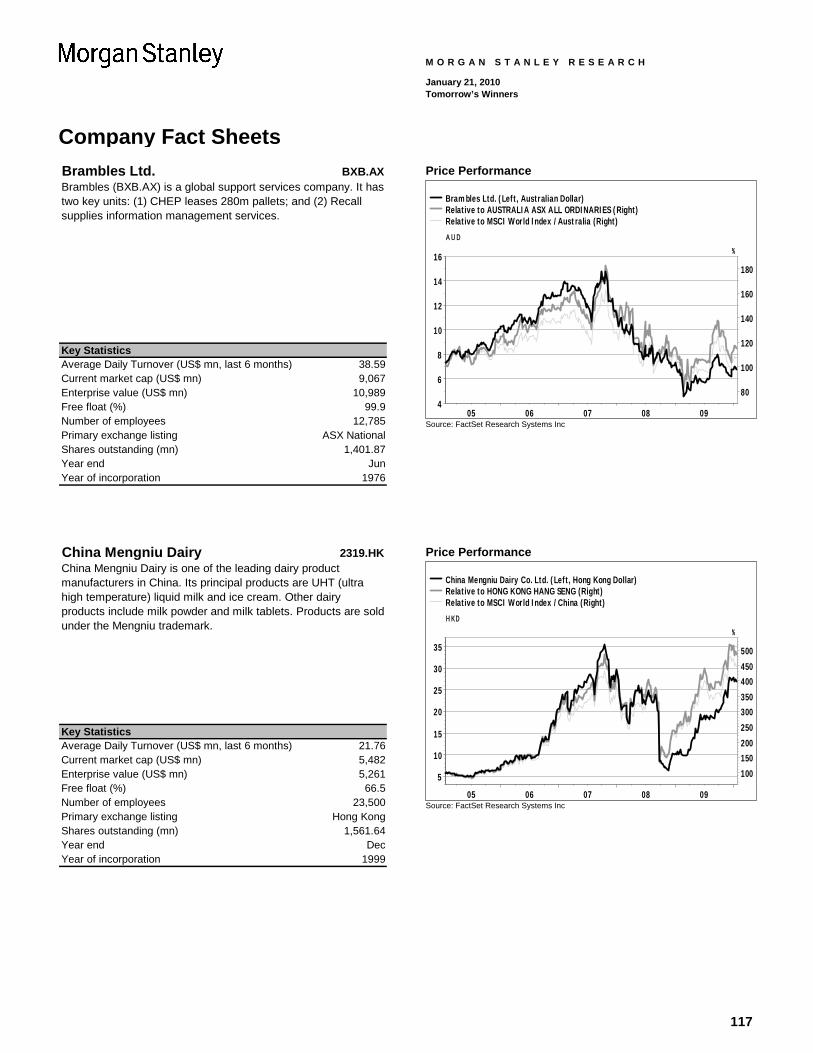
117
Company Fact Sheets
M O R G A N S T A N L E Y R E S E A R C H
January 21, 2010 Tomorrow’s Winners
Brambles Ltd. BXB.AX
Key StatisticsAverage Daily Turnover (US$ mn, last 6 months) 38.59 Current market cap (US$ mn) 9,067Enterprise value (US$ mn) 10,989Free float (%) 99.9Number of employees 12,785Primary exchange listing ASX NationalShares outstanding (mn) 1,401.87 Year end JunYear of incorporation 1976
Brambles (BXB.AX) is a global support services company. It has two key units: (1) CHEP leases 280m pallets; and (2) Recall supplies information management services.
Price Performance
05 06 07 08 094
6
8
10
12
14
16%
80
100
120
140
160
180
A U D
Brambles Ltd. (Left, Australian Dollar)Relative to AUSTRALIA ASX ALL ORDINARIES (Right)Relative to MSCI World Index /Australia (Right)
Source: FactSet Research Systems Inc
China Mengniu Dairy 2319.HK
Key StatisticsAverage Daily Turnover (US$ mn, last 6 months) 21.76 Current market cap (US$ mn) 5,482Enterprise value (US$ mn) 5,261Free float (%) 66.5Number of employees 23,500Primary exchange listing Hong KongShares outstanding (mn) 1,561.64 Year end DecYear of incorporation 1999
China Mengniu Dairy is one of the leading dairy product manufacturers in China. Its principal products are UHT (ultra high temperature) liquid milk and ice cream. Other dairy products include milk powder and milk tablets. Products are sold under the Mengniu trademark.
Price Performance
05 06 07 08 09
5
10
15
20
25
30
35
%
100
150200
250
300350
400450
500
H KD
China Mengniu Dairy Co. Ltd. (Left, Hong Kong Dollar)Relative to HONG KONG HANG SENG (Right)Relative to MSCI World Index /China (Right)
Source: FactSet Research Systems Inc
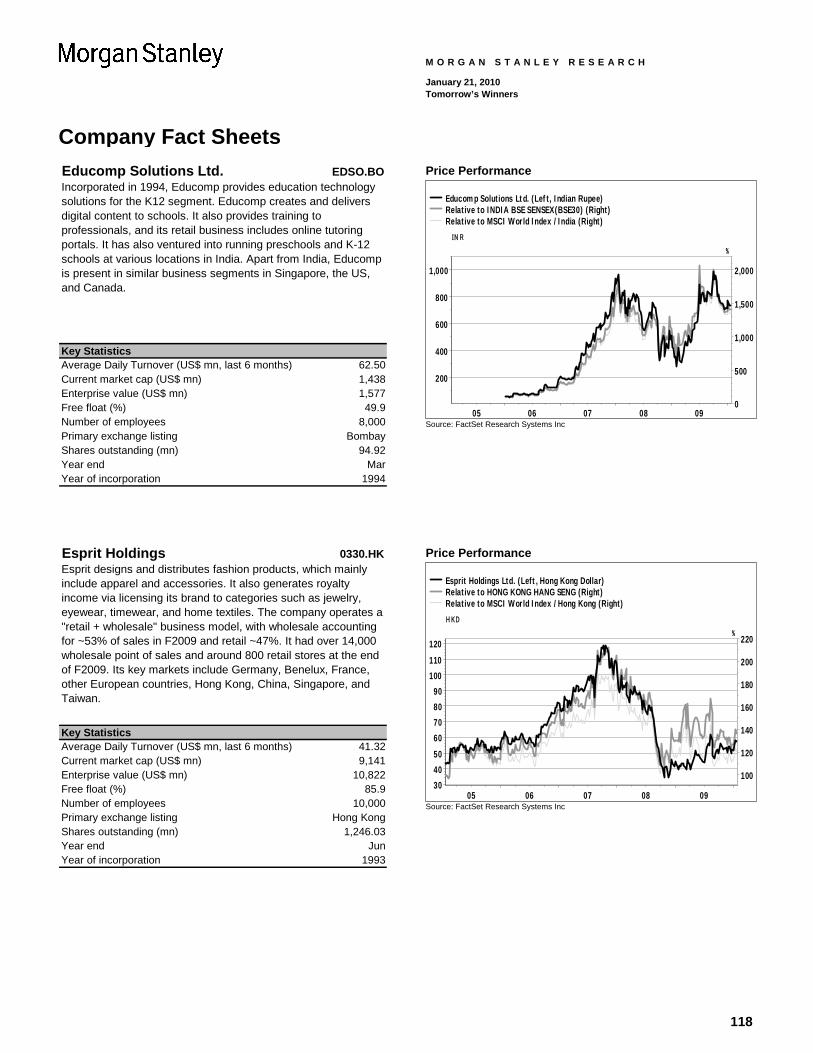
118
Company Fact Sheets
M O R G A N S T A N L E Y R E S E A R C H
January 21, 2010 Tomorrow’s Winners
Educomp Solutions Ltd. EDSO.BO
Key StatisticsAverage Daily Turnover (US$ mn, last 6 months) 62.50 Current market cap (US$ mn) 1,438Enterprise value (US$ mn) 1,577Free float (%) 49.9Number of employees 8,000Primary exchange listing BombayShares outstanding (mn) 94.92 Year end MarYear of incorporation 1994
Incorporated in 1994, Educomp provides education technology solutions for the K12 segment. Educomp creates and delivers digital content to schools. It also provides training to professionals, and its retail business includes online tutoring portals. It has also ventured into running preschools and K-12 schools at various locations in India. Apart from India, Educomp is present in similar business segments in Singapore, the US, and Canada.
Price Performance
05 06 07 08 09
200
400
600
800
1,000
%
0
500
1,000
1,500
2,000
IN R
Educomp Solutions Ltd. (Left, Indian Rupee)Relative to INDIA BSE SENSEX(BSE30) (Right)Relative to MSCI World Index /India (Right)
Source: FactSet Research Systems Inc
Esprit Holdings 0330.HK
Key StatisticsAverage Daily Turnover (US$ mn, last 6 months) 41.32 Current market cap (US$ mn) 9,141Enterprise value (US$ mn) 10,822Free float (%) 85.9Number of employees 10,000Primary exchange listing Hong KongShares outstanding (mn) 1,246.03 Year end JunYear of incorporation 1993
Esprit designs and distributes fashion products, which mainly include apparel and accessories. It also generates royalty income via licensing its brand to categories such as jewelry, eyewear, timewear, and home textiles. The company operates a "retail + wholesale" business model, with wholesale accounting for ~53% of sales in F2009 and retail ~47%. It had over 14,000 wholesale point of sales and around 800 retail stores at the end of F2009. Its key markets include Germany, Benelux, France, other European countries, Hong Kong, China, Singapore, and Taiwan.
Price Performance
05 06 07 08 0930
40
50
60
70
80
90
100
110
120%
100
120
140
160
180
200
220
H KD
Esprit Holdings Ltd. (Left, Hong Kong Dollar)Relative to HONG KONG HANG SENG (Right)Relative to MSCI World Index /Hong Kong (Right)
Source: FactSet Research Systems Inc
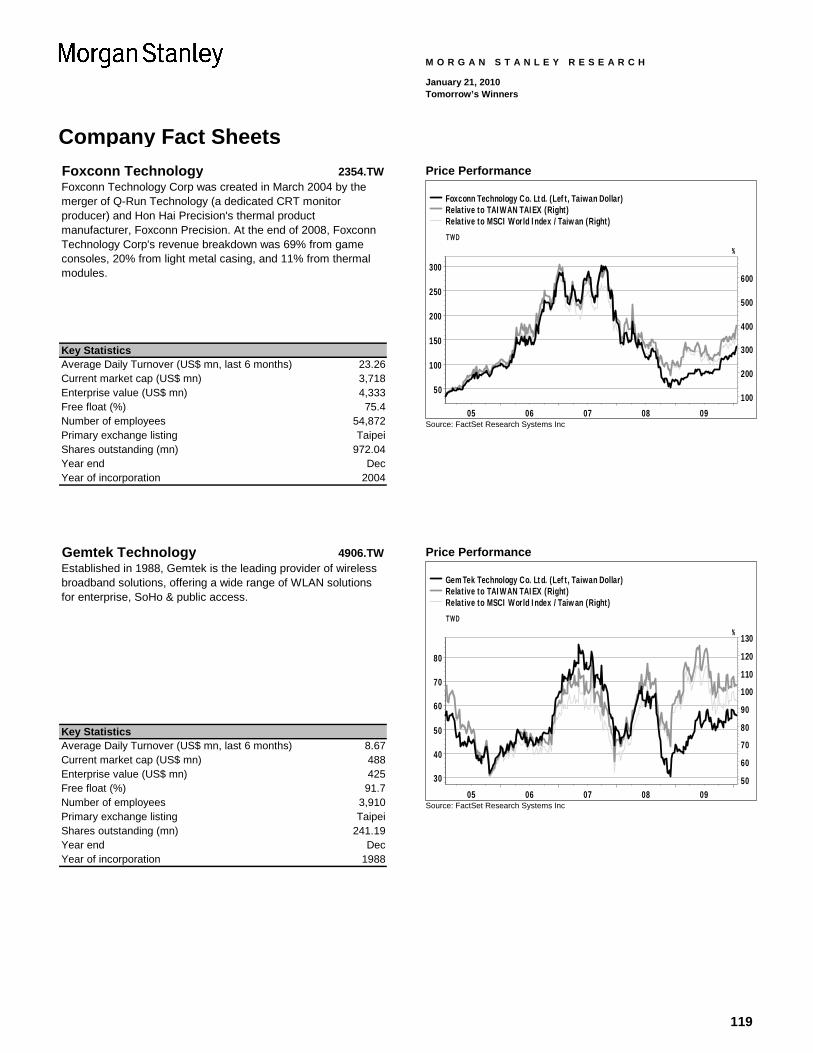
119
Company Fact Sheets
M O R G A N S T A N L E Y R E S E A R C H
January 21, 2010 Tomorrow’s Winners
Foxconn Technology 2354.TW
Key StatisticsAverage Daily Turnover (US$ mn, last 6 months) 23.26 Current market cap (US$ mn) 3,718Enterprise value (US$ mn) 4,333Free float (%) 75.4Number of employees 54,872Primary exchange listing TaipeiShares outstanding (mn) 972.04 Year end DecYear of incorporation 2004
Foxconn Technology Corp was created in March 2004 by the merger of Q-Run Technology (a dedicated CRT monitor producer) and Hon Hai Precision's thermal product manufacturer, Foxconn Precision. At the end of 2008, Foxconn Technology Corp's revenue breakdown was 69% from game consoles, 20% from light metal casing, and 11% from thermal modules.
Price Performance
05 06 07 08 09
50
100
150
200
250
300
%
100
200
300
400
500
600
TWD
Foxconn Technology C o. Ltd. (Left, Taiwan Dollar)Relative to TAIWAN TAIEX (Right)Relative to MSCI World Index /Taiwan (Right)
Source: FactSet Research Systems Inc
Gemtek Technology 4906.TW
Key StatisticsAverage Daily Turnover (US$ mn, last 6 months) 8.67 Current market cap (US$ mn) 488Enterprise value (US$ mn) 425Free float (%) 91.7Number of employees 3,910Primary exchange listing TaipeiShares outstanding (mn) 241.19 Year end DecYear of incorporation 1988
Established in 1988, Gemtek is the leading provider of wireless broadband solutions, offering a wide range of WLAN solutions for enterprise, SoHo & public access.
Price Performance
05 06 07 08 09
30
40
50
60
70
80
%
50
60
70
80
90
100
110
120
130
TWD
GemTek Technology C o. Ltd. (Left, Taiwan Dollar)Relative to TAIWAN TAIEX (Right)Relative to MSCI World Index /Taiwan (Right)
Source: FactSet Research Systems Inc
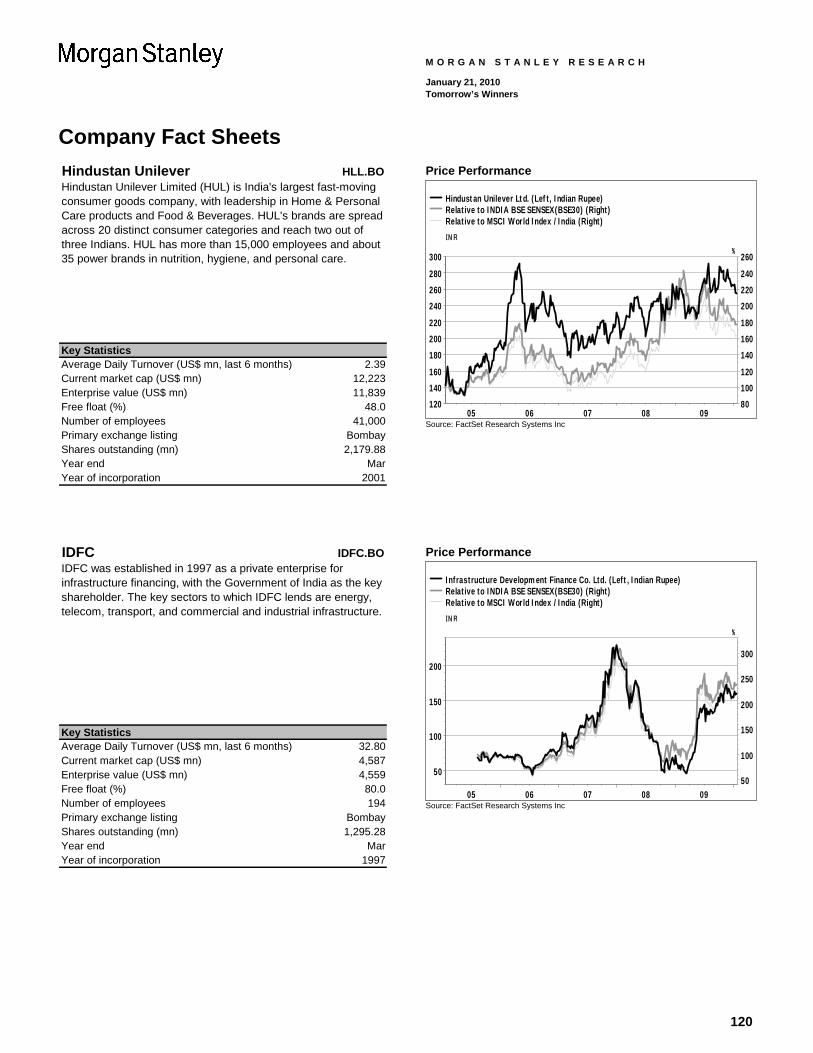
120
Company Fact Sheets
M O R G A N S T A N L E Y R E S E A R C H
January 21, 2010 Tomorrow’s Winners
Hindustan Unilever HLL.BO
Key StatisticsAverage Daily Turnover (US$ mn, last 6 months) 2.39 Current market cap (US$ mn) 12,223Enterprise value (US$ mn) 11,839Free float (%) 48.0Number of employees 41,000Primary exchange listing BombayShares outstanding (mn) 2,179.88 Year end MarYear of incorporation 2001
Hindustan Unilever Limited (HUL) is India's largest fast-moving consumer goods company, with leadership in Home & Personal Care products and Food & Beverages. HUL's brands are spread across 20 distinct consumer categories and reach two out of three Indians. HUL has more than 15,000 employees and about 35 power brands in nutrition, hygiene, and personal care.
Price Performance
05 06 07 08 09120
140
160
180
200
220
240
260
280
300%
80
100
120
140
160
180
200
220
240
260
IN R
Hindustan Unilever Ltd. (Left, Indian Rupee)Relative to INDIA BSE SENSEX(BSE30) (Right)Relative to MSCI World Index /India (Right)
Source: FactSet Research Systems Inc
IDFC IDFC.BO
Key StatisticsAverage Daily Turnover (US$ mn, last 6 months) 32.80 Current market cap (US$ mn) 4,587Enterprise value (US$ mn) 4,559Free float (%) 80.0Number of employees 194Primary exchange listing BombayShares outstanding (mn) 1,295.28 Year end MarYear of incorporation 1997
IDFC was established in 1997 as a private enterprise for infrastructure financing, with the Government of India as the key shareholder. The key sectors to which IDFC lends are energy, telecom, transport, and commercial and industrial infrastructure.
Price Performance
05 06 07 08 09
50
100
150
200
%
50
100
150
200
250
300
IN R
Infrastructure Development Finance Co. Ltd. (Left, Indian Rupee)Relative to INDIA BSE SENSEX(BSE30) (Right)Relative to MSCI World Index /India (Right)
Source: FactSet Research Systems Inc
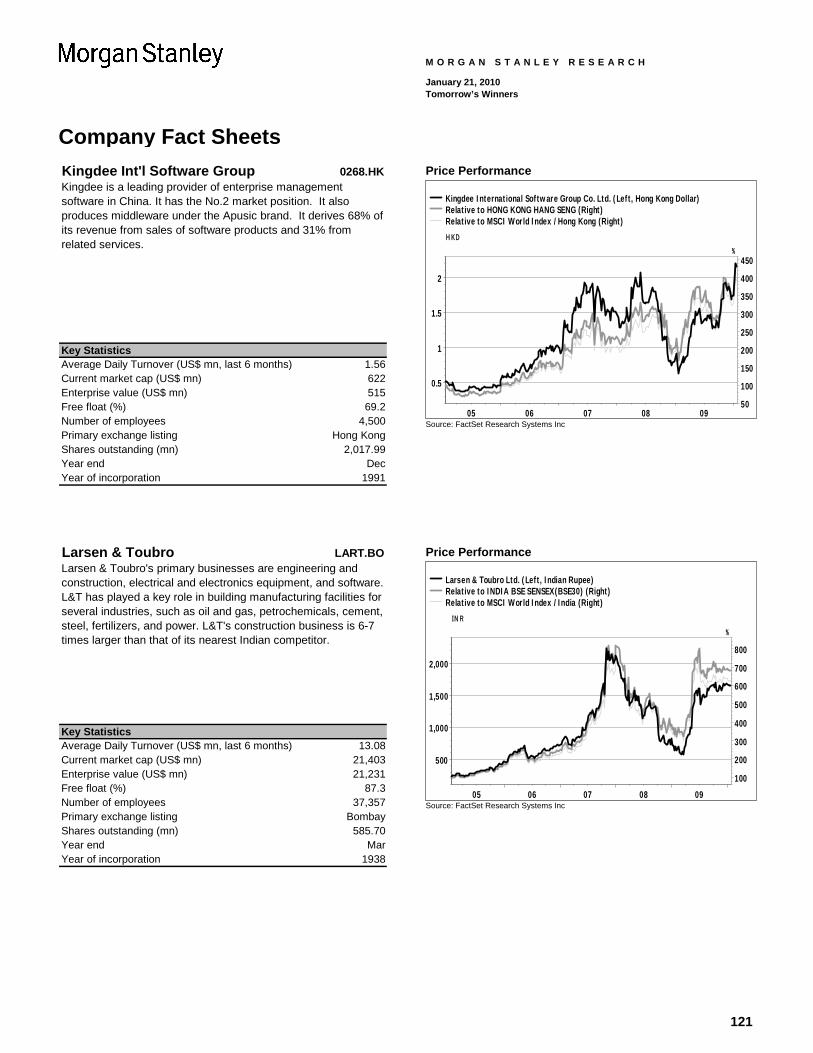
121
Company Fact Sheets
M O R G A N S T A N L E Y R E S E A R C H
January 21, 2010 Tomorrow’s Winners
Kingdee Int'l Software Group 0268.HK
Key StatisticsAverage Daily Turnover (US$ mn, last 6 months) 1.56 Current market cap (US$ mn) 622Enterprise value (US$ mn) 515Free float (%) 69.2Number of employees 4,500Primary exchange listing Hong KongShares outstanding (mn) 2,017.99 Year end DecYear of incorporation 1991
Kingdee is a leading provider of enterprise management software in China. It has the No.2 market position. It also produces middleware under the Apusic brand. It derives 68% of its revenue from sales of software products and 31% from related services.
Price Performance
05 06 07 08 09
0.5
1
1.5
2
%
50
100
150
200
250
300
350
400
450
H KD
Kingdee International Software Group Co. Ltd. (Left, Hong Kong Dollar)Relative to HONG KONG HANG SENG (Right)Relative to MSCI World Index /Hong Kong (Right)
Source: FactSet Research Systems Inc
Larsen & Toubro LART.BO
Key StatisticsAverage Daily Turnover (US$ mn, last 6 months) 13.08 Current market cap (US$ mn) 21,403Enterprise value (US$ mn) 21,231Free float (%) 87.3Number of employees 37,357Primary exchange listing BombayShares outstanding (mn) 585.70 Year end MarYear of incorporation 1938
Larsen & Toubro's primary businesses are engineering and construction, electrical and electronics equipment, and software. L&T has played a key role in building manufacturing facilities for several industries, such as oil and gas, petrochemicals, cement, steel, fertilizers, and power. L&T's construction business is 6-7 times larger than that of its nearest Indian competitor.
Price Performance
05 06 07 08 09
500
1,000
1,500
2,000
%
100
200
300
400
500
600
700
800
IN R
Larsen & Toubro Ltd. (Left, Indian Rupee)Relative to INDIA BSE SENSEX(BSE30) (Right)Relative to MSCI World Index /India (Right)
Source: FactSet Research Systems Inc
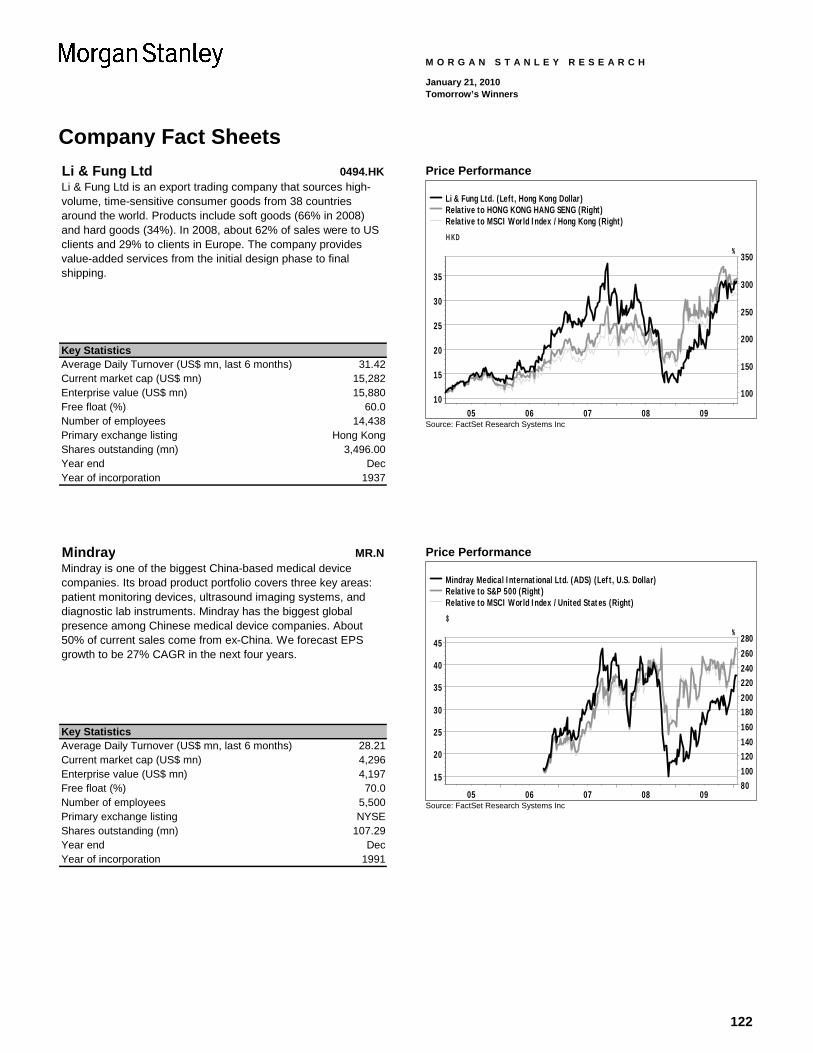
122
Company Fact Sheets
M O R G A N S T A N L E Y R E S E A R C H
January 21, 2010 Tomorrow’s Winners
Li & Fung Ltd 0494.HK
Key StatisticsAverage Daily Turnover (US$ mn, last 6 months) 31.42 Current market cap (US$ mn) 15,282Enterprise value (US$ mn) 15,880Free float (%) 60.0Number of employees 14,438Primary exchange listing Hong KongShares outstanding (mn) 3,496.00 Year end DecYear of incorporation 1937
Li & Fung Ltd is an export trading company that sources high-volume, time-sensitive consumer goods from 38 countries around the world. Products include soft goods (66% in 2008) and hard goods (34%). In 2008, about 62% of sales were to US clients and 29% to clients in Europe. The company provides value-added services from the initial design phase to final shipping.
Price Performance
05 06 07 08 0910
15
20
25
30
35
%
100
150
200
250
300
350
H KD
Li & Fung Ltd. (Left, Hong Kong Dollar)Relative to HONG KONG HANG SENG (Right)Relative to MSCI World Index /Hong Kong (Right)
Source: FactSet Research Systems Inc
Mindray MR.N
Key StatisticsAverage Daily Turnover (US$ mn, last 6 months) 28.21 Current market cap (US$ mn) 4,296Enterprise value (US$ mn) 4,197Free float (%) 70.0Number of employees 5,500Primary exchange listing NYSEShares outstanding (mn) 107.29 Year end DecYear of incorporation 1991
Mindray is one of the biggest China-based medical device companies. Its broad product portfolio covers three key areas: patient monitoring devices, ultrasound imaging systems, and diagnostic lab instruments. Mindray has the biggest global presence among Chinese medical device companies. About 50% of current sales come from ex-China. We forecast EPS growth to be 27% CAGR in the next four years.
Price Performance
05 06 07 08 09
15
20
25
30
35
40
45%
80100120140160180200220240260280
$
Mindray Medical International Ltd. (ADS) (Left, U.S. Dollar)Relative to S&P 500 (Right)Relative to MSCI World Index /United States (Right)
Source: FactSet Research Systems Inc
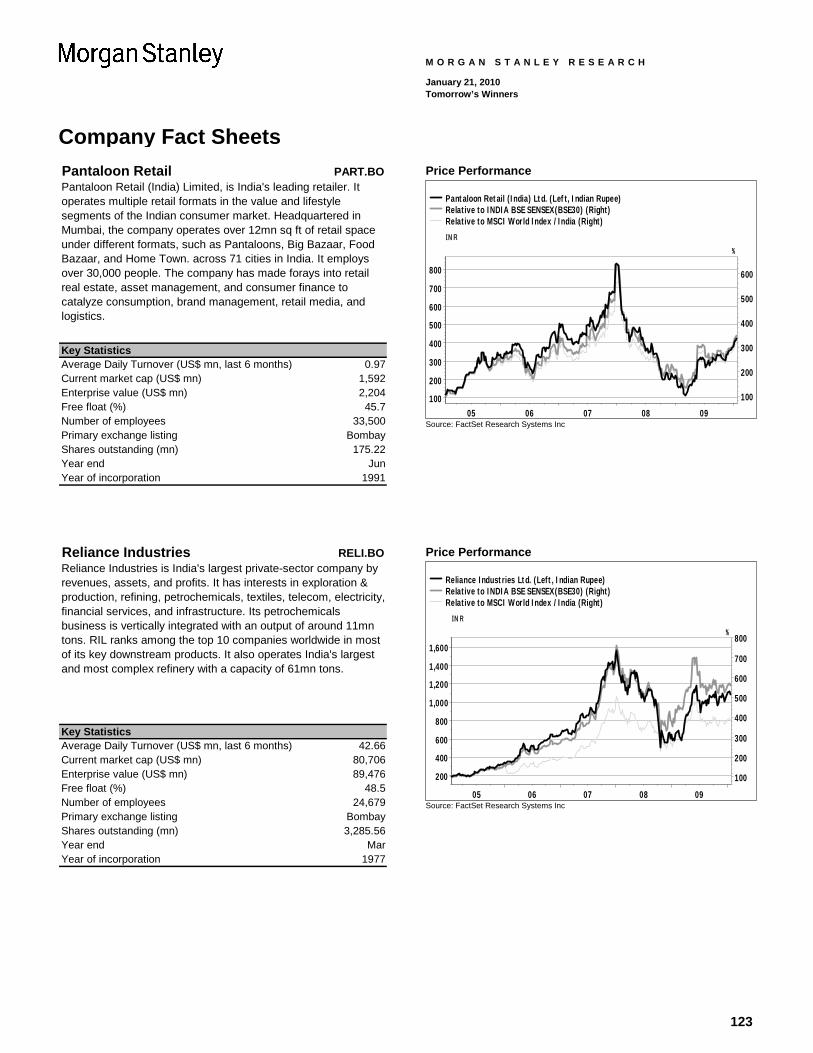
123
Company Fact Sheets
M O R G A N S T A N L E Y R E S E A R C H
January 21, 2010 Tomorrow’s Winners
Pantaloon Retail PART.BO
Key StatisticsAverage Daily Turnover (US$ mn, last 6 months) 0.97 Current market cap (US$ mn) 1,592Enterprise value (US$ mn) 2,204Free float (%) 45.7Number of employees 33,500Primary exchange listing BombayShares outstanding (mn) 175.22 Year end JunYear of incorporation 1991
Pantaloon Retail (India) Limited, is India's leading retailer. It operates multiple retail formats in the value and lifestyle segments of the Indian consumer market. Headquartered in Mumbai, the company operates over 12mn sq ft of retail space under different formats, such as Pantaloons, Big Bazaar, Food Bazaar, and Home Town. across 71 cities in India. It employs over 30,000 people. The company has made forays into retail real estate, asset management, and consumer finance to catalyze consumption, brand management, retail media, and logistics.
Price Performance
05 06 07 08 09100
200
300
400
500
600
700
800
%
100
200
300
400
500
600
IN R
Pantaloon Retail (India) Ltd. (Left, Indian Rupee)Relative to INDIA BSE SENSEX(BSE30) (Right)Relative to MSCI World Index /India (Right)
Source: FactSet Research Systems Inc
Reliance Industries RELI.BO
Key StatisticsAverage Daily Turnover (US$ mn, last 6 months) 42.66 Current market cap (US$ mn) 80,706Enterprise value (US$ mn) 89,476Free float (%) 48.5Number of employees 24,679Primary exchange listing BombayShares outstanding (mn) 3,285.56 Year end MarYear of incorporation 1977
Reliance Industries is India's largest private-sector company by revenues, assets, and profits. It has interests in exploration & production, refining, petrochemicals, textiles, telecom, electricity, financial services, and infrastructure. Its petrochemicals business is vertically integrated with an output of around 11mn tons. RIL ranks among the top 10 companies worldwide in most of its key downstream products. It also operates India's largest and most complex refinery with a capacity of 61mn tons.
Price Performance
05 06 07 08 09
200
400
600
800
1,000
1,200
1,400
1,600
%
100
200
300
400
500
600
700
800
IN R
Reliance Industries Ltd. (Left, Indian Rupee)Relative to INDIA BSE SENSEX(BSE30) (Right)Relative to MSCI World Index /India (Right)
Source: FactSet Research Systems Inc
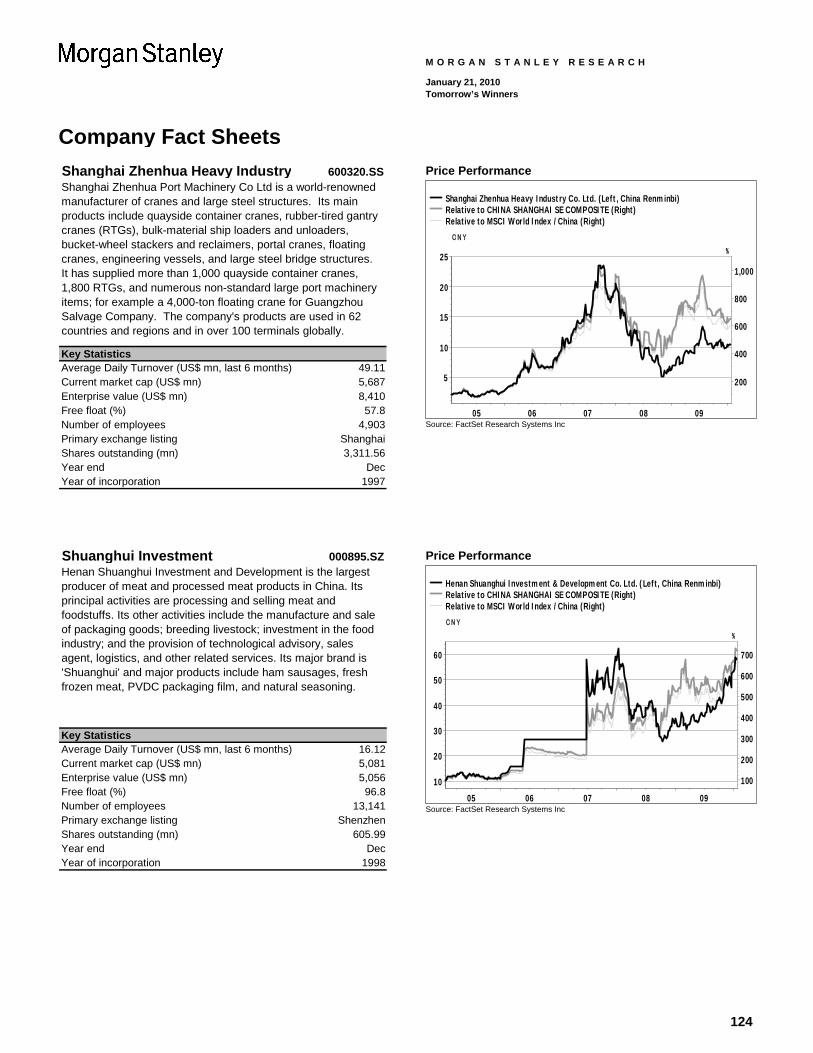
124
Company Fact Sheets
M O R G A N S T A N L E Y R E S E A R C H
January 21, 2010 Tomorrow’s Winners
Shanghai Zhenhua Heavy Industry 600320.SS
Key StatisticsAverage Daily Turnover (US$ mn, last 6 months) 49.11 Current market cap (US$ mn) 5,687Enterprise value (US$ mn) 8,410Free float (%) 57.8Number of employees 4,903Primary exchange listing ShanghaiShares outstanding (mn) 3,311.56 Year end DecYear of incorporation 1997
Shanghai Zhenhua Port Machinery Co Ltd is a world-renowned manufacturer of cranes and large steel structures. Its main products include quayside container cranes, rubber-tired gantry cranes (RTGs), bulk-material ship loaders and unloaders, bucket-wheel stackers and reclaimers, portal cranes, floating cranes, engineering vessels, and large steel bridge structures. It has supplied more than 1,000 quayside container cranes, 1,800 RTGs, and numerous non-standard large port machinery items; for example a 4,000-ton floating crane for Guangzhou Salvage Company. The company's products are used in 62 countries and regions and in over 100 terminals globally.
Price Performance
05 06 07 08 09
5
10
15
20
25%
200
400
600
800
1,000
C N Y
Shanghai Zhenhua Heavy Industry Co. Ltd. (Left, China Renminbi)Relative to CHINA SHANGHAI SE COMPOSITE (Right)Relative to MSCI World Index /China (Right)
Source: FactSet Research Systems Inc
Shuanghui Investment 000895.SZ
Key StatisticsAverage Daily Turnover (US$ mn, last 6 months) 16.12 Current market cap (US$ mn) 5,081Enterprise value (US$ mn) 5,056Free float (%) 96.8Number of employees 13,141Primary exchange listing ShenzhenShares outstanding (mn) 605.99 Year end DecYear of incorporation 1998
Henan Shuanghui Investment and Development is the largest producer of meat and processed meat products in China. Its principal activities are processing and selling meat and foodstuffs. Its other activities include the manufacture and sale of packaging goods; breeding livestock; investment in the food industry; and the provision of technological advisory, sales agent, logistics, and other related services. Its major brand is 'Shuanghui' and major products include ham sausages, fresh frozen meat, PVDC packaging film, and natural seasoning.
Price Performance
05 06 07 08 09
10
20
30
40
50
60
%
100
200
300
400
500
600
700
CN Y
Henan Shuanghui Investment & Development Co. Ltd. (Left, China Renminbi)Relative to CHINA SHANGHAI SE COMPOSITE (Right)Relative to MSCI World Index /China (Right)
Source: FactSet Research Systems Inc
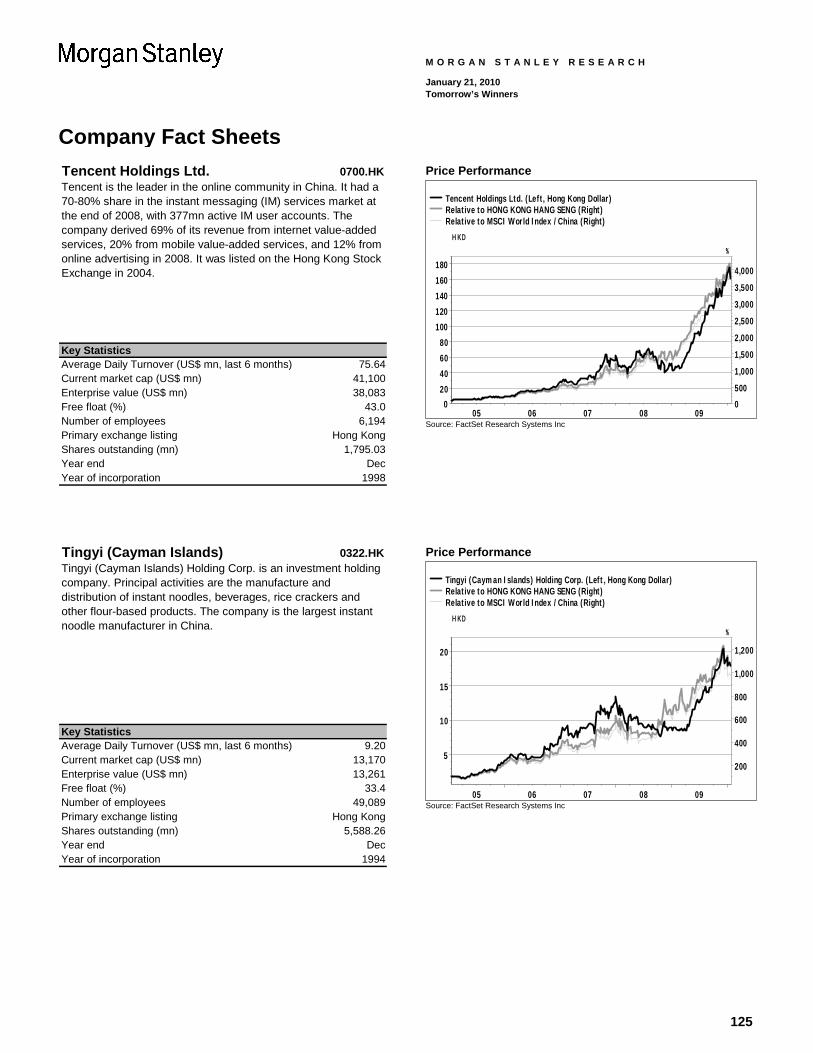
125
Company Fact Sheets
M O R G A N S T A N L E Y R E S E A R C H
January 21, 2010 Tomorrow’s Winners
Tencent Holdings Ltd. 0700.HK
Key StatisticsAverage Daily Turnover (US$ mn, last 6 months) 75.64 Current market cap (US$ mn) 41,100Enterprise value (US$ mn) 38,083Free float (%) 43.0Number of employees 6,194Primary exchange listing Hong KongShares outstanding (mn) 1,795.03 Year end DecYear of incorporation 1998
Tencent is the leader in the online community in China. It had a 70-80% share in the instant messaging (IM) services market at the end of 2008, with 377mn active IM user accounts. The company derived 69% of its revenue from internet value-added services, 20% from mobile value-added services, and 12% from online advertising in 2008. It was listed on the Hong Kong Stock Exchange in 2004.
Price Performance
05 06 07 08 090
20
40
60
80
100
120
140
160
180%
0
500
1,000
1,500
2,000
2,500
3,000
3,500
4,000
H KD
Tencent Holdings Ltd. (Left, Hong Kong Dollar)Relative to HONG KONG HANG SENG (Right)Relative to MSCI World Index /China (Right)
Source: FactSet Research Systems Inc
Tingyi (Cayman Islands) 0322.HK
Key StatisticsAverage Daily Turnover (US$ mn, last 6 months) 9.20 Current market cap (US$ mn) 13,170Enterprise value (US$ mn) 13,261Free float (%) 33.4Number of employees 49,089Primary exchange listing Hong KongShares outstanding (mn) 5,588.26 Year end DecYear of incorporation 1994
Tingyi (Cayman Islands) Holding Corp. is an investment holding company. Principal activities are the manufacture and distribution of instant noodles, beverages, rice crackers and other flour-based products. The company is the largest instant noodle manufacturer in China.
Price Performance
05 06 07 08 09
5
10
15
20
%
200
400
600
800
1,000
1,200
H KD
Tingyi (Cayman Islands) Holding Corp. (Left, Hong Kong Dollar)Relative to HONG KONG HANG SENG (Right)Relative to MSCI World Index /China (Right)
Source: FactSet Research Systems Inc

126
Company Fact Sheets
M O R G A N S T A N L E Y R E S E A R C H
January 21, 2010 Tomorrow’s Winners
Woori Finance Holdings 053000.KS
Key StatisticsAverage Daily Turnover (US$ mn, last 6 months) 54.24 Current market cap (US$ mn) 10,788Enterprise value (US$ mn) 13,366Free float (%) 100.0Number of employees 24,214Primary exchange listing Korea Stock Shares outstanding (mn) 806.01 Year end DecYear of incorporation 2001
Woori Finance Holdings is a financial holding company for Woori Bank, Kwangju Bank, Kyongnam Bank, Woori Investment & Securities, and other subsidiaries. It provides a full range of financial services, including commercial banking, securities brokerage, and asset management.
Price Performance
05 06 07 08 095,000
10,000
15,000
20,000
25,000
%
50
100
150
200
250
KR W
Woori Finance Holdings Co. Ltd. (Left, South Korean Won)Relative to KOREA KOSPI COMPOSITE (Right)Relative to MSCI World Index /Korea (Right)
Source: FactSet Research Systems Inc
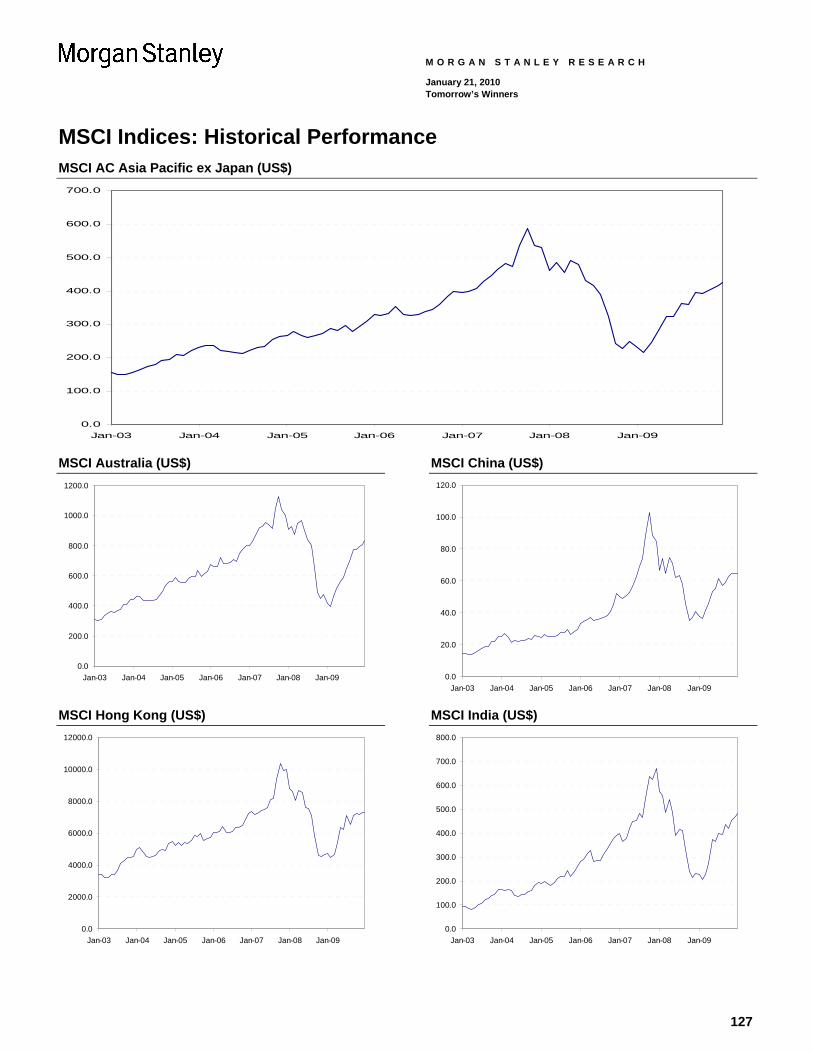
127
MSCI Indices: Historical Performance
M O R G A N S T A N L E Y R E S E A R C H
January 21, 2010 Tomorrow’s Winners
MSCI AC Asia Pacific ex Japan (US$)
0.0
100.0
200.0
300.0
400.0
500.0
600.0
700.0
Jan-03 Jan-04 Jan-05 Jan-06 Jan-07 Jan-08 Jan-09 MSCI Australia (US$)
0.0
200.0
400.0
600.0
800.0
1000.0
1200.0
Jan-03 Jan-04 Jan-05 Jan-06 Jan-07 Jan-08 Jan-09
MSCI China (US$)
0.0
20.0
40.0
60.0
80.0
100.0
120.0
Jan-03 Jan-04 Jan-05 Jan-06 Jan-07 Jan-08 Jan-09
MSCI Hong Kong (US$)
0.0
2000.0
4000.0
6000.0
8000.0
10000.0
12000.0
Jan-03 Jan-04 Jan-05 Jan-06 Jan-07 Jan-08 Jan-09
MSCI India (US$)
0.0
100.0
200.0
300.0
400.0
500.0
600.0
700.0
800.0
Jan-03 Jan-04 Jan-05 Jan-06 Jan-07 Jan-08 Jan-09

128
MSCI Indices: Historical Performance
M O R G A N S T A N L E Y R E S E A R C H
January 21, 2010 Tomorrow’s Winners
MSCI Korea (US$)
0.0
100.0
200.0
300.0
400.0
500.0
600.0
Jan-03 Jan-04 Jan-05 Jan-06 Jan-07 Jan-08 Jan-09
MSCI Taiwan (US$)
0.0
50.0
100.0
150.0
200.0
250.0
300.0
350.0
400.0
Jan-03 Jan-04 Jan-05 Jan-06 Jan-07 Jan-08 Jan-09 Source: MSC
129
M O R G A N S T A N L E Y R E S E A R C H
January 21, 2010 Tomorrow’s Winners
Morgan Stanley ModelWare is a proprietary analytic framework that helps clients uncover value, adjusting for distortions and ambiguities created by local accounting regulations. For example, ModelWare EPS adjusts for one-time events, capitalizes operating leases (where their use is significant), and converts inventory from LIFO costing to a FIFO basis. ModelWare also emphasizes the separation of operating performance of a company from its financing for a more complete view of how a company generates earnings.
Disclosure Section The information and opinions in Morgan Stanley Research were prepared or are disseminated by Morgan Stanley Asia Limited (which accepts the responsibility for its contents) and/or Morgan Stanley Asia (Singapore) Pte. (Registration number 199206298Z, regulated by the Monetary Authority of Singapore, which accepts the responsibility for its contents), and/or Morgan Stanley Asia (Singapore) Securities Pte Ltd (Registration number 200008434H, regulated by the Monetary Authority of Singapore, which accepts the responsibility for its contents), and/or Morgan Stanley Taiwan Limited and/or Morgan Stanley & Co International plc, Seoul Branch, and/or Morgan Stanley Australia Limited (A.B.N. 67 003 734 576, holder of Australian financial services license No. 233742, which accepts responsibility for its contents), and/or Morgan Stanley Smith Barney Australia Pty Ltd (A.B.N. 19 009 145 555, holder of Australian financial services license No. 240813, which accepts responsibility for its contents), and/or Morgan Stanley India Company Private Limited and their affiliates (collectively, "Morgan Stanley"). For important disclosures, stock price charts and equity rating histories regarding companies that are the subject of this report, please see the Morgan Stanley Research Disclosure Website at www.morganstanley.com/researchdisclosures, or contact your investment representative or Morgan Stanley Research at 1585 Broadway, (Attention: Research Management), New York, NY, 10036 USA.
Analyst Certification As to each company mentioned in this report, the respective primary research analyst or analysts covering that company hereby certify that their views about the companies and their securities discussed in this report are accurately expressed and that they have not received and will not receive direct or indirect compensation in exchange for expressing specific recommendations or views in this report. Unless otherwise stated, the individuals listed on the cover page of this report are research analysts.
Global Research Conflict Management Policy Morgan Stanley Research has been published in accordance with our conflict management policy, which is available at www.morganstanley.com/institutional/research/conflictpolicies.
Important US Regulatory Disclosures on Subject Companies As of December 31, 2009, Morgan Stanley beneficially owned 1% or more of a class of common equity securities of the following companies covered in Morgan Stanley Research: Belle International, Esprit Holdings, IDFC, Li & Fung Ltd, Mindray, Tencent Holdings Ltd.. As of January 1, 2010, Morgan Stanley held a net long or short position of US$1 million or more of the debt securities of the following issuers covered in Morgan Stanley Research (including where guarantor of the securities): Hindustan Unilever, Li & Fung Ltd, Reliance Industries, Woori Finance Holdings. Within the last 12 months, Morgan Stanley managed or co-managed a public offering (or 144A offering) of securities of Belle International, Reliance Industries, Woori Finance Holdings. Within the last 12 months, Morgan Stanley has received compensation for investment banking services from Reliance Industries. In the next 3 months, Morgan Stanley expects to receive or intends to seek compensation for investment banking services from Belle International, Brambles Ltd., IDFC, Kingdee International Software Group, Larsen & Toubro, Li & Fung Ltd, Mindray, Pantaloon Retail, Reliance Industries, Tencent Holdings Ltd., Tingyi (Cayman Islands), Woori Finance Holdings. Within the last 12 months, Morgan Stanley & Co. Incorporated has received compensation for products and services other than investment banking services from Reliance Industries, Woori Finance Holdings. Within the last 12 months, Morgan Stanley has provided or is providing investment banking services to, or has an investment banking client relationship with, the following company: Belle International, Brambles Ltd., IDFC, Kingdee International Software Group, Larsen & Toubro, Li & Fung Ltd, Mindray, Pantaloon Retail, Reliance Industries, Tencent Holdings Ltd., Tingyi (Cayman Islands), Woori Finance Holdings. Within the last 12 months, Morgan Stanley has either provided or is providing non-investment banking, securities-related services to and/or in the past has entered into an agreement to provide services or has a client relationship with the following company: Belle International, IDFC, Reliance Industries, Woori Finance Holdings. An employee, director or consultant of Morgan Stanley is a director of Belle International and Sina Corp. A Morgan Stanley employee is a director on the board of China Dongxiang Group Co Ltd. The equity research analysts or strategists principally responsible for the preparation of Morgan Stanley Research have received compensation based upon various factors, including quality of research, investor client feedback, stock picking, competitive factors, firm revenues and overall investment banking revenues. The fixed income research analysts or strategists principally responsible for the preparation of Morgan Stanley Research have received compensation based upon various factors, including quality, accuracy and value of research, firm profitability or revenues (which include fixed income trading and capital markets profitability or revenues), client feedback and competitive factors. Fixed Income Research analysts' or strategists' compensation is not linked to investment banking or capital markets transactions performed by Morgan Stanley or the profitability or revenues of particular trading desks.
130
M O R G A N S T A N L E Y R E S E A R C H
January 21, 2010 Tomorrow’s Winners
Morgan Stanley and its affiliates do business that relates to companies/instruments covered in Morgan Stanley Research, including market making, providing liquidity and specialized trading, risk arbitrage and other proprietary trading, fund management, commercial banking, extension of credit, investment services and investment banking. Morgan Stanley sells to and buys from customers the securities/instruments of companies covered in Morgan Stanley Research on a principal basis. Morgan Stanley may have a position in the debt of the Company or instruments discussed in this report. Certain disclosures listed above are also for compliance with applicable regulations in non-US jurisdictions
STOCK RATINGS Morgan Stanley uses a relative rating system using terms such as Overweight, Equal-weight, Not-Rated or Underweight (see definitions below). Morgan Stanley does not assign ratings of Buy, Hold or Sell to the stocks we cover. Overweight, Equal-weight, Not-Rated and Underweight are not the equivalent of buy, hold and sell. Investors should carefully read the definitions of all ratings used in Morgan Stanley Research. In addition, since Morgan Stanley Research contains more complete information concerning the analyst's views, investors should carefully read Morgan Stanley Research, in its entirety, and not infer the contents from the rating alone. In any case, ratings (or research) should not be used or relied upon as investment advice. An investor's decision to buy or sell a stock should depend on individual circumstances (such as the investor's existing holdings) and other considerations.
Global Stock Ratings Distribution (as of December 31, 2009) For disclosure purposes only (in accordance with NASD and NYSE requirements), we include the category headings of Buy, Hold, and Sell alongside our ratings of Overweight, Equal-weight, Not-Rated and Underweight. Morgan Stanley does not assign ratings of Buy, Hold or Sell to the stocks we cover. Overweight, Equal-weight, Not-Rated and Underweight are not the equivalent of buy, hold, and sell but represent recommended relative weightings (see definitions below). To satisfy regulatory requirements, we correspond Overweight, our most positive stock rating, with a buy recommendation; we correspond Equal-weight and Not-Rated to hold and Underweight to sell recommendations, respectively.
Coverage Universe Investment Banking Clients (IBC)
Stock Rating Category Count % of Total Count
% of Total IBC
% of Rating Category
Overweight/Buy 953 39% 286 41% 30%Equal-weight/Hold 1093 45% 322 46% 29%Not-Rated/Hold 23 1% 3 0% 13%Underweight/Sell 376 15% 82 12% 22%Total 2,445 693 Data include common stock and ADRs currently assigned ratings. An investor's decision to buy or sell a stock should depend on individual circumstances (such as the investor's existing holdings) and other considerations. Investment Banking Clients are companies from whom Morgan Stanley or an affiliate received investment banking compensation in the last 12 months.
Analyst Stock Ratings Overweight (O or Over) - The stock's total return is expected to exceed the total return of the relevant country MSCI Index, on a risk-adjusted basis over the next 12-18 months. Equal-weight (E or Equal) - The stock's total return is expected to be in line with the total return of the relevant country MSCI Index, on a risk-adjusted basis over the next 12-18 months. Not-Rated (NR) - Currently the analyst does not have adequate conviction about the stock's total return relative to the relevant country MSCI Index on a risk-adjusted basis, over the next 12-18 months. Underweight (U or Under) - The stock's total return is expected to be below the total return of the relevant country MSCI Index, on a risk-adjusted basis, over the next 12-18 months. Unless otherwise specified, the time frame for price targets included in Morgan Stanley Research is 12 to 18 months.
Analyst Industry Views Attractive (A): The analyst expects the performance of his or her industry coverage universe over the next 12-18 months to be attractive vs. the relevant broad market benchmark, as indicated below. In-Line (I): The analyst expects the performance of his or her industry coverage universe over the next 12-18 months to be in line with the relevant broad market benchmark, as indicated below. Cautious (C): The analyst views the performance of his or her industry coverage universe over the next 12-18 months with caution vs. the relevant broad market benchmark, as indicated below. Benchmarks for each region are as follows: North America - S&P 500; Latin America - relevant MSCI country index or MSCI Latin America Index; Europe - MSCI Europe; Japan - TOPIX; Asia - relevant MSCI country index. .
Important Disclosures for Morgan Stanley Smith Barney LLC Customers Citi Investment Research & Analysis (CIRA) research reports may be available about the companies or topics that are the subject of Morgan Stanley Research. Ask your Financial Advisor or use Research Center to view any available CIRA research reports in addition to Morgan Stanley research reports.
131
M O R G A N S T A N L E Y R E S E A R C H
January 21, 2010 Tomorrow’s Winners
Important disclosures regarding the relationship between the companies that are the subject of Morgan Stanley Research and Morgan Stanley Smith Barney LLC, Morgan Stanley and Citigroup Global Markets Inc. or any of their affiliates, are available on the Morgan Stanley Smith Barney disclosure website at www.morganstanleysmithbarney.com/researchdisclosures.
For Morgan Stanley and Citigroup Global Markets, Inc. specific disclosures, you may refer to www.morganstanley.com/researchdisclosures and https://www.citigroupgeo.com/geopublic/Disclosures/index_a.html.
Each Morgan Stanley Equity Research report is reviewed and approved on behalf of Morgan Stanley Smith Barney LLC. This review and approval is conducted by the same person who reviews the Equity Research report on behalf of Morgan Stanley. This could create a conflict of interest.
Other Important Disclosures Morgan Stanley produces an equity research product called a "Tactical Idea." Views contained in a "Tactical Idea" on a particular stock may be contrary to the recommendations or views expressed in research on the same stock. This may be the result of differing time horizons, methodologies, market events, or other factors. For all research available on a particular stock, please contact your sales representative or go to Client Link at www.morganstanley.com.
For a discussion, if applicable, of the valuation methods and the risks related to any price targets, please refer to the latest relevant published research on these stocks.
Morgan Stanley Research does not provide individually tailored investment advice. Morgan Stanley Research has been prepared without regard to the individual financial circumstances and objectives of persons who receive it. Morgan Stanley recommends that investors independently evaluate particular investments and strategies, and encourages investors to seek the advice of a financial adviser. The appropriateness of a particular investment or strategy will depend on an investor's individual circumstances and objectives. The securities, instruments, or strategies discussed in Morgan Stanley Research may not be suitable for all investors, and certain investors may not be eligible to purchase or participate in some or all of them.
Morgan Stanley Research is not an offer to buy or sell or the solicitation of an offer to buy or sell any security/instrument or to participate in any particular trading strategy. The "Important US Regulatory Disclosures on Subject Companies" section in Morgan Stanley Research lists all companies mentioned where Morgan Stanley owns 1% or more of a class of common equity securities of the companies. For all other companies mentioned in Morgan Stanley Research, Morgan Stanley may have an investment of less than 1% in securities/instruments or derivatives of securities/instruments of companies and may trade them in ways different from those discussed in Morgan Stanley Research. Employees of Morgan Stanley not involved in the preparation of Morgan Stanley Research may have investments in securities/instruments or derivatives of securities/instruments of companies mentioned and may trade them in ways different from those discussed in Morgan Stanley Research. Derivatives may be issued by Morgan Stanley or associated persons
With the exception of information regarding Morgan Stanley, Morgan Stanley Research is based on public information. Morgan Stanley makes every effort to use reliable, comprehensive information, but we make no representation that it is accurate or complete. We have no obligation to tell you when opinions or information in Morgan Stanley Research change apart from when we intend to discontinue equity research coverage of a subject company. Facts and views presented in Morgan Stanley Research have not been reviewed by, and may not reflect information known to, professionals in other Morgan Stanley business areas, including investment banking personnel.
Morgan Stanley Research personnel conduct site visits from time to time but are prohibited from accepting payment or reimbursement by the company of travel expenses for such visits.
The value of and income from your investments may vary because of changes in interest rates, foreign exchange rates, default rates, prepayment rates, securities/instruments prices, market indexes, operational or financial conditions of companies or other factors. There may be time limitations on the exercise of options or other rights in securities/instruments transactions. Past performance is not necessarily a guide to future performance. Estimates of future performance are based on assumptions that may not be realized. If provided, and unless otherwise stated, the closing price on the cover page is that of the primary exchange for the subject company's securities/instruments.
Morgan Stanley may make investment decisions or take proprietary positions that are inconsistent with the recommendations or views in this report.
To our readers in Taiwan: Information on securities/instruments that trade in Taiwan is distributed by Morgan Stanley Taiwan Limited ("MSTL"). Such information is for your reference only. Information on any securities/instruments issued by a company owned by the government of or incorporated in the PRC and listed in on the Stock Exchange of Hong Kong ("SEHK"), namely the H-shares, including the component company stocks of the Stock Exchange of Hong Kong ("SEHK")'s Hang Seng China Enterprise Index; or any securities/instruments issued by a company that is 30% or more directly- or indirectly-owned by the government of or a company incorporated in the PRC and traded on an exchange in Hong Kong or Macau, namely SEHK's Red Chip shares, including the component company of the SEHK's China-affiliated Corp Index is distributed only to Taiwan Securities Investment Trust Enterprises ("SITE"). The reader should independently evaluate the investment risks and is solely responsible for their investment decisions. Morgan Stanley Research may not be distributed to the public media or quoted or used by the public media without the express written consent of Morgan Stanley. Information on securities/instruments that do not trade in Taiwan is for informational purposes only and is not to be construed as a recommendation or a solicitation to trade in such securities/instruments. MSTL may not execute transactions for clients in these securities/instruments.
To our readers in Hong Kong: Information is distributed in Hong Kong by and on behalf of, and is attributable to, Morgan Stanley Asia Limited as part of its regulated activities in Hong Kong. If you have any queries concerning Morgan Stanley Research, please contact our Hong Kong sales representatives.
Certain information in Morgan Stanley Research was sourced by employees of the Shanghai Representative Office of Morgan Stanley Asia Limited for the use of Morgan Stanley Asia Limited.
Morgan Stanley Research is disseminated in Japan by Morgan Stanley Japan Securities Co., Ltd.; in Hong Kong by Morgan Stanley Asia Limited (which accepts responsibility for its contents); in Singapore by Morgan Stanley Asia (Singapore) Pte. (Registration number 199206298Z) and/or Morgan Stanley Asia (Singapore) Securities Pte Ltd (Registration number 200008434H), regulated by the Monetary Authority of Singapore, which accepts responsibility for its contents; in Australia to "wholesale clients" within the meaning of the Australian Corporations Act by Morgan Stanley Australia Limited A.B.N. 67 003 734 576, holder of Australian financial services license No. 233742, which accepts responsibility for its contents; in Australia to "wholesale clients" and "retail clients" within the meaning of the Australian Corporations Act by Morgan Stanley Smith Barney Australia Pty Ltd (A.B.N. 19 009 145 555, holder of Australian financial services license No. 240813, which accepts responsibility for its contents; in Korea by Morgan Stanley & Co International plc, Seoul Branch; in India by Morgan Stanley India Company Private Limited; in Canada by Morgan Stanley Canada Limited, which has approved of, and has agreed to take responsibility for, the contents of Morgan Stanley Research in Canada; in Germany by Morgan Stanley Bank AG, Frankfurt am Main and Morgan Stanley Private Wealth Management Limited, Niederlassung Deutschland, regulated by Bundesanstalt fuer Finanzdienstleistungsaufsicht (BaFin); in Spain by Morgan Stanley, S.V., S.A., a Morgan Stanley group company, which is supervised by the Spanish Securities Markets Commission (CNMV) and states that Morgan Stanley Research has been written and distributed in accordance with the rules of conduct applicable to financial research as established under Spanish regulations; in the United States by Morgan Stanley & Co. Incorporated, which accepts responsibility for its contents. Morgan Stanley & Co. International plc, authorized and regulated by the Financial Services Authority, disseminates in the UK research that it has prepared, and approves solely for the
132
M O R G A N S T A N L E Y R E S E A R C H
January 21, 2010 Tomorrow’s Winners
purposes of section 21 of the Financial Services and Markets Act 2000, research which has been prepared by any of its affiliates. Morgan Stanley Private Wealth Management Limited, authorized and regulated by the Financial Services Authority, also disseminates Morgan Stanley Research in the UK. Private U.K. investors should obtain the advice of their Morgan Stanley & Co. International plc or Morgan Stanley Private Wealth Management representative about the investments concerned. RMB Morgan Stanley (Proprietary) Limited is a member of the JSE Limited and regulated by the Financial Services Board in South Africa. RMB Morgan Stanley (Proprietary) Limited is a joint venture owned equally by Morgan Stanley International Holdings Inc. and RMB Investment Advisory (Proprietary) Limited, which is wholly owned by FirstRand Limited.
The information in Morgan Stanley Research is being communicated by Morgan Stanley & Co. International plc (DIFC Branch), regulated by the Dubai Financial Services Authority (the DFSA), and is directed at Professional Clients only, as defined by the DFSA. The financial products or financial services to which this research relates will only be made available to a customer who we are satisfied meets the regulatory criteria to be a Professional Client.
The information in Morgan Stanley Research is being communicated by Morgan Stanley & Co. International plc (QFC Branch), regulated by the Qatar Financial Centre Regulatory Authority (the QFCRA), and is directed at business customers and market counterparties only and is not intended for Retail Customers as defined by the QFCRA.
As required by the Capital Markets Board of Turkey, investment information, comments and recommendations stated here, are not within the scope of investment advisory activity. Investment advisory service is provided in accordance with a contract of engagement on investment advisory concluded between brokerage houses, portfolio management companies, non-deposit banks and clients. Comments and recommendations stated here rely on the individual opinions of the ones providing these comments and recommendations. These opinions may not fit to your financial status, risk and return preferences. For this reason, to make an investment decision by relying solely to this information stated here may not bring about outcomes that fit your expectations.
The trademarks and service marks contained in Morgan Stanley Research are the property of their respective owners. Third-party data providers make no warranties or representations of any kind relating to the accuracy, completeness, or timeliness of the data they provide and shall not have liability for any damages of any kind relating to such data. The Global Industry Classification Standard ("GICS") was developed by and is the exclusive property of MSCI and S&P.
Morgan Stanley has based its projections, opinions, forecasts and trading strategies regarding the MSCI Country Index Series solely on publicly available information. MSCI has not reviewed, approved or endorsed the projections, opinions, forecasts and trading strategies contained herein. Morgan Stanley has no influence on or control over MSCI's index compilation decisions.
Morgan Stanley Research, or any portion thereof may not be reprinted, sold or redistributed without the written consent of Morgan Stanley.
Morgan Stanley Research is disseminated and available primarily electronically, and, in some cases, in printed form.
Additional information on recommended securities/instruments is available on request.
© 2010 Morgan Stanley