morgan stanley investment funds - fundsquare
TRANSCRIPT
Morgan Stanley Investment Funds
Société d’Investissement à Capital Variable incorporated under the laws of Luxembourg
Semi-Annual ReportJune 30, 2015
InveStMent ManageMent
R.C.S. Luxembourg: B-29. 192

Morgan Stanley Investment Funds 30 June 2015
Table of contents
1 Shareholders’ information
SCHEDULE of invEStmEntS
Equity funds
2 Asian Equity Fund
5 Asia-Pacific Equity Fund
8 Asian Property Fund
10 Emerging Europe, Middle East and Africa Equity Fund
12 Emerging Leaders Equity Fund
15 Emerging Markets Equity Fund
19 European Equity Alpha Fund
21 European Property Fund
24 Eurozone Equity Alpha Fund
26 Frontier Emerging Markets Equity Fund
29 Global Advantage Fund
32 Global Brands Fund
34 Global Discovery Fund
36 Global Infrastructure Fund
39 Global Opportunity Fund
42 Global Property Fund
46 Global Quality Fund
48 Indian Equity Fund
50 International Equity (ex US) Fund
53 Japanese Equity Fund
56 Latin American Equity Fund
58 US Advantage Fund
61 US Growth Fund
64 US Insight Fund
66 US Property Fund
Bond funds
68 Absolute Return Fixed Income Fund
74 Asian Fixed Income Opportunities Fund
77 Emerging Markets Corporate Debt Fund
83 Emerging Markets Debt Fund
88 Emerging Markets Domestic Debt Fund
91 Euro Bond Fund
97 Euro Corporate Bond Fund
106 Euro Corporate Bond (ex Financials) Fund
112 Euro Strategic Bond Fund
123 European Currencies High Yield Bond Fund
129 Global Bond Fund
139 Global Convertible Bond Fund
145 Global Credit Fund
153 Global Fixed Income Opportunities Fund
165 Global High Yield Bond Fund
172 Global Mortgage Securities Fund
179 Global Premier Credit Fund
183 Short Maturity Euro Bond Fund
189 US Dollar High Yield Bond Fund
194 US Dollar Short Duration High Yield Bond Fund
Liquidity funds
199 US Dollar Liquidity Fund
Asset Allocation funds
200 Diversified Alpha Plus Fund
210 Diversified Alpha Plus Low Volatility Fund
219 Global Balanced Income Fund
226 Global Balanced Risk Control Fund of Funds
Alternative investment funds
228 Liquid Alpha Capture Fund
231 Liquid Alternatives Fund
StAtEmEntS AnD notES
235 Statement of assets and liabilities
248 Statement of changes in number of shares
257 Statement of operations and changes in net assets
271 Statement of share and net assets statistics
282 Notes to the financial statements
otHER infoRmAtion
298 Directors and service providers
300 Paying and information agents
301 Appendix 1: Fund expense ratios (unaudited)
305 Appendix 2: Portfolio turnover rate (unaudited)
306 Appendix 3: Sub-Advisers
307 Appendix 4: Hedged Share Classes
1 Morgan Stanley Investment Funds 30 June 2015
The annual general meeting of shareholders of Morgan Stanley Investment Funds (the “Company”) is held at the registered office of the Company and will be held on the second Tuesday of the month of May at 10.30 am, or if such day is not a bank business day on the following bank business day.
notices of all general meetings are sent by mail to all registered shareholders at their registered address at least 8 days prior to the meeting. Such notices will indicate the time and place of the meeting as well as the conditions of admission thereto. Said notices will also contain the agenda and requirements of Luxembourg law with regard to the necessary quorum and majorities at the meeting. to the extent required by law, further notices will be published in the Mémorial and in one Luxembourg newspaper.
audited financial statements in respect of the preceding financial period are made available at the registered office of the Company and are available to shareholders upon request. In addition, unaudited semi-annual reports are also made available at the registered office.
The annual and semi-annual reports are also available on the Company’s web-site (www.morganstanleyinvestmentfunds.com).
The Company’s financial year end is 31 December.
any other notices relevant to the Company are also published in a Luxembourg newspaper or mailed to affected shareholders.
The net asset value per share of each Class of Share is available on each dealing day during Luxembourg business hours at the registered office of the Company. net asset value per share information is also available from market information providers, such as Bloomberg and Morningstar, as well as being available at www.morganstanleyinvestmentfunds.com.
no subscriptions can be received on the basis of financial reports alone. Subscriptions are only valid if made on the basis of the current prospectus and the latest Key Investor Information Document.
Morgan Stanley & Co. International plc, London, Zurich Branch, Bahnhofstrasse 92, 8001 Zurich, was the representative in Switzerland until 31 March 2015. From 1 april 2015, Carnege Fund Services S.a, 11, rue du général-Dufour 1204 geneva was appointed as representative in Switzerland. RBC Investor Services Bank S.a., esch-sur-alzette, Zurich Branch, Badenerstrasse 567, 8048 Zurich, was the paying agent in Switzerland until 31 March 2015. From 1 april 2015, Banque Cantonale de genève, 17, quai de I’lle, 1204 geneva was appointed as the paying agent in Switzerland. The Prospectus, the latest Key Investor Information Document, the articles and the annual and semi-annual reports of the Company may be obtained free of charge from the representative in Switzerland.
a list of purchases and sales (securities transactions) carried out by the Company during the reporting period may be obtained free of charge from the representative in Switzerland.
The investment aims set out in this annual report are summaries only. The complete investment objectives and policies for each Fund are set out in the Company’s current prospectus.
Shareholders’ information
Morgan Stanley Investment Funds 30 June 2015 2
invEStmEnt Aim
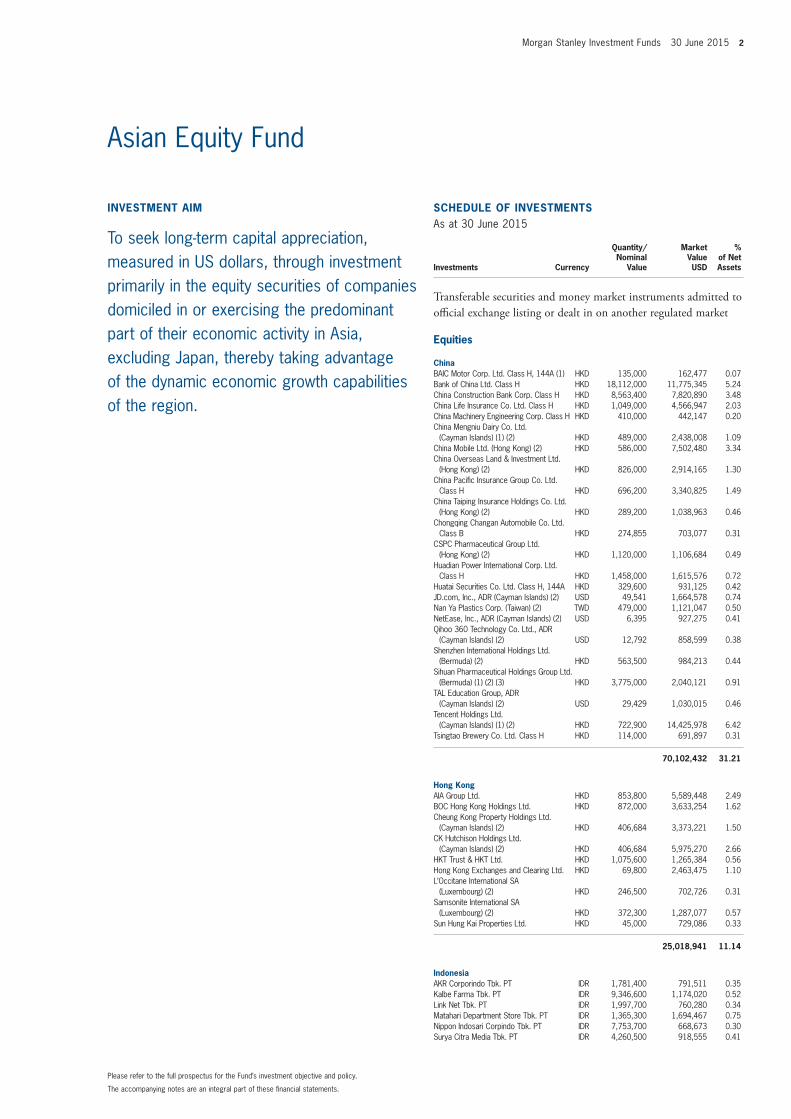
To seek long-term capital appreciation, measured in US dollars, through investment primarily in the equity securities of companies domiciled in or exercising the predominant part of their economic activity in Asia, excluding Japan, thereby taking advantage of the dynamic economic growth capabilities of the region.
SCHEDULE of invEStmEntSAs at 30 June 2015
Investments Currency
Quantity/Nominal
Value
Market Value USD
% of Net Assets
transferable securities and money market instruments admitted to official exchange listing or dealt in on another regulated market
Equities
ChinaBAIC Motor Corp. Ltd. Class H, 144A (1) HKD 135,000 162,477 0.07Bank of China Ltd. Class H HKD 18,112,000 11,775,345 5.24China Construction Bank Corp. Class H HKD 8,563,400 7,820,890 3.48China Life Insurance Co. Ltd. Class H HKD 1,049,000 4,566,947 2.03China Machinery Engineering Corp. Class H HKD 410,000 442,147 0.20China Mengniu Dairy Co. Ltd.
(Cayman Islands) (1) (2) HKD 489,000 2,438,008 1.09China Mobile Ltd. (Hong Kong) (2) HKD 586,000 7,502,480 3.34China Overseas Land & Investment Ltd.
(Hong Kong) (2) HKD 826,000 2,914,165 1.30China Pacific Insurance Group Co. Ltd.
Class H HKD 696,200 3,340,825 1.49China Taiping Insurance Holdings Co. Ltd.
(Hong Kong) (2) HKD 289,200 1,038,963 0.46Chongqing Changan Automobile Co. Ltd.
Class B HKD 274,855 703,077 0.31CSPC Pharmaceutical Group Ltd.
(Hong Kong) (2) HKD 1,120,000 1,106,684 0.49Huadian Power International Corp. Ltd.
Class H HKD 1,458,000 1,615,576 0.72Huatai Securities Co. Ltd. Class H, 144A HKD 329,600 931,125 0.42JD.com, Inc., ADR (Cayman Islands) (2) USD 49,541 1,664,578 0.74Nan Ya Plastics Corp. (Taiwan) (2) TWD 479,000 1,121,047 0.50NetEase, Inc., ADR (Cayman Islands) (2) USD 6,395 927,275 0.41Qihoo 360 Technology Co. Ltd., ADR
(Cayman Islands) (2) USD 12,792 858,599 0.38Shenzhen International Holdings Ltd.
(Bermuda) (2) HKD 563,500 984,213 0.44Sihuan Pharmaceutical Holdings Group Ltd.
(Bermuda) (1) (2) (3) HKD 3,775,000 2,040,121 0.91TAL Education Group, ADR
(Cayman Islands) (2) USD 29,429 1,030,015 0.46Tencent Holdings Ltd.
(Cayman Islands) (1) (2) HKD 722,900 14,425,978 6.42Tsingtao Brewery Co. Ltd. Class H HKD 114,000 691,897 0.31
70,102,432 31.21
Hong KongAIA Group Ltd. HKD 853,800 5,589,448 2.49BOC Hong Kong Holdings Ltd. HKD 872,000 3,633,254 1.62Cheung Kong Property Holdings Ltd.
(Cayman Islands) (2) HKD 406,684 3,373,221 1.50CK Hutchison Holdings Ltd.
(Cayman Islands) (2) HKD 406,684 5,975,270 2.66HKT Trust & HKT Ltd. HKD 1,075,600 1,265,384 0.56Hong Kong Exchanges and Clearing Ltd. HKD 69,800 2,463,475 1.10L’Occitane International SA
(Luxembourg) (2) HKD 246,500 702,726 0.31Samsonite International SA
(Luxembourg) (2) HKD 372,300 1,287,077 0.57Sun Hung Kai Properties Ltd. HKD 45,000 729,086 0.33
25,018,941 11.14
indonesiaAKR Corporindo Tbk. PT IDR 1,781,400 791,511 0.35Kalbe Farma Tbk. PT IDR 9,346,600 1,174,020 0.52Link Net Tbk. PT IDR 1,997,700 760,280 0.34Matahari Department Store Tbk. PT IDR 1,365,300 1,694,467 0.75Nippon Indosari Corpindo Tbk. PT IDR 7,753,700 668,673 0.30Surya Citra Media Tbk. PT IDR 4,260,500 918,555 0.41
The accompanying notes are an integral part of these financial statements.
Please refer to the full prospectus for the Fund’s investment objective and policy.
Asian Equity Fund
SCHEDULE of investmentsEquity Funds
3 Morgan Stanley Investment Funds 30 June 2015
SCHEDULE of invEStmEntSAs at 30 June 2015
Investments Currency
Quantity/Nominal
Value
Market Value USD
% of Net Assets
transferable securities and money market instruments admitted to official exchange listing or dealt in on another regulated market
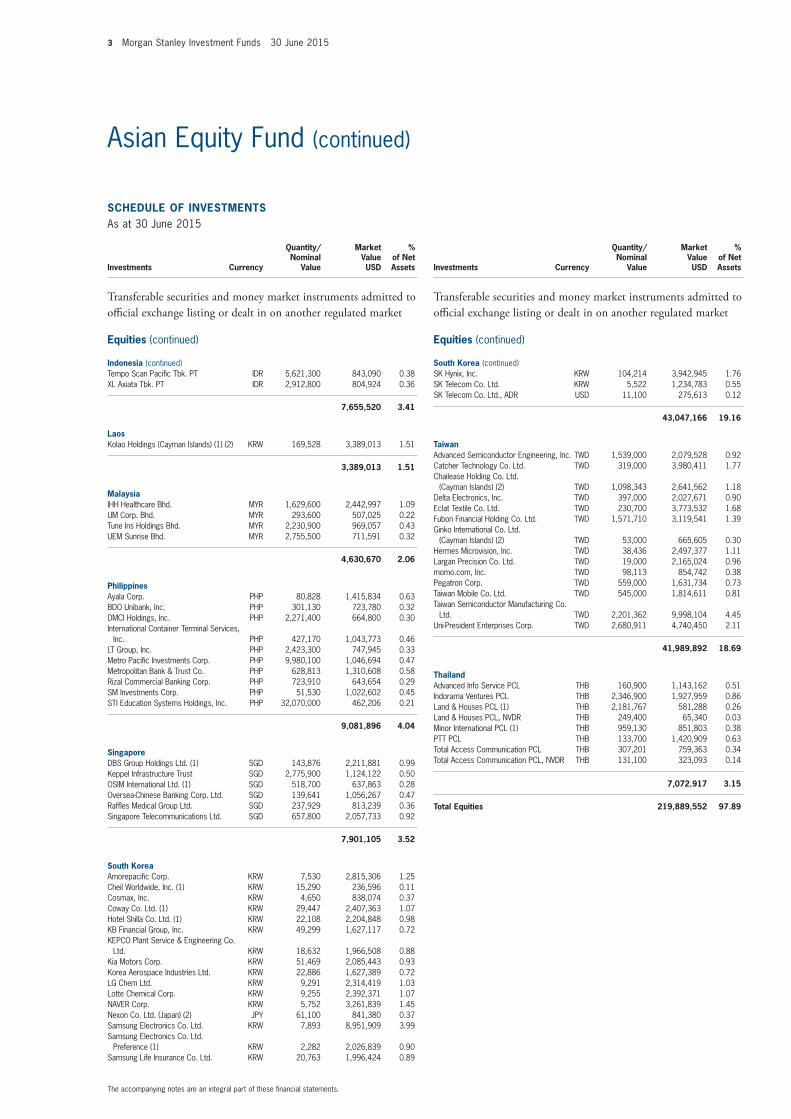
Equities (continued)
indonesia (continued)Tempo Scan Pacific Tbk. PT IDR 5,621,300 843,090 0.38XL Axiata Tbk. PT IDR 2,912,800 804,924 0.36
7,655,520 3.41
LaosKolao Holdings (Cayman Islands) (1) (2) KRW 169,528 3,389,013 1.51
3,389,013 1.51
malaysiaIHH Healthcare Bhd. MYR 1,629,600 2,442,997 1.09IJM Corp. Bhd. MYR 293,600 507,025 0.22Tune Ins Holdings Bhd. MYR 2,230,900 969,057 0.43UEM Sunrise Bhd. MYR 2,755,500 711,591 0.32
4,630,670 2.06
PhilippinesAyala Corp. PHP 80,828 1,415,834 0.63BDO Unibank, Inc. PHP 301,130 723,780 0.32DMCI Holdings, Inc. PHP 2,271,400 664,800 0.30International Container Terminal Services,
Inc. PHP 427,170 1,043,773 0.46LT Group, Inc. PHP 2,423,300 747,945 0.33Metro Pacific Investments Corp. PHP 9,980,100 1,046,694 0.47Metropolitan Bank & Trust Co. PHP 628,813 1,310,608 0.58Rizal Commercial Banking Corp. PHP 723,910 643,654 0.29SM Investments Corp. PHP 51,530 1,022,602 0.45STI Education Systems Holdings, Inc. PHP 32,070,000 462,206 0.21
9,081,896 4.04
SingaporeDBS Group Holdings Ltd. (1) SGD 143,876 2,211,881 0.99Keppel Infrastructure Trust SGD 2,775,900 1,124,122 0.50OSIM International Ltd. (1) SGD 518,700 637,863 0.28Oversea-Chinese Banking Corp. Ltd. SGD 139,641 1,056,267 0.47Raffles Medical Group Ltd. SGD 237,929 813,239 0.36Singapore Telecommunications Ltd. SGD 657,800 2,057,733 0.92
7,901,105 3.52
South KoreaAmorepacific Corp. KRW 7,530 2,815,306 1.25Cheil Worldwide, Inc. (1) KRW 15,290 236,596 0.11Cosmax, Inc. KRW 4,650 838,074 0.37Coway Co. Ltd. (1) KRW 29,447 2,407,363 1.07Hotel Shilla Co. Ltd. (1) KRW 22,108 2,204,848 0.98KB Financial Group, Inc. KRW 49,299 1,627,117 0.72KEPCO Plant Service & Engineering Co.
Ltd. KRW 18,632 1,966,508 0.88Kia Motors Corp. KRW 51,469 2,085,443 0.93Korea Aerospace Industries Ltd. KRW 22,886 1,627,389 0.72LG Chem Ltd. KRW 9,291 2,314,419 1.03Lotte Chemical Corp. KRW 9,255 2,392,371 1.07NAVER Corp. KRW 5,752 3,261,839 1.45Nexon Co. Ltd. (Japan) (2) JPY 61,100 841,380 0.37Samsung Electronics Co. Ltd. KRW 7,893 8,951,909 3.99Samsung Electronics Co. Ltd.
Preference (1) KRW 2,282 2,026,839 0.90Samsung Life Insurance Co. Ltd. KRW 20,763 1,996,424 0.89
SCHEDULE of invEStmEntSAs at 30 June 2015
Investments Currency
Quantity/Nominal
Value
Market Value USD
% of Net Assets
transferable securities and money market instruments admitted to official exchange listing or dealt in on another regulated market
Equities (continued)
South Korea (continued)SK Hynix, Inc. KRW 104,214 3,942,945 1.76SK Telecom Co. Ltd. KRW 5,522 1,234,783 0.55SK Telecom Co. Ltd., ADR USD 11,100 275,613 0.12
43,047,166 19.16
taiwanAdvanced Semiconductor Engineering, Inc. TWD 1,539,000 2,079,528 0.92Catcher Technology Co. Ltd. TWD 319,000 3,980,411 1.77Chailease Holding Co. Ltd.
(Cayman Islands) (2) TWD 1,098,343 2,641,562 1.18Delta Electronics, Inc. TWD 397,000 2,027,671 0.90Eclat Textile Co. Ltd. TWD 230,700 3,773,532 1.68Fubon Financial Holding Co. Ltd. TWD 1,571,710 3,119,541 1.39Ginko International Co. Ltd.
(Cayman Islands) (2) TWD 53,000 665,605 0.30Hermes Microvision, Inc. TWD 38,436 2,497,377 1.11Largan Precision Co. Ltd. TWD 19,000 2,165,024 0.96momo.com, Inc. TWD 98,113 854,742 0.38Pegatron Corp. TWD 559,000 1,631,734 0.73Taiwan Mobile Co. Ltd. TWD 545,000 1,814,611 0.81Taiwan Semiconductor Manufacturing Co.
Ltd. TWD 2,201,362 9,998,104 4.45Uni-President Enterprises Corp. TWD 2,680,911 4,740,450 2.11
41,989,892 18.69
thailandAdvanced Info Service PCL THB 160,900 1,143,162 0.51Indorama Ventures PCL THB 2,346,900 1,927,959 0.86Land & Houses PCL (1) THB 2,181,767 581,288 0.26Land & Houses PCL, NVDR THB 249,400 65,340 0.03Minor International PCL (1) THB 959,130 851,803 0.38PTT PCL THB 133,700 1,420,909 0.63Total Access Communication PCL THB 307,201 759,363 0.34Total Access Communication PCL, NVDR THB 131,100 323,093 0.14
7,072,917 3.15
total Equities 219,889,552 97.89
The accompanying notes are an integral part of these financial statements.
Asian Equity Fund (continued)
Morgan Stanley Investment Funds 30 June 2015 4
SCHEDULE of invEStmEntSAs at 30 June 2015
Investments Currency
Quantity/Nominal
Value
Market Value USD
% of Net Assets
transferable securities and money market instruments admitted to official exchange listing or dealt in on another regulated market
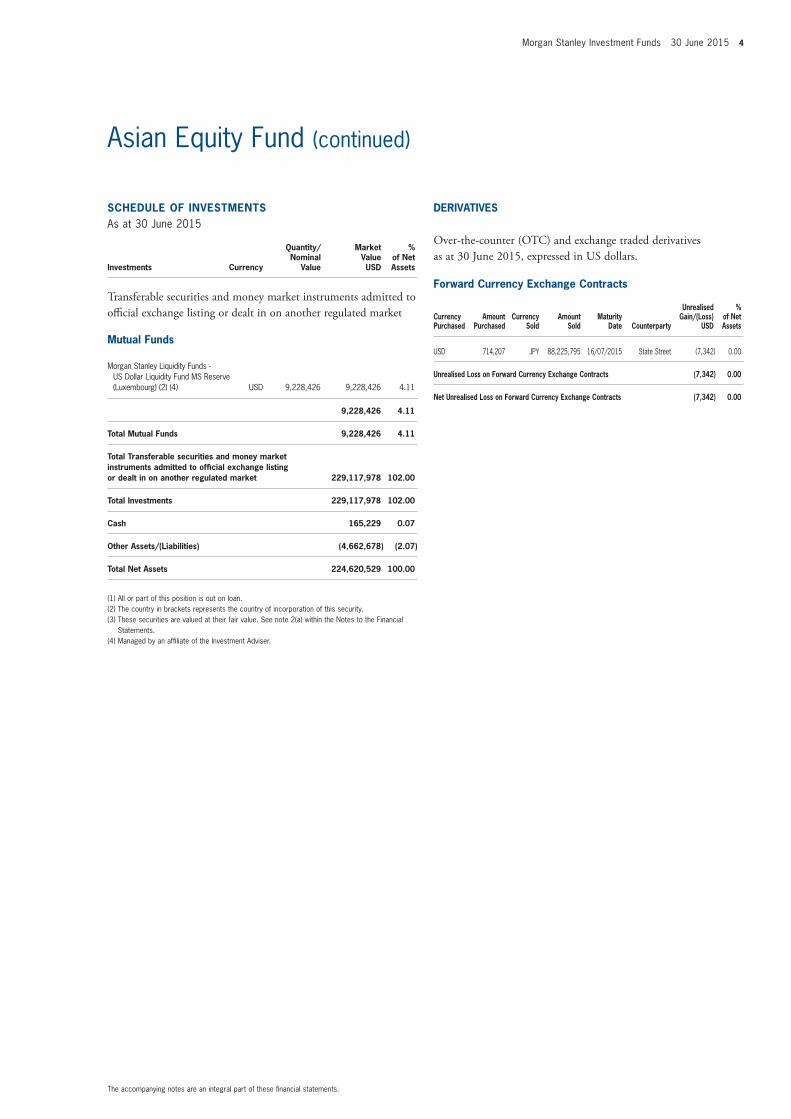
mutual funds
Morgan Stanley Liquidity Funds - US Dollar Liquidity Fund MS Reserve (Luxembourg) (2) (4) USD 9,228,426 9,228,426 4.11
9,228,426 4.11
total mutual funds 9,228,426 4.11
total transferable securities and money market instruments admitted to official exchange listing or dealt in on another regulated market 229,117,978 102.00
total investments 229,117,978 102.00
Cash 165,229 0.07
other Assets/(Liabilities) (4,662,678) (2.07)
total net Assets 224,620,529 100.00
(1) All or part of this position is out on loan.(2) The country in brackets represents the country of incorporation of this security.(3) These securities are valued at their fair value. See note 2(a) within the Notes to the Financial
Statements.(4) Managed by an affiliate of the Investment Adviser.
The accompanying notes are an integral part of these financial statements.
Asian Equity Fund (continued)
forward Currency Exchange Contracts
Currency Purchased
Amount Purchased
Currency Sold
Amount Sold
maturity Date Counterparty
Unrealised Gain/(Loss)
USD
% of net Assets
USD 714,207 JPY 88,225,795 16/07/2015 State Street (7,342) 0.00
Unrealised Loss on forward Currency Exchange Contracts (7,342) 0.00
net Unrealised Loss on forward Currency Exchange Contracts (7,342) 0.00
DERivAtivES
Over-the-counter (OtC) and exchange traded derivatives as at 30 June 2015, expressed in US dollars.
5 Morgan Stanley Investment Funds 30 June 2015
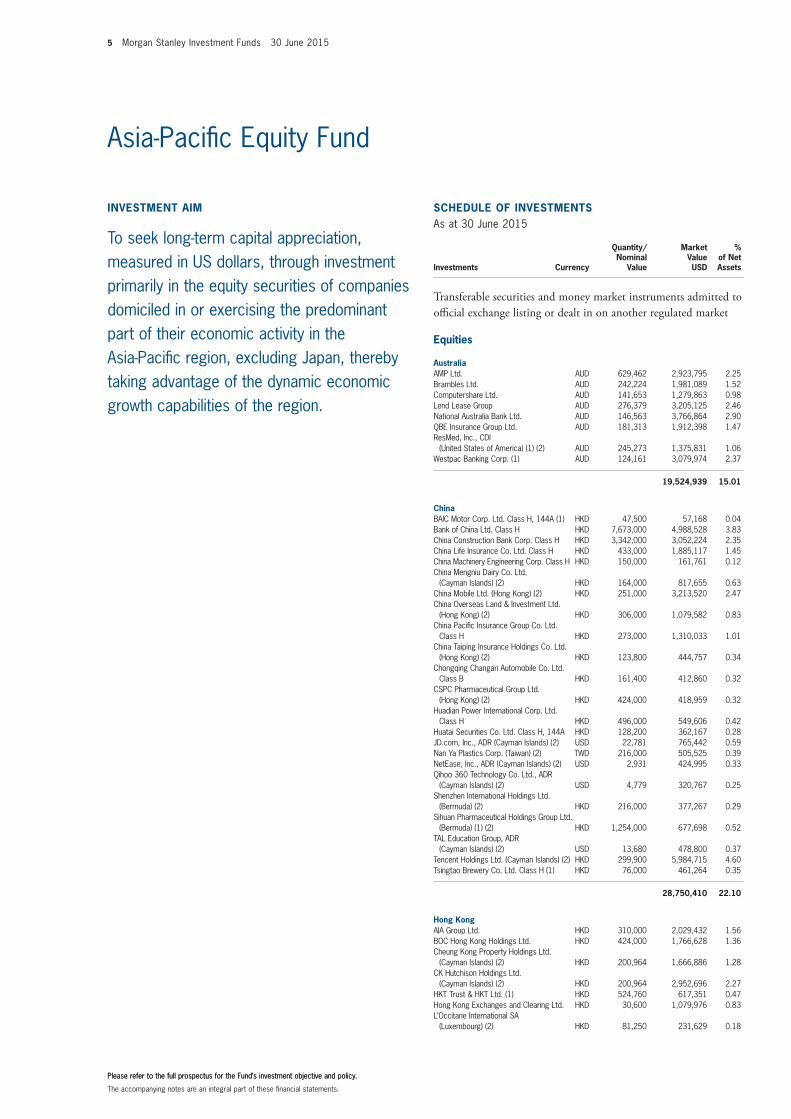
invEStmEnt Aim
To seek long-term capital appreciation, measured in US dollars, through investment primarily in the equity securities of companies domiciled in or exercising the predominant part of their economic activity in the Asia-Pacific region, excluding Japan, thereby taking advantage of the dynamic economic growth capabilities of the region.
SCHEDULE of invEStmEntSAs at 30 June 2015
Investments Currency
Quantity/Nominal
Value
Market Value USD
% of Net Assets
transferable securities and money market instruments admitted to official exchange listing or dealt in on another regulated market
Equities
AustraliaAMP Ltd. AUD 629,462 2,923,795 2.25Brambles Ltd. AUD 242,224 1,981,089 1.52Computershare Ltd. AUD 141,653 1,279,863 0.98Lend Lease Group AUD 276,379 3,205,125 2.46National Australia Bank Ltd. AUD 146,563 3,766,864 2.90QBE Insurance Group Ltd. AUD 181,313 1,912,398 1.47ResMed, Inc., CDI
(United States of America) (1) (2) AUD 245,273 1,375,831 1.06Westpac Banking Corp. (1) AUD 124,161 3,079,974 2.37
19,524,939 15.01
ChinaBAIC Motor Corp. Ltd. Class H, 144A (1) HKD 47,500 57,168 0.04Bank of China Ltd. Class H HKD 7,673,000 4,988,528 3.83China Construction Bank Corp. Class H HKD 3,342,000 3,052,224 2.35China Life Insurance Co. Ltd. Class H HKD 433,000 1,885,117 1.45China Machinery Engineering Corp. Class H HKD 150,000 161,761 0.12China Mengniu Dairy Co. Ltd.
(Cayman Islands) (2) HKD 164,000 817,655 0.63China Mobile Ltd. (Hong Kong) (2) HKD 251,000 3,213,520 2.47China Overseas Land & Investment Ltd.
(Hong Kong) (2) HKD 306,000 1,079,582 0.83China Pacific Insurance Group Co. Ltd.
Class H HKD 273,000 1,310,033 1.01China Taiping Insurance Holdings Co. Ltd.
(Hong Kong) (2) HKD 123,800 444,757 0.34Chongqing Changan Automobile Co. Ltd.
Class B HKD 161,400 412,860 0.32CSPC Pharmaceutical Group Ltd.
(Hong Kong) (2) HKD 424,000 418,959 0.32Huadian Power International Corp. Ltd.
Class H HKD 496,000 549,606 0.42Huatai Securities Co. Ltd. Class H, 144A HKD 128,200 362,167 0.28JD.com, Inc., ADR (Cayman Islands) (2) USD 22,781 765,442 0.59Nan Ya Plastics Corp. (Taiwan) (2) TWD 216,000 505,525 0.39NetEase, Inc., ADR (Cayman Islands) (2) USD 2,931 424,995 0.33Qihoo 360 Technology Co. Ltd., ADR
(Cayman Islands) (2) USD 4,779 320,767 0.25Shenzhen International Holdings Ltd.
(Bermuda) (2) HKD 216,000 377,267 0.29Sihuan Pharmaceutical Holdings Group Ltd.
(Bermuda) (1) (2) HKD 1,254,000 677,698 0.52TAL Education Group, ADR
(Cayman Islands) (2) USD 13,680 478,800 0.37Tencent Holdings Ltd. (Cayman Islands) (2) HKD 299,900 5,984,715 4.60Tsingtao Brewery Co. Ltd. Class H (1) HKD 76,000 461,264 0.35
28,750,410 22.10
Hong KongAIA Group Ltd. HKD 310,000 2,029,432 1.56BOC Hong Kong Holdings Ltd. HKD 424,000 1,766,628 1.36Cheung Kong Property Holdings Ltd.
(Cayman Islands) (2) HKD 200,964 1,666,886 1.28CK Hutchison Holdings Ltd.
(Cayman Islands) (2) HKD 200,964 2,952,696 2.27HKT Trust & HKT Ltd. (1) HKD 524,760 617,351 0.47Hong Kong Exchanges and Clearing Ltd. HKD 30,600 1,079,976 0.83L’Occitane International SA
(Luxembourg) (2) HKD 81,250 231,629 0.18
The accompanying notes are an integral part of these financial statements.
Please refer to the full prospectus for the Fund’s investment objective and policy.Please refer to the full prospectus for the Fund’s investment objective and policy.
Asia-Pacific Equity Fund
Morgan Stanley Investment Funds 30 June 2015 6
SCHEDULE of invEStmEntSAs at 30 June 2015
Investments Currency
Quantity/Nominal
Value
Market Value USD
% of Net Assets
transferable securities and money market instruments admitted to official exchange listing or dealt in on another regulated market
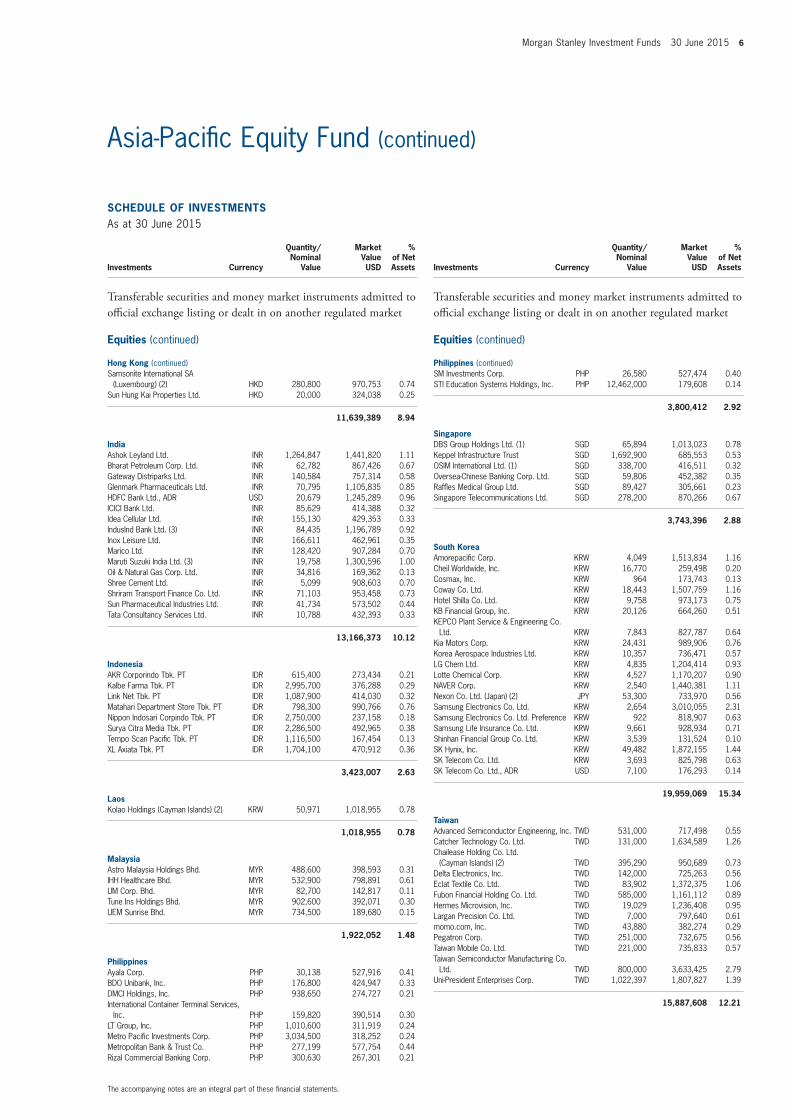
Equities (continued)
Hong Kong (continued)Samsonite International SA
(Luxembourg) (2) HKD 280,800 970,753 0.74Sun Hung Kai Properties Ltd. HKD 20,000 324,038 0.25
11,639,389 8.94
indiaAshok Leyland Ltd. INR 1,264,847 1,441,820 1.11Bharat Petroleum Corp. Ltd. INR 62,782 867,426 0.67Gateway Distriparks Ltd. INR 140,584 757,314 0.58Glenmark Pharmaceuticals Ltd. INR 70,795 1,105,835 0.85HDFC Bank Ltd., ADR USD 20,679 1,245,289 0.96ICICI Bank Ltd. INR 85,629 414,388 0.32Idea Cellular Ltd. INR 155,130 429,353 0.33IndusInd Bank Ltd. (3) INR 84,435 1,196,789 0.92Inox Leisure Ltd. INR 166,611 462,961 0.35Marico Ltd. INR 128,420 907,284 0.70Maruti Suzuki India Ltd. (3) INR 19,758 1,300,596 1.00Oil & Natural Gas Corp. Ltd. INR 34,816 169,362 0.13Shree Cement Ltd. INR 5,099 908,603 0.70Shriram Transport Finance Co. Ltd. INR 71,103 953,458 0.73Sun Pharmaceutical Industries Ltd. INR 41,734 573,502 0.44Tata Consultancy Services Ltd. INR 10,788 432,393 0.33
13,166,373 10.12
indonesiaAKR Corporindo Tbk. PT IDR 615,400 273,434 0.21Kalbe Farma Tbk. PT IDR 2,995,700 376,288 0.29Link Net Tbk. PT IDR 1,087,900 414,030 0.32Matahari Department Store Tbk. PT IDR 798,300 990,766 0.76Nippon Indosari Corpindo Tbk. PT IDR 2,750,000 237,158 0.18Surya Citra Media Tbk. PT IDR 2,286,500 492,965 0.38Tempo Scan Pacific Tbk. PT IDR 1,116,500 167,454 0.13XL Axiata Tbk. PT IDR 1,704,100 470,912 0.36
3,423,007 2.63
LaosKolao Holdings (Cayman Islands) (2) KRW 50,971 1,018,955 0.78
1,018,955 0.78
malaysiaAstro Malaysia Holdings Bhd. MYR 488,600 398,593 0.31IHH Healthcare Bhd. MYR 532,900 798,891 0.61IJM Corp. Bhd. MYR 82,700 142,817 0.11Tune Ins Holdings Bhd. MYR 902,600 392,071 0.30UEM Sunrise Bhd. MYR 734,500 189,680 0.15
1,922,052 1.48
PhilippinesAyala Corp. PHP 30,138 527,916 0.41BDO Unibank, Inc. PHP 176,800 424,947 0.33DMCI Holdings, Inc. PHP 938,650 274,727 0.21International Container Terminal Services,
Inc. PHP 159,820 390,514 0.30LT Group, Inc. PHP 1,010,600 311,919 0.24Metro Pacific Investments Corp. PHP 3,034,500 318,252 0.24Metropolitan Bank & Trust Co. PHP 277,199 577,754 0.44Rizal Commercial Banking Corp. PHP 300,630 267,301 0.21
SCHEDULE of invEStmEntSAs at 30 June 2015
Investments Currency
Quantity/Nominal
Value
Market Value USD
% of Net Assets
transferable securities and money market instruments admitted to official exchange listing or dealt in on another regulated market
Equities (continued)
Philippines (continued)SM Investments Corp. PHP 26,580 527,474 0.40STI Education Systems Holdings, Inc. PHP 12,462,000 179,608 0.14
3,800,412 2.92
SingaporeDBS Group Holdings Ltd. (1) SGD 65,894 1,013,023 0.78Keppel Infrastructure Trust SGD 1,692,900 685,553 0.53OSIM International Ltd. (1) SGD 338,700 416,511 0.32Oversea-Chinese Banking Corp. Ltd. SGD 59,806 452,382 0.35Raffles Medical Group Ltd. SGD 89,427 305,661 0.23Singapore Telecommunications Ltd. SGD 278,200 870,266 0.67
3,743,396 2.88
South KoreaAmorepacific Corp. KRW 4,049 1,513,834 1.16Cheil Worldwide, Inc. KRW 16,770 259,498 0.20Cosmax, Inc. KRW 964 173,743 0.13Coway Co. Ltd. KRW 18,443 1,507,759 1.16Hotel Shilla Co. Ltd. KRW 9,758 973,173 0.75KB Financial Group, Inc. KRW 20,126 664,260 0.51KEPCO Plant Service & Engineering Co.
Ltd. KRW 7,843 827,787 0.64Kia Motors Corp. KRW 24,431 989,906 0.76Korea Aerospace Industries Ltd. KRW 10,357 736,471 0.57LG Chem Ltd. KRW 4,835 1,204,414 0.93Lotte Chemical Corp. KRW 4,527 1,170,207 0.90NAVER Corp. KRW 2,540 1,440,381 1.11Nexon Co. Ltd. (Japan) (2) JPY 53,300 733,970 0.56Samsung Electronics Co. Ltd. KRW 2,654 3,010,055 2.31Samsung Electronics Co. Ltd. Preference KRW 922 818,907 0.63Samsung Life Insurance Co. Ltd. KRW 9,661 928,934 0.71Shinhan Financial Group Co. Ltd. KRW 3,539 131,524 0.10SK Hynix, Inc. KRW 49,482 1,872,155 1.44SK Telecom Co. Ltd. KRW 3,693 825,798 0.63SK Telecom Co. Ltd., ADR USD 7,100 176,293 0.14
19,959,069 15.34
taiwanAdvanced Semiconductor Engineering, Inc. TWD 531,000 717,498 0.55Catcher Technology Co. Ltd. TWD 131,000 1,634,589 1.26Chailease Holding Co. Ltd.
(Cayman Islands) (2) TWD 395,290 950,689 0.73Delta Electronics, Inc. TWD 142,000 725,263 0.56Eclat Textile Co. Ltd. TWD 83,902 1,372,375 1.06Fubon Financial Holding Co. Ltd. TWD 585,000 1,161,112 0.89Hermes Microvision, Inc. TWD 19,029 1,236,408 0.95Largan Precision Co. Ltd. TWD 7,000 797,640 0.61momo.com, Inc. TWD 43,880 382,274 0.29Pegatron Corp. TWD 251,000 732,675 0.56Taiwan Mobile Co. Ltd. TWD 221,000 735,833 0.57Taiwan Semiconductor Manufacturing Co.
Ltd. TWD 800,000 3,633,425 2.79Uni-President Enterprises Corp. TWD 1,022,397 1,807,827 1.39
15,887,608 12.21
The accompanying notes are an integral part of these financial statements.
Asia-Pacific Equity Fund (continued)
7 Morgan Stanley Investment Funds 30 June 2015
SCHEDULE of invEStmEntSAs at 30 June 2015
Investments Currency
Quantity/Nominal
Value
Market Value USD
% of Net Assets
transferable securities and money market instruments admitted to official exchange listing or dealt in on another regulated market
Equities (continued)
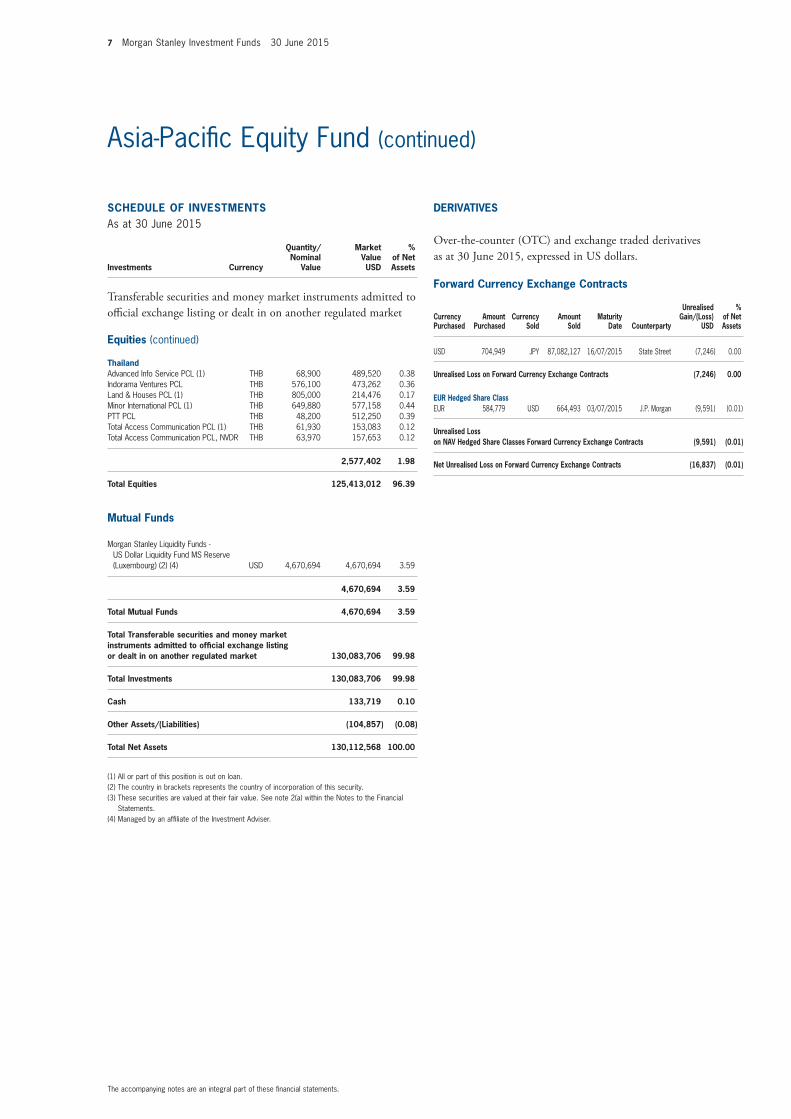
thailandAdvanced Info Service PCL (1) THB 68,900 489,520 0.38Indorama Ventures PCL THB 576,100 473,262 0.36Land & Houses PCL (1) THB 805,000 214,476 0.17Minor International PCL (1) THB 649,880 577,158 0.44PTT PCL THB 48,200 512,250 0.39Total Access Communication PCL (1) THB 61,930 153,083 0.12Total Access Communication PCL, NVDR THB 63,970 157,653 0.12
2,577,402 1.98
total Equities 125,413,012 96.39
mutual funds
Morgan Stanley Liquidity Funds - US Dollar Liquidity Fund MS Reserve (Luxembourg) (2) (4) USD 4,670,694 4,670,694 3.59
4,670,694 3.59
total mutual funds 4,670,694 3.59
total transferable securities and money market instruments admitted to official exchange listing or dealt in on another regulated market 130,083,706 99.98
total investments 130,083,706 99.98
Cash 133,719 0.10
other Assets/(Liabilities) (104,857) (0.08)
total net Assets 130,112,568 100.00
(1) All or part of this position is out on loan.(2) The country in brackets represents the country of incorporation of this security.(3) These securities are valued at their fair value. See note 2(a) within the Notes to the Financial
Statements.(4) Managed by an affiliate of the Investment Adviser.
The accompanying notes are an integral part of these financial statements.
Asia-Pacific Equity Fund (continued)
forward Currency Exchange Contracts
Currency Purchased
Amount Purchased
Currency Sold
Amount Sold
maturity Date Counterparty
Unrealised Gain/(Loss)
USD
% of net Assets
USD 704,949 JPY 87,082,127 16/07/2015 State Street (7,246) 0.00
Unrealised Loss on forward Currency Exchange Contracts (7,246) 0.00
EUR Hedged Share ClassEUR 584,779 USD 664,493 03/07/2015 J.P. Morgan (9,591) (0.01)
Unrealised Loss on nAv Hedged Share Classes forward Currency Exchange Contracts (9,591) (0.01)
net Unrealised Loss on forward Currency Exchange Contracts (16,837) (0.01)
DERivAtivES
Over-the-counter (OtC) and exchange traded derivatives as at 30 June 2015, expressed in US dollars.
Morgan Stanley Investment Funds 30 June 2015 8
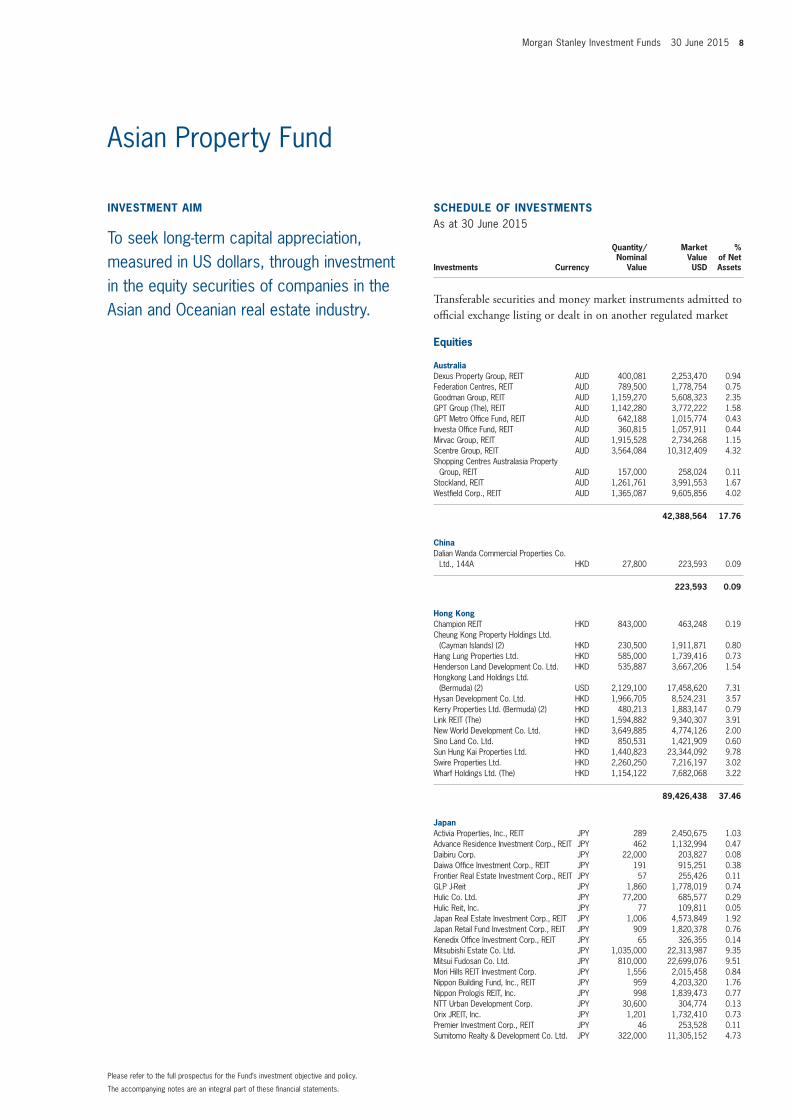
invEStmEnt Aim
To seek long-term capital appreciation, measured in US dollars, through investment in the equity securities of companies in the Asian and Oceanian real estate industry.
SCHEDULE of invEStmEntSAs at 30 June 2015
Investments Currency
Quantity/Nominal
Value
Market Value USD
% of Net Assets
transferable securities and money market instruments admitted to official exchange listing or dealt in on another regulated market
Equities
AustraliaDexus Property Group, REIT AUD 400,081 2,253,470 0.94Federation Centres, REIT AUD 789,500 1,778,754 0.75Goodman Group, REIT AUD 1,159,270 5,608,323 2.35GPT Group (The), REIT AUD 1,142,280 3,772,222 1.58GPT Metro Office Fund, REIT AUD 642,188 1,015,774 0.43Investa Office Fund, REIT AUD 360,815 1,057,911 0.44Mirvac Group, REIT AUD 1,915,528 2,734,268 1.15Scentre Group, REIT AUD 3,564,084 10,312,409 4.32Shopping Centres Australasia Property
Group, REIT AUD 157,000 258,024 0.11Stockland, REIT AUD 1,261,761 3,991,553 1.67Westfield Corp., REIT AUD 1,365,087 9,605,856 4.02
42,388,564 17.76
ChinaDalian Wanda Commercial Properties Co.
Ltd., 144A HKD 27,800 223,593 0.09
223,593 0.09
Hong KongChampion REIT HKD 843,000 463,248 0.19Cheung Kong Property Holdings Ltd.
(Cayman Islands) (2) HKD 230,500 1,911,871 0.80Hang Lung Properties Ltd. HKD 585,000 1,739,416 0.73Henderson Land Development Co. Ltd. HKD 535,887 3,667,206 1.54Hongkong Land Holdings Ltd.
(Bermuda) (2) USD 2,129,100 17,458,620 7.31Hysan Development Co. Ltd. HKD 1,966,705 8,524,231 3.57Kerry Properties Ltd. (Bermuda) (2) HKD 480,213 1,883,147 0.79Link REIT (The) HKD 1,594,882 9,340,307 3.91New World Development Co. Ltd. HKD 3,649,885 4,774,126 2.00Sino Land Co. Ltd. HKD 850,531 1,421,909 0.60Sun Hung Kai Properties Ltd. HKD 1,440,823 23,344,092 9.78Swire Properties Ltd. HKD 2,260,250 7,216,197 3.02Wharf Holdings Ltd. (The) HKD 1,154,122 7,682,068 3.22
89,426,438 37.46
JapanActivia Properties, Inc., REIT JPY 289 2,450,675 1.03Advance Residence Investment Corp., REIT JPY 462 1,132,994 0.47Daibiru Corp. JPY 22,000 203,827 0.08Daiwa Office Investment Corp., REIT JPY 191 915,251 0.38Frontier Real Estate Investment Corp., REIT JPY 57 255,426 0.11GLP J-Reit JPY 1,860 1,778,019 0.74Hulic Co. Ltd. JPY 77,200 685,577 0.29Hulic Reit, Inc. JPY 77 109,811 0.05Japan Real Estate Investment Corp., REIT JPY 1,006 4,573,849 1.92Japan Retail Fund Investment Corp., REIT JPY 909 1,820,378 0.76Kenedix Office Investment Corp., REIT JPY 65 326,355 0.14Mitsubishi Estate Co. Ltd. JPY 1,035,000 22,313,987 9.35Mitsui Fudosan Co. Ltd. JPY 810,000 22,699,076 9.51Mori Hills REIT Investment Corp. JPY 1,556 2,015,458 0.84Nippon Building Fund, Inc., REIT JPY 959 4,203,320 1.76Nippon Prologis REIT, Inc. JPY 998 1,839,473 0.77NTT Urban Development Corp. JPY 30,600 304,774 0.13Orix JREIT, Inc. JPY 1,201 1,732,410 0.73Premier Investment Corp., REIT JPY 46 253,528 0.11Sumitomo Realty & Development Co. Ltd. JPY 322,000 11,305,152 4.73
The accompanying notes are an integral part of these financial statements.
Please refer to the full prospectus for the Fund’s investment objective and policy.
Asian Property Fund
9 Morgan Stanley Investment Funds 30 June 2015
SCHEDULE of invEStmEntSAs at 30 June 2015
Investments Currency
Quantity/Nominal
Value
Market Value USD
% of Net Assets
transferable securities and money market instruments admitted to official exchange listing or dealt in on another regulated market
Equities (continued)
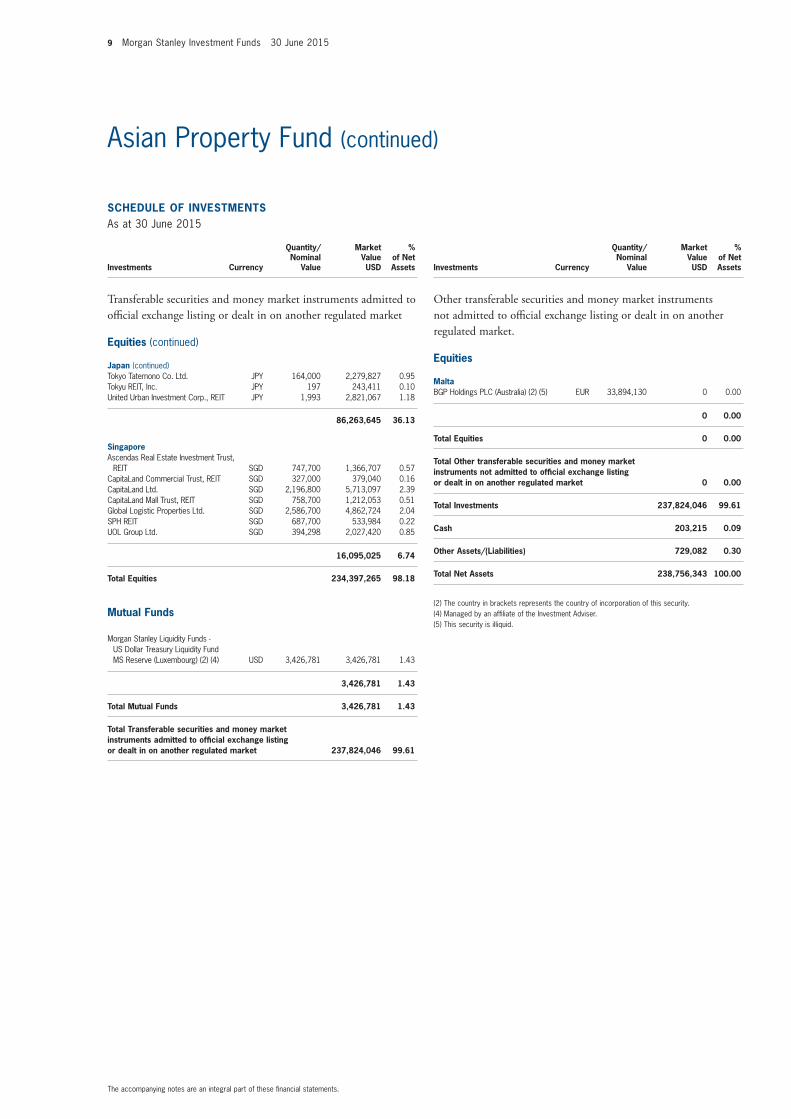
Japan (continued)Tokyo Tatemono Co. Ltd. JPY 164,000 2,279,827 0.95Tokyu REIT, Inc. JPY 197 243,411 0.10United Urban Investment Corp., REIT JPY 1,993 2,821,067 1.18
86,263,645 36.13
SingaporeAscendas Real Estate Investment Trust,
REIT SGD 747,700 1,366,707 0.57CapitaLand Commercial Trust, REIT SGD 327,000 379,040 0.16CapitaLand Ltd. SGD 2,196,800 5,713,097 2.39CapitaLand Mall Trust, REIT SGD 758,700 1,212,053 0.51Global Logistic Properties Ltd. SGD 2,586,700 4,862,724 2.04SPH REIT SGD 687,700 533,984 0.22UOL Group Ltd. SGD 394,298 2,027,420 0.85
16,095,025 6.74
total Equities 234,397,265 98.18
mutual funds
Morgan Stanley Liquidity Funds - US Dollar Treasury Liquidity Fund MS Reserve (Luxembourg) (2) (4) USD 3,426,781 3,426,781 1.43
3,426,781 1.43
total mutual funds 3,426,781 1.43
total transferable securities and money market instruments admitted to official exchange listing or dealt in on another regulated market 237,824,046 99.61
SCHEDULE of invEStmEntSAs at 30 June 2015
Investments Currency
Quantity/Nominal
Value
Market Value USD
% of Net Assets
Other transferable securities and money market instruments not admitted to official exchange listing or dealt in on another regulated market.
Equities
maltaBGP Holdings PLC (Australia) (2) (5) EUR 33,894,130 0 0.00
0 0.00
total Equities 0 0.00
total other transferable securities and money market instruments not admitted to official exchange listing or dealt in on another regulated market 0 0.00
total investments 237,824,046 99.61
Cash 203,215 0.09
other Assets/(Liabilities) 729,082 0.30
total net Assets 238,756,343 100.00
(2) The country in brackets represents the country of incorporation of this security.(4) Managed by an affiliate of the Investment Adviser.(5) This security is illiquid.
The accompanying notes are an integral part of these financial statements.
Asian Property Fund (continued)
Morgan Stanley Investment Funds 30 June 2015 10
SCHEDULE of invEStmEntSAs at 30 June 2015
Investments Currency
Quantity/Nominal
Value
Market Value EUR
% of Net Assets
transferable securities and money market instruments admitted to official exchange listing or dealt in on another regulated market
Equities
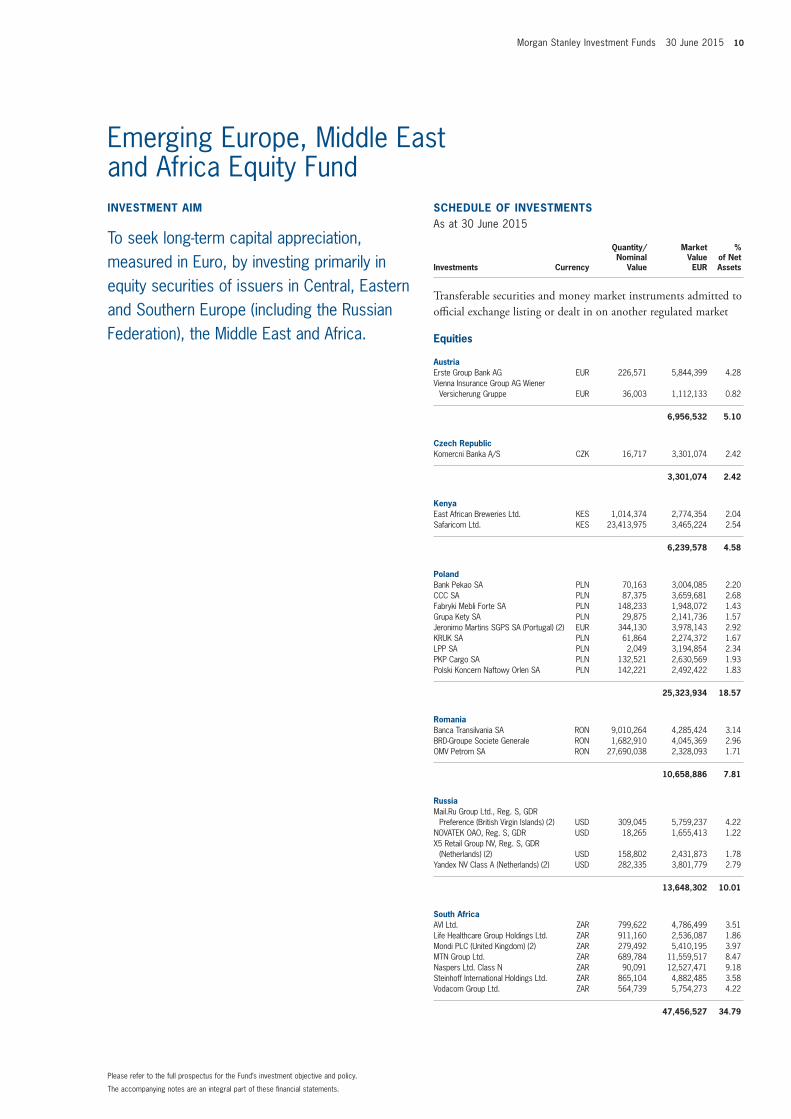
AustriaErste Group Bank AG EUR 226,571 5,844,399 4.28Vienna Insurance Group AG Wiener
Versicherung Gruppe EUR 36,003 1,112,133 0.82
6,956,532 5.10
Czech RepublicKomercni Banka A/S CZK 16,717 3,301,074 2.42
3,301,074 2.42
KenyaEast African Breweries Ltd. KES 1,014,374 2,774,354 2.04Safaricom Ltd. KES 23,413,975 3,465,224 2.54
6,239,578 4.58
PolandBank Pekao SA PLN 70,163 3,004,085 2.20CCC SA PLN 87,375 3,659,681 2.68Fabryki Mebli Forte SA PLN 148,233 1,948,072 1.43Grupa Kety SA PLN 29,875 2,141,736 1.57Jeronimo Martins SGPS SA (Portugal) (2) EUR 344,130 3,978,143 2.92KRUK SA PLN 61,864 2,274,372 1.67LPP SA PLN 2,049 3,194,854 2.34PKP Cargo SA PLN 132,521 2,630,569 1.93Polski Koncern Naftowy Orlen SA PLN 142,221 2,492,422 1.83
25,323,934 18.57
RomaniaBanca Transilvania SA RON 9,010,264 4,285,424 3.14BRD-Groupe Societe Generale RON 1,682,910 4,045,369 2.96OMV Petrom SA RON 27,690,038 2,328,093 1.71
10,658,886 7.81
RussiaMail.Ru Group Ltd., Reg. S, GDR
Preference (British Virgin Islands) (2) USD 309,045 5,759,237 4.22NOVATEK OAO, Reg. S, GDR USD 18,265 1,655,413 1.22X5 Retail Group NV, Reg. S, GDR
(Netherlands) (2) USD 158,802 2,431,873 1.78Yandex NV Class A (Netherlands) (2) USD 282,335 3,801,779 2.79
13,648,302 10.01
South AfricaAVI Ltd. ZAR 799,622 4,786,499 3.51Life Healthcare Group Holdings Ltd. ZAR 911,160 2,536,087 1.86Mondi PLC (United Kingdom) (2) ZAR 279,492 5,410,195 3.97MTN Group Ltd. ZAR 689,784 11,559,517 8.47Naspers Ltd. Class N ZAR 90,091 12,527,471 9.18Steinhoff International Holdings Ltd. ZAR 865,104 4,882,485 3.58Vodacom Group Ltd. ZAR 564,739 5,754,273 4.22
47,456,527 34.79
invEStmEnt Aim
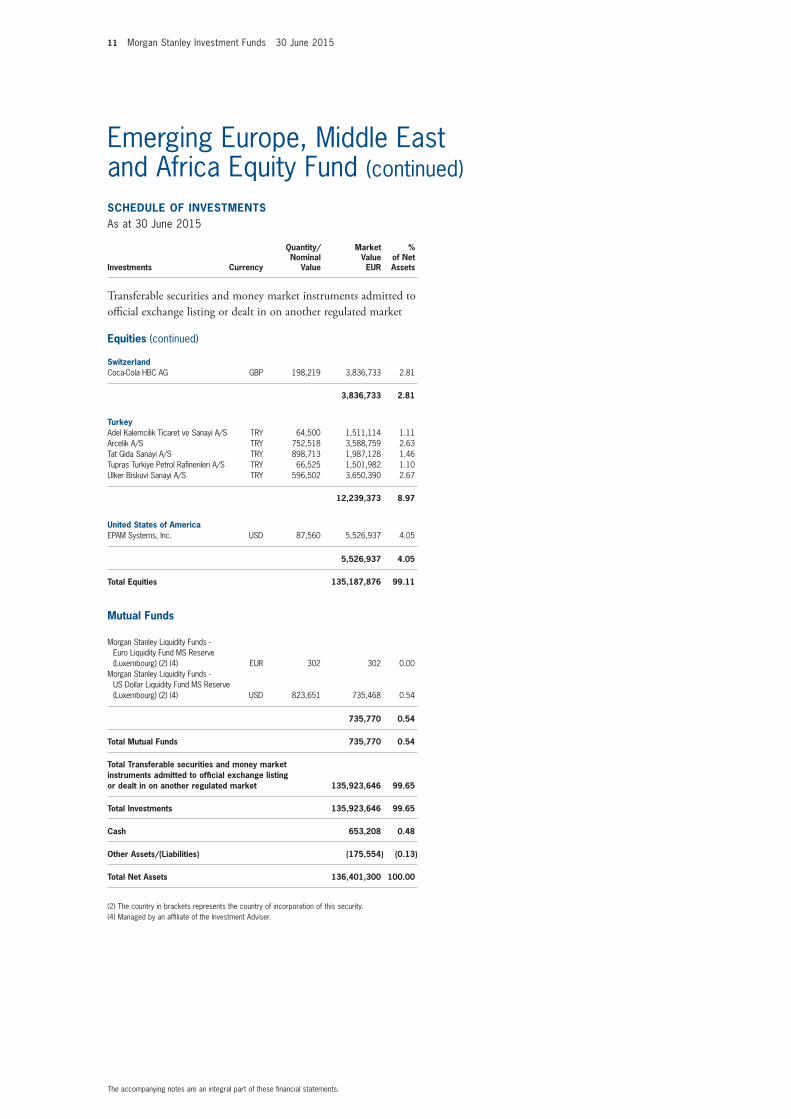
To seek long-term capital appreciation, measured in Euro, by investing primarily in equity securities of issuers in Central, Eastern and Southern Europe (including the Russian Federation), the Middle East and Africa.
The accompanying notes are an integral part of these financial statements.
Please refer to the full prospectus for the Fund’s investment objective and policy.
Emerging Europe, Middle East and Africa Equity Fund
11 Morgan Stanley Investment Funds 30 June 2015
SCHEDULE of invEStmEntSAs at 30 June 2015
Investments Currency
Quantity/Nominal
Value
Market Value EUR
% of Net Assets
transferable securities and money market instruments admitted to official exchange listing or dealt in on another regulated market
Equities (continued)
SwitzerlandCoca-Cola HBC AG GBP 198,219 3,836,733 2.81
3,836,733 2.81
turkeyAdel Kalemcilik Ticaret ve Sanayi A/S TRY 64,500 1,511,114 1.11Arcelik A/S TRY 752,518 3,588,759 2.63Tat Gida Sanayi A/S TRY 898,713 1,987,128 1.46Tupras Turkiye Petrol Rafinerileri A/S TRY 66,525 1,501,982 1.10Ulker Biskuvi Sanayi A/S TRY 596,502 3,650,390 2.67
12,239,373 8.97
United States of AmericaEPAM Systems, Inc. USD 87,560 5,526,937 4.05
5,526,937 4.05
total Equities 135,187,876 99.11
mutual funds
Morgan Stanley Liquidity Funds - Euro Liquidity Fund MS Reserve (Luxembourg) (2) (4) EUR 302 302 0.00
Morgan Stanley Liquidity Funds - US Dollar Liquidity Fund MS Reserve (Luxembourg) (2) (4) USD 823,651 735,468 0.54
735,770 0.54
total mutual funds 735,770 0.54
total transferable securities and money market instruments admitted to official exchange listing or dealt in on another regulated market 135,923,646 99.65
total investments 135,923,646 99.65
Cash 653,208 0.48
other Assets/(Liabilities) (175,554) (0.13)
total net Assets 136,401,300 100.00
(2) The country in brackets represents the country of incorporation of this security.(4) Managed by an affiliate of the Investment Adviser.
The accompanying notes are an integral part of these financial statements.
Emerging Europe, Middle East and Africa Equity Fund (continued)
Morgan Stanley Investment Funds 30 June 2015 12
SCHEDULE of invEStmEntSAs at 30 June 2015
Investments Currency
Quantity/Nominal
Value
Market Value USD
% of Net Assets
transferable securities and money market instruments admitted to official exchange listing or dealt in on another regulated market
Equities
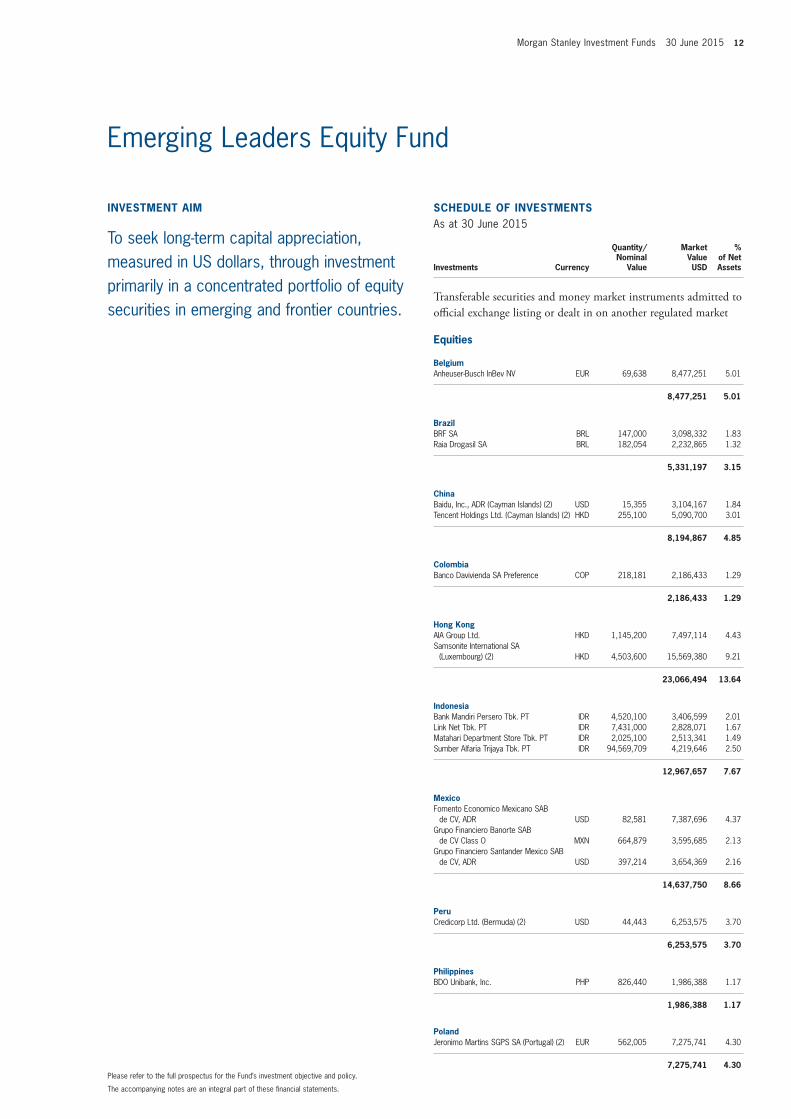
BelgiumAnheuser-Busch InBev NV EUR 69,638 8,477,251 5.01
8,477,251 5.01
BrazilBRF SA BRL 147,000 3,098,332 1.83Raia Drogasil SA BRL 182,054 2,232,865 1.32
5,331,197 3.15
ChinaBaidu, Inc., ADR (Cayman Islands) (2) USD 15,355 3,104,167 1.84Tencent Holdings Ltd. (Cayman Islands) (2) HKD 255,100 5,090,700 3.01
8,194,867 4.85
ColombiaBanco Davivienda SA Preference COP 218,181 2,186,433 1.29
2,186,433 1.29
Hong KongAIA Group Ltd. HKD 1,145,200 7,497,114 4.43Samsonite International SA
(Luxembourg) (2) HKD 4,503,600 15,569,380 9.21
23,066,494 13.64
indonesiaBank Mandiri Persero Tbk. PT IDR 4,520,100 3,406,599 2.01Link Net Tbk. PT IDR 7,431,000 2,828,071 1.67Matahari Department Store Tbk. PT IDR 2,025,100 2,513,341 1.49Sumber Alfaria Trijaya Tbk. PT IDR 94,569,709 4,219,646 2.50
12,967,657 7.67
mexicoFomento Economico Mexicano SAB
de CV, ADR USD 82,581 7,387,696 4.37Grupo Financiero Banorte SAB
de CV Class O MXN 664,879 3,595,685 2.13Grupo Financiero Santander Mexico SAB
de CV, ADR USD 397,214 3,654,369 2.16
14,637,750 8.66
PeruCredicorp Ltd. (Bermuda) (2) USD 44,443 6,253,575 3.70
6,253,575 3.70
PhilippinesBDO Unibank, Inc. PHP 826,440 1,986,388 1.17
1,986,388 1.17
PolandJeronimo Martins SGPS SA (Portugal) (2) EUR 562,005 7,275,741 4.30
7,275,741 4.30
invEStmEnt Aim
To seek long-term capital appreciation, measured in US dollars, through investment primarily in a concentrated portfolio of equity securities in emerging and frontier countries.
The accompanying notes are an integral part of these financial statements.
Please refer to the full prospectus for the Fund’s investment objective and policy.
Emerging Leaders Equity Fund
13 Morgan Stanley Investment Funds 30 June 2015
SCHEDULE of invEStmEntSAs at 30 June 2015
Investments Currency
Quantity/Nominal
Value
Market Value USD
% of Net Assets
transferable securities and money market instruments admitted to official exchange listing or dealt in on another regulated market
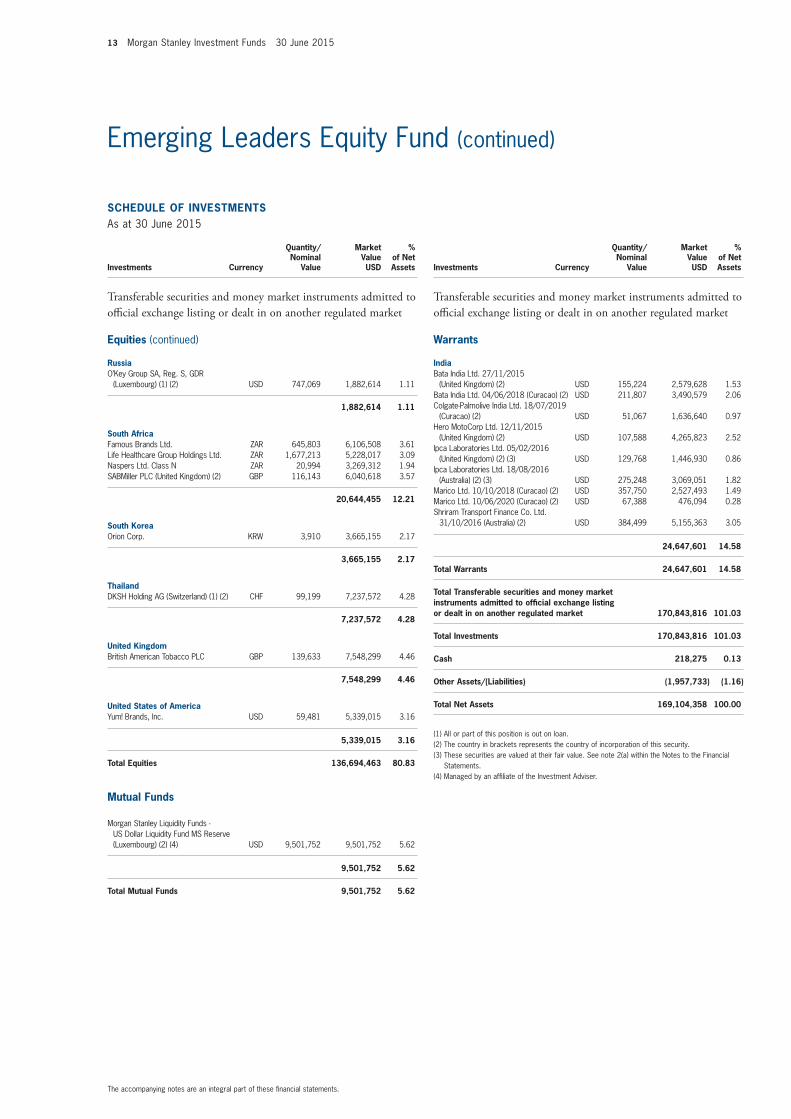
Equities (continued)
RussiaO’Key Group SA, Reg. S, GDR
(Luxembourg) (1) (2) USD 747,069 1,882,614 1.11
1,882,614 1.11
South AfricaFamous Brands Ltd. ZAR 645,803 6,106,508 3.61Life Healthcare Group Holdings Ltd. ZAR 1,677,213 5,228,017 3.09Naspers Ltd. Class N ZAR 20,994 3,269,312 1.94SABMiller PLC (United Kingdom) (2) GBP 116,143 6,040,618 3.57
20,644,455 12.21
South KoreaOrion Corp. KRW 3,910 3,665,155 2.17
3,665,155 2.17
thailandDKSH Holding AG (Switzerland) (1) (2) CHF 99,199 7,237,572 4.28
7,237,572 4.28
United KingdomBritish American Tobacco PLC GBP 139,633 7,548,299 4.46
7,548,299 4.46
United States of AmericaYum! Brands, Inc. USD 59,481 5,339,015 3.16
5,339,015 3.16
total Equities 136,694,463 80.83
mutual funds
Morgan Stanley Liquidity Funds - US Dollar Liquidity Fund MS Reserve (Luxembourg) (2) (4) USD 9,501,752 9,501,752 5.62
9,501,752 5.62
total mutual funds 9,501,752 5.62
SCHEDULE of invEStmEntSAs at 30 June 2015
Investments Currency
Quantity/Nominal
Value
Market Value USD
% of Net Assets
transferable securities and money market instruments admitted to official exchange listing or dealt in on another regulated market
Warrants
indiaBata India Ltd. 27/11/2015
(United Kingdom) (2) USD 155,224 2,579,628 1.53Bata India Ltd. 04/06/2018 (Curacao) (2) USD 211,807 3,490,579 2.06Colgate-Palmolive India Ltd. 18/07/2019
(Curacao) (2) USD 51,067 1,636,640 0.97Hero MotoCorp Ltd. 12/11/2015
(United Kingdom) (2) USD 107,588 4,265,823 2.52Ipca Laboratories Ltd. 05/02/2016
(United Kingdom) (2) (3) USD 129,768 1,446,930 0.86Ipca Laboratories Ltd. 18/08/2016
(Australia) (2) (3) USD 275,248 3,069,051 1.82Marico Ltd. 10/10/2018 (Curacao) (2) USD 357,750 2,527,493 1.49Marico Ltd. 10/06/2020 (Curacao) (2) USD 67,388 476,094 0.28Shriram Transport Finance Co. Ltd.
31/10/2016 (Australia) (2) USD 384,499 5,155,363 3.05
24,647,601 14.58
total Warrants 24,647,601 14.58
total transferable securities and money market instruments admitted to official exchange listing or dealt in on another regulated market 170,843,816 101.03
total investments 170,843,816 101.03
Cash 218,275 0.13
other Assets/(Liabilities) (1,957,733) (1.16)
total net Assets 169,104,358 100.00
(1) All or part of this position is out on loan.(2) The country in brackets represents the country of incorporation of this security.(3) These securities are valued at their fair value. See note 2(a) within the Notes to the Financial
Statements.(4) Managed by an affiliate of the Investment Adviser.
The accompanying notes are an integral part of these financial statements.
Emerging Leaders Equity Fund (continued)
Morgan Stanley Investment Funds 30 June 2015 14
The accompanying notes are an integral part of these financial statements.
Emerging Leaders Equity Fund (continued)
forward Currency Exchange Contracts
Currency Purchased
Amount Purchased
Currency Sold
Amount Sold
maturity Date Counterparty
Unrealised Gain/(Loss)
USD
% of net Assets
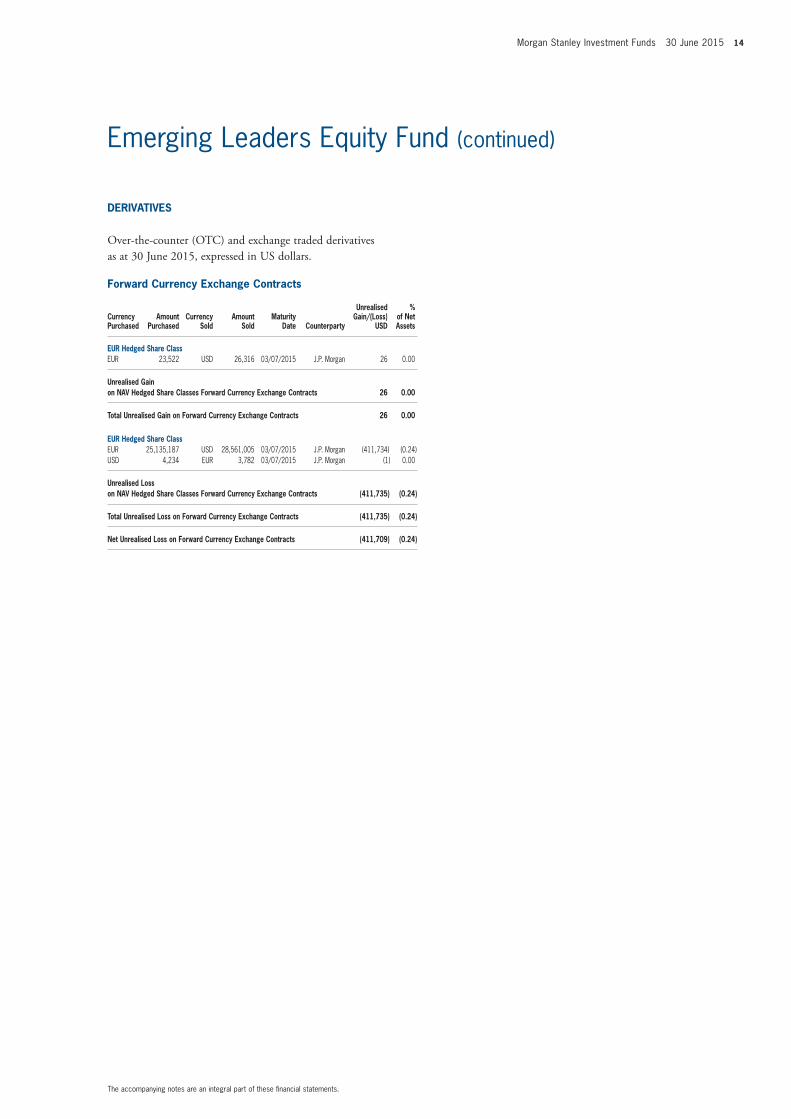
EUR Hedged Share ClassEUR 23,522 USD 26,316 03/07/2015 J.P. Morgan 26 0.00
Unrealised Gain on nAv Hedged Share Classes forward Currency Exchange Contracts 26 0.00
total Unrealised Gain on forward Currency Exchange Contracts 26 0.00
EUR Hedged Share ClassEUR 25,135,187 USD 28,561,005 03/07/2015 J.P. Morgan (411,734) (0.24)USD 4,234 EUR 3,782 03/07/2015 J.P. Morgan (1) 0.00
Unrealised Loss on nAv Hedged Share Classes forward Currency Exchange Contracts (411,735) (0.24)
total Unrealised Loss on forward Currency Exchange Contracts (411,735) (0.24)
net Unrealised Loss on forward Currency Exchange Contracts (411,709) (0.24)
DERivAtivES
Over-the-counter (OtC) and exchange traded derivatives as at 30 June 2015, expressed in US dollars.
15 Morgan Stanley Investment Funds 30 June 2015
SCHEDULE of invEStmEntSAs at 30 June 2015
Investments Currency
Quantity/Nominal
Value
Market Value USD
% of Net Assets
transferable securities and money market instruments admitted to official exchange listing or dealt in on another regulated market
Equities
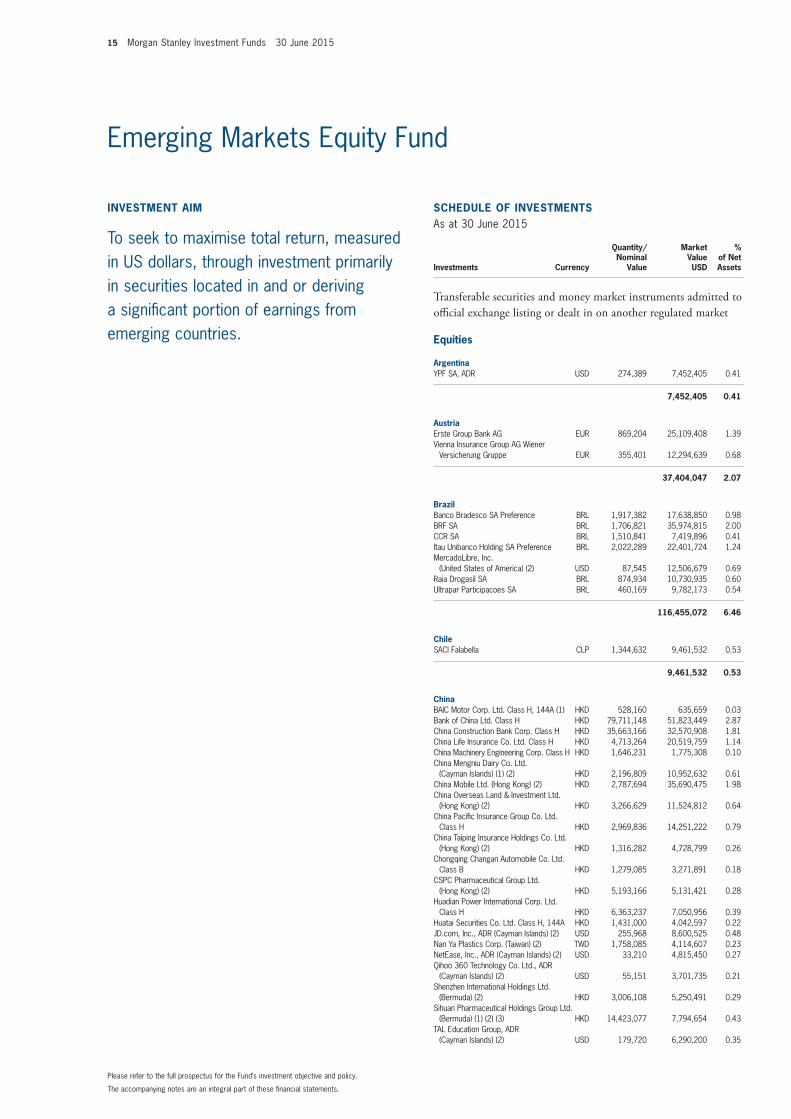
ArgentinaYPF SA, ADR USD 274,389 7,452,405 0.41
7,452,405 0.41
AustriaErste Group Bank AG EUR 869,204 25,109,408 1.39Vienna Insurance Group AG Wiener
Versicherung Gruppe EUR 355,401 12,294,639 0.68
37,404,047 2.07
BrazilBanco Bradesco SA Preference BRL 1,917,382 17,638,850 0.98BRF SA BRL 1,706,821 35,974,815 2.00CCR SA BRL 1,510,841 7,419,896 0.41Itau Unibanco Holding SA Preference BRL 2,022,289 22,401,724 1.24MercadoLibre, Inc.
(United States of America) (2) USD 87,545 12,506,679 0.69Raia Drogasil SA BRL 874,934 10,730,935 0.60Ultrapar Participacoes SA BRL 460,169 9,782,173 0.54
116,455,072 6.46
ChileSACI Falabella CLP 1,344,632 9,461,532 0.53
9,461,532 0.53
ChinaBAIC Motor Corp. Ltd. Class H, 144A (1) HKD 528,160 635,659 0.03Bank of China Ltd. Class H HKD 79,711,148 51,823,449 2.87China Construction Bank Corp. Class H HKD 35,663,166 32,570,908 1.81China Life Insurance Co. Ltd. Class H HKD 4,713,264 20,519,759 1.14China Machinery Engineering Corp. Class H HKD 1,646,231 1,775,308 0.10China Mengniu Dairy Co. Ltd.
(Cayman Islands) (1) (2) HKD 2,196,809 10,952,632 0.61China Mobile Ltd. (Hong Kong) (2) HKD 2,787,694 35,690,475 1.98China Overseas Land & Investment Ltd.
(Hong Kong) (2) HKD 3,266,629 11,524,812 0.64China Pacific Insurance Group Co. Ltd.
Class H HKD 2,969,836 14,251,222 0.79China Taiping Insurance Holdings Co. Ltd.
(Hong Kong) (2) HKD 1,316,282 4,728,799 0.26Chongqing Changan Automobile Co. Ltd.
Class B HKD 1,279,085 3,271,891 0.18CSPC Pharmaceutical Group Ltd.
(Hong Kong) (2) HKD 5,193,166 5,131,421 0.28Huadian Power International Corp. Ltd.
Class H HKD 6,363,237 7,050,956 0.39Huatai Securities Co. Ltd. Class H, 144A HKD 1,431,000 4,042,597 0.22JD.com, Inc., ADR (Cayman Islands) (2) USD 255,968 8,600,525 0.48Nan Ya Plastics Corp. (Taiwan) (2) TWD 1,758,085 4,114,607 0.23NetEase, Inc., ADR (Cayman Islands) (2) USD 33,210 4,815,450 0.27Qihoo 360 Technology Co. Ltd., ADR
(Cayman Islands) (2) USD 55,151 3,701,735 0.21Shenzhen International Holdings Ltd.
(Bermuda) (2) HKD 3,006,108 5,250,491 0.29Sihuan Pharmaceutical Holdings Group Ltd.
(Bermuda) (1) (2) (3) HKD 14,423,077 7,794,654 0.43TAL Education Group, ADR
(Cayman Islands) (2) USD 179,720 6,290,200 0.35
invEStmEnt Aim
To seek to maximise total return, measured in US dollars, through investment primarily in securities located in and or deriving a significant portion of earnings from emerging countries.
The accompanying notes are an integral part of these financial statements.
Please refer to the full prospectus for the Fund’s investment objective and policy.
Emerging Markets Equity Fund
Morgan Stanley Investment Funds 30 June 2015 16
SCHEDULE of invEStmEntSAs at 30 June 2015
Investments Currency
Quantity/Nominal
Value
Market Value USD
% of Net Assets
transferable securities and money market instruments admitted to official exchange listing or dealt in on another regulated market
Equities (continued)
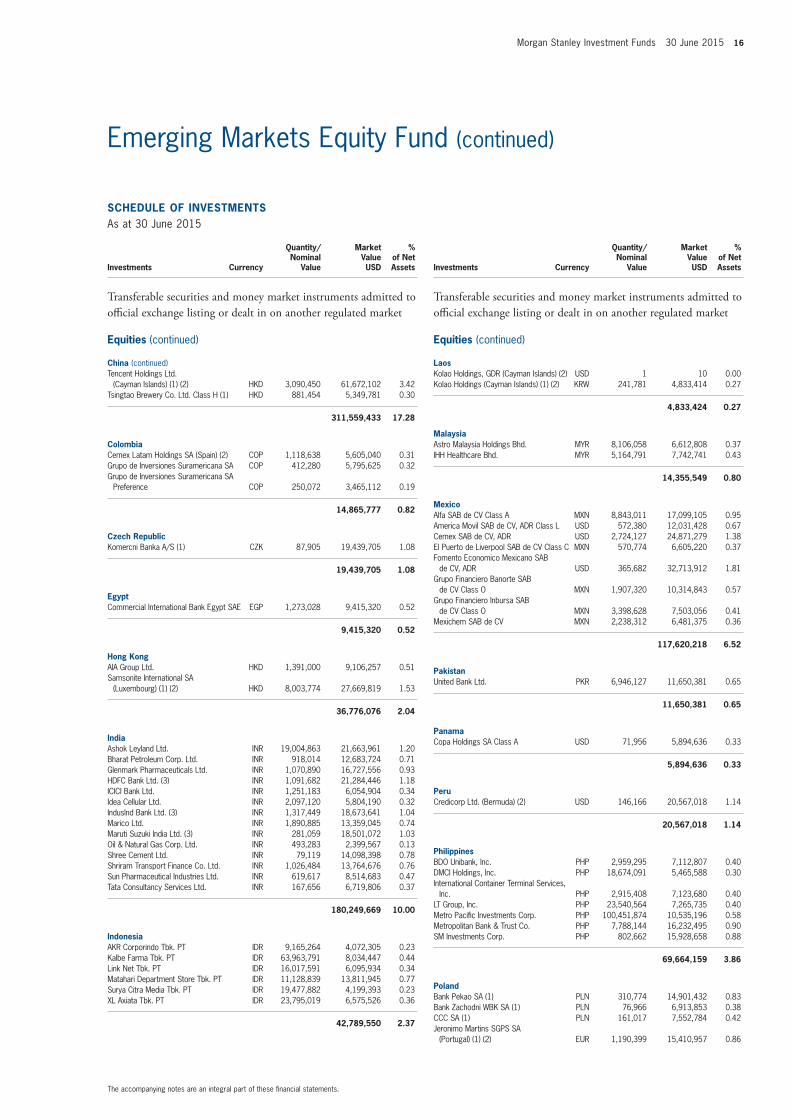
China (continued)Tencent Holdings Ltd.
(Cayman Islands) (1) (2) HKD 3,090,450 61,672,102 3.42Tsingtao Brewery Co. Ltd. Class H (1) HKD 881,454 5,349,781 0.30
311,559,433 17.28
ColombiaCemex Latam Holdings SA (Spain) (2) COP 1,118,638 5,605,040 0.31Grupo de Inversiones Suramericana SA COP 412,280 5,795,625 0.32Grupo de Inversiones Suramericana SA
Preference COP 250,072 3,465,112 0.19
14,865,777 0.82
Czech RepublicKomercni Banka A/S (1) CZK 87,905 19,439,705 1.08
19,439,705 1.08
EgyptCommercial International Bank Egypt SAE EGP 1,273,028 9,415,320 0.52
9,415,320 0.52
Hong KongAIA Group Ltd. HKD 1,391,000 9,106,257 0.51Samsonite International SA
(Luxembourg) (1) (2) HKD 8,003,774 27,669,819 1.53
36,776,076 2.04
indiaAshok Leyland Ltd. INR 19,004,863 21,663,961 1.20Bharat Petroleum Corp. Ltd. INR 918,014 12,683,724 0.71Glenmark Pharmaceuticals Ltd. INR 1,070,890 16,727,556 0.93HDFC Bank Ltd. (3) INR 1,091,682 21,284,446 1.18ICICI Bank Ltd. INR 1,251,183 6,054,904 0.34Idea Cellular Ltd. INR 2,097,120 5,804,190 0.32IndusInd Bank Ltd. (3) INR 1,317,449 18,673,641 1.04Marico Ltd. INR 1,890,885 13,359,045 0.74Maruti Suzuki India Ltd. (3) INR 281,059 18,501,072 1.03Oil & Natural Gas Corp. Ltd. INR 493,283 2,399,567 0.13Shree Cement Ltd. INR 79,119 14,098,398 0.78Shriram Transport Finance Co. Ltd. INR 1,026,484 13,764,676 0.76Sun Pharmaceutical Industries Ltd. INR 619,617 8,514,683 0.47Tata Consultancy Services Ltd. INR 167,656 6,719,806 0.37
180,249,669 10.00
indonesiaAKR Corporindo Tbk. PT IDR 9,165,264 4,072,305 0.23Kalbe Farma Tbk. PT IDR 63,963,791 8,034,447 0.44Link Net Tbk. PT IDR 16,017,591 6,095,934 0.34Matahari Department Store Tbk. PT IDR 11,128,839 13,811,945 0.77Surya Citra Media Tbk. PT IDR 19,477,882 4,199,393 0.23XL Axiata Tbk. PT IDR 23,795,019 6,575,526 0.36
42,789,550 2.37
SCHEDULE of invEStmEntSAs at 30 June 2015
Investments Currency
Quantity/Nominal
Value
Market Value USD
% of Net Assets
transferable securities and money market instruments admitted to official exchange listing or dealt in on another regulated market
Equities (continued)
LaosKolao Holdings, GDR (Cayman Islands) (2) USD 1 10 0.00Kolao Holdings (Cayman Islands) (1) (2) KRW 241,781 4,833,414 0.27
4,833,424 0.27
malaysiaAstro Malaysia Holdings Bhd. MYR 8,106,058 6,612,808 0.37IHH Healthcare Bhd. MYR 5,164,791 7,742,741 0.43
14,355,549 0.80
mexicoAlfa SAB de CV Class A MXN 8,843,011 17,099,105 0.95America Movil SAB de CV, ADR Class L USD 572,380 12,031,428 0.67Cemex SAB de CV, ADR USD 2,724,127 24,871,279 1.38El Puerto de Liverpool SAB de CV Class C MXN 570,774 6,605,220 0.37Fomento Economico Mexicano SAB
de CV, ADR USD 365,682 32,713,912 1.81Grupo Financiero Banorte SAB
de CV Class O MXN 1,907,320 10,314,843 0.57Grupo Financiero Inbursa SAB
de CV Class O MXN 3,398,628 7,503,056 0.41Mexichem SAB de CV MXN 2,238,312 6,481,375 0.36
117,620,218 6.52
PakistanUnited Bank Ltd. PKR 6,946,127 11,650,381 0.65
11,650,381 0.65
PanamaCopa Holdings SA Class A USD 71,956 5,894,636 0.33
5,894,636 0.33
PeruCredicorp Ltd. (Bermuda) (2) USD 146,166 20,567,018 1.14
20,567,018 1.14
PhilippinesBDO Unibank, Inc. PHP 2,959,295 7,112,807 0.40DMCI Holdings, Inc. PHP 18,674,091 5,465,588 0.30International Container Terminal Services,
Inc. PHP 2,915,408 7,123,680 0.40LT Group, Inc. PHP 23,540,564 7,265,735 0.40Metro Pacific Investments Corp. PHP 100,451,874 10,535,196 0.58Metropolitan Bank & Trust Co. PHP 7,788,144 16,232,495 0.90SM Investments Corp. PHP 802,662 15,928,658 0.88
69,664,159 3.86
PolandBank Pekao SA (1) PLN 310,774 14,901,432 0.83Bank Zachodni WBK SA (1) PLN 76,966 6,913,853 0.38CCC SA (1) PLN 161,017 7,552,784 0.42Jeronimo Martins SGPS SA
(Portugal) (1) (2) EUR 1,190,399 15,410,957 0.86
The accompanying notes are an integral part of these financial statements.
Emerging Markets Equity Fund (continued)
17 Morgan Stanley Investment Funds 30 June 2015
SCHEDULE of invEStmEntSAs at 30 June 2015
Investments Currency
Quantity/Nominal
Value
Market Value USD
% of Net Assets
transferable securities and money market instruments admitted to official exchange listing or dealt in on another regulated market
Equities (continued)
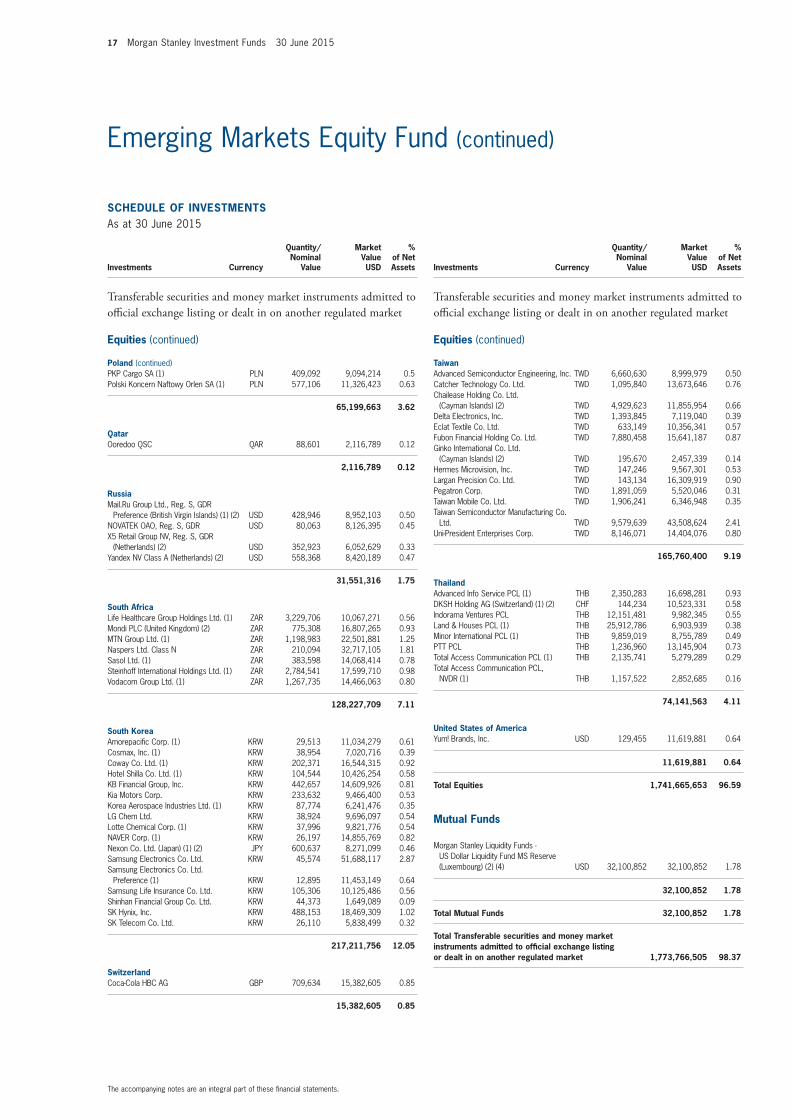
Poland (continued)PKP Cargo SA (1) PLN 409,092 9,094,214 0.5Polski Koncern Naftowy Orlen SA (1) PLN 577,106 11,326,423 0.63
65,199,663 3.62
QatarOoredoo QSC QAR 88,601 2,116,789 0.12
2,116,789 0.12
RussiaMail.Ru Group Ltd., Reg. S, GDR
Preference (British Virgin Islands) (1) (2) USD 428,946 8,952,103 0.50NOVATEK OAO, Reg. S, GDR USD 80,063 8,126,395 0.45X5 Retail Group NV, Reg. S, GDR
(Netherlands) (2) USD 352,923 6,052,629 0.33Yandex NV Class A (Netherlands) (2) USD 558,368 8,420,189 0.47
31,551,316 1.75
South AfricaLife Healthcare Group Holdings Ltd. (1) ZAR 3,229,706 10,067,271 0.56Mondi PLC (United Kingdom) (2) ZAR 775,308 16,807,265 0.93MTN Group Ltd. (1) ZAR 1,198,983 22,501,881 1.25Naspers Ltd. Class N ZAR 210,094 32,717,105 1.81Sasol Ltd. (1) ZAR 383,598 14,068,414 0.78Steinhoff International Holdings Ltd. (1) ZAR 2,784,541 17,599,710 0.98Vodacom Group Ltd. (1) ZAR 1,267,735 14,466,063 0.80
128,227,709 7.11
South KoreaAmorepacific Corp. (1) KRW 29,513 11,034,279 0.61Cosmax, Inc. (1) KRW 38,954 7,020,716 0.39Coway Co. Ltd. (1) KRW 202,371 16,544,315 0.92Hotel Shilla Co. Ltd. (1) KRW 104,544 10,426,254 0.58KB Financial Group, Inc. KRW 442,657 14,609,926 0.81Kia Motors Corp. KRW 233,632 9,466,400 0.53Korea Aerospace Industries Ltd. (1) KRW 87,774 6,241,476 0.35LG Chem Ltd. KRW 38,924 9,696,097 0.54Lotte Chemical Corp. (1) KRW 37,996 9,821,776 0.54NAVER Corp. (1) KRW 26,197 14,855,769 0.82Nexon Co. Ltd. (Japan) (1) (2) JPY 600,637 8,271,099 0.46Samsung Electronics Co. Ltd. KRW 45,574 51,688,117 2.87Samsung Electronics Co. Ltd.
Preference (1) KRW 12,895 11,453,149 0.64Samsung Life Insurance Co. Ltd. KRW 105,306 10,125,486 0.56Shinhan Financial Group Co. Ltd. KRW 44,373 1,649,089 0.09SK Hynix, Inc. KRW 488,153 18,469,309 1.02SK Telecom Co. Ltd. KRW 26,110 5,838,499 0.32
217,211,756 12.05
SwitzerlandCoca-Cola HBC AG GBP 709,634 15,382,605 0.85
15,382,605 0.85
SCHEDULE of invEStmEntSAs at 30 June 2015
Investments Currency
Quantity/Nominal
Value
Market Value USD
% of Net Assets
transferable securities and money market instruments admitted to official exchange listing or dealt in on another regulated market
Equities (continued)
taiwanAdvanced Semiconductor Engineering, Inc. TWD 6,660,630 8,999,979 0.50Catcher Technology Co. Ltd. TWD 1,095,840 13,673,646 0.76Chailease Holding Co. Ltd.
(Cayman Islands) (2) TWD 4,929,623 11,855,954 0.66Delta Electronics, Inc. TWD 1,393,845 7,119,040 0.39Eclat Textile Co. Ltd. TWD 633,149 10,356,341 0.57Fubon Financial Holding Co. Ltd. TWD 7,880,458 15,641,187 0.87Ginko International Co. Ltd.
(Cayman Islands) (2) TWD 195,670 2,457,339 0.14Hermes Microvision, Inc. TWD 147,246 9,567,301 0.53Largan Precision Co. Ltd. TWD 143,134 16,309,919 0.90Pegatron Corp. TWD 1,891,059 5,520,046 0.31Taiwan Mobile Co. Ltd. TWD 1,906,241 6,346,948 0.35Taiwan Semiconductor Manufacturing Co.
Ltd. TWD 9,579,639 43,508,624 2.41Uni-President Enterprises Corp. TWD 8,146,071 14,404,076 0.80
165,760,400 9.19
thailandAdvanced Info Service PCL (1) THB 2,350,283 16,698,281 0.93DKSH Holding AG (Switzerland) (1) (2) CHF 144,234 10,523,331 0.58Indorama Ventures PCL THB 12,151,481 9,982,345 0.55Land & Houses PCL (1) THB 25,912,786 6,903,939 0.38Minor International PCL (1) THB 9,859,019 8,755,789 0.49PTT PCL THB 1,236,960 13,145,904 0.73Total Access Communication PCL (1) THB 2,135,741 5,279,289 0.29Total Access Communication PCL,
NVDR (1) THB 1,157,522 2,852,685 0.16
74,141,563 4.11
United States of AmericaYum! Brands, Inc. USD 129,455 11,619,881 0.64
11,619,881 0.64
total Equities 1,741,665,653 96.59
mutual funds
Morgan Stanley Liquidity Funds - US Dollar Liquidity Fund MS Reserve (Luxembourg) (2) (4) USD 32,100,852 32,100,852 1.78
32,100,852 1.78
total mutual funds 32,100,852 1.78
total transferable securities and money market instruments admitted to official exchange listing or dealt in on another regulated market 1,773,766,505 98.37
The accompanying notes are an integral part of these financial statements.
Emerging Markets Equity Fund (continued)
Morgan Stanley Investment Funds 30 June 2015 18
SCHEDULE of invEStmEntSAs at 30 June 2015
Investments Currency
Quantity/Nominal
Value
Market Value USD
% of Net Assets
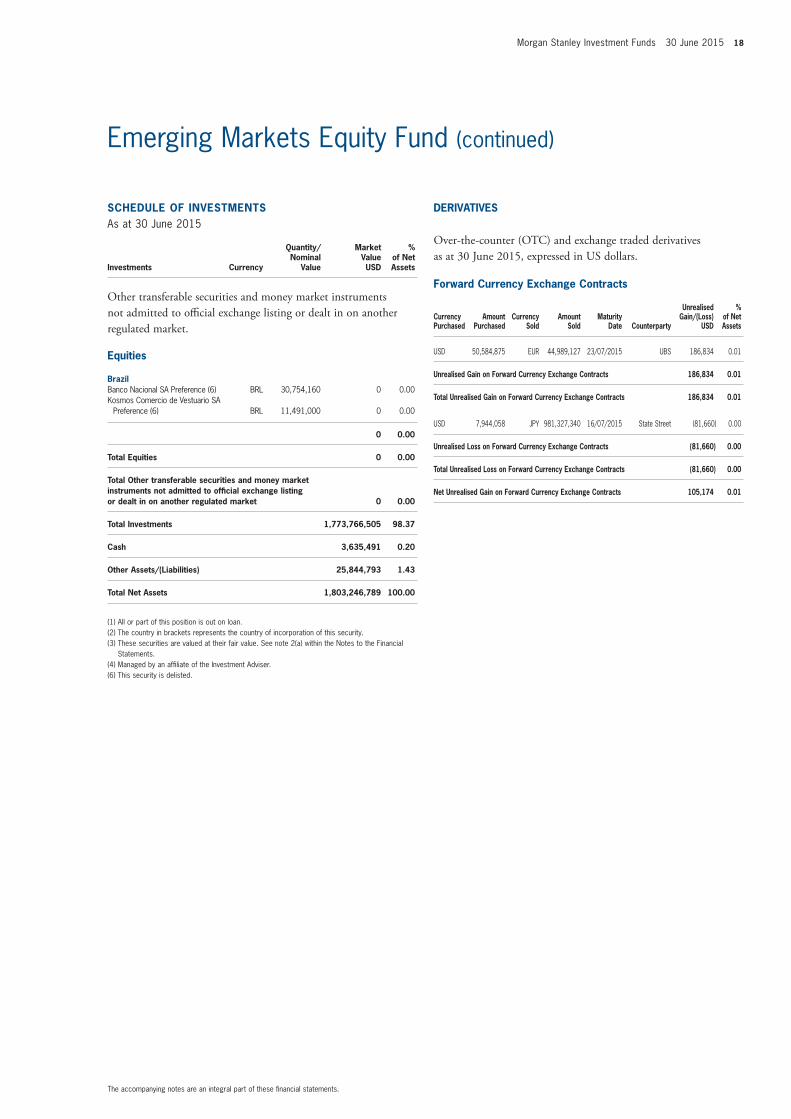
Other transferable securities and money market instruments not admitted to official exchange listing or dealt in on another regulated market.
Equities
BrazilBanco Nacional SA Preference (6) BRL 30,754,160 0 0.00Kosmos Comercio de Vestuario SA
Preference (6) BRL 11,491,000 0 0.00
0 0.00
total Equities 0 0.00
total other transferable securities and money market instruments not admitted to official exchange listing or dealt in on another regulated market 0 0.00
total investments 1,773,766,505 98.37
Cash 3,635,491 0.20
other Assets/(Liabilities) 25,844,793 1.43
total net Assets 1,803,246,789 100.00
(1) All or part of this position is out on loan.(2) The country in brackets represents the country of incorporation of this security.(3) These securities are valued at their fair value. See note 2(a) within the Notes to the Financial
Statements.(4) Managed by an affiliate of the Investment Adviser.(6) This security is delisted.
The accompanying notes are an integral part of these financial statements.
Emerging Markets Equity Fund (continued)
forward Currency Exchange Contracts
Currency Purchased
Amount Purchased
Currency Sold
Amount Sold
maturity Date Counterparty
Unrealised Gain/(Loss)
USD
% of net Assets
USD 50,584,875 EUR 44,989,127 23/07/2015 UBS 186,834 0.01
Unrealised Gain on forward Currency Exchange Contracts 186,834 0.01
total Unrealised Gain on forward Currency Exchange Contracts 186,834 0.01
USD 7,944,058 JPY 981,327,340 16/07/2015 State Street (81,660) 0.00
Unrealised Loss on forward Currency Exchange Contracts (81,660) 0.00
total Unrealised Loss on forward Currency Exchange Contracts (81,660) 0.00
net Unrealised Gain on forward Currency Exchange Contracts 105,174 0.01
DERivAtivES
Over-the-counter (OtC) and exchange traded derivatives as at 30 June 2015, expressed in US dollars.
19 Morgan Stanley Investment Funds 30 June 2015
SCHEDULE of invEStmEntSAs at 30 June 2015
Investments Currency
Quantity/Nominal
Value
Market Value EUR
% of Net Assets
transferable securities and money market instruments admitted to official exchange listing or dealt in on another regulated market
Equities
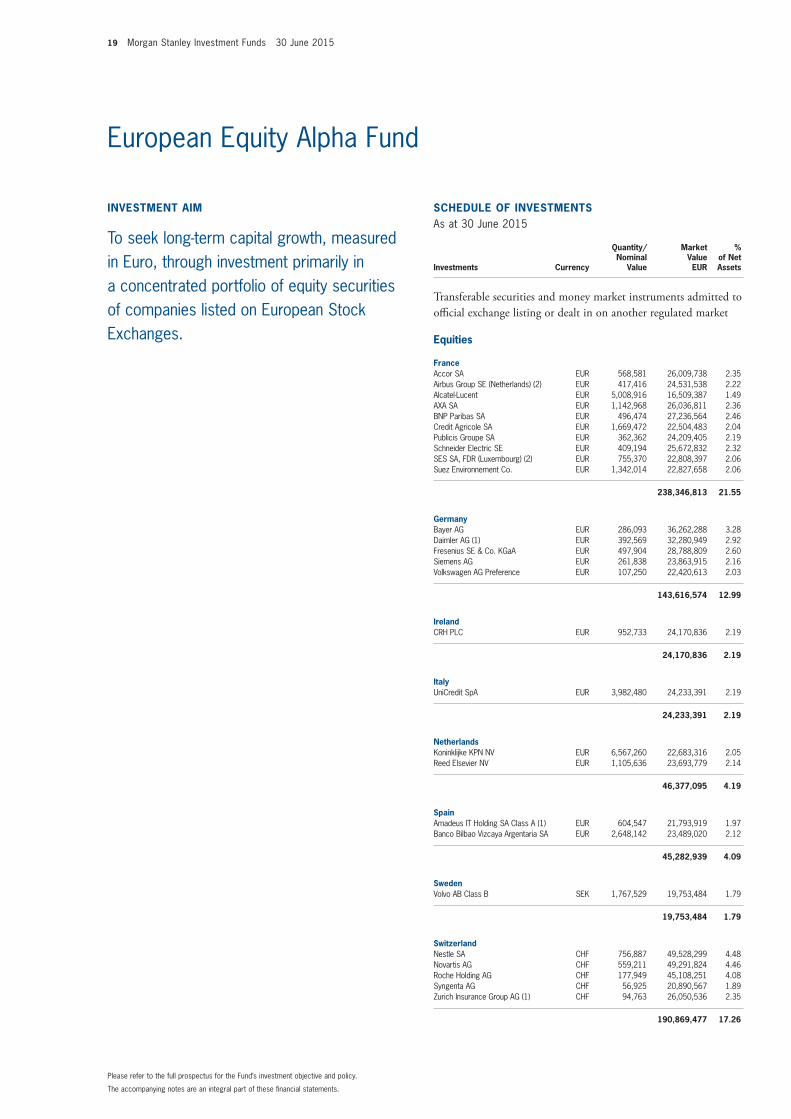
franceAccor SA EUR 568,581 26,009,738 2.35Airbus Group SE (Netherlands) (2) EUR 417,416 24,531,538 2.22Alcatel-Lucent EUR 5,008,916 16,509,387 1.49AXA SA EUR 1,142,968 26,036,811 2.36BNP Paribas SA EUR 496,474 27,236,564 2.46Credit Agricole SA EUR 1,669,472 22,504,483 2.04Publicis Groupe SA EUR 362,362 24,209,405 2.19Schneider Electric SE EUR 409,194 25,672,832 2.32SES SA, FDR (Luxembourg) (2) EUR 755,370 22,808,397 2.06Suez Environnement Co. EUR 1,342,014 22,827,658 2.06
238,346,813 21.55
GermanyBayer AG EUR 286,093 36,262,288 3.28Daimler AG (1) EUR 392,569 32,280,949 2.92Fresenius SE & Co. KGaA EUR 497,904 28,788,809 2.60Siemens AG EUR 261,838 23,863,915 2.16Volkswagen AG Preference EUR 107,250 22,420,613 2.03
143,616,574 12.99
irelandCRH PLC EUR 952,733 24,170,836 2.19
24,170,836 2.19
italyUniCredit SpA EUR 3,982,480 24,233,391 2.19
24,233,391 2.19
netherlandsKoninklijke KPN NV EUR 6,567,260 22,683,316 2.05Reed Elsevier NV EUR 1,105,636 23,693,779 2.14
46,377,095 4.19
SpainAmadeus IT Holding SA Class A (1) EUR 604,547 21,793,919 1.97Banco Bilbao Vizcaya Argentaria SA EUR 2,648,142 23,489,020 2.12
45,282,939 4.09
SwedenVolvo AB Class B SEK 1,767,529 19,753,484 1.79
19,753,484 1.79
SwitzerlandNestle SA CHF 756,887 49,528,299 4.48Novartis AG CHF 559,211 49,291,824 4.46Roche Holding AG CHF 177,949 45,108,251 4.08Syngenta AG CHF 56,925 20,890,567 1.89Zurich Insurance Group AG (1) CHF 94,763 26,050,536 2.35
190,869,477 17.26
invEStmEnt Aim
To seek long-term capital growth, measured in Euro, through investment primarily in a concentrated portfolio of equity securities of companies listed on European Stock Exchanges.
The accompanying notes are an integral part of these financial statements.
Please refer to the full prospectus for the Fund’s investment objective and policy.
European Equity Alpha Fund
Morgan Stanley Investment Funds 30 June 2015 20
SCHEDULE of invEStmEntSAs at 30 June 2015
Investments Currency
Quantity/Nominal
Value
Market Value EUR
% of Net Assets
transferable securities and money market instruments admitted to official exchange listing or dealt in on another regulated market
Equities (continued)
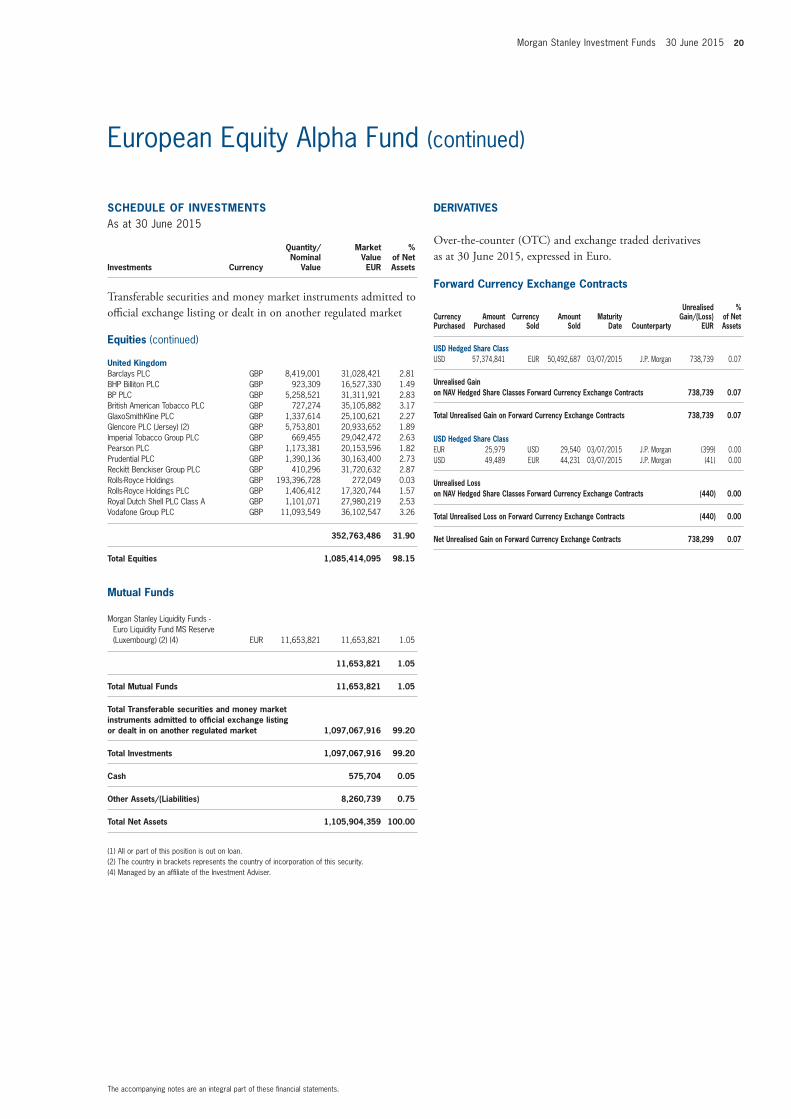
United KingdomBarclays PLC GBP 8,419,001 31,028,421 2.81BHP Billiton PLC GBP 923,309 16,527,330 1.49BP PLC GBP 5,258,521 31,311,921 2.83British American Tobacco PLC GBP 727,274 35,105,882 3.17GlaxoSmithKline PLC GBP 1,337,614 25,100,621 2.27Glencore PLC (Jersey) (2) GBP 5,753,801 20,933,652 1.89Imperial Tobacco Group PLC GBP 669,455 29,042,472 2.63Pearson PLC GBP 1,173,381 20,153,596 1.82Prudential PLC GBP 1,390,136 30,163,400 2.73Reckitt Benckiser Group PLC GBP 410,296 31,720,632 2.87Rolls-Royce Holdings GBP 193,396,728 272,049 0.03Rolls-Royce Holdings PLC GBP 1,406,412 17,320,744 1.57Royal Dutch Shell PLC Class A GBP 1,101,071 27,980,219 2.53Vodafone Group PLC GBP 11,093,549 36,102,547 3.26
352,763,486 31.90
total Equities 1,085,414,095 98.15
mutual funds
Morgan Stanley Liquidity Funds - Euro Liquidity Fund MS Reserve (Luxembourg) (2) (4) EUR 11,653,821 11,653,821 1.05
11,653,821 1.05
total mutual funds 11,653,821 1.05
total transferable securities and money market instruments admitted to official exchange listing or dealt in on another regulated market 1,097,067,916 99.20
total investments 1,097,067,916 99.20
Cash 575,704 0.05
other Assets/(Liabilities) 8,260,739 0.75
total net Assets 1,105,904,359 100.00
(1) All or part of this position is out on loan.(2) The country in brackets represents the country of incorporation of this security.(4) Managed by an affiliate of the Investment Adviser.
The accompanying notes are an integral part of these financial statements.
European Equity Alpha Fund (continued)
forward Currency Exchange Contracts
Currency Purchased
Amount Purchased
Currency Sold
Amount Sold
maturity Date Counterparty
Unrealised Gain/(Loss)
EUR
% of net Assets
USD Hedged Share ClassUSD 57,374,841 EUR 50,492,687 03/07/2015 J.P. Morgan 738,739 0.07
Unrealised Gain on nAv Hedged Share Classes forward Currency Exchange Contracts 738,739 0.07
total Unrealised Gain on forward Currency Exchange Contracts 738,739 0.07
USD Hedged Share ClassEUR 25,979 USD 29,540 03/07/2015 J.P. Morgan (399) 0.00USD 49,489 EUR 44,231 03/07/2015 J.P. Morgan (41) 0.00
Unrealised Loss on nAv Hedged Share Classes forward Currency Exchange Contracts (440) 0.00
total Unrealised Loss on forward Currency Exchange Contracts (440) 0.00
net Unrealised Gain on forward Currency Exchange Contracts 738,299 0.07
DERivAtivES
Over-the-counter (OtC) and exchange traded derivatives as at 30 June 2015, expressed in euro.
21 Morgan Stanley Investment Funds 30 June 2015
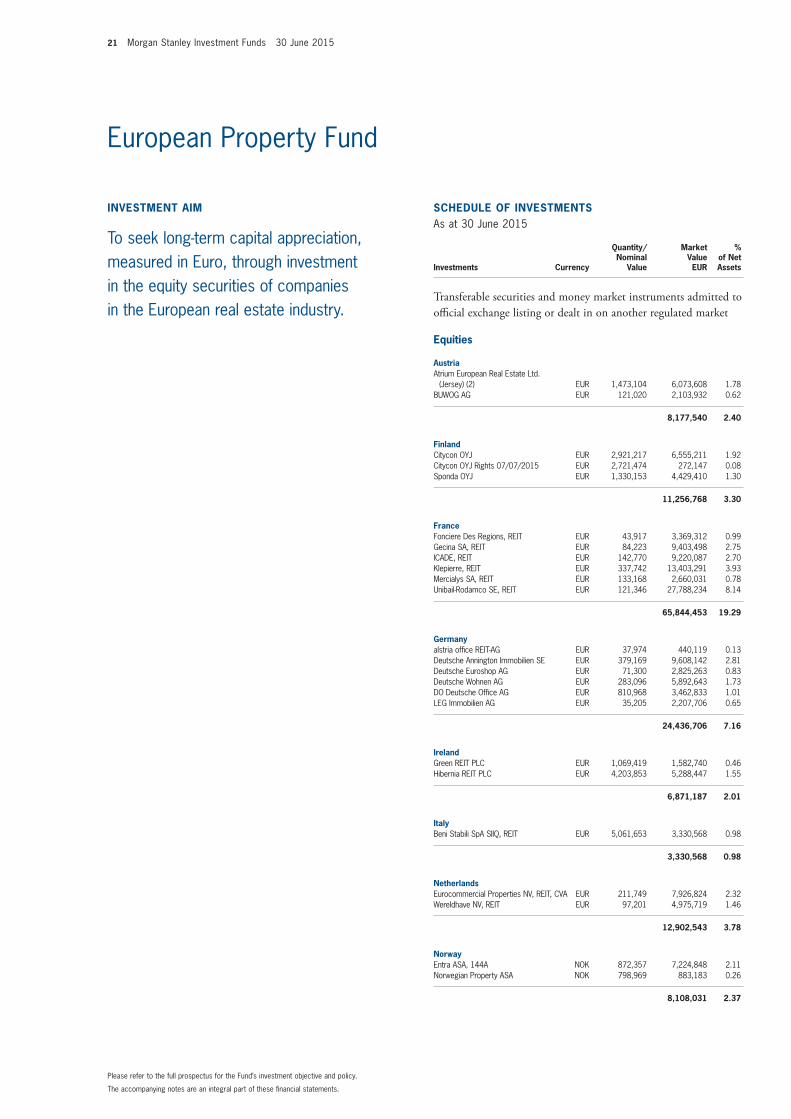
invEStmEnt Aim
To seek long-term capital appreciation, measured in Euro, through investment in the equity securities of companies in the European real estate industry.
SCHEDULE of invEStmEntSAs at 30 June 2015
Investments Currency
Quantity/Nominal
Value
Market Value EUR
% of Net Assets
transferable securities and money market instruments admitted to official exchange listing or dealt in on another regulated market
Equities
AustriaAtrium European Real Estate Ltd.
(Jersey) (2) EUR 1,473,104 6,073,608 1.78BUWOG AG EUR 121,020 2,103,932 0.62
8,177,540 2.40
finlandCitycon OYJ EUR 2,921,217 6,555,211 1.92Citycon OYJ Rights 07/07/2015 EUR 2,721,474 272,147 0.08Sponda OYJ EUR 1,330,153 4,429,410 1.30
11,256,768 3.30
franceFonciere Des Regions, REIT EUR 43,917 3,369,312 0.99Gecina SA, REIT EUR 84,223 9,403,498 2.75ICADE, REIT EUR 142,770 9,220,087 2.70Klepierre, REIT EUR 337,742 13,403,291 3.93Mercialys SA, REIT EUR 133,168 2,660,031 0.78Unibail-Rodamco SE, REIT EUR 121,346 27,788,234 8.14
65,844,453 19.29
Germanyalstria office REIT-AG EUR 37,974 440,119 0.13Deutsche Annington Immobilien SE EUR 379,169 9,608,142 2.81Deutsche Euroshop AG EUR 71,300 2,825,263 0.83Deutsche Wohnen AG EUR 283,096 5,892,643 1.73DO Deutsche Office AG EUR 810,968 3,462,833 1.01LEG Immobilien AG EUR 35,205 2,207,706 0.65
24,436,706 7.16
irelandGreen REIT PLC EUR 1,069,419 1,582,740 0.46Hibernia REIT PLC EUR 4,203,853 5,288,447 1.55
6,871,187 2.01
italyBeni Stabili SpA SIIQ, REIT EUR 5,061,653 3,330,568 0.98
3,330,568 0.98
netherlandsEurocommercial Properties NV, REIT, CVA EUR 211,749 7,926,824 2.32Wereldhave NV, REIT EUR 97,201 4,975,719 1.46
12,902,543 3.78
norwayEntra ASA, 144A NOK 872,357 7,224,848 2.11Norwegian Property ASA NOK 798,969 883,183 0.26
8,108,031 2.37
The accompanying notes are an integral part of these financial statements.
Please refer to the full prospectus for the Fund’s investment objective and policy.
European Property Fund
Morgan Stanley Investment Funds 30 June 2015 22
SCHEDULE of invEStmEntSAs at 30 June 2015
Investments Currency
Quantity/Nominal
Value
Market Value EUR
% of Net Assets
transferable securities and money market instruments admitted to official exchange listing or dealt in on another regulated market
Equities (continued)
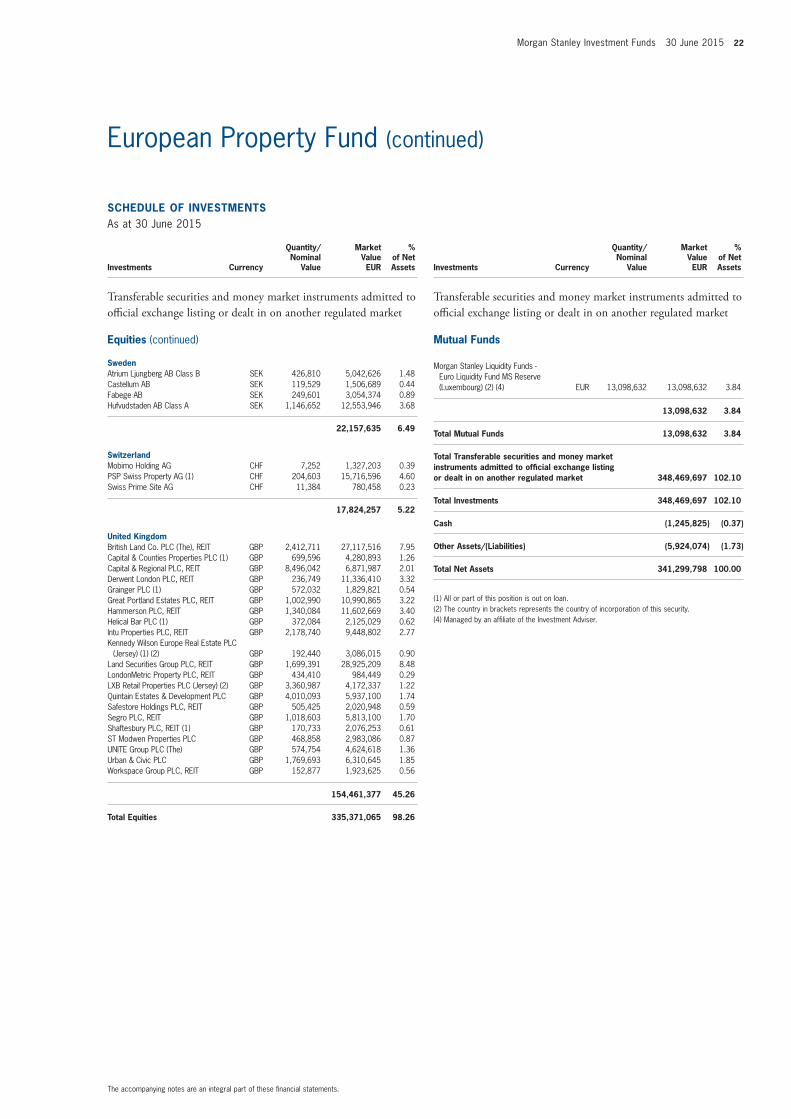
SwedenAtrium Ljungberg AB Class B SEK 426,810 5,042,626 1.48Castellum AB SEK 119,529 1,506,689 0.44Fabege AB SEK 249,601 3,054,374 0.89Hufvudstaden AB Class A SEK 1,146,652 12,553,946 3.68
22,157,635 6.49
SwitzerlandMobimo Holding AG CHF 7,252 1,327,203 0.39PSP Swiss Property AG (1) CHF 204,603 15,716,596 4.60Swiss Prime Site AG CHF 11,384 780,458 0.23
17,824,257 5.22
United KingdomBritish Land Co. PLC (The), REIT GBP 2,412,711 27,117,516 7.95Capital & Counties Properties PLC (1) GBP 699,596 4,280,893 1.26Capital & Regional PLC, REIT GBP 8,496,042 6,871,987 2.01Derwent London PLC, REIT GBP 236,749 11,336,410 3.32Grainger PLC (1) GBP 572,032 1,829,821 0.54Great Portland Estates PLC, REIT GBP 1,002,990 10,990,865 3.22Hammerson PLC, REIT GBP 1,340,084 11,602,669 3.40Helical Bar PLC (1) GBP 372,084 2,125,029 0.62Intu Properties PLC, REIT GBP 2,178,740 9,448,802 2.77Kennedy Wilson Europe Real Estate PLC
(Jersey) (1) (2) GBP 192,440 3,086,015 0.90Land Securities Group PLC, REIT GBP 1,699,391 28,925,209 8.48LondonMetric Property PLC, REIT GBP 434,410 984,449 0.29LXB Retail Properties PLC (Jersey) (2) GBP 3,360,987 4,172,337 1.22Quintain Estates & Development PLC GBP 4,010,093 5,937,100 1.74Safestore Holdings PLC, REIT GBP 505,425 2,020,948 0.59Segro PLC, REIT GBP 1,018,603 5,813,100 1.70Shaftesbury PLC, REIT (1) GBP 170,733 2,076,253 0.61ST Modwen Properties PLC GBP 468,858 2,983,086 0.87UNITE Group PLC (The) GBP 574,754 4,624,618 1.36Urban & Civic PLC GBP 1,769,693 6,310,645 1.85Workspace Group PLC, REIT GBP 152,877 1,923,625 0.56
154,461,377 45.26
total Equities 335,371,065 98.26
SCHEDULE of invEStmEntSAs at 30 June 2015
Investments Currency
Quantity/Nominal
Value
Market Value EUR
% of Net Assets
transferable securities and money market instruments admitted to official exchange listing or dealt in on another regulated market
mutual funds
Morgan Stanley Liquidity Funds - Euro Liquidity Fund MS Reserve (Luxembourg) (2) (4) EUR 13,098,632 13,098,632 3.84
13,098,632 3.84
total mutual funds 13,098,632 3.84
total transferable securities and money market instruments admitted to official exchange listing or dealt in on another regulated market 348,469,697 102.10
total investments 348,469,697 102.10
Cash (1,245,825) (0.37)
other Assets/(Liabilities) (5,924,074) (1.73)
total net Assets 341,299,798 100.00
(1) All or part of this position is out on loan.(2) The country in brackets represents the country of incorporation of this security.(4) Managed by an affiliate of the Investment Adviser.
The accompanying notes are an integral part of these financial statements.
European Property Fund (continued)
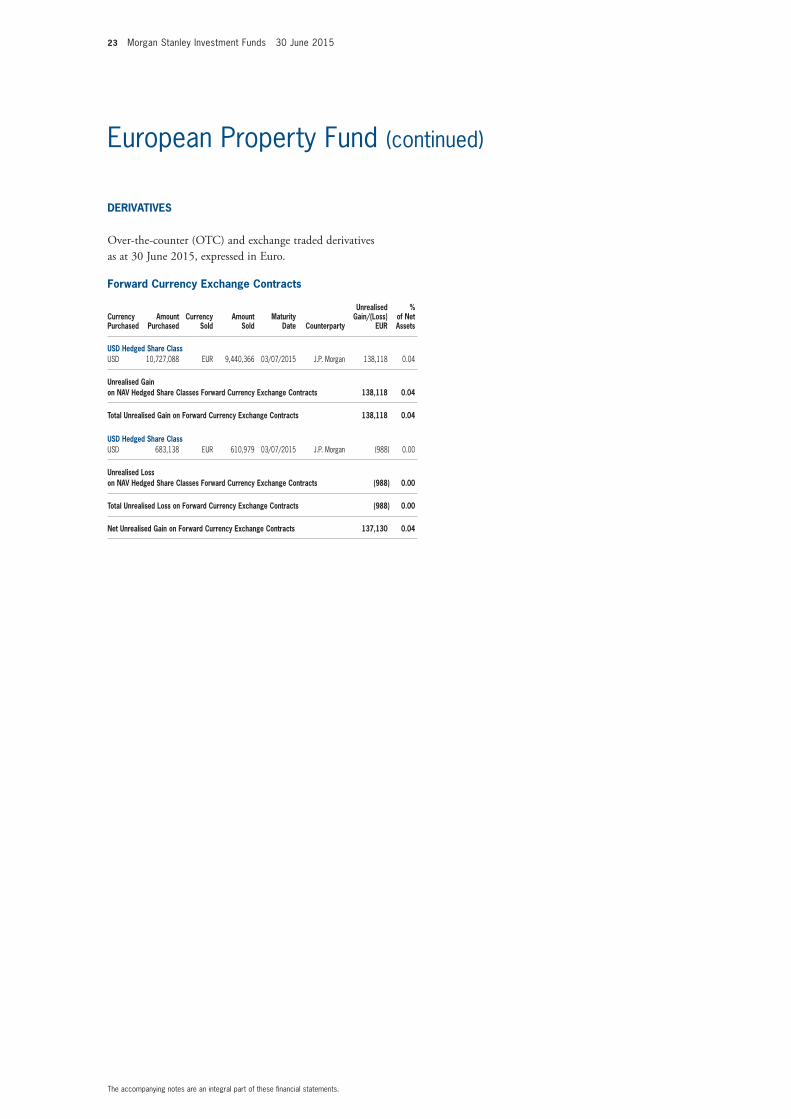
23 Morgan Stanley Investment Funds 30 June 2015
The accompanying notes are an integral part of these financial statements.
European Property Fund (continued)
forward Currency Exchange Contracts
Currency Purchased
Amount Purchased
Currency Sold
Amount Sold
maturity Date Counterparty
Unrealised Gain/(Loss)
EUR
% of net Assets
USD Hedged Share ClassUSD 10,727,088 EUR 9,440,366 03/07/2015 J.P. Morgan 138,118 0.04
Unrealised Gain on nAv Hedged Share Classes forward Currency Exchange Contracts 138,118 0.04
total Unrealised Gain on forward Currency Exchange Contracts 138,118 0.04
USD Hedged Share ClassUSD 683,138 EUR 610,979 03/07/2015 J.P. Morgan (988) 0.00
Unrealised Loss on nAv Hedged Share Classes forward Currency Exchange Contracts (988) 0.00
total Unrealised Loss on forward Currency Exchange Contracts (988) 0.00
net Unrealised Gain on forward Currency Exchange Contracts 137,130 0.04
DERivAtivES
Over-the-counter (OtC) and exchange traded derivatives as at 30 June 2015, expressed in euro.
Morgan Stanley Investment Funds 30 June 2015 24
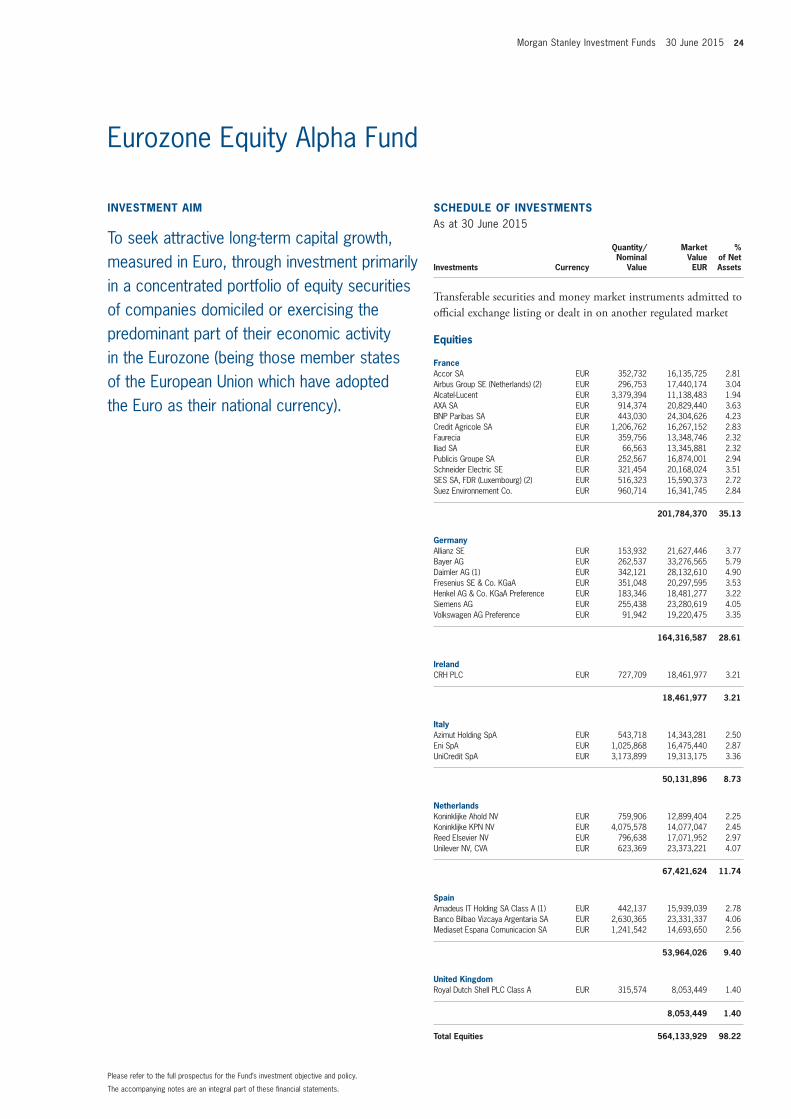
invEStmEnt Aim
To seek attractive long-term capital growth, measured in Euro, through investment primarily in a concentrated portfolio of equity securities of companies domiciled or exercising the predominant part of their economic activity in the Eurozone (being those member states of the European Union which have adopted the Euro as their national currency).
SCHEDULE of invEStmEntSAs at 30 June 2015
Investments Currency
Quantity/Nominal
Value
Market Value EUR
% of Net Assets
transferable securities and money market instruments admitted to official exchange listing or dealt in on another regulated market
Equities
franceAccor SA EUR 352,732 16,135,725 2.81Airbus Group SE (Netherlands) (2) EUR 296,753 17,440,174 3.04Alcatel-Lucent EUR 3,379,394 11,138,483 1.94AXA SA EUR 914,374 20,829,440 3.63BNP Paribas SA EUR 443,030 24,304,626 4.23Credit Agricole SA EUR 1,206,762 16,267,152 2.83Faurecia EUR 359,756 13,348,746 2.32Iliad SA EUR 66,563 13,345,881 2.32Publicis Groupe SA EUR 252,567 16,874,001 2.94Schneider Electric SE EUR 321,454 20,168,024 3.51SES SA, FDR (Luxembourg) (2) EUR 516,323 15,590,373 2.72Suez Environnement Co. EUR 960,714 16,341,745 2.84
201,784,370 35.13
GermanyAllianz SE EUR 153,932 21,627,446 3.77Bayer AG EUR 262,537 33,276,565 5.79Daimler AG (1) EUR 342,121 28,132,610 4.90Fresenius SE & Co. KGaA EUR 351,048 20,297,595 3.53Henkel AG & Co. KGaA Preference EUR 183,346 18,481,277 3.22Siemens AG EUR 255,438 23,280,619 4.05Volkswagen AG Preference EUR 91,942 19,220,475 3.35
164,316,587 28.61
irelandCRH PLC EUR 727,709 18,461,977 3.21
18,461,977 3.21
italyAzimut Holding SpA EUR 543,718 14,343,281 2.50Eni SpA EUR 1,025,868 16,475,440 2.87UniCredit SpA EUR 3,173,899 19,313,175 3.36
50,131,896 8.73
netherlandsKoninklijke Ahold NV EUR 759,906 12,899,404 2.25Koninklijke KPN NV EUR 4,075,578 14,077,047 2.45Reed Elsevier NV EUR 796,638 17,071,952 2.97Unilever NV, CVA EUR 623,369 23,373,221 4.07
67,421,624 11.74
SpainAmadeus IT Holding SA Class A (1) EUR 442,137 15,939,039 2.78Banco Bilbao Vizcaya Argentaria SA EUR 2,630,365 23,331,337 4.06Mediaset Espana Comunicacion SA EUR 1,241,542 14,693,650 2.56
53,964,026 9.40
United KingdomRoyal Dutch Shell PLC Class A EUR 315,574 8,053,449 1.40
8,053,449 1.40
total Equities 564,133,929 98.22
The accompanying notes are an integral part of these financial statements.
Please refer to the full prospectus for the Fund’s investment objective and policy.
Eurozone Equity Alpha Fund
25 Morgan Stanley Investment Funds 30 June 2015
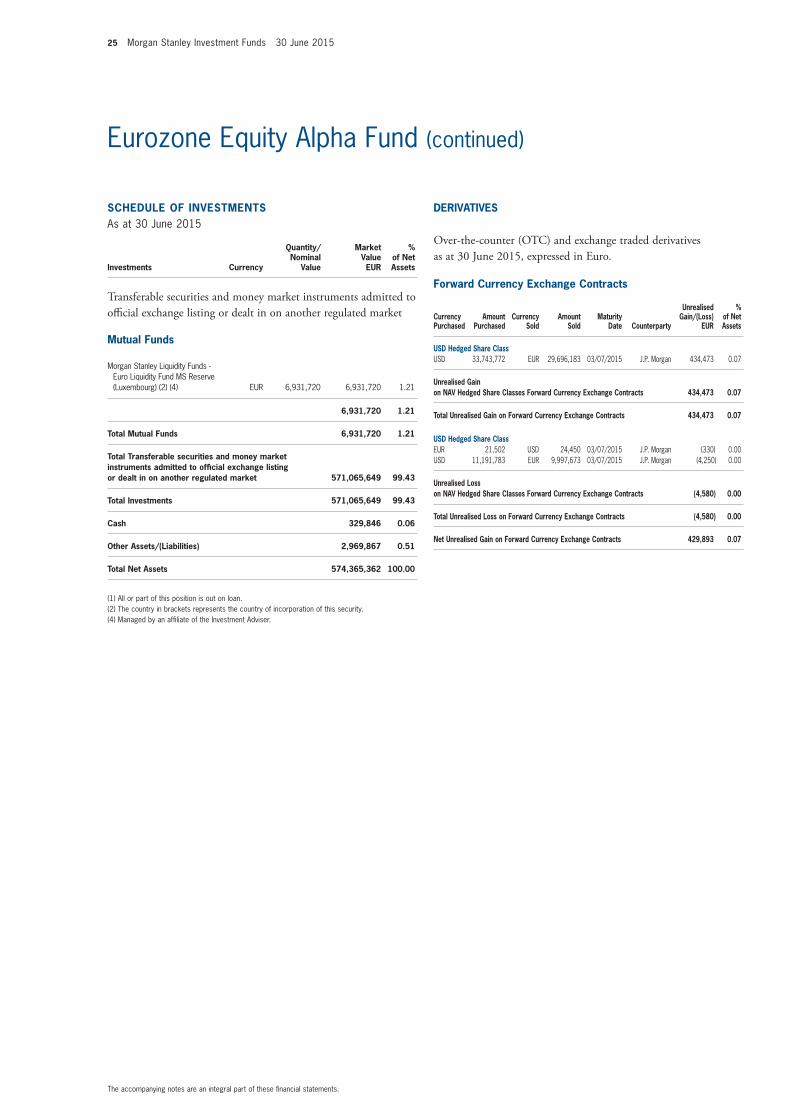
SCHEDULE of invEStmEntSAs at 30 June 2015
Investments Currency
Quantity/Nominal
Value
Market Value EUR
% of Net Assets
transferable securities and money market instruments admitted to official exchange listing or dealt in on another regulated market
mutual funds
Morgan Stanley Liquidity Funds - Euro Liquidity Fund MS Reserve (Luxembourg) (2) (4) EUR 6,931,720 6,931,720 1.21
6,931,720 1.21
total mutual funds 6,931,720 1.21
total transferable securities and money market instruments admitted to official exchange listing or dealt in on another regulated market 571,065,649 99.43
total investments 571,065,649 99.43
Cash 329,846 0.06
other Assets/(Liabilities) 2,969,867 0.51
total net Assets 574,365,362 100.00
(1) All or part of this position is out on loan.(2) The country in brackets represents the country of incorporation of this security.(4) Managed by an affiliate of the Investment Adviser.
The accompanying notes are an integral part of these financial statements.
Eurozone Equity Alpha Fund (continued)
DERivAtivES
Over-the-counter (OtC) and exchange traded derivatives as at 30 June 2015, expressed in euro.
forward Currency Exchange Contracts
Currency Purchased
Amount Purchased
Currency Sold
Amount Sold
maturity Date Counterparty
Unrealised Gain/(Loss)
EUR
% of net Assets
USD Hedged Share ClassUSD 33,743,772 EUR 29,696,183 03/07/2015 J.P. Morgan 434,473 0.07
Unrealised Gain on nAv Hedged Share Classes forward Currency Exchange Contracts 434,473 0.07
total Unrealised Gain on forward Currency Exchange Contracts 434,473 0.07
USD Hedged Share ClassEUR 21,502 USD 24,450 03/07/2015 J.P. Morgan (330) 0.00USD 11,191,783 EUR 9,997,673 03/07/2015 J.P. Morgan (4,250) 0.00
Unrealised Loss on nAv Hedged Share Classes forward Currency Exchange Contracts (4,580) 0.00
total Unrealised Loss on forward Currency Exchange Contracts (4,580) 0.00
net Unrealised Gain on forward Currency Exchange Contracts 429,893 0.07
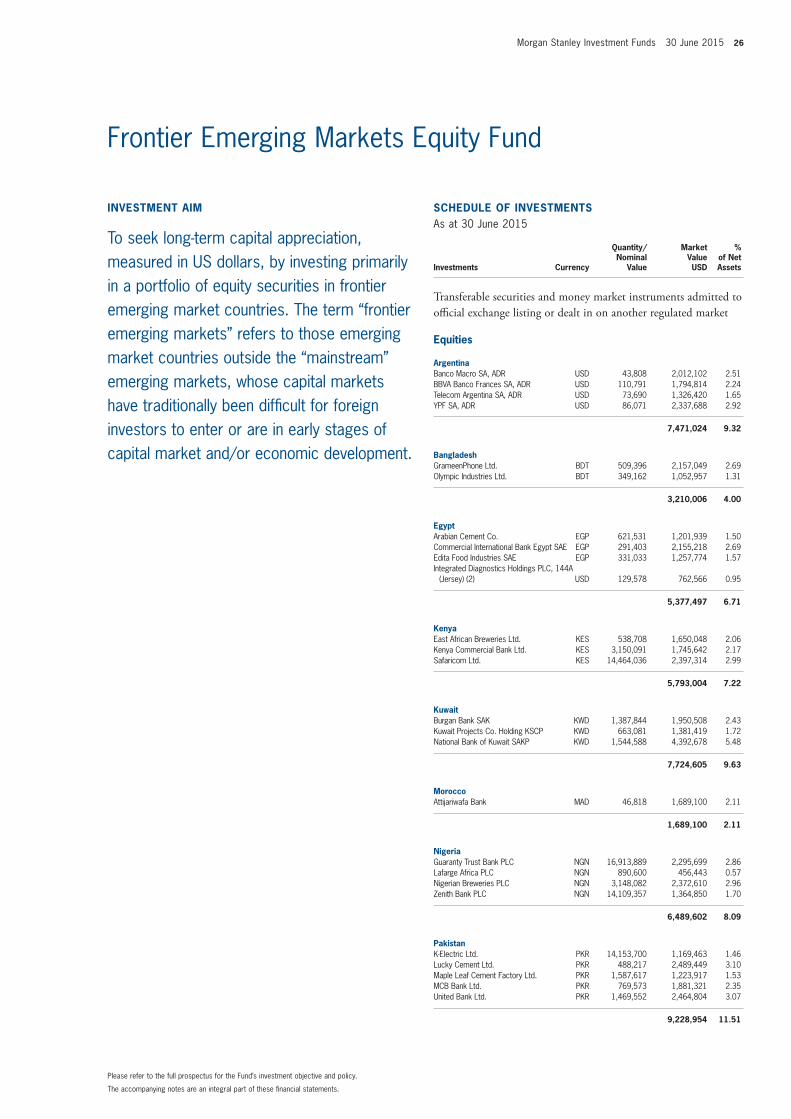
Morgan Stanley Investment Funds 30 June 2015 26
invEStmEnt Aim
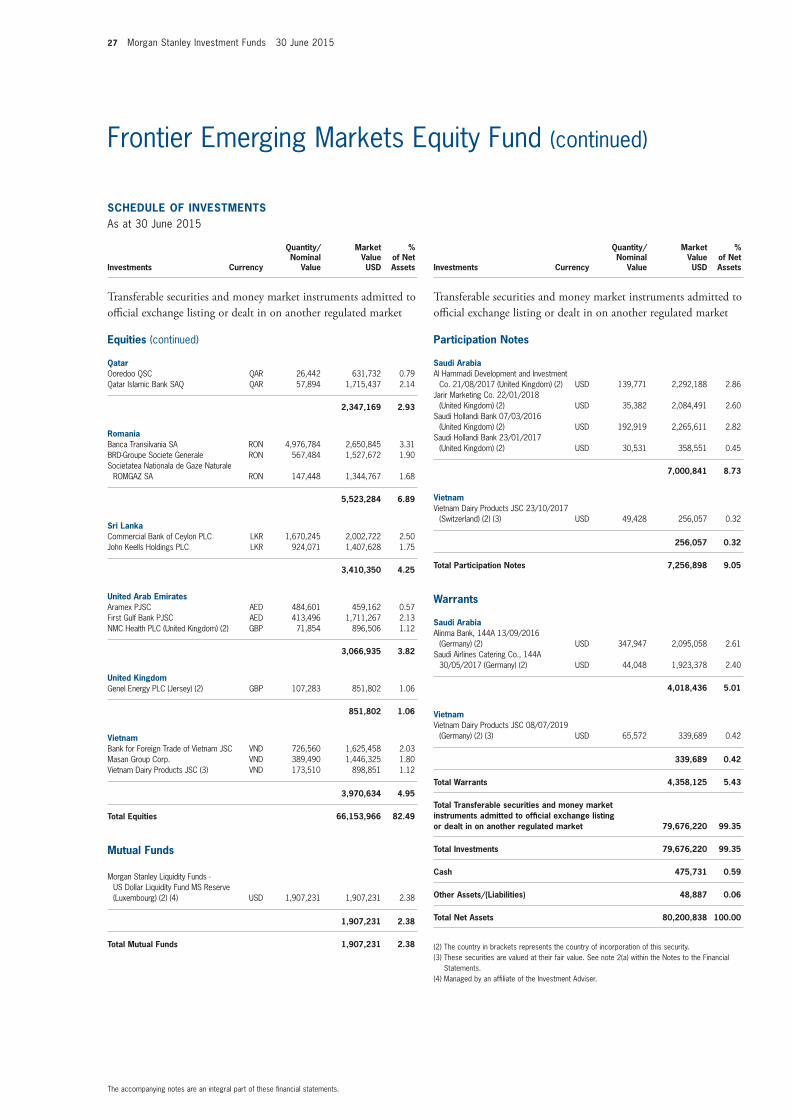
To seek long-term capital appreciation, measured in US dollars, by investing primarily in a portfolio of equity securities in frontier emerging market countries. The term “frontier emerging markets” refers to those emerging market countries outside the “mainstream” emerging markets, whose capital markets have traditionally been difficult for foreign investors to enter or are in early stages of capital market and/or economic development.
SCHEDULE of invEStmEntSAs at 30 June 2015
Investments Currency
Quantity/Nominal
Value
Market Value USD
% of Net Assets
transferable securities and money market instruments admitted to official exchange listing or dealt in on another regulated market
Equities
ArgentinaBanco Macro SA, ADR USD 43,808 2,012,102 2.51BBVA Banco Frances SA, ADR USD 110,791 1,794,814 2.24Telecom Argentina SA, ADR USD 73,690 1,326,420 1.65YPF SA, ADR USD 86,071 2,337,688 2.92
7,471,024 9.32
BangladeshGrameenPhone Ltd. BDT 509,396 2,157,049 2.69Olympic Industries Ltd. BDT 349,162 1,052,957 1.31
3,210,006 4.00
EgyptArabian Cement Co. EGP 621,531 1,201,939 1.50Commercial International Bank Egypt SAE EGP 291,403 2,155,218 2.69Edita Food Industries SAE EGP 331,033 1,257,774 1.57Integrated Diagnostics Holdings PLC, 144A
(Jersey) (2) USD 129,578 762,566 0.95
5,377,497 6.71
KenyaEast African Breweries Ltd. KES 538,708 1,650,048 2.06Kenya Commercial Bank Ltd. KES 3,150,091 1,745,642 2.17Safaricom Ltd. KES 14,464,036 2,397,314 2.99
5,793,004 7.22
KuwaitBurgan Bank SAK KWD 1,387,844 1,950,508 2.43Kuwait Projects Co. Holding KSCP KWD 663,081 1,381,419 1.72National Bank of Kuwait SAKP KWD 1,544,588 4,392,678 5.48
7,724,605 9.63
moroccoAttijariwafa Bank MAD 46,818 1,689,100 2.11
1,689,100 2.11
nigeriaGuaranty Trust Bank PLC NGN 16,913,889 2,295,699 2.86Lafarge Africa PLC NGN 890,600 456,443 0.57Nigerian Breweries PLC NGN 3,148,082 2,372,610 2.96Zenith Bank PLC NGN 14,109,357 1,364,850 1.70
6,489,602 8.09
PakistanK-Electric Ltd. PKR 14,153,700 1,169,463 1.46Lucky Cement Ltd. PKR 488,217 2,489,449 3.10Maple Leaf Cement Factory Ltd. PKR 1,587,617 1,223,917 1.53MCB Bank Ltd. PKR 769,573 1,881,321 2.35United Bank Ltd. PKR 1,469,552 2,464,804 3.07
9,228,954 11.51
The accompanying notes are an integral part of these financial statements.
Please refer to the full prospectus for the Fund’s investment objective and policy.
Frontier Emerging Markets Equity Fund
27 Morgan Stanley Investment Funds 30 June 2015
SCHEDULE of invEStmEntSAs at 30 June 2015
Investments Currency
Quantity/Nominal
Value
Market Value USD
% of Net Assets
transferable securities and money market instruments admitted to official exchange listing or dealt in on another regulated market
Equities (continued)
QatarOoredoo QSC QAR 26,442 631,732 0.79Qatar Islamic Bank SAQ QAR 57,894 1,715,437 2.14
2,347,169 2.93
RomaniaBanca Transilvania SA RON 4,976,784 2,650,845 3.31BRD-Groupe Societe Generale RON 567,484 1,527,672 1.90Societatea Nationala de Gaze Naturale
ROMGAZ SA RON 147,448 1,344,767 1.68
5,523,284 6.89
Sri LankaCommercial Bank of Ceylon PLC LKR 1,670,245 2,002,722 2.50John Keells Holdings PLC LKR 924,071 1,407,628 1.75
3,410,350 4.25
United Arab EmiratesAramex PJSC AED 484,601 459,162 0.57First Gulf Bank PJSC AED 413,496 1,711,267 2.13NMC Health PLC (United Kingdom) (2) GBP 71,854 896,506 1.12
3,066,935 3.82
United KingdomGenel Energy PLC (Jersey) (2) GBP 107,283 851,802 1.06
851,802 1.06
vietnamBank for Foreign Trade of Vietnam JSC VND 726,560 1,625,458 2.03Masan Group Corp. VND 389,490 1,446,325 1.80Vietnam Dairy Products JSC (3) VND 173,510 898,851 1.12
3,970,634 4.95
total Equities 66,153,966 82.49
mutual funds
Morgan Stanley Liquidity Funds - US Dollar Liquidity Fund MS Reserve (Luxembourg) (2) (4) USD 1,907,231 1,907,231 2.38
1,907,231 2.38
total mutual funds 1,907,231 2.38
SCHEDULE of invEStmEntSAs at 30 June 2015
Investments Currency
Quantity/Nominal
Value
Market Value USD
% of Net Assets
transferable securities and money market instruments admitted to official exchange listing or dealt in on another regulated market
Participation notes
Saudi ArabiaAl Hammadi Development and Investment
Co. 21/08/2017 (United Kingdom) (2) USD 139,771 2,292,188 2.86Jarir Marketing Co. 22/01/2018
(United Kingdom) (2) USD 35,382 2,084,491 2.60Saudi Hollandi Bank 07/03/2016
(United Kingdom) (2) USD 192,919 2,265,611 2.82Saudi Hollandi Bank 23/01/2017
(United Kingdom) (2) USD 30,531 358,551 0.45
7,000,841 8.73
vietnamVietnam Dairy Products JSC 23/10/2017
(Switzerland) (2) (3) USD 49,428 256,057 0.32
256,057 0.32
total Participation notes 7,256,898 9.05
Warrants
Saudi ArabiaAlinma Bank, 144A 13/09/2016
(Germany) (2) USD 347,947 2,095,058 2.61Saudi Airlines Catering Co., 144A
30/05/2017 (Germany) (2) USD 44,048 1,923,378 2.40
4,018,436 5.01
vietnamVietnam Dairy Products JSC 08/07/2019
(Germany) (2) (3) USD 65,572 339,689 0.42
339,689 0.42
total Warrants 4,358,125 5.43
total transferable securities and money market instruments admitted to official exchange listing or dealt in on another regulated market 79,676,220 99.35
total investments 79,676,220 99.35
Cash 475,731 0.59
other Assets/(Liabilities) 48,887 0.06
total net Assets 80,200,838 100.00
(2) The country in brackets represents the country of incorporation of this security.(3) These securities are valued at their fair value. See note 2(a) within the Notes to the Financial
Statements.(4) Managed by an affiliate of the Investment Adviser.
The accompanying notes are an integral part of these financial statements.
Frontier Emerging Markets Equity Fund (continued)
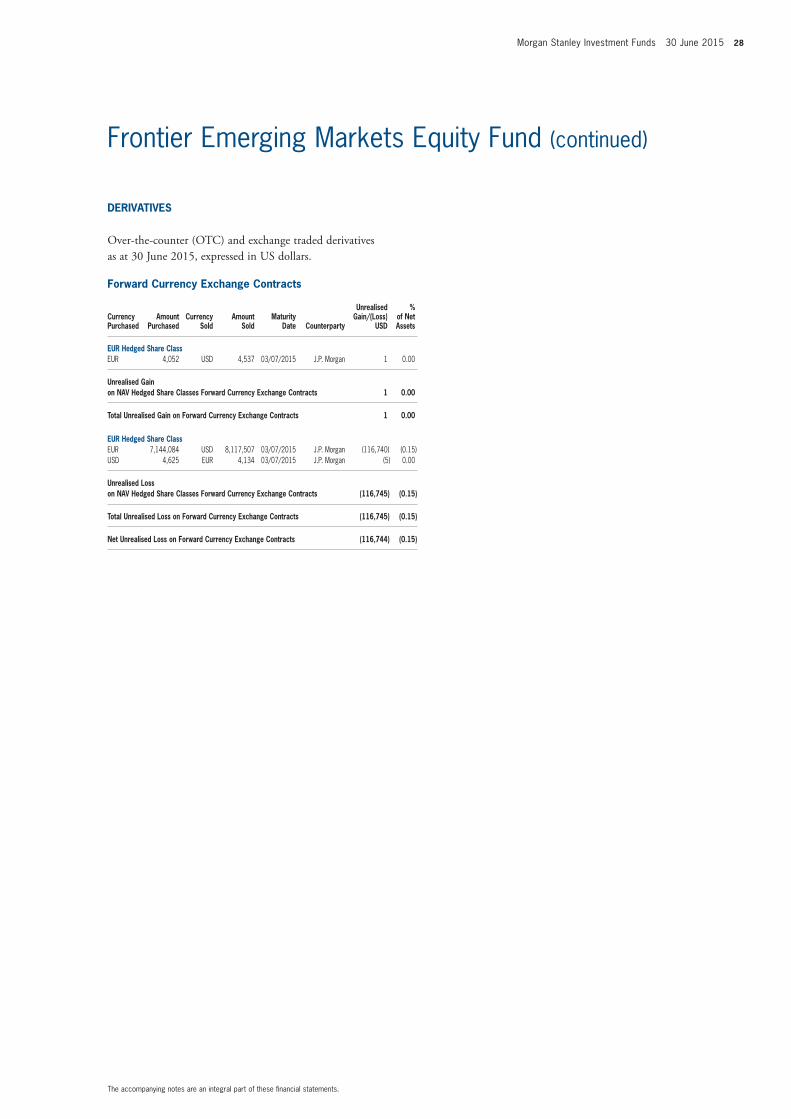
Morgan Stanley Investment Funds 30 June 2015 28
The accompanying notes are an integral part of these financial statements.
Frontier Emerging Markets Equity Fund (continued)
DERivAtivES
Over-the-counter (OtC) and exchange traded derivatives as at 30 June 2015, expressed in US dollars.
forward Currency Exchange Contracts
Currency Purchased
Amount Purchased
Currency Sold
Amount Sold
maturity Date Counterparty
Unrealised Gain/(Loss)
USD
% of net Assets
EUR Hedged Share ClassEUR 4,052 USD 4,537 03/07/2015 J.P. Morgan 1 0.00
Unrealised Gain on nAv Hedged Share Classes forward Currency Exchange Contracts 1 0.00
total Unrealised Gain on forward Currency Exchange Contracts 1 0.00
EUR Hedged Share ClassEUR 7,144,084 USD 8,117,507 03/07/2015 J.P. Morgan (116,740) (0.15)USD 4,625 EUR 4,134 03/07/2015 J.P. Morgan (5) 0.00
Unrealised Loss on nAv Hedged Share Classes forward Currency Exchange Contracts (116,745) (0.15)
total Unrealised Loss on forward Currency Exchange Contracts (116,745) (0.15)
net Unrealised Loss on forward Currency Exchange Contracts (116,744) (0.15)
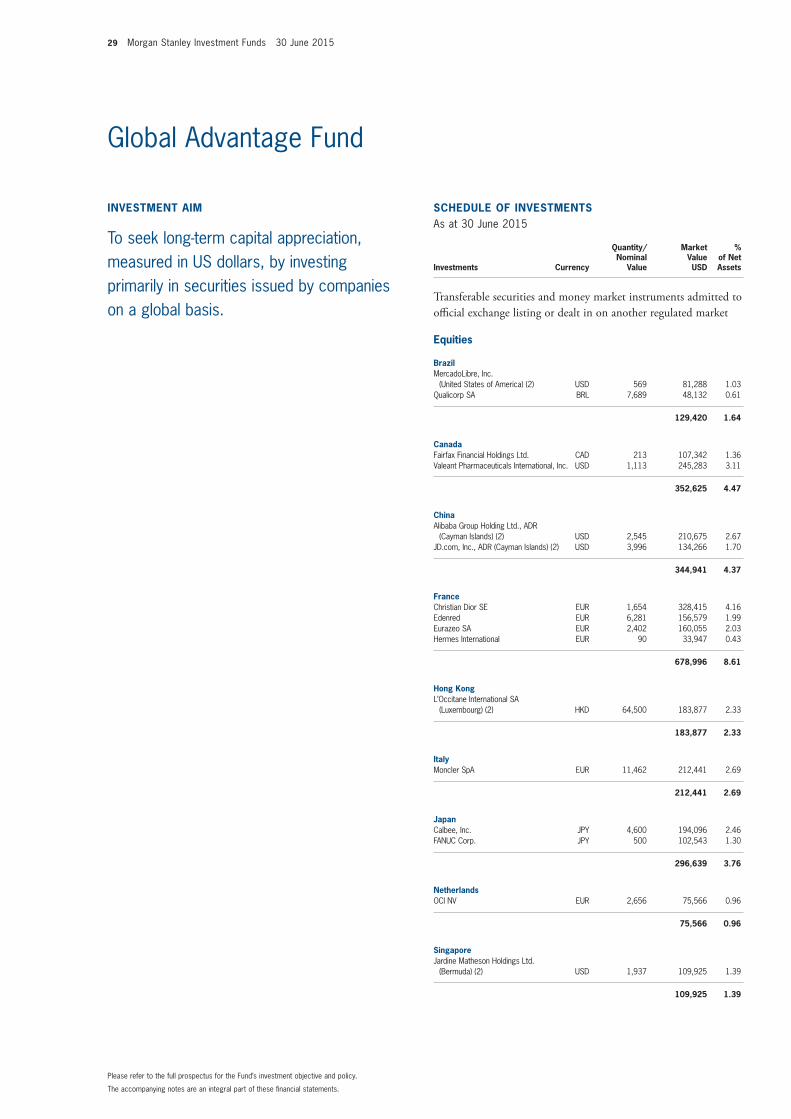
29 Morgan Stanley Investment Funds 30 June 2015
invEStmEnt Aim
To seek long-term capital appreciation, measured in US dollars, by investing primarily in securities issued by companies on a global basis.
SCHEDULE of invEStmEntSAs at 30 June 2015
Investments Currency
Quantity/Nominal
Value
Market Value USD
% of Net Assets
transferable securities and money market instruments admitted to official exchange listing or dealt in on another regulated market
Equities
BrazilMercadoLibre, Inc.
(United States of America) (2) USD 569 81,288 1.03Qualicorp SA BRL 7,689 48,132 0.61
129,420 1.64
CanadaFairfax Financial Holdings Ltd. CAD 213 107,342 1.36Valeant Pharmaceuticals International, Inc. USD 1,113 245,283 3.11
352,625 4.47
ChinaAlibaba Group Holding Ltd., ADR
(Cayman Islands) (2) USD 2,545 210,675 2.67JD.com, Inc., ADR (Cayman Islands) (2) USD 3,996 134,266 1.70
344,941 4.37
franceChristian Dior SE EUR 1,654 328,415 4.16Edenred EUR 6,281 156,579 1.99Eurazeo SA EUR 2,402 160,055 2.03Hermes International EUR 90 33,947 0.43
678,996 8.61
Hong KongL’Occitane International SA
(Luxembourg) (2) HKD 64,500 183,877 2.33
183,877 2.33
italyMoncler SpA EUR 11,462 212,441 2.69
212,441 2.69
JapanCalbee, Inc. JPY 4,600 194,096 2.46FANUC Corp. JPY 500 102,543 1.30
296,639 3.76
netherlandsOCI NV EUR 2,656 75,566 0.96
75,566 0.96
SingaporeJardine Matheson Holdings Ltd.
(Bermuda) (2) USD 1,937 109,925 1.39
109,925 1.39
The accompanying notes are an integral part of these financial statements.
Please refer to the full prospectus for the Fund’s investment objective and policy.
Global Advantage Fund
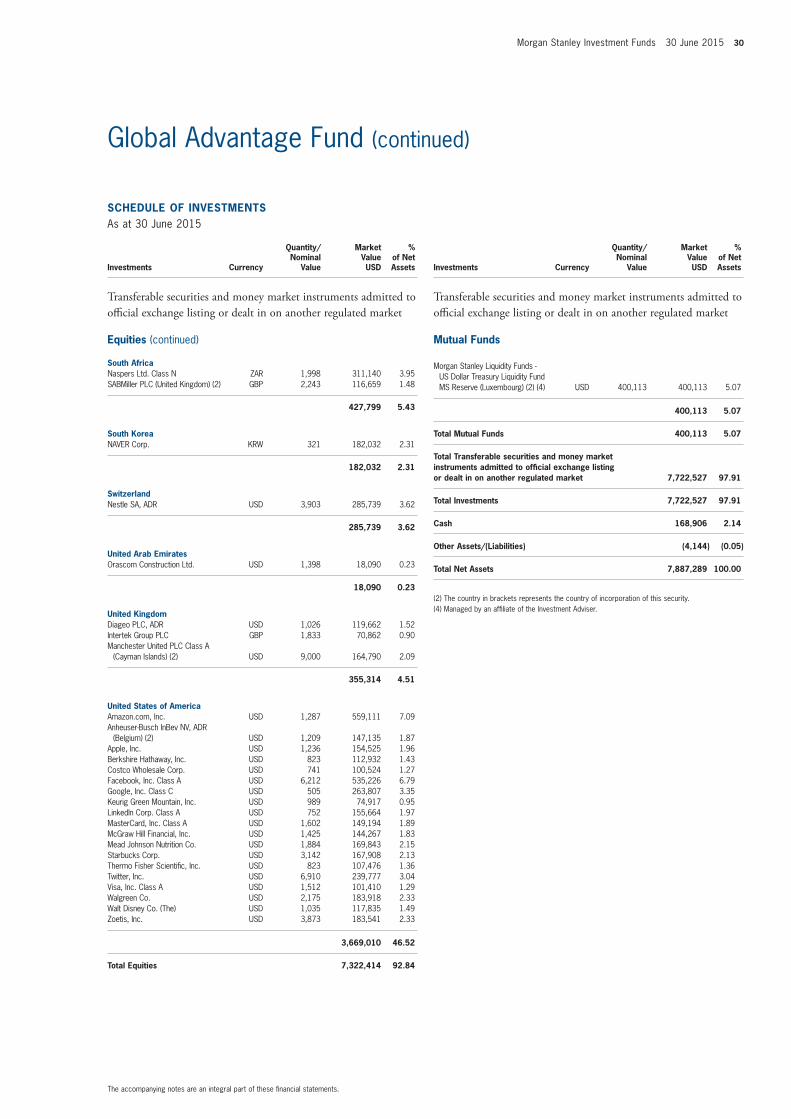
Morgan Stanley Investment Funds 30 June 2015 30
SCHEDULE of invEStmEntSAs at 30 June 2015
Investments Currency
Quantity/Nominal
Value
Market Value USD
% of Net Assets
transferable securities and money market instruments admitted to official exchange listing or dealt in on another regulated market
Equities (continued)
South AfricaNaspers Ltd. Class N ZAR 1,998 311,140 3.95SABMiller PLC (United Kingdom) (2) GBP 2,243 116,659 1.48
427,799 5.43
South KoreaNAVER Corp. KRW 321 182,032 2.31
182,032 2.31
SwitzerlandNestle SA, ADR USD 3,903 285,739 3.62
285,739 3.62
United Arab EmiratesOrascom Construction Ltd. USD 1,398 18,090 0.23
18,090 0.23
United KingdomDiageo PLC, ADR USD 1,026 119,662 1.52Intertek Group PLC GBP 1,833 70,862 0.90Manchester United PLC Class A
(Cayman Islands) (2) USD 9,000 164,790 2.09
355,314 4.51
United States of AmericaAmazon.com, Inc. USD 1,287 559,111 7.09Anheuser-Busch InBev NV, ADR
(Belgium) (2) USD 1,209 147,135 1.87Apple, Inc. USD 1,236 154,525 1.96Berkshire Hathaway, Inc. USD 823 112,932 1.43Costco Wholesale Corp. USD 741 100,524 1.27Facebook, Inc. Class A USD 6,212 535,226 6.79Google, Inc. Class C USD 505 263,807 3.35Keurig Green Mountain, Inc. USD 989 74,917 0.95LinkedIn Corp. Class A USD 752 155,664 1.97MasterCard, Inc. Class A USD 1,602 149,194 1.89McGraw Hill Financial, Inc. USD 1,425 144,267 1.83Mead Johnson Nutrition Co. USD 1,884 169,843 2.15Starbucks Corp. USD 3,142 167,908 2.13Thermo Fisher Scientific, Inc. USD 823 107,476 1.36Twitter, Inc. USD 6,910 239,777 3.04Visa, Inc. Class A USD 1,512 101,410 1.29Walgreen Co. USD 2,175 183,918 2.33Walt Disney Co. (The) USD 1,035 117,835 1.49Zoetis, Inc. USD 3,873 183,541 2.33
3,669,010 46.52
total Equities 7,322,414 92.84
SCHEDULE of invEStmEntSAs at 30 June 2015
Investments Currency
Quantity/Nominal
Value
Market Value USD
% of Net Assets
transferable securities and money market instruments admitted to official exchange listing or dealt in on another regulated market
mutual funds
Morgan Stanley Liquidity Funds - US Dollar Treasury Liquidity Fund MS Reserve (Luxembourg) (2) (4) USD 400,113 400,113 5.07
400,113 5.07
total mutual funds 400,113 5.07
total transferable securities and money market instruments admitted to official exchange listing or dealt in on another regulated market 7,722,527 97.91
total investments 7,722,527 97.91
Cash 168,906 2.14
other Assets/(Liabilities) (4,144) (0.05)
total net Assets 7,887,289 100.00
(2) The country in brackets represents the country of incorporation of this security.(4) Managed by an affiliate of the Investment Adviser.
The accompanying notes are an integral part of these financial statements.
Global Advantage Fund (continued)
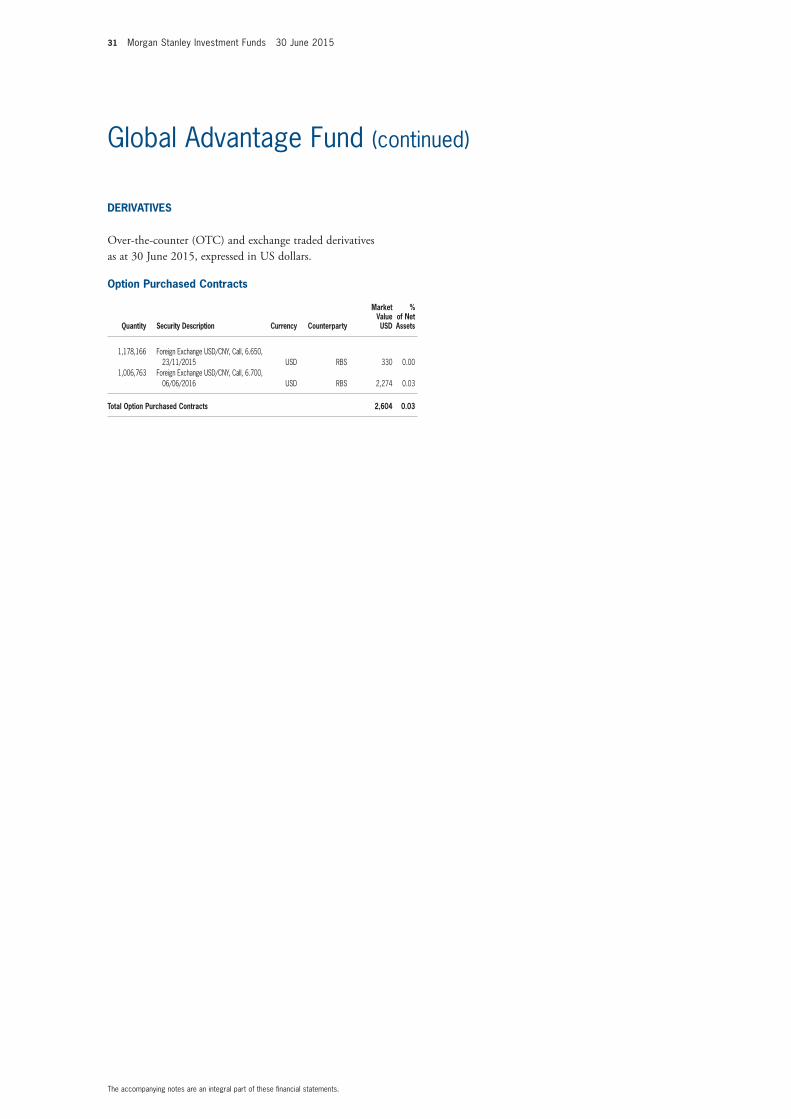
31 Morgan Stanley Investment Funds 30 June 2015
The accompanying notes are an integral part of these financial statements.
Global Advantage Fund (continued)
option Purchased Contracts
Quantity Security Description Currency Counterparty
market value USD
% of net Assets
1,178,166 Foreign Exchange USD/CNY, Call, 6.650, 23/11/2015 USD RBS 330 0.00
1,006,763 Foreign Exchange USD/CNY, Call, 6.700, 06/06/2016 USD RBS 2,274 0.03
total option Purchased Contracts 2,604 0.03
DERivAtivES
Over-the-counter (OtC) and exchange traded derivatives as at 30 June 2015, expressed in US dollars.
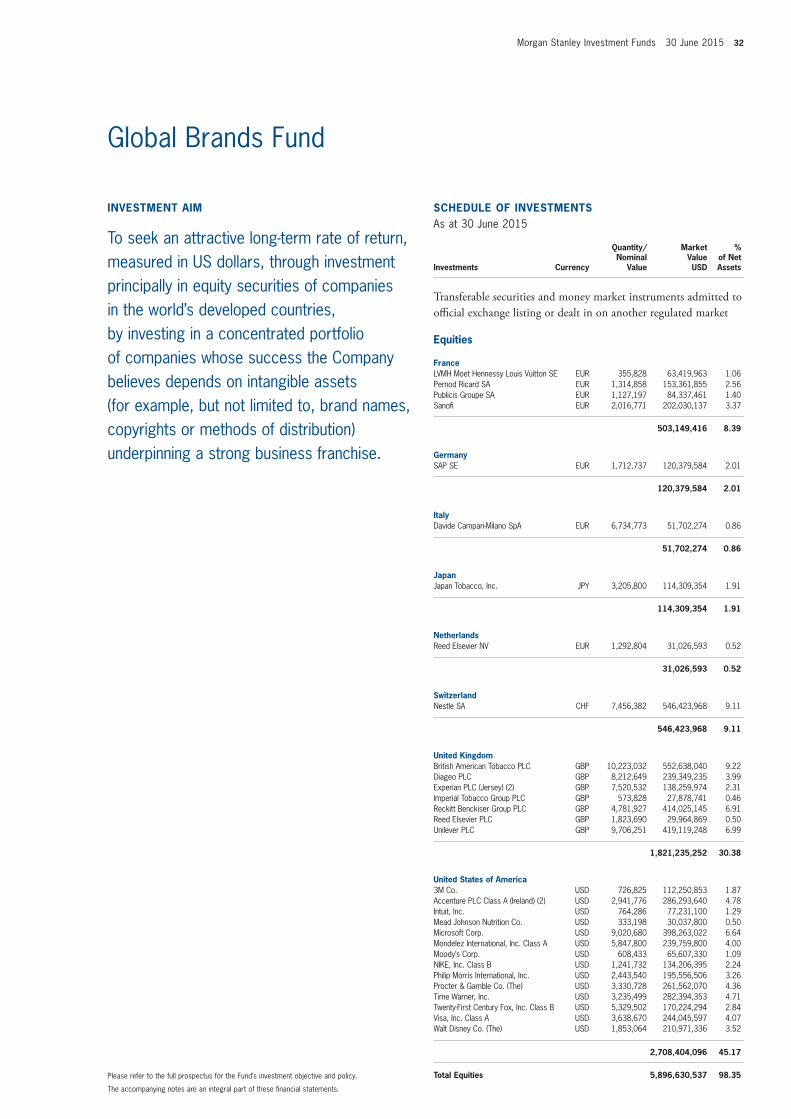
Morgan Stanley Investment Funds 30 June 2015 32
invEStmEnt Aim
To seek an attractive long-term rate of return, measured in US dollars, through investment principally in equity securities of companies in the world’s developed countries, by investing in a concentrated portfolio of companies whose success the Company believes depends on intangible assets (for example, but not limited to, brand names, copyrights or methods of distribution) underpinning a strong business franchise.
SCHEDULE of invEStmEntSAs at 30 June 2015
Investments Currency
Quantity/Nominal
Value
Market Value USD
% of Net Assets
transferable securities and money market instruments admitted to official exchange listing or dealt in on another regulated market
Equities
franceLVMH Moet Hennessy Louis Vuitton SE EUR 355,828 63,419,963 1.06Pernod Ricard SA EUR 1,314,858 153,361,855 2.56Publicis Groupe SA EUR 1,127,197 84,337,461 1.40Sanofi EUR 2,016,771 202,030,137 3.37
503,149,416 8.39
GermanySAP SE EUR 1,712,737 120,379,584 2.01
120,379,584 2.01
italyDavide Campari-Milano SpA EUR 6,734,773 51,702,274 0.86
51,702,274 0.86
JapanJapan Tobacco, Inc. JPY 3,205,800 114,309,354 1.91
114,309,354 1.91
netherlandsReed Elsevier NV EUR 1,292,804 31,026,593 0.52
31,026,593 0.52
SwitzerlandNestle SA CHF 7,456,382 546,423,968 9.11
546,423,968 9.11
United KingdomBritish American Tobacco PLC GBP 10,223,032 552,638,040 9.22Diageo PLC GBP 8,212,649 239,349,235 3.99Experian PLC (Jersey) (2) GBP 7,520,532 138,259,974 2.31Imperial Tobacco Group PLC GBP 573,828 27,878,741 0.46Reckitt Benckiser Group PLC GBP 4,781,927 414,025,145 6.91Reed Elsevier PLC GBP 1,823,690 29,964,869 0.50Unilever PLC GBP 9,706,251 419,119,248 6.99
1,821,235,252 30.38
United States of America3M Co. USD 726,825 112,250,853 1.87Accenture PLC Class A (Ireland) (2) USD 2,941,776 286,293,640 4.78Intuit, Inc. USD 764,286 77,231,100 1.29Mead Johnson Nutrition Co. USD 333,198 30,037,800 0.50Microsoft Corp. USD 9,020,680 398,263,022 6.64Mondelez International, Inc. Class A USD 5,847,800 239,759,800 4.00Moody’s Corp. USD 608,433 65,607,330 1.09NIKE, Inc. Class B USD 1,241,732 134,206,395 2.24Philip Morris International, Inc. USD 2,443,540 195,556,506 3.26Procter & Gamble Co. (The) USD 3,330,728 261,562,070 4.36Time Warner, Inc. USD 3,235,499 282,394,353 4.71Twenty-First Century Fox, Inc. Class B USD 5,329,502 170,224,294 2.84Visa, Inc. Class A USD 3,638,670 244,045,597 4.07Walt Disney Co. (The) USD 1,853,064 210,971,336 3.52
2,708,404,096 45.17
total Equities 5,896,630,537 98.35
The accompanying notes are an integral part of these financial statements.
Please refer to the full prospectus for the Fund’s investment objective and policy.
Global Brands Fund
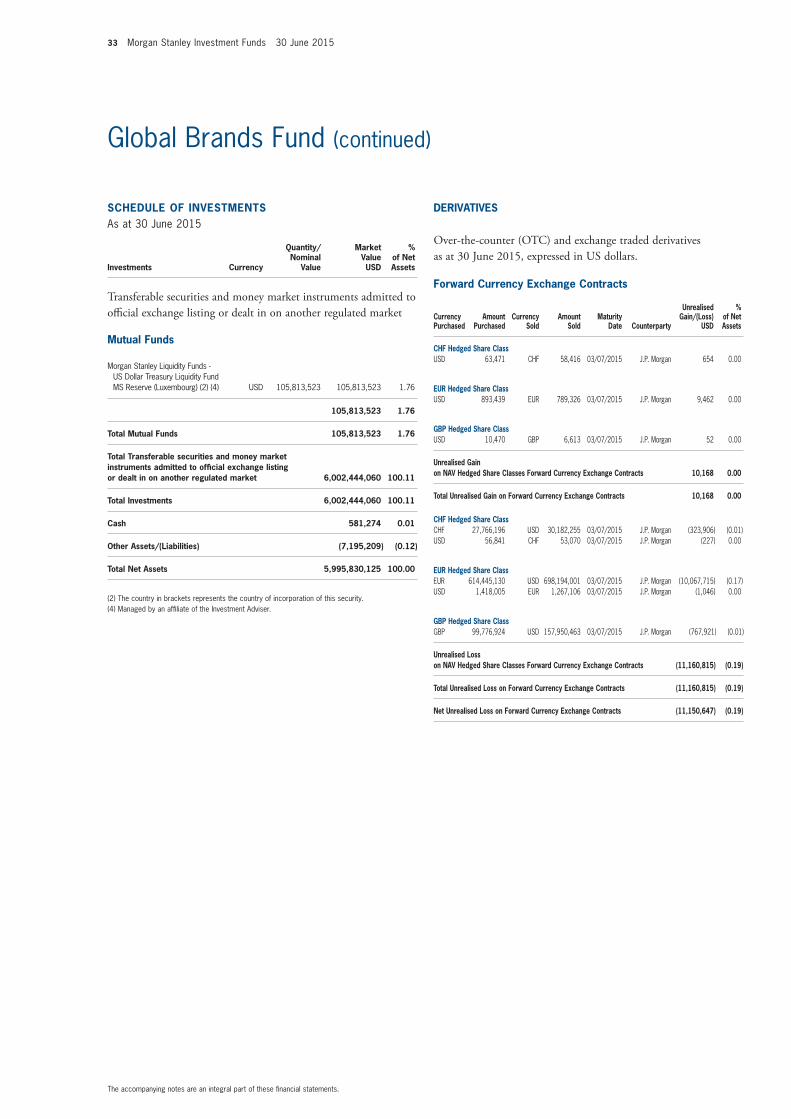
33 Morgan Stanley Investment Funds 30 June 2015
SCHEDULE of invEStmEntSAs at 30 June 2015
Investments Currency
Quantity/Nominal
Value
Market Value USD
% of Net Assets
transferable securities and money market instruments admitted to official exchange listing or dealt in on another regulated market
mutual funds
Morgan Stanley Liquidity Funds - US Dollar Treasury Liquidity Fund MS Reserve (Luxembourg) (2) (4) USD 105,813,523 105,813,523 1.76
105,813,523 1.76
total mutual funds 105,813,523 1.76
total transferable securities and money market instruments admitted to official exchange listing or dealt in on another regulated market 6,002,444,060 100.11
total investments 6,002,444,060 100.11
Cash 581,274 0.01
other Assets/(Liabilities) (7,195,209) (0.12)
total net Assets 5,995,830,125 100.00
(2) The country in brackets represents the country of incorporation of this security.(4) Managed by an affiliate of the Investment Adviser.
DERivAtivES
Over-the-counter (OtC) and exchange traded derivatives as at 30 June 2015, expressed in US dollars.
forward Currency Exchange Contracts
Currency Purchased
Amount Purchased
Currency Sold
Amount Sold
maturity Date Counterparty
Unrealised Gain/(Loss)
USD
% of net Assets
CHf Hedged Share ClassUSD 63,471 CHF 58,416 03/07/2015 J.P. Morgan 654 0.00
EUR Hedged Share ClassUSD 893,439 EUR 789,326 03/07/2015 J.P. Morgan 9,462 0.00
GBP Hedged Share ClassUSD 10,470 GBP 6,613 03/07/2015 J.P. Morgan 52 0.00
Unrealised Gain on nAv Hedged Share Classes forward Currency Exchange Contracts 10,168 0.00
total Unrealised Gain on forward Currency Exchange Contracts 10,168 0.00
CHf Hedged Share ClassCHF 27,766,196 USD 30,182,255 03/07/2015 J.P. Morgan (323,906) (0.01)USD 56,841 CHF 53,070 03/07/2015 J.P. Morgan (227) 0.00
EUR Hedged Share ClassEUR 614,445,130 USD 698,194,001 03/07/2015 J.P. Morgan (10,067,715) (0.17)USD 1,418,005 EUR 1,267,106 03/07/2015 J.P. Morgan (1,046) 0.00
GBP Hedged Share ClassGBP 99,776,924 USD 157,950,463 03/07/2015 J.P. Morgan (767,921) (0.01)
Unrealised Loss on nAv Hedged Share Classes forward Currency Exchange Contracts (11,160,815) (0.19)
total Unrealised Loss on forward Currency Exchange Contracts (11,160,815) (0.19)
net Unrealised Loss on forward Currency Exchange Contracts (11,150,647) (0.19)
The accompanying notes are an integral part of these financial statements.
Global Brands Fund (continued)
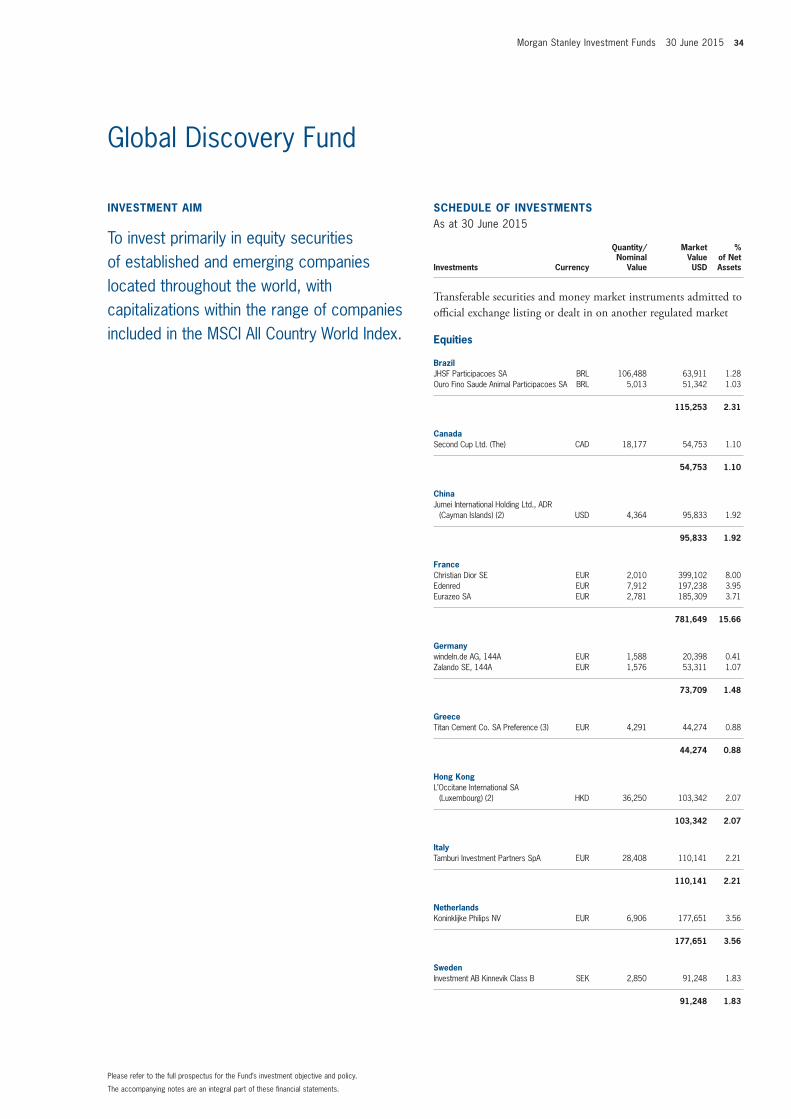
Morgan Stanley Investment Funds 30 June 2015 34
invEStmEnt Aim
To invest primarily in equity securities of established and emerging companies located throughout the world, with capitalizations within the range of companies included in the MSCI All Country World Index.
SCHEDULE of invEStmEntSAs at 30 June 2015
Investments Currency
Quantity/Nominal
Value
Market Value USD
% of Net Assets
transferable securities and money market instruments admitted to official exchange listing or dealt in on another regulated market
Equities
BrazilJHSF Participacoes SA BRL 106,488 63,911 1.28Ouro Fino Saude Animal Participacoes SA BRL 5,013 51,342 1.03
115,253 2.31
CanadaSecond Cup Ltd. (The) CAD 18,177 54,753 1.10
54,753 1.10
ChinaJumei International Holding Ltd., ADR
(Cayman Islands) (2) USD 4,364 95,833 1.92
95,833 1.92
franceChristian Dior SE EUR 2,010 399,102 8.00Edenred EUR 7,912 197,238 3.95Eurazeo SA EUR 2,781 185,309 3.71
781,649 15.66
Germanywindeln.de AG, 144A EUR 1,588 20,398 0.41Zalando SE, 144A EUR 1,576 53,311 1.07
73,709 1.48
GreeceTitan Cement Co. SA Preference (3) EUR 4,291 44,274 0.88
44,274 0.88
Hong KongL’Occitane International SA
(Luxembourg) (2) HKD 36,250 103,342 2.07
103,342 2.07
italyTamburi Investment Partners SpA EUR 28,408 110,141 2.21
110,141 2.21
netherlandsKoninklijke Philips NV EUR 6,906 177,651 3.56
177,651 3.56
SwedenInvestment AB Kinnevik Class B SEK 2,850 91,248 1.83
91,248 1.83
The accompanying notes are an integral part of these financial statements.
Please refer to the full prospectus for the Fund’s investment objective and policy.
Global Discovery Fund
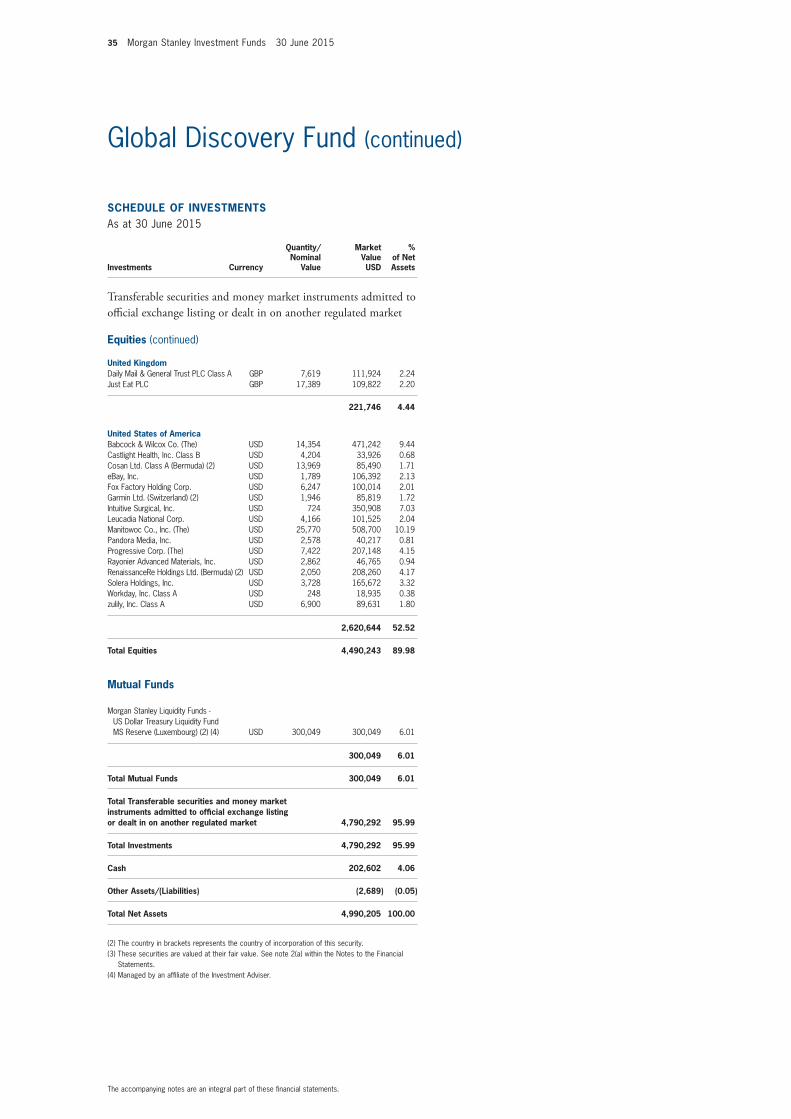
35 Morgan Stanley Investment Funds 30 June 2015
SCHEDULE of invEStmEntSAs at 30 June 2015
Investments Currency
Quantity/Nominal
Value
Market Value USD
% of Net Assets
transferable securities and money market instruments admitted to official exchange listing or dealt in on another regulated market
Equities (continued)
United KingdomDaily Mail & General Trust PLC Class A GBP 7,619 111,924 2.24Just Eat PLC GBP 17,389 109,822 2.20
221,746 4.44
United States of AmericaBabcock & Wilcox Co. (The) USD 14,354 471,242 9.44Castlight Health, Inc. Class B USD 4,204 33,926 0.68Cosan Ltd. Class A (Bermuda) (2) USD 13,969 85,490 1.71eBay, Inc. USD 1,789 106,392 2.13Fox Factory Holding Corp. USD 6,247 100,014 2.01Garmin Ltd. (Switzerland) (2) USD 1,946 85,819 1.72Intuitive Surgical, Inc. USD 724 350,908 7.03Leucadia National Corp. USD 4,166 101,525 2.04Manitowoc Co., Inc. (The) USD 25,770 508,700 10.19Pandora Media, Inc. USD 2,578 40,217 0.81Progressive Corp. (The) USD 7,422 207,148 4.15Rayonier Advanced Materials, Inc. USD 2,862 46,765 0.94RenaissanceRe Holdings Ltd. (Bermuda) (2) USD 2,050 208,260 4.17Solera Holdings, Inc. USD 3,728 165,672 3.32Workday, Inc. Class A USD 248 18,935 0.38zulily, Inc. Class A USD 6,900 89,631 1.80
2,620,644 52.52
total Equities 4,490,243 89.98
mutual funds
Morgan Stanley Liquidity Funds - US Dollar Treasury Liquidity Fund MS Reserve (Luxembourg) (2) (4) USD 300,049 300,049 6.01
300,049 6.01
total mutual funds 300,049 6.01
total transferable securities and money market instruments admitted to official exchange listing or dealt in on another regulated market 4,790,292 95.99
total investments 4,790,292 95.99
Cash 202,602 4.06
other Assets/(Liabilities) (2,689) (0.05)
total net Assets 4,990,205 100.00
(2) The country in brackets represents the country of incorporation of this security.(3) These securities are valued at their fair value. See note 2(a) within the Notes to the Financial
Statements.(4) Managed by an affiliate of the Investment Adviser.
The accompanying notes are an integral part of these financial statements.
Global Discovery Fund (continued)
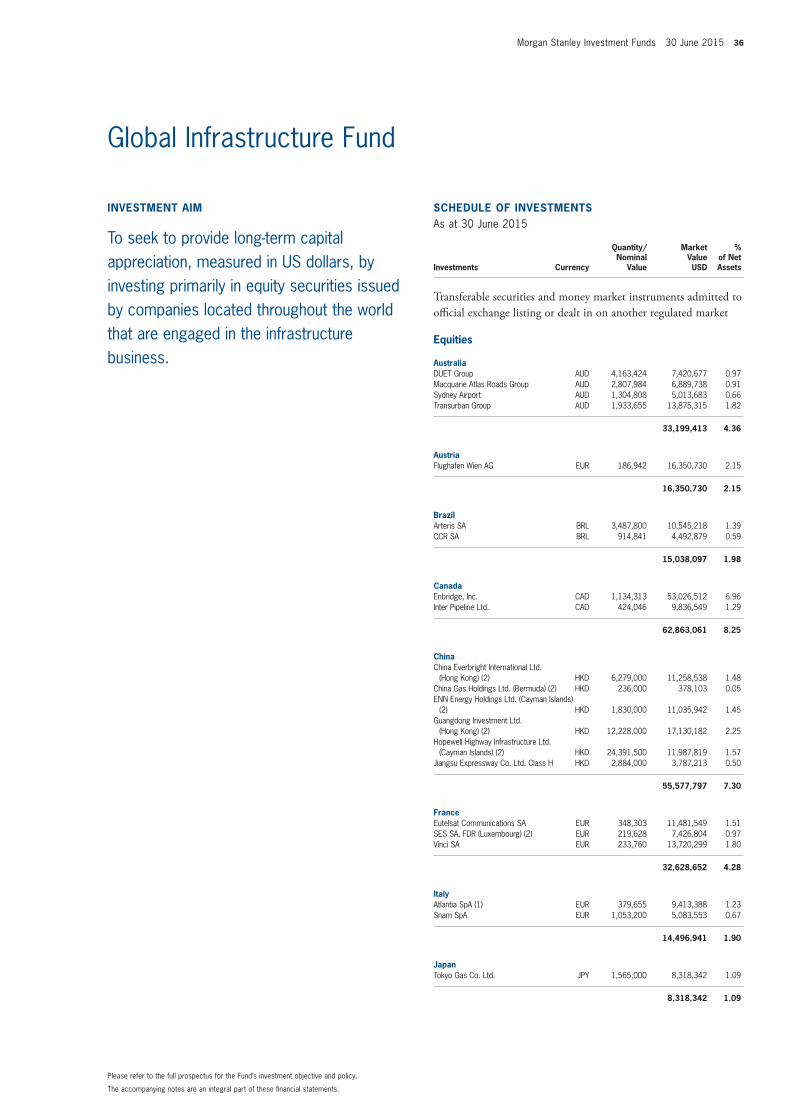
Morgan Stanley Investment Funds 30 June 2015 36
invEStmEnt Aim
To seek to provide long-term capital appreciation, measured in US dollars, by investing primarily in equity securities issued by companies located throughout the world that are engaged in the infrastructure business.
SCHEDULE of invEStmEntSAs at 30 June 2015
Investments Currency
Quantity/Nominal
Value
Market Value USD
% of Net Assets
transferable securities and money market instruments admitted to official exchange listing or dealt in on another regulated market
Equities
AustraliaDUET Group AUD 4,163,424 7,420,677 0.97Macquarie Atlas Roads Group AUD 2,807,984 6,889,738 0.91Sydney Airport AUD 1,304,808 5,013,683 0.66Transurban Group AUD 1,933,655 13,875,315 1.82
33,199,413 4.36
AustriaFlughafen Wien AG EUR 186,942 16,350,730 2.15
16,350,730 2.15
BrazilArteris SA BRL 3,487,800 10,545,218 1.39CCR SA BRL 914,841 4,492,879 0.59
15,038,097 1.98
CanadaEnbridge, Inc. CAD 1,134,313 53,026,512 6.96Inter Pipeline Ltd. CAD 424,046 9,836,549 1.29
62,863,061 8.25
ChinaChina Everbright International Ltd.
(Hong Kong) (2) HKD 6,279,000 11,258,538 1.48China Gas Holdings Ltd. (Bermuda) (2) HKD 236,000 378,103 0.05ENN Energy Holdings Ltd. (Cayman Islands)
(2) HKD 1,830,000 11,035,942 1.45Guangdong Investment Ltd.
(Hong Kong) (2) HKD 12,228,000 17,130,182 2.25Hopewell Highway Infrastructure Ltd.
(Cayman Islands) (2) HKD 24,391,500 11,987,819 1.57Jiangsu Expressway Co. Ltd. Class H HKD 2,884,000 3,787,213 0.50
55,577,797 7.30
franceEutelsat Communications SA EUR 348,303 11,481,549 1.51SES SA, FDR (Luxembourg) (2) EUR 219,628 7,426,804 0.97Vinci SA EUR 233,760 13,720,299 1.80
32,628,652 4.28
italyAtlantia SpA (1) EUR 379,655 9,413,388 1.23Snam SpA EUR 1,053,200 5,083,553 0.67
14,496,941 1.90
JapanTokyo Gas Co. Ltd. JPY 1,565,000 8,318,342 1.09
8,318,342 1.09
The accompanying notes are an integral part of these financial statements.
Please refer to the full prospectus for the Fund’s investment objective and policy.
Global Infrastructure Fund
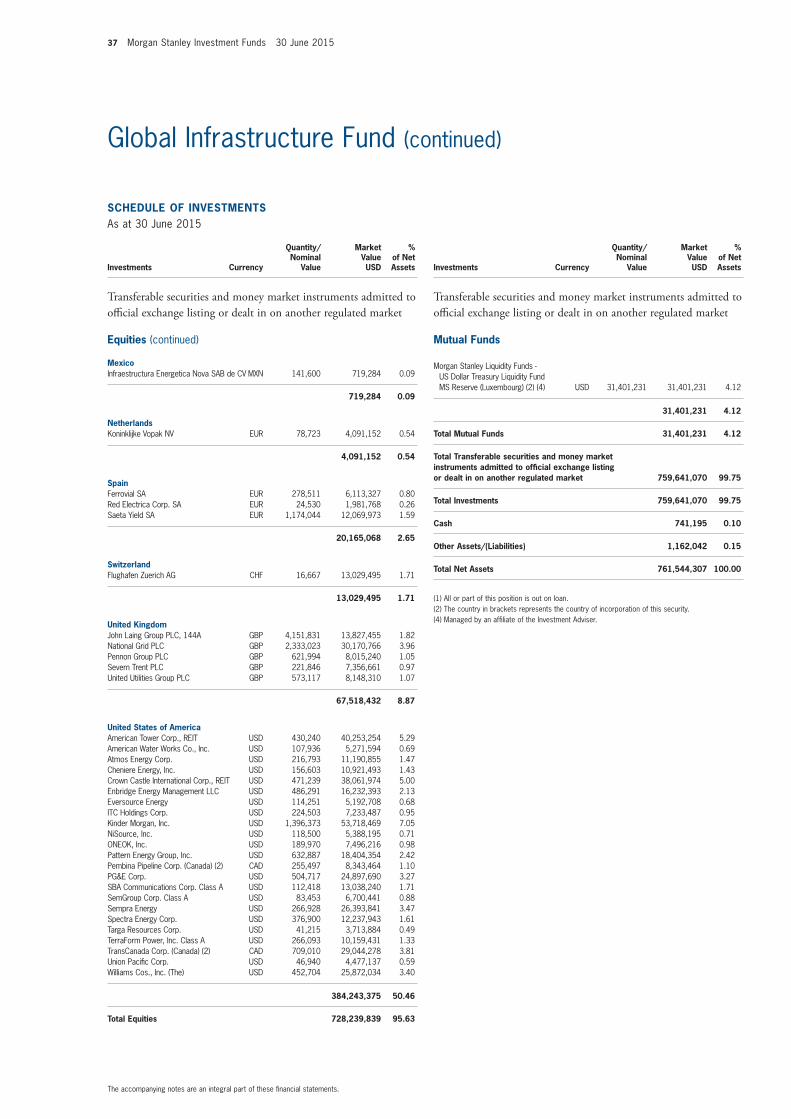
37 Morgan Stanley Investment Funds 30 June 2015
SCHEDULE of invEStmEntSAs at 30 June 2015
Investments Currency
Quantity/Nominal
Value
Market Value USD
% of Net Assets
transferable securities and money market instruments admitted to official exchange listing or dealt in on another regulated market
Equities (continued)
mexicoInfraestructura Energetica Nova SAB de CV MXN 141,600 719,284 0.09
719,284 0.09
netherlandsKoninklijke Vopak NV EUR 78,723 4,091,152 0.54
4,091,152 0.54
SpainFerrovial SA EUR 278,511 6,113,327 0.80Red Electrica Corp. SA EUR 24,530 1,981,768 0.26Saeta Yield SA EUR 1,174,044 12,069,973 1.59
20,165,068 2.65
SwitzerlandFlughafen Zuerich AG CHF 16,667 13,029,495 1.71
13,029,495 1.71
United KingdomJohn Laing Group PLC, 144A GBP 4,151,831 13,827,455 1.82National Grid PLC GBP 2,333,023 30,170,766 3.96Pennon Group PLC GBP 621,994 8,015,240 1.05Severn Trent PLC GBP 221,846 7,356,661 0.97United Utilities Group PLC GBP 573,117 8,148,310 1.07
67,518,432 8.87
United States of AmericaAmerican Tower Corp., REIT USD 430,240 40,253,254 5.29American Water Works Co., Inc. USD 107,936 5,271,594 0.69Atmos Energy Corp. USD 216,793 11,190,855 1.47Cheniere Energy, Inc. USD 156,603 10,921,493 1.43Crown Castle International Corp., REIT USD 471,239 38,061,974 5.00Enbridge Energy Management LLC USD 486,291 16,232,393 2.13Eversource Energy USD 114,251 5,192,708 0.68ITC Holdings Corp. USD 224,503 7,233,487 0.95Kinder Morgan, Inc. USD 1,396,373 53,718,469 7.05NiSource, Inc. USD 118,500 5,388,195 0.71ONEOK, Inc. USD 189,970 7,496,216 0.98Pattern Energy Group, Inc. USD 632,887 18,404,354 2.42Pembina Pipeline Corp. (Canada) (2) CAD 255,497 8,343,464 1.10PG&E Corp. USD 504,717 24,897,690 3.27SBA Communications Corp. Class A USD 112,418 13,038,240 1.71SemGroup Corp. Class A USD 83,453 6,700,441 0.88Sempra Energy USD 266,928 26,393,841 3.47Spectra Energy Corp. USD 376,900 12,237,943 1.61Targa Resources Corp. USD 41,215 3,713,884 0.49TerraForm Power, Inc. Class A USD 266,093 10,159,431 1.33TransCanada Corp. (Canada) (2) CAD 709,010 29,044,278 3.81Union Pacific Corp. USD 46,940 4,477,137 0.59Williams Cos., Inc. (The) USD 452,704 25,872,034 3.40
384,243,375 50.46
total Equities 728,239,839 95.63
SCHEDULE of invEStmEntSAs at 30 June 2015
Investments Currency
Quantity/Nominal
Value
Market Value USD
% of Net Assets
transferable securities and money market instruments admitted to official exchange listing or dealt in on another regulated market
mutual funds
Morgan Stanley Liquidity Funds - US Dollar Treasury Liquidity Fund MS Reserve (Luxembourg) (2) (4) USD 31,401,231 31,401,231 4.12
31,401,231 4.12
total mutual funds 31,401,231 4.12
total transferable securities and money market instruments admitted to official exchange listing or dealt in on another regulated market 759,641,070 99.75
total investments 759,641,070 99.75
Cash 741,195 0.10
other Assets/(Liabilities) 1,162,042 0.15
total net Assets 761,544,307 100.00
(1) All or part of this position is out on loan.(2) The country in brackets represents the country of incorporation of this security.(4) Managed by an affiliate of the Investment Adviser.
The accompanying notes are an integral part of these financial statements.
Global Infrastructure Fund (continued)
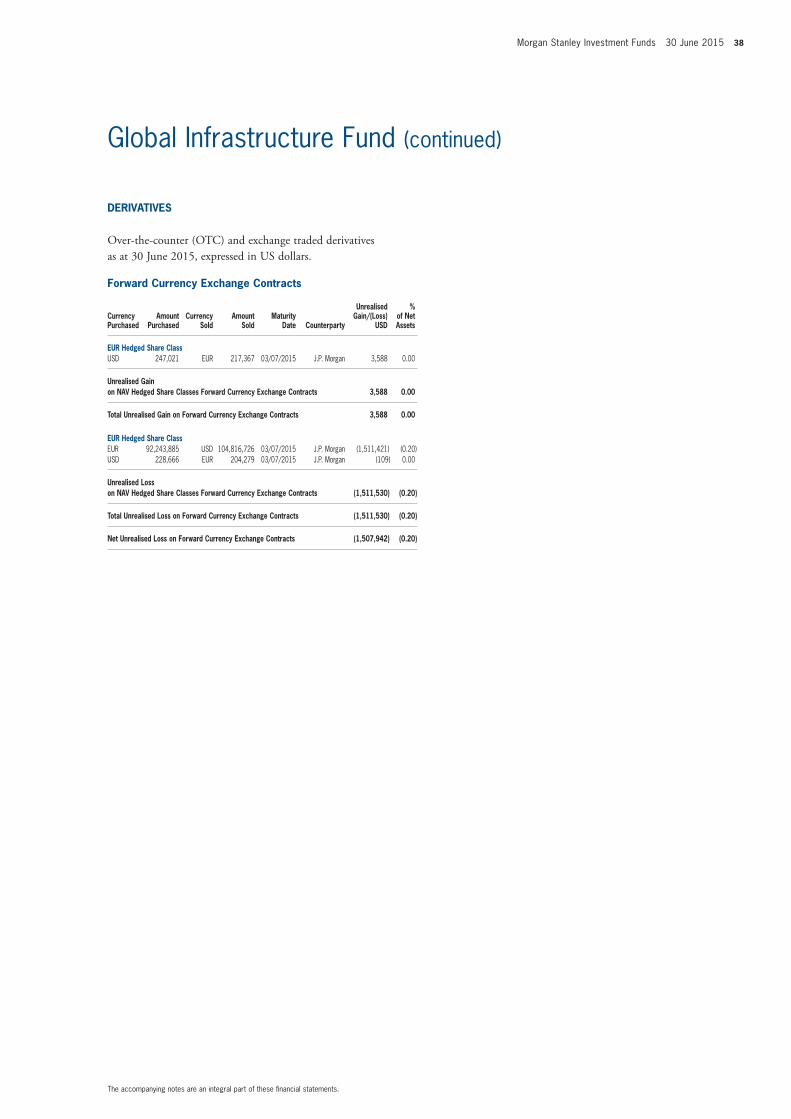
Morgan Stanley Investment Funds 30 June 2015 38
DERivAtivES
Over-the-counter (OtC) and exchange traded derivatives as at 30 June 2015, expressed in US dollars.
forward Currency Exchange Contracts
Currency Purchased
Amount Purchased
Currency Sold
Amount Sold
maturity Date Counterparty
Unrealised Gain/(Loss)
USD
% of net Assets
EUR Hedged Share ClassUSD 247,021 EUR 217,367 03/07/2015 J.P. Morgan 3,588 0.00
Unrealised Gain on nAv Hedged Share Classes forward Currency Exchange Contracts 3,588 0.00
total Unrealised Gain on forward Currency Exchange Contracts 3,588 0.00
EUR Hedged Share ClassEUR 92,243,885 USD 104,816,726 03/07/2015 J.P. Morgan (1,511,421) (0.20)USD 228,666 EUR 204,279 03/07/2015 J.P. Morgan (109) 0.00
Unrealised Loss on nAv Hedged Share Classes forward Currency Exchange Contracts (1,511,530) (0.20)
total Unrealised Loss on forward Currency Exchange Contracts (1,511,530) (0.20)
net Unrealised Loss on forward Currency Exchange Contracts (1,507,942) (0.20)
The accompanying notes are an integral part of these financial statements.
Global Infrastructure Fund (continued)
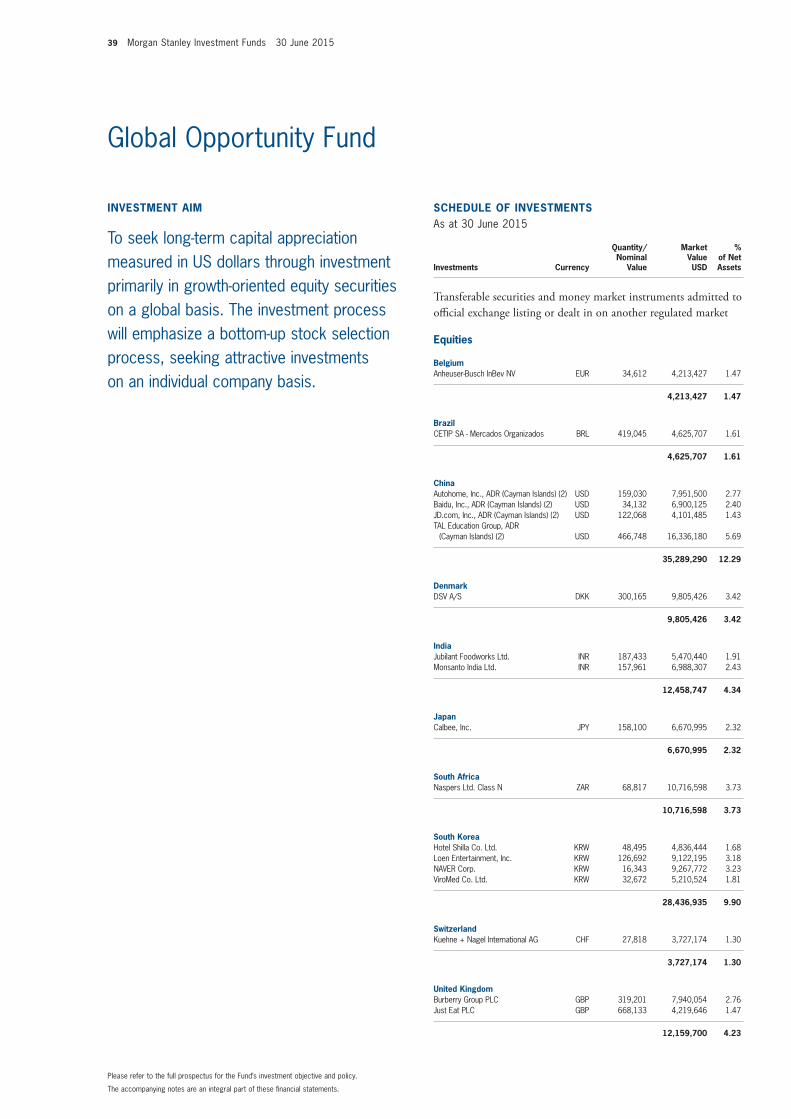
39 Morgan Stanley Investment Funds 30 June 2015
invEStmEnt Aim
To seek long-term capital appreciation measured in US dollars through investment primarily in growth-oriented equity securities on a global basis. The investment process will emphasize a bottom-up stock selection process, seeking attractive investments on an individual company basis.
SCHEDULE of invEStmEntSAs at 30 June 2015
Investments Currency
Quantity/Nominal
Value
Market Value USD
% of Net Assets
transferable securities and money market instruments admitted to official exchange listing or dealt in on another regulated market
Equities
BelgiumAnheuser-Busch InBev NV EUR 34,612 4,213,427 1.47
4,213,427 1.47
BrazilCETIP SA - Mercados Organizados BRL 419,045 4,625,707 1.61
4,625,707 1.61
ChinaAutohome, Inc., ADR (Cayman Islands) (2) USD 159,030 7,951,500 2.77Baidu, Inc., ADR (Cayman Islands) (2) USD 34,132 6,900,125 2.40JD.com, Inc., ADR (Cayman Islands) (2) USD 122,068 4,101,485 1.43TAL Education Group, ADR
(Cayman Islands) (2) USD 466,748 16,336,180 5.69
35,289,290 12.29
DenmarkDSV A/S DKK 300,165 9,805,426 3.42
9,805,426 3.42
indiaJubilant Foodworks Ltd. INR 187,433 5,470,440 1.91Monsanto India Ltd. INR 157,961 6,988,307 2.43
12,458,747 4.34
JapanCalbee, Inc. JPY 158,100 6,670,995 2.32
6,670,995 2.32
South AfricaNaspers Ltd. Class N ZAR 68,817 10,716,598 3.73
10,716,598 3.73
South KoreaHotel Shilla Co. Ltd. KRW 48,495 4,836,444 1.68Loen Entertainment, Inc. KRW 126,692 9,122,195 3.18NAVER Corp. KRW 16,343 9,267,772 3.23ViroMed Co. Ltd. KRW 32,672 5,210,524 1.81
28,436,935 9.90
SwitzerlandKuehne + Nagel International AG CHF 27,818 3,727,174 1.30
3,727,174 1.30
United KingdomBurberry Group PLC GBP 319,201 7,940,054 2.76Just Eat PLC GBP 668,133 4,219,646 1.47
12,159,700 4.23
The accompanying notes are an integral part of these financial statements.
Please refer to the full prospectus for the Fund’s investment objective and policy.
Global Opportunity Fund
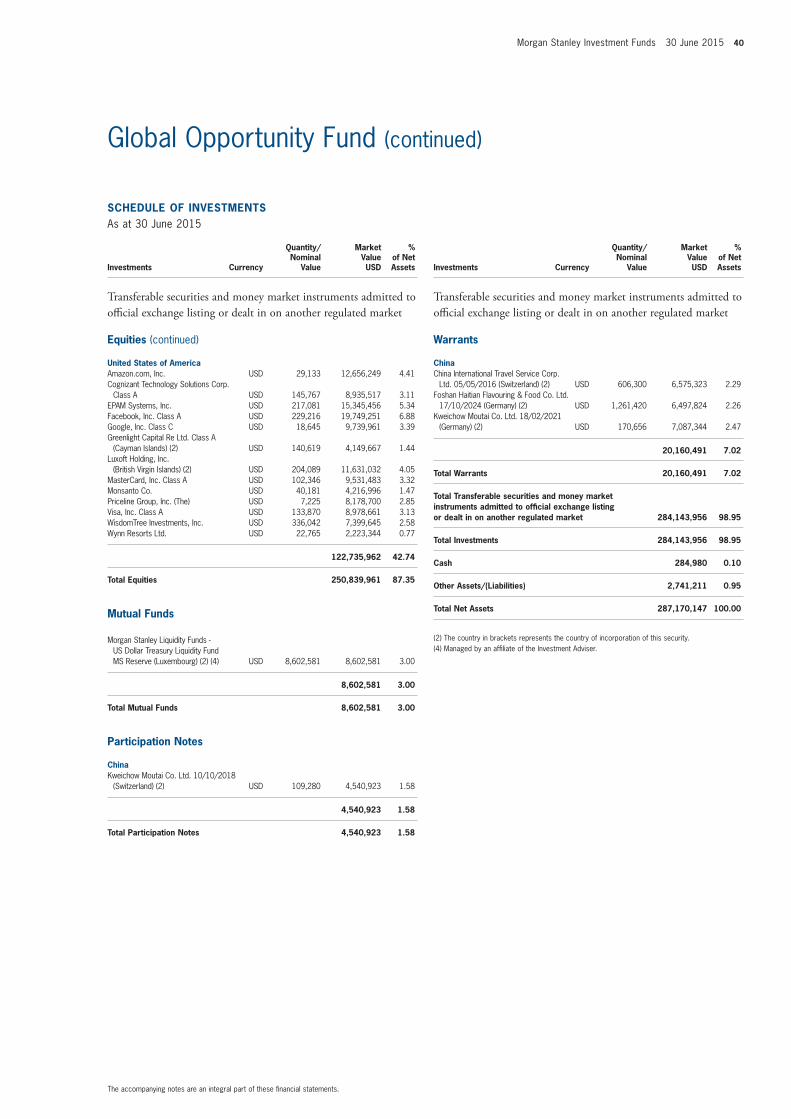
Morgan Stanley Investment Funds 30 June 2015 40
SCHEDULE of invEStmEntSAs at 30 June 2015
Investments Currency
Quantity/Nominal
Value
Market Value USD
% of Net Assets
transferable securities and money market instruments admitted to official exchange listing or dealt in on another regulated market
Equities (continued)
United States of AmericaAmazon.com, Inc. USD 29,133 12,656,249 4.41Cognizant Technology Solutions Corp.
Class A USD 145,767 8,935,517 3.11EPAM Systems, Inc. USD 217,081 15,345,456 5.34Facebook, Inc. Class A USD 229,216 19,749,251 6.88Google, Inc. Class C USD 18,645 9,739,961 3.39Greenlight Capital Re Ltd. Class A
(Cayman Islands) (2) USD 140,619 4,149,667 1.44Luxoft Holding, Inc.
(British Virgin Islands) (2) USD 204,089 11,631,032 4.05MasterCard, Inc. Class A USD 102,346 9,531,483 3.32Monsanto Co. USD 40,181 4,216,996 1.47Priceline Group, Inc. (The) USD 7,225 8,178,700 2.85Visa, Inc. Class A USD 133,870 8,978,661 3.13WisdomTree Investments, Inc. USD 336,042 7,399,645 2.58Wynn Resorts Ltd. USD 22,765 2,223,344 0.77
122,735,962 42.74
total Equities 250,839,961 87.35
mutual funds
Morgan Stanley Liquidity Funds - US Dollar Treasury Liquidity Fund MS Reserve (Luxembourg) (2) (4) USD 8,602,581 8,602,581 3.00
8,602,581 3.00
total mutual funds 8,602,581 3.00
Participation notes
ChinaKweichow Moutai Co. Ltd. 10/10/2018
(Switzerland) (2) USD 109,280 4,540,923 1.58
4,540,923 1.58
total Participation notes 4,540,923 1.58
SCHEDULE of invEStmEntSAs at 30 June 2015
Investments Currency
Quantity/Nominal
Value
Market Value USD
% of Net Assets
transferable securities and money market instruments admitted to official exchange listing or dealt in on another regulated market
Warrants
ChinaChina International Travel Service Corp.
Ltd. 05/05/2016 (Switzerland) (2) USD 606,300 6,575,323 2.29Foshan Haitian Flavouring & Food Co. Ltd.
17/10/2024 (Germany) (2) USD 1,261,420 6,497,824 2.26Kweichow Moutai Co. Ltd. 18/02/2021
(Germany) (2) USD 170,656 7,087,344 2.47
20,160,491 7.02
total Warrants 20,160,491 7.02
total transferable securities and money market instruments admitted to official exchange listing or dealt in on another regulated market 284,143,956 98.95
total investments 284,143,956 98.95
Cash 284,980 0.10
other Assets/(Liabilities) 2,741,211 0.95
total net Assets 287,170,147 100.00
(2) The country in brackets represents the country of incorporation of this security.(4) Managed by an affiliate of the Investment Adviser.
The accompanying notes are an integral part of these financial statements.
Global Opportunity Fund (continued)
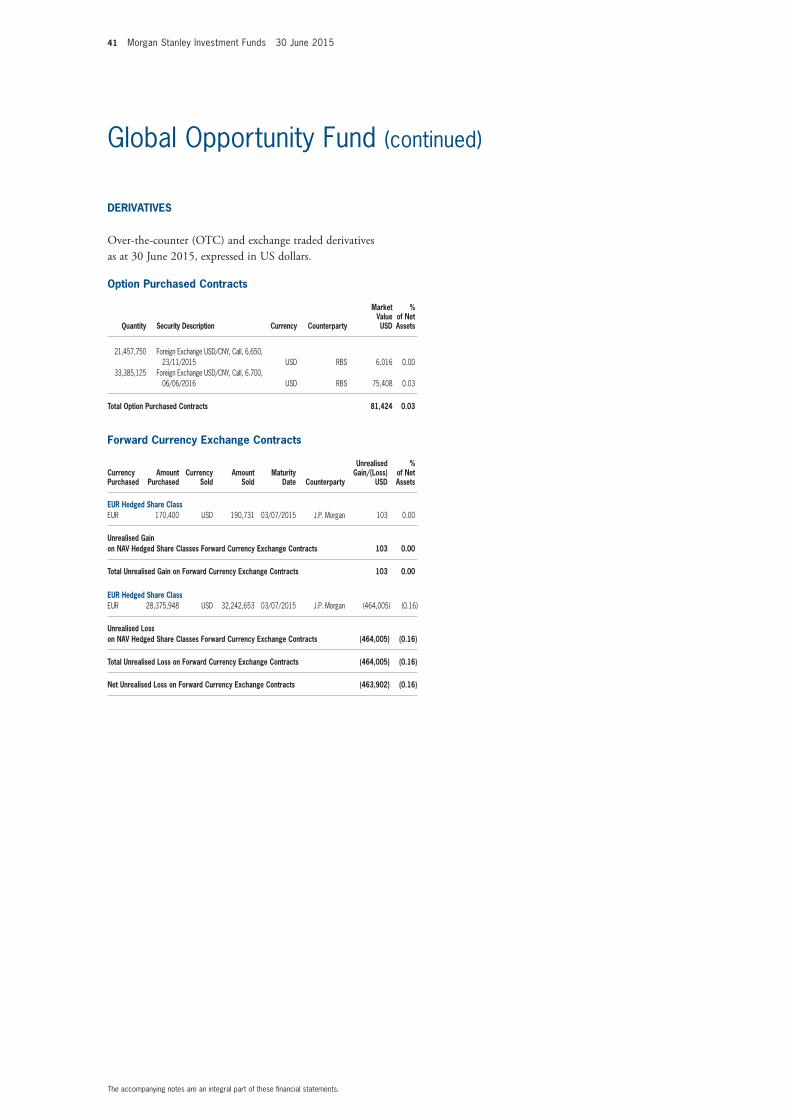
41 Morgan Stanley Investment Funds 30 June 2015
The accompanying notes are an integral part of these financial statements.
Global Opportunity Fund (continued)
option Purchased Contracts
Quantity Security Description Currency Counterparty
market value USD
% of net Assets
21,457,750 Foreign Exchange USD/CNY, Call, 6.650, 23/11/2015 USD RBS 6,016 0.00
33,385,125 Foreign Exchange USD/CNY, Call, 6.700, 06/06/2016 USD RBS 75,408 0.03
total option Purchased Contracts 81,424 0.03
forward Currency Exchange Contracts
Currency Purchased
Amount Purchased
Currency Sold
Amount Sold
maturity Date Counterparty
Unrealised Gain/(Loss)
USD
% of net Assets
EUR Hedged Share ClassEUR 170,400 USD 190,731 03/07/2015 J.P. Morgan 103 0.00
Unrealised Gain on nAv Hedged Share Classes forward Currency Exchange Contracts 103 0.00
total Unrealised Gain on forward Currency Exchange Contracts 103 0.00
EUR Hedged Share ClassEUR 28,375,948 USD 32,242,653 03/07/2015 J.P. Morgan (464,005) (0.16)
Unrealised Loss on nAv Hedged Share Classes forward Currency Exchange Contracts (464,005) (0.16)
total Unrealised Loss on forward Currency Exchange Contracts (464,005) (0.16)
net Unrealised Loss on forward Currency Exchange Contracts (463,902) (0.16)
DERivAtivES
Over-the-counter (OtC) and exchange traded derivatives as at 30 June 2015, expressed in US dollars.
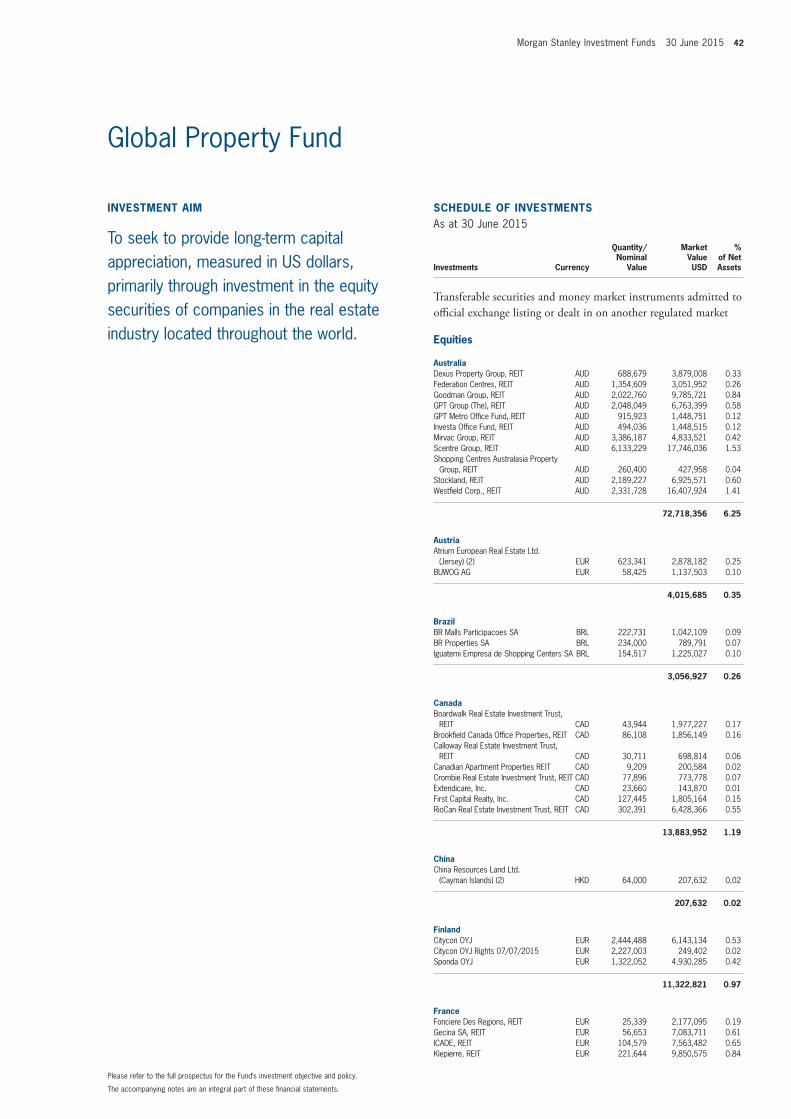
Morgan Stanley Investment Funds 30 June 2015 42
invEStmEnt Aim
To seek to provide long-term capital appreciation, measured in US dollars, primarily through investment in the equity securities of companies in the real estate industry located throughout the world.
SCHEDULE of invEStmEntSAs at 30 June 2015
Investments Currency
Quantity/Nominal
Value
Market Value USD
% of Net Assets
transferable securities and money market instruments admitted to official exchange listing or dealt in on another regulated market
Equities
AustraliaDexus Property Group, REIT AUD 688,679 3,879,008 0.33Federation Centres, REIT AUD 1,354,609 3,051,952 0.26Goodman Group, REIT AUD 2,022,760 9,785,721 0.84GPT Group (The), REIT AUD 2,048,049 6,763,399 0.58GPT Metro Office Fund, REIT AUD 915,923 1,448,751 0.12Investa Office Fund, REIT AUD 494,036 1,448,515 0.12Mirvac Group, REIT AUD 3,386,187 4,833,521 0.42Scentre Group, REIT AUD 6,133,229 17,746,036 1.53Shopping Centres Australasia Property
Group, REIT AUD 260,400 427,958 0.04Stockland, REIT AUD 2,189,227 6,925,571 0.60Westfield Corp., REIT AUD 2,331,728 16,407,924 1.41
72,718,356 6.25
AustriaAtrium European Real Estate Ltd.
(Jersey) (2) EUR 623,341 2,878,182 0.25BUWOG AG EUR 58,425 1,137,503 0.10
4,015,685 0.35
BrazilBR Malls Participacoes SA BRL 222,731 1,042,109 0.09BR Properties SA BRL 234,000 789,791 0.07Iguatemi Empresa de Shopping Centers SA BRL 154,517 1,225,027 0.10
3,056,927 0.26
CanadaBoardwalk Real Estate Investment Trust,
REIT CAD 43,944 1,977,227 0.17Brookfield Canada Office Properties, REIT CAD 86,108 1,856,149 0.16Calloway Real Estate Investment Trust,
REIT CAD 30,711 698,814 0.06Canadian Apartment Properties REIT CAD 9,209 200,584 0.02Crombie Real Estate Investment Trust, REIT CAD 77,896 773,778 0.07Extendicare, Inc. CAD 23,660 143,870 0.01First Capital Realty, Inc. CAD 127,445 1,805,164 0.15RioCan Real Estate Investment Trust, REIT CAD 302,391 6,428,366 0.55
13,883,952 1.19
ChinaChina Resources Land Ltd.
(Cayman Islands) (2) HKD 64,000 207,632 0.02
207,632 0.02
finlandCitycon OYJ EUR 2,444,488 6,143,134 0.53Citycon OYJ Rights 07/07/2015 EUR 2,227,003 249,402 0.02Sponda OYJ EUR 1,322,052 4,930,285 0.42
11,322,821 0.97
franceFonciere Des Regions, REIT EUR 25,339 2,177,095 0.19Gecina SA, REIT EUR 56,653 7,083,711 0.61ICADE, REIT EUR 104,579 7,563,482 0.65Klepierre, REIT EUR 221,644 9,850,575 0.84
The accompanying notes are an integral part of these financial statements.
Please refer to the full prospectus for the Fund’s investment objective and policy.
Global Property Fund
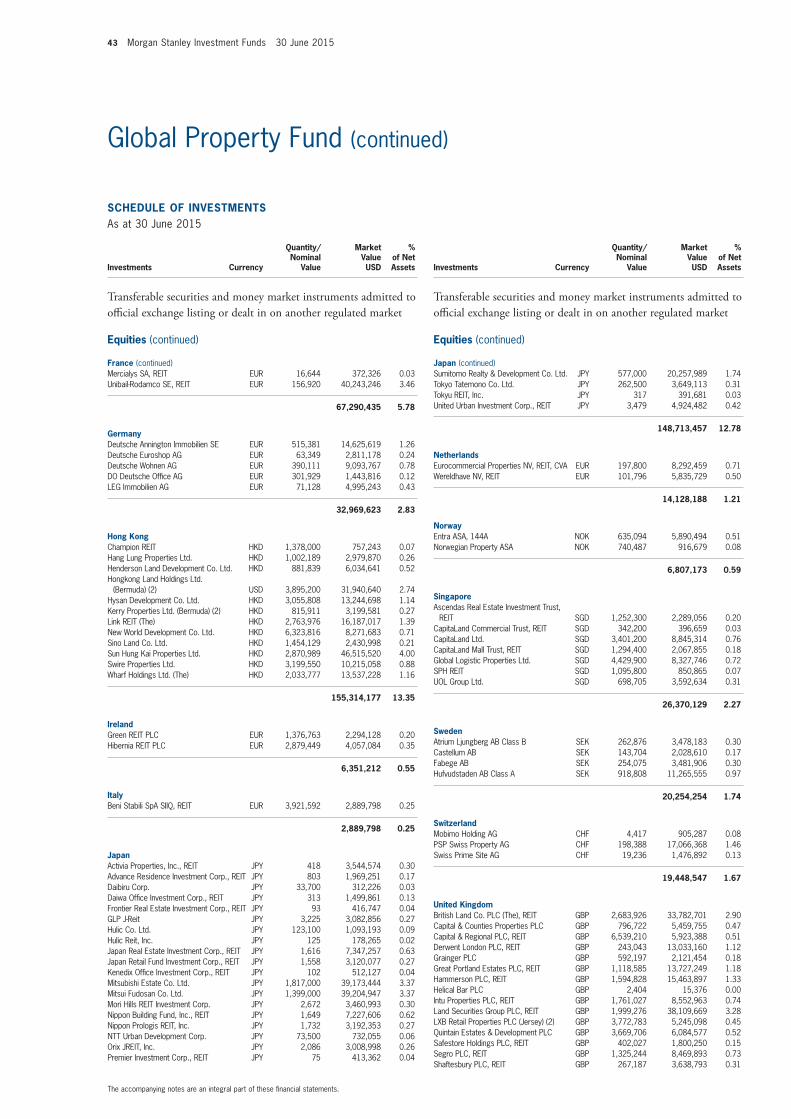
43 Morgan Stanley Investment Funds 30 June 2015
SCHEDULE of invEStmEntSAs at 30 June 2015
Investments Currency
Quantity/Nominal
Value
Market Value USD
% of Net Assets
transferable securities and money market instruments admitted to official exchange listing or dealt in on another regulated market
Equities (continued)
france (continued)Mercialys SA, REIT EUR 16,644 372,326 0.03Unibail-Rodamco SE, REIT EUR 156,920 40,243,246 3.46
67,290,435 5.78
GermanyDeutsche Annington Immobilien SE EUR 515,381 14,625,619 1.26Deutsche Euroshop AG EUR 63,349 2,811,178 0.24Deutsche Wohnen AG EUR 390,111 9,093,767 0.78DO Deutsche Office AG EUR 301,929 1,443,816 0.12LEG Immobilien AG EUR 71,128 4,995,243 0.43
32,969,623 2.83
Hong KongChampion REIT HKD 1,378,000 757,243 0.07Hang Lung Properties Ltd. HKD 1,002,189 2,979,870 0.26Henderson Land Development Co. Ltd. HKD 881,839 6,034,641 0.52Hongkong Land Holdings Ltd.
(Bermuda) (2) USD 3,895,200 31,940,640 2.74Hysan Development Co. Ltd. HKD 3,055,808 13,244,698 1.14Kerry Properties Ltd. (Bermuda) (2) HKD 815,911 3,199,581 0.27Link REIT (The) HKD 2,763,976 16,187,017 1.39New World Development Co. Ltd. HKD 6,323,816 8,271,683 0.71Sino Land Co. Ltd. HKD 1,454,129 2,430,998 0.21Sun Hung Kai Properties Ltd. HKD 2,870,989 46,515,520 4.00Swire Properties Ltd. HKD 3,199,550 10,215,058 0.88Wharf Holdings Ltd. (The) HKD 2,033,777 13,537,228 1.16
155,314,177 13.35
irelandGreen REIT PLC EUR 1,376,763 2,294,128 0.20Hibernia REIT PLC EUR 2,879,449 4,057,084 0.35
6,351,212 0.55
italyBeni Stabili SpA SIIQ, REIT EUR 3,921,592 2,889,798 0.25
2,889,798 0.25
JapanActivia Properties, Inc., REIT JPY 418 3,544,574 0.30Advance Residence Investment Corp., REIT JPY 803 1,969,251 0.17Daibiru Corp. JPY 33,700 312,226 0.03Daiwa Office Investment Corp., REIT JPY 313 1,499,861 0.13Frontier Real Estate Investment Corp., REIT JPY 93 416,747 0.04GLP J-Reit JPY 3,225 3,082,856 0.27Hulic Co. Ltd. JPY 123,100 1,093,193 0.09Hulic Reit, Inc. JPY 125 178,265 0.02Japan Real Estate Investment Corp., REIT JPY 1,616 7,347,257 0.63Japan Retail Fund Investment Corp., REIT JPY 1,558 3,120,077 0.27Kenedix Office Investment Corp., REIT JPY 102 512,127 0.04Mitsubishi Estate Co. Ltd. JPY 1,817,000 39,173,444 3.37Mitsui Fudosan Co. Ltd. JPY 1,399,000 39,204,947 3.37Mori Hills REIT Investment Corp. JPY 2,672 3,460,993 0.30Nippon Building Fund, Inc., REIT JPY 1,649 7,227,606 0.62Nippon Prologis REIT, Inc. JPY 1,732 3,192,353 0.27NTT Urban Development Corp. JPY 73,500 732,055 0.06Orix JREIT, Inc. JPY 2,086 3,008,998 0.26Premier Investment Corp., REIT JPY 75 413,362 0.04
SCHEDULE of invEStmEntSAs at 30 June 2015
Investments Currency
Quantity/Nominal
Value
Market Value USD
% of Net Assets
transferable securities and money market instruments admitted to official exchange listing or dealt in on another regulated market
Equities (continued)
Japan (continued)Sumitomo Realty & Development Co. Ltd. JPY 577,000 20,257,989 1.74Tokyo Tatemono Co. Ltd. JPY 262,500 3,649,113 0.31Tokyu REIT, Inc. JPY 317 391,681 0.03United Urban Investment Corp., REIT JPY 3,479 4,924,482 0.42
148,713,457 12.78
netherlandsEurocommercial Properties NV, REIT, CVA EUR 197,800 8,292,459 0.71Wereldhave NV, REIT EUR 101,796 5,835,729 0.50
14,128,188 1.21
norwayEntra ASA, 144A NOK 635,094 5,890,494 0.51Norwegian Property ASA NOK 740,487 916,679 0.08
6,807,173 0.59
SingaporeAscendas Real Estate Investment Trust,
REIT SGD 1,252,300 2,289,056 0.20CapitaLand Commercial Trust, REIT SGD 342,200 396,659 0.03CapitaLand Ltd. SGD 3,401,200 8,845,314 0.76CapitaLand Mall Trust, REIT SGD 1,294,400 2,067,855 0.18Global Logistic Properties Ltd. SGD 4,429,900 8,327,746 0.72SPH REIT SGD 1,095,800 850,865 0.07UOL Group Ltd. SGD 698,705 3,592,634 0.31
26,370,129 2.27
SwedenAtrium Ljungberg AB Class B SEK 262,876 3,478,183 0.30Castellum AB SEK 143,704 2,028,610 0.17Fabege AB SEK 254,075 3,481,906 0.30Hufvudstaden AB Class A SEK 918,808 11,265,555 0.97
20,254,254 1.74
SwitzerlandMobimo Holding AG CHF 4,417 905,287 0.08PSP Swiss Property AG CHF 198,388 17,066,368 1.46Swiss Prime Site AG CHF 19,236 1,476,892 0.13
19,448,547 1.67
United KingdomBritish Land Co. PLC (The), REIT GBP 2,683,926 33,782,701 2.90Capital & Counties Properties PLC GBP 796,722 5,459,755 0.47Capital & Regional PLC, REIT GBP 6,539,210 5,923,388 0.51Derwent London PLC, REIT GBP 243,043 13,033,160 1.12Grainger PLC GBP 592,197 2,121,454 0.18Great Portland Estates PLC, REIT GBP 1,118,585 13,727,249 1.18Hammerson PLC, REIT GBP 1,594,828 15,463,897 1.33Helical Bar PLC GBP 2,404 15,376 0.00Intu Properties PLC, REIT GBP 1,761,027 8,552,963 0.74Land Securities Group PLC, REIT GBP 1,999,276 38,109,669 3.28LXB Retail Properties PLC (Jersey) (2) GBP 3,772,783 5,245,098 0.45Quintain Estates & Development PLC GBP 3,669,706 6,084,577 0.52Safestore Holdings PLC, REIT GBP 402,027 1,800,250 0.15Segro PLC, REIT GBP 1,325,244 8,469,893 0.73Shaftesbury PLC, REIT GBP 267,187 3,638,793 0.31
The accompanying notes are an integral part of these financial statements.
Global Property Fund (continued)
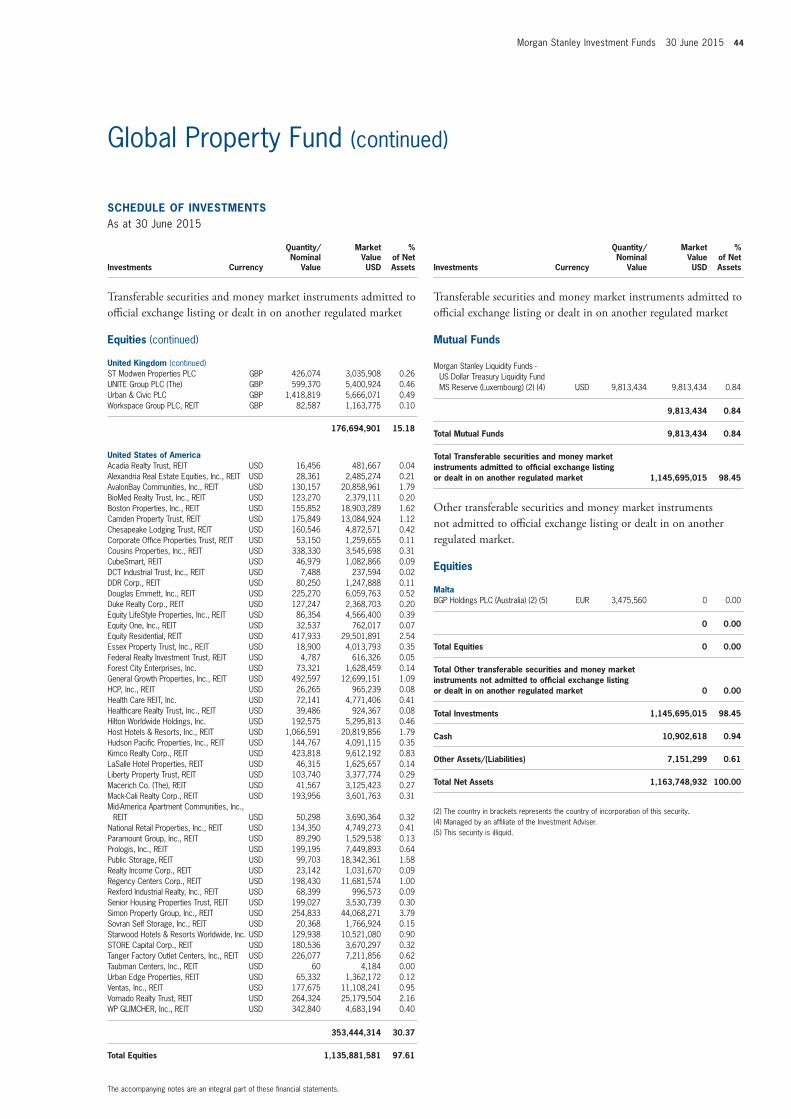
Morgan Stanley Investment Funds 30 June 2015 44
SCHEDULE of invEStmEntSAs at 30 June 2015
Investments Currency
Quantity/Nominal
Value
Market Value USD
% of Net Assets
transferable securities and money market instruments admitted to official exchange listing or dealt in on another regulated market
Equities (continued)
United Kingdom (continued)ST Modwen Properties PLC GBP 426,074 3,035,908 0.26UNITE Group PLC (The) GBP 599,370 5,400,924 0.46Urban & Civic PLC GBP 1,418,819 5,666,071 0.49Workspace Group PLC, REIT GBP 82,587 1,163,775 0.10
176,694,901 15.18
United States of AmericaAcadia Realty Trust, REIT USD 16,456 481,667 0.04Alexandria Real Estate Equities, Inc., REIT USD 28,361 2,485,274 0.21AvalonBay Communities, Inc., REIT USD 130,157 20,858,961 1.79BioMed Realty Trust, Inc., REIT USD 123,270 2,379,111 0.20Boston Properties, Inc., REIT USD 155,852 18,903,289 1.62Camden Property Trust, REIT USD 175,849 13,084,924 1.12Chesapeake Lodging Trust, REIT USD 160,546 4,872,571 0.42Corporate Office Properties Trust, REIT USD 53,150 1,259,655 0.11Cousins Properties, Inc., REIT USD 338,330 3,545,698 0.31CubeSmart, REIT USD 46,979 1,082,866 0.09DCT Industrial Trust, Inc., REIT USD 7,488 237,594 0.02DDR Corp., REIT USD 80,250 1,247,888 0.11Douglas Emmett, Inc., REIT USD 225,270 6,059,763 0.52Duke Realty Corp., REIT USD 127,247 2,368,703 0.20Equity LifeStyle Properties, Inc., REIT USD 86,354 4,566,400 0.39Equity One, Inc., REIT USD 32,537 762,017 0.07Equity Residential, REIT USD 417,933 29,501,891 2.54Essex Property Trust, Inc., REIT USD 18,900 4,013,793 0.35Federal Realty Investment Trust, REIT USD 4,787 616,326 0.05Forest City Enterprises, Inc. USD 73,321 1,628,459 0.14General Growth Properties, Inc., REIT USD 492,597 12,699,151 1.09HCP, Inc., REIT USD 26,265 965,239 0.08Health Care REIT, Inc. USD 72,141 4,771,406 0.41Healthcare Realty Trust, Inc., REIT USD 39,486 924,367 0.08Hilton Worldwide Holdings, Inc. USD 192,575 5,295,813 0.46Host Hotels & Resorts, Inc., REIT USD 1,066,591 20,819,856 1.79Hudson Pacific Properties, Inc., REIT USD 144,767 4,091,115 0.35Kimco Realty Corp., REIT USD 423,818 9,612,192 0.83LaSalle Hotel Properties, REIT USD 46,315 1,625,657 0.14Liberty Property Trust, REIT USD 103,740 3,377,774 0.29Macerich Co. (The), REIT USD 41,567 3,125,423 0.27Mack-Cali Realty Corp., REIT USD 193,956 3,601,763 0.31Mid-America Apartment Communities, Inc.,
REIT USD 50,298 3,690,364 0.32National Retail Properties, Inc., REIT USD 134,350 4,749,273 0.41Paramount Group, Inc., REIT USD 89,290 1,529,538 0.13Prologis, Inc., REIT USD 199,195 7,449,893 0.64Public Storage, REIT USD 99,703 18,342,361 1.58Realty Income Corp., REIT USD 23,142 1,031,670 0.09Regency Centers Corp., REIT USD 198,430 11,681,574 1.00Rexford Industrial Realty, Inc., REIT USD 68,399 996,573 0.09Senior Housing Properties Trust, REIT USD 199,027 3,530,739 0.30Simon Property Group, Inc., REIT USD 254,833 44,068,271 3.79Sovran Self Storage, Inc., REIT USD 20,368 1,766,924 0.15Starwood Hotels & Resorts Worldwide, Inc. USD 129,938 10,521,080 0.90STORE Capital Corp., REIT USD 180,536 3,670,297 0.32Tanger Factory Outlet Centers, Inc., REIT USD 226,077 7,211,856 0.62Taubman Centers, Inc., REIT USD 60 4,184 0.00Urban Edge Properties, REIT USD 65,332 1,362,172 0.12Ventas, Inc., REIT USD 177,675 11,108,241 0.95Vornado Realty Trust, REIT USD 264,324 25,179,504 2.16WP GLIMCHER, Inc., REIT USD 342,840 4,683,194 0.40
353,444,314 30.37
total Equities 1,135,881,581 97.61
SCHEDULE of invEStmEntSAs at 30 June 2015
Investments Currency
Quantity/Nominal
Value
Market Value USD
% of Net Assets
transferable securities and money market instruments admitted to official exchange listing or dealt in on another regulated market
mutual funds
Morgan Stanley Liquidity Funds - US Dollar Treasury Liquidity Fund MS Reserve (Luxembourg) (2) (4) USD 9,813,434 9,813,434 0.84
9,813,434 0.84
total mutual funds 9,813,434 0.84
total transferable securities and money market instruments admitted to official exchange listing or dealt in on another regulated market 1,145,695,015 98.45
Other transferable securities and money market instruments not admitted to official exchange listing or dealt in on another regulated market.
Equities
maltaBGP Holdings PLC (Australia) (2) (5) EUR 3,475,560 0 0.00
0 0.00
total Equities 0 0.00
total other transferable securities and money market instruments not admitted to official exchange listing or dealt in on another regulated market 0 0.00
total investments 1,145,695,015 98.45
Cash 10,902,618 0.94
other Assets/(Liabilities) 7,151,299 0.61
total net Assets 1,163,748,932 100.00
(2) The country in brackets represents the country of incorporation of this security.(4) Managed by an affiliate of the Investment Adviser.(5) This security is illiquid.
The accompanying notes are an integral part of these financial statements.
Global Property Fund (continued)
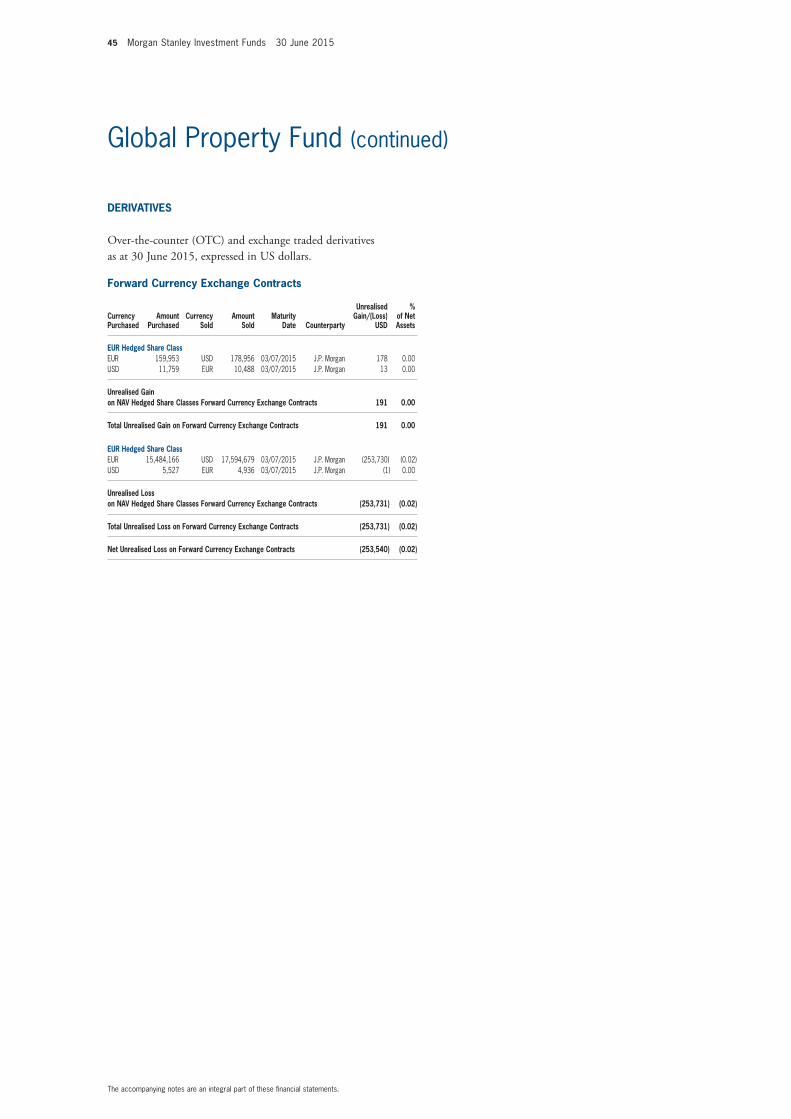
45 Morgan Stanley Investment Funds 30 June 2015
The accompanying notes are an integral part of these financial statements.
Global Property Fund (continued)
forward Currency Exchange Contracts
Currency Purchased
Amount Purchased
Currency Sold
Amount Sold
maturity Date Counterparty
Unrealised Gain/(Loss)
USD
% of net Assets
EUR Hedged Share ClassEUR 159,953 USD 178,956 03/07/2015 J.P. Morgan 178 0.00USD 11,759 EUR 10,488 03/07/2015 J.P. Morgan 13 0.00
Unrealised Gain on nAv Hedged Share Classes forward Currency Exchange Contracts 191 0.00
total Unrealised Gain on forward Currency Exchange Contracts 191 0.00
EUR Hedged Share ClassEUR 15,484,166 USD 17,594,679 03/07/2015 J.P. Morgan (253,730) (0.02)USD 5,527 EUR 4,936 03/07/2015 J.P. Morgan (1) 0.00
Unrealised Loss on nAv Hedged Share Classes forward Currency Exchange Contracts (253,731) (0.02)
total Unrealised Loss on forward Currency Exchange Contracts (253,731) (0.02)
net Unrealised Loss on forward Currency Exchange Contracts (253,540) (0.02)
DERivAtivES
Over-the-counter (OtC) and exchange traded derivatives as at 30 June 2015, expressed in US dollars.
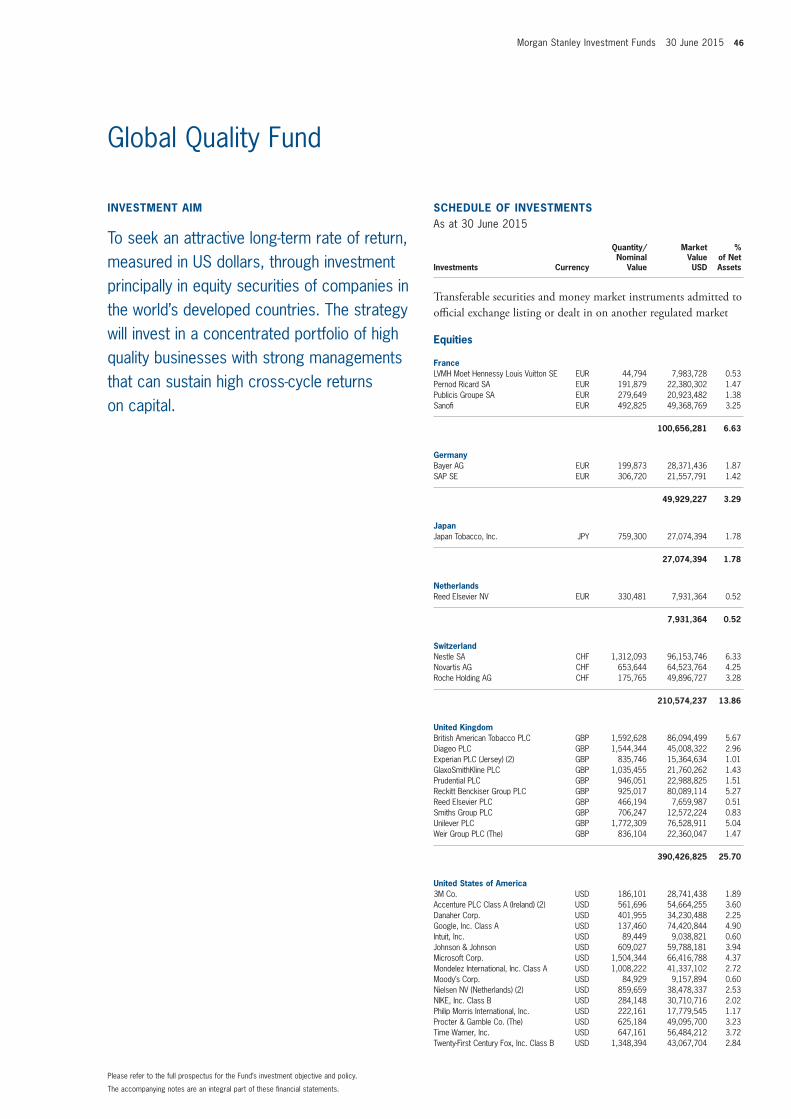
Morgan Stanley Investment Funds 30 June 2015 46
invEStmEnt Aim
To seek an attractive long-term rate of return, measured in US dollars, through investment principally in equity securities of companies in the world’s developed countries. The strategy will invest in a concentrated portfolio of high quality businesses with strong managements that can sustain high cross-cycle returns on capital.
SCHEDULE of invEStmEntSAs at 30 June 2015
Investments Currency
Quantity/Nominal
Value
Market Value USD
% of Net Assets
transferable securities and money market instruments admitted to official exchange listing or dealt in on another regulated market
Equities
franceLVMH Moet Hennessy Louis Vuitton SE EUR 44,794 7,983,728 0.53Pernod Ricard SA EUR 191,879 22,380,302 1.47Publicis Groupe SA EUR 279,649 20,923,482 1.38Sanofi EUR 492,825 49,368,769 3.25
100,656,281 6.63
GermanyBayer AG EUR 199,873 28,371,436 1.87SAP SE EUR 306,720 21,557,791 1.42
49,929,227 3.29
JapanJapan Tobacco, Inc. JPY 759,300 27,074,394 1.78
27,074,394 1.78
netherlandsReed Elsevier NV EUR 330,481 7,931,364 0.52
7,931,364 0.52
SwitzerlandNestle SA CHF 1,312,093 96,153,746 6.33Novartis AG CHF 653,644 64,523,764 4.25Roche Holding AG CHF 175,765 49,896,727 3.28
210,574,237 13.86
United KingdomBritish American Tobacco PLC GBP 1,592,628 86,094,499 5.67Diageo PLC GBP 1,544,344 45,008,322 2.96Experian PLC (Jersey) (2) GBP 835,746 15,364,634 1.01GlaxoSmithKline PLC GBP 1,035,455 21,760,262 1.43Prudential PLC GBP 946,051 22,988,825 1.51Reckitt Benckiser Group PLC GBP 925,017 80,089,114 5.27Reed Elsevier PLC GBP 466,194 7,659,987 0.51Smiths Group PLC GBP 706,247 12,572,224 0.83Unilever PLC GBP 1,772,309 76,528,911 5.04Weir Group PLC (The) GBP 836,104 22,360,047 1.47
390,426,825 25.70
United States of America3M Co. USD 186,101 28,741,438 1.89Accenture PLC Class A (Ireland) (2) USD 561,696 54,664,255 3.60Danaher Corp. USD 401,955 34,230,488 2.25Google, Inc. Class A USD 137,460 74,420,844 4.90Intuit, Inc. USD 89,449 9,038,821 0.60Johnson & Johnson USD 609,027 59,788,181 3.94Microsoft Corp. USD 1,504,344 66,416,788 4.37Mondelez International, Inc. Class A USD 1,008,222 41,337,102 2.72Moody’s Corp. USD 84,929 9,157,894 0.60Nielsen NV (Netherlands) (2) USD 859,659 38,478,337 2.53NIKE, Inc. Class B USD 284,148 30,710,716 2.02Philip Morris International, Inc. USD 222,161 17,779,545 1.17Procter & Gamble Co. (The) USD 625,184 49,095,700 3.23Time Warner, Inc. USD 647,161 56,484,212 3.72Twenty-First Century Fox, Inc. Class B USD 1,348,394 43,067,704 2.84
The accompanying notes are an integral part of these financial statements.
Please refer to the full prospectus for the Fund’s investment objective and policy.
Global Quality Fund
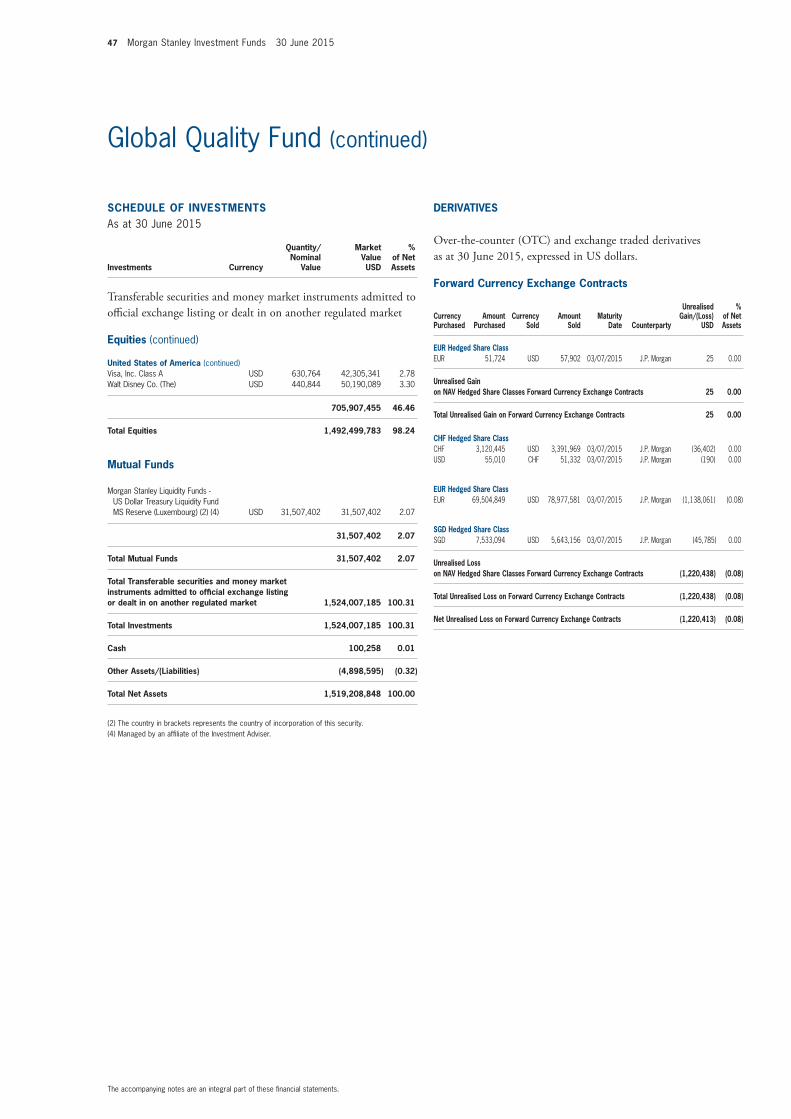
47 Morgan Stanley Investment Funds 30 June 2015
SCHEDULE of invEStmEntSAs at 30 June 2015
Investments Currency
Quantity/Nominal
Value
Market Value USD
% of Net Assets
transferable securities and money market instruments admitted to official exchange listing or dealt in on another regulated market
Equities (continued)
United States of America (continued)Visa, Inc. Class A USD 630,764 42,305,341 2.78Walt Disney Co. (The) USD 440,844 50,190,089 3.30
705,907,455 46.46
total Equities 1,492,499,783 98.24
mutual funds
Morgan Stanley Liquidity Funds - US Dollar Treasury Liquidity Fund MS Reserve (Luxembourg) (2) (4) USD 31,507,402 31,507,402 2.07
31,507,402 2.07
total mutual funds 31,507,402 2.07
total transferable securities and money market instruments admitted to official exchange listing or dealt in on another regulated market 1,524,007,185 100.31
total investments 1,524,007,185 100.31
Cash 100,258 0.01
other Assets/(Liabilities) (4,898,595) (0.32)
total net Assets 1,519,208,848 100.00
(2) The country in brackets represents the country of incorporation of this security.(4) Managed by an affiliate of the Investment Adviser.
The accompanying notes are an integral part of these financial statements.
Global Quality Fund (continued)
DERivAtivES
Over-the-counter (OtC) and exchange traded derivatives as at 30 June 2015, expressed in US dollars.
forward Currency Exchange Contracts
Currency Purchased
Amount Purchased
Currency Sold
Amount Sold
maturity Date Counterparty
Unrealised Gain/(Loss)
USD
% of net Assets
EUR Hedged Share ClassEUR 51,724 USD 57,902 03/07/2015 J.P. Morgan 25 0.00
Unrealised Gain on nAv Hedged Share Classes forward Currency Exchange Contracts 25 0.00
total Unrealised Gain on forward Currency Exchange Contracts 25 0.00
CHf Hedged Share ClassCHF 3,120,445 USD 3,391,969 03/07/2015 J.P. Morgan (36,402) 0.00USD 55,010 CHF 51,332 03/07/2015 J.P. Morgan (190) 0.00
EUR Hedged Share ClassEUR 69,504,849 USD 78,977,581 03/07/2015 J.P. Morgan (1,138,061) (0.08)
SGD Hedged Share ClassSGD 7,533,094 USD 5,643,156 03/07/2015 J.P. Morgan (45,785) 0.00
Unrealised Loss on nAv Hedged Share Classes forward Currency Exchange Contracts (1,220,438) (0.08)
total Unrealised Loss on forward Currency Exchange Contracts (1,220,438) (0.08)
net Unrealised Loss on forward Currency Exchange Contracts (1,220,413) (0.08)
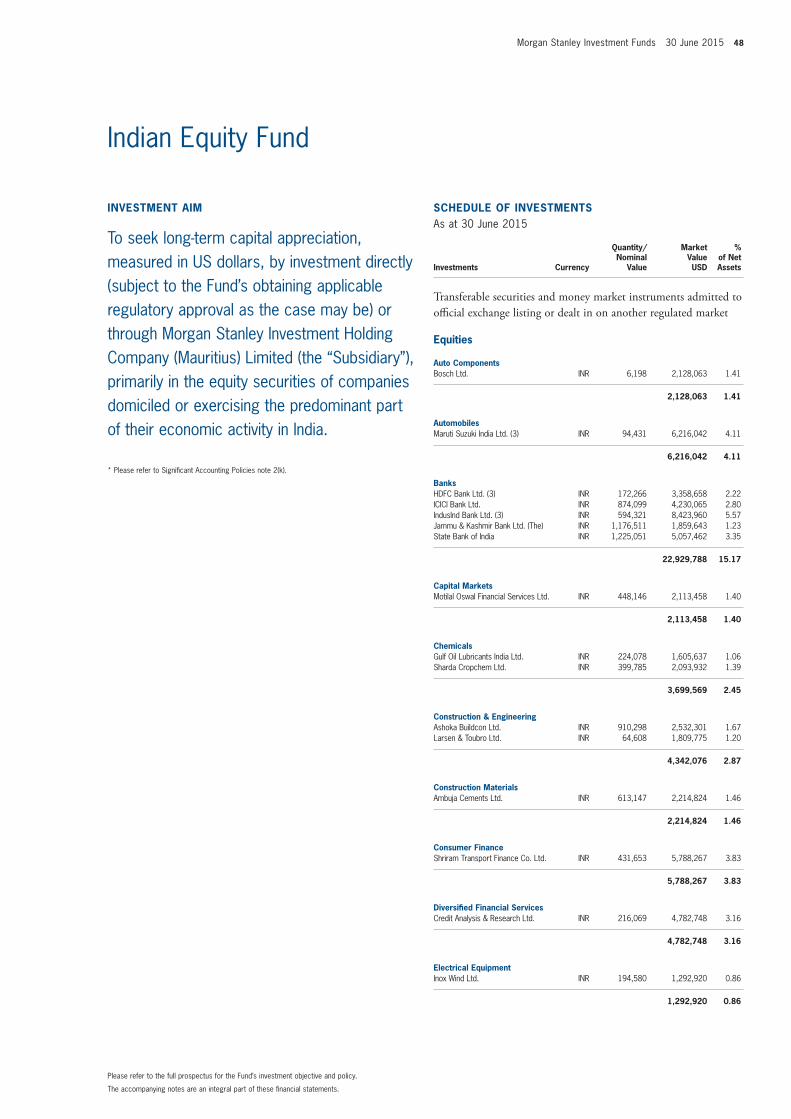
Morgan Stanley Investment Funds 30 June 2015 48
invEStmEnt Aim
To seek long-term capital appreciation, measured in US dollars, by investment directly (subject to the Fund’s obtaining applicable regulatory approval as the case may be) or through Morgan Stanley Investment Holding Company (Mauritius) Limited (the “Subsidiary”), primarily in the equity securities of companies domiciled or exercising the predominant part of their economic activity in India.
* Please refer to Significant Accounting Policies note 2(k).
SCHEDULE of invEStmEntSAs at 30 June 2015
Investments Currency
Quantity/Nominal
Value
Market Value USD
% of Net Assets
transferable securities and money market instruments admitted to official exchange listing or dealt in on another regulated market
Equities
Auto ComponentsBosch Ltd. INR 6,198 2,128,063 1.41
2,128,063 1.41
AutomobilesMaruti Suzuki India Ltd. (3) INR 94,431 6,216,042 4.11
6,216,042 4.11
BanksHDFC Bank Ltd. (3) INR 172,266 3,358,658 2.22ICICI Bank Ltd. INR 874,099 4,230,065 2.80IndusInd Bank Ltd. (3) INR 594,321 8,423,960 5.57Jammu & Kashmir Bank Ltd. (The) INR 1,176,511 1,859,643 1.23State Bank of India INR 1,225,051 5,057,462 3.35
22,929,788 15.17
Capital marketsMotilal Oswal Financial Services Ltd. INR 448,146 2,113,458 1.40
2,113,458 1.40
ChemicalsGulf Oil Lubricants India Ltd. INR 224,078 1,605,637 1.06Sharda Cropchem Ltd. INR 399,785 2,093,932 1.39
3,699,569 2.45
Construction & EngineeringAshoka Buildcon Ltd. INR 910,298 2,532,301 1.67Larsen & Toubro Ltd. INR 64,608 1,809,775 1.20
4,342,076 2.87
Construction materialsAmbuja Cements Ltd. INR 613,147 2,214,824 1.46
2,214,824 1.46
Consumer financeShriram Transport Finance Co. Ltd. INR 431,653 5,788,267 3.83
5,788,267 3.83
Diversified financial ServicesCredit Analysis & Research Ltd. INR 216,069 4,782,748 3.16
4,782,748 3.16
Electrical EquipmentInox Wind Ltd. INR 194,580 1,292,920 0.86
1,292,920 0.86
The accompanying notes are an integral part of these financial statements.
Please refer to the full prospectus for the Fund’s investment objective and policy.
Indian Equity Fund
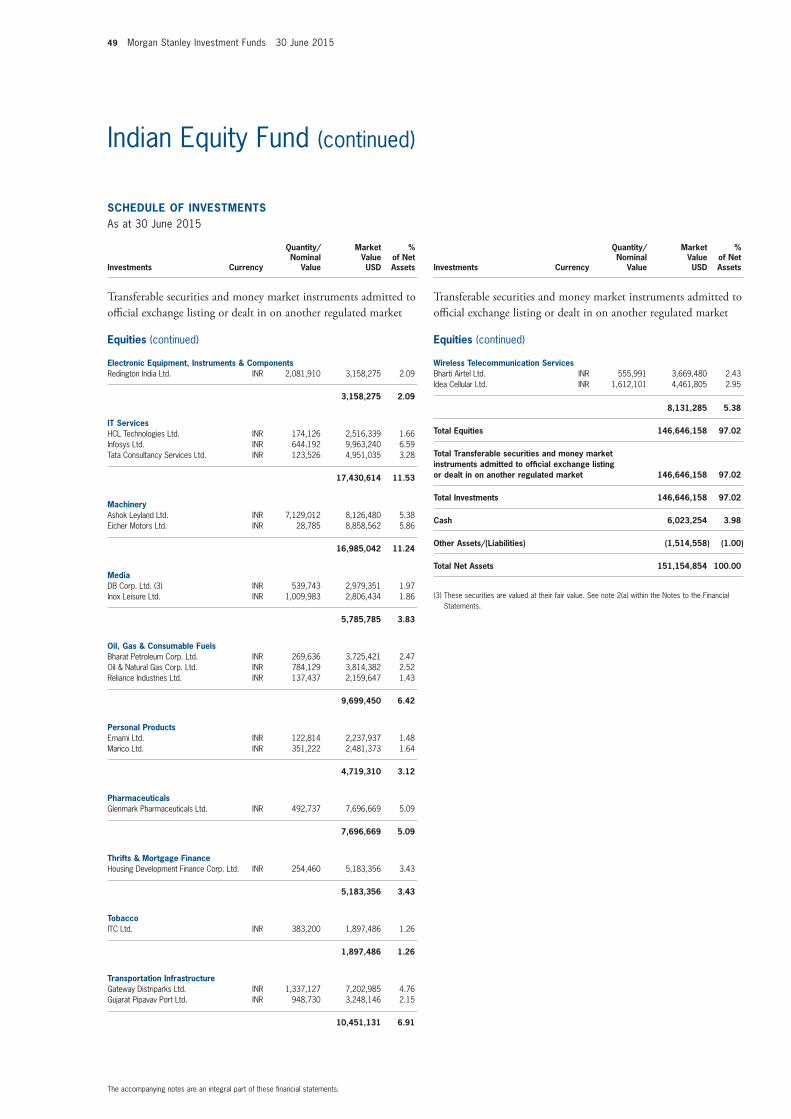
49 Morgan Stanley Investment Funds 30 June 2015
SCHEDULE of invEStmEntSAs at 30 June 2015
Investments Currency
Quantity/Nominal
Value
Market Value USD
% of Net Assets
transferable securities and money market instruments admitted to official exchange listing or dealt in on another regulated market
Equities (continued)
Electronic Equipment, instruments & ComponentsRedington India Ltd. INR 2,081,910 3,158,275 2.09
3,158,275 2.09
it ServicesHCL Technologies Ltd. INR 174,126 2,516,339 1.66Infosys Ltd. INR 644,192 9,963,240 6.59Tata Consultancy Services Ltd. INR 123,526 4,951,035 3.28
17,430,614 11.53
machineryAshok Leyland Ltd. INR 7,129,012 8,126,480 5.38Eicher Motors Ltd. INR 28,785 8,858,562 5.86
16,985,042 11.24
mediaDB Corp. Ltd. (3) INR 539,743 2,979,351 1.97Inox Leisure Ltd. INR 1,009,983 2,806,434 1.86
5,785,785 3.83
oil, Gas & Consumable fuelsBharat Petroleum Corp. Ltd. INR 269,636 3,725,421 2.47Oil & Natural Gas Corp. Ltd. INR 784,129 3,814,382 2.52Reliance Industries Ltd. INR 137,437 2,159,647 1.43
9,699,450 6.42
Personal ProductsEmami Ltd. INR 122,814 2,237,937 1.48Marico Ltd. INR 351,222 2,481,373 1.64
4,719,310 3.12
PharmaceuticalsGlenmark Pharmaceuticals Ltd. INR 492,737 7,696,669 5.09
7,696,669 5.09
thrifts & mortgage financeHousing Development Finance Corp. Ltd. INR 254,460 5,183,356 3.43
5,183,356 3.43
tobaccoITC Ltd. INR 383,200 1,897,486 1.26
1,897,486 1.26
transportation infrastructureGateway Distriparks Ltd. INR 1,337,127 7,202,985 4.76Gujarat Pipavav Port Ltd. INR 948,730 3,248,146 2.15
10,451,131 6.91
SCHEDULE of invEStmEntSAs at 30 June 2015
Investments Currency
Quantity/Nominal
Value
Market Value USD
% of Net Assets
transferable securities and money market instruments admitted to official exchange listing or dealt in on another regulated market
Equities (continued)
Wireless telecommunication ServicesBharti Airtel Ltd. INR 555,991 3,669,480 2.43Idea Cellular Ltd. INR 1,612,101 4,461,805 2.95
8,131,285 5.38
total Equities 146,646,158 97.02
total transferable securities and money market instruments admitted to official exchange listing or dealt in on another regulated market 146,646,158 97.02
total investments 146,646,158 97.02
Cash 6,023,254 3.98
other Assets/(Liabilities) (1,514,558) (1.00)
total net Assets 151,154,854 100.00
(3) These securities are valued at their fair value. See note 2(a) within the Notes to the Financial Statements.
The accompanying notes are an integral part of these financial statements.
Indian Equity Fund (continued)
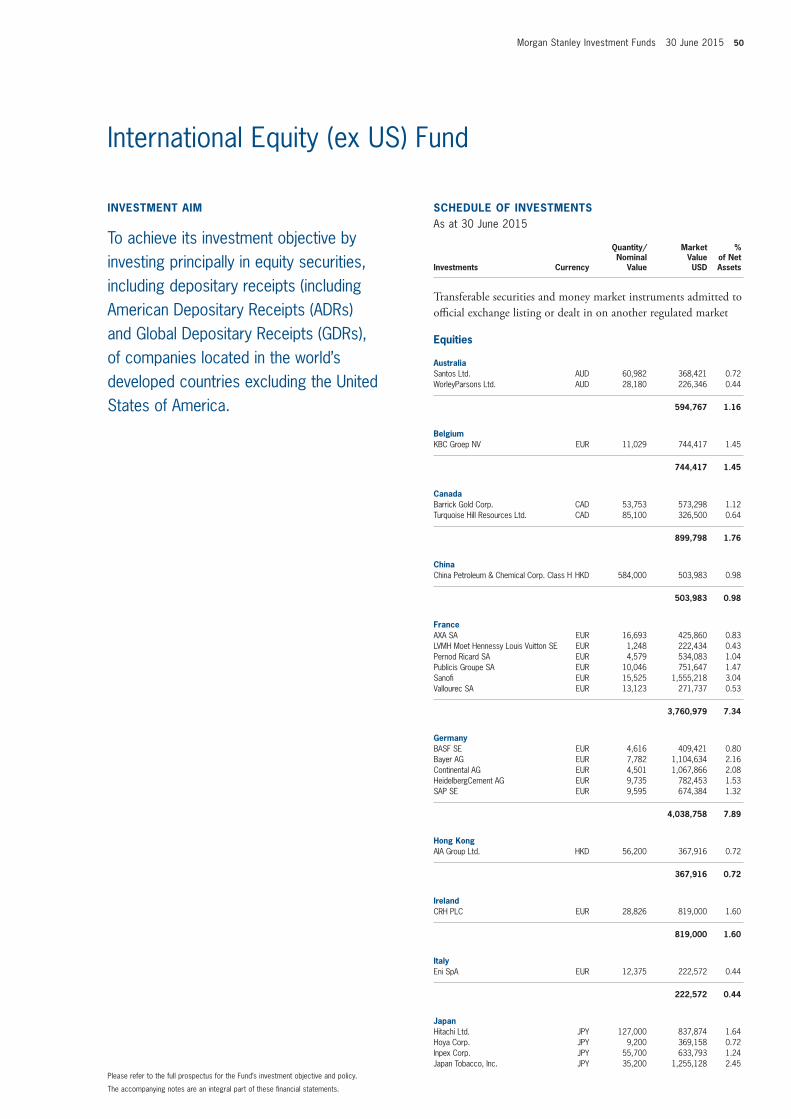
Morgan Stanley Investment Funds 30 June 2015 50
invEStmEnt Aim
To achieve its investment objective by investing principally in equity securities, including depositary receipts (including American Depositary Receipts (ADRs) and Global Depositary Receipts (GDRs), of companies located in the world’s developed countries excluding the United States of America.
SCHEDULE of invEStmEntSAs at 30 June 2015
Investments Currency
Quantity/Nominal
Value
Market Value USD
% of Net Assets
transferable securities and money market instruments admitted to official exchange listing or dealt in on another regulated market
Equities
AustraliaSantos Ltd. AUD 60,982 368,421 0.72WorleyParsons Ltd. AUD 28,180 226,346 0.44
594,767 1.16
BelgiumKBC Groep NV EUR 11,029 744,417 1.45
744,417 1.45
CanadaBarrick Gold Corp. CAD 53,753 573,298 1.12Turquoise Hill Resources Ltd. CAD 85,100 326,500 0.64
899,798 1.76
ChinaChina Petroleum & Chemical Corp. Class H HKD 584,000 503,983 0.98
503,983 0.98
franceAXA SA EUR 16,693 425,860 0.83LVMH Moet Hennessy Louis Vuitton SE EUR 1,248 222,434 0.43Pernod Ricard SA EUR 4,579 534,083 1.04Publicis Groupe SA EUR 10,046 751,647 1.47Sanofi EUR 15,525 1,555,218 3.04Vallourec SA EUR 13,123 271,737 0.53
3,760,979 7.34
GermanyBASF SE EUR 4,616 409,421 0.80Bayer AG EUR 7,782 1,104,634 2.16Continental AG EUR 4,501 1,067,866 2.08HeidelbergCement AG EUR 9,735 782,453 1.53SAP SE EUR 9,595 674,384 1.32
4,038,758 7.89
Hong KongAIA Group Ltd. HKD 56,200 367,916 0.72
367,916 0.72
irelandCRH PLC EUR 28,826 819,000 1.60
819,000 1.60
italyEni SpA EUR 12,375 222,572 0.44
222,572 0.44
JapanHitachi Ltd. JPY 127,000 837,874 1.64Hoya Corp. JPY 9,200 369,158 0.72Inpex Corp. JPY 55,700 633,793 1.24Japan Tobacco, Inc. JPY 35,200 1,255,128 2.45
The accompanying notes are an integral part of these financial statements.
Please refer to the full prospectus for the Fund’s investment objective and policy.
International Equity (ex US) Fund
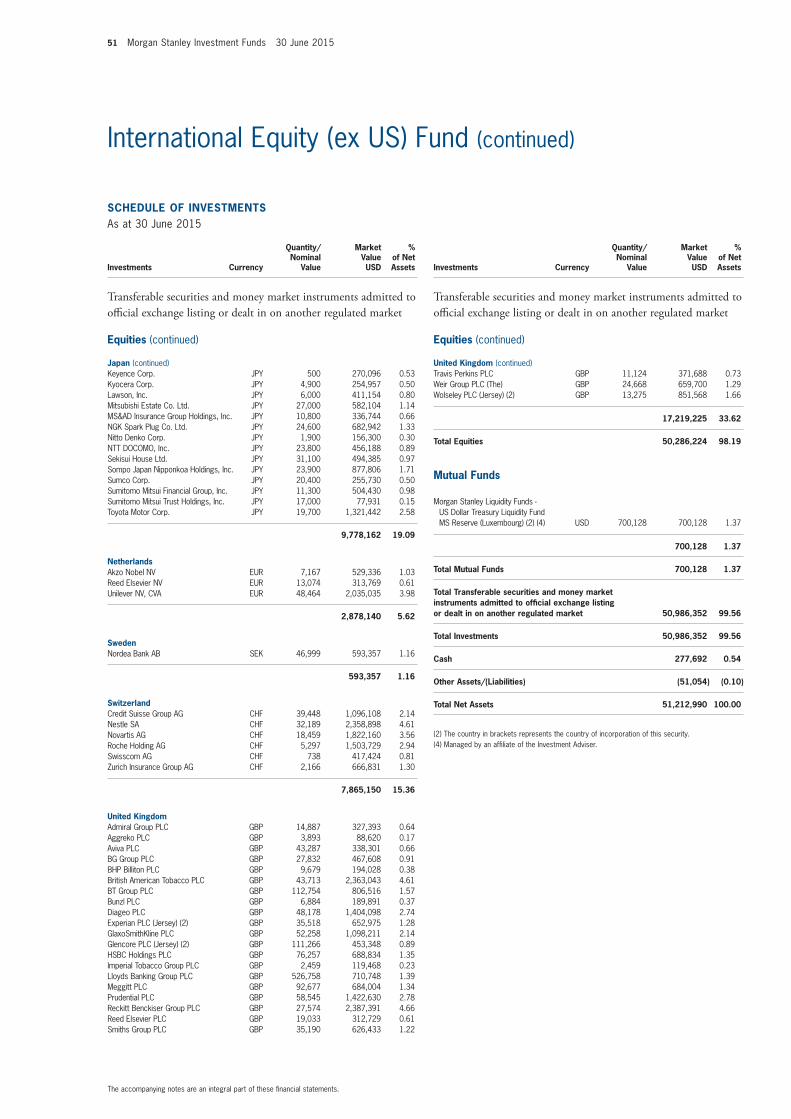
51 Morgan Stanley Investment Funds 30 June 2015
SCHEDULE of invEStmEntSAs at 30 June 2015
Investments Currency
Quantity/Nominal
Value
Market Value USD
% of Net Assets
transferable securities and money market instruments admitted to official exchange listing or dealt in on another regulated market
Equities (continued)
Japan (continued)Keyence Corp. JPY 500 270,096 0.53Kyocera Corp. JPY 4,900 254,957 0.50Lawson, Inc. JPY 6,000 411,154 0.80Mitsubishi Estate Co. Ltd. JPY 27,000 582,104 1.14MS&AD Insurance Group Holdings, Inc. JPY 10,800 336,744 0.66NGK Spark Plug Co. Ltd. JPY 24,600 682,942 1.33Nitto Denko Corp. JPY 1,900 156,300 0.30NTT DOCOMO, Inc. JPY 23,800 456,188 0.89Sekisui House Ltd. JPY 31,100 494,385 0.97Sompo Japan Nipponkoa Holdings, Inc. JPY 23,900 877,806 1.71Sumco Corp. JPY 20,400 255,730 0.50Sumitomo Mitsui Financial Group, Inc. JPY 11,300 504,430 0.98Sumitomo Mitsui Trust Holdings, Inc. JPY 17,000 77,931 0.15Toyota Motor Corp. JPY 19,700 1,321,442 2.58
9,778,162 19.09
netherlandsAkzo Nobel NV EUR 7,167 529,336 1.03Reed Elsevier NV EUR 13,074 313,769 0.61Unilever NV, CVA EUR 48,464 2,035,035 3.98
2,878,140 5.62
SwedenNordea Bank AB SEK 46,999 593,357 1.16
593,357 1.16
SwitzerlandCredit Suisse Group AG CHF 39,448 1,096,108 2.14Nestle SA CHF 32,189 2,358,898 4.61Novartis AG CHF 18,459 1,822,160 3.56Roche Holding AG CHF 5,297 1,503,729 2.94Swisscom AG CHF 738 417,424 0.81Zurich Insurance Group AG CHF 2,166 666,831 1.30
7,865,150 15.36
United KingdomAdmiral Group PLC GBP 14,887 327,393 0.64Aggreko PLC GBP 3,893 88,620 0.17Aviva PLC GBP 43,287 338,301 0.66BG Group PLC GBP 27,832 467,608 0.91BHP Billiton PLC GBP 9,679 194,028 0.38British American Tobacco PLC GBP 43,713 2,363,043 4.61BT Group PLC GBP 112,754 806,516 1.57Bunzl PLC GBP 6,884 189,891 0.37Diageo PLC GBP 48,178 1,404,098 2.74Experian PLC (Jersey) (2) GBP 35,518 652,975 1.28GlaxoSmithKline PLC GBP 52,258 1,098,211 2.14Glencore PLC (Jersey) (2) GBP 111,266 453,348 0.89HSBC Holdings PLC GBP 76,257 688,834 1.35Imperial Tobacco Group PLC GBP 2,459 119,468 0.23Lloyds Banking Group PLC GBP 526,758 710,748 1.39Meggitt PLC GBP 92,677 684,004 1.34Prudential PLC GBP 58,545 1,422,630 2.78Reckitt Benckiser Group PLC GBP 27,574 2,387,391 4.66Reed Elsevier PLC GBP 19,033 312,729 0.61Smiths Group PLC GBP 35,190 626,433 1.22
SCHEDULE of invEStmEntSAs at 30 June 2015
Investments Currency
Quantity/Nominal
Value
Market Value USD
% of Net Assets
transferable securities and money market instruments admitted to official exchange listing or dealt in on another regulated market
Equities (continued)
United Kingdom (continued)Travis Perkins PLC GBP 11,124 371,688 0.73Weir Group PLC (The) GBP 24,668 659,700 1.29Wolseley PLC (Jersey) (2) GBP 13,275 851,568 1.66
17,219,225 33.62
total Equities 50,286,224 98.19
mutual funds
Morgan Stanley Liquidity Funds - US Dollar Treasury Liquidity Fund MS Reserve (Luxembourg) (2) (4) USD 700,128 700,128 1.37
700,128 1.37
total mutual funds 700,128 1.37
total transferable securities and money market instruments admitted to official exchange listing or dealt in on another regulated market 50,986,352 99.56
total investments 50,986,352 99.56
Cash 277,692 0.54
other Assets/(Liabilities) (51,054) (0.10)
total net Assets 51,212,990 100.00
(2) The country in brackets represents the country of incorporation of this security.(4) Managed by an affiliate of the Investment Adviser.
The accompanying notes are an integral part of these financial statements.
International Equity (ex US) Fund (continued)
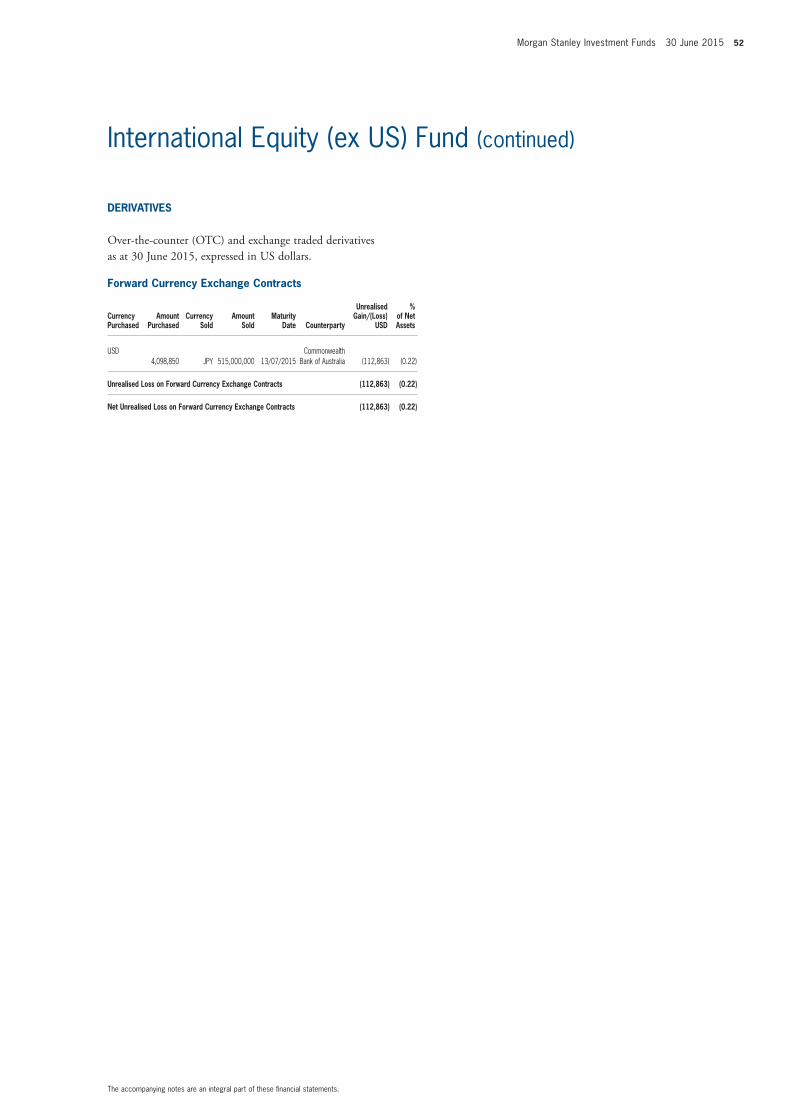
Morgan Stanley Investment Funds 30 June 2015 52
The accompanying notes are an integral part of these financial statements.
International Equity (ex US) Fund (continued)
DERivAtivES
Over-the-counter (OtC) and exchange traded derivatives as at 30 June 2015, expressed in US dollars.
forward Currency Exchange Contracts
Currency Purchased
Amount Purchased
Currency Sold
Amount Sold
maturity Date Counterparty
Unrealised Gain/(Loss)
USD
% of net Assets
USD4,098,850 JPY 515,000,000 13/07/2015
Commonwealth Bank of Australia (112,863) (0.22)
Unrealised Loss on forward Currency Exchange Contracts (112,863) (0.22)
net Unrealised Loss on forward Currency Exchange Contracts (112,863) (0.22)
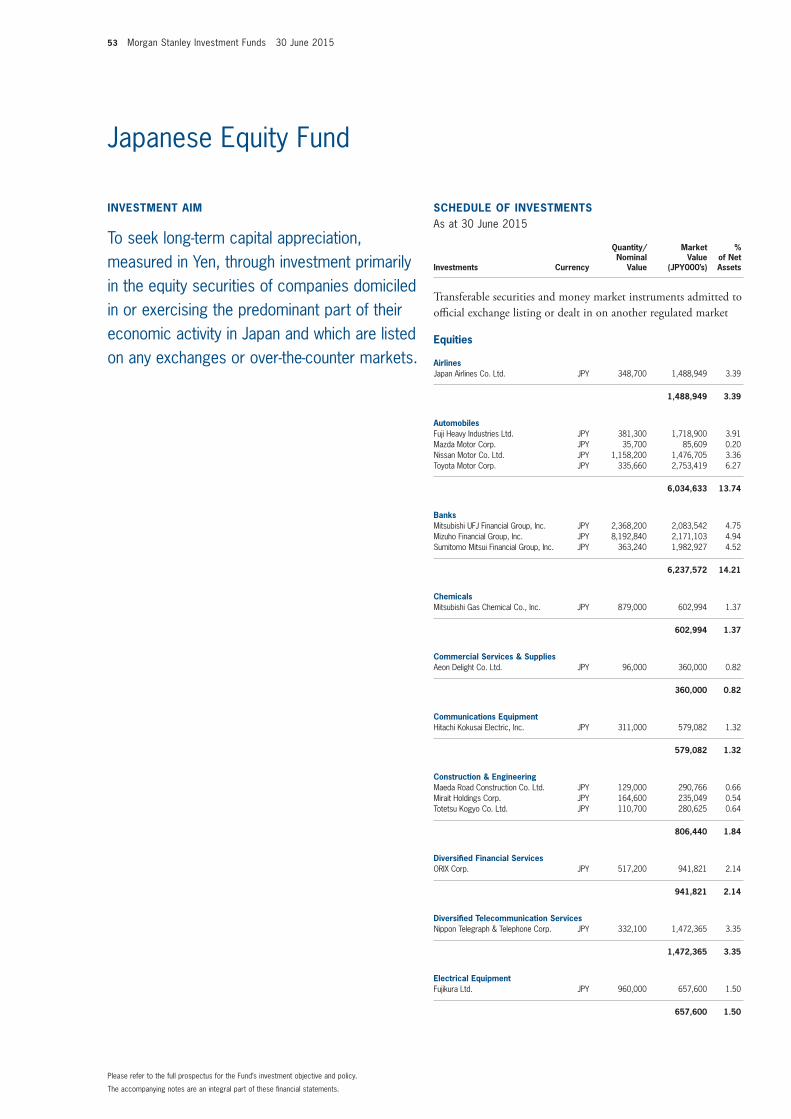
53 Morgan Stanley Investment Funds 30 June 2015
invEStmEnt Aim
To seek long-term capital appreciation, measured in Yen, through investment primarily in the equity securities of companies domiciled in or exercising the predominant part of their economic activity in Japan and which are listed on any exchanges or over-the-counter markets.
SCHEDULE of invEStmEntSAs at 30 June 2015
Investments Currency
Quantity/Nominal
Value
Market Value
(JPY000’s)
% of Net Assets
transferable securities and money market instruments admitted to official exchange listing or dealt in on another regulated market
Equities
AirlinesJapan Airlines Co. Ltd. JPY 348,700 1,488,949 3.39
1,488,949 3.39
AutomobilesFuji Heavy Industries Ltd. JPY 381,300 1,718,900 3.91Mazda Motor Corp. JPY 35,700 85,609 0.20Nissan Motor Co. Ltd. JPY 1,158,200 1,476,705 3.36Toyota Motor Corp. JPY 335,660 2,753,419 6.27
6,034,633 13.74
BanksMitsubishi UFJ Financial Group, Inc. JPY 2,368,200 2,083,542 4.75Mizuho Financial Group, Inc. JPY 8,192,840 2,171,103 4.94Sumitomo Mitsui Financial Group, Inc. JPY 363,240 1,982,927 4.52
6,237,572 14.21
ChemicalsMitsubishi Gas Chemical Co., Inc. JPY 879,000 602,994 1.37
602,994 1.37
Commercial Services & SuppliesAeon Delight Co. Ltd. JPY 96,000 360,000 0.82
360,000 0.82
Communications EquipmentHitachi Kokusai Electric, Inc. JPY 311,000 579,082 1.32
579,082 1.32
Construction & EngineeringMaeda Road Construction Co. Ltd. JPY 129,000 290,766 0.66Mirait Holdings Corp. JPY 164,600 235,049 0.54Totetsu Kogyo Co. Ltd. JPY 110,700 280,625 0.64
806,440 1.84
Diversified financial ServicesORIX Corp. JPY 517,200 941,821 2.14
941,821 2.14
Diversified telecommunication ServicesNippon Telegraph & Telephone Corp. JPY 332,100 1,472,365 3.35
1,472,365 3.35
Electrical EquipmentFujikura Ltd. JPY 960,000 657,600 1.50
657,600 1.50
The accompanying notes are an integral part of these financial statements.
Please refer to the full prospectus for the Fund’s investment objective and policy.
Japanese Equity Fund
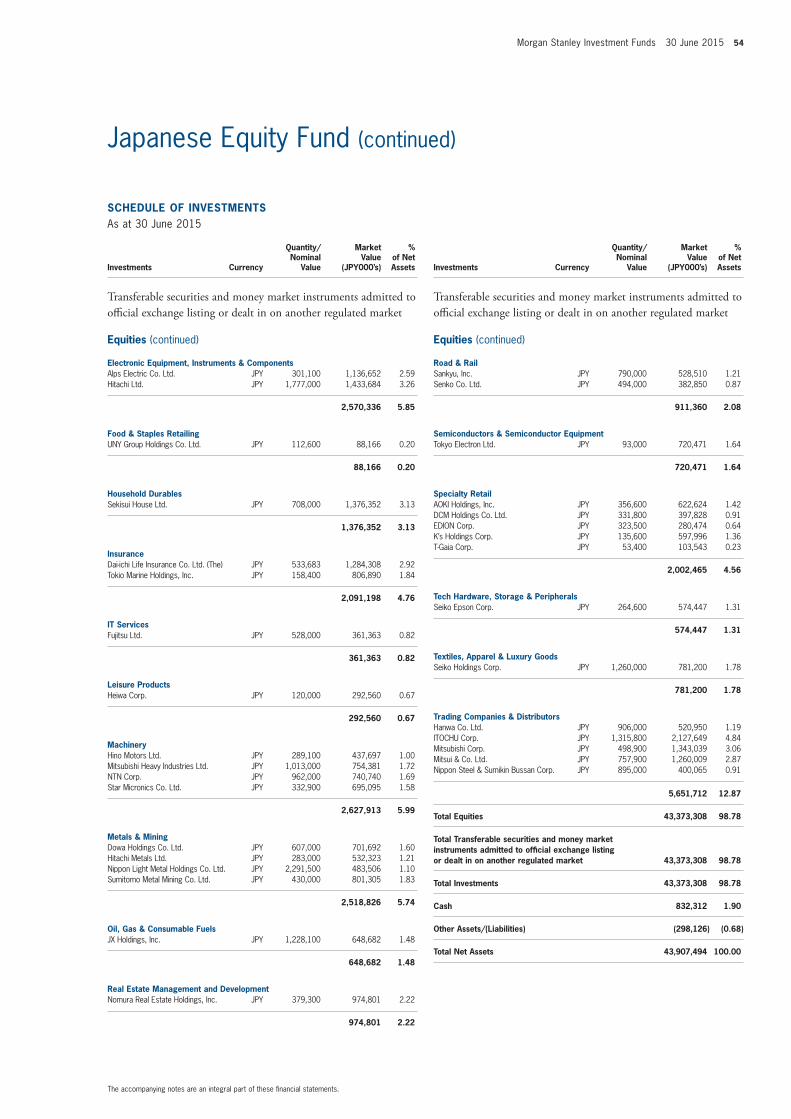
Morgan Stanley Investment Funds 30 June 2015 54
SCHEDULE of invEStmEntSAs at 30 June 2015
Investments Currency
Quantity/Nominal
Value
Market Value
(JPY000’s)
% of Net Assets
transferable securities and money market instruments admitted to official exchange listing or dealt in on another regulated market
Equities (continued)
Electronic Equipment, instruments & ComponentsAlps Electric Co. Ltd. JPY 301,100 1,136,652 2.59Hitachi Ltd. JPY 1,777,000 1,433,684 3.26
2,570,336 5.85
food & Staples RetailingUNY Group Holdings Co. Ltd. JPY 112,600 88,166 0.20
88,166 0.20
Household DurablesSekisui House Ltd. JPY 708,000 1,376,352 3.13
1,376,352 3.13
insuranceDai-ichi Life Insurance Co. Ltd. (The) JPY 533,683 1,284,308 2.92Tokio Marine Holdings, Inc. JPY 158,400 806,890 1.84
2,091,198 4.76
it ServicesFujitsu Ltd. JPY 528,000 361,363 0.82
361,363 0.82
Leisure ProductsHeiwa Corp. JPY 120,000 292,560 0.67
292,560 0.67
machineryHino Motors Ltd. JPY 289,100 437,697 1.00Mitsubishi Heavy Industries Ltd. JPY 1,013,000 754,381 1.72NTN Corp. JPY 962,000 740,740 1.69Star Micronics Co. Ltd. JPY 332,900 695,095 1.58
2,627,913 5.99
metals & miningDowa Holdings Co. Ltd. JPY 607,000 701,692 1.60Hitachi Metals Ltd. JPY 283,000 532,323 1.21Nippon Light Metal Holdings Co. Ltd. JPY 2,291,500 483,506 1.10Sumitomo Metal Mining Co. Ltd. JPY 430,000 801,305 1.83
2,518,826 5.74
oil, Gas & Consumable fuelsJX Holdings, Inc. JPY 1,228,100 648,682 1.48
648,682 1.48
Real Estate management and DevelopmentNomura Real Estate Holdings, Inc. JPY 379,300 974,801 2.22
974,801 2.22
SCHEDULE of invEStmEntSAs at 30 June 2015
Investments Currency
Quantity/Nominal
Value
Market Value
(JPY000’s)
% of Net Assets
transferable securities and money market instruments admitted to official exchange listing or dealt in on another regulated market
Equities (continued)
Road & RailSankyu, Inc. JPY 790,000 528,510 1.21Senko Co. Ltd. JPY 494,000 382,850 0.87
911,360 2.08
Semiconductors & Semiconductor EquipmentTokyo Electron Ltd. JPY 93,000 720,471 1.64
720,471 1.64
Specialty RetailAOKI Holdings, Inc. JPY 356,600 622,624 1.42DCM Holdings Co. Ltd. JPY 331,800 397,828 0.91EDION Corp. JPY 323,500 280,474 0.64K’s Holdings Corp. JPY 135,600 597,996 1.36T-Gaia Corp. JPY 53,400 103,543 0.23
2,002,465 4.56
tech Hardware, Storage & PeripheralsSeiko Epson Corp. JPY 264,600 574,447 1.31
574,447 1.31
textiles, Apparel & Luxury GoodsSeiko Holdings Corp. JPY 1,260,000 781,200 1.78
781,200 1.78
trading Companies & DistributorsHanwa Co. Ltd. JPY 906,000 520,950 1.19ITOCHU Corp. JPY 1,315,800 2,127,649 4.84Mitsubishi Corp. JPY 498,900 1,343,039 3.06Mitsui & Co. Ltd. JPY 757,900 1,260,009 2.87Nippon Steel & Sumikin Bussan Corp. JPY 895,000 400,065 0.91
5,651,712 12.87
total Equities 43,373,308 98.78
total transferable securities and money market instruments admitted to official exchange listing or dealt in on another regulated market 43,373,308 98.78
total investments 43,373,308 98.78
Cash 832,312 1.90
other Assets/(Liabilities) (298,126) (0.68)
total net Assets 43,907,494 100.00
The accompanying notes are an integral part of these financial statements.
Japanese Equity Fund (continued)
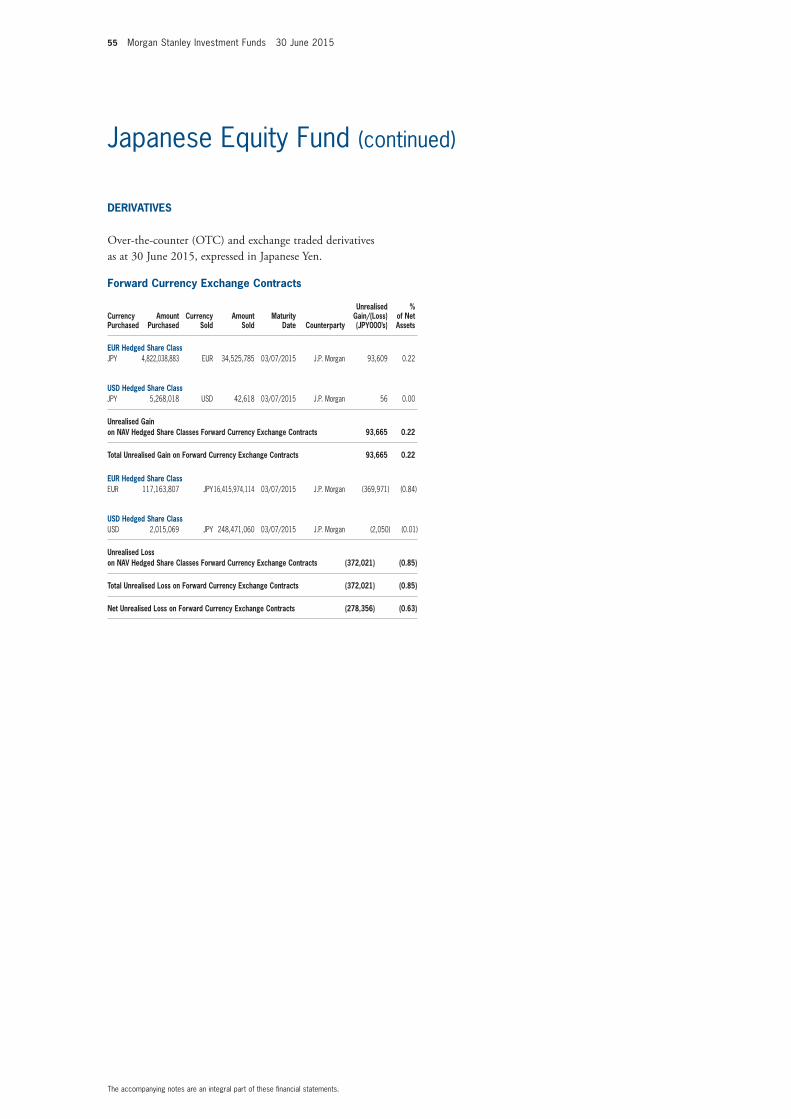
55 Morgan Stanley Investment Funds 30 June 2015
The accompanying notes are an integral part of these financial statements.
Japanese Equity Fund (continued)
DERivAtivES
Over-the-counter (OtC) and exchange traded derivatives as at 30 June 2015, expressed in Japanese Yen.
forward Currency Exchange Contracts
Currency Purchased
Amount Purchased
Currency Sold
Amount Sold
maturity Date Counterparty
Unrealised Gain/(Loss) (JPY000’s)
% of net Assets
EUR Hedged Share ClassJPY 4,822,038,883 EUR 34,525,785 03/07/2015 J.P. Morgan 93,609 0.22
USD Hedged Share ClassJPY 5,268,018 USD 42,618 03/07/2015 J.P. Morgan 56 0.00
Unrealised Gain on nAv Hedged Share Classes forward Currency Exchange Contracts 93,665 0.22
total Unrealised Gain on forward Currency Exchange Contracts 93,665 0.22
EUR Hedged Share ClassEUR 117,163,807 JPY16,415,974,114 03/07/2015 J.P. Morgan (369,971) (0.84)
USD Hedged Share ClassUSD 2,015,069 JPY 248,471,060 03/07/2015 J.P. Morgan (2,050) (0.01)
Unrealised Loss on nAv Hedged Share Classes forward Currency Exchange Contracts (372,021) (0.85)
total Unrealised Loss on forward Currency Exchange Contracts (372,021) (0.85)
net Unrealised Loss on forward Currency Exchange Contracts (278,356) (0.63)
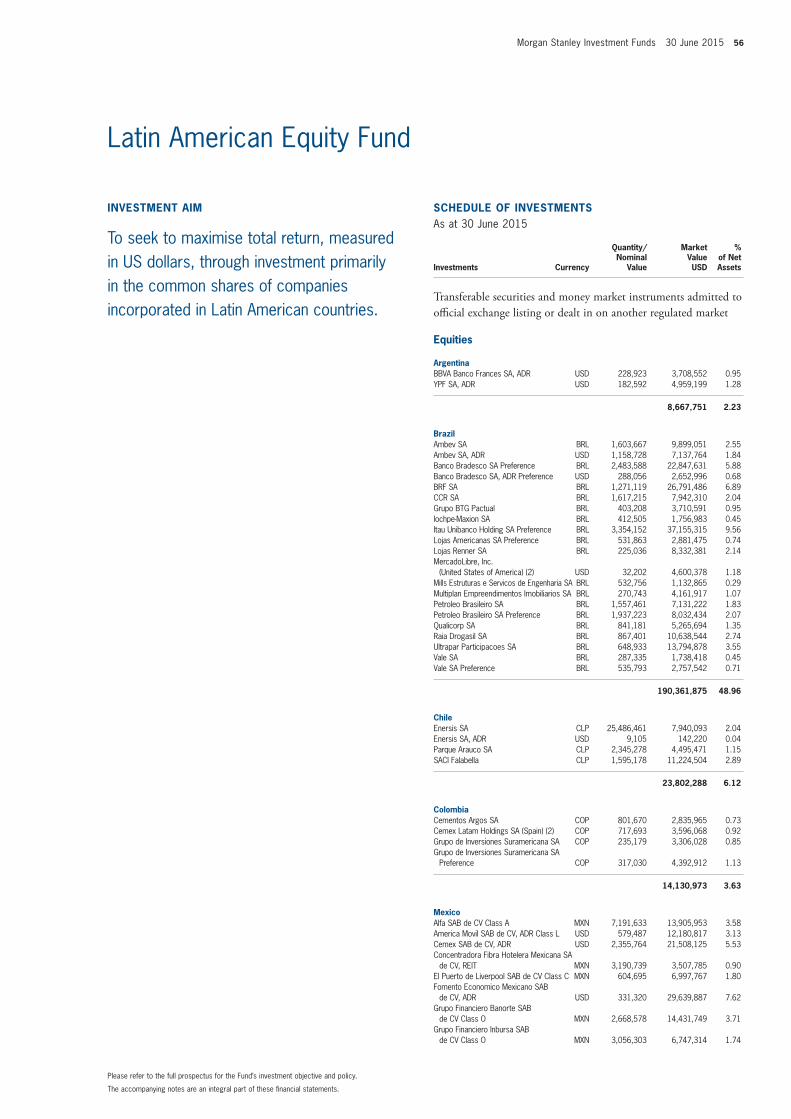
Morgan Stanley Investment Funds 30 June 2015 56
invEStmEnt Aim
To seek to maximise total return, measured in US dollars, through investment primarily in the common shares of companies incorporated in Latin American countries.
SCHEDULE of invEStmEntSAs at 30 June 2015
Investments Currency
Quantity/Nominal
Value
Market Value USD
% of Net Assets
transferable securities and money market instruments admitted to official exchange listing or dealt in on another regulated market
Equities
ArgentinaBBVA Banco Frances SA, ADR USD 228,923 3,708,552 0.95YPF SA, ADR USD 182,592 4,959,199 1.28
8,667,751 2.23
BrazilAmbev SA BRL 1,603,667 9,899,051 2.55Ambev SA, ADR USD 1,158,728 7,137,764 1.84Banco Bradesco SA Preference BRL 2,483,588 22,847,631 5.88Banco Bradesco SA, ADR Preference USD 288,056 2,652,996 0.68BRF SA BRL 1,271,119 26,791,486 6.89CCR SA BRL 1,617,215 7,942,310 2.04Grupo BTG Pactual BRL 403,208 3,710,591 0.95Iochpe-Maxion SA BRL 412,505 1,756,983 0.45Itau Unibanco Holding SA Preference BRL 3,354,152 37,155,315 9.56Lojas Americanas SA Preference BRL 531,863 2,881,475 0.74Lojas Renner SA BRL 225,036 8,332,381 2.14MercadoLibre, Inc.
(United States of America) (2) USD 32,202 4,600,378 1.18Mills Estruturas e Servicos de Engenharia SA BRL 532,756 1,132,865 0.29Multiplan Empreendimentos Imobiliarios SA BRL 270,743 4,161,917 1.07Petroleo Brasileiro SA BRL 1,557,461 7,131,222 1.83Petroleo Brasileiro SA Preference BRL 1,937,223 8,032,434 2.07Qualicorp SA BRL 841,181 5,265,694 1.35Raia Drogasil SA BRL 867,401 10,638,544 2.74Ultrapar Participacoes SA BRL 648,933 13,794,878 3.55Vale SA BRL 287,335 1,738,418 0.45Vale SA Preference BRL 535,793 2,757,542 0.71
190,361,875 48.96
ChileEnersis SA CLP 25,486,461 7,940,093 2.04Enersis SA, ADR USD 9,105 142,220 0.04Parque Arauco SA CLP 2,345,278 4,495,471 1.15SACI Falabella CLP 1,595,178 11,224,504 2.89
23,802,288 6.12
ColombiaCementos Argos SA COP 801,670 2,835,965 0.73Cemex Latam Holdings SA (Spain) (2) COP 717,693 3,596,068 0.92Grupo de Inversiones Suramericana SA COP 235,179 3,306,028 0.85Grupo de Inversiones Suramericana SA
Preference COP 317,030 4,392,912 1.13
14,130,973 3.63
mexicoAlfa SAB de CV Class A MXN 7,191,633 13,905,953 3.58America Movil SAB de CV, ADR Class L USD 579,487 12,180,817 3.13Cemex SAB de CV, ADR USD 2,355,764 21,508,125 5.53Concentradora Fibra Hotelera Mexicana SA
de CV, REIT MXN 3,190,739 3,507,785 0.90El Puerto de Liverpool SAB de CV Class C MXN 604,695 6,997,767 1.80Fomento Economico Mexicano SAB
de CV, ADR USD 331,320 29,639,887 7.62Grupo Financiero Banorte SAB
de CV Class O MXN 2,668,578 14,431,749 3.71Grupo Financiero Inbursa SAB
de CV Class O MXN 3,056,303 6,747,314 1.74
The accompanying notes are an integral part of these financial statements.
Please refer to the full prospectus for the Fund’s investment objective and policy.
Latin American Equity Fund
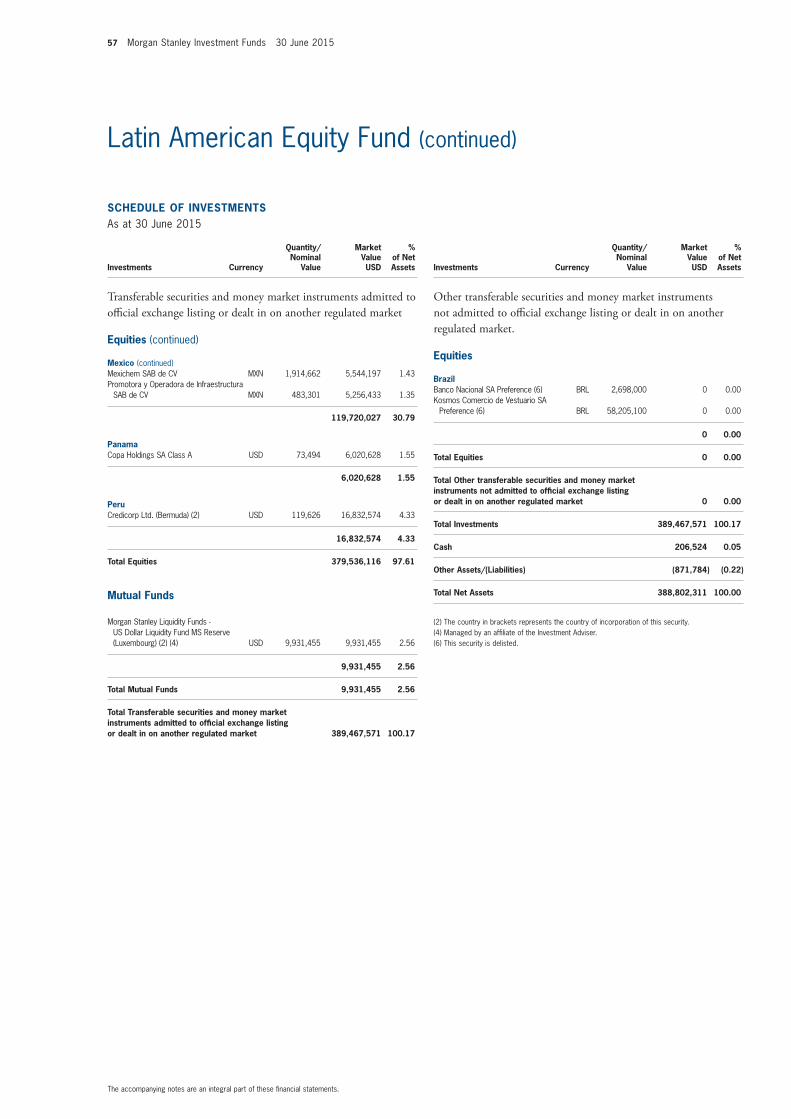
57 Morgan Stanley Investment Funds 30 June 2015
SCHEDULE of invEStmEntSAs at 30 June 2015
Investments Currency
Quantity/Nominal
Value
Market Value USD
% of Net Assets
transferable securities and money market instruments admitted to official exchange listing or dealt in on another regulated market
Equities (continued)
mexico (continued)Mexichem SAB de CV MXN 1,914,662 5,544,197 1.43Promotora y Operadora de Infraestructura
SAB de CV MXN 483,301 5,256,433 1.35
119,720,027 30.79
PanamaCopa Holdings SA Class A USD 73,494 6,020,628 1.55
6,020,628 1.55
PeruCredicorp Ltd. (Bermuda) (2) USD 119,626 16,832,574 4.33
16,832,574 4.33
total Equities 379,536,116 97.61
mutual funds
Morgan Stanley Liquidity Funds - US Dollar Liquidity Fund MS Reserve (Luxembourg) (2) (4) USD 9,931,455 9,931,455 2.56
9,931,455 2.56
total mutual funds 9,931,455 2.56
total transferable securities and money market instruments admitted to official exchange listing or dealt in on another regulated market 389,467,571 100.17
SCHEDULE of invEStmEntSAs at 30 June 2015
Investments Currency
Quantity/Nominal
Value
Market Value USD
% of Net Assets
Other transferable securities and money market instruments not admitted to official exchange listing or dealt in on another regulated market.
Equities
BrazilBanco Nacional SA Preference (6) BRL 2,698,000 0 0.00Kosmos Comercio de Vestuario SA
Preference (6) BRL 58,205,100 0 0.00
0 0.00
total Equities 0 0.00
total other transferable securities and money market instruments not admitted to official exchange listing or dealt in on another regulated market 0 0.00
total investments 389,467,571 100.17
Cash 206,524 0.05
other Assets/(Liabilities) (871,784) (0.22)
total net Assets 388,802,311 100.00
(2) The country in brackets represents the country of incorporation of this security.(4) Managed by an affiliate of the Investment Adviser.(6) This security is delisted.
The accompanying notes are an integral part of these financial statements.
Latin American Equity Fund (continued)
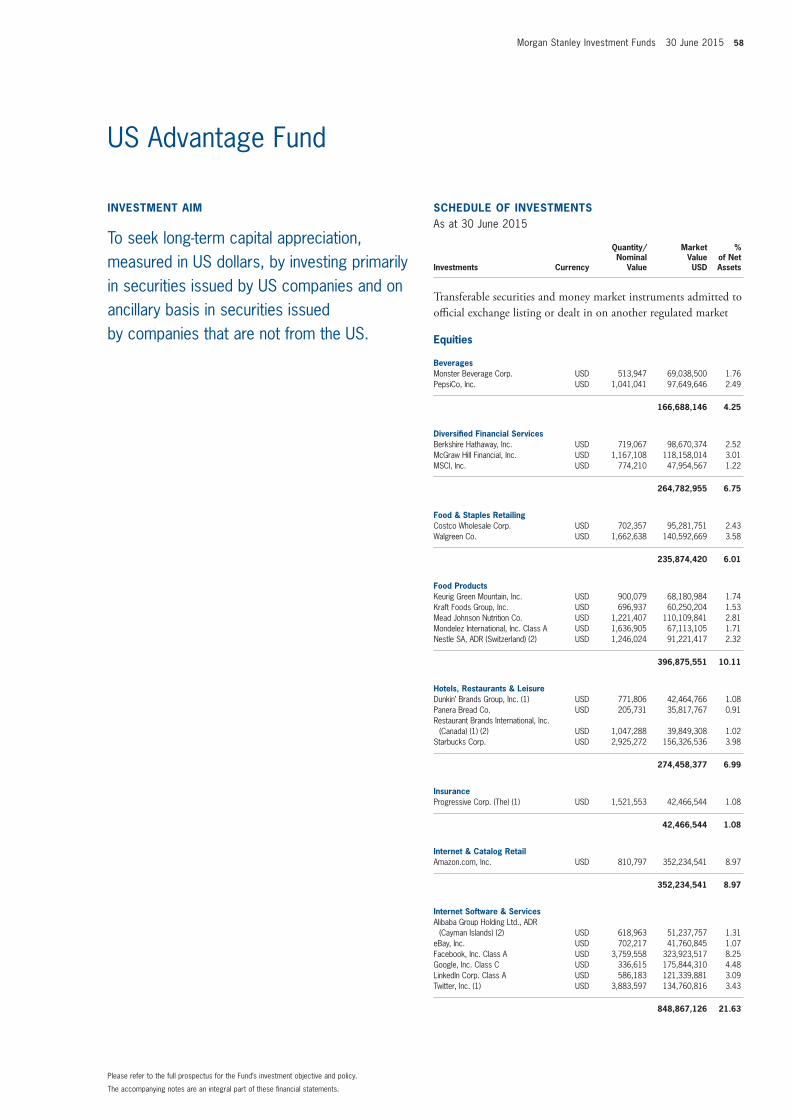
Morgan Stanley Investment Funds 30 June 2015 58
SCHEDULE of invEStmEntSAs at 30 June 2015
Investments Currency
Quantity/Nominal
Value
Market Value USD
% of Net Assets
transferable securities and money market instruments admitted to official exchange listing or dealt in on another regulated market
Equities
BeveragesMonster Beverage Corp. USD 513,947 69,038,500 1.76PepsiCo, Inc. USD 1,041,041 97,649,646 2.49
166,688,146 4.25
Diversified financial ServicesBerkshire Hathaway, Inc. USD 719,067 98,670,374 2.52McGraw Hill Financial, Inc. USD 1,167,108 118,158,014 3.01MSCI, Inc. USD 774,210 47,954,567 1.22
264,782,955 6.75
food & Staples RetailingCostco Wholesale Corp. USD 702,357 95,281,751 2.43Walgreen Co. USD 1,662,638 140,592,669 3.58
235,874,420 6.01
food ProductsKeurig Green Mountain, Inc. USD 900,079 68,180,984 1.74Kraft Foods Group, Inc. USD 696,937 60,250,204 1.53Mead Johnson Nutrition Co. USD 1,221,407 110,109,841 2.81Mondelez International, Inc. Class A USD 1,636,905 67,113,105 1.71Nestle SA, ADR (Switzerland) (2) USD 1,246,024 91,221,417 2.32
396,875,551 10.11
Hotels, Restaurants & LeisureDunkin’ Brands Group, Inc. (1) USD 771,806 42,464,766 1.08Panera Bread Co. USD 205,731 35,817,767 0.91Restaurant Brands International, Inc.
(Canada) (1) (2) USD 1,047,288 39,849,308 1.02Starbucks Corp. USD 2,925,272 156,326,536 3.98
274,458,377 6.99
insuranceProgressive Corp. (The) (1) USD 1,521,553 42,466,544 1.08
42,466,544 1.08
internet & Catalog RetailAmazon.com, Inc. USD 810,797 352,234,541 8.97
352,234,541 8.97
internet Software & ServicesAlibaba Group Holding Ltd., ADR
(Cayman Islands) (2) USD 618,963 51,237,757 1.31eBay, Inc. USD 702,217 41,760,845 1.07Facebook, Inc. Class A USD 3,759,558 323,923,517 8.25Google, Inc. Class C USD 336,615 175,844,310 4.48LinkedIn Corp. Class A USD 586,183 121,339,881 3.09Twitter, Inc. (1) USD 3,883,597 134,760,816 3.43
848,867,126 21.63
invEStmEnt Aim
To seek long-term capital appreciation, measured in US dollars, by investing primarily in securities issued by US companies and on ancillary basis in securities issued by companies that are not from the US.
The accompanying notes are an integral part of these financial statements.
Please refer to the full prospectus for the Fund’s investment objective and policy.
US Advantage Fund
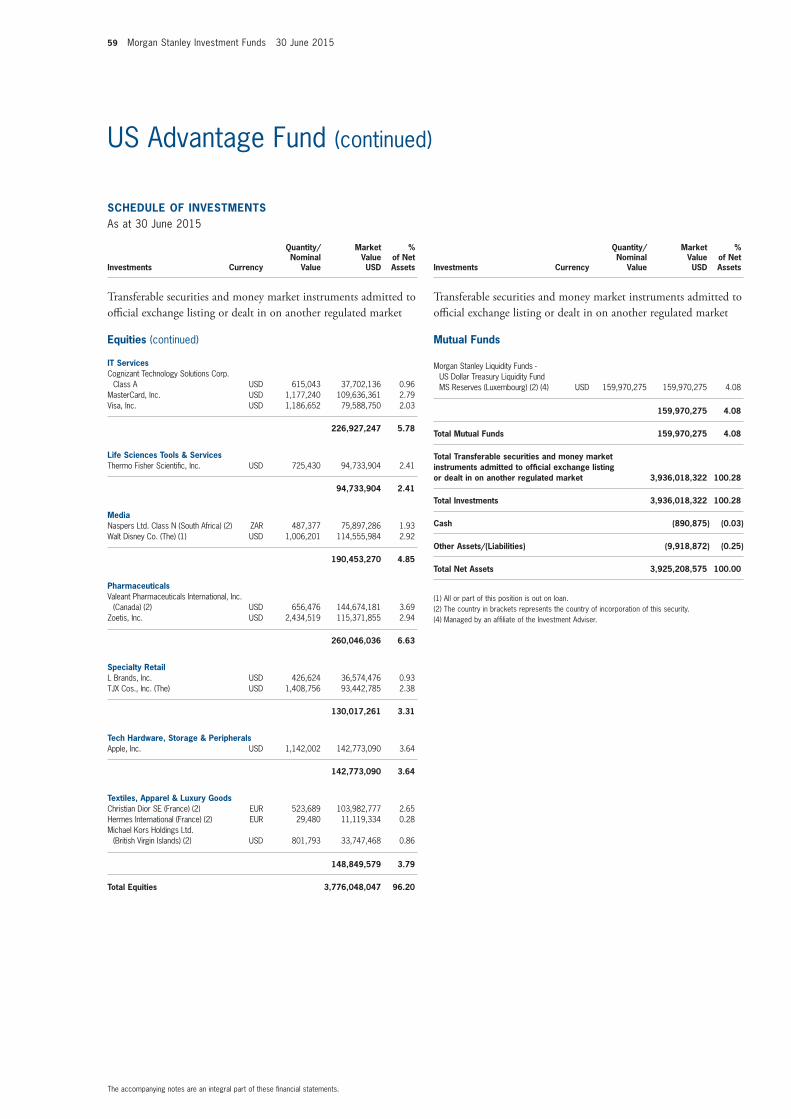
59 Morgan Stanley Investment Funds 30 June 2015
SCHEDULE of invEStmEntSAs at 30 June 2015
Investments Currency
Quantity/Nominal
Value
Market Value USD
% of Net Assets
transferable securities and money market instruments admitted to official exchange listing or dealt in on another regulated market
Equities (continued)
it ServicesCognizant Technology Solutions Corp.
Class A USD 615,043 37,702,136 0.96MasterCard, Inc. USD 1,177,240 109,636,361 2.79Visa, Inc. USD 1,186,652 79,588,750 2.03
226,927,247 5.78
Life Sciences tools & ServicesThermo Fisher Scientific, Inc. USD 725,430 94,733,904 2.41
94,733,904 2.41
mediaNaspers Ltd. Class N (South Africa) (2) ZAR 487,377 75,897,286 1.93Walt Disney Co. (The) (1) USD 1,006,201 114,555,984 2.92
190,453,270 4.85
PharmaceuticalsValeant Pharmaceuticals International, Inc.
(Canada) (2) USD 656,476 144,674,181 3.69Zoetis, Inc. USD 2,434,519 115,371,855 2.94
260,046,036 6.63
Specialty RetailL Brands, Inc. USD 426,624 36,574,476 0.93TJX Cos., Inc. (The) USD 1,408,756 93,442,785 2.38
130,017,261 3.31
tech Hardware, Storage & PeripheralsApple, Inc. USD 1,142,002 142,773,090 3.64
142,773,090 3.64
textiles, Apparel & Luxury GoodsChristian Dior SE (France) (2) EUR 523,689 103,982,777 2.65Hermes International (France) (2) EUR 29,480 11,119,334 0.28Michael Kors Holdings Ltd.
(British Virgin Islands) (2) USD 801,793 33,747,468 0.86
148,849,579 3.79
total Equities 3,776,048,047 96.20
SCHEDULE of invEStmEntSAs at 30 June 2015
Investments Currency
Quantity/Nominal
Value
Market Value USD
% of Net Assets
transferable securities and money market instruments admitted to official exchange listing or dealt in on another regulated market
mutual funds
Morgan Stanley Liquidity Funds - US Dollar Treasury Liquidity Fund MS Reserves (Luxembourg) (2) (4) USD 159,970,275 159,970,275 4.08
159,970,275 4.08
total mutual funds 159,970,275 4.08
total transferable securities and money market instruments admitted to official exchange listing or dealt in on another regulated market 3,936,018,322 100.28
total investments 3,936,018,322 100.28
Cash (890,875) (0.03)
other Assets/(Liabilities) (9,918,872) (0.25)
total net Assets 3,925,208,575 100.00
(1) All or part of this position is out on loan.(2) The country in brackets represents the country of incorporation of this security.(4) Managed by an affiliate of the Investment Adviser.
The accompanying notes are an integral part of these financial statements.
US Advantage Fund (continued)
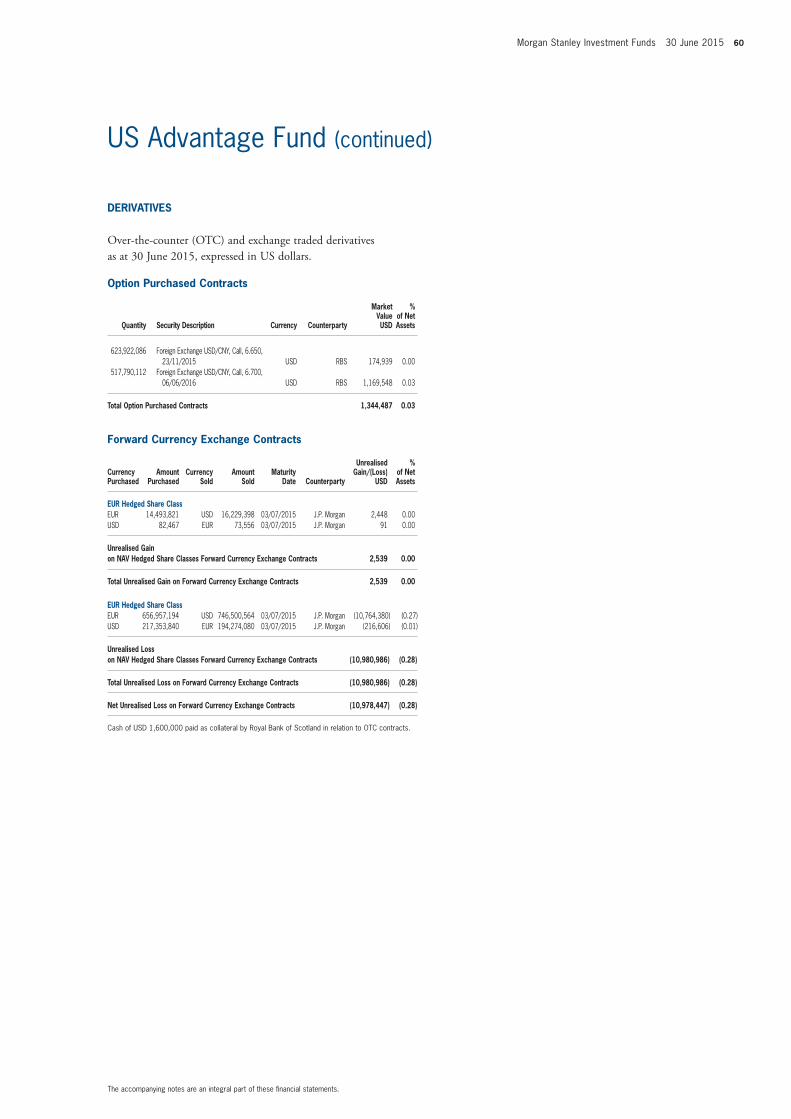
Morgan Stanley Investment Funds 30 June 2015 60
The accompanying notes are an integral part of these financial statements.
US Advantage Fund (continued)
DERivAtivES
Over-the-counter (OtC) and exchange traded derivatives as at 30 June 2015, expressed in US dollars.
option Purchased Contracts
Quantity Security Description Currency Counterparty
market value USD
% of net Assets
623,922,086 Foreign Exchange USD/CNY, Call, 6.650, 23/11/2015 USD RBS 174,939 0.00
517,790,112 Foreign Exchange USD/CNY, Call, 6.700, 06/06/2016 USD RBS 1,169,548 0.03
total option Purchased Contracts 1,344,487 0.03
forward Currency Exchange Contracts
Currency Purchased
Amount Purchased
Currency Sold
Amount Sold
maturity Date Counterparty
Unrealised Gain/(Loss)
USD
% of net Assets
EUR Hedged Share ClassEUR 14,493,821 USD 16,229,398 03/07/2015 J.P. Morgan 2,448 0.00USD 82,467 EUR 73,556 03/07/2015 J.P. Morgan 91 0.00
Unrealised Gain on nAv Hedged Share Classes forward Currency Exchange Contracts 2,539 0.00
total Unrealised Gain on forward Currency Exchange Contracts 2,539 0.00
EUR Hedged Share ClassEUR 656,957,194 USD 746,500,564 03/07/2015 J.P. Morgan (10,764,380) (0.27)USD 217,353,840 EUR 194,274,080 03/07/2015 J.P. Morgan (216,606) (0.01)
Unrealised Loss on nAv Hedged Share Classes forward Currency Exchange Contracts (10,980,986) (0.28)
total Unrealised Loss on forward Currency Exchange Contracts (10,980,986) (0.28)
net Unrealised Loss on forward Currency Exchange Contracts (10,978,447) (0.28)
Cash of USD 1,600,000 paid as collateral by Royal Bank of Scotland in relation to OTC contracts.
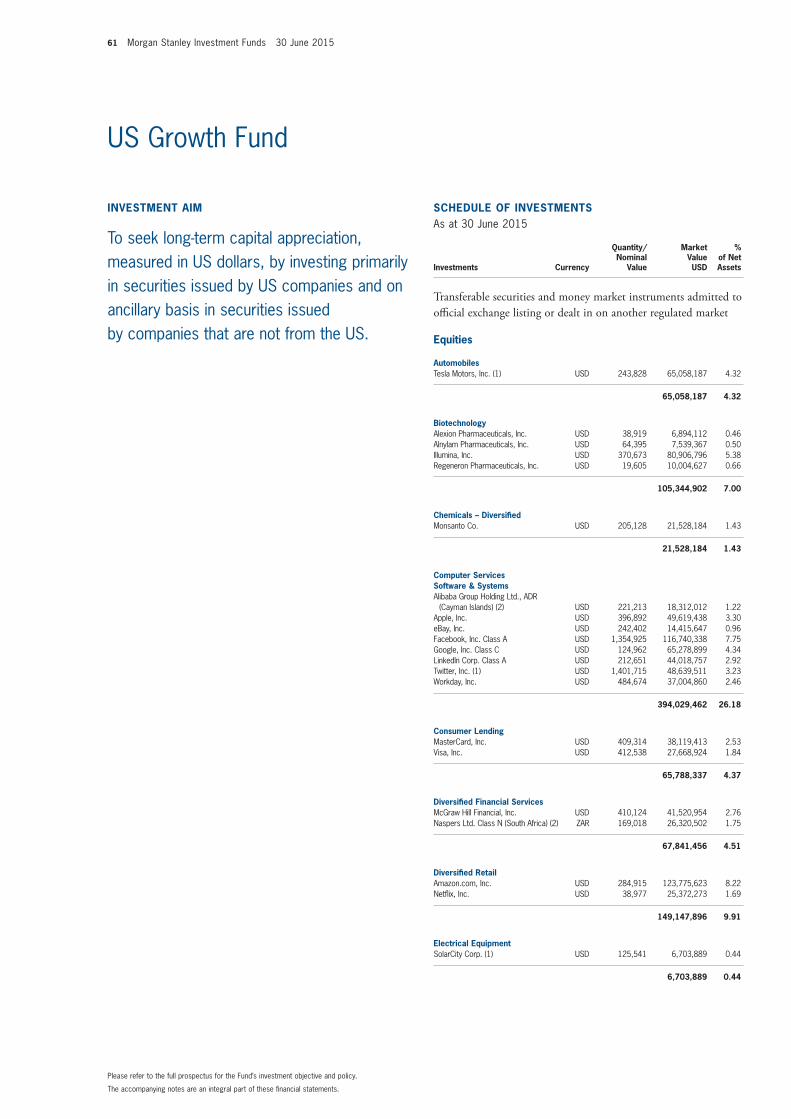
61 Morgan Stanley Investment Funds 30 June 2015
invEStmEnt Aim
To seek long-term capital appreciation, measured in US dollars, by investing primarily in securities issued by US companies and on ancillary basis in securities issued by companies that are not from the US.
SCHEDULE of invEStmEntSAs at 30 June 2015
Investments Currency
Quantity/Nominal
Value
Market Value USD
% of Net Assets
transferable securities and money market instruments admitted to official exchange listing or dealt in on another regulated market
Equities
AutomobilesTesla Motors, Inc. (1) USD 243,828 65,058,187 4.32
65,058,187 4.32
BiotechnologyAlexion Pharmaceuticals, Inc. USD 38,919 6,894,112 0.46Alnylam Pharmaceuticals, Inc. USD 64,395 7,539,367 0.50Illumina, Inc. USD 370,673 80,906,796 5.38Regeneron Pharmaceuticals, Inc. USD 19,605 10,004,627 0.66
105,344,902 7.00
Chemicals – DiversifiedMonsanto Co. USD 205,128 21,528,184 1.43
21,528,184 1.43
Computer Services Software & SystemsAlibaba Group Holding Ltd., ADR
(Cayman Islands) (2) USD 221,213 18,312,012 1.22Apple, Inc. USD 396,892 49,619,438 3.30eBay, Inc. USD 242,402 14,415,647 0.96Facebook, Inc. Class A USD 1,354,925 116,740,338 7.75Google, Inc. Class C USD 124,962 65,278,899 4.34LinkedIn Corp. Class A USD 212,651 44,018,757 2.92Twitter, Inc. (1) USD 1,401,715 48,639,511 3.23Workday, Inc. USD 484,674 37,004,860 2.46
394,029,462 26.18
Consumer LendingMasterCard, Inc. USD 409,314 38,119,413 2.53Visa, Inc. USD 412,538 27,668,924 1.84
65,788,337 4.37
Diversified financial ServicesMcGraw Hill Financial, Inc. USD 410,124 41,520,954 2.76Naspers Ltd. Class N (South Africa) (2) ZAR 169,018 26,320,502 1.75
67,841,456 4.51
Diversified RetailAmazon.com, Inc. USD 284,915 123,775,623 8.22Netflix, Inc. USD 38,977 25,372,273 1.69
149,147,896 9.91
Electrical EquipmentSolarCity Corp. (1) USD 125,541 6,703,889 0.44
6,703,889 0.44
The accompanying notes are an integral part of these financial statements.
Please refer to the full prospectus for the Fund’s investment objective and policy.
US Growth Fund
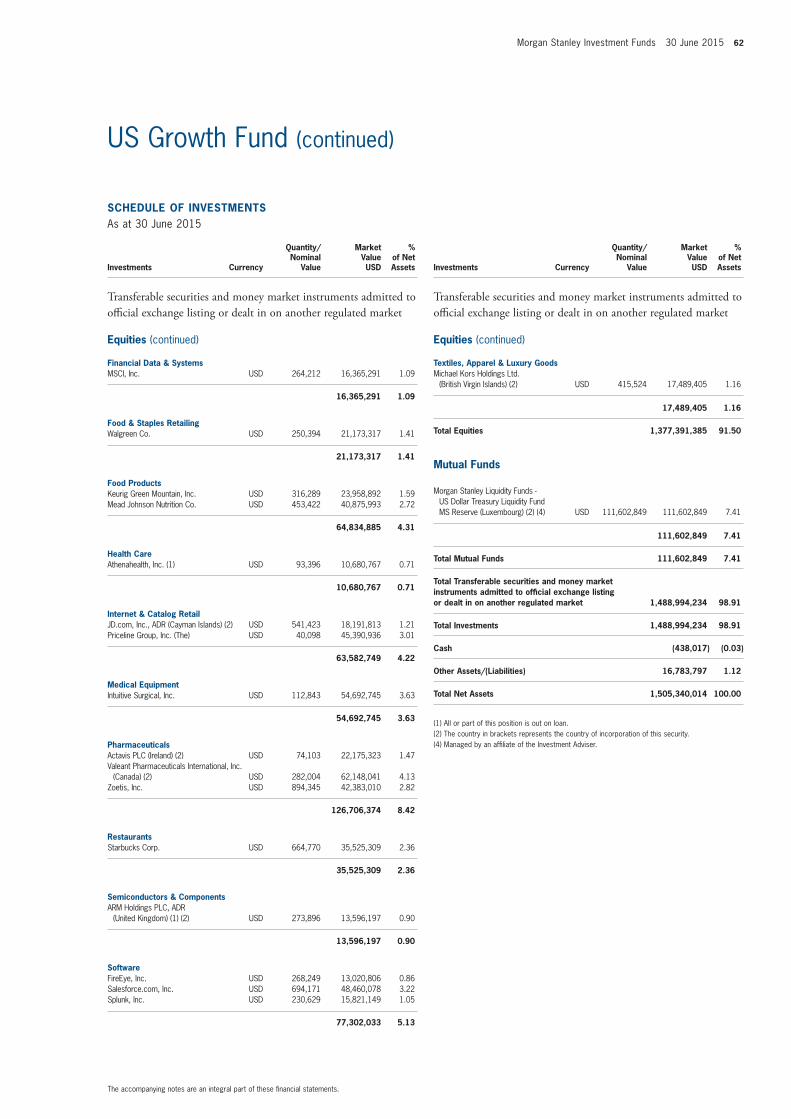
Morgan Stanley Investment Funds 30 June 2015 62
SCHEDULE of invEStmEntSAs at 30 June 2015
Investments Currency
Quantity/Nominal
Value
Market Value USD
% of Net Assets
transferable securities and money market instruments admitted to official exchange listing or dealt in on another regulated market
Equities (continued)
financial Data & SystemsMSCI, Inc. USD 264,212 16,365,291 1.09
16,365,291 1.09
food & Staples RetailingWalgreen Co. USD 250,394 21,173,317 1.41
21,173,317 1.41
food ProductsKeurig Green Mountain, Inc. USD 316,289 23,958,892 1.59Mead Johnson Nutrition Co. USD 453,422 40,875,993 2.72
64,834,885 4.31
Health CareAthenahealth, Inc. (1) USD 93,396 10,680,767 0.71
10,680,767 0.71
internet & Catalog RetailJD.com, Inc., ADR (Cayman Islands) (2) USD 541,423 18,191,813 1.21Priceline Group, Inc. (The) USD 40,098 45,390,936 3.01
63,582,749 4.22
medical EquipmentIntuitive Surgical, Inc. USD 112,843 54,692,745 3.63
54,692,745 3.63
PharmaceuticalsActavis PLC (Ireland) (2) USD 74,103 22,175,323 1.47Valeant Pharmaceuticals International, Inc.
(Canada) (2) USD 282,004 62,148,041 4.13Zoetis, Inc. USD 894,345 42,383,010 2.82
126,706,374 8.42
RestaurantsStarbucks Corp. USD 664,770 35,525,309 2.36
35,525,309 2.36
Semiconductors & ComponentsARM Holdings PLC, ADR
(United Kingdom) (1) (2) USD 273,896 13,596,197 0.90
13,596,197 0.90
SoftwareFireEye, Inc. USD 268,249 13,020,806 0.86Salesforce.com, Inc. USD 694,171 48,460,078 3.22Splunk, Inc. USD 230,629 15,821,149 1.05
77,302,033 5.13
SCHEDULE of invEStmEntSAs at 30 June 2015
Investments Currency
Quantity/Nominal
Value
Market Value USD
% of Net Assets
transferable securities and money market instruments admitted to official exchange listing or dealt in on another regulated market
Equities (continued)
textiles, Apparel & Luxury GoodsMichael Kors Holdings Ltd.
(British Virgin Islands) (2) USD 415,524 17,489,405 1.16
17,489,405 1.16
total Equities 1,377,391,385 91.50
mutual funds
Morgan Stanley Liquidity Funds - US Dollar Treasury Liquidity Fund MS Reserve (Luxembourg) (2) (4) USD 111,602,849 111,602,849 7.41
111,602,849 7.41
total mutual funds 111,602,849 7.41
total transferable securities and money market instruments admitted to official exchange listing or dealt in on another regulated market 1,488,994,234 98.91
total investments 1,488,994,234 98.91
Cash (438,017) (0.03)
other Assets/(Liabilities) 16,783,797 1.12
total net Assets 1,505,340,014 100.00
(1) All or part of this position is out on loan.(2) The country in brackets represents the country of incorporation of this security.(4) Managed by an affiliate of the Investment Adviser.
The accompanying notes are an integral part of these financial statements.
US Growth Fund (continued)
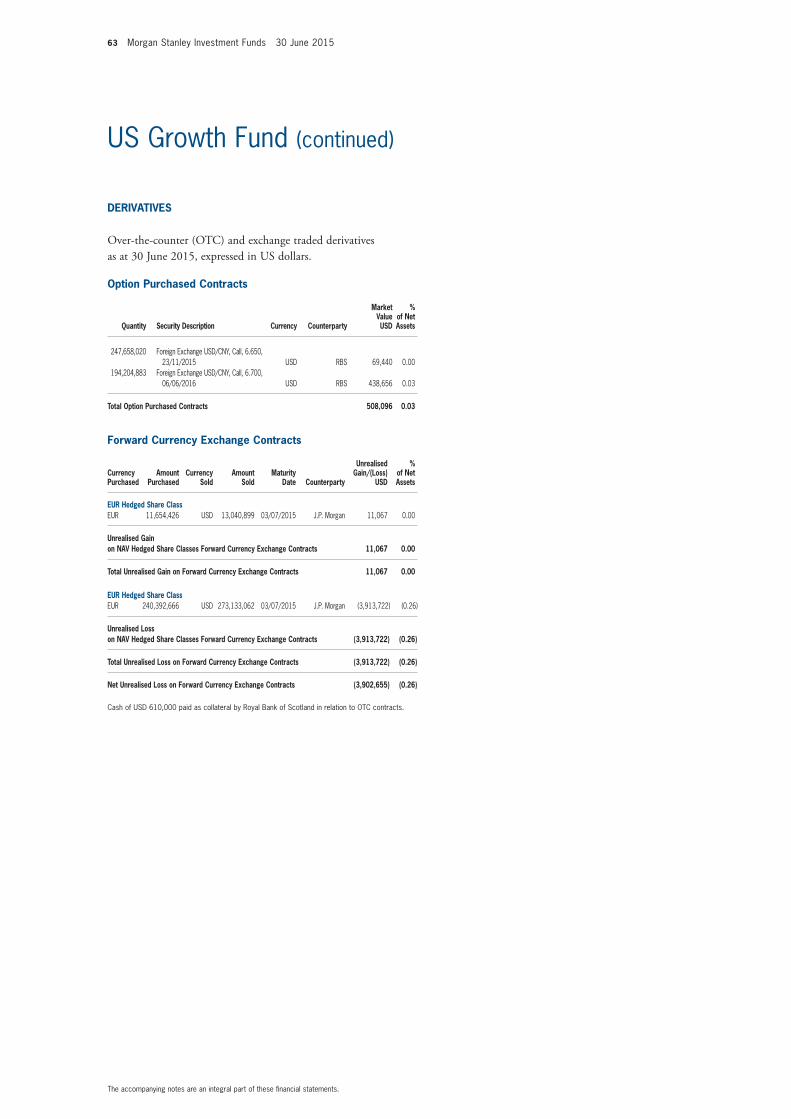
63 Morgan Stanley Investment Funds 30 June 2015
The accompanying notes are an integral part of these financial statements.
US Growth Fund (continued)
DERivAtivES
Over-the-counter (OtC) and exchange traded derivatives as at 30 June 2015, expressed in US dollars.
option Purchased Contracts
Quantity Security Description Currency Counterparty
market value USD
% of net Assets
247,658,020 Foreign Exchange USD/CNY, Call, 6.650, 23/11/2015 USD RBS 69,440 0.00
194,204,883 Foreign Exchange USD/CNY, Call, 6.700, 06/06/2016 USD RBS 438,656 0.03
total option Purchased Contracts 508,096 0.03
forward Currency Exchange Contracts
Currency Purchased
Amount Purchased
Currency Sold
Amount Sold
maturity Date Counterparty
Unrealised Gain/(Loss)
USD
% of net Assets
EUR Hedged Share ClassEUR 11,654,426 USD 13,040,899 03/07/2015 J.P. Morgan 11,067 0.00
Unrealised Gain on nAv Hedged Share Classes forward Currency Exchange Contracts 11,067 0.00
total Unrealised Gain on forward Currency Exchange Contracts 11,067 0.00
EUR Hedged Share ClassEUR 240,392,666 USD 273,133,062 03/07/2015 J.P. Morgan (3,913,722) (0.26)
Unrealised Loss on nAv Hedged Share Classes forward Currency Exchange Contracts (3,913,722) (0.26)
total Unrealised Loss on forward Currency Exchange Contracts (3,913,722) (0.26)
net Unrealised Loss on forward Currency Exchange Contracts (3,902,655) (0.26)
Cash of USD 610,000 paid as collateral by Royal Bank of Scotland in relation to OTC contracts.
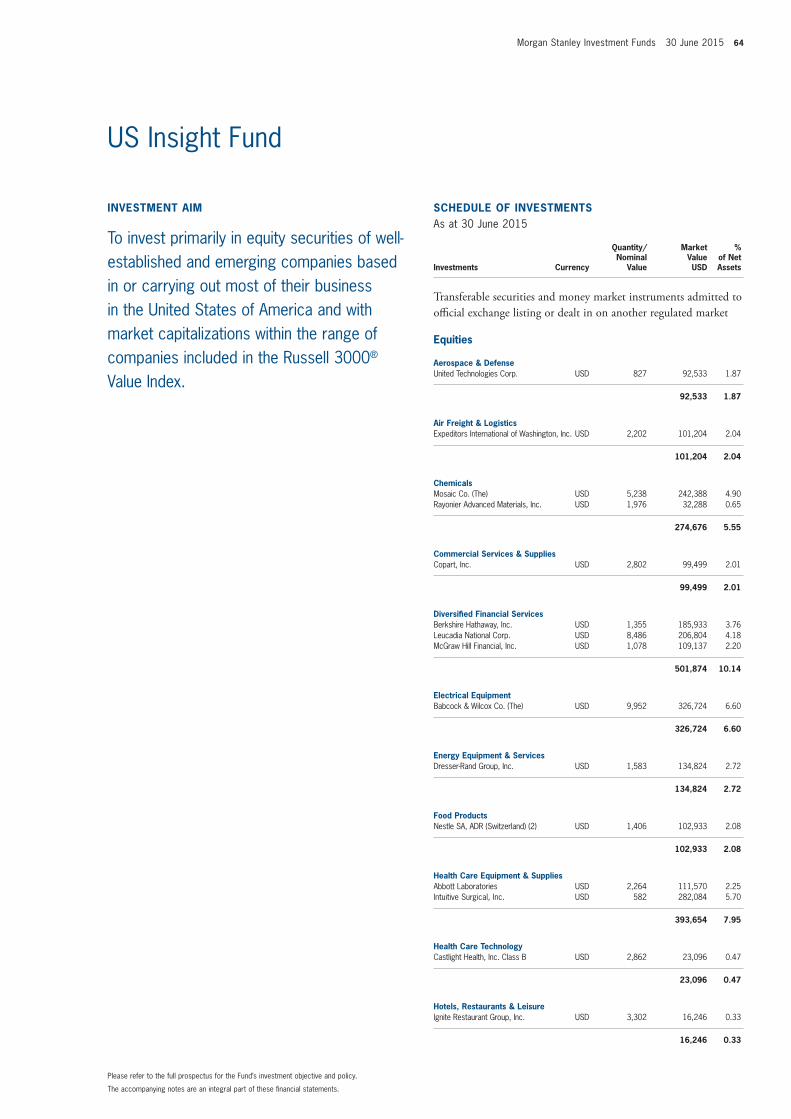
Morgan Stanley Investment Funds 30 June 2015 64
invEStmEnt Aim
To invest primarily in equity securities of well-established and emerging companies based in or carrying out most of their business in the United States of America and with market capitalizations within the range of companies included in the Russell 3000® Value Index.
SCHEDULE of invEStmEntSAs at 30 June 2015
Investments Currency
Quantity/Nominal
Value
Market Value USD
% of Net Assets
transferable securities and money market instruments admitted to official exchange listing or dealt in on another regulated market
Equities
Aerospace & DefenseUnited Technologies Corp. USD 827 92,533 1.87
92,533 1.87
Air freight & LogisticsExpeditors International of Washington, Inc. USD 2,202 101,204 2.04
101,204 2.04
ChemicalsMosaic Co. (The) USD 5,238 242,388 4.90Rayonier Advanced Materials, Inc. USD 1,976 32,288 0.65
274,676 5.55
Commercial Services & SuppliesCopart, Inc. USD 2,802 99,499 2.01
99,499 2.01
Diversified financial ServicesBerkshire Hathaway, Inc. USD 1,355 185,933 3.76Leucadia National Corp. USD 8,486 206,804 4.18McGraw Hill Financial, Inc. USD 1,078 109,137 2.20
501,874 10.14
Electrical EquipmentBabcock & Wilcox Co. (The) USD 9,952 326,724 6.60
326,724 6.60
Energy Equipment & ServicesDresser-Rand Group, Inc. USD 1,583 134,824 2.72
134,824 2.72
food ProductsNestle SA, ADR (Switzerland) (2) USD 1,406 102,933 2.08
102,933 2.08
Health Care Equipment & SuppliesAbbott Laboratories USD 2,264 111,570 2.25Intuitive Surgical, Inc. USD 582 282,084 5.70
393,654 7.95
Health Care technologyCastlight Health, Inc. Class B USD 2,862 23,096 0.47
23,096 0.47
Hotels, Restaurants & LeisureIgnite Restaurant Group, Inc. USD 3,302 16,246 0.33
16,246 0.33
The accompanying notes are an integral part of these financial statements.
Please refer to the full prospectus for the Fund’s investment objective and policy.
US Insight Fund
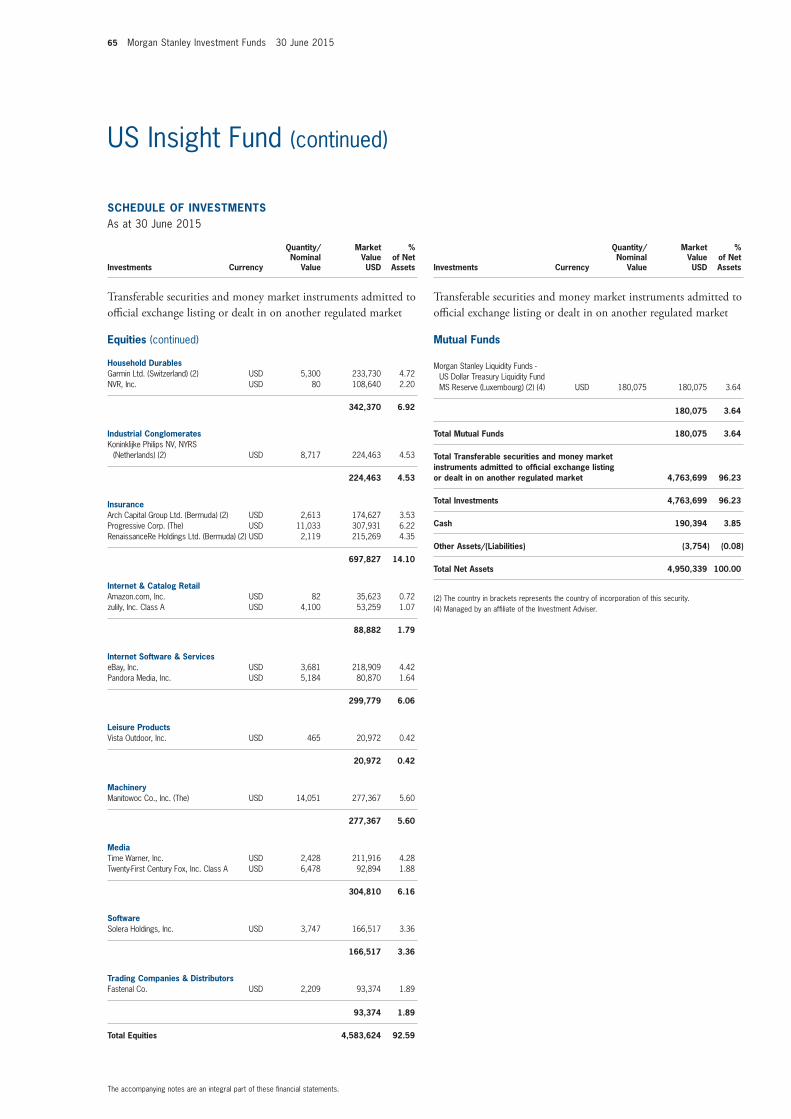
65 Morgan Stanley Investment Funds 30 June 2015
SCHEDULE of invEStmEntSAs at 30 June 2015
Investments Currency
Quantity/Nominal
Value
Market Value USD
% of Net Assets
transferable securities and money market instruments admitted to official exchange listing or dealt in on another regulated market
Equities (continued)
Household DurablesGarmin Ltd. (Switzerland) (2) USD 5,300 233,730 4.72NVR, Inc. USD 80 108,640 2.20
342,370 6.92
industrial ConglomeratesKoninklijke Philips NV, NYRS
(Netherlands) (2) USD 8,717 224,463 4.53
224,463 4.53
insuranceArch Capital Group Ltd. (Bermuda) (2) USD 2,613 174,627 3.53Progressive Corp. (The) USD 11,033 307,931 6.22RenaissanceRe Holdings Ltd. (Bermuda) (2) USD 2,119 215,269 4.35
697,827 14.10
internet & Catalog RetailAmazon.com, Inc. USD 82 35,623 0.72zulily, Inc. Class A USD 4,100 53,259 1.07
88,882 1.79
internet Software & ServiceseBay, Inc. USD 3,681 218,909 4.42Pandora Media, Inc. USD 5,184 80,870 1.64
299,779 6.06
Leisure ProductsVista Outdoor, Inc. USD 465 20,972 0.42
20,972 0.42
machineryManitowoc Co., Inc. (The) USD 14,051 277,367 5.60
277,367 5.60
mediaTime Warner, Inc. USD 2,428 211,916 4.28Twenty-First Century Fox, Inc. Class A USD 6,478 92,894 1.88
304,810 6.16
SoftwareSolera Holdings, Inc. USD 3,747 166,517 3.36
166,517 3.36
trading Companies & DistributorsFastenal Co. USD 2,209 93,374 1.89
93,374 1.89
total Equities 4,583,624 92.59
SCHEDULE of invEStmEntSAs at 30 June 2015
Investments Currency
Quantity/Nominal
Value
Market Value USD
% of Net Assets
transferable securities and money market instruments admitted to official exchange listing or dealt in on another regulated market
mutual funds
Morgan Stanley Liquidity Funds - US Dollar Treasury Liquidity Fund MS Reserve (Luxembourg) (2) (4) USD 180,075 180,075 3.64
180,075 3.64
total mutual funds 180,075 3.64
total transferable securities and money market instruments admitted to official exchange listing or dealt in on another regulated market 4,763,699 96.23
total investments 4,763,699 96.23
Cash 190,394 3.85
other Assets/(Liabilities) (3,754) (0.08)
total net Assets 4,950,339 100.00
(2) The country in brackets represents the country of incorporation of this security.(4) Managed by an affiliate of the Investment Adviser.
The accompanying notes are an integral part of these financial statements.
US Insight Fund (continued)
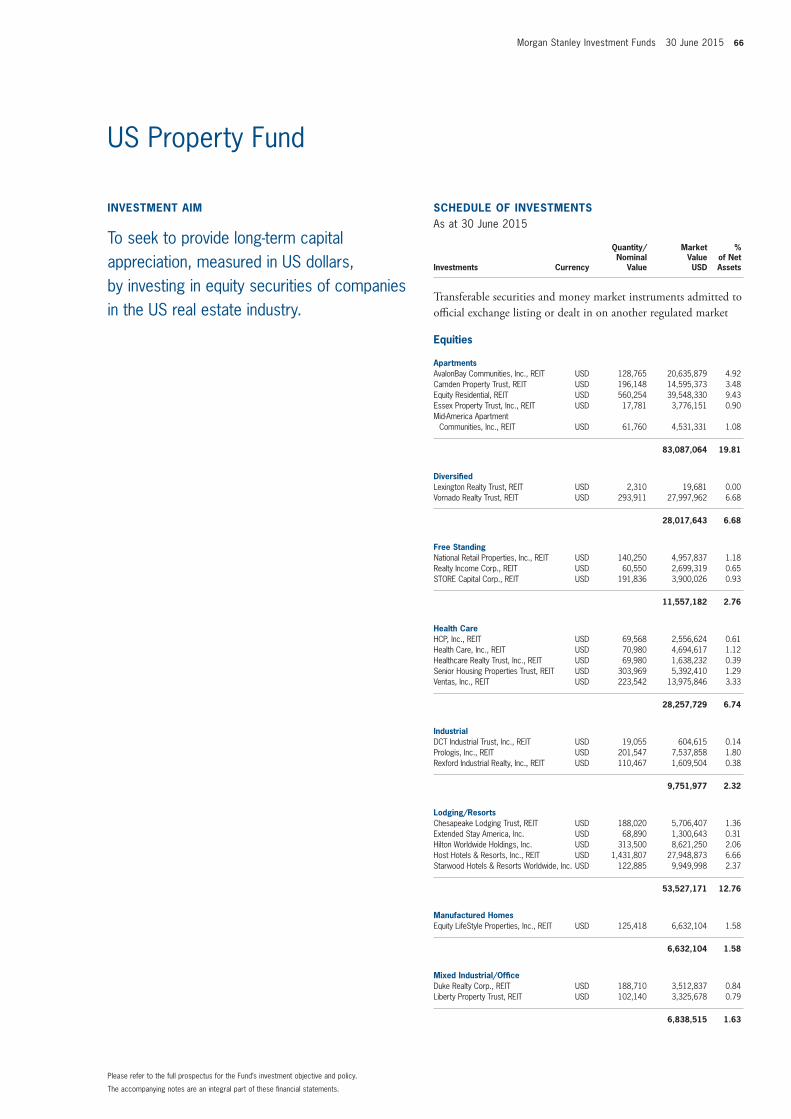
Morgan Stanley Investment Funds 30 June 2015 66
invEStmEnt Aim
To seek to provide long-term capital appreciation, measured in US dollars, by investing in equity securities of companies in the US real estate industry.
SCHEDULE of invEStmEntSAs at 30 June 2015
Investments Currency
Quantity/Nominal
Value
Market Value USD
% of Net Assets
transferable securities and money market instruments admitted to official exchange listing or dealt in on another regulated market
Equities
ApartmentsAvalonBay Communities, Inc., REIT USD 128,765 20,635,879 4.92Camden Property Trust, REIT USD 196,148 14,595,373 3.48Equity Residential, REIT USD 560,254 39,548,330 9.43Essex Property Trust, Inc., REIT USD 17,781 3,776,151 0.90Mid-America Apartment
Communities, Inc., REIT USD 61,760 4,531,331 1.08
83,087,064 19.81
DiversifiedLexington Realty Trust, REIT USD 2,310 19,681 0.00Vornado Realty Trust, REIT USD 293,911 27,997,962 6.68
28,017,643 6.68
free StandingNational Retail Properties, Inc., REIT USD 140,250 4,957,837 1.18Realty Income Corp., REIT USD 60,550 2,699,319 0.65STORE Capital Corp., REIT USD 191,836 3,900,026 0.93
11,557,182 2.76
Health CareHCP, Inc., REIT USD 69,568 2,556,624 0.61Health Care, Inc., REIT USD 70,980 4,694,617 1.12Healthcare Realty Trust, Inc., REIT USD 69,980 1,638,232 0.39Senior Housing Properties Trust, REIT USD 303,969 5,392,410 1.29Ventas, Inc., REIT USD 223,542 13,975,846 3.33
28,257,729 6.74
industrialDCT Industrial Trust, Inc., REIT USD 19,055 604,615 0.14Prologis, Inc., REIT USD 201,547 7,537,858 1.80Rexford Industrial Realty, Inc., REIT USD 110,467 1,609,504 0.38
9,751,977 2.32
Lodging/ResortsChesapeake Lodging Trust, REIT USD 188,020 5,706,407 1.36Extended Stay America, Inc. USD 68,890 1,300,643 0.31Hilton Worldwide Holdings, Inc. USD 313,500 8,621,250 2.06Host Hotels & Resorts, Inc., REIT USD 1,431,807 27,948,873 6.66Starwood Hotels & Resorts Worldwide, Inc. USD 122,885 9,949,998 2.37
53,527,171 12.76
manufactured HomesEquity LifeStyle Properties, Inc., REIT USD 125,418 6,632,104 1.58
6,632,104 1.58
mixed industrial/officeDuke Realty Corp., REIT USD 188,710 3,512,837 0.84Liberty Property Trust, REIT USD 102,140 3,325,678 0.79
6,838,515 1.63
The accompanying notes are an integral part of these financial statements.
Please refer to the full prospectus for the Fund’s investment objective and policy.
US Property Fund
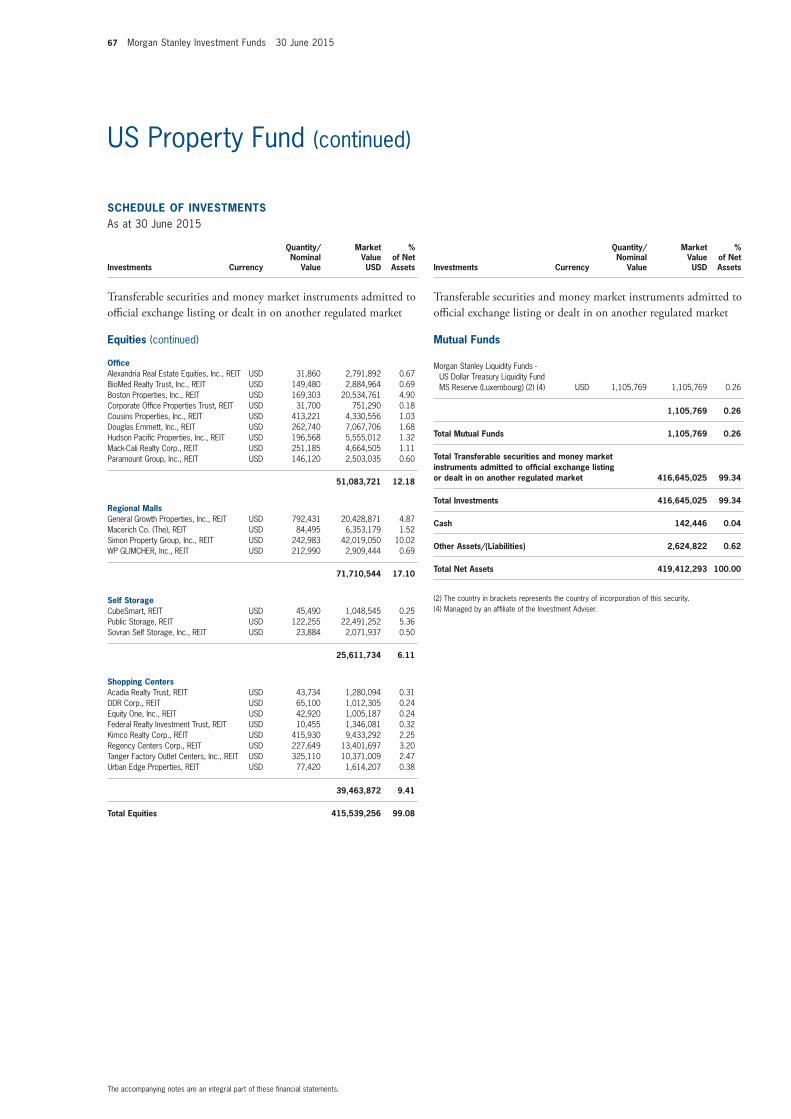
67 Morgan Stanley Investment Funds 30 June 2015
SCHEDULE of invEStmEntSAs at 30 June 2015
Investments Currency
Quantity/Nominal
Value
Market Value USD
% of Net Assets
transferable securities and money market instruments admitted to official exchange listing or dealt in on another regulated market
Equities (continued)
officeAlexandria Real Estate Equities, Inc., REIT USD 31,860 2,791,892 0.67BioMed Realty Trust, Inc., REIT USD 149,480 2,884,964 0.69Boston Properties, Inc., REIT USD 169,303 20,534,761 4.90Corporate Office Properties Trust, REIT USD 31,700 751,290 0.18Cousins Properties, Inc., REIT USD 413,221 4,330,556 1.03Douglas Emmett, Inc., REIT USD 262,740 7,067,706 1.68Hudson Pacific Properties, Inc., REIT USD 196,568 5,555,012 1.32Mack-Cali Realty Corp., REIT USD 251,185 4,664,505 1.11Paramount Group, Inc., REIT USD 146,120 2,503,035 0.60
51,083,721 12.18
Regional mallsGeneral Growth Properties, Inc., REIT USD 792,431 20,428,871 4.87Macerich Co. (The), REIT USD 84,495 6,353,179 1.52Simon Property Group, Inc., REIT USD 242,983 42,019,050 10.02WP GLIMCHER, Inc., REIT USD 212,990 2,909,444 0.69
71,710,544 17.10
Self StorageCubeSmart, REIT USD 45,490 1,048,545 0.25Public Storage, REIT USD 122,255 22,491,252 5.36Sovran Self Storage, Inc., REIT USD 23,884 2,071,937 0.50
25,611,734 6.11
Shopping CentersAcadia Realty Trust, REIT USD 43,734 1,280,094 0.31DDR Corp., REIT USD 65,100 1,012,305 0.24Equity One, Inc., REIT USD 42,920 1,005,187 0.24Federal Realty Investment Trust, REIT USD 10,455 1,346,081 0.32Kimco Realty Corp., REIT USD 415,930 9,433,292 2.25Regency Centers Corp., REIT USD 227,649 13,401,697 3.20Tanger Factory Outlet Centers, Inc., REIT USD 325,110 10,371,009 2.47Urban Edge Properties, REIT USD 77,420 1,614,207 0.38
39,463,872 9.41
total Equities 415,539,256 99.08
SCHEDULE of invEStmEntSAs at 30 June 2015
Investments Currency
Quantity/Nominal
Value
Market Value USD
% of Net Assets
transferable securities and money market instruments admitted to official exchange listing or dealt in on another regulated market
mutual funds
Morgan Stanley Liquidity Funds - US Dollar Treasury Liquidity Fund MS Reserve (Luxembourg) (2) (4) USD 1,105,769 1,105,769 0.26
1,105,769 0.26
total mutual funds 1,105,769 0.26
total transferable securities and money market instruments admitted to official exchange listing or dealt in on another regulated market 416,645,025 99.34
total investments 416,645,025 99.34
Cash 142,446 0.04
other Assets/(Liabilities) 2,624,822 0.62
total net Assets 419,412,293 100.00
(2) The country in brackets represents the country of incorporation of this security.(4) Managed by an affiliate of the Investment Adviser.
The accompanying notes are an integral part of these financial statements.
US Property Fund (continued)
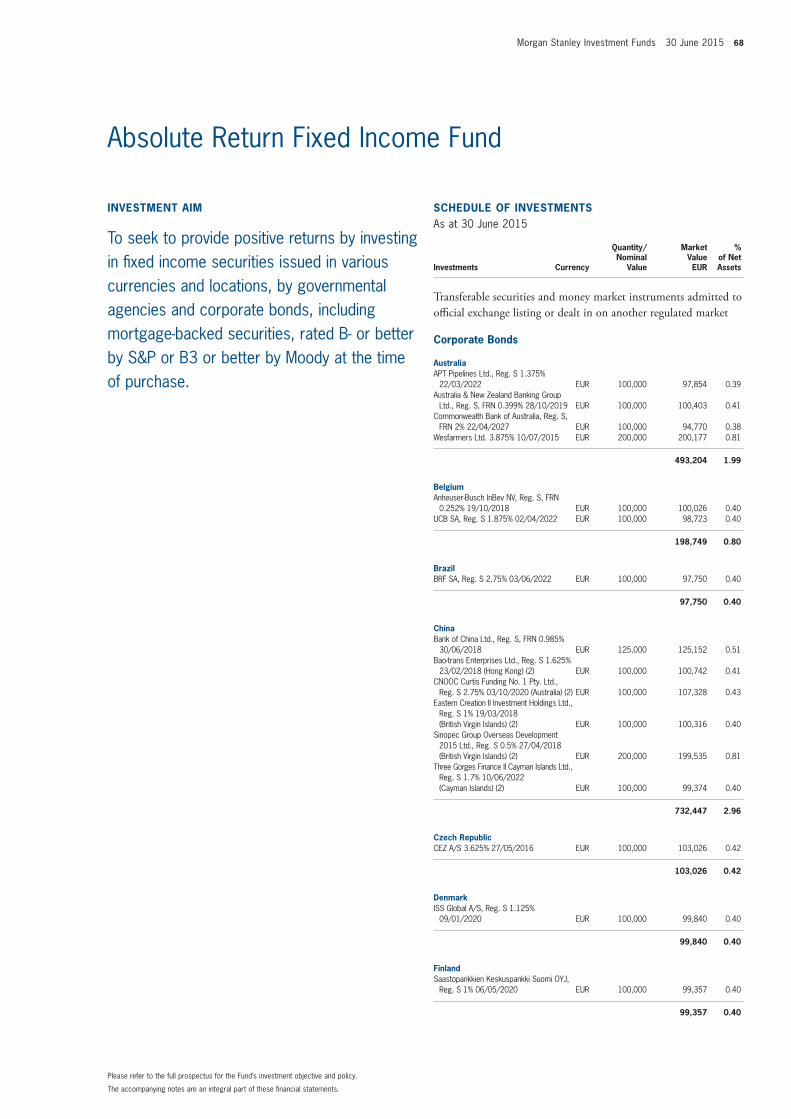
Morgan Stanley Investment Funds 30 June 2015 68
invEStmEnt Aim
To seek to provide positive returns by investing in fixed income securities issued in various currencies and locations, by governmental agencies and corporate bonds, including mortgage-backed securities, rated B- or better by S&P or B3 or better by Moody at the time of purchase.
SCHEDULE of invEStmEntSAs at 30 June 2015
Investments Currency
Quantity/Nominal
Value
Market Value EUR
% of Net Assets
transferable securities and money market instruments admitted to official exchange listing or dealt in on another regulated market
Corporate Bonds
AustraliaAPT Pipelines Ltd., Reg. S 1.375%
22/03/2022 EUR 100,000 97,854 0.39Australia & New Zealand Banking Group
Ltd., Reg. S, FRN 0.399% 28/10/2019 EUR 100,000 100,403 0.41Commonwealth Bank of Australia, Reg. S,
FRN 2% 22/04/2027 EUR 100,000 94,770 0.38Wesfarmers Ltd. 3.875% 10/07/2015 EUR 200,000 200,177 0.81
493,204 1.99
BelgiumAnheuser-Busch InBev NV, Reg. S, FRN
0.252% 19/10/2018 EUR 100,000 100,026 0.40UCB SA, Reg. S 1.875% 02/04/2022 EUR 100,000 98,723 0.40
198,749 0.80
BrazilBRF SA, Reg. S 2.75% 03/06/2022 EUR 100,000 97,750 0.40
97,750 0.40
ChinaBank of China Ltd., Reg. S, FRN 0.985%
30/06/2018 EUR 125,000 125,152 0.51Bao-trans Enterprises Ltd., Reg. S 1.625%
23/02/2018 (Hong Kong) (2) EUR 100,000 100,742 0.41CNOOC Curtis Funding No. 1 Pty. Ltd.,
Reg. S 2.75% 03/10/2020 (Australia) (2) EUR 100,000 107,328 0.43Eastern Creation II Investment Holdings Ltd.,
Reg. S 1% 19/03/2018 (British Virgin Islands) (2) EUR 100,000 100,316 0.40
Sinopec Group Overseas Development 2015 Ltd., Reg. S 0.5% 27/04/2018 (British Virgin Islands) (2) EUR 200,000 199,535 0.81
Three Gorges Finance II Cayman Islands Ltd., Reg. S 1.7% 10/06/2022 (Cayman Islands) (2) EUR 100,000 99,374 0.40
732,447 2.96
Czech RepublicCEZ A/S 3.625% 27/05/2016 EUR 100,000 103,026 0.42
103,026 0.42
DenmarkISS Global A/S, Reg. S 1.125%
09/01/2020 EUR 100,000 99,840 0.40
99,840 0.40
finlandSaastopankkien Keskuspankki Suomi OYJ,
Reg. S 1% 06/05/2020 EUR 100,000 99,357 0.40
99,357 0.40
The accompanying notes are an integral part of these financial statements.
Please refer to the full prospectus for the Fund’s investment objective and policy.
Absolute Return Fixed Income Fund
Bond Funds
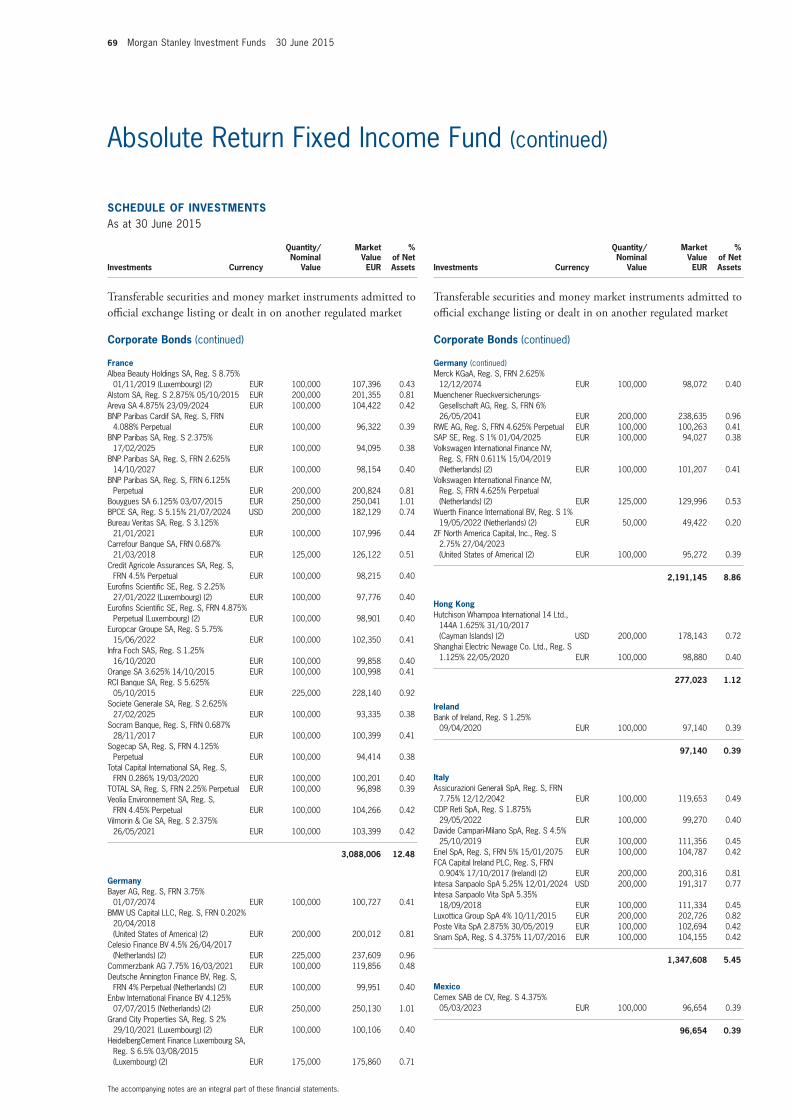
69 Morgan Stanley Investment Funds 30 June 2015
SCHEDULE of invEStmEntSAs at 30 June 2015
Investments Currency
Quantity/Nominal
Value
Market Value EUR
% of Net Assets
transferable securities and money market instruments admitted to official exchange listing or dealt in on another regulated market
Corporate Bonds (continued)
franceAlbea Beauty Holdings SA, Reg. S 8.75%
01/11/2019 (Luxembourg) (2) EUR 100,000 107,396 0.43Alstom SA, Reg. S 2.875% 05/10/2015 EUR 200,000 201,355 0.81Areva SA 4.875% 23/09/2024 EUR 100,000 104,422 0.42BNP Paribas Cardif SA, Reg. S, FRN
4.088% Perpetual EUR 100,000 96,322 0.39BNP Paribas SA, Reg. S 2.375%
17/02/2025 EUR 100,000 94,095 0.38BNP Paribas SA, Reg. S, FRN 2.625%
14/10/2027 EUR 100,000 98,154 0.40BNP Paribas SA, Reg. S, FRN 6.125%
Perpetual EUR 200,000 200,824 0.81Bouygues SA 6.125% 03/07/2015 EUR 250,000 250,041 1.01BPCE SA, Reg. S 5.15% 21/07/2024 USD 200,000 182,129 0.74Bureau Veritas SA, Reg. S 3.125%
21/01/2021 EUR 100,000 107,996 0.44Carrefour Banque SA, FRN 0.687%
21/03/2018 EUR 125,000 126,122 0.51Credit Agricole Assurances SA, Reg. S,
FRN 4.5% Perpetual EUR 100,000 98,215 0.40Eurofins Scientific SE, Reg. S 2.25%
27/01/2022 (Luxembourg) (2) EUR 100,000 97,776 0.40Eurofins Scientific SE, Reg. S, FRN 4.875%
Perpetual (Luxembourg) (2) EUR 100,000 98,901 0.40Europcar Groupe SA, Reg. S 5.75%
15/06/2022 EUR 100,000 102,350 0.41Infra Foch SAS, Reg. S 1.25%
16/10/2020 EUR 100,000 99,858 0.40Orange SA 3.625% 14/10/2015 EUR 100,000 100,998 0.41RCI Banque SA, Reg. S 5.625%
05/10/2015 EUR 225,000 228,140 0.92Societe Generale SA, Reg. S 2.625%
27/02/2025 EUR 100,000 93,335 0.38Socram Banque, Reg. S, FRN 0.687%
28/11/2017 EUR 100,000 100,399 0.41Sogecap SA, Reg. S, FRN 4.125%
Perpetual EUR 100,000 94,414 0.38Total Capital International SA, Reg. S,
FRN 0.286% 19/03/2020 EUR 100,000 100,201 0.40TOTAL SA, Reg. S, FRN 2.25% Perpetual EUR 100,000 96,898 0.39Veolia Environnement SA, Reg. S,
FRN 4.45% Perpetual EUR 100,000 104,266 0.42Vilmorin & Cie SA, Reg. S 2.375%
26/05/2021 EUR 100,000 103,399 0.42
3,088,006 12.48
GermanyBayer AG, Reg. S, FRN 3.75%
01/07/2074 EUR 100,000 100,727 0.41BMW US Capital LLC, Reg. S, FRN 0.202%
20/04/2018 (United States of America) (2) EUR 200,000 200,012 0.81
Celesio Finance BV 4.5% 26/04/2017 (Netherlands) (2) EUR 225,000 237,609 0.96
Commerzbank AG 7.75% 16/03/2021 EUR 100,000 119,856 0.48Deutsche Annington Finance BV, Reg. S,
FRN 4% Perpetual (Netherlands) (2) EUR 100,000 99,951 0.40Enbw International Finance BV 4.125%
07/07/2015 (Netherlands) (2) EUR 250,000 250,130 1.01Grand City Properties SA, Reg. S 2%
29/10/2021 (Luxembourg) (2) EUR 100,000 100,106 0.40HeidelbergCement Finance Luxembourg SA,
Reg. S 6.5% 03/08/2015 (Luxembourg) (2) EUR 175,000 175,860 0.71
SCHEDULE of invEStmEntSAs at 30 June 2015
Investments Currency
Quantity/Nominal
Value
Market Value EUR
% of Net Assets
transferable securities and money market instruments admitted to official exchange listing or dealt in on another regulated market
Corporate Bonds (continued)
Germany (continued)Merck KGaA, Reg. S, FRN 2.625%
12/12/2074 EUR 100,000 98,072 0.40Muenchener Rueckversicherungs-
Gesellschaft AG, Reg. S, FRN 6% 26/05/2041 EUR 200,000 238,635 0.96
RWE AG, Reg. S, FRN 4.625% Perpetual EUR 100,000 100,263 0.41SAP SE, Reg. S 1% 01/04/2025 EUR 100,000 94,027 0.38Volkswagen International Finance NV,
Reg. S, FRN 0.611% 15/04/2019 (Netherlands) (2) EUR 100,000 101,207 0.41
Volkswagen International Finance NV, Reg. S, FRN 4.625% Perpetual (Netherlands) (2) EUR 125,000 129,996 0.53
Wuerth Finance International BV, Reg. S 1% 19/05/2022 (Netherlands) (2) EUR 50,000 49,422 0.20
ZF North America Capital, Inc., Reg. S 2.75% 27/04/2023 (United States of America) (2) EUR 100,000 95,272 0.39
2,191,145 8.86
Hong KongHutchison Whampoa International 14 Ltd.,
144A 1.625% 31/10/2017 (Cayman Islands) (2) USD 200,000 178,143 0.72
Shanghai Electric Newage Co. Ltd., Reg. S 1.125% 22/05/2020 EUR 100,000 98,880 0.40
277,023 1.12
irelandBank of Ireland, Reg. S 1.25%
09/04/2020 EUR 100,000 97,140 0.39
97,140 0.39
italyAssicurazioni Generali SpA, Reg. S, FRN
7.75% 12/12/2042 EUR 100,000 119,653 0.49CDP Reti SpA, Reg. S 1.875%
29/05/2022 EUR 100,000 99,270 0.40Davide Campari-Milano SpA, Reg. S 4.5%
25/10/2019 EUR 100,000 111,356 0.45Enel SpA, Reg. S, FRN 5% 15/01/2075 EUR 100,000 104,787 0.42FCA Capital Ireland PLC, Reg. S, FRN
0.904% 17/10/2017 (Ireland) (2) EUR 200,000 200,316 0.81Intesa Sanpaolo SpA 5.25% 12/01/2024 USD 200,000 191,317 0.77Intesa Sanpaolo Vita SpA 5.35%
18/09/2018 EUR 100,000 111,334 0.45Luxottica Group SpA 4% 10/11/2015 EUR 200,000 202,726 0.82Poste Vita SpA 2.875% 30/05/2019 EUR 100,000 102,694 0.42Snam SpA, Reg. S 4.375% 11/07/2016 EUR 100,000 104,155 0.42
1,347,608 5.45
mexicoCemex SAB de CV, Reg. S 4.375%
05/03/2023 EUR 100,000 96,654 0.39
96,654 0.39
The accompanying notes are an integral part of these financial statements.
Absolute Return Fixed Income Fund (continued)
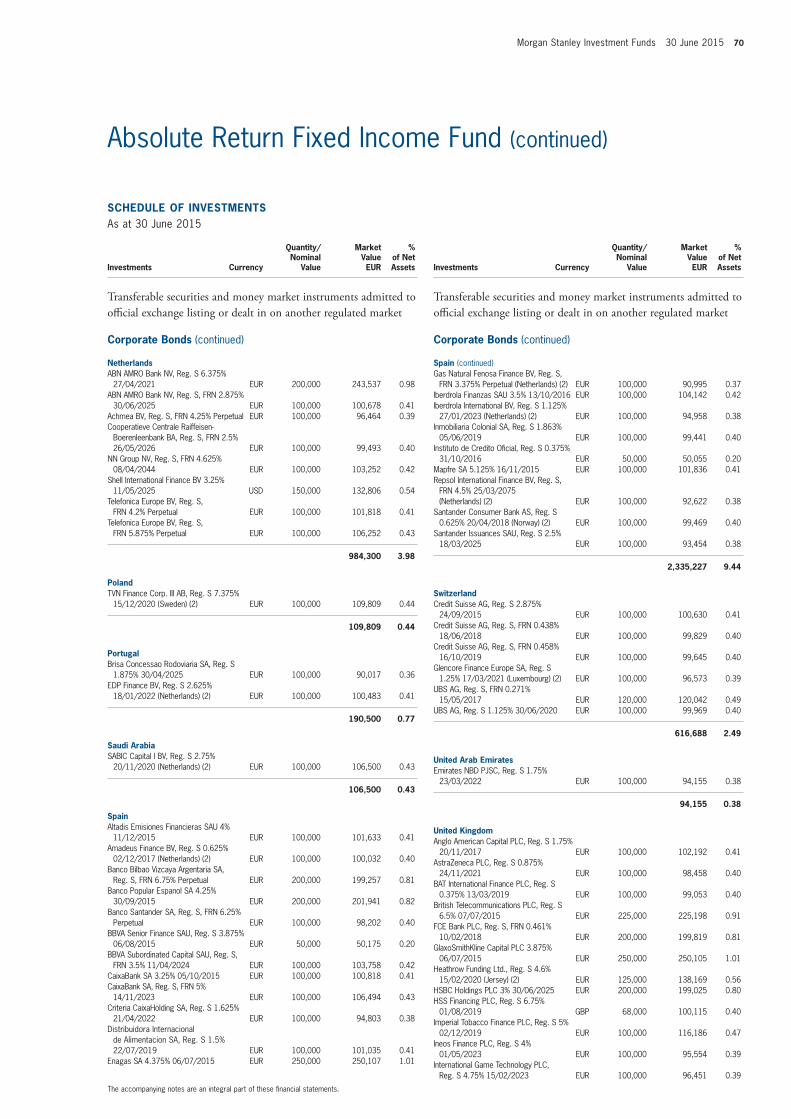
Morgan Stanley Investment Funds 30 June 2015 70
SCHEDULE of invEStmEntSAs at 30 June 2015
Investments Currency
Quantity/Nominal
Value
Market Value EUR
% of Net Assets
transferable securities and money market instruments admitted to official exchange listing or dealt in on another regulated market
Corporate Bonds (continued)
netherlandsABN AMRO Bank NV, Reg. S 6.375%
27/04/2021 EUR 200,000 243,537 0.98ABN AMRO Bank NV, Reg. S, FRN 2.875%
30/06/2025 EUR 100,000 100,678 0.41Achmea BV, Reg. S, FRN 4.25% Perpetual EUR 100,000 96,464 0.39Cooperatieve Centrale Raiffeisen-
Boerenleenbank BA, Reg. S, FRN 2.5% 26/05/2026 EUR 100,000 99,493 0.40
NN Group NV, Reg. S, FRN 4.625% 08/04/2044 EUR 100,000 103,252 0.42
Shell International Finance BV 3.25% 11/05/2025 USD 150,000 132,806 0.54
Telefonica Europe BV, Reg. S, FRN 4.2% Perpetual EUR 100,000 101,818 0.41
Telefonica Europe BV, Reg. S, FRN 5.875% Perpetual EUR 100,000 106,252 0.43
984,300 3.98
PolandTVN Finance Corp. III AB, Reg. S 7.375%
15/12/2020 (Sweden) (2) EUR 100,000 109,809 0.44
109,809 0.44
PortugalBrisa Concessao Rodoviaria SA, Reg. S
1.875% 30/04/2025 EUR 100,000 90,017 0.36EDP Finance BV, Reg. S 2.625%
18/01/2022 (Netherlands) (2) EUR 100,000 100,483 0.41
190,500 0.77
Saudi ArabiaSABIC Capital I BV, Reg. S 2.75%
20/11/2020 (Netherlands) (2) EUR 100,000 106,500 0.43
106,500 0.43
SpainAltadis Emisiones Financieras SAU 4%
11/12/2015 EUR 100,000 101,633 0.41Amadeus Finance BV, Reg. S 0.625%
02/12/2017 (Netherlands) (2) EUR 100,000 100,032 0.40Banco Bilbao Vizcaya Argentaria SA,
Reg. S, FRN 6.75% Perpetual EUR 200,000 199,257 0.81Banco Popular Espanol SA 4.25%
30/09/2015 EUR 200,000 201,941 0.82Banco Santander SA, Reg. S, FRN 6.25%
Perpetual EUR 100,000 98,202 0.40BBVA Senior Finance SAU, Reg. S 3.875%
06/08/2015 EUR 50,000 50,175 0.20BBVA Subordinated Capital SAU, Reg. S,
FRN 3.5% 11/04/2024 EUR 100,000 103,758 0.42CaixaBank SA 3.25% 05/10/2015 EUR 100,000 100,818 0.41CaixaBank SA, Reg. S, FRN 5%
14/11/2023 EUR 100,000 106,494 0.43Criteria CaixaHolding SA, Reg. S 1.625%
21/04/2022 EUR 100,000 94,803 0.38Distribuidora Internacional
de Alimentacion SA, Reg. S 1.5% 22/07/2019 EUR 100,000 101,035 0.41
Enagas SA 4.375% 06/07/2015 EUR 250,000 250,107 1.01
SCHEDULE of invEStmEntSAs at 30 June 2015
Investments Currency
Quantity/Nominal
Value
Market Value EUR
% of Net Assets
transferable securities and money market instruments admitted to official exchange listing or dealt in on another regulated market
Corporate Bonds (continued)
Spain (continued)Gas Natural Fenosa Finance BV, Reg. S,
FRN 3.375% Perpetual (Netherlands) (2) EUR 100,000 90,995 0.37Iberdrola Finanzas SAU 3.5% 13/10/2016 EUR 100,000 104,142 0.42Iberdrola International BV, Reg. S 1.125%
27/01/2023 (Netherlands) (2) EUR 100,000 94,958 0.38Inmobiliaria Colonial SA, Reg. S 1.863%
05/06/2019 EUR 100,000 99,441 0.40Instituto de Credito Oficial, Reg. S 0.375%
31/10/2016 EUR 50,000 50,055 0.20Mapfre SA 5.125% 16/11/2015 EUR 100,000 101,836 0.41Repsol International Finance BV, Reg. S,
FRN 4.5% 25/03/2075 (Netherlands) (2) EUR 100,000 92,622 0.38
Santander Consumer Bank AS, Reg. S 0.625% 20/04/2018 (Norway) (2) EUR 100,000 99,469 0.40
Santander Issuances SAU, Reg. S 2.5% 18/03/2025 EUR 100,000 93,454 0.38
2,335,227 9.44
SwitzerlandCredit Suisse AG, Reg. S 2.875%
24/09/2015 EUR 100,000 100,630 0.41Credit Suisse AG, Reg. S, FRN 0.438%
18/06/2018 EUR 100,000 99,829 0.40Credit Suisse AG, Reg. S, FRN 0.458%
16/10/2019 EUR 100,000 99,645 0.40Glencore Finance Europe SA, Reg. S
1.25% 17/03/2021 (Luxembourg) (2) EUR 100,000 96,573 0.39UBS AG, Reg. S, FRN 0.271%
15/05/2017 EUR 120,000 120,042 0.49UBS AG, Reg. S 1.125% 30/06/2020 EUR 100,000 99,969 0.40
616,688 2.49
United Arab EmiratesEmirates NBD PJSC, Reg. S 1.75%
23/03/2022 EUR 100,000 94,155 0.38
94,155 0.38
United KingdomAnglo American Capital PLC, Reg. S 1.75%
20/11/2017 EUR 100,000 102,192 0.41AstraZeneca PLC, Reg. S 0.875%
24/11/2021 EUR 100,000 98,458 0.40BAT International Finance PLC, Reg. S
0.375% 13/03/2019 EUR 100,000 99,053 0.40British Telecommunications PLC, Reg. S
6.5% 07/07/2015 EUR 225,000 225,198 0.91FCE Bank PLC, Reg. S, FRN 0.461%
10/02/2018 EUR 200,000 199,819 0.81GlaxoSmithKline Capital PLC 3.875%
06/07/2015 EUR 250,000 250,105 1.01Heathrow Funding Ltd., Reg. S 4.6%
15/02/2020 (Jersey) (2) EUR 125,000 138,169 0.56HSBC Holdings PLC 3% 30/06/2025 EUR 200,000 199,025 0.80HSS Financing PLC, Reg. S 6.75%
01/08/2019 GBP 68,000 100,115 0.40Imperial Tobacco Finance PLC, Reg. S 5%
02/12/2019 EUR 100,000 116,186 0.47Ineos Finance PLC, Reg. S 4%
01/05/2023 EUR 100,000 95,554 0.39International Game Technology PLC,
Reg. S 4.75% 15/02/2023 EUR 100,000 96,451 0.39
The accompanying notes are an integral part of these financial statements.
Absolute Return Fixed Income Fund (continued)
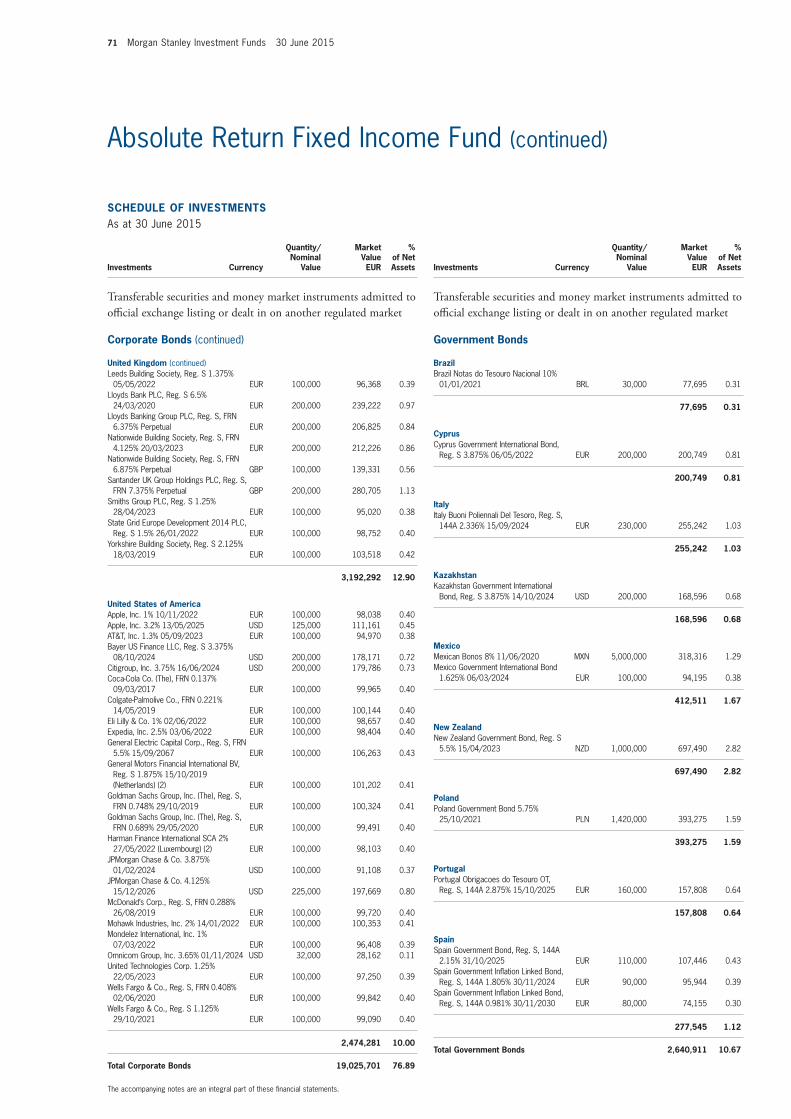
71 Morgan Stanley Investment Funds 30 June 2015
SCHEDULE of invEStmEntSAs at 30 June 2015
Investments Currency
Quantity/Nominal
Value
Market Value EUR
% of Net Assets
transferable securities and money market instruments admitted to official exchange listing or dealt in on another regulated market
Corporate Bonds (continued)
United Kingdom (continued)Leeds Building Society, Reg. S 1.375%
05/05/2022 EUR 100,000 96,368 0.39Lloyds Bank PLC, Reg. S 6.5%
24/03/2020 EUR 200,000 239,222 0.97Lloyds Banking Group PLC, Reg. S, FRN
6.375% Perpetual EUR 200,000 206,825 0.84Nationwide Building Society, Reg. S, FRN
4.125% 20/03/2023 EUR 200,000 212,226 0.86Nationwide Building Society, Reg. S, FRN
6.875% Perpetual GBP 100,000 139,331 0.56Santander UK Group Holdings PLC, Reg. S,
FRN 7.375% Perpetual GBP 200,000 280,705 1.13Smiths Group PLC, Reg. S 1.25%
28/04/2023 EUR 100,000 95,020 0.38State Grid Europe Development 2014 PLC,
Reg. S 1.5% 26/01/2022 EUR 100,000 98,752 0.40Yorkshire Building Society, Reg. S 2.125%
18/03/2019 EUR 100,000 103,518 0.42
3,192,292 12.90
United States of AmericaApple, Inc. 1% 10/11/2022 EUR 100,000 98,038 0.40Apple, Inc. 3.2% 13/05/2025 USD 125,000 111,161 0.45AT&T, Inc. 1.3% 05/09/2023 EUR 100,000 94,970 0.38Bayer US Finance LLC, Reg. S 3.375%
08/10/2024 USD 200,000 178,171 0.72Citigroup, Inc. 3.75% 16/06/2024 USD 200,000 179,786 0.73Coca-Cola Co. (The), FRN 0.137%
09/03/2017 EUR 100,000 99,965 0.40Colgate-Palmolive Co., FRN 0.221%
14/05/2019 EUR 100,000 100,144 0.40Eli Lilly & Co. 1% 02/06/2022 EUR 100,000 98,657 0.40Expedia, Inc. 2.5% 03/06/2022 EUR 100,000 98,404 0.40General Electric Capital Corp., Reg. S, FRN
5.5% 15/09/2067 EUR 100,000 106,263 0.43General Motors Financial International BV,
Reg. S 1.875% 15/10/2019 (Netherlands) (2) EUR 100,000 101,202 0.41
Goldman Sachs Group, Inc. (The), Reg. S, FRN 0.748% 29/10/2019 EUR 100,000 100,324 0.41
Goldman Sachs Group, Inc. (The), Reg. S, FRN 0.689% 29/05/2020 EUR 100,000 99,491 0.40
Harman Finance International SCA 2% 27/05/2022 (Luxembourg) (2) EUR 100,000 98,103 0.40
JPMorgan Chase & Co. 3.875% 01/02/2024 USD 100,000 91,108 0.37
JPMorgan Chase & Co. 4.125% 15/12/2026 USD 225,000 197,669 0.80
McDonald’s Corp., Reg. S, FRN 0.288% 26/08/2019 EUR 100,000 99,720 0.40
Mohawk Industries, Inc. 2% 14/01/2022 EUR 100,000 100,353 0.41Mondelez International, Inc. 1%
07/03/2022 EUR 100,000 96,408 0.39Omnicom Group, Inc. 3.65% 01/11/2024 USD 32,000 28,162 0.11United Technologies Corp. 1.25%
22/05/2023 EUR 100,000 97,250 0.39Wells Fargo & Co., Reg. S, FRN 0.408%
02/06/2020 EUR 100,000 99,842 0.40Wells Fargo & Co., Reg. S 1.125%
29/10/2021 EUR 100,000 99,090 0.40
2,474,281 10.00
total Corporate Bonds 19,025,701 76.89
SCHEDULE of invEStmEntSAs at 30 June 2015
Investments Currency
Quantity/Nominal
Value
Market Value EUR
% of Net Assets
transferable securities and money market instruments admitted to official exchange listing or dealt in on another regulated market
Government Bonds
BrazilBrazil Notas do Tesouro Nacional 10%
01/01/2021 BRL 30,000 77,695 0.31
77,695 0.31
CyprusCyprus Government International Bond,
Reg. S 3.875% 06/05/2022 EUR 200,000 200,749 0.81
200,749 0.81
italyItaly Buoni Poliennali Del Tesoro, Reg. S,
144A 2.336% 15/09/2024 EUR 230,000 255,242 1.03
255,242 1.03
KazakhstanKazakhstan Government International
Bond, Reg. S 3.875% 14/10/2024 USD 200,000 168,596 0.68
168,596 0.68
mexicoMexican Bonos 8% 11/06/2020 MXN 5,000,000 318,316 1.29Mexico Government International Bond
1.625% 06/03/2024 EUR 100,000 94,195 0.38
412,511 1.67
new ZealandNew Zealand Government Bond, Reg. S
5.5% 15/04/2023 NZD 1,000,000 697,490 2.82
697,490 2.82
PolandPoland Government Bond 5.75%
25/10/2021 PLN 1,420,000 393,275 1.59
393,275 1.59
PortugalPortugal Obrigacoes do Tesouro OT,
Reg. S, 144A 2.875% 15/10/2025 EUR 160,000 157,808 0.64
157,808 0.64
SpainSpain Government Bond, Reg. S, 144A
2.15% 31/10/2025 EUR 110,000 107,446 0.43Spain Government Inflation Linked Bond,
Reg. S, 144A 1.805% 30/11/2024 EUR 90,000 95,944 0.39Spain Government Inflation Linked Bond,
Reg. S, 144A 0.981% 30/11/2030 EUR 80,000 74,155 0.30
277,545 1.12
total Government Bonds 2,640,911 10.67
The accompanying notes are an integral part of these financial statements.
Absolute Return Fixed Income Fund (continued)
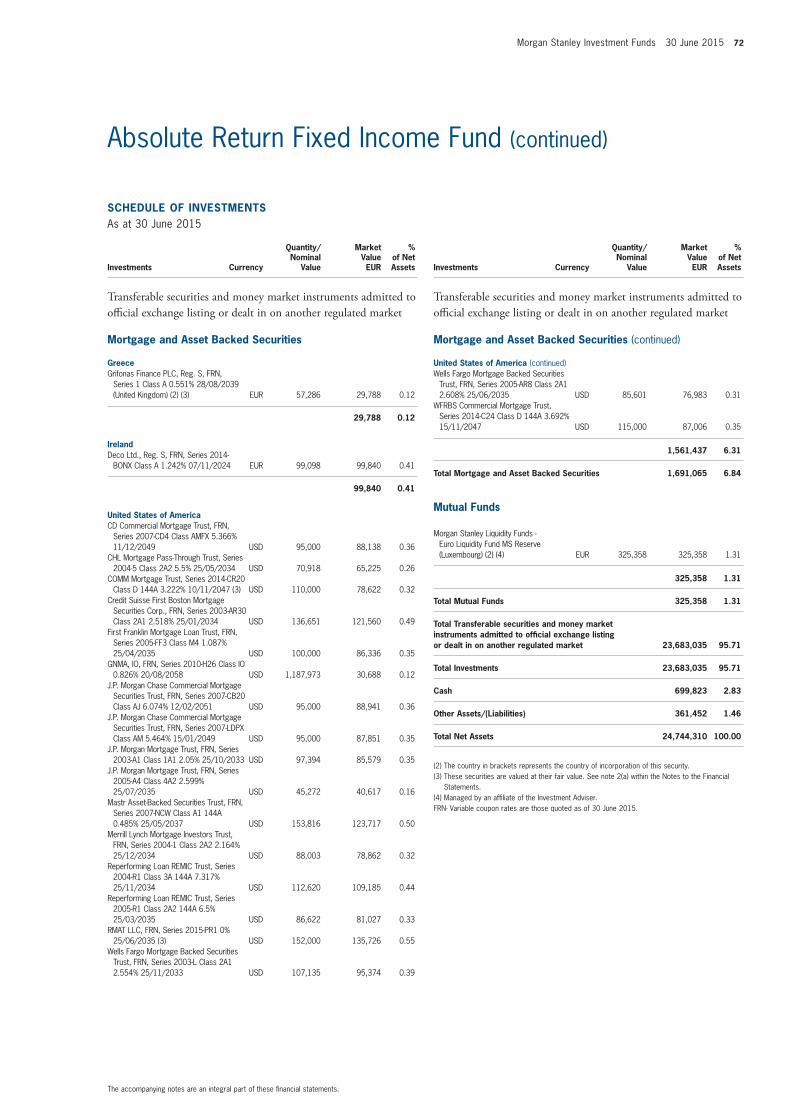
Morgan Stanley Investment Funds 30 June 2015 72
SCHEDULE of invEStmEntSAs at 30 June 2015
Investments Currency
Quantity/Nominal
Value
Market Value EUR
% of Net Assets
transferable securities and money market instruments admitted to official exchange listing or dealt in on another regulated market
mortgage and Asset Backed Securities
GreeceGrifonas Finance PLC, Reg. S, FRN,
Series 1 Class A 0.551% 28/08/2039 (United Kingdom) (2) (3) EUR 57,286 29,788 0.12
29,788 0.12
irelandDeco Ltd., Reg. S, FRN, Series 2014-
BONX Class A 1.242% 07/11/2024 EUR 99,098 99,840 0.41
99,840 0.41
United States of AmericaCD Commercial Mortgage Trust, FRN,
Series 2007-CD4 Class AMFX 5.366% 11/12/2049 USD 95,000 88,138 0.36
CHL Mortgage Pass-Through Trust, Series 2004-5 Class 2A2 5.5% 25/05/2034 USD 70,918 65,225 0.26
COMM Mortgage Trust, Series 2014-CR20 Class D 144A 3.222% 10/11/2047 (3) USD 110,000 78,622 0.32
Credit Suisse First Boston Mortgage Securities Corp., FRN, Series 2003-AR30 Class 2A1 2.518% 25/01/2034 USD 136,651 121,560 0.49
First Franklin Mortgage Loan Trust, FRN, Series 2005-FF3 Class M4 1.087% 25/04/2035 USD 100,000 86,336 0.35
GNMA, IO, FRN, Series 2010-H26 Class IO 0.826% 20/08/2058 USD 1,187,973 30,688 0.12
J.P. Morgan Chase Commercial Mortgage Securities Trust, FRN, Series 2007-CB20 Class AJ 6.074% 12/02/2051 USD 95,000 88,941 0.36
J.P. Morgan Chase Commercial Mortgage Securities Trust, FRN, Series 2007-LDPX Class AM 5.464% 15/01/2049 USD 95,000 87,851 0.35
J.P. Morgan Mortgage Trust, FRN, Series 2003-A1 Class 1A1 2.05% 25/10/2033 USD 97,394 85,579 0.35
J.P. Morgan Mortgage Trust, FRN, Series 2005-A4 Class 4A2 2.599% 25/07/2035 USD 45,272 40,617 0.16
Mastr Asset-Backed Securities Trust, FRN, Series 2007-NCW Class A1 144A 0.485% 25/05/2037 USD 153,816 123,717 0.50
Merrill Lynch Mortgage Investors Trust, FRN, Series 2004-1 Class 2A2 2.164% 25/12/2034 USD 88,003 78,862 0.32
Reperforming Loan REMIC Trust, Series 2004-R1 Class 3A 144A 7.317% 25/11/2034 USD 112,620 109,185 0.44
Reperforming Loan REMIC Trust, Series 2005-R1 Class 2A2 144A 6.5% 25/03/2035 USD 86,622 81,027 0.33
RMAT LLC, FRN, Series 2015-PR1 0% 25/06/2035 (3) USD 152,000 135,726 0.55
Wells Fargo Mortgage Backed Securities Trust, FRN, Series 2003-L Class 2A1 2.554% 25/11/2033 USD 107,135 95,374 0.39
SCHEDULE of invEStmEntSAs at 30 June 2015
Investments Currency
Quantity/Nominal
Value
Market Value EUR
% of Net Assets
transferable securities and money market instruments admitted to official exchange listing or dealt in on another regulated market
mortgage and Asset Backed Securities (continued)
United States of America (continued)Wells Fargo Mortgage Backed Securities
Trust, FRN, Series 2005-AR8 Class 2A1 2.608% 25/06/2035 USD 85,601 76,983 0.31
WFRBS Commercial Mortgage Trust, Series 2014-C24 Class D 144A 3.692% 15/11/2047 USD 115,000 87,006 0.35
1,561,437 6.31
total mortgage and Asset Backed Securities 1,691,065 6.84
mutual funds
Morgan Stanley Liquidity Funds - Euro Liquidity Fund MS Reserve (Luxembourg) (2) (4) EUR 325,358 325,358 1.31
325,358 1.31
total mutual funds 325,358 1.31
total transferable securities and money market instruments admitted to official exchange listing or dealt in on another regulated market 23,683,035 95.71
total investments 23,683,035 95.71
Cash 699,823 2.83
other Assets/(Liabilities) 361,452 1.46
total net Assets 24,744,310 100.00
(2) The country in brackets represents the country of incorporation of this security. (3) These securities are valued at their fair value. See note 2(a) within the Notes to the Financial
Statements.(4) Managed by an affiliate of the Investment Adviser.FRN- Variable coupon rates are those quoted as of 30 June 2015.
The accompanying notes are an integral part of these financial statements.
Absolute Return Fixed Income Fund (continued)
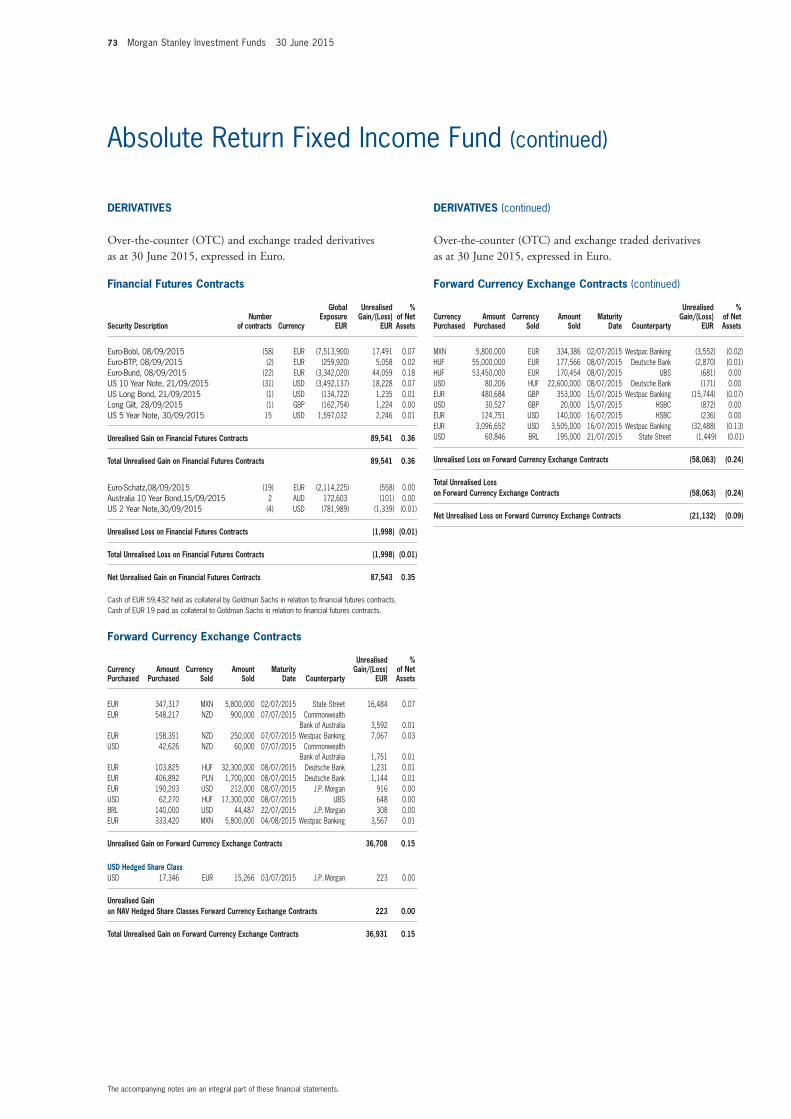
73 Morgan Stanley Investment Funds 30 June 2015
The accompanying notes are an integral part of these financial statements.
Absolute Return Fixed Income Fund (continued)
financial futures Contracts
Security Descriptionnumber
of contracts Currency
Global Exposure
EUR
Unrealised Gain/(Loss)
EUR
% of net Assets
Euro-Bobl, 08/09/2015 (58) EUR (7,513,900) 17,491 0.07Euro-BTP, 08/09/2015 (2) EUR (259,920) 5,058 0.02Euro-Bund, 08/09/2015 (22) EUR (3,342,020) 44,059 0.18US 10 Year Note, 21/09/2015 (31) USD (3,492,137) 18,228 0.07US Long Bond, 21/09/2015 (1) USD (134,722) 1,235 0.01Long Gilt, 28/09/2015 (1) GBP (162,754) 1,224 0.00US 5 Year Note, 30/09/2015 15 USD 1,597,032 2,246 0.01
Unrealised Gain on financial futures Contracts 89,541 0.36
total Unrealised Gain on financial futures Contracts 89,541 0.36
Euro-Schatz,08/09/2015 (19) EUR (2,114,225) (558) 0.00Australia 10 Year Bond,15/09/2015 2 AUD 172,603 (101) 0.00US 2 Year Note,30/09/2015 (4) USD (781,989) (1,339) (0.01)
Unrealised Loss on financial futures Contracts (1,998) (0.01)
total Unrealised Loss on financial futures Contracts (1,998) (0.01)
net Unrealised Gain on financial futures Contracts 87,543 0.35
Cash of EUR 59,432 held as collateral by Goldman Sachs in relation to financial futures contracts.Cash of EUR 19 paid as collateral to Goldman Sachs in relation to financial futures contracts.
forward Currency Exchange Contracts (continued)
Currency Purchased
Amount Purchased
Currency Sold
Amount Sold
maturity Date Counterparty
Unrealised Gain/(Loss)
EUR
% of net Assets
EUR 347,317 MXN 5,800,000 02/07/2015 State Street 16,484 0.07EUR 548,217 NZD 900,000 07/07/2015 Commonwealth
Bank of Australia 3,592 0.01EUR 158,351 NZD 250,000 07/07/2015 Westpac Banking 7,067 0.03USD 42,626 NZD 60,000 07/07/2015 Commonwealth
Bank of Australia 1,751 0.01EUR 103,825 HUF 32,300,000 08/07/2015 Deutsche Bank 1,231 0.01EUR 406,892 PLN 1,700,000 08/07/2015 Deutsche Bank 1,144 0.01EUR 190,203 USD 212,000 08/07/2015 J.P. Morgan 916 0.00USD 62,270 HUF 17,300,000 08/07/2015 UBS 648 0.00BRL 140,000 USD 44,487 22/07/2015 J.P. Morgan 308 0.00EUR 333,420 MXN 5,800,000 04/08/2015 Westpac Banking 3,567 0.01
Unrealised Gain on forward Currency Exchange Contracts 36,708 0.15
USD Hedged Share ClassUSD 17,346 EUR 15,266 03/07/2015 J.P. Morgan 223 0.00
Unrealised Gain on nAv Hedged Share Classes forward Currency Exchange Contracts 223 0.00
total Unrealised Gain on forward Currency Exchange Contracts 36,931 0.15
forward Currency Exchange Contracts (continued)
Currency Purchased
Amount Purchased
Currency Sold
Amount Sold
maturity Date Counterparty
Unrealised Gain/(Loss)
EUR
% of net Assets
MXN 5,800,000 EUR 334,386 02/07/2015 Westpac Banking (3,552) (0.02)HUF 55,000,000 EUR 177,566 08/07/2015 Deutsche Bank (2,870) (0.01)HUF 53,450,000 EUR 170,454 08/07/2015 UBS (681) 0.00USD 80,206 HUF 22,600,000 08/07/2015 Deutsche Bank (171) 0.00EUR 480,684 GBP 353,000 15/07/2015 Westpac Banking (15,744) (0.07)USD 30,527 GBP 20,000 15/07/2015 HSBC (872) 0.00EUR 124,751 USD 140,000 16/07/2015 HSBC (236) 0.00EUR 3,096,652 USD 3,505,000 16/07/2015 Westpac Banking (32,488) (0.13)USD 60,846 BRL 195,000 21/07/2015 State Street (1,449) (0.01)
Unrealised Loss on forward Currency Exchange Contracts (58,063) (0.24)
total Unrealised Loss on forward Currency Exchange Contracts (58,063) (0.24)
net Unrealised Loss on forward Currency Exchange Contracts (21,132) (0.09)
DERivAtivES
Over-the-counter (OtC) and exchange traded derivatives as at 30 June 2015, expressed in euro.
DERivAtivES (continued)
Over-the-counter (OtC) and exchange traded derivatives as at 30 June 2015, expressed in euro.
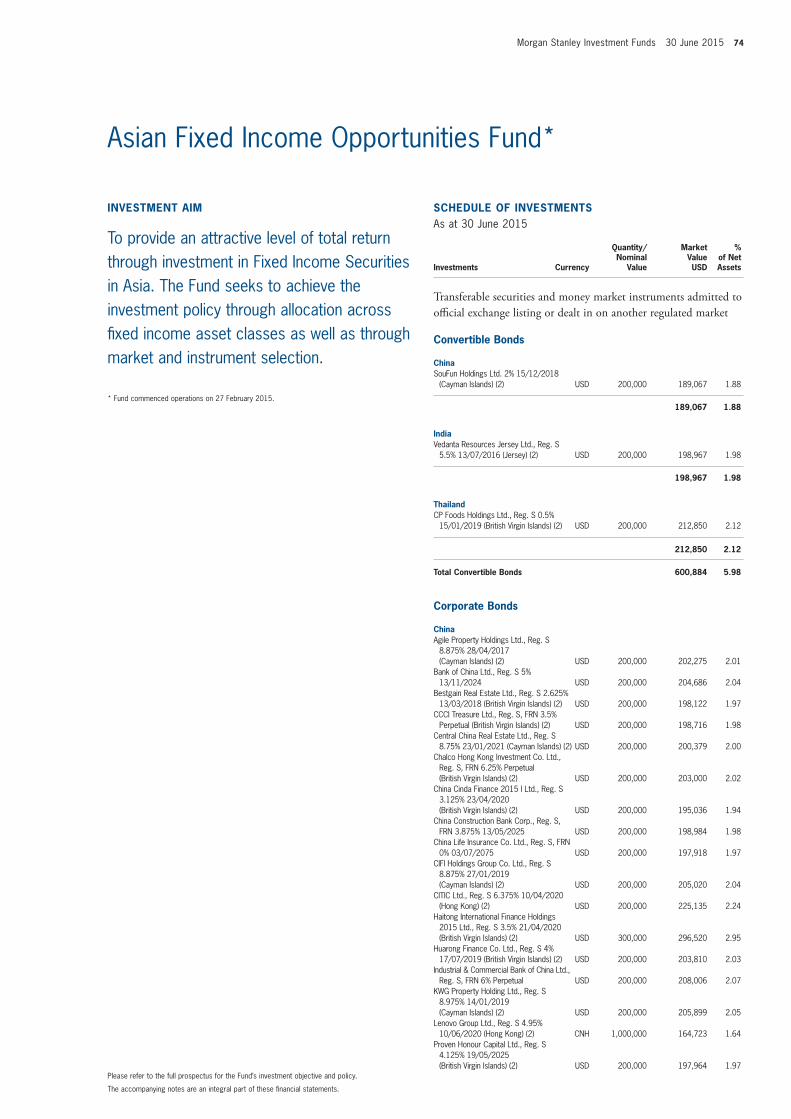
Morgan Stanley Investment Funds 30 June 2015 74
invEStmEnt Aim
To provide an attractive level of total return through investment in Fixed Income Securities in Asia. The Fund seeks to achieve the investment policy through allocation across fixed income asset classes as well as through market and instrument selection.
* Fund commenced operations on 27 February 2015.
SCHEDULE of invEStmEntSAs at 30 June 2015
Investments Currency
Quantity/Nominal
Value
Market Value USD
% of Net Assets
transferable securities and money market instruments admitted to official exchange listing or dealt in on another regulated market
Convertible Bonds
ChinaSouFun Holdings Ltd. 2% 15/12/2018
(Cayman Islands) (2) USD 200,000 189,067 1.88
189,067 1.88
indiaVedanta Resources Jersey Ltd., Reg. S
5.5% 13/07/2016 (Jersey) (2) USD 200,000 198,967 1.98
198,967 1.98
thailandCP Foods Holdings Ltd., Reg. S 0.5%
15/01/2019 (British Virgin Islands) (2) USD 200,000 212,850 2.12
212,850 2.12
total Convertible Bonds 600,884 5.98
Corporate Bonds
ChinaAgile Property Holdings Ltd., Reg. S
8.875% 28/04/2017 (Cayman Islands) (2) USD 200,000 202,275 2.01
Bank of China Ltd., Reg. S 5% 13/11/2024 USD 200,000 204,686 2.04
Bestgain Real Estate Ltd., Reg. S 2.625% 13/03/2018 (British Virgin Islands) (2) USD 200,000 198,122 1.97
CCCI Treasure Ltd., Reg. S, FRN 3.5% Perpetual (British Virgin Islands) (2) USD 200,000 198,716 1.98
Central China Real Estate Ltd., Reg. S 8.75% 23/01/2021 (Cayman Islands) (2) USD 200,000 200,379 2.00
Chalco Hong Kong Investment Co. Ltd., Reg. S, FRN 6.25% Perpetual (British Virgin Islands) (2) USD 200,000 203,000 2.02
China Cinda Finance 2015 I Ltd., Reg. S 3.125% 23/04/2020 (British Virgin Islands) (2) USD 200,000 195,036 1.94
China Construction Bank Corp., Reg. S, FRN 3.875% 13/05/2025 USD 200,000 198,984 1.98
China Life Insurance Co. Ltd., Reg. S, FRN 0% 03/07/2075 USD 200,000 197,918 1.97
CIFI Holdings Group Co. Ltd., Reg. S 8.875% 27/01/2019 (Cayman Islands) (2) USD 200,000 205,020 2.04
CITIC Ltd., Reg. S 6.375% 10/04/2020 (Hong Kong) (2) USD 200,000 225,135 2.24
Haitong International Finance Holdings 2015 Ltd., Reg. S 3.5% 21/04/2020 (British Virgin Islands) (2) USD 300,000 296,520 2.95
Huarong Finance Co. Ltd., Reg. S 4% 17/07/2019 (British Virgin Islands) (2) USD 200,000 203,810 2.03
Industrial & Commercial Bank of China Ltd., Reg. S, FRN 6% Perpetual USD 200,000 208,006 2.07
KWG Property Holding Ltd., Reg. S 8.975% 14/01/2019 (Cayman Islands) (2) USD 200,000 205,899 2.05
Lenovo Group Ltd., Reg. S 4.95% 10/06/2020 (Hong Kong) (2) CNH 1,000,000 164,723 1.64
Proven Honour Capital Ltd., Reg. S 4.125% 19/05/2025 (British Virgin Islands) (2) USD 200,000 197,964 1.97
The accompanying notes are an integral part of these financial statements.
Please refer to the full prospectus for the Fund’s investment objective and policy.
Asian Fixed Income Opportunities Fund*
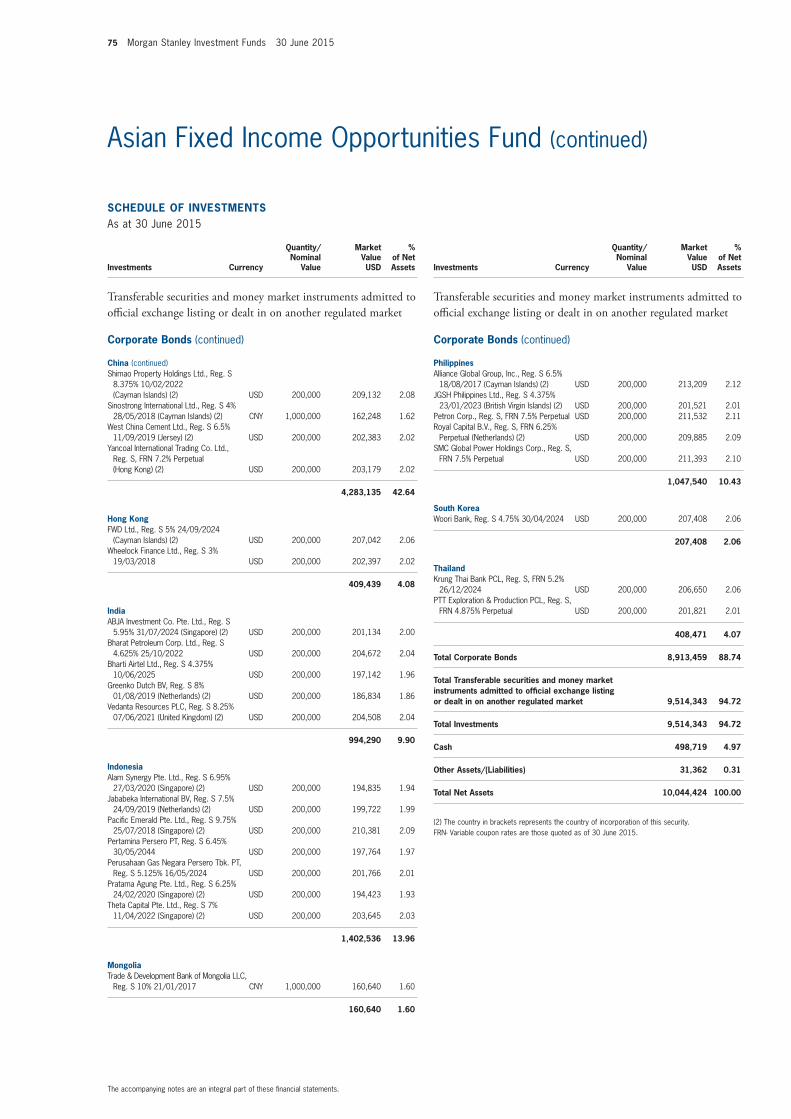
75 Morgan Stanley Investment Funds 30 June 2015
SCHEDULE of invEStmEntSAs at 30 June 2015
Investments Currency
Quantity/Nominal
Value
Market Value USD
% of Net Assets
transferable securities and money market instruments admitted to official exchange listing or dealt in on another regulated market
Corporate Bonds (continued)
China (continued)Shimao Property Holdings Ltd., Reg. S
8.375% 10/02/2022 (Cayman Islands) (2) USD 200,000 209,132 2.08
Sinostrong International Ltd., Reg. S 4% 28/05/2018 (Cayman Islands) (2) CNY 1,000,000 162,248 1.62
West China Cement Ltd., Reg. S 6.5% 11/09/2019 (Jersey) (2) USD 200,000 202,383 2.02
Yancoal International Trading Co. Ltd., Reg. S, FRN 7.2% Perpetual (Hong Kong) (2) USD 200,000 203,179 2.02
4,283,135 42.64
Hong KongFWD Ltd., Reg. S 5% 24/09/2024
(Cayman Islands) (2) USD 200,000 207,042 2.06Wheelock Finance Ltd., Reg. S 3%
19/03/2018 USD 200,000 202,397 2.02
409,439 4.08
indiaABJA Investment Co. Pte. Ltd., Reg. S
5.95% 31/07/2024 (Singapore) (2) USD 200,000 201,134 2.00Bharat Petroleum Corp. Ltd., Reg. S
4.625% 25/10/2022 USD 200,000 204,672 2.04Bharti Airtel Ltd., Reg. S 4.375%
10/06/2025 USD 200,000 197,142 1.96Greenko Dutch BV, Reg. S 8%
01/08/2019 (Netherlands) (2) USD 200,000 186,834 1.86Vedanta Resources PLC, Reg. S 8.25%
07/06/2021 (United Kingdom) (2) USD 200,000 204,508 2.04
994,290 9.90
indonesiaAlam Synergy Pte. Ltd., Reg. S 6.95%
27/03/2020 (Singapore) (2) USD 200,000 194,835 1.94Jababeka International BV, Reg. S 7.5%
24/09/2019 (Netherlands) (2) USD 200,000 199,722 1.99Pacific Emerald Pte. Ltd., Reg. S 9.75%
25/07/2018 (Singapore) (2) USD 200,000 210,381 2.09Pertamina Persero PT, Reg. S 6.45%
30/05/2044 USD 200,000 197,764 1.97Perusahaan Gas Negara Persero Tbk. PT,
Reg. S 5.125% 16/05/2024 USD 200,000 201,766 2.01Pratama Agung Pte. Ltd., Reg. S 6.25%
24/02/2020 (Singapore) (2) USD 200,000 194,423 1.93Theta Capital Pte. Ltd., Reg. S 7%
11/04/2022 (Singapore) (2) USD 200,000 203,645 2.03
1,402,536 13.96
mongoliaTrade & Development Bank of Mongolia LLC,
Reg. S 10% 21/01/2017 CNY 1,000,000 160,640 1.60
160,640 1.60
SCHEDULE of invEStmEntSAs at 30 June 2015
Investments Currency
Quantity/Nominal
Value
Market Value USD
% of Net Assets
transferable securities and money market instruments admitted to official exchange listing or dealt in on another regulated market
Corporate Bonds (continued)
PhilippinesAlliance Global Group, Inc., Reg. S 6.5%
18/08/2017 (Cayman Islands) (2) USD 200,000 213,209 2.12JGSH Philippines Ltd., Reg. S 4.375%
23/01/2023 (British Virgin Islands) (2) USD 200,000 201,521 2.01Petron Corp., Reg. S, FRN 7.5% Perpetual USD 200,000 211,532 2.11Royal Capital B.V., Reg. S, FRN 6.25%
Perpetual (Netherlands) (2) USD 200,000 209,885 2.09SMC Global Power Holdings Corp., Reg. S,
FRN 7.5% Perpetual USD 200,000 211,393 2.10
1,047,540 10.43
South KoreaWoori Bank, Reg. S 4.75% 30/04/2024 USD 200,000 207,408 2.06
207,408 2.06
thailandKrung Thai Bank PCL, Reg. S, FRN 5.2%
26/12/2024 USD 200,000 206,650 2.06PTT Exploration & Production PCL, Reg. S,
FRN 4.875% Perpetual USD 200,000 201,821 2.01
408,471 4.07
total Corporate Bonds 8,913,459 88.74
total transferable securities and money market instruments admitted to official exchange listing or dealt in on another regulated market 9,514,343 94.72
total investments 9,514,343 94.72
Cash 498,719 4.97
other Assets/(Liabilities) 31,362 0.31
total net Assets 10,044,424 100.00
(2) The country in brackets represents the country of incorporation of this security.FRN- Variable coupon rates are those quoted as of 30 June 2015.
The accompanying notes are an integral part of these financial statements.
Asian Fixed Income Opportunities Fund (continued)
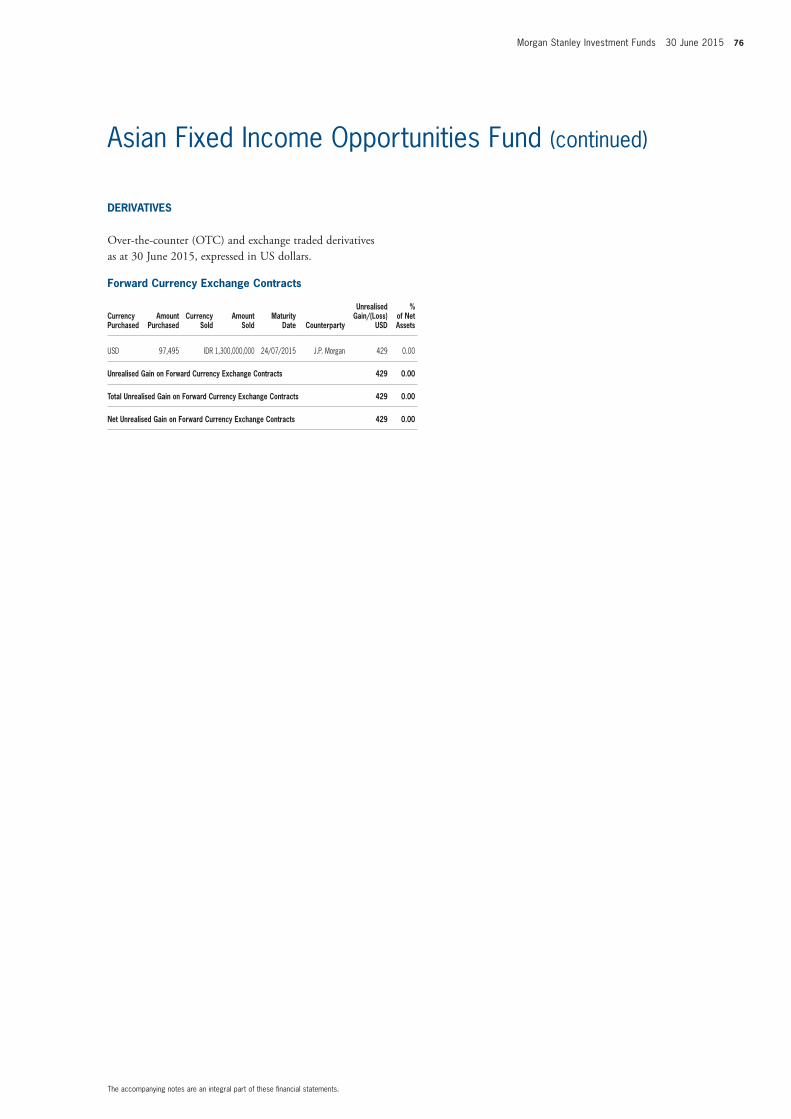
Morgan Stanley Investment Funds 30 June 2015 76
DERivAtivES
Over-the-counter (OtC) and exchange traded derivatives as at 30 June 2015, expressed in US dollars.
forward Currency Exchange Contracts
Currency Purchased
Amount Purchased
Currency Sold
Amount Sold
maturity Date Counterparty
Unrealised Gain/(Loss)
USD
% of net Assets
USD 97,495 IDR 1,300,000,000 24/07/2015 J.P. Morgan 429 0.00
Unrealised Gain on forward Currency Exchange Contracts 429 0.00
total Unrealised Gain on forward Currency Exchange Contracts 429 0.00
net Unrealised Gain on forward Currency Exchange Contracts 429 0.00
The accompanying notes are an integral part of these financial statements.
Asian Fixed Income Opportunities Fund (continued)
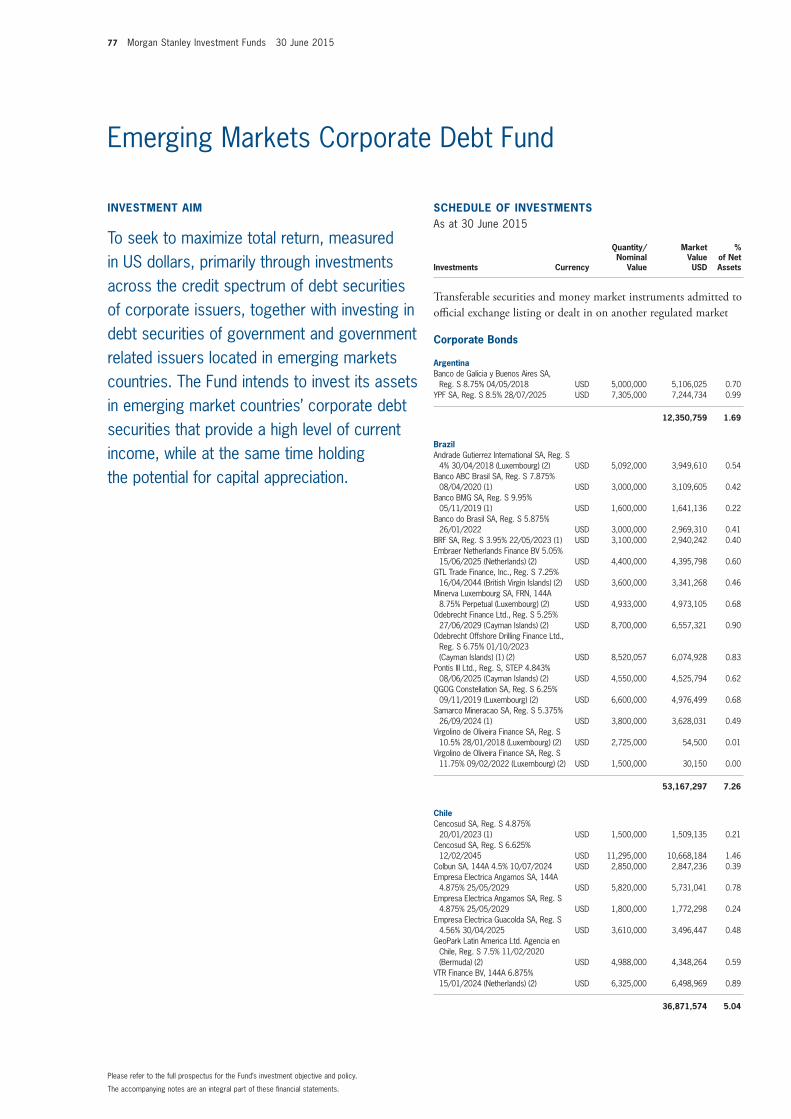
77 Morgan Stanley Investment Funds 30 June 2015
invEStmEnt Aim
To seek to maximize total return, measured in US dollars, primarily through investments across the credit spectrum of debt securities of corporate issuers, together with investing in debt securities of government and government related issuers located in emerging markets countries. The Fund intends to invest its assets in emerging market countries’ corporate debt securities that provide a high level of current income, while at the same time holding the potential for capital appreciation.
SCHEDULE of invEStmEntSAs at 30 June 2015
Investments Currency
Quantity/Nominal
Value
Market Value USD
% of Net Assets
transferable securities and money market instruments admitted to official exchange listing or dealt in on another regulated market
Corporate Bonds
ArgentinaBanco de Galicia y Buenos Aires SA,
Reg. S 8.75% 04/05/2018 USD 5,000,000 5,106,025 0.70YPF SA, Reg. S 8.5% 28/07/2025 USD 7,305,000 7,244,734 0.99
12,350,759 1.69
BrazilAndrade Gutierrez International SA, Reg. S
4% 30/04/2018 (Luxembourg) (2) USD 5,092,000 3,949,610 0.54Banco ABC Brasil SA, Reg. S 7.875%
08/04/2020 (1) USD 3,000,000 3,109,605 0.42Banco BMG SA, Reg. S 9.95%
05/11/2019 (1) USD 1,600,000 1,641,136 0.22Banco do Brasil SA, Reg. S 5.875%
26/01/2022 USD 3,000,000 2,969,310 0.41BRF SA, Reg. S 3.95% 22/05/2023 (1) USD 3,100,000 2,940,242 0.40Embraer Netherlands Finance BV 5.05%
15/06/2025 (Netherlands) (2) USD 4,400,000 4,395,798 0.60GTL Trade Finance, Inc., Reg. S 7.25%
16/04/2044 (British Virgin Islands) (2) USD 3,600,000 3,341,268 0.46Minerva Luxembourg SA, FRN, 144A
8.75% Perpetual (Luxembourg) (2) USD 4,933,000 4,973,105 0.68Odebrecht Finance Ltd., Reg. S 5.25%
27/06/2029 (Cayman Islands) (2) USD 8,700,000 6,557,321 0.90Odebrecht Offshore Drilling Finance Ltd.,
Reg. S 6.75% 01/10/2023 (Cayman Islands) (1) (2) USD 8,520,057 6,074,928 0.83
Pontis III Ltd., Reg. S, STEP 4.843% 08/06/2025 (Cayman Islands) (2) USD 4,550,000 4,525,794 0.62
QGOG Constellation SA, Reg. S 6.25% 09/11/2019 (Luxembourg) (2) USD 6,600,000 4,976,499 0.68
Samarco Mineracao SA, Reg. S 5.375% 26/09/2024 (1) USD 3,800,000 3,628,031 0.49
Virgolino de Oliveira Finance SA, Reg. S 10.5% 28/01/2018 (Luxembourg) (2) USD 2,725,000 54,500 0.01
Virgolino de Oliveira Finance SA, Reg. S 11.75% 09/02/2022 (Luxembourg) (2) USD 1,500,000 30,150 0.00
53,167,297 7.26
ChileCencosud SA, Reg. S 4.875%
20/01/2023 (1) USD 1,500,000 1,509,135 0.21Cencosud SA, Reg. S 6.625%
12/02/2045 USD 11,295,000 10,668,184 1.46Colbun SA, 144A 4.5% 10/07/2024 USD 2,850,000 2,847,236 0.39Empresa Electrica Angamos SA, 144A
4.875% 25/05/2029 USD 5,820,000 5,731,041 0.78Empresa Electrica Angamos SA, Reg. S
4.875% 25/05/2029 USD 1,800,000 1,772,298 0.24Empresa Electrica Guacolda SA, Reg. S
4.56% 30/04/2025 USD 3,610,000 3,496,447 0.48GeoPark Latin America Ltd. Agencia en
Chile, Reg. S 7.5% 11/02/2020 (Bermuda) (2) USD 4,988,000 4,348,264 0.59
VTR Finance BV, 144A 6.875% 15/01/2024 (Netherlands) (2) USD 6,325,000 6,498,969 0.89
36,871,574 5.04
The accompanying notes are an integral part of these financial statements.
Please refer to the full prospectus for the Fund’s investment objective and policy.
Emerging Markets Corporate Debt Fund
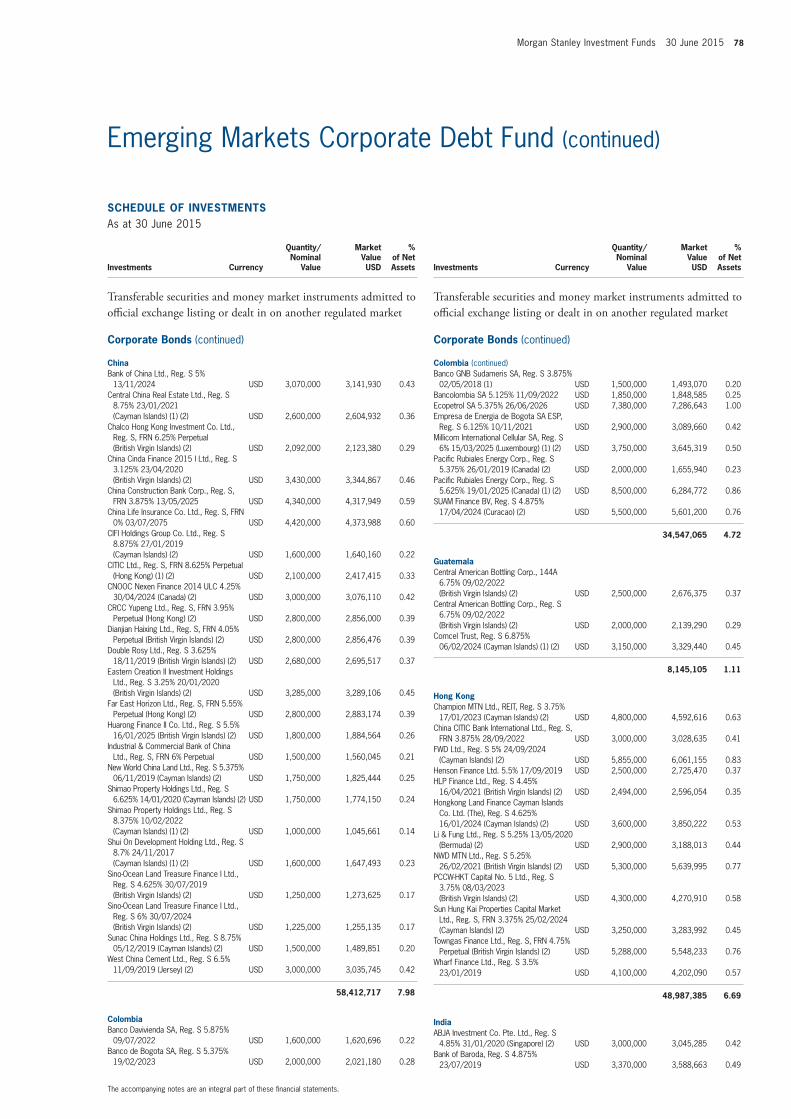
Morgan Stanley Investment Funds 30 June 2015 78
SCHEDULE of invEStmEntSAs at 30 June 2015
Investments Currency
Quantity/Nominal
Value
Market Value USD
% of Net Assets
transferable securities and money market instruments admitted to official exchange listing or dealt in on another regulated market
Corporate Bonds (continued)
ChinaBank of China Ltd., Reg. S 5%
13/11/2024 USD 3,070,000 3,141,930 0.43Central China Real Estate Ltd., Reg. S
8.75% 23/01/2021 (Cayman Islands) (1) (2) USD 2,600,000 2,604,932 0.36
Chalco Hong Kong Investment Co. Ltd., Reg. S, FRN 6.25% Perpetual (British Virgin Islands) (2) USD 2,092,000 2,123,380 0.29
China Cinda Finance 2015 I Ltd., Reg. S 3.125% 23/04/2020 (British Virgin Islands) (2) USD 3,430,000 3,344,867 0.46
China Construction Bank Corp., Reg. S, FRN 3.875% 13/05/2025 USD 4,340,000 4,317,949 0.59
China Life Insurance Co. Ltd., Reg. S, FRN 0% 03/07/2075 USD 4,420,000 4,373,988 0.60
CIFI Holdings Group Co. Ltd., Reg. S 8.875% 27/01/2019 (Cayman Islands) (2) USD 1,600,000 1,640,160 0.22
CITIC Ltd., Reg. S, FRN 8.625% Perpetual (Hong Kong) (1) (2) USD 2,100,000 2,417,415 0.33
CNOOC Nexen Finance 2014 ULC 4.25% 30/04/2024 (Canada) (2) USD 3,000,000 3,076,110 0.42
CRCC Yupeng Ltd., Reg. S, FRN 3.95% Perpetual (Hong Kong) (2) USD 2,800,000 2,856,000 0.39
Dianjian Haixing Ltd., Reg. S, FRN 4.05% Perpetual (British Virgin Islands) (2) USD 2,800,000 2,856,476 0.39
Double Rosy Ltd., Reg. S 3.625% 18/11/2019 (British Virgin Islands) (2) USD 2,680,000 2,695,517 0.37
Eastern Creation II Investment Holdings Ltd., Reg. S 3.25% 20/01/2020 (British Virgin Islands) (2) USD 3,285,000 3,289,106 0.45
Far East Horizon Ltd., Reg. S, FRN 5.55% Perpetual (Hong Kong) (2) USD 2,800,000 2,883,174 0.39
Huarong Finance II Co. Ltd., Reg. S 5.5% 16/01/2025 (British Virgin Islands) (2) USD 1,800,000 1,884,564 0.26
Industrial & Commercial Bank of China Ltd., Reg. S, FRN 6% Perpetual USD 1,500,000 1,560,045 0.21
New World China Land Ltd., Reg. S 5.375% 06/11/2019 (Cayman Islands) (2) USD 1,750,000 1,825,444 0.25
Shimao Property Holdings Ltd., Reg. S 6.625% 14/01/2020 (Cayman Islands) (2) USD 1,750,000 1,774,150 0.24
Shimao Property Holdings Ltd., Reg. S 8.375% 10/02/2022 (Cayman Islands) (1) (2) USD 1,000,000 1,045,661 0.14
Shui On Development Holding Ltd., Reg. S 8.7% 24/11/2017 (Cayman Islands) (1) (2) USD 1,600,000 1,647,493 0.23
Sino-Ocean Land Treasure Finance I Ltd., Reg. S 4.625% 30/07/2019 (British Virgin Islands) (2) USD 1,250,000 1,273,625 0.17
Sino-Ocean Land Treasure Finance I Ltd., Reg. S 6% 30/07/2024 (British Virgin Islands) (2) USD 1,225,000 1,255,135 0.17
Sunac China Holdings Ltd., Reg. S 8.75% 05/12/2019 (Cayman Islands) (2) USD 1,500,000 1,489,851 0.20
West China Cement Ltd., Reg. S 6.5% 11/09/2019 (Jersey) (2) USD 3,000,000 3,035,745 0.42
58,412,717 7.98
ColombiaBanco Davivienda SA, Reg. S 5.875%
09/07/2022 USD 1,600,000 1,620,696 0.22Banco de Bogota SA, Reg. S 5.375%
19/02/2023 USD 2,000,000 2,021,180 0.28
SCHEDULE of invEStmEntSAs at 30 June 2015
Investments Currency
Quantity/Nominal
Value
Market Value USD
% of Net Assets
transferable securities and money market instruments admitted to official exchange listing or dealt in on another regulated market
Corporate Bonds (continued)
Colombia (continued)Banco GNB Sudameris SA, Reg. S 3.875%
02/05/2018 (1) USD 1,500,000 1,493,070 0.20Bancolombia SA 5.125% 11/09/2022 USD 1,850,000 1,848,585 0.25Ecopetrol SA 5.375% 26/06/2026 USD 7,380,000 7,286,643 1.00Empresa de Energia de Bogota SA ESP,
Reg. S 6.125% 10/11/2021 USD 2,900,000 3,089,660 0.42Millicom International Cellular SA, Reg. S
6% 15/03/2025 (Luxembourg) (1) (2) USD 3,750,000 3,645,319 0.50Pacific Rubiales Energy Corp., Reg. S
5.375% 26/01/2019 (Canada) (2) USD 2,000,000 1,655,940 0.23Pacific Rubiales Energy Corp., Reg. S
5.625% 19/01/2025 (Canada) (1) (2) USD 8,500,000 6,284,772 0.86SUAM Finance BV, Reg. S 4.875%
17/04/2024 (Curacao) (2) USD 5,500,000 5,601,200 0.76
34,547,065 4.72
GuatemalaCentral American Bottling Corp., 144A
6.75% 09/02/2022 (British Virgin Islands) (2) USD 2,500,000 2,676,375 0.37
Central American Bottling Corp., Reg. S 6.75% 09/02/2022 (British Virgin Islands) (2) USD 2,000,000 2,139,290 0.29
Comcel Trust, Reg. S 6.875% 06/02/2024 (Cayman Islands) (1) (2) USD 3,150,000 3,329,440 0.45
8,145,105 1.11
Hong KongChampion MTN Ltd., REIT, Reg. S 3.75%
17/01/2023 (Cayman Islands) (2) USD 4,800,000 4,592,616 0.63China CITIC Bank International Ltd., Reg. S,
FRN 3.875% 28/09/2022 USD 3,000,000 3,028,635 0.41FWD Ltd., Reg. S 5% 24/09/2024
(Cayman Islands) (2) USD 5,855,000 6,061,155 0.83Henson Finance Ltd. 5.5% 17/09/2019 USD 2,500,000 2,725,470 0.37HLP Finance Ltd., Reg. S 4.45%
16/04/2021 (British Virgin Islands) (2) USD 2,494,000 2,596,054 0.35Hongkong Land Finance Cayman Islands
Co. Ltd. (The), Reg. S 4.625% 16/01/2024 (Cayman Islands) (2) USD 3,600,000 3,850,222 0.53
Li & Fung Ltd., Reg. S 5.25% 13/05/2020 (Bermuda) (2) USD 2,900,000 3,188,013 0.44
NWD MTN Ltd., Reg. S 5.25% 26/02/2021 (British Virgin Islands) (2) USD 5,300,000 5,639,995 0.77
PCCW-HKT Capital No. 5 Ltd., Reg. S 3.75% 08/03/2023 (British Virgin Islands) (2) USD 4,300,000 4,270,910 0.58
Sun Hung Kai Properties Capital Market Ltd., Reg. S, FRN 3.375% 25/02/2024 (Cayman Islands) (2) USD 3,250,000 3,283,992 0.45
Towngas Finance Ltd., Reg. S, FRN 4.75% Perpetual (British Virgin Islands) (2) USD 5,288,000 5,548,233 0.76
Wharf Finance Ltd., Reg. S 3.5% 23/01/2019 USD 4,100,000 4,202,090 0.57
48,987,385 6.69
indiaABJA Investment Co. Pte. Ltd., Reg. S
4.85% 31/01/2020 (Singapore) (2) USD 3,000,000 3,045,285 0.42Bank of Baroda, Reg. S 4.875%
23/07/2019 USD 3,370,000 3,588,663 0.49
The accompanying notes are an integral part of these financial statements.
Emerging Markets Corporate Debt Fund (continued)
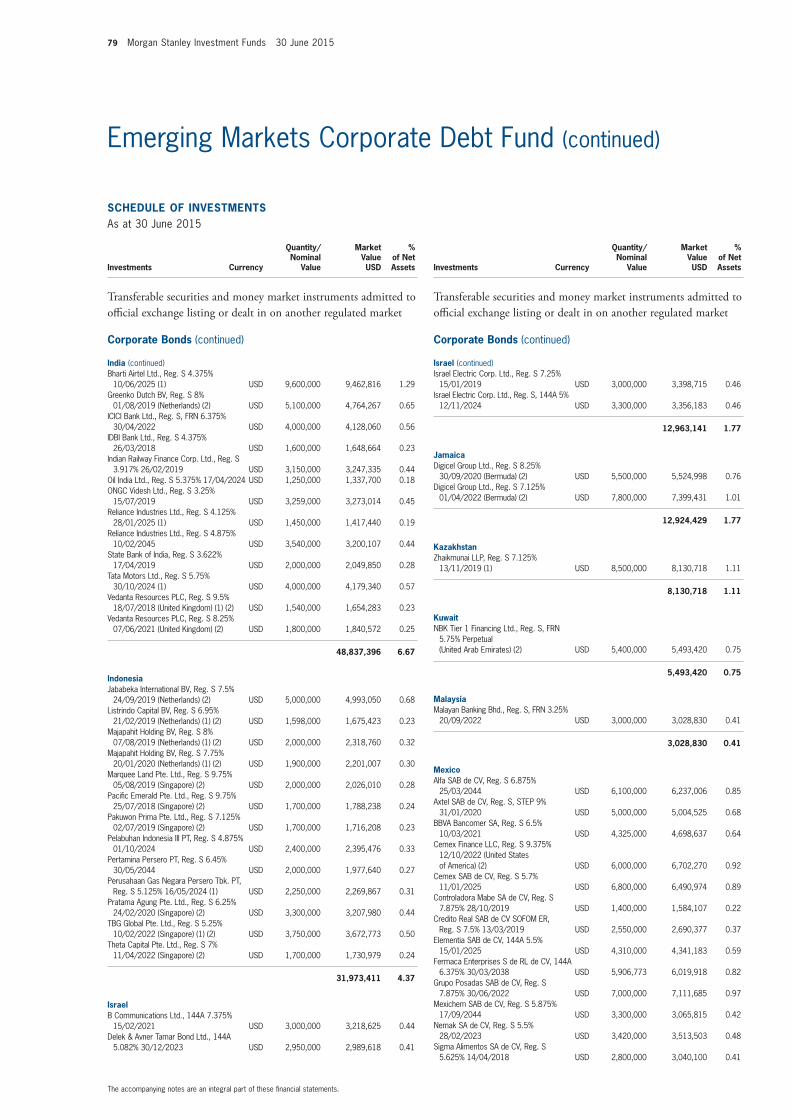
79 Morgan Stanley Investment Funds 30 June 2015
SCHEDULE of invEStmEntSAs at 30 June 2015
Investments Currency
Quantity/Nominal
Value
Market Value USD
% of Net Assets
transferable securities and money market instruments admitted to official exchange listing or dealt in on another regulated market
Corporate Bonds (continued)
india (continued)Bharti Airtel Ltd., Reg. S 4.375%
10/06/2025 (1) USD 9,600,000 9,462,816 1.29Greenko Dutch BV, Reg. S 8%
01/08/2019 (Netherlands) (2) USD 5,100,000 4,764,267 0.65ICICI Bank Ltd., Reg. S, FRN 6.375%
30/04/2022 USD 4,000,000 4,128,060 0.56IDBI Bank Ltd., Reg. S 4.375%
26/03/2018 USD 1,600,000 1,648,664 0.23Indian Railway Finance Corp. Ltd., Reg. S
3.917% 26/02/2019 USD 3,150,000 3,247,335 0.44Oil India Ltd., Reg. S 5.375% 17/04/2024 USD 1,250,000 1,337,700 0.18ONGC Videsh Ltd., Reg. S 3.25%
15/07/2019 USD 3,259,000 3,273,014 0.45Reliance Industries Ltd., Reg. S 4.125%
28/01/2025 (1) USD 1,450,000 1,417,440 0.19Reliance Industries Ltd., Reg. S 4.875%
10/02/2045 USD 3,540,000 3,200,107 0.44State Bank of India, Reg. S 3.622%
17/04/2019 USD 2,000,000 2,049,850 0.28Tata Motors Ltd., Reg. S 5.75%
30/10/2024 (1) USD 4,000,000 4,179,340 0.57Vedanta Resources PLC, Reg. S 9.5%
18/07/2018 (United Kingdom) (1) (2) USD 1,540,000 1,654,283 0.23Vedanta Resources PLC, Reg. S 8.25%
07/06/2021 (United Kingdom) (2) USD 1,800,000 1,840,572 0.25
48,837,396 6.67
indonesiaJababeka International BV, Reg. S 7.5%
24/09/2019 (Netherlands) (2) USD 5,000,000 4,993,050 0.68Listrindo Capital BV, Reg. S 6.95%
21/02/2019 (Netherlands) (1) (2) USD 1,598,000 1,675,423 0.23Majapahit Holding BV, Reg. S 8%
07/08/2019 (Netherlands) (1) (2) USD 2,000,000 2,318,760 0.32Majapahit Holding BV, Reg. S 7.75%
20/01/2020 (Netherlands) (1) (2) USD 1,900,000 2,201,007 0.30Marquee Land Pte. Ltd., Reg. S 9.75%
05/08/2019 (Singapore) (2) USD 2,000,000 2,026,010 0.28Pacific Emerald Pte. Ltd., Reg. S 9.75%
25/07/2018 (Singapore) (2) USD 1,700,000 1,788,238 0.24Pakuwon Prima Pte. Ltd., Reg. S 7.125%
02/07/2019 (Singapore) (2) USD 1,700,000 1,716,208 0.23Pelabuhan Indonesia III PT, Reg. S 4.875%
01/10/2024 USD 2,400,000 2,395,476 0.33Pertamina Persero PT, Reg. S 6.45%
30/05/2044 USD 2,000,000 1,977,640 0.27Perusahaan Gas Negara Persero Tbk. PT,
Reg. S 5.125% 16/05/2024 (1) USD 2,250,000 2,269,867 0.31Pratama Agung Pte. Ltd., Reg. S 6.25%
24/02/2020 (Singapore) (2) USD 3,300,000 3,207,980 0.44TBG Global Pte. Ltd., Reg. S 5.25%
10/02/2022 (Singapore) (1) (2) USD 3,750,000 3,672,773 0.50Theta Capital Pte. Ltd., Reg. S 7%
11/04/2022 (Singapore) (2) USD 1,700,000 1,730,979 0.24
31,973,411 4.37
israelB Communications Ltd., 144A 7.375%
15/02/2021 USD 3,000,000 3,218,625 0.44Delek & Avner Tamar Bond Ltd., 144A
5.082% 30/12/2023 USD 2,950,000 2,989,618 0.41
SCHEDULE of invEStmEntSAs at 30 June 2015
Investments Currency
Quantity/Nominal
Value
Market Value USD
% of Net Assets
transferable securities and money market instruments admitted to official exchange listing or dealt in on another regulated market
Corporate Bonds (continued)
israel (continued)Israel Electric Corp. Ltd., Reg. S 7.25%
15/01/2019 USD 3,000,000 3,398,715 0.46Israel Electric Corp. Ltd., Reg. S, 144A 5%
12/11/2024 USD 3,300,000 3,356,183 0.46
12,963,141 1.77
JamaicaDigicel Group Ltd., Reg. S 8.25%
30/09/2020 (Bermuda) (2) USD 5,500,000 5,524,998 0.76Digicel Group Ltd., Reg. S 7.125%
01/04/2022 (Bermuda) (2) USD 7,800,000 7,399,431 1.01
12,924,429 1.77
KazakhstanZhaikmunai LLP, Reg. S 7.125%
13/11/2019 (1) USD 8,500,000 8,130,718 1.11
8,130,718 1.11
KuwaitNBK Tier 1 Financing Ltd., Reg. S, FRN
5.75% Perpetual (United Arab Emirates) (2) USD 5,400,000 5,493,420 0.75
5,493,420 0.75
malaysiaMalayan Banking Bhd., Reg. S, FRN 3.25%
20/09/2022 USD 3,000,000 3,028,830 0.41
3,028,830 0.41
mexicoAlfa SAB de CV, Reg. S 6.875%
25/03/2044 USD 6,100,000 6,237,006 0.85Axtel SAB de CV, Reg. S, STEP 9%
31/01/2020 USD 5,000,000 5,004,525 0.68BBVA Bancomer SA, Reg. S 6.5%
10/03/2021 USD 4,325,000 4,698,637 0.64Cemex Finance LLC, Reg. S 9.375%
12/10/2022 (United States of America) (2) USD 6,000,000 6,702,270 0.92
Cemex SAB de CV, Reg. S 5.7% 11/01/2025 USD 6,800,000 6,490,974 0.89
Controladora Mabe SA de CV, Reg. S 7.875% 28/10/2019 USD 1,400,000 1,584,107 0.22
Credito Real SAB de CV SOFOM ER, Reg. S 7.5% 13/03/2019 USD 2,550,000 2,690,377 0.37
Elementia SAB de CV, 144A 5.5% 15/01/2025 USD 4,310,000 4,341,183 0.59
Fermaca Enterprises S de RL de CV, 144A 6.375% 30/03/2038 USD 5,906,773 6,019,918 0.82
Grupo Posadas SAB de CV, Reg. S 7.875% 30/06/2022 USD 7,000,000 7,111,685 0.97
Mexichem SAB de CV, Reg. S 5.875% 17/09/2044 USD 3,300,000 3,065,815 0.42
Nemak SA de CV, Reg. S 5.5% 28/02/2023 USD 3,420,000 3,513,503 0.48
Sigma Alimentos SA de CV, Reg. S 5.625% 14/04/2018 USD 2,800,000 3,040,100 0.41
The accompanying notes are an integral part of these financial statements.
Emerging Markets Corporate Debt Fund (continued)
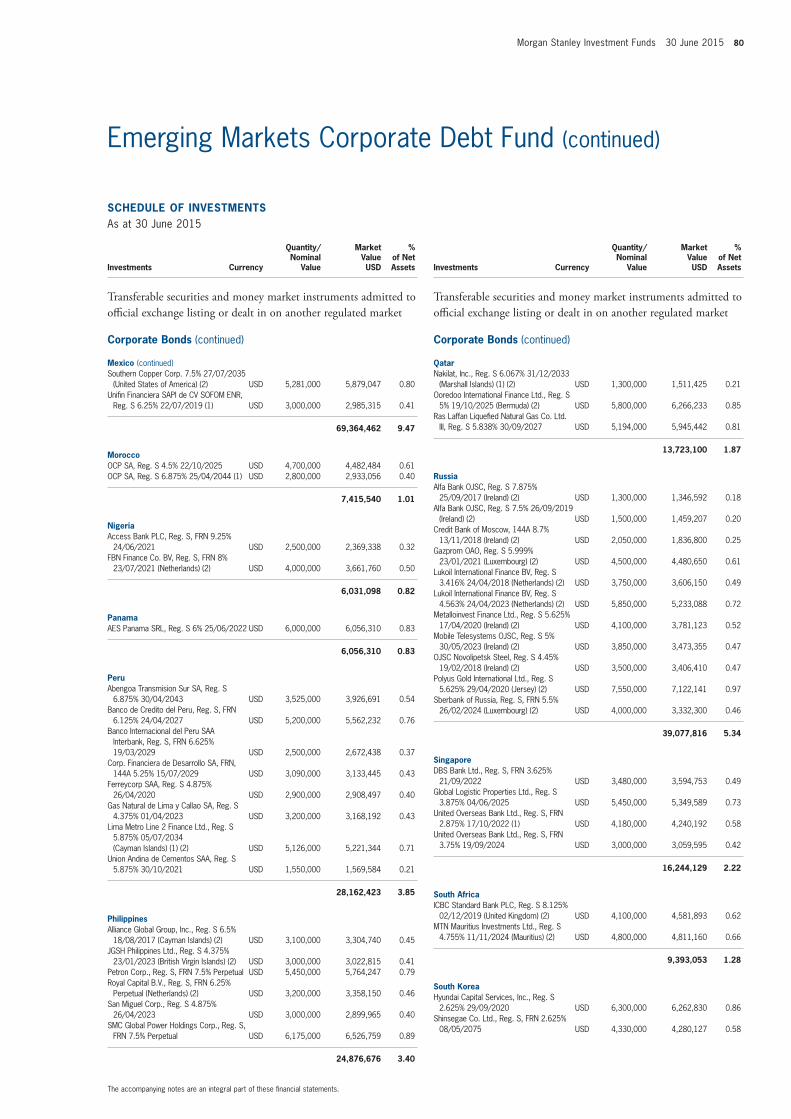
Morgan Stanley Investment Funds 30 June 2015 80
SCHEDULE of invEStmEntSAs at 30 June 2015
Investments Currency
Quantity/Nominal
Value
Market Value USD
% of Net Assets
transferable securities and money market instruments admitted to official exchange listing or dealt in on another regulated market
Corporate Bonds (continued)
mexico (continued)Southern Copper Corp. 7.5% 27/07/2035
(United States of America) (2) USD 5,281,000 5,879,047 0.80Unifin Financiera SAPI de CV SOFOM ENR,
Reg. S 6.25% 22/07/2019 (1) USD 3,000,000 2,985,315 0.41
69,364,462 9.47
moroccoOCP SA, Reg. S 4.5% 22/10/2025 USD 4,700,000 4,482,484 0.61OCP SA, Reg. S 6.875% 25/04/2044 (1) USD 2,800,000 2,933,056 0.40
7,415,540 1.01
nigeriaAccess Bank PLC, Reg. S, FRN 9.25%
24/06/2021 USD 2,500,000 2,369,338 0.32FBN Finance Co. BV, Reg. S, FRN 8%
23/07/2021 (Netherlands) (2) USD 4,000,000 3,661,760 0.50
6,031,098 0.82
PanamaAES Panama SRL, Reg. S 6% 25/06/2022 USD 6,000,000 6,056,310 0.83
6,056,310 0.83
PeruAbengoa Transmision Sur SA, Reg. S
6.875% 30/04/2043 USD 3,525,000 3,926,691 0.54Banco de Credito del Peru, Reg. S, FRN
6.125% 24/04/2027 USD 5,200,000 5,562,232 0.76Banco Internacional del Peru SAA
Interbank, Reg. S, FRN 6.625% 19/03/2029 USD 2,500,000 2,672,438 0.37
Corp. Financiera de Desarrollo SA, FRN, 144A 5.25% 15/07/2029 USD 3,090,000 3,133,445 0.43
Ferreycorp SAA, Reg. S 4.875% 26/04/2020 USD 2,900,000 2,908,497 0.40
Gas Natural de Lima y Callao SA, Reg. S 4.375% 01/04/2023 USD 3,200,000 3,168,192 0.43
Lima Metro Line 2 Finance Ltd., Reg. S 5.875% 05/07/2034 (Cayman Islands) (1) (2) USD 5,126,000 5,221,344 0.71
Union Andina de Cementos SAA, Reg. S 5.875% 30/10/2021 USD 1,550,000 1,569,584 0.21
28,162,423 3.85
PhilippinesAlliance Global Group, Inc., Reg. S 6.5%
18/08/2017 (Cayman Islands) (2) USD 3,100,000 3,304,740 0.45JGSH Philippines Ltd., Reg. S 4.375%
23/01/2023 (British Virgin Islands) (2) USD 3,000,000 3,022,815 0.41Petron Corp., Reg. S, FRN 7.5% Perpetual USD 5,450,000 5,764,247 0.79Royal Capital B.V., Reg. S, FRN 6.25%
Perpetual (Netherlands) (2) USD 3,200,000 3,358,150 0.46San Miguel Corp., Reg. S 4.875%
26/04/2023 USD 3,000,000 2,899,965 0.40SMC Global Power Holdings Corp., Reg. S,
FRN 7.5% Perpetual USD 6,175,000 6,526,759 0.89
24,876,676 3.40
SCHEDULE of invEStmEntSAs at 30 June 2015
Investments Currency
Quantity/Nominal
Value
Market Value USD
% of Net Assets
transferable securities and money market instruments admitted to official exchange listing or dealt in on another regulated market
Corporate Bonds (continued)
QatarNakilat, Inc., Reg. S 6.067% 31/12/2033
(Marshall Islands) (1) (2) USD 1,300,000 1,511,425 0.21Ooredoo International Finance Ltd., Reg. S
5% 19/10/2025 (Bermuda) (2) USD 5,800,000 6,266,233 0.85Ras Laffan Liquefied Natural Gas Co. Ltd.
III, Reg. S 5.838% 30/09/2027 USD 5,194,000 5,945,442 0.81
13,723,100 1.87
RussiaAlfa Bank OJSC, Reg. S 7.875%
25/09/2017 (Ireland) (2) USD 1,300,000 1,346,592 0.18Alfa Bank OJSC, Reg. S 7.5% 26/09/2019
(Ireland) (2) USD 1,500,000 1,459,207 0.20Credit Bank of Moscow, 144A 8.7%
13/11/2018 (Ireland) (2) USD 2,050,000 1,836,800 0.25Gazprom OAO, Reg. S 5.999%
23/01/2021 (Luxembourg) (2) USD 4,500,000 4,480,650 0.61Lukoil International Finance BV, Reg. S
3.416% 24/04/2018 (Netherlands) (2) USD 3,750,000 3,606,150 0.49Lukoil International Finance BV, Reg. S
4.563% 24/04/2023 (Netherlands) (2) USD 5,850,000 5,233,088 0.72Metalloinvest Finance Ltd., Reg. S 5.625%
17/04/2020 (Ireland) (2) USD 4,100,000 3,781,123 0.52Mobile Telesystems OJSC, Reg. S 5%
30/05/2023 (Ireland) (2) USD 3,850,000 3,473,355 0.47OJSC Novolipetsk Steel, Reg. S 4.45%
19/02/2018 (Ireland) (2) USD 3,500,000 3,406,410 0.47Polyus Gold International Ltd., Reg. S
5.625% 29/04/2020 (Jersey) (2) USD 7,550,000 7,122,141 0.97Sberbank of Russia, Reg. S, FRN 5.5%
26/02/2024 (Luxembourg) (2) USD 4,000,000 3,332,300 0.46
39,077,816 5.34
SingaporeDBS Bank Ltd., Reg. S, FRN 3.625%
21/09/2022 USD 3,480,000 3,594,753 0.49Global Logistic Properties Ltd., Reg. S
3.875% 04/06/2025 USD 5,450,000 5,349,589 0.73United Overseas Bank Ltd., Reg. S, FRN
2.875% 17/10/2022 (1) USD 4,180,000 4,240,192 0.58United Overseas Bank Ltd., Reg. S, FRN
3.75% 19/09/2024 USD 3,000,000 3,059,595 0.42
16,244,129 2.22
South AfricaICBC Standard Bank PLC, Reg. S 8.125%
02/12/2019 (United Kingdom) (2) USD 4,100,000 4,581,893 0.62MTN Mauritius Investments Ltd., Reg. S
4.755% 11/11/2024 (Mauritius) (2) USD 4,800,000 4,811,160 0.66
9,393,053 1.28
South KoreaHyundai Capital Services, Inc., Reg. S
2.625% 29/09/2020 USD 6,300,000 6,262,830 0.86Shinsegae Co. Ltd., Reg. S, FRN 2.625%
08/05/2075 USD 4,330,000 4,280,127 0.58
The accompanying notes are an integral part of these financial statements.
Emerging Markets Corporate Debt Fund (continued)
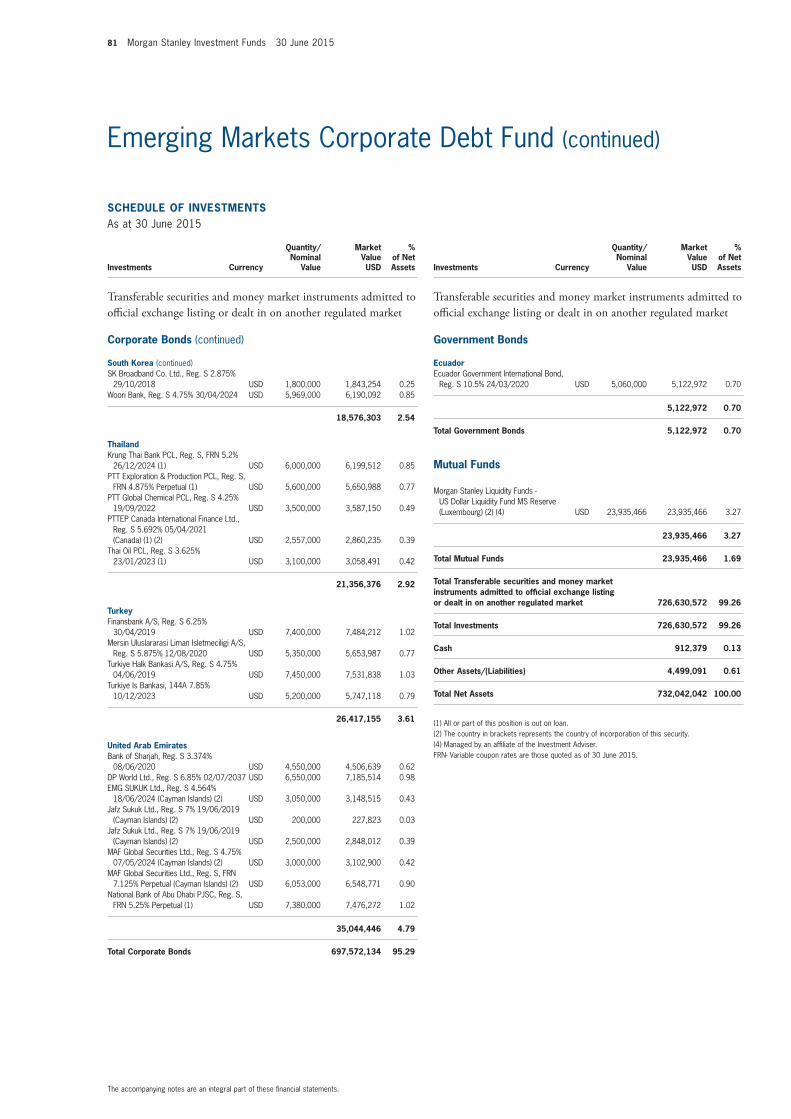
81 Morgan Stanley Investment Funds 30 June 2015
SCHEDULE of invEStmEntSAs at 30 June 2015
Investments Currency
Quantity/Nominal
Value
Market Value USD
% of Net Assets
transferable securities and money market instruments admitted to official exchange listing or dealt in on another regulated market
Corporate Bonds (continued)
South Korea (continued)SK Broadband Co. Ltd., Reg. S 2.875%
29/10/2018 USD 1,800,000 1,843,254 0.25Woori Bank, Reg. S 4.75% 30/04/2024 USD 5,969,000 6,190,092 0.85
18,576,303 2.54
thailandKrung Thai Bank PCL, Reg. S, FRN 5.2%
26/12/2024 (1) USD 6,000,000 6,199,512 0.85PTT Exploration & Production PCL, Reg. S,
FRN 4.875% Perpetual (1) USD 5,600,000 5,650,988 0.77PTT Global Chemical PCL, Reg. S 4.25%
19/09/2022 USD 3,500,000 3,587,150 0.49PTTEP Canada International Finance Ltd.,
Reg. S 5.692% 05/04/2021 (Canada) (1) (2) USD 2,557,000 2,860,235 0.39
Thai Oil PCL, Reg. S 3.625% 23/01/2023 (1) USD 3,100,000 3,058,491 0.42
21,356,376 2.92
turkeyFinansbank A/S, Reg. S 6.25%
30/04/2019 USD 7,400,000 7,484,212 1.02Mersin Uluslararasi Liman Isletmeciligi A/S,
Reg. S 5.875% 12/08/2020 USD 5,350,000 5,653,987 0.77Turkiye Halk Bankasi A/S, Reg. S 4.75%
04/06/2019 USD 7,450,000 7,531,838 1.03Turkiye Is Bankasi, 144A 7.85%
10/12/2023 USD 5,200,000 5,747,118 0.79
26,417,155 3.61
United Arab EmiratesBank of Sharjah, Reg. S 3.374%
08/06/2020 USD 4,550,000 4,506,639 0.62DP World Ltd., Reg. S 6.85% 02/07/2037 USD 6,550,000 7,185,514 0.98EMG SUKUK Ltd., Reg. S 4.564%
18/06/2024 (Cayman Islands) (2) USD 3,050,000 3,148,515 0.43Jafz Sukuk Ltd., Reg. S 7% 19/06/2019
(Cayman Islands) (2) USD 200,000 227,823 0.03Jafz Sukuk Ltd., Reg. S 7% 19/06/2019
(Cayman Islands) (2) USD 2,500,000 2,848,012 0.39MAF Global Securities Ltd., Reg. S 4.75%
07/05/2024 (Cayman Islands) (2) USD 3,000,000 3,102,900 0.42MAF Global Securities Ltd., Reg. S, FRN
7.125% Perpetual (Cayman Islands) (2) USD 6,053,000 6,548,771 0.90National Bank of Abu Dhabi PJSC, Reg. S,
FRN 5.25% Perpetual (1) USD 7,380,000 7,476,272 1.02
35,044,446 4.79
total Corporate Bonds 697,572,134 95.29
SCHEDULE of invEStmEntSAs at 30 June 2015
Investments Currency
Quantity/Nominal
Value
Market Value USD
% of Net Assets
transferable securities and money market instruments admitted to official exchange listing or dealt in on another regulated market
Government Bonds
EcuadorEcuador Government International Bond,
Reg. S 10.5% 24/03/2020 USD 5,060,000 5,122,972 0.70
5,122,972 0.70
total Government Bonds 5,122,972 0.70
mutual funds
Morgan Stanley Liquidity Funds - US Dollar Liquidity Fund MS Reserve (Luxembourg) (2) (4) USD 23,935,466 23,935,466 3.27
23,935,466 3.27
total mutual funds 23,935,466 1.69
total transferable securities and money market instruments admitted to official exchange listing or dealt in on another regulated market 726,630,572 99.26
total investments 726,630,572 99.26
Cash 912,379 0.13
other Assets/(Liabilities) 4,499,091 0.61
total net Assets 732,042,042 100.00
(1) All or part of this position is out on loan.(2) The country in brackets represents the country of incorporation of this security.(4) Managed by an affiliate of the Investment Adviser.FRN- Variable coupon rates are those quoted as of 30 June 2015.
The accompanying notes are an integral part of these financial statements.
Emerging Markets Corporate Debt Fund (continued)
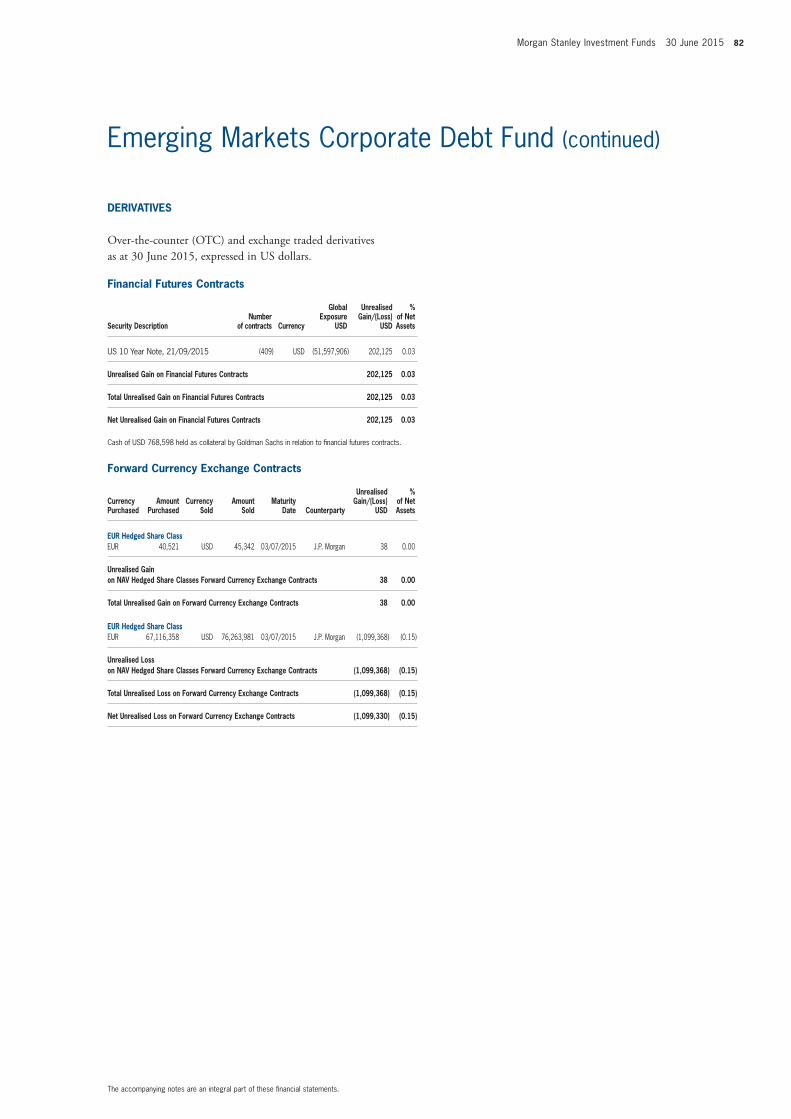
Morgan Stanley Investment Funds 30 June 2015 82
financial futures Contracts
Security Descriptionnumber
of contracts Currency
Global Exposure
USD
Unrealised Gain/(Loss)
USD
% of net Assets
US 10 Year Note, 21/09/2015 (409) USD (51,597,906) 202,125 0.03
Unrealised Gain on financial futures Contracts 202,125 0.03
total Unrealised Gain on financial futures Contracts 202,125 0.03
net Unrealised Gain on financial futures Contracts 202,125 0.03
Cash of USD 768,598 held as collateral by Goldman Sachs in relation to financial futures contracts.
forward Currency Exchange Contracts
Currency Purchased
Amount Purchased
Currency Sold
Amount Sold
maturity Date Counterparty
Unrealised Gain/(Loss)
USD
% of net Assets
EUR Hedged Share ClassEUR 40,521 USD 45,342 03/07/2015 J.P. Morgan 38 0.00
Unrealised Gain on nAv Hedged Share Classes forward Currency Exchange Contracts 38 0.00
total Unrealised Gain on forward Currency Exchange Contracts 38 0.00
EUR Hedged Share ClassEUR 67,116,358 USD 76,263,981 03/07/2015 J.P. Morgan (1,099,368) (0.15)
Unrealised Loss on nAv Hedged Share Classes forward Currency Exchange Contracts (1,099,368) (0.15)
total Unrealised Loss on forward Currency Exchange Contracts (1,099,368) (0.15)
net Unrealised Loss on forward Currency Exchange Contracts (1,099,330) (0.15)
DERivAtivES
Over-the-counter (OtC) and exchange traded derivatives as at 30 June 2015, expressed in US dollars.
The accompanying notes are an integral part of these financial statements.
Emerging Markets Corporate Debt Fund (continued)
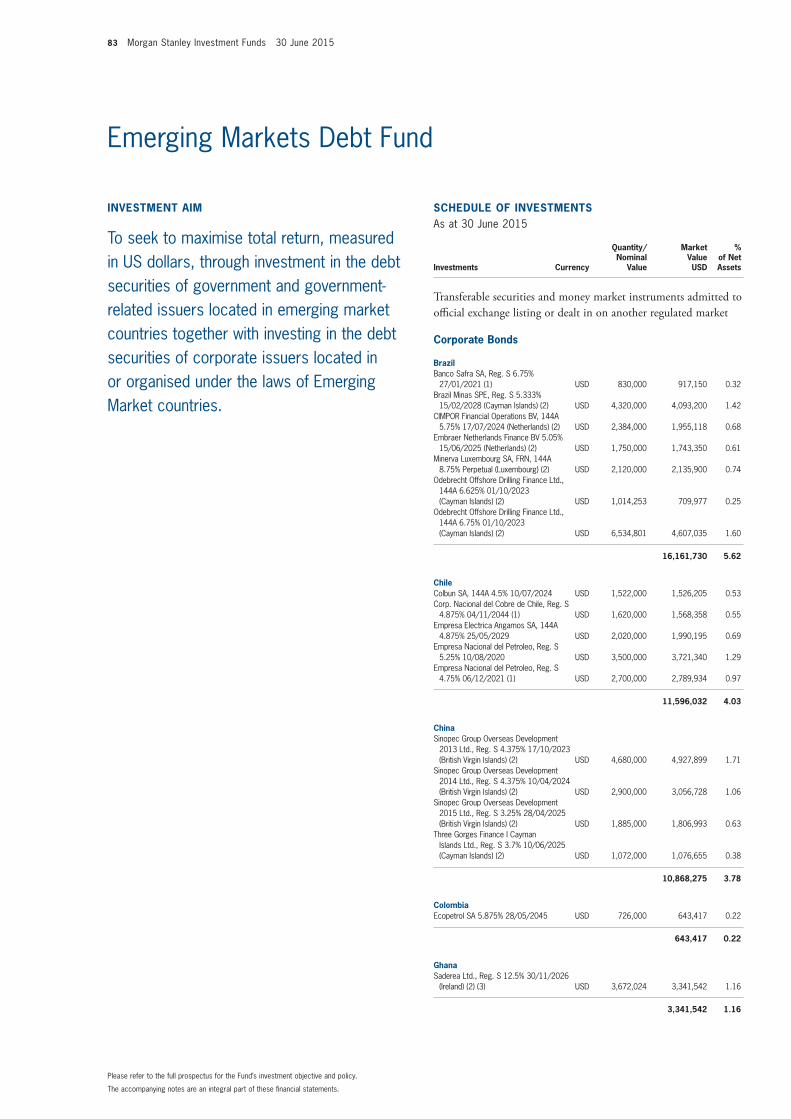
83 Morgan Stanley Investment Funds 30 June 2015
invEStmEnt Aim
To seek to maximise total return, measured in US dollars, through investment in the debt securities of government and government-related issuers located in emerging market countries together with investing in the debt securities of corporate issuers located in or organised under the laws of Emerging Market countries.
SCHEDULE of invEStmEntSAs at 30 June 2015
Investments Currency
Quantity/Nominal
Value
Market Value USD
% of Net Assets
transferable securities and money market instruments admitted to official exchange listing or dealt in on another regulated market
Corporate Bonds
BrazilBanco Safra SA, Reg. S 6.75%
27/01/2021 (1) USD 830,000 917,150 0.32Brazil Minas SPE, Reg. S 5.333%
15/02/2028 (Cayman Islands) (2) USD 4,320,000 4,093,200 1.42CIMPOR Financial Operations BV, 144A
5.75% 17/07/2024 (Netherlands) (2) USD 2,384,000 1,955,118 0.68Embraer Netherlands Finance BV 5.05%
15/06/2025 (Netherlands) (2) USD 1,750,000 1,743,350 0.61Minerva Luxembourg SA, FRN, 144A
8.75% Perpetual (Luxembourg) (2) USD 2,120,000 2,135,900 0.74Odebrecht Offshore Drilling Finance Ltd.,
144A 6.625% 01/10/2023 (Cayman Islands) (2) USD 1,014,253 709,977 0.25
Odebrecht Offshore Drilling Finance Ltd., 144A 6.75% 01/10/2023 (Cayman Islands) (2) USD 6,534,801 4,607,035 1.60
16,161,730 5.62
ChileColbun SA, 144A 4.5% 10/07/2024 USD 1,522,000 1,526,205 0.53Corp. Nacional del Cobre de Chile, Reg. S
4.875% 04/11/2044 (1) USD 1,620,000 1,568,358 0.55Empresa Electrica Angamos SA, 144A
4.875% 25/05/2029 USD 2,020,000 1,990,195 0.69Empresa Nacional del Petroleo, Reg. S
5.25% 10/08/2020 USD 3,500,000 3,721,340 1.29Empresa Nacional del Petroleo, Reg. S
4.75% 06/12/2021 (1) USD 2,700,000 2,789,934 0.97
11,596,032 4.03
ChinaSinopec Group Overseas Development
2013 Ltd., Reg. S 4.375% 17/10/2023 (British Virgin Islands) (2) USD 4,680,000 4,927,899 1.71
Sinopec Group Overseas Development 2014 Ltd., Reg. S 4.375% 10/04/2024 (British Virgin Islands) (2) USD 2,900,000 3,056,728 1.06
Sinopec Group Overseas Development 2015 Ltd., Reg. S 3.25% 28/04/2025 (British Virgin Islands) (2) USD 1,885,000 1,806,993 0.63
Three Gorges Finance I Cayman Islands Ltd., Reg. S 3.7% 10/06/2025 (Cayman Islands) (2) USD 1,072,000 1,076,655 0.38
10,868,275 3.78
ColombiaEcopetrol SA 5.875% 28/05/2045 USD 726,000 643,417 0.22
643,417 0.22
GhanaSaderea Ltd., Reg. S 12.5% 30/11/2026
(Ireland) (2) (3) USD 3,672,024 3,341,542 1.16
3,341,542 1.16
The accompanying notes are an integral part of these financial statements.
Please refer to the full prospectus for the Fund’s investment objective and policy.
Emerging Markets Debt Fund
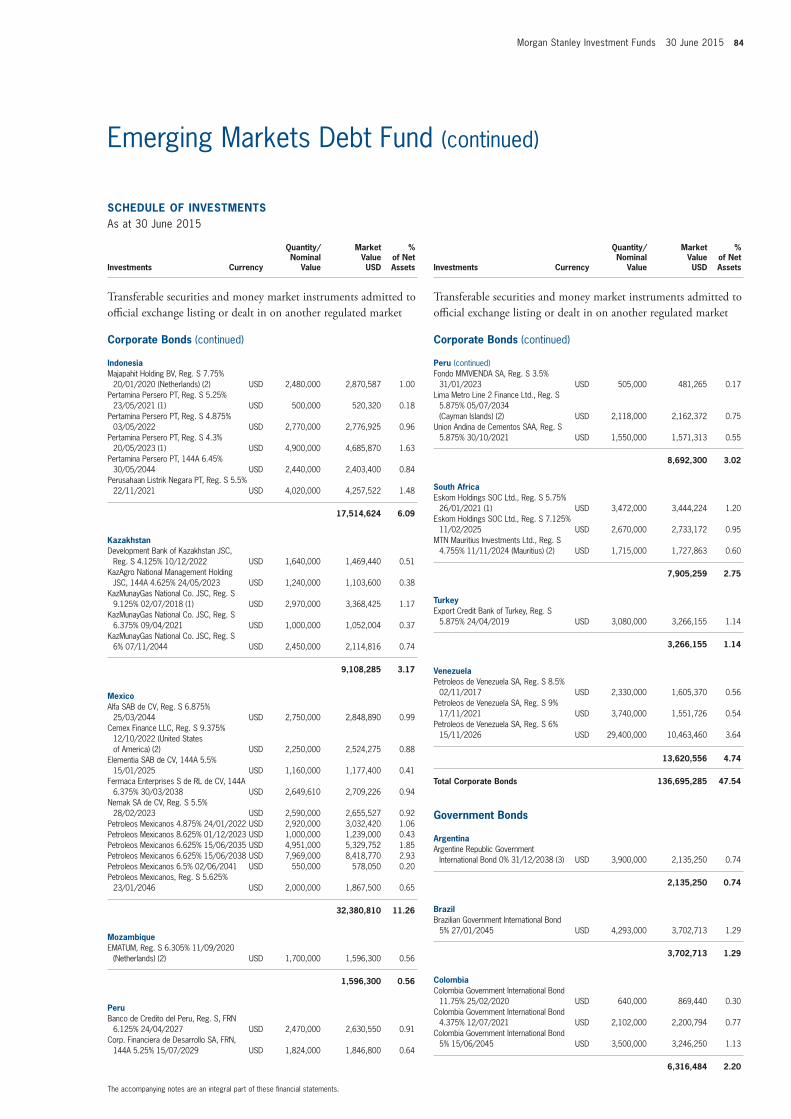
Morgan Stanley Investment Funds 30 June 2015 84
SCHEDULE of invEStmEntSAs at 30 June 2015
Investments Currency
Quantity/Nominal
Value
Market Value USD
% of Net Assets
transferable securities and money market instruments admitted to official exchange listing or dealt in on another regulated market
Corporate Bonds (continued)
indonesiaMajapahit Holding BV, Reg. S 7.75%
20/01/2020 (Netherlands) (2) USD 2,480,000 2,870,587 1.00Pertamina Persero PT, Reg. S 5.25%
23/05/2021 (1) USD 500,000 520,320 0.18Pertamina Persero PT, Reg. S 4.875%
03/05/2022 USD 2,770,000 2,776,925 0.96Pertamina Persero PT, Reg. S 4.3%
20/05/2023 (1) USD 4,900,000 4,685,870 1.63Pertamina Persero PT, 144A 6.45%
30/05/2044 USD 2,440,000 2,403,400 0.84Perusahaan Listrik Negara PT, Reg. S 5.5%
22/11/2021 USD 4,020,000 4,257,522 1.48
17,514,624 6.09
KazakhstanDevelopment Bank of Kazakhstan JSC,
Reg. S 4.125% 10/12/2022 USD 1,640,000 1,469,440 0.51KazAgro National Management Holding
JSC, 144A 4.625% 24/05/2023 USD 1,240,000 1,103,600 0.38KazMunayGas National Co. JSC, Reg. S
9.125% 02/07/2018 (1) USD 2,970,000 3,368,425 1.17KazMunayGas National Co. JSC, Reg. S
6.375% 09/04/2021 USD 1,000,000 1,052,004 0.37KazMunayGas National Co. JSC, Reg. S
6% 07/11/2044 USD 2,450,000 2,114,816 0.74
9,108,285 3.17
mexicoAlfa SAB de CV, Reg. S 6.875%
25/03/2044 USD 2,750,000 2,848,890 0.99Cemex Finance LLC, Reg. S 9.375%
12/10/2022 (United States of America) (2) USD 2,250,000 2,524,275 0.88
Elementia SAB de CV, 144A 5.5% 15/01/2025 USD 1,160,000 1,177,400 0.41
Fermaca Enterprises S de RL de CV, 144A 6.375% 30/03/2038 USD 2,649,610 2,709,226 0.94
Nemak SA de CV, Reg. S 5.5% 28/02/2023 USD 2,590,000 2,655,527 0.92
Petroleos Mexicanos 4.875% 24/01/2022 USD 2,920,000 3,032,420 1.06Petroleos Mexicanos 8.625% 01/12/2023 USD 1,000,000 1,239,000 0.43Petroleos Mexicanos 6.625% 15/06/2035 USD 4,951,000 5,329,752 1.85Petroleos Mexicanos 6.625% 15/06/2038 USD 7,969,000 8,418,770 2.93Petroleos Mexicanos 6.5% 02/06/2041 USD 550,000 578,050 0.20Petroleos Mexicanos, Reg. S 5.625%
23/01/2046 USD 2,000,000 1,867,500 0.65
32,380,810 11.26
mozambiqueEMATUM, Reg. S 6.305% 11/09/2020
(Netherlands) (2) USD 1,700,000 1,596,300 0.56
1,596,300 0.56
PeruBanco de Credito del Peru, Reg. S, FRN
6.125% 24/04/2027 USD 2,470,000 2,630,550 0.91Corp. Financiera de Desarrollo SA, FRN,
144A 5.25% 15/07/2029 USD 1,824,000 1,846,800 0.64
SCHEDULE of invEStmEntSAs at 30 June 2015
Investments Currency
Quantity/Nominal
Value
Market Value USD
% of Net Assets
transferable securities and money market instruments admitted to official exchange listing or dealt in on another regulated market
Corporate Bonds (continued)
Peru (continued)Fondo MIVIVIENDA SA, Reg. S 3.5%
31/01/2023 USD 505,000 481,265 0.17Lima Metro Line 2 Finance Ltd., Reg. S
5.875% 05/07/2034 (Cayman Islands) (2) USD 2,118,000 2,162,372 0.75
Union Andina de Cementos SAA, Reg. S 5.875% 30/10/2021 USD 1,550,000 1,571,313 0.55
8,692,300 3.02
South AfricaEskom Holdings SOC Ltd., Reg. S 5.75%
26/01/2021 (1) USD 3,472,000 3,444,224 1.20Eskom Holdings SOC Ltd., Reg. S 7.125%
11/02/2025 USD 2,670,000 2,733,172 0.95MTN Mauritius Investments Ltd., Reg. S
4.755% 11/11/2024 (Mauritius) (2) USD 1,715,000 1,727,863 0.60
7,905,259 2.75
turkeyExport Credit Bank of Turkey, Reg. S
5.875% 24/04/2019 USD 3,080,000 3,266,155 1.14
3,266,155 1.14
venezuelaPetroleos de Venezuela SA, Reg. S 8.5%
02/11/2017 USD 2,330,000 1,605,370 0.56Petroleos de Venezuela SA, Reg. S 9%
17/11/2021 USD 3,740,000 1,551,726 0.54Petroleos de Venezuela SA, Reg. S 6%
15/11/2026 USD 29,400,000 10,463,460 3.64
13,620,556 4.74
total Corporate Bonds 136,695,285 47.54
Government Bonds
ArgentinaArgentine Republic Government
International Bond 0% 31/12/2038 (3) USD 3,900,000 2,135,250 0.74
2,135,250 0.74
BrazilBrazilian Government International Bond
5% 27/01/2045 USD 4,293,000 3,702,713 1.29
3,702,713 1.29
ColombiaColombia Government International Bond
11.75% 25/02/2020 USD 640,000 869,440 0.30Colombia Government International Bond
4.375% 12/07/2021 USD 2,102,000 2,200,794 0.77Colombia Government International Bond
5% 15/06/2045 USD 3,500,000 3,246,250 1.13
6,316,484 2.20
The accompanying notes are an integral part of these financial statements.
Emerging Markets Debt Fund (continued)
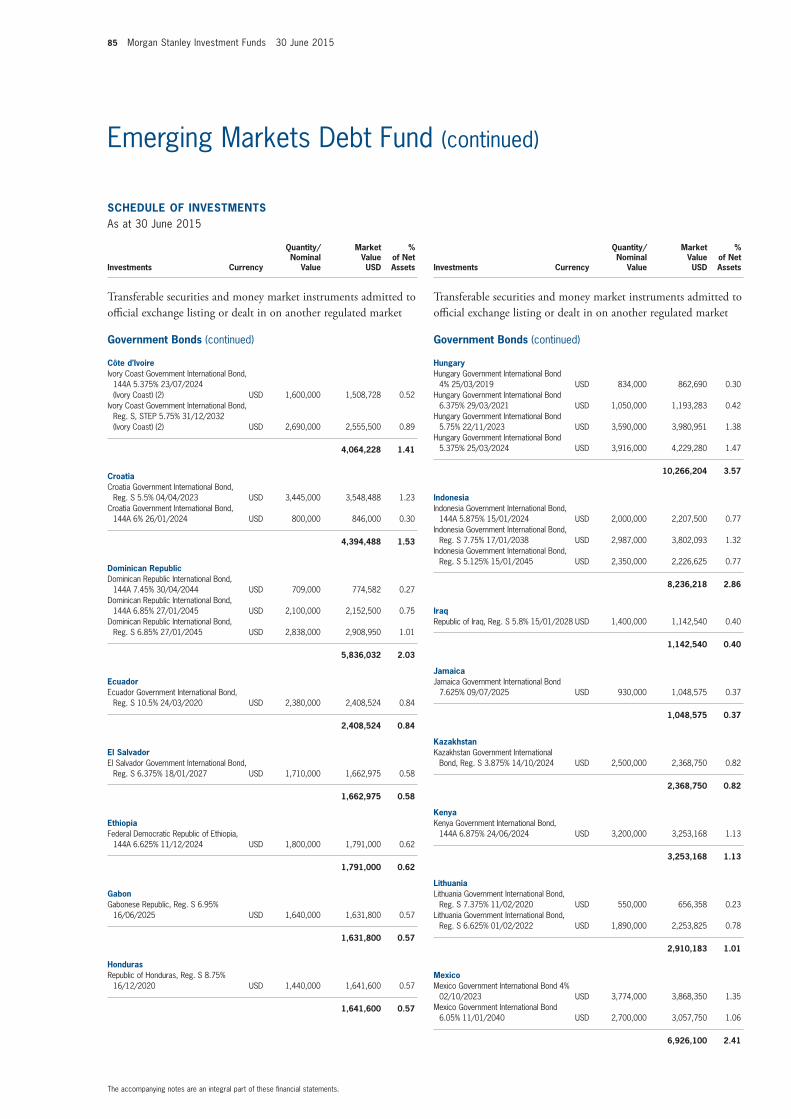
85 Morgan Stanley Investment Funds 30 June 2015
SCHEDULE of invEStmEntSAs at 30 June 2015
Investments Currency
Quantity/Nominal
Value
Market Value USD
% of Net Assets
transferable securities and money market instruments admitted to official exchange listing or dealt in on another regulated market
Government Bonds (continued)
Côte d’ivoireIvory Coast Government International Bond,
144A 5.375% 23/07/2024 (Ivory Coast) (2) USD 1,600,000 1,508,728 0.52
Ivory Coast Government International Bond, Reg. S, STEP 5.75% 31/12/2032 (Ivory Coast) (2) USD 2,690,000 2,555,500 0.89
4,064,228 1.41
CroatiaCroatia Government International Bond,
Reg. S 5.5% 04/04/2023 USD 3,445,000 3,548,488 1.23Croatia Government International Bond,
144A 6% 26/01/2024 USD 800,000 846,000 0.30
4,394,488 1.53
Dominican RepublicDominican Republic International Bond,
144A 7.45% 30/04/2044 USD 709,000 774,582 0.27Dominican Republic International Bond,
144A 6.85% 27/01/2045 USD 2,100,000 2,152,500 0.75Dominican Republic International Bond,
Reg. S 6.85% 27/01/2045 USD 2,838,000 2,908,950 1.01
5,836,032 2.03
EcuadorEcuador Government International Bond,
Reg. S 10.5% 24/03/2020 USD 2,380,000 2,408,524 0.84
2,408,524 0.84
El SalvadorEl Salvador Government International Bond,
Reg. S 6.375% 18/01/2027 USD 1,710,000 1,662,975 0.58
1,662,975 0.58
EthiopiaFederal Democratic Republic of Ethiopia,
144A 6.625% 11/12/2024 USD 1,800,000 1,791,000 0.62
1,791,000 0.62
GabonGabonese Republic, Reg. S 6.95%
16/06/2025 USD 1,640,000 1,631,800 0.57
1,631,800 0.57
HondurasRepublic of Honduras, Reg. S 8.75%
16/12/2020 USD 1,440,000 1,641,600 0.57
1,641,600 0.57
SCHEDULE of invEStmEntSAs at 30 June 2015
Investments Currency
Quantity/Nominal
Value
Market Value USD
% of Net Assets
transferable securities and money market instruments admitted to official exchange listing or dealt in on another regulated market
Government Bonds (continued)
HungaryHungary Government International Bond
4% 25/03/2019 USD 834,000 862,690 0.30Hungary Government International Bond
6.375% 29/03/2021 USD 1,050,000 1,193,283 0.42Hungary Government International Bond
5.75% 22/11/2023 USD 3,590,000 3,980,951 1.38Hungary Government International Bond
5.375% 25/03/2024 USD 3,916,000 4,229,280 1.47
10,266,204 3.57
indonesiaIndonesia Government International Bond,
144A 5.875% 15/01/2024 USD 2,000,000 2,207,500 0.77Indonesia Government International Bond,
Reg. S 7.75% 17/01/2038 USD 2,987,000 3,802,093 1.32Indonesia Government International Bond,
Reg. S 5.125% 15/01/2045 USD 2,350,000 2,226,625 0.77
8,236,218 2.86
iraqRepublic of Iraq, Reg. S 5.8% 15/01/2028 USD 1,400,000 1,142,540 0.40
1,142,540 0.40
JamaicaJamaica Government International Bond
7.625% 09/07/2025 USD 930,000 1,048,575 0.37
1,048,575 0.37
KazakhstanKazakhstan Government International
Bond, Reg. S 3.875% 14/10/2024 USD 2,500,000 2,368,750 0.82
2,368,750 0.82
KenyaKenya Government International Bond,
144A 6.875% 24/06/2024 USD 3,200,000 3,253,168 1.13
3,253,168 1.13
LithuaniaLithuania Government International Bond,
Reg. S 7.375% 11/02/2020 USD 550,000 656,358 0.23Lithuania Government International Bond,
Reg. S 6.625% 01/02/2022 USD 1,890,000 2,253,825 0.78
2,910,183 1.01
mexicoMexico Government International Bond 4%
02/10/2023 USD 3,774,000 3,868,350 1.35Mexico Government International Bond
6.05% 11/01/2040 USD 2,700,000 3,057,750 1.06
6,926,100 2.41
The accompanying notes are an integral part of these financial statements.
Emerging Markets Debt Fund (continued)
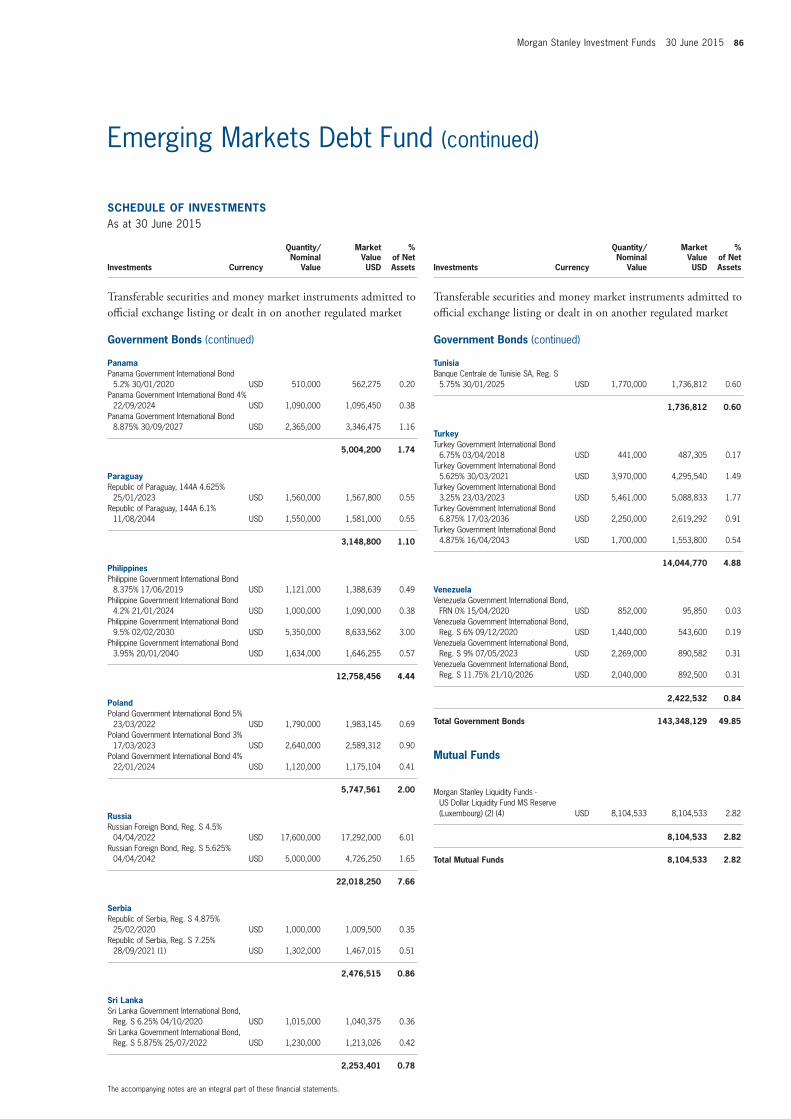
Morgan Stanley Investment Funds 30 June 2015 86
SCHEDULE of invEStmEntSAs at 30 June 2015
Investments Currency
Quantity/Nominal
Value
Market Value USD
% of Net Assets
transferable securities and money market instruments admitted to official exchange listing or dealt in on another regulated market
Government Bonds (continued)
PanamaPanama Government International Bond
5.2% 30/01/2020 USD 510,000 562,275 0.20Panama Government International Bond 4%
22/09/2024 USD 1,090,000 1,095,450 0.38Panama Government International Bond
8.875% 30/09/2027 USD 2,365,000 3,346,475 1.16
5,004,200 1.74
ParaguayRepublic of Paraguay, 144A 4.625%
25/01/2023 USD 1,560,000 1,567,800 0.55Republic of Paraguay, 144A 6.1%
11/08/2044 USD 1,550,000 1,581,000 0.55
3,148,800 1.10
PhilippinesPhilippine Government International Bond
8.375% 17/06/2019 USD 1,121,000 1,388,639 0.49Philippine Government International Bond
4.2% 21/01/2024 USD 1,000,000 1,090,000 0.38Philippine Government International Bond
9.5% 02/02/2030 USD 5,350,000 8,633,562 3.00Philippine Government International Bond
3.95% 20/01/2040 USD 1,634,000 1,646,255 0.57
12,758,456 4.44
PolandPoland Government International Bond 5%
23/03/2022 USD 1,790,000 1,983,145 0.69Poland Government International Bond 3%
17/03/2023 USD 2,640,000 2,589,312 0.90Poland Government International Bond 4%
22/01/2024 USD 1,120,000 1,175,104 0.41
5,747,561 2.00
RussiaRussian Foreign Bond, Reg. S 4.5%
04/04/2022 USD 17,600,000 17,292,000 6.01Russian Foreign Bond, Reg. S 5.625%
04/04/2042 USD 5,000,000 4,726,250 1.65
22,018,250 7.66
SerbiaRepublic of Serbia, Reg. S 4.875%
25/02/2020 USD 1,000,000 1,009,500 0.35Republic of Serbia, Reg. S 7.25%
28/09/2021 (1) USD 1,302,000 1,467,015 0.51
2,476,515 0.86
Sri LankaSri Lanka Government International Bond,
Reg. S 6.25% 04/10/2020 USD 1,015,000 1,040,375 0.36Sri Lanka Government International Bond,
Reg. S 5.875% 25/07/2022 USD 1,230,000 1,213,026 0.42
2,253,401 0.78
SCHEDULE of invEStmEntSAs at 30 June 2015
Investments Currency
Quantity/Nominal
Value
Market Value USD
% of Net Assets
transferable securities and money market instruments admitted to official exchange listing or dealt in on another regulated market
Government Bonds (continued)
tunisiaBanque Centrale de Tunisie SA, Reg. S
5.75% 30/01/2025 USD 1,770,000 1,736,812 0.60
1,736,812 0.60
turkeyTurkey Government International Bond
6.75% 03/04/2018 USD 441,000 487,305 0.17Turkey Government International Bond
5.625% 30/03/2021 USD 3,970,000 4,295,540 1.49Turkey Government International Bond
3.25% 23/03/2023 USD 5,461,000 5,088,833 1.77Turkey Government International Bond
6.875% 17/03/2036 USD 2,250,000 2,619,292 0.91Turkey Government International Bond
4.875% 16/04/2043 USD 1,700,000 1,553,800 0.54
14,044,770 4.88
venezuelaVenezuela Government International Bond,
FRN 0% 15/04/2020 USD 852,000 95,850 0.03Venezuela Government International Bond,
Reg. S 6% 09/12/2020 USD 1,440,000 543,600 0.19Venezuela Government International Bond,
Reg. S 9% 07/05/2023 USD 2,269,000 890,582 0.31Venezuela Government International Bond,
Reg. S 11.75% 21/10/2026 USD 2,040,000 892,500 0.31
2,422,532 0.84
total Government Bonds 143,348,129 49.85
mutual funds
Morgan Stanley Liquidity Funds - US Dollar Liquidity Fund MS Reserve (Luxembourg) (2) (4) USD 8,104,533 8,104,533 2.82
8,104,533 2.82
total mutual funds 8,104,533 2.82
The accompanying notes are an integral part of these financial statements.
Emerging Markets Debt Fund (continued)
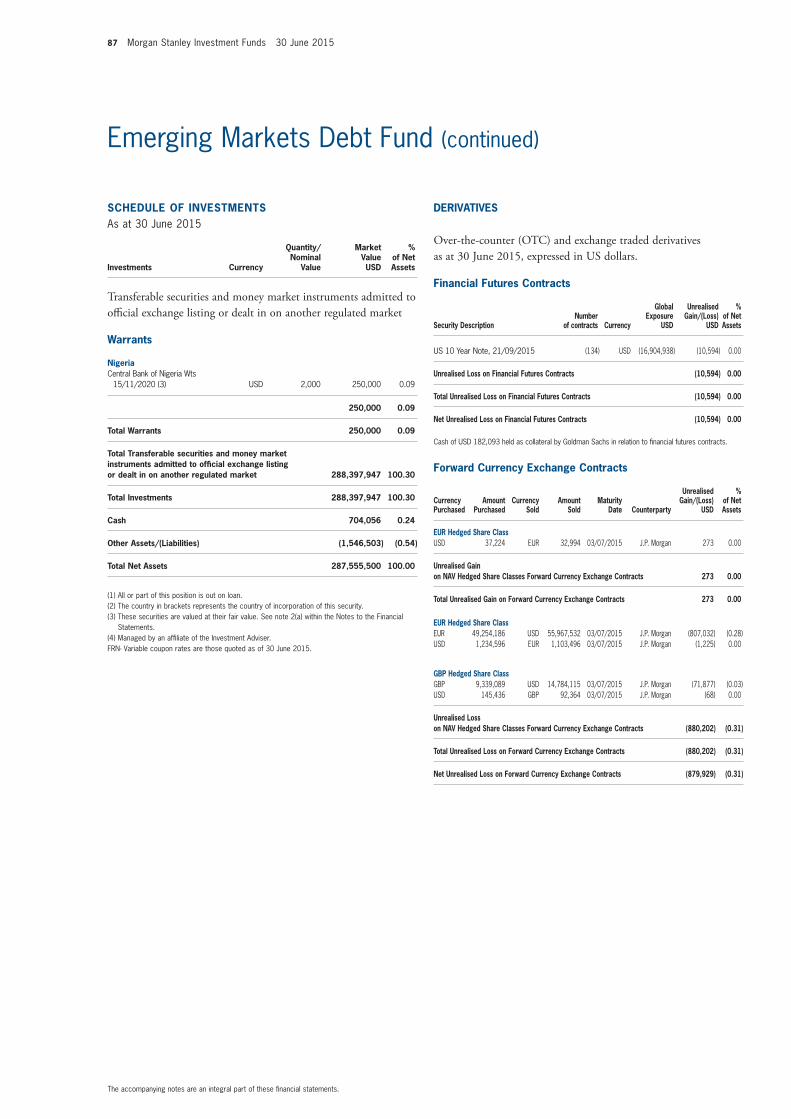
87 Morgan Stanley Investment Funds 30 June 2015
SCHEDULE of invEStmEntSAs at 30 June 2015
Investments Currency
Quantity/Nominal
Value
Market Value USD
% of Net Assets
transferable securities and money market instruments admitted to official exchange listing or dealt in on another regulated market
Warrants
nigeriaCentral Bank of Nigeria Wts
15/11/2020 (3) USD 2,000 250,000 0.09
250,000 0.09
total Warrants 250,000 0.09
total transferable securities and money market instruments admitted to official exchange listing or dealt in on another regulated market 288,397,947 100.30
total investments 288,397,947 100.30
Cash 704,056 0.24
other Assets/(Liabilities) (1,546,503) (0.54)
total net Assets 287,555,500 100.00
(1) All or part of this position is out on loan.(2) The country in brackets represents the country of incorporation of this security.(3) These securities are valued at their fair value. See note 2(a) within the Notes to the Financial
Statements.(4) Managed by an affiliate of the Investment Adviser.FRN- Variable coupon rates are those quoted as of 30 June 2015.
The accompanying notes are an integral part of these financial statements.
Emerging Markets Debt Fund (continued)
financial futures Contracts
Security Descriptionnumber
of contracts Currency
Global Exposure
USD
Unrealised Gain/(Loss)
USD
% of net Assets
US 10 Year Note, 21/09/2015 (134) USD (16,904,938) (10,594) 0.00
Unrealised Loss on financial futures Contracts (10,594) 0.00
total Unrealised Loss on financial futures Contracts (10,594) 0.00
net Unrealised Loss on financial futures Contracts (10,594) 0.00
Cash of USD 182,093 held as collateral by Goldman Sachs in relation to financial futures contracts.
forward Currency Exchange Contracts
Currency Purchased
Amount Purchased
Currency Sold
Amount Sold
maturity Date Counterparty
Unrealised Gain/(Loss)
USD
% of net Assets
EUR Hedged Share ClassUSD 37,224 EUR 32,994 03/07/2015 J.P. Morgan 273 0.00
Unrealised Gain on nAv Hedged Share Classes forward Currency Exchange Contracts 273 0.00
total Unrealised Gain on forward Currency Exchange Contracts 273 0.00
EUR Hedged Share ClassEUR 49,254,186 USD 55,967,532 03/07/2015 J.P. Morgan (807,032) (0.28)USD 1,234,596 EUR 1,103,496 03/07/2015 J.P. Morgan (1,225) 0.00
GBP Hedged Share ClassGBP 9,339,089 USD 14,784,115 03/07/2015 J.P. Morgan (71,877) (0.03)USD 145,436 GBP 92,364 03/07/2015 J.P. Morgan (68) 0.00
Unrealised Loss on nAv Hedged Share Classes forward Currency Exchange Contracts (880,202) (0.31)
total Unrealised Loss on forward Currency Exchange Contracts (880,202) (0.31)
net Unrealised Loss on forward Currency Exchange Contracts (879,929) (0.31)
DERivAtivES
Over-the-counter (OtC) and exchange traded derivatives as at 30 June 2015, expressed in US dollars.
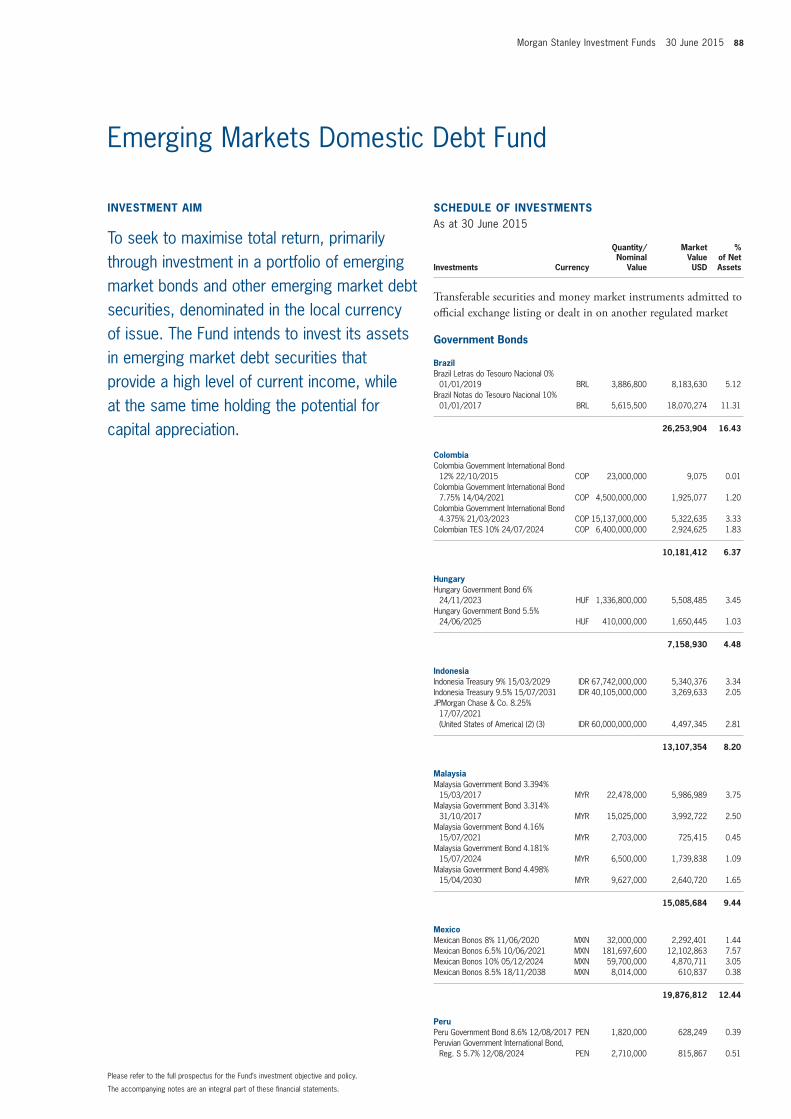
Morgan Stanley Investment Funds 30 June 2015 88
SCHEDULE of invEStmEntSAs at 30 June 2015
Investments Currency
Quantity/Nominal
Value
Market Value USD
% of Net Assets
transferable securities and money market instruments admitted to official exchange listing or dealt in on another regulated market
Government Bonds
BrazilBrazil Letras do Tesouro Nacional 0%
01/01/2019 BRL 3,886,800 8,183,630 5.12Brazil Notas do Tesouro Nacional 10%
01/01/2017 BRL 5,615,500 18,070,274 11.31
26,253,904 16.43
ColombiaColombia Government International Bond
12% 22/10/2015 COP 23,000,000 9,075 0.01Colombia Government International Bond
7.75% 14/04/2021 COP 4,500,000,000 1,925,077 1.20Colombia Government International Bond
4.375% 21/03/2023 COP 15,137,000,000 5,322,635 3.33Colombian TES 10% 24/07/2024 COP 6,400,000,000 2,924,625 1.83
10,181,412 6.37
HungaryHungary Government Bond 6%
24/11/2023 HUF 1,336,800,000 5,508,485 3.45Hungary Government Bond 5.5%
24/06/2025 HUF 410,000,000 1,650,445 1.03
7,158,930 4.48
indonesiaIndonesia Treasury 9% 15/03/2029 IDR 67,742,000,000 5,340,376 3.34Indonesia Treasury 9.5% 15/07/2031 IDR 40,105,000,000 3,269,633 2.05JPMorgan Chase & Co. 8.25%
17/07/2021 (United States of America) (2) (3) IDR 60,000,000,000 4,497,345 2.81
13,107,354 8.20
malaysiaMalaysia Government Bond 3.394%
15/03/2017 MYR 22,478,000 5,986,989 3.75Malaysia Government Bond 3.314%
31/10/2017 MYR 15,025,000 3,992,722 2.50Malaysia Government Bond 4.16%
15/07/2021 MYR 2,703,000 725,415 0.45Malaysia Government Bond 4.181%
15/07/2024 MYR 6,500,000 1,739,838 1.09Malaysia Government Bond 4.498%
15/04/2030 MYR 9,627,000 2,640,720 1.65
15,085,684 9.44
mexicoMexican Bonos 8% 11/06/2020 MXN 32,000,000 2,292,401 1.44Mexican Bonos 6.5% 10/06/2021 MXN 181,697,600 12,102,863 7.57Mexican Bonos 10% 05/12/2024 MXN 59,700,000 4,870,711 3.05Mexican Bonos 8.5% 18/11/2038 MXN 8,014,000 610,837 0.38
19,876,812 12.44
PeruPeru Government Bond 8.6% 12/08/2017 PEN 1,820,000 628,249 0.39Peruvian Government International Bond,
Reg. S 5.7% 12/08/2024 PEN 2,710,000 815,867 0.51
invEStmEnt Aim
To seek to maximise total return, primarily through investment in a portfolio of emerging market bonds and other emerging market debt securities, denominated in the local currency of issue. The Fund intends to invest its assets in emerging market debt securities that provide a high level of current income, while at the same time holding the potential for capital appreciation.
The accompanying notes are an integral part of these financial statements.
Please refer to the full prospectus for the Fund’s investment objective and policy.
Emerging Markets Domestic Debt Fund
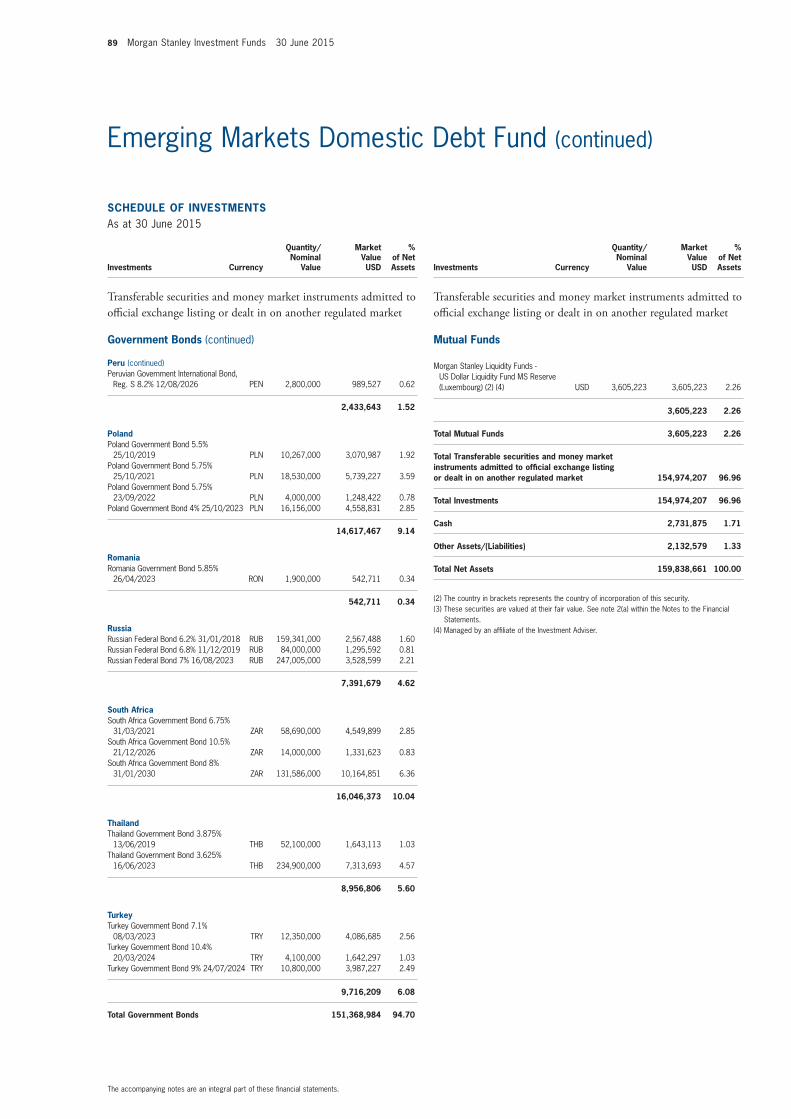
89 Morgan Stanley Investment Funds 30 June 2015
SCHEDULE of invEStmEntSAs at 30 June 2015
Investments Currency
Quantity/Nominal
Value
Market Value USD
% of Net Assets
transferable securities and money market instruments admitted to official exchange listing or dealt in on another regulated market
Government Bonds (continued)
Peru (continued)Peruvian Government International Bond,
Reg. S 8.2% 12/08/2026 PEN 2,800,000 989,527 0.62
2,433,643 1.52
PolandPoland Government Bond 5.5%
25/10/2019 PLN 10,267,000 3,070,987 1.92Poland Government Bond 5.75%
25/10/2021 PLN 18,530,000 5,739,227 3.59Poland Government Bond 5.75%
23/09/2022 PLN 4,000,000 1,248,422 0.78Poland Government Bond 4% 25/10/2023 PLN 16,156,000 4,558,831 2.85
14,617,467 9.14
RomaniaRomania Government Bond 5.85%
26/04/2023 RON 1,900,000 542,711 0.34
542,711 0.34
RussiaRussian Federal Bond 6.2% 31/01/2018 RUB 159,341,000 2,567,488 1.60Russian Federal Bond 6.8% 11/12/2019 RUB 84,000,000 1,295,592 0.81Russian Federal Bond 7% 16/08/2023 RUB 247,005,000 3,528,599 2.21
7,391,679 4.62
South AfricaSouth Africa Government Bond 6.75%
31/03/2021 ZAR 58,690,000 4,549,899 2.85South Africa Government Bond 10.5%
21/12/2026 ZAR 14,000,000 1,331,623 0.83South Africa Government Bond 8%
31/01/2030 ZAR 131,586,000 10,164,851 6.36
16,046,373 10.04
thailandThailand Government Bond 3.875%
13/06/2019 THB 52,100,000 1,643,113 1.03Thailand Government Bond 3.625%
16/06/2023 THB 234,900,000 7,313,693 4.57
8,956,806 5.60
turkeyTurkey Government Bond 7.1%
08/03/2023 TRY 12,350,000 4,086,685 2.56Turkey Government Bond 10.4%
20/03/2024 TRY 4,100,000 1,642,297 1.03Turkey Government Bond 9% 24/07/2024 TRY 10,800,000 3,987,227 2.49
9,716,209 6.08
total Government Bonds 151,368,984 94.70
SCHEDULE of invEStmEntSAs at 30 June 2015
Investments Currency
Quantity/Nominal
Value
Market Value USD
% of Net Assets
transferable securities and money market instruments admitted to official exchange listing or dealt in on another regulated market
mutual funds
Morgan Stanley Liquidity Funds - US Dollar Liquidity Fund MS Reserve (Luxembourg) (2) (4) USD 3,605,223 3,605,223 2.26
3,605,223 2.26
total mutual funds 3,605,223 2.26
total transferable securities and money market instruments admitted to official exchange listing or dealt in on another regulated market 154,974,207 96.96
total investments 154,974,207 96.96
Cash 2,731,875 1.71
other Assets/(Liabilities) 2,132,579 1.33
total net Assets 159,838,661 100.00
(2) The country in brackets represents the country of incorporation of this security.(3) These securities are valued at their fair value. See note 2(a) within the Notes to the Financial
Statements.(4) Managed by an affiliate of the Investment Adviser.
The accompanying notes are an integral part of these financial statements.
Emerging Markets Domestic Debt Fund (continued)
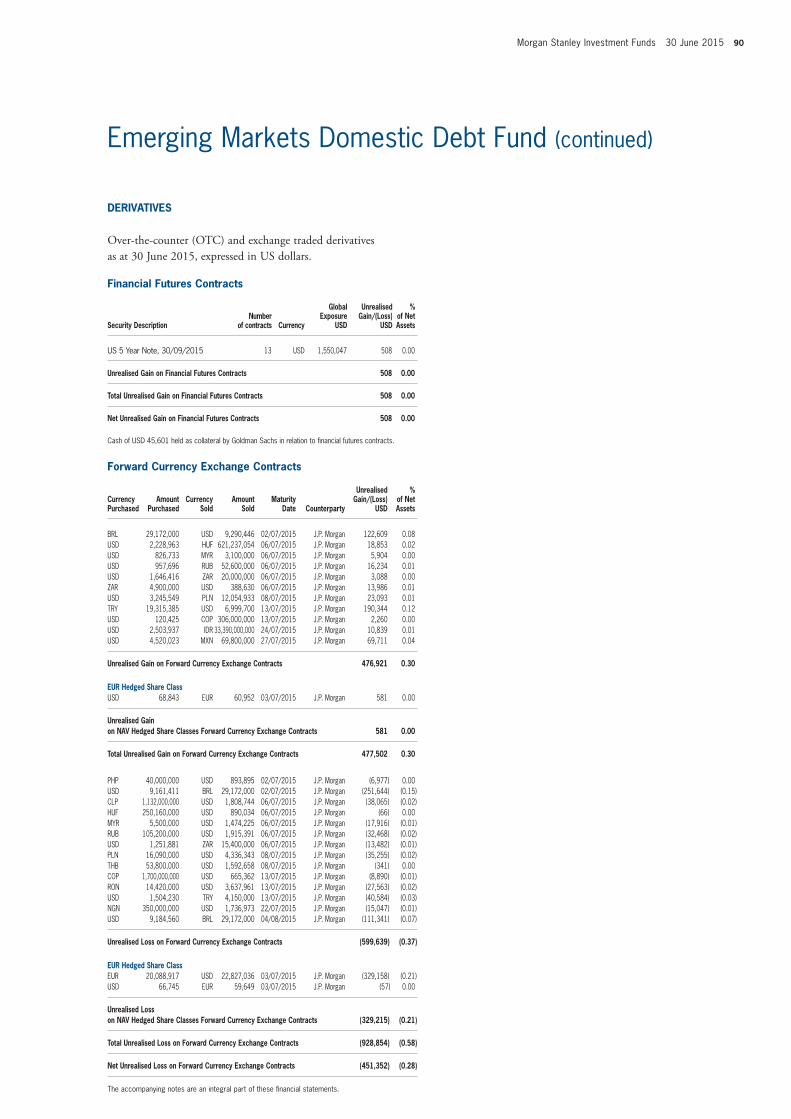
Morgan Stanley Investment Funds 30 June 2015 90
The accompanying notes are an integral part of these financial statements.
Emerging Markets Domestic Debt Fund (continued)
financial futures Contracts
Security Descriptionnumber
of contracts Currency
Global Exposure
USD
Unrealised Gain/(Loss)
USD
% of net Assets
US 5 Year Note, 30/09/2015 13 USD 1,550,047 508 0.00
Unrealised Gain on financial futures Contracts 508 0.00
total Unrealised Gain on financial futures Contracts 508 0.00
net Unrealised Gain on financial futures Contracts 508 0.00
Cash of USD 45,601 held as collateral by Goldman Sachs in relation to financial futures contracts.
forward Currency Exchange Contracts
Currency Purchased
Amount Purchased
Currency Sold
Amount Sold
maturity Date Counterparty
Unrealised Gain/(Loss)
USD
% of net Assets
BRL 29,172,000 USD 9,290,446 02/07/2015 J.P. Morgan 122,609 0.08USD 2,228,963 HUF 621,237,054 06/07/2015 J.P. Morgan 18,853 0.02USD 826,733 MYR 3,100,000 06/07/2015 J.P. Morgan 5,904 0.00USD 957,696 RUB 52,600,000 06/07/2015 J.P. Morgan 16,234 0.01USD 1,646,416 ZAR 20,000,000 06/07/2015 J.P. Morgan 3,088 0.00ZAR 4,900,000 USD 388,630 06/07/2015 J.P. Morgan 13,986 0.01USD 3,245,549 PLN 12,054,933 08/07/2015 J.P. Morgan 23,093 0.01TRY 19,315,385 USD 6,999,700 13/07/2015 J.P. Morgan 190,344 0.12USD 120,425 COP 306,000,000 13/07/2015 J.P. Morgan 2,260 0.00USD 2,503,937 IDR 33,390,000,000 24/07/2015 J.P. Morgan 10,839 0.01USD 4,520,023 MXN 69,800,000 27/07/2015 J.P. Morgan 69,711 0.04
Unrealised Gain on forward Currency Exchange Contracts 476,921 0.30
EUR Hedged Share ClassUSD 68,843 EUR 60,952 03/07/2015 J.P. Morgan 581 0.00
Unrealised Gain on nAv Hedged Share Classes forward Currency Exchange Contracts 581 0.00
total Unrealised Gain on forward Currency Exchange Contracts 477,502 0.30
PHP 40,000,000 USD 893,895 02/07/2015 J.P. Morgan (6,977) 0.00USD 9,161,411 BRL 29,172,000 02/07/2015 J.P. Morgan (251,644) (0.15)CLP 1,132,000,000 USD 1,808,744 06/07/2015 J.P. Morgan (38,065) (0.02)HUF 250,160,000 USD 890,034 06/07/2015 J.P. Morgan (66) 0.00MYR 5,500,000 USD 1,474,225 06/07/2015 J.P. Morgan (17,916) (0.01)RUB 105,200,000 USD 1,915,391 06/07/2015 J.P. Morgan (32,468) (0.02)USD 1,251,881 ZAR 15,400,000 06/07/2015 J.P. Morgan (13,482) (0.01)PLN 16,090,000 USD 4,336,343 08/07/2015 J.P. Morgan (35,255) (0.02)THB 53,800,000 USD 1,592,658 08/07/2015 J.P. Morgan (341) 0.00COP 1,700,000,000 USD 665,362 13/07/2015 J.P. Morgan (8,890) (0.01)RON 14,420,000 USD 3,637,961 13/07/2015 J.P. Morgan (27,563) (0.02)USD 1,504,230 TRY 4,150,000 13/07/2015 J.P. Morgan (40,584) (0.03)NGN 350,000,000 USD 1,736,973 22/07/2015 J.P. Morgan (15,047) (0.01)USD 9,184,560 BRL 29,172,000 04/08/2015 J.P. Morgan (111,341) (0.07)
Unrealised Loss on forward Currency Exchange Contracts (599,639) (0.37)
EUR Hedged Share ClassEUR 20,088,917 USD 22,827,036 03/07/2015 J.P. Morgan (329,158) (0.21)USD 66,745 EUR 59,649 03/07/2015 J.P. Morgan (57) 0.00
Unrealised Loss on nAv Hedged Share Classes forward Currency Exchange Contracts (329,215) (0.21)
total Unrealised Loss on forward Currency Exchange Contracts (928,854) (0.58)
net Unrealised Loss on forward Currency Exchange Contracts (451,352) (0.28)
DERivAtivES
Over-the-counter (OtC) and exchange traded derivatives as at 30 June 2015, expressed in US dollars.
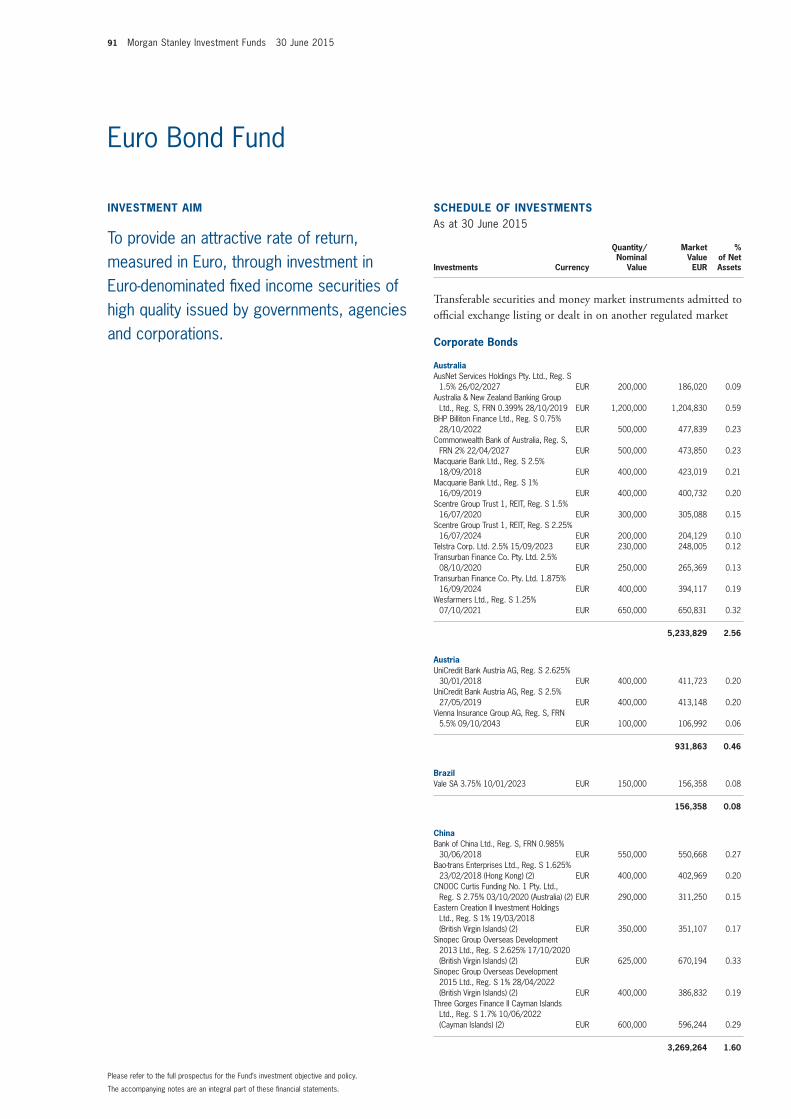
91 Morgan Stanley Investment Funds 30 June 2015
invEStmEnt Aim
To provide an attractive rate of return, measured in Euro, through investment in Euro-denominated fixed income securities of high quality issued by governments, agencies and corporations.
SCHEDULE of invEStmEntSAs at 30 June 2015
Investments Currency
Quantity/Nominal
Value
Market Value EUR
% of Net Assets
transferable securities and money market instruments admitted to official exchange listing or dealt in on another regulated market
Corporate Bonds
AustraliaAusNet Services Holdings Pty. Ltd., Reg. S
1.5% 26/02/2027 EUR 200,000 186,020 0.09Australia & New Zealand Banking Group
Ltd., Reg. S, FRN 0.399% 28/10/2019 EUR 1,200,000 1,204,830 0.59BHP Billiton Finance Ltd., Reg. S 0.75%
28/10/2022 EUR 500,000 477,839 0.23Commonwealth Bank of Australia, Reg. S,
FRN 2% 22/04/2027 EUR 500,000 473,850 0.23Macquarie Bank Ltd., Reg. S 2.5%
18/09/2018 EUR 400,000 423,019 0.21Macquarie Bank Ltd., Reg. S 1%
16/09/2019 EUR 400,000 400,732 0.20Scentre Group Trust 1, REIT, Reg. S 1.5%
16/07/2020 EUR 300,000 305,088 0.15Scentre Group Trust 1, REIT, Reg. S 2.25%
16/07/2024 EUR 200,000 204,129 0.10Telstra Corp. Ltd. 2.5% 15/09/2023 EUR 230,000 248,005 0.12Transurban Finance Co. Pty. Ltd. 2.5%
08/10/2020 EUR 250,000 265,369 0.13Transurban Finance Co. Pty. Ltd. 1.875%
16/09/2024 EUR 400,000 394,117 0.19Wesfarmers Ltd., Reg. S 1.25%
07/10/2021 EUR 650,000 650,831 0.32
5,233,829 2.56
AustriaUniCredit Bank Austria AG, Reg. S 2.625%
30/01/2018 EUR 400,000 411,723 0.20UniCredit Bank Austria AG, Reg. S 2.5%
27/05/2019 EUR 400,000 413,148 0.20Vienna Insurance Group AG, Reg. S, FRN
5.5% 09/10/2043 EUR 100,000 106,992 0.06
931,863 0.46
BrazilVale SA 3.75% 10/01/2023 EUR 150,000 156,358 0.08
156,358 0.08
ChinaBank of China Ltd., Reg. S, FRN 0.985%
30/06/2018 EUR 550,000 550,668 0.27Bao-trans Enterprises Ltd., Reg. S 1.625%
23/02/2018 (Hong Kong) (2) EUR 400,000 402,969 0.20CNOOC Curtis Funding No. 1 Pty. Ltd.,
Reg. S 2.75% 03/10/2020 (Australia) (2) EUR 290,000 311,250 0.15Eastern Creation II Investment Holdings
Ltd., Reg. S 1% 19/03/2018 (British Virgin Islands) (2) EUR 350,000 351,107 0.17
Sinopec Group Overseas Development 2013 Ltd., Reg. S 2.625% 17/10/2020 (British Virgin Islands) (2) EUR 625,000 670,194 0.33
Sinopec Group Overseas Development 2015 Ltd., Reg. S 1% 28/04/2022 (British Virgin Islands) (2) EUR 400,000 386,832 0.19
Three Gorges Finance II Cayman Islands Ltd., Reg. S 1.7% 10/06/2022 (Cayman Islands) (2) EUR 600,000 596,244 0.29
3,269,264 1.60
The accompanying notes are an integral part of these financial statements.
Please refer to the full prospectus for the Fund’s investment objective and policy.
Euro Bond Fund
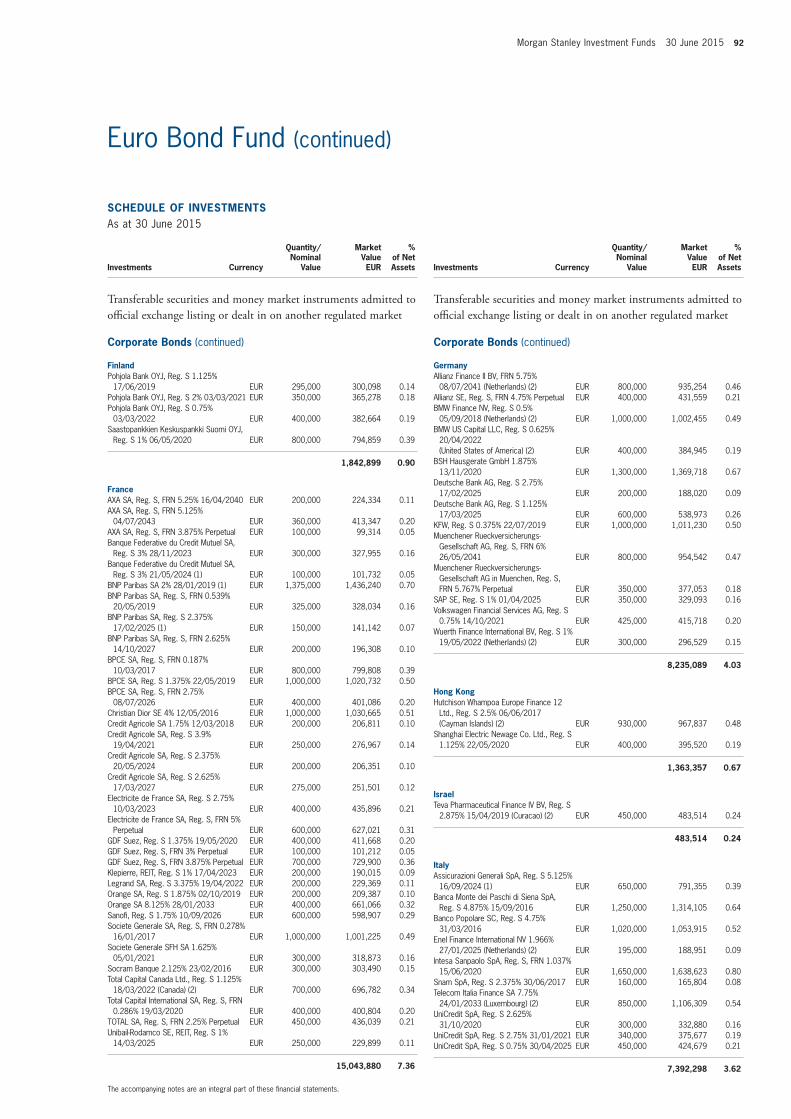
Morgan Stanley Investment Funds 30 June 2015 92
SCHEDULE of invEStmEntSAs at 30 June 2015
Investments Currency
Quantity/Nominal
Value
Market Value EUR
% of Net Assets
transferable securities and money market instruments admitted to official exchange listing or dealt in on another regulated market
Corporate Bonds (continued)
finlandPohjola Bank OYJ, Reg. S 1.125%
17/06/2019 EUR 295,000 300,098 0.14Pohjola Bank OYJ, Reg. S 2% 03/03/2021 EUR 350,000 365,278 0.18Pohjola Bank OYJ, Reg. S 0.75%
03/03/2022 EUR 400,000 382,664 0.19Saastopankkien Keskuspankki Suomi OYJ,
Reg. S 1% 06/05/2020 EUR 800,000 794,859 0.39
1,842,899 0.90
franceAXA SA, Reg. S, FRN 5.25% 16/04/2040 EUR 200,000 224,334 0.11AXA SA, Reg. S, FRN 5.125%
04/07/2043 EUR 360,000 413,347 0.20AXA SA, Reg. S, FRN 3.875% Perpetual EUR 100,000 99,314 0.05Banque Federative du Credit Mutuel SA,
Reg. S 3% 28/11/2023 EUR 300,000 327,955 0.16Banque Federative du Credit Mutuel SA,
Reg. S 3% 21/05/2024 (1) EUR 100,000 101,732 0.05BNP Paribas SA 2% 28/01/2019 (1) EUR 1,375,000 1,436,240 0.70BNP Paribas SA, Reg. S, FRN 0.539%
20/05/2019 EUR 325,000 328,034 0.16BNP Paribas SA, Reg. S 2.375%
17/02/2025 (1) EUR 150,000 141,142 0.07BNP Paribas SA, Reg. S, FRN 2.625%
14/10/2027 EUR 200,000 196,308 0.10BPCE SA, Reg. S, FRN 0.187%
10/03/2017 EUR 800,000 799,808 0.39BPCE SA, Reg. S 1.375% 22/05/2019 EUR 1,000,000 1,020,732 0.50BPCE SA, Reg. S, FRN 2.75%
08/07/2026 EUR 400,000 401,086 0.20Christian Dior SE 4% 12/05/2016 EUR 1,000,000 1,030,665 0.51Credit Agricole SA 1.75% 12/03/2018 EUR 200,000 206,811 0.10Credit Agricole SA, Reg. S 3.9%
19/04/2021 EUR 250,000 276,967 0.14Credit Agricole SA, Reg. S 2.375%
20/05/2024 EUR 200,000 206,351 0.10Credit Agricole SA, Reg. S 2.625%
17/03/2027 EUR 275,000 251,501 0.12Electricite de France SA, Reg. S 2.75%
10/03/2023 EUR 400,000 435,896 0.21Electricite de France SA, Reg. S, FRN 5%
Perpetual EUR 600,000 627,021 0.31GDF Suez, Reg. S 1.375% 19/05/2020 EUR 400,000 411,668 0.20GDF Suez, Reg. S, FRN 3% Perpetual EUR 100,000 101,212 0.05GDF Suez, Reg. S, FRN 3.875% Perpetual EUR 700,000 729,900 0.36Klepierre, REIT, Reg. S 1% 17/04/2023 EUR 200,000 190,015 0.09Legrand SA, Reg. S 3.375% 19/04/2022 EUR 200,000 229,369 0.11Orange SA, Reg. S 1.875% 02/10/2019 EUR 200,000 209,387 0.10Orange SA 8.125% 28/01/2033 EUR 400,000 661,066 0.32Sanofi, Reg. S 1.75% 10/09/2026 EUR 600,000 598,907 0.29Societe Generale SA, Reg. S, FRN 0.278%
16/01/2017 EUR 1,000,000 1,001,225 0.49Societe Generale SFH SA 1.625%
05/01/2021 EUR 300,000 318,873 0.16Socram Banque 2.125% 23/02/2016 EUR 300,000 303,490 0.15Total Capital Canada Ltd., Reg. S 1.125%
18/03/2022 (Canada) (2) EUR 700,000 696,782 0.34Total Capital International SA, Reg. S, FRN
0.286% 19/03/2020 EUR 400,000 400,804 0.20TOTAL SA, Reg. S, FRN 2.25% Perpetual EUR 450,000 436,039 0.21Unibail-Rodamco SE, REIT, Reg. S 1%
14/03/2025 EUR 250,000 229,899 0.11
15,043,880 7.36
SCHEDULE of invEStmEntSAs at 30 June 2015
Investments Currency
Quantity/Nominal
Value
Market Value EUR
% of Net Assets
transferable securities and money market instruments admitted to official exchange listing or dealt in on another regulated market
Corporate Bonds (continued)
GermanyAllianz Finance II BV, FRN 5.75%
08/07/2041 (Netherlands) (2) EUR 800,000 935,254 0.46Allianz SE, Reg. S, FRN 4.75% Perpetual EUR 400,000 431,559 0.21BMW Finance NV, Reg. S 0.5%
05/09/2018 (Netherlands) (2) EUR 1,000,000 1,002,455 0.49BMW US Capital LLC, Reg. S 0.625%
20/04/2022 (United States of America) (2) EUR 400,000 384,945 0.19
BSH Hausgerate GmbH 1.875% 13/11/2020 EUR 1,300,000 1,369,718 0.67
Deutsche Bank AG, Reg. S 2.75% 17/02/2025 EUR 200,000 188,020 0.09
Deutsche Bank AG, Reg. S 1.125% 17/03/2025 EUR 600,000 538,973 0.26
KFW, Reg. S 0.375% 22/07/2019 EUR 1,000,000 1,011,230 0.50Muenchener Rueckversicherungs-
Gesellschaft AG, Reg. S, FRN 6% 26/05/2041 EUR 800,000 954,542 0.47
Muenchener Rueckversicherungs-Gesellschaft AG in Muenchen, Reg. S, FRN 5.767% Perpetual EUR 350,000 377,053 0.18
SAP SE, Reg. S 1% 01/04/2025 EUR 350,000 329,093 0.16Volkswagen Financial Services AG, Reg. S
0.75% 14/10/2021 EUR 425,000 415,718 0.20Wuerth Finance International BV, Reg. S 1%
19/05/2022 (Netherlands) (2) EUR 300,000 296,529 0.15
8,235,089 4.03
Hong KongHutchison Whampoa Europe Finance 12
Ltd., Reg. S 2.5% 06/06/2017 (Cayman Islands) (2) EUR 930,000 967,837 0.48
Shanghai Electric Newage Co. Ltd., Reg. S 1.125% 22/05/2020 EUR 400,000 395,520 0.19
1,363,357 0.67
israelTeva Pharmaceutical Finance IV BV, Reg. S
2.875% 15/04/2019 (Curacao) (2) EUR 450,000 483,514 0.24
483,514 0.24
italyAssicurazioni Generali SpA, Reg. S 5.125%
16/09/2024 (1) EUR 650,000 791,355 0.39Banca Monte dei Paschi di Siena SpA,
Reg. S 4.875% 15/09/2016 EUR 1,250,000 1,314,105 0.64Banco Popolare SC, Reg. S 4.75%
31/03/2016 EUR 1,020,000 1,053,915 0.52Enel Finance International NV 1.966%
27/01/2025 (Netherlands) (2) EUR 195,000 188,951 0.09Intesa Sanpaolo SpA, Reg. S, FRN 1.037%
15/06/2020 EUR 1,650,000 1,638,623 0.80Snam SpA, Reg. S 2.375% 30/06/2017 EUR 160,000 165,804 0.08Telecom Italia Finance SA 7.75%
24/01/2033 (Luxembourg) (2) EUR 850,000 1,106,309 0.54UniCredit SpA, Reg. S 2.625%
31/10/2020 EUR 300,000 332,880 0.16UniCredit SpA, Reg. S 2.75% 31/01/2021 EUR 340,000 375,677 0.19UniCredit SpA, Reg. S 0.75% 30/04/2025 EUR 450,000 424,679 0.21
7,392,298 3.62
The accompanying notes are an integral part of these financial statements.
Euro Bond Fund (continued)
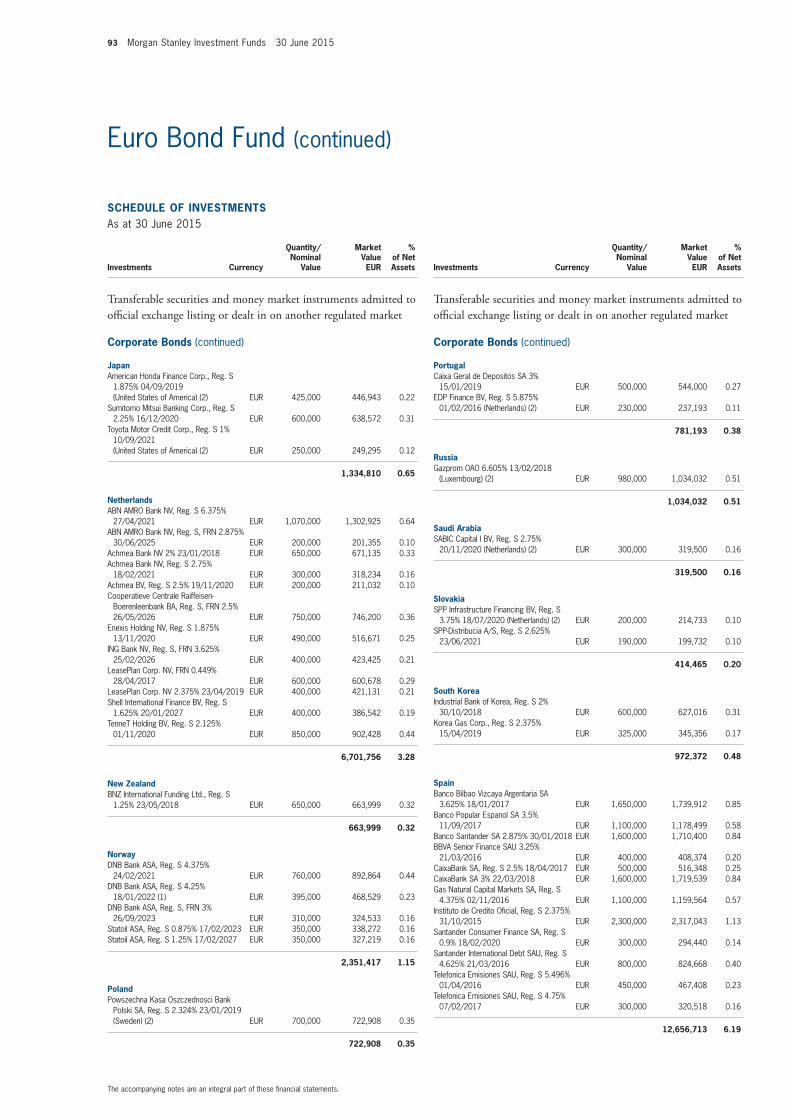
93 Morgan Stanley Investment Funds 30 June 2015
SCHEDULE of invEStmEntSAs at 30 June 2015
Investments Currency
Quantity/Nominal
Value
Market Value EUR
% of Net Assets
transferable securities and money market instruments admitted to official exchange listing or dealt in on another regulated market
Corporate Bonds (continued)
JapanAmerican Honda Finance Corp., Reg. S
1.875% 04/09/2019 (United States of America) (2) EUR 425,000 446,943 0.22
Sumitomo Mitsui Banking Corp., Reg. S 2.25% 16/12/2020 EUR 600,000 638,572 0.31
Toyota Motor Credit Corp., Reg. S 1% 10/09/2021 (United States of America) (2) EUR 250,000 249,295 0.12
1,334,810 0.65
netherlandsABN AMRO Bank NV, Reg. S 6.375%
27/04/2021 EUR 1,070,000 1,302,925 0.64ABN AMRO Bank NV, Reg. S, FRN 2.875%
30/06/2025 EUR 200,000 201,355 0.10Achmea Bank NV 2% 23/01/2018 EUR 650,000 671,135 0.33Achmea Bank NV, Reg. S 2.75%
18/02/2021 EUR 300,000 318,234 0.16Achmea BV, Reg. S 2.5% 19/11/2020 EUR 200,000 211,032 0.10Cooperatieve Centrale Raiffeisen-
Boerenleenbank BA, Reg. S, FRN 2.5% 26/05/2026 EUR 750,000 746,200 0.36
Enexis Holding NV, Reg. S 1.875% 13/11/2020 EUR 490,000 516,671 0.25
ING Bank NV, Reg. S, FRN 3.625% 25/02/2026 EUR 400,000 423,425 0.21
LeasePlan Corp. NV, FRN 0.449% 28/04/2017 EUR 600,000 600,678 0.29
LeasePlan Corp. NV 2.375% 23/04/2019 EUR 400,000 421,131 0.21Shell International Finance BV, Reg. S
1.625% 20/01/2027 EUR 400,000 386,542 0.19TenneT Holding BV, Reg. S 2.125%
01/11/2020 EUR 850,000 902,428 0.44
6,701,756 3.28
new ZealandBNZ International Funding Ltd., Reg. S
1.25% 23/05/2018 EUR 650,000 663,999 0.32
663,999 0.32
norwayDNB Bank ASA, Reg. S 4.375%
24/02/2021 EUR 760,000 892,864 0.44DNB Bank ASA, Reg. S 4.25%
18/01/2022 (1) EUR 395,000 468,529 0.23DNB Bank ASA, Reg. S, FRN 3%
26/09/2023 EUR 310,000 324,533 0.16Statoil ASA, Reg. S 0.875% 17/02/2023 EUR 350,000 338,272 0.16Statoil ASA, Reg. S 1.25% 17/02/2027 EUR 350,000 327,219 0.16
2,351,417 1.15
PolandPowszechna Kasa Oszczednosci Bank
Polski SA, Reg. S 2.324% 23/01/2019 (Sweden) (2) EUR 700,000 722,908 0.35
722,908 0.35
SCHEDULE of invEStmEntSAs at 30 June 2015
Investments Currency
Quantity/Nominal
Value
Market Value EUR
% of Net Assets
transferable securities and money market instruments admitted to official exchange listing or dealt in on another regulated market
Corporate Bonds (continued)
PortugalCaixa Geral de Depositos SA 3%
15/01/2019 EUR 500,000 544,000 0.27EDP Finance BV, Reg. S 5.875%
01/02/2016 (Netherlands) (2) EUR 230,000 237,193 0.11
781,193 0.38
RussiaGazprom OAO 6.605% 13/02/2018
(Luxembourg) (2) EUR 980,000 1,034,032 0.51
1,034,032 0.51
Saudi ArabiaSABIC Capital I BV, Reg. S 2.75%
20/11/2020 (Netherlands) (2) EUR 300,000 319,500 0.16
319,500 0.16
SlovakiaSPP Infrastructure Financing BV, Reg. S
3.75% 18/07/2020 (Netherlands) (2) EUR 200,000 214,733 0.10SPP-Distribucia A/S, Reg. S 2.625%
23/06/2021 EUR 190,000 199,732 0.10
414,465 0.20
South KoreaIndustrial Bank of Korea, Reg. S 2%
30/10/2018 EUR 600,000 627,016 0.31Korea Gas Corp., Reg. S 2.375%
15/04/2019 EUR 325,000 345,356 0.17
972,372 0.48
SpainBanco Bilbao Vizcaya Argentaria SA
3.625% 18/01/2017 EUR 1,650,000 1,739,912 0.85Banco Popular Espanol SA 3.5%
11/09/2017 EUR 1,100,000 1,178,499 0.58Banco Santander SA 2.875% 30/01/2018 EUR 1,600,000 1,710,400 0.84BBVA Senior Finance SAU 3.25%
21/03/2016 EUR 400,000 408,374 0.20CaixaBank SA, Reg. S 2.5% 18/04/2017 EUR 500,000 516,348 0.25CaixaBank SA 3% 22/03/2018 EUR 1,600,000 1,719,539 0.84Gas Natural Capital Markets SA, Reg. S
4.375% 02/11/2016 EUR 1,100,000 1,159,564 0.57Instituto de Credito Oficial, Reg. S 2.375%
31/10/2015 EUR 2,300,000 2,317,043 1.13Santander Consumer Finance SA, Reg. S
0.9% 18/02/2020 EUR 300,000 294,440 0.14Santander International Debt SAU, Reg. S
4.625% 21/03/2016 EUR 800,000 824,668 0.40Telefonica Emisiones SAU, Reg. S 5.496%
01/04/2016 EUR 450,000 467,408 0.23Telefonica Emisiones SAU, Reg. S 4.75%
07/02/2017 EUR 300,000 320,518 0.16
12,656,713 6.19
The accompanying notes are an integral part of these financial statements.
Euro Bond Fund (continued)
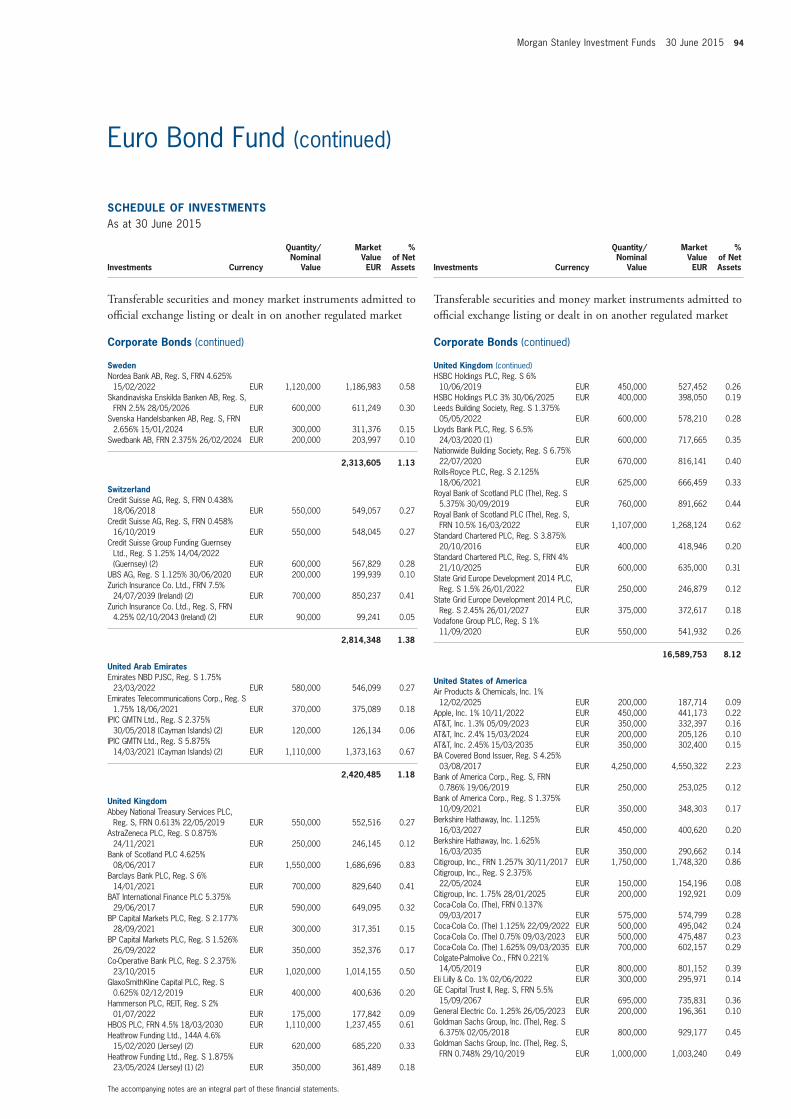
Morgan Stanley Investment Funds 30 June 2015 94
SCHEDULE of invEStmEntSAs at 30 June 2015
Investments Currency
Quantity/Nominal
Value
Market Value EUR
% of Net Assets
transferable securities and money market instruments admitted to official exchange listing or dealt in on another regulated market
Corporate Bonds (continued)
SwedenNordea Bank AB, Reg. S, FRN 4.625%
15/02/2022 EUR 1,120,000 1,186,983 0.58Skandinaviska Enskilda Banken AB, Reg. S,
FRN 2.5% 28/05/2026 EUR 600,000 611,249 0.30Svenska Handelsbanken AB, Reg. S, FRN
2.656% 15/01/2024 EUR 300,000 311,376 0.15Swedbank AB, FRN 2.375% 26/02/2024 EUR 200,000 203,997 0.10
2,313,605 1.13
SwitzerlandCredit Suisse AG, Reg. S, FRN 0.438%
18/06/2018 EUR 550,000 549,057 0.27Credit Suisse AG, Reg. S, FRN 0.458%
16/10/2019 EUR 550,000 548,045 0.27Credit Suisse Group Funding Guernsey
Ltd., Reg. S 1.25% 14/04/2022 (Guernsey) (2) EUR 600,000 567,829 0.28
UBS AG, Reg. S 1.125% 30/06/2020 EUR 200,000 199,939 0.10Zurich Insurance Co. Ltd., FRN 7.5%
24/07/2039 (Ireland) (2) EUR 700,000 850,237 0.41Zurich Insurance Co. Ltd., Reg. S, FRN
4.25% 02/10/2043 (Ireland) (2) EUR 90,000 99,241 0.05
2,814,348 1.38
United Arab EmiratesEmirates NBD PJSC, Reg. S 1.75%
23/03/2022 EUR 580,000 546,099 0.27Emirates Telecommunications Corp., Reg. S
1.75% 18/06/2021 EUR 370,000 375,089 0.18IPIC GMTN Ltd., Reg. S 2.375%
30/05/2018 (Cayman Islands) (2) EUR 120,000 126,134 0.06IPIC GMTN Ltd., Reg. S 5.875%
14/03/2021 (Cayman Islands) (2) EUR 1,110,000 1,373,163 0.67
2,420,485 1.18
United KingdomAbbey National Treasury Services PLC,
Reg. S, FRN 0.613% 22/05/2019 EUR 550,000 552,516 0.27AstraZeneca PLC, Reg. S 0.875%
24/11/2021 EUR 250,000 246,145 0.12Bank of Scotland PLC 4.625%
08/06/2017 EUR 1,550,000 1,686,696 0.83Barclays Bank PLC, Reg. S 6%
14/01/2021 EUR 700,000 829,640 0.41BAT International Finance PLC 5.375%
29/06/2017 EUR 590,000 649,095 0.32BP Capital Markets PLC, Reg. S 2.177%
28/09/2021 EUR 300,000 317,351 0.15BP Capital Markets PLC, Reg. S 1.526%
26/09/2022 EUR 350,000 352,376 0.17Co-Operative Bank PLC, Reg. S 2.375%
23/10/2015 EUR 1,020,000 1,014,155 0.50GlaxoSmithKline Capital PLC, Reg. S
0.625% 02/12/2019 EUR 400,000 400,636 0.20Hammerson PLC, REIT, Reg. S 2%
01/07/2022 EUR 175,000 177,842 0.09HBOS PLC, FRN 4.5% 18/03/2030 EUR 1,110,000 1,237,455 0.61Heathrow Funding Ltd., 144A 4.6%
15/02/2020 (Jersey) (2) EUR 620,000 685,220 0.33Heathrow Funding Ltd., Reg. S 1.875%
23/05/2024 (Jersey) (1) (2) EUR 350,000 361,489 0.18
SCHEDULE of invEStmEntSAs at 30 June 2015
Investments Currency
Quantity/Nominal
Value
Market Value EUR
% of Net Assets
transferable securities and money market instruments admitted to official exchange listing or dealt in on another regulated market
Corporate Bonds (continued)
United Kingdom (continued)HSBC Holdings PLC, Reg. S 6%
10/06/2019 EUR 450,000 527,452 0.26HSBC Holdings PLC 3% 30/06/2025 EUR 400,000 398,050 0.19Leeds Building Society, Reg. S 1.375%
05/05/2022 EUR 600,000 578,210 0.28Lloyds Bank PLC, Reg. S 6.5%
24/03/2020 (1) EUR 600,000 717,665 0.35Nationwide Building Society, Reg. S 6.75%
22/07/2020 EUR 670,000 816,141 0.40Rolls-Royce PLC, Reg. S 2.125%
18/06/2021 EUR 625,000 666,459 0.33Royal Bank of Scotland PLC (The), Reg. S
5.375% 30/09/2019 EUR 760,000 891,662 0.44Royal Bank of Scotland PLC (The), Reg. S,
FRN 10.5% 16/03/2022 EUR 1,107,000 1,268,124 0.62Standard Chartered PLC, Reg. S 3.875%
20/10/2016 EUR 400,000 418,946 0.20Standard Chartered PLC, Reg. S, FRN 4%
21/10/2025 EUR 600,000 635,000 0.31State Grid Europe Development 2014 PLC,
Reg. S 1.5% 26/01/2022 EUR 250,000 246,879 0.12State Grid Europe Development 2014 PLC,
Reg. S 2.45% 26/01/2027 EUR 375,000 372,617 0.18Vodafone Group PLC, Reg. S 1%
11/09/2020 EUR 550,000 541,932 0.26
16,589,753 8.12
United States of AmericaAir Products & Chemicals, Inc. 1%
12/02/2025 EUR 200,000 187,714 0.09Apple, Inc. 1% 10/11/2022 EUR 450,000 441,173 0.22AT&T, Inc. 1.3% 05/09/2023 EUR 350,000 332,397 0.16AT&T, Inc. 2.4% 15/03/2024 EUR 200,000 205,126 0.10AT&T, Inc. 2.45% 15/03/2035 EUR 350,000 302,400 0.15BA Covered Bond Issuer, Reg. S 4.25%
03/08/2017 EUR 4,250,000 4,550,322 2.23Bank of America Corp., Reg. S, FRN
0.786% 19/06/2019 EUR 250,000 253,025 0.12Bank of America Corp., Reg. S 1.375%
10/09/2021 EUR 350,000 348,303 0.17Berkshire Hathaway, Inc. 1.125%
16/03/2027 EUR 450,000 400,620 0.20Berkshire Hathaway, Inc. 1.625%
16/03/2035 EUR 350,000 290,662 0.14Citigroup, Inc., FRN 1.257% 30/11/2017 EUR 1,750,000 1,748,320 0.86Citigroup, Inc., Reg. S 2.375%
22/05/2024 EUR 150,000 154,196 0.08Citigroup, Inc. 1.75% 28/01/2025 EUR 200,000 192,921 0.09Coca-Cola Co. (The), FRN 0.137%
09/03/2017 EUR 575,000 574,799 0.28Coca-Cola Co. (The) 1.125% 22/09/2022 EUR 500,000 495,042 0.24Coca-Cola Co. (The) 0.75% 09/03/2023 EUR 500,000 475,487 0.23Coca-Cola Co. (The) 1.625% 09/03/2035 EUR 700,000 602,157 0.29Colgate-Palmolive Co., FRN 0.221%
14/05/2019 EUR 800,000 801,152 0.39Eli Lilly & Co. 1% 02/06/2022 EUR 300,000 295,971 0.14GE Capital Trust II, Reg. S, FRN 5.5%
15/09/2067 EUR 695,000 735,831 0.36General Electric Co. 1.25% 26/05/2023 EUR 200,000 196,361 0.10Goldman Sachs Group, Inc. (The), Reg. S
6.375% 02/05/2018 EUR 800,000 929,177 0.45Goldman Sachs Group, Inc. (The), Reg. S,
FRN 0.748% 29/10/2019 EUR 1,000,000 1,003,240 0.49
The accompanying notes are an integral part of these financial statements.
Euro Bond Fund (continued)
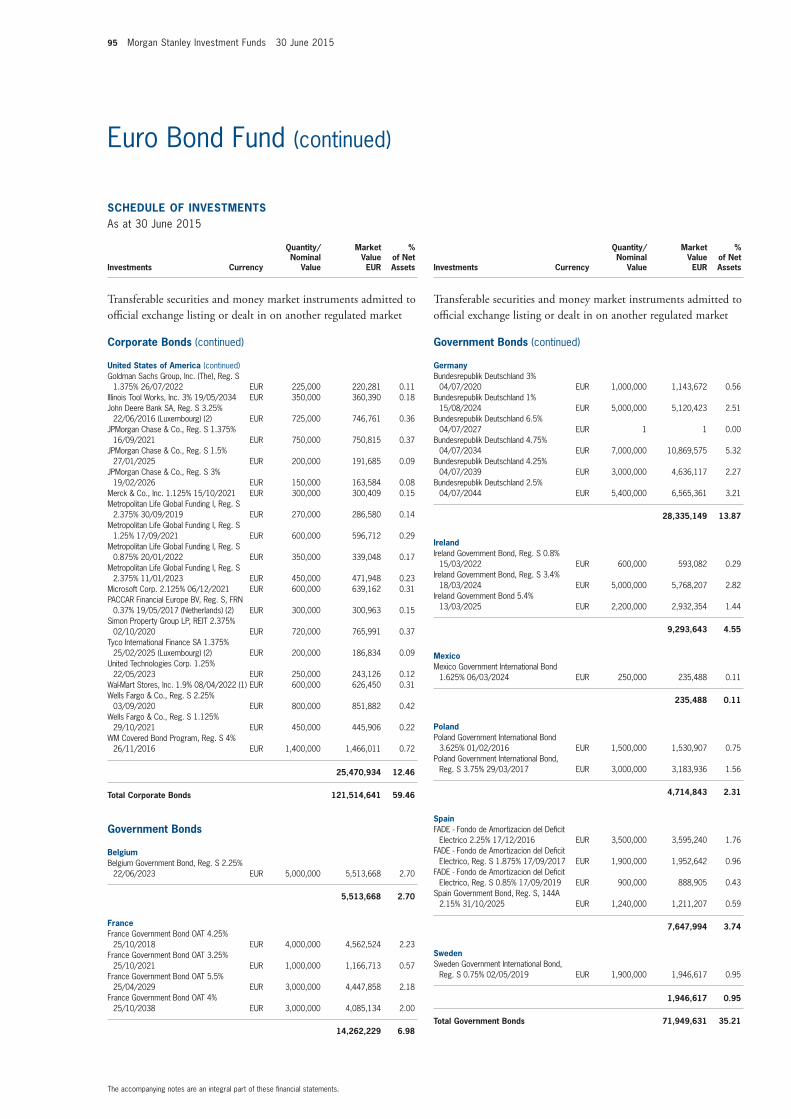
95 Morgan Stanley Investment Funds 30 June 2015
SCHEDULE of invEStmEntSAs at 30 June 2015
Investments Currency
Quantity/Nominal
Value
Market Value EUR
% of Net Assets
transferable securities and money market instruments admitted to official exchange listing or dealt in on another regulated market
Corporate Bonds (continued)
United States of America (continued)Goldman Sachs Group, Inc. (The), Reg. S
1.375% 26/07/2022 EUR 225,000 220,281 0.11Illinois Tool Works, Inc. 3% 19/05/2034 EUR 350,000 360,390 0.18John Deere Bank SA, Reg. S 3.25%
22/06/2016 (Luxembourg) (2) EUR 725,000 746,761 0.36JPMorgan Chase & Co., Reg. S 1.375%
16/09/2021 EUR 750,000 750,815 0.37JPMorgan Chase & Co., Reg. S 1.5%
27/01/2025 EUR 200,000 191,685 0.09JPMorgan Chase & Co., Reg. S 3%
19/02/2026 EUR 150,000 163,584 0.08Merck & Co., Inc. 1.125% 15/10/2021 EUR 300,000 300,409 0.15Metropolitan Life Global Funding I, Reg. S
2.375% 30/09/2019 EUR 270,000 286,580 0.14Metropolitan Life Global Funding I, Reg. S
1.25% 17/09/2021 EUR 600,000 596,712 0.29Metropolitan Life Global Funding I, Reg. S
0.875% 20/01/2022 EUR 350,000 339,048 0.17Metropolitan Life Global Funding I, Reg. S
2.375% 11/01/2023 EUR 450,000 471,948 0.23Microsoft Corp. 2.125% 06/12/2021 EUR 600,000 639,162 0.31PACCAR Financial Europe BV, Reg. S, FRN
0.37% 19/05/2017 (Netherlands) (2) EUR 300,000 300,963 0.15Simon Property Group LP, REIT 2.375%
02/10/2020 EUR 720,000 765,991 0.37Tyco International Finance SA 1.375%
25/02/2025 (Luxembourg) (2) EUR 200,000 186,834 0.09United Technologies Corp. 1.25%
22/05/2023 EUR 250,000 243,126 0.12Wal-Mart Stores, Inc. 1.9% 08/04/2022 (1) EUR 600,000 626,450 0.31Wells Fargo & Co., Reg. S 2.25%
03/09/2020 EUR 800,000 851,882 0.42Wells Fargo & Co., Reg. S 1.125%
29/10/2021 EUR 450,000 445,906 0.22WM Covered Bond Program, Reg. S 4%
26/11/2016 EUR 1,400,000 1,466,011 0.72
25,470,934 12.46
total Corporate Bonds 121,514,641 59.46
Government Bonds
BelgiumBelgium Government Bond, Reg. S 2.25%
22/06/2023 EUR 5,000,000 5,513,668 2.70
5,513,668 2.70
franceFrance Government Bond OAT 4.25%
25/10/2018 EUR 4,000,000 4,562,524 2.23France Government Bond OAT 3.25%
25/10/2021 EUR 1,000,000 1,166,713 0.57France Government Bond OAT 5.5%
25/04/2029 EUR 3,000,000 4,447,858 2.18France Government Bond OAT 4%
25/10/2038 EUR 3,000,000 4,085,134 2.00
14,262,229 6.98
SCHEDULE of invEStmEntSAs at 30 June 2015
Investments Currency
Quantity/Nominal
Value
Market Value EUR
% of Net Assets
transferable securities and money market instruments admitted to official exchange listing or dealt in on another regulated market
Government Bonds (continued)
GermanyBundesrepublik Deutschland 3%
04/07/2020 EUR 1,000,000 1,143,672 0.56Bundesrepublik Deutschland 1%
15/08/2024 EUR 5,000,000 5,120,423 2.51Bundesrepublik Deutschland 6.5%
04/07/2027 EUR 1 1 0.00Bundesrepublik Deutschland 4.75%
04/07/2034 EUR 7,000,000 10,869,575 5.32Bundesrepublik Deutschland 4.25%
04/07/2039 EUR 3,000,000 4,636,117 2.27Bundesrepublik Deutschland 2.5%
04/07/2044 EUR 5,400,000 6,565,361 3.21
28,335,149 13.87
irelandIreland Government Bond, Reg. S 0.8%
15/03/2022 EUR 600,000 593,082 0.29Ireland Government Bond, Reg. S 3.4%
18/03/2024 EUR 5,000,000 5,768,207 2.82Ireland Government Bond 5.4%
13/03/2025 EUR 2,200,000 2,932,354 1.44
9,293,643 4.55
mexicoMexico Government International Bond
1.625% 06/03/2024 EUR 250,000 235,488 0.11
235,488 0.11
PolandPoland Government International Bond
3.625% 01/02/2016 EUR 1,500,000 1,530,907 0.75Poland Government International Bond,
Reg. S 3.75% 29/03/2017 EUR 3,000,000 3,183,936 1.56
4,714,843 2.31
SpainFADE - Fondo de Amortizacion del Deficit
Electrico 2.25% 17/12/2016 EUR 3,500,000 3,595,240 1.76FADE - Fondo de Amortizacion del Deficit
Electrico, Reg. S 1.875% 17/09/2017 EUR 1,900,000 1,952,642 0.96FADE - Fondo de Amortizacion del Deficit
Electrico, Reg. S 0.85% 17/09/2019 EUR 900,000 888,905 0.43Spain Government Bond, Reg. S, 144A
2.15% 31/10/2025 EUR 1,240,000 1,211,207 0.59
7,647,994 3.74
SwedenSweden Government International Bond,
Reg. S 0.75% 02/05/2019 EUR 1,900,000 1,946,617 0.95
1,946,617 0.95
total Government Bonds 71,949,631 35.21
The accompanying notes are an integral part of these financial statements.
Euro Bond Fund (continued)
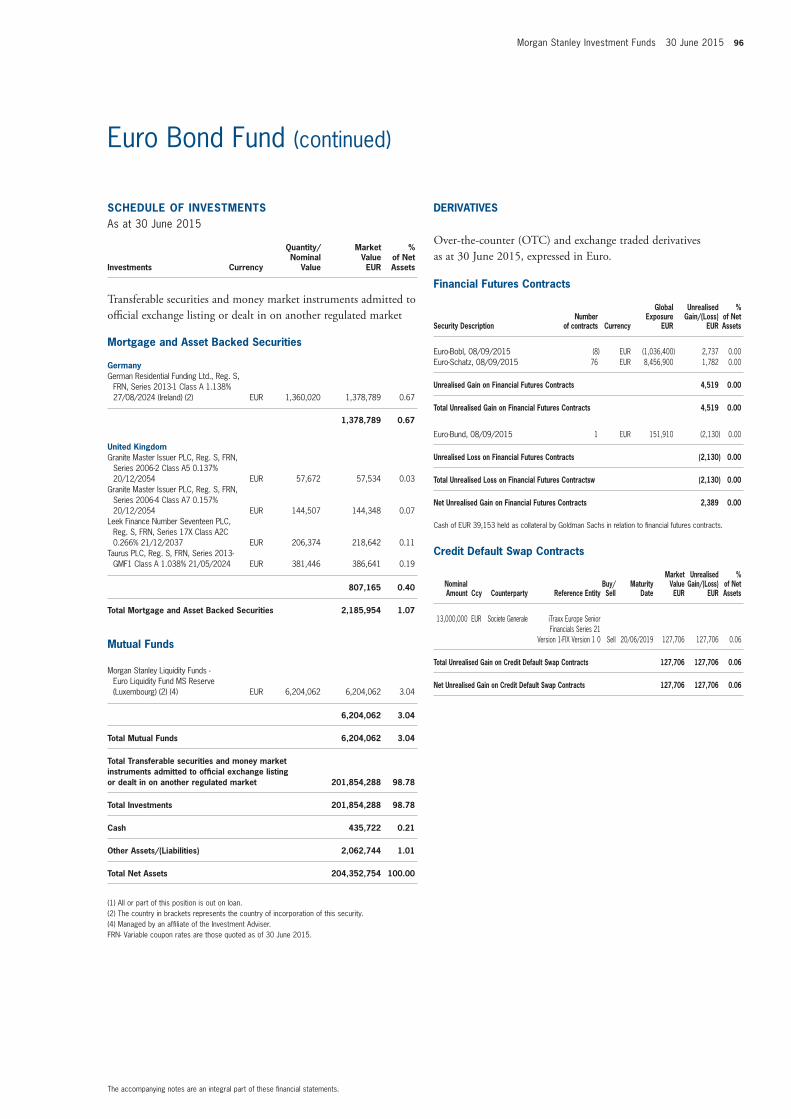
Morgan Stanley Investment Funds 30 June 2015 96
SCHEDULE of invEStmEntSAs at 30 June 2015
Investments Currency
Quantity/Nominal
Value
Market Value EUR
% of Net Assets
transferable securities and money market instruments admitted to official exchange listing or dealt in on another regulated market
mortgage and Asset Backed Securities
GermanyGerman Residential Funding Ltd., Reg. S,
FRN, Series 2013-1 Class A 1.138% 27/08/2024 (Ireland) (2) EUR 1,360,020 1,378,789 0.67
1,378,789 0.67
United KingdomGranite Master Issuer PLC, Reg. S, FRN,
Series 2006-2 Class A5 0.137% 20/12/2054 EUR 57,672 57,534 0.03
Granite Master Issuer PLC, Reg. S, FRN, Series 2006-4 Class A7 0.157% 20/12/2054 EUR 144,507 144,348 0.07
Leek Finance Number Seventeen PLC, Reg. S, FRN, Series 17X Class A2C 0.266% 21/12/2037 EUR 206,374 218,642 0.11
Taurus PLC, Reg. S, FRN, Series 2013-GMF1 Class A 1.038% 21/05/2024 EUR 381,446 386,641 0.19
807,165 0.40
total mortgage and Asset Backed Securities 2,185,954 1.07
mutual funds
Morgan Stanley Liquidity Funds - Euro Liquidity Fund MS Reserve (Luxembourg) (2) (4) EUR 6,204,062 6,204,062 3.04
6,204,062 3.04
total mutual funds 6,204,062 3.04
total transferable securities and money market instruments admitted to official exchange listing or dealt in on another regulated market 201,854,288 98.78
total investments 201,854,288 98.78
Cash 435,722 0.21
other Assets/(Liabilities) 2,062,744 1.01
total net Assets 204,352,754 100.00
(1) All or part of this position is out on loan.(2) The country in brackets represents the country of incorporation of this security.(4) Managed by an affiliate of the Investment Adviser.FRN- Variable coupon rates are those quoted as of 30 June 2015.
DERivAtivES
Over-the-counter (OtC) and exchange traded derivatives as at 30 June 2015, expressed in euro.
financial futures Contracts
Security Descriptionnumber
of contracts Currency
Global Exposure
EUR
Unrealised Gain/(Loss)
EUR
% of net Assets
Euro-Bobl, 08/09/2015 (8) EUR (1,036,400) 2,737 0.00Euro-Schatz, 08/09/2015 76 EUR 8,456,900 1,782 0.00
Unrealised Gain on financial futures Contracts 4,519 0.00
total Unrealised Gain on financial futures Contracts 4,519 0.00
Euro-Bund, 08/09/2015 1 EUR 151,910 (2,130) 0.00
Unrealised Loss on financial futures Contracts (2,130) 0.00
total Unrealised Loss on financial futures Contractsw (2,130) 0.00
net Unrealised Gain on financial futures Contracts 2,389 0.00
Cash of EUR 39,153 held as collateral by Goldman Sachs in relation to financial futures contracts.
Credit Default Swap Contracts
nominal Amount Ccy Counterparty Reference Entity
Buy/Sell
maturity Date
market value EUR
Unrealised Gain/(Loss)
EUR
% of net Assets
13,000,000 EUR Societe Generale iTraxx Europe Senior Financials Series 21
Version 1-FIX Version 1 0 Sell 20/06/2019 127,706 127,706 0.06
total Unrealised Gain on Credit Default Swap Contracts 127,706 127,706 0.06
net Unrealised Gain on Credit Default Swap Contracts 127,706 127,706 0.06
The accompanying notes are an integral part of these financial statements.
Euro Bond Fund (continued)
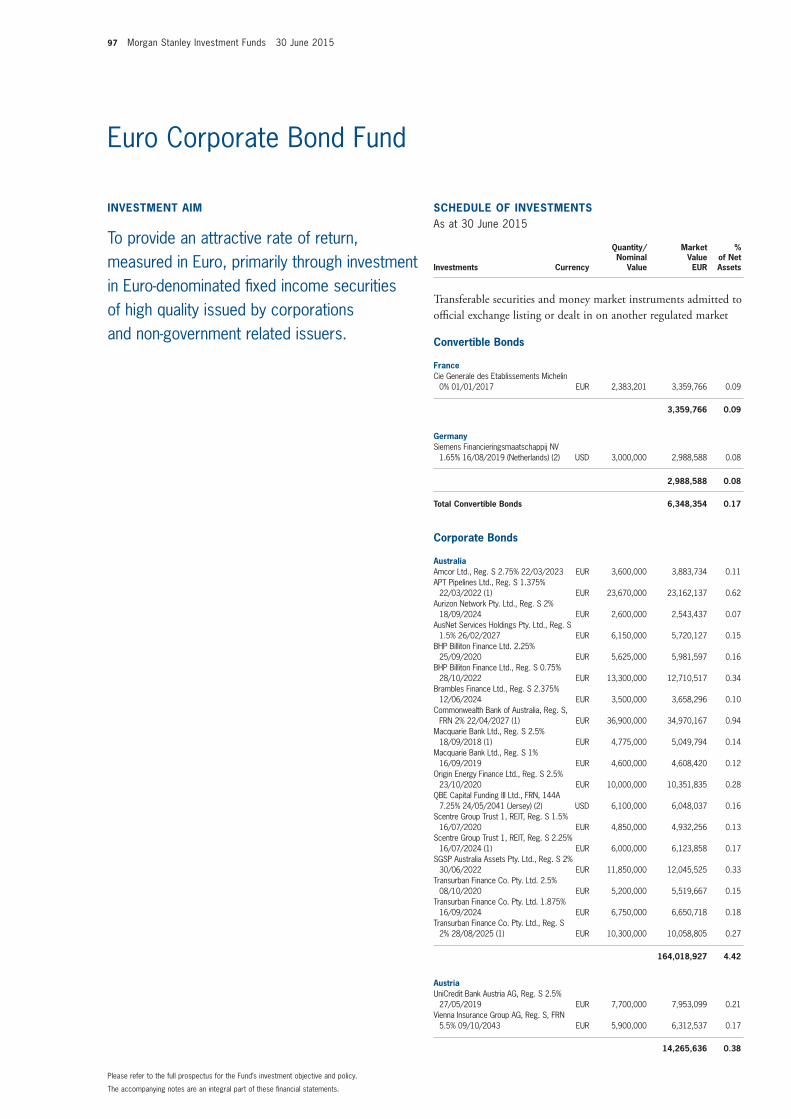
97 Morgan Stanley Investment Funds 30 June 2015
invEStmEnt Aim
To provide an attractive rate of return, measured in Euro, primarily through investment in Euro-denominated fixed income securities of high quality issued by corporations and non-government related issuers.
SCHEDULE of invEStmEntSAs at 30 June 2015
Investments Currency
Quantity/Nominal
Value
Market Value EUR
% of Net Assets
transferable securities and money market instruments admitted to official exchange listing or dealt in on another regulated market
Convertible Bonds
franceCie Generale des Etablissements Michelin
0% 01/01/2017 EUR 2,383,201 3,359,766 0.09
3,359,766 0.09
GermanySiemens Financieringsmaatschappij NV
1.65% 16/08/2019 (Netherlands) (2) USD 3,000,000 2,988,588 0.08
2,988,588 0.08
total Convertible Bonds 6,348,354 0.17
Corporate Bonds
AustraliaAmcor Ltd., Reg. S 2.75% 22/03/2023 EUR 3,600,000 3,883,734 0.11APT Pipelines Ltd., Reg. S 1.375%
22/03/2022 (1) EUR 23,670,000 23,162,137 0.62Aurizon Network Pty. Ltd., Reg. S 2%
18/09/2024 EUR 2,600,000 2,543,437 0.07AusNet Services Holdings Pty. Ltd., Reg. S
1.5% 26/02/2027 EUR 6,150,000 5,720,127 0.15BHP Billiton Finance Ltd. 2.25%
25/09/2020 EUR 5,625,000 5,981,597 0.16BHP Billiton Finance Ltd., Reg. S 0.75%
28/10/2022 EUR 13,300,000 12,710,517 0.34Brambles Finance Ltd., Reg. S 2.375%
12/06/2024 EUR 3,500,000 3,658,296 0.10Commonwealth Bank of Australia, Reg. S,
FRN 2% 22/04/2027 (1) EUR 36,900,000 34,970,167 0.94Macquarie Bank Ltd., Reg. S 2.5%
18/09/2018 (1) EUR 4,775,000 5,049,794 0.14Macquarie Bank Ltd., Reg. S 1%
16/09/2019 EUR 4,600,000 4,608,420 0.12Origin Energy Finance Ltd., Reg. S 2.5%
23/10/2020 EUR 10,000,000 10,351,835 0.28QBE Capital Funding III Ltd., FRN, 144A
7.25% 24/05/2041 (Jersey) (2) USD 6,100,000 6,048,037 0.16Scentre Group Trust 1, REIT, Reg. S 1.5%
16/07/2020 EUR 4,850,000 4,932,256 0.13Scentre Group Trust 1, REIT, Reg. S 2.25%
16/07/2024 (1) EUR 6,000,000 6,123,858 0.17SGSP Australia Assets Pty. Ltd., Reg. S 2%
30/06/2022 EUR 11,850,000 12,045,525 0.33Transurban Finance Co. Pty. Ltd. 2.5%
08/10/2020 EUR 5,200,000 5,519,667 0.15Transurban Finance Co. Pty. Ltd. 1.875%
16/09/2024 EUR 6,750,000 6,650,718 0.18Transurban Finance Co. Pty. Ltd., Reg. S
2% 28/08/2025 (1) EUR 10,300,000 10,058,805 0.27
164,018,927 4.42
AustriaUniCredit Bank Austria AG, Reg. S 2.5%
27/05/2019 EUR 7,700,000 7,953,099 0.21Vienna Insurance Group AG, Reg. S, FRN
5.5% 09/10/2043 EUR 5,900,000 6,312,537 0.17
14,265,636 0.38
The accompanying notes are an integral part of these financial statements.
Please refer to the full prospectus for the Fund’s investment objective and policy.
Euro Corporate Bond Fund
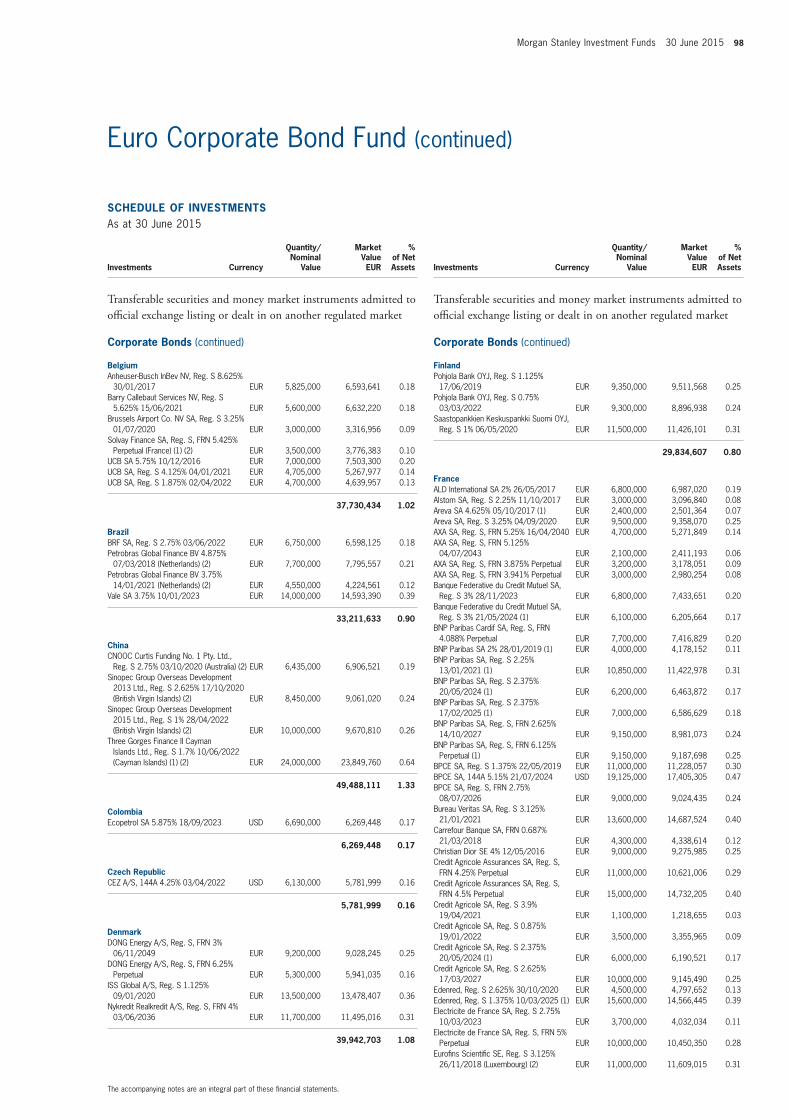
Morgan Stanley Investment Funds 30 June 2015 98
SCHEDULE of invEStmEntSAs at 30 June 2015
Investments Currency
Quantity/Nominal
Value
Market Value EUR
% of Net Assets
transferable securities and money market instruments admitted to official exchange listing or dealt in on another regulated market
Corporate Bonds (continued)
BelgiumAnheuser-Busch InBev NV, Reg. S 8.625%
30/01/2017 EUR 5,825,000 6,593,641 0.18Barry Callebaut Services NV, Reg. S
5.625% 15/06/2021 EUR 5,600,000 6,632,220 0.18Brussels Airport Co. NV SA, Reg. S 3.25%
01/07/2020 EUR 3,000,000 3,316,956 0.09Solvay Finance SA, Reg. S, FRN 5.425%
Perpetual (France) (1) (2) EUR 3,500,000 3,776,383 0.10UCB SA 5.75% 10/12/2016 EUR 7,000,000 7,503,300 0.20UCB SA, Reg. S 4.125% 04/01/2021 EUR 4,705,000 5,267,977 0.14UCB SA, Reg. S 1.875% 02/04/2022 EUR 4,700,000 4,639,957 0.13
37,730,434 1.02
BrazilBRF SA, Reg. S 2.75% 03/06/2022 EUR 6,750,000 6,598,125 0.18Petrobras Global Finance BV 4.875%
07/03/2018 (Netherlands) (2) EUR 7,700,000 7,795,557 0.21Petrobras Global Finance BV 3.75%
14/01/2021 (Netherlands) (2) EUR 4,550,000 4,224,561 0.12Vale SA 3.75% 10/01/2023 EUR 14,000,000 14,593,390 0.39
33,211,633 0.90
ChinaCNOOC Curtis Funding No. 1 Pty. Ltd.,
Reg. S 2.75% 03/10/2020 (Australia) (2) EUR 6,435,000 6,906,521 0.19Sinopec Group Overseas Development
2013 Ltd., Reg. S 2.625% 17/10/2020 (British Virgin Islands) (2) EUR 8,450,000 9,061,020 0.24
Sinopec Group Overseas Development 2015 Ltd., Reg. S 1% 28/04/2022 (British Virgin Islands) (2) EUR 10,000,000 9,670,810 0.26
Three Gorges Finance II Cayman Islands Ltd., Reg. S 1.7% 10/06/2022 (Cayman Islands) (1) (2) EUR 24,000,000 23,849,760 0.64
49,488,111 1.33
ColombiaEcopetrol SA 5.875% 18/09/2023 USD 6,690,000 6,269,448 0.17
6,269,448 0.17
Czech RepublicCEZ A/S, 144A 4.25% 03/04/2022 USD 6,130,000 5,781,999 0.16
5,781,999 0.16
DenmarkDONG Energy A/S, Reg. S, FRN 3%
06/11/2049 EUR 9,200,000 9,028,245 0.25DONG Energy A/S, Reg. S, FRN 6.25%
Perpetual EUR 5,300,000 5,941,035 0.16ISS Global A/S, Reg. S 1.125%
09/01/2020 EUR 13,500,000 13,478,407 0.36Nykredit Realkredit A/S, Reg. S, FRN 4%
03/06/2036 EUR 11,700,000 11,495,016 0.31
39,942,703 1.08
SCHEDULE of invEStmEntSAs at 30 June 2015
Investments Currency
Quantity/Nominal
Value
Market Value EUR
% of Net Assets
transferable securities and money market instruments admitted to official exchange listing or dealt in on another regulated market
Corporate Bonds (continued)
finlandPohjola Bank OYJ, Reg. S 1.125%
17/06/2019 EUR 9,350,000 9,511,568 0.25Pohjola Bank OYJ, Reg. S 0.75%
03/03/2022 EUR 9,300,000 8,896,938 0.24Saastopankkien Keskuspankki Suomi OYJ,
Reg. S 1% 06/05/2020 EUR 11,500,000 11,426,101 0.31
29,834,607 0.80
franceALD International SA 2% 26/05/2017 EUR 6,800,000 6,987,020 0.19Alstom SA, Reg. S 2.25% 11/10/2017 EUR 3,000,000 3,096,840 0.08Areva SA 4.625% 05/10/2017 (1) EUR 2,400,000 2,501,364 0.07Areva SA, Reg. S 3.25% 04/09/2020 EUR 9,500,000 9,358,070 0.25AXA SA, Reg. S, FRN 5.25% 16/04/2040 EUR 4,700,000 5,271,849 0.14AXA SA, Reg. S, FRN 5.125%
04/07/2043 EUR 2,100,000 2,411,193 0.06AXA SA, Reg. S, FRN 3.875% Perpetual EUR 3,200,000 3,178,051 0.09AXA SA, Reg. S, FRN 3.941% Perpetual EUR 3,000,000 2,980,254 0.08Banque Federative du Credit Mutuel SA,
Reg. S 3% 28/11/2023 EUR 6,800,000 7,433,651 0.20Banque Federative du Credit Mutuel SA,
Reg. S 3% 21/05/2024 (1) EUR 6,100,000 6,205,664 0.17BNP Paribas Cardif SA, Reg. S, FRN
4.088% Perpetual EUR 7,700,000 7,416,829 0.20BNP Paribas SA 2% 28/01/2019 (1) EUR 4,000,000 4,178,152 0.11BNP Paribas SA, Reg. S 2.25%
13/01/2021 (1) EUR 10,850,000 11,422,978 0.31BNP Paribas SA, Reg. S 2.375%
20/05/2024 (1) EUR 6,200,000 6,463,872 0.17BNP Paribas SA, Reg. S 2.375%
17/02/2025 (1) EUR 7,000,000 6,586,629 0.18BNP Paribas SA, Reg. S, FRN 2.625%
14/10/2027 EUR 9,150,000 8,981,073 0.24BNP Paribas SA, Reg. S, FRN 6.125%
Perpetual (1) EUR 9,150,000 9,187,698 0.25BPCE SA, Reg. S 1.375% 22/05/2019 EUR 11,000,000 11,228,057 0.30BPCE SA, 144A 5.15% 21/07/2024 USD 19,125,000 17,405,305 0.47BPCE SA, Reg. S, FRN 2.75%
08/07/2026 EUR 9,000,000 9,024,435 0.24Bureau Veritas SA, Reg. S 3.125%
21/01/2021 EUR 13,600,000 14,687,524 0.40Carrefour Banque SA, FRN 0.687%
21/03/2018 EUR 4,300,000 4,338,614 0.12Christian Dior SE 4% 12/05/2016 EUR 9,000,000 9,275,985 0.25Credit Agricole Assurances SA, Reg. S,
FRN 4.25% Perpetual EUR 11,000,000 10,621,006 0.29Credit Agricole Assurances SA, Reg. S,
FRN 4.5% Perpetual EUR 15,000,000 14,732,205 0.40Credit Agricole SA, Reg. S 3.9%
19/04/2021 EUR 1,100,000 1,218,655 0.03Credit Agricole SA, Reg. S 0.875%
19/01/2022 EUR 3,500,000 3,355,965 0.09Credit Agricole SA, Reg. S 2.375%
20/05/2024 (1) EUR 6,000,000 6,190,521 0.17Credit Agricole SA, Reg. S 2.625%
17/03/2027 EUR 10,000,000 9,145,490 0.25Edenred, Reg. S 2.625% 30/10/2020 EUR 4,500,000 4,797,652 0.13Edenred, Reg. S 1.375% 10/03/2025 (1) EUR 15,600,000 14,566,445 0.39Electricite de France SA, Reg. S 2.75%
10/03/2023 EUR 3,700,000 4,032,034 0.11Electricite de France SA, Reg. S, FRN 5%
Perpetual EUR 10,000,000 10,450,350 0.28Eurofins Scientific SE, Reg. S 3.125%
26/11/2018 (Luxembourg) (2) EUR 11,000,000 11,609,015 0.31
The accompanying notes are an integral part of these financial statements.
Euro Corporate Bond Fund (continued)
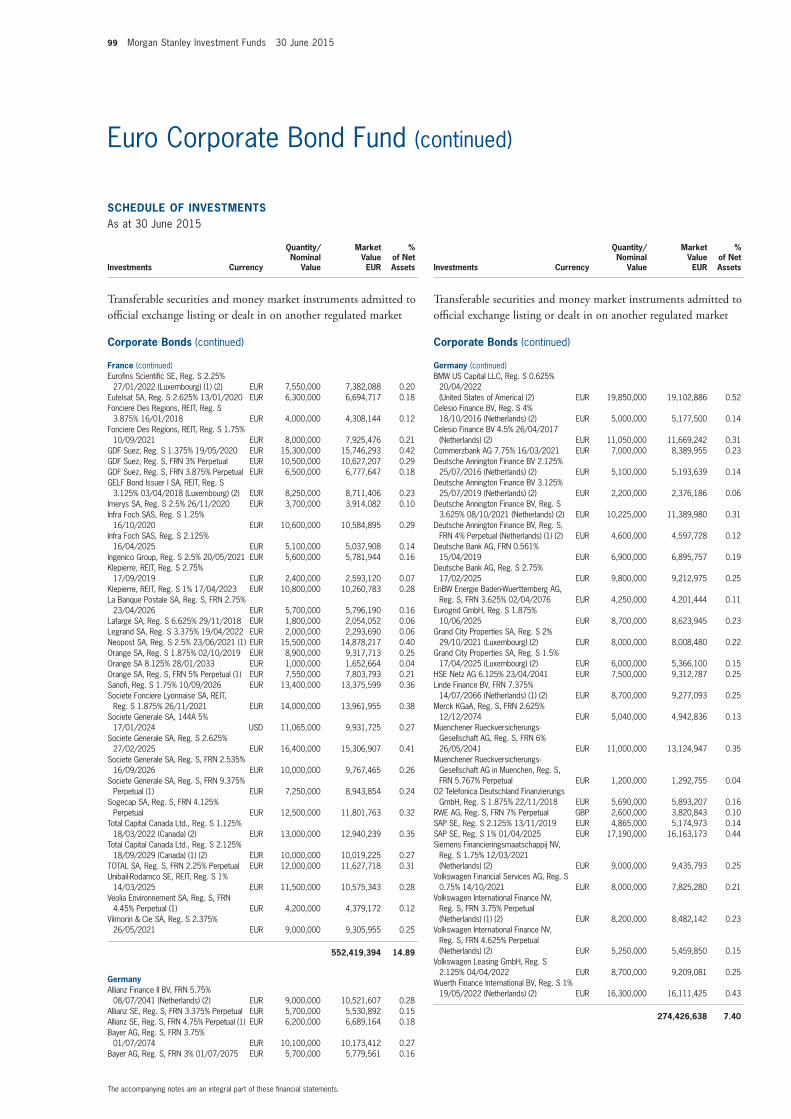
99 Morgan Stanley Investment Funds 30 June 2015
SCHEDULE of invEStmEntSAs at 30 June 2015
Investments Currency
Quantity/Nominal
Value
Market Value EUR
% of Net Assets
transferable securities and money market instruments admitted to official exchange listing or dealt in on another regulated market
Corporate Bonds (continued)
france (continued)Eurofins Scientific SE, Reg. S 2.25%
27/01/2022 (Luxembourg) (1) (2) EUR 7,550,000 7,382,088 0.20Eutelsat SA, Reg. S 2.625% 13/01/2020 EUR 6,300,000 6,694,717 0.18Fonciere Des Regions, REIT, Reg. S
3.875% 16/01/2018 EUR 4,000,000 4,308,144 0.12Fonciere Des Regions, REIT, Reg. S 1.75%
10/09/2021 EUR 8,000,000 7,925,476 0.21GDF Suez, Reg. S 1.375% 19/05/2020 EUR 15,300,000 15,746,293 0.42GDF Suez, Reg. S, FRN 3% Perpetual EUR 10,500,000 10,627,207 0.29GDF Suez, Reg. S, FRN 3.875% Perpetual EUR 6,500,000 6,777,647 0.18GELF Bond Issuer I SA, REIT, Reg. S
3.125% 03/04/2018 (Luxembourg) (2) EUR 8,250,000 8,711,406 0.23Imerys SA, Reg. S 2.5% 26/11/2020 EUR 3,700,000 3,914,082 0.10Infra Foch SAS, Reg. S 1.25%
16/10/2020 EUR 10,600,000 10,584,895 0.29Infra Foch SAS, Reg. S 2.125%
16/04/2025 EUR 5,100,000 5,037,908 0.14Ingenico Group, Reg. S 2.5% 20/05/2021 EUR 5,600,000 5,781,944 0.16Klepierre, REIT, Reg. S 2.75%
17/09/2019 EUR 2,400,000 2,593,120 0.07Klepierre, REIT, Reg. S 1% 17/04/2023 EUR 10,800,000 10,260,783 0.28La Banque Postale SA, Reg. S, FRN 2.75%
23/04/2026 EUR 5,700,000 5,796,190 0.16Lafarge SA, Reg. S 6.625% 29/11/2018 EUR 1,800,000 2,054,052 0.06Legrand SA, Reg. S 3.375% 19/04/2022 EUR 2,000,000 2,293,690 0.06Neopost SA, Reg. S 2.5% 23/06/2021 (1) EUR 15,500,000 14,878,217 0.40Orange SA, Reg. S 1.875% 02/10/2019 EUR 8,900,000 9,317,713 0.25Orange SA 8.125% 28/01/2033 EUR 1,000,000 1,652,664 0.04Orange SA, Reg. S, FRN 5% Perpetual (1) EUR 7,550,000 7,803,793 0.21Sanofi, Reg. S 1.75% 10/09/2026 EUR 13,400,000 13,375,599 0.36Societe Fonciere Lyonnaise SA, REIT,
Reg. S 1.875% 26/11/2021 EUR 14,000,000 13,961,955 0.38Societe Generale SA, 144A 5%
17/01/2024 USD 11,065,000 9,931,725 0.27Societe Generale SA, Reg. S 2.625%
27/02/2025 EUR 16,400,000 15,306,907 0.41Societe Generale SA, Reg. S, FRN 2.535%
16/09/2026 EUR 10,000,000 9,767,465 0.26Societe Generale SA, Reg. S, FRN 9.375%
Perpetual (1) EUR 7,250,000 8,943,854 0.24Sogecap SA, Reg. S, FRN 4.125%
Perpetual EUR 12,500,000 11,801,763 0.32Total Capital Canada Ltd., Reg. S 1.125%
18/03/2022 (Canada) (2) EUR 13,000,000 12,940,239 0.35Total Capital Canada Ltd., Reg. S 2.125%
18/09/2029 (Canada) (1) (2) EUR 10,000,000 10,019,225 0.27TOTAL SA, Reg. S, FRN 2.25% Perpetual EUR 12,000,000 11,627,718 0.31Unibail-Rodamco SE, REIT, Reg. S 1%
14/03/2025 EUR 11,500,000 10,575,343 0.28Veolia Environnement SA, Reg. S, FRN
4.45% Perpetual (1) EUR 4,200,000 4,379,172 0.12Vilmorin & Cie SA, Reg. S 2.375%
26/05/2021 EUR 9,000,000 9,305,955 0.25
552,419,394 14.89
GermanyAllianz Finance II BV, FRN 5.75%
08/07/2041 (Netherlands) (2) EUR 9,000,000 10,521,607 0.28Allianz SE, Reg. S, FRN 3.375% Perpetual EUR 5,700,000 5,530,892 0.15Allianz SE, Reg. S, FRN 4.75% Perpetual (1) EUR 6,200,000 6,689,164 0.18Bayer AG, Reg. S, FRN 3.75%
01/07/2074 EUR 10,100,000 10,173,412 0.27Bayer AG, Reg. S, FRN 3% 01/07/2075 EUR 5,700,000 5,779,561 0.16
SCHEDULE of invEStmEntSAs at 30 June 2015
Investments Currency
Quantity/Nominal
Value
Market Value EUR
% of Net Assets
transferable securities and money market instruments admitted to official exchange listing or dealt in on another regulated market
Corporate Bonds (continued)
Germany (continued)BMW US Capital LLC, Reg. S 0.625%
20/04/2022 (United States of America) (2) EUR 19,850,000 19,102,886 0.52
Celesio Finance BV, Reg. S 4% 18/10/2016 (Netherlands) (2) EUR 5,000,000 5,177,500 0.14
Celesio Finance BV 4.5% 26/04/2017 (Netherlands) (2) EUR 11,050,000 11,669,242 0.31
Commerzbank AG 7.75% 16/03/2021 EUR 7,000,000 8,389,955 0.23Deutsche Annington Finance BV 2.125%
25/07/2016 (Netherlands) (2) EUR 5,100,000 5,193,639 0.14Deutsche Annington Finance BV 3.125%
25/07/2019 (Netherlands) (2) EUR 2,200,000 2,376,186 0.06Deutsche Annington Finance BV, Reg. S
3.625% 08/10/2021 (Netherlands) (2) EUR 10,225,000 11,389,980 0.31Deutsche Annington Finance BV, Reg. S,
FRN 4% Perpetual (Netherlands) (1) (2) EUR 4,600,000 4,597,728 0.12Deutsche Bank AG, FRN 0.561%
15/04/2019 EUR 6,900,000 6,895,757 0.19Deutsche Bank AG, Reg. S 2.75%
17/02/2025 EUR 9,800,000 9,212,975 0.25EnBW Energie Baden-Wuerttemberg AG,
Reg. S, FRN 3.625% 02/04/2076 EUR 4,250,000 4,201,444 0.11Eurogrid GmbH, Reg. S 1.875%
10/06/2025 EUR 8,700,000 8,623,945 0.23Grand City Properties SA, Reg. S 2%
29/10/2021 (Luxembourg) (2) EUR 8,000,000 8,008,480 0.22Grand City Properties SA, Reg. S 1.5%
17/04/2025 (Luxembourg) (2) EUR 6,000,000 5,366,100 0.15HSE Netz AG 6.125% 23/04/2041 EUR 7,500,000 9,312,787 0.25Linde Finance BV, FRN 7.375%
14/07/2066 (Netherlands) (1) (2) EUR 8,700,000 9,277,093 0.25Merck KGaA, Reg. S, FRN 2.625%
12/12/2074 EUR 5,040,000 4,942,836 0.13Muenchener Rueckversicherungs-
Gesellschaft AG, Reg. S, FRN 6% 26/05/2041 EUR 11,000,000 13,124,947 0.35
Muenchener Rueckversicherungs-Gesellschaft AG in Muenchen, Reg. S, FRN 5.767% Perpetual EUR 1,200,000 1,292,755 0.04
O2 Telefonica Deutschland Finanzierungs GmbH, Reg. S 1.875% 22/11/2018 EUR 5,690,000 5,893,207 0.16
RWE AG, Reg. S, FRN 7% Perpetual GBP 2,600,000 3,820,843 0.10SAP SE, Reg. S 2.125% 13/11/2019 EUR 4,865,000 5,174,973 0.14SAP SE, Reg. S 1% 01/04/2025 EUR 17,190,000 16,163,173 0.44Siemens Financieringsmaatschappij NV,
Reg. S 1.75% 12/03/2021 (Netherlands) (2) EUR 9,000,000 9,435,793 0.25
Volkswagen Financial Services AG, Reg. S 0.75% 14/10/2021 EUR 8,000,000 7,825,280 0.21
Volkswagen International Finance NV, Reg. S, FRN 3.75% Perpetual (Netherlands) (1) (2) EUR 8,200,000 8,482,142 0.23
Volkswagen International Finance NV, Reg. S, FRN 4.625% Perpetual (Netherlands) (2) EUR 5,250,000 5,459,850 0.15
Volkswagen Leasing GmbH, Reg. S 2.125% 04/04/2022 EUR 8,700,000 9,209,081 0.25
Wuerth Finance International BV, Reg. S 1% 19/05/2022 (Netherlands) (2) EUR 16,300,000 16,111,425 0.43
274,426,638 7.40
The accompanying notes are an integral part of these financial statements.
Euro Corporate Bond Fund (continued)
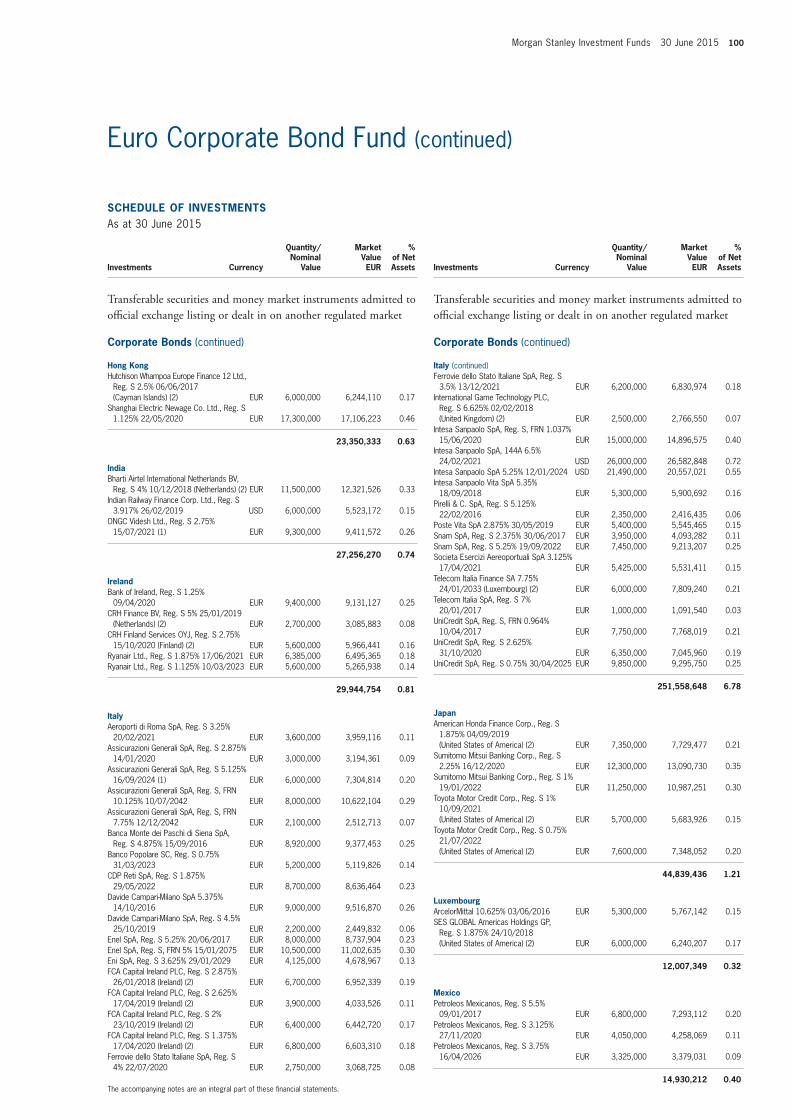
Morgan Stanley Investment Funds 30 June 2015 100
SCHEDULE of invEStmEntSAs at 30 June 2015
Investments Currency
Quantity/Nominal
Value
Market Value EUR
% of Net Assets
transferable securities and money market instruments admitted to official exchange listing or dealt in on another regulated market
Corporate Bonds (continued)
Hong KongHutchison Whampoa Europe Finance 12 Ltd.,
Reg. S 2.5% 06/06/2017 (Cayman Islands) (2) EUR 6,000,000 6,244,110 0.17
Shanghai Electric Newage Co. Ltd., Reg. S 1.125% 22/05/2020 EUR 17,300,000 17,106,223 0.46
23,350,333 0.63
indiaBharti Airtel International Netherlands BV,
Reg. S 4% 10/12/2018 (Netherlands) (2) EUR 11,500,000 12,321,526 0.33Indian Railway Finance Corp. Ltd., Reg. S
3.917% 26/02/2019 USD 6,000,000 5,523,172 0.15ONGC Videsh Ltd., Reg. S 2.75%
15/07/2021 (1) EUR 9,300,000 9,411,572 0.26
27,256,270 0.74
irelandBank of Ireland, Reg. S 1.25%
09/04/2020 EUR 9,400,000 9,131,127 0.25CRH Finance BV, Reg. S 5% 25/01/2019
(Netherlands) (2) EUR 2,700,000 3,085,883 0.08CRH Finland Services OYJ, Reg. S 2.75%
15/10/2020 (Finland) (2) EUR 5,600,000 5,966,441 0.16Ryanair Ltd., Reg. S 1.875% 17/06/2021 EUR 6,385,000 6,495,365 0.18Ryanair Ltd., Reg. S 1.125% 10/03/2023 EUR 5,600,000 5,265,938 0.14
29,944,754 0.81
italyAeroporti di Roma SpA, Reg. S 3.25%
20/02/2021 EUR 3,600,000 3,959,116 0.11Assicurazioni Generali SpA, Reg. S 2.875%
14/01/2020 EUR 3,000,000 3,194,361 0.09Assicurazioni Generali SpA, Reg. S 5.125%
16/09/2024 (1) EUR 6,000,000 7,304,814 0.20Assicurazioni Generali SpA, Reg. S, FRN
10.125% 10/07/2042 EUR 8,000,000 10,622,104 0.29Assicurazioni Generali SpA, Reg. S, FRN
7.75% 12/12/2042 EUR 2,100,000 2,512,713 0.07Banca Monte dei Paschi di Siena SpA,
Reg. S 4.875% 15/09/2016 EUR 8,920,000 9,377,453 0.25Banco Popolare SC, Reg. S 0.75%
31/03/2023 EUR 5,200,000 5,119,826 0.14CDP Reti SpA, Reg. S 1.875%
29/05/2022 EUR 8,700,000 8,636,464 0.23Davide Campari-Milano SpA 5.375%
14/10/2016 EUR 9,000,000 9,516,870 0.26Davide Campari-Milano SpA, Reg. S 4.5%
25/10/2019 EUR 2,200,000 2,449,832 0.06Enel SpA, Reg. S 5.25% 20/06/2017 EUR 8,000,000 8,737,904 0.23Enel SpA, Reg. S, FRN 5% 15/01/2075 EUR 10,500,000 11,002,635 0.30Eni SpA, Reg. S 3.625% 29/01/2029 EUR 4,125,000 4,678,967 0.13FCA Capital Ireland PLC, Reg. S 2.875%
26/01/2018 (Ireland) (2) EUR 6,700,000 6,952,339 0.19FCA Capital Ireland PLC, Reg. S 2.625%
17/04/2019 (Ireland) (2) EUR 3,900,000 4,033,526 0.11FCA Capital Ireland PLC, Reg. S 2%
23/10/2019 (Ireland) (2) EUR 6,400,000 6,442,720 0.17FCA Capital Ireland PLC, Reg. S 1.375%
17/04/2020 (Ireland) (2) EUR 6,800,000 6,603,310 0.18Ferrovie dello Stato Italiane SpA, Reg. S
4% 22/07/2020 EUR 2,750,000 3,068,725 0.08
SCHEDULE of invEStmEntSAs at 30 June 2015
Investments Currency
Quantity/Nominal
Value
Market Value EUR
% of Net Assets
transferable securities and money market instruments admitted to official exchange listing or dealt in on another regulated market
Corporate Bonds (continued)
italy (continued)Ferrovie dello Stato Italiane SpA, Reg. S
3.5% 13/12/2021 EUR 6,200,000 6,830,974 0.18International Game Technology PLC,
Reg. S 6.625% 02/02/2018 (United Kingdom) (2) EUR 2,500,000 2,766,550 0.07
Intesa Sanpaolo SpA, Reg. S, FRN 1.037% 15/06/2020 EUR 15,000,000 14,896,575 0.40
Intesa Sanpaolo SpA, 144A 6.5% 24/02/2021 USD 26,000,000 26,582,848 0.72
Intesa Sanpaolo SpA 5.25% 12/01/2024 USD 21,490,000 20,557,021 0.55Intesa Sanpaolo Vita SpA 5.35%
18/09/2018 EUR 5,300,000 5,900,692 0.16Pirelli & C. SpA, Reg. S 5.125%
22/02/2016 EUR 2,350,000 2,416,435 0.06Poste Vita SpA 2.875% 30/05/2019 EUR 5,400,000 5,545,465 0.15Snam SpA, Reg. S 2.375% 30/06/2017 EUR 3,950,000 4,093,282 0.11Snam SpA, Reg. S 5.25% 19/09/2022 EUR 7,450,000 9,213,207 0.25Societa Esercizi Aereoportuali SpA 3.125%
17/04/2021 EUR 5,425,000 5,531,411 0.15Telecom Italia Finance SA 7.75%
24/01/2033 (Luxembourg) (2) EUR 6,000,000 7,809,240 0.21Telecom Italia SpA, Reg. S 7%
20/01/2017 EUR 1,000,000 1,091,540 0.03UniCredit SpA, Reg. S, FRN 0.964%
10/04/2017 EUR 7,750,000 7,768,019 0.21UniCredit SpA, Reg. S 2.625%
31/10/2020 EUR 6,350,000 7,045,960 0.19UniCredit SpA, Reg. S 0.75% 30/04/2025 EUR 9,850,000 9,295,750 0.25
251,558,648 6.78
JapanAmerican Honda Finance Corp., Reg. S
1.875% 04/09/2019 (United States of America) (2) EUR 7,350,000 7,729,477 0.21
Sumitomo Mitsui Banking Corp., Reg. S 2.25% 16/12/2020 EUR 12,300,000 13,090,730 0.35
Sumitomo Mitsui Banking Corp., Reg. S 1% 19/01/2022 EUR 11,250,000 10,987,251 0.30
Toyota Motor Credit Corp., Reg. S 1% 10/09/2021 (United States of America) (2) EUR 5,700,000 5,683,926 0.15
Toyota Motor Credit Corp., Reg. S 0.75% 21/07/2022 (United States of America) (2) EUR 7,600,000 7,348,052 0.20
44,839,436 1.21
LuxembourgArcelorMittal 10.625% 03/06/2016 EUR 5,300,000 5,767,142 0.15SES GLOBAL Americas Holdings GP,
Reg. S 1.875% 24/10/2018 (United States of America) (2) EUR 6,000,000 6,240,207 0.17
12,007,349 0.32
mexicoPetroleos Mexicanos, Reg. S 5.5%
09/01/2017 EUR 6,800,000 7,293,112 0.20Petroleos Mexicanos, Reg. S 3.125%
27/11/2020 EUR 4,050,000 4,258,069 0.11Petroleos Mexicanos, Reg. S 3.75%
16/04/2026 EUR 3,325,000 3,379,031 0.09
14,930,212 0.40The accompanying notes are an integral part of these financial statements.
Euro Corporate Bond Fund (continued)
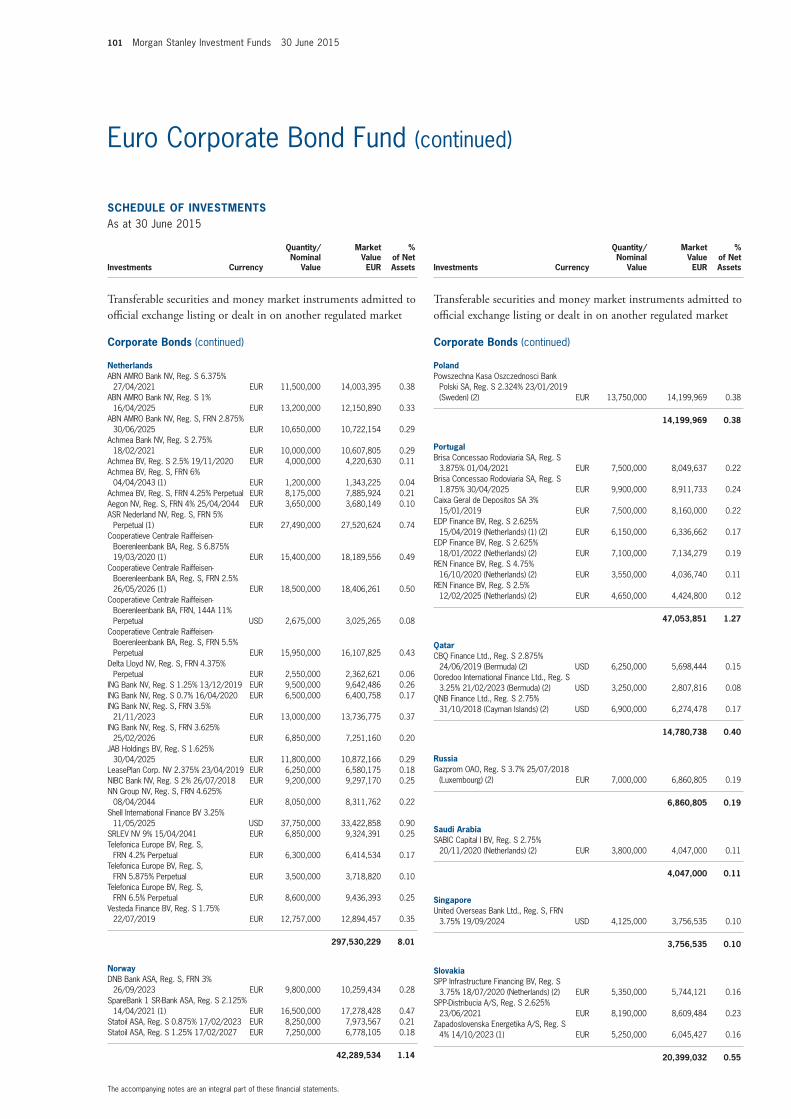
101 Morgan Stanley Investment Funds 30 June 2015
SCHEDULE of invEStmEntSAs at 30 June 2015
Investments Currency
Quantity/Nominal
Value
Market Value EUR
% of Net Assets
transferable securities and money market instruments admitted to official exchange listing or dealt in on another regulated market
Corporate Bonds (continued)
netherlandsABN AMRO Bank NV, Reg. S 6.375%
27/04/2021 EUR 11,500,000 14,003,395 0.38ABN AMRO Bank NV, Reg. S 1%
16/04/2025 EUR 13,200,000 12,150,890 0.33ABN AMRO Bank NV, Reg. S, FRN 2.875%
30/06/2025 EUR 10,650,000 10,722,154 0.29Achmea Bank NV, Reg. S 2.75%
18/02/2021 EUR 10,000,000 10,607,805 0.29Achmea BV, Reg. S 2.5% 19/11/2020 EUR 4,000,000 4,220,630 0.11Achmea BV, Reg. S, FRN 6%
04/04/2043 (1) EUR 1,200,000 1,343,225 0.04Achmea BV, Reg. S, FRN 4.25% Perpetual EUR 8,175,000 7,885,924 0.21Aegon NV, Reg. S, FRN 4% 25/04/2044 EUR 3,650,000 3,680,149 0.10ASR Nederland NV, Reg. S, FRN 5%
Perpetual (1) EUR 27,490,000 27,520,624 0.74Cooperatieve Centrale Raiffeisen-
Boerenleenbank BA, Reg. S 6.875% 19/03/2020 (1) EUR 15,400,000 18,189,556 0.49
Cooperatieve Centrale Raiffeisen-Boerenleenbank BA, Reg. S, FRN 2.5% 26/05/2026 (1) EUR 18,500,000 18,406,261 0.50
Cooperatieve Centrale Raiffeisen-Boerenleenbank BA, FRN, 144A 11% Perpetual USD 2,675,000 3,025,265 0.08
Cooperatieve Centrale Raiffeisen-Boerenleenbank BA, Reg. S, FRN 5.5% Perpetual EUR 15,950,000 16,107,825 0.43
Delta Lloyd NV, Reg. S, FRN 4.375% Perpetual EUR 2,550,000 2,362,621 0.06
ING Bank NV, Reg. S 1.25% 13/12/2019 EUR 9,500,000 9,642,486 0.26ING Bank NV, Reg. S 0.7% 16/04/2020 EUR 6,500,000 6,400,758 0.17ING Bank NV, Reg. S, FRN 3.5%
21/11/2023 EUR 13,000,000 13,736,775 0.37ING Bank NV, Reg. S, FRN 3.625%
25/02/2026 EUR 6,850,000 7,251,160 0.20JAB Holdings BV, Reg. S 1.625%
30/04/2025 EUR 11,800,000 10,872,166 0.29LeasePlan Corp. NV 2.375% 23/04/2019 EUR 6,250,000 6,580,175 0.18NIBC Bank NV, Reg. S 2% 26/07/2018 EUR 9,200,000 9,297,170 0.25NN Group NV, Reg. S, FRN 4.625%
08/04/2044 EUR 8,050,000 8,311,762 0.22Shell International Finance BV 3.25%
11/05/2025 USD 37,750,000 33,422,858 0.90SRLEV NV 9% 15/04/2041 EUR 6,850,000 9,324,391 0.25Telefonica Europe BV, Reg. S,
FRN 4.2% Perpetual EUR 6,300,000 6,414,534 0.17Telefonica Europe BV, Reg. S,
FRN 5.875% Perpetual EUR 3,500,000 3,718,820 0.10Telefonica Europe BV, Reg. S,
FRN 6.5% Perpetual EUR 8,600,000 9,436,393 0.25Vesteda Finance BV, Reg. S 1.75%
22/07/2019 EUR 12,757,000 12,894,457 0.35
297,530,229 8.01
norwayDNB Bank ASA, Reg. S, FRN 3%
26/09/2023 EUR 9,800,000 10,259,434 0.28SpareBank 1 SR-Bank ASA, Reg. S 2.125%
14/04/2021 (1) EUR 16,500,000 17,278,428 0.47Statoil ASA, Reg. S 0.875% 17/02/2023 EUR 8,250,000 7,973,567 0.21Statoil ASA, Reg. S 1.25% 17/02/2027 EUR 7,250,000 6,778,105 0.18
42,289,534 1.14
SCHEDULE of invEStmEntSAs at 30 June 2015
Investments Currency
Quantity/Nominal
Value
Market Value EUR
% of Net Assets
transferable securities and money market instruments admitted to official exchange listing or dealt in on another regulated market
Corporate Bonds (continued)
PolandPowszechna Kasa Oszczednosci Bank
Polski SA, Reg. S 2.324% 23/01/2019 (Sweden) (2) EUR 13,750,000 14,199,969 0.38
14,199,969 0.38
PortugalBrisa Concessao Rodoviaria SA, Reg. S
3.875% 01/04/2021 EUR 7,500,000 8,049,637 0.22Brisa Concessao Rodoviaria SA, Reg. S
1.875% 30/04/2025 EUR 9,900,000 8,911,733 0.24Caixa Geral de Depositos SA 3%
15/01/2019 EUR 7,500,000 8,160,000 0.22EDP Finance BV, Reg. S 2.625%
15/04/2019 (Netherlands) (1) (2) EUR 6,150,000 6,336,662 0.17EDP Finance BV, Reg. S 2.625%
18/01/2022 (Netherlands) (2) EUR 7,100,000 7,134,279 0.19REN Finance BV, Reg. S 4.75%
16/10/2020 (Netherlands) (2) EUR 3,550,000 4,036,740 0.11REN Finance BV, Reg. S 2.5%
12/02/2025 (Netherlands) (2) EUR 4,650,000 4,424,800 0.12
47,053,851 1.27
QatarCBQ Finance Ltd., Reg. S 2.875%
24/06/2019 (Bermuda) (2) USD 6,250,000 5,698,444 0.15Ooredoo International Finance Ltd., Reg. S
3.25% 21/02/2023 (Bermuda) (2) USD 3,250,000 2,807,816 0.08QNB Finance Ltd., Reg. S 2.75%
31/10/2018 (Cayman Islands) (2) USD 6,900,000 6,274,478 0.17
14,780,738 0.40
RussiaGazprom OAO, Reg. S 3.7% 25/07/2018
(Luxembourg) (2) EUR 7,000,000 6,860,805 0.19
6,860,805 0.19
Saudi ArabiaSABIC Capital I BV, Reg. S 2.75%
20/11/2020 (Netherlands) (2) EUR 3,800,000 4,047,000 0.11
4,047,000 0.11
SingaporeUnited Overseas Bank Ltd., Reg. S, FRN
3.75% 19/09/2024 USD 4,125,000 3,756,535 0.10
3,756,535 0.10
SlovakiaSPP Infrastructure Financing BV, Reg. S
3.75% 18/07/2020 (Netherlands) (2) EUR 5,350,000 5,744,121 0.16SPP-Distribucia A/S, Reg. S 2.625%
23/06/2021 EUR 8,190,000 8,609,484 0.23Zapadoslovenska Energetika A/S, Reg. S
4% 14/10/2023 (1) EUR 5,250,000 6,045,427 0.16
20,399,032 0.55
The accompanying notes are an integral part of these financial statements.
Euro Corporate Bond Fund (continued)
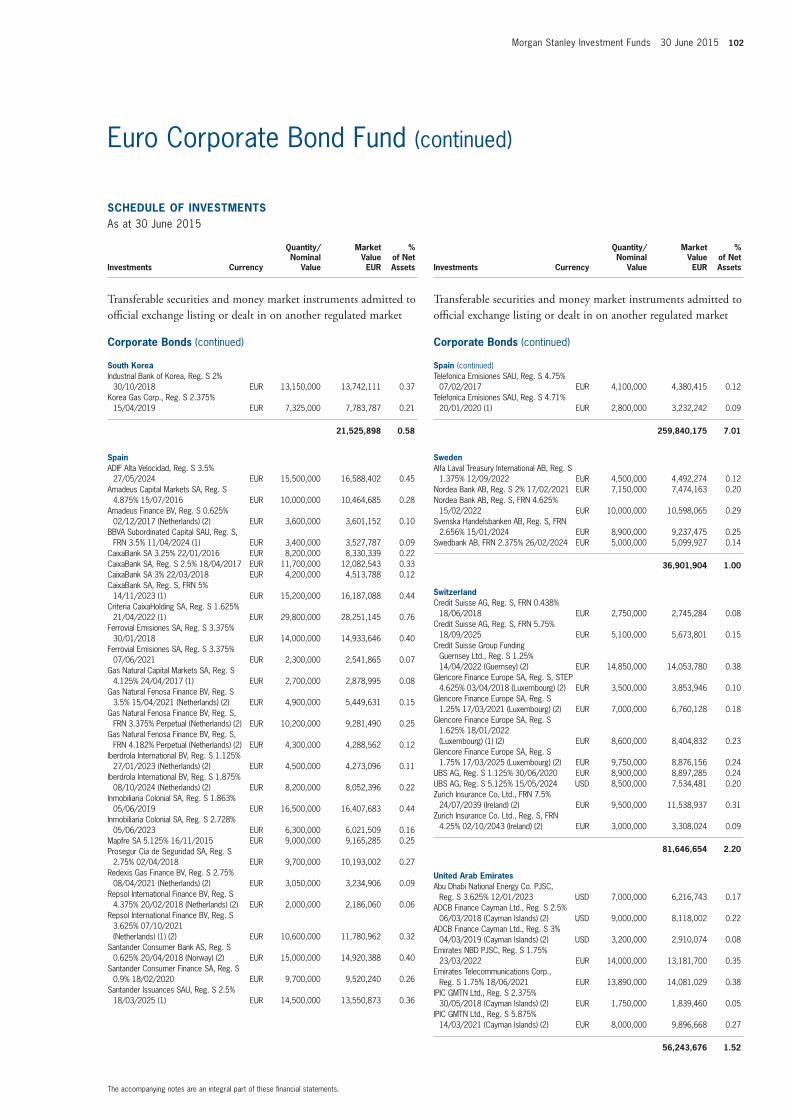
Morgan Stanley Investment Funds 30 June 2015 102
SCHEDULE of invEStmEntSAs at 30 June 2015
Investments Currency
Quantity/Nominal
Value
Market Value EUR
% of Net Assets
transferable securities and money market instruments admitted to official exchange listing or dealt in on another regulated market
Corporate Bonds (continued)
South KoreaIndustrial Bank of Korea, Reg. S 2%
30/10/2018 EUR 13,150,000 13,742,111 0.37Korea Gas Corp., Reg. S 2.375%
15/04/2019 EUR 7,325,000 7,783,787 0.21
21,525,898 0.58
SpainADIF Alta Velocidad, Reg. S 3.5%
27/05/2024 EUR 15,500,000 16,588,402 0.45Amadeus Capital Markets SA, Reg. S
4.875% 15/07/2016 EUR 10,000,000 10,464,685 0.28Amadeus Finance BV, Reg. S 0.625%
02/12/2017 (Netherlands) (2) EUR 3,600,000 3,601,152 0.10BBVA Subordinated Capital SAU, Reg. S,
FRN 3.5% 11/04/2024 (1) EUR 3,400,000 3,527,787 0.09CaixaBank SA 3.25% 22/01/2016 EUR 8,200,000 8,330,339 0.22CaixaBank SA, Reg. S 2.5% 18/04/2017 EUR 11,700,000 12,082,543 0.33CaixaBank SA 3% 22/03/2018 EUR 4,200,000 4,513,788 0.12CaixaBank SA, Reg. S, FRN 5%
14/11/2023 (1) EUR 15,200,000 16,187,088 0.44Criteria CaixaHolding SA, Reg. S 1.625%
21/04/2022 (1) EUR 29,800,000 28,251,145 0.76Ferrovial Emisiones SA, Reg. S 3.375%
30/01/2018 EUR 14,000,000 14,933,646 0.40Ferrovial Emisiones SA, Reg. S 3.375%
07/06/2021 EUR 2,300,000 2,541,865 0.07Gas Natural Capital Markets SA, Reg. S
4.125% 24/04/2017 (1) EUR 2,700,000 2,878,995 0.08Gas Natural Fenosa Finance BV, Reg. S
3.5% 15/04/2021 (Netherlands) (2) EUR 4,900,000 5,449,631 0.15Gas Natural Fenosa Finance BV, Reg. S,
FRN 3.375% Perpetual (Netherlands) (2) EUR 10,200,000 9,281,490 0.25Gas Natural Fenosa Finance BV, Reg. S,
FRN 4.182% Perpetual (Netherlands) (2) EUR 4,300,000 4,288,562 0.12Iberdrola International BV, Reg. S 1.125%
27/01/2023 (Netherlands) (2) EUR 4,500,000 4,273,096 0.11Iberdrola International BV, Reg. S 1.875%
08/10/2024 (Netherlands) (2) EUR 8,200,000 8,052,396 0.22Inmobiliaria Colonial SA, Reg. S 1.863%
05/06/2019 EUR 16,500,000 16,407,683 0.44Inmobiliaria Colonial SA, Reg. S 2.728%
05/06/2023 EUR 6,300,000 6,021,509 0.16Mapfre SA 5.125% 16/11/2015 EUR 9,000,000 9,165,285 0.25Prosegur Cia de Seguridad SA, Reg. S
2.75% 02/04/2018 EUR 9,700,000 10,193,002 0.27Redexis Gas Finance BV, Reg. S 2.75%
08/04/2021 (Netherlands) (2) EUR 3,050,000 3,234,906 0.09Repsol International Finance BV, Reg. S
4.375% 20/02/2018 (Netherlands) (2) EUR 2,000,000 2,186,060 0.06Repsol International Finance BV, Reg. S
3.625% 07/10/2021 (Netherlands) (1) (2) EUR 10,600,000 11,780,962 0.32
Santander Consumer Bank AS, Reg. S 0.625% 20/04/2018 (Norway) (2) EUR 15,000,000 14,920,388 0.40
Santander Consumer Finance SA, Reg. S 0.9% 18/02/2020 EUR 9,700,000 9,520,240 0.26
Santander Issuances SAU, Reg. S 2.5% 18/03/2025 (1) EUR 14,500,000 13,550,873 0.36
SCHEDULE of invEStmEntSAs at 30 June 2015
Investments Currency
Quantity/Nominal
Value
Market Value EUR
% of Net Assets
transferable securities and money market instruments admitted to official exchange listing or dealt in on another regulated market
Corporate Bonds (continued)
Spain (continued)Telefonica Emisiones SAU, Reg. S 4.75%
07/02/2017 EUR 4,100,000 4,380,415 0.12Telefonica Emisiones SAU, Reg. S 4.71%
20/01/2020 (1) EUR 2,800,000 3,232,242 0.09
259,840,175 7.01
SwedenAlfa Laval Treasury International AB, Reg. S
1.375% 12/09/2022 EUR 4,500,000 4,492,274 0.12Nordea Bank AB, Reg. S 2% 17/02/2021 EUR 7,150,000 7,474,163 0.20Nordea Bank AB, Reg. S, FRN 4.625%
15/02/2022 EUR 10,000,000 10,598,065 0.29Svenska Handelsbanken AB, Reg. S, FRN
2.656% 15/01/2024 EUR 8,900,000 9,237,475 0.25Swedbank AB, FRN 2.375% 26/02/2024 EUR 5,000,000 5,099,927 0.14
36,901,904 1.00
SwitzerlandCredit Suisse AG, Reg. S, FRN 0.438%
18/06/2018 EUR 2,750,000 2,745,284 0.08Credit Suisse AG, Reg. S, FRN 5.75%
18/09/2025 EUR 5,100,000 5,673,801 0.15Credit Suisse Group Funding
Guernsey Ltd., Reg. S 1.25% 14/04/2022 (Guernsey) (2) EUR 14,850,000 14,053,780 0.38
Glencore Finance Europe SA, Reg. S, STEP 4.625% 03/04/2018 (Luxembourg) (2) EUR 3,500,000 3,853,946 0.10
Glencore Finance Europe SA, Reg. S 1.25% 17/03/2021 (Luxembourg) (2) EUR 7,000,000 6,760,128 0.18
Glencore Finance Europe SA, Reg. S 1.625% 18/01/2022 (Luxembourg) (1) (2) EUR 8,600,000 8,404,832 0.23
Glencore Finance Europe SA, Reg. S 1.75% 17/03/2025 (Luxembourg) (2) EUR 9,750,000 8,876,156 0.24
UBS AG, Reg. S 1.125% 30/06/2020 EUR 8,900,000 8,897,285 0.24UBS AG, Reg. S 5.125% 15/05/2024 USD 8,500,000 7,534,481 0.20Zurich Insurance Co. Ltd., FRN 7.5%
24/07/2039 (Ireland) (2) EUR 9,500,000 11,538,937 0.31Zurich Insurance Co. Ltd., Reg. S, FRN
4.25% 02/10/2043 (Ireland) (2) EUR 3,000,000 3,308,024 0.09
81,646,654 2.20
United Arab EmiratesAbu Dhabi National Energy Co. PJSC,
Reg. S 3.625% 12/01/2023 USD 7,000,000 6,216,743 0.17ADCB Finance Cayman Ltd., Reg. S 2.5%
06/03/2018 (Cayman Islands) (2) USD 9,000,000 8,118,002 0.22ADCB Finance Cayman Ltd., Reg. S 3%
04/03/2019 (Cayman Islands) (2) USD 3,200,000 2,910,074 0.08Emirates NBD PJSC, Reg. S 1.75%
23/03/2022 EUR 14,000,000 13,181,700 0.35Emirates Telecommunications Corp.,
Reg. S 1.75% 18/06/2021 EUR 13,890,000 14,081,029 0.38IPIC GMTN Ltd., Reg. S 2.375%
30/05/2018 (Cayman Islands) (2) EUR 1,750,000 1,839,460 0.05IPIC GMTN Ltd., Reg. S 5.875%
14/03/2021 (Cayman Islands) (2) EUR 8,000,000 9,896,668 0.27
56,243,676 1.52
The accompanying notes are an integral part of these financial statements.
Euro Corporate Bond Fund (continued)
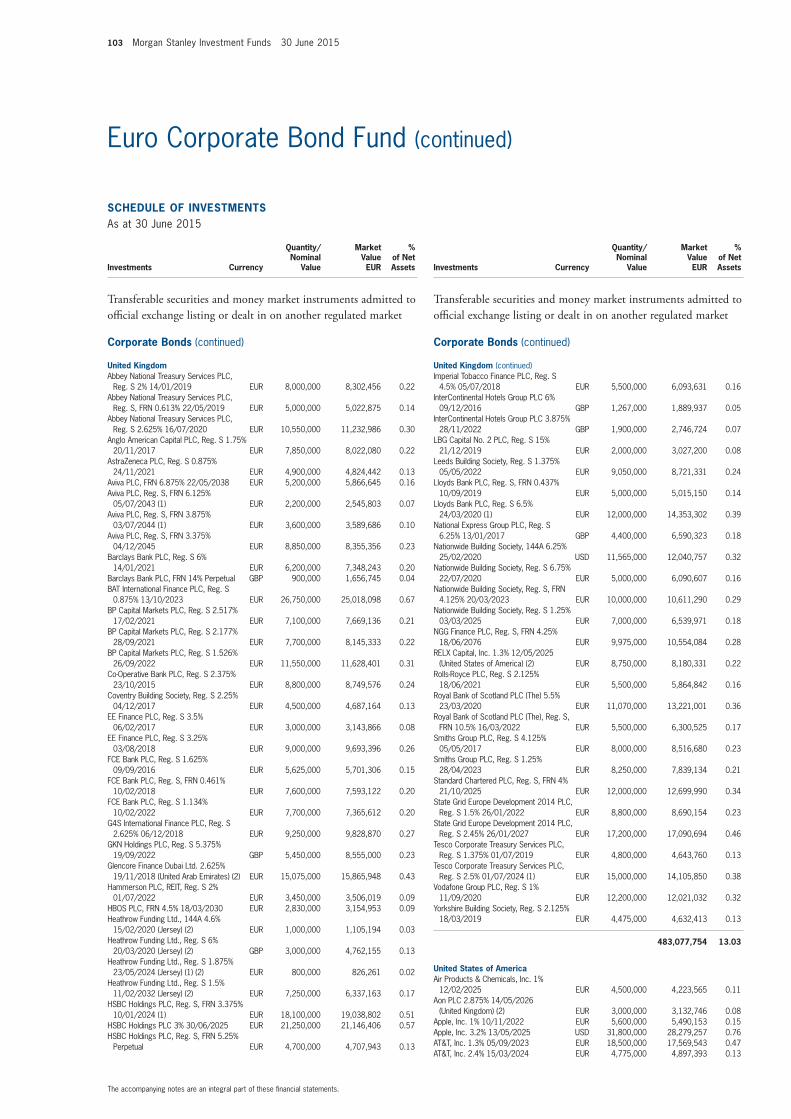
103 Morgan Stanley Investment Funds 30 June 2015
SCHEDULE of invEStmEntSAs at 30 June 2015
Investments Currency
Quantity/Nominal
Value
Market Value EUR
% of Net Assets
transferable securities and money market instruments admitted to official exchange listing or dealt in on another regulated market
Corporate Bonds (continued)
United KingdomAbbey National Treasury Services PLC,
Reg. S 2% 14/01/2019 EUR 8,000,000 8,302,456 0.22Abbey National Treasury Services PLC,
Reg. S, FRN 0.613% 22/05/2019 EUR 5,000,000 5,022,875 0.14Abbey National Treasury Services PLC,
Reg. S 2.625% 16/07/2020 EUR 10,550,000 11,232,986 0.30Anglo American Capital PLC, Reg. S 1.75%
20/11/2017 EUR 7,850,000 8,022,080 0.22AstraZeneca PLC, Reg. S 0.875%
24/11/2021 EUR 4,900,000 4,824,442 0.13Aviva PLC, FRN 6.875% 22/05/2038 EUR 5,200,000 5,866,645 0.16Aviva PLC, Reg. S, FRN 6.125%
05/07/2043 (1) EUR 2,200,000 2,545,803 0.07Aviva PLC, Reg. S, FRN 3.875%
03/07/2044 (1) EUR 3,600,000 3,589,686 0.10Aviva PLC, Reg. S, FRN 3.375%
04/12/2045 EUR 8,850,000 8,355,356 0.23Barclays Bank PLC, Reg. S 6%
14/01/2021 EUR 6,200,000 7,348,243 0.20Barclays Bank PLC, FRN 14% Perpetual GBP 900,000 1,656,745 0.04BAT International Finance PLC, Reg. S
0.875% 13/10/2023 EUR 26,750,000 25,018,098 0.67BP Capital Markets PLC, Reg. S 2.517%
17/02/2021 EUR 7,100,000 7,669,136 0.21BP Capital Markets PLC, Reg. S 2.177%
28/09/2021 EUR 7,700,000 8,145,333 0.22BP Capital Markets PLC, Reg. S 1.526%
26/09/2022 EUR 11,550,000 11,628,401 0.31Co-Operative Bank PLC, Reg. S 2.375%
23/10/2015 EUR 8,800,000 8,749,576 0.24Coventry Building Society, Reg. S 2.25%
04/12/2017 EUR 4,500,000 4,687,164 0.13EE Finance PLC, Reg. S 3.5%
06/02/2017 EUR 3,000,000 3,143,866 0.08EE Finance PLC, Reg. S 3.25%
03/08/2018 EUR 9,000,000 9,693,396 0.26FCE Bank PLC, Reg. S 1.625%
09/09/2016 EUR 5,625,000 5,701,306 0.15FCE Bank PLC, Reg. S, FRN 0.461%
10/02/2018 EUR 7,600,000 7,593,122 0.20FCE Bank PLC, Reg. S 1.134%
10/02/2022 EUR 7,700,000 7,365,612 0.20G4S International Finance PLC, Reg. S
2.625% 06/12/2018 EUR 9,250,000 9,828,870 0.27GKN Holdings PLC, Reg. S 5.375%
19/09/2022 GBP 5,450,000 8,555,000 0.23Glencore Finance Dubai Ltd. 2.625%
19/11/2018 (United Arab Emirates) (2) EUR 15,075,000 15,865,948 0.43Hammerson PLC, REIT, Reg. S 2%
01/07/2022 EUR 3,450,000 3,506,019 0.09HBOS PLC, FRN 4.5% 18/03/2030 EUR 2,830,000 3,154,953 0.09Heathrow Funding Ltd., 144A 4.6%
15/02/2020 (Jersey) (2) EUR 1,000,000 1,105,194 0.03Heathrow Funding Ltd., Reg. S 6%
20/03/2020 (Jersey) (2) GBP 3,000,000 4,762,155 0.13Heathrow Funding Ltd., Reg. S 1.875%
23/05/2024 (Jersey) (1) (2) EUR 800,000 826,261 0.02Heathrow Funding Ltd., Reg. S 1.5%
11/02/2032 (Jersey) (2) EUR 7,250,000 6,337,163 0.17HSBC Holdings PLC, Reg. S, FRN 3.375%
10/01/2024 (1) EUR 18,100,000 19,038,802 0.51HSBC Holdings PLC 3% 30/06/2025 EUR 21,250,000 21,146,406 0.57HSBC Holdings PLC, Reg. S, FRN 5.25%
Perpetual EUR 4,700,000 4,707,943 0.13
SCHEDULE of invEStmEntSAs at 30 June 2015
Investments Currency
Quantity/Nominal
Value
Market Value EUR
% of Net Assets
transferable securities and money market instruments admitted to official exchange listing or dealt in on another regulated market
Corporate Bonds (continued)
United Kingdom (continued)Imperial Tobacco Finance PLC, Reg. S
4.5% 05/07/2018 EUR 5,500,000 6,093,631 0.16InterContinental Hotels Group PLC 6%
09/12/2016 GBP 1,267,000 1,889,937 0.05InterContinental Hotels Group PLC 3.875%
28/11/2022 GBP 1,900,000 2,746,724 0.07LBG Capital No. 2 PLC, Reg. S 15%
21/12/2019 EUR 2,000,000 3,027,200 0.08Leeds Building Society, Reg. S 1.375%
05/05/2022 EUR 9,050,000 8,721,331 0.24Lloyds Bank PLC, Reg. S, FRN 0.437%
10/09/2019 EUR 5,000,000 5,015,150 0.14Lloyds Bank PLC, Reg. S 6.5%
24/03/2020 (1) EUR 12,000,000 14,353,302 0.39National Express Group PLC, Reg. S
6.25% 13/01/2017 GBP 4,400,000 6,590,323 0.18Nationwide Building Society, 144A 6.25%
25/02/2020 USD 11,565,000 12,040,757 0.32Nationwide Building Society, Reg. S 6.75%
22/07/2020 EUR 5,000,000 6,090,607 0.16Nationwide Building Society, Reg. S, FRN
4.125% 20/03/2023 EUR 10,000,000 10,611,290 0.29Nationwide Building Society, Reg. S 1.25%
03/03/2025 EUR 7,000,000 6,539,971 0.18NGG Finance PLC, Reg. S, FRN 4.25%
18/06/2076 EUR 9,975,000 10,554,084 0.28RELX Capital, Inc. 1.3% 12/05/2025
(United States of America) (2) EUR 8,750,000 8,180,331 0.22Rolls-Royce PLC, Reg. S 2.125%
18/06/2021 EUR 5,500,000 5,864,842 0.16Royal Bank of Scotland PLC (The) 5.5%
23/03/2020 EUR 11,070,000 13,221,001 0.36Royal Bank of Scotland PLC (The), Reg. S,
FRN 10.5% 16/03/2022 EUR 5,500,000 6,300,525 0.17Smiths Group PLC, Reg. S 4.125%
05/05/2017 EUR 8,000,000 8,516,680 0.23Smiths Group PLC, Reg. S 1.25%
28/04/2023 EUR 8,250,000 7,839,134 0.21Standard Chartered PLC, Reg. S, FRN 4%
21/10/2025 EUR 12,000,000 12,699,990 0.34State Grid Europe Development 2014 PLC,
Reg. S 1.5% 26/01/2022 EUR 8,800,000 8,690,154 0.23State Grid Europe Development 2014 PLC,
Reg. S 2.45% 26/01/2027 EUR 17,200,000 17,090,694 0.46Tesco Corporate Treasury Services PLC,
Reg. S 1.375% 01/07/2019 EUR 4,800,000 4,643,760 0.13Tesco Corporate Treasury Services PLC,
Reg. S 2.5% 01/07/2024 (1) EUR 15,000,000 14,105,850 0.38Vodafone Group PLC, Reg. S 1%
11/09/2020 EUR 12,200,000 12,021,032 0.32Yorkshire Building Society, Reg. S 2.125%
18/03/2019 EUR 4,475,000 4,632,413 0.13
483,077,754 13.03
United States of AmericaAir Products & Chemicals, Inc. 1%
12/02/2025 EUR 4,500,000 4,223,565 0.11Aon PLC 2.875% 14/05/2026
(United Kingdom) (2) EUR 3,000,000 3,132,746 0.08Apple, Inc. 1% 10/11/2022 EUR 5,600,000 5,490,153 0.15Apple, Inc. 3.2% 13/05/2025 USD 31,800,000 28,279,257 0.76AT&T, Inc. 1.3% 05/09/2023 EUR 18,500,000 17,569,543 0.47AT&T, Inc. 2.4% 15/03/2024 EUR 4,775,000 4,897,393 0.13
The accompanying notes are an integral part of these financial statements.
Euro Corporate Bond Fund (continued)
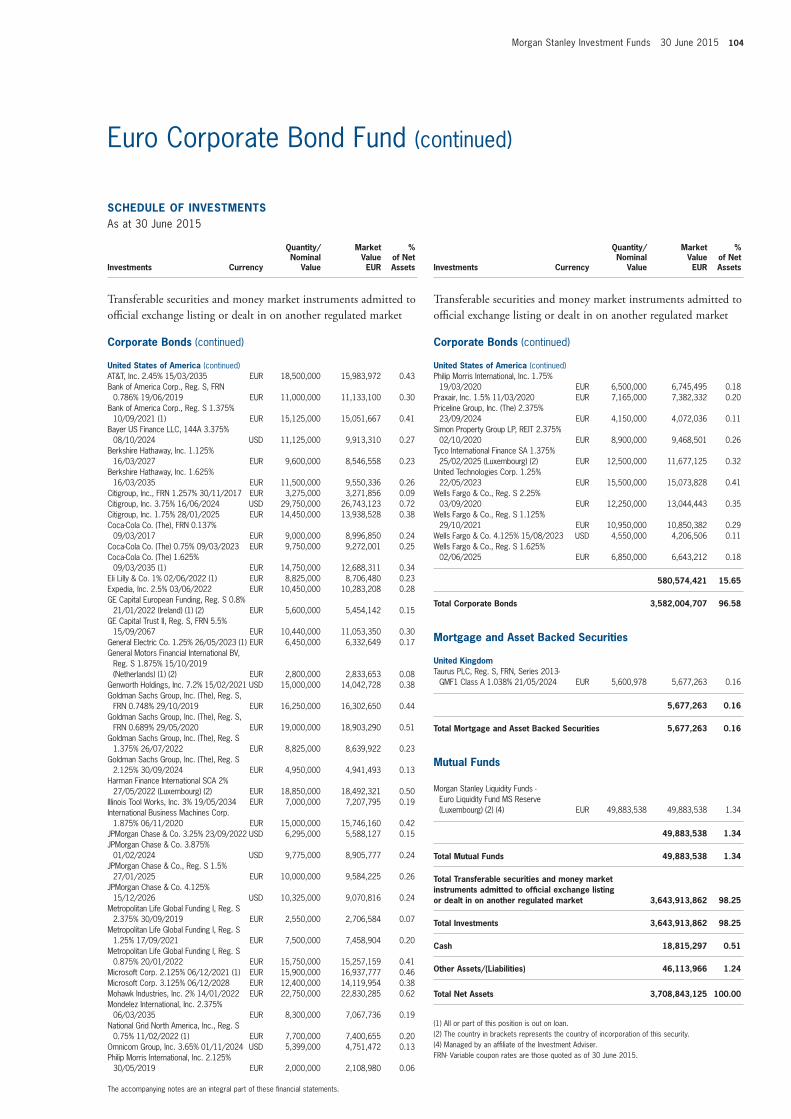
Morgan Stanley Investment Funds 30 June 2015 104
SCHEDULE of invEStmEntSAs at 30 June 2015
Investments Currency
Quantity/Nominal
Value
Market Value EUR
% of Net Assets
transferable securities and money market instruments admitted to official exchange listing or dealt in on another regulated market
Corporate Bonds (continued)
United States of America (continued)AT&T, Inc. 2.45% 15/03/2035 EUR 18,500,000 15,983,972 0.43Bank of America Corp., Reg. S, FRN
0.786% 19/06/2019 EUR 11,000,000 11,133,100 0.30Bank of America Corp., Reg. S 1.375%
10/09/2021 (1) EUR 15,125,000 15,051,667 0.41Bayer US Finance LLC, 144A 3.375%
08/10/2024 USD 11,125,000 9,913,310 0.27Berkshire Hathaway, Inc. 1.125%
16/03/2027 EUR 9,600,000 8,546,558 0.23Berkshire Hathaway, Inc. 1.625%
16/03/2035 EUR 11,500,000 9,550,336 0.26Citigroup, Inc., FRN 1.257% 30/11/2017 EUR 3,275,000 3,271,856 0.09Citigroup, Inc. 3.75% 16/06/2024 USD 29,750,000 26,743,123 0.72Citigroup, Inc. 1.75% 28/01/2025 EUR 14,450,000 13,938,528 0.38Coca-Cola Co. (The), FRN 0.137%
09/03/2017 EUR 9,000,000 8,996,850 0.24Coca-Cola Co. (The) 0.75% 09/03/2023 EUR 9,750,000 9,272,001 0.25Coca-Cola Co. (The) 1.625%
09/03/2035 (1) EUR 14,750,000 12,688,311 0.34Eli Lilly & Co. 1% 02/06/2022 (1) EUR 8,825,000 8,706,480 0.23Expedia, Inc. 2.5% 03/06/2022 EUR 10,450,000 10,283,208 0.28GE Capital European Funding, Reg. S 0.8%
21/01/2022 (Ireland) (1) (2) EUR 5,600,000 5,454,142 0.15GE Capital Trust II, Reg. S, FRN 5.5%
15/09/2067 EUR 10,440,000 11,053,350 0.30General Electric Co. 1.25% 26/05/2023 (1) EUR 6,450,000 6,332,649 0.17General Motors Financial International BV,
Reg. S 1.875% 15/10/2019 (Netherlands) (1) (2) EUR 2,800,000 2,833,653 0.08
Genworth Holdings, Inc. 7.2% 15/02/2021 USD 15,000,000 14,042,728 0.38Goldman Sachs Group, Inc. (The), Reg. S,
FRN 0.748% 29/10/2019 EUR 16,250,000 16,302,650 0.44Goldman Sachs Group, Inc. (The), Reg. S,
FRN 0.689% 29/05/2020 EUR 19,000,000 18,903,290 0.51Goldman Sachs Group, Inc. (The), Reg. S
1.375% 26/07/2022 EUR 8,825,000 8,639,922 0.23Goldman Sachs Group, Inc. (The), Reg. S
2.125% 30/09/2024 EUR 4,950,000 4,941,493 0.13Harman Finance International SCA 2%
27/05/2022 (Luxembourg) (2) EUR 18,850,000 18,492,321 0.50Illinois Tool Works, Inc. 3% 19/05/2034 EUR 7,000,000 7,207,795 0.19International Business Machines Corp.
1.875% 06/11/2020 EUR 15,000,000 15,746,160 0.42JPMorgan Chase & Co. 3.25% 23/09/2022 USD 6,295,000 5,588,127 0.15JPMorgan Chase & Co. 3.875%
01/02/2024 USD 9,775,000 8,905,777 0.24JPMorgan Chase & Co., Reg. S 1.5%
27/01/2025 EUR 10,000,000 9,584,225 0.26JPMorgan Chase & Co. 4.125%
15/12/2026 USD 10,325,000 9,070,816 0.24Metropolitan Life Global Funding I, Reg. S
2.375% 30/09/2019 EUR 2,550,000 2,706,584 0.07Metropolitan Life Global Funding I, Reg. S
1.25% 17/09/2021 EUR 7,500,000 7,458,904 0.20Metropolitan Life Global Funding I, Reg. S
0.875% 20/01/2022 EUR 15,750,000 15,257,159 0.41Microsoft Corp. 2.125% 06/12/2021 (1) EUR 15,900,000 16,937,777 0.46Microsoft Corp. 3.125% 06/12/2028 EUR 12,400,000 14,119,954 0.38Mohawk Industries, Inc. 2% 14/01/2022 EUR 22,750,000 22,830,285 0.62Mondelez International, Inc. 2.375%
06/03/2035 EUR 8,300,000 7,067,736 0.19National Grid North America, Inc., Reg. S
0.75% 11/02/2022 (1) EUR 7,700,000 7,400,655 0.20Omnicom Group, Inc. 3.65% 01/11/2024 USD 5,399,000 4,751,472 0.13Philip Morris International, Inc. 2.125%
30/05/2019 EUR 2,000,000 2,108,980 0.06
SCHEDULE of invEStmEntSAs at 30 June 2015
Investments Currency
Quantity/Nominal
Value
Market Value EUR
% of Net Assets
transferable securities and money market instruments admitted to official exchange listing or dealt in on another regulated market
Corporate Bonds (continued)
United States of America (continued)Philip Morris International, Inc. 1.75%
19/03/2020 EUR 6,500,000 6,745,495 0.18Praxair, Inc. 1.5% 11/03/2020 EUR 7,165,000 7,382,332 0.20Priceline Group, Inc. (The) 2.375%
23/09/2024 EUR 4,150,000 4,072,036 0.11Simon Property Group LP, REIT 2.375%
02/10/2020 EUR 8,900,000 9,468,501 0.26Tyco International Finance SA 1.375%
25/02/2025 (Luxembourg) (2) EUR 12,500,000 11,677,125 0.32United Technologies Corp. 1.25%
22/05/2023 EUR 15,500,000 15,073,828 0.41Wells Fargo & Co., Reg. S 2.25%
03/09/2020 EUR 12,250,000 13,044,443 0.35Wells Fargo & Co., Reg. S 1.125%
29/10/2021 EUR 10,950,000 10,850,382 0.29Wells Fargo & Co. 4.125% 15/08/2023 USD 4,550,000 4,206,506 0.11Wells Fargo & Co., Reg. S 1.625%
02/06/2025 EUR 6,850,000 6,643,212 0.18
580,574,421 15.65
total Corporate Bonds 3,582,004,707 96.58
mortgage and Asset Backed Securities
United KingdomTaurus PLC, Reg. S, FRN, Series 2013-
GMF1 Class A 1.038% 21/05/2024 EUR 5,600,978 5,677,263 0.16
5,677,263 0.16
total mortgage and Asset Backed Securities 5,677,263 0.16
mutual funds
Morgan Stanley Liquidity Funds - Euro Liquidity Fund MS Reserve (Luxembourg) (2) (4) EUR 49,883,538 49,883,538 1.34
49,883,538 1.34
total mutual funds 49,883,538 1.34
total transferable securities and money market instruments admitted to official exchange listing or dealt in on another regulated market 3,643,913,862 98.25
total investments 3,643,913,862 98.25
Cash 18,815,297 0.51
other Assets/(Liabilities) 46,113,966 1.24
total net Assets 3,708,843,125 100.00
(1) All or part of this position is out on loan.(2) The country in brackets represents the country of incorporation of this security.(4) Managed by an affiliate of the Investment Adviser.FRN- Variable coupon rates are those quoted as of 30 June 2015.
The accompanying notes are an integral part of these financial statements.
Euro Corporate Bond Fund (continued)
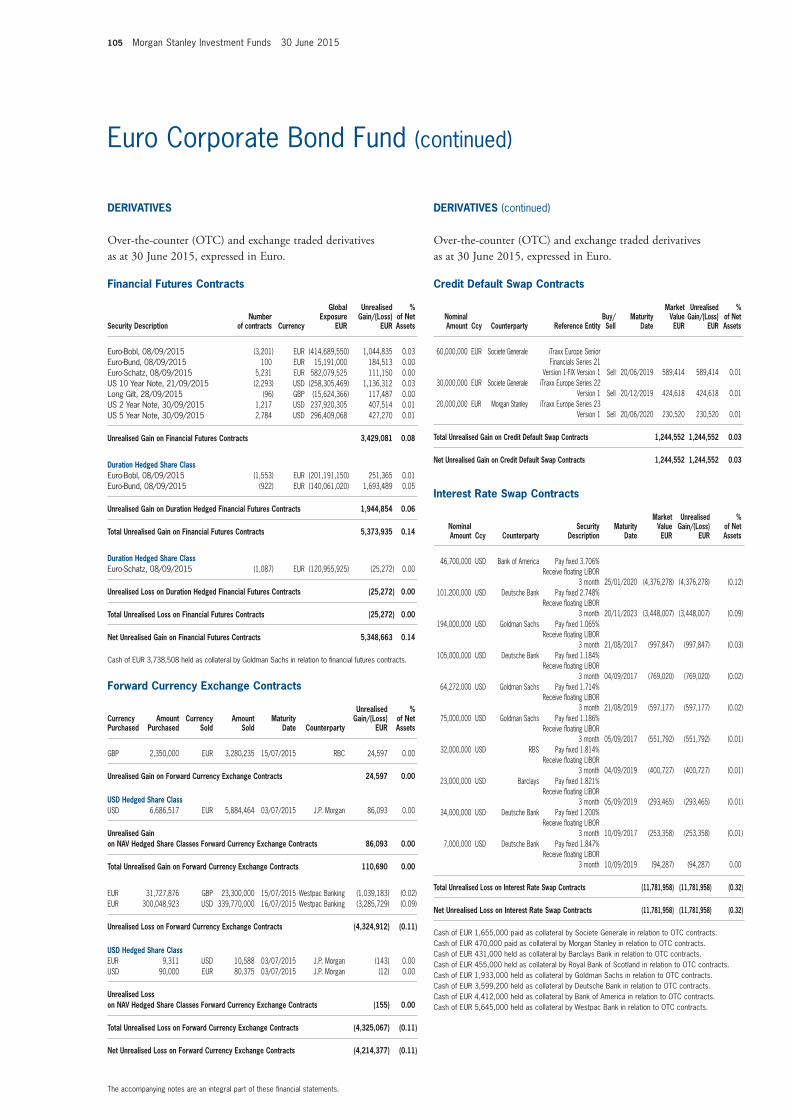
105 Morgan Stanley Investment Funds 30 June 2015
The accompanying notes are an integral part of these financial statements.
Euro Corporate Bond Fund (continued)
financial futures Contracts
Security Descriptionnumber
of contracts Currency
Global Exposure
EUR
Unrealised Gain/(Loss)
EUR
% of net Assets
Euro-Bobl, 08/09/2015 (3,201) EUR (414,689,550) 1,044,835 0.03Euro-Bund, 08/09/2015 100 EUR 15,191,000 184,513 0.00Euro-Schatz, 08/09/2015 5,231 EUR 582,079,525 111,150 0.00US 10 Year Note, 21/09/2015 (2,293) USD (258,305,469) 1,136,312 0.03Long Gilt, 28/09/2015 (96) GBP (15,624,366) 117,487 0.00US 2 Year Note, 30/09/2015 1,217 USD 237,920,305 407,514 0.01US 5 Year Note, 30/09/2015 2,784 USD 296,409,068 427,270 0.01
Unrealised Gain on financial futures Contracts 3,429,081 0.08
Duration Hedged Share ClassEuro-Bobl, 08/09/2015 (1,553) EUR (201,191,150) 251,365 0.01Euro-Bund, 08/09/2015 (922) EUR (140,061,020) 1,693,489 0.05
Unrealised Gain on Duration Hedged financial futures Contracts 1,944,854 0.06
total Unrealised Gain on financial futures Contracts 5,373,935 0.14
Duration Hedged Share ClassEuro-Schatz, 08/09/2015 (1,087) EUR (120,955,925) (25,272) 0.00
Unrealised Loss on Duration Hedged financial futures Contracts (25,272) 0.00
total Unrealised Loss on financial futures Contracts (25,272) 0.00
net Unrealised Gain on financial futures Contracts 5,348,663 0.14
Cash of EUR 3,738,508 held as collateral by Goldman Sachs in relation to financial futures contracts.
forward Currency Exchange Contracts
Currency Purchased
Amount Purchased
Currency Sold
Amount Sold
maturity Date Counterparty
Unrealised Gain/(Loss)
EUR
% of net Assets
GBP 2,350,000 EUR 3,280,235 15/07/2015 RBC 24,597 0.00
Unrealised Gain on forward Currency Exchange Contracts 24,597 0.00
USD Hedged Share ClassUSD 6,686,517 EUR 5,884,464 03/07/2015 J.P. Morgan 86,093 0.00
Unrealised Gain on nAv Hedged Share Classes forward Currency Exchange Contracts 86,093 0.00
total Unrealised Gain on forward Currency Exchange Contracts 110,690 0.00
EUR 31,727,876 GBP 23,300,000 15/07/2015 Westpac Banking (1,039,183) (0.02)EUR 300,048,923 USD 339,770,000 16/07/2015 Westpac Banking (3,285,729) (0.09)
Unrealised Loss on forward Currency Exchange Contracts (4,324,912) (0.11)
USD Hedged Share ClassEUR 9,311 USD 10,588 03/07/2015 J.P. Morgan (143) 0.00USD 90,000 EUR 80,375 03/07/2015 J.P. Morgan (12) 0.00
Unrealised Loss on nAv Hedged Share Classes forward Currency Exchange Contracts (155) 0.00
total Unrealised Loss on forward Currency Exchange Contracts (4,325,067) (0.11)
net Unrealised Loss on forward Currency Exchange Contracts (4,214,377) (0.11)
Credit Default Swap Contracts
nominal Amount Ccy Counterparty Reference Entity
Buy/Sell
maturity Date
market value EUR
Unrealised Gain/(Loss)
EUR
% of net Assets
60,000,000 EUR Societe Generale iTraxx Europe Senior Financials Series 21
Version 1-FIX Version 1 Sell 20/06/2019 589,414 589,414 0.0130,000,000 EUR Societe Generale iTraxx Europe Series 22
Version 1 Sell 20/12/2019 424,618 424,618 0.0120,000,000 EUR Morgan Stanley iTraxx Europe Series 23
Version 1 Sell 20/06/2020 230,520 230,520 0.01
total Unrealised Gain on Credit Default Swap Contracts 1,244,552 1,244,552 0.03
net Unrealised Gain on Credit Default Swap Contracts 1,244,552 1,244,552 0.03
interest Rate Swap Contracts
nominal Amount Ccy Counterparty
Security Description
maturity Date
market value EUR
Unrealised Gain/(Loss)
EUR
% of net Assets
46,700,000 USD Bank of America Pay fixed 3.706% Receive floating LIBOR
3 month 25/01/2020 (4,376,278) (4,376,278) (0.12)101,200,000 USD Deutsche Bank Pay fixed 2.748%
Receive floating LIBOR 3 month 20/11/2023 (3,448,007) (3,448,007) (0.09)
194,000,000 USD Goldman Sachs Pay fixed 1.065% Receive floating LIBOR
3 month 21/08/2017 (997,847) (997,847) (0.03)105,000,000 USD Deutsche Bank Pay fixed 1.184%
Receive floating LIBOR 3 month 04/09/2017 (769,020) (769,020) (0.02)
64,272,000 USD Goldman Sachs Pay fixed 1.714% Receive floating LIBOR
3 month 21/08/2019 (597,177) (597,177) (0.02)75,000,000 USD Goldman Sachs Pay fixed 1.186%
Receive floating LIBOR 3 month 05/09/2017 (551,792) (551,792) (0.01)
32,000,000 USD RBS Pay fixed 1.814% Receive floating LIBOR
3 month 04/09/2019 (400,727) (400,727) (0.01)23,000,000 USD Barclays Pay fixed 1.821%
Receive floating LIBOR 3 month 05/09/2019 (293,465) (293,465) (0.01)
34,000,000 USD Deutsche Bank Pay fixed 1.200% Receive floating LIBOR
3 month 10/09/2017 (253,358) (253,358) (0.01)7,000,000 USD Deutsche Bank Pay fixed 1.847%
Receive floating LIBOR 3 month 10/09/2019 (94,287) (94,287) 0.00
total Unrealised Loss on interest Rate Swap Contracts (11,781,958) (11,781,958) (0.32)
net Unrealised Loss on interest Rate Swap Contracts (11,781,958) (11,781,958) (0.32)
Cash of EUR 1,655,000 paid as collateral by Societe Generale in relation to OTC contracts.Cash of EUR 470,000 paid as collateral by Morgan Stanley in relation to OTC contracts.Cash of EUR 431,000 held as collateral by Barclays Bank in relation to OTC contracts.Cash of EUR 455,000 held as collateral by Royal Bank of Scotland in relation to OTC contracts.Cash of EUR 1,933,000 held as collateral by Goldman Sachs in relation to OTC contracts.Cash of EUR 3,599,200 held as collateral by Deutsche Bank in relation to OTC contracts.Cash of EUR 4,412,000 held as collateral by Bank of America in relation to OTC contracts.Cash of EUR 5,645,000 held as collateral by Westpac Bank in relation to OTC contracts.
DERivAtivES
Over-the-counter (OtC) and exchange traded derivatives as at 30 June 2015, expressed in euro.
DERivAtivES (continued)
Over-the-counter (OtC) and exchange traded derivatives as at 30 June 2015, expressed in euro.
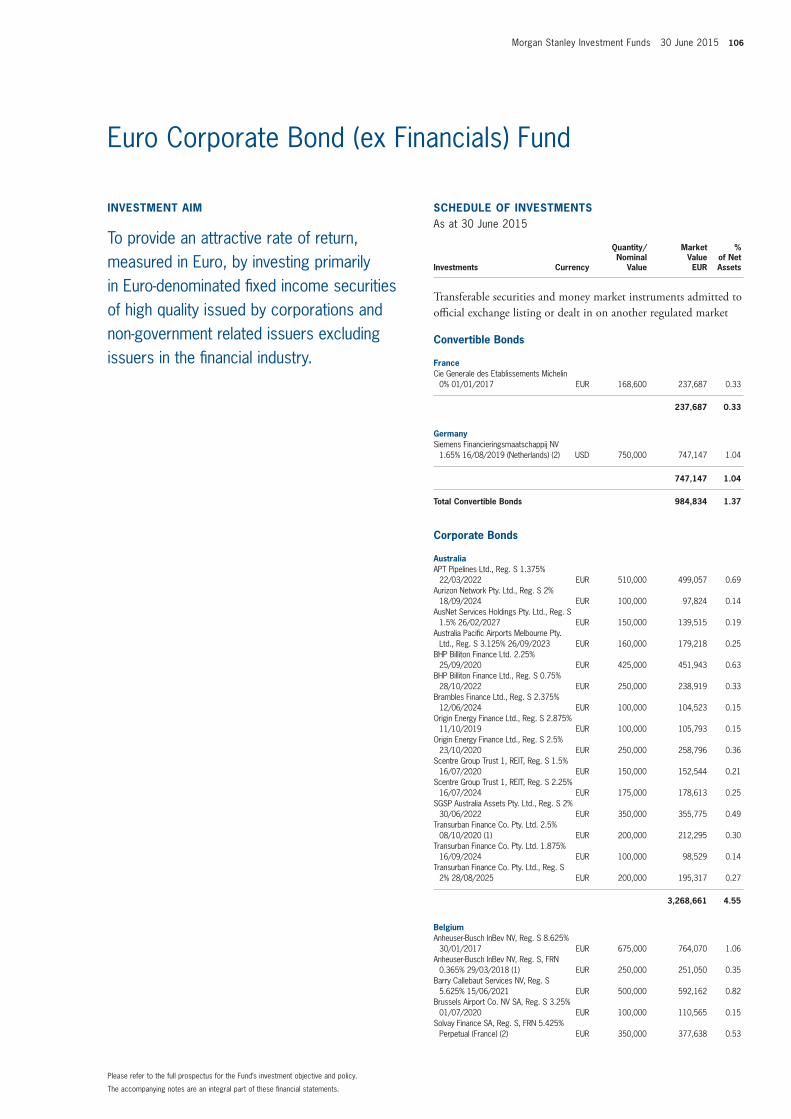
Morgan Stanley Investment Funds 30 June 2015 106
invEStmEnt Aim
To provide an attractive rate of return, measured in Euro, by investing primarily in Euro-denominated fixed income securities of high quality issued by corporations and non-government related issuers excluding issuers in the financial industry.
SCHEDULE of invEStmEntSAs at 30 June 2015
Investments Currency
Quantity/Nominal
Value
Market Value EUR
% of Net Assets
transferable securities and money market instruments admitted to official exchange listing or dealt in on another regulated market
Convertible Bonds
franceCie Generale des Etablissements Michelin
0% 01/01/2017 EUR 168,600 237,687 0.33
237,687 0.33
GermanySiemens Financieringsmaatschappij NV
1.65% 16/08/2019 (Netherlands) (2) USD 750,000 747,147 1.04
747,147 1.04
total Convertible Bonds 984,834 1.37
Corporate Bonds
AustraliaAPT Pipelines Ltd., Reg. S 1.375%
22/03/2022 EUR 510,000 499,057 0.69Aurizon Network Pty. Ltd., Reg. S 2%
18/09/2024 EUR 100,000 97,824 0.14AusNet Services Holdings Pty. Ltd., Reg. S
1.5% 26/02/2027 EUR 150,000 139,515 0.19Australia Pacific Airports Melbourne Pty.
Ltd., Reg. S 3.125% 26/09/2023 EUR 160,000 179,218 0.25BHP Billiton Finance Ltd. 2.25%
25/09/2020 EUR 425,000 451,943 0.63BHP Billiton Finance Ltd., Reg. S 0.75%
28/10/2022 EUR 250,000 238,919 0.33Brambles Finance Ltd., Reg. S 2.375%
12/06/2024 EUR 100,000 104,523 0.15Origin Energy Finance Ltd., Reg. S 2.875%
11/10/2019 EUR 100,000 105,793 0.15Origin Energy Finance Ltd., Reg. S 2.5%
23/10/2020 EUR 250,000 258,796 0.36Scentre Group Trust 1, REIT, Reg. S 1.5%
16/07/2020 EUR 150,000 152,544 0.21Scentre Group Trust 1, REIT, Reg. S 2.25%
16/07/2024 EUR 175,000 178,613 0.25SGSP Australia Assets Pty. Ltd., Reg. S 2%
30/06/2022 EUR 350,000 355,775 0.49Transurban Finance Co. Pty. Ltd. 2.5%
08/10/2020 (1) EUR 200,000 212,295 0.30Transurban Finance Co. Pty. Ltd. 1.875%
16/09/2024 EUR 100,000 98,529 0.14Transurban Finance Co. Pty. Ltd., Reg. S
2% 28/08/2025 EUR 200,000 195,317 0.27
3,268,661 4.55
BelgiumAnheuser-Busch InBev NV, Reg. S 8.625%
30/01/2017 EUR 675,000 764,070 1.06Anheuser-Busch InBev NV, Reg. S, FRN
0.365% 29/03/2018 (1) EUR 250,000 251,050 0.35Barry Callebaut Services NV, Reg. S
5.625% 15/06/2021 EUR 500,000 592,162 0.82Brussels Airport Co. NV SA, Reg. S 3.25%
01/07/2020 EUR 100,000 110,565 0.15Solvay Finance SA, Reg. S, FRN 5.425%
Perpetual (France) (2) EUR 350,000 377,638 0.53
The accompanying notes are an integral part of these financial statements.
Please refer to the full prospectus for the Fund’s investment objective and policy.
Euro Corporate Bond (ex Financials) Fund
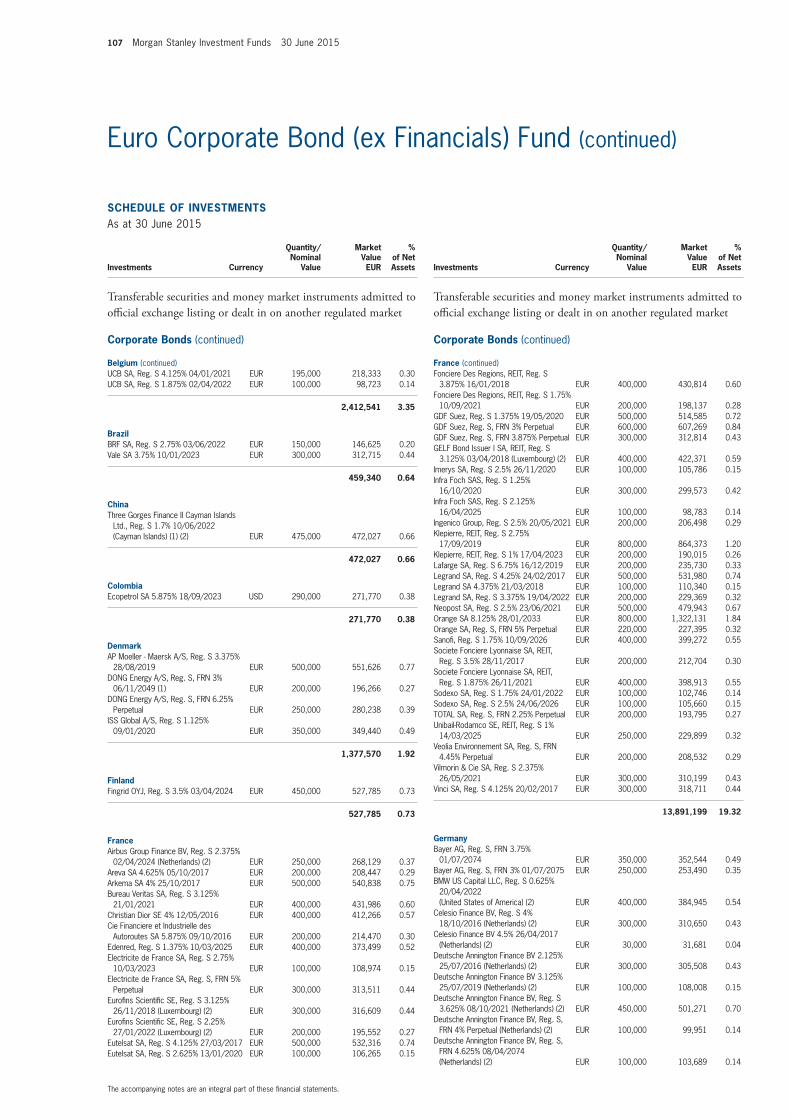
107 Morgan Stanley Investment Funds 30 June 2015
SCHEDULE of invEStmEntSAs at 30 June 2015
Investments Currency
Quantity/Nominal
Value
Market Value EUR
% of Net Assets
transferable securities and money market instruments admitted to official exchange listing or dealt in on another regulated market
Corporate Bonds (continued)
Belgium (continued)UCB SA, Reg. S 4.125% 04/01/2021 EUR 195,000 218,333 0.30UCB SA, Reg. S 1.875% 02/04/2022 EUR 100,000 98,723 0.14
2,412,541 3.35
BrazilBRF SA, Reg. S 2.75% 03/06/2022 EUR 150,000 146,625 0.20Vale SA 3.75% 10/01/2023 EUR 300,000 312,715 0.44
459,340 0.64
ChinaThree Gorges Finance II Cayman Islands
Ltd., Reg. S 1.7% 10/06/2022 (Cayman Islands) (1) (2) EUR 475,000 472,027 0.66
472,027 0.66
ColombiaEcopetrol SA 5.875% 18/09/2023 USD 290,000 271,770 0.38
271,770 0.38
DenmarkAP Moeller - Maersk A/S, Reg. S 3.375%
28/08/2019 EUR 500,000 551,626 0.77DONG Energy A/S, Reg. S, FRN 3%
06/11/2049 (1) EUR 200,000 196,266 0.27DONG Energy A/S, Reg. S, FRN 6.25%
Perpetual EUR 250,000 280,238 0.39ISS Global A/S, Reg. S 1.125%
09/01/2020 EUR 350,000 349,440 0.49
1,377,570 1.92
finlandFingrid OYJ, Reg. S 3.5% 03/04/2024 EUR 450,000 527,785 0.73
527,785 0.73
franceAirbus Group Finance BV, Reg. S 2.375%
02/04/2024 (Netherlands) (2) EUR 250,000 268,129 0.37Areva SA 4.625% 05/10/2017 EUR 200,000 208,447 0.29Arkema SA 4% 25/10/2017 EUR 500,000 540,838 0.75Bureau Veritas SA, Reg. S 3.125%
21/01/2021 EUR 400,000 431,986 0.60Christian Dior SE 4% 12/05/2016 EUR 400,000 412,266 0.57Cie Financiere et Industrielle des
Autoroutes SA 5.875% 09/10/2016 EUR 200,000 214,470 0.30Edenred, Reg. S 1.375% 10/03/2025 EUR 400,000 373,499 0.52Electricite de France SA, Reg. S 2.75%
10/03/2023 EUR 100,000 108,974 0.15Electricite de France SA, Reg. S, FRN 5%
Perpetual EUR 300,000 313,511 0.44Eurofins Scientific SE, Reg. S 3.125%
26/11/2018 (Luxembourg) (2) EUR 300,000 316,609 0.44Eurofins Scientific SE, Reg. S 2.25%
27/01/2022 (Luxembourg) (2) EUR 200,000 195,552 0.27Eutelsat SA, Reg. S 4.125% 27/03/2017 EUR 500,000 532,316 0.74Eutelsat SA, Reg. S 2.625% 13/01/2020 EUR 100,000 106,265 0.15
SCHEDULE of invEStmEntSAs at 30 June 2015
Investments Currency
Quantity/Nominal
Value
Market Value EUR
% of Net Assets
transferable securities and money market instruments admitted to official exchange listing or dealt in on another regulated market
Corporate Bonds (continued)
france (continued)Fonciere Des Regions, REIT, Reg. S
3.875% 16/01/2018 EUR 400,000 430,814 0.60Fonciere Des Regions, REIT, Reg. S 1.75%
10/09/2021 EUR 200,000 198,137 0.28GDF Suez, Reg. S 1.375% 19/05/2020 EUR 500,000 514,585 0.72GDF Suez, Reg. S, FRN 3% Perpetual EUR 600,000 607,269 0.84GDF Suez, Reg. S, FRN 3.875% Perpetual EUR 300,000 312,814 0.43GELF Bond Issuer I SA, REIT, Reg. S
3.125% 03/04/2018 (Luxembourg) (2) EUR 400,000 422,371 0.59Imerys SA, Reg. S 2.5% 26/11/2020 EUR 100,000 105,786 0.15Infra Foch SAS, Reg. S 1.25%
16/10/2020 EUR 300,000 299,573 0.42Infra Foch SAS, Reg. S 2.125%
16/04/2025 EUR 100,000 98,783 0.14Ingenico Group, Reg. S 2.5% 20/05/2021 EUR 200,000 206,498 0.29Klepierre, REIT, Reg. S 2.75%
17/09/2019 EUR 800,000 864,373 1.20Klepierre, REIT, Reg. S 1% 17/04/2023 EUR 200,000 190,015 0.26Lafarge SA, Reg. S 6.75% 16/12/2019 EUR 200,000 235,730 0.33Legrand SA, Reg. S 4.25% 24/02/2017 EUR 500,000 531,980 0.74Legrand SA 4.375% 21/03/2018 EUR 100,000 110,340 0.15Legrand SA, Reg. S 3.375% 19/04/2022 EUR 200,000 229,369 0.32Neopost SA, Reg. S 2.5% 23/06/2021 EUR 500,000 479,943 0.67Orange SA 8.125% 28/01/2033 EUR 800,000 1,322,131 1.84Orange SA, Reg. S, FRN 5% Perpetual EUR 220,000 227,395 0.32Sanofi, Reg. S 1.75% 10/09/2026 EUR 400,000 399,272 0.55Societe Fonciere Lyonnaise SA, REIT,
Reg. S 3.5% 28/11/2017 EUR 200,000 212,704 0.30Societe Fonciere Lyonnaise SA, REIT,
Reg. S 1.875% 26/11/2021 EUR 400,000 398,913 0.55Sodexo SA, Reg. S 1.75% 24/01/2022 EUR 100,000 102,746 0.14Sodexo SA, Reg. S 2.5% 24/06/2026 EUR 100,000 105,660 0.15TOTAL SA, Reg. S, FRN 2.25% Perpetual EUR 200,000 193,795 0.27Unibail-Rodamco SE, REIT, Reg. S 1%
14/03/2025 EUR 250,000 229,899 0.32Veolia Environnement SA, Reg. S, FRN
4.45% Perpetual EUR 200,000 208,532 0.29Vilmorin & Cie SA, Reg. S 2.375%
26/05/2021 EUR 300,000 310,199 0.43Vinci SA, Reg. S 4.125% 20/02/2017 EUR 300,000 318,711 0.44
13,891,199 19.32
GermanyBayer AG, Reg. S, FRN 3.75%
01/07/2074 EUR 350,000 352,544 0.49Bayer AG, Reg. S, FRN 3% 01/07/2075 EUR 250,000 253,490 0.35BMW US Capital LLC, Reg. S 0.625%
20/04/2022 (United States of America) (2) EUR 400,000 384,945 0.54
Celesio Finance BV, Reg. S 4% 18/10/2016 (Netherlands) (2) EUR 300,000 310,650 0.43
Celesio Finance BV 4.5% 26/04/2017 (Netherlands) (2) EUR 30,000 31,681 0.04
Deutsche Annington Finance BV 2.125% 25/07/2016 (Netherlands) (2) EUR 300,000 305,508 0.43
Deutsche Annington Finance BV 3.125% 25/07/2019 (Netherlands) (2) EUR 100,000 108,008 0.15
Deutsche Annington Finance BV, Reg. S 3.625% 08/10/2021 (Netherlands) (2) EUR 450,000 501,271 0.70
Deutsche Annington Finance BV, Reg. S, FRN 4% Perpetual (Netherlands) (2) EUR 100,000 99,951 0.14
Deutsche Annington Finance BV, Reg. S, FRN 4.625% 08/04/2074 (Netherlands) (2) EUR 100,000 103,689 0.14
The accompanying notes are an integral part of these financial statements.
Euro Corporate Bond (ex Financials) Fund (continued)
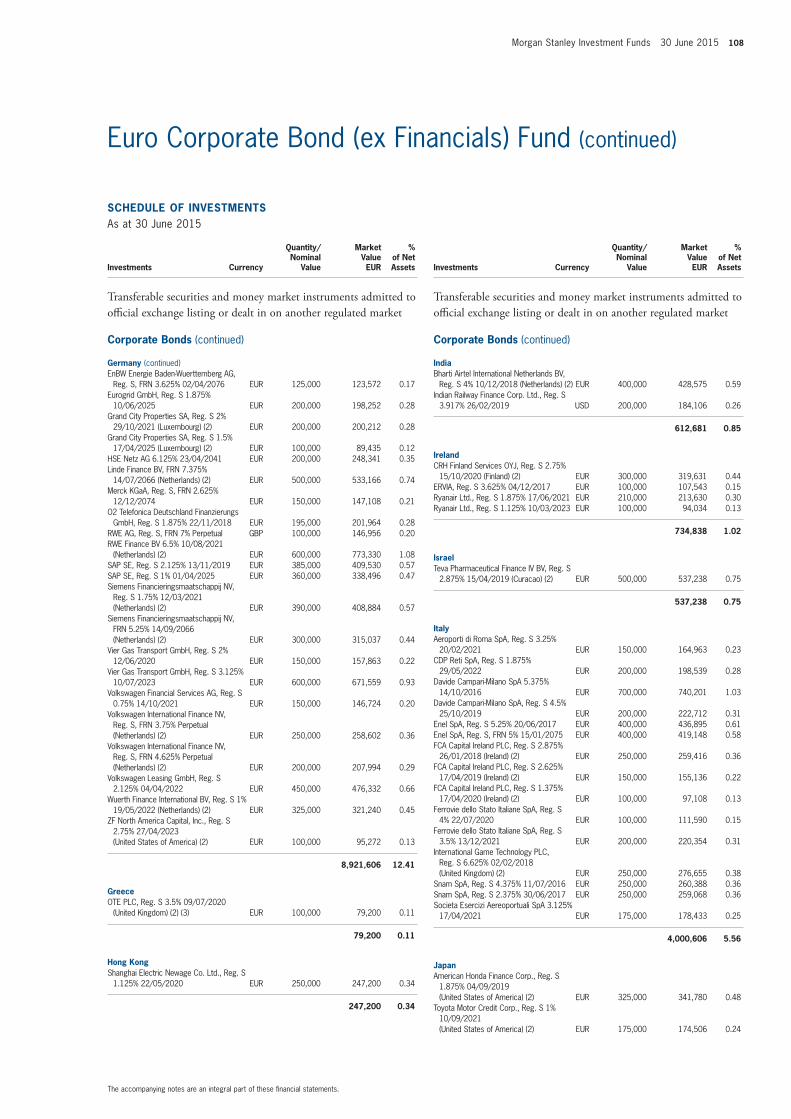
Morgan Stanley Investment Funds 30 June 2015 108
SCHEDULE of invEStmEntSAs at 30 June 2015
Investments Currency
Quantity/Nominal
Value
Market Value EUR
% of Net Assets
transferable securities and money market instruments admitted to official exchange listing or dealt in on another regulated market
Corporate Bonds (continued)
Germany (continued)EnBW Energie Baden-Wuerttemberg AG,
Reg. S, FRN 3.625% 02/04/2076 EUR 125,000 123,572 0.17Eurogrid GmbH, Reg. S 1.875%
10/06/2025 EUR 200,000 198,252 0.28Grand City Properties SA, Reg. S 2%
29/10/2021 (Luxembourg) (2) EUR 200,000 200,212 0.28Grand City Properties SA, Reg. S 1.5%
17/04/2025 (Luxembourg) (2) EUR 100,000 89,435 0.12HSE Netz AG 6.125% 23/04/2041 EUR 200,000 248,341 0.35Linde Finance BV, FRN 7.375%
14/07/2066 (Netherlands) (2) EUR 500,000 533,166 0.74Merck KGaA, Reg. S, FRN 2.625%
12/12/2074 EUR 150,000 147,108 0.21O2 Telefonica Deutschland Finanzierungs
GmbH, Reg. S 1.875% 22/11/2018 EUR 195,000 201,964 0.28RWE AG, Reg. S, FRN 7% Perpetual GBP 100,000 146,956 0.20RWE Finance BV 6.5% 10/08/2021
(Netherlands) (2) EUR 600,000 773,330 1.08SAP SE, Reg. S 2.125% 13/11/2019 EUR 385,000 409,530 0.57SAP SE, Reg. S 1% 01/04/2025 EUR 360,000 338,496 0.47Siemens Financieringsmaatschappij NV,
Reg. S 1.75% 12/03/2021 (Netherlands) (2) EUR 390,000 408,884 0.57
Siemens Financieringsmaatschappij NV, FRN 5.25% 14/09/2066 (Netherlands) (2) EUR 300,000 315,037 0.44
Vier Gas Transport GmbH, Reg. S 2% 12/06/2020 EUR 150,000 157,863 0.22
Vier Gas Transport GmbH, Reg. S 3.125% 10/07/2023 EUR 600,000 671,559 0.93
Volkswagen Financial Services AG, Reg. S 0.75% 14/10/2021 EUR 150,000 146,724 0.20
Volkswagen International Finance NV, Reg. S, FRN 3.75% Perpetual (Netherlands) (2) EUR 250,000 258,602 0.36
Volkswagen International Finance NV, Reg. S, FRN 4.625% Perpetual (Netherlands) (2) EUR 200,000 207,994 0.29
Volkswagen Leasing GmbH, Reg. S 2.125% 04/04/2022 EUR 450,000 476,332 0.66
Wuerth Finance International BV, Reg. S 1% 19/05/2022 (Netherlands) (2) EUR 325,000 321,240 0.45
ZF North America Capital, Inc., Reg. S 2.75% 27/04/2023 (United States of America) (2) EUR 100,000 95,272 0.13
8,921,606 12.41
GreeceOTE PLC, Reg. S 3.5% 09/07/2020
(United Kingdom) (2) (3) EUR 100,000 79,200 0.11
79,200 0.11
Hong KongShanghai Electric Newage Co. Ltd., Reg. S
1.125% 22/05/2020 EUR 250,000 247,200 0.34
247,200 0.34
SCHEDULE of invEStmEntSAs at 30 June 2015
Investments Currency
Quantity/Nominal
Value
Market Value EUR
% of Net Assets
transferable securities and money market instruments admitted to official exchange listing or dealt in on another regulated market
Corporate Bonds (continued)
indiaBharti Airtel International Netherlands BV,
Reg. S 4% 10/12/2018 (Netherlands) (2) EUR 400,000 428,575 0.59Indian Railway Finance Corp. Ltd., Reg. S
3.917% 26/02/2019 USD 200,000 184,106 0.26
612,681 0.85
irelandCRH Finland Services OYJ, Reg. S 2.75%
15/10/2020 (Finland) (2) EUR 300,000 319,631 0.44ERVIA, Reg. S 3.625% 04/12/2017 EUR 100,000 107,543 0.15Ryanair Ltd., Reg. S 1.875% 17/06/2021 EUR 210,000 213,630 0.30Ryanair Ltd., Reg. S 1.125% 10/03/2023 EUR 100,000 94,034 0.13
734,838 1.02
israelTeva Pharmaceutical Finance IV BV, Reg. S
2.875% 15/04/2019 (Curacao) (2) EUR 500,000 537,238 0.75
537,238 0.75
italyAeroporti di Roma SpA, Reg. S 3.25%
20/02/2021 EUR 150,000 164,963 0.23CDP Reti SpA, Reg. S 1.875%
29/05/2022 EUR 200,000 198,539 0.28Davide Campari-Milano SpA 5.375%
14/10/2016 EUR 700,000 740,201 1.03Davide Campari-Milano SpA, Reg. S 4.5%
25/10/2019 EUR 200,000 222,712 0.31Enel SpA, Reg. S 5.25% 20/06/2017 EUR 400,000 436,895 0.61Enel SpA, Reg. S, FRN 5% 15/01/2075 EUR 400,000 419,148 0.58FCA Capital Ireland PLC, Reg. S 2.875%
26/01/2018 (Ireland) (2) EUR 250,000 259,416 0.36FCA Capital Ireland PLC, Reg. S 2.625%
17/04/2019 (Ireland) (2) EUR 150,000 155,136 0.22FCA Capital Ireland PLC, Reg. S 1.375%
17/04/2020 (Ireland) (2) EUR 100,000 97,108 0.13Ferrovie dello Stato Italiane SpA, Reg. S
4% 22/07/2020 EUR 100,000 111,590 0.15Ferrovie dello Stato Italiane SpA, Reg. S
3.5% 13/12/2021 EUR 200,000 220,354 0.31International Game Technology PLC,
Reg. S 6.625% 02/02/2018 (United Kingdom) (2) EUR 250,000 276,655 0.38
Snam SpA, Reg. S 4.375% 11/07/2016 EUR 250,000 260,388 0.36Snam SpA, Reg. S 2.375% 30/06/2017 EUR 250,000 259,068 0.36Societa Esercizi Aereoportuali SpA 3.125%
17/04/2021 EUR 175,000 178,433 0.25
4,000,606 5.56
JapanAmerican Honda Finance Corp., Reg. S
1.875% 04/09/2019 (United States of America) (2) EUR 325,000 341,780 0.48
Toyota Motor Credit Corp., Reg. S 1% 10/09/2021 (United States of America) (2) EUR 175,000 174,506 0.24
The accompanying notes are an integral part of these financial statements.
Euro Corporate Bond (ex Financials) Fund (continued)
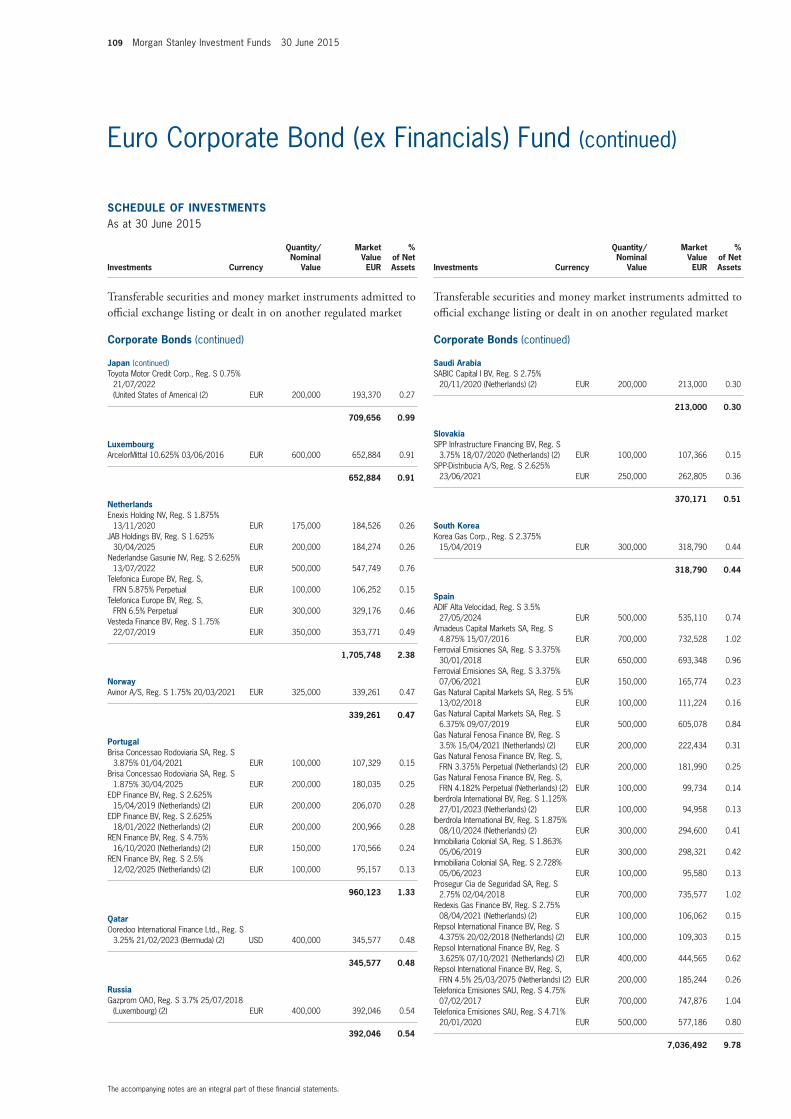
109 Morgan Stanley Investment Funds 30 June 2015
SCHEDULE of invEStmEntSAs at 30 June 2015
Investments Currency
Quantity/Nominal
Value
Market Value EUR
% of Net Assets
transferable securities and money market instruments admitted to official exchange listing or dealt in on another regulated market
Corporate Bonds (continued)
Japan (continued)Toyota Motor Credit Corp., Reg. S 0.75%
21/07/2022 (United States of America) (2) EUR 200,000 193,370 0.27
709,656 0.99
LuxembourgArcelorMittal 10.625% 03/06/2016 EUR 600,000 652,884 0.91
652,884 0.91
netherlandsEnexis Holding NV, Reg. S 1.875%
13/11/2020 EUR 175,000 184,526 0.26JAB Holdings BV, Reg. S 1.625%
30/04/2025 EUR 200,000 184,274 0.26Nederlandse Gasunie NV, Reg. S 2.625%
13/07/2022 EUR 500,000 547,749 0.76Telefonica Europe BV, Reg. S,
FRN 5.875% Perpetual EUR 100,000 106,252 0.15Telefonica Europe BV, Reg. S,
FRN 6.5% Perpetual EUR 300,000 329,176 0.46Vesteda Finance BV, Reg. S 1.75%
22/07/2019 EUR 350,000 353,771 0.49
1,705,748 2.38
norwayAvinor A/S, Reg. S 1.75% 20/03/2021 EUR 325,000 339,261 0.47
339,261 0.47
PortugalBrisa Concessao Rodoviaria SA, Reg. S
3.875% 01/04/2021 EUR 100,000 107,329 0.15Brisa Concessao Rodoviaria SA, Reg. S
1.875% 30/04/2025 EUR 200,000 180,035 0.25EDP Finance BV, Reg. S 2.625%
15/04/2019 (Netherlands) (2) EUR 200,000 206,070 0.28EDP Finance BV, Reg. S 2.625%
18/01/2022 (Netherlands) (2) EUR 200,000 200,966 0.28REN Finance BV, Reg. S 4.75%
16/10/2020 (Netherlands) (2) EUR 150,000 170,566 0.24REN Finance BV, Reg. S 2.5%
12/02/2025 (Netherlands) (2) EUR 100,000 95,157 0.13
960,123 1.33
QatarOoredoo International Finance Ltd., Reg. S
3.25% 21/02/2023 (Bermuda) (2) USD 400,000 345,577 0.48
345,577 0.48
RussiaGazprom OAO, Reg. S 3.7% 25/07/2018
(Luxembourg) (2) EUR 400,000 392,046 0.54
392,046 0.54
SCHEDULE of invEStmEntSAs at 30 June 2015
Investments Currency
Quantity/Nominal
Value
Market Value EUR
% of Net Assets
transferable securities and money market instruments admitted to official exchange listing or dealt in on another regulated market
Corporate Bonds (continued)
Saudi ArabiaSABIC Capital I BV, Reg. S 2.75%
20/11/2020 (Netherlands) (2) EUR 200,000 213,000 0.30
213,000 0.30
SlovakiaSPP Infrastructure Financing BV, Reg. S
3.75% 18/07/2020 (Netherlands) (2) EUR 100,000 107,366 0.15SPP-Distribucia A/S, Reg. S 2.625%
23/06/2021 EUR 250,000 262,805 0.36
370,171 0.51
South KoreaKorea Gas Corp., Reg. S 2.375%
15/04/2019 EUR 300,000 318,790 0.44
318,790 0.44
SpainADIF Alta Velocidad, Reg. S 3.5%
27/05/2024 EUR 500,000 535,110 0.74Amadeus Capital Markets SA, Reg. S
4.875% 15/07/2016 EUR 700,000 732,528 1.02Ferrovial Emisiones SA, Reg. S 3.375%
30/01/2018 EUR 650,000 693,348 0.96Ferrovial Emisiones SA, Reg. S 3.375%
07/06/2021 EUR 150,000 165,774 0.23Gas Natural Capital Markets SA, Reg. S 5%
13/02/2018 EUR 100,000 111,224 0.16Gas Natural Capital Markets SA, Reg. S
6.375% 09/07/2019 EUR 500,000 605,078 0.84Gas Natural Fenosa Finance BV, Reg. S
3.5% 15/04/2021 (Netherlands) (2) EUR 200,000 222,434 0.31Gas Natural Fenosa Finance BV, Reg. S,
FRN 3.375% Perpetual (Netherlands) (2) EUR 200,000 181,990 0.25Gas Natural Fenosa Finance BV, Reg. S,
FRN 4.182% Perpetual (Netherlands) (2) EUR 100,000 99,734 0.14Iberdrola International BV, Reg. S 1.125%
27/01/2023 (Netherlands) (2) EUR 100,000 94,958 0.13Iberdrola International BV, Reg. S 1.875%
08/10/2024 (Netherlands) (2) EUR 300,000 294,600 0.41Inmobiliaria Colonial SA, Reg. S 1.863%
05/06/2019 EUR 300,000 298,321 0.42Inmobiliaria Colonial SA, Reg. S 2.728%
05/06/2023 EUR 100,000 95,580 0.13Prosegur Cia de Seguridad SA, Reg. S
2.75% 02/04/2018 EUR 700,000 735,577 1.02Redexis Gas Finance BV, Reg. S 2.75%
08/04/2021 (Netherlands) (2) EUR 100,000 106,062 0.15Repsol International Finance BV, Reg. S
4.375% 20/02/2018 (Netherlands) (2) EUR 100,000 109,303 0.15Repsol International Finance BV, Reg. S
3.625% 07/10/2021 (Netherlands) (2) EUR 400,000 444,565 0.62Repsol International Finance BV, Reg. S,
FRN 4.5% 25/03/2075 (Netherlands) (2) EUR 200,000 185,244 0.26Telefonica Emisiones SAU, Reg. S 4.75%
07/02/2017 EUR 700,000 747,876 1.04Telefonica Emisiones SAU, Reg. S 4.71%
20/01/2020 EUR 500,000 577,186 0.80
7,036,492 9.78
The accompanying notes are an integral part of these financial statements.
Euro Corporate Bond (ex Financials) Fund (continued)
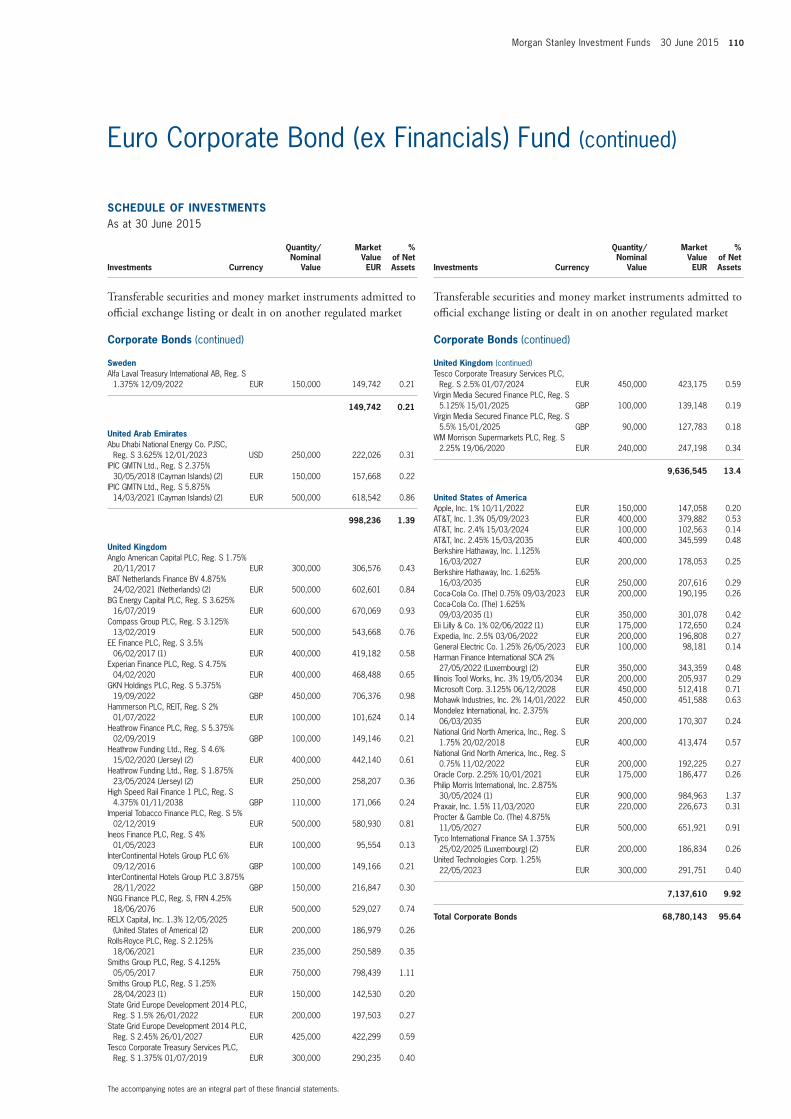
Morgan Stanley Investment Funds 30 June 2015 110
SCHEDULE of invEStmEntSAs at 30 June 2015
Investments Currency
Quantity/Nominal
Value
Market Value EUR
% of Net Assets
transferable securities and money market instruments admitted to official exchange listing or dealt in on another regulated market
Corporate Bonds (continued)
SwedenAlfa Laval Treasury International AB, Reg. S
1.375% 12/09/2022 EUR 150,000 149,742 0.21
149,742 0.21
United Arab EmiratesAbu Dhabi National Energy Co. PJSC,
Reg. S 3.625% 12/01/2023 USD 250,000 222,026 0.31IPIC GMTN Ltd., Reg. S 2.375%
30/05/2018 (Cayman Islands) (2) EUR 150,000 157,668 0.22IPIC GMTN Ltd., Reg. S 5.875%
14/03/2021 (Cayman Islands) (2) EUR 500,000 618,542 0.86
998,236 1.39
United KingdomAnglo American Capital PLC, Reg. S 1.75%
20/11/2017 EUR 300,000 306,576 0.43BAT Netherlands Finance BV 4.875%
24/02/2021 (Netherlands) (2) EUR 500,000 602,601 0.84BG Energy Capital PLC, Reg. S 3.625%
16/07/2019 EUR 600,000 670,069 0.93Compass Group PLC, Reg. S 3.125%
13/02/2019 EUR 500,000 543,668 0.76EE Finance PLC, Reg. S 3.5%
06/02/2017 (1) EUR 400,000 419,182 0.58Experian Finance PLC, Reg. S 4.75%
04/02/2020 EUR 400,000 468,488 0.65GKN Holdings PLC, Reg. S 5.375%
19/09/2022 GBP 450,000 706,376 0.98Hammerson PLC, REIT, Reg. S 2%
01/07/2022 EUR 100,000 101,624 0.14Heathrow Finance PLC, Reg. S 5.375%
02/09/2019 GBP 100,000 149,146 0.21Heathrow Funding Ltd., Reg. S 4.6%
15/02/2020 (Jersey) (2) EUR 400,000 442,140 0.61Heathrow Funding Ltd., Reg. S 1.875%
23/05/2024 (Jersey) (2) EUR 250,000 258,207 0.36High Speed Rail Finance 1 PLC, Reg. S
4.375% 01/11/2038 GBP 110,000 171,066 0.24Imperial Tobacco Finance PLC, Reg. S 5%
02/12/2019 EUR 500,000 580,930 0.81Ineos Finance PLC, Reg. S 4%
01/05/2023 EUR 100,000 95,554 0.13InterContinental Hotels Group PLC 6%
09/12/2016 GBP 100,000 149,166 0.21InterContinental Hotels Group PLC 3.875%
28/11/2022 GBP 150,000 216,847 0.30NGG Finance PLC, Reg. S, FRN 4.25%
18/06/2076 EUR 500,000 529,027 0.74RELX Capital, Inc. 1.3% 12/05/2025
(United States of America) (2) EUR 200,000 186,979 0.26Rolls-Royce PLC, Reg. S 2.125%
18/06/2021 EUR 235,000 250,589 0.35Smiths Group PLC, Reg. S 4.125%
05/05/2017 EUR 750,000 798,439 1.11Smiths Group PLC, Reg. S 1.25%
28/04/2023 (1) EUR 150,000 142,530 0.20State Grid Europe Development 2014 PLC,
Reg. S 1.5% 26/01/2022 EUR 200,000 197,503 0.27State Grid Europe Development 2014 PLC,
Reg. S 2.45% 26/01/2027 EUR 425,000 422,299 0.59Tesco Corporate Treasury Services PLC,
Reg. S 1.375% 01/07/2019 EUR 300,000 290,235 0.40
SCHEDULE of invEStmEntSAs at 30 June 2015
Investments Currency
Quantity/Nominal
Value
Market Value EUR
% of Net Assets
transferable securities and money market instruments admitted to official exchange listing or dealt in on another regulated market
Corporate Bonds (continued)
United Kingdom (continued)Tesco Corporate Treasury Services PLC,
Reg. S 2.5% 01/07/2024 EUR 450,000 423,175 0.59Virgin Media Secured Finance PLC, Reg. S
5.125% 15/01/2025 GBP 100,000 139,148 0.19Virgin Media Secured Finance PLC, Reg. S
5.5% 15/01/2025 GBP 90,000 127,783 0.18WM Morrison Supermarkets PLC, Reg. S
2.25% 19/06/2020 EUR 240,000 247,198 0.34
9,636,545 13.4
United States of AmericaApple, Inc. 1% 10/11/2022 EUR 150,000 147,058 0.20AT&T, Inc. 1.3% 05/09/2023 EUR 400,000 379,882 0.53AT&T, Inc. 2.4% 15/03/2024 EUR 100,000 102,563 0.14AT&T, Inc. 2.45% 15/03/2035 EUR 400,000 345,599 0.48Berkshire Hathaway, Inc. 1.125%
16/03/2027 EUR 200,000 178,053 0.25Berkshire Hathaway, Inc. 1.625%
16/03/2035 EUR 250,000 207,616 0.29Coca-Cola Co. (The) 0.75% 09/03/2023 EUR 200,000 190,195 0.26Coca-Cola Co. (The) 1.625%
09/03/2035 (1) EUR 350,000 301,078 0.42Eli Lilly & Co. 1% 02/06/2022 (1) EUR 175,000 172,650 0.24Expedia, Inc. 2.5% 03/06/2022 EUR 200,000 196,808 0.27General Electric Co. 1.25% 26/05/2023 EUR 100,000 98,181 0.14Harman Finance International SCA 2%
27/05/2022 (Luxembourg) (2) EUR 350,000 343,359 0.48Illinois Tool Works, Inc. 3% 19/05/2034 EUR 200,000 205,937 0.29Microsoft Corp. 3.125% 06/12/2028 EUR 450,000 512,418 0.71Mohawk Industries, Inc. 2% 14/01/2022 EUR 450,000 451,588 0.63Mondelez International, Inc. 2.375%
06/03/2035 EUR 200,000 170,307 0.24National Grid North America, Inc., Reg. S
1.75% 20/02/2018 EUR 400,000 413,474 0.57National Grid North America, Inc., Reg. S
0.75% 11/02/2022 EUR 200,000 192,225 0.27Oracle Corp. 2.25% 10/01/2021 EUR 175,000 186,477 0.26Philip Morris International, Inc. 2.875%
30/05/2024 (1) EUR 900,000 984,963 1.37Praxair, Inc. 1.5% 11/03/2020 EUR 220,000 226,673 0.31Procter & Gamble Co. (The) 4.875%
11/05/2027 EUR 500,000 651,921 0.91Tyco International Finance SA 1.375%
25/02/2025 (Luxembourg) (2) EUR 200,000 186,834 0.26United Technologies Corp. 1.25%
22/05/2023 EUR 300,000 291,751 0.40
7,137,610 9.92
total Corporate Bonds 68,780,143 95.64
The accompanying notes are an integral part of these financial statements.
Euro Corporate Bond (ex Financials) Fund (continued)
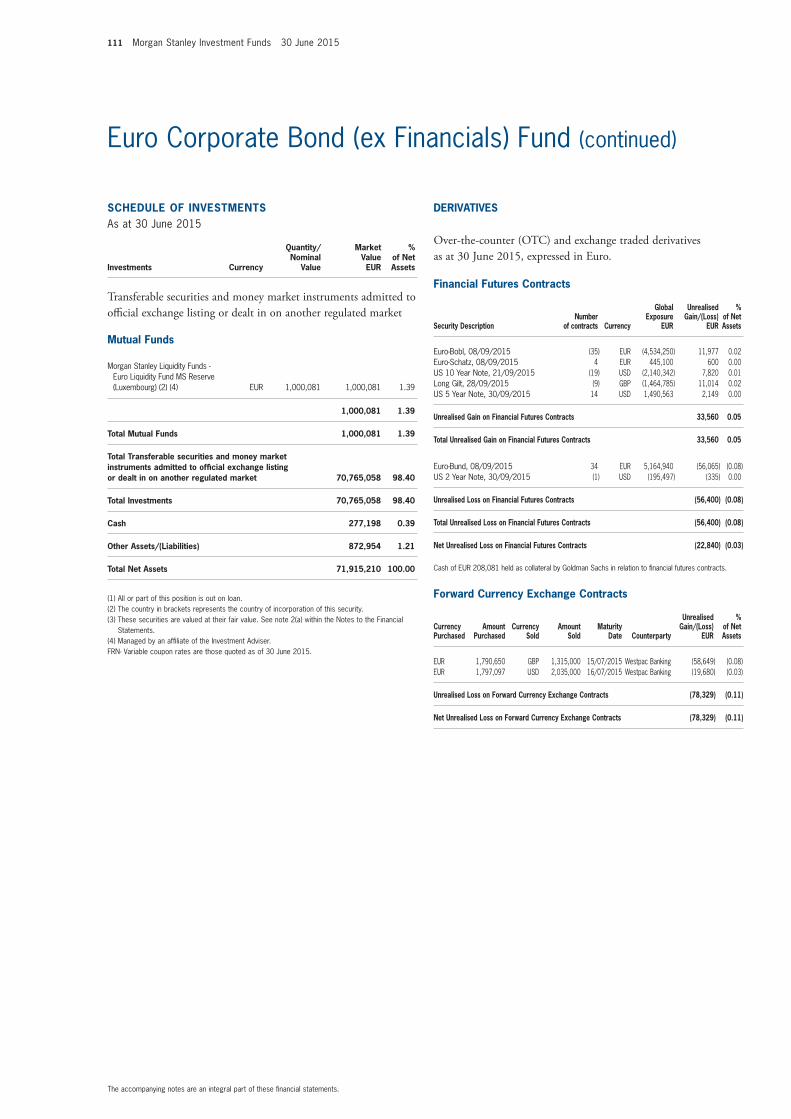
111 Morgan Stanley Investment Funds 30 June 2015
SCHEDULE of invEStmEntSAs at 30 June 2015
Investments Currency
Quantity/Nominal
Value
Market Value EUR
% of Net Assets
transferable securities and money market instruments admitted to official exchange listing or dealt in on another regulated market
mutual funds
Morgan Stanley Liquidity Funds - Euro Liquidity Fund MS Reserve (Luxembourg) (2) (4) EUR 1,000,081 1,000,081 1.39
1,000,081 1.39
total mutual funds 1,000,081 1.39
total transferable securities and money market instruments admitted to official exchange listing or dealt in on another regulated market 70,765,058 98.40
total investments 70,765,058 98.40
Cash 277,198 0.39
other Assets/(Liabilities) 872,954 1.21
total net Assets 71,915,210 100.00
(1) All or part of this position is out on loan.(2) The country in brackets represents the country of incorporation of this security.(3) These securities are valued at their fair value. See note 2(a) within the Notes to the Financial
Statements.(4) Managed by an affiliate of the Investment Adviser.FRN- Variable coupon rates are those quoted as of 30 June 2015.
The accompanying notes are an integral part of these financial statements.
Euro Corporate Bond (ex Financials) Fund (continued)
financial futures Contracts
Security Descriptionnumber
of contracts Currency
Global Exposure
EUR
Unrealised Gain/(Loss)
EUR
% of net Assets
Euro-Bobl, 08/09/2015 (35) EUR (4,534,250) 11,977 0.02Euro-Schatz, 08/09/2015 4 EUR 445,100 600 0.00US 10 Year Note, 21/09/2015 (19) USD (2,140,342) 7,820 0.01Long Gilt, 28/09/2015 (9) GBP (1,464,785) 11,014 0.02US 5 Year Note, 30/09/2015 14 USD 1,490,563 2,149 0.00
Unrealised Gain on financial futures Contracts 33,560 0.05
total Unrealised Gain on financial futures Contracts 33,560 0.05
Euro-Bund, 08/09/2015 34 EUR 5,164,940 (56,065) (0.08)US 2 Year Note, 30/09/2015 (1) USD (195,497) (335) 0.00
Unrealised Loss on financial futures Contracts (56,400) (0.08)
total Unrealised Loss on financial futures Contracts (56,400) (0.08)
net Unrealised Loss on financial futures Contracts (22,840) (0.03)
Cash of EUR 208,081 held as collateral by Goldman Sachs in relation to financial futures contracts.
forward Currency Exchange Contracts
Currency Purchased
Amount Purchased
Currency Sold
Amount Sold
maturity Date Counterparty
Unrealised Gain/(Loss)
EUR
% of net Assets
EUR 1,790,650 GBP 1,315,000 15/07/2015 Westpac Banking (58,649) (0.08)EUR 1,797,097 USD 2,035,000 16/07/2015 Westpac Banking (19,680) (0.03)
Unrealised Loss on forward Currency Exchange Contracts (78,329) (0.11)
net Unrealised Loss on forward Currency Exchange Contracts (78,329) (0.11)
DERivAtivES
Over-the-counter (OtC) and exchange traded derivatives as at 30 June 2015, expressed in euro.
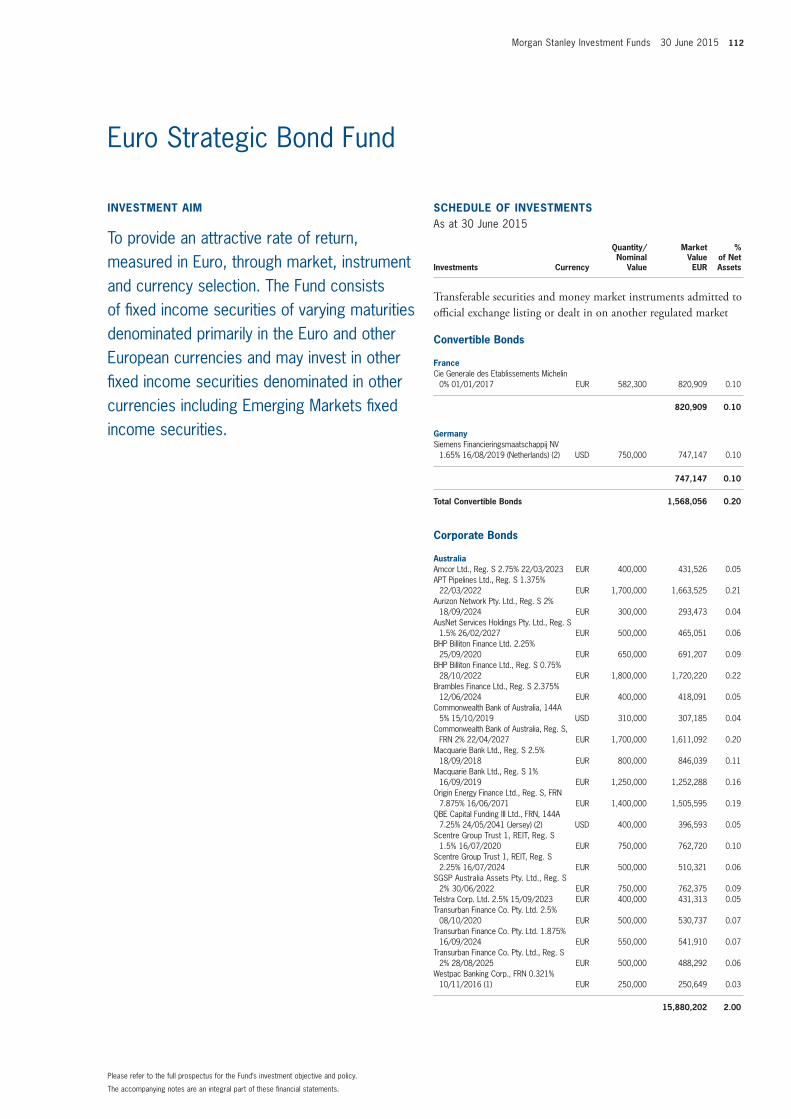
Morgan Stanley Investment Funds 30 June 2015 112
invEStmEnt Aim
To provide an attractive rate of return, measured in Euro, through market, instrument and currency selection. The Fund consists of fixed income securities of varying maturities denominated primarily in the Euro and other European currencies and may invest in other fixed income securities denominated in other currencies including Emerging Markets fixed income securities.
SCHEDULE of invEStmEntSAs at 30 June 2015
Investments Currency
Quantity/Nominal
Value
Market Value EUR
% of Net Assets
transferable securities and money market instruments admitted to official exchange listing or dealt in on another regulated market
Convertible Bonds
franceCie Generale des Etablissements Michelin
0% 01/01/2017 EUR 582,300 820,909 0.10
820,909 0.10
GermanySiemens Financieringsmaatschappij NV
1.65% 16/08/2019 (Netherlands) (2) USD 750,000 747,147 0.10
747,147 0.10
total Convertible Bonds 1,568,056 0.20
Corporate Bonds
AustraliaAmcor Ltd., Reg. S 2.75% 22/03/2023 EUR 400,000 431,526 0.05APT Pipelines Ltd., Reg. S 1.375%
22/03/2022 EUR 1,700,000 1,663,525 0.21Aurizon Network Pty. Ltd., Reg. S 2%
18/09/2024 EUR 300,000 293,473 0.04AusNet Services Holdings Pty. Ltd., Reg. S
1.5% 26/02/2027 EUR 500,000 465,051 0.06BHP Billiton Finance Ltd. 2.25%
25/09/2020 EUR 650,000 691,207 0.09BHP Billiton Finance Ltd., Reg. S 0.75%
28/10/2022 EUR 1,800,000 1,720,220 0.22Brambles Finance Ltd., Reg. S 2.375%
12/06/2024 EUR 400,000 418,091 0.05Commonwealth Bank of Australia, 144A
5% 15/10/2019 USD 310,000 307,185 0.04Commonwealth Bank of Australia, Reg. S,
FRN 2% 22/04/2027 EUR 1,700,000 1,611,092 0.20Macquarie Bank Ltd., Reg. S 2.5%
18/09/2018 EUR 800,000 846,039 0.11Macquarie Bank Ltd., Reg. S 1%
16/09/2019 EUR 1,250,000 1,252,288 0.16Origin Energy Finance Ltd., Reg. S, FRN
7.875% 16/06/2071 EUR 1,400,000 1,505,595 0.19QBE Capital Funding III Ltd., FRN, 144A
7.25% 24/05/2041 (Jersey) (2) USD 400,000 396,593 0.05Scentre Group Trust 1, REIT, Reg. S
1.5% 16/07/2020 EUR 750,000 762,720 0.10Scentre Group Trust 1, REIT, Reg. S
2.25% 16/07/2024 EUR 500,000 510,321 0.06SGSP Australia Assets Pty. Ltd., Reg. S
2% 30/06/2022 EUR 750,000 762,375 0.09Telstra Corp. Ltd. 2.5% 15/09/2023 EUR 400,000 431,313 0.05Transurban Finance Co. Pty. Ltd. 2.5%
08/10/2020 EUR 500,000 530,737 0.07Transurban Finance Co. Pty. Ltd. 1.875%
16/09/2024 EUR 550,000 541,910 0.07Transurban Finance Co. Pty. Ltd., Reg. S
2% 28/08/2025 EUR 500,000 488,292 0.06Westpac Banking Corp., FRN 0.321%
10/11/2016 (1) EUR 250,000 250,649 0.03
15,880,202 2.00
The accompanying notes are an integral part of these financial statements.
Please refer to the full prospectus for the Fund’s investment objective and policy.
Euro Strategic Bond Fund
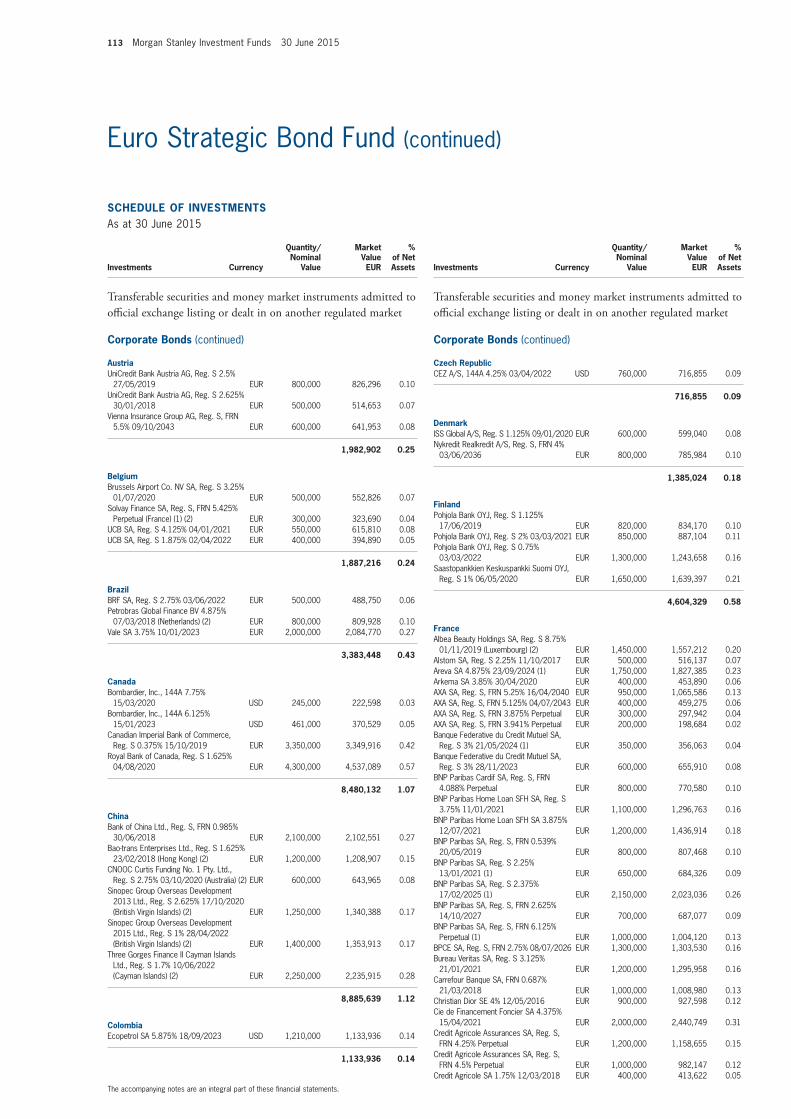
113 Morgan Stanley Investment Funds 30 June 2015
SCHEDULE of invEStmEntSAs at 30 June 2015
Investments Currency
Quantity/Nominal
Value
Market Value EUR
% of Net Assets
transferable securities and money market instruments admitted to official exchange listing or dealt in on another regulated market
Corporate Bonds (continued)
AustriaUniCredit Bank Austria AG, Reg. S 2.5%
27/05/2019 EUR 800,000 826,296 0.10UniCredit Bank Austria AG, Reg. S 2.625%
30/01/2018 EUR 500,000 514,653 0.07Vienna Insurance Group AG, Reg. S, FRN
5.5% 09/10/2043 EUR 600,000 641,953 0.08
1,982,902 0.25
BelgiumBrussels Airport Co. NV SA, Reg. S 3.25%
01/07/2020 EUR 500,000 552,826 0.07Solvay Finance SA, Reg. S, FRN 5.425%
Perpetual (France) (1) (2) EUR 300,000 323,690 0.04UCB SA, Reg. S 4.125% 04/01/2021 EUR 550,000 615,810 0.08UCB SA, Reg. S 1.875% 02/04/2022 EUR 400,000 394,890 0.05
1,887,216 0.24
BrazilBRF SA, Reg. S 2.75% 03/06/2022 EUR 500,000 488,750 0.06Petrobras Global Finance BV 4.875%
07/03/2018 (Netherlands) (2) EUR 800,000 809,928 0.10Vale SA 3.75% 10/01/2023 EUR 2,000,000 2,084,770 0.27
3,383,448 0.43
CanadaBombardier, Inc., 144A 7.75%
15/03/2020 USD 245,000 222,598 0.03Bombardier, Inc., 144A 6.125%
15/01/2023 USD 461,000 370,529 0.05Canadian Imperial Bank of Commerce,
Reg. S 0.375% 15/10/2019 EUR 3,350,000 3,349,916 0.42Royal Bank of Canada, Reg. S 1.625%
04/08/2020 EUR 4,300,000 4,537,089 0.57
8,480,132 1.07
ChinaBank of China Ltd., Reg. S, FRN 0.985%
30/06/2018 EUR 2,100,000 2,102,551 0.27Bao-trans Enterprises Ltd., Reg. S 1.625%
23/02/2018 (Hong Kong) (2) EUR 1,200,000 1,208,907 0.15CNOOC Curtis Funding No. 1 Pty. Ltd.,
Reg. S 2.75% 03/10/2020 (Australia) (2) EUR 600,000 643,965 0.08Sinopec Group Overseas Development
2013 Ltd., Reg. S 2.625% 17/10/2020 (British Virgin Islands) (2) EUR 1,250,000 1,340,388 0.17
Sinopec Group Overseas Development 2015 Ltd., Reg. S 1% 28/04/2022 (British Virgin Islands) (2) EUR 1,400,000 1,353,913 0.17
Three Gorges Finance II Cayman Islands Ltd., Reg. S 1.7% 10/06/2022 (Cayman Islands) (2) EUR 2,250,000 2,235,915 0.28
8,885,639 1.12
ColombiaEcopetrol SA 5.875% 18/09/2023 USD 1,210,000 1,133,936 0.14
1,133,936 0.14
SCHEDULE of invEStmEntSAs at 30 June 2015
Investments Currency
Quantity/Nominal
Value
Market Value EUR
% of Net Assets
transferable securities and money market instruments admitted to official exchange listing or dealt in on another regulated market
Corporate Bonds (continued)
Czech RepublicCEZ A/S, 144A 4.25% 03/04/2022 USD 760,000 716,855 0.09
716,855 0.09
DenmarkISS Global A/S, Reg. S 1.125% 09/01/2020 EUR 600,000 599,040 0.08Nykredit Realkredit A/S, Reg. S, FRN 4%
03/06/2036 EUR 800,000 785,984 0.10
1,385,024 0.18
finlandPohjola Bank OYJ, Reg. S 1.125%
17/06/2019 EUR 820,000 834,170 0.10Pohjola Bank OYJ, Reg. S 2% 03/03/2021 EUR 850,000 887,104 0.11Pohjola Bank OYJ, Reg. S 0.75%
03/03/2022 EUR 1,300,000 1,243,658 0.16Saastopankkien Keskuspankki Suomi OYJ,
Reg. S 1% 06/05/2020 EUR 1,650,000 1,639,397 0.21
4,604,329 0.58
franceAlbea Beauty Holdings SA, Reg. S 8.75%
01/11/2019 (Luxembourg) (2) EUR 1,450,000 1,557,212 0.20Alstom SA, Reg. S 2.25% 11/10/2017 EUR 500,000 516,137 0.07Areva SA 4.875% 23/09/2024 (1) EUR 1,750,000 1,827,385 0.23Arkema SA 3.85% 30/04/2020 EUR 400,000 453,890 0.06AXA SA, Reg. S, FRN 5.25% 16/04/2040 EUR 950,000 1,065,586 0.13AXA SA, Reg. S, FRN 5.125% 04/07/2043 EUR 400,000 459,275 0.06AXA SA, Reg. S, FRN 3.875% Perpetual EUR 300,000 297,942 0.04AXA SA, Reg. S, FRN 3.941% Perpetual EUR 200,000 198,684 0.02Banque Federative du Credit Mutuel SA,
Reg. S 3% 21/05/2024 (1) EUR 350,000 356,063 0.04Banque Federative du Credit Mutuel SA,
Reg. S 3% 28/11/2023 EUR 600,000 655,910 0.08BNP Paribas Cardif SA, Reg. S, FRN
4.088% Perpetual EUR 800,000 770,580 0.10BNP Paribas Home Loan SFH SA, Reg. S
3.75% 11/01/2021 EUR 1,100,000 1,296,763 0.16BNP Paribas Home Loan SFH SA 3.875%
12/07/2021 EUR 1,200,000 1,436,914 0.18BNP Paribas SA, Reg. S, FRN 0.539%
20/05/2019 EUR 800,000 807,468 0.10BNP Paribas SA, Reg. S 2.25%
13/01/2021 (1) EUR 650,000 684,326 0.09BNP Paribas SA, Reg. S 2.375%
17/02/2025 (1) EUR 2,150,000 2,023,036 0.26BNP Paribas SA, Reg. S, FRN 2.625%
14/10/2027 EUR 700,000 687,077 0.09BNP Paribas SA, Reg. S, FRN 6.125%
Perpetual (1) EUR 1,000,000 1,004,120 0.13BPCE SA, Reg. S, FRN 2.75% 08/07/2026 EUR 1,300,000 1,303,530 0.16Bureau Veritas SA, Reg. S 3.125%
21/01/2021 EUR 1,200,000 1,295,958 0.16Carrefour Banque SA, FRN 0.687%
21/03/2018 EUR 1,000,000 1,008,980 0.13Christian Dior SE 4% 12/05/2016 EUR 900,000 927,598 0.12Cie de Financement Foncier SA 4.375%
15/04/2021 EUR 2,000,000 2,440,749 0.31Credit Agricole Assurances SA, Reg. S,
FRN 4.25% Perpetual EUR 1,200,000 1,158,655 0.15Credit Agricole Assurances SA, Reg. S,
FRN 4.5% Perpetual EUR 1,000,000 982,147 0.12Credit Agricole SA 1.75% 12/03/2018 EUR 400,000 413,622 0.05
The accompanying notes are an integral part of these financial statements.
Euro Strategic Bond Fund (continued)
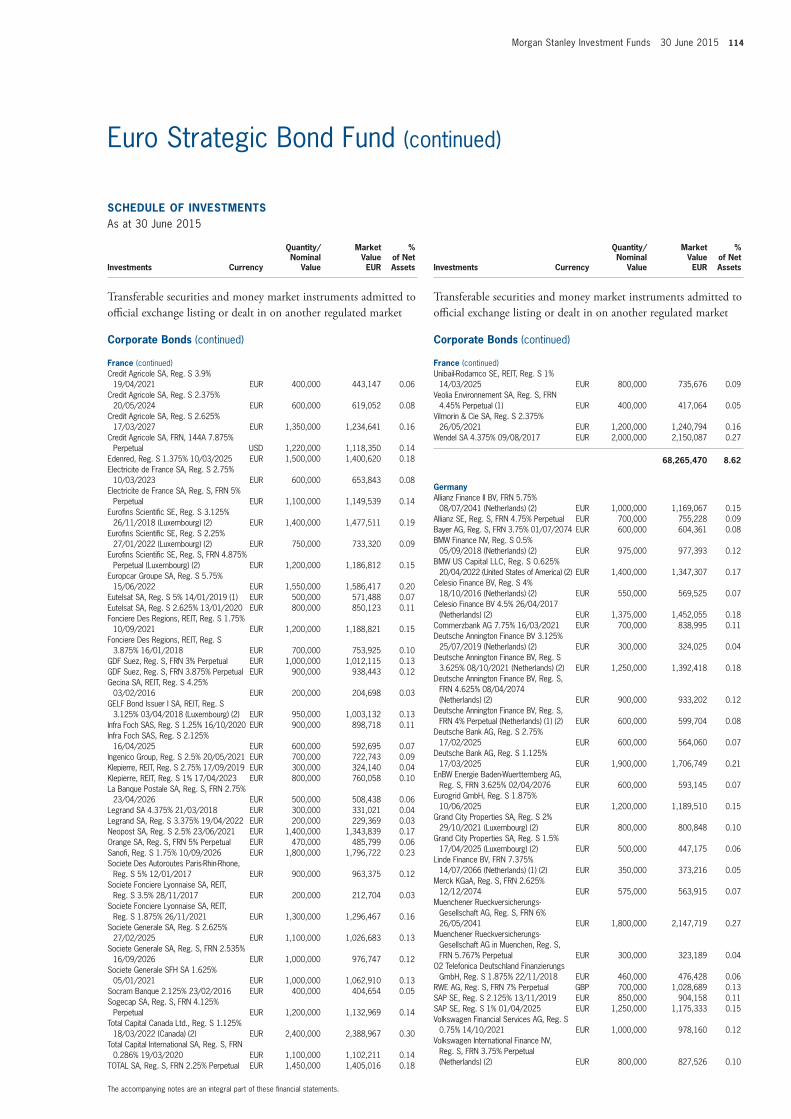
Morgan Stanley Investment Funds 30 June 2015 114
SCHEDULE of invEStmEntSAs at 30 June 2015
Investments Currency
Quantity/Nominal
Value
Market Value EUR
% of Net Assets
transferable securities and money market instruments admitted to official exchange listing or dealt in on another regulated market
Corporate Bonds (continued)
france (continued)Credit Agricole SA, Reg. S 3.9%
19/04/2021 EUR 400,000 443,147 0.06Credit Agricole SA, Reg. S 2.375%
20/05/2024 EUR 600,000 619,052 0.08Credit Agricole SA, Reg. S 2.625%
17/03/2027 EUR 1,350,000 1,234,641 0.16Credit Agricole SA, FRN, 144A 7.875%
Perpetual USD 1,220,000 1,118,350 0.14Edenred, Reg. S 1.375% 10/03/2025 EUR 1,500,000 1,400,620 0.18Electricite de France SA, Reg. S 2.75%
10/03/2023 EUR 600,000 653,843 0.08Electricite de France SA, Reg. S, FRN 5%
Perpetual EUR 1,100,000 1,149,539 0.14Eurofins Scientific SE, Reg. S 3.125%
26/11/2018 (Luxembourg) (2) EUR 1,400,000 1,477,511 0.19Eurofins Scientific SE, Reg. S 2.25%
27/01/2022 (Luxembourg) (2) EUR 750,000 733,320 0.09Eurofins Scientific SE, Reg. S, FRN 4.875%
Perpetual (Luxembourg) (2) EUR 1,200,000 1,186,812 0.15Europcar Groupe SA, Reg. S 5.75%
15/06/2022 EUR 1,550,000 1,586,417 0.20Eutelsat SA, Reg. S 5% 14/01/2019 (1) EUR 500,000 571,488 0.07Eutelsat SA, Reg. S 2.625% 13/01/2020 EUR 800,000 850,123 0.11Fonciere Des Regions, REIT, Reg. S 1.75%
10/09/2021 EUR 1,200,000 1,188,821 0.15Fonciere Des Regions, REIT, Reg. S
3.875% 16/01/2018 EUR 700,000 753,925 0.10GDF Suez, Reg. S, FRN 3% Perpetual EUR 1,000,000 1,012,115 0.13GDF Suez, Reg. S, FRN 3.875% Perpetual EUR 900,000 938,443 0.12Gecina SA, REIT, Reg. S 4.25%
03/02/2016 EUR 200,000 204,698 0.03GELF Bond Issuer I SA, REIT, Reg. S
3.125% 03/04/2018 (Luxembourg) (2) EUR 950,000 1,003,132 0.13Infra Foch SAS, Reg. S 1.25% 16/10/2020 EUR 900,000 898,718 0.11Infra Foch SAS, Reg. S 2.125%
16/04/2025 EUR 600,000 592,695 0.07Ingenico Group, Reg. S 2.5% 20/05/2021 EUR 700,000 722,743 0.09Klepierre, REIT, Reg. S 2.75% 17/09/2019 EUR 300,000 324,140 0.04Klepierre, REIT, Reg. S 1% 17/04/2023 EUR 800,000 760,058 0.10La Banque Postale SA, Reg. S, FRN 2.75%
23/04/2026 EUR 500,000 508,438 0.06Legrand SA 4.375% 21/03/2018 EUR 300,000 331,021 0.04Legrand SA, Reg. S 3.375% 19/04/2022 EUR 200,000 229,369 0.03Neopost SA, Reg. S 2.5% 23/06/2021 EUR 1,400,000 1,343,839 0.17Orange SA, Reg. S, FRN 5% Perpetual EUR 470,000 485,799 0.06Sanofi, Reg. S 1.75% 10/09/2026 EUR 1,800,000 1,796,722 0.23Societe Des Autoroutes Paris-Rhin-Rhone,
Reg. S 5% 12/01/2017 EUR 900,000 963,375 0.12Societe Fonciere Lyonnaise SA, REIT,
Reg. S 3.5% 28/11/2017 EUR 200,000 212,704 0.03Societe Fonciere Lyonnaise SA, REIT,
Reg. S 1.875% 26/11/2021 EUR 1,300,000 1,296,467 0.16Societe Generale SA, Reg. S 2.625%
27/02/2025 EUR 1,100,000 1,026,683 0.13Societe Generale SA, Reg. S, FRN 2.535%
16/09/2026 EUR 1,000,000 976,747 0.12Societe Generale SFH SA 1.625%
05/01/2021 EUR 1,000,000 1,062,910 0.13Socram Banque 2.125% 23/02/2016 EUR 400,000 404,654 0.05Sogecap SA, Reg. S, FRN 4.125%
Perpetual EUR 1,200,000 1,132,969 0.14Total Capital Canada Ltd., Reg. S 1.125%
18/03/2022 (Canada) (2) EUR 2,400,000 2,388,967 0.30Total Capital International SA, Reg. S, FRN
0.286% 19/03/2020 EUR 1,100,000 1,102,211 0.14TOTAL SA, Reg. S, FRN 2.25% Perpetual EUR 1,450,000 1,405,016 0.18
SCHEDULE of invEStmEntSAs at 30 June 2015
Investments Currency
Quantity/Nominal
Value
Market Value EUR
% of Net Assets
transferable securities and money market instruments admitted to official exchange listing or dealt in on another regulated market
Corporate Bonds (continued)
france (continued)Unibail-Rodamco SE, REIT, Reg. S 1%
14/03/2025 EUR 800,000 735,676 0.09Veolia Environnement SA, Reg. S, FRN
4.45% Perpetual (1) EUR 400,000 417,064 0.05Vilmorin & Cie SA, Reg. S 2.375%
26/05/2021 EUR 1,200,000 1,240,794 0.16Wendel SA 4.375% 09/08/2017 EUR 2,000,000 2,150,087 0.27
68,265,470 8.62
GermanyAllianz Finance II BV, FRN 5.75%
08/07/2041 (Netherlands) (2) EUR 1,000,000 1,169,067 0.15Allianz SE, Reg. S, FRN 4.75% Perpetual EUR 700,000 755,228 0.09Bayer AG, Reg. S, FRN 3.75% 01/07/2074 EUR 600,000 604,361 0.08BMW Finance NV, Reg. S 0.5%
05/09/2018 (Netherlands) (2) EUR 975,000 977,393 0.12BMW US Capital LLC, Reg. S 0.625%
20/04/2022 (United States of America) (2) EUR 1,400,000 1,347,307 0.17Celesio Finance BV, Reg. S 4%
18/10/2016 (Netherlands) (2) EUR 550,000 569,525 0.07Celesio Finance BV 4.5% 26/04/2017
(Netherlands) (2) EUR 1,375,000 1,452,055 0.18Commerzbank AG 7.75% 16/03/2021 EUR 700,000 838,995 0.11Deutsche Annington Finance BV 3.125%
25/07/2019 (Netherlands) (2) EUR 300,000 324,025 0.04Deutsche Annington Finance BV, Reg. S
3.625% 08/10/2021 (Netherlands) (2) EUR 1,250,000 1,392,418 0.18Deutsche Annington Finance BV, Reg. S,
FRN 4.625% 08/04/2074 (Netherlands) (2) EUR 900,000 933,202 0.12
Deutsche Annington Finance BV, Reg. S, FRN 4% Perpetual (Netherlands) (1) (2) EUR 600,000 599,704 0.08
Deutsche Bank AG, Reg. S 2.75% 17/02/2025 EUR 600,000 564,060 0.07
Deutsche Bank AG, Reg. S 1.125% 17/03/2025 EUR 1,900,000 1,706,749 0.21
EnBW Energie Baden-Wuerttemberg AG, Reg. S, FRN 3.625% 02/04/2076 EUR 600,000 593,145 0.07
Eurogrid GmbH, Reg. S 1.875% 10/06/2025 EUR 1,200,000 1,189,510 0.15
Grand City Properties SA, Reg. S 2% 29/10/2021 (Luxembourg) (2) EUR 800,000 800,848 0.10
Grand City Properties SA, Reg. S 1.5% 17/04/2025 (Luxembourg) (2) EUR 500,000 447,175 0.06
Linde Finance BV, FRN 7.375% 14/07/2066 (Netherlands) (1) (2) EUR 350,000 373,216 0.05
Merck KGaA, Reg. S, FRN 2.625% 12/12/2074 EUR 575,000 563,915 0.07
Muenchener Rueckversicherungs-Gesellschaft AG, Reg. S, FRN 6% 26/05/2041 EUR 1,800,000 2,147,719 0.27
Muenchener Rueckversicherungs-Gesellschaft AG in Muenchen, Reg. S, FRN 5.767% Perpetual EUR 300,000 323,189 0.04
O2 Telefonica Deutschland Finanzierungs GmbH, Reg. S 1.875% 22/11/2018 EUR 460,000 476,428 0.06
RWE AG, Reg. S, FRN 7% Perpetual GBP 700,000 1,028,689 0.13SAP SE, Reg. S 2.125% 13/11/2019 EUR 850,000 904,158 0.11SAP SE, Reg. S 1% 01/04/2025 EUR 1,250,000 1,175,333 0.15Volkswagen Financial Services AG, Reg. S
0.75% 14/10/2021 EUR 1,000,000 978,160 0.12Volkswagen International Finance NV,
Reg. S, FRN 3.75% Perpetual (Netherlands) (2) EUR 800,000 827,526 0.10
The accompanying notes are an integral part of these financial statements.
Euro Strategic Bond Fund (continued)
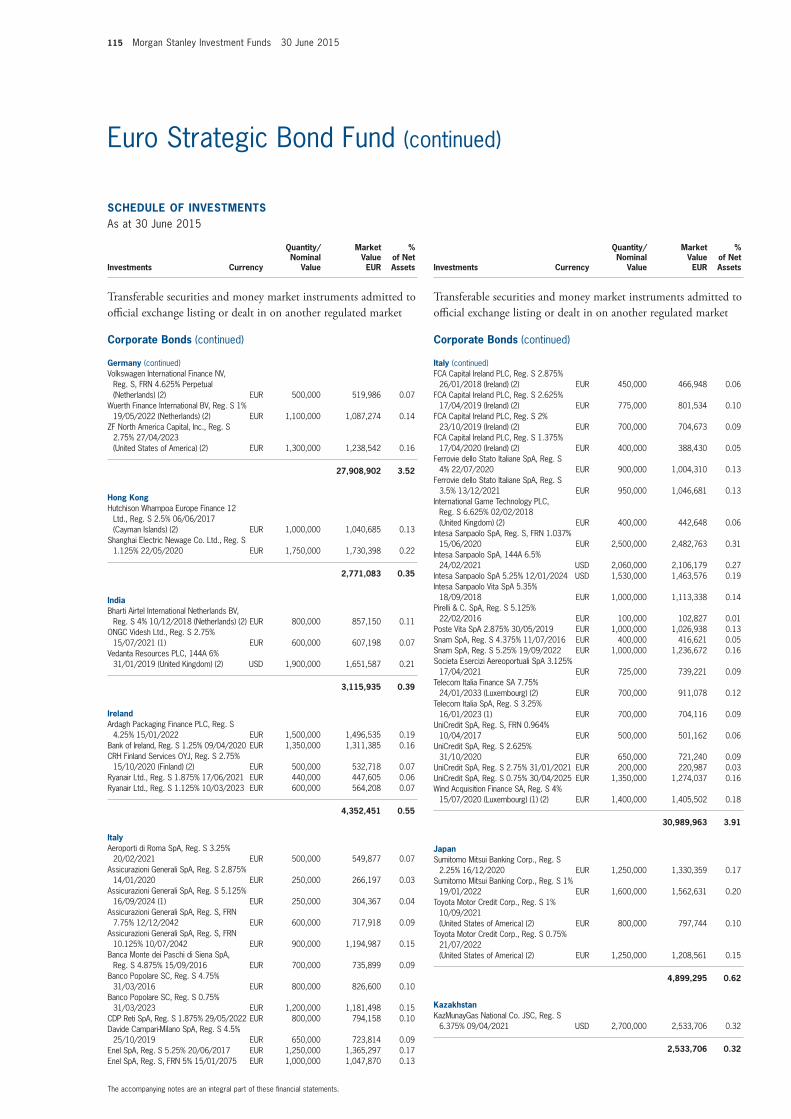
115 Morgan Stanley Investment Funds 30 June 2015
SCHEDULE of invEStmEntSAs at 30 June 2015
Investments Currency
Quantity/Nominal
Value
Market Value EUR
% of Net Assets
transferable securities and money market instruments admitted to official exchange listing or dealt in on another regulated market
Corporate Bonds (continued)
Germany (continued)Volkswagen International Finance NV,
Reg. S, FRN 4.625% Perpetual (Netherlands) (2) EUR 500,000 519,986 0.07
Wuerth Finance International BV, Reg. S 1% 19/05/2022 (Netherlands) (2) EUR 1,100,000 1,087,274 0.14
ZF North America Capital, Inc., Reg. S 2.75% 27/04/2023 (United States of America) (2) EUR 1,300,000 1,238,542 0.16
27,908,902 3.52
Hong KongHutchison Whampoa Europe Finance 12
Ltd., Reg. S 2.5% 06/06/2017 (Cayman Islands) (2) EUR 1,000,000 1,040,685 0.13
Shanghai Electric Newage Co. Ltd., Reg. S 1.125% 22/05/2020 EUR 1,750,000 1,730,398 0.22
2,771,083 0.35
indiaBharti Airtel International Netherlands BV,
Reg. S 4% 10/12/2018 (Netherlands) (2) EUR 800,000 857,150 0.11ONGC Videsh Ltd., Reg. S 2.75%
15/07/2021 (1) EUR 600,000 607,198 0.07Vedanta Resources PLC, 144A 6%
31/01/2019 (United Kingdom) (2) USD 1,900,000 1,651,587 0.21
3,115,935 0.39
irelandArdagh Packaging Finance PLC, Reg. S
4.25% 15/01/2022 EUR 1,500,000 1,496,535 0.19Bank of Ireland, Reg. S 1.25% 09/04/2020 EUR 1,350,000 1,311,385 0.16CRH Finland Services OYJ, Reg. S 2.75%
15/10/2020 (Finland) (2) EUR 500,000 532,718 0.07Ryanair Ltd., Reg. S 1.875% 17/06/2021 EUR 440,000 447,605 0.06Ryanair Ltd., Reg. S 1.125% 10/03/2023 EUR 600,000 564,208 0.07
4,352,451 0.55
italyAeroporti di Roma SpA, Reg. S 3.25%
20/02/2021 EUR 500,000 549,877 0.07Assicurazioni Generali SpA, Reg. S 2.875%
14/01/2020 EUR 250,000 266,197 0.03Assicurazioni Generali SpA, Reg. S 5.125%
16/09/2024 (1) EUR 250,000 304,367 0.04Assicurazioni Generali SpA, Reg. S, FRN
7.75% 12/12/2042 EUR 600,000 717,918 0.09Assicurazioni Generali SpA, Reg. S, FRN
10.125% 10/07/2042 EUR 900,000 1,194,987 0.15Banca Monte dei Paschi di Siena SpA,
Reg. S 4.875% 15/09/2016 EUR 700,000 735,899 0.09Banco Popolare SC, Reg. S 4.75%
31/03/2016 EUR 800,000 826,600 0.10Banco Popolare SC, Reg. S 0.75%
31/03/2023 EUR 1,200,000 1,181,498 0.15CDP Reti SpA, Reg. S 1.875% 29/05/2022 EUR 800,000 794,158 0.10Davide Campari-Milano SpA, Reg. S 4.5%
25/10/2019 EUR 650,000 723,814 0.09Enel SpA, Reg. S 5.25% 20/06/2017 EUR 1,250,000 1,365,297 0.17Enel SpA, Reg. S, FRN 5% 15/01/2075 EUR 1,000,000 1,047,870 0.13
SCHEDULE of invEStmEntSAs at 30 June 2015
Investments Currency
Quantity/Nominal
Value
Market Value EUR
% of Net Assets
transferable securities and money market instruments admitted to official exchange listing or dealt in on another regulated market
Corporate Bonds (continued)
italy (continued)FCA Capital Ireland PLC, Reg. S 2.875%
26/01/2018 (Ireland) (2) EUR 450,000 466,948 0.06FCA Capital Ireland PLC, Reg. S 2.625%
17/04/2019 (Ireland) (2) EUR 775,000 801,534 0.10FCA Capital Ireland PLC, Reg. S 2%
23/10/2019 (Ireland) (2) EUR 700,000 704,673 0.09FCA Capital Ireland PLC, Reg. S 1.375%
17/04/2020 (Ireland) (2) EUR 400,000 388,430 0.05Ferrovie dello Stato Italiane SpA, Reg. S
4% 22/07/2020 EUR 900,000 1,004,310 0.13Ferrovie dello Stato Italiane SpA, Reg. S
3.5% 13/12/2021 EUR 950,000 1,046,681 0.13International Game Technology PLC,
Reg. S 6.625% 02/02/2018 (United Kingdom) (2) EUR 400,000 442,648 0.06
Intesa Sanpaolo SpA, Reg. S, FRN 1.037% 15/06/2020 EUR 2,500,000 2,482,763 0.31
Intesa Sanpaolo SpA, 144A 6.5% 24/02/2021 USD 2,060,000 2,106,179 0.27
Intesa Sanpaolo SpA 5.25% 12/01/2024 USD 1,530,000 1,463,576 0.19Intesa Sanpaolo Vita SpA 5.35%
18/09/2018 EUR 1,000,000 1,113,338 0.14Pirelli & C. SpA, Reg. S 5.125%
22/02/2016 EUR 100,000 102,827 0.01Poste Vita SpA 2.875% 30/05/2019 EUR 1,000,000 1,026,938 0.13Snam SpA, Reg. S 4.375% 11/07/2016 EUR 400,000 416,621 0.05Snam SpA, Reg. S 5.25% 19/09/2022 EUR 1,000,000 1,236,672 0.16Societa Esercizi Aereoportuali SpA 3.125%
17/04/2021 EUR 725,000 739,221 0.09Telecom Italia Finance SA 7.75%
24/01/2033 (Luxembourg) (2) EUR 700,000 911,078 0.12Telecom Italia SpA, Reg. S 3.25%
16/01/2023 (1) EUR 700,000 704,116 0.09UniCredit SpA, Reg. S, FRN 0.964%
10/04/2017 EUR 500,000 501,162 0.06UniCredit SpA, Reg. S 2.625%
31/10/2020 EUR 650,000 721,240 0.09UniCredit SpA, Reg. S 2.75% 31/01/2021 EUR 200,000 220,987 0.03UniCredit SpA, Reg. S 0.75% 30/04/2025 EUR 1,350,000 1,274,037 0.16Wind Acquisition Finance SA, Reg. S 4%
15/07/2020 (Luxembourg) (1) (2) EUR 1,400,000 1,405,502 0.18
30,989,963 3.91
JapanSumitomo Mitsui Banking Corp., Reg. S
2.25% 16/12/2020 EUR 1,250,000 1,330,359 0.17Sumitomo Mitsui Banking Corp., Reg. S 1%
19/01/2022 EUR 1,600,000 1,562,631 0.20Toyota Motor Credit Corp., Reg. S 1%
10/09/2021 (United States of America) (2) EUR 800,000 797,744 0.10
Toyota Motor Credit Corp., Reg. S 0.75% 21/07/2022 (United States of America) (2) EUR 1,250,000 1,208,561 0.15
4,899,295 0.62
KazakhstanKazMunayGas National Co. JSC, Reg. S
6.375% 09/04/2021 USD 2,700,000 2,533,706 0.32
2,533,706 0.32
The accompanying notes are an integral part of these financial statements.
Euro Strategic Bond Fund (continued)
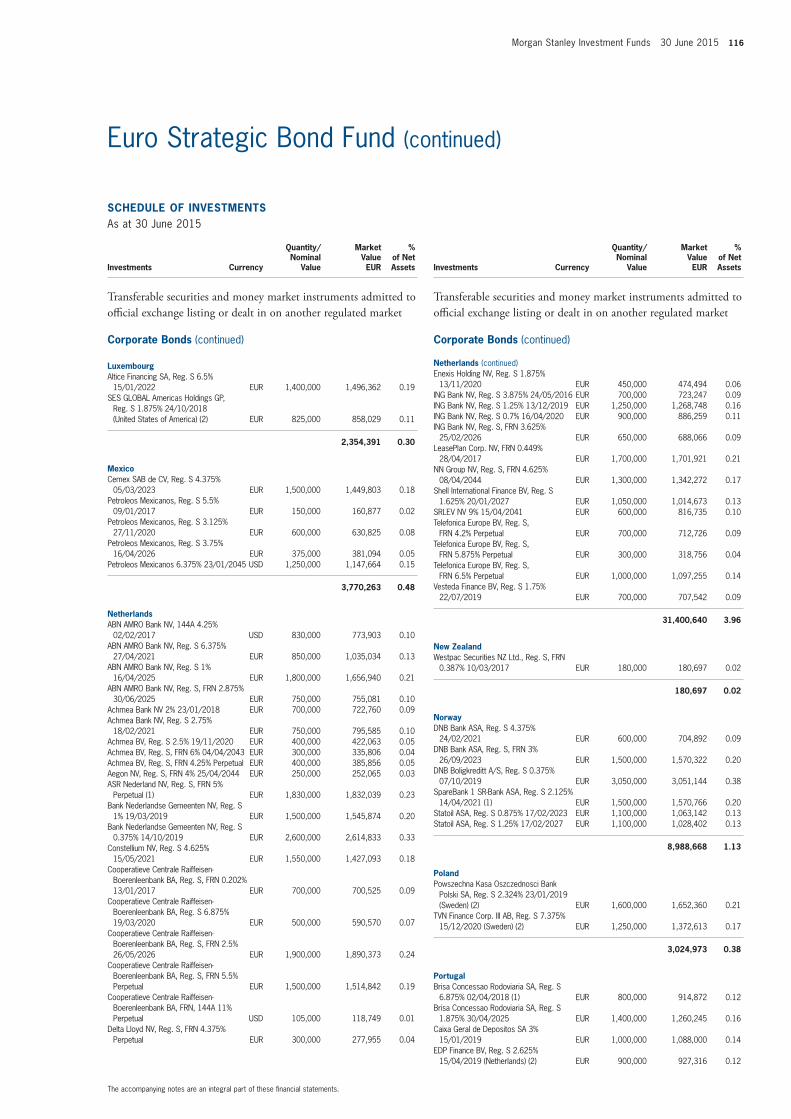
Morgan Stanley Investment Funds 30 June 2015 116
SCHEDULE of invEStmEntSAs at 30 June 2015
Investments Currency
Quantity/Nominal
Value
Market Value EUR
% of Net Assets
transferable securities and money market instruments admitted to official exchange listing or dealt in on another regulated market
Corporate Bonds (continued)
LuxembourgAltice Financing SA, Reg. S 6.5%
15/01/2022 EUR 1,400,000 1,496,362 0.19SES GLOBAL Americas Holdings GP,
Reg. S 1.875% 24/10/2018 (United States of America) (2) EUR 825,000 858,029 0.11
2,354,391 0.30
mexicoCemex SAB de CV, Reg. S 4.375%
05/03/2023 EUR 1,500,000 1,449,803 0.18Petroleos Mexicanos, Reg. S 5.5%
09/01/2017 EUR 150,000 160,877 0.02Petroleos Mexicanos, Reg. S 3.125%
27/11/2020 EUR 600,000 630,825 0.08Petroleos Mexicanos, Reg. S 3.75%
16/04/2026 EUR 375,000 381,094 0.05Petroleos Mexicanos 6.375% 23/01/2045 USD 1,250,000 1,147,664 0.15
3,770,263 0.48
netherlandsABN AMRO Bank NV, 144A 4.25%
02/02/2017 USD 830,000 773,903 0.10ABN AMRO Bank NV, Reg. S 6.375%
27/04/2021 EUR 850,000 1,035,034 0.13ABN AMRO Bank NV, Reg. S 1%
16/04/2025 EUR 1,800,000 1,656,940 0.21ABN AMRO Bank NV, Reg. S, FRN 2.875%
30/06/2025 EUR 750,000 755,081 0.10Achmea Bank NV 2% 23/01/2018 EUR 700,000 722,760 0.09Achmea Bank NV, Reg. S 2.75%
18/02/2021 EUR 750,000 795,585 0.10Achmea BV, Reg. S 2.5% 19/11/2020 EUR 400,000 422,063 0.05Achmea BV, Reg. S, FRN 6% 04/04/2043 EUR 300,000 335,806 0.04Achmea BV, Reg. S, FRN 4.25% Perpetual EUR 400,000 385,856 0.05Aegon NV, Reg. S, FRN 4% 25/04/2044 EUR 250,000 252,065 0.03ASR Nederland NV, Reg. S, FRN 5%
Perpetual (1) EUR 1,830,000 1,832,039 0.23Bank Nederlandse Gemeenten NV, Reg. S
1% 19/03/2019 EUR 1,500,000 1,545,874 0.20Bank Nederlandse Gemeenten NV, Reg. S
0.375% 14/10/2019 EUR 2,600,000 2,614,833 0.33Constellium NV, Reg. S 4.625%
15/05/2021 EUR 1,550,000 1,427,093 0.18Cooperatieve Centrale Raiffeisen-
Boerenleenbank BA, Reg. S, FRN 0.202% 13/01/2017 EUR 700,000 700,525 0.09
Cooperatieve Centrale Raiffeisen-Boerenleenbank BA, Reg. S 6.875% 19/03/2020 EUR 500,000 590,570 0.07
Cooperatieve Centrale Raiffeisen-Boerenleenbank BA, Reg. S, FRN 2.5% 26/05/2026 EUR 1,900,000 1,890,373 0.24
Cooperatieve Centrale Raiffeisen-Boerenleenbank BA, Reg. S, FRN 5.5% Perpetual EUR 1,500,000 1,514,842 0.19
Cooperatieve Centrale Raiffeisen-Boerenleenbank BA, FRN, 144A 11% Perpetual USD 105,000 118,749 0.01
Delta Lloyd NV, Reg. S, FRN 4.375% Perpetual EUR 300,000 277,955 0.04
SCHEDULE of invEStmEntSAs at 30 June 2015
Investments Currency
Quantity/Nominal
Value
Market Value EUR
% of Net Assets
transferable securities and money market instruments admitted to official exchange listing or dealt in on another regulated market
Corporate Bonds (continued)
netherlands (continued)Enexis Holding NV, Reg. S 1.875%
13/11/2020 EUR 450,000 474,494 0.06ING Bank NV, Reg. S 3.875% 24/05/2016 EUR 700,000 723,247 0.09ING Bank NV, Reg. S 1.25% 13/12/2019 EUR 1,250,000 1,268,748 0.16ING Bank NV, Reg. S 0.7% 16/04/2020 EUR 900,000 886,259 0.11ING Bank NV, Reg. S, FRN 3.625%
25/02/2026 EUR 650,000 688,066 0.09LeasePlan Corp. NV, FRN 0.449%
28/04/2017 EUR 1,700,000 1,701,921 0.21NN Group NV, Reg. S, FRN 4.625%
08/04/2044 EUR 1,300,000 1,342,272 0.17Shell International Finance BV, Reg. S
1.625% 20/01/2027 EUR 1,050,000 1,014,673 0.13SRLEV NV 9% 15/04/2041 EUR 600,000 816,735 0.10Telefonica Europe BV, Reg. S,
FRN 4.2% Perpetual EUR 700,000 712,726 0.09Telefonica Europe BV, Reg. S,
FRN 5.875% Perpetual EUR 300,000 318,756 0.04Telefonica Europe BV, Reg. S,
FRN 6.5% Perpetual EUR 1,000,000 1,097,255 0.14Vesteda Finance BV, Reg. S 1.75%
22/07/2019 EUR 700,000 707,542 0.09
31,400,640 3.96
new ZealandWestpac Securities NZ Ltd., Reg. S, FRN
0.387% 10/03/2017 EUR 180,000 180,697 0.02
180,697 0.02
norwayDNB Bank ASA, Reg. S 4.375%
24/02/2021 EUR 600,000 704,892 0.09DNB Bank ASA, Reg. S, FRN 3%
26/09/2023 EUR 1,500,000 1,570,322 0.20DNB Boligkreditt A/S, Reg. S 0.375%
07/10/2019 EUR 3,050,000 3,051,144 0.38SpareBank 1 SR-Bank ASA, Reg. S 2.125%
14/04/2021 (1) EUR 1,500,000 1,570,766 0.20Statoil ASA, Reg. S 0.875% 17/02/2023 EUR 1,100,000 1,063,142 0.13Statoil ASA, Reg. S 1.25% 17/02/2027 EUR 1,100,000 1,028,402 0.13
8,988,668 1.13
PolandPowszechna Kasa Oszczednosci Bank
Polski SA, Reg. S 2.324% 23/01/2019 (Sweden) (2) EUR 1,600,000 1,652,360 0.21
TVN Finance Corp. III AB, Reg. S 7.375% 15/12/2020 (Sweden) (2) EUR 1,250,000 1,372,613 0.17
3,024,973 0.38
PortugalBrisa Concessao Rodoviaria SA, Reg. S
6.875% 02/04/2018 (1) EUR 800,000 914,872 0.12Brisa Concessao Rodoviaria SA, Reg. S
1.875% 30/04/2025 EUR 1,400,000 1,260,245 0.16Caixa Geral de Depositos SA 3%
15/01/2019 EUR 1,000,000 1,088,000 0.14EDP Finance BV, Reg. S 2.625%
15/04/2019 (Netherlands) (2) EUR 900,000 927,316 0.12
The accompanying notes are an integral part of these financial statements.
Euro Strategic Bond Fund (continued)
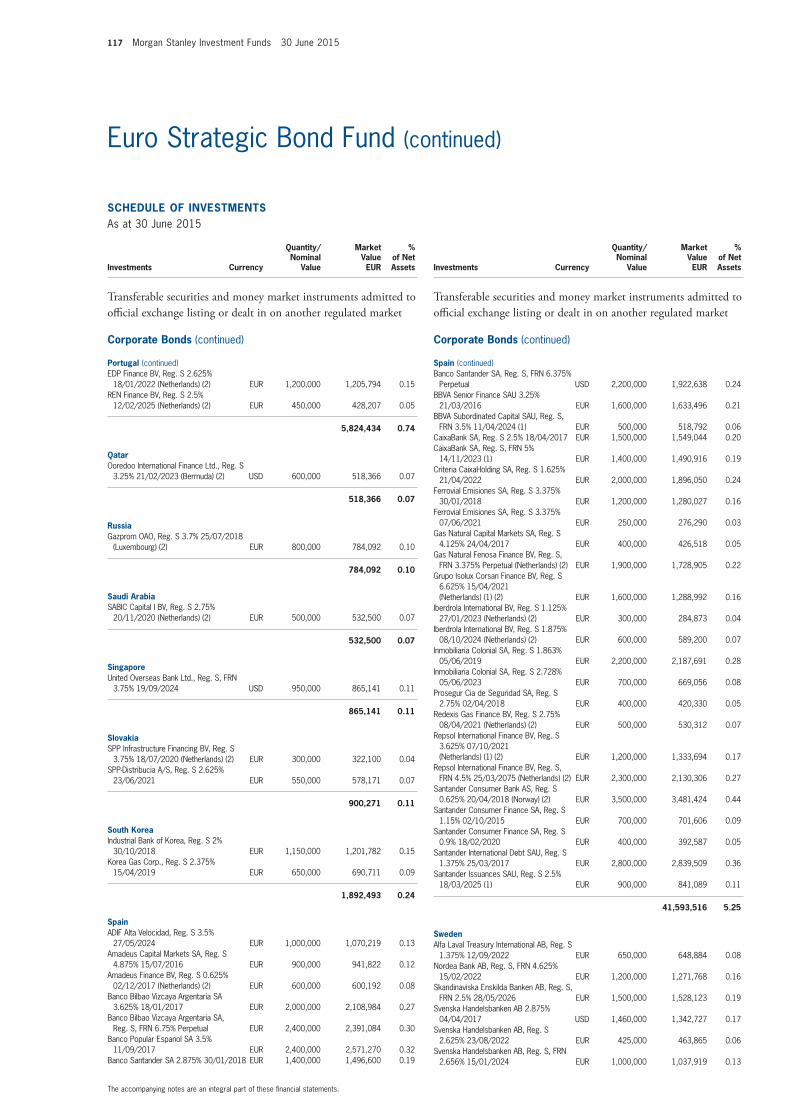
117 Morgan Stanley Investment Funds 30 June 2015
SCHEDULE of invEStmEntSAs at 30 June 2015
Investments Currency
Quantity/Nominal
Value
Market Value EUR
% of Net Assets
transferable securities and money market instruments admitted to official exchange listing or dealt in on another regulated market
Corporate Bonds (continued)
Portugal (continued)EDP Finance BV, Reg. S 2.625%
18/01/2022 (Netherlands) (2) EUR 1,200,000 1,205,794 0.15REN Finance BV, Reg. S 2.5%
12/02/2025 (Netherlands) (2) EUR 450,000 428,207 0.05
5,824,434 0.74
QatarOoredoo International Finance Ltd., Reg. S
3.25% 21/02/2023 (Bermuda) (2) USD 600,000 518,366 0.07
518,366 0.07
RussiaGazprom OAO, Reg. S 3.7% 25/07/2018
(Luxembourg) (2) EUR 800,000 784,092 0.10
784,092 0.10
Saudi ArabiaSABIC Capital I BV, Reg. S 2.75%
20/11/2020 (Netherlands) (2) EUR 500,000 532,500 0.07
532,500 0.07
SingaporeUnited Overseas Bank Ltd., Reg. S, FRN
3.75% 19/09/2024 USD 950,000 865,141 0.11
865,141 0.11
SlovakiaSPP Infrastructure Financing BV, Reg. S
3.75% 18/07/2020 (Netherlands) (2) EUR 300,000 322,100 0.04SPP-Distribucia A/S, Reg. S 2.625%
23/06/2021 EUR 550,000 578,171 0.07
900,271 0.11
South KoreaIndustrial Bank of Korea, Reg. S 2%
30/10/2018 EUR 1,150,000 1,201,782 0.15Korea Gas Corp., Reg. S 2.375%
15/04/2019 EUR 650,000 690,711 0.09
1,892,493 0.24
SpainADIF Alta Velocidad, Reg. S 3.5%
27/05/2024 EUR 1,000,000 1,070,219 0.13Amadeus Capital Markets SA, Reg. S
4.875% 15/07/2016 EUR 900,000 941,822 0.12Amadeus Finance BV, Reg. S 0.625%
02/12/2017 (Netherlands) (2) EUR 600,000 600,192 0.08Banco Bilbao Vizcaya Argentaria SA
3.625% 18/01/2017 EUR 2,000,000 2,108,984 0.27Banco Bilbao Vizcaya Argentaria SA,
Reg. S, FRN 6.75% Perpetual EUR 2,400,000 2,391,084 0.30Banco Popular Espanol SA 3.5%
11/09/2017 EUR 2,400,000 2,571,270 0.32Banco Santander SA 2.875% 30/01/2018 EUR 1,400,000 1,496,600 0.19
SCHEDULE of invEStmEntSAs at 30 June 2015
Investments Currency
Quantity/Nominal
Value
Market Value EUR
% of Net Assets
transferable securities and money market instruments admitted to official exchange listing or dealt in on another regulated market
Corporate Bonds (continued)
Spain (continued)Banco Santander SA, Reg. S, FRN 6.375%
Perpetual USD 2,200,000 1,922,638 0.24BBVA Senior Finance SAU 3.25%
21/03/2016 EUR 1,600,000 1,633,496 0.21BBVA Subordinated Capital SAU, Reg. S,
FRN 3.5% 11/04/2024 (1) EUR 500,000 518,792 0.06CaixaBank SA, Reg. S 2.5% 18/04/2017 EUR 1,500,000 1,549,044 0.20CaixaBank SA, Reg. S, FRN 5%
14/11/2023 (1) EUR 1,400,000 1,490,916 0.19Criteria CaixaHolding SA, Reg. S 1.625%
21/04/2022 EUR 2,000,000 1,896,050 0.24Ferrovial Emisiones SA, Reg. S 3.375%
30/01/2018 EUR 1,200,000 1,280,027 0.16Ferrovial Emisiones SA, Reg. S 3.375%
07/06/2021 EUR 250,000 276,290 0.03Gas Natural Capital Markets SA, Reg. S
4.125% 24/04/2017 EUR 400,000 426,518 0.05Gas Natural Fenosa Finance BV, Reg. S,
FRN 3.375% Perpetual (Netherlands) (2) EUR 1,900,000 1,728,905 0.22Grupo Isolux Corsan Finance BV, Reg. S
6.625% 15/04/2021 (Netherlands) (1) (2) EUR 1,600,000 1,288,992 0.16
Iberdrola International BV, Reg. S 1.125% 27/01/2023 (Netherlands) (2) EUR 300,000 284,873 0.04
Iberdrola International BV, Reg. S 1.875% 08/10/2024 (Netherlands) (2) EUR 600,000 589,200 0.07
Inmobiliaria Colonial SA, Reg. S 1.863% 05/06/2019 EUR 2,200,000 2,187,691 0.28
Inmobiliaria Colonial SA, Reg. S 2.728% 05/06/2023 EUR 700,000 669,056 0.08
Prosegur Cia de Seguridad SA, Reg. S 2.75% 02/04/2018 EUR 400,000 420,330 0.05
Redexis Gas Finance BV, Reg. S 2.75% 08/04/2021 (Netherlands) (2) EUR 500,000 530,312 0.07
Repsol International Finance BV, Reg. S 3.625% 07/10/2021 (Netherlands) (1) (2) EUR 1,200,000 1,333,694 0.17
Repsol International Finance BV, Reg. S, FRN 4.5% 25/03/2075 (Netherlands) (2) EUR 2,300,000 2,130,306 0.27
Santander Consumer Bank AS, Reg. S 0.625% 20/04/2018 (Norway) (2) EUR 3,500,000 3,481,424 0.44
Santander Consumer Finance SA, Reg. S 1.15% 02/10/2015 EUR 700,000 701,606 0.09
Santander Consumer Finance SA, Reg. S 0.9% 18/02/2020 EUR 400,000 392,587 0.05
Santander International Debt SAU, Reg. S 1.375% 25/03/2017 EUR 2,800,000 2,839,509 0.36
Santander Issuances SAU, Reg. S 2.5% 18/03/2025 (1) EUR 900,000 841,089 0.11
41,593,516 5.25
SwedenAlfa Laval Treasury International AB, Reg. S
1.375% 12/09/2022 EUR 650,000 648,884 0.08Nordea Bank AB, Reg. S, FRN 4.625%
15/02/2022 EUR 1,200,000 1,271,768 0.16Skandinaviska Enskilda Banken AB, Reg. S,
FRN 2.5% 28/05/2026 EUR 1,500,000 1,528,123 0.19Svenska Handelsbanken AB 2.875%
04/04/2017 USD 1,460,000 1,342,727 0.17Svenska Handelsbanken AB, Reg. S
2.625% 23/08/2022 EUR 425,000 463,865 0.06Svenska Handelsbanken AB, Reg. S, FRN
2.656% 15/01/2024 EUR 1,000,000 1,037,919 0.13
The accompanying notes are an integral part of these financial statements.
Euro Strategic Bond Fund (continued)
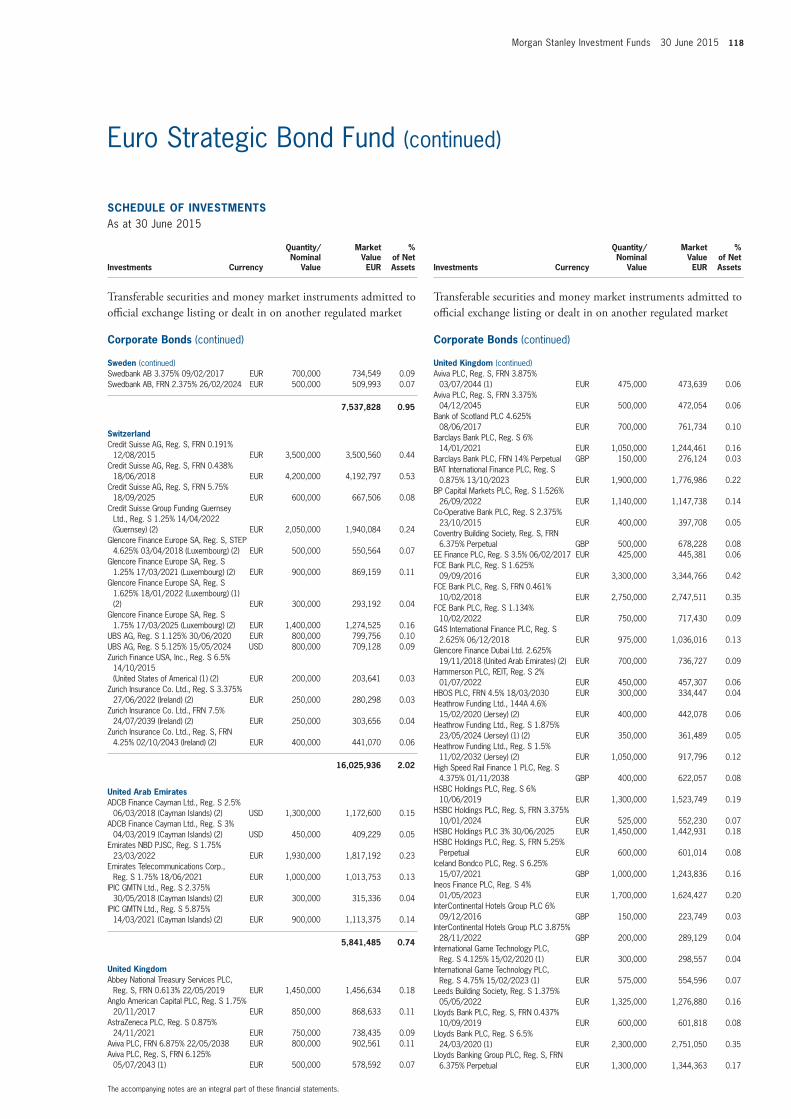
Morgan Stanley Investment Funds 30 June 2015 118
SCHEDULE of invEStmEntSAs at 30 June 2015
Investments Currency
Quantity/Nominal
Value
Market Value EUR
% of Net Assets
transferable securities and money market instruments admitted to official exchange listing or dealt in on another regulated market
Corporate Bonds (continued)
Sweden (continued)Swedbank AB 3.375% 09/02/2017 EUR 700,000 734,549 0.09Swedbank AB, FRN 2.375% 26/02/2024 EUR 500,000 509,993 0.07
7,537,828 0.95
SwitzerlandCredit Suisse AG, Reg. S, FRN 0.191%
12/08/2015 EUR 3,500,000 3,500,560 0.44Credit Suisse AG, Reg. S, FRN 0.438%
18/06/2018 EUR 4,200,000 4,192,797 0.53Credit Suisse AG, Reg. S, FRN 5.75%
18/09/2025 EUR 600,000 667,506 0.08Credit Suisse Group Funding Guernsey
Ltd., Reg. S 1.25% 14/04/2022 (Guernsey) (2) EUR 2,050,000 1,940,084 0.24
Glencore Finance Europe SA, Reg. S, STEP 4.625% 03/04/2018 (Luxembourg) (2) EUR 500,000 550,564 0.07
Glencore Finance Europe SA, Reg. S 1.25% 17/03/2021 (Luxembourg) (2) EUR 900,000 869,159 0.11
Glencore Finance Europe SA, Reg. S 1.625% 18/01/2022 (Luxembourg) (1) (2) EUR 300,000 293,192 0.04
Glencore Finance Europe SA, Reg. S 1.75% 17/03/2025 (Luxembourg) (2) EUR 1,400,000 1,274,525 0.16
UBS AG, Reg. S 1.125% 30/06/2020 EUR 800,000 799,756 0.10UBS AG, Reg. S 5.125% 15/05/2024 USD 800,000 709,128 0.09Zurich Finance USA, Inc., Reg. S 6.5%
14/10/2015 (United States of America) (1) (2) EUR 200,000 203,641 0.03
Zurich Insurance Co. Ltd., Reg. S 3.375% 27/06/2022 (Ireland) (2) EUR 250,000 280,298 0.03
Zurich Insurance Co. Ltd., FRN 7.5% 24/07/2039 (Ireland) (2) EUR 250,000 303,656 0.04
Zurich Insurance Co. Ltd., Reg. S, FRN 4.25% 02/10/2043 (Ireland) (2) EUR 400,000 441,070 0.06
16,025,936 2.02
United Arab EmiratesADCB Finance Cayman Ltd., Reg. S 2.5%
06/03/2018 (Cayman Islands) (2) USD 1,300,000 1,172,600 0.15ADCB Finance Cayman Ltd., Reg. S 3%
04/03/2019 (Cayman Islands) (2) USD 450,000 409,229 0.05Emirates NBD PJSC, Reg. S 1.75%
23/03/2022 EUR 1,930,000 1,817,192 0.23Emirates Telecommunications Corp.,
Reg. S 1.75% 18/06/2021 EUR 1,000,000 1,013,753 0.13IPIC GMTN Ltd., Reg. S 2.375%
30/05/2018 (Cayman Islands) (2) EUR 300,000 315,336 0.04IPIC GMTN Ltd., Reg. S 5.875%
14/03/2021 (Cayman Islands) (2) EUR 900,000 1,113,375 0.14
5,841,485 0.74
United KingdomAbbey National Treasury Services PLC,
Reg. S, FRN 0.613% 22/05/2019 EUR 1,450,000 1,456,634 0.18Anglo American Capital PLC, Reg. S 1.75%
20/11/2017 EUR 850,000 868,633 0.11AstraZeneca PLC, Reg. S 0.875%
24/11/2021 EUR 750,000 738,435 0.09Aviva PLC, FRN 6.875% 22/05/2038 EUR 800,000 902,561 0.11Aviva PLC, Reg. S, FRN 6.125%
05/07/2043 (1) EUR 500,000 578,592 0.07
SCHEDULE of invEStmEntSAs at 30 June 2015
Investments Currency
Quantity/Nominal
Value
Market Value EUR
% of Net Assets
transferable securities and money market instruments admitted to official exchange listing or dealt in on another regulated market
Corporate Bonds (continued)
United Kingdom (continued)Aviva PLC, Reg. S, FRN 3.875%
03/07/2044 (1) EUR 475,000 473,639 0.06Aviva PLC, Reg. S, FRN 3.375%
04/12/2045 EUR 500,000 472,054 0.06Bank of Scotland PLC 4.625%
08/06/2017 EUR 700,000 761,734 0.10Barclays Bank PLC, Reg. S 6%
14/01/2021 EUR 1,050,000 1,244,461 0.16Barclays Bank PLC, FRN 14% Perpetual GBP 150,000 276,124 0.03BAT International Finance PLC, Reg. S
0.875% 13/10/2023 EUR 1,900,000 1,776,986 0.22BP Capital Markets PLC, Reg. S 1.526%
26/09/2022 EUR 1,140,000 1,147,738 0.14Co-Operative Bank PLC, Reg. S 2.375%
23/10/2015 EUR 400,000 397,708 0.05Coventry Building Society, Reg. S, FRN
6.375% Perpetual GBP 500,000 678,228 0.08EE Finance PLC, Reg. S 3.5% 06/02/2017 EUR 425,000 445,381 0.06FCE Bank PLC, Reg. S 1.625%
09/09/2016 EUR 3,300,000 3,344,766 0.42FCE Bank PLC, Reg. S, FRN 0.461%
10/02/2018 EUR 2,750,000 2,747,511 0.35FCE Bank PLC, Reg. S 1.134%
10/02/2022 EUR 750,000 717,430 0.09G4S International Finance PLC, Reg. S
2.625% 06/12/2018 EUR 975,000 1,036,016 0.13Glencore Finance Dubai Ltd. 2.625%
19/11/2018 (United Arab Emirates) (2) EUR 700,000 736,727 0.09Hammerson PLC, REIT, Reg. S 2%
01/07/2022 EUR 450,000 457,307 0.06HBOS PLC, FRN 4.5% 18/03/2030 EUR 300,000 334,447 0.04Heathrow Funding Ltd., 144A 4.6%
15/02/2020 (Jersey) (2) EUR 400,000 442,078 0.06Heathrow Funding Ltd., Reg. S 1.875%
23/05/2024 (Jersey) (1) (2) EUR 350,000 361,489 0.05Heathrow Funding Ltd., Reg. S 1.5%
11/02/2032 (Jersey) (2) EUR 1,050,000 917,796 0.12High Speed Rail Finance 1 PLC, Reg. S
4.375% 01/11/2038 GBP 400,000 622,057 0.08HSBC Holdings PLC, Reg. S 6%
10/06/2019 EUR 1,300,000 1,523,749 0.19HSBC Holdings PLC, Reg. S, FRN 3.375%
10/01/2024 EUR 525,000 552,230 0.07HSBC Holdings PLC 3% 30/06/2025 EUR 1,450,000 1,442,931 0.18HSBC Holdings PLC, Reg. S, FRN 5.25%
Perpetual EUR 600,000 601,014 0.08Iceland Bondco PLC, Reg. S 6.25%
15/07/2021 GBP 1,000,000 1,243,836 0.16Ineos Finance PLC, Reg. S 4%
01/05/2023 EUR 1,700,000 1,624,427 0.20InterContinental Hotels Group PLC 6%
09/12/2016 GBP 150,000 223,749 0.03InterContinental Hotels Group PLC 3.875%
28/11/2022 GBP 200,000 289,129 0.04International Game Technology PLC,
Reg. S 4.125% 15/02/2020 (1) EUR 300,000 298,557 0.04International Game Technology PLC,
Reg. S 4.75% 15/02/2023 (1) EUR 575,000 554,596 0.07Leeds Building Society, Reg. S 1.375%
05/05/2022 EUR 1,325,000 1,276,880 0.16Lloyds Bank PLC, Reg. S, FRN 0.437%
10/09/2019 EUR 600,000 601,818 0.08Lloyds Bank PLC, Reg. S 6.5%
24/03/2020 (1) EUR 2,300,000 2,751,050 0.35Lloyds Banking Group PLC, Reg. S, FRN
6.375% Perpetual EUR 1,300,000 1,344,363 0.17
The accompanying notes are an integral part of these financial statements.
Euro Strategic Bond Fund (continued)
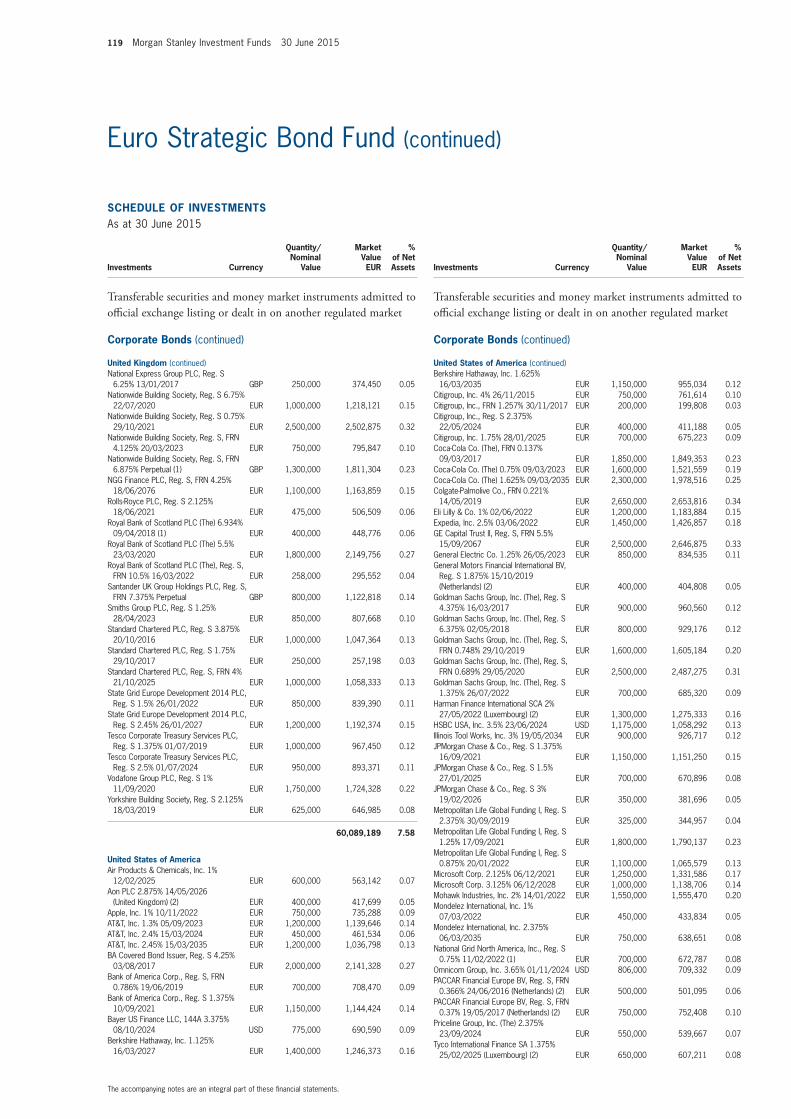
119 Morgan Stanley Investment Funds 30 June 2015
SCHEDULE of invEStmEntSAs at 30 June 2015
Investments Currency
Quantity/Nominal
Value
Market Value EUR
% of Net Assets
transferable securities and money market instruments admitted to official exchange listing or dealt in on another regulated market
Corporate Bonds (continued)
United Kingdom (continued)National Express Group PLC, Reg. S
6.25% 13/01/2017 GBP 250,000 374,450 0.05Nationwide Building Society, Reg. S 6.75%
22/07/2020 EUR 1,000,000 1,218,121 0.15Nationwide Building Society, Reg. S 0.75%
29/10/2021 EUR 2,500,000 2,502,875 0.32Nationwide Building Society, Reg. S, FRN
4.125% 20/03/2023 EUR 750,000 795,847 0.10Nationwide Building Society, Reg. S, FRN
6.875% Perpetual (1) GBP 1,300,000 1,811,304 0.23NGG Finance PLC, Reg. S, FRN 4.25%
18/06/2076 EUR 1,100,000 1,163,859 0.15Rolls-Royce PLC, Reg. S 2.125%
18/06/2021 EUR 475,000 506,509 0.06Royal Bank of Scotland PLC (The) 6.934%
09/04/2018 (1) EUR 400,000 448,776 0.06Royal Bank of Scotland PLC (The) 5.5%
23/03/2020 EUR 1,800,000 2,149,756 0.27Royal Bank of Scotland PLC (The), Reg. S,
FRN 10.5% 16/03/2022 EUR 258,000 295,552 0.04Santander UK Group Holdings PLC, Reg. S,
FRN 7.375% Perpetual GBP 800,000 1,122,818 0.14Smiths Group PLC, Reg. S 1.25%
28/04/2023 EUR 850,000 807,668 0.10Standard Chartered PLC, Reg. S 3.875%
20/10/2016 EUR 1,000,000 1,047,364 0.13Standard Chartered PLC, Reg. S 1.75%
29/10/2017 EUR 250,000 257,198 0.03Standard Chartered PLC, Reg. S, FRN 4%
21/10/2025 EUR 1,000,000 1,058,333 0.13State Grid Europe Development 2014 PLC,
Reg. S 1.5% 26/01/2022 EUR 850,000 839,390 0.11State Grid Europe Development 2014 PLC,
Reg. S 2.45% 26/01/2027 EUR 1,200,000 1,192,374 0.15Tesco Corporate Treasury Services PLC,
Reg. S 1.375% 01/07/2019 EUR 1,000,000 967,450 0.12Tesco Corporate Treasury Services PLC,
Reg. S 2.5% 01/07/2024 EUR 950,000 893,371 0.11Vodafone Group PLC, Reg. S 1%
11/09/2020 EUR 1,750,000 1,724,328 0.22Yorkshire Building Society, Reg. S 2.125%
18/03/2019 EUR 625,000 646,985 0.08
60,089,189 7.58
United States of AmericaAir Products & Chemicals, Inc. 1%
12/02/2025 EUR 600,000 563,142 0.07Aon PLC 2.875% 14/05/2026
(United Kingdom) (2) EUR 400,000 417,699 0.05Apple, Inc. 1% 10/11/2022 EUR 750,000 735,288 0.09AT&T, Inc. 1.3% 05/09/2023 EUR 1,200,000 1,139,646 0.14AT&T, Inc. 2.4% 15/03/2024 EUR 450,000 461,534 0.06AT&T, Inc. 2.45% 15/03/2035 EUR 1,200,000 1,036,798 0.13BA Covered Bond Issuer, Reg. S 4.25%
03/08/2017 EUR 2,000,000 2,141,328 0.27Bank of America Corp., Reg. S, FRN
0.786% 19/06/2019 EUR 700,000 708,470 0.09Bank of America Corp., Reg. S 1.375%
10/09/2021 EUR 1,150,000 1,144,424 0.14Bayer US Finance LLC, 144A 3.375%
08/10/2024 USD 775,000 690,590 0.09Berkshire Hathaway, Inc. 1.125%
16/03/2027 EUR 1,400,000 1,246,373 0.16
SCHEDULE of invEStmEntSAs at 30 June 2015
Investments Currency
Quantity/Nominal
Value
Market Value EUR
% of Net Assets
transferable securities and money market instruments admitted to official exchange listing or dealt in on another regulated market
Corporate Bonds (continued)
United States of America (continued)Berkshire Hathaway, Inc. 1.625%
16/03/2035 EUR 1,150,000 955,034 0.12Citigroup, Inc. 4% 26/11/2015 EUR 750,000 761,614 0.10Citigroup, Inc., FRN 1.257% 30/11/2017 EUR 200,000 199,808 0.03Citigroup, Inc., Reg. S 2.375%
22/05/2024 EUR 400,000 411,188 0.05Citigroup, Inc. 1.75% 28/01/2025 EUR 700,000 675,223 0.09Coca-Cola Co. (The), FRN 0.137%
09/03/2017 EUR 1,850,000 1,849,353 0.23Coca-Cola Co. (The) 0.75% 09/03/2023 EUR 1,600,000 1,521,559 0.19Coca-Cola Co. (The) 1.625% 09/03/2035 EUR 2,300,000 1,978,516 0.25Colgate-Palmolive Co., FRN 0.221%
14/05/2019 EUR 2,650,000 2,653,816 0.34Eli Lilly & Co. 1% 02/06/2022 EUR 1,200,000 1,183,884 0.15Expedia, Inc. 2.5% 03/06/2022 EUR 1,450,000 1,426,857 0.18GE Capital Trust II, Reg. S, FRN 5.5%
15/09/2067 EUR 2,500,000 2,646,875 0.33General Electric Co. 1.25% 26/05/2023 EUR 850,000 834,535 0.11General Motors Financial International BV,
Reg. S 1.875% 15/10/2019 (Netherlands) (2) EUR 400,000 404,808 0.05
Goldman Sachs Group, Inc. (The), Reg. S 4.375% 16/03/2017 EUR 900,000 960,560 0.12
Goldman Sachs Group, Inc. (The), Reg. S 6.375% 02/05/2018 EUR 800,000 929,176 0.12
Goldman Sachs Group, Inc. (The), Reg. S, FRN 0.748% 29/10/2019 EUR 1,600,000 1,605,184 0.20
Goldman Sachs Group, Inc. (The), Reg. S, FRN 0.689% 29/05/2020 EUR 2,500,000 2,487,275 0.31
Goldman Sachs Group, Inc. (The), Reg. S 1.375% 26/07/2022 EUR 700,000 685,320 0.09
Harman Finance International SCA 2% 27/05/2022 (Luxembourg) (2) EUR 1,300,000 1,275,333 0.16
HSBC USA, Inc. 3.5% 23/06/2024 USD 1,175,000 1,058,292 0.13Illinois Tool Works, Inc. 3% 19/05/2034 EUR 900,000 926,717 0.12JPMorgan Chase & Co., Reg. S 1.375%
16/09/2021 EUR 1,150,000 1,151,250 0.15JPMorgan Chase & Co., Reg. S 1.5%
27/01/2025 EUR 700,000 670,896 0.08JPMorgan Chase & Co., Reg. S 3%
19/02/2026 EUR 350,000 381,696 0.05Metropolitan Life Global Funding I, Reg. S
2.375% 30/09/2019 EUR 325,000 344,957 0.04Metropolitan Life Global Funding I, Reg. S
1.25% 17/09/2021 EUR 1,800,000 1,790,137 0.23Metropolitan Life Global Funding I, Reg. S
0.875% 20/01/2022 EUR 1,100,000 1,065,579 0.13Microsoft Corp. 2.125% 06/12/2021 EUR 1,250,000 1,331,586 0.17Microsoft Corp. 3.125% 06/12/2028 EUR 1,000,000 1,138,706 0.14Mohawk Industries, Inc. 2% 14/01/2022 EUR 1,550,000 1,555,470 0.20Mondelez International, Inc. 1%
07/03/2022 EUR 450,000 433,834 0.05Mondelez International, Inc. 2.375%
06/03/2035 EUR 750,000 638,651 0.08National Grid North America, Inc., Reg. S
0.75% 11/02/2022 (1) EUR 700,000 672,787 0.08Omnicom Group, Inc. 3.65% 01/11/2024 USD 806,000 709,332 0.09PACCAR Financial Europe BV, Reg. S, FRN
0.366% 24/06/2016 (Netherlands) (2) EUR 500,000 501,095 0.06PACCAR Financial Europe BV, Reg. S, FRN
0.37% 19/05/2017 (Netherlands) (2) EUR 750,000 752,408 0.10Priceline Group, Inc. (The) 2.375%
23/09/2024 EUR 550,000 539,667 0.07Tyco International Finance SA 1.375%
25/02/2025 (Luxembourg) (2) EUR 650,000 607,211 0.08
The accompanying notes are an integral part of these financial statements.
Euro Strategic Bond Fund (continued)
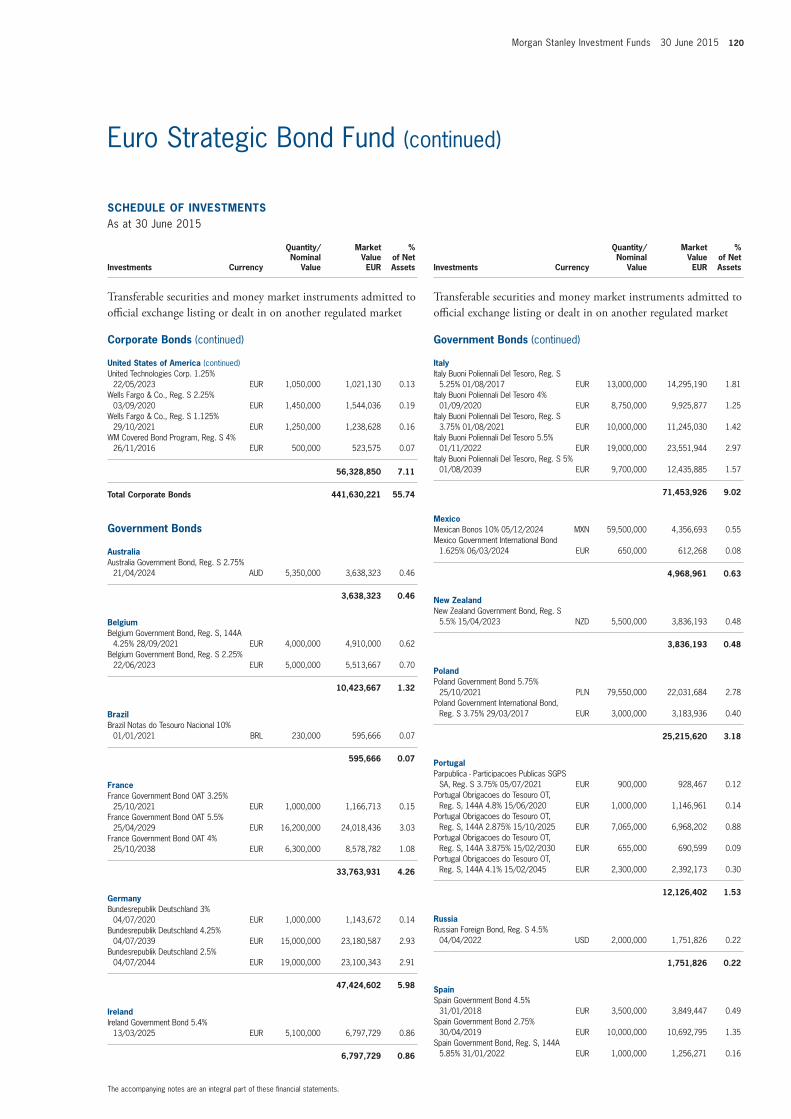
Morgan Stanley Investment Funds 30 June 2015 120
SCHEDULE of invEStmEntSAs at 30 June 2015
Investments Currency
Quantity/Nominal
Value
Market Value EUR
% of Net Assets
transferable securities and money market instruments admitted to official exchange listing or dealt in on another regulated market
Corporate Bonds (continued)
United States of America (continued)United Technologies Corp. 1.25%
22/05/2023 EUR 1,050,000 1,021,130 0.13Wells Fargo & Co., Reg. S 2.25%
03/09/2020 EUR 1,450,000 1,544,036 0.19Wells Fargo & Co., Reg. S 1.125%
29/10/2021 EUR 1,250,000 1,238,628 0.16WM Covered Bond Program, Reg. S 4%
26/11/2016 EUR 500,000 523,575 0.07
56,328,850 7.11
total Corporate Bonds 441,630,221 55.74
Government Bonds
AustraliaAustralia Government Bond, Reg. S 2.75%
21/04/2024 AUD 5,350,000 3,638,323 0.46
3,638,323 0.46
BelgiumBelgium Government Bond, Reg. S, 144A
4.25% 28/09/2021 EUR 4,000,000 4,910,000 0.62Belgium Government Bond, Reg. S 2.25%
22/06/2023 EUR 5,000,000 5,513,667 0.70
10,423,667 1.32
BrazilBrazil Notas do Tesouro Nacional 10%
01/01/2021 BRL 230,000 595,666 0.07
595,666 0.07
franceFrance Government Bond OAT 3.25%
25/10/2021 EUR 1,000,000 1,166,713 0.15France Government Bond OAT 5.5%
25/04/2029 EUR 16,200,000 24,018,436 3.03France Government Bond OAT 4%
25/10/2038 EUR 6,300,000 8,578,782 1.08
33,763,931 4.26
GermanyBundesrepublik Deutschland 3%
04/07/2020 EUR 1,000,000 1,143,672 0.14Bundesrepublik Deutschland 4.25%
04/07/2039 EUR 15,000,000 23,180,587 2.93Bundesrepublik Deutschland 2.5%
04/07/2044 EUR 19,000,000 23,100,343 2.91
47,424,602 5.98
irelandIreland Government Bond 5.4%
13/03/2025 EUR 5,100,000 6,797,729 0.86
6,797,729 0.86
SCHEDULE of invEStmEntSAs at 30 June 2015
Investments Currency
Quantity/Nominal
Value
Market Value EUR
% of Net Assets
transferable securities and money market instruments admitted to official exchange listing or dealt in on another regulated market
Government Bonds (continued)
italyItaly Buoni Poliennali Del Tesoro, Reg. S
5.25% 01/08/2017 EUR 13,000,000 14,295,190 1.81Italy Buoni Poliennali Del Tesoro 4%
01/09/2020 EUR 8,750,000 9,925,877 1.25Italy Buoni Poliennali Del Tesoro, Reg. S
3.75% 01/08/2021 EUR 10,000,000 11,245,030 1.42Italy Buoni Poliennali Del Tesoro 5.5%
01/11/2022 EUR 19,000,000 23,551,944 2.97Italy Buoni Poliennali Del Tesoro, Reg. S 5%
01/08/2039 EUR 9,700,000 12,435,885 1.57
71,453,926 9.02
mexicoMexican Bonos 10% 05/12/2024 MXN 59,500,000 4,356,693 0.55Mexico Government International Bond
1.625% 06/03/2024 EUR 650,000 612,268 0.08
4,968,961 0.63
new ZealandNew Zealand Government Bond, Reg. S
5.5% 15/04/2023 NZD 5,500,000 3,836,193 0.48
3,836,193 0.48
PolandPoland Government Bond 5.75%
25/10/2021 PLN 79,550,000 22,031,684 2.78Poland Government International Bond,
Reg. S 3.75% 29/03/2017 EUR 3,000,000 3,183,936 0.40
25,215,620 3.18
PortugalParpublica - Participacoes Publicas SGPS
SA, Reg. S 3.75% 05/07/2021 EUR 900,000 928,467 0.12Portugal Obrigacoes do Tesouro OT,
Reg. S, 144A 4.8% 15/06/2020 EUR 1,000,000 1,146,961 0.14Portugal Obrigacoes do Tesouro OT,
Reg. S, 144A 2.875% 15/10/2025 EUR 7,065,000 6,968,202 0.88Portugal Obrigacoes do Tesouro OT,
Reg. S, 144A 3.875% 15/02/2030 EUR 655,000 690,599 0.09Portugal Obrigacoes do Tesouro OT,
Reg. S, 144A 4.1% 15/02/2045 EUR 2,300,000 2,392,173 0.30
12,126,402 1.53
RussiaRussian Foreign Bond, Reg. S 4.5%
04/04/2022 USD 2,000,000 1,751,826 0.22
1,751,826 0.22
SpainSpain Government Bond 4.5%
31/01/2018 EUR 3,500,000 3,849,447 0.49Spain Government Bond 2.75%
30/04/2019 EUR 10,000,000 10,692,795 1.35Spain Government Bond, Reg. S, 144A
5.85% 31/01/2022 EUR 1,000,000 1,256,271 0.16
The accompanying notes are an integral part of these financial statements.
Euro Strategic Bond Fund (continued)
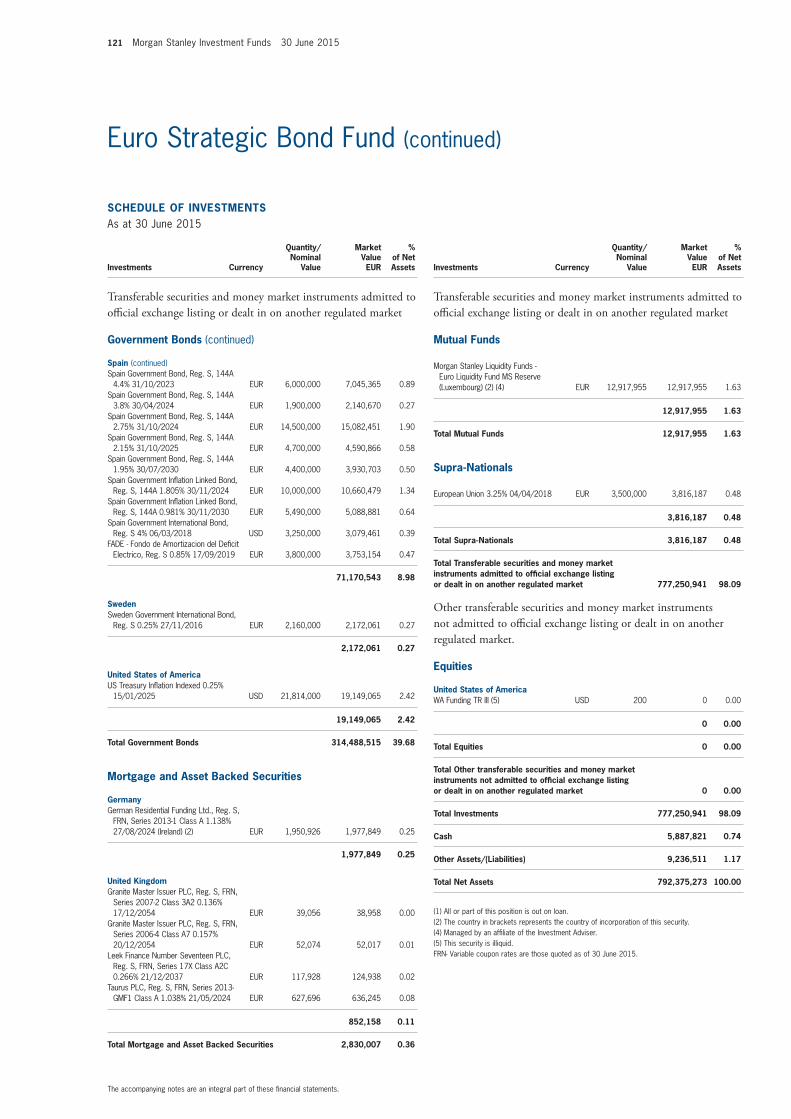
121 Morgan Stanley Investment Funds 30 June 2015
SCHEDULE of invEStmEntSAs at 30 June 2015
Investments Currency
Quantity/Nominal
Value
Market Value EUR
% of Net Assets
transferable securities and money market instruments admitted to official exchange listing or dealt in on another regulated market
Government Bonds (continued)
Spain (continued)Spain Government Bond, Reg. S, 144A
4.4% 31/10/2023 EUR 6,000,000 7,045,365 0.89Spain Government Bond, Reg. S, 144A
3.8% 30/04/2024 EUR 1,900,000 2,140,670 0.27Spain Government Bond, Reg. S, 144A
2.75% 31/10/2024 EUR 14,500,000 15,082,451 1.90Spain Government Bond, Reg. S, 144A
2.15% 31/10/2025 EUR 4,700,000 4,590,866 0.58Spain Government Bond, Reg. S, 144A
1.95% 30/07/2030 EUR 4,400,000 3,930,703 0.50Spain Government Inflation Linked Bond,
Reg. S, 144A 1.805% 30/11/2024 EUR 10,000,000 10,660,479 1.34Spain Government Inflation Linked Bond,
Reg. S, 144A 0.981% 30/11/2030 EUR 5,490,000 5,088,881 0.64Spain Government International Bond,
Reg. S 4% 06/03/2018 USD 3,250,000 3,079,461 0.39FADE - Fondo de Amortizacion del Deficit
Electrico, Reg. S 0.85% 17/09/2019 EUR 3,800,000 3,753,154 0.47
71,170,543 8.98
SwedenSweden Government International Bond,
Reg. S 0.25% 27/11/2016 EUR 2,160,000 2,172,061 0.27
2,172,061 0.27
United States of AmericaUS Treasury Inflation Indexed 0.25%
15/01/2025 USD 21,814,000 19,149,065 2.42
19,149,065 2.42
total Government Bonds 314,488,515 39.68
mortgage and Asset Backed Securities
GermanyGerman Residential Funding Ltd., Reg. S,
FRN, Series 2013-1 Class A 1.138% 27/08/2024 (Ireland) (2) EUR 1,950,926 1,977,849 0.25
1,977,849 0.25
United KingdomGranite Master Issuer PLC, Reg. S, FRN,
Series 2007-2 Class 3A2 0.136% 17/12/2054 EUR 39,056 38,958 0.00
Granite Master Issuer PLC, Reg. S, FRN, Series 2006-4 Class A7 0.157% 20/12/2054 EUR 52,074 52,017 0.01
Leek Finance Number Seventeen PLC, Reg. S, FRN, Series 17X Class A2C 0.266% 21/12/2037 EUR 117,928 124,938 0.02
Taurus PLC, Reg. S, FRN, Series 2013-GMF1 Class A 1.038% 21/05/2024 EUR 627,696 636,245 0.08
852,158 0.11
total mortgage and Asset Backed Securities 2,830,007 0.36
SCHEDULE of invEStmEntSAs at 30 June 2015
Investments Currency
Quantity/Nominal
Value
Market Value EUR
% of Net Assets
transferable securities and money market instruments admitted to official exchange listing or dealt in on another regulated market
mutual funds
Morgan Stanley Liquidity Funds - Euro Liquidity Fund MS Reserve (Luxembourg) (2) (4) EUR 12,917,955 12,917,955 1.63
12,917,955 1.63
total mutual funds 12,917,955 1.63
Supra-nationals
European Union 3.25% 04/04/2018 EUR 3,500,000 3,816,187 0.48
3,816,187 0.48
total Supra-nationals 3,816,187 0.48
total transferable securities and money market instruments admitted to official exchange listing or dealt in on another regulated market 777,250,941 98.09
Other transferable securities and money market instruments not admitted to official exchange listing or dealt in on another regulated market.
Equities
United States of AmericaWA Funding TR III (5) USD 200 0 0.00
0 0.00
total Equities 0 0.00
total other transferable securities and money market instruments not admitted to official exchange listing or dealt in on another regulated market 0 0.00
total investments 777,250,941 98.09
Cash 5,887,821 0.74
other Assets/(Liabilities) 9,236,511 1.17
total net Assets 792,375,273 100.00
(1) All or part of this position is out on loan.(2) The country in brackets represents the country of incorporation of this security.(4) Managed by an affiliate of the Investment Adviser.(5) This security is illiquid.FRN- Variable coupon rates are those quoted as of 30 June 2015.
The accompanying notes are an integral part of these financial statements.
Euro Strategic Bond Fund (continued)
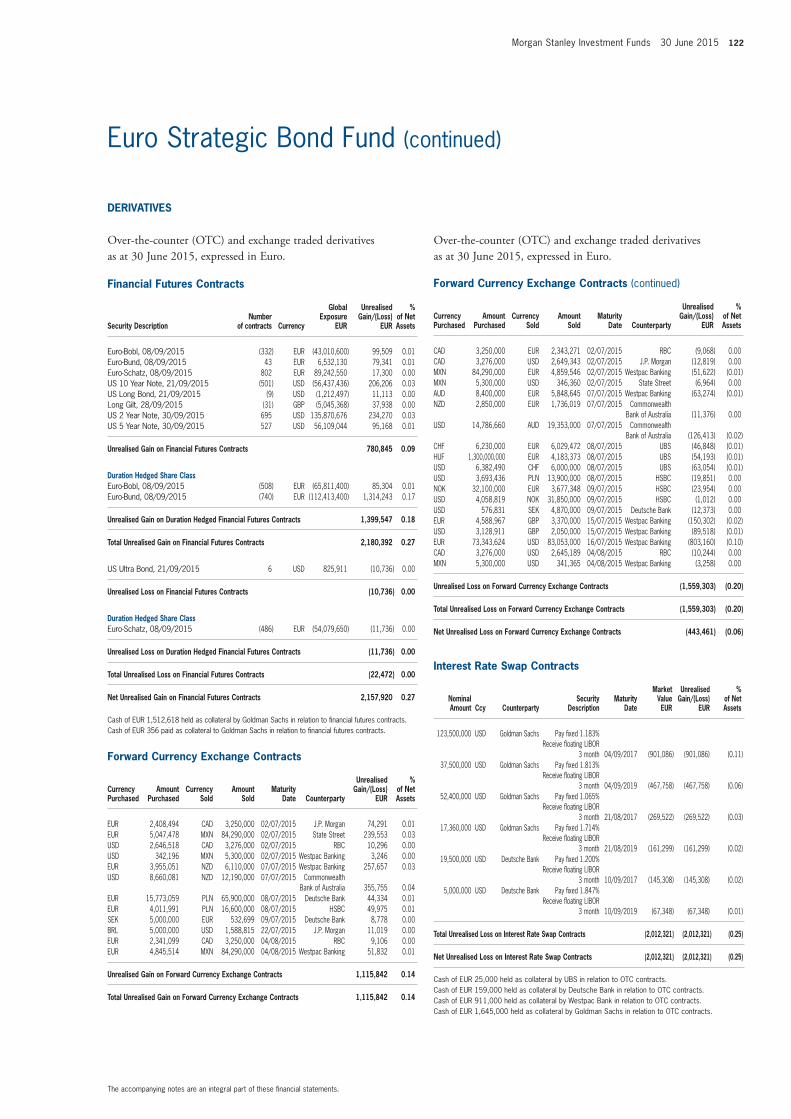
Morgan Stanley Investment Funds 30 June 2015 122
The accompanying notes are an integral part of these financial statements.
Euro Strategic Bond Fund (continued)
financial futures Contracts
Security Descriptionnumber
of contracts Currency
Global Exposure
EUR
Unrealised Gain/(Loss)
EUR
% of net Assets
Euro-Bobl, 08/09/2015 (332) EUR (43,010,600) 99,509 0.01Euro-Bund, 08/09/2015 43 EUR 6,532,130 79,341 0.01Euro-Schatz, 08/09/2015 802 EUR 89,242,550 17,300 0.00US 10 Year Note, 21/09/2015 (501) USD (56,437,436) 206,206 0.03US Long Bond, 21/09/2015 (9) USD (1,212,497) 11,113 0.00Long Gilt, 28/09/2015 (31) GBP (5,045,368) 37,938 0.00US 2 Year Note, 30/09/2015 695 USD 135,870,676 234,270 0.03US 5 Year Note, 30/09/2015 527 USD 56,109,044 95,168 0.01
Unrealised Gain on financial futures Contracts 780,845 0.09
Duration Hedged Share ClassEuro-Bobl, 08/09/2015 (508) EUR (65,811,400) 85,304 0.01Euro-Bund, 08/09/2015 (740) EUR (112,413,400) 1,314,243 0.17
Unrealised Gain on Duration Hedged financial futures Contracts 1,399,547 0.18
total Unrealised Gain on financial futures Contracts 2,180,392 0.27
US Ultra Bond, 21/09/2015 6 USD 825,911 (10,736) 0.00
Unrealised Loss on financial futures Contracts (10,736) 0.00
Duration Hedged Share ClassEuro-Schatz, 08/09/2015 (486) EUR (54,079,650) (11,736) 0.00
Unrealised Loss on Duration Hedged financial futures Contracts (11,736) 0.00
total Unrealised Loss on financial futures Contracts (22,472) 0.00
net Unrealised Gain on financial futures Contracts 2,157,920 0.27
Cash of EUR 1,512,618 held as collateral by Goldman Sachs in relation to financial futures contracts.Cash of EUR 356 paid as collateral to Goldman Sachs in relation to financial futures contracts.
forward Currency Exchange Contracts (continued)
Currency Purchased
Amount Purchased
Currency Sold
Amount Sold
maturity Date Counterparty
Unrealised Gain/(Loss)
EUR
% of net Assets
EUR 2,408,494 CAD 3,250,000 02/07/2015 J.P. Morgan 74,291 0.01EUR 5,047,478 MXN 84,290,000 02/07/2015 State Street 239,553 0.03USD 2,646,518 CAD 3,276,000 02/07/2015 RBC 10,296 0.00USD 342,196 MXN 5,300,000 02/07/2015 Westpac Banking 3,246 0.00EUR 3,955,051 NZD 6,110,000 07/07/2015 Westpac Banking 257,657 0.03USD 8,660,081 NZD 12,190,000 07/07/2015 Commonwealth
Bank of Australia 355,755 0.04EUR 15,773,059 PLN 65,900,000 08/07/2015 Deutsche Bank 44,334 0.01EUR 4,011,991 PLN 16,600,000 08/07/2015 HSBC 49,975 0.01SEK 5,000,000 EUR 532,699 09/07/2015 Deutsche Bank 8,778 0.00BRL 5,000,000 USD 1,588,815 22/07/2015 J.P. Morgan 11,019 0.00EUR 2,341,099 CAD 3,250,000 04/08/2015 RBC 9,106 0.00EUR 4,845,514 MXN 84,290,000 04/08/2015 Westpac Banking 51,832 0.01
Unrealised Gain on forward Currency Exchange Contracts 1,115,842 0.14
total Unrealised Gain on forward Currency Exchange Contracts 1,115,842 0.14
DERivAtivES
Over-the-counter (OtC) and exchange traded derivatives as at 30 June 2015, expressed in euro.
DERivAtivES (continued)
Over-the-counter (OtC) and exchange traded derivatives as at 30 June 2015, expressed in euro.
forward Currency Exchange Contracts (continued)
Currency Purchased
Amount Purchased
Currency Sold
Amount Sold
maturity Date Counterparty
Unrealised Gain/(Loss)
EUR
% of net Assets
CAD 3,250,000 EUR 2,343,271 02/07/2015 RBC (9,068) 0.00CAD 3,276,000 USD 2,649,343 02/07/2015 J.P. Morgan (12,819) 0.00MXN 84,290,000 EUR 4,859,546 02/07/2015 Westpac Banking (51,622) (0.01)MXN 5,300,000 USD 346,360 02/07/2015 State Street (6,964) 0.00AUD 8,400,000 EUR 5,848,645 07/07/2015 Westpac Banking (63,274) (0.01)NZD 2,850,000 EUR 1,736,019 07/07/2015 Commonwealth
Bank of Australia (11,376) 0.00USD 14,786,660 AUD 19,353,000 07/07/2015 Commonwealth
Bank of Australia (126,413) (0.02)CHF 6,230,000 EUR 6,029,472 08/07/2015 UBS (46,848) (0.01)HUF 1,300,000,000 EUR 4,183,373 08/07/2015 UBS (54,193) (0.01)USD 6,382,490 CHF 6,000,000 08/07/2015 UBS (63,054) (0.01)USD 3,693,436 PLN 13,900,000 08/07/2015 HSBC (19,851) 0.00NOK 32,100,000 EUR 3,677,348 09/07/2015 HSBC (23,954) 0.00USD 4,058,819 NOK 31,850,000 09/07/2015 HSBC (1,012) 0.00USD 576,831 SEK 4,870,000 09/07/2015 Deutsche Bank (12,373) 0.00EUR 4,588,967 GBP 3,370,000 15/07/2015 Westpac Banking (150,302) (0.02)USD 3,128,911 GBP 2,050,000 15/07/2015 Westpac Banking (89,518) (0.01)EUR 73,343,624 USD 83,053,000 16/07/2015 Westpac Banking (803,160) (0.10)CAD 3,276,000 USD 2,645,189 04/08/2015 RBC (10,244) 0.00MXN 5,300,000 USD 341,365 04/08/2015 Westpac Banking (3,258) 0.00
Unrealised Loss on forward Currency Exchange Contracts (1,559,303) (0.20)
total Unrealised Loss on forward Currency Exchange Contracts (1,559,303) (0.20)
net Unrealised Loss on forward Currency Exchange Contracts (443,461) (0.06)
interest Rate Swap Contracts
nominal Amount Ccy Counterparty
Security Description
maturity Date
market value EUR
Unrealised Gain/(Loss)
EUR
% of net Assets
123,500,000 USD Goldman Sachs Pay fixed 1.183% Receive floating LIBOR
3 month 04/09/2017 (901,086) (901,086) (0.11)37,500,000 USD Goldman Sachs Pay fixed 1.813%
Receive floating LIBOR 3 month 04/09/2019 (467,758) (467,758) (0.06)
52,400,000 USD Goldman Sachs Pay fixed 1.065% Receive floating LIBOR
3 month 21/08/2017 (269,522) (269,522) (0.03)17,360,000 USD Goldman Sachs Pay fixed 1.714%
Receive floating LIBOR 3 month 21/08/2019 (161,299) (161,299) (0.02)
19,500,000 USD Deutsche Bank Pay fixed 1.200% Receive floating LIBOR
3 month 10/09/2017 (145,308) (145,308) (0.02)5,000,000 USD Deutsche Bank Pay fixed 1.847%
Receive floating LIBOR 3 month 10/09/2019 (67,348) (67,348) (0.01)
total Unrealised Loss on interest Rate Swap Contracts (2,012,321) (2,012,321) (0.25)
net Unrealised Loss on interest Rate Swap Contracts (2,012,321) (2,012,321) (0.25)
Cash of EUR 25,000 held as collateral by UBS in relation to OTC contracts.Cash of EUR 159,000 held as collateral by Deutsche Bank in relation to OTC contracts.Cash of EUR 911,000 held as collateral by Westpac Bank in relation to OTC contracts.Cash of EUR 1,645,000 held as collateral by Goldman Sachs in relation to OTC contracts.
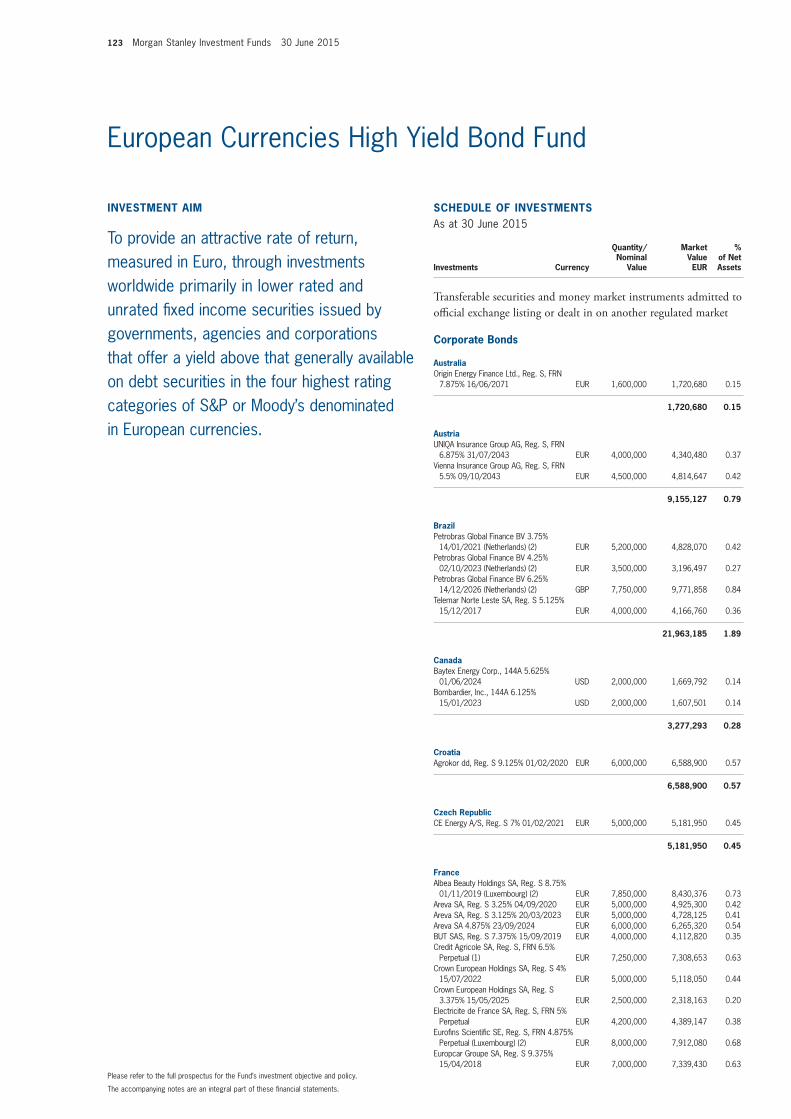
123 Morgan Stanley Investment Funds 30 June 2015
invEStmEnt Aim
To provide an attractive rate of return, measured in Euro, through investments worldwide primarily in lower rated and unrated fixed income securities issued by governments, agencies and corporations that offer a yield above that generally available on debt securities in the four highest rating categories of S&P or Moody’s denominated in European currencies.
SCHEDULE of invEStmEntSAs at 30 June 2015
Investments Currency
Quantity/Nominal
Value
Market Value EUR
% of Net Assets
transferable securities and money market instruments admitted to official exchange listing or dealt in on another regulated market
Corporate Bonds
AustraliaOrigin Energy Finance Ltd., Reg. S, FRN
7.875% 16/06/2071 EUR 1,600,000 1,720,680 0.15
1,720,680 0.15
AustriaUNIQA Insurance Group AG, Reg. S, FRN
6.875% 31/07/2043 EUR 4,000,000 4,340,480 0.37Vienna Insurance Group AG, Reg. S, FRN
5.5% 09/10/2043 EUR 4,500,000 4,814,647 0.42
9,155,127 0.79
BrazilPetrobras Global Finance BV 3.75%
14/01/2021 (Netherlands) (2) EUR 5,200,000 4,828,070 0.42Petrobras Global Finance BV 4.25%
02/10/2023 (Netherlands) (2) EUR 3,500,000 3,196,497 0.27Petrobras Global Finance BV 6.25%
14/12/2026 (Netherlands) (2) GBP 7,750,000 9,771,858 0.84Telemar Norte Leste SA, Reg. S 5.125%
15/12/2017 EUR 4,000,000 4,166,760 0.36
21,963,185 1.89
CanadaBaytex Energy Corp., 144A 5.625%
01/06/2024 USD 2,000,000 1,669,792 0.14Bombardier, Inc., 144A 6.125%
15/01/2023 USD 2,000,000 1,607,501 0.14
3,277,293 0.28
CroatiaAgrokor dd, Reg. S 9.125% 01/02/2020 EUR 6,000,000 6,588,900 0.57
6,588,900 0.57
Czech RepublicCE Energy A/S, Reg. S 7% 01/02/2021 EUR 5,000,000 5,181,950 0.45
5,181,950 0.45
franceAlbea Beauty Holdings SA, Reg. S 8.75%
01/11/2019 (Luxembourg) (2) EUR 7,850,000 8,430,376 0.73Areva SA, Reg. S 3.25% 04/09/2020 EUR 5,000,000 4,925,300 0.42Areva SA, Reg. S 3.125% 20/03/2023 EUR 5,000,000 4,728,125 0.41Areva SA 4.875% 23/09/2024 EUR 6,000,000 6,265,320 0.54BUT SAS, Reg. S 7.375% 15/09/2019 EUR 4,000,000 4,112,820 0.35Credit Agricole SA, Reg. S, FRN 6.5%
Perpetual (1) EUR 7,250,000 7,308,653 0.63Crown European Holdings SA, Reg. S 4%
15/07/2022 EUR 5,000,000 5,118,050 0.44Crown European Holdings SA, Reg. S
3.375% 15/05/2025 EUR 2,500,000 2,318,163 0.20Electricite de France SA, Reg. S, FRN 5%
Perpetual EUR 4,200,000 4,389,147 0.38Eurofins Scientific SE, Reg. S, FRN 4.875%
Perpetual (Luxembourg) (2) EUR 8,000,000 7,912,080 0.68Europcar Groupe SA, Reg. S 9.375%
15/04/2018 EUR 7,000,000 7,339,430 0.63
The accompanying notes are an integral part of these financial statements.
Please refer to the full prospectus for the Fund’s investment objective and policy.
European Currencies High Yield Bond Fund
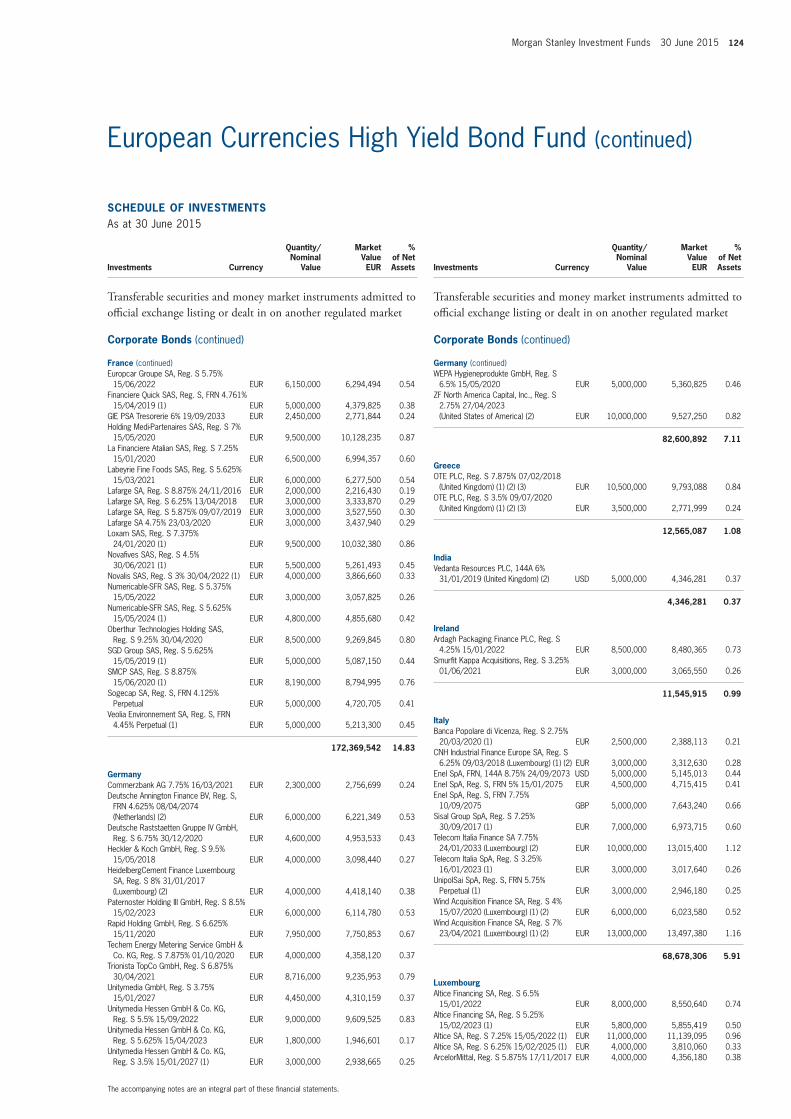
Morgan Stanley Investment Funds 30 June 2015 124
SCHEDULE of invEStmEntSAs at 30 June 2015
Investments Currency
Quantity/Nominal
Value
Market Value EUR
% of Net Assets
transferable securities and money market instruments admitted to official exchange listing or dealt in on another regulated market
Corporate Bonds (continued)
france (continued)Europcar Groupe SA, Reg. S 5.75%
15/06/2022 EUR 6,150,000 6,294,494 0.54Financiere Quick SAS, Reg. S, FRN 4.761%
15/04/2019 (1) EUR 5,000,000 4,379,825 0.38GIE PSA Tresorerie 6% 19/09/2033 EUR 2,450,000 2,771,844 0.24Holding Medi-Partenaires SAS, Reg. S 7%
15/05/2020 EUR 9,500,000 10,128,235 0.87La Financiere Atalian SAS, Reg. S 7.25%
15/01/2020 EUR 6,500,000 6,994,357 0.60Labeyrie Fine Foods SAS, Reg. S 5.625%
15/03/2021 EUR 6,000,000 6,277,500 0.54Lafarge SA, Reg. S 8.875% 24/11/2016 EUR 2,000,000 2,216,430 0.19Lafarge SA, Reg. S 6.25% 13/04/2018 EUR 3,000,000 3,333,870 0.29Lafarge SA, Reg. S 5.875% 09/07/2019 EUR 3,000,000 3,527,550 0.30Lafarge SA 4.75% 23/03/2020 EUR 3,000,000 3,437,940 0.29Loxam SAS, Reg. S 7.375%
24/01/2020 (1) EUR 9,500,000 10,032,380 0.86Novafives SAS, Reg. S 4.5%
30/06/2021 (1) EUR 5,500,000 5,261,493 0.45Novalis SAS, Reg. S 3% 30/04/2022 (1) EUR 4,000,000 3,866,660 0.33Numericable-SFR SAS, Reg. S 5.375%
15/05/2022 EUR 3,000,000 3,057,825 0.26Numericable-SFR SAS, Reg. S 5.625%
15/05/2024 (1) EUR 4,800,000 4,855,680 0.42Oberthur Technologies Holding SAS,
Reg. S 9.25% 30/04/2020 EUR 8,500,000 9,269,845 0.80SGD Group SAS, Reg. S 5.625%
15/05/2019 (1) EUR 5,000,000 5,087,150 0.44SMCP SAS, Reg. S 8.875%
15/06/2020 (1) EUR 8,190,000 8,794,995 0.76Sogecap SA, Reg. S, FRN 4.125%
Perpetual EUR 5,000,000 4,720,705 0.41Veolia Environnement SA, Reg. S, FRN
4.45% Perpetual (1) EUR 5,000,000 5,213,300 0.45
172,369,542 14.83
GermanyCommerzbank AG 7.75% 16/03/2021 EUR 2,300,000 2,756,699 0.24Deutsche Annington Finance BV, Reg. S,
FRN 4.625% 08/04/2074 (Netherlands) (2) EUR 6,000,000 6,221,349 0.53
Deutsche Raststaetten Gruppe IV GmbH, Reg. S 6.75% 30/12/2020 EUR 4,600,000 4,953,533 0.43
Heckler & Koch GmbH, Reg. S 9.5% 15/05/2018 EUR 4,000,000 3,098,440 0.27
HeidelbergCement Finance Luxembourg SA, Reg. S 8% 31/01/2017 (Luxembourg) (2) EUR 4,000,000 4,418,140 0.38
Paternoster Holding III GmbH, Reg. S 8.5% 15/02/2023 EUR 6,000,000 6,114,780 0.53
Rapid Holding GmbH, Reg. S 6.625% 15/11/2020 EUR 7,950,000 7,750,853 0.67
Techem Energy Metering Service GmbH & Co. KG, Reg. S 7.875% 01/10/2020 EUR 4,000,000 4,358,120 0.37
Trionista TopCo GmbH, Reg. S 6.875% 30/04/2021 EUR 8,716,000 9,235,953 0.79
Unitymedia GmbH, Reg. S 3.75% 15/01/2027 EUR 4,450,000 4,310,159 0.37
Unitymedia Hessen GmbH & Co. KG, Reg. S 5.5% 15/09/2022 EUR 9,000,000 9,609,525 0.83
Unitymedia Hessen GmbH & Co. KG, Reg. S 5.625% 15/04/2023 EUR 1,800,000 1,946,601 0.17
Unitymedia Hessen GmbH & Co. KG, Reg. S 3.5% 15/01/2027 (1) EUR 3,000,000 2,938,665 0.25
SCHEDULE of invEStmEntSAs at 30 June 2015
Investments Currency
Quantity/Nominal
Value
Market Value EUR
% of Net Assets
transferable securities and money market instruments admitted to official exchange listing or dealt in on another regulated market
Corporate Bonds (continued)
Germany (continued)WEPA Hygieneprodukte GmbH, Reg. S
6.5% 15/05/2020 EUR 5,000,000 5,360,825 0.46ZF North America Capital, Inc., Reg. S
2.75% 27/04/2023 (United States of America) (2) EUR 10,000,000 9,527,250 0.82
82,600,892 7.11
GreeceOTE PLC, Reg. S 7.875% 07/02/2018
(United Kingdom) (1) (2) (3) EUR 10,500,000 9,793,088 0.84OTE PLC, Reg. S 3.5% 09/07/2020
(United Kingdom) (1) (2) (3) EUR 3,500,000 2,771,999 0.24
12,565,087 1.08
indiaVedanta Resources PLC, 144A 6%
31/01/2019 (United Kingdom) (2) USD 5,000,000 4,346,281 0.37
4,346,281 0.37
irelandArdagh Packaging Finance PLC, Reg. S
4.25% 15/01/2022 EUR 8,500,000 8,480,365 0.73Smurfit Kappa Acquisitions, Reg. S 3.25%
01/06/2021 EUR 3,000,000 3,065,550 0.26
11,545,915 0.99
italyBanca Popolare di Vicenza, Reg. S 2.75%
20/03/2020 (1) EUR 2,500,000 2,388,113 0.21CNH Industrial Finance Europe SA, Reg. S
6.25% 09/03/2018 (Luxembourg) (1) (2) EUR 3,000,000 3,312,630 0.28Enel SpA, FRN, 144A 8.75% 24/09/2073 USD 5,000,000 5,145,013 0.44Enel SpA, Reg. S, FRN 5% 15/01/2075 EUR 4,500,000 4,715,415 0.41Enel SpA, Reg. S, FRN 7.75%
10/09/2075 GBP 5,000,000 7,643,240 0.66Sisal Group SpA, Reg. S 7.25%
30/09/2017 (1) EUR 7,000,000 6,973,715 0.60Telecom Italia Finance SA 7.75%
24/01/2033 (Luxembourg) (2) EUR 10,000,000 13,015,400 1.12Telecom Italia SpA, Reg. S 3.25%
16/01/2023 (1) EUR 3,000,000 3,017,640 0.26UnipolSai SpA, Reg. S, FRN 5.75%
Perpetual (1) EUR 3,000,000 2,946,180 0.25Wind Acquisition Finance SA, Reg. S 4%
15/07/2020 (Luxembourg) (1) (2) EUR 6,000,000 6,023,580 0.52Wind Acquisition Finance SA, Reg. S 7%
23/04/2021 (Luxembourg) (1) (2) EUR 13,000,000 13,497,380 1.16
68,678,306 5.91
LuxembourgAltice Financing SA, Reg. S 6.5%
15/01/2022 EUR 8,000,000 8,550,640 0.74Altice Financing SA, Reg. S 5.25%
15/02/2023 (1) EUR 5,800,000 5,855,419 0.50Altice SA, Reg. S 7.25% 15/05/2022 (1) EUR 11,000,000 11,139,095 0.96Altice SA, Reg. S 6.25% 15/02/2025 (1) EUR 4,000,000 3,810,060 0.33ArcelorMittal, Reg. S 5.875% 17/11/2017 EUR 4,000,000 4,356,180 0.38
The accompanying notes are an integral part of these financial statements.
European Currencies High Yield Bond Fund (continued)
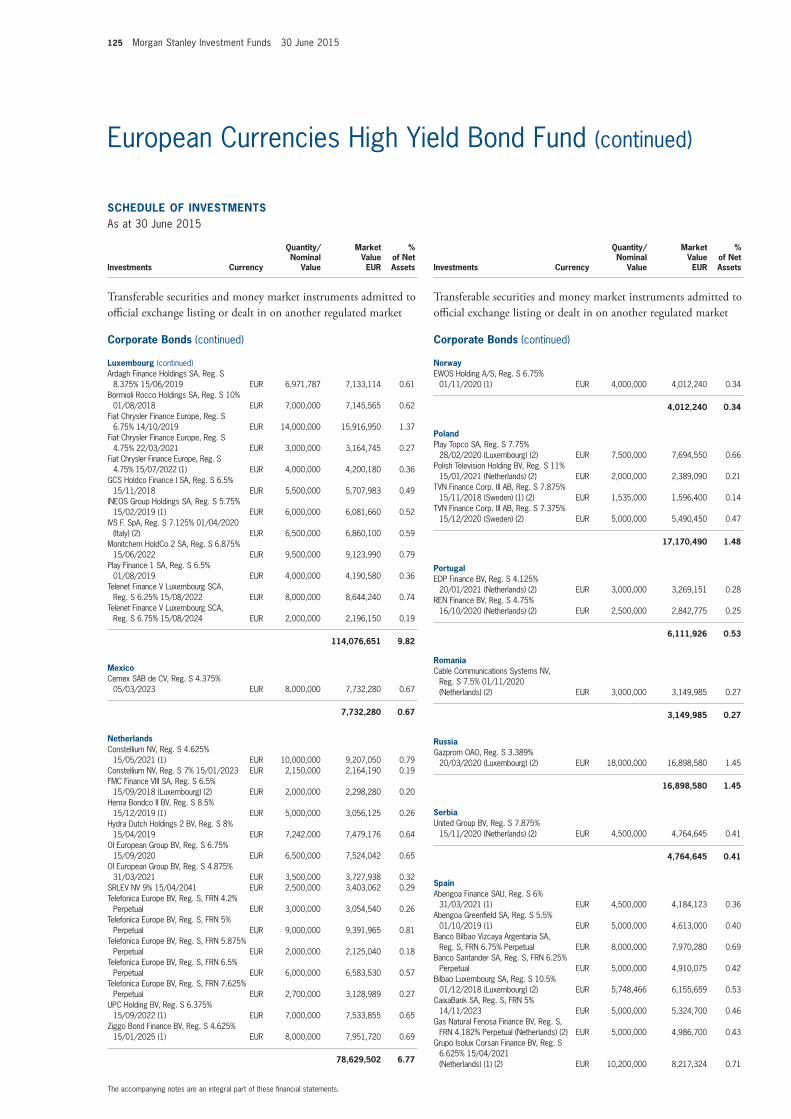
125 Morgan Stanley Investment Funds 30 June 2015
SCHEDULE of invEStmEntSAs at 30 June 2015
Investments Currency
Quantity/Nominal
Value
Market Value EUR
% of Net Assets
transferable securities and money market instruments admitted to official exchange listing or dealt in on another regulated market
Corporate Bonds (continued)
Luxembourg (continued)Ardagh Finance Holdings SA, Reg. S
8.375% 15/06/2019 EUR 6,971,787 7,133,114 0.61Bormioli Rocco Holdings SA, Reg. S 10%
01/08/2018 EUR 7,000,000 7,145,565 0.62Fiat Chrysler Finance Europe, Reg. S
6.75% 14/10/2019 EUR 14,000,000 15,916,950 1.37Fiat Chrysler Finance Europe, Reg. S
4.75% 22/03/2021 EUR 3,000,000 3,164,745 0.27Fiat Chrysler Finance Europe, Reg. S
4.75% 15/07/2022 (1) EUR 4,000,000 4,200,180 0.36GCS Holdco Finance I SA, Reg. S 6.5%
15/11/2018 EUR 5,500,000 5,707,983 0.49INEOS Group Holdings SA, Reg. S 5.75%
15/02/2019 (1) EUR 6,000,000 6,081,660 0.52IVS F. SpA, Reg. S 7.125% 01/04/2020
(Italy) (2) EUR 6,500,000 6,860,100 0.59Monitchem HoldCo 2 SA, Reg. S 6.875%
15/06/2022 EUR 9,500,000 9,123,990 0.79Play Finance 1 SA, Reg. S 6.5%
01/08/2019 EUR 4,000,000 4,190,580 0.36Telenet Finance V Luxembourg SCA,
Reg. S 6.25% 15/08/2022 EUR 8,000,000 8,644,240 0.74Telenet Finance V Luxembourg SCA,
Reg. S 6.75% 15/08/2024 EUR 2,000,000 2,196,150 0.19
114,076,651 9.82
mexicoCemex SAB de CV, Reg. S 4.375%
05/03/2023 EUR 8,000,000 7,732,280 0.67
7,732,280 0.67
netherlandsConstellium NV, Reg. S 4.625%
15/05/2021 (1) EUR 10,000,000 9,207,050 0.79Constellium NV, Reg. S 7% 15/01/2023 EUR 2,150,000 2,164,190 0.19FMC Finance VIII SA, Reg. S 6.5%
15/09/2018 (Luxembourg) (2) EUR 2,000,000 2,298,280 0.20Hema Bondco II BV, Reg. S 8.5%
15/12/2019 (1) EUR 5,000,000 3,056,125 0.26Hydra Dutch Holdings 2 BV, Reg. S 8%
15/04/2019 EUR 7,242,000 7,479,176 0.64OI European Group BV, Reg. S 6.75%
15/09/2020 EUR 6,500,000 7,524,042 0.65OI European Group BV, Reg. S 4.875%
31/03/2021 EUR 3,500,000 3,727,938 0.32SRLEV NV 9% 15/04/2041 EUR 2,500,000 3,403,062 0.29Telefonica Europe BV, Reg. S, FRN 4.2%
Perpetual EUR 3,000,000 3,054,540 0.26Telefonica Europe BV, Reg. S, FRN 5%
Perpetual EUR 9,000,000 9,391,965 0.81Telefonica Europe BV, Reg. S, FRN 5.875%
Perpetual EUR 2,000,000 2,125,040 0.18Telefonica Europe BV, Reg. S, FRN 6.5%
Perpetual EUR 6,000,000 6,583,530 0.57Telefonica Europe BV, Reg. S, FRN 7.625%
Perpetual EUR 2,700,000 3,128,989 0.27UPC Holding BV, Reg. S 6.375%
15/09/2022 (1) EUR 7,000,000 7,533,855 0.65Ziggo Bond Finance BV, Reg. S 4.625%
15/01/2025 (1) EUR 8,000,000 7,951,720 0.69
78,629,502 6.77
SCHEDULE of invEStmEntSAs at 30 June 2015
Investments Currency
Quantity/Nominal
Value
Market Value EUR
% of Net Assets
transferable securities and money market instruments admitted to official exchange listing or dealt in on another regulated market
Corporate Bonds (continued)
norwayEWOS Holding A/S, Reg. S 6.75%
01/11/2020 (1) EUR 4,000,000 4,012,240 0.34
4,012,240 0.34
PolandPlay Topco SA, Reg. S 7.75%
28/02/2020 (Luxembourg) (2) EUR 7,500,000 7,694,550 0.66Polish Television Holding BV, Reg. S 11%
15/01/2021 (Netherlands) (2) EUR 2,000,000 2,389,090 0.21TVN Finance Corp. III AB, Reg. S 7.875%
15/11/2018 (Sweden) (1) (2) EUR 1,535,000 1,596,400 0.14TVN Finance Corp. III AB, Reg. S 7.375%
15/12/2020 (Sweden) (2) EUR 5,000,000 5,490,450 0.47
17,170,490 1.48
PortugalEDP Finance BV, Reg. S 4.125%
20/01/2021 (Netherlands) (2) EUR 3,000,000 3,269,151 0.28REN Finance BV, Reg. S 4.75%
16/10/2020 (Netherlands) (2) EUR 2,500,000 2,842,775 0.25
6,111,926 0.53
RomaniaCable Communications Systems NV,
Reg. S 7.5% 01/11/2020 (Netherlands) (2) EUR 3,000,000 3,149,985 0.27
3,149,985 0.27
RussiaGazprom OAO, Reg. S 3.389%
20/03/2020 (Luxembourg) (2) EUR 18,000,000 16,898,580 1.45
16,898,580 1.45
SerbiaUnited Group BV, Reg. S 7.875%
15/11/2020 (Netherlands) (2) EUR 4,500,000 4,764,645 0.41
4,764,645 0.41
SpainAbengoa Finance SAU, Reg. S 6%
31/03/2021 (1) EUR 4,500,000 4,184,123 0.36Abengoa Greenfield SA, Reg. S 5.5%
01/10/2019 (1) EUR 5,000,000 4,613,000 0.40Banco Bilbao Vizcaya Argentaria SA,
Reg. S, FRN 6.75% Perpetual EUR 8,000,000 7,970,280 0.69Banco Santander SA, Reg. S, FRN 6.25%
Perpetual EUR 5,000,000 4,910,075 0.42Bilbao Luxembourg SA, Reg. S 10.5%
01/12/2018 (Luxembourg) (2) EUR 5,748,466 6,155,659 0.53CaixaBank SA, Reg. S, FRN 5%
14/11/2023 EUR 5,000,000 5,324,700 0.46Gas Natural Fenosa Finance BV, Reg. S,
FRN 4.182% Perpetual (Netherlands) (2) EUR 5,000,000 4,986,700 0.43Grupo Isolux Corsan Finance BV, Reg. S
6.625% 15/04/2021 (Netherlands) (1) (2) EUR 10,200,000 8,217,324 0.71
The accompanying notes are an integral part of these financial statements.
European Currencies High Yield Bond Fund (continued)
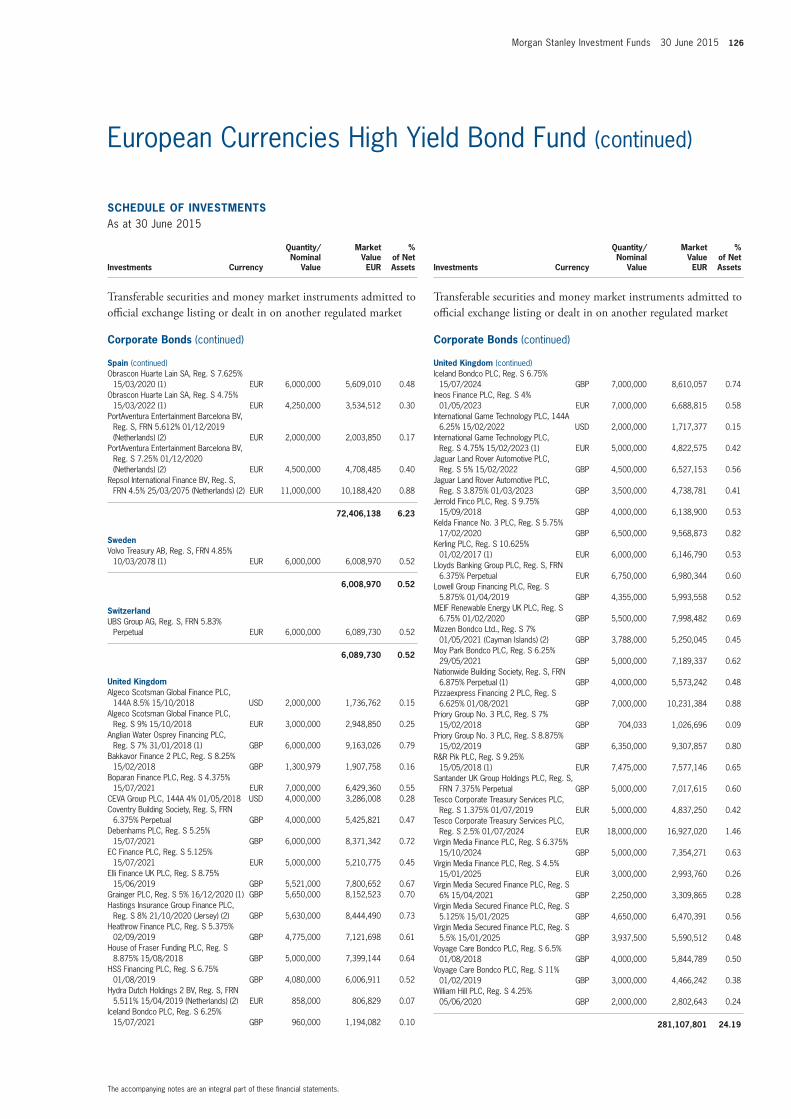
Morgan Stanley Investment Funds 30 June 2015 126
SCHEDULE of invEStmEntSAs at 30 June 2015
Investments Currency
Quantity/Nominal
Value
Market Value EUR
% of Net Assets
transferable securities and money market instruments admitted to official exchange listing or dealt in on another regulated market
Corporate Bonds (continued)
Spain (continued)Obrascon Huarte Lain SA, Reg. S 7.625%
15/03/2020 (1) EUR 6,000,000 5,609,010 0.48Obrascon Huarte Lain SA, Reg. S 4.75%
15/03/2022 (1) EUR 4,250,000 3,534,512 0.30PortAventura Entertainment Barcelona BV,
Reg. S, FRN 5.612% 01/12/2019 (Netherlands) (2) EUR 2,000,000 2,003,850 0.17
PortAventura Entertainment Barcelona BV, Reg. S 7.25% 01/12/2020 (Netherlands) (2) EUR 4,500,000 4,708,485 0.40
Repsol International Finance BV, Reg. S, FRN 4.5% 25/03/2075 (Netherlands) (2) EUR 11,000,000 10,188,420 0.88
72,406,138 6.23
SwedenVolvo Treasury AB, Reg. S, FRN 4.85%
10/03/2078 (1) EUR 6,000,000 6,008,970 0.52
6,008,970 0.52
SwitzerlandUBS Group AG, Reg. S, FRN 5.83%
Perpetual EUR 6,000,000 6,089,730 0.52
6,089,730 0.52
United KingdomAlgeco Scotsman Global Finance PLC,
144A 8.5% 15/10/2018 USD 2,000,000 1,736,762 0.15Algeco Scotsman Global Finance PLC,
Reg. S 9% 15/10/2018 EUR 3,000,000 2,948,850 0.25Anglian Water Osprey Financing PLC,
Reg. S 7% 31/01/2018 (1) GBP 6,000,000 9,163,026 0.79Bakkavor Finance 2 PLC, Reg. S 8.25%
15/02/2018 GBP 1,300,979 1,907,758 0.16Boparan Finance PLC, Reg. S 4.375%
15/07/2021 EUR 7,000,000 6,429,360 0.55CEVA Group PLC, 144A 4% 01/05/2018 USD 4,000,000 3,286,008 0.28Coventry Building Society, Reg. S, FRN
6.375% Perpetual GBP 4,000,000 5,425,821 0.47Debenhams PLC, Reg. S 5.25%
15/07/2021 GBP 6,000,000 8,371,342 0.72EC Finance PLC, Reg. S 5.125%
15/07/2021 EUR 5,000,000 5,210,775 0.45Elli Finance UK PLC, Reg. S 8.75%
15/06/2019 GBP 5,521,000 7,800,652 0.67Grainger PLC, Reg. S 5% 16/12/2020 (1) GBP 5,650,000 8,152,523 0.70Hastings Insurance Group Finance PLC,
Reg. S 8% 21/10/2020 (Jersey) (2) GBP 5,630,000 8,444,490 0.73Heathrow Finance PLC, Reg. S 5.375%
02/09/2019 GBP 4,775,000 7,121,698 0.61House of Fraser Funding PLC, Reg. S
8.875% 15/08/2018 GBP 5,000,000 7,399,144 0.64HSS Financing PLC, Reg. S 6.75%
01/08/2019 GBP 4,080,000 6,006,911 0.52Hydra Dutch Holdings 2 BV, Reg. S, FRN
5.511% 15/04/2019 (Netherlands) (2) EUR 858,000 806,829 0.07Iceland Bondco PLC, Reg. S 6.25%
15/07/2021 GBP 960,000 1,194,082 0.10
SCHEDULE of invEStmEntSAs at 30 June 2015
Investments Currency
Quantity/Nominal
Value
Market Value EUR
% of Net Assets
transferable securities and money market instruments admitted to official exchange listing or dealt in on another regulated market
Corporate Bonds (continued)
United Kingdom (continued)Iceland Bondco PLC, Reg. S 6.75%
15/07/2024 GBP 7,000,000 8,610,057 0.74Ineos Finance PLC, Reg. S 4%
01/05/2023 EUR 7,000,000 6,688,815 0.58International Game Technology PLC, 144A
6.25% 15/02/2022 USD 2,000,000 1,717,377 0.15International Game Technology PLC,
Reg. S 4.75% 15/02/2023 (1) EUR 5,000,000 4,822,575 0.42Jaguar Land Rover Automotive PLC,
Reg. S 5% 15/02/2022 GBP 4,500,000 6,527,153 0.56Jaguar Land Rover Automotive PLC,
Reg. S 3.875% 01/03/2023 GBP 3,500,000 4,738,781 0.41Jerrold Finco PLC, Reg. S 9.75%
15/09/2018 GBP 4,000,000 6,138,900 0.53Kelda Finance No. 3 PLC, Reg. S 5.75%
17/02/2020 GBP 6,500,000 9,568,873 0.82Kerling PLC, Reg. S 10.625%
01/02/2017 (1) EUR 6,000,000 6,146,790 0.53Lloyds Banking Group PLC, Reg. S, FRN
6.375% Perpetual EUR 6,750,000 6,980,344 0.60Lowell Group Financing PLC, Reg. S
5.875% 01/04/2019 GBP 4,355,000 5,993,558 0.52MEIF Renewable Energy UK PLC, Reg. S
6.75% 01/02/2020 GBP 5,500,000 7,998,482 0.69Mizzen Bondco Ltd., Reg. S 7%
01/05/2021 (Cayman Islands) (2) GBP 3,788,000 5,250,045 0.45Moy Park Bondco PLC, Reg. S 6.25%
29/05/2021 GBP 5,000,000 7,189,337 0.62Nationwide Building Society, Reg. S, FRN
6.875% Perpetual (1) GBP 4,000,000 5,573,242 0.48Pizzaexpress Financing 2 PLC, Reg. S
6.625% 01/08/2021 GBP 7,000,000 10,231,384 0.88Priory Group No. 3 PLC, Reg. S 7%
15/02/2018 GBP 704,033 1,026,696 0.09Priory Group No. 3 PLC, Reg. S 8.875%
15/02/2019 GBP 6,350,000 9,307,857 0.80R&R Pik PLC, Reg. S 9.25%
15/05/2018 (1) EUR 7,475,000 7,577,146 0.65Santander UK Group Holdings PLC, Reg. S,
FRN 7.375% Perpetual GBP 5,000,000 7,017,615 0.60Tesco Corporate Treasury Services PLC,
Reg. S 1.375% 01/07/2019 EUR 5,000,000 4,837,250 0.42Tesco Corporate Treasury Services PLC,
Reg. S 2.5% 01/07/2024 EUR 18,000,000 16,927,020 1.46Virgin Media Finance PLC, Reg. S 6.375%
15/10/2024 GBP 5,000,000 7,354,271 0.63Virgin Media Finance PLC, Reg. S 4.5%
15/01/2025 EUR 3,000,000 2,993,760 0.26Virgin Media Secured Finance PLC, Reg. S
6% 15/04/2021 GBP 2,250,000 3,309,865 0.28Virgin Media Secured Finance PLC, Reg. S
5.125% 15/01/2025 GBP 4,650,000 6,470,391 0.56Virgin Media Secured Finance PLC, Reg. S
5.5% 15/01/2025 GBP 3,937,500 5,590,512 0.48Voyage Care Bondco PLC, Reg. S 6.5%
01/08/2018 GBP 4,000,000 5,844,789 0.50Voyage Care Bondco PLC, Reg. S 11%
01/02/2019 GBP 3,000,000 4,466,242 0.38William Hill PLC, Reg. S 4.25%
05/06/2020 GBP 2,000,000 2,802,643 0.24
281,107,801 24.19
The accompanying notes are an integral part of these financial statements.
European Currencies High Yield Bond Fund (continued)
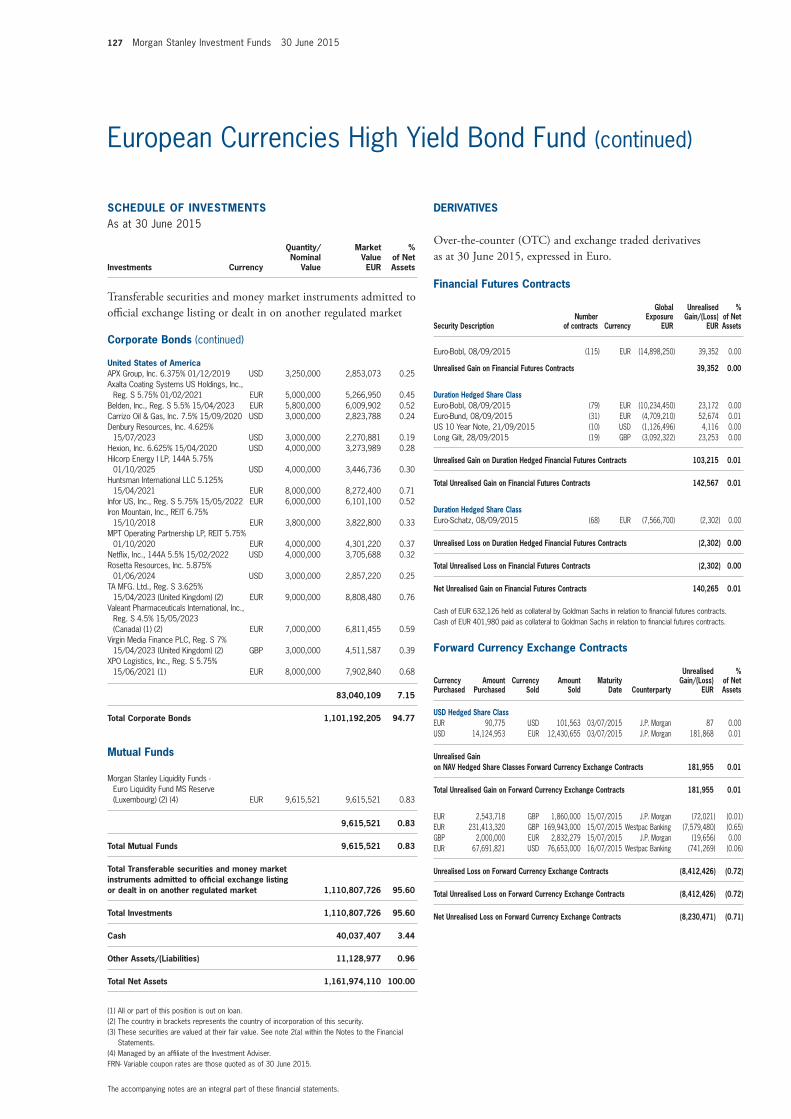
127 Morgan Stanley Investment Funds 30 June 2015
SCHEDULE of invEStmEntSAs at 30 June 2015
Investments Currency
Quantity/Nominal
Value
Market Value EUR
% of Net Assets
transferable securities and money market instruments admitted to official exchange listing or dealt in on another regulated market
Corporate Bonds (continued)
United States of AmericaAPX Group, Inc. 6.375% 01/12/2019 USD 3,250,000 2,853,073 0.25Axalta Coating Systems US Holdings, Inc.,
Reg. S 5.75% 01/02/2021 EUR 5,000,000 5,266,950 0.45Belden, Inc., Reg. S 5.5% 15/04/2023 EUR 5,800,000 6,009,902 0.52Carrizo Oil & Gas, Inc. 7.5% 15/09/2020 USD 3,000,000 2,823,788 0.24Denbury Resources, Inc. 4.625%
15/07/2023 USD 3,000,000 2,270,881 0.19Hexion, Inc. 6.625% 15/04/2020 USD 4,000,000 3,273,989 0.28Hilcorp Energy I LP, 144A 5.75%
01/10/2025 USD 4,000,000 3,446,736 0.30Huntsman International LLC 5.125%
15/04/2021 EUR 8,000,000 8,272,400 0.71Infor US, Inc., Reg. S 5.75% 15/05/2022 EUR 6,000,000 6,101,100 0.52Iron Mountain, Inc., REIT 6.75%
15/10/2018 EUR 3,800,000 3,822,800 0.33MPT Operating Partnership LP, REIT 5.75%
01/10/2020 EUR 4,000,000 4,301,220 0.37Netflix, Inc., 144A 5.5% 15/02/2022 USD 4,000,000 3,705,688 0.32Rosetta Resources, Inc. 5.875%
01/06/2024 USD 3,000,000 2,857,220 0.25TA MFG. Ltd., Reg. S 3.625%
15/04/2023 (United Kingdom) (2) EUR 9,000,000 8,808,480 0.76Valeant Pharmaceuticals International, Inc.,
Reg. S 4.5% 15/05/2023 (Canada) (1) (2) EUR 7,000,000 6,811,455 0.59
Virgin Media Finance PLC, Reg. S 7% 15/04/2023 (United Kingdom) (2) GBP 3,000,000 4,511,587 0.39
XPO Logistics, Inc., Reg. S 5.75% 15/06/2021 (1) EUR 8,000,000 7,902,840 0.68
83,040,109 7.15
total Corporate Bonds 1,101,192,205 94.77
mutual funds
Morgan Stanley Liquidity Funds - Euro Liquidity Fund MS Reserve (Luxembourg) (2) (4) EUR 9,615,521 9,615,521 0.83
9,615,521 0.83
total mutual funds 9,615,521 0.83
total transferable securities and money market instruments admitted to official exchange listing or dealt in on another regulated market 1,110,807,726 95.60
total investments 1,110,807,726 95.60
Cash 40,037,407 3.44
other Assets/(Liabilities) 11,128,977 0.96
total net Assets 1,161,974,110 100.00
(1) All or part of this position is out on loan.(2) The country in brackets represents the country of incorporation of this security.(3) These securities are valued at their fair value. See note 2(a) within the Notes to the Financial
Statements.(4) Managed by an affiliate of the Investment Adviser.FRN- Variable coupon rates are those quoted as of 30 June 2015.
The accompanying notes are an integral part of these financial statements.
European Currencies High Yield Bond Fund (continued)
financial futures Contracts
Security Descriptionnumber
of contracts Currency
Global Exposure
EUR
Unrealised Gain/(Loss)
EUR
% of net Assets
Euro-Bobl, 08/09/2015 (115) EUR (14,898,250) 39,352 0.00
Unrealised Gain on financial futures Contracts 39,352 0.00
Duration Hedged Share ClassEuro-Bobl, 08/09/2015 (79) EUR (10,234,450) 23,172 0.00Euro-Bund, 08/09/2015 (31) EUR (4,709,210) 52,674 0.01US 10 Year Note, 21/09/2015 (10) USD (1,126,496) 4,116 0.00Long Gilt, 28/09/2015 (19) GBP (3,092,322) 23,253 0.00
Unrealised Gain on Duration Hedged financial futures Contracts 103,215 0.01
total Unrealised Gain on financial futures Contracts 142,567 0.01
Duration Hedged Share ClassEuro-Schatz, 08/09/2015 (68) EUR (7,566,700) (2,302) 0.00
Unrealised Loss on Duration Hedged financial futures Contracts (2,302) 0.00
total Unrealised Loss on financial futures Contracts (2,302) 0.00
net Unrealised Gain on financial futures Contracts 140,265 0.01
Cash of EUR 632,126 held as collateral by Goldman Sachs in relation to financial futures contracts.Cash of EUR 401,980 paid as collateral to Goldman Sachs in relation to financial futures contracts.
forward Currency Exchange Contracts
Currency Purchased
Amount Purchased
Currency Sold
Amount Sold
maturity Date Counterparty
Unrealised Gain/(Loss)
EUR
% of net Assets
USD Hedged Share ClassEUR 90,775 USD 101,563 03/07/2015 J.P. Morgan 87 0.00USD 14,124,953 EUR 12,430,655 03/07/2015 J.P. Morgan 181,868 0.01
Unrealised Gain on nAv Hedged Share Classes forward Currency Exchange Contracts 181,955 0.01
total Unrealised Gain on forward Currency Exchange Contracts 181,955 0.01
EUR 2,543,718 GBP 1,860,000 15/07/2015 J.P. Morgan (72,021) (0.01)EUR 231,413,320 GBP 169,943,000 15/07/2015 Westpac Banking (7,579,480) (0.65)GBP 2,000,000 EUR 2,832,279 15/07/2015 J.P. Morgan (19,656) 0.00EUR 67,691,821 USD 76,653,000 16/07/2015 Westpac Banking (741,269) (0.06)
Unrealised Loss on forward Currency Exchange Contracts (8,412,426) (0.72)
total Unrealised Loss on forward Currency Exchange Contracts (8,412,426) (0.72)
net Unrealised Loss on forward Currency Exchange Contracts (8,230,471) (0.71)
DERivAtivES
Over-the-counter (OtC) and exchange traded derivatives as at 30 June 2015, expressed in euro.
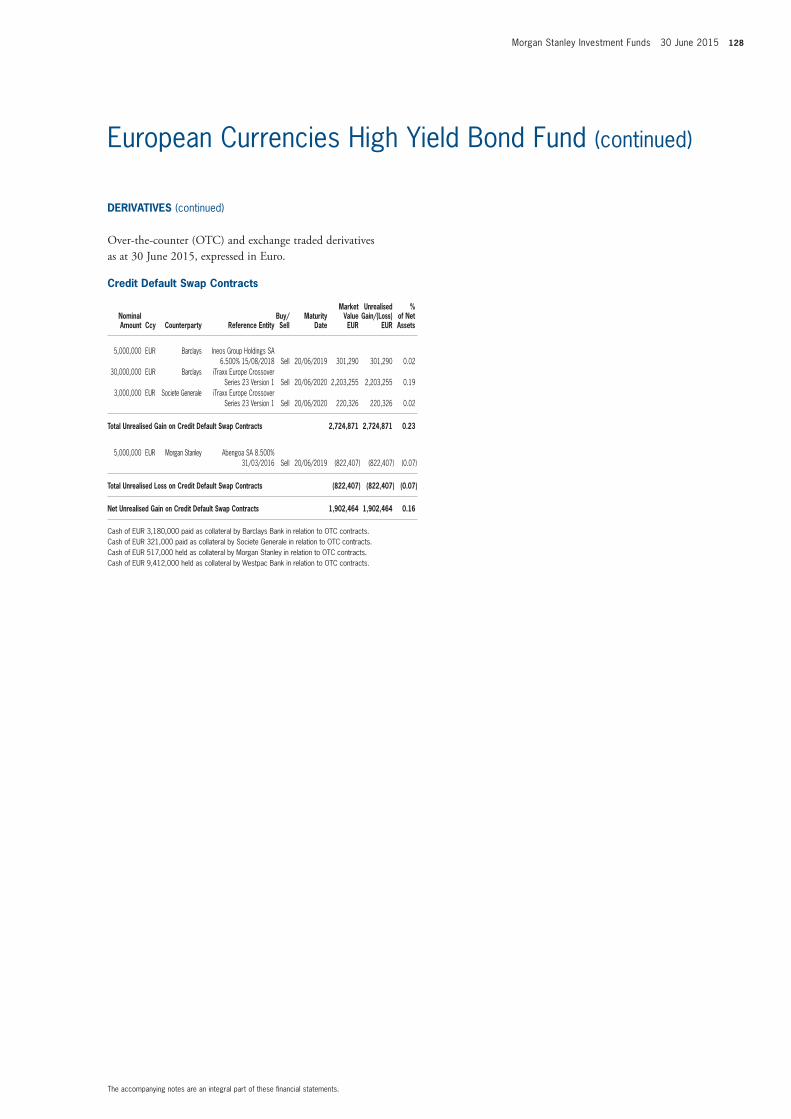
Morgan Stanley Investment Funds 30 June 2015 128
The accompanying notes are an integral part of these financial statements.
European Currencies High Yield Bond Fund (continued)
Credit Default Swap Contracts
nominal Amount Ccy Counterparty Reference Entity
Buy/Sell
maturity Date
market value EUR
Unrealised Gain/(Loss)
EUR
% of net Assets
5,000,000 EUR Barclays Ineos Group Holdings SA 6.500% 15/08/2018 Sell 20/06/2019 301,290 301,290 0.02
30,000,000 EUR Barclays iTraxx Europe Crossover Series 23 Version 1 Sell 20/06/2020 2,203,255 2,203,255 0.19
3,000,000 EUR Societe Generale iTraxx Europe Crossover Series 23 Version 1 Sell 20/06/2020 220,326 220,326 0.02
total Unrealised Gain on Credit Default Swap Contracts 2,724,871 2,724,871 0.23
5,000,000 EUR Morgan Stanley Abengoa SA 8.500% 31/03/2016 Sell 20/06/2019 (822,407) (822,407) (0.07)
total Unrealised Loss on Credit Default Swap Contracts (822,407) (822,407) (0.07)
net Unrealised Gain on Credit Default Swap Contracts 1,902,464 1,902,464 0.16
Cash of EUR 3,180,000 paid as collateral by Barclays Bank in relation to OTC contracts.Cash of EUR 321,000 paid as collateral by Societe Generale in relation to OTC contracts.Cash of EUR 517,000 held as collateral by Morgan Stanley in relation to OTC contracts.Cash of EUR 9,412,000 held as collateral by Westpac Bank in relation to OTC contracts.
DERivAtivES (continued)
Over-the-counter (OtC) and exchange traded derivatives as at 30 June 2015, expressed in euro.
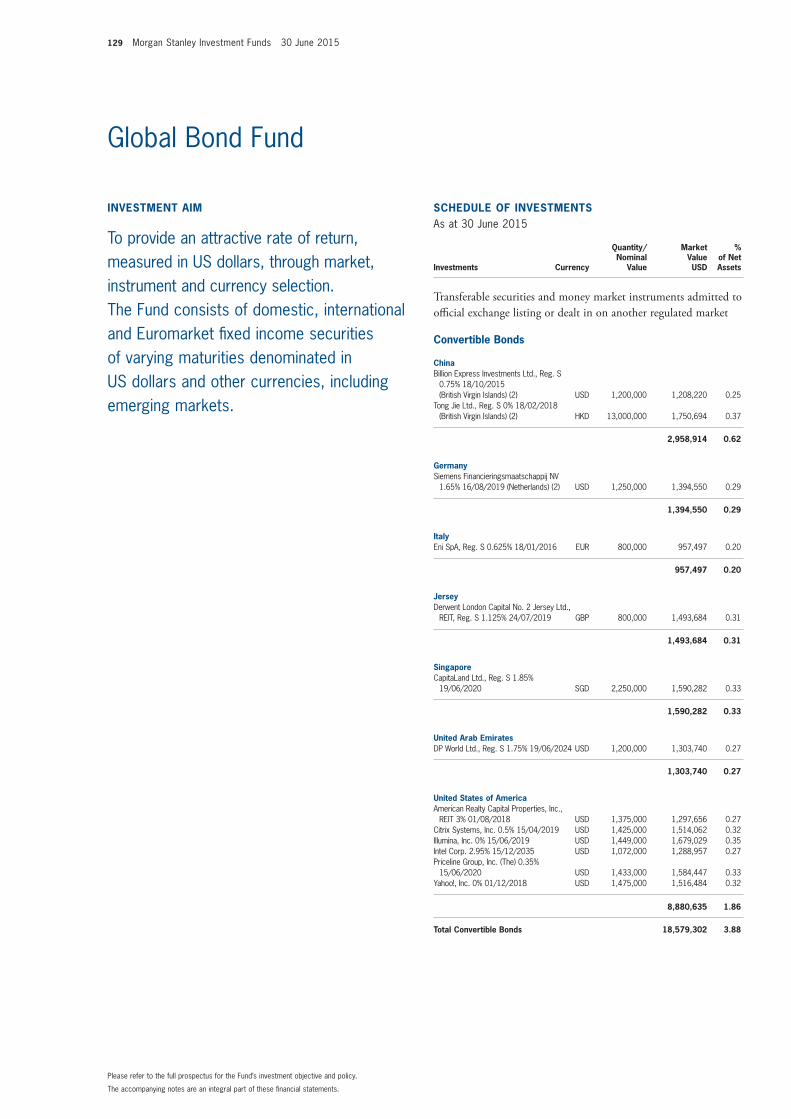
129 Morgan Stanley Investment Funds 30 June 2015
invEStmEnt Aim
To provide an attractive rate of return, measured in US dollars, through market, instrument and currency selection. The Fund consists of domestic, international and Euromarket fixed income securities of varying maturities denominated in US dollars and other currencies, including emerging markets.
SCHEDULE of invEStmEntSAs at 30 June 2015
Investments Currency
Quantity/Nominal
Value
Market Value USD
% of Net Assets
transferable securities and money market instruments admitted to official exchange listing or dealt in on another regulated market
Convertible Bonds
ChinaBillion Express Investments Ltd., Reg. S
0.75% 18/10/2015 (British Virgin Islands) (2) USD 1,200,000 1,208,220 0.25
Tong Jie Ltd., Reg. S 0% 18/02/2018 (British Virgin Islands) (2) HKD 13,000,000 1,750,694 0.37
2,958,914 0.62
GermanySiemens Financieringsmaatschappij NV
1.65% 16/08/2019 (Netherlands) (2) USD 1,250,000 1,394,550 0.29
1,394,550 0.29
italyEni SpA, Reg. S 0.625% 18/01/2016 EUR 800,000 957,497 0.20
957,497 0.20
JerseyDerwent London Capital No. 2 Jersey Ltd.,
REIT, Reg. S 1.125% 24/07/2019 GBP 800,000 1,493,684 0.31
1,493,684 0.31
SingaporeCapitaLand Ltd., Reg. S 1.85%
19/06/2020 SGD 2,250,000 1,590,282 0.33
1,590,282 0.33
United Arab EmiratesDP World Ltd., Reg. S 1.75% 19/06/2024 USD 1,200,000 1,303,740 0.27
1,303,740 0.27
United States of AmericaAmerican Realty Capital Properties, Inc.,
REIT 3% 01/08/2018 USD 1,375,000 1,297,656 0.27Citrix Systems, Inc. 0.5% 15/04/2019 USD 1,425,000 1,514,062 0.32Illumina, Inc. 0% 15/06/2019 USD 1,449,000 1,679,029 0.35Intel Corp. 2.95% 15/12/2035 USD 1,072,000 1,288,957 0.27Priceline Group, Inc. (The) 0.35%
15/06/2020 USD 1,433,000 1,584,447 0.33Yahoo!, Inc. 0% 01/12/2018 USD 1,475,000 1,516,484 0.32
8,880,635 1.86
total Convertible Bonds 18,579,302 3.88
The accompanying notes are an integral part of these financial statements.
Please refer to the full prospectus for the Fund’s investment objective and policy.
Global Bond Fund
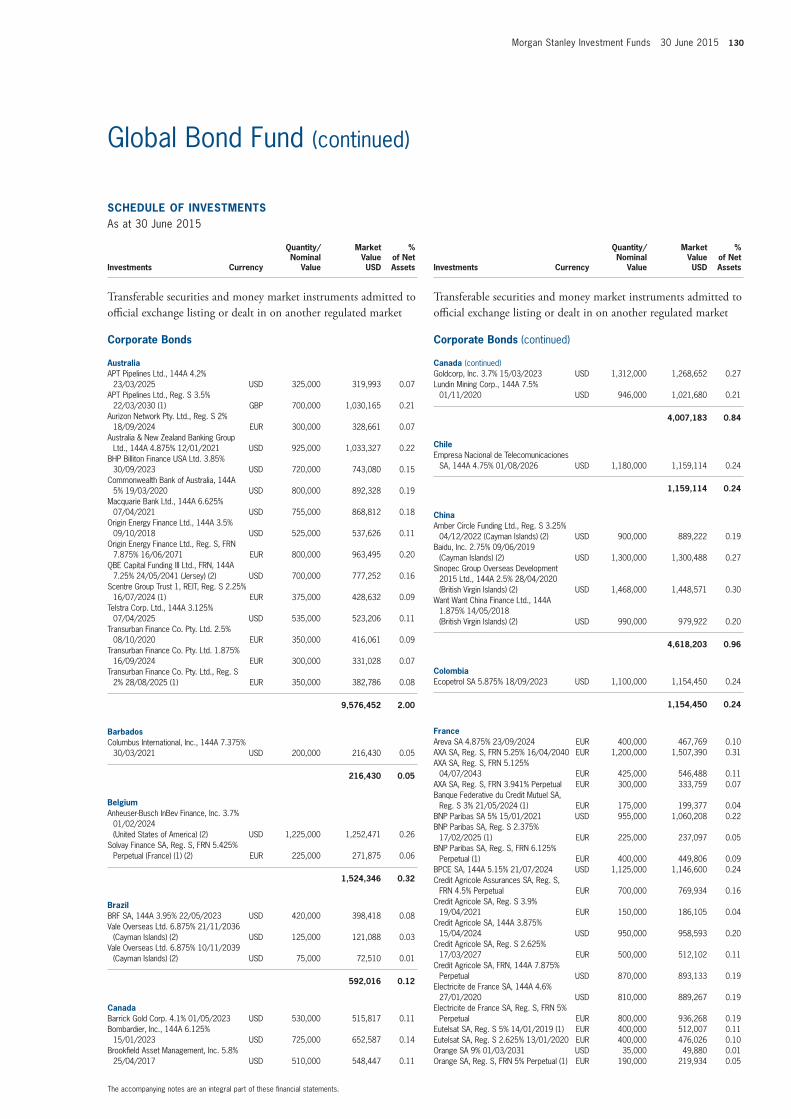
Morgan Stanley Investment Funds 30 June 2015 130
SCHEDULE of invEStmEntSAs at 30 June 2015
Investments Currency
Quantity/Nominal
Value
Market Value USD
% of Net Assets
transferable securities and money market instruments admitted to official exchange listing or dealt in on another regulated market
Corporate Bonds
AustraliaAPT Pipelines Ltd., 144A 4.2%
23/03/2025 USD 325,000 319,993 0.07APT Pipelines Ltd., Reg. S 3.5%
22/03/2030 (1) GBP 700,000 1,030,165 0.21Aurizon Network Pty. Ltd., Reg. S 2%
18/09/2024 EUR 300,000 328,661 0.07Australia & New Zealand Banking Group
Ltd., 144A 4.875% 12/01/2021 USD 925,000 1,033,327 0.22BHP Billiton Finance USA Ltd. 3.85%
30/09/2023 USD 720,000 743,080 0.15Commonwealth Bank of Australia, 144A
5% 19/03/2020 USD 800,000 892,328 0.19Macquarie Bank Ltd., 144A 6.625%
07/04/2021 USD 755,000 868,812 0.18Origin Energy Finance Ltd., 144A 3.5%
09/10/2018 USD 525,000 537,626 0.11Origin Energy Finance Ltd., Reg. S, FRN
7.875% 16/06/2071 EUR 800,000 963,495 0.20QBE Capital Funding III Ltd., FRN, 144A
7.25% 24/05/2041 (Jersey) (2) USD 700,000 777,252 0.16Scentre Group Trust 1, REIT, Reg. S 2.25%
16/07/2024 (1) EUR 375,000 428,632 0.09Telstra Corp. Ltd., 144A 3.125%
07/04/2025 USD 535,000 523,206 0.11Transurban Finance Co. Pty. Ltd. 2.5%
08/10/2020 EUR 350,000 416,061 0.09Transurban Finance Co. Pty. Ltd. 1.875%
16/09/2024 EUR 300,000 331,028 0.07Transurban Finance Co. Pty. Ltd., Reg. S
2% 28/08/2025 (1) EUR 350,000 382,786 0.08
9,576,452 2.00
BarbadosColumbus International, Inc., 144A 7.375%
30/03/2021 USD 200,000 216,430 0.05
216,430 0.05
BelgiumAnheuser-Busch InBev Finance, Inc. 3.7%
01/02/2024 (United States of America) (2) USD 1,225,000 1,252,471 0.26
Solvay Finance SA, Reg. S, FRN 5.425% Perpetual (France) (1) (2) EUR 225,000 271,875 0.06
1,524,346 0.32
BrazilBRF SA, 144A 3.95% 22/05/2023 USD 420,000 398,418 0.08Vale Overseas Ltd. 6.875% 21/11/2036
(Cayman Islands) (2) USD 125,000 121,088 0.03Vale Overseas Ltd. 6.875% 10/11/2039
(Cayman Islands) (2) USD 75,000 72,510 0.01
592,016 0.12
CanadaBarrick Gold Corp. 4.1% 01/05/2023 USD 530,000 515,817 0.11Bombardier, Inc., 144A 6.125%
15/01/2023 USD 725,000 652,587 0.14Brookfield Asset Management, Inc. 5.8%
25/04/2017 USD 510,000 548,447 0.11
SCHEDULE of invEStmEntSAs at 30 June 2015
Investments Currency
Quantity/Nominal
Value
Market Value USD
% of Net Assets
transferable securities and money market instruments admitted to official exchange listing or dealt in on another regulated market
Corporate Bonds (continued)
Canada (continued)Goldcorp, Inc. 3.7% 15/03/2023 USD 1,312,000 1,268,652 0.27Lundin Mining Corp., 144A 7.5%
01/11/2020 USD 946,000 1,021,680 0.21
4,007,183 0.84
ChileEmpresa Nacional de Telecomunicaciones
SA, 144A 4.75% 01/08/2026 USD 1,180,000 1,159,114 0.24
1,159,114 0.24
ChinaAmber Circle Funding Ltd., Reg. S 3.25%
04/12/2022 (Cayman Islands) (2) USD 900,000 889,222 0.19Baidu, Inc. 2.75% 09/06/2019
(Cayman Islands) (2) USD 1,300,000 1,300,488 0.27Sinopec Group Overseas Development
2015 Ltd., 144A 2.5% 28/04/2020 (British Virgin Islands) (2) USD 1,468,000 1,448,571 0.30
Want Want China Finance Ltd., 144A 1.875% 14/05/2018 (British Virgin Islands) (2) USD 990,000 979,922 0.20
4,618,203 0.96
ColombiaEcopetrol SA 5.875% 18/09/2023 USD 1,100,000 1,154,450 0.24
1,154,450 0.24
franceAreva SA 4.875% 23/09/2024 EUR 400,000 467,769 0.10AXA SA, Reg. S, FRN 5.25% 16/04/2040 EUR 1,200,000 1,507,390 0.31AXA SA, Reg. S, FRN 5.125%
04/07/2043 EUR 425,000 546,488 0.11AXA SA, Reg. S, FRN 3.941% Perpetual EUR 300,000 333,759 0.07Banque Federative du Credit Mutuel SA,
Reg. S 3% 21/05/2024 (1) EUR 175,000 199,377 0.04BNP Paribas SA 5% 15/01/2021 USD 955,000 1,060,208 0.22BNP Paribas SA, Reg. S 2.375%
17/02/2025 (1) EUR 225,000 237,097 0.05BNP Paribas SA, Reg. S, FRN 6.125%
Perpetual (1) EUR 400,000 449,806 0.09BPCE SA, 144A 5.15% 21/07/2024 USD 1,125,000 1,146,600 0.24Credit Agricole Assurances SA, Reg. S,
FRN 4.5% Perpetual EUR 700,000 769,934 0.16Credit Agricole SA, Reg. S 3.9%
19/04/2021 EUR 150,000 186,105 0.04Credit Agricole SA, 144A 3.875%
15/04/2024 USD 950,000 958,593 0.20Credit Agricole SA, Reg. S 2.625%
17/03/2027 EUR 500,000 512,102 0.11Credit Agricole SA, FRN, 144A 7.875%
Perpetual USD 870,000 893,133 0.19Electricite de France SA, 144A 4.6%
27/01/2020 USD 810,000 889,267 0.19Electricite de France SA, Reg. S, FRN 5%
Perpetual EUR 800,000 936,268 0.19Eutelsat SA, Reg. S 5% 14/01/2019 (1) EUR 400,000 512,007 0.11Eutelsat SA, Reg. S 2.625% 13/01/2020 EUR 400,000 476,026 0.10Orange SA 9% 01/03/2031 USD 35,000 49,880 0.01Orange SA, Reg. S, FRN 5% Perpetual (1) EUR 190,000 219,934 0.05
The accompanying notes are an integral part of these financial statements.
Global Bond Fund (continued)
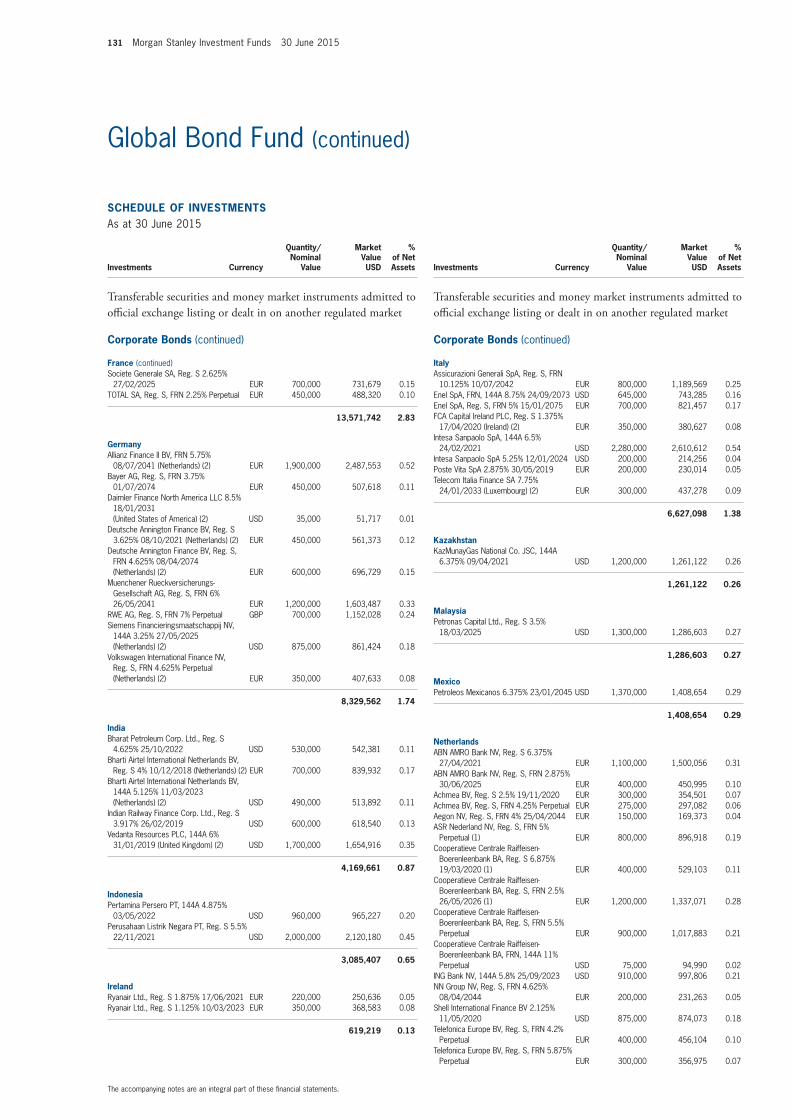
131 Morgan Stanley Investment Funds 30 June 2015
SCHEDULE of invEStmEntSAs at 30 June 2015
Investments Currency
Quantity/Nominal
Value
Market Value USD
% of Net Assets
transferable securities and money market instruments admitted to official exchange listing or dealt in on another regulated market
Corporate Bonds (continued)
france (continued)Societe Generale SA, Reg. S 2.625%
27/02/2025 EUR 700,000 731,679 0.15TOTAL SA, Reg. S, FRN 2.25% Perpetual EUR 450,000 488,320 0.10
13,571,742 2.83
GermanyAllianz Finance II BV, FRN 5.75%
08/07/2041 (Netherlands) (2) EUR 1,900,000 2,487,553 0.52Bayer AG, Reg. S, FRN 3.75%
01/07/2074 EUR 450,000 507,618 0.11Daimler Finance North America LLC 8.5%
18/01/2031 (United States of America) (2) USD 35,000 51,717 0.01
Deutsche Annington Finance BV, Reg. S 3.625% 08/10/2021 (Netherlands) (2) EUR 450,000 561,373 0.12
Deutsche Annington Finance BV, Reg. S, FRN 4.625% 08/04/2074 (Netherlands) (2) EUR 600,000 696,729 0.15
Muenchener Rueckversicherungs-Gesellschaft AG, Reg. S, FRN 6% 26/05/2041 EUR 1,200,000 1,603,487 0.33
RWE AG, Reg. S, FRN 7% Perpetual GBP 700,000 1,152,028 0.24Siemens Financieringsmaatschappij NV,
144A 3.25% 27/05/2025 (Netherlands) (2) USD 875,000 861,424 0.18
Volkswagen International Finance NV, Reg. S, FRN 4.625% Perpetual (Netherlands) (2) EUR 350,000 407,633 0.08
8,329,562 1.74
indiaBharat Petroleum Corp. Ltd., Reg. S
4.625% 25/10/2022 USD 530,000 542,381 0.11Bharti Airtel International Netherlands BV,
Reg. S 4% 10/12/2018 (Netherlands) (2) EUR 700,000 839,932 0.17Bharti Airtel International Netherlands BV,
144A 5.125% 11/03/2023 (Netherlands) (2) USD 490,000 513,892 0.11
Indian Railway Finance Corp. Ltd., Reg. S 3.917% 26/02/2019 USD 600,000 618,540 0.13
Vedanta Resources PLC, 144A 6% 31/01/2019 (United Kingdom) (2) USD 1,700,000 1,654,916 0.35
4,169,661 0.87
indonesiaPertamina Persero PT, 144A 4.875%
03/05/2022 USD 960,000 965,227 0.20Perusahaan Listrik Negara PT, Reg. S 5.5%
22/11/2021 USD 2,000,000 2,120,180 0.45
3,085,407 0.65
irelandRyanair Ltd., Reg. S 1.875% 17/06/2021 EUR 220,000 250,636 0.05Ryanair Ltd., Reg. S 1.125% 10/03/2023 EUR 350,000 368,583 0.08
619,219 0.13
SCHEDULE of invEStmEntSAs at 30 June 2015
Investments Currency
Quantity/Nominal
Value
Market Value USD
% of Net Assets
transferable securities and money market instruments admitted to official exchange listing or dealt in on another regulated market
Corporate Bonds (continued)
italyAssicurazioni Generali SpA, Reg. S, FRN
10.125% 10/07/2042 EUR 800,000 1,189,569 0.25Enel SpA, FRN, 144A 8.75% 24/09/2073 USD 645,000 743,285 0.16Enel SpA, Reg. S, FRN 5% 15/01/2075 EUR 700,000 821,457 0.17FCA Capital Ireland PLC, Reg. S 1.375%
17/04/2020 (Ireland) (2) EUR 350,000 380,627 0.08Intesa Sanpaolo SpA, 144A 6.5%
24/02/2021 USD 2,280,000 2,610,612 0.54Intesa Sanpaolo SpA 5.25% 12/01/2024 USD 200,000 214,256 0.04Poste Vita SpA 2.875% 30/05/2019 EUR 200,000 230,014 0.05Telecom Italia Finance SA 7.75%
24/01/2033 (Luxembourg) (2) EUR 300,000 437,278 0.09
6,627,098 1.38
KazakhstanKazMunayGas National Co. JSC, 144A
6.375% 09/04/2021 USD 1,200,000 1,261,122 0.26
1,261,122 0.26
malaysiaPetronas Capital Ltd., Reg. S 3.5%
18/03/2025 USD 1,300,000 1,286,603 0.27
1,286,603 0.27
mexicoPetroleos Mexicanos 6.375% 23/01/2045 USD 1,370,000 1,408,654 0.29
1,408,654 0.29
netherlandsABN AMRO Bank NV, Reg. S 6.375%
27/04/2021 EUR 1,100,000 1,500,056 0.31ABN AMRO Bank NV, Reg. S, FRN 2.875%
30/06/2025 EUR 400,000 450,995 0.10Achmea BV, Reg. S 2.5% 19/11/2020 EUR 300,000 354,501 0.07Achmea BV, Reg. S, FRN 4.25% Perpetual EUR 275,000 297,082 0.06Aegon NV, Reg. S, FRN 4% 25/04/2044 EUR 150,000 169,373 0.04ASR Nederland NV, Reg. S, FRN 5%
Perpetual (1) EUR 800,000 896,918 0.19Cooperatieve Centrale Raiffeisen-
Boerenleenbank BA, Reg. S 6.875% 19/03/2020 (1) EUR 400,000 529,103 0.11
Cooperatieve Centrale Raiffeisen-Boerenleenbank BA, Reg. S, FRN 2.5% 26/05/2026 (1) EUR 1,200,000 1,337,071 0.28
Cooperatieve Centrale Raiffeisen-Boerenleenbank BA, Reg. S, FRN 5.5% Perpetual EUR 900,000 1,017,883 0.21
Cooperatieve Centrale Raiffeisen-Boerenleenbank BA, FRN, 144A 11% Perpetual USD 75,000 94,990 0.02
ING Bank NV, 144A 5.8% 25/09/2023 USD 910,000 997,806 0.21NN Group NV, Reg. S, FRN 4.625%
08/04/2044 EUR 200,000 231,263 0.05Shell International Finance BV 2.125%
11/05/2020 USD 875,000 874,073 0.18Telefonica Europe BV, Reg. S, FRN 4.2%
Perpetual EUR 400,000 456,104 0.10Telefonica Europe BV, Reg. S, FRN 5.875%
Perpetual EUR 300,000 356,975 0.07
The accompanying notes are an integral part of these financial statements.
Global Bond Fund (continued)
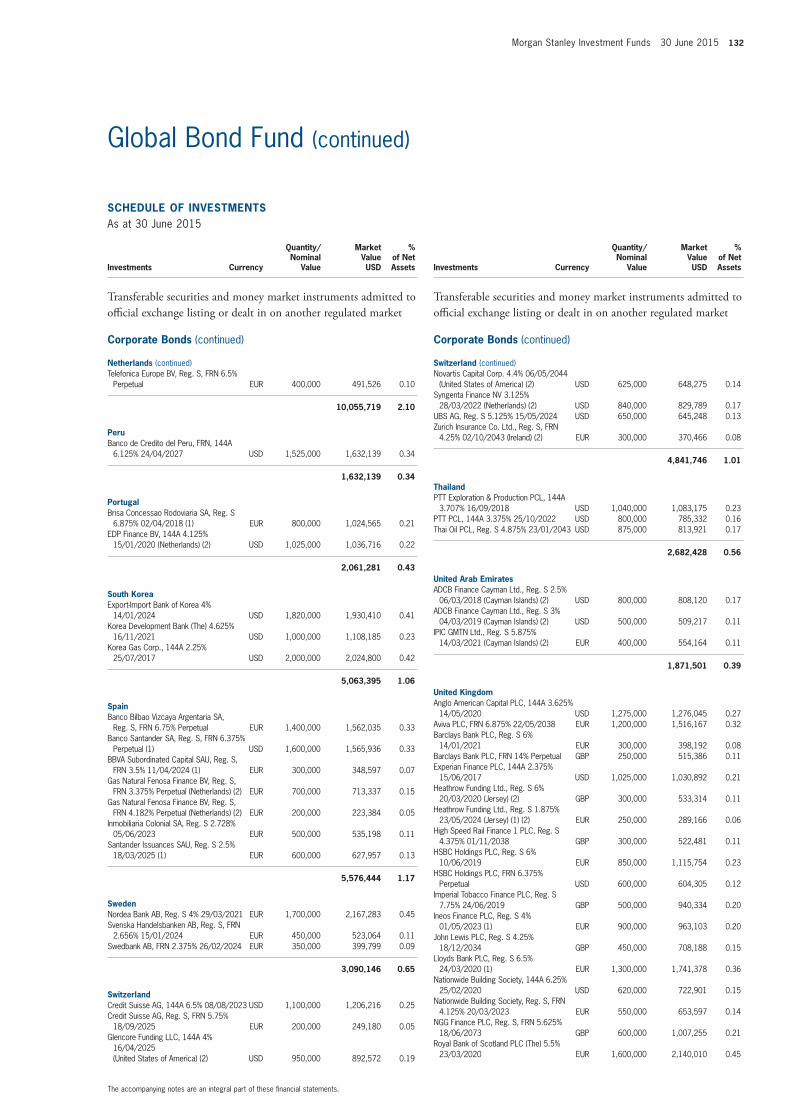
Morgan Stanley Investment Funds 30 June 2015 132
SCHEDULE of invEStmEntSAs at 30 June 2015
Investments Currency
Quantity/Nominal
Value
Market Value USD
% of Net Assets
transferable securities and money market instruments admitted to official exchange listing or dealt in on another regulated market
Corporate Bonds (continued)
netherlands (continued)Telefonica Europe BV, Reg. S, FRN 6.5%
Perpetual EUR 400,000 491,526 0.10
10,055,719 2.10
PeruBanco de Credito del Peru, FRN, 144A
6.125% 24/04/2027 USD 1,525,000 1,632,139 0.34
1,632,139 0.34
PortugalBrisa Concessao Rodoviaria SA, Reg. S
6.875% 02/04/2018 (1) EUR 800,000 1,024,565 0.21EDP Finance BV, 144A 4.125%
15/01/2020 (Netherlands) (2) USD 1,025,000 1,036,716 0.22
2,061,281 0.43
South KoreaExport-Import Bank of Korea 4%
14/01/2024 USD 1,820,000 1,930,410 0.41Korea Development Bank (The) 4.625%
16/11/2021 USD 1,000,000 1,108,185 0.23Korea Gas Corp., 144A 2.25%
25/07/2017 USD 2,000,000 2,024,800 0.42
5,063,395 1.06
SpainBanco Bilbao Vizcaya Argentaria SA,
Reg. S, FRN 6.75% Perpetual EUR 1,400,000 1,562,035 0.33Banco Santander SA, Reg. S, FRN 6.375%
Perpetual (1) USD 1,600,000 1,565,936 0.33BBVA Subordinated Capital SAU, Reg. S,
FRN 3.5% 11/04/2024 (1) EUR 300,000 348,597 0.07Gas Natural Fenosa Finance BV, Reg. S,
FRN 3.375% Perpetual (Netherlands) (2) EUR 700,000 713,337 0.15Gas Natural Fenosa Finance BV, Reg. S,
FRN 4.182% Perpetual (Netherlands) (2) EUR 200,000 223,384 0.05Inmobiliaria Colonial SA, Reg. S 2.728%
05/06/2023 EUR 500,000 535,198 0.11Santander Issuances SAU, Reg. S 2.5%
18/03/2025 (1) EUR 600,000 627,957 0.13
5,576,444 1.17
SwedenNordea Bank AB, Reg. S 4% 29/03/2021 EUR 1,700,000 2,167,283 0.45Svenska Handelsbanken AB, Reg. S, FRN
2.656% 15/01/2024 EUR 450,000 523,064 0.11Swedbank AB, FRN 2.375% 26/02/2024 EUR 350,000 399,799 0.09
3,090,146 0.65
SwitzerlandCredit Suisse AG, 144A 6.5% 08/08/2023 USD 1,100,000 1,206,216 0.25Credit Suisse AG, Reg. S, FRN 5.75%
18/09/2025 EUR 200,000 249,180 0.05Glencore Funding LLC, 144A 4%
16/04/2025 (United States of America) (2) USD 950,000 892,572 0.19
SCHEDULE of invEStmEntSAs at 30 June 2015
Investments Currency
Quantity/Nominal
Value
Market Value USD
% of Net Assets
transferable securities and money market instruments admitted to official exchange listing or dealt in on another regulated market
Corporate Bonds (continued)
Switzerland (continued)Novartis Capital Corp. 4.4% 06/05/2044
(United States of America) (2) USD 625,000 648,275 0.14Syngenta Finance NV 3.125%
28/03/2022 (Netherlands) (2) USD 840,000 829,789 0.17UBS AG, Reg. S 5.125% 15/05/2024 USD 650,000 645,248 0.13Zurich Insurance Co. Ltd., Reg. S, FRN
4.25% 02/10/2043 (Ireland) (2) EUR 300,000 370,466 0.08
4,841,746 1.01
thailandPTT Exploration & Production PCL, 144A
3.707% 16/09/2018 USD 1,040,000 1,083,175 0.23PTT PCL, 144A 3.375% 25/10/2022 USD 800,000 785,332 0.16Thai Oil PCL, Reg. S 4.875% 23/01/2043 USD 875,000 813,921 0.17
2,682,428 0.56
United Arab EmiratesADCB Finance Cayman Ltd., Reg. S 2.5%
06/03/2018 (Cayman Islands) (2) USD 800,000 808,120 0.17ADCB Finance Cayman Ltd., Reg. S 3%
04/03/2019 (Cayman Islands) (2) USD 500,000 509,217 0.11IPIC GMTN Ltd., Reg. S 5.875%
14/03/2021 (Cayman Islands) (2) EUR 400,000 554,164 0.11
1,871,501 0.39
United KingdomAnglo American Capital PLC, 144A 3.625%
14/05/2020 USD 1,275,000 1,276,045 0.27Aviva PLC, FRN 6.875% 22/05/2038 EUR 1,200,000 1,516,167 0.32Barclays Bank PLC, Reg. S 6%
14/01/2021 EUR 300,000 398,192 0.08Barclays Bank PLC, FRN 14% Perpetual GBP 250,000 515,386 0.11Experian Finance PLC, 144A 2.375%
15/06/2017 USD 1,025,000 1,030,892 0.21Heathrow Funding Ltd., Reg. S 6%
20/03/2020 (Jersey) (2) GBP 300,000 533,314 0.11Heathrow Funding Ltd., Reg. S 1.875%
23/05/2024 (Jersey) (1) (2) EUR 250,000 289,166 0.06High Speed Rail Finance 1 PLC, Reg. S
4.375% 01/11/2038 GBP 300,000 522,481 0.11HSBC Holdings PLC, Reg. S 6%
10/06/2019 EUR 850,000 1,115,754 0.23HSBC Holdings PLC, FRN 6.375%
Perpetual USD 600,000 604,305 0.12Imperial Tobacco Finance PLC, Reg. S
7.75% 24/06/2019 GBP 500,000 940,334 0.20Ineos Finance PLC, Reg. S 4%
01/05/2023 (1) EUR 900,000 963,103 0.20John Lewis PLC, Reg. S 4.25%
18/12/2034 GBP 450,000 708,188 0.15Lloyds Bank PLC, Reg. S 6.5%
24/03/2020 (1) EUR 1,300,000 1,741,378 0.36Nationwide Building Society, 144A 6.25%
25/02/2020 USD 620,000 722,901 0.15Nationwide Building Society, Reg. S, FRN
4.125% 20/03/2023 EUR 550,000 653,597 0.14NGG Finance PLC, Reg. S, FRN 5.625%
18/06/2073 GBP 600,000 1,007,255 0.21Royal Bank of Scotland PLC (The) 5.5%
23/03/2020 EUR 1,600,000 2,140,010 0.45
The accompanying notes are an integral part of these financial statements.
Global Bond Fund (continued)
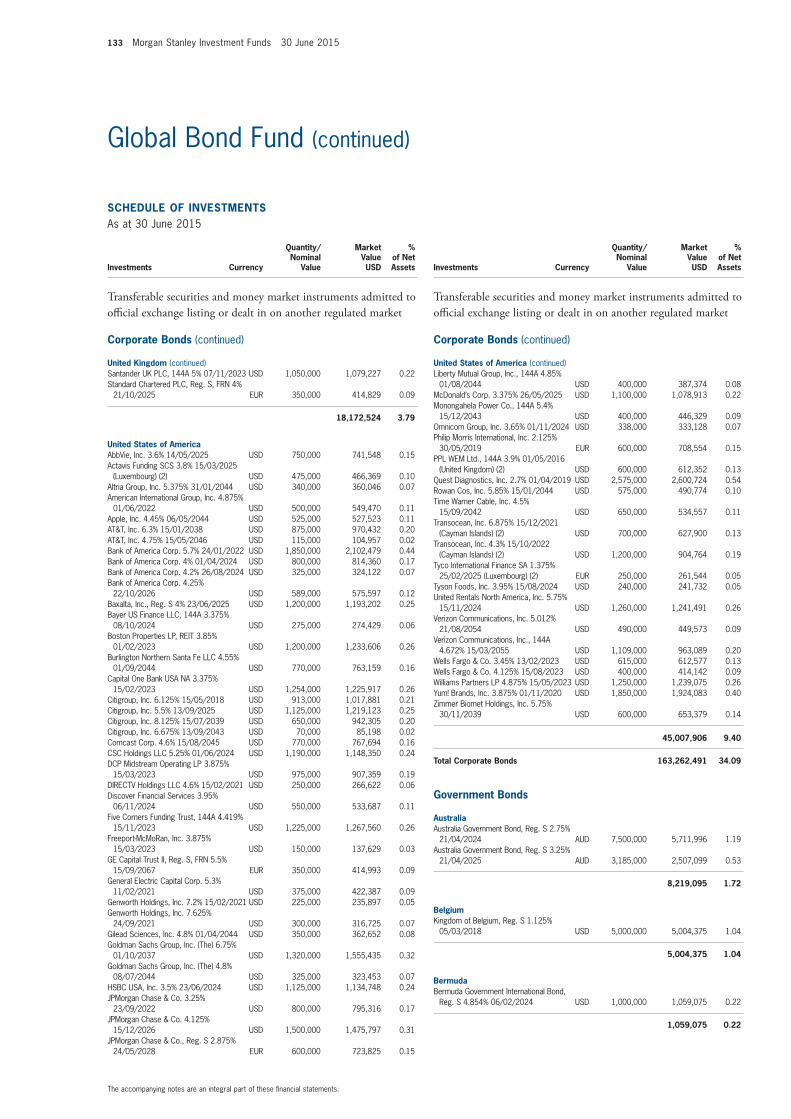
133 Morgan Stanley Investment Funds 30 June 2015
SCHEDULE of invEStmEntSAs at 30 June 2015
Investments Currency
Quantity/Nominal
Value
Market Value USD
% of Net Assets
transferable securities and money market instruments admitted to official exchange listing or dealt in on another regulated market
Corporate Bonds (continued)
United Kingdom (continued)Santander UK PLC, 144A 5% 07/11/2023 USD 1,050,000 1,079,227 0.22Standard Chartered PLC, Reg. S, FRN 4%
21/10/2025 EUR 350,000 414,829 0.09
18,172,524 3.79
United States of AmericaAbbVie, Inc. 3.6% 14/05/2025 USD 750,000 741,548 0.15Actavis Funding SCS 3.8% 15/03/2025
(Luxembourg) (2) USD 475,000 466,369 0.10Altria Group, Inc. 5.375% 31/01/2044 USD 340,000 360,046 0.07American International Group, Inc. 4.875%
01/06/2022 USD 500,000 549,470 0.11Apple, Inc. 4.45% 06/05/2044 USD 525,000 527,523 0.11AT&T, Inc. 6.3% 15/01/2038 USD 875,000 970,432 0.20AT&T, Inc. 4.75% 15/05/2046 USD 115,000 104,957 0.02Bank of America Corp. 5.7% 24/01/2022 USD 1,850,000 2,102,479 0.44Bank of America Corp. 4% 01/04/2024 USD 800,000 814,360 0.17Bank of America Corp. 4.2% 26/08/2024 USD 325,000 324,122 0.07Bank of America Corp. 4.25%
22/10/2026 USD 589,000 575,597 0.12Baxalta, Inc., Reg. S 4% 23/06/2025 USD 1,200,000 1,193,202 0.25Bayer US Finance LLC, 144A 3.375%
08/10/2024 USD 275,000 274,429 0.06Boston Properties LP, REIT 3.85%
01/02/2023 USD 1,200,000 1,233,606 0.26Burlington Northern Santa Fe LLC 4.55%
01/09/2044 USD 770,000 763,159 0.16Capital One Bank USA NA 3.375%
15/02/2023 USD 1,254,000 1,225,917 0.26Citigroup, Inc. 6.125% 15/05/2018 USD 913,000 1,017,881 0.21Citigroup, Inc. 5.5% 13/09/2025 USD 1,125,000 1,219,123 0.25Citigroup, Inc. 8.125% 15/07/2039 USD 650,000 942,305 0.20Citigroup, Inc. 6.675% 13/09/2043 USD 70,000 85,198 0.02Comcast Corp. 4.6% 15/08/2045 USD 770,000 767,694 0.16CSC Holdings LLC 5.25% 01/06/2024 USD 1,190,000 1,148,350 0.24DCP Midstream Operating LP 3.875%
15/03/2023 USD 975,000 907,359 0.19DIRECTV Holdings LLC 4.6% 15/02/2021 USD 250,000 266,622 0.06Discover Financial Services 3.95%
06/11/2024 USD 550,000 533,687 0.11Five Corners Funding Trust, 144A 4.419%
15/11/2023 USD 1,225,000 1,267,560 0.26Freeport-McMoRan, Inc. 3.875%
15/03/2023 USD 150,000 137,629 0.03GE Capital Trust II, Reg. S, FRN 5.5%
15/09/2067 EUR 350,000 414,993 0.09General Electric Capital Corp. 5.3%
11/02/2021 USD 375,000 422,387 0.09Genworth Holdings, Inc. 7.2% 15/02/2021 USD 225,000 235,897 0.05Genworth Holdings, Inc. 7.625%
24/09/2021 USD 300,000 316,725 0.07Gilead Sciences, Inc. 4.8% 01/04/2044 USD 350,000 362,652 0.08Goldman Sachs Group, Inc. (The) 6.75%
01/10/2037 USD 1,320,000 1,555,435 0.32Goldman Sachs Group, Inc. (The) 4.8%
08/07/2044 USD 325,000 323,453 0.07HSBC USA, Inc. 3.5% 23/06/2024 USD 1,125,000 1,134,748 0.24JPMorgan Chase & Co. 3.25%
23/09/2022 USD 800,000 795,316 0.17JPMorgan Chase & Co. 4.125%
15/12/2026 USD 1,500,000 1,475,797 0.31JPMorgan Chase & Co., Reg. S 2.875%
24/05/2028 EUR 600,000 723,825 0.15
SCHEDULE of invEStmEntSAs at 30 June 2015
Investments Currency
Quantity/Nominal
Value
Market Value USD
% of Net Assets
transferable securities and money market instruments admitted to official exchange listing or dealt in on another regulated market
Corporate Bonds (continued)
United States of America (continued)Liberty Mutual Group, Inc., 144A 4.85%
01/08/2044 USD 400,000 387,374 0.08McDonald’s Corp. 3.375% 26/05/2025 USD 1,100,000 1,078,913 0.22Monongahela Power Co., 144A 5.4%
15/12/2043 USD 400,000 446,329 0.09Omnicom Group, Inc. 3.65% 01/11/2024 USD 338,000 333,128 0.07Philip Morris International, Inc. 2.125%
30/05/2019 EUR 600,000 708,554 0.15PPL WEM Ltd., 144A 3.9% 01/05/2016
(United Kingdom) (2) USD 600,000 612,352 0.13Quest Diagnostics, Inc. 2.7% 01/04/2019 USD 2,575,000 2,600,724 0.54Rowan Cos, Inc. 5.85% 15/01/2044 USD 575,000 490,774 0.10Time Warner Cable, Inc. 4.5%
15/09/2042 USD 650,000 534,557 0.11Transocean, Inc. 6.875% 15/12/2021
(Cayman Islands) (2) USD 700,000 627,900 0.13Transocean, Inc. 4.3% 15/10/2022
(Cayman Islands) (2) USD 1,200,000 904,764 0.19Tyco International Finance SA 1.375%
25/02/2025 (Luxembourg) (2) EUR 250,000 261,544 0.05Tyson Foods, Inc. 3.95% 15/08/2024 USD 240,000 241,732 0.05United Rentals North America, Inc. 5.75%
15/11/2024 USD 1,260,000 1,241,491 0.26Verizon Communications, Inc. 5.012%
21/08/2054 USD 490,000 449,573 0.09Verizon Communications, Inc., 144A
4.672% 15/03/2055 USD 1,109,000 963,089 0.20Wells Fargo & Co. 3.45% 13/02/2023 USD 615,000 612,577 0.13Wells Fargo & Co. 4.125% 15/08/2023 USD 400,000 414,142 0.09Williams Partners LP 4.875% 15/05/2023 USD 1,250,000 1,239,075 0.26Yum! Brands, Inc. 3.875% 01/11/2020 USD 1,850,000 1,924,083 0.40Zimmer Biomet Holdings, Inc. 5.75%
30/11/2039 USD 600,000 653,379 0.14
45,007,906 9.40
total Corporate Bonds 163,262,491 34.09
Government Bonds
AustraliaAustralia Government Bond, Reg. S 2.75%
21/04/2024 AUD 7,500,000 5,711,996 1.19Australia Government Bond, Reg. S 3.25%
21/04/2025 AUD 3,185,000 2,507,099 0.53
8,219,095 1.72
BelgiumKingdom of Belgium, Reg. S 1.125%
05/03/2018 USD 5,000,000 5,004,375 1.04
5,004,375 1.04
BermudaBermuda Government International Bond,
Reg. S 4.854% 06/02/2024 USD 1,000,000 1,059,075 0.22
1,059,075 0.22
The accompanying notes are an integral part of these financial statements.
Global Bond Fund (continued)
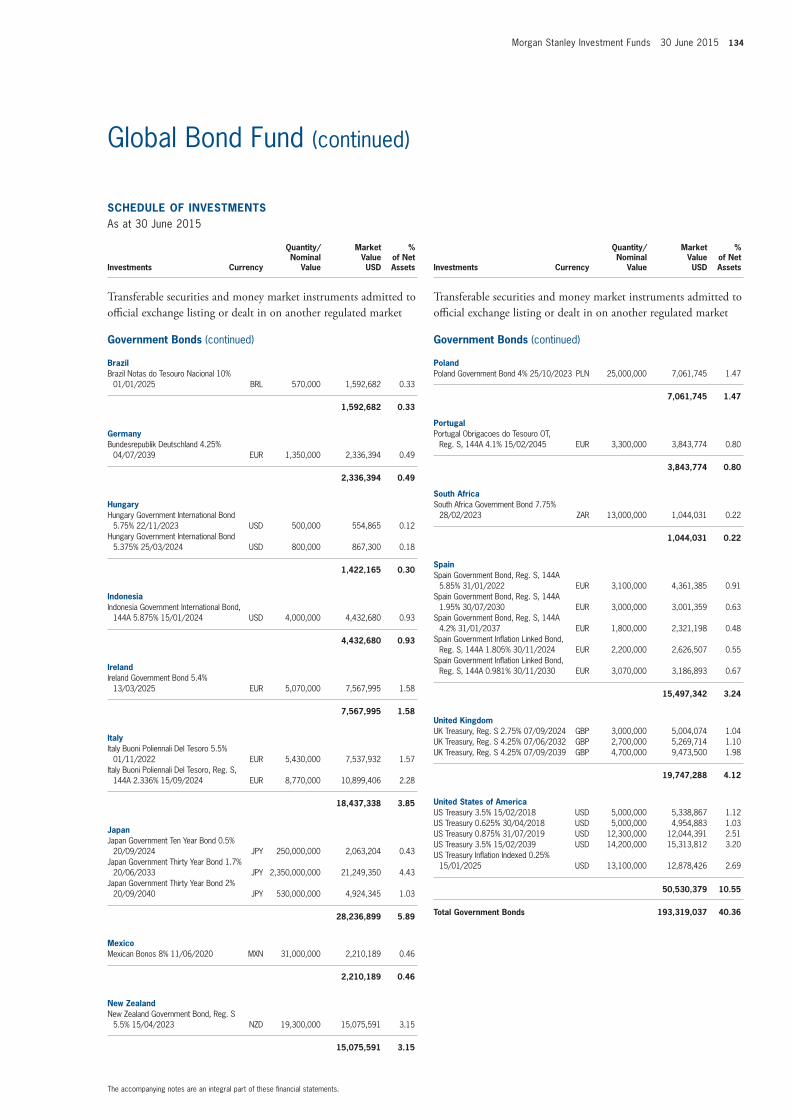
Morgan Stanley Investment Funds 30 June 2015 134
SCHEDULE of invEStmEntSAs at 30 June 2015
Investments Currency
Quantity/Nominal
Value
Market Value USD
% of Net Assets
transferable securities and money market instruments admitted to official exchange listing or dealt in on another regulated market
Government Bonds (continued)
BrazilBrazil Notas do Tesouro Nacional 10%
01/01/2025 BRL 570,000 1,592,682 0.33
1,592,682 0.33
GermanyBundesrepublik Deutschland 4.25%
04/07/2039 EUR 1,350,000 2,336,394 0.49
2,336,394 0.49
HungaryHungary Government International Bond
5.75% 22/11/2023 USD 500,000 554,865 0.12Hungary Government International Bond
5.375% 25/03/2024 USD 800,000 867,300 0.18
1,422,165 0.30
indonesiaIndonesia Government International Bond,
144A 5.875% 15/01/2024 USD 4,000,000 4,432,680 0.93
4,432,680 0.93
irelandIreland Government Bond 5.4%
13/03/2025 EUR 5,070,000 7,567,995 1.58
7,567,995 1.58
italyItaly Buoni Poliennali Del Tesoro 5.5%
01/11/2022 EUR 5,430,000 7,537,932 1.57Italy Buoni Poliennali Del Tesoro, Reg. S,
144A 2.336% 15/09/2024 EUR 8,770,000 10,899,406 2.28
18,437,338 3.85
JapanJapan Government Ten Year Bond 0.5%
20/09/2024 JPY 250,000,000 2,063,204 0.43Japan Government Thirty Year Bond 1.7%
20/06/2033 JPY 2,350,000,000 21,249,350 4.43Japan Government Thirty Year Bond 2%
20/09/2040 JPY 530,000,000 4,924,345 1.03
28,236,899 5.89
mexicoMexican Bonos 8% 11/06/2020 MXN 31,000,000 2,210,189 0.46
2,210,189 0.46
new ZealandNew Zealand Government Bond, Reg. S
5.5% 15/04/2023 NZD 19,300,000 15,075,591 3.15
15,075,591 3.15
SCHEDULE of invEStmEntSAs at 30 June 2015
Investments Currency
Quantity/Nominal
Value
Market Value USD
% of Net Assets
transferable securities and money market instruments admitted to official exchange listing or dealt in on another regulated market
Government Bonds (continued)
PolandPoland Government Bond 4% 25/10/2023 PLN 25,000,000 7,061,745 1.47
7,061,745 1.47
PortugalPortugal Obrigacoes do Tesouro OT,
Reg. S, 144A 4.1% 15/02/2045 EUR 3,300,000 3,843,774 0.80
3,843,774 0.80
South AfricaSouth Africa Government Bond 7.75%
28/02/2023 ZAR 13,000,000 1,044,031 0.22
1,044,031 0.22
SpainSpain Government Bond, Reg. S, 144A
5.85% 31/01/2022 EUR 3,100,000 4,361,385 0.91Spain Government Bond, Reg. S, 144A
1.95% 30/07/2030 EUR 3,000,000 3,001,359 0.63Spain Government Bond, Reg. S, 144A
4.2% 31/01/2037 EUR 1,800,000 2,321,198 0.48Spain Government Inflation Linked Bond,
Reg. S, 144A 1.805% 30/11/2024 EUR 2,200,000 2,626,507 0.55Spain Government Inflation Linked Bond,
Reg. S, 144A 0.981% 30/11/2030 EUR 3,070,000 3,186,893 0.67
15,497,342 3.24
United KingdomUK Treasury, Reg. S 2.75% 07/09/2024 GBP 3,000,000 5,004,074 1.04UK Treasury, Reg. S 4.25% 07/06/2032 GBP 2,700,000 5,269,714 1.10UK Treasury, Reg. S 4.25% 07/09/2039 GBP 4,700,000 9,473,500 1.98
19,747,288 4.12
United States of AmericaUS Treasury 3.5% 15/02/2018 USD 5,000,000 5,338,867 1.12US Treasury 0.625% 30/04/2018 USD 5,000,000 4,954,883 1.03US Treasury 0.875% 31/07/2019 USD 12,300,000 12,044,391 2.51US Treasury 3.5% 15/02/2039 USD 14,200,000 15,313,812 3.20US Treasury Inflation Indexed 0.25%
15/01/2025 USD 13,100,000 12,878,426 2.69
50,530,379 10.55
total Government Bonds 193,319,037 40.36
The accompanying notes are an integral part of these financial statements.
Global Bond Fund (continued)
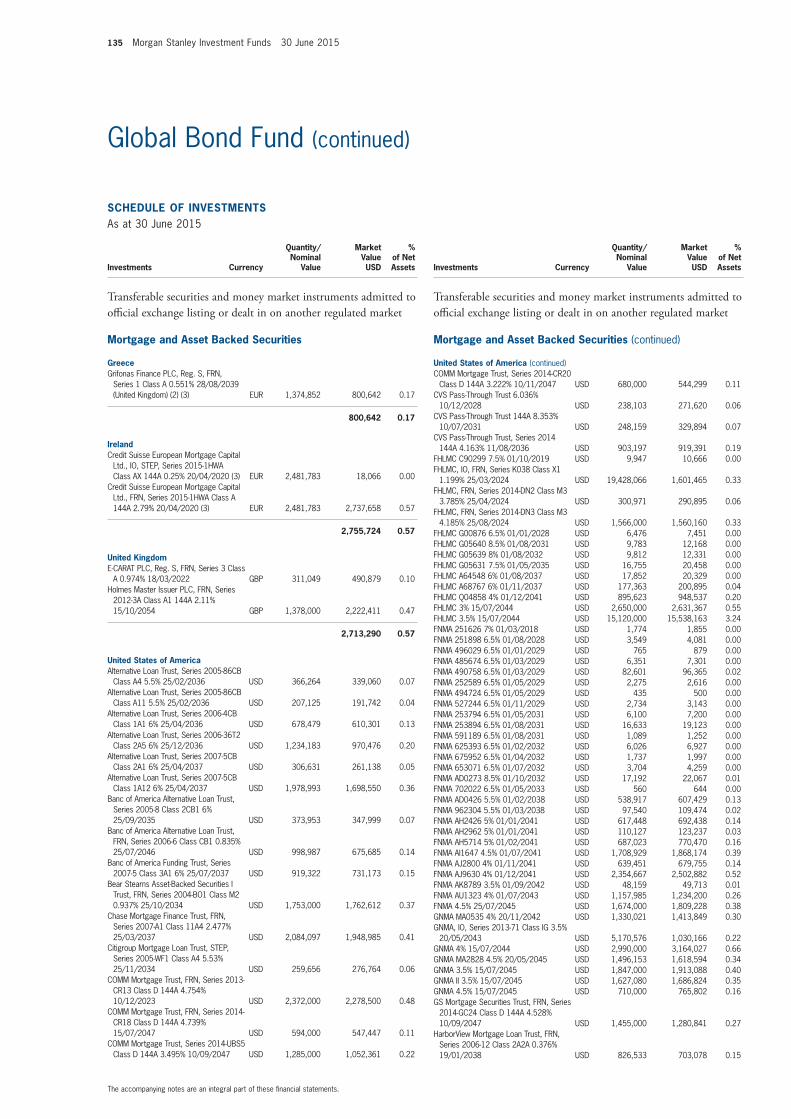
135 Morgan Stanley Investment Funds 30 June 2015
SCHEDULE of invEStmEntSAs at 30 June 2015
Investments Currency
Quantity/Nominal
Value
Market Value USD
% of Net Assets
transferable securities and money market instruments admitted to official exchange listing or dealt in on another regulated market
mortgage and Asset Backed Securities
GreeceGrifonas Finance PLC, Reg. S, FRN,
Series 1 Class A 0.551% 28/08/2039 (United Kingdom) (2) (3) EUR 1,374,852 800,642 0.17
800,642 0.17
irelandCredit Suisse European Mortgage Capital
Ltd., IO, STEP, Series 2015-1HWA Class AX 144A 0.25% 20/04/2020 (3) EUR 2,481,783 18,066 0.00
Credit Suisse European Mortgage Capital Ltd., FRN, Series 2015-1HWA Class A 144A 2.79% 20/04/2020 (3) EUR 2,481,783 2,737,658 0.57
2,755,724 0.57
United KingdomE-CARAT PLC, Reg. S, FRN, Series 3 Class
A 0.974% 18/03/2022 GBP 311,049 490,879 0.10Holmes Master Issuer PLC, FRN, Series
2012-3A Class A1 144A 2.11% 15/10/2054 GBP 1,378,000 2,222,411 0.47
2,713,290 0.57
United States of AmericaAlternative Loan Trust, Series 2005-86CB
Class A4 5.5% 25/02/2036 USD 366,264 339,060 0.07Alternative Loan Trust, Series 2005-86CB
Class A11 5.5% 25/02/2036 USD 207,125 191,742 0.04Alternative Loan Trust, Series 2006-4CB
Class 1A1 6% 25/04/2036 USD 678,479 610,301 0.13Alternative Loan Trust, Series 2006-36T2
Class 2A5 6% 25/12/2036 USD 1,234,183 970,476 0.20Alternative Loan Trust, Series 2007-5CB
Class 2A1 6% 25/04/2037 USD 306,631 261,138 0.05Alternative Loan Trust, Series 2007-5CB
Class 1A12 6% 25/04/2037 USD 1,978,993 1,698,550 0.36Banc of America Alternative Loan Trust,
Series 2005-8 Class 2CB1 6% 25/09/2035 USD 373,953 347,999 0.07
Banc of America Alternative Loan Trust, FRN, Series 2006-6 Class CB1 0.835% 25/07/2046 USD 998,987 675,685 0.14
Banc of America Funding Trust, Series 2007-5 Class 3A1 6% 25/07/2037 USD 919,322 731,173 0.15
Bear Stearns Asset-Backed Securities I Trust, FRN, Series 2004-BO1 Class M2 0.937% 25/10/2034 USD 1,753,000 1,762,612 0.37
Chase Mortgage Finance Trust, FRN, Series 2007-A1 Class 11A4 2.477% 25/03/2037 USD 2,084,097 1,948,985 0.41
Citigroup Mortgage Loan Trust, STEP, Series 2005-WF1 Class A4 5.53% 25/11/2034 USD 259,656 276,764 0.06
COMM Mortgage Trust, FRN, Series 2013-CR13 Class D 144A 4.754% 10/12/2023 USD 2,372,000 2,278,500 0.48
COMM Mortgage Trust, FRN, Series 2014-CR18 Class D 144A 4.739% 15/07/2047 USD 594,000 547,447 0.11
COMM Mortgage Trust, Series 2014-UBS5 Class D 144A 3.495% 10/09/2047 USD 1,285,000 1,052,361 0.22
SCHEDULE of invEStmEntSAs at 30 June 2015
Investments Currency
Quantity/Nominal
Value
Market Value USD
% of Net Assets
transferable securities and money market instruments admitted to official exchange listing or dealt in on another regulated market
mortgage and Asset Backed Securities (continued)
United States of America (continued)COMM Mortgage Trust, Series 2014-CR20
Class D 144A 3.222% 10/11/2047 USD 680,000 544,299 0.11CVS Pass-Through Trust 6.036%
10/12/2028 USD 238,103 271,620 0.06CVS Pass-Through Trust 144A 8.353%
10/07/2031 USD 248,159 329,894 0.07CVS Pass-Through Trust, Series 2014
144A 4.163% 11/08/2036 USD 903,197 919,391 0.19FHLMC C90299 7.5% 01/10/2019 USD 9,947 10,666 0.00FHLMC, IO, FRN, Series K038 Class X1
1.199% 25/03/2024 USD 19,428,066 1,601,465 0.33FHLMC, FRN, Series 2014-DN2 Class M3
3.785% 25/04/2024 USD 300,971 290,895 0.06FHLMC, FRN, Series 2014-DN3 Class M3
4.185% 25/08/2024 USD 1,566,000 1,560,160 0.33FHLMC G00876 6.5% 01/01/2028 USD 6,476 7,451 0.00FHLMC G05640 8.5% 01/08/2031 USD 9,783 12,168 0.00FHLMC G05639 8% 01/08/2032 USD 9,812 12,331 0.00FHLMC G05631 7.5% 01/05/2035 USD 16,755 20,458 0.00FHLMC A64548 6% 01/08/2037 USD 17,852 20,329 0.00FHLMC A68767 6% 01/11/2037 USD 177,363 200,895 0.04FHLMC Q04858 4% 01/12/2041 USD 895,623 948,537 0.20FHLMC 3% 15/07/2044 USD 2,650,000 2,631,367 0.55FHLMC 3.5% 15/07/2044 USD 15,120,000 15,538,163 3.24FNMA 251626 7% 01/03/2018 USD 1,774 1,855 0.00FNMA 251898 6.5% 01/08/2028 USD 3,549 4,081 0.00FNMA 496029 6.5% 01/01/2029 USD 765 879 0.00FNMA 485674 6.5% 01/03/2029 USD 6,351 7,301 0.00FNMA 490758 6.5% 01/03/2029 USD 82,601 96,365 0.02FNMA 252589 6.5% 01/05/2029 USD 2,275 2,616 0.00FNMA 494724 6.5% 01/05/2029 USD 435 500 0.00FNMA 527244 6.5% 01/11/2029 USD 2,734 3,143 0.00FNMA 253794 6.5% 01/05/2031 USD 6,100 7,200 0.00FNMA 253894 6.5% 01/08/2031 USD 16,633 19,123 0.00FNMA 591189 6.5% 01/08/2031 USD 1,089 1,252 0.00FNMA 625393 6.5% 01/02/2032 USD 6,026 6,927 0.00FNMA 675952 6.5% 01/04/2032 USD 1,737 1,997 0.00FNMA 653071 6.5% 01/07/2032 USD 3,704 4,259 0.00FNMA AD0273 8.5% 01/10/2032 USD 17,192 22,067 0.01FNMA 702022 6.5% 01/05/2033 USD 560 644 0.00FNMA AD0426 5.5% 01/02/2038 USD 538,917 607,429 0.13FNMA 962304 5.5% 01/03/2038 USD 97,540 109,474 0.02FNMA AH2426 5% 01/01/2041 USD 617,448 692,438 0.14FNMA AH2962 5% 01/01/2041 USD 110,127 123,237 0.03FNMA AH5714 5% 01/02/2041 USD 687,023 770,470 0.16FNMA AI1647 4.5% 01/07/2041 USD 1,708,929 1,868,174 0.39FNMA AJ2800 4% 01/11/2041 USD 639,451 679,755 0.14FNMA AJ9630 4% 01/12/2041 USD 2,354,667 2,502,882 0.52FNMA AK8789 3.5% 01/09/2042 USD 48,159 49,713 0.01FNMA AU1323 4% 01/07/2043 USD 1,157,985 1,234,200 0.26FNMA 4.5% 25/07/2045 USD 1,674,000 1,809,228 0.38GNMA MA0535 4% 20/11/2042 USD 1,330,021 1,413,849 0.30GNMA, IO, Series 2013-71 Class IG 3.5%
20/05/2043 USD 5,170,576 1,030,166 0.22GNMA 4% 15/07/2044 USD 2,990,000 3,164,027 0.66GNMA MA2828 4.5% 20/05/2045 USD 1,496,153 1,618,594 0.34GNMA 3.5% 15/07/2045 USD 1,847,000 1,913,088 0.40GNMA II 3.5% 15/07/2045 USD 1,627,080 1,686,824 0.35GNMA 4.5% 15/07/2045 USD 710,000 765,802 0.16GS Mortgage Securities Trust, FRN, Series
2014-GC24 Class D 144A 4.528% 10/09/2047 USD 1,455,000 1,280,841 0.27
HarborView Mortgage Loan Trust, FRN, Series 2006-12 Class 2A2A 0.376% 19/01/2038 USD 826,533 703,078 0.15
The accompanying notes are an integral part of these financial statements.
Global Bond Fund (continued)
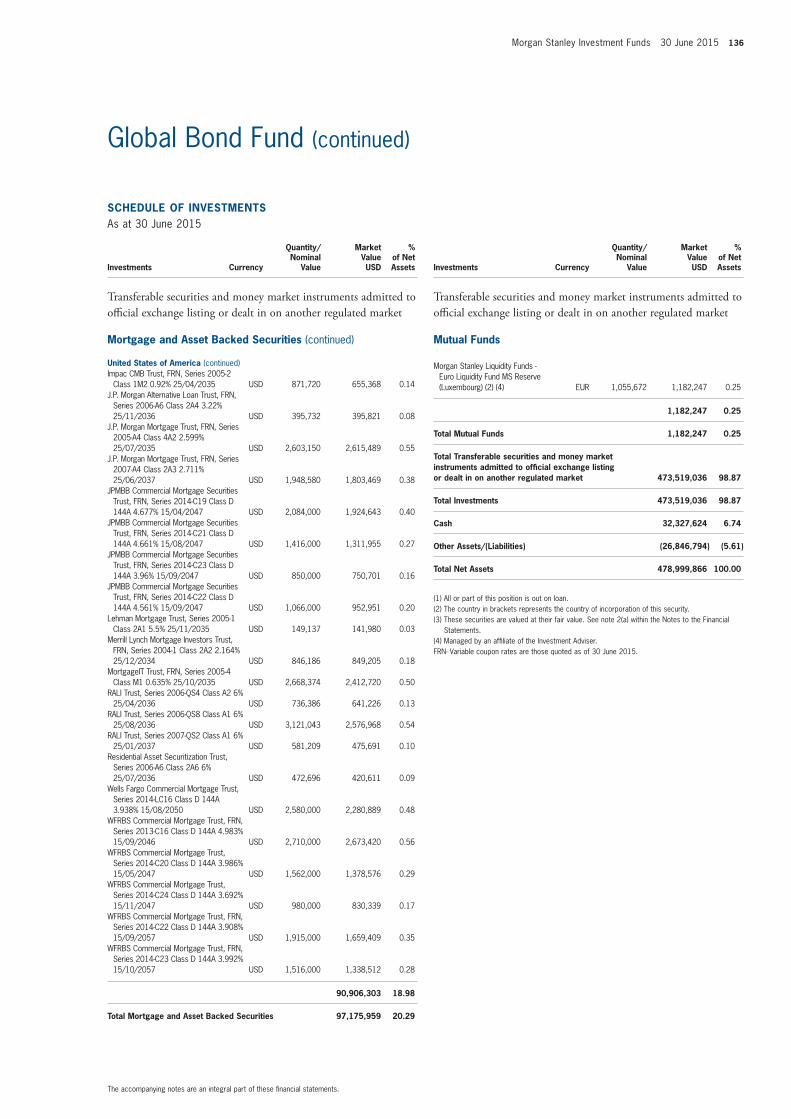
Morgan Stanley Investment Funds 30 June 2015 136
SCHEDULE of invEStmEntSAs at 30 June 2015
Investments Currency
Quantity/Nominal
Value
Market Value USD
% of Net Assets
transferable securities and money market instruments admitted to official exchange listing or dealt in on another regulated market
mortgage and Asset Backed Securities (continued)
United States of America (continued)Impac CMB Trust, FRN, Series 2005-2
Class 1M2 0.92% 25/04/2035 USD 871,720 655,368 0.14J.P. Morgan Alternative Loan Trust, FRN,
Series 2006-A6 Class 2A4 3.22% 25/11/2036 USD 395,732 395,821 0.08
J.P. Morgan Mortgage Trust, FRN, Series 2005-A4 Class 4A2 2.599% 25/07/2035 USD 2,603,150 2,615,489 0.55
J.P. Morgan Mortgage Trust, FRN, Series 2007-A4 Class 2A3 2.711% 25/06/2037 USD 1,948,580 1,803,469 0.38
JPMBB Commercial Mortgage Securities Trust, FRN, Series 2014-C19 Class D 144A 4.677% 15/04/2047 USD 2,084,000 1,924,643 0.40
JPMBB Commercial Mortgage Securities Trust, FRN, Series 2014-C21 Class D 144A 4.661% 15/08/2047 USD 1,416,000 1,311,955 0.27
JPMBB Commercial Mortgage Securities Trust, FRN, Series 2014-C23 Class D 144A 3.96% 15/09/2047 USD 850,000 750,701 0.16
JPMBB Commercial Mortgage Securities Trust, FRN, Series 2014-C22 Class D 144A 4.561% 15/09/2047 USD 1,066,000 952,951 0.20
Lehman Mortgage Trust, Series 2005-1 Class 2A1 5.5% 25/11/2035 USD 149,137 141,980 0.03
Merrill Lynch Mortgage Investors Trust, FRN, Series 2004-1 Class 2A2 2.164% 25/12/2034 USD 846,186 849,205 0.18
MortgageIT Trust, FRN, Series 2005-4 Class M1 0.635% 25/10/2035 USD 2,668,374 2,412,720 0.50
RALI Trust, Series 2006-QS4 Class A2 6% 25/04/2036 USD 736,386 641,226 0.13
RALI Trust, Series 2006-QS8 Class A1 6% 25/08/2036 USD 3,121,043 2,576,968 0.54
RALI Trust, Series 2007-QS2 Class A1 6% 25/01/2037 USD 581,209 475,691 0.10
Residential Asset Securitization Trust, Series 2006-A6 Class 2A6 6% 25/07/2036 USD 472,696 420,611 0.09
Wells Fargo Commercial Mortgage Trust, Series 2014-LC16 Class D 144A 3.938% 15/08/2050 USD 2,580,000 2,280,889 0.48
WFRBS Commercial Mortgage Trust, FRN, Series 2013-C16 Class D 144A 4.983% 15/09/2046 USD 2,710,000 2,673,420 0.56
WFRBS Commercial Mortgage Trust, Series 2014-C20 Class D 144A 3.986% 15/05/2047 USD 1,562,000 1,378,576 0.29
WFRBS Commercial Mortgage Trust, Series 2014-C24 Class D 144A 3.692% 15/11/2047 USD 980,000 830,339 0.17
WFRBS Commercial Mortgage Trust, FRN, Series 2014-C22 Class D 144A 3.908% 15/09/2057 USD 1,915,000 1,659,409 0.35
WFRBS Commercial Mortgage Trust, FRN, Series 2014-C23 Class D 144A 3.992% 15/10/2057 USD 1,516,000 1,338,512 0.28
90,906,303 18.98
total mortgage and Asset Backed Securities 97,175,959 20.29
SCHEDULE of invEStmEntSAs at 30 June 2015
Investments Currency
Quantity/Nominal
Value
Market Value USD
% of Net Assets
transferable securities and money market instruments admitted to official exchange listing or dealt in on another regulated market
mutual funds
Morgan Stanley Liquidity Funds - Euro Liquidity Fund MS Reserve (Luxembourg) (2) (4) EUR 1,055,672 1,182,247 0.25
1,182,247 0.25
total mutual funds 1,182,247 0.25
total transferable securities and money market instruments admitted to official exchange listing or dealt in on another regulated market 473,519,036 98.87
total investments 473,519,036 98.87
Cash 32,327,624 6.74
other Assets/(Liabilities) (26,846,794) (5.61)
total net Assets 478,999,866 100.00
(1) All or part of this position is out on loan.(2) The country in brackets represents the country of incorporation of this security.(3) These securities are valued at their fair value. See note 2(a) within the Notes to the Financial
Statements.(4) Managed by an affiliate of the Investment Adviser.FRN- Variable coupon rates are those quoted as of 30 June 2015.
The accompanying notes are an integral part of these financial statements.
Global Bond Fund (continued)
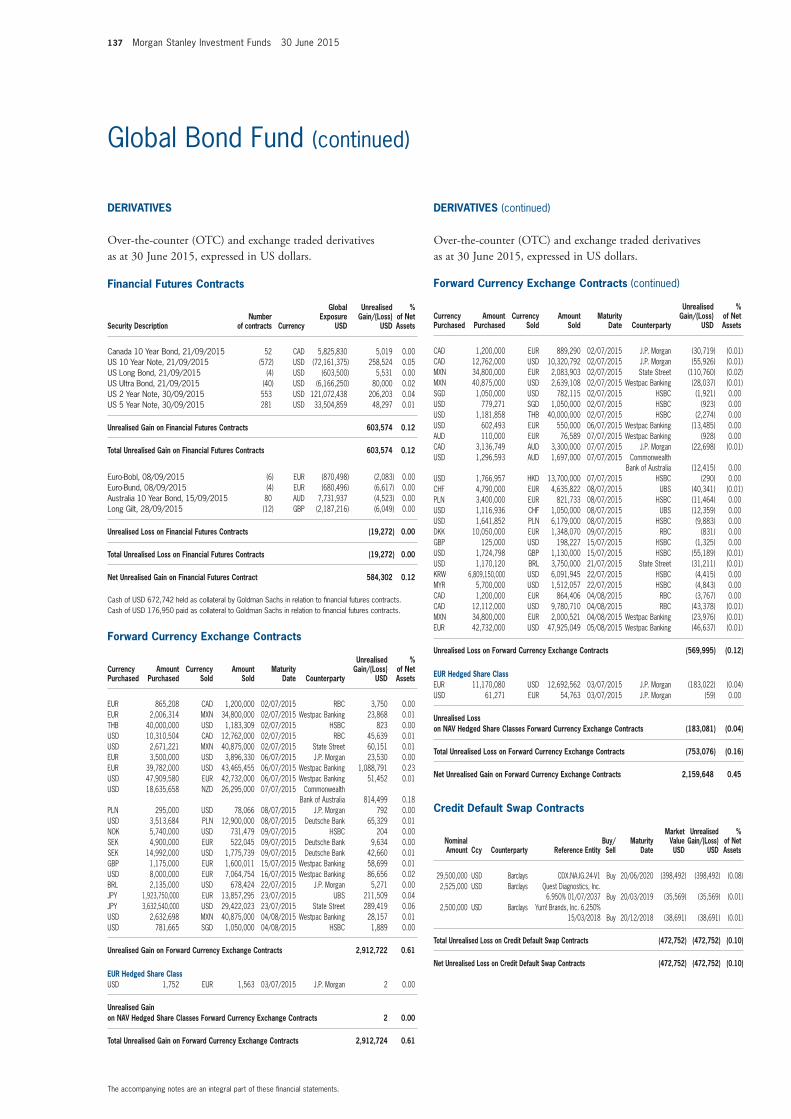
137 Morgan Stanley Investment Funds 30 June 2015
The accompanying notes are an integral part of these financial statements.
Global Bond Fund (continued)
financial futures Contracts
Security Descriptionnumber
of contracts Currency
Global Exposure
USD
Unrealised Gain/(Loss)
USD
% of net Assets
Canada 10 Year Bond, 21/09/2015 52 CAD 5,825,830 5,019 0.00US 10 Year Note, 21/09/2015 (572) USD (72,161,375) 258,524 0.05US Long Bond, 21/09/2015 (4) USD (603,500) 5,531 0.00US Ultra Bond, 21/09/2015 (40) USD (6,166,250) 80,000 0.02US 2 Year Note, 30/09/2015 553 USD 121,072,438 206,203 0.04US 5 Year Note, 30/09/2015 281 USD 33,504,859 48,297 0.01
Unrealised Gain on financial futures Contracts 603,574 0.12
total Unrealised Gain on financial futures Contracts 603,574 0.12
Euro-Bobl, 08/09/2015 (6) EUR (870,498) (2,083) 0.00Euro-Bund, 08/09/2015 (4) EUR (680,496) (6,617) 0.00Australia 10 Year Bond, 15/09/2015 80 AUD 7,731,937 (4,523) 0.00Long Gilt, 28/09/2015 (12) GBP (2,187,216) (6,049) 0.00
Unrealised Loss on financial futures Contracts (19,272) 0.00
total Unrealised Loss on financial futures Contracts (19,272) 0.00
net Unrealised Gain on financial futures Contract 584,302 0.12
Cash of USD 672,742 held as collateral by Goldman Sachs in relation to financial futures contracts.Cash of USD 176,950 paid as collateral to Goldman Sachs in relation to financial futures contracts.
forward Currency Exchange Contracts (continued)
Currency Purchased
Amount Purchased
Currency Sold
Amount Sold
maturity Date Counterparty
Unrealised Gain/(Loss)
USD
% of net Assets
EUR 865,208 CAD 1,200,000 02/07/2015 RBC 3,750 0.00EUR 2,006,314 MXN 34,800,000 02/07/2015 Westpac Banking 23,868 0.01THB 40,000,000 USD 1,183,309 02/07/2015 HSBC 823 0.00USD 10,310,504 CAD 12,762,000 02/07/2015 RBC 45,639 0.01USD 2,671,221 MXN 40,875,000 02/07/2015 State Street 60,151 0.01EUR 3,500,000 USD 3,896,330 06/07/2015 J.P. Morgan 23,530 0.00EUR 39,782,000 USD 43,465,455 06/07/2015 Westpac Banking 1,088,791 0.23USD 47,909,580 EUR 42,732,000 06/07/2015 Westpac Banking 51,452 0.01USD 18,635,658 NZD 26,295,000 07/07/2015 Commonwealth
Bank of Australia 814,499 0.18PLN 295,000 USD 78,066 08/07/2015 J.P. Morgan 792 0.00USD 3,513,684 PLN 12,900,000 08/07/2015 Deutsche Bank 65,329 0.01NOK 5,740,000 USD 731,479 09/07/2015 HSBC 204 0.00SEK 4,900,000 EUR 522,045 09/07/2015 Deutsche Bank 9,634 0.00SEK 14,992,000 USD 1,775,739 09/07/2015 Deutsche Bank 42,660 0.01GBP 1,175,000 EUR 1,600,011 15/07/2015 Westpac Banking 58,699 0.01USD 8,000,000 EUR 7,064,754 16/07/2015 Westpac Banking 86,656 0.02BRL 2,135,000 USD 678,424 22/07/2015 J.P. Morgan 5,271 0.00JPY 1,923,750,000 EUR 13,857,295 23/07/2015 UBS 211,509 0.04JPY 3,632,540,000 USD 29,422,023 23/07/2015 State Street 289,419 0.06USD 2,632,698 MXN 40,875,000 04/08/2015 Westpac Banking 28,157 0.01USD 781,665 SGD 1,050,000 04/08/2015 HSBC 1,889 0.00
Unrealised Gain on forward Currency Exchange Contracts 2,912,722 0.61
EUR Hedged Share ClassUSD 1,752 EUR 1,563 03/07/2015 J.P. Morgan 2 0.00
Unrealised Gain on nAv Hedged Share Classes forward Currency Exchange Contracts 2 0.00
total Unrealised Gain on forward Currency Exchange Contracts 2,912,724 0.61
forward Currency Exchange Contracts (continued)
Currency Purchased
Amount Purchased
Currency Sold
Amount Sold
maturity Date Counterparty
Unrealised Gain/(Loss)
USD
% of net Assets
CAD 1,200,000 EUR 889,290 02/07/2015 J.P. Morgan (30,719) (0.01)CAD 12,762,000 USD 10,320,792 02/07/2015 J.P. Morgan (55,926) (0.01)MXN 34,800,000 EUR 2,083,903 02/07/2015 State Street (110,760) (0.02)MXN 40,875,000 USD 2,639,108 02/07/2015 Westpac Banking (28,037) (0.01)SGD 1,050,000 USD 782,115 02/07/2015 HSBC (1,921) 0.00USD 779,271 SGD 1,050,000 02/07/2015 HSBC (923) 0.00USD 1,181,858 THB 40,000,000 02/07/2015 HSBC (2,274) 0.00USD 602,493 EUR 550,000 06/07/2015 Westpac Banking (13,485) 0.00AUD 110,000 EUR 76,589 07/07/2015 Westpac Banking (928) 0.00CAD 3,136,749 AUD 3,300,000 07/07/2015 J.P. Morgan (22,698) (0.01)USD 1,296,593 AUD 1,697,000 07/07/2015 Commonwealth
Bank of Australia (12,415) 0.00USD 1,766,957 HKD 13,700,000 07/07/2015 HSBC (290) 0.00CHF 4,790,000 EUR 4,635,822 08/07/2015 UBS (40,341) (0.01)PLN 3,400,000 EUR 821,733 08/07/2015 HSBC (11,464) 0.00USD 1,116,936 CHF 1,050,000 08/07/2015 UBS (12,359) 0.00USD 1,641,852 PLN 6,179,000 08/07/2015 HSBC (9,883) 0.00DKK 10,050,000 EUR 1,348,070 09/07/2015 RBC (831) 0.00GBP 125,000 USD 198,227 15/07/2015 HSBC (1,325) 0.00USD 1,724,798 GBP 1,130,000 15/07/2015 HSBC (55,189) (0.01)USD 1,170,120 BRL 3,750,000 21/07/2015 State Street (31,211) (0.01)KRW 6,809,150,000 USD 6,091,945 22/07/2015 HSBC (4,415) 0.00MYR 5,700,000 USD 1,512,057 22/07/2015 HSBC (4,843) 0.00CAD 1,200,000 EUR 864,406 04/08/2015 RBC (3,767) 0.00CAD 12,112,000 USD 9,780,710 04/08/2015 RBC (43,378) (0.01)MXN 34,800,000 EUR 2,000,521 04/08/2015 Westpac Banking (23,976) (0.01)EUR 42,732,000 USD 47,925,049 05/08/2015 Westpac Banking (46,637) (0.01)
Unrealised Loss on forward Currency Exchange Contracts (569,995) (0.12)
EUR Hedged Share ClassEUR 11,170,080 USD 12,692,562 03/07/2015 J.P. Morgan (183,022) (0.04)USD 61,271 EUR 54,763 03/07/2015 J.P. Morgan (59) 0.00
Unrealised Loss on nAv Hedged Share Classes forward Currency Exchange Contracts (183,081) (0.04)
total Unrealised Loss on forward Currency Exchange Contracts (753,076) (0.16)
net Unrealised Gain on forward Currency Exchange Contracts 2,159,648 0.45
Credit Default Swap Contracts
nominal Amount Ccy Counterparty Reference Entity
Buy/Sell
maturity Date
market value USD
Unrealised Gain/(Loss)
USD
% of net Assets
29,500,000 USD Barclays CDX.NA.IG.24-V1 Buy 20/06/2020 (398,492) (398,492) (0.08)2,525,000 USD Barclays Quest Diagnostics, Inc.
6.950% 01/07/2037 Buy 20/03/2019 (35,569) (35,569) (0.01)2,500,000 USD Barclays Yum! Brands, Inc. 6.250%
15/03/2018 Buy 20/12/2018 (38,691) (38,691) (0.01)
total Unrealised Loss on Credit Default Swap Contracts (472,752) (472,752) (0.10)
net Unrealised Loss on Credit Default Swap Contracts (472,752) (472,752) (0.10)
DERivAtivES
Over-the-counter (OtC) and exchange traded derivatives as at 30 June 2015, expressed in US dollars.
DERivAtivES (continued)
Over-the-counter (OtC) and exchange traded derivatives as at 30 June 2015, expressed in US dollars.
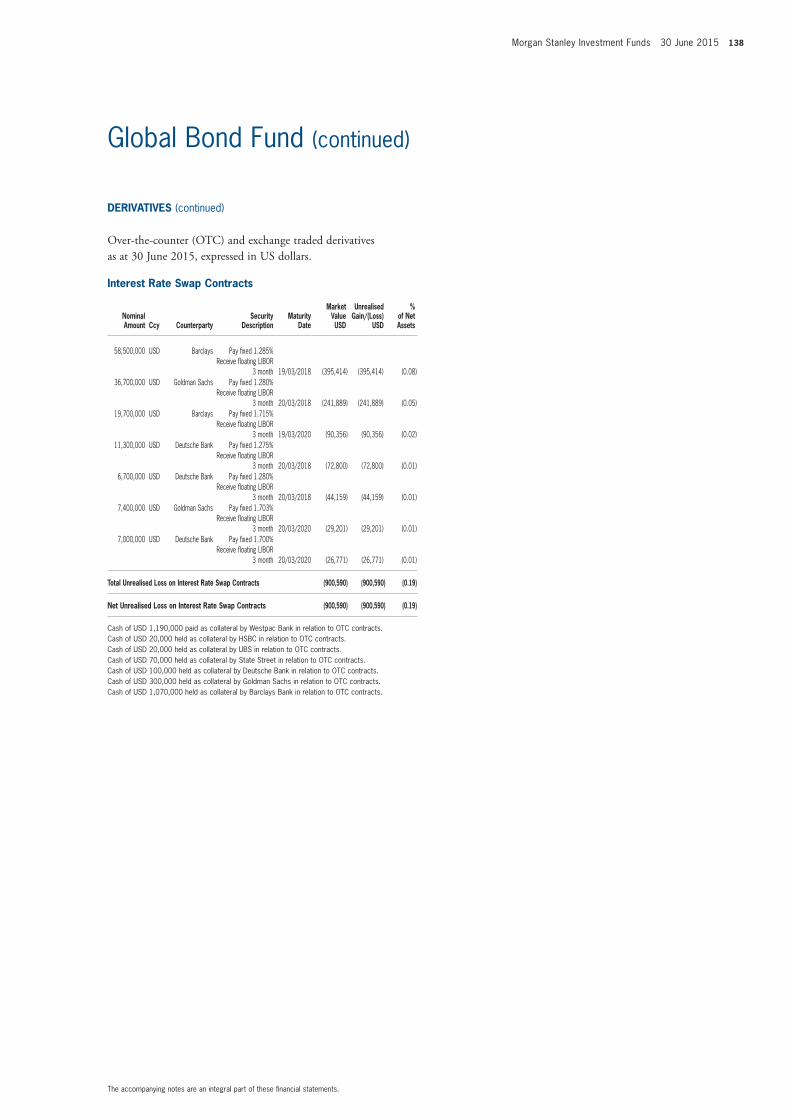
Morgan Stanley Investment Funds 30 June 2015 138
The accompanying notes are an integral part of these financial statements.
Global Bond Fund (continued)
interest Rate Swap Contracts
nominal Amount Ccy Counterparty
Security Description
maturity Date
market value USD
Unrealised Gain/(Loss)
USD
% of net Assets
58,500,000 USD Barclays Pay fixed 1.285% Receive floating LIBOR
3 month 19/03/2018 (395,414) (395,414) (0.08)36,700,000 USD Goldman Sachs Pay fixed 1.280%
Receive floating LIBOR 3 month 20/03/2018 (241,889) (241,889) (0.05)
19,700,000 USD Barclays Pay fixed 1.715% Receive floating LIBOR
3 month 19/03/2020 (90,356) (90,356) (0.02)11,300,000 USD Deutsche Bank Pay fixed 1.275%
Receive floating LIBOR 3 month 20/03/2018 (72,800) (72,800) (0.01)
6,700,000 USD Deutsche Bank Pay fixed 1.280% Receive floating LIBOR
3 month 20/03/2018 (44,159) (44,159) (0.01)7,400,000 USD Goldman Sachs Pay fixed 1.703%
Receive floating LIBOR 3 month 20/03/2020 (29,201) (29,201) (0.01)
7,000,000 USD Deutsche Bank Pay fixed 1.700% Receive floating LIBOR
3 month 20/03/2020 (26,771) (26,771) (0.01)
total Unrealised Loss on interest Rate Swap Contracts (900,590) (900,590) (0.19)
net Unrealised Loss on interest Rate Swap Contracts (900,590) (900,590) (0.19)
Cash of USD 1,190,000 paid as collateral by Westpac Bank in relation to OTC contracts.Cash of USD 20,000 held as collateral by HSBC in relation to OTC contracts.Cash of USD 20,000 held as collateral by UBS in relation to OTC contracts.Cash of USD 70,000 held as collateral by State Street in relation to OTC contracts.Cash of USD 100,000 held as collateral by Deutsche Bank in relation to OTC contracts.Cash of USD 300,000 held as collateral by Goldman Sachs in relation to OTC contracts.Cash of USD 1,070,000 held as collateral by Barclays Bank in relation to OTC contracts.
DERivAtivES (continued)
Over-the-counter (OtC) and exchange traded derivatives as at 30 June 2015, expressed in US dollars.
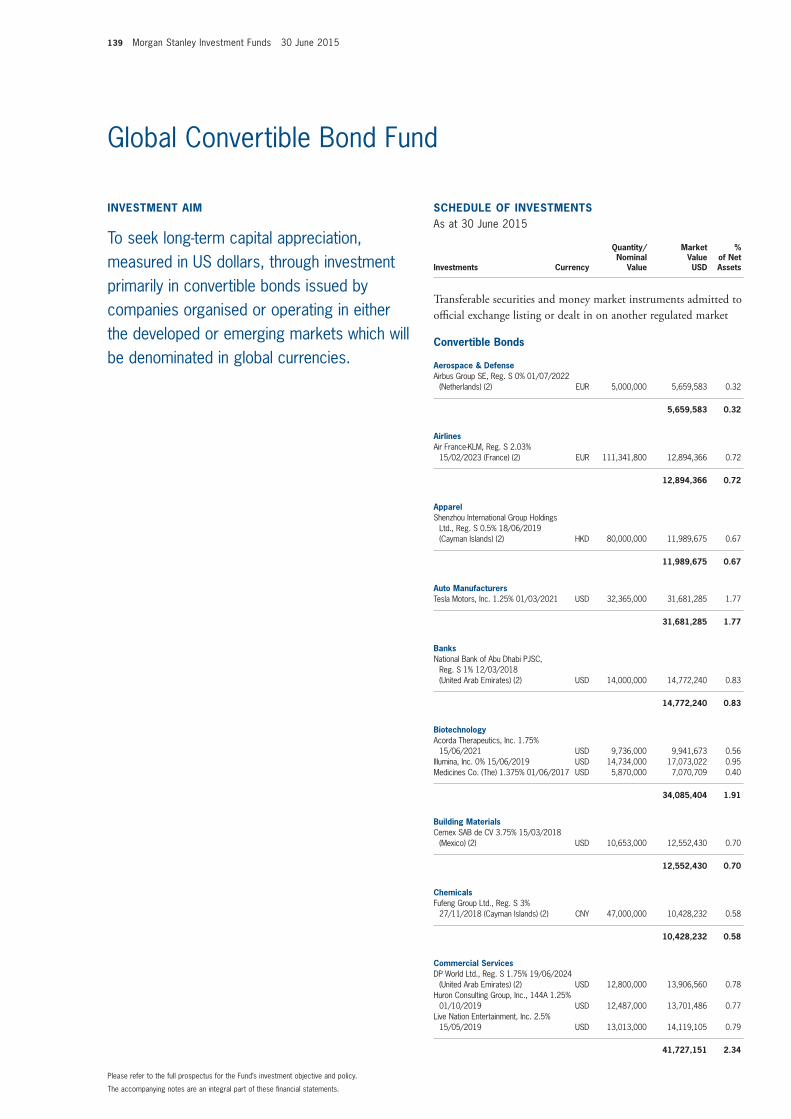
139 Morgan Stanley Investment Funds 30 June 2015
The accompanying notes are an integral part of these financial statements.
Please refer to the full prospectus for the Fund’s investment objective and policy.
Global Convertible Bond Fund
invEStmEnt Aim
To seek long-term capital appreciation, measured in US dollars, through investment primarily in convertible bonds issued by companies organised or operating in either the developed or emerging markets which will be denominated in global currencies.
SCHEDULE of invEStmEntSAs at 30 June 2015
Investments Currency
Quantity/Nominal
Value
Market Value USD
% of Net Assets
transferable securities and money market instruments admitted to official exchange listing or dealt in on another regulated market
Convertible Bonds
Aerospace & DefenseAirbus Group SE, Reg. S 0% 01/07/2022
(Netherlands) (2) EUR 5,000,000 5,659,583 0.32
5,659,583 0.32
AirlinesAir France-KLM, Reg. S 2.03%
15/02/2023 (France) (2) EUR 111,341,800 12,894,366 0.72
12,894,366 0.72
ApparelShenzhou International Group Holdings
Ltd., Reg. S 0.5% 18/06/2019 (Cayman Islands) (2) HKD 80,000,000 11,989,675 0.67
11,989,675 0.67
Auto manufacturersTesla Motors, Inc. 1.25% 01/03/2021 USD 32,365,000 31,681,285 1.77
31,681,285 1.77
BanksNational Bank of Abu Dhabi PJSC,
Reg. S 1% 12/03/2018 (United Arab Emirates) (2) USD 14,000,000 14,772,240 0.83
14,772,240 0.83
BiotechnologyAcorda Therapeutics, Inc. 1.75%
15/06/2021 USD 9,736,000 9,941,673 0.56Illumina, Inc. 0% 15/06/2019 USD 14,734,000 17,073,022 0.95Medicines Co. (The) 1.375% 01/06/2017 USD 5,870,000 7,070,709 0.40
34,085,404 1.91
Building materialsCemex SAB de CV 3.75% 15/03/2018
(Mexico) (2) USD 10,653,000 12,552,430 0.70
12,552,430 0.70
ChemicalsFufeng Group Ltd., Reg. S 3%
27/11/2018 (Cayman Islands) (2) CNY 47,000,000 10,428,232 0.58
10,428,232 0.58
Commercial ServicesDP World Ltd., Reg. S 1.75% 19/06/2024
(United Arab Emirates) (2) USD 12,800,000 13,906,560 0.78Huron Consulting Group, Inc., 144A 1.25%
01/10/2019 USD 12,487,000 13,701,486 0.77Live Nation Entertainment, Inc. 2.5%
15/05/2019 USD 13,013,000 14,119,105 0.79
41,727,151 2.34
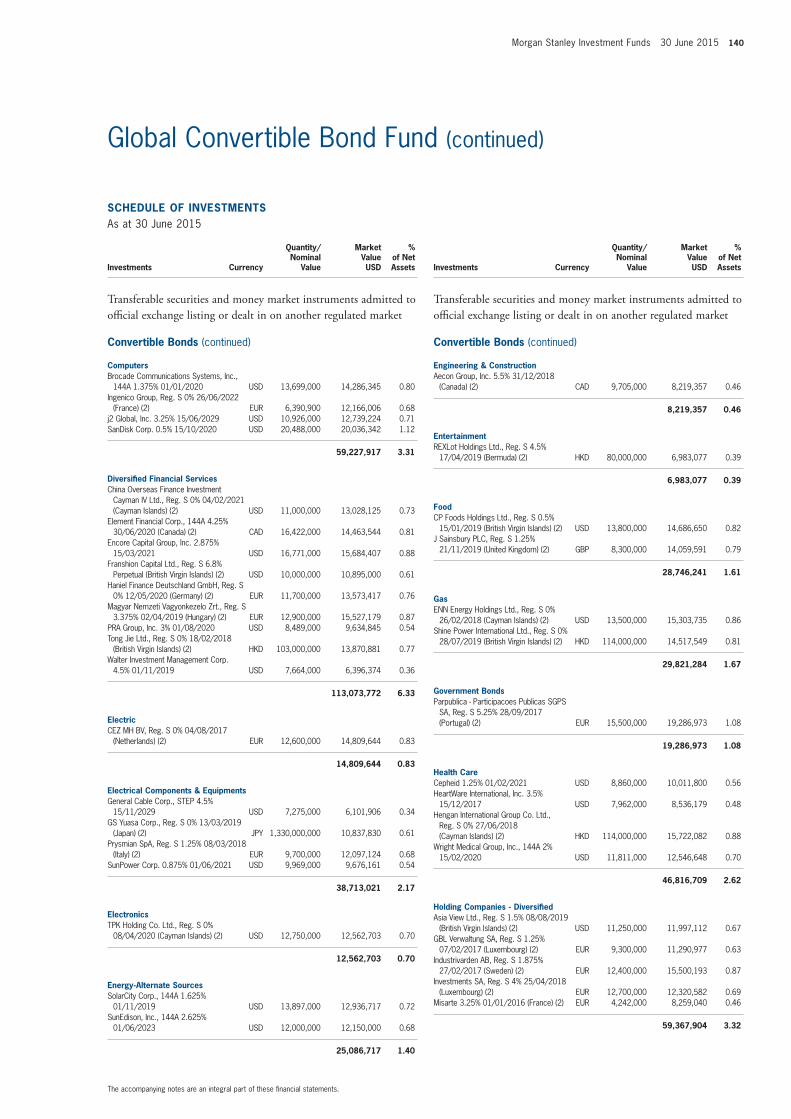
Morgan Stanley Investment Funds 30 June 2015 140
The accompanying notes are an integral part of these financial statements.
Global Convertible Bond Fund (continued)
SCHEDULE of invEStmEntSAs at 30 June 2015
Investments Currency
Quantity/Nominal
Value
Market Value USD
% of Net Assets
transferable securities and money market instruments admitted to official exchange listing or dealt in on another regulated market
Convertible Bonds (continued)
ComputersBrocade Communications Systems, Inc.,
144A 1.375% 01/01/2020 USD 13,699,000 14,286,345 0.80Ingenico Group, Reg. S 0% 26/06/2022
(France) (2) EUR 6,390,900 12,166,006 0.68j2 Global, Inc. 3.25% 15/06/2029 USD 10,926,000 12,739,224 0.71SanDisk Corp. 0.5% 15/10/2020 USD 20,488,000 20,036,342 1.12
59,227,917 3.31
Diversified financial ServicesChina Overseas Finance Investment
Cayman IV Ltd., Reg. S 0% 04/02/2021 (Cayman Islands) (2) USD 11,000,000 13,028,125 0.73
Element Financial Corp., 144A 4.25% 30/06/2020 (Canada) (2) CAD 16,422,000 14,463,544 0.81
Encore Capital Group, Inc. 2.875% 15/03/2021 USD 16,771,000 15,684,407 0.88
Franshion Capital Ltd., Reg. S 6.8% Perpetual (British Virgin Islands) (2) USD 10,000,000 10,895,000 0.61
Haniel Finance Deutschland GmbH, Reg. S 0% 12/05/2020 (Germany) (2) EUR 11,700,000 13,573,417 0.76
Magyar Nemzeti Vagyonkezelo Zrt., Reg. S 3.375% 02/04/2019 (Hungary) (2) EUR 12,900,000 15,527,179 0.87
PRA Group, Inc. 3% 01/08/2020 USD 8,489,000 9,634,845 0.54Tong Jie Ltd., Reg. S 0% 18/02/2018
(British Virgin Islands) (2) HKD 103,000,000 13,870,881 0.77Walter Investment Management Corp.
4.5% 01/11/2019 USD 7,664,000 6,396,374 0.36
113,073,772 6.33
ElectricCEZ MH BV, Reg. S 0% 04/08/2017
(Netherlands) (2) EUR 12,600,000 14,809,644 0.83
14,809,644 0.83
Electrical Components & EquipmentsGeneral Cable Corp., STEP 4.5%
15/11/2029 USD 7,275,000 6,101,906 0.34GS Yuasa Corp., Reg. S 0% 13/03/2019
(Japan) (2) JPY 1,330,000,000 10,837,830 0.61Prysmian SpA, Reg. S 1.25% 08/03/2018
(Italy) (2) EUR 9,700,000 12,097,124 0.68SunPower Corp. 0.875% 01/06/2021 USD 9,969,000 9,676,161 0.54
38,713,021 2.17
ElectronicsTPK Holding Co. Ltd., Reg. S 0%
08/04/2020 (Cayman Islands) (2) USD 12,750,000 12,562,703 0.70
12,562,703 0.70
Energy-Alternate SourcesSolarCity Corp., 144A 1.625%
01/11/2019 USD 13,897,000 12,936,717 0.72SunEdison, Inc., 144A 2.625%
01/06/2023 USD 12,000,000 12,150,000 0.68
25,086,717 1.40
SCHEDULE of invEStmEntSAs at 30 June 2015
Investments Currency
Quantity/Nominal
Value
Market Value USD
% of Net Assets
transferable securities and money market instruments admitted to official exchange listing or dealt in on another regulated market
Convertible Bonds (continued)
Engineering & ConstructionAecon Group, Inc. 5.5% 31/12/2018
(Canada) (2) CAD 9,705,000 8,219,357 0.46
8,219,357 0.46
EntertainmentREXLot Holdings Ltd., Reg. S 4.5%
17/04/2019 (Bermuda) (2) HKD 80,000,000 6,983,077 0.39
6,983,077 0.39
foodCP Foods Holdings Ltd., Reg. S 0.5%
15/01/2019 (British Virgin Islands) (2) USD 13,800,000 14,686,650 0.82J Sainsbury PLC, Reg. S 1.25%
21/11/2019 (United Kingdom) (2) GBP 8,300,000 14,059,591 0.79
28,746,241 1.61
GasENN Energy Holdings Ltd., Reg. S 0%
26/02/2018 (Cayman Islands) (2) USD 13,500,000 15,303,735 0.86Shine Power International Ltd., Reg. S 0%
28/07/2019 (British Virgin Islands) (2) HKD 114,000,000 14,517,549 0.81
29,821,284 1.67
Government BondsParpublica - Participacoes Publicas SGPS
SA, Reg. S 5.25% 28/09/2017 (Portugal) (2) EUR 15,500,000 19,286,973 1.08
19,286,973 1.08
Health CareCepheid 1.25% 01/02/2021 USD 8,860,000 10,011,800 0.56HeartWare International, Inc. 3.5%
15/12/2017 USD 7,962,000 8,536,179 0.48Hengan International Group Co. Ltd.,
Reg. S 0% 27/06/2018 (Cayman Islands) (2) HKD 114,000,000 15,722,082 0.88
Wright Medical Group, Inc., 144A 2% 15/02/2020 USD 11,811,000 12,546,648 0.70
46,816,709 2.62
Holding Companies - DiversifiedAsia View Ltd., Reg. S 1.5% 08/08/2019
(British Virgin Islands) (2) USD 11,250,000 11,997,112 0.67GBL Verwaltung SA, Reg. S 1.25%
07/02/2017 (Luxembourg) (2) EUR 9,300,000 11,290,977 0.63Industrivarden AB, Reg. S 1.875%
27/02/2017 (Sweden) (2) EUR 12,400,000 15,500,193 0.87Investments SA, Reg. S 4% 25/04/2018
(Luxembourg) (2) EUR 12,700,000 12,320,582 0.69Misarte 3.25% 01/01/2016 (France) (2) EUR 4,242,000 8,259,040 0.46
59,367,904 3.32
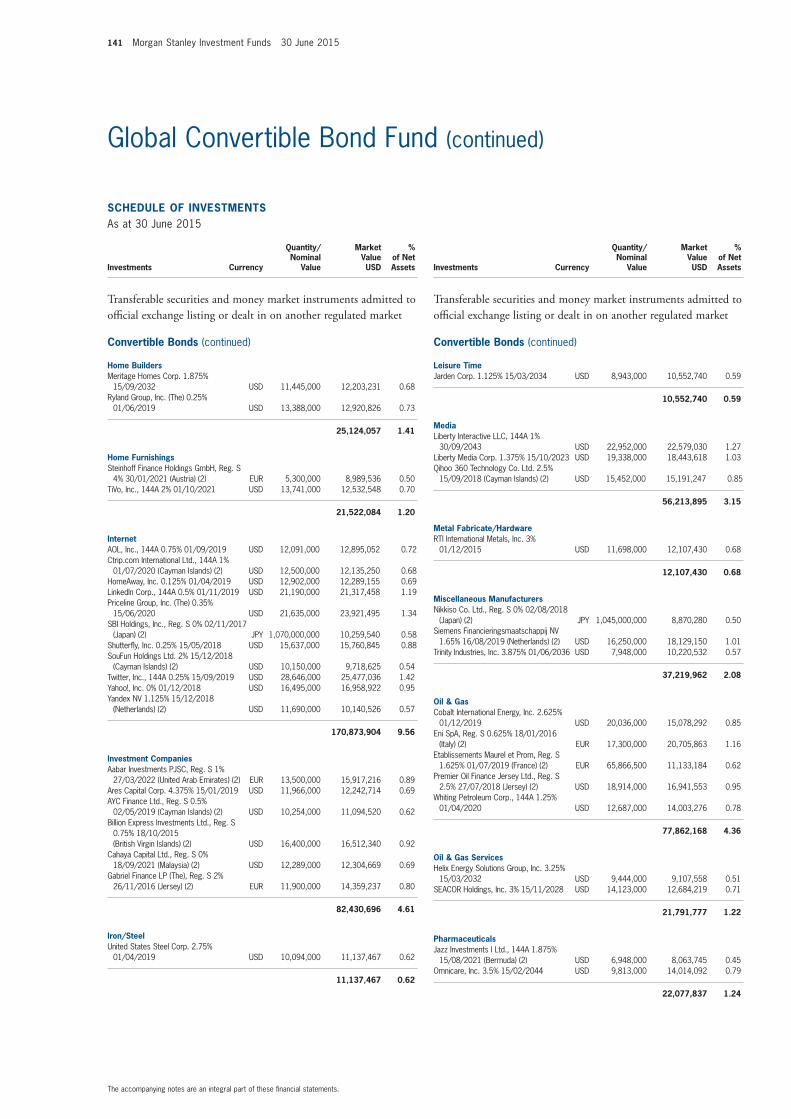
141 Morgan Stanley Investment Funds 30 June 2015
The accompanying notes are an integral part of these financial statements.
Global Convertible Bond Fund (continued)
SCHEDULE of invEStmEntSAs at 30 June 2015
Investments Currency
Quantity/Nominal
Value
Market Value USD
% of Net Assets
transferable securities and money market instruments admitted to official exchange listing or dealt in on another regulated market
Convertible Bonds (continued)
Home BuildersMeritage Homes Corp. 1.875%
15/09/2032 USD 11,445,000 12,203,231 0.68Ryland Group, Inc. (The) 0.25%
01/06/2019 USD 13,388,000 12,920,826 0.73
25,124,057 1.41
Home furnishingsSteinhoff Finance Holdings GmbH, Reg. S
4% 30/01/2021 (Austria) (2) EUR 5,300,000 8,989,536 0.50TiVo, Inc., 144A 2% 01/10/2021 USD 13,741,000 12,532,548 0.70
21,522,084 1.20
internetAOL, Inc., 144A 0.75% 01/09/2019 USD 12,091,000 12,895,052 0.72Ctrip.com International Ltd., 144A 1%
01/07/2020 (Cayman Islands) (2) USD 12,500,000 12,135,250 0.68HomeAway, Inc. 0.125% 01/04/2019 USD 12,902,000 12,289,155 0.69LinkedIn Corp., 144A 0.5% 01/11/2019 USD 21,190,000 21,317,458 1.19Priceline Group, Inc. (The) 0.35%
15/06/2020 USD 21,635,000 23,921,495 1.34SBI Holdings, Inc., Reg. S 0% 02/11/2017
(Japan) (2) JPY 1,070,000,000 10,259,540 0.58Shutterfly, Inc. 0.25% 15/05/2018 USD 15,637,000 15,760,845 0.88SouFun Holdings Ltd. 2% 15/12/2018
(Cayman Islands) (2) USD 10,150,000 9,718,625 0.54Twitter, Inc., 144A 0.25% 15/09/2019 USD 28,646,000 25,477,036 1.42Yahoo!, Inc. 0% 01/12/2018 USD 16,495,000 16,958,922 0.95Yandex NV 1.125% 15/12/2018
(Netherlands) (2) USD 11,690,000 10,140,526 0.57
170,873,904 9.56
investment CompaniesAabar Investments PJSC, Reg. S 1%
27/03/2022 (United Arab Emirates) (2) EUR 13,500,000 15,917,216 0.89Ares Capital Corp. 4.375% 15/01/2019 USD 11,966,000 12,242,714 0.69AYC Finance Ltd., Reg. S 0.5%
02/05/2019 (Cayman Islands) (2) USD 10,254,000 11,094,520 0.62Billion Express Investments Ltd., Reg. S
0.75% 18/10/2015 (British Virgin Islands) (2) USD 16,400,000 16,512,340 0.92
Cahaya Capital Ltd., Reg. S 0% 18/09/2021 (Malaysia) (2) USD 12,289,000 12,304,669 0.69
Gabriel Finance LP (The), Reg. S 2% 26/11/2016 (Jersey) (2) EUR 11,900,000 14,359,237 0.80
82,430,696 4.61
iron/SteelUnited States Steel Corp. 2.75%
01/04/2019 USD 10,094,000 11,137,467 0.62
11,137,467 0.62
SCHEDULE of invEStmEntSAs at 30 June 2015
Investments Currency
Quantity/Nominal
Value
Market Value USD
% of Net Assets
transferable securities and money market instruments admitted to official exchange listing or dealt in on another regulated market
Convertible Bonds (continued)
Leisure timeJarden Corp. 1.125% 15/03/2034 USD 8,943,000 10,552,740 0.59
10,552,740 0.59
mediaLiberty Interactive LLC, 144A 1%
30/09/2043 USD 22,952,000 22,579,030 1.27Liberty Media Corp. 1.375% 15/10/2023 USD 19,338,000 18,443,618 1.03Qihoo 360 Technology Co. Ltd. 2.5%
15/09/2018 (Cayman Islands) (2) USD 15,452,000 15,191,247 0.85
56,213,895 3.15
metal fabricate/HardwareRTI International Metals, Inc. 3%
01/12/2015 USD 11,698,000 12,107,430 0.68
12,107,430 0.68
miscellaneous manufacturersNikkiso Co. Ltd., Reg. S 0% 02/08/2018
(Japan) (2) JPY 1,045,000,000 8,870,280 0.50Siemens Financieringsmaatschappij NV
1.65% 16/08/2019 (Netherlands) (2) USD 16,250,000 18,129,150 1.01Trinity Industries, Inc. 3.875% 01/06/2036 USD 7,948,000 10,220,532 0.57
37,219,962 2.08
oil & GasCobalt International Energy, Inc. 2.625%
01/12/2019 USD 20,036,000 15,078,292 0.85Eni SpA, Reg. S 0.625% 18/01/2016
(Italy) (2) EUR 17,300,000 20,705,863 1.16Etablissements Maurel et Prom, Reg. S
1.625% 01/07/2019 (France) (2) EUR 65,866,500 11,133,184 0.62Premier Oil Finance Jersey Ltd., Reg. S
2.5% 27/07/2018 (Jersey) (2) USD 18,914,000 16,941,553 0.95Whiting Petroleum Corp., 144A 1.25%
01/04/2020 USD 12,687,000 14,003,276 0.78
77,862,168 4.36
oil & Gas ServicesHelix Energy Solutions Group, Inc. 3.25%
15/03/2032 USD 9,444,000 9,107,558 0.51SEACOR Holdings, Inc. 3% 15/11/2028 USD 14,123,000 12,684,219 0.71
21,791,777 1.22
PharmaceuticalsJazz Investments I Ltd., 144A 1.875%
15/08/2021 (Bermuda) (2) USD 6,948,000 8,063,745 0.45Omnicare, Inc. 3.5% 15/02/2044 USD 9,813,000 14,014,092 0.79
22,077,837 1.24
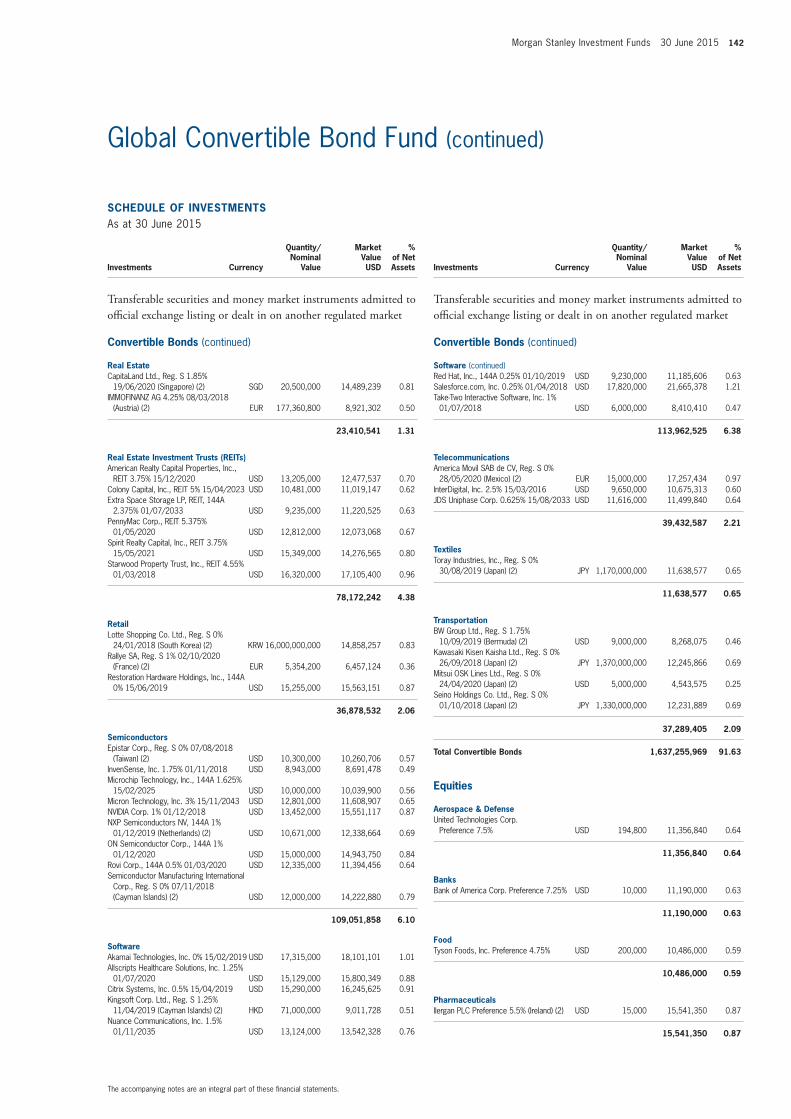
Morgan Stanley Investment Funds 30 June 2015 142
The accompanying notes are an integral part of these financial statements.
Global Convertible Bond Fund (continued)
SCHEDULE of invEStmEntSAs at 30 June 2015
Investments Currency
Quantity/Nominal
Value
Market Value USD
% of Net Assets
transferable securities and money market instruments admitted to official exchange listing or dealt in on another regulated market
Convertible Bonds (continued)
Real EstateCapitaLand Ltd., Reg. S 1.85%
19/06/2020 (Singapore) (2) SGD 20,500,000 14,489,239 0.81IMMOFINANZ AG 4.25% 08/03/2018
(Austria) (2) EUR 177,360,800 8,921,302 0.50
23,410,541 1.31
Real Estate investment trusts (REits)American Realty Capital Properties, Inc.,
REIT 3.75% 15/12/2020 USD 13,205,000 12,477,537 0.70Colony Capital, Inc., REIT 5% 15/04/2023 USD 10,481,000 11,019,147 0.62Extra Space Storage LP, REIT, 144A
2.375% 01/07/2033 USD 9,235,000 11,220,525 0.63PennyMac Corp., REIT 5.375%
01/05/2020 USD 12,812,000 12,073,068 0.67Spirit Realty Capital, Inc., REIT 3.75%
15/05/2021 USD 15,349,000 14,276,565 0.80Starwood Property Trust, Inc., REIT 4.55%
01/03/2018 USD 16,320,000 17,105,400 0.96
78,172,242 4.38
RetailLotte Shopping Co. Ltd., Reg. S 0%
24/01/2018 (South Korea) (2) KRW 16,000,000,000 14,858,257 0.83Rallye SA, Reg. S 1% 02/10/2020
(France) (2) EUR 5,354,200 6,457,124 0.36Restoration Hardware Holdings, Inc., 144A
0% 15/06/2019 USD 15,255,000 15,563,151 0.87
36,878,532 2.06
SemiconductorsEpistar Corp., Reg. S 0% 07/08/2018
(Taiwan) (2) USD 10,300,000 10,260,706 0.57InvenSense, Inc. 1.75% 01/11/2018 USD 8,943,000 8,691,478 0.49Microchip Technology, Inc., 144A 1.625%
15/02/2025 USD 10,000,000 10,039,900 0.56Micron Technology, Inc. 3% 15/11/2043 USD 12,801,000 11,608,907 0.65NVIDIA Corp. 1% 01/12/2018 USD 13,452,000 15,551,117 0.87NXP Semiconductors NV, 144A 1%
01/12/2019 (Netherlands) (2) USD 10,671,000 12,338,664 0.69ON Semiconductor Corp., 144A 1%
01/12/2020 USD 15,000,000 14,943,750 0.84Rovi Corp., 144A 0.5% 01/03/2020 USD 12,335,000 11,394,456 0.64Semiconductor Manufacturing International
Corp., Reg. S 0% 07/11/2018 (Cayman Islands) (2) USD 12,000,000 14,222,880 0.79
109,051,858 6.10
SoftwareAkamai Technologies, Inc. 0% 15/02/2019 USD 17,315,000 18,101,101 1.01Allscripts Healthcare Solutions, Inc. 1.25%
01/07/2020 USD 15,129,000 15,800,349 0.88Citrix Systems, Inc. 0.5% 15/04/2019 USD 15,290,000 16,245,625 0.91Kingsoft Corp. Ltd., Reg. S 1.25%
11/04/2019 (Cayman Islands) (2) HKD 71,000,000 9,011,728 0.51Nuance Communications, Inc. 1.5%
01/11/2035 USD 13,124,000 13,542,328 0.76
SCHEDULE of invEStmEntSAs at 30 June 2015
Investments Currency
Quantity/Nominal
Value
Market Value USD
% of Net Assets
transferable securities and money market instruments admitted to official exchange listing or dealt in on another regulated market
Convertible Bonds (continued)
Software (continued)Red Hat, Inc., 144A 0.25% 01/10/2019 USD 9,230,000 11,185,606 0.63Salesforce.com, Inc. 0.25% 01/04/2018 USD 17,820,000 21,665,378 1.21Take-Two Interactive Software, Inc. 1%
01/07/2018 USD 6,000,000 8,410,410 0.47
113,962,525 6.38
telecommunicationsAmerica Movil SAB de CV, Reg. S 0%
28/05/2020 (Mexico) (2) EUR 15,000,000 17,257,434 0.97InterDigital, Inc. 2.5% 15/03/2016 USD 9,650,000 10,675,313 0.60JDS Uniphase Corp. 0.625% 15/08/2033 USD 11,616,000 11,499,840 0.64
39,432,587 2.21
textilesToray Industries, Inc., Reg. S 0%
30/08/2019 (Japan) (2) JPY 1,170,000,000 11,638,577 0.65
11,638,577 0.65
transportationBW Group Ltd., Reg. S 1.75%
10/09/2019 (Bermuda) (2) USD 9,000,000 8,268,075 0.46Kawasaki Kisen Kaisha Ltd., Reg. S 0%
26/09/2018 (Japan) (2) JPY 1,370,000,000 12,245,866 0.69Mitsui OSK Lines Ltd., Reg. S 0%
24/04/2020 (Japan) (2) USD 5,000,000 4,543,575 0.25Seino Holdings Co. Ltd., Reg. S 0%
01/10/2018 (Japan) (2) JPY 1,330,000,000 12,231,889 0.69
37,289,405 2.09
total Convertible Bonds 1,637,255,969 91.63
Equities
Aerospace & DefenseUnited Technologies Corp.
Preference 7.5% USD 194,800 11,356,840 0.64
11,356,840 0.64
BanksBank of America Corp. Preference 7.25% USD 10,000 11,190,000 0.63
11,190,000 0.63
foodTyson Foods, Inc. Preference 4.75% USD 200,000 10,486,000 0.59
10,486,000 0.59
Pharmaceuticalsllergan PLC Preference 5.5% (Ireland) (2) USD 15,000 15,541,350 0.87
15,541,350 0.87
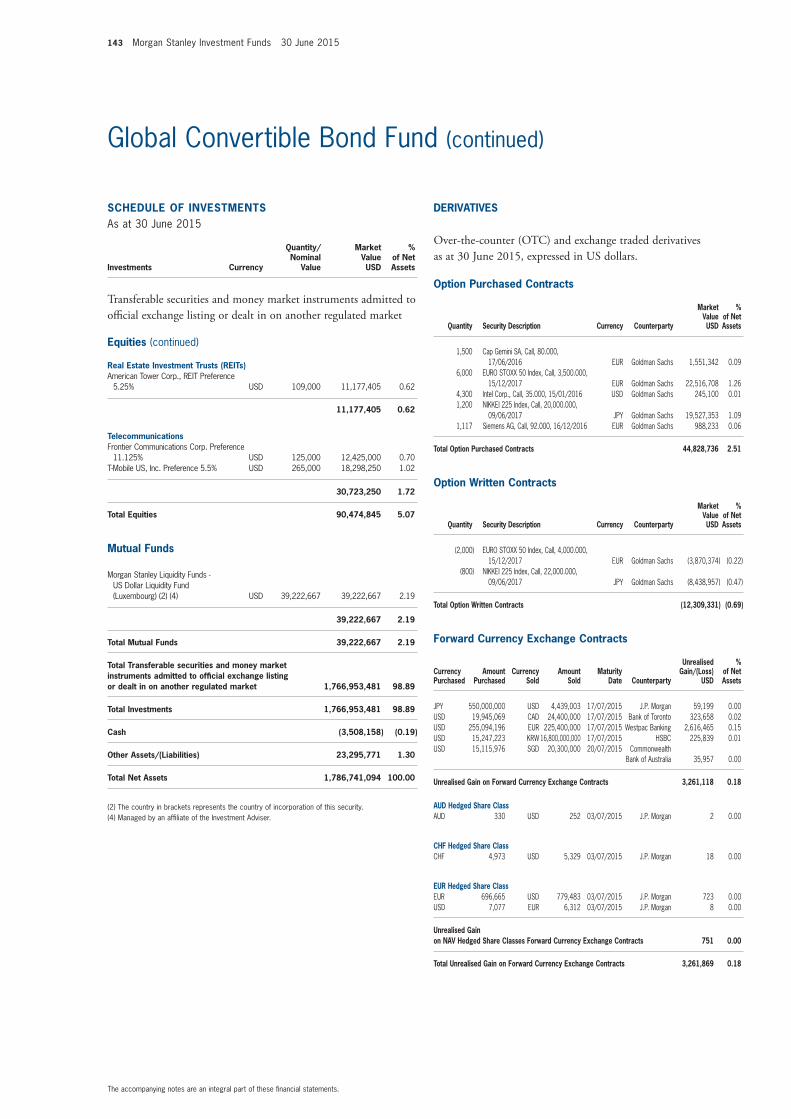
143 Morgan Stanley Investment Funds 30 June 2015
The accompanying notes are an integral part of these financial statements.
Global Convertible Bond Fund (continued)
SCHEDULE of invEStmEntSAs at 30 June 2015
Investments Currency
Quantity/Nominal
Value
Market Value USD
% of Net Assets
transferable securities and money market instruments admitted to official exchange listing or dealt in on another regulated market
Equities (continued)
Real Estate investment trusts (REits)American Tower Corp., REIT Preference
5.25% USD 109,000 11,177,405 0.62
11,177,405 0.62
telecommunicationsFrontier Communications Corp. Preference
11.125% USD 125,000 12,425,000 0.70T-Mobile US, Inc. Preference 5.5% USD 265,000 18,298,250 1.02
30,723,250 1.72
total Equities 90,474,845 5.07
mutual funds
Morgan Stanley Liquidity Funds - US Dollar Liquidity Fund (Luxembourg) (2) (4) USD 39,222,667 39,222,667 2.19
39,222,667 2.19
total mutual funds 39,222,667 2.19
total transferable securities and money market instruments admitted to official exchange listing or dealt in on another regulated market 1,766,953,481 98.89
total investments 1,766,953,481 98.89
Cash (3,508,158) (0.19)
other Assets/(Liabilities) 23,295,771 1.30
total net Assets 1,786,741,094 100.00
(2) The country in brackets represents the country of incorporation of this security.(4) Managed by an affiliate of the Investment Adviser.
option Purchased Contracts
Quantity Security Description Currency Counterparty
market value USD
% of net Assets
1,500 Cap Gemini SA, Call, 80.000, 17/06/2016 EUR Goldman Sachs 1,551,342 0.09
6,000 EURO STOXX 50 Index, Call, 3,500.000, 15/12/2017 EUR Goldman Sachs 22,516,708 1.26
4,300 Intel Corp., Call, 35.000, 15/01/2016 USD Goldman Sachs 245,100 0.011,200 NIKKEI 225 Index, Call, 20,000.000,
09/06/2017 JPY Goldman Sachs 19,527,353 1.091,117 Siemens AG, Call, 92.000, 16/12/2016 EUR Goldman Sachs 988,233 0.06
total option Purchased Contracts 44,828,736 2.51
option Written Contracts
Quantity Security Description Currency Counterparty
market value USD
% of net Assets
(2,000) EURO STOXX 50 Index, Call, 4,000.000, 15/12/2017 EUR Goldman Sachs (3,870,374) (0.22)
(800) NIKKEI 225 Index, Call, 22,000.000, 09/06/2017 JPY Goldman Sachs (8,438,957) (0.47)
total option Written Contracts (12,309,331) (0.69)
forward Currency Exchange Contracts (continued)
Currency Purchased
Amount Purchased
Currency Sold
Amount Sold
maturity Date Counterparty
Unrealised Gain/(Loss)
USD
% of net Assets
JPY 550,000,000 USD 4,439,003 17/07/2015 J.P. Morgan 59,199 0.00USD 19,945,069 CAD 24,400,000 17/07/2015 Bank of Toronto 323,658 0.02USD 255,094,196 EUR 225,400,000 17/07/2015 Westpac Banking 2,616,465 0.15USD 15,247,223 KRW 16,800,000,000 17/07/2015 HSBC 225,839 0.01USD 15,115,976 SGD 20,300,000 20/07/2015 Commonwealth
Bank of Australia 35,957 0.00
Unrealised Gain on forward Currency Exchange Contracts 3,261,118 0.18
AUD Hedged Share ClassAUD 330 USD 252 03/07/2015 J.P. Morgan 2 0.00
CHf Hedged Share ClassCHF 4,973 USD 5,329 03/07/2015 J.P. Morgan 18 0.00
EUR Hedged Share ClassEUR 696,665 USD 779,483 03/07/2015 J.P. Morgan 723 0.00USD 7,077 EUR 6,312 03/07/2015 J.P. Morgan 8 0.00
Unrealised Gain on nAv Hedged Share Classes forward Currency Exchange Contracts 751 0.00
total Unrealised Gain on forward Currency Exchange Contracts 3,261,869 0.18
DERivAtivES
Over-the-counter (OtC) and exchange traded derivatives as at 30 June 2015, expressed in US dollars.
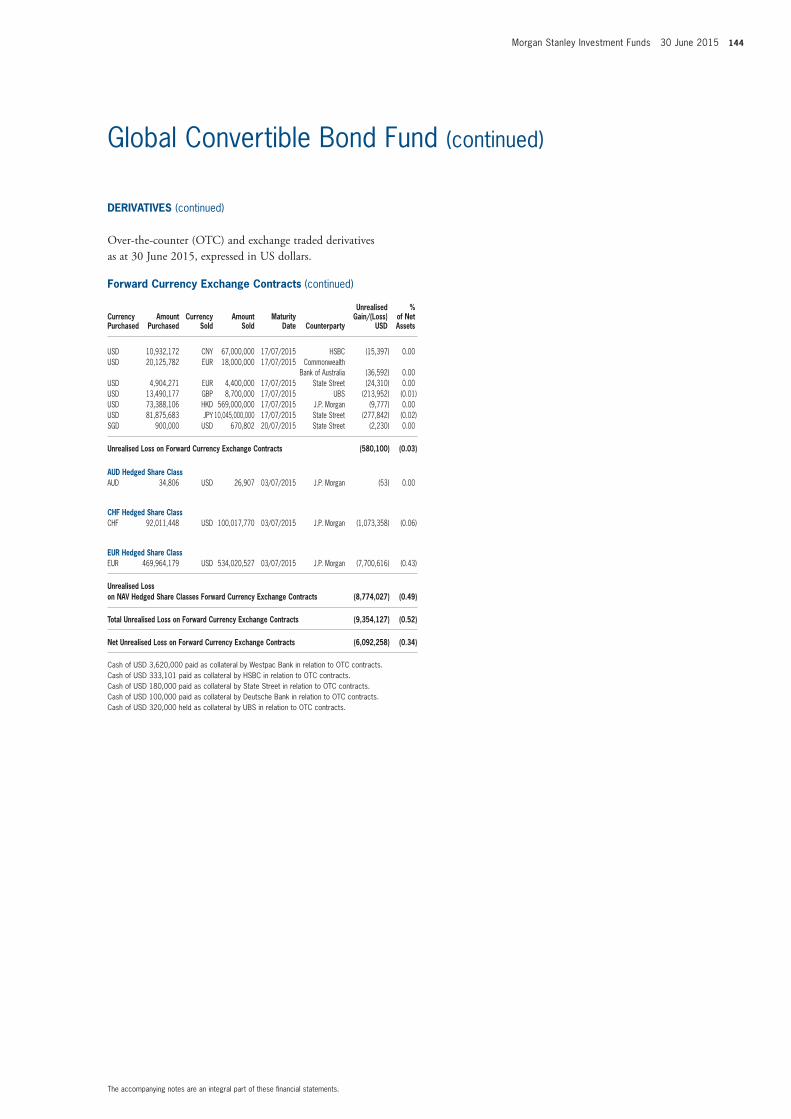
Morgan Stanley Investment Funds 30 June 2015 144
The accompanying notes are an integral part of these financial statements.
Global Convertible Bond Fund (continued)
forward Currency Exchange Contracts (continued)
Currency Purchased
Amount Purchased
Currency Sold
Amount Sold
maturity Date Counterparty
Unrealised Gain/(Loss)
USD
% of net Assets
USD 10,932,172 CNY 67,000,000 17/07/2015 HSBC (15,397) 0.00USD 20,125,782 EUR 18,000,000 17/07/2015 Commonwealth
Bank of Australia (36,592) 0.00USD 4,904,271 EUR 4,400,000 17/07/2015 State Street (24,310) 0.00USD 13,490,177 GBP 8,700,000 17/07/2015 UBS (213,952) (0.01)USD 73,388,106 HKD 569,000,000 17/07/2015 J.P. Morgan (9,777) 0.00USD 81,875,683 JPY 10,045,000,000 17/07/2015 State Street (277,842) (0.02)SGD 900,000 USD 670,802 20/07/2015 State Street (2,230) 0.00
Unrealised Loss on forward Currency Exchange Contracts (580,100) (0.03)
AUD Hedged Share ClassAUD 34,806 USD 26,907 03/07/2015 J.P. Morgan (53) 0.00
CHf Hedged Share ClassCHF 92,011,448 USD 100,017,770 03/07/2015 J.P. Morgan (1,073,358) (0.06)
EUR Hedged Share ClassEUR 469,964,179 USD 534,020,527 03/07/2015 J.P. Morgan (7,700,616) (0.43)
Unrealised Loss on nAv Hedged Share Classes forward Currency Exchange Contracts (8,774,027) (0.49)
total Unrealised Loss on forward Currency Exchange Contracts (9,354,127) (0.52)
net Unrealised Loss on forward Currency Exchange Contracts (6,092,258) (0.34)
Cash of USD 3,620,000 paid as collateral by Westpac Bank in relation to OTC contracts.Cash of USD 333,101 paid as collateral by HSBC in relation to OTC contracts.Cash of USD 180,000 paid as collateral by State Street in relation to OTC contracts.Cash of USD 100,000 paid as collateral by Deutsche Bank in relation to OTC contracts.Cash of USD 320,000 held as collateral by UBS in relation to OTC contracts.
DERivAtivES (continued)
Over-the-counter (OtC) and exchange traded derivatives as at 30 June 2015, expressed in US dollars.
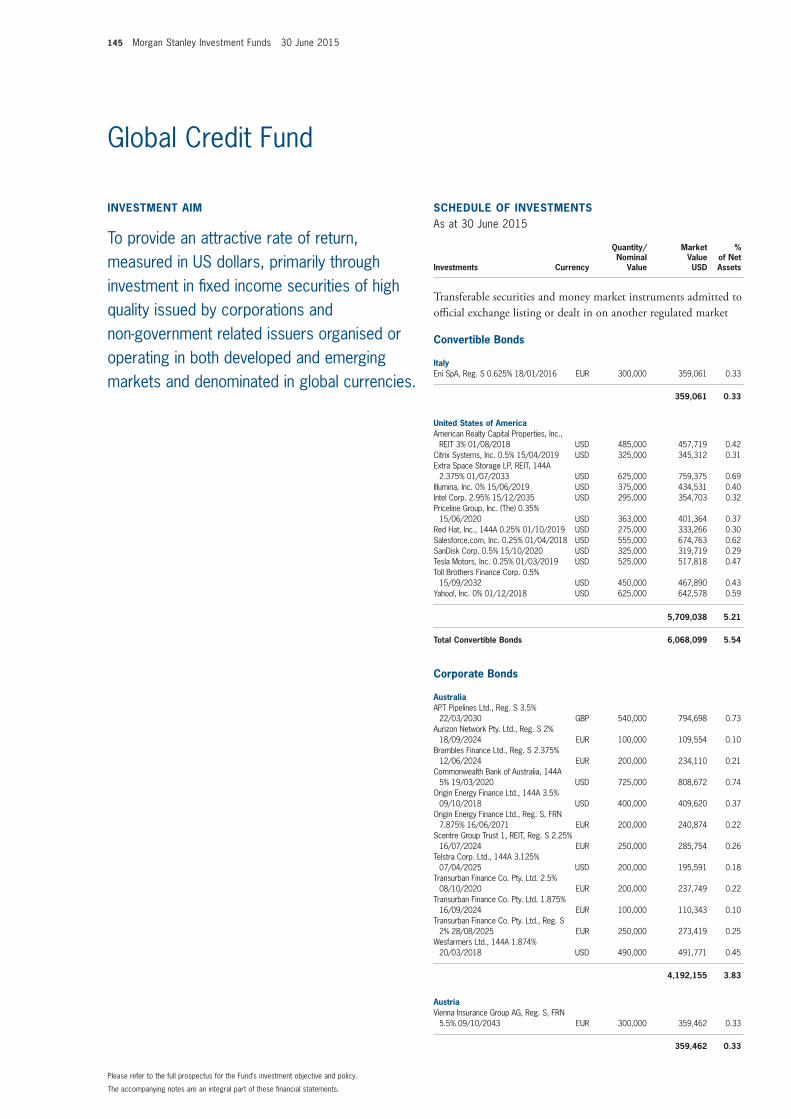
145 Morgan Stanley Investment Funds 30 June 2015
invEStmEnt Aim
To provide an attractive rate of return, measured in US dollars, primarily through investment in fixed income securities of high quality issued by corporations and non-government related issuers organised or operating in both developed and emerging markets and denominated in global currencies.
SCHEDULE of invEStmEntSAs at 30 June 2015
Investments Currency
Quantity/Nominal
Value
Market Value USD
% of Net Assets
transferable securities and money market instruments admitted to official exchange listing or dealt in on another regulated market
Convertible Bonds
italyEni SpA, Reg. S 0.625% 18/01/2016 EUR 300,000 359,061 0.33
359,061 0.33
United States of AmericaAmerican Realty Capital Properties, Inc.,
REIT 3% 01/08/2018 USD 485,000 457,719 0.42Citrix Systems, Inc. 0.5% 15/04/2019 USD 325,000 345,312 0.31Extra Space Storage LP, REIT, 144A
2.375% 01/07/2033 USD 625,000 759,375 0.69Illumina, Inc. 0% 15/06/2019 USD 375,000 434,531 0.40Intel Corp. 2.95% 15/12/2035 USD 295,000 354,703 0.32Priceline Group, Inc. (The) 0.35%
15/06/2020 USD 363,000 401,364 0.37Red Hat, Inc., 144A 0.25% 01/10/2019 USD 275,000 333,266 0.30Salesforce.com, Inc. 0.25% 01/04/2018 USD 555,000 674,763 0.62SanDisk Corp. 0.5% 15/10/2020 USD 325,000 319,719 0.29Tesla Motors, Inc. 0.25% 01/03/2019 USD 525,000 517,818 0.47Toll Brothers Finance Corp. 0.5%
15/09/2032 USD 450,000 467,890 0.43Yahoo!, Inc. 0% 01/12/2018 USD 625,000 642,578 0.59
5,709,038 5.21
total Convertible Bonds 6,068,099 5.54
Corporate Bonds
AustraliaAPT Pipelines Ltd., Reg. S 3.5%
22/03/2030 GBP 540,000 794,698 0.73Aurizon Network Pty. Ltd., Reg. S 2%
18/09/2024 EUR 100,000 109,554 0.10Brambles Finance Ltd., Reg. S 2.375%
12/06/2024 EUR 200,000 234,110 0.21Commonwealth Bank of Australia, 144A
5% 19/03/2020 USD 725,000 808,672 0.74Origin Energy Finance Ltd., 144A 3.5%
09/10/2018 USD 400,000 409,620 0.37Origin Energy Finance Ltd., Reg. S, FRN
7.875% 16/06/2071 EUR 200,000 240,874 0.22Scentre Group Trust 1, REIT, Reg. S 2.25%
16/07/2024 EUR 250,000 285,754 0.26Telstra Corp. Ltd., 144A 3.125%
07/04/2025 USD 200,000 195,591 0.18Transurban Finance Co. Pty. Ltd. 2.5%
08/10/2020 EUR 200,000 237,749 0.22Transurban Finance Co. Pty. Ltd. 1.875%
16/09/2024 EUR 100,000 110,343 0.10Transurban Finance Co. Pty. Ltd., Reg. S
2% 28/08/2025 EUR 250,000 273,419 0.25Wesfarmers Ltd., 144A 1.874%
20/03/2018 USD 490,000 491,771 0.45
4,192,155 3.83
AustriaVienna Insurance Group AG, Reg. S, FRN
5.5% 09/10/2043 EUR 300,000 359,462 0.33
359,462 0.33
The accompanying notes are an integral part of these financial statements.
Please refer to the full prospectus for the Fund’s investment objective and policy.
Global Credit Fund
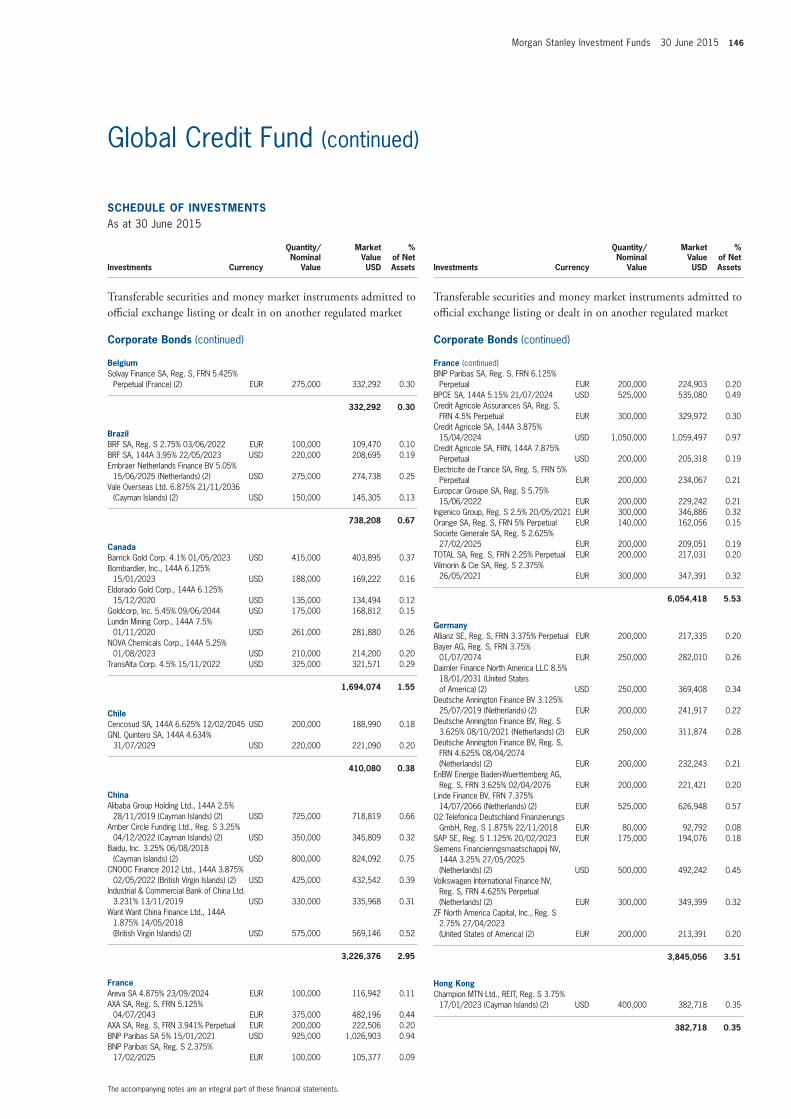
Morgan Stanley Investment Funds 30 June 2015 146
SCHEDULE of invEStmEntSAs at 30 June 2015
Investments Currency
Quantity/Nominal
Value
Market Value USD
% of Net Assets
transferable securities and money market instruments admitted to official exchange listing or dealt in on another regulated market
Corporate Bonds (continued)
BelgiumSolvay Finance SA, Reg. S, FRN 5.425%
Perpetual (France) (2) EUR 275,000 332,292 0.30
332,292 0.30
BrazilBRF SA, Reg. S 2.75% 03/06/2022 EUR 100,000 109,470 0.10BRF SA, 144A 3.95% 22/05/2023 USD 220,000 208,695 0.19Embraer Netherlands Finance BV 5.05%
15/06/2025 (Netherlands) (2) USD 275,000 274,738 0.25Vale Overseas Ltd. 6.875% 21/11/2036
(Cayman Islands) (2) USD 150,000 145,305 0.13
738,208 0.67
CanadaBarrick Gold Corp. 4.1% 01/05/2023 USD 415,000 403,895 0.37Bombardier, Inc., 144A 6.125%
15/01/2023 USD 188,000 169,222 0.16Eldorado Gold Corp., 144A 6.125%
15/12/2020 USD 135,000 134,494 0.12Goldcorp, Inc. 5.45% 09/06/2044 USD 175,000 168,812 0.15Lundin Mining Corp., 144A 7.5%
01/11/2020 USD 261,000 281,880 0.26NOVA Chemicals Corp., 144A 5.25%
01/08/2023 USD 210,000 214,200 0.20TransAlta Corp. 4.5% 15/11/2022 USD 325,000 321,571 0.29
1,694,074 1.55
ChileCencosud SA, 144A 6.625% 12/02/2045 USD 200,000 188,990 0.18GNL Quintero SA, 144A 4.634%
31/07/2029 USD 220,000 221,090 0.20
410,080 0.38
ChinaAlibaba Group Holding Ltd., 144A 2.5%
28/11/2019 (Cayman Islands) (2) USD 725,000 718,819 0.66Amber Circle Funding Ltd., Reg. S 3.25%
04/12/2022 (Cayman Islands) (2) USD 350,000 345,809 0.32Baidu, Inc. 3.25% 06/08/2018
(Cayman Islands) (2) USD 800,000 824,092 0.75CNOOC Finance 2012 Ltd., 144A 3.875%
02/05/2022 (British Virgin Islands) (2) USD 425,000 432,542 0.39Industrial & Commercial Bank of China Ltd.
3.231% 13/11/2019 USD 330,000 335,968 0.31Want Want China Finance Ltd., 144A
1.875% 14/05/2018 (British Virgin Islands) (2) USD 575,000 569,146 0.52
3,226,376 2.95
franceAreva SA 4.875% 23/09/2024 EUR 100,000 116,942 0.11AXA SA, Reg. S, FRN 5.125%
04/07/2043 EUR 375,000 482,196 0.44AXA SA, Reg. S, FRN 3.941% Perpetual EUR 200,000 222,506 0.20BNP Paribas SA 5% 15/01/2021 USD 925,000 1,026,903 0.94BNP Paribas SA, Reg. S 2.375%
17/02/2025 EUR 100,000 105,377 0.09
SCHEDULE of invEStmEntSAs at 30 June 2015
Investments Currency
Quantity/Nominal
Value
Market Value USD
% of Net Assets
transferable securities and money market instruments admitted to official exchange listing or dealt in on another regulated market
Corporate Bonds (continued)
france (continued)BNP Paribas SA, Reg. S, FRN 6.125%
Perpetual EUR 200,000 224,903 0.20BPCE SA, 144A 5.15% 21/07/2024 USD 525,000 535,080 0.49Credit Agricole Assurances SA, Reg. S,
FRN 4.5% Perpetual EUR 300,000 329,972 0.30Credit Agricole SA, 144A 3.875%
15/04/2024 USD 1,050,000 1,059,497 0.97Credit Agricole SA, FRN, 144A 7.875%
Perpetual USD 200,000 205,318 0.19Electricite de France SA, Reg. S, FRN 5%
Perpetual EUR 200,000 234,067 0.21Europcar Groupe SA, Reg. S 5.75%
15/06/2022 EUR 200,000 229,242 0.21Ingenico Group, Reg. S 2.5% 20/05/2021 EUR 300,000 346,886 0.32Orange SA, Reg. S, FRN 5% Perpetual EUR 140,000 162,056 0.15Societe Generale SA, Reg. S 2.625%
27/02/2025 EUR 200,000 209,051 0.19TOTAL SA, Reg. S, FRN 2.25% Perpetual EUR 200,000 217,031 0.20Vilmorin & Cie SA, Reg. S 2.375%
26/05/2021 EUR 300,000 347,391 0.32
6,054,418 5.53
GermanyAllianz SE, Reg. S, FRN 3.375% Perpetual EUR 200,000 217,335 0.20Bayer AG, Reg. S, FRN 3.75%
01/07/2074 EUR 250,000 282,010 0.26Daimler Finance North America LLC 8.5%
18/01/2031 (United States of America) (2) USD 250,000 369,408 0.34
Deutsche Annington Finance BV 3.125% 25/07/2019 (Netherlands) (2) EUR 200,000 241,917 0.22
Deutsche Annington Finance BV, Reg. S 3.625% 08/10/2021 (Netherlands) (2) EUR 250,000 311,874 0.28
Deutsche Annington Finance BV, Reg. S, FRN 4.625% 08/04/2074 (Netherlands) (2) EUR 200,000 232,243 0.21
EnBW Energie Baden-Wuerttemberg AG, Reg. S, FRN 3.625% 02/04/2076 EUR 200,000 221,421 0.20
Linde Finance BV, FRN 7.375% 14/07/2066 (Netherlands) (2) EUR 525,000 626,948 0.57
O2 Telefonica Deutschland Finanzierungs GmbH, Reg. S 1.875% 22/11/2018 EUR 80,000 92,792 0.08
SAP SE, Reg. S 1.125% 20/02/2023 EUR 175,000 194,076 0.18Siemens Financieringsmaatschappij NV,
144A 3.25% 27/05/2025 (Netherlands) (2) USD 500,000 492,242 0.45
Volkswagen International Finance NV, Reg. S, FRN 4.625% Perpetual (Netherlands) (2) EUR 300,000 349,399 0.32
ZF North America Capital, Inc., Reg. S 2.75% 27/04/2023 (United States of America) (2) EUR 200,000 213,391 0.20
3,845,056 3.51
Hong KongChampion MTN Ltd., REIT, Reg. S 3.75%
17/01/2023 (Cayman Islands) (2) USD 400,000 382,718 0.35
382,718 0.35
The accompanying notes are an integral part of these financial statements.
Global Credit Fund (continued)
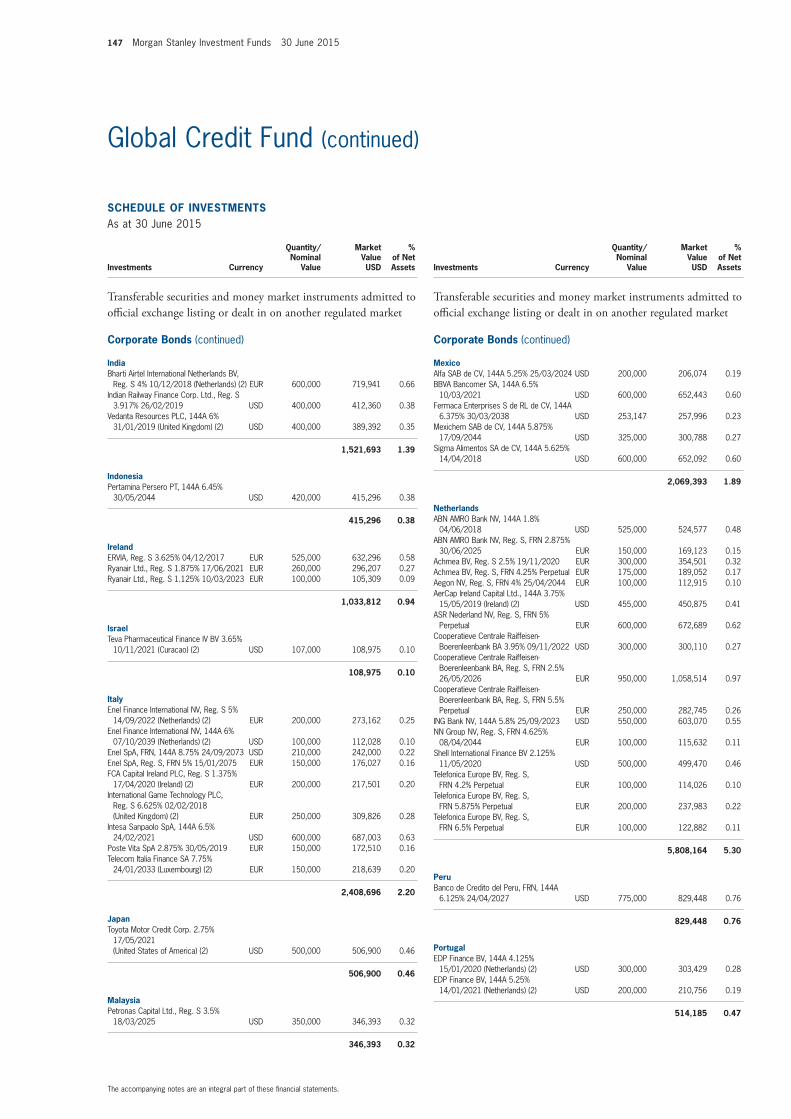
147 Morgan Stanley Investment Funds 30 June 2015
SCHEDULE of invEStmEntSAs at 30 June 2015
Investments Currency
Quantity/Nominal
Value
Market Value USD
% of Net Assets
transferable securities and money market instruments admitted to official exchange listing or dealt in on another regulated market
Corporate Bonds (continued)
indiaBharti Airtel International Netherlands BV,
Reg. S 4% 10/12/2018 (Netherlands) (2) EUR 600,000 719,941 0.66Indian Railway Finance Corp. Ltd., Reg. S
3.917% 26/02/2019 USD 400,000 412,360 0.38Vedanta Resources PLC, 144A 6%
31/01/2019 (United Kingdom) (2) USD 400,000 389,392 0.35
1,521,693 1.39
indonesiaPertamina Persero PT, 144A 6.45%
30/05/2044 USD 420,000 415,296 0.38
415,296 0.38
irelandERVIA, Reg. S 3.625% 04/12/2017 EUR 525,000 632,296 0.58Ryanair Ltd., Reg. S 1.875% 17/06/2021 EUR 260,000 296,207 0.27Ryanair Ltd., Reg. S 1.125% 10/03/2023 EUR 100,000 105,309 0.09
1,033,812 0.94
israelTeva Pharmaceutical Finance IV BV 3.65%
10/11/2021 (Curacao) (2) USD 107,000 108,975 0.10
108,975 0.10
italyEnel Finance International NV, Reg. S 5%
14/09/2022 (Netherlands) (2) EUR 200,000 273,162 0.25Enel Finance International NV, 144A 6%
07/10/2039 (Netherlands) (2) USD 100,000 112,028 0.10Enel SpA, FRN, 144A 8.75% 24/09/2073 USD 210,000 242,000 0.22Enel SpA, Reg. S, FRN 5% 15/01/2075 EUR 150,000 176,027 0.16FCA Capital Ireland PLC, Reg. S 1.375%
17/04/2020 (Ireland) (2) EUR 200,000 217,501 0.20International Game Technology PLC,
Reg. S 6.625% 02/02/2018 (United Kingdom) (2) EUR 250,000 309,826 0.28
Intesa Sanpaolo SpA, 144A 6.5% 24/02/2021 USD 600,000 687,003 0.63
Poste Vita SpA 2.875% 30/05/2019 EUR 150,000 172,510 0.16Telecom Italia Finance SA 7.75%
24/01/2033 (Luxembourg) (2) EUR 150,000 218,639 0.20
2,408,696 2.20
JapanToyota Motor Credit Corp. 2.75%
17/05/2021 (United States of America) (2) USD 500,000 506,900 0.46
506,900 0.46
malaysiaPetronas Capital Ltd., Reg. S 3.5%
18/03/2025 USD 350,000 346,393 0.32
346,393 0.32
SCHEDULE of invEStmEntSAs at 30 June 2015
Investments Currency
Quantity/Nominal
Value
Market Value USD
% of Net Assets
transferable securities and money market instruments admitted to official exchange listing or dealt in on another regulated market
Corporate Bonds (continued)
mexicoAlfa SAB de CV, 144A 5.25% 25/03/2024 USD 200,000 206,074 0.19BBVA Bancomer SA, 144A 6.5%
10/03/2021 USD 600,000 652,443 0.60Fermaca Enterprises S de RL de CV, 144A
6.375% 30/03/2038 USD 253,147 257,996 0.23Mexichem SAB de CV, 144A 5.875%
17/09/2044 USD 325,000 300,788 0.27Sigma Alimentos SA de CV, 144A 5.625%
14/04/2018 USD 600,000 652,092 0.60
2,069,393 1.89
netherlandsABN AMRO Bank NV, 144A 1.8%
04/06/2018 USD 525,000 524,577 0.48ABN AMRO Bank NV, Reg. S, FRN 2.875%
30/06/2025 EUR 150,000 169,123 0.15Achmea BV, Reg. S 2.5% 19/11/2020 EUR 300,000 354,501 0.32Achmea BV, Reg. S, FRN 4.25% Perpetual EUR 175,000 189,052 0.17Aegon NV, Reg. S, FRN 4% 25/04/2044 EUR 100,000 112,915 0.10AerCap Ireland Capital Ltd., 144A 3.75%
15/05/2019 (Ireland) (2) USD 455,000 450,875 0.41ASR Nederland NV, Reg. S, FRN 5%
Perpetual EUR 600,000 672,689 0.62Cooperatieve Centrale Raiffeisen-
Boerenleenbank BA 3.95% 09/11/2022 USD 300,000 300,110 0.27Cooperatieve Centrale Raiffeisen-
Boerenleenbank BA, Reg. S, FRN 2.5% 26/05/2026 EUR 950,000 1,058,514 0.97
Cooperatieve Centrale Raiffeisen-Boerenleenbank BA, Reg. S, FRN 5.5% Perpetual EUR 250,000 282,745 0.26
ING Bank NV, 144A 5.8% 25/09/2023 USD 550,000 603,070 0.55NN Group NV, Reg. S, FRN 4.625%
08/04/2044 EUR 100,000 115,632 0.11Shell International Finance BV 2.125%
11/05/2020 USD 500,000 499,470 0.46Telefonica Europe BV, Reg. S,
FRN 4.2% Perpetual EUR 100,000 114,026 0.10Telefonica Europe BV, Reg. S,
FRN 5.875% Perpetual EUR 200,000 237,983 0.22Telefonica Europe BV, Reg. S,
FRN 6.5% Perpetual EUR 100,000 122,882 0.11
5,808,164 5.30
PeruBanco de Credito del Peru, FRN, 144A
6.125% 24/04/2027 USD 775,000 829,448 0.76
829,448 0.76
PortugalEDP Finance BV, 144A 4.125%
15/01/2020 (Netherlands) (2) USD 300,000 303,429 0.28EDP Finance BV, 144A 5.25%
14/01/2021 (Netherlands) (2) USD 200,000 210,756 0.19
514,185 0.47
The accompanying notes are an integral part of these financial statements.
Global Credit Fund (continued)
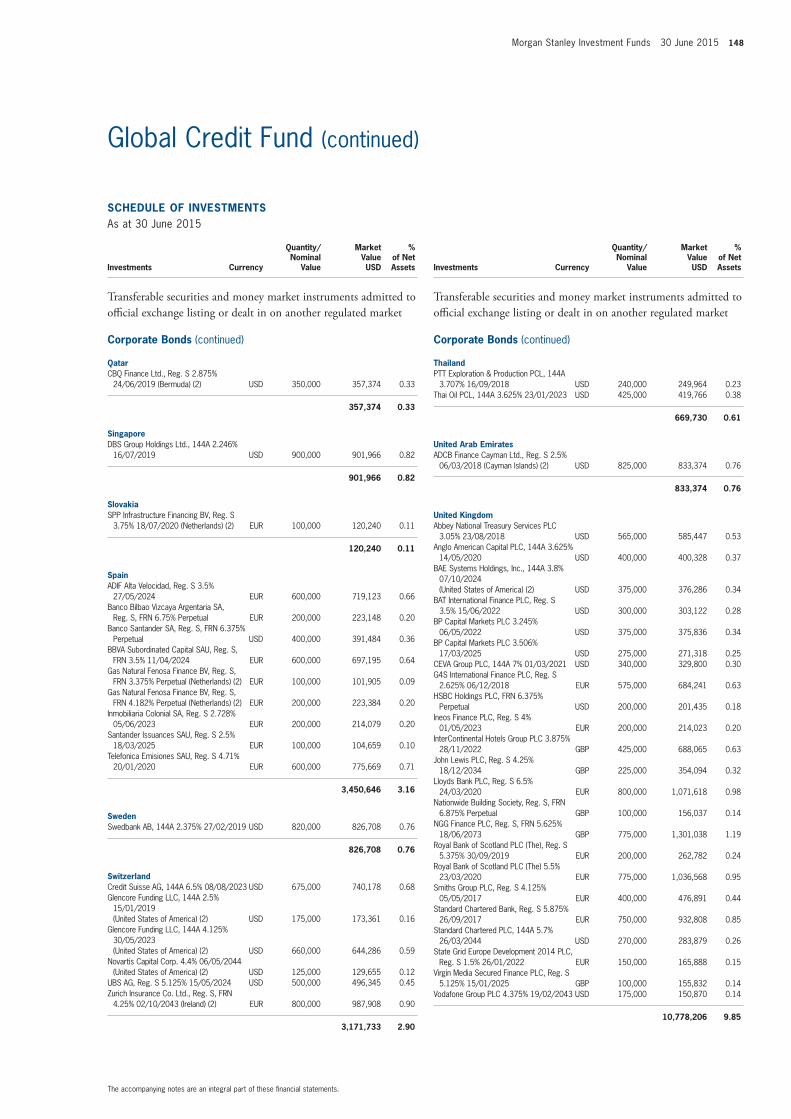
Morgan Stanley Investment Funds 30 June 2015 148
SCHEDULE of invEStmEntSAs at 30 June 2015
Investments Currency
Quantity/Nominal
Value
Market Value USD
% of Net Assets
transferable securities and money market instruments admitted to official exchange listing or dealt in on another regulated market
Corporate Bonds (continued)
QatarCBQ Finance Ltd., Reg. S 2.875%
24/06/2019 (Bermuda) (2) USD 350,000 357,374 0.33
357,374 0.33
SingaporeDBS Group Holdings Ltd., 144A 2.246%
16/07/2019 USD 900,000 901,966 0.82
901,966 0.82
SlovakiaSPP Infrastructure Financing BV, Reg. S
3.75% 18/07/2020 (Netherlands) (2) EUR 100,000 120,240 0.11
120,240 0.11
SpainADIF Alta Velocidad, Reg. S 3.5%
27/05/2024 EUR 600,000 719,123 0.66Banco Bilbao Vizcaya Argentaria SA,
Reg. S, FRN 6.75% Perpetual EUR 200,000 223,148 0.20Banco Santander SA, Reg. S, FRN 6.375%
Perpetual USD 400,000 391,484 0.36BBVA Subordinated Capital SAU, Reg. S,
FRN 3.5% 11/04/2024 EUR 600,000 697,195 0.64Gas Natural Fenosa Finance BV, Reg. S,
FRN 3.375% Perpetual (Netherlands) (2) EUR 100,000 101,905 0.09Gas Natural Fenosa Finance BV, Reg. S,
FRN 4.182% Perpetual (Netherlands) (2) EUR 200,000 223,384 0.20Inmobiliaria Colonial SA, Reg. S 2.728%
05/06/2023 EUR 200,000 214,079 0.20Santander Issuances SAU, Reg. S 2.5%
18/03/2025 EUR 100,000 104,659 0.10Telefonica Emisiones SAU, Reg. S 4.71%
20/01/2020 EUR 600,000 775,669 0.71
3,450,646 3.16
SwedenSwedbank AB, 144A 2.375% 27/02/2019 USD 820,000 826,708 0.76
826,708 0.76
SwitzerlandCredit Suisse AG, 144A 6.5% 08/08/2023 USD 675,000 740,178 0.68Glencore Funding LLC, 144A 2.5%
15/01/2019 (United States of America) (2) USD 175,000 173,361 0.16
Glencore Funding LLC, 144A 4.125% 30/05/2023 (United States of America) (2) USD 660,000 644,286 0.59
Novartis Capital Corp. 4.4% 06/05/2044 (United States of America) (2) USD 125,000 129,655 0.12
UBS AG, Reg. S 5.125% 15/05/2024 USD 500,000 496,345 0.45Zurich Insurance Co. Ltd., Reg. S, FRN
4.25% 02/10/2043 (Ireland) (2) EUR 800,000 987,908 0.90
3,171,733 2.90
SCHEDULE of invEStmEntSAs at 30 June 2015
Investments Currency
Quantity/Nominal
Value
Market Value USD
% of Net Assets
transferable securities and money market instruments admitted to official exchange listing or dealt in on another regulated market
Corporate Bonds (continued)
thailandPTT Exploration & Production PCL, 144A
3.707% 16/09/2018 USD 240,000 249,964 0.23Thai Oil PCL, 144A 3.625% 23/01/2023 USD 425,000 419,766 0.38
669,730 0.61
United Arab EmiratesADCB Finance Cayman Ltd., Reg. S 2.5%
06/03/2018 (Cayman Islands) (2) USD 825,000 833,374 0.76
833,374 0.76
United KingdomAbbey National Treasury Services PLC
3.05% 23/08/2018 USD 565,000 585,447 0.53Anglo American Capital PLC, 144A 3.625%
14/05/2020 USD 400,000 400,328 0.37BAE Systems Holdings, Inc., 144A 3.8%
07/10/2024 (United States of America) (2) USD 375,000 376,286 0.34
BAT International Finance PLC, Reg. S 3.5% 15/06/2022 USD 300,000 303,122 0.28
BP Capital Markets PLC 3.245% 06/05/2022 USD 375,000 375,836 0.34
BP Capital Markets PLC 3.506% 17/03/2025 USD 275,000 271,318 0.25
CEVA Group PLC, 144A 7% 01/03/2021 USD 340,000 329,800 0.30G4S International Finance PLC, Reg. S
2.625% 06/12/2018 EUR 575,000 684,241 0.63HSBC Holdings PLC, FRN 6.375%
Perpetual USD 200,000 201,435 0.18Ineos Finance PLC, Reg. S 4%
01/05/2023 EUR 200,000 214,023 0.20InterContinental Hotels Group PLC 3.875%
28/11/2022 GBP 425,000 688,065 0.63John Lewis PLC, Reg. S 4.25%
18/12/2034 GBP 225,000 354,094 0.32Lloyds Bank PLC, Reg. S 6.5%
24/03/2020 EUR 800,000 1,071,618 0.98Nationwide Building Society, Reg. S, FRN
6.875% Perpetual GBP 100,000 156,037 0.14NGG Finance PLC, Reg. S, FRN 5.625%
18/06/2073 GBP 775,000 1,301,038 1.19Royal Bank of Scotland PLC (The), Reg. S
5.375% 30/09/2019 EUR 200,000 262,782 0.24Royal Bank of Scotland PLC (The) 5.5%
23/03/2020 EUR 775,000 1,036,568 0.95Smiths Group PLC, Reg. S 4.125%
05/05/2017 EUR 400,000 476,891 0.44Standard Chartered Bank, Reg. S 5.875%
26/09/2017 EUR 750,000 932,808 0.85Standard Chartered PLC, 144A 5.7%
26/03/2044 USD 270,000 283,879 0.26State Grid Europe Development 2014 PLC,
Reg. S 1.5% 26/01/2022 EUR 150,000 165,888 0.15Virgin Media Secured Finance PLC, Reg. S
5.125% 15/01/2025 GBP 100,000 155,832 0.14Vodafone Group PLC 4.375% 19/02/2043 USD 175,000 150,870 0.14
10,778,206 9.85
The accompanying notes are an integral part of these financial statements.
Global Credit Fund (continued)
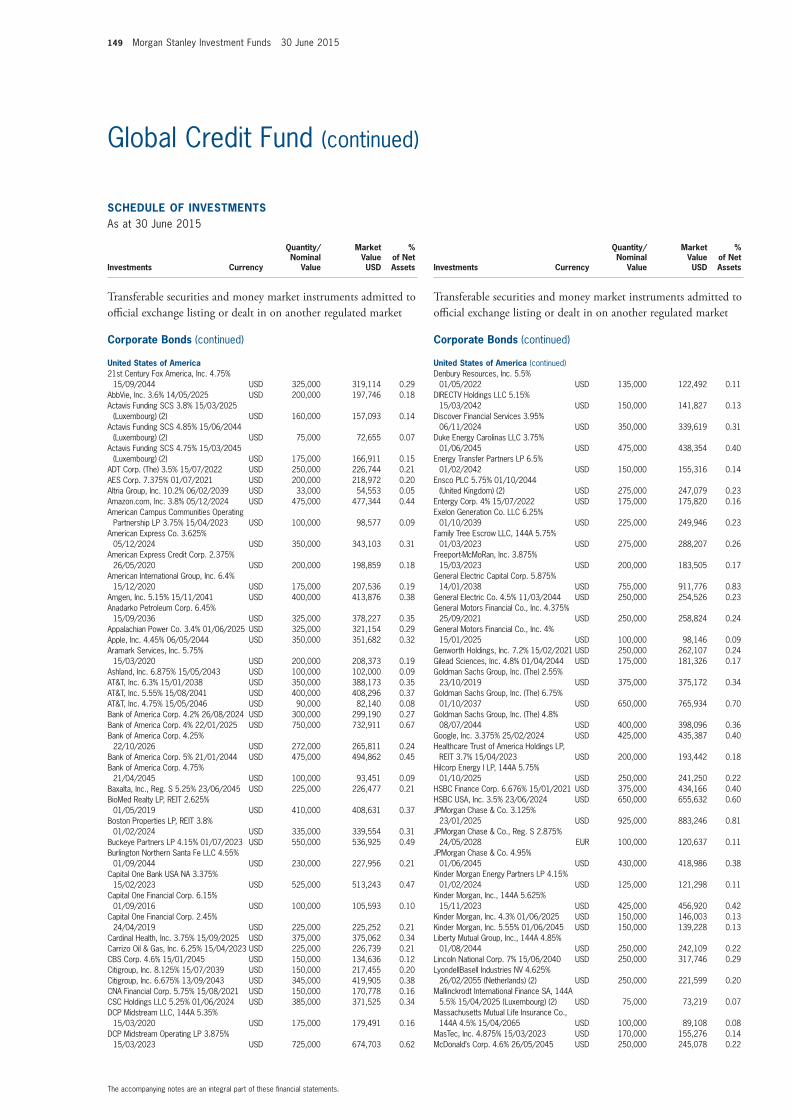
149 Morgan Stanley Investment Funds 30 June 2015
SCHEDULE of invEStmEntSAs at 30 June 2015
Investments Currency
Quantity/Nominal
Value
Market Value USD
% of Net Assets
transferable securities and money market instruments admitted to official exchange listing or dealt in on another regulated market
Corporate Bonds (continued)
United States of America21st Century Fox America, Inc. 4.75%
15/09/2044 USD 325,000 319,114 0.29AbbVie, Inc. 3.6% 14/05/2025 USD 200,000 197,746 0.18Actavis Funding SCS 3.8% 15/03/2025
(Luxembourg) (2) USD 160,000 157,093 0.14Actavis Funding SCS 4.85% 15/06/2044
(Luxembourg) (2) USD 75,000 72,655 0.07Actavis Funding SCS 4.75% 15/03/2045
(Luxembourg) (2) USD 175,000 166,911 0.15ADT Corp. (The) 3.5% 15/07/2022 USD 250,000 226,744 0.21AES Corp. 7.375% 01/07/2021 USD 200,000 218,972 0.20Altria Group, Inc. 10.2% 06/02/2039 USD 33,000 54,553 0.05Amazon.com, Inc. 3.8% 05/12/2024 USD 475,000 477,344 0.44American Campus Communities Operating
Partnership LP 3.75% 15/04/2023 USD 100,000 98,577 0.09American Express Co. 3.625%
05/12/2024 USD 350,000 343,103 0.31American Express Credit Corp. 2.375%
26/05/2020 USD 200,000 198,859 0.18American International Group, Inc. 6.4%
15/12/2020 USD 175,000 207,536 0.19Amgen, Inc. 5.15% 15/11/2041 USD 400,000 413,876 0.38Anadarko Petroleum Corp. 6.45%
15/09/2036 USD 325,000 378,227 0.35Appalachian Power Co. 3.4% 01/06/2025 USD 325,000 321,154 0.29Apple, Inc. 4.45% 06/05/2044 USD 350,000 351,682 0.32Aramark Services, Inc. 5.75%
15/03/2020 USD 200,000 208,373 0.19Ashland, Inc. 6.875% 15/05/2043 USD 100,000 102,000 0.09AT&T, Inc. 6.3% 15/01/2038 USD 350,000 388,173 0.35AT&T, Inc. 5.55% 15/08/2041 USD 400,000 408,296 0.37AT&T, Inc. 4.75% 15/05/2046 USD 90,000 82,140 0.08Bank of America Corp. 4.2% 26/08/2024 USD 300,000 299,190 0.27Bank of America Corp. 4% 22/01/2025 USD 750,000 732,911 0.67Bank of America Corp. 4.25%
22/10/2026 USD 272,000 265,811 0.24Bank of America Corp. 5% 21/01/2044 USD 475,000 494,862 0.45Bank of America Corp. 4.75%
21/04/2045 USD 100,000 93,451 0.09Baxalta, Inc., Reg. S 5.25% 23/06/2045 USD 225,000 226,477 0.21BioMed Realty LP, REIT 2.625%
01/05/2019 USD 410,000 408,631 0.37Boston Properties LP, REIT 3.8%
01/02/2024 USD 335,000 339,554 0.31Buckeye Partners LP 4.15% 01/07/2023 USD 550,000 536,925 0.49Burlington Northern Santa Fe LLC 4.55%
01/09/2044 USD 230,000 227,956 0.21Capital One Bank USA NA 3.375%
15/02/2023 USD 525,000 513,243 0.47Capital One Financial Corp. 6.15%
01/09/2016 USD 100,000 105,593 0.10Capital One Financial Corp. 2.45%
24/04/2019 USD 225,000 225,252 0.21Cardinal Health, Inc. 3.75% 15/09/2025 USD 375,000 375,062 0.34Carrizo Oil & Gas, Inc. 6.25% 15/04/2023 USD 225,000 226,739 0.21CBS Corp. 4.6% 15/01/2045 USD 150,000 134,636 0.12Citigroup, Inc. 8.125% 15/07/2039 USD 150,000 217,455 0.20Citigroup, Inc. 6.675% 13/09/2043 USD 345,000 419,905 0.38CNA Financial Corp. 5.75% 15/08/2021 USD 150,000 170,778 0.16CSC Holdings LLC 5.25% 01/06/2024 USD 385,000 371,525 0.34DCP Midstream LLC, 144A 5.35%
15/03/2020 USD 175,000 179,491 0.16DCP Midstream Operating LP 3.875%
15/03/2023 USD 725,000 674,703 0.62
SCHEDULE of invEStmEntSAs at 30 June 2015
Investments Currency
Quantity/Nominal
Value
Market Value USD
% of Net Assets
transferable securities and money market instruments admitted to official exchange listing or dealt in on another regulated market
Corporate Bonds (continued)
United States of America (continued)Denbury Resources, Inc. 5.5%
01/05/2022 USD 135,000 122,492 0.11DIRECTV Holdings LLC 5.15%
15/03/2042 USD 150,000 141,827 0.13Discover Financial Services 3.95%
06/11/2024 USD 350,000 339,619 0.31Duke Energy Carolinas LLC 3.75%
01/06/2045 USD 475,000 438,354 0.40Energy Transfer Partners LP 6.5%
01/02/2042 USD 150,000 155,316 0.14Ensco PLC 5.75% 01/10/2044
(United Kingdom) (2) USD 275,000 247,079 0.23Entergy Corp. 4% 15/07/2022 USD 175,000 175,820 0.16Exelon Generation Co. LLC 6.25%
01/10/2039 USD 225,000 249,946 0.23Family Tree Escrow LLC, 144A 5.75%
01/03/2023 USD 275,000 288,207 0.26Freeport-McMoRan, Inc. 3.875%
15/03/2023 USD 200,000 183,505 0.17General Electric Capital Corp. 5.875%
14/01/2038 USD 755,000 911,776 0.83General Electric Co. 4.5% 11/03/2044 USD 250,000 254,526 0.23General Motors Financial Co., Inc. 4.375%
25/09/2021 USD 250,000 258,824 0.24General Motors Financial Co., Inc. 4%
15/01/2025 USD 100,000 98,146 0.09Genworth Holdings, Inc. 7.2% 15/02/2021 USD 250,000 262,107 0.24Gilead Sciences, Inc. 4.8% 01/04/2044 USD 175,000 181,326 0.17Goldman Sachs Group, Inc. (The) 2.55%
23/10/2019 USD 375,000 375,172 0.34Goldman Sachs Group, Inc. (The) 6.75%
01/10/2037 USD 650,000 765,934 0.70Goldman Sachs Group, Inc. (The) 4.8%
08/07/2044 USD 400,000 398,096 0.36Google, Inc. 3.375% 25/02/2024 USD 425,000 435,387 0.40Healthcare Trust of America Holdings LP,
REIT 3.7% 15/04/2023 USD 200,000 193,442 0.18Hilcorp Energy I LP, 144A 5.75%
01/10/2025 USD 250,000 241,250 0.22HSBC Finance Corp. 6.676% 15/01/2021 USD 375,000 434,166 0.40HSBC USA, Inc. 3.5% 23/06/2024 USD 650,000 655,632 0.60JPMorgan Chase & Co. 3.125%
23/01/2025 USD 925,000 883,246 0.81JPMorgan Chase & Co., Reg. S 2.875%
24/05/2028 EUR 100,000 120,637 0.11JPMorgan Chase & Co. 4.95%
01/06/2045 USD 430,000 418,986 0.38Kinder Morgan Energy Partners LP 4.15%
01/02/2024 USD 125,000 121,298 0.11Kinder Morgan, Inc., 144A 5.625%
15/11/2023 USD 425,000 456,920 0.42Kinder Morgan, Inc. 4.3% 01/06/2025 USD 150,000 146,003 0.13Kinder Morgan, Inc. 5.55% 01/06/2045 USD 150,000 139,228 0.13Liberty Mutual Group, Inc., 144A 4.85%
01/08/2044 USD 250,000 242,109 0.22Lincoln National Corp. 7% 15/06/2040 USD 250,000 317,746 0.29LyondellBasell Industries NV 4.625%
26/02/2055 (Netherlands) (2) USD 250,000 221,599 0.20Mallinckrodt International Finance SA, 144A
5.5% 15/04/2025 (Luxembourg) (2) USD 75,000 73,219 0.07Massachusetts Mutual Life Insurance Co.,
144A 4.5% 15/04/2065 USD 100,000 89,108 0.08MasTec, Inc. 4.875% 15/03/2023 USD 170,000 155,276 0.14McDonald’s Corp. 4.6% 26/05/2045 USD 250,000 245,078 0.22
The accompanying notes are an integral part of these financial statements.
Global Credit Fund (continued)
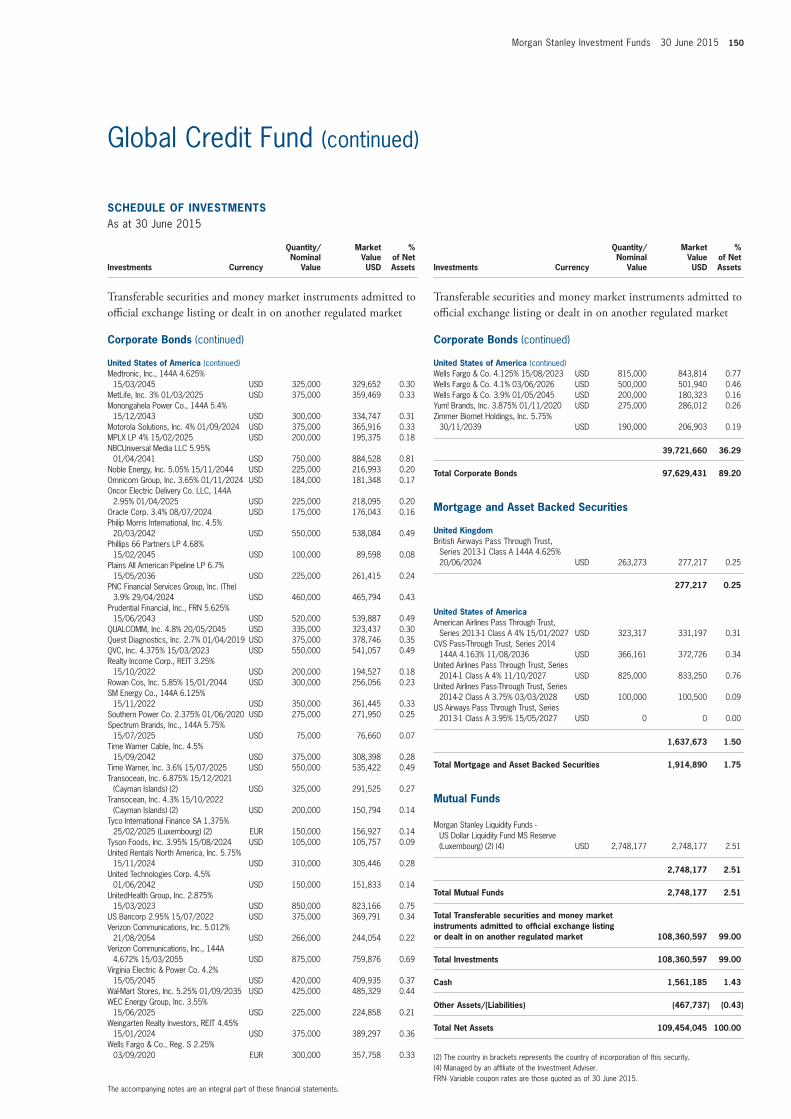
Morgan Stanley Investment Funds 30 June 2015 150
SCHEDULE of invEStmEntSAs at 30 June 2015
Investments Currency
Quantity/Nominal
Value
Market Value USD
% of Net Assets
transferable securities and money market instruments admitted to official exchange listing or dealt in on another regulated market
Corporate Bonds (continued)
United States of America (continued)Medtronic, Inc., 144A 4.625%
15/03/2045 USD 325,000 329,652 0.30MetLife, Inc. 3% 01/03/2025 USD 375,000 359,469 0.33Monongahela Power Co., 144A 5.4%
15/12/2043 USD 300,000 334,747 0.31Motorola Solutions, Inc. 4% 01/09/2024 USD 375,000 365,916 0.33MPLX LP 4% 15/02/2025 USD 200,000 195,375 0.18NBCUniversal Media LLC 5.95%
01/04/2041 USD 750,000 884,528 0.81Noble Energy, Inc. 5.05% 15/11/2044 USD 225,000 216,993 0.20Omnicom Group, Inc. 3.65% 01/11/2024 USD 184,000 181,348 0.17Oncor Electric Delivery Co. LLC, 144A
2.95% 01/04/2025 USD 225,000 218,095 0.20Oracle Corp. 3.4% 08/07/2024 USD 175,000 176,043 0.16Philip Morris International, Inc. 4.5%
20/03/2042 USD 550,000 538,084 0.49Phillips 66 Partners LP 4.68%
15/02/2045 USD 100,000 89,598 0.08Plains All American Pipeline LP 6.7%
15/05/2036 USD 225,000 261,415 0.24PNC Financial Services Group, Inc. (The)
3.9% 29/04/2024 USD 460,000 465,794 0.43Prudential Financial, Inc., FRN 5.625%
15/06/2043 USD 520,000 539,887 0.49QUALCOMM, Inc. 4.8% 20/05/2045 USD 335,000 323,437 0.30Quest Diagnostics, Inc. 2.7% 01/04/2019 USD 375,000 378,746 0.35QVC, Inc. 4.375% 15/03/2023 USD 550,000 541,057 0.49Realty Income Corp., REIT 3.25%
15/10/2022 USD 200,000 194,527 0.18Rowan Cos, Inc. 5.85% 15/01/2044 USD 300,000 256,056 0.23SM Energy Co., 144A 6.125%
15/11/2022 USD 350,000 361,445 0.33Southern Power Co. 2.375% 01/06/2020 USD 275,000 271,950 0.25Spectrum Brands, Inc., 144A 5.75%
15/07/2025 USD 75,000 76,660 0.07Time Warner Cable, Inc. 4.5%
15/09/2042 USD 375,000 308,398 0.28Time Warner, Inc. 3.6% 15/07/2025 USD 550,000 535,422 0.49Transocean, Inc. 6.875% 15/12/2021
(Cayman Islands) (2) USD 325,000 291,525 0.27Transocean, Inc. 4.3% 15/10/2022
(Cayman Islands) (2) USD 200,000 150,794 0.14Tyco International Finance SA 1.375%
25/02/2025 (Luxembourg) (2) EUR 150,000 156,927 0.14Tyson Foods, Inc. 3.95% 15/08/2024 USD 105,000 105,757 0.09United Rentals North America, Inc. 5.75%
15/11/2024 USD 310,000 305,446 0.28United Technologies Corp. 4.5%
01/06/2042 USD 150,000 151,833 0.14UnitedHealth Group, Inc. 2.875%
15/03/2023 USD 850,000 823,166 0.75US Bancorp 2.95% 15/07/2022 USD 375,000 369,791 0.34Verizon Communications, Inc. 5.012%
21/08/2054 USD 266,000 244,054 0.22Verizon Communications, Inc., 144A
4.672% 15/03/2055 USD 875,000 759,876 0.69Virginia Electric & Power Co. 4.2%
15/05/2045 USD 420,000 409,935 0.37Wal-Mart Stores, Inc. 5.25% 01/09/2035 USD 425,000 485,329 0.44WEC Energy Group, Inc. 3.55%
15/06/2025 USD 225,000 224,858 0.21Weingarten Realty Investors, REIT 4.45%
15/01/2024 USD 375,000 389,297 0.36Wells Fargo & Co., Reg. S 2.25%
03/09/2020 EUR 300,000 357,758 0.33
SCHEDULE of invEStmEntSAs at 30 June 2015
Investments Currency
Quantity/Nominal
Value
Market Value USD
% of Net Assets
transferable securities and money market instruments admitted to official exchange listing or dealt in on another regulated market
Corporate Bonds (continued)
United States of America (continued)Wells Fargo & Co. 4.125% 15/08/2023 USD 815,000 843,814 0.77Wells Fargo & Co. 4.1% 03/06/2026 USD 500,000 501,940 0.46Wells Fargo & Co. 3.9% 01/05/2045 USD 200,000 180,323 0.16Yum! Brands, Inc. 3.875% 01/11/2020 USD 275,000 286,012 0.26Zimmer Biomet Holdings, Inc. 5.75%
30/11/2039 USD 190,000 206,903 0.19
39,721,660 36.29
total Corporate Bonds 97,629,431 89.20
mortgage and Asset Backed Securities
United KingdomBritish Airways Pass Through Trust,
Series 2013-1 Class A 144A 4.625% 20/06/2024 USD 263,273 277,217 0.25
277,217 0.25
United States of AmericaAmerican Airlines Pass Through Trust,
Series 2013-1 Class A 4% 15/01/2027 USD 323,317 331,197 0.31CVS Pass-Through Trust, Series 2014
144A 4.163% 11/08/2036 USD 366,161 372,726 0.34United Airlines Pass Through Trust, Series
2014-1 Class A 4% 11/10/2027 USD 825,000 833,250 0.76United Airlines Pass-Through Trust, Series
2014-2 Class A 3.75% 03/03/2028 USD 100,000 100,500 0.09US Airways Pass Through Trust, Series
2013-1 Class A 3.95% 15/05/2027 USD 0 0 0.00
1,637,673 1.50
total mortgage and Asset Backed Securities 1,914,890 1.75
mutual funds
Morgan Stanley Liquidity Funds - US Dollar Liquidity Fund MS Reserve (Luxembourg) (2) (4) USD 2,748,177 2,748,177 2.51
2,748,177 2.51
total mutual funds 2,748,177 2.51
total transferable securities and money market instruments admitted to official exchange listing or dealt in on another regulated market 108,360,597 99.00
total investments 108,360,597 99.00
Cash 1,561,185 1.43
other Assets/(Liabilities) (467,737) (0.43)
total net Assets 109,454,045 100.00
(2) The country in brackets represents the country of incorporation of this security.(4) Managed by an affiliate of the Investment Adviser.FRN- Variable coupon rates are those quoted as of 30 June 2015.
The accompanying notes are an integral part of these financial statements.
Global Credit Fund (continued)
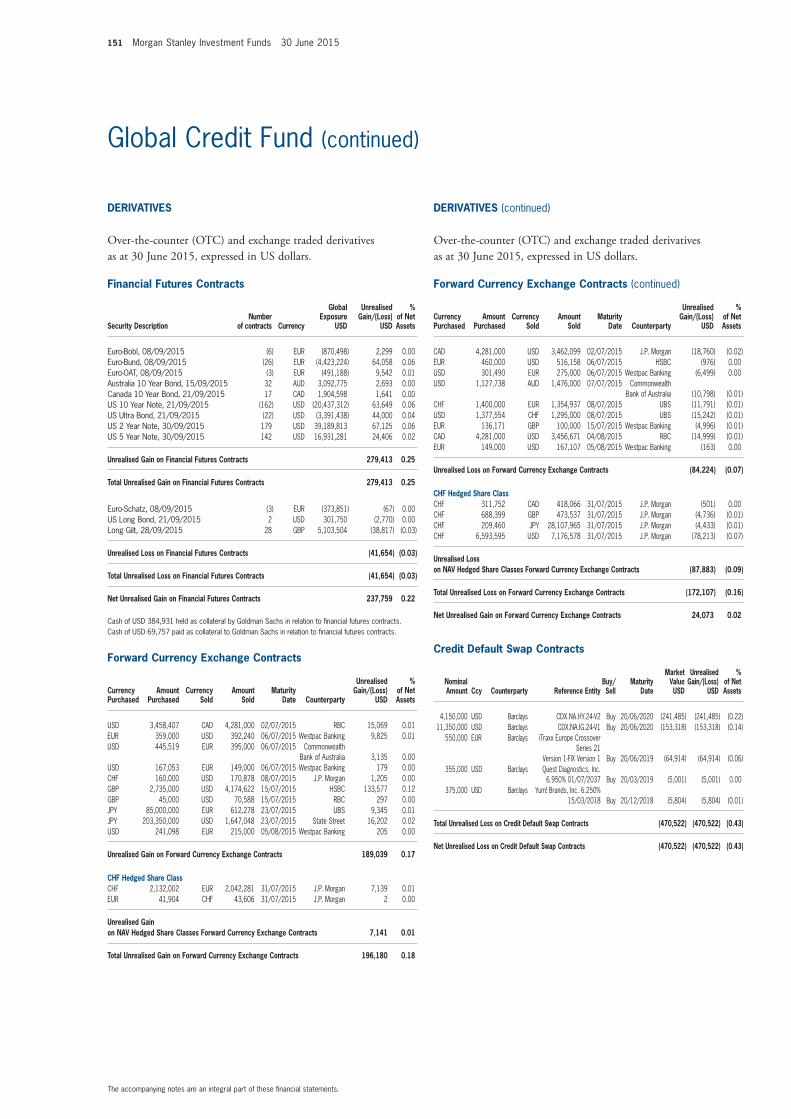
151 Morgan Stanley Investment Funds 30 June 2015
The accompanying notes are an integral part of these financial statements.
Global Credit Fund (continued)
financial futures Contracts
Security Descriptionnumber
of contracts Currency
Global Exposure
USD
Unrealised Gain/(Loss)
USD
% of net Assets
Euro-Bobl, 08/09/2015 (6) EUR (870,498) 2,299 0.00Euro-Bund, 08/09/2015 (26) EUR (4,423,224) 64,058 0.06Euro-OAT, 08/09/2015 (3) EUR (491,188) 9,542 0.01Australia 10 Year Bond, 15/09/2015 32 AUD 3,092,775 2,693 0.00Canada 10 Year Bond, 21/09/2015 17 CAD 1,904,598 1,641 0.00US 10 Year Note, 21/09/2015 (162) USD (20,437,312) 63,649 0.06US Ultra Bond, 21/09/2015 (22) USD (3,391,438) 44,000 0.04US 2 Year Note, 30/09/2015 179 USD 39,189,813 67,125 0.06US 5 Year Note, 30/09/2015 142 USD 16,931,281 24,406 0.02
Unrealised Gain on financial futures Contracts 279,413 0.25
total Unrealised Gain on financial futures Contracts 279,413 0.25
Euro-Schatz, 08/09/2015 (3) EUR (373,851) (67) 0.00US Long Bond, 21/09/2015 2 USD 301,750 (2,770) 0.00Long Gilt, 28/09/2015 28 GBP 5,103,504 (38,817) (0.03)
Unrealised Loss on financial futures Contracts (41,654) (0.03)
total Unrealised Loss on financial futures Contracts (41,654) (0.03)
net Unrealised Gain on financial futures Contracts 237,759 0.22
Cash of USD 384,931 held as collateral by Goldman Sachs in relation to financial futures contracts.Cash of USD 69,757 paid as collateral to Goldman Sachs in relation to financial futures contracts.
forward Currency Exchange Contracts (continued)
Currency Purchased
Amount Purchased
Currency Sold
Amount Sold
maturity Date Counterparty
Unrealised Gain/(Loss)
USD
% of net Assets
USD 3,458,407 CAD 4,281,000 02/07/2015 RBC 15,069 0.01EUR 359,000 USD 392,240 06/07/2015 Westpac Banking 9,825 0.01USD 445,519 EUR 395,000 06/07/2015 Commonwealth
Bank of Australia 3,135 0.00USD 167,053 EUR 149,000 06/07/2015 Westpac Banking 179 0.00CHF 160,000 USD 170,878 08/07/2015 J.P. Morgan 1,205 0.00GBP 2,735,000 USD 4,174,622 15/07/2015 HSBC 133,577 0.12GBP 45,000 USD 70,588 15/07/2015 RBC 297 0.00JPY 85,000,000 EUR 612,278 23/07/2015 UBS 9,345 0.01JPY 203,350,000 USD 1,647,048 23/07/2015 State Street 16,202 0.02USD 241,098 EUR 215,000 05/08/2015 Westpac Banking 205 0.00
Unrealised Gain on forward Currency Exchange Contracts 189,039 0.17
CHf Hedged Share ClassCHF 2,132,002 EUR 2,042,281 31/07/2015 J.P. Morgan 7,139 0.01EUR 41,904 CHF 43,606 31/07/2015 J.P. Morgan 2 0.00
Unrealised Gain on nAv Hedged Share Classes forward Currency Exchange Contracts 7,141 0.01
total Unrealised Gain on forward Currency Exchange Contracts 196,180 0.18
forward Currency Exchange Contracts (continued)
Currency Purchased
Amount Purchased
Currency Sold
Amount Sold
maturity Date Counterparty
Unrealised Gain/(Loss)
USD
% of net Assets
CAD 4,281,000 USD 3,462,099 02/07/2015 J.P. Morgan (18,760) (0.02)EUR 460,000 USD 516,158 06/07/2015 HSBC (976) 0.00USD 301,490 EUR 275,000 06/07/2015 Westpac Banking (6,499) 0.00USD 1,127,738 AUD 1,476,000 07/07/2015 Commonwealth
Bank of Australia (10,798) (0.01)CHF 1,400,000 EUR 1,354,937 08/07/2015 UBS (11,791) (0.01)USD 1,377,554 CHF 1,295,000 08/07/2015 UBS (15,242) (0.01)EUR 136,171 GBP 100,000 15/07/2015 Westpac Banking (4,996) (0.01)CAD 4,281,000 USD 3,456,671 04/08/2015 RBC (14,999) (0.01)EUR 149,000 USD 167,107 05/08/2015 Westpac Banking (163) 0.00
Unrealised Loss on forward Currency Exchange Contracts (84,224) (0.07)
CHf Hedged Share ClassCHF 311,752 CAD 418,066 31/07/2015 J.P. Morgan (501) 0.00CHF 688,399 GBP 473,537 31/07/2015 J.P. Morgan (4,736) (0.01)CHF 209,460 JPY 28,107,965 31/07/2015 J.P. Morgan (4,433) (0.01)CHF 6,593,595 USD 7,176,578 31/07/2015 J.P. Morgan (78,213) (0.07)
Unrealised Loss on nAv Hedged Share Classes forward Currency Exchange Contracts (87,883) (0.09)
total Unrealised Loss on forward Currency Exchange Contracts (172,107) (0.16)
net Unrealised Gain on forward Currency Exchange Contracts 24,073 0.02
Credit Default Swap Contracts
nominal Amount Ccy Counterparty Reference Entity
Buy/Sell
maturity Date
market value USD
Unrealised Gain/(Loss)
USD
% of net Assets
4,150,000 USD Barclays CDX.NA.HY.24-V2 Buy 20/06/2020 (241,485) (241,485) (0.22)11,350,000 USD Barclays CDX.NA.IG.24-V1 Buy 20/06/2020 (153,318) (153,318) (0.14)
550,000 EUR Barclays iTraxx Europe Crossover Series 21
Version 1-FIX Version 1 Buy 20/06/2019 (64,914) (64,914) (0.06)355,000 USD Barclays Quest Diagnostics, Inc.
6.950% 01/07/2037 Buy 20/03/2019 (5,001) (5,001) 0.00375,000 USD Barclays Yum! Brands, Inc. 6.250%
15/03/2018 Buy 20/12/2018 (5,804) (5,804) (0.01)
total Unrealised Loss on Credit Default Swap Contracts (470,522) (470,522) (0.43)
net Unrealised Loss on Credit Default Swap Contracts (470,522) (470,522) (0.43)
DERivAtivES
Over-the-counter (OtC) and exchange traded derivatives as at 30 June 2015, expressed in US dollars.
DERivAtivES (continued)
Over-the-counter (OtC) and exchange traded derivatives as at 30 June 2015, expressed in US dollars.
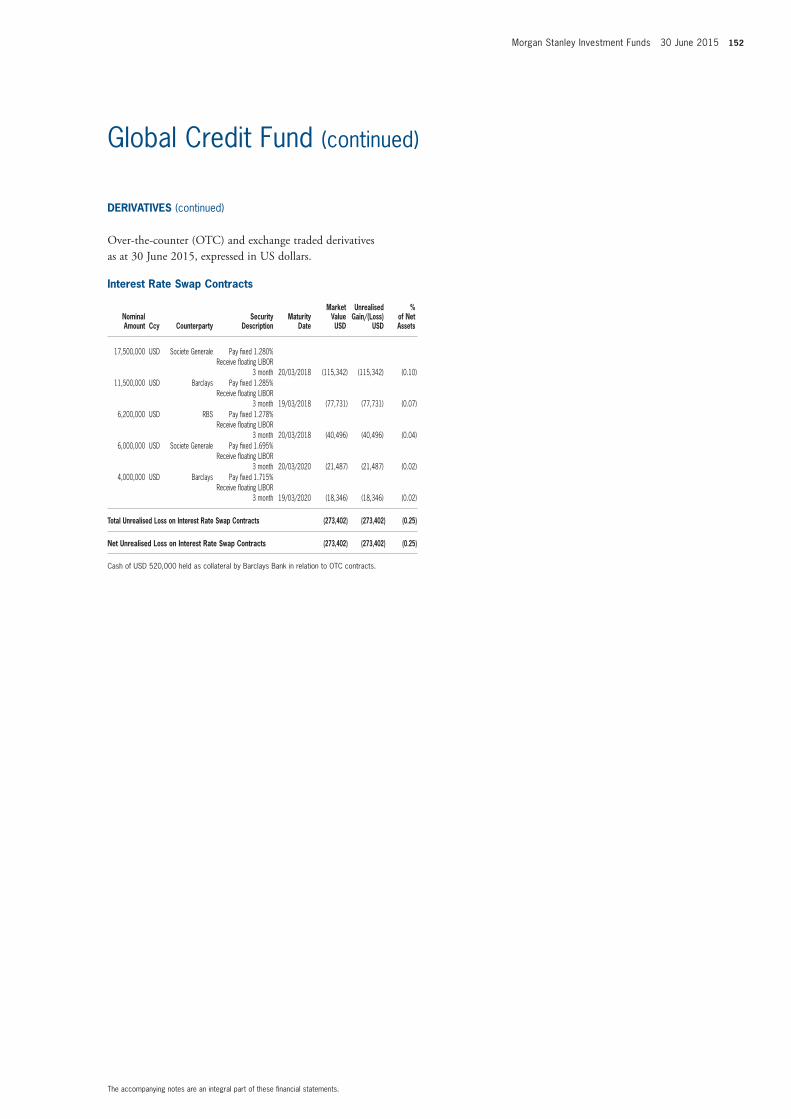
Morgan Stanley Investment Funds 30 June 2015 152
The accompanying notes are an integral part of these financial statements.
Global Credit Fund (continued)
interest Rate Swap Contracts
nominal Amount Ccy Counterparty
Security Description
maturity Date
market value USD
Unrealised Gain/(Loss)
USD
% of net Assets
17,500,000 USD Societe Generale Pay fixed 1.280% Receive floating LIBOR
3 month 20/03/2018 (115,342) (115,342) (0.10)11,500,000 USD Barclays Pay fixed 1.285%
Receive floating LIBOR 3 month 19/03/2018 (77,731) (77,731) (0.07)
6,200,000 USD RBS Pay fixed 1.278% Receive floating LIBOR
3 month 20/03/2018 (40,496) (40,496) (0.04)6,000,000 USD Societe Generale Pay fixed 1.695%
Receive floating LIBOR 3 month 20/03/2020 (21,487) (21,487) (0.02)
4,000,000 USD Barclays Pay fixed 1.715% Receive floating LIBOR
3 month 19/03/2020 (18,346) (18,346) (0.02)
total Unrealised Loss on interest Rate Swap Contracts (273,402) (273,402) (0.25)
net Unrealised Loss on interest Rate Swap Contracts (273,402) (273,402) (0.25)
Cash of USD 520,000 held as collateral by Barclays Bank in relation to OTC contracts.
DERivAtivES (continued)
Over-the-counter (OtC) and exchange traded derivatives as at 30 June 2015, expressed in US dollars.
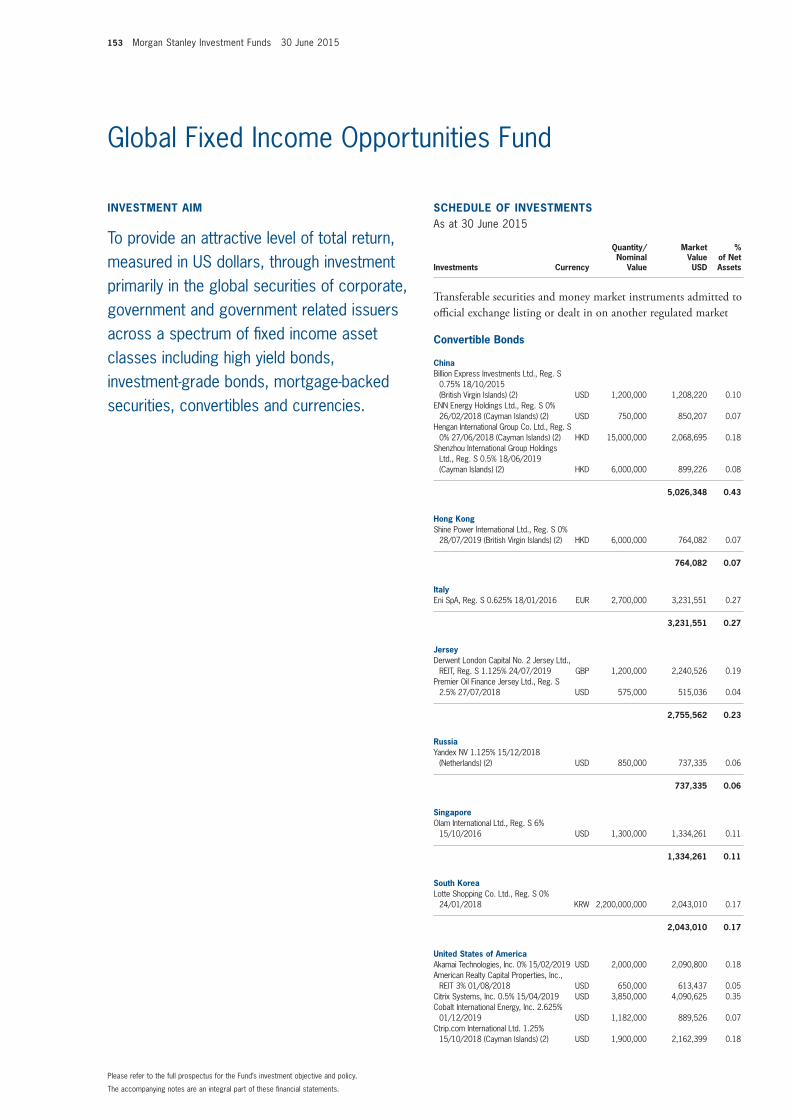
153 Morgan Stanley Investment Funds 30 June 2015
invEStmEnt Aim
To provide an attractive level of total return, measured in US dollars, through investment primarily in the global securities of corporate, government and government related issuers across a spectrum of fixed income asset classes including high yield bonds, investment-grade bonds, mortgage-backed securities, convertibles and currencies.
SCHEDULE of invEStmEntSAs at 30 June 2015
Investments Currency
Quantity/Nominal
Value
Market Value USD
% of Net Assets
transferable securities and money market instruments admitted to official exchange listing or dealt in on another regulated market
Convertible Bonds
ChinaBillion Express Investments Ltd., Reg. S
0.75% 18/10/2015 (British Virgin Islands) (2) USD 1,200,000 1,208,220 0.10
ENN Energy Holdings Ltd., Reg. S 0% 26/02/2018 (Cayman Islands) (2) USD 750,000 850,207 0.07
Hengan International Group Co. Ltd., Reg. S 0% 27/06/2018 (Cayman Islands) (2) HKD 15,000,000 2,068,695 0.18
Shenzhou International Group Holdings Ltd., Reg. S 0.5% 18/06/2019 (Cayman Islands) (2) HKD 6,000,000 899,226 0.08
5,026,348 0.43
Hong KongShine Power International Ltd., Reg. S 0%
28/07/2019 (British Virgin Islands) (2) HKD 6,000,000 764,082 0.07
764,082 0.07
italyEni SpA, Reg. S 0.625% 18/01/2016 EUR 2,700,000 3,231,551 0.27
3,231,551 0.27
JerseyDerwent London Capital No. 2 Jersey Ltd.,
REIT, Reg. S 1.125% 24/07/2019 GBP 1,200,000 2,240,526 0.19Premier Oil Finance Jersey Ltd., Reg. S
2.5% 27/07/2018 USD 575,000 515,036 0.04
2,755,562 0.23
RussiaYandex NV 1.125% 15/12/2018
(Netherlands) (2) USD 850,000 737,335 0.06
737,335 0.06
SingaporeOlam International Ltd., Reg. S 6%
15/10/2016 USD 1,300,000 1,334,261 0.11
1,334,261 0.11
South KoreaLotte Shopping Co. Ltd., Reg. S 0%
24/01/2018 KRW 2,200,000,000 2,043,010 0.17
2,043,010 0.17
United States of AmericaAkamai Technologies, Inc. 0% 15/02/2019 USD 2,000,000 2,090,800 0.18American Realty Capital Properties, Inc.,
REIT 3% 01/08/2018 USD 650,000 613,437 0.05Citrix Systems, Inc. 0.5% 15/04/2019 USD 3,850,000 4,090,625 0.35Cobalt International Energy, Inc. 2.625%
01/12/2019 USD 1,182,000 889,526 0.07Ctrip.com International Ltd. 1.25%
15/10/2018 (Cayman Islands) (2) USD 1,900,000 2,162,399 0.18
The accompanying notes are an integral part of these financial statements.
Please refer to the full prospectus for the Fund’s investment objective and policy.
Global Fixed Income Opportunities Fund
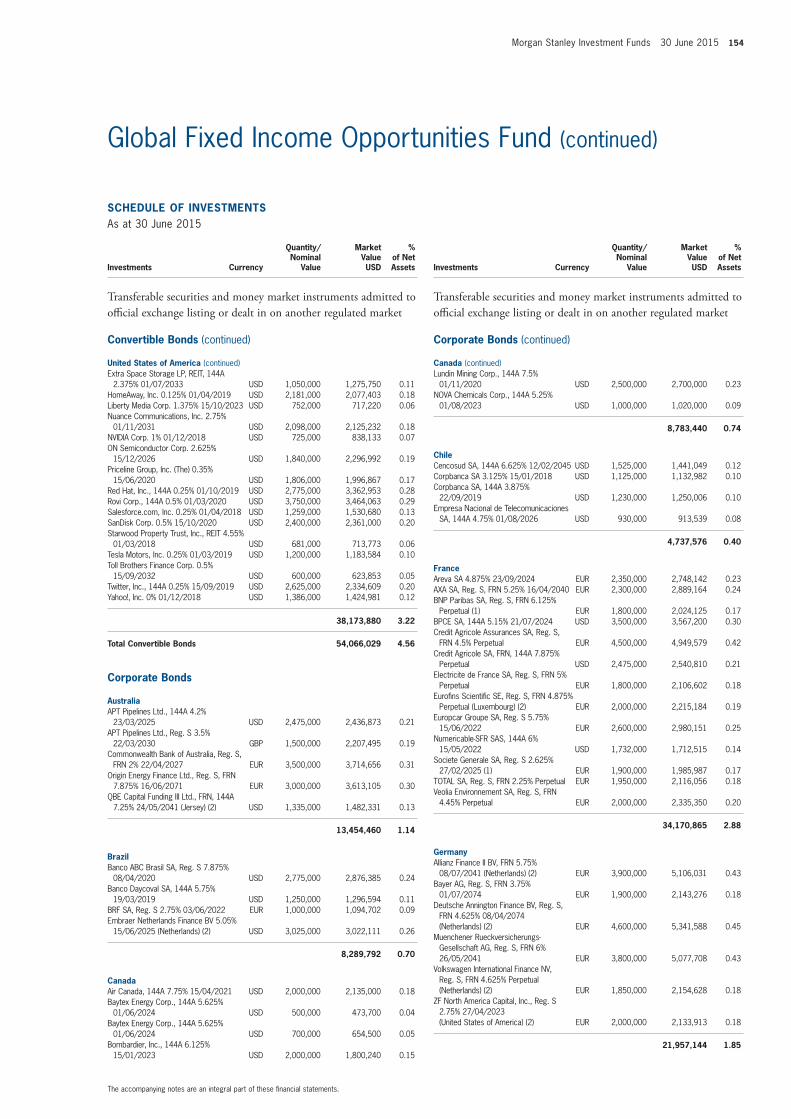
Morgan Stanley Investment Funds 30 June 2015 154
SCHEDULE of invEStmEntSAs at 30 June 2015
Investments Currency
Quantity/Nominal
Value
Market Value USD
% of Net Assets
transferable securities and money market instruments admitted to official exchange listing or dealt in on another regulated market
Convertible Bonds (continued)
United States of America (continued)Extra Space Storage LP, REIT, 144A
2.375% 01/07/2033 USD 1,050,000 1,275,750 0.11HomeAway, Inc. 0.125% 01/04/2019 USD 2,181,000 2,077,403 0.18Liberty Media Corp. 1.375% 15/10/2023 USD 752,000 717,220 0.06Nuance Communications, Inc. 2.75%
01/11/2031 USD 2,098,000 2,125,232 0.18NVIDIA Corp. 1% 01/12/2018 USD 725,000 838,133 0.07ON Semiconductor Corp. 2.625%
15/12/2026 USD 1,840,000 2,296,992 0.19Priceline Group, Inc. (The) 0.35%
15/06/2020 USD 1,806,000 1,996,867 0.17Red Hat, Inc., 144A 0.25% 01/10/2019 USD 2,775,000 3,362,953 0.28Rovi Corp., 144A 0.5% 01/03/2020 USD 3,750,000 3,464,063 0.29Salesforce.com, Inc. 0.25% 01/04/2018 USD 1,259,000 1,530,680 0.13SanDisk Corp. 0.5% 15/10/2020 USD 2,400,000 2,361,000 0.20Starwood Property Trust, Inc., REIT 4.55%
01/03/2018 USD 681,000 713,773 0.06Tesla Motors, Inc. 0.25% 01/03/2019 USD 1,200,000 1,183,584 0.10Toll Brothers Finance Corp. 0.5%
15/09/2032 USD 600,000 623,853 0.05Twitter, Inc., 144A 0.25% 15/09/2019 USD 2,625,000 2,334,609 0.20Yahoo!, Inc. 0% 01/12/2018 USD 1,386,000 1,424,981 0.12
38,173,880 3.22
total Convertible Bonds 54,066,029 4.56
Corporate Bonds
AustraliaAPT Pipelines Ltd., 144A 4.2%
23/03/2025 USD 2,475,000 2,436,873 0.21APT Pipelines Ltd., Reg. S 3.5%
22/03/2030 GBP 1,500,000 2,207,495 0.19Commonwealth Bank of Australia, Reg. S,
FRN 2% 22/04/2027 EUR 3,500,000 3,714,656 0.31Origin Energy Finance Ltd., Reg. S, FRN
7.875% 16/06/2071 EUR 3,000,000 3,613,105 0.30QBE Capital Funding III Ltd., FRN, 144A
7.25% 24/05/2041 (Jersey) (2) USD 1,335,000 1,482,331 0.13
13,454,460 1.14
BrazilBanco ABC Brasil SA, Reg. S 7.875%
08/04/2020 USD 2,775,000 2,876,385 0.24Banco Daycoval SA, 144A 5.75%
19/03/2019 USD 1,250,000 1,296,594 0.11BRF SA, Reg. S 2.75% 03/06/2022 EUR 1,000,000 1,094,702 0.09Embraer Netherlands Finance BV 5.05%
15/06/2025 (Netherlands) (2) USD 3,025,000 3,022,111 0.26
8,289,792 0.70
CanadaAir Canada, 144A 7.75% 15/04/2021 USD 2,000,000 2,135,000 0.18Baytex Energy Corp., 144A 5.625%
01/06/2024 USD 500,000 473,700 0.04Baytex Energy Corp., 144A 5.625%
01/06/2024 USD 700,000 654,500 0.05Bombardier, Inc., 144A 6.125%
15/01/2023 USD 2,000,000 1,800,240 0.15
SCHEDULE of invEStmEntSAs at 30 June 2015
Investments Currency
Quantity/Nominal
Value
Market Value USD
% of Net Assets
transferable securities and money market instruments admitted to official exchange listing or dealt in on another regulated market
Corporate Bonds (continued)
Canada (continued)Lundin Mining Corp., 144A 7.5%
01/11/2020 USD 2,500,000 2,700,000 0.23NOVA Chemicals Corp., 144A 5.25%
01/08/2023 USD 1,000,000 1,020,000 0.09
8,783,440 0.74
ChileCencosud SA, 144A 6.625% 12/02/2045 USD 1,525,000 1,441,049 0.12Corpbanca SA 3.125% 15/01/2018 USD 1,125,000 1,132,982 0.10Corpbanca SA, 144A 3.875%
22/09/2019 USD 1,230,000 1,250,006 0.10Empresa Nacional de Telecomunicaciones
SA, 144A 4.75% 01/08/2026 USD 930,000 913,539 0.08
4,737,576 0.40
franceAreva SA 4.875% 23/09/2024 EUR 2,350,000 2,748,142 0.23AXA SA, Reg. S, FRN 5.25% 16/04/2040 EUR 2,300,000 2,889,164 0.24BNP Paribas SA, Reg. S, FRN 6.125%
Perpetual (1) EUR 1,800,000 2,024,125 0.17BPCE SA, 144A 5.15% 21/07/2024 USD 3,500,000 3,567,200 0.30Credit Agricole Assurances SA, Reg. S,
FRN 4.5% Perpetual EUR 4,500,000 4,949,579 0.42Credit Agricole SA, FRN, 144A 7.875%
Perpetual USD 2,475,000 2,540,810 0.21Electricite de France SA, Reg. S, FRN 5%
Perpetual EUR 1,800,000 2,106,602 0.18Eurofins Scientific SE, Reg. S, FRN 4.875%
Perpetual (Luxembourg) (2) EUR 2,000,000 2,215,184 0.19Europcar Groupe SA, Reg. S 5.75%
15/06/2022 EUR 2,600,000 2,980,151 0.25Numericable-SFR SAS, 144A 6%
15/05/2022 USD 1,732,000 1,712,515 0.14Societe Generale SA, Reg. S 2.625%
27/02/2025 (1) EUR 1,900,000 1,985,987 0.17TOTAL SA, Reg. S, FRN 2.25% Perpetual EUR 1,950,000 2,116,056 0.18Veolia Environnement SA, Reg. S, FRN
4.45% Perpetual EUR 2,000,000 2,335,350 0.20
34,170,865 2.88
GermanyAllianz Finance II BV, FRN 5.75%
08/07/2041 (Netherlands) (2) EUR 3,900,000 5,106,031 0.43Bayer AG, Reg. S, FRN 3.75%
01/07/2074 EUR 1,900,000 2,143,276 0.18Deutsche Annington Finance BV, Reg. S,
FRN 4.625% 08/04/2074 (Netherlands) (2) EUR 4,600,000 5,341,588 0.45
Muenchener Rueckversicherungs-Gesellschaft AG, Reg. S, FRN 6% 26/05/2041 EUR 3,800,000 5,077,708 0.43
Volkswagen International Finance NV, Reg. S, FRN 4.625% Perpetual (Netherlands) (2) EUR 1,850,000 2,154,628 0.18
ZF North America Capital, Inc., Reg. S 2.75% 27/04/2023 (United States of America) (2) EUR 2,000,000 2,133,913 0.18
21,957,144 1.85
The accompanying notes are an integral part of these financial statements.
Global Fixed Income Opportunities Fund (continued)
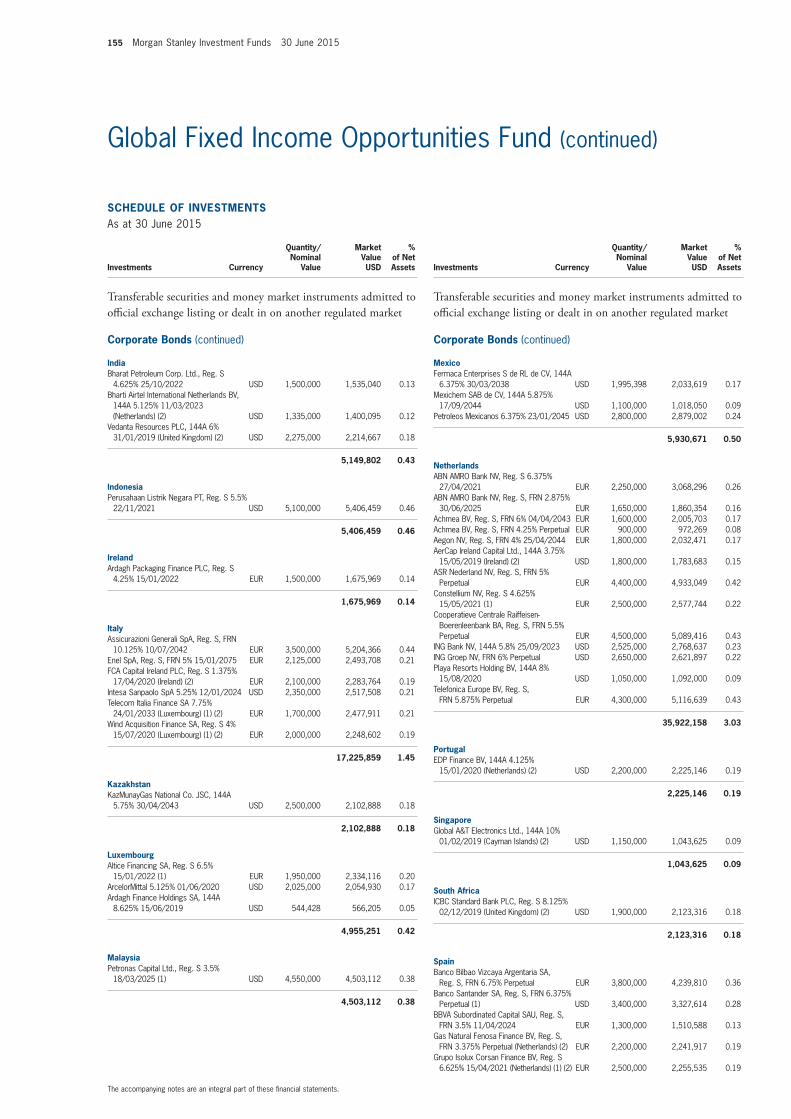
155 Morgan Stanley Investment Funds 30 June 2015
SCHEDULE of invEStmEntSAs at 30 June 2015
Investments Currency
Quantity/Nominal
Value
Market Value USD
% of Net Assets
transferable securities and money market instruments admitted to official exchange listing or dealt in on another regulated market
Corporate Bonds (continued)
indiaBharat Petroleum Corp. Ltd., Reg. S
4.625% 25/10/2022 USD 1,500,000 1,535,040 0.13Bharti Airtel International Netherlands BV,
144A 5.125% 11/03/2023 (Netherlands) (2) USD 1,335,000 1,400,095 0.12
Vedanta Resources PLC, 144A 6% 31/01/2019 (United Kingdom) (2) USD 2,275,000 2,214,667 0.18
5,149,802 0.43
indonesiaPerusahaan Listrik Negara PT, Reg. S 5.5%
22/11/2021 USD 5,100,000 5,406,459 0.46
5,406,459 0.46
irelandArdagh Packaging Finance PLC, Reg. S
4.25% 15/01/2022 EUR 1,500,000 1,675,969 0.14
1,675,969 0.14
italyAssicurazioni Generali SpA, Reg. S, FRN
10.125% 10/07/2042 EUR 3,500,000 5,204,366 0.44Enel SpA, Reg. S, FRN 5% 15/01/2075 EUR 2,125,000 2,493,708 0.21FCA Capital Ireland PLC, Reg. S 1.375%
17/04/2020 (Ireland) (2) EUR 2,100,000 2,283,764 0.19Intesa Sanpaolo SpA 5.25% 12/01/2024 USD 2,350,000 2,517,508 0.21Telecom Italia Finance SA 7.75%
24/01/2033 (Luxembourg) (1) (2) EUR 1,700,000 2,477,911 0.21Wind Acquisition Finance SA, Reg. S 4%
15/07/2020 (Luxembourg) (1) (2) EUR 2,000,000 2,248,602 0.19
17,225,859 1.45
KazakhstanKazMunayGas National Co. JSC, 144A
5.75% 30/04/2043 USD 2,500,000 2,102,888 0.18
2,102,888 0.18
LuxembourgAltice Financing SA, Reg. S 6.5%
15/01/2022 (1) EUR 1,950,000 2,334,116 0.20ArcelorMittal 5.125% 01/06/2020 USD 2,025,000 2,054,930 0.17Ardagh Finance Holdings SA, 144A
8.625% 15/06/2019 USD 544,428 566,205 0.05
4,955,251 0.42
malaysiaPetronas Capital Ltd., Reg. S 3.5%
18/03/2025 (1) USD 4,550,000 4,503,112 0.38
4,503,112 0.38
SCHEDULE of invEStmEntSAs at 30 June 2015
Investments Currency
Quantity/Nominal
Value
Market Value USD
% of Net Assets
transferable securities and money market instruments admitted to official exchange listing or dealt in on another regulated market
Corporate Bonds (continued)
mexicoFermaca Enterprises S de RL de CV, 144A
6.375% 30/03/2038 USD 1,995,398 2,033,619 0.17Mexichem SAB de CV, 144A 5.875%
17/09/2044 USD 1,100,000 1,018,050 0.09Petroleos Mexicanos 6.375% 23/01/2045 USD 2,800,000 2,879,002 0.24
5,930,671 0.50
netherlandsABN AMRO Bank NV, Reg. S 6.375%
27/04/2021 EUR 2,250,000 3,068,296 0.26ABN AMRO Bank NV, Reg. S, FRN 2.875%
30/06/2025 EUR 1,650,000 1,860,354 0.16Achmea BV, Reg. S, FRN 6% 04/04/2043 EUR 1,600,000 2,005,703 0.17Achmea BV, Reg. S, FRN 4.25% Perpetual EUR 900,000 972,269 0.08Aegon NV, Reg. S, FRN 4% 25/04/2044 EUR 1,800,000 2,032,471 0.17AerCap Ireland Capital Ltd., 144A 3.75%
15/05/2019 (Ireland) (2) USD 1,800,000 1,783,683 0.15ASR Nederland NV, Reg. S, FRN 5%
Perpetual EUR 4,400,000 4,933,049 0.42Constellium NV, Reg. S 4.625%
15/05/2021 (1) EUR 2,500,000 2,577,744 0.22Cooperatieve Centrale Raiffeisen-
Boerenleenbank BA, Reg. S, FRN 5.5% Perpetual EUR 4,500,000 5,089,416 0.43
ING Bank NV, 144A 5.8% 25/09/2023 USD 2,525,000 2,768,637 0.23ING Groep NV, FRN 6% Perpetual USD 2,650,000 2,621,897 0.22Playa Resorts Holding BV, 144A 8%
15/08/2020 USD 1,050,000 1,092,000 0.09Telefonica Europe BV, Reg. S,
FRN 5.875% Perpetual EUR 4,300,000 5,116,639 0.43
35,922,158 3.03
PortugalEDP Finance BV, 144A 4.125%
15/01/2020 (Netherlands) (2) USD 2,200,000 2,225,146 0.19
2,225,146 0.19
SingaporeGlobal A&T Electronics Ltd., 144A 10%
01/02/2019 (Cayman Islands) (2) USD 1,150,000 1,043,625 0.09
1,043,625 0.09
South AfricaICBC Standard Bank PLC, Reg. S 8.125%
02/12/2019 (United Kingdom) (2) USD 1,900,000 2,123,316 0.18
2,123,316 0.18
SpainBanco Bilbao Vizcaya Argentaria SA,
Reg. S, FRN 6.75% Perpetual EUR 3,800,000 4,239,810 0.36Banco Santander SA, Reg. S, FRN 6.375%
Perpetual (1) USD 3,400,000 3,327,614 0.28BBVA Subordinated Capital SAU, Reg. S,
FRN 3.5% 11/04/2024 EUR 1,300,000 1,510,588 0.13Gas Natural Fenosa Finance BV, Reg. S,
FRN 3.375% Perpetual (Netherlands) (2) EUR 2,200,000 2,241,917 0.19Grupo Isolux Corsan Finance BV, Reg. S
6.625% 15/04/2021 (Netherlands) (1) (2) EUR 2,500,000 2,255,535 0.19
The accompanying notes are an integral part of these financial statements.
Global Fixed Income Opportunities Fund (continued)
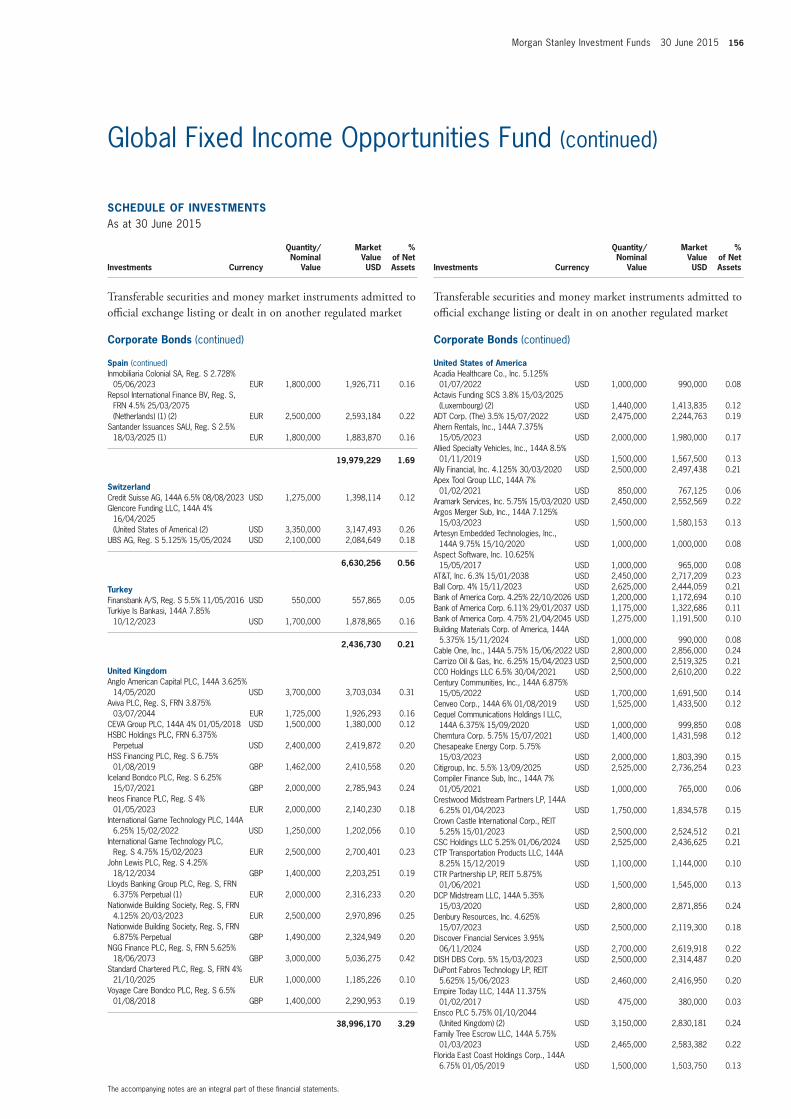
Morgan Stanley Investment Funds 30 June 2015 156
SCHEDULE of invEStmEntSAs at 30 June 2015
Investments Currency
Quantity/Nominal
Value
Market Value USD
% of Net Assets
transferable securities and money market instruments admitted to official exchange listing or dealt in on another regulated market
Corporate Bonds (continued)
Spain (continued)Inmobiliaria Colonial SA, Reg. S 2.728%
05/06/2023 EUR 1,800,000 1,926,711 0.16Repsol International Finance BV, Reg. S,
FRN 4.5% 25/03/2075 (Netherlands) (1) (2) EUR 2,500,000 2,593,184 0.22
Santander Issuances SAU, Reg. S 2.5% 18/03/2025 (1) EUR 1,800,000 1,883,870 0.16
19,979,229 1.69
SwitzerlandCredit Suisse AG, 144A 6.5% 08/08/2023 USD 1,275,000 1,398,114 0.12Glencore Funding LLC, 144A 4%
16/04/2025 (United States of America) (2) USD 3,350,000 3,147,493 0.26
UBS AG, Reg. S 5.125% 15/05/2024 USD 2,100,000 2,084,649 0.18
6,630,256 0.56
turkeyFinansbank A/S, Reg. S 5.5% 11/05/2016 USD 550,000 557,865 0.05Turkiye Is Bankasi, 144A 7.85%
10/12/2023 USD 1,700,000 1,878,865 0.16
2,436,730 0.21
United KingdomAnglo American Capital PLC, 144A 3.625%
14/05/2020 USD 3,700,000 3,703,034 0.31Aviva PLC, Reg. S, FRN 3.875%
03/07/2044 EUR 1,725,000 1,926,293 0.16CEVA Group PLC, 144A 4% 01/05/2018 USD 1,500,000 1,380,000 0.12HSBC Holdings PLC, FRN 6.375%
Perpetual USD 2,400,000 2,419,872 0.20HSS Financing PLC, Reg. S 6.75%
01/08/2019 GBP 1,462,000 2,410,558 0.20Iceland Bondco PLC, Reg. S 6.25%
15/07/2021 GBP 2,000,000 2,785,943 0.24Ineos Finance PLC, Reg. S 4%
01/05/2023 EUR 2,000,000 2,140,230 0.18International Game Technology PLC, 144A
6.25% 15/02/2022 USD 1,250,000 1,202,056 0.10International Game Technology PLC,
Reg. S 4.75% 15/02/2023 EUR 2,500,000 2,700,401 0.23John Lewis PLC, Reg. S 4.25%
18/12/2034 GBP 1,400,000 2,203,251 0.19Lloyds Banking Group PLC, Reg. S, FRN
6.375% Perpetual (1) EUR 2,000,000 2,316,233 0.20Nationwide Building Society, Reg. S, FRN
4.125% 20/03/2023 EUR 2,500,000 2,970,896 0.25Nationwide Building Society, Reg. S, FRN
6.875% Perpetual GBP 1,490,000 2,324,949 0.20NGG Finance PLC, Reg. S, FRN 5.625%
18/06/2073 GBP 3,000,000 5,036,275 0.42Standard Chartered PLC, Reg. S, FRN 4%
21/10/2025 EUR 1,000,000 1,185,226 0.10Voyage Care Bondco PLC, Reg. S 6.5%
01/08/2018 GBP 1,400,000 2,290,953 0.19
38,996,170 3.29
SCHEDULE of invEStmEntSAs at 30 June 2015
Investments Currency
Quantity/Nominal
Value
Market Value USD
% of Net Assets
transferable securities and money market instruments admitted to official exchange listing or dealt in on another regulated market
Corporate Bonds (continued)
United States of AmericaAcadia Healthcare Co., Inc. 5.125%
01/07/2022 USD 1,000,000 990,000 0.08Actavis Funding SCS 3.8% 15/03/2025
(Luxembourg) (2) USD 1,440,000 1,413,835 0.12ADT Corp. (The) 3.5% 15/07/2022 USD 2,475,000 2,244,763 0.19Ahern Rentals, Inc., 144A 7.375%
15/05/2023 USD 2,000,000 1,980,000 0.17Allied Specialty Vehicles, Inc., 144A 8.5%
01/11/2019 USD 1,500,000 1,567,500 0.13Ally Financial, Inc. 4.125% 30/03/2020 USD 2,500,000 2,497,438 0.21Apex Tool Group LLC, 144A 7%
01/02/2021 USD 850,000 767,125 0.06Aramark Services, Inc. 5.75% 15/03/2020 USD 2,450,000 2,552,569 0.22Argos Merger Sub, Inc., 144A 7.125%
15/03/2023 USD 1,500,000 1,580,153 0.13Artesyn Embedded Technologies, Inc.,
144A 9.75% 15/10/2020 USD 1,000,000 1,000,000 0.08Aspect Software, Inc. 10.625%
15/05/2017 USD 1,000,000 965,000 0.08AT&T, Inc. 6.3% 15/01/2038 USD 2,450,000 2,717,209 0.23Ball Corp. 4% 15/11/2023 USD 2,625,000 2,444,059 0.21Bank of America Corp. 4.25% 22/10/2026 USD 1,200,000 1,172,694 0.10Bank of America Corp. 6.11% 29/01/2037 USD 1,175,000 1,322,686 0.11Bank of America Corp. 4.75% 21/04/2045 USD 1,275,000 1,191,500 0.10Building Materials Corp. of America, 144A
5.375% 15/11/2024 USD 1,000,000 990,000 0.08Cable One, Inc., 144A 5.75% 15/06/2022 USD 2,800,000 2,856,000 0.24Carrizo Oil & Gas, Inc. 6.25% 15/04/2023 USD 2,500,000 2,519,325 0.21CCO Holdings LLC 6.5% 30/04/2021 USD 2,500,000 2,610,200 0.22Century Communities, Inc., 144A 6.875%
15/05/2022 USD 1,700,000 1,691,500 0.14Cenveo Corp., 144A 6% 01/08/2019 USD 1,525,000 1,433,500 0.12Cequel Communications Holdings I LLC,
144A 6.375% 15/09/2020 USD 1,000,000 999,850 0.08Chemtura Corp. 5.75% 15/07/2021 USD 1,400,000 1,431,598 0.12Chesapeake Energy Corp. 5.75%
15/03/2023 USD 2,000,000 1,803,390 0.15Citigroup, Inc. 5.5% 13/09/2025 USD 2,525,000 2,736,254 0.23Compiler Finance Sub, Inc., 144A 7%
01/05/2021 USD 1,000,000 765,000 0.06Crestwood Midstream Partners LP, 144A
6.25% 01/04/2023 USD 1,750,000 1,834,578 0.15Crown Castle International Corp., REIT
5.25% 15/01/2023 USD 2,500,000 2,524,512 0.21CSC Holdings LLC 5.25% 01/06/2024 USD 2,525,000 2,436,625 0.21CTP Transportation Products LLC, 144A
8.25% 15/12/2019 USD 1,100,000 1,144,000 0.10CTR Partnership LP, REIT 5.875%
01/06/2021 USD 1,500,000 1,545,000 0.13DCP Midstream LLC, 144A 5.35%
15/03/2020 USD 2,800,000 2,871,856 0.24Denbury Resources, Inc. 4.625%
15/07/2023 USD 2,500,000 2,119,300 0.18Discover Financial Services 3.95%
06/11/2024 USD 2,700,000 2,619,918 0.22DISH DBS Corp. 5% 15/03/2023 USD 2,500,000 2,314,487 0.20DuPont Fabros Technology LP, REIT
5.625% 15/06/2023 USD 2,460,000 2,416,950 0.20Empire Today LLC, 144A 11.375%
01/02/2017 USD 475,000 380,000 0.03Ensco PLC 5.75% 01/10/2044
(United Kingdom) (2) USD 3,150,000 2,830,181 0.24Family Tree Escrow LLC, 144A 5.75%
01/03/2023 USD 2,465,000 2,583,382 0.22Florida East Coast Holdings Corp., 144A
6.75% 01/05/2019 USD 1,500,000 1,503,750 0.13
The accompanying notes are an integral part of these financial statements.
Global Fixed Income Opportunities Fund (continued)
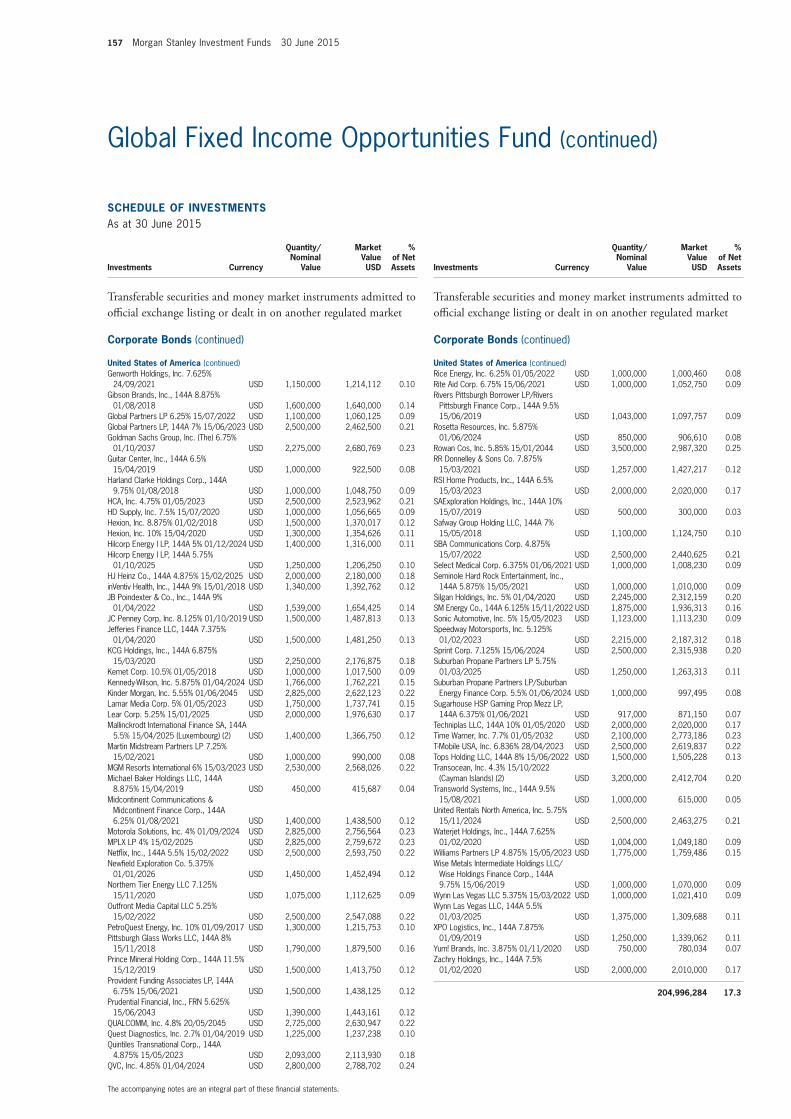
157 Morgan Stanley Investment Funds 30 June 2015
SCHEDULE of invEStmEntSAs at 30 June 2015
Investments Currency
Quantity/Nominal
Value
Market Value USD
% of Net Assets
transferable securities and money market instruments admitted to official exchange listing or dealt in on another regulated market
Corporate Bonds (continued)
United States of America (continued)Genworth Holdings, Inc. 7.625%
24/09/2021 USD 1,150,000 1,214,112 0.10Gibson Brands, Inc., 144A 8.875%
01/08/2018 USD 1,600,000 1,640,000 0.14Global Partners LP 6.25% 15/07/2022 USD 1,100,000 1,060,125 0.09Global Partners LP, 144A 7% 15/06/2023 USD 2,500,000 2,462,500 0.21Goldman Sachs Group, Inc. (The) 6.75%
01/10/2037 USD 2,275,000 2,680,769 0.23Guitar Center, Inc., 144A 6.5%
15/04/2019 USD 1,000,000 922,500 0.08Harland Clarke Holdings Corp., 144A
9.75% 01/08/2018 USD 1,000,000 1,048,750 0.09HCA, Inc. 4.75% 01/05/2023 USD 2,500,000 2,523,962 0.21HD Supply, Inc. 7.5% 15/07/2020 USD 1,000,000 1,056,665 0.09Hexion, Inc. 8.875% 01/02/2018 USD 1,500,000 1,370,017 0.12Hexion, Inc. 10% 15/04/2020 USD 1,300,000 1,354,626 0.11Hilcorp Energy I LP, 144A 5% 01/12/2024 USD 1,400,000 1,316,000 0.11Hilcorp Energy I LP, 144A 5.75%
01/10/2025 USD 1,250,000 1,206,250 0.10HJ Heinz Co., 144A 4.875% 15/02/2025 USD 2,000,000 2,180,000 0.18inVentiv Health, Inc., 144A 9% 15/01/2018 USD 1,340,000 1,392,762 0.12JB Poindexter & Co., Inc., 144A 9%
01/04/2022 USD 1,539,000 1,654,425 0.14JC Penney Corp, Inc. 8.125% 01/10/2019 USD 1,500,000 1,487,813 0.13Jefferies Finance LLC, 144A 7.375%
01/04/2020 USD 1,500,000 1,481,250 0.13KCG Holdings, Inc., 144A 6.875%
15/03/2020 USD 2,250,000 2,176,875 0.18Kemet Corp. 10.5% 01/05/2018 USD 1,000,000 1,017,500 0.09Kennedy-Wilson, Inc. 5.875% 01/04/2024 USD 1,766,000 1,762,221 0.15Kinder Morgan, Inc. 5.55% 01/06/2045 USD 2,825,000 2,622,123 0.22Lamar Media Corp. 5% 01/05/2023 USD 1,750,000 1,737,741 0.15Lear Corp. 5.25% 15/01/2025 USD 2,000,000 1,976,630 0.17Mallinckrodt International Finance SA, 144A
5.5% 15/04/2025 (Luxembourg) (2) USD 1,400,000 1,366,750 0.12Martin Midstream Partners LP 7.25%
15/02/2021 USD 1,000,000 990,000 0.08MGM Resorts International 6% 15/03/2023 USD 2,530,000 2,568,026 0.22Michael Baker Holdings LLC, 144A
8.875% 15/04/2019 USD 450,000 415,687 0.04Midcontinent Communications &
Midcontinent Finance Corp., 144A 6.25% 01/08/2021 USD 1,400,000 1,438,500 0.12
Motorola Solutions, Inc. 4% 01/09/2024 USD 2,825,000 2,756,564 0.23MPLX LP 4% 15/02/2025 USD 2,825,000 2,759,672 0.23Netflix, Inc., 144A 5.5% 15/02/2022 USD 2,500,000 2,593,750 0.22Newfield Exploration Co. 5.375%
01/01/2026 USD 1,450,000 1,452,494 0.12Northern Tier Energy LLC 7.125%
15/11/2020 USD 1,075,000 1,112,625 0.09Outfront Media Capital LLC 5.25%
15/02/2022 USD 2,500,000 2,547,088 0.22PetroQuest Energy, Inc. 10% 01/09/2017 USD 1,300,000 1,215,753 0.10Pittsburgh Glass Works LLC, 144A 8%
15/11/2018 USD 1,790,000 1,879,500 0.16Prince Mineral Holding Corp., 144A 11.5%
15/12/2019 USD 1,500,000 1,413,750 0.12Provident Funding Associates LP, 144A
6.75% 15/06/2021 USD 1,500,000 1,438,125 0.12Prudential Financial, Inc., FRN 5.625%
15/06/2043 USD 1,390,000 1,443,161 0.12QUALCOMM, Inc. 4.8% 20/05/2045 USD 2,725,000 2,630,947 0.22Quest Diagnostics, Inc. 2.7% 01/04/2019 USD 1,225,000 1,237,238 0.10Quintiles Transnational Corp., 144A
4.875% 15/05/2023 USD 2,093,000 2,113,930 0.18QVC, Inc. 4.85% 01/04/2024 USD 2,800,000 2,788,702 0.24
SCHEDULE of invEStmEntSAs at 30 June 2015
Investments Currency
Quantity/Nominal
Value
Market Value USD
% of Net Assets
transferable securities and money market instruments admitted to official exchange listing or dealt in on another regulated market
Corporate Bonds (continued)
United States of America (continued)Rice Energy, Inc. 6.25% 01/05/2022 USD 1,000,000 1,000,460 0.08Rite Aid Corp. 6.75% 15/06/2021 USD 1,000,000 1,052,750 0.09Rivers Pittsburgh Borrower LP/Rivers
Pittsburgh Finance Corp., 144A 9.5% 15/06/2019 USD 1,043,000 1,097,757 0.09
Rosetta Resources, Inc. 5.875% 01/06/2024 USD 850,000 906,610 0.08
Rowan Cos, Inc. 5.85% 15/01/2044 USD 3,500,000 2,987,320 0.25RR Donnelley & Sons Co. 7.875%
15/03/2021 USD 1,257,000 1,427,217 0.12RSI Home Products, Inc., 144A 6.5%
15/03/2023 USD 2,000,000 2,020,000 0.17SAExploration Holdings, Inc., 144A 10%
15/07/2019 USD 500,000 300,000 0.03Safway Group Holding LLC, 144A 7%
15/05/2018 USD 1,100,000 1,124,750 0.10 SBA Communications Corp. 4.875%
15/07/2022 USD 2,500,000 2,440,625 0.21Select Medical Corp. 6.375% 01/06/2021 USD 1,000,000 1,008,230 0.09Seminole Hard Rock Entertainment, Inc.,
144A 5.875% 15/05/2021 USD 1,000,000 1,010,000 0.09Silgan Holdings, Inc. 5% 01/04/2020 USD 2,245,000 2,312,159 0.20SM Energy Co., 144A 6.125% 15/11/2022 USD 1,875,000 1,936,313 0.16Sonic Automotive, Inc. 5% 15/05/2023 USD 1,123,000 1,113,230 0.09Speedway Motorsports, Inc. 5.125%
01/02/2023 USD 2,215,000 2,187,312 0.18Sprint Corp. 7.125% 15/06/2024 USD 2,500,000 2,315,938 0.20Suburban Propane Partners LP 5.75%
01/03/2025 USD 1,250,000 1,263,313 0.11Suburban Propane Partners LP/Suburban
Energy Finance Corp. 5.5% 01/06/2024 USD 1,000,000 997,495 0.08Sugarhouse HSP Gaming Prop Mezz LP,
144A 6.375% 01/06/2021 USD 917,000 871,150 0.07Techniplas LLC, 144A 10% 01/05/2020 USD 2,000,000 2,020,000 0.17Time Warner, Inc. 7.7% 01/05/2032 USD 2,100,000 2,773,186 0.23T-Mobile USA, Inc. 6.836% 28/04/2023 USD 2,500,000 2,619,837 0.22Tops Holding LLC, 144A 8% 15/06/2022 USD 1,500,000 1,505,228 0.13Transocean, Inc. 4.3% 15/10/2022
(Cayman Islands) (2) USD 3,200,000 2,412,704 0.20Transworld Systems, Inc., 144A 9.5%
15/08/2021 USD 1,000,000 615,000 0.05United Rentals North America, Inc. 5.75%
15/11/2024 USD 2,500,000 2,463,275 0.21Waterjet Holdings, Inc., 144A 7.625%
01/02/2020 USD 1,004,000 1,049,180 0.09Williams Partners LP 4.875% 15/05/2023 USD 1,775,000 1,759,486 0.15Wise Metals Intermediate Holdings LLC/
Wise Holdings Finance Corp., 144A 9.75% 15/06/2019 USD 1,000,000 1,070,000 0.09
Wynn Las Vegas LLC 5.375% 15/03/2022 USD 1,000,000 1,021,410 0.09Wynn Las Vegas LLC, 144A 5.5%
01/03/2025 USD 1,375,000 1,309,688 0.11XPO Logistics, Inc., 144A 7.875%
01/09/2019 USD 1,250,000 1,339,062 0.11Yum! Brands, Inc. 3.875% 01/11/2020 USD 750,000 780,034 0.07Zachry Holdings, Inc., 144A 7.5%
01/02/2020 USD 2,000,000 2,010,000 0.17
204,996,284 17.3
The accompanying notes are an integral part of these financial statements.
Global Fixed Income Opportunities Fund (continued)
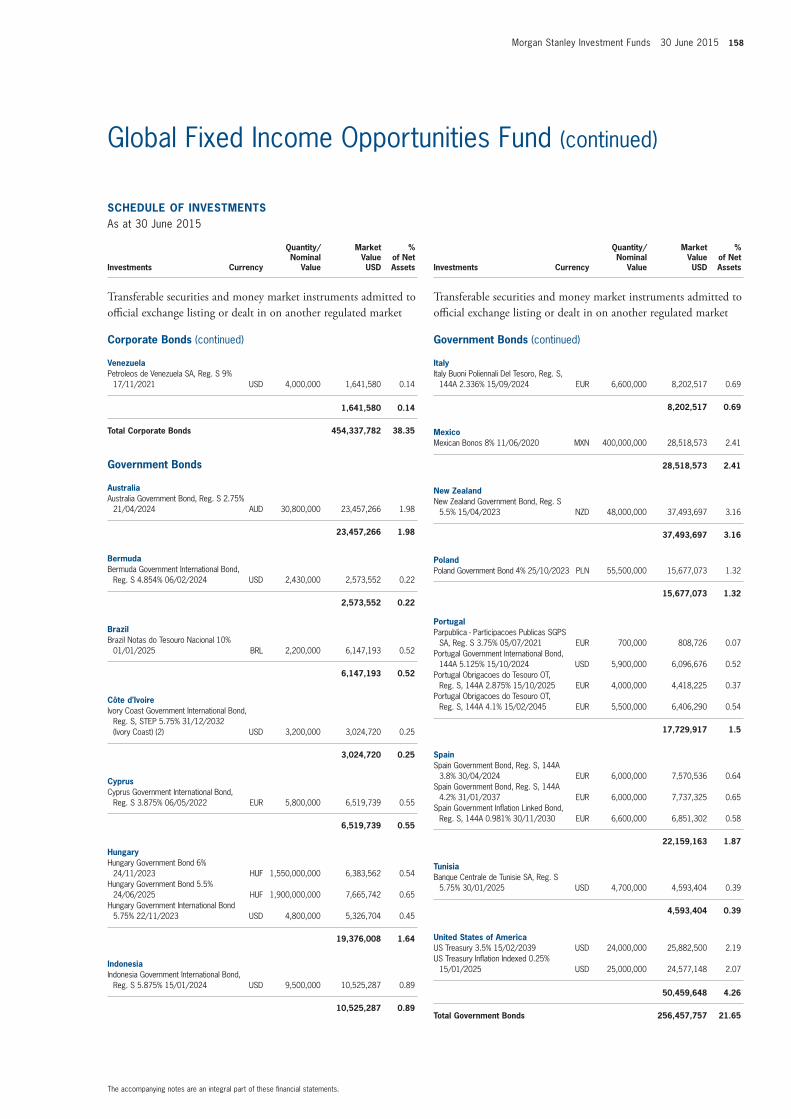
Morgan Stanley Investment Funds 30 June 2015 158
SCHEDULE of invEStmEntSAs at 30 June 2015
Investments Currency
Quantity/Nominal
Value
Market Value USD
% of Net Assets
transferable securities and money market instruments admitted to official exchange listing or dealt in on another regulated market
Corporate Bonds (continued)
venezuelaPetroleos de Venezuela SA, Reg. S 9%
17/11/2021 USD 4,000,000 1,641,580 0.14
1,641,580 0.14
total Corporate Bonds 454,337,782 38.35
Government Bonds
AustraliaAustralia Government Bond, Reg. S 2.75%
21/04/2024 AUD 30,800,000 23,457,266 1.98
23,457,266 1.98
BermudaBermuda Government International Bond,
Reg. S 4.854% 06/02/2024 USD 2,430,000 2,573,552 0.22
2,573,552 0.22
BrazilBrazil Notas do Tesouro Nacional 10%
01/01/2025 BRL 2,200,000 6,147,193 0.52
6,147,193 0.52
Côte d’ivoireIvory Coast Government International Bond,
Reg. S, STEP 5.75% 31/12/2032 (Ivory Coast) (2) USD 3,200,000 3,024,720 0.25
3,024,720 0.25
CyprusCyprus Government International Bond,
Reg. S 3.875% 06/05/2022 EUR 5,800,000 6,519,739 0.55
6,519,739 0.55
HungaryHungary Government Bond 6%
24/11/2023 HUF 1,550,000,000 6,383,562 0.54Hungary Government Bond 5.5%
24/06/2025 HUF 1,900,000,000 7,665,742 0.65Hungary Government International Bond
5.75% 22/11/2023 USD 4,800,000 5,326,704 0.45
19,376,008 1.64
indonesiaIndonesia Government International Bond,
Reg. S 5.875% 15/01/2024 USD 9,500,000 10,525,287 0.89
10,525,287 0.89
SCHEDULE of invEStmEntSAs at 30 June 2015
Investments Currency
Quantity/Nominal
Value
Market Value USD
% of Net Assets
transferable securities and money market instruments admitted to official exchange listing or dealt in on another regulated market
Government Bonds (continued)
italyItaly Buoni Poliennali Del Tesoro, Reg. S,
144A 2.336% 15/09/2024 EUR 6,600,000 8,202,517 0.69
8,202,517 0.69
mexicoMexican Bonos 8% 11/06/2020 MXN 400,000,000 28,518,573 2.41
28,518,573 2.41
new ZealandNew Zealand Government Bond, Reg. S
5.5% 15/04/2023 NZD 48,000,000 37,493,697 3.16
37,493,697 3.16
PolandPoland Government Bond 4% 25/10/2023 PLN 55,500,000 15,677,073 1.32
15,677,073 1.32
PortugalParpublica - Participacoes Publicas SGPS
SA, Reg. S 3.75% 05/07/2021 EUR 700,000 808,726 0.07Portugal Government International Bond,
144A 5.125% 15/10/2024 USD 5,900,000 6,096,676 0.52Portugal Obrigacoes do Tesouro OT,
Reg. S, 144A 2.875% 15/10/2025 EUR 4,000,000 4,418,225 0.37Portugal Obrigacoes do Tesouro OT,
Reg. S, 144A 4.1% 15/02/2045 EUR 5,500,000 6,406,290 0.54
17,729,917 1.5
SpainSpain Government Bond, Reg. S, 144A
3.8% 30/04/2024 EUR 6,000,000 7,570,536 0.64Spain Government Bond, Reg. S, 144A
4.2% 31/01/2037 EUR 6,000,000 7,737,325 0.65Spain Government Inflation Linked Bond,
Reg. S, 144A 0.981% 30/11/2030 EUR 6,600,000 6,851,302 0.58
22,159,163 1.87
tunisiaBanque Centrale de Tunisie SA, Reg. S
5.75% 30/01/2025 USD 4,700,000 4,593,404 0.39
4,593,404 0.39
United States of AmericaUS Treasury 3.5% 15/02/2039 USD 24,000,000 25,882,500 2.19US Treasury Inflation Indexed 0.25%
15/01/2025 USD 25,000,000 24,577,148 2.07
50,459,648 4.26
total Government Bonds 256,457,757 21.65
The accompanying notes are an integral part of these financial statements.
Global Fixed Income Opportunities Fund (continued)
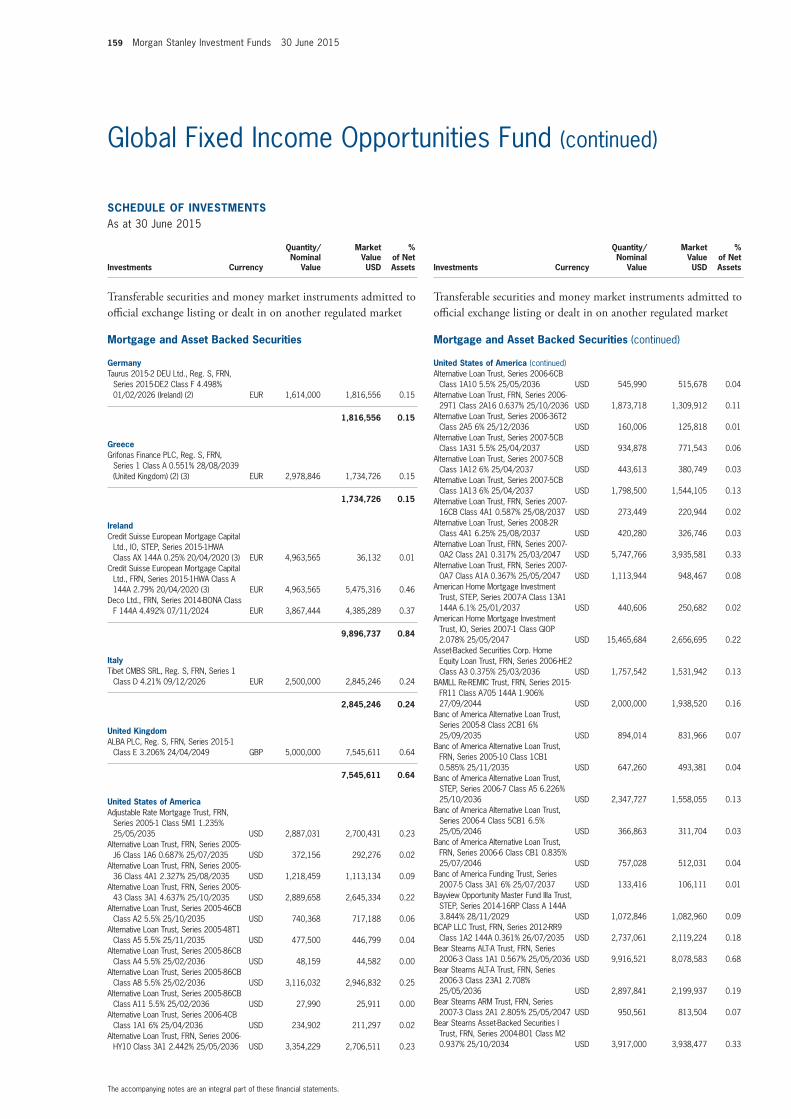
159 Morgan Stanley Investment Funds 30 June 2015
SCHEDULE of invEStmEntSAs at 30 June 2015
Investments Currency
Quantity/Nominal
Value
Market Value USD
% of Net Assets
transferable securities and money market instruments admitted to official exchange listing or dealt in on another regulated market
mortgage and Asset Backed Securities
GermanyTaurus 2015-2 DEU Ltd., Reg. S, FRN,
Series 2015-DE2 Class F 4.498% 01/02/2026 (Ireland) (2) EUR 1,614,000 1,816,556 0.15
1,816,556 0.15
GreeceGrifonas Finance PLC, Reg. S, FRN,
Series 1 Class A 0.551% 28/08/2039 (United Kingdom) (2) (3) EUR 2,978,846 1,734,726 0.15
1,734,726 0.15
irelandCredit Suisse European Mortgage Capital
Ltd., IO, STEP, Series 2015-1HWA Class AX 144A 0.25% 20/04/2020 (3) EUR 4,963,565 36,132 0.01
Credit Suisse European Mortgage Capital Ltd., FRN, Series 2015-1HWA Class A 144A 2.79% 20/04/2020 (3) EUR 4,963,565 5,475,316 0.46
Deco Ltd., FRN, Series 2014-BONA Class F 144A 4.492% 07/11/2024 EUR 3,867,444 4,385,289 0.37
9,896,737 0.84
italyTibet CMBS SRL, Reg. S, FRN, Series 1
Class D 4.21% 09/12/2026 EUR 2,500,000 2,845,246 0.24
2,845,246 0.24
United KingdomALBA PLC, Reg. S, FRN, Series 2015-1
Class E 3.206% 24/04/2049 GBP 5,000,000 7,545,611 0.64
7,545,611 0.64
United States of AmericaAdjustable Rate Mortgage Trust, FRN,
Series 2005-1 Class 5M1 1.235% 25/05/2035 USD 2,887,031 2,700,431 0.23
Alternative Loan Trust, FRN, Series 2005-J6 Class 1A6 0.687% 25/07/2035 USD 372,156 292,276 0.02
Alternative Loan Trust, FRN, Series 2005-36 Class 4A1 2.327% 25/08/2035 USD 1,218,459 1,113,134 0.09
Alternative Loan Trust, FRN, Series 2005-43 Class 3A1 4.637% 25/10/2035 USD 2,889,658 2,645,334 0.22
Alternative Loan Trust, Series 2005-46CB Class A2 5.5% 25/10/2035 USD 740,368 717,188 0.06
Alternative Loan Trust, Series 2005-48T1 Class A5 5.5% 25/11/2035 USD 477,500 446,799 0.04
Alternative Loan Trust, Series 2005-86CB Class A4 5.5% 25/02/2036 USD 48,159 44,582 0.00
Alternative Loan Trust, Series 2005-86CB Class A8 5.5% 25/02/2036 USD 3,116,032 2,946,832 0.25
Alternative Loan Trust, Series 2005-86CB Class A11 5.5% 25/02/2036 USD 27,990 25,911 0.00
Alternative Loan Trust, Series 2006-4CB Class 1A1 6% 25/04/2036 USD 234,902 211,297 0.02
Alternative Loan Trust, FRN, Series 2006-HY10 Class 3A1 2.442% 25/05/2036 USD 3,354,229 2,706,511 0.23
SCHEDULE of invEStmEntSAs at 30 June 2015
Investments Currency
Quantity/Nominal
Value
Market Value USD
% of Net Assets
transferable securities and money market instruments admitted to official exchange listing or dealt in on another regulated market
mortgage and Asset Backed Securities (continued)
United States of America (continued)Alternative Loan Trust, Series 2006-6CB
Class 1A10 5.5% 25/05/2036 USD 545,990 515,678 0.04Alternative Loan Trust, FRN, Series 2006-
29T1 Class 2A16 0.637% 25/10/2036 USD 1,873,718 1,309,912 0.11Alternative Loan Trust, Series 2006-36T2
Class 2A5 6% 25/12/2036 USD 160,006 125,818 0.01Alternative Loan Trust, Series 2007-5CB
Class 1A31 5.5% 25/04/2037 USD 934,878 771,543 0.06Alternative Loan Trust, Series 2007-5CB
Class 1A12 6% 25/04/2037 USD 443,613 380,749 0.03Alternative Loan Trust, Series 2007-5CB
Class 1A13 6% 25/04/2037 USD 1,798,500 1,544,105 0.13Alternative Loan Trust, FRN, Series 2007-
16CB Class 4A1 0.587% 25/08/2037 USD 273,449 220,944 0.02Alternative Loan Trust, Series 2008-2R
Class 4A1 6.25% 25/08/2037 USD 420,280 326,746 0.03Alternative Loan Trust, FRN, Series 2007-
OA2 Class 2A1 0.317% 25/03/2047 USD 5,747,766 3,935,581 0.33Alternative Loan Trust, FRN, Series 2007-
OA7 Class A1A 0.367% 25/05/2047 USD 1,113,944 948,467 0.08American Home Mortgage Investment
Trust, STEP, Series 2007-A Class 13A1 144A 6.1% 25/01/2037 USD 440,606 250,682 0.02
American Home Mortgage Investment Trust, IO, Series 2007-1 Class GIOP 2.078% 25/05/2047 USD 15,465,684 2,656,695 0.22
Asset-Backed Securities Corp. Home Equity Loan Trust, FRN, Series 2006-HE2 Class A3 0.375% 25/03/2036 USD 1,757,542 1,531,942 0.13
BAMLL Re-REMIC Trust, FRN, Series 2015-FR11 Class A705 144A 1.906% 27/09/2044 USD 2,000,000 1,938,520 0.16
Banc of America Alternative Loan Trust, Series 2005-8 Class 2CB1 6% 25/09/2035 USD 894,014 831,966 0.07
Banc of America Alternative Loan Trust, FRN, Series 2005-10 Class 1CB1 0.585% 25/11/2035 USD 647,260 493,381 0.04
Banc of America Alternative Loan Trust, STEP, Series 2006-7 Class A5 6.226% 25/10/2036 USD 2,347,727 1,558,055 0.13
Banc of America Alternative Loan Trust, Series 2006-4 Class 5CB1 6.5% 25/05/2046 USD 366,863 311,704 0.03
Banc of America Alternative Loan Trust, FRN, Series 2006-6 Class CB1 0.835% 25/07/2046 USD 757,028 512,031 0.04
Banc of America Funding Trust, Series 2007-5 Class 3A1 6% 25/07/2037 USD 133,416 106,111 0.01
Bayview Opportunity Master Fund IIIa Trust, STEP, Series 2014-16RP Class A 144A 3.844% 28/11/2029 USD 1,072,846 1,082,960 0.09
BCAP LLC Trust, FRN, Series 2012-RR9 Class 1A2 144A 0.361% 26/07/2035 USD 2,737,061 2,119,224 0.18
Bear Stearns ALT-A Trust, FRN, Series 2006-3 Class 1A1 0.567% 25/05/2036 USD 9,916,521 8,078,583 0.68
Bear Stearns ALT-A Trust, FRN, Series 2006-3 Class 23A1 2.708% 25/05/2036 USD 2,897,841 2,199,937 0.19
Bear Stearns ARM Trust, FRN, Series 2007-3 Class 2A1 2.805% 25/05/2047 USD 950,561 813,504 0.07
Bear Stearns Asset-Backed Securities I Trust, FRN, Series 2004-BO1 Class M2 0.937% 25/10/2034 USD 3,917,000 3,938,477 0.33
The accompanying notes are an integral part of these financial statements.
Global Fixed Income Opportunities Fund (continued)
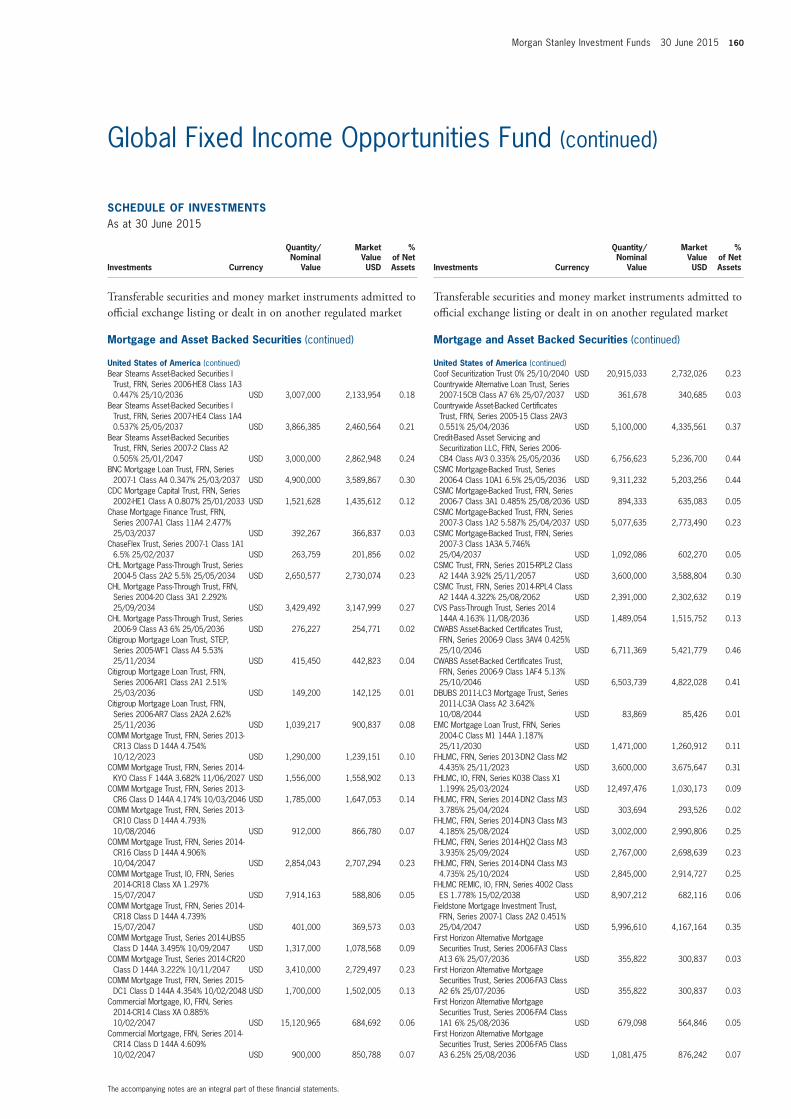
Morgan Stanley Investment Funds 30 June 2015 160
SCHEDULE of invEStmEntSAs at 30 June 2015
Investments Currency
Quantity/Nominal
Value
Market Value USD
% of Net Assets
transferable securities and money market instruments admitted to official exchange listing or dealt in on another regulated market
mortgage and Asset Backed Securities (continued)
United States of America (continued)Bear Stearns Asset-Backed Securities I
Trust, FRN, Series 2006-HE8 Class 1A3 0.447% 25/10/2036 USD 3,007,000 2,133,954 0.18
Bear Stearns Asset-Backed Securities I Trust, FRN, Series 2007-HE4 Class 1A4 0.537% 25/05/2037 USD 3,866,385 2,460,564 0.21
Bear Stearns Asset-Backed Securities Trust, FRN, Series 2007-2 Class A2 0.505% 25/01/2047 USD 3,000,000 2,862,948 0.24
BNC Mortgage Loan Trust, FRN, Series 2007-1 Class A4 0.347% 25/03/2037 USD 4,900,000 3,589,867 0.30
CDC Mortgage Capital Trust, FRN, Series 2002-HE1 Class A 0.807% 25/01/2033 USD 1,521,628 1,435,612 0.12
Chase Mortgage Finance Trust, FRN, Series 2007-A1 Class 11A4 2.477% 25/03/2037 USD 392,267 366,837 0.03
ChaseFlex Trust, Series 2007-1 Class 1A1 6.5% 25/02/2037 USD 263,759 201,856 0.02
CHL Mortgage Pass-Through Trust, Series 2004-5 Class 2A2 5.5% 25/05/2034 USD 2,650,577 2,730,074 0.23
CHL Mortgage Pass-Through Trust, FRN, Series 2004-20 Class 3A1 2.292% 25/09/2034 USD 3,429,492 3,147,999 0.27
CHL Mortgage Pass-Through Trust, Series 2006-9 Class A3 6% 25/05/2036 USD 276,227 254,771 0.02
Citigroup Mortgage Loan Trust, STEP, Series 2005-WF1 Class A4 5.53% 25/11/2034 USD 415,450 442,823 0.04
Citigroup Mortgage Loan Trust, FRN, Series 2006-AR1 Class 2A1 2.51% 25/03/2036 USD 149,200 142,125 0.01
Citigroup Mortgage Loan Trust, FRN, Series 2006-AR7 Class 2A2A 2.62% 25/11/2036 USD 1,039,217 900,837 0.08
COMM Mortgage Trust, FRN, Series 2013-CR13 Class D 144A 4.754% 10/12/2023 USD 1,290,000 1,239,151 0.10
COMM Mortgage Trust, FRN, Series 2014-KYO Class F 144A 3.682% 11/06/2027 USD 1,556,000 1,558,902 0.13
COMM Mortgage Trust, FRN, Series 2013-CR6 Class D 144A 4.174% 10/03/2046 USD 1,785,000 1,647,053 0.14
COMM Mortgage Trust, FRN, Series 2013-CR10 Class D 144A 4.793% 10/08/2046 USD 912,000 866,780 0.07
COMM Mortgage Trust, FRN, Series 2014-CR16 Class D 144A 4.906% 10/04/2047 USD 2,854,043 2,707,294 0.23
COMM Mortgage Trust, IO, FRN, Series 2014-CR18 Class XA 1.297% 15/07/2047 USD 7,914,163 588,806 0.05
COMM Mortgage Trust, FRN, Series 2014-CR18 Class D 144A 4.739% 15/07/2047 USD 401,000 369,573 0.03
COMM Mortgage Trust, Series 2014-UBS5 Class D 144A 3.495% 10/09/2047 USD 1,317,000 1,078,568 0.09
COMM Mortgage Trust, Series 2014-CR20 Class D 144A 3.222% 10/11/2047 USD 3,410,000 2,729,497 0.23
COMM Mortgage Trust, FRN, Series 2015-DC1 Class D 144A 4.354% 10/02/2048 USD 1,700,000 1,502,005 0.13
Commercial Mortgage, IO, FRN, Series 2014-CR14 Class XA 0.885% 10/02/2047 USD 15,120,965 684,692 0.06
Commercial Mortgage, FRN, Series 2014-CR14 Class D 144A 4.609% 10/02/2047 USD 900,000 850,788 0.07
SCHEDULE of invEStmEntSAs at 30 June 2015
Investments Currency
Quantity/Nominal
Value
Market Value USD
% of Net Assets
transferable securities and money market instruments admitted to official exchange listing or dealt in on another regulated market
mortgage and Asset Backed Securities (continued)
United States of America (continued)Coof Securitization Trust 0% 25/10/2040 USD 20,915,033 2,732,026 0.23Countrywide Alternative Loan Trust, Series
2007-15CB Class A7 6% 25/07/2037 USD 361,678 340,685 0.03Countrywide Asset-Backed Certificates
Trust, FRN, Series 2005-15 Class 2AV3 0.551% 25/04/2036 USD 5,100,000 4,335,561 0.37
Credit-Based Asset Servicing and Securitization LLC, FRN, Series 2006-CB4 Class AV3 0.335% 25/05/2036 USD 6,756,623 5,236,700 0.44
CSMC Mortgage-Backed Trust, Series 2006-4 Class 10A1 6.5% 25/05/2036 USD 9,311,232 5,203,256 0.44
CSMC Mortgage-Backed Trust, FRN, Series 2006-7 Class 3A1 0.485% 25/08/2036 USD 894,333 635,083 0.05
CSMC Mortgage-Backed Trust, FRN, Series 2007-3 Class 1A2 5.587% 25/04/2037 USD 5,077,635 2,773,490 0.23
CSMC Mortgage-Backed Trust, FRN, Series 2007-3 Class 1A3A 5.746% 25/04/2037 USD 1,092,086 602,270 0.05
CSMC Trust, FRN, Series 2015-RPL2 Class A2 144A 3.92% 25/11/2057 USD 3,600,000 3,588,804 0.30
CSMC Trust, FRN, Series 2014-RPL4 Class A2 144A 4.322% 25/08/2062 USD 2,391,000 2,302,632 0.19
CVS Pass-Through Trust, Series 2014 144A 4.163% 11/08/2036 USD 1,489,054 1,515,752 0.13
CWABS Asset-Backed Certificates Trust, FRN, Series 2006-9 Class 3AV4 0.425% 25/10/2046 USD 6,711,369 5,421,779 0.46
CWABS Asset-Backed Certificates Trust, FRN, Series 2006-9 Class 1AF4 5.13% 25/10/2046 USD 6,503,739 4,822,028 0.41
DBUBS 2011-LC3 Mortgage Trust, Series 2011-LC3A Class A2 3.642% 10/08/2044 USD 83,869 85,426 0.01
EMC Mortgage Loan Trust, FRN, Series 2004-C Class M1 144A 1.187% 25/11/2030 USD 1,471,000 1,260,912 0.11
FHLMC, FRN, Series 2013-DN2 Class M2 4.435% 25/11/2023 USD 3,600,000 3,675,647 0.31
FHLMC, IO, FRN, Series K038 Class X1 1.199% 25/03/2024 USD 12,497,476 1,030,173 0.09
FHLMC, FRN, Series 2014-DN2 Class M3 3.785% 25/04/2024 USD 303,694 293,526 0.02
FHLMC, FRN, Series 2014-DN3 Class M3 4.185% 25/08/2024 USD 3,002,000 2,990,806 0.25
FHLMC, FRN, Series 2014-HQ2 Class M3 3.935% 25/09/2024 USD 2,767,000 2,698,639 0.23
FHLMC, FRN, Series 2014-DN4 Class M3 4.735% 25/10/2024 USD 2,845,000 2,914,727 0.25
FHLMC REMIC, IO, FRN, Series 4002 Class ES 1.778% 15/02/2038 USD 8,907,212 682,116 0.06
Fieldstone Mortgage Investment Trust, FRN, Series 2007-1 Class 2A2 0.451% 25/04/2047 USD 5,996,610 4,167,164 0.35
First Horizon Alternative Mortgage Securities Trust, Series 2006-FA3 Class A13 6% 25/07/2036 USD 355,822 300,837 0.03
First Horizon Alternative Mortgage Securities Trust, Series 2006-FA3 Class A2 6% 25/07/2036 USD 355,822 300,837 0.03
First Horizon Alternative Mortgage Securities Trust, Series 2006-FA4 Class 1A1 6% 25/08/2036 USD 679,098 564,846 0.05
First Horizon Alternative Mortgage Securities Trust, Series 2006-FA5 Class A3 6.25% 25/08/2036 USD 1,081,475 876,242 0.07
The accompanying notes are an integral part of these financial statements.
Global Fixed Income Opportunities Fund (continued)
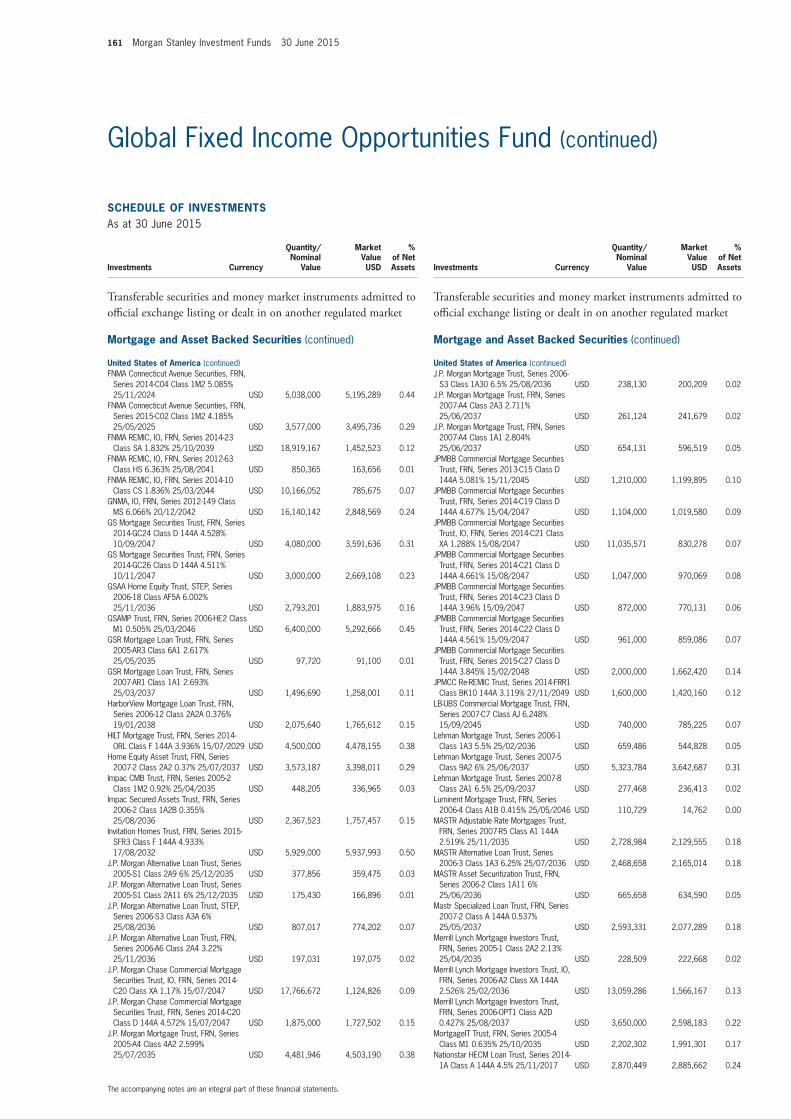
161 Morgan Stanley Investment Funds 30 June 2015
SCHEDULE of invEStmEntSAs at 30 June 2015
Investments Currency
Quantity/Nominal
Value
Market Value USD
% of Net Assets
transferable securities and money market instruments admitted to official exchange listing or dealt in on another regulated market
mortgage and Asset Backed Securities (continued)
United States of America (continued)FNMA Connecticut Avenue Securities, FRN,
Series 2014-C04 Class 1M2 5.085% 25/11/2024 USD 5,038,000 5,195,289 0.44
FNMA Connecticut Avenue Securities, FRN, Series 2015-C02 Class 1M2 4.185% 25/05/2025 USD 3,577,000 3,495,736 0.29
FNMA REMIC, IO, FRN, Series 2014-23 Class SA 1.832% 25/10/2039 USD 18,919,167 1,452,523 0.12
FNMA REMIC, IO, FRN, Series 2012-63 Class HS 6.363% 25/08/2041 USD 850,365 163,656 0.01
FNMA REMIC, IO, FRN, Series 2014-10 Class CS 1.836% 25/03/2044 USD 10,166,052 785,675 0.07
GNMA, IO, FRN, Series 2012-149 Class MS 6.066% 20/12/2042 USD 16,140,142 2,848,569 0.24
GS Mortgage Securities Trust, FRN, Series 2014-GC24 Class D 144A 4.528% 10/09/2047 USD 4,080,000 3,591,636 0.31
GS Mortgage Securities Trust, FRN, Series 2014-GC26 Class D 144A 4.511% 10/11/2047 USD 3,000,000 2,669,108 0.23
GSAA Home Equity Trust, STEP, Series 2006-18 Class AF5A 6.002% 25/11/2036 USD 2,793,201 1,883,975 0.16
GSAMP Trust, FRN, Series 2006-HE2 Class M1 0.505% 25/03/2046 USD 6,400,000 5,292,666 0.45
GSR Mortgage Loan Trust, FRN, Series 2005-AR3 Class 6A1 2.617% 25/05/2035 USD 97,720 91,100 0.01
GSR Mortgage Loan Trust, FRN, Series 2007-AR1 Class 1A1 2.693% 25/03/2037 USD 1,496,690 1,258,001 0.11
HarborView Mortgage Loan Trust, FRN, Series 2006-12 Class 2A2A 0.376% 19/01/2038 USD 2,075,640 1,765,612 0.15
HILT Mortgage Trust, FRN, Series 2014-ORL Class F 144A 3.936% 15/07/2029 USD 4,500,000 4,478,155 0.38
Home Equity Asset Trust, FRN, Series 2007-2 Class 2A2 0.37% 25/07/2037 USD 3,573,187 3,398,011 0.29
Impac CMB Trust, FRN, Series 2005-2 Class 1M2 0.92% 25/04/2035 USD 448,205 336,965 0.03
Impac Secured Assets Trust, FRN, Series 2006-2 Class 1A2B 0.355% 25/08/2036 USD 2,367,523 1,757,457 0.15
Invitation Homes Trust, FRN, Series 2015-SFR3 Class F 144A 4.933% 17/08/2032 USD 5,929,000 5,937,993 0.50
J.P. Morgan Alternative Loan Trust, Series 2005-S1 Class 2A9 6% 25/12/2035 USD 377,856 359,475 0.03
J.P. Morgan Alternative Loan Trust, Series 2005-S1 Class 2A11 6% 25/12/2035 USD 175,430 166,896 0.01
J.P. Morgan Alternative Loan Trust, STEP, Series 2006-S3 Class A3A 6% 25/08/2036 USD 807,017 774,202 0.07
J.P. Morgan Alternative Loan Trust, FRN, Series 2006-A6 Class 2A4 3.22% 25/11/2036 USD 197,031 197,075 0.02
J.P. Morgan Chase Commercial Mortgage Securities Trust, IO, FRN, Series 2014-C20 Class XA 1.17% 15/07/2047 USD 17,766,672 1,124,826 0.09
J.P. Morgan Chase Commercial Mortgage Securities Trust, FRN, Series 2014-C20 Class D 144A 4.572% 15/07/2047 USD 1,875,000 1,727,502 0.15
J.P. Morgan Mortgage Trust, FRN, Series 2005-A4 Class 4A2 2.599% 25/07/2035 USD 4,481,946 4,503,190 0.38
SCHEDULE of invEStmEntSAs at 30 June 2015
Investments Currency
Quantity/Nominal
Value
Market Value USD
% of Net Assets
transferable securities and money market instruments admitted to official exchange listing or dealt in on another regulated market
mortgage and Asset Backed Securities (continued)
United States of America (continued)J.P. Morgan Mortgage Trust, Series 2006-
S3 Class 1A30 6.5% 25/08/2036 USD 238,130 200,209 0.02J.P. Morgan Mortgage Trust, FRN, Series
2007-A4 Class 2A3 2.711% 25/06/2037 USD 261,124 241,679 0.02
J.P. Morgan Mortgage Trust, FRN, Series 2007-A4 Class 1A1 2.804% 25/06/2037 USD 654,131 596,519 0.05
JPMBB Commercial Mortgage Securities Trust, FRN, Series 2013-C15 Class D 144A 5.081% 15/11/2045 USD 1,210,000 1,199,895 0.10
JPMBB Commercial Mortgage Securities Trust, FRN, Series 2014-C19 Class D 144A 4.677% 15/04/2047 USD 1,104,000 1,019,580 0.09
JPMBB Commercial Mortgage Securities Trust, IO, FRN, Series 2014-C21 Class XA 1.288% 15/08/2047 USD 11,035,571 830,278 0.07
JPMBB Commercial Mortgage Securities Trust, FRN, Series 2014-C21 Class D 144A 4.661% 15/08/2047 USD 1,047,000 970,069 0.08
JPMBB Commercial Mortgage Securities Trust, FRN, Series 2014-C23 Class D 144A 3.96% 15/09/2047 USD 872,000 770,131 0.06
JPMBB Commercial Mortgage Securities Trust, FRN, Series 2014-C22 Class D 144A 4.561% 15/09/2047 USD 961,000 859,086 0.07
JPMBB Commercial Mortgage Securities Trust, FRN, Series 2015-C27 Class D 144A 3.845% 15/02/2048 USD 2,000,000 1,662,420 0.14
JPMCC Re-REMIC Trust, Series 2014-FRR1 Class BK10 144A 3.119% 27/11/2049 USD 1,600,000 1,420,160 0.12
LB-UBS Commercial Mortgage Trust, FRN, Series 2007-C7 Class AJ 6.248% 15/09/2045 USD 740,000 785,225 0.07
Lehman Mortgage Trust, Series 2006-1 Class 1A3 5.5% 25/02/2036 USD 659,486 544,828 0.05
Lehman Mortgage Trust, Series 2007-5 Class 9A2 6% 25/06/2037 USD 5,323,784 3,642,687 0.31
Lehman Mortgage Trust, Series 2007-8 Class 2A1 6.5% 25/09/2037 USD 277,468 236,413 0.02
Luminent Mortgage Trust, FRN, Series 2006-4 Class A1B 0.415% 25/05/2046 USD 110,729 14,762 0.00
MASTR Adjustable Rate Mortgages Trust, FRN, Series 2007-R5 Class A1 144A 2.519% 25/11/2035 USD 2,728,984 2,129,555 0.18
MASTR Alternative Loan Trust, Series 2006-3 Class 1A3 6.25% 25/07/2036 USD 2,468,658 2,165,014 0.18
MASTR Asset Securitization Trust, FRN, Series 2006-2 Class 1A11 6% 25/06/2036 USD 665,658 634,590 0.05
Mastr Specialized Loan Trust, FRN, Series 2007-2 Class A 144A 0.537% 25/05/2037 USD 2,593,331 2,077,289 0.18
Merrill Lynch Mortgage Investors Trust, FRN, Series 2005-1 Class 2A2 2.13% 25/04/2035 USD 228,509 222,668 0.02
Merrill Lynch Mortgage Investors Trust, IO, FRN, Series 2006-A2 Class XA 144A 2.526% 25/02/2036 USD 13,059,286 1,566,167 0.13
Merrill Lynch Mortgage Investors Trust, FRN, Series 2006-OPT1 Class A2D 0.427% 25/08/2037 USD 3,650,000 2,598,183 0.22
MortgageIT Trust, FRN, Series 2005-4 Class M1 0.635% 25/10/2035 USD 2,202,302 1,991,301 0.17
Nationstar HECM Loan Trust, Series 2014-1A Class A 144A 4.5% 25/11/2017 USD 2,870,449 2,885,662 0.24
The accompanying notes are an integral part of these financial statements.
Global Fixed Income Opportunities Fund (continued)
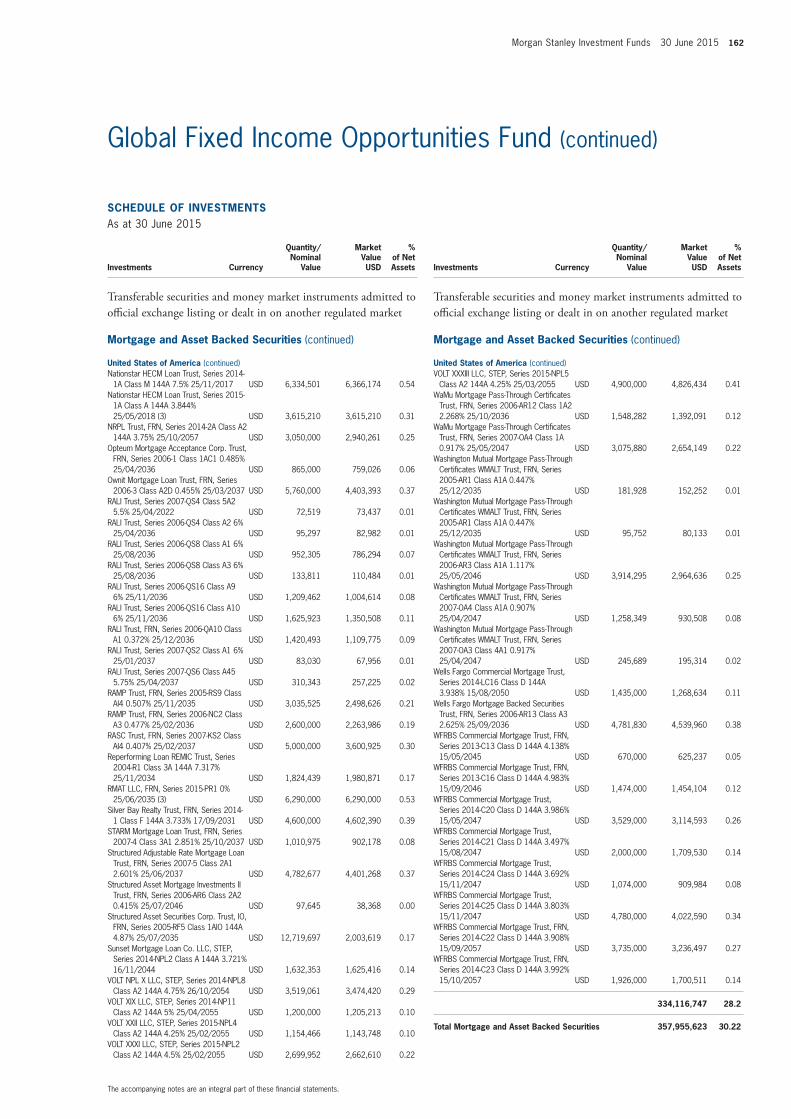
Morgan Stanley Investment Funds 30 June 2015 162
SCHEDULE of invEStmEntSAs at 30 June 2015
Investments Currency
Quantity/Nominal
Value
Market Value USD
% of Net Assets
transferable securities and money market instruments admitted to official exchange listing or dealt in on another regulated market
mortgage and Asset Backed Securities (continued)
United States of America (continued)Nationstar HECM Loan Trust, Series 2014-
1A Class M 144A 7.5% 25/11/2017 USD 6,334,501 6,366,174 0.54Nationstar HECM Loan Trust, Series 2015-
1A Class A 144A 3.844% 25/05/2018 (3) USD 3,615,210 3,615,210 0.31
NRPL Trust, FRN, Series 2014-2A Class A2 144A 3.75% 25/10/2057 USD 3,050,000 2,940,261 0.25
Opteum Mortgage Acceptance Corp. Trust, FRN, Series 2006-1 Class 1AC1 0.485% 25/04/2036 USD 865,000 759,026 0.06
Ownit Mortgage Loan Trust, FRN, Series 2006-3 Class A2D 0.455% 25/03/2037 USD 5,760,000 4,403,393 0.37
RALI Trust, Series 2007-QS4 Class 5A2 5.5% 25/04/2022 USD 72,519 73,437 0.01
RALI Trust, Series 2006-QS4 Class A2 6% 25/04/2036 USD 95,297 82,982 0.01
RALI Trust, Series 2006-QS8 Class A1 6% 25/08/2036 USD 952,305 786,294 0.07
RALI Trust, Series 2006-QS8 Class A3 6% 25/08/2036 USD 133,811 110,484 0.01
RALI Trust, Series 2006-QS16 Class A9 6% 25/11/2036 USD 1,209,462 1,004,614 0.08
RALI Trust, Series 2006-QS16 Class A10 6% 25/11/2036 USD 1,625,923 1,350,508 0.11
RALI Trust, FRN, Series 2006-QA10 Class A1 0.372% 25/12/2036 USD 1,420,493 1,109,775 0.09
RALI Trust, Series 2007-QS2 Class A1 6% 25/01/2037 USD 83,030 67,956 0.01
RALI Trust, Series 2007-QS6 Class A45 5.75% 25/04/2037 USD 310,343 257,225 0.02
RAMP Trust, FRN, Series 2005-RS9 Class AI4 0.507% 25/11/2035 USD 3,035,525 2,498,626 0.21
RAMP Trust, FRN, Series 2006-NC2 Class A3 0.477% 25/02/2036 USD 2,600,000 2,263,986 0.19
RASC Trust, FRN, Series 2007-KS2 Class AI4 0.407% 25/02/2037 USD 5,000,000 3,600,925 0.30
Reperforming Loan REMIC Trust, Series 2004-R1 Class 3A 144A 7.317% 25/11/2034 USD 1,824,439 1,980,871 0.17
RMAT LLC, FRN, Series 2015-PR1 0% 25/06/2035 (3) USD 6,290,000 6,290,000 0.53
Silver Bay Realty Trust, FRN, Series 2014-1 Class F 144A 3.733% 17/09/2031 USD 4,600,000 4,602,390 0.39
STARM Mortgage Loan Trust, FRN, Series 2007-4 Class 3A1 2.851% 25/10/2037 USD 1,010,975 902,178 0.08
Structured Adjustable Rate Mortgage Loan Trust, FRN, Series 2007-5 Class 2A1 2.601% 25/06/2037 USD 4,782,677 4,401,268 0.37
Structured Asset Mortgage Investments II Trust, FRN, Series 2006-AR6 Class 2A2 0.415% 25/07/2046 USD 97,645 38,368 0.00
Structured Asset Securities Corp. Trust, IO, FRN, Series 2005-RF5 Class 1AIO 144A 4.87% 25/07/2035 USD 12,719,697 2,003,619 0.17
Sunset Mortgage Loan Co. LLC, STEP, Series 2014-NPL2 Class A 144A 3.721% 16/11/2044 USD 1,632,353 1,625,416 0.14
VOLT NPL X LLC, STEP, Series 2014-NPL8 Class A2 144A 4.75% 26/10/2054 USD 3,519,061 3,474,420 0.29
VOLT XIX LLC, STEP, Series 2014-NP11 Class A2 144A 5% 25/04/2055 USD 1,200,000 1,205,213 0.10
VOLT XXII LLC, STEP, Series 2015-NPL4 Class A2 144A 4.25% 25/02/2055 USD 1,154,466 1,143,748 0.10
VOLT XXXI LLC, STEP, Series 2015-NPL2 Class A2 144A 4.5% 25/02/2055 USD 2,699,952 2,662,610 0.22
SCHEDULE of invEStmEntSAs at 30 June 2015
Investments Currency
Quantity/Nominal
Value
Market Value USD
% of Net Assets
transferable securities and money market instruments admitted to official exchange listing or dealt in on another regulated market
mortgage and Asset Backed Securities (continued)
United States of America (continued)VOLT XXXIII LLC, STEP, Series 2015-NPL5
Class A2 144A 4.25% 25/03/2055 USD 4,900,000 4,826,434 0.41WaMu Mortgage Pass-Through Certificates
Trust, FRN, Series 2006-AR12 Class 1A2 2.268% 25/10/2036 USD 1,548,282 1,392,091 0.12
WaMu Mortgage Pass-Through Certificates Trust, FRN, Series 2007-OA4 Class 1A 0.917% 25/05/2047 USD 3,075,880 2,654,149 0.22
Washington Mutual Mortgage Pass-Through Certificates WMALT Trust, FRN, Series 2005-AR1 Class A1A 0.447% 25/12/2035 USD 181,928 152,252 0.01
Washington Mutual Mortgage Pass-Through Certificates WMALT Trust, FRN, Series 2005-AR1 Class A1A 0.447% 25/12/2035 USD 95,752 80,133 0.01
Washington Mutual Mortgage Pass-Through Certificates WMALT Trust, FRN, Series 2006-AR3 Class A1A 1.117% 25/05/2046 USD 3,914,295 2,964,636 0.25
Washington Mutual Mortgage Pass-Through Certificates WMALT Trust, FRN, Series 2007-OA4 Class A1A 0.907% 25/04/2047 USD 1,258,349 930,508 0.08
Washington Mutual Mortgage Pass-Through Certificates WMALT Trust, FRN, Series 2007-OA3 Class 4A1 0.917% 25/04/2047 USD 245,689 195,314 0.02
Wells Fargo Commercial Mortgage Trust, Series 2014-LC16 Class D 144A 3.938% 15/08/2050 USD 1,435,000 1,268,634 0.11
Wells Fargo Mortgage Backed Securities Trust, FRN, Series 2006-AR13 Class A3 2.625% 25/09/2036 USD 4,781,830 4,539,960 0.38
WFRBS Commercial Mortgage Trust, FRN, Series 2013-C13 Class D 144A 4.138% 15/05/2045 USD 670,000 625,237 0.05
WFRBS Commercial Mortgage Trust, FRN, Series 2013-C16 Class D 144A 4.983% 15/09/2046 USD 1,474,000 1,454,104 0.12
WFRBS Commercial Mortgage Trust, Series 2014-C20 Class D 144A 3.986% 15/05/2047 USD 3,529,000 3,114,593 0.26
WFRBS Commercial Mortgage Trust, Series 2014-C21 Class D 144A 3.497% 15/08/2047 USD 2,000,000 1,709,530 0.14
WFRBS Commercial Mortgage Trust, Series 2014-C24 Class D 144A 3.692% 15/11/2047 USD 1,074,000 909,984 0.08
WFRBS Commercial Mortgage Trust, Series 2014-C25 Class D 144A 3.803% 15/11/2047 USD 4,780,000 4,022,590 0.34
WFRBS Commercial Mortgage Trust, FRN, Series 2014-C22 Class D 144A 3.908% 15/09/2057 USD 3,735,000 3,236,497 0.27
WFRBS Commercial Mortgage Trust, FRN, Series 2014-C23 Class D 144A 3.992% 15/10/2057 USD 1,926,000 1,700,511 0.14
334,116,747 28.2
total mortgage and Asset Backed Securities 357,955,623 30.22
The accompanying notes are an integral part of these financial statements.
Global Fixed Income Opportunities Fund (continued)
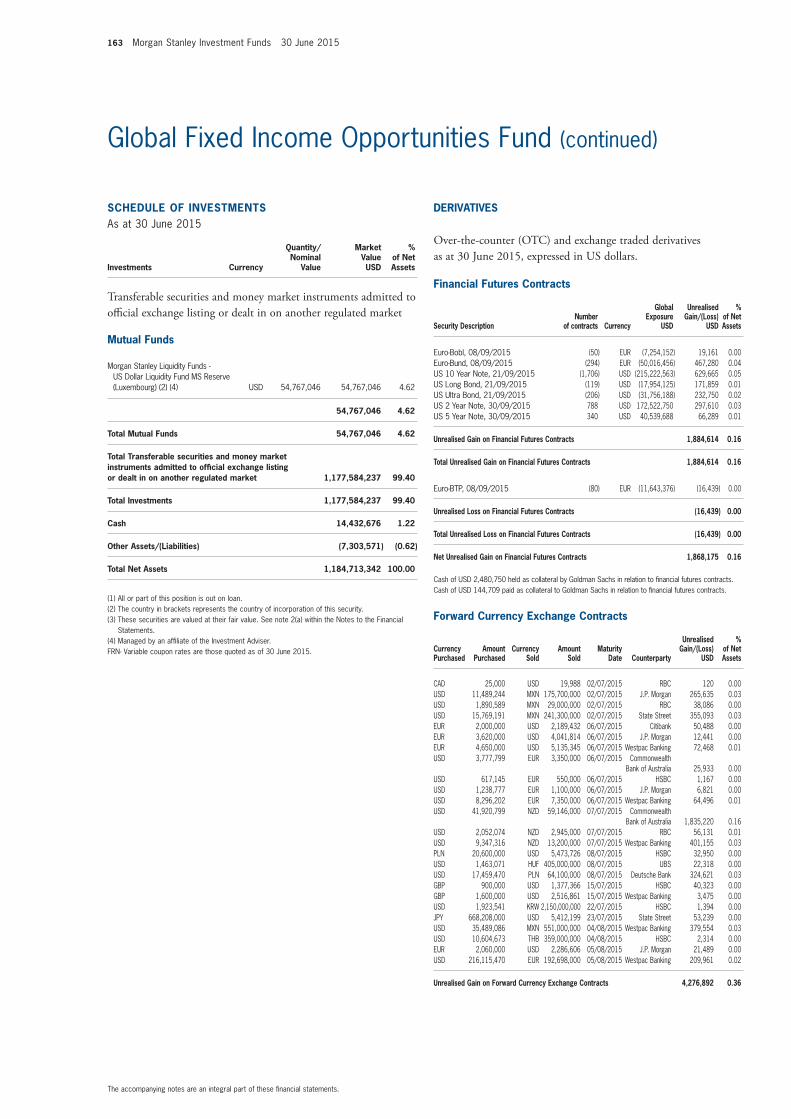
163 Morgan Stanley Investment Funds 30 June 2015
SCHEDULE of invEStmEntSAs at 30 June 2015
Investments Currency
Quantity/Nominal
Value
Market Value USD
% of Net Assets
transferable securities and money market instruments admitted to official exchange listing or dealt in on another regulated market
mutual funds
Morgan Stanley Liquidity Funds - US Dollar Liquidity Fund MS Reserve (Luxembourg) (2) (4) USD 54,767,046 54,767,046 4.62
54,767,046 4.62
total mutual funds 54,767,046 4.62
total transferable securities and money market instruments admitted to official exchange listing or dealt in on another regulated market 1,177,584,237 99.40
total investments 1,177,584,237 99.40
Cash 14,432,676 1.22
other Assets/(Liabilities) (7,303,571) (0.62)
total net Assets 1,184,713,342 100.00
(1) All or part of this position is out on loan.(2) The country in brackets represents the country of incorporation of this security.(3) These securities are valued at their fair value. See note 2(a) within the Notes to the Financial
Statements.(4) Managed by an affiliate of the Investment Adviser.FRN- Variable coupon rates are those quoted as of 30 June 2015.
financial futures Contracts
Security Descriptionnumber
of contracts Currency
Global Exposure
USD
Unrealised Gain/(Loss)
USD
% of net Assets
Euro-Bobl, 08/09/2015 (50) EUR (7,254,152) 19,161 0.00Euro-Bund, 08/09/2015 (294) EUR (50,016,456) 467,280 0.04US 10 Year Note, 21/09/2015 (1,706) USD (215,222,563) 629,665 0.05US Long Bond, 21/09/2015 (119) USD (17,954,125) 171,859 0.01US Ultra Bond, 21/09/2015 (206) USD (31,756,188) 232,750 0.02US 2 Year Note, 30/09/2015 788 USD 172,522,750 297,610 0.03US 5 Year Note, 30/09/2015 340 USD 40,539,688 66,289 0.01
Unrealised Gain on financial futures Contracts 1,884,614 0.16
total Unrealised Gain on financial futures Contracts 1,884,614 0.16
Euro-BTP, 08/09/2015 (80) EUR (11,643,376) (16,439) 0.00
Unrealised Loss on financial futures Contracts (16,439) 0.00
total Unrealised Loss on financial futures Contracts (16,439) 0.00
net Unrealised Gain on financial futures Contracts 1,868,175 0.16
Cash of USD 2,480,750 held as collateral by Goldman Sachs in relation to financial futures contracts.Cash of USD 144,709 paid as collateral to Goldman Sachs in relation to financial futures contracts.
forward Currency Exchange Contracts (continued)
Currency Purchased
Amount Purchased
Currency Sold
Amount Sold
maturity Date Counterparty
Unrealised Gain/(Loss)
USD
% of net Assets
CAD 25,000 USD 19,988 02/07/2015 RBC 120 0.00USD 11,489,244 MXN 175,700,000 02/07/2015 J.P. Morgan 265,635 0.03USD 1,890,589 MXN 29,000,000 02/07/2015 RBC 38,086 0.00USD 15,769,191 MXN 241,300,000 02/07/2015 State Street 355,093 0.03EUR 2,000,000 USD 2,189,432 06/07/2015 Citibank 50,488 0.00EUR 3,620,000 USD 4,041,814 06/07/2015 J.P. Morgan 12,441 0.00EUR 4,650,000 USD 5,135,345 06/07/2015 Westpac Banking 72,468 0.01USD 3,777,799 EUR 3,350,000 06/07/2015 Commonwealth
Bank of Australia 25,933 0.00USD 617,145 EUR 550,000 06/07/2015 HSBC 1,167 0.00USD 1,238,777 EUR 1,100,000 06/07/2015 J.P. Morgan 6,821 0.00USD 8,296,202 EUR 7,350,000 06/07/2015 Westpac Banking 64,496 0.01USD 41,920,799 NZD 59,146,000 07/07/2015 Commonwealth
Bank of Australia 1,835,220 0.16USD 2,052,074 NZD 2,945,000 07/07/2015 RBC 56,131 0.01USD 9,347,316 NZD 13,200,000 07/07/2015 Westpac Banking 401,155 0.03PLN 20,600,000 USD 5,473,726 08/07/2015 HSBC 32,950 0.00USD 1,463,071 HUF 405,000,000 08/07/2015 UBS 22,318 0.00USD 17,459,470 PLN 64,100,000 08/07/2015 Deutsche Bank 324,621 0.03GBP 900,000 USD 1,377,366 15/07/2015 HSBC 40,323 0.00GBP 1,600,000 USD 2,516,861 15/07/2015 Westpac Banking 3,475 0.00USD 1,923,541 KRW 2,150,000,000 22/07/2015 HSBC 1,394 0.00JPY 668,208,000 USD 5,412,199 23/07/2015 State Street 53,239 0.00USD 35,489,086 MXN 551,000,000 04/08/2015 Westpac Banking 379,554 0.03USD 10,604,673 THB 359,000,000 04/08/2015 HSBC 2,314 0.00EUR 2,060,000 USD 2,286,606 05/08/2015 J.P. Morgan 21,489 0.00USD 216,115,470 EUR 192,698,000 05/08/2015 Westpac Banking 209,961 0.02
Unrealised Gain on forward Currency Exchange Contracts 4,276,892 0.36
The accompanying notes are an integral part of these financial statements.
Global Fixed Income Opportunities Fund (continued)
DERivAtivES
Over-the-counter (OtC) and exchange traded derivatives as at 30 June 2015, expressed in US dollars.
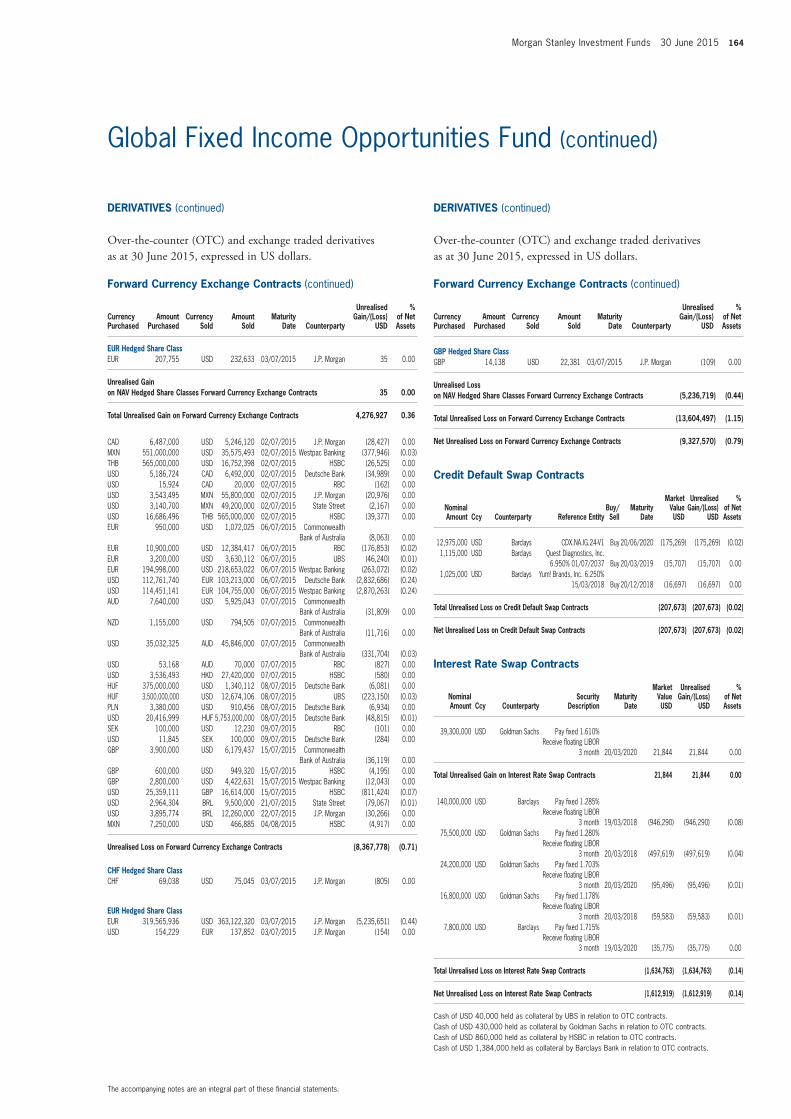
Morgan Stanley Investment Funds 30 June 2015 164
DERivAtivES (continued)
Over-the-counter (OtC) and exchange traded derivatives as at 30 June 2015, expressed in US dollars.
forward Currency Exchange Contracts (continued)
Currency Purchased
Amount Purchased
Currency Sold
Amount Sold
maturity Date Counterparty
Unrealised Gain/(Loss)
USD
% of net Assets
EUR Hedged Share ClassEUR 207,755 USD 232,633 03/07/2015 J.P. Morgan 35 0.00
Unrealised Gain on nAv Hedged Share Classes forward Currency Exchange Contracts 35 0.00
total Unrealised Gain on forward Currency Exchange Contracts 4,276,927 0.36
CAD 6,487,000 USD 5,246,120 02/07/2015 J.P. Morgan (28,427) 0.00MXN 551,000,000 USD 35,575,493 02/07/2015 Westpac Banking (377,946) (0.03)THB 565,000,000 USD 16,752,398 02/07/2015 HSBC (26,525) 0.00USD 5,186,724 CAD 6,492,000 02/07/2015 Deutsche Bank (34,989) 0.00USD 15,924 CAD 20,000 02/07/2015 RBC (162) 0.00USD 3,543,495 MXN 55,800,000 02/07/2015 J.P. Morgan (20,976) 0.00USD 3,140,700 MXN 49,200,000 02/07/2015 State Street (2,167) 0.00USD 16,686,496 THB 565,000,000 02/07/2015 HSBC (39,377) 0.00EUR 950,000 USD 1,072,025 06/07/2015 Commonwealth
Bank of Australia (8,063) 0.00EUR 10,900,000 USD 12,384,417 06/07/2015 RBC (176,853) (0.02)EUR 3,200,000 USD 3,630,112 06/07/2015 UBS (46,240) (0.01)EUR 194,998,000 USD 218,653,022 06/07/2015 Westpac Banking (263,072) (0.02)USD 112,761,740 EUR 103,213,000 06/07/2015 Deutsche Bank (2,832,686) (0.24)USD 114,451,141 EUR 104,755,000 06/07/2015 Westpac Banking (2,870,263) (0.24)AUD 7,640,000 USD 5,925,043 07/07/2015 Commonwealth
Bank of Australia (31,809) 0.00NZD 1,155,000 USD 794,505 07/07/2015 Commonwealth
Bank of Australia (11,716) 0.00USD 35,032,325 AUD 45,846,000 07/07/2015 Commonwealth
Bank of Australia (331,704) (0.03)USD 53,168 AUD 70,000 07/07/2015 RBC (827) 0.00USD 3,536,493 HKD 27,420,000 07/07/2015 HSBC (580) 0.00HUF 375,000,000 USD 1,340,112 08/07/2015 Deutsche Bank (6,081) 0.00HUF 3,500,000,000 USD 12,674,106 08/07/2015 UBS (223,150) (0.03)PLN 3,380,000 USD 910,456 08/07/2015 Deutsche Bank (6,934) 0.00USD 20,416,999 HUF 5,753,000,000 08/07/2015 Deutsche Bank (48,815) (0.01)SEK 100,000 USD 12,230 09/07/2015 RBC (101) 0.00USD 11,845 SEK 100,000 09/07/2015 Deutsche Bank (284) 0.00GBP 3,900,000 USD 6,179,437 15/07/2015 Commonwealth
Bank of Australia (36,119) 0.00GBP 600,000 USD 949,320 15/07/2015 HSBC (4,195) 0.00GBP 2,800,000 USD 4,422,631 15/07/2015 Westpac Banking (12,043) 0.00USD 25,359,111 GBP 16,614,000 15/07/2015 HSBC (811,424) (0.07)USD 2,964,304 BRL 9,500,000 21/07/2015 State Street (79,067) (0.01)USD 3,895,774 BRL 12,260,000 22/07/2015 J.P. Morgan (30,266) 0.00MXN 7,250,000 USD 466,885 04/08/2015 HSBC (4,917) 0.00
Unrealised Loss on forward Currency Exchange Contracts (8,367,778) (0.71)
CHf Hedged Share ClassCHF 69,038 USD 75,045 03/07/2015 J.P. Morgan (805) 0.00
EUR Hedged Share ClassEUR 319,565,936 USD 363,122,320 03/07/2015 J.P. Morgan (5,235,651) (0.44)USD 154,229 EUR 137,852 03/07/2015 J.P. Morgan (154) 0.00
DERivAtivES (continued)
Over-the-counter (OtC) and exchange traded derivatives as at 30 June 2015, expressed in US dollars.
forward Currency Exchange Contracts (continued)
Currency Purchased
Amount Purchased
Currency Sold
Amount Sold
maturity Date Counterparty
Unrealised Gain/(Loss)
USD
% of net Assets
GBP Hedged Share ClassGBP 14,138 USD 22,381 03/07/2015 J.P. Morgan (109) 0.00
Unrealised Loss on nAv Hedged Share Classes forward Currency Exchange Contracts (5,236,719) (0.44)
total Unrealised Loss on forward Currency Exchange Contracts (13,604,497) (1.15)
net Unrealised Loss on forward Currency Exchange Contracts (9,327,570) (0.79)
Credit Default Swap Contracts
nominal Amount Ccy Counterparty Reference Entity
Buy/Sell
maturity Date
market value USD
Unrealised Gain/(Loss)
USD
% of net Assets
12,975,000 USD Barclays CDX.NA.IG.24-V1 Buy 20/06/2020 (175,269) (175,269) (0.02)1,115,000 USD Barclays Quest Diagnostics, Inc.
6.950% 01/07/2037 Buy 20/03/2019 (15,707) (15,707) 0.001,025,000 USD Barclays Yum! Brands, Inc. 6.250%
15/03/2018 Buy 20/12/2018 (16,697) (16,697) 0.00
total Unrealised Loss on Credit Default Swap Contracts (207,673) (207,673) (0.02)
net Unrealised Loss on Credit Default Swap Contracts (207,673) (207,673) (0.02)
interest Rate Swap Contracts
nominal Amount Ccy Counterparty
Security Description
maturity Date
market value USD
Unrealised Gain/(Loss)
USD
% of net Assets
39,300,000 USD Goldman Sachs Pay fixed 1.610% Receive floating LIBOR
3 month 20/03/2020 21,844 21,844 0.00
total Unrealised Gain on interest Rate Swap Contracts 21,844 21,844 0.00
140,000,000 USD Barclays Pay fixed 1.285% Receive floating LIBOR
3 month 19/03/2018 (946,290) (946,290) (0.08)75,500,000 USD Goldman Sachs Pay fixed 1.280%
Receive floating LIBOR 3 month 20/03/2018 (497,619) (497,619) (0.04)
24,200,000 USD Goldman Sachs Pay fixed 1.703% Receive floating LIBOR
3 month 20/03/2020 (95,496) (95,496) (0.01)16,800,000 USD Goldman Sachs Pay fixed 1.178%
Receive floating LIBOR 3 month 20/03/2018 (59,583) (59,583) (0.01)
7,800,000 USD Barclays Pay fixed 1.715% Receive floating LIBOR
3 month 19/03/2020 (35,775) (35,775) 0.00
total Unrealised Loss on interest Rate Swap Contracts (1,634,763) (1,634,763) (0.14)
net Unrealised Loss on interest Rate Swap Contracts (1,612,919) (1,612,919) (0.14)
Cash of USD 40,000 held as collateral by UBS in relation to OTC contracts.Cash of USD 430,000 held as collateral by Goldman Sachs in relation to OTC contracts.Cash of USD 860,000 held as collateral by HSBC in relation to OTC contracts.Cash of USD 1,384,000 held as collateral by Barclays Bank in relation to OTC contracts.
The accompanying notes are an integral part of these financial statements.
Global Fixed Income Opportunities Fund (continued)
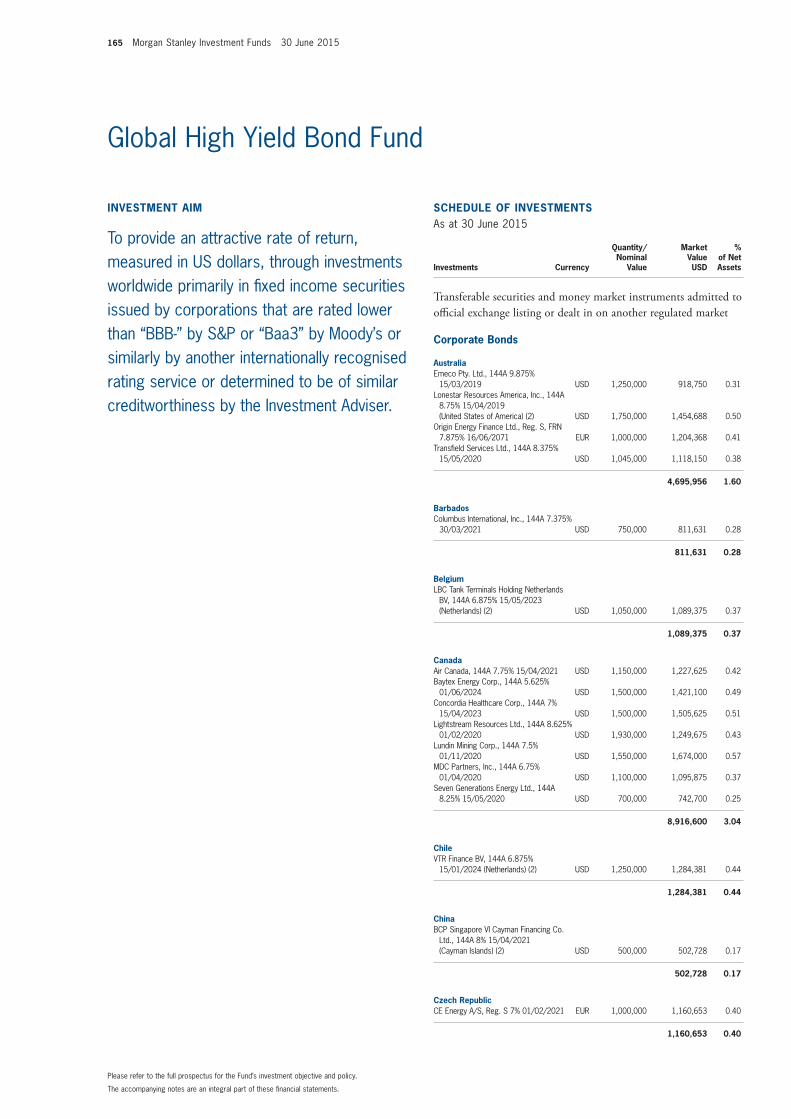
165 Morgan Stanley Investment Funds 30 June 2015
invEStmEnt Aim
To provide an attractive rate of return, measured in US dollars, through investments worldwide primarily in fixed income securities issued by corporations that are rated lower than “BBB-” by S&P or “Baa3” by Moody’s or similarly by another internationally recognised rating service or determined to be of similar creditworthiness by the Investment Adviser.
SCHEDULE of invEStmEntSAs at 30 June 2015
Investments Currency
Quantity/Nominal
Value
Market Value USD
% of Net Assets
transferable securities and money market instruments admitted to official exchange listing or dealt in on another regulated market
Corporate Bonds
AustraliaEmeco Pty. Ltd., 144A 9.875%
15/03/2019 USD 1,250,000 918,750 0.31Lonestar Resources America, Inc., 144A
8.75% 15/04/2019 (United States of America) (2) USD 1,750,000 1,454,688 0.50
Origin Energy Finance Ltd., Reg. S, FRN 7.875% 16/06/2071 EUR 1,000,000 1,204,368 0.41
Transfield Services Ltd., 144A 8.375% 15/05/2020 USD 1,045,000 1,118,150 0.38
4,695,956 1.60
BarbadosColumbus International, Inc., 144A 7.375%
30/03/2021 USD 750,000 811,631 0.28
811,631 0.28
BelgiumLBC Tank Terminals Holding Netherlands
BV, 144A 6.875% 15/05/2023 (Netherlands) (2) USD 1,050,000 1,089,375 0.37
1,089,375 0.37
CanadaAir Canada, 144A 7.75% 15/04/2021 USD 1,150,000 1,227,625 0.42Baytex Energy Corp., 144A 5.625%
01/06/2024 USD 1,500,000 1,421,100 0.49Concordia Healthcare Corp., 144A 7%
15/04/2023 USD 1,500,000 1,505,625 0.51Lightstream Resources Ltd., 144A 8.625%
01/02/2020 USD 1,930,000 1,249,675 0.43Lundin Mining Corp., 144A 7.5%
01/11/2020 USD 1,550,000 1,674,000 0.57MDC Partners, Inc., 144A 6.75%
01/04/2020 USD 1,100,000 1,095,875 0.37Seven Generations Energy Ltd., 144A
8.25% 15/05/2020 USD 700,000 742,700 0.25
8,916,600 3.04
ChileVTR Finance BV, 144A 6.875%
15/01/2024 (Netherlands) (2) USD 1,250,000 1,284,381 0.44
1,284,381 0.44
ChinaBCP Singapore VI Cayman Financing Co.
Ltd., 144A 8% 15/04/2021 (Cayman Islands) (2) USD 500,000 502,728 0.17
502,728 0.17
Czech RepublicCE Energy A/S, Reg. S 7% 01/02/2021 EUR 1,000,000 1,160,653 0.40
1,160,653 0.40
The accompanying notes are an integral part of these financial statements.
Please refer to the full prospectus for the Fund’s investment objective and policy.
Global High Yield Bond Fund
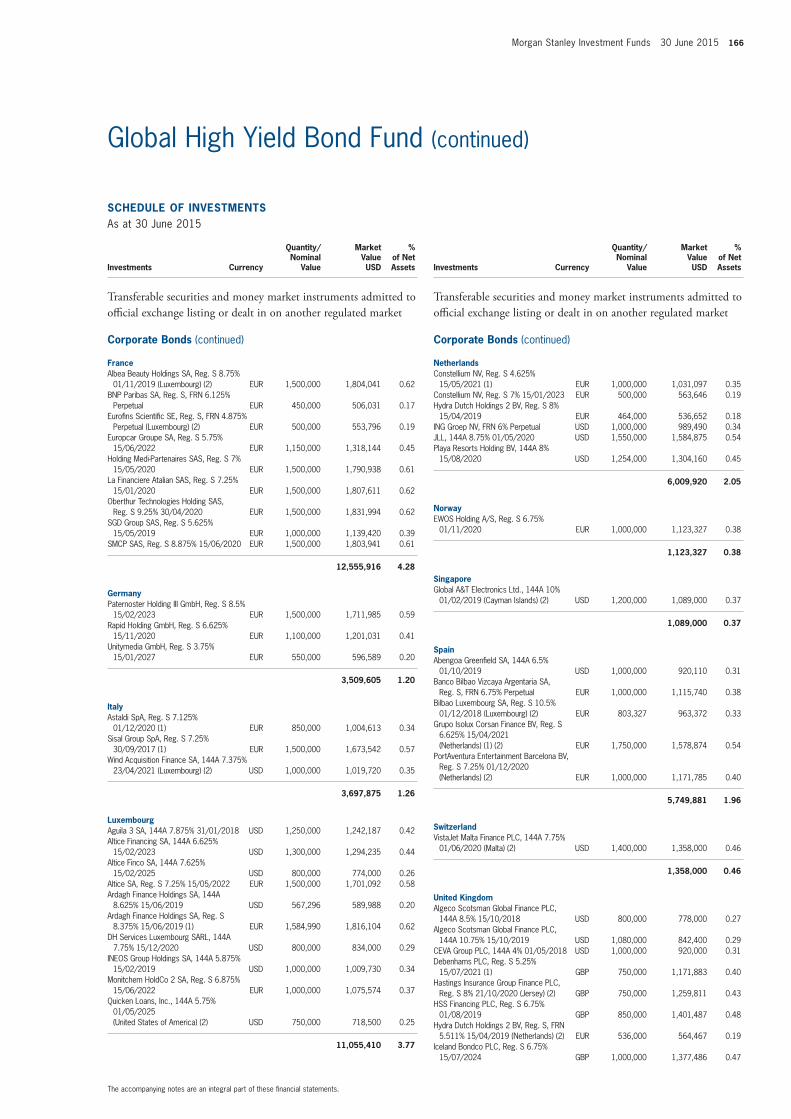
Morgan Stanley Investment Funds 30 June 2015 166
SCHEDULE of invEStmEntSAs at 30 June 2015
Investments Currency
Quantity/Nominal
Value
Market Value USD
% of Net Assets
transferable securities and money market instruments admitted to official exchange listing or dealt in on another regulated market
Corporate Bonds (continued)
franceAlbea Beauty Holdings SA, Reg. S 8.75%
01/11/2019 (Luxembourg) (2) EUR 1,500,000 1,804,041 0.62BNP Paribas SA, Reg. S, FRN 6.125%
Perpetual EUR 450,000 506,031 0.17Eurofins Scientific SE, Reg. S, FRN 4.875%
Perpetual (Luxembourg) (2) EUR 500,000 553,796 0.19Europcar Groupe SA, Reg. S 5.75%
15/06/2022 EUR 1,150,000 1,318,144 0.45Holding Medi-Partenaires SAS, Reg. S 7%
15/05/2020 EUR 1,500,000 1,790,938 0.61La Financiere Atalian SAS, Reg. S 7.25%
15/01/2020 EUR 1,500,000 1,807,611 0.62Oberthur Technologies Holding SAS,
Reg. S 9.25% 30/04/2020 EUR 1,500,000 1,831,994 0.62SGD Group SAS, Reg. S 5.625%
15/05/2019 EUR 1,000,000 1,139,420 0.39SMCP SAS, Reg. S 8.875% 15/06/2020 EUR 1,500,000 1,803,941 0.61
12,555,916 4.28
GermanyPaternoster Holding III GmbH, Reg. S 8.5%
15/02/2023 EUR 1,500,000 1,711,985 0.59Rapid Holding GmbH, Reg. S 6.625%
15/11/2020 EUR 1,100,000 1,201,031 0.41Unitymedia GmbH, Reg. S 3.75%
15/01/2027 EUR 550,000 596,589 0.20
3,509,605 1.20
italyAstaldi SpA, Reg. S 7.125%
01/12/2020 (1) EUR 850,000 1,004,613 0.34Sisal Group SpA, Reg. S 7.25%
30/09/2017 (1) EUR 1,500,000 1,673,542 0.57Wind Acquisition Finance SA, 144A 7.375%
23/04/2021 (Luxembourg) (2) USD 1,000,000 1,019,720 0.35
3,697,875 1.26
LuxembourgAguila 3 SA, 144A 7.875% 31/01/2018 USD 1,250,000 1,242,187 0.42Altice Financing SA, 144A 6.625%
15/02/2023 USD 1,300,000 1,294,235 0.44Altice Finco SA, 144A 7.625%
15/02/2025 USD 800,000 774,000 0.26Altice SA, Reg. S 7.25% 15/05/2022 EUR 1,500,000 1,701,092 0.58Ardagh Finance Holdings SA, 144A
8.625% 15/06/2019 USD 567,296 589,988 0.20Ardagh Finance Holdings SA, Reg. S
8.375% 15/06/2019 (1) EUR 1,584,990 1,816,104 0.62DH Services Luxembourg SARL, 144A
7.75% 15/12/2020 USD 800,000 834,000 0.29INEOS Group Holdings SA, 144A 5.875%
15/02/2019 USD 1,000,000 1,009,730 0.34Monitchem HoldCo 2 SA, Reg. S 6.875%
15/06/2022 EUR 1,000,000 1,075,574 0.37Quicken Loans, Inc., 144A 5.75%
01/05/2025 (United States of America) (2) USD 750,000 718,500 0.25
11,055,410 3.77
SCHEDULE of invEStmEntSAs at 30 June 2015
Investments Currency
Quantity/Nominal
Value
Market Value USD
% of Net Assets
transferable securities and money market instruments admitted to official exchange listing or dealt in on another regulated market
Corporate Bonds (continued)
netherlandsConstellium NV, Reg. S 4.625%
15/05/2021 (1) EUR 1,000,000 1,031,097 0.35Constellium NV, Reg. S 7% 15/01/2023 EUR 500,000 563,646 0.19Hydra Dutch Holdings 2 BV, Reg. S 8%
15/04/2019 EUR 464,000 536,652 0.18ING Groep NV, FRN 6% Perpetual USD 1,000,000 989,490 0.34JLL, 144A 8.75% 01/05/2020 USD 1,550,000 1,584,875 0.54Playa Resorts Holding BV, 144A 8%
15/08/2020 USD 1,254,000 1,304,160 0.45
6,009,920 2.05
norwayEWOS Holding A/S, Reg. S 6.75%
01/11/2020 EUR 1,000,000 1,123,327 0.38
1,123,327 0.38
SingaporeGlobal A&T Electronics Ltd., 144A 10%
01/02/2019 (Cayman Islands) (2) USD 1,200,000 1,089,000 0.37
1,089,000 0.37
SpainAbengoa Greenfield SA, 144A 6.5%
01/10/2019 USD 1,000,000 920,110 0.31Banco Bilbao Vizcaya Argentaria SA,
Reg. S, FRN 6.75% Perpetual EUR 1,000,000 1,115,740 0.38Bilbao Luxembourg SA, Reg. S 10.5%
01/12/2018 (Luxembourg) (2) EUR 803,327 963,372 0.33Grupo Isolux Corsan Finance BV, Reg. S
6.625% 15/04/2021 (Netherlands) (1) (2) EUR 1,750,000 1,578,874 0.54
PortAventura Entertainment Barcelona BV, Reg. S 7.25% 01/12/2020 (Netherlands) (2) EUR 1,000,000 1,171,785 0.40
5,749,881 1.96
SwitzerlandVistaJet Malta Finance PLC, 144A 7.75%
01/06/2020 (Malta) (2) USD 1,400,000 1,358,000 0.46
1,358,000 0.46
United KingdomAlgeco Scotsman Global Finance PLC,
144A 8.5% 15/10/2018 USD 800,000 778,000 0.27Algeco Scotsman Global Finance PLC,
144A 10.75% 15/10/2019 USD 1,080,000 842,400 0.29CEVA Group PLC, 144A 4% 01/05/2018 USD 1,000,000 920,000 0.31Debenhams PLC, Reg. S 5.25%
15/07/2021 (1) GBP 750,000 1,171,883 0.40Hastings Insurance Group Finance PLC,
Reg. S 8% 21/10/2020 (Jersey) (2) GBP 750,000 1,259,811 0.43HSS Financing PLC, Reg. S 6.75%
01/08/2019 GBP 850,000 1,401,487 0.48Hydra Dutch Holdings 2 BV, Reg. S, FRN
5.511% 15/04/2019 (Netherlands) (2) EUR 536,000 564,467 0.19Iceland Bondco PLC, Reg. S 6.75%
15/07/2024 GBP 1,000,000 1,377,486 0.47
The accompanying notes are an integral part of these financial statements.
Global High Yield Bond Fund (continued)
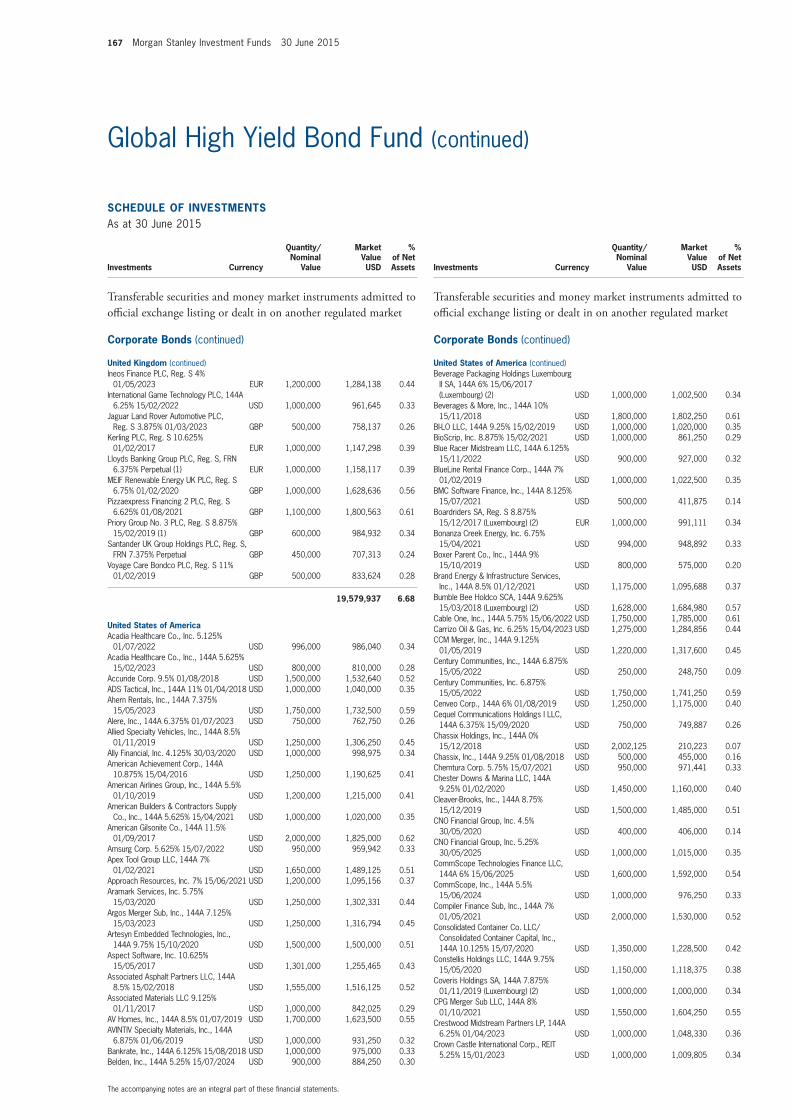
167 Morgan Stanley Investment Funds 30 June 2015
SCHEDULE of invEStmEntSAs at 30 June 2015
Investments Currency
Quantity/Nominal
Value
Market Value USD
% of Net Assets
transferable securities and money market instruments admitted to official exchange listing or dealt in on another regulated market
Corporate Bonds (continued)
United Kingdom (continued)Ineos Finance PLC, Reg. S 4%
01/05/2023 EUR 1,200,000 1,284,138 0.44International Game Technology PLC, 144A
6.25% 15/02/2022 USD 1,000,000 961,645 0.33Jaguar Land Rover Automotive PLC,
Reg. S 3.875% 01/03/2023 GBP 500,000 758,137 0.26Kerling PLC, Reg. S 10.625%
01/02/2017 EUR 1,000,000 1,147,298 0.39Lloyds Banking Group PLC, Reg. S, FRN
6.375% Perpetual (1) EUR 1,000,000 1,158,117 0.39MEIF Renewable Energy UK PLC, Reg. S
6.75% 01/02/2020 GBP 1,000,000 1,628,636 0.56Pizzaexpress Financing 2 PLC, Reg. S
6.625% 01/08/2021 GBP 1,100,000 1,800,563 0.61Priory Group No. 3 PLC, Reg. S 8.875%
15/02/2019 (1) GBP 600,000 984,932 0.34Santander UK Group Holdings PLC, Reg. S,
FRN 7.375% Perpetual GBP 450,000 707,313 0.24Voyage Care Bondco PLC, Reg. S 11%
01/02/2019 GBP 500,000 833,624 0.28
19,579,937 6.68
United States of AmericaAcadia Healthcare Co., Inc. 5.125%
01/07/2022 USD 996,000 986,040 0.34Acadia Healthcare Co., Inc., 144A 5.625%
15/02/2023 USD 800,000 810,000 0.28Accuride Corp. 9.5% 01/08/2018 USD 1,500,000 1,532,640 0.52ADS Tactical, Inc., 144A 11% 01/04/2018 USD 1,000,000 1,040,000 0.35Ahern Rentals, Inc., 144A 7.375%
15/05/2023 USD 1,750,000 1,732,500 0.59Alere, Inc., 144A 6.375% 01/07/2023 USD 750,000 762,750 0.26Allied Specialty Vehicles, Inc., 144A 8.5%
01/11/2019 USD 1,250,000 1,306,250 0.45Ally Financial, Inc. 4.125% 30/03/2020 USD 1,000,000 998,975 0.34American Achievement Corp., 144A
10.875% 15/04/2016 USD 1,250,000 1,190,625 0.41American Airlines Group, Inc., 144A 5.5%
01/10/2019 USD 1,200,000 1,215,000 0.41American Builders & Contractors Supply
Co., Inc., 144A 5.625% 15/04/2021 USD 1,000,000 1,020,000 0.35American Gilsonite Co., 144A 11.5%
01/09/2017 USD 2,000,000 1,825,000 0.62Amsurg Corp. 5.625% 15/07/2022 USD 950,000 959,942 0.33Apex Tool Group LLC, 144A 7%
01/02/2021 USD 1,650,000 1,489,125 0.51Approach Resources, Inc. 7% 15/06/2021 USD 1,200,000 1,095,156 0.37Aramark Services, Inc. 5.75%
15/03/2020 USD 1,250,000 1,302,331 0.44Argos Merger Sub, Inc., 144A 7.125%
15/03/2023 USD 1,250,000 1,316,794 0.45Artesyn Embedded Technologies, Inc.,
144A 9.75% 15/10/2020 USD 1,500,000 1,500,000 0.51Aspect Software, Inc. 10.625%
15/05/2017 USD 1,301,000 1,255,465 0.43Associated Asphalt Partners LLC, 144A
8.5% 15/02/2018 USD 1,555,000 1,516,125 0.52Associated Materials LLC 9.125%
01/11/2017 USD 1,000,000 842,025 0.29AV Homes, Inc., 144A 8.5% 01/07/2019 USD 1,700,000 1,623,500 0.55AVINTIV Specialty Materials, Inc., 144A
6.875% 01/06/2019 USD 1,000,000 931,250 0.32Bankrate, Inc., 144A 6.125% 15/08/2018 USD 1,000,000 975,000 0.33Belden, Inc., 144A 5.25% 15/07/2024 USD 900,000 884,250 0.30
SCHEDULE of invEStmEntSAs at 30 June 2015
Investments Currency
Quantity/Nominal
Value
Market Value USD
% of Net Assets
transferable securities and money market instruments admitted to official exchange listing or dealt in on another regulated market
Corporate Bonds (continued)
United States of America (continued)Beverage Packaging Holdings Luxembourg
II SA, 144A 6% 15/06/2017 (Luxembourg) (2) USD 1,000,000 1,002,500 0.34
Beverages & More, Inc., 144A 10% 15/11/2018 USD 1,800,000 1,802,250 0.61
BI-LO LLC, 144A 9.25% 15/02/2019 USD 1,000,000 1,020,000 0.35BioScrip, Inc. 8.875% 15/02/2021 USD 1,000,000 861,250 0.29Blue Racer Midstream LLC, 144A 6.125%
15/11/2022 USD 900,000 927,000 0.32BlueLine Rental Finance Corp., 144A 7%
01/02/2019 USD 1,000,000 1,022,500 0.35BMC Software Finance, Inc., 144A 8.125%
15/07/2021 USD 500,000 411,875 0.14Boardriders SA, Reg. S 8.875%
15/12/2017 (Luxembourg) (2) EUR 1,000,000 991,111 0.34Bonanza Creek Energy, Inc. 6.75%
15/04/2021 USD 994,000 948,892 0.33Boxer Parent Co., Inc., 144A 9%
15/10/2019 USD 800,000 575,000 0.20Brand Energy & Infrastructure Services,
Inc., 144A 8.5% 01/12/2021 USD 1,175,000 1,095,688 0.37Bumble Bee Holdco SCA, 144A 9.625%
15/03/2018 (Luxembourg) (2) USD 1,628,000 1,684,980 0.57Cable One, Inc., 144A 5.75% 15/06/2022 USD 1,750,000 1,785,000 0.61Carrizo Oil & Gas, Inc. 6.25% 15/04/2023 USD 1,275,000 1,284,856 0.44CCM Merger, Inc., 144A 9.125%
01/05/2019 USD 1,220,000 1,317,600 0.45Century Communities, Inc., 144A 6.875%
15/05/2022 USD 250,000 248,750 0.09Century Communities, Inc. 6.875%
15/05/2022 USD 1,750,000 1,741,250 0.59Cenveo Corp., 144A 6% 01/08/2019 USD 1,250,000 1,175,000 0.40Cequel Communications Holdings I LLC,
144A 6.375% 15/09/2020 USD 750,000 749,887 0.26Chassix Holdings, Inc., 144A 0%
15/12/2018 USD 2,002,125 210,223 0.07Chassix, Inc., 144A 9.25% 01/08/2018 USD 500,000 455,000 0.16Chemtura Corp. 5.75% 15/07/2021 USD 950,000 971,441 0.33Chester Downs & Marina LLC, 144A
9.25% 01/02/2020 USD 1,450,000 1,160,000 0.40Cleaver-Brooks, Inc., 144A 8.75%
15/12/2019 USD 1,500,000 1,485,000 0.51CNO Financial Group, Inc. 4.5%
30/05/2020 USD 400,000 406,000 0.14CNO Financial Group, Inc. 5.25%
30/05/2025 USD 1,000,000 1,015,000 0.35CommScope Technologies Finance LLC,
144A 6% 15/06/2025 USD 1,600,000 1,592,000 0.54CommScope, Inc., 144A 5.5%
15/06/2024 USD 1,000,000 976,250 0.33Compiler Finance Sub, Inc., 144A 7%
01/05/2021 USD 2,000,000 1,530,000 0.52Consolidated Container Co. LLC/
Consolidated Container Capital, Inc., 144A 10.125% 15/07/2020 USD 1,350,000 1,228,500 0.42
Constellis Holdings LLC, 144A 9.75% 15/05/2020 USD 1,150,000 1,118,375 0.38
Coveris Holdings SA, 144A 7.875% 01/11/2019 (Luxembourg) (2) USD 1,000,000 1,000,000 0.34
CPG Merger Sub LLC, 144A 8% 01/10/2021 USD 1,550,000 1,604,250 0.55
Crestwood Midstream Partners LP, 144A 6.25% 01/04/2023 USD 1,000,000 1,048,330 0.36
Crown Castle International Corp., REIT 5.25% 15/01/2023 USD 1,000,000 1,009,805 0.34
The accompanying notes are an integral part of these financial statements.
Global High Yield Bond Fund (continued)
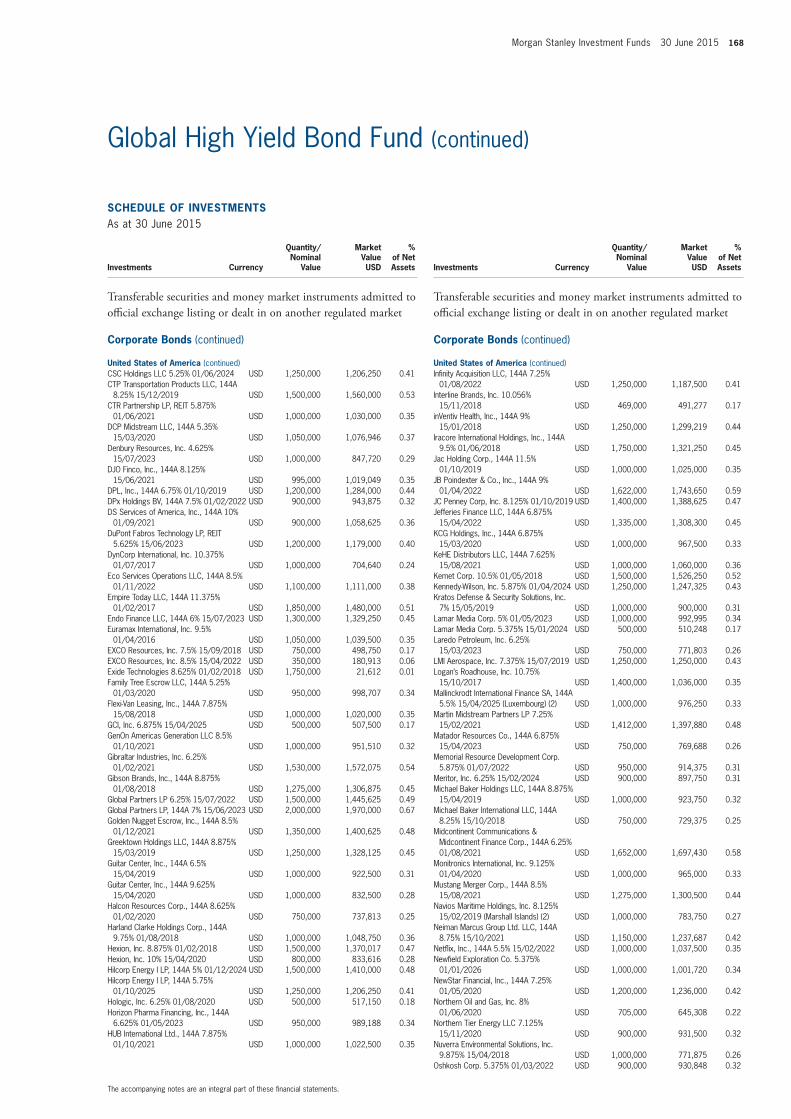
Morgan Stanley Investment Funds 30 June 2015 168
SCHEDULE of invEStmEntSAs at 30 June 2015
Investments Currency
Quantity/Nominal
Value
Market Value USD
% of Net Assets
transferable securities and money market instruments admitted to official exchange listing or dealt in on another regulated market
Corporate Bonds (continued)
United States of America (continued)CSC Holdings LLC 5.25% 01/06/2024 USD 1,250,000 1,206,250 0.41CTP Transportation Products LLC, 144A
8.25% 15/12/2019 USD 1,500,000 1,560,000 0.53CTR Partnership LP, REIT 5.875%
01/06/2021 USD 1,000,000 1,030,000 0.35DCP Midstream LLC, 144A 5.35%
15/03/2020 USD 1,050,000 1,076,946 0.37Denbury Resources, Inc. 4.625%
15/07/2023 USD 1,000,000 847,720 0.29DJO Finco, Inc., 144A 8.125%
15/06/2021 USD 995,000 1,019,049 0.35DPL, Inc., 144A 6.75% 01/10/2019 USD 1,200,000 1,284,000 0.44DPx Holdings BV, 144A 7.5% 01/02/2022 USD 900,000 943,875 0.32DS Services of America, Inc., 144A 10%
01/09/2021 USD 900,000 1,058,625 0.36DuPont Fabros Technology LP, REIT
5.625% 15/06/2023 USD 1,200,000 1,179,000 0.40DynCorp International, Inc. 10.375%
01/07/2017 USD 1,000,000 704,640 0.24Eco Services Operations LLC, 144A 8.5%
01/11/2022 USD 1,100,000 1,111,000 0.38Empire Today LLC, 144A 11.375%
01/02/2017 USD 1,850,000 1,480,000 0.51Endo Finance LLC, 144A 6% 15/07/2023 USD 1,300,000 1,329,250 0.45Euramax International, Inc. 9.5%
01/04/2016 USD 1,050,000 1,039,500 0.35EXCO Resources, Inc. 7.5% 15/09/2018 USD 750,000 498,750 0.17EXCO Resources, Inc. 8.5% 15/04/2022 USD 350,000 180,913 0.06Exide Technologies 8.625% 01/02/2018 USD 1,750,000 21,612 0.01Family Tree Escrow LLC, 144A 5.25%
01/03/2020 USD 950,000 998,707 0.34Flexi-Van Leasing, Inc., 144A 7.875%
15/08/2018 USD 1,000,000 1,020,000 0.35GCI, Inc. 6.875% 15/04/2025 USD 500,000 507,500 0.17GenOn Americas Generation LLC 8.5%
01/10/2021 USD 1,000,000 951,510 0.32Gibraltar Industries, Inc. 6.25%
01/02/2021 USD 1,530,000 1,572,075 0.54Gibson Brands, Inc., 144A 8.875%
01/08/2018 USD 1,275,000 1,306,875 0.45Global Partners LP 6.25% 15/07/2022 USD 1,500,000 1,445,625 0.49Global Partners LP, 144A 7% 15/06/2023 USD 2,000,000 1,970,000 0.67Golden Nugget Escrow, Inc., 144A 8.5%
01/12/2021 USD 1,350,000 1,400,625 0.48Greektown Holdings LLC, 144A 8.875%
15/03/2019 USD 1,250,000 1,328,125 0.45Guitar Center, Inc., 144A 6.5%
15/04/2019 USD 1,000,000 922,500 0.31Guitar Center, Inc., 144A 9.625%
15/04/2020 USD 1,000,000 832,500 0.28Halcon Resources Corp., 144A 8.625%
01/02/2020 USD 750,000 737,813 0.25Harland Clarke Holdings Corp., 144A
9.75% 01/08/2018 USD 1,000,000 1,048,750 0.36Hexion, Inc. 8.875% 01/02/2018 USD 1,500,000 1,370,017 0.47Hexion, Inc. 10% 15/04/2020 USD 800,000 833,616 0.28Hilcorp Energy I LP, 144A 5% 01/12/2024 USD 1,500,000 1,410,000 0.48Hilcorp Energy I LP, 144A 5.75%
01/10/2025 USD 1,250,000 1,206,250 0.41Hologic, Inc. 6.25% 01/08/2020 USD 500,000 517,150 0.18Horizon Pharma Financing, Inc., 144A
6.625% 01/05/2023 USD 950,000 989,188 0.34HUB International Ltd., 144A 7.875%
01/10/2021 USD 1,000,000 1,022,500 0.35
SCHEDULE of invEStmEntSAs at 30 June 2015
Investments Currency
Quantity/Nominal
Value
Market Value USD
% of Net Assets
transferable securities and money market instruments admitted to official exchange listing or dealt in on another regulated market
Corporate Bonds (continued)
United States of America (continued)Infinity Acquisition LLC, 144A 7.25%
01/08/2022 USD 1,250,000 1,187,500 0.41Interline Brands, Inc. 10.056%
15/11/2018 USD 469,000 491,277 0.17inVentiv Health, Inc., 144A 9%
15/01/2018 USD 1,250,000 1,299,219 0.44Iracore International Holdings, Inc., 144A
9.5% 01/06/2018 USD 1,750,000 1,321,250 0.45Jac Holding Corp., 144A 11.5%
01/10/2019 USD 1,000,000 1,025,000 0.35JB Poindexter & Co., Inc., 144A 9%
01/04/2022 USD 1,622,000 1,743,650 0.59JC Penney Corp, Inc. 8.125% 01/10/2019 USD 1,400,000 1,388,625 0.47Jefferies Finance LLC, 144A 6.875%
15/04/2022 USD 1,335,000 1,308,300 0.45KCG Holdings, Inc., 144A 6.875%
15/03/2020 USD 1,000,000 967,500 0.33KeHE Distributors LLC, 144A 7.625%
15/08/2021 USD 1,000,000 1,060,000 0.36Kemet Corp. 10.5% 01/05/2018 USD 1,500,000 1,526,250 0.52Kennedy-Wilson, Inc. 5.875% 01/04/2024 USD 1,250,000 1,247,325 0.43Kratos Defense & Security Solutions, Inc.
7% 15/05/2019 USD 1,000,000 900,000 0.31Lamar Media Corp. 5% 01/05/2023 USD 1,000,000 992,995 0.34Lamar Media Corp. 5.375% 15/01/2024 USD 500,000 510,248 0.17Laredo Petroleum, Inc. 6.25%
15/03/2023 USD 750,000 771,803 0.26LMI Aerospace, Inc. 7.375% 15/07/2019 USD 1,250,000 1,250,000 0.43Logan’s Roadhouse, Inc. 10.75%
15/10/2017 USD 1,400,000 1,036,000 0.35Mallinckrodt International Finance SA, 144A
5.5% 15/04/2025 (Luxembourg) (2) USD 1,000,000 976,250 0.33Martin Midstream Partners LP 7.25%
15/02/2021 USD 1,412,000 1,397,880 0.48Matador Resources Co., 144A 6.875%
15/04/2023 USD 750,000 769,688 0.26Memorial Resource Development Corp.
5.875% 01/07/2022 USD 950,000 914,375 0.31Meritor, Inc. 6.25% 15/02/2024 USD 900,000 897,750 0.31Michael Baker Holdings LLC, 144A 8.875%
15/04/2019 USD 1,000,000 923,750 0.32Michael Baker International LLC, 144A
8.25% 15/10/2018 USD 750,000 729,375 0.25Midcontinent Communications &
Midcontinent Finance Corp., 144A 6.25% 01/08/2021 USD 1,652,000 1,697,430 0.58
Monitronics International, Inc. 9.125% 01/04/2020 USD 1,000,000 965,000 0.33
Mustang Merger Corp., 144A 8.5% 15/08/2021 USD 1,275,000 1,300,500 0.44
Navios Maritime Holdings, Inc. 8.125% 15/02/2019 (Marshall Islands) (2) USD 1,000,000 783,750 0.27
Neiman Marcus Group Ltd. LLC, 144A 8.75% 15/10/2021 USD 1,150,000 1,237,687 0.42
Netflix, Inc., 144A 5.5% 15/02/2022 USD 1,000,000 1,037,500 0.35Newfield Exploration Co. 5.375%
01/01/2026 USD 1,000,000 1,001,720 0.34NewStar Financial, Inc., 144A 7.25%
01/05/2020 USD 1,200,000 1,236,000 0.42Northern Oil and Gas, Inc. 8%
01/06/2020 USD 705,000 645,308 0.22Northern Tier Energy LLC 7.125%
15/11/2020 USD 900,000 931,500 0.32Nuverra Environmental Solutions, Inc.
9.875% 15/04/2018 USD 1,000,000 771,875 0.26Oshkosh Corp. 5.375% 01/03/2022 USD 900,000 930,848 0.32
The accompanying notes are an integral part of these financial statements.
Global High Yield Bond Fund (continued)
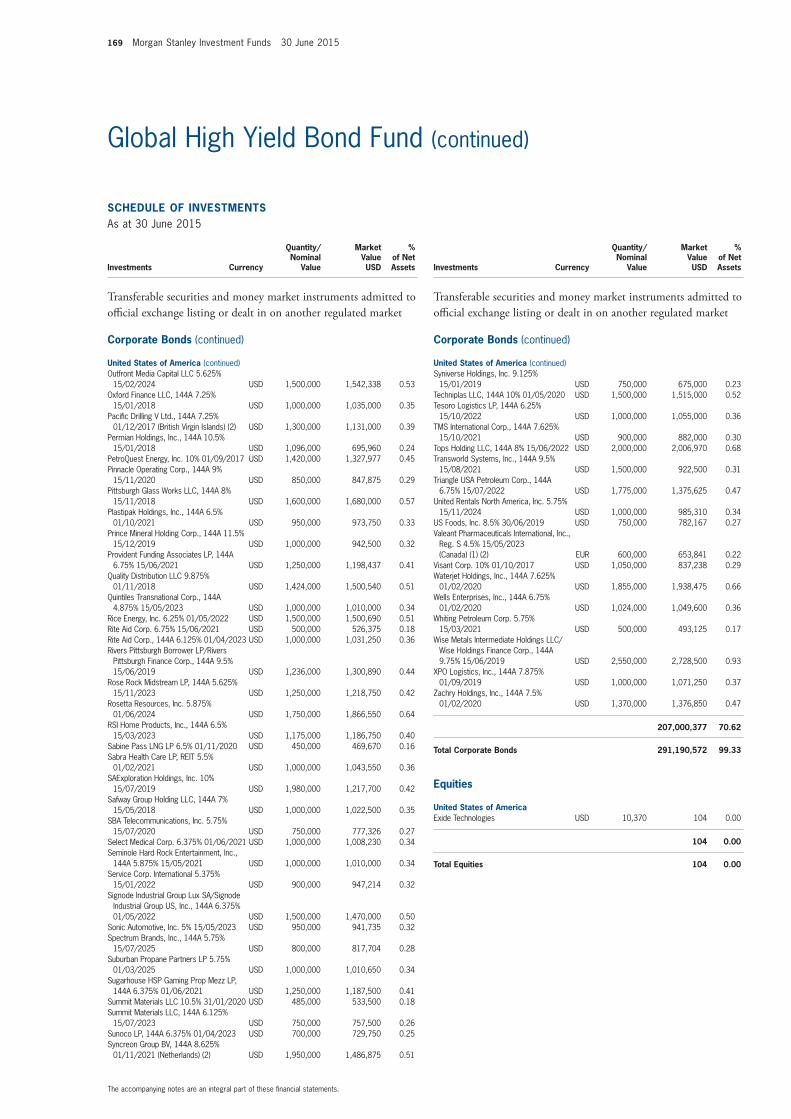
169 Morgan Stanley Investment Funds 30 June 2015
SCHEDULE of invEStmEntSAs at 30 June 2015
Investments Currency
Quantity/Nominal
Value
Market Value USD
% of Net Assets
transferable securities and money market instruments admitted to official exchange listing or dealt in on another regulated market
Corporate Bonds (continued)
United States of America (continued)Outfront Media Capital LLC 5.625%
15/02/2024 USD 1,500,000 1,542,338 0.53Oxford Finance LLC, 144A 7.25%
15/01/2018 USD 1,000,000 1,035,000 0.35Pacific Drilling V Ltd., 144A 7.25%
01/12/2017 (British Virgin Islands) (2) USD 1,300,000 1,131,000 0.39Permian Holdings, Inc., 144A 10.5%
15/01/2018 USD 1,096,000 695,960 0.24PetroQuest Energy, Inc. 10% 01/09/2017 USD 1,420,000 1,327,977 0.45Pinnacle Operating Corp., 144A 9%
15/11/2020 USD 850,000 847,875 0.29Pittsburgh Glass Works LLC, 144A 8%
15/11/2018 USD 1,600,000 1,680,000 0.57Plastipak Holdings, Inc., 144A 6.5%
01/10/2021 USD 950,000 973,750 0.33Prince Mineral Holding Corp., 144A 11.5%
15/12/2019 USD 1,000,000 942,500 0.32Provident Funding Associates LP, 144A
6.75% 15/06/2021 USD 1,250,000 1,198,437 0.41Quality Distribution LLC 9.875%
01/11/2018 USD 1,424,000 1,500,540 0.51Quintiles Transnational Corp., 144A
4.875% 15/05/2023 USD 1,000,000 1,010,000 0.34Rice Energy, Inc. 6.25% 01/05/2022 USD 1,500,000 1,500,690 0.51Rite Aid Corp. 6.75% 15/06/2021 USD 500,000 526,375 0.18Rite Aid Corp., 144A 6.125% 01/04/2023 USD 1,000,000 1,031,250 0.36Rivers Pittsburgh Borrower LP/Rivers
Pittsburgh Finance Corp., 144A 9.5% 15/06/2019 USD 1,236,000 1,300,890 0.44
Rose Rock Midstream LP, 144A 5.625% 15/11/2023 USD 1,250,000 1,218,750 0.42
Rosetta Resources, Inc. 5.875% 01/06/2024 USD 1,750,000 1,866,550 0.64
RSI Home Products, Inc., 144A 6.5% 15/03/2023 USD 1,175,000 1,186,750 0.40
Sabine Pass LNG LP 6.5% 01/11/2020 USD 450,000 469,670 0.16Sabra Health Care LP, REIT 5.5%
01/02/2021 USD 1,000,000 1,043,550 0.36SAExploration Holdings, Inc. 10%
15/07/2019 USD 1,980,000 1,217,700 0.42Safway Group Holding LLC, 144A 7%
15/05/2018 USD 1,000,000 1,022,500 0.35SBA Telecommunications, Inc. 5.75%
15/07/2020 USD 750,000 777,326 0.27Select Medical Corp. 6.375% 01/06/2021 USD 1,000,000 1,008,230 0.34Seminole Hard Rock Entertainment, Inc.,
144A 5.875% 15/05/2021 USD 1,000,000 1,010,000 0.34Service Corp. International 5.375%
15/01/2022 USD 900,000 947,214 0.32Signode Industrial Group Lux SA/Signode
Industrial Group US, Inc., 144A 6.375% 01/05/2022 USD 1,500,000 1,470,000 0.50
Sonic Automotive, Inc. 5% 15/05/2023 USD 950,000 941,735 0.32Spectrum Brands, Inc., 144A 5.75%
15/07/2025 USD 800,000 817,704 0.28Suburban Propane Partners LP 5.75%
01/03/2025 USD 1,000,000 1,010,650 0.34Sugarhouse HSP Gaming Prop Mezz LP,
144A 6.375% 01/06/2021 USD 1,250,000 1,187,500 0.41Summit Materials LLC 10.5% 31/01/2020 USD 485,000 533,500 0.18Summit Materials LLC, 144A 6.125%
15/07/2023 USD 750,000 757,500 0.26Sunoco LP, 144A 6.375% 01/04/2023 USD 700,000 729,750 0.25Syncreon Group BV, 144A 8.625%
01/11/2021 (Netherlands) (2) USD 1,950,000 1,486,875 0.51
SCHEDULE of invEStmEntSAs at 30 June 2015
Investments Currency
Quantity/Nominal
Value
Market Value USD
% of Net Assets
transferable securities and money market instruments admitted to official exchange listing or dealt in on another regulated market
Corporate Bonds (continued)
United States of America (continued)Syniverse Holdings, Inc. 9.125%
15/01/2019 USD 750,000 675,000 0.23Techniplas LLC, 144A 10% 01/05/2020 USD 1,500,000 1,515,000 0.52Tesoro Logistics LP, 144A 6.25%
15/10/2022 USD 1,000,000 1,055,000 0.36TMS International Corp., 144A 7.625%
15/10/2021 USD 900,000 882,000 0.30Tops Holding LLC, 144A 8% 15/06/2022 USD 2,000,000 2,006,970 0.68Transworld Systems, Inc., 144A 9.5%
15/08/2021 USD 1,500,000 922,500 0.31Triangle USA Petroleum Corp., 144A
6.75% 15/07/2022 USD 1,775,000 1,375,625 0.47United Rentals North America, Inc. 5.75%
15/11/2024 USD 1,000,000 985,310 0.34US Foods, Inc. 8.5% 30/06/2019 USD 750,000 782,167 0.27Valeant Pharmaceuticals International, Inc.,
Reg. S 4.5% 15/05/2023 (Canada) (1) (2) EUR 600,000 653,841 0.22
Visant Corp. 10% 01/10/2017 USD 1,050,000 837,238 0.29Waterjet Holdings, Inc., 144A 7.625%
01/02/2020 USD 1,855,000 1,938,475 0.66Wells Enterprises, Inc., 144A 6.75%
01/02/2020 USD 1,024,000 1,049,600 0.36Whiting Petroleum Corp. 5.75%
15/03/2021 USD 500,000 493,125 0.17Wise Metals Intermediate Holdings LLC/
Wise Holdings Finance Corp., 144A 9.75% 15/06/2019 USD 2,550,000 2,728,500 0.93
XPO Logistics, Inc., 144A 7.875% 01/09/2019 USD 1,000,000 1,071,250 0.37
Zachry Holdings, Inc., 144A 7.5% 01/02/2020 USD 1,370,000 1,376,850 0.47
207,000,377 70.62
total Corporate Bonds 291,190,572 99.33
Equities
United States of AmericaExide Technologies USD 10,370 104 0.00
104 0.00
total Equities 104 0.00
The accompanying notes are an integral part of these financial statements.
Global High Yield Bond Fund (continued)
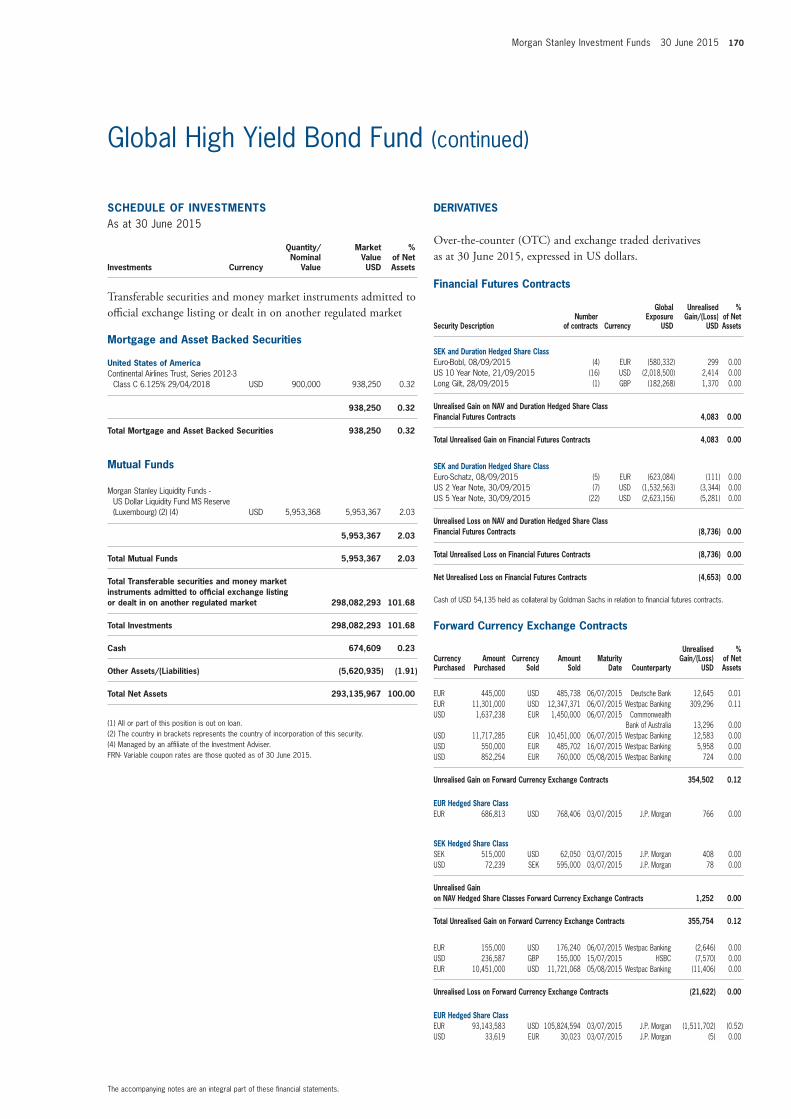
Morgan Stanley Investment Funds 30 June 2015 170
SCHEDULE of invEStmEntSAs at 30 June 2015
Investments Currency
Quantity/Nominal
Value
Market Value USD
% of Net Assets
transferable securities and money market instruments admitted to official exchange listing or dealt in on another regulated market
mortgage and Asset Backed Securities
United States of AmericaContinental Airlines Trust, Series 2012-3
Class C 6.125% 29/04/2018 USD 900,000 938,250 0.32
938,250 0.32
total mortgage and Asset Backed Securities 938,250 0.32
mutual funds
Morgan Stanley Liquidity Funds - US Dollar Liquidity Fund MS Reserve (Luxembourg) (2) (4) USD 5,953,368 5,953,367 2.03
5,953,367 2.03
total mutual funds 5,953,367 2.03
total transferable securities and money market instruments admitted to official exchange listing or dealt in on another regulated market 298,082,293 101.68
total investments 298,082,293 101.68
Cash 674,609 0.23
other Assets/(Liabilities) (5,620,935) (1.91)
total net Assets 293,135,967 100.00
(1) All or part of this position is out on loan.(2) The country in brackets represents the country of incorporation of this security.(4) Managed by an affiliate of the Investment Adviser.FRN- Variable coupon rates are those quoted as of 30 June 2015.
The accompanying notes are an integral part of these financial statements.
Global High Yield Bond Fund (continued)
financial futures Contracts
Security Descriptionnumber
of contracts Currency
Global Exposure
USD
Unrealised Gain/(Loss)
USD
% of net Assets
SEK and Duration Hedged Share ClassEuro-Bobl, 08/09/2015 (4) EUR (580,332) 299 0.00US 10 Year Note, 21/09/2015 (16) USD (2,018,500) 2,414 0.00Long Gilt, 28/09/2015 (1) GBP (182,268) 1,370 0.00
Unrealised Gain on nAv and Duration Hedged Share Class financial futures Contracts 4,083 0.00
total Unrealised Gain on financial futures Contracts 4,083 0.00
SEK and Duration Hedged Share ClassEuro-Schatz, 08/09/2015 (5) EUR (623,084) (111) 0.00US 2 Year Note, 30/09/2015 (7) USD (1,532,563) (3,344) 0.00US 5 Year Note, 30/09/2015 (22) USD (2,623,156) (5,281) 0.00
Unrealised Loss on nAv and Duration Hedged Share Class financial futures Contracts (8,736) 0.00
total Unrealised Loss on financial futures Contracts (8,736) 0.00
net Unrealised Loss on financial futures Contracts (4,653) 0.00
Cash of USD 54,135 held as collateral by Goldman Sachs in relation to financial futures contracts.
forward Currency Exchange Contracts (continued)
Currency Purchased
Amount Purchased
Currency Sold
Amount Sold
maturity Date Counterparty
Unrealised Gain/(Loss)
USD
% of net Assets
EUR 445,000 USD 485,738 06/07/2015 Deutsche Bank 12,645 0.01EUR 11,301,000 USD 12,347,371 06/07/2015 Westpac Banking 309,296 0.11USD 1,637,238 EUR 1,450,000 06/07/2015 Commonwealth
Bank of Australia 13,296 0.00USD 11,717,285 EUR 10,451,000 06/07/2015 Westpac Banking 12,583 0.00USD 550,000 EUR 485,702 16/07/2015 Westpac Banking 5,958 0.00USD 852,254 EUR 760,000 05/08/2015 Westpac Banking 724 0.00
Unrealised Gain on forward Currency Exchange Contracts 354,502 0.12
EUR Hedged Share ClassEUR 686,813 USD 768,406 03/07/2015 J.P. Morgan 766 0.00
SEK Hedged Share ClassSEK 515,000 USD 62,050 03/07/2015 J.P. Morgan 408 0.00USD 72,239 SEK 595,000 03/07/2015 J.P. Morgan 78 0.00
Unrealised Gain on nAv Hedged Share Classes forward Currency Exchange Contracts 1,252 0.00
total Unrealised Gain on forward Currency Exchange Contracts 355,754 0.12
EUR 155,000 USD 176,240 06/07/2015 Westpac Banking (2,646) 0.00USD 236,587 GBP 155,000 15/07/2015 HSBC (7,570) 0.00EUR 10,451,000 USD 11,721,068 05/08/2015 Westpac Banking (11,406) 0.00
Unrealised Loss on forward Currency Exchange Contracts (21,622) 0.00
EUR Hedged Share ClassEUR 93,143,583 USD 105,824,594 03/07/2015 J.P. Morgan (1,511,702) (0.52)USD 33,619 EUR 30,023 03/07/2015 J.P. Morgan (5) 0.00
DERivAtivES
Over-the-counter (OtC) and exchange traded derivatives as at 30 June 2015, expressed in US dollars.
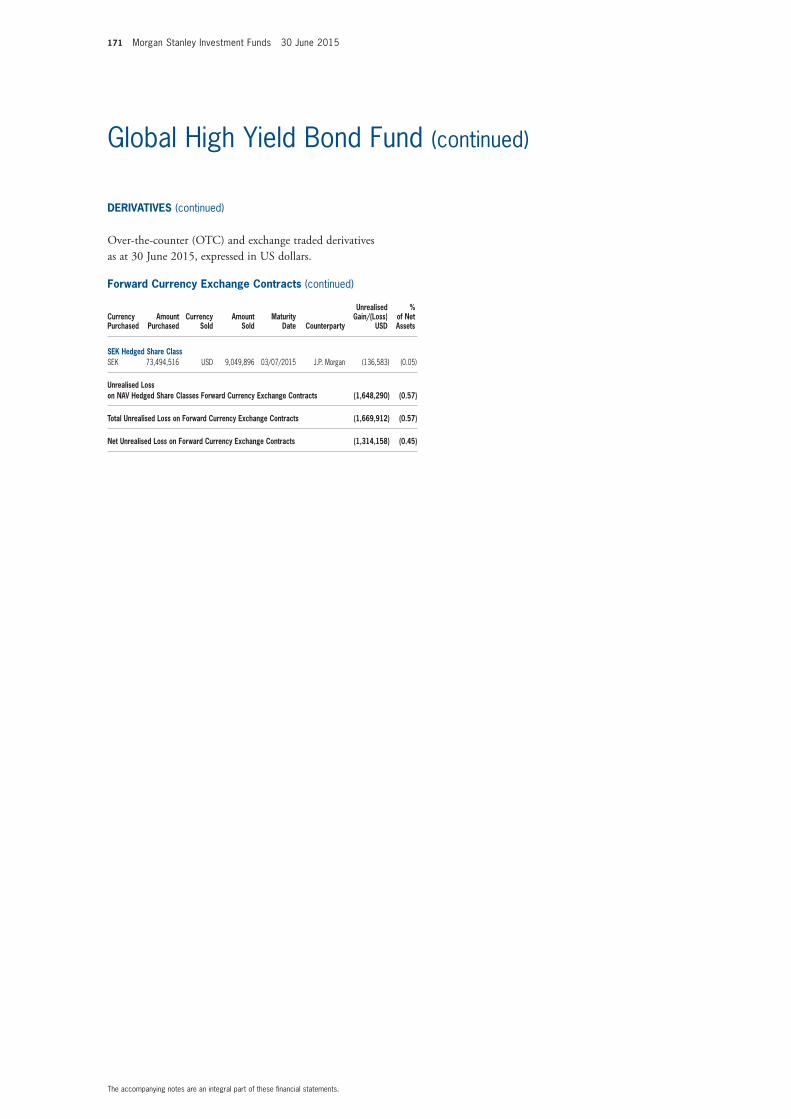
171 Morgan Stanley Investment Funds 30 June 2015
The accompanying notes are an integral part of these financial statements.
Global High Yield Bond Fund (continued)
forward Currency Exchange Contracts (continued)
Currency Purchased
Amount Purchased
Currency Sold
Amount Sold
maturity Date Counterparty
Unrealised Gain/(Loss)
USD
% of net Assets
SEK Hedged Share ClassSEK 73,494,516 USD 9,049,896 03/07/2015 J.P. Morgan (136,583) (0.05)
Unrealised Loss on nAv Hedged Share Classes forward Currency Exchange Contracts (1,648,290) (0.57)
total Unrealised Loss on forward Currency Exchange Contracts (1,669,912) (0.57)
net Unrealised Loss on forward Currency Exchange Contracts (1,314,158) (0.45)
DERivAtivES (continued)
Over-the-counter (OtC) and exchange traded derivatives as at 30 June 2015, expressed in US dollars.
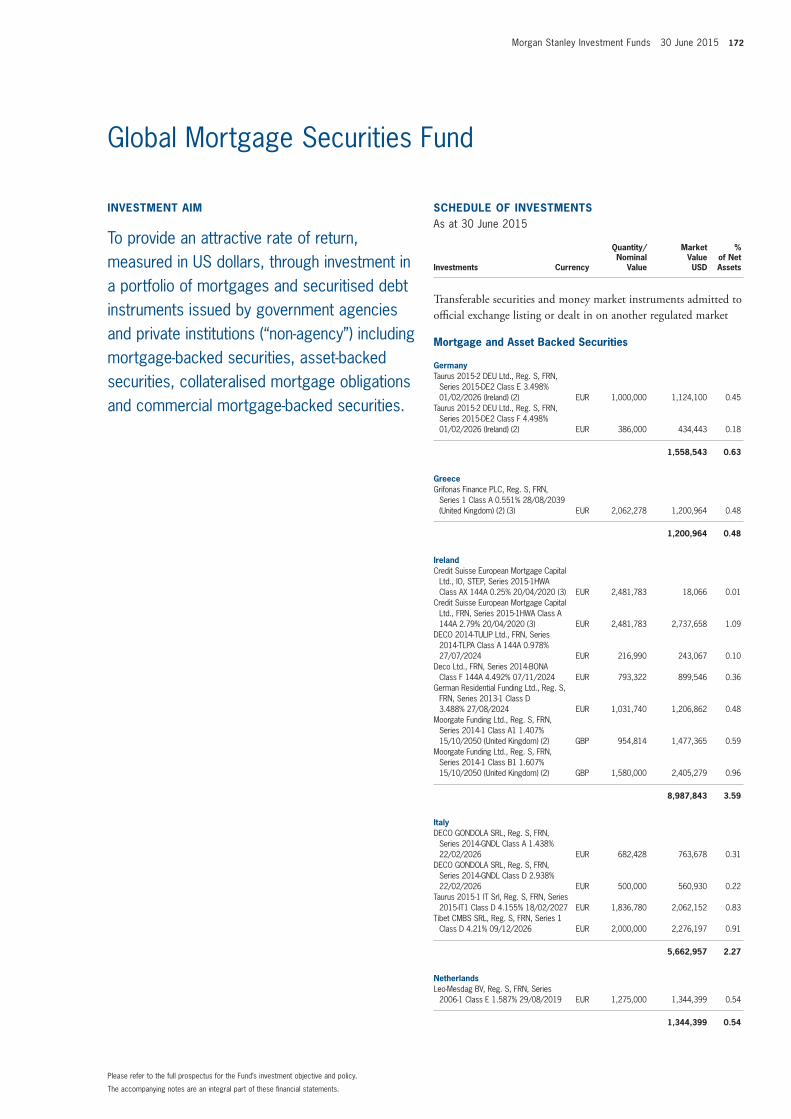
Morgan Stanley Investment Funds 30 June 2015 172
invEStmEnt Aim
To provide an attractive rate of return, measured in US dollars, through investment in a portfolio of mortgages and securitised debt instruments issued by government agencies and private institutions (“non-agency”) including mortgage-backed securities, asset-backed securities, collateralised mortgage obligations and commercial mortgage-backed securities.
SCHEDULE of invEStmEntSAs at 30 June 2015
Investments Currency
Quantity/Nominal
Value
Market Value USD
% of Net Assets
transferable securities and money market instruments admitted to official exchange listing or dealt in on another regulated market
mortgage and Asset Backed Securities
GermanyTaurus 2015-2 DEU Ltd., Reg. S, FRN,
Series 2015-DE2 Class E 3.498% 01/02/2026 (Ireland) (2) EUR 1,000,000 1,124,100 0.45
Taurus 2015-2 DEU Ltd., Reg. S, FRN, Series 2015-DE2 Class F 4.498% 01/02/2026 (Ireland) (2) EUR 386,000 434,443 0.18
1,558,543 0.63
GreeceGrifonas Finance PLC, Reg. S, FRN,
Series 1 Class A 0.551% 28/08/2039 (United Kingdom) (2) (3) EUR 2,062,278 1,200,964 0.48
1,200,964 0.48
irelandCredit Suisse European Mortgage Capital
Ltd., IO, STEP, Series 2015-1HWA Class AX 144A 0.25% 20/04/2020 (3) EUR 2,481,783 18,066 0.01
Credit Suisse European Mortgage Capital Ltd., FRN, Series 2015-1HWA Class A 144A 2.79% 20/04/2020 (3) EUR 2,481,783 2,737,658 1.09
DECO 2014-TULIP Ltd., FRN, Series 2014-TLPA Class A 144A 0.978% 27/07/2024 EUR 216,990 243,067 0.10
Deco Ltd., FRN, Series 2014-BONA Class F 144A 4.492% 07/11/2024 EUR 793,322 899,546 0.36
German Residential Funding Ltd., Reg. S, FRN, Series 2013-1 Class D 3.488% 27/08/2024 EUR 1,031,740 1,206,862 0.48
Moorgate Funding Ltd., Reg. S, FRN, Series 2014-1 Class A1 1.407% 15/10/2050 (United Kingdom) (2) GBP 954,814 1,477,365 0.59
Moorgate Funding Ltd., Reg. S, FRN, Series 2014-1 Class B1 1.607% 15/10/2050 (United Kingdom) (2) GBP 1,580,000 2,405,279 0.96
8,987,843 3.59
italyDECO GONDOLA SRL, Reg. S, FRN,
Series 2014-GNDL Class A 1.438% 22/02/2026 EUR 682,428 763,678 0.31
DECO GONDOLA SRL, Reg. S, FRN, Series 2014-GNDL Class D 2.938% 22/02/2026 EUR 500,000 560,930 0.22
Taurus 2015-1 IT Srl, Reg. S, FRN, Series 2015-IT1 Class D 4.155% 18/02/2027 EUR 1,836,780 2,062,152 0.83
Tibet CMBS SRL, Reg. S, FRN, Series 1 Class D 4.21% 09/12/2026 EUR 2,000,000 2,276,197 0.91
5,662,957 2.27
netherlandsLeo-Mesdag BV, Reg. S, FRN, Series
2006-1 Class E 1.587% 29/08/2019 EUR 1,275,000 1,344,399 0.54
1,344,399 0.54
The accompanying notes are an integral part of these financial statements.
Please refer to the full prospectus for the Fund’s investment objective and policy.
Global Mortgage Securities Fund
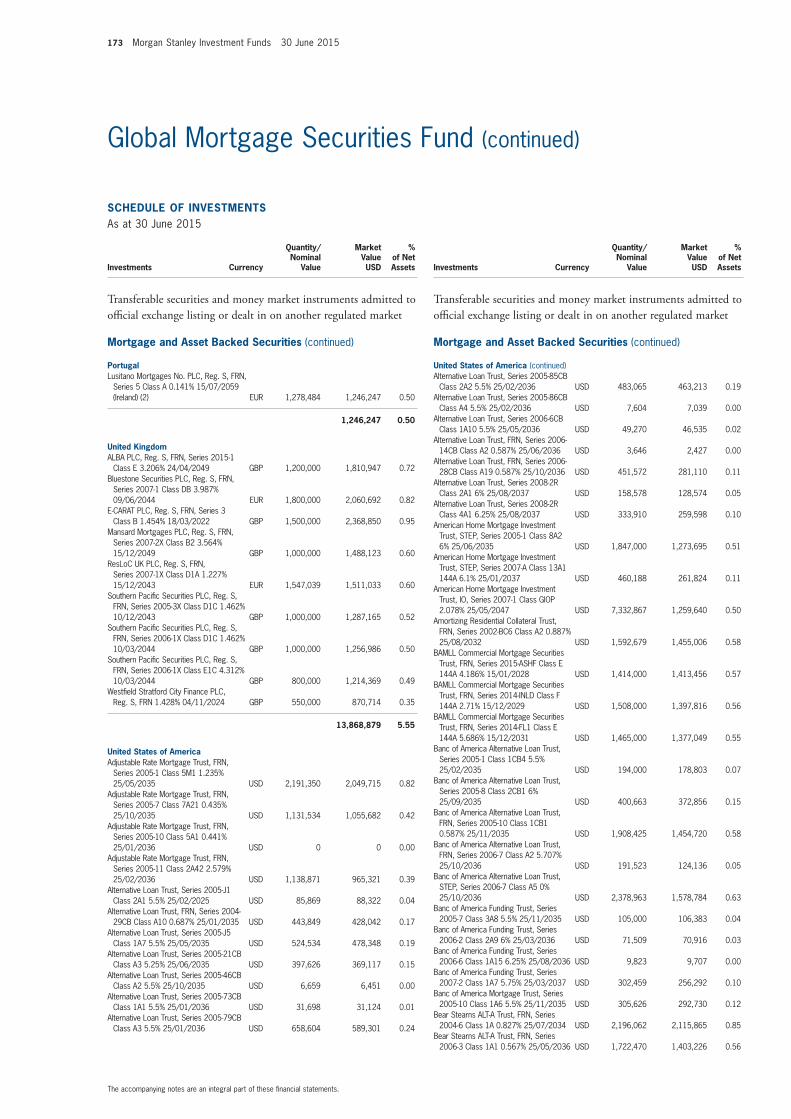
173 Morgan Stanley Investment Funds 30 June 2015
SCHEDULE of invEStmEntSAs at 30 June 2015
Investments Currency
Quantity/Nominal
Value
Market Value USD
% of Net Assets
transferable securities and money market instruments admitted to official exchange listing or dealt in on another regulated market
mortgage and Asset Backed Securities (continued)
PortugalLusitano Mortgages No. PLC, Reg. S, FRN,
Series 5 Class A 0.141% 15/07/2059 (Ireland) (2) EUR 1,278,484 1,246,247 0.50
1,246,247 0.50
United KingdomALBA PLC, Reg. S, FRN, Series 2015-1
Class E 3.206% 24/04/2049 GBP 1,200,000 1,810,947 0.72Bluestone Securities PLC, Reg. S, FRN,
Series 2007-1 Class DB 3.987% 09/06/2044 EUR 1,800,000 2,060,692 0.82
E-CARAT PLC, Reg. S, FRN, Series 3 Class B 1.454% 18/03/2022 GBP 1,500,000 2,368,850 0.95
Mansard Mortgages PLC, Reg. S, FRN, Series 2007-2X Class B2 3.564% 15/12/2049 GBP 1,000,000 1,488,123 0.60
ResLoC UK PLC, Reg. S, FRN, Series 2007-1X Class D1A 1.227% 15/12/2043 EUR 1,547,039 1,511,033 0.60
Southern Pacific Securities PLC, Reg. S, FRN, Series 2005-3X Class D1C 1.462% 10/12/2043 GBP 1,000,000 1,287,165 0.52
Southern Pacific Securities PLC, Reg. S, FRN, Series 2006-1X Class D1C 1.462% 10/03/2044 GBP 1,000,000 1,256,986 0.50
Southern Pacific Securities PLC, Reg. S, FRN, Series 2006-1X Class E1C 4.312% 10/03/2044 GBP 800,000 1,214,369 0.49
Westfield Stratford City Finance PLC, Reg. S, FRN 1.428% 04/11/2024 GBP 550,000 870,714 0.35
13,868,879 5.55
United States of AmericaAdjustable Rate Mortgage Trust, FRN,
Series 2005-1 Class 5M1 1.235% 25/05/2035 USD 2,191,350 2,049,715 0.82
Adjustable Rate Mortgage Trust, FRN, Series 2005-7 Class 7A21 0.435% 25/10/2035 USD 1,131,534 1,055,682 0.42
Adjustable Rate Mortgage Trust, FRN, Series 2005-10 Class 5A1 0.441% 25/01/2036 USD 0 0 0.00
Adjustable Rate Mortgage Trust, FRN, Series 2005-11 Class 2A42 2.579% 25/02/2036 USD 1,138,871 965,321 0.39
Alternative Loan Trust, Series 2005-J1 Class 2A1 5.5% 25/02/2025 USD 85,869 88,322 0.04
Alternative Loan Trust, FRN, Series 2004-29CB Class A10 0.687% 25/01/2035 USD 443,849 428,042 0.17
Alternative Loan Trust, Series 2005-J5 Class 1A7 5.5% 25/05/2035 USD 524,534 478,348 0.19
Alternative Loan Trust, Series 2005-21CB Class A3 5.25% 25/06/2035 USD 397,626 369,117 0.15
Alternative Loan Trust, Series 2005-46CB Class A2 5.5% 25/10/2035 USD 6,659 6,451 0.00
Alternative Loan Trust, Series 2005-73CB Class 1A1 5.5% 25/01/2036 USD 31,698 31,124 0.01
Alternative Loan Trust, Series 2005-79CB Class A3 5.5% 25/01/2036 USD 658,604 589,301 0.24
SCHEDULE of invEStmEntSAs at 30 June 2015
Investments Currency
Quantity/Nominal
Value
Market Value USD
% of Net Assets
transferable securities and money market instruments admitted to official exchange listing or dealt in on another regulated market
mortgage and Asset Backed Securities (continued)
United States of America (continued)Alternative Loan Trust, Series 2005-85CB
Class 2A2 5.5% 25/02/2036 USD 483,065 463,213 0.19Alternative Loan Trust, Series 2005-86CB
Class A4 5.5% 25/02/2036 USD 7,604 7,039 0.00Alternative Loan Trust, Series 2006-6CB
Class 1A10 5.5% 25/05/2036 USD 49,270 46,535 0.02Alternative Loan Trust, FRN, Series 2006-
14CB Class A2 0.587% 25/06/2036 USD 3,646 2,427 0.00Alternative Loan Trust, FRN, Series 2006-
28CB Class A19 0.587% 25/10/2036 USD 451,572 281,110 0.11Alternative Loan Trust, Series 2008-2R
Class 2A1 6% 25/08/2037 USD 158,578 128,574 0.05Alternative Loan Trust, Series 2008-2R
Class 4A1 6.25% 25/08/2037 USD 333,910 259,598 0.10American Home Mortgage Investment
Trust, STEP, Series 2005-1 Class 8A2 6% 25/06/2035 USD 1,847,000 1,273,695 0.51
American Home Mortgage Investment Trust, STEP, Series 2007-A Class 13A1 144A 6.1% 25/01/2037 USD 460,188 261,824 0.11
American Home Mortgage Investment Trust, IO, Series 2007-1 Class GIOP 2.078% 25/05/2047 USD 7,332,867 1,259,640 0.50
Amortizing Residential Collateral Trust, FRN, Series 2002-BC6 Class A2 0.887% 25/08/2032 USD 1,592,679 1,455,006 0.58
BAMLL Commercial Mortgage Securities Trust, FRN, Series 2015-ASHF Class E 144A 4.186% 15/01/2028 USD 1,414,000 1,413,456 0.57
BAMLL Commercial Mortgage Securities Trust, FRN, Series 2014-INLD Class F 144A 2.71% 15/12/2029 USD 1,508,000 1,397,816 0.56
BAMLL Commercial Mortgage Securities Trust, FRN, Series 2014-FL1 Class E 144A 5.686% 15/12/2031 USD 1,465,000 1,377,049 0.55
Banc of America Alternative Loan Trust, Series 2005-1 Class 1CB4 5.5% 25/02/2035 USD 194,000 178,803 0.07
Banc of America Alternative Loan Trust, Series 2005-8 Class 2CB1 6% 25/09/2035 USD 400,663 372,856 0.15
Banc of America Alternative Loan Trust, FRN, Series 2005-10 Class 1CB1 0.587% 25/11/2035 USD 1,908,425 1,454,720 0.58
Banc of America Alternative Loan Trust, FRN, Series 2006-7 Class A2 5.707% 25/10/2036 USD 191,523 124,136 0.05
Banc of America Alternative Loan Trust, STEP, Series 2006-7 Class A5 0% 25/10/2036 USD 2,378,963 1,578,784 0.63
Banc of America Funding Trust, Series 2005-7 Class 3A8 5.5% 25/11/2035 USD 105,000 106,383 0.04
Banc of America Funding Trust, Series 2006-2 Class 2A9 6% 25/03/2036 USD 71,509 70,916 0.03
Banc of America Funding Trust, Series 2006-6 Class 1A15 6.25% 25/08/2036 USD 9,823 9,707 0.00
Banc of America Funding Trust, Series 2007-2 Class 1A7 5.75% 25/03/2037 USD 302,459 256,292 0.10
Banc of America Mortgage Trust, Series 2005-10 Class 1A6 5.5% 25/11/2035 USD 305,626 292,730 0.12
Bear Stearns ALT-A Trust, FRN, Series 2004-6 Class 1A 0.827% 25/07/2034 USD 2,196,062 2,115,865 0.85
Bear Stearns ALT-A Trust, FRN, Series 2006-3 Class 1A1 0.567% 25/05/2036 USD 1,722,470 1,403,226 0.56
The accompanying notes are an integral part of these financial statements.
Global Mortgage Securities Fund (continued)
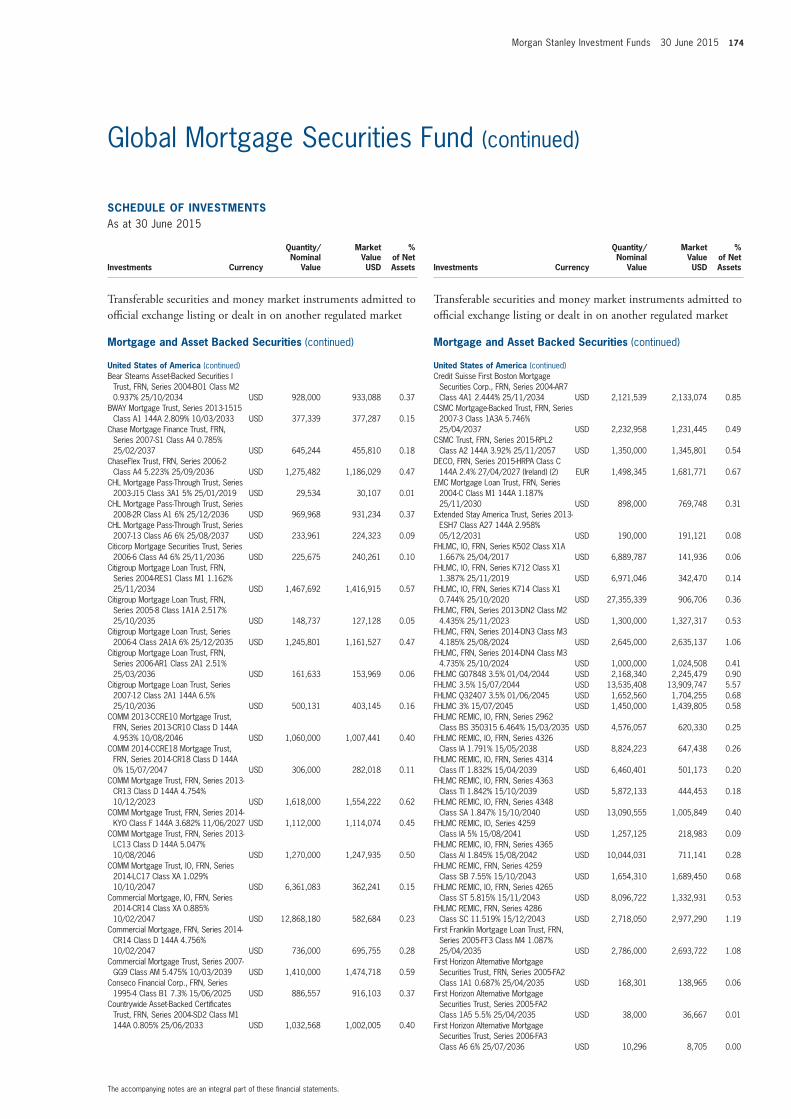
Morgan Stanley Investment Funds 30 June 2015 174
SCHEDULE of invEStmEntSAs at 30 June 2015
Investments Currency
Quantity/Nominal
Value
Market Value USD
% of Net Assets
transferable securities and money market instruments admitted to official exchange listing or dealt in on another regulated market
mortgage and Asset Backed Securities (continued)
United States of America (continued)Bear Stearns Asset-Backed Securities I
Trust, FRN, Series 2004-BO1 Class M2 0.937% 25/10/2034 USD 928,000 933,088 0.37
BWAY Mortgage Trust, Series 2013-1515 Class A1 144A 2.809% 10/03/2033 USD 377,339 377,287 0.15
Chase Mortgage Finance Trust, FRN, Series 2007-S1 Class A4 0.785% 25/02/2037 USD 645,244 455,810 0.18
ChaseFlex Trust, FRN, Series 2006-2 Class A4 5.223% 25/09/2036 USD 1,275,482 1,186,029 0.47
CHL Mortgage Pass-Through Trust, Series 2003-J15 Class 3A1 5% 25/01/2019 USD 29,534 30,107 0.01
CHL Mortgage Pass-Through Trust, Series 2008-2R Class A1 6% 25/12/2036 USD 969,968 931,234 0.37
CHL Mortgage Pass-Through Trust, Series 2007-13 Class A6 6% 25/08/2037 USD 233,961 224,323 0.09
Citicorp Mortgage Securities Trust, Series 2006-6 Class A4 6% 25/11/2036 USD 225,675 240,261 0.10
Citigroup Mortgage Loan Trust, FRN, Series 2004-RES1 Class M1 1.162% 25/11/2034 USD 1,467,692 1,416,915 0.57
Citigroup Mortgage Loan Trust, FRN, Series 2005-8 Class 1A1A 2.517% 25/10/2035 USD 148,737 127,128 0.05
Citigroup Mortgage Loan Trust, Series 2006-4 Class 2A1A 6% 25/12/2035 USD 1,245,801 1,161,527 0.47
Citigroup Mortgage Loan Trust, FRN, Series 2006-AR1 Class 2A1 2.51% 25/03/2036 USD 161,633 153,969 0.06
Citigroup Mortgage Loan Trust, Series 2007-12 Class 2A1 144A 6.5% 25/10/2036 USD 500,131 403,145 0.16
COMM 2013-CCRE10 Mortgage Trust, FRN, Series 2013-CR10 Class D 144A 4.953% 10/08/2046 USD 1,060,000 1,007,441 0.40
COMM 2014-CCRE18 Mortgage Trust, FRN, Series 2014-CR18 Class D 144A 0% 15/07/2047 USD 306,000 282,018 0.11
COMM Mortgage Trust, FRN, Series 2013-CR13 Class D 144A 4.754% 10/12/2023 USD 1,618,000 1,554,222 0.62
COMM Mortgage Trust, FRN, Series 2014-KYO Class F 144A 3.682% 11/06/2027 USD 1,112,000 1,114,074 0.45
COMM Mortgage Trust, FRN, Series 2013-LC13 Class D 144A 5.047% 10/08/2046 USD 1,270,000 1,247,935 0.50
COMM Mortgage Trust, IO, FRN, Series 2014-LC17 Class XA 1.029% 10/10/2047 USD 6,361,083 362,241 0.15
Commercial Mortgage, IO, FRN, Series 2014-CR14 Class XA 0.885% 10/02/2047 USD 12,868,180 582,684 0.23
Commercial Mortgage, FRN, Series 2014-CR14 Class D 144A 4.756% 10/02/2047 USD 736,000 695,755 0.28
Commercial Mortgage Trust, Series 2007-GG9 Class AM 5.475% 10/03/2039 USD 1,410,000 1,474,718 0.59
Conseco Financial Corp., FRN, Series 1995-4 Class B1 7.3% 15/06/2025 USD 886,557 916,103 0.37
Countrywide Asset-Backed Certificates Trust, FRN, Series 2004-SD2 Class M1 144A 0.805% 25/06/2033 USD 1,032,568 1,002,005 0.40
SCHEDULE of invEStmEntSAs at 30 June 2015
Investments Currency
Quantity/Nominal
Value
Market Value USD
% of Net Assets
transferable securities and money market instruments admitted to official exchange listing or dealt in on another regulated market
mortgage and Asset Backed Securities (continued)
United States of America (continued)Credit Suisse First Boston Mortgage
Securities Corp., FRN, Series 2004-AR7 Class 4A1 2.444% 25/11/2034 USD 2,121,539 2,133,074 0.85
CSMC Mortgage-Backed Trust, FRN, Series 2007-3 Class 1A3A 5.746% 25/04/2037 USD 2,232,958 1,231,445 0.49
CSMC Trust, FRN, Series 2015-RPL2 Class A2 144A 3.92% 25/11/2057 USD 1,350,000 1,345,801 0.54
DECO, FRN, Series 2015-HRPA Class C 144A 2.4% 27/04/2027 (Ireland) (2) EUR 1,498,345 1,681,771 0.67
EMC Mortgage Loan Trust, FRN, Series 2004-C Class M1 144A 1.187% 25/11/2030 USD 898,000 769,748 0.31
Extended Stay America Trust, Series 2013-ESH7 Class A27 144A 2.958% 05/12/2031 USD 190,000 191,121 0.08
FHLMC, IO, FRN, Series K502 Class X1A 1.667% 25/04/2017 USD 6,889,787 141,936 0.06
FHLMC, IO, FRN, Series K712 Class X1 1.387% 25/11/2019 USD 6,971,046 342,470 0.14
FHLMC, IO, FRN, Series K714 Class X1 0.744% 25/10/2020 USD 27,355,339 906,706 0.36
FHLMC, FRN, Series 2013-DN2 Class M2 4.435% 25/11/2023 USD 1,300,000 1,327,317 0.53
FHLMC, FRN, Series 2014-DN3 Class M3 4.185% 25/08/2024 USD 2,645,000 2,635,137 1.06
FHLMC, FRN, Series 2014-DN4 Class M3 4.735% 25/10/2024 USD 1,000,000 1,024,508 0.41
FHLMC G07848 3.5% 01/04/2044 USD 2,168,340 2,245,479 0.90FHLMC 3.5% 15/07/2044 USD 13,535,408 13,909,747 5.57FHLMC Q32407 3.5% 01/06/2045 USD 1,652,560 1,704,255 0.68FHLMC 3% 15/07/2045 USD 1,450,000 1,439,805 0.58FHLMC REMIC, IO, FRN, Series 2962
Class BS 350315 6.464% 15/03/2035 USD 4,576,057 620,330 0.25FHLMC REMIC, IO, FRN, Series 4326
Class IA 1.791% 15/05/2038 USD 8,824,223 647,438 0.26FHLMC REMIC, IO, FRN, Series 4314
Class IT 1.832% 15/04/2039 USD 6,460,401 501,173 0.20FHLMC REMIC, IO, FRN, Series 4363
Class TI 1.842% 15/10/2039 USD 5,872,133 444,453 0.18FHLMC REMIC, IO, FRN, Series 4348
Class SA 1.847% 15/10/2040 USD 13,090,555 1,005,849 0.40FHLMC REMIC, IO, Series 4259
Class IA 5% 15/08/2041 USD 1,257,125 218,983 0.09FHLMC REMIC, IO, FRN, Series 4365
Class AI 1.845% 15/08/2042 USD 10,044,031 711,141 0.28FHLMC REMIC, FRN, Series 4259
Class SB 7.55% 15/10/2043 USD 1,654,310 1,689,450 0.68FHLMC REMIC, IO, FRN, Series 4265
Class ST 5.815% 15/11/2043 USD 8,096,722 1,332,931 0.53FHLMC REMIC, FRN, Series 4286
Class SC 11.519% 15/12/2043 USD 2,718,050 2,977,290 1.19First Franklin Mortgage Loan Trust, FRN,
Series 2005-FF3 Class M4 1.087% 25/04/2035 USD 2,786,000 2,693,722 1.08
First Horizon Alternative Mortgage Securities Trust, FRN, Series 2005-FA2 Class 1A1 0.687% 25/04/2035 USD 168,301 138,965 0.06
First Horizon Alternative Mortgage Securities Trust, Series 2005-FA2 Class 1A5 5.5% 25/04/2035 USD 38,000 36,667 0.01
First Horizon Alternative Mortgage Securities Trust, Series 2006-FA3 Class A6 6% 25/07/2036 USD 10,296 8,705 0.00
The accompanying notes are an integral part of these financial statements.
Global Mortgage Securities Fund (continued)
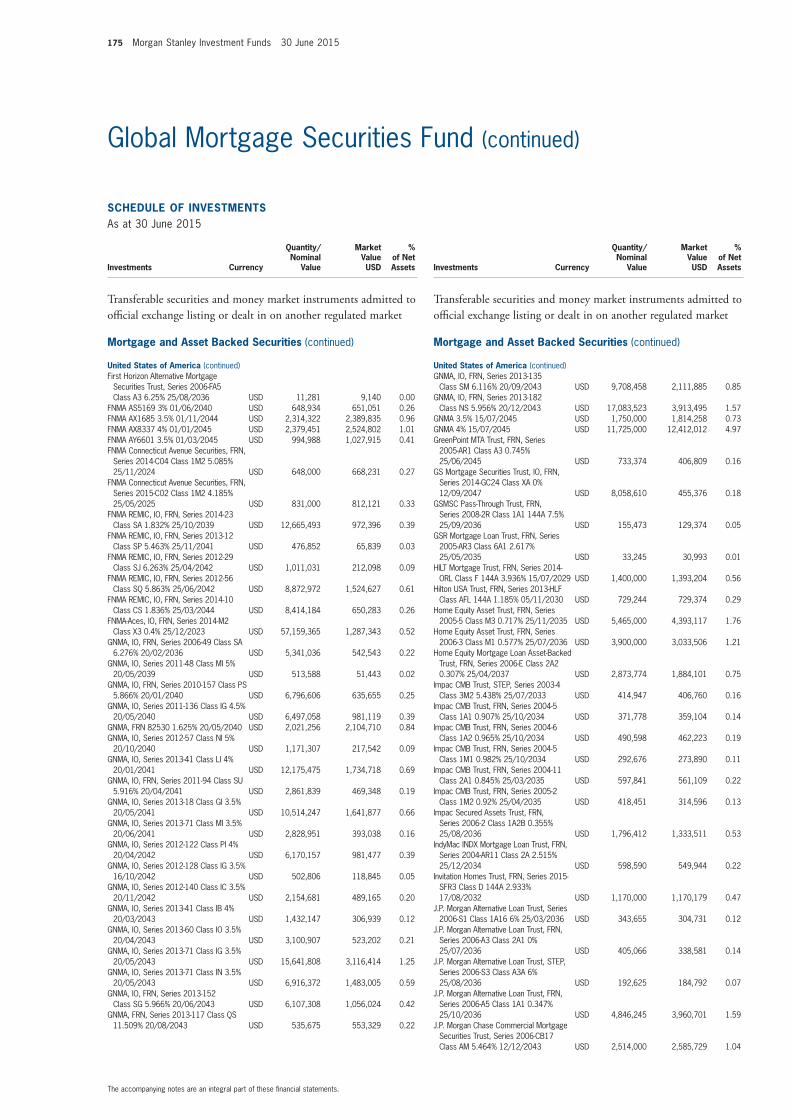
175 Morgan Stanley Investment Funds 30 June 2015
SCHEDULE of invEStmEntSAs at 30 June 2015
Investments Currency
Quantity/Nominal
Value
Market Value USD
% of Net Assets
transferable securities and money market instruments admitted to official exchange listing or dealt in on another regulated market
mortgage and Asset Backed Securities (continued)
United States of America (continued)First Horizon Alternative Mortgage
Securities Trust, Series 2006-FA5 Class A3 6.25% 25/08/2036 USD 11,281 9,140 0.00
FNMA AS5169 3% 01/06/2040 USD 648,934 651,051 0.26FNMA AX1685 3.5% 01/11/2044 USD 2,314,322 2,389,835 0.96FNMA AX8337 4% 01/01/2045 USD 2,379,451 2,524,802 1.01FNMA AY6601 3.5% 01/03/2045 USD 994,988 1,027,915 0.41FNMA Connecticut Avenue Securities, FRN,
Series 2014-C04 Class 1M2 5.085% 25/11/2024 USD 648,000 668,231 0.27
FNMA Connecticut Avenue Securities, FRN, Series 2015-C02 Class 1M2 4.185% 25/05/2025 USD 831,000 812,121 0.33
FNMA REMIC, IO, FRN, Series 2014-23 Class SA 1.832% 25/10/2039 USD 12,665,493 972,396 0.39
FNMA REMIC, IO, FRN, Series 2013-12 Class SP 5.463% 25/11/2041 USD 476,852 65,839 0.03
FNMA REMIC, IO, FRN, Series 2012-29 Class SJ 6.263% 25/04/2042 USD 1,011,031 212,098 0.09
FNMA REMIC, IO, FRN, Series 2012-56 Class SQ 5.863% 25/06/2042 USD 8,872,972 1,524,627 0.61
FNMA REMIC, IO, FRN, Series 2014-10 Class CS 1.836% 25/03/2044 USD 8,414,184 650,283 0.26
FNMA-Aces, IO, FRN, Series 2014-M2 Class X3 0.4% 25/12/2023 USD 57,159,365 1,287,343 0.52
GNMA, IO, FRN, Series 2006-49 Class SA 6.276% 20/02/2036 USD 5,341,036 542,543 0.22
GNMA, IO, Series 2011-48 Class MI 5% 20/05/2039 USD 513,588 51,443 0.02
GNMA, IO, FRN, Series 2010-157 Class PS 5.866% 20/01/2040 USD 6,796,606 635,655 0.25
GNMA, IO, Series 2011-136 Class IG 4.5% 20/05/2040 USD 6,497,058 981,119 0.39
GNMA, FRN 82530 1.625% 20/05/2040 USD 2,021,256 2,104,710 0.84GNMA, IO, Series 2012-57 Class NI 5%
20/10/2040 USD 1,171,307 217,542 0.09GNMA, IO, Series 2013-41 Class LI 4%
20/01/2041 USD 12,175,475 1,734,718 0.69GNMA, IO, FRN, Series 2011-94 Class SU
5.916% 20/04/2041 USD 2,861,839 469,348 0.19GNMA, IO, Series 2013-18 Class GI 3.5%
20/05/2041 USD 10,514,247 1,641,877 0.66GNMA, IO, Series 2013-71 Class MI 3.5%
20/06/2041 USD 2,828,951 393,038 0.16GNMA, IO, Series 2012-122 Class PI 4%
20/04/2042 USD 6,170,157 981,477 0.39GNMA, IO, Series 2012-128 Class IG 3.5%
16/10/2042 USD 502,806 118,845 0.05GNMA, IO, Series 2012-140 Class IC 3.5%
20/11/2042 USD 2,154,681 489,165 0.20GNMA, IO, Series 2013-41 Class IB 4%
20/03/2043 USD 1,432,147 306,939 0.12GNMA, IO, Series 2013-60 Class IO 3.5%
20/04/2043 USD 3,100,907 523,202 0.21GNMA, IO, Series 2013-71 Class IG 3.5%
20/05/2043 USD 15,641,808 3,116,414 1.25GNMA, IO, Series 2013-71 Class IN 3.5%
20/05/2043 USD 6,916,372 1,483,005 0.59GNMA, IO, FRN, Series 2013-152
Class SG 5.966% 20/06/2043 USD 6,107,308 1,056,024 0.42GNMA, FRN, Series 2013-117 Class QS
11.509% 20/08/2043 USD 535,675 553,329 0.22
SCHEDULE of invEStmEntSAs at 30 June 2015
Investments Currency
Quantity/Nominal
Value
Market Value USD
% of Net Assets
transferable securities and money market instruments admitted to official exchange listing or dealt in on another regulated market
mortgage and Asset Backed Securities (continued)
United States of America (continued)GNMA, IO, FRN, Series 2013-135
Class SM 6.116% 20/09/2043 USD 9,708,458 2,111,885 0.85GNMA, IO, FRN, Series 2013-182
Class NS 5.956% 20/12/2043 USD 17,083,523 3,913,495 1.57GNMA 3.5% 15/07/2045 USD 1,750,000 1,814,258 0.73GNMA 4% 15/07/2045 USD 11,725,000 12,412,012 4.97GreenPoint MTA Trust, FRN, Series
2005-AR1 Class A3 0.745% 25/06/2045 USD 733,374 406,809 0.16
GS Mortgage Securities Trust, IO, FRN, Series 2014-GC24 Class XA 0% 12/09/2047 USD 8,058,610 455,376 0.18
GSMSC Pass-Through Trust, FRN, Series 2008-2R Class 1A1 144A 7.5% 25/09/2036 USD 155,473 129,374 0.05
GSR Mortgage Loan Trust, FRN, Series 2005-AR3 Class 6A1 2.617% 25/05/2035 USD 33,245 30,993 0.01
HILT Mortgage Trust, FRN, Series 2014-ORL Class F 144A 3.936% 15/07/2029 USD 1,400,000 1,393,204 0.56
Hilton USA Trust, FRN, Series 2013-HLF Class AFL 144A 1.185% 05/11/2030 USD 729,244 729,374 0.29
Home Equity Asset Trust, FRN, Series 2005-5 Class M3 0.717% 25/11/2035 USD 5,465,000 4,393,117 1.76
Home Equity Asset Trust, FRN, Series 2006-3 Class M1 0.577% 25/07/2036 USD 3,900,000 3,033,506 1.21
Home Equity Mortgage Loan Asset-Backed Trust, FRN, Series 2006-E Class 2A2 0.307% 25/04/2037 USD 2,873,774 1,884,101 0.75
Impac CMB Trust, STEP, Series 2003-4 Class 3M2 5.438% 25/07/2033 USD 414,947 406,760 0.16
Impac CMB Trust, FRN, Series 2004-5 Class 1A1 0.907% 25/10/2034 USD 371,778 359,104 0.14
Impac CMB Trust, FRN, Series 2004-6 Class 1A2 0.965% 25/10/2034 USD 490,598 462,223 0.19
Impac CMB Trust, FRN, Series 2004-5 Class 1M1 0.982% 25/10/2034 USD 292,676 273,890 0.11
Impac CMB Trust, FRN, Series 2004-11 Class 2A1 0.845% 25/03/2035 USD 597,841 561,109 0.22
Impac CMB Trust, FRN, Series 2005-2 Class 1M2 0.92% 25/04/2035 USD 418,451 314,596 0.13
Impac Secured Assets Trust, FRN, Series 2006-2 Class 1A2B 0.355% 25/08/2036 USD 1,796,412 1,333,511 0.53
IndyMac INDX Mortgage Loan Trust, FRN, Series 2004-AR11 Class 2A 2.515% 25/12/2034 USD 598,590 549,944 0.22
Invitation Homes Trust, FRN, Series 2015-SFR3 Class D 144A 2.933% 17/08/2032 USD 1,170,000 1,170,179 0.47
J.P. Morgan Alternative Loan Trust, Series 2006-S1 Class 1A16 6% 25/03/2036 USD 343,655 304,731 0.12
J.P. Morgan Alternative Loan Trust, FRN, Series 2006-A3 Class 2A1 0% 25/07/2036 USD 405,066 338,581 0.14
J.P. Morgan Alternative Loan Trust, STEP, Series 2006-S3 Class A3A 6% 25/08/2036 USD 192,625 184,792 0.07
J.P. Morgan Alternative Loan Trust, FRN, Series 2006-A5 Class 1A1 0.347% 25/10/2036 USD 4,846,245 3,960,701 1.59
J.P. Morgan Chase Commercial Mortgage Securities Trust, Series 2006-CB17 Class AM 5.464% 12/12/2043 USD 2,514,000 2,585,729 1.04
The accompanying notes are an integral part of these financial statements.
Global Mortgage Securities Fund (continued)
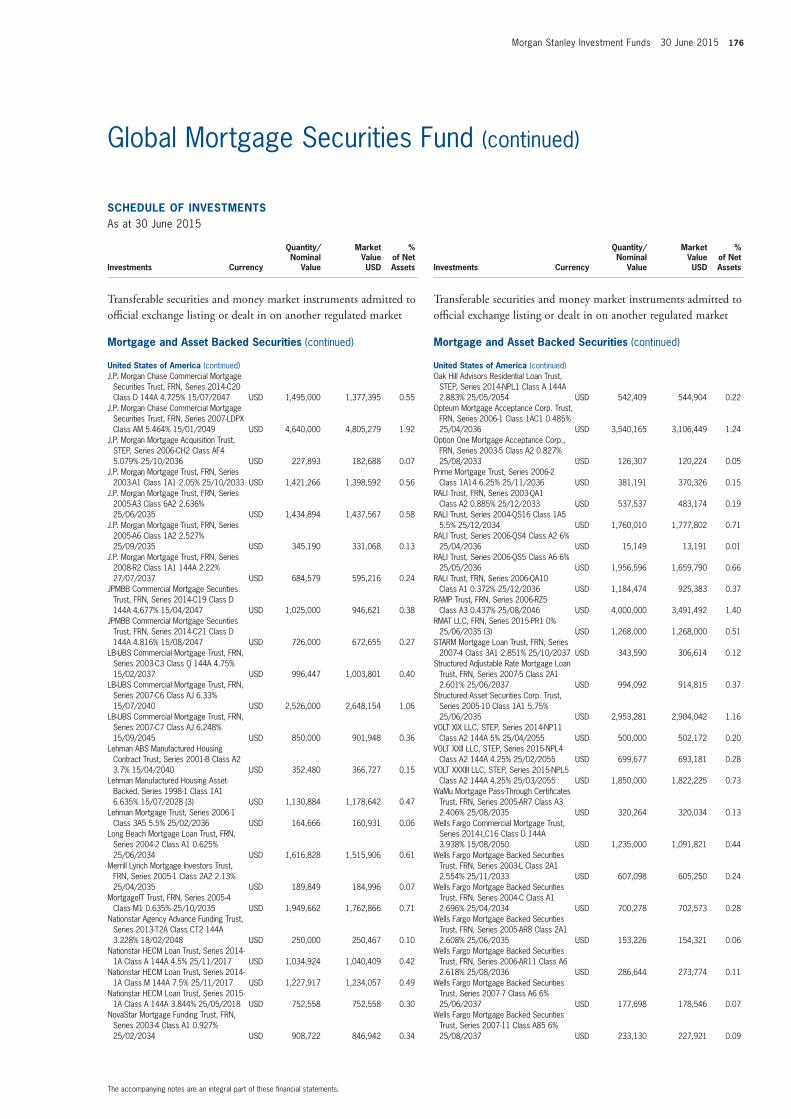
Morgan Stanley Investment Funds 30 June 2015 176
SCHEDULE of invEStmEntSAs at 30 June 2015
Investments Currency
Quantity/Nominal
Value
Market Value USD
% of Net Assets
transferable securities and money market instruments admitted to official exchange listing or dealt in on another regulated market
mortgage and Asset Backed Securities (continued)
United States of America (continued)J.P. Morgan Chase Commercial Mortgage
Securities Trust, FRN, Series 2014-C20 Class D 144A 4.725% 15/07/2047 USD 1,495,000 1,377,395 0.55
J.P. Morgan Chase Commercial Mortgage Securities Trust, FRN, Series 2007-LDPX Class AM 5.464% 15/01/2049 USD 4,640,000 4,805,279 1.92
J.P. Morgan Mortgage Acquisition Trust, STEP, Series 2006-CH2 Class AF4 5.079% 25/10/2036 USD 227,893 182,688 0.07
J.P. Morgan Mortgage Trust, FRN, Series 2003-A1 Class 1A1 2.05% 25/10/2033 USD 1,421,266 1,398,592 0.56
J.P. Morgan Mortgage Trust, FRN, Series 2005-A3 Class 6A2 2.636% 25/06/2035 USD 1,434,894 1,437,567 0.58
J.P. Morgan Mortgage Trust, FRN, Series 2005-A6 Class 1A2 2.527% 25/09/2035 USD 345,190 331,068 0.13
J.P. Morgan Mortgage Trust, FRN, Series 2008-R2 Class 1A1 144A 2.22% 27/07/2037 USD 684,579 595,216 0.24
JPMBB Commercial Mortgage Securities Trust, FRN, Series 2014-C19 Class D 144A 4.677% 15/04/2047 USD 1,025,000 946,621 0.38
JPMBB Commercial Mortgage Securities Trust, FRN, Series 2014-C21 Class D 144A 4.816% 15/08/2047 USD 726,000 672,655 0.27
LB-UBS Commercial Mortgage Trust, FRN, Series 2003-C3 Class Q 144A 4.75% 15/02/2037 USD 996,447 1,003,801 0.40
LB-UBS Commercial Mortgage Trust, FRN, Series 2007-C6 Class AJ 6.33% 15/07/2040 USD 2,526,000 2,648,154 1.06
LB-UBS Commercial Mortgage Trust, FRN, Series 2007-C7 Class AJ 6.248% 15/09/2045 USD 850,000 901,948 0.36
Lehman ABS Manufactured Housing Contract Trust, Series 2001-B Class A2 3.7% 15/04/2040 USD 352,480 366,727 0.15
Lehman Manufactured Housing Asset-Backed, Series 1998-1 Class 1A1 6.635% 15/07/2028 (3) USD 1,130,884 1,178,642 0.47
Lehman Mortgage Trust, Series 2006-1 Class 3A5 5.5% 25/02/2036 USD 164,666 160,931 0.06
Long Beach Mortgage Loan Trust, FRN, Series 2004-2 Class A1 0.625% 25/06/2034 USD 1,616,828 1,515,906 0.61
Merrill Lynch Mortgage Investors Trust, FRN, Series 2005-1 Class 2A2 2.13% 25/04/2035 USD 189,849 184,996 0.07
MortgageIT Trust, FRN, Series 2005-4 Class M1 0.635% 25/10/2035 USD 1,949,662 1,762,866 0.71
Nationstar Agency Advance Funding Trust, Series 2013-T2A Class CT2 144A 3.228% 18/02/2048 USD 250,000 250,467 0.10
Nationstar HECM Loan Trust, Series 2014-1A Class A 144A 4.5% 25/11/2017 USD 1,034,924 1,040,409 0.42
Nationstar HECM Loan Trust, Series 2014-1A Class M 144A 7.5% 25/11/2017 USD 1,227,917 1,234,057 0.49
Nationstar HECM Loan Trust, Series 2015-1A Class A 144A 3.844% 25/05/2018 USD 752,558 752,558 0.30
NovaStar Mortgage Funding Trust, FRN, Series 2003-4 Class A1 0.927% 25/02/2034 USD 908,722 846,942 0.34
SCHEDULE of invEStmEntSAs at 30 June 2015
Investments Currency
Quantity/Nominal
Value
Market Value USD
% of Net Assets
transferable securities and money market instruments admitted to official exchange listing or dealt in on another regulated market
mortgage and Asset Backed Securities (continued)
United States of America (continued)Oak Hill Advisors Residential Loan Trust,
STEP, Series 2014-NPL1 Class A 144A 2.883% 25/05/2054 USD 542,409 544,904 0.22
Opteum Mortgage Acceptance Corp. Trust, FRN, Series 2006-1 Class 1AC1 0.485% 25/04/2036 USD 3,540,165 3,106,449 1.24
Option One Mortgage Acceptance Corp., FRN, Series 2003-5 Class A2 0.827% 25/08/2033 USD 126,307 120,224 0.05
Prime Mortgage Trust, Series 2006-2 Class 1A14 6.25% 25/11/2036 USD 381,191 370,326 0.15
RALI Trust, FRN, Series 2003-QA1 Class A2 0.885% 25/12/2033 USD 537,537 483,174 0.19
RALI Trust, Series 2004-QS16 Class 1A5 5.5% 25/12/2034 USD 1,760,010 1,777,802 0.71
RALI Trust, Series 2006-QS4 Class A2 6% 25/04/2036 USD 15,149 13,191 0.01
RALI Trust, Series 2006-QS5 Class A6 6% 25/05/2036 USD 1,956,596 1,659,790 0.66
RALI Trust, FRN, Series 2006-QA10 Class A1 0.372% 25/12/2036 USD 1,184,474 925,383 0.37
RAMP Trust, FRN, Series 2006-RZ5 Class A3 0.437% 25/08/2046 USD 4,000,000 3,491,492 1.40
RMAT LLC, FRN, Series 2015-PR1 0% 25/06/2035 (3) USD 1,268,000 1,268,000 0.51
STARM Mortgage Loan Trust, FRN, Series 2007-4 Class 3A1 2.851% 25/10/2037 USD 343,590 306,614 0.12
Structured Adjustable Rate Mortgage Loan Trust, FRN, Series 2007-5 Class 2A1 2.601% 25/06/2037 USD 994,092 914,815 0.37
Structured Asset Securities Corp. Trust, Series 2005-10 Class 1A1 5.75% 25/06/2035 USD 2,953,281 2,904,042 1.16
VOLT XIX LLC, STEP, Series 2014-NP11 Class A2 144A 5% 25/04/2055 USD 500,000 502,172 0.20
VOLT XXII LLC, STEP, Series 2015-NPL4 Class A2 144A 4.25% 25/02/2055 USD 699,677 693,181 0.28
VOLT XXXIII LLC, STEP, Series 2015-NPL5 Class A2 144A 4.25% 25/03/2055 USD 1,850,000 1,822,225 0.73
WaMu Mortgage Pass-Through Certificates Trust, FRN, Series 2005-AR7 Class A3 2.406% 25/08/2035 USD 320,264 320,034 0.13
Wells Fargo Commercial Mortgage Trust, Series 2014-LC16 Class D 144A 3.938% 15/08/2050 USD 1,235,000 1,091,821 0.44
Wells Fargo Mortgage Backed Securities Trust, FRN, Series 2003-L Class 2A1 2.554% 25/11/2033 USD 607,098 605,250 0.24
Wells Fargo Mortgage Backed Securities Trust, FRN, Series 2004-C Class A1 2.696% 25/04/2034 USD 700,278 702,573 0.28
Wells Fargo Mortgage Backed Securities Trust, FRN, Series 2005-AR8 Class 2A1 2.608% 25/06/2035 USD 153,226 154,321 0.06
Wells Fargo Mortgage Backed Securities Trust, FRN, Series 2006-AR11 Class A6 2.618% 25/08/2036 USD 286,644 273,774 0.11
Wells Fargo Mortgage Backed Securities Trust, Series 2007-7 Class A6 6% 25/06/2037 USD 177,698 178,546 0.07
Wells Fargo Mortgage Backed Securities Trust, Series 2007-11 Class A85 6% 25/08/2037 USD 233,130 227,921 0.09
The accompanying notes are an integral part of these financial statements.
Global Mortgage Securities Fund (continued)
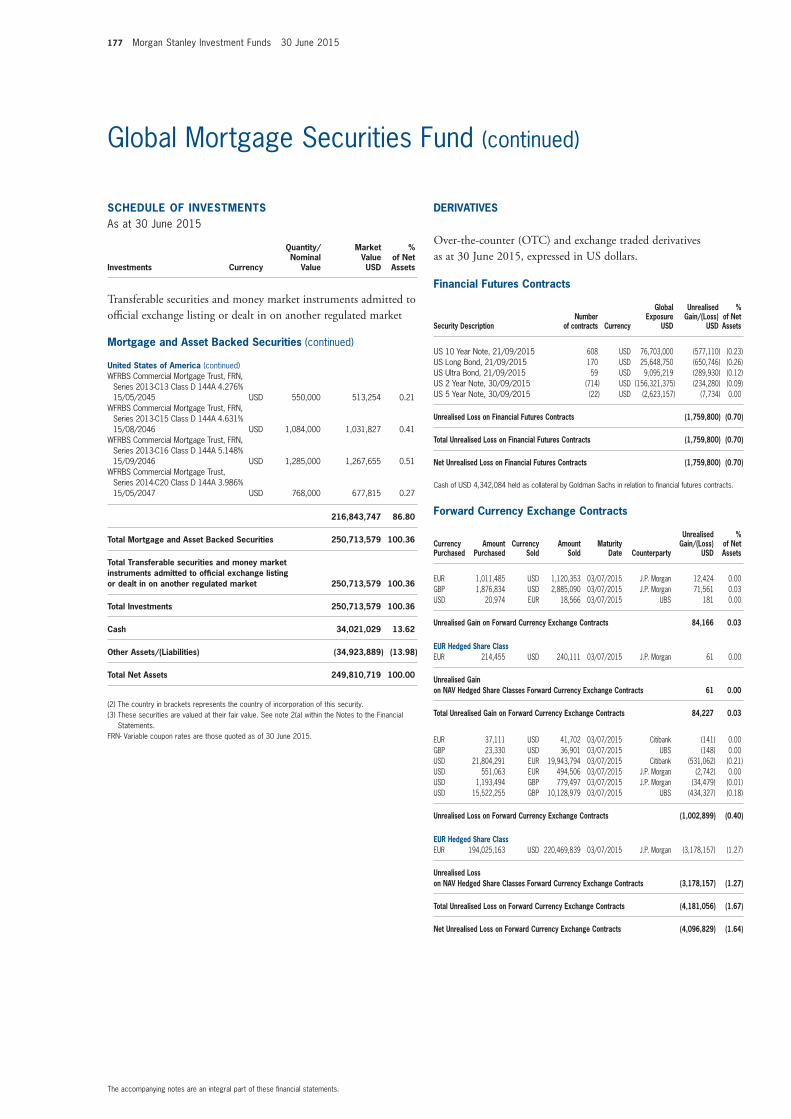
177 Morgan Stanley Investment Funds 30 June 2015
SCHEDULE of invEStmEntSAs at 30 June 2015
Investments Currency
Quantity/Nominal
Value
Market Value USD
% of Net Assets
transferable securities and money market instruments admitted to official exchange listing or dealt in on another regulated market
mortgage and Asset Backed Securities (continued)
United States of America (continued)WFRBS Commercial Mortgage Trust, FRN,
Series 2013-C13 Class D 144A 4.276% 15/05/2045 USD 550,000 513,254 0.21
WFRBS Commercial Mortgage Trust, FRN, Series 2013-C15 Class D 144A 4.631% 15/08/2046 USD 1,084,000 1,031,827 0.41
WFRBS Commercial Mortgage Trust, FRN, Series 2013-C16 Class D 144A 5.148% 15/09/2046 USD 1,285,000 1,267,655 0.51
WFRBS Commercial Mortgage Trust, Series 2014-C20 Class D 144A 3.986% 15/05/2047 USD 768,000 677,815 0.27
216,843,747 86.80
total mortgage and Asset Backed Securities 250,713,579 100.36
total transferable securities and money market instruments admitted to official exchange listing or dealt in on another regulated market 250,713,579 100.36
total investments 250,713,579 100.36
Cash 34,021,029 13.62
other Assets/(Liabilities) (34,923,889) (13.98)
total net Assets 249,810,719 100.00
(2) The country in brackets represents the country of incorporation of this security.(3) These securities are valued at their fair value. See note 2(a) within the Notes to the Financial
Statements.FRN- Variable coupon rates are those quoted as of 30 June 2015.
The accompanying notes are an integral part of these financial statements.
Global Mortgage Securities Fund (continued)
financial futures Contracts
Security Descriptionnumber
of contracts Currency
Global Exposure
USD
Unrealised Gain/(Loss)
USD
% of net Assets
US 10 Year Note, 21/09/2015 608 USD 76,703,000 (577,110) (0.23)US Long Bond, 21/09/2015 170 USD 25,648,750 (650,746) (0.26)US Ultra Bond, 21/09/2015 59 USD 9,095,219 (289,930) (0.12)US 2 Year Note, 30/09/2015 (714) USD (156,321,375) (234,280) (0.09)US 5 Year Note, 30/09/2015 (22) USD (2,623,157) (7,734) 0.00
Unrealised Loss on financial futures Contracts (1,759,800) (0.70)
total Unrealised Loss on financial futures Contracts (1,759,800) (0.70)
net Unrealised Loss on financial futures Contracts (1,759,800) (0.70)
Cash of USD 4,342,084 held as collateral by Goldman Sachs in relation to financial futures contracts.
forward Currency Exchange Contracts
Currency Purchased
Amount Purchased
Currency Sold
Amount Sold
maturity Date Counterparty
Unrealised Gain/(Loss)
USD
% of net Assets
EUR 1,011,485 USD 1,120,353 03/07/2015 J.P. Morgan 12,424 0.00GBP 1,876,834 USD 2,885,090 03/07/2015 J.P. Morgan 71,561 0.03USD 20,974 EUR 18,566 03/07/2015 UBS 181 0.00
Unrealised Gain on forward Currency Exchange Contracts 84,166 0.03
EUR Hedged Share ClassEUR 214,455 USD 240,111 03/07/2015 J.P. Morgan 61 0.00
Unrealised Gain on nAv Hedged Share Classes forward Currency Exchange Contracts 61 0.00
total Unrealised Gain on forward Currency Exchange Contracts 84,227 0.03
EUR 37,111 USD 41,702 03/07/2015 Citibank (141) 0.00GBP 23,330 USD 36,901 03/07/2015 UBS (148) 0.00USD 21,804,291 EUR 19,943,794 03/07/2015 Citibank (531,062) (0.21)USD 551,063 EUR 494,506 03/07/2015 J.P. Morgan (2,742) 0.00USD 1,193,494 GBP 779,497 03/07/2015 J.P. Morgan (34,479) (0.01)USD 15,522,255 GBP 10,128,979 03/07/2015 UBS (434,327) (0.18)
Unrealised Loss on forward Currency Exchange Contracts (1,002,899) (0.40)
EUR Hedged Share ClassEUR 194,025,163 USD 220,469,839 03/07/2015 J.P. Morgan (3,178,157) (1.27)
Unrealised Loss on nAv Hedged Share Classes forward Currency Exchange Contracts (3,178,157) (1.27)
total Unrealised Loss on forward Currency Exchange Contracts (4,181,056) (1.67)
net Unrealised Loss on forward Currency Exchange Contracts (4,096,829) (1.64)
DERivAtivES
Over-the-counter (OtC) and exchange traded derivatives as at 30 June 2015, expressed in US dollars.
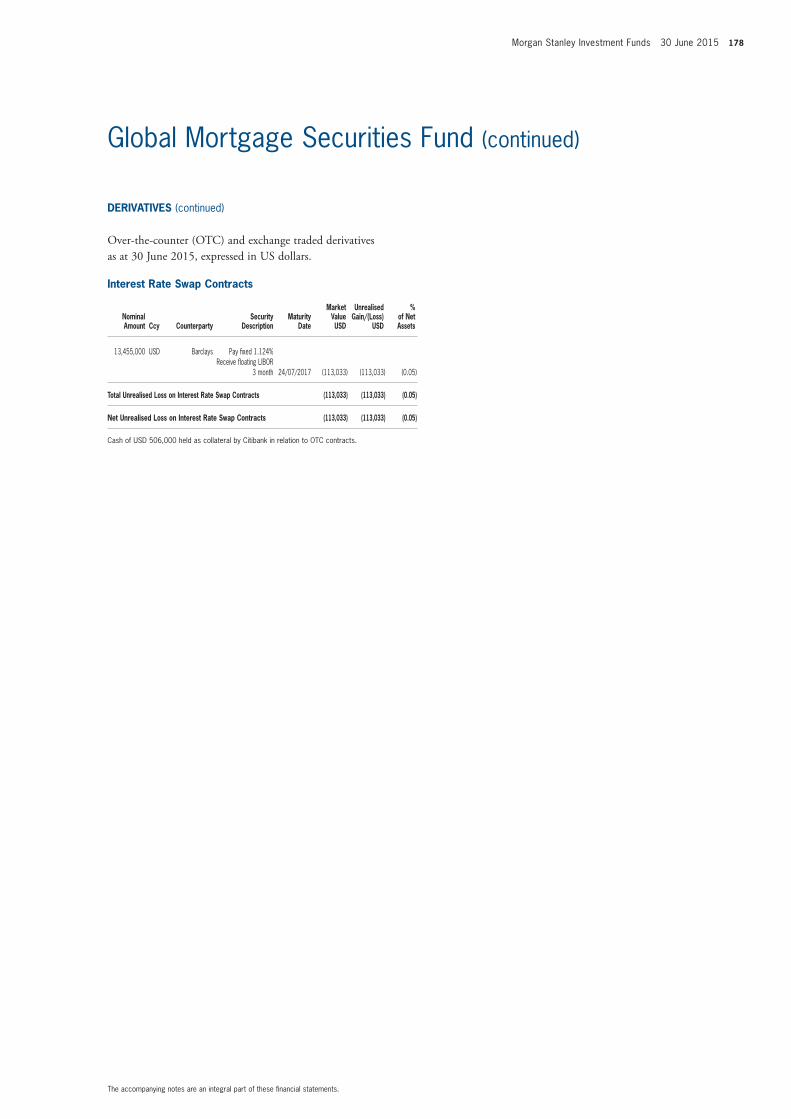
Morgan Stanley Investment Funds 30 June 2015 178
The accompanying notes are an integral part of these financial statements.
Global Mortgage Securities Fund (continued)
interest Rate Swap Contracts
nominal Amount Ccy Counterparty
Security Description
maturity Date
market value USD
Unrealised Gain/(Loss)
USD
% of net Assets
13,455,000 USD Barclays Pay fixed 1.124% Receive floating LIBOR
3 month 24/07/2017 (113,033) (113,033) (0.05)
total Unrealised Loss on interest Rate Swap Contracts (113,033) (113,033) (0.05)
net Unrealised Loss on interest Rate Swap Contracts (113,033) (113,033) (0.05)
Cash of USD 506,000 held as collateral by Citibank in relation to OTC contracts.
DERivAtivES (continued)
Over-the-counter (OtC) and exchange traded derivatives as at 30 June 2015, expressed in US dollars.
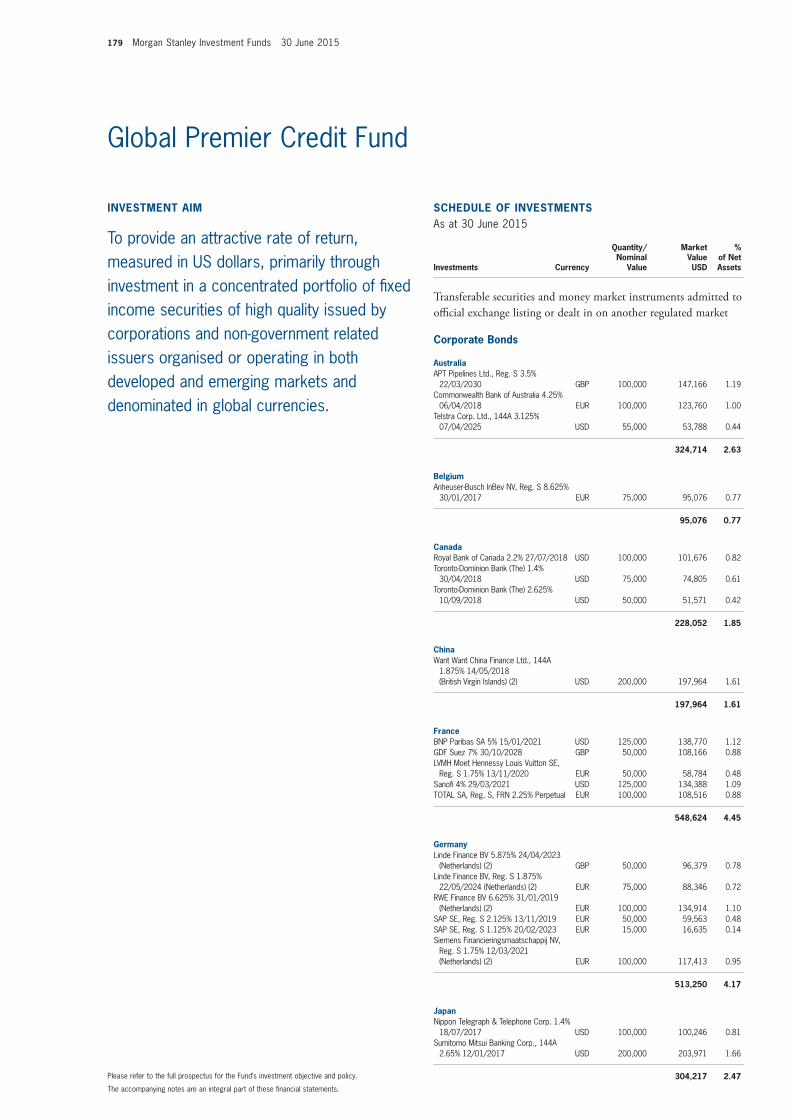
179 Morgan Stanley Investment Funds 30 June 2015
invEStmEnt Aim
To provide an attractive rate of return, measured in US dollars, primarily through investment in a concentrated portfolio of fixed income securities of high quality issued by corporations and non-government related issuers organised or operating in both developed and emerging markets and denominated in global currencies.
SCHEDULE of invEStmEntSAs at 30 June 2015
Investments Currency
Quantity/Nominal
Value
Market Value USD
% of Net Assets
transferable securities and money market instruments admitted to official exchange listing or dealt in on another regulated market
Corporate Bonds
AustraliaAPT Pipelines Ltd., Reg. S 3.5%
22/03/2030 GBP 100,000 147,166 1.19Commonwealth Bank of Australia 4.25%
06/04/2018 EUR 100,000 123,760 1.00Telstra Corp. Ltd., 144A 3.125%
07/04/2025 USD 55,000 53,788 0.44
324,714 2.63
BelgiumAnheuser-Busch InBev NV, Reg. S 8.625%
30/01/2017 EUR 75,000 95,076 0.77
95,076 0.77
CanadaRoyal Bank of Canada 2.2% 27/07/2018 USD 100,000 101,676 0.82Toronto-Dominion Bank (The) 1.4%
30/04/2018 USD 75,000 74,805 0.61Toronto-Dominion Bank (The) 2.625%
10/09/2018 USD 50,000 51,571 0.42
228,052 1.85
ChinaWant Want China Finance Ltd., 144A
1.875% 14/05/2018 (British Virgin Islands) (2) USD 200,000 197,964 1.61
197,964 1.61
franceBNP Paribas SA 5% 15/01/2021 USD 125,000 138,770 1.12GDF Suez 7% 30/10/2028 GBP 50,000 108,166 0.88LVMH Moet Hennessy Louis Vuitton SE,
Reg. S 1.75% 13/11/2020 EUR 50,000 58,784 0.48Sanofi 4% 29/03/2021 USD 125,000 134,388 1.09TOTAL SA, Reg. S, FRN 2.25% Perpetual EUR 100,000 108,516 0.88
548,624 4.45
GermanyLinde Finance BV 5.875% 24/04/2023
(Netherlands) (2) GBP 50,000 96,379 0.78Linde Finance BV, Reg. S 1.875%
22/05/2024 (Netherlands) (2) EUR 75,000 88,346 0.72RWE Finance BV 6.625% 31/01/2019
(Netherlands) (2) EUR 100,000 134,914 1.10SAP SE, Reg. S 2.125% 13/11/2019 EUR 50,000 59,563 0.48SAP SE, Reg. S 1.125% 20/02/2023 EUR 15,000 16,635 0.14Siemens Financieringsmaatschappij NV,
Reg. S 1.75% 12/03/2021 (Netherlands) (2) EUR 100,000 117,413 0.95
513,250 4.17
JapanNippon Telegraph & Telephone Corp. 1.4%
18/07/2017 USD 100,000 100,246 0.81Sumitomo Mitsui Banking Corp., 144A
2.65% 12/01/2017 USD 200,000 203,971 1.66
304,217 2.47The accompanying notes are an integral part of these financial statements.
Please refer to the full prospectus for the Fund’s investment objective and policy.
Global Premier Credit Fund
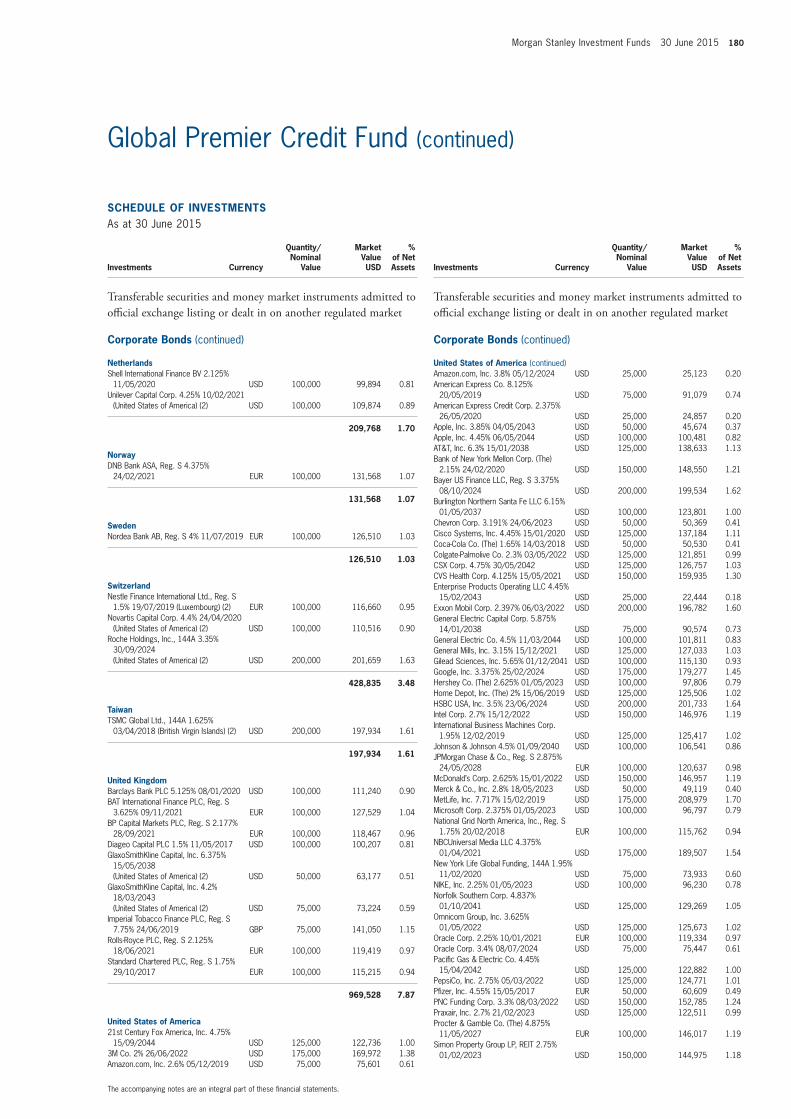
Morgan Stanley Investment Funds 30 June 2015 180
SCHEDULE of invEStmEntSAs at 30 June 2015
Investments Currency
Quantity/Nominal
Value
Market Value USD
% of Net Assets
transferable securities and money market instruments admitted to official exchange listing or dealt in on another regulated market
Corporate Bonds (continued)
netherlandsShell International Finance BV 2.125%
11/05/2020 USD 100,000 99,894 0.81Unilever Capital Corp. 4.25% 10/02/2021
(United States of America) (2) USD 100,000 109,874 0.89
209,768 1.70
norwayDNB Bank ASA, Reg. S 4.375%
24/02/2021 EUR 100,000 131,568 1.07
131,568 1.07
SwedenNordea Bank AB, Reg. S 4% 11/07/2019 EUR 100,000 126,510 1.03
126,510 1.03
SwitzerlandNestle Finance International Ltd., Reg. S
1.5% 19/07/2019 (Luxembourg) (2) EUR 100,000 116,660 0.95Novartis Capital Corp. 4.4% 24/04/2020
(United States of America) (2) USD 100,000 110,516 0.90Roche Holdings, Inc., 144A 3.35%
30/09/2024 (United States of America) (2) USD 200,000 201,659 1.63
428,835 3.48
taiwanTSMC Global Ltd., 144A 1.625%
03/04/2018 (British Virgin Islands) (2) USD 200,000 197,934 1.61
197,934 1.61
United KingdomBarclays Bank PLC 5.125% 08/01/2020 USD 100,000 111,240 0.90BAT International Finance PLC, Reg. S
3.625% 09/11/2021 EUR 100,000 127,529 1.04BP Capital Markets PLC, Reg. S 2.177%
28/09/2021 EUR 100,000 118,467 0.96Diageo Capital PLC 1.5% 11/05/2017 USD 100,000 100,207 0.81GlaxoSmithKline Capital, Inc. 6.375%
15/05/2038 (United States of America) (2) USD 50,000 63,177 0.51
GlaxoSmithKline Capital, Inc. 4.2% 18/03/2043 (United States of America) (2) USD 75,000 73,224 0.59
Imperial Tobacco Finance PLC, Reg. S 7.75% 24/06/2019 GBP 75,000 141,050 1.15
Rolls-Royce PLC, Reg. S 2.125% 18/06/2021 EUR 100,000 119,419 0.97
Standard Chartered PLC, Reg. S 1.75% 29/10/2017 EUR 100,000 115,215 0.94
969,528 7.87
United States of America21st Century Fox America, Inc. 4.75%
15/09/2044 USD 125,000 122,736 1.003M Co. 2% 26/06/2022 USD 175,000 169,972 1.38Amazon.com, Inc. 2.6% 05/12/2019 USD 75,000 75,601 0.61
SCHEDULE of invEStmEntSAs at 30 June 2015
Investments Currency
Quantity/Nominal
Value
Market Value USD
% of Net Assets
transferable securities and money market instruments admitted to official exchange listing or dealt in on another regulated market
Corporate Bonds (continued)
United States of America (continued)Amazon.com, Inc. 3.8% 05/12/2024 USD 25,000 25,123 0.20American Express Co. 8.125%
20/05/2019 USD 75,000 91,079 0.74American Express Credit Corp. 2.375%
26/05/2020 USD 25,000 24,857 0.20Apple, Inc. 3.85% 04/05/2043 USD 50,000 45,674 0.37Apple, Inc. 4.45% 06/05/2044 USD 100,000 100,481 0.82AT&T, Inc. 6.3% 15/01/2038 USD 125,000 138,633 1.13Bank of New York Mellon Corp. (The)
2.15% 24/02/2020 USD 150,000 148,550 1.21Bayer US Finance LLC, Reg. S 3.375%
08/10/2024 USD 200,000 199,534 1.62Burlington Northern Santa Fe LLC 6.15%
01/05/2037 USD 100,000 123,801 1.00Chevron Corp. 3.191% 24/06/2023 USD 50,000 50,369 0.41Cisco Systems, Inc. 4.45% 15/01/2020 USD 125,000 137,184 1.11Coca-Cola Co. (The) 1.65% 14/03/2018 USD 50,000 50,530 0.41Colgate-Palmolive Co. 2.3% 03/05/2022 USD 125,000 121,851 0.99CSX Corp. 4.75% 30/05/2042 USD 125,000 126,757 1.03CVS Health Corp. 4.125% 15/05/2021 USD 150,000 159,935 1.30Enterprise Products Operating LLC 4.45%
15/02/2043 USD 25,000 22,444 0.18Exxon Mobil Corp. 2.397% 06/03/2022 USD 200,000 196,782 1.60General Electric Capital Corp. 5.875%
14/01/2038 USD 75,000 90,574 0.73General Electric Co. 4.5% 11/03/2044 USD 100,000 101,811 0.83General Mills, Inc. 3.15% 15/12/2021 USD 125,000 127,033 1.03Gilead Sciences, Inc. 5.65% 01/12/2041 USD 100,000 115,130 0.93Google, Inc. 3.375% 25/02/2024 USD 175,000 179,277 1.45Hershey Co. (The) 2.625% 01/05/2023 USD 100,000 97,806 0.79Home Depot, Inc. (The) 2% 15/06/2019 USD 125,000 125,506 1.02HSBC USA, Inc. 3.5% 23/06/2024 USD 200,000 201,733 1.64Intel Corp. 2.7% 15/12/2022 USD 150,000 146,976 1.19International Business Machines Corp.
1.95% 12/02/2019 USD 125,000 125,417 1.02Johnson & Johnson 4.5% 01/09/2040 USD 100,000 106,541 0.86JPMorgan Chase & Co., Reg. S 2.875%
24/05/2028 EUR 100,000 120,637 0.98McDonald’s Corp. 2.625% 15/01/2022 USD 150,000 146,957 1.19Merck & Co., Inc. 2.8% 18/05/2023 USD 50,000 49,119 0.40MetLife, Inc. 7.717% 15/02/2019 USD 175,000 208,979 1.70Microsoft Corp. 2.375% 01/05/2023 USD 100,000 96,797 0.79National Grid North America, Inc., Reg. S
1.75% 20/02/2018 EUR 100,000 115,762 0.94NBCUniversal Media LLC 4.375%
01/04/2021 USD 175,000 189,507 1.54New York Life Global Funding, 144A 1.95%
11/02/2020 USD 75,000 73,933 0.60NIKE, Inc. 2.25% 01/05/2023 USD 100,000 96,230 0.78Norfolk Southern Corp. 4.837%
01/10/2041 USD 125,000 129,269 1.05Omnicom Group, Inc. 3.625%
01/05/2022 USD 125,000 125,673 1.02Oracle Corp. 2.25% 10/01/2021 EUR 100,000 119,334 0.97Oracle Corp. 3.4% 08/07/2024 USD 75,000 75,447 0.61Pacific Gas & Electric Co. 4.45%
15/04/2042 USD 125,000 122,882 1.00PepsiCo, Inc. 2.75% 05/03/2022 USD 125,000 124,771 1.01Pfizer, Inc. 4.55% 15/05/2017 EUR 50,000 60,609 0.49PNC Funding Corp. 3.3% 08/03/2022 USD 150,000 152,785 1.24Praxair, Inc. 2.7% 21/02/2023 USD 125,000 122,511 0.99Procter & Gamble Co. (The) 4.875%
11/05/2027 EUR 100,000 146,017 1.19Simon Property Group LP, REIT 2.75%
01/02/2023 USD 150,000 144,975 1.18
The accompanying notes are an integral part of these financial statements.
Global Premier Credit Fund (continued)
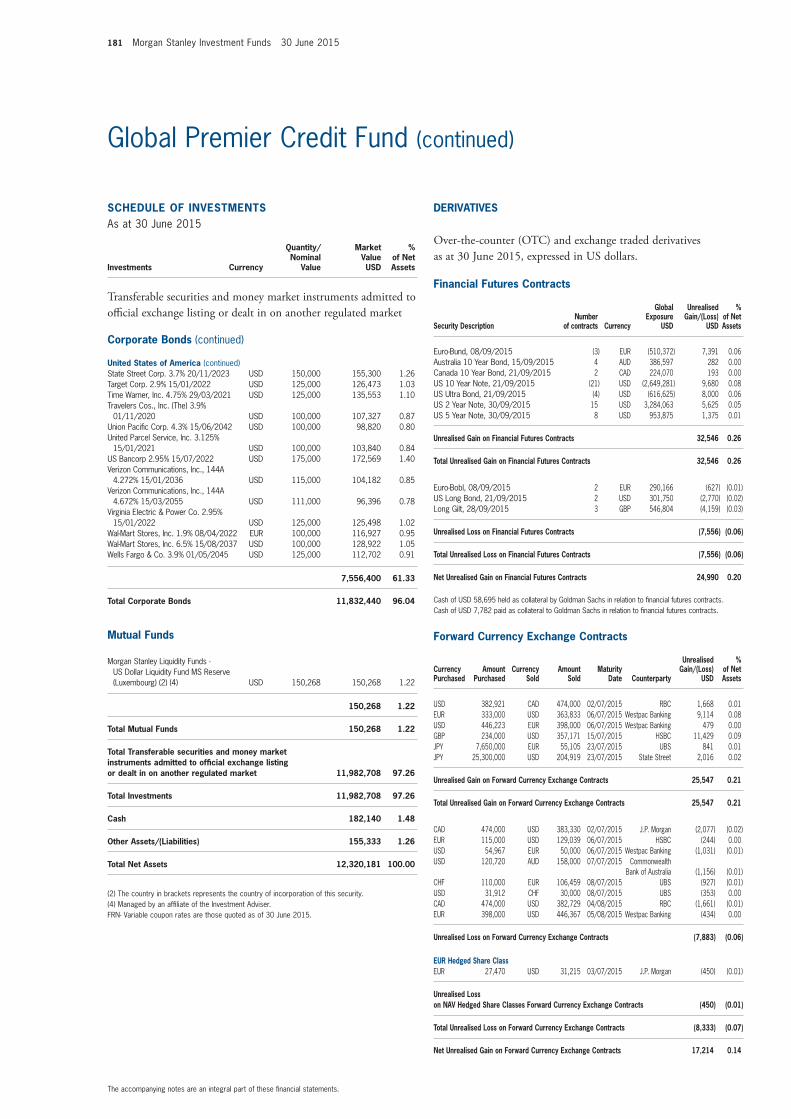
181 Morgan Stanley Investment Funds 30 June 2015
SCHEDULE of invEStmEntSAs at 30 June 2015
Investments Currency
Quantity/Nominal
Value
Market Value USD
% of Net Assets
transferable securities and money market instruments admitted to official exchange listing or dealt in on another regulated market
Corporate Bonds (continued)
United States of America (continued)State Street Corp. 3.7% 20/11/2023 USD 150,000 155,300 1.26Target Corp. 2.9% 15/01/2022 USD 125,000 126,473 1.03Time Warner, Inc. 4.75% 29/03/2021 USD 125,000 135,553 1.10Travelers Cos., Inc. (The) 3.9%
01/11/2020 USD 100,000 107,327 0.87Union Pacific Corp. 4.3% 15/06/2042 USD 100,000 98,820 0.80United Parcel Service, Inc. 3.125%
15/01/2021 USD 100,000 103,840 0.84US Bancorp 2.95% 15/07/2022 USD 175,000 172,569 1.40Verizon Communications, Inc., 144A
4.272% 15/01/2036 USD 115,000 104,182 0.85Verizon Communications, Inc., 144A
4.672% 15/03/2055 USD 111,000 96,396 0.78Virginia Electric & Power Co. 2.95%
15/01/2022 USD 125,000 125,498 1.02Wal-Mart Stores, Inc. 1.9% 08/04/2022 EUR 100,000 116,927 0.95Wal-Mart Stores, Inc. 6.5% 15/08/2037 USD 100,000 128,922 1.05Wells Fargo & Co. 3.9% 01/05/2045 USD 125,000 112,702 0.91
7,556,400 61.33
total Corporate Bonds 11,832,440 96.04
mutual funds
Morgan Stanley Liquidity Funds - US Dollar Liquidity Fund MS Reserve (Luxembourg) (2) (4) USD 150,268 150,268 1.22
150,268 1.22
total mutual funds 150,268 1.22
total transferable securities and money market instruments admitted to official exchange listing or dealt in on another regulated market 11,982,708 97.26
total investments 11,982,708 97.26
Cash 182,140 1.48
other Assets/(Liabilities) 155,333 1.26
total net Assets 12,320,181 100.00
(2) The country in brackets represents the country of incorporation of this security.(4) Managed by an affiliate of the Investment Adviser.FRN- Variable coupon rates are those quoted as of 30 June 2015.
The accompanying notes are an integral part of these financial statements.
Global Premier Credit Fund (continued)
financial futures Contracts
Security Descriptionnumber
of contracts Currency
Global Exposure
USD
Unrealised Gain/(Loss)
USD
% of net Assets
Euro-Bund, 08/09/2015 (3) EUR (510,372) 7,391 0.06Australia 10 Year Bond, 15/09/2015 4 AUD 386,597 282 0.00Canada 10 Year Bond, 21/09/2015 2 CAD 224,070 193 0.00US 10 Year Note, 21/09/2015 (21) USD (2,649,281) 9,680 0.08US Ultra Bond, 21/09/2015 (4) USD (616,625) 8,000 0.06US 2 Year Note, 30/09/2015 15 USD 3,284,063 5,625 0.05US 5 Year Note, 30/09/2015 8 USD 953,875 1,375 0.01
Unrealised Gain on financial futures Contracts 32,546 0.26
total Unrealised Gain on financial futures Contracts 32,546 0.26
Euro-Bobl, 08/09/2015 2 EUR 290,166 (627) (0.01)US Long Bond, 21/09/2015 2 USD 301,750 (2,770) (0.02)Long Gilt, 28/09/2015 3 GBP 546,804 (4,159) (0.03)
Unrealised Loss on financial futures Contracts (7,556) (0.06)
total Unrealised Loss on financial futures Contracts (7,556) (0.06)
net Unrealised Gain on financial futures Contracts 24,990 0.20
Cash of USD 58,695 held as collateral by Goldman Sachs in relation to financial futures contracts.Cash of USD 7,782 paid as collateral to Goldman Sachs in relation to financial futures contracts.
forward Currency Exchange Contracts
Currency Purchased
Amount Purchased
Currency Sold
Amount Sold
maturity Date Counterparty
Unrealised Gain/(Loss)
USD
% of net Assets
USD 382,921 CAD 474,000 02/07/2015 RBC 1,668 0.01EUR 333,000 USD 363,833 06/07/2015 Westpac Banking 9,114 0.08USD 446,223 EUR 398,000 06/07/2015 Westpac Banking 479 0.00GBP 234,000 USD 357,171 15/07/2015 HSBC 11,429 0.09JPY 7,650,000 EUR 55,105 23/07/2015 UBS 841 0.01JPY 25,300,000 USD 204,919 23/07/2015 State Street 2,016 0.02
Unrealised Gain on forward Currency Exchange Contracts 25,547 0.21
total Unrealised Gain on forward Currency Exchange Contracts 25,547 0.21
CAD 474,000 USD 383,330 02/07/2015 J.P. Morgan (2,077) (0.02)EUR 115,000 USD 129,039 06/07/2015 HSBC (244) 0.00USD 54,967 EUR 50,000 06/07/2015 Westpac Banking (1,031) (0.01)USD 120,720 AUD 158,000 07/07/2015 Commonwealth
Bank of Australia (1,156) (0.01)CHF 110,000 EUR 106,459 08/07/2015 UBS (927) (0.01)USD 31,912 CHF 30,000 08/07/2015 UBS (353) 0.00CAD 474,000 USD 382,729 04/08/2015 RBC (1,661) (0.01)EUR 398,000 USD 446,367 05/08/2015 Westpac Banking (434) 0.00
Unrealised Loss on forward Currency Exchange Contracts (7,883) (0.06)
EUR Hedged Share ClassEUR 27,470 USD 31,215 03/07/2015 J.P. Morgan (450) (0.01)
Unrealised Loss on nAv Hedged Share Classes forward Currency Exchange Contracts (450) (0.01)
total Unrealised Loss on forward Currency Exchange Contracts (8,333) (0.07)
net Unrealised Gain on forward Currency Exchange Contracts 17,214 0.14
DERivAtivES
Over-the-counter (OtC) and exchange traded derivatives as at 30 June 2015, expressed in US dollars.
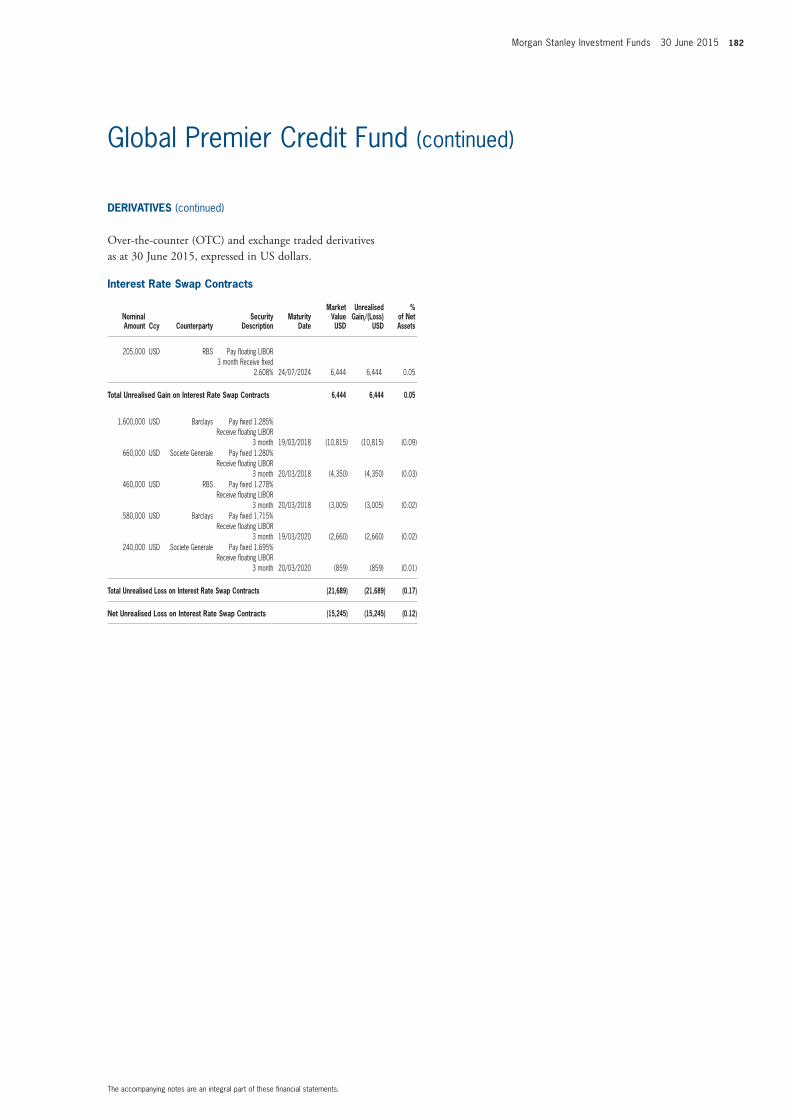
Morgan Stanley Investment Funds 30 June 2015 182
The accompanying notes are an integral part of these financial statements.
Global Premier Credit Fund (continued)
interest Rate Swap Contracts
nominal Amount Ccy Counterparty
Security Description
maturity Date
market value USD
Unrealised Gain/(Loss)
USD
% of net Assets
205,000 USD RBS Pay floating LIBOR 3 month Receive fixed
2.608% 24/07/2024 6,444 6,444 0.05
total Unrealised Gain on interest Rate Swap Contracts 6,444 6,444 0.05
1,600,000 USD Barclays Pay fixed 1.285% Receive floating LIBOR
3 month 19/03/2018 (10,815) (10,815) (0.09)660,000 USD Societe Generale Pay fixed 1.280%
Receive floating LIBOR 3 month 20/03/2018 (4,350) (4,350) (0.03)
460,000 USD RBS Pay fixed 1.278% Receive floating LIBOR
3 month 20/03/2018 (3,005) (3,005) (0.02)580,000 USD Barclays Pay fixed 1.715%
Receive floating LIBOR 3 month 19/03/2020 (2,660) (2,660) (0.02)
240,000 USD Societe Generale Pay fixed 1.695% Receive floating LIBOR
3 month 20/03/2020 (859) (859) (0.01)
total Unrealised Loss on interest Rate Swap Contracts (21,689) (21,689) (0.17)
net Unrealised Loss on interest Rate Swap Contracts (15,245) (15,245) (0.12)
DERivAtivES (continued)
Over-the-counter (OtC) and exchange traded derivatives as at 30 June 2015, expressed in US dollars.
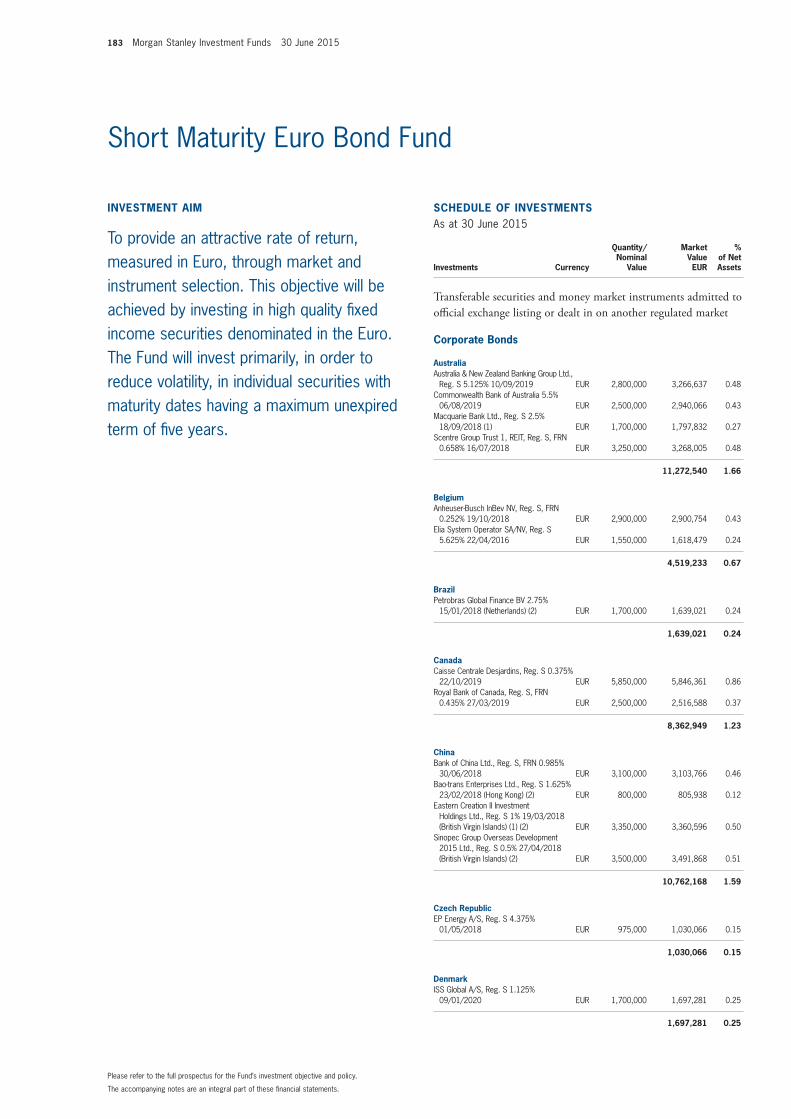
183 Morgan Stanley Investment Funds 30 June 2015
invEStmEnt Aim
To provide an attractive rate of return, measured in Euro, through market and instrument selection. This objective will be achieved by investing in high quality fixed income securities denominated in the Euro. The Fund will invest primarily, in order to reduce volatility, in individual securities with maturity dates having a maximum unexpired term of five years.
SCHEDULE of invEStmEntSAs at 30 June 2015
Investments Currency
Quantity/Nominal
Value
Market Value EUR
% of Net Assets
transferable securities and money market instruments admitted to official exchange listing or dealt in on another regulated market
Corporate Bonds
AustraliaAustralia & New Zealand Banking Group Ltd.,
Reg. S 5.125% 10/09/2019 EUR 2,800,000 3,266,637 0.48Commonwealth Bank of Australia 5.5%
06/08/2019 EUR 2,500,000 2,940,066 0.43Macquarie Bank Ltd., Reg. S 2.5%
18/09/2018 (1) EUR 1,700,000 1,797,832 0.27Scentre Group Trust 1, REIT, Reg. S, FRN
0.658% 16/07/2018 EUR 3,250,000 3,268,005 0.48
11,272,540 1.66
BelgiumAnheuser-Busch InBev NV, Reg. S, FRN
0.252% 19/10/2018 EUR 2,900,000 2,900,754 0.43Elia System Operator SA/NV, Reg. S
5.625% 22/04/2016 EUR 1,550,000 1,618,479 0.24
4,519,233 0.67
BrazilPetrobras Global Finance BV 2.75%
15/01/2018 (Netherlands) (2) EUR 1,700,000 1,639,021 0.24
1,639,021 0.24
CanadaCaisse Centrale Desjardins, Reg. S 0.375%
22/10/2019 EUR 5,850,000 5,846,361 0.86Royal Bank of Canada, Reg. S, FRN
0.435% 27/03/2019 EUR 2,500,000 2,516,588 0.37
8,362,949 1.23
ChinaBank of China Ltd., Reg. S, FRN 0.985%
30/06/2018 EUR 3,100,000 3,103,766 0.46Bao-trans Enterprises Ltd., Reg. S 1.625%
23/02/2018 (Hong Kong) (2) EUR 800,000 805,938 0.12Eastern Creation II Investment
Holdings Ltd., Reg. S 1% 19/03/2018 (British Virgin Islands) (1) (2) EUR 3,350,000 3,360,596 0.50
Sinopec Group Overseas Development 2015 Ltd., Reg. S 0.5% 27/04/2018 (British Virgin Islands) (2) EUR 3,500,000 3,491,868 0.51
10,762,168 1.59
Czech RepublicEP Energy A/S, Reg. S 4.375%
01/05/2018 EUR 975,000 1,030,066 0.15
1,030,066 0.15
DenmarkISS Global A/S, Reg. S 1.125%
09/01/2020 EUR 1,700,000 1,697,281 0.25
1,697,281 0.25
The accompanying notes are an integral part of these financial statements.
Please refer to the full prospectus for the Fund’s investment objective and policy.
Short Maturity Euro Bond Fund
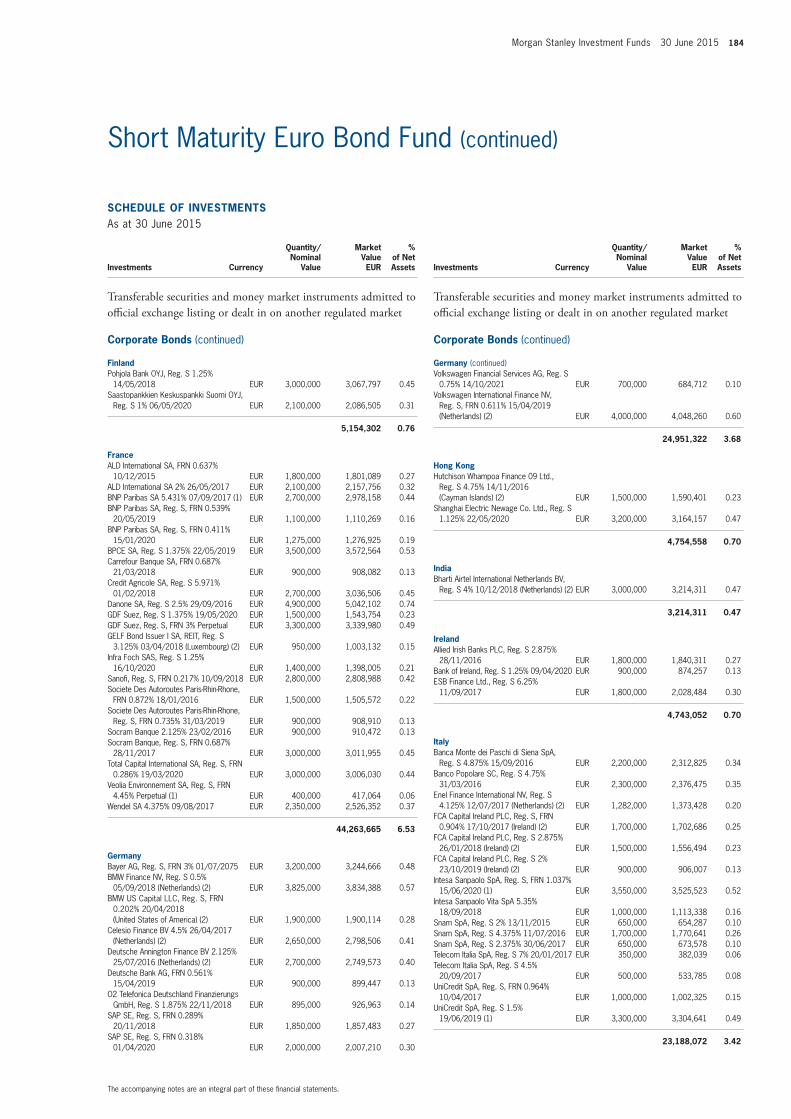
Morgan Stanley Investment Funds 30 June 2015 184
SCHEDULE of invEStmEntSAs at 30 June 2015
Investments Currency
Quantity/Nominal
Value
Market Value EUR
% of Net Assets
transferable securities and money market instruments admitted to official exchange listing or dealt in on another regulated market
Corporate Bonds (continued)
finlandPohjola Bank OYJ, Reg. S 1.25%
14/05/2018 EUR 3,000,000 3,067,797 0.45Saastopankkien Keskuspankki Suomi OYJ,
Reg. S 1% 06/05/2020 EUR 2,100,000 2,086,505 0.31
5,154,302 0.76
franceALD International SA, FRN 0.637%
10/12/2015 EUR 1,800,000 1,801,089 0.27ALD International SA 2% 26/05/2017 EUR 2,100,000 2,157,756 0.32BNP Paribas SA 5.431% 07/09/2017 (1) EUR 2,700,000 2,978,158 0.44BNP Paribas SA, Reg. S, FRN 0.539%
20/05/2019 EUR 1,100,000 1,110,269 0.16BNP Paribas SA, Reg. S, FRN 0.411%
15/01/2020 EUR 1,275,000 1,276,925 0.19BPCE SA, Reg. S 1.375% 22/05/2019 EUR 3,500,000 3,572,564 0.53Carrefour Banque SA, FRN 0.687%
21/03/2018 EUR 900,000 908,082 0.13Credit Agricole SA, Reg. S 5.971%
01/02/2018 EUR 2,700,000 3,036,506 0.45Danone SA, Reg. S 2.5% 29/09/2016 EUR 4,900,000 5,042,102 0.74GDF Suez, Reg. S 1.375% 19/05/2020 EUR 1,500,000 1,543,754 0.23GDF Suez, Reg. S, FRN 3% Perpetual EUR 3,300,000 3,339,980 0.49GELF Bond Issuer I SA, REIT, Reg. S
3.125% 03/04/2018 (Luxembourg) (2) EUR 950,000 1,003,132 0.15Infra Foch SAS, Reg. S 1.25%
16/10/2020 EUR 1,400,000 1,398,005 0.21Sanofi, Reg. S, FRN 0.217% 10/09/2018 EUR 2,800,000 2,808,988 0.42Societe Des Autoroutes Paris-Rhin-Rhone,
FRN 0.872% 18/01/2016 EUR 1,500,000 1,505,572 0.22Societe Des Autoroutes Paris-Rhin-Rhone,
Reg. S, FRN 0.735% 31/03/2019 EUR 900,000 908,910 0.13Socram Banque 2.125% 23/02/2016 EUR 900,000 910,472 0.13Socram Banque, Reg. S, FRN 0.687%
28/11/2017 EUR 3,000,000 3,011,955 0.45Total Capital International SA, Reg. S, FRN
0.286% 19/03/2020 EUR 3,000,000 3,006,030 0.44Veolia Environnement SA, Reg. S, FRN
4.45% Perpetual (1) EUR 400,000 417,064 0.06Wendel SA 4.375% 09/08/2017 EUR 2,350,000 2,526,352 0.37
44,263,665 6.53
GermanyBayer AG, Reg. S, FRN 3% 01/07/2075 EUR 3,200,000 3,244,666 0.48BMW Finance NV, Reg. S 0.5%
05/09/2018 (Netherlands) (2) EUR 3,825,000 3,834,388 0.57BMW US Capital LLC, Reg. S, FRN
0.202% 20/04/2018 (United States of America) (2) EUR 1,900,000 1,900,114 0.28
Celesio Finance BV 4.5% 26/04/2017 (Netherlands) (2) EUR 2,650,000 2,798,506 0.41
Deutsche Annington Finance BV 2.125% 25/07/2016 (Netherlands) (2) EUR 2,700,000 2,749,573 0.40
Deutsche Bank AG, FRN 0.561% 15/04/2019 EUR 900,000 899,447 0.13
O2 Telefonica Deutschland Finanzierungs GmbH, Reg. S 1.875% 22/11/2018 EUR 895,000 926,963 0.14
SAP SE, Reg. S, FRN 0.289% 20/11/2018 EUR 1,850,000 1,857,483 0.27
SAP SE, Reg. S, FRN 0.318% 01/04/2020 EUR 2,000,000 2,007,210 0.30
SCHEDULE of invEStmEntSAs at 30 June 2015
Investments Currency
Quantity/Nominal
Value
Market Value EUR
% of Net Assets
transferable securities and money market instruments admitted to official exchange listing or dealt in on another regulated market
Corporate Bonds (continued)
Germany (continued)Volkswagen Financial Services AG, Reg. S
0.75% 14/10/2021 EUR 700,000 684,712 0.10Volkswagen International Finance NV,
Reg. S, FRN 0.611% 15/04/2019 (Netherlands) (2) EUR 4,000,000 4,048,260 0.60
24,951,322 3.68
Hong KongHutchison Whampoa Finance 09 Ltd.,
Reg. S 4.75% 14/11/2016 (Cayman Islands) (2) EUR 1,500,000 1,590,401 0.23
Shanghai Electric Newage Co. Ltd., Reg. S 1.125% 22/05/2020 EUR 3,200,000 3,164,157 0.47
4,754,558 0.70
indiaBharti Airtel International Netherlands BV,
Reg. S 4% 10/12/2018 (Netherlands) (2) EUR 3,000,000 3,214,311 0.47
3,214,311 0.47
irelandAllied Irish Banks PLC, Reg. S 2.875%
28/11/2016 EUR 1,800,000 1,840,311 0.27Bank of Ireland, Reg. S 1.25% 09/04/2020 EUR 900,000 874,257 0.13ESB Finance Ltd., Reg. S 6.25%
11/09/2017 EUR 1,800,000 2,028,484 0.30
4,743,052 0.70
italyBanca Monte dei Paschi di Siena SpA,
Reg. S 4.875% 15/09/2016 EUR 2,200,000 2,312,825 0.34Banco Popolare SC, Reg. S 4.75%
31/03/2016 EUR 2,300,000 2,376,475 0.35Enel Finance International NV, Reg. S
4.125% 12/07/2017 (Netherlands) (2) EUR 1,282,000 1,373,428 0.20FCA Capital Ireland PLC, Reg. S, FRN
0.904% 17/10/2017 (Ireland) (2) EUR 1,700,000 1,702,686 0.25FCA Capital Ireland PLC, Reg. S 2.875%
26/01/2018 (Ireland) (2) EUR 1,500,000 1,556,494 0.23FCA Capital Ireland PLC, Reg. S 2%
23/10/2019 (Ireland) (2) EUR 900,000 906,007 0.13Intesa Sanpaolo SpA, Reg. S, FRN 1.037%
15/06/2020 (1) EUR 3,550,000 3,525,523 0.52Intesa Sanpaolo Vita SpA 5.35%
18/09/2018 EUR 1,000,000 1,113,338 0.16Snam SpA, Reg. S 2% 13/11/2015 EUR 650,000 654,287 0.10Snam SpA, Reg. S 4.375% 11/07/2016 EUR 1,700,000 1,770,641 0.26Snam SpA, Reg. S 2.375% 30/06/2017 EUR 650,000 673,578 0.10Telecom Italia SpA, Reg. S 7% 20/01/2017 EUR 350,000 382,039 0.06Telecom Italia SpA, Reg. S 4.5%
20/09/2017 EUR 500,000 533,785 0.08UniCredit SpA, Reg. S, FRN 0.964%
10/04/2017 EUR 1,000,000 1,002,325 0.15UniCredit SpA, Reg. S 1.5%
19/06/2019 (1) EUR 3,300,000 3,304,641 0.49
23,188,072 3.42
The accompanying notes are an integral part of these financial statements.
Short Maturity Euro Bond Fund (continued)
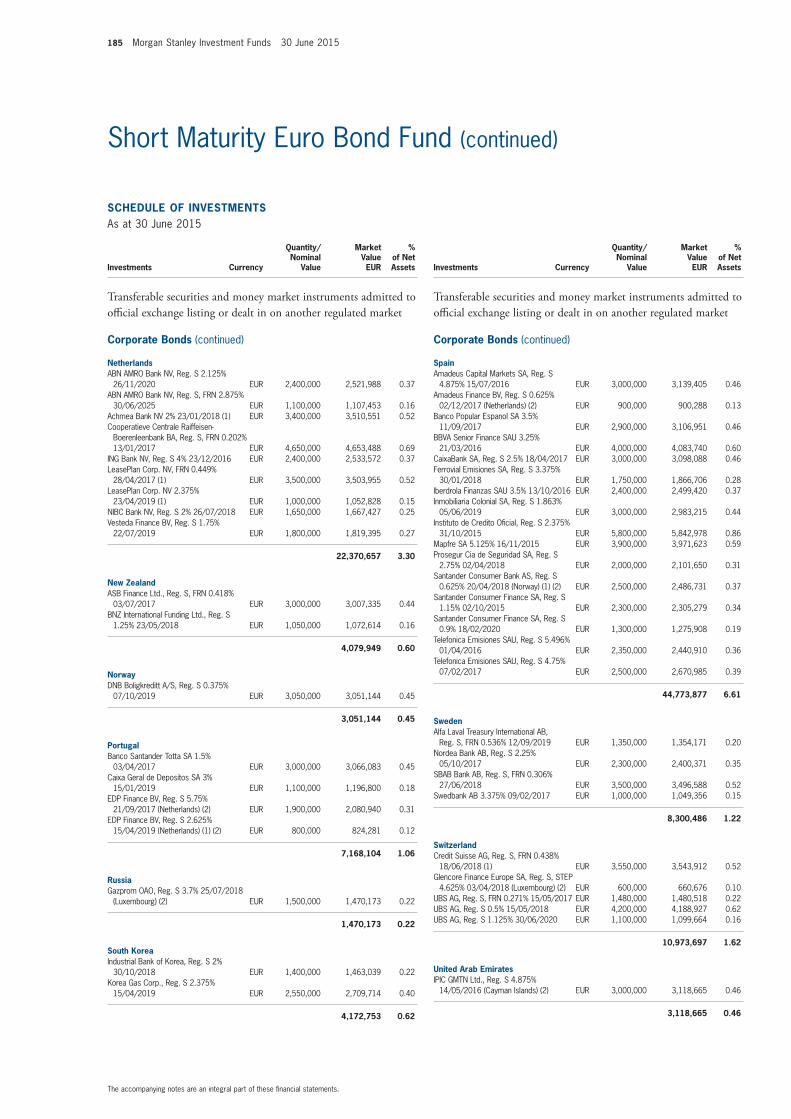
185 Morgan Stanley Investment Funds 30 June 2015
SCHEDULE of invEStmEntSAs at 30 June 2015
Investments Currency
Quantity/Nominal
Value
Market Value EUR
% of Net Assets
transferable securities and money market instruments admitted to official exchange listing or dealt in on another regulated market
Corporate Bonds (continued)
netherlandsABN AMRO Bank NV, Reg. S 2.125%
26/11/2020 EUR 2,400,000 2,521,988 0.37ABN AMRO Bank NV, Reg. S, FRN 2.875%
30/06/2025 EUR 1,100,000 1,107,453 0.16Achmea Bank NV 2% 23/01/2018 (1) EUR 3,400,000 3,510,551 0.52Cooperatieve Centrale Raiffeisen-
Boerenleenbank BA, Reg. S, FRN 0.202% 13/01/2017 EUR 4,650,000 4,653,488 0.69
ING Bank NV, Reg. S 4% 23/12/2016 EUR 2,400,000 2,533,572 0.37LeasePlan Corp. NV, FRN 0.449%
28/04/2017 (1) EUR 3,500,000 3,503,955 0.52LeasePlan Corp. NV 2.375%
23/04/2019 (1) EUR 1,000,000 1,052,828 0.15NIBC Bank NV, Reg. S 2% 26/07/2018 EUR 1,650,000 1,667,427 0.25Vesteda Finance BV, Reg. S 1.75%
22/07/2019 EUR 1,800,000 1,819,395 0.27
22,370,657 3.30
new ZealandASB Finance Ltd., Reg. S, FRN 0.418%
03/07/2017 EUR 3,000,000 3,007,335 0.44BNZ International Funding Ltd., Reg. S
1.25% 23/05/2018 EUR 1,050,000 1,072,614 0.16
4,079,949 0.60
norwayDNB Boligkreditt A/S, Reg. S 0.375%
07/10/2019 EUR 3,050,000 3,051,144 0.45
3,051,144 0.45
PortugalBanco Santander Totta SA 1.5%
03/04/2017 EUR 3,000,000 3,066,083 0.45Caixa Geral de Depositos SA 3%
15/01/2019 EUR 1,100,000 1,196,800 0.18EDP Finance BV, Reg. S 5.75%
21/09/2017 (Netherlands) (2) EUR 1,900,000 2,080,940 0.31EDP Finance BV, Reg. S 2.625%
15/04/2019 (Netherlands) (1) (2) EUR 800,000 824,281 0.12
7,168,104 1.06
RussiaGazprom OAO, Reg. S 3.7% 25/07/2018
(Luxembourg) (2) EUR 1,500,000 1,470,173 0.22
1,470,173 0.22
South KoreaIndustrial Bank of Korea, Reg. S 2%
30/10/2018 EUR 1,400,000 1,463,039 0.22Korea Gas Corp., Reg. S 2.375%
15/04/2019 EUR 2,550,000 2,709,714 0.40
4,172,753 0.62
SCHEDULE of invEStmEntSAs at 30 June 2015
Investments Currency
Quantity/Nominal
Value
Market Value EUR
% of Net Assets
transferable securities and money market instruments admitted to official exchange listing or dealt in on another regulated market
Corporate Bonds (continued)
SpainAmadeus Capital Markets SA, Reg. S
4.875% 15/07/2016 EUR 3,000,000 3,139,405 0.46Amadeus Finance BV, Reg. S 0.625%
02/12/2017 (Netherlands) (2) EUR 900,000 900,288 0.13Banco Popular Espanol SA 3.5%
11/09/2017 EUR 2,900,000 3,106,951 0.46BBVA Senior Finance SAU 3.25%
21/03/2016 EUR 4,000,000 4,083,740 0.60CaixaBank SA, Reg. S 2.5% 18/04/2017 EUR 3,000,000 3,098,088 0.46Ferrovial Emisiones SA, Reg. S 3.375%
30/01/2018 EUR 1,750,000 1,866,706 0.28Iberdrola Finanzas SAU 3.5% 13/10/2016 EUR 2,400,000 2,499,420 0.37Inmobiliaria Colonial SA, Reg. S 1.863%
05/06/2019 EUR 3,000,000 2,983,215 0.44Instituto de Credito Oficial, Reg. S 2.375%
31/10/2015 EUR 5,800,000 5,842,978 0.86Mapfre SA 5.125% 16/11/2015 EUR 3,900,000 3,971,623 0.59Prosegur Cia de Seguridad SA, Reg. S
2.75% 02/04/2018 EUR 2,000,000 2,101,650 0.31Santander Consumer Bank AS, Reg. S
0.625% 20/04/2018 (Norway) (1) (2) EUR 2,500,000 2,486,731 0.37Santander Consumer Finance SA, Reg. S
1.15% 02/10/2015 EUR 2,300,000 2,305,279 0.34Santander Consumer Finance SA, Reg. S
0.9% 18/02/2020 EUR 1,300,000 1,275,908 0.19Telefonica Emisiones SAU, Reg. S 5.496%
01/04/2016 EUR 2,350,000 2,440,910 0.36Telefonica Emisiones SAU, Reg. S 4.75%
07/02/2017 EUR 2,500,000 2,670,985 0.39
44,773,877 6.61
SwedenAlfa Laval Treasury International AB,
Reg. S, FRN 0.536% 12/09/2019 EUR 1,350,000 1,354,171 0.20Nordea Bank AB, Reg. S 2.25%
05/10/2017 EUR 2,300,000 2,400,371 0.35SBAB Bank AB, Reg. S, FRN 0.306%
27/06/2018 EUR 3,500,000 3,496,588 0.52Swedbank AB 3.375% 09/02/2017 EUR 1,000,000 1,049,356 0.15
8,300,486 1.22
SwitzerlandCredit Suisse AG, Reg. S, FRN 0.438%
18/06/2018 (1) EUR 3,550,000 3,543,912 0.52Glencore Finance Europe SA, Reg. S, STEP
4.625% 03/04/2018 (Luxembourg) (2) EUR 600,000 660,676 0.10UBS AG, Reg. S, FRN 0.271% 15/05/2017 EUR 1,480,000 1,480,518 0.22UBS AG, Reg. S 0.5% 15/05/2018 EUR 4,200,000 4,188,927 0.62UBS AG, Reg. S 1.125% 30/06/2020 EUR 1,100,000 1,099,664 0.16
10,973,697 1.62
United Arab EmiratesIPIC GMTN Ltd., Reg. S 4.875%
14/05/2016 (Cayman Islands) (2) EUR 3,000,000 3,118,665 0.46
3,118,665 0.46
The accompanying notes are an integral part of these financial statements.
Short Maturity Euro Bond Fund (continued)
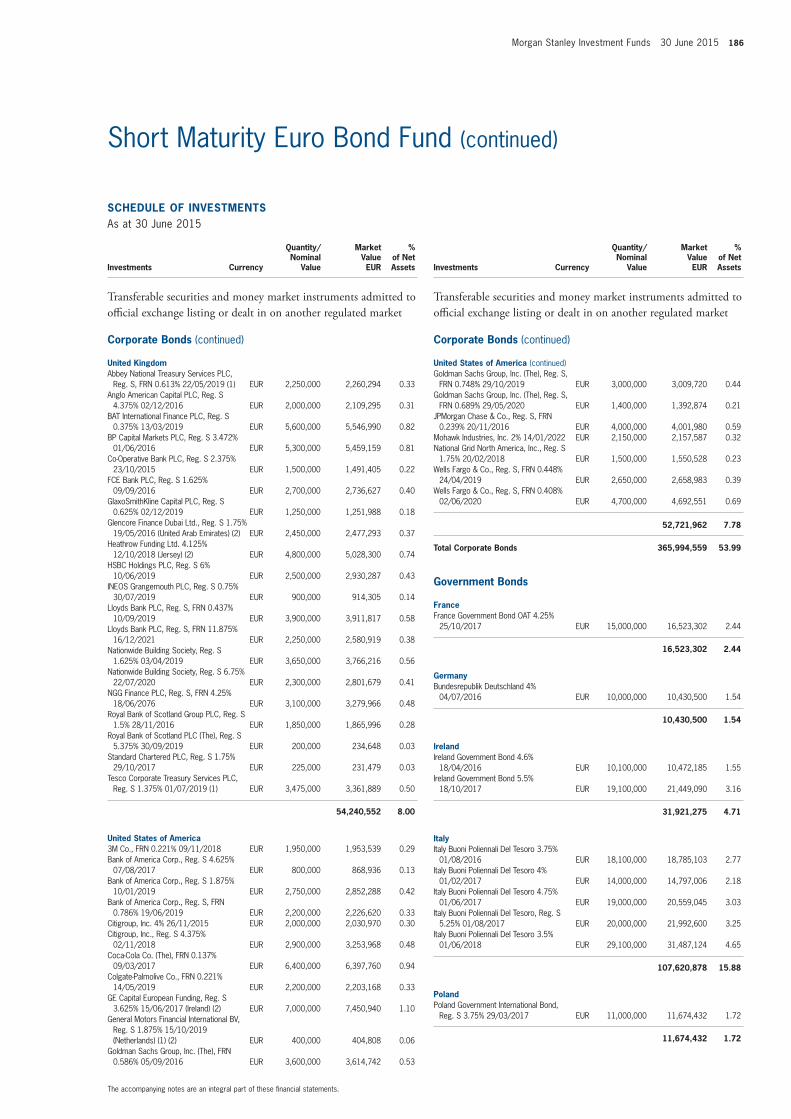
Morgan Stanley Investment Funds 30 June 2015 186
SCHEDULE of invEStmEntSAs at 30 June 2015
Investments Currency
Quantity/Nominal
Value
Market Value EUR
% of Net Assets
transferable securities and money market instruments admitted to official exchange listing or dealt in on another regulated market
Corporate Bonds (continued)
United KingdomAbbey National Treasury Services PLC,
Reg. S, FRN 0.613% 22/05/2019 (1) EUR 2,250,000 2,260,294 0.33Anglo American Capital PLC, Reg. S
4.375% 02/12/2016 EUR 2,000,000 2,109,295 0.31BAT International Finance PLC, Reg. S
0.375% 13/03/2019 EUR 5,600,000 5,546,990 0.82BP Capital Markets PLC, Reg. S 3.472%
01/06/2016 EUR 5,300,000 5,459,159 0.81Co-Operative Bank PLC, Reg. S 2.375%
23/10/2015 EUR 1,500,000 1,491,405 0.22FCE Bank PLC, Reg. S 1.625%
09/09/2016 EUR 2,700,000 2,736,627 0.40GlaxoSmithKline Capital PLC, Reg. S
0.625% 02/12/2019 EUR 1,250,000 1,251,988 0.18Glencore Finance Dubai Ltd., Reg. S 1.75%
19/05/2016 (United Arab Emirates) (2) EUR 2,450,000 2,477,293 0.37Heathrow Funding Ltd. 4.125%
12/10/2018 (Jersey) (2) EUR 4,800,000 5,028,300 0.74HSBC Holdings PLC, Reg. S 6%
10/06/2019 EUR 2,500,000 2,930,287 0.43INEOS Grangemouth PLC, Reg. S 0.75%
30/07/2019 EUR 900,000 914,305 0.14Lloyds Bank PLC, Reg. S, FRN 0.437%
10/09/2019 EUR 3,900,000 3,911,817 0.58Lloyds Bank PLC, Reg. S, FRN 11.875%
16/12/2021 EUR 2,250,000 2,580,919 0.38Nationwide Building Society, Reg. S
1.625% 03/04/2019 EUR 3,650,000 3,766,216 0.56Nationwide Building Society, Reg. S 6.75%
22/07/2020 EUR 2,300,000 2,801,679 0.41NGG Finance PLC, Reg. S, FRN 4.25%
18/06/2076 EUR 3,100,000 3,279,966 0.48Royal Bank of Scotland Group PLC, Reg. S
1.5% 28/11/2016 EUR 1,850,000 1,865,996 0.28Royal Bank of Scotland PLC (The), Reg. S
5.375% 30/09/2019 EUR 200,000 234,648 0.03Standard Chartered PLC, Reg. S 1.75%
29/10/2017 EUR 225,000 231,479 0.03Tesco Corporate Treasury Services PLC,
Reg. S 1.375% 01/07/2019 (1) EUR 3,475,000 3,361,889 0.50
54,240,552 8.00
United States of America3M Co., FRN 0.221% 09/11/2018 EUR 1,950,000 1,953,539 0.29Bank of America Corp., Reg. S 4.625%
07/08/2017 EUR 800,000 868,936 0.13Bank of America Corp., Reg. S 1.875%
10/01/2019 EUR 2,750,000 2,852,288 0.42Bank of America Corp., Reg. S, FRN
0.786% 19/06/2019 EUR 2,200,000 2,226,620 0.33Citigroup, Inc. 4% 26/11/2015 EUR 2,000,000 2,030,970 0.30Citigroup, Inc., Reg. S 4.375%
02/11/2018 EUR 2,900,000 3,253,968 0.48Coca-Cola Co. (The), FRN 0.137%
09/03/2017 EUR 6,400,000 6,397,760 0.94Colgate-Palmolive Co., FRN 0.221%
14/05/2019 EUR 2,200,000 2,203,168 0.33GE Capital European Funding, Reg. S
3.625% 15/06/2017 (Ireland) (2) EUR 7,000,000 7,450,940 1.10General Motors Financial International BV,
Reg. S 1.875% 15/10/2019 (Netherlands) (1) (2) EUR 400,000 404,808 0.06
Goldman Sachs Group, Inc. (The), FRN 0.586% 05/09/2016 EUR 3,600,000 3,614,742 0.53
SCHEDULE of invEStmEntSAs at 30 June 2015
Investments Currency
Quantity/Nominal
Value
Market Value EUR
% of Net Assets
transferable securities and money market instruments admitted to official exchange listing or dealt in on another regulated market
Corporate Bonds (continued)
United States of America (continued)Goldman Sachs Group, Inc. (The), Reg. S,
FRN 0.748% 29/10/2019 EUR 3,000,000 3,009,720 0.44Goldman Sachs Group, Inc. (The), Reg. S,
FRN 0.689% 29/05/2020 EUR 1,400,000 1,392,874 0.21JPMorgan Chase & Co., Reg. S, FRN
0.239% 20/11/2016 EUR 4,000,000 4,001,980 0.59Mohawk Industries, Inc. 2% 14/01/2022 EUR 2,150,000 2,157,587 0.32National Grid North America, Inc., Reg. S
1.75% 20/02/2018 EUR 1,500,000 1,550,528 0.23Wells Fargo & Co., Reg. S, FRN 0.448%
24/04/2019 EUR 2,650,000 2,658,983 0.39Wells Fargo & Co., Reg. S, FRN 0.408%
02/06/2020 EUR 4,700,000 4,692,551 0.69
52,721,962 7.78
total Corporate Bonds 365,994,559 53.99
Government Bonds
franceFrance Government Bond OAT 4.25%
25/10/2017 EUR 15,000,000 16,523,302 2.44
16,523,302 2.44
GermanyBundesrepublik Deutschland 4%
04/07/2016 EUR 10,000,000 10,430,500 1.54
10,430,500 1.54
irelandIreland Government Bond 4.6%
18/04/2016 EUR 10,100,000 10,472,185 1.55Ireland Government Bond 5.5%
18/10/2017 EUR 19,100,000 21,449,090 3.16
31,921,275 4.71
italyItaly Buoni Poliennali Del Tesoro 3.75%
01/08/2016 EUR 18,100,000 18,785,103 2.77Italy Buoni Poliennali Del Tesoro 4%
01/02/2017 EUR 14,000,000 14,797,006 2.18Italy Buoni Poliennali Del Tesoro 4.75%
01/06/2017 EUR 19,000,000 20,559,045 3.03Italy Buoni Poliennali Del Tesoro, Reg. S
5.25% 01/08/2017 EUR 20,000,000 21,992,600 3.25Italy Buoni Poliennali Del Tesoro 3.5%
01/06/2018 EUR 29,100,000 31,487,124 4.65
107,620,878 15.88
PolandPoland Government International Bond,
Reg. S 3.75% 29/03/2017 EUR 11,000,000 11,674,432 1.72
11,674,432 1.72
The accompanying notes are an integral part of these financial statements.
Short Maturity Euro Bond Fund (continued)
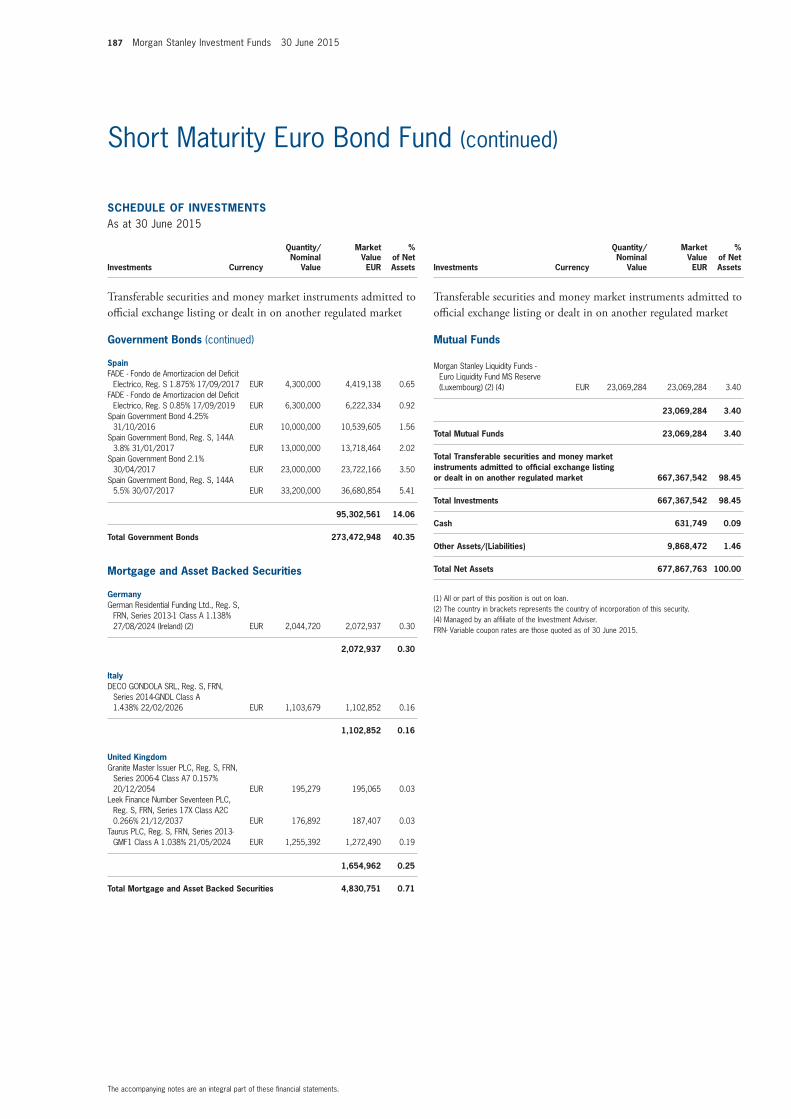
187 Morgan Stanley Investment Funds 30 June 2015
SCHEDULE of invEStmEntSAs at 30 June 2015
Investments Currency
Quantity/Nominal
Value
Market Value EUR
% of Net Assets
transferable securities and money market instruments admitted to official exchange listing or dealt in on another regulated market
Government Bonds (continued)
SpainFADE - Fondo de Amortizacion del Deficit
Electrico, Reg. S 1.875% 17/09/2017 EUR 4,300,000 4,419,138 0.65FADE - Fondo de Amortizacion del Deficit
Electrico, Reg. S 0.85% 17/09/2019 EUR 6,300,000 6,222,334 0.92Spain Government Bond 4.25%
31/10/2016 EUR 10,000,000 10,539,605 1.56Spain Government Bond, Reg. S, 144A
3.8% 31/01/2017 EUR 13,000,000 13,718,464 2.02Spain Government Bond 2.1%
30/04/2017 EUR 23,000,000 23,722,166 3.50Spain Government Bond, Reg. S, 144A
5.5% 30/07/2017 EUR 33,200,000 36,680,854 5.41
95,302,561 14.06
total Government Bonds 273,472,948 40.35
mortgage and Asset Backed Securities
GermanyGerman Residential Funding Ltd., Reg. S,
FRN, Series 2013-1 Class A 1.138% 27/08/2024 (Ireland) (2) EUR 2,044,720 2,072,937 0.30
2,072,937 0.30
italyDECO GONDOLA SRL, Reg. S, FRN,
Series 2014-GNDL Class A 1.438% 22/02/2026 EUR 1,103,679 1,102,852 0.16
1,102,852 0.16
United KingdomGranite Master Issuer PLC, Reg. S, FRN,
Series 2006-4 Class A7 0.157% 20/12/2054 EUR 195,279 195,065 0.03
Leek Finance Number Seventeen PLC, Reg. S, FRN, Series 17X Class A2C 0.266% 21/12/2037 EUR 176,892 187,407 0.03
Taurus PLC, Reg. S, FRN, Series 2013-GMF1 Class A 1.038% 21/05/2024 EUR 1,255,392 1,272,490 0.19
1,654,962 0.25
total mortgage and Asset Backed Securities 4,830,751 0.71
SCHEDULE of invEStmEntSAs at 30 June 2015
Investments Currency
Quantity/Nominal
Value
Market Value EUR
% of Net Assets
transferable securities and money market instruments admitted to official exchange listing or dealt in on another regulated market
mutual funds
Morgan Stanley Liquidity Funds - Euro Liquidity Fund MS Reserve (Luxembourg) (2) (4) EUR 23,069,284 23,069,284 3.40
23,069,284 3.40
total mutual funds 23,069,284 3.40
total transferable securities and money market instruments admitted to official exchange listing or dealt in on another regulated market 667,367,542 98.45
total investments 667,367,542 98.45
Cash 631,749 0.09
other Assets/(Liabilities) 9,868,472 1.46
total net Assets 677,867,763 100.00
(1) All or part of this position is out on loan.(2) The country in brackets represents the country of incorporation of this security.(4) Managed by an affiliate of the Investment Adviser.FRN- Variable coupon rates are those quoted as of 30 June 2015.
The accompanying notes are an integral part of these financial statements.
Short Maturity Euro Bond Fund (continued)
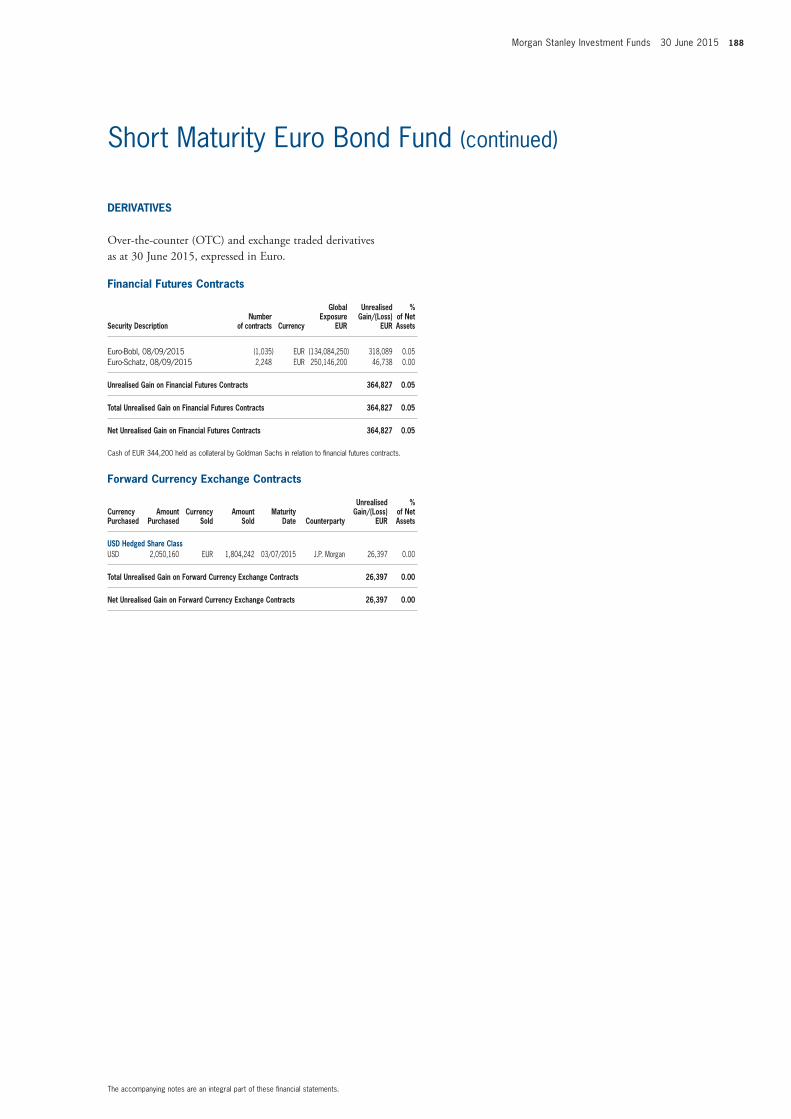
Morgan Stanley Investment Funds 30 June 2015 188
financial futures Contracts
Security Descriptionnumber
of contracts Currency
Global Exposure
EUR
Unrealised Gain/(Loss)
EUR
% of net Assets
Euro-Bobl, 08/09/2015 (1,035) EUR (134,084,250) 318,089 0.05Euro-Schatz, 08/09/2015 2,248 EUR 250,146,200 46,738 0.00
Unrealised Gain on financial futures Contracts 364,827 0.05
total Unrealised Gain on financial futures Contracts 364,827 0.05
net Unrealised Gain on financial futures Contracts 364,827 0.05
Cash of EUR 344,200 held as collateral by Goldman Sachs in relation to financial futures contracts.
forward Currency Exchange Contracts
Currency Purchased
Amount Purchased
Currency Sold
Amount Sold
maturity Date Counterparty
Unrealised Gain/(Loss)
EUR
% of net Assets
USD Hedged Share ClassUSD 2,050,160 EUR 1,804,242 03/07/2015 J.P. Morgan 26,397 0.00
total Unrealised Gain on forward Currency Exchange Contracts 26,397 0.00
net Unrealised Gain on forward Currency Exchange Contracts 26,397 0.00
DERivAtivES
Over-the-counter (OtC) and exchange traded derivatives as at 30 June 2015, expressed in euro.
The accompanying notes are an integral part of these financial statements.
Short Maturity Euro Bond Fund (continued)
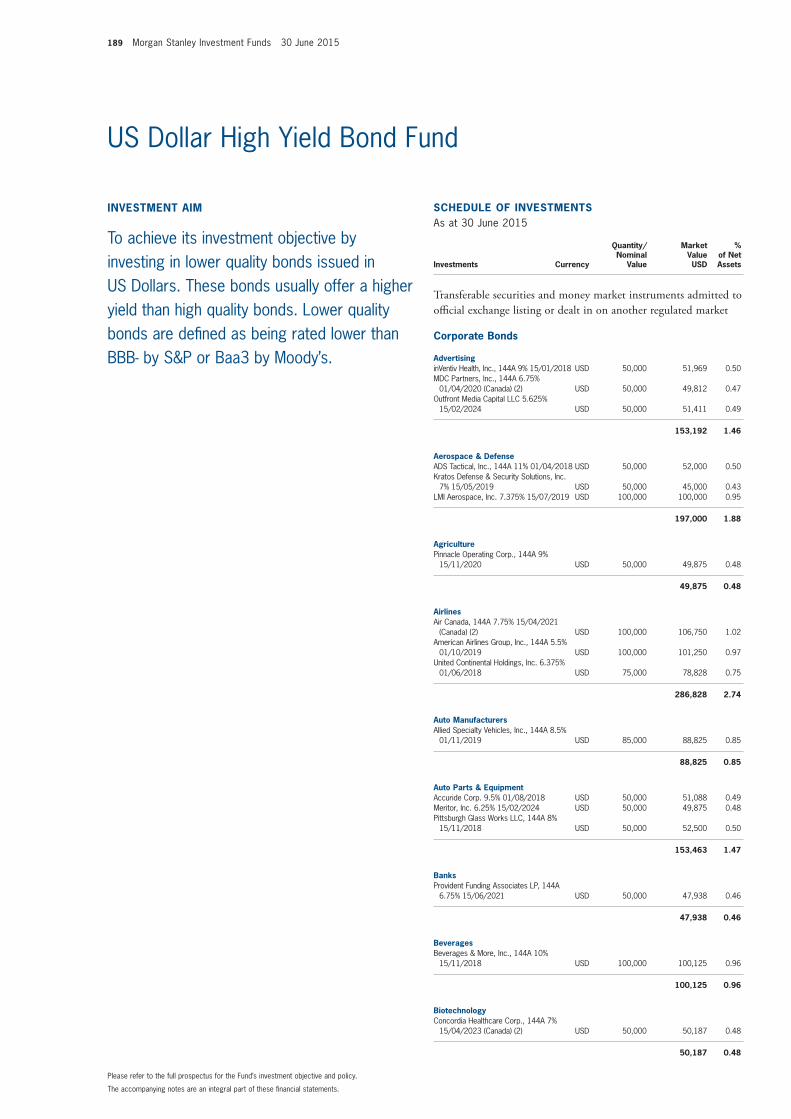
189 Morgan Stanley Investment Funds 30 June 2015
invEStmEnt Aim
To achieve its investment objective by investing in lower quality bonds issued in US Dollars. These bonds usually offer a higher yield than high quality bonds. Lower quality bonds are defined as being rated lower than BBB- by S&P or Baa3 by Moody’s.
SCHEDULE of invEStmEntSAs at 30 June 2015
Investments Currency
Quantity/Nominal
Value
Market Value USD
% of Net Assets
transferable securities and money market instruments admitted to official exchange listing or dealt in on another regulated market
Corporate Bonds
AdvertisinginVentiv Health, Inc., 144A 9% 15/01/2018 USD 50,000 51,969 0.50MDC Partners, Inc., 144A 6.75%
01/04/2020 (Canada) (2) USD 50,000 49,812 0.47Outfront Media Capital LLC 5.625%
15/02/2024 USD 50,000 51,411 0.49
153,192 1.46
Aerospace & DefenseADS Tactical, Inc., 144A 11% 01/04/2018 USD 50,000 52,000 0.50Kratos Defense & Security Solutions, Inc.
7% 15/05/2019 USD 50,000 45,000 0.43LMI Aerospace, Inc. 7.375% 15/07/2019 USD 100,000 100,000 0.95
197,000 1.88
AgriculturePinnacle Operating Corp., 144A 9%
15/11/2020 USD 50,000 49,875 0.48
49,875 0.48
AirlinesAir Canada, 144A 7.75% 15/04/2021
(Canada) (2) USD 100,000 106,750 1.02American Airlines Group, Inc., 144A 5.5%
01/10/2019 USD 100,000 101,250 0.97United Continental Holdings, Inc. 6.375%
01/06/2018 USD 75,000 78,828 0.75
286,828 2.74
Auto manufacturersAllied Specialty Vehicles, Inc., 144A 8.5%
01/11/2019 USD 85,000 88,825 0.85
88,825 0.85
Auto Parts & EquipmentAccuride Corp. 9.5% 01/08/2018 USD 50,000 51,088 0.49Meritor, Inc. 6.25% 15/02/2024 USD 50,000 49,875 0.48Pittsburgh Glass Works LLC, 144A 8%
15/11/2018 USD 50,000 52,500 0.50
153,463 1.47
BanksProvident Funding Associates LP, 144A
6.75% 15/06/2021 USD 50,000 47,938 0.46
47,938 0.46
BeveragesBeverages & More, Inc., 144A 10%
15/11/2018 USD 100,000 100,125 0.96
100,125 0.96
BiotechnologyConcordia Healthcare Corp., 144A 7%
15/04/2023 (Canada) (2) USD 50,000 50,187 0.48
50,187 0.48
The accompanying notes are an integral part of these financial statements.
Please refer to the full prospectus for the Fund’s investment objective and policy.
US Dollar High Yield Bond Fund
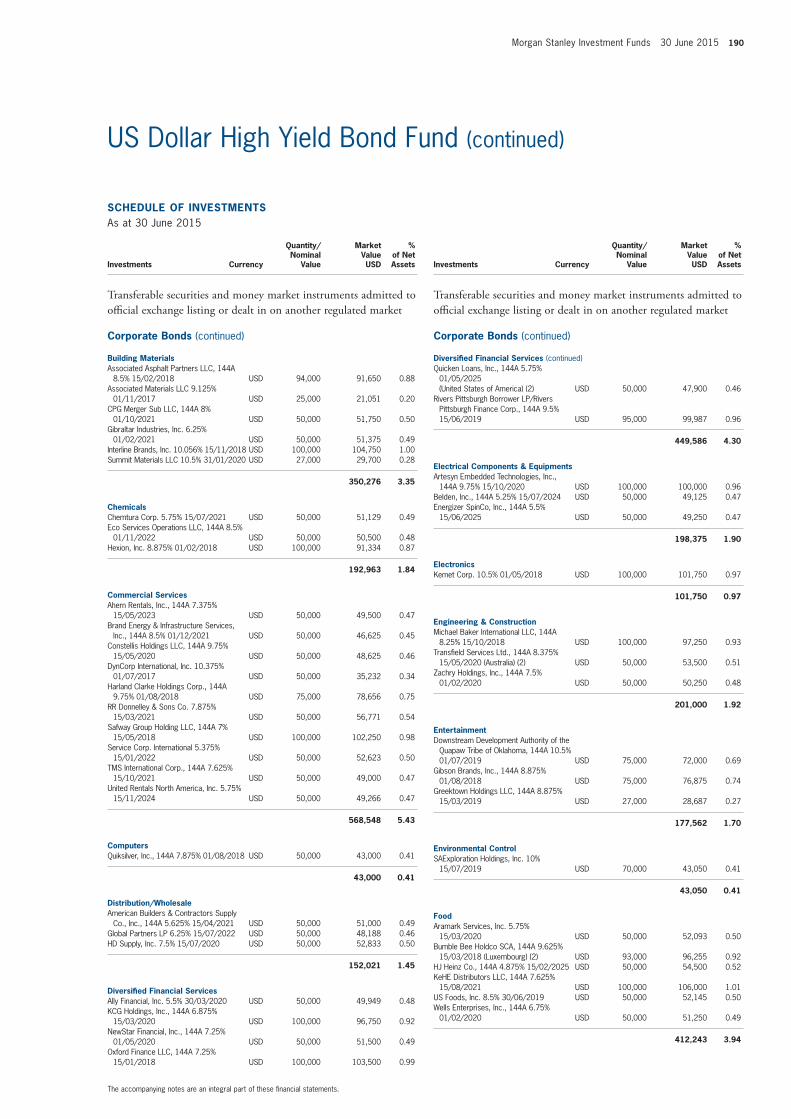
Morgan Stanley Investment Funds 30 June 2015 190
SCHEDULE of invEStmEntSAs at 30 June 2015
Investments Currency
Quantity/Nominal
Value
Market Value USD
% of Net Assets
transferable securities and money market instruments admitted to official exchange listing or dealt in on another regulated market
Corporate Bonds (continued)
Building materialsAssociated Asphalt Partners LLC, 144A
8.5% 15/02/2018 USD 94,000 91,650 0.88Associated Materials LLC 9.125%
01/11/2017 USD 25,000 21,051 0.20CPG Merger Sub LLC, 144A 8%
01/10/2021 USD 50,000 51,750 0.50Gibraltar Industries, Inc. 6.25%
01/02/2021 USD 50,000 51,375 0.49Interline Brands, Inc. 10.056% 15/11/2018 USD 100,000 104,750 1.00Summit Materials LLC 10.5% 31/01/2020 USD 27,000 29,700 0.28
350,276 3.35
ChemicalsChemtura Corp. 5.75% 15/07/2021 USD 50,000 51,129 0.49Eco Services Operations LLC, 144A 8.5%
01/11/2022 USD 50,000 50,500 0.48Hexion, Inc. 8.875% 01/02/2018 USD 100,000 91,334 0.87
192,963 1.84
Commercial ServicesAhern Rentals, Inc., 144A 7.375%
15/05/2023 USD 50,000 49,500 0.47Brand Energy & Infrastructure Services,
Inc., 144A 8.5% 01/12/2021 USD 50,000 46,625 0.45Constellis Holdings LLC, 144A 9.75%
15/05/2020 USD 50,000 48,625 0.46DynCorp International, Inc. 10.375%
01/07/2017 USD 50,000 35,232 0.34Harland Clarke Holdings Corp., 144A
9.75% 01/08/2018 USD 75,000 78,656 0.75RR Donnelley & Sons Co. 7.875%
15/03/2021 USD 50,000 56,771 0.54Safway Group Holding LLC, 144A 7%
15/05/2018 USD 100,000 102,250 0.98Service Corp. International 5.375%
15/01/2022 USD 50,000 52,623 0.50TMS International Corp., 144A 7.625%
15/10/2021 USD 50,000 49,000 0.47United Rentals North America, Inc. 5.75%
15/11/2024 USD 50,000 49,266 0.47
568,548 5.43
ComputersQuiksilver, Inc., 144A 7.875% 01/08/2018 USD 50,000 43,000 0.41
43,000 0.41
Distribution/WholesaleAmerican Builders & Contractors Supply
Co., Inc., 144A 5.625% 15/04/2021 USD 50,000 51,000 0.49Global Partners LP 6.25% 15/07/2022 USD 50,000 48,188 0.46HD Supply, Inc. 7.5% 15/07/2020 USD 50,000 52,833 0.50
152,021 1.45
Diversified financial ServicesAlly Financial, Inc. 5.5% 30/03/2020 USD 50,000 49,949 0.48KCG Holdings, Inc., 144A 6.875%
15/03/2020 USD 100,000 96,750 0.92NewStar Financial, Inc., 144A 7.25%
01/05/2020 USD 50,000 51,500 0.49Oxford Finance LLC, 144A 7.25%
15/01/2018 USD 100,000 103,500 0.99
SCHEDULE of invEStmEntSAs at 30 June 2015
Investments Currency
Quantity/Nominal
Value
Market Value USD
% of Net Assets
transferable securities and money market instruments admitted to official exchange listing or dealt in on another regulated market
Corporate Bonds (continued)
Diversified financial Services (continued)Quicken Loans, Inc., 144A 5.75%
01/05/2025 (United States of America) (2) USD 50,000 47,900 0.46
Rivers Pittsburgh Borrower LP/Rivers Pittsburgh Finance Corp., 144A 9.5% 15/06/2019 USD 95,000 99,987 0.96
449,586 4.30
Electrical Components & EquipmentsArtesyn Embedded Technologies, Inc.,
144A 9.75% 15/10/2020 USD 100,000 100,000 0.96Belden, Inc., 144A 5.25% 15/07/2024 USD 50,000 49,125 0.47Energizer SpinCo, Inc., 144A 5.5%
15/06/2025 USD 50,000 49,250 0.47
198,375 1.90
ElectronicsKemet Corp. 10.5% 01/05/2018 USD 100,000 101,750 0.97
101,750 0.97
Engineering & ConstructionMichael Baker International LLC, 144A
8.25% 15/10/2018 USD 100,000 97,250 0.93Transfield Services Ltd., 144A 8.375%
15/05/2020 (Australia) (2) USD 50,000 53,500 0.51Zachry Holdings, Inc., 144A 7.5%
01/02/2020 USD 50,000 50,250 0.48
201,000 1.92
EntertainmentDownstream Development Authority of the
Quapaw Tribe of Oklahoma, 144A 10.5% 01/07/2019 USD 75,000 72,000 0.69
Gibson Brands, Inc., 144A 8.875% 01/08/2018 USD 75,000 76,875 0.74
Greektown Holdings LLC, 144A 8.875% 15/03/2019 USD 27,000 28,687 0.27
177,562 1.70
Environmental ControlSAExploration Holdings, Inc. 10%
15/07/2019 USD 70,000 43,050 0.41
43,050 0.41
foodAramark Services, Inc. 5.75%
15/03/2020 USD 50,000 52,093 0.50Bumble Bee Holdco SCA, 144A 9.625%
15/03/2018 (Luxembourg) (2) USD 93,000 96,255 0.92HJ Heinz Co., 144A 4.875% 15/02/2025 USD 50,000 54,500 0.52KeHE Distributors LLC, 144A 7.625%
15/08/2021 USD 100,000 106,000 1.01US Foods, Inc. 8.5% 30/06/2019 USD 50,000 52,145 0.50Wells Enterprises, Inc., 144A 6.75%
01/02/2020 USD 50,000 51,250 0.49
412,243 3.94
The accompanying notes are an integral part of these financial statements.
US Dollar High Yield Bond Fund (continued)
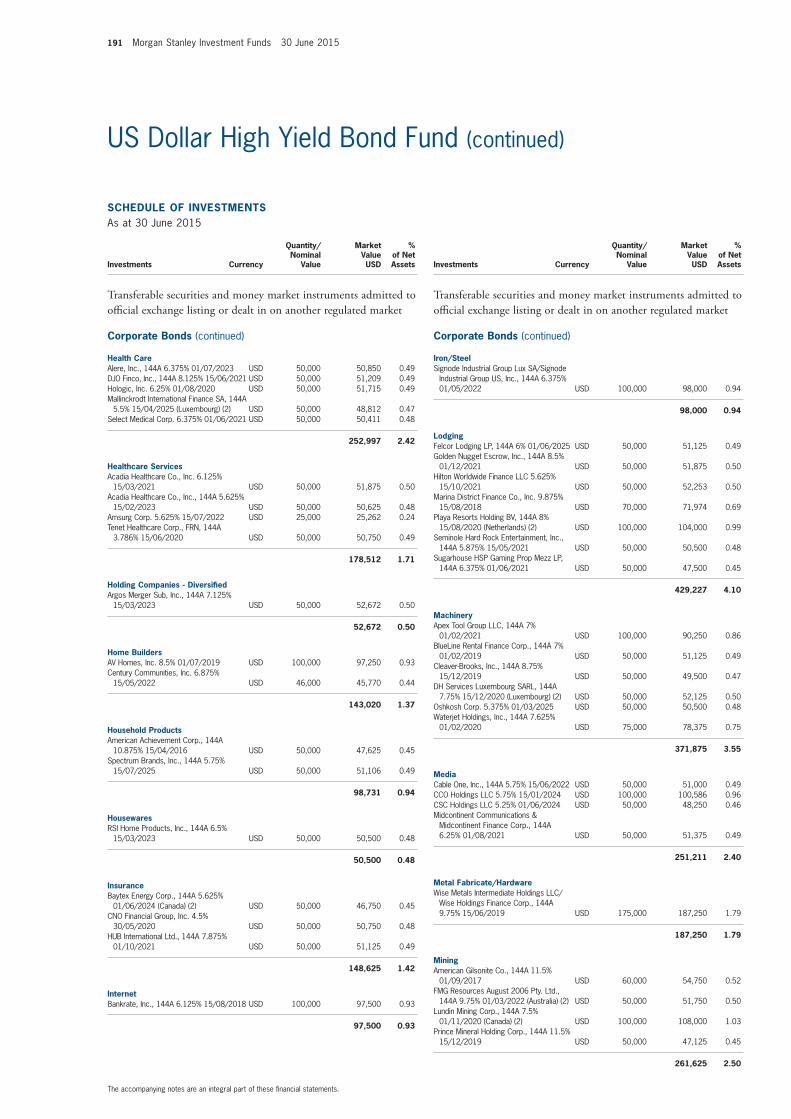
191 Morgan Stanley Investment Funds 30 June 2015
SCHEDULE of invEStmEntSAs at 30 June 2015
Investments Currency
Quantity/Nominal
Value
Market Value USD
% of Net Assets
transferable securities and money market instruments admitted to official exchange listing or dealt in on another regulated market
Corporate Bonds (continued)
Health CareAlere, Inc., 144A 6.375% 01/07/2023 USD 50,000 50,850 0.49DJO Finco, Inc., 144A 8.125% 15/06/2021 USD 50,000 51,209 0.49Hologic, Inc. 6.25% 01/08/2020 USD 50,000 51,715 0.49Mallinckrodt International Finance SA, 144A
5.5% 15/04/2025 (Luxembourg) (2) USD 50,000 48,812 0.47Select Medical Corp. 6.375% 01/06/2021 USD 50,000 50,411 0.48
252,997 2.42
Healthcare ServicesAcadia Healthcare Co., Inc. 6.125%
15/03/2021 USD 50,000 51,875 0.50Acadia Healthcare Co., Inc., 144A 5.625%
15/02/2023 USD 50,000 50,625 0.48Amsurg Corp. 5.625% 15/07/2022 USD 25,000 25,262 0.24Tenet Healthcare Corp., FRN, 144A
3.786% 15/06/2020 USD 50,000 50,750 0.49
178,512 1.71
Holding Companies - DiversifiedArgos Merger Sub, Inc., 144A 7.125%
15/03/2023 USD 50,000 52,672 0.50
52,672 0.50
Home BuildersAV Homes, Inc. 8.5% 01/07/2019 USD 100,000 97,250 0.93Century Communities, Inc. 6.875%
15/05/2022 USD 46,000 45,770 0.44
143,020 1.37
Household ProductsAmerican Achievement Corp., 144A
10.875% 15/04/2016 USD 50,000 47,625 0.45Spectrum Brands, Inc., 144A 5.75%
15/07/2025 USD 50,000 51,106 0.49
98,731 0.94
HousewaresRSI Home Products, Inc., 144A 6.5%
15/03/2023 USD 50,000 50,500 0.48
50,500 0.48
insuranceBaytex Energy Corp., 144A 5.625%
01/06/2024 (Canada) (2) USD 50,000 46,750 0.45CNO Financial Group, Inc. 4.5%
30/05/2020 USD 50,000 50,750 0.48HUB International Ltd., 144A 7.875%
01/10/2021 USD 50,000 51,125 0.49
148,625 1.42
internetBankrate, Inc., 144A 6.125% 15/08/2018 USD 100,000 97,500 0.93
97,500 0.93
SCHEDULE of invEStmEntSAs at 30 June 2015
Investments Currency
Quantity/Nominal
Value
Market Value USD
% of Net Assets
transferable securities and money market instruments admitted to official exchange listing or dealt in on another regulated market
Corporate Bonds (continued)
iron/SteelSignode Industrial Group Lux SA/Signode
Industrial Group US, Inc., 144A 6.375% 01/05/2022 USD 100,000 98,000 0.94
98,000 0.94
LodgingFelcor Lodging LP, 144A 6% 01/06/2025 USD 50,000 51,125 0.49Golden Nugget Escrow, Inc., 144A 8.5%
01/12/2021 USD 50,000 51,875 0.50Hilton Worldwide Finance LLC 5.625%
15/10/2021 USD 50,000 52,253 0.50Marina District Finance Co., Inc. 9.875%
15/08/2018 USD 70,000 71,974 0.69Playa Resorts Holding BV, 144A 8%
15/08/2020 (Netherlands) (2) USD 100,000 104,000 0.99Seminole Hard Rock Entertainment, Inc.,
144A 5.875% 15/05/2021 USD 50,000 50,500 0.48Sugarhouse HSP Gaming Prop Mezz LP,
144A 6.375% 01/06/2021 USD 50,000 47,500 0.45
429,227 4.10
machineryApex Tool Group LLC, 144A 7%
01/02/2021 USD 100,000 90,250 0.86BlueLine Rental Finance Corp., 144A 7%
01/02/2019 USD 50,000 51,125 0.49Cleaver-Brooks, Inc., 144A 8.75%
15/12/2019 USD 50,000 49,500 0.47DH Services Luxembourg SARL, 144A
7.75% 15/12/2020 (Luxembourg) (2) USD 50,000 52,125 0.50Oshkosh Corp. 5.375% 01/03/2025 USD 50,000 50,500 0.48Waterjet Holdings, Inc., 144A 7.625%
01/02/2020 USD 75,000 78,375 0.75
371,875 3.55
mediaCable One, Inc., 144A 5.75% 15/06/2022 USD 50,000 51,000 0.49CCO Holdings LLC 5.75% 15/01/2024 USD 100,000 100,586 0.96CSC Holdings LLC 5.25% 01/06/2024 USD 50,000 48,250 0.46Midcontinent Communications &
Midcontinent Finance Corp., 144A 6.25% 01/08/2021 USD 50,000 51,375 0.49
251,211 2.40
metal fabricate/HardwareWise Metals Intermediate Holdings LLC/
Wise Holdings Finance Corp., 144A 9.75% 15/06/2019 USD 175,000 187,250 1.79
187,250 1.79
miningAmerican Gilsonite Co., 144A 11.5%
01/09/2017 USD 60,000 54,750 0.52FMG Resources August 2006 Pty. Ltd.,
144A 9.75% 01/03/2022 (Australia) (2) USD 50,000 51,750 0.50Lundin Mining Corp., 144A 7.5%
01/11/2020 (Canada) (2) USD 100,000 108,000 1.03Prince Mineral Holding Corp., 144A 11.5%
15/12/2019 USD 50,000 47,125 0.45
261,625 2.50
The accompanying notes are an integral part of these financial statements.
US Dollar High Yield Bond Fund (continued)
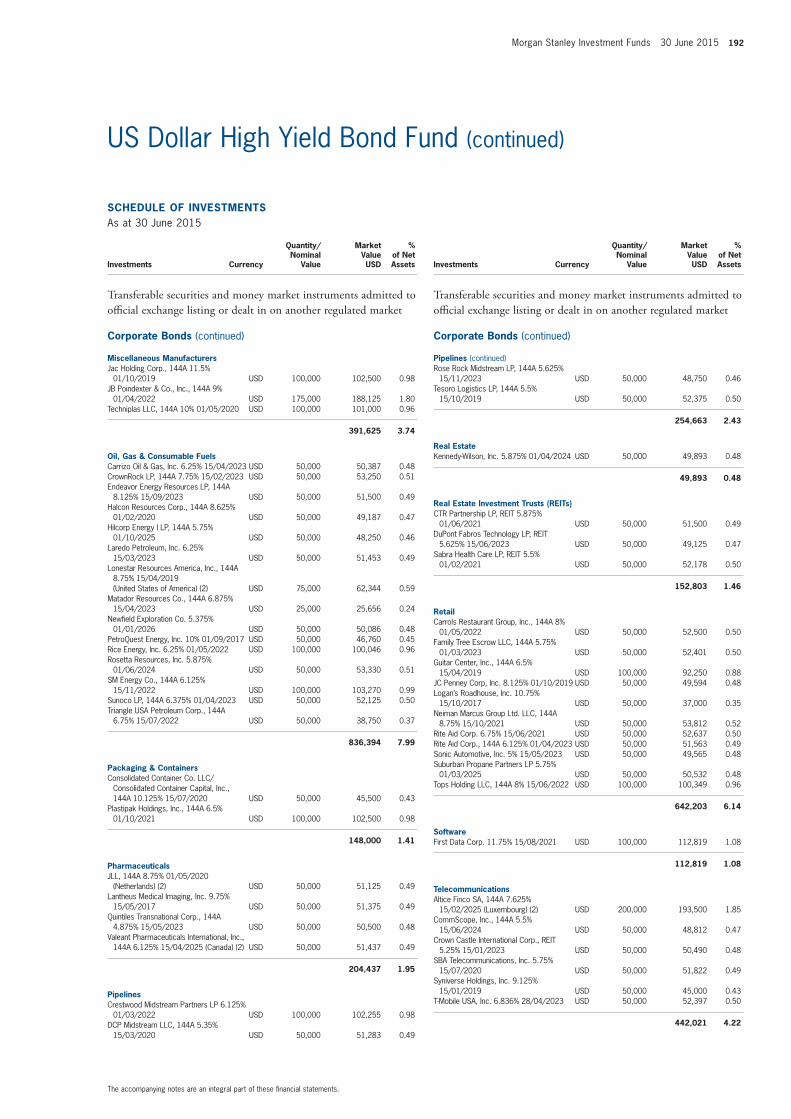
Morgan Stanley Investment Funds 30 June 2015 192
SCHEDULE of invEStmEntSAs at 30 June 2015
Investments Currency
Quantity/Nominal
Value
Market Value USD
% of Net Assets
transferable securities and money market instruments admitted to official exchange listing or dealt in on another regulated market
Corporate Bonds (continued)
miscellaneous manufacturersJac Holding Corp., 144A 11.5%
01/10/2019 USD 100,000 102,500 0.98JB Poindexter & Co., Inc., 144A 9%
01/04/2022 USD 175,000 188,125 1.80Techniplas LLC, 144A 10% 01/05/2020 USD 100,000 101,000 0.96
391,625 3.74
oil, Gas & Consumable fuelsCarrizo Oil & Gas, Inc. 6.25% 15/04/2023 USD 50,000 50,387 0.48CrownRock LP, 144A 7.75% 15/02/2023 USD 50,000 53,250 0.51Endeavor Energy Resources LP, 144A
8.125% 15/09/2023 USD 50,000 51,500 0.49Halcon Resources Corp., 144A 8.625%
01/02/2020 USD 50,000 49,187 0.47Hilcorp Energy I LP, 144A 5.75%
01/10/2025 USD 50,000 48,250 0.46Laredo Petroleum, Inc. 6.25%
15/03/2023 USD 50,000 51,453 0.49Lonestar Resources America, Inc., 144A
8.75% 15/04/2019 (United States of America) (2) USD 75,000 62,344 0.59
Matador Resources Co., 144A 6.875% 15/04/2023 USD 25,000 25,656 0.24
Newfield Exploration Co. 5.375% 01/01/2026 USD 50,000 50,086 0.48
PetroQuest Energy, Inc. 10% 01/09/2017 USD 50,000 46,760 0.45Rice Energy, Inc. 6.25% 01/05/2022 USD 100,000 100,046 0.96Rosetta Resources, Inc. 5.875%
01/06/2024 USD 50,000 53,330 0.51SM Energy Co., 144A 6.125%
15/11/2022 USD 100,000 103,270 0.99Sunoco LP, 144A 6.375% 01/04/2023 USD 50,000 52,125 0.50Triangle USA Petroleum Corp., 144A
6.75% 15/07/2022 USD 50,000 38,750 0.37
836,394 7.99
Packaging & ContainersConsolidated Container Co. LLC/
Consolidated Container Capital, Inc., 144A 10.125% 15/07/2020 USD 50,000 45,500 0.43
Plastipak Holdings, Inc., 144A 6.5% 01/10/2021 USD 100,000 102,500 0.98
148,000 1.41
PharmaceuticalsJLL, 144A 8.75% 01/05/2020
(Netherlands) (2) USD 50,000 51,125 0.49Lantheus Medical Imaging, Inc. 9.75%
15/05/2017 USD 50,000 51,375 0.49Quintiles Transnational Corp., 144A
4.875% 15/05/2023 USD 50,000 50,500 0.48Valeant Pharmaceuticals International, Inc.,
144A 6.125% 15/04/2025 (Canada) (2) USD 50,000 51,437 0.49
204,437 1.95
PipelinesCrestwood Midstream Partners LP 6.125%
01/03/2022 USD 100,000 102,255 0.98DCP Midstream LLC, 144A 5.35%
15/03/2020 USD 50,000 51,283 0.49
SCHEDULE of invEStmEntSAs at 30 June 2015
Investments Currency
Quantity/Nominal
Value
Market Value USD
% of Net Assets
transferable securities and money market instruments admitted to official exchange listing or dealt in on another regulated market
Corporate Bonds (continued)
Pipelines (continued)Rose Rock Midstream LP, 144A 5.625%
15/11/2023 USD 50,000 48,750 0.46Tesoro Logistics LP, 144A 5.5%
15/10/2019 USD 50,000 52,375 0.50
254,663 2.43
Real EstateKennedy-Wilson, Inc. 5.875% 01/04/2024 USD 50,000 49,893 0.48
49,893 0.48
Real Estate investment trusts (REits)CTR Partnership LP, REIT 5.875%
01/06/2021 USD 50,000 51,500 0.49DuPont Fabros Technology LP, REIT
5.625% 15/06/2023 USD 50,000 49,125 0.47Sabra Health Care LP, REIT 5.5%
01/02/2021 USD 50,000 52,178 0.50
152,803 1.46
RetailCarrols Restaurant Group, Inc., 144A 8%
01/05/2022 USD 50,000 52,500 0.50Family Tree Escrow LLC, 144A 5.75%
01/03/2023 USD 50,000 52,401 0.50Guitar Center, Inc., 144A 6.5%
15/04/2019 USD 100,000 92,250 0.88JC Penney Corp, Inc. 8.125% 01/10/2019 USD 50,000 49,594 0.48Logan’s Roadhouse, Inc. 10.75%
15/10/2017 USD 50,000 37,000 0.35Neiman Marcus Group Ltd. LLC, 144A
8.75% 15/10/2021 USD 50,000 53,812 0.52Rite Aid Corp. 6.75% 15/06/2021 USD 50,000 52,637 0.50Rite Aid Corp., 144A 6.125% 01/04/2023 USD 50,000 51,563 0.49Sonic Automotive, Inc. 5% 15/05/2023 USD 50,000 49,565 0.48Suburban Propane Partners LP 5.75%
01/03/2025 USD 50,000 50,532 0.48Tops Holding LLC, 144A 8% 15/06/2022 USD 100,000 100,349 0.96
642,203 6.14
SoftwareFirst Data Corp. 11.75% 15/08/2021 USD 100,000 112,819 1.08
112,819 1.08
telecommunicationsAltice Finco SA, 144A 7.625%
15/02/2025 (Luxembourg) (2) USD 200,000 193,500 1.85CommScope, Inc., 144A 5.5%
15/06/2024 USD 50,000 48,812 0.47Crown Castle International Corp., REIT
5.25% 15/01/2023 USD 50,000 50,490 0.48SBA Telecommunications, Inc. 5.75%
15/07/2020 USD 50,000 51,822 0.49Syniverse Holdings, Inc. 9.125%
15/01/2019 USD 50,000 45,000 0.43T-Mobile USA, Inc. 6.836% 28/04/2023 USD 50,000 52,397 0.50
442,021 4.22
The accompanying notes are an integral part of these financial statements.
US Dollar High Yield Bond Fund (continued)
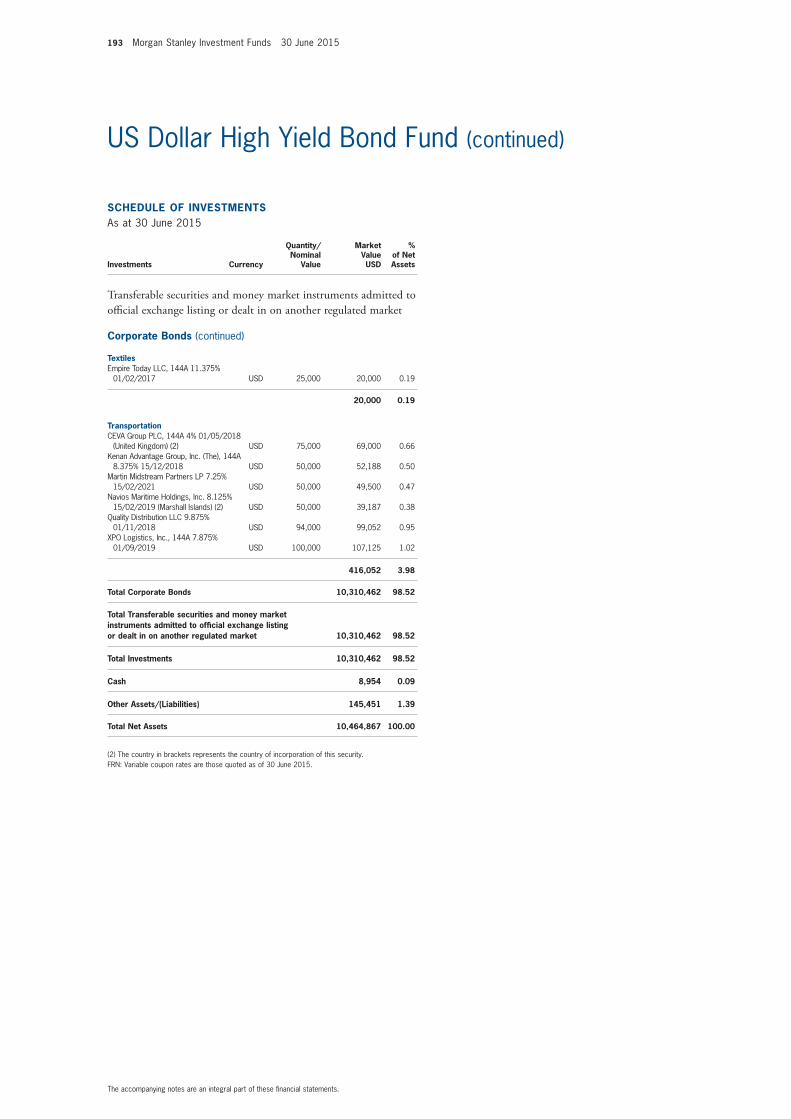
193 Morgan Stanley Investment Funds 30 June 2015
SCHEDULE of invEStmEntSAs at 30 June 2015
Investments Currency
Quantity/Nominal
Value
Market Value USD
% of Net Assets
transferable securities and money market instruments admitted to official exchange listing or dealt in on another regulated market
Corporate Bonds (continued)
textilesEmpire Today LLC, 144A 11.375%
01/02/2017 USD 25,000 20,000 0.19
20,000 0.19
transportationCEVA Group PLC, 144A 4% 01/05/2018
(United Kingdom) (2) USD 75,000 69,000 0.66Kenan Advantage Group, Inc. (The), 144A
8.375% 15/12/2018 USD 50,000 52,188 0.50Martin Midstream Partners LP 7.25%
15/02/2021 USD 50,000 49,500 0.47Navios Maritime Holdings, Inc. 8.125%
15/02/2019 (Marshall Islands) (2) USD 50,000 39,187 0.38Quality Distribution LLC 9.875%
01/11/2018 USD 94,000 99,052 0.95XPO Logistics, Inc., 144A 7.875%
01/09/2019 USD 100,000 107,125 1.02
416,052 3.98
total Corporate Bonds 10,310,462 98.52
total transferable securities and money market instruments admitted to official exchange listing or dealt in on another regulated market 10,310,462 98.52
total investments 10,310,462 98.52
Cash 8,954 0.09
other Assets/(Liabilities) 145,451 1.39
total net Assets 10,464,867 100.00
(2) The country in brackets represents the country of incorporation of this security.FRN: Variable coupon rates are those quoted as of 30 June 2015.
The accompanying notes are an integral part of these financial statements.
US Dollar High Yield Bond Fund (continued)
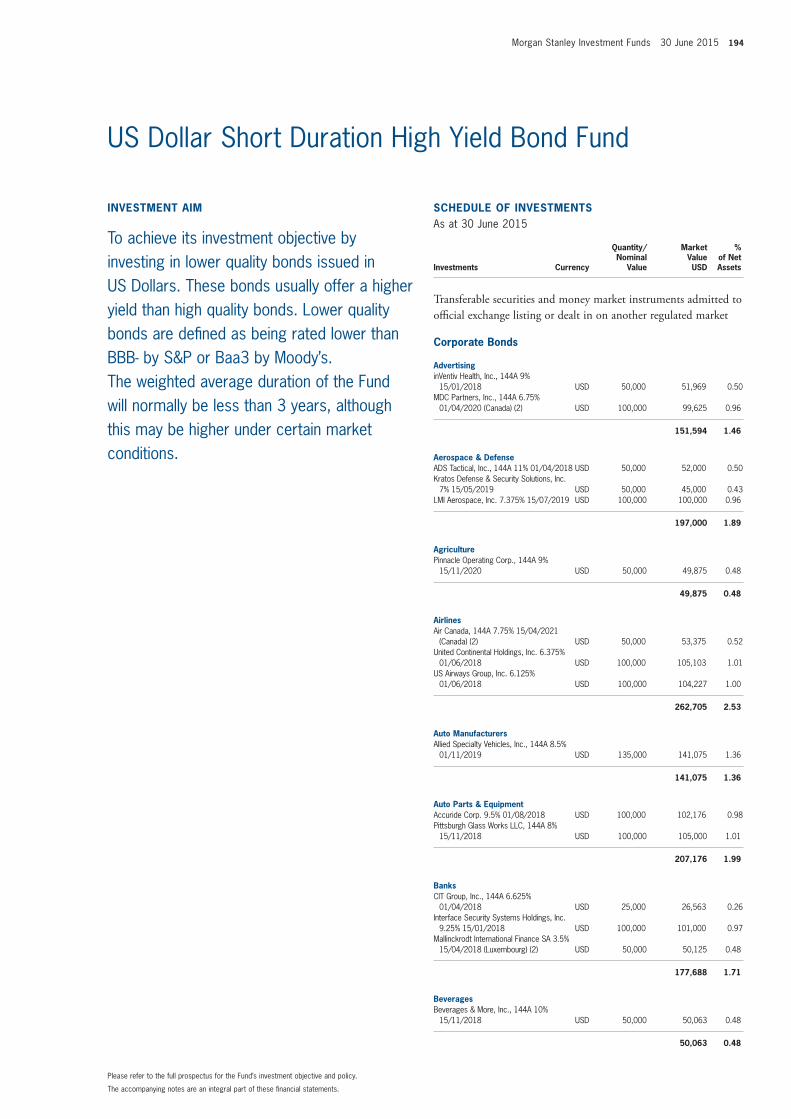
Morgan Stanley Investment Funds 30 June 2015 194
invEStmEnt Aim
To achieve its investment objective by investing in lower quality bonds issued in US Dollars. These bonds usually offer a higher yield than high quality bonds. Lower quality bonds are defined as being rated lower than BBB- by S&P or Baa3 by Moody’s. The weighted average duration of the Fund will normally be less than 3 years, although this may be higher under certain market conditions.
SCHEDULE of invEStmEntSAs at 30 June 2015
Investments Currency
Quantity/Nominal
Value
Market Value USD
% of Net Assets
transferable securities and money market instruments admitted to official exchange listing or dealt in on another regulated market
Corporate Bonds
AdvertisinginVentiv Health, Inc., 144A 9%
15/01/2018 USD 50,000 51,969 0.50MDC Partners, Inc., 144A 6.75%
01/04/2020 (Canada) (2) USD 100,000 99,625 0.96
151,594 1.46
Aerospace & DefenseADS Tactical, Inc., 144A 11% 01/04/2018 USD 50,000 52,000 0.50Kratos Defense & Security Solutions, Inc.
7% 15/05/2019 USD 50,000 45,000 0.43LMI Aerospace, Inc. 7.375% 15/07/2019 USD 100,000 100,000 0.96
197,000 1.89
AgriculturePinnacle Operating Corp., 144A 9%
15/11/2020 USD 50,000 49,875 0.48
49,875 0.48
AirlinesAir Canada, 144A 7.75% 15/04/2021
(Canada) (2) USD 50,000 53,375 0.52United Continental Holdings, Inc. 6.375%
01/06/2018 USD 100,000 105,103 1.01US Airways Group, Inc. 6.125%
01/06/2018 USD 100,000 104,227 1.00
262,705 2.53
Auto manufacturersAllied Specialty Vehicles, Inc., 144A 8.5%
01/11/2019 USD 135,000 141,075 1.36
141,075 1.36
Auto Parts & EquipmentAccuride Corp. 9.5% 01/08/2018 USD 100,000 102,176 0.98Pittsburgh Glass Works LLC, 144A 8%
15/11/2018 USD 100,000 105,000 1.01
207,176 1.99
BanksCIT Group, Inc., 144A 6.625%
01/04/2018 USD 25,000 26,563 0.26Interface Security Systems Holdings, Inc.
9.25% 15/01/2018 USD 100,000 101,000 0.97Mallinckrodt International Finance SA 3.5%
15/04/2018 (Luxembourg) (2) USD 50,000 50,125 0.48
177,688 1.71
BeveragesBeverages & More, Inc., 144A 10%
15/11/2018 USD 50,000 50,063 0.48
50,063 0.48
The accompanying notes are an integral part of these financial statements.
Please refer to the full prospectus for the Fund’s investment objective and policy.
US Dollar Short Duration High Yield Bond Fund
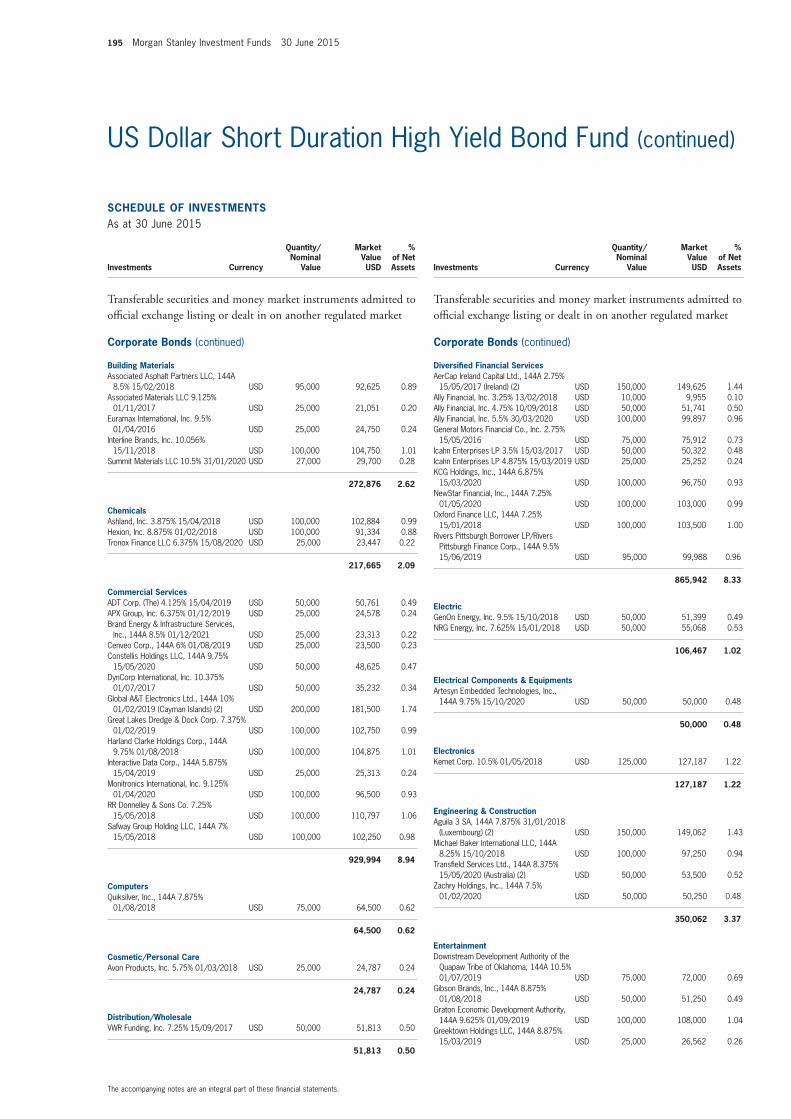
195 Morgan Stanley Investment Funds 30 June 2015
SCHEDULE of invEStmEntSAs at 30 June 2015
Investments Currency
Quantity/Nominal
Value
Market Value USD
% of Net Assets
transferable securities and money market instruments admitted to official exchange listing or dealt in on another regulated market
Corporate Bonds (continued)
Building materialsAssociated Asphalt Partners LLC, 144A
8.5% 15/02/2018 USD 95,000 92,625 0.89Associated Materials LLC 9.125%
01/11/2017 USD 25,000 21,051 0.20Euramax International, Inc. 9.5%
01/04/2016 USD 25,000 24,750 0.24Interline Brands, Inc. 10.056%
15/11/2018 USD 100,000 104,750 1.01Summit Materials LLC 10.5% 31/01/2020 USD 27,000 29,700 0.28
272,876 2.62
ChemicalsAshland, Inc. 3.875% 15/04/2018 USD 100,000 102,884 0.99Hexion, Inc. 8.875% 01/02/2018 USD 100,000 91,334 0.88Tronox Finance LLC 6.375% 15/08/2020 USD 25,000 23,447 0.22
217,665 2.09
Commercial ServicesADT Corp. (The) 4.125% 15/04/2019 USD 50,000 50,761 0.49APX Group, Inc. 6.375% 01/12/2019 USD 25,000 24,578 0.24Brand Energy & Infrastructure Services,
Inc., 144A 8.5% 01/12/2021 USD 25,000 23,313 0.22Cenveo Corp., 144A 6% 01/08/2019 USD 25,000 23,500 0.23Constellis Holdings LLC, 144A 9.75%
15/05/2020 USD 50,000 48,625 0.47DynCorp International, Inc. 10.375%
01/07/2017 USD 50,000 35,232 0.34Global A&T Electronics Ltd., 144A 10%
01/02/2019 (Cayman Islands) (2) USD 200,000 181,500 1.74Great Lakes Dredge & Dock Corp. 7.375%
01/02/2019 USD 100,000 102,750 0.99Harland Clarke Holdings Corp., 144A
9.75% 01/08/2018 USD 100,000 104,875 1.01Interactive Data Corp., 144A 5.875%
15/04/2019 USD 25,000 25,313 0.24Monitronics International, Inc. 9.125%
01/04/2020 USD 100,000 96,500 0.93RR Donnelley & Sons Co. 7.25%
15/05/2018 USD 100,000 110,797 1.06Safway Group Holding LLC, 144A 7%
15/05/2018 USD 100,000 102,250 0.98
929,994 8.94
ComputersQuiksilver, Inc., 144A 7.875%
01/08/2018 USD 75,000 64,500 0.62
64,500 0.62
Cosmetic/Personal CareAvon Products, Inc. 5.75% 01/03/2018 USD 25,000 24,787 0.24
24,787 0.24
Distribution/WholesaleVWR Funding, Inc. 7.25% 15/09/2017 USD 50,000 51,813 0.50
51,813 0.50
SCHEDULE of invEStmEntSAs at 30 June 2015
Investments Currency
Quantity/Nominal
Value
Market Value USD
% of Net Assets
transferable securities and money market instruments admitted to official exchange listing or dealt in on another regulated market
Corporate Bonds (continued)
Diversified financial ServicesAerCap Ireland Capital Ltd., 144A 2.75%
15/05/2017 (Ireland) (2) USD 150,000 149,625 1.44Ally Financial, Inc. 3.25% 13/02/2018 USD 10,000 9,955 0.10Ally Financial, Inc. 4.75% 10/09/2018 USD 50,000 51,741 0.50Ally Financial, Inc. 5.5% 30/03/2020 USD 100,000 99,897 0.96General Motors Financial Co., Inc. 2.75%
15/05/2016 USD 75,000 75,912 0.73Icahn Enterprises LP 3.5% 15/03/2017 USD 50,000 50,322 0.48Icahn Enterprises LP 4.875% 15/03/2019 USD 25,000 25,252 0.24KCG Holdings, Inc., 144A 6.875%
15/03/2020 USD 100,000 96,750 0.93NewStar Financial, Inc., 144A 7.25%
01/05/2020 USD 100,000 103,000 0.99Oxford Finance LLC, 144A 7.25%
15/01/2018 USD 100,000 103,500 1.00Rivers Pittsburgh Borrower LP/Rivers
Pittsburgh Finance Corp., 144A 9.5% 15/06/2019 USD 95,000 99,988 0.96
865,942 8.33
ElectricGenOn Energy, Inc. 9.5% 15/10/2018 USD 50,000 51,399 0.49NRG Energy, Inc. 7.625% 15/01/2018 USD 50,000 55,068 0.53
106,467 1.02
Electrical Components & EquipmentsArtesyn Embedded Technologies, Inc.,
144A 9.75% 15/10/2020 USD 50,000 50,000 0.48
50,000 0.48
ElectronicsKemet Corp. 10.5% 01/05/2018 USD 125,000 127,187 1.22
127,187 1.22
Engineering & ConstructionAguila 3 SA, 144A 7.875% 31/01/2018
(Luxembourg) (2) USD 150,000 149,062 1.43Michael Baker International LLC, 144A
8.25% 15/10/2018 USD 100,000 97,250 0.94Transfield Services Ltd., 144A 8.375%
15/05/2020 (Australia) (2) USD 50,000 53,500 0.52Zachry Holdings, Inc., 144A 7.5%
01/02/2020 USD 50,000 50,250 0.48
350,062 3.37
EntertainmentDownstream Development Authority of the
Quapaw Tribe of Oklahoma, 144A 10.5% 01/07/2019 USD 75,000 72,000 0.69
Gibson Brands, Inc., 144A 8.875% 01/08/2018 USD 50,000 51,250 0.49
Graton Economic Development Authority, 144A 9.625% 01/09/2019 USD 100,000 108,000 1.04
Greektown Holdings LLC, 144A 8.875% 15/03/2019 USD 25,000 26,562 0.26
The accompanying notes are an integral part of these financial statements.
US Dollar Short Duration High Yield Bond Fund (continued)
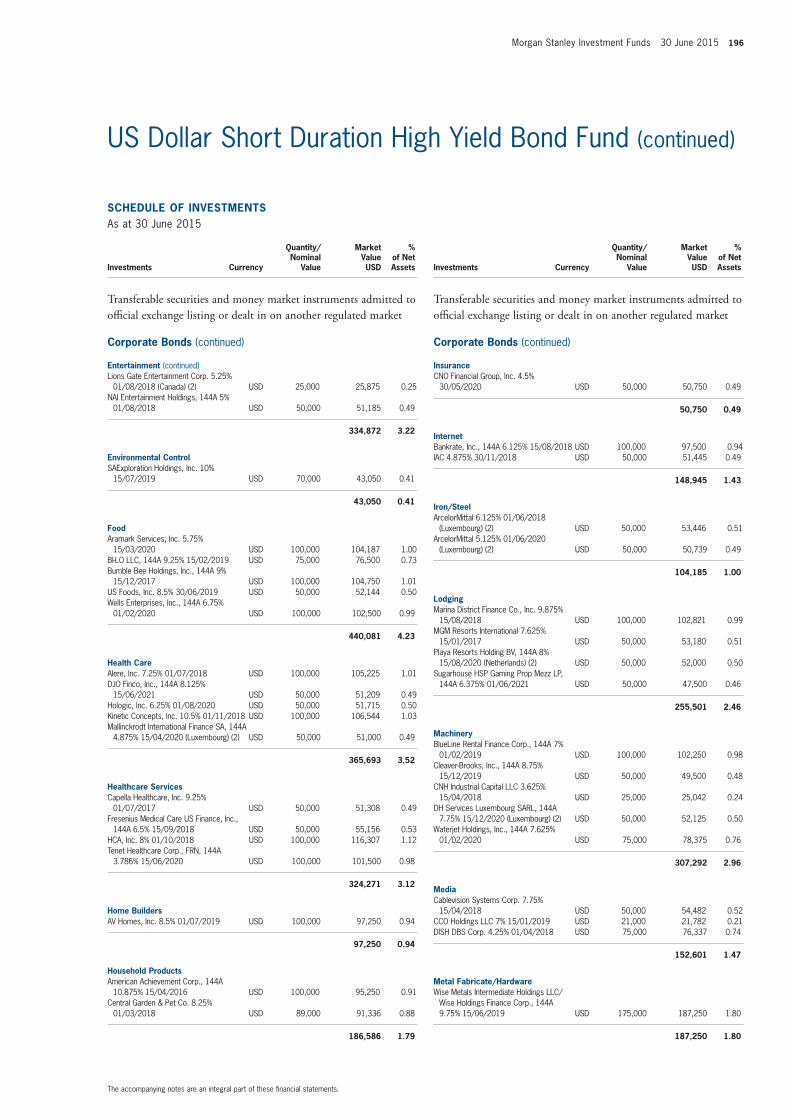
Morgan Stanley Investment Funds 30 June 2015 196
SCHEDULE of invEStmEntSAs at 30 June 2015
Investments Currency
Quantity/Nominal
Value
Market Value USD
% of Net Assets
transferable securities and money market instruments admitted to official exchange listing or dealt in on another regulated market
Corporate Bonds (continued)
Entertainment (continued)Lions Gate Entertainment Corp. 5.25%
01/08/2018 (Canada) (2) USD 25,000 25,875 0.25NAI Entertainment Holdings, 144A 5%
01/08/2018 USD 50,000 51,185 0.49
334,872 3.22
Environmental ControlSAExploration Holdings, Inc. 10%
15/07/2019 USD 70,000 43,050 0.41
43,050 0.41
foodAramark Services, Inc. 5.75%
15/03/2020 USD 100,000 104,187 1.00BI-LO LLC, 144A 9.25% 15/02/2019 USD 75,000 76,500 0.73Bumble Bee Holdings, Inc., 144A 9%
15/12/2017 USD 100,000 104,750 1.01US Foods, Inc. 8.5% 30/06/2019 USD 50,000 52,144 0.50Wells Enterprises, Inc., 144A 6.75%
01/02/2020 USD 100,000 102,500 0.99
440,081 4.23
Health CareAlere, Inc. 7.25% 01/07/2018 USD 100,000 105,225 1.01DJO Finco, Inc., 144A 8.125%
15/06/2021 USD 50,000 51,209 0.49Hologic, Inc. 6.25% 01/08/2020 USD 50,000 51,715 0.50Kinetic Concepts, Inc. 10.5% 01/11/2018 USD 100,000 106,544 1.03Mallinckrodt International Finance SA, 144A
4.875% 15/04/2020 (Luxembourg) (2) USD 50,000 51,000 0.49
365,693 3.52
Healthcare ServicesCapella Healthcare, Inc. 9.25%
01/07/2017 USD 50,000 51,308 0.49Fresenius Medical Care US Finance, Inc.,
144A 6.5% 15/09/2018 USD 50,000 55,156 0.53HCA, Inc. 8% 01/10/2018 USD 100,000 116,307 1.12Tenet Healthcare Corp., FRN, 144A
3.786% 15/06/2020 USD 100,000 101,500 0.98
324,271 3.12
Home BuildersAV Homes, Inc. 8.5% 01/07/2019 USD 100,000 97,250 0.94
97,250 0.94
Household ProductsAmerican Achievement Corp., 144A
10.875% 15/04/2016 USD 100,000 95,250 0.91Central Garden & Pet Co. 8.25%
01/03/2018 USD 89,000 91,336 0.88
186,586 1.79
SCHEDULE of invEStmEntSAs at 30 June 2015
Investments Currency
Quantity/Nominal
Value
Market Value USD
% of Net Assets
transferable securities and money market instruments admitted to official exchange listing or dealt in on another regulated market
Corporate Bonds (continued)
insuranceCNO Financial Group, Inc. 4.5%
30/05/2020 USD 50,000 50,750 0.49
50,750 0.49
internetBankrate, Inc., 144A 6.125% 15/08/2018 USD 100,000 97,500 0.94IAC 4.875% 30/11/2018 USD 50,000 51,445 0.49
148,945 1.43
iron/SteelArcelorMittal 6.125% 01/06/2018
(Luxembourg) (2) USD 50,000 53,446 0.51ArcelorMittal 5.125% 01/06/2020
(Luxembourg) (2) USD 50,000 50,739 0.49
104,185 1.00
LodgingMarina District Finance Co., Inc. 9.875%
15/08/2018 USD 100,000 102,821 0.99MGM Resorts International 7.625%
15/01/2017 USD 50,000 53,180 0.51Playa Resorts Holding BV, 144A 8%
15/08/2020 (Netherlands) (2) USD 50,000 52,000 0.50Sugarhouse HSP Gaming Prop Mezz LP,
144A 6.375% 01/06/2021 USD 50,000 47,500 0.46
255,501 2.46
machineryBlueLine Rental Finance Corp., 144A 7%
01/02/2019 USD 100,000 102,250 0.98Cleaver-Brooks, Inc., 144A 8.75%
15/12/2019 USD 50,000 49,500 0.48CNH Industrial Capital LLC 3.625%
15/04/2018 USD 25,000 25,042 0.24DH Services Luxembourg SARL, 144A
7.75% 15/12/2020 (Luxembourg) (2) USD 50,000 52,125 0.50Waterjet Holdings, Inc., 144A 7.625%
01/02/2020 USD 75,000 78,375 0.76
307,292 2.96
mediaCablevision Systems Corp. 7.75%
15/04/2018 USD 50,000 54,482 0.52CCO Holdings LLC 7% 15/01/2019 USD 21,000 21,782 0.21DISH DBS Corp. 4.25% 01/04/2018 USD 75,000 76,337 0.74
152,601 1.47
metal fabricate/HardwareWise Metals Intermediate Holdings LLC/
Wise Holdings Finance Corp., 144A 9.75% 15/06/2019 USD 175,000 187,250 1.80
187,250 1.80
The accompanying notes are an integral part of these financial statements.
US Dollar Short Duration High Yield Bond Fund (continued)
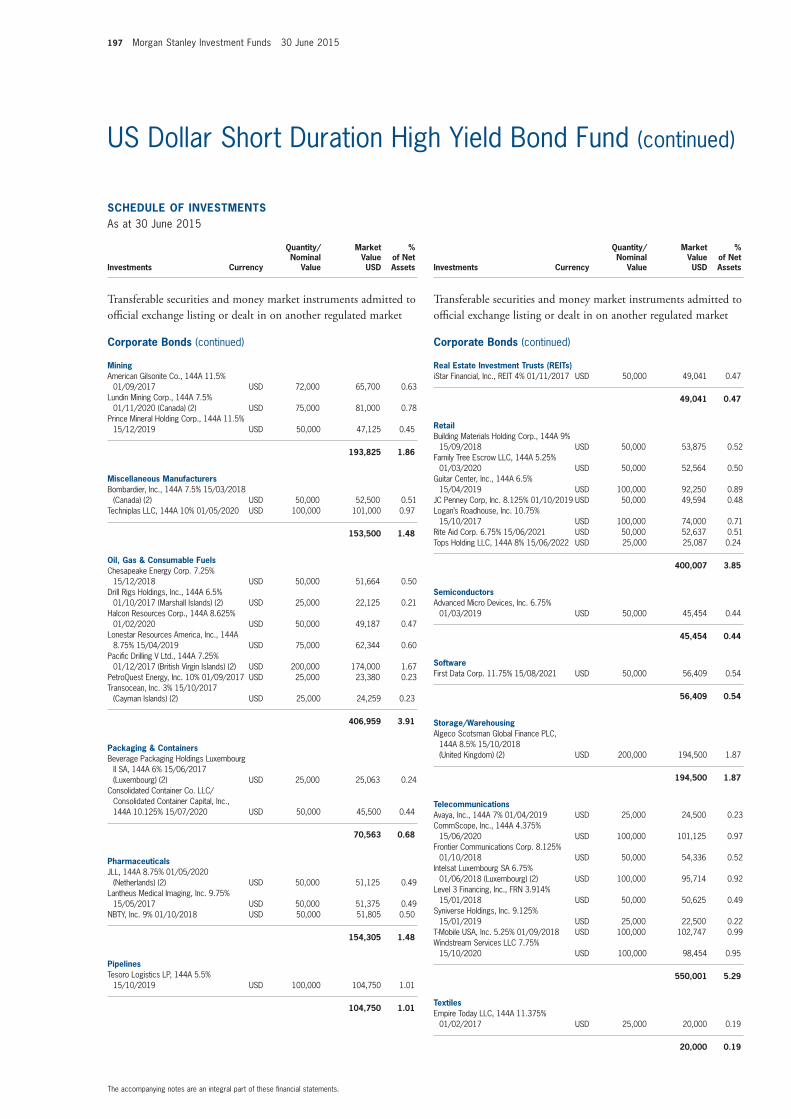
197 Morgan Stanley Investment Funds 30 June 2015
SCHEDULE of invEStmEntSAs at 30 June 2015
Investments Currency
Quantity/Nominal
Value
Market Value USD
% of Net Assets
transferable securities and money market instruments admitted to official exchange listing or dealt in on another regulated market
Corporate Bonds (continued)
miningAmerican Gilsonite Co., 144A 11.5%
01/09/2017 USD 72,000 65,700 0.63Lundin Mining Corp., 144A 7.5%
01/11/2020 (Canada) (2) USD 75,000 81,000 0.78Prince Mineral Holding Corp., 144A 11.5%
15/12/2019 USD 50,000 47,125 0.45
193,825 1.86
miscellaneous manufacturersBombardier, Inc., 144A 7.5% 15/03/2018
(Canada) (2) USD 50,000 52,500 0.51Techniplas LLC, 144A 10% 01/05/2020 USD 100,000 101,000 0.97
153,500 1.48
oil, Gas & Consumable fuelsChesapeake Energy Corp. 7.25%
15/12/2018 USD 50,000 51,664 0.50Drill Rigs Holdings, Inc., 144A 6.5%
01/10/2017 (Marshall Islands) (2) USD 25,000 22,125 0.21Halcon Resources Corp., 144A 8.625%
01/02/2020 USD 50,000 49,187 0.47Lonestar Resources America, Inc., 144A
8.75% 15/04/2019 USD 75,000 62,344 0.60Pacific Drilling V Ltd., 144A 7.25%
01/12/2017 (British Virgin Islands) (2) USD 200,000 174,000 1.67PetroQuest Energy, Inc. 10% 01/09/2017 USD 25,000 23,380 0.23Transocean, Inc. 3% 15/10/2017
(Cayman Islands) (2) USD 25,000 24,259 0.23
406,959 3.91
Packaging & ContainersBeverage Packaging Holdings Luxembourg
II SA, 144A 6% 15/06/2017 (Luxembourg) (2) USD 25,000 25,063 0.24
Consolidated Container Co. LLC/Consolidated Container Capital, Inc., 144A 10.125% 15/07/2020 USD 50,000 45,500 0.44
70,563 0.68
PharmaceuticalsJLL, 144A 8.75% 01/05/2020
(Netherlands) (2) USD 50,000 51,125 0.49Lantheus Medical Imaging, Inc. 9.75%
15/05/2017 USD 50,000 51,375 0.49NBTY, Inc. 9% 01/10/2018 USD 50,000 51,805 0.50
154,305 1.48
PipelinesTesoro Logistics LP, 144A 5.5%
15/10/2019 USD 100,000 104,750 1.01
104,750 1.01
SCHEDULE of invEStmEntSAs at 30 June 2015
Investments Currency
Quantity/Nominal
Value
Market Value USD
% of Net Assets
transferable securities and money market instruments admitted to official exchange listing or dealt in on another regulated market
Corporate Bonds (continued)
Real Estate investment trusts (REits)iStar Financial, Inc., REIT 4% 01/11/2017 USD 50,000 49,041 0.47
49,041 0.47
RetailBuilding Materials Holding Corp., 144A 9%
15/09/2018 USD 50,000 53,875 0.52Family Tree Escrow LLC, 144A 5.25%
01/03/2020 USD 50,000 52,564 0.50Guitar Center, Inc., 144A 6.5%
15/04/2019 USD 100,000 92,250 0.89JC Penney Corp, Inc. 8.125% 01/10/2019 USD 50,000 49,594 0.48Logan’s Roadhouse, Inc. 10.75%
15/10/2017 USD 100,000 74,000 0.71Rite Aid Corp. 6.75% 15/06/2021 USD 50,000 52,637 0.51Tops Holding LLC, 144A 8% 15/06/2022 USD 25,000 25,087 0.24
400,007 3.85
SemiconductorsAdvanced Micro Devices, Inc. 6.75%
01/03/2019 USD 50,000 45,454 0.44
45,454 0.44
SoftwareFirst Data Corp. 11.75% 15/08/2021 USD 50,000 56,409 0.54
56,409 0.54
Storage/WarehousingAlgeco Scotsman Global Finance PLC,
144A 8.5% 15/10/2018 (United Kingdom) (2) USD 200,000 194,500 1.87
194,500 1.87
telecommunicationsAvaya, Inc., 144A 7% 01/04/2019 USD 25,000 24,500 0.23CommScope, Inc., 144A 4.375%
15/06/2020 USD 100,000 101,125 0.97Frontier Communications Corp. 8.125%
01/10/2018 USD 50,000 54,336 0.52Intelsat Luxembourg SA 6.75%
01/06/2018 (Luxembourg) (2) USD 100,000 95,714 0.92Level 3 Financing, Inc., FRN 3.914%
15/01/2018 USD 50,000 50,625 0.49Syniverse Holdings, Inc. 9.125%
15/01/2019 USD 25,000 22,500 0.22T-Mobile USA, Inc. 5.25% 01/09/2018 USD 100,000 102,747 0.99Windstream Services LLC 7.75%
15/10/2020 USD 100,000 98,454 0.95
550,001 5.29
textilesEmpire Today LLC, 144A 11.375%
01/02/2017 USD 25,000 20,000 0.19
20,000 0.19
The accompanying notes are an integral part of these financial statements.
US Dollar Short Duration High Yield Bond Fund (continued)
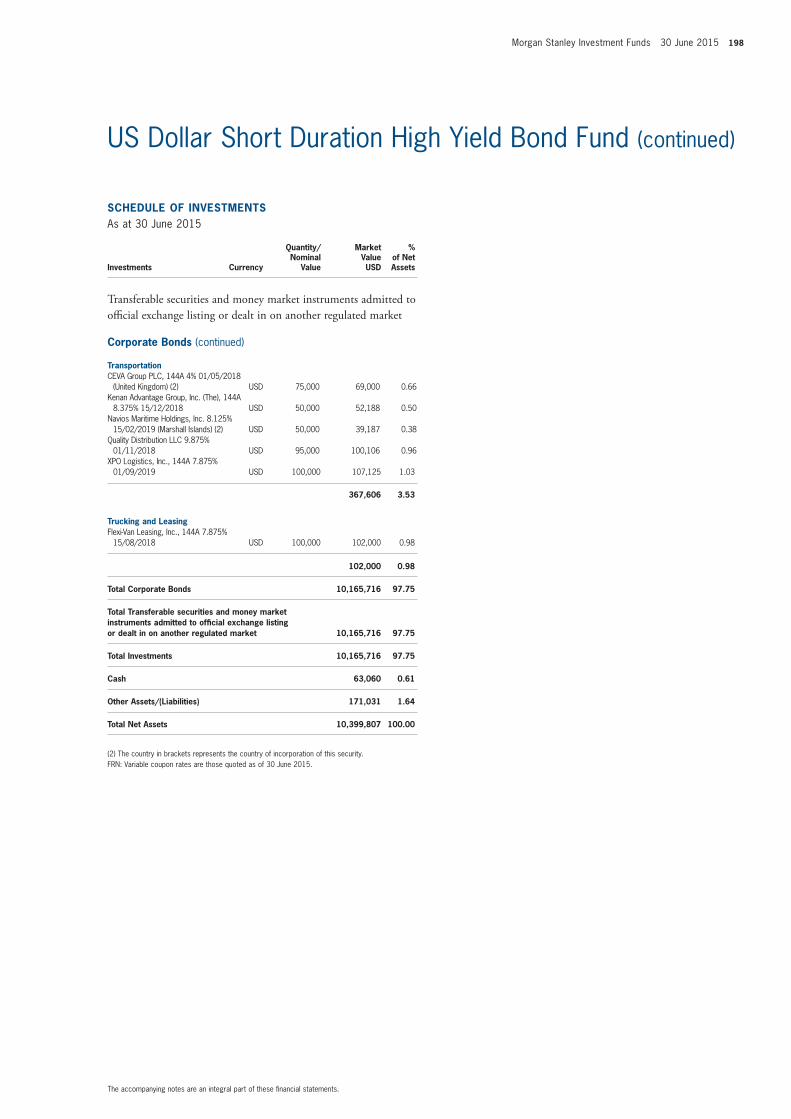
Morgan Stanley Investment Funds 30 June 2015 198
SCHEDULE of invEStmEntSAs at 30 June 2015
Investments Currency
Quantity/Nominal
Value
Market Value USD
% of Net Assets
transferable securities and money market instruments admitted to official exchange listing or dealt in on another regulated market
Corporate Bonds (continued)
transportationCEVA Group PLC, 144A 4% 01/05/2018
(United Kingdom) (2) USD 75,000 69,000 0.66Kenan Advantage Group, Inc. (The), 144A
8.375% 15/12/2018 USD 50,000 52,188 0.50Navios Maritime Holdings, Inc. 8.125%
15/02/2019 (Marshall Islands) (2) USD 50,000 39,187 0.38Quality Distribution LLC 9.875%
01/11/2018 USD 95,000 100,106 0.96XPO Logistics, Inc., 144A 7.875%
01/09/2019 USD 100,000 107,125 1.03
367,606 3.53
trucking and LeasingFlexi-Van Leasing, Inc., 144A 7.875%
15/08/2018 USD 100,000 102,000 0.98
102,000 0.98
total Corporate Bonds 10,165,716 97.75
total transferable securities and money market instruments admitted to official exchange listing or dealt in on another regulated market 10,165,716 97.75
total investments 10,165,716 97.75
Cash 63,060 0.61
other Assets/(Liabilities) 171,031 1.64
total net Assets 10,399,807 100.00
(2) The country in brackets represents the country of incorporation of this security.FRN: Variable coupon rates are those quoted as of 30 June 2015.
The accompanying notes are an integral part of these financial statements.
US Dollar Short Duration High Yield Bond Fund (continued)
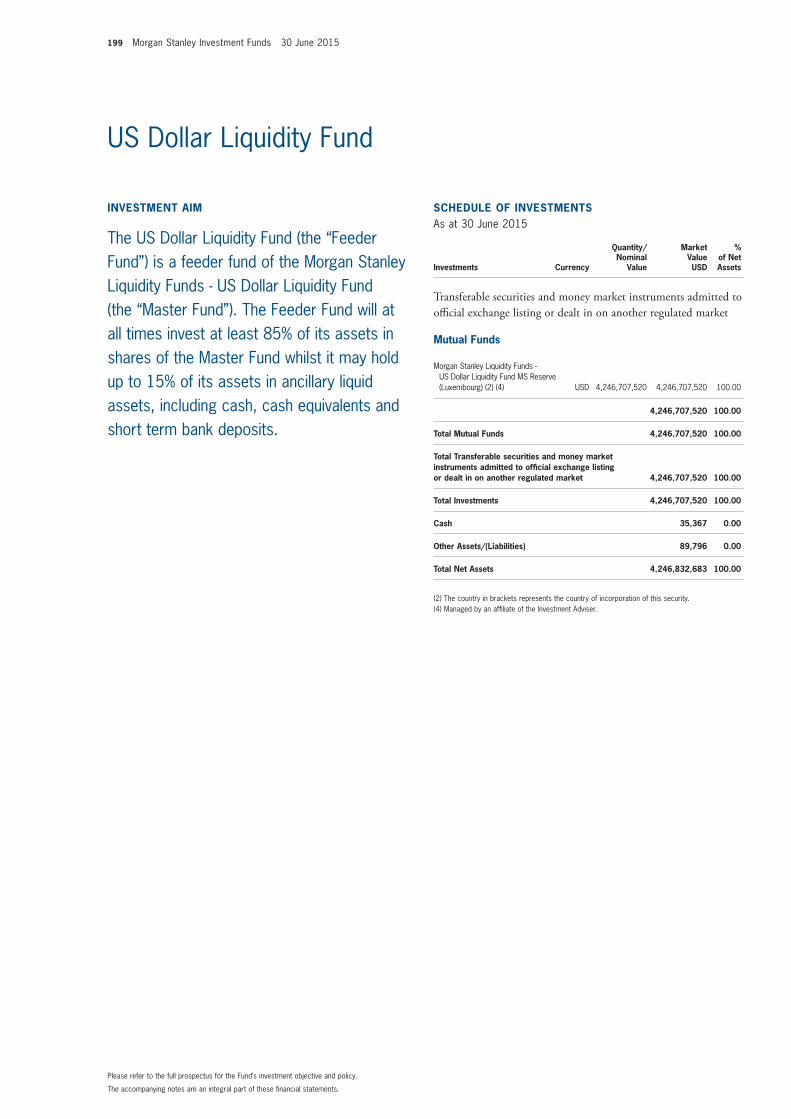
199 Morgan Stanley Investment Funds 30 June 2015
invEStmEnt Aim
The US Dollar Liquidity Fund (the “Feeder Fund”) is a feeder fund of the Morgan Stanley Liquidity Funds - US Dollar Liquidity Fund (the “Master Fund”). The Feeder Fund will at all times invest at least 85% of its assets in shares of the Master Fund whilst it may hold up to 15% of its assets in ancillary liquid assets, including cash, cash equivalents and short term bank deposits.
SCHEDULE of invEStmEntSAs at 30 June 2015
Investments Currency
Quantity/Nominal
Value
Market Value USD
% of Net Assets
transferable securities and money market instruments admitted to official exchange listing or dealt in on another regulated market
mutual funds
Morgan Stanley Liquidity Funds - US Dollar Liquidity Fund MS Reserve (Luxembourg) (2) (4) USD 4,246,707,520 4,246,707,520 100.00
4,246,707,520 100.00
total mutual funds 4,246,707,520 100.00
total transferable securities and money market instruments admitted to official exchange listing or dealt in on another regulated market 4,246,707,520 100.00
total investments 4,246,707,520 100.00
Cash 35,367 0.00
other Assets/(Liabilities) 89,796 0.00
total net Assets 4,246,832,683 100.00
(2) The country in brackets represents the country of incorporation of this security.(4) Managed by an affiliate of the Investment Adviser.
The accompanying notes are an integral part of these financial statements.
Please refer to the full prospectus for the Fund’s investment objective and policy.
US Dollar Liquidity Fund
Liquidity Funds
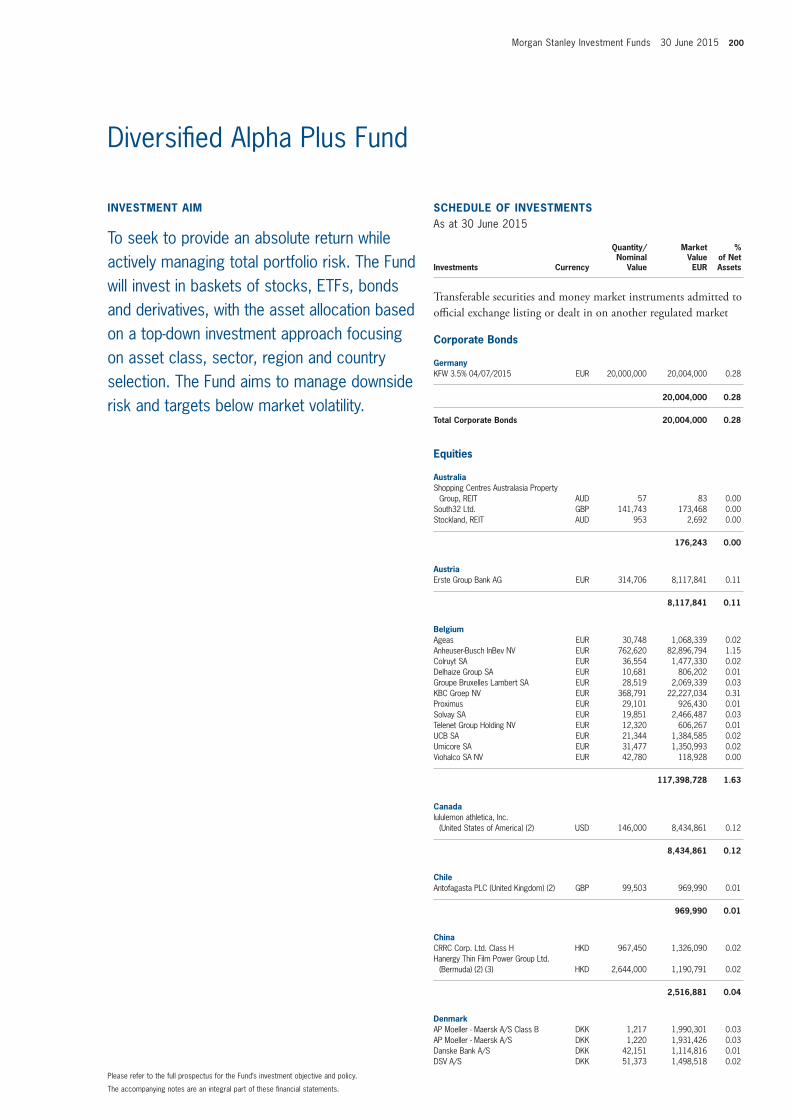
Morgan Stanley Investment Funds 30 June 2015 200
invEStmEnt Aim
To seek to provide an absolute return while actively managing total portfolio risk. The Fund will invest in baskets of stocks, ETFs, bonds and derivatives, with the asset allocation based on a top-down investment approach focusing on asset class, sector, region and country selection. The Fund aims to manage downside risk and targets below market volatility.
SCHEDULE of invEStmEntSAs at 30 June 2015
Investments Currency
Quantity/Nominal
Value
Market Value EUR
% of Net Assets
transferable securities and money market instruments admitted to official exchange listing or dealt in on another regulated market
Corporate Bonds
GermanyKFW 3.5% 04/07/2015 EUR 20,000,000 20,004,000 0.28
20,004,000 0.28
total Corporate Bonds 20,004,000 0.28
Equities
AustraliaShopping Centres Australasia Property
Group, REIT AUD 57 83 0.00South32 Ltd. GBP 141,743 173,468 0.00Stockland, REIT AUD 953 2,692 0.00
176,243 0.00
AustriaErste Group Bank AG EUR 314,706 8,117,841 0.11
8,117,841 0.11
BelgiumAgeas EUR 30,748 1,068,339 0.02Anheuser-Busch InBev NV EUR 762,620 82,896,794 1.15Colruyt SA EUR 36,554 1,477,330 0.02Delhaize Group SA EUR 10,681 806,202 0.01Groupe Bruxelles Lambert SA EUR 28,519 2,069,339 0.03KBC Groep NV EUR 368,791 22,227,034 0.31Proximus EUR 29,101 926,430 0.01Solvay SA EUR 19,851 2,466,487 0.03Telenet Group Holding NV EUR 12,320 606,267 0.01UCB SA EUR 21,344 1,384,585 0.02Umicore SA EUR 31,477 1,350,993 0.02Viohalco SA NV EUR 42,780 118,928 0.00
117,398,728 1.63
Canadalululemon athletica, Inc.
(United States of America) (2) USD 146,000 8,434,861 0.12
8,434,861 0.12
ChileAntofagasta PLC (United Kingdom) (2) GBP 99,503 969,990 0.01
969,990 0.01
ChinaCRRC Corp. Ltd. Class H HKD 967,450 1,326,090 0.02Hanergy Thin Film Power Group Ltd.
(Bermuda) (2) (3) HKD 2,644,000 1,190,791 0.02
2,516,881 0.04
DenmarkAP Moeller - Maersk A/S Class B DKK 1,217 1,990,301 0.03AP Moeller - Maersk A/S DKK 1,220 1,931,426 0.03Danske Bank A/S DKK 42,151 1,114,816 0.01DSV A/S DKK 51,373 1,498,518 0.02
The accompanying notes are an integral part of these financial statements.
Please refer to the full prospectus for the Fund’s investment objective and policy.
Diversified Alpha Plus Fund
Asset Allocation Funds
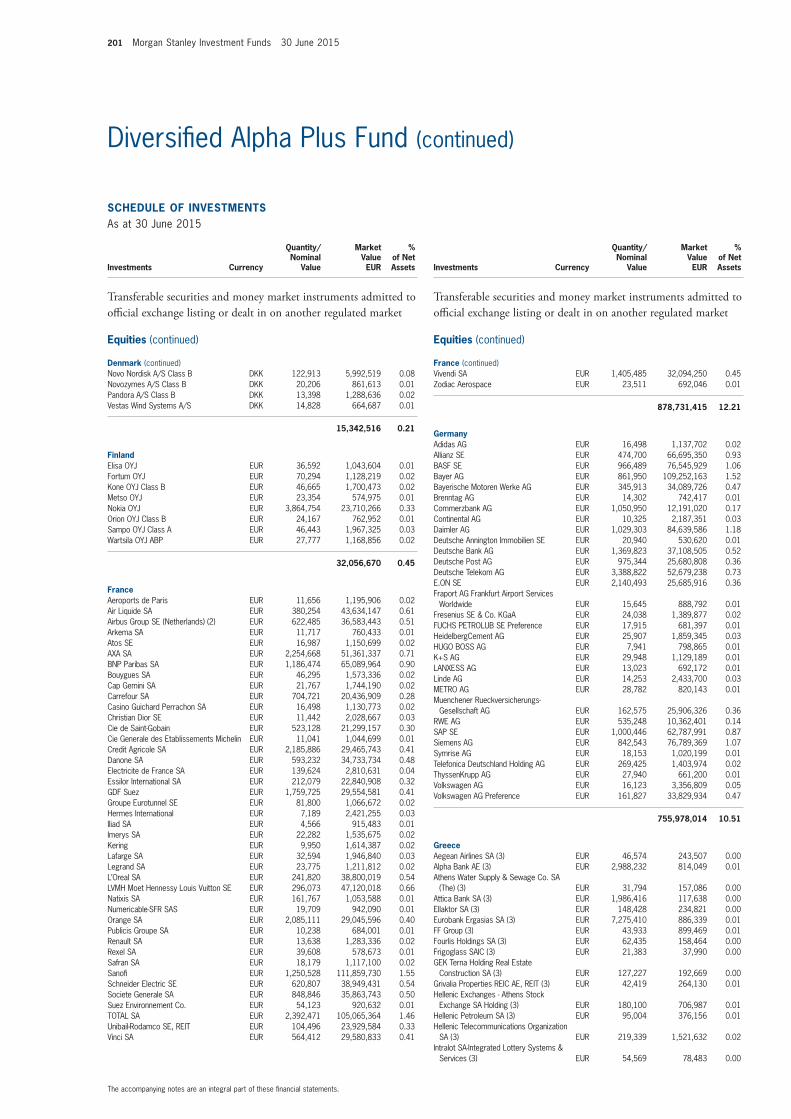
201 Morgan Stanley Investment Funds 30 June 2015
SCHEDULE of invEStmEntSAs at 30 June 2015
Investments Currency
Quantity/Nominal
Value
Market Value EUR
% of Net Assets
transferable securities and money market instruments admitted to official exchange listing or dealt in on another regulated market
Equities (continued)
Denmark (continued)Novo Nordisk A/S Class B DKK 122,913 5,992,519 0.08Novozymes A/S Class B DKK 20,206 861,613 0.01Pandora A/S Class B DKK 13,398 1,288,636 0.02Vestas Wind Systems A/S DKK 14,828 664,687 0.01
15,342,516 0.21
finlandElisa OYJ EUR 36,592 1,043,604 0.01Fortum OYJ EUR 70,294 1,128,219 0.02Kone OYJ Class B EUR 46,665 1,700,473 0.02Metso OYJ EUR 23,354 574,975 0.01Nokia OYJ EUR 3,864,754 23,710,266 0.33Orion OYJ Class B EUR 24,167 762,952 0.01Sampo OYJ Class A EUR 46,443 1,967,325 0.03Wartsila OYJ ABP EUR 27,777 1,168,856 0.02
32,056,670 0.45
franceAeroports de Paris EUR 11,656 1,195,906 0.02Air Liquide SA EUR 380,254 43,634,147 0.61Airbus Group SE (Netherlands) (2) EUR 622,485 36,583,443 0.51Arkema SA EUR 11,717 760,433 0.01Atos SE EUR 16,987 1,150,699 0.02AXA SA EUR 2,254,668 51,361,337 0.71BNP Paribas SA EUR 1,186,474 65,089,964 0.90Bouygues SA EUR 46,295 1,573,336 0.02Cap Gemini SA EUR 21,767 1,744,190 0.02Carrefour SA EUR 704,721 20,436,909 0.28Casino Guichard Perrachon SA EUR 16,498 1,130,773 0.02Christian Dior SE EUR 11,442 2,028,667 0.03Cie de Saint-Gobain EUR 523,128 21,299,157 0.30Cie Generale des Etablissements Michelin EUR 11,041 1,044,699 0.01Credit Agricole SA EUR 2,185,886 29,465,743 0.41Danone SA EUR 593,232 34,733,734 0.48Electricite de France SA EUR 139,624 2,810,631 0.04Essilor International SA EUR 212,079 22,840,908 0.32GDF Suez EUR 1,759,725 29,554,581 0.41Groupe Eurotunnel SE EUR 81,800 1,066,672 0.02Hermes International EUR 7,189 2,421,255 0.03Iliad SA EUR 4,566 915,483 0.01Imerys SA EUR 22,282 1,535,675 0.02Kering EUR 9,950 1,614,387 0.02Lafarge SA EUR 32,594 1,946,840 0.03Legrand SA EUR 23,775 1,211,812 0.02L’Oreal SA EUR 241,820 38,800,019 0.54LVMH Moet Hennessy Louis Vuitton SE EUR 296,073 47,120,018 0.66Natixis SA EUR 161,767 1,053,588 0.01Numericable-SFR SAS EUR 19,709 942,090 0.01Orange SA EUR 2,085,111 29,045,596 0.40Publicis Groupe SA EUR 10,238 684,001 0.01Renault SA EUR 13,638 1,283,336 0.02Rexel SA EUR 39,608 578,673 0.01Safran SA EUR 18,179 1,117,100 0.02Sanofi EUR 1,250,528 111,859,730 1.55Schneider Electric SE EUR 620,807 38,949,431 0.54Societe Generale SA EUR 848,846 35,863,743 0.50Suez Environnement Co. EUR 54,123 920,632 0.01TOTAL SA EUR 2,392,471 105,065,364 1.46Unibail-Rodamco SE, REIT EUR 104,496 23,929,584 0.33Vinci SA EUR 564,412 29,580,833 0.41
SCHEDULE of invEStmEntSAs at 30 June 2015
Investments Currency
Quantity/Nominal
Value
Market Value EUR
% of Net Assets
transferable securities and money market instruments admitted to official exchange listing or dealt in on another regulated market
Equities (continued)
france (continued)Vivendi SA EUR 1,405,485 32,094,250 0.45Zodiac Aerospace EUR 23,511 692,046 0.01
878,731,415 12.21
GermanyAdidas AG EUR 16,498 1,137,702 0.02Allianz SE EUR 474,700 66,695,350 0.93BASF SE EUR 966,489 76,545,929 1.06Bayer AG EUR 861,950 109,252,163 1.52Bayerische Motoren Werke AG EUR 345,913 34,089,726 0.47Brenntag AG EUR 14,302 742,417 0.01Commerzbank AG EUR 1,050,950 12,191,020 0.17Continental AG EUR 10,325 2,187,351 0.03Daimler AG EUR 1,029,303 84,639,586 1.18Deutsche Annington Immobilien SE EUR 20,940 530,620 0.01Deutsche Bank AG EUR 1,369,823 37,108,505 0.52Deutsche Post AG EUR 975,344 25,680,808 0.36Deutsche Telekom AG EUR 3,388,822 52,679,238 0.73E.ON SE EUR 2,140,493 25,685,916 0.36Fraport AG Frankfurt Airport Services
Worldwide EUR 15,645 888,792 0.01Fresenius SE & Co. KGaA EUR 24,038 1,389,877 0.02FUCHS PETROLUB SE Preference EUR 17,915 681,397 0.01HeidelbergCement AG EUR 25,907 1,859,345 0.03HUGO BOSS AG EUR 7,941 798,865 0.01K+S AG EUR 29,948 1,129,189 0.01LANXESS AG EUR 13,023 692,172 0.01Linde AG EUR 14,253 2,433,700 0.03METRO AG EUR 28,782 820,143 0.01Muenchener Rueckversicherungs-
Gesellschaft AG EUR 162,575 25,906,326 0.36RWE AG EUR 535,248 10,362,401 0.14SAP SE EUR 1,000,446 62,787,991 0.87Siemens AG EUR 842,543 76,789,369 1.07Symrise AG EUR 18,153 1,020,199 0.01Telefonica Deutschland Holding AG EUR 269,425 1,403,974 0.02ThyssenKrupp AG EUR 27,940 661,200 0.01Volkswagen AG EUR 16,123 3,356,809 0.05Volkswagen AG Preference EUR 161,827 33,829,934 0.47
755,978,014 10.51
GreeceAegean Airlines SA (3) EUR 46,574 243,507 0.00Alpha Bank AE (3) EUR 2,988,232 814,049 0.01Athens Water Supply & Sewage Co. SA
(The) (3) EUR 31,794 157,086 0.00Attica Bank SA (3) EUR 1,986,416 117,638 0.00Ellaktor SA (3) EUR 148,428 234,821 0.00Eurobank Ergasias SA (3) EUR 7,275,410 886,339 0.01FF Group (3) EUR 43,933 899,469 0.01Fourlis Holdings SA (3) EUR 62,435 158,464 0.00Frigoglass SAIC (3) EUR 21,383 37,990 0.00GEK Terna Holding Real Estate
Construction SA (3) EUR 127,227 192,669 0.00Grivalia Properties REIC AE, REIT (3) EUR 42,419 264,130 0.01Hellenic Exchanges - Athens Stock
Exchange SA Holding (3) EUR 180,100 706,987 0.01Hellenic Petroleum SA (3) EUR 95,004 376,156 0.01Hellenic Telecommunications Organization
SA (3) EUR 219,339 1,521,632 0.02Intralot SA-Integrated Lottery Systems &
Services (3) EUR 54,569 78,483 0.00
The accompanying notes are an integral part of these financial statements.
Diversified Alpha Plus Fund (continued)
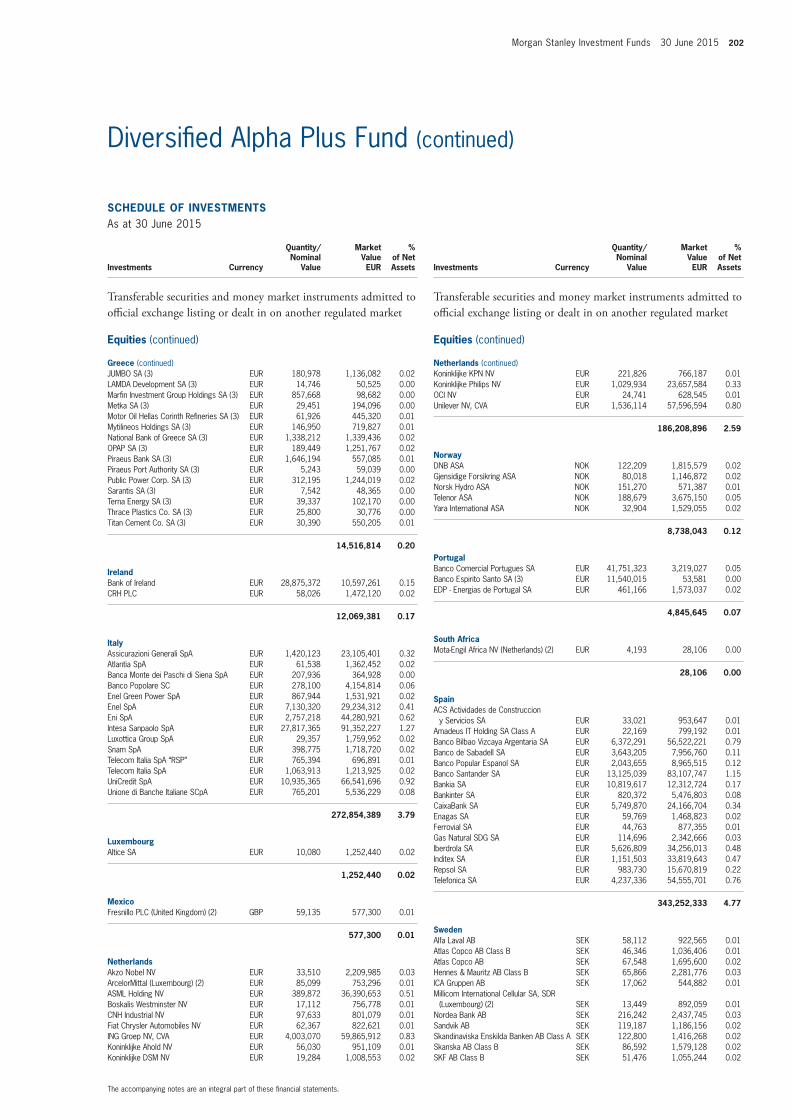
Morgan Stanley Investment Funds 30 June 2015 202
SCHEDULE of invEStmEntSAs at 30 June 2015
Investments Currency
Quantity/Nominal
Value
Market Value EUR
% of Net Assets
transferable securities and money market instruments admitted to official exchange listing or dealt in on another regulated market
Equities (continued)
Greece (continued)JUMBO SA (3) EUR 180,978 1,136,082 0.02LAMDA Development SA (3) EUR 14,746 50,525 0.00Marfin Investment Group Holdings SA (3) EUR 857,668 98,682 0.00Metka SA (3) EUR 29,451 194,096 0.00Motor Oil Hellas Corinth Refineries SA (3) EUR 61,926 445,320 0.01Mytilineos Holdings SA (3) EUR 146,950 719,827 0.01National Bank of Greece SA (3) EUR 1,338,212 1,339,436 0.02OPAP SA (3) EUR 189,449 1,251,767 0.02Piraeus Bank SA (3) EUR 1,646,194 557,085 0.01Piraeus Port Authority SA (3) EUR 5,243 59,039 0.00Public Power Corp. SA (3) EUR 312,195 1,244,019 0.02Sarantis SA (3) EUR 7,542 48,365 0.00Terna Energy SA (3) EUR 39,337 102,170 0.00Thrace Plastics Co. SA (3) EUR 25,800 30,776 0.00Titan Cement Co. SA (3) EUR 30,390 550,205 0.01
14,516,814 0.20
irelandBank of Ireland EUR 28,875,372 10,597,261 0.15CRH PLC EUR 58,026 1,472,120 0.02
12,069,381 0.17
italyAssicurazioni Generali SpA EUR 1,420,123 23,105,401 0.32Atlantia SpA EUR 61,538 1,362,452 0.02Banca Monte dei Paschi di Siena SpA EUR 207,936 364,928 0.00Banco Popolare SC EUR 278,100 4,154,814 0.06Enel Green Power SpA EUR 867,944 1,531,921 0.02Enel SpA EUR 7,130,320 29,234,312 0.41Eni SpA EUR 2,757,218 44,280,921 0.62Intesa Sanpaolo SpA EUR 27,817,365 91,352,227 1.27Luxottica Group SpA EUR 29,357 1,759,952 0.02Snam SpA EUR 398,775 1,718,720 0.02Telecom Italia SpA “RSP” EUR 765,394 696,891 0.01Telecom Italia SpA EUR 1,063,913 1,213,925 0.02UniCredit SpA EUR 10,935,365 66,541,696 0.92Unione di Banche Italiane SCpA EUR 765,201 5,536,229 0.08
272,854,389 3.79
LuxembourgAltice SA EUR 10,080 1,252,440 0.02
1,252,440 0.02
mexicoFresnillo PLC (United Kingdom) (2) GBP 59,135 577,300 0.01
577,300 0.01
netherlandsAkzo Nobel NV EUR 33,510 2,209,985 0.03ArcelorMittal (Luxembourg) (2) EUR 85,099 753,296 0.01ASML Holding NV EUR 389,872 36,390,653 0.51Boskalis Westminster NV EUR 17,112 756,778 0.01CNH Industrial NV EUR 97,633 801,079 0.01Fiat Chrysler Automobiles NV EUR 62,367 822,621 0.01ING Groep NV, CVA EUR 4,003,070 59,865,912 0.83Koninklijke Ahold NV EUR 56,030 951,109 0.01Koninklijke DSM NV EUR 19,284 1,008,553 0.02
SCHEDULE of invEStmEntSAs at 30 June 2015
Investments Currency
Quantity/Nominal
Value
Market Value EUR
% of Net Assets
transferable securities and money market instruments admitted to official exchange listing or dealt in on another regulated market
Equities (continued)
netherlands (continued)Koninklijke KPN NV EUR 221,826 766,187 0.01Koninklijke Philips NV EUR 1,029,934 23,657,584 0.33OCI NV EUR 24,741 628,545 0.01Unilever NV, CVA EUR 1,536,114 57,596,594 0.80
186,208,896 2.59
norwayDNB ASA NOK 122,209 1,815,579 0.02Gjensidige Forsikring ASA NOK 80,018 1,146,872 0.02Norsk Hydro ASA NOK 151,270 571,387 0.01Telenor ASA NOK 188,679 3,675,150 0.05Yara International ASA NOK 32,904 1,529,055 0.02
8,738,043 0.12
PortugalBanco Comercial Portugues SA EUR 41,751,323 3,219,027 0.05Banco Espirito Santo SA (3) EUR 11,540,015 53,581 0.00EDP - Energias de Portugal SA EUR 461,166 1,573,037 0.02
4,845,645 0.07
South AfricaMota-Engil Africa NV (Netherlands) (2) EUR 4,193 28,106 0.00
28,106 0.00
SpainACS Actividades de Construccion
y Servicios SA EUR 33,021 953,647 0.01Amadeus IT Holding SA Class A EUR 22,169 799,192 0.01Banco Bilbao Vizcaya Argentaria SA EUR 6,372,291 56,522,221 0.79Banco de Sabadell SA EUR 3,643,205 7,956,760 0.11Banco Popular Espanol SA EUR 2,043,655 8,965,515 0.12Banco Santander SA EUR 13,125,039 83,107,747 1.15Bankia SA EUR 10,819,617 12,312,724 0.17Bankinter SA EUR 820,372 5,476,803 0.08CaixaBank SA EUR 5,749,870 24,166,704 0.34Enagas SA EUR 59,769 1,468,823 0.02Ferrovial SA EUR 44,763 877,355 0.01Gas Natural SDG SA EUR 114,696 2,342,666 0.03Iberdrola SA EUR 5,626,809 34,256,013 0.48Inditex SA EUR 1,151,503 33,819,643 0.47Repsol SA EUR 983,730 15,670,819 0.22Telefonica SA EUR 4,237,336 54,555,701 0.76
343,252,333 4.77
SwedenAlfa Laval AB SEK 58,112 922,565 0.01Atlas Copco AB Class B SEK 46,346 1,036,406 0.01Atlas Copco AB SEK 67,548 1,695,600 0.02Hennes & Mauritz AB Class B SEK 65,866 2,281,776 0.03ICA Gruppen AB SEK 17,062 544,882 0.01Millicom International Cellular SA, SDR
(Luxembourg) (2) SEK 13,449 892,059 0.01Nordea Bank AB SEK 216,242 2,437,745 0.03Sandvik AB SEK 119,187 1,186,156 0.02Skandinaviska Enskilda Banken AB Class A SEK 122,800 1,416,268 0.02Skanska AB Class B SEK 86,592 1,579,128 0.02SKF AB Class B SEK 51,476 1,055,244 0.02
The accompanying notes are an integral part of these financial statements.
Diversified Alpha Plus Fund (continued)
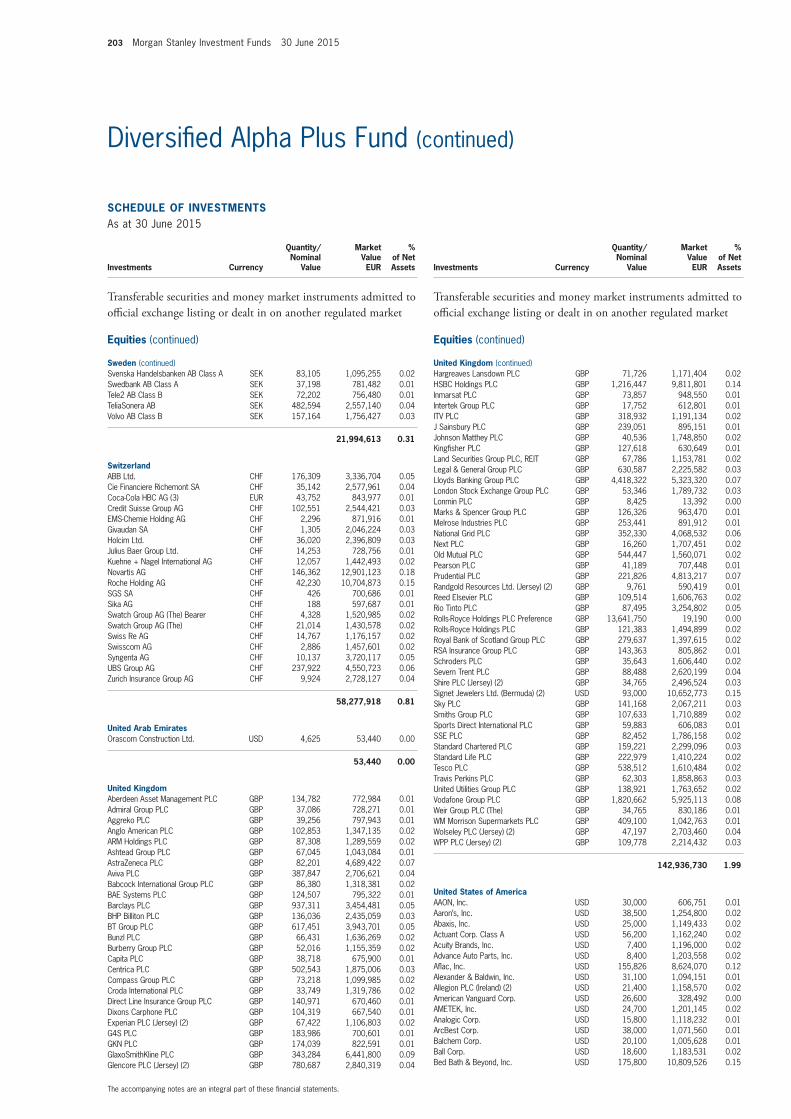
203 Morgan Stanley Investment Funds 30 June 2015
SCHEDULE of invEStmEntSAs at 30 June 2015
Investments Currency
Quantity/Nominal
Value
Market Value EUR
% of Net Assets
transferable securities and money market instruments admitted to official exchange listing or dealt in on another regulated market
Equities (continued)
Sweden (continued)Svenska Handelsbanken AB Class A SEK 83,105 1,095,255 0.02Swedbank AB Class A SEK 37,198 781,482 0.01Tele2 AB Class B SEK 72,202 756,480 0.01TeliaSonera AB SEK 482,594 2,557,140 0.04Volvo AB Class B SEK 157,164 1,756,427 0.03
21,994,613 0.31
SwitzerlandABB Ltd. CHF 176,309 3,336,704 0.05Cie Financiere Richemont SA CHF 35,142 2,577,961 0.04Coca-Cola HBC AG (3) EUR 43,752 843,977 0.01Credit Suisse Group AG CHF 102,551 2,544,421 0.03EMS-Chemie Holding AG CHF 2,296 871,916 0.01Givaudan SA CHF 1,305 2,046,224 0.03Holcim Ltd. CHF 36,020 2,396,809 0.03Julius Baer Group Ltd. CHF 14,253 728,756 0.01Kuehne + Nagel International AG CHF 12,057 1,442,493 0.02Novartis AG CHF 146,362 12,901,123 0.18Roche Holding AG CHF 42,230 10,704,873 0.15SGS SA CHF 426 700,686 0.01Sika AG CHF 188 597,687 0.01Swatch Group AG (The) Bearer CHF 4,328 1,520,985 0.02Swatch Group AG (The) CHF 21,014 1,430,578 0.02Swiss Re AG CHF 14,767 1,176,157 0.02Swisscom AG CHF 2,886 1,457,601 0.02Syngenta AG CHF 10,137 3,720,117 0.05UBS Group AG CHF 237,922 4,550,723 0.06Zurich Insurance Group AG CHF 9,924 2,728,127 0.04
58,277,918 0.81
United Arab EmiratesOrascom Construction Ltd. USD 4,625 53,440 0.00
53,440 0.00
United KingdomAberdeen Asset Management PLC GBP 134,782 772,984 0.01Admiral Group PLC GBP 37,086 728,271 0.01Aggreko PLC GBP 39,256 797,943 0.01Anglo American PLC GBP 102,853 1,347,135 0.02ARM Holdings PLC GBP 87,308 1,289,559 0.02Ashtead Group PLC GBP 67,045 1,043,084 0.01AstraZeneca PLC GBP 82,201 4,689,422 0.07Aviva PLC GBP 387,847 2,706,621 0.04Babcock International Group PLC GBP 86,380 1,318,381 0.02BAE Systems PLC GBP 124,507 795,322 0.01Barclays PLC GBP 937,311 3,454,481 0.05BHP Billiton PLC GBP 136,036 2,435,059 0.03BT Group PLC GBP 617,451 3,943,701 0.05Bunzl PLC GBP 66,431 1,636,269 0.02Burberry Group PLC GBP 52,016 1,155,359 0.02Capita PLC GBP 38,718 675,900 0.01Centrica PLC GBP 502,543 1,875,006 0.03Compass Group PLC GBP 73,218 1,099,985 0.02Croda International PLC GBP 33,749 1,319,786 0.02Direct Line Insurance Group PLC GBP 140,971 670,460 0.01Dixons Carphone PLC GBP 104,319 667,540 0.01Experian PLC (Jersey) (2) GBP 67,422 1,106,803 0.02G4S PLC GBP 183,986 700,601 0.01GKN PLC GBP 174,039 822,591 0.01GlaxoSmithKline PLC GBP 343,284 6,441,800 0.09Glencore PLC (Jersey) (2) GBP 780,687 2,840,319 0.04
SCHEDULE of invEStmEntSAs at 30 June 2015
Investments Currency
Quantity/Nominal
Value
Market Value EUR
% of Net Assets
transferable securities and money market instruments admitted to official exchange listing or dealt in on another regulated market
Equities (continued)
United Kingdom (continued)Hargreaves Lansdown PLC GBP 71,726 1,171,404 0.02HSBC Holdings PLC GBP 1,216,447 9,811,801 0.14Inmarsat PLC GBP 73,857 948,550 0.01Intertek Group PLC GBP 17,752 612,801 0.01ITV PLC GBP 318,932 1,191,134 0.02J Sainsbury PLC GBP 239,051 895,151 0.01Johnson Matthey PLC GBP 40,536 1,748,850 0.02Kingfisher PLC GBP 127,618 630,649 0.01Land Securities Group PLC, REIT GBP 67,786 1,153,781 0.02Legal & General Group PLC GBP 630,587 2,225,582 0.03Lloyds Banking Group PLC GBP 4,418,322 5,323,320 0.07London Stock Exchange Group PLC GBP 53,346 1,789,732 0.03Lonmin PLC GBP 8,425 13,392 0.00Marks & Spencer Group PLC GBP 126,326 963,470 0.01Melrose Industries PLC GBP 253,441 891,912 0.01National Grid PLC GBP 352,330 4,068,532 0.06Next PLC GBP 16,260 1,707,451 0.02Old Mutual PLC GBP 544,447 1,560,071 0.02Pearson PLC GBP 41,189 707,448 0.01Prudential PLC GBP 221,826 4,813,217 0.07Randgold Resources Ltd. (Jersey) (2) GBP 9,761 590,419 0.01Reed Elsevier PLC GBP 109,514 1,606,763 0.02Rio Tinto PLC GBP 87,495 3,254,802 0.05Rolls-Royce Holdings PLC Preference GBP 13,641,750 19,190 0.00Rolls-Royce Holdings PLC GBP 121,383 1,494,899 0.02Royal Bank of Scotland Group PLC GBP 279,637 1,397,615 0.02RSA Insurance Group PLC GBP 143,363 805,862 0.01Schroders PLC GBP 35,643 1,606,440 0.02Severn Trent PLC GBP 88,488 2,620,199 0.04Shire PLC (Jersey) (2) GBP 34,765 2,496,524 0.03Signet Jewelers Ltd. (Bermuda) (2) USD 93,000 10,652,773 0.15Sky PLC GBP 141,168 2,067,211 0.03Smiths Group PLC GBP 107,633 1,710,889 0.02Sports Direct International PLC GBP 59,883 606,083 0.01SSE PLC GBP 82,452 1,786,158 0.02Standard Chartered PLC GBP 159,221 2,299,096 0.03Standard Life PLC GBP 222,979 1,410,224 0.02Tesco PLC GBP 538,512 1,610,484 0.02Travis Perkins PLC GBP 62,303 1,858,863 0.03United Utilities Group PLC GBP 138,921 1,763,652 0.02Vodafone Group PLC GBP 1,820,662 5,925,113 0.08Weir Group PLC (The) GBP 34,765 830,186 0.01WM Morrison Supermarkets PLC GBP 409,100 1,042,763 0.01Wolseley PLC (Jersey) (2) GBP 47,197 2,703,460 0.04WPP PLC (Jersey) (2) GBP 109,778 2,214,432 0.03
142,936,730 1.99
United States of AmericaAAON, Inc. USD 30,000 606,751 0.01Aaron’s, Inc. USD 38,500 1,254,800 0.02Abaxis, Inc. USD 25,000 1,149,433 0.02Actuant Corp. Class A USD 56,200 1,162,240 0.02Acuity Brands, Inc. USD 7,400 1,196,000 0.02Advance Auto Parts, Inc. USD 8,400 1,203,558 0.02Aflac, Inc. USD 155,826 8,624,070 0.12Alexander & Baldwin, Inc. USD 31,100 1,094,151 0.01Allegion PLC (Ireland) (2) USD 21,400 1,158,570 0.02American Vanguard Corp. USD 26,600 328,492 0.00AMETEK, Inc. USD 24,700 1,201,145 0.02Analogic Corp. USD 15,800 1,118,232 0.01ArcBest Corp. USD 38,000 1,071,560 0.01Balchem Corp. USD 20,100 1,005,628 0.01Ball Corp. USD 18,600 1,183,531 0.02Bed Bath & Beyond, Inc. USD 175,800 10,809,526 0.15
The accompanying notes are an integral part of these financial statements.
Diversified Alpha Plus Fund (continued)
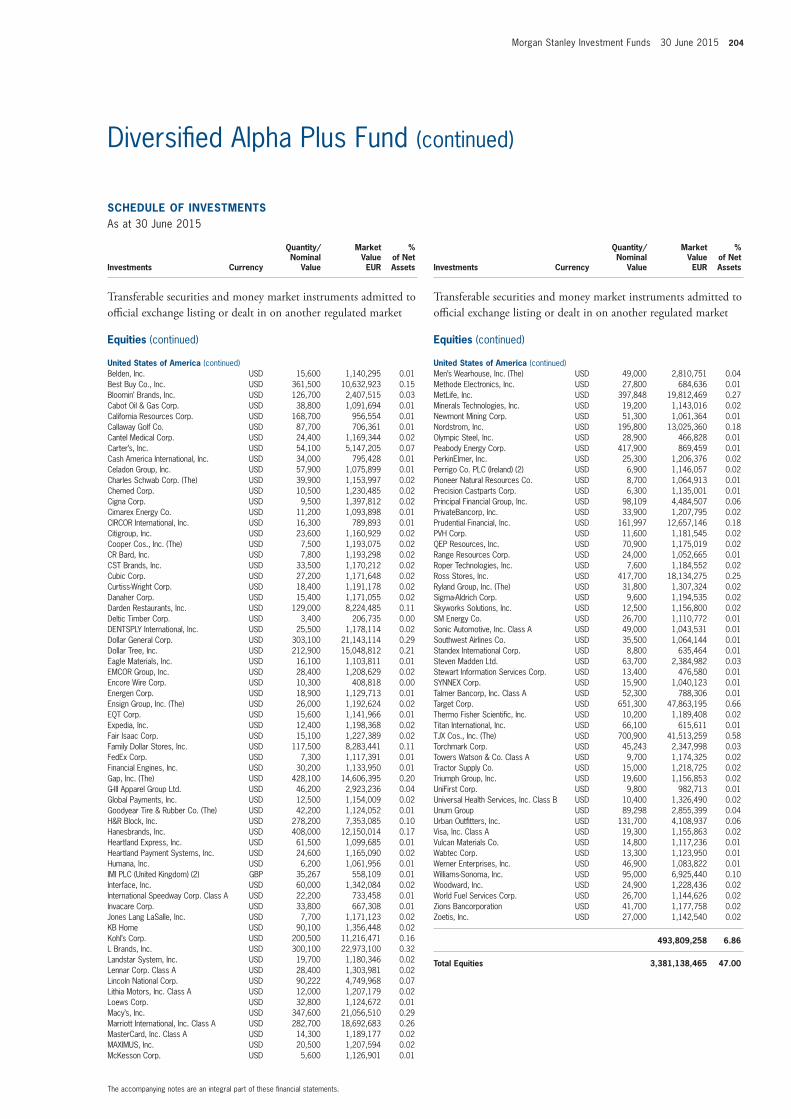
Morgan Stanley Investment Funds 30 June 2015 204
SCHEDULE of invEStmEntSAs at 30 June 2015
Investments Currency
Quantity/Nominal
Value
Market Value EUR
% of Net Assets
transferable securities and money market instruments admitted to official exchange listing or dealt in on another regulated market
Equities (continued)
United States of America (continued)Belden, Inc. USD 15,600 1,140,295 0.01Best Buy Co., Inc. USD 361,500 10,632,923 0.15Bloomin’ Brands, Inc. USD 126,700 2,407,515 0.03Cabot Oil & Gas Corp. USD 38,800 1,091,694 0.01California Resources Corp. USD 168,700 956,554 0.01Callaway Golf Co. USD 87,700 706,361 0.01Cantel Medical Corp. USD 24,400 1,169,344 0.02Carter’s, Inc. USD 54,100 5,147,205 0.07Cash America International, Inc. USD 34,000 795,428 0.01Celadon Group, Inc. USD 57,900 1,075,899 0.01Charles Schwab Corp. (The) USD 39,900 1,153,997 0.02Chemed Corp. USD 10,500 1,230,485 0.02Cigna Corp. USD 9,500 1,397,812 0.02Cimarex Energy Co. USD 11,200 1,093,898 0.01CIRCOR International, Inc. USD 16,300 789,893 0.01Citigroup, Inc. USD 23,600 1,160,929 0.02Cooper Cos., Inc. (The) USD 7,500 1,193,075 0.02CR Bard, Inc. USD 7,800 1,193,298 0.02CST Brands, Inc. USD 33,500 1,170,212 0.02Cubic Corp. USD 27,200 1,171,648 0.02Curtiss-Wright Corp. USD 18,400 1,191,178 0.02Danaher Corp. USD 15,400 1,171,055 0.02Darden Restaurants, Inc. USD 129,000 8,224,485 0.11Deltic Timber Corp. USD 3,400 206,735 0.00DENTSPLY International, Inc. USD 25,500 1,178,114 0.02Dollar General Corp. USD 303,100 21,143,114 0.29Dollar Tree, Inc. USD 212,900 15,048,812 0.21Eagle Materials, Inc. USD 16,100 1,103,811 0.01EMCOR Group, Inc. USD 28,400 1,208,629 0.02Encore Wire Corp. USD 10,300 408,818 0.00Energen Corp. USD 18,900 1,129,713 0.01Ensign Group, Inc. (The) USD 26,000 1,192,624 0.02EQT Corp. USD 15,600 1,141,966 0.01Expedia, Inc. USD 12,400 1,198,368 0.02Fair Isaac Corp. USD 15,100 1,227,389 0.02Family Dollar Stores, Inc. USD 117,500 8,283,441 0.11FedEx Corp. USD 7,300 1,117,391 0.01Financial Engines, Inc. USD 30,200 1,133,950 0.01Gap, Inc. (The) USD 428,100 14,606,395 0.20G-III Apparel Group Ltd. USD 46,200 2,923,236 0.04Global Payments, Inc. USD 12,500 1,154,009 0.02Goodyear Tire & Rubber Co. (The) USD 42,200 1,124,052 0.01H&R Block, Inc. USD 278,200 7,353,085 0.10Hanesbrands, Inc. USD 408,000 12,150,014 0.17Heartland Express, Inc. USD 61,500 1,099,685 0.01Heartland Payment Systems, Inc. USD 24,600 1,165,090 0.02Humana, Inc. USD 6,200 1,061,956 0.01IMI PLC (United Kingdom) (2) GBP 35,267 558,109 0.01Interface, Inc. USD 60,000 1,342,084 0.02International Speedway Corp. Class A USD 22,200 733,458 0.01Invacare Corp. USD 33,800 667,308 0.01Jones Lang LaSalle, Inc. USD 7,700 1,171,123 0.02KB Home USD 90,100 1,356,448 0.02Kohl’s Corp. USD 200,500 11,216,471 0.16L Brands, Inc. USD 300,100 22,973,100 0.32Landstar System, Inc. USD 19,700 1,180,346 0.02Lennar Corp. Class A USD 28,400 1,303,981 0.02Lincoln National Corp. USD 90,222 4,749,968 0.07Lithia Motors, Inc. Class A USD 12,000 1,207,179 0.02Loews Corp. USD 32,800 1,124,672 0.01Macy’s, Inc. USD 347,600 21,056,510 0.29Marriott International, Inc. Class A USD 282,700 18,692,683 0.26MasterCard, Inc. Class A USD 14,300 1,189,177 0.02MAXIMUS, Inc. USD 20,500 1,207,594 0.02McKesson Corp. USD 5,600 1,126,901 0.01
SCHEDULE of invEStmEntSAs at 30 June 2015
Investments Currency
Quantity/Nominal
Value
Market Value EUR
% of Net Assets
transferable securities and money market instruments admitted to official exchange listing or dealt in on another regulated market
Equities (continued)
United States of America (continued)Men’s Wearhouse, Inc. (The) USD 49,000 2,810,751 0.04Methode Electronics, Inc. USD 27,800 684,636 0.01MetLife, Inc. USD 397,848 19,812,469 0.27Minerals Technologies, Inc. USD 19,200 1,143,016 0.02Newmont Mining Corp. USD 51,300 1,061,364 0.01Nordstrom, Inc. USD 195,800 13,025,360 0.18Olympic Steel, Inc. USD 28,900 466,828 0.01Peabody Energy Corp. USD 417,900 869,459 0.01PerkinElmer, Inc. USD 25,300 1,206,376 0.02Perrigo Co. PLC (Ireland) (2) USD 6,900 1,146,057 0.02Pioneer Natural Resources Co. USD 8,700 1,064,913 0.01Precision Castparts Corp. USD 6,300 1,135,001 0.01Principal Financial Group, Inc. USD 98,109 4,484,507 0.06PrivateBancorp, Inc. USD 33,900 1,207,795 0.02Prudential Financial, Inc. USD 161,997 12,657,146 0.18PVH Corp. USD 11,600 1,181,545 0.02QEP Resources, Inc. USD 70,900 1,175,019 0.02Range Resources Corp. USD 24,000 1,052,665 0.01Roper Technologies, Inc. USD 7,600 1,184,552 0.02Ross Stores, Inc. USD 417,700 18,134,275 0.25Ryland Group, Inc. (The) USD 31,800 1,307,324 0.02Sigma-Aldrich Corp. USD 9,600 1,194,535 0.02Skyworks Solutions, Inc. USD 12,500 1,156,800 0.02SM Energy Co. USD 26,700 1,110,772 0.01Sonic Automotive, Inc. Class A USD 49,000 1,043,531 0.01Southwest Airlines Co. USD 35,500 1,064,144 0.01Standex International Corp. USD 8,800 635,464 0.01Steven Madden Ltd. USD 63,700 2,384,982 0.03Stewart Information Services Corp. USD 13,400 476,580 0.01SYNNEX Corp. USD 15,900 1,040,123 0.01Talmer Bancorp, Inc. Class A USD 52,300 788,306 0.01Target Corp. USD 651,300 47,863,195 0.66Thermo Fisher Scientific, Inc. USD 10,200 1,189,408 0.02Titan International, Inc. USD 66,100 615,611 0.01TJX Cos., Inc. (The) USD 700,900 41,513,259 0.58Torchmark Corp. USD 45,243 2,347,998 0.03Towers Watson & Co. Class A USD 9,700 1,174,325 0.02Tractor Supply Co. USD 15,000 1,218,725 0.02Triumph Group, Inc. USD 19,600 1,156,853 0.02UniFirst Corp. USD 9,800 982,713 0.01Universal Health Services, Inc. Class B USD 10,400 1,326,490 0.02Unum Group USD 89,298 2,855,399 0.04Urban Outfitters, Inc. USD 131,700 4,108,937 0.06Visa, Inc. Class A USD 19,300 1,155,863 0.02Vulcan Materials Co. USD 14,800 1,117,236 0.01Wabtec Corp. USD 13,300 1,123,950 0.01Werner Enterprises, Inc. USD 46,900 1,083,822 0.01Williams-Sonoma, Inc. USD 95,000 6,925,440 0.10Woodward, Inc. USD 24,900 1,228,436 0.02World Fuel Services Corp. USD 26,700 1,144,626 0.02Zions Bancorporation USD 41,700 1,177,758 0.02Zoetis, Inc. USD 27,000 1,142,540 0.02
493,809,258 6.86
total Equities 3,381,138,465 47.00
The accompanying notes are an integral part of these financial statements.
Diversified Alpha Plus Fund (continued)
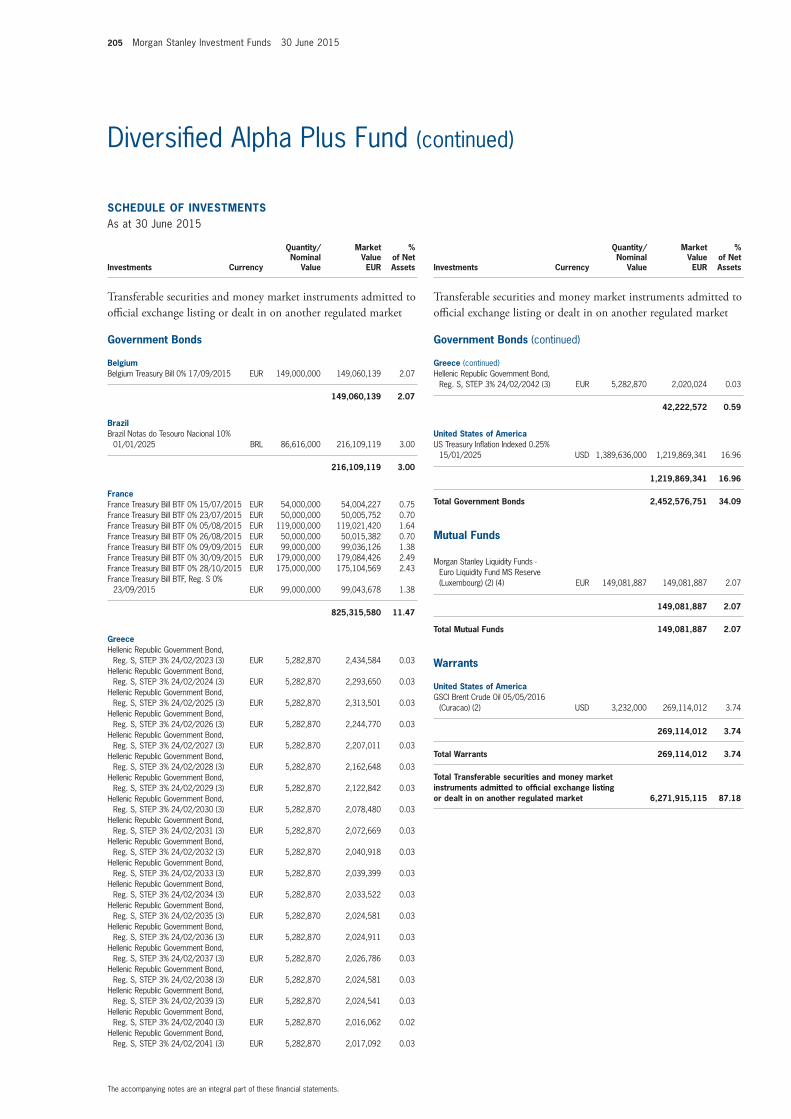
205 Morgan Stanley Investment Funds 30 June 2015
SCHEDULE of invEStmEntSAs at 30 June 2015
Investments Currency
Quantity/Nominal
Value
Market Value EUR
% of Net Assets
transferable securities and money market instruments admitted to official exchange listing or dealt in on another regulated market
Government Bonds
BelgiumBelgium Treasury Bill 0% 17/09/2015 EUR 149,000,000 149,060,139 2.07
149,060,139 2.07
BrazilBrazil Notas do Tesouro Nacional 10%
01/01/2025 BRL 86,616,000 216,109,119 3.00
216,109,119 3.00
franceFrance Treasury Bill BTF 0% 15/07/2015 EUR 54,000,000 54,004,227 0.75France Treasury Bill BTF 0% 23/07/2015 EUR 50,000,000 50,005,752 0.70France Treasury Bill BTF 0% 05/08/2015 EUR 119,000,000 119,021,420 1.64France Treasury Bill BTF 0% 26/08/2015 EUR 50,000,000 50,015,382 0.70France Treasury Bill BTF 0% 09/09/2015 EUR 99,000,000 99,036,126 1.38France Treasury Bill BTF 0% 30/09/2015 EUR 179,000,000 179,084,426 2.49France Treasury Bill BTF 0% 28/10/2015 EUR 175,000,000 175,104,569 2.43France Treasury Bill BTF, Reg. S 0%
23/09/2015 EUR 99,000,000 99,043,678 1.38
825,315,580 11.47
GreeceHellenic Republic Government Bond,
Reg. S, STEP 3% 24/02/2023 (3) EUR 5,282,870 2,434,584 0.03Hellenic Republic Government Bond,
Reg. S, STEP 3% 24/02/2024 (3) EUR 5,282,870 2,293,650 0.03Hellenic Republic Government Bond,
Reg. S, STEP 3% 24/02/2025 (3) EUR 5,282,870 2,313,501 0.03Hellenic Republic Government Bond,
Reg. S, STEP 3% 24/02/2026 (3) EUR 5,282,870 2,244,770 0.03Hellenic Republic Government Bond,
Reg. S, STEP 3% 24/02/2027 (3) EUR 5,282,870 2,207,011 0.03Hellenic Republic Government Bond,
Reg. S, STEP 3% 24/02/2028 (3) EUR 5,282,870 2,162,648 0.03Hellenic Republic Government Bond,
Reg. S, STEP 3% 24/02/2029 (3) EUR 5,282,870 2,122,842 0.03Hellenic Republic Government Bond,
Reg. S, STEP 3% 24/02/2030 (3) EUR 5,282,870 2,078,480 0.03Hellenic Republic Government Bond,
Reg. S, STEP 3% 24/02/2031 (3) EUR 5,282,870 2,072,669 0.03Hellenic Republic Government Bond,
Reg. S, STEP 3% 24/02/2032 (3) EUR 5,282,870 2,040,918 0.03Hellenic Republic Government Bond,
Reg. S, STEP 3% 24/02/2033 (3) EUR 5,282,870 2,039,399 0.03Hellenic Republic Government Bond,
Reg. S, STEP 3% 24/02/2034 (3) EUR 5,282,870 2,033,522 0.03Hellenic Republic Government Bond,
Reg. S, STEP 3% 24/02/2035 (3) EUR 5,282,870 2,024,581 0.03Hellenic Republic Government Bond,
Reg. S, STEP 3% 24/02/2036 (3) EUR 5,282,870 2,024,911 0.03Hellenic Republic Government Bond,
Reg. S, STEP 3% 24/02/2037 (3) EUR 5,282,870 2,026,786 0.03Hellenic Republic Government Bond,
Reg. S, STEP 3% 24/02/2038 (3) EUR 5,282,870 2,024,581 0.03Hellenic Republic Government Bond,
Reg. S, STEP 3% 24/02/2039 (3) EUR 5,282,870 2,024,541 0.03Hellenic Republic Government Bond,
Reg. S, STEP 3% 24/02/2040 (3) EUR 5,282,870 2,016,062 0.02Hellenic Republic Government Bond,
Reg. S, STEP 3% 24/02/2041 (3) EUR 5,282,870 2,017,092 0.03
SCHEDULE of invEStmEntSAs at 30 June 2015
Investments Currency
Quantity/Nominal
Value
Market Value EUR
% of Net Assets
transferable securities and money market instruments admitted to official exchange listing or dealt in on another regulated market
Government Bonds (continued)
Greece (continued)Hellenic Republic Government Bond,
Reg. S, STEP 3% 24/02/2042 (3) EUR 5,282,870 2,020,024 0.03
42,222,572 0.59
United States of AmericaUS Treasury Inflation Indexed 0.25%
15/01/2025 USD 1,389,636,000 1,219,869,341 16.96
1,219,869,341 16.96
total Government Bonds 2,452,576,751 34.09
mutual funds
Morgan Stanley Liquidity Funds - Euro Liquidity Fund MS Reserve (Luxembourg) (2) (4) EUR 149,081,887 149,081,887 2.07
149,081,887 2.07
total mutual funds 149,081,887 2.07
Warrants
United States of AmericaGSCI Brent Crude Oil 05/05/2016
(Curacao) (2) USD 3,232,000 269,114,012 3.74
269,114,012 3.74
total Warrants 269,114,012 3.74
total transferable securities and money market instruments admitted to official exchange listing or dealt in on another regulated market 6,271,915,115 87.18
The accompanying notes are an integral part of these financial statements.
Diversified Alpha Plus Fund (continued)
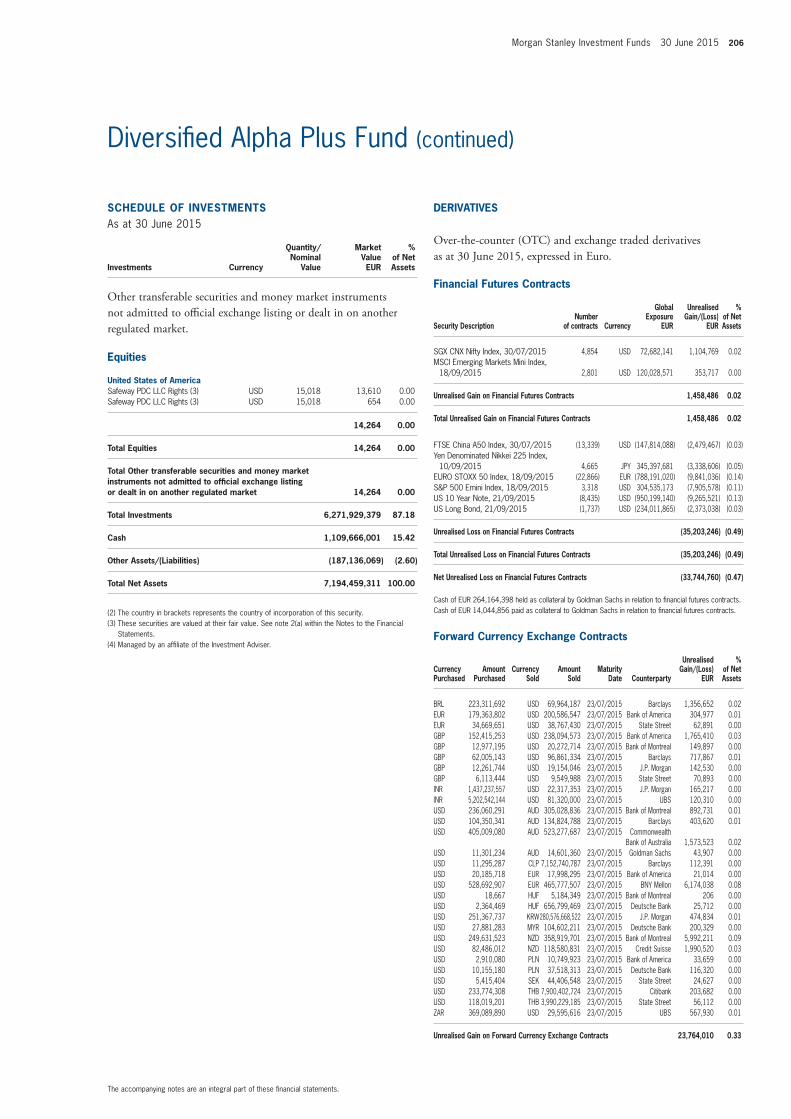
Morgan Stanley Investment Funds 30 June 2015 206
SCHEDULE of invEStmEntSAs at 30 June 2015
Investments Currency
Quantity/Nominal
Value
Market Value EUR
% of Net Assets
Other transferable securities and money market instruments not admitted to official exchange listing or dealt in on another regulated market.
Equities
United States of AmericaSafeway PDC LLC Rights (3) USD 15,018 13,610 0.00Safeway PDC LLC Rights (3) USD 15,018 654 0.00
14,264 0.00
total Equities 14,264 0.00
total other transferable securities and money market instruments not admitted to official exchange listing or dealt in on another regulated market 14,264 0.00
total investments 6,271,929,379 87.18
Cash 1,109,666,001 15.42
other Assets/(Liabilities) (187,136,069) (2.60)
total net Assets 7,194,459,311 100.00
(2) The country in brackets represents the country of incorporation of this security.(3) These securities are valued at their fair value. See note 2(a) within the Notes to the Financial
Statements.(4) Managed by an affiliate of the Investment Adviser.
The accompanying notes are an integral part of these financial statements.
Diversified Alpha Plus Fund (continued)
financial futures Contracts
Security Descriptionnumber
of contracts Currency
Global Exposure
EUR
Unrealised Gain/(Loss)
EUR
% of net Assets
SGX CNX Nifty Index, 30/07/2015 4,854 USD 72,682,141 1,104,769 0.02MSCI Emerging Markets Mini Index,
18/09/2015 2,801 USD 120,028,571 353,717 0.00
Unrealised Gain on financial futures Contracts 1,458,486 0.02
total Unrealised Gain on financial futures Contracts 1,458,486 0.02
FTSE China A50 Index, 30/07/2015 (13,339) USD (147,814,088) (2,479,467) (0.03)Yen Denominated Nikkei 225 Index,
10/09/2015 4,665 JPY 345,397,681 (3,338,606) (0.05)EURO STOXX 50 Index, 18/09/2015 (22,866) EUR (788,191,020) (9,841,036) (0.14)S&P 500 Emini Index, 18/09/2015 3,318 USD 304,535,173 (7,905,578) (0.11)US 10 Year Note, 21/09/2015 (8,435) USD (950,199,140) (9,265,521) (0.13)US Long Bond, 21/09/2015 (1,737) USD (234,011,865) (2,373,038) (0.03)
Unrealised Loss on financial futures Contracts (35,203,246) (0.49)
total Unrealised Loss on financial futures Contracts (35,203,246) (0.49)
net Unrealised Loss on financial futures Contracts (33,744,760) (0.47)
Cash of EUR 264,164,398 held as collateral by Goldman Sachs in relation to financial futures contracts.Cash of EUR 14,044,856 paid as collateral to Goldman Sachs in relation to financial futures contracts.
forward Currency Exchange Contracts (continued)
Currency Purchased
Amount Purchased
Currency Sold
Amount Sold
maturity Date Counterparty
Unrealised Gain/(Loss)
EUR
% of net Assets
BRL 223,311,692 USD 69,964,187 23/07/2015 Barclays 1,356,652 0.02EUR 179,363,802 USD 200,586,547 23/07/2015 Bank of America 304,977 0.01EUR 34,669,651 USD 38,767,430 23/07/2015 State Street 62,891 0.00GBP 152,415,253 USD 238,094,573 23/07/2015 Bank of America 1,765,410 0.03GBP 12,977,195 USD 20,272,714 23/07/2015 Bank of Montreal 149,897 0.00GBP 62,005,143 USD 96,861,334 23/07/2015 Barclays 717,867 0.01GBP 12,261,744 USD 19,154,046 23/07/2015 J.P. Morgan 142,530 0.00GBP 6,113,444 USD 9,549,988 23/07/2015 State Street 70,893 0.00INR 1,437,237,557 USD 22,317,353 23/07/2015 J.P. Morgan 165,217 0.00INR 5,202,542,144 USD 81,320,000 23/07/2015 UBS 120,310 0.00USD 236,060,291 AUD 305,028,836 23/07/2015 Bank of Montreal 892,731 0.01USD 104,350,341 AUD 134,824,788 23/07/2015 Barclays 403,620 0.01USD 405,009,080 AUD 523,277,687 23/07/2015 Commonwealth
Bank of Australia 1,573,523 0.02USD 11,301,234 AUD 14,601,360 23/07/2015 Goldman Sachs 43,907 0.00USD 11,295,287 CLP 7,152,740,787 23/07/2015 Barclays 112,391 0.00USD 20,185,718 EUR 17,998,295 23/07/2015 Bank of America 21,014 0.00USD 528,692,907 EUR 465,777,507 23/07/2015 BNY Mellon 6,174,038 0.08USD 18,667 HUF 5,184,349 23/07/2015 Bank of Montreal 206 0.00USD 2,364,469 HUF 656,799,469 23/07/2015 Deutsche Bank 25,712 0.00USD 251,367,737 KRW280,576,668,522 23/07/2015 J.P. Morgan 474,834 0.01USD 27,881,283 MYR 104,602,211 23/07/2015 Deutsche Bank 200,329 0.00USD 249,631,523 NZD 358,919,701 23/07/2015 Bank of Montreal 5,992,211 0.09USD 82,486,012 NZD 118,580,831 23/07/2015 Credit Suisse 1,990,520 0.03USD 2,910,080 PLN 10,749,923 23/07/2015 Bank of America 33,659 0.00USD 10,155,180 PLN 37,518,313 23/07/2015 Deutsche Bank 116,320 0.00USD 5,415,404 SEK 44,406,548 23/07/2015 State Street 24,627 0.00USD 233,774,308 THB 7,900,402,724 23/07/2015 Citibank 203,682 0.00USD 118,019,201 THB 3,990,229,185 23/07/2015 State Street 56,112 0.00ZAR 369,089,890 USD 29,595,616 23/07/2015 UBS 567,930 0.01
Unrealised Gain on forward Currency Exchange Contracts 23,764,010 0.33
DERivAtivES
Over-the-counter (OtC) and exchange traded derivatives as at 30 June 2015, expressed in euro.
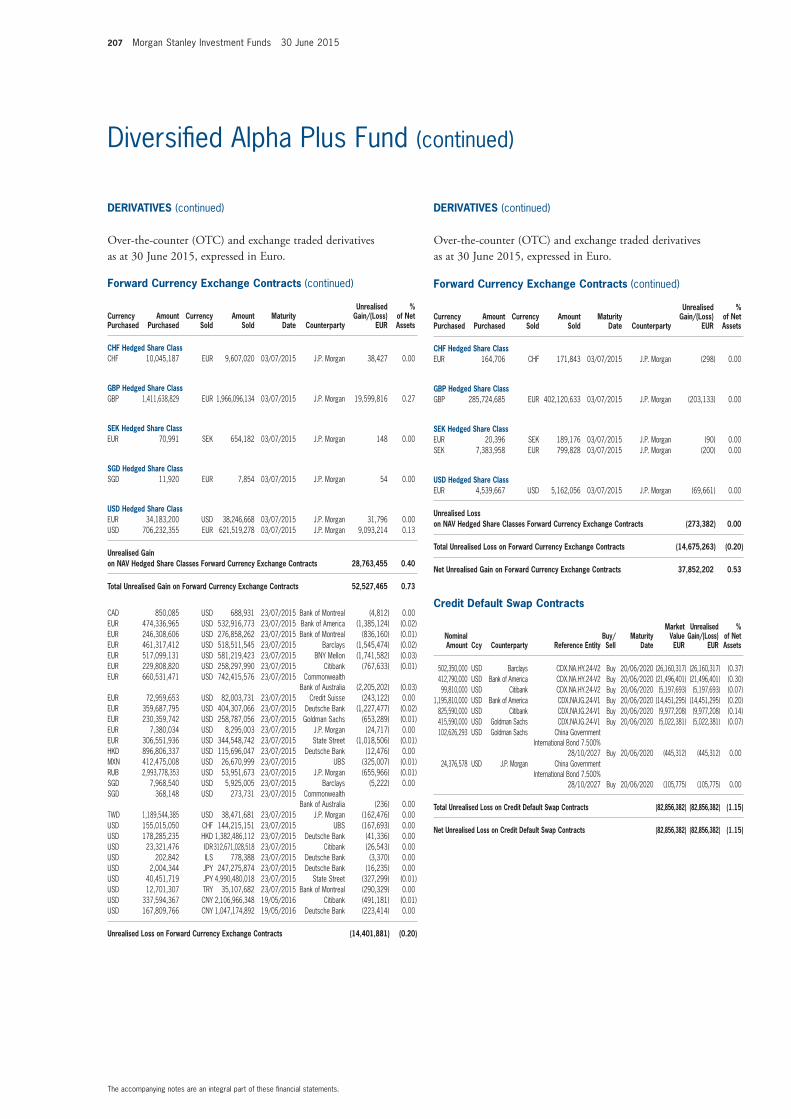
207 Morgan Stanley Investment Funds 30 June 2015
forward Currency Exchange Contracts (continued)
Currency Purchased
Amount Purchased
Currency Sold
Amount Sold
maturity Date Counterparty
Unrealised Gain/(Loss)
EUR
% of net Assets
CHf Hedged Share ClassCHF 10,045,187 EUR 9,607,020 03/07/2015 J.P. Morgan 38,427 0.00
GBP Hedged Share ClassGBP 1,411,638,829 EUR 1,966,096,134 03/07/2015 J.P. Morgan 19,599,816 0.27
SEK Hedged Share ClassEUR 70,991 SEK 654,182 03/07/2015 J.P. Morgan 148 0.00
SGD Hedged Share ClassSGD 11,920 EUR 7,854 03/07/2015 J.P. Morgan 54 0.00
USD Hedged Share ClassEUR 34,183,200 USD 38,246,668 03/07/2015 J.P. Morgan 31,796 0.00USD 706,232,355 EUR 621,519,278 03/07/2015 J.P. Morgan 9,093,214 0.13
Unrealised Gain on nAv Hedged Share Classes forward Currency Exchange Contracts 28,763,455 0.40
total Unrealised Gain on forward Currency Exchange Contracts 52,527,465 0.73
CAD 850,085 USD 688,931 23/07/2015 Bank of Montreal (4,812) 0.00EUR 474,336,965 USD 532,916,773 23/07/2015 Bank of America (1,385,124) (0.02)EUR 246,308,606 USD 276,858,262 23/07/2015 Bank of Montreal (836,160) (0.01)EUR 461,317,412 USD 518,511,545 23/07/2015 Barclays (1,545,474) (0.02)EUR 517,099,131 USD 581,219,423 23/07/2015 BNY Mellon (1,741,582) (0.03)EUR 229,808,820 USD 258,297,990 23/07/2015 Citibank (767,633) (0.01)EUR 660,531,471 USD 742,415,576 23/07/2015 Commonwealth
Bank of Australia (2,205,202) (0.03)EUR 72,959,653 USD 82,003,731 23/07/2015 Credit Suisse (243,122) 0.00EUR 359,687,795 USD 404,307,066 23/07/2015 Deutsche Bank (1,227,477) (0.02)EUR 230,359,742 USD 258,787,056 23/07/2015 Goldman Sachs (653,289) (0.01)EUR 7,380,034 USD 8,295,003 23/07/2015 J.P. Morgan (24,717) 0.00EUR 306,551,936 USD 344,548,742 23/07/2015 State Street (1,018,506) (0.01)HKD 896,806,337 USD 115,696,047 23/07/2015 Deutsche Bank (12,476) 0.00MXN 412,475,008 USD 26,670,999 23/07/2015 UBS (325,007) (0.01)RUB 2,993,778,353 USD 53,951,673 23/07/2015 J.P. Morgan (655,966) (0.01)SGD 7,968,540 USD 5,925,005 23/07/2015 Barclays (5,222) 0.00SGD 368,148 USD 273,731 23/07/2015 Commonwealth
Bank of Australia (236) 0.00TWD 1,189,544,385 USD 38,471,681 23/07/2015 J.P. Morgan (162,476) 0.00USD 155,015,050 CHF 144,215,151 23/07/2015 UBS (167,693) 0.00USD 178,285,235 HKD 1,382,486,112 23/07/2015 Deutsche Bank (41,336) 0.00USD 23,321,476 IDR312,671,028,518 23/07/2015 Citibank (26,543) 0.00USD 202,842 ILS 778,388 23/07/2015 Deutsche Bank (3,370) 0.00USD 2,004,344 JPY 247,275,874 23/07/2015 Deutsche Bank (16,235) 0.00USD 40,451,719 JPY 4,990,480,018 23/07/2015 State Street (327,299) (0.01)USD 12,701,307 TRY 35,107,682 23/07/2015 Bank of Montreal (290,329) 0.00USD 337,594,367 CNY 2,106,966,348 19/05/2016 Citibank (491,181) (0.01)USD 167,809,766 CNY 1,047,174,892 19/05/2016 Deutsche Bank (223,414) 0.00
Unrealised Loss on forward Currency Exchange Contracts (14,401,881) (0.20)
forward Currency Exchange Contracts (continued)
Currency Purchased
Amount Purchased
Currency Sold
Amount Sold
maturity Date Counterparty
Unrealised Gain/(Loss)
EUR
% of net Assets
CHf Hedged Share ClassEUR 164,706 CHF 171,843 03/07/2015 J.P. Morgan (298) 0.00
GBP Hedged Share ClassGBP 285,724,685 EUR 402,120,633 03/07/2015 J.P. Morgan (203,133) 0.00
SEK Hedged Share ClassEUR 20,396 SEK 189,176 03/07/2015 J.P. Morgan (90) 0.00SEK 7,383,958 EUR 799,828 03/07/2015 J.P. Morgan (200) 0.00
USD Hedged Share ClassEUR 4,539,667 USD 5,162,056 03/07/2015 J.P. Morgan (69,661) 0.00
Unrealised Loss on nAv Hedged Share Classes forward Currency Exchange Contracts (273,382) 0.00
total Unrealised Loss on forward Currency Exchange Contracts (14,675,263) (0.20)
net Unrealised Gain on forward Currency Exchange Contracts 37,852,202 0.53
Credit Default Swap Contracts
nominal Amount Ccy Counterparty Reference Entity
Buy/Sell
maturity Date
market value EUR
Unrealised Gain/(Loss)
EUR
% of net Assets
502,350,000 USD Barclays CDX.NA.HY.24-V2 Buy 20/06/2020 (26,160,317) (26,160,317) (0.37)412,790,000 USD Bank of America CDX.NA.HY.24-V2 Buy 20/06/2020 (21,496,401) (21,496,401) (0.30)99,810,000 USD Citibank CDX.NA.HY.24-V2 Buy 20/06/2020 (5,197,693) (5,197,693) (0.07)
1,195,810,000 USD Bank of America CDX.NA.IG.24-V1 Buy 20/06/2020 (14,451,295) (14,451,295) (0.20)825,590,000 USD Citibank CDX.NA.IG.24-V1 Buy 20/06/2020 (9,977,208) (9,977,208) (0.14)415,590,000 USD Goldman Sachs CDX.NA.IG.24-V1 Buy 20/06/2020 (5,022,381) (5,022,381) (0.07)102,626,293 USD Goldman Sachs China Government
International Bond 7.500% 28/10/2027 Buy 20/06/2020 (445,312) (445,312) 0.00
24,376,578 USD J.P. Morgan China Government International Bond 7.500%
28/10/2027 Buy 20/06/2020 (105,775) (105,775) 0.00
total Unrealised Loss on Credit Default Swap Contracts (82,856,382) (82,856,382) (1.15)
net Unrealised Loss on Credit Default Swap Contracts (82,856,382) (82,856,382) (1.15)
The accompanying notes are an integral part of these financial statements.
Diversified Alpha Plus Fund (continued)
DERivAtivES (continued)
Over-the-counter (OtC) and exchange traded derivatives as at 30 June 2015, expressed in euro.
DERivAtivES (continued)
Over-the-counter (OtC) and exchange traded derivatives as at 30 June 2015, expressed in euro.
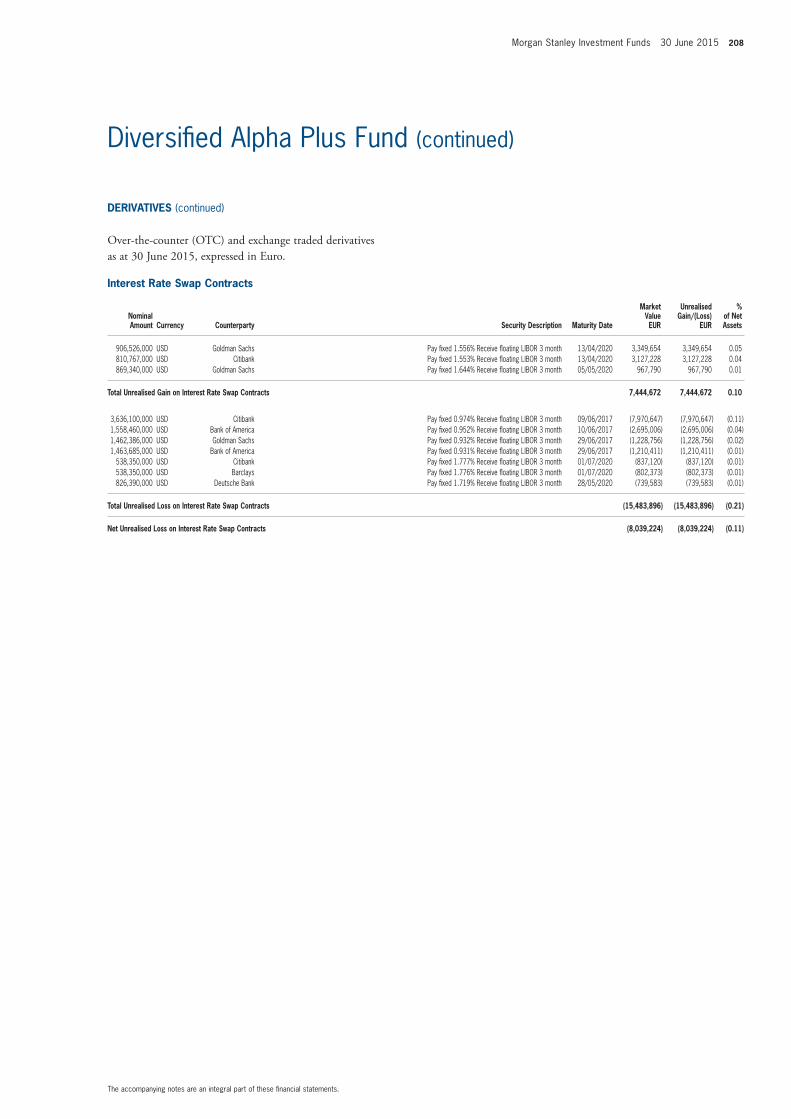
Morgan Stanley Investment Funds 30 June 2015 208
The accompanying notes are an integral part of these financial statements.
Diversified Alpha Plus Fund (continued)
DERivAtivES (continued)
Over-the-counter (OtC) and exchange traded derivatives as at 30 June 2015, expressed in euro.
interest Rate Swap Contracts
nominal Amount Currency Counterparty Security Description maturity Date
market value EUR
Unrealised Gain/(Loss)
EUR
% of net Assets
906,526,000 USD Goldman Sachs Pay fixed 1.556% Receive floating LIBOR 3 month 13/04/2020 3,349,654 3,349,654 0.05810,767,000 USD Citibank Pay fixed 1.553% Receive floating LIBOR 3 month 13/04/2020 3,127,228 3,127,228 0.04869,340,000 USD Goldman Sachs Pay fixed 1.644% Receive floating LIBOR 3 month 05/05/2020 967,790 967,790 0.01
total Unrealised Gain on interest Rate Swap Contracts 7,444,672 7,444,672 0.10
3,636,100,000 USD Citibank Pay fixed 0.974% Receive floating LIBOR 3 month 09/06/2017 (7,970,647) (7,970,647) (0.11)1,558,460,000 USD Bank of America Pay fixed 0.952% Receive floating LIBOR 3 month 10/06/2017 (2,695,006) (2,695,006) (0.04)1,462,386,000 USD Goldman Sachs Pay fixed 0.932% Receive floating LIBOR 3 month 29/06/2017 (1,228,756) (1,228,756) (0.02)1,463,685,000 USD Bank of America Pay fixed 0.931% Receive floating LIBOR 3 month 29/06/2017 (1,210,411) (1,210,411) (0.01)
538,350,000 USD Citibank Pay fixed 1.777% Receive floating LIBOR 3 month 01/07/2020 (837,120) (837,120) (0.01)538,350,000 USD Barclays Pay fixed 1.776% Receive floating LIBOR 3 month 01/07/2020 (802,373) (802,373) (0.01)826,390,000 USD Deutsche Bank Pay fixed 1.719% Receive floating LIBOR 3 month 28/05/2020 (739,583) (739,583) (0.01)
total Unrealised Loss on interest Rate Swap Contracts (15,483,896) (15,483,896) (0.21)
net Unrealised Loss on interest Rate Swap Contracts (8,039,224) (8,039,224) (0.11)
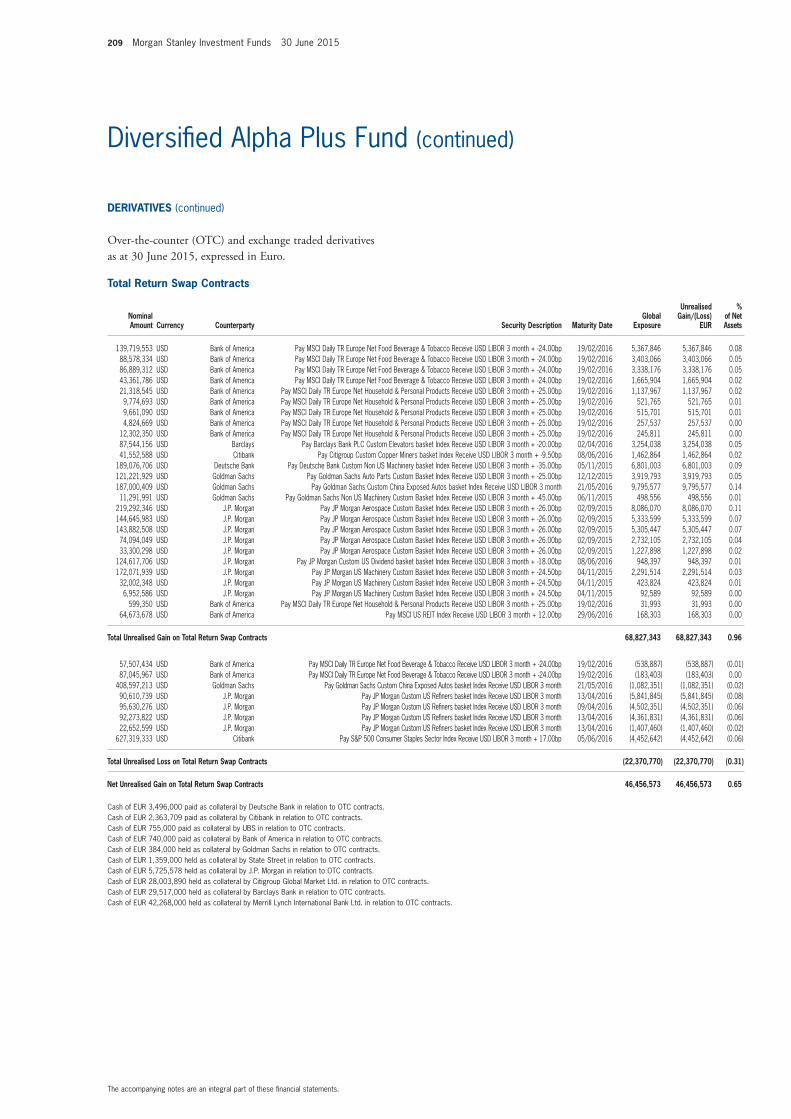
209 Morgan Stanley Investment Funds 30 June 2015
The accompanying notes are an integral part of these financial statements.
Diversified Alpha Plus Fund (continued)
total Return Swap Contracts
nominal Amount Currency Counterparty Security Description maturity Date
Global Exposure
Unrealised Gain/(Loss)
EUR
% of net Assets
139,719,553 USD Bank of America Pay MSCI Daily TR Europe Net Food Beverage & Tobacco Receive USD LIBOR 3 month + -24.00bp 19/02/2016 5,367,846 5,367,846 0.0888,578,334 USD Bank of America Pay MSCI Daily TR Europe Net Food Beverage & Tobacco Receive USD LIBOR 3 month + -24.00bp 19/02/2016 3,403,066 3,403,066 0.0586,889,312 USD Bank of America Pay MSCI Daily TR Europe Net Food Beverage & Tobacco Receive USD LIBOR 3 month + -24.00bp 19/02/2016 3,338,176 3,338,176 0.0543,361,786 USD Bank of America Pay MSCI Daily TR Europe Net Food Beverage & Tobacco Receive USD LIBOR 3 month + -24.00bp 19/02/2016 1,665,904 1,665,904 0.0221,318,545 USD Bank of America Pay MSCI Daily TR Europe Net Household & Personal Products Receive USD LIBOR 3 month + -25.00bp 19/02/2016 1,137,967 1,137,967 0.029,774,693 USD Bank of America Pay MSCI Daily TR Europe Net Household & Personal Products Receive USD LIBOR 3 month + -25.00bp 19/02/2016 521,765 521,765 0.019,661,090 USD Bank of America Pay MSCI Daily TR Europe Net Household & Personal Products Receive USD LIBOR 3 month + -25.00bp 19/02/2016 515,701 515,701 0.014,824,669 USD Bank of America Pay MSCI Daily TR Europe Net Household & Personal Products Receive USD LIBOR 3 month + -25.00bp 19/02/2016 257,537 257,537 0.00
12,302,350 USD Bank of America Pay MSCI Daily TR Europe Net Household & Personal Products Receive USD LIBOR 3 month + -25.00bp 19/02/2016 245,811 245,811 0.0087,544,156 USD Barclays Pay Barclays Bank PLC Custom Elevators basket Index Receive USD LIBOR 3 month + -20.00bp 02/04/2016 3,254,038 3,254,038 0.0541,552,588 USD Citibank Pay Citigroup Custom Copper Miners basket Index Receive USD LIBOR 3 month + -9.50bp 08/06/2016 1,462,864 1,462,864 0.02
189,076,706 USD Deutsche Bank Pay Deutsche Bank Custom Non US Machinery basket Index Receive USD LIBOR 3 month + -35.00bp 05/11/2015 6,801,003 6,801,003 0.09121,221,929 USD Goldman Sachs Pay Goldman Sachs Auto Parts Custom Basket Index Receive USD LIBOR 3 month + -25.00bp 12/12/2015 3,919,793 3,919,793 0.05187,000,409 USD Goldman Sachs Pay Goldman Sachs Custom China Exposed Autos basket Index Receive USD LIBOR 3 month 21/05/2016 9,795,577 9,795,577 0.1411,291,991 USD Goldman Sachs Pay Goldman Sachs Non US Machinery Custom Basket Index Receive USD LIBOR 3 month + -45.00bp 06/11/2015 498,556 498,556 0.01
219,292,346 USD J.P. Morgan Pay JP Morgan Aerospace Custom Basket Index Receive USD LIBOR 3 month + -26.00bp 02/09/2015 8,086,070 8,086,070 0.11144,645,983 USD J.P. Morgan Pay JP Morgan Aerospace Custom Basket Index Receive USD LIBOR 3 month + -26.00bp 02/09/2015 5,333,599 5,333,599 0.07143,882,508 USD J.P. Morgan Pay JP Morgan Aerospace Custom Basket Index Receive USD LIBOR 3 month + -26.00bp 02/09/2015 5,305,447 5,305,447 0.0774,094,049 USD J.P. Morgan Pay JP Morgan Aerospace Custom Basket Index Receive USD LIBOR 3 month + -26.00bp 02/09/2015 2,732,105 2,732,105 0.0433,300,298 USD J.P. Morgan Pay JP Morgan Aerospace Custom Basket Index Receive USD LIBOR 3 month + -26.00bp 02/09/2015 1,227,898 1,227,898 0.02
124,617,706 USD J.P. Morgan Pay JP Morgan Custom US Dividend basket basket Index Receive USD LIBOR 3 month + -18.00bp 08/06/2016 948,397 948,397 0.01172,071,939 USD J.P. Morgan Pay JP Morgan US Machinery Custom Basket Index Receive USD LIBOR 3 month + -24.50bp 04/11/2015 2,291,514 2,291,514 0.0332,002,348 USD J.P. Morgan Pay JP Morgan US Machinery Custom Basket Index Receive USD LIBOR 3 month + -24.50bp 04/11/2015 423,824 423,824 0.016,952,586 USD J.P. Morgan Pay JP Morgan US Machinery Custom Basket Index Receive USD LIBOR 3 month + -24.50bp 04/11/2015 92,589 92,589 0.00
599,350 USD Bank of America Pay MSCI Daily TR Europe Net Household & Personal Products Receive USD LIBOR 3 month + -25.00bp 19/02/2016 31,993 31,993 0.0064,673,678 USD Bank of America Pay MSCI US REIT Index Receive USD LIBOR 3 month + 12.00bp 29/06/2016 168,303 168,303 0.00
total Unrealised Gain on total Return Swap Contracts 68,827,343 68,827,343 0.96
57,507,434 USD Bank of America Pay MSCI Daily TR Europe Net Food Beverage & Tobacco Receive USD LIBOR 3 month + -24.00bp 19/02/2016 (538,887) (538,887) (0.01)87,045,967 USD Bank of America Pay MSCI Daily TR Europe Net Food Beverage & Tobacco Receive USD LIBOR 3 month + -24.00bp 19/02/2016 (183,403) (183,403) 0.00
408,597,213 USD Goldman Sachs Pay Goldman Sachs Custom China Exposed Autos basket Index Receive USD LIBOR 3 month 21/05/2016 (1,082,351) (1,082,351) (0.02)90,610,739 USD J.P. Morgan Pay JP Morgan Custom US Refiners basket Index Receive USD LIBOR 3 month 13/04/2016 (5,841,845) (5,841,845) (0.08)95,630,276 USD J.P. Morgan Pay JP Morgan Custom US Refiners basket Index Receive USD LIBOR 3 month 09/04/2016 (4,502,351) (4,502,351) (0.06)92,273,822 USD J.P. Morgan Pay JP Morgan Custom US Refiners basket Index Receive USD LIBOR 3 month 13/04/2016 (4,361,831) (4,361,831) (0.06)22,652,599 USD J.P. Morgan Pay JP Morgan Custom US Refiners basket Index Receive USD LIBOR 3 month 13/04/2016 (1,407,460) (1,407,460) (0.02)
627,319,333 USD Citibank Pay S&P 500 Consumer Staples Sector Index Receive USD LIBOR 3 month + 17.00bp 05/06/2016 (4,452,642) (4,452,642) (0.06)
total Unrealised Loss on total Return Swap Contracts (22,370,770) (22,370,770) (0.31)
net Unrealised Gain on total Return Swap Contracts 46,456,573 46,456,573 0.65
Cash of EUR 3,496,000 paid as collateral by Deutsche Bank in relation to OTC contracts.Cash of EUR 2,363,709 paid as collateral by Citibank in relation to OTC contracts.Cash of EUR 755,000 paid as collateral by UBS in relation to OTC contracts.Cash of EUR 740,000 paid as collateral by Bank of America in relation to OTC contracts.Cash of EUR 384,000 held as collateral by Goldman Sachs in relation to OTC contracts.Cash of EUR 1,359,000 held as collateral by State Street in relation to OTC contracts.Cash of EUR 5,725,578 held as collateral by J.P. Morgan in relation to OTC contracts.Cash of EUR 28,003,890 held as collateral by Citigroup Global Market Ltd. in relation to OTC contracts.Cash of EUR 29,517,000 held as collateral by Barclays Bank in relation to OTC contracts.Cash of EUR 42,268,000 held as collateral by Merrill Lynch International Bank Ltd. in relation to OTC contracts.
DERivAtivES (continued)
Over-the-counter (OtC) and exchange traded derivatives as at 30 June 2015, expressed in euro.
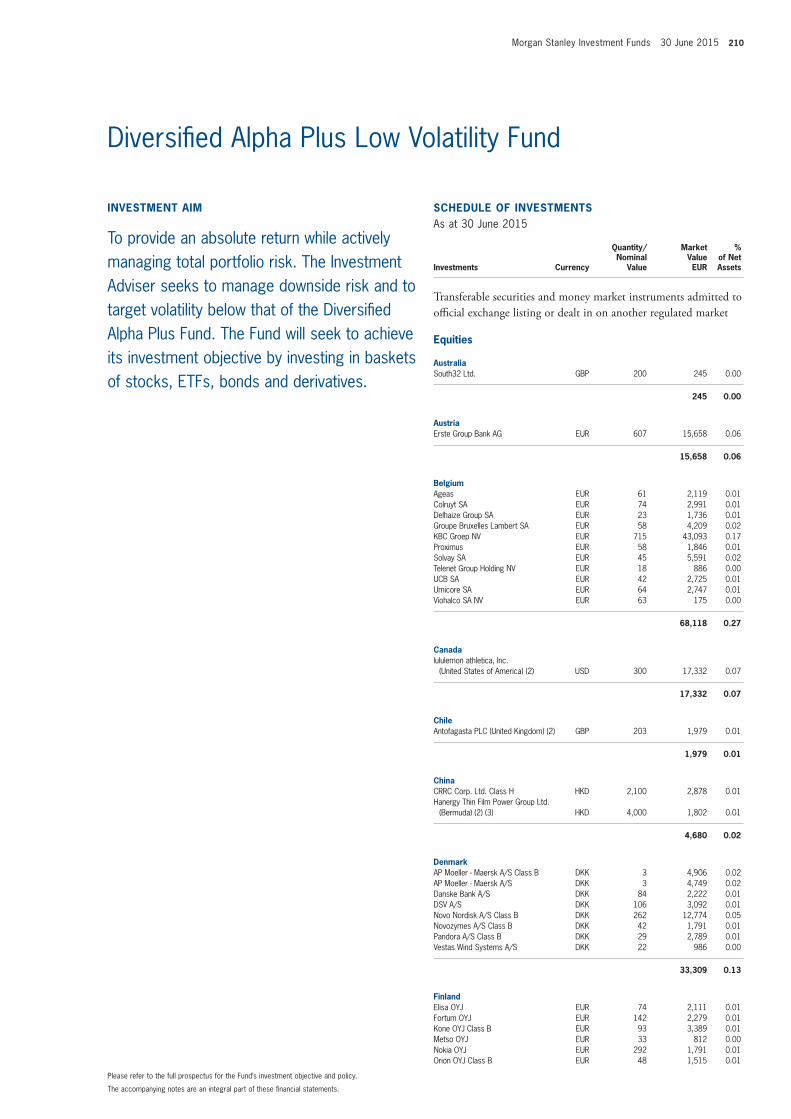
Morgan Stanley Investment Funds 30 June 2015 210
invEStmEnt Aim
To provide an absolute return while actively managing total portfolio risk. The Investment Adviser seeks to manage downside risk and to target volatility below that of the Diversified Alpha Plus Fund. The Fund will seek to achieve its investment objective by investing in baskets of stocks, ETFs, bonds and derivatives.
SCHEDULE of invEStmEntSAs at 30 June 2015
Investments Currency
Quantity/Nominal
Value
Market Value EUR
% of Net Assets
transferable securities and money market instruments admitted to official exchange listing or dealt in on another regulated market
Equities
AustraliaSouth32 Ltd. GBP 200 245 0.00
245 0.00
AustriaErste Group Bank AG EUR 607 15,658 0.06
15,658 0.06
BelgiumAgeas EUR 61 2,119 0.01Colruyt SA EUR 74 2,991 0.01Delhaize Group SA EUR 23 1,736 0.01Groupe Bruxelles Lambert SA EUR 58 4,209 0.02KBC Groep NV EUR 715 43,093 0.17Proximus EUR 58 1,846 0.01Solvay SA EUR 45 5,591 0.02Telenet Group Holding NV EUR 18 886 0.00UCB SA EUR 42 2,725 0.01Umicore SA EUR 64 2,747 0.01Viohalco SA NV EUR 63 175 0.00
68,118 0.27
Canadalululemon athletica, Inc.
(United States of America) (2) USD 300 17,332 0.07
17,332 0.07
ChileAntofagasta PLC (United Kingdom) (2) GBP 203 1,979 0.01
1,979 0.01
ChinaCRRC Corp. Ltd. Class H HKD 2,100 2,878 0.01Hanergy Thin Film Power Group Ltd.
(Bermuda) (2) (3) HKD 4,000 1,802 0.01
4,680 0.02
DenmarkAP Moeller - Maersk A/S Class B DKK 3 4,906 0.02AP Moeller - Maersk A/S DKK 3 4,749 0.02Danske Bank A/S DKK 84 2,222 0.01DSV A/S DKK 106 3,092 0.01Novo Nordisk A/S Class B DKK 262 12,774 0.05Novozymes A/S Class B DKK 42 1,791 0.01Pandora A/S Class B DKK 29 2,789 0.01Vestas Wind Systems A/S DKK 22 986 0.00
33,309 0.13
finlandElisa OYJ EUR 74 2,111 0.01Fortum OYJ EUR 142 2,279 0.01Kone OYJ Class B EUR 93 3,389 0.01Metso OYJ EUR 33 812 0.00Nokia OYJ EUR 292 1,791 0.01Orion OYJ Class B EUR 48 1,515 0.01
The accompanying notes are an integral part of these financial statements.
Please refer to the full prospectus for the Fund’s investment objective and policy.
Diversified Alpha Plus Low Volatility Fund
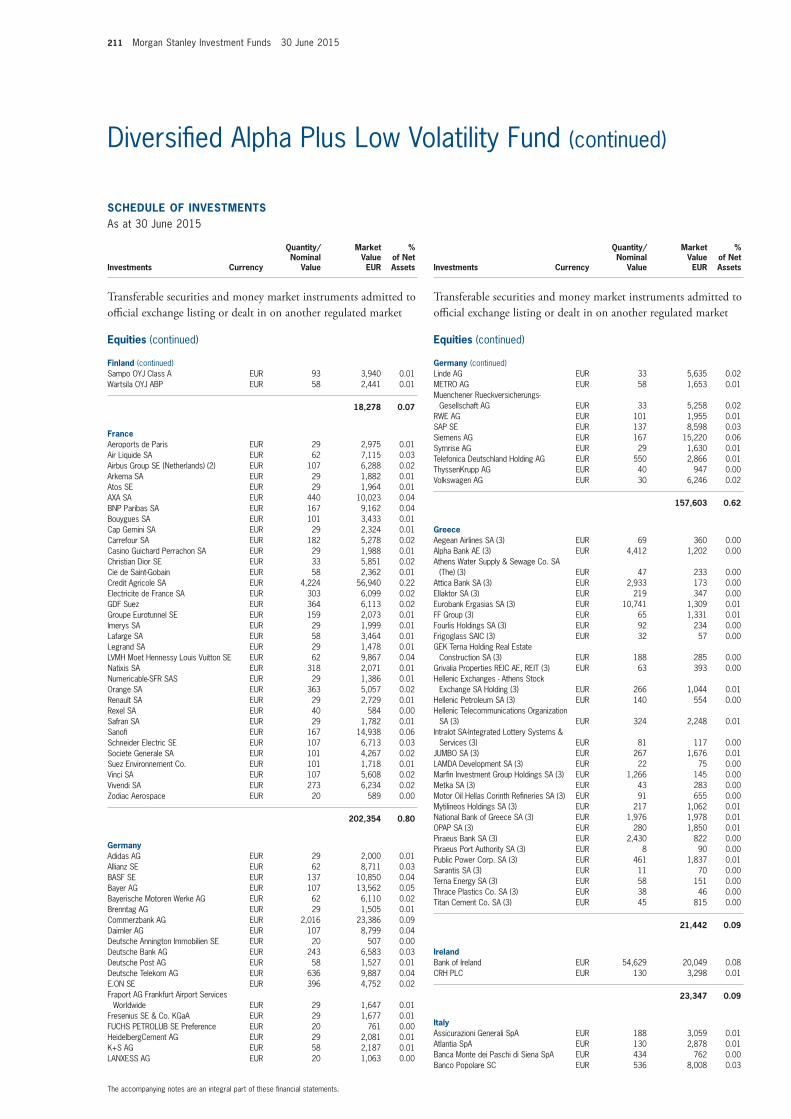
211 Morgan Stanley Investment Funds 30 June 2015
SCHEDULE of invEStmEntSAs at 30 June 2015
Investments Currency
Quantity/Nominal
Value
Market Value EUR
% of Net Assets
transferable securities and money market instruments admitted to official exchange listing or dealt in on another regulated market
Equities (continued)
finland (continued)Sampo OYJ Class A EUR 93 3,940 0.01Wartsila OYJ ABP EUR 58 2,441 0.01
18,278 0.07
franceAeroports de Paris EUR 29 2,975 0.01Air Liquide SA EUR 62 7,115 0.03Airbus Group SE (Netherlands) (2) EUR 107 6,288 0.02Arkema SA EUR 29 1,882 0.01Atos SE EUR 29 1,964 0.01AXA SA EUR 440 10,023 0.04BNP Paribas SA EUR 167 9,162 0.04Bouygues SA EUR 101 3,433 0.01Cap Gemini SA EUR 29 2,324 0.01Carrefour SA EUR 182 5,278 0.02Casino Guichard Perrachon SA EUR 29 1,988 0.01Christian Dior SE EUR 33 5,851 0.02Cie de Saint-Gobain EUR 58 2,362 0.01Credit Agricole SA EUR 4,224 56,940 0.22Electricite de France SA EUR 303 6,099 0.02GDF Suez EUR 364 6,113 0.02Groupe Eurotunnel SE EUR 159 2,073 0.01Imerys SA EUR 29 1,999 0.01Lafarge SA EUR 58 3,464 0.01Legrand SA EUR 29 1,478 0.01LVMH Moet Hennessy Louis Vuitton SE EUR 62 9,867 0.04Natixis SA EUR 318 2,071 0.01Numericable-SFR SAS EUR 29 1,386 0.01Orange SA EUR 363 5,057 0.02Renault SA EUR 29 2,729 0.01Rexel SA EUR 40 584 0.00Safran SA EUR 29 1,782 0.01Sanofi EUR 167 14,938 0.06Schneider Electric SE EUR 107 6,713 0.03Societe Generale SA EUR 101 4,267 0.02Suez Environnement Co. EUR 101 1,718 0.01Vinci SA EUR 107 5,608 0.02Vivendi SA EUR 273 6,234 0.02Zodiac Aerospace EUR 20 589 0.00
202,354 0.80
GermanyAdidas AG EUR 29 2,000 0.01Allianz SE EUR 62 8,711 0.03BASF SE EUR 137 10,850 0.04Bayer AG EUR 107 13,562 0.05Bayerische Motoren Werke AG EUR 62 6,110 0.02Brenntag AG EUR 29 1,505 0.01Commerzbank AG EUR 2,016 23,386 0.09Daimler AG EUR 107 8,799 0.04Deutsche Annington Immobilien SE EUR 20 507 0.00Deutsche Bank AG EUR 243 6,583 0.03Deutsche Post AG EUR 58 1,527 0.01Deutsche Telekom AG EUR 636 9,887 0.04E.ON SE EUR 396 4,752 0.02Fraport AG Frankfurt Airport Services
Worldwide EUR 29 1,647 0.01Fresenius SE & Co. KGaA EUR 29 1,677 0.01FUCHS PETROLUB SE Preference EUR 20 761 0.00HeidelbergCement AG EUR 29 2,081 0.01K+S AG EUR 58 2,187 0.01LANXESS AG EUR 20 1,063 0.00
SCHEDULE of invEStmEntSAs at 30 June 2015
Investments Currency
Quantity/Nominal
Value
Market Value EUR
% of Net Assets
transferable securities and money market instruments admitted to official exchange listing or dealt in on another regulated market
Equities (continued)
Germany (continued)Linde AG EUR 33 5,635 0.02METRO AG EUR 58 1,653 0.01Muenchener Rueckversicherungs-
Gesellschaft AG EUR 33 5,258 0.02RWE AG EUR 101 1,955 0.01SAP SE EUR 137 8,598 0.03Siemens AG EUR 167 15,220 0.06Symrise AG EUR 29 1,630 0.01Telefonica Deutschland Holding AG EUR 550 2,866 0.01ThyssenKrupp AG EUR 40 947 0.00Volkswagen AG EUR 30 6,246 0.02
157,603 0.62
GreeceAegean Airlines SA (3) EUR 69 360 0.00Alpha Bank AE (3) EUR 4,412 1,202 0.00Athens Water Supply & Sewage Co. SA
(The) (3) EUR 47 233 0.00Attica Bank SA (3) EUR 2,933 173 0.00Ellaktor SA (3) EUR 219 347 0.00Eurobank Ergasias SA (3) EUR 10,741 1,309 0.01FF Group (3) EUR 65 1,331 0.01Fourlis Holdings SA (3) EUR 92 234 0.00Frigoglass SAIC (3) EUR 32 57 0.00GEK Terna Holding Real Estate
Construction SA (3) EUR 188 285 0.00Grivalia Properties REIC AE, REIT (3) EUR 63 393 0.00Hellenic Exchanges - Athens Stock
Exchange SA Holding (3) EUR 266 1,044 0.01Hellenic Petroleum SA (3) EUR 140 554 0.00Hellenic Telecommunications Organization
SA (3) EUR 324 2,248 0.01Intralot SA-Integrated Lottery Systems &
Services (3) EUR 81 117 0.00JUMBO SA (3) EUR 267 1,676 0.01LAMDA Development SA (3) EUR 22 75 0.00Marfin Investment Group Holdings SA (3) EUR 1,266 145 0.00Metka SA (3) EUR 43 283 0.00Motor Oil Hellas Corinth Refineries SA (3) EUR 91 655 0.00Mytilineos Holdings SA (3) EUR 217 1,062 0.01National Bank of Greece SA (3) EUR 1,976 1,978 0.01OPAP SA (3) EUR 280 1,850 0.01Piraeus Bank SA (3) EUR 2,430 822 0.00Piraeus Port Authority SA (3) EUR 8 90 0.00Public Power Corp. SA (3) EUR 461 1,837 0.01Sarantis SA (3) EUR 11 70 0.00Terna Energy SA (3) EUR 58 151 0.00Thrace Plastics Co. SA (3) EUR 38 46 0.00Titan Cement Co. SA (3) EUR 45 815 0.00
21,442 0.09
irelandBank of Ireland EUR 54,629 20,049 0.08CRH PLC EUR 130 3,298 0.01
23,347 0.09
italyAssicurazioni Generali SpA EUR 188 3,059 0.01Atlantia SpA EUR 130 2,878 0.01Banca Monte dei Paschi di Siena SpA EUR 434 762 0.00Banco Popolare SC EUR 536 8,008 0.03
The accompanying notes are an integral part of these financial statements.
Diversified Alpha Plus Low Volatility Fund (continued)
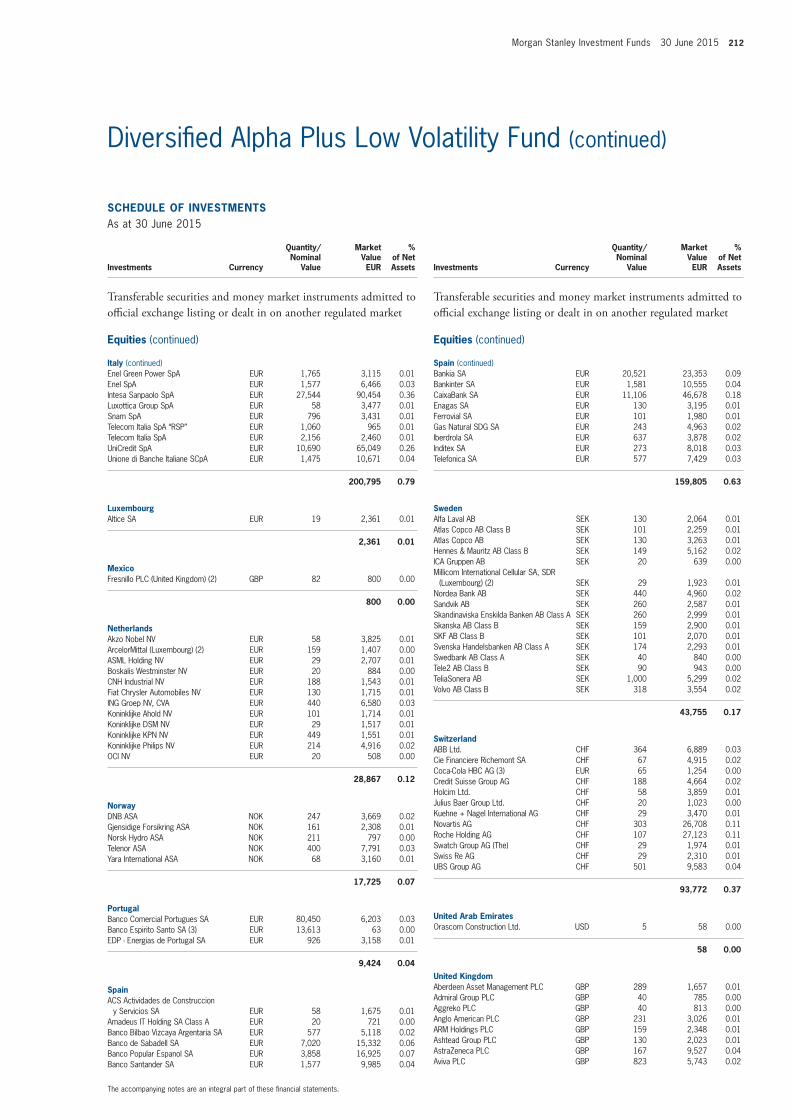
Morgan Stanley Investment Funds 30 June 2015 212
SCHEDULE of invEStmEntSAs at 30 June 2015
Investments Currency
Quantity/Nominal
Value
Market Value EUR
% of Net Assets
transferable securities and money market instruments admitted to official exchange listing or dealt in on another regulated market
Equities (continued)
italy (continued)Enel Green Power SpA EUR 1,765 3,115 0.01Enel SpA EUR 1,577 6,466 0.03Intesa Sanpaolo SpA EUR 27,544 90,454 0.36Luxottica Group SpA EUR 58 3,477 0.01Snam SpA EUR 796 3,431 0.01Telecom Italia SpA “RSP” EUR 1,060 965 0.01Telecom Italia SpA EUR 2,156 2,460 0.01UniCredit SpA EUR 10,690 65,049 0.26Unione di Banche Italiane SCpA EUR 1,475 10,671 0.04
200,795 0.79
LuxembourgAltice SA EUR 19 2,361 0.01
2,361 0.01
mexicoFresnillo PLC (United Kingdom) (2) GBP 82 800 0.00
800 0.00
netherlandsAkzo Nobel NV EUR 58 3,825 0.01ArcelorMittal (Luxembourg) (2) EUR 159 1,407 0.00ASML Holding NV EUR 29 2,707 0.01Boskalis Westminster NV EUR 20 884 0.00CNH Industrial NV EUR 188 1,543 0.01Fiat Chrysler Automobiles NV EUR 130 1,715 0.01ING Groep NV, CVA EUR 440 6,580 0.03Koninklijke Ahold NV EUR 101 1,714 0.01Koninklijke DSM NV EUR 29 1,517 0.01Koninklijke KPN NV EUR 449 1,551 0.01Koninklijke Philips NV EUR 214 4,916 0.02OCI NV EUR 20 508 0.00
28,867 0.12
norwayDNB ASA NOK 247 3,669 0.02Gjensidige Forsikring ASA NOK 161 2,308 0.01Norsk Hydro ASA NOK 211 797 0.00Telenor ASA NOK 400 7,791 0.03Yara International ASA NOK 68 3,160 0.01
17,725 0.07
PortugalBanco Comercial Portugues SA EUR 80,450 6,203 0.03Banco Espirito Santo SA (3) EUR 13,613 63 0.00EDP - Energias de Portugal SA EUR 926 3,158 0.01
9,424 0.04
SpainACS Actividades de Construccion
y Servicios SA EUR 58 1,675 0.01Amadeus IT Holding SA Class A EUR 20 721 0.00Banco Bilbao Vizcaya Argentaria SA EUR 577 5,118 0.02Banco de Sabadell SA EUR 7,020 15,332 0.06Banco Popular Espanol SA EUR 3,858 16,925 0.07Banco Santander SA EUR 1,577 9,985 0.04
SCHEDULE of invEStmEntSAs at 30 June 2015
Investments Currency
Quantity/Nominal
Value
Market Value EUR
% of Net Assets
transferable securities and money market instruments admitted to official exchange listing or dealt in on another regulated market
Equities (continued)
Spain (continued)Bankia SA EUR 20,521 23,353 0.09Bankinter SA EUR 1,581 10,555 0.04CaixaBank SA EUR 11,106 46,678 0.18Enagas SA EUR 130 3,195 0.01Ferrovial SA EUR 101 1,980 0.01Gas Natural SDG SA EUR 243 4,963 0.02Iberdrola SA EUR 637 3,878 0.02Inditex SA EUR 273 8,018 0.03Telefonica SA EUR 577 7,429 0.03
159,805 0.63
SwedenAlfa Laval AB SEK 130 2,064 0.01Atlas Copco AB Class B SEK 101 2,259 0.01Atlas Copco AB SEK 130 3,263 0.01Hennes & Mauritz AB Class B SEK 149 5,162 0.02ICA Gruppen AB SEK 20 639 0.00Millicom International Cellular SA, SDR
(Luxembourg) (2) SEK 29 1,923 0.01Nordea Bank AB SEK 440 4,960 0.02Sandvik AB SEK 260 2,587 0.01Skandinaviska Enskilda Banken AB Class A SEK 260 2,999 0.01Skanska AB Class B SEK 159 2,900 0.01SKF AB Class B SEK 101 2,070 0.01Svenska Handelsbanken AB Class A SEK 174 2,293 0.01Swedbank AB Class A SEK 40 840 0.00Tele2 AB Class B SEK 90 943 0.00TeliaSonera AB SEK 1,000 5,299 0.02Volvo AB Class B SEK 318 3,554 0.02
43,755 0.17
SwitzerlandABB Ltd. CHF 364 6,889 0.03Cie Financiere Richemont SA CHF 67 4,915 0.02Coca-Cola HBC AG (3) EUR 65 1,254 0.00Credit Suisse Group AG CHF 188 4,664 0.02Holcim Ltd. CHF 58 3,859 0.01Julius Baer Group Ltd. CHF 20 1,023 0.00Kuehne + Nagel International AG CHF 29 3,470 0.01Novartis AG CHF 303 26,708 0.11Roche Holding AG CHF 107 27,123 0.11Swatch Group AG (The) CHF 29 1,974 0.01Swiss Re AG CHF 29 2,310 0.01UBS Group AG CHF 501 9,583 0.04
93,772 0.37
United Arab EmiratesOrascom Construction Ltd. USD 5 58 0.00
58 0.00
United KingdomAberdeen Asset Management PLC GBP 289 1,657 0.01Admiral Group PLC GBP 40 785 0.00Aggreko PLC GBP 40 813 0.00Anglo American PLC GBP 231 3,026 0.01ARM Holdings PLC GBP 159 2,348 0.01Ashtead Group PLC GBP 130 2,023 0.01AstraZeneca PLC GBP 167 9,527 0.04Aviva PLC GBP 823 5,743 0.02
The accompanying notes are an integral part of these financial statements.
Diversified Alpha Plus Low Volatility Fund (continued)
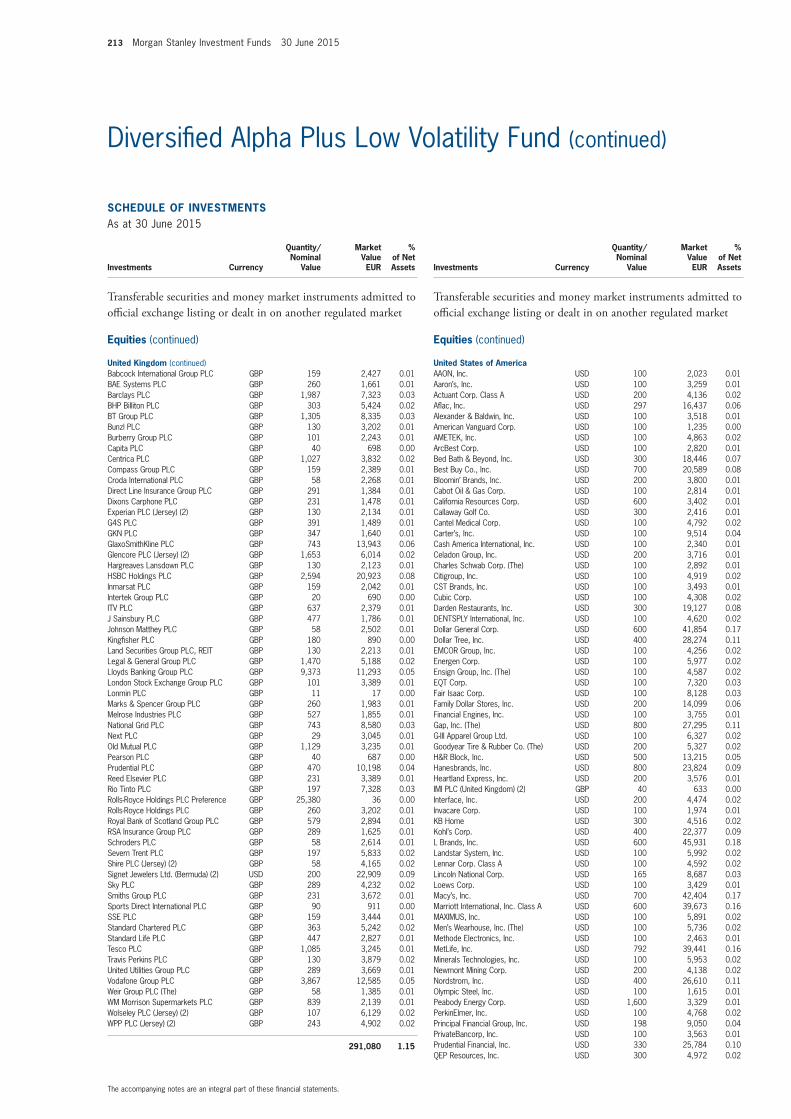
213 Morgan Stanley Investment Funds 30 June 2015
SCHEDULE of invEStmEntSAs at 30 June 2015
Investments Currency
Quantity/Nominal
Value
Market Value EUR
% of Net Assets
transferable securities and money market instruments admitted to official exchange listing or dealt in on another regulated market
Equities (continued)
United Kingdom (continued)Babcock International Group PLC GBP 159 2,427 0.01BAE Systems PLC GBP 260 1,661 0.01Barclays PLC GBP 1,987 7,323 0.03BHP Billiton PLC GBP 303 5,424 0.02BT Group PLC GBP 1,305 8,335 0.03Bunzl PLC GBP 130 3,202 0.01Burberry Group PLC GBP 101 2,243 0.01Capita PLC GBP 40 698 0.00Centrica PLC GBP 1,027 3,832 0.02Compass Group PLC GBP 159 2,389 0.01Croda International PLC GBP 58 2,268 0.01Direct Line Insurance Group PLC GBP 291 1,384 0.01Dixons Carphone PLC GBP 231 1,478 0.01Experian PLC (Jersey) (2) GBP 130 2,134 0.01G4S PLC GBP 391 1,489 0.01GKN PLC GBP 347 1,640 0.01GlaxoSmithKline PLC GBP 743 13,943 0.06Glencore PLC (Jersey) (2) GBP 1,653 6,014 0.02Hargreaves Lansdown PLC GBP 130 2,123 0.01HSBC Holdings PLC GBP 2,594 20,923 0.08Inmarsat PLC GBP 159 2,042 0.01Intertek Group PLC GBP 20 690 0.00ITV PLC GBP 637 2,379 0.01J Sainsbury PLC GBP 477 1,786 0.01Johnson Matthey PLC GBP 58 2,502 0.01Kingfisher PLC GBP 180 890 0.00Land Securities Group PLC, REIT GBP 130 2,213 0.01Legal & General Group PLC GBP 1,470 5,188 0.02Lloyds Banking Group PLC GBP 9,373 11,293 0.05London Stock Exchange Group PLC GBP 101 3,389 0.01Lonmin PLC GBP 11 17 0.00Marks & Spencer Group PLC GBP 260 1,983 0.01Melrose Industries PLC GBP 527 1,855 0.01National Grid PLC GBP 743 8,580 0.03Next PLC GBP 29 3,045 0.01Old Mutual PLC GBP 1,129 3,235 0.01Pearson PLC GBP 40 687 0.00Prudential PLC GBP 470 10,198 0.04Reed Elsevier PLC GBP 231 3,389 0.01Rio Tinto PLC GBP 197 7,328 0.03Rolls-Royce Holdings PLC Preference GBP 25,380 36 0.00Rolls-Royce Holdings PLC GBP 260 3,202 0.01Royal Bank of Scotland Group PLC GBP 579 2,894 0.01RSA Insurance Group PLC GBP 289 1,625 0.01Schroders PLC GBP 58 2,614 0.01Severn Trent PLC GBP 197 5,833 0.02Shire PLC (Jersey) (2) GBP 58 4,165 0.02Signet Jewelers Ltd. (Bermuda) (2) USD 200 22,909 0.09Sky PLC GBP 289 4,232 0.02Smiths Group PLC GBP 231 3,672 0.01Sports Direct International PLC GBP 90 911 0.00SSE PLC GBP 159 3,444 0.01Standard Chartered PLC GBP 363 5,242 0.02Standard Life PLC GBP 447 2,827 0.01Tesco PLC GBP 1,085 3,245 0.01Travis Perkins PLC GBP 130 3,879 0.02United Utilities Group PLC GBP 289 3,669 0.01Vodafone Group PLC GBP 3,867 12,585 0.05Weir Group PLC (The) GBP 58 1,385 0.01WM Morrison Supermarkets PLC GBP 839 2,139 0.01Wolseley PLC (Jersey) (2) GBP 107 6,129 0.02WPP PLC (Jersey) (2) GBP 243 4,902 0.02
291,080 1.15
SCHEDULE of invEStmEntSAs at 30 June 2015
Investments Currency
Quantity/Nominal
Value
Market Value EUR
% of Net Assets
transferable securities and money market instruments admitted to official exchange listing or dealt in on another regulated market
Equities (continued)
United States of AmericaAAON, Inc. USD 100 2,023 0.01Aaron’s, Inc. USD 100 3,259 0.01Actuant Corp. Class A USD 200 4,136 0.02Aflac, Inc. USD 297 16,437 0.06Alexander & Baldwin, Inc. USD 100 3,518 0.01American Vanguard Corp. USD 100 1,235 0.00AMETEK, Inc. USD 100 4,863 0.02ArcBest Corp. USD 100 2,820 0.01Bed Bath & Beyond, Inc. USD 300 18,446 0.07Best Buy Co., Inc. USD 700 20,589 0.08Bloomin’ Brands, Inc. USD 200 3,800 0.01Cabot Oil & Gas Corp. USD 100 2,814 0.01California Resources Corp. USD 600 3,402 0.01Callaway Golf Co. USD 300 2,416 0.01Cantel Medical Corp. USD 100 4,792 0.02Carter’s, Inc. USD 100 9,514 0.04Cash America International, Inc. USD 100 2,340 0.01Celadon Group, Inc. USD 200 3,716 0.01Charles Schwab Corp. (The) USD 100 2,892 0.01Citigroup, Inc. USD 100 4,919 0.02CST Brands, Inc. USD 100 3,493 0.01Cubic Corp. USD 100 4,308 0.02Darden Restaurants, Inc. USD 300 19,127 0.08DENTSPLY International, Inc. USD 100 4,620 0.02Dollar General Corp. USD 600 41,854 0.17Dollar Tree, Inc. USD 400 28,274 0.11EMCOR Group, Inc. USD 100 4,256 0.02Energen Corp. USD 100 5,977 0.02Ensign Group, Inc. (The) USD 100 4,587 0.02EQT Corp. USD 100 7,320 0.03Fair Isaac Corp. USD 100 8,128 0.03Family Dollar Stores, Inc. USD 200 14,099 0.06Financial Engines, Inc. USD 100 3,755 0.01Gap, Inc. (The) USD 800 27,295 0.11G-III Apparel Group Ltd. USD 100 6,327 0.02Goodyear Tire & Rubber Co. (The) USD 200 5,327 0.02H&R Block, Inc. USD 500 13,215 0.05Hanesbrands, Inc. USD 800 23,824 0.09Heartland Express, Inc. USD 200 3,576 0.01IMI PLC (United Kingdom) (2) GBP 40 633 0.00Interface, Inc. USD 200 4,474 0.02Invacare Corp. USD 100 1,974 0.01KB Home USD 300 4,516 0.02Kohl’s Corp. USD 400 22,377 0.09L Brands, Inc. USD 600 45,931 0.18Landstar System, Inc. USD 100 5,992 0.02Lennar Corp. Class A USD 100 4,592 0.02Lincoln National Corp. USD 165 8,687 0.03Loews Corp. USD 100 3,429 0.01Macy’s, Inc. USD 700 42,404 0.17Marriott International, Inc. Class A USD 600 39,673 0.16MAXIMUS, Inc. USD 100 5,891 0.02Men’s Wearhouse, Inc. (The) USD 100 5,736 0.02Methode Electronics, Inc. USD 100 2,463 0.01MetLife, Inc. USD 792 39,441 0.16Minerals Technologies, Inc. USD 100 5,953 0.02Newmont Mining Corp. USD 200 4,138 0.02Nordstrom, Inc. USD 400 26,610 0.11Olympic Steel, Inc. USD 100 1,615 0.01Peabody Energy Corp. USD 1,600 3,329 0.01PerkinElmer, Inc. USD 100 4,768 0.02Principal Financial Group, Inc. USD 198 9,050 0.04PrivateBancorp, Inc. USD 100 3,563 0.01Prudential Financial, Inc. USD 330 25,784 0.10QEP Resources, Inc. USD 300 4,972 0.02
The accompanying notes are an integral part of these financial statements.
Diversified Alpha Plus Low Volatility Fund (continued)
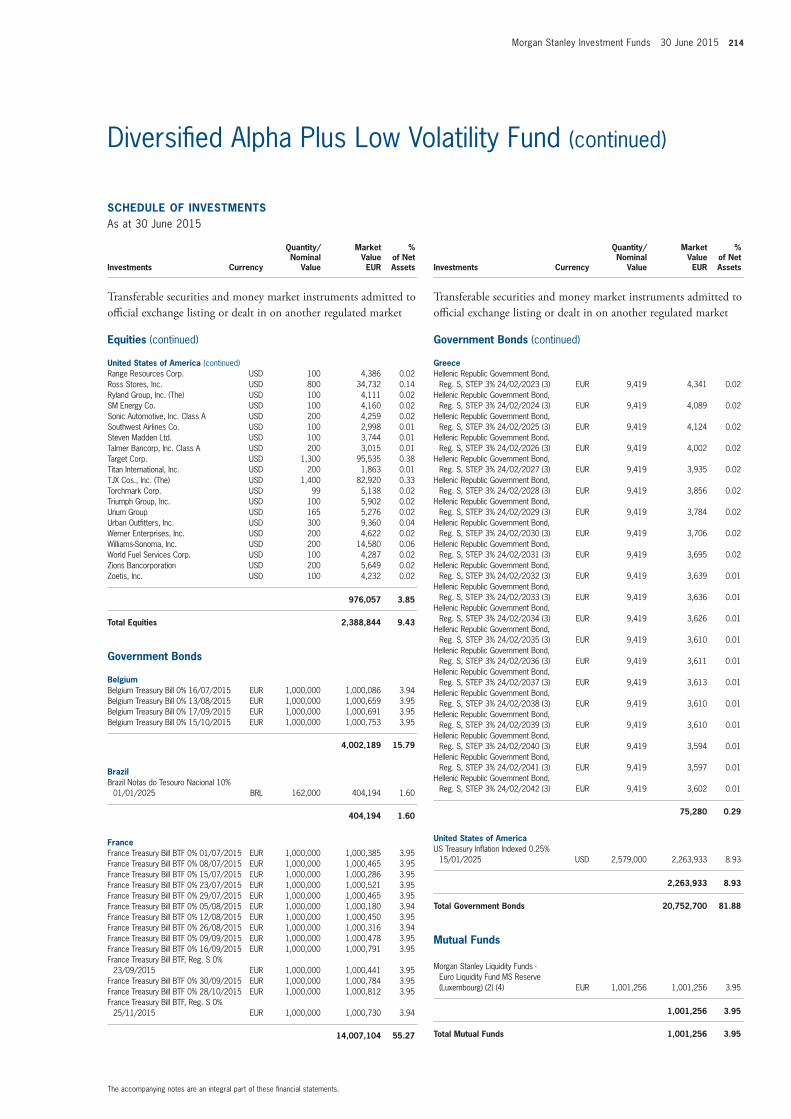
Morgan Stanley Investment Funds 30 June 2015 214
SCHEDULE of invEStmEntSAs at 30 June 2015
Investments Currency
Quantity/Nominal
Value
Market Value EUR
% of Net Assets
transferable securities and money market instruments admitted to official exchange listing or dealt in on another regulated market
Equities (continued)
United States of America (continued)Range Resources Corp. USD 100 4,386 0.02Ross Stores, Inc. USD 800 34,732 0.14Ryland Group, Inc. (The) USD 100 4,111 0.02SM Energy Co. USD 100 4,160 0.02Sonic Automotive, Inc. Class A USD 200 4,259 0.02Southwest Airlines Co. USD 100 2,998 0.01Steven Madden Ltd. USD 100 3,744 0.01Talmer Bancorp, Inc. Class A USD 200 3,015 0.01Target Corp. USD 1,300 95,535 0.38Titan International, Inc. USD 200 1,863 0.01TJX Cos., Inc. (The) USD 1,400 82,920 0.33Torchmark Corp. USD 99 5,138 0.02Triumph Group, Inc. USD 100 5,902 0.02Unum Group USD 165 5,276 0.02Urban Outfitters, Inc. USD 300 9,360 0.04Werner Enterprises, Inc. USD 200 4,622 0.02Williams-Sonoma, Inc. USD 200 14,580 0.06World Fuel Services Corp. USD 100 4,287 0.02Zions Bancorporation USD 200 5,649 0.02Zoetis, Inc. USD 100 4,232 0.02
976,057 3.85
total Equities 2,388,844 9.43
Government Bonds
BelgiumBelgium Treasury Bill 0% 16/07/2015 EUR 1,000,000 1,000,086 3.94Belgium Treasury Bill 0% 13/08/2015 EUR 1,000,000 1,000,659 3.95Belgium Treasury Bill 0% 17/09/2015 EUR 1,000,000 1,000,691 3.95Belgium Treasury Bill 0% 15/10/2015 EUR 1,000,000 1,000,753 3.95
4,002,189 15.79
BrazilBrazil Notas do Tesouro Nacional 10%
01/01/2025 BRL 162,000 404,194 1.60
404,194 1.60
franceFrance Treasury Bill BTF 0% 01/07/2015 EUR 1,000,000 1,000,385 3.95France Treasury Bill BTF 0% 08/07/2015 EUR 1,000,000 1,000,465 3.95France Treasury Bill BTF 0% 15/07/2015 EUR 1,000,000 1,000,286 3.95France Treasury Bill BTF 0% 23/07/2015 EUR 1,000,000 1,000,521 3.95France Treasury Bill BTF 0% 29/07/2015 EUR 1,000,000 1,000,465 3.95France Treasury Bill BTF 0% 05/08/2015 EUR 1,000,000 1,000,180 3.94France Treasury Bill BTF 0% 12/08/2015 EUR 1,000,000 1,000,450 3.95France Treasury Bill BTF 0% 26/08/2015 EUR 1,000,000 1,000,316 3.94France Treasury Bill BTF 0% 09/09/2015 EUR 1,000,000 1,000,478 3.95France Treasury Bill BTF 0% 16/09/2015 EUR 1,000,000 1,000,791 3.95France Treasury Bill BTF, Reg. S 0%
23/09/2015 EUR 1,000,000 1,000,441 3.95France Treasury Bill BTF 0% 30/09/2015 EUR 1,000,000 1,000,784 3.95France Treasury Bill BTF 0% 28/10/2015 EUR 1,000,000 1,000,812 3.95France Treasury Bill BTF, Reg. S 0%
25/11/2015 EUR 1,000,000 1,000,730 3.94
14,007,104 55.27
SCHEDULE of invEStmEntSAs at 30 June 2015
Investments Currency
Quantity/Nominal
Value
Market Value EUR
% of Net Assets
transferable securities and money market instruments admitted to official exchange listing or dealt in on another regulated market
Government Bonds (continued)
GreeceHellenic Republic Government Bond,
Reg. S, STEP 3% 24/02/2023 (3) EUR 9,419 4,341 0.02Hellenic Republic Government Bond,
Reg. S, STEP 3% 24/02/2024 (3) EUR 9,419 4,089 0.02Hellenic Republic Government Bond,
Reg. S, STEP 3% 24/02/2025 (3) EUR 9,419 4,124 0.02Hellenic Republic Government Bond,
Reg. S, STEP 3% 24/02/2026 (3) EUR 9,419 4,002 0.02Hellenic Republic Government Bond,
Reg. S, STEP 3% 24/02/2027 (3) EUR 9,419 3,935 0.02Hellenic Republic Government Bond,
Reg. S, STEP 3% 24/02/2028 (3) EUR 9,419 3,856 0.02Hellenic Republic Government Bond,
Reg. S, STEP 3% 24/02/2029 (3) EUR 9,419 3,784 0.02Hellenic Republic Government Bond,
Reg. S, STEP 3% 24/02/2030 (3) EUR 9,419 3,706 0.02Hellenic Republic Government Bond,
Reg. S, STEP 3% 24/02/2031 (3) EUR 9,419 3,695 0.02Hellenic Republic Government Bond,
Reg. S, STEP 3% 24/02/2032 (3) EUR 9,419 3,639 0.01Hellenic Republic Government Bond,
Reg. S, STEP 3% 24/02/2033 (3) EUR 9,419 3,636 0.01Hellenic Republic Government Bond,
Reg. S, STEP 3% 24/02/2034 (3) EUR 9,419 3,626 0.01Hellenic Republic Government Bond,
Reg. S, STEP 3% 24/02/2035 (3) EUR 9,419 3,610 0.01Hellenic Republic Government Bond,
Reg. S, STEP 3% 24/02/2036 (3) EUR 9,419 3,611 0.01Hellenic Republic Government Bond,
Reg. S, STEP 3% 24/02/2037 (3) EUR 9,419 3,613 0.01Hellenic Republic Government Bond,
Reg. S, STEP 3% 24/02/2038 (3) EUR 9,419 3,610 0.01Hellenic Republic Government Bond,
Reg. S, STEP 3% 24/02/2039 (3) EUR 9,419 3,610 0.01Hellenic Republic Government Bond,
Reg. S, STEP 3% 24/02/2040 (3) EUR 9,419 3,594 0.01Hellenic Republic Government Bond,
Reg. S, STEP 3% 24/02/2041 (3) EUR 9,419 3,597 0.01Hellenic Republic Government Bond,
Reg. S, STEP 3% 24/02/2042 (3) EUR 9,419 3,602 0.01
75,280 0.29
United States of AmericaUS Treasury Inflation Indexed 0.25%
15/01/2025 USD 2,579,000 2,263,933 8.93
2,263,933 8.93
total Government Bonds 20,752,700 81.88
mutual funds
Morgan Stanley Liquidity Funds - Euro Liquidity Fund MS Reserve (Luxembourg) (2) (4) EUR 1,001,256 1,001,256 3.95
1,001,256 3.95
total mutual funds 1,001,256 3.95
The accompanying notes are an integral part of these financial statements.
Diversified Alpha Plus Low Volatility Fund (continued)
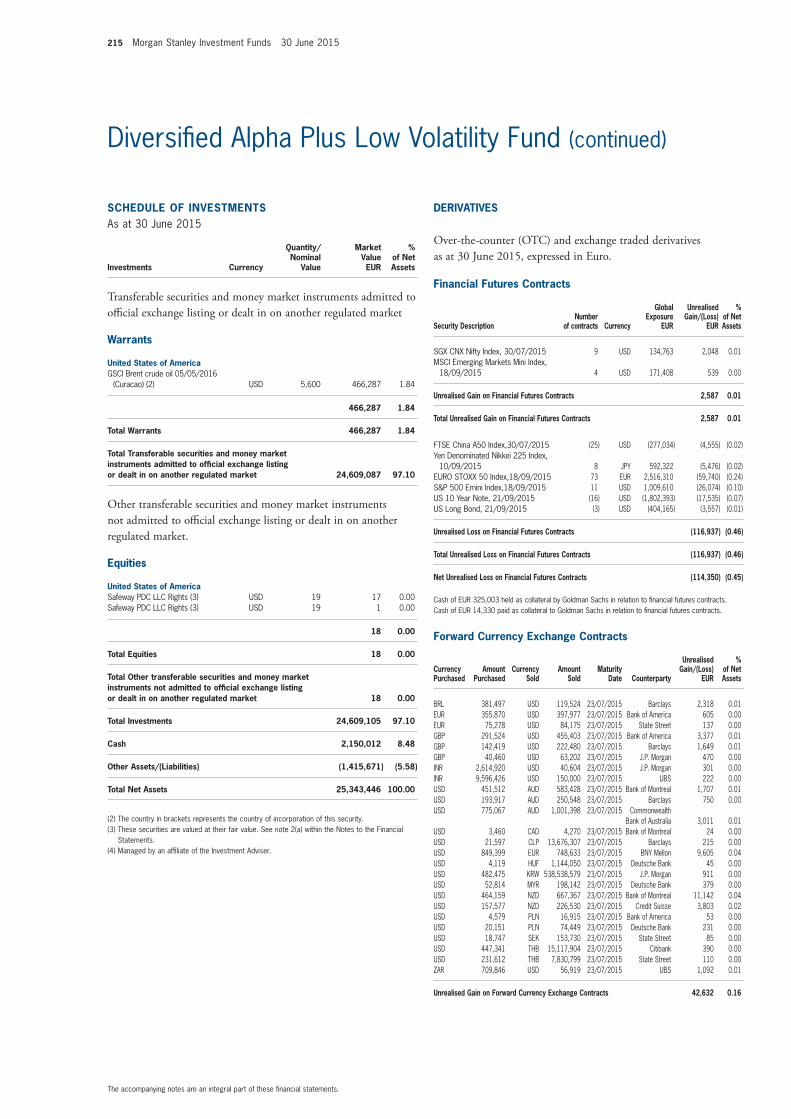
215 Morgan Stanley Investment Funds 30 June 2015
SCHEDULE of invEStmEntSAs at 30 June 2015
Investments Currency
Quantity/Nominal
Value
Market Value EUR
% of Net Assets
transferable securities and money market instruments admitted to official exchange listing or dealt in on another regulated market
Warrants
United States of AmericaGSCI Brent crude oil 05/05/2016
(Curacao) (2) USD 5,600 466,287 1.84
466,287 1.84
total Warrants 466,287 1.84
total transferable securities and money market instruments admitted to official exchange listing or dealt in on another regulated market 24,609,087 97.10
Other transferable securities and money market instruments not admitted to official exchange listing or dealt in on another regulated market.
Equities
United States of AmericaSafeway PDC LLC Rights (3) USD 19 17 0.00Safeway PDC LLC Rights (3) USD 19 1 0.00
18 0.00
total Equities 18 0.00
total other transferable securities and money market instruments not admitted to official exchange listing or dealt in on another regulated market 18 0.00
total investments 24,609,105 97.10
Cash 2,150,012 8.48
other Assets/(Liabilities) (1,415,671) (5.58)
total net Assets 25,343,446 100.00
(2) The country in brackets represents the country of incorporation of this security.(3) These securities are valued at their fair value. See note 2(a) within the Notes to the Financial
Statements.(4) Managed by an affiliate of the Investment Adviser.
The accompanying notes are an integral part of these financial statements.
Diversified Alpha Plus Low Volatility Fund (continued)
financial futures Contracts
Security Descriptionnumber
of contracts Currency
Global Exposure
EUR
Unrealised Gain/(Loss)
EUR
% of net Assets
SGX CNX Nifty Index, 30/07/2015 9 USD 134,763 2,048 0.01MSCI Emerging Markets Mini Index,
18/09/2015 4 USD 171,408 539 0.00
Unrealised Gain on financial futures Contracts 2,587 0.01
total Unrealised Gain on financial futures Contracts 2,587 0.01
FTSE China A50 Index,30/07/2015 (25) USD (277,034) (4,555) (0.02)Yen Denominated Nikkei 225 Index,
10/09/2015 8 JPY 592,322 (5,476) (0.02)EURO STOXX 50 Index,18/09/2015 73 EUR 2,516,310 (59,740) (0.24)S&P 500 Emini Index,18/09/2015 11 USD 1,009,610 (26,074) (0.10)US 10 Year Note, 21/09/2015 (16) USD (1,802,393) (17,535) (0.07)US Long Bond, 21/09/2015 (3) USD (404,165) (3,557) (0.01)
Unrealised Loss on financial futures Contracts (116,937) (0.46)
total Unrealised Loss on financial futures Contracts (116,937) (0.46)
net Unrealised Loss on financial futures Contracts (114,350) (0.45)
Cash of EUR 325,003 held as collateral by Goldman Sachs in relation to financial futures contracts.Cash of EUR 14,330 paid as collateral to Goldman Sachs in relation to financial futures contracts.
forward Currency Exchange Contracts (continued)
Currency Purchased
Amount Purchased
Currency Sold
Amount Sold
maturity Date Counterparty
Unrealised Gain/(Loss)
EUR
% of net Assets
BRL 381,497 USD 119,524 23/07/2015 Barclays 2,318 0.01EUR 355,870 USD 397,977 23/07/2015 Bank of America 605 0.00EUR 75,278 USD 84,175 23/07/2015 State Street 137 0.00GBP 291,524 USD 455,403 23/07/2015 Bank of America 3,377 0.01GBP 142,419 USD 222,480 23/07/2015 Barclays 1,649 0.01GBP 40,460 USD 63,202 23/07/2015 J.P. Morgan 470 0.00INR 2,614,920 USD 40,604 23/07/2015 J.P. Morgan 301 0.00INR 9,596,426 USD 150,000 23/07/2015 UBS 222 0.00USD 451,512 AUD 583,428 23/07/2015 Bank of Montreal 1,707 0.01USD 193,917 AUD 250,548 23/07/2015 Barclays 750 0.00USD 775,067 AUD 1,001,398 23/07/2015 Commonwealth
Bank of Australia 3,011 0.01USD 3,460 CAD 4,270 23/07/2015 Bank of Montreal 24 0.00USD 21,597 CLP 13,676,307 23/07/2015 Barclays 215 0.00USD 849,399 EUR 748,633 23/07/2015 BNY Mellon 9,605 0.04USD 4,119 HUF 1,144,050 23/07/2015 Deutsche Bank 45 0.00USD 482,475 KRW 538,538,579 23/07/2015 J.P. Morgan 911 0.00USD 52,814 MYR 198,142 23/07/2015 Deutsche Bank 379 0.00USD 464,159 NZD 667,367 23/07/2015 Bank of Montreal 11,142 0.04USD 157,577 NZD 226,530 23/07/2015 Credit Suisse 3,803 0.02USD 4,579 PLN 16,915 23/07/2015 Bank of America 53 0.00USD 20,151 PLN 74,449 23/07/2015 Deutsche Bank 231 0.00USD 18,747 SEK 153,730 23/07/2015 State Street 85 0.00USD 447,341 THB 15,117,904 23/07/2015 Citibank 390 0.00USD 231,612 THB 7,830,799 23/07/2015 State Street 110 0.00ZAR 709,846 USD 56,919 23/07/2015 UBS 1,092 0.01
Unrealised Gain on forward Currency Exchange Contracts 42,632 0.16
DERivAtivES
Over-the-counter (OtC) and exchange traded derivatives as at 30 June 2015, expressed in euro.
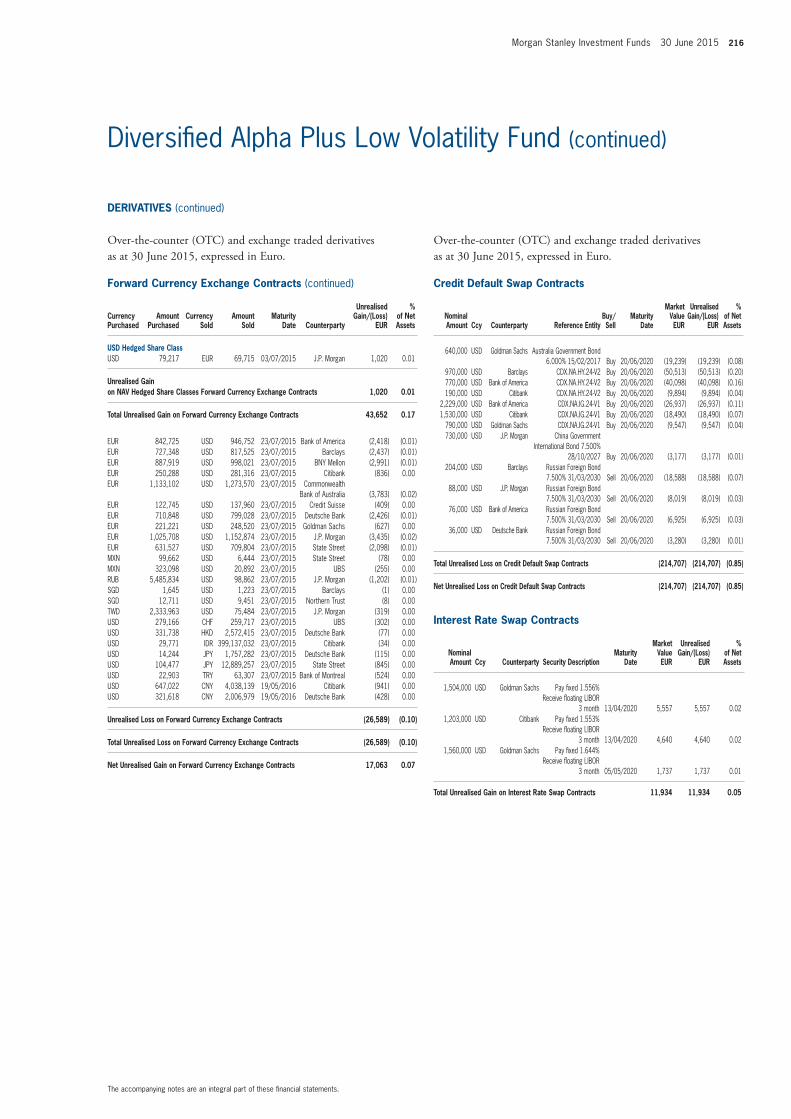
Morgan Stanley Investment Funds 30 June 2015 216
forward Currency Exchange Contracts (continued)
Currency Purchased
Amount Purchased
Currency Sold
Amount Sold
maturity Date Counterparty
Unrealised Gain/(Loss)
EUR
% of net Assets
USD Hedged Share ClassUSD 79,217 EUR 69,715 03/07/2015 J.P. Morgan 1,020 0.01
Unrealised Gain on nAv Hedged Share Classes forward Currency Exchange Contracts 1,020 0.01
total Unrealised Gain on forward Currency Exchange Contracts 43,652 0.17
EUR 842,725 USD 946,752 23/07/2015 Bank of America (2,418) (0.01)EUR 727,348 USD 817,525 23/07/2015 Barclays (2,437) (0.01)EUR 887,919 USD 998,021 23/07/2015 BNY Mellon (2,991) (0.01)EUR 250,288 USD 281,316 23/07/2015 Citibank (836) 0.00EUR 1,133,102 USD 1,273,570 23/07/2015 Commonwealth
Bank of Australia (3,783) (0.02)EUR 122,745 USD 137,960 23/07/2015 Credit Suisse (409) 0.00EUR 710,848 USD 799,028 23/07/2015 Deutsche Bank (2,426) (0.01)EUR 221,221 USD 248,520 23/07/2015 Goldman Sachs (627) 0.00EUR 1,025,708 USD 1,152,874 23/07/2015 J.P. Morgan (3,435) (0.02)EUR 631,527 USD 709,804 23/07/2015 State Street (2,098) (0.01)MXN 99,662 USD 6,444 23/07/2015 State Street (78) 0.00MXN 323,098 USD 20,892 23/07/2015 UBS (255) 0.00RUB 5,485,834 USD 98,862 23/07/2015 J.P. Morgan (1,202) (0.01)SGD 1,645 USD 1,223 23/07/2015 Barclays (1) 0.00SGD 12,711 USD 9,451 23/07/2015 Northern Trust (8) 0.00TWD 2,333,963 USD 75,484 23/07/2015 J.P. Morgan (319) 0.00USD 279,166 CHF 259,717 23/07/2015 UBS (302) 0.00USD 331,738 HKD 2,572,415 23/07/2015 Deutsche Bank (77) 0.00USD 29,771 IDR 399,137,032 23/07/2015 Citibank (34) 0.00USD 14,244 JPY 1,757,282 23/07/2015 Deutsche Bank (115) 0.00USD 104,477 JPY 12,889,257 23/07/2015 State Street (845) 0.00USD 22,903 TRY 63,307 23/07/2015 Bank of Montreal (524) 0.00USD 647,022 CNY 4,038,139 19/05/2016 Citibank (941) 0.00USD 321,618 CNY 2,006,979 19/05/2016 Deutsche Bank (428) 0.00
Unrealised Loss on forward Currency Exchange Contracts (26,589) (0.10)
total Unrealised Loss on forward Currency Exchange Contracts (26,589) (0.10)
net Unrealised Gain on forward Currency Exchange Contracts 17,063 0.07
Credit Default Swap Contracts
nominal Amount Ccy Counterparty Reference Entity
Buy/Sell
maturity Date
market value EUR
Unrealised Gain/(Loss)
EUR
% of net Assets
640,000 USD Goldman Sachs Australia Government Bond 6.000% 15/02/2017 Buy 20/06/2020 (19,239) (19,239) (0.08)
970,000 USD Barclays CDX.NA.HY.24-V2 Buy 20/06/2020 (50,513) (50,513) (0.20)770,000 USD Bank of America CDX.NA.HY.24-V2 Buy 20/06/2020 (40,098) (40,098) (0.16)190,000 USD Citibank CDX.NA.HY.24-V2 Buy 20/06/2020 (9,894) (9,894) (0.04)
2,229,000 USD Bank of America CDX.NA.IG.24-V1 Buy 20/06/2020 (26,937) (26,937) (0.11)1,530,000 USD Citibank CDX.NA.IG.24-V1 Buy 20/06/2020 (18,490) (18,490) (0.07)
790,000 USD Goldman Sachs CDX.NA.IG.24-V1 Buy 20/06/2020 (9,547) (9,547) (0.04)730,000 USD J.P. Morgan China Government
International Bond 7.500% 28/10/2027 Buy 20/06/2020 (3,177) (3,177) (0.01)
204,000 USD Barclays Russian Foreign Bond 7.500% 31/03/2030 Sell 20/06/2020 (18,588) (18,588) (0.07)
88,000 USD J.P. Morgan Russian Foreign Bond 7.500% 31/03/2030 Sell 20/06/2020 (8,019) (8,019) (0.03)
76,000 USD Bank of America Russian Foreign Bond 7.500% 31/03/2030 Sell 20/06/2020 (6,925) (6,925) (0.03)
36,000 USD Deutsche Bank Russian Foreign Bond 7.500% 31/03/2030 Sell 20/06/2020 (3,280) (3,280) (0.01)
total Unrealised Loss on Credit Default Swap Contracts (214,707) (214,707) (0.85)
net Unrealised Loss on Credit Default Swap Contracts (214,707) (214,707) (0.85)
interest Rate Swap Contracts (continued)
nominal Amount Ccy Counterparty Security Description
maturity Date
market value EUR
Unrealised Gain/(Loss)
EUR
% of net Assets
1,504,000 USD Goldman Sachs Pay fixed 1.556% Receive floating LIBOR
3 month 13/04/2020 5,557 5,557 0.021,203,000 USD Citibank Pay fixed 1.553%
Receive floating LIBOR 3 month 13/04/2020 4,640 4,640 0.02
1,560,000 USD Goldman Sachs Pay fixed 1.644% Receive floating LIBOR
3 month 05/05/2020 1,737 1,737 0.01
total Unrealised Gain on interest Rate Swap Contracts 11,934 11,934 0.05
The accompanying notes are an integral part of these financial statements.
Diversified Alpha Plus Low Volatility Fund (continued)
DERivAtivES (continued)
Over-the-counter (OtC) and exchange traded derivatives as at 30 June 2015, expressed in euro.
DERivAtivES (continued)
Over-the-counter (OtC) and exchange traded derivatives as at 30 June 2015, expressed in euro.
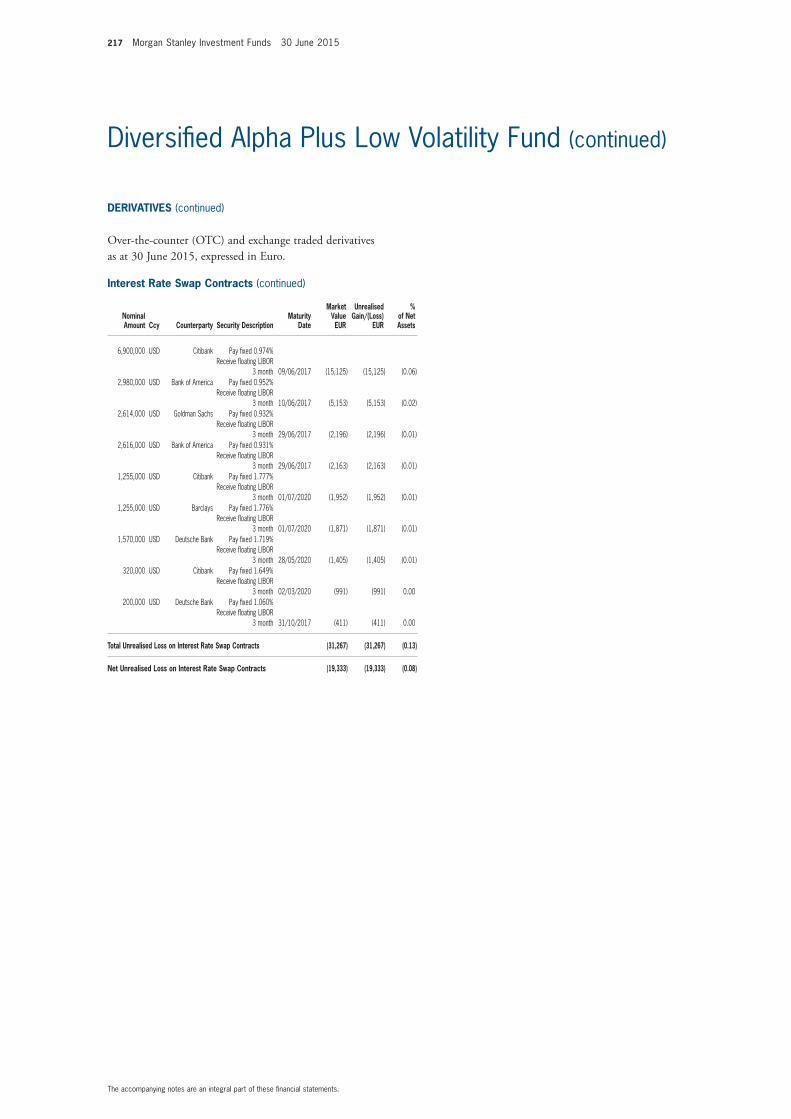
217 Morgan Stanley Investment Funds 30 June 2015
interest Rate Swap Contracts (continued)
nominal Amount Ccy Counterparty Security Description
maturity Date
market value EUR
Unrealised Gain/(Loss)
EUR
% of net Assets
6,900,000 USD Citibank Pay fixed 0.974% Receive floating LIBOR
3 month 09/06/2017 (15,125) (15,125) (0.06)2,980,000 USD Bank of America Pay fixed 0.952%
Receive floating LIBOR 3 month 10/06/2017 (5,153) (5,153) (0.02)
2,614,000 USD Goldman Sachs Pay fixed 0.932% Receive floating LIBOR
3 month 29/06/2017 (2,196) (2,196) (0.01)2,616,000 USD Bank of America Pay fixed 0.931%
Receive floating LIBOR 3 month 29/06/2017 (2,163) (2,163) (0.01)
1,255,000 USD Citibank Pay fixed 1.777% Receive floating LIBOR
3 month 01/07/2020 (1,952) (1,952) (0.01)1,255,000 USD Barclays Pay fixed 1.776%
Receive floating LIBOR 3 month 01/07/2020 (1,871) (1,871) (0.01)
1,570,000 USD Deutsche Bank Pay fixed 1.719% Receive floating LIBOR
3 month 28/05/2020 (1,405) (1,405) (0.01)320,000 USD Citibank Pay fixed 1.649%
Receive floating LIBOR 3 month 02/03/2020 (991) (991) 0.00
200,000 USD Deutsche Bank Pay fixed 1.060% Receive floating LIBOR
3 month 31/10/2017 (411) (411) 0.00
total Unrealised Loss on interest Rate Swap Contracts (31,267) (31,267) (0.13)
net Unrealised Loss on interest Rate Swap Contracts (19,333) (19,333) (0.08)
The accompanying notes are an integral part of these financial statements.
Diversified Alpha Plus Low Volatility Fund (continued)
DERivAtivES (continued)
Over-the-counter (OtC) and exchange traded derivatives as at 30 June 2015, expressed in euro.
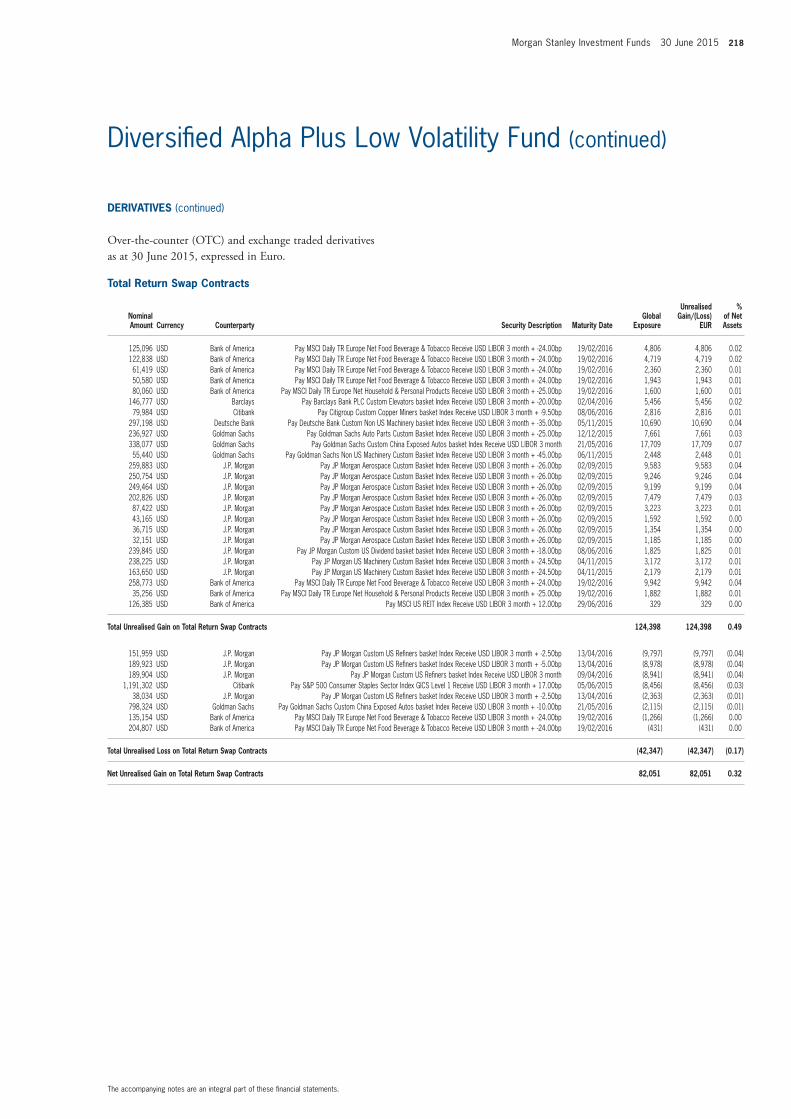
Morgan Stanley Investment Funds 30 June 2015 218
The accompanying notes are an integral part of these financial statements.
Diversified Alpha Plus Low Volatility Fund (continued)
DERivAtivES (continued)
Over-the-counter (OtC) and exchange traded derivatives as at 30 June 2015, expressed in euro.
total Return Swap Contracts
nominal Amount Currency Counterparty Security Description maturity Date
Global Exposure
Unrealised Gain/(Loss)
EUR
% of net Assets
125,096 USD Bank of America Pay MSCI Daily TR Europe Net Food Beverage & Tobacco Receive USD LIBOR 3 month + -24.00bp 19/02/2016 4,806 4,806 0.02122,838 USD Bank of America Pay MSCI Daily TR Europe Net Food Beverage & Tobacco Receive USD LIBOR 3 month + -24.00bp 19/02/2016 4,719 4,719 0.0261,419 USD Bank of America Pay MSCI Daily TR Europe Net Food Beverage & Tobacco Receive USD LIBOR 3 month + -24.00bp 19/02/2016 2,360 2,360 0.0150,580 USD Bank of America Pay MSCI Daily TR Europe Net Food Beverage & Tobacco Receive USD LIBOR 3 month + -24.00bp 19/02/2016 1,943 1,943 0.0180,060 USD Bank of America Pay MSCI Daily TR Europe Net Household & Personal Products Receive USD LIBOR 3 month + -25.00bp 19/02/2016 1,600 1,600 0.01
146,777 USD Barclays Pay Barclays Bank PLC Custom Elevators basket Index Receive USD LIBOR 3 month + -20.00bp 02/04/2016 5,456 5,456 0.0279,984 USD Citibank Pay Citigroup Custom Copper Miners basket Index Receive USD LIBOR 3 month + -9.50bp 08/06/2016 2,816 2,816 0.01
297,198 USD Deutsche Bank Pay Deutsche Bank Custom Non US Machinery basket Index Receive USD LIBOR 3 month + -35.00bp 05/11/2015 10,690 10,690 0.04236,927 USD Goldman Sachs Pay Goldman Sachs Auto Parts Custom Basket Index Receive USD LIBOR 3 month + -25.00bp 12/12/2015 7,661 7,661 0.03338,077 USD Goldman Sachs Pay Goldman Sachs Custom China Exposed Autos basket Index Receive USD LIBOR 3 month 21/05/2016 17,709 17,709 0.0755,440 USD Goldman Sachs Pay Goldman Sachs Non US Machinery Custom Basket Index Receive USD LIBOR 3 month + -45.00bp 06/11/2015 2,448 2,448 0.01
259,883 USD J.P. Morgan Pay JP Morgan Aerospace Custom Basket Index Receive USD LIBOR 3 month + -26.00bp 02/09/2015 9,583 9,583 0.04250,754 USD J.P. Morgan Pay JP Morgan Aerospace Custom Basket Index Receive USD LIBOR 3 month + -26.00bp 02/09/2015 9,246 9,246 0.04249,464 USD J.P. Morgan Pay JP Morgan Aerospace Custom Basket Index Receive USD LIBOR 3 month + -26.00bp 02/09/2015 9,199 9,199 0.04202,826 USD J.P. Morgan Pay JP Morgan Aerospace Custom Basket Index Receive USD LIBOR 3 month + -26.00bp 02/09/2015 7,479 7,479 0.0387,422 USD J.P. Morgan Pay JP Morgan Aerospace Custom Basket Index Receive USD LIBOR 3 month + -26.00bp 02/09/2015 3,223 3,223 0.0143,165 USD J.P. Morgan Pay JP Morgan Aerospace Custom Basket Index Receive USD LIBOR 3 month + -26.00bp 02/09/2015 1,592 1,592 0.0036,715 USD J.P. Morgan Pay JP Morgan Aerospace Custom Basket Index Receive USD LIBOR 3 month + -26.00bp 02/09/2015 1,354 1,354 0.0032,151 USD J.P. Morgan Pay JP Morgan Aerospace Custom Basket Index Receive USD LIBOR 3 month + -26.00bp 02/09/2015 1,185 1,185 0.00
239,845 USD J.P. Morgan Pay JP Morgan Custom US Dividend basket basket Index Receive USD LIBOR 3 month + -18.00bp 08/06/2016 1,825 1,825 0.01238,225 USD J.P. Morgan Pay JP Morgan US Machinery Custom Basket Index Receive USD LIBOR 3 month + -24.50bp 04/11/2015 3,172 3,172 0.01163,650 USD J.P. Morgan Pay JP Morgan US Machinery Custom Basket Index Receive USD LIBOR 3 month + -24.50bp 04/11/2015 2,179 2,179 0.01258,773 USD Bank of America Pay MSCI Daily TR Europe Net Food Beverage & Tobacco Receive USD LIBOR 3 month + -24.00bp 19/02/2016 9,942 9,942 0.0435,256 USD Bank of America Pay MSCI Daily TR Europe Net Household & Personal Products Receive USD LIBOR 3 month + -25.00bp 19/02/2016 1,882 1,882 0.01
126,385 USD Bank of America Pay MSCI US REIT Index Receive USD LIBOR 3 month + 12.00bp 29/06/2016 329 329 0.00
total Unrealised Gain on total Return Swap Contracts 124,398 124,398 0.49
151,959 USD J.P. Morgan Pay JP Morgan Custom US Refiners basket Index Receive USD LIBOR 3 month + -2.50bp 13/04/2016 (9,797) (9,797) (0.04)189,923 USD J.P. Morgan Pay JP Morgan Custom US Refiners basket Index Receive USD LIBOR 3 month + -5.00bp 13/04/2016 (8,978) (8,978) (0.04)189,904 USD J.P. Morgan Pay JP Morgan Custom US Refiners basket Index Receive USD LIBOR 3 month 09/04/2016 (8,941) (8,941) (0.04)
1,191,302 USD Citibank Pay S&P 500 Consumer Staples Sector Index GICS Level 1 Receive USD LIBOR 3 month + 17.00bp 05/06/2015 (8,456) (8,456) (0.03)38,034 USD J.P. Morgan Pay JP Morgan Custom US Refiners basket Index Receive USD LIBOR 3 month + -2.50bp 13/04/2016 (2,363) (2,363) (0.01)
798,324 USD Goldman Sachs Pay Goldman Sachs Custom China Exposed Autos basket Index Receive USD LIBOR 3 month + -10.00bp 21/05/2016 (2,115) (2,115) (0.01)135,154 USD Bank of America Pay MSCI Daily TR Europe Net Food Beverage & Tobacco Receive USD LIBOR 3 month + -24.00bp 19/02/2016 (1,266) (1,266) 0.00204,807 USD Bank of America Pay MSCI Daily TR Europe Net Food Beverage & Tobacco Receive USD LIBOR 3 month + -24.00bp 19/02/2016 (431) (431) 0.00
total Unrealised Loss on total Return Swap Contracts (42,347) (42,347) (0.17)
net Unrealised Gain on total Return Swap Contracts 82,051 82,051 0.32
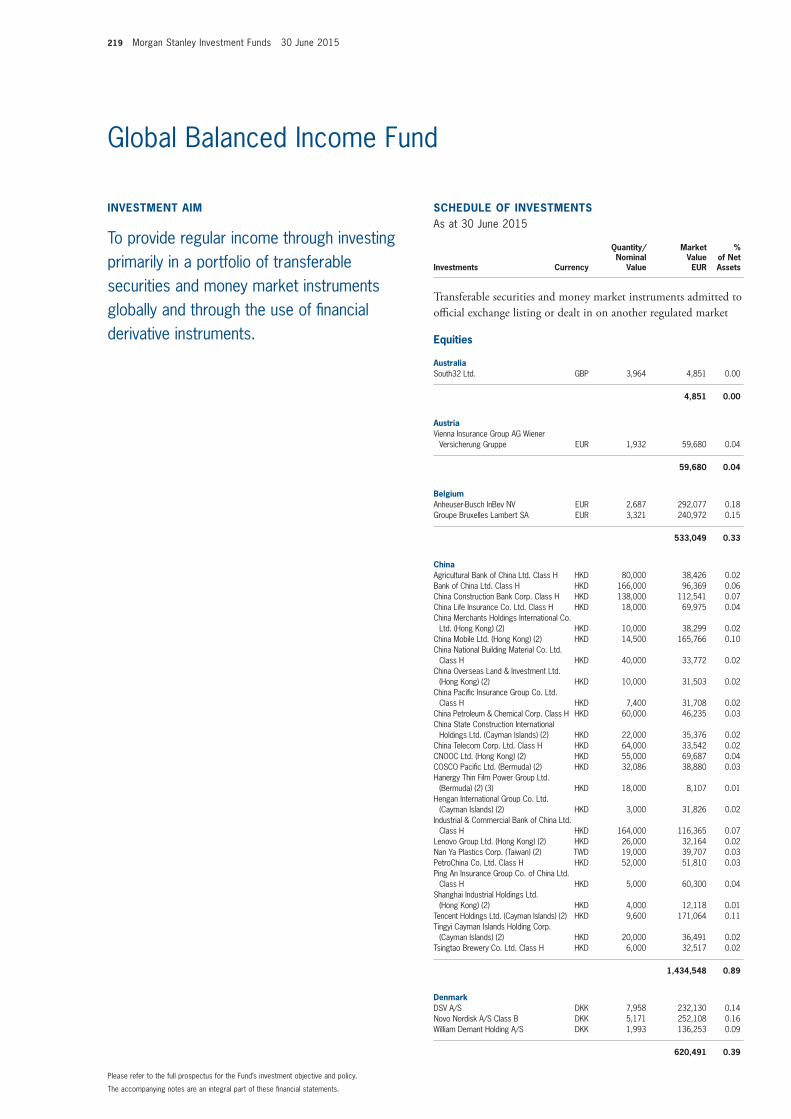
219 Morgan Stanley Investment Funds 30 June 2015
invEStmEnt Aim
To provide regular income through investing primarily in a portfolio of transferable securities and money market instruments globally and through the use of financial derivative instruments.
SCHEDULE of invEStmEntSAs at 30 June 2015
Investments Currency
Quantity/Nominal
Value
Market Value EUR
% of Net Assets
transferable securities and money market instruments admitted to official exchange listing or dealt in on another regulated market
Equities
AustraliaSouth32 Ltd. GBP 3,964 4,851 0.00
4,851 0.00
AustriaVienna Insurance Group AG Wiener
Versicherung Gruppe EUR 1,932 59,680 0.04
59,680 0.04
BelgiumAnheuser-Busch InBev NV EUR 2,687 292,077 0.18Groupe Bruxelles Lambert SA EUR 3,321 240,972 0.15
533,049 0.33
ChinaAgricultural Bank of China Ltd. Class H HKD 80,000 38,426 0.02Bank of China Ltd. Class H HKD 166,000 96,369 0.06China Construction Bank Corp. Class H HKD 138,000 112,541 0.07China Life Insurance Co. Ltd. Class H HKD 18,000 69,975 0.04China Merchants Holdings International Co.
Ltd. (Hong Kong) (2) HKD 10,000 38,299 0.02China Mobile Ltd. (Hong Kong) (2) HKD 14,500 165,766 0.10China National Building Material Co. Ltd.
Class H HKD 40,000 33,772 0.02China Overseas Land & Investment Ltd.
(Hong Kong) (2) HKD 10,000 31,503 0.02China Pacific Insurance Group Co. Ltd.
Class H HKD 7,400 31,708 0.02China Petroleum & Chemical Corp. Class H HKD 60,000 46,235 0.03China State Construction International
Holdings Ltd. (Cayman Islands) (2) HKD 22,000 35,376 0.02China Telecom Corp. Ltd. Class H HKD 64,000 33,542 0.02CNOOC Ltd. (Hong Kong) (2) HKD 55,000 69,687 0.04COSCO Pacific Ltd. (Bermuda) (2) HKD 32,086 38,880 0.03Hanergy Thin Film Power Group Ltd.
(Bermuda) (2) (3) HKD 18,000 8,107 0.01Hengan International Group Co. Ltd.
(Cayman Islands) (2) HKD 3,000 31,826 0.02Industrial & Commercial Bank of China Ltd.
Class H HKD 164,000 116,365 0.07Lenovo Group Ltd. (Hong Kong) (2) HKD 26,000 32,164 0.02Nan Ya Plastics Corp. (Taiwan) (2) TWD 19,000 39,707 0.03PetroChina Co. Ltd. Class H HKD 52,000 51,810 0.03Ping An Insurance Group Co. of China Ltd.
Class H HKD 5,000 60,300 0.04Shanghai Industrial Holdings Ltd.
(Hong Kong) (2) HKD 4,000 12,118 0.01Tencent Holdings Ltd. (Cayman Islands) (2) HKD 9,600 171,064 0.11Tingyi Cayman Islands Holding Corp.
(Cayman Islands) (2) HKD 20,000 36,491 0.02Tsingtao Brewery Co. Ltd. Class H HKD 6,000 32,517 0.02
1,434,548 0.89
DenmarkDSV A/S DKK 7,958 232,130 0.14Novo Nordisk A/S Class B DKK 5,171 252,108 0.16William Demant Holding A/S DKK 1,993 136,253 0.09
620,491 0.39
The accompanying notes are an integral part of these financial statements.
Please refer to the full prospectus for the Fund’s investment objective and policy.
Global Balanced Income Fund
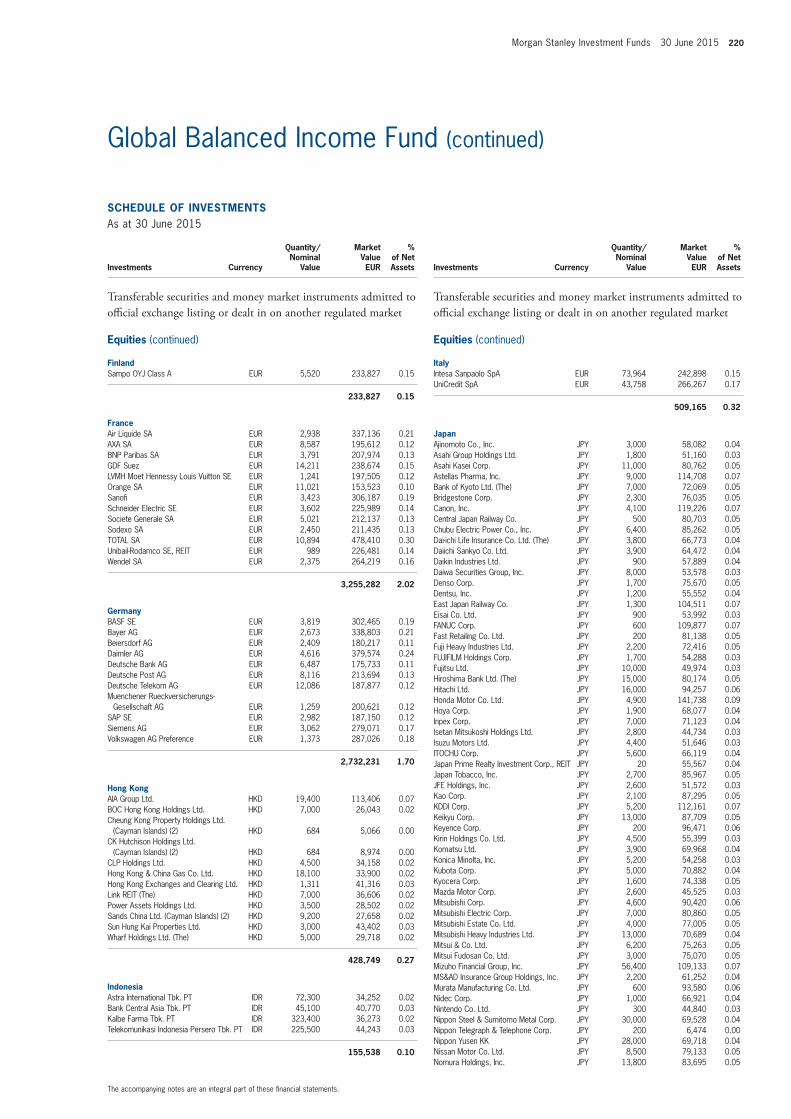
Morgan Stanley Investment Funds 30 June 2015 220
SCHEDULE of invEStmEntSAs at 30 June 2015
Investments Currency
Quantity/Nominal
Value
Market Value EUR
% of Net Assets
transferable securities and money market instruments admitted to official exchange listing or dealt in on another regulated market
Equities (continued)
finlandSampo OYJ Class A EUR 5,520 233,827 0.15
233,827 0.15
franceAir Liquide SA EUR 2,938 337,136 0.21AXA SA EUR 8,587 195,612 0.12BNP Paribas SA EUR 3,791 207,974 0.13GDF Suez EUR 14,211 238,674 0.15LVMH Moet Hennessy Louis Vuitton SE EUR 1,241 197,505 0.12Orange SA EUR 11,021 153,523 0.10Sanofi EUR 3,423 306,187 0.19Schneider Electric SE EUR 3,602 225,989 0.14Societe Generale SA EUR 5,021 212,137 0.13Sodexo SA EUR 2,450 211,435 0.13TOTAL SA EUR 10,894 478,410 0.30Unibail-Rodamco SE, REIT EUR 989 226,481 0.14Wendel SA EUR 2,375 264,219 0.16
3,255,282 2.02
GermanyBASF SE EUR 3,819 302,465 0.19Bayer AG EUR 2,673 338,803 0.21Beiersdorf AG EUR 2,409 180,217 0.11Daimler AG EUR 4,616 379,574 0.24Deutsche Bank AG EUR 6,487 175,733 0.11Deutsche Post AG EUR 8,116 213,694 0.13Deutsche Telekom AG EUR 12,086 187,877 0.12Muenchener Rueckversicherungs-
Gesellschaft AG EUR 1,259 200,621 0.12SAP SE EUR 2,982 187,150 0.12Siemens AG EUR 3,062 279,071 0.17Volkswagen AG Preference EUR 1,373 287,026 0.18
2,732,231 1.70
Hong KongAIA Group Ltd. HKD 19,400 113,406 0.07BOC Hong Kong Holdings Ltd. HKD 7,000 26,043 0.02Cheung Kong Property Holdings Ltd.
(Cayman Islands) (2) HKD 684 5,066 0.00CK Hutchison Holdings Ltd.
(Cayman Islands) (2) HKD 684 8,974 0.00CLP Holdings Ltd. HKD 4,500 34,158 0.02Hong Kong & China Gas Co. Ltd. HKD 18,100 33,900 0.02Hong Kong Exchanges and Clearing Ltd. HKD 1,311 41,316 0.03Link REIT (The) HKD 7,000 36,606 0.02Power Assets Holdings Ltd. HKD 3,500 28,502 0.02Sands China Ltd. (Cayman Islands) (2) HKD 9,200 27,658 0.02Sun Hung Kai Properties Ltd. HKD 3,000 43,402 0.03Wharf Holdings Ltd. (The) HKD 5,000 29,718 0.02
428,749 0.27
indonesiaAstra International Tbk. PT IDR 72,300 34,252 0.02Bank Central Asia Tbk. PT IDR 45,100 40,770 0.03Kalbe Farma Tbk. PT IDR 323,400 36,273 0.02Telekomunikasi Indonesia Persero Tbk. PT IDR 225,500 44,243 0.03
155,538 0.10
SCHEDULE of invEStmEntSAs at 30 June 2015
Investments Currency
Quantity/Nominal
Value
Market Value EUR
% of Net Assets
transferable securities and money market instruments admitted to official exchange listing or dealt in on another regulated market
Equities (continued)
italyIntesa Sanpaolo SpA EUR 73,964 242,898 0.15UniCredit SpA EUR 43,758 266,267 0.17
509,165 0.32
JapanAjinomoto Co., Inc. JPY 3,000 58,082 0.04Asahi Group Holdings Ltd. JPY 1,800 51,160 0.03Asahi Kasei Corp. JPY 11,000 80,762 0.05Astellas Pharma, Inc. JPY 9,000 114,708 0.07Bank of Kyoto Ltd. (The) JPY 7,000 72,069 0.05Bridgestone Corp. JPY 2,300 76,035 0.05Canon, Inc. JPY 4,100 119,226 0.07Central Japan Railway Co. JPY 500 80,703 0.05Chubu Electric Power Co., Inc. JPY 6,400 85,262 0.05Dai-ichi Life Insurance Co. Ltd. (The) JPY 3,800 66,773 0.04Daiichi Sankyo Co. Ltd. JPY 3,900 64,472 0.04Daikin Industries Ltd. JPY 900 57,889 0.04Daiwa Securities Group, Inc. JPY 8,000 53,578 0.03Denso Corp. JPY 1,700 75,670 0.05Dentsu, Inc. JPY 1,200 55,552 0.04East Japan Railway Co. JPY 1,300 104,511 0.07Eisai Co. Ltd. JPY 900 53,992 0.03FANUC Corp. JPY 600 109,877 0.07Fast Retailing Co. Ltd. JPY 200 81,138 0.05Fuji Heavy Industries Ltd. JPY 2,200 72,416 0.05FUJIFILM Holdings Corp. JPY 1,700 54,288 0.03Fujitsu Ltd. JPY 10,000 49,974 0.03Hiroshima Bank Ltd. (The) JPY 15,000 80,174 0.05Hitachi Ltd. JPY 16,000 94,257 0.06Honda Motor Co. Ltd. JPY 4,900 141,738 0.09Hoya Corp. JPY 1,900 68,077 0.04Inpex Corp. JPY 7,000 71,123 0.04Isetan Mitsukoshi Holdings Ltd. JPY 2,800 44,734 0.03Isuzu Motors Ltd. JPY 4,400 51,646 0.03ITOCHU Corp. JPY 5,600 66,119 0.04Japan Prime Realty Investment Corp., REIT JPY 20 55,567 0.04Japan Tobacco, Inc. JPY 2,700 85,967 0.05JFE Holdings, Inc. JPY 2,600 51,572 0.03Kao Corp. JPY 2,100 87,295 0.05KDDI Corp. JPY 5,200 112,161 0.07Keikyu Corp. JPY 13,000 87,709 0.05Keyence Corp. JPY 200 96,471 0.06Kirin Holdings Co. Ltd. JPY 4,500 55,399 0.03Komatsu Ltd. JPY 3,900 69,968 0.04Konica Minolta, Inc. JPY 5,200 54,258 0.03Kubota Corp. JPY 5,000 70,882 0.04Kyocera Corp. JPY 1,600 74,338 0.05Mazda Motor Corp. JPY 2,600 45,525 0.03Mitsubishi Corp. JPY 4,600 90,420 0.06Mitsubishi Electric Corp. JPY 7,000 80,860 0.05Mitsubishi Estate Co. Ltd. JPY 4,000 77,005 0.05Mitsubishi Heavy Industries Ltd. JPY 13,000 70,689 0.04Mitsui & Co. Ltd. JPY 6,200 75,263 0.05Mitsui Fudosan Co. Ltd. JPY 3,000 75,070 0.05Mizuho Financial Group, Inc. JPY 56,400 109,133 0.07MS&AD Insurance Group Holdings, Inc. JPY 2,200 61,252 0.04Murata Manufacturing Co. Ltd. JPY 600 93,580 0.06Nidec Corp. JPY 1,000 66,921 0.04Nintendo Co. Ltd. JPY 300 44,840 0.03Nippon Steel & Sumitomo Metal Corp. JPY 30,000 69,528 0.04Nippon Telegraph & Telephone Corp. JPY 200 6,474 0.00Nippon Yusen KK JPY 28,000 69,718 0.04Nissan Motor Co. Ltd. JPY 8,500 79,133 0.05Nomura Holdings, Inc. JPY 13,800 83,695 0.05
The accompanying notes are an integral part of these financial statements.
Global Balanced Income Fund (continued)
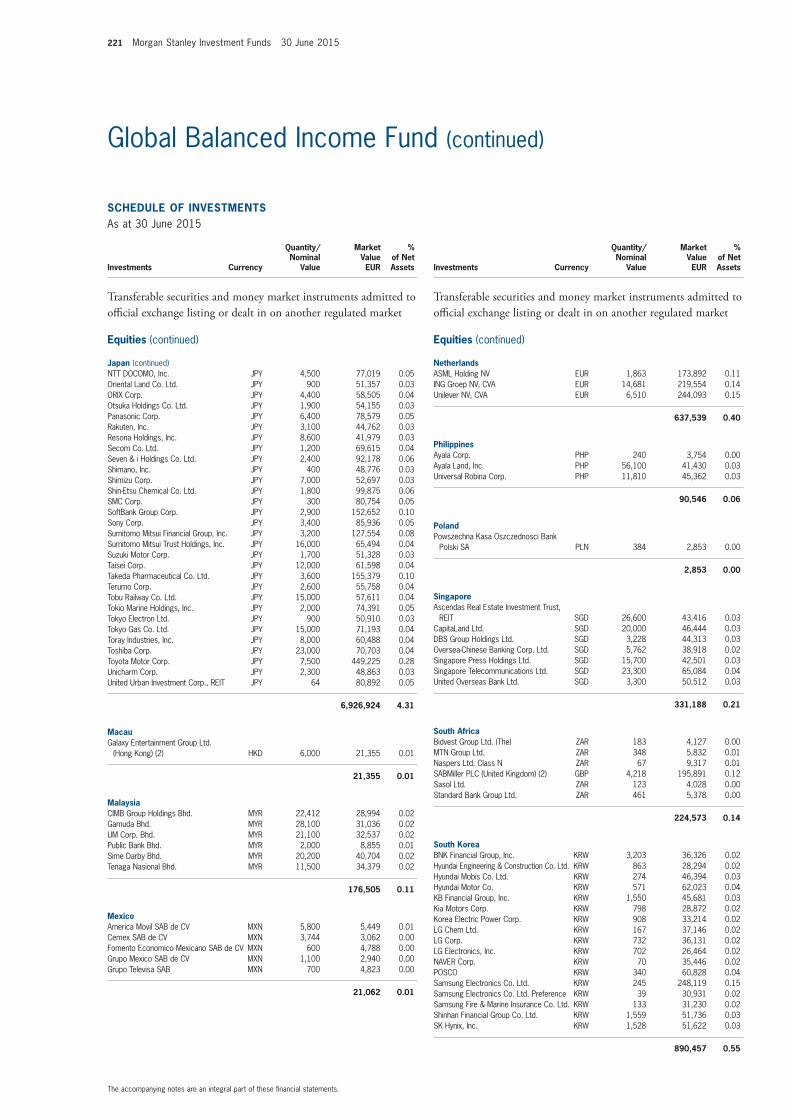
221 Morgan Stanley Investment Funds 30 June 2015
SCHEDULE of invEStmEntSAs at 30 June 2015
Investments Currency
Quantity/Nominal
Value
Market Value EUR
% of Net Assets
transferable securities and money market instruments admitted to official exchange listing or dealt in on another regulated market
Equities (continued)
Japan (continued)NTT DOCOMO, Inc. JPY 4,500 77,019 0.05Oriental Land Co. Ltd. JPY 900 51,357 0.03ORIX Corp. JPY 4,400 58,505 0.04Otsuka Holdings Co. Ltd. JPY 1,900 54,155 0.03Panasonic Corp. JPY 6,400 78,579 0.05Rakuten, Inc. JPY 3,100 44,762 0.03Resona Holdings, Inc. JPY 8,600 41,979 0.03Secom Co. Ltd. JPY 1,200 69,615 0.04Seven & i Holdings Co. Ltd. JPY 2,400 92,178 0.06Shimano, Inc. JPY 400 48,776 0.03Shimizu Corp. JPY 7,000 52,697 0.03Shin-Etsu Chemical Co. Ltd. JPY 1,800 99,875 0.06SMC Corp. JPY 300 80,754 0.05SoftBank Group Corp. JPY 2,900 152,652 0.10Sony Corp. JPY 3,400 85,936 0.05Sumitomo Mitsui Financial Group, Inc. JPY 3,200 127,554 0.08Sumitomo Mitsui Trust Holdings, Inc. JPY 16,000 65,494 0.04Suzuki Motor Corp. JPY 1,700 51,328 0.03Taisei Corp. JPY 12,000 61,598 0.04Takeda Pharmaceutical Co. Ltd. JPY 3,600 155,379 0.10Terumo Corp. JPY 2,600 55,758 0.04Tobu Railway Co. Ltd. JPY 15,000 57,611 0.04Tokio Marine Holdings, Inc. JPY 2,000 74,391 0.05Tokyo Electron Ltd. JPY 900 50,910 0.03Tokyo Gas Co. Ltd. JPY 15,000 71,193 0.04Toray Industries, Inc. JPY 8,000 60,488 0.04Toshiba Corp. JPY 23,000 70,703 0.04Toyota Motor Corp. JPY 7,500 449,225 0.28Unicharm Corp. JPY 2,300 48,863 0.03United Urban Investment Corp., REIT JPY 64 80,892 0.05
6,926,924 4.31
macauGalaxy Entertainment Group Ltd.
(Hong Kong) (2) HKD 6,000 21,355 0.01
21,355 0.01
malaysiaCIMB Group Holdings Bhd. MYR 22,412 28,994 0.02Gamuda Bhd. MYR 28,100 31,036 0.02IJM Corp. Bhd. MYR 21,100 32,537 0.02Public Bank Bhd. MYR 2,000 8,855 0.01Sime Darby Bhd. MYR 20,200 40,704 0.02Tenaga Nasional Bhd. MYR 11,500 34,379 0.02
176,505 0.11
mexicoAmerica Movil SAB de CV MXN 5,800 5,449 0.01Cemex SAB de CV MXN 3,744 3,062 0.00Fomento Economico Mexicano SAB de CV MXN 600 4,788 0.00Grupo Mexico SAB de CV MXN 1,100 2,940 0.00Grupo Televisa SAB MXN 700 4,823 0.00
21,062 0.01
SCHEDULE of invEStmEntSAs at 30 June 2015
Investments Currency
Quantity/Nominal
Value
Market Value EUR
% of Net Assets
transferable securities and money market instruments admitted to official exchange listing or dealt in on another regulated market
Equities (continued)
netherlandsASML Holding NV EUR 1,863 173,892 0.11ING Groep NV, CVA EUR 14,681 219,554 0.14Unilever NV, CVA EUR 6,510 244,093 0.15
637,539 0.40
PhilippinesAyala Corp. PHP 240 3,754 0.00Ayala Land, Inc. PHP 56,100 41,430 0.03Universal Robina Corp. PHP 11,810 45,362 0.03
90,546 0.06
PolandPowszechna Kasa Oszczednosci Bank
Polski SA PLN 384 2,853 0.00
2,853 0.00
SingaporeAscendas Real Estate Investment Trust,
REIT SGD 26,600 43,416 0.03CapitaLand Ltd. SGD 20,000 46,444 0.03DBS Group Holdings Ltd. SGD 3,228 44,313 0.03Oversea-Chinese Banking Corp. Ltd. SGD 5,762 38,918 0.02Singapore Press Holdings Ltd. SGD 15,700 42,501 0.03Singapore Telecommunications Ltd. SGD 23,300 65,084 0.04United Overseas Bank Ltd. SGD 3,300 50,512 0.03
331,188 0.21
South AfricaBidvest Group Ltd. (The) ZAR 183 4,127 0.00MTN Group Ltd. ZAR 348 5,832 0.01Naspers Ltd. Class N ZAR 67 9,317 0.01SABMiller PLC (United Kingdom) (2) GBP 4,218 195,891 0.12Sasol Ltd. ZAR 123 4,028 0.00Standard Bank Group Ltd. ZAR 461 5,378 0.00
224,573 0.14
South KoreaBNK Financial Group, Inc. KRW 3,203 36,326 0.02Hyundai Engineering & Construction Co. Ltd. KRW 863 28,294 0.02Hyundai Mobis Co. Ltd. KRW 274 46,394 0.03Hyundai Motor Co. KRW 571 62,023 0.04KB Financial Group, Inc. KRW 1,550 45,681 0.03Kia Motors Corp. KRW 798 28,872 0.02Korea Electric Power Corp. KRW 908 33,214 0.02LG Chem Ltd. KRW 167 37,146 0.02LG Corp. KRW 732 36,131 0.02LG Electronics, Inc. KRW 702 26,464 0.02NAVER Corp. KRW 70 35,446 0.02POSCO KRW 340 60,828 0.04Samsung Electronics Co. Ltd. KRW 245 248,119 0.15Samsung Electronics Co. Ltd. Preference KRW 39 30,931 0.02Samsung Fire & Marine Insurance Co. Ltd. KRW 133 31,230 0.02Shinhan Financial Group Co. Ltd. KRW 1,559 51,736 0.03SK Hynix, Inc. KRW 1,528 51,622 0.03
890,457 0.55
The accompanying notes are an integral part of these financial statements.
Global Balanced Income Fund (continued)
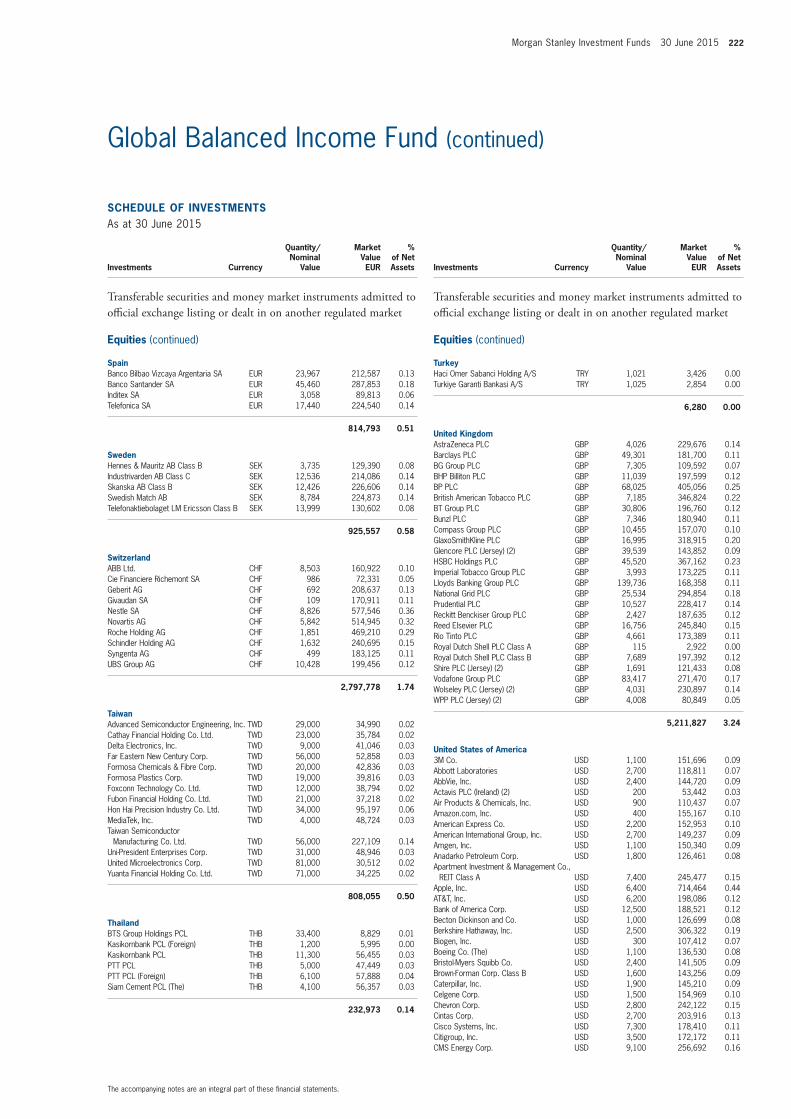
Morgan Stanley Investment Funds 30 June 2015 222
SCHEDULE of invEStmEntSAs at 30 June 2015
Investments Currency
Quantity/Nominal
Value
Market Value EUR
% of Net Assets
transferable securities and money market instruments admitted to official exchange listing or dealt in on another regulated market
Equities (continued)
SpainBanco Bilbao Vizcaya Argentaria SA EUR 23,967 212,587 0.13Banco Santander SA EUR 45,460 287,853 0.18Inditex SA EUR 3,058 89,813 0.06Telefonica SA EUR 17,440 224,540 0.14
814,793 0.51
SwedenHennes & Mauritz AB Class B SEK 3,735 129,390 0.08Industrivarden AB Class C SEK 12,536 214,086 0.14Skanska AB Class B SEK 12,426 226,606 0.14Swedish Match AB SEK 8,784 224,873 0.14Telefonaktiebolaget LM Ericsson Class B SEK 13,999 130,602 0.08
925,557 0.58
SwitzerlandABB Ltd. CHF 8,503 160,922 0.10Cie Financiere Richemont SA CHF 986 72,331 0.05Geberit AG CHF 692 208,637 0.13Givaudan SA CHF 109 170,911 0.11Nestle SA CHF 8,826 577,546 0.36Novartis AG CHF 5,842 514,945 0.32Roche Holding AG CHF 1,851 469,210 0.29Schindler Holding AG CHF 1,632 240,695 0.15Syngenta AG CHF 499 183,125 0.11UBS Group AG CHF 10,428 199,456 0.12
2,797,778 1.74
taiwanAdvanced Semiconductor Engineering, Inc. TWD 29,000 34,990 0.02Cathay Financial Holding Co. Ltd. TWD 23,000 35,784 0.02Delta Electronics, Inc. TWD 9,000 41,046 0.03Far Eastern New Century Corp. TWD 56,000 52,858 0.03Formosa Chemicals & Fibre Corp. TWD 20,000 42,836 0.03Formosa Plastics Corp. TWD 19,000 39,816 0.03Foxconn Technology Co. Ltd. TWD 12,000 38,794 0.02Fubon Financial Holding Co. Ltd. TWD 21,000 37,218 0.02Hon Hai Precision Industry Co. Ltd. TWD 34,000 95,197 0.06MediaTek, Inc. TWD 4,000 48,724 0.03Taiwan Semiconductor
Manufacturing Co. Ltd. TWD 56,000 227,109 0.14Uni-President Enterprises Corp. TWD 31,000 48,946 0.03United Microelectronics Corp. TWD 81,000 30,512 0.02Yuanta Financial Holding Co. Ltd. TWD 71,000 34,225 0.02
808,055 0.50
thailandBTS Group Holdings PCL THB 33,400 8,829 0.01Kasikornbank PCL (Foreign) THB 1,200 5,995 0.00Kasikornbank PCL THB 11,300 56,455 0.03PTT PCL THB 5,000 47,449 0.03PTT PCL (Foreign) THB 6,100 57,888 0.04Siam Cement PCL (The) THB 4,100 56,357 0.03
232,973 0.14
SCHEDULE of invEStmEntSAs at 30 June 2015
Investments Currency
Quantity/Nominal
Value
Market Value EUR
% of Net Assets
transferable securities and money market instruments admitted to official exchange listing or dealt in on another regulated market
Equities (continued)
turkeyHaci Omer Sabanci Holding A/S TRY 1,021 3,426 0.00Turkiye Garanti Bankasi A/S TRY 1,025 2,854 0.00
6,280 0.00
United KingdomAstraZeneca PLC GBP 4,026 229,676 0.14Barclays PLC GBP 49,301 181,700 0.11BG Group PLC GBP 7,305 109,592 0.07BHP Billiton PLC GBP 11,039 197,599 0.12BP PLC GBP 68,025 405,056 0.25British American Tobacco PLC GBP 7,185 346,824 0.22BT Group PLC GBP 30,806 196,760 0.12Bunzl PLC GBP 7,346 180,940 0.11Compass Group PLC GBP 10,455 157,070 0.10GlaxoSmithKline PLC GBP 16,995 318,915 0.20Glencore PLC (Jersey) (2) GBP 39,539 143,852 0.09HSBC Holdings PLC GBP 45,520 367,162 0.23Imperial Tobacco Group PLC GBP 3,993 173,225 0.11Lloyds Banking Group PLC GBP 139,736 168,358 0.11National Grid PLC GBP 25,534 294,854 0.18Prudential PLC GBP 10,527 228,417 0.14Reckitt Benckiser Group PLC GBP 2,427 187,635 0.12Reed Elsevier PLC GBP 16,756 245,840 0.15Rio Tinto PLC GBP 4,661 173,389 0.11Royal Dutch Shell PLC Class A GBP 115 2,922 0.00Royal Dutch Shell PLC Class B GBP 7,689 197,392 0.12Shire PLC (Jersey) (2) GBP 1,691 121,433 0.08Vodafone Group PLC GBP 83,417 271,470 0.17Wolseley PLC (Jersey) (2) GBP 4,031 230,897 0.14WPP PLC (Jersey) (2) GBP 4,008 80,849 0.05
5,211,827 3.24
United States of America3M Co. USD 1,100 151,696 0.09Abbott Laboratories USD 2,700 118,811 0.07AbbVie, Inc. USD 2,400 144,720 0.09Actavis PLC (Ireland) (2) USD 200 53,442 0.03Air Products & Chemicals, Inc. USD 900 110,437 0.07Amazon.com, Inc. USD 400 155,167 0.10American Express Co. USD 2,200 152,953 0.10American International Group, Inc. USD 2,700 149,237 0.09Amgen, Inc. USD 1,100 150,340 0.09Anadarko Petroleum Corp. USD 1,800 126,461 0.08Apartment Investment & Management Co.,
REIT Class A USD 7,400 245,477 0.15Apple, Inc. USD 6,400 714,464 0.44AT&T, Inc. USD 6,200 198,086 0.12Bank of America Corp. USD 12,500 188,521 0.12Becton Dickinson and Co. USD 1,000 126,699 0.08Berkshire Hathaway, Inc. USD 2,500 306,322 0.19Biogen, Inc. USD 300 107,412 0.07Boeing Co. (The) USD 1,100 136,530 0.08Bristol-Myers Squibb Co. USD 2,400 141,505 0.09Brown-Forman Corp. Class B USD 1,600 143,256 0.09Caterpillar, Inc. USD 1,900 145,210 0.09Celgene Corp. USD 1,500 154,969 0.10Chevron Corp. USD 2,800 242,122 0.15Cintas Corp. USD 2,700 203,916 0.13Cisco Systems, Inc. USD 7,300 178,410 0.11Citigroup, Inc. USD 3,500 172,172 0.11CMS Energy Corp. USD 9,100 256,692 0.16
The accompanying notes are an integral part of these financial statements.
Global Balanced Income Fund (continued)
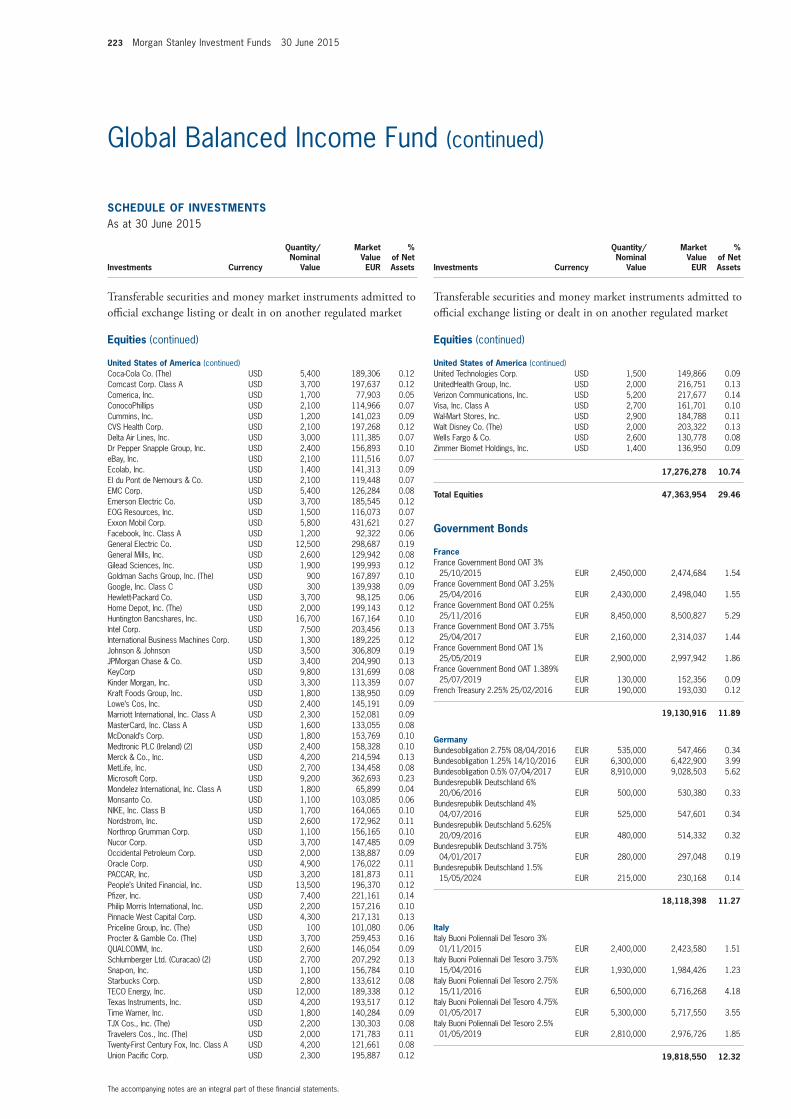
223 Morgan Stanley Investment Funds 30 June 2015
SCHEDULE of invEStmEntSAs at 30 June 2015
Investments Currency
Quantity/Nominal
Value
Market Value EUR
% of Net Assets
transferable securities and money market instruments admitted to official exchange listing or dealt in on another regulated market
Equities (continued)
United States of America (continued)Coca-Cola Co. (The) USD 5,400 189,306 0.12Comcast Corp. Class A USD 3,700 197,637 0.12Comerica, Inc. USD 1,700 77,903 0.05ConocoPhillips USD 2,100 114,966 0.07Cummins, Inc. USD 1,200 141,023 0.09CVS Health Corp. USD 2,100 197,268 0.12Delta Air Lines, Inc. USD 3,000 111,385 0.07Dr Pepper Snapple Group, Inc. USD 2,400 156,893 0.10eBay, Inc. USD 2,100 111,516 0.07Ecolab, Inc. USD 1,400 141,313 0.09EI du Pont de Nemours & Co. USD 2,100 119,448 0.07EMC Corp. USD 5,400 126,284 0.08Emerson Electric Co. USD 3,700 185,545 0.12EOG Resources, Inc. USD 1,500 116,073 0.07Exxon Mobil Corp. USD 5,800 431,621 0.27Facebook, Inc. Class A USD 1,200 92,322 0.06General Electric Co. USD 12,500 298,687 0.19General Mills, Inc. USD 2,600 129,942 0.08Gilead Sciences, Inc. USD 1,900 199,993 0.12Goldman Sachs Group, Inc. (The) USD 900 167,897 0.10Google, Inc. Class C USD 300 139,938 0.09Hewlett-Packard Co. USD 3,700 98,125 0.06Home Depot, Inc. (The) USD 2,000 199,143 0.12Huntington Bancshares, Inc. USD 16,700 167,164 0.10Intel Corp. USD 7,500 203,456 0.13International Business Machines Corp. USD 1,300 189,225 0.12Johnson & Johnson USD 3,500 306,809 0.19JPMorgan Chase & Co. USD 3,400 204,990 0.13KeyCorp USD 9,800 131,699 0.08Kinder Morgan, Inc. USD 3,300 113,359 0.07Kraft Foods Group, Inc. USD 1,800 138,950 0.09Lowe’s Cos, Inc. USD 2,400 145,191 0.09Marriott International, Inc. Class A USD 2,300 152,081 0.09MasterCard, Inc. Class A USD 1,600 133,055 0.08McDonald’s Corp. USD 1,800 153,769 0.10Medtronic PLC (Ireland) (2) USD 2,400 158,328 0.10Merck & Co., Inc. USD 4,200 214,594 0.13MetLife, Inc. USD 2,700 134,458 0.08Microsoft Corp. USD 9,200 362,693 0.23Mondelez International, Inc. Class A USD 1,800 65,899 0.04Monsanto Co. USD 1,100 103,085 0.06NIKE, Inc. Class B USD 1,700 164,065 0.10Nordstrom, Inc. USD 2,600 172,962 0.11Northrop Grumman Corp. USD 1,100 156,165 0.10Nucor Corp. USD 3,700 147,485 0.09Occidental Petroleum Corp. USD 2,000 138,887 0.09Oracle Corp. USD 4,900 176,022 0.11PACCAR, Inc. USD 3,200 181,873 0.11People’s United Financial, Inc. USD 13,500 196,370 0.12Pfizer, Inc. USD 7,400 221,161 0.14Philip Morris International, Inc. USD 2,200 157,216 0.10Pinnacle West Capital Corp. USD 4,300 217,131 0.13Priceline Group, Inc. (The) USD 100 101,080 0.06Procter & Gamble Co. (The) USD 3,700 259,453 0.16QUALCOMM, Inc. USD 2,600 146,054 0.09Schlumberger Ltd. (Curacao) (2) USD 2,700 207,292 0.13Snap-on, Inc. USD 1,100 156,784 0.10Starbucks Corp. USD 2,800 133,612 0.08TECO Energy, Inc. USD 12,000 189,338 0.12Texas Instruments, Inc. USD 4,200 193,517 0.12Time Warner, Inc. USD 1,800 140,284 0.09TJX Cos., Inc. (The) USD 2,200 130,303 0.08Travelers Cos., Inc. (The) USD 2,000 171,783 0.11Twenty-First Century Fox, Inc. Class A USD 4,200 121,661 0.08Union Pacific Corp. USD 2,300 195,887 0.12
SCHEDULE of invEStmEntSAs at 30 June 2015
Investments Currency
Quantity/Nominal
Value
Market Value EUR
% of Net Assets
transferable securities and money market instruments admitted to official exchange listing or dealt in on another regulated market
Equities (continued)
United States of America (continued)United Technologies Corp. USD 1,500 149,866 0.09UnitedHealth Group, Inc. USD 2,000 216,751 0.13Verizon Communications, Inc. USD 5,200 217,677 0.14Visa, Inc. Class A USD 2,700 161,701 0.10Wal-Mart Stores, Inc. USD 2,900 184,788 0.11Walt Disney Co. (The) USD 2,000 203,322 0.13Wells Fargo & Co. USD 2,600 130,778 0.08Zimmer Biomet Holdings, Inc. USD 1,400 136,950 0.09
17,276,278 10.74
total Equities 47,363,954 29.46
Government Bonds
franceFrance Government Bond OAT 3%
25/10/2015 EUR 2,450,000 2,474,684 1.54France Government Bond OAT 3.25%
25/04/2016 EUR 2,430,000 2,498,040 1.55France Government Bond OAT 0.25%
25/11/2016 EUR 8,450,000 8,500,827 5.29France Government Bond OAT 3.75%
25/04/2017 EUR 2,160,000 2,314,037 1.44France Government Bond OAT 1%
25/05/2019 EUR 2,900,000 2,997,942 1.86France Government Bond OAT 1.389%
25/07/2019 EUR 130,000 152,356 0.09French Treasury 2.25% 25/02/2016 EUR 190,000 193,030 0.12
19,130,916 11.89
GermanyBundesobligation 2.75% 08/04/2016 EUR 535,000 547,466 0.34Bundesobligation 1.25% 14/10/2016 EUR 6,300,000 6,422,900 3.99Bundesobligation 0.5% 07/04/2017 EUR 8,910,000 9,028,503 5.62Bundesrepublik Deutschland 6%
20/06/2016 EUR 500,000 530,380 0.33Bundesrepublik Deutschland 4%
04/07/2016 EUR 525,000 547,601 0.34Bundesrepublik Deutschland 5.625%
20/09/2016 EUR 480,000 514,332 0.32Bundesrepublik Deutschland 3.75%
04/01/2017 EUR 280,000 297,048 0.19Bundesrepublik Deutschland 1.5%
15/05/2024 EUR 215,000 230,168 0.14
18,118,398 11.27
italyItaly Buoni Poliennali Del Tesoro 3%
01/11/2015 EUR 2,400,000 2,423,580 1.51Italy Buoni Poliennali Del Tesoro 3.75%
15/04/2016 EUR 1,930,000 1,984,426 1.23Italy Buoni Poliennali Del Tesoro 2.75%
15/11/2016 EUR 6,500,000 6,716,268 4.18Italy Buoni Poliennali Del Tesoro 4.75%
01/05/2017 EUR 5,300,000 5,717,550 3.55Italy Buoni Poliennali Del Tesoro 2.5%
01/05/2019 EUR 2,810,000 2,976,726 1.85
19,818,550 12.32
The accompanying notes are an integral part of these financial statements.
Global Balanced Income Fund (continued)
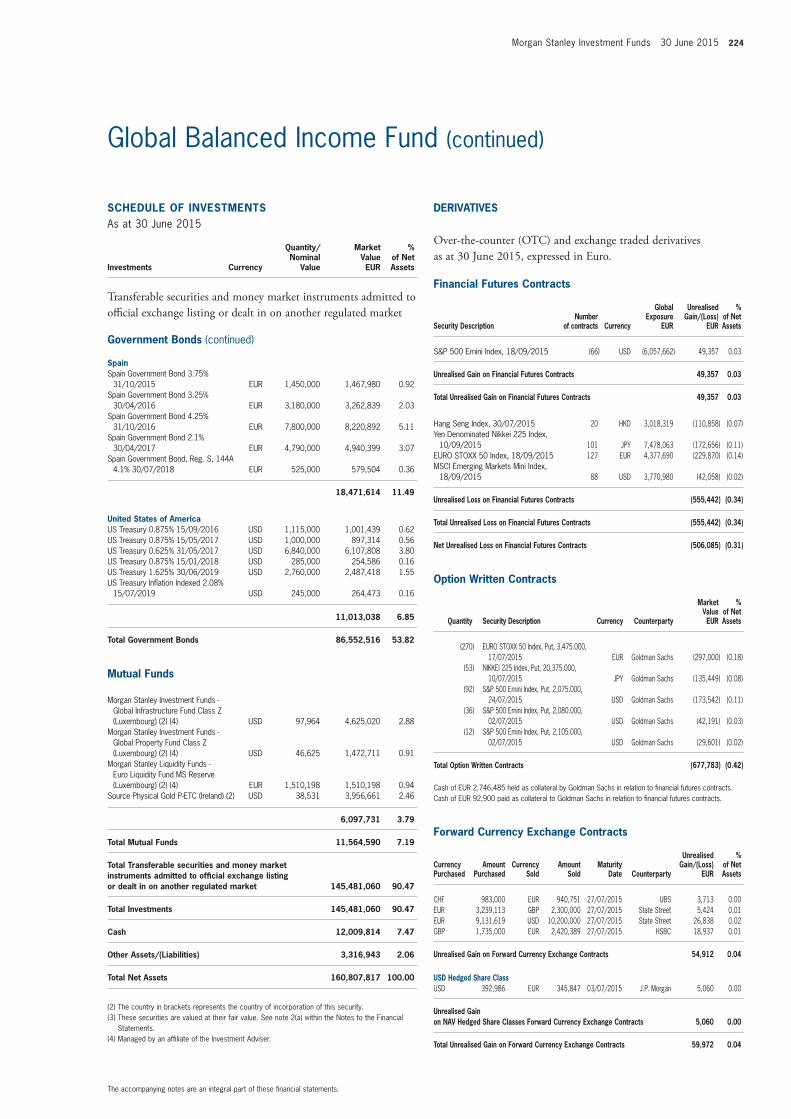
Morgan Stanley Investment Funds 30 June 2015 224
SCHEDULE of invEStmEntSAs at 30 June 2015
Investments Currency
Quantity/Nominal
Value
Market Value EUR
% of Net Assets
transferable securities and money market instruments admitted to official exchange listing or dealt in on another regulated market
Government Bonds (continued)
SpainSpain Government Bond 3.75%
31/10/2015 EUR 1,450,000 1,467,980 0.92Spain Government Bond 3.25%
30/04/2016 EUR 3,180,000 3,262,839 2.03Spain Government Bond 4.25%
31/10/2016 EUR 7,800,000 8,220,892 5.11Spain Government Bond 2.1%
30/04/2017 EUR 4,790,000 4,940,399 3.07Spain Government Bond, Reg. S, 144A
4.1% 30/07/2018 EUR 525,000 579,504 0.36
18,471,614 11.49
United States of AmericaUS Treasury 0.875% 15/09/2016 USD 1,115,000 1,001,439 0.62US Treasury 0.875% 15/05/2017 USD 1,000,000 897,314 0.56US Treasury 0.625% 31/05/2017 USD 6,840,000 6,107,808 3.80US Treasury 0.875% 15/01/2018 USD 285,000 254,586 0.16US Treasury 1.625% 30/06/2019 USD 2,760,000 2,487,418 1.55US Treasury Inflation Indexed 2.08%
15/07/2019 USD 245,000 264,473 0.16
11,013,038 6.85
total Government Bonds 86,552,516 53.82
mutual funds
Morgan Stanley Investment Funds - Global Infrastructure Fund Class Z (Luxembourg) (2) (4) USD 97,964 4,625,020 2.88
Morgan Stanley Investment Funds - Global Property Fund Class Z (Luxembourg) (2) (4) USD 46,625 1,472,711 0.91
Morgan Stanley Liquidity Funds - Euro Liquidity Fund MS Reserve (Luxembourg) (2) (4) EUR 1,510,198 1,510,198 0.94
Source Physical Gold P-ETC (Ireland) (2) USD 38,531 3,956,661 2.46
6,097,731 3.79
total mutual funds 11,564,590 7.19
total transferable securities and money market instruments admitted to official exchange listing or dealt in on another regulated market 145,481,060 90.47
total investments 145,481,060 90.47
Cash 12,009,814 7.47
other Assets/(Liabilities) 3,316,943 2.06
total net Assets 160,807,817 100.00
(2) The country in brackets represents the country of incorporation of this security.(3) These securities are valued at their fair value. See note 2(a) within the Notes to the Financial
Statements.(4) Managed by an affiliate of the Investment Adviser.
The accompanying notes are an integral part of these financial statements.
Global Balanced Income Fund (continued)
financial futures Contracts
Security Descriptionnumber
of contracts Currency
Global Exposure
EUR
Unrealised Gain/(Loss)
EUR
% of net Assets
S&P 500 Emini Index, 18/09/2015 (66) USD (6,057,662) 49,357 0.03
Unrealised Gain on financial futures Contracts 49,357 0.03
total Unrealised Gain on financial futures Contracts 49,357 0.03
Hang Seng Index, 30/07/2015 20 HKD 3,018,319 (110,858) (0.07)Yen Denominated Nikkei 225 Index,
10/09/2015 101 JPY 7,478,063 (172,656) (0.11)EURO STOXX 50 Index, 18/09/2015 127 EUR 4,377,690 (229,870) (0.14)MSCI Emerging Markets Mini Index,
18/09/2015 88 USD 3,770,980 (42,058) (0.02)
Unrealised Loss on financial futures Contracts (555,442) (0.34)
total Unrealised Loss on financial futures Contracts (555,442) (0.34)
net Unrealised Loss on financial futures Contracts (506,085) (0.31)
option Written Contracts
Quantity Security Description Currency Counterparty
market value EUR
% of net Assets
(270) EURO STOXX 50 Index, Put, 3,475.000, 17/07/2015 EUR Goldman Sachs (297,000) (0.18)
(53) NIKKEI 225 Index, Put, 20,375.000, 10/07/2015 JPY Goldman Sachs (135,449) (0.08)
(92) S&P 500 Emini Index, Put, 2,075.000, 24/07/2015 USD Goldman Sachs (173,542) (0.11)
(36) S&P 500 Emini Index, Put, 2,080.000, 02/07/2015 USD Goldman Sachs (42,191) (0.03)
(12) S&P 500 Emini Index, Put, 2,105.000, 02/07/2015 USD Goldman Sachs (29,601) (0.02)
total option Written Contracts (677,783) (0.42)
Cash of EUR 2,746,485 held as collateral by Goldman Sachs in relation to financial futures contracts.Cash of EUR 92,900 paid as collateral to Goldman Sachs in relation to financial futures contracts.
forward Currency Exchange Contracts (continued)
Currency Purchased
Amount Purchased
Currency Sold
Amount Sold
maturity Date Counterparty
Unrealised Gain/(Loss)
EUR
% of net Assets
CHF 983,000 EUR 940,751 27/07/2015 UBS 3,713 0.00EUR 3,239,113 GBP 2,300,000 27/07/2015 State Street 5,424 0.01EUR 9,131,619 USD 10,200,000 27/07/2015 State Street 26,838 0.02GBP 1,735,000 EUR 2,420,389 27/07/2015 HSBC 18,937 0.01
Unrealised Gain on forward Currency Exchange Contracts 54,912 0.04
USD Hedged Share ClassUSD 392,986 EUR 345,847 03/07/2015 J.P. Morgan 5,060 0.00
Unrealised Gain on nAv Hedged Share Classes forward Currency Exchange Contracts 5,060 0.00
total Unrealised Gain on forward Currency Exchange Contracts 59,972 0.04
DERivAtivES
Over-the-counter (OtC) and exchange traded derivatives as at 30 June 2015, expressed in euro.
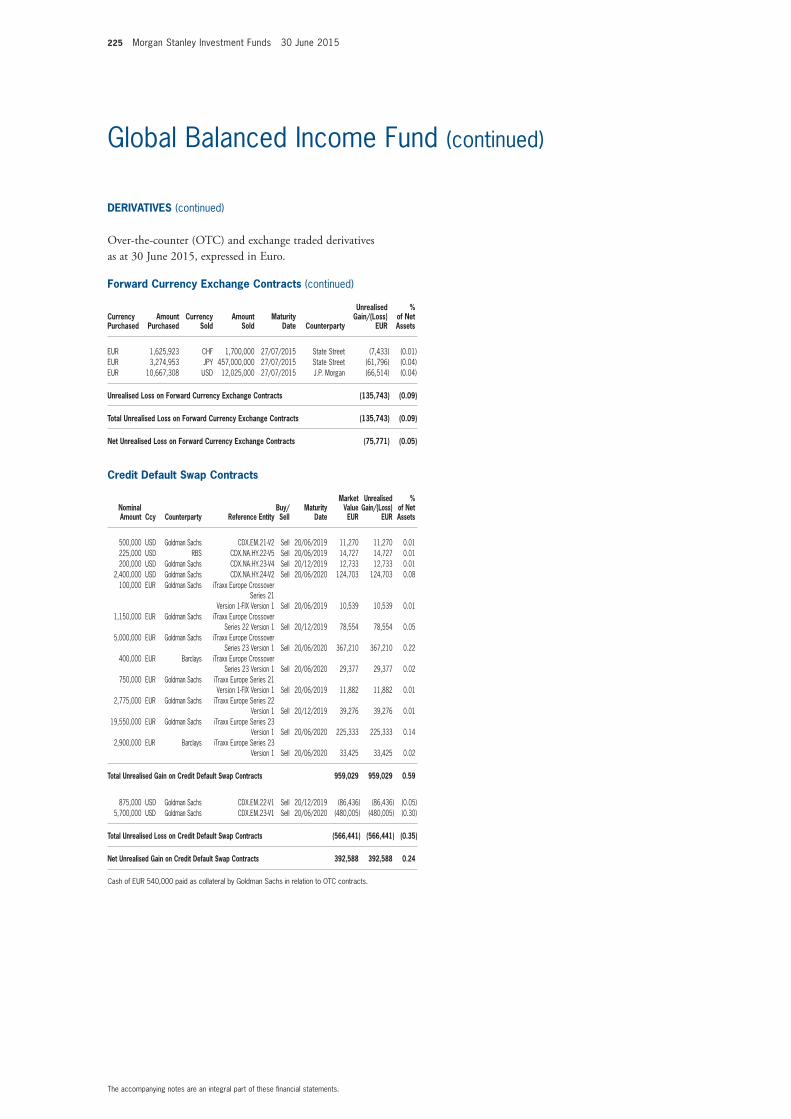
225 Morgan Stanley Investment Funds 30 June 2015
The accompanying notes are an integral part of these financial statements.
Global Balanced Income Fund (continued)
forward Currency Exchange Contracts (continued)
Currency Purchased
Amount Purchased
Currency Sold
Amount Sold
maturity Date Counterparty
Unrealised Gain/(Loss)
EUR
% of net Assets
EUR 1,625,923 CHF 1,700,000 27/07/2015 State Street (7,433) (0.01)EUR 3,274,953 JPY 457,000,000 27/07/2015 State Street (61,796) (0.04)EUR 10,667,308 USD 12,025,000 27/07/2015 J.P. Morgan (66,514) (0.04)
Unrealised Loss on forward Currency Exchange Contracts (135,743) (0.09)
total Unrealised Loss on forward Currency Exchange Contracts (135,743) (0.09)
net Unrealised Loss on forward Currency Exchange Contracts (75,771) (0.05)
Credit Default Swap Contracts
nominal Amount Ccy Counterparty Reference Entity
Buy/Sell
maturity Date
market value EUR
Unrealised Gain/(Loss)
EUR
% of net Assets
500,000 USD Goldman Sachs CDX.EM.21-V2 Sell 20/06/2019 11,270 11,270 0.01225,000 USD RBS CDX.NA.HY.22-V5 Sell 20/06/2019 14,727 14,727 0.01200,000 USD Goldman Sachs CDX.NA.HY.23-V4 Sell 20/12/2019 12,733 12,733 0.01
2,400,000 USD Goldman Sachs CDX.NA.HY.24-V2 Sell 20/06/2020 124,703 124,703 0.08100,000 EUR Goldman Sachs iTraxx Europe Crossover
Series 21 Version 1-FIX Version 1 Sell 20/06/2019 10,539 10,539 0.01
1,150,000 EUR Goldman Sachs iTraxx Europe Crossover Series 22 Version 1 Sell 20/12/2019 78,554 78,554 0.05
5,000,000 EUR Goldman Sachs iTraxx Europe Crossover Series 23 Version 1 Sell 20/06/2020 367,210 367,210 0.22
400,000 EUR Barclays iTraxx Europe Crossover Series 23 Version 1 Sell 20/06/2020 29,377 29,377 0.02
750,000 EUR Goldman Sachs iTraxx Europe Series 21 Version 1-FIX Version 1 Sell 20/06/2019 11,882 11,882 0.01
2,775,000 EUR Goldman Sachs iTraxx Europe Series 22 Version 1 Sell 20/12/2019 39,276 39,276 0.01
19,550,000 EUR Goldman Sachs iTraxx Europe Series 23 Version 1 Sell 20/06/2020 225,333 225,333 0.14
2,900,000 EUR Barclays iTraxx Europe Series 23 Version 1 Sell 20/06/2020 33,425 33,425 0.02
total Unrealised Gain on Credit Default Swap Contracts 959,029 959,029 0.59
875,000 USD Goldman Sachs CDX.EM.22-V1 Sell 20/12/2019 (86,436) (86,436) (0.05)5,700,000 USD Goldman Sachs CDX.EM.23-V1 Sell 20/06/2020 (480,005) (480,005) (0.30)
total Unrealised Loss on Credit Default Swap Contracts (566,441) (566,441) (0.35)
net Unrealised Gain on Credit Default Swap Contracts 392,588 392,588 0.24
Cash of EUR 540,000 paid as collateral by Goldman Sachs in relation to OTC contracts.
DERivAtivES (continued)
Over-the-counter (OtC) and exchange traded derivatives as at 30 June 2015, expressed in euro.
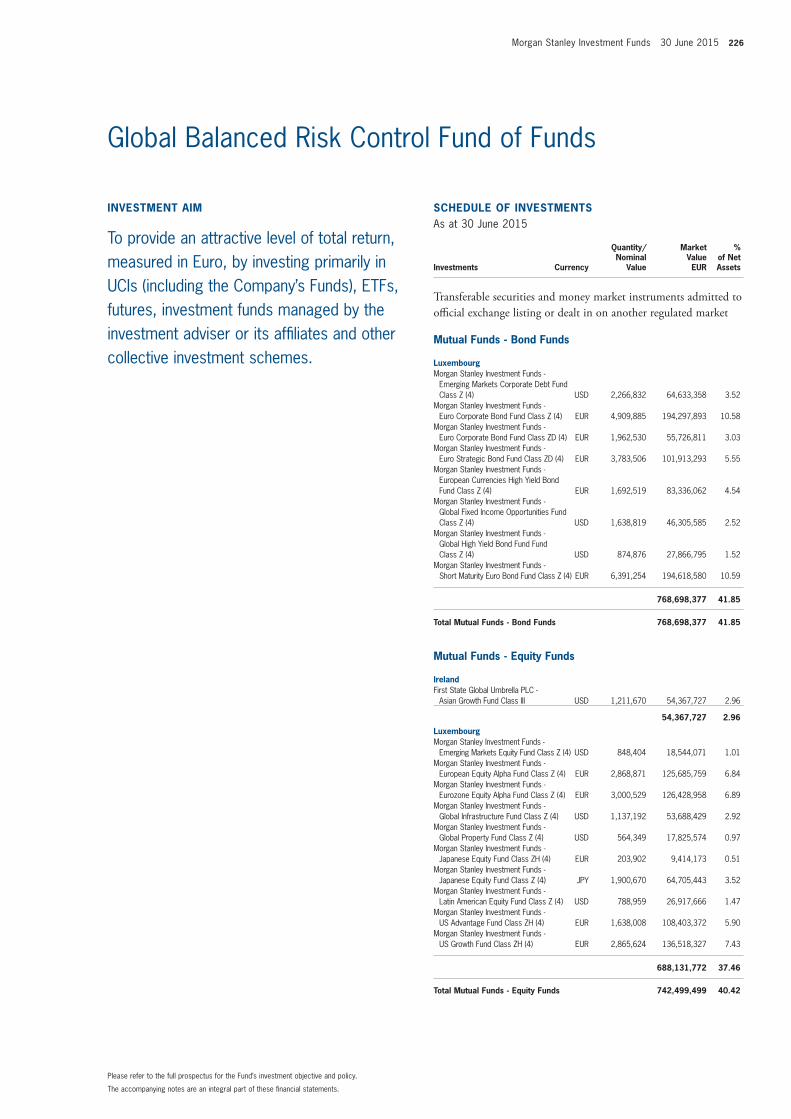
Morgan Stanley Investment Funds 30 June 2015 226
invEStmEnt Aim
To provide an attractive level of total return, measured in Euro, by investing primarily in UCIs (including the Company’s Funds), ETFs, futures, investment funds managed by the investment adviser or its affiliates and other collective investment schemes.
SCHEDULE of invEStmEntSAs at 30 June 2015
Investments Currency
Quantity/Nominal
Value
Market Value EUR
% of Net Assets
transferable securities and money market instruments admitted to official exchange listing or dealt in on another regulated market
mutual funds - Bond funds
LuxembourgMorgan Stanley Investment Funds -
Emerging Markets Corporate Debt Fund Class Z (4) USD 2,266,832 64,633,358 3.52
Morgan Stanley Investment Funds - Euro Corporate Bond Fund Class Z (4) EUR 4,909,885 194,297,893 10.58
Morgan Stanley Investment Funds - Euro Corporate Bond Fund Class ZD (4) EUR 1,962,530 55,726,811 3.03
Morgan Stanley Investment Funds - Euro Strategic Bond Fund Class ZD (4) EUR 3,783,506 101,913,293 5.55
Morgan Stanley Investment Funds - European Currencies High Yield Bond Fund Class Z (4) EUR 1,692,519 83,336,062 4.54
Morgan Stanley Investment Funds - Global Fixed Income Opportunities Fund Class Z (4) USD 1,638,819 46,305,585 2.52
Morgan Stanley Investment Funds - Global High Yield Bond Fund Fund Class Z (4) USD 874,876 27,866,795 1.52
Morgan Stanley Investment Funds - Short Maturity Euro Bond Fund Class Z (4) EUR 6,391,254 194,618,580 10.59
768,698,377 41.85
total mutual funds - Bond funds 768,698,377 41.85
mutual funds - Equity funds
irelandFirst State Global Umbrella PLC -
Asian Growth Fund Class III USD 1,211,670 54,367,727 2.96
54,367,727 2.96
LuxembourgMorgan Stanley Investment Funds -
Emerging Markets Equity Fund Class Z (4) USD 848,404 18,544,071 1.01Morgan Stanley Investment Funds -
European Equity Alpha Fund Class Z (4) EUR 2,868,871 125,685,759 6.84Morgan Stanley Investment Funds -
Eurozone Equity Alpha Fund Class Z (4) EUR 3,000,529 126,428,958 6.89Morgan Stanley Investment Funds -
Global Infrastructure Fund Class Z (4) USD 1,137,192 53,688,429 2.92Morgan Stanley Investment Funds -
Global Property Fund Class Z (4) USD 564,349 17,825,574 0.97Morgan Stanley Investment Funds -
Japanese Equity Fund Class ZH (4) EUR 203,902 9,414,173 0.51Morgan Stanley Investment Funds -
Japanese Equity Fund Class Z (4) JPY 1,900,670 64,705,443 3.52Morgan Stanley Investment Funds -
Latin American Equity Fund Class Z (4) USD 788,959 26,917,666 1.47Morgan Stanley Investment Funds -
US Advantage Fund Class ZH (4) EUR 1,638,008 108,403,372 5.90Morgan Stanley Investment Funds -
US Growth Fund Class ZH (4) EUR 2,865,624 136,518,327 7.43
688,131,772 37.46
total mutual funds - Equity funds 742,499,499 40.42
The accompanying notes are an integral part of these financial statements.
Please refer to the full prospectus for the Fund’s investment objective and policy.
Global Balanced Risk Control Fund of Funds
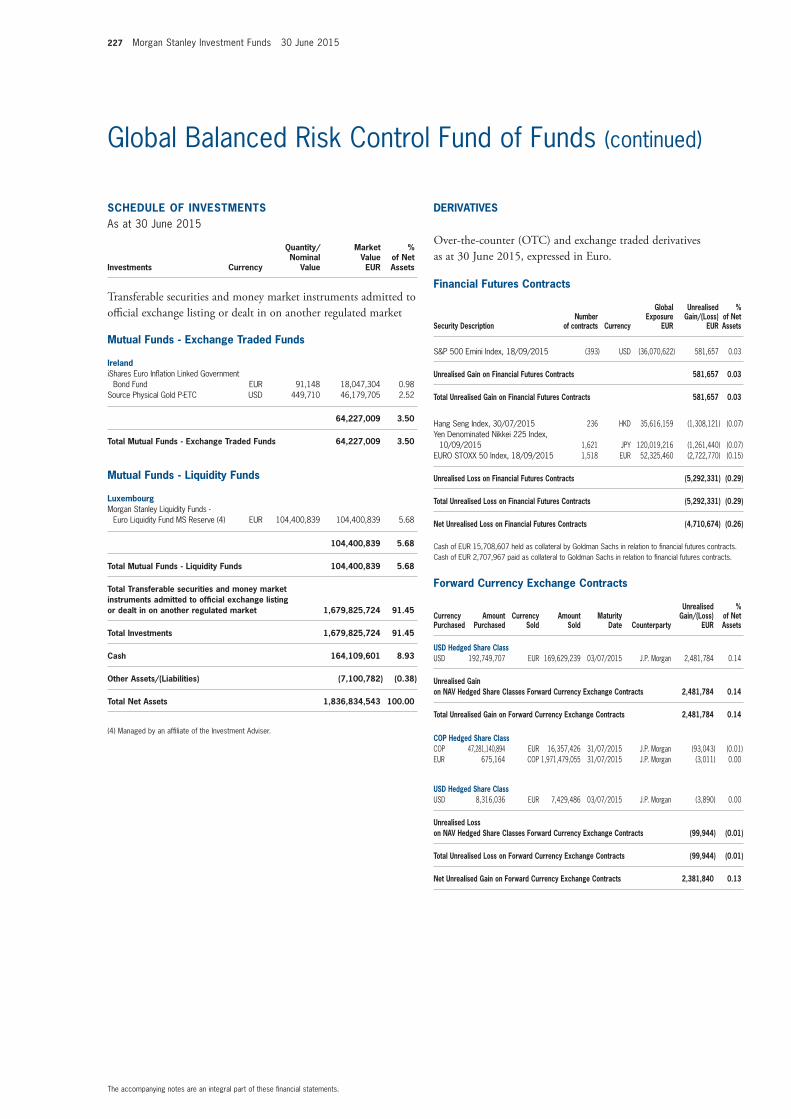
227 Morgan Stanley Investment Funds 30 June 2015
SCHEDULE of invEStmEntSAs at 30 June 2015
Investments Currency
Quantity/Nominal
Value
Market Value EUR
% of Net Assets
transferable securities and money market instruments admitted to official exchange listing or dealt in on another regulated market
mutual funds - Exchange traded funds
irelandiShares Euro Inflation Linked Government
Bond Fund EUR 91,148 18,047,304 0.98Source Physical Gold P-ETC USD 449,710 46,179,705 2.52
64,227,009 3.50
total mutual funds - Exchange traded funds 64,227,009 3.50
mutual funds - Liquidity funds
LuxembourgMorgan Stanley Liquidity Funds -
Euro Liquidity Fund MS Reserve (4) EUR 104,400,839 104,400,839 5.68
104,400,839 5.68
total mutual funds - Liquidity funds 104,400,839 5.68
total transferable securities and money market instruments admitted to official exchange listing or dealt in on another regulated market 1,679,825,724 91.45
total investments 1,679,825,724 91.45
Cash 164,109,601 8.93
other Assets/(Liabilities) (7,100,782) (0.38)
total net Assets 1,836,834,543 100.00
(4) Managed by an affiliate of the Investment Adviser.
The accompanying notes are an integral part of these financial statements.
Global Balanced Risk Control Fund of Funds (continued)
financial futures Contracts
Security Descriptionnumber
of contracts Currency
Global Exposure
EUR
Unrealised Gain/(Loss)
EUR
% of net Assets
S&P 500 Emini Index, 18/09/2015 (393) USD (36,070,622) 581,657 0.03
Unrealised Gain on financial futures Contracts 581,657 0.03
total Unrealised Gain on financial futures Contracts 581,657 0.03
Hang Seng Index, 30/07/2015 236 HKD 35,616,159 (1,308,121) (0.07)Yen Denominated Nikkei 225 Index,
10/09/2015 1,621 JPY 120,019,216 (1,261,440) (0.07)EURO STOXX 50 Index, 18/09/2015 1,518 EUR 52,325,460 (2,722,770) (0.15)
Unrealised Loss on financial futures Contracts (5,292,331) (0.29)
total Unrealised Loss on financial futures Contracts (5,292,331) (0.29)
net Unrealised Loss on financial futures Contracts (4,710,674) (0.26)
Cash of EUR 15,708,607 held as collateral by Goldman Sachs in relation to financial futures contracts.Cash of EUR 2,707,967 paid as collateral to Goldman Sachs in relation to financial futures contracts.
forward Currency Exchange Contracts
Currency Purchased
Amount Purchased
Currency Sold
Amount Sold
maturity Date Counterparty
Unrealised Gain/(Loss)
EUR
% of net Assets
USD Hedged Share ClassUSD 192,749,707 EUR 169,629,239 03/07/2015 J.P. Morgan 2,481,784 0.14
Unrealised Gain on nAv Hedged Share Classes forward Currency Exchange Contracts 2,481,784 0.14
total Unrealised Gain on forward Currency Exchange Contracts 2,481,784 0.14
CoP Hedged Share ClassCOP 47,281,140,894 EUR 16,357,426 31/07/2015 J.P. Morgan (93,043) (0.01)EUR 675,164 COP 1,971,479,055 31/07/2015 J.P. Morgan (3,011) 0.00
USD Hedged Share ClassUSD 8,316,036 EUR 7,429,486 03/07/2015 J.P. Morgan (3,890) 0.00
Unrealised Loss on nAv Hedged Share Classes forward Currency Exchange Contracts (99,944) (0.01)
total Unrealised Loss on forward Currency Exchange Contracts (99,944) (0.01)
net Unrealised Gain on forward Currency Exchange Contracts 2,381,840 0.13
DERivAtivES
Over-the-counter (OtC) and exchange traded derivatives as at 30 June 2015, expressed in euro.
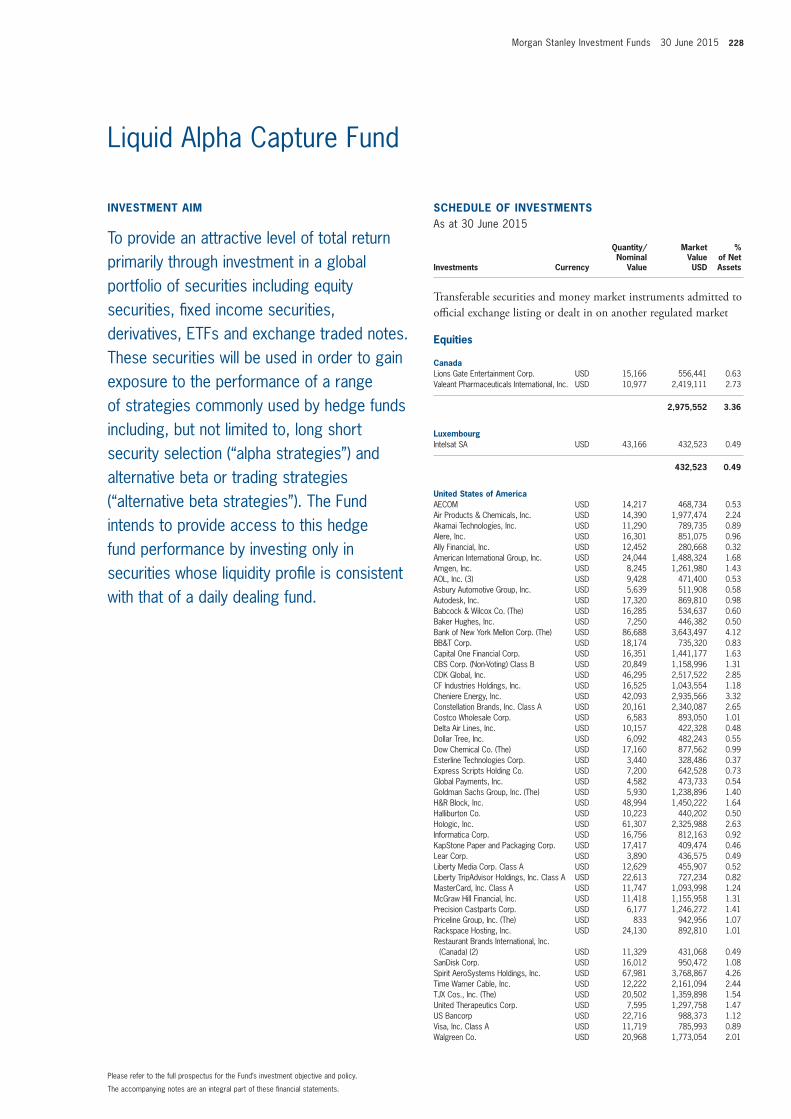
Morgan Stanley Investment Funds 30 June 2015 228
invEStmEnt Aim
To provide an attractive level of total return primarily through investment in a global portfolio of securities including equity securities, fixed income securities, derivatives, ETFs and exchange traded notes. These securities will be used in order to gain exposure to the performance of a range of strategies commonly used by hedge funds including, but not limited to, long short security selection (“alpha strategies”) and alternative beta or trading strategies (“alternative beta strategies”). The Fund intends to provide access to this hedge fund performance by investing only in securities whose liquidity profile is consistent with that of a daily dealing fund.
SCHEDULE of invEStmEntSAs at 30 June 2015
Investments Currency
Quantity/Nominal
Value
Market Value USD
% of Net Assets
transferable securities and money market instruments admitted to official exchange listing or dealt in on another regulated market
Equities
CanadaLions Gate Entertainment Corp. USD 15,166 556,441 0.63Valeant Pharmaceuticals International, Inc. USD 10,977 2,419,111 2.73
2,975,552 3.36
LuxembourgIntelsat SA USD 43,166 432,523 0.49
432,523 0.49
United States of AmericaAECOM USD 14,217 468,734 0.53Air Products & Chemicals, Inc. USD 14,390 1,977,474 2.24Akamai Technologies, Inc. USD 11,290 789,735 0.89Alere, Inc. USD 16,301 851,075 0.96Ally Financial, Inc. USD 12,452 280,668 0.32American International Group, Inc. USD 24,044 1,488,324 1.68Amgen, Inc. USD 8,245 1,261,980 1.43AOL, Inc. (3) USD 9,428 471,400 0.53Asbury Automotive Group, Inc. USD 5,639 511,908 0.58Autodesk, Inc. USD 17,320 869,810 0.98Babcock & Wilcox Co. (The) USD 16,285 534,637 0.60Baker Hughes, Inc. USD 7,250 446,382 0.50Bank of New York Mellon Corp. (The) USD 86,688 3,643,497 4.12BB&T Corp. USD 18,174 735,320 0.83Capital One Financial Corp. USD 16,351 1,441,177 1.63CBS Corp. (Non-Voting) Class B USD 20,849 1,158,996 1.31CDK Global, Inc. USD 46,295 2,517,522 2.85CF Industries Holdings, Inc. USD 16,525 1,043,554 1.18Cheniere Energy, Inc. USD 42,093 2,935,566 3.32Constellation Brands, Inc. Class A USD 20,161 2,340,087 2.65Costco Wholesale Corp. USD 6,583 893,050 1.01Delta Air Lines, Inc. USD 10,157 422,328 0.48Dollar Tree, Inc. USD 6,092 482,243 0.55Dow Chemical Co. (The) USD 17,160 877,562 0.99Esterline Technologies Corp. USD 3,440 328,486 0.37Express Scripts Holding Co. USD 7,200 642,528 0.73Global Payments, Inc. USD 4,582 473,733 0.54Goldman Sachs Group, Inc. (The) USD 5,930 1,238,896 1.40H&R Block, Inc. USD 48,994 1,450,222 1.64Halliburton Co. USD 10,223 440,202 0.50Hologic, Inc. USD 61,307 2,325,988 2.63Informatica Corp. USD 16,756 812,163 0.92KapStone Paper and Packaging Corp. USD 17,417 409,474 0.46Lear Corp. USD 3,890 436,575 0.49Liberty Media Corp. Class A USD 12,629 455,907 0.52Liberty TripAdvisor Holdings, Inc. Class A USD 22,613 727,234 0.82MasterCard, Inc. Class A USD 11,747 1,093,998 1.24McGraw Hill Financial, Inc. USD 11,418 1,155,958 1.31Precision Castparts Corp. USD 6,177 1,246,272 1.41Priceline Group, Inc. (The) USD 833 942,956 1.07Rackspace Hosting, Inc. USD 24,130 892,810 1.01Restaurant Brands International, Inc.
(Canada) (2) USD 11,329 431,068 0.49SanDisk Corp. USD 16,012 950,472 1.08Spirit AeroSystems Holdings, Inc. USD 67,981 3,768,867 4.26Time Warner Cable, Inc. USD 12,222 2,161,094 2.44TJX Cos., Inc. (The) USD 20,502 1,359,898 1.54United Therapeutics Corp. USD 7,595 1,297,758 1.47US Bancorp USD 22,716 988,373 1.12Visa, Inc. Class A USD 11,719 785,993 0.89Walgreen Co. USD 20,968 1,773,054 2.01
The accompanying notes are an integral part of these financial statements.
Please refer to the full prospectus for the Fund’s investment objective and policy.
Liquid Alpha Capture Fund
Alternative Investment Funds
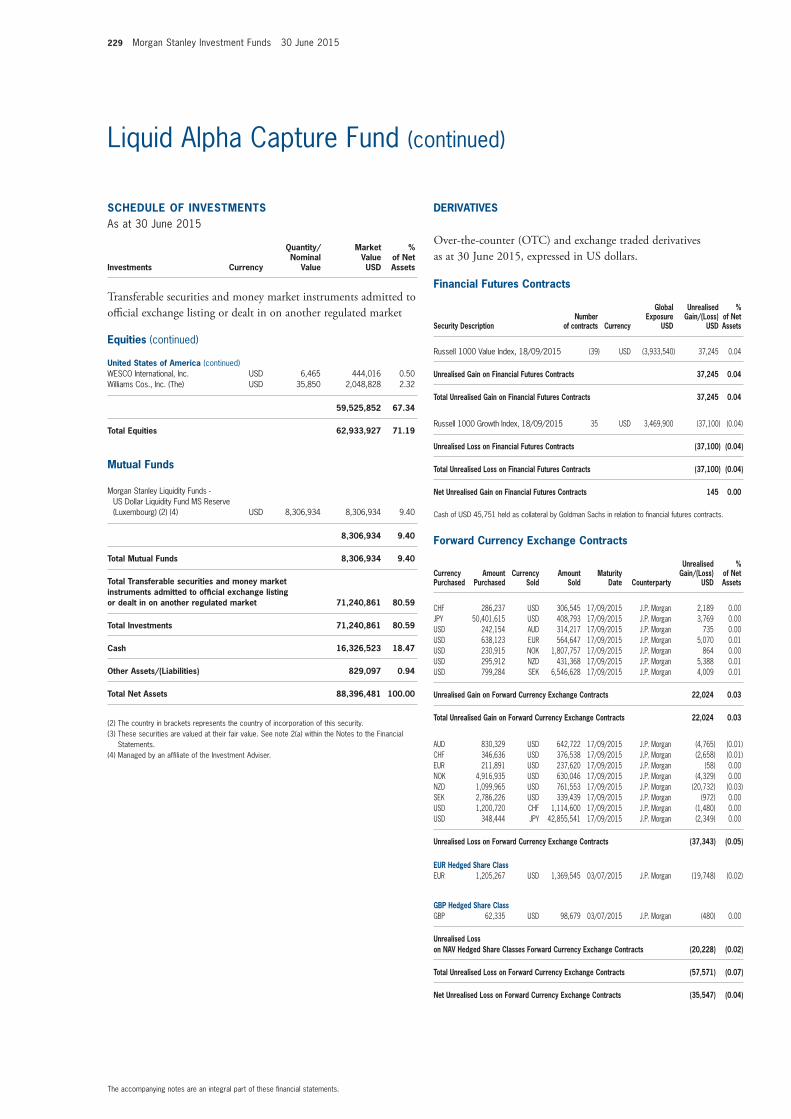
229 Morgan Stanley Investment Funds 30 June 2015
SCHEDULE of invEStmEntSAs at 30 June 2015
Investments Currency
Quantity/Nominal
Value
Market Value USD
% of Net Assets
transferable securities and money market instruments admitted to official exchange listing or dealt in on another regulated market
Equities (continued)
United States of America (continued)WESCO International, Inc. USD 6,465 444,016 0.50Williams Cos., Inc. (The) USD 35,850 2,048,828 2.32
59,525,852 67.34
total Equities 62,933,927 71.19
mutual funds
Morgan Stanley Liquidity Funds - US Dollar Liquidity Fund MS Reserve (Luxembourg) (2) (4) USD 8,306,934 8,306,934 9.40
8,306,934 9.40
total mutual funds 8,306,934 9.40
total transferable securities and money market instruments admitted to official exchange listing or dealt in on another regulated market 71,240,861 80.59
total investments 71,240,861 80.59
Cash 16,326,523 18.47
other Assets/(Liabilities) 829,097 0.94
total net Assets 88,396,481 100.00
(2) The country in brackets represents the country of incorporation of this security.(3) These securities are valued at their fair value. See note 2(a) within the Notes to the Financial
Statements.(4) Managed by an affiliate of the Investment Adviser.
The accompanying notes are an integral part of these financial statements.
Liquid Alpha Capture Fund (continued)
financial futures Contracts
Security Descriptionnumber
of contracts Currency
Global Exposure
USD
Unrealised Gain/(Loss)
USD
% of net Assets
Russell 1000 Value Index, 18/09/2015 (39) USD (3,933,540) 37,245 0.04
Unrealised Gain on financial futures Contracts 37,245 0.04
total Unrealised Gain on financial futures Contracts 37,245 0.04
Russell 1000 Growth Index, 18/09/2015 35 USD 3,469,900 (37,100) (0.04)
Unrealised Loss on financial futures Contracts (37,100) (0.04)
total Unrealised Loss on financial futures Contracts (37,100) (0.04)
net Unrealised Gain on financial futures Contracts 145 0.00
Cash of USD 45,751 held as collateral by Goldman Sachs in relation to financial futures contracts.
forward Currency Exchange Contracts
Currency Purchased
Amount Purchased
Currency Sold
Amount Sold
maturity Date Counterparty
Unrealised Gain/(Loss)
USD
% of net Assets
CHF 286,237 USD 306,545 17/09/2015 J.P. Morgan 2,189 0.00JPY 50,401,615 USD 408,793 17/09/2015 J.P. Morgan 3,769 0.00USD 242,154 AUD 314,217 17/09/2015 J.P. Morgan 735 0.00USD 638,123 EUR 564,647 17/09/2015 J.P. Morgan 5,070 0.01USD 230,915 NOK 1,807,757 17/09/2015 J.P. Morgan 864 0.00USD 295,912 NZD 431,368 17/09/2015 J.P. Morgan 5,388 0.01USD 799,284 SEK 6,546,628 17/09/2015 J.P. Morgan 4,009 0.01
Unrealised Gain on forward Currency Exchange Contracts 22,024 0.03
total Unrealised Gain on forward Currency Exchange Contracts 22,024 0.03
AUD 830,329 USD 642,722 17/09/2015 J.P. Morgan (4,765) (0.01)CHF 346,636 USD 376,538 17/09/2015 J.P. Morgan (2,658) (0.01)EUR 211,891 USD 237,620 17/09/2015 J.P. Morgan (58) 0.00NOK 4,916,935 USD 630,046 17/09/2015 J.P. Morgan (4,329) 0.00NZD 1,099,965 USD 761,553 17/09/2015 J.P. Morgan (20,732) (0.03)SEK 2,786,226 USD 339,439 17/09/2015 J.P. Morgan (972) 0.00USD 1,200,720 CHF 1,114,600 17/09/2015 J.P. Morgan (1,480) 0.00USD 348,444 JPY 42,855,541 17/09/2015 J.P. Morgan (2,349) 0.00
Unrealised Loss on forward Currency Exchange Contracts (37,343) (0.05)
EUR Hedged Share ClassEUR 1,205,267 USD 1,369,545 03/07/2015 J.P. Morgan (19,748) (0.02)
GBP Hedged Share ClassGBP 62,335 USD 98,679 03/07/2015 J.P. Morgan (480) 0.00
Unrealised Loss on nAv Hedged Share Classes forward Currency Exchange Contracts (20,228) (0.02)
total Unrealised Loss on forward Currency Exchange Contracts (57,571) (0.07)
net Unrealised Loss on forward Currency Exchange Contracts (35,547) (0.04)
DERivAtivES
Over-the-counter (OtC) and exchange traded derivatives as at 30 June 2015, expressed in US dollars.

Morgan Stanley Investment Funds 30 June 2015 230
The accompanying notes are an integral part of these financial statements.
Liquid Alpha Capture Fund (continued)
total Return Swap Contracts
nominal Amount Currency Counterparty Security Description
maturity Date
Global Exposure
Unrealised Gain/(Loss)
USD
% of net Assets
8,176,484 USD Goldman Sachs Pay Goldman Sachs Custom AIP US short basket Index Receive USD LIBOR 3 month + -18.00bp 19/05/2016 112,864 112,864 0.131,849,126 USD Goldman Sachs Pay Goldman Sachs Custom AIP US short basket Index Receive USD LIBOR 3 month + -18.00bp 19/05/2016 21,993 21,993 0.02
10,740,791 USD Goldman Sachs Pay S&P 500 Receive USD LIBOR 3 month + 29.00bp 18/03/2016 318,706 318,706 0.3610,383,941 USD Goldman Sachs Pay S&P 500 Receive USD LIBOR 3 month + 29.00bp 18/03/2016 308,118 308,118 0.352,980,285 USD Goldman Sachs Pay S&P 500 Receive USD LIBOR 3 month + 29.00bp 18/03/2016 88,433 88,433 0.102,607,750 USD Goldman Sachs Pay S&P 500 Receive USD LIBOR 3 month + 29.00bp 18/03/2016 77,378 77,378 0.092,363,963 USD Bank of America Pay USD 0.85 Receive Bank of America Merrill Lynch Daily vs Biweekly Index 31/03/2016 8,520 8,520 0.01
738,890 USD Bank of America Pay USD 0.85 Receive Bank of America Merrill Lynch Daily vs Biweekly Index 31/03/2016 2,663 2,663 0.00
total Unrealised Gain on total Return Swap Contracts 938,675 938,675 1.06
9,171,137 USD Bank of America Pay USD LIBOR 3 month + -55.00bp Receive Russell 2000 Total Return Index 22/01/2016 (64,232) (64,232) (0.07)3,665,308 USD Societe Generale Pay USD LIBOR 3 month + 35.00bp Receive SGI Quant Merger Arbitrage 19/05/2016 (32,526) (32,526) (0.04)1,655,000 USD Societe Generale Pay USD LIBOR 3 month + 35.00bp Receive SGI Quant Merger Arbitrage 19/05/2016 (2,336) (2,336) 0.00
total Unrealised Loss on total Return Swap Contracts (99,094) (99,094) (0.11)
net Unrealised Gain on total Return Swap Contracts 839,581 839,581 0.95
Cash of USD 60,000 held as collateral by Goldman Sachs in relation to OTC contracts.
DERivAtivES (continued)
Over-the-counter (OtC) and exchange traded derivatives as at 30 June 2015, expressed in US dollars.
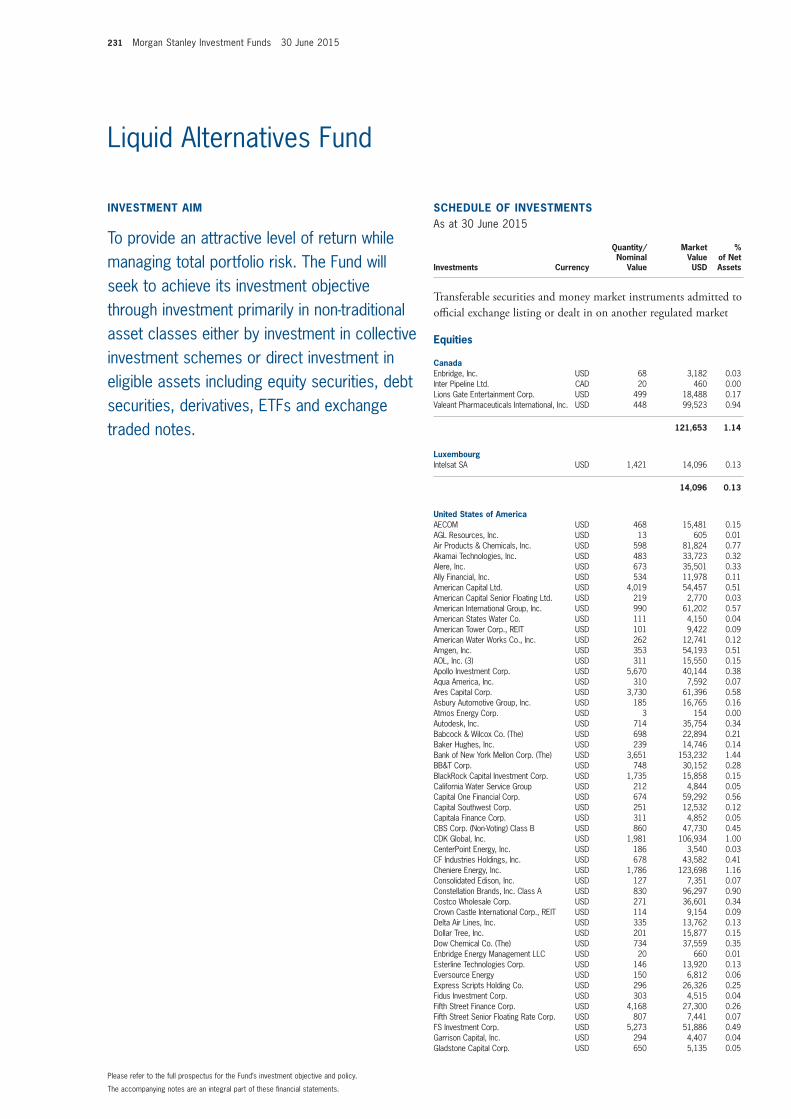
231 Morgan Stanley Investment Funds 30 June 2015
SCHEDULE of invEStmEntSAs at 30 June 2015
Investments Currency
Quantity/Nominal
Value
Market Value USD
% of Net Assets
transferable securities and money market instruments admitted to official exchange listing or dealt in on another regulated market
Equities
CanadaEnbridge, Inc. USD 68 3,182 0.03Inter Pipeline Ltd. CAD 20 460 0.00Lions Gate Entertainment Corp. USD 499 18,488 0.17Valeant Pharmaceuticals International, Inc. USD 448 99,523 0.94
121,653 1.14
LuxembourgIntelsat SA USD 1,421 14,096 0.13
14,096 0.13
United States of AmericaAECOM USD 468 15,481 0.15AGL Resources, Inc. USD 13 605 0.01Air Products & Chemicals, Inc. USD 598 81,824 0.77Akamai Technologies, Inc. USD 483 33,723 0.32Alere, Inc. USD 673 35,501 0.33Ally Financial, Inc. USD 534 11,978 0.11American Capital Ltd. USD 4,019 54,457 0.51American Capital Senior Floating Ltd. USD 219 2,770 0.03American International Group, Inc. USD 990 61,202 0.57American States Water Co. USD 111 4,150 0.04American Tower Corp., REIT USD 101 9,422 0.09American Water Works Co., Inc. USD 262 12,741 0.12Amgen, Inc. USD 353 54,193 0.51AOL, Inc. (3) USD 311 15,550 0.15Apollo Investment Corp. USD 5,670 40,144 0.38Aqua America, Inc. USD 310 7,592 0.07Ares Capital Corp. USD 3,730 61,396 0.58Asbury Automotive Group, Inc. USD 185 16,765 0.16Atmos Energy Corp. USD 3 154 0.00Autodesk, Inc. USD 714 35,754 0.34Babcock & Wilcox Co. (The) USD 698 22,894 0.21Baker Hughes, Inc. USD 239 14,746 0.14Bank of New York Mellon Corp. (The) USD 3,651 153,232 1.44BB&T Corp. USD 748 30,152 0.28BlackRock Capital Investment Corp. USD 1,735 15,858 0.15California Water Service Group USD 212 4,844 0.05Capital One Financial Corp. USD 674 59,292 0.56Capital Southwest Corp. USD 251 12,532 0.12Capitala Finance Corp. USD 311 4,852 0.05CBS Corp. (Non-Voting) Class B USD 860 47,730 0.45CDK Global, Inc. USD 1,981 106,934 1.00CenterPoint Energy, Inc. USD 186 3,540 0.03CF Industries Holdings, Inc. USD 678 43,582 0.41Cheniere Energy, Inc. USD 1,786 123,698 1.16Consolidated Edison, Inc. USD 127 7,351 0.07Constellation Brands, Inc. Class A USD 830 96,297 0.90Costco Wholesale Corp. USD 271 36,601 0.34Crown Castle International Corp., REIT USD 114 9,154 0.09Delta Air Lines, Inc. USD 335 13,762 0.13Dollar Tree, Inc. USD 201 15,877 0.15Dow Chemical Co. (The) USD 734 37,559 0.35Enbridge Energy Management LLC USD 20 660 0.01Esterline Technologies Corp. USD 146 13,920 0.13Eversource Energy USD 150 6,812 0.06Express Scripts Holding Co. USD 296 26,326 0.25Fidus Investment Corp. USD 303 4,515 0.04Fifth Street Finance Corp. USD 4,168 27,300 0.26Fifth Street Senior Floating Rate Corp. USD 807 7,441 0.07FS Investment Corp. USD 5,273 51,886 0.49Garrison Capital, Inc. USD 294 4,407 0.04Gladstone Capital Corp. USD 650 5,135 0.05
The accompanying notes are an integral part of these financial statements.
Please refer to the full prospectus for the Fund’s investment objective and policy.
Liquid Alternatives Fund
invEStmEnt Aim
To provide an attractive level of return while managing total portfolio risk. The Fund will seek to achieve its investment objective through investment primarily in non-traditional asset classes either by investment in collective investment schemes or direct investment in eligible assets including equity securities, debt securities, derivatives, ETFs and exchange traded notes.
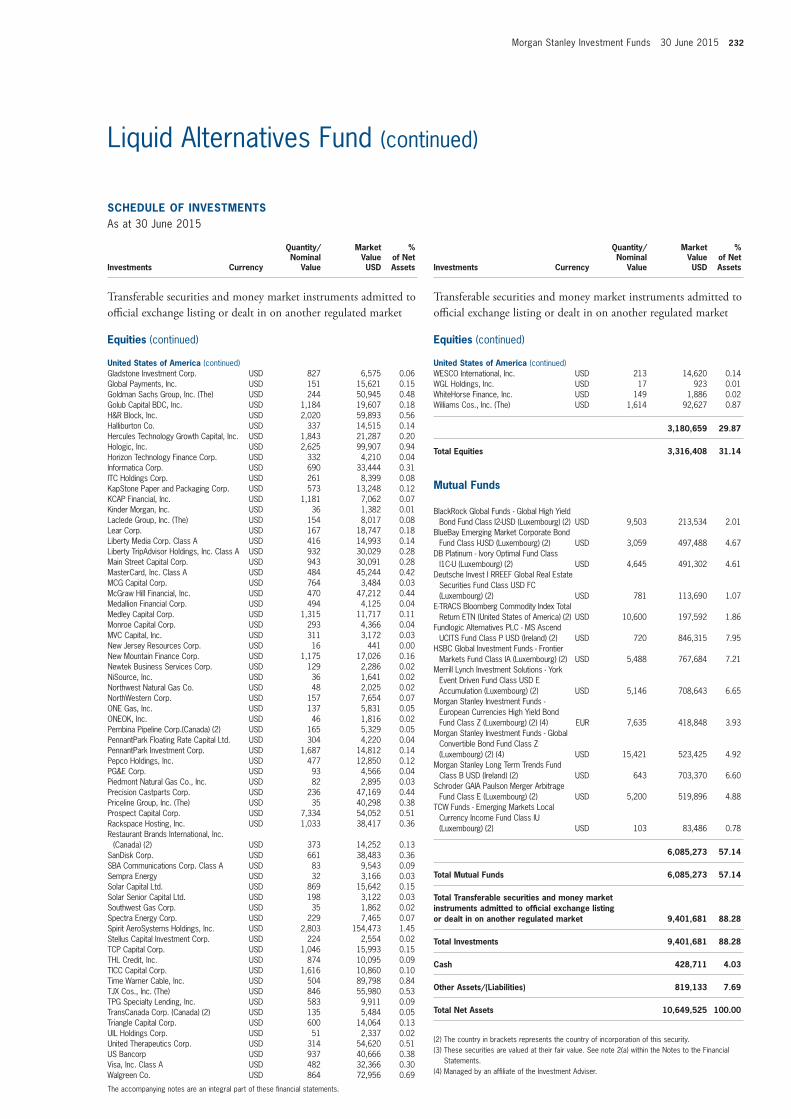
Morgan Stanley Investment Funds 30 June 2015 232
SCHEDULE of invEStmEntSAs at 30 June 2015
Investments Currency
Quantity/Nominal
Value
Market Value USD
% of Net Assets
transferable securities and money market instruments admitted to official exchange listing or dealt in on another regulated market
Equities (continued)
United States of America (continued)Gladstone Investment Corp. USD 827 6,575 0.06Global Payments, Inc. USD 151 15,621 0.15Goldman Sachs Group, Inc. (The) USD 244 50,945 0.48Golub Capital BDC, Inc. USD 1,184 19,607 0.18H&R Block, Inc. USD 2,020 59,893 0.56Halliburton Co. USD 337 14,515 0.14Hercules Technology Growth Capital, Inc. USD 1,843 21,287 0.20Hologic, Inc. USD 2,625 99,907 0.94Horizon Technology Finance Corp. USD 332 4,210 0.04Informatica Corp. USD 690 33,444 0.31ITC Holdings Corp. USD 261 8,399 0.08KapStone Paper and Packaging Corp. USD 573 13,248 0.12KCAP Financial, Inc. USD 1,181 7,062 0.07Kinder Morgan, Inc. USD 36 1,382 0.01Laclede Group, Inc. (The) USD 154 8,017 0.08Lear Corp. USD 167 18,747 0.18Liberty Media Corp. Class A USD 416 14,993 0.14Liberty TripAdvisor Holdings, Inc. Class A USD 932 30,029 0.28Main Street Capital Corp. USD 943 30,091 0.28MasterCard, Inc. Class A USD 484 45,244 0.42MCG Capital Corp. USD 764 3,484 0.03McGraw Hill Financial, Inc. USD 470 47,212 0.44Medallion Financial Corp. USD 494 4,125 0.04Medley Capital Corp. USD 1,315 11,717 0.11Monroe Capital Corp. USD 293 4,366 0.04MVC Capital, Inc. USD 311 3,172 0.03New Jersey Resources Corp. USD 16 441 0.00New Mountain Finance Corp. USD 1,175 17,026 0.16Newtek Business Services Corp. USD 129 2,286 0.02NiSource, Inc. USD 36 1,641 0.02Northwest Natural Gas Co. USD 48 2,025 0.02NorthWestern Corp. USD 157 7,654 0.07ONE Gas, Inc. USD 137 5,831 0.05ONEOK, Inc. USD 46 1,816 0.02Pembina Pipeline Corp.(Canada) (2) USD 165 5,329 0.05PennantPark Floating Rate Capital Ltd. USD 304 4,220 0.04PennantPark Investment Corp. USD 1,687 14,812 0.14Pepco Holdings, Inc. USD 477 12,850 0.12PG&E Corp. USD 93 4,566 0.04Piedmont Natural Gas Co., Inc. USD 82 2,895 0.03Precision Castparts Corp. USD 236 47,169 0.44Priceline Group, Inc. (The) USD 35 40,298 0.38Prospect Capital Corp. USD 7,334 54,052 0.51Rackspace Hosting, Inc. USD 1,033 38,417 0.36Restaurant Brands International, Inc.
(Canada) (2) USD 373 14,252 0.13SanDisk Corp. USD 661 38,483 0.36SBA Communications Corp. Class A USD 83 9,543 0.09Sempra Energy USD 32 3,166 0.03Solar Capital Ltd. USD 869 15,642 0.15Solar Senior Capital Ltd. USD 198 3,122 0.03Southwest Gas Corp. USD 35 1,862 0.02Spectra Energy Corp. USD 229 7,465 0.07Spirit AeroSystems Holdings, Inc. USD 2,803 154,473 1.45Stellus Capital Investment Corp. USD 224 2,554 0.02TCP Capital Corp. USD 1,046 15,993 0.15THL Credit, Inc. USD 874 10,095 0.09TICC Capital Corp. USD 1,616 10,860 0.10Time Warner Cable, Inc. USD 504 89,798 0.84TJX Cos., Inc. (The) USD 846 55,980 0.53TPG Specialty Lending, Inc. USD 583 9,911 0.09TransCanada Corp. (Canada) (2) USD 135 5,484 0.05Triangle Capital Corp. USD 600 14,064 0.13UIL Holdings Corp. USD 51 2,337 0.02United Therapeutics Corp. USD 314 54,620 0.51US Bancorp USD 937 40,666 0.38Visa, Inc. Class A USD 482 32,366 0.30Walgreen Co. USD 864 72,956 0.69
SCHEDULE of invEStmEntSAs at 30 June 2015
Investments Currency
Quantity/Nominal
Value
Market Value USD
% of Net Assets
transferable securities and money market instruments admitted to official exchange listing or dealt in on another regulated market
Equities (continued)
United States of America (continued)WESCO International, Inc. USD 213 14,620 0.14WGL Holdings, Inc. USD 17 923 0.01WhiteHorse Finance, Inc. USD 149 1,886 0.02Williams Cos., Inc. (The) USD 1,614 92,627 0.87
3,180,659 29.87
total Equities 3,316,408 31.14
mutual funds
BlackRock Global Funds - Global High Yield Bond Fund Class I2-USD (Luxembourg) (2) USD 9,503 213,534 2.01
BlueBay Emerging Market Corporate Bond Fund Class I-USD (Luxembourg) (2) USD 3,059 497,488 4.67
DB Platinum - Ivory Optimal Fund Class I1C-U (Luxembourg) (2) USD 4,645 491,302 4.61
Deutsche Invest I RREEF Global Real Estate Securities Fund Class USD FC (Luxembourg) (2) USD 781 113,690 1.07
E-TRACS Bloomberg Commodity Index Total Return ETN (United States of America) (2) USD 10,600 197,592 1.86
Fundlogic Alternatives PLC - MS Ascend UCITS Fund Class P USD (Ireland) (2) USD 720 846,315 7.95
HSBC Global Investment Funds - Frontier Markets Fund Class IA (Luxembourg) (2) USD 5,488 767,684 7.21
Merrill Lynch Investment Solutions - York Event Driven Fund Class USD E Accumulation (Luxembourg) (2) USD 5,146 708,643 6.65
Morgan Stanley Investment Funds - European Currencies High Yield Bond Fund Class Z (Luxembourg) (2) (4) EUR 7,635 418,848 3.93
Morgan Stanley Investment Funds - Global Convertible Bond Fund Class Z (Luxembourg) (2) (4) USD 15,421 523,425 4.92
Morgan Stanley Long Term Trends Fund Class B USD (Ireland) (2) USD 643 703,370 6.60
Schroder GAIA Paulson Merger Arbitrage Fund Class E (Luxembourg) (2) USD 5,200 519,896 4.88
TCW Funds - Emerging Markets Local Currency Income Fund Class IU (Luxembourg) (2) USD 103 83,486 0.78
6,085,273 57.14
total mutual funds 6,085,273 57.14
total transferable securities and money market instruments admitted to official exchange listing or dealt in on another regulated market 9,401,681 88.28
total investments 9,401,681 88.28
Cash 428,711 4.03
other Assets/(Liabilities) 819,133 7.69
total net Assets 10,649,525 100.00
(2) The country in brackets represents the country of incorporation of this security.(3) These securities are valued at their fair value. See note 2(a) within the Notes to the Financial
Statements.(4) Managed by an affiliate of the Investment Adviser.
The accompanying notes are an integral part of these financial statements.
Liquid Alternatives Fund (continued)
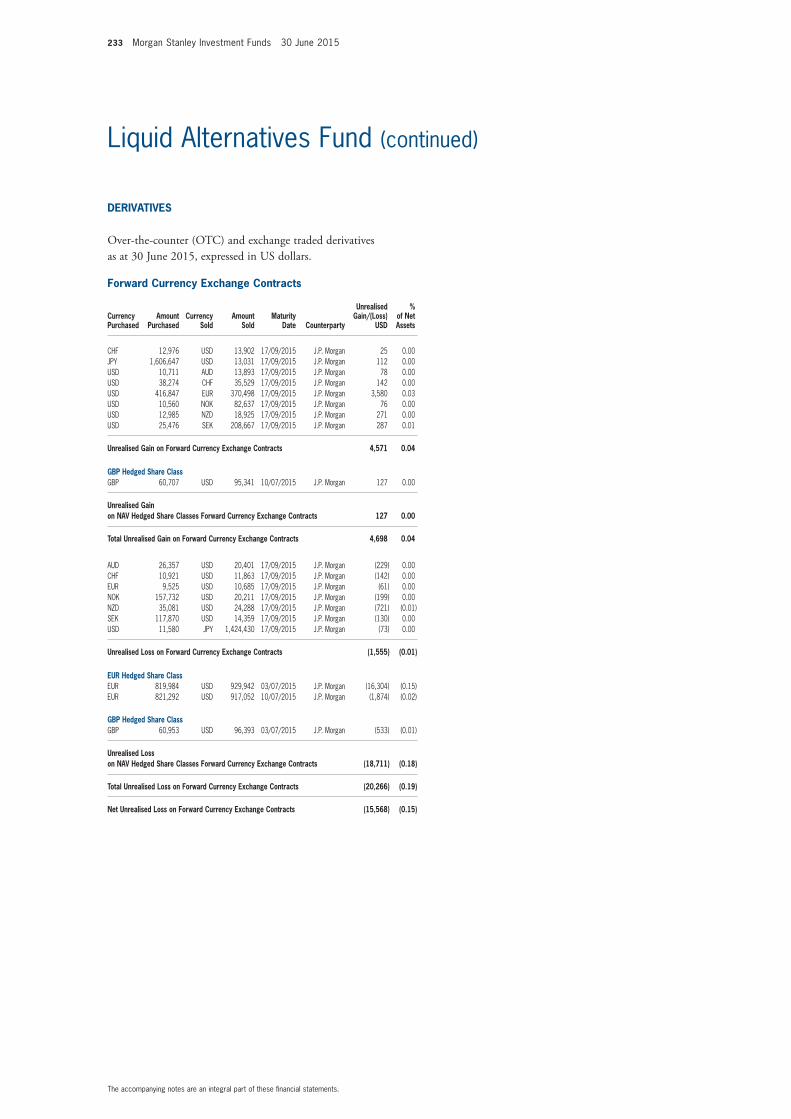
233 Morgan Stanley Investment Funds 30 June 2015
The accompanying notes are an integral part of these financial statements.
Liquid Alternatives Fund (continued)
DERivAtivES
Over-the-counter (OtC) and exchange traded derivatives as at 30 June 2015, expressed in US dollars.
forward Currency Exchange Contracts (continued)
Currency Purchased
Amount Purchased
Currency Sold
Amount Sold
maturity Date Counterparty
Unrealised Gain/(Loss)
USD
% of net Assets
CHF 12,976 USD 13,902 17/09/2015 J.P. Morgan 25 0.00JPY 1,606,647 USD 13,031 17/09/2015 J.P. Morgan 112 0.00USD 10,711 AUD 13,893 17/09/2015 J.P. Morgan 78 0.00USD 38,274 CHF 35,529 17/09/2015 J.P. Morgan 142 0.00USD 416,847 EUR 370,498 17/09/2015 J.P. Morgan 3,580 0.03USD 10,560 NOK 82,637 17/09/2015 J.P. Morgan 76 0.00USD 12,985 NZD 18,925 17/09/2015 J.P. Morgan 271 0.00USD 25,476 SEK 208,667 17/09/2015 J.P. Morgan 287 0.01
Unrealised Gain on forward Currency Exchange Contracts 4,571 0.04
GBP Hedged Share ClassGBP 60,707 USD 95,341 10/07/2015 J.P. Morgan 127 0.00
Unrealised Gain on nAv Hedged Share Classes forward Currency Exchange Contracts 127 0.00
total Unrealised Gain on forward Currency Exchange Contracts 4,698 0.04
AUD 26,357 USD 20,401 17/09/2015 J.P. Morgan (229) 0.00CHF 10,921 USD 11,863 17/09/2015 J.P. Morgan (142) 0.00EUR 9,525 USD 10,685 17/09/2015 J.P. Morgan (61) 0.00NOK 157,732 USD 20,211 17/09/2015 J.P. Morgan (199) 0.00NZD 35,081 USD 24,288 17/09/2015 J.P. Morgan (721) (0.01)SEK 117,870 USD 14,359 17/09/2015 J.P. Morgan (130) 0.00USD 11,580 JPY 1,424,430 17/09/2015 J.P. Morgan (73) 0.00
Unrealised Loss on forward Currency Exchange Contracts (1,555) (0.01)
EUR Hedged Share ClassEUR 819,984 USD 929,942 03/07/2015 J.P. Morgan (16,304) (0.15)EUR 821,292 USD 917,052 10/07/2015 J.P. Morgan (1,874) (0.02)
GBP Hedged Share ClassGBP 60,953 USD 96,393 03/07/2015 J.P. Morgan (533) (0.01)
Unrealised Loss on nAv Hedged Share Classes forward Currency Exchange Contracts (18,711) (0.18)
total Unrealised Loss on forward Currency Exchange Contracts (20,266) (0.19)
net Unrealised Loss on forward Currency Exchange Contracts (15,568) (0.15)
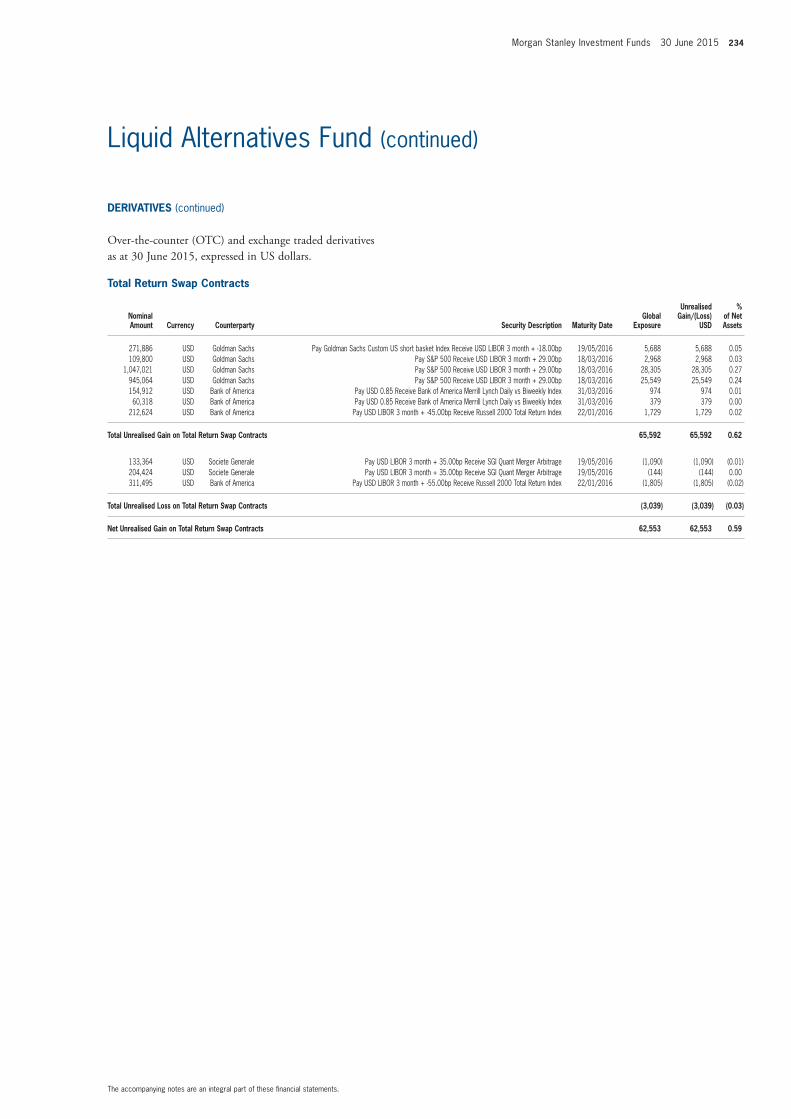
Morgan Stanley Investment Funds 30 June 2015 234
The accompanying notes are an integral part of these financial statements.
Liquid Alternatives Fund (continued)
total Return Swap Contracts
nominal Amount Currency Counterparty Security Description maturity Date
Global Exposure
Unrealised Gain/(Loss)
USD
% of net Assets
271,886 USD Goldman Sachs Pay Goldman Sachs Custom US short basket Index Receive USD LIBOR 3 month + -18.00bp 19/05/2016 5,688 5,688 0.05109,800 USD Goldman Sachs Pay S&P 500 Receive USD LIBOR 3 month + 29.00bp 18/03/2016 2,968 2,968 0.03
1,047,021 USD Goldman Sachs Pay S&P 500 Receive USD LIBOR 3 month + 29.00bp 18/03/2016 28,305 28,305 0.27945,064 USD Goldman Sachs Pay S&P 500 Receive USD LIBOR 3 month + 29.00bp 18/03/2016 25,549 25,549 0.24154,912 USD Bank of America Pay USD 0.85 Receive Bank of America Merrill Lynch Daily vs Biweekly Index 31/03/2016 974 974 0.0160,318 USD Bank of America Pay USD 0.85 Receive Bank of America Merrill Lynch Daily vs Biweekly Index 31/03/2016 379 379 0.00
212,624 USD Bank of America Pay USD LIBOR 3 month + -45.00bp Receive Russell 2000 Total Return Index 22/01/2016 1,729 1,729 0.02
total Unrealised Gain on total Return Swap Contracts 65,592 65,592 0.62
133,364 USD Societe Generale Pay USD LIBOR 3 month + 35.00bp Receive SGI Quant Merger Arbitrage 19/05/2016 (1,090) (1,090) (0.01)204,424 USD Societe Generale Pay USD LIBOR 3 month + 35.00bp Receive SGI Quant Merger Arbitrage 19/05/2016 (144) (144) 0.00311,495 USD Bank of America Pay USD LIBOR 3 month + -55.00bp Receive Russell 2000 Total Return Index 22/01/2016 (1,805) (1,805) (0.02)
total Unrealised Loss on total Return Swap Contracts (3,039) (3,039) (0.03)
net Unrealised Gain on total Return Swap Contracts 62,553 62,553 0.59
DERivAtivES (continued)
Over-the-counter (OtC) and exchange traded derivatives as at 30 June 2015, expressed in US dollars.
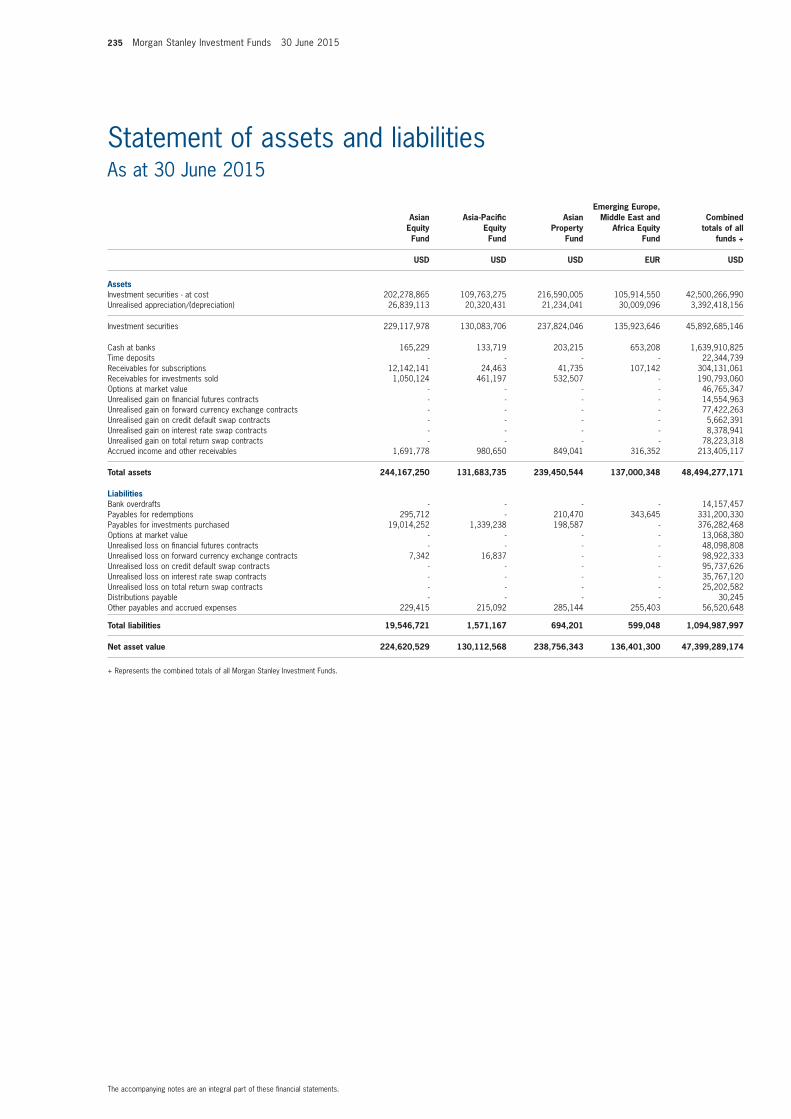
235 Morgan Stanley Investment Funds 30 June 2015
The accompanying notes are an integral part of these financial statements.
Statement of assets and liabilitiesAs at 30 June 2015
Asian Equity fund
Asia-Pacific Equity fund
Asian Property
fund
Emerging Europe, middle East and
Africa Equity fund
Combined totals of all
funds +
USD USD USD EUR USD
AssetsInvestment securities - at cost 202,278,865 109,763,275 216,590,005 105,914,550 42,500,266,990 Unrealised appreciation/(depreciation) 26,839,113 20,320,431 21,234,041 30,009,096 3,392,418,156
Investment securities 229,117,978 130,083,706 237,824,046 135,923,646 45,892,685,146
Cash at banks 165,229 133,719 203,215 653,208 1,639,910,825 Time deposits - - - - 22,344,739 Receivables for subscriptions 12,142,141 24,463 41,735 107,142 304,131,061 Receivables for investments sold 1,050,124 461,197 532,507 - 190,793,060 Options at market value - - - - 46,765,347 Unrealised gain on financial futures contracts - - - - 14,554,963 Unrealised gain on forward currency exchange contracts - - - - 77,422,263 Unrealised gain on credit default swap contracts - - - - 5,662,391 Unrealised gain on interest rate swap contracts - - - - 8,378,941 Unrealised gain on total return swap contracts - - - - 78,223,318 Accrued income and other receivables 1,691,778 980,650 849,041 316,352 213,405,117
total assets 244,167,250 131,683,735 239,450,544 137,000,348 48,494,277,171
LiabilitiesBank overdrafts - - - - 14,157,457 Payables for redemptions 295,712 - 210,470 343,645 331,200,330 Payables for investments purchased 19,014,252 1,339,238 198,587 - 376,282,468 Options at market value - - - - 13,068,380Unrealised loss on financial futures contracts - - - - 48,098,808 Unrealised loss on forward currency exchange contracts 7,342 16,837 - - 98,922,333 Unrealised loss on credit default swap contracts - - - - 95,737,626 Unrealised loss on interest rate swap contracts - - - - 35,767,120 Unrealised loss on total return swap contracts - - - - 25,202,582 Distributions payable - - - - 30,245 Other payables and accrued expenses 229,415 215,092 285,144 255,403 56,520,648
total liabilities 19,546,721 1,571,167 694,201 599,048 1,094,987,997
net asset value 224,620,529 130,112,568 238,756,343 136,401,300 47,399,289,174
+ Represents the combined totals of all Morgan Stanley Investment Funds.
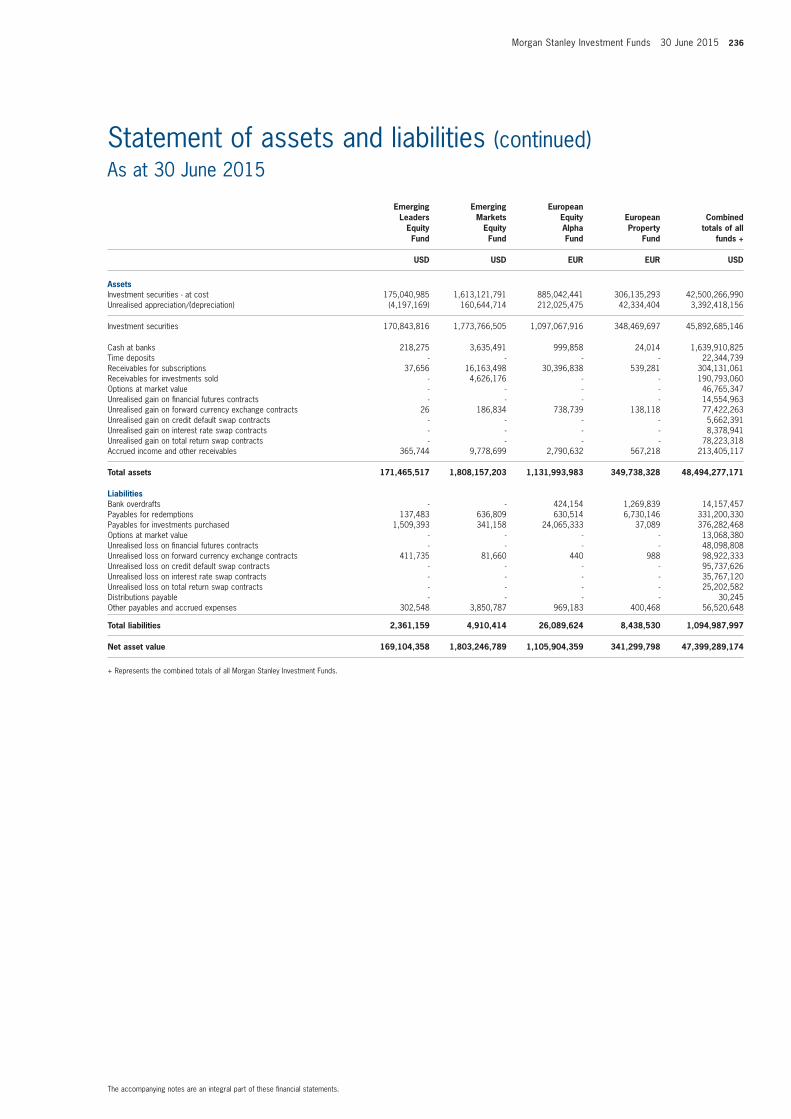
Morgan Stanley Investment Funds 30 June 2015 236
The accompanying notes are an integral part of these financial statements.
Statement of assets and liabilities (continued)As at 30 June 2015
Emerging Leaders
Equity fund
Emerging markets
Equity fund
European Equity Alpha fund
European Property
fund
Combined totals of all
funds +
USD USD EUR EUR USD
AssetsInvestment securities - at cost 175,040,985 1,613,121,791 885,042,441 306,135,293 42,500,266,990 Unrealised appreciation/(depreciation) (4,197,169) 160,644,714 212,025,475 42,334,404 3,392,418,156
Investment securities 170,843,816 1,773,766,505 1,097,067,916 348,469,697 45,892,685,146
Cash at banks 218,275 3,635,491 999,858 24,014 1,639,910,825 Time deposits - - - - 22,344,739 Receivables for subscriptions 37,656 16,163,498 30,396,838 539,281 304,131,061 Receivables for investments sold - 4,626,176 - - 190,793,060 Options at market value - - - - 46,765,347 Unrealised gain on financial futures contracts - - - - 14,554,963 Unrealised gain on forward currency exchange contracts 26 186,834 738,739 138,118 77,422,263 Unrealised gain on credit default swap contracts - - - - 5,662,391 Unrealised gain on interest rate swap contracts - - - - 8,378,941 Unrealised gain on total return swap contracts - - - - 78,223,318 Accrued income and other receivables 365,744 9,778,699 2,790,632 567,218 213,405,117
total assets 171,465,517 1,808,157,203 1,131,993,983 349,738,328 48,494,277,171
LiabilitiesBank overdrafts - - 424,154 1,269,839 14,157,457 Payables for redemptions 137,483 636,809 630,514 6,730,146 331,200,330 Payables for investments purchased 1,509,393 341,158 24,065,333 37,089 376,282,468 Options at market value - - - - 13,068,380Unrealised loss on financial futures contracts - - - - 48,098,808 Unrealised loss on forward currency exchange contracts 411,735 81,660 440 988 98,922,333 Unrealised loss on credit default swap contracts - - - - 95,737,626 Unrealised loss on interest rate swap contracts - - - - 35,767,120 Unrealised loss on total return swap contracts - - - - 25,202,582 Distributions payable - - - - 30,245 Other payables and accrued expenses 302,548 3,850,787 969,183 400,468 56,520,648
total liabilities 2,361,159 4,910,414 26,089,624 8,438,530 1,094,987,997
net asset value 169,104,358 1,803,246,789 1,105,904,359 341,299,798 47,399,289,174
+ Represents the combined totals of all Morgan Stanley Investment Funds.
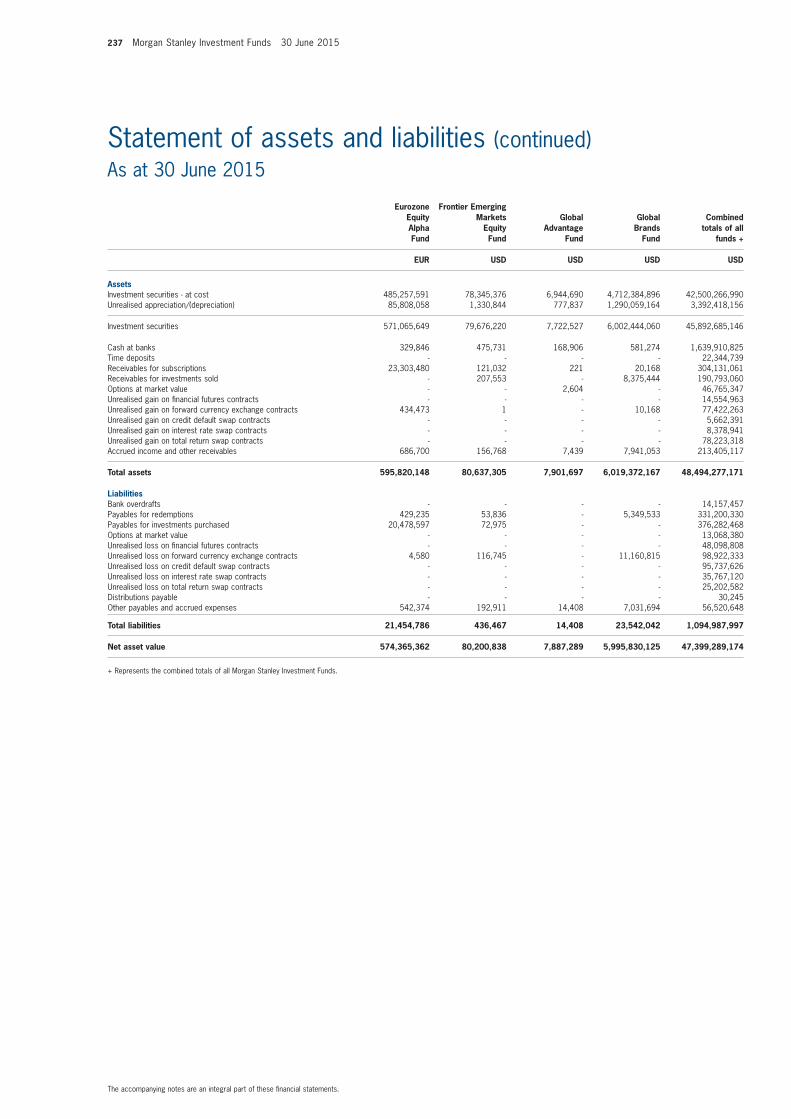
237 Morgan Stanley Investment Funds 30 June 2015
The accompanying notes are an integral part of these financial statements.
Statement of assets and liabilities (continued)As at 30 June 2015
Eurozone Equity Alpha fund
frontier Emerging markets
Equity fund
Global Advantage
fund
Global Brands
fund
Combined totals of all
funds +
EUR USD USD USD USD
AssetsInvestment securities - at cost 485,257,591 78,345,376 6,944,690 4,712,384,896 42,500,266,990 Unrealised appreciation/(depreciation) 85,808,058 1,330,844 777,837 1,290,059,164 3,392,418,156
Investment securities 571,065,649 79,676,220 7,722,527 6,002,444,060 45,892,685,146
Cash at banks 329,846 475,731 168,906 581,274 1,639,910,825 Time deposits - - - - 22,344,739 Receivables for subscriptions 23,303,480 121,032 221 20,168 304,131,061 Receivables for investments sold - 207,553 - 8,375,444 190,793,060 Options at market value - - 2,604 - 46,765,347 Unrealised gain on financial futures contracts - - - - 14,554,963 Unrealised gain on forward currency exchange contracts 434,473 1 - 10,168 77,422,263 Unrealised gain on credit default swap contracts - - - - 5,662,391 Unrealised gain on interest rate swap contracts - - - - 8,378,941 Unrealised gain on total return swap contracts - - - - 78,223,318 Accrued income and other receivables 686,700 156,768 7,439 7,941,053 213,405,117
total assets 595,820,148 80,637,305 7,901,697 6,019,372,167 48,494,277,171
LiabilitiesBank overdrafts - - - - 14,157,457 Payables for redemptions 429,235 53,836 - 5,349,533 331,200,330 Payables for investments purchased 20,478,597 72,975 - - 376,282,468 Options at market value - - - - 13,068,380Unrealised loss on financial futures contracts - - - - 48,098,808 Unrealised loss on forward currency exchange contracts 4,580 116,745 - 11,160,815 98,922,333 Unrealised loss on credit default swap contracts - - - - 95,737,626 Unrealised loss on interest rate swap contracts - - - - 35,767,120 Unrealised loss on total return swap contracts - - - - 25,202,582 Distributions payable - - - - 30,245 Other payables and accrued expenses 542,374 192,911 14,408 7,031,694 56,520,648
total liabilities 21,454,786 436,467 14,408 23,542,042 1,094,987,997
net asset value 574,365,362 80,200,838 7,887,289 5,995,830,125 47,399,289,174
+ Represents the combined totals of all Morgan Stanley Investment Funds.
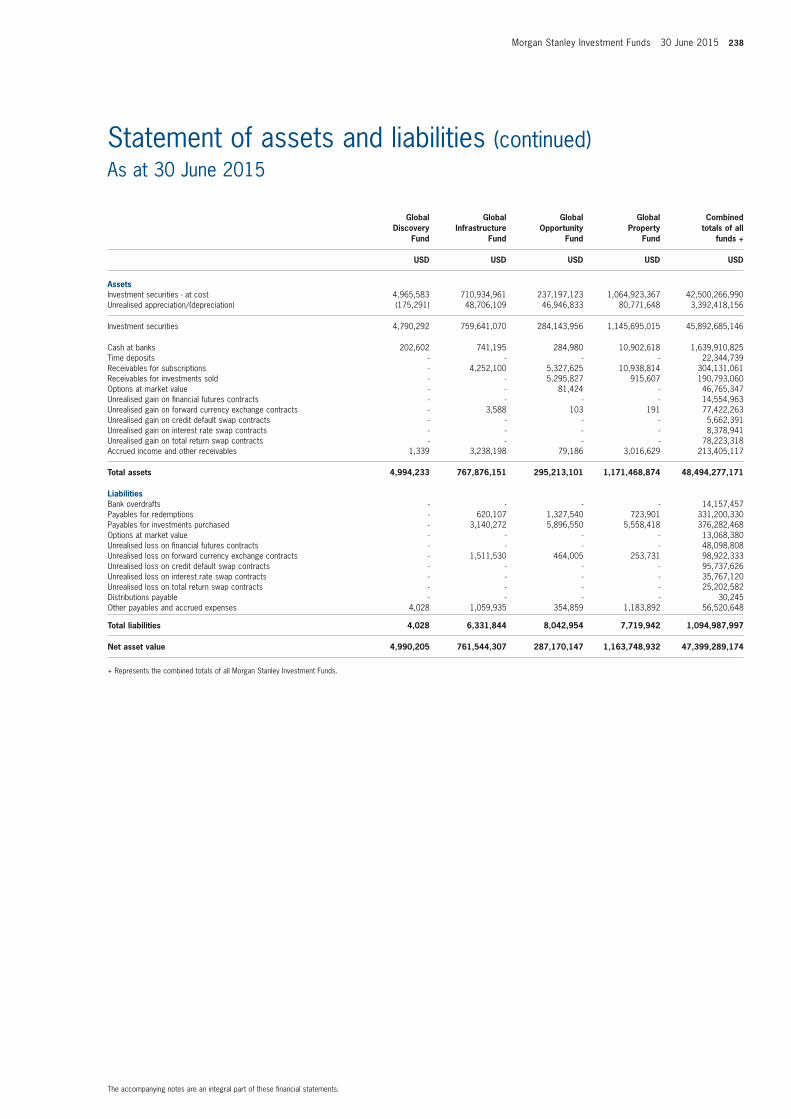
Morgan Stanley Investment Funds 30 June 2015 238
The accompanying notes are an integral part of these financial statements.
Statement of assets and liabilities (continued)As at 30 June 2015
Global
Discovery fund
Global infrastructure
fund
Global opportunity
fund
Global Property
fund
Combined totals of all
funds +
USD USD USD USD USD
AssetsInvestment securities - at cost 4,965,583 710,934,961 237,197,123 1,064,923,367 42,500,266,990 Unrealised appreciation/(depreciation) (175,291) 48,706,109 46,946,833 80,771,648 3,392,418,156
Investment securities 4,790,292 759,641,070 284,143,956 1,145,695,015 45,892,685,146
Cash at banks 202,602 741,195 284,980 10,902,618 1,639,910,825 Time deposits - - - - 22,344,739 Receivables for subscriptions - 4,252,100 5,327,625 10,938,814 304,131,061 Receivables for investments sold - - 5,295,827 915,607 190,793,060 Options at market value - - 81,424 - 46,765,347 Unrealised gain on financial futures contracts - - - - 14,554,963 Unrealised gain on forward currency exchange contracts - 3,588 103 191 77,422,263 Unrealised gain on credit default swap contracts - - - - 5,662,391 Unrealised gain on interest rate swap contracts - - - - 8,378,941 Unrealised gain on total return swap contracts - - - - 78,223,318 Accrued income and other receivables 1,339 3,238,198 79,186 3,016,629 213,405,117
total assets 4,994,233 767,876,151 295,213,101 1,171,468,874 48,494,277,171
LiabilitiesBank overdrafts - - - - 14,157,457 Payables for redemptions - 620,107 1,327,540 723,901 331,200,330 Payables for investments purchased - 3,140,272 5,896,550 5,558,418 376,282,468 Options at market value - - - - 13,068,380Unrealised loss on financial futures contracts - - - - 48,098,808 Unrealised loss on forward currency exchange contracts - 1,511,530 464,005 253,731 98,922,333 Unrealised loss on credit default swap contracts - - - - 95,737,626 Unrealised loss on interest rate swap contracts - - - - 35,767,120 Unrealised loss on total return swap contracts - - - - 25,202,582 Distributions payable - - - - 30,245 Other payables and accrued expenses 4,028 1,059,935 354,859 1,183,892 56,520,648
total liabilities 4,028 6,331,844 8,042,954 7,719,942 1,094,987,997
net asset value 4,990,205 761,544,307 287,170,147 1,163,748,932 47,399,289,174
+ Represents the combined totals of all Morgan Stanley Investment Funds.
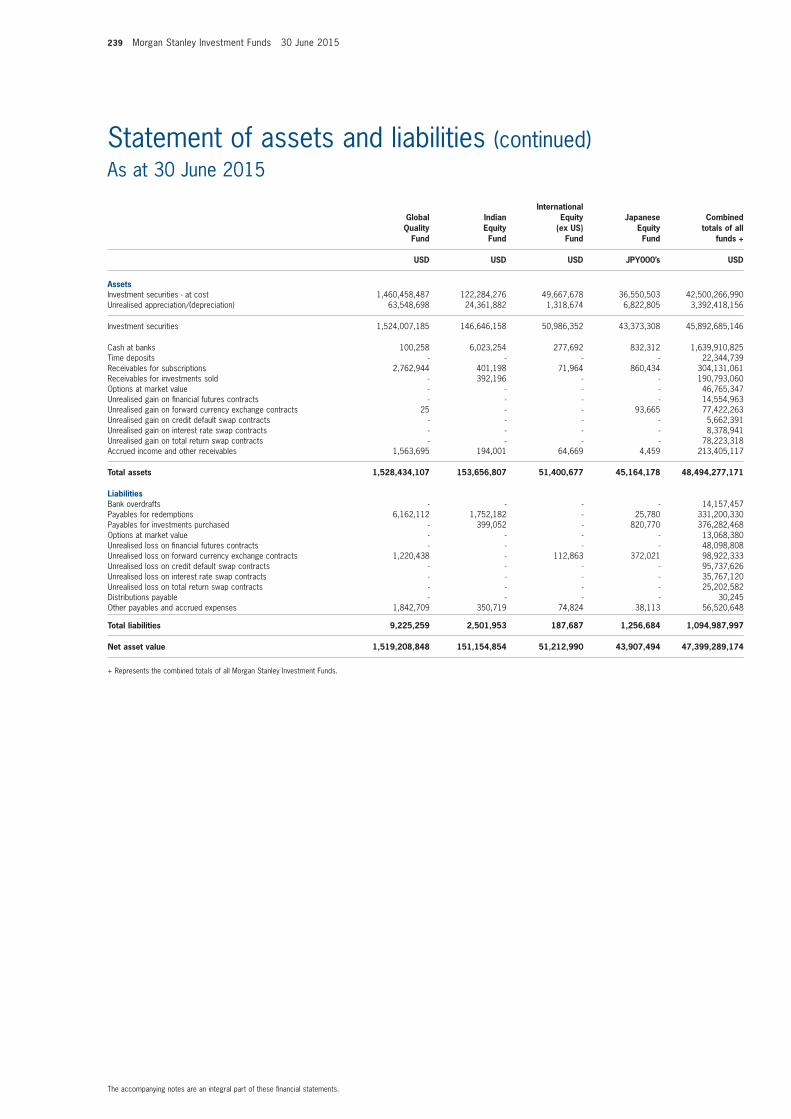
239 Morgan Stanley Investment Funds 30 June 2015
The accompanying notes are an integral part of these financial statements.
Statement of assets and liabilities (continued)As at 30 June 2015
Global Quality
fund
indian Equity fund
international Equity
(ex US) fund
Japanese Equity fund
Combined totals of all
funds +
USD USD USD JPY000’s USD
AssetsInvestment securities - at cost 1,460,458,487 122,284,276 49,667,678 36,550,503 42,500,266,990 Unrealised appreciation/(depreciation) 63,548,698 24,361,882 1,318,674 6,822,805 3,392,418,156
Investment securities 1,524,007,185 146,646,158 50,986,352 43,373,308 45,892,685,146
Cash at banks 100,258 6,023,254 277,692 832,312 1,639,910,825 Time deposits - - - - 22,344,739 Receivables for subscriptions 2,762,944 401,198 71,964 860,434 304,131,061 Receivables for investments sold - 392,196 - - 190,793,060 Options at market value - - - - 46,765,347 Unrealised gain on financial futures contracts - - - - 14,554,963 Unrealised gain on forward currency exchange contracts 25 - - 93,665 77,422,263 Unrealised gain on credit default swap contracts - - - - 5,662,391 Unrealised gain on interest rate swap contracts - - - - 8,378,941 Unrealised gain on total return swap contracts - - - - 78,223,318 Accrued income and other receivables 1,563,695 194,001 64,669 4,459 213,405,117
total assets 1,528,434,107 153,656,807 51,400,677 45,164,178 48,494,277,171
LiabilitiesBank overdrafts - - - - 14,157,457 Payables for redemptions 6,162,112 1,752,182 - 25,780 331,200,330 Payables for investments purchased - 399,052 - 820,770 376,282,468 Options at market value - - - - 13,068,380Unrealised loss on financial futures contracts - - - - 48,098,808 Unrealised loss on forward currency exchange contracts 1,220,438 - 112,863 372,021 98,922,333 Unrealised loss on credit default swap contracts - - - - 95,737,626 Unrealised loss on interest rate swap contracts - - - - 35,767,120 Unrealised loss on total return swap contracts - - - - 25,202,582 Distributions payable - - - - 30,245 Other payables and accrued expenses 1,842,709 350,719 74,824 38,113 56,520,648
total liabilities 9,225,259 2,501,953 187,687 1,256,684 1,094,987,997
net asset value 1,519,208,848 151,154,854 51,212,990 43,907,494 47,399,289,174
+ Represents the combined totals of all Morgan Stanley Investment Funds.
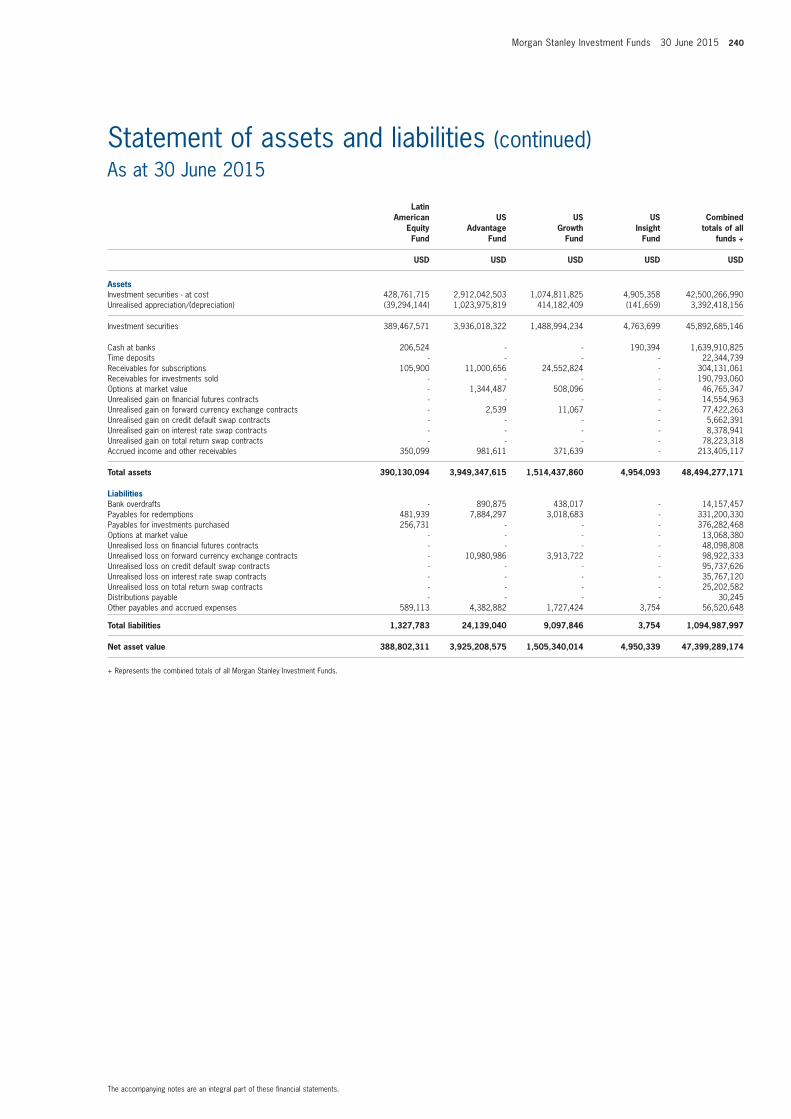
Morgan Stanley Investment Funds 30 June 2015 240
The accompanying notes are an integral part of these financial statements.
Statement of assets and liabilities (continued)As at 30 June 2015
Latin American
Equity fund
US Advantage
fund
US Growth
fund
US insight
fund
Combined totals of all
funds +
USD USD USD USD USD
AssetsInvestment securities - at cost 428,761,715 2,912,042,503 1,074,811,825 4,905,358 42,500,266,990 Unrealised appreciation/(depreciation) (39,294,144) 1,023,975,819 414,182,409 (141,659) 3,392,418,156
Investment securities 389,467,571 3,936,018,322 1,488,994,234 4,763,699 45,892,685,146
Cash at banks 206,524 - - 190,394 1,639,910,825 Time deposits - - - - 22,344,739 Receivables for subscriptions 105,900 11,000,656 24,552,824 - 304,131,061 Receivables for investments sold - - - - 190,793,060 Options at market value - 1,344,487 508,096 - 46,765,347 Unrealised gain on financial futures contracts - - - - 14,554,963 Unrealised gain on forward currency exchange contracts - 2,539 11,067 - 77,422,263 Unrealised gain on credit default swap contracts - - - - 5,662,391 Unrealised gain on interest rate swap contracts - - - - 8,378,941 Unrealised gain on total return swap contracts - - - - 78,223,318 Accrued income and other receivables 350,099 981,611 371,639 - 213,405,117
total assets 390,130,094 3,949,347,615 1,514,437,860 4,954,093 48,494,277,171
LiabilitiesBank overdrafts - 890,875 438,017 - 14,157,457 Payables for redemptions 481,939 7,884,297 3,018,683 - 331,200,330 Payables for investments purchased 256,731 - - - 376,282,468 Options at market value - - - - 13,068,380Unrealised loss on financial futures contracts - - - - 48,098,808 Unrealised loss on forward currency exchange contracts - 10,980,986 3,913,722 - 98,922,333 Unrealised loss on credit default swap contracts - - - - 95,737,626 Unrealised loss on interest rate swap contracts - - - - 35,767,120 Unrealised loss on total return swap contracts - - - - 25,202,582 Distributions payable - - - - 30,245 Other payables and accrued expenses 589,113 4,382,882 1,727,424 3,754 56,520,648
total liabilities 1,327,783 24,139,040 9,097,846 3,754 1,094,987,997
net asset value 388,802,311 3,925,208,575 1,505,340,014 4,950,339 47,399,289,174
+ Represents the combined totals of all Morgan Stanley Investment Funds.
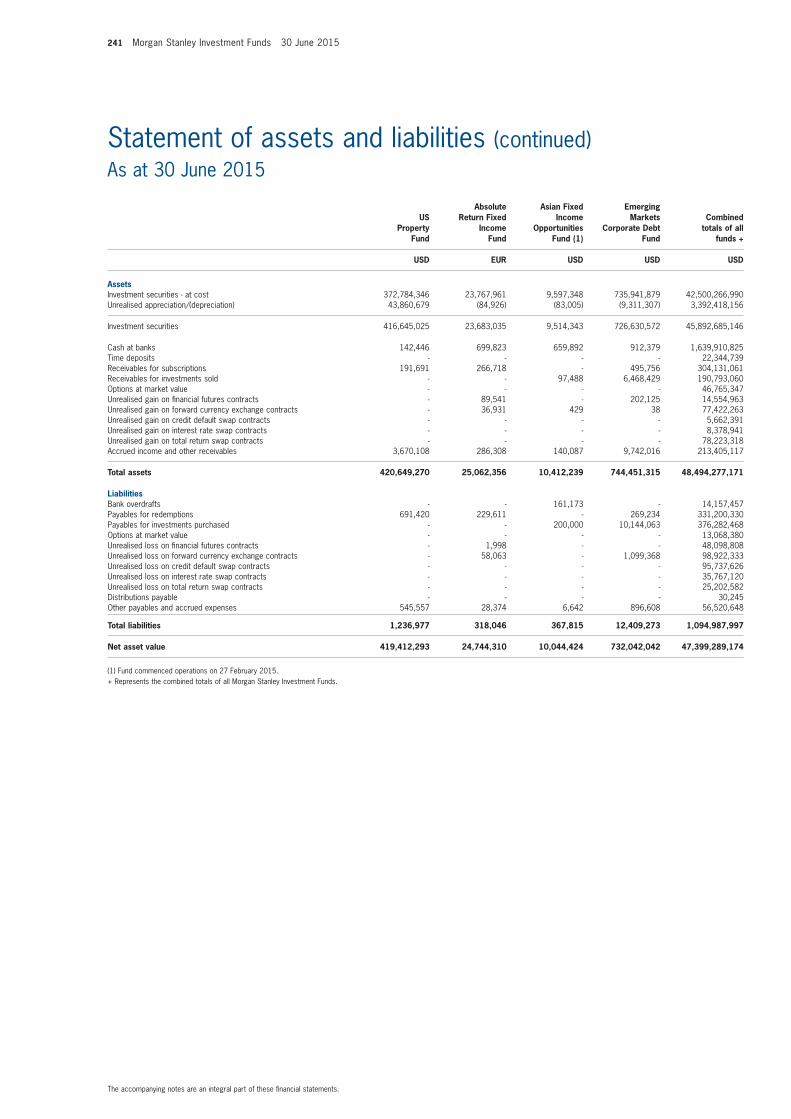
241 Morgan Stanley Investment Funds 30 June 2015
The accompanying notes are an integral part of these financial statements.
Statement of assets and liabilities (continued)As at 30 June 2015
US Property
fund
Absolute Return fixed
income fund
Asian fixed income
opportunities fund (1)
Emerging markets
Corporate Debt fund
Combined totals of all
funds +
USD EUR USD USD USD
AssetsInvestment securities - at cost 372,784,346 23,767,961 9,597,348 735,941,879 42,500,266,990 Unrealised appreciation/(depreciation) 43,860,679 (84,926) (83,005) (9,311,307) 3,392,418,156
Investment securities 416,645,025 23,683,035 9,514,343 726,630,572 45,892,685,146
Cash at banks 142,446 699,823 659,892 912,379 1,639,910,825 Time deposits - - - - 22,344,739 Receivables for subscriptions 191,691 266,718 - 495,756 304,131,061 Receivables for investments sold - - 97,488 6,468,429 190,793,060 Options at market value - - - - 46,765,347 Unrealised gain on financial futures contracts - 89,541 - 202,125 14,554,963 Unrealised gain on forward currency exchange contracts - 36,931 429 38 77,422,263 Unrealised gain on credit default swap contracts - - - - 5,662,391 Unrealised gain on interest rate swap contracts - - - - 8,378,941 Unrealised gain on total return swap contracts - - - - 78,223,318 Accrued income and other receivables 3,670,108 286,308 140,087 9,742,016 213,405,117
total assets 420,649,270 25,062,356 10,412,239 744,451,315 48,494,277,171
LiabilitiesBank overdrafts - - 161,173 - 14,157,457 Payables for redemptions 691,420 229,611 - 269,234 331,200,330 Payables for investments purchased - - 200,000 10,144,063 376,282,468 Options at market value - - - - 13,068,380Unrealised loss on financial futures contracts - 1,998 - - 48,098,808 Unrealised loss on forward currency exchange contracts - 58,063 - 1,099,368 98,922,333 Unrealised loss on credit default swap contracts - - - - 95,737,626 Unrealised loss on interest rate swap contracts - - - - 35,767,120 Unrealised loss on total return swap contracts - - - - 25,202,582 Distributions payable - - - - 30,245 Other payables and accrued expenses 545,557 28,374 6,642 896,608 56,520,648
total liabilities 1,236,977 318,046 367,815 12,409,273 1,094,987,997
net asset value 419,412,293 24,744,310 10,044,424 732,042,042 47,399,289,174
(1) Fund commenced operations on 27 February 2015.+ Represents the combined totals of all Morgan Stanley Investment Funds.
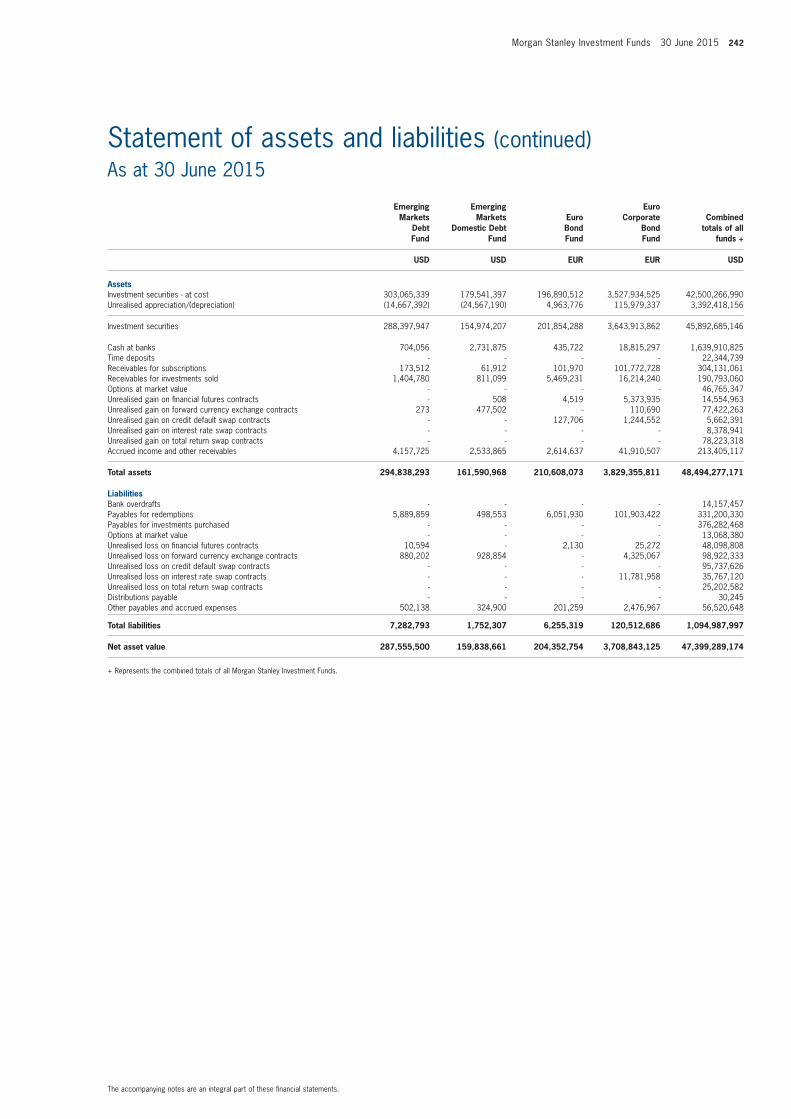
Morgan Stanley Investment Funds 30 June 2015 242
The accompanying notes are an integral part of these financial statements.
Statement of assets and liabilities (continued)As at 30 June 2015
Emerging markets
Debt fund
Emerging markets
Domestic Debt fund
Euro Bond fund
Euro Corporate
Bond fund
Combined totals of all
funds +
USD USD EUR EUR USD
AssetsInvestment securities - at cost 303,065,339 179,541,397 196,890,512 3,527,934,525 42,500,266,990 Unrealised appreciation/(depreciation) (14,667,392) (24,567,190) 4,963,776 115,979,337 3,392,418,156
Investment securities 288,397,947 154,974,207 201,854,288 3,643,913,862 45,892,685,146
Cash at banks 704,056 2,731,875 435,722 18,815,297 1,639,910,825 Time deposits - - - - 22,344,739 Receivables for subscriptions 173,512 61,912 101,970 101,772,728 304,131,061 Receivables for investments sold 1,404,780 811,099 5,469,231 16,214,240 190,793,060 Options at market value - - - - 46,765,347 Unrealised gain on financial futures contracts - 508 4,519 5,373,935 14,554,963 Unrealised gain on forward currency exchange contracts 273 477,502 - 110,690 77,422,263 Unrealised gain on credit default swap contracts - - 127,706 1,244,552 5,662,391 Unrealised gain on interest rate swap contracts - - - - 8,378,941 Unrealised gain on total return swap contracts - - - - 78,223,318 Accrued income and other receivables 4,157,725 2,533,865 2,614,637 41,910,507 213,405,117
total assets 294,838,293 161,590,968 210,608,073 3,829,355,811 48,494,277,171
LiabilitiesBank overdrafts - - - - 14,157,457 Payables for redemptions 5,889,859 498,553 6,051,930 101,903,422 331,200,330 Payables for investments purchased - - - - 376,282,468 Options at market value - - - - 13,068,380Unrealised loss on financial futures contracts 10,594 - 2,130 25,272 48,098,808 Unrealised loss on forward currency exchange contracts 880,202 928,854 - 4,325,067 98,922,333 Unrealised loss on credit default swap contracts - - - - 95,737,626 Unrealised loss on interest rate swap contracts - - - 11,781,958 35,767,120 Unrealised loss on total return swap contracts - - - - 25,202,582 Distributions payable - - - - 30,245 Other payables and accrued expenses 502,138 324,900 201,259 2,476,967 56,520,648
total liabilities 7,282,793 1,752,307 6,255,319 120,512,686 1,094,987,997
net asset value 287,555,500 159,838,661 204,352,754 3,708,843,125 47,399,289,174
+ Represents the combined totals of all Morgan Stanley Investment Funds.
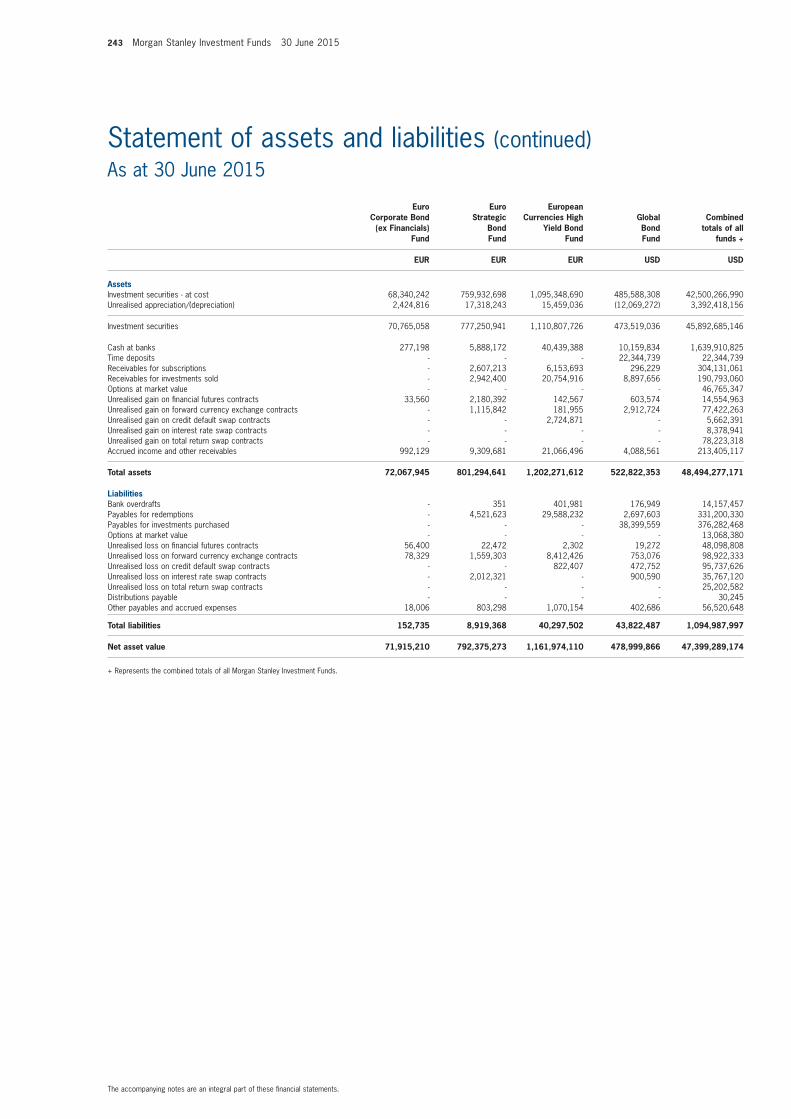
243 Morgan Stanley Investment Funds 30 June 2015
The accompanying notes are an integral part of these financial statements.
Statement of assets and liabilities (continued)As at 30 June 2015
Euro Corporate Bond
(ex financials) fund
Euro Strategic
Bond fund
European Currencies High
Yield Bond fund
Global Bond fund
Combined totals of all
funds +
EUR EUR EUR USD USD
AssetsInvestment securities - at cost 68,340,242 759,932,698 1,095,348,690 485,588,308 42,500,266,990 Unrealised appreciation/(depreciation) 2,424,816 17,318,243 15,459,036 (12,069,272) 3,392,418,156
Investment securities 70,765,058 777,250,941 1,110,807,726 473,519,036 45,892,685,146
Cash at banks 277,198 5,888,172 40,439,388 10,159,834 1,639,910,825 Time deposits - - - 22,344,739 22,344,739 Receivables for subscriptions - 2,607,213 6,153,693 296,229 304,131,061 Receivables for investments sold - 2,942,400 20,754,916 8,897,656 190,793,060 Options at market value - - - - 46,765,347 Unrealised gain on financial futures contracts 33,560 2,180,392 142,567 603,574 14,554,963 Unrealised gain on forward currency exchange contracts - 1,115,842 181,955 2,912,724 77,422,263 Unrealised gain on credit default swap contracts - - 2,724,871 - 5,662,391 Unrealised gain on interest rate swap contracts - - - - 8,378,941 Unrealised gain on total return swap contracts - - - - 78,223,318 Accrued income and other receivables 992,129 9,309,681 21,066,496 4,088,561 213,405,117
total assets 72,067,945 801,294,641 1,202,271,612 522,822,353 48,494,277,171
LiabilitiesBank overdrafts - 351 401,981 176,949 14,157,457 Payables for redemptions - 4,521,623 29,588,232 2,697,603 331,200,330 Payables for investments purchased - - - 38,399,559 376,282,468 Options at market value - - - - 13,068,380Unrealised loss on financial futures contracts 56,400 22,472 2,302 19,272 48,098,808 Unrealised loss on forward currency exchange contracts 78,329 1,559,303 8,412,426 753,076 98,922,333 Unrealised loss on credit default swap contracts - - 822,407 472,752 95,737,626 Unrealised loss on interest rate swap contracts - 2,012,321 - 900,590 35,767,120 Unrealised loss on total return swap contracts - - - - 25,202,582 Distributions payable - - - - 30,245 Other payables and accrued expenses 18,006 803,298 1,070,154 402,686 56,520,648
total liabilities 152,735 8,919,368 40,297,502 43,822,487 1,094,987,997
net asset value 71,915,210 792,375,273 1,161,974,110 478,999,866 47,399,289,174
+ Represents the combined totals of all Morgan Stanley Investment Funds.
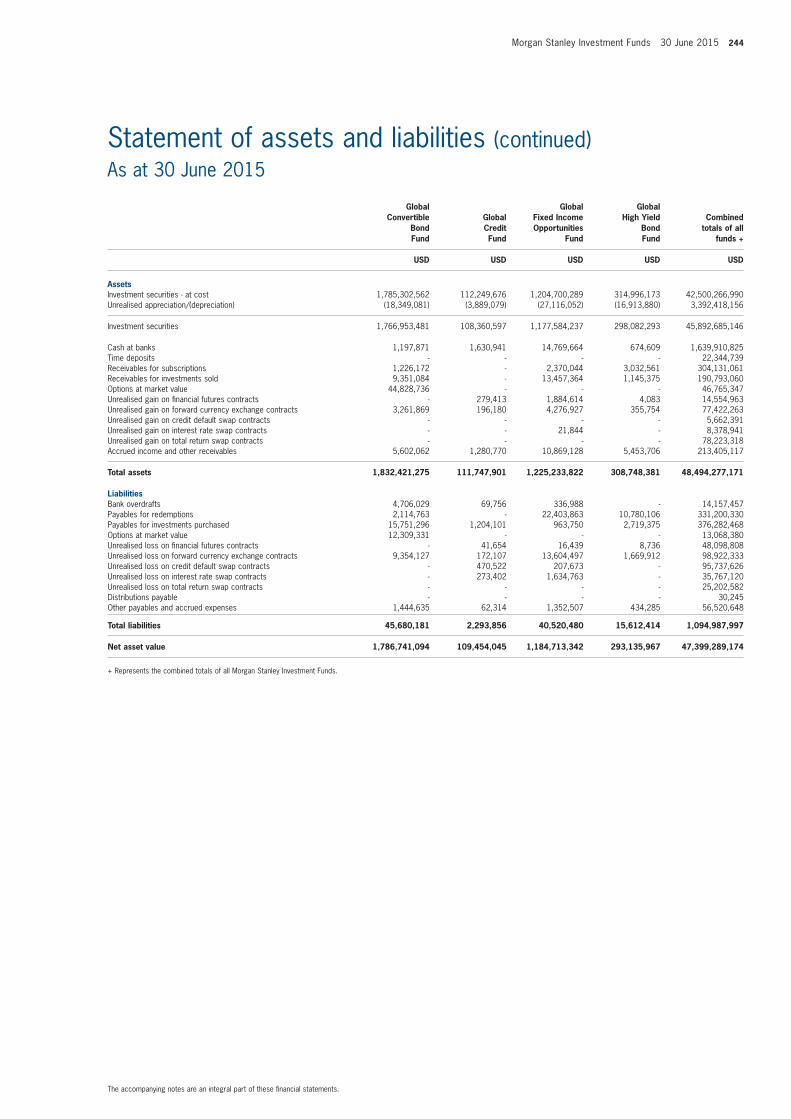
Morgan Stanley Investment Funds 30 June 2015 244
The accompanying notes are an integral part of these financial statements.
Statement of assets and liabilities (continued)As at 30 June 2015
Global Convertible
Bond fund
Global Credit fund
Global fixed income opportunities
fund
Global High Yield
Bond fund
Combined totals of all
funds +
USD USD USD USD USD
AssetsInvestment securities - at cost 1,785,302,562 112,249,676 1,204,700,289 314,996,173 42,500,266,990 Unrealised appreciation/(depreciation) (18,349,081) (3,889,079) (27,116,052) (16,913,880) 3,392,418,156
Investment securities 1,766,953,481 108,360,597 1,177,584,237 298,082,293 45,892,685,146
Cash at banks 1,197,871 1,630,941 14,769,664 674,609 1,639,910,825 Time deposits - - - - 22,344,739 Receivables for subscriptions 1,226,172 - 2,370,044 3,032,561 304,131,061 Receivables for investments sold 9,351,084 - 13,457,364 1,145,375 190,793,060 Options at market value 44,828,736 - - - 46,765,347 Unrealised gain on financial futures contracts - 279,413 1,884,614 4,083 14,554,963 Unrealised gain on forward currency exchange contracts 3,261,869 196,180 4,276,927 355,754 77,422,263 Unrealised gain on credit default swap contracts - - - - 5,662,391 Unrealised gain on interest rate swap contracts - - 21,844 - 8,378,941 Unrealised gain on total return swap contracts - - - - 78,223,318 Accrued income and other receivables 5,602,062 1,280,770 10,869,128 5,453,706 213,405,117
total assets 1,832,421,275 111,747,901 1,225,233,822 308,748,381 48,494,277,171
LiabilitiesBank overdrafts 4,706,029 69,756 336,988 - 14,157,457 Payables for redemptions 2,114,763 - 22,403,863 10,780,106 331,200,330 Payables for investments purchased 15,751,296 1,204,101 963,750 2,719,375 376,282,468 Options at market value 12,309,331 - - - 13,068,380Unrealised loss on financial futures contracts - 41,654 16,439 8,736 48,098,808 Unrealised loss on forward currency exchange contracts 9,354,127 172,107 13,604,497 1,669,912 98,922,333 Unrealised loss on credit default swap contracts - 470,522 207,673 - 95,737,626 Unrealised loss on interest rate swap contracts - 273,402 1,634,763 - 35,767,120 Unrealised loss on total return swap contracts - - - - 25,202,582 Distributions payable - - - - 30,245 Other payables and accrued expenses 1,444,635 62,314 1,352,507 434,285 56,520,648
total liabilities 45,680,181 2,293,856 40,520,480 15,612,414 1,094,987,997
net asset value 1,786,741,094 109,454,045 1,184,713,342 293,135,967 47,399,289,174
+ Represents the combined totals of all Morgan Stanley Investment Funds.
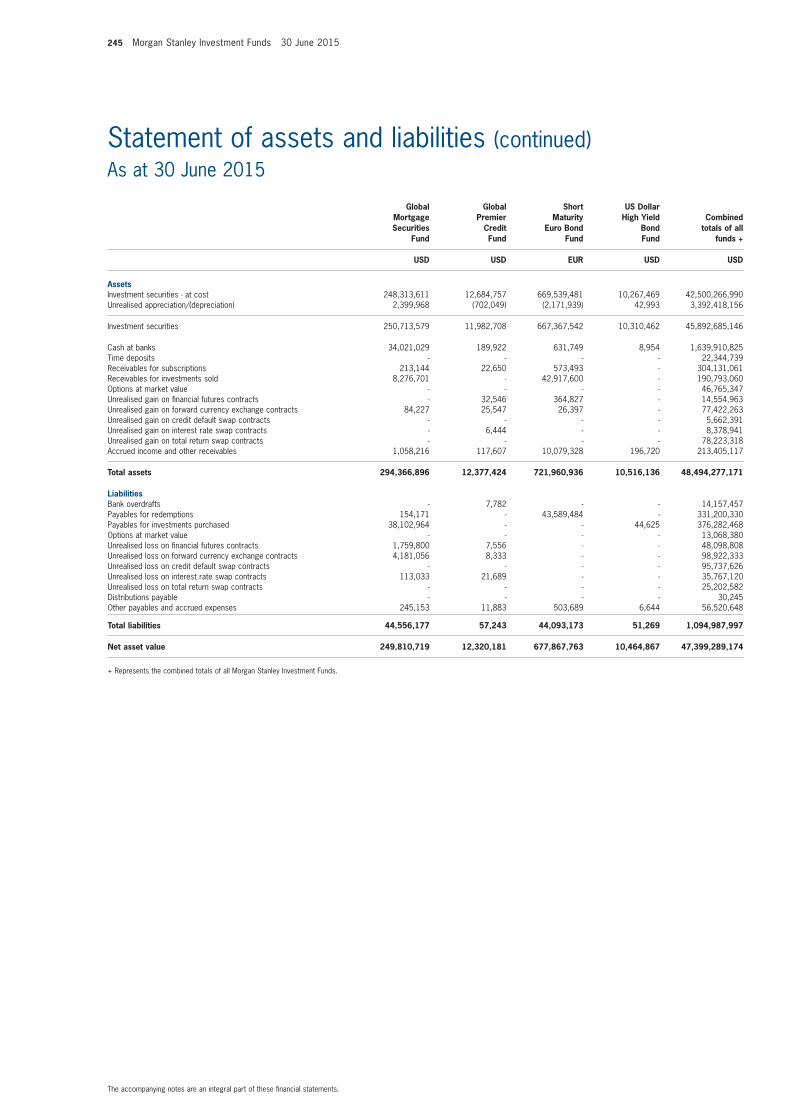
245 Morgan Stanley Investment Funds 30 June 2015
The accompanying notes are an integral part of these financial statements.
Statement of assets and liabilities (continued)As at 30 June 2015
Global mortgage Securities
fund
Global Premier
Credit fund
Short maturity
Euro Bond fund
US Dollar High Yield
Bond fund
Combined totals of all
funds +
USD USD EUR USD USD
AssetsInvestment securities - at cost 248,313,611 12,684,757 669,539,481 10,267,469 42,500,266,990 Unrealised appreciation/(depreciation) 2,399,968 (702,049) (2,171,939) 42,993 3,392,418,156
Investment securities 250,713,579 11,982,708 667,367,542 10,310,462 45,892,685,146
Cash at banks 34,021,029 189,922 631,749 8,954 1,639,910,825 Time deposits - - - - 22,344,739 Receivables for subscriptions 213,144 22,650 573,493 - 304,131,061 Receivables for investments sold 8,276,701 - 42,917,600 - 190,793,060 Options at market value - - - - 46,765,347 Unrealised gain on financial futures contracts - 32,546 364,827 - 14,554,963 Unrealised gain on forward currency exchange contracts 84,227 25,547 26,397 - 77,422,263 Unrealised gain on credit default swap contracts - - - - 5,662,391 Unrealised gain on interest rate swap contracts - 6,444 - - 8,378,941 Unrealised gain on total return swap contracts - - - - 78,223,318 Accrued income and other receivables 1,058,216 117,607 10,079,328 196,720 213,405,117
total assets 294,366,896 12,377,424 721,960,936 10,516,136 48,494,277,171
LiabilitiesBank overdrafts - 7,782 - - 14,157,457 Payables for redemptions 154,171 - 43,589,484 - 331,200,330 Payables for investments purchased 38,102,964 - - 44,625 376,282,468 Options at market value - - - - 13,068,380Unrealised loss on financial futures contracts 1,759,800 7,556 - - 48,098,808 Unrealised loss on forward currency exchange contracts 4,181,056 8,333 - - 98,922,333 Unrealised loss on credit default swap contracts - - - - 95,737,626 Unrealised loss on interest rate swap contracts 113,033 21,689 - - 35,767,120 Unrealised loss on total return swap contracts - - - - 25,202,582 Distributions payable - - - - 30,245 Other payables and accrued expenses 245,153 11,883 503,689 6,644 56,520,648
total liabilities 44,556,177 57,243 44,093,173 51,269 1,094,987,997
net asset value 249,810,719 12,320,181 677,867,763 10,464,867 47,399,289,174
+ Represents the combined totals of all Morgan Stanley Investment Funds.
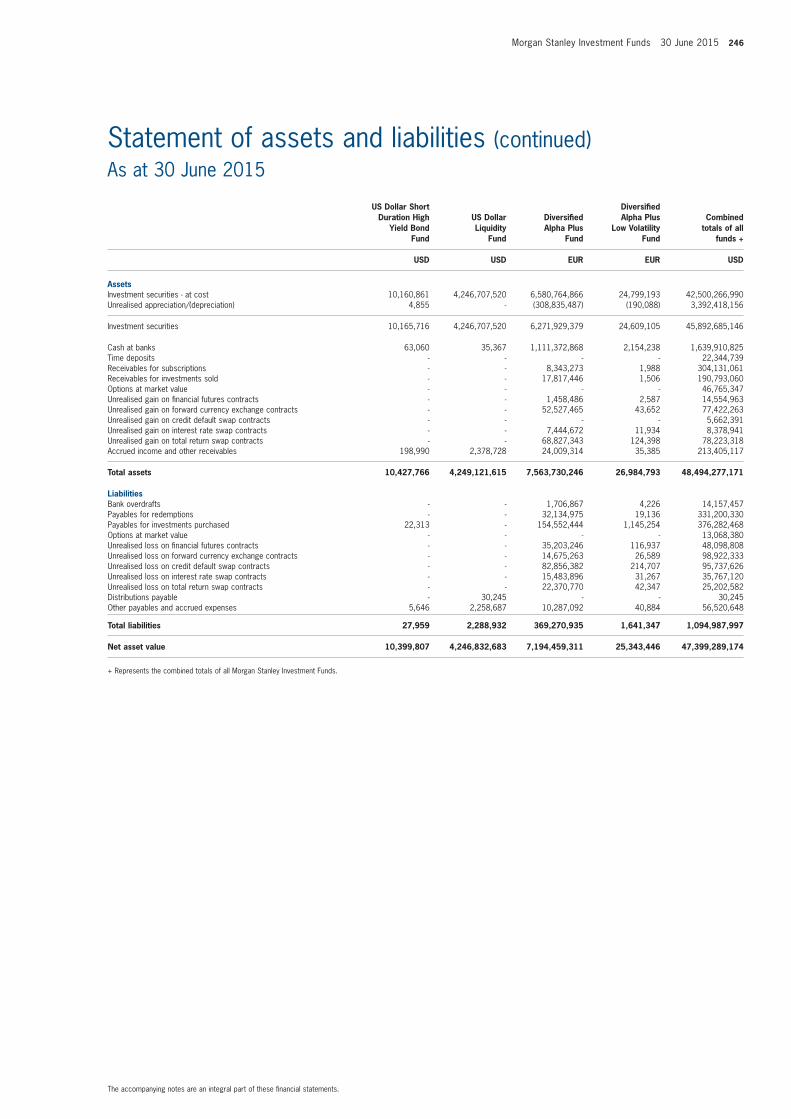
Morgan Stanley Investment Funds 30 June 2015 246
The accompanying notes are an integral part of these financial statements.
Statement of assets and liabilities (continued)As at 30 June 2015
US Dollar Short Duration High
Yield Bond fund
US Dollar Liquidity
fund
Diversified Alpha Plus
fund
Diversified Alpha Plus
Low volatility fund
Combined totals of all
funds +
USD USD EUR EUR USD
AssetsInvestment securities - at cost 10,160,861 4,246,707,520 6,580,764,866 24,799,193 42,500,266,990 Unrealised appreciation/(depreciation) 4,855 - (308,835,487) (190,088) 3,392,418,156
Investment securities 10,165,716 4,246,707,520 6,271,929,379 24,609,105 45,892,685,146
Cash at banks 63,060 35,367 1,111,372,868 2,154,238 1,639,910,825 Time deposits - - - - 22,344,739 Receivables for subscriptions - - 8,343,273 1,988 304,131,061 Receivables for investments sold - - 17,817,446 1,506 190,793,060 Options at market value - - - - 46,765,347 Unrealised gain on financial futures contracts - - 1,458,486 2,587 14,554,963 Unrealised gain on forward currency exchange contracts - - 52,527,465 43,652 77,422,263 Unrealised gain on credit default swap contracts - - - - 5,662,391 Unrealised gain on interest rate swap contracts - - 7,444,672 11,934 8,378,941 Unrealised gain on total return swap contracts - - 68,827,343 124,398 78,223,318 Accrued income and other receivables 198,990 2,378,728 24,009,314 35,385 213,405,117
total assets 10,427,766 4,249,121,615 7,563,730,246 26,984,793 48,494,277,171
LiabilitiesBank overdrafts - - 1,706,867 4,226 14,157,457 Payables for redemptions - - 32,134,975 19,136 331,200,330 Payables for investments purchased 22,313 - 154,552,444 1,145,254 376,282,468 Options at market value - - - - 13,068,380Unrealised loss on financial futures contracts - - 35,203,246 116,937 48,098,808 Unrealised loss on forward currency exchange contracts - - 14,675,263 26,589 98,922,333 Unrealised loss on credit default swap contracts - - 82,856,382 214,707 95,737,626 Unrealised loss on interest rate swap contracts - - 15,483,896 31,267 35,767,120 Unrealised loss on total return swap contracts - - 22,370,770 42,347 25,202,582 Distributions payable - 30,245 - - 30,245 Other payables and accrued expenses 5,646 2,258,687 10,287,092 40,884 56,520,648
total liabilities 27,959 2,288,932 369,270,935 1,641,347 1,094,987,997
net asset value 10,399,807 4,246,832,683 7,194,459,311 25,343,446 47,399,289,174
+ Represents the combined totals of all Morgan Stanley Investment Funds.
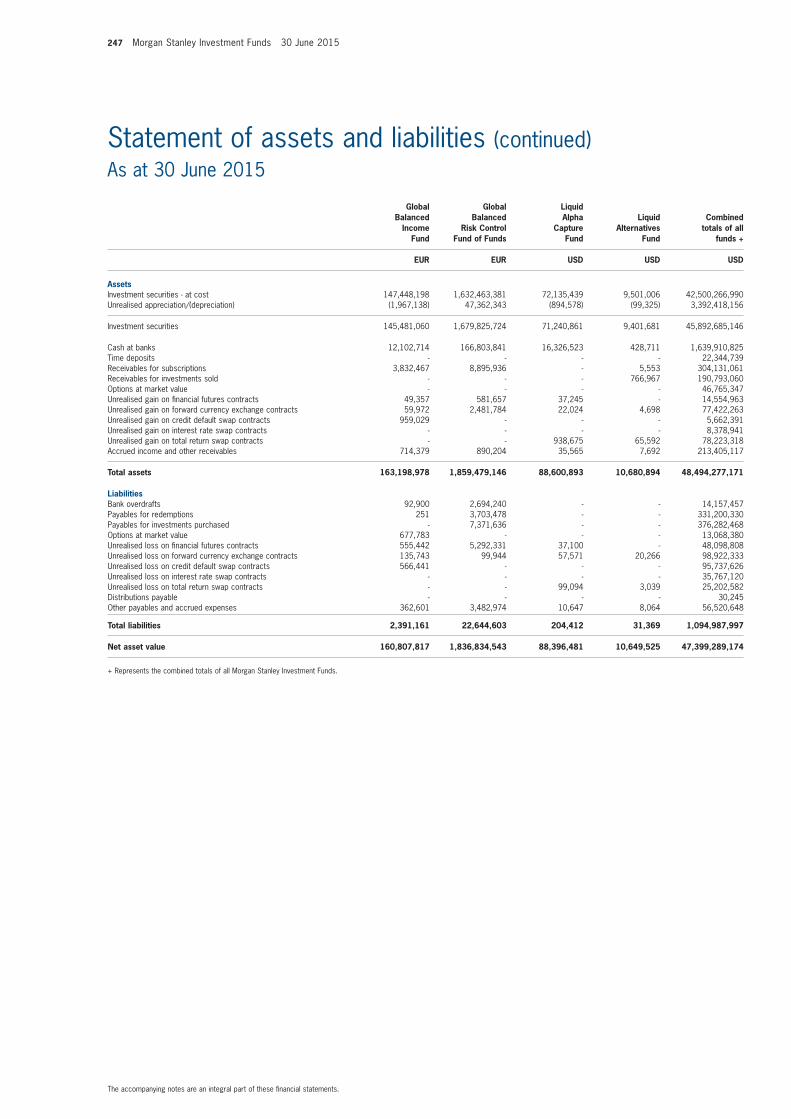
247 Morgan Stanley Investment Funds 30 June 2015
The accompanying notes are an integral part of these financial statements.
Statement of assets and liabilities (continued)As at 30 June 2015
Global Balanced
income fund
Global Balanced
Risk Control fund of funds
Liquid Alpha
Capture fund
Liquid Alternatives
fund
Combined totals of all
funds +
EUR EUR USD USD USD
AssetsInvestment securities - at cost 147,448,198 1,632,463,381 72,135,439 9,501,006 42,500,266,990 Unrealised appreciation/(depreciation) (1,967,138) 47,362,343 (894,578) (99,325) 3,392,418,156
Investment securities 145,481,060 1,679,825,724 71,240,861 9,401,681 45,892,685,146
Cash at banks 12,102,714 166,803,841 16,326,523 428,711 1,639,910,825 Time deposits - - - - 22,344,739 Receivables for subscriptions 3,832,467 8,895,936 - 5,553 304,131,061 Receivables for investments sold - - - 766,967 190,793,060 Options at market value - - - - 46,765,347 Unrealised gain on financial futures contracts 49,357 581,657 37,245 - 14,554,963 Unrealised gain on forward currency exchange contracts 59,972 2,481,784 22,024 4,698 77,422,263 Unrealised gain on credit default swap contracts 959,029 - - - 5,662,391 Unrealised gain on interest rate swap contracts - - - - 8,378,941 Unrealised gain on total return swap contracts - - 938,675 65,592 78,223,318 Accrued income and other receivables 714,379 890,204 35,565 7,692 213,405,117
total assets 163,198,978 1,859,479,146 88,600,893 10,680,894 48,494,277,171
LiabilitiesBank overdrafts 92,900 2,694,240 - - 14,157,457 Payables for redemptions 251 3,703,478 - - 331,200,330 Payables for investments purchased - 7,371,636 - - 376,282,468 Options at market value 677,783 - - - 13,068,380Unrealised loss on financial futures contracts 555,442 5,292,331 37,100 - 48,098,808 Unrealised loss on forward currency exchange contracts 135,743 99,944 57,571 20,266 98,922,333 Unrealised loss on credit default swap contracts 566,441 - - - 95,737,626 Unrealised loss on interest rate swap contracts - - - - 35,767,120 Unrealised loss on total return swap contracts - - 99,094 3,039 25,202,582 Distributions payable - - - - 30,245 Other payables and accrued expenses 362,601 3,482,974 10,647 8,064 56,520,648
total liabilities 2,391,161 22,644,603 204,412 31,369 1,094,987,997
net asset value 160,807,817 1,836,834,543 88,396,481 10,649,525 47,399,289,174
+ Represents the combined totals of all Morgan Stanley Investment Funds.
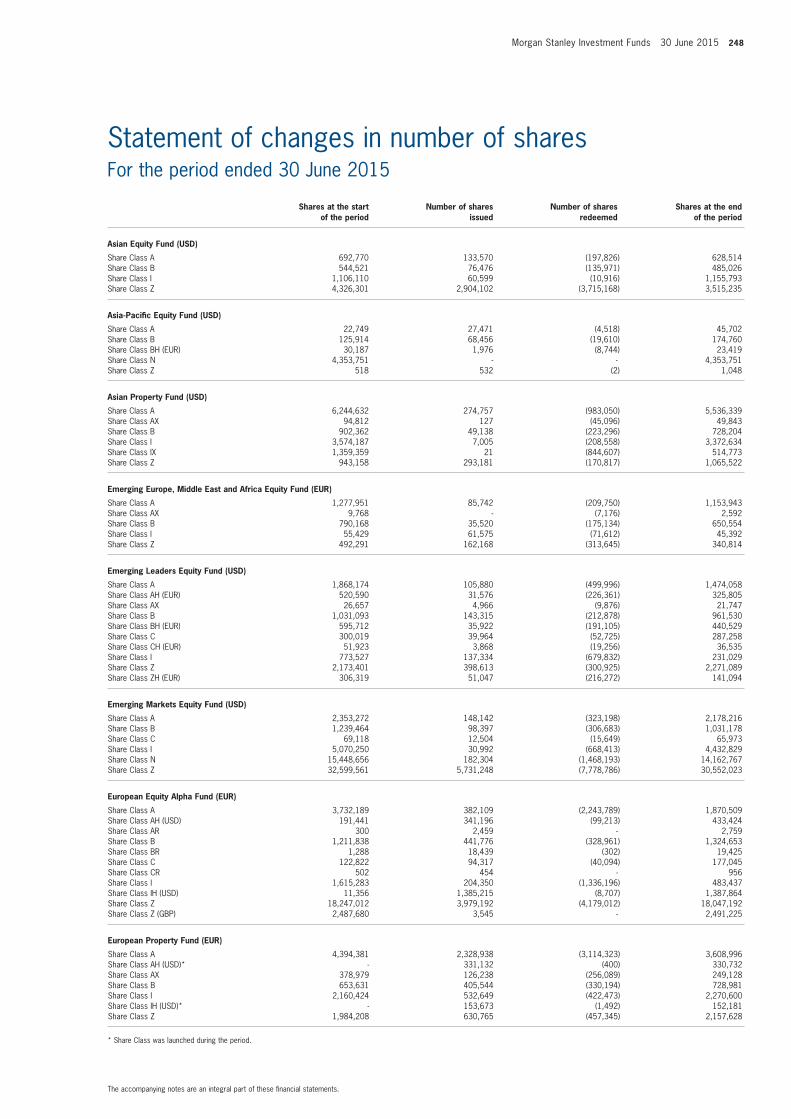
Morgan Stanley Investment Funds 30 June 2015 248
The accompanying notes are an integral part of these financial statements.
Statement of changes in number of sharesFor the period ended 30 June 2015
Shares at the start of the period
number of shares issued
number of shares redeemed
Shares at the end of the period
Asian Equity fund (USD)
Share Class A 692,770 133,570 (197,826) 628,514Share Class B 544,521 76,476 (135,971) 485,026Share Class I 1,106,110 60,599 (10,916) 1,155,793Share Class Z 4,326,301 2,904,102 (3,715,168) 3,515,235
Asia-Pacific Equity fund (USD)
Share Class A 22,749 27,471 (4,518) 45,702Share Class B 125,914 68,456 (19,610) 174,760Share Class BH (EUR) 30,187 1,976 (8,744) 23,419Share Class N 4,353,751 - - 4,353,751Share Class Z 518 532 (2) 1,048
Asian Property fund (USD)
Share Class A 6,244,632 274,757 (983,050) 5,536,339Share Class AX 94,812 127 (45,096) 49,843Share Class B 902,362 49,138 (223,296) 728,204Share Class I 3,574,187 7,005 (208,558) 3,372,634Share Class IX 1,359,359 21 (844,607) 514,773Share Class Z 943,158 293,181 (170,817) 1,065,522
Emerging Europe, middle East and Africa Equity fund (EUR)
Share Class A 1,277,951 85,742 (209,750) 1,153,943Share Class AX 9,768 - (7,176) 2,592Share Class B 790,168 35,520 (175,134) 650,554Share Class I 55,429 61,575 (71,612) 45,392Share Class Z 492,291 162,168 (313,645) 340,814
Emerging Leaders Equity fund (USD)
Share Class A 1,868,174 105,880 (499,996) 1,474,058Share Class AH (EUR) 520,590 31,576 (226,361) 325,805Share Class AX 26,657 4,966 (9,876) 21,747Share Class B 1,031,093 143,315 (212,878) 961,530Share Class BH (EUR) 595,712 35,922 (191,105) 440,529Share Class C 300,019 39,964 (52,725) 287,258Share Class CH (EUR) 51,923 3,868 (19,256) 36,535Share Class I 773,527 137,334 (679,832) 231,029Share Class Z 2,173,401 398,613 (300,925) 2,271,089Share Class ZH (EUR) 306,319 51,047 (216,272) 141,094
Emerging markets Equity fund (USD)
Share Class A 2,353,272 148,142 (323,198) 2,178,216Share Class B 1,239,464 98,397 (306,683) 1,031,178Share Class C 69,118 12,504 (15,649) 65,973Share Class I 5,070,250 30,992 (668,413) 4,432,829Share Class N 15,448,656 182,304 (1,468,193) 14,162,767Share Class Z 32,599,561 5,731,248 (7,778,786) 30,552,023
European Equity Alpha fund (EUR)
Share Class A 3,732,189 382,109 (2,243,789) 1,870,509Share Class AH (USD) 191,441 341,196 (99,213) 433,424Share Class AR 300 2,459 - 2,759Share Class B 1,211,838 441,776 (328,961) 1,324,653Share Class BR 1,288 18,439 (302) 19,425Share Class C 122,822 94,317 (40,094) 177,045Share Class CR 502 454 - 956Share Class I 1,615,283 204,350 (1,336,196) 483,437Share Class IH (USD) 11,356 1,385,215 (8,707) 1,387,864Share Class Z 18,247,012 3,979,192 (4,179,012) 18,047,192Share Class Z (GBP) 2,487,680 3,545 - 2,491,225
European Property fund (EUR)
Share Class A 4,394,381 2,328,938 (3,114,323) 3,608,996Share Class AH (USD)* - 331,132 (400) 330,732Share Class AX 378,979 126,238 (256,089) 249,128Share Class B 653,631 405,544 (330,194) 728,981Share Class I 2,160,424 532,649 (422,473) 2,270,600Share Class IH (USD)* - 153,673 (1,492) 152,181Share Class Z 1,984,208 630,765 (457,345) 2,157,628
* Share Class was launched during the period.
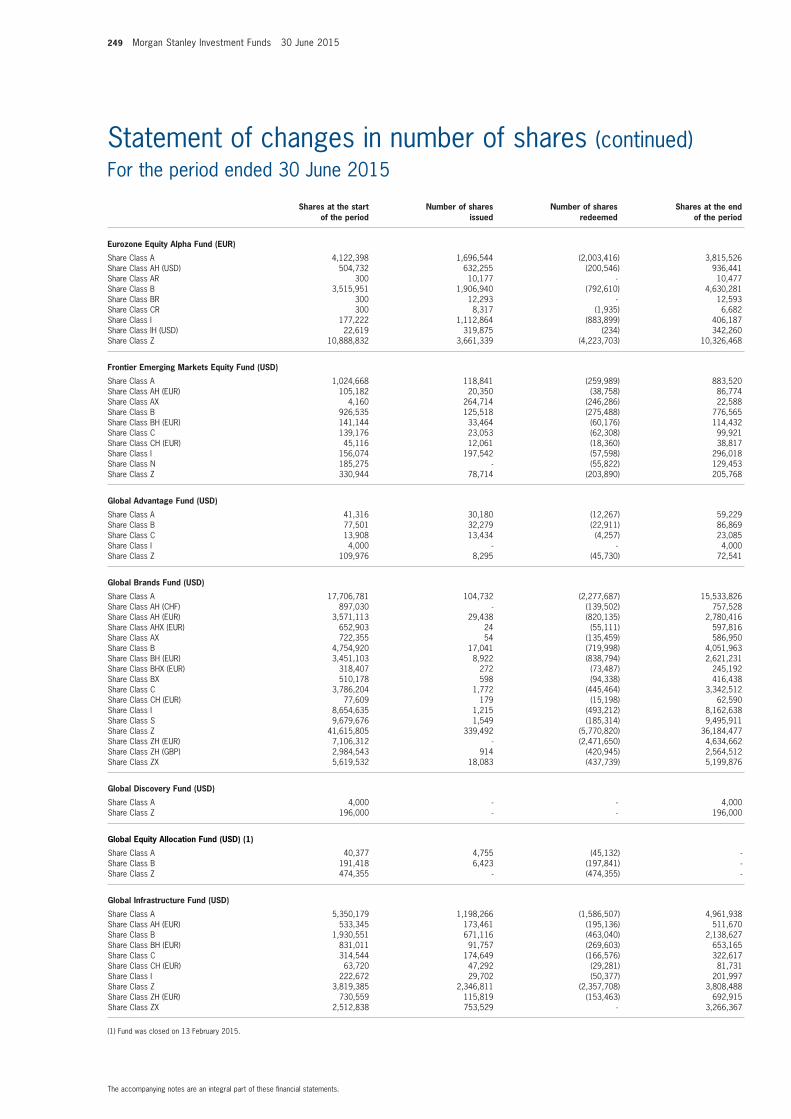
249 Morgan Stanley Investment Funds 30 June 2015
The accompanying notes are an integral part of these financial statements.
Statement of changes in number of shares (continued)For the period ended 30 June 2015
Shares at the start of the period
number of shares issued
number of shares redeemed
Shares at the end of the period
Eurozone Equity Alpha fund (EUR)
Share Class A 4,122,398 1,696,544 (2,003,416) 3,815,526Share Class AH (USD) 504,732 632,255 (200,546) 936,441Share Class AR 300 10,177 - 10,477Share Class B 3,515,951 1,906,940 (792,610) 4,630,281Share Class BR 300 12,293 - 12,593Share Class CR 300 8,317 (1,935) 6,682Share Class I 177,222 1,112,864 (883,899) 406,187Share Class IH (USD) 22,619 319,875 (234) 342,260Share Class Z 10,888,832 3,661,339 (4,223,703) 10,326,468
frontier Emerging markets Equity fund (USD)
Share Class A 1,024,668 118,841 (259,989) 883,520Share Class AH (EUR) 105,182 20,350 (38,758) 86,774Share Class AX 4,160 264,714 (246,286) 22,588Share Class B 926,535 125,518 (275,488) 776,565Share Class BH (EUR) 141,144 33,464 (60,176) 114,432Share Class C 139,176 23,053 (62,308) 99,921Share Class CH (EUR) 45,116 12,061 (18,360) 38,817Share Class I 156,074 197,542 (57,598) 296,018Share Class N 185,275 - (55,822) 129,453Share Class Z 330,944 78,714 (203,890) 205,768
Global Advantage fund (USD)
Share Class A 41,316 30,180 (12,267) 59,229Share Class B 77,501 32,279 (22,911) 86,869Share Class C 13,908 13,434 (4,257) 23,085Share Class I 4,000 - - 4,000Share Class Z 109,976 8,295 (45,730) 72,541
Global Brands fund (USD)
Share Class A 17,706,781 104,732 (2,277,687) 15,533,826Share Class AH (CHF) 897,030 - (139,502) 757,528Share Class AH (EUR) 3,571,113 29,438 (820,135) 2,780,416Share Class AHX (EUR) 652,903 24 (55,111) 597,816Share Class AX 722,355 54 (135,459) 586,950Share Class B 4,754,920 17,041 (719,998) 4,051,963Share Class BH (EUR) 3,451,103 8,922 (838,794) 2,621,231Share Class BHX (EUR) 318,407 272 (73,487) 245,192Share Class BX 510,178 598 (94,338) 416,438Share Class C 3,786,204 1,772 (445,464) 3,342,512Share Class CH (EUR) 77,609 179 (15,198) 62,590Share Class I 8,654,635 1,215 (493,212) 8,162,638Share Class S 9,679,676 1,549 (185,314) 9,495,911Share Class Z 41,615,805 339,492 (5,770,820) 36,184,477Share Class ZH (EUR) 7,106,312 - (2,471,650) 4,634,662Share Class ZH (GBP) 2,984,543 914 (420,945) 2,564,512Share Class ZX 5,619,532 18,083 (437,739) 5,199,876
Global Discovery fund (USD)
Share Class A 4,000 - - 4,000Share Class Z 196,000 - - 196,000
Global Equity Allocation fund (USD) (1)
Share Class A 40,377 4,755 (45,132) -Share Class B 191,418 6,423 (197,841) -Share Class Z 474,355 - (474,355) -
Global infrastructure fund (USD)
Share Class A 5,350,179 1,198,266 (1,586,507) 4,961,938Share Class AH (EUR) 533,345 173,461 (195,136) 511,670Share Class B 1,930,551 671,116 (463,040) 2,138,627Share Class BH (EUR) 831,011 91,757 (269,603) 653,165Share Class C 314,544 174,649 (166,576) 322,617Share Class CH (EUR) 63,720 47,292 (29,281) 81,731Share Class I 222,672 29,702 (50,377) 201,997Share Class Z 3,819,385 2,346,811 (2,357,708) 3,808,488Share Class ZH (EUR) 730,559 115,819 (153,463) 692,915Share Class ZX 2,512,838 753,529 - 3,266,367
(1) Fund was closed on 13 February 2015.
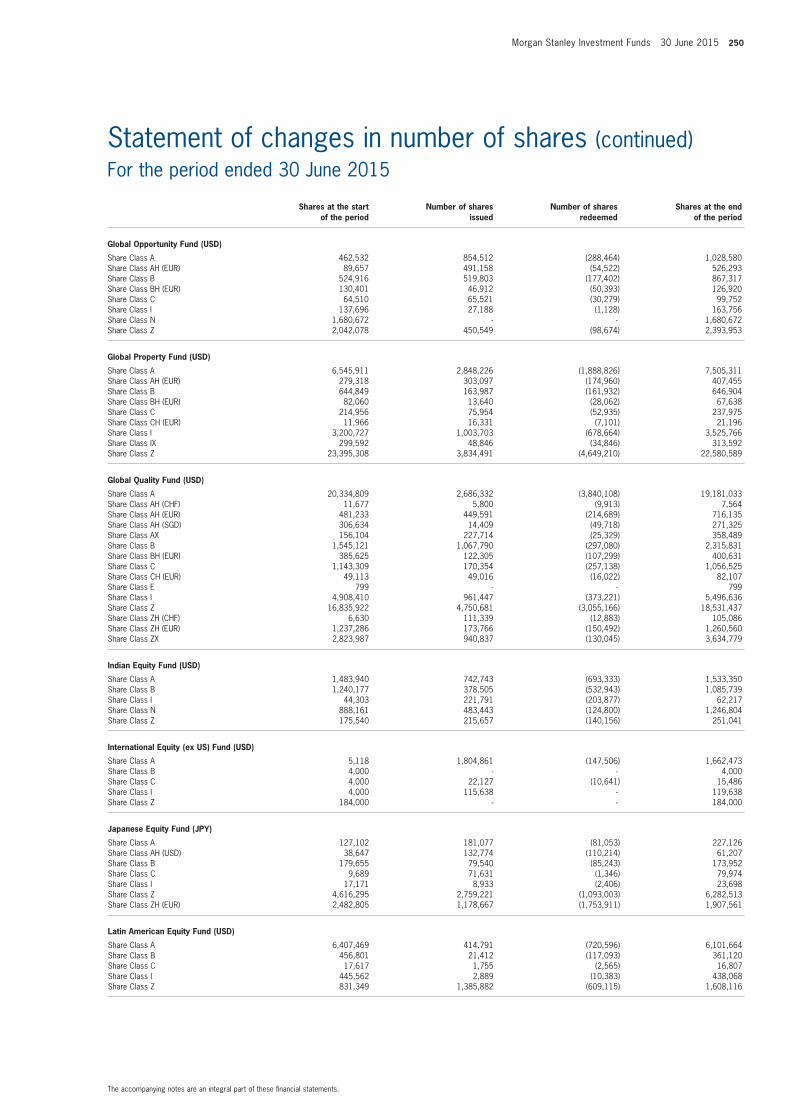
Morgan Stanley Investment Funds 30 June 2015 250
The accompanying notes are an integral part of these financial statements.
Statement of changes in number of shares (continued)For the period ended 30 June 2015
Shares at the start of the period
number of shares issued
number of shares redeemed
Shares at the end of the period
Global opportunity fund (USD)
Share Class A 462,532 854,512 (288,464) 1,028,580Share Class AH (EUR) 89,657 491,158 (54,522) 526,293Share Class B 524,916 519,803 (177,402) 867,317Share Class BH (EUR) 130,401 46,912 (50,393) 126,920Share Class C 64,510 65,521 (30,279) 99,752Share Class I 137,696 27,188 (1,128) 163,756Share Class N 1,680,672 - - 1,680,672Share Class Z 2,042,078 450,549 (98,674) 2,393,953
Global Property fund (USD)
Share Class A 6,545,911 2,848,226 (1,888,826) 7,505,311Share Class AH (EUR) 279,318 303,097 (174,960) 407,455Share Class B 644,849 163,987 (161,932) 646,904Share Class BH (EUR) 82,060 13,640 (28,062) 67,638Share Class C 214,956 75,954 (52,935) 237,975Share Class CH (EUR) 11,966 16,331 (7,101) 21,196Share Class I 3,200,727 1,003,703 (678,664) 3,525,766Share Class IX 299,592 48,846 (34,846) 313,592Share Class Z 23,395,308 3,834,491 (4,649,210) 22,580,589
Global Quality fund (USD)
Share Class A 20,334,809 2,686,332 (3,840,108) 19,181,033Share Class AH (CHF) 11,677 5,800 (9,913) 7,564Share Class AH (EUR) 481,233 449,591 (214,689) 716,135Share Class AH (SGD) 306,634 14,409 (49,718) 271,325Share Class AX 156,104 227,714 (25,329) 358,489Share Class B 1,545,121 1,067,790 (297,080) 2,315,831Share Class BH (EUR) 385,625 122,305 (107,299) 400,631Share Class C 1,143,309 170,354 (257,138) 1,056,525Share Class CH (EUR) 49,113 49,016 (16,022) 82,107Share Class E 799 - - 799Share Class I 4,908,410 961,447 (373,221) 5,496,636Share Class Z 16,835,922 4,750,681 (3,055,166) 18,531,437Share Class ZH (CHF) 6,630 111,339 (12,883) 105,086Share Class ZH (EUR) 1,237,286 173,766 (150,492) 1,260,560Share Class ZX 2,823,987 940,837 (130,045) 3,634,779
indian Equity fund (USD)
Share Class A 1,483,940 742,743 (693,333) 1,533,350Share Class B 1,240,177 378,505 (532,943) 1,085,739Share Class I 44,303 221,791 (203,877) 62,217Share Class N 888,161 483,443 (124,800) 1,246,804Share Class Z 175,540 215,657 (140,156) 251,041
international Equity (ex US) fund (USD)
Share Class A 5,118 1,804,861 (147,506) 1,662,473Share Class B 4,000 - - 4,000Share Class C 4,000 22,127 (10,641) 15,486Share Class I 4,000 115,638 - 119,638Share Class Z 184,000 - - 184,000
Japanese Equity fund (JPY)
Share Class A 127,102 181,077 (81,053) 227,126Share Class AH (USD) 38,647 132,774 (110,214) 61,207Share Class B 179,655 79,540 (85,243) 173,952Share Class C 9,689 71,631 (1,346) 79,974Share Class I 17,171 8,933 (2,406) 23,698Share Class Z 4,616,295 2,759,221 (1,093,003) 6,282,513Share Class ZH (EUR) 2,482,805 1,178,667 (1,753,911) 1,907,561
Latin American Equity fund (USD)
Share Class A 6,407,469 414,791 (720,596) 6,101,664Share Class B 456,801 21,412 (117,093) 361,120Share Class C 17,617 1,755 (2,565) 16,807Share Class I 445,562 2,889 (10,383) 438,068Share Class Z 831,349 1,385,882 (609,115) 1,608,116
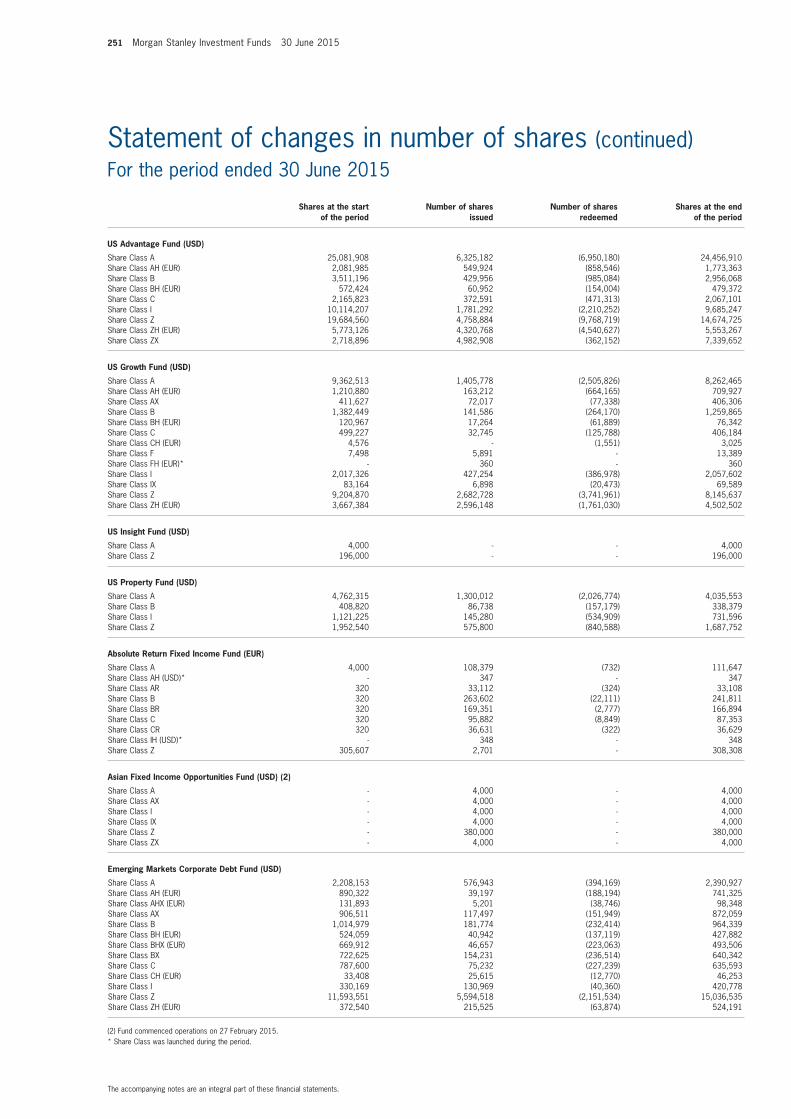
251 Morgan Stanley Investment Funds 30 June 2015
The accompanying notes are an integral part of these financial statements.
Statement of changes in number of shares (continued)For the period ended 30 June 2015
Shares at the start of the period
number of shares issued
number of shares redeemed
Shares at the end of the period
US Advantage fund (USD)
Share Class A 25,081,908 6,325,182 (6,950,180) 24,456,910Share Class AH (EUR) 2,081,985 549,924 (858,546) 1,773,363Share Class B 3,511,196 429,956 (985,084) 2,956,068Share Class BH (EUR) 572,424 60,952 (154,004) 479,372Share Class C 2,165,823 372,591 (471,313) 2,067,101Share Class I 10,114,207 1,781,292 (2,210,252) 9,685,247Share Class Z 19,684,560 4,758,884 (9,768,719) 14,674,725Share Class ZH (EUR) 5,773,126 4,320,768 (4,540,627) 5,553,267Share Class ZX 2,718,896 4,982,908 (362,152) 7,339,652
US Growth fund (USD)
Share Class A 9,362,513 1,405,778 (2,505,826) 8,262,465Share Class AH (EUR) 1,210,880 163,212 (664,165) 709,927Share Class AX 411,627 72,017 (77,338) 406,306Share Class B 1,382,449 141,586 (264,170) 1,259,865Share Class BH (EUR) 120,967 17,264 (61,889) 76,342Share Class C 499,227 32,745 (125,788) 406,184Share Class CH (EUR) 4,576 - (1,551) 3,025Share Class F 7,498 5,891 - 13,389Share Class FH (EUR)* - 360 - 360Share Class I 2,017,326 427,254 (386,978) 2,057,602Share Class IX 83,164 6,898 (20,473) 69,589Share Class Z 9,204,870 2,682,728 (3,741,961) 8,145,637Share Class ZH (EUR) 3,667,384 2,596,148 (1,761,030) 4,502,502
US insight fund (USD)
Share Class A 4,000 - - 4,000Share Class Z 196,000 - - 196,000
US Property fund (USD)
Share Class A 4,762,315 1,300,012 (2,026,774) 4,035,553Share Class B 408,820 86,738 (157,179) 338,379Share Class I 1,121,225 145,280 (534,909) 731,596Share Class Z 1,952,540 575,800 (840,588) 1,687,752
Absolute Return fixed income fund (EUR)
Share Class A 4,000 108,379 (732) 111,647Share Class AH (USD)* - 347 - 347Share Class AR 320 33,112 (324) 33,108Share Class B 320 263,602 (22,111) 241,811Share Class BR 320 169,351 (2,777) 166,894Share Class C 320 95,882 (8,849) 87,353Share Class CR 320 36,631 (322) 36,629Share Class IH (USD)* - 348 - 348Share Class Z 305,607 2,701 - 308,308
Asian fixed income opportunities fund (USD) (2)
Share Class A - 4,000 - 4,000Share Class AX - 4,000 - 4,000Share Class I - 4,000 - 4,000Share Class IX - 4,000 - 4,000Share Class Z - 380,000 - 380,000Share Class ZX - 4,000 - 4,000
Emerging markets Corporate Debt fund (USD)
Share Class A 2,208,153 576,943 (394,169) 2,390,927Share Class AH (EUR) 890,322 39,197 (188,194) 741,325Share Class AHX (EUR) 131,893 5,201 (38,746) 98,348Share Class AX 906,511 117,497 (151,949) 872,059Share Class B 1,014,979 181,774 (232,414) 964,339Share Class BH (EUR) 524,059 40,942 (137,119) 427,882Share Class BHX (EUR) 669,912 46,657 (223,063) 493,506Share Class BX 722,625 154,231 (236,514) 640,342Share Class C 787,600 75,232 (227,239) 635,593Share Class CH (EUR) 33,408 25,615 (12,770) 46,253Share Class I 330,169 130,969 (40,360) 420,778Share Class Z 11,593,551 5,594,518 (2,151,534) 15,036,535Share Class ZH (EUR) 372,540 215,525 (63,874) 524,191
(2) Fund commenced operations on 27 February 2015.* Share Class was launched during the period.
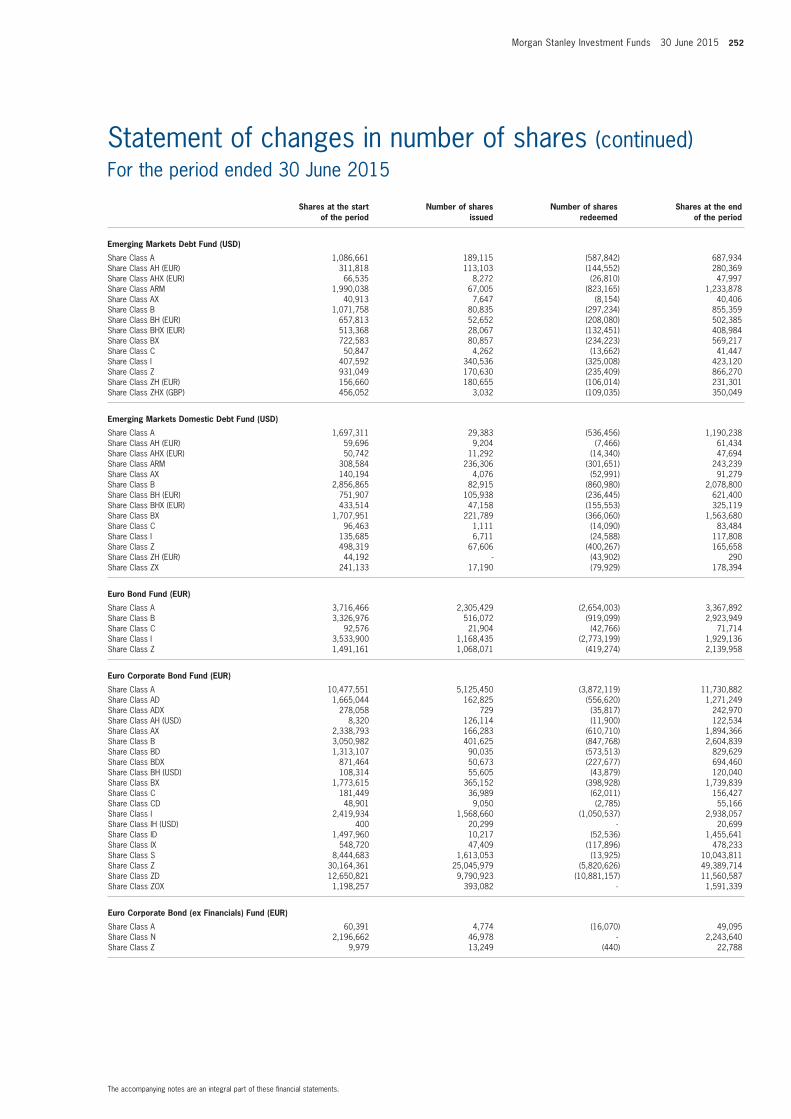
Morgan Stanley Investment Funds 30 June 2015 252
The accompanying notes are an integral part of these financial statements.
Statement of changes in number of shares (continued)For the period ended 30 June 2015
Shares at the start of the period
number of shares issued
number of shares redeemed
Shares at the end of the period
Emerging markets Debt fund (USD)
Share Class A 1,086,661 189,115 (587,842) 687,934Share Class AH (EUR) 311,818 113,103 (144,552) 280,369Share Class AHX (EUR) 66,535 8,272 (26,810) 47,997Share Class ARM 1,990,038 67,005 (823,165) 1,233,878Share Class AX 40,913 7,647 (8,154) 40,406Share Class B 1,071,758 80,835 (297,234) 855,359Share Class BH (EUR) 657,813 52,652 (208,080) 502,385Share Class BHX (EUR) 513,368 28,067 (132,451) 408,984Share Class BX 722,583 80,857 (234,223) 569,217Share Class C 50,847 4,262 (13,662) 41,447Share Class I 407,592 340,536 (325,008) 423,120Share Class Z 931,049 170,630 (235,409) 866,270Share Class ZH (EUR) 156,660 180,655 (106,014) 231,301Share Class ZHX (GBP) 456,052 3,032 (109,035) 350,049
Emerging markets Domestic Debt fund (USD)
Share Class A 1,697,311 29,383 (536,456) 1,190,238Share Class AH (EUR) 59,696 9,204 (7,466) 61,434Share Class AHX (EUR) 50,742 11,292 (14,340) 47,694Share Class ARM 308,584 236,306 (301,651) 243,239Share Class AX 140,194 4,076 (52,991) 91,279Share Class B 2,856,865 82,915 (860,980) 2,078,800Share Class BH (EUR) 751,907 105,938 (236,445) 621,400Share Class BHX (EUR) 433,514 47,158 (155,553) 325,119Share Class BX 1,707,951 221,789 (366,060) 1,563,680Share Class C 96,463 1,111 (14,090) 83,484Share Class I 135,685 6,711 (24,588) 117,808Share Class Z 498,319 67,606 (400,267) 165,658Share Class ZH (EUR) 44,192 - (43,902) 290Share Class ZX 241,133 17,190 (79,929) 178,394
Euro Bond fund (EUR)
Share Class A 3,716,466 2,305,429 (2,654,003) 3,367,892Share Class B 3,326,976 516,072 (919,099) 2,923,949Share Class C 92,576 21,904 (42,766) 71,714Share Class I 3,533,900 1,168,435 (2,773,199) 1,929,136Share Class Z 1,491,161 1,068,071 (419,274) 2,139,958
Euro Corporate Bond fund (EUR)
Share Class A 10,477,551 5,125,450 (3,872,119) 11,730,882Share Class AD 1,665,044 162,825 (556,620) 1,271,249Share Class ADX 278,058 729 (35,817) 242,970Share Class AH (USD) 8,320 126,114 (11,900) 122,534Share Class AX 2,338,793 166,283 (610,710) 1,894,366Share Class B 3,050,982 401,625 (847,768) 2,604,839Share Class BD 1,313,107 90,035 (573,513) 829,629Share Class BDX 871,464 50,673 (227,677) 694,460Share Class BH (USD) 108,314 55,605 (43,879) 120,040Share Class BX 1,773,615 365,152 (398,928) 1,739,839Share Class C 181,449 36,989 (62,011) 156,427Share Class CD 48,901 9,050 (2,785) 55,166Share Class I 2,419,934 1,568,660 (1,050,537) 2,938,057Share Class IH (USD) 400 20,299 - 20,699Share Class ID 1,497,960 10,217 (52,536) 1,455,641Share Class IX 548,720 47,409 (117,896) 478,233Share Class S 8,444,683 1,613,053 (13,925) 10,043,811Share Class Z 30,164,361 25,045,979 (5,820,626) 49,389,714Share Class ZD 12,650,821 9,790,923 (10,881,157) 11,560,587Share Class ZOX 1,198,257 393,082 - 1,591,339
Euro Corporate Bond (ex financials) fund (EUR)
Share Class A 60,391 4,774 (16,070) 49,095Share Class N 2,196,662 46,978 - 2,243,640Share Class Z 9,979 13,249 (440) 22,788
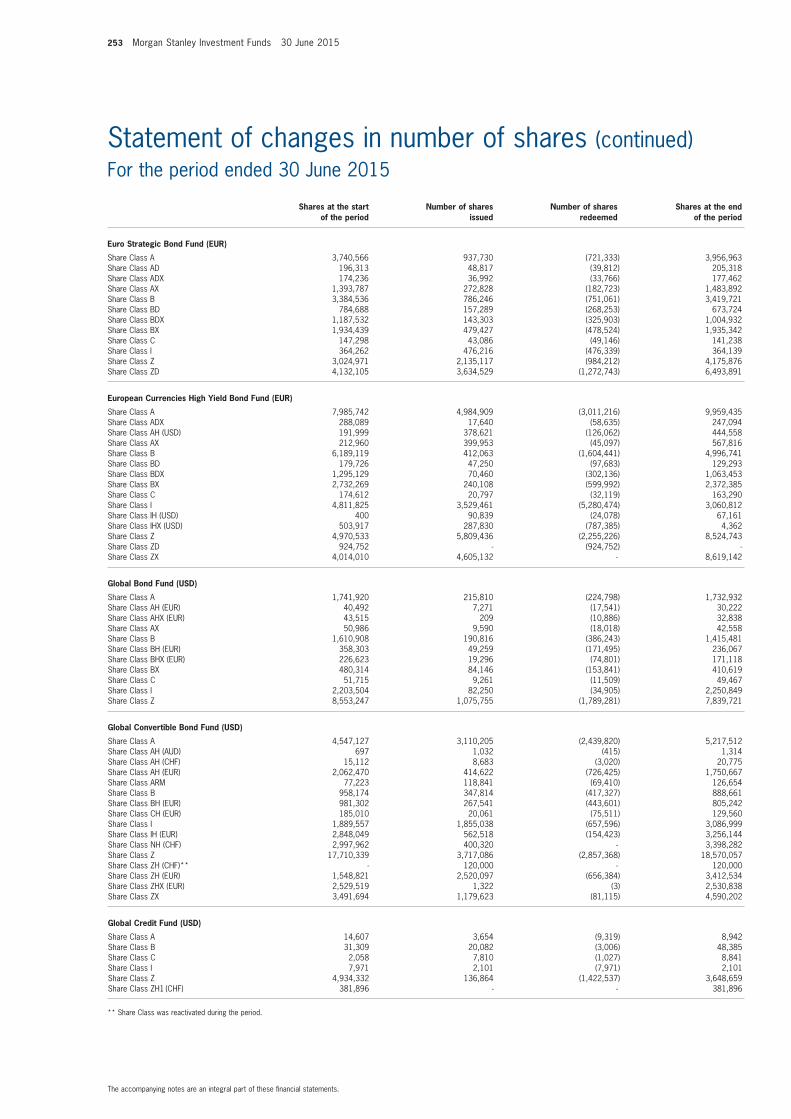
253 Morgan Stanley Investment Funds 30 June 2015
The accompanying notes are an integral part of these financial statements.
Statement of changes in number of shares (continued)For the period ended 30 June 2015
Shares at the start of the period
number of shares issued
number of shares redeemed
Shares at the end of the period
Euro Strategic Bond fund (EUR)
Share Class A 3,740,566 937,730 (721,333) 3,956,963Share Class AD 196,313 48,817 (39,812) 205,318Share Class ADX 174,236 36,992 (33,766) 177,462Share Class AX 1,393,787 272,828 (182,723) 1,483,892Share Class B 3,384,536 786,246 (751,061) 3,419,721Share Class BD 784,688 157,289 (268,253) 673,724Share Class BDX 1,187,532 143,303 (325,903) 1,004,932Share Class BX 1,934,439 479,427 (478,524) 1,935,342Share Class C 147,298 43,086 (49,146) 141,238Share Class I 364,262 476,216 (476,339) 364,139Share Class Z 3,024,971 2,135,117 (984,212) 4,175,876Share Class ZD 4,132,105 3,634,529 (1,272,743) 6,493,891
European Currencies High Yield Bond fund (EUR)
Share Class A 7,985,742 4,984,909 (3,011,216) 9,959,435Share Class ADX 288,089 17,640 (58,635) 247,094Share Class AH (USD) 191,999 378,621 (126,062) 444,558Share Class AX 212,960 399,953 (45,097) 567,816Share Class B 6,189,119 412,063 (1,604,441) 4,996,741Share Class BD 179,726 47,250 (97,683) 129,293Share Class BDX 1,295,129 70,460 (302,136) 1,063,453Share Class BX 2,732,269 240,108 (599,992) 2,372,385Share Class C 174,612 20,797 (32,119) 163,290Share Class I 4,811,825 3,529,461 (5,280,474) 3,060,812Share Class IH (USD) 400 90,839 (24,078) 67,161Share Class IHX (USD) 503,917 287,830 (787,385) 4,362Share Class Z 4,970,533 5,809,436 (2,255,226) 8,524,743Share Class ZD 924,752 - (924,752) -Share Class ZX 4,014,010 4,605,132 - 8,619,142
Global Bond fund (USD)
Share Class A 1,741,920 215,810 (224,798) 1,732,932Share Class AH (EUR) 40,492 7,271 (17,541) 30,222Share Class AHX (EUR) 43,515 209 (10,886) 32,838Share Class AX 50,986 9,590 (18,018) 42,558Share Class B 1,610,908 190,816 (386,243) 1,415,481Share Class BH (EUR) 358,303 49,259 (171,495) 236,067Share Class BHX (EUR) 226,623 19,296 (74,801) 171,118Share Class BX 480,314 84,146 (153,841) 410,619Share Class C 51,715 9,261 (11,509) 49,467Share Class I 2,203,504 82,250 (34,905) 2,250,849Share Class Z 8,553,247 1,075,755 (1,789,281) 7,839,721
Global Convertible Bond fund (USD)
Share Class A 4,547,127 3,110,205 (2,439,820) 5,217,512Share Class AH (AUD) 697 1,032 (415) 1,314Share Class AH (CHF) 15,112 8,683 (3,020) 20,775Share Class AH (EUR) 2,062,470 414,622 (726,425) 1,750,667Share Class ARM 77,223 118,841 (69,410) 126,654Share Class B 958,174 347,814 (417,327) 888,661Share Class BH (EUR) 981,302 267,541 (443,601) 805,242Share Class CH (EUR) 185,010 20,061 (75,511) 129,560Share Class I 1,889,557 1,855,038 (657,596) 3,086,999Share Class IH (EUR) 2,848,049 562,518 (154,423) 3,256,144Share Class NH (CHF) 2,997,962 400,320 - 3,398,282Share Class Z 17,710,339 3,717,086 (2,857,368) 18,570,057Share Class ZH (CHF)** - 120,000 - 120,000Share Class ZH (EUR) 1,548,821 2,520,097 (656,384) 3,412,534Share Class ZHX (EUR) 2,529,519 1,322 (3) 2,530,838Share Class ZX 3,491,694 1,179,623 (81,115) 4,590,202
Global Credit fund (USD)
Share Class A 14,607 3,654 (9,319) 8,942Share Class B 31,309 20,082 (3,006) 48,385Share Class C 2,058 7,810 (1,027) 8,841Share Class I 7,971 2,101 (7,971) 2,101Share Class Z 4,934,332 136,864 (1,422,537) 3,648,659Share Class ZH1 (CHF) 381,896 - - 381,896
** Share Class was reactivated during the period.
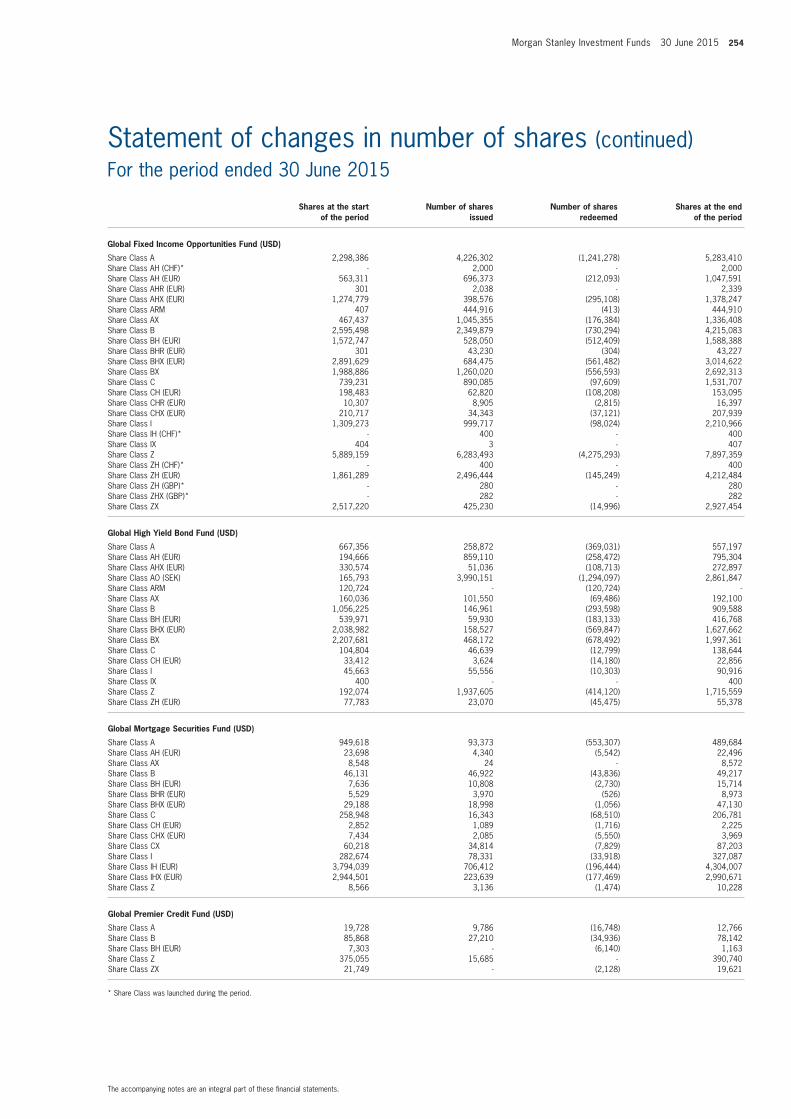
Morgan Stanley Investment Funds 30 June 2015 254
The accompanying notes are an integral part of these financial statements.
Statement of changes in number of shares (continued)For the period ended 30 June 2015
Shares at the start of the period
number of shares issued
number of shares redeemed
Shares at the end of the period
Global fixed income opportunities fund (USD)
Share Class A 2,298,386 4,226,302 (1,241,278) 5,283,410Share Class AH (CHF)* - 2,000 - 2,000Share Class AH (EUR) 563,311 696,373 (212,093) 1,047,591Share Class AHR (EUR) 301 2,038 - 2,339Share Class AHX (EUR) 1,274,779 398,576 (295,108) 1,378,247Share Class ARM 407 444,916 (413) 444,910Share Class AX 467,437 1,045,355 (176,384) 1,336,408Share Class B 2,595,498 2,349,879 (730,294) 4,215,083Share Class BH (EUR) 1,572,747 528,050 (512,409) 1,588,388Share Class BHR (EUR) 301 43,230 (304) 43,227Share Class BHX (EUR) 2,891,629 684,475 (561,482) 3,014,622Share Class BX 1,988,886 1,260,020 (556,593) 2,692,313Share Class C 739,231 890,085 (97,609) 1,531,707Share Class CH (EUR) 198,483 62,820 (108,208) 153,095Share Class CHR (EUR) 10,307 8,905 (2,815) 16,397Share Class CHX (EUR) 210,717 34,343 (37,121) 207,939Share Class I 1,309,273 999,717 (98,024) 2,210,966Share Class IH (CHF)* - 400 - 400Share Class IX 404 3 - 407Share Class Z 5,889,159 6,283,493 (4,275,293) 7,897,359Share Class ZH (CHF)* - 400 - 400Share Class ZH (EUR) 1,861,289 2,496,444 (145,249) 4,212,484Share Class ZH (GBP)* - 280 - 280Share Class ZHX (GBP)* - 282 - 282Share Class ZX 2,517,220 425,230 (14,996) 2,927,454
Global High Yield Bond fund (USD)
Share Class A 667,356 258,872 (369,031) 557,197Share Class AH (EUR) 194,666 859,110 (258,472) 795,304Share Class AHX (EUR) 330,574 51,036 (108,713) 272,897Share Class AO (SEK) 165,793 3,990,151 (1,294,097) 2,861,847Share Class ARM 120,724 - (120,724) -Share Class AX 160,036 101,550 (69,486) 192,100Share Class B 1,056,225 146,961 (293,598) 909,588Share Class BH (EUR) 539,971 59,930 (183,133) 416,768Share Class BHX (EUR) 2,038,982 158,527 (569,847) 1,627,662Share Class BX 2,207,681 468,172 (678,492) 1,997,361Share Class C 104,804 46,639 (12,799) 138,644Share Class CH (EUR) 33,412 3,624 (14,180) 22,856Share Class I 45,663 55,556 (10,303) 90,916Share Class IX 400 - - 400Share Class Z 192,074 1,937,605 (414,120) 1,715,559Share Class ZH (EUR) 77,783 23,070 (45,475) 55,378
Global mortgage Securities fund (USD)
Share Class A 949,618 93,373 (553,307) 489,684Share Class AH (EUR) 23,698 4,340 (5,542) 22,496Share Class AX 8,548 24 - 8,572Share Class B 46,131 46,922 (43,836) 49,217Share Class BH (EUR) 7,636 10,808 (2,730) 15,714Share Class BHR (EUR) 5,529 3,970 (526) 8,973Share Class BHX (EUR) 29,188 18,998 (1,056) 47,130Share Class C 258,948 16,343 (68,510) 206,781Share Class CH (EUR) 2,852 1,089 (1,716) 2,225Share Class CHX (EUR) 7,434 2,085 (5,550) 3,969Share Class CX 60,218 34,814 (7,829) 87,203Share Class I 282,674 78,331 (33,918) 327,087Share Class IH (EUR) 3,794,039 706,412 (196,444) 4,304,007Share Class IHX (EUR) 2,944,501 223,639 (177,469) 2,990,671Share Class Z 8,566 3,136 (1,474) 10,228
Global Premier Credit fund (USD)
Share Class A 19,728 9,786 (16,748) 12,766Share Class B 85,868 27,210 (34,936) 78,142Share Class BH (EUR) 7,303 - (6,140) 1,163Share Class Z 375,055 15,685 - 390,740Share Class ZX 21,749 - (2,128) 19,621
* Share Class was launched during the period.
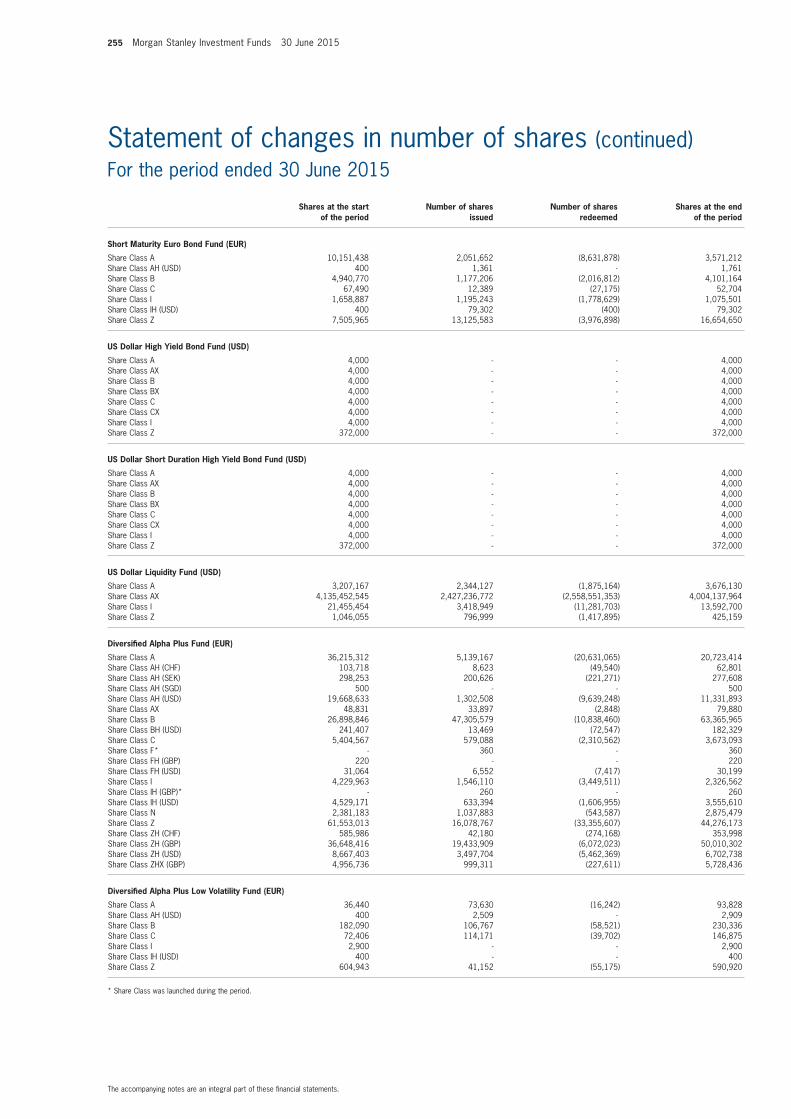
255 Morgan Stanley Investment Funds 30 June 2015
The accompanying notes are an integral part of these financial statements.
Statement of changes in number of shares (continued)For the period ended 30 June 2015
Shares at the start of the period
number of shares issued
number of shares redeemed
Shares at the end of the period
Short maturity Euro Bond fund (EUR)
Share Class A 10,151,438 2,051,652 (8,631,878) 3,571,212Share Class AH (USD) 400 1,361 - 1,761Share Class B 4,940,770 1,177,206 (2,016,812) 4,101,164Share Class C 67,490 12,389 (27,175) 52,704Share Class I 1,658,887 1,195,243 (1,778,629) 1,075,501Share Class IH (USD) 400 79,302 (400) 79,302Share Class Z 7,505,965 13,125,583 (3,976,898) 16,654,650
US Dollar High Yield Bond fund (USD)
Share Class A 4,000 - - 4,000Share Class AX 4,000 - - 4,000Share Class B 4,000 - - 4,000Share Class BX 4,000 - - 4,000Share Class C 4,000 - - 4,000Share Class CX 4,000 - - 4,000Share Class I 4,000 - - 4,000Share Class Z 372,000 - - 372,000
US Dollar Short Duration High Yield Bond fund (USD)
Share Class A 4,000 - - 4,000Share Class AX 4,000 - - 4,000Share Class B 4,000 - - 4,000Share Class BX 4,000 - - 4,000Share Class C 4,000 - - 4,000Share Class CX 4,000 - - 4,000Share Class I 4,000 - - 4,000Share Class Z 372,000 - - 372,000
US Dollar Liquidity fund (USD)
Share Class A 3,207,167 2,344,127 (1,875,164) 3,676,130Share Class AX 4,135,452,545 2,427,236,772 (2,558,551,353) 4,004,137,964Share Class I 21,455,454 3,418,949 (11,281,703) 13,592,700Share Class Z 1,046,055 796,999 (1,417,895) 425,159
Diversified Alpha Plus fund (EUR)
Share Class A 36,215,312 5,139,167 (20,631,065) 20,723,414Share Class AH (CHF) 103,718 8,623 (49,540) 62,801Share Class AH (SEK) 298,253 200,626 (221,271) 277,608Share Class AH (SGD) 500 - - 500Share Class AH (USD) 19,668,633 1,302,508 (9,639,248) 11,331,893Share Class AX 48,831 33,897 (2,848) 79,880Share Class B 26,898,846 47,305,579 (10,838,460) 63,365,965Share Class BH (USD) 241,407 13,469 (72,547) 182,329Share Class C 5,404,567 579,088 (2,310,562) 3,673,093Share Class F* - 360 - 360Share Class FH (GBP) 220 - - 220Share Class FH (USD) 31,064 6,552 (7,417) 30,199Share Class I 4,229,963 1,546,110 (3,449,511) 2,326,562Share Class IH (GBP)* - 260 - 260Share Class IH (USD) 4,529,171 633,394 (1,606,955) 3,555,610Share Class N 2,381,183 1,037,883 (543,587) 2,875,479Share Class Z 61,553,013 16,078,767 (33,355,607) 44,276,173Share Class ZH (CHF) 585,986 42,180 (274,168) 353,998Share Class ZH (GBP) 36,648,416 19,433,909 (6,072,023) 50,010,302Share Class ZH (USD) 8,667,403 3,497,704 (5,462,369) 6,702,738Share Class ZHX (GBP) 4,956,736 999,311 (227,611) 5,728,436
Diversified Alpha Plus Low volatility fund (EUR)
Share Class A 36,440 73,630 (16,242) 93,828Share Class AH (USD) 400 2,509 - 2,909Share Class B 182,090 106,767 (58,521) 230,336Share Class C 72,406 114,171 (39,702) 146,875Share Class I 2,900 - - 2,900Share Class IH (USD) 400 - - 400Share Class Z 604,943 41,152 (55,175) 590,920
* Share Class was launched during the period.
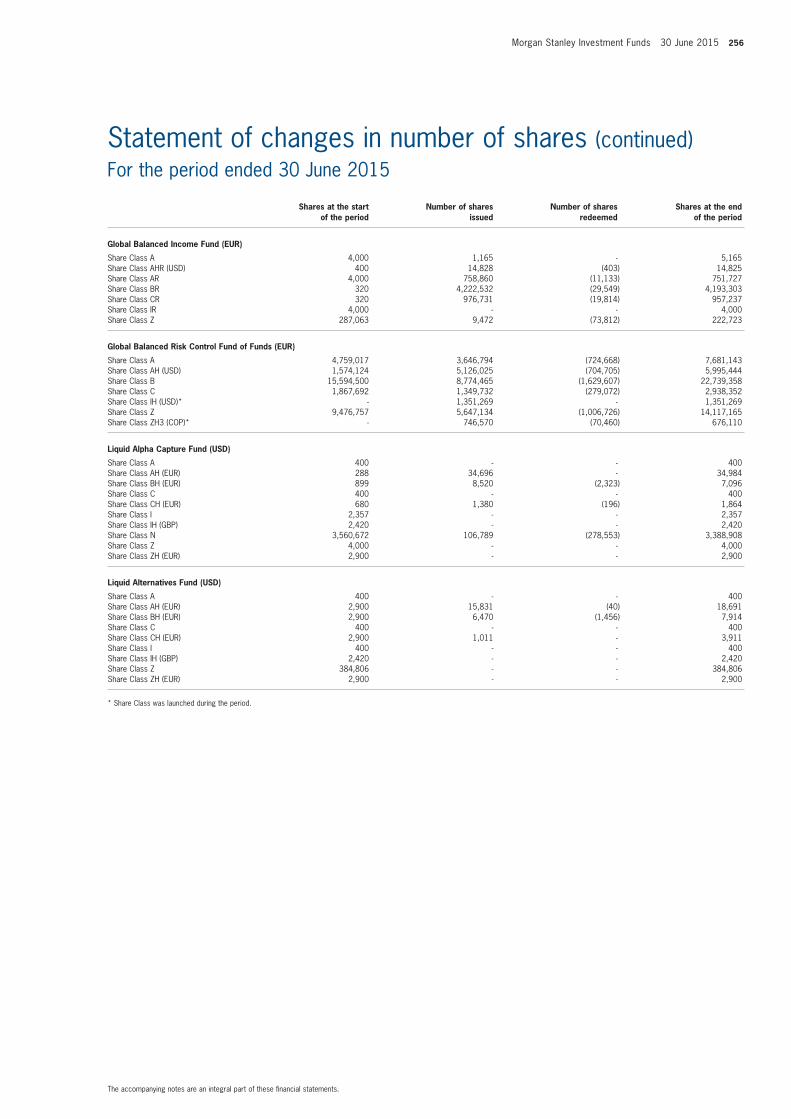
Morgan Stanley Investment Funds 30 June 2015 256
The accompanying notes are an integral part of these financial statements.
Statement of changes in number of shares (continued)For the period ended 30 June 2015
Shares at the start of the period
number of shares issued
number of shares redeemed
Shares at the end of the period
Global Balanced income fund (EUR)
Share Class A 4,000 1,165 - 5,165Share Class AHR (USD) 400 14,828 (403) 14,825Share Class AR 4,000 758,860 (11,133) 751,727Share Class BR 320 4,222,532 (29,549) 4,193,303Share Class CR 320 976,731 (19,814) 957,237Share Class IR 4,000 - - 4,000Share Class Z 287,063 9,472 (73,812) 222,723
Global Balanced Risk Control fund of funds (EUR)
Share Class A 4,759,017 3,646,794 (724,668) 7,681,143Share Class AH (USD) 1,574,124 5,126,025 (704,705) 5,995,444Share Class B 15,594,500 8,774,465 (1,629,607) 22,739,358Share Class C 1,867,692 1,349,732 (279,072) 2,938,352Share Class IH (USD)* - 1,351,269 - 1,351,269Share Class Z 9,476,757 5,647,134 (1,006,726) 14,117,165Share Class ZH3 (COP)* - 746,570 (70,460) 676,110
Liquid Alpha Capture fund (USD)
Share Class A 400 - - 400Share Class AH (EUR) 288 34,696 - 34,984Share Class BH (EUR) 899 8,520 (2,323) 7,096Share Class C 400 - - 400Share Class CH (EUR) 680 1,380 (196) 1,864Share Class I 2,357 - - 2,357Share Class IH (GBP) 2,420 - - 2,420Share Class N 3,560,672 106,789 (278,553) 3,388,908Share Class Z 4,000 - - 4,000Share Class ZH (EUR) 2,900 - - 2,900
Liquid Alternatives fund (USD)
Share Class A 400 - - 400Share Class AH (EUR) 2,900 15,831 (40) 18,691Share Class BH (EUR) 2,900 6,470 (1,456) 7,914Share Class C 400 - - 400Share Class CH (EUR) 2,900 1,011 - 3,911Share Class I 400 - - 400Share Class IH (GBP) 2,420 - - 2,420Share Class Z 384,806 - - 384,806Share Class ZH (EUR) 2,900 - - 2,900
* Share Class was launched during the period.
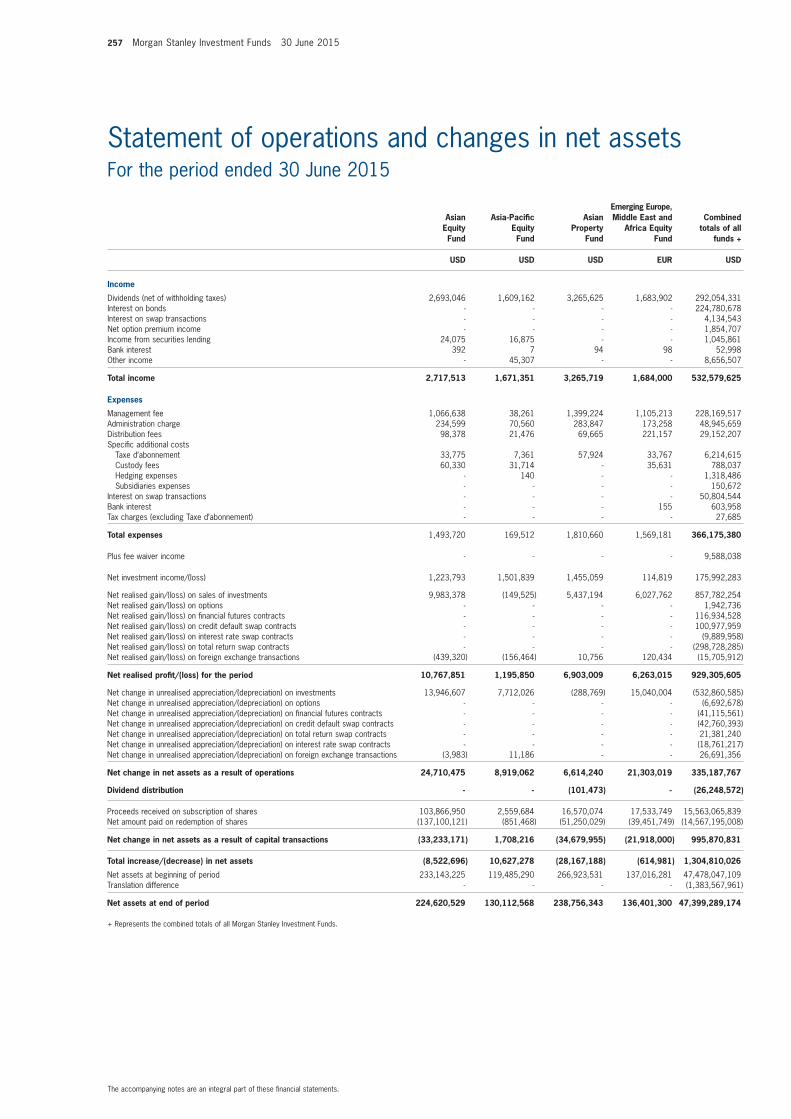
257 Morgan Stanley Investment Funds 30 June 2015
The accompanying notes are an integral part of these financial statements.
Statement of operations and changes in net assetsFor the period ended 30 June 2015
Asian Equity fund
Asia-Pacific Equity fund
Asian Property
fund
Emerging Europe, middle East and
Africa Equity fund
Combined totals of all
funds +
USD USD USD EUR USD
income
Dividends (net of withholding taxes) 2,693,046 1,609,162 3,265,625 1,683,902 292,054,331Interest on bonds - - - - 224,780,678Interest on swap transactions - - - - 4,134,543Net option premium income - - - - 1,854,707Income from securities lending 24,075 16,875 - - 1,045,861Bank interest 392 7 94 98 52,998Other income - 45,307 - - 8,656,507
total income 2,717,513 1,671,351 3,265,719 1,684,000 532,579,625
Expenses
Management fee 1,066,638 38,261 1,399,224 1,105,213 228,169,517Administration charge 234,599 70,560 283,847 173,258 48,945,659Distribution fees 98,378 21,476 69,665 221,157 29,152,207Specific additional costs Taxe d’abonnement 33,775 7,361 57,924 33,767 6,214,615 Custody fees 60,330 31,714 - 35,631 788,037 Hedging expenses - 140 - - 1,318,486 Subsidiaries expenses - - - - 150,672Interest on swap transactions - - - - 50,804,544Bank interest - - - 155 603,958Tax charges (excluding Taxe d’abonnement) - - - - 27,685
total expenses 1,493,720 169,512 1,810,660 1,569,181 366,175,380
Plus fee waiver income - - - - 9,588,038
Net investment income/(loss) 1,223,793 1,501,839 1,455,059 114,819 175,992,283
Net realised gain/(loss) on sales of investments 9,983,378 (149,525) 5,437,194 6,027,762 857,782,254Net realised gain/(loss) on options - - - - 1,942,736Net realised gain/(loss) on financial futures contracts - - - - 116,934,528Net realised gain/(loss) on credit default swap contracts - - - - 100,977,959Net realised gain/(loss) on interest rate swap contracts - - - - (9,889,958)Net realised gain/(loss) on total return swap contracts - - - - (298,728,285)Net realised gain/(loss) on foreign exchange transactions (439,320) (156,464) 10,756 120,434 (15,705,912)
net realised profit/(loss) for the period 10,767,851 1,195,850 6,903,009 6,263,015 929,305,605
Net change in unrealised appreciation/(depreciation) on investments 13,946,607 7,712,026 (288,769) 15,040,004 (532,860,585)Net change in unrealised appreciation/(depreciation) on options - - - - (6,692,678)Net change in unrealised appreciation/(depreciation) on financial futures contracts - - - - (41,115,561)Net change in unrealised appreciation/(depreciation) on credit default swap contracts - - - - (42,760,393)Net change in unrealised appreciation/(depreciation) on total return swap contracts - - - - 21,381,240Net change in unrealised appreciation/(depreciation) on interest rate swap contracts - - - - (18,761,217)Net change in unrealised appreciation/(depreciation) on foreign exchange transactions (3,983) 11,186 - - 26,691,356
net change in net assets as a result of operations 24,710,475 8,919,062 6,614,240 21,303,019 335,187,767
Dividend distribution - - (101,473) - (26,248,572)
Proceeds received on subscription of shares 103,866,950 2,559,684 16,570,074 17,533,749 15,563,065,839Net amount paid on redemption of shares (137,100,121) (851,468) (51,250,029) (39,451,749) (14,567,195,008)
net change in net assets as a result of capital transactions (33,233,171) 1,708,216 (34,679,955) (21,918,000) 995,870,831
total increase/(decrease) in net assets (8,522,696) 10,627,278 (28,167,188) (614,981) 1,304,810,026
Net assets at beginning of period 233,143,225 119,485,290 266,923,531 137,016,281 47,478,047,109Translation difference - - - - (1,383,567,961)
net assets at end of period 224,620,529 130,112,568 238,756,343 136,401,300 47,399,289,174
+ Represents the combined totals of all Morgan Stanley Investment Funds.
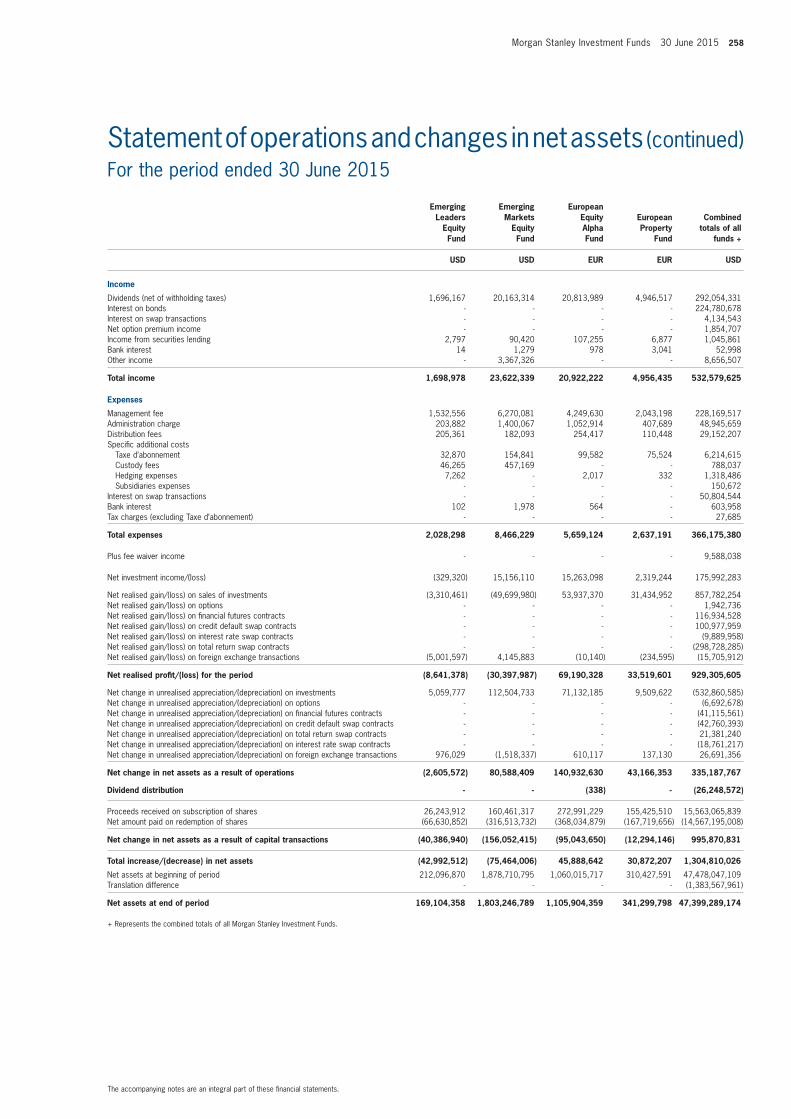
Morgan Stanley Investment Funds 30 June 2015 258
The accompanying notes are an integral part of these financial statements.
Statement of operations and changes in net assets (continued)For the period ended 30 June 2015
Emerging Leaders
Equity fund
Emerging markets
Equity fund
European Equity Alpha fund
European Property
fund
Combined totals of all
funds +
USD USD EUR EUR USD
income
Dividends (net of withholding taxes) 1,696,167 20,163,314 20,813,989 4,946,517 292,054,331Interest on bonds - - - - 224,780,678Interest on swap transactions - - - - 4,134,543Net option premium income - - - - 1,854,707Income from securities lending 2,797 90,420 107,255 6,877 1,045,861Bank interest 14 1,279 978 3,041 52,998Other income - 3,367,326 - - 8,656,507
total income 1,698,978 23,622,339 20,922,222 4,956,435 532,579,625
Expenses
Management fee 1,532,556 6,270,081 4,249,630 2,043,198 228,169,517Administration charge 203,882 1,400,067 1,052,914 407,689 48,945,659Distribution fees 205,361 182,093 254,417 110,448 29,152,207Specific additional costs Taxe d’abonnement 32,870 154,841 99,582 75,524 6,214,615 Custody fees 46,265 457,169 - - 788,037 Hedging expenses 7,262 - 2,017 332 1,318,486 Subsidiaries expenses - - - - 150,672Interest on swap transactions - - - - 50,804,544Bank interest 102 1,978 564 - 603,958Tax charges (excluding Taxe d’abonnement) - - - - 27,685
total expenses 2,028,298 8,466,229 5,659,124 2,637,191 366,175,380
Plus fee waiver income - - - - 9,588,038
Net investment income/(loss) (329,320) 15,156,110 15,263,098 2,319,244 175,992,283
Net realised gain/(loss) on sales of investments (3,310,461) (49,699,980) 53,937,370 31,434,952 857,782,254Net realised gain/(loss) on options - - - - 1,942,736Net realised gain/(loss) on financial futures contracts - - - - 116,934,528Net realised gain/(loss) on credit default swap contracts - - - - 100,977,959Net realised gain/(loss) on interest rate swap contracts - - - - (9,889,958)Net realised gain/(loss) on total return swap contracts - - - - (298,728,285)Net realised gain/(loss) on foreign exchange transactions (5,001,597) 4,145,883 (10,140) (234,595) (15,705,912)
net realised profit/(loss) for the period (8,641,378) (30,397,987) 69,190,328 33,519,601 929,305,605
Net change in unrealised appreciation/(depreciation) on investments 5,059,777 112,504,733 71,132,185 9,509,622 (532,860,585)Net change in unrealised appreciation/(depreciation) on options - - - - (6,692,678)Net change in unrealised appreciation/(depreciation) on financial futures contracts - - - - (41,115,561)Net change in unrealised appreciation/(depreciation) on credit default swap contracts - - - - (42,760,393)Net change in unrealised appreciation/(depreciation) on total return swap contracts - - - - 21,381,240Net change in unrealised appreciation/(depreciation) on interest rate swap contracts - - - - (18,761,217)Net change in unrealised appreciation/(depreciation) on foreign exchange transactions 976,029 (1,518,337) 610,117 137,130 26,691,356
net change in net assets as a result of operations (2,605,572) 80,588,409 140,932,630 43,166,353 335,187,767
Dividend distribution - - (338) - (26,248,572)
Proceeds received on subscription of shares 26,243,912 160,461,317 272,991,229 155,425,510 15,563,065,839Net amount paid on redemption of shares (66,630,852) (316,513,732) (368,034,879) (167,719,656) (14,567,195,008)
net change in net assets as a result of capital transactions (40,386,940) (156,052,415) (95,043,650) (12,294,146) 995,870,831
total increase/(decrease) in net assets (42,992,512) (75,464,006) 45,888,642 30,872,207 1,304,810,026
Net assets at beginning of period 212,096,870 1,878,710,795 1,060,015,717 310,427,591 47,478,047,109Translation difference - - - - (1,383,567,961)
net assets at end of period 169,104,358 1,803,246,789 1,105,904,359 341,299,798 47,399,289,174
+ Represents the combined totals of all Morgan Stanley Investment Funds.
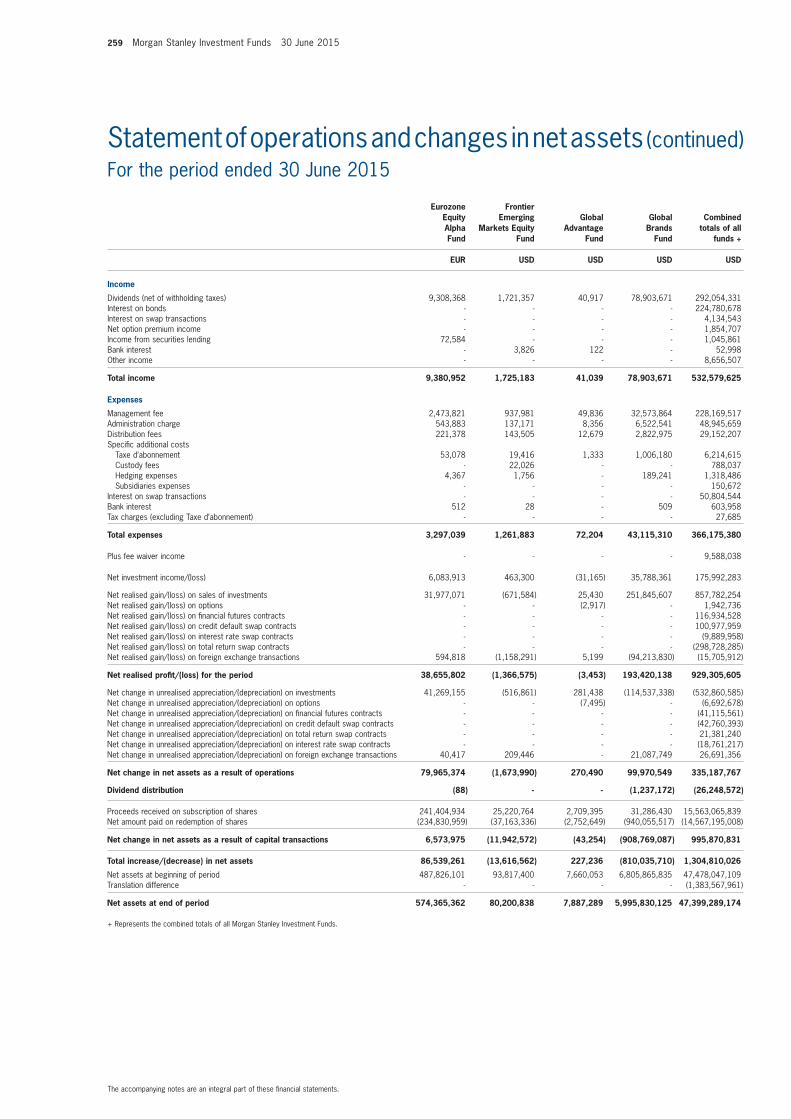
259 Morgan Stanley Investment Funds 30 June 2015
The accompanying notes are an integral part of these financial statements.
Statement of operations and changes in net assets (continued)For the period ended 30 June 2015
Eurozone Equity Alpha fund
frontier Emerging
markets Equity fund
Global Advantage
fund
Global Brands
fund
Combined totals of all
funds +
EUR USD USD USD USD
income
Dividends (net of withholding taxes) 9,308,368 1,721,357 40,917 78,903,671 292,054,331Interest on bonds - - - - 224,780,678Interest on swap transactions - - - - 4,134,543Net option premium income - - - - 1,854,707Income from securities lending 72,584 - - - 1,045,861Bank interest - 3,826 122 - 52,998Other income - - - - 8,656,507
total income 9,380,952 1,725,183 41,039 78,903,671 532,579,625
Expenses
Management fee 2,473,821 937,981 49,836 32,573,864 228,169,517Administration charge 543,883 137,171 8,356 6,522,541 48,945,659Distribution fees 221,378 143,505 12,679 2,822,975 29,152,207Specific additional costs Taxe d’abonnement 53,078 19,416 1,333 1,006,180 6,214,615 Custody fees - 22,026 - - 788,037 Hedging expenses 4,367 1,756 - 189,241 1,318,486 Subsidiaries expenses - - - - 150,672Interest on swap transactions - - - - 50,804,544Bank interest 512 28 - 509 603,958Tax charges (excluding Taxe d’abonnement) - - - - 27,685
total expenses 3,297,039 1,261,883 72,204 43,115,310 366,175,380
Plus fee waiver income - - - - 9,588,038
Net investment income/(loss) 6,083,913 463,300 (31,165) 35,788,361 175,992,283
Net realised gain/(loss) on sales of investments 31,977,071 (671,584) 25,430 251,845,607 857,782,254Net realised gain/(loss) on options - - (2,917) - 1,942,736Net realised gain/(loss) on financial futures contracts - - - - 116,934,528Net realised gain/(loss) on credit default swap contracts - - - - 100,977,959Net realised gain/(loss) on interest rate swap contracts - - - - (9,889,958)Net realised gain/(loss) on total return swap contracts - - - - (298,728,285)Net realised gain/(loss) on foreign exchange transactions 594,818 (1,158,291) 5,199 (94,213,830) (15,705,912)
net realised profit/(loss) for the period 38,655,802 (1,366,575) (3,453) 193,420,138 929,305,605
Net change in unrealised appreciation/(depreciation) on investments 41,269,155 (516,861) 281,438 (114,537,338) (532,860,585)Net change in unrealised appreciation/(depreciation) on options - - (7,495) - (6,692,678)Net change in unrealised appreciation/(depreciation) on financial futures contracts - - - - (41,115,561)Net change in unrealised appreciation/(depreciation) on credit default swap contracts - - - - (42,760,393)Net change in unrealised appreciation/(depreciation) on total return swap contracts - - - - 21,381,240Net change in unrealised appreciation/(depreciation) on interest rate swap contracts - - - - (18,761,217)Net change in unrealised appreciation/(depreciation) on foreign exchange transactions 40,417 209,446 - 21,087,749 26,691,356
net change in net assets as a result of operations 79,965,374 (1,673,990) 270,490 99,970,549 335,187,767
Dividend distribution (88) - - (1,237,172) (26,248,572)
Proceeds received on subscription of shares 241,404,934 25,220,764 2,709,395 31,286,430 15,563,065,839Net amount paid on redemption of shares (234,830,959) (37,163,336) (2,752,649) (940,055,517) (14,567,195,008)
net change in net assets as a result of capital transactions 6,573,975 (11,942,572) (43,254) (908,769,087) 995,870,831
total increase/(decrease) in net assets 86,539,261 (13,616,562) 227,236 (810,035,710) 1,304,810,026
Net assets at beginning of period 487,826,101 93,817,400 7,660,053 6,805,865,835 47,478,047,109Translation difference - - - - (1,383,567,961)
net assets at end of period 574,365,362 80,200,838 7,887,289 5,995,830,125 47,399,289,174
+ Represents the combined totals of all Morgan Stanley Investment Funds.
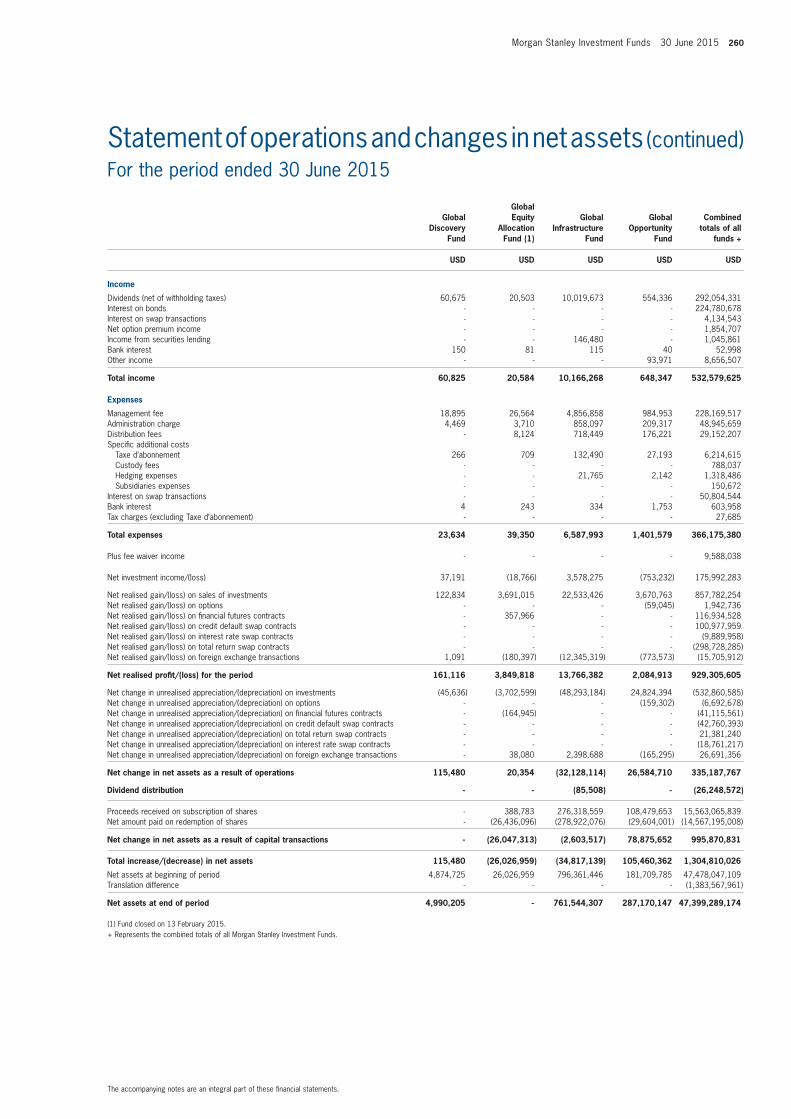
Morgan Stanley Investment Funds 30 June 2015 260
The accompanying notes are an integral part of these financial statements.
Statement of operations and changes in net assets (continued)For the period ended 30 June 2015
Global Discovery
fund
Global Equity
Allocation fund (1)
Global infrastructure
fund
Global opportunity
fund
Combined totals of all
funds +
USD USD USD USD USD
income
Dividends (net of withholding taxes) 60,675 20,503 10,019,673 554,336 292,054,331Interest on bonds - - - - 224,780,678Interest on swap transactions - - - - 4,134,543Net option premium income - - - - 1,854,707Income from securities lending - - 146,480 - 1,045,861Bank interest 150 81 115 40 52,998Other income - - - 93,971 8,656,507
total income 60,825 20,584 10,166,268 648,347 532,579,625
Expenses
Management fee 18,895 26,564 4,856,858 984,953 228,169,517Administration charge 4,469 3,710 858,097 209,317 48,945,659Distribution fees - 8,124 718,449 176,221 29,152,207Specific additional costs Taxe d’abonnement 266 709 132,490 27,193 6,214,615 Custody fees - - - - 788,037 Hedging expenses - - 21,765 2,142 1,318,486 Subsidiaries expenses - - - - 150,672Interest on swap transactions - - - - 50,804,544Bank interest 4 243 334 1,753 603,958Tax charges (excluding Taxe d’abonnement) - - - - 27,685
total expenses 23,634 39,350 6,587,993 1,401,579 366,175,380
Plus fee waiver income - - - - 9,588,038
Net investment income/(loss) 37,191 (18,766) 3,578,275 (753,232) 175,992,283
Net realised gain/(loss) on sales of investments 122,834 3,691,015 22,533,426 3,670,763 857,782,254Net realised gain/(loss) on options - - - (59,045) 1,942,736Net realised gain/(loss) on financial futures contracts - 357,966 - - 116,934,528Net realised gain/(loss) on credit default swap contracts - - - - 100,977,959Net realised gain/(loss) on interest rate swap contracts - - - - (9,889,958)Net realised gain/(loss) on total return swap contracts - - - - (298,728,285)Net realised gain/(loss) on foreign exchange transactions 1,091 (180,397) (12,345,319) (773,573) (15,705,912)
net realised profit/(loss) for the period 161,116 3,849,818 13,766,382 2,084,913 929,305,605
Net change in unrealised appreciation/(depreciation) on investments (45,636) (3,702,599) (48,293,184) 24,824,394 (532,860,585)Net change in unrealised appreciation/(depreciation) on options - - - (159,302) (6,692,678)Net change in unrealised appreciation/(depreciation) on financial futures contracts - (164,945) - - (41,115,561)Net change in unrealised appreciation/(depreciation) on credit default swap contracts - - - - (42,760,393)Net change in unrealised appreciation/(depreciation) on total return swap contracts - - - - 21,381,240Net change in unrealised appreciation/(depreciation) on interest rate swap contracts - - - - (18,761,217)Net change in unrealised appreciation/(depreciation) on foreign exchange transactions - 38,080 2,398,688 (165,295) 26,691,356
net change in net assets as a result of operations 115,480 20,354 (32,128,114) 26,584,710 335,187,767
Dividend distribution - - (85,508) - (26,248,572)
Proceeds received on subscription of shares - 388,783 276,318,559 108,479,653 15,563,065,839Net amount paid on redemption of shares - (26,436,096) (278,922,076) (29,604,001) (14,567,195,008)
net change in net assets as a result of capital transactions - (26,047,313) (2,603,517) 78,875,652 995,870,831
total increase/(decrease) in net assets 115,480 (26,026,959) (34,817,139) 105,460,362 1,304,810,026
Net assets at beginning of period 4,874,725 26,026,959 796,361,446 181,709,785 47,478,047,109Translation difference - - - - (1,383,567,961)
net assets at end of period 4,990,205 - 761,544,307 287,170,147 47,399,289,174
(1) Fund closed on 13 February 2015.+ Represents the combined totals of all Morgan Stanley Investment Funds.
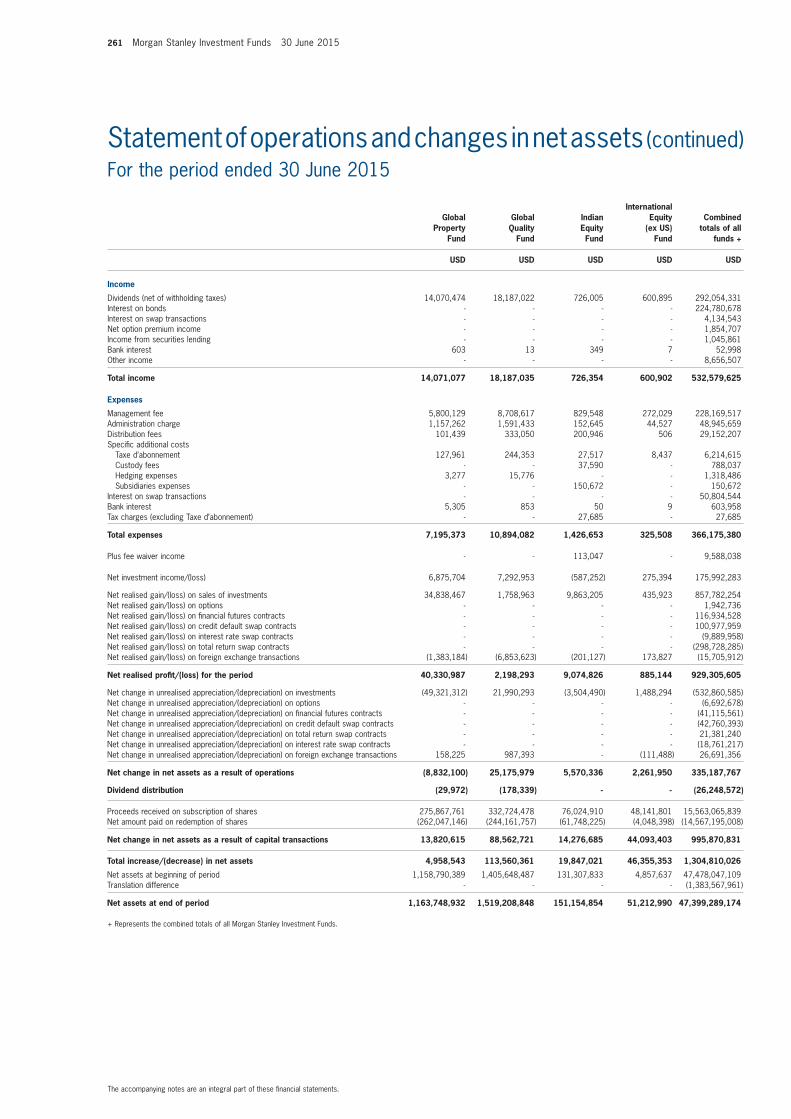
261 Morgan Stanley Investment Funds 30 June 2015
The accompanying notes are an integral part of these financial statements.
Statement of operations and changes in net assets (continued)For the period ended 30 June 2015
Global Property
fund
Global Quality
fund
indian Equity fund
international Equity
(ex US) fund
Combined totals of all
funds +
USD USD USD USD USD
income
Dividends (net of withholding taxes) 14,070,474 18,187,022 726,005 600,895 292,054,331Interest on bonds - - - - 224,780,678Interest on swap transactions - - - - 4,134,543Net option premium income - - - - 1,854,707Income from securities lending - - - - 1,045,861Bank interest 603 13 349 7 52,998Other income - - - - 8,656,507
total income 14,071,077 18,187,035 726,354 600,902 532,579,625
Expenses
Management fee 5,800,129 8,708,617 829,548 272,029 228,169,517Administration charge 1,157,262 1,591,433 152,645 44,527 48,945,659Distribution fees 101,439 333,050 200,946 506 29,152,207Specific additional costs Taxe d’abonnement 127,961 244,353 27,517 8,437 6,214,615 Custody fees - - 37,590 - 788,037 Hedging expenses 3,277 15,776 - - 1,318,486 Subsidiaries expenses - - 150,672 - 150,672Interest on swap transactions - - - - 50,804,544Bank interest 5,305 853 50 9 603,958Tax charges (excluding Taxe d’abonnement) - - 27,685 - 27,685
total expenses 7,195,373 10,894,082 1,426,653 325,508 366,175,380
Plus fee waiver income - - 113,047 - 9,588,038
Net investment income/(loss) 6,875,704 7,292,953 (587,252) 275,394 175,992,283
Net realised gain/(loss) on sales of investments 34,838,467 1,758,963 9,863,205 435,923 857,782,254Net realised gain/(loss) on options - - - - 1,942,736Net realised gain/(loss) on financial futures contracts - - - - 116,934,528Net realised gain/(loss) on credit default swap contracts - - - - 100,977,959Net realised gain/(loss) on interest rate swap contracts - - - - (9,889,958)Net realised gain/(loss) on total return swap contracts - - - - (298,728,285)Net realised gain/(loss) on foreign exchange transactions (1,383,184) (6,853,623) (201,127) 173,827 (15,705,912)
net realised profit/(loss) for the period 40,330,987 2,198,293 9,074,826 885,144 929,305,605
Net change in unrealised appreciation/(depreciation) on investments (49,321,312) 21,990,293 (3,504,490) 1,488,294 (532,860,585)Net change in unrealised appreciation/(depreciation) on options - - - - (6,692,678)Net change in unrealised appreciation/(depreciation) on financial futures contracts - - - - (41,115,561)Net change in unrealised appreciation/(depreciation) on credit default swap contracts - - - - (42,760,393)Net change in unrealised appreciation/(depreciation) on total return swap contracts - - - - 21,381,240Net change in unrealised appreciation/(depreciation) on interest rate swap contracts - - - - (18,761,217)Net change in unrealised appreciation/(depreciation) on foreign exchange transactions 158,225 987,393 - (111,488) 26,691,356
net change in net assets as a result of operations (8,832,100) 25,175,979 5,570,336 2,261,950 335,187,767
Dividend distribution (29,972) (178,339) - - (26,248,572)
Proceeds received on subscription of shares 275,867,761 332,724,478 76,024,910 48,141,801 15,563,065,839Net amount paid on redemption of shares (262,047,146) (244,161,757) (61,748,225) (4,048,398) (14,567,195,008)
net change in net assets as a result of capital transactions 13,820,615 88,562,721 14,276,685 44,093,403 995,870,831
total increase/(decrease) in net assets 4,958,543 113,560,361 19,847,021 46,355,353 1,304,810,026
Net assets at beginning of period 1,158,790,389 1,405,648,487 131,307,833 4,857,637 47,478,047,109Translation difference - - - - (1,383,567,961)
net assets at end of period 1,163,748,932 1,519,208,848 151,154,854 51,212,990 47,399,289,174
+ Represents the combined totals of all Morgan Stanley Investment Funds.
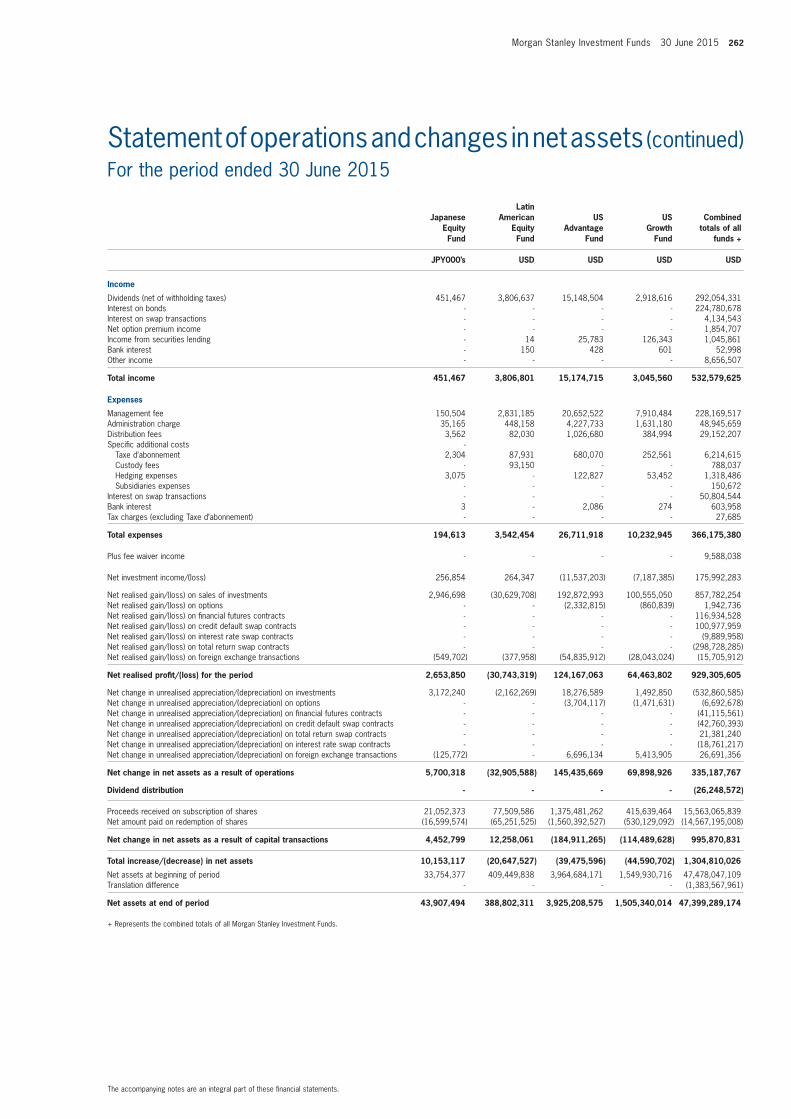
Morgan Stanley Investment Funds 30 June 2015 262
The accompanying notes are an integral part of these financial statements.
Statement of operations and changes in net assets (continued)For the period ended 30 June 2015
Japanese Equity fund
Latin American
Equity fund
US Advantage
fund
US Growth
fund
Combined totals of all
funds +
JPY000’s USD USD USD USD
income
Dividends (net of withholding taxes) 451,467 3,806,637 15,148,504 2,918,616 292,054,331Interest on bonds - - - - 224,780,678Interest on swap transactions - - - - 4,134,543Net option premium income - - - - 1,854,707Income from securities lending - 14 25,783 126,343 1,045,861Bank interest - 150 428 601 52,998Other income - - - - 8,656,507
total income 451,467 3,806,801 15,174,715 3,045,560 532,579,625
Expenses
Management fee 150,504 2,831,185 20,652,522 7,910,484 228,169,517Administration charge 35,165 448,158 4,227,733 1,631,180 48,945,659Distribution fees 3,562 82,030 1,026,680 384,994 29,152,207Specific additional costs - Taxe d’abonnement 2,304 87,931 680,070 252,561 6,214,615 Custody fees - 93,150 - - 788,037 Hedging expenses 3,075 - 122,827 53,452 1,318,486 Subsidiaries expenses - - - - 150,672Interest on swap transactions - - - - 50,804,544Bank interest 3 - 2,086 274 603,958Tax charges (excluding Taxe d’abonnement) - - - - 27,685
total expenses 194,613 3,542,454 26,711,918 10,232,945 366,175,380
Plus fee waiver income - - - - 9,588,038
Net investment income/(loss) 256,854 264,347 (11,537,203) (7,187,385) 175,992,283
Net realised gain/(loss) on sales of investments 2,946,698 (30,629,708) 192,872,993 100,555,050 857,782,254Net realised gain/(loss) on options - - (2,332,815) (860,839) 1,942,736Net realised gain/(loss) on financial futures contracts - - - - 116,934,528Net realised gain/(loss) on credit default swap contracts - - - - 100,977,959Net realised gain/(loss) on interest rate swap contracts - - - - (9,889,958)Net realised gain/(loss) on total return swap contracts - - - - (298,728,285)Net realised gain/(loss) on foreign exchange transactions (549,702) (377,958) (54,835,912) (28,043,024) (15,705,912)
net realised profit/(loss) for the period 2,653,850 (30,743,319) 124,167,063 64,463,802 929,305,605
Net change in unrealised appreciation/(depreciation) on investments 3,172,240 (2,162,269) 18,276,589 1,492,850 (532,860,585)Net change in unrealised appreciation/(depreciation) on options - - (3,704,117) (1,471,631) (6,692,678)Net change in unrealised appreciation/(depreciation) on financial futures contracts - - - - (41,115,561)Net change in unrealised appreciation/(depreciation) on credit default swap contracts - - - - (42,760,393)Net change in unrealised appreciation/(depreciation) on total return swap contracts - - - - 21,381,240Net change in unrealised appreciation/(depreciation) on interest rate swap contracts - - - - (18,761,217)Net change in unrealised appreciation/(depreciation) on foreign exchange transactions (125,772) - 6,696,134 5,413,905 26,691,356
net change in net assets as a result of operations 5,700,318 (32,905,588) 145,435,669 69,898,926 335,187,767
Dividend distribution - - - - (26,248,572)
Proceeds received on subscription of shares 21,052,373 77,509,586 1,375,481,262 415,639,464 15,563,065,839Net amount paid on redemption of shares (16,599,574) (65,251,525) (1,560,392,527) (530,129,092) (14,567,195,008)
net change in net assets as a result of capital transactions 4,452,799 12,258,061 (184,911,265) (114,489,628) 995,870,831
total increase/(decrease) in net assets 10,153,117 (20,647,527) (39,475,596) (44,590,702) 1,304,810,026
Net assets at beginning of period 33,754,377 409,449,838 3,964,684,171 1,549,930,716 47,478,047,109Translation difference - - - - (1,383,567,961)
net assets at end of period 43,907,494 388,802,311 3,925,208,575 1,505,340,014 47,399,289,174
+ Represents the combined totals of all Morgan Stanley Investment Funds.
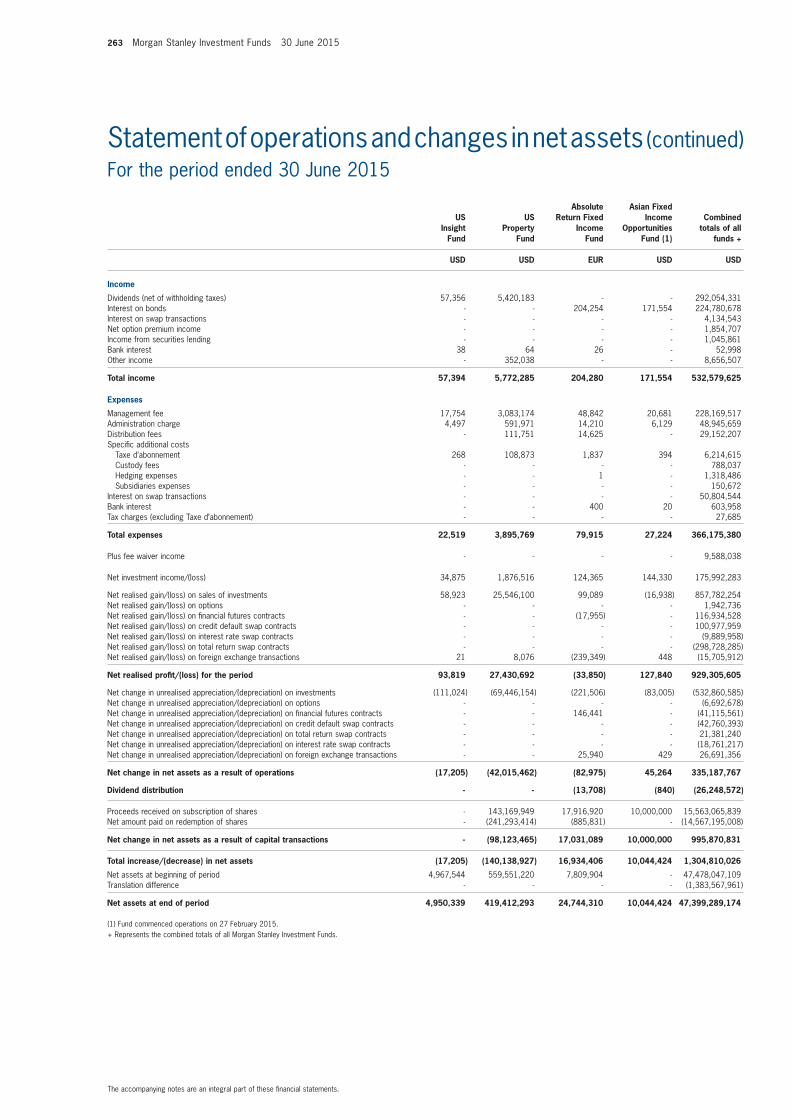
263 Morgan Stanley Investment Funds 30 June 2015
The accompanying notes are an integral part of these financial statements.
Statement of operations and changes in net assets (continued)For the period ended 30 June 2015
US insight
fund
US Property
fund
Absolute Return fixed
income fund
Asian fixed income
opportunities fund (1)
Combined totals of all
funds +
USD USD EUR USD USD
income
Dividends (net of withholding taxes) 57,356 5,420,183 - - 292,054,331Interest on bonds - - 204,254 171,554 224,780,678Interest on swap transactions - - - - 4,134,543Net option premium income - - - - 1,854,707Income from securities lending - - - - 1,045,861Bank interest 38 64 26 - 52,998Other income - 352,038 - - 8,656,507
total income 57,394 5,772,285 204,280 171,554 532,579,625
Expenses
Management fee 17,754 3,083,174 48,842 20,681 228,169,517Administration charge 4,497 591,971 14,210 6,129 48,945,659Distribution fees - 111,751 14,625 - 29,152,207Specific additional costs Taxe d’abonnement 268 108,873 1,837 394 6,214,615 Custody fees - - - - 788,037 Hedging expenses - - 1 - 1,318,486 Subsidiaries expenses - - - - 150,672Interest on swap transactions - - - - 50,804,544Bank interest - - 400 20 603,958Tax charges (excluding Taxe d’abonnement) - - - - 27,685
total expenses 22,519 3,895,769 79,915 27,224 366,175,380
Plus fee waiver income - - - - 9,588,038
Net investment income/(loss) 34,875 1,876,516 124,365 144,330 175,992,283
Net realised gain/(loss) on sales of investments 58,923 25,546,100 99,089 (16,938) 857,782,254Net realised gain/(loss) on options - - - - 1,942,736Net realised gain/(loss) on financial futures contracts - - (17,955) - 116,934,528Net realised gain/(loss) on credit default swap contracts - - - - 100,977,959Net realised gain/(loss) on interest rate swap contracts - - - - (9,889,958)Net realised gain/(loss) on total return swap contracts - - - - (298,728,285)Net realised gain/(loss) on foreign exchange transactions 21 8,076 (239,349) 448 (15,705,912)
net realised profit/(loss) for the period 93,819 27,430,692 (33,850) 127,840 929,305,605
Net change in unrealised appreciation/(depreciation) on investments (111,024) (69,446,154) (221,506) (83,005) (532,860,585)Net change in unrealised appreciation/(depreciation) on options - - - - (6,692,678)Net change in unrealised appreciation/(depreciation) on financial futures contracts - - 146,441 - (41,115,561)Net change in unrealised appreciation/(depreciation) on credit default swap contracts - - - - (42,760,393)Net change in unrealised appreciation/(depreciation) on total return swap contracts - - - - 21,381,240Net change in unrealised appreciation/(depreciation) on interest rate swap contracts - - - - (18,761,217)Net change in unrealised appreciation/(depreciation) on foreign exchange transactions - - 25,940 429 26,691,356
net change in net assets as a result of operations (17,205) (42,015,462) (82,975) 45,264 335,187,767
Dividend distribution - - (13,708) (840) (26,248,572)
Proceeds received on subscription of shares - 143,169,949 17,916,920 10,000,000 15,563,065,839Net amount paid on redemption of shares - (241,293,414) (885,831) - (14,567,195,008)
net change in net assets as a result of capital transactions - (98,123,465) 17,031,089 10,000,000 995,870,831
total increase/(decrease) in net assets (17,205) (140,138,927) 16,934,406 10,044,424 1,304,810,026
Net assets at beginning of period 4,967,544 559,551,220 7,809,904 - 47,478,047,109Translation difference - - - - (1,383,567,961)
net assets at end of period 4,950,339 419,412,293 24,744,310 10,044,424 47,399,289,174
(1) Fund commenced operations on 27 February 2015.+ Represents the combined totals of all Morgan Stanley Investment Funds.
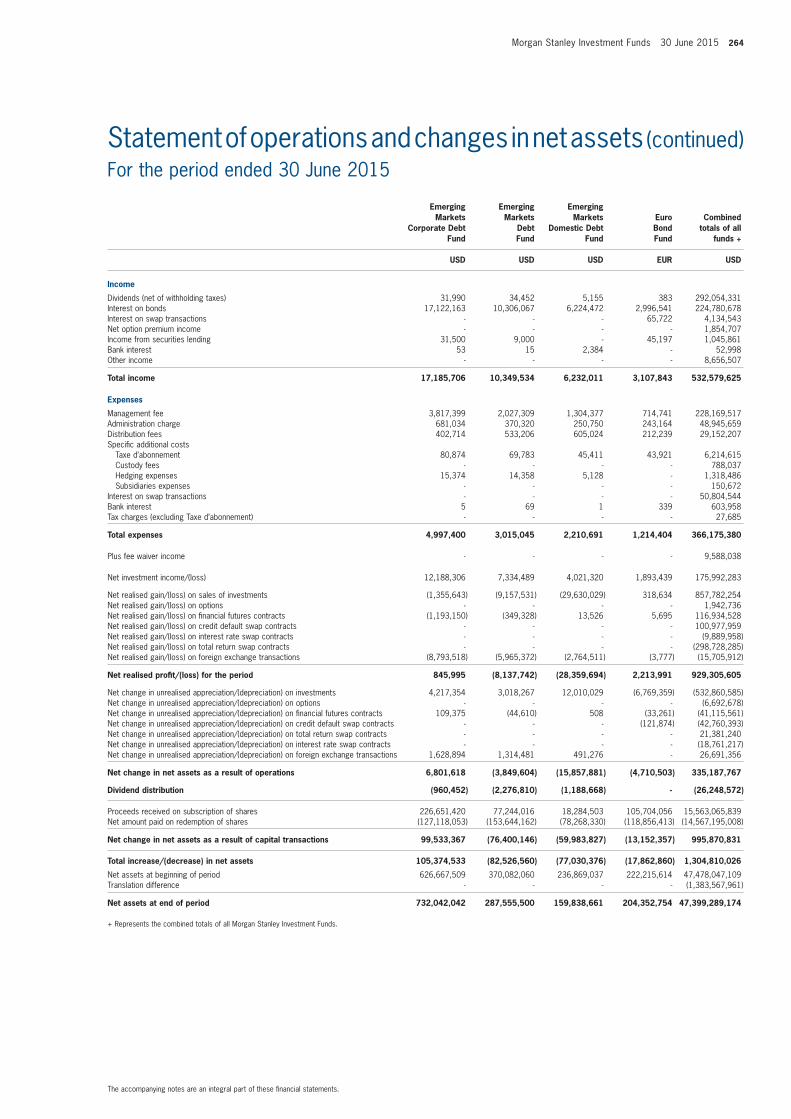
Morgan Stanley Investment Funds 30 June 2015 264
The accompanying notes are an integral part of these financial statements.
Statement of operations and changes in net assets (continued)For the period ended 30 June 2015
Emerging markets
Corporate Debt fund
Emerging markets
Debt fund
Emerging markets
Domestic Debt fund
Euro Bond fund
Combined totals of all
funds +
USD USD USD EUR USD
income
Dividends (net of withholding taxes) 31,990 34,452 5,155 383 292,054,331Interest on bonds 17,122,163 10,306,067 6,224,472 2,996,541 224,780,678Interest on swap transactions - - - 65,722 4,134,543Net option premium income - - - - 1,854,707Income from securities lending 31,500 9,000 - 45,197 1,045,861Bank interest 53 15 2,384 - 52,998Other income - - - - 8,656,507
total income 17,185,706 10,349,534 6,232,011 3,107,843 532,579,625
Expenses
Management fee 3,817,399 2,027,309 1,304,377 714,741 228,169,517Administration charge 681,034 370,320 250,750 243,164 48,945,659Distribution fees 402,714 533,206 605,024 212,239 29,152,207Specific additional costs Taxe d’abonnement 80,874 69,783 45,411 43,921 6,214,615 Custody fees - - - - 788,037 Hedging expenses 15,374 14,358 5,128 - 1,318,486 Subsidiaries expenses - - - - 150,672Interest on swap transactions - - - - 50,804,544Bank interest 5 69 1 339 603,958Tax charges (excluding Taxe d’abonnement) - - - - 27,685
total expenses 4,997,400 3,015,045 2,210,691 1,214,404 366,175,380
Plus fee waiver income - - - - 9,588,038
Net investment income/(loss) 12,188,306 7,334,489 4,021,320 1,893,439 175,992,283
Net realised gain/(loss) on sales of investments (1,355,643) (9,157,531) (29,630,029) 318,634 857,782,254Net realised gain/(loss) on options - - - - 1,942,736Net realised gain/(loss) on financial futures contracts (1,193,150) (349,328) 13,526 5,695 116,934,528Net realised gain/(loss) on credit default swap contracts - - - - 100,977,959Net realised gain/(loss) on interest rate swap contracts - - - - (9,889,958)Net realised gain/(loss) on total return swap contracts - - - - (298,728,285)Net realised gain/(loss) on foreign exchange transactions (8,793,518) (5,965,372) (2,764,511) (3,777) (15,705,912)
net realised profit/(loss) for the period 845,995 (8,137,742) (28,359,694) 2,213,991 929,305,605
Net change in unrealised appreciation/(depreciation) on investments 4,217,354 3,018,267 12,010,029 (6,769,359) (532,860,585)Net change in unrealised appreciation/(depreciation) on options - - - - (6,692,678)Net change in unrealised appreciation/(depreciation) on financial futures contracts 109,375 (44,610) 508 (33,261) (41,115,561)Net change in unrealised appreciation/(depreciation) on credit default swap contracts - - - (121,874) (42,760,393)Net change in unrealised appreciation/(depreciation) on total return swap contracts - - - - 21,381,240Net change in unrealised appreciation/(depreciation) on interest rate swap contracts - - - - (18,761,217)Net change in unrealised appreciation/(depreciation) on foreign exchange transactions 1,628,894 1,314,481 491,276 - 26,691,356
net change in net assets as a result of operations 6,801,618 (3,849,604) (15,857,881) (4,710,503) 335,187,767
Dividend distribution (960,452) (2,276,810) (1,188,668) - (26,248,572)
Proceeds received on subscription of shares 226,651,420 77,244,016 18,284,503 105,704,056 15,563,065,839Net amount paid on redemption of shares (127,118,053) (153,644,162) (78,268,330) (118,856,413) (14,567,195,008)
net change in net assets as a result of capital transactions 99,533,367 (76,400,146) (59,983,827) (13,152,357) 995,870,831
total increase/(decrease) in net assets 105,374,533 (82,526,560) (77,030,376) (17,862,860) 1,304,810,026
Net assets at beginning of period 626,667,509 370,082,060 236,869,037 222,215,614 47,478,047,109Translation difference - - - - (1,383,567,961)
net assets at end of period 732,042,042 287,555,500 159,838,661 204,352,754 47,399,289,174
+ Represents the combined totals of all Morgan Stanley Investment Funds.
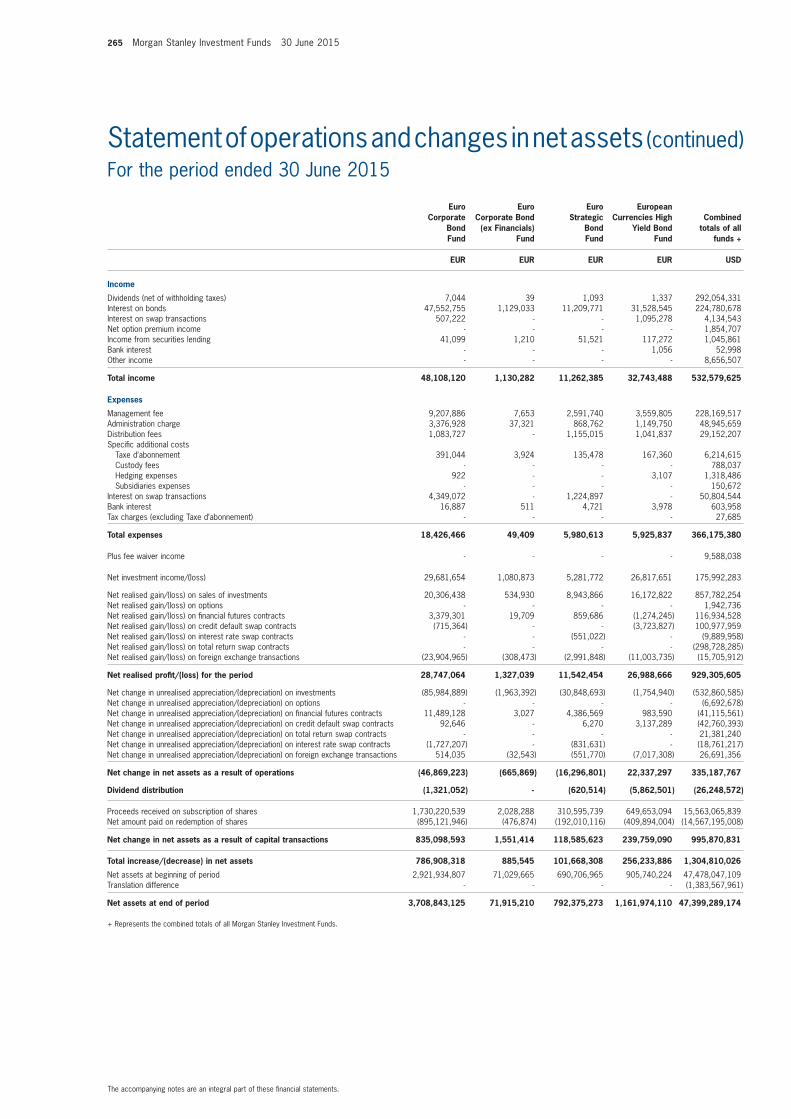
265 Morgan Stanley Investment Funds 30 June 2015
The accompanying notes are an integral part of these financial statements.
Statement of operations and changes in net assets (continued)For the period ended 30 June 2015
Euro Corporate
Bond fund
Euro Corporate Bond
(ex financials) fund
Euro Strategic
Bond fund
European Currencies High
Yield Bond fund
Combined totals of all
funds +
EUR EUR EUR EUR USD
income
Dividends (net of withholding taxes) 7,044 39 1,093 1,337 292,054,331Interest on bonds 47,552,755 1,129,033 11,209,771 31,528,545 224,780,678Interest on swap transactions 507,222 - - 1,095,278 4,134,543Net option premium income - - - - 1,854,707Income from securities lending 41,099 1,210 51,521 117,272 1,045,861Bank interest - - - 1,056 52,998Other income - - - - 8,656,507
total income 48,108,120 1,130,282 11,262,385 32,743,488 532,579,625
Expenses
Management fee 9,207,886 7,653 2,591,740 3,559,805 228,169,517Administration charge 3,376,928 37,321 868,762 1,149,750 48,945,659Distribution fees 1,083,727 - 1,155,015 1,041,837 29,152,207Specific additional costs Taxe d’abonnement 391,044 3,924 135,478 167,360 6,214,615 Custody fees - - - - 788,037 Hedging expenses 922 - - 3,107 1,318,486 Subsidiaries expenses - - - - 150,672Interest on swap transactions 4,349,072 - 1,224,897 - 50,804,544Bank interest 16,887 511 4,721 3,978 603,958Tax charges (excluding Taxe d’abonnement) - - - - 27,685
total expenses 18,426,466 49,409 5,980,613 5,925,837 366,175,380
Plus fee waiver income - - - - 9,588,038
Net investment income/(loss) 29,681,654 1,080,873 5,281,772 26,817,651 175,992,283
Net realised gain/(loss) on sales of investments 20,306,438 534,930 8,943,866 16,172,822 857,782,254Net realised gain/(loss) on options - - - - 1,942,736Net realised gain/(loss) on financial futures contracts 3,379,301 19,709 859,686 (1,274,245) 116,934,528Net realised gain/(loss) on credit default swap contracts (715,364) - - (3,723,827) 100,977,959Net realised gain/(loss) on interest rate swap contracts - - (551,022) - (9,889,958)Net realised gain/(loss) on total return swap contracts - - - - (298,728,285)Net realised gain/(loss) on foreign exchange transactions (23,904,965) (308,473) (2,991,848) (11,003,735) (15,705,912)
net realised profit/(loss) for the period 28,747,064 1,327,039 11,542,454 26,988,666 929,305,605
Net change in unrealised appreciation/(depreciation) on investments (85,984,889) (1,963,392) (30,848,693) (1,754,940) (532,860,585)Net change in unrealised appreciation/(depreciation) on options - - - - (6,692,678)Net change in unrealised appreciation/(depreciation) on financial futures contracts 11,489,128 3,027 4,386,569 983,590 (41,115,561)Net change in unrealised appreciation/(depreciation) on credit default swap contracts 92,646 - 6,270 3,137,289 (42,760,393)Net change in unrealised appreciation/(depreciation) on total return swap contracts - - - - 21,381,240Net change in unrealised appreciation/(depreciation) on interest rate swap contracts (1,727,207) - (831,631) - (18,761,217)Net change in unrealised appreciation/(depreciation) on foreign exchange transactions 514,035 (32,543) (551,770) (7,017,308) 26,691,356
net change in net assets as a result of operations (46,869,223) (665,869) (16,296,801) 22,337,297 335,187,767
Dividend distribution (1,321,052) - (620,514) (5,862,501) (26,248,572)
Proceeds received on subscription of shares 1,730,220,539 2,028,288 310,595,739 649,653,094 15,563,065,839Net amount paid on redemption of shares (895,121,946) (476,874) (192,010,116) (409,894,004) (14,567,195,008)
net change in net assets as a result of capital transactions 835,098,593 1,551,414 118,585,623 239,759,090 995,870,831
total increase/(decrease) in net assets 786,908,318 885,545 101,668,308 256,233,886 1,304,810,026
Net assets at beginning of period 2,921,934,807 71,029,665 690,706,965 905,740,224 47,478,047,109Translation difference - - - - (1,383,567,961)
net assets at end of period 3,708,843,125 71,915,210 792,375,273 1,161,974,110 47,399,289,174
+ Represents the combined totals of all Morgan Stanley Investment Funds.
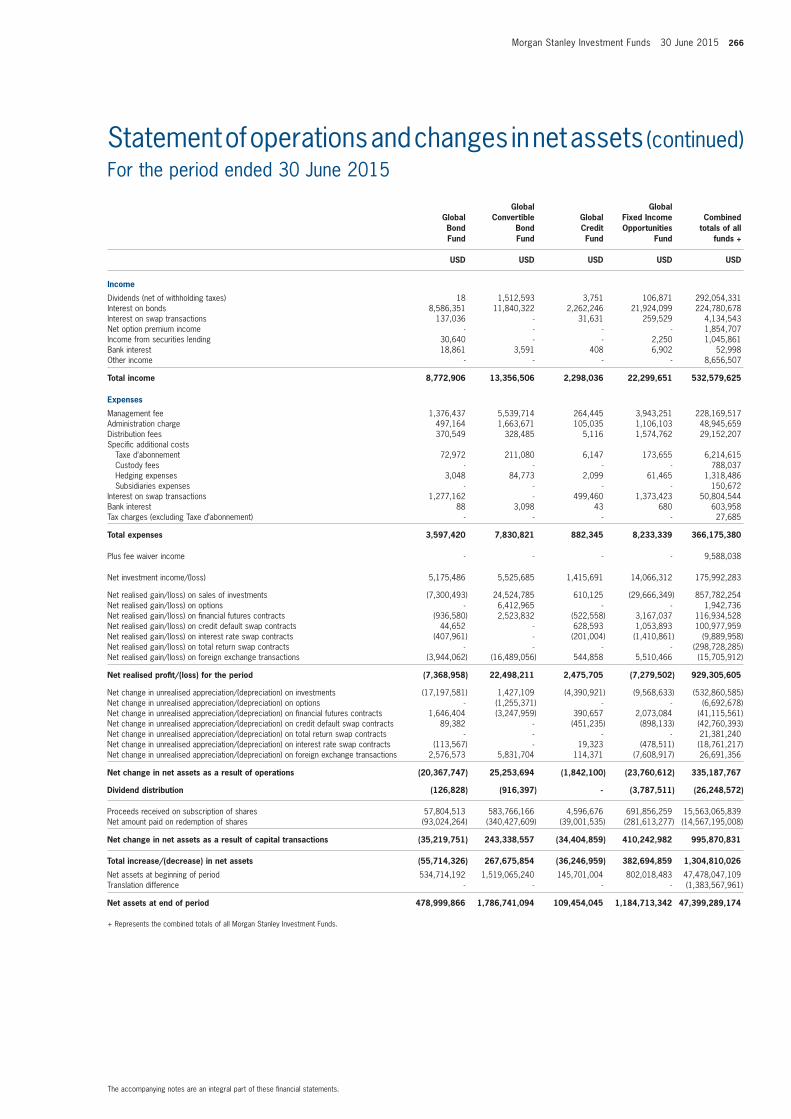
Morgan Stanley Investment Funds 30 June 2015 266
The accompanying notes are an integral part of these financial statements.
Statement of operations and changes in net assets (continued)For the period ended 30 June 2015
Global Bond fund
Global Convertible
Bond fund
Global Credit fund
Global fixed income opportunities
fund
Combined totals of all
funds +
USD USD USD USD USD
income
Dividends (net of withholding taxes) 18 1,512,593 3,751 106,871 292,054,331Interest on bonds 8,586,351 11,840,322 2,262,246 21,924,099 224,780,678Interest on swap transactions 137,036 - 31,631 259,529 4,134,543Net option premium income - - - - 1,854,707Income from securities lending 30,640 - - 2,250 1,045,861Bank interest 18,861 3,591 408 6,902 52,998Other income - - - - 8,656,507
total income 8,772,906 13,356,506 2,298,036 22,299,651 532,579,625
Expenses
Management fee 1,376,437 5,539,714 264,445 3,943,251 228,169,517Administration charge 497,164 1,663,671 105,035 1,106,103 48,945,659Distribution fees 370,549 328,485 5,116 1,574,762 29,152,207Specific additional costs Taxe d’abonnement 72,972 211,080 6,147 173,655 6,214,615 Custody fees - - - - 788,037 Hedging expenses 3,048 84,773 2,099 61,465 1,318,486 Subsidiaries expenses - - - - 150,672Interest on swap transactions 1,277,162 - 499,460 1,373,423 50,804,544Bank interest 88 3,098 43 680 603,958Tax charges (excluding Taxe d’abonnement) - - - - 27,685
total expenses 3,597,420 7,830,821 882,345 8,233,339 366,175,380
Plus fee waiver income - - - - 9,588,038
Net investment income/(loss) 5,175,486 5,525,685 1,415,691 14,066,312 175,992,283
Net realised gain/(loss) on sales of investments (7,300,493) 24,524,785 610,125 (29,666,349) 857,782,254Net realised gain/(loss) on options - 6,412,965 - - 1,942,736Net realised gain/(loss) on financial futures contracts (936,580) 2,523,832 (522,558) 3,167,037 116,934,528Net realised gain/(loss) on credit default swap contracts 44,652 - 628,593 1,053,893 100,977,959Net realised gain/(loss) on interest rate swap contracts (407,961) - (201,004) (1,410,861) (9,889,958)Net realised gain/(loss) on total return swap contracts - - - - (298,728,285)Net realised gain/(loss) on foreign exchange transactions (3,944,062) (16,489,056) 544,858 5,510,466 (15,705,912)
net realised profit/(loss) for the period (7,368,958) 22,498,211 2,475,705 (7,279,502) 929,305,605
Net change in unrealised appreciation/(depreciation) on investments (17,197,581) 1,427,109 (4,390,921) (9,568,633) (532,860,585)Net change in unrealised appreciation/(depreciation) on options - (1,255,371) - - (6,692,678)Net change in unrealised appreciation/(depreciation) on financial futures contracts 1,646,404 (3,247,959) 390,657 2,073,084 (41,115,561)Net change in unrealised appreciation/(depreciation) on credit default swap contracts 89,382 - (451,235) (898,133) (42,760,393)Net change in unrealised appreciation/(depreciation) on total return swap contracts - - - - 21,381,240Net change in unrealised appreciation/(depreciation) on interest rate swap contracts (113,567) - 19,323 (478,511) (18,761,217)Net change in unrealised appreciation/(depreciation) on foreign exchange transactions 2,576,573 5,831,704 114,371 (7,608,917) 26,691,356
net change in net assets as a result of operations (20,367,747) 25,253,694 (1,842,100) (23,760,612) 335,187,767
Dividend distribution (126,828) (916,397) - (3,787,511) (26,248,572)
Proceeds received on subscription of shares 57,804,513 583,766,166 4,596,676 691,856,259 15,563,065,839Net amount paid on redemption of shares (93,024,264) (340,427,609) (39,001,535) (281,613,277) (14,567,195,008)
net change in net assets as a result of capital transactions (35,219,751) 243,338,557 (34,404,859) 410,242,982 995,870,831
total increase/(decrease) in net assets (55,714,326) 267,675,854 (36,246,959) 382,694,859 1,304,810,026
Net assets at beginning of period 534,714,192 1,519,065,240 145,701,004 802,018,483 47,478,047,109Translation difference - - - - (1,383,567,961)
net assets at end of period 478,999,866 1,786,741,094 109,454,045 1,184,713,342 47,399,289,174
+ Represents the combined totals of all Morgan Stanley Investment Funds.
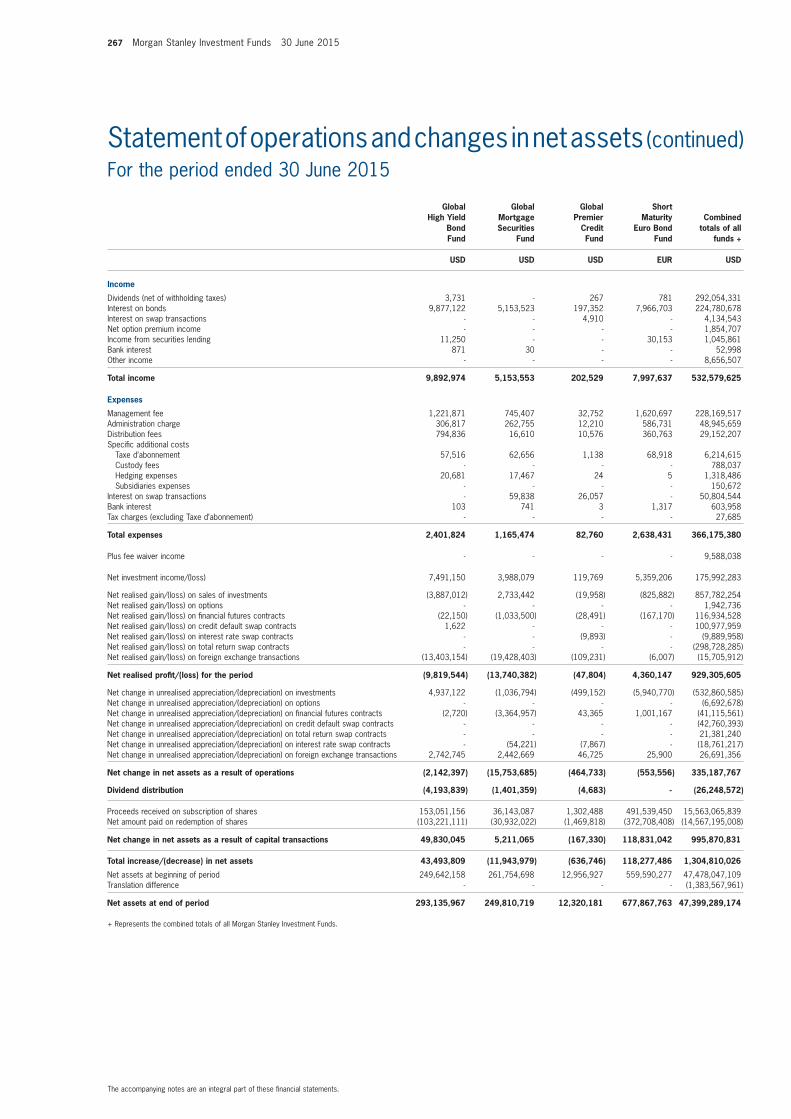
267 Morgan Stanley Investment Funds 30 June 2015
The accompanying notes are an integral part of these financial statements.
Statement of operations and changes in net assets (continued)For the period ended 30 June 2015
Global High Yield
Bond fund
Global mortgage Securities
fund
Global Premier
Credit fund
Short maturity
Euro Bond fund
Combined totals of all
funds +
USD USD USD EUR USD
income
Dividends (net of withholding taxes) 3,731 - 267 781 292,054,331Interest on bonds 9,877,122 5,153,523 197,352 7,966,703 224,780,678Interest on swap transactions - - 4,910 - 4,134,543Net option premium income - - - - 1,854,707Income from securities lending 11,250 - - 30,153 1,045,861Bank interest 871 30 - - 52,998Other income - - - - 8,656,507
total income 9,892,974 5,153,553 202,529 7,997,637 532,579,625
Expenses
Management fee 1,221,871 745,407 32,752 1,620,697 228,169,517Administration charge 306,817 262,755 12,210 586,731 48,945,659Distribution fees 794,836 16,610 10,576 360,763 29,152,207Specific additional costs Taxe d’abonnement 57,516 62,656 1,138 68,918 6,214,615 Custody fees - - - - 788,037 Hedging expenses 20,681 17,467 24 5 1,318,486 Subsidiaries expenses - - - - 150,672Interest on swap transactions - 59,838 26,057 - 50,804,544Bank interest 103 741 3 1,317 603,958Tax charges (excluding Taxe d’abonnement) - - - - 27,685
total expenses 2,401,824 1,165,474 82,760 2,638,431 366,175,380
Plus fee waiver income - - - - 9,588,038
Net investment income/(loss) 7,491,150 3,988,079 119,769 5,359,206 175,992,283
Net realised gain/(loss) on sales of investments (3,887,012) 2,733,442 (19,958) (825,882) 857,782,254Net realised gain/(loss) on options - - - - 1,942,736Net realised gain/(loss) on financial futures contracts (22,150) (1,033,500) (28,491) (167,170) 116,934,528Net realised gain/(loss) on credit default swap contracts 1,622 - - - 100,977,959Net realised gain/(loss) on interest rate swap contracts - - (9,893) - (9,889,958)Net realised gain/(loss) on total return swap contracts - - - - (298,728,285)Net realised gain/(loss) on foreign exchange transactions (13,403,154) (19,428,403) (109,231) (6,007) (15,705,912)
net realised profit/(loss) for the period (9,819,544) (13,740,382) (47,804) 4,360,147 929,305,605
Net change in unrealised appreciation/(depreciation) on investments 4,937,122 (1,036,794) (499,152) (5,940,770) (532,860,585)Net change in unrealised appreciation/(depreciation) on options - - - - (6,692,678)Net change in unrealised appreciation/(depreciation) on financial futures contracts (2,720) (3,364,957) 43,365 1,001,167 (41,115,561)Net change in unrealised appreciation/(depreciation) on credit default swap contracts - - - - (42,760,393)Net change in unrealised appreciation/(depreciation) on total return swap contracts - - - - 21,381,240Net change in unrealised appreciation/(depreciation) on interest rate swap contracts - (54,221) (7,867) - (18,761,217)Net change in unrealised appreciation/(depreciation) on foreign exchange transactions 2,742,745 2,442,669 46,725 25,900 26,691,356
net change in net assets as a result of operations (2,142,397) (15,753,685) (464,733) (553,556) 335,187,767
Dividend distribution (4,193,839) (1,401,359) (4,683) - (26,248,572)
Proceeds received on subscription of shares 153,051,156 36,143,087 1,302,488 491,539,450 15,563,065,839Net amount paid on redemption of shares (103,221,111) (30,932,022) (1,469,818) (372,708,408) (14,567,195,008)
net change in net assets as a result of capital transactions 49,830,045 5,211,065 (167,330) 118,831,042 995,870,831
total increase/(decrease) in net assets 43,493,809 (11,943,979) (636,746) 118,277,486 1,304,810,026
Net assets at beginning of period 249,642,158 261,754,698 12,956,927 559,590,277 47,478,047,109Translation difference - - - - (1,383,567,961)
net assets at end of period 293,135,967 249,810,719 12,320,181 677,867,763 47,399,289,174
+ Represents the combined totals of all Morgan Stanley Investment Funds.
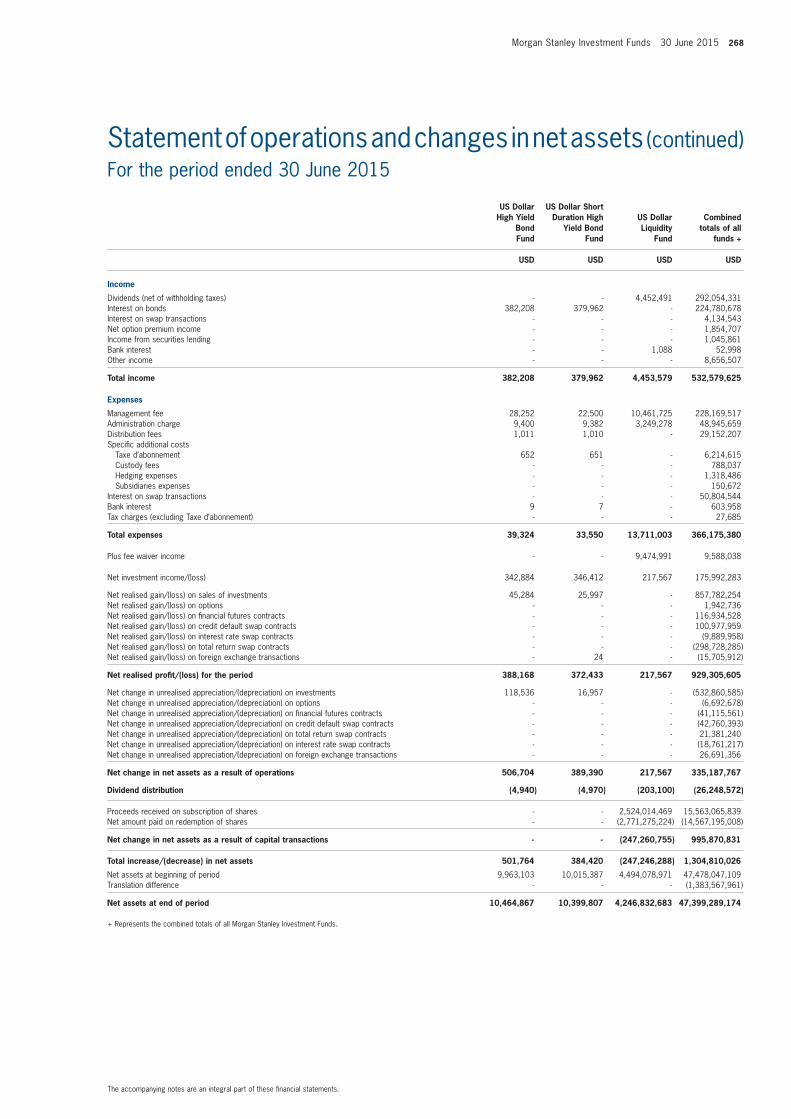
Morgan Stanley Investment Funds 30 June 2015 268
The accompanying notes are an integral part of these financial statements.
Statement of operations and changes in net assets (continued)For the period ended 30 June 2015
US Dollar High Yield
Bond fund
US Dollar Short Duration High
Yield Bond fund
US Dollar Liquidity
fund
Combined totals of all
funds +
USD USD USD USD
income
Dividends (net of withholding taxes) - - 4,452,491 292,054,331Interest on bonds 382,208 379,962 - 224,780,678Interest on swap transactions - - - 4,134,543Net option premium income - - - 1,854,707Income from securities lending - - - 1,045,861Bank interest - - 1,088 52,998Other income - - - 8,656,507
total income 382,208 379,962 4,453,579 532,579,625
Expenses
Management fee 28,252 22,500 10,461,725 228,169,517Administration charge 9,400 9,382 3,249,278 48,945,659Distribution fees 1,011 1,010 - 29,152,207Specific additional costs Taxe d’abonnement 652 651 - 6,214,615 Custody fees - - - 788,037 Hedging expenses - - - 1,318,486 Subsidiaries expenses - - - 150,672Interest on swap transactions - - - 50,804,544Bank interest 9 7 - 603,958Tax charges (excluding Taxe d’abonnement) - - - 27,685
total expenses 39,324 33,550 13,711,003 366,175,380
Plus fee waiver income - - 9,474,991 9,588,038
Net investment income/(loss) 342,884 346,412 217,567 175,992,283
Net realised gain/(loss) on sales of investments 45,284 25,997 - 857,782,254Net realised gain/(loss) on options - - - 1,942,736Net realised gain/(loss) on financial futures contracts - - - 116,934,528Net realised gain/(loss) on credit default swap contracts - - - 100,977,959Net realised gain/(loss) on interest rate swap contracts - - - (9,889,958)Net realised gain/(loss) on total return swap contracts - - - (298,728,285)Net realised gain/(loss) on foreign exchange transactions - 24 - (15,705,912)
net realised profit/(loss) for the period 388,168 372,433 217,567 929,305,605
Net change in unrealised appreciation/(depreciation) on investments 118,536 16,957 - (532,860,585)Net change in unrealised appreciation/(depreciation) on options - - - (6,692,678)Net change in unrealised appreciation/(depreciation) on financial futures contracts - - - (41,115,561)Net change in unrealised appreciation/(depreciation) on credit default swap contracts - - - (42,760,393)Net change in unrealised appreciation/(depreciation) on total return swap contracts - - - 21,381,240Net change in unrealised appreciation/(depreciation) on interest rate swap contracts - - - (18,761,217)Net change in unrealised appreciation/(depreciation) on foreign exchange transactions - - - 26,691,356
net change in net assets as a result of operations 506,704 389,390 217,567 335,187,767
Dividend distribution (4,940) (4,970) (203,100) (26,248,572)
Proceeds received on subscription of shares - - 2,524,014,469 15,563,065,839Net amount paid on redemption of shares - - (2,771,275,224) (14,567,195,008)
net change in net assets as a result of capital transactions - - (247,260,755) 995,870,831
total increase/(decrease) in net assets 501,764 384,420 (247,246,288) 1,304,810,026
Net assets at beginning of period 9,963,103 10,015,387 4,494,078,971 47,478,047,109Translation difference - - - (1,383,567,961)
net assets at end of period 10,464,867 10,399,807 4,246,832,683 47,399,289,174
+ Represents the combined totals of all Morgan Stanley Investment Funds.
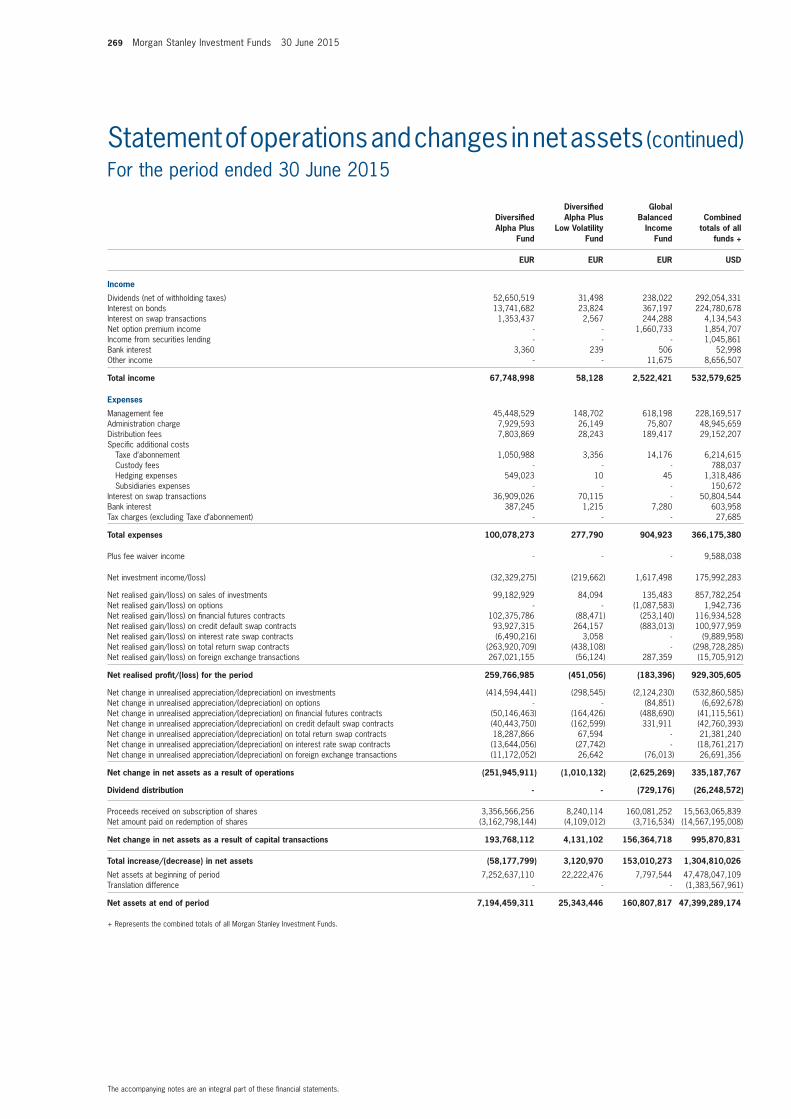
269 Morgan Stanley Investment Funds 30 June 2015
The accompanying notes are an integral part of these financial statements.
Statement of operations and changes in net assets (continued)For the period ended 30 June 2015
Diversified Alpha Plus
fund
Diversified Alpha Plus
Low volatility fund
Global Balanced
income fund
Combined totals of all
funds +
EUR EUR EUR USD
income
Dividends (net of withholding taxes) 52,650,519 31,498 238,022 292,054,331Interest on bonds 13,741,682 23,824 367,197 224,780,678Interest on swap transactions 1,353,437 2,567 244,288 4,134,543Net option premium income - - 1,660,733 1,854,707Income from securities lending - - - 1,045,861Bank interest 3,360 239 506 52,998Other income - - 11,675 8,656,507
total income 67,748,998 58,128 2,522,421 532,579,625
Expenses
Management fee 45,448,529 148,702 618,198 228,169,517Administration charge 7,929,593 26,149 75,807 48,945,659Distribution fees 7,803,869 28,243 189,417 29,152,207Specific additional costs Taxe d’abonnement 1,050,988 3,356 14,176 6,214,615 Custody fees - - - 788,037 Hedging expenses 549,023 10 45 1,318,486 Subsidiaries expenses - - - 150,672Interest on swap transactions 36,909,026 70,115 - 50,804,544Bank interest 387,245 1,215 7,280 603,958Tax charges (excluding Taxe d’abonnement) - - - 27,685
total expenses 100,078,273 277,790 904,923 366,175,380
Plus fee waiver income - - - 9,588,038
Net investment income/(loss) (32,329,275) (219,662) 1,617,498 175,992,283
Net realised gain/(loss) on sales of investments 99,182,929 84,094 135,483 857,782,254Net realised gain/(loss) on options - - (1,087,583) 1,942,736Net realised gain/(loss) on financial futures contracts 102,375,786 (88,471) (253,140) 116,934,528Net realised gain/(loss) on credit default swap contracts 93,927,315 264,157 (883,013) 100,977,959Net realised gain/(loss) on interest rate swap contracts (6,490,216) 3,058 - (9,889,958)Net realised gain/(loss) on total return swap contracts (263,920,709) (438,108) - (298,728,285)Net realised gain/(loss) on foreign exchange transactions 267,021,155 (56,124) 287,359 (15,705,912)
net realised profit/(loss) for the period 259,766,985 (451,056) (183,396) 929,305,605
Net change in unrealised appreciation/(depreciation) on investments (414,594,441) (298,545) (2,124,230) (532,860,585)Net change in unrealised appreciation/(depreciation) on options - - (84,851) (6,692,678)Net change in unrealised appreciation/(depreciation) on financial futures contracts (50,146,463) (164,426) (488,690) (41,115,561)Net change in unrealised appreciation/(depreciation) on credit default swap contracts (40,443,750) (162,599) 331,911 (42,760,393)Net change in unrealised appreciation/(depreciation) on total return swap contracts 18,287,866 67,594 - 21,381,240Net change in unrealised appreciation/(depreciation) on interest rate swap contracts (13,644,056) (27,742) - (18,761,217)Net change in unrealised appreciation/(depreciation) on foreign exchange transactions (11,172,052) 26,642 (76,013) 26,691,356
net change in net assets as a result of operations (251,945,911) (1,010,132) (2,625,269) 335,187,767
Dividend distribution - - (729,176) (26,248,572)
Proceeds received on subscription of shares 3,356,566,256 8,240,114 160,081,252 15,563,065,839Net amount paid on redemption of shares (3,162,798,144) (4,109,012) (3,716,534) (14,567,195,008)
net change in net assets as a result of capital transactions 193,768,112 4,131,102 156,364,718 995,870,831
total increase/(decrease) in net assets (58,177,799) 3,120,970 153,010,273 1,304,810,026
Net assets at beginning of period 7,252,637,110 22,222,476 7,797,544 47,478,047,109Translation difference - - - (1,383,567,961)
net assets at end of period 7,194,459,311 25,343,446 160,807,817 47,399,289,174
+ Represents the combined totals of all Morgan Stanley Investment Funds.
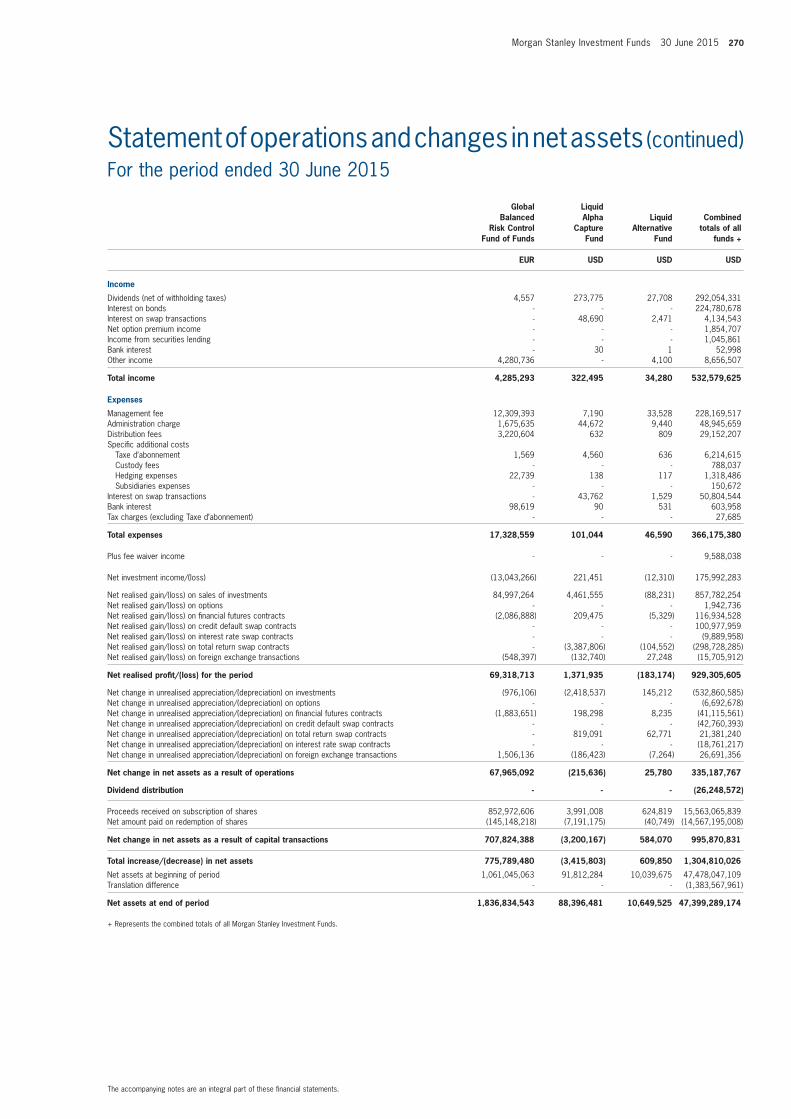
Morgan Stanley Investment Funds 30 June 2015 270
The accompanying notes are an integral part of these financial statements.
Statement of operations and changes in net assets (continued)For the period ended 30 June 2015
Global Balanced
Risk Control fund of funds
Liquid Alpha
Capture fund
Liquid Alternative
fund
Combined totals of all
funds +
EUR USD USD USD
income
Dividends (net of withholding taxes) 4,557 273,775 27,708 292,054,331Interest on bonds - - - 224,780,678Interest on swap transactions - 48,690 2,471 4,134,543Net option premium income - - - 1,854,707Income from securities lending - - - 1,045,861Bank interest - 30 1 52,998Other income 4,280,736 - 4,100 8,656,507
total income 4,285,293 322,495 34,280 532,579,625
Expenses
Management fee 12,309,393 7,190 33,528 228,169,517Administration charge 1,675,635 44,672 9,440 48,945,659Distribution fees 3,220,604 632 809 29,152,207Specific additional costs Taxe d’abonnement 1,569 4,560 636 6,214,615 Custody fees - - - 788,037 Hedging expenses 22,739 138 117 1,318,486 Subsidiaries expenses - - - 150,672Interest on swap transactions - 43,762 1,529 50,804,544Bank interest 98,619 90 531 603,958Tax charges (excluding Taxe d’abonnement) - - - 27,685
total expenses 17,328,559 101,044 46,590 366,175,380
Plus fee waiver income - - - 9,588,038
Net investment income/(loss) (13,043,266) 221,451 (12,310) 175,992,283
Net realised gain/(loss) on sales of investments 84,997,264 4,461,555 (88,231) 857,782,254Net realised gain/(loss) on options - - - 1,942,736Net realised gain/(loss) on financial futures contracts (2,086,888) 209,475 (5,329) 116,934,528Net realised gain/(loss) on credit default swap contracts - - - 100,977,959Net realised gain/(loss) on interest rate swap contracts - - - (9,889,958)Net realised gain/(loss) on total return swap contracts - (3,387,806) (104,552) (298,728,285)Net realised gain/(loss) on foreign exchange transactions (548,397) (132,740) 27,248 (15,705,912)
net realised profit/(loss) for the period 69,318,713 1,371,935 (183,174) 929,305,605
Net change in unrealised appreciation/(depreciation) on investments (976,106) (2,418,537) 145,212 (532,860,585)Net change in unrealised appreciation/(depreciation) on options - - - (6,692,678)Net change in unrealised appreciation/(depreciation) on financial futures contracts (1,883,651) 198,298 8,235 (41,115,561)Net change in unrealised appreciation/(depreciation) on credit default swap contracts - - - (42,760,393)Net change in unrealised appreciation/(depreciation) on total return swap contracts - 819,091 62,771 21,381,240Net change in unrealised appreciation/(depreciation) on interest rate swap contracts - - - (18,761,217)Net change in unrealised appreciation/(depreciation) on foreign exchange transactions 1,506,136 (186,423) (7,264) 26,691,356
net change in net assets as a result of operations 67,965,092 (215,636) 25,780 335,187,767
Dividend distribution - - - (26,248,572)
Proceeds received on subscription of shares 852,972,606 3,991,008 624,819 15,563,065,839Net amount paid on redemption of shares (145,148,218) (7,191,175) (40,749) (14,567,195,008)
net change in net assets as a result of capital transactions 707,824,388 (3,200,167) 584,070 995,870,831
total increase/(decrease) in net assets 775,789,480 (3,415,803) 609,850 1,304,810,026
Net assets at beginning of period 1,061,045,063 91,812,284 10,039,675 47,478,047,109Translation difference - - - (1,383,567,961)
net assets at end of period 1,836,834,543 88,396,481 10,649,525 47,399,289,174
+ Represents the combined totals of all Morgan Stanley Investment Funds.
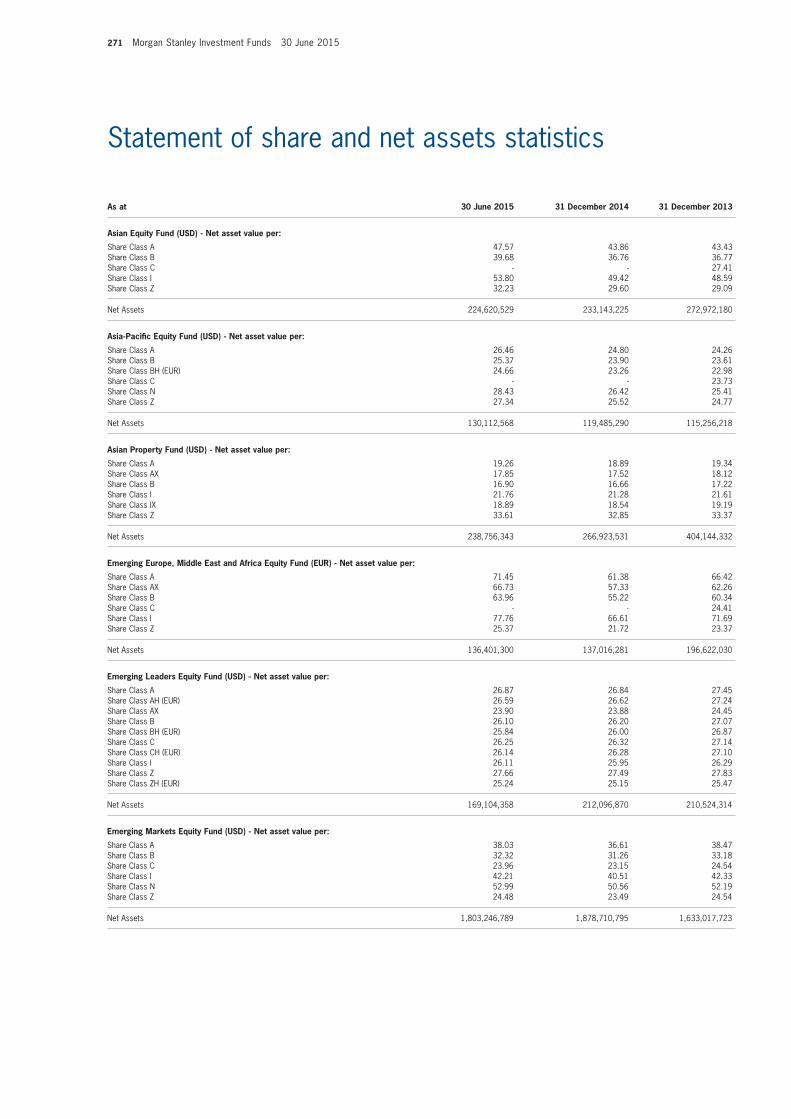
271 Morgan Stanley Investment Funds 30 June 2015
Statement of share and net assets statistics
As at 30 June 2015 31 December 2014 31 December 2013
Asian Equity fund (USD) - net asset value per:
Share Class A 47.57 43.86 43.43Share Class B 39.68 36.76 36.77Share Class C - - 27.41Share Class I 53.80 49.42 48.59Share Class Z 32.23 29.60 29.09
Net Assets 224,620,529 233,143,225 272,972,180
Asia-Pacific Equity fund (USD) - net asset value per:
Share Class A 26.46 24.80 24.26Share Class B 25.37 23.90 23.61Share Class BH (EUR) 24.66 23.26 22.98Share Class C - - 23.73Share Class N 28.43 26.42 25.41Share Class Z 27.34 25.52 24.77
Net Assets 130,112,568 119,485,290 115,256,218
Asian Property fund (USD) - net asset value per:
Share Class A 19.26 18.89 19.34Share Class AX 17.85 17.52 18.12Share Class B 16.90 16.66 17.22Share Class I 21.76 21.28 21.61Share Class IX 18.89 18.54 19.19Share Class Z 33.61 32.85 33.37
Net Assets 238,756,343 266,923,531 404,144,332
Emerging Europe, middle East and Africa Equity fund (EUR) - net asset value per:
Share Class A 71.45 61.38 66.42Share Class AX 66.73 57.33 62.26Share Class B 63.96 55.22 60.34Share Class C - - 24.41Share Class I 77.76 66.61 71.69Share Class Z 25.37 21.72 23.37
Net Assets 136,401,300 137,016,281 196,622,030
Emerging Leaders Equity fund (USD) - net asset value per:
Share Class A 26.87 26.84 27.45Share Class AH (EUR) 26.59 26.62 27.24Share Class AX 23.90 23.88 24.45Share Class B 26.10 26.20 27.07Share Class BH (EUR) 25.84 26.00 26.87Share Class C 26.25 26.32 27.14Share Class CH (EUR) 26.14 26.28 27.10Share Class I 26.11 25.95 26.29Share Class Z 27.66 27.49 27.83Share Class ZH (EUR) 25.24 25.15 25.47
Net Assets 169,104,358 212,096,870 210,524,314
Emerging markets Equity fund (USD) - net asset value per:
Share Class A 38.03 36.61 38.47Share Class B 32.32 31.26 33.18Share Class C 23.96 23.15 24.54Share Class I 42.21 40.51 42.33Share Class N 52.99 50.56 52.19Share Class Z 24.48 23.49 24.54
Net Assets 1,803,246,789 1,878,710,795 1,633,017,723
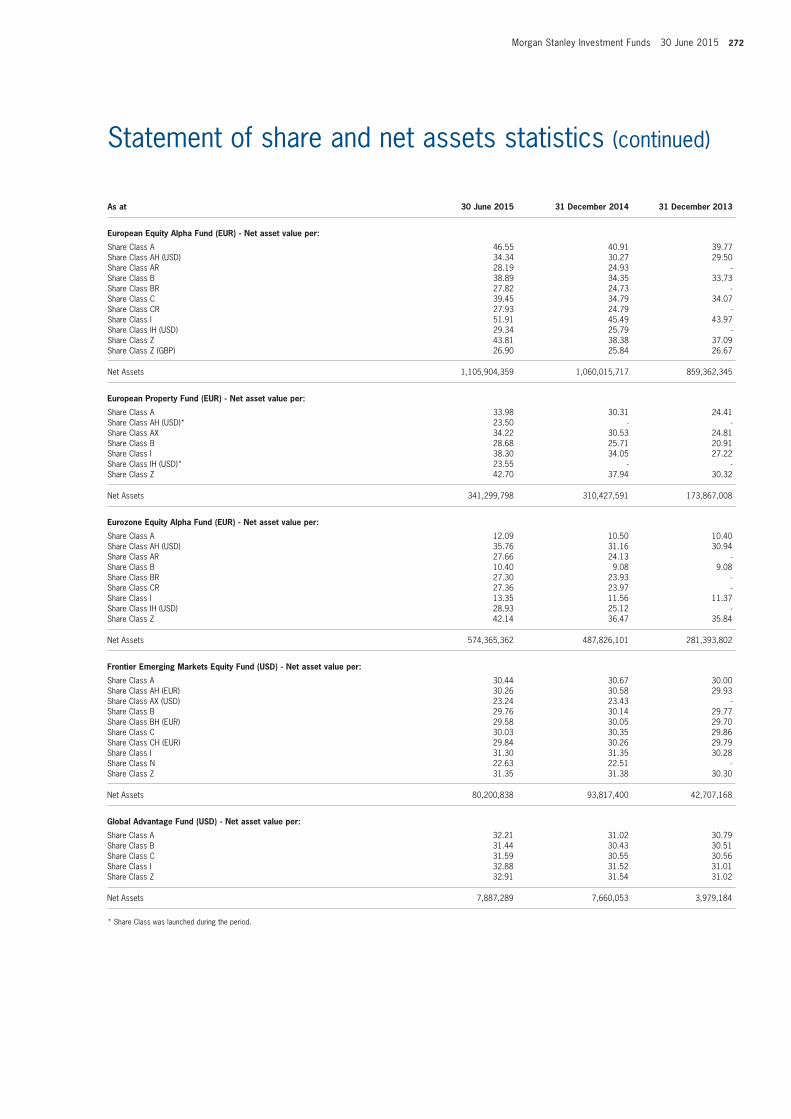
Morgan Stanley Investment Funds 30 June 2015 272
Statement of share and net assets statistics (continued)
As at 30 June 2015 31 December 2014 31 December 2013
European Equity Alpha fund (EUR) - net asset value per:
Share Class A 46.55 40.91 39.77Share Class AH (USD) 34.34 30.27 29.50Share Class AR 28.19 24.93 -Share Class B 38.89 34.35 33.73Share Class BR 27.82 24.73 -Share Class C 39.45 34.79 34.07Share Class CR 27.93 24.79 -Share Class I 51.91 45.49 43.97Share Class IH (USD) 29.34 25.79 -Share Class Z 43.81 38.38 37.09Share Class Z (GBP) 26.90 25.84 26.67
Net Assets 1,105,904,359 1,060,015,717 859,362,345
European Property fund (EUR) - net asset value per:
Share Class A 33.98 30.31 24.41Share Class AH (USD)* 23.50 - -Share Class AX 34.22 30.53 24.81Share Class B 28.68 25.71 20.91Share Class I 38.30 34.05 27.22Share Class IH (USD)* 23.55 - -Share Class Z 42.70 37.94 30.32
Net Assets 341,299,798 310,427,591 173,867,008
Eurozone Equity Alpha fund (EUR) - net asset value per:
Share Class A 12.09 10.50 10.40Share Class AH (USD) 35.76 31.16 30.94Share Class AR 27.66 24.13 -Share Class B 10.40 9.08 9.08Share Class BR 27.30 23.93 -Share Class CR 27.36 23.97 -Share Class I 13.35 11.56 11.37Share Class IH (USD) 28.93 25.12 -Share Class Z 42.14 36.47 35.84
Net Assets 574,365,362 487,826,101 281,393,802
frontier Emerging markets Equity fund (USD) - net asset value per:
Share Class A 30.44 30.67 30.00Share Class AH (EUR) 30.26 30.58 29.93Share Class AX (USD) 23.24 23.43 -Share Class B 29.76 30.14 29.77Share Class BH (EUR) 29.58 30.05 29.70Share Class C 30.03 30.35 29.86Share Class CH (EUR) 29.84 30.26 29.79Share Class I 31.30 31.35 30.28Share Class N 22.63 22.51 -Share Class Z 31.35 31.38 30.30
Net Assets 80,200,838 93,817,400 42,707,168
Global Advantage fund (USD) - net asset value per:
Share Class A 32.21 31.02 30.79Share Class B 31.44 30.43 30.51Share Class C 31.59 30.55 30.56Share Class I 32.88 31.52 31.01Share Class Z 32.91 31.54 31.02
Net Assets 7,887,289 7,660,053 3,979,184
* Share Class was launched during the period.
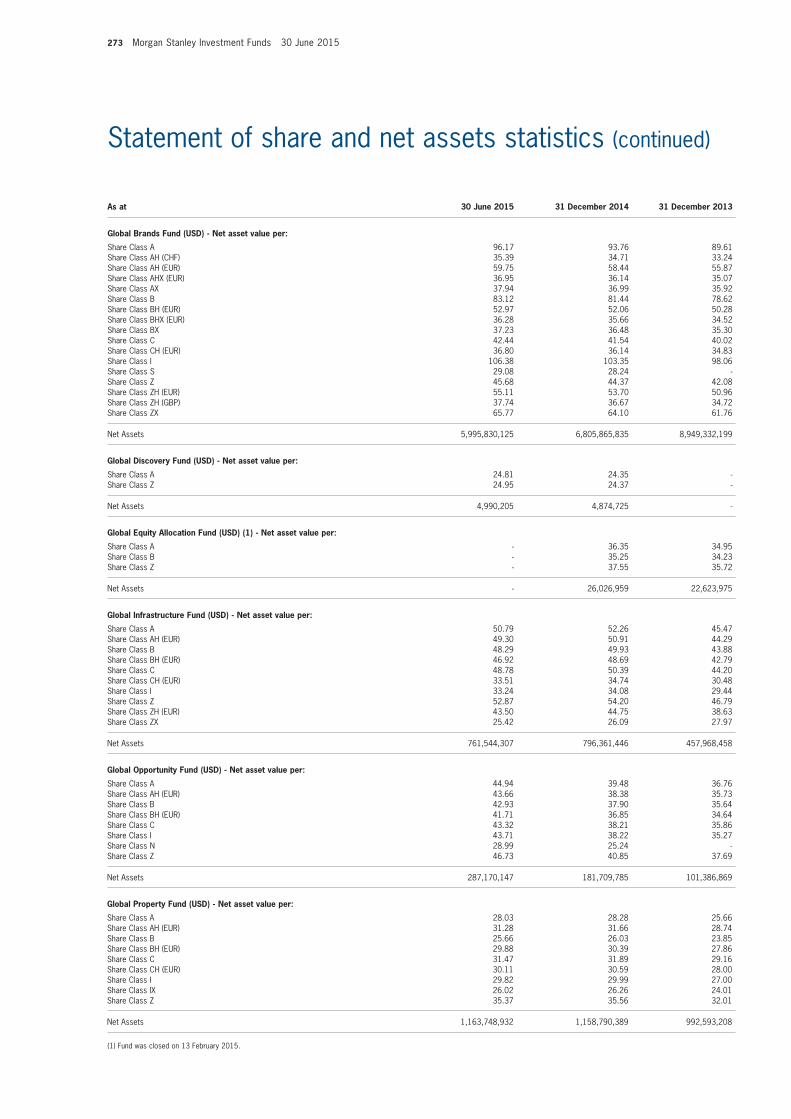
273 Morgan Stanley Investment Funds 30 June 2015
Statement of share and net assets statistics (continued)
As at 30 June 2015 31 December 2014 31 December 2013
Global Brands fund (USD) - net asset value per:
Share Class A 96.17 93.76 89.61Share Class AH (CHF) 35.39 34.71 33.24Share Class AH (EUR) 59.75 58.44 55.87Share Class AHX (EUR) 36.95 36.14 35.07Share Class AX 37.94 36.99 35.92Share Class B 83.12 81.44 78.62Share Class BH (EUR) 52.97 52.06 50.28Share Class BHX (EUR) 36.28 35.66 34.52Share Class BX 37.23 36.48 35.30Share Class C 42.44 41.54 40.02Share Class CH (EUR) 36.80 36.14 34.83Share Class I 106.38 103.35 98.06Share Class S 29.08 28.24 -Share Class Z 45.68 44.37 42.08Share Class ZH (EUR) 55.11 53.70 50.96Share Class ZH (GBP) 37.74 36.67 34.72Share Class ZX 65.77 64.10 61.76
Net Assets 5,995,830,125 6,805,865,835 8,949,332,199
Global Discovery fund (USD) - net asset value per:
Share Class A 24.81 24.35 -Share Class Z 24.95 24.37 -
Net Assets 4,990,205 4,874,725 -
Global Equity Allocation fund (USD) (1) - net asset value per:
Share Class A - 36.35 34.95Share Class B - 35.25 34.23Share Class Z - 37.55 35.72
Net Assets - 26,026,959 22,623,975
Global infrastructure fund (USD) - net asset value per:
Share Class A 50.79 52.26 45.47Share Class AH (EUR) 49.30 50.91 44.29Share Class B 48.29 49.93 43.88Share Class BH (EUR) 46.92 48.69 42.79Share Class C 48.78 50.39 44.20Share Class CH (EUR) 33.51 34.74 30.48Share Class I 33.24 34.08 29.44Share Class Z 52.87 54.20 46.79Share Class ZH (EUR) 43.50 44.75 38.63Share Class ZX 25.42 26.09 27.97
Net Assets 761,544,307 796,361,446 457,968,458
Global opportunity fund (USD) - net asset value per:
Share Class A 44.94 39.48 36.76Share Class AH (EUR) 43.66 38.38 35.73Share Class B 42.93 37.90 35.64Share Class BH (EUR) 41.71 36.85 34.64Share Class C 43.32 38.21 35.86Share Class I 43.71 38.22 35.27Share Class N 28.99 25.24 -Share Class Z 46.73 40.85 37.69
Net Assets 287,170,147 181,709,785 101,386,869
Global Property fund (USD) - net asset value per:
Share Class A 28.03 28.28 25.66Share Class AH (EUR) 31.28 31.66 28.74Share Class B 25.66 26.03 23.85Share Class BH (EUR) 29.88 30.39 27.86Share Class C 31.47 31.89 29.16Share Class CH (EUR) 30.11 30.59 28.00Share Class I 29.82 29.99 27.00Share Class IX 26.02 26.26 24.01Share Class Z 35.37 35.56 32.01
Net Assets 1,163,748,932 1,158,790,389 992,593,208
(1) Fund was closed on 13 February 2015.
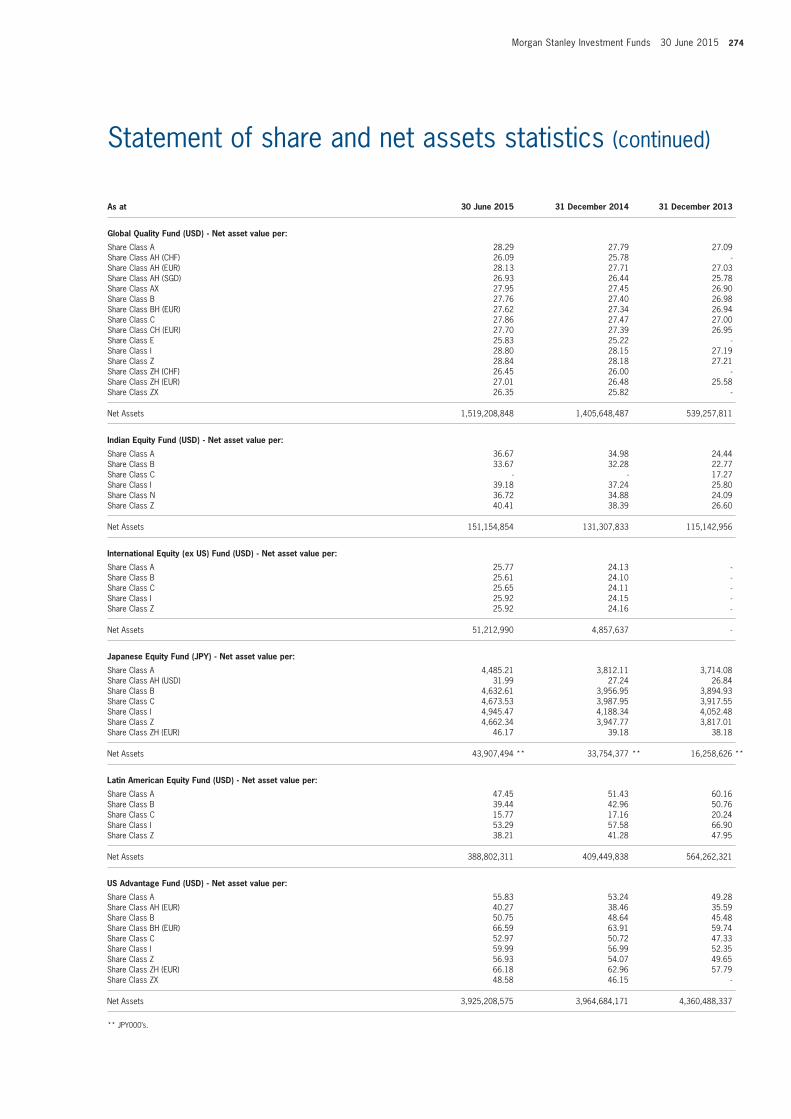
Morgan Stanley Investment Funds 30 June 2015 274
Statement of share and net assets statistics (continued)
As at 30 June 2015 31 December 2014 31 December 2013
Global Quality fund (USD) - net asset value per:
Share Class A 28.29 27.79 27.09Share Class AH (CHF) 26.09 25.78 -Share Class AH (EUR) 28.13 27.71 27.03Share Class AH (SGD) 26.93 26.44 25.78Share Class AX 27.95 27.45 26.90Share Class B 27.76 27.40 26.98Share Class BH (EUR) 27.62 27.34 26.94Share Class C 27.86 27.47 27.00Share Class CH (EUR) 27.70 27.39 26.95Share Class E 25.83 25.22 -Share Class I 28.80 28.15 27.19Share Class Z 28.84 28.18 27.21Share Class ZH (CHF) 26.45 26.00 -Share Class ZH (EUR) 27.01 26.48 25.58Share Class ZX 26.35 25.82 -
Net Assets 1,519,208,848 1,405,648,487 539,257,811
indian Equity fund (USD) - net asset value per:
Share Class A 36.67 34.98 24.44Share Class B 33.67 32.28 22.77Share Class C - - 17.27Share Class I 39.18 37.24 25.80Share Class N 36.72 34.88 24.09Share Class Z 40.41 38.39 26.60
Net Assets 151,154,854 131,307,833 115,142,956
international Equity (ex US) fund (USD) - net asset value per:
Share Class A 25.77 24.13 -Share Class B 25.61 24.10 -Share Class C 25.65 24.11 -Share Class I 25.92 24.15 -Share Class Z 25.92 24.16 -
Net Assets 51,212,990 4,857,637 -
Japanese Equity fund (JPY) - net asset value per:
Share Class A 4,485.21 3,812.11 3,714.08Share Class AH (USD) 31.99 27.24 26.84Share Class B 4,632.61 3,956.95 3,894.93Share Class C 4,673.53 3,987.95 3,917.55Share Class I 4,945.47 4,188.34 4,052.48Share Class Z 4,662.34 3,947.77 3,817.01Share Class ZH (EUR) 46.17 39.18 38.18
Net Assets 43,907,494 ** 33,754,377 ** 16,258,626 **
Latin American Equity fund (USD) - net asset value per:
Share Class A 47.45 51.43 60.16Share Class B 39.44 42.96 50.76Share Class C 15.77 17.16 20.24Share Class I 53.29 57.58 66.90Share Class Z 38.21 41.28 47.95
Net Assets 388,802,311 409,449,838 564,262,321
US Advantage fund (USD) - net asset value per:
Share Class A 55.83 53.24 49.28Share Class AH (EUR) 40.27 38.46 35.59Share Class B 50.75 48.64 45.48Share Class BH (EUR) 66.59 63.91 59.74Share Class C 52.97 50.72 47.33Share Class I 59.99 56.99 52.35Share Class Z 56.93 54.07 49.65Share Class ZH (EUR) 66.18 62.96 57.79Share Class ZX 48.58 46.15 -
Net Assets 3,925,208,575 3,964,684,171 4,360,488,337
** JPY000’s.
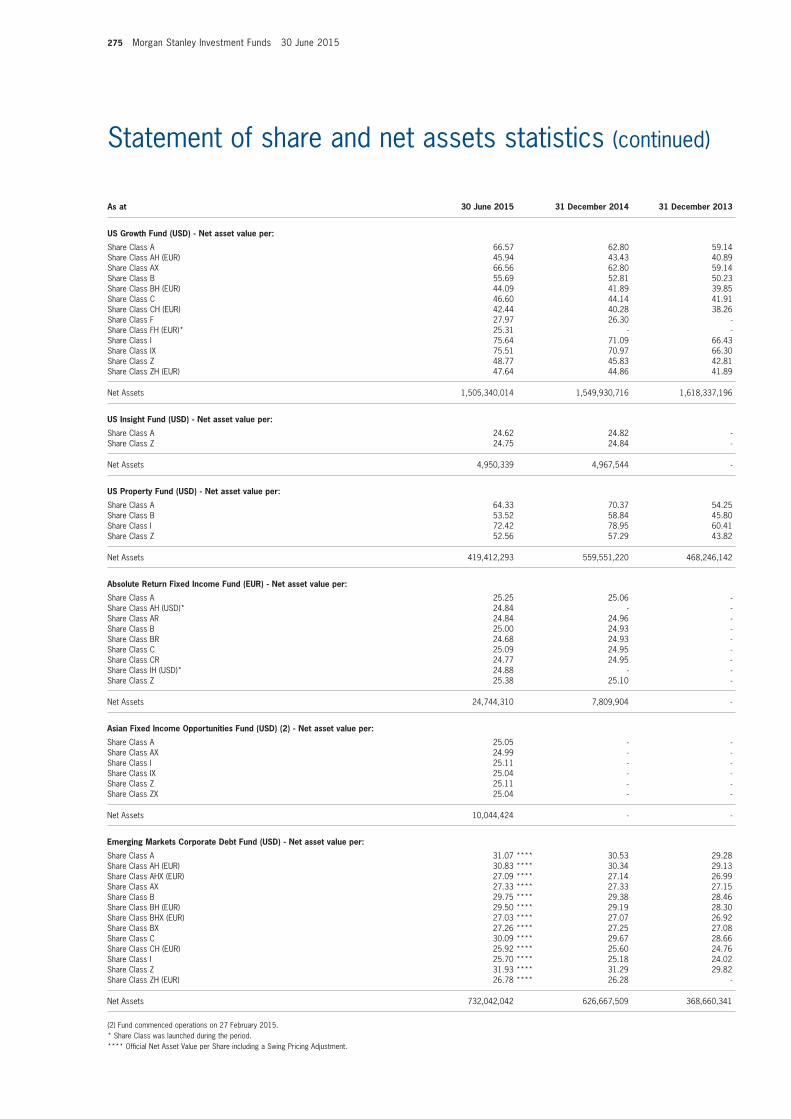
275 Morgan Stanley Investment Funds 30 June 2015
Statement of share and net assets statistics (continued)
As at 30 June 2015 31 December 2014 31 December 2013
US Growth fund (USD) - net asset value per:
Share Class A 66.57 62.80 59.14Share Class AH (EUR) 45.94 43.43 40.89Share Class AX 66.56 62.80 59.14Share Class B 55.69 52.81 50.23Share Class BH (EUR) 44.09 41.89 39.85Share Class C 46.60 44.14 41.91Share Class CH (EUR) 42.44 40.28 38.26Share Class F 27.97 26.30 -Share Class FH (EUR)* 25.31 - -Share Class I 75.64 71.09 66.43Share Class IX 75.51 70.97 66.30Share Class Z 48.77 45.83 42.81Share Class ZH (EUR) 47.64 44.86 41.89
Net Assets 1,505,340,014 1,549,930,716 1,618,337,196
US insight fund (USD) - net asset value per:
Share Class A 24.62 24.82 -Share Class Z 24.75 24.84 -
Net Assets 4,950,339 4,967,544 -
US Property fund (USD) - net asset value per:
Share Class A 64.33 70.37 54.25Share Class B 53.52 58.84 45.80Share Class I 72.42 78.95 60.41Share Class Z 52.56 57.29 43.82
Net Assets 419,412,293 559,551,220 468,246,142
Absolute Return fixed income fund (EUR) - net asset value per:
Share Class A 25.25 25.06 -Share Class AH (USD)* 24.84 - -Share Class AR 24.84 24.96 -Share Class B 25.00 24.93 -Share Class BR 24.68 24.93 -Share Class C 25.09 24.95 -Share Class CR 24.77 24.95 -Share Class IH (USD)* 24.88 - -Share Class Z 25.38 25.10 -
Net Assets 24,744,310 7,809,904 -
Asian fixed income opportunities fund (USD) (2) - net asset value per:
Share Class A 25.05 - -Share Class AX 24.99 - -Share Class I 25.11 - -Share Class IX 25.04 - -Share Class Z 25.11 - -Share Class ZX 25.04 - -
Net Assets 10,044,424 - -
Emerging markets Corporate Debt fund (USD) - net asset value per:
Share Class A 31.07 **** 30.53 29.28Share Class AH (EUR) 30.83 **** 30.34 29.13Share Class AHX (EUR) 27.09 **** 27.14 26.99Share Class AX 27.33 **** 27.33 27.15Share Class B 29.75 **** 29.38 28.46Share Class BH (EUR) 29.50 **** 29.19 28.30Share Class BHX (EUR) 27.03 **** 27.07 26.92Share Class BX 27.26 **** 27.25 27.08Share Class C 30.09 **** 29.67 28.66Share Class CH (EUR) 25.92 **** 25.60 24.76Share Class I 25.70 **** 25.18 24.02Share Class Z 31.93 **** 31.29 29.82Share Class ZH (EUR) 26.78 **** 26.28 -
Net Assets 732,042,042 626,667,509 368,660,341
(2) Fund commenced operations on 27 February 2015.* Share Class was launched during the period.**** Official Net Asset Value per Share including a Swing Pricing Adjustment.
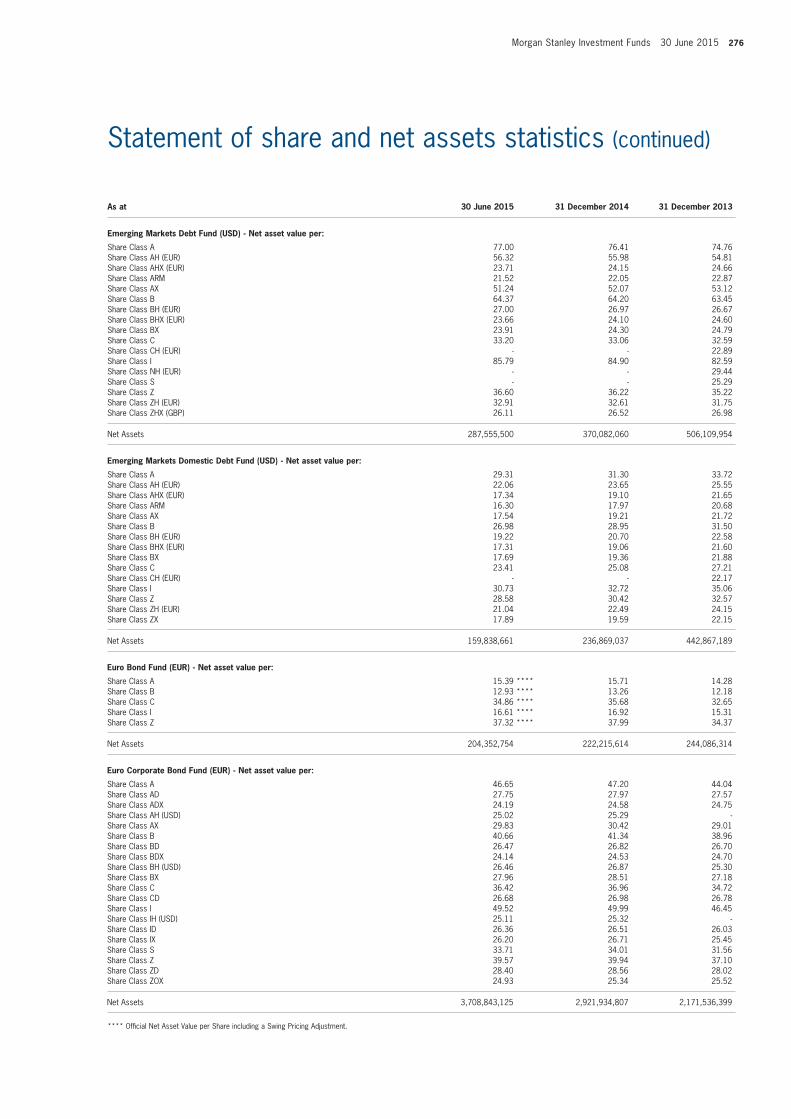
Morgan Stanley Investment Funds 30 June 2015 276
Statement of share and net assets statistics (continued)
As at 30 June 2015 31 December 2014 31 December 2013
Emerging markets Debt fund (USD) - net asset value per:
Share Class A 77.00 76.41 74.76Share Class AH (EUR) 56.32 55.98 54.81Share Class AHX (EUR) 23.71 24.15 24.66Share Class ARM 21.52 22.05 22.87Share Class AX 51.24 52.07 53.12Share Class B 64.37 64.20 63.45Share Class BH (EUR) 27.00 26.97 26.67Share Class BHX (EUR) 23.66 24.10 24.60Share Class BX 23.91 24.30 24.79Share Class C 33.20 33.06 32.59Share Class CH (EUR) - - 22.89Share Class I 85.79 84.90 82.59Share Class NH (EUR) - - 29.44Share Class S - - 25.29Share Class Z 36.60 36.22 35.22Share Class ZH (EUR) 32.91 32.61 31.75Share Class ZHX (GBP) 26.11 26.52 26.98
Net Assets 287,555,500 370,082,060 506,109,954
Emerging markets Domestic Debt fund (USD) - net asset value per:
Share Class A 29.31 31.30 33.72Share Class AH (EUR) 22.06 23.65 25.55Share Class AHX (EUR) 17.34 19.10 21.65Share Class ARM 16.30 17.97 20.68Share Class AX 17.54 19.21 21.72Share Class B 26.98 28.95 31.50Share Class BH (EUR) 19.22 20.70 22.58Share Class BHX (EUR) 17.31 19.06 21.60Share Class BX 17.69 19.36 21.88Share Class C 23.41 25.08 27.21Share Class CH (EUR) - - 22.17Share Class I 30.73 32.72 35.06Share Class Z 28.58 30.42 32.57Share Class ZH (EUR) 21.04 22.49 24.15Share Class ZX 17.89 19.59 22.15
Net Assets 159,838,661 236,869,037 442,867,189
Euro Bond fund (EUR) - net asset value per:
Share Class A 15.39 **** 15.71 14.28Share Class B 12.93 **** 13.26 12.18Share Class C 34.86 **** 35.68 32.65Share Class I 16.61 **** 16.92 15.31Share Class Z 37.32 **** 37.99 34.37
Net Assets 204,352,754 222,215,614 244,086,314
Euro Corporate Bond fund (EUR) - net asset value per:
Share Class A 46.65 47.20 44.04Share Class AD 27.75 27.97 27.57Share Class ADX 24.19 24.58 24.75Share Class AH (USD) 25.02 25.29 -Share Class AX 29.83 30.42 29.01Share Class B 40.66 41.34 38.96Share Class BD 26.47 26.82 26.70Share Class BDX 24.14 24.53 24.70Share Class BH (USD) 26.46 26.87 25.30Share Class BX 27.96 28.51 27.18Share Class C 36.42 36.96 34.72Share Class CD 26.68 26.98 26.78Share Class I 49.52 49.99 46.45Share Class IH (USD) 25.11 25.32 -Share Class ID 26.36 26.51 26.03Share Class IX 26.20 26.71 25.45Share Class S 33.71 34.01 31.56Share Class Z 39.57 39.94 37.10Share Class ZD 28.40 28.56 28.02Share Class ZOX 24.93 25.34 25.52
Net Assets 3,708,843,125 2,921,934,807 2,171,536,399
**** Official Net Asset Value per Share including a Swing Pricing Adjustment.
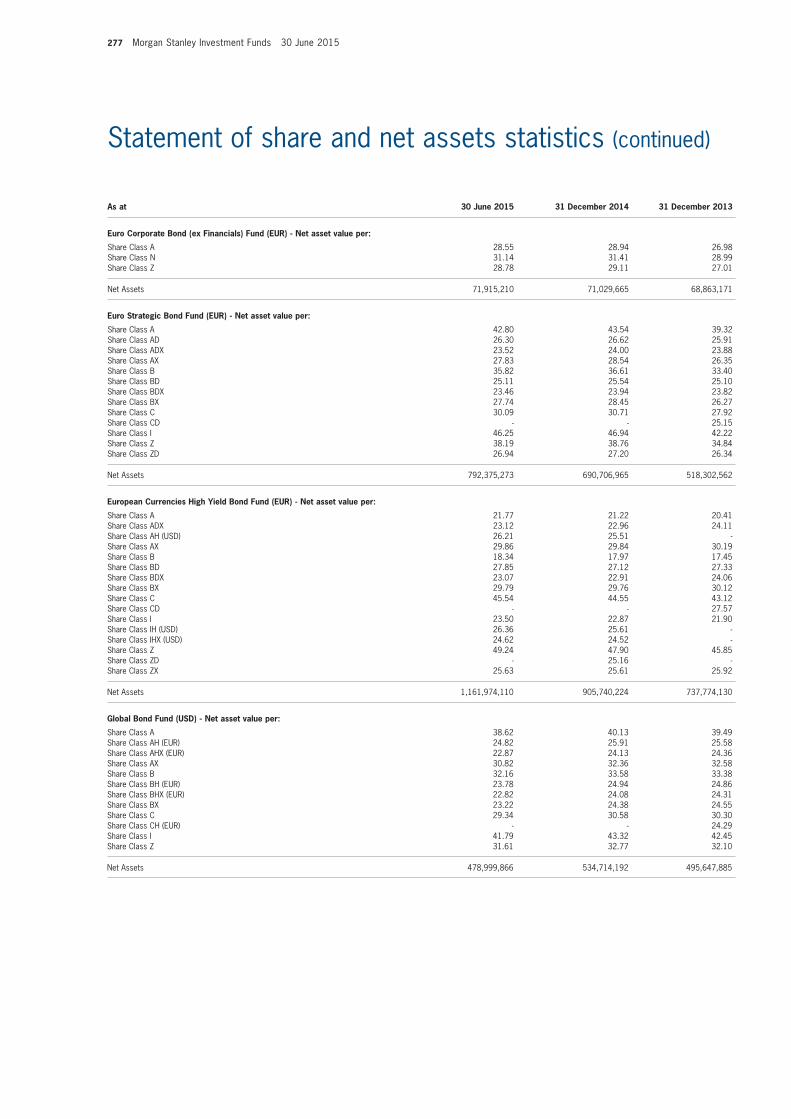
277 Morgan Stanley Investment Funds 30 June 2015
Statement of share and net assets statistics (continued)
As at 30 June 2015 31 December 2014 31 December 2013
Euro Corporate Bond (ex financials) fund (EUR) - net asset value per:
Share Class A 28.55 28.94 26.98Share Class N 31.14 31.41 28.99Share Class Z 28.78 29.11 27.01
Net Assets 71,915,210 71,029,665 68,863,171
Euro Strategic Bond fund (EUR) - net asset value per:
Share Class A 42.80 43.54 39.32Share Class AD 26.30 26.62 25.91Share Class ADX 23.52 24.00 23.88Share Class AX 27.83 28.54 26.35Share Class B 35.82 36.61 33.40Share Class BD 25.11 25.54 25.10Share Class BDX 23.46 23.94 23.82Share Class BX 27.74 28.45 26.27Share Class C 30.09 30.71 27.92Share Class CD - - 25.15Share Class I 46.25 46.94 42.22Share Class Z 38.19 38.76 34.84Share Class ZD 26.94 27.20 26.34
Net Assets 792,375,273 690,706,965 518,302,562
European Currencies High Yield Bond fund (EUR) - net asset value per:
Share Class A 21.77 21.22 20.41Share Class ADX 23.12 22.96 24.11Share Class AH (USD) 26.21 25.51 -Share Class AX 29.86 29.84 30.19Share Class B 18.34 17.97 17.45Share Class BD 27.85 27.12 27.33Share Class BDX 23.07 22.91 24.06Share Class BX 29.79 29.76 30.12Share Class C 45.54 44.55 43.12Share Class CD - - 27.57Share Class I 23.50 22.87 21.90Share Class IH (USD) 26.36 25.61 -Share Class IHX (USD) 24.62 24.52 -Share Class Z 49.24 47.90 45.85Share Class ZD - 25.16 -Share Class ZX 25.63 25.61 25.92
Net Assets 1,161,974,110 905,740,224 737,774,130
Global Bond fund (USD) - net asset value per:
Share Class A 38.62 40.13 39.49Share Class AH (EUR) 24.82 25.91 25.58Share Class AHX (EUR) 22.87 24.13 24.36Share Class AX 30.82 32.36 32.58Share Class B 32.16 33.58 33.38Share Class BH (EUR) 23.78 24.94 24.86Share Class BHX (EUR) 22.82 24.08 24.31Share Class BX 23.22 24.38 24.55Share Class C 29.34 30.58 30.30Share Class CH (EUR) - - 24.29Share Class I 41.79 43.32 42.45Share Class Z 31.61 32.77 32.10
Net Assets 478,999,866 534,714,192 495,647,885
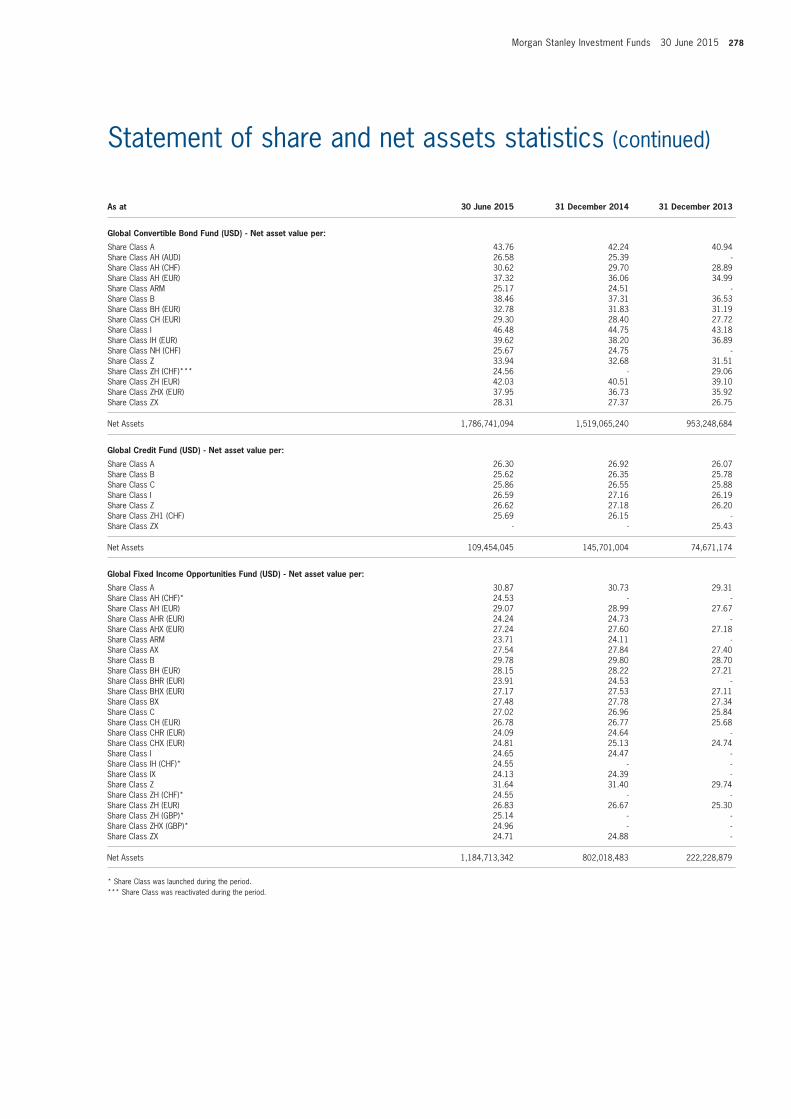
Morgan Stanley Investment Funds 30 June 2015 278
Statement of share and net assets statistics (continued)
As at 30 June 2015 31 December 2014 31 December 2013
Global Convertible Bond fund (USD) - net asset value per:
Share Class A 43.76 42.24 40.94Share Class AH (AUD) 26.58 25.39 -Share Class AH (CHF) 30.62 29.70 28.89Share Class AH (EUR) 37.32 36.06 34.99Share Class ARM 25.17 24.51 -Share Class B 38.46 37.31 36.53Share Class BH (EUR) 32.78 31.83 31.19Share Class CH (EUR) 29.30 28.40 27.72Share Class I 46.48 44.75 43.18Share Class IH (EUR) 39.62 38.20 36.89Share Class NH (CHF) 25.67 24.75 -Share Class Z 33.94 32.68 31.51Share Class ZH (CHF)*** 24.56 - 29.06Share Class ZH (EUR) 42.03 40.51 39.10Share Class ZHX (EUR) 37.95 36.73 35.92Share Class ZX 28.31 27.37 26.75
Net Assets 1,786,741,094 1,519,065,240 953,248,684
Global Credit fund (USD) - net asset value per:
Share Class A 26.30 26.92 26.07Share Class B 25.62 26.35 25.78Share Class C 25.86 26.55 25.88Share Class I 26.59 27.16 26.19Share Class Z 26.62 27.18 26.20Share Class ZH1 (CHF) 25.69 26.15 -Share Class ZX - - 25.43
Net Assets 109,454,045 145,701,004 74,671,174
Global fixed income opportunities fund (USD) - net asset value per:
Share Class A 30.87 30.73 29.31Share Class AH (CHF)* 24.53 - -Share Class AH (EUR) 29.07 28.99 27.67Share Class AHR (EUR) 24.24 24.73 -Share Class AHX (EUR) 27.24 27.60 27.18Share Class ARM 23.71 24.11 -Share Class AX 27.54 27.84 27.40Share Class B 29.78 29.80 28.70Share Class BH (EUR) 28.15 28.22 27.21Share Class BHR (EUR) 23.91 24.53 -Share Class BHX (EUR) 27.17 27.53 27.11Share Class BX 27.48 27.78 27.34Share Class C 27.02 26.96 25.84Share Class CH (EUR) 26.78 26.77 25.68Share Class CHR (EUR) 24.09 24.64 -Share Class CHX (EUR) 24.81 25.13 24.74Share Class I 24.65 24.47 -Share Class IH (CHF)* 24.55 - -Share Class IX 24.13 24.39 -Share Class Z 31.64 31.40 29.74Share Class ZH (CHF)* 24.55 - -Share Class ZH (EUR) 26.83 26.67 25.30Share Class ZH (GBP)* 25.14 - -Share Class ZHX (GBP)* 24.96 - -Share Class ZX 24.71 24.88 -
Net Assets 1,184,713,342 802,018,483 222,228,879
* Share Class was launched during the period.*** Share Class was reactivated during the period.
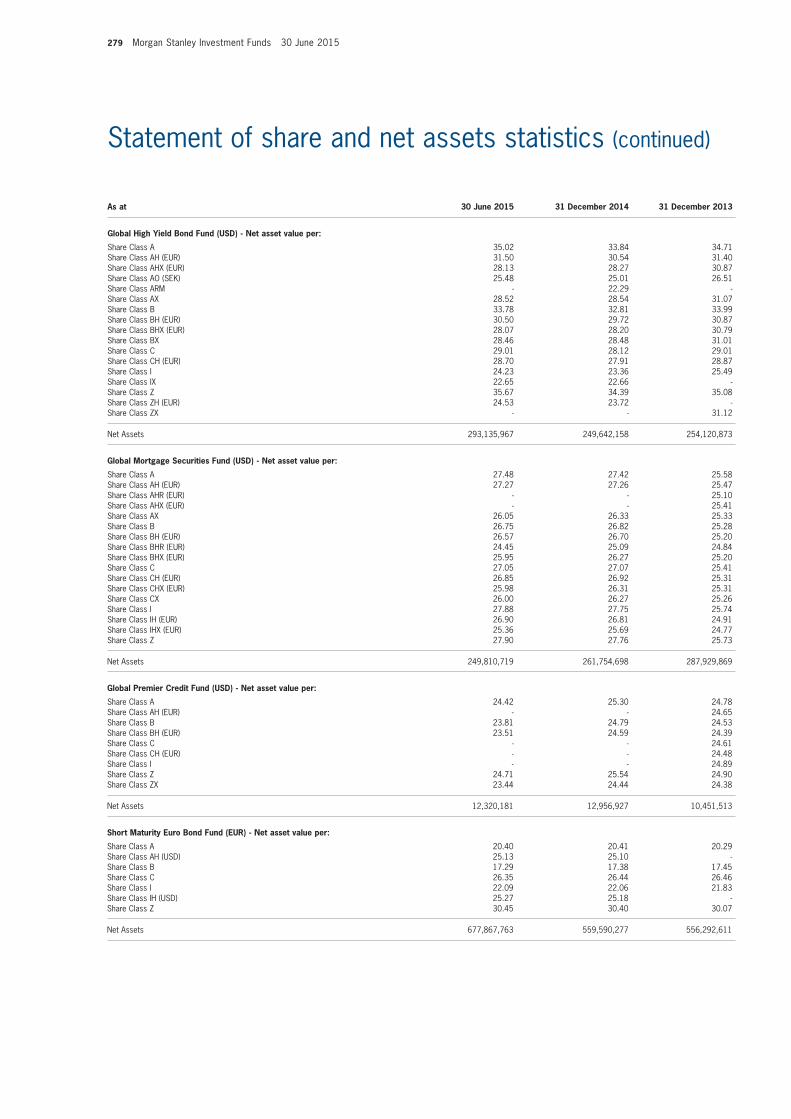
279 Morgan Stanley Investment Funds 30 June 2015
Statement of share and net assets statistics (continued)
As at 30 June 2015 31 December 2014 31 December 2013
Global High Yield Bond fund (USD) - net asset value per:
Share Class A 35.02 33.84 34.71Share Class AH (EUR) 31.50 30.54 31.40Share Class AHX (EUR) 28.13 28.27 30.87Share Class AO (SEK) 25.48 25.01 26.51Share Class ARM - 22.29 -Share Class AX 28.52 28.54 31.07Share Class B 33.78 32.81 33.99Share Class BH (EUR) 30.50 29.72 30.87Share Class BHX (EUR) 28.07 28.20 30.79Share Class BX 28.46 28.48 31.01Share Class C 29.01 28.12 29.01Share Class CH (EUR) 28.70 27.91 28.87Share Class I 24.23 23.36 25.49Share Class IX 22.65 22.66 -Share Class Z 35.67 34.39 35.08Share Class ZH (EUR) 24.53 23.72 -Share Class ZX - - 31.12
Net Assets 293,135,967 249,642,158 254,120,873
Global mortgage Securities fund (USD) - net asset value per:
Share Class A 27.48 27.42 25.58Share Class AH (EUR) 27.27 27.26 25.47Share Class AHR (EUR) - - 25.10Share Class AHX (EUR) - - 25.41Share Class AX 26.05 26.33 25.33Share Class B 26.75 26.82 25.28Share Class BH (EUR) 26.57 26.70 25.20Share Class BHR (EUR) 24.45 25.09 24.84Share Class BHX (EUR) 25.95 26.27 25.20Share Class C 27.05 27.07 25.41Share Class CH (EUR) 26.85 26.92 25.31Share Class CHX (EUR) 25.98 26.31 25.31Share Class CX 26.00 26.27 25.26Share Class I 27.88 27.75 25.74Share Class IH (EUR) 26.90 26.81 24.91Share Class IHX (EUR) 25.36 25.69 24.77Share Class Z 27.90 27.76 25.73
Net Assets 249,810,719 261,754,698 287,929,869
Global Premier Credit fund (USD) - net asset value per:
Share Class A 24.42 25.30 24.78Share Class AH (EUR) - - 24.65Share Class B 23.81 24.79 24.53Share Class BH (EUR) 23.51 24.59 24.39Share Class C - - 24.61Share Class CH (EUR) - - 24.48Share Class I - - 24.89Share Class Z 24.71 25.54 24.90Share Class ZX 23.44 24.44 24.38
Net Assets 12,320,181 12,956,927 10,451,513
Short maturity Euro Bond fund (EUR) - net asset value per:
Share Class A 20.40 20.41 20.29Share Class AH (USD) 25.13 25.10 -Share Class B 17.29 17.38 17.45Share Class C 26.35 26.44 26.46Share Class I 22.09 22.06 21.83Share Class IH (USD) 25.27 25.18 -Share Class Z 30.45 30.40 30.07
Net Assets 677,867,763 559,590,277 556,292,611
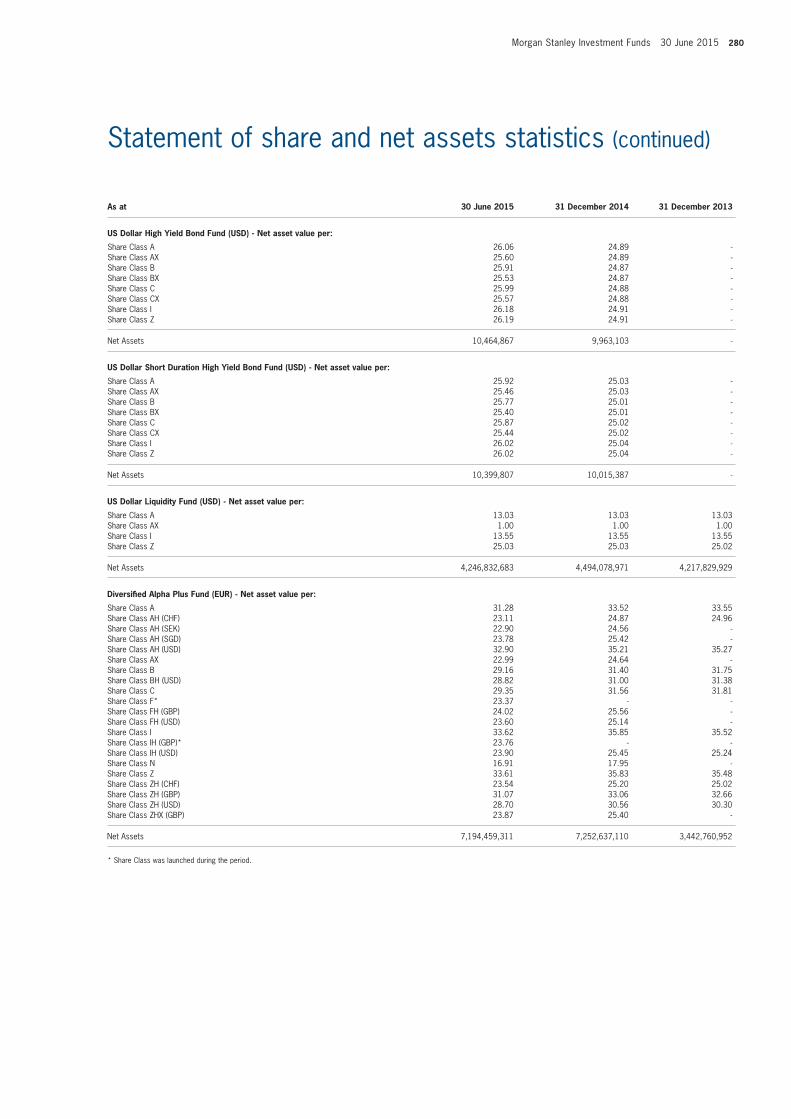
Morgan Stanley Investment Funds 30 June 2015 280
Statement of share and net assets statistics (continued)
As at 30 June 2015 31 December 2014 31 December 2013
US Dollar High Yield Bond fund (USD) - net asset value per:
Share Class A 26.06 24.89 -Share Class AX 25.60 24.89 -Share Class B 25.91 24.87 -Share Class BX 25.53 24.87 -Share Class C 25.99 24.88 -Share Class CX 25.57 24.88 -Share Class I 26.18 24.91 -Share Class Z 26.19 24.91 -
Net Assets 10,464,867 9,963,103 -
US Dollar Short Duration High Yield Bond fund (USD) - net asset value per:
Share Class A 25.92 25.03 -Share Class AX 25.46 25.03 -Share Class B 25.77 25.01 -Share Class BX 25.40 25.01 -Share Class C 25.87 25.02 -Share Class CX 25.44 25.02 -Share Class I 26.02 25.04 -Share Class Z 26.02 25.04 -
Net Assets 10,399,807 10,015,387 -
US Dollar Liquidity fund (USD) - net asset value per:
Share Class A 13.03 13.03 13.03Share Class AX 1.00 1.00 1.00Share Class I 13.55 13.55 13.55Share Class Z 25.03 25.03 25.02
Net Assets 4,246,832,683 4,494,078,971 4,217,829,929
Diversified Alpha Plus fund (EUR) - net asset value per:
Share Class A 31.28 33.52 33.55Share Class AH (CHF) 23.11 24.87 24.96Share Class AH (SEK) 22.90 24.56 -Share Class AH (SGD) 23.78 25.42 -Share Class AH (USD) 32.90 35.21 35.27Share Class AX 22.99 24.64 -Share Class B 29.16 31.40 31.75Share Class BH (USD) 28.82 31.00 31.38Share Class C 29.35 31.56 31.81Share Class F* 23.37 - -Share Class FH (GBP) 24.02 25.56 -Share Class FH (USD) 23.60 25.14 -Share Class I 33.62 35.85 35.52Share Class IH (GBP)* 23.76 - -Share Class IH (USD) 23.90 25.45 25.24Share Class N 16.91 17.95 -Share Class Z 33.61 35.83 35.48Share Class ZH (CHF) 23.54 25.20 25.02Share Class ZH (GBP) 31.07 33.06 32.66Share Class ZH (USD) 28.70 30.56 30.30Share Class ZHX (GBP) 23.87 25.40 -
Net Assets 7,194,459,311 7,252,637,110 3,442,760,952
* Share Class was launched during the period.
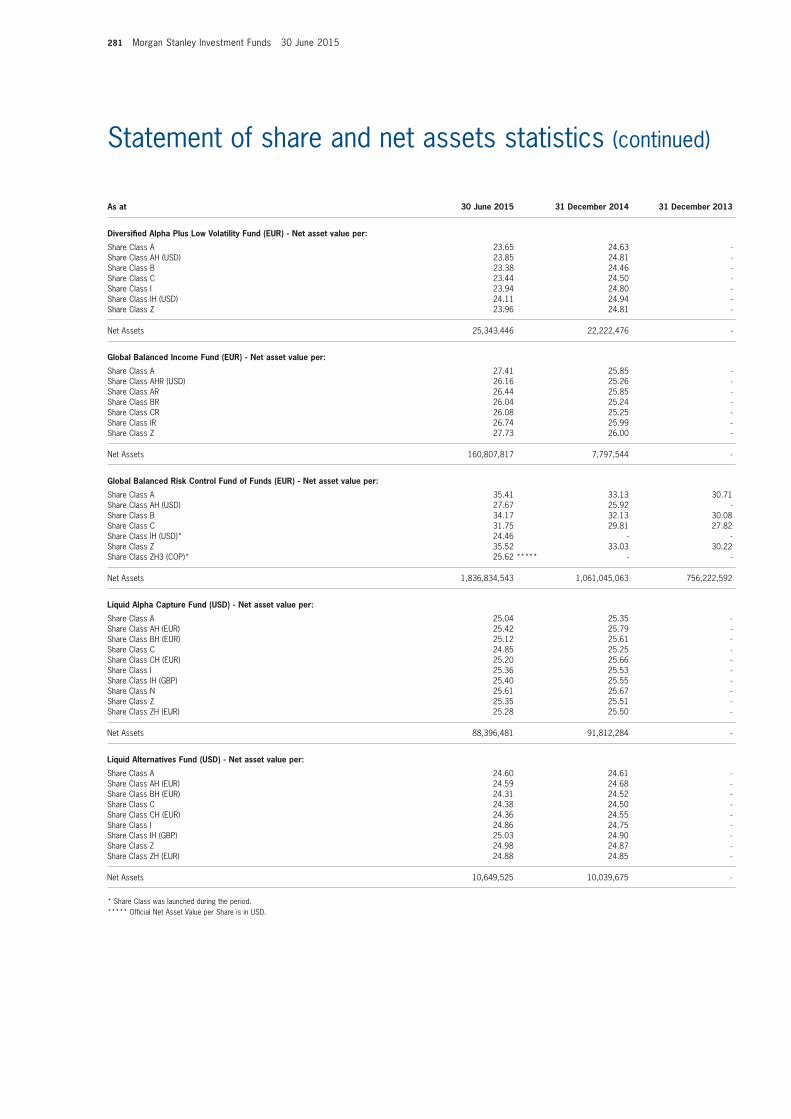
281 Morgan Stanley Investment Funds 30 June 2015
Statement of share and net assets statistics (continued)
As at 30 June 2015 31 December 2014 31 December 2013
Diversified Alpha Plus Low volatility fund (EUR) - net asset value per:
Share Class A 23.65 24.63 -Share Class AH (USD) 23.85 24.81 -Share Class B 23.38 24.46 -Share Class C 23.44 24.50 -Share Class I 23.94 24.80 -Share Class IH (USD) 24.11 24.94 -Share Class Z 23.96 24.81 -
Net Assets 25,343,446 22,222,476 -
Global Balanced income fund (EUR) - net asset value per:
Share Class A 27.41 25.85 -Share Class AHR (USD) 26.16 25.26 -Share Class AR 26.44 25.85 -Share Class BR 26.04 25.24 -Share Class CR 26.08 25.25 -Share Class IR 26.74 25.99 -Share Class Z 27.73 26.00 -
Net Assets 160,807,817 7,797,544 -
Global Balanced Risk Control fund of funds (EUR) - net asset value per:
Share Class A 35.41 33.13 30.71Share Class AH (USD) 27.67 25.92 -Share Class B 34.17 32.13 30.08Share Class C 31.75 29.81 27.82Share Class IH (USD)* 24.46 - -Share Class Z 35.52 33.03 30.22Share Class ZH3 (COP)* 25.62 ***** - -
Net Assets 1,836,834,543 1,061,045,063 756,222,592
Liquid Alpha Capture fund (USD) - net asset value per:
Share Class A 25.04 25.35 -Share Class AH (EUR) 25.42 25.79 -Share Class BH (EUR) 25.12 25.61 -Share Class C 24.85 25.25 -Share Class CH (EUR) 25.20 25.66 -Share Class I 25.36 25.53 -Share Class IH (GBP) 25.40 25.55 -Share Class N 25.61 25.67 -Share Class Z 25.35 25.51 -Share Class ZH (EUR) 25.28 25.50 -
Net Assets 88,396,481 91,812,284 -
Liquid Alternatives fund (USD) - net asset value per:
Share Class A 24.60 24.61 -Share Class AH (EUR) 24.59 24.68 -Share Class BH (EUR) 24.31 24.52 -Share Class C 24.38 24.50 -Share Class CH (EUR) 24.36 24.55 -Share Class I 24.86 24.75 -Share Class IH (GBP) 25.03 24.90 -Share Class Z 24.98 24.87 -Share Class ZH (EUR) 24.88 24.85 -
Net Assets 10,649,525 10,039,675 -
* Share Class was launched during the period.***** Official Net Asset Value per Share is in USD.
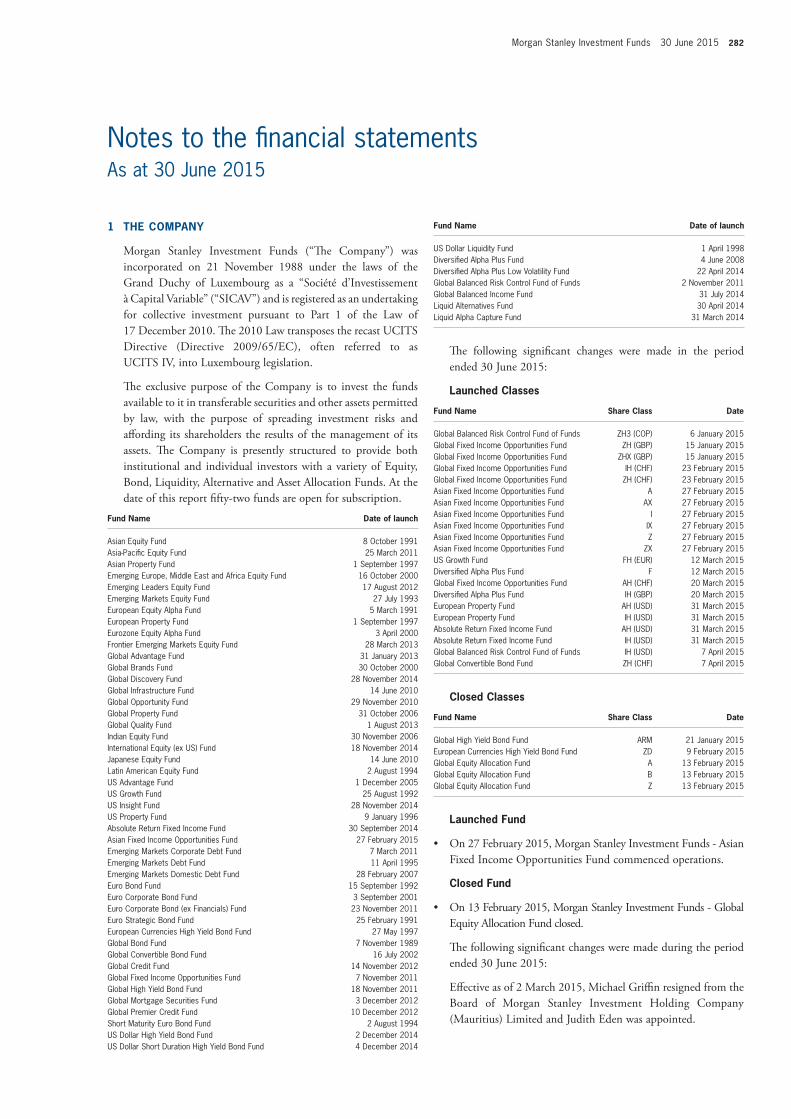
Morgan Stanley Investment Funds 30 June 2015 282
1 tHE ComPAnY
Morgan Stanley Investment Funds (“The Company”) was incorporated on 21 november 1988 under the laws of the grand Duchy of Luxembourg as a “Société d’Investissement à Capital variable” (“SICav”) and is registered as an undertaking for collective investment pursuant to Part 1 of the Law of 17 December 2010. The 2010 Law transposes the recast UCItS Directive (Directive 2009/65/eC), often referred to as UCItS Iv, into Luxembourg legislation.
The exclusive purpose of the Company is to invest the funds available to it in transferable securities and other assets permitted by law, with the purpose of spreading investment risks and affording its shareholders the results of the management of its assets. The Company is presently structured to provide both institutional and individual investors with a variety of equity, Bond, Liquidity, alternative and asset allocation Funds. at the date of this report fifty-two funds are open for subscription.
fund name Date of launch
Asian Equity Fund 8 October 1991Asia-Pacific Equity Fund 25 March 2011Asian Property Fund 1 September 1997Emerging Europe, Middle East and Africa Equity Fund 16 October 2000Emerging Leaders Equity Fund 17 August 2012Emerging Markets Equity Fund 27 July 1993European Equity Alpha Fund 5 March 1991European Property Fund 1 September 1997Eurozone Equity Alpha Fund 3 April 2000Frontier Emerging Markets Equity Fund 28 March 2013Global Advantage Fund 31 January 2013Global Brands Fund 30 October 2000Global Discovery Fund 28 November 2014Global Infrastructure Fund 14 June 2010Global Opportunity Fund 29 November 2010Global Property Fund 31 October 2006Global Quality Fund 1 August 2013Indian Equity Fund 30 November 2006International Equity (ex US) Fund 18 November 2014Japanese Equity Fund 14 June 2010Latin American Equity Fund 2 August 1994US Advantage Fund 1 December 2005US Growth Fund 25 August 1992US Insight Fund 28 November 2014US Property Fund 9 January 1996Absolute Return Fixed Income Fund 30 September 2014Asian Fixed Income Opportunities Fund 27 February 2015Emerging Markets Corporate Debt Fund 7 March 2011Emerging Markets Debt Fund 11 April 1995Emerging Markets Domestic Debt Fund 28 February 2007Euro Bond Fund 15 September 1992Euro Corporate Bond Fund 3 September 2001Euro Corporate Bond (ex Financials) Fund 23 November 2011Euro Strategic Bond Fund 25 February 1991European Currencies High Yield Bond Fund 27 May 1997Global Bond Fund 7 November 1989Global Convertible Bond Fund 16 July 2002Global Credit Fund 14 November 2012Global Fixed Income Opportunities Fund 7 November 2011Global High Yield Bond Fund 18 November 2011Global Mortgage Securities Fund 3 December 2012Global Premier Credit Fund 10 December 2012Short Maturity Euro Bond Fund 2 August 1994US Dollar High Yield Bond Fund 2 December 2014US Dollar Short Duration High Yield Bond Fund 4 December 2014
fund name Date of launch
US Dollar Liquidity Fund 1 April 1998Diversified Alpha Plus Fund 4 June 2008Diversified Alpha Plus Low Volatility Fund 22 April 2014Global Balanced Risk Control Fund of Funds 2 November 2011Global Balanced Income Fund 31 July 2014Liquid Alternatives Fund 30 April 2014Liquid Alpha Capture Fund 31 March 2014
The following significant changes were made in the period ended 30 June 2015:
Launched Classes
fund name Share Class Date
Global Balanced Risk Control Fund of Funds ZH3 (COP) 6 January 2015Global Fixed Income Opportunities Fund ZH (GBP) 15 January 2015Global Fixed Income Opportunities Fund ZHX (GBP) 15 January 2015Global Fixed Income Opportunities Fund IH (CHF) 23 February 2015Global Fixed Income Opportunities Fund ZH (CHF) 23 February 2015Asian Fixed Income Opportunities Fund A 27 February 2015Asian Fixed Income Opportunities Fund AX 27 February 2015Asian Fixed Income Opportunities Fund I 27 February 2015Asian Fixed Income Opportunities Fund IX 27 February 2015Asian Fixed Income Opportunities Fund Z 27 February 2015Asian Fixed Income Opportunities Fund ZX 27 February 2015US Growth Fund FH (EUR) 12 March 2015Diversified Alpha Plus Fund F 12 March 2015Global Fixed Income Opportunities Fund AH (CHF) 20 March 2015Diversified Alpha Plus Fund IH (GBP) 20 March 2015European Property Fund AH (USD) 31 March 2015European Property Fund IH (USD) 31 March 2015Absolute Return Fixed Income Fund AH (USD) 31 March 2015Absolute Return Fixed Income Fund IH (USD) 31 March 2015Global Balanced Risk Control Fund of Funds IH (USD) 7 April 2015Global Convertible Bond Fund ZH (CHF) 7 April 2015
Closed Classes
fund name Share Class Date
Global High Yield Bond Fund ARM 21 January 2015European Currencies High Yield Bond Fund ZD 9 February 2015Global Equity Allocation Fund A 13 February 2015Global Equity Allocation Fund B 13 February 2015Global Equity Allocation Fund Z 13 February 2015
Launched fund
• On27February2015,MorganStanleyInvestmentFunds-AsianFixed Income Opportunities Fund commenced operations.
Closed fund
• On13February2015,MorganStanleyInvestmentFunds-Globalequity allocation Fund closed.
The following significant changes were made during the period ended 30 June 2015:
effective as of 2 March 2015, Michael griffin resigned from the Board of Morgan Stanley Investment Holding Company (Mauritius) Limited and Judith eden was appointed.
Notes to the financial statementsAs at 30 June 2015
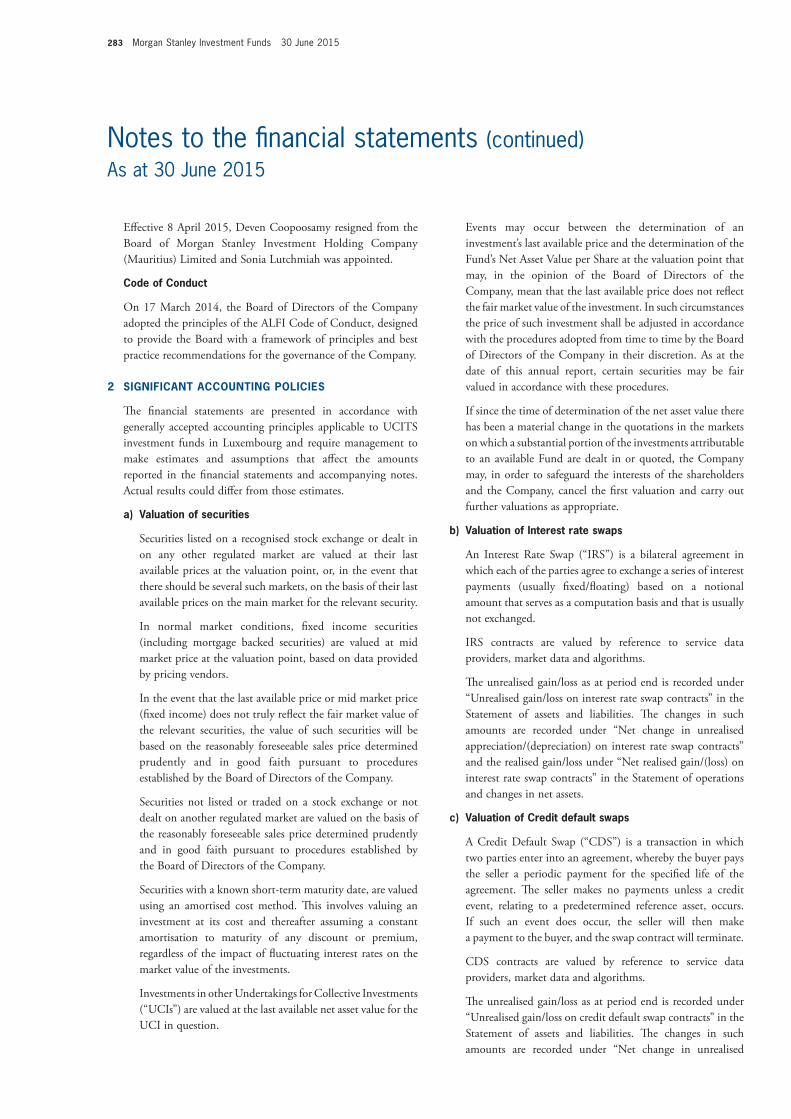
283 Morgan Stanley Investment Funds 30 June 2015
effective 8 april 2015, Deven Coopoosamy resigned from the Board of Morgan Stanley Investment Holding Company (Mauritius) Limited and Sonia Lutchmiah was appointed.
Code of Conduct
On 17 March 2014, the Board of Directors of the Company adopted the principles of the aLFI Code of Conduct, designed to provide the Board with a framework of principles and best practice recommendations for the governance of the Company.
2 SiGnifiCAnt ACCoUntinG PoLiCiES
The financial statements are presented in accordance with generally accepted accounting principles applicable to UCItS investment funds in Luxembourg and require management to make estimates and assumptions that affect the amounts reported in the financial statements and accompanying notes. actual results could differ from those estimates.
a) valuation of securities
Securities listed on a recognised stock exchange or dealt in on any other regulated market are valued at their last available prices at the valuation point, or, in the event that there should be several such markets, on the basis of their last available prices on the main market for the relevant security.
In normal market conditions, fixed income securities (including mortgage backed securities) are valued at mid market price at the valuation point, based on data provided by pricing vendors.
In the event that the last available price or mid market price (fixed income) does not truly reflect the fair market value of the relevant securities, the value of such securities will be based on the reasonably foreseeable sales price determined prudently and in good faith pursuant to procedures established by the Board of Directors of the Company.
Securities not listed or traded on a stock exchange or not dealt on another regulated market are valued on the basis of the reasonably foreseeable sales price determined prudently and in good faith pursuant to procedures established by the Board of Directors of the Company.
Securities with a known short-term maturity date, are valued using an amortised cost method. This involves valuing an investment at its cost and thereafter assuming a constant amortisation to maturity of any discount or premium, regardless of the impact of fluctuating interest rates on the market value of the investments.
Investments in other Undertakings for Collective Investments (“UCIs”) are valued at the last available net asset value for the UCI in question.
events may occur between the determination of an investment’s last available price and the determination of the Fund’s net asset value per Share at the valuation point that may, in the opinion of the Board of Directors of the Company, mean that the last available price does not reflect the fair market value of the investment. In such circumstances the price of such investment shall be adjusted in accordance with the procedures adopted from time to time by the Board of Directors of the Company in their discretion. as at the date of this annual report, certain securities may be fair valued in accordance with these procedures.
If since the time of determination of the net asset value there has been a material change in the quotations in the markets on which a substantial portion of the investments attributable to an available Fund are dealt in or quoted, the Company may, in order to safeguard the interests of the shareholders and the Company, cancel the first valuation and carry out further valuations as appropriate.
b) valuation of interest rate swaps
an Interest Rate Swap (“IRS”) is a bilateral agreement in which each of the parties agree to exchange a series of interest payments (usually fixed/floating) based on a notional amount that serves as a computation basis and that is usually not exchanged.
IRS contracts are valued by reference to service data providers, market data and algorithms.
The unrealised gain/loss as at period end is recorded under “Unrealised gain/loss on interest rate swap contracts” in the Statement of assets and liabilities. The changes in such amounts are recorded under “net change in unrealised appreciation/(depreciation) on interest rate swap contracts” and the realised gain/loss under “net realised gain/(loss) on interest rate swap contracts” in the Statement of operations and changes in net assets.
c) valuation of Credit default swaps
a Credit Default Swap (“CDS”) is a transaction in which two parties enter into an agreement, whereby the buyer pays the seller a periodic payment for the specified life of the agreement. The seller makes no payments unless a credit event, relating to a predetermined reference asset, occurs. If such an event does occur, the seller will then make a payment to the buyer, and the swap contract will terminate.
CDS contracts are valued by reference to service data providers, market data and algorithms.
The unrealised gain/loss as at period end is recorded under “Unrealised gain/loss on credit default swap contracts” in the Statement of assets and liabilities. The changes in such amounts are recorded under “net change in unrealised
Notes to the financial statements (continued)As at 30 June 2015
Morgan Stanley Investment Funds 30 June 2015 284
appreciation/(depreciation) on credit default swap contracts” and the realised gain/loss under “net realised gain/(loss) on credit default swap contracts” in the Statement of operations and changes in net assets.
The notional amount represents the highest potential liability of a contract and is not shown in the Statement of assets and liabilities.
d) valuation of total return swaps
a total Return Swap (“tRS”) is a transaction in which the buyer receives the performance of an underlying asset and in return the buyer pays funding costs and generally, an arrangement fee. The underlying asset may be, but not limited to, a specific security, basket of securities, other instruments and index.
tRS contracts are valued by reference to the mark to market value based on the market value of the underlying asset.
The unrealised gain/loss as at period end is recorded under “Unrealised gain/loss on total return swap contracts” in the Statement of assets and liabilities. The changes in such amounts are recorded under “net change in unrealised appreciation/(depreciation) on total return swap contracts” and the realised gain/loss under “net realised gain/(loss) on total return swap contracts” in the Statement of operations and changes in net assets.
e) valuation of options
Options are contractual agreements that convey the right, but not the obligation, for the purchaser either to buy or sell a specific amount of a financial instrument at a fixed price, either at a fixed future date or at any time within a specified period.
Options are valued by reference to the expected future cash flow based on the market implied performance, spot level and the volatility of the underlying asset(s).
In determining the accounting treatment for options, consideration is given to the nature of the instrument itself and the Fund’s Investment objective. When the underlying is acquired or delivered upon exercise of an option, the acquisition cost or sale proceeds are adjusted by the amount of the premium paid. When an option is closed, the difference between the premium and the cost to close the position is recorded under “net realised gain/(loss) on options” in the Statement of operations and changes in net assets. When an option expires, the premium is accounted for as a realised gain for options written or as a realised loss for options purchased.
For the global Balanced Income Fund, the net option premium received on written options will be taken to income. When an option is closed, the cost to close the
position is recorded under “net realised gain/(loss) on options” in the Statement of operations and changes in net assets.
The market value of options as at period end is recorded under “Options at market value” in the Statement of assets and liabilities. The changes in unrealised gain/(loss) on options are recorded under “net change in unrealised appreciation/(depreciation) on options” in the Statement of operations and changes in net assets.
f) valuation of forward currency exchange contracts
a forward currency exchange contract is an agreement between two parties to exchange one currency for another at a specific price and date in the future.
Open forward contracts are valued by reference to the last available currency rates prevailing at the relevant valuation point.
The unrealised gain/loss as at period end is recorded under “Unrealised gain/loss on forward currency exchange contracts” in the Statement of assets and liabilities. The changes in such amounts are recorded under “net change in unrealised appreciation/(depreciation) on foreign exchange transactions” and the realised gain/loss under “net realised gain/(loss) on foreign exchange transactions” in the Statement of operations and changes in net assets.
g) valuation of financial futures contracts
a financial futures contract is a contractual agreement, to buy or sell a particular commodity or financial instrument at a pre-determined price in the future. Financial futures contracts detail the quality and quantity of the underlying asset and they are standardised to facilitate trading on a futures exchange.
Futures contracts are valued at the last available prices, on the exchanges for which the contracts are traded on, as at the valuation point.
The unrealised gain/loss as at period end is recorded under “Unrealised gain/loss on financial futures contracts” in the Statement of assets and liabilities. The changes in such amounts are recorded under “net change in unrealised appreciation/(depreciation) on financial futures contracts” and the realised gain/loss under “net realised gain/(loss) on financial futures contracts” in the Statement of operations and changes in net assets.
at the time the Fund enters into a financial futures contract the Fund deposits and maintains with the broker as collateral an initial margin as required by the exchange on which the transaction is affected. Pursuant to the contract, the Fund agrees to receive from or pay to the broker an amount of cash equal to the daily fluctuation in the value of the contract.
Notes to the financial statements (continued)As at 30 June 2015
285 Morgan Stanley Investment Funds 30 June 2015
Such receipts or payments are known as the variation margin and are recorded by the Fund as unrealised appreciation/(depreciation) on financial futures contracts. When the contract is closed, the Fund records a “net realised gain/(loss) on financial futures contracts” equal to the difference between the value of the contract at the time it was opened and the time it is closed.
h) income and securities transactions
Dividend income is recorded on the ex-dividend date. Interest income is accrued daily. Discounts and premiums are accreted and amortised as adjustments to interest income for short-term money market instrument only. Income from securities lending is recorded on a cash receipts basis.
Securities transactions are accounted for on a trade date basis, on the date the securities are purchased or sold. Realised gains or losses on the sale of securities are determined on the basis of the average cost method and are recorded under “net realised gain/(loss) on sales of investments” in the Statement of operations and changes in net assets.
For the global Mortgage Securities Fund, realised gains and losses on the sale of interest only mortgaged-backed securities are determined on a First In First Out (FIFO) basis of cost method and are recorded under “net realised gain/(loss) on sales of investments” in the Statement of operations and changes in net assets.
i) valuation of Repurchase agreements
Under a repurchase agreement, the Company purchases securities and agrees to re-sell them at a mutually agreed upon date and price. a repurchase agreement is collateralised by securities. Repurchase agreements are valued at cost with interest accrued from the date of purchase.
Repurchase agreements outstanding as at year end, if any, are included in the Statement of assets and liabilities. net repurchase agreements income is included under “Bank interest” in the Statement of operations and changes in net assets. See note 11 for further details.
j) translation of foreign currencies
transactions in foreign currencies are translated into the currency of each Fund at the last available rate of exchange prevailing in a recognised market at the date of the transactions. assets and liabilities denominated in foreign currencies are translated into the currency of each Fund at the last available rate of exchange prevailing in a recognised market at the date of the Statement of assets and liabilities.
The Combined statement of assets and liabilities is presented in US Dollars at the last available rate of exchange prevailing
in a recognised market at the date of the Statement of assets and liabilities, while the combined Statement of operations and changes in net assets is presented in US Dollars at the average exchange rates ruling during the year.
The difference between opening net assets stated at exchange rates at the beginning of the period and their value at the end of the period is shown as “translation difference” in the Statement of operations and changes in net assets.
k) mauritian subsidiary
The Indian equity Fund currently invests through Morgan Stanley Investment Holding Company (Mauritius) Limited (“the Subsidiary”). all assets and liabilities, income and expenses of the Subsidiary are recorded in the Statement of assets and liabilities and the Statement of operations and changes in net assets of the Indian equity Fund. all investments held by the Subsidiary are individually disclosed in the statement of investments of the Indian equity Fund.
The Subsidiary incurs and pays certain fees and expenses relating to its investment activity in India. These fees and expenses may include brokerage costs and commissions, transaction costs associated with converting currency to and from Indian Rupee to US Dollars, fees incurred by its standing proxy, corporate and registration fees and taxes associated with the establishment and operation of the Subsidiary.
The audited annual report of the subsidiary is made available to the shareholders free of charge upon request at the registered office of the Morgan Stanley Investment Holding Company (Mauritius) Limited: CIM Fund Services Ltd, 33 edith Cavell Street, Port Louis, Republic of Mauritius.
3 SECURitiES LEnDinG
Certain Funds may lend securities to qualified financial institutions, such as broker-dealers, to earn additional income. any increase or decrease in the fair value of the securities loaned that might occur and any interest earned or dividends declared on those securities during the term of the loan would remain in the Fund. Funds that lend securities, receive securities as collateral in an amount equal to or exceeding 100% of the current fair value of the loaned securities. The collateral is marked to market daily, by the securities lending agent, to ensure that a minimum of 100% collateral coverage is maintained throughout the term of the loan. Securities lending income is generated as a result of securities on loan less compensation to the administrative agent. net securities lending income is included in the Statement of operations and changes in net assets. See note 4(b) for related party disclosure on securities lending transactions.
Notes to the financial statements (continued)As at 30 June 2015
Morgan Stanley Investment Funds 30 June 2015 286
The value of loaned securities, related collateral outstanding, identity of the counterparties, security lending income and associated operational costs and fees as at 30 June 2015 are as follows:
fund namevalue of loaned
securities in USD
Securities Collateral mv
in USD*fund
Currency
Lending income (Gross)
in fund Currency
Lending Agent fees
in fund Currency
Lending income (net)
in fund Currency
Asian Equity Fund 17,570,835 18,798,233 USD 26,750 2,675 24,075Asia-Pacific Equity Fund 6,943,619 7,428,661 USD 18,750 1,875 16,875Emerging Leaders Equity Fund 6,975,034 7,462,270 USD 3,496 699 2,797Emerging Markets Equity Fund 241,158,848 258,004,827 USD 100,467 10,047 90,420European Equity Alpha Fund 70,402,887 75,320,830 EUR 119,172 11,917 107,255European Property Fund 16,639,125 17,571,317 EUR 8,597 1,720 6,877Eurozone Equity Alpha Fund 33,014,826 35,321,053 EUR 80,649 8,065 72,584Global Infrastructure Fund 8,344,392 8,927,284 USD 183,100 36,620 146,480Latin American Equity Fund - - USD 18 4 14US Advantage Fund 83,192,052 85,008,458 USD 32,229 6,446 25,783US Growth Fund 92,524,312 96,187,161 USD 157,929 31,586 126,343Emerging Markets Corporate Debt Fund
33,399,415 35,506,395 USD 35,000 3,500 31,500
Emerging Markets Debt Fund 10,387,593 11,042,887 USD 10,000 1,000 9,000Euro Bond Fund 4,879,699 4,977,992 EUR 50,219 5,022 45,197Euro Corporate Bond Fund 218,826,896 223,234,771 EUR 45,666 4,567 41,099Euro Corporate Bond (ex Financials) Fund
2,918,188 3,013,643 EUR 1,344 134 1,210
Euro Strategic Bond Fund 26,456,954 27,050,914 EUR 57,246 5,725 51,521European Currencies High Yield Bond Fund
151,503,058 154,881,860 EUR 130,302 13,030 117,272
Global Bond Fund 11,176,403 11,462,138 USD 34,044 3,404 30,640Global Fixed Income Opportunities Fund
15,667,537 16,296,329 USD 2,500 250 2,250
Global High Yield Bond Fund 6,708,462 6,982,850 USD 12,500 1,250 11,250Short Maturity Euro Bond Fund 14,004,310 14,286,401 EUR 33,503 3,350 30,153
total 1,072,694,445 1,118,766,274
* Collateral is comprised of government bonds issued by the following countries: Austria, Belgium, Germany, Finland, France, UK, Netherlands and USA.
fund namevalue of loaned
securities in USD Collateral mv in USD Counterparty
Asian Equity Fund 17,570,835 18,798,233 Morgan Stanley & Co. InternationalAsia-Pacific Equity Fund 6,943,619 7,428,661 Morgan Stanley & Co. InternationalEmerging Leaders Equity Fund 6,975,034 7,462,270 Morgan Stanley & Co. InternationalEmerging Markets Equity Fund 241,158,848 258,004,827 Morgan Stanley & Co. InternationalEuropean Equity Alpha Fund 70,402,887 75,320,830 Morgan Stanley & Co. InternationalEuropean Property Fund 16,639,125 17,571,317 Morgan Stanley & Co. InternationalEurozone Equity Alpha Fund 33,014,826 35,321,053 Morgan Stanley & Co. InternationalGlobal Infrastructure Fund 8,344,392 8,927,284 Morgan Stanley & Co. InternationalUS Advantage Fund 13,726,162 14,105,583 Deutsche BankUS Advantage Fund 64,710,985 66,049,530 Credit Suisse Securities (USA)US Advantage Fund 4,754,905 4,853,345 Morgan Stanley & Co. InternationalUS Growth Fund 67,882,166 71,025,909 Barclays BankUS Growth Fund 104,808 112,405 Credit Suisse Securities (Europe)US Growth Fund 13,829,204 14,115,261 Credit Suisse Securities (USA)US Growth Fund 10,708,134 10,933,586 Goldman SachsEmerging Markets Corporate Debt Fund 33,399,415 35,506,395 Morgan Stanley & Co. InternationalEmerging Markets Debt Fund 10,387,593 11,042,887 Morgan Stanley & Co. InternationalEuro Bond Fund 4,879,699 4,977,992 Barclays BankEuro Corporate Bond Fund 218,826,896 223,234,771 Barclays BankEuro Corporate Bond (ex Financials) Fund 2,918,188 3,013,643 Morgan Stanley & Co. InternationalEuro Strategic Bond Fund 26,456,954 27,050,914 Barclays BankEuropean Currencies High Yield Bond Fund 151,503,058 154,881,860 Barclays BankGlobal Bond Fund 11,176,403 11,462,138 Barclays BankGlobal Fixed Income Opportunities Fund 15,667,537 16,296,329 Morgan Stanley & Co. InternationalGlobal High Yield Bond Fund 6,708,462 6,982,850 Morgan Stanley & Co. InternationalShort Maturity Euro Bond Fund 14,004,310 14,286,401 Barclays Bank
total 1,072,694,445 1,118,766,274
4 RELAtED PARtY tRAnSACtionS AnD AffiLiAtionS
Under the terms of an investment advisory agreement, Morgan Stanley Investment Management Limited has been appointed Investment adviser with responsibility for advising the Company within the scope of the day-to-day management of the various Funds. The Investment adviser may delegate any of its responsibilities to any other party subject to approval by the Board of Directors of the Company and the CSSF but the Investment adviser shall remain responsible for the proper performance by such party of those responsibilities. a full list of sub-advisers can be found on page 306.
effective 1 april 2014, Morgan Stanley Investment Management (aCD) Limited (MSIM (aCD) Limited) was appointed to provide collective portfolio management services, investment management, distribution, central administration and transfer agency services to Morgan Stanley Investment Funds. MSIM (aCD) Limited is authorised by the Financial Conduct authority in the United Kingdom to provide these services. The Management Company may delegate some of its tasks to any other party subject to approval by the Company. The Management Company’s liability to the Company for the performance of collective portfolio management services has not been affected by such delegation. Under the terms of the Management Company Services agreement the Management Company is entitled to receive a fixed fee. The updated fee structure is described in full in Section 2.5 Charges and expenses, in the May 2015 Prospectus.
The Investment adviser was entitled to receive from the Company a fee payable monthly in arrears, and calculated on the basis of the average daily net assets (before deduction of the fee) of each Fund attributable to each Class of Shares.
The Company has delegated to the Management Company MSIM (aCD) Limited under the overall supervision and control of the Board of Directors of the Company, its investment management services, central administration, registrar and transfer agency services as well as marketing, principal distribution and sales services, as more specifically detailed in the management company services agreement as well as in the prospectus of the Company.
The Management Company in turn delegates the investment management functions to Morgan Stanley & Co. International plc (with respect to the Liquidity Fund) and Morgan Stanley Investment Management Limited (with respect to any other Fund), collectively the “Investment advisers”.
Under the terms of the Management Company Services agreement the Management Company is entitled to receive a Management Fee at the annual rates set out below. Under the Investment advisory agreements the Investment advisers are entitled to receive a fee for their discretionary investment management and investment advisory services. Under the
Notes to the financial statements (continued)As at 30 June 2015
287 Morgan Stanley Investment Funds 30 June 2015
Distribution agreement the Distributor is entitled to receive a fee for their distribution services. The fees of the Investment adviser and the Distributor will be paid out of the Management Fee.
The Management Fees are at the following annual rates:
fund name
Classes A, AD, ADX, AH, AHR,
AHX, Ao, AR, ARm, AX, B,
BD, BDX, BH, BHR, BHX, BR
and BX
Classes C, CD, CH,
CHR, CHX, CR and CX
Classes f, fH, i, iD, iH,
iHX, iR, iX, Z, ZD, ZH, ZH1, ZH3,
ZoX, ZX and ZXH Class S
Asian Equity Fund 1.40% 2.20% 0.75% - Asia-Pacific Equity Fund 1.50% 2.30% 0.85% - Asian Property Fund 1.40% 2.20% 0.75% - Emerging Europe, Middle East and Africa Equity Fund 1.60% 2.40% 1.10% - Emerging Leaders Equity Fund 2.00% 2.80% 1.10% - Emerging Markets Equity Fund 1.60% 2.40% 1.10% - European Equity Alpha Fund 1.20% 1.90% 0.70% - European Property Fund 1.40% 2.20% 0.75% - Eurozone Equity Alpha Fund 1.40% 2.20% 0.75% - Frontier Emerging Markets Equity Fund 2.40% 3.00% 1.20% -Global Advantage Fund 1.60% 2.40% 0.75% - Global Brands Fund 1.40% 2.20% 0.75% 0.75% Global Discovery Fund 1.60% 2.40% 0.75% -Global Equity Allocation Fund1 1.50% 2.30% 0.55% - Global Infrastructure Fund 1.50% 2.30% 0.85% - Global Opportunity Fund 1.60% 2.40% 0.75% - Global Property Fund 1.50% 2.30% 0.85% 0.85% Global Quality Fund 1.60% 2.40% 0.75% -Indian Equity Fund 1.60% 2.40% 0.90% - International Equity (ex US) Fund 1.60% 2.40% 0.75% -Japanese Equity Fund 1.40% 2.20% 0.75% - Latin American Equity Fund 1.60% 2.40% 1.00% - US Advantage Fund 1.40% 2.20% 0.70% - US Growth Fund 1.40% 2.20% 0.70% - US Insight Fund 1.50% 2.20% 0.70% -US Property Fund 1.40% 2.20% 0.75% - Absolute Return Fixed Income Fund 1.00% 1.45% 0.45% - Asian Fixed Income Opportunities Fund2 1.20% 1.80% 0.60% - Emerging Markets Corporate Debt Fund 1.45% 2.15% 0.95% - Emerging Markets Debt Fund 1.40% 2.10% 0.90% 0.60%Emerging Markets Domestic Debt Fund 1.40% 2.10% 0.90% - Euro Bond Fund 0.80% 1.45% 0.45% - Euro Corporate Bond Fund 0.80% 1.45% 0.45% 0.40%Euro Corporate Bond (ex Financials) Fund 0.80% 1.45% 0.45% -Euro Strategic Bond Fund 0.80% 1.45% 0.45% - European Currencies High Yield Bond Fund 0.85% 1.50% 0.50% - Global Bond Fund 0.80% 1.45% 0.45% - Global Convertible Bond Fund 1.00% 1.60% 0.60% 0.55%Global Credit Fund 0.80% 1.45% 0.45% - Global Fixed Income Opportunities Fund 1.00% 1.45% 0.45% - Global High Yield Bond Fund 1.00% 1.60% 0.60% - Global Mortgage Securities Fund 1.00% 1.60% 0.50% - Global Premier Credit Fund 0.80% 1.45% 0.45% - Short Maturity Euro Bond Fund 0.80% 1.45% 0.45% - US Dollar High Yield Bond Fund 1.25% 1.70% 0.50% -US Dollar Short Duration High Yield Bond Fund 1.00% 1.30% 0.40% -US Dollar Liquidity Fund 0.50% 0.85% 0.20% - Diversified Alpha Plus Fund 1.75% 2.45% 0.80% - Diversified Alpha Plus Low Volatility Fund 1.65% 2.40% 0.70% - Global Balanced Risk Control Fund of Funds 2.00% 2.70% 0.80% - Global Balanced Income Fund 2.00% 2.70% 0.80% - Liquid Alternatives Fund 1.50% 2.30% 0.60% -Liquid Alpha Capture Fund 1.85% 2.55% 0.75% -
1 Fund was closed on 13 February 2015. 2 Fund commenced operations on 27 February 2015.
Class e and eX Shares are available for the global Brands Fund, the global Quality Fund and the International equity (ex US) Fund only. The Management Fee payable for these funds is 0.55%.
no Management Fee is payable in respect of Class n, nD, nH, nHX, nO, nOX and nX Shares.
In the case of any individual Fund or Class, the Management Company, the Investment adviser(s) or/and Distributors may choose to waive or rebate all of their fees and charges or any portion thereof at their absolute discretion for an indefinite period, in order to reduce the impact such fee may have on the performance of the Fund or Class for instance where the net assets of the Fund or Class are of insufficient size.
Where the Funds invest into underlying investment funds that are managed by the Investment adviser or its affiliates, the fees and charges of the underlying investment funds are rebated to the Funds to avoid duplicated Management Fee otherwise known as “double dipping”. Other income in the Statement of operations and changes in net assets of the global Balanced Risk Control Fund of Funds, of the global Balanced Income Fund and of the Liquid alternatives Fund consists of such rebate.
The Board of Directors of the Company has sought to provide more transparency in relation to the fees and charges applicable by (i) centralising the payment of charges and fees with the Management Company, and (ii) effectively fixing the total fees, costs and expenses, so that from 1 april 2014, the Funds are subject to the following:
i) Management Fee at the levels described above. The Management Fee covers the fees of the principal distributor and the Investment adviser (together formerly known as the Investment advisory Fee).
ii) a monthly administration Charge at a maximum annual rate of 0.25% of the Funds’ aggregate average daily net asset value attributable to all Classes of Shares of the Funds. The current fees are as follows:
A, AD, ADM, ADX, AH, AHM, AHR, AHX, AM, AO, AOM, AOX, AR, ARM, AX, B, BD, BDX, BH, BHX, BHR, BO, BOX, BR, BX, C, CD, CH, CHR, CHX, CO, COX, CR, CRM, CX, F, FD, FH, FHX, FX 0.25%*I, ID, IH, IHR, IHX, IO, IOX, IR, IRM, IX, Z, ZD, ZDX, ZH, ZH1, ZH3, ZO, ZOX, ZX, ZXH 0.18%*S, SH, SHX, SX 0.15%E, EX, N, ND, NH, NHX, NO, NOX, NX 0.10%
* Except for the US Dollar Liquidity Fund which charge 0.15%.
The administration Charge will remain in force for an unlimited period and may be changed, subject to the maximum noted above, by the Company upon no less than one month’s prior written notice.
The administration Charge will be utilised by the Company to pay the fees of the administrator, the transfer agent, the Domiciliary agent and the Management Company. The
Notes to the financial statements (continued)As at 30 June 2015
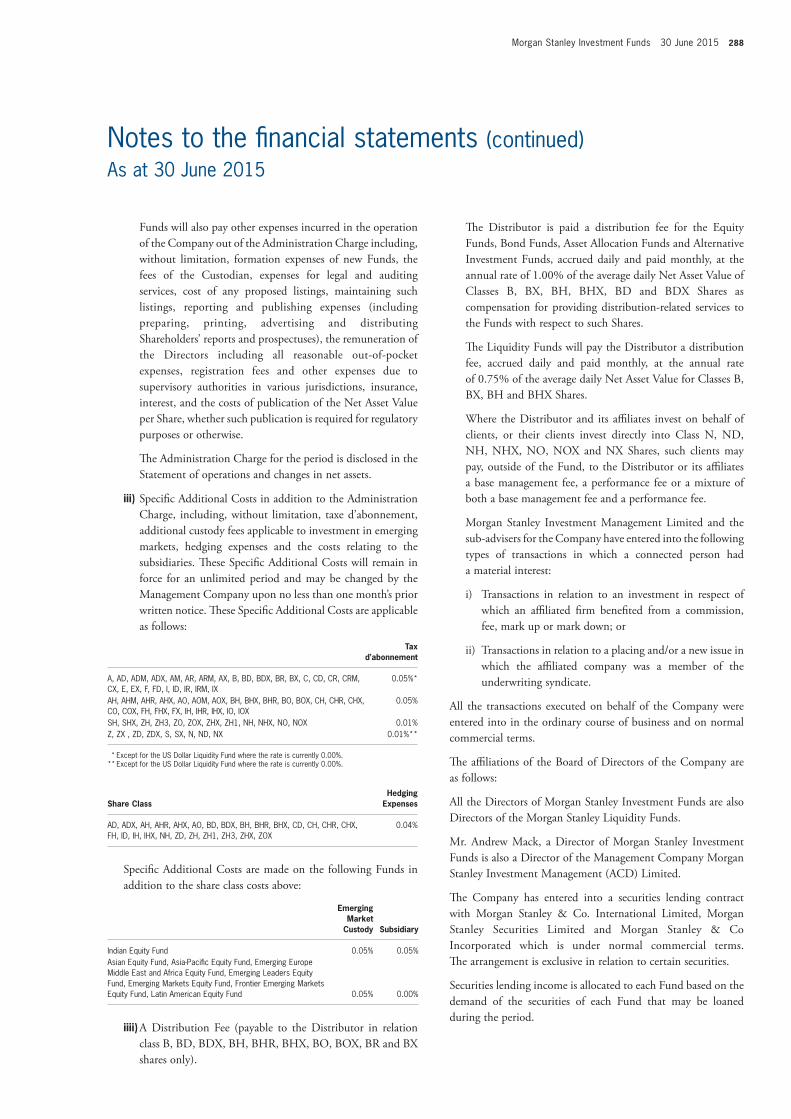
Morgan Stanley Investment Funds 30 June 2015 288
The Distributor is paid a distribution fee for the equity Funds, Bond Funds, asset allocation Funds and alternative Investment Funds, accrued daily and paid monthly, at the annual rate of 1.00% of the average daily net asset value of Classes B, BX, BH, BHX, BD and BDX Shares as compensation for providing distribution-related services to the Funds with respect to such Shares.
The Liquidity Funds will pay the Distributor a distribution fee, accrued daily and paid monthly, at the annual rate of 0.75% of the average daily net asset value for Classes B, BX, BH and BHX Shares.
Where the Distributor and its affiliates invest on behalf of clients, or their clients invest directly into Class n, nD, nH, nHX, nO, nOX and nX Shares, such clients may pay, outside of the Fund, to the Distributor or its affiliates a base management fee, a performance fee or a mixture of both a base management fee and a performance fee.
Morgan Stanley Investment Management Limited and the sub-advisers for the Company have entered into the following types of transactions in which a connected person had a material interest:
i) transactions in relation to an investment in respect of which an affiliated firm benefited from a commission, fee, mark up or mark down; or
ii) transactions in relation to a placing and/or a new issue in which the affiliated company was a member of the underwriting syndicate.
all the transactions executed on behalf of the Company were entered into in the ordinary course of business and on normal commercial terms.
The affiliations of the Board of Directors of the Company are as follows:
all the Directors of Morgan Stanley Investment Funds are also Directors of the Morgan Stanley Liquidity Funds.
Mr. andrew Mack, a Director of Morgan Stanley Investment Funds is also a Director of the Management Company Morgan Stanley Investment Management (aCD) Limited.
The Company has entered into a securities lending contract with Morgan Stanley & Co. International Limited, Morgan Stanley Securities Limited and Morgan Stanley & Co Incorporated which is under normal commercial terms. The arrangement is exclusive in relation to certain securities.
Securities lending income is allocated to each Fund based on the demand of the securities of each Fund that may be loaned during the period.
Funds will also pay other expenses incurred in the operation of the Company out of the administration Charge including, without limitation, formation expenses of new Funds, the fees of the Custodian, expenses for legal and auditing services, cost of any proposed listings, maintaining such listings, reporting and publishing expenses (including preparing, printing, advertising and distributing Shareholders’ reports and prospectuses), the remuneration of the Directors including all reasonable out-of-pocket expenses, registration fees and other expenses due to supervisory authorities in various jurisdictions, insurance, interest, and the costs of publication of the net asset value per Share, whether such publication is required for regulatory purposes or otherwise.
The administration Charge for the period is disclosed in the Statement of operations and changes in net assets.
iii) Specific additional Costs in addition to the administration Charge, including, without limitation, taxe d’abonnement, additional custody fees applicable to investment in emerging markets, hedging expenses and the costs relating to the subsidiaries. These Specific additional Costs will remain in force for an unlimited period and may be changed by the Management Company upon no less than one month’s prior written notice. These Specific additional Costs are applicable as follows:
tax
d’abonnement
A, AD, ADM, ADX, AM, AR, ARM, AX, B, BD, BDX, BR, BX, C, CD, CR, CRM, CX, E, EX, F, FD, I, ID, IR, IRM, IX
0.05%*
AH, AHM, AHR, AHX, AO, AOM, AOX, BH, BHX, BHR, BO, BOX, CH, CHR, CHX, CO, COX, FH, FHX, FX, IH, IHR, IHX, IO, IOX
0.05%
SH, SHX, ZH, ZH3, ZO, ZOX, ZHX, ZH1, NH, NHX, NO, NOX 0.01%Z, ZX , ZD, ZDX, S, SX, N, ND, NX 0.01%**
* Except for the US Dollar Liquidity Fund where the rate is currently 0.00%.** Except for the US Dollar Liquidity Fund where the rate is currently 0.00%.
Share ClassHedging
Expenses
AD, ADX, AH, AHR, AHX, AO, BD, BDX, BH, BHR, BHX, CD, CH, CHR, CHX, FH, ID, IH, IHX, NH, ZD, ZH, ZH1, ZH3, ZHX, ZOX
0.04%
Specific additional Costs are made on the following Funds in addition to the share class costs above:
Emerging market
Custody Subsidiary
Indian Equity Fund 0.05% 0.05%Asian Equity Fund, Asia-Pacific Equity Fund, Emerging Europe Middle East and Africa Equity Fund, Emerging Leaders Equity Fund, Emerging Markets Equity Fund, Frontier Emerging Markets Equity Fund, Latin American Equity Fund 0.05% 0.00%
iiii) a Distribution Fee (payable to the Distributor in relation class B, BD, BDX, BH, BHR, BHX, BO, BOX, BR and BX shares only).
Notes to the financial statements (continued)As at 30 June 2015
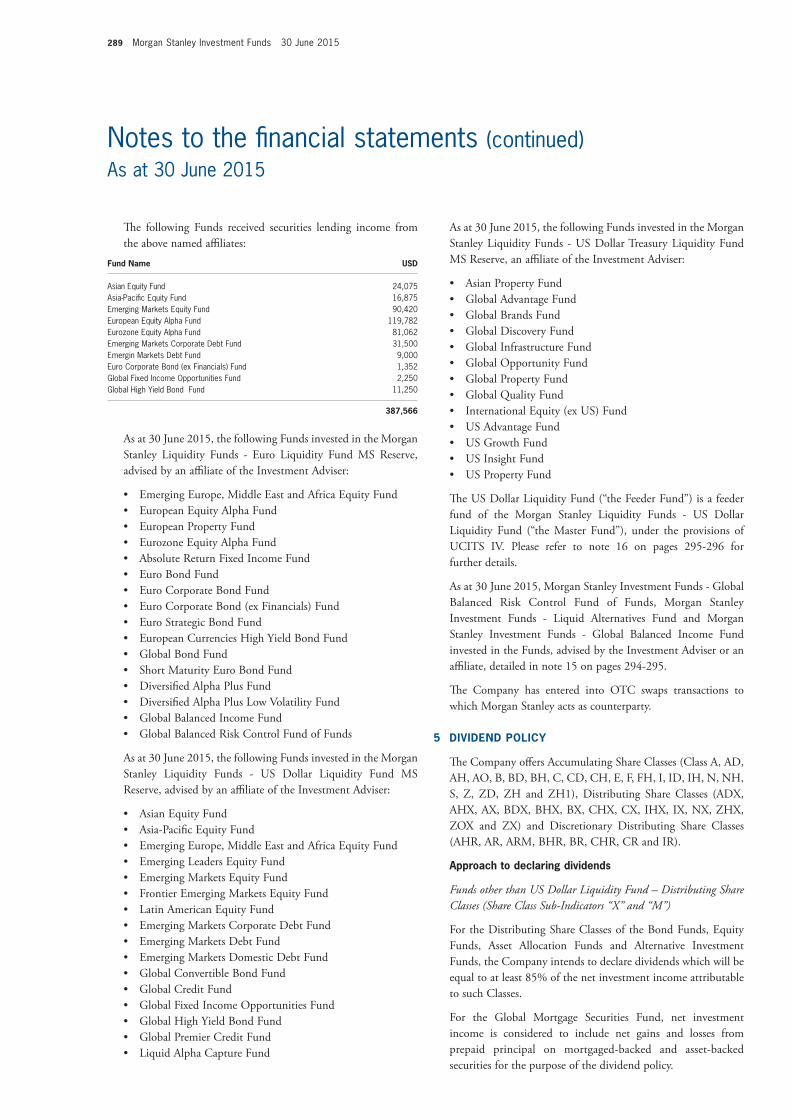
289 Morgan Stanley Investment Funds 30 June 2015
as at 30 June 2015, the following Funds invested in the Morgan Stanley Liquidity Funds - US Dollar treasury Liquidity Fund MS Reserve, an affiliate of the Investment adviser:
• AsianPropertyFund • GlobalAdvantageFund • GlobalBrandsFund • GlobalDiscoveryFund • GlobalInfrastructureFund • GlobalOpportunityFund • GlobalPropertyFund • GlobalQualityFund • InternationalEquity(exUS)Fund • USAdvantageFund • USGrowthFund • USInsightFund • USPropertyFund
The US Dollar Liquidity Fund (“the Feeder Fund”) is a feeder fund of the Morgan Stanley Liquidity Funds - US Dollar Liquidity Fund (“the Master Fund”), under the provisions of UCItS Iv. Please refer to note 16 on pages 295-296 for further details.
as at 30 June 2015, Morgan Stanley Investment Funds - global Balanced Risk Control Fund of Funds, Morgan Stanley Investment Funds - Liquid alternatives Fund and Morgan Stanley Investment Funds - global Balanced Income Fund invested in the Funds, advised by the Investment adviser or an affiliate, detailed in note 15 on pages 294-295.
The Company has entered into OtC swaps transactions to which Morgan Stanley acts as counterparty.
5 DiviDEnD PoLiCY
The Company offers accumulating Share Classes (Class a, aD, aH, aO, B, BD, BH, C, CD, CH, e, F, FH, I, ID, IH, n, nH, S, Z, ZD, ZH and ZH1), Distributing Share Classes (aDX, aHX, aX, BDX, BHX, BX, CHX, CX, IHX, IX, nX, ZHX, ZOX and ZX) and Discretionary Distributing Share Classes (aHR, aR, aRM, BHR, BR, CHR, CR and IR).
Approach to declaring dividends
Funds other than US Dollar Liquidity Fund – Distributing Share Classes (Share Class Sub-Indicators “X” and “M”)
For the Distributing Share Classes of the Bond Funds, equity Funds, asset allocation Funds and alternative Investment Funds, the Company intends to declare dividends which will be equal to at least 85% of the net investment income attributable to such Classes.
For the global Mortgage Securities Fund, net investment income is considered to include net gains and losses from prepaid principal on mortgaged-backed and asset-backed securities for the purpose of the dividend policy.
The following Funds received securities lending income from the above named affiliates:
fund name USD
Asian Equity Fund 24,075 Asia-Pacific Equity Fund 16,875 Emerging Markets Equity Fund 90,420European Equity Alpha Fund 119,782Eurozone Equity Alpha Fund 81,062 Emerging Markets Corporate Debt Fund 31,500 Emergin Markets Debt Fund 9,000 Euro Corporate Bond (ex Financials) Fund 1,352 Global Fixed Income Opportunities Fund 2,250 Global High Yield Bond Fund 11,250
387,566
as at 30 June 2015, the following Funds invested in the Morgan Stanley Liquidity Funds - euro Liquidity Fund MS Reserve, advised by an affiliate of the Investment adviser:
• EmergingEurope,MiddleEastandAfricaEquityFund • EuropeanEquityAlphaFund • EuropeanPropertyFund • EurozoneEquityAlphaFund • AbsoluteReturnFixedIncomeFund • EuroBondFund • EuroCorporateBondFund • EuroCorporateBond(exFinancials)Fund • EuroStrategicBondFund • EuropeanCurrenciesHighYieldBondFund • GlobalBondFund • ShortMaturityEuroBondFund • DiversifiedAlphaPlusFund • DiversifiedAlphaPlusLowVolatilityFund • GlobalBalancedIncomeFund • GlobalBalancedRiskControlFundofFunds
as at 30 June 2015, the following Funds invested in the Morgan Stanley Liquidity Funds - US Dollar Liquidity Fund MS Reserve, advised by an affiliate of the Investment adviser:
• AsianEquityFund • Asia-PacificEquityFund • EmergingEurope,MiddleEastandAfricaEquityFund • EmergingLeadersEquityFund • EmergingMarketsEquityFund • FrontierEmergingMarketsEquityFund • LatinAmericanEquityFund • EmergingMarketsCorporateDebtFund • EmergingMarketsDebtFund • EmergingMarketsDomesticDebtFund • GlobalConvertibleBondFund • GlobalCreditFund • GlobalFixedIncomeOpportunitiesFund • GlobalHighYieldBondFund • GlobalPremierCreditFund • LiquidAlphaCaptureFund
Notes to the financial statements (continued)As at 30 June 2015
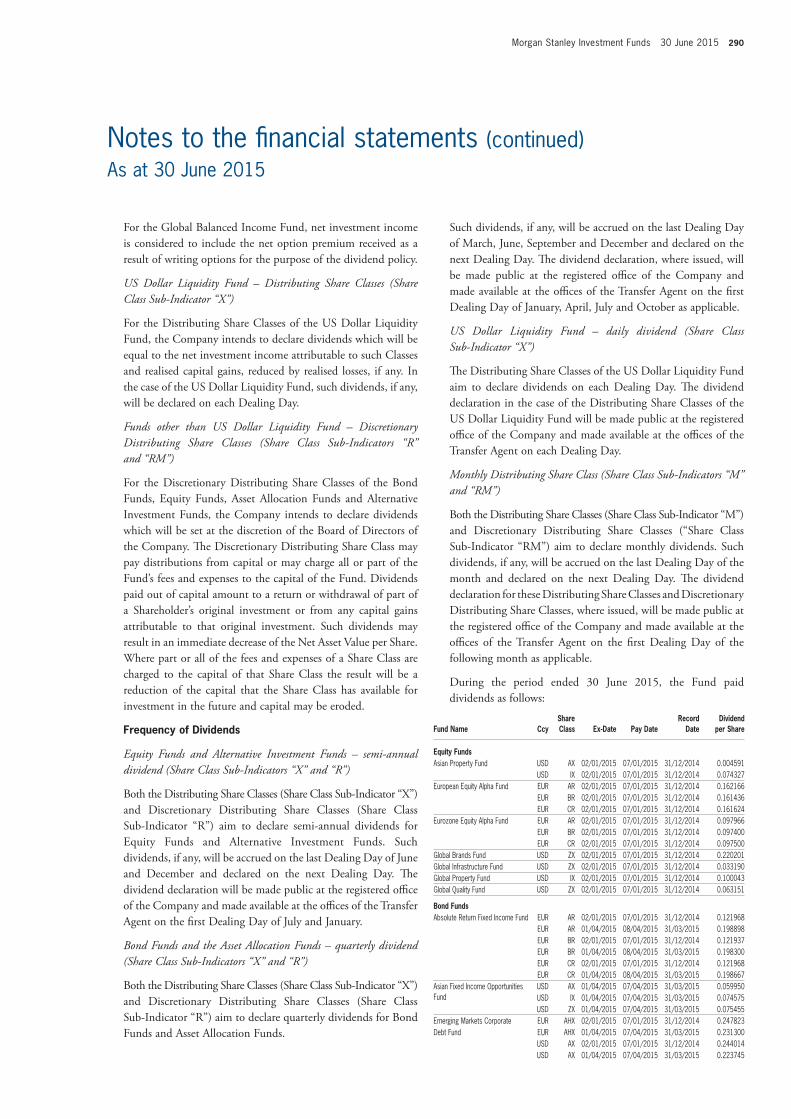
Morgan Stanley Investment Funds 30 June 2015 290
Such dividends, if any, will be accrued on the last Dealing Day of March, June, September and December and declared on the next Dealing Day. The dividend declaration, where issued, will be made public at the registered office of the Company and made available at the offices of the transfer agent on the first Dealing Day of January, april, July and October as applicable.
US Dollar Liquidity Fund – daily dividend (Share Class Sub-Indicator “X”)
The Distributing Share Classes of the US Dollar Liquidity Fund aim to declare dividends on each Dealing Day. The dividend declaration in the case of the Distributing Share Classes of the US Dollar Liquidity Fund will be made public at the registered office of the Company and made available at the offices of the transfer agent on each Dealing Day.
Monthly Distributing Share Class (Share Class Sub-Indicators “M” and “RM”)
Both the Distributing Share Classes (Share Class Sub-Indicator “M”) and Discretionary Distributing Share Classes (“Share Class Sub-Indicator “RM”) aim to declare monthly dividends. Such dividends, if any, will be accrued on the last Dealing Day of the month and declared on the next Dealing Day. The dividend declaration for these Distributing Share Classes and Discretionary Distributing Share Classes, where issued, will be made public at the registered office of the Company and made available at the offices of the transfer agent on the first Dealing Day of the following month as applicable.
During the period ended 30 June 2015, the Fund paid dividends as follows:
fund name CcyShare Class Ex-Date Pay Date
Record Date
Dividend per Share
Equity funds Asian Property Fund USD AX 02/01/2015 07/01/2015 31/12/2014 0.004591
USD IX 02/01/2015 07/01/2015 31/12/2014 0.074327European Equity Alpha Fund EUR AR 02/01/2015 07/01/2015 31/12/2014 0.162166
EUR BR 02/01/2015 07/01/2015 31/12/2014 0.161436EUR CR 02/01/2015 07/01/2015 31/12/2014 0.161624
Eurozone Equity Alpha Fund EUR AR 02/01/2015 07/01/2015 31/12/2014 0.097966EUR BR 02/01/2015 07/01/2015 31/12/2014 0.097400EUR CR 02/01/2015 07/01/2015 31/12/2014 0.097500
Global Brands Fund USD ZX 02/01/2015 07/01/2015 31/12/2014 0.220201Global Infrastructure Fund USD ZX 02/01/2015 07/01/2015 31/12/2014 0.033190Global Property Fund USD IX 02/01/2015 07/01/2015 31/12/2014 0.100043Global Quality Fund USD ZX 02/01/2015 07/01/2015 31/12/2014 0.063151
Bond fundsAbsolute Return Fixed Income Fund EUR AR 02/01/2015 07/01/2015 31/12/2014 0.121968
EUR AR 01/04/2015 08/04/2015 31/03/2015 0.198898EUR BR 02/01/2015 07/01/2015 31/12/2014 0.121937EUR BR 01/04/2015 08/04/2015 31/03/2015 0.198300EUR CR 02/01/2015 07/01/2015 31/12/2014 0.121968EUR CR 01/04/2015 08/04/2015 31/03/2015 0.198667
Asian Fixed Income Opportunities Fund
USD AX 01/04/2015 07/04/2015 31/03/2015 0.059950USD IX 01/04/2015 07/04/2015 31/03/2015 0.074575USD ZX 01/04/2015 07/04/2015 31/03/2015 0.075455
Emerging Markets Corporate EUR AHX 02/01/2015 07/01/2015 31/12/2014 0.247823Debt Fund EUR AHX 01/04/2015 07/04/2015 31/03/2015 0.231300
USD AX 02/01/2015 07/01/2015 31/12/2014 0.244014USD AX 01/04/2015 07/04/2015 31/03/2015 0.223745
For the global Balanced Income Fund, net investment income is considered to include the net option premium received as a result of writing options for the purpose of the dividend policy.
US Dollar Liquidity Fund – Distributing Share Classes (Share Class Sub-Indicator “X”)
For the Distributing Share Classes of the US Dollar Liquidity Fund, the Company intends to declare dividends which will be equal to the net investment income attributable to such Classes and realised capital gains, reduced by realised losses, if any. In the case of the US Dollar Liquidity Fund, such dividends, if any, will be declared on each Dealing Day.
Funds other than US Dollar Liquidity Fund – Discretionary Distributing Share Classes (Share Class Sub-Indicators “R” and “RM”)
For the Discretionary Distributing Share Classes of the Bond Funds, equity Funds, asset allocation Funds and alternative Investment Funds, the Company intends to declare dividends which will be set at the discretion of the Board of Directors of the Company. The Discretionary Distributing Share Class may pay distributions from capital or may charge all or part of the Fund’s fees and expenses to the capital of the Fund. Dividends paid out of capital amount to a return or withdrawal of part of a Shareholder’s original investment or from any capital gains attributable to that original investment. Such dividends may result in an immediate decrease of the net asset value per Share. Where part or all of the fees and expenses of a Share Class are charged to the capital of that Share Class the result will be a reduction of the capital that the Share Class has available for investment in the future and capital may be eroded.
frequency of Dividends
Equity Funds and Alternative Investment Funds – semi-annual dividend (Share Class Sub-Indicators “X” and “R”)
Both the Distributing Share Classes (Share Class Sub-Indicator “X”) and Discretionary Distributing Share Classes (Share Class Sub-Indicator “R”) aim to declare semi-annual dividends for equity Funds and alternative Investment Funds. Such dividends, if any, will be accrued on the last Dealing Day of June and December and declared on the next Dealing Day. The dividend declaration will be made public at the registered office of the Company and made available at the offices of the transfer agent on the first Dealing Day of July and January.
Bond Funds and the Asset Allocation Funds – quarterly dividend (Share Class Sub-Indicators “X” and “R”)
Both the Distributing Share Classes (Share Class Sub-Indicator “X”) and Discretionary Distributing Share Classes (Share Class Sub-Indicator “R”) aim to declare quarterly dividends for Bond Funds and asset allocation Funds.
Notes to the financial statements (continued)As at 30 June 2015
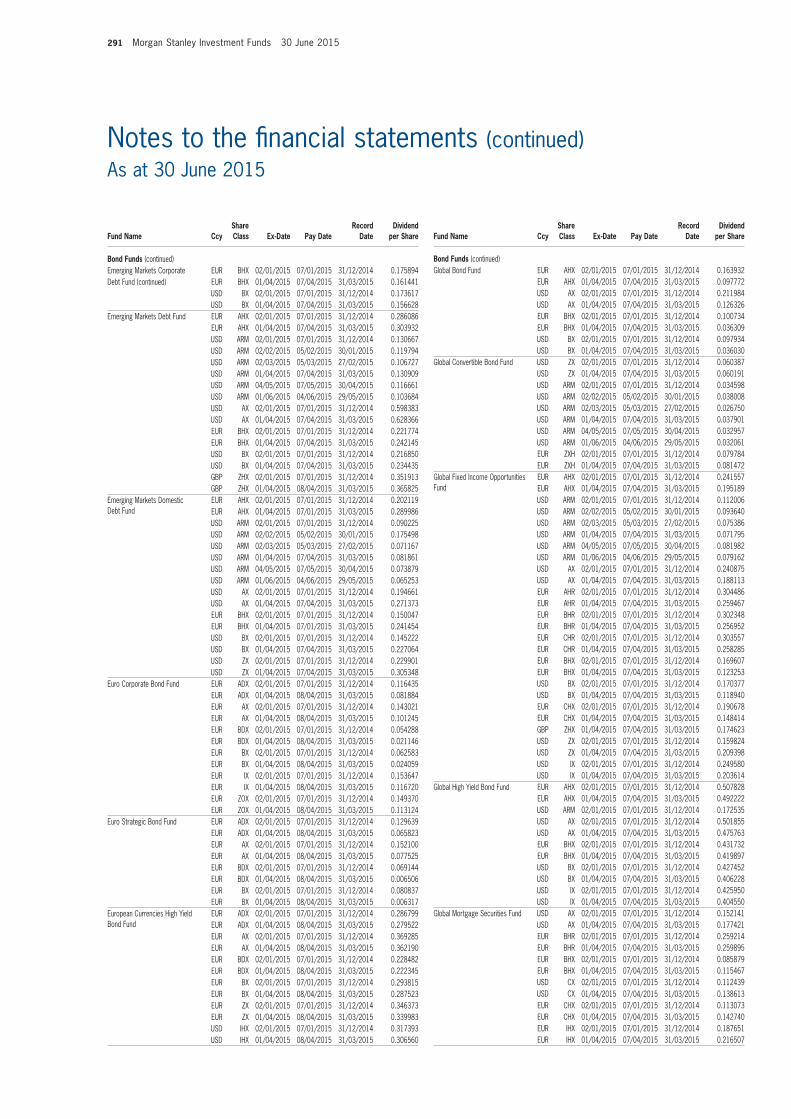
291 Morgan Stanley Investment Funds 30 June 2015
fund name CcyShare Class Ex-Date Pay Date
Record Date
Dividend per Share
Bond funds (continued)Global Bond Fund EUR AHX 02/01/2015 07/01/2015 31/12/2014 0.163932
EUR AHX 01/04/2015 07/04/2015 31/03/2015 0.097772USD AX 02/01/2015 07/01/2015 31/12/2014 0.211984USD AX 01/04/2015 07/04/2015 31/03/2015 0.126326EUR BHX 02/01/2015 07/01/2015 31/12/2014 0.100734EUR BHX 01/04/2015 07/04/2015 31/03/2015 0.036309USD BX 02/01/2015 07/01/2015 31/12/2014 0.097934USD BX 01/04/2015 07/04/2015 31/03/2015 0.036030
Global Convertible Bond Fund USD ZX 02/01/2015 07/01/2015 31/12/2014 0.060387USD ZX 01/04/2015 07/04/2015 31/03/2015 0.060191USD ARM 02/01/2015 07/01/2015 31/12/2014 0.034598USD ARM 02/02/2015 05/02/2015 30/01/2015 0.038008USD ARM 02/03/2015 05/03/2015 27/02/2015 0.026750USD ARM 01/04/2015 07/04/2015 31/03/2015 0.037901USD ARM 04/05/2015 07/05/2015 30/04/2015 0.032957USD ARM 01/06/2015 04/06/2015 29/05/2015 0.032061EUR ZXH 02/01/2015 07/01/2015 31/12/2014 0.079784EUR ZXH 01/04/2015 07/04/2015 31/03/2015 0.081472
Global Fixed Income Opportunities Fund
EUR AHX 02/01/2015 07/01/2015 31/12/2014 0.241557EUR AHX 01/04/2015 07/04/2015 31/03/2015 0.195189USD ARM 02/01/2015 07/01/2015 31/12/2014 0.112006USD ARM 02/02/2015 05/02/2015 30/01/2015 0.093640USD ARM 02/03/2015 05/03/2015 27/02/2015 0.075386USD ARM 01/04/2015 07/04/2015 31/03/2015 0.071795USD ARM 04/05/2015 07/05/2015 30/04/2015 0.081982USD ARM 01/06/2015 04/06/2015 29/05/2015 0.079162USD AX 02/01/2015 07/01/2015 31/12/2014 0.240875USD AX 01/04/2015 07/04/2015 31/03/2015 0.188113EUR AHR 02/01/2015 07/01/2015 31/12/2014 0.304486EUR AHR 01/04/2015 07/04/2015 31/03/2015 0.259467EUR BHR 02/01/2015 07/01/2015 31/12/2014 0.302348EUR BHR 01/04/2015 07/04/2015 31/03/2015 0.256952EUR CHR 02/01/2015 07/01/2015 31/12/2014 0.303557EUR CHR 01/04/2015 07/04/2015 31/03/2015 0.258285EUR BHX 02/01/2015 07/01/2015 31/12/2014 0.169607EUR BHX 01/04/2015 07/04/2015 31/03/2015 0.123253USD BX 02/01/2015 07/01/2015 31/12/2014 0.170377USD BX 01/04/2015 07/04/2015 31/03/2015 0.118940EUR CHX 02/01/2015 07/01/2015 31/12/2014 0.190678EUR CHX 01/04/2015 07/04/2015 31/03/2015 0.148414GBP ZHX 01/04/2015 07/04/2015 31/03/2015 0.174623USD ZX 02/01/2015 07/01/2015 31/12/2014 0.159824USD ZX 01/04/2015 07/04/2015 31/03/2015 0.209398USD IX 02/01/2015 07/01/2015 31/12/2014 0.249580USD IX 01/04/2015 07/04/2015 31/03/2015 0.203614
Global High Yield Bond Fund EUR AHX 02/01/2015 07/01/2015 31/12/2014 0.507828EUR AHX 01/04/2015 07/04/2015 31/03/2015 0.492222USD ARM 02/01/2015 07/01/2015 31/12/2014 0.172535USD AX 02/01/2015 07/01/2015 31/12/2014 0.501855USD AX 01/04/2015 07/04/2015 31/03/2015 0.475763EUR BHX 02/01/2015 07/01/2015 31/12/2014 0.431732EUR BHX 01/04/2015 07/04/2015 31/03/2015 0.419897USD BX 02/01/2015 07/01/2015 31/12/2014 0.427452USD BX 01/04/2015 07/04/2015 31/03/2015 0.406228USD IX 02/01/2015 07/01/2015 31/12/2014 0.425950USD IX 01/04/2015 07/04/2015 31/03/2015 0.404550
Global Mortgage Securities Fund USD AX 02/01/2015 07/01/2015 31/12/2014 0.152141USD AX 01/04/2015 07/04/2015 31/03/2015 0.177421EUR BHR 02/01/2015 07/01/2015 31/12/2014 0.259214EUR BHR 01/04/2015 07/04/2015 31/03/2015 0.259895EUR BHX 02/01/2015 07/01/2015 31/12/2014 0.085879EUR BHX 01/04/2015 07/04/2015 31/03/2015 0.115467USD CX 02/01/2015 07/01/2015 31/12/2014 0.112439USD CX 01/04/2015 07/04/2015 31/03/2015 0.138613EUR CHX 02/01/2015 07/01/2015 31/12/2014 0.113073EUR CHX 01/04/2015 07/04/2015 31/03/2015 0.142740EUR IHX 02/01/2015 07/01/2015 31/12/2014 0.187651EUR IHX 01/04/2015 07/04/2015 31/03/2015 0.216507
fund name CcyShare Class Ex-Date Pay Date
Record Date
Dividend per Share
Bond funds (continued)Emerging Markets Corporate EUR BHX 02/01/2015 07/01/2015 31/12/2014 0.175894Debt Fund (continued) EUR BHX 01/04/2015 07/04/2015 31/03/2015 0.161441
USD BX 02/01/2015 07/01/2015 31/12/2014 0.173617USD BX 01/04/2015 07/04/2015 31/03/2015 0.156628
Emerging Markets Debt Fund EUR AHX 02/01/2015 07/01/2015 31/12/2014 0.286086EUR AHX 01/04/2015 07/04/2015 31/03/2015 0.303932USD ARM 02/01/2015 07/01/2015 31/12/2014 0.130667USD ARM 02/02/2015 05/02/2015 30/01/2015 0.119794USD ARM 02/03/2015 05/03/2015 27/02/2015 0.106727USD ARM 01/04/2015 07/04/2015 31/03/2015 0.130909USD ARM 04/05/2015 07/05/2015 30/04/2015 0.116661USD ARM 01/06/2015 04/06/2015 29/05/2015 0.103684USD AX 02/01/2015 07/01/2015 31/12/2014 0.598383USD AX 01/04/2015 07/04/2015 31/03/2015 0.628366EUR BHX 02/01/2015 07/01/2015 31/12/2014 0.221774EUR BHX 01/04/2015 07/04/2015 31/03/2015 0.242145USD BX 02/01/2015 07/01/2015 31/12/2014 0.216850USD BX 01/04/2015 07/04/2015 31/03/2015 0.234435GBP ZHX 02/01/2015 07/01/2015 31/12/2014 0.351913GBP ZHX 01/04/2015 08/04/2015 31/03/2015 0.365825
Emerging Markets Domestic Debt Fund
EUR AHX 02/01/2015 07/01/2015 31/12/2014 0.202119EUR AHX 01/04/2015 07/01/2015 31/03/2015 0.289986USD ARM 02/01/2015 07/01/2015 31/12/2014 0.090225USD ARM 02/02/2015 05/02/2015 30/01/2015 0.175498USD ARM 02/03/2015 05/03/2015 27/02/2015 0.071167USD ARM 01/04/2015 07/04/2015 31/03/2015 0.081861USD ARM 04/05/2015 07/05/2015 30/04/2015 0.073879USD ARM 01/06/2015 04/06/2015 29/05/2015 0.065253USD AX 02/01/2015 07/01/2015 31/12/2014 0.194661USD AX 01/04/2015 07/04/2015 31/03/2015 0.271373EUR BHX 02/01/2015 07/01/2015 31/12/2014 0.150047EUR BHX 01/04/2015 07/01/2015 31/03/2015 0.241454USD BX 02/01/2015 07/01/2015 31/12/2014 0.145222USD BX 01/04/2015 07/04/2015 31/03/2015 0.227064USD ZX 02/01/2015 07/01/2015 31/12/2014 0.229901USD ZX 01/04/2015 07/04/2015 31/03/2015 0.305348
Euro Corporate Bond Fund EUR ADX 02/01/2015 07/01/2015 31/12/2014 0.116435EUR ADX 01/04/2015 08/04/2015 31/03/2015 0.081884EUR AX 02/01/2015 07/01/2015 31/12/2014 0.143021EUR AX 01/04/2015 08/04/2015 31/03/2015 0.101245EUR BDX 02/01/2015 07/01/2015 31/12/2014 0.054288EUR BDX 01/04/2015 08/04/2015 31/03/2015 0.021146EUR BX 02/01/2015 07/01/2015 31/12/2014 0.062583EUR BX 01/04/2015 08/04/2015 31/03/2015 0.024059EUR IX 02/01/2015 07/01/2015 31/12/2014 0.153647EUR IX 01/04/2015 08/04/2015 31/03/2015 0.116720EUR ZOX 02/01/2015 07/01/2015 31/12/2014 0.149370EUR ZOX 01/04/2015 08/04/2015 31/03/2015 0.113124
Euro Strategic Bond Fund EUR ADX 02/01/2015 07/01/2015 31/12/2014 0.129639EUR ADX 01/04/2015 08/04/2015 31/03/2015 0.065823EUR AX 02/01/2015 07/01/2015 31/12/2014 0.152100EUR AX 01/04/2015 08/04/2015 31/03/2015 0.077525EUR BDX 02/01/2015 07/01/2015 31/12/2014 0.069144EUR BDX 01/04/2015 08/04/2015 31/03/2015 0.006506EUR BX 02/01/2015 07/01/2015 31/12/2014 0.080837EUR BX 01/04/2015 08/04/2015 31/03/2015 0.006317
European Currencies High Yield Bond Fund
EUR ADX 02/01/2015 07/01/2015 31/12/2014 0.286799EUR ADX 01/04/2015 08/04/2015 31/03/2015 0.279522EUR AX 02/01/2015 07/01/2015 31/12/2014 0.369285EUR AX 01/04/2015 08/04/2015 31/03/2015 0.362190EUR BDX 02/01/2015 07/01/2015 31/12/2014 0.228482EUR BDX 01/04/2015 08/04/2015 31/03/2015 0.222345EUR BX 02/01/2015 07/01/2015 31/12/2014 0.293815EUR BX 01/04/2015 08/04/2015 31/03/2015 0.287523EUR ZX 02/01/2015 07/01/2015 31/12/2014 0.346373EUR ZX 01/04/2015 08/04/2015 31/03/2015 0.339983USD IHX 02/01/2015 07/01/2015 31/12/2014 0.317393USD IHX 01/04/2015 08/04/2015 31/03/2015 0.306560
Notes to the financial statements (continued)As at 30 June 2015
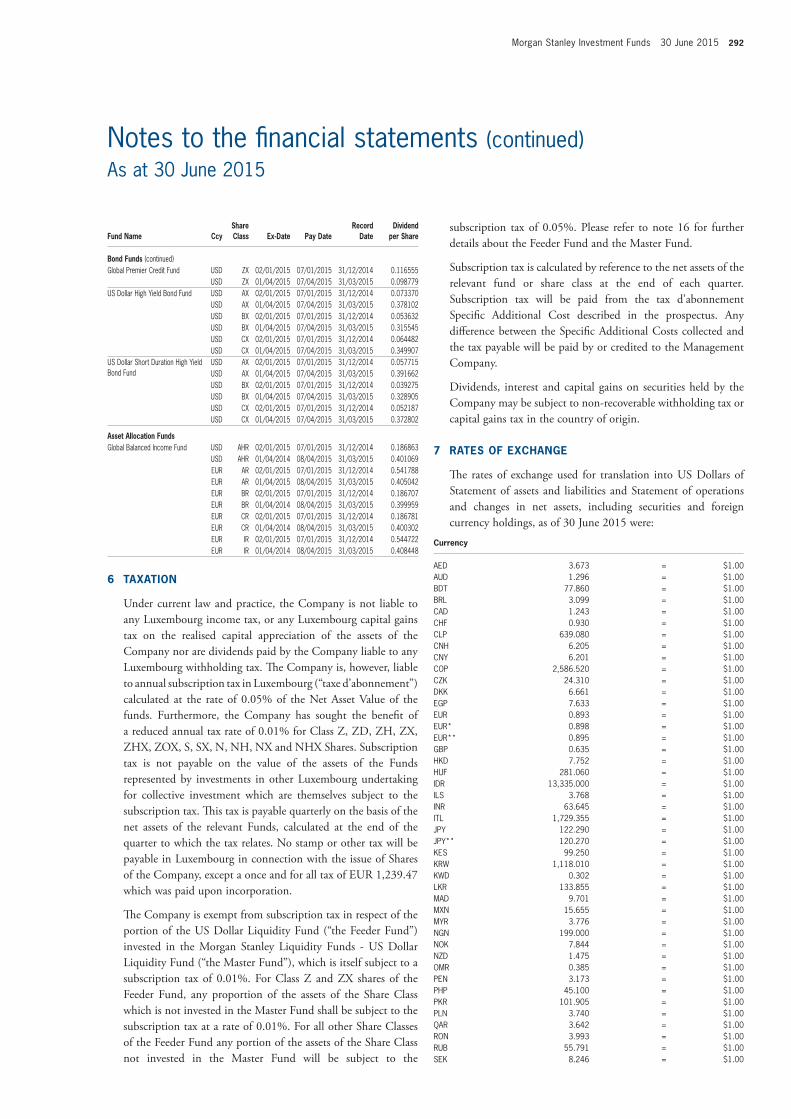
Morgan Stanley Investment Funds 30 June 2015 292
subscription tax of 0.05%. Please refer to note 16 for further details about the Feeder Fund and the Master Fund.
Subscription tax is calculated by reference to the net assets of the relevant fund or share class at the end of each quarter. Subscription tax will be paid from the tax d’abonnement Specific additional Cost described in the prospectus. any difference between the Specific additional Costs collected and the tax payable will be paid by or credited to the Management Company.
Dividends, interest and capital gains on securities held by the Company may be subject to non-recoverable withholding tax or capital gains tax in the country of origin.
7 RAtES of EXCHAnGE
The rates of exchange used for translation into US Dollars of Statement of assets and liabilities and Statement of operations and changes in net assets, including securities and foreign currency holdings, as of 30 June 2015 were:
Currency
AED 3.673 = $1.00AUD 1.296 = $1.00BDT 77.860 = $1.00BRL 3.099 = $1.00CAD 1.243 = $1.00CHF 0.930 = $1.00CLP 639.080 = $1.00CNH 6.205 = $1.00CNY 6.201 = $1.00COP 2,586.520 = $1.00CZK 24.310 = $1.00DKK 6.661 = $1.00EGP 7.633 = $1.00EUR 0.893 = $1.00EUR* 0.898 = $1.00EUR** 0.895 = $1.00GBP 0.635 = $1.00HKD 7.752 = $1.00HUF 281.060 = $1.00IDR 13,335.000 = $1.00ILS 3.768 = $1.00INR 63.645 = $1.00ITL 1,729.355 = $1.00JPY 122.290 = $1.00JPY** 120.270 = $1.00KES 99.250 = $1.00KRW 1,118.010 = $1.00KWD 0.302 = $1.00LKR 133.855 = $1.00MAD 9.701 = $1.00MXN 15.655 = $1.00MYR 3.776 = $1.00NGN 199.000 = $1.00NOK 7.844 = $1.00NZD 1.475 = $1.00OMR 0.385 = $1.00PEN 3.173 = $1.00PHP 45.100 = $1.00PKR 101.905 = $1.00PLN 3.740 = $1.00QAR 3.642 = $1.00RON 3.993 = $1.00RUB 55.791 = $1.00SEK 8.246 = $1.00
fund name CcyShare Class Ex-Date Pay Date
Record Date
Dividend per Share
Bond funds (continued)Global Premier Credit Fund USD ZX 02/01/2015 07/01/2015 31/12/2014 0.116555
USD ZX 01/04/2015 07/04/2015 31/03/2015 0.098779US Dollar High Yield Bond Fund USD AX 02/01/2015 07/01/2015 31/12/2014 0.073370
USD AX 01/04/2015 07/04/2015 31/03/2015 0.378102USD BX 02/01/2015 07/01/2015 31/12/2014 0.053632USD BX 01/04/2015 07/04/2015 31/03/2015 0.315545USD CX 02/01/2015 07/01/2015 31/12/2014 0.064482USD CX 01/04/2015 07/04/2015 31/03/2015 0.349907
US Dollar Short Duration High Yield Bond Fund
USD AX 02/01/2015 07/01/2015 31/12/2014 0.057715USD AX 01/04/2015 07/04/2015 31/03/2015 0.391662USD BX 02/01/2015 07/01/2015 31/12/2014 0.039275USD BX 01/04/2015 07/04/2015 31/03/2015 0.328905USD CX 02/01/2015 07/01/2015 31/12/2014 0.052187USD CX 01/04/2015 07/04/2015 31/03/2015 0.372802
Asset Allocation fundsGlobal Balanced Income Fund USD AHR 02/01/2015 07/01/2015 31/12/2014 0.186863
USD AHR 01/04/2014 08/04/2015 31/03/2015 0.401069EUR AR 02/01/2015 07/01/2015 31/12/2014 0.541788EUR AR 01/04/2015 08/04/2015 31/03/2015 0.405042EUR BR 02/01/2015 07/01/2015 31/12/2014 0.186707EUR BR 01/04/2014 08/04/2015 31/03/2015 0.399959EUR CR 02/01/2015 07/01/2015 31/12/2014 0.186781EUR CR 01/04/2014 08/04/2015 31/03/2015 0.400302EUR IR 02/01/2015 07/01/2015 31/12/2014 0.544722EUR IR 01/04/2014 08/04/2015 31/03/2015 0.408448
6 tAXAtion
Under current law and practice, the Company is not liable to any Luxembourg income tax, or any Luxembourg capital gains tax on the realised capital appreciation of the assets of the Company nor are dividends paid by the Company liable to any Luxembourg withholding tax. The Company is, however, liable to annual subscription tax in Luxembourg (“taxe d’abonnement”) calculated at the rate of 0.05% of the net asset value of the funds. Furthermore, the Company has sought the benefit of a reduced annual tax rate of 0.01% for Class Z, ZD, ZH, ZX, ZHX, ZOX, S, SX, n, nH, nX and nHX Shares. Subscription tax is not payable on the value of the assets of the Funds represented by investments in other Luxembourg undertaking for collective investment which are themselves subject to the subscription tax. This tax is payable quarterly on the basis of the net assets of the relevant Funds, calculated at the end of the quarter to which the tax relates. no stamp or other tax will be payable in Luxembourg in connection with the issue of Shares of the Company, except a once and for all tax of eUR 1,239.47 which was paid upon incorporation.
The Company is exempt from subscription tax in respect of the portion of the US Dollar Liquidity Fund (“the Feeder Fund”) invested in the Morgan Stanley Liquidity Funds - US Dollar Liquidity Fund (“the Master Fund”), which is itself subject to a subscription tax of 0.01%. For Class Z and ZX shares of the Feeder Fund, any proportion of the assets of the Share Class which is not invested in the Master Fund shall be subject to the subscription tax at a rate of 0.01%. For all other Share Classes of the Feeder Fund any portion of the assets of the Share Class not invested in the Master Fund will be subject to the
Notes to the financial statements (continued)As at 30 June 2015
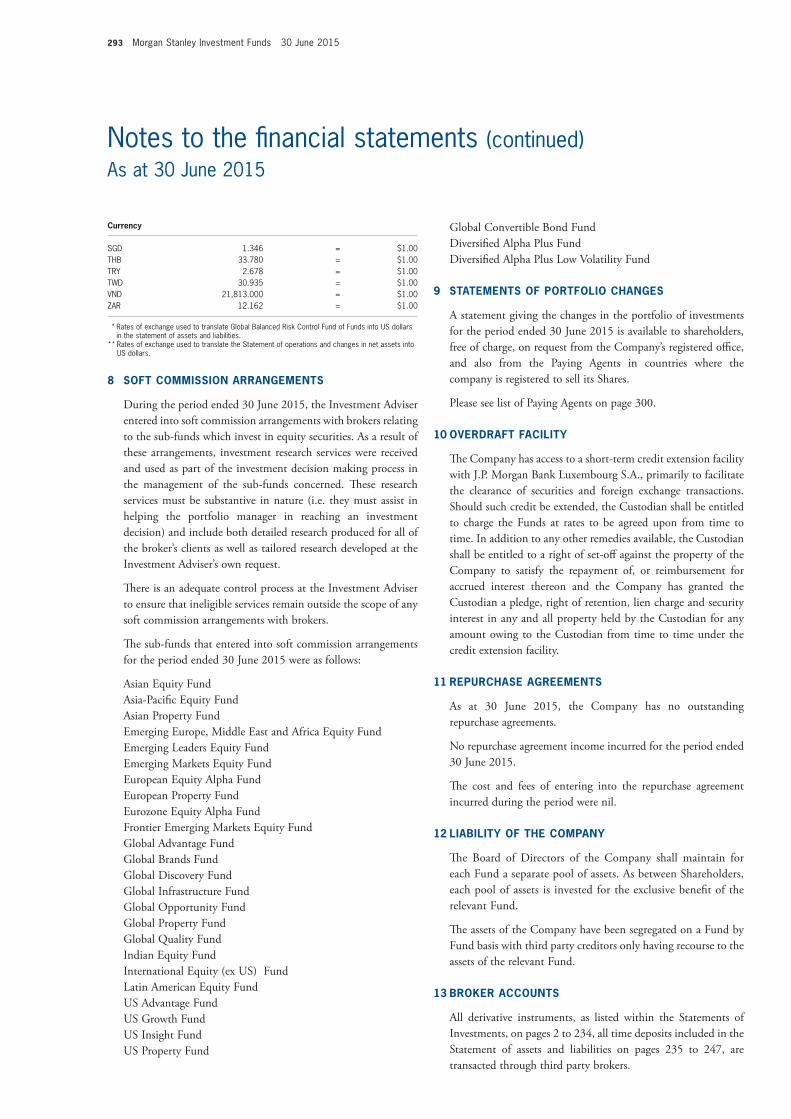
293 Morgan Stanley Investment Funds 30 June 2015
global Convertible Bond FundDiversified alpha Plus FundDiversified alpha Plus Low volatility Fund
9 StAtEmEntS of PoRtfoLio CHAnGES
a statement giving the changes in the portfolio of investments for the period ended 30 June 2015 is available to shareholders, free of charge, on request from the Company’s registered office, and also from the Paying agents in countries where the company is registered to sell its Shares.
Please see list of Paying agents on page 300.
10 ovERDRAft fACiLitY
The Company has access to a short-term credit extension facility with J.P. Morgan Bank Luxembourg S.a., primarily to facilitate the clearance of securities and foreign exchange transactions. Should such credit be extended, the Custodian shall be entitled to charge the Funds at rates to be agreed upon from time to time. In addition to any other remedies available, the Custodian shall be entitled to a right of set-off against the property of the Company to satisfy the repayment of, or reimbursement for accrued interest thereon and the Company has granted the Custodian a pledge, right of retention, lien charge and security interest in any and all property held by the Custodian for any amount owing to the Custodian from time to time under the credit extension facility.
11 REPURCHASE AGREEmEntS
as at 30 June 2015, the Company has no outstanding repurchase agreements.
no repurchase agreement income incurred for the period ended 30 June 2015.
The cost and fees of entering into the repurchase agreement incurred during the period were nil.
12 LiABiLitY of tHE ComPAnY
The Board of Directors of the Company shall maintain for each Fund a separate pool of assets. as between Shareholders, each pool of assets is invested for the exclusive benefit of the relevant Fund.
The assets of the Company have been segregated on a Fund by Fund basis with third party creditors only having recourse to the assets of the relevant Fund.
13 BRoKER ACCoUntS
all derivative instruments, as listed within the Statements of Investments, on pages 2 to 234, all time deposits included in the Statement of assets and liabilities on pages 235 to 247, are transacted through third party brokers.
Currency
SGD 1.346 = $1.00THB 33.780 = $1.00TRY 2.678 = $1.00TWD 30.935 = $1.00VND 21,813.000 = $1.00ZAR 12.162 = $1.00
* Rates of exchange used to translate Global Balanced Risk Control Fund of Funds into US dollars in the statement of assets and liabilities.
** Rates of exchange used to translate the Statement of operations and changes in net assets into US dollars.
8 Soft CommiSSion ARRAnGEmEntS
During the period ended 30 June 2015, the Investment adviser entered into soft commission arrangements with brokers relating to the sub-funds which invest in equity securities. as a result of these arrangements, investment research services were received and used as part of the investment decision making process in the management of the sub-funds concerned. These research services must be substantive in nature (i.e. they must assist in helping the portfolio manager in reaching an investment decision) and include both detailed research produced for all of the broker’s clients as well as tailored research developed at the Investment adviser’s own request.
There is an adequate control process at the Investment adviser to ensure that ineligible services remain outside the scope of any soft commission arrangements with brokers.
The sub-funds that entered into soft commission arrangements for the period ended 30 June 2015 were as follows:
asian equity Fundasia-Pacific equity Fundasian Property Fundemerging europe, Middle east and africa equity Fundemerging Leaders equity Fundemerging Markets equity Fundeuropean equity alpha Fundeuropean Property Fundeurozone equity alpha FundFrontier emerging Markets equity Fundglobal advantage Fundglobal Brands Fund global Discovery Fundglobal Infrastructure Fundglobal Opportunity Fundglobal Property Fundglobal Quality FundIndian equity FundInternational equity (ex US) FundLatin american equity FundUS advantage FundUS growth FundUS Insight FundUS Property Fund
Notes to the financial statements (continued)As at 30 June 2015
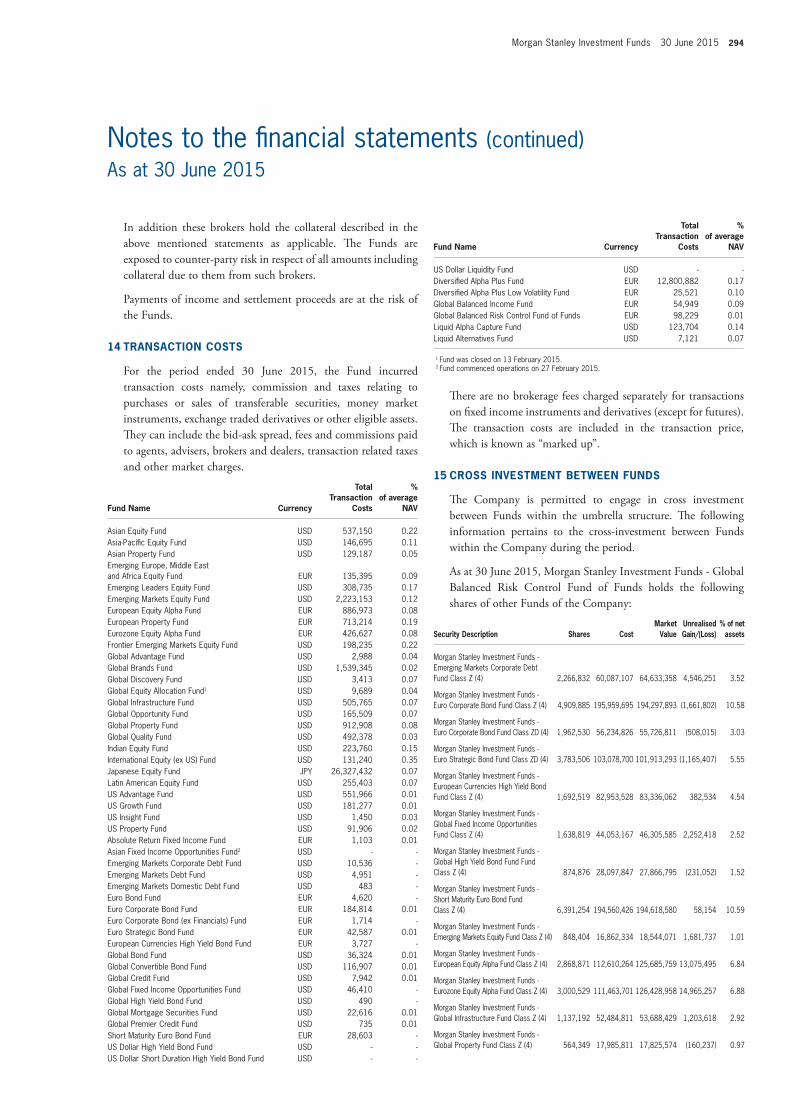
Morgan Stanley Investment Funds 30 June 2015 294
fund name Currency
total transaction
Costs
% of average
nAv
US Dollar Liquidity Fund USD - -Diversified Alpha Plus Fund EUR 12,800,882 0.17Diversified Alpha Plus Low Volatility Fund EUR 25,521 0.10Global Balanced Income Fund EUR 54,949 0.09Global Balanced Risk Control Fund of Funds EUR 98,229 0.01Liquid Alpha Capture Fund USD 123,704 0.14Liquid Alternatives Fund USD 7,121 0.07
1 Fund was closed on 13 February 2015. 2 Fund commenced operations on 27 February 2015.
There are no brokerage fees charged separately for transactions on fixed income instruments and derivatives (except for futures). The transaction costs are included in the transaction price, which is known as “marked up”.
15 CRoSS invEStmEnt BEtWEEn fUnDS
The Company is permitted to engage in cross investment between Funds within the umbrella structure. The following information pertains to the cross-investment between Funds within the Company during the period.
as at 30 June 2015, Morgan Stanley Investment Funds - global Balanced Risk Control Fund of Funds holds the following shares of other Funds of the Company:
Security Description Shares Costmarket
valueUnrealised Gain/(Loss)
% of net assets
Morgan Stanley Investment Funds - Emerging Markets Corporate Debt Fund Class Z (4) 2,266,832 60,087,107 64,633,358 4,546,251 3.52
Morgan Stanley Investment Funds - Euro Corporate Bond Fund Class Z (4) 4,909,885 195,959,695 194,297,893 (1,661,802) 10.58
Morgan Stanley Investment Funds - Euro Corporate Bond Fund Class ZD (4) 1,962,530 56,234,826 55,726,811 (508,015) 3.03
Morgan Stanley Investment Funds - Euro Strategic Bond Fund Class ZD (4) 3,783,506 103,078,700 101,913,293 (1,165,407) 5.55
Morgan Stanley Investment Funds - European Currencies High Yield Bond Fund Class Z (4) 1,692,519 82,953,528 83,336,062 382,534 4.54
Morgan Stanley Investment Funds - Global Fixed Income Opportunities Fund Class Z (4) 1,638,819 44,053,167 46,305,585 2,252,418 2.52
Morgan Stanley Investment Funds - Global High Yield Bond Fund Fund Class Z (4) 874,876 28,097,847 27,866,795 (231,052) 1.52
Morgan Stanley Investment Funds - Short Maturity Euro Bond Fund Class Z (4) 6,391,254 194,560,426 194,618,580 58,154 10.59
Morgan Stanley Investment Funds - Emerging Markets Equity Fund Class Z (4) 848,404 16,862,334 18,544,071 1,681,737 1.01
Morgan Stanley Investment Funds - European Equity Alpha Fund Class Z (4) 2,868,871 112,610,264 125,685,759 13,075,495 6.84
Morgan Stanley Investment Funds - Eurozone Equity Alpha Fund Class Z (4) 3,000,529 111,463,701 126,428,958 14,965,257 6.88
Morgan Stanley Investment Funds - Global Infrastructure Fund Class Z (4) 1,137,192 52,484,811 53,688,429 1,203,618 2.92
Morgan Stanley Investment Funds - Global Property Fund Class Z (4) 564,349 17,985,811 17,825,574 (160,237) 0.97
In addition these brokers hold the collateral described in the above mentioned statements as applicable. The Funds are exposed to counter-party risk in respect of all amounts including collateral due to them from such brokers.
Payments of income and settlement proceeds are at the risk of the Funds.
14 tRAnSACtion CoStS
For the period ended 30 June 2015, the Fund incurred transaction costs namely, commission and taxes relating to purchases or sales of transferable securities, money market instruments, exchange traded derivatives or other eligible assets. They can include the bid-ask spread, fees and commissions paid to agents, advisers, brokers and dealers, transaction related taxes and other market charges.
fund name Currency
total transaction
Costs
% of average
nAv
Asian Equity Fund USD 537,150 0.22Asia-Pacific Equity Fund USD 146,695 0.11Asian Property Fund USD 129,187 0.05Emerging Europe, Middle East and Africa Equity Fund EUR 135,395 0.09Emerging Leaders Equity Fund USD 308,735 0.17Emerging Markets Equity Fund USD 2,223,153 0.12European Equity Alpha Fund EUR 886,973 0.08European Property Fund EUR 713,214 0.19Eurozone Equity Alpha Fund EUR 426,627 0.08Frontier Emerging Markets Equity Fund USD 198,235 0.22Global Advantage Fund USD 2,988 0.04Global Brands Fund USD 1,539,345 0.02Global Discovery Fund USD 3,413 0.07Global Equity Allocation Fund1 USD 9,689 0.04Global Infrastructure Fund USD 505,765 0.07Global Opportunity Fund USD 165,509 0.07Global Property Fund USD 912,908 0.08Global Quality Fund USD 492,378 0.03Indian Equity Fund USD 223,760 0.15International Equity (ex US) Fund USD 131,240 0.35Japanese Equity Fund JPY 26,327,432 0.07Latin American Equity Fund USD 255,403 0.07US Advantage Fund USD 551,966 0.01US Growth Fund USD 181,277 0.01US Insight Fund USD 1,450 0.03US Property Fund USD 91,906 0.02Absolute Return Fixed Income Fund EUR 1,103 0.01Asian Fixed Income Opportunities Fund2 USD - -Emerging Markets Corporate Debt Fund USD 10,536 -Emerging Markets Debt Fund USD 4,951 -Emerging Markets Domestic Debt Fund USD 483 -Euro Bond Fund EUR 4,620 -Euro Corporate Bond Fund EUR 184,814 0.01Euro Corporate Bond (ex Financials) Fund EUR 1,714 -Euro Strategic Bond Fund EUR 42,587 0.01European Currencies High Yield Bond Fund EUR 3,727 -Global Bond Fund USD 36,324 0.01Global Convertible Bond Fund USD 116,907 0.01Global Credit Fund USD 7,942 0.01Global Fixed Income Opportunities Fund USD 46,410 -Global High Yield Bond Fund USD 490 -Global Mortgage Securities Fund USD 22,616 0.01Global Premier Credit Fund USD 735 0.01Short Maturity Euro Bond Fund EUR 28,603 -US Dollar High Yield Bond Fund USD - -US Dollar Short Duration High Yield Bond Fund USD - -
Notes to the financial statements (continued)As at 30 June 2015
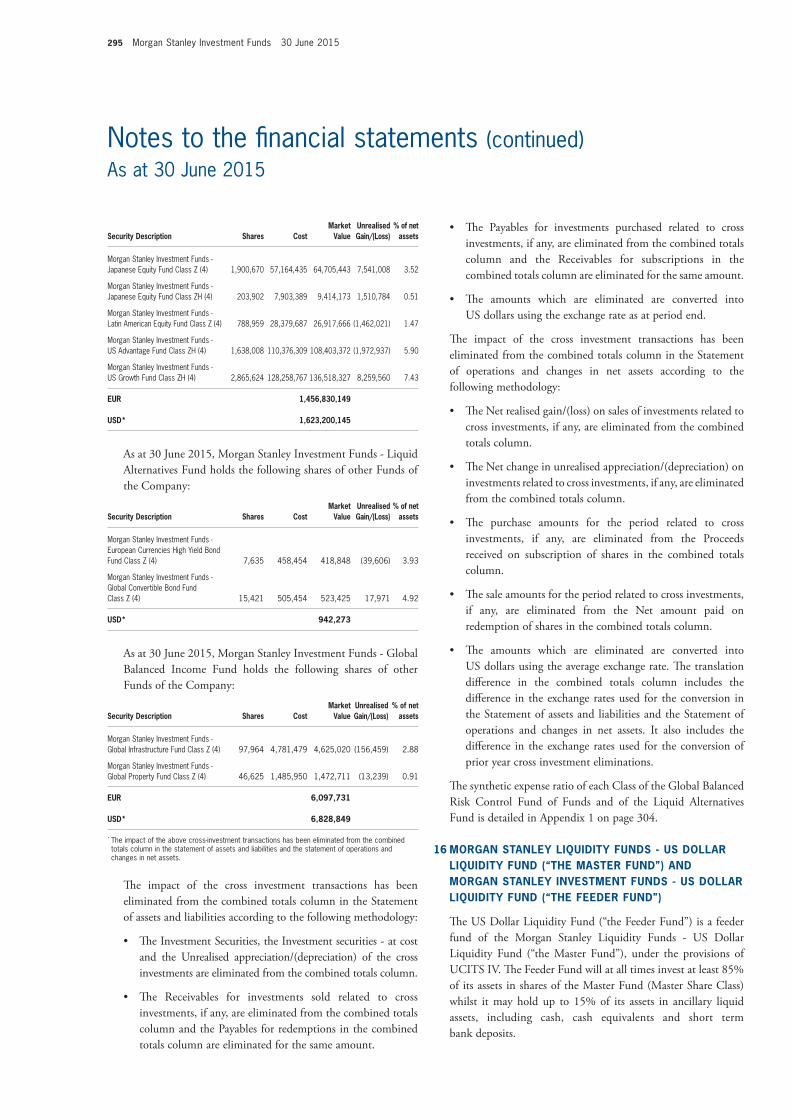
295 Morgan Stanley Investment Funds 30 June 2015
• The Payables for investments purchased related to crossinvestments, if any, are eliminated from the combined totals column and the Receivables for subscriptions in the combined totals column are eliminated for the same amount.
• The amounts which are eliminated are converted intoUS dollars using the exchange rate as at period end.
The impact of the cross investment transactions has been eliminated from the combined totals column in the Statement of operations and changes in net assets according to the following methodology:
• TheNetrealisedgain/(loss)onsalesofinvestmentsrelatedtocross investments, if any, are eliminated from the combined totals column.
• TheNetchangeinunrealisedappreciation/(depreciation)oninvestments related to cross investments, if any, are eliminated from the combined totals column.
• The purchase amounts for the period related to crossinvestments, if any, are eliminated from the Proceeds received on subscription of shares in the combined totals column.
• Thesaleamountsfortheperiodrelatedtocrossinvestments,if any, are eliminated from the net amount paid on redemption of shares in the combined totals column.
• The amounts which are eliminated are converted intoUS dollars using the average exchange rate. The translation difference in the combined totals column includes the difference in the exchange rates used for the conversion in the Statement of assets and liabilities and the Statement of operations and changes in net assets. It also includes the difference in the exchange rates used for the conversion of prior year cross investment eliminations.
The synthetic expense ratio of each Class of the global Balanced Risk Control Fund of Funds and of the Liquid alternatives Fund is detailed in appendix 1 on page 304.
16 moRGAn StAnLEY LiQUiDitY fUnDS - US DoLLAR LiQUiDitY fUnD (“tHE mAStER fUnD”) AnD moRGAn StAnLEY invEStmEnt fUnDS - US DoLLAR LiQUiDitY fUnD (“tHE fEEDER fUnD”)
The US Dollar Liquidity Fund (“the Feeder Fund”) is a feeder fund of the Morgan Stanley Liquidity Funds - US Dollar Liquidity Fund (“the Master Fund”), under the provisions of UCItS Iv. The Feeder Fund will at all times invest at least 85% of its assets in shares of the Master Fund (Master Share Class) whilst it may hold up to 15% of its assets in ancillary liquid assets, including cash, cash equivalents and short term bank deposits.
Security Description Shares Costmarket
valueUnrealised Gain/(Loss)
% of net assets
Morgan Stanley Investment Funds - Japanese Equity Fund Class Z (4) 1,900,670 57,164,435 64,705,443 7,541,008 3.52
Morgan Stanley Investment Funds - Japanese Equity Fund Class ZH (4) 203,902 7,903,389 9,414,173 1,510,784 0.51
Morgan Stanley Investment Funds - Latin American Equity Fund Class Z (4) 788,959 28,379,687 26,917,666 (1,462,021) 1.47
Morgan Stanley Investment Funds - US Advantage Fund Class ZH (4) 1,638,008 110,376,309 108,403,372 (1,972,937) 5.90
Morgan Stanley Investment Funds - US Growth Fund Class ZH (4) 2,865,624 128,258,767 136,518,327 8,259,560 7.43
EUR 1,456,830,149
USD* 1,623,200,145
as at 30 June 2015, Morgan Stanley Investment Funds - Liquid alternatives Fund holds the following shares of other Funds of the Company:
Security Description Shares Costmarket
valueUnrealised Gain/(Loss)
% of net assets
Morgan Stanley Investment Funds - European Currencies High Yield Bond Fund Class Z (4) 7,635 458,454 418,848 (39,606) 3.93
Morgan Stanley Investment Funds - Global Convertible Bond Fund Class Z (4) 15,421 505,454 523,425 17,971 4.92
USD* 942,273
as at 30 June 2015, Morgan Stanley Investment Funds - global Balanced Income Fund holds the following shares of other Funds of the Company:
Security Description Shares Costmarket
valueUnrealised Gain/(Loss)
% of net assets
Morgan Stanley Investment Funds - Global Infrastructure Fund Class Z (4) 97,964 4,781,479 4,625,020 (156,459) 2.88
Morgan Stanley Investment Funds - Global Property Fund Class Z (4) 46,625 1,485,950 1,472,711 (13,239) 0.91
EUR 6,097,731
USD* 6,828,849
* The impact of the above cross-investment transactions has been eliminated from the combined totals column in the statement of assets and liabilities and the statement of operations and changes in net assets.
The impact of the cross investment transactions has been eliminated from the combined totals column in the Statement of assets and liabilities according to the following methodology:
• TheInvestmentSecurities,theInvestmentsecurities-atcostand the Unrealised appreciation/(depreciation) of the cross investments are eliminated from the combined totals column.
• The Receivables for investments sold related to crossinvestments, if any, are eliminated from the combined totals column and the Payables for redemptions in the combined totals column are eliminated for the same amount.
Notes to the financial statements (continued)As at 30 June 2015
Morgan Stanley Investment Funds 30 June 2015 296
to satisfy the net transactions received in respect of a particular day.
Under normal market circumstances, the Swing Factor shall not exceed 1% of the net asset value of the relevant Fund on the relevant day. When net subscriptions in a Fund exceed a certain threshold on a given day, the net asset value is adjusted upwards by the Swing Factor. Similarly, when net redemptions in a Fund exceed a certain threshold on a given day, the net asset value of the Fund is adjusted downwards by the Swing Factor.
as at 30 June 2015, the net asset value of the emerging Markets Corporate Debt Fund and of the euro Bond Fund was swung because of a large redemption exceeding the threshold.
The official net asset value per Share as at period-end, disclosed in the Statement of share and net assets statistics therefore includes a Swing Pricing adjustment, which is not recognised in the Statement of assets and liabilities and the Statement of operations and changes in net assets.
18 inDEmnifiCAtionS
The Company has arrangements in place for the indemnification of the members of its Board of Directors, and of its service providers (the “Indemnified Parties”) in certain circumstances, which exclude the Indemnified Parties’ own negligence, wilful default, or fraud. The Company’s service providers include the Management Company, the Investment advisers, the Sub-Investment advisers, the Custodian, the administrator and Paying agent, the Distributor and the Registrar and transfer agent.
19 DiRECtoRS’ REmUnERAtion
The administration charge will be utilised to pay the renumeration of the Directors including reasonable out-of-pocket expenses. Directors fees remain ultimately subject to approval by the Company’s shareholders.
20 SUBSEQUEnt EvEntS
The following significant changes were made after period end:
Launched fund
• On 31 July 2015, Morgan Stanley Investment Funds –Breakout nations Fund commenced operations.
• On 3 August 2015,Morgan Stanley Investment Funds –emerging Markets Fixed Income Opportunities Fund commenced operations.
The investment objective of the Feeder Fund is to provide liquidity and high current income, to the extent consistent with the preservation of capital. The Feeder Fund seeks to achieve its investment objective by investing substantially all of its assets in shares of the Master Fund shares. The Feeder Fund does not invest in money market instruments directly and will only obtain its exposure to money market instruments through its investment in the Master Fund.
The Master Fund’s investment objective is to provide liquidity and an attractive rate of income, to the extent consistent with the preservation of capital. The Master Fund will seek to achieve its investment objective primarily by investing in high quality short-term Money Market Instruments comprising transferable debt securities (which may include by way of example fixed or floating rate instruments including without limitation commercial paper, certificates of deposit, freely transferable promissory notes, government and corporate bonds and asset-backed securities) that are denominated in US Dollars, provided that, at the time of acquisition, their initial or residual maturity does not exceed 397 days.
These financial statements should be read in conjunction with the financial statements of the Master Fund.
The audited annual report and the unaudited semi-annual report of the Master Fund are available to the Shareholders free of charge upon request at the registered office of the Morgan Stanley Liquidity Funds - US Dollar Liquidity Fund (“the Master Fund”): 6B, route de trèves, L-2633 Senningerberg, grand Duchy of Luxembourg. The Master Fund’s accounting year begins on 1 april and ends on 31 March of each year.
as of 30 June 2015, the Feeder Fund holds 37.91% of the net asset value of the Master Fund, and 100% of the Master Share Class.
For the period ended 30 June 2015, the aggregated total expenses of the Feeder Fund and the Master Fund are USD 4,452,634.
The synthetic expense ratio of each Class of the Feeder Fund is detailed in appendix 1 on page 304. The total expense ratio of the Master Fund (Master Share Class) is 0.01%.
17 SWinG PRiCinG
to the extent that the Board of Directors of the Company consider that it is in the best interests of Shareholders, taking into account factors including the prevailing market conditions, the level of subscriptions and redemptions in a particular Fund and the size of the Fund, the Board of Directors of the Company may decide to adjust the net asset value of a Fund to reflect the estimated dealing spreads, costs and charges (“Swing Factor”) to be incurred by the Fund in liquidating or purchasing investments
Notes to the financial statements (continued)As at 30 June 2015
297 Morgan Stanley Investment Funds 30 June 2015
Launched Classes
fund name Share Class Date
European Currencies High Yield Bond Fund ZH (USD) 17 July 2015US Growth Fund ZX 24 July 2015Breakout Nations Fund A 31 July 2015Breakout Nations Fund AH (EUR) 31 July 2015Breakout Nations Fund B 31 July 2015Breakout Nations Fund BH (EUR) 31 July 2015Breakout Nations Fund C 31 July 2015Breakout Nations Fund CH (EUR) 31 July 2015Breakout Nations Fund Z 31 July 2015Global Balanced Income Fund ZHR (GBP) 31 July 2015Global Balanced Income Fund ZHR (USD) 31 July 2015
investment Sub-Advisor name Change
as a result of the merger between Mitsubishi UFJ asset Management Co., Ltd. (MUaM) and KOKUSaI asset Management Co., Ltd. (KaM) effective 1 July 2015, Mitsubishi UFJ asset Management Co., Ltd (Japan) changed name to “Mitsubishi UFJ Kokusai asset Management Co., Ltd”.
Notes to the financial statements (continued)As at 30 June 2015
Morgan Stanley Investment Funds 30 June 2015 298
DiRECtoRS
William Jonesnon-executive DirectorLuxembourg
michael Griffinnon-executive DirectorDublinIreland
Henry Kellynon-executive DirectorLuxembourg
Andrew macknon-executive DirectorLondonUnited Kingdom
mAnAGEmEnt ComPAnY
morgan Stanley investment management (ACD) Limited25 Cabot Square Canary Wharf London e14 4Qa United Kingdom
DiRECtoRS of tHE mAnAGEmEnt ComPAnY
Judith EdenManaging Director Morgan Stanley InvestmentManagement LimitedLondon United Kingdom
véronique Gillet(Until 12 May 2015)non-executive Director Luxembourg
Bryan Greenerexecutive Director Morgan Stanley Investment Management Limited LondonUnited Kingdom
Andrew macknon-executive Director LondonUnited Kingdom
Andrew onslow Managing Director Morgan Stanley InvestmentManagement LimitedLondon United Kingdom
Ruairi o’HealaiManaging DirectorMorgan Stanley InvestmentManagement LimitedLondon United Kingdom
DiRECtoRS of moRGAn StAnLEY invEStmEnt HoLDinG ComPAnY (mAURitiUS) LimitED
Deven Coopoosamy(Until 8 april 2015)DirectorBusiness DevelopmentCIM global Business CompaniesRepublic of Mauritius
Sonia Lutchmiah(From 8 april 2015)DirectorCIM global Business CompaniesRepublic of Mauritius
Judith Eden(From 3 March 2015)Managing DirectorMorgan Stanley InvestmentManagement LimitedLondonUnited Kingdom
William Jonesnon-executive DirectorLuxembourg
michael Griffin(Until 2 March 2015)non-executive DirectorDublinIreland
Andrew mack non-executive DirectorLondonUnited Kingdom
Ashraf Ramtoola Director Fund administrationCIM global Business CompaniesRepublic of Mauritius
* Delegated from the Management Company.
Directors and service providers
Other information
299 Morgan Stanley Investment Funds 30 June 2015
invEStmEnt ADviSERS*
morgan Stanley investmentmanagement Limited25 Cabot SquareCanary WharfLondon e14 4QaUnited Kingdom
morgan Stanley & Co. international plc25 Cabot SquareCanary WharfLondon e14 4QaUnited Kingdom
invEStmEnt SUB-ADviSERS
morgan Stanleyinvestment management inc.522 Fifth avenuenew York, nY 10036USa
morgan Stanley investmentmanagement Company23 Church Street16-01 Capital SquareSingapore, 049481
mitsubishi UfJ Asset management (UK) Ltd24 Lombard StreetLondon eC3v 9aJUnited Kingdom
DELEGAtED SUB-ADviSER
mitsubishi UfJ Asset management Co., Ltd (Japan) 1-4-5 Marunouchi, Chiyoda-ku tokyo 100-8212 Japan
REGiStERED offiCE
6B, route de trèves2633 SenningerbergLuxembourg
DiStRiBUtoR*
morgan Stanley investmentmanagement Limited25 Cabot SquareCanary WharfLondon e14 4QaUnited Kingdom
CUStoDiAn BAnK
J.P. morgan BankLuxembourg S.A.european Bankand Business Centre6C, route de trèves2633 SenningerbergLuxembourg
ADminiStRAtoR AnD PAYinG AGEnt*
J.P. morgan BankLuxembourg S.A.european Bankand Business Centre6C, route de trèves2633 SenningerbergLuxembourg
DomiCiLiARY AGEnt
morgan Stanley investment management Limited, Luxembourg Brancheuropean Bank and Business Centre6B, route de trèves2633 SenningerbergLuxembourg
ADminiStRAtoR of tHE SUBSiDiARY
Cim fund Services Ltd.33 edith Cavell StreetPort LouisRepublic of Mauritius
REGiStRAR AnD tRAnSfER AGEnt*
RBC investor ServicesBank S.A.14 rue Porte de France4360 esch-sur-alzetteLuxembourg
inDEPEnDEnt AUDitoR
Ernst & Young S.A.7 rue gabriel LippmannParc d’activité Syrdall 25365 MunsbachLuxembourg
AUDitoR of tHE SUBSiDiARY
Ernst & Young9th Floor nexteracom tower ICybercityebeneRepublic of Mauritius
LEGAL ADviSER
Arendt & medernach14 rue erasme2082 LuxembourgLuxembourg
* Delegated from the Management Company.
Directors and service providers (continued)As at 30 June 2015
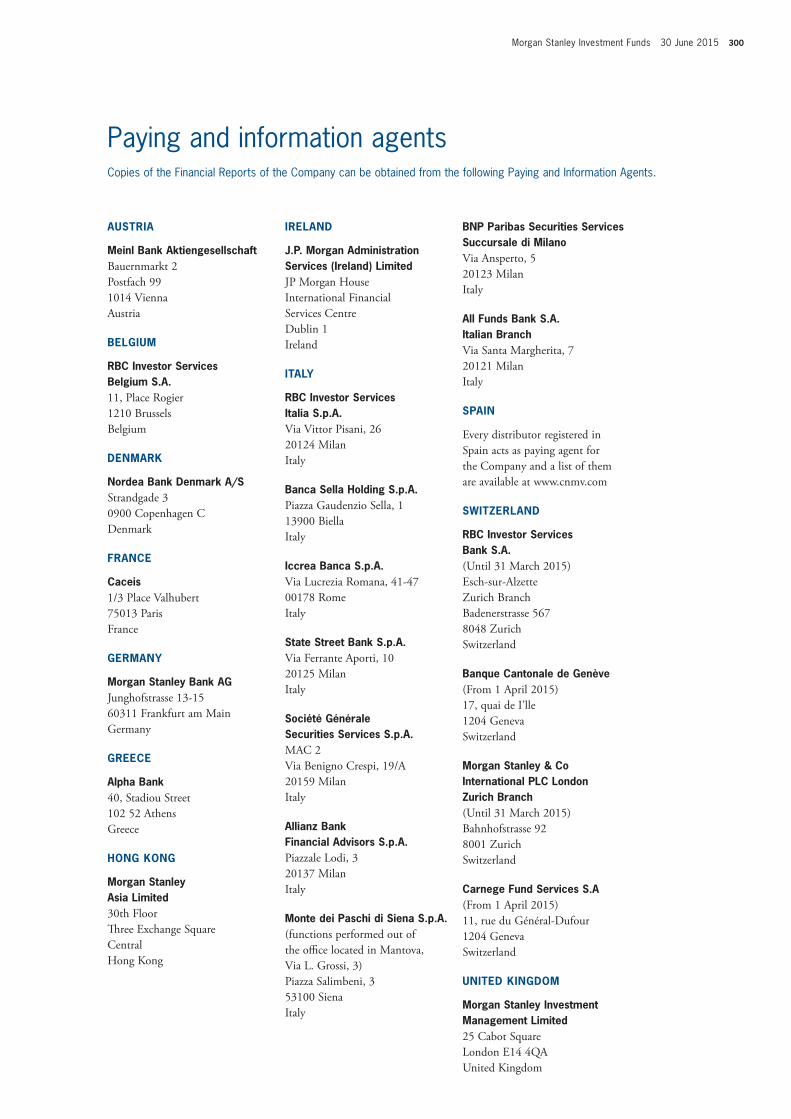
Morgan Stanley Investment Funds 30 June 2015 300
AUStRiA
meinl Bank AktiengesellschaftBauernmarkt 2Postfach 991014 viennaaustria
BELGiUm
RBC investor Services Belgium S.A.11, Place Rogier1210 BrusselsBelgium
DEnmARK
nordea Bank Denmark A/SStrandgade 30900 Copenhagen CDenmark
fRAnCE
Caceis1/3 Place valhubert75013 ParisFrance
GERmAnY
morgan Stanley Bank AGJunghofstrasse 13-1560311 Frankfurt am Maingermany
GREECE
Alpha Bank40, Stadiou Street102 52 athensgreece
HonG KonG
morgan Stanley Asia Limited30th FloorThree exchange SquareCentralHong Kong
iRELAnD
J.P. morgan Administration Services (ireland) LimitedJP Morgan HouseInternational Financial Services CentreDublin 1Ireland
itALY
RBC investor Services italia S.p.A.via vittor Pisani, 2620124 MilanItaly
Banca Sella Holding S.p.A.Piazza gaudenzio Sella, 113900 BiellaItaly
iccrea Banca S.p.A.via Lucrezia Romana, 41-4700178 RomeItaly
State Street Bank S.p.A.via Ferrante aporti, 1020125 MilanItaly
Société Générale Securities Services S.p.A.MaC 2via Benigno Crespi, 19/a20159 MilanItaly
Allianz Bankfinancial Advisors S.p.A.Piazzale Lodi, 320137 MilanItaly
monte dei Paschi di Siena S.p.A.(functions performed out of the office located in Mantova, via L. grossi, 3) Piazza Salimbeni, 3 53100 Siena Italy
BnP Paribas Securities Services Succursale di milanovia ansperto, 520123 MilanItaly
All funds Bank S.A. italian Branch via Santa Margherita, 720121 MilanItaly
SPAin
every distributor registered in Spain acts as paying agent for the Company and a list of them are available at www.cnmv.com
SWitZERLAnD
RBC investor Services Bank S.A.(Until 31 March 2015)esch-sur-alzetteZurich Branch Badenerstrasse 5678048 Zurich Switzerland
Banque Cantonale de Genève(From 1 april 2015)17, quai de I’lle1204 genevaSwitzerland
morgan Stanley & Co international PLC LondonZurich Branch (Until 31 March 2015)Bahnhofstrasse 928001 ZurichSwitzerland
Carnege fund Services S.A(From 1 april 2015)11, rue du général-Dufour1204 geneva Switzerland
UnitED KinGDom
morgan Stanley investment management Limited25 Cabot SquareLondon e14 4QaUnited Kingdom
Paying and information agentsCopies of the Financial Reports of the Company can be obtained from the following Paying and Information Agents.
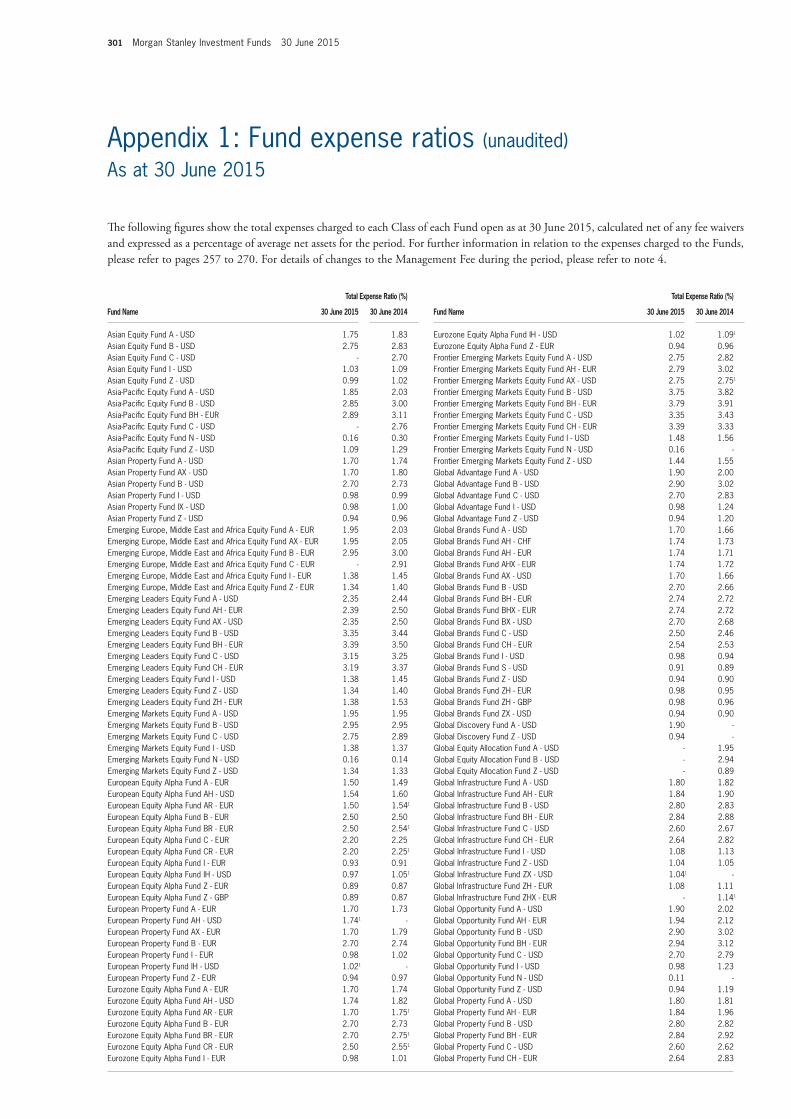
301 Morgan Stanley Investment Funds 30 June 2015
total Expense Ratio (%)
fund name 30 June 2015 30 June 2014
Eurozone Equity Alpha Fund IH - USD 1.02 1.091
Eurozone Equity Alpha Fund Z - EUR 0.94 0.96Frontier Emerging Markets Equity Fund A - USD 2.75 2.82Frontier Emerging Markets Equity Fund AH - EUR 2.79 3.02Frontier Emerging Markets Equity Fund AX - USD 2.75 2.751
Frontier Emerging Markets Equity Fund B - USD 3.75 3.82Frontier Emerging Markets Equity Fund BH - EUR 3.79 3.91Frontier Emerging Markets Equity Fund C - USD 3.35 3.43Frontier Emerging Markets Equity Fund CH - EUR 3.39 3.33Frontier Emerging Markets Equity Fund I - USD 1.48 1.56Frontier Emerging Markets Equity Fund N - USD 0.16 -Frontier Emerging Markets Equity Fund Z - USD 1.44 1.55Global Advantage Fund A - USD 1.90 2.00Global Advantage Fund B - USD 2.90 3.02Global Advantage Fund C - USD 2.70 2.83Global Advantage Fund I - USD 0.98 1.24Global Advantage Fund Z - USD 0.94 1.20Global Brands Fund A - USD 1.70 1.66Global Brands Fund AH - CHF 1.74 1.73Global Brands Fund AH - EUR 1.74 1.71Global Brands Fund AHX - EUR 1.74 1.72Global Brands Fund AX - USD 1.70 1.66Global Brands Fund B - USD 2.70 2.66Global Brands Fund BH - EUR 2.74 2.72Global Brands Fund BHX - EUR 2.74 2.72Global Brands Fund BX - USD 2.70 2.68Global Brands Fund C - USD 2.50 2.46Global Brands Fund CH - EUR 2.54 2.53Global Brands Fund I - USD 0.98 0.94Global Brands Fund S - USD 0.91 0.89Global Brands Fund Z - USD 0.94 0.90Global Brands Fund ZH - EUR 0.98 0.95Global Brands Fund ZH - GBP 0.98 0.96Global Brands Fund ZX - USD 0.94 0.90Global Discovery Fund A - USD 1.90 -Global Discovery Fund Z - USD 0.94 -Global Equity Allocation Fund A - USD - 1.95Global Equity Allocation Fund B - USD - 2.94Global Equity Allocation Fund Z - USD - 0.89Global Infrastructure Fund A - USD 1.80 1.82Global Infrastructure Fund AH - EUR 1.84 1.90Global Infrastructure Fund B - USD 2.80 2.83Global Infrastructure Fund BH - EUR 2.84 2.88Global Infrastructure Fund C - USD 2.60 2.67Global Infrastructure Fund CH - EUR 2.64 2.82Global Infrastructure Fund I - USD 1.08 1.13Global Infrastructure Fund Z - USD 1.04 1.05Global Infrastructure Fund ZX - USD 1.041 -Global Infrastructure Fund ZH - EUR 1.08 1.11Global Infrastructure Fund ZHX - EUR - 1.141
Global Opportunity Fund A - USD 1.90 2.02Global Opportunity Fund AH - EUR 1.94 2.12Global Opportunity Fund B - USD 2.90 3.02Global Opportunity Fund BH - EUR 2.94 3.12Global Opportunity Fund C - USD 2.70 2.79Global Opportunity Fund I - USD 0.98 1.23Global Opportunity Fund N - USD 0.11 -Global Opportunity Fund Z - USD 0.94 1.19Global Property Fund A - USD 1.80 1.81Global Property Fund AH - EUR 1.84 1.96Global Property Fund B - USD 2.80 2.82Global Property Fund BH - EUR 2.84 2.92Global Property Fund C - USD 2.60 2.62Global Property Fund CH - EUR 2.64 2.83
total Expense Ratio (%)
fund name 30 June 2015 30 June 2014
Asian Equity Fund A - USD 1.75 1.83Asian Equity Fund B - USD 2.75 2.83Asian Equity Fund C - USD - 2.70Asian Equity Fund I - USD 1.03 1.09Asian Equity Fund Z - USD 0.99 1.02Asia-Pacific Equity Fund A - USD 1.85 2.03Asia-Pacific Equity Fund B - USD 2.85 3.00Asia-Pacific Equity Fund BH - EUR 2.89 3.11Asia-Pacific Equity Fund C - USD - 2.76Asia-Pacific Equity Fund N - USD 0.16 0.30Asia-Pacific Equity Fund Z - USD 1.09 1.29Asian Property Fund A - USD 1.70 1.74Asian Property Fund AX - USD 1.70 1.80Asian Property Fund B - USD 2.70 2.73Asian Property Fund I - USD 0.98 0.99Asian Property Fund IX - USD 0.98 1.00Asian Property Fund Z - USD 0.94 0.96Emerging Europe, Middle East and Africa Equity Fund A - EUR 1.95 2.03Emerging Europe, Middle East and Africa Equity Fund AX - EUR 1.95 2.05Emerging Europe, Middle East and Africa Equity Fund B - EUR 2.95 3.00Emerging Europe, Middle East and Africa Equity Fund C - EUR - 2.91Emerging Europe, Middle East and Africa Equity Fund I - EUR 1.38 1.45Emerging Europe, Middle East and Africa Equity Fund Z - EUR 1.34 1.40Emerging Leaders Equity Fund A - USD 2.35 2.44Emerging Leaders Equity Fund AH - EUR 2.39 2.50Emerging Leaders Equity Fund AX - USD 2.35 2.50Emerging Leaders Equity Fund B - USD 3.35 3.44Emerging Leaders Equity Fund BH - EUR 3.39 3.50Emerging Leaders Equity Fund C - USD 3.15 3.25Emerging Leaders Equity Fund CH - EUR 3.19 3.37Emerging Leaders Equity Fund I - USD 1.38 1.45Emerging Leaders Equity Fund Z - USD 1.34 1.40Emerging Leaders Equity Fund ZH - EUR 1.38 1.53Emerging Markets Equity Fund A - USD 1.95 1.95Emerging Markets Equity Fund B - USD 2.95 2.95Emerging Markets Equity Fund C - USD 2.75 2.89Emerging Markets Equity Fund I - USD 1.38 1.37Emerging Markets Equity Fund N - USD 0.16 0.14Emerging Markets Equity Fund Z - USD 1.34 1.33European Equity Alpha Fund A - EUR 1.50 1.49European Equity Alpha Fund AH - USD 1.54 1.60European Equity Alpha Fund AR - EUR 1.50 1.541
European Equity Alpha Fund B - EUR 2.50 2.50European Equity Alpha Fund BR - EUR 2.50 2.541
European Equity Alpha Fund C - EUR 2.20 2.25European Equity Alpha Fund CR - EUR 2.20 2.251
European Equity Alpha Fund I - EUR 0.93 0.91European Equity Alpha Fund IH - USD 0.97 1.051
European Equity Alpha Fund Z - EUR 0.89 0.87European Equity Alpha Fund Z - GBP 0.89 0.87European Property Fund A - EUR 1.70 1.73European Property Fund AH - USD 1.741 -European Property Fund AX - EUR 1.70 1.79European Property Fund B - EUR 2.70 2.74European Property Fund I - EUR 0.98 1.02European Property Fund IH - USD 1.021 -European Property Fund Z - EUR 0.94 0.97Eurozone Equity Alpha Fund A - EUR 1.70 1.74Eurozone Equity Alpha Fund AH - USD 1.74 1.82Eurozone Equity Alpha Fund AR - EUR 1.70 1.751
Eurozone Equity Alpha Fund B - EUR 2.70 2.73Eurozone Equity Alpha Fund BR - EUR 2.70 2.751
Eurozone Equity Alpha Fund CR - EUR 2.50 2.551
Eurozone Equity Alpha Fund I - EUR 0.98 1.01
The following figures show the total expenses charged to each Class of each Fund open as at 30 June 2015, calculated net of any fee waivers and expressed as a percentage of average net assets for the period. For further information in relation to the expenses charged to the Funds, please refer to pages 257 to 270. For details of changes to the Management Fee during the period, please refer to note 4.
teksty do app nie tagujemy a dajemy w długich tekstach
Appendix 1: Fund expense ratios (unaudited)As at 30 June 2015
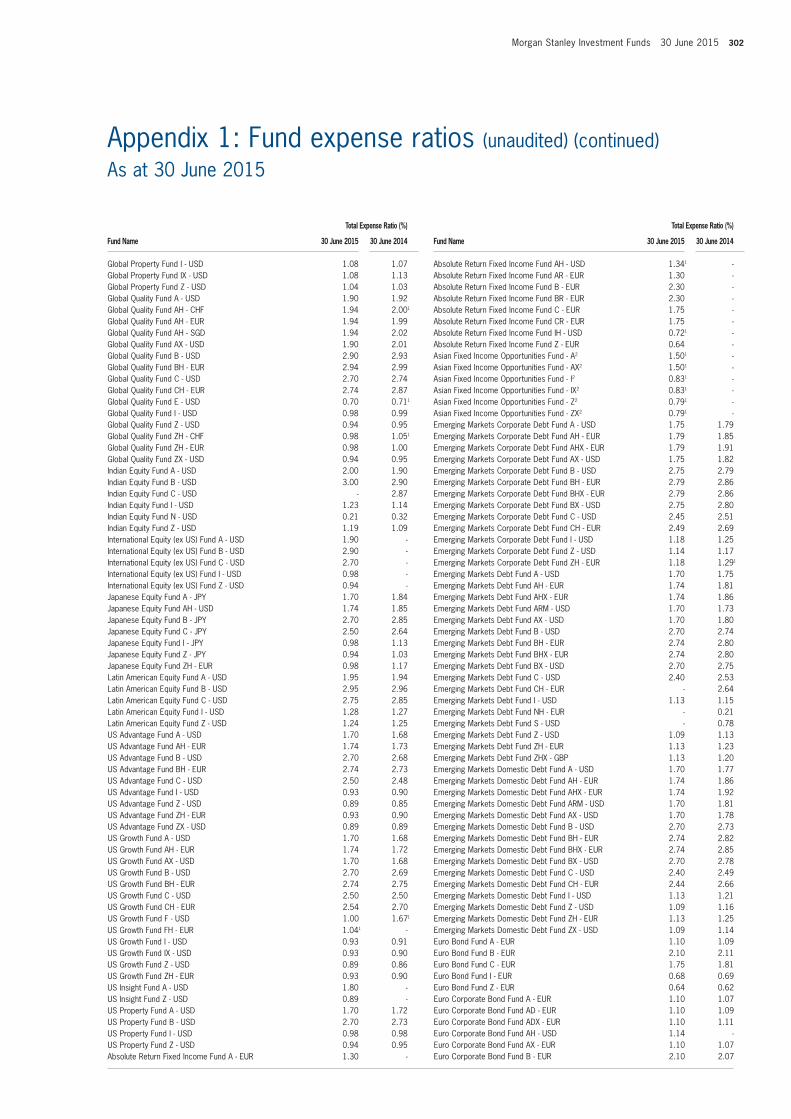
Morgan Stanley Investment Funds 30 June 2015 302
total Expense Ratio (%)
fund name 30 June 2015 30 June 2014
Absolute Return Fixed Income Fund AH - USD 1.341 -Absolute Return Fixed Income Fund AR - EUR 1.30 -Absolute Return Fixed Income Fund B - EUR 2.30 -Absolute Return Fixed Income Fund BR - EUR 2.30 -Absolute Return Fixed Income Fund C - EUR 1.75 -Absolute Return Fixed Income Fund CR - EUR 1.75 -Absolute Return Fixed Income Fund IH - USD 0.721 -Absolute Return Fixed Income Fund Z - EUR 0.64 -Asian Fixed Income Opportunities Fund - A2 1.501 -Asian Fixed Income Opportunities Fund - AX2 1.501 -Asian Fixed Income Opportunities Fund - I2 0.831 -Asian Fixed Income Opportunities Fund - IX2 0.831 -Asian Fixed Income Opportunities Fund - Z2 0.791 -Asian Fixed Income Opportunities Fund - ZX2 0.791 -Emerging Markets Corporate Debt Fund A - USD 1.75 1.79Emerging Markets Corporate Debt Fund AH - EUR 1.79 1.85Emerging Markets Corporate Debt Fund AHX - EUR 1.79 1.91Emerging Markets Corporate Debt Fund AX - USD 1.75 1.82Emerging Markets Corporate Debt Fund B - USD 2.75 2.79Emerging Markets Corporate Debt Fund BH - EUR 2.79 2.86Emerging Markets Corporate Debt Fund BHX - EUR 2.79 2.86Emerging Markets Corporate Debt Fund BX - USD 2.75 2.80Emerging Markets Corporate Debt Fund C - USD 2.45 2.51Emerging Markets Corporate Debt Fund CH - EUR 2.49 2.69Emerging Markets Corporate Debt Fund I - USD 1.18 1.25Emerging Markets Corporate Debt Fund Z - USD 1.14 1.17Emerging Markets Corporate Debt Fund ZH - EUR 1.18 1.291
Emerging Markets Debt Fund A - USD 1.70 1.75Emerging Markets Debt Fund AH - EUR 1.74 1.81Emerging Markets Debt Fund AHX - EUR 1.74 1.86Emerging Markets Debt Fund ARM - USD 1.70 1.73Emerging Markets Debt Fund AX - USD 1.70 1.80Emerging Markets Debt Fund B - USD 2.70 2.74Emerging Markets Debt Fund BH - EUR 2.74 2.80Emerging Markets Debt Fund BHX - EUR 2.74 2.80Emerging Markets Debt Fund BX - USD 2.70 2.75Emerging Markets Debt Fund C - USD 2.40 2.53Emerging Markets Debt Fund CH - EUR - 2.64Emerging Markets Debt Fund I - USD 1.13 1.15Emerging Markets Debt Fund NH - EUR - 0.21Emerging Markets Debt Fund S - USD - 0.78Emerging Markets Debt Fund Z - USD 1.09 1.13Emerging Markets Debt Fund ZH - EUR 1.13 1.23Emerging Markets Debt Fund ZHX - GBP 1.13 1.20Emerging Markets Domestic Debt Fund A - USD 1.70 1.77Emerging Markets Domestic Debt Fund AH - EUR 1.74 1.86Emerging Markets Domestic Debt Fund AHX - EUR 1.74 1.92Emerging Markets Domestic Debt Fund ARM - USD 1.70 1.81Emerging Markets Domestic Debt Fund AX - USD 1.70 1.78Emerging Markets Domestic Debt Fund B - USD 2.70 2.73Emerging Markets Domestic Debt Fund BH - EUR 2.74 2.82Emerging Markets Domestic Debt Fund BHX - EUR 2.74 2.85Emerging Markets Domestic Debt Fund BX - USD 2.70 2.78Emerging Markets Domestic Debt Fund C - USD 2.40 2.49Emerging Markets Domestic Debt Fund CH - EUR 2.44 2.66Emerging Markets Domestic Debt Fund I - USD 1.13 1.21Emerging Markets Domestic Debt Fund Z - USD 1.09 1.16Emerging Markets Domestic Debt Fund ZH - EUR 1.13 1.25Emerging Markets Domestic Debt Fund ZX - USD 1.09 1.14Euro Bond Fund A - EUR 1.10 1.09Euro Bond Fund B - EUR 2.10 2.11Euro Bond Fund C - EUR 1.75 1.81Euro Bond Fund I - EUR 0.68 0.69Euro Bond Fund Z - EUR 0.64 0.62Euro Corporate Bond Fund A - EUR 1.10 1.07Euro Corporate Bond Fund AD - EUR 1.10 1.09Euro Corporate Bond Fund ADX - EUR 1.10 1.11Euro Corporate Bond Fund AH - USD 1.14 -Euro Corporate Bond Fund AX - EUR 1.10 1.07Euro Corporate Bond Fund B - EUR 2.10 2.07
total Expense Ratio (%)
fund name 30 June 2015 30 June 2014
Global Property Fund I - USD 1.08 1.07Global Property Fund IX - USD 1.08 1.13Global Property Fund Z - USD 1.04 1.03Global Quality Fund A - USD 1.90 1.92Global Quality Fund AH - CHF 1.94 2.001
Global Quality Fund AH - EUR 1.94 1.99Global Quality Fund AH - SGD 1.94 2.02Global Quality Fund AX - USD 1.90 2.01Global Quality Fund B - USD 2.90 2.93Global Quality Fund BH - EUR 2.94 2.99Global Quality Fund C - USD 2.70 2.74Global Quality Fund CH - EUR 2.74 2.87Global Quality Fund E - USD 0.70 0.711
Global Quality Fund I - USD 0.98 0.99Global Quality Fund Z - USD 0.94 0.95Global Quality Fund ZH - CHF 0.98 1.051
Global Quality Fund ZH - EUR 0.98 1.00Global Quality Fund ZX - USD 0.94 0.95Indian Equity Fund A - USD 2.00 1.90Indian Equity Fund B - USD 3.00 2.90Indian Equity Fund C - USD - 2.87Indian Equity Fund I - USD 1.23 1.14Indian Equity Fund N - USD 0.21 0.32Indian Equity Fund Z - USD 1.19 1.09International Equity (ex US) Fund A - USD 1.90 -International Equity (ex US) Fund B - USD 2.90 -International Equity (ex US) Fund C - USD 2.70 -International Equity (ex US) Fund I - USD 0.98 -International Equity (ex US) Fund Z - USD 0.94 -Japanese Equity Fund A - JPY 1.70 1.84Japanese Equity Fund AH - USD 1.74 1.85Japanese Equity Fund B - JPY 2.70 2.85Japanese Equity Fund C - JPY 2.50 2.64Japanese Equity Fund I - JPY 0.98 1.13Japanese Equity Fund Z - JPY 0.94 1.03Japanese Equity Fund ZH - EUR 0.98 1.17Latin American Equity Fund A - USD 1.95 1.94Latin American Equity Fund B - USD 2.95 2.96Latin American Equity Fund C - USD 2.75 2.85Latin American Equity Fund I - USD 1.28 1.27Latin American Equity Fund Z - USD 1.24 1.25US Advantage Fund A - USD 1.70 1.68US Advantage Fund AH - EUR 1.74 1.73US Advantage Fund B - USD 2.70 2.68US Advantage Fund BH - EUR 2.74 2.73US Advantage Fund C - USD 2.50 2.48US Advantage Fund I - USD 0.93 0.90US Advantage Fund Z - USD 0.89 0.85US Advantage Fund ZH - EUR 0.93 0.90US Advantage Fund ZX - USD 0.89 0.89US Growth Fund A - USD 1.70 1.68US Growth Fund AH - EUR 1.74 1.72US Growth Fund AX - USD 1.70 1.68US Growth Fund B - USD 2.70 2.69US Growth Fund BH - EUR 2.74 2.75US Growth Fund C - USD 2.50 2.50US Growth Fund CH - EUR 2.54 2.70US Growth Fund F - USD 1.00 1.671
US Growth Fund FH - EUR 1.041 -US Growth Fund I - USD 0.93 0.91US Growth Fund IX - USD 0.93 0.90US Growth Fund Z - USD 0.89 0.86US Growth Fund ZH - EUR 0.93 0.90US Insight Fund A - USD 1.80 -US Insight Fund Z - USD 0.89 -US Property Fund A - USD 1.70 1.72US Property Fund B - USD 2.70 2.73US Property Fund I - USD 0.98 0.98US Property Fund Z - USD 0.94 0.95Absolute Return Fixed Income Fund A - EUR 1.30 -
Appendix 1: Fund expense ratios (unaudited) (continued)As at 30 June 2015

303 Morgan Stanley Investment Funds 30 June 2015
total Expense Ratio (%)
fund name 30 June 2015 30 June 2014
Global Convertible Bond Fund ZH - CHF 0.831 -Global Convertible Bond Fund ZH - EUR 0.83 0.84Global Convertible Bond Fund ZX - USD 0.79 0.79Global Convertible Bond Fund ZXH - EUR 0.83 0.83Global Credit Fund A - USD 1.10 1.20Global Credit Fund B - USD 2.10 2.16Global Credit Fund C - USD 1.75 1.87Global Credit Fund I - USD 0.68 0.79Global Credit Fund Z - USD 0.64 0.72Global Credit Fund ZH1 - CHF 0.68 0.731
Global Credit Fund ZX - USD - 0.79Global Fixed Income Opportunities Fund A - USD 1.30 1.39Global Fixed Income Opportunities Fund AH - CHF 1.341 -Global Fixed Income Opportunities Fund AH - EUR 1.34 1.46Global Fixed Income Opportunities Fund AHR - EUR 1.34 1.451
Global Fixed Income Opportunities Fund AHX - EUR 1.34 1.44Global Fixed Income Opportunities Fund ARM - USD 1.30 -Global Fixed Income Opportunities Fund AX - USD 1.30 1.41Global Fixed Income Opportunities Fund B - USD 2.30 2.38Global Fixed Income Opportunities Fund BH - EUR 2.34 2.43Global Fixed Income Opportunities Fund BHR - EUR 2.34 2.451
Global Fixed Income Opportunities Fund BHX - EUR 2.34 2.43Global Fixed Income Opportunities Fund BX - USD 2.30 2.39Global Fixed Income Opportunities Fund C - USD 1.75 1.85Global Fixed Income Opportunities Fund CH - EUR 1.79 1.93Global Fixed Income Opportunities Fund CHR - EUR 1.79 1.901
Global Fixed Income Opportunities Fund CHX - EUR 1.79 1.93Global Fixed Income Opportunities Fund I - USD 0.68 -Global Fixed Income Opportunities Fund IH - CHF 0.721 -Global Fixed Income Opportunities Fund IX - USD 0.68 -Global Fixed Income Opportunities Fund Z - USD 0.64 0.70Global Fixed Income Opportunities Fund ZH - CHF 0.681 -Global Fixed Income Opportunities Fund ZH - EUR 0.68 0.81Global Fixed Income Opportunities Fund ZH - GBP 0.681 -Global Fixed Income Opportunities Fund ZHX - GBP 0.681 -Global Fixed Income Opportunities Fund ZX - USD 0.64 -Global High Yield Bond Fund A - USD 1.30 1.38Global High Yield Bond Fund AH - EUR 1.34 1.44Global High Yield Bond Fund AHX - EUR 1.34 1.46Global High Yield Bond Fund AO - SEK 1.34 1.41Global High Yield Bond Fund AX - USD 1.30 1.44Global High Yield Bond Fund B - USD 2.30 2.39Global High Yield Bond Fund BH - EUR 2.34 2.43Global High Yield Bond Fund BHX - EUR 2.34 2.42Global High Yield Bond Fund BX - USD 2.30 2.37Global High Yield Bond Fund C - USD 1.90 2.00Global High Yield Bond Fund CH - EUR 1.94 2.07Global High Yield Bond Fund I - USD 0.83 0.83Global High Yield Bond Fund IX - USD 0.83 -Global High Yield Bond Fund Z - USD 0.79 0.87Global High Yield Bond Fund ZH - EUR 0.83 0.951
Global High Yield Bond Fund ZX - USD 0.79 0.95Global Mortgage Securities Fund A - USD 1.30 1.35Global Mortgage Securities Fund AH - EUR 1.34 1.49Global Mortgage Securities Fund AHR - EUR - 1.50Global Mortgage Securities Fund AHX - EUR - 1.50Global Mortgage Securities Fund AX - USD 1.30 1.49Global Mortgage Securities Fund B - USD 2.30 2.40Global Mortgage Securities Fund BH - EUR 2.34 2.48Global Mortgage Securities Fund BHR - EUR 2.34 2.47Global Mortgage Securities Fund BHX - EUR 2.34 2.49Global Mortgage Securities Fund C - USD 1.90 1.98Global Mortgage Securities Fund CH - EUR 1.94 2.10Global Mortgage Securities Fund CHX - EUR 1.94 2.09Global Mortgage Securities Fund CX - USD 1.90 2.04Global Mortgage Securities Fund I - USD 0.73 0.78Global Mortgage Securities Fund IH - EUR 0.77 0.83Global Mortgage Securities Fund IHX - EUR 0.77 0.83Global Mortgage Securities Fund Z - USD 0.69 0.80Global Premier Credit Fund A - USD 1.10 1.23
total Expense Ratio (%)
fund name 30 June 2015 30 June 2014
Euro Corporate Bond Fund BD - EUR 2.10 2.07Euro Corporate Bond Fund BDX - EUR 2.10 2.09Euro Corporate Bond Fund BH - USD 2.14 2.17Euro Corporate Bond Fund BX - EUR 2.10 2.08Euro Corporate Bond Fund C - EUR 1.75 1.76Euro Corporate Bond Fund CD - EUR 1.75 1.82Euro Corporate Bond Fund I - EUR 0.68 0.65Euro Corporate Bond Fund ID - EUR 0.68 0.65Euro Corporate Bond Fund IH - USD 0.72 -Euro Corporate Bond Fund IX - EUR 0.68 0.67Euro Corporate Bond Fund S - EUR 0.56 0.53Euro Corporate Bond Fund Z - EUR 0.64 0.61Euro Corporate Bond Fund ZD - EUR 0.64 0.60Euro Corporate Bond Fund ZOX - EUR 0.64 0.61Euro Corporate Bond (ex Financials) Fund A - EUR 1.10 1.18Euro Corporate Bond (ex Financials) Fund N - EUR 0.11 0.17Euro Corporate Bond (ex Financials) Fund Z - EUR 0.64 0.72Euro Strategic Bond Fund A - EUR 1.10 1.11Euro Strategic Bond Fund AD - EUR 1.10 1.14Euro Strategic Bond Fund ADX - EUR 1.10 1.16Euro Strategic Bond Fund AX - EUR 1.10 1.11Euro Strategic Bond Fund B - EUR 2.10 2.11Euro Strategic Bond Fund BD - EUR 2.10 2.10Euro Strategic Bond Fund BDX - EUR 2.10 2.11Euro Strategic Bond Fund BX - EUR 2.10 2.12Euro Strategic Bond Fund C - EUR 1.75 1.80Euro Strategic Bond Fund CD - EUR 1.75 1.83Euro Strategic Bond Fund I - EUR 0.68 0.71Euro Strategic Bond Fund Z - EUR 0.64 0.66Euro Strategic Bond Fund ZD - EUR 0.64 0.63European Currencies High Yield Bond Fund A - EUR 1.15 1.15European Currencies High Yield Bond Fund ADX - EUR 1.15 1.19European Currencies High Yield Bond Fund AH - USD 1.19 1.201
European Currencies High Yield Bond Fund AX - EUR 1.15 1.20European Currencies High Yield Bond Fund B - EUR 2.15 2.15European Currencies High Yield Bond Fund BD - EUR 2.15 2.17European Currencies High Yield Bond Fund BDX - EUR 2.15 2.16European Currencies High Yield Bond Fund BX - EUR 2.15 2.15European Currencies High Yield Bond Fund C - EUR 1.80 1.81European Currencies High Yield Bond Fund CD - EUR - 1.87European Currencies High Yield Bond Fund I - EUR 0.73 0.71European Currencies High Yield Bond Fund IH - USD 0.77 0.791
European Currencies High Yield Bond Fund IHX - USD 0.77 -European Currencies High Yield Bond Fund Z - EUR 0.69 0.67European Currencies High Yield Bond Fund ZD - EUR - 0.711
European Currencies High Yield Bond Fund ZX - EUR 0.69 0.68Global Bond Fund A - USD 1.10 1.14Global Bond Fund AH - EUR 1.14 1.33Global Bond Fund AHX - EUR 1.14 1.29Global Bond Fund AX - USD 1.10 1.19Global Bond Fund B - USD 2.10 2.13Global Bond Fund BH - EUR 2.14 2.22Global Bond Fund BHX - EUR 2.14 2.23Global Bond Fund BX - USD 2.10 2.14Global Bond Fund C - USD 1.75 1.86Global Bond Fund CH - EUR 1.79 1.96Global Bond Fund I - USD 0.68 0.69Global Bond Fund Z - USD 0.64 0.66Global Convertible Bond Fund A - USD 1.30 1.30Global Convertible Bond Fund AH - AUD 1.34 1.381
Global Convertible Bond Fund AH - CHF 1.34 1.50Global Convertible Bond Fund AH - EUR 1.34 1.36Global Convertible Bond Fund ARM - USD 1.30 1.301
Global Convertible Bond Fund B - USD 2.30 2.32Global Convertible Bond Fund BH - EUR 2.34 2.35Global Convertible Bond Fund CH - EUR 1.94 2.02Global Convertible Bond Fund I - USD 0.83 0.84Global Convertible Bond Fund IH - EUR 0.87 0.88Global Convertible Bond Fund NH - CHF 0.15 -Global Convertible Bond Fund Z - USD 0.79 0.78
Appendix 1: Fund expense ratios (unaudited) (continued)As at 30 June 2015
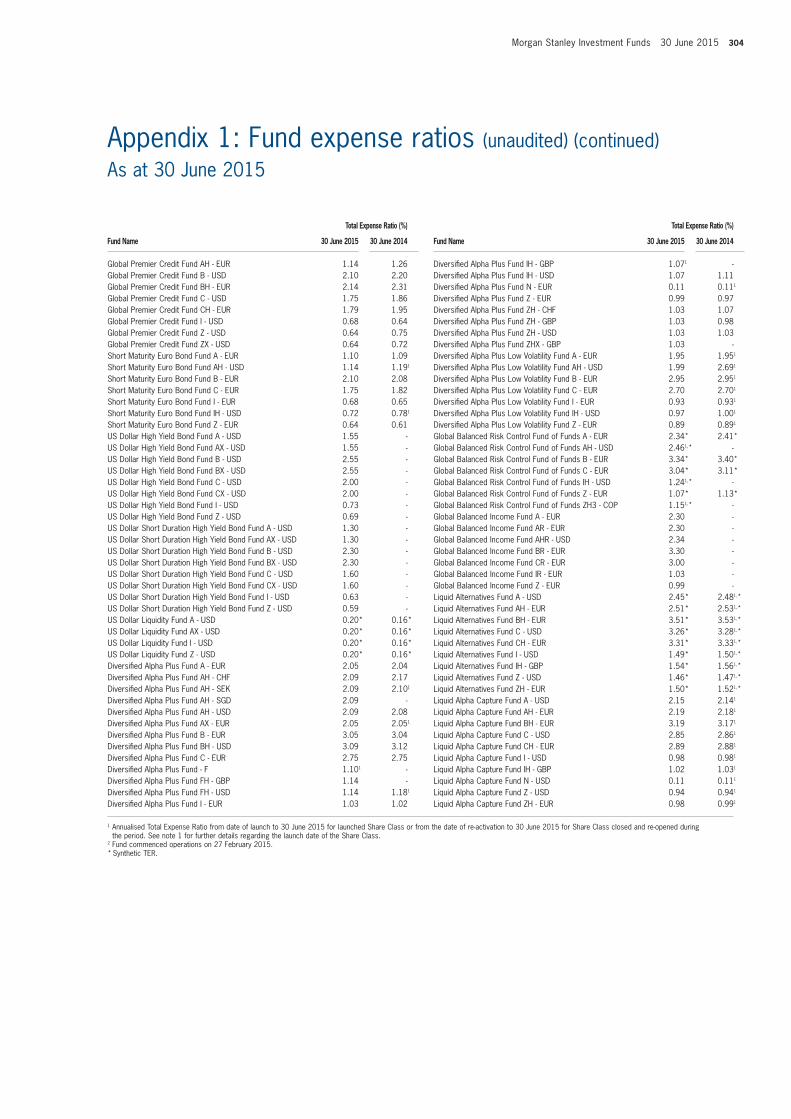
Morgan Stanley Investment Funds 30 June 2015 304
total Expense Ratio (%)
fund name 30 June 2015 30 June 2014
Diversified Alpha Plus Fund IH - GBP 1.071 -Diversified Alpha Plus Fund IH - USD 1.07 1.11Diversified Alpha Plus Fund N - EUR 0.11 0.111
Diversified Alpha Plus Fund Z - EUR 0.99 0.97Diversified Alpha Plus Fund ZH - CHF 1.03 1.07Diversified Alpha Plus Fund ZH - GBP 1.03 0.98Diversified Alpha Plus Fund ZH - USD 1.03 1.03Diversified Alpha Plus Fund ZHX - GBP 1.03 -Diversified Alpha Plus Low Volatility Fund A - EUR 1.95 1.951
Diversified Alpha Plus Low Volatility Fund AH - USD 1.99 2.691
Diversified Alpha Plus Low Volatility Fund B - EUR 2.95 2.951
Diversified Alpha Plus Low Volatility Fund C - EUR 2.70 2.701
Diversified Alpha Plus Low Volatility Fund I - EUR 0.93 0.931
Diversified Alpha Plus Low Volatility Fund IH - USD 0.97 1.001
Diversified Alpha Plus Low Volatility Fund Z - EUR 0.89 0.891
Global Balanced Risk Control Fund of Funds A - EUR 2.34* 2.41*
Global Balanced Risk Control Fund of Funds AH - USD 2.461,* -Global Balanced Risk Control Fund of Funds B - EUR 3.34* 3.40*
Global Balanced Risk Control Fund of Funds C - EUR 3.04* 3.11*Global Balanced Risk Control Fund of Funds IH - USD 1.241,* -Global Balanced Risk Control Fund of Funds Z - EUR 1.07* 1.13*Global Balanced Risk Control Fund of Funds ZH3 - COP 1.151,* -Global Balanced Income Fund A - EUR 2.30 -Global Balanced Income Fund AR - EUR 2.30 -Global Balanced Income Fund AHR - USD 2.34 -Global Balanced Income Fund BR - EUR 3.30 -Global Balanced Income Fund CR - EUR 3.00 -Global Balanced Income Fund IR - EUR 1.03 -Global Balanced Income Fund Z - EUR 0.99 -Liquid Alternatives Fund A - USD 2.45* 2.481,*
Liquid Alternatives Fund AH - EUR 2.51* 2.531,*
Liquid Alternatives Fund BH - EUR 3.51* 3.531,*
Liquid Alternatives Fund C - USD 3.26* 3.281,*
Liquid Alternatives Fund CH - EUR 3.31* 3.331,*
Liquid Alternatives Fund I - USD 1.49* 1.501,*
Liquid Alternatives Fund IH - GBP 1.54* 1.561,*
Liquid Alternatives Fund Z - USD 1.46* 1.471,*
Liquid Alternatives Fund ZH - EUR 1.50* 1.521,*
Liquid Alpha Capture Fund A - USD 2.15 2.141
Liquid Alpha Capture Fund AH - EUR 2.19 2.181
Liquid Alpha Capture Fund BH - EUR 3.19 3.171
Liquid Alpha Capture Fund C - USD 2.85 2.861
Liquid Alpha Capture Fund CH - EUR 2.89 2.881
Liquid Alpha Capture Fund I - USD 0.98 0.981
Liquid Alpha Capture Fund IH - GBP 1.02 1.031
Liquid Alpha Capture Fund N - USD 0.11 0.111
Liquid Alpha Capture Fund Z - USD 0.94 0.941
Liquid Alpha Capture Fund ZH - EUR 0.98 0.991
total Expense Ratio (%)
fund name 30 June 2015 30 June 2014
Global Premier Credit Fund AH - EUR 1.14 1.26Global Premier Credit Fund B - USD 2.10 2.20Global Premier Credit Fund BH - EUR 2.14 2.31Global Premier Credit Fund C - USD 1.75 1.86Global Premier Credit Fund CH - EUR 1.79 1.95Global Premier Credit Fund I - USD 0.68 0.64Global Premier Credit Fund Z - USD 0.64 0.75Global Premier Credit Fund ZX - USD 0.64 0.72Short Maturity Euro Bond Fund A - EUR 1.10 1.09Short Maturity Euro Bond Fund AH - USD 1.14 1.191
Short Maturity Euro Bond Fund B - EUR 2.10 2.08Short Maturity Euro Bond Fund C - EUR 1.75 1.82Short Maturity Euro Bond Fund I - EUR 0.68 0.65Short Maturity Euro Bond Fund IH - USD 0.72 0.781
Short Maturity Euro Bond Fund Z - EUR 0.64 0.61US Dollar High Yield Bond Fund A - USD 1.55 -US Dollar High Yield Bond Fund AX - USD 1.55 -US Dollar High Yield Bond Fund B - USD 2.55 -US Dollar High Yield Bond Fund BX - USD 2.55 -US Dollar High Yield Bond Fund C - USD 2.00 -US Dollar High Yield Bond Fund CX - USD 2.00 -US Dollar High Yield Bond Fund I - USD 0.73 -US Dollar High Yield Bond Fund Z - USD 0.69 -US Dollar Short Duration High Yield Bond Fund A - USD 1.30 -US Dollar Short Duration High Yield Bond Fund AX - USD 1.30 -US Dollar Short Duration High Yield Bond Fund B - USD 2.30 -US Dollar Short Duration High Yield Bond Fund BX - USD 2.30 -US Dollar Short Duration High Yield Bond Fund C - USD 1.60 -US Dollar Short Duration High Yield Bond Fund CX - USD 1.60 -US Dollar Short Duration High Yield Bond Fund I - USD 0.63 -US Dollar Short Duration High Yield Bond Fund Z - USD 0.59 -US Dollar Liquidity Fund A - USD 0.20* 0.16*US Dollar Liquidity Fund AX - USD 0.20* 0.16*US Dollar Liquidity Fund I - USD 0.20* 0.16*US Dollar Liquidity Fund Z - USD 0.20* 0.16*Diversified Alpha Plus Fund A - EUR 2.05 2.04Diversified Alpha Plus Fund AH - CHF 2.09 2.17Diversified Alpha Plus Fund AH - SEK 2.09 2.101
Diversified Alpha Plus Fund AH - SGD 2.09 -Diversified Alpha Plus Fund AH - USD 2.09 2.08Diversified Alpha Plus Fund AX - EUR 2.05 2.051
Diversified Alpha Plus Fund B - EUR 3.05 3.04Diversified Alpha Plus Fund BH - USD 3.09 3.12Diversified Alpha Plus Fund C - EUR 2.75 2.75Diversified Alpha Plus Fund - F 1.101 -Diversified Alpha Plus Fund FH - GBP 1.14 -Diversified Alpha Plus Fund FH - USD 1.14 1.181
Diversified Alpha Plus Fund I - EUR 1.03 1.02
Appendix 1: Fund expense ratios (unaudited) (continued)As at 30 June 2015
1 Annualised Total Expense Ratio from date of launch to 30 June 2015 for launched Share Class or from the date of re-activation to 30 June 2015 for Share Class closed and re-opened during the period. See note 1 for further details regarding the launch date of the Share Class.
2 Fund commenced operations on 27 February 2015.* Synthetic TER.
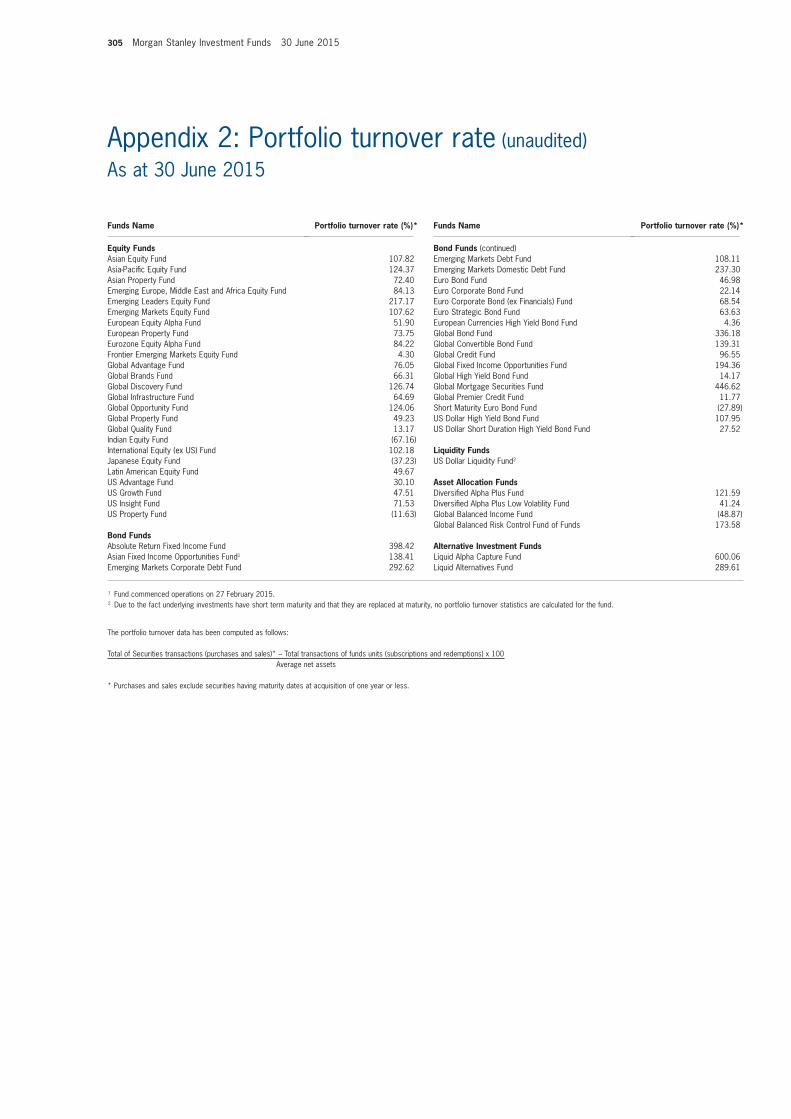
305 Morgan Stanley Investment Funds 30 June 2015
Appendix 2: Portfolio turnover rate (unaudited)As at 30 June 2015
funds name Portfolio turnover rate (%)*
Equity fundsAsian Equity Fund 107.82Asia-Pacific Equity Fund 124.37Asian Property Fund 72.40Emerging Europe, Middle East and Africa Equity Fund 84.13Emerging Leaders Equity Fund 217.17Emerging Markets Equity Fund 107.62European Equity Alpha Fund 51.90European Property Fund 73.75Eurozone Equity Alpha Fund 84.22Frontier Emerging Markets Equity Fund 4.30Global Advantage Fund 76.05Global Brands Fund 66.31Global Discovery Fund 126.74Global Infrastructure Fund 64.69Global Opportunity Fund 124.06Global Property Fund 49.23Global Quality Fund 13.17Indian Equity Fund (67.16)International Equity (ex US) Fund 102.18Japanese Equity Fund (37.23)Latin American Equity Fund 49.67US Advantage Fund 30.10US Growth Fund 47.51US Insight Fund 71.53US Property Fund (11.63)
Bond fundsAbsolute Return Fixed Income Fund 398.42Asian Fixed Income Opportunities Fund1 138.41Emerging Markets Corporate Debt Fund 292.62
funds name Portfolio turnover rate (%)*
Bond funds (continued)Emerging Markets Debt Fund 108.11Emerging Markets Domestic Debt Fund 237.30Euro Bond Fund 46.98Euro Corporate Bond Fund 22.14Euro Corporate Bond (ex Financials) Fund 68.54Euro Strategic Bond Fund 63.63European Currencies High Yield Bond Fund 4.36Global Bond Fund 336.18Global Convertible Bond Fund 139.31Global Credit Fund 96.55Global Fixed Income Opportunities Fund 194.36Global High Yield Bond Fund 14.17Global Mortgage Securities Fund 446.62Global Premier Credit Fund 11.77Short Maturity Euro Bond Fund (27.89)US Dollar High Yield Bond Fund 107.95US Dollar Short Duration High Yield Bond Fund 27.52
Liquidity fundsUS Dollar Liquidity Fund2
Asset Allocation fundsDiversified Alpha Plus Fund 121.59Diversified Alpha Plus Low Volatility Fund 41.24Global Balanced Income Fund (48.87)Global Balanced Risk Control Fund of Funds 173.58
Alternative investment fundsLiquid Alpha Capture Fund 600.06Liquid Alternatives Fund 289.61
1 Fund commenced operations on 27 February 2015. 2 Due to the fact underlying investments have short term maturity and that they are replaced at maturity, no portfolio turnover statistics are calculated for the fund.
The portfolio turnover data has been computed as follows:
Total of Securities transactions (purchases and sales)* – Total transactions of funds units (subscriptions and redemptions) x 100Average net assets
* Purchases and sales exclude securities having maturity dates at acquisition of one year or less.
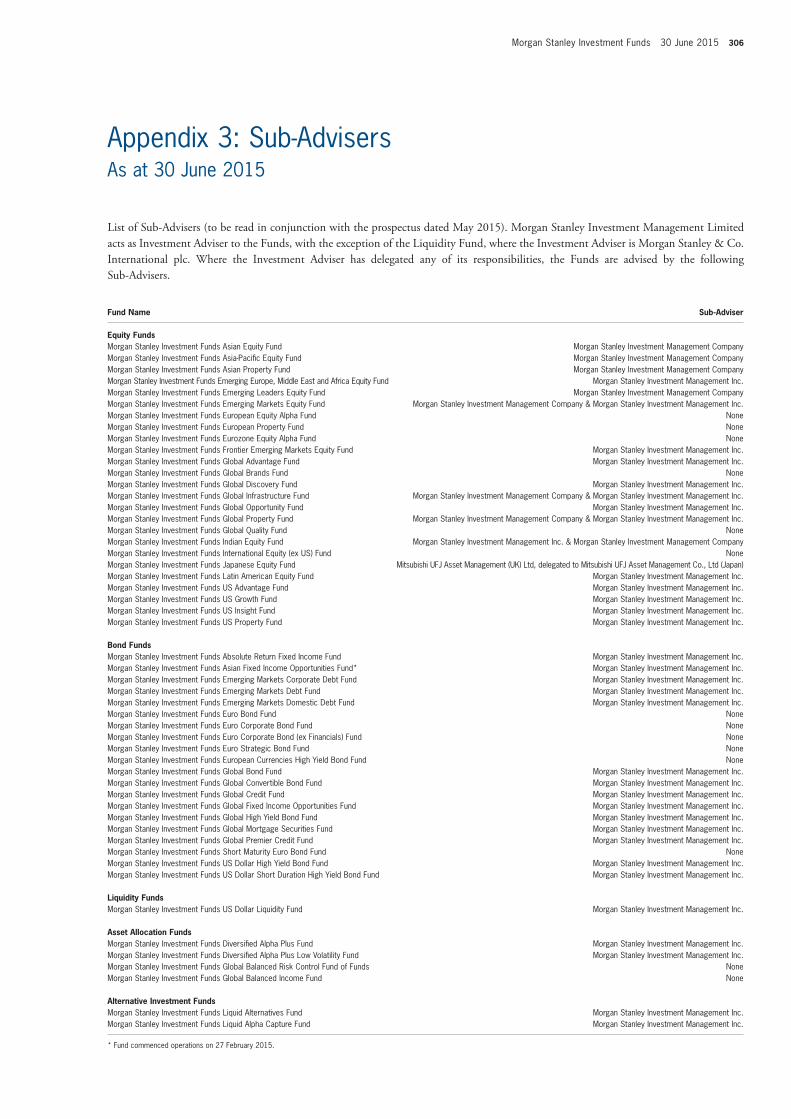
Morgan Stanley Investment Funds 30 June 2015 306
fund name Sub-Adviser
Equity fundsMorgan Stanley Investment Funds Asian Equity Fund Morgan Stanley Investment Management CompanyMorgan Stanley Investment Funds Asia-Pacific Equity Fund Morgan Stanley Investment Management CompanyMorgan Stanley Investment Funds Asian Property Fund Morgan Stanley Investment Management CompanyMorgan Stanley Investment Funds Emerging Europe, Middle East and Africa Equity Fund Morgan Stanley Investment Management Inc.Morgan Stanley Investment Funds Emerging Leaders Equity Fund Morgan Stanley Investment Management CompanyMorgan Stanley Investment Funds Emerging Markets Equity Fund Morgan Stanley Investment Management Company & Morgan Stanley Investment Management Inc.Morgan Stanley Investment Funds European Equity Alpha Fund NoneMorgan Stanley Investment Funds European Property Fund NoneMorgan Stanley Investment Funds Eurozone Equity Alpha Fund NoneMorgan Stanley Investment Funds Frontier Emerging Markets Equity Fund Morgan Stanley Investment Management Inc.Morgan Stanley Investment Funds Global Advantage Fund Morgan Stanley Investment Management Inc.Morgan Stanley Investment Funds Global Brands Fund None Morgan Stanley Investment Funds Global Discovery Fund Morgan Stanley Investment Management Inc.Morgan Stanley Investment Funds Global Infrastructure Fund Morgan Stanley Investment Management Company & Morgan Stanley Investment Management Inc.Morgan Stanley Investment Funds Global Opportunity Fund Morgan Stanley Investment Management Inc.Morgan Stanley Investment Funds Global Property Fund Morgan Stanley Investment Management Company & Morgan Stanley Investment Management Inc.Morgan Stanley Investment Funds Global Quality Fund None Morgan Stanley Investment Funds Indian Equity Fund Morgan Stanley Investment Management Inc. & Morgan Stanley Investment Management CompanyMorgan Stanley Investment Funds International Equity (ex US) Fund None Morgan Stanley Investment Funds Japanese Equity Fund Mitsubishi UFJ Asset Management (UK) Ltd, delegated to Mitsubishi UFJ Asset Management Co., Ltd (Japan) Morgan Stanley Investment Funds Latin American Equity Fund Morgan Stanley Investment Management Inc.Morgan Stanley Investment Funds US Advantage Fund Morgan Stanley Investment Management Inc.Morgan Stanley Investment Funds US Growth Fund Morgan Stanley Investment Management Inc.Morgan Stanley Investment Funds US Insight Fund Morgan Stanley Investment Management Inc.Morgan Stanley Investment Funds US Property Fund Morgan Stanley Investment Management Inc.
Bond fundsMorgan Stanley Investment Funds Absolute Return Fixed Income Fund Morgan Stanley Investment Management Inc.Morgan Stanley Investment Funds Asian Fixed Income Opportunities Fund* Morgan Stanley Investment Management Inc.Morgan Stanley Investment Funds Emerging Markets Corporate Debt Fund Morgan Stanley Investment Management Inc.Morgan Stanley Investment Funds Emerging Markets Debt Fund Morgan Stanley Investment Management Inc.Morgan Stanley Investment Funds Emerging Markets Domestic Debt Fund Morgan Stanley Investment Management Inc.Morgan Stanley Investment Funds Euro Bond Fund NoneMorgan Stanley Investment Funds Euro Corporate Bond Fund NoneMorgan Stanley Investment Funds Euro Corporate Bond (ex Financials) Fund NoneMorgan Stanley Investment Funds Euro Strategic Bond Fund NoneMorgan Stanley Investment Funds European Currencies High Yield Bond Fund NoneMorgan Stanley Investment Funds Global Bond Fund Morgan Stanley Investment Management Inc. Morgan Stanley Investment Funds Global Convertible Bond Fund Morgan Stanley Investment Management Inc. Morgan Stanley Investment Funds Global Credit Fund Morgan Stanley Investment Management Inc. Morgan Stanley Investment Funds Global Fixed Income Opportunities Fund Morgan Stanley Investment Management Inc. Morgan Stanley Investment Funds Global High Yield Bond Fund Morgan Stanley Investment Management Inc. Morgan Stanley Investment Funds Global Mortgage Securities Fund Morgan Stanley Investment Management Inc. Morgan Stanley Investment Funds Global Premier Credit Fund Morgan Stanley Investment Management Inc. Morgan Stanley Investment Funds Short Maturity Euro Bond Fund NoneMorgan Stanley Investment Funds US Dollar High Yield Bond Fund Morgan Stanley Investment Management Inc.Morgan Stanley Investment Funds US Dollar Short Duration High Yield Bond Fund Morgan Stanley Investment Management Inc.
Liquidity fundsMorgan Stanley Investment Funds US Dollar Liquidity Fund Morgan Stanley Investment Management Inc.
Asset Allocation fundsMorgan Stanley Investment Funds Diversified Alpha Plus Fund Morgan Stanley Investment Management Inc.Morgan Stanley Investment Funds Diversified Alpha Plus Low Volatility Fund Morgan Stanley Investment Management Inc.Morgan Stanley Investment Funds Global Balanced Risk Control Fund of Funds NoneMorgan Stanley Investment Funds Global Balanced Income Fund None
Alternative investment fundsMorgan Stanley Investment Funds Liquid Alternatives Fund Morgan Stanley Investment Management Inc.Morgan Stanley Investment Funds Liquid Alpha Capture Fund Morgan Stanley Investment Management Inc.
* Fund commenced operations on 27 February 2015.
List of Sub-advisers (to be read in conjunction with the prospectus dated May 2015). Morgan Stanley Investment Management Limited acts as Investment adviser to the Funds, with the exception of the Liquidity Fund, where the Investment adviser is Morgan Stanley & Co. International plc. Where the Investment adviser has delegated any of its responsibilities, the Funds are advised by the following Sub-advisers.
Appendix 3: Sub-AdvisersAs at 30 June 2015
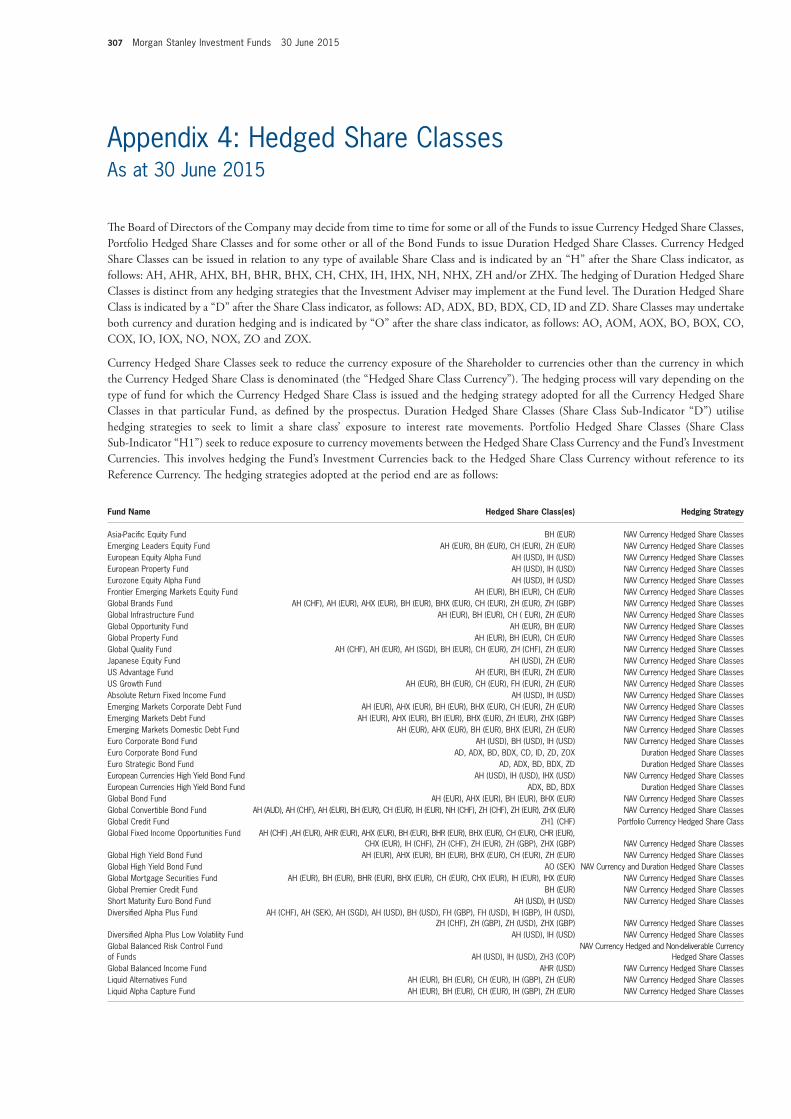
307 Morgan Stanley Investment Funds 30 June 2015
fund name Hedged Share Class(es) Hedging Strategy
Asia-Pacific Equity Fund BH (EUR) NAV Currency Hedged Share ClassesEmerging Leaders Equity Fund AH (EUR), BH (EUR), CH (EUR), ZH (EUR) NAV Currency Hedged Share ClassesEuropean Equity Alpha Fund AH (USD), IH (USD) NAV Currency Hedged Share ClassesEuropean Property Fund AH (USD), IH (USD) NAV Currency Hedged Share ClassesEurozone Equity Alpha Fund AH (USD), IH (USD) NAV Currency Hedged Share ClassesFrontier Emerging Markets Equity Fund AH (EUR), BH (EUR), CH (EUR) NAV Currency Hedged Share ClassesGlobal Brands Fund AH (CHF), AH (EUR), AHX (EUR), BH (EUR), BHX (EUR), CH (EUR), ZH (EUR), ZH (GBP) NAV Currency Hedged Share ClassesGlobal Infrastructure Fund AH (EUR), BH (EUR), CH ( EUR), ZH (EUR) NAV Currency Hedged Share ClassesGlobal Opportunity Fund AH (EUR), BH (EUR) NAV Currency Hedged Share ClassesGlobal Property Fund AH (EUR), BH (EUR), CH (EUR) NAV Currency Hedged Share ClassesGlobal Quality Fund AH (CHF), AH (EUR), AH (SGD), BH (EUR), CH (EUR), ZH (CHF), ZH (EUR) NAV Currency Hedged Share ClassesJapanese Equity Fund AH (USD), ZH (EUR) NAV Currency Hedged Share ClassesUS Advantage Fund AH (EUR), BH (EUR), ZH (EUR) NAV Currency Hedged Share ClassesUS Growth Fund AH (EUR), BH (EUR), CH (EUR), FH (EUR), ZH (EUR) NAV Currency Hedged Share ClassesAbsolute Return Fixed Income Fund AH (USD), IH (USD) NAV Currency Hedged Share ClassesEmerging Markets Corporate Debt Fund AH (EUR), AHX (EUR), BH (EUR), BHX (EUR), CH (EUR), ZH (EUR) NAV Currency Hedged Share ClassesEmerging Markets Debt Fund AH (EUR), AHX (EUR), BH (EUR), BHX (EUR), ZH (EUR), ZHX (GBP) NAV Currency Hedged Share ClassesEmerging Markets Domestic Debt Fund AH (EUR), AHX (EUR), BH (EUR), BHX (EUR), ZH (EUR) NAV Currency Hedged Share ClassesEuro Corporate Bond Fund AH (USD), BH (USD), IH (USD) NAV Currency Hedged Share ClassesEuro Corporate Bond Fund AD, ADX, BD, BDX, CD, ID, ZD, ZOX Duration Hedged Share ClassesEuro Strategic Bond Fund AD, ADX, BD, BDX, ZD Duration Hedged Share ClassesEuropean Currencies High Yield Bond Fund AH (USD), IH (USD), IHX (USD) NAV Currency Hedged Share ClassesEuropean Currencies High Yield Bond Fund ADX, BD, BDX Duration Hedged Share ClassesGlobal Bond Fund AH (EUR), AHX (EUR), BH (EUR), BHX (EUR) NAV Currency Hedged Share ClassesGlobal Convertible Bond Fund AH (AUD), AH (CHF), AH (EUR), BH (EUR), CH (EUR), IH (EUR), NH (CHF), ZH (CHF), ZH (EUR), ZHX (EUR) NAV Currency Hedged Share ClassesGlobal Credit Fund ZH1 (CHF) Portfolio Currency Hedged Share ClassGlobal Fixed Income Opportunities Fund AH (CHF) ,AH (EUR), AHR (EUR), AHX (EUR), BH (EUR), BHR (EUR), BHX (EUR), CH (EUR), CHR (EUR),
CHX (EUR), IH (CHF), ZH (CHF), ZH (EUR), ZH (GBP), ZHX (GBP) NAV Currency Hedged Share ClassesGlobal High Yield Bond Fund AH (EUR), AHX (EUR), BH (EUR), BHX (EUR), CH (EUR), ZH (EUR) NAV Currency Hedged Share ClassesGlobal High Yield Bond Fund AO (SEK) NAV Currency and Duration Hedged Share ClassesGlobal Mortgage Securities Fund AH (EUR), BH (EUR), BHR (EUR), BHX (EUR), CH (EUR), CHX (EUR), IH (EUR), IHX (EUR) NAV Currency Hedged Share ClassesGlobal Premier Credit Fund BH (EUR) NAV Currency Hedged Share ClassesShort Maturity Euro Bond Fund AH (USD), IH (USD) NAV Currency Hedged Share ClassesDiversified Alpha Plus Fund AH (CHF), AH (SEK), AH (SGD), AH (USD), BH (USD), FH (GBP), FH (USD), IH (GBP), IH (USD),
ZH (CHF), ZH (GBP), ZH (USD), ZHX (GBP) NAV Currency Hedged Share ClassesDiversified Alpha Plus Low Volatility Fund AH (USD), IH (USD) NAV Currency Hedged Share ClassesGlobal Balanced Risk Control Fund of Funds AH (USD), IH (USD), ZH3 (COP)
NAV Currency Hedged and Non-deliverable Currency Hedged Share Classes
Global Balanced Income Fund AHR (USD) NAV Currency Hedged Share ClassesLiquid Alternatives Fund AH (EUR), BH (EUR), CH (EUR), IH (GBP), ZH (EUR) NAV Currency Hedged Share ClassesLiquid Alpha Capture Fund AH (EUR), BH (EUR), CH (EUR), IH (GBP), ZH (EUR) NAV Currency Hedged Share Classes
The Board of Directors of the Company may decide from time to time for some or all of the Funds to issue Currency Hedged Share Classes, Portfolio Hedged Share Classes and for some other or all of the Bond Funds to issue Duration Hedged Share Classes. Currency Hedged Share Classes can be issued in relation to any type of available Share Class and is indicated by an “H” after the Share Class indicator, as follows: aH, aHR, aHX, BH, BHR, BHX, CH, CHX, IH, IHX, nH, nHX, ZH and/or ZHX. The hedging of Duration Hedged Share Classes is distinct from any hedging strategies that the Investment adviser may implement at the Fund level. The Duration Hedged Share Class is indicated by a “D” after the Share Class indicator, as follows: aD, aDX, BD, BDX, CD, ID and ZD. Share Classes may undertake both currency and duration hedging and is indicated by “O” after the share class indicator, as follows: aO, aOM, aOX, BO, BOX, CO, COX, IO, IOX, nO, nOX, ZO and ZOX.
Currency Hedged Share Classes seek to reduce the currency exposure of the Shareholder to currencies other than the currency in which the Currency Hedged Share Class is denominated (the “Hedged Share Class Currency”). The hedging process will vary depending on the type of fund for which the Currency Hedged Share Class is issued and the hedging strategy adopted for all the Currency Hedged Share Classes in that particular Fund, as defined by the prospectus. Duration Hedged Share Classes (Share Class Sub-Indicator “D”) utilise hedging strategies to seek to limit a share class’ exposure to interest rate movements. Portfolio Hedged Share Classes (Share Class Sub-Indicator “H1”) seek to reduce exposure to currency movements between the Hedged Share Class Currency and the Fund’s Investment Currencies. This involves hedging the Fund’s Investment Currencies back to the Hedged Share Class Currency without reference to its Reference Currency. The hedging strategies adopted at the period end are as follows:
Appendix 4: Hedged Share Classes (continued)As at 30 June 2015Appendix 4: Hedged Share ClassesAs at 30 June 2015


www.morganstanleyinvestmentfunds.com CN S
AR S
ICAV
15