kairos international sicav - fundsquare
TRANSCRIPT
KAIROS INTERNATIONAL SICAVSociété d'Investissement à Capital Variable
R.C.S. Luxembourg N° B 119 723Unaudited Semi-Annual Report as at June 30, 2019
KAIROS INTERNATIONAL SICAV
KAIROS INTERNATIONAL SICAV - BOND
KAIROS INTERNATIONAL SICAV - BOND PLUS
KAIROS INTERNATIONAL SICAV - PENTAGON
KAIROS INTERNATIONAL SICAV - FINANCIAL INCOME
KAIROS INTERNATIONAL SICAV - TARGET ITALY ALPHA
KAIROS INTERNATIONAL SICAV - WORLD*
KAIROS INTERNATIONAL SICAV - EUROPA
KAIROS INTERNATIONAL SICAV - ITALIA
KAIROS INTERNATIONAL SICAV - ITALIA PIR
KAIROS INTERNATIONAL SICAV - PEGASUS UCITS
KAIROS INTERNATIONAL SICAV - RISORGIMENTO
KAIROS INTERNATIONAL SICAV - PATRIOT
KAIROS INTERNATIONAL SICAV - KEY
KAIROS INTERNATIONAL SICAV - AMERICA**
KAIROS INTERNATIONAL SICAV - EMERGING MARKETS
KAIROS INTERNATIONAL SICAV - ALGO
KAIROS INTERNATIONAL SICAV - GLOBAL BOND***
KAIROS INTERNATIONAL SICAV - ALPHABETA****
No subscription can be received on the basis of financial reports. Subscriptions are only valid if made on the basis of the current prospectus which will be accompaniedby a copy of the latest available annual report and a copy of the latest available semi-annual report, if published after such annual report.
*This Sub-Fund was merged into KAIROS INTERNATIONAL SICAV – PENTAGON on May 24, 2019** This Sub-Fund was merged into KAIROS INTERNATIONAL SICAV – PENTAGON on May 24, 2019*** This Sub-Fund was merged into KAIROS INTERNATIONAL SICAV – BOND PLUS on May 24, 2019**** This Sub-Fund was merged into KAIROS INTERNATIONAL SICAV – BOND PLUS on May 24, 2019
KAIROS INTERNATIONAL SICAV
1
Table of Contents
Organisational Structure 5
General Information 6
Statistics 7
Combined Statement of Net Assets as at June 30, 2019 15
Combined Statement of Operations and Changes in Net Assets for the period ended June 30, 2019 15
KAIROS INTERNATIONAL SICAV - BOND
Statement of Net Assets as at June 30, 2019 16
Statement of Operations and Changes in Net Assets for the period ended June 30, 2019 16
Statement of Changes in Number of Shares 17
Securities Portfolio as at June 30, 2019 18
Financial derivative instruments as at June 30, 2019 19
Portfolio Breakdowns 20
Top Ten Holdings 20
KAIROS INTERNATIONAL SICAV - BOND PLUS
Statement of Net Assets as at June 30, 2019 21
Statement of Operations and Changes in Net Assets for the period ended June 30, 2019 21
Statement of Changes in Number of Shares 22
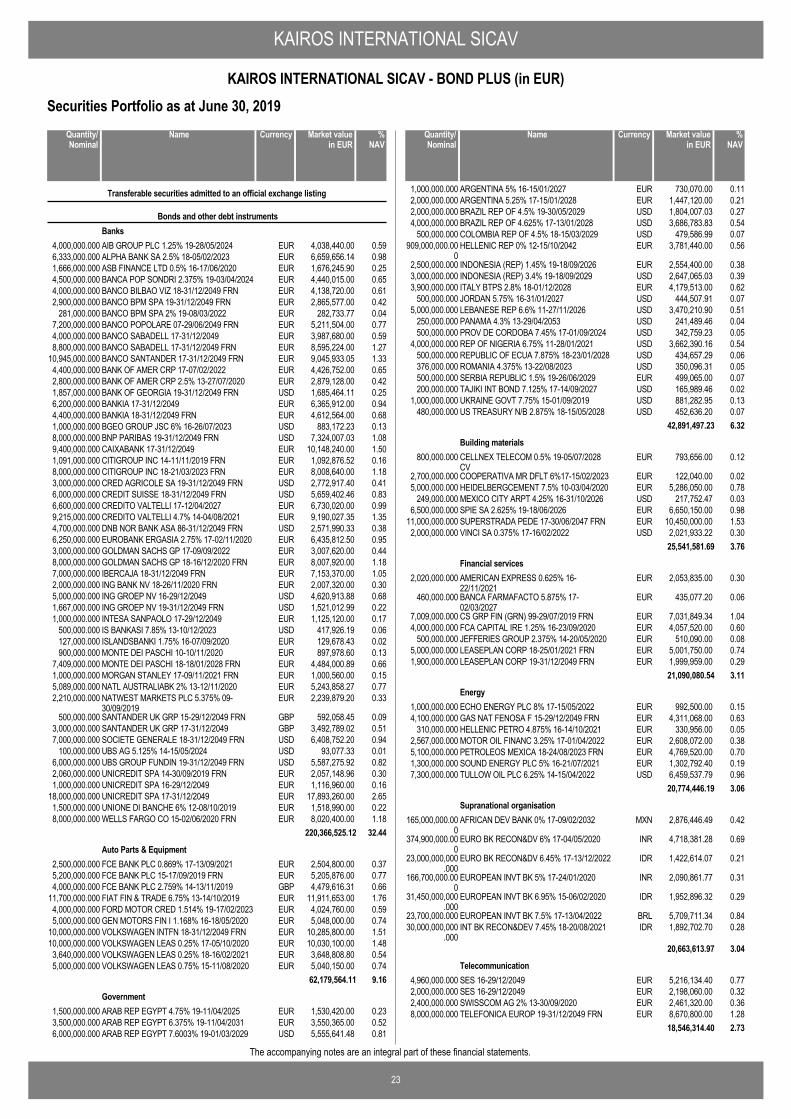
Securities Portfolio as at June 30, 2019 23
Financial derivative instruments as at June 30, 2019 24
Portfolio Breakdowns 26
Top Ten Holdings 26
KAIROS INTERNATIONAL SICAV - PENTAGON
Statement of Net Assets as at June 30, 2019 27
Statement of Operations and Changes in Net Assets for the period ended June 30, 2019 27
Statement of Changes in Number of Shares 28
Securities Portfolio as at June 30, 2019 29
Financial derivative instruments as at June 30, 2019 29
Portfolio Breakdowns 30
Top Ten Holdings 30
KAIROS INTERNATIONAL SICAV - FINANCIAL INCOME
Statement of Net Assets as at June 30, 2019 31
Statement of Operations and Changes in Net Assets for the period ended June 30, 2019 31
Statement of Changes in Number of Shares 32
Securities Portfolio as at June 30, 2019 33
Financial derivative instruments as at June 30, 2019 33
Portfolio Breakdowns 35
Top Ten Holdings 35
*This Sub-Fund was merged into KAIROS INTERNATIONAL SICAV – PENTAGON on May 24, 2019** This Sub-Fund was merged into KAIROS INTERNATIONAL SICAV – PENTAGON on May 24, 2019*** This Sub-Fund was merged into KAIROS INTERNATIONAL SICAV – BOND PLUS on May 24, 2019**** This Sub-Fund was merged into KAIROS INTERNATIONAL SICAV – BOND PLUS on May 24, 2019
KAIROS INTERNATIONAL SICAV
2
Table of Contents
KAIROS INTERNATIONAL SICAV - TARGET ITALY ALPHA
Statement of Net Assets as at June 30, 2019 36
Statement of Operations and Changes in Net Assets for the period ended June 30, 2019 36
Statement of Changes in Number of Shares 37
Securities Portfolio as at June 30, 2019 38
Financial derivative instruments as at June 30, 2019 39
Portfolio Breakdowns 40
Top Ten Holdings 40
KAIROS INTERNATIONAL SICAV - WORLD*
Statement of Net Assets as at May 23, 2019 41
Statement of Operations and Changes in Net Assets for the period ended May 23, 2019 41
Statement of Changes in Number of Shares 42
KAIROS INTERNATIONAL SICAV - EUROPA
Statement of Net Assets as at June 30, 2019 43
Statement of Operations and Changes in Net Assets for the period ended June 30, 2019 43
Statement of Changes in Number of Shares 44
Securities Portfolio as at June 30, 2019 45
Financial derivative instruments as at June 30, 2019 46
Portfolio Breakdowns 47
Top Ten Holdings 47
KAIROS INTERNATIONAL SICAV - ITALIA
Statement of Net Assets as at June 30, 2019 48
Statement of Operations and Changes in Net Assets for the period ended June 30, 2019 48
Statement of Changes in Number of Shares 49
Securities Portfolio as at June 30, 2019 50
Financial derivative instruments as at June 30, 2019 52
Portfolio Breakdowns 53
Top Ten Holdings 53
KAIROS INTERNATIONAL SICAV - ITALIA PIR
Statement of Net Assets as at June 30, 2019 54
Statement of Operations and Changes in Net Assets for the period ended June 30, 2019 54
Statement of Changes in Number of Shares 55
Securities Portfolio as at June 30, 2019 56
Financial derivative instruments as at June 30, 2019 57
Portfolio Breakdowns 58
Top Ten Holdings 58
*This Sub-Fund was merged into KAIROS INTERNATIONAL SICAV – PENTAGON on May 24, 2019** This Sub-Fund was merged into KAIROS INTERNATIONAL SICAV – PENTAGON on May 24, 2019*** This Sub-Fund was merged into KAIROS INTERNATIONAL SICAV – BOND PLUS on May 24, 2019**** This Sub-Fund was merged into KAIROS INTERNATIONAL SICAV – BOND PLUS on May 24, 2019
KAIROS INTERNATIONAL SICAV
3
Table of Contents
KAIROS INTERNATIONAL SICAV - PEGASUS UCITS
Statement of Net Assets as at June 30, 2019 59
Statement of Operations and Changes in Net Assets for the period ended June 30, 2019 59
Statement of Changes in Number of Shares 60
Securities Portfolio as at June 30, 2019 61
Financial derivative instruments as at June 30, 2019 62
Portfolio Breakdowns 64
Top Ten Holdings 64
KAIROS INTERNATIONAL SICAV - RISORGIMENTO
Statement of Net Assets as at June 30, 2019 65
Statement of Operations and Changes in Net Assets for the period ended June 30, 2019 65
Statement of Changes in Number of Shares 66
Securities Portfolio as at June 30, 2019 67
Financial derivative instruments as at June 30, 2019 68
Portfolio Breakdowns 69
Top Ten Holdings 69
KAIROS INTERNATIONAL SICAV - PATRIOT
Statement of Net Assets as at June 30, 2019 70
Statement of Operations and Changes in Net Assets for the period ended June 30, 2019 70
Statement of Changes in Number of Shares 71
Securities Portfolio as at June 30, 2019 72
Financial derivative instruments as at June 30, 2019 73
Portfolio Breakdowns 74
Top Ten Holdings 74
KAIROS INTERNATIONAL SICAV - KEY
Statement of Net Assets as at June 30, 2019 75
Statement of Operations and Changes in Net Assets for the period ended June 30, 2019 75
Statement of Changes in Number of Shares 76
Securities Portfolio as at June 30, 2019 77
Financial derivative instruments as at June 30, 2019 77
Portfolio Breakdowns 79
Top Ten Holdings 79
KAIROS INTERNATIONAL SICAV - AMERICA**
Statement of Net Assets as at May 23, 2019 80
Statement of Operations and Changes in Net Assets for the period ended May 23, 2019 80
Statement of Changes in Number of Shares 81
*This Sub-Fund was merged into KAIROS INTERNATIONAL SICAV – PENTAGON on May 24, 2019** This Sub-Fund was merged into KAIROS INTERNATIONAL SICAV – PENTAGON on May 24, 2019*** This Sub-Fund was merged into KAIROS INTERNATIONAL SICAV – BOND PLUS on May 24, 2019**** This Sub-Fund was merged into KAIROS INTERNATIONAL SICAV – BOND PLUS on May 24, 2019
KAIROS INTERNATIONAL SICAV
4
Table of Contents
KAIROS INTERNATIONAL SICAV - EMERGING MARKETS
Statement of Net Assets as at June 30, 2019 82
Statement of Operations and Changes in Net Assets for the period ended June 30, 2019 82
Statement of Changes in Number of Shares 83
Securities Portfolio as at June 30, 2019 84
Financial derivative instruments as at June 30, 2019 84
Portfolio Breakdowns 85
Top Ten Holdings 85
KAIROS INTERNATIONAL SICAV - ALGO
Statement of Net Assets as at June 30, 2019 86
Statement of Operations and Changes in Net Assets for the period ended June 30, 2019 86
Statement of Changes in Number of Shares 87
Securities Portfolio as at June 30, 2019 88
Financial derivative instruments as at June 30, 2019 88
Portfolio Breakdowns 89
Top Ten Holdings 89
KAIROS INTERNATIONAL SICAV - GLOBAL BOND***
Statement of Net Assets as at May 23, 2019 90
Statement of Operations and Changes in Net Assets for the period ended May 23, 2019 90
Statement of Changes in Number of Shares 91
KAIROS INTERNATIONAL SICAV - ALPHABETA****
Statement of Net Assets as at May 23, 2019 92
Statement of Operations and Changes in Net Assets for the period ended May 23, 2019 92
Statement of Changes in Number of Shares 93
Notes to the Financial Statements 94
Additional Information (unaudited) 105
*This Sub-Fund was merged into KAIROS INTERNATIONAL SICAV – PENTAGON on May 24, 2019** This Sub-Fund was merged into KAIROS INTERNATIONAL SICAV – PENTAGON on May 24, 2019*** This Sub-Fund was merged into KAIROS INTERNATIONAL SICAV – BOND PLUS on May 24, 2019**** This Sub-Fund was merged into KAIROS INTERNATIONAL SICAV – BOND PLUS on May 24, 2019
KAIROS INTERNATIONAL SICAV
5
Registered Office60, Avenue J.F. KennedyL-1855 Luxembourg
Board of DirectorsChairmanMassimo Paolo Gentili, founding partner of Gentili & Partners (since April 9, 2019)Marco Petronio, TMF Compliance, Luxembourg (until April 9, 2019)
DirectorsRoberto Rosso, Head of Middle-Back Office, Kairos Partners SGR S.p.A.John Alldis, Managing Director, Carne Group, Luxembourg
Management CompanyKairos Partners SGR S.p.A.Via San Prospero, 2I-20121 Milan
Depositary, Domiciliary, Administrative, Registrar and Transfer AgentBNP Paribas Securities Services, Luxembourg Branch60, Avenue J.F.KennedyL-1855 Luxembourg
Investment ManagerKairos Investment Management Ltd.10, Portman SquareLondon W1H6AZUnited Kingdom
Legal AdvisorArendt & Medernach SA41, Avenue J.F. KennedyL-2082 Luxembourg
AuditorKPMG Luxembourg, Société coopérative39, Avenue J.F. KennedyL-1855 Luxembourg
Organisational Structure
KAIROS INTERNATIONAL SICAV
6
The KAIROS INTERNATIONAL SICAV (the "Fund") was incorporated for an unlimited period on September 28, 2006 as a société anonyme underthe laws of the Grand Duchy of Luxembourg and qualifies as an open-ended société d'investissement à capital variable with UCITS status. TheArticles of Incorporation were published in the Mémorial of October 9, 2006.
The Fund is registered with the Registre de Commerce et des Sociétés of Luxembourg under Number B 119 723. The Fund was incorporated withan initial capital of 300,000 Euro. The Shares subscribed for by the Founders at the incorporation of the Fund were transferred to investorssubscribing in the period during which the Shares were initially offered. The capital of the Fund shall be equal to the net assets of the Fund. Theminimum capital of the Fund is EUR 1,250,000.
The Fund is authorised by the Luxembourg supervisory authority as a UCITS under the amended Law of December 17, 2010 relating toundertakings for collective investment.
Since September 1, 2014, the Board of Directors of the Fund has appointed Kairos Partners SGR S.p.A. to act as Management Company of theFund. The Management Company is an incorporated company under Italian law of May 20, 1999 and controlled by Julius Baer Group Ltd.
The subscription proceeds of all shares in a Sub-Fund are invested in one common underlying portfolio of investments. Each share is, upon issue,entitled to participate equally in the assets of the Sub-Fund to which it relates on liquidation and in dividends and other distributions as declared forsuch Sub-Fund or Class. The shares will carry no preferential or pre-emptive rights and each whole share will be entitled to one vote at all meetingsof Shareholders.
Shareholders' information
The annual general meeting of Shareholders shall be held each year at the Fund's registered office or at any other location in Luxembourg whichwill be specified in the convening notice to the meeting.
The annual general meeting shall be held on the second Tuesday of the month of April or, if such day is not a Business Day, on the next BusinessDay thereafter.
Shareholders will meet upon the call of the Board of Directors in accordance with the provisions of Luxembourg law.
In accordance with the Articles of Incorporation and the Luxembourg law, all decisions taken by the Shareholders pertaining to the Fund shall betaken at the general meeting of all Shareholders. Any decisions affecting Shareholders in one or several Sub-Funds may be taken by just thoseShareholders in the relevant Sub-Funds to the extent that this is allowed by law. In this particular instance, the requirements on quorum andmajority voting rules as laid down in the Articles of Incorporation shall apply.
The Fund will publish an annual report, including audited financial statements within four months after the end of the business year and anunaudited semi-annual report within two months after the end of the period to which it refers. Annual report, including audited financial statementsand un-audited interim reports for the Fund combining the accounts of the Sub-Funds will be drawn up in Euro. Both sets of reports will also bemade available at the registered office of the Fund.
The annual report, including audited financial statements will be mailed to Shareholders at their registered address upon request. The accountingyear of the Fund starts on January 1st and ends on December 31st each year.
Portfolio movements are available to Investors upon request, free of charge at the address of the registered office of the Fund.
General Information
KAIROS INTERNATIONAL SICAV
7
The accompanying notes are an integral part of these financial statements.
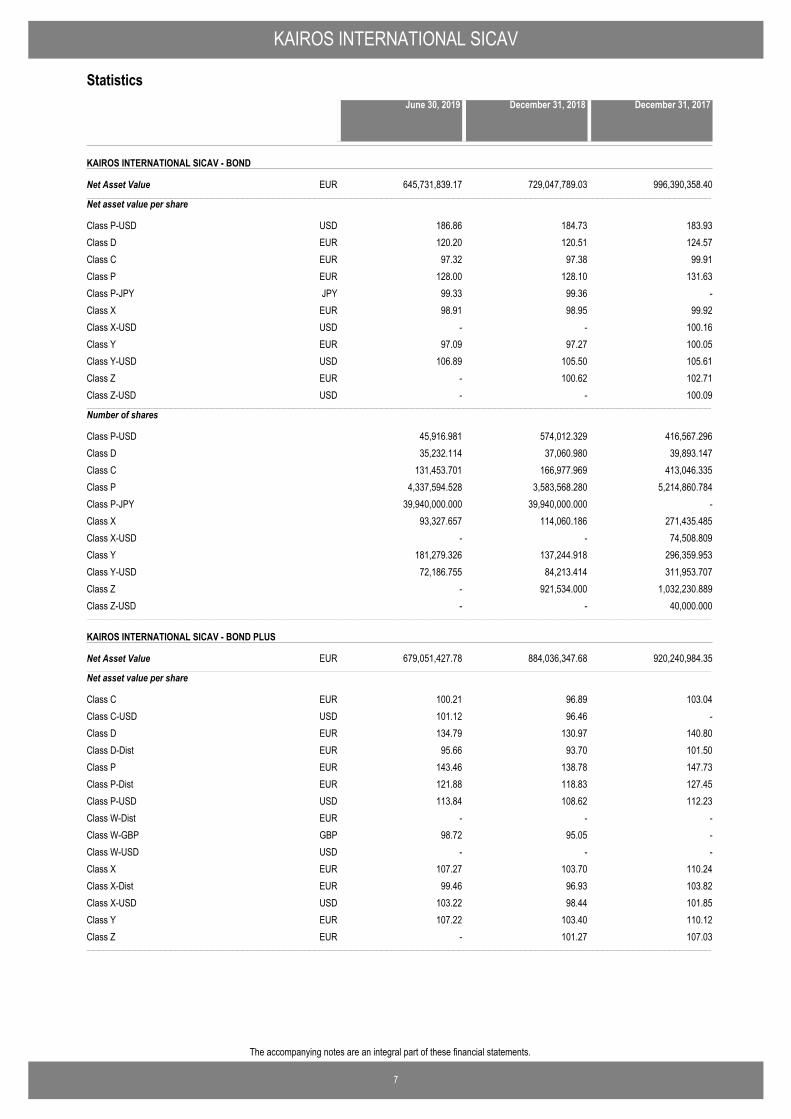
Statistics
KAIROS INTERNATIONAL SICAV - BOND
Net Asset Value−−−−−−−−−−−−−−−−−−−−−−−−−−−−−−−−−−−−−−−−−−−−−−−−−−−−−−−−−−−−−−−−−−−−−−−−−−−−−−−−−−−−−−−−−−−−−−−−−−−−−−−−−−−−−−−−−−−−−−−−−−−−−−−−−−−−−−−−−−−−−−−−−−−−−−−−−−−−−−−−−−−−−−−−−−−−−−−−−−−−−−−−−−−−−−−−−−−−−−−−−−−−−−−−−−−−−−−−−−−−−−−−−−−−−−−−−−−−−−−−−−−−−−−−−−−−−−−−−−−−−−−−−−−−−−−−−−−−−−−−−−−−−−−−−−−−−−−−−−−−−−−−−−−−−−−−−−−−−−−−−−−−−−−−−−−−−−−−−−−−−−−−−−−−−−−−−−−−−−−−−−−−−−−−−−−−−−−−−−−−−−−−−−−−−−−−−−−−−−−−−−−−−−−−−−−−−−−−−−−−−−−−−−−−−−−−−−−−−−−−−−−−−−−−−−−−−−−−−−−−−−−−−−−−−−−−−−−−−−−−−−−−−−−−−−−−−−−−−−−−−−−
645,731,839.17 729,047,789.03 996,390,358.40EUR
Net asset value per share
Class P-USD 186.86 184.73 183.93USDClass D 120.20 120.51 124.57EURClass C 97.32 97.38 99.91EURClass P 128.00 128.10 131.63EURClass P-JPY 99.33 99.36 -JPYClass X 98.91 98.95 99.92EURClass X-USD - - 100.16USDClass Y 97.09 97.27 100.05EURClass Y-USD 106.89 105.50 105.61USDClass Z - 100.62 102.71EURClass Z-USD - - 100.09USD−−−−−−−−−−−−−−−−−−−−−−−−−−−−−−−−−−−−−−−−−−−−−−−−−−−−−−−−−−−−−−−−−−−−−−−−−−−−−−−−−−−−−−−−−−−−−−−−−−−−−−−−−−−−−−−−−−−−−−−−−−−−−−−−−−−−−−−−−−−−−−−−−−−−−−−−−−−−−−−−−−−−−−−−−−−−−−−−−−−−−−−−−−−−−−−−−−−−−−−−−−−−−−−−−−−−−−−−−−−−−−−−−−−−−−−−−−−−−−−−−−−−−−−−−−−−−−−−−−−−−−−−−−−−−−−−−−−−−−−−−−−−−−−−−−−−−−−−−−−−−−−−−−−−−−−−−−−−−−−−−−−−−−−−−−−−−−−−−−−−−−−−−−−−−−−−−−−−−−−−−−−−−−−−−−−−−−−−−−−−−−−−−−−−−−−−−−−−−−−−−−−−−−−−−−−−−−−−−−−−−−−−−−−−−−−−−−−−−−−−−−−−−−−−−−−−−−−−−−−−−−−−−−−−−−−−−−−−−−−−−−−−−−−−−−−−−−−−−−−−−−−
Number of shares
Class P-USD 45,916.981 574,012.329 416,567.296Class D 35,232.114 37,060.980 39,893.147Class C 131,453.701 166,977.969 413,046.335Class P 4,337,594.528 3,583,568.280 5,214,860.784Class P-JPY 39,940,000.000 39,940,000.000 -Class X 93,327.657 114,060.186 271,435.485Class X-USD - - 74,508.809Class Y 181,279.326 137,244.918 296,359.953Class Y-USD 72,186.755 84,213.414 311,953.707Class Z - 921,534.000 1,032,230.889Class Z-USD - - 40,000.000−−−−−−−−−−−−−−−−−−−−−−−−−−−−−−−−−−−−−−−−−−−−−−−−−−−−−−−−−−−−−−−−−−−−−−−−−−−−−−−−−−−−−−−−−−−−−−−−−−−−−−−−−−−−−−−−−−−−−−−−−−−−−−−−−−−−−−−−−−−−−−−−−−−−−−−−−−−−−−−−−−−−−−−−−−−−−−−−−−−−−−−−−−−−−−−−−−−−−−−−−−−−−−−−−−−−−−−−−−−−−−−−−−−−−−−−−−−−−−−−−−−−−−−−−−−−−−−−−−−−−−−−−−−−−−−−−−−−−−−−−−−−−−−−−−−−−−−−−−−−−−−−−−−−−−−−−−−−−−−−−−−−−−−−−−−−−−−−−−−−−−−−−−−−−−−−−−−−−−−−−−−−−−−−−−−−−−−−−−−−−−−−−−−−−−−−−−−−−−−−−−−−−−−−−−−−−−−−−−−−−−−−−−−−−−−−−−−−−−−−−−−−−−−−−−−−−−−−−−−−−−−−−−−−−−−−−−−−−−−−−−−−−−−−−−−−−−−−−−−−−−−
KAIROS INTERNATIONAL SICAV - BOND PLUS
Net Asset Value−−−−−−−−−−−−−−−−−−−−−−−−−−−−−−−−−−−−−−−−−−−−−−−−−−−−−−−−−−−−−−−−−−−−−−−−−−−−−−−−−−−−−−−−−−−−−−−−−−−−−−−−−−−−−−−−−−−−−−−−−−−−−−−−−−−−−−−−−−−−−−−−−−−−−−−−−−−−−−−−−−−−−−−−−−−−−−−−−−−−−−−−−−−−−−−−−−−−−−−−−−−−−−−−−−−−−−−−−−−−−−−−−−−−−−−−−−−−−−−−−−−−−−−−−−−−−−−−−−−−−−−−−−−−−−−−−−−−−−−−−−−−−−−−−−−−−−−−−−−−−−−−−−−−−−−−−−−−−−−−−−−−−−−−−−−−−−−−−−−−−−−−−−−−−−−−−−−−−−−−−−−−−−−−−−−−−−−−−−−−−−−−−−−−−−−−−−−−−−−−−−−−−−−−−−−−−−−−−−−−−−−−−−−−−−−−−−−−−−−−−−−−−−−−−−−−−−−−−−−−−−−−−−−−−−−−−−−−−−−−−−−−−−−−−−−−−−−−−−−−−−−
679,051,427.78 884,036,347.68 920,240,984.35EUR
Net asset value per share
Class C 100.21 96.89 103.04EURClass C-USD 101.12 96.46 -USDClass D 134.79 130.97 140.80EURClass D-Dist 95.66 93.70 101.50EURClass P 143.46 138.78 147.73EURClass P-Dist 121.88 118.83 127.45EURClass P-USD 113.84 108.62 112.23USDClass W-Dist - - -EURClass W-GBP 98.72 95.05 -GBPClass W-USD - - -USDClass X 107.27 103.70 110.24EURClass X-Dist 99.46 96.93 103.82EURClass X-USD 103.22 98.44 101.85USDClass Y 107.22 103.40 110.12EURClass Z - 101.27 107.03EUR−−−−−−−−−−−−−−−−−−−−−−−−−−−−−−−−−−−−−−−−−−−−−−−−−−−−−−−−−−−−−−−−−−−−−−−−−−−−−−−−−−−−−−−−−−−−−−−−−−−−−−−−−−−−−−−−−−−−−−−−−−−−−−−−−−−−−−−−−−−−−−−−−−−−−−−−−−−−−−−−−−−−−−−−−−−−−−−−−−−−−−−−−−−−−−−−−−−−−−−−−−−−−−−−−−−−−−−−−−−−−−−−−−−−−−−−−−−−−−−−−−−−−−−−−−−−−−−−−−−−−−−−−−−−−−−−−−−−−−−−−−−−−−−−−−−−−−−−−−−−−−−−−−−−−−−−−−−−−−−−−−−−−−−−−−−−−−−−−−−−−−−−−−−−−−−−−−−−−−−−−−−−−−−−−−−−−−−−−−−−−−−−−−−−−−−−−−−−−−−−−−−−−−−−−−−−−−−−−−−−−−−−−−−−−−−−−−−−−−−−−−−−−−−−−−−−−−−−−−−−−−−−−−−−−−−−−−−−−−−−−−−−−−−−−−−−−−−−−−−−−−−
December 31, 2017June 30, 2019 December 31, 2018
KAIROS INTERNATIONAL SICAV
8
The accompanying notes are an integral part of these financial statements.
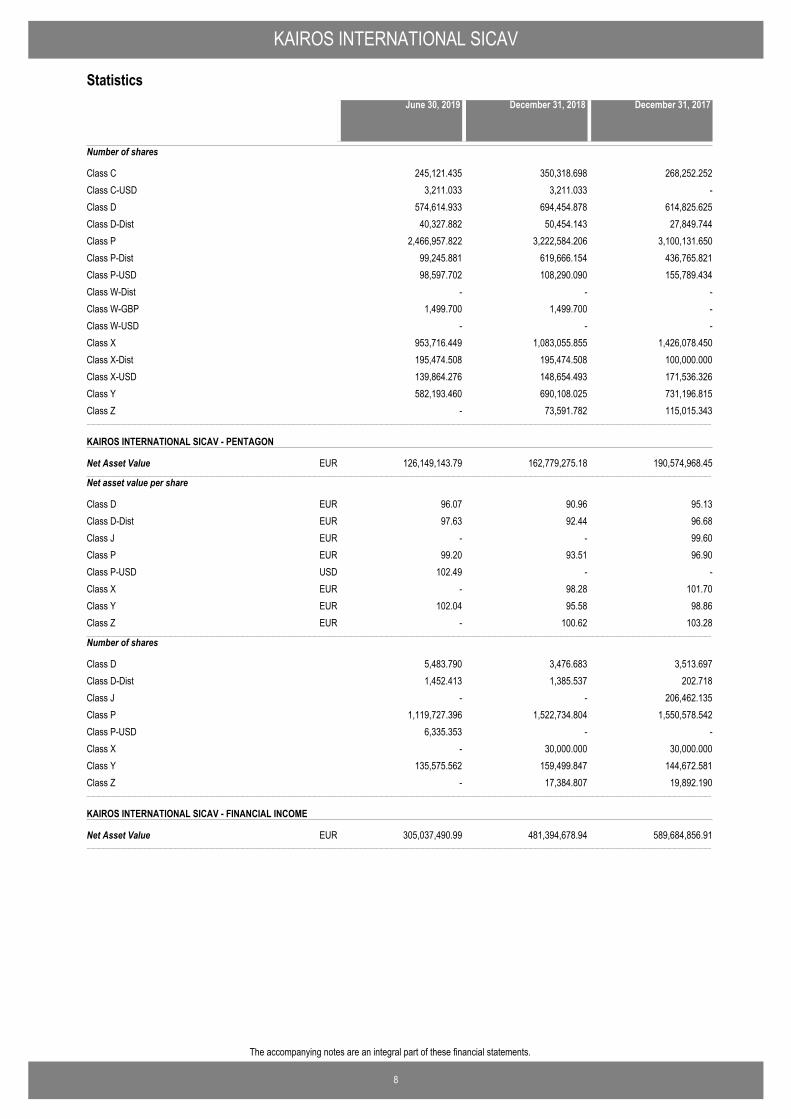
Statistics
Number of shares
Class C 245,121.435 350,318.698 268,252.252Class C-USD 3,211.033 3,211.033 -Class D 574,614.933 694,454.878 614,825.625Class D-Dist 40,327.882 50,454.143 27,849.744Class P 2,466,957.822 3,222,584.206 3,100,131.650Class P-Dist 99,245.881 619,666.154 436,765.821Class P-USD 98,597.702 108,290.090 155,789.434Class W-Dist - - -Class W-GBP 1,499.700 1,499.700 -Class W-USD - - -Class X 953,716.449 1,083,055.855 1,426,078.450Class X-Dist 195,474.508 195,474.508 100,000.000Class X-USD 139,864.276 148,654.493 171,536.326Class Y 582,193.460 690,108.025 731,196.815Class Z - 73,591.782 115,015.343−−−−−−−−−−−−−−−−−−−−−−−−−−−−−−−−−−−−−−−−−−−−−−−−−−−−−−−−−−−−−−−−−−−−−−−−−−−−−−−−−−−−−−−−−−−−−−−−−−−−−−−−−−−−−−−−−−−−−−−−−−−−−−−−−−−−−−−−−−−−−−−−−−−−−−−−−−−−−−−−−−−−−−−−−−−−−−−−−−−−−−−−−−−−−−−−−−−−−−−−−−−−−−−−−−−−−−−−−−−−−−−−−−−−−−−−−−−−−−−−−−−−−−−−−−−−−−−−−−−−−−−−−−−−−−−−−−−−−−−−−−−−−−−−−−−−−−−−−−−−−−−−−−−−−−−−−−−−−−−−−−−−−−−−−−−−−−−−−−−−−−−−−−−−−−−−−−−−−−−−−−−−−−−−−−−−−−−−−−−−−−−−−−−−−−−−−−−−−−−−−−−−−−−−−−−−−−−−−−−−−−−−−−−−−−−−−−−−−−−−−−−−−−−−−−−−−−−−−−−−−−−−−−−−−−−−−−−−−−−−−−−−−−−−−−−−−−−−−−−−−−−
KAIROS INTERNATIONAL SICAV - PENTAGON
Net Asset Value−−−−−−−−−−−−−−−−−−−−−−−−−−−−−−−−−−−−−−−−−−−−−−−−−−−−−−−−−−−−−−−−−−−−−−−−−−−−−−−−−−−−−−−−−−−−−−−−−−−−−−−−−−−−−−−−−−−−−−−−−−−−−−−−−−−−−−−−−−−−−−−−−−−−−−−−−−−−−−−−−−−−−−−−−−−−−−−−−−−−−−−−−−−−−−−−−−−−−−−−−−−−−−−−−−−−−−−−−−−−−−−−−−−−−−−−−−−−−−−−−−−−−−−−−−−−−−−−−−−−−−−−−−−−−−−−−−−−−−−−−−−−−−−−−−−−−−−−−−−−−−−−−−−−−−−−−−−−−−−−−−−−−−−−−−−−−−−−−−−−−−−−−−−−−−−−−−−−−−−−−−−−−−−−−−−−−−−−−−−−−−−−−−−−−−−−−−−−−−−−−−−−−−−−−−−−−−−−−−−−−−−−−−−−−−−−−−−−−−−−−−−−−−−−−−−−−−−−−−−−−−−−−−−−−−−−−−−−−−−−−−−−−−−−−−−−−−−−−−−−−−−
126,149,143.79 162,779,275.18 190,574,968.45EUR
Net asset value per share
Class D 96.07 90.96 95.13EURClass D-Dist 97.63 92.44 96.68EURClass J - - 99.60EURClass P 99.20 93.51 96.90EURClass P-USD 102.49 - -USDClass X - 98.28 101.70EURClass Y 102.04 95.58 98.86EURClass Z - 100.62 103.28EUR−−−−−−−−−−−−−−−−−−−−−−−−−−−−−−−−−−−−−−−−−−−−−−−−−−−−−−−−−−−−−−−−−−−−−−−−−−−−−−−−−−−−−−−−−−−−−−−−−−−−−−−−−−−−−−−−−−−−−−−−−−−−−−−−−−−−−−−−−−−−−−−−−−−−−−−−−−−−−−−−−−−−−−−−−−−−−−−−−−−−−−−−−−−−−−−−−−−−−−−−−−−−−−−−−−−−−−−−−−−−−−−−−−−−−−−−−−−−−−−−−−−−−−−−−−−−−−−−−−−−−−−−−−−−−−−−−−−−−−−−−−−−−−−−−−−−−−−−−−−−−−−−−−−−−−−−−−−−−−−−−−−−−−−−−−−−−−−−−−−−−−−−−−−−−−−−−−−−−−−−−−−−−−−−−−−−−−−−−−−−−−−−−−−−−−−−−−−−−−−−−−−−−−−−−−−−−−−−−−−−−−−−−−−−−−−−−−−−−−−−−−−−−−−−−−−−−−−−−−−−−−−−−−−−−−−−−−−−−−−−−−−−−−−−−−−−−−−−−−−−−−−
Number of shares
Class D 5,483.790 3,476.683 3,513.697Class D-Dist 1,452.413 1,385.537 202.718Class J - - 206,462.135Class P 1,119,727.396 1,522,734.804 1,550,578.542Class P-USD 6,335.353 - -Class X - 30,000.000 30,000.000Class Y 135,575.562 159,499.847 144,672.581Class Z - 17,384.807 19,892.190−−−−−−−−−−−−−−−−−−−−−−−−−−−−−−−−−−−−−−−−−−−−−−−−−−−−−−−−−−−−−−−−−−−−−−−−−−−−−−−−−−−−−−−−−−−−−−−−−−−−−−−−−−−−−−−−−−−−−−−−−−−−−−−−−−−−−−−−−−−−−−−−−−−−−−−−−−−−−−−−−−−−−−−−−−−−−−−−−−−−−−−−−−−−−−−−−−−−−−−−−−−−−−−−−−−−−−−−−−−−−−−−−−−−−−−−−−−−−−−−−−−−−−−−−−−−−−−−−−−−−−−−−−−−−−−−−−−−−−−−−−−−−−−−−−−−−−−−−−−−−−−−−−−−−−−−−−−−−−−−−−−−−−−−−−−−−−−−−−−−−−−−−−−−−−−−−−−−−−−−−−−−−−−−−−−−−−−−−−−−−−−−−−−−−−−−−−−−−−−−−−−−−−−−−−−−−−−−−−−−−−−−−−−−−−−−−−−−−−−−−−−−−−−−−−−−−−−−−−−−−−−−−−−−−−−−−−−−−−−−−−−−−−−−−−−−−−−−−−−−−−−
KAIROS INTERNATIONAL SICAV - FINANCIAL INCOME
Net Asset Value−−−−−−−−−−−−−−−−−−−−−−−−−−−−−−−−−−−−−−−−−−−−−−−−−−−−−−−−−−−−−−−−−−−−−−−−−−−−−−−−−−−−−−−−−−−−−−−−−−−−−−−−−−−−−−−−−−−−−−−−−−−−−−−−−−−−−−−−−−−−−−−−−−−−−−−−−−−−−−−−−−−−−−−−−−−−−−−−−−−−−−−−−−−−−−−−−−−−−−−−−−−−−−−−−−−−−−−−−−−−−−−−−−−−−−−−−−−−−−−−−−−−−−−−−−−−−−−−−−−−−−−−−−−−−−−−−−−−−−−−−−−−−−−−−−−−−−−−−−−−−−−−−−−−−−−−−−−−−−−−−−−−−−−−−−−−−−−−−−−−−−−−−−−−−−−−−−−−−−−−−−−−−−−−−−−−−−−−−−−−−−−−−−−−−−−−−−−−−−−−−−−−−−−−−−−−−−−−−−−−−−−−−−−−−−−−−−−−−−−−−−−−−−−−−−−−−−−−−−−−−−−−−−−−−−−−−−−−−−−−−−−−−−−−−−−−−−−−−−−−−−−
305,037,490.99 481,394,678.94 589,684,856.91EUR
December 31, 2017June 30, 2019 December 31, 2018
KAIROS INTERNATIONAL SICAV
9
The accompanying notes are an integral part of these financial statements.
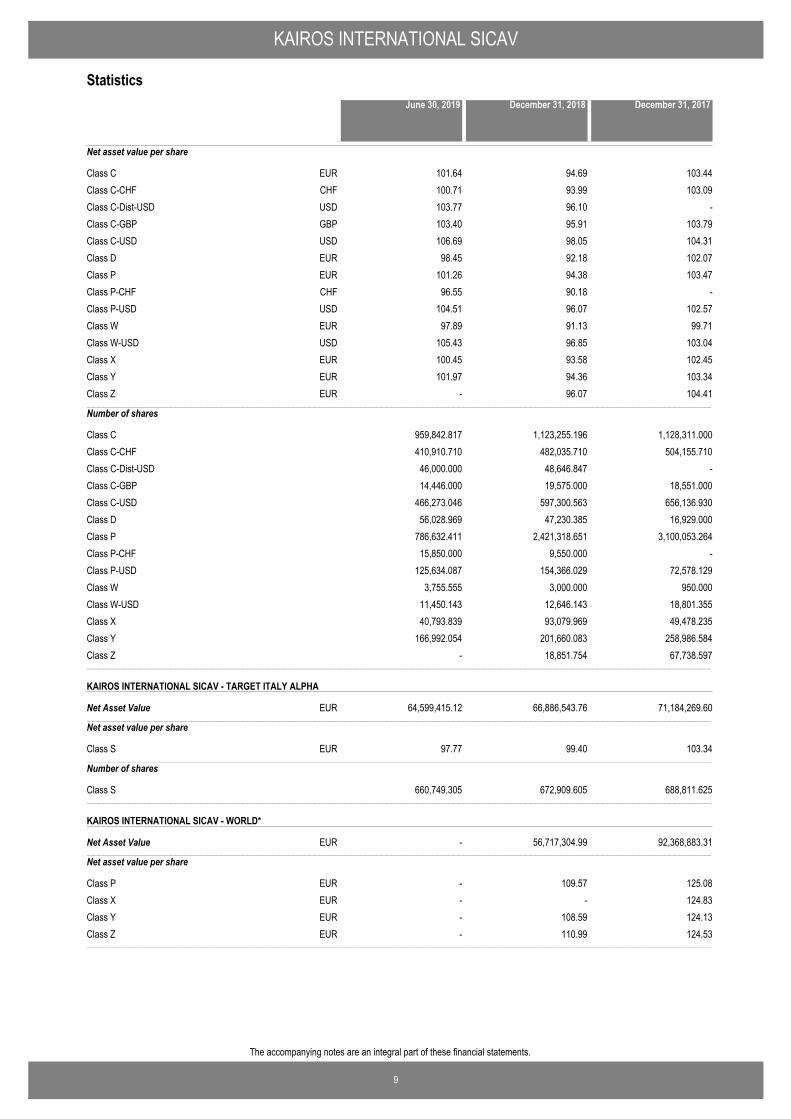
Statistics
Net asset value per share
Class C 101.64 94.69 103.44EURClass C-CHF 100.71 93.99 103.09CHFClass C-Dist-USD 103.77 96.10 -USDClass C-GBP 103.40 95.91 103.79GBPClass C-USD 106.69 98.05 104.31USDClass D 98.45 92.18 102.07EURClass P 101.26 94.38 103.47EURClass P-CHF 96.55 90.18 -CHFClass P-USD 104.51 96.07 102.57USDClass W 97.89 91.13 99.71EURClass W-USD 105.43 96.85 103.04USDClass X 100.45 93.58 102.45EURClass Y 101.97 94.36 103.34EURClass Z - 96.07 104.41EUR−−−−−−−−−−−−−−−−−−−−−−−−−−−−−−−−−−−−−−−−−−−−−−−−−−−−−−−−−−−−−−−−−−−−−−−−−−−−−−−−−−−−−−−−−−−−−−−−−−−−−−−−−−−−−−−−−−−−−−−−−−−−−−−−−−−−−−−−−−−−−−−−−−−−−−−−−−−−−−−−−−−−−−−−−−−−−−−−−−−−−−−−−−−−−−−−−−−−−−−−−−−−−−−−−−−−−−−−−−−−−−−−−−−−−−−−−−−−−−−−−−−−−−−−−−−−−−−−−−−−−−−−−−−−−−−−−−−−−−−−−−−−−−−−−−−−−−−−−−−−−−−−−−−−−−−−−−−−−−−−−−−−−−−−−−−−−−−−−−−−−−−−−−−−−−−−−−−−−−−−−−−−−−−−−−−−−−−−−−−−−−−−−−−−−−−−−−−−−−−−−−−−−−−−−−−−−−−−−−−−−−−−−−−−−−−−−−−−−−−−−−−−−−−−−−−−−−−−−−−−−−−−−−−−−−−−−−−−−−−−−−−−−−−−−−−−−−−−−−−−−−−
Number of shares
Class C 959,842.817 1,123,255.196 1,128,311.000Class C-CHF 410,910.710 482,035.710 504,155.710Class C-Dist-USD 46,000.000 48,646.847 -Class C-GBP 14,446.000 19,575.000 18,551.000Class C-USD 466,273.046 597,300.563 656,136.930Class D 56,028.969 47,230.385 16,929.000Class P 786,632.411 2,421,318.651 3,100,053.264Class P-CHF 15,850.000 9,550.000 -Class P-USD 125,634.087 154,366.029 72,578.129Class W 3,755.555 3,000.000 950.000Class W-USD 11,450.143 12,646.143 18,801.355Class X 40,793.839 93,079.969 49,478.235Class Y 166,992.054 201,660.083 258,986.584Class Z - 18,851.754 67,738.597−−−−−−−−−−−−−−−−−−−−−−−−−−−−−−−−−−−−−−−−−−−−−−−−−−−−−−−−−−−−−−−−−−−−−−−−−−−−−−−−−−−−−−−−−−−−−−−−−−−−−−−−−−−−−−−−−−−−−−−−−−−−−−−−−−−−−−−−−−−−−−−−−−−−−−−−−−−−−−−−−−−−−−−−−−−−−−−−−−−−−−−−−−−−−−−−−−−−−−−−−−−−−−−−−−−−−−−−−−−−−−−−−−−−−−−−−−−−−−−−−−−−−−−−−−−−−−−−−−−−−−−−−−−−−−−−−−−−−−−−−−−−−−−−−−−−−−−−−−−−−−−−−−−−−−−−−−−−−−−−−−−−−−−−−−−−−−−−−−−−−−−−−−−−−−−−−−−−−−−−−−−−−−−−−−−−−−−−−−−−−−−−−−−−−−−−−−−−−−−−−−−−−−−−−−−−−−−−−−−−−−−−−−−−−−−−−−−−−−−−−−−−−−−−−−−−−−−−−−−−−−−−−−−−−−−−−−−−−−−−−−−−−−−−−−−−−−−−−−−−−−−
KAIROS INTERNATIONAL SICAV - TARGET ITALY ALPHA
Net Asset Value−−−−−−−−−−−−−−−−−−−−−−−−−−−−−−−−−−−−−−−−−−−−−−−−−−−−−−−−−−−−−−−−−−−−−−−−−−−−−−−−−−−−−−−−−−−−−−−−−−−−−−−−−−−−−−−−−−−−−−−−−−−−−−−−−−−−−−−−−−−−−−−−−−−−−−−−−−−−−−−−−−−−−−−−−−−−−−−−−−−−−−−−−−−−−−−−−−−−−−−−−−−−−−−−−−−−−−−−−−−−−−−−−−−−−−−−−−−−−−−−−−−−−−−−−−−−−−−−−−−−−−−−−−−−−−−−−−−−−−−−−−−−−−−−−−−−−−−−−−−−−−−−−−−−−−−−−−−−−−−−−−−−−−−−−−−−−−−−−−−−−−−−−−−−−−−−−−−−−−−−−−−−−−−−−−−−−−−−−−−−−−−−−−−−−−−−−−−−−−−−−−−−−−−−−−−−−−−−−−−−−−−−−−−−−−−−−−−−−−−−−−−−−−−−−−−−−−−−−−−−−−−−−−−−−−−−−−−−−−−−−−−−−−−−−−−−−−−−−−−−−−−
64,599,415.12 66,886,543.76 71,184,269.60EUR
Net asset value per share
Class S 97.77 99.40 103.34EUR−−−−−−−−−−−−−−−−−−−−−−−−−−−−−−−−−−−−−−−−−−−−−−−−−−−−−−−−−−−−−−−−−−−−−−−−−−−−−−−−−−−−−−−−−−−−−−−−−−−−−−−−−−−−−−−−−−−−−−−−−−−−−−−−−−−−−−−−−−−−−−−−−−−−−−−−−−−−−−−−−−−−−−−−−−−−−−−−−−−−−−−−−−−−−−−−−−−−−−−−−−−−−−−−−−−−−−−−−−−−−−−−−−−−−−−−−−−−−−−−−−−−−−−−−−−−−−−−−−−−−−−−−−−−−−−−−−−−−−−−−−−−−−−−−−−−−−−−−−−−−−−−−−−−−−−−−−−−−−−−−−−−−−−−−−−−−−−−−−−−−−−−−−−−−−−−−−−−−−−−−−−−−−−−−−−−−−−−−−−−−−−−−−−−−−−−−−−−−−−−−−−−−−−−−−−−−−−−−−−−−−−−−−−−−−−−−−−−−−−−−−−−−−−−−−−−−−−−−−−−−−−−−−−−−−−−−−−−−−−−−−−−−−−−−−−−−−−−−−−−−−−
Number of shares
Class S 660,749.305 672,909.605 688,811.625−−−−−−−−−−−−−−−−−−−−−−−−−−−−−−−−−−−−−−−−−−−−−−−−−−−−−−−−−−−−−−−−−−−−−−−−−−−−−−−−−−−−−−−−−−−−−−−−−−−−−−−−−−−−−−−−−−−−−−−−−−−−−−−−−−−−−−−−−−−−−−−−−−−−−−−−−−−−−−−−−−−−−−−−−−−−−−−−−−−−−−−−−−−−−−−−−−−−−−−−−−−−−−−−−−−−−−−−−−−−−−−−−−−−−−−−−−−−−−−−−−−−−−−−−−−−−−−−−−−−−−−−−−−−−−−−−−−−−−−−−−−−−−−−−−−−−−−−−−−−−−−−−−−−−−−−−−−−−−−−−−−−−−−−−−−−−−−−−−−−−−−−−−−−−−−−−−−−−−−−−−−−−−−−−−−−−−−−−−−−−−−−−−−−−−−−−−−−−−−−−−−−−−−−−−−−−−−−−−−−−−−−−−−−−−−−−−−−−−−−−−−−−−−−−−−−−−−−−−−−−−−−−−−−−−−−−−−−−−−−−−−−−−−−−−−−−−−−−−−−−−−
KAIROS INTERNATIONAL SICAV - WORLD*
Net Asset Value−−−−−−−−−−−−−−−−−−−−−−−−−−−−−−−−−−−−−−−−−−−−−−−−−−−−−−−−−−−−−−−−−−−−−−−−−−−−−−−−−−−−−−−−−−−−−−−−−−−−−−−−−−−−−−−−−−−−−−−−−−−−−−−−−−−−−−−−−−−−−−−−−−−−−−−−−−−−−−−−−−−−−−−−−−−−−−−−−−−−−−−−−−−−−−−−−−−−−−−−−−−−−−−−−−−−−−−−−−−−−−−−−−−−−−−−−−−−−−−−−−−−−−−−−−−−−−−−−−−−−−−−−−−−−−−−−−−−−−−−−−−−−−−−−−−−−−−−−−−−−−−−−−−−−−−−−−−−−−−−−−−−−−−−−−−−−−−−−−−−−−−−−−−−−−−−−−−−−−−−−−−−−−−−−−−−−−−−−−−−−−−−−−−−−−−−−−−−−−−−−−−−−−−−−−−−−−−−−−−−−−−−−−−−−−−−−−−−−−−−−−−−−−−−−−−−−−−−−−−−−−−−−−−−−−−−−−−−−−−−−−−−−−−−−−−−−−−−−−−−−−−
- 56,717,304.99 92,368,883.31EUR
Net asset value per share
Class P - 109.57 125.08EURClass X - - 124.83EURClass Y - 108.59 124.13EURClass Z - 110.99 124.53EUR−−−−−−−−−−−−−−−−−−−−−−−−−−−−−−−−−−−−−−−−−−−−−−−−−−−−−−−−−−−−−−−−−−−−−−−−−−−−−−−−−−−−−−−−−−−−−−−−−−−−−−−−−−−−−−−−−−−−−−−−−−−−−−−−−−−−−−−−−−−−−−−−−−−−−−−−−−−−−−−−−−−−−−−−−−−−−−−−−−−−−−−−−−−−−−−−−−−−−−−−−−−−−−−−−−−−−−−−−−−−−−−−−−−−−−−−−−−−−−−−−−−−−−−−−−−−−−−−−−−−−−−−−−−−−−−−−−−−−−−−−−−−−−−−−−−−−−−−−−−−−−−−−−−−−−−−−−−−−−−−−−−−−−−−−−−−−−−−−−−−−−−−−−−−−−−−−−−−−−−−−−−−−−−−−−−−−−−−−−−−−−−−−−−−−−−−−−−−−−−−−−−−−−−−−−−−−−−−−−−−−−−−−−−−−−−−−−−−−−−−−−−−−−−−−−−−−−−−−−−−−−−−−−−−−−−−−−−−−−−−−−−−−−−−−−−−−−−−−−−−−−−
December 31, 2017June 30, 2019 December 31, 2018
KAIROS INTERNATIONAL SICAV
10
The accompanying notes are an integral part of these financial statements.
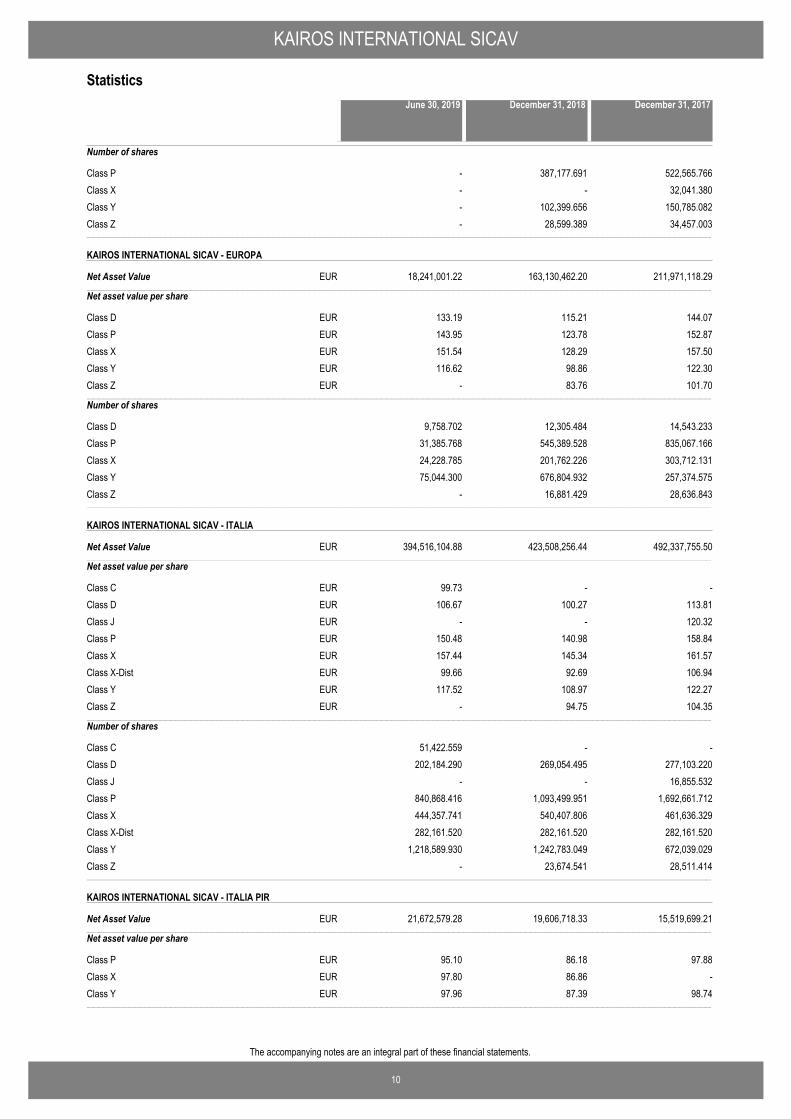
Statistics
Number of shares
Class P - 387,177.691 522,565.766Class X - - 32,041.380Class Y - 102,399.656 150,785.082Class Z - 28,599.389 34,457.003−−−−−−−−−−−−−−−−−−−−−−−−−−−−−−−−−−−−−−−−−−−−−−−−−−−−−−−−−−−−−−−−−−−−−−−−−−−−−−−−−−−−−−−−−−−−−−−−−−−−−−−−−−−−−−−−−−−−−−−−−−−−−−−−−−−−−−−−−−−−−−−−−−−−−−−−−−−−−−−−−−−−−−−−−−−−−−−−−−−−−−−−−−−−−−−−−−−−−−−−−−−−−−−−−−−−−−−−−−−−−−−−−−−−−−−−−−−−−−−−−−−−−−−−−−−−−−−−−−−−−−−−−−−−−−−−−−−−−−−−−−−−−−−−−−−−−−−−−−−−−−−−−−−−−−−−−−−−−−−−−−−−−−−−−−−−−−−−−−−−−−−−−−−−−−−−−−−−−−−−−−−−−−−−−−−−−−−−−−−−−−−−−−−−−−−−−−−−−−−−−−−−−−−−−−−−−−−−−−−−−−−−−−−−−−−−−−−−−−−−−−−−−−−−−−−−−−−−−−−−−−−−−−−−−−−−−−−−−−−−−−−−−−−−−−−−−−−−−−−−−−−
KAIROS INTERNATIONAL SICAV - EUROPA
Net Asset Value−−−−−−−−−−−−−−−−−−−−−−−−−−−−−−−−−−−−−−−−−−−−−−−−−−−−−−−−−−−−−−−−−−−−−−−−−−−−−−−−−−−−−−−−−−−−−−−−−−−−−−−−−−−−−−−−−−−−−−−−−−−−−−−−−−−−−−−−−−−−−−−−−−−−−−−−−−−−−−−−−−−−−−−−−−−−−−−−−−−−−−−−−−−−−−−−−−−−−−−−−−−−−−−−−−−−−−−−−−−−−−−−−−−−−−−−−−−−−−−−−−−−−−−−−−−−−−−−−−−−−−−−−−−−−−−−−−−−−−−−−−−−−−−−−−−−−−−−−−−−−−−−−−−−−−−−−−−−−−−−−−−−−−−−−−−−−−−−−−−−−−−−−−−−−−−−−−−−−−−−−−−−−−−−−−−−−−−−−−−−−−−−−−−−−−−−−−−−−−−−−−−−−−−−−−−−−−−−−−−−−−−−−−−−−−−−−−−−−−−−−−−−−−−−−−−−−−−−−−−−−−−−−−−−−−−−−−−−−−−−−−−−−−−−−−−−−−−−−−−−−−−
18,241,001.22 163,130,462.20 211,971,118.29EUR
Net asset value per share
Class D 133.19 115.21 144.07EURClass P 143.95 123.78 152.87EURClass X 151.54 128.29 157.50EURClass Y 116.62 98.86 122.30EURClass Z - 83.76 101.70EUR−−−−−−−−−−−−−−−−−−−−−−−−−−−−−−−−−−−−−−−−−−−−−−−−−−−−−−−−−−−−−−−−−−−−−−−−−−−−−−−−−−−−−−−−−−−−−−−−−−−−−−−−−−−−−−−−−−−−−−−−−−−−−−−−−−−−−−−−−−−−−−−−−−−−−−−−−−−−−−−−−−−−−−−−−−−−−−−−−−−−−−−−−−−−−−−−−−−−−−−−−−−−−−−−−−−−−−−−−−−−−−−−−−−−−−−−−−−−−−−−−−−−−−−−−−−−−−−−−−−−−−−−−−−−−−−−−−−−−−−−−−−−−−−−−−−−−−−−−−−−−−−−−−−−−−−−−−−−−−−−−−−−−−−−−−−−−−−−−−−−−−−−−−−−−−−−−−−−−−−−−−−−−−−−−−−−−−−−−−−−−−−−−−−−−−−−−−−−−−−−−−−−−−−−−−−−−−−−−−−−−−−−−−−−−−−−−−−−−−−−−−−−−−−−−−−−−−−−−−−−−−−−−−−−−−−−−−−−−−−−−−−−−−−−−−−−−−−−−−−−−−−
Number of shares
Class D 9,758.702 12,305.484 14,543.233Class P 31,385.768 545,389.528 835,067.166Class X 24,228.785 201,762.226 303,712.131Class Y 75,044.300 676,804.932 257,374.575Class Z - 16,881.429 28,636.843−−−−−−−−−−−−−−−−−−−−−−−−−−−−−−−−−−−−−−−−−−−−−−−−−−−−−−−−−−−−−−−−−−−−−−−−−−−−−−−−−−−−−−−−−−−−−−−−−−−−−−−−−−−−−−−−−−−−−−−−−−−−−−−−−−−−−−−−−−−−−−−−−−−−−−−−−−−−−−−−−−−−−−−−−−−−−−−−−−−−−−−−−−−−−−−−−−−−−−−−−−−−−−−−−−−−−−−−−−−−−−−−−−−−−−−−−−−−−−−−−−−−−−−−−−−−−−−−−−−−−−−−−−−−−−−−−−−−−−−−−−−−−−−−−−−−−−−−−−−−−−−−−−−−−−−−−−−−−−−−−−−−−−−−−−−−−−−−−−−−−−−−−−−−−−−−−−−−−−−−−−−−−−−−−−−−−−−−−−−−−−−−−−−−−−−−−−−−−−−−−−−−−−−−−−−−−−−−−−−−−−−−−−−−−−−−−−−−−−−−−−−−−−−−−−−−−−−−−−−−−−−−−−−−−−−−−−−−−−−−−−−−−−−−−−−−−−−−−−−−−−−
KAIROS INTERNATIONAL SICAV - ITALIA
Net Asset Value−−−−−−−−−−−−−−−−−−−−−−−−−−−−−−−−−−−−−−−−−−−−−−−−−−−−−−−−−−−−−−−−−−−−−−−−−−−−−−−−−−−−−−−−−−−−−−−−−−−−−−−−−−−−−−−−−−−−−−−−−−−−−−−−−−−−−−−−−−−−−−−−−−−−−−−−−−−−−−−−−−−−−−−−−−−−−−−−−−−−−−−−−−−−−−−−−−−−−−−−−−−−−−−−−−−−−−−−−−−−−−−−−−−−−−−−−−−−−−−−−−−−−−−−−−−−−−−−−−−−−−−−−−−−−−−−−−−−−−−−−−−−−−−−−−−−−−−−−−−−−−−−−−−−−−−−−−−−−−−−−−−−−−−−−−−−−−−−−−−−−−−−−−−−−−−−−−−−−−−−−−−−−−−−−−−−−−−−−−−−−−−−−−−−−−−−−−−−−−−−−−−−−−−−−−−−−−−−−−−−−−−−−−−−−−−−−−−−−−−−−−−−−−−−−−−−−−−−−−−−−−−−−−−−−−−−−−−−−−−−−−−−−−−−−−−−−−−−−−−−−−−
394,516,104.88 423,508,256.44 492,337,755.50EUR
Net asset value per share
Class C 99.73 - -EURClass D 106.67 100.27 113.81EURClass J - - 120.32EURClass P 150.48 140.98 158.84EURClass X 157.44 145.34 161.57EURClass X-Dist 99.66 92.69 106.94EURClass Y 117.52 108.97 122.27EURClass Z - 94.75 104.35EUR−−−−−−−−−−−−−−−−−−−−−−−−−−−−−−−−−−−−−−−−−−−−−−−−−−−−−−−−−−−−−−−−−−−−−−−−−−−−−−−−−−−−−−−−−−−−−−−−−−−−−−−−−−−−−−−−−−−−−−−−−−−−−−−−−−−−−−−−−−−−−−−−−−−−−−−−−−−−−−−−−−−−−−−−−−−−−−−−−−−−−−−−−−−−−−−−−−−−−−−−−−−−−−−−−−−−−−−−−−−−−−−−−−−−−−−−−−−−−−−−−−−−−−−−−−−−−−−−−−−−−−−−−−−−−−−−−−−−−−−−−−−−−−−−−−−−−−−−−−−−−−−−−−−−−−−−−−−−−−−−−−−−−−−−−−−−−−−−−−−−−−−−−−−−−−−−−−−−−−−−−−−−−−−−−−−−−−−−−−−−−−−−−−−−−−−−−−−−−−−−−−−−−−−−−−−−−−−−−−−−−−−−−−−−−−−−−−−−−−−−−−−−−−−−−−−−−−−−−−−−−−−−−−−−−−−−−−−−−−−−−−−−−−−−−−−−−−−−−−−−−−−
Number of shares
Class C 51,422.559 - -Class D 202,184.290 269,054.495 277,103.220Class J - - 16,855.532Class P 840,868.416 1,093,499.951 1,692,661.712Class X 444,357.741 540,407.806 461,636.329Class X-Dist 282,161.520 282,161.520 282,161.520Class Y 1,218,589.930 1,242,783.049 672,039.029Class Z - 23,674.541 28,511.414−−−−−−−−−−−−−−−−−−−−−−−−−−−−−−−−−−−−−−−−−−−−−−−−−−−−−−−−−−−−−−−−−−−−−−−−−−−−−−−−−−−−−−−−−−−−−−−−−−−−−−−−−−−−−−−−−−−−−−−−−−−−−−−−−−−−−−−−−−−−−−−−−−−−−−−−−−−−−−−−−−−−−−−−−−−−−−−−−−−−−−−−−−−−−−−−−−−−−−−−−−−−−−−−−−−−−−−−−−−−−−−−−−−−−−−−−−−−−−−−−−−−−−−−−−−−−−−−−−−−−−−−−−−−−−−−−−−−−−−−−−−−−−−−−−−−−−−−−−−−−−−−−−−−−−−−−−−−−−−−−−−−−−−−−−−−−−−−−−−−−−−−−−−−−−−−−−−−−−−−−−−−−−−−−−−−−−−−−−−−−−−−−−−−−−−−−−−−−−−−−−−−−−−−−−−−−−−−−−−−−−−−−−−−−−−−−−−−−−−−−−−−−−−−−−−−−−−−−−−−−−−−−−−−−−−−−−−−−−−−−−−−−−−−−−−−−−−−−−−−−−−
KAIROS INTERNATIONAL SICAV - ITALIA PIR
Net Asset Value−−−−−−−−−−−−−−−−−−−−−−−−−−−−−−−−−−−−−−−−−−−−−−−−−−−−−−−−−−−−−−−−−−−−−−−−−−−−−−−−−−−−−−−−−−−−−−−−−−−−−−−−−−−−−−−−−−−−−−−−−−−−−−−−−−−−−−−−−−−−−−−−−−−−−−−−−−−−−−−−−−−−−−−−−−−−−−−−−−−−−−−−−−−−−−−−−−−−−−−−−−−−−−−−−−−−−−−−−−−−−−−−−−−−−−−−−−−−−−−−−−−−−−−−−−−−−−−−−−−−−−−−−−−−−−−−−−−−−−−−−−−−−−−−−−−−−−−−−−−−−−−−−−−−−−−−−−−−−−−−−−−−−−−−−−−−−−−−−−−−−−−−−−−−−−−−−−−−−−−−−−−−−−−−−−−−−−−−−−−−−−−−−−−−−−−−−−−−−−−−−−−−−−−−−−−−−−−−−−−−−−−−−−−−−−−−−−−−−−−−−−−−−−−−−−−−−−−−−−−−−−−−−−−−−−−−−−−−−−−−−−−−−−−−−−−−−−−−−−−−−−−
21,672,579.28 19,606,718.33 15,519,699.21EUR
Net asset value per share
Class P 95.10 86.18 97.88EURClass X 97.80 86.86 -EURClass Y 97.96 87.39 98.74EUR−−−−−−−−−−−−−−−−−−−−−−−−−−−−−−−−−−−−−−−−−−−−−−−−−−−−−−−−−−−−−−−−−−−−−−−−−−−−−−−−−−−−−−−−−−−−−−−−−−−−−−−−−−−−−−−−−−−−−−−−−−−−−−−−−−−−−−−−−−−−−−−−−−−−−−−−−−−−−−−−−−−−−−−−−−−−−−−−−−−−−−−−−−−−−−−−−−−−−−−−−−−−−−−−−−−−−−−−−−−−−−−−−−−−−−−−−−−−−−−−−−−−−−−−−−−−−−−−−−−−−−−−−−−−−−−−−−−−−−−−−−−−−−−−−−−−−−−−−−−−−−−−−−−−−−−−−−−−−−−−−−−−−−−−−−−−−−−−−−−−−−−−−−−−−−−−−−−−−−−−−−−−−−−−−−−−−−−−−−−−−−−−−−−−−−−−−−−−−−−−−−−−−−−−−−−−−−−−−−−−−−−−−−−−−−−−−−−−−−−−−−−−−−−−−−−−−−−−−−−−−−−−−−−−−−−−−−−−−−−−−−−−−−−−−−−−−−−−−−−−−−−
December 31, 2017June 30, 2019 December 31, 2018
KAIROS INTERNATIONAL SICAV
11
The accompanying notes are an integral part of these financial statements.
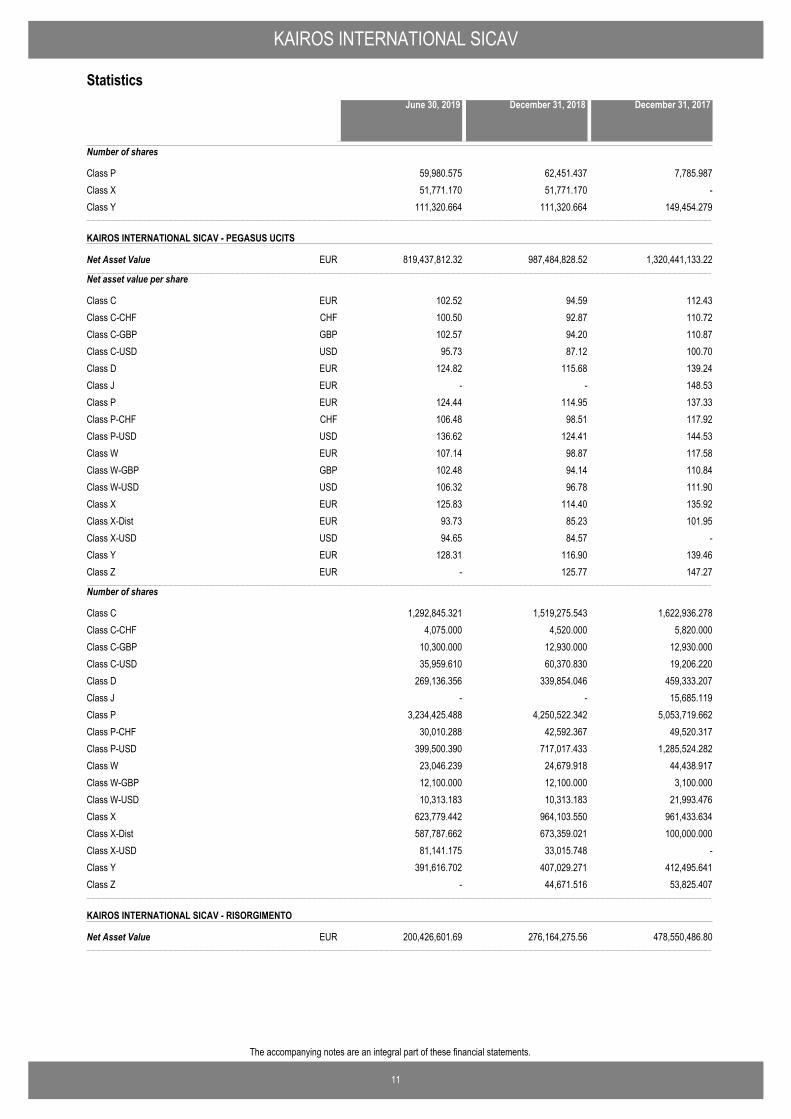
Statistics
Number of shares
Class P 59,980.575 62,451.437 7,785.987Class X 51,771.170 51,771.170 -Class Y 111,320.664 111,320.664 149,454.279−−−−−−−−−−−−−−−−−−−−−−−−−−−−−−−−−−−−−−−−−−−−−−−−−−−−−−−−−−−−−−−−−−−−−−−−−−−−−−−−−−−−−−−−−−−−−−−−−−−−−−−−−−−−−−−−−−−−−−−−−−−−−−−−−−−−−−−−−−−−−−−−−−−−−−−−−−−−−−−−−−−−−−−−−−−−−−−−−−−−−−−−−−−−−−−−−−−−−−−−−−−−−−−−−−−−−−−−−−−−−−−−−−−−−−−−−−−−−−−−−−−−−−−−−−−−−−−−−−−−−−−−−−−−−−−−−−−−−−−−−−−−−−−−−−−−−−−−−−−−−−−−−−−−−−−−−−−−−−−−−−−−−−−−−−−−−−−−−−−−−−−−−−−−−−−−−−−−−−−−−−−−−−−−−−−−−−−−−−−−−−−−−−−−−−−−−−−−−−−−−−−−−−−−−−−−−−−−−−−−−−−−−−−−−−−−−−−−−−−−−−−−−−−−−−−−−−−−−−−−−−−−−−−−−−−−−−−−−−−−−−−−−−−−−−−−−−−−−−−−−−−
KAIROS INTERNATIONAL SICAV - PEGASUS UCITS
Net Asset Value−−−−−−−−−−−−−−−−−−−−−−−−−−−−−−−−−−−−−−−−−−−−−−−−−−−−−−−−−−−−−−−−−−−−−−−−−−−−−−−−−−−−−−−−−−−−−−−−−−−−−−−−−−−−−−−−−−−−−−−−−−−−−−−−−−−−−−−−−−−−−−−−−−−−−−−−−−−−−−−−−−−−−−−−−−−−−−−−−−−−−−−−−−−−−−−−−−−−−−−−−−−−−−−−−−−−−−−−−−−−−−−−−−−−−−−−−−−−−−−−−−−−−−−−−−−−−−−−−−−−−−−−−−−−−−−−−−−−−−−−−−−−−−−−−−−−−−−−−−−−−−−−−−−−−−−−−−−−−−−−−−−−−−−−−−−−−−−−−−−−−−−−−−−−−−−−−−−−−−−−−−−−−−−−−−−−−−−−−−−−−−−−−−−−−−−−−−−−−−−−−−−−−−−−−−−−−−−−−−−−−−−−−−−−−−−−−−−−−−−−−−−−−−−−−−−−−−−−−−−−−−−−−−−−−−−−−−−−−−−−−−−−−−−−−−−−−−−−−−−−−−−
819,437,812.32 987,484,828.52 1,320,441,133.22EUR
Net asset value per share
Class C 102.52 94.59 112.43EURClass C-CHF 100.50 92.87 110.72CHFClass C-GBP 102.57 94.20 110.87GBPClass C-USD 95.73 87.12 100.70USDClass D 124.82 115.68 139.24EURClass J - - 148.53EURClass P 124.44 114.95 137.33EURClass P-CHF 106.48 98.51 117.92CHFClass P-USD 136.62 124.41 144.53USDClass W 107.14 98.87 117.58EURClass W-GBP 102.48 94.14 110.84GBPClass W-USD 106.32 96.78 111.90USDClass X 125.83 114.40 135.92EURClass X-Dist 93.73 85.23 101.95EURClass X-USD 94.65 84.57 -USDClass Y 128.31 116.90 139.46EURClass Z - 125.77 147.27EUR−−−−−−−−−−−−−−−−−−−−−−−−−−−−−−−−−−−−−−−−−−−−−−−−−−−−−−−−−−−−−−−−−−−−−−−−−−−−−−−−−−−−−−−−−−−−−−−−−−−−−−−−−−−−−−−−−−−−−−−−−−−−−−−−−−−−−−−−−−−−−−−−−−−−−−−−−−−−−−−−−−−−−−−−−−−−−−−−−−−−−−−−−−−−−−−−−−−−−−−−−−−−−−−−−−−−−−−−−−−−−−−−−−−−−−−−−−−−−−−−−−−−−−−−−−−−−−−−−−−−−−−−−−−−−−−−−−−−−−−−−−−−−−−−−−−−−−−−−−−−−−−−−−−−−−−−−−−−−−−−−−−−−−−−−−−−−−−−−−−−−−−−−−−−−−−−−−−−−−−−−−−−−−−−−−−−−−−−−−−−−−−−−−−−−−−−−−−−−−−−−−−−−−−−−−−−−−−−−−−−−−−−−−−−−−−−−−−−−−−−−−−−−−−−−−−−−−−−−−−−−−−−−−−−−−−−−−−−−−−−−−−−−−−−−−−−−−−−−−−−−−−
Number of shares
Class C 1,292,845.321 1,519,275.543 1,622,936.278Class C-CHF 4,075.000 4,520.000 5,820.000Class C-GBP 10,300.000 12,930.000 12,930.000Class C-USD 35,959.610 60,370.830 19,206.220Class D 269,136.356 339,854.046 459,333.207Class J - - 15,685.119Class P 3,234,425.488 4,250,522.342 5,053,719.662Class P-CHF 30,010.288 42,592.367 49,520.317Class P-USD 399,500.390 717,017.433 1,285,524.282Class W 23,046.239 24,679.918 44,438.917Class W-GBP 12,100.000 12,100.000 3,100.000Class W-USD 10,313.183 10,313.183 21,993.476Class X 623,779.442 964,103.550 961,433.634Class X-Dist 587,787.662 673,359.021 100,000.000Class X-USD 81,141.175 33,015.748 -Class Y 391,616.702 407,029.271 412,495.641Class Z - 44,671.516 53,825.407−−−−−−−−−−−−−−−−−−−−−−−−−−−−−−−−−−−−−−−−−−−−−−−−−−−−−−−−−−−−−−−−−−−−−−−−−−−−−−−−−−−−−−−−−−−−−−−−−−−−−−−−−−−−−−−−−−−−−−−−−−−−−−−−−−−−−−−−−−−−−−−−−−−−−−−−−−−−−−−−−−−−−−−−−−−−−−−−−−−−−−−−−−−−−−−−−−−−−−−−−−−−−−−−−−−−−−−−−−−−−−−−−−−−−−−−−−−−−−−−−−−−−−−−−−−−−−−−−−−−−−−−−−−−−−−−−−−−−−−−−−−−−−−−−−−−−−−−−−−−−−−−−−−−−−−−−−−−−−−−−−−−−−−−−−−−−−−−−−−−−−−−−−−−−−−−−−−−−−−−−−−−−−−−−−−−−−−−−−−−−−−−−−−−−−−−−−−−−−−−−−−−−−−−−−−−−−−−−−−−−−−−−−−−−−−−−−−−−−−−−−−−−−−−−−−−−−−−−−−−−−−−−−−−−−−−−−−−−−−−−−−−−−−−−−−−−−−−−−−−−−−
KAIROS INTERNATIONAL SICAV - RISORGIMENTO
Net Asset Value−−−−−−−−−−−−−−−−−−−−−−−−−−−−−−−−−−−−−−−−−−−−−−−−−−−−−−−−−−−−−−−−−−−−−−−−−−−−−−−−−−−−−−−−−−−−−−−−−−−−−−−−−−−−−−−−−−−−−−−−−−−−−−−−−−−−−−−−−−−−−−−−−−−−−−−−−−−−−−−−−−−−−−−−−−−−−−−−−−−−−−−−−−−−−−−−−−−−−−−−−−−−−−−−−−−−−−−−−−−−−−−−−−−−−−−−−−−−−−−−−−−−−−−−−−−−−−−−−−−−−−−−−−−−−−−−−−−−−−−−−−−−−−−−−−−−−−−−−−−−−−−−−−−−−−−−−−−−−−−−−−−−−−−−−−−−−−−−−−−−−−−−−−−−−−−−−−−−−−−−−−−−−−−−−−−−−−−−−−−−−−−−−−−−−−−−−−−−−−−−−−−−−−−−−−−−−−−−−−−−−−−−−−−−−−−−−−−−−−−−−−−−−−−−−−−−−−−−−−−−−−−−−−−−−−−−−−−−−−−−−−−−−−−−−−−−−−−−−−−−−−−
200,426,601.69 276,164,275.56 478,550,486.80EUR
December 31, 2017June 30, 2019 December 31, 2018
KAIROS INTERNATIONAL SICAV
12
The accompanying notes are an integral part of these financial statements.
Statistics
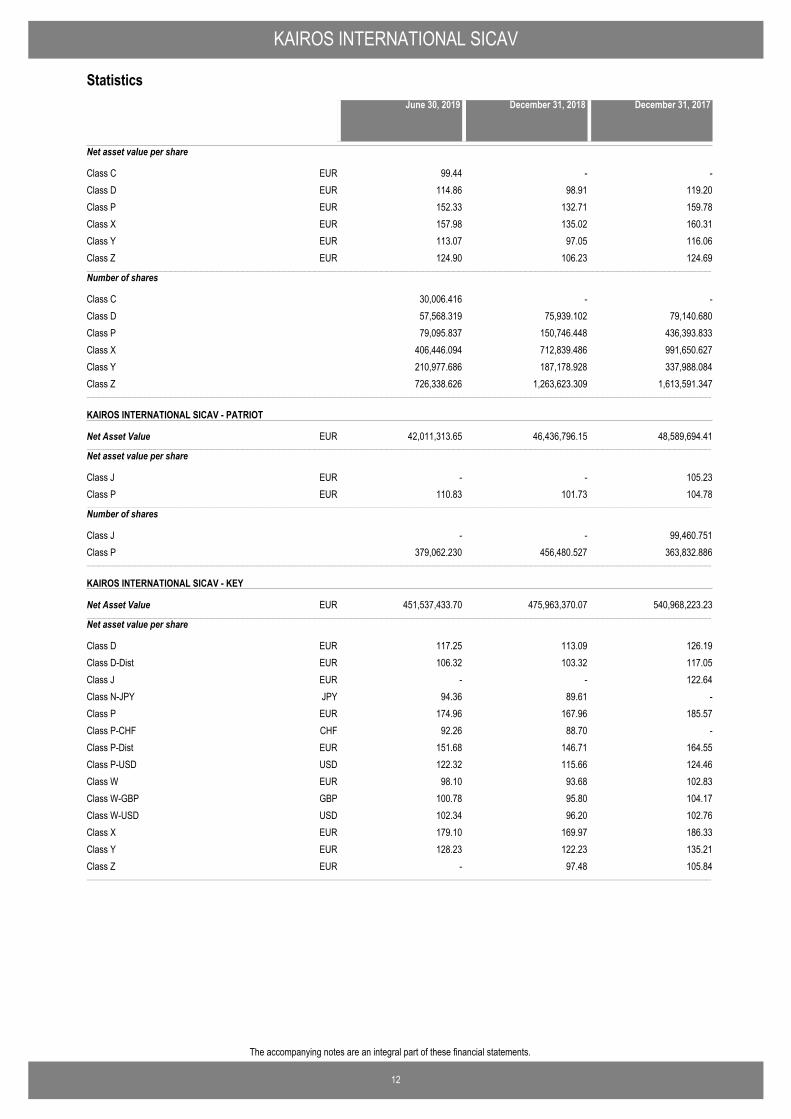
Net asset value per share
Class C 99.44 - -EURClass D 114.86 98.91 119.20EURClass P 152.33 132.71 159.78EURClass X 157.98 135.02 160.31EURClass Y 113.07 97.05 116.06EURClass Z 124.90 106.23 124.69EUR−−−−−−−−−−−−−−−−−−−−−−−−−−−−−−−−−−−−−−−−−−−−−−−−−−−−−−−−−−−−−−−−−−−−−−−−−−−−−−−−−−−−−−−−−−−−−−−−−−−−−−−−−−−−−−−−−−−−−−−−−−−−−−−−−−−−−−−−−−−−−−−−−−−−−−−−−−−−−−−−−−−−−−−−−−−−−−−−−−−−−−−−−−−−−−−−−−−−−−−−−−−−−−−−−−−−−−−−−−−−−−−−−−−−−−−−−−−−−−−−−−−−−−−−−−−−−−−−−−−−−−−−−−−−−−−−−−−−−−−−−−−−−−−−−−−−−−−−−−−−−−−−−−−−−−−−−−−−−−−−−−−−−−−−−−−−−−−−−−−−−−−−−−−−−−−−−−−−−−−−−−−−−−−−−−−−−−−−−−−−−−−−−−−−−−−−−−−−−−−−−−−−−−−−−−−−−−−−−−−−−−−−−−−−−−−−−−−−−−−−−−−−−−−−−−−−−−−−−−−−−−−−−−−−−−−−−−−−−−−−−−−−−−−−−−−−−−−−−−−−−−−
Number of shares
Class C 30,006.416 - -Class D 57,568.319 75,939.102 79,140.680Class P 79,095.837 150,746.448 436,393.833Class X 406,446.094 712,839.486 991,650.627Class Y 210,977.686 187,178.928 337,988.084Class Z 726,338.626 1,263,623.309 1,613,591.347−−−−−−−−−−−−−−−−−−−−−−−−−−−−−−−−−−−−−−−−−−−−−−−−−−−−−−−−−−−−−−−−−−−−−−−−−−−−−−−−−−−−−−−−−−−−−−−−−−−−−−−−−−−−−−−−−−−−−−−−−−−−−−−−−−−−−−−−−−−−−−−−−−−−−−−−−−−−−−−−−−−−−−−−−−−−−−−−−−−−−−−−−−−−−−−−−−−−−−−−−−−−−−−−−−−−−−−−−−−−−−−−−−−−−−−−−−−−−−−−−−−−−−−−−−−−−−−−−−−−−−−−−−−−−−−−−−−−−−−−−−−−−−−−−−−−−−−−−−−−−−−−−−−−−−−−−−−−−−−−−−−−−−−−−−−−−−−−−−−−−−−−−−−−−−−−−−−−−−−−−−−−−−−−−−−−−−−−−−−−−−−−−−−−−−−−−−−−−−−−−−−−−−−−−−−−−−−−−−−−−−−−−−−−−−−−−−−−−−−−−−−−−−−−−−−−−−−−−−−−−−−−−−−−−−−−−−−−−−−−−−−−−−−−−−−−−−−−−−−−−−−
KAIROS INTERNATIONAL SICAV - PATRIOT
Net Asset Value−−−−−−−−−−−−−−−−−−−−−−−−−−−−−−−−−−−−−−−−−−−−−−−−−−−−−−−−−−−−−−−−−−−−−−−−−−−−−−−−−−−−−−−−−−−−−−−−−−−−−−−−−−−−−−−−−−−−−−−−−−−−−−−−−−−−−−−−−−−−−−−−−−−−−−−−−−−−−−−−−−−−−−−−−−−−−−−−−−−−−−−−−−−−−−−−−−−−−−−−−−−−−−−−−−−−−−−−−−−−−−−−−−−−−−−−−−−−−−−−−−−−−−−−−−−−−−−−−−−−−−−−−−−−−−−−−−−−−−−−−−−−−−−−−−−−−−−−−−−−−−−−−−−−−−−−−−−−−−−−−−−−−−−−−−−−−−−−−−−−−−−−−−−−−−−−−−−−−−−−−−−−−−−−−−−−−−−−−−−−−−−−−−−−−−−−−−−−−−−−−−−−−−−−−−−−−−−−−−−−−−−−−−−−−−−−−−−−−−−−−−−−−−−−−−−−−−−−−−−−−−−−−−−−−−−−−−−−−−−−−−−−−−−−−−−−−−−−−−−−−−−
42,011,313.65 46,436,796.15 48,589,694.41EUR
Net asset value per share
Class J - - 105.23EURClass P 110.83 101.73 104.78EUR−−−−−−−−−−−−−−−−−−−−−−−−−−−−−−−−−−−−−−−−−−−−−−−−−−−−−−−−−−−−−−−−−−−−−−−−−−−−−−−−−−−−−−−−−−−−−−−−−−−−−−−−−−−−−−−−−−−−−−−−−−−−−−−−−−−−−−−−−−−−−−−−−−−−−−−−−−−−−−−−−−−−−−−−−−−−−−−−−−−−−−−−−−−−−−−−−−−−−−−−−−−−−−−−−−−−−−−−−−−−−−−−−−−−−−−−−−−−−−−−−−−−−−−−−−−−−−−−−−−−−−−−−−−−−−−−−−−−−−−−−−−−−−−−−−−−−−−−−−−−−−−−−−−−−−−−−−−−−−−−−−−−−−−−−−−−−−−−−−−−−−−−−−−−−−−−−−−−−−−−−−−−−−−−−−−−−−−−−−−−−−−−−−−−−−−−−−−−−−−−−−−−−−−−−−−−−−−−−−−−−−−−−−−−−−−−−−−−−−−−−−−−−−−−−−−−−−−−−−−−−−−−−−−−−−−−−−−−−−−−−−−−−−−−−−−−−−−−−−−−−−−
Number of shares
Class J - - 99,460.751Class P 379,062.230 456,480.527 363,832.886−−−−−−−−−−−−−−−−−−−−−−−−−−−−−−−−−−−−−−−−−−−−−−−−−−−−−−−−−−−−−−−−−−−−−−−−−−−−−−−−−−−−−−−−−−−−−−−−−−−−−−−−−−−−−−−−−−−−−−−−−−−−−−−−−−−−−−−−−−−−−−−−−−−−−−−−−−−−−−−−−−−−−−−−−−−−−−−−−−−−−−−−−−−−−−−−−−−−−−−−−−−−−−−−−−−−−−−−−−−−−−−−−−−−−−−−−−−−−−−−−−−−−−−−−−−−−−−−−−−−−−−−−−−−−−−−−−−−−−−−−−−−−−−−−−−−−−−−−−−−−−−−−−−−−−−−−−−−−−−−−−−−−−−−−−−−−−−−−−−−−−−−−−−−−−−−−−−−−−−−−−−−−−−−−−−−−−−−−−−−−−−−−−−−−−−−−−−−−−−−−−−−−−−−−−−−−−−−−−−−−−−−−−−−−−−−−−−−−−−−−−−−−−−−−−−−−−−−−−−−−−−−−−−−−−−−−−−−−−−−−−−−−−−−−−−−−−−−−−−−−−−
KAIROS INTERNATIONAL SICAV - KEY
Net Asset Value−−−−−−−−−−−−−−−−−−−−−−−−−−−−−−−−−−−−−−−−−−−−−−−−−−−−−−−−−−−−−−−−−−−−−−−−−−−−−−−−−−−−−−−−−−−−−−−−−−−−−−−−−−−−−−−−−−−−−−−−−−−−−−−−−−−−−−−−−−−−−−−−−−−−−−−−−−−−−−−−−−−−−−−−−−−−−−−−−−−−−−−−−−−−−−−−−−−−−−−−−−−−−−−−−−−−−−−−−−−−−−−−−−−−−−−−−−−−−−−−−−−−−−−−−−−−−−−−−−−−−−−−−−−−−−−−−−−−−−−−−−−−−−−−−−−−−−−−−−−−−−−−−−−−−−−−−−−−−−−−−−−−−−−−−−−−−−−−−−−−−−−−−−−−−−−−−−−−−−−−−−−−−−−−−−−−−−−−−−−−−−−−−−−−−−−−−−−−−−−−−−−−−−−−−−−−−−−−−−−−−−−−−−−−−−−−−−−−−−−−−−−−−−−−−−−−−−−−−−−−−−−−−−−−−−−−−−−−−−−−−−−−−−−−−−−−−−−−−−−−−−−
451,537,433.70 475,963,370.07 540,968,223.23EUR
Net asset value per share
Class D 117.25 113.09 126.19EURClass D-Dist 106.32 103.32 117.05EURClass J - - 122.64EURClass N-JPY 94.36 89.61 -JPYClass P 174.96 167.96 185.57EURClass P-CHF 92.26 88.70 -CHFClass P-Dist 151.68 146.71 164.55EURClass P-USD 122.32 115.66 124.46USDClass W 98.10 93.68 102.83EURClass W-GBP 100.78 95.80 104.17GBPClass W-USD 102.34 96.20 102.76USDClass X 179.10 169.97 186.33EURClass Y 128.23 122.23 135.21EURClass Z - 97.48 105.84EUR−−−−−−−−−−−−−−−−−−−−−−−−−−−−−−−−−−−−−−−−−−−−−−−−−−−−−−−−−−−−−−−−−−−−−−−−−−−−−−−−−−−−−−−−−−−−−−−−−−−−−−−−−−−−−−−−−−−−−−−−−−−−−−−−−−−−−−−−−−−−−−−−−−−−−−−−−−−−−−−−−−−−−−−−−−−−−−−−−−−−−−−−−−−−−−−−−−−−−−−−−−−−−−−−−−−−−−−−−−−−−−−−−−−−−−−−−−−−−−−−−−−−−−−−−−−−−−−−−−−−−−−−−−−−−−−−−−−−−−−−−−−−−−−−−−−−−−−−−−−−−−−−−−−−−−−−−−−−−−−−−−−−−−−−−−−−−−−−−−−−−−−−−−−−−−−−−−−−−−−−−−−−−−−−−−−−−−−−−−−−−−−−−−−−−−−−−−−−−−−−−−−−−−−−−−−−−−−−−−−−−−−−−−−−−−−−−−−−−−−−−−−−−−−−−−−−−−−−−−−−−−−−−−−−−−−−−−−−−−−−−−−−−−−−−−−−−−−−−−−−−−−
December 31, 2017June 30, 2019 December 31, 2018
KAIROS INTERNATIONAL SICAV
13
The accompanying notes are an integral part of these financial statements.
Statistics
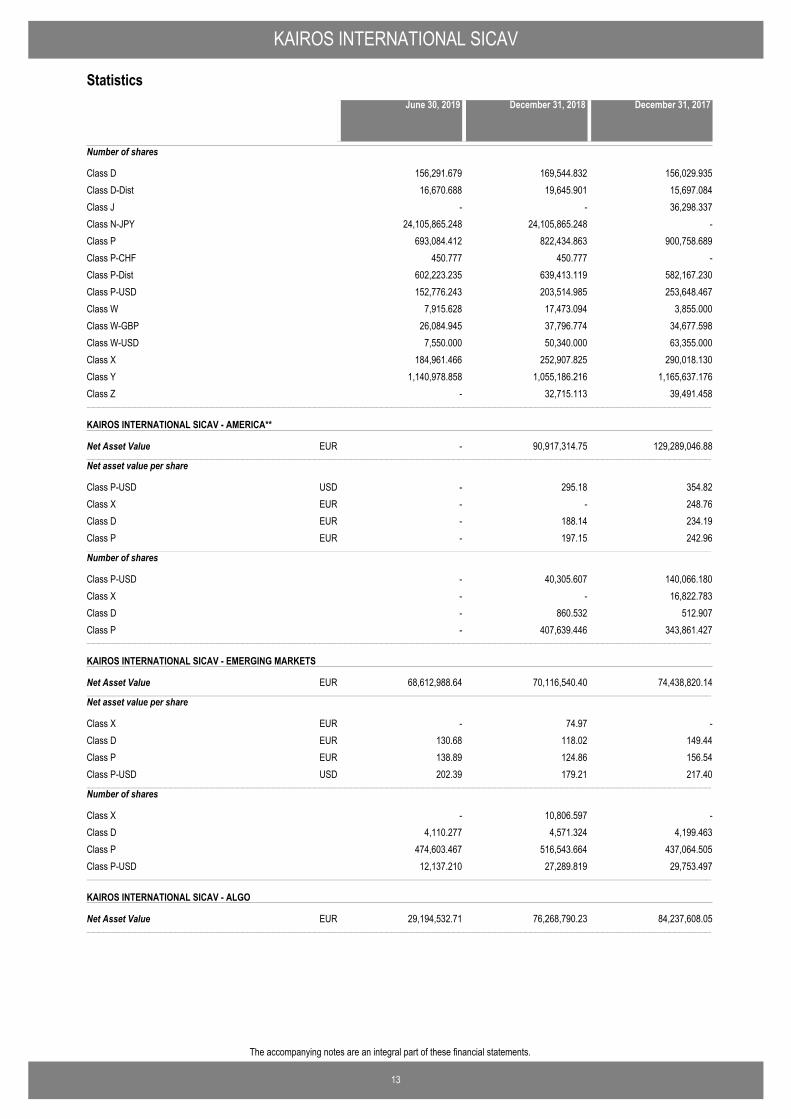
Number of shares
Class D 156,291.679 169,544.832 156,029.935Class D-Dist 16,670.688 19,645.901 15,697.084Class J - - 36,298.337Class N-JPY 24,105,865.248 24,105,865.248 -Class P 693,084.412 822,434.863 900,758.689Class P-CHF 450.777 450.777 -Class P-Dist 602,223.235 639,413.119 582,167.230Class P-USD 152,776.243 203,514.985 253,648.467Class W 7,915.628 17,473.094 3,855.000Class W-GBP 26,084.945 37,796.774 34,677.598Class W-USD 7,550.000 50,340.000 63,355.000Class X 184,961.466 252,907.825 290,018.130Class Y 1,140,978.858 1,055,186.216 1,165,637.176Class Z - 32,715.113 39,491.458−−−−−−−−−−−−−−−−−−−−−−−−−−−−−−−−−−−−−−−−−−−−−−−−−−−−−−−−−−−−−−−−−−−−−−−−−−−−−−−−−−−−−−−−−−−−−−−−−−−−−−−−−−−−−−−−−−−−−−−−−−−−−−−−−−−−−−−−−−−−−−−−−−−−−−−−−−−−−−−−−−−−−−−−−−−−−−−−−−−−−−−−−−−−−−−−−−−−−−−−−−−−−−−−−−−−−−−−−−−−−−−−−−−−−−−−−−−−−−−−−−−−−−−−−−−−−−−−−−−−−−−−−−−−−−−−−−−−−−−−−−−−−−−−−−−−−−−−−−−−−−−−−−−−−−−−−−−−−−−−−−−−−−−−−−−−−−−−−−−−−−−−−−−−−−−−−−−−−−−−−−−−−−−−−−−−−−−−−−−−−−−−−−−−−−−−−−−−−−−−−−−−−−−−−−−−−−−−−−−−−−−−−−−−−−−−−−−−−−−−−−−−−−−−−−−−−−−−−−−−−−−−−−−−−−−−−−−−−−−−−−−−−−−−−−−−−−−−−−−−−−−
KAIROS INTERNATIONAL SICAV - AMERICA**
Net Asset Value−−−−−−−−−−−−−−−−−−−−−−−−−−−−−−−−−−−−−−−−−−−−−−−−−−−−−−−−−−−−−−−−−−−−−−−−−−−−−−−−−−−−−−−−−−−−−−−−−−−−−−−−−−−−−−−−−−−−−−−−−−−−−−−−−−−−−−−−−−−−−−−−−−−−−−−−−−−−−−−−−−−−−−−−−−−−−−−−−−−−−−−−−−−−−−−−−−−−−−−−−−−−−−−−−−−−−−−−−−−−−−−−−−−−−−−−−−−−−−−−−−−−−−−−−−−−−−−−−−−−−−−−−−−−−−−−−−−−−−−−−−−−−−−−−−−−−−−−−−−−−−−−−−−−−−−−−−−−−−−−−−−−−−−−−−−−−−−−−−−−−−−−−−−−−−−−−−−−−−−−−−−−−−−−−−−−−−−−−−−−−−−−−−−−−−−−−−−−−−−−−−−−−−−−−−−−−−−−−−−−−−−−−−−−−−−−−−−−−−−−−−−−−−−−−−−−−−−−−−−−−−−−−−−−−−−−−−−−−−−−−−−−−−−−−−−−−−−−−−−−−−−
- 90,917,314.75 129,289,046.88EUR
Net asset value per share
Class P-USD - 295.18 354.82USDClass X - - 248.76EURClass D - 188.14 234.19EURClass P - 197.15 242.96EUR−−−−−−−−−−−−−−−−−−−−−−−−−−−−−−−−−−−−−−−−−−−−−−−−−−−−−−−−−−−−−−−−−−−−−−−−−−−−−−−−−−−−−−−−−−−−−−−−−−−−−−−−−−−−−−−−−−−−−−−−−−−−−−−−−−−−−−−−−−−−−−−−−−−−−−−−−−−−−−−−−−−−−−−−−−−−−−−−−−−−−−−−−−−−−−−−−−−−−−−−−−−−−−−−−−−−−−−−−−−−−−−−−−−−−−−−−−−−−−−−−−−−−−−−−−−−−−−−−−−−−−−−−−−−−−−−−−−−−−−−−−−−−−−−−−−−−−−−−−−−−−−−−−−−−−−−−−−−−−−−−−−−−−−−−−−−−−−−−−−−−−−−−−−−−−−−−−−−−−−−−−−−−−−−−−−−−−−−−−−−−−−−−−−−−−−−−−−−−−−−−−−−−−−−−−−−−−−−−−−−−−−−−−−−−−−−−−−−−−−−−−−−−−−−−−−−−−−−−−−−−−−−−−−−−−−−−−−−−−−−−−−−−−−−−−−−−−−−−−−−−−−
Number of shares
Class P-USD - 40,305.607 140,066.180Class X - - 16,822.783Class D - 860.532 512.907Class P - 407,639.446 343,861.427−−−−−−−−−−−−−−−−−−−−−−−−−−−−−−−−−−−−−−−−−−−−−−−−−−−−−−−−−−−−−−−−−−−−−−−−−−−−−−−−−−−−−−−−−−−−−−−−−−−−−−−−−−−−−−−−−−−−−−−−−−−−−−−−−−−−−−−−−−−−−−−−−−−−−−−−−−−−−−−−−−−−−−−−−−−−−−−−−−−−−−−−−−−−−−−−−−−−−−−−−−−−−−−−−−−−−−−−−−−−−−−−−−−−−−−−−−−−−−−−−−−−−−−−−−−−−−−−−−−−−−−−−−−−−−−−−−−−−−−−−−−−−−−−−−−−−−−−−−−−−−−−−−−−−−−−−−−−−−−−−−−−−−−−−−−−−−−−−−−−−−−−−−−−−−−−−−−−−−−−−−−−−−−−−−−−−−−−−−−−−−−−−−−−−−−−−−−−−−−−−−−−−−−−−−−−−−−−−−−−−−−−−−−−−−−−−−−−−−−−−−−−−−−−−−−−−−−−−−−−−−−−−−−−−−−−−−−−−−−−−−−−−−−−−−−−−−−−−−−−−−−
KAIROS INTERNATIONAL SICAV - EMERGING MARKETS
Net Asset Value−−−−−−−−−−−−−−−−−−−−−−−−−−−−−−−−−−−−−−−−−−−−−−−−−−−−−−−−−−−−−−−−−−−−−−−−−−−−−−−−−−−−−−−−−−−−−−−−−−−−−−−−−−−−−−−−−−−−−−−−−−−−−−−−−−−−−−−−−−−−−−−−−−−−−−−−−−−−−−−−−−−−−−−−−−−−−−−−−−−−−−−−−−−−−−−−−−−−−−−−−−−−−−−−−−−−−−−−−−−−−−−−−−−−−−−−−−−−−−−−−−−−−−−−−−−−−−−−−−−−−−−−−−−−−−−−−−−−−−−−−−−−−−−−−−−−−−−−−−−−−−−−−−−−−−−−−−−−−−−−−−−−−−−−−−−−−−−−−−−−−−−−−−−−−−−−−−−−−−−−−−−−−−−−−−−−−−−−−−−−−−−−−−−−−−−−−−−−−−−−−−−−−−−−−−−−−−−−−−−−−−−−−−−−−−−−−−−−−−−−−−−−−−−−−−−−−−−−−−−−−−−−−−−−−−−−−−−−−−−−−−−−−−−−−−−−−−−−−−−−−−−
68,612,988.64 70,116,540.40 74,438,820.14EUR
Net asset value per share
Class X - 74.97 -EURClass D 130.68 118.02 149.44EURClass P 138.89 124.86 156.54EURClass P-USD 202.39 179.21 217.40USD−−−−−−−−−−−−−−−−−−−−−−−−−−−−−−−−−−−−−−−−−−−−−−−−−−−−−−−−−−−−−−−−−−−−−−−−−−−−−−−−−−−−−−−−−−−−−−−−−−−−−−−−−−−−−−−−−−−−−−−−−−−−−−−−−−−−−−−−−−−−−−−−−−−−−−−−−−−−−−−−−−−−−−−−−−−−−−−−−−−−−−−−−−−−−−−−−−−−−−−−−−−−−−−−−−−−−−−−−−−−−−−−−−−−−−−−−−−−−−−−−−−−−−−−−−−−−−−−−−−−−−−−−−−−−−−−−−−−−−−−−−−−−−−−−−−−−−−−−−−−−−−−−−−−−−−−−−−−−−−−−−−−−−−−−−−−−−−−−−−−−−−−−−−−−−−−−−−−−−−−−−−−−−−−−−−−−−−−−−−−−−−−−−−−−−−−−−−−−−−−−−−−−−−−−−−−−−−−−−−−−−−−−−−−−−−−−−−−−−−−−−−−−−−−−−−−−−−−−−−−−−−−−−−−−−−−−−−−−−−−−−−−−−−−−−−−−−−−−−−−−−−
Number of shares
Class X - 10,806.597 -Class D 4,110.277 4,571.324 4,199.463Class P 474,603.467 516,543.664 437,064.505Class P-USD 12,137.210 27,289.819 29,753.497−−−−−−−−−−−−−−−−−−−−−−−−−−−−−−−−−−−−−−−−−−−−−−−−−−−−−−−−−−−−−−−−−−−−−−−−−−−−−−−−−−−−−−−−−−−−−−−−−−−−−−−−−−−−−−−−−−−−−−−−−−−−−−−−−−−−−−−−−−−−−−−−−−−−−−−−−−−−−−−−−−−−−−−−−−−−−−−−−−−−−−−−−−−−−−−−−−−−−−−−−−−−−−−−−−−−−−−−−−−−−−−−−−−−−−−−−−−−−−−−−−−−−−−−−−−−−−−−−−−−−−−−−−−−−−−−−−−−−−−−−−−−−−−−−−−−−−−−−−−−−−−−−−−−−−−−−−−−−−−−−−−−−−−−−−−−−−−−−−−−−−−−−−−−−−−−−−−−−−−−−−−−−−−−−−−−−−−−−−−−−−−−−−−−−−−−−−−−−−−−−−−−−−−−−−−−−−−−−−−−−−−−−−−−−−−−−−−−−−−−−−−−−−−−−−−−−−−−−−−−−−−−−−−−−−−−−−−−−−−−−−−−−−−−−−−−−−−−−−−−−−−
KAIROS INTERNATIONAL SICAV - ALGO
Net Asset Value−−−−−−−−−−−−−−−−−−−−−−−−−−−−−−−−−−−−−−−−−−−−−−−−−−−−−−−−−−−−−−−−−−−−−−−−−−−−−−−−−−−−−−−−−−−−−−−−−−−−−−−−−−−−−−−−−−−−−−−−−−−−−−−−−−−−−−−−−−−−−−−−−−−−−−−−−−−−−−−−−−−−−−−−−−−−−−−−−−−−−−−−−−−−−−−−−−−−−−−−−−−−−−−−−−−−−−−−−−−−−−−−−−−−−−−−−−−−−−−−−−−−−−−−−−−−−−−−−−−−−−−−−−−−−−−−−−−−−−−−−−−−−−−−−−−−−−−−−−−−−−−−−−−−−−−−−−−−−−−−−−−−−−−−−−−−−−−−−−−−−−−−−−−−−−−−−−−−−−−−−−−−−−−−−−−−−−−−−−−−−−−−−−−−−−−−−−−−−−−−−−−−−−−−−−−−−−−−−−−−−−−−−−−−−−−−−−−−−−−−−−−−−−−−−−−−−−−−−−−−−−−−−−−−−−−−−−−−−−−−−−−−−−−−−−−−−−−−−−−−−−−
29,194,532.71 76,268,790.23 84,237,608.05EUR
December 31, 2017June 30, 2019 December 31, 2018
KAIROS INTERNATIONAL SICAV
14
The accompanying notes are an integral part of these financial statements.
Statistics
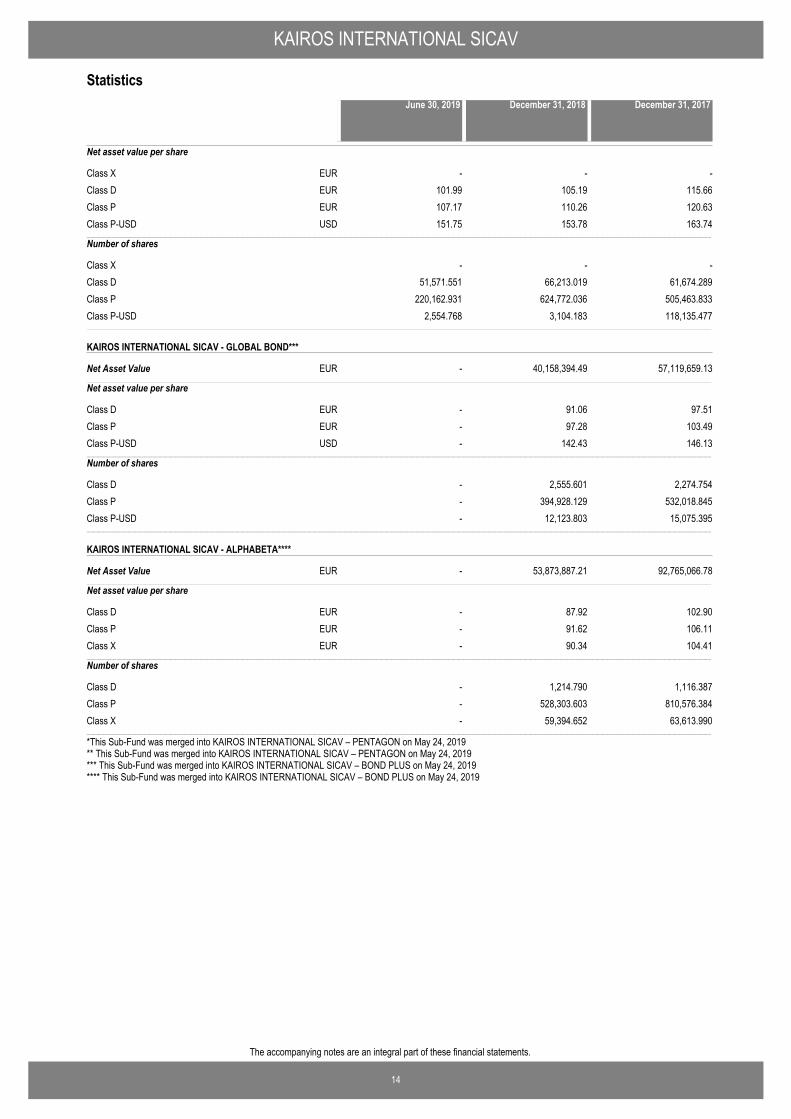
*This Sub-Fund was merged into KAIROS INTERNATIONAL SICAV – PENTAGON on May 24, 2019** This Sub-Fund was merged into KAIROS INTERNATIONAL SICAV – PENTAGON on May 24, 2019*** This Sub-Fund was merged into KAIROS INTERNATIONAL SICAV – BOND PLUS on May 24, 2019**** This Sub-Fund was merged into KAIROS INTERNATIONAL SICAV – BOND PLUS on May 24, 2019
Net asset value per share
Class X - - -EURClass D 101.99 105.19 115.66EURClass P 107.17 110.26 120.63EURClass P-USD 151.75 153.78 163.74USD−−−−−−−−−−−−−−−−−−−−−−−−−−−−−−−−−−−−−−−−−−−−−−−−−−−−−−−−−−−−−−−−−−−−−−−−−−−−−−−−−−−−−−−−−−−−−−−−−−−−−−−−−−−−−−−−−−−−−−−−−−−−−−−−−−−−−−−−−−−−−−−−−−−−−−−−−−−−−−−−−−−−−−−−−−−−−−−−−−−−−−−−−−−−−−−−−−−−−−−−−−−−−−−−−−−−−−−−−−−−−−−−−−−−−−−−−−−−−−−−−−−−−−−−−−−−−−−−−−−−−−−−−−−−−−−−−−−−−−−−−−−−−−−−−−−−−−−−−−−−−−−−−−−−−−−−−−−−−−−−−−−−−−−−−−−−−−−−−−−−−−−−−−−−−−−−−−−−−−−−−−−−−−−−−−−−−−−−−−−−−−−−−−−−−−−−−−−−−−−−−−−−−−−−−−−−−−−−−−−−−−−−−−−−−−−−−−−−−−−−−−−−−−−−−−−−−−−−−−−−−−−−−−−−−−−−−−−−−−−−−−−−−−−−−−−−−−−−−−−−−−−
Number of shares
Class X - - -Class D 51,571.551 66,213.019 61,674.289Class P 220,162.931 624,772.036 505,463.833Class P-USD 2,554.768 3,104.183 118,135.477−−−−−−−−−−−−−−−−−−−−−−−−−−−−−−−−−−−−−−−−−−−−−−−−−−−−−−−−−−−−−−−−−−−−−−−−−−−−−−−−−−−−−−−−−−−−−−−−−−−−−−−−−−−−−−−−−−−−−−−−−−−−−−−−−−−−−−−−−−−−−−−−−−−−−−−−−−−−−−−−−−−−−−−−−−−−−−−−−−−−−−−−−−−−−−−−−−−−−−−−−−−−−−−−−−−−−−−−−−−−−−−−−−−−−−−−−−−−−−−−−−−−−−−−−−−−−−−−−−−−−−−−−−−−−−−−−−−−−−−−−−−−−−−−−−−−−−−−−−−−−−−−−−−−−−−−−−−−−−−−−−−−−−−−−−−−−−−−−−−−−−−−−−−−−−−−−−−−−−−−−−−−−−−−−−−−−−−−−−−−−−−−−−−−−−−−−−−−−−−−−−−−−−−−−−−−−−−−−−−−−−−−−−−−−−−−−−−−−−−−−−−−−−−−−−−−−−−−−−−−−−−−−−−−−−−−−−−−−−−−−−−−−−−−−−−−−−−−−−−−−−−
KAIROS INTERNATIONAL SICAV - GLOBAL BOND***
Net Asset Value−−−−−−−−−−−−−−−−−−−−−−−−−−−−−−−−−−−−−−−−−−−−−−−−−−−−−−−−−−−−−−−−−−−−−−−−−−−−−−−−−−−−−−−−−−−−−−−−−−−−−−−−−−−−−−−−−−−−−−−−−−−−−−−−−−−−−−−−−−−−−−−−−−−−−−−−−−−−−−−−−−−−−−−−−−−−−−−−−−−−−−−−−−−−−−−−−−−−−−−−−−−−−−−−−−−−−−−−−−−−−−−−−−−−−−−−−−−−−−−−−−−−−−−−−−−−−−−−−−−−−−−−−−−−−−−−−−−−−−−−−−−−−−−−−−−−−−−−−−−−−−−−−−−−−−−−−−−−−−−−−−−−−−−−−−−−−−−−−−−−−−−−−−−−−−−−−−−−−−−−−−−−−−−−−−−−−−−−−−−−−−−−−−−−−−−−−−−−−−−−−−−−−−−−−−−−−−−−−−−−−−−−−−−−−−−−−−−−−−−−−−−−−−−−−−−−−−−−−−−−−−−−−−−−−−−−−−−−−−−−−−−−−−−−−−−−−−−−−−−−−−−
- 40,158,394.49 57,119,659.13EUR
Net asset value per share
Class D - 91.06 97.51EURClass P - 97.28 103.49EURClass P-USD - 142.43 146.13USD−−−−−−−−−−−−−−−−−−−−−−−−−−−−−−−−−−−−−−−−−−−−−−−−−−−−−−−−−−−−−−−−−−−−−−−−−−−−−−−−−−−−−−−−−−−−−−−−−−−−−−−−−−−−−−−−−−−−−−−−−−−−−−−−−−−−−−−−−−−−−−−−−−−−−−−−−−−−−−−−−−−−−−−−−−−−−−−−−−−−−−−−−−−−−−−−−−−−−−−−−−−−−−−−−−−−−−−−−−−−−−−−−−−−−−−−−−−−−−−−−−−−−−−−−−−−−−−−−−−−−−−−−−−−−−−−−−−−−−−−−−−−−−−−−−−−−−−−−−−−−−−−−−−−−−−−−−−−−−−−−−−−−−−−−−−−−−−−−−−−−−−−−−−−−−−−−−−−−−−−−−−−−−−−−−−−−−−−−−−−−−−−−−−−−−−−−−−−−−−−−−−−−−−−−−−−−−−−−−−−−−−−−−−−−−−−−−−−−−−−−−−−−−−−−−−−−−−−−−−−−−−−−−−−−−−−−−−−−−−−−−−−−−−−−−−−−−−−−−−−−−−
Number of shares
Class D - 2,555.601 2,274.754Class P - 394,928.129 532,018.845Class P-USD - 12,123.803 15,075.395−−−−−−−−−−−−−−−−−−−−−−−−−−−−−−−−−−−−−−−−−−−−−−−−−−−−−−−−−−−−−−−−−−−−−−−−−−−−−−−−−−−−−−−−−−−−−−−−−−−−−−−−−−−−−−−−−−−−−−−−−−−−−−−−−−−−−−−−−−−−−−−−−−−−−−−−−−−−−−−−−−−−−−−−−−−−−−−−−−−−−−−−−−−−−−−−−−−−−−−−−−−−−−−−−−−−−−−−−−−−−−−−−−−−−−−−−−−−−−−−−−−−−−−−−−−−−−−−−−−−−−−−−−−−−−−−−−−−−−−−−−−−−−−−−−−−−−−−−−−−−−−−−−−−−−−−−−−−−−−−−−−−−−−−−−−−−−−−−−−−−−−−−−−−−−−−−−−−−−−−−−−−−−−−−−−−−−−−−−−−−−−−−−−−−−−−−−−−−−−−−−−−−−−−−−−−−−−−−−−−−−−−−−−−−−−−−−−−−−−−−−−−−−−−−−−−−−−−−−−−−−−−−−−−−−−−−−−−−−−−−−−−−−−−−−−−−−−−−−−−−−−
KAIROS INTERNATIONAL SICAV - ALPHABETA****
Net Asset Value−−−−−−−−−−−−−−−−−−−−−−−−−−−−−−−−−−−−−−−−−−−−−−−−−−−−−−−−−−−−−−−−−−−−−−−−−−−−−−−−−−−−−−−−−−−−−−−−−−−−−−−−−−−−−−−−−−−−−−−−−−−−−−−−−−−−−−−−−−−−−−−−−−−−−−−−−−−−−−−−−−−−−−−−−−−−−−−−−−−−−−−−−−−−−−−−−−−−−−−−−−−−−−−−−−−−−−−−−−−−−−−−−−−−−−−−−−−−−−−−−−−−−−−−−−−−−−−−−−−−−−−−−−−−−−−−−−−−−−−−−−−−−−−−−−−−−−−−−−−−−−−−−−−−−−−−−−−−−−−−−−−−−−−−−−−−−−−−−−−−−−−−−−−−−−−−−−−−−−−−−−−−−−−−−−−−−−−−−−−−−−−−−−−−−−−−−−−−−−−−−−−−−−−−−−−−−−−−−−−−−−−−−−−−−−−−−−−−−−−−−−−−−−−−−−−−−−−−−−−−−−−−−−−−−−−−−−−−−−−−−−−−−−−−−−−−−−−−−−−−−−−
- 53,873,887.21 92,765,066.78EUR
Net asset value per share
Class D - 87.92 102.90EURClass P - 91.62 106.11EURClass X - 90.34 104.41EUR−−−−−−−−−−−−−−−−−−−−−−−−−−−−−−−−−−−−−−−−−−−−−−−−−−−−−−−−−−−−−−−−−−−−−−−−−−−−−−−−−−−−−−−−−−−−−−−−−−−−−−−−−−−−−−−−−−−−−−−−−−−−−−−−−−−−−−−−−−−−−−−−−−−−−−−−−−−−−−−−−−−−−−−−−−−−−−−−−−−−−−−−−−−−−−−−−−−−−−−−−−−−−−−−−−−−−−−−−−−−−−−−−−−−−−−−−−−−−−−−−−−−−−−−−−−−−−−−−−−−−−−−−−−−−−−−−−−−−−−−−−−−−−−−−−−−−−−−−−−−−−−−−−−−−−−−−−−−−−−−−−−−−−−−−−−−−−−−−−−−−−−−−−−−−−−−−−−−−−−−−−−−−−−−−−−−−−−−−−−−−−−−−−−−−−−−−−−−−−−−−−−−−−−−−−−−−−−−−−−−−−−−−−−−−−−−−−−−−−−−−−−−−−−−−−−−−−−−−−−−−−−−−−−−−−−−−−−−−−−−−−−−−−−−−−−−−−−−−−−−−−−
Number of shares
Class D - 1,214.790 1,116.387Class P - 528,303.603 810,576.384Class X - 59,394.652 63,613.990−−−−−−−−−−−−−−−−−−−−−−−−−−−−−−−−−−−−−−−−−−−−−−−−−−−−−−−−−−−−−−−−−−−−−−−−−−−−−−−−−−−−−−−−−−−−−−−−−−−−−−−−−−−−−−−−−−−−−−−−−−−−−−−−−−−−−−−−−−−−−−−−−−−−−−−−−−−−−−−−−−−−−−−−−−−−−−−−−−−−−−−−−−−−−−−−−−−−−−−−−−−−−−−−−−−−−−−−−−−−−−−−−−−−−−−−−−−−−−−−−−−−−−−−−−−−−−−−−−−−−−−−−−−−−−−−−−−−−−−−−−−−−−−−−−−−−−−−−−−−−−−−−−−−−−−−−−−−−−−−−−−−−−−−−−−−−−−−−−−−−−−−−−−−−−−−−−−−−−−−−−−−−−−−−−−−−−−−−−−−−−−−−−−−−−−−−−−−−−−−−−−−−−−−−−−−−−−−−−−−−−−−−−−−−−−−−−−−−−−−−−−−−−−−−−−−−−−−−−−−−−−−−−−−−−−−−−−−−−−−−−−−−−−−−−−−−−−−−−−−−−−
December 31, 2017June 30, 2019 December 31, 2018
15
The accompanying notes are an integral part of these financial statements.
KAIROS INTERNATIONAL SICAV
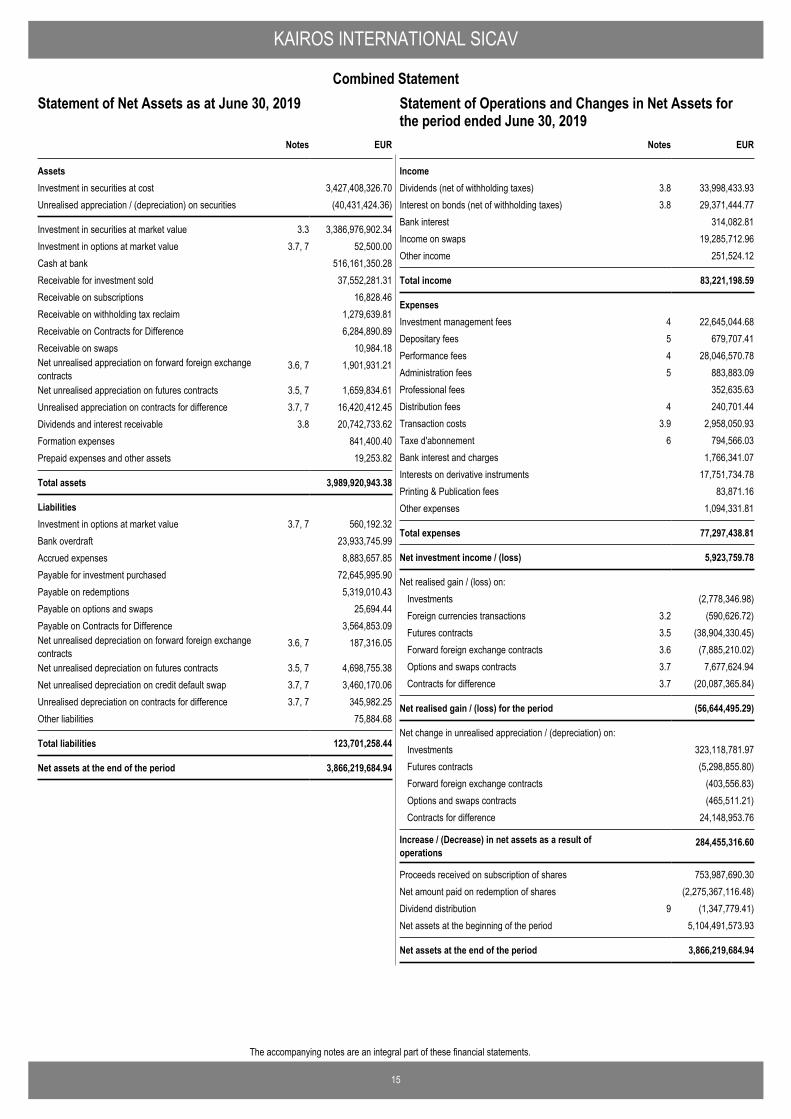
Combined Statement
EUR
AssetsInvestment in securities at cost 3,427,408,326.70Unrealised appreciation / (depreciation) on securities (40,431,424.36)
Investment in securities at market value 3.3 3,386,976,902.34Investment in options at market value 3.7, 7 52,500.00Cash at bank 516,161,350.28Receivable for investment sold 37,552,281.31Receivable on subscriptions 16,828.46Receivable on withholding tax reclaim 1,279,639.81Receivable on Contracts for Difference 6,284,890.89Receivable on swaps 10,984.18Net unrealised appreciation on forward foreign exchangecontracts
3.6, 7 1,901,931.21
Net unrealised appreciation on futures contracts 3.5, 7 1,659,834.61Unrealised appreciation on contracts for difference 3.7, 7 16,420,412.45Dividends and interest receivable 3.8 20,742,733.62Formation expenses 841,400.40Prepaid expenses and other assets 19,253.82
Total assets 3,989,920,943.38
LiabilitiesInvestment in options at market value 3.7, 7 560,192.32Bank overdraft 23,933,745.99Accrued expenses 8,883,657.85Payable for investment purchased 72,645,995.90Payable on redemptions 5,319,010.43Payable on options and swaps 25,694.44Payable on Contracts for Difference 3,564,853.09Net unrealised depreciation on forward foreign exchangecontracts
3.6, 7 187,316.05
Net unrealised depreciation on futures contracts 3.5, 7 4,698,755.38Net unrealised depreciation on credit default swap 3.7, 7 3,460,170.06Unrealised depreciation on contracts for difference 3.7, 7 345,982.25Other liabilities 75,884.68
Total liabilities 123,701,258.44
Net assets at the end of the period 3,866,219,684.94
Notes
Statement of Net Assets as at June 30, 2019
IncomeDividends (net of withholding taxes) 3.8 33,998,433.93Interest on bonds (net of withholding taxes) 3.8 29,371,444.77Bank interest 314,082.81Income on swaps 19,285,712.96Other income 251,524.12
Total income 83,221,198.59
ExpensesInvestment management fees 4 22,645,044.68Depositary fees 5 679,707.41Performance fees 4 28,046,570.78Administration fees 5 883,883.09Professional fees 352,635.63Distribution fees 4 240,701.44Transaction costs 3.9 2,958,050.93Taxe d'abonnement 6 794,566.03Bank interest and charges 1,766,341.07Interests on derivative instruments 17,751,734.78Printing & Publication fees 83,871.16Other expenses 1,094,331.81
Total expenses 77,297,438.81
Net investment income / (loss) 5,923,759.78
Net realised gain / (loss) on: Investments (2,778,346.98)Foreign currencies transactions 3.2 (590,626.72)Futures contracts 3.5 (38,904,330.45)Forward foreign exchange contracts 3.6 (7,885,210.02)Options and swaps contracts 3.7 7,677,624.94Contracts for difference 3.7 (20,087,365.84)
Net realised gain / (loss) for the period (56,644,495.29)
Net change in unrealised appreciation / (depreciation) on: Investments 323,118,781.97Futures contracts (5,298,855.80)Forward foreign exchange contracts (403,556.83)Options and swaps contracts (465,511.21)Contracts for difference 24,148,953.76
Increase / (Decrease) in net assets as a result ofoperations
284,455,316.60
Proceeds received on subscription of shares 753,987,690.30Net amount paid on redemption of shares (2,275,367,116.48)Dividend distribution 9 (1,347,779.41)Net assets at the beginning of the period 5,104,491,573.93
Net assets at the end of the period 3,866,219,684.94
EURNotes
Statement of Operations and Changes in Net Assets forthe period ended June 30, 2019
16
The accompanying notes are an integral part of these financial statements.
KAIROS INTERNATIONAL SICAV
KAIROS INTERNATIONAL SICAV - BOND (in EUR)Statement of Operations and Changes in Net Assets for theperiod ended June 30, 2019
EUR
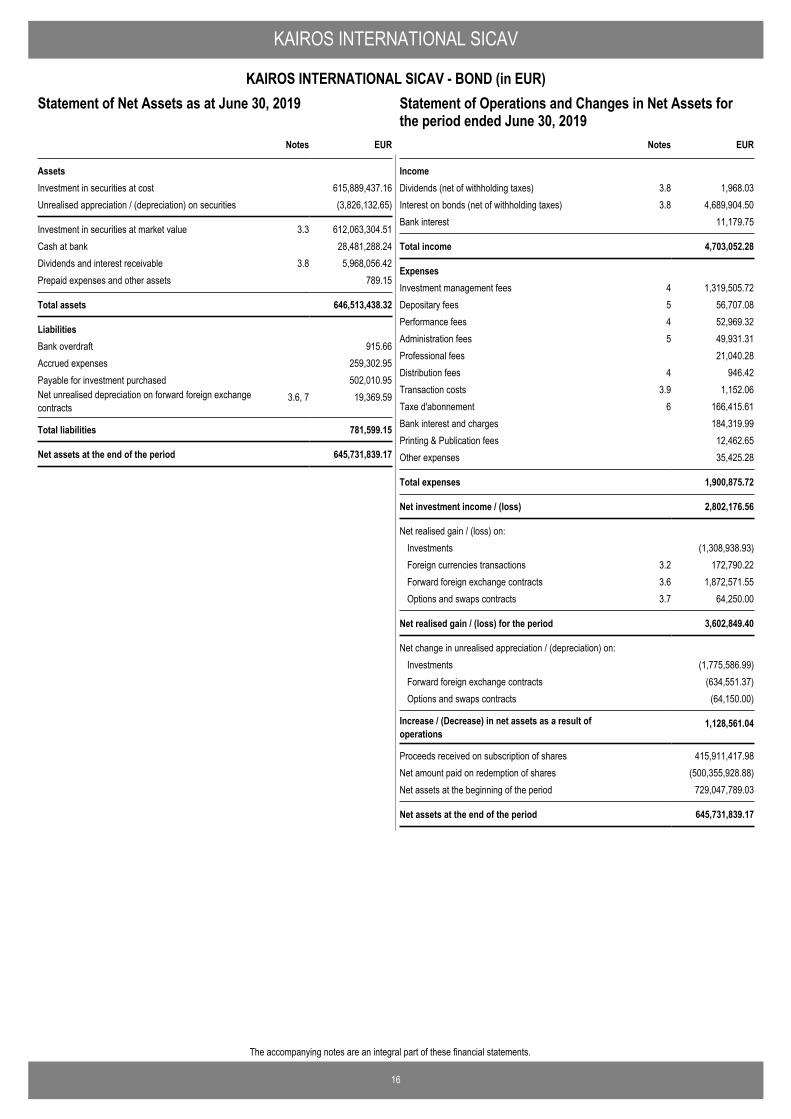
AssetsInvestment in securities at cost 615,889,437.16Unrealised appreciation / (depreciation) on securities (3,826,132.65)
Investment in securities at market value 3.3 612,063,304.51Cash at bank 28,481,288.24Dividends and interest receivable 3.8 5,968,056.42Prepaid expenses and other assets 789.15
Total assets 646,513,438.32
LiabilitiesBank overdraft 915.66Accrued expenses 259,302.95Payable for investment purchased 502,010.95Net unrealised depreciation on forward foreign exchangecontracts
3.6, 7 19,369.59
Total liabilities 781,599.15
Net assets at the end of the period 645,731,839.17
Notes
Statement of Net Assets as at June 30, 2019
IncomeDividends (net of withholding taxes) 3.8 1,968.03Interest on bonds (net of withholding taxes) 3.8 4,689,904.50Bank interest 11,179.75
Total income 4,703,052.28
ExpensesInvestment management fees 4 1,319,505.72Depositary fees 5 56,707.08Performance fees 4 52,969.32Administration fees 5 49,931.31Professional fees 21,040.28Distribution fees 4 946.42Transaction costs 3.9 1,152.06Taxe d'abonnement 6 166,415.61Bank interest and charges 184,319.99Printing & Publication fees 12,462.65Other expenses 35,425.28
Total expenses 1,900,875.72
Net investment income / (loss) 2,802,176.56
Net realised gain / (loss) on: Investments (1,308,938.93)Foreign currencies transactions 3.2 172,790.22Forward foreign exchange contracts 3.6 1,872,571.55Options and swaps contracts 3.7 64,250.00
Net realised gain / (loss) for the period 3,602,849.40
Net change in unrealised appreciation / (depreciation) on: Investments (1,775,586.99)Forward foreign exchange contracts (634,551.37)Options and swaps contracts (64,150.00)
Increase / (Decrease) in net assets as a result ofoperations
1,128,561.04
Proceeds received on subscription of shares 415,911,417.98Net amount paid on redemption of shares (500,355,928.88)Net assets at the beginning of the period 729,047,789.03
Net assets at the end of the period 645,731,839.17
EURNotes
Statement of Operations and Changes in Net Assets forthe period ended June 30, 2019
17
The accompanying notes are an integral part of these financial statements.
KAIROS INTERNATIONAL SICAV
KAIROS INTERNATIONAL SICAV - BOND (in EUR)
Number of shares in issue atthe end of the period
Number of shares in issue atthe beginning of the period
Number of sharessubscribed
Number of sharesredeemed
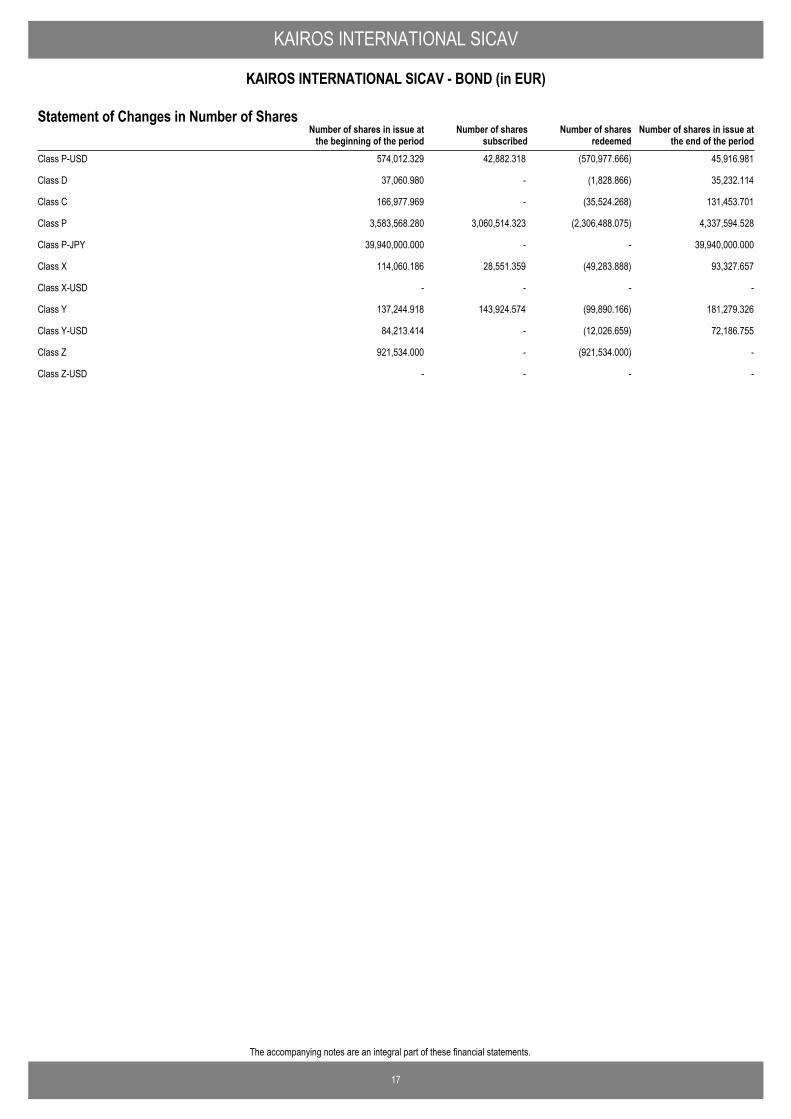
Statement of Changes in Number of Shares
Class P-USD 574,012.329 42,882.318 (570,977.666) 45,916.981
Class D 37,060.980 - (1,828.866) 35,232.114
Class C 166,977.969 - (35,524.268) 131,453.701
Class P 3,583,568.280 3,060,514.323 (2,306,488.075) 4,337,594.528
Class P-JPY 39,940,000.000 - - 39,940,000.000
Class X 114,060.186 28,551.359 (49,283.888) 93,327.657
Class X-USD - - - -
Class Y 137,244.918 143,924.574 (99,890.166) 181,279.326
Class Y-USD 84,213.414 - (12,026.659) 72,186.755
Class Z 921,534.000 - (921,534.000) -
Class Z-USD - - - -
KAIROS INTERNATIONAL SICAV
18
KAIROS INTERNATIONAL SICAV - BOND (in EUR)
The accompanying notes are an integral part of these financial statements.
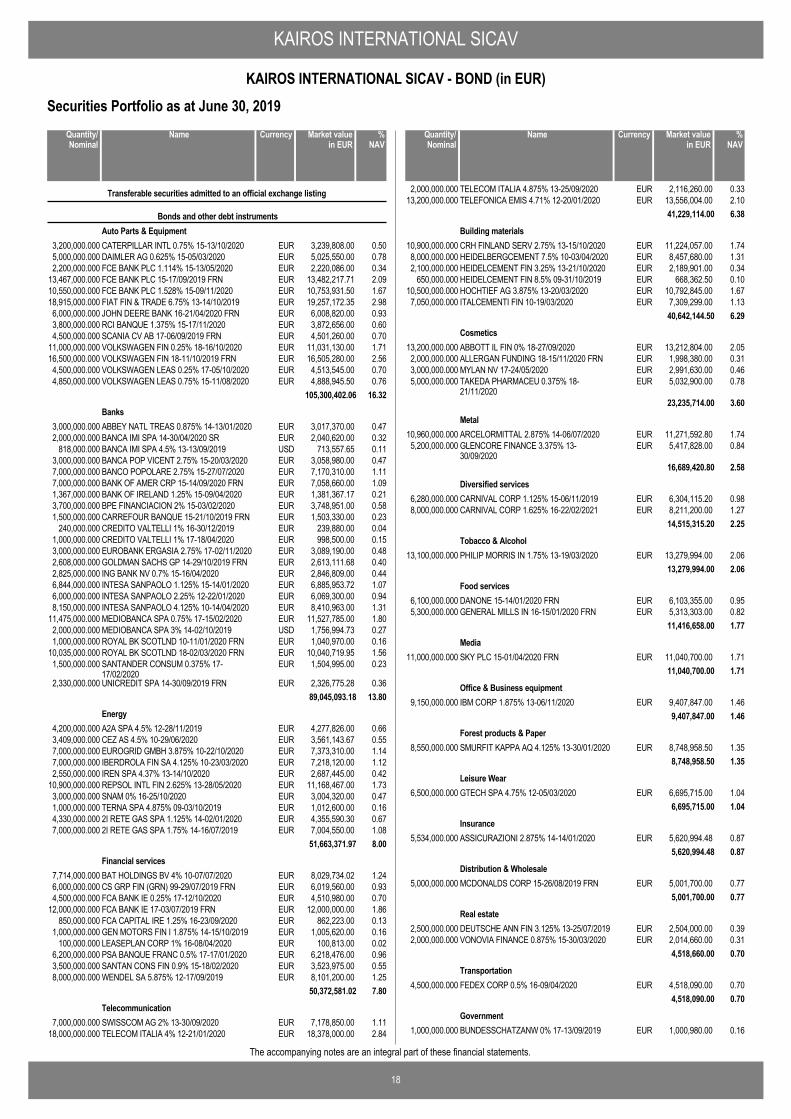
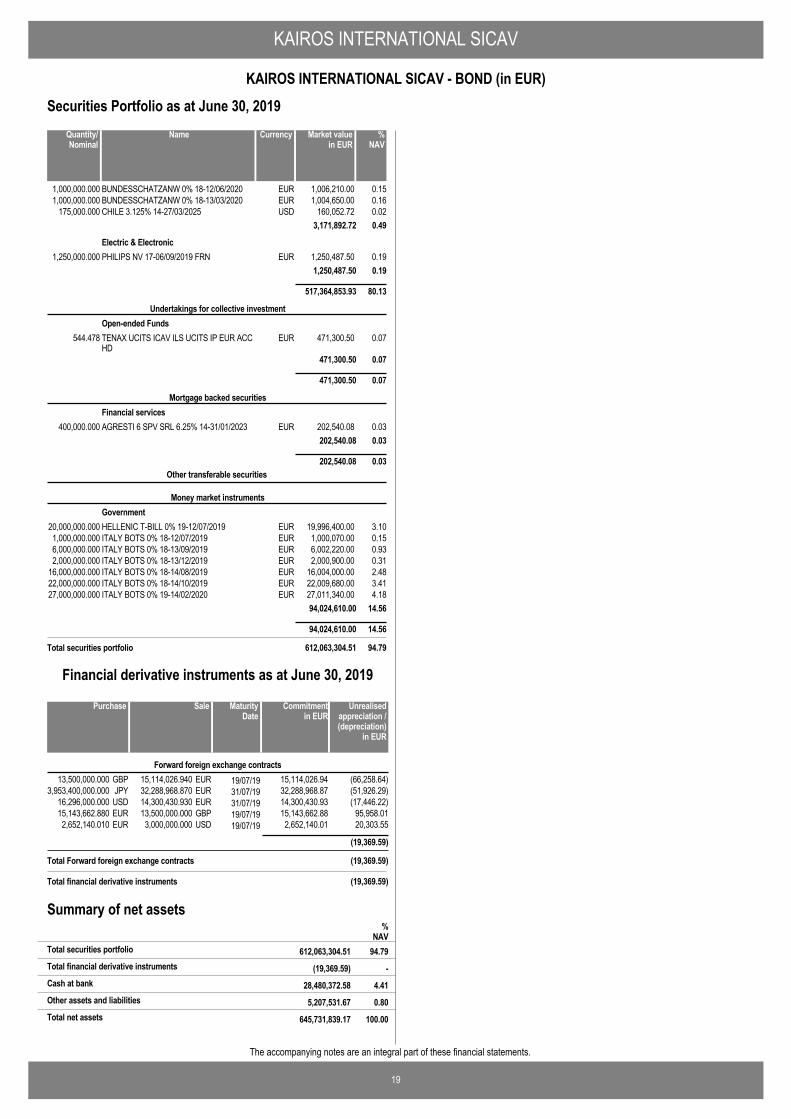
Securities Portfolio as at June 30, 2019
CATERPILLAR INTL 0.75% 15-13/10/2020 EUR 3,239,808.00 0.503,200,000.000
Transferable securities admitted to an official exchange listing
Bonds and other debt instrumentsAuto Parts & Equipment
DAIMLER AG 0.625% 15-05/03/2020 EUR 5,025,550.00 0.785,000,000.000FCE BANK PLC 1.114% 15-13/05/2020 EUR 2,220,086.00 0.342,200,000.000FCE BANK PLC 15-17/09/2019 FRN EUR 13,482,217.71 2.0913,467,000.000FCE BANK PLC 1.528% 15-09/11/2020 EUR 10,753,931.50 1.6710,550,000.000FIAT FIN & TRADE 6.75% 13-14/10/2019 EUR 19,257,172.35 2.9818,915,000.000JOHN DEERE BANK 16-21/04/2020 FRN EUR 6,008,820.00 0.936,000,000.000RCI BANQUE 1.375% 15-17/11/2020 EUR 3,872,656.00 0.603,800,000.000SCANIA CV AB 17-06/09/2019 FRN EUR 4,501,260.00 0.704,500,000.000VOLKSWAGEN FIN 0.25% 18-16/10/2020 EUR 11,031,130.00 1.7111,000,000.000VOLKSWAGEN FIN 18-11/10/2019 FRN EUR 16,505,280.00 2.5616,500,000.000VOLKSWAGEN LEAS 0.25% 17-05/10/2020 EUR 4,513,545.00 0.704,500,000.000VOLKSWAGEN LEAS 0.75% 15-11/08/2020 EUR 4,888,945.50 0.764,850,000.000
105,300,402.06 16.32
ABBEY NATL TREAS 0.875% 14-13/01/2020 EUR 3,017,370.00 0.473,000,000.000Banks
BANCA IMI SPA 14-30/04/2020 SR EUR 2,040,620.00 0.322,000,000.000BANCA IMI SPA 4.5% 13-13/09/2019 USD 713,557.65 0.11818,000.000BANCA POP VICENT 2.75% 15-20/03/2020 EUR 3,058,980.00 0.473,000,000.000BANCO POPOLARE 2.75% 15-27/07/2020 EUR 7,170,310.00 1.117,000,000.000BANK OF AMER CRP 15-14/09/2020 FRN EUR 7,058,660.00 1.097,000,000.000BANK OF IRELAND 1.25% 15-09/04/2020 EUR 1,381,367.17 0.211,367,000.000BPE FINANCIACION 2% 15-03/02/2020 EUR 3,748,951.00 0.583,700,000.000CARREFOUR BANQUE 15-21/10/2019 FRN EUR 1,503,330.00 0.231,500,000.000CREDITO VALTELLI 1% 16-30/12/2019 EUR 239,880.00 0.04240,000.000CREDITO VALTELLI 1% 17-18/04/2020 EUR 998,500.00 0.151,000,000.000EUROBANK ERGASIA 2.75% 17-02/11/2020 EUR 3,089,190.00 0.483,000,000.000GOLDMAN SACHS GP 14-29/10/2019 FRN EUR 2,613,111.68 0.402,608,000.000ING BANK NV 0.7% 15-16/04/2020 EUR 2,846,809.00 0.442,825,000.000INTESA SANPAOLO 1.125% 15-14/01/2020 EUR 6,885,953.72 1.076,844,000.000INTESA SANPAOLO 2.25% 12-22/01/2020 EUR 6,069,300.00 0.946,000,000.000INTESA SANPAOLO 4.125% 10-14/04/2020 EUR 8,410,963.00 1.318,150,000.000MEDIOBANCA SPA 0.75% 17-15/02/2020 EUR 11,527,785.00 1.8011,475,000.000MEDIOBANCA SPA 3% 14-02/10/2019 USD 1,756,994.73 0.272,000,000.000ROYAL BK SCOTLND 10-11/01/2020 FRN EUR 1,040,970.00 0.161,000,000.000ROYAL BK SCOTLND 18-02/03/2020 FRN EUR 10,040,719.95 1.5610,035,000.000SANTANDER CONSUM 0.375% 17-17/02/2020
EUR 1,504,995.00 0.231,500,000.000
UNICREDIT SPA 14-30/09/2019 FRN EUR 2,326,775.28 0.362,330,000.00089,045,093.18 13.80
A2A SPA 4.5% 12-28/11/2019 EUR 4,277,826.00 0.664,200,000.000Energy
CEZ AS 4.5% 10-29/06/2020 EUR 3,561,143.67 0.553,409,000.000EUROGRID GMBH 3.875% 10-22/10/2020 EUR 7,373,310.00 1.147,000,000.000IBERDROLA FIN SA 4.125% 10-23/03/2020 EUR 7,218,120.00 1.127,000,000.000IREN SPA 4.37% 13-14/10/2020 EUR 2,687,445.00 0.422,550,000.000REPSOL INTL FIN 2.625% 13-28/05/2020 EUR 11,168,467.00 1.7310,900,000.000SNAM 0% 16-25/10/2020 EUR 3,004,320.00 0.473,000,000.000TERNA SPA 4.875% 09-03/10/2019 EUR 1,012,600.00 0.161,000,000.0002I RETE GAS SPA 1.125% 14-02/01/2020 EUR 4,355,590.30 0.674,330,000.0002I RETE GAS SPA 1.75% 14-16/07/2019 EUR 7,004,550.00 1.087,000,000.000
51,663,371.97 8.00
BAT HOLDINGS BV 4% 10-07/07/2020 EUR 8,029,734.02 1.247,714,000.000Financial services
CS GRP FIN (GRN) 99-29/07/2019 FRN EUR 6,019,560.00 0.936,000,000.000FCA BANK IE 0.25% 17-12/10/2020 EUR 4,510,980.00 0.704,500,000.000FCA BANK IE 17-03/07/2019 FRN EUR 12,000,000.00 1.8612,000,000.000FCA CAPITAL IRE 1.25% 16-23/09/2020 EUR 862,223.00 0.13850,000.000GEN MOTORS FIN I 1.875% 14-15/10/2019 EUR 1,005,620.00 0.161,000,000.000LEASEPLAN CORP 1% 16-08/04/2020 EUR 100,813.00 0.02100,000.000PSA BANQUE FRANC 0.5% 17-17/01/2020 EUR 6,218,476.00 0.966,200,000.000SANTAN CONS FIN 0.9% 15-18/02/2020 EUR 3,523,975.00 0.553,500,000.000WENDEL SA 5.875% 12-17/09/2019 EUR 8,101,200.00 1.258,000,000.000
50,372,581.02 7.80
SWISSCOM AG 2% 13-30/09/2020 EUR 7,178,850.00 1.117,000,000.000Telecommunication
TELECOM ITALIA 4% 12-21/01/2020 EUR 18,378,000.00 2.8418,000,000.000
NameQuantity/Nominal
Market valuein EUR
Currency %NAV
TELECOM ITALIA 4.875% 13-25/09/2020 EUR 2,116,260.00 0.332,000,000.000TELEFONICA EMIS 4.71% 12-20/01/2020 EUR 13,556,004.00 2.1013,200,000.000
41,229,114.00 6.38
CRH FINLAND SERV 2.75% 13-15/10/2020 EUR 11,224,057.00 1.7410,900,000.000Building materials
HEIDELBERGCEMENT 7.5% 10-03/04/2020 EUR 8,457,680.00 1.318,000,000.000HEIDELCEMENT FIN 3.25% 13-21/10/2020 EUR 2,189,901.00 0.342,100,000.000HEIDELCEMENT FIN 8.5% 09-31/10/2019 EUR 668,362.50 0.10650,000.000HOCHTIEF AG 3.875% 13-20/03/2020 EUR 10,792,845.00 1.6710,500,000.000ITALCEMENTI FIN 10-19/03/2020 EUR 7,309,299.00 1.137,050,000.000
40,642,144.50 6.29
ABBOTT IL FIN 0% 18-27/09/2020 EUR 13,212,804.00 2.0513,200,000.000Cosmetics
ALLERGAN FUNDING 18-15/11/2020 FRN EUR 1,998,380.00 0.312,000,000.000MYLAN NV 17-24/05/2020 EUR 2,991,630.00 0.463,000,000.000TAKEDA PHARMACEU 0.375% 18-21/11/2020
EUR 5,032,900.00 0.785,000,000.000
23,235,714.00 3.60
ARCELORMITTAL 2.875% 14-06/07/2020 EUR 11,271,592.80 1.7410,960,000.000Metal
GLENCORE FINANCE 3.375% 13-30/09/2020
EUR 5,417,828.00 0.845,200,000.000
16,689,420.80 2.58
CARNIVAL CORP 1.125% 15-06/11/2019 EUR 6,304,115.20 0.986,280,000.000Diversified services
CARNIVAL CORP 1.625% 16-22/02/2021 EUR 8,211,200.00 1.278,000,000.00014,515,315.20 2.25
PHILIP MORRIS IN 1.75% 13-19/03/2020 EUR 13,279,994.00 2.0613,100,000.000Tobacco & Alcohol
13,279,994.00 2.06
DANONE 15-14/01/2020 FRN EUR 6,103,355.00 0.956,100,000.000Food services
GENERAL MILLS IN 16-15/01/2020 FRN EUR 5,313,303.00 0.825,300,000.00011,416,658.00 1.77
SKY PLC 15-01/04/2020 FRN EUR 11,040,700.00 1.7111,000,000.000Media
11,040,700.00 1.71
IBM CORP 1.875% 13-06/11/2020 EUR 9,407,847.00 1.469,150,000.000Office & Business equipment
9,407,847.00 1.46
SMURFIT KAPPA AQ 4.125% 13-30/01/2020 EUR 8,748,958.50 1.358,550,000.000Forest products & Paper
8,748,958.50 1.35
GTECH SPA 4.75% 12-05/03/2020 EUR 6,695,715.00 1.046,500,000.000Leisure Wear
6,695,715.00 1.04
ASSICURAZIONI 2.875% 14-14/01/2020 EUR 5,620,994.48 0.875,534,000.000Insurance
5,620,994.48 0.87
MCDONALDS CORP 15-26/08/2019 FRN EUR 5,001,700.00 0.775,000,000.000Distribution & Wholesale
5,001,700.00 0.77
DEUTSCHE ANN FIN 3.125% 13-25/07/2019 EUR 2,504,000.00 0.392,500,000.000Real estate
VONOVIA FINANCE 0.875% 15-30/03/2020 EUR 2,014,660.00 0.312,000,000.0004,518,660.00 0.70
FEDEX CORP 0.5% 16-09/04/2020 EUR 4,518,090.00 0.704,500,000.000Transportation
4,518,090.00 0.70
BUNDESSCHATZANW 0% 17-13/09/2019 EUR 1,000,980.00 0.161,000,000.000Government
NameQuantity/Nominal
Market valuein EUR
Currency %NAV
KAIROS INTERNATIONAL SICAV
19
KAIROS INTERNATIONAL SICAV - BOND (in EUR)
The accompanying notes are an integral part of these financial statements.
Securities Portfolio as at June 30, 2019
BUNDESSCHATZANW 0% 18-12/06/2020 EUR 1,006,210.00 0.151,000,000.000BUNDESSCHATZANW 0% 18-13/03/2020 EUR 1,004,650.00 0.161,000,000.000CHILE 3.125% 14-27/03/2025 USD 160,052.72 0.02175,000.000
3,171,892.72 0.49
PHILIPS NV 17-06/09/2019 FRN EUR 1,250,487.50 0.191,250,000.000Electric & Electronic
1,250,487.50 0.19
517,364,853.93 80.13
TENAX UCITS ICAV ILS UCITS IP EUR ACCHD
EUR 471,300.50 0.07544.478
Undertakings for collective investmentOpen-ended Funds
471,300.50 0.07
471,300.50 0.07
AGRESTI 6 SPV SRL 6.25% 14-31/01/2023 EUR 202,540.08 0.03400,000.000
Mortgage backed securitiesFinancial services
202,540.08 0.03
202,540.08 0.03
HELLENIC T-BILL 0% 19-12/07/2019 EUR 19,996,400.00 3.1020,000,000.000
Other transferable securities
Money market instrumentsGovernment
ITALY BOTS 0% 18-12/07/2019 EUR 1,000,070.00 0.151,000,000.000ITALY BOTS 0% 18-13/09/2019 EUR 6,002,220.00 0.936,000,000.000ITALY BOTS 0% 18-13/12/2019 EUR 2,000,900.00 0.312,000,000.000ITALY BOTS 0% 18-14/08/2019 EUR 16,004,000.00 2.4816,000,000.000ITALY BOTS 0% 18-14/10/2019 EUR 22,009,680.00 3.4122,000,000.000ITALY BOTS 0% 19-14/02/2020 EUR 27,011,340.00 4.1827,000,000.000
94,024,610.00 14.56
94,024,610.00 14.56
Total securities portfolio 612,063,304.51 94.79
NameQuantity/Nominal
Market valuein EUR
Currency %NAV
15,114,026.940 19/07/1913,500,000.000 (66,258.64)EURGBP 15,114,026.94Forward foreign exchange contracts
32,288,968.870 31/07/193,953,400,000.000 (51,926.29)EURJPY 32,288,968.8714,300,430.930 31/07/1916,296,000.000 (17,446.22)EURUSD 14,300,430.9313,500,000.000 19/07/1915,143,662.880 95,958.01GBPEUR 15,143,662.883,000,000.000 19/07/192,652,140.010 20,303.55USDEUR 2,652,140.01
(19,369.59)
Total Forward foreign exchange contracts (19,369.59)
SalePurchase Unrealisedappreciation /(depreciation)
in EUR
MaturityDate
Commitmentin EUR
Financial derivative instruments as at June 30, 2019
Total financial derivative instruments (19,369.59)
Summary of net assets
(19,369.59) -Total financial derivative instruments
%NAV
612,063,304.51 94.79Total securities portfolio
28,480,372.58 4.41Cash at bank
5,207,531.67 0.80Other assets and liabilities
645,731,839.17 100.00Total net assets
KAIROS INTERNATIONAL SICAV
20
KAIROS INTERNATIONAL SICAV - BOND (in EUR)
The accompanying notes are an integral part of these financial statements.
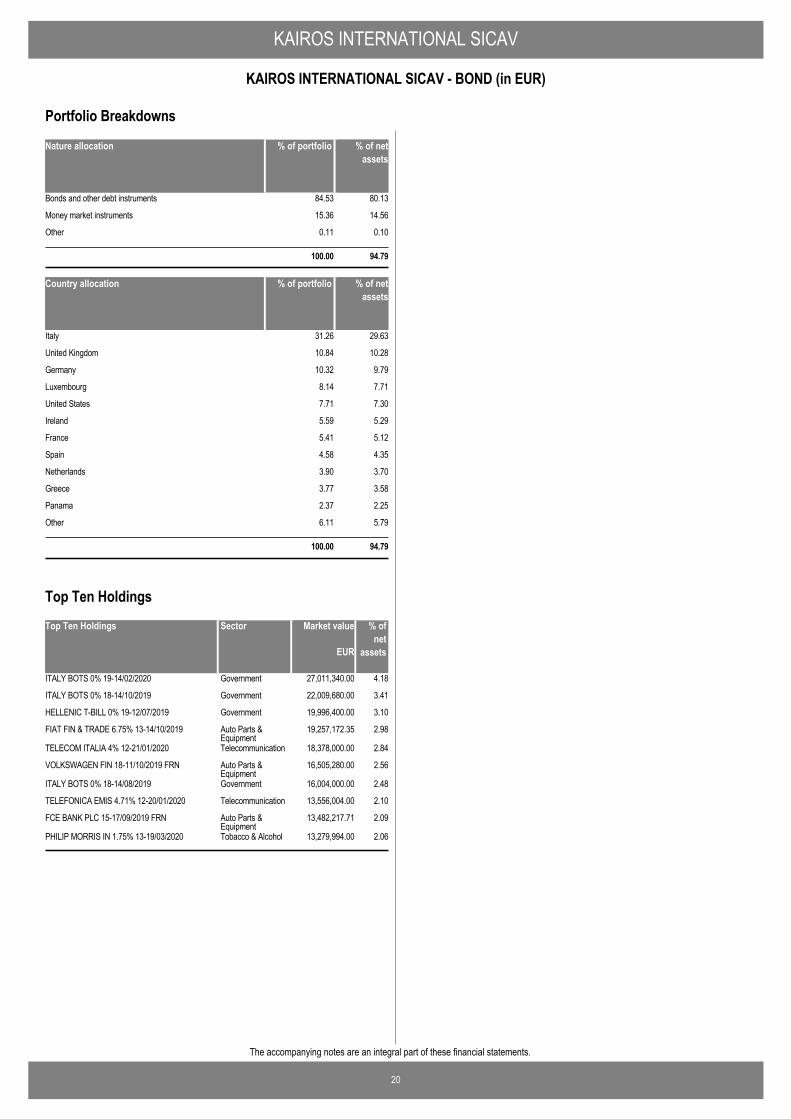
Nature allocation % of portfolio % of netassets
Bonds and other debt instruments 84.53 80.13
Money market instruments 15.36 14.56
Other 0.11 0.10
100.00 94.79
Country allocation % of portfolio % of netassets
Italy 31.26 29.63
United Kingdom 10.84 10.28
Germany 10.32 9.79
Luxembourg 8.14 7.71
United States 7.71 7.30
Ireland 5.59 5.29
France 5.41 5.12
Spain 4.58 4.35
Netherlands 3.90 3.70
Greece 3.77 3.58
Panama 2.37 2.25
Other 6.11 5.79
100.00 94.79
Portfolio Breakdowns
Top Ten Holdings Market value % ofnet
assets
ITALY BOTS 0% 19-14/02/2020 27,011,340.00 4.18Government
ITALY BOTS 0% 18-14/10/2019 22,009,680.00 3.41Government
HELLENIC T-BILL 0% 19-12/07/2019 19,996,400.00 3.10Government
FIAT FIN & TRADE 6.75% 13-14/10/2019 19,257,172.35 2.98Auto Parts &Equipment
TELECOM ITALIA 4% 12-21/01/2020 18,378,000.00 2.84Telecommunication
VOLKSWAGEN FIN 18-11/10/2019 FRN 16,505,280.00 2.56Auto Parts &Equipment
ITALY BOTS 0% 18-14/08/2019 16,004,000.00 2.48Government
TELEFONICA EMIS 4.71% 12-20/01/2020 13,556,004.00 2.10Telecommunication
FCE BANK PLC 15-17/09/2019 FRN 13,482,217.71 2.09Auto Parts &Equipment
PHILIP MORRIS IN 1.75% 13-19/03/2020 13,279,994.00 2.06Tobacco & Alcohol
EUR
Sector
Top Ten Holdings
21
The accompanying notes are an integral part of these financial statements.
KAIROS INTERNATIONAL SICAV
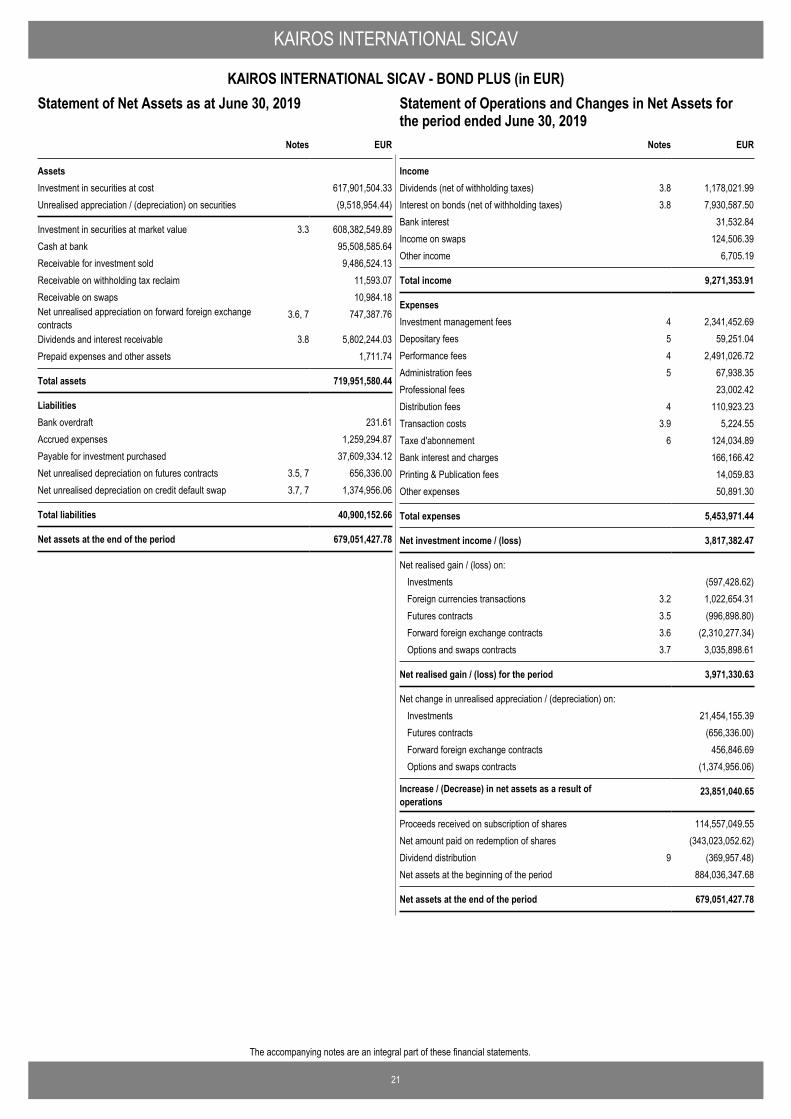
KAIROS INTERNATIONAL SICAV - BOND PLUS (in EUR)Statement of Operations and Changes in Net Assets for theperiod ended June 30, 2019
EUR
AssetsInvestment in securities at cost 617,901,504.33Unrealised appreciation / (depreciation) on securities (9,518,954.44)
Investment in securities at market value 3.3 608,382,549.89Cash at bank 95,508,585.64Receivable for investment sold 9,486,524.13Receivable on withholding tax reclaim 11,593.07Receivable on swaps 10,984.18Net unrealised appreciation on forward foreign exchangecontracts
3.6, 7 747,387.76
Dividends and interest receivable 3.8 5,802,244.03Prepaid expenses and other assets 1,711.74
Total assets 719,951,580.44
LiabilitiesBank overdraft 231.61Accrued expenses 1,259,294.87Payable for investment purchased 37,609,334.12Net unrealised depreciation on futures contracts 3.5, 7 656,336.00Net unrealised depreciation on credit default swap 3.7, 7 1,374,956.06
Total liabilities 40,900,152.66
Net assets at the end of the period 679,051,427.78
Notes
Statement of Net Assets as at June 30, 2019
IncomeDividends (net of withholding taxes) 3.8 1,178,021.99Interest on bonds (net of withholding taxes) 3.8 7,930,587.50Bank interest 31,532.84Income on swaps 124,506.39Other income 6,705.19
Total income 9,271,353.91
ExpensesInvestment management fees 4 2,341,452.69Depositary fees 5 59,251.04Performance fees 4 2,491,026.72Administration fees 5 67,938.35Professional fees 23,002.42Distribution fees 4 110,923.23Transaction costs 3.9 5,224.55Taxe d'abonnement 6 124,034.89Bank interest and charges 166,166.42Printing & Publication fees 14,059.83Other expenses 50,891.30
Total expenses 5,453,971.44
Net investment income / (loss) 3,817,382.47
Net realised gain / (loss) on: Investments (597,428.62)Foreign currencies transactions 3.2 1,022,654.31Futures contracts 3.5 (996,898.80)Forward foreign exchange contracts 3.6 (2,310,277.34)Options and swaps contracts 3.7 3,035,898.61
Net realised gain / (loss) for the period 3,971,330.63
Net change in unrealised appreciation / (depreciation) on: Investments 21,454,155.39Futures contracts (656,336.00)Forward foreign exchange contracts 456,846.69Options and swaps contracts (1,374,956.06)
Increase / (Decrease) in net assets as a result ofoperations
23,851,040.65
Proceeds received on subscription of shares 114,557,049.55Net amount paid on redemption of shares (343,023,052.62)Dividend distribution 9 (369,957.48)Net assets at the beginning of the period 884,036,347.68
Net assets at the end of the period 679,051,427.78
EURNotes
Statement of Operations and Changes in Net Assets forthe period ended June 30, 2019
22
The accompanying notes are an integral part of these financial statements.
KAIROS INTERNATIONAL SICAV
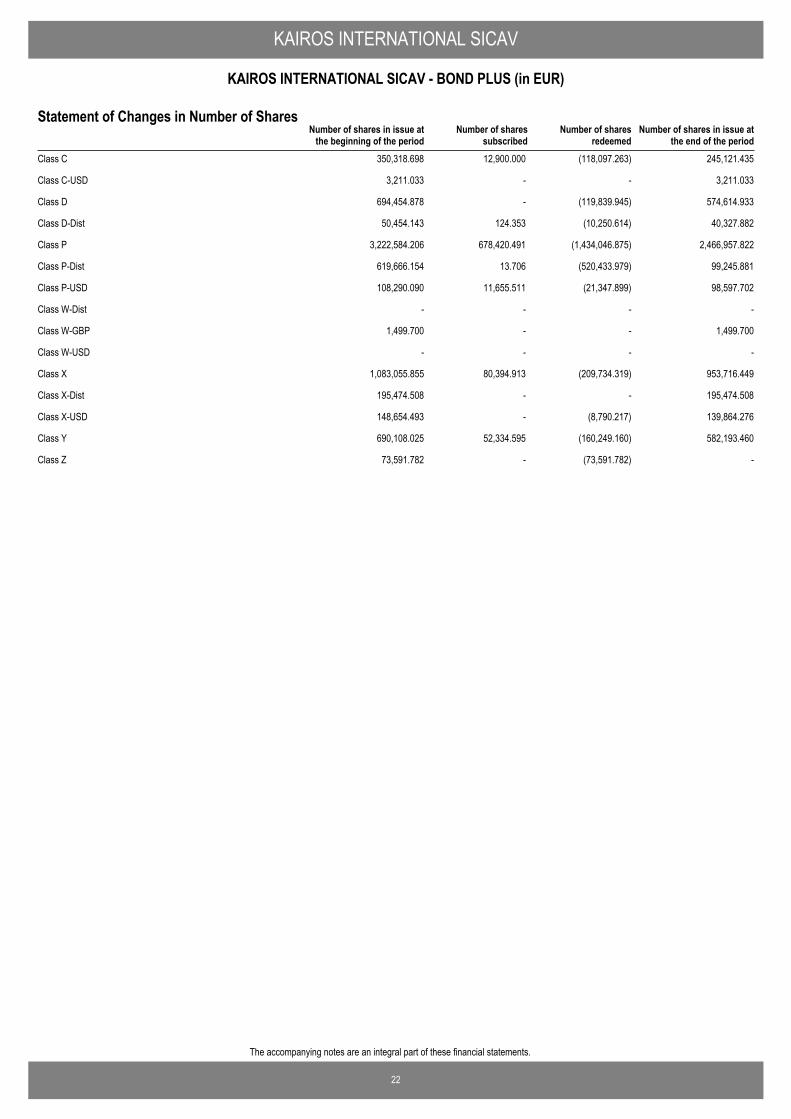
KAIROS INTERNATIONAL SICAV - BOND PLUS (in EUR)
Number of shares in issue atthe end of the period
Number of shares in issue atthe beginning of the period
Number of sharessubscribed
Number of sharesredeemed
Statement of Changes in Number of Shares
Class C 350,318.698 12,900.000 (118,097.263) 245,121.435
Class C-USD 3,211.033 - - 3,211.033
Class D 694,454.878 - (119,839.945) 574,614.933
Class D-Dist 50,454.143 124.353 (10,250.614) 40,327.882
Class P 3,222,584.206 678,420.491 (1,434,046.875) 2,466,957.822
Class P-Dist 619,666.154 13.706 (520,433.979) 99,245.881
Class P-USD 108,290.090 11,655.511 (21,347.899) 98,597.702
Class W-Dist - - - -
Class W-GBP 1,499.700 - - 1,499.700
Class W-USD - - - -
Class X 1,083,055.855 80,394.913 (209,734.319) 953,716.449
Class X-Dist 195,474.508 - - 195,474.508
Class X-USD 148,654.493 - (8,790.217) 139,864.276
Class Y 690,108.025 52,334.595 (160,249.160) 582,193.460
Class Z 73,591.782 - (73,591.782) -
KAIROS INTERNATIONAL SICAV
23
KAIROS INTERNATIONAL SICAV - BOND PLUS (in EUR)
The accompanying notes are an integral part of these financial statements.
Securities Portfolio as at June 30, 2019
AIB GROUP PLC 1.25% 19-28/05/2024 EUR 4,038,440.00 0.594,000,000.000
Transferable securities admitted to an official exchange listing
Bonds and other debt instrumentsBanks
ALPHA BANK SA 2.5% 18-05/02/2023 EUR 6,659,656.14 0.986,333,000.000ASB FINANCE LTD 0.5% 16-17/06/2020 EUR 1,676,245.90 0.251,666,000.000BANCA POP SONDRI 2.375% 19-03/04/2024 EUR 4,440,015.00 0.654,500,000.000BANCO BILBAO VIZ 18-31/12/2049 FRN EUR 4,138,720.00 0.614,000,000.000BANCO BPM SPA 19-31/12/2049 FRN EUR 2,865,577.00 0.422,900,000.000BANCO BPM SPA 2% 19-08/03/2022 EUR 282,733.77 0.04281,000.000BANCO POPOLARE 07-29/06/2049 FRN EUR 5,211,504.00 0.777,200,000.000BANCO SABADELL 17-31/12/2049 EUR 3,987,680.00 0.594,000,000.000BANCO SABADELL 17-31/12/2049 FRN EUR 8,595,224.00 1.278,800,000.000BANCO SANTANDER 17-31/12/2049 FRN EUR 9,045,933.05 1.3310,945,000.000BANK OF AMER CRP 17-07/02/2022 EUR 4,426,752.00 0.654,400,000.000BANK OF AMER CRP 2.5% 13-27/07/2020 EUR 2,879,128.00 0.422,800,000.000BANK OF GEORGIA 19-31/12/2049 FRN USD 1,685,464.11 0.251,857,000.000BANKIA 17-31/12/2049 EUR 6,365,912.00 0.946,200,000.000BANKIA 18-31/12/2049 FRN EUR 4,612,564.00 0.684,400,000.000BGEO GROUP JSC 6% 16-26/07/2023 USD 883,172.23 0.131,000,000.000BNP PARIBAS 19-31/12/2049 FRN USD 7,324,007.03 1.088,000,000.000CAIXABANK 17-31/12/2049 EUR 10,148,240.00 1.509,400,000.000CITIGROUP INC 14-11/11/2019 FRN EUR 1,092,876.52 0.161,091,000.000CITIGROUP INC 18-21/03/2023 FRN EUR 8,008,640.00 1.188,000,000.000CRED AGRICOLE SA 19-31/12/2049 FRN USD 2,772,917.40 0.413,000,000.000CREDIT SUISSE 18-31/12/2049 FRN USD 5,659,402.46 0.836,000,000.000CREDITO VALTELLI 17-12/04/2027 EUR 6,730,020.00 0.996,600,000.000CREDITO VALTELLI 4.7% 14-04/08/2021 EUR 9,190,027.35 1.359,215,000.000DNB NOR BANK ASA 86-31/12/2049 FRN USD 2,571,990.33 0.384,700,000.000EUROBANK ERGASIA 2.75% 17-02/11/2020 EUR 6,435,812.50 0.956,250,000.000GOLDMAN SACHS GP 17-09/09/2022 EUR 3,007,620.00 0.443,000,000.000GOLDMAN SACHS GP 18-16/12/2020 FRN EUR 8,007,920.00 1.188,000,000.000IBERCAJA 18-31/12/2049 FRN EUR 7,153,370.00 1.057,000,000.000ING BANK NV 18-26/11/2020 FRN EUR 2,007,320.00 0.302,000,000.000ING GROEP NV 16-29/12/2049 USD 4,620,913.88 0.685,000,000.000ING GROEP NV 19-31/12/2049 FRN USD 1,521,012.99 0.221,667,000.000INTESA SANPAOLO 17-29/12/2049 EUR 1,125,120.00 0.171,000,000.000IS BANKASI 7.85% 13-10/12/2023 USD 417,926.19 0.06500,000.000ISLANDSBANKI 1.75% 16-07/09/2020 EUR 129,678.43 0.02127,000.000MONTE DEI PASCHI 10-10/11/2020 EUR 897,978.60 0.13900,000.000MONTE DEI PASCHI 18-18/01/2028 FRN EUR 4,484,000.89 0.667,409,000.000MORGAN STANLEY 17-09/11/2021 FRN EUR 1,000,560.00 0.151,000,000.000NATL AUSTRALIABK 2% 13-12/11/2020 EUR 5,243,858.27 0.775,089,000.000NATWEST MARKETS PLC 5.375% 09-30/09/2019
EUR 2,239,879.20 0.332,210,000.000
SANTANDER UK GRP 15-29/12/2049 FRN GBP 592,058.45 0.09500,000.000SANTANDER UK GRP 17-31/12/2049 GBP 3,492,789.02 0.513,000,000.000SOCIETE GENERALE 18-31/12/2049 FRN USD 6,408,752.20 0.947,000,000.000UBS AG 5.125% 14-15/05/2024 USD 93,077.33 0.01100,000.000UBS GROUP FUNDIN 19-31/12/2049 FRN USD 5,587,275.92 0.826,000,000.000UNICREDIT SPA 14-30/09/2019 FRN EUR 2,057,148.96 0.302,060,000.000UNICREDIT SPA 16-29/12/2049 EUR 1,116,960.00 0.161,000,000.000UNICREDIT SPA 17-31/12/2049 EUR 17,893,260.00 2.6518,000,000.000UNIONE DI BANCHE 6% 12-08/10/2019 EUR 1,518,990.00 0.221,500,000.000WELLS FARGO CO 15-02/06/2020 FRN EUR 8,020,400.00 1.188,000,000.000
220,366,525.12 32.44
FCE BANK PLC 0.869% 17-13/09/2021 EUR 2,504,800.00 0.372,500,000.000Auto Parts & Equipment
FCE BANK PLC 15-17/09/2019 FRN EUR 5,205,876.00 0.775,200,000.000FCE BANK PLC 2.759% 14-13/11/2019 GBP 4,479,616.31 0.664,000,000.000FIAT FIN & TRADE 6.75% 13-14/10/2019 EUR 11,911,653.00 1.7611,700,000.000FORD MOTOR CRED 1.514% 19-17/02/2023 EUR 4,024,760.00 0.594,000,000.000GEN MOTORS FIN I 1.168% 16-18/05/2020 EUR 5,048,000.00 0.745,000,000.000VOLKSWAGEN INTFN 18-31/12/2049 FRN EUR 10,285,800.00 1.5110,000,000.000VOLKSWAGEN LEAS 0.25% 17-05/10/2020 EUR 10,030,100.00 1.4810,000,000.000VOLKSWAGEN LEAS 0.25% 18-16/02/2021 EUR 3,648,808.80 0.543,640,000.000VOLKSWAGEN LEAS 0.75% 15-11/08/2020 EUR 5,040,150.00 0.745,000,000.000
62,179,564.11 9.16
ARAB REP EGYPT 4.75% 19-11/04/2025 EUR 1,530,420.00 0.231,500,000.000Government
ARAB REP EGYPT 6.375% 19-11/04/2031 EUR 3,550,365.00 0.523,500,000.000ARAB REP EGYPT 7.6003% 19-01/03/2029 USD 5,555,641.48 0.816,000,000.000
NameQuantity/Nominal
Market valuein EUR
Currency %NAV
ARGENTINA 5% 16-15/01/2027 EUR 730,070.00 0.111,000,000.000ARGENTINA 5.25% 17-15/01/2028 EUR 1,447,120.00 0.212,000,000.000BRAZIL REP OF 4.5% 19-30/05/2029 USD 1,804,007.03 0.272,000,000.000BRAZIL REP OF 4.625% 17-13/01/2028 USD 3,686,783.83 0.544,000,000.000COLOMBIA REP OF 4.5% 18-15/03/2029 USD 479,586.99 0.07500,000.000HELLENIC REP 0% 12-15/10/2042 EUR 3,781,440.00 0.56909,000,000.00
0INDONESIA (REP) 1.45% 19-18/09/2026 EUR 2,554,400.00 0.382,500,000.000INDONESIA (REP) 3.4% 19-18/09/2029 USD 2,647,065.03 0.393,000,000.000ITALY BTPS 2.8% 18-01/12/2028 EUR 4,179,513.00 0.623,900,000.000JORDAN 5.75% 16-31/01/2027 USD 444,507.91 0.07500,000.000LEBANESE REP 6.6% 11-27/11/2026 USD 3,470,210.90 0.515,000,000.000PANAMA 4.3% 13-29/04/2053 USD 241,489.46 0.04250,000.000PROV DE CORDOBA 7.45% 17-01/09/2024 USD 342,759.23 0.05500,000.000REP OF NIGERIA 6.75% 11-28/01/2021 USD 3,662,390.16 0.544,000,000.000REPUBLIC OF ECUA 7.875% 18-23/01/2028 USD 434,657.29 0.06500,000.000ROMANIA 4.375% 13-22/08/2023 USD 350,096.31 0.05376,000.000SERBIA REPUBLIC 1.5% 19-26/06/2029 EUR 499,065.00 0.07500,000.000TAJIKI INT BOND 7.125% 17-14/09/2027 USD 165,989.46 0.02200,000.000UKRAINE GOVT 7.75% 15-01/09/2019 USD 881,282.95 0.131,000,000.000US TREASURY N/B 2.875% 18-15/05/2028 USD 452,636.20 0.07480,000.000
42,891,497.23 6.32
CELLNEX TELECOM 0.5% 19-05/07/2028CV
EUR 793,656.00 0.12800,000.000Building materials
COOPERATIVA MR DFLT 6%17-15/02/2023 EUR 122,040.00 0.022,700,000.000HEIDELBERGCEMENT 7.5% 10-03/04/2020 EUR 5,286,050.00 0.785,000,000.000MEXICO CITY ARPT 4.25% 16-31/10/2026 USD 217,752.47 0.03249,000.000SPIE SA 2.625% 19-18/06/2026 EUR 6,650,150.00 0.986,500,000.000SUPERSTRADA PEDE 17-30/06/2047 FRN EUR 10,450,000.00 1.5311,000,000.000VINCI SA 0.375% 17-16/02/2022 USD 2,021,933.22 0.302,000,000.000
25,541,581.69 3.76
AMERICAN EXPRESS 0.625% 16-22/11/2021
EUR 2,053,835.00 0.302,020,000.000Financial services
BANCA FARMAFACTO 5.875% 17-02/03/2027
EUR 435,077.20 0.06460,000.000
CS GRP FIN (GRN) 99-29/07/2019 FRN EUR 7,031,849.34 1.047,009,000.000FCA CAPITAL IRE 1.25% 16-23/09/2020 EUR 4,057,520.00 0.604,000,000.000JEFFERIES GROUP 2.375% 14-20/05/2020 EUR 510,090.00 0.08500,000.000LEASEPLAN CORP 18-25/01/2021 FRN EUR 5,001,750.00 0.745,000,000.000LEASEPLAN CORP 19-31/12/2049 FRN EUR 1,999,959.00 0.291,900,000.000
21,090,080.54 3.11
ECHO ENERGY PLC 8% 17-15/05/2022 EUR 992,500.00 0.151,000,000.000Energy
GAS NAT FENOSA F 15-29/12/2049 FRN EUR 4,311,068.00 0.634,100,000.000HELLENIC PETRO 4.875% 16-14/10/2021 EUR 330,956.00 0.05310,000.000MOTOR OIL FINANC 3.25% 17-01/04/2022 EUR 2,608,072.00 0.382,567,000.000PETROLEOS MEXICA 18-24/08/2023 FRN EUR 4,769,520.00 0.705,100,000.000SOUND ENERGY PLC 5% 16-21/07/2021 EUR 1,302,792.40 0.191,300,000.000TULLOW OIL PLC 6.25% 14-15/04/2022 USD 6,459,537.79 0.967,300,000.000
20,774,446.19 3.06
AFRICAN DEV BANK 0% 17-09/02/2032 MXN 2,876,446.49 0.42165,000,000.000
Supranational organisation
EURO BK RECON&DV 6% 17-04/05/2020 INR 4,718,381.28 0.69374,900,000.000
EURO BK RECON&DV 6.45% 17-13/12/2022 IDR 1,422,614.07 0.2123,000,000,000.000
EUROPEAN INVT BK 5% 17-24/01/2020 INR 2,090,861.77 0.31166,700,000.000
EUROPEAN INVT BK 6.95% 15-06/02/2020 IDR 1,952,896.32 0.2931,450,000,000.000
EUROPEAN INVT BK 7.5% 17-13/04/2022 BRL 5,709,711.34 0.8423,700,000.000INT BK RECON&DEV 7.45% 18-20/08/2021 IDR 1,892,702.70 0.2830,000,000,000
.00020,663,613.97 3.04
SES 16-29/12/2049 EUR 5,216,134.40 0.774,960,000.000Telecommunication
SES 16-29/12/2049 EUR 2,198,060.00 0.322,000,000.000SWISSCOM AG 2% 13-30/09/2020 EUR 2,461,320.00 0.362,400,000.000TELEFONICA EUROP 19-31/12/2049 FRN EUR 8,670,800.00 1.288,000,000.000
18,546,314.40 2.73
NameQuantity/Nominal
Market valuein EUR
Currency %NAV
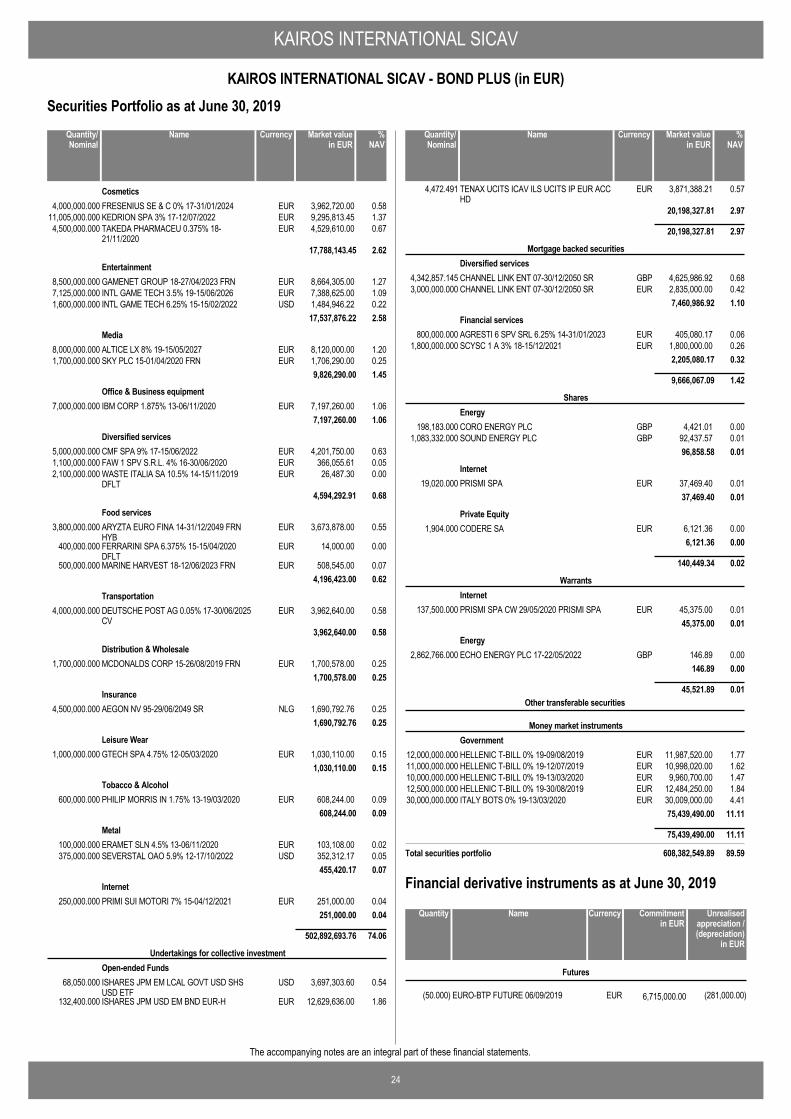
KAIROS INTERNATIONAL SICAV
24
KAIROS INTERNATIONAL SICAV - BOND PLUS (in EUR)
The accompanying notes are an integral part of these financial statements.
Securities Portfolio as at June 30, 2019
FRESENIUS SE & C 0% 17-31/01/2024 EUR 3,962,720.00 0.584,000,000.000Cosmetics
KEDRION SPA 3% 17-12/07/2022 EUR 9,295,813.45 1.3711,005,000.000TAKEDA PHARMACEU 0.375% 18-21/11/2020
EUR 4,529,610.00 0.674,500,000.000
17,788,143.45 2.62
GAMENET GROUP 18-27/04/2023 FRN EUR 8,664,305.00 1.278,500,000.000Entertainment
INTL GAME TECH 3.5% 19-15/06/2026 EUR 7,388,625.00 1.097,125,000.000INTL GAME TECH 6.25% 15-15/02/2022 USD 1,484,946.22 0.221,600,000.000
17,537,876.22 2.58
ALTICE LX 8% 19-15/05/2027 EUR 8,120,000.00 1.208,000,000.000Media
SKY PLC 15-01/04/2020 FRN EUR 1,706,290.00 0.251,700,000.0009,826,290.00 1.45
IBM CORP 1.875% 13-06/11/2020 EUR 7,197,260.00 1.067,000,000.000Office & Business equipment
7,197,260.00 1.06
CMF SPA 9% 17-15/06/2022 EUR 4,201,750.00 0.635,000,000.000Diversified services
FAW 1 SPV S.R.L. 4% 16-30/06/2020 EUR 366,055.61 0.051,100,000.000WASTE ITALIA SA 10.5% 14-15/11/2019DFLT
EUR 26,487.30 0.002,100,000.000
4,594,292.91 0.68
ARYZTA EURO FINA 14-31/12/2049 FRNHYB
EUR 3,673,878.00 0.553,800,000.000Food services
FERRARINI SPA 6.375% 15-15/04/2020DFLT
EUR 14,000.00 0.00400,000.000
MARINE HARVEST 18-12/06/2023 FRN EUR 508,545.00 0.07500,000.0004,196,423.00 0.62
DEUTSCHE POST AG 0.05% 17-30/06/2025CV
EUR 3,962,640.00 0.584,000,000.000Transportation
3,962,640.00 0.58
MCDONALDS CORP 15-26/08/2019 FRN EUR 1,700,578.00 0.251,700,000.000Distribution & Wholesale
1,700,578.00 0.25
AEGON NV 95-29/06/2049 SR NLG 1,690,792.76 0.254,500,000.000Insurance
1,690,792.76 0.25
GTECH SPA 4.75% 12-05/03/2020 EUR 1,030,110.00 0.151,000,000.000Leisure Wear
1,030,110.00 0.15
PHILIP MORRIS IN 1.75% 13-19/03/2020 EUR 608,244.00 0.09600,000.000Tobacco & Alcohol
608,244.00 0.09
ERAMET SLN 4.5% 13-06/11/2020 EUR 103,108.00 0.02100,000.000Metal
SEVERSTAL OAO 5.9% 12-17/10/2022 USD 352,312.17 0.05375,000.000455,420.17 0.07
PRIMI SUI MOTORI 7% 15-04/12/2021 EUR 251,000.00 0.04250,000.000Internet
251,000.00 0.04
502,892,693.76 74.06
ISHARES JPM EM LCAL GOVT USD SHSUSD ETF
USD 3,697,303.60 0.5468,050.000
Undertakings for collective investmentOpen-ended Funds
ISHARES JPM USD EM BND EUR-H EUR 12,629,636.00 1.86132,400.000
NameQuantity/Nominal
Market valuein EUR
Currency %NAV
TENAX UCITS ICAV ILS UCITS IP EUR ACCHD
EUR 3,871,388.21 0.574,472.491
20,198,327.81 2.97
20,198,327.81 2.97
CHANNEL LINK ENT 07-30/12/2050 SR GBP 4,625,986.92 0.684,342,857.145
Mortgage backed securitiesDiversified services
CHANNEL LINK ENT 07-30/12/2050 SR EUR 2,835,000.00 0.423,000,000.0007,460,986.92 1.10
AGRESTI 6 SPV SRL 6.25% 14-31/01/2023 EUR 405,080.17 0.06800,000.000Financial services
SCYSC 1 A 3% 18-15/12/2021 EUR 1,800,000.00 0.261,800,000.0002,205,080.17 0.32
9,666,067.09 1.42
CORO ENERGY PLC GBP 4,421.01 0.00198,183.000
SharesEnergy
SOUND ENERGY PLC GBP 92,437.57 0.011,083,332.00096,858.58 0.01
PRISMI SPA EUR 37,469.40 0.0119,020.000Internet
37,469.40 0.01
CODERE SA EUR 6,121.36 0.001,904.000Private Equity
6,121.36 0.00
140,449.34 0.02
PRISMI SPA CW 29/05/2020 PRISMI SPA EUR 45,375.00 0.01137,500.000
WarrantsInternet
45,375.00 0.01
ECHO ENERGY PLC 17-22/05/2022 GBP 146.89 0.002,862,766.000Energy
146.89 0.00
45,521.89 0.01
HELLENIC T-BILL 0% 19-09/08/2019 EUR 11,987,520.00 1.7712,000,000.000
Other transferable securities
Money market instrumentsGovernment
HELLENIC T-BILL 0% 19-12/07/2019 EUR 10,998,020.00 1.6211,000,000.000HELLENIC T-BILL 0% 19-13/03/2020 EUR 9,960,700.00 1.4710,000,000.000HELLENIC T-BILL 0% 19-30/08/2019 EUR 12,484,250.00 1.8412,500,000.000ITALY BOTS 0% 19-13/03/2020 EUR 30,009,000.00 4.4130,000,000.000
75,439,490.00 11.11
75,439,490.00 11.11
Total securities portfolio 608,382,549.89 89.59
NameQuantity/Nominal
Market valuein EUR
Currency %NAV
EURO-BTP FUTURE 06/09/2019 EUR 6,715,000.00(50.000) (281,000.00)
Futures
NameQuantity Commitmentin EUR
Currency Unrealisedappreciation /(depreciation)
in EUR
Financial derivative instruments as at June 30, 2019
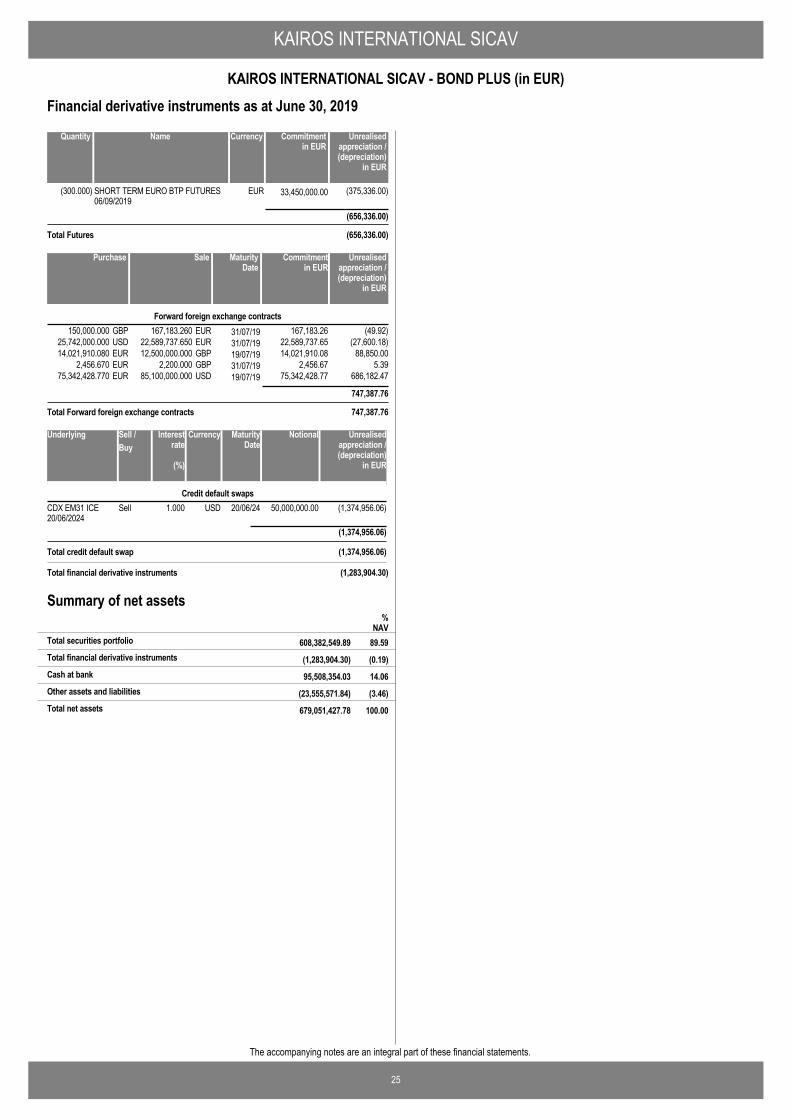
KAIROS INTERNATIONAL SICAV
25
KAIROS INTERNATIONAL SICAV - BOND PLUS (in EUR)
The accompanying notes are an integral part of these financial statements.
SHORT TERM EURO BTP FUTURES06/09/2019
EUR 33,450,000.00(300.000) (375,336.00)
(656,336.00)
Total Futures (656,336.00)
NameQuantity Commitmentin EUR
Currency Unrealisedappreciation /(depreciation)
in EUR
Financial derivative instruments as at June 30, 2019
167,183.260 31/07/19150,000.000 (49.92)EURGBP 167,183.26Forward foreign exchange contracts
22,589,737.650 31/07/1925,742,000.000 (27,600.18)EURUSD 22,589,737.6512,500,000.000 19/07/1914,021,910.080 88,850.00GBPEUR 14,021,910.08
2,200.000 31/07/192,456.670 5.39GBPEUR 2,456.6785,100,000.000 19/07/1975,342,428.770 686,182.47USDEUR 75,342,428.77
747,387.76
Total Forward foreign exchange contracts 747,387.76
SalePurchase Unrealisedappreciation /(depreciation)
in EUR
MaturityDate
Commitmentin EUR
20/06/24CDX EM31 ICE20/06/2024
50,000,000.00 (1,374,956.06)USDSell 1.000Credit default swaps
(1,374,956.06)
Sell /Buy
Underlying NotionalMaturityDate
Unrealisedappreciation /(depreciation)
in EUR
CurrencyInterestrate
(%)
Total credit default swap (1,374,956.06)
Total financial derivative instruments (1,283,904.30)
Summary of net assets
(1,283,904.30) (0.19)Total financial derivative instruments
%NAV
608,382,549.89 89.59Total securities portfolio
95,508,354.03 14.06Cash at bank
(23,555,571.84) (3.46)Other assets and liabilities
679,051,427.78 100.00Total net assets
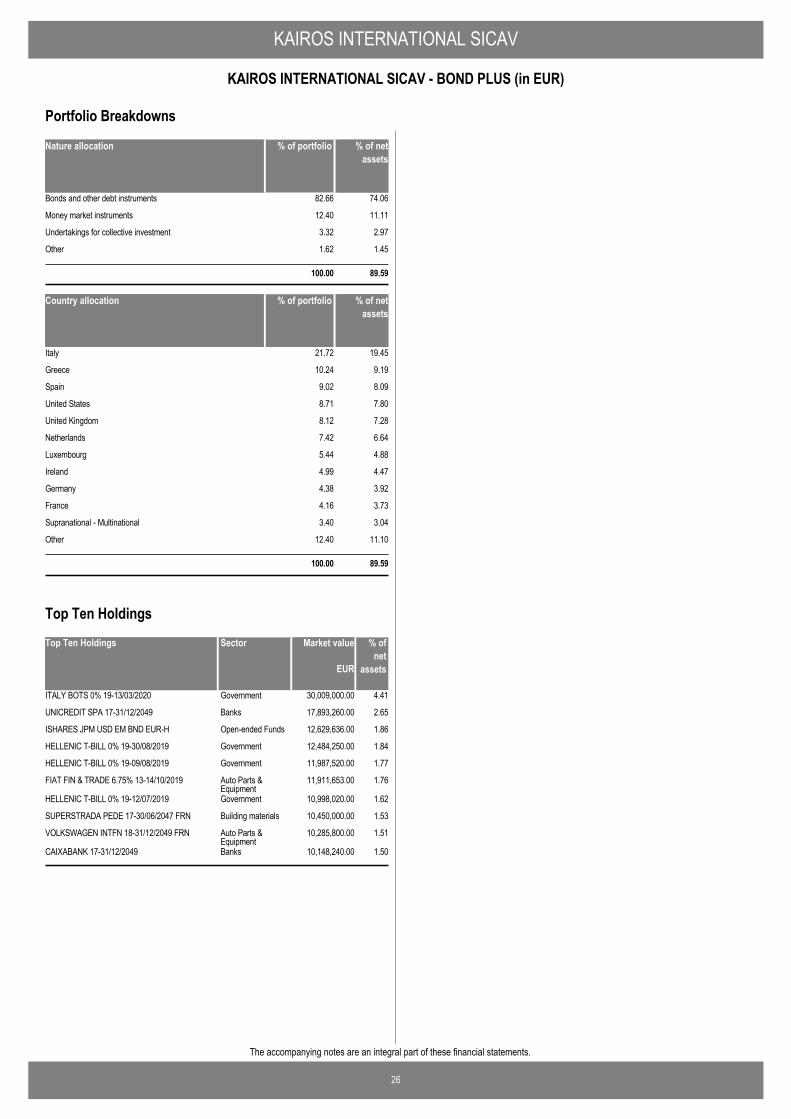
KAIROS INTERNATIONAL SICAV
26
KAIROS INTERNATIONAL SICAV - BOND PLUS (in EUR)
The accompanying notes are an integral part of these financial statements.
Nature allocation % of portfolio % of netassets
Bonds and other debt instruments 82.66 74.06
Money market instruments 12.40 11.11
Undertakings for collective investment 3.32 2.97
Other 1.62 1.45
100.00 89.59
Country allocation % of portfolio % of netassets
Italy 21.72 19.45
Greece 10.24 9.19
Spain 9.02 8.09
United States 8.71 7.80
United Kingdom 8.12 7.28
Netherlands 7.42 6.64
Luxembourg 5.44 4.88
Ireland 4.99 4.47
Germany 4.38 3.92
France 4.16 3.73
Supranational - Multinational 3.40 3.04
Other 12.40 11.10
100.00 89.59
Portfolio Breakdowns
Top Ten Holdings Market value % ofnet
assets
ITALY BOTS 0% 19-13/03/2020 30,009,000.00 4.41Government
UNICREDIT SPA 17-31/12/2049 17,893,260.00 2.65Banks
ISHARES JPM USD EM BND EUR-H 12,629,636.00 1.86Open-ended Funds
HELLENIC T-BILL 0% 19-30/08/2019 12,484,250.00 1.84Government
HELLENIC T-BILL 0% 19-09/08/2019 11,987,520.00 1.77Government
FIAT FIN & TRADE 6.75% 13-14/10/2019 11,911,653.00 1.76Auto Parts &Equipment
HELLENIC T-BILL 0% 19-12/07/2019 10,998,020.00 1.62Government
SUPERSTRADA PEDE 17-30/06/2047 FRN 10,450,000.00 1.53Building materials
VOLKSWAGEN INTFN 18-31/12/2049 FRN 10,285,800.00 1.51Auto Parts &Equipment
CAIXABANK 17-31/12/2049 10,148,240.00 1.50Banks
EUR
Sector
Top Ten Holdings
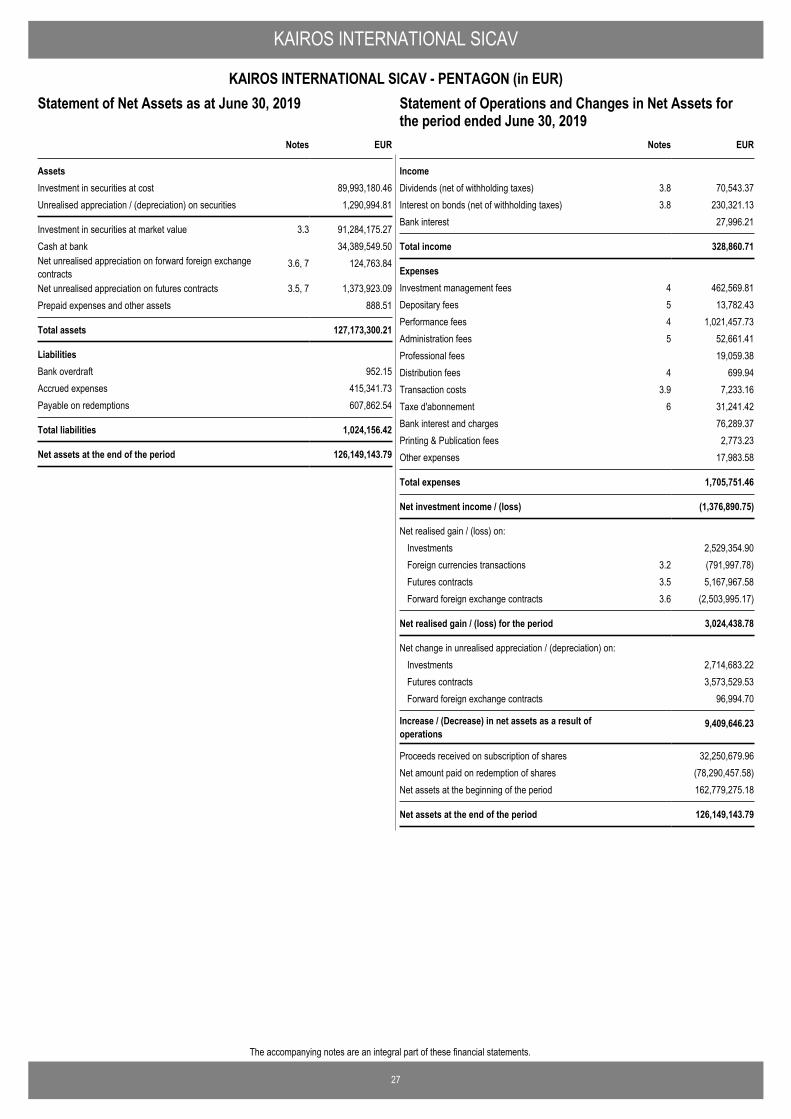
27
The accompanying notes are an integral part of these financial statements.
KAIROS INTERNATIONAL SICAV
KAIROS INTERNATIONAL SICAV - PENTAGON (in EUR)Statement of Operations and Changes in Net Assets for theperiod ended June 30, 2019
EUR
AssetsInvestment in securities at cost 89,993,180.46Unrealised appreciation / (depreciation) on securities 1,290,994.81
Investment in securities at market value 3.3 91,284,175.27Cash at bank 34,389,549.50Net unrealised appreciation on forward foreign exchangecontracts
3.6, 7 124,763.84
Net unrealised appreciation on futures contracts 3.5, 7 1,373,923.09Prepaid expenses and other assets 888.51
Total assets 127,173,300.21
LiabilitiesBank overdraft 952.15Accrued expenses 415,341.73Payable on redemptions 607,862.54
Total liabilities 1,024,156.42
Net assets at the end of the period 126,149,143.79
Notes
Statement of Net Assets as at June 30, 2019
IncomeDividends (net of withholding taxes) 3.8 70,543.37Interest on bonds (net of withholding taxes) 3.8 230,321.13Bank interest 27,996.21
Total income 328,860.71
ExpensesInvestment management fees 4 462,569.81Depositary fees 5 13,782.43Performance fees 4 1,021,457.73Administration fees 5 52,661.41Professional fees 19,059.38Distribution fees 4 699.94Transaction costs 3.9 7,233.16Taxe d'abonnement 6 31,241.42Bank interest and charges 76,289.37Printing & Publication fees 2,773.23Other expenses 17,983.58
Total expenses 1,705,751.46
Net investment income / (loss) (1,376,890.75)
Net realised gain / (loss) on: Investments 2,529,354.90Foreign currencies transactions 3.2 (791,997.78)Futures contracts 3.5 5,167,967.58Forward foreign exchange contracts 3.6 (2,503,995.17)
Net realised gain / (loss) for the period 3,024,438.78
Net change in unrealised appreciation / (depreciation) on: Investments 2,714,683.22Futures contracts 3,573,529.53Forward foreign exchange contracts 96,994.70
Increase / (Decrease) in net assets as a result ofoperations
9,409,646.23
Proceeds received on subscription of shares 32,250,679.96Net amount paid on redemption of shares (78,290,457.58)Net assets at the beginning of the period 162,779,275.18
Net assets at the end of the period 126,149,143.79
EURNotes
Statement of Operations and Changes in Net Assets forthe period ended June 30, 2019
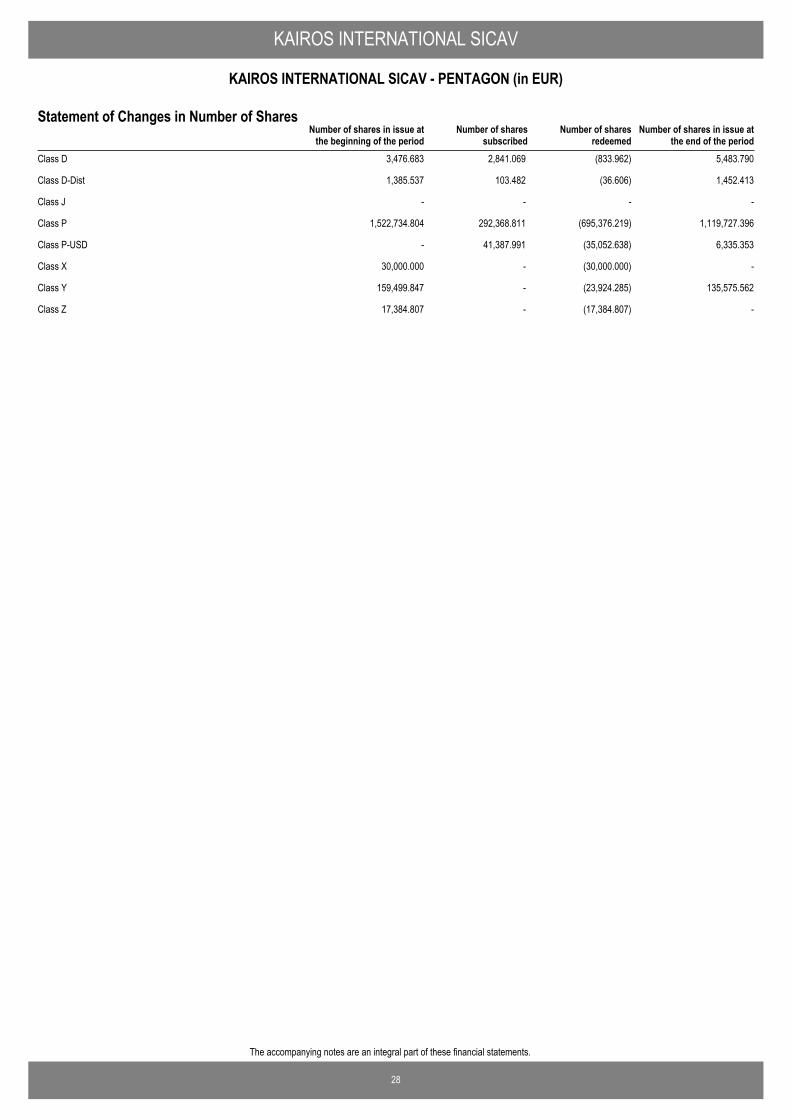
28
The accompanying notes are an integral part of these financial statements.
KAIROS INTERNATIONAL SICAV
KAIROS INTERNATIONAL SICAV - PENTAGON (in EUR)
Number of shares in issue atthe end of the period
Number of shares in issue atthe beginning of the period
Number of sharessubscribed
Number of sharesredeemed
Statement of Changes in Number of Shares
Class D 3,476.683 2,841.069 (833.962) 5,483.790
Class D-Dist 1,385.537 103.482 (36.606) 1,452.413
Class J - - - -
Class P 1,522,734.804 292,368.811 (695,376.219) 1,119,727.396
Class P-USD - 41,387.991 (35,052.638) 6,335.353
Class X 30,000.000 - (30,000.000) -
Class Y 159,499.847 - (23,924.285) 135,575.562
Class Z 17,384.807 - (17,384.807) -
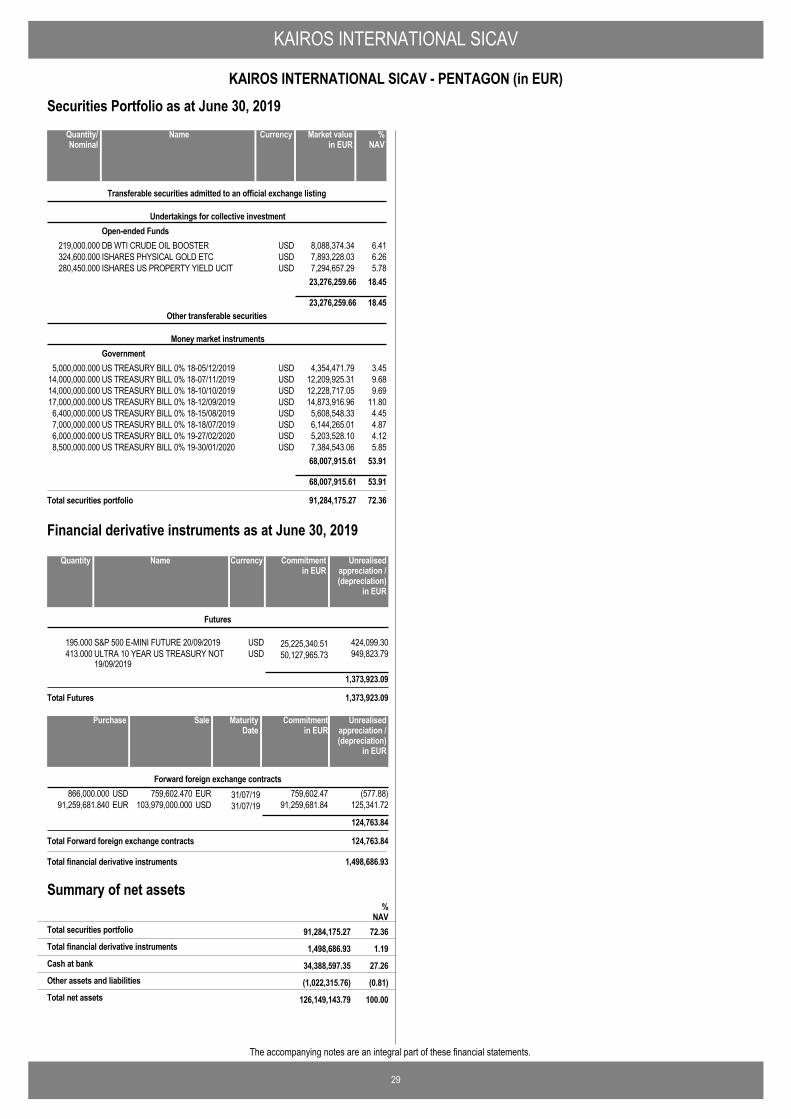
KAIROS INTERNATIONAL SICAV
29
KAIROS INTERNATIONAL SICAV - PENTAGON (in EUR)
The accompanying notes are an integral part of these financial statements.
Securities Portfolio as at June 30, 2019
DB WTI CRUDE OIL BOOSTER USD 8,088,374.34 6.41219,000.000
Transferable securities admitted to an official exchange listing
Undertakings for collective investmentOpen-ended Funds
ISHARES PHYSICAL GOLD ETC USD 7,893,228.03 6.26324,600.000ISHARES US PROPERTY YIELD UCIT USD 7,294,657.29 5.78280,450.000
23,276,259.66 18.45
23,276,259.66 18.45
US TREASURY BILL 0% 18-05/12/2019 USD 4,354,471.79 3.455,000,000.000
Other transferable securities
Money market instrumentsGovernment
US TREASURY BILL 0% 18-07/11/2019 USD 12,209,925.31 9.6814,000,000.000US TREASURY BILL 0% 18-10/10/2019 USD 12,228,717.05 9.6914,000,000.000US TREASURY BILL 0% 18-12/09/2019 USD 14,873,916.96 11.8017,000,000.000US TREASURY BILL 0% 18-15/08/2019 USD 5,608,548.33 4.456,400,000.000US TREASURY BILL 0% 18-18/07/2019 USD 6,144,265.01 4.877,000,000.000US TREASURY BILL 0% 19-27/02/2020 USD 5,203,528.10 4.126,000,000.000US TREASURY BILL 0% 19-30/01/2020 USD 7,384,543.06 5.858,500,000.000
68,007,915.61 53.91
68,007,915.61 53.91
Total securities portfolio 91,284,175.27 72.36
NameQuantity/Nominal
Market valuein EUR
Currency %NAV
S&P 500 E-MINI FUTURE 20/09/2019 USD 25,225,340.51195.000 424,099.30
Futures
ULTRA 10 YEAR US TREASURY NOT19/09/2019
USD 50,127,965.73413.000 949,823.79
1,373,923.09
Total Futures 1,373,923.09
NameQuantity Commitmentin EUR
Currency Unrealisedappreciation /(depreciation)
in EUR
Financial derivative instruments as at June 30, 2019
759,602.470 31/07/19866,000.000 (577.88)EURUSD 759,602.47Forward foreign exchange contracts
103,979,000.000 31/07/1991,259,681.840 125,341.72USDEUR 91,259,681.84
124,763.84
Total Forward foreign exchange contracts 124,763.84
SalePurchase Unrealisedappreciation /(depreciation)
in EUR
MaturityDate
Commitmentin EUR
Total financial derivative instruments 1,498,686.93
Summary of net assets
1,498,686.93 1.19Total financial derivative instruments
%NAV
91,284,175.27 72.36Total securities portfolio
34,388,597.35 27.26Cash at bank
(1,022,315.76) (0.81)Other assets and liabilities
126,149,143.79 100.00Total net assets
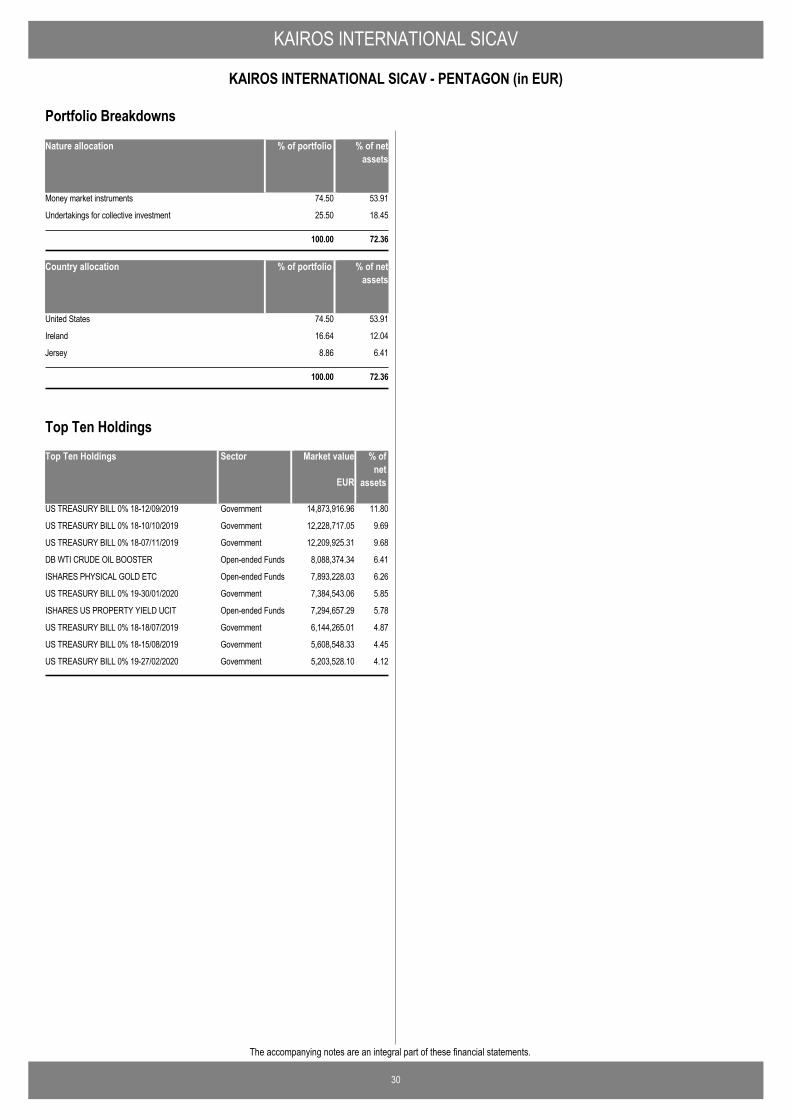
KAIROS INTERNATIONAL SICAV
30
KAIROS INTERNATIONAL SICAV - PENTAGON (in EUR)
The accompanying notes are an integral part of these financial statements.
Nature allocation % of portfolio % of netassets
Money market instruments 74.50 53.91
Undertakings for collective investment 25.50 18.45
100.00 72.36
Country allocation % of portfolio % of netassets
United States 74.50 53.91
Ireland 16.64 12.04
Jersey 8.86 6.41
100.00 72.36
Portfolio Breakdowns
Top Ten Holdings Market value % ofnet
assets
US TREASURY BILL 0% 18-12/09/2019 14,873,916.96 11.80Government
US TREASURY BILL 0% 18-10/10/2019 12,228,717.05 9.69Government
US TREASURY BILL 0% 18-07/11/2019 12,209,925.31 9.68Government
DB WTI CRUDE OIL BOOSTER 8,088,374.34 6.41Open-ended Funds
ISHARES PHYSICAL GOLD ETC 7,893,228.03 6.26Open-ended Funds
US TREASURY BILL 0% 19-30/01/2020 7,384,543.06 5.85Government
ISHARES US PROPERTY YIELD UCIT 7,294,657.29 5.78Open-ended Funds
US TREASURY BILL 0% 18-18/07/2019 6,144,265.01 4.87Government
US TREASURY BILL 0% 18-15/08/2019 5,608,548.33 4.45Government
US TREASURY BILL 0% 19-27/02/2020 5,203,528.10 4.12Government
EUR
Sector
Top Ten Holdings
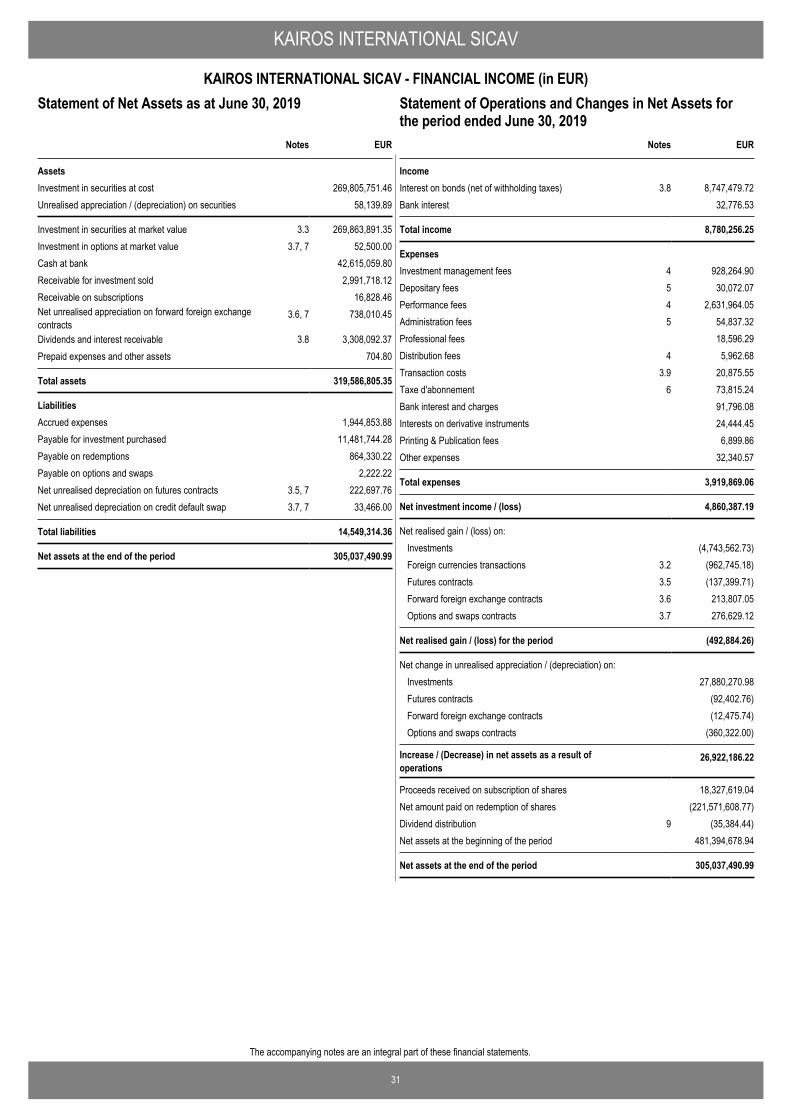
31
The accompanying notes are an integral part of these financial statements.
KAIROS INTERNATIONAL SICAV
KAIROS INTERNATIONAL SICAV - FINANCIAL INCOME (in EUR)Statement of Operations and Changes in Net Assets for theperiod ended June 30, 2019
EUR
AssetsInvestment in securities at cost 269,805,751.46Unrealised appreciation / (depreciation) on securities 58,139.89
Investment in securities at market value 3.3 269,863,891.35Investment in options at market value 3.7, 7 52,500.00Cash at bank 42,615,059.80Receivable for investment sold 2,991,718.12Receivable on subscriptions 16,828.46Net unrealised appreciation on forward foreign exchangecontracts
3.6, 7 738,010.45
Dividends and interest receivable 3.8 3,308,092.37Prepaid expenses and other assets 704.80
Total assets 319,586,805.35
LiabilitiesAccrued expenses 1,944,853.88Payable for investment purchased 11,481,744.28Payable on redemptions 864,330.22Payable on options and swaps 2,222.22Net unrealised depreciation on futures contracts 3.5, 7 222,697.76Net unrealised depreciation on credit default swap 3.7, 7 33,466.00
Total liabilities 14,549,314.36
Net assets at the end of the period 305,037,490.99
Notes
Statement of Net Assets as at June 30, 2019
IncomeInterest on bonds (net of withholding taxes) 3.8 8,747,479.72Bank interest 32,776.53
Total income 8,780,256.25
ExpensesInvestment management fees 4 928,264.90Depositary fees 5 30,072.07Performance fees 4 2,631,964.05Administration fees 5 54,837.32Professional fees 18,596.29Distribution fees 4 5,962.68Transaction costs 3.9 20,875.55Taxe d'abonnement 6 73,815.24Bank interest and charges 91,796.08Interests on derivative instruments 24,444.45Printing & Publication fees 6,899.86Other expenses 32,340.57
Total expenses 3,919,869.06
Net investment income / (loss) 4,860,387.19
Net realised gain / (loss) on: Investments (4,743,562.73)Foreign currencies transactions 3.2 (962,745.18)Futures contracts 3.5 (137,399.71)Forward foreign exchange contracts 3.6 213,807.05Options and swaps contracts 3.7 276,629.12
Net realised gain / (loss) for the period (492,884.26)
Net change in unrealised appreciation / (depreciation) on: Investments 27,880,270.98Futures contracts (92,402.76)Forward foreign exchange contracts (12,475.74)Options and swaps contracts (360,322.00)
Increase / (Decrease) in net assets as a result ofoperations
26,922,186.22
Proceeds received on subscription of shares 18,327,619.04Net amount paid on redemption of shares (221,571,608.77)Dividend distribution 9 (35,384.44)Net assets at the beginning of the period 481,394,678.94
Net assets at the end of the period 305,037,490.99
EURNotes
Statement of Operations and Changes in Net Assets forthe period ended June 30, 2019
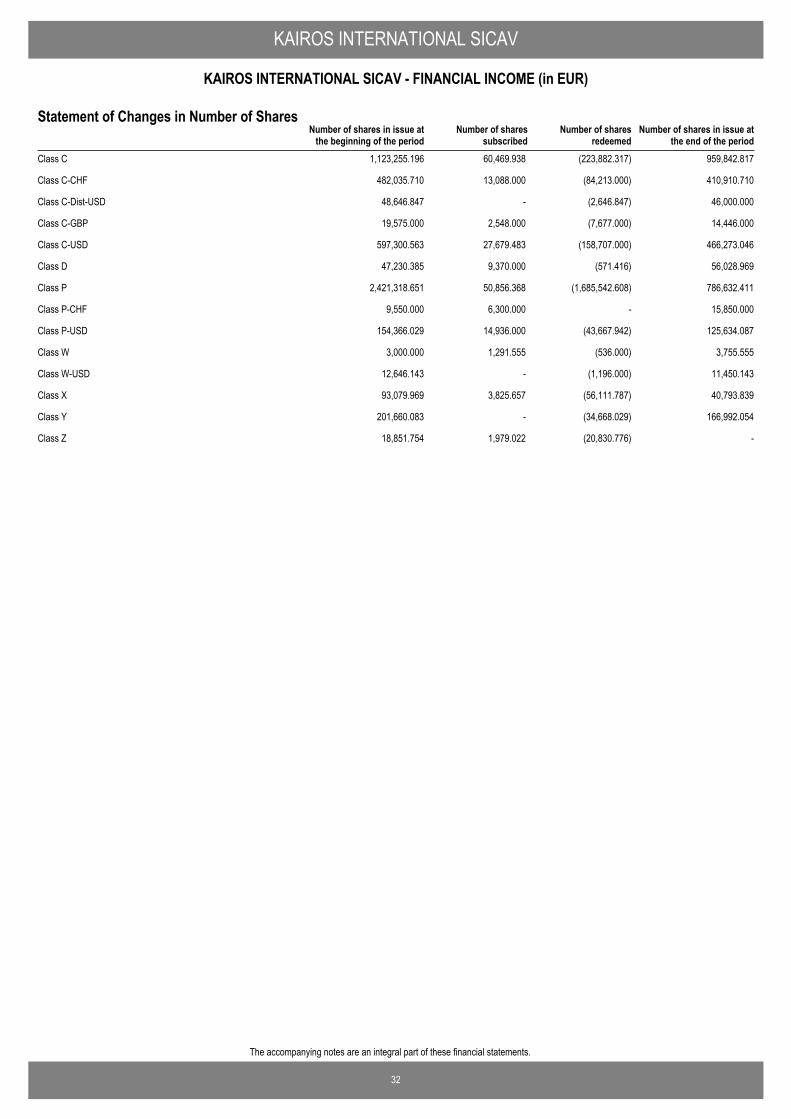
32
The accompanying notes are an integral part of these financial statements.
KAIROS INTERNATIONAL SICAV
KAIROS INTERNATIONAL SICAV - FINANCIAL INCOME (in EUR)
Number of shares in issue atthe end of the period
Number of shares in issue atthe beginning of the period
Number of sharessubscribed
Number of sharesredeemed
Statement of Changes in Number of Shares
Class C 1,123,255.196 60,469.938 (223,882.317) 959,842.817
Class C-CHF 482,035.710 13,088.000 (84,213.000) 410,910.710
Class C-Dist-USD 48,646.847 - (2,646.847) 46,000.000
Class C-GBP 19,575.000 2,548.000 (7,677.000) 14,446.000
Class C-USD 597,300.563 27,679.483 (158,707.000) 466,273.046
Class D 47,230.385 9,370.000 (571.416) 56,028.969
Class P 2,421,318.651 50,856.368 (1,685,542.608) 786,632.411
Class P-CHF 9,550.000 6,300.000 - 15,850.000
Class P-USD 154,366.029 14,936.000 (43,667.942) 125,634.087
Class W 3,000.000 1,291.555 (536.000) 3,755.555
Class W-USD 12,646.143 - (1,196.000) 11,450.143
Class X 93,079.969 3,825.657 (56,111.787) 40,793.839
Class Y 201,660.083 - (34,668.029) 166,992.054
Class Z 18,851.754 1,979.022 (20,830.776) -
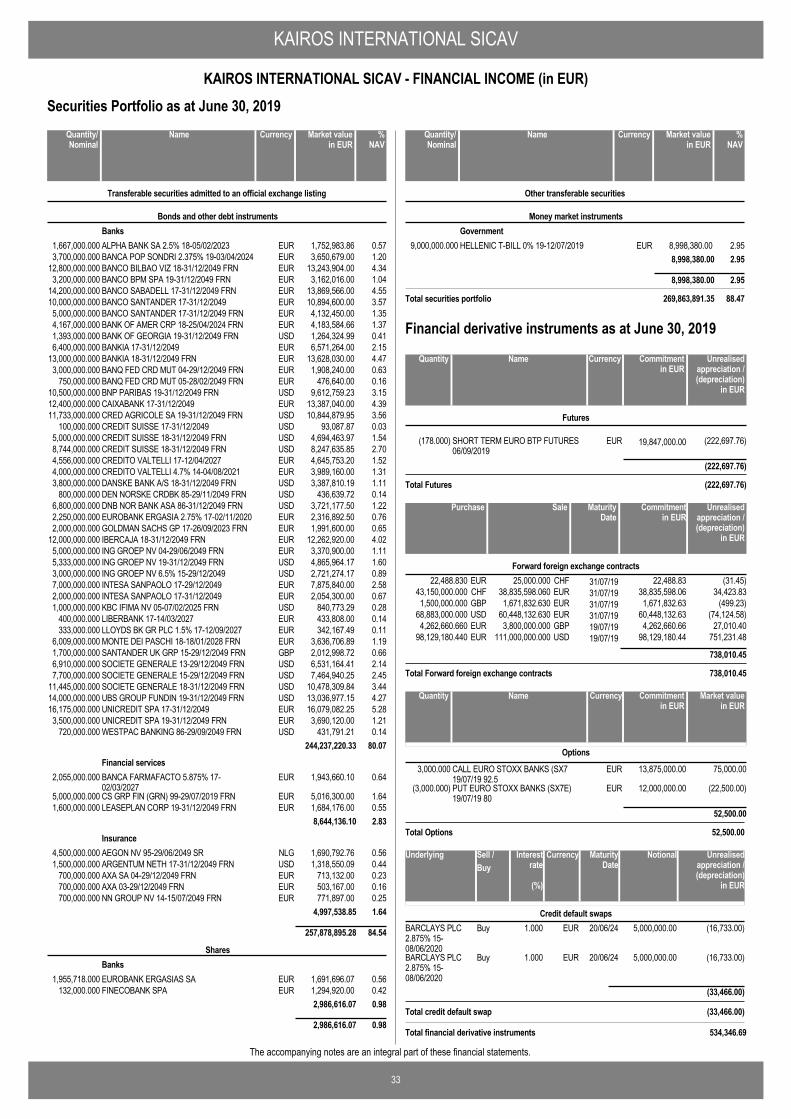
KAIROS INTERNATIONAL SICAV
33
KAIROS INTERNATIONAL SICAV - FINANCIAL INCOME (in EUR)
The accompanying notes are an integral part of these financial statements.
Securities Portfolio as at June 30, 2019
ALPHA BANK SA 2.5% 18-05/02/2023 EUR 1,752,983.86 0.571,667,000.000
Transferable securities admitted to an official exchange listing
Bonds and other debt instrumentsBanks
BANCA POP SONDRI 2.375% 19-03/04/2024 EUR 3,650,679.00 1.203,700,000.000BANCO BILBAO VIZ 18-31/12/2049 FRN EUR 13,243,904.00 4.3412,800,000.000BANCO BPM SPA 19-31/12/2049 FRN EUR 3,162,016.00 1.043,200,000.000BANCO SABADELL 17-31/12/2049 FRN EUR 13,869,566.00 4.5514,200,000.000BANCO SANTANDER 17-31/12/2049 EUR 10,894,600.00 3.5710,000,000.000BANCO SANTANDER 17-31/12/2049 FRN EUR 4,132,450.00 1.355,000,000.000BANK OF AMER CRP 18-25/04/2024 FRN EUR 4,183,584.66 1.374,167,000.000BANK OF GEORGIA 19-31/12/2049 FRN USD 1,264,324.99 0.411,393,000.000BANKIA 17-31/12/2049 EUR 6,571,264.00 2.156,400,000.000BANKIA 18-31/12/2049 FRN EUR 13,628,030.00 4.4713,000,000.000BANQ FED CRD MUT 04-29/12/2049 FRN EUR 1,908,240.00 0.633,000,000.000BANQ FED CRD MUT 05-28/02/2049 FRN EUR 476,640.00 0.16750,000.000BNP PARIBAS 19-31/12/2049 FRN USD 9,612,759.23 3.1510,500,000.000CAIXABANK 17-31/12/2049 EUR 13,387,040.00 4.3912,400,000.000CRED AGRICOLE SA 19-31/12/2049 FRN USD 10,844,879.95 3.5611,733,000.000CREDIT SUISSE 17-31/12/2049 USD 93,087.87 0.03100,000.000CREDIT SUISSE 18-31/12/2049 FRN USD 4,694,463.97 1.545,000,000.000CREDIT SUISSE 18-31/12/2049 FRN USD 8,247,635.85 2.708,744,000.000CREDITO VALTELLI 17-12/04/2027 EUR 4,645,753.20 1.524,556,000.000CREDITO VALTELLI 4.7% 14-04/08/2021 EUR 3,989,160.00 1.314,000,000.000DANSKE BANK A/S 18-31/12/2049 FRN USD 3,387,810.19 1.113,800,000.000DEN NORSKE CRDBK 85-29/11/2049 FRN USD 436,639.72 0.14800,000.000DNB NOR BANK ASA 86-31/12/2049 FRN USD 3,721,177.50 1.226,800,000.000EUROBANK ERGASIA 2.75% 17-02/11/2020 EUR 2,316,892.50 0.762,250,000.000GOLDMAN SACHS GP 17-26/09/2023 FRN EUR 1,991,600.00 0.652,000,000.000IBERCAJA 18-31/12/2049 FRN EUR 12,262,920.00 4.0212,000,000.000ING GROEP NV 04-29/06/2049 FRN EUR 3,370,900.00 1.115,000,000.000ING GROEP NV 19-31/12/2049 FRN USD 4,865,964.17 1.605,333,000.000ING GROEP NV 6.5% 15-29/12/2049 USD 2,721,274.17 0.893,000,000.000INTESA SANPAOLO 17-29/12/2049 EUR 7,875,840.00 2.587,000,000.000INTESA SANPAOLO 17-31/12/2049 EUR 2,054,300.00 0.672,000,000.000KBC IFIMA NV 05-07/02/2025 FRN USD 840,773.29 0.281,000,000.000LIBERBANK 17-14/03/2027 EUR 433,808.00 0.14400,000.000LLOYDS BK GR PLC 1.5% 17-12/09/2027 EUR 342,167.49 0.11333,000.000MONTE DEI PASCHI 18-18/01/2028 FRN EUR 3,636,706.89 1.196,009,000.000SANTANDER UK GRP 15-29/12/2049 FRN GBP 2,012,998.72 0.661,700,000.000SOCIETE GENERALE 13-29/12/2049 FRN USD 6,531,164.41 2.146,910,000.000SOCIETE GENERALE 15-29/12/2049 FRN USD 7,464,940.25 2.457,700,000.000SOCIETE GENERALE 18-31/12/2049 FRN USD 10,478,309.84 3.4411,445,000.000UBS GROUP FUNDIN 19-31/12/2049 FRN USD 13,036,977.15 4.2714,000,000.000UNICREDIT SPA 17-31/12/2049 EUR 16,079,082.25 5.2816,175,000.000UNICREDIT SPA 19-31/12/2049 FRN EUR 3,690,120.00 1.213,500,000.000WESTPAC BANKING 86-29/09/2049 FRN USD 431,791.21 0.14720,000.000
244,237,220.33 80.07
BANCA FARMAFACTO 5.875% 17-02/03/2027
EUR 1,943,660.10 0.642,055,000.000Financial services
CS GRP FIN (GRN) 99-29/07/2019 FRN EUR 5,016,300.00 1.645,000,000.000LEASEPLAN CORP 19-31/12/2049 FRN EUR 1,684,176.00 0.551,600,000.000
8,644,136.10 2.83
AEGON NV 95-29/06/2049 SR NLG 1,690,792.76 0.564,500,000.000Insurance
ARGENTUM NETH 17-31/12/2049 FRN USD 1,318,550.09 0.441,500,000.000AXA SA 04-29/12/2049 FRN EUR 713,132.00 0.23700,000.000AXA 03-29/12/2049 FRN EUR 503,167.00 0.16700,000.000NN GROUP NV 14-15/07/2049 FRN EUR 771,897.00 0.25700,000.000
4,997,538.85 1.64
257,878,895.28 84.54
EUROBANK ERGASIAS SA EUR 1,691,696.07 0.561,955,718.000
SharesBanks
FINECOBANK SPA EUR 1,294,920.00 0.42132,000.0002,986,616.07 0.98
2,986,616.07 0.98
NameQuantity/Nominal
Market valuein EUR
Currency %NAV
HELLENIC T-BILL 0% 19-12/07/2019 EUR 8,998,380.00 2.959,000,000.000
Other transferable securities
Money market instrumentsGovernment
8,998,380.00 2.95
8,998,380.00 2.95
Total securities portfolio 269,863,891.35 88.47
NameQuantity/Nominal
Market valuein EUR
Currency %NAV
SHORT TERM EURO BTP FUTURES06/09/2019
EUR 19,847,000.00(178.000) (222,697.76)
Futures
(222,697.76)
Total Futures (222,697.76)
NameQuantity Commitmentin EUR
Currency Unrealisedappreciation /(depreciation)
in EUR
Financial derivative instruments as at June 30, 2019
25,000.000 31/07/1922,488.830 (31.45)CHFEUR 22,488.83Forward foreign exchange contracts
38,835,598.060 31/07/1943,150,000.000 34,423.83EURCHF 38,835,598.061,671,832.630 31/07/191,500,000.000 (499.23)EURGBP 1,671,832.63
60,448,132.630 31/07/1968,883,000.000 (74,124.58)EURUSD 60,448,132.633,800,000.000 19/07/194,262,660.660 27,010.40GBPEUR 4,262,660.66
111,000,000.000 19/07/1998,129,180.440 751,231.48USDEUR 98,129,180.44
738,010.45
Total Forward foreign exchange contracts 738,010.45
SalePurchase Unrealisedappreciation /(depreciation)
in EUR
MaturityDate
Commitmentin EUR
CALL EURO STOXX BANKS (SX719/07/19 92.5
EUR3,000.000 13,875,000.00 75,000.00
Options
PUT EURO STOXX BANKS (SX7E)19/07/19 80
EUR(3,000.000) 12,000,000.00 (22,500.00)
52,500.00
Total Options 52,500.00
NameQuantity Market valuein EUR
Currency Commitmentin EUR
20/06/24BARCLAYS PLC2.875% 15-08/06/2020
5,000,000.00 (16,733.00)EURBuy 1.000Credit default swaps
20/06/24BARCLAYS PLC2.875% 15-08/06/2020
5,000,000.00 (16,733.00)EURBuy 1.000
(33,466.00)
Sell /Buy
Underlying NotionalMaturityDate
Unrealisedappreciation /(depreciation)
in EUR
CurrencyInterestrate
(%)
Total credit default swap (33,466.00)
Total financial derivative instruments 534,346.69
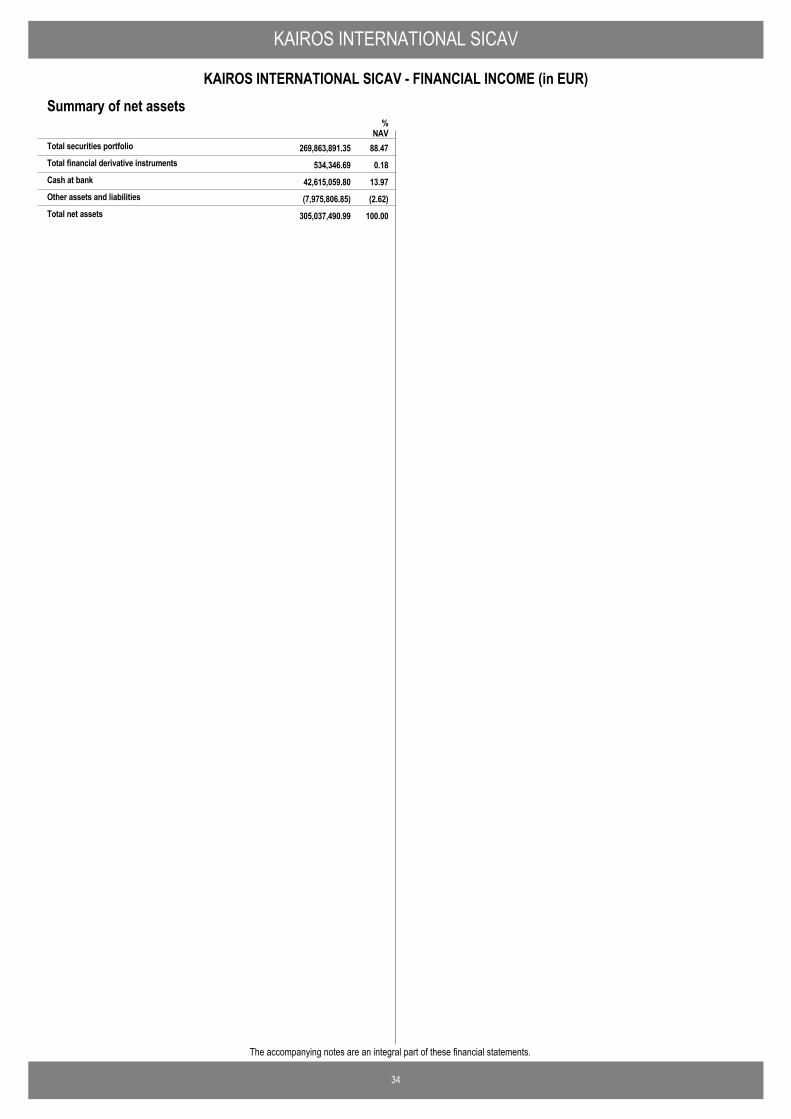
KAIROS INTERNATIONAL SICAV
34
KAIROS INTERNATIONAL SICAV - FINANCIAL INCOME (in EUR)
The accompanying notes are an integral part of these financial statements.
Summary of net assets
534,346.69 0.18Total financial derivative instruments
%NAV
269,863,891.35 88.47Total securities portfolio
42,615,059.80 13.97Cash at bank
(7,975,806.85) (2.62)Other assets and liabilities
305,037,490.99 100.00Total net assets
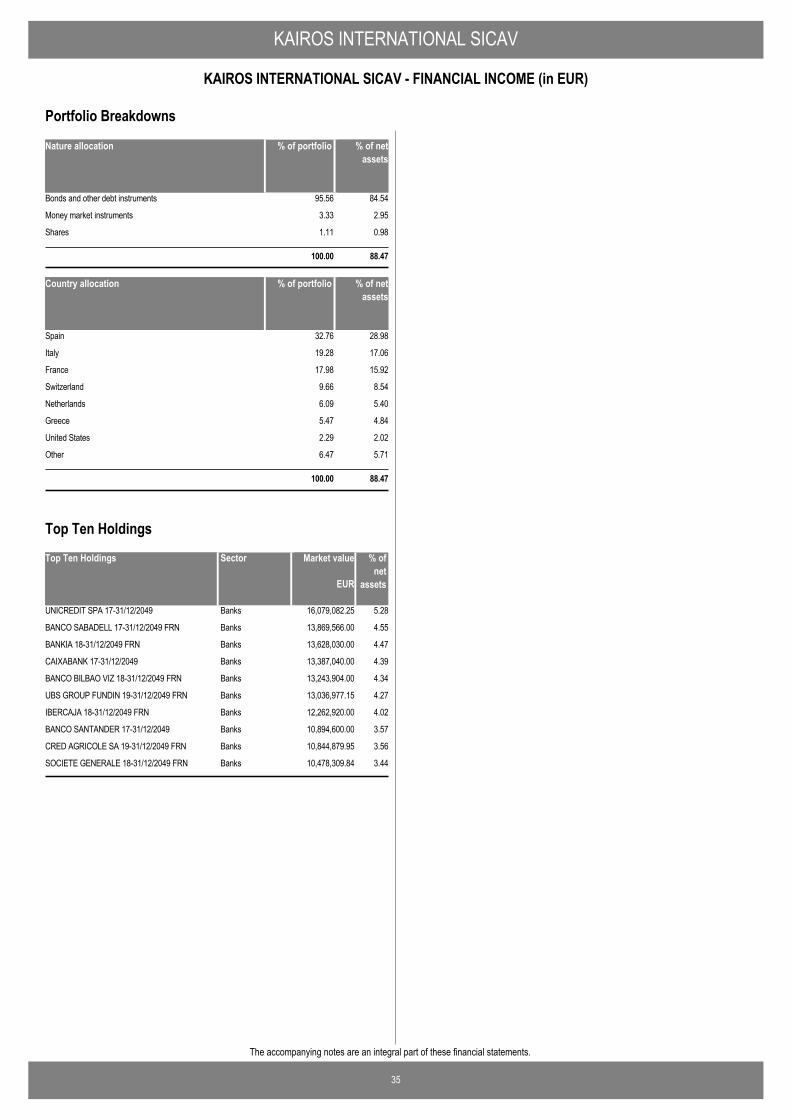
KAIROS INTERNATIONAL SICAV
35
KAIROS INTERNATIONAL SICAV - FINANCIAL INCOME (in EUR)
The accompanying notes are an integral part of these financial statements.
Nature allocation % of portfolio % of netassets
Bonds and other debt instruments 95.56 84.54
Money market instruments 3.33 2.95
Shares 1.11 0.98
100.00 88.47
Country allocation % of portfolio % of netassets
Spain 32.76 28.98
Italy 19.28 17.06
France 17.98 15.92
Switzerland 9.66 8.54
Netherlands 6.09 5.40
Greece 5.47 4.84
United States 2.29 2.02
Other 6.47 5.71
100.00 88.47
Portfolio Breakdowns
Top Ten Holdings Market value % ofnet
assets
UNICREDIT SPA 17-31/12/2049 16,079,082.25 5.28Banks
BANCO SABADELL 17-31/12/2049 FRN 13,869,566.00 4.55Banks
BANKIA 18-31/12/2049 FRN 13,628,030.00 4.47Banks
CAIXABANK 17-31/12/2049 13,387,040.00 4.39Banks
BANCO BILBAO VIZ 18-31/12/2049 FRN 13,243,904.00 4.34Banks
UBS GROUP FUNDIN 19-31/12/2049 FRN 13,036,977.15 4.27Banks
IBERCAJA 18-31/12/2049 FRN 12,262,920.00 4.02Banks
BANCO SANTANDER 17-31/12/2049 10,894,600.00 3.57Banks
CRED AGRICOLE SA 19-31/12/2049 FRN 10,844,879.95 3.56Banks
SOCIETE GENERALE 18-31/12/2049 FRN 10,478,309.84 3.44Banks
EUR
Sector
Top Ten Holdings
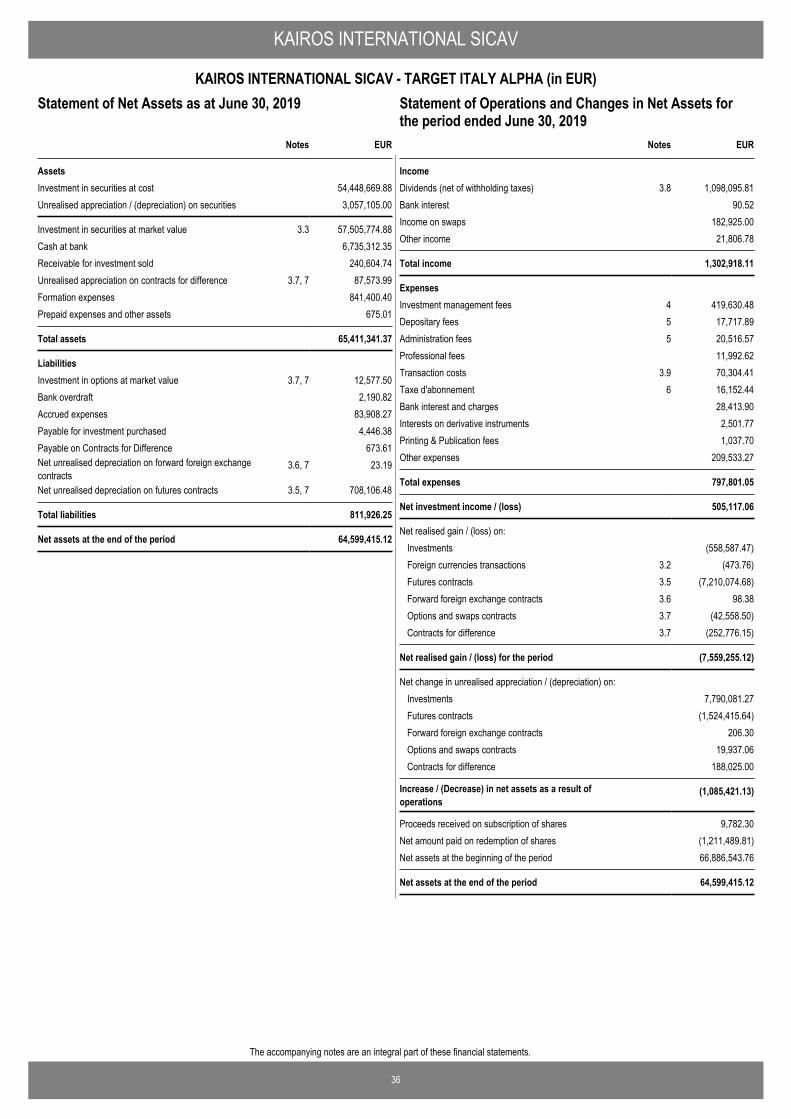
36
The accompanying notes are an integral part of these financial statements.
KAIROS INTERNATIONAL SICAV
KAIROS INTERNATIONAL SICAV - TARGET ITALY ALPHA (in EUR)Statement of Operations and Changes in Net Assets for theperiod ended June 30, 2019
EUR
AssetsInvestment in securities at cost 54,448,669.88Unrealised appreciation / (depreciation) on securities 3,057,105.00
Investment in securities at market value 3.3 57,505,774.88Cash at bank 6,735,312.35Receivable for investment sold 240,604.74Unrealised appreciation on contracts for difference 3.7, 7 87,573.99Formation expenses 841,400.40Prepaid expenses and other assets 675.01
Total assets 65,411,341.37
LiabilitiesInvestment in options at market value 3.7, 7 12,577.50Bank overdraft 2,190.82Accrued expenses 83,908.27Payable for investment purchased 4,446.38Payable on Contracts for Difference 673.61Net unrealised depreciation on forward foreign exchangecontracts
3.6, 7 23.19
Net unrealised depreciation on futures contracts 3.5, 7 708,106.48
Total liabilities 811,926.25
Net assets at the end of the period 64,599,415.12
Notes
Statement of Net Assets as at June 30, 2019
IncomeDividends (net of withholding taxes) 3.8 1,098,095.81Bank interest 90.52Income on swaps 182,925.00Other income 21,806.78
Total income 1,302,918.11
ExpensesInvestment management fees 4 419,630.48Depositary fees 5 17,717.89Administration fees 5 20,516.57Professional fees 11,992.62Transaction costs 3.9 70,304.41Taxe d'abonnement 6 16,152.44Bank interest and charges 28,413.90Interests on derivative instruments 2,501.77Printing & Publication fees 1,037.70Other expenses 209,533.27
Total expenses 797,801.05
Net investment income / (loss) 505,117.06
Net realised gain / (loss) on: Investments (558,587.47)Foreign currencies transactions 3.2 (473.76)Futures contracts 3.5 (7,210,074.68)Forward foreign exchange contracts 3.6 98.38Options and swaps contracts 3.7 (42,558.50)Contracts for difference 3.7 (252,776.15)
Net realised gain / (loss) for the period (7,559,255.12)
Net change in unrealised appreciation / (depreciation) on: Investments 7,790,081.27Futures contracts (1,524,415.64)Forward foreign exchange contracts 206.30Options and swaps contracts 19,937.06Contracts for difference 188,025.00
Increase / (Decrease) in net assets as a result ofoperations
(1,085,421.13)
Proceeds received on subscription of shares 9,782.30Net amount paid on redemption of shares (1,211,489.81)Net assets at the beginning of the period 66,886,543.76
Net assets at the end of the period 64,599,415.12
EURNotes
Statement of Operations and Changes in Net Assets forthe period ended June 30, 2019
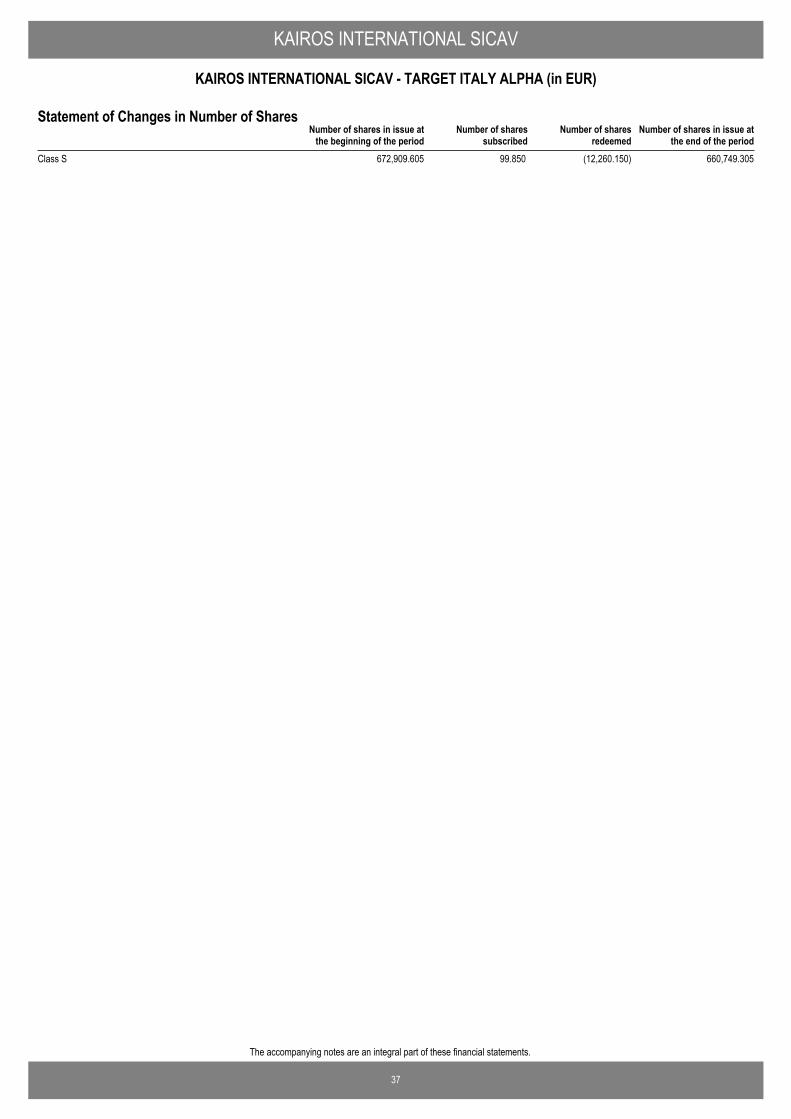
37
The accompanying notes are an integral part of these financial statements.
KAIROS INTERNATIONAL SICAV
KAIROS INTERNATIONAL SICAV - TARGET ITALY ALPHA (in EUR)
Number of shares in issue atthe end of the period
Number of shares in issue atthe beginning of the period
Number of sharessubscribed
Number of sharesredeemed
Statement of Changes in Number of Shares
Class S 672,909.605 99.850 (12,260.150) 660,749.305
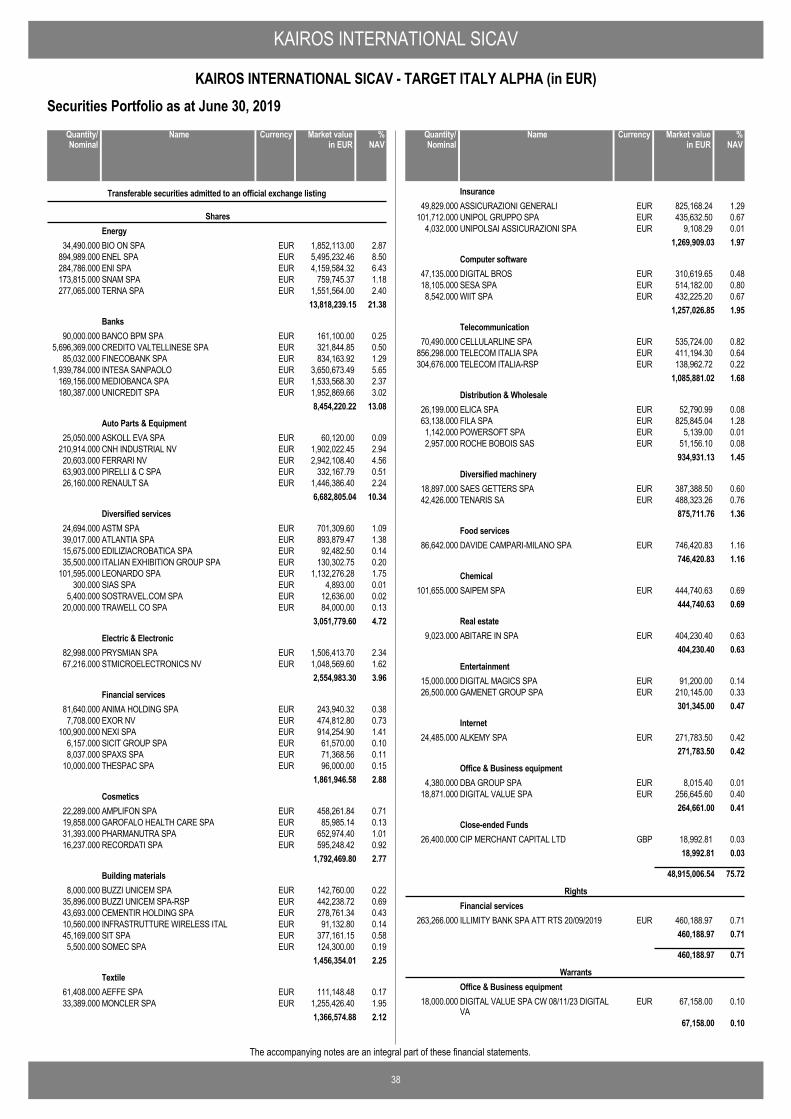
KAIROS INTERNATIONAL SICAV
38
KAIROS INTERNATIONAL SICAV - TARGET ITALY ALPHA (in EUR)
The accompanying notes are an integral part of these financial statements.
Securities Portfolio as at June 30, 2019
BIO ON SPA EUR 1,852,113.00 2.8734,490.000
Transferable securities admitted to an official exchange listing
SharesEnergy
ENEL SPA EUR 5,495,232.46 8.50894,989.000ENI SPA EUR 4,159,584.32 6.43284,786.000SNAM SPA EUR 759,745.37 1.18173,815.000TERNA SPA EUR 1,551,564.00 2.40277,065.000
13,818,239.15 21.38
BANCO BPM SPA EUR 161,100.00 0.2590,000.000Banks
CREDITO VALTELLINESE SPA EUR 321,844.85 0.505,696,369.000FINECOBANK SPA EUR 834,163.92 1.2985,032.000INTESA SANPAOLO EUR 3,650,673.49 5.651,939,784.000MEDIOBANCA SPA EUR 1,533,568.30 2.37169,156.000UNICREDIT SPA EUR 1,952,869.66 3.02180,387.000
8,454,220.22 13.08
ASKOLL EVA SPA EUR 60,120.00 0.0925,050.000Auto Parts & Equipment
CNH INDUSTRIAL NV EUR 1,902,022.45 2.94210,914.000FERRARI NV EUR 2,942,108.40 4.5620,603.000PIRELLI & C SPA EUR 332,167.79 0.5163,903.000RENAULT SA EUR 1,446,386.40 2.2426,160.000
6,682,805.04 10.34
ASTM SPA EUR 701,309.60 1.0924,694.000Diversified services
ATLANTIA SPA EUR 893,879.47 1.3839,017.000EDILIZIACROBATICA SPA EUR 92,482.50 0.1415,675.000ITALIAN EXHIBITION GROUP SPA EUR 130,302.75 0.2035,500.000LEONARDO SPA EUR 1,132,276.28 1.75101,595.000SIAS SPA EUR 4,893.00 0.01300.000SOSTRAVEL.COM SPA EUR 12,636.00 0.025,400.000TRAWELL CO SPA EUR 84,000.00 0.1320,000.000
3,051,779.60 4.72
PRYSMIAN SPA EUR 1,506,413.70 2.3482,998.000Electric & Electronic
STMICROELECTRONICS NV EUR 1,048,569.60 1.6267,216.0002,554,983.30 3.96
ANIMA HOLDING SPA EUR 243,940.32 0.3881,640.000Financial services
EXOR NV EUR 474,812.80 0.737,708.000NEXI SPA EUR 914,254.90 1.41100,900.000SICIT GROUP SPA EUR 61,570.00 0.106,157.000SPAXS SPA EUR 71,368.56 0.118,037.000THESPAC SPA EUR 96,000.00 0.1510,000.000
1,861,946.58 2.88
AMPLIFON SPA EUR 458,261.84 0.7122,289.000Cosmetics
GAROFALO HEALTH CARE SPA EUR 85,985.14 0.1319,858.000PHARMANUTRA SPA EUR 652,974.40 1.0131,393.000RECORDATI SPA EUR 595,248.42 0.9216,237.000
1,792,469.80 2.77
BUZZI UNICEM SPA EUR 142,760.00 0.228,000.000Building materials
BUZZI UNICEM SPA-RSP EUR 442,238.72 0.6935,896.000CEMENTIR HOLDING SPA EUR 278,761.34 0.4343,693.000INFRASTRUTTURE WIRELESS ITAL EUR 91,132.80 0.1410,560.000SIT SPA EUR 377,161.15 0.5845,169.000SOMEC SPA EUR 124,300.00 0.195,500.000
1,456,354.01 2.25
AEFFE SPA EUR 111,148.48 0.1761,408.000Textile
MONCLER SPA EUR 1,255,426.40 1.9533,389.0001,366,574.88 2.12
NameQuantity/Nominal
Market valuein EUR
Currency %NAV
ASSICURAZIONI GENERALI EUR 825,168.24 1.2949,829.000Insurance
UNIPOL GRUPPO SPA EUR 435,632.50 0.67101,712.000UNIPOLSAI ASSICURAZIONI SPA EUR 9,108.29 0.014,032.000
1,269,909.03 1.97
DIGITAL BROS EUR 310,619.65 0.4847,135.000Computer software
SESA SPA EUR 514,182.00 0.8018,105.000WIIT SPA EUR 432,225.20 0.678,542.000
1,257,026.85 1.95
CELLULARLINE SPA EUR 535,724.00 0.8270,490.000Telecommunication
TELECOM ITALIA SPA EUR 411,194.30 0.64856,298.000TELECOM ITALIA-RSP EUR 138,962.72 0.22304,676.000
1,085,881.02 1.68
ELICA SPA EUR 52,790.99 0.0826,199.000Distribution & Wholesale
FILA SPA EUR 825,845.04 1.2863,138.000POWERSOFT SPA EUR 5,139.00 0.011,142.000ROCHE BOBOIS SAS EUR 51,156.10 0.082,957.000
934,931.13 1.45
SAES GETTERS SPA EUR 387,388.50 0.6018,897.000Diversified machinery
TENARIS SA EUR 488,323.26 0.7642,426.000875,711.76 1.36
DAVIDE CAMPARI-MILANO SPA EUR 746,420.83 1.1686,642.000Food services
746,420.83 1.16
SAIPEM SPA EUR 444,740.63 0.69101,655.000Chemical
444,740.63 0.69
ABITARE IN SPA EUR 404,230.40 0.639,023.000Real estate
404,230.40 0.63
DIGITAL MAGICS SPA EUR 91,200.00 0.1415,000.000Entertainment
GAMENET GROUP SPA EUR 210,145.00 0.3326,500.000301,345.00 0.47
ALKEMY SPA EUR 271,783.50 0.4224,485.000Internet
271,783.50 0.42
DBA GROUP SPA EUR 8,015.40 0.014,380.000Office & Business equipment
DIGITAL VALUE SPA EUR 256,645.60 0.4018,871.000264,661.00 0.41
CIP MERCHANT CAPITAL LTD GBP 18,992.81 0.0326,400.000Close-ended Funds
18,992.81 0.03
48,915,006.54 75.72
ILLIMITY BANK SPA ATT RTS 20/09/2019 EUR 460,188.97 0.71263,266.000
RightsFinancial services
460,188.97 0.71
460,188.97 0.71
DIGITAL VALUE SPA CW 08/11/23 DIGITALVA
EUR 67,158.00 0.1018,000.000
WarrantsOffice & Business equipment
67,158.00 0.10
NameQuantity/Nominal
Market valuein EUR
Currency %NAV
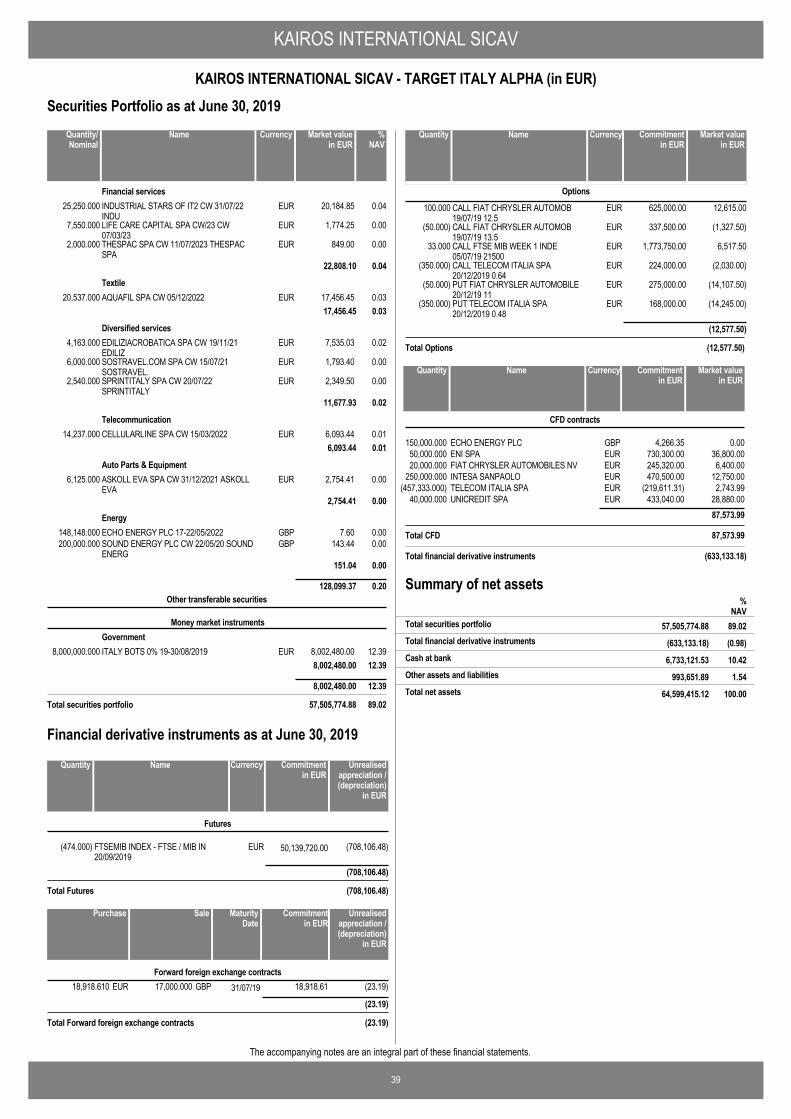
KAIROS INTERNATIONAL SICAV
39
KAIROS INTERNATIONAL SICAV - TARGET ITALY ALPHA (in EUR)
The accompanying notes are an integral part of these financial statements.
Securities Portfolio as at June 30, 2019
INDUSTRIAL STARS OF IT2 CW 31/07/22INDU
EUR 20,184.85 0.0425,250.000Financial services
LIFE CARE CAPITAL SPA CW/23 CW07/03/23
EUR 1,774.25 0.007,550.000
THESPAC SPA CW 11/07/2023 THESPACSPA
EUR 849.00 0.002,000.000
22,808.10 0.04
AQUAFIL SPA CW 05/12/2022 EUR 17,456.45 0.0320,537.000Textile
17,456.45 0.03
EDILIZIACROBATICA SPA CW 19/11/21EDILIZ
EUR 7,535.03 0.024,163.000Diversified services
SOSTRAVEL.COM SPA CW 15/07/21SOSTRAVEL.
EUR 1,793.40 0.006,000.000
SPRINTITALY SPA CW 20/07/22SPRINTITALY
EUR 2,349.50 0.002,540.000
11,677.93 0.02
CELLULARLINE SPA CW 15/03/2022 EUR 6,093.44 0.0114,237.000Telecommunication
6,093.44 0.01
ASKOLL EVA SPA CW 31/12/2021 ASKOLLEVA
EUR 2,754.41 0.006,125.000Auto Parts & Equipment
2,754.41 0.00
ECHO ENERGY PLC 17-22/05/2022 GBP 7.60 0.00148,148.000Energy
SOUND ENERGY PLC CW 22/05/20 SOUNDENERG
GBP 143.44 0.00200,000.000
151.04 0.00
128,099.37 0.20
ITALY BOTS 0% 19-30/08/2019 EUR 8,002,480.00 12.398,000,000.000
Other transferable securities
Money market instrumentsGovernment
8,002,480.00 12.39
8,002,480.00 12.39
Total securities portfolio 57,505,774.88 89.02
NameQuantity/Nominal
Market valuein EUR
Currency %NAV
FTSEMIB INDEX - FTSE / MIB IN20/09/2019
EUR 50,139,720.00(474.000) (708,106.48)
Futures
(708,106.48)
Total Futures (708,106.48)
NameQuantity Commitmentin EUR
Currency Unrealisedappreciation /(depreciation)
in EUR
Financial derivative instruments as at June 30, 2019
17,000.000 31/07/1918,918.610 (23.19)GBPEUR 18,918.61Forward foreign exchange contracts
(23.19)
Total Forward foreign exchange contracts (23.19)
SalePurchase Unrealisedappreciation /(depreciation)
in EUR
MaturityDate
Commitmentin EUR
CALL FIAT CHRYSLER AUTOMOB19/07/19 12.5
EUR100.000 625,000.00 12,615.00
Options
CALL FIAT CHRYSLER AUTOMOB19/07/19 13.5
EUR(50.000) 337,500.00 (1,327.50)
CALL FTSE MIB WEEK 1 INDE05/07/19 21500
EUR33.000 1,773,750.00 6,517.50
CALL TELECOM ITALIA SPA20/12/2019 0.64
EUR(350.000) 224,000.00 (2,030.00)
PUT FIAT CHRYSLER AUTOMOBILE20/12/19 11
EUR(50.000) 275,000.00 (14,107.50)
PUT TELECOM ITALIA SPA20/12/2019 0.48
EUR(350.000) 168,000.00 (14,245.00)
(12,577.50)
Total Options (12,577.50)
NameQuantity Market valuein EUR
Currency Commitmentin EUR
ECHO ENERGY PLC GBP 0.004,266.35150,000.000
CFD contracts
NameQuantity Market valuein EUR
Currency Commitmentin EUR
ENI SPA EUR 36,800.00730,300.0050,000.000FIAT CHRYSLER AUTOMOBILES NV EUR 6,400.00245,320.0020,000.000INTESA SANPAOLO EUR 12,750.00470,500.00250,000.000TELECOM ITALIA SPA EUR 2,743.99(219,611.31)(457,333.000)UNICREDIT SPA EUR 28,880.00433,040.0040,000.000
87,573.99
Total CFD 87,573.99
Total financial derivative instruments (633,133.18)
Summary of net assets
(633,133.18) (0.98)Total financial derivative instruments
%NAV
57,505,774.88 89.02Total securities portfolio
6,733,121.53 10.42Cash at bank
993,651.89 1.54Other assets and liabilities
64,599,415.12 100.00Total net assets

KAIROS INTERNATIONAL SICAV
40
KAIROS INTERNATIONAL SICAV - TARGET ITALY ALPHA (in EUR)
The accompanying notes are an integral part of these financial statements.
Nature allocation % of portfolio % of netassets
Shares 85.06 75.72
Money market instruments 13.92 12.39
Other 1.02 0.91
100.00 89.02
Country allocation % of portfolio % of netassets
Italy 85.45 76.06
Netherlands 11.07 9.85
France 2.60 2.32
Other 0.88 0.79
100.00 89.02
Portfolio Breakdowns
Top Ten Holdings Market value % ofnet
assets
ITALY BOTS 0% 19-30/08/2019 8,002,480.00 12.39Government
ENEL SPA 5,495,232.46 8.50Energy
ENI SPA 4,159,584.32 6.43Energy
INTESA SANPAOLO 3,650,673.49 5.65Banks
FERRARI NV 2,942,108.40 4.56Auto Parts &Equipment
UNICREDIT SPA 1,952,869.66 3.02Banks
CNH INDUSTRIAL NV 1,902,022.45 2.94Auto Parts &Equipment
BIO ON SPA 1,852,113.00 2.87Energy
TERNA SPA 1,551,564.00 2.40Energy
MEDIOBANCA SPA 1,533,568.30 2.37Banks
EUR
Sector
Top Ten Holdings

41
The accompanying notes are an integral part of these financial statements.
KAIROS INTERNATIONAL SICAV
KAIROS INTERNATIONAL SICAV - WORLD* (in EUR)Statement of Operations and Changes in Net Assets for theperiod ended May 23, 2019
EUR
Assets
Liabilities
Net assets at the end of the period -
Notes
Statement of Net Assets as at May 23, 2019
*This Sub-Fund was merged into KAIROS INTERNATIONAL SICAV – PENTAGON on May24, 2019
IncomeInterest on bonds (net of withholding taxes) 3.8 134,567.57Bank interest 3,043.67
Total income 137,611.24
ExpensesInvestment management fees 4 108,928.30Depositary fees 5 4,573.52Performance fees 4 484,821.12Administration fees 5 11,135.85Professional fees 16,887.91Transaction costs 3.9 4,556.63Taxe d'abonnement 6 1,373.26Bank interest and charges 10,788.11Interests on derivative instruments 1,949.12Printing & Publication fees 487.59Other expenses 15,291.93
Total expenses 660,793.34
Net investment income / (loss) (523,182.10)
Net realised gain / (loss) on:Investments (476,022.70)Foreign currencies transactions 3.2 (39,058.69)Futures contracts 3.5 2,659,943.71Forward foreign exchange contracts 3.6 (76,604.66)Contracts for difference 3.7 749,133.04
Net realised gain / (loss) for the period 2,294,208.60
Net change in unrealised appreciation / (depreciation) on:Investments 1,319,218.85Futures contracts 1,051,016.88Forward foreign exchange contracts 11,841.85Contracts for difference 166,151.91
Increase / (Decrease) in net assets as a result ofoperations
4,842,438.09
Proceeds received on subscription of shares 210,175.74Net amount paid on redemption of shares (61,769,918.82)Net assets at the beginning of the period 56,717,304.99
Net assets at the end of the period -
EURNotes
Statement of Operations and Changes in Net Assets forthe period ended May 23, 2019
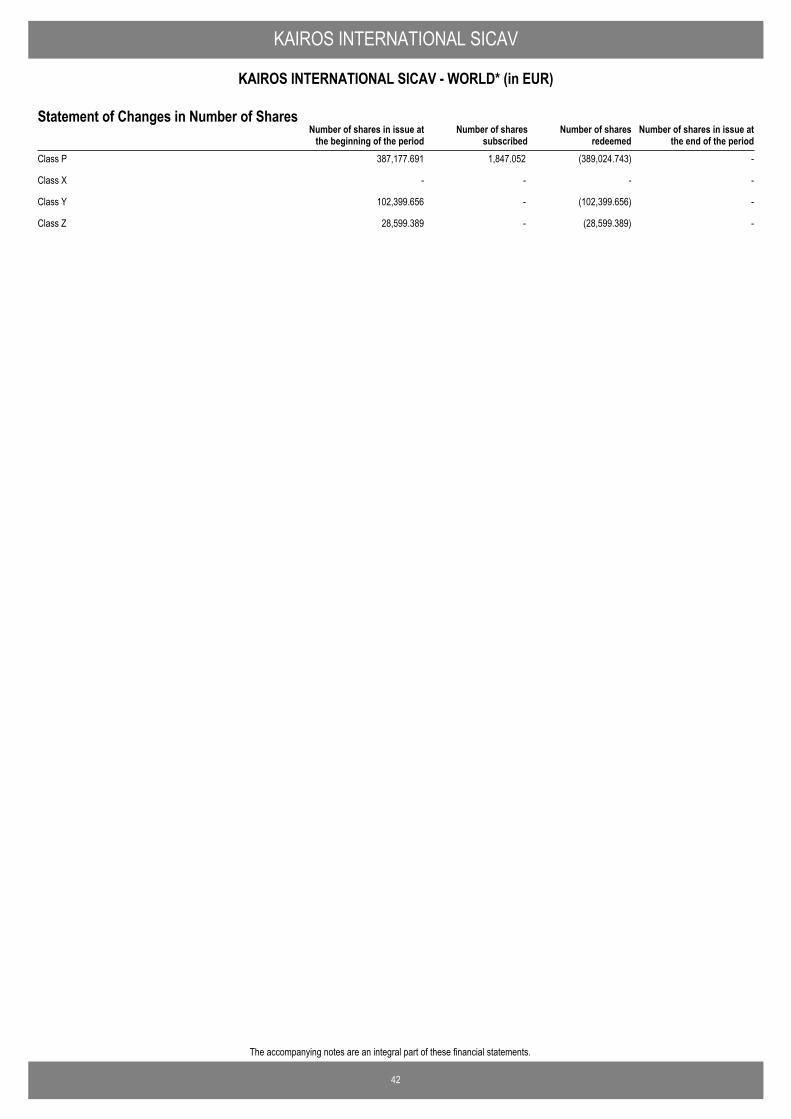
42
The accompanying notes are an integral part of these financial statements.
KAIROS INTERNATIONAL SICAV
KAIROS INTERNATIONAL SICAV - WORLD* (in EUR)
Number of shares in issue atthe end of the period
Number of shares in issue atthe beginning of the period
Number of sharessubscribed
Number of sharesredeemed
Statement of Changes in Number of Shares
Class P 387,177.691 1,847.052 (389,024.743) -
Class X - - - -
Class Y 102,399.656 - (102,399.656) -
Class Z 28,599.389 - (28,599.389) -
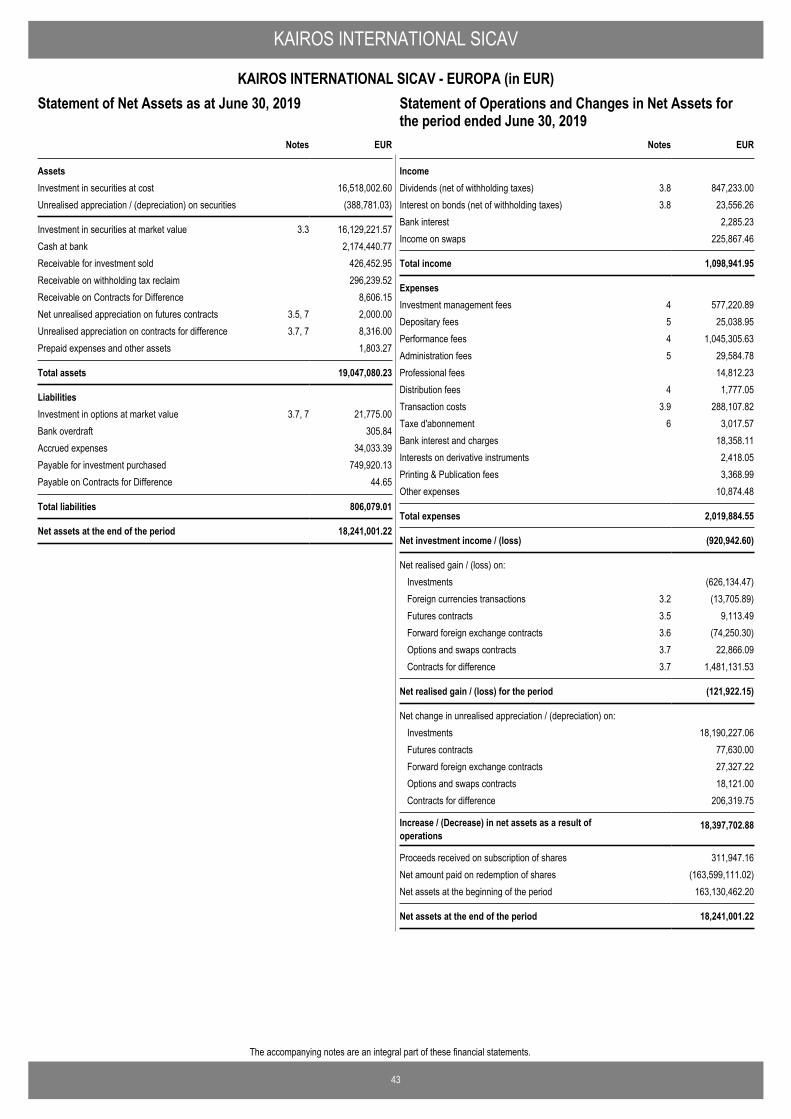
43
The accompanying notes are an integral part of these financial statements.
KAIROS INTERNATIONAL SICAV
KAIROS INTERNATIONAL SICAV - EUROPA (in EUR)Statement of Operations and Changes in Net Assets for theperiod ended June 30, 2019
EUR
AssetsInvestment in securities at cost 16,518,002.60Unrealised appreciation / (depreciation) on securities (388,781.03)
Investment in securities at market value 3.3 16,129,221.57Cash at bank 2,174,440.77Receivable for investment sold 426,452.95Receivable on withholding tax reclaim 296,239.52Receivable on Contracts for Difference 8,606.15Net unrealised appreciation on futures contracts 3.5, 7 2,000.00Unrealised appreciation on contracts for difference 3.7, 7 8,316.00Prepaid expenses and other assets 1,803.27
Total assets 19,047,080.23
LiabilitiesInvestment in options at market value 3.7, 7 21,775.00Bank overdraft 305.84Accrued expenses 34,033.39Payable for investment purchased 749,920.13Payable on Contracts for Difference 44.65
Total liabilities 806,079.01
Net assets at the end of the period 18,241,001.22
Notes
Statement of Net Assets as at June 30, 2019
IncomeDividends (net of withholding taxes) 3.8 847,233.00Interest on bonds (net of withholding taxes) 3.8 23,556.26Bank interest 2,285.23Income on swaps 225,867.46
Total income 1,098,941.95
ExpensesInvestment management fees 4 577,220.89Depositary fees 5 25,038.95Performance fees 4 1,045,305.63Administration fees 5 29,584.78Professional fees 14,812.23Distribution fees 4 1,777.05Transaction costs 3.9 288,107.82Taxe d'abonnement 6 3,017.57Bank interest and charges 18,358.11Interests on derivative instruments 2,418.05Printing & Publication fees 3,368.99Other expenses 10,874.48
Total expenses 2,019,884.55
Net investment income / (loss) (920,942.60)
Net realised gain / (loss) on: Investments (626,134.47)Foreign currencies transactions 3.2 (13,705.89)Futures contracts 3.5 9,113.49Forward foreign exchange contracts 3.6 (74,250.30)Options and swaps contracts 3.7 22,866.09Contracts for difference 3.7 1,481,131.53
Net realised gain / (loss) for the period (121,922.15)
Net change in unrealised appreciation / (depreciation) on: Investments 18,190,227.06Futures contracts 77,630.00Forward foreign exchange contracts 27,327.22Options and swaps contracts 18,121.00Contracts for difference 206,319.75
Increase / (Decrease) in net assets as a result ofoperations
18,397,702.88
Proceeds received on subscription of shares 311,947.16Net amount paid on redemption of shares (163,599,111.02)Net assets at the beginning of the period 163,130,462.20
Net assets at the end of the period 18,241,001.22
EURNotes
Statement of Operations and Changes in Net Assets forthe period ended June 30, 2019
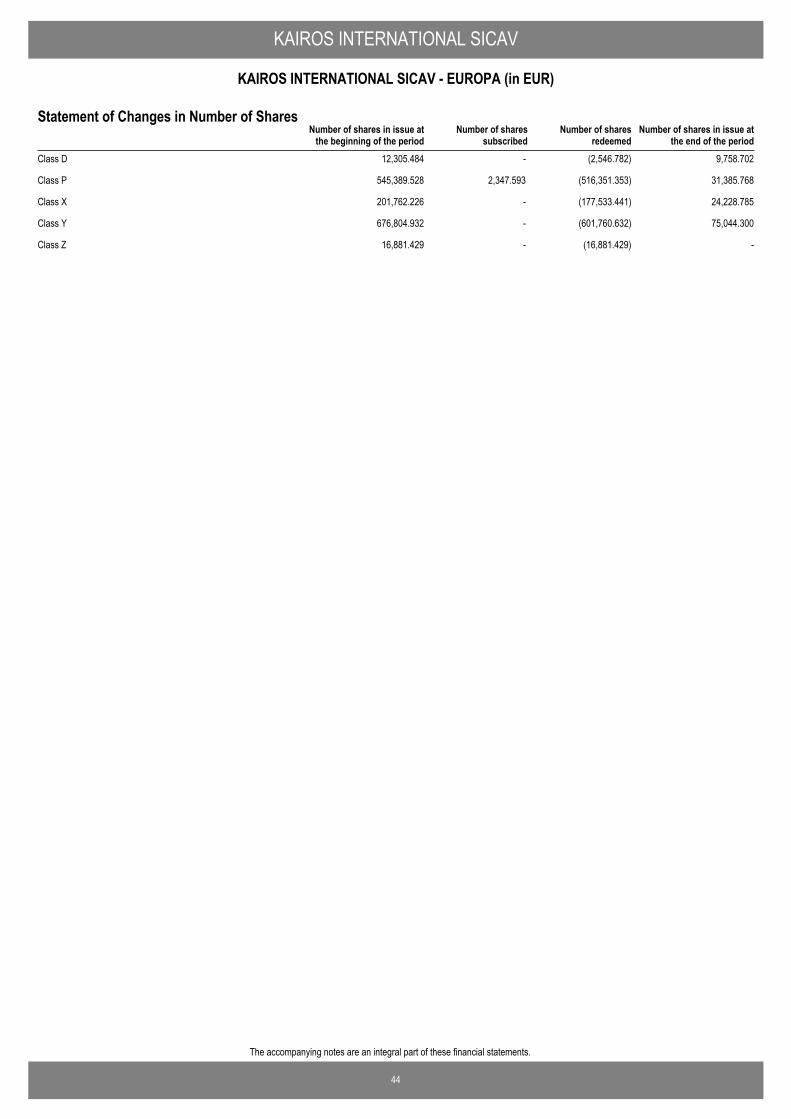
44
The accompanying notes are an integral part of these financial statements.
KAIROS INTERNATIONAL SICAV
KAIROS INTERNATIONAL SICAV - EUROPA (in EUR)
Number of shares in issue atthe end of the period
Number of shares in issue atthe beginning of the period
Number of sharessubscribed
Number of sharesredeemed
Statement of Changes in Number of Shares
Class D 12,305.484 - (2,546.782) 9,758.702
Class P 545,389.528 2,347.593 (516,351.353) 31,385.768
Class X 201,762.226 - (177,533.441) 24,228.785
Class Y 676,804.932 - (601,760.632) 75,044.300
Class Z 16,881.429 - (16,881.429) -
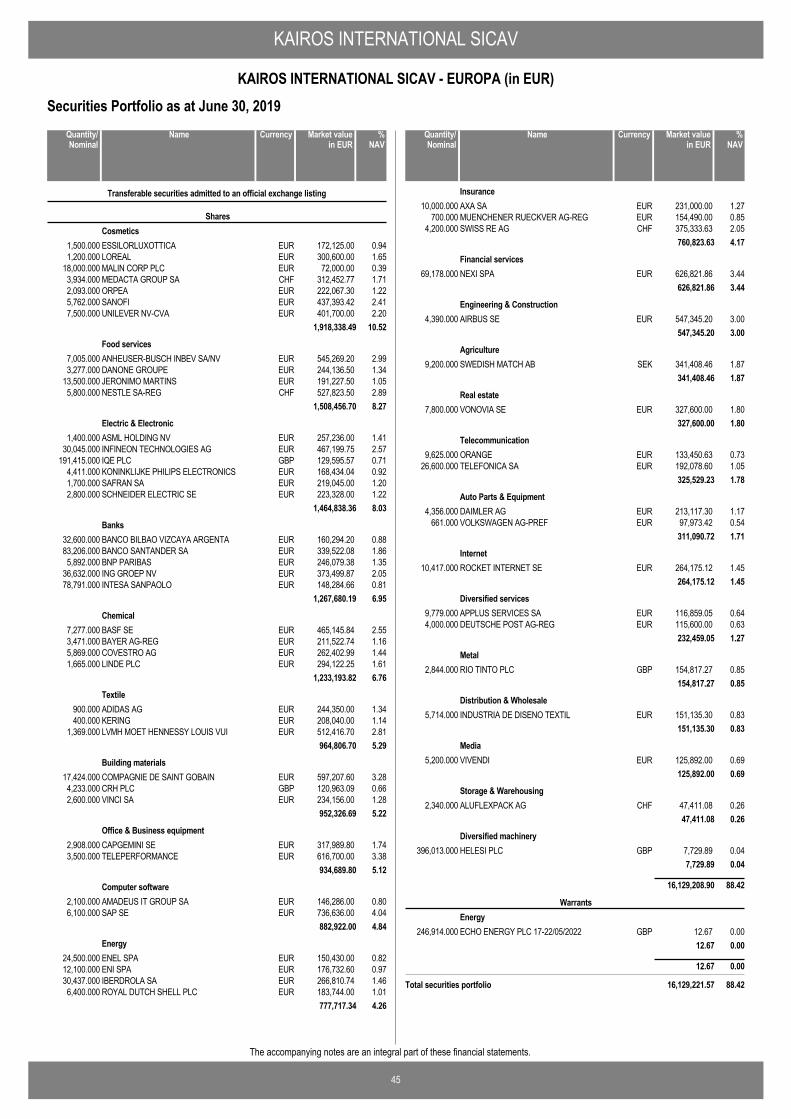
KAIROS INTERNATIONAL SICAV
45
KAIROS INTERNATIONAL SICAV - EUROPA (in EUR)
The accompanying notes are an integral part of these financial statements.
Securities Portfolio as at June 30, 2019
ESSILORLUXOTTICA EUR 172,125.00 0.941,500.000
Transferable securities admitted to an official exchange listing
SharesCosmetics
LOREAL EUR 300,600.00 1.651,200.000MALIN CORP PLC EUR 72,000.00 0.3918,000.000MEDACTA GROUP SA CHF 312,452.77 1.713,934.000ORPEA EUR 222,067.30 1.222,093.000SANOFI EUR 437,393.42 2.415,762.000UNILEVER NV-CVA EUR 401,700.00 2.207,500.000
1,918,338.49 10.52
ANHEUSER-BUSCH INBEV SA/NV EUR 545,269.20 2.997,005.000Food services
DANONE GROUPE EUR 244,136.50 1.343,277.000JERONIMO MARTINS EUR 191,227.50 1.0513,500.000NESTLE SA-REG CHF 527,823.50 2.895,800.000
1,508,456.70 8.27
ASML HOLDING NV EUR 257,236.00 1.411,400.000Electric & Electronic
INFINEON TECHNOLOGIES AG EUR 467,199.75 2.5730,045.000IQE PLC GBP 129,595.57 0.71191,415.000KONINKLIJKE PHILIPS ELECTRONICS EUR 168,434.04 0.924,411.000SAFRAN SA EUR 219,045.00 1.201,700.000SCHNEIDER ELECTRIC SE EUR 223,328.00 1.222,800.000
1,464,838.36 8.03
BANCO BILBAO VIZCAYA ARGENTA EUR 160,294.20 0.8832,600.000Banks
BANCO SANTANDER SA EUR 339,522.08 1.8683,206.000BNP PARIBAS EUR 246,079.38 1.355,892.000ING GROEP NV EUR 373,499.87 2.0536,632.000INTESA SANPAOLO EUR 148,284.66 0.8178,791.000
1,267,680.19 6.95
BASF SE EUR 465,145.84 2.557,277.000Chemical
BAYER AG-REG EUR 211,522.74 1.163,471.000COVESTRO AG EUR 262,402.99 1.445,869.000LINDE PLC EUR 294,122.25 1.611,665.000
1,233,193.82 6.76
ADIDAS AG EUR 244,350.00 1.34900.000Textile
KERING EUR 208,040.00 1.14400.000LVMH MOET HENNESSY LOUIS VUI EUR 512,416.70 2.811,369.000
964,806.70 5.29
COMPAGNIE DE SAINT GOBAIN EUR 597,207.60 3.2817,424.000Building materials
CRH PLC GBP 120,963.09 0.664,233.000VINCI SA EUR 234,156.00 1.282,600.000
952,326.69 5.22
CAPGEMINI SE EUR 317,989.80 1.742,908.000Office & Business equipment
TELEPERFORMANCE EUR 616,700.00 3.383,500.000934,689.80 5.12
AMADEUS IT GROUP SA EUR 146,286.00 0.802,100.000Computer software
SAP SE EUR 736,636.00 4.046,100.000882,922.00 4.84
ENEL SPA EUR 150,430.00 0.8224,500.000Energy
ENI SPA EUR 176,732.60 0.9712,100.000IBERDROLA SA EUR 266,810.74 1.4630,437.000ROYAL DUTCH SHELL PLC EUR 183,744.00 1.016,400.000
777,717.34 4.26
NameQuantity/Nominal
Market valuein EUR
Currency %NAV
AXA SA EUR 231,000.00 1.2710,000.000Insurance
MUENCHENER RUECKVER AG-REG EUR 154,490.00 0.85700.000SWISS RE AG CHF 375,333.63 2.054,200.000
760,823.63 4.17
NEXI SPA EUR 626,821.86 3.4469,178.000Financial services
626,821.86 3.44
AIRBUS SE EUR 547,345.20 3.004,390.000Engineering & Construction
547,345.20 3.00
SWEDISH MATCH AB SEK 341,408.46 1.879,200.000Agriculture
341,408.46 1.87
VONOVIA SE EUR 327,600.00 1.807,800.000Real estate
327,600.00 1.80
ORANGE EUR 133,450.63 0.739,625.000Telecommunication
TELEFONICA SA EUR 192,078.60 1.0526,600.000325,529.23 1.78
DAIMLER AG EUR 213,117.30 1.174,356.000Auto Parts & Equipment
VOLKSWAGEN AG-PREF EUR 97,973.42 0.54661.000311,090.72 1.71
ROCKET INTERNET SE EUR 264,175.12 1.4510,417.000Internet
264,175.12 1.45
APPLUS SERVICES SA EUR 116,859.05 0.649,779.000Diversified services
DEUTSCHE POST AG-REG EUR 115,600.00 0.634,000.000232,459.05 1.27
RIO TINTO PLC GBP 154,817.27 0.852,844.000Metal
154,817.27 0.85
INDUSTRIA DE DISENO TEXTIL EUR 151,135.30 0.835,714.000Distribution & Wholesale
151,135.30 0.83
VIVENDI EUR 125,892.00 0.695,200.000Media
125,892.00 0.69
ALUFLEXPACK AG CHF 47,411.08 0.262,340.000Storage & Warehousing
47,411.08 0.26
HELESI PLC GBP 7,729.89 0.04396,013.000Diversified machinery
7,729.89 0.04
16,129,208.90 88.42
ECHO ENERGY PLC 17-22/05/2022 GBP 12.67 0.00246,914.000
WarrantsEnergy
12.67 0.00
12.67 0.00
Total securities portfolio 16,129,221.57 88.42
NameQuantity/Nominal
Market valuein EUR
Currency %NAV
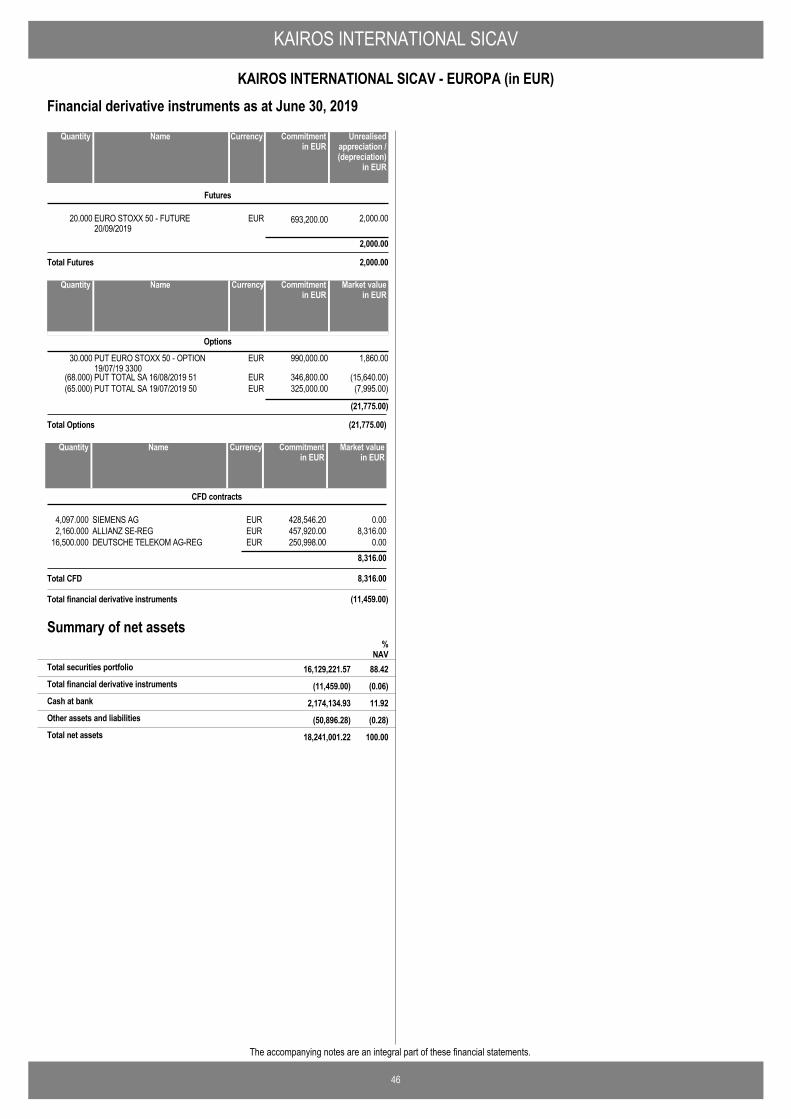
KAIROS INTERNATIONAL SICAV
46
KAIROS INTERNATIONAL SICAV - EUROPA (in EUR)
The accompanying notes are an integral part of these financial statements.
EURO STOXX 50 - FUTURE20/09/2019
EUR 693,200.0020.000 2,000.00
Futures
2,000.00
Total Futures 2,000.00
NameQuantity Commitmentin EUR
Currency Unrealisedappreciation /(depreciation)
in EUR
Financial derivative instruments as at June 30, 2019
PUT EURO STOXX 50 - OPTION19/07/19 3300
EUR30.000 990,000.00 1,860.00
Options
PUT TOTAL SA 16/08/2019 51 EUR(68.000) 346,800.00 (15,640.00)PUT TOTAL SA 19/07/2019 50 EUR(65.000) 325,000.00 (7,995.00)
(21,775.00)
Total Options (21,775.00)
NameQuantity Market valuein EUR
Currency Commitmentin EUR
SIEMENS AG EUR 0.00428,546.204,097.000
CFD contracts
NameQuantity Market valuein EUR
Currency Commitmentin EUR
ALLIANZ SE-REG EUR 8,316.00457,920.002,160.000DEUTSCHE TELEKOM AG-REG EUR 0.00250,998.0016,500.000
8,316.00
Total CFD 8,316.00
Total financial derivative instruments (11,459.00)
Summary of net assets
(11,459.00) (0.06)Total financial derivative instruments
%NAV
16,129,221.57 88.42Total securities portfolio
2,174,134.93 11.92Cash at bank
(50,896.28) (0.28)Other assets and liabilities
18,241,001.22 100.00Total net assets

KAIROS INTERNATIONAL SICAV
47
KAIROS INTERNATIONAL SICAV - EUROPA (in EUR)
The accompanying notes are an integral part of these financial statements.
Nature allocation % of portfolio % of netassets
Shares 100.00 88.42
Warrants - -
100.00 88.42
Country allocation % of portfolio % of netassets
France 31.26 27.65
Germany 22.07 19.54
Netherlands 11.98 10.59
Spain 8.51 7.52
Switzerland 7.83 6.91
Italy 6.83 6.04
Belgium 3.38 2.99
Ireland 3.02 2.66
Sweden 2.12 1.87
Other 3.00 2.65
100.00 88.42
Portfolio Breakdowns
Top Ten Holdings Market value % ofnet
assets
SAP SE 736,636.00 4.04Computer software
NEXI SPA 626,821.86 3.44Financial services
TELEPERFORMANCE 616,700.00 3.38Office & Businessequipment
COMPAGNIE DE SAINT GOBAIN 597,207.60 3.28Building materials
AIRBUS SE 547,345.20 3.00Engineering &Construction
ANHEUSER-BUSCH INBEV SA/NV 545,269.20 2.99Food services
NESTLE SA-REG 527,823.50 2.89Food services
LVMH MOET HENNESSY LOUIS VUI 512,416.70 2.81Textile
INFINEON TECHNOLOGIES AG 467,199.75 2.57Electric & Electronic
BASF SE 465,145.84 2.55Chemical
EUR
Sector
Top Ten Holdings
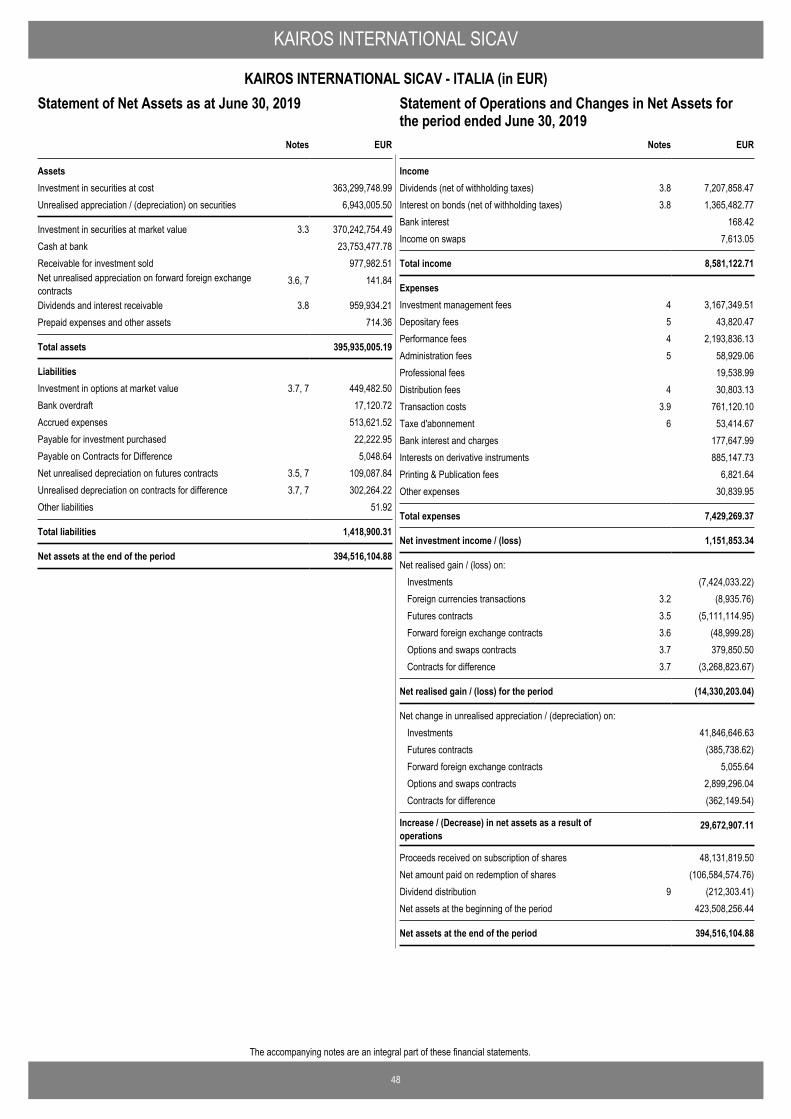
48
The accompanying notes are an integral part of these financial statements.
KAIROS INTERNATIONAL SICAV
KAIROS INTERNATIONAL SICAV - ITALIA (in EUR)Statement of Operations and Changes in Net Assets for theperiod ended June 30, 2019
EUR
AssetsInvestment in securities at cost 363,299,748.99Unrealised appreciation / (depreciation) on securities 6,943,005.50
Investment in securities at market value 3.3 370,242,754.49Cash at bank 23,753,477.78Receivable for investment sold 977,982.51Net unrealised appreciation on forward foreign exchangecontracts
3.6, 7 141.84
Dividends and interest receivable 3.8 959,934.21Prepaid expenses and other assets 714.36
Total assets 395,935,005.19
LiabilitiesInvestment in options at market value 3.7, 7 449,482.50Bank overdraft 17,120.72Accrued expenses 513,621.52Payable for investment purchased 22,222.95Payable on Contracts for Difference 5,048.64Net unrealised depreciation on futures contracts 3.5, 7 109,087.84Unrealised depreciation on contracts for difference 3.7, 7 302,264.22Other liabilities 51.92
Total liabilities 1,418,900.31
Net assets at the end of the period 394,516,104.88
Notes
Statement of Net Assets as at June 30, 2019
IncomeDividends (net of withholding taxes) 3.8 7,207,858.47Interest on bonds (net of withholding taxes) 3.8 1,365,482.77Bank interest 168.42Income on swaps 7,613.05
Total income 8,581,122.71
ExpensesInvestment management fees 4 3,167,349.51Depositary fees 5 43,820.47Performance fees 4 2,193,836.13Administration fees 5 58,929.06Professional fees 19,538.99Distribution fees 4 30,803.13Transaction costs 3.9 761,120.10Taxe d'abonnement 6 53,414.67Bank interest and charges 177,647.99Interests on derivative instruments 885,147.73Printing & Publication fees 6,821.64Other expenses 30,839.95
Total expenses 7,429,269.37
Net investment income / (loss) 1,151,853.34
Net realised gain / (loss) on: Investments (7,424,033.22)Foreign currencies transactions 3.2 (8,935.76)Futures contracts 3.5 (5,111,114.95)Forward foreign exchange contracts 3.6 (48,999.28)Options and swaps contracts 3.7 379,850.50Contracts for difference 3.7 (3,268,823.67)
Net realised gain / (loss) for the period (14,330,203.04)
Net change in unrealised appreciation / (depreciation) on: Investments 41,846,646.63Futures contracts (385,738.62)Forward foreign exchange contracts 5,055.64Options and swaps contracts 2,899,296.04Contracts for difference (362,149.54)
Increase / (Decrease) in net assets as a result ofoperations
29,672,907.11
Proceeds received on subscription of shares 48,131,819.50Net amount paid on redemption of shares (106,584,574.76)Dividend distribution 9 (212,303.41)Net assets at the beginning of the period 423,508,256.44
Net assets at the end of the period 394,516,104.88
EURNotes
Statement of Operations and Changes in Net Assets forthe period ended June 30, 2019
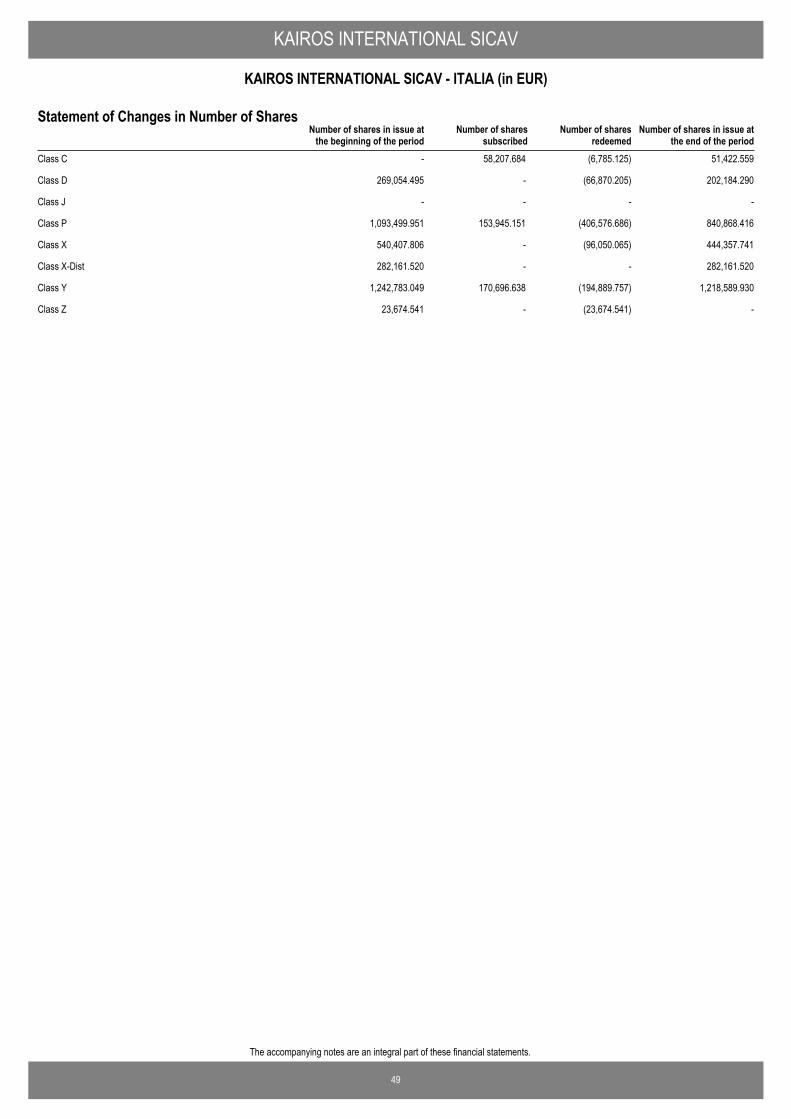
49
The accompanying notes are an integral part of these financial statements.
KAIROS INTERNATIONAL SICAV
KAIROS INTERNATIONAL SICAV - ITALIA (in EUR)
Number of shares in issue atthe end of the period
Number of shares in issue atthe beginning of the period
Number of sharessubscribed
Number of sharesredeemed
Statement of Changes in Number of Shares
Class C - 58,207.684 (6,785.125) 51,422.559
Class D 269,054.495 - (66,870.205) 202,184.290
Class J - - - -
Class P 1,093,499.951 153,945.151 (406,576.686) 840,868.416
Class X 540,407.806 - (96,050.065) 444,357.741
Class X-Dist 282,161.520 - - 282,161.520
Class Y 1,242,783.049 170,696.638 (194,889.757) 1,218,589.930
Class Z 23,674.541 - (23,674.541) -
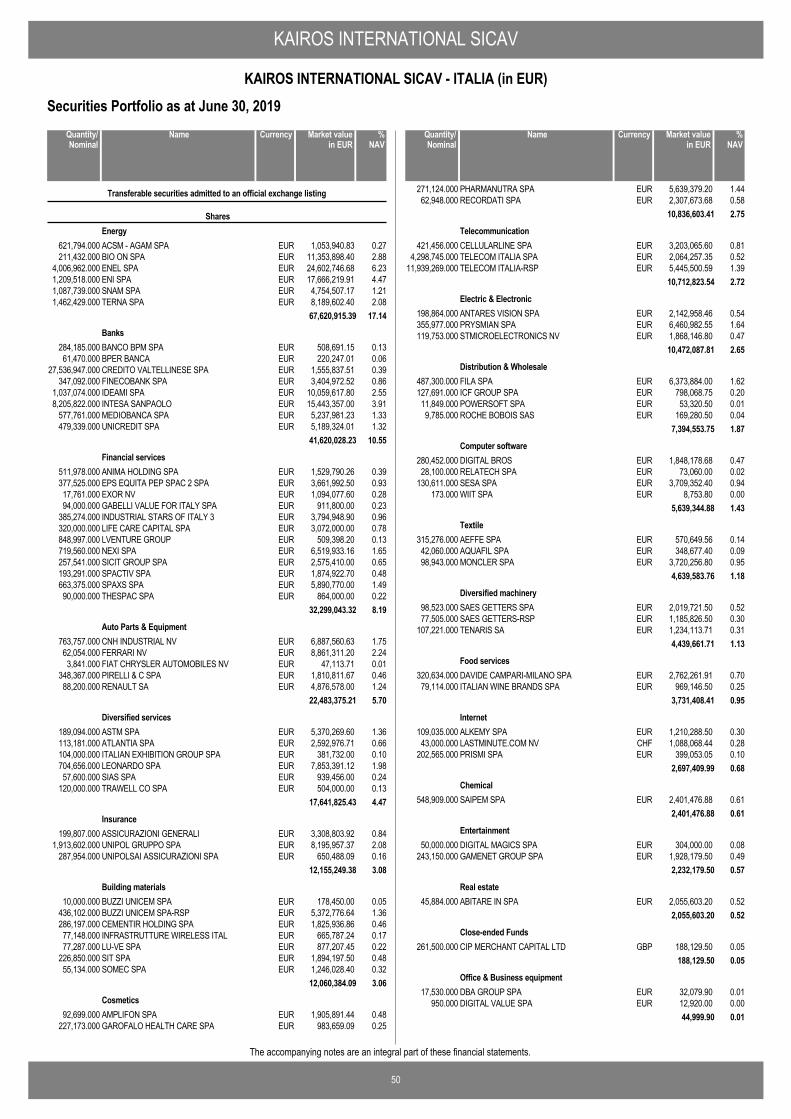
KAIROS INTERNATIONAL SICAV
50
KAIROS INTERNATIONAL SICAV - ITALIA (in EUR)
The accompanying notes are an integral part of these financial statements.
Securities Portfolio as at June 30, 2019
ACSM - AGAM SPA EUR 1,053,940.83 0.27621,794.000
Transferable securities admitted to an official exchange listing
SharesEnergy
BIO ON SPA EUR 11,353,898.40 2.88211,432.000ENEL SPA EUR 24,602,746.68 6.234,006,962.000ENI SPA EUR 17,666,219.91 4.471,209,518.000SNAM SPA EUR 4,754,507.17 1.211,087,739.000TERNA SPA EUR 8,189,602.40 2.081,462,429.000
67,620,915.39 17.14
BANCO BPM SPA EUR 508,691.15 0.13284,185.000Banks
BPER BANCA EUR 220,247.01 0.0661,470.000CREDITO VALTELLINESE SPA EUR 1,555,837.51 0.3927,536,947.000FINECOBANK SPA EUR 3,404,972.52 0.86347,092.000IDEAMI SPA EUR 10,059,617.80 2.551,037,074.000INTESA SANPAOLO EUR 15,443,357.00 3.918,205,822.000MEDIOBANCA SPA EUR 5,237,981.23 1.33577,761.000UNICREDIT SPA EUR 5,189,324.01 1.32479,339.000
41,620,028.23 10.55
ANIMA HOLDING SPA EUR 1,529,790.26 0.39511,978.000Financial services
EPS EQUITA PEP SPAC 2 SPA EUR 3,661,992.50 0.93377,525.000EXOR NV EUR 1,094,077.60 0.2817,761.000GABELLI VALUE FOR ITALY SPA EUR 911,800.00 0.2394,000.000INDUSTRIAL STARS OF ITALY 3 EUR 3,794,948.90 0.96385,274.000LIFE CARE CAPITAL SPA EUR 3,072,000.00 0.78320,000.000LVENTURE GROUP EUR 509,398.20 0.13848,997.000NEXI SPA EUR 6,519,933.16 1.65719,560.000SICIT GROUP SPA EUR 2,575,410.00 0.65257,541.000SPACTIV SPA EUR 1,874,922.70 0.48193,291.000SPAXS SPA EUR 5,890,770.00 1.49663,375.000THESPAC SPA EUR 864,000.00 0.2290,000.000
32,299,043.32 8.19
CNH INDUSTRIAL NV EUR 6,887,560.63 1.75763,757.000Auto Parts & Equipment
FERRARI NV EUR 8,861,311.20 2.2462,054.000FIAT CHRYSLER AUTOMOBILES NV EUR 47,113.71 0.013,841.000PIRELLI & C SPA EUR 1,810,811.67 0.46348,367.000RENAULT SA EUR 4,876,578.00 1.2488,200.000
22,483,375.21 5.70
ASTM SPA EUR 5,370,269.60 1.36189,094.000Diversified services
ATLANTIA SPA EUR 2,592,976.71 0.66113,181.000ITALIAN EXHIBITION GROUP SPA EUR 381,732.00 0.10104,000.000LEONARDO SPA EUR 7,853,391.12 1.98704,656.000SIAS SPA EUR 939,456.00 0.2457,600.000TRAWELL CO SPA EUR 504,000.00 0.13120,000.000
17,641,825.43 4.47
ASSICURAZIONI GENERALI EUR 3,308,803.92 0.84199,807.000Insurance
UNIPOL GRUPPO SPA EUR 8,195,957.37 2.081,913,602.000UNIPOLSAI ASSICURAZIONI SPA EUR 650,488.09 0.16287,954.000
12,155,249.38 3.08
BUZZI UNICEM SPA EUR 178,450.00 0.0510,000.000Building materials
BUZZI UNICEM SPA-RSP EUR 5,372,776.64 1.36436,102.000CEMENTIR HOLDING SPA EUR 1,825,936.86 0.46286,197.000INFRASTRUTTURE WIRELESS ITAL EUR 665,787.24 0.1777,148.000LU-VE SPA EUR 877,207.45 0.2277,287.000SIT SPA EUR 1,894,197.50 0.48226,850.000SOMEC SPA EUR 1,246,028.40 0.3255,134.000
12,060,384.09 3.06
AMPLIFON SPA EUR 1,905,891.44 0.4892,699.000Cosmetics
GAROFALO HEALTH CARE SPA EUR 983,659.09 0.25227,173.000
NameQuantity/Nominal
Market valuein EUR
Currency %NAV
PHARMANUTRA SPA EUR 5,639,379.20 1.44271,124.000RECORDATI SPA EUR 2,307,673.68 0.5862,948.000
10,836,603.41 2.75
CELLULARLINE SPA EUR 3,203,065.60 0.81421,456.000Telecommunication
TELECOM ITALIA SPA EUR 2,064,257.35 0.524,298,745.000TELECOM ITALIA-RSP EUR 5,445,500.59 1.3911,939,269.000
10,712,823.54 2.72
ANTARES VISION SPA EUR 2,142,958.46 0.54198,864.000Electric & Electronic
PRYSMIAN SPA EUR 6,460,982.55 1.64355,977.000STMICROELECTRONICS NV EUR 1,868,146.80 0.47119,753.000
10,472,087.81 2.65
FILA SPA EUR 6,373,884.00 1.62487,300.000Distribution & Wholesale
ICF GROUP SPA EUR 798,068.75 0.20127,691.000POWERSOFT SPA EUR 53,320.50 0.0111,849.000ROCHE BOBOIS SAS EUR 169,280.50 0.049,785.000
7,394,553.75 1.87
DIGITAL BROS EUR 1,848,178.68 0.47280,452.000Computer software
RELATECH SPA EUR 73,060.00 0.0228,100.000SESA SPA EUR 3,709,352.40 0.94130,611.000WIIT SPA EUR 8,753.80 0.00173.000
5,639,344.88 1.43
AEFFE SPA EUR 570,649.56 0.14315,276.000Textile
AQUAFIL SPA EUR 348,677.40 0.0942,060.000MONCLER SPA EUR 3,720,256.80 0.9598,943.000
4,639,583.76 1.18
SAES GETTERS SPA EUR 2,019,721.50 0.5298,523.000Diversified machinery
SAES GETTERS-RSP EUR 1,185,826.50 0.3077,505.000TENARIS SA EUR 1,234,113.71 0.31107,221.000
4,439,661.71 1.13
DAVIDE CAMPARI-MILANO SPA EUR 2,762,261.91 0.70320,634.000Food services
ITALIAN WINE BRANDS SPA EUR 969,146.50 0.2579,114.0003,731,408.41 0.95
ALKEMY SPA EUR 1,210,288.50 0.30109,035.000Internet
LASTMINUTE.COM NV CHF 1,088,068.44 0.2843,000.000PRISMI SPA EUR 399,053.05 0.10202,565.000
2,697,409.99 0.68
SAIPEM SPA EUR 2,401,476.88 0.61548,909.000Chemical
2,401,476.88 0.61
DIGITAL MAGICS SPA EUR 304,000.00 0.0850,000.000Entertainment
GAMENET GROUP SPA EUR 1,928,179.50 0.49243,150.0002,232,179.50 0.57
ABITARE IN SPA EUR 2,055,603.20 0.5245,884.000Real estate
2,055,603.20 0.52
CIP MERCHANT CAPITAL LTD GBP 188,129.50 0.05261,500.000Close-ended Funds
188,129.50 0.05
DBA GROUP SPA EUR 32,079.90 0.0117,530.000Office & Business equipment
DIGITAL VALUE SPA EUR 12,920.00 0.00950.00044,999.90 0.01
NameQuantity/Nominal
Market valuein EUR
Currency %NAV
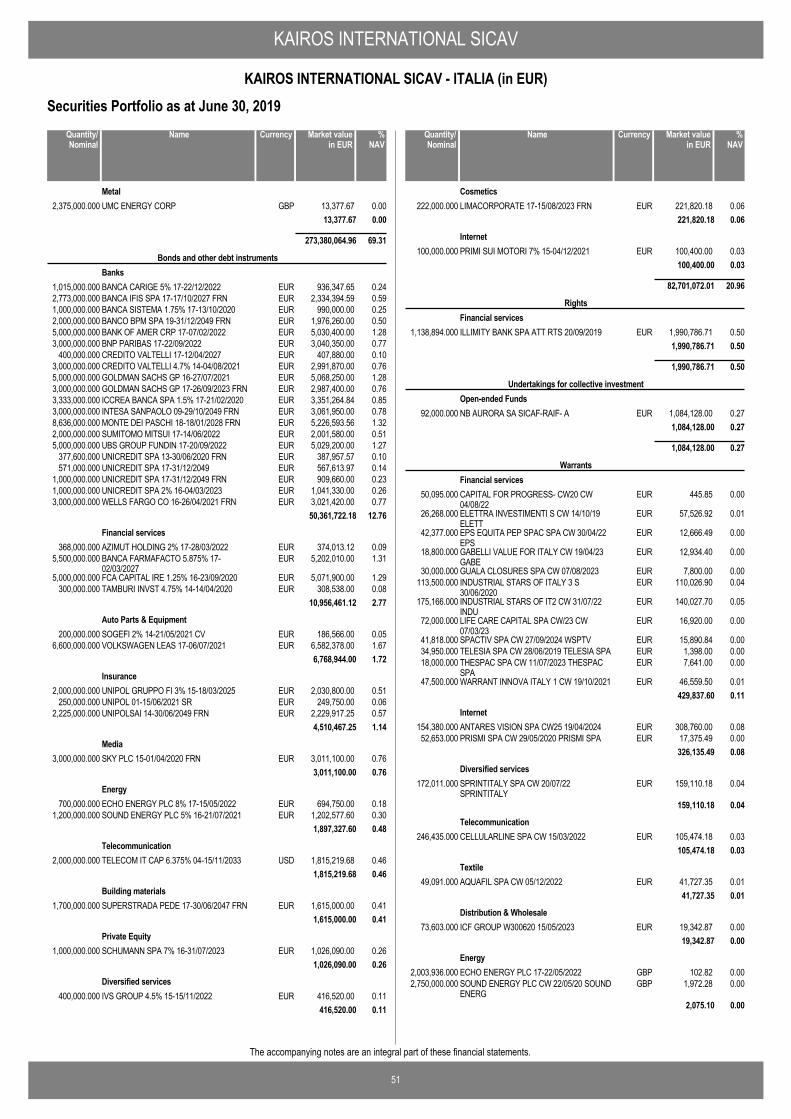
KAIROS INTERNATIONAL SICAV
51
KAIROS INTERNATIONAL SICAV - ITALIA (in EUR)
The accompanying notes are an integral part of these financial statements.
Securities Portfolio as at June 30, 2019
UMC ENERGY CORP GBP 13,377.67 0.002,375,000.000Metal
13,377.67 0.00
273,380,064.96 69.31
BANCA CARIGE 5% 17-22/12/2022 EUR 936,347.65 0.241,015,000.000
Bonds and other debt instrumentsBanks
BANCA IFIS SPA 17-17/10/2027 FRN EUR 2,334,394.59 0.592,773,000.000BANCA SISTEMA 1.75% 17-13/10/2020 EUR 990,000.00 0.251,000,000.000BANCO BPM SPA 19-31/12/2049 FRN EUR 1,976,260.00 0.502,000,000.000BANK OF AMER CRP 17-07/02/2022 EUR 5,030,400.00 1.285,000,000.000BNP PARIBAS 17-22/09/2022 EUR 3,040,350.00 0.773,000,000.000CREDITO VALTELLI 17-12/04/2027 EUR 407,880.00 0.10400,000.000CREDITO VALTELLI 4.7% 14-04/08/2021 EUR 2,991,870.00 0.763,000,000.000GOLDMAN SACHS GP 16-27/07/2021 EUR 5,068,250.00 1.285,000,000.000GOLDMAN SACHS GP 17-26/09/2023 FRN EUR 2,987,400.00 0.763,000,000.000ICCREA BANCA SPA 1.5% 17-21/02/2020 EUR 3,351,264.84 0.853,333,000.000INTESA SANPAOLO 09-29/10/2049 FRN EUR 3,061,950.00 0.783,000,000.000MONTE DEI PASCHI 18-18/01/2028 FRN EUR 5,226,593.56 1.328,636,000.000SUMITOMO MITSUI 17-14/06/2022 EUR 2,001,580.00 0.512,000,000.000UBS GROUP FUNDIN 17-20/09/2022 EUR 5,029,200.00 1.275,000,000.000UNICREDIT SPA 13-30/06/2020 FRN EUR 387,957.57 0.10377,600.000UNICREDIT SPA 17-31/12/2049 EUR 567,613.97 0.14571,000.000UNICREDIT SPA 17-31/12/2049 FRN EUR 909,660.00 0.231,000,000.000UNICREDIT SPA 2% 16-04/03/2023 EUR 1,041,330.00 0.261,000,000.000WELLS FARGO CO 16-26/04/2021 FRN EUR 3,021,420.00 0.773,000,000.000
50,361,722.18 12.76
AZIMUT HOLDING 2% 17-28/03/2022 EUR 374,013.12 0.09368,000.000Financial services
BANCA FARMAFACTO 5.875% 17-02/03/2027
EUR 5,202,010.00 1.315,500,000.000
FCA CAPITAL IRE 1.25% 16-23/09/2020 EUR 5,071,900.00 1.295,000,000.000TAMBURI INVST 4.75% 14-14/04/2020 EUR 308,538.00 0.08300,000.000
10,956,461.12 2.77
SOGEFI 2% 14-21/05/2021 CV EUR 186,566.00 0.05200,000.000Auto Parts & Equipment
VOLKSWAGEN LEAS 17-06/07/2021 EUR 6,582,378.00 1.676,600,000.0006,768,944.00 1.72
UNIPOL GRUPPO FI 3% 15-18/03/2025 EUR 2,030,800.00 0.512,000,000.000Insurance
UNIPOL 01-15/06/2021 SR EUR 249,750.00 0.06250,000.000UNIPOLSAI 14-30/06/2049 FRN EUR 2,229,917.25 0.572,225,000.000
4,510,467.25 1.14
SKY PLC 15-01/04/2020 FRN EUR 3,011,100.00 0.763,000,000.000Media
3,011,100.00 0.76
ECHO ENERGY PLC 8% 17-15/05/2022 EUR 694,750.00 0.18700,000.000Energy
SOUND ENERGY PLC 5% 16-21/07/2021 EUR 1,202,577.60 0.301,200,000.0001,897,327.60 0.48
TELECOM IT CAP 6.375% 04-15/11/2033 USD 1,815,219.68 0.462,000,000.000Telecommunication
1,815,219.68 0.46
SUPERSTRADA PEDE 17-30/06/2047 FRN EUR 1,615,000.00 0.411,700,000.000Building materials
1,615,000.00 0.41
SCHUMANN SPA 7% 16-31/07/2023 EUR 1,026,090.00 0.261,000,000.000Private Equity
1,026,090.00 0.26
IVS GROUP 4.5% 15-15/11/2022 EUR 416,520.00 0.11400,000.000Diversified services
416,520.00 0.11
NameQuantity/Nominal
Market valuein EUR
Currency %NAV
LIMACORPORATE 17-15/08/2023 FRN EUR 221,820.18 0.06222,000.000Cosmetics
221,820.18 0.06
PRIMI SUI MOTORI 7% 15-04/12/2021 EUR 100,400.00 0.03100,000.000Internet
100,400.00 0.03
82,701,072.01 20.96
ILLIMITY BANK SPA ATT RTS 20/09/2019 EUR 1,990,786.71 0.501,138,894.000
RightsFinancial services
1,990,786.71 0.50
1,990,786.71 0.50
NB AURORA SA SICAF-RAIF- A EUR 1,084,128.00 0.2792,000.000
Undertakings for collective investmentOpen-ended Funds
1,084,128.00 0.27
1,084,128.00 0.27
CAPITAL FOR PROGRESS- CW20 CW04/08/22
EUR 445.85 0.0050,095.000
WarrantsFinancial services
ELETTRA INVESTIMENTI S CW 14/10/19ELETT
EUR 57,526.92 0.0126,268.000
EPS EQUITA PEP SPAC SPA CW 30/04/22EPS
EUR 12,666.49 0.0042,377.000
GABELLI VALUE FOR ITALY CW 19/04/23GABE
EUR 12,934.40 0.0018,800.000
GUALA CLOSURES SPA CW 07/08/2023 EUR 7,800.00 0.0030,000.000INDUSTRIAL STARS OF ITALY 3 S30/06/2020
EUR 110,026.90 0.04113,500.000
INDUSTRIAL STARS OF IT2 CW 31/07/22INDU
EUR 140,027.70 0.05175,166.000
LIFE CARE CAPITAL SPA CW/23 CW07/03/23
EUR 16,920.00 0.0072,000.000
SPACTIV SPA CW 27/09/2024 WSPTV EUR 15,890.84 0.0041,818.000TELESIA SPA CW 28/06/2019 TELESIA SPA EUR 1,398.00 0.0034,950.000THESPAC SPA CW 11/07/2023 THESPACSPA
EUR 7,641.00 0.0018,000.000
WARRANT INNOVA ITALY 1 CW 19/10/2021 EUR 46,559.50 0.0147,500.000429,837.60 0.11
ANTARES VISION SPA CW25 19/04/2024 EUR 308,760.00 0.08154,380.000Internet
PRISMI SPA CW 29/05/2020 PRISMI SPA EUR 17,375.49 0.0052,653.000326,135.49 0.08
SPRINTITALY SPA CW 20/07/22SPRINTITALY
EUR 159,110.18 0.04172,011.000Diversified services
159,110.18 0.04
CELLULARLINE SPA CW 15/03/2022 EUR 105,474.18 0.03246,435.000Telecommunication
105,474.18 0.03
AQUAFIL SPA CW 05/12/2022 EUR 41,727.35 0.0149,091.000Textile
41,727.35 0.01
ICF GROUP W300620 15/05/2023 EUR 19,342.87 0.0073,603.000Distribution & Wholesale
19,342.87 0.00
ECHO ENERGY PLC 17-22/05/2022 GBP 102.82 0.002,003,936.000Energy
SOUND ENERGY PLC CW 22/05/20 SOUNDENERG
GBP 1,972.28 0.002,750,000.000
2,075.10 0.00
NameQuantity/Nominal
Market valuein EUR
Currency %NAV
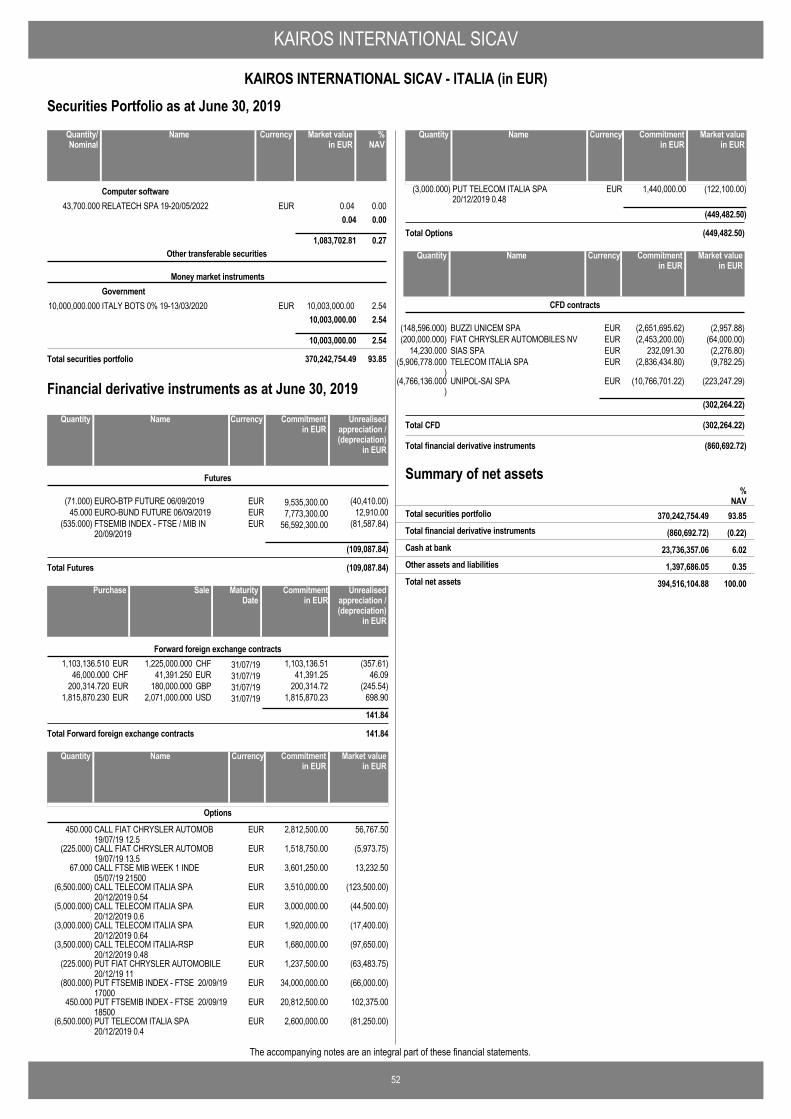
KAIROS INTERNATIONAL SICAV
52
KAIROS INTERNATIONAL SICAV - ITALIA (in EUR)
The accompanying notes are an integral part of these financial statements.
Securities Portfolio as at June 30, 2019
RELATECH SPA 19-20/05/2022 EUR 0.04 0.0043,700.000Computer software
0.04 0.00
1,083,702.81 0.27
ITALY BOTS 0% 19-13/03/2020 EUR 10,003,000.00 2.5410,000,000.000
Other transferable securities
Money market instrumentsGovernment
10,003,000.00 2.54
10,003,000.00 2.54
Total securities portfolio 370,242,754.49 93.85
NameQuantity/Nominal
Market valuein EUR
Currency %NAV
EURO-BTP FUTURE 06/09/2019 EUR 9,535,300.00(71.000) (40,410.00)
Futures
EURO-BUND FUTURE 06/09/2019 EUR 7,773,300.0045.000 12,910.00FTSEMIB INDEX - FTSE / MIB IN20/09/2019
EUR 56,592,300.00(535.000) (81,587.84)
(109,087.84)
Total Futures (109,087.84)
NameQuantity Commitmentin EUR
Currency Unrealisedappreciation /(depreciation)
in EUR
Financial derivative instruments as at June 30, 2019
1,225,000.000 31/07/191,103,136.510 (357.61)CHFEUR 1,103,136.51Forward foreign exchange contracts
41,391.250 31/07/1946,000.000 46.09EURCHF 41,391.25180,000.000 31/07/19200,314.720 (245.54)GBPEUR 200,314.72
2,071,000.000 31/07/191,815,870.230 698.90USDEUR 1,815,870.23
141.84
Total Forward foreign exchange contracts 141.84
SalePurchase Unrealisedappreciation /(depreciation)
in EUR
MaturityDate
Commitmentin EUR
CALL FIAT CHRYSLER AUTOMOB19/07/19 12.5
EUR450.000 2,812,500.00 56,767.50
Options
CALL FIAT CHRYSLER AUTOMOB19/07/19 13.5
EUR(225.000) 1,518,750.00 (5,973.75)
CALL FTSE MIB WEEK 1 INDE05/07/19 21500
EUR67.000 3,601,250.00 13,232.50
CALL TELECOM ITALIA SPA20/12/2019 0.54
EUR(6,500.000) 3,510,000.00 (123,500.00)
CALL TELECOM ITALIA SPA20/12/2019 0.6
EUR(5,000.000) 3,000,000.00 (44,500.00)
CALL TELECOM ITALIA SPA20/12/2019 0.64
EUR(3,000.000) 1,920,000.00 (17,400.00)
CALL TELECOM ITALIA-RSP20/12/2019 0.48
EUR(3,500.000) 1,680,000.00 (97,650.00)
PUT FIAT CHRYSLER AUTOMOBILE20/12/19 11
EUR(225.000) 1,237,500.00 (63,483.75)
PUT FTSEMIB INDEX - FTSE 20/09/1917000
EUR(800.000) 34,000,000.00 (66,000.00)
PUT FTSEMIB INDEX - FTSE 20/09/1918500
EUR450.000 20,812,500.00 102,375.00
PUT TELECOM ITALIA SPA20/12/2019 0.4
EUR(6,500.000) 2,600,000.00 (81,250.00)
NameQuantity Market valuein EUR
Currency Commitmentin EUR
PUT TELECOM ITALIA SPA20/12/2019 0.48
EUR(3,000.000) 1,440,000.00 (122,100.00)
(449,482.50)
Total Options (449,482.50)
NameQuantity Market valuein EUR
Currency Commitmentin EUR
BUZZI UNICEM SPA EUR (2,957.88)(2,651,695.62)(148,596.000)
CFD contracts
NameQuantity Market valuein EUR
Currency Commitmentin EUR
FIAT CHRYSLER AUTOMOBILES NV EUR (64,000.00)(2,453,200.00)(200,000.000)SIAS SPA EUR (2,276.80)232,091.3014,230.000TELECOM ITALIA SPA EUR (9,782.25)(2,836,434.80)(5,906,778.000
)UNIPOL-SAI SPA EUR (223,247.29)(10,766,701.22)(4,766,136.000
)(302,264.22)
Total CFD (302,264.22)
Total financial derivative instruments (860,692.72)
Summary of net assets
(860,692.72) (0.22)Total financial derivative instruments
%NAV
370,242,754.49 93.85Total securities portfolio
23,736,357.06 6.02Cash at bank
1,397,686.05 0.35Other assets and liabilities
394,516,104.88 100.00Total net assets
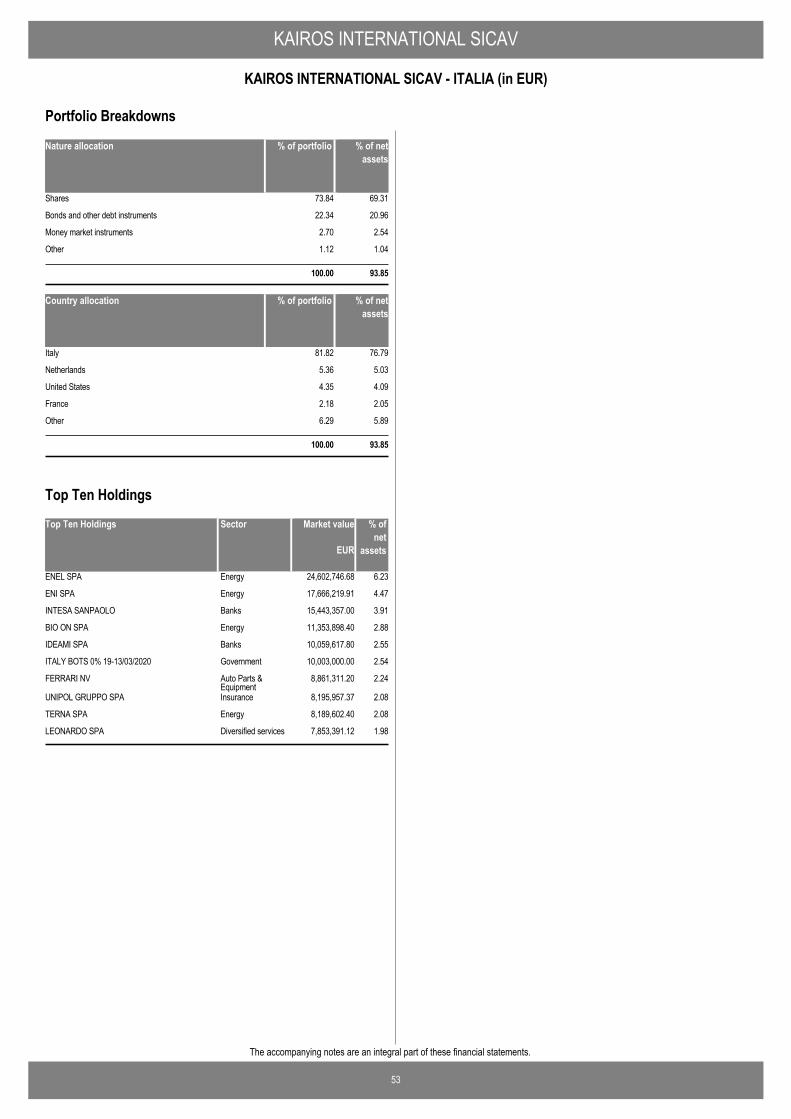
KAIROS INTERNATIONAL SICAV
53
KAIROS INTERNATIONAL SICAV - ITALIA (in EUR)
The accompanying notes are an integral part of these financial statements.
Nature allocation % of portfolio % of netassets
Shares 73.84 69.31
Bonds and other debt instruments 22.34 20.96
Money market instruments 2.70 2.54
Other 1.12 1.04
100.00 93.85
Country allocation % of portfolio % of netassets
Italy 81.82 76.79
Netherlands 5.36 5.03
United States 4.35 4.09
France 2.18 2.05
Other 6.29 5.89
100.00 93.85
Portfolio Breakdowns
Top Ten Holdings Market value % ofnet
assets
ENEL SPA 24,602,746.68 6.23Energy
ENI SPA 17,666,219.91 4.47Energy
INTESA SANPAOLO 15,443,357.00 3.91Banks
BIO ON SPA 11,353,898.40 2.88Energy
IDEAMI SPA 10,059,617.80 2.55Banks
ITALY BOTS 0% 19-13/03/2020 10,003,000.00 2.54Government
FERRARI NV 8,861,311.20 2.24Auto Parts &Equipment
UNIPOL GRUPPO SPA 8,195,957.37 2.08Insurance
TERNA SPA 8,189,602.40 2.08Energy
LEONARDO SPA 7,853,391.12 1.98Diversified services
EUR
Sector
Top Ten Holdings
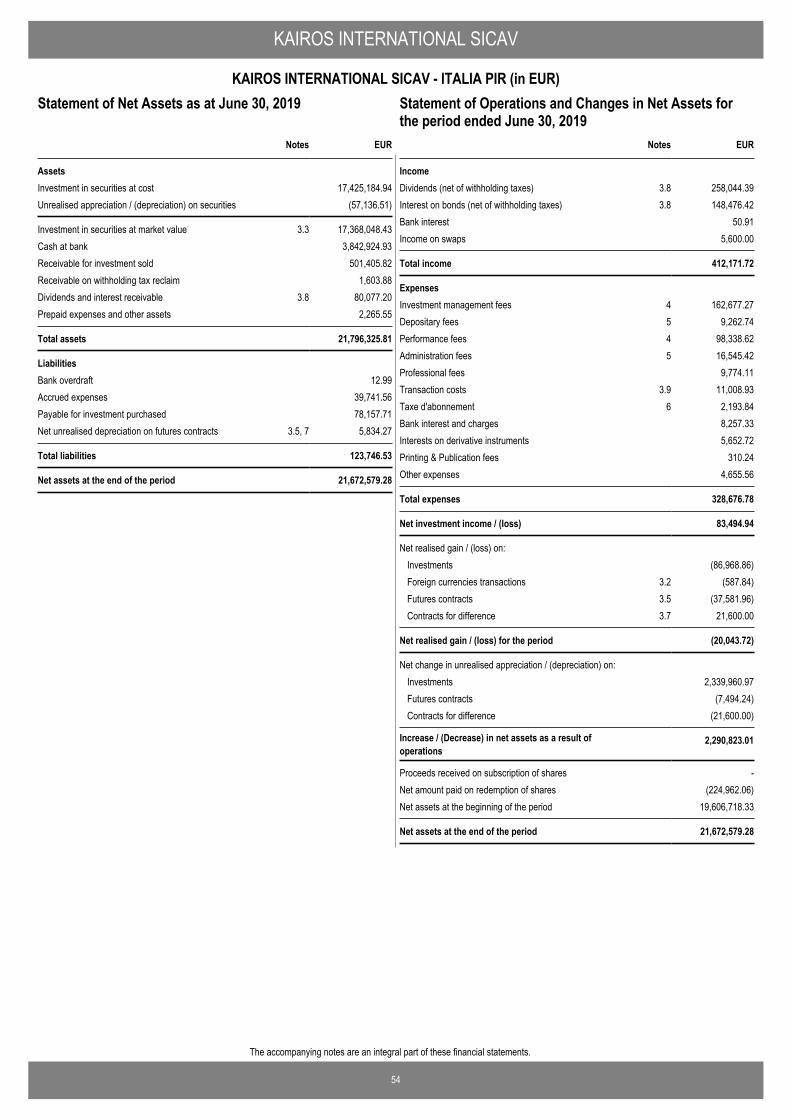
54
The accompanying notes are an integral part of these financial statements.
KAIROS INTERNATIONAL SICAV
KAIROS INTERNATIONAL SICAV - ITALIA PIR (in EUR)Statement of Operations and Changes in Net Assets for theperiod ended June 30, 2019
EUR
AssetsInvestment in securities at cost 17,425,184.94Unrealised appreciation / (depreciation) on securities (57,136.51)
Investment in securities at market value 3.3 17,368,048.43Cash at bank 3,842,924.93Receivable for investment sold 501,405.82Receivable on withholding tax reclaim 1,603.88Dividends and interest receivable 3.8 80,077.20Prepaid expenses and other assets 2,265.55
Total assets 21,796,325.81
LiabilitiesBank overdraft 12.99Accrued expenses 39,741.56Payable for investment purchased 78,157.71Net unrealised depreciation on futures contracts 3.5, 7 5,834.27
Total liabilities 123,746.53
Net assets at the end of the period 21,672,579.28
Notes
Statement of Net Assets as at June 30, 2019
IncomeDividends (net of withholding taxes) 3.8 258,044.39Interest on bonds (net of withholding taxes) 3.8 148,476.42Bank interest 50.91Income on swaps 5,600.00
Total income 412,171.72
ExpensesInvestment management fees 4 162,677.27Depositary fees 5 9,262.74Performance fees 4 98,338.62Administration fees 5 16,545.42Professional fees 9,774.11Transaction costs 3.9 11,008.93Taxe d'abonnement 6 2,193.84Bank interest and charges 8,257.33Interests on derivative instruments 5,652.72Printing & Publication fees 310.24Other expenses 4,655.56
Total expenses 328,676.78
Net investment income / (loss) 83,494.94
Net realised gain / (loss) on: Investments (86,968.86)Foreign currencies transactions 3.2 (587.84)Futures contracts 3.5 (37,581.96)Contracts for difference 3.7 21,600.00
Net realised gain / (loss) for the period (20,043.72)
Net change in unrealised appreciation / (depreciation) on: Investments 2,339,960.97Futures contracts (7,494.24)Contracts for difference (21,600.00)
Increase / (Decrease) in net assets as a result ofoperations
2,290,823.01
Proceeds received on subscription of shares -Net amount paid on redemption of shares (224,962.06)Net assets at the beginning of the period 19,606,718.33
Net assets at the end of the period 21,672,579.28
EURNotes
Statement of Operations and Changes in Net Assets forthe period ended June 30, 2019
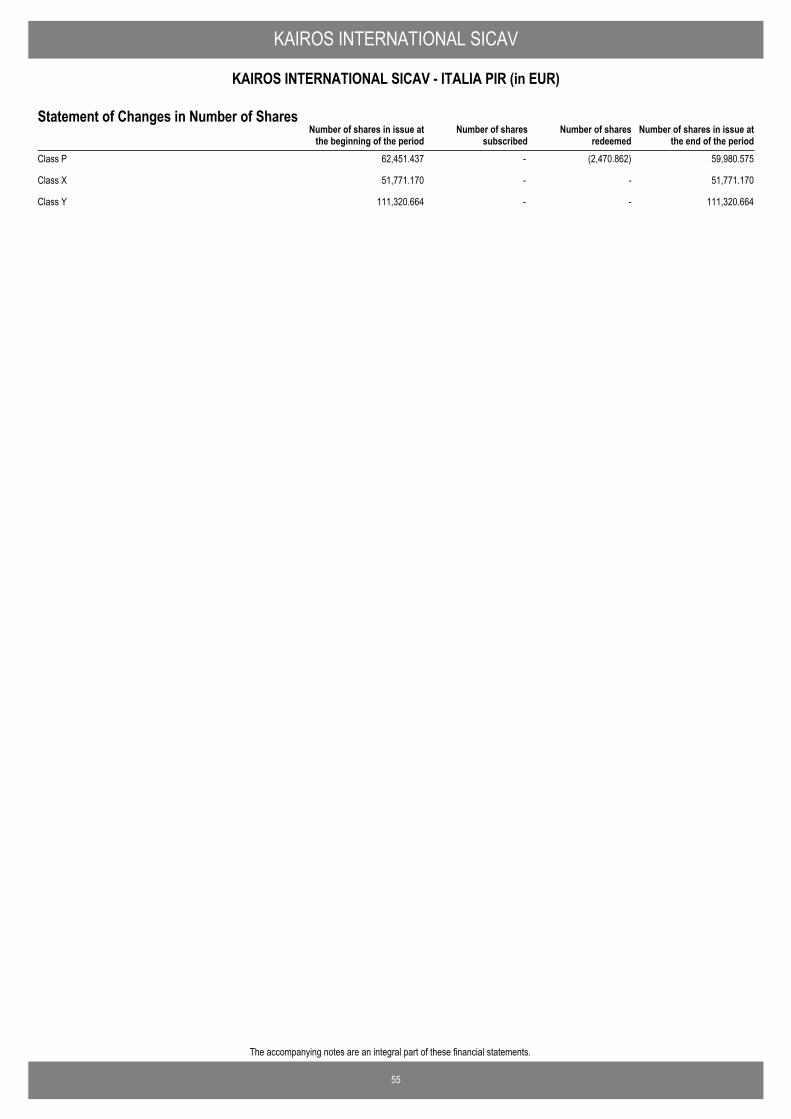
55
The accompanying notes are an integral part of these financial statements.
KAIROS INTERNATIONAL SICAV
KAIROS INTERNATIONAL SICAV - ITALIA PIR (in EUR)
Number of shares in issue atthe end of the period
Number of shares in issue atthe beginning of the period
Number of sharessubscribed
Number of sharesredeemed
Statement of Changes in Number of Shares
Class P 62,451.437 - (2,470.862) 59,980.575
Class X 51,771.170 - - 51,771.170
Class Y 111,320.664 - - 111,320.664
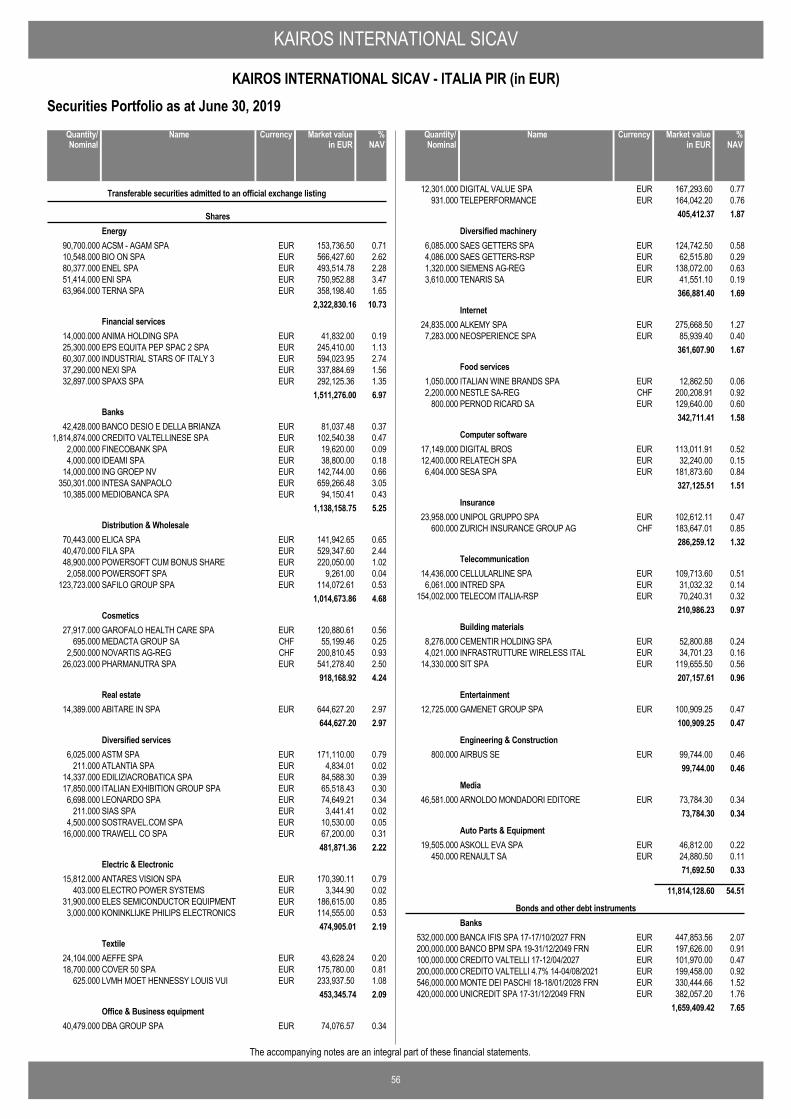
KAIROS INTERNATIONAL SICAV
56
KAIROS INTERNATIONAL SICAV - ITALIA PIR (in EUR)
The accompanying notes are an integral part of these financial statements.
Securities Portfolio as at June 30, 2019
ACSM - AGAM SPA EUR 153,736.50 0.7190,700.000
Transferable securities admitted to an official exchange listing
SharesEnergy
BIO ON SPA EUR 566,427.60 2.6210,548.000ENEL SPA EUR 493,514.78 2.2880,377.000ENI SPA EUR 750,952.88 3.4751,414.000TERNA SPA EUR 358,198.40 1.6563,964.000
2,322,830.16 10.73
ANIMA HOLDING SPA EUR 41,832.00 0.1914,000.000Financial services
EPS EQUITA PEP SPAC 2 SPA EUR 245,410.00 1.1325,300.000INDUSTRIAL STARS OF ITALY 3 EUR 594,023.95 2.7460,307.000NEXI SPA EUR 337,884.69 1.5637,290.000SPAXS SPA EUR 292,125.36 1.3532,897.000
1,511,276.00 6.97
BANCO DESIO E DELLA BRIANZA EUR 81,037.48 0.3742,428.000Banks
CREDITO VALTELLINESE SPA EUR 102,540.38 0.471,814,874.000FINECOBANK SPA EUR 19,620.00 0.092,000.000IDEAMI SPA EUR 38,800.00 0.184,000.000ING GROEP NV EUR 142,744.00 0.6614,000.000INTESA SANPAOLO EUR 659,266.48 3.05350,301.000MEDIOBANCA SPA EUR 94,150.41 0.4310,385.000
1,138,158.75 5.25
ELICA SPA EUR 141,942.65 0.6570,443.000Distribution & Wholesale
FILA SPA EUR 529,347.60 2.4440,470.000POWERSOFT CUM BONUS SHARE EUR 220,050.00 1.0248,900.000POWERSOFT SPA EUR 9,261.00 0.042,058.000SAFILO GROUP SPA EUR 114,072.61 0.53123,723.000
1,014,673.86 4.68
GAROFALO HEALTH CARE SPA EUR 120,880.61 0.5627,917.000Cosmetics
MEDACTA GROUP SA CHF 55,199.46 0.25695.000NOVARTIS AG-REG CHF 200,810.45 0.932,500.000PHARMANUTRA SPA EUR 541,278.40 2.5026,023.000
918,168.92 4.24
ABITARE IN SPA EUR 644,627.20 2.9714,389.000Real estate
644,627.20 2.97
ASTM SPA EUR 171,110.00 0.796,025.000Diversified services
ATLANTIA SPA EUR 4,834.01 0.02211.000EDILIZIACROBATICA SPA EUR 84,588.30 0.3914,337.000ITALIAN EXHIBITION GROUP SPA EUR 65,518.43 0.3017,850.000LEONARDO SPA EUR 74,649.21 0.346,698.000SIAS SPA EUR 3,441.41 0.02211.000SOSTRAVEL.COM SPA EUR 10,530.00 0.054,500.000TRAWELL CO SPA EUR 67,200.00 0.3116,000.000
481,871.36 2.22
ANTARES VISION SPA EUR 170,390.11 0.7915,812.000Electric & Electronic
ELECTRO POWER SYSTEMS EUR 3,344.90 0.02403.000ELES SEMICONDUCTOR EQUIPMENT EUR 186,615.00 0.8531,900.000KONINKLIJKE PHILIPS ELECTRONICS EUR 114,555.00 0.533,000.000
474,905.01 2.19
AEFFE SPA EUR 43,628.24 0.2024,104.000Textile
COVER 50 SPA EUR 175,780.00 0.8118,700.000LVMH MOET HENNESSY LOUIS VUI EUR 233,937.50 1.08625.000
453,345.74 2.09
DBA GROUP SPA EUR 74,076.57 0.3440,479.000Office & Business equipment
NameQuantity/Nominal
Market valuein EUR
Currency %NAV
DIGITAL VALUE SPA EUR 167,293.60 0.7712,301.000TELEPERFORMANCE EUR 164,042.20 0.76931.000
405,412.37 1.87
SAES GETTERS SPA EUR 124,742.50 0.586,085.000Diversified machinery
SAES GETTERS-RSP EUR 62,515.80 0.294,086.000SIEMENS AG-REG EUR 138,072.00 0.631,320.000TENARIS SA EUR 41,551.10 0.193,610.000
366,881.40 1.69
ALKEMY SPA EUR 275,668.50 1.2724,835.000Internet
NEOSPERIENCE SPA EUR 85,939.40 0.407,283.000361,607.90 1.67
ITALIAN WINE BRANDS SPA EUR 12,862.50 0.061,050.000Food services
NESTLE SA-REG CHF 200,208.91 0.922,200.000PERNOD RICARD SA EUR 129,640.00 0.60800.000
342,711.41 1.58
DIGITAL BROS EUR 113,011.91 0.5217,149.000Computer software
RELATECH SPA EUR 32,240.00 0.1512,400.000SESA SPA EUR 181,873.60 0.846,404.000
327,125.51 1.51
UNIPOL GRUPPO SPA EUR 102,612.11 0.4723,958.000Insurance
ZURICH INSURANCE GROUP AG CHF 183,647.01 0.85600.000286,259.12 1.32
CELLULARLINE SPA EUR 109,713.60 0.5114,436.000Telecommunication
INTRED SPA EUR 31,032.32 0.146,061.000TELECOM ITALIA-RSP EUR 70,240.31 0.32154,002.000
210,986.23 0.97
CEMENTIR HOLDING SPA EUR 52,800.88 0.248,276.000Building materials
INFRASTRUTTURE WIRELESS ITAL EUR 34,701.23 0.164,021.000SIT SPA EUR 119,655.50 0.5614,330.000
207,157.61 0.96
GAMENET GROUP SPA EUR 100,909.25 0.4712,725.000Entertainment
100,909.25 0.47
AIRBUS SE EUR 99,744.00 0.46800.000Engineering & Construction
99,744.00 0.46
ARNOLDO MONDADORI EDITORE EUR 73,784.30 0.3446,581.000Media
73,784.30 0.34
ASKOLL EVA SPA EUR 46,812.00 0.2219,505.000Auto Parts & Equipment
RENAULT SA EUR 24,880.50 0.11450.00071,692.50 0.33
11,814,128.60 54.51
BANCA IFIS SPA 17-17/10/2027 FRN EUR 447,853.56 2.07532,000.000
Bonds and other debt instrumentsBanks
BANCO BPM SPA 19-31/12/2049 FRN EUR 197,626.00 0.91200,000.000CREDITO VALTELLI 17-12/04/2027 EUR 101,970.00 0.47100,000.000CREDITO VALTELLI 4.7% 14-04/08/2021 EUR 199,458.00 0.92200,000.000MONTE DEI PASCHI 18-18/01/2028 FRN EUR 330,444.66 1.52546,000.000UNICREDIT SPA 17-31/12/2049 FRN EUR 382,057.20 1.76420,000.000
1,659,409.42 7.65
NameQuantity/Nominal
Market valuein EUR
Currency %NAV
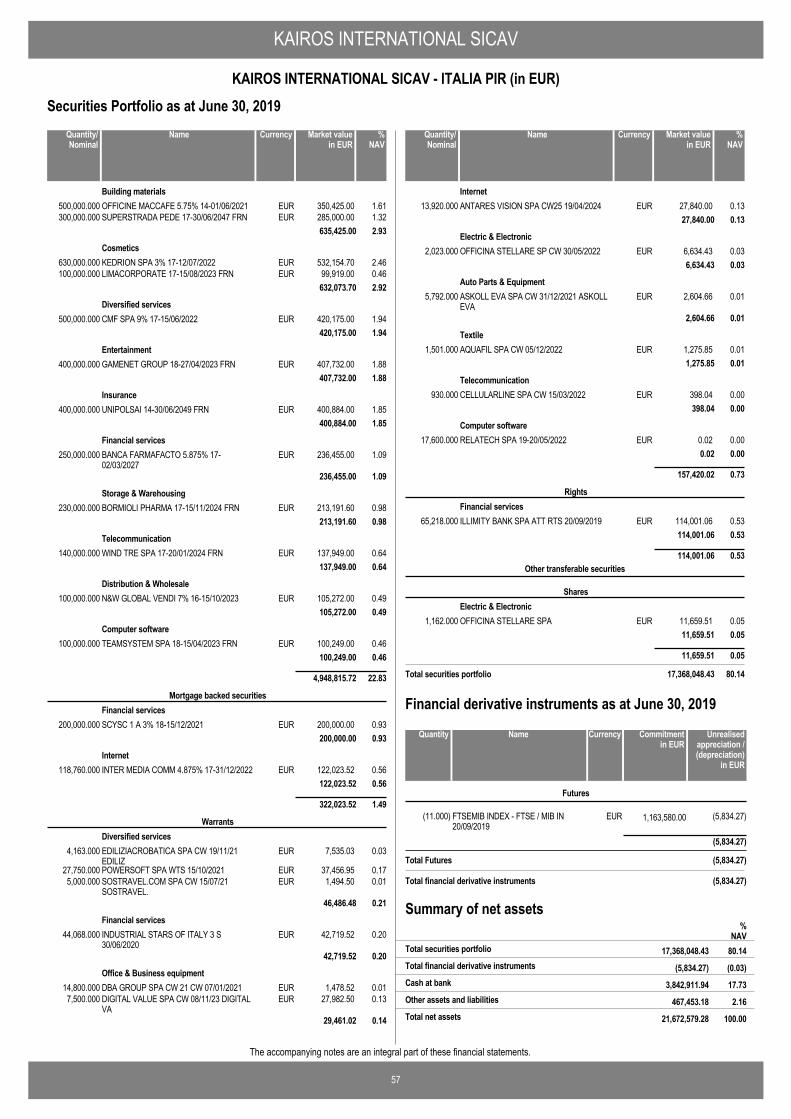
KAIROS INTERNATIONAL SICAV
57
KAIROS INTERNATIONAL SICAV - ITALIA PIR (in EUR)
The accompanying notes are an integral part of these financial statements.
Securities Portfolio as at June 30, 2019
OFFICINE MACCAFE 5.75% 14-01/06/2021 EUR 350,425.00 1.61500,000.000Building materials
SUPERSTRADA PEDE 17-30/06/2047 FRN EUR 285,000.00 1.32300,000.000635,425.00 2.93
KEDRION SPA 3% 17-12/07/2022 EUR 532,154.70 2.46630,000.000Cosmetics
LIMACORPORATE 17-15/08/2023 FRN EUR 99,919.00 0.46100,000.000632,073.70 2.92
CMF SPA 9% 17-15/06/2022 EUR 420,175.00 1.94500,000.000Diversified services
420,175.00 1.94
GAMENET GROUP 18-27/04/2023 FRN EUR 407,732.00 1.88400,000.000Entertainment
407,732.00 1.88
UNIPOLSAI 14-30/06/2049 FRN EUR 400,884.00 1.85400,000.000Insurance
400,884.00 1.85
BANCA FARMAFACTO 5.875% 17-02/03/2027
EUR 236,455.00 1.09250,000.000Financial services
236,455.00 1.09
BORMIOLI PHARMA 17-15/11/2024 FRN EUR 213,191.60 0.98230,000.000Storage & Warehousing
213,191.60 0.98
WIND TRE SPA 17-20/01/2024 FRN EUR 137,949.00 0.64140,000.000Telecommunication
137,949.00 0.64
N&W GLOBAL VENDI 7% 16-15/10/2023 EUR 105,272.00 0.49100,000.000Distribution & Wholesale
105,272.00 0.49
TEAMSYSTEM SPA 18-15/04/2023 FRN EUR 100,249.00 0.46100,000.000Computer software
100,249.00 0.46
4,948,815.72 22.83
SCYSC 1 A 3% 18-15/12/2021 EUR 200,000.00 0.93200,000.000
Mortgage backed securitiesFinancial services
200,000.00 0.93
INTER MEDIA COMM 4.875% 17-31/12/2022 EUR 122,023.52 0.56118,760.000Internet
122,023.52 0.56
322,023.52 1.49
EDILIZIACROBATICA SPA CW 19/11/21EDILIZ
EUR 7,535.03 0.034,163.000
WarrantsDiversified services
POWERSOFT SPA WTS 15/10/2021 EUR 37,456.95 0.1727,750.000SOSTRAVEL.COM SPA CW 15/07/21SOSTRAVEL.
EUR 1,494.50 0.015,000.000
46,486.48 0.21
INDUSTRIAL STARS OF ITALY 3 S30/06/2020
EUR 42,719.52 0.2044,068.000Financial services
42,719.52 0.20
DBA GROUP SPA CW 21 CW 07/01/2021 EUR 1,478.52 0.0114,800.000Office & Business equipment
DIGITAL VALUE SPA CW 08/11/23 DIGITALVA
EUR 27,982.50 0.137,500.000
29,461.02 0.14
NameQuantity/Nominal
Market valuein EUR
Currency %NAV
ANTARES VISION SPA CW25 19/04/2024 EUR 27,840.00 0.1313,920.000Internet
27,840.00 0.13
OFFICINA STELLARE SP CW 30/05/2022 EUR 6,634.43 0.032,023.000Electric & Electronic
6,634.43 0.03
ASKOLL EVA SPA CW 31/12/2021 ASKOLLEVA
EUR 2,604.66 0.015,792.000Auto Parts & Equipment
2,604.66 0.01
AQUAFIL SPA CW 05/12/2022 EUR 1,275.85 0.011,501.000Textile
1,275.85 0.01
CELLULARLINE SPA CW 15/03/2022 EUR 398.04 0.00930.000Telecommunication
398.04 0.00
RELATECH SPA 19-20/05/2022 EUR 0.02 0.0017,600.000Computer software
0.02 0.00
157,420.02 0.73
ILLIMITY BANK SPA ATT RTS 20/09/2019 EUR 114,001.06 0.5365,218.000
RightsFinancial services
114,001.06 0.53
114,001.06 0.53
OFFICINA STELLARE SPA EUR 11,659.51 0.051,162.000
Other transferable securities
SharesElectric & Electronic
11,659.51 0.05
11,659.51 0.05
Total securities portfolio 17,368,048.43 80.14
NameQuantity/Nominal
Market valuein EUR
Currency %NAV
FTSEMIB INDEX - FTSE / MIB IN20/09/2019
EUR 1,163,580.00(11.000) (5,834.27)
Futures
(5,834.27)
Total Futures (5,834.27)
NameQuantity Commitmentin EUR
Currency Unrealisedappreciation /(depreciation)
in EUR
Financial derivative instruments as at June 30, 2019
Total financial derivative instruments (5,834.27)
Summary of net assets
(5,834.27) (0.03)Total financial derivative instruments
%NAV
17,368,048.43 80.14Total securities portfolio
3,842,911.94 17.73Cash at bank
467,453.18 2.16Other assets and liabilities
21,672,579.28 100.00Total net assets
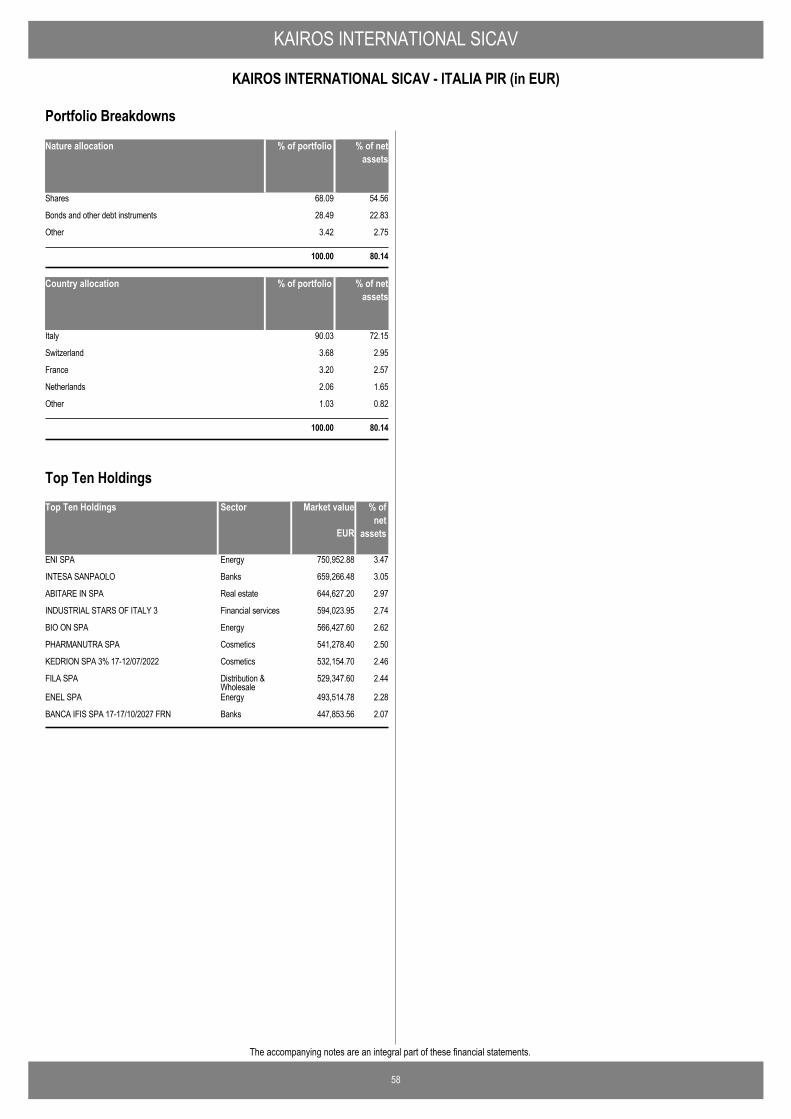
KAIROS INTERNATIONAL SICAV
58
KAIROS INTERNATIONAL SICAV - ITALIA PIR (in EUR)
The accompanying notes are an integral part of these financial statements.
Nature allocation % of portfolio % of netassets
Shares 68.09 54.56
Bonds and other debt instruments 28.49 22.83
Other 3.42 2.75
100.00 80.14
Country allocation % of portfolio % of netassets
Italy 90.03 72.15
Switzerland 3.68 2.95
France 3.20 2.57
Netherlands 2.06 1.65
Other 1.03 0.82
100.00 80.14
Portfolio Breakdowns
Top Ten Holdings Market value % ofnet
assets
ENI SPA 750,952.88 3.47Energy
INTESA SANPAOLO 659,266.48 3.05Banks
ABITARE IN SPA 644,627.20 2.97Real estate
INDUSTRIAL STARS OF ITALY 3 594,023.95 2.74Financial services
BIO ON SPA 566,427.60 2.62Energy
PHARMANUTRA SPA 541,278.40 2.50Cosmetics
KEDRION SPA 3% 17-12/07/2022 532,154.70 2.46Cosmetics
FILA SPA 529,347.60 2.44Distribution &Wholesale
ENEL SPA 493,514.78 2.28Energy
BANCA IFIS SPA 17-17/10/2027 FRN 447,853.56 2.07Banks
EUR
Sector
Top Ten Holdings
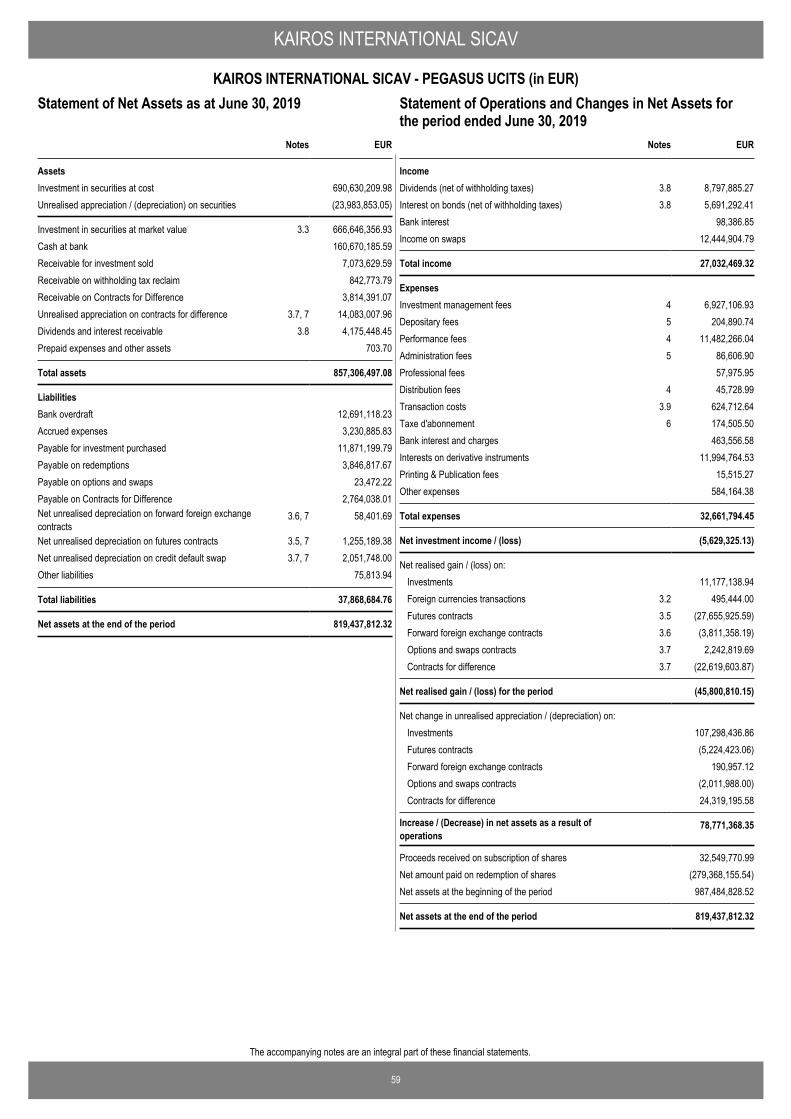
59
The accompanying notes are an integral part of these financial statements.
KAIROS INTERNATIONAL SICAV
KAIROS INTERNATIONAL SICAV - PEGASUS UCITS (in EUR)Statement of Operations and Changes in Net Assets for theperiod ended June 30, 2019
EUR
AssetsInvestment in securities at cost 690,630,209.98Unrealised appreciation / (depreciation) on securities (23,983,853.05)
Investment in securities at market value 3.3 666,646,356.93Cash at bank 160,670,185.59Receivable for investment sold 7,073,629.59Receivable on withholding tax reclaim 842,773.79Receivable on Contracts for Difference 3,814,391.07Unrealised appreciation on contracts for difference 3.7, 7 14,083,007.96Dividends and interest receivable 3.8 4,175,448.45Prepaid expenses and other assets 703.70
Total assets 857,306,497.08
LiabilitiesBank overdraft 12,691,118.23Accrued expenses 3,230,885.83Payable for investment purchased 11,871,199.79Payable on redemptions 3,846,817.67Payable on options and swaps 23,472.22Payable on Contracts for Difference 2,764,038.01Net unrealised depreciation on forward foreign exchangecontracts
3.6, 7 58,401.69
Net unrealised depreciation on futures contracts 3.5, 7 1,255,189.38Net unrealised depreciation on credit default swap 3.7, 7 2,051,748.00Other liabilities 75,813.94
Total liabilities 37,868,684.76
Net assets at the end of the period 819,437,812.32
Notes
Statement of Net Assets as at June 30, 2019
IncomeDividends (net of withholding taxes) 3.8 8,797,885.27Interest on bonds (net of withholding taxes) 3.8 5,691,292.41Bank interest 98,386.85Income on swaps 12,444,904.79
Total income 27,032,469.32
ExpensesInvestment management fees 4 6,927,106.93Depositary fees 5 204,890.74Performance fees 4 11,482,266.04Administration fees 5 86,606.90Professional fees 57,975.95Distribution fees 4 45,728.99Transaction costs 3.9 624,712.64Taxe d'abonnement 6 174,505.50Bank interest and charges 463,556.58Interests on derivative instruments 11,994,764.53Printing & Publication fees 15,515.27Other expenses 584,164.38
Total expenses 32,661,794.45
Net investment income / (loss) (5,629,325.13)
Net realised gain / (loss) on: Investments 11,177,138.94Foreign currencies transactions 3.2 495,444.00Futures contracts 3.5 (27,655,925.59)Forward foreign exchange contracts 3.6 (3,811,358.19)Options and swaps contracts 3.7 2,242,819.69Contracts for difference 3.7 (22,619,603.87)
Net realised gain / (loss) for the period (45,800,810.15)
Net change in unrealised appreciation / (depreciation) on: Investments 107,298,436.86Futures contracts (5,224,423.06)Forward foreign exchange contracts 190,957.12Options and swaps contracts (2,011,988.00)Contracts for difference 24,319,195.58
Increase / (Decrease) in net assets as a result ofoperations
78,771,368.35
Proceeds received on subscription of shares 32,549,770.99Net amount paid on redemption of shares (279,368,155.54)Net assets at the beginning of the period 987,484,828.52
Net assets at the end of the period 819,437,812.32
EURNotes
Statement of Operations and Changes in Net Assets forthe period ended June 30, 2019
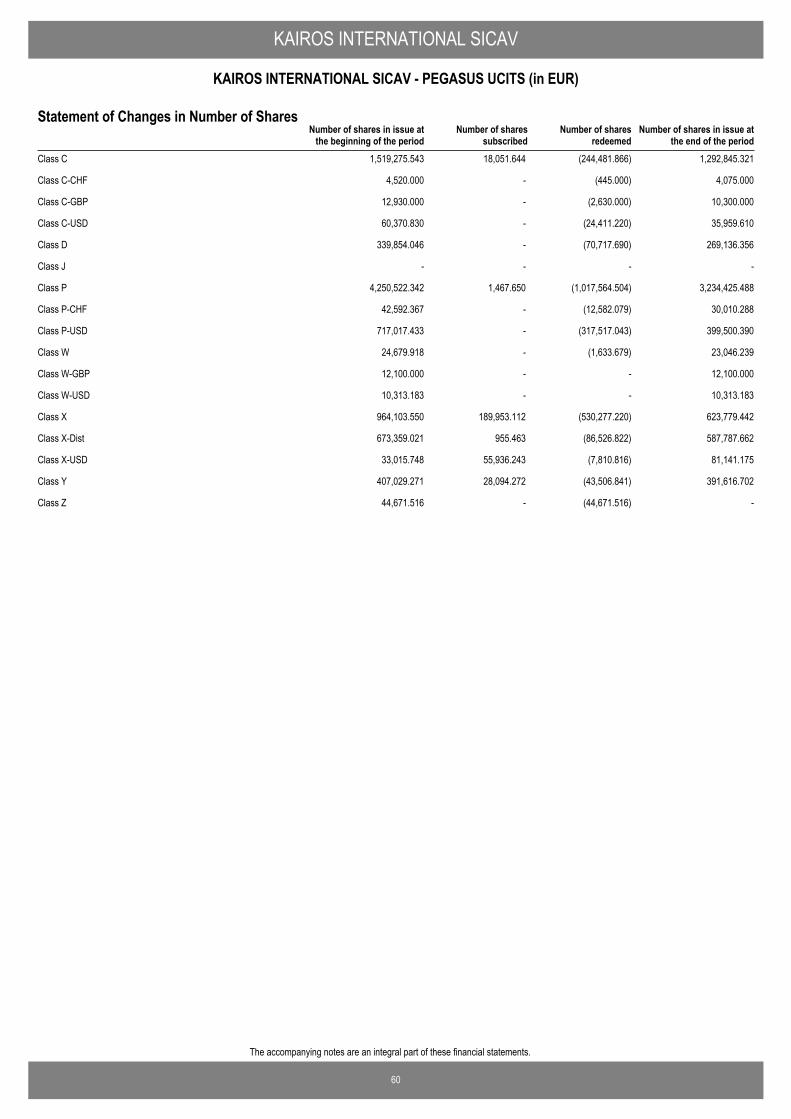
60
The accompanying notes are an integral part of these financial statements.
KAIROS INTERNATIONAL SICAV
KAIROS INTERNATIONAL SICAV - PEGASUS UCITS (in EUR)
Number of shares in issue atthe end of the period
Number of shares in issue atthe beginning of the period
Number of sharessubscribed
Number of sharesredeemed
Statement of Changes in Number of Shares
Class C 1,519,275.543 18,051.644 (244,481.866) 1,292,845.321
Class C-CHF 4,520.000 - (445.000) 4,075.000
Class C-GBP 12,930.000 - (2,630.000) 10,300.000
Class C-USD 60,370.830 - (24,411.220) 35,959.610
Class D 339,854.046 - (70,717.690) 269,136.356
Class J - - - -
Class P 4,250,522.342 1,467.650 (1,017,564.504) 3,234,425.488
Class P-CHF 42,592.367 - (12,582.079) 30,010.288
Class P-USD 717,017.433 - (317,517.043) 399,500.390
Class W 24,679.918 - (1,633.679) 23,046.239
Class W-GBP 12,100.000 - - 12,100.000
Class W-USD 10,313.183 - - 10,313.183
Class X 964,103.550 189,953.112 (530,277.220) 623,779.442
Class X-Dist 673,359.021 955.463 (86,526.822) 587,787.662
Class X-USD 33,015.748 55,936.243 (7,810.816) 81,141.175
Class Y 407,029.271 28,094.272 (43,506.841) 391,616.702
Class Z 44,671.516 - (44,671.516) -
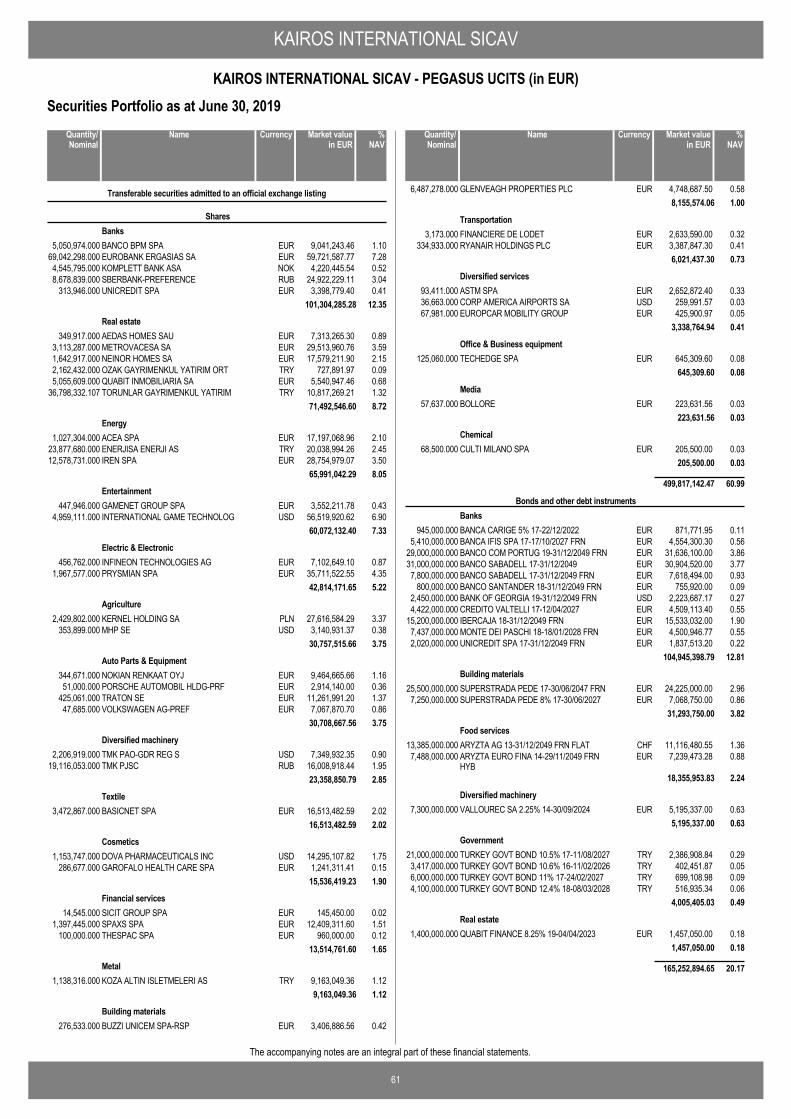
KAIROS INTERNATIONAL SICAV
61
KAIROS INTERNATIONAL SICAV - PEGASUS UCITS (in EUR)
The accompanying notes are an integral part of these financial statements.
Securities Portfolio as at June 30, 2019
BANCO BPM SPA EUR 9,041,243.46 1.105,050,974.000
Transferable securities admitted to an official exchange listing
SharesBanks
EUROBANK ERGASIAS SA EUR 59,721,587.77 7.2869,042,298.000KOMPLETT BANK ASA NOK 4,220,445.54 0.524,545,795.000SBERBANK-PREFERENCE RUB 24,922,229.11 3.048,678,839.000UNICREDIT SPA EUR 3,398,779.40 0.41313,946.000
101,304,285.28 12.35
AEDAS HOMES SAU EUR 7,313,265.30 0.89349,917.000Real estate
METROVACESA SA EUR 29,513,960.76 3.593,113,287.000NEINOR HOMES SA EUR 17,579,211.90 2.151,642,917.000OZAK GAYRIMENKUL YATIRIM ORT TRY 727,891.97 0.092,162,432.000QUABIT INMOBILIARIA SA EUR 5,540,947.46 0.685,055,609.000TORUNLAR GAYRIMENKUL YATIRIM TRY 10,817,269.21 1.3236,798,332.107
71,492,546.60 8.72
ACEA SPA EUR 17,197,068.96 2.101,027,304.000Energy
ENERJISA ENERJI AS TRY 20,038,994.26 2.4523,877,680.000IREN SPA EUR 28,754,979.07 3.5012,578,731.000
65,991,042.29 8.05
GAMENET GROUP SPA EUR 3,552,211.78 0.43447,946.000Entertainment
INTERNATIONAL GAME TECHNOLOG USD 56,519,920.62 6.904,959,111.00060,072,132.40 7.33
INFINEON TECHNOLOGIES AG EUR 7,102,649.10 0.87456,762.000Electric & Electronic
PRYSMIAN SPA EUR 35,711,522.55 4.351,967,577.00042,814,171.65 5.22
KERNEL HOLDING SA PLN 27,616,584.29 3.372,429,802.000Agriculture
MHP SE USD 3,140,931.37 0.38353,899.00030,757,515.66 3.75
NOKIAN RENKAAT OYJ EUR 9,464,665.66 1.16344,671.000Auto Parts & Equipment
PORSCHE AUTOMOBIL HLDG-PRF EUR 2,914,140.00 0.3651,000.000TRATON SE EUR 11,261,991.20 1.37425,061.000VOLKSWAGEN AG-PREF EUR 7,067,870.70 0.8647,685.000
30,708,667.56 3.75
TMK PAO-GDR REG S USD 7,349,932.35 0.902,206,919.000Diversified machinery
TMK PJSC RUB 16,008,918.44 1.9519,116,053.00023,358,850.79 2.85
BASICNET SPA EUR 16,513,482.59 2.023,472,867.000Textile
16,513,482.59 2.02
DOVA PHARMACEUTICALS INC USD 14,295,107.82 1.751,153,747.000Cosmetics
GAROFALO HEALTH CARE SPA EUR 1,241,311.41 0.15286,677.00015,536,419.23 1.90
SICIT GROUP SPA EUR 145,450.00 0.0214,545.000Financial services
SPAXS SPA EUR 12,409,311.60 1.511,397,445.000THESPAC SPA EUR 960,000.00 0.12100,000.000
13,514,761.60 1.65
KOZA ALTIN ISLETMELERI AS TRY 9,163,049.36 1.121,138,316.000Metal
9,163,049.36 1.12
BUZZI UNICEM SPA-RSP EUR 3,406,886.56 0.42276,533.000Building materials
NameQuantity/Nominal
Market valuein EUR
Currency %NAV
GLENVEAGH PROPERTIES PLC EUR 4,748,687.50 0.586,487,278.0008,155,574.06 1.00
FINANCIERE DE LODET EUR 2,633,590.00 0.323,173.000Transportation
RYANAIR HOLDINGS PLC EUR 3,387,847.30 0.41334,933.0006,021,437.30 0.73
ASTM SPA EUR 2,652,872.40 0.3393,411.000Diversified services
CORP AMERICA AIRPORTS SA USD 259,991.57 0.0336,663.000EUROPCAR MOBILITY GROUP EUR 425,900.97 0.0567,981.000
3,338,764.94 0.41
TECHEDGE SPA EUR 645,309.60 0.08125,060.000Office & Business equipment
645,309.60 0.08
BOLLORE EUR 223,631.56 0.0357,637.000Media
223,631.56 0.03
CULTI MILANO SPA EUR 205,500.00 0.0368,500.000Chemical
205,500.00 0.03
499,817,142.47 60.99
BANCA CARIGE 5% 17-22/12/2022 EUR 871,771.95 0.11945,000.000
Bonds and other debt instrumentsBanks
BANCA IFIS SPA 17-17/10/2027 FRN EUR 4,554,300.30 0.565,410,000.000BANCO COM PORTUG 19-31/12/2049 FRN EUR 31,636,100.00 3.8629,000,000.000BANCO SABADELL 17-31/12/2049 EUR 30,904,520.00 3.7731,000,000.000BANCO SABADELL 17-31/12/2049 FRN EUR 7,618,494.00 0.937,800,000.000BANCO SANTANDER 18-31/12/2049 FRN EUR 755,920.00 0.09800,000.000BANK OF GEORGIA 19-31/12/2049 FRN USD 2,223,687.17 0.272,450,000.000CREDITO VALTELLI 17-12/04/2027 EUR 4,509,113.40 0.554,422,000.000IBERCAJA 18-31/12/2049 FRN EUR 15,533,032.00 1.9015,200,000.000MONTE DEI PASCHI 18-18/01/2028 FRN EUR 4,500,946.77 0.557,437,000.000UNICREDIT SPA 17-31/12/2049 FRN EUR 1,837,513.20 0.222,020,000.000
104,945,398.79 12.81
SUPERSTRADA PEDE 17-30/06/2047 FRN EUR 24,225,000.00 2.9625,500,000.000Building materials
SUPERSTRADA PEDE 8% 17-30/06/2027 EUR 7,068,750.00 0.867,250,000.00031,293,750.00 3.82
ARYZTA AG 13-31/12/2049 FRN FLAT CHF 11,116,480.55 1.3613,385,000.000Food services
ARYZTA EURO FINA 14-29/11/2049 FRNHYB
EUR 7,239,473.28 0.887,488,000.000
18,355,953.83 2.24
VALLOUREC SA 2.25% 14-30/09/2024 EUR 5,195,337.00 0.637,300,000.000Diversified machinery
5,195,337.00 0.63
TURKEY GOVT BOND 10.5% 17-11/08/2027 TRY 2,386,908.84 0.2921,000,000.000Government
TURKEY GOVT BOND 10.6% 16-11/02/2026 TRY 402,451.87 0.053,417,000.000TURKEY GOVT BOND 11% 17-24/02/2027 TRY 699,108.98 0.096,000,000.000TURKEY GOVT BOND 12.4% 18-08/03/2028 TRY 516,935.34 0.064,100,000.000
4,005,405.03 0.49
QUABIT FINANCE 8.25% 19-04/04/2023 EUR 1,457,050.00 0.181,400,000.000Real estate
1,457,050.00 0.18
165,252,894.65 20.17
NameQuantity/Nominal
Market valuein EUR
Currency %NAV
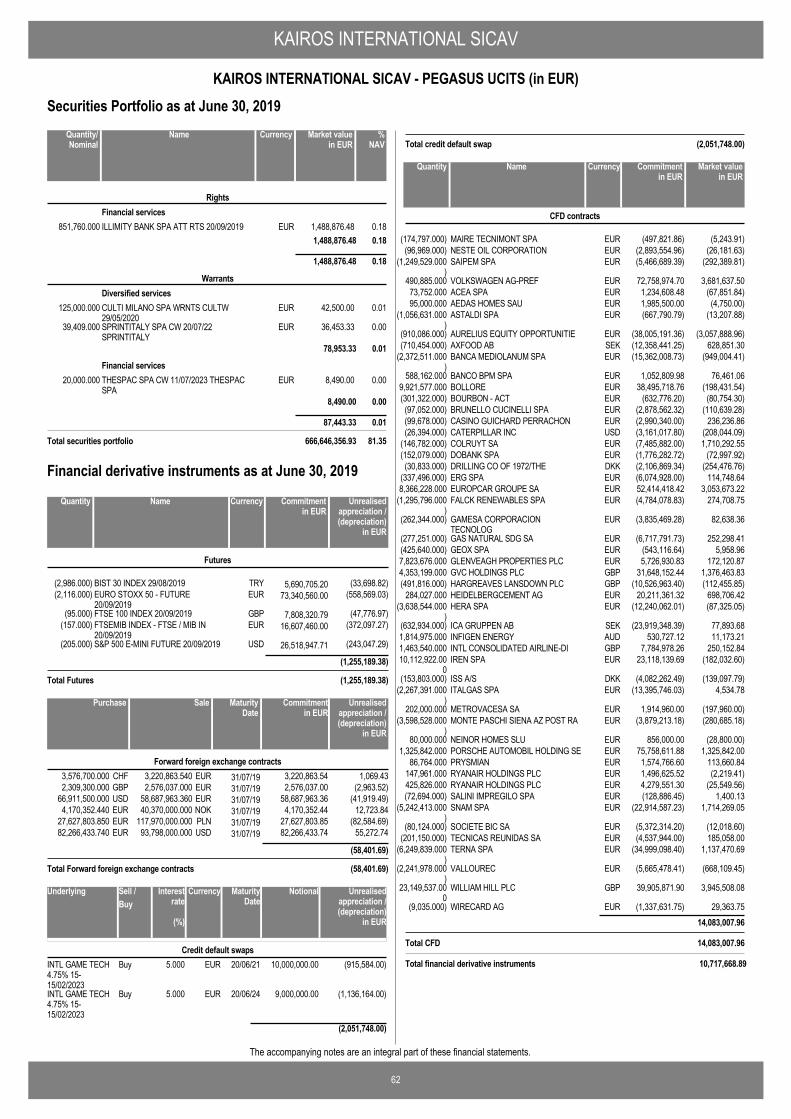
KAIROS INTERNATIONAL SICAV
62
KAIROS INTERNATIONAL SICAV - PEGASUS UCITS (in EUR)
The accompanying notes are an integral part of these financial statements.
Securities Portfolio as at June 30, 2019
ILLIMITY BANK SPA ATT RTS 20/09/2019 EUR 1,488,876.48 0.18851,760.000
RightsFinancial services
1,488,876.48 0.18
1,488,876.48 0.18
CULTI MILANO SPA WRNTS CULTW29/05/2020
EUR 42,500.00 0.01125,000.000
WarrantsDiversified services
SPRINTITALY SPA CW 20/07/22SPRINTITALY
EUR 36,453.33 0.0039,409.000
78,953.33 0.01
THESPAC SPA CW 11/07/2023 THESPACSPA
EUR 8,490.00 0.0020,000.000Financial services
8,490.00 0.00
87,443.33 0.01
Total securities portfolio 666,646,356.93 81.35
NameQuantity/Nominal
Market valuein EUR
Currency %NAV
BIST 30 INDEX 29/08/2019 TRY 5,690,705.20(2,986.000) (33,698.82)
Futures
EURO STOXX 50 - FUTURE20/09/2019
EUR 73,340,560.00(2,116.000) (558,569.03)
FTSE 100 INDEX 20/09/2019 GBP 7,808,320.79(95.000) (47,776.97)FTSEMIB INDEX - FTSE / MIB IN20/09/2019
EUR 16,607,460.00(157.000) (372,097.27)
S&P 500 E-MINI FUTURE 20/09/2019 USD 26,518,947.71(205.000) (243,047.29)
(1,255,189.38)
Total Futures (1,255,189.38)
NameQuantity Commitmentin EUR
Currency Unrealisedappreciation /(depreciation)
in EUR
Financial derivative instruments as at June 30, 2019
3,220,863.540 31/07/193,576,700.000 1,069.43EURCHF 3,220,863.54Forward foreign exchange contracts
2,576,037.000 31/07/192,309,300.000 (2,963.52)EURGBP 2,576,037.0058,687,963.360 31/07/1966,911,500.000 (41,919.49)EURUSD 58,687,963.3640,370,000.000 31/07/194,170,352.440 12,723.84NOKEUR 4,170,352.44
117,970,000.000 31/07/1927,627,803.850 (82,584.69)PLNEUR 27,627,803.8593,798,000.000 31/07/1982,266,433.740 55,272.74USDEUR 82,266,433.74
(58,401.69)
Total Forward foreign exchange contracts (58,401.69)
SalePurchase Unrealisedappreciation /(depreciation)
in EUR
MaturityDate
Commitmentin EUR
20/06/21INTL GAME TECH4.75% 15-15/02/2023
10,000,000.00 (915,584.00)EURBuy 5.000Credit default swaps
20/06/24INTL GAME TECH4.75% 15-15/02/2023
9,000,000.00 (1,136,164.00)EURBuy 5.000
(2,051,748.00)
Sell /Buy
Underlying NotionalMaturityDate
Unrealisedappreciation /(depreciation)
in EUR
CurrencyInterestrate
(%)
Total credit default swap (2,051,748.00)
MAIRE TECNIMONT SPA EUR (5,243.91)(497,821.86)(174,797.000)
CFD contracts
NameQuantity Market valuein EUR
Currency Commitmentin EUR
NESTE OIL CORPORATION EUR (26,181.63)(2,893,554.96)(96,969.000)SAIPEM SPA EUR (292,389.81)(5,466,689.39)(1,249,529.000
)VOLKSWAGEN AG-PREF EUR 3,681,637.5072,758,974.70490,885.000ACEA SPA EUR (67,851.84)1,234,608.4873,752.000AEDAS HOMES SAU EUR (4,750.00)1,985,500.0095,000.000ASTALDI SPA EUR (13,207.88)(667,790.79)(1,056,631.000
)AURELIUS EQUITY OPPORTUNITIE EUR (3,057,888.96)(38,005,191.36)(910,086.000)AXFOOD AB SEK 628,851.30(12,358,441.25)(710,454.000)BANCA MEDIOLANUM SPA EUR (949,004.41)(15,362,008.73)(2,372,511.000
)BANCO BPM SPA EUR 76,461.061,052,809.98588,162.000BOLLORE EUR (198,431.54)38,495,718.769,921,577.000BOURBON - ACT EUR (80,754.30)(632,776.20)(301,322.000)BRUNELLO CUCINELLI SPA EUR (110,639.28)(2,878,562.32)(97,052.000)CASINO GUICHARD PERRACHON EUR 236,236.86(2,990,340.00)(99,678.000)CATERPILLAR INC USD (208,044.09)(3,161,017.80)(26,394.000)COLRUYT SA EUR 1,710,292.55(7,485,882.00)(146,782.000)DOBANK SPA EUR (72,997.92)(1,776,282.72)(152,079.000)DRILLING CO OF 1972/THE DKK (254,476.76)(2,106,869.34)(30,833.000)ERG SPA EUR 114,748.64(6,074,928.00)(337,496.000)EUROPCAR GROUPE SA EUR 3,053,673.2252,414,418.428,366,228.000FALCK RENEWABLES SPA EUR 274,708.75(4,784,078.83)(1,295,796.000
)GAMESA CORPORACIONTECNOLOG
EUR 82,638.36(3,835,469.28)(262,344.000)
GAS NATURAL SDG SA EUR 252,298.41(6,717,791.73)(277,251.000)GEOX SPA EUR 5,958.96(543,116.64)(425,640.000)GLENVEAGH PROPERTIES PLC EUR 172,120.875,726,930.837,823,676.000GVC HOLDINGS PLC GBP 1,376,463.8331,648,152.444,353,199.000HARGREAVES LANSDOWN PLC GBP (112,455.85)(10,526,963.40)(491,816.000)HEIDELBERGCEMENT AG EUR 698,706.4220,211,361.32284,027.000HERA SPA EUR (87,325.05)(12,240,062.01)(3,638,544.000
)ICA GRUPPEN AB SEK 77,893.68(23,919,348.39)(632,934.000)INFIGEN ENERGY AUD 11,173.21530,727.121,814,975.000INTL CONSOLIDATED AIRLINE-DI GBP 250,152.847,784,978.261,463,540.000IREN SPA EUR (182,032.60)23,118,139.6910,112,922.00
0ISS A/S DKK (139,097.79)(4,082,262.49)(153,803.000)ITALGAS SPA EUR 4,534.78(13,395,746.03)(2,267,391.000
)METROVACESA SA EUR (197,960.00)1,914,960.00202,000.000MONTE PASCHI SIENA AZ POST RA EUR (280,685.18)(3,879,213.18)(3,598,528.000
)NEINOR HOMES SLU EUR (28,800.00)856,000.0080,000.000PORSCHE AUTOMOBIL HOLDING SE EUR 1,325,842.0075,758,611.881,325,842.000PRYSMIAN EUR 113,660.841,574,766.6086,764.000RYANAIR HOLDINGS PLC EUR (2,219.41)1,496,625.52147,961.000RYANAIR HOLDINGS PLC EUR (25,549.56)4,279,551.30425,826.000SALINI IMPREGILO SPA EUR 1,400.13(128,886.45)(72,694.000)SNAM SPA EUR 1,714,269.05(22,914,587.23)(5,242,413.000
)SOCIETE BIC SA EUR (12,018.60)(5,372,314.20)(80,124.000)TECNICAS REUNIDAS SA EUR 185,058.00(4,537,944.00)(201,150.000)TERNA SPA EUR 1,137,470.69(34,999,098.40)(6,249,839.000
)VALLOUREC EUR (668,109.45)(5,665,478.41)(2,241,978.000
)WILLIAM HILL PLC GBP 3,945,508.0839,905,871.9023,149,537.00
0WIRECARD AG EUR 29,363.75(1,337,631.75)(9,035.000)
14,083,007.96
Total CFD 14,083,007.96
Total financial derivative instruments 10,717,668.89
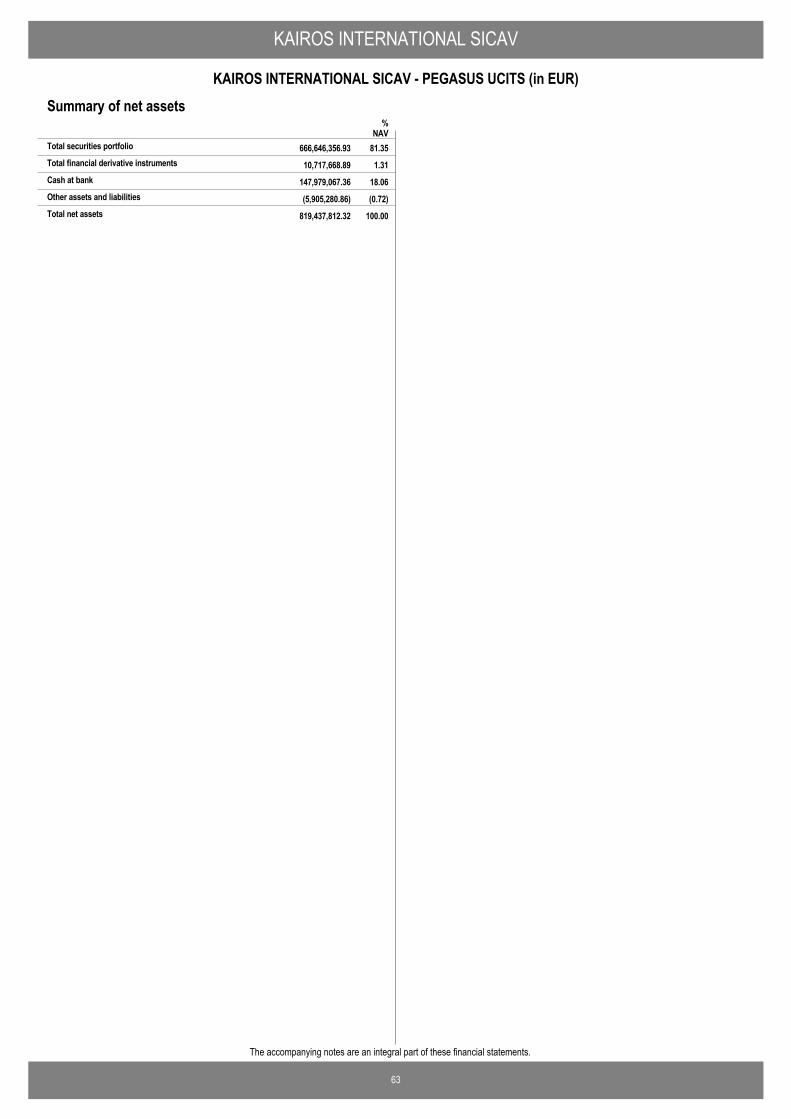
KAIROS INTERNATIONAL SICAV
63
KAIROS INTERNATIONAL SICAV - PEGASUS UCITS (in EUR)
The accompanying notes are an integral part of these financial statements.
Summary of net assets
10,717,668.89 1.31Total financial derivative instruments
%NAV
666,646,356.93 81.35Total securities portfolio
147,979,067.36 18.06Cash at bank
(5,905,280.86) (0.72)Other assets and liabilities
819,437,812.32 100.00Total net assets
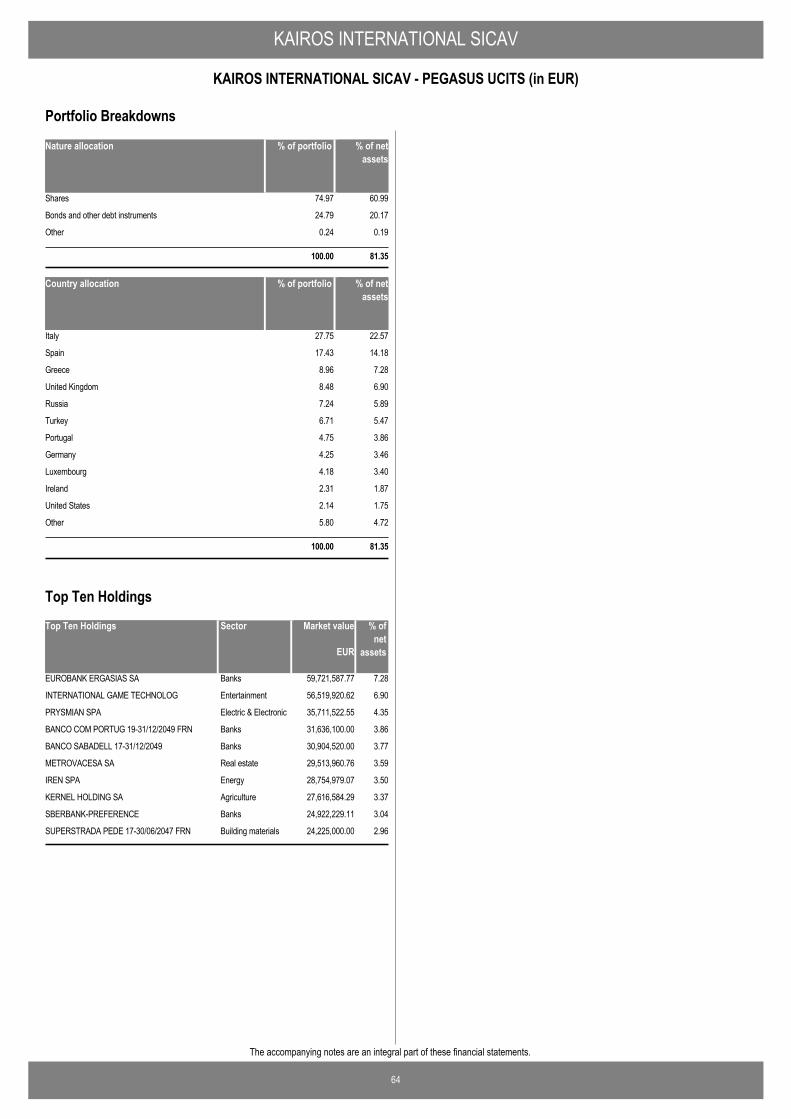
KAIROS INTERNATIONAL SICAV
64
KAIROS INTERNATIONAL SICAV - PEGASUS UCITS (in EUR)
The accompanying notes are an integral part of these financial statements.
Nature allocation % of portfolio % of netassets
Shares 74.97 60.99
Bonds and other debt instruments 24.79 20.17
Other 0.24 0.19
100.00 81.35
Country allocation % of portfolio % of netassets
Italy 27.75 22.57
Spain 17.43 14.18
Greece 8.96 7.28
United Kingdom 8.48 6.90
Russia 7.24 5.89
Turkey 6.71 5.47
Portugal 4.75 3.86
Germany 4.25 3.46
Luxembourg 4.18 3.40
Ireland 2.31 1.87
United States 2.14 1.75
Other 5.80 4.72
100.00 81.35
Portfolio Breakdowns
Top Ten Holdings Market value % ofnet
assets
EUROBANK ERGASIAS SA 59,721,587.77 7.28Banks
INTERNATIONAL GAME TECHNOLOG 56,519,920.62 6.90Entertainment
PRYSMIAN SPA 35,711,522.55 4.35Electric & Electronic
BANCO COM PORTUG 19-31/12/2049 FRN 31,636,100.00 3.86Banks
BANCO SABADELL 17-31/12/2049 30,904,520.00 3.77Banks
METROVACESA SA 29,513,960.76 3.59Real estate
IREN SPA 28,754,979.07 3.50Energy
KERNEL HOLDING SA 27,616,584.29 3.37Agriculture
SBERBANK-PREFERENCE 24,922,229.11 3.04Banks
SUPERSTRADA PEDE 17-30/06/2047 FRN 24,225,000.00 2.96Building materials
EUR
Sector
Top Ten Holdings
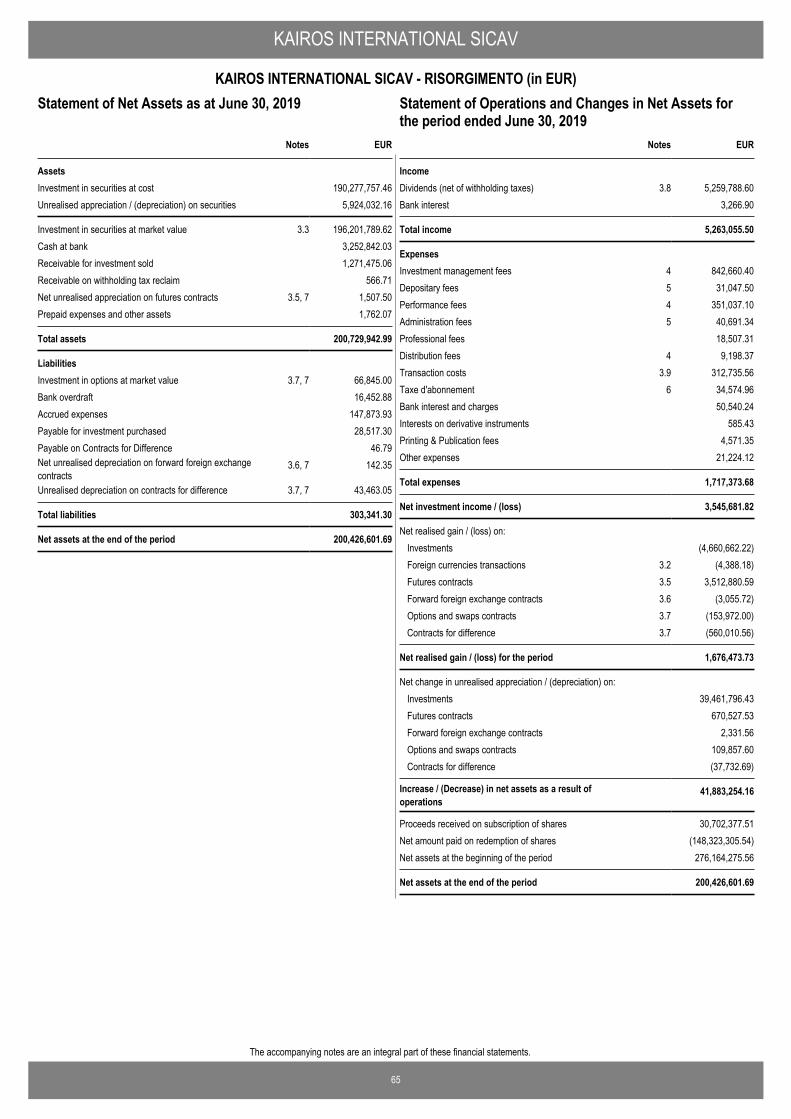
65
The accompanying notes are an integral part of these financial statements.
KAIROS INTERNATIONAL SICAV
KAIROS INTERNATIONAL SICAV - RISORGIMENTO (in EUR)Statement of Operations and Changes in Net Assets for theperiod ended June 30, 2019
EUR
AssetsInvestment in securities at cost 190,277,757.46Unrealised appreciation / (depreciation) on securities 5,924,032.16
Investment in securities at market value 3.3 196,201,789.62Cash at bank 3,252,842.03Receivable for investment sold 1,271,475.06Receivable on withholding tax reclaim 566.71Net unrealised appreciation on futures contracts 3.5, 7 1,507.50Prepaid expenses and other assets 1,762.07
Total assets 200,729,942.99
LiabilitiesInvestment in options at market value 3.7, 7 66,845.00Bank overdraft 16,452.88Accrued expenses 147,873.93Payable for investment purchased 28,517.30Payable on Contracts for Difference 46.79Net unrealised depreciation on forward foreign exchangecontracts
3.6, 7 142.35
Unrealised depreciation on contracts for difference 3.7, 7 43,463.05
Total liabilities 303,341.30
Net assets at the end of the period 200,426,601.69
Notes
Statement of Net Assets as at June 30, 2019
IncomeDividends (net of withholding taxes) 3.8 5,259,788.60Bank interest 3,266.90
Total income 5,263,055.50
ExpensesInvestment management fees 4 842,660.40Depositary fees 5 31,047.50Performance fees 4 351,037.10Administration fees 5 40,691.34Professional fees 18,507.31Distribution fees 4 9,198.37Transaction costs 3.9 312,735.56Taxe d'abonnement 6 34,574.96Bank interest and charges 50,540.24Interests on derivative instruments 585.43Printing & Publication fees 4,571.35Other expenses 21,224.12
Total expenses 1,717,373.68
Net investment income / (loss) 3,545,681.82
Net realised gain / (loss) on: Investments (4,660,662.22)Foreign currencies transactions 3.2 (4,388.18)Futures contracts 3.5 3,512,880.59Forward foreign exchange contracts 3.6 (3,055.72)Options and swaps contracts 3.7 (153,972.00)Contracts for difference 3.7 (560,010.56)
Net realised gain / (loss) for the period 1,676,473.73
Net change in unrealised appreciation / (depreciation) on: Investments 39,461,796.43Futures contracts 670,527.53Forward foreign exchange contracts 2,331.56Options and swaps contracts 109,857.60Contracts for difference (37,732.69)
Increase / (Decrease) in net assets as a result ofoperations
41,883,254.16
Proceeds received on subscription of shares 30,702,377.51Net amount paid on redemption of shares (148,323,305.54)Net assets at the beginning of the period 276,164,275.56
Net assets at the end of the period 200,426,601.69
EURNotes
Statement of Operations and Changes in Net Assets forthe period ended June 30, 2019
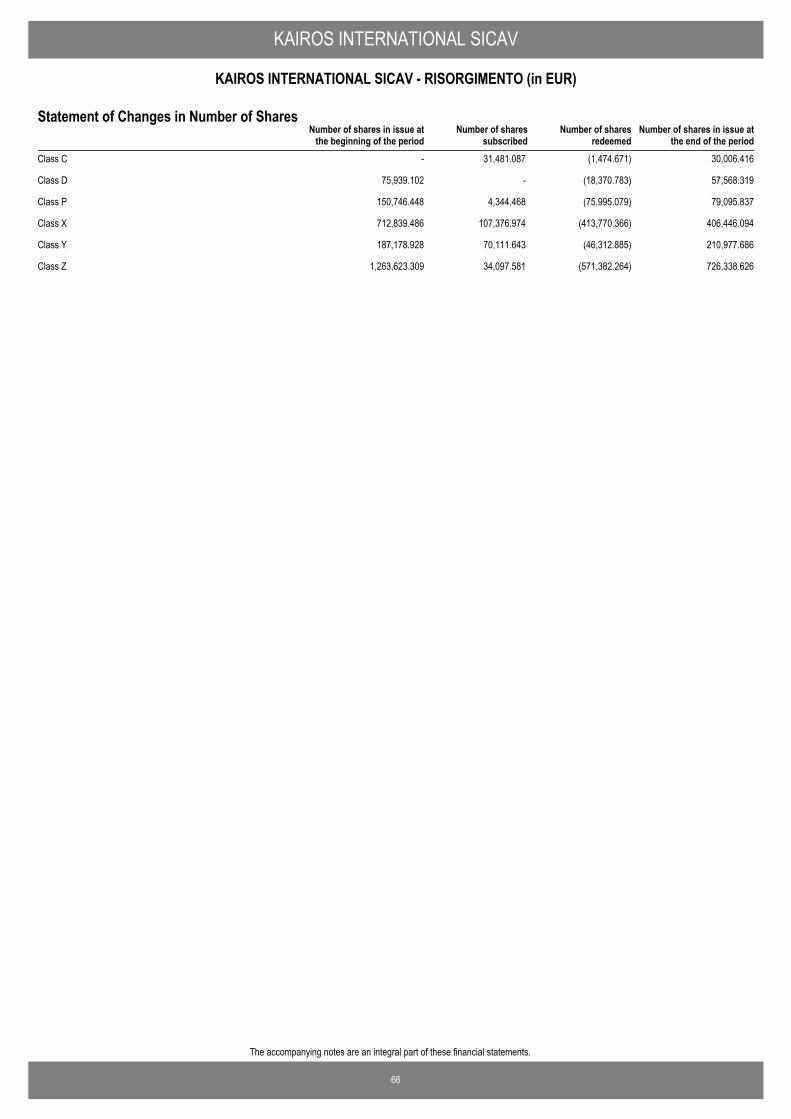
66
The accompanying notes are an integral part of these financial statements.
KAIROS INTERNATIONAL SICAV
KAIROS INTERNATIONAL SICAV - RISORGIMENTO (in EUR)
Number of shares in issue atthe end of the period
Number of shares in issue atthe beginning of the period
Number of sharessubscribed
Number of sharesredeemed
Statement of Changes in Number of Shares
Class C - 31,481.087 (1,474.671) 30,006.416
Class D 75,939.102 - (18,370.783) 57,568.319
Class P 150,746.448 4,344.468 (75,995.079) 79,095.837
Class X 712,839.486 107,376.974 (413,770.366) 406,446.094
Class Y 187,178.928 70,111.643 (46,312.885) 210,977.686
Class Z 1,263,623.309 34,097.581 (571,382.264) 726,338.626
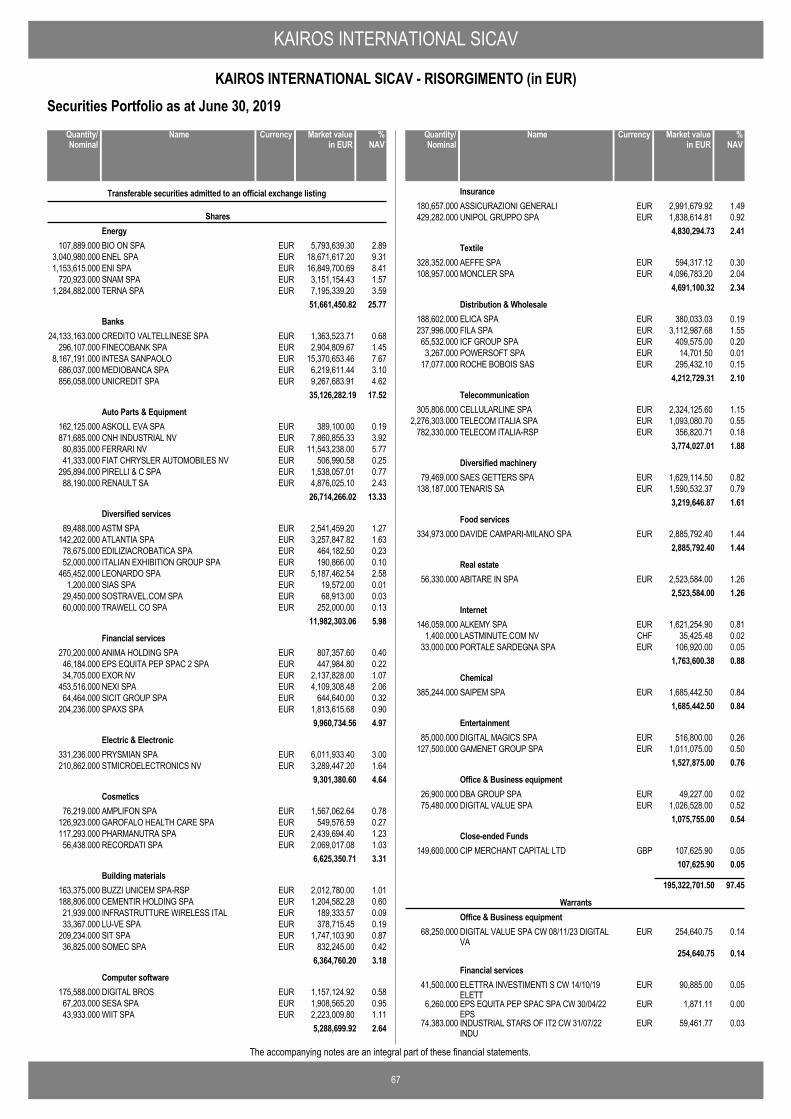
KAIROS INTERNATIONAL SICAV
67
KAIROS INTERNATIONAL SICAV - RISORGIMENTO (in EUR)
The accompanying notes are an integral part of these financial statements.
Securities Portfolio as at June 30, 2019
BIO ON SPA EUR 5,793,639.30 2.89107,889.000
Transferable securities admitted to an official exchange listing
SharesEnergy
ENEL SPA EUR 18,671,617.20 9.313,040,980.000ENI SPA EUR 16,849,700.69 8.411,153,615.000SNAM SPA EUR 3,151,154.43 1.57720,923.000TERNA SPA EUR 7,195,339.20 3.591,284,882.000
51,661,450.82 25.77
CREDITO VALTELLINESE SPA EUR 1,363,523.71 0.6824,133,163.000Banks
FINECOBANK SPA EUR 2,904,809.67 1.45296,107.000INTESA SANPAOLO EUR 15,370,653.46 7.678,167,191.000MEDIOBANCA SPA EUR 6,219,611.44 3.10686,037.000UNICREDIT SPA EUR 9,267,683.91 4.62856,058.000
35,126,282.19 17.52
ASKOLL EVA SPA EUR 389,100.00 0.19162,125.000Auto Parts & Equipment
CNH INDUSTRIAL NV EUR 7,860,855.33 3.92871,685.000FERRARI NV EUR 11,543,238.00 5.7780,835.000FIAT CHRYSLER AUTOMOBILES NV EUR 506,990.58 0.2541,333.000PIRELLI & C SPA EUR 1,538,057.01 0.77295,894.000RENAULT SA EUR 4,876,025.10 2.4388,190.000
26,714,266.02 13.33
ASTM SPA EUR 2,541,459.20 1.2789,488.000Diversified services
ATLANTIA SPA EUR 3,257,847.82 1.63142,202.000EDILIZIACROBATICA SPA EUR 464,182.50 0.2378,675.000ITALIAN EXHIBITION GROUP SPA EUR 190,866.00 0.1052,000.000LEONARDO SPA EUR 5,187,462.54 2.58465,452.000SIAS SPA EUR 19,572.00 0.011,200.000SOSTRAVEL.COM SPA EUR 68,913.00 0.0329,450.000TRAWELL CO SPA EUR 252,000.00 0.1360,000.000
11,982,303.06 5.98
ANIMA HOLDING SPA EUR 807,357.60 0.40270,200.000Financial services
EPS EQUITA PEP SPAC 2 SPA EUR 447,984.80 0.2246,184.000EXOR NV EUR 2,137,828.00 1.0734,705.000NEXI SPA EUR 4,109,308.48 2.06453,516.000SICIT GROUP SPA EUR 644,640.00 0.3264,464.000SPAXS SPA EUR 1,813,615.68 0.90204,236.000
9,960,734.56 4.97
PRYSMIAN SPA EUR 6,011,933.40 3.00331,236.000Electric & Electronic
STMICROELECTRONICS NV EUR 3,289,447.20 1.64210,862.0009,301,380.60 4.64
AMPLIFON SPA EUR 1,567,062.64 0.7876,219.000Cosmetics
GAROFALO HEALTH CARE SPA EUR 549,576.59 0.27126,923.000PHARMANUTRA SPA EUR 2,439,694.40 1.23117,293.000RECORDATI SPA EUR 2,069,017.08 1.0356,438.000
6,625,350.71 3.31
BUZZI UNICEM SPA-RSP EUR 2,012,780.00 1.01163,375.000Building materials
CEMENTIR HOLDING SPA EUR 1,204,582.28 0.60188,806.000INFRASTRUTTURE WIRELESS ITAL EUR 189,333.57 0.0921,939.000LU-VE SPA EUR 378,715.45 0.1933,367.000SIT SPA EUR 1,747,103.90 0.87209,234.000SOMEC SPA EUR 832,245.00 0.4236,825.000
6,364,760.20 3.18
DIGITAL BROS EUR 1,157,124.92 0.58175,588.000Computer software
SESA SPA EUR 1,908,565.20 0.9567,203.000WIIT SPA EUR 2,223,009.80 1.1143,933.000
5,288,699.92 2.64
NameQuantity/Nominal
Market valuein EUR
Currency %NAV
ASSICURAZIONI GENERALI EUR 2,991,679.92 1.49180,657.000Insurance
UNIPOL GRUPPO SPA EUR 1,838,614.81 0.92429,282.0004,830,294.73 2.41
AEFFE SPA EUR 594,317.12 0.30328,352.000Textile
MONCLER SPA EUR 4,096,783.20 2.04108,957.0004,691,100.32 2.34
ELICA SPA EUR 380,033.03 0.19188,602.000Distribution & Wholesale
FILA SPA EUR 3,112,987.68 1.55237,996.000ICF GROUP SPA EUR 409,575.00 0.2065,532.000POWERSOFT SPA EUR 14,701.50 0.013,267.000ROCHE BOBOIS SAS EUR 295,432.10 0.1517,077.000
4,212,729.31 2.10
CELLULARLINE SPA EUR 2,324,125.60 1.15305,806.000Telecommunication
TELECOM ITALIA SPA EUR 1,093,080.70 0.552,276,303.000TELECOM ITALIA-RSP EUR 356,820.71 0.18782,330.000
3,774,027.01 1.88
SAES GETTERS SPA EUR 1,629,114.50 0.8279,469.000Diversified machinery
TENARIS SA EUR 1,590,532.37 0.79138,187.0003,219,646.87 1.61
DAVIDE CAMPARI-MILANO SPA EUR 2,885,792.40 1.44334,973.000Food services
2,885,792.40 1.44
ABITARE IN SPA EUR 2,523,584.00 1.2656,330.000Real estate
2,523,584.00 1.26
ALKEMY SPA EUR 1,621,254.90 0.81146,059.000Internet
LASTMINUTE.COM NV CHF 35,425.48 0.021,400.000PORTALE SARDEGNA SPA EUR 106,920.00 0.0533,000.000
1,763,600.38 0.88
SAIPEM SPA EUR 1,685,442.50 0.84385,244.000Chemical
1,685,442.50 0.84
DIGITAL MAGICS SPA EUR 516,800.00 0.2685,000.000Entertainment
GAMENET GROUP SPA EUR 1,011,075.00 0.50127,500.0001,527,875.00 0.76
DBA GROUP SPA EUR 49,227.00 0.0226,900.000Office & Business equipment
DIGITAL VALUE SPA EUR 1,026,528.00 0.5275,480.0001,075,755.00 0.54
CIP MERCHANT CAPITAL LTD GBP 107,625.90 0.05149,600.000Close-ended Funds
107,625.90 0.05
195,322,701.50 97.45
DIGITAL VALUE SPA CW 08/11/23 DIGITALVA
EUR 254,640.75 0.1468,250.000
WarrantsOffice & Business equipment
254,640.75 0.14
ELETTRA INVESTIMENTI S CW 14/10/19ELETT
EUR 90,885.00 0.0541,500.000Financial services
EPS EQUITA PEP SPAC SPA CW 30/04/22EPS
EUR 1,871.11 0.006,260.000
INDUSTRIAL STARS OF IT2 CW 31/07/22INDU
EUR 59,461.77 0.0374,383.000
NameQuantity/Nominal
Market valuein EUR
Currency %NAV
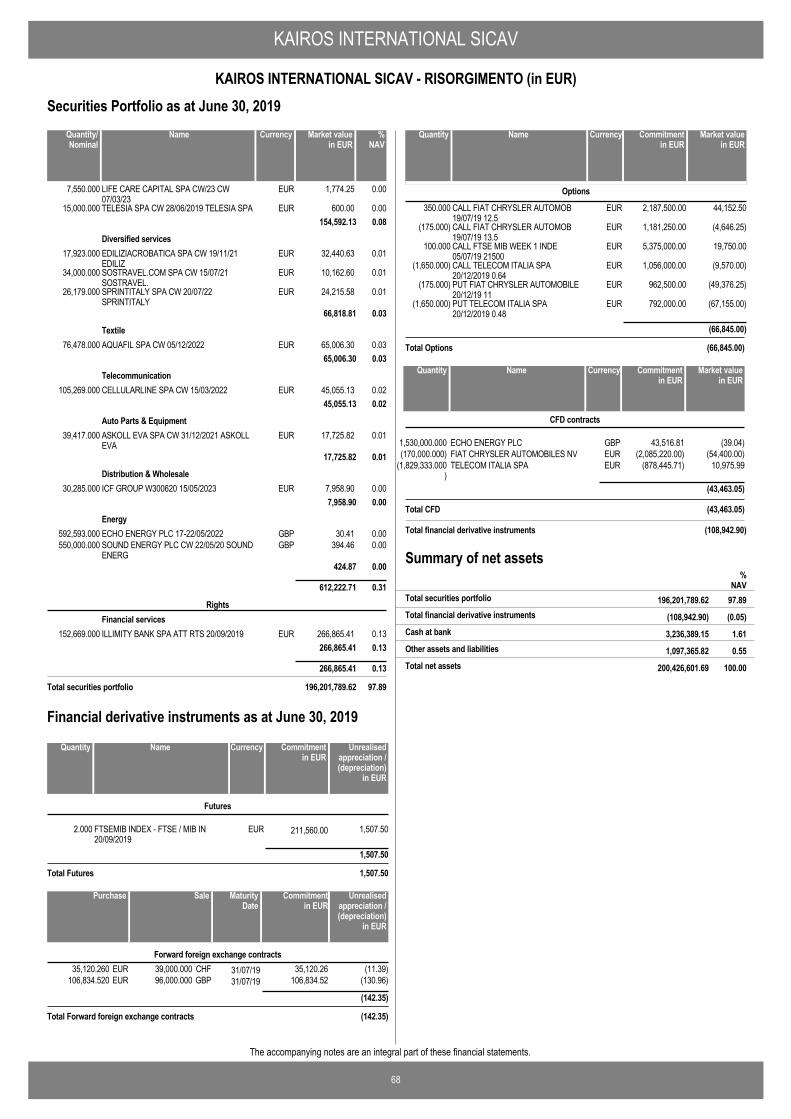
KAIROS INTERNATIONAL SICAV
68
KAIROS INTERNATIONAL SICAV - RISORGIMENTO (in EUR)
The accompanying notes are an integral part of these financial statements.
Securities Portfolio as at June 30, 2019
LIFE CARE CAPITAL SPA CW/23 CW07/03/23
EUR 1,774.25 0.007,550.000
TELESIA SPA CW 28/06/2019 TELESIA SPA EUR 600.00 0.0015,000.000154,592.13 0.08
EDILIZIACROBATICA SPA CW 19/11/21EDILIZ
EUR 32,440.63 0.0117,923.000Diversified services
SOSTRAVEL.COM SPA CW 15/07/21SOSTRAVEL.
EUR 10,162.60 0.0134,000.000
SPRINTITALY SPA CW 20/07/22SPRINTITALY
EUR 24,215.58 0.0126,179.000
66,818.81 0.03
AQUAFIL SPA CW 05/12/2022 EUR 65,006.30 0.0376,478.000Textile
65,006.30 0.03
CELLULARLINE SPA CW 15/03/2022 EUR 45,055.13 0.02105,269.000Telecommunication
45,055.13 0.02
ASKOLL EVA SPA CW 31/12/2021 ASKOLLEVA
EUR 17,725.82 0.0139,417.000Auto Parts & Equipment
17,725.82 0.01
ICF GROUP W300620 15/05/2023 EUR 7,958.90 0.0030,285.000Distribution & Wholesale
7,958.90 0.00
ECHO ENERGY PLC 17-22/05/2022 GBP 30.41 0.00592,593.000Energy
SOUND ENERGY PLC CW 22/05/20 SOUNDENERG
GBP 394.46 0.00550,000.000
424.87 0.00
612,222.71 0.31
ILLIMITY BANK SPA ATT RTS 20/09/2019 EUR 266,865.41 0.13152,669.000
RightsFinancial services
266,865.41 0.13
266,865.41 0.13
Total securities portfolio 196,201,789.62 97.89
NameQuantity/Nominal
Market valuein EUR
Currency %NAV
FTSEMIB INDEX - FTSE / MIB IN20/09/2019
EUR 211,560.002.000 1,507.50
Futures
1,507.50
Total Futures 1,507.50
NameQuantity Commitmentin EUR
Currency Unrealisedappreciation /(depreciation)
in EUR
Financial derivative instruments as at June 30, 2019
39,000.000 31/07/1935,120.260 (11.39)CHFEUR 35,120.26Forward foreign exchange contracts
96,000.000 31/07/19106,834.520 (130.96)GBPEUR 106,834.52
(142.35)
Total Forward foreign exchange contracts (142.35)
SalePurchase Unrealisedappreciation /(depreciation)
in EUR
MaturityDate
Commitmentin EUR
CALL FIAT CHRYSLER AUTOMOB19/07/19 12.5
EUR350.000 2,187,500.00 44,152.50
Options
CALL FIAT CHRYSLER AUTOMOB19/07/19 13.5
EUR(175.000) 1,181,250.00 (4,646.25)
CALL FTSE MIB WEEK 1 INDE05/07/19 21500
EUR100.000 5,375,000.00 19,750.00
CALL TELECOM ITALIA SPA20/12/2019 0.64
EUR(1,650.000) 1,056,000.00 (9,570.00)
PUT FIAT CHRYSLER AUTOMOBILE20/12/19 11
EUR(175.000) 962,500.00 (49,376.25)
PUT TELECOM ITALIA SPA20/12/2019 0.48
EUR(1,650.000) 792,000.00 (67,155.00)
(66,845.00)
Total Options (66,845.00)
NameQuantity Market valuein EUR
Currency Commitmentin EUR
ECHO ENERGY PLC GBP (39.04)43,516.811,530,000.000
CFD contracts
NameQuantity Market valuein EUR
Currency Commitmentin EUR
FIAT CHRYSLER AUTOMOBILES NV EUR (54,400.00)(2,085,220.00)(170,000.000)TELECOM ITALIA SPA EUR 10,975.99(878,445.71)(1,829,333.000
)(43,463.05)
Total CFD (43,463.05)
Total financial derivative instruments (108,942.90)
Summary of net assets
(108,942.90) (0.05)Total financial derivative instruments
%NAV
196,201,789.62 97.89Total securities portfolio
3,236,389.15 1.61Cash at bank
1,097,365.82 0.55Other assets and liabilities
200,426,601.69 100.00Total net assets
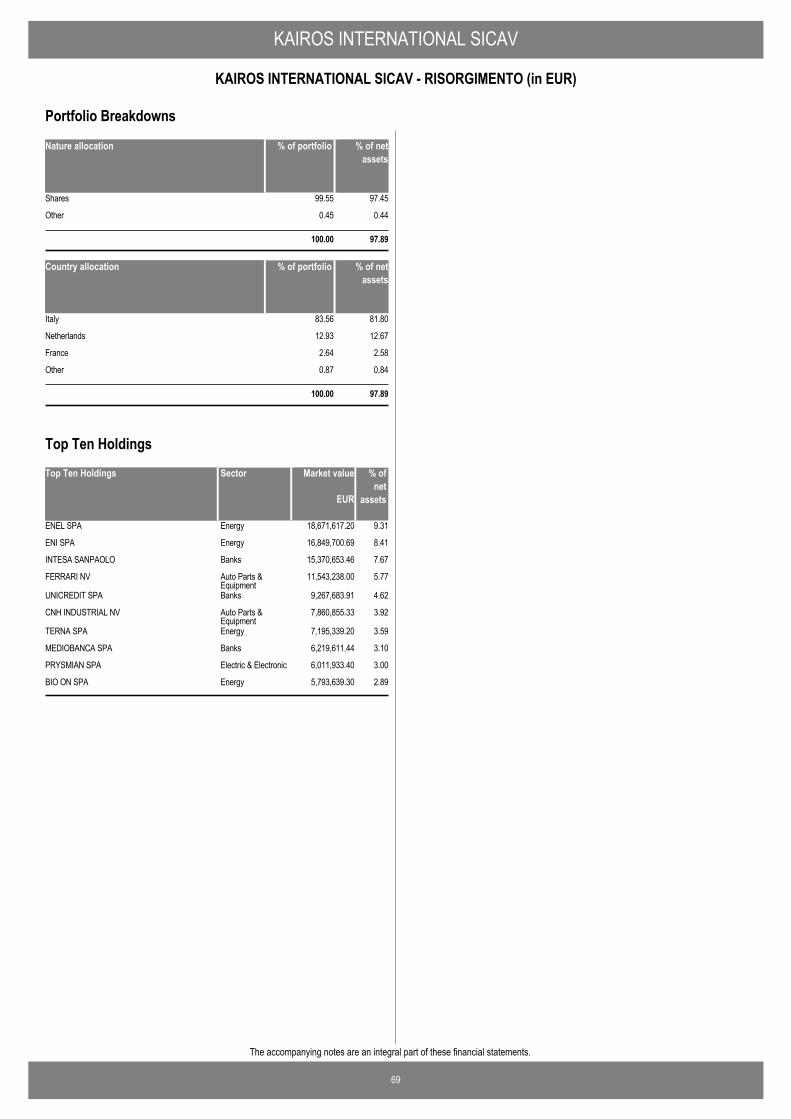
KAIROS INTERNATIONAL SICAV
69
KAIROS INTERNATIONAL SICAV - RISORGIMENTO (in EUR)
The accompanying notes are an integral part of these financial statements.
Nature allocation % of portfolio % of netassets
Shares 99.55 97.45
Other 0.45 0.44
100.00 97.89
Country allocation % of portfolio % of netassets
Italy 83.56 81.80
Netherlands 12.93 12.67
France 2.64 2.58
Other 0.87 0.84
100.00 97.89
Portfolio Breakdowns
Top Ten Holdings Market value % ofnet
assets
ENEL SPA 18,671,617.20 9.31Energy
ENI SPA 16,849,700.69 8.41Energy
INTESA SANPAOLO 15,370,653.46 7.67Banks
FERRARI NV 11,543,238.00 5.77Auto Parts &Equipment
UNICREDIT SPA 9,267,683.91 4.62Banks
CNH INDUSTRIAL NV 7,860,855.33 3.92Auto Parts &Equipment
TERNA SPA 7,195,339.20 3.59Energy
MEDIOBANCA SPA 6,219,611.44 3.10Banks
PRYSMIAN SPA 6,011,933.40 3.00Electric & Electronic
BIO ON SPA 5,793,639.30 2.89Energy
EUR
Sector
Top Ten Holdings
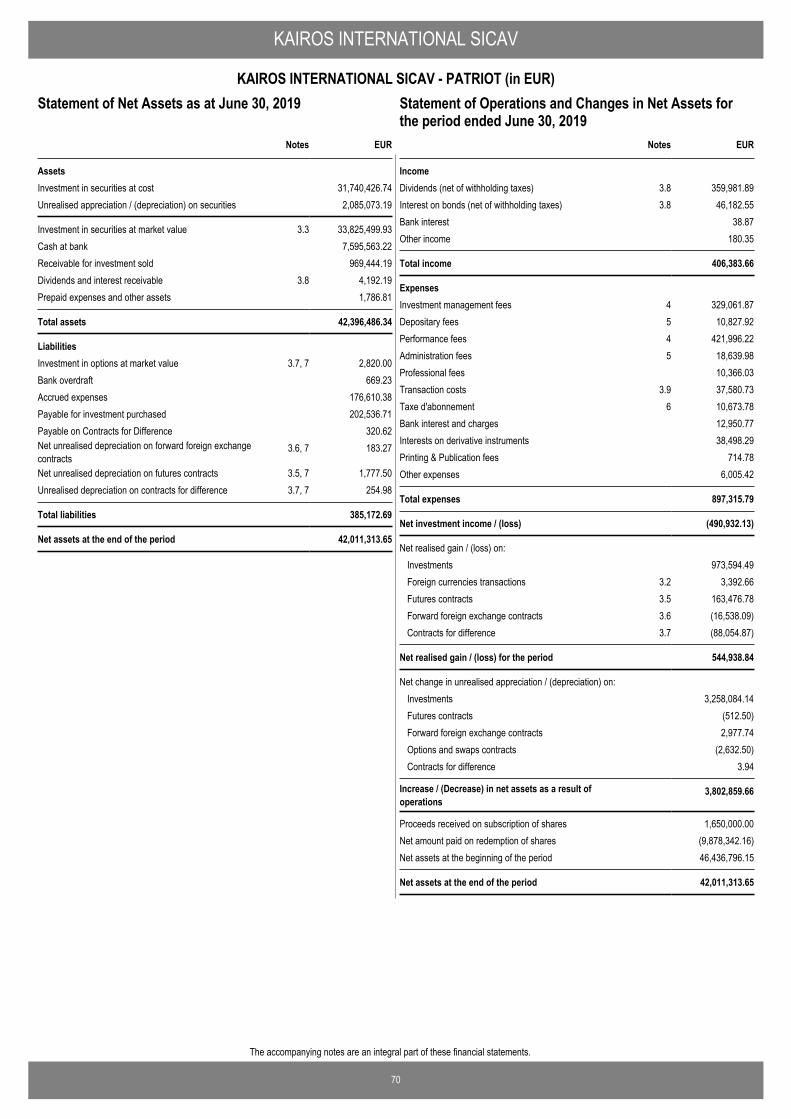
70
The accompanying notes are an integral part of these financial statements.
KAIROS INTERNATIONAL SICAV
KAIROS INTERNATIONAL SICAV - PATRIOT (in EUR)Statement of Operations and Changes in Net Assets for theperiod ended June 30, 2019
EUR
AssetsInvestment in securities at cost 31,740,426.74Unrealised appreciation / (depreciation) on securities 2,085,073.19
Investment in securities at market value 3.3 33,825,499.93Cash at bank 7,595,563.22Receivable for investment sold 969,444.19Dividends and interest receivable 3.8 4,192.19Prepaid expenses and other assets 1,786.81
Total assets 42,396,486.34
LiabilitiesInvestment in options at market value 3.7, 7 2,820.00Bank overdraft 669.23Accrued expenses 176,610.38Payable for investment purchased 202,536.71Payable on Contracts for Difference 320.62Net unrealised depreciation on forward foreign exchangecontracts
3.6, 7 183.27
Net unrealised depreciation on futures contracts 3.5, 7 1,777.50Unrealised depreciation on contracts for difference 3.7, 7 254.98
Total liabilities 385,172.69
Net assets at the end of the period 42,011,313.65
Notes
Statement of Net Assets as at June 30, 2019
IncomeDividends (net of withholding taxes) 3.8 359,981.89Interest on bonds (net of withholding taxes) 3.8 46,182.55Bank interest 38.87Other income 180.35
Total income 406,383.66
ExpensesInvestment management fees 4 329,061.87Depositary fees 5 10,827.92Performance fees 4 421,996.22Administration fees 5 18,639.98Professional fees 10,366.03Transaction costs 3.9 37,580.73Taxe d'abonnement 6 10,673.78Bank interest and charges 12,950.77Interests on derivative instruments 38,498.29Printing & Publication fees 714.78Other expenses 6,005.42
Total expenses 897,315.79
Net investment income / (loss) (490,932.13)
Net realised gain / (loss) on: Investments 973,594.49Foreign currencies transactions 3.2 3,392.66Futures contracts 3.5 163,476.78Forward foreign exchange contracts 3.6 (16,538.09)Contracts for difference 3.7 (88,054.87)
Net realised gain / (loss) for the period 544,938.84
Net change in unrealised appreciation / (depreciation) on: Investments 3,258,084.14Futures contracts (512.50)Forward foreign exchange contracts 2,977.74Options and swaps contracts (2,632.50)Contracts for difference 3.94
Increase / (Decrease) in net assets as a result ofoperations
3,802,859.66
Proceeds received on subscription of shares 1,650,000.00Net amount paid on redemption of shares (9,878,342.16)Net assets at the beginning of the period 46,436,796.15
Net assets at the end of the period 42,011,313.65
EURNotes
Statement of Operations and Changes in Net Assets forthe period ended June 30, 2019
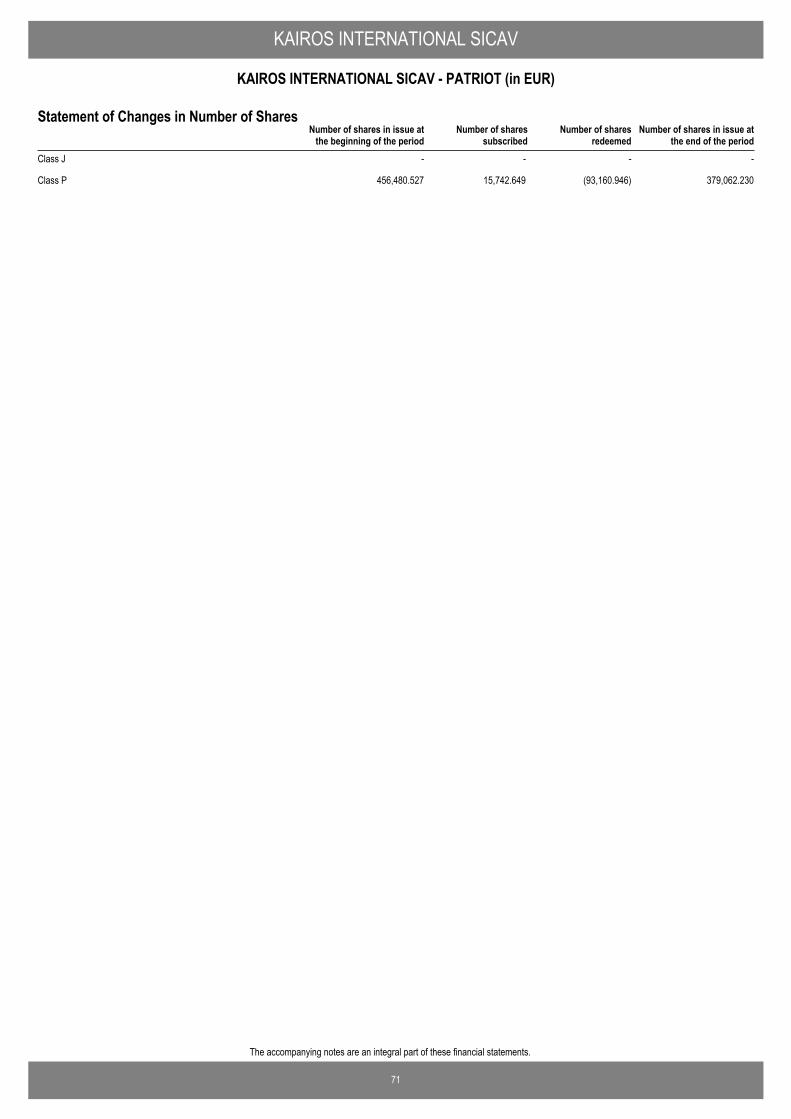
71
The accompanying notes are an integral part of these financial statements.
KAIROS INTERNATIONAL SICAV
KAIROS INTERNATIONAL SICAV - PATRIOT (in EUR)
Number of shares in issue atthe end of the period
Number of shares in issue atthe beginning of the period
Number of sharessubscribed
Number of sharesredeemed
Statement of Changes in Number of Shares
Class J - - - -
Class P 456,480.527 15,742.649 (93,160.946) 379,062.230

KAIROS INTERNATIONAL SICAV
72
KAIROS INTERNATIONAL SICAV - PATRIOT (in EUR)
The accompanying notes are an integral part of these financial statements.
Securities Portfolio as at June 30, 2019
EPS EQUITA PEP SPAC 2 SPA EUR 1,630,259.60 3.88168,068.000
Transferable securities admitted to an official exchange listing
SharesFinancial services
INDUSTRIAL STARS OF ITALY 3 EUR 1,988,902.15 4.73201,919.000LIFE CARE CAPITAL SPA EUR 490,560.00 1.1751,100.000NEXI SPA EUR 660,528.78 1.5772,898.000SICIT GROUP SPA EUR 360,260.00 0.8636,026.000SPACTIV SPA EUR 547,962.70 1.3056,491.000SPAXS SPA EUR 329,510.16 0.7837,107.000
6,007,983.39 14.29
FINECOBANK SPA EUR 98,100.00 0.2310,000.000Banks
IDEAMI SPA EUR 1,892,722.20 4.51195,126.0001,990,822.20 4.74
ABITARE IN SPA EUR 1,836,755.20 4.3740,999.000Real estate
1,836,755.20 4.37
ELICA SPA EUR 302,747.71 0.72150,247.000Distribution & Wholesale
FILA SPA EUR 696,523.08 1.6653,251.000POWERSOFT CUM BONUS SHARE EUR 268,200.00 0.6459,600.000POWERSOFT SPA EUR 12,078.00 0.032,684.000SAFILO GROUP SPA EUR 230,909.37 0.55250,444.000
1,510,458.16 3.60
ACSM - AGAM SPA EUR 375,781.50 0.89221,700.000Energy
BIO ON SPA EUR 858,126.00 2.0515,980.000ENEL SPA EUR 76,750.00 0.1812,500.000ENI SPA EUR 58,424.00 0.144,000.000
1,369,081.50 3.26
ASTM SPA EUR 241,968.00 0.588,520.000Diversified services
CRAMO OYJ EUR 522,000.00 1.2325,000.000EDILIZIACROBATICA SPA EUR 208,346.70 0.5035,313.000ITALIAN EXHIBITION GROUP SPA EUR 129,018.08 0.3135,150.000SIAS SPA EUR 21,203.00 0.051,300.000SOSTRAVEL.COM SPA EUR 40,131.00 0.1017,150.000
1,162,666.78 2.77
ALKEMY SPA EUR 367,765.20 0.8833,132.000Internet
LASTMINUTE.COM NV CHF 561,392.71 1.3422,186.000NEOSPERIENCE SPA EUR 232,660.60 0.5519,717.000
1,161,818.51 2.77
GAROFALO HEALTH CARE SPA EUR 104,474.24 0.2524,128.000Cosmetics
PHARMANUTRA SPA EUR 1,016,371.20 2.4248,864.0001,120,845.44 2.67
DBA GROUP SPA EUR 190,706.13 0.45104,211.000Office & Business equipment
DIGITAL VALUE SPA EUR 581,400.00 1.3942,750.000772,106.13 1.84
ANTARES VISION SPA EUR 297,568.46 0.7127,614.000Electric & Electronic
ELECTRO POWER SYSTEMS EUR 20,517.60 0.052,472.000ELES SEMICONDUCTOR EQUIPMENT EUR 357,435.00 0.8561,100.000PRYSMIAN SPA EUR 89,225.40 0.214,916.000
764,746.46 1.82
DIGITAL BROS EUR 308,985.33 0.7346,887.000Computer software
RELATECH SPA EUR 125,840.00 0.3048,400.000SESA SPA EUR 262,700.00 0.639,250.000
697,525.33 1.66
NameQuantity/Nominal
Market valuein EUR
Currency %NAV
CELLULARLINE SPA EUR 342,372.40 0.8245,049.000Telecommunication
INTRED SPA EUR 115,215.36 0.2722,503.000457,587.76 1.09
UNIPOL GRUPPO SPA EUR 428,300.00 1.02100,000.000Insurance
428,300.00 1.02
SAES GETTERS SPA EUR 283,310.00 0.6813,820.000Diversified machinery
SAES GETTERS-RSP EUR 107,100.00 0.257,000.000390,410.00 0.93
MAILUP SPA EUR 310,281.62 0.7482,963.000Advertising
310,281.62 0.74
SIT SPA EUR 254,808.60 0.6130,516.000Building materials
254,808.60 0.61
GAMENET GROUP SPA EUR 226,401.50 0.5428,550.000Entertainment
226,401.50 0.54
AEFFE SPA EUR 13,062.77 0.037,217.000Textile
COVER 50 SPA EUR 179,540.00 0.4319,100.000192,602.77 0.46
ITALIAN WINE BRANDS SPA EUR 190,757.00 0.4515,572.000Food services
190,757.00 0.45
ASKOLL EVA SPA EUR 111,168.00 0.2646,320.000Auto Parts & Equipment
111,168.00 0.26
OFFICINA STELLARE SPA EUR 5,017.00 0.01500.000Engineering & Construction
5,017.00 0.01
20,962,143.35 49.90
BANK OF AMER CRP 17-07/02/2022 EUR 503,040.00 1.20500,000.000
Bonds and other debt instrumentsBanks
BNP PARIBAS 17-22/09/2022 EUR 506,725.00 1.21500,000.000CITIGROUP INC 18-21/03/2023 FRN EUR 2,002,160.00 4.762,000,000.000GOLDMAN SACHS GP 16-27/07/2021 EUR 506,825.00 1.20500,000.000
3,518,750.00 8.37
LEASEPLAN CORP 18-25/01/2021 FRN EUR 1,500,525.00 3.571,500,000.000Financial services
1,500,525.00 3.57
REPSOL INTL FIN 2.625% 13-28/05/2020 EUR 1,229,556.00 2.931,200,000.000Energy
1,229,556.00 2.93
6,248,831.00 14.87
ILLIMITY BANK SPA ATT RTS 20/09/2019 EUR 780,686.52 1.86446,617.000
RightsFinancial services
780,686.52 1.86
780,686.52 1.86
AEDES SPA CW 07/07/2020 AEDES SPA EUR 1,303.38 0.00362,051.000
WarrantsFinancial services
CAPITAL FOR PROGRESS- CW20 CW04/08/22
EUR 449.45 0.0050,500.000
NameQuantity/Nominal
Market valuein EUR
Currency %NAV
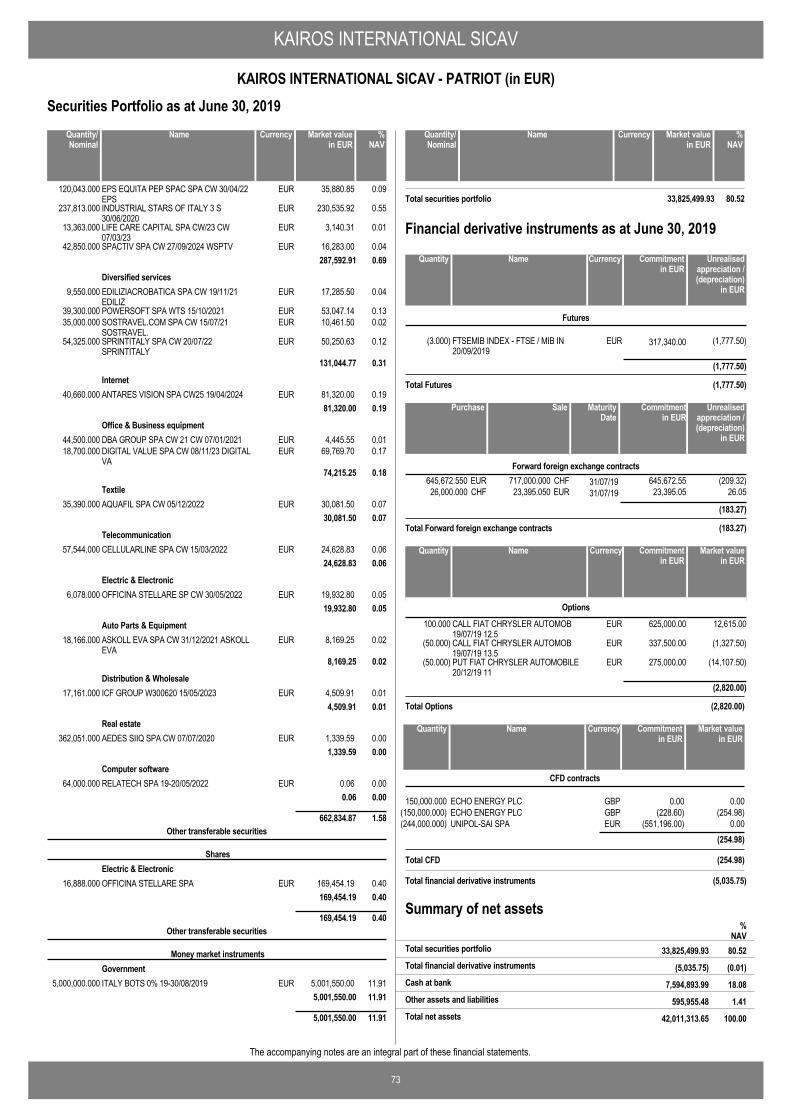
KAIROS INTERNATIONAL SICAV
73
KAIROS INTERNATIONAL SICAV - PATRIOT (in EUR)
The accompanying notes are an integral part of these financial statements.
Securities Portfolio as at June 30, 2019
EPS EQUITA PEP SPAC SPA CW 30/04/22EPS
EUR 35,880.85 0.09120,043.000
INDUSTRIAL STARS OF ITALY 3 S30/06/2020
EUR 230,535.92 0.55237,813.000
LIFE CARE CAPITAL SPA CW/23 CW07/03/23
EUR 3,140.31 0.0113,363.000
SPACTIV SPA CW 27/09/2024 WSPTV EUR 16,283.00 0.0442,850.000287,592.91 0.69
EDILIZIACROBATICA SPA CW 19/11/21EDILIZ
EUR 17,285.50 0.049,550.000Diversified services
POWERSOFT SPA WTS 15/10/2021 EUR 53,047.14 0.1339,300.000SOSTRAVEL.COM SPA CW 15/07/21SOSTRAVEL.
EUR 10,461.50 0.0235,000.000
SPRINTITALY SPA CW 20/07/22SPRINTITALY
EUR 50,250.63 0.1254,325.000
131,044.77 0.31
ANTARES VISION SPA CW25 19/04/2024 EUR 81,320.00 0.1940,660.000Internet
81,320.00 0.19
DBA GROUP SPA CW 21 CW 07/01/2021 EUR 4,445.55 0.0144,500.000Office & Business equipment
DIGITAL VALUE SPA CW 08/11/23 DIGITALVA
EUR 69,769.70 0.1718,700.000
74,215.25 0.18
AQUAFIL SPA CW 05/12/2022 EUR 30,081.50 0.0735,390.000Textile
30,081.50 0.07
CELLULARLINE SPA CW 15/03/2022 EUR 24,628.83 0.0657,544.000Telecommunication
24,628.83 0.06
OFFICINA STELLARE SP CW 30/05/2022 EUR 19,932.80 0.056,078.000Electric & Electronic
19,932.80 0.05
ASKOLL EVA SPA CW 31/12/2021 ASKOLLEVA
EUR 8,169.25 0.0218,166.000Auto Parts & Equipment
8,169.25 0.02
ICF GROUP W300620 15/05/2023 EUR 4,509.91 0.0117,161.000Distribution & Wholesale
4,509.91 0.01
AEDES SIIQ SPA CW 07/07/2020 EUR 1,339.59 0.00362,051.000Real estate
1,339.59 0.00
RELATECH SPA 19-20/05/2022 EUR 0.06 0.0064,000.000Computer software
0.06 0.00
662,834.87 1.58
OFFICINA STELLARE SPA EUR 169,454.19 0.4016,888.000
Other transferable securities
SharesElectric & Electronic
169,454.19 0.40
169,454.19 0.40
ITALY BOTS 0% 19-30/08/2019 EUR 5,001,550.00 11.915,000,000.000
Other transferable securities
Money market instrumentsGovernment
5,001,550.00 11.91
5,001,550.00 11.91
NameQuantity/Nominal
Market valuein EUR
Currency %NAV
Total securities portfolio 33,825,499.93 80.52
NameQuantity/Nominal
Market valuein EUR
Currency %NAV
FTSEMIB INDEX - FTSE / MIB IN20/09/2019
EUR 317,340.00(3.000) (1,777.50)
Futures
(1,777.50)
Total Futures (1,777.50)
NameQuantity Commitmentin EUR
Currency Unrealisedappreciation /(depreciation)
in EUR
Financial derivative instruments as at June 30, 2019
717,000.000 31/07/19645,672.550 (209.32)CHFEUR 645,672.55Forward foreign exchange contracts
23,395.050 31/07/1926,000.000 26.05EURCHF 23,395.05
(183.27)
Total Forward foreign exchange contracts (183.27)
SalePurchase Unrealisedappreciation /(depreciation)
in EUR
MaturityDate
Commitmentin EUR
CALL FIAT CHRYSLER AUTOMOB19/07/19 12.5
EUR100.000 625,000.00 12,615.00
Options
CALL FIAT CHRYSLER AUTOMOB19/07/19 13.5
EUR(50.000) 337,500.00 (1,327.50)
PUT FIAT CHRYSLER AUTOMOBILE20/12/19 11
EUR(50.000) 275,000.00 (14,107.50)
(2,820.00)
Total Options (2,820.00)
NameQuantity Market valuein EUR
Currency Commitmentin EUR
ECHO ENERGY PLC GBP 0.000.00150,000.000
CFD contracts
NameQuantity Market valuein EUR
Currency Commitmentin EUR
ECHO ENERGY PLC GBP (254.98)(228.60)(150,000.000)UNIPOL-SAI SPA EUR 0.00(551,196.00)(244,000.000)
(254.98)
Total CFD (254.98)
Total financial derivative instruments (5,035.75)
Summary of net assets
(5,035.75) (0.01)Total financial derivative instruments
%NAV
33,825,499.93 80.52Total securities portfolio
7,594,893.99 18.08Cash at bank
595,955.48 1.41Other assets and liabilities
42,011,313.65 100.00Total net assets
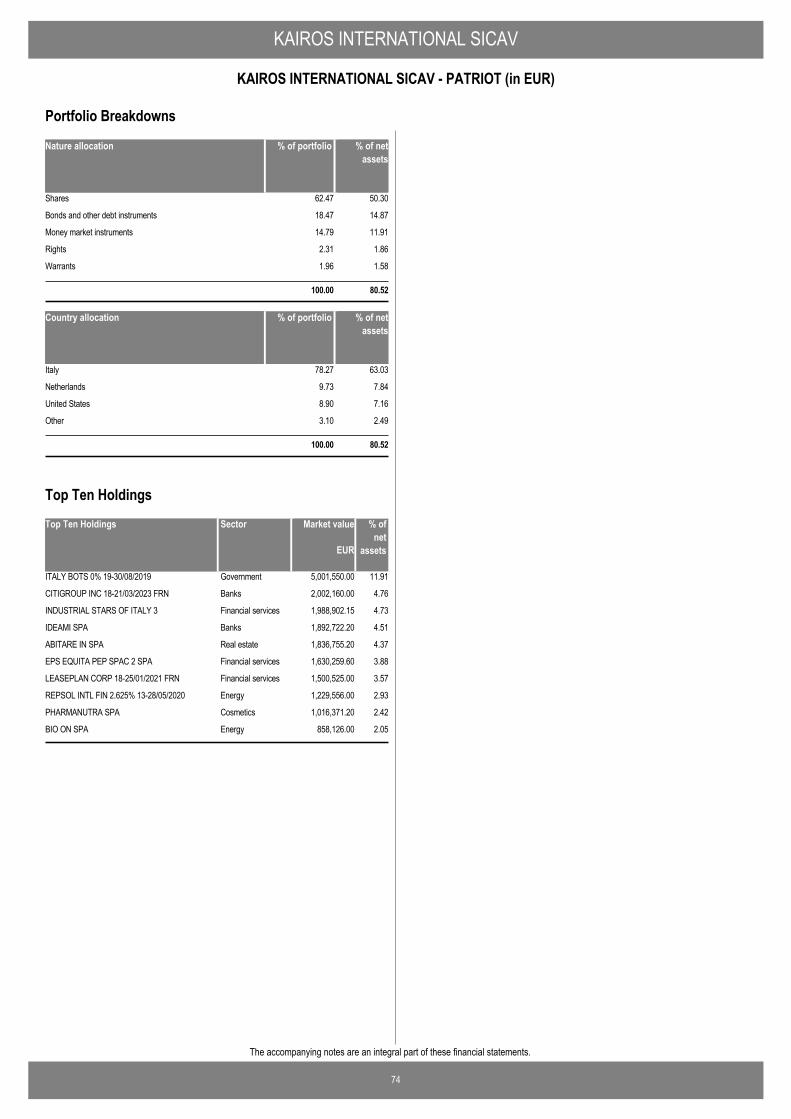
KAIROS INTERNATIONAL SICAV
74
KAIROS INTERNATIONAL SICAV - PATRIOT (in EUR)
The accompanying notes are an integral part of these financial statements.
Nature allocation % of portfolio % of netassets
Shares 62.47 50.30
Bonds and other debt instruments 18.47 14.87
Money market instruments 14.79 11.91
Rights 2.31 1.86
Warrants 1.96 1.58
100.00 80.52
Country allocation % of portfolio % of netassets
Italy 78.27 63.03
Netherlands 9.73 7.84
United States 8.90 7.16
Other 3.10 2.49
100.00 80.52
Portfolio Breakdowns
Top Ten Holdings Market value % ofnet
assets
ITALY BOTS 0% 19-30/08/2019 5,001,550.00 11.91Government
CITIGROUP INC 18-21/03/2023 FRN 2,002,160.00 4.76Banks
INDUSTRIAL STARS OF ITALY 3 1,988,902.15 4.73Financial services
IDEAMI SPA 1,892,722.20 4.51Banks
ABITARE IN SPA 1,836,755.20 4.37Real estate
EPS EQUITA PEP SPAC 2 SPA 1,630,259.60 3.88Financial services
LEASEPLAN CORP 18-25/01/2021 FRN 1,500,525.00 3.57Financial services
REPSOL INTL FIN 2.625% 13-28/05/2020 1,229,556.00 2.93Energy
PHARMANUTRA SPA 1,016,371.20 2.42Cosmetics
BIO ON SPA 858,126.00 2.05Energy
EUR
Sector
Top Ten Holdings
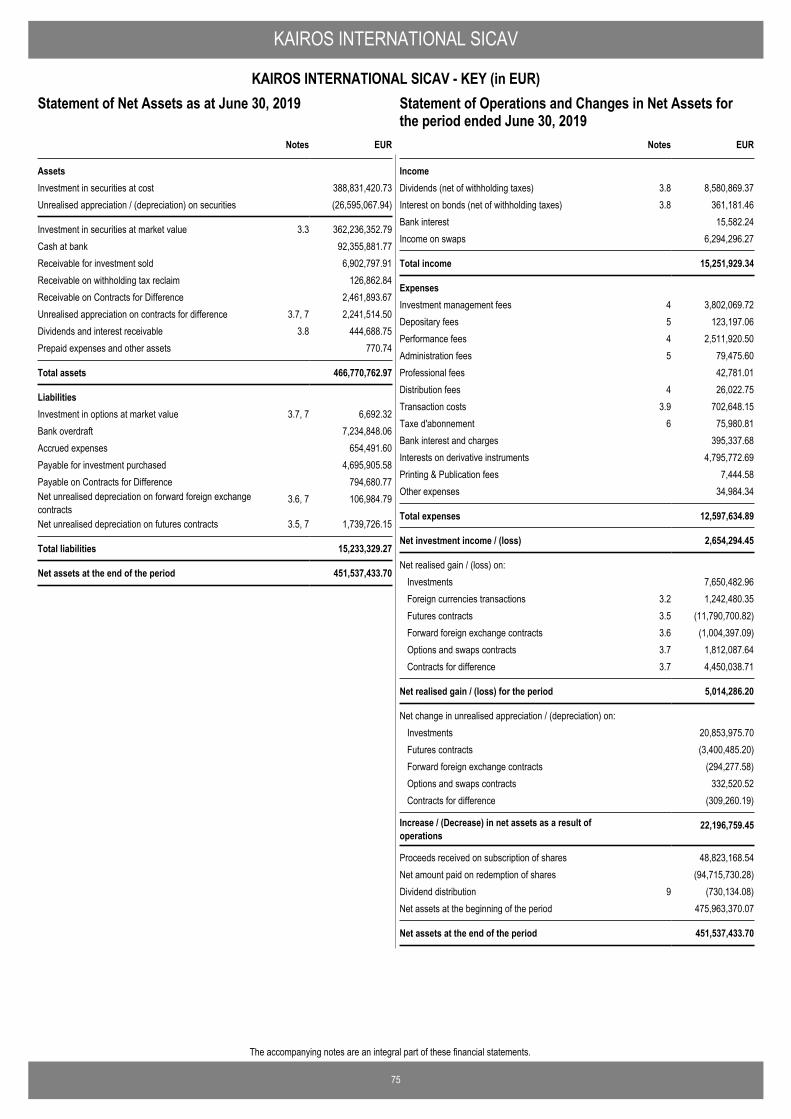
75
The accompanying notes are an integral part of these financial statements.
KAIROS INTERNATIONAL SICAV
KAIROS INTERNATIONAL SICAV - KEY (in EUR)Statement of Operations and Changes in Net Assets for theperiod ended June 30, 2019
EUR
AssetsInvestment in securities at cost 388,831,420.73Unrealised appreciation / (depreciation) on securities (26,595,067.94)
Investment in securities at market value 3.3 362,236,352.79Cash at bank 92,355,881.77Receivable for investment sold 6,902,797.91Receivable on withholding tax reclaim 126,862.84Receivable on Contracts for Difference 2,461,893.67Unrealised appreciation on contracts for difference 3.7, 7 2,241,514.50Dividends and interest receivable 3.8 444,688.75Prepaid expenses and other assets 770.74
Total assets 466,770,762.97
LiabilitiesInvestment in options at market value 3.7, 7 6,692.32Bank overdraft 7,234,848.06Accrued expenses 654,491.60Payable for investment purchased 4,695,905.58Payable on Contracts for Difference 794,680.77Net unrealised depreciation on forward foreign exchangecontracts
3.6, 7 106,984.79
Net unrealised depreciation on futures contracts 3.5, 7 1,739,726.15
Total liabilities 15,233,329.27
Net assets at the end of the period 451,537,433.70
Notes
Statement of Net Assets as at June 30, 2019
IncomeDividends (net of withholding taxes) 3.8 8,580,869.37Interest on bonds (net of withholding taxes) 3.8 361,181.46Bank interest 15,582.24Income on swaps 6,294,296.27
Total income 15,251,929.34
ExpensesInvestment management fees 4 3,802,069.72Depositary fees 5 123,197.06Performance fees 4 2,511,920.50Administration fees 5 79,475.60Professional fees 42,781.01Distribution fees 4 26,022.75Transaction costs 3.9 702,648.15Taxe d'abonnement 6 75,980.81Bank interest and charges 395,337.68Interests on derivative instruments 4,795,772.69Printing & Publication fees 7,444.58Other expenses 34,984.34
Total expenses 12,597,634.89
Net investment income / (loss) 2,654,294.45
Net realised gain / (loss) on: Investments 7,650,482.96Foreign currencies transactions 3.2 1,242,480.35Futures contracts 3.5 (11,790,700.82)Forward foreign exchange contracts 3.6 (1,004,397.09)Options and swaps contracts 3.7 1,812,087.64Contracts for difference 3.7 4,450,038.71
Net realised gain / (loss) for the period 5,014,286.20
Net change in unrealised appreciation / (depreciation) on: Investments 20,853,975.70Futures contracts (3,400,485.20)Forward foreign exchange contracts (294,277.58)Options and swaps contracts 332,520.52Contracts for difference (309,260.19)
Increase / (Decrease) in net assets as a result ofoperations
22,196,759.45
Proceeds received on subscription of shares 48,823,168.54Net amount paid on redemption of shares (94,715,730.28)Dividend distribution 9 (730,134.08)Net assets at the beginning of the period 475,963,370.07
Net assets at the end of the period 451,537,433.70
EURNotes
Statement of Operations and Changes in Net Assets forthe period ended June 30, 2019
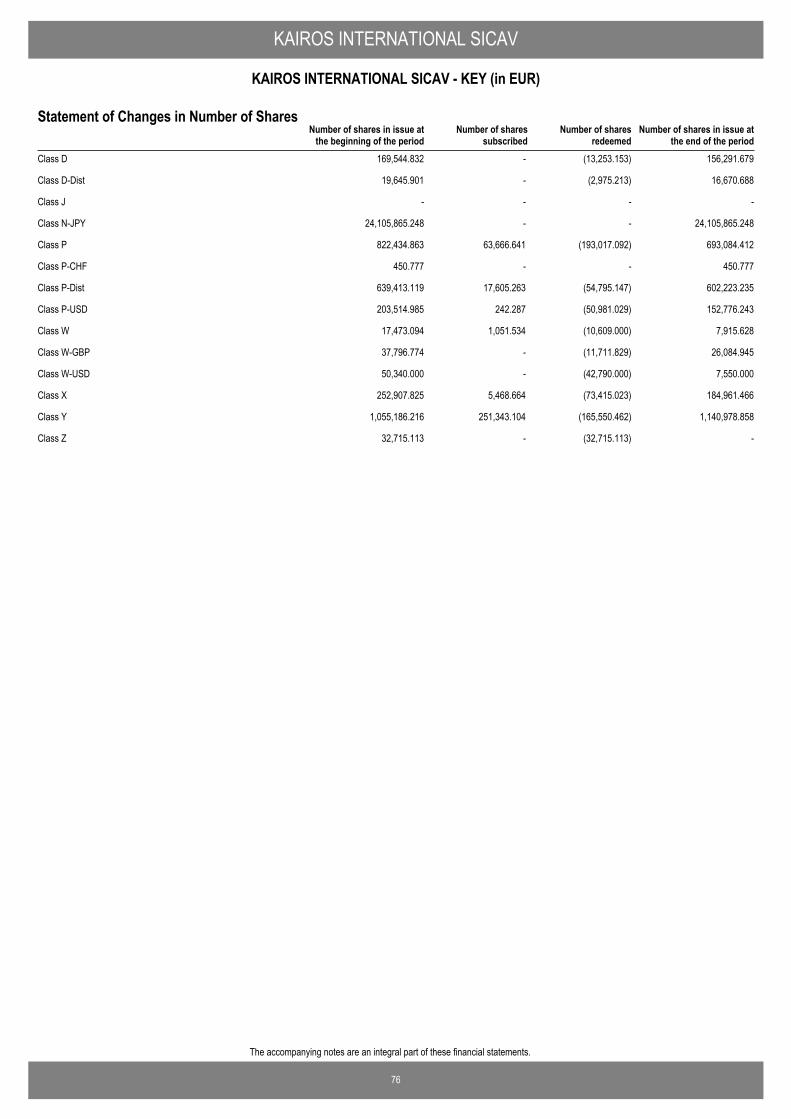
76
The accompanying notes are an integral part of these financial statements.
KAIROS INTERNATIONAL SICAV
KAIROS INTERNATIONAL SICAV - KEY (in EUR)
Number of shares in issue atthe end of the period
Number of shares in issue atthe beginning of the period
Number of sharessubscribed
Number of sharesredeemed
Statement of Changes in Number of Shares
Class D 169,544.832 - (13,253.153) 156,291.679
Class D-Dist 19,645.901 - (2,975.213) 16,670.688
Class J - - - -
Class N-JPY 24,105,865.248 - - 24,105,865.248
Class P 822,434.863 63,666.641 (193,017.092) 693,084.412
Class P-CHF 450.777 - - 450.777
Class P-Dist 639,413.119 17,605.263 (54,795.147) 602,223.235
Class P-USD 203,514.985 242.287 (50,981.029) 152,776.243
Class W 17,473.094 1,051.534 (10,609.000) 7,915.628
Class W-GBP 37,796.774 - (11,711.829) 26,084.945
Class W-USD 50,340.000 - (42,790.000) 7,550.000
Class X 252,907.825 5,468.664 (73,415.023) 184,961.466
Class Y 1,055,186.216 251,343.104 (165,550.462) 1,140,978.858
Class Z 32,715.113 - (32,715.113) -
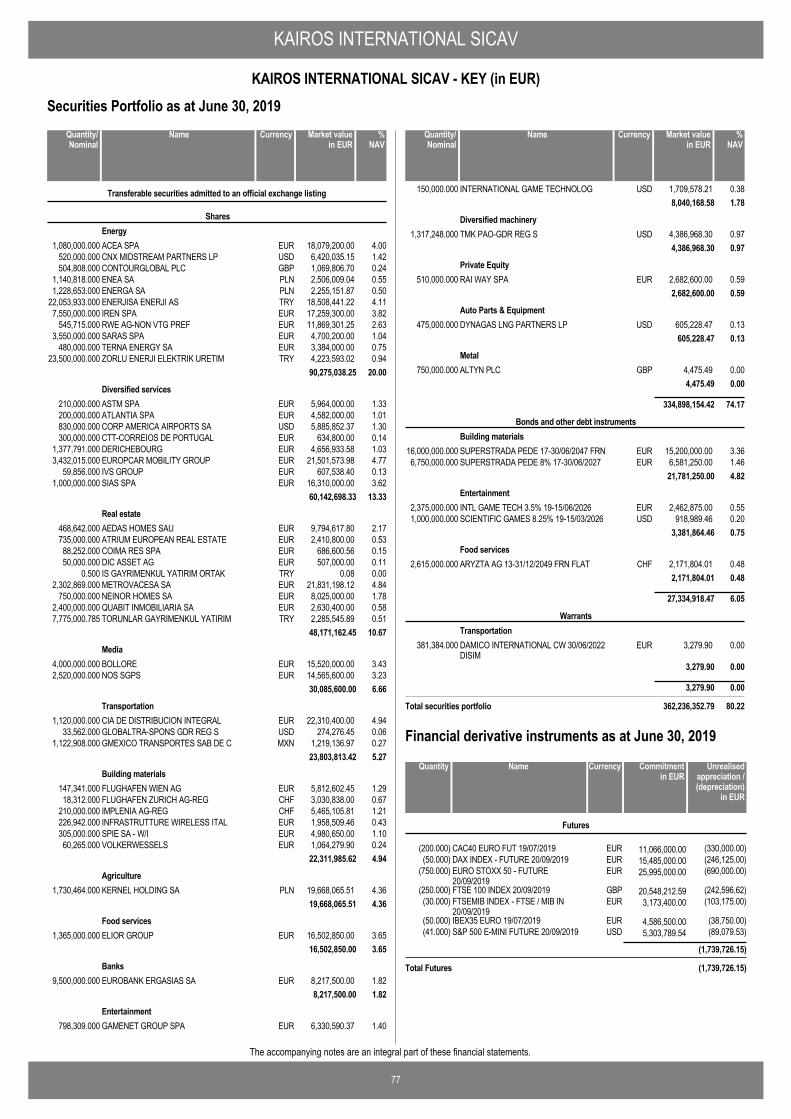
KAIROS INTERNATIONAL SICAV
77
KAIROS INTERNATIONAL SICAV - KEY (in EUR)
The accompanying notes are an integral part of these financial statements.
Securities Portfolio as at June 30, 2019
ACEA SPA EUR 18,079,200.00 4.001,080,000.000
Transferable securities admitted to an official exchange listing
SharesEnergy
CNX MIDSTREAM PARTNERS LP USD 6,420,035.15 1.42520,000.000CONTOURGLOBAL PLC GBP 1,069,806.70 0.24504,808.000ENEA SA PLN 2,506,009.04 0.551,140,818.000ENERGA SA PLN 2,255,151.87 0.501,228,653.000ENERJISA ENERJI AS TRY 18,508,441.22 4.1122,053,933.000IREN SPA EUR 17,259,300.00 3.827,550,000.000RWE AG-NON VTG PREF EUR 11,869,301.25 2.63545,715.000SARAS SPA EUR 4,700,200.00 1.043,550,000.000TERNA ENERGY SA EUR 3,384,000.00 0.75480,000.000ZORLU ENERJI ELEKTRIK URETIM TRY 4,223,593.02 0.9423,500,000.000
90,275,038.25 20.00
ASTM SPA EUR 5,964,000.00 1.33210,000.000Diversified services
ATLANTIA SPA EUR 4,582,000.00 1.01200,000.000CORP AMERICA AIRPORTS SA USD 5,885,852.37 1.30830,000.000CTT-CORREIOS DE PORTUGAL EUR 634,800.00 0.14300,000.000DERICHEBOURG EUR 4,656,933.58 1.031,377,791.000EUROPCAR MOBILITY GROUP EUR 21,501,573.98 4.773,432,015.000IVS GROUP EUR 607,538.40 0.1359,856.000SIAS SPA EUR 16,310,000.00 3.621,000,000.000
60,142,698.33 13.33
AEDAS HOMES SAU EUR 9,794,617.80 2.17468,642.000Real estate
ATRIUM EUROPEAN REAL ESTATE EUR 2,410,800.00 0.53735,000.000COIMA RES SPA EUR 686,600.56 0.1588,252.000DIC ASSET AG EUR 507,000.00 0.1150,000.000IS GAYRIMENKUL YATIRIM ORTAK TRY 0.08 0.000.500METROVACESA SA EUR 21,831,198.12 4.842,302,869.000NEINOR HOMES SA EUR 8,025,000.00 1.78750,000.000QUABIT INMOBILIARIA SA EUR 2,630,400.00 0.582,400,000.000TORUNLAR GAYRIMENKUL YATIRIM TRY 2,285,545.89 0.517,775,000.785
48,171,162.45 10.67
BOLLORE EUR 15,520,000.00 3.434,000,000.000Media
NOS SGPS EUR 14,565,600.00 3.232,520,000.00030,085,600.00 6.66
CIA DE DISTRIBUCION INTEGRAL EUR 22,310,400.00 4.941,120,000.000Transportation
GLOBALTRA-SPONS GDR REG S USD 274,276.45 0.0633,562.000GMEXICO TRANSPORTES SAB DE C MXN 1,219,136.97 0.271,122,908.000
23,803,813.42 5.27
FLUGHAFEN WIEN AG EUR 5,812,602.45 1.29147,341.000Building materials
FLUGHAFEN ZURICH AG-REG CHF 3,030,838.00 0.6718,312.000IMPLENIA AG-REG CHF 5,465,105.81 1.21210,000.000INFRASTRUTTURE WIRELESS ITAL EUR 1,958,509.46 0.43226,942.000SPIE SA - W/I EUR 4,980,650.00 1.10305,000.000VOLKERWESSELS EUR 1,064,279.90 0.2460,265.000
22,311,985.62 4.94
KERNEL HOLDING SA PLN 19,668,065.51 4.361,730,464.000Agriculture
19,668,065.51 4.36
ELIOR GROUP EUR 16,502,850.00 3.651,365,000.000Food services
16,502,850.00 3.65
EUROBANK ERGASIAS SA EUR 8,217,500.00 1.829,500,000.000Banks
8,217,500.00 1.82
GAMENET GROUP SPA EUR 6,330,590.37 1.40798,309.000Entertainment
NameQuantity/Nominal
Market valuein EUR
Currency %NAV
INTERNATIONAL GAME TECHNOLOG USD 1,709,578.21 0.38150,000.0008,040,168.58 1.78
TMK PAO-GDR REG S USD 4,386,968.30 0.971,317,248.000Diversified machinery
4,386,968.30 0.97
RAI WAY SPA EUR 2,682,600.00 0.59510,000.000Private Equity
2,682,600.00 0.59
DYNAGAS LNG PARTNERS LP USD 605,228.47 0.13475,000.000Auto Parts & Equipment
605,228.47 0.13
ALTYN PLC GBP 4,475.49 0.00750,000.000Metal
4,475.49 0.00
334,898,154.42 74.17
SUPERSTRADA PEDE 17-30/06/2047 FRN EUR 15,200,000.00 3.3616,000,000.000
Bonds and other debt instrumentsBuilding materials
SUPERSTRADA PEDE 8% 17-30/06/2027 EUR 6,581,250.00 1.466,750,000.00021,781,250.00 4.82
INTL GAME TECH 3.5% 19-15/06/2026 EUR 2,462,875.00 0.552,375,000.000Entertainment
SCIENTIFIC GAMES 8.25% 19-15/03/2026 USD 918,989.46 0.201,000,000.0003,381,864.46 0.75
ARYZTA AG 13-31/12/2049 FRN FLAT CHF 2,171,804.01 0.482,615,000.000Food services
2,171,804.01 0.48
27,334,918.47 6.05
DAMICO INTERNATIONAL CW 30/06/2022DISIM
EUR 3,279.90 0.00381,384.000
WarrantsTransportation
3,279.90 0.00
3,279.90 0.00
Total securities portfolio 362,236,352.79 80.22
NameQuantity/Nominal
Market valuein EUR
Currency %NAV
CAC40 EURO FUT 19/07/2019 EUR 11,066,000.00(200.000) (330,000.00)
Futures
DAX INDEX - FUTURE 20/09/2019 EUR 15,485,000.00(50.000) (246,125.00)EURO STOXX 50 - FUTURE20/09/2019
EUR 25,995,000.00(750.000) (690,000.00)
FTSE 100 INDEX 20/09/2019 GBP 20,548,212.59(250.000) (242,596.62)FTSEMIB INDEX - FTSE / MIB IN20/09/2019
EUR 3,173,400.00(30.000) (103,175.00)
IBEX35 EURO 19/07/2019 EUR 4,586,500.00(50.000) (38,750.00)S&P 500 E-MINI FUTURE 20/09/2019 USD 5,303,789.54(41.000) (89,079.53)
(1,739,726.15)
Total Futures (1,739,726.15)
NameQuantity Commitmentin EUR
Currency Unrealisedappreciation /(depreciation)
in EUR
Financial derivative instruments as at June 30, 2019
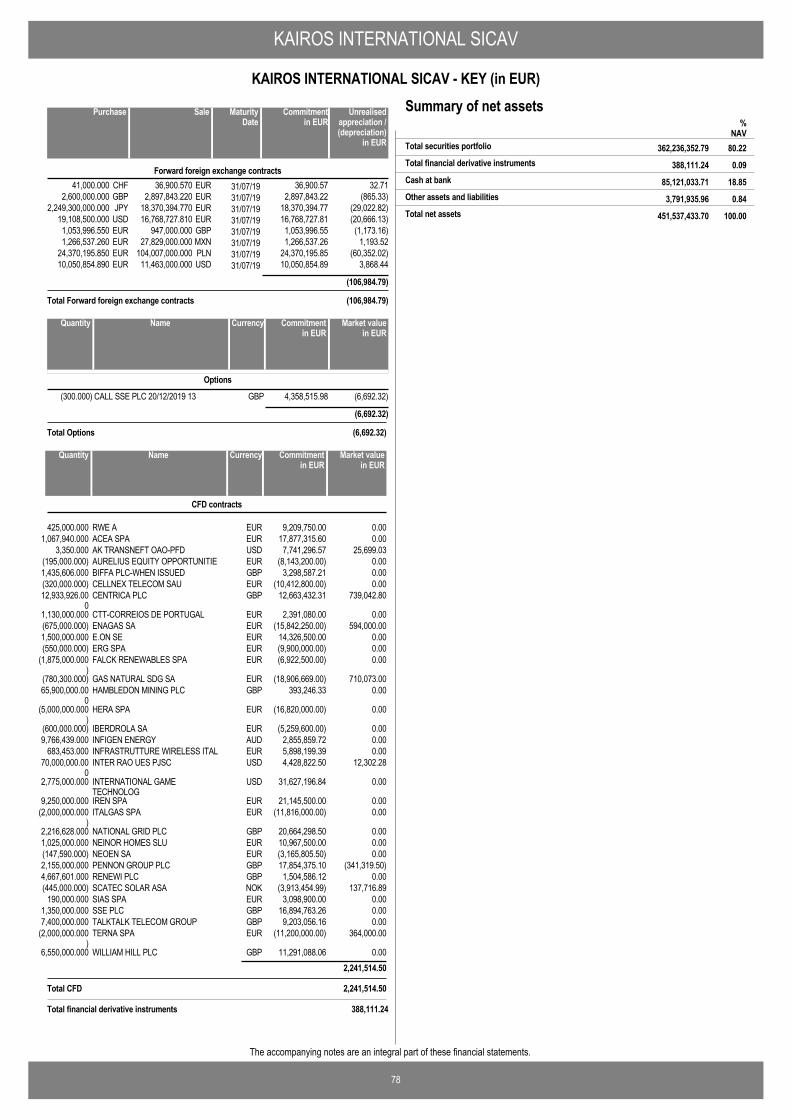
KAIROS INTERNATIONAL SICAV
78
KAIROS INTERNATIONAL SICAV - KEY (in EUR)
The accompanying notes are an integral part of these financial statements.
36,900.570 31/07/1941,000.000 32.71EURCHF 36,900.57Forward foreign exchange contracts
2,897,843.220 31/07/192,600,000.000 (865.33)EURGBP 2,897,843.2218,370,394.770 31/07/192,249,300,000.000 (29,022.82)EURJPY 18,370,394.7716,768,727.810 31/07/1919,108,500.000 (20,666.13)EURUSD 16,768,727.81
947,000.000 31/07/191,053,996.550 (1,173.16)GBPEUR 1,053,996.5527,829,000.000 31/07/191,266,537.260 1,193.52MXNEUR 1,266,537.26
104,007,000.000 31/07/1924,370,195.850 (60,352.02)PLNEUR 24,370,195.8511,463,000.000 31/07/1910,050,854.890 3,868.44USDEUR 10,050,854.89
(106,984.79)
Total Forward foreign exchange contracts (106,984.79)
SalePurchase Unrealisedappreciation /(depreciation)
in EUR
MaturityDate
Commitmentin EUR
CALL SSE PLC 20/12/2019 13 GBP(300.000) 4,358,515.98 (6,692.32)
Options
(6,692.32)
Total Options (6,692.32)
NameQuantity Market valuein EUR
Currency Commitmentin EUR
RWE A EUR 0.009,209,750.00425,000.000
CFD contracts
NameQuantity Market valuein EUR
Currency Commitmentin EUR
ACEA SPA EUR 0.0017,877,315.601,067,940.000AK TRANSNEFT OAO-PFD USD 25,699.037,741,296.573,350.000AURELIUS EQUITY OPPORTUNITIE EUR 0.00(8,143,200.00)(195,000.000)BIFFA PLC-WHEN ISSUED GBP 0.003,298,587.211,435,606.000CELLNEX TELECOM SAU EUR 0.00(10,412,800.00)(320,000.000)CENTRICA PLC GBP 739,042.8012,663,432.3112,933,926.00
0CTT-CORREIOS DE PORTUGAL EUR 0.002,391,080.001,130,000.000ENAGAS SA EUR 594,000.00(15,842,250.00)(675,000.000)E.ON SE EUR 0.0014,326,500.001,500,000.000ERG SPA EUR 0.00(9,900,000.00)(550,000.000)FALCK RENEWABLES SPA EUR 0.00(6,922,500.00)(1,875,000.000
)GAS NATURAL SDG SA EUR 710,073.00(18,906,669.00)(780,300.000)HAMBLEDON MINING PLC GBP 0.00393,246.3365,900,000.00
0HERA SPA EUR 0.00(16,820,000.00)(5,000,000.000
)IBERDROLA SA EUR 0.00(5,259,600.00)(600,000.000)INFIGEN ENERGY AUD 0.002,855,859.729,766,439.000INFRASTRUTTURE WIRELESS ITAL EUR 0.005,898,199.39683,453.000INTER RAO UES PJSC USD 12,302.284,428,822.5070,000,000.00
0INTERNATIONAL GAMETECHNOLOG
USD 0.0031,627,196.842,775,000.000
IREN SPA EUR 0.0021,145,500.009,250,000.000ITALGAS SPA EUR 0.00(11,816,000.00)(2,000,000.000
)NATIONAL GRID PLC GBP 0.0020,664,298.502,216,628.000NEINOR HOMES SLU EUR 0.0010,967,500.001,025,000.000NEOEN SA EUR 0.00(3,165,805.50)(147,590.000)PENNON GROUP PLC GBP (341,319.50)17,854,375.102,155,000.000RENEWI PLC GBP 0.001,504,586.124,667,601.000SCATEC SOLAR ASA NOK 137,716.89(3,913,454.99)(445,000.000)SIAS SPA EUR 0.003,098,900.00190,000.000SSE PLC GBP 0.0016,894,763.261,350,000.000TALKTALK TELECOM GROUP GBP 0.009,203,056.167,400,000.000TERNA SPA EUR 364,000.00(11,200,000.00)(2,000,000.000
)WILLIAM HILL PLC GBP 0.0011,291,088.066,550,000.000
2,241,514.50
Total CFD 2,241,514.50
Total financial derivative instruments 388,111.24
Summary of net assets
388,111.24 0.09Total financial derivative instruments
%NAV
362,236,352.79 80.22Total securities portfolio
85,121,033.71 18.85Cash at bank
3,791,935.96 0.84Other assets and liabilities
451,537,433.70 100.00Total net assets
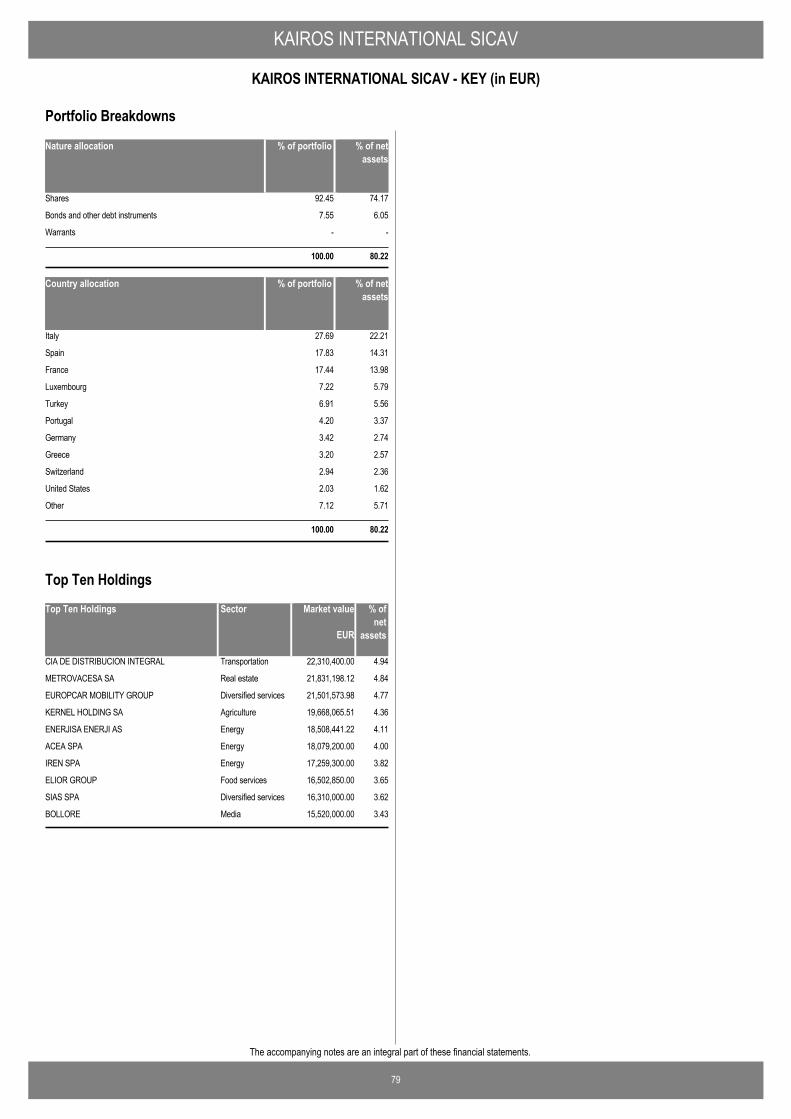
KAIROS INTERNATIONAL SICAV
79
KAIROS INTERNATIONAL SICAV - KEY (in EUR)
The accompanying notes are an integral part of these financial statements.
Nature allocation % of portfolio % of netassets
Shares 92.45 74.17
Bonds and other debt instruments 7.55 6.05
Warrants - -
100.00 80.22
Country allocation % of portfolio % of netassets
Italy 27.69 22.21
Spain 17.83 14.31
France 17.44 13.98
Luxembourg 7.22 5.79
Turkey 6.91 5.56
Portugal 4.20 3.37
Germany 3.42 2.74
Greece 3.20 2.57
Switzerland 2.94 2.36
United States 2.03 1.62
Other 7.12 5.71
100.00 80.22
Portfolio Breakdowns
Top Ten Holdings Market value % ofnet
assets
CIA DE DISTRIBUCION INTEGRAL 22,310,400.00 4.94Transportation
METROVACESA SA 21,831,198.12 4.84Real estate
EUROPCAR MOBILITY GROUP 21,501,573.98 4.77Diversified services
KERNEL HOLDING SA 19,668,065.51 4.36Agriculture
ENERJISA ENERJI AS 18,508,441.22 4.11Energy
ACEA SPA 18,079,200.00 4.00Energy
IREN SPA 17,259,300.00 3.82Energy
ELIOR GROUP 16,502,850.00 3.65Food services
SIAS SPA 16,310,000.00 3.62Diversified services
BOLLORE 15,520,000.00 3.43Media
EUR
Sector
Top Ten Holdings
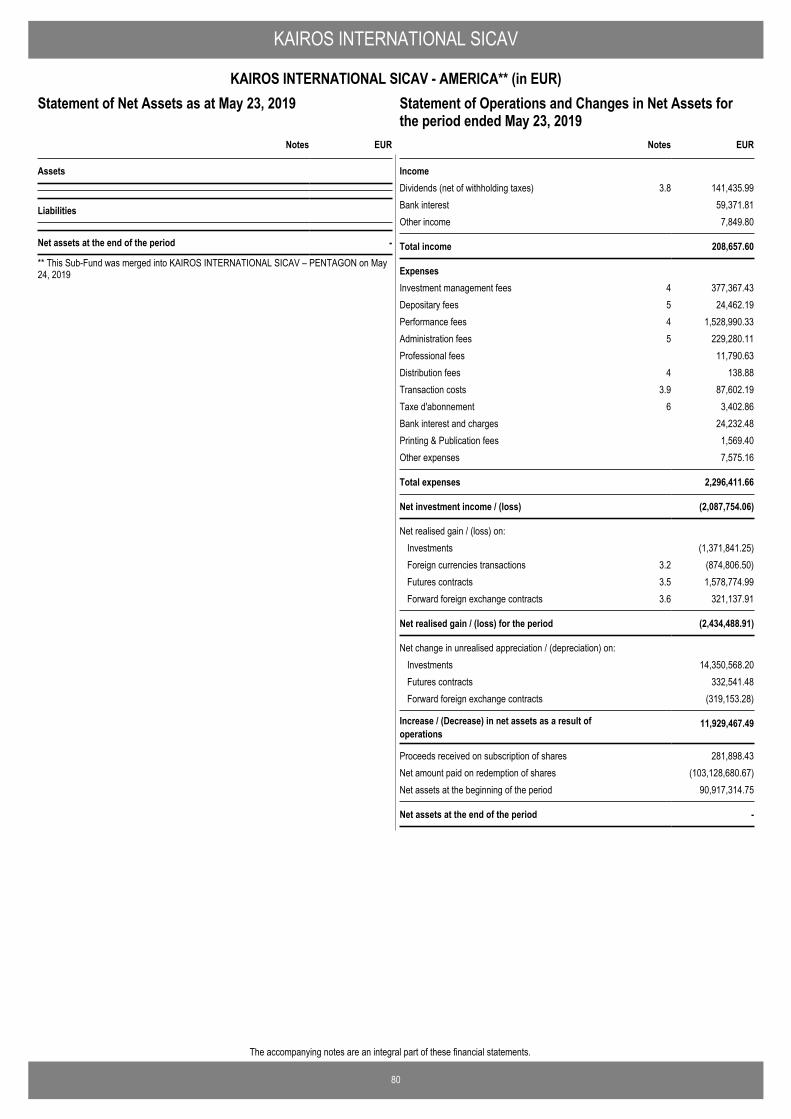
80
The accompanying notes are an integral part of these financial statements.
KAIROS INTERNATIONAL SICAV
KAIROS INTERNATIONAL SICAV - AMERICA** (in EUR)Statement of Operations and Changes in Net Assets for theperiod ended May 23, 2019
EUR
Assets
Liabilities
Net assets at the end of the period -
Notes
Statement of Net Assets as at May 23, 2019
** This Sub-Fund was merged into KAIROS INTERNATIONAL SICAV – PENTAGON on May24, 2019
IncomeDividends (net of withholding taxes) 3.8 141,435.99Bank interest 59,371.81Other income 7,849.80
Total income 208,657.60
ExpensesInvestment management fees 4 377,367.43Depositary fees 5 24,462.19Performance fees 4 1,528,990.33Administration fees 5 229,280.11Professional fees 11,790.63Distribution fees 4 138.88Transaction costs 3.9 87,602.19Taxe d'abonnement 6 3,402.86Bank interest and charges 24,232.48Printing & Publication fees 1,569.40Other expenses 7,575.16
Total expenses 2,296,411.66
Net investment income / (loss) (2,087,754.06)
Net realised gain / (loss) on: Investments (1,371,841.25)Foreign currencies transactions 3.2 (874,806.50)Futures contracts 3.5 1,578,774.99Forward foreign exchange contracts 3.6 321,137.91
Net realised gain / (loss) for the period (2,434,488.91)
Net change in unrealised appreciation / (depreciation) on: Investments 14,350,568.20Futures contracts 332,541.48Forward foreign exchange contracts (319,153.28)
Increase / (Decrease) in net assets as a result ofoperations
11,929,467.49
Proceeds received on subscription of shares 281,898.43Net amount paid on redemption of shares (103,128,680.67)Net assets at the beginning of the period 90,917,314.75
Net assets at the end of the period -
EURNotes
Statement of Operations and Changes in Net Assets forthe period ended May 23, 2019
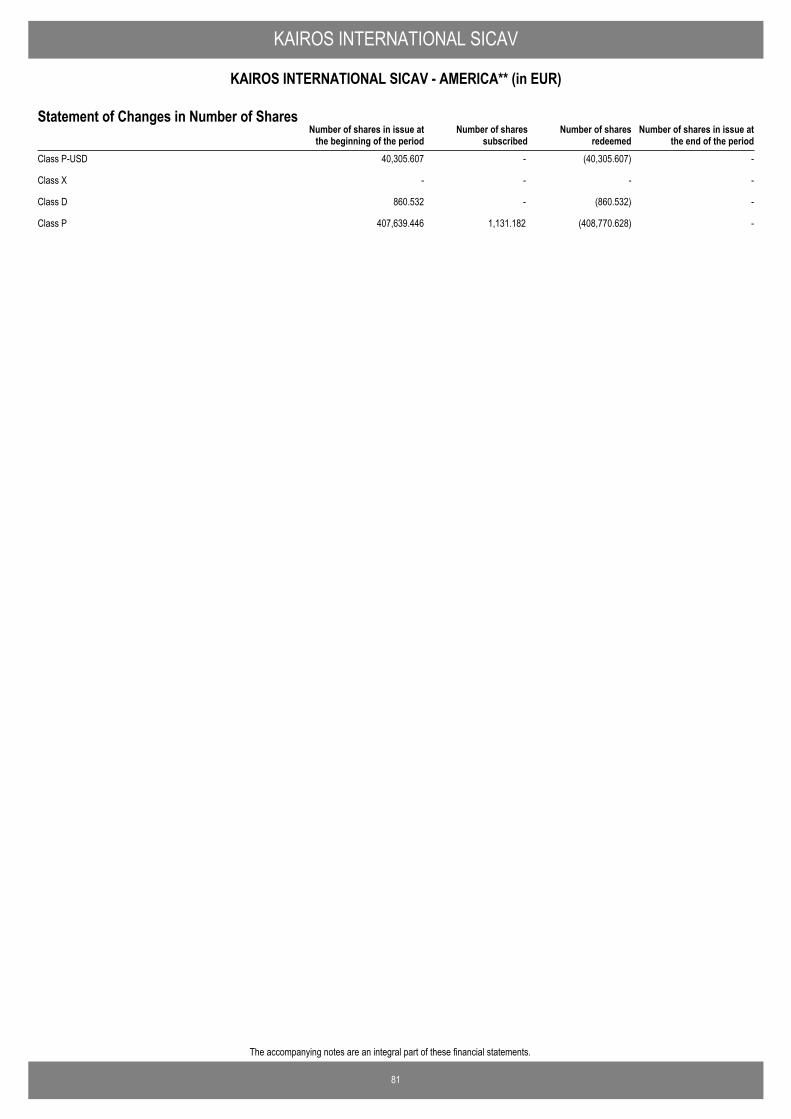
81
The accompanying notes are an integral part of these financial statements.
KAIROS INTERNATIONAL SICAV
KAIROS INTERNATIONAL SICAV - AMERICA** (in EUR)
Number of shares in issue atthe end of the period
Number of shares in issue atthe beginning of the period
Number of sharessubscribed
Number of sharesredeemed
Statement of Changes in Number of Shares
Class P-USD 40,305.607 - (40,305.607) -
Class X - - - -
Class D 860.532 - (860.532) -
Class P 407,639.446 1,131.182 (408,770.628) -
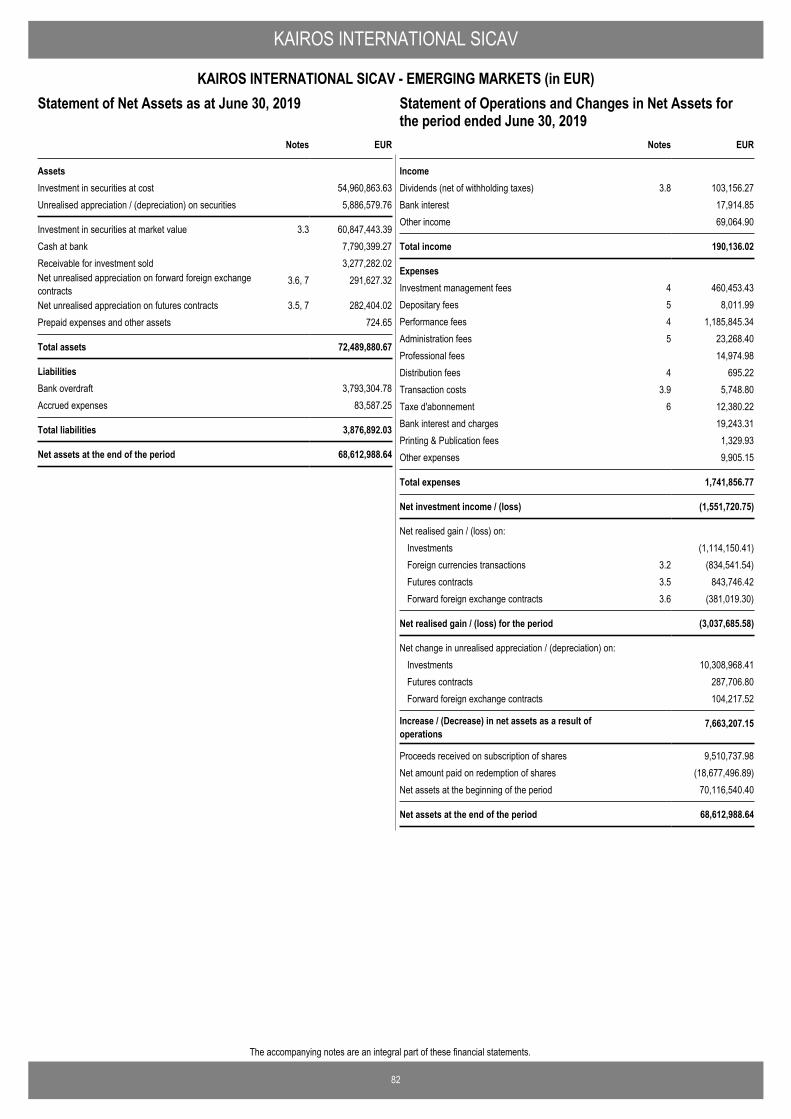
82
The accompanying notes are an integral part of these financial statements.
KAIROS INTERNATIONAL SICAV
KAIROS INTERNATIONAL SICAV - EMERGING MARKETS (in EUR)Statement of Operations and Changes in Net Assets for theperiod ended June 30, 2019
EUR
AssetsInvestment in securities at cost 54,960,863.63Unrealised appreciation / (depreciation) on securities 5,886,579.76
Investment in securities at market value 3.3 60,847,443.39Cash at bank 7,790,399.27Receivable for investment sold 3,277,282.02Net unrealised appreciation on forward foreign exchangecontracts
3.6, 7 291,627.32
Net unrealised appreciation on futures contracts 3.5, 7 282,404.02Prepaid expenses and other assets 724.65
Total assets 72,489,880.67
LiabilitiesBank overdraft 3,793,304.78Accrued expenses 83,587.25
Total liabilities 3,876,892.03
Net assets at the end of the period 68,612,988.64
Notes
Statement of Net Assets as at June 30, 2019
IncomeDividends (net of withholding taxes) 3.8 103,156.27Bank interest 17,914.85Other income 69,064.90
Total income 190,136.02
ExpensesInvestment management fees 4 460,453.43Depositary fees 5 8,011.99Performance fees 4 1,185,845.34Administration fees 5 23,268.40Professional fees 14,974.98Distribution fees 4 695.22Transaction costs 3.9 5,748.80Taxe d'abonnement 6 12,380.22Bank interest and charges 19,243.31Printing & Publication fees 1,329.93Other expenses 9,905.15
Total expenses 1,741,856.77
Net investment income / (loss) (1,551,720.75)
Net realised gain / (loss) on: Investments (1,114,150.41)Foreign currencies transactions 3.2 (834,541.54)Futures contracts 3.5 843,746.42Forward foreign exchange contracts 3.6 (381,019.30)
Net realised gain / (loss) for the period (3,037,685.58)
Net change in unrealised appreciation / (depreciation) on: Investments 10,308,968.41Futures contracts 287,706.80Forward foreign exchange contracts 104,217.52
Increase / (Decrease) in net assets as a result ofoperations
7,663,207.15
Proceeds received on subscription of shares 9,510,737.98Net amount paid on redemption of shares (18,677,496.89)Net assets at the beginning of the period 70,116,540.40
Net assets at the end of the period 68,612,988.64
EURNotes
Statement of Operations and Changes in Net Assets forthe period ended June 30, 2019
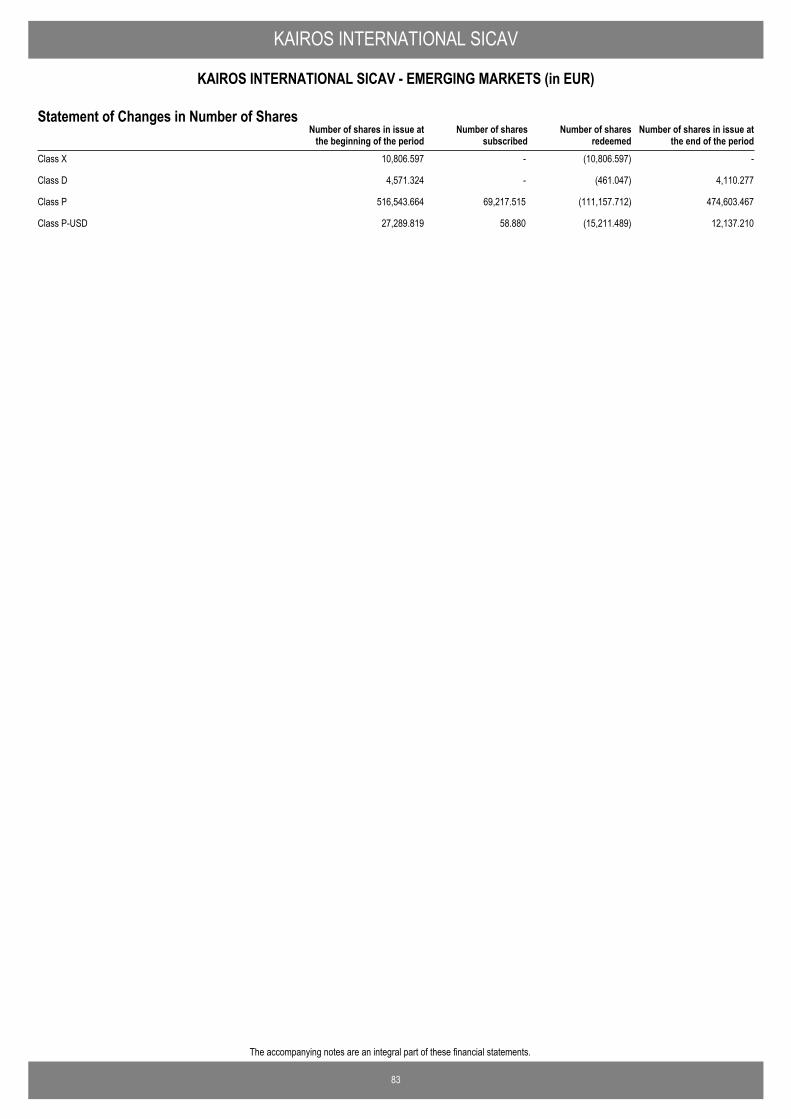
83
The accompanying notes are an integral part of these financial statements.
KAIROS INTERNATIONAL SICAV
KAIROS INTERNATIONAL SICAV - EMERGING MARKETS (in EUR)
Number of shares in issue atthe end of the period
Number of shares in issue atthe beginning of the period
Number of sharessubscribed
Number of sharesredeemed
Statement of Changes in Number of Shares
Class X 10,806.597 - (10,806.597) -
Class D 4,571.324 - (461.047) 4,110.277
Class P 516,543.664 69,217.515 (111,157.712) 474,603.467
Class P-USD 27,289.819 58.880 (15,211.489) 12,137.210
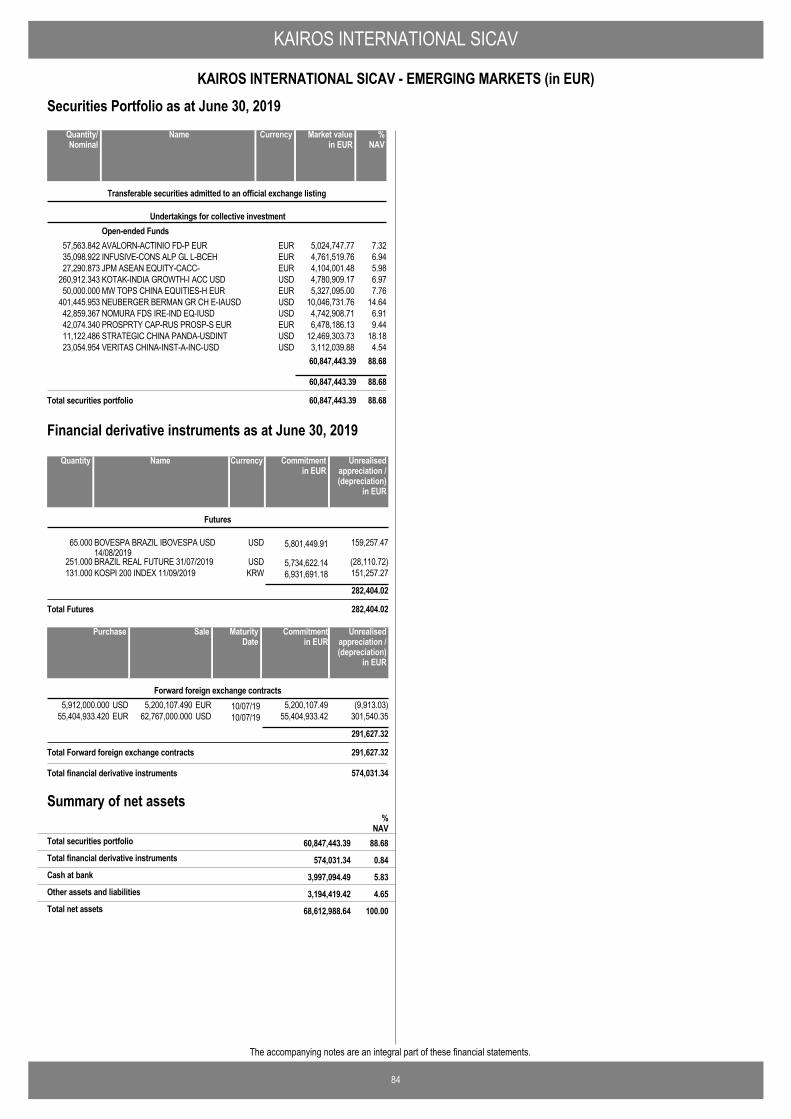
KAIROS INTERNATIONAL SICAV
84
KAIROS INTERNATIONAL SICAV - EMERGING MARKETS (in EUR)
The accompanying notes are an integral part of these financial statements.
Securities Portfolio as at June 30, 2019
AVALORN-ACTINIO FD-P EUR EUR 5,024,747.77 7.3257,563.842
Transferable securities admitted to an official exchange listing
Undertakings for collective investmentOpen-ended Funds
INFUSIVE-CONS ALP GL L-BCEH EUR 4,761,519.76 6.9435,098.922JPM ASEAN EQUITY-CACC- EUR 4,104,001.48 5.9827,290.873KOTAK-INDIA GROWTH-I ACC USD USD 4,780,909.17 6.97260,912.343MW TOPS CHINA EQUITIES-H EUR EUR 5,327,095.00 7.7650,000.000NEUBERGER BERMAN GR CH E-IAUSD USD 10,046,731.76 14.64401,445.953NOMURA FDS IRE-IND EQ-IUSD USD 4,742,908.71 6.9142,859.367PROSPRTY CAP-RUS PROSP-S EUR EUR 6,478,186.13 9.4442,074.340STRATEGIC CHINA PANDA-USDINT USD 12,469,303.73 18.1811,122.486VERITAS CHINA-INST-A-INC-USD USD 3,112,039.88 4.5423,054.954
60,847,443.39 88.68
60,847,443.39 88.68
Total securities portfolio 60,847,443.39 88.68
NameQuantity/Nominal
Market valuein EUR
Currency %NAV
BOVESPA BRAZIL IBOVESPA USD14/08/2019
USD 5,801,449.9165.000 159,257.47
Futures
BRAZIL REAL FUTURE 31/07/2019 USD 5,734,622.14251.000 (28,110.72)KOSPI 200 INDEX 11/09/2019 KRW 6,931,691.18131.000 151,257.27
282,404.02
Total Futures 282,404.02
NameQuantity Commitmentin EUR
Currency Unrealisedappreciation /(depreciation)
in EUR
Financial derivative instruments as at June 30, 2019
5,200,107.490 10/07/195,912,000.000 (9,913.03)EURUSD 5,200,107.49Forward foreign exchange contracts
62,767,000.000 10/07/1955,404,933.420 301,540.35USDEUR 55,404,933.42
291,627.32
Total Forward foreign exchange contracts 291,627.32
SalePurchase Unrealisedappreciation /(depreciation)
in EUR
MaturityDate
Commitmentin EUR
Total financial derivative instruments 574,031.34
Summary of net assets
574,031.34 0.84Total financial derivative instruments
%NAV
60,847,443.39 88.68Total securities portfolio
3,997,094.49 5.83Cash at bank
3,194,419.42 4.65Other assets and liabilities
68,612,988.64 100.00Total net assets

KAIROS INTERNATIONAL SICAV
85
KAIROS INTERNATIONAL SICAV - EMERGING MARKETS (in EUR)
The accompanying notes are an integral part of these financial statements.
Nature allocation % of portfolio % of netassets
Undertakings for collective investment 100.00 88.68
100.00 88.68
Country allocation % of portfolio % of netassets
Ireland 58.67 52.03
Luxembourg 41.33 36.65
100.00 88.68
Portfolio Breakdowns
Top Ten Holdings Market value % ofnet
assets
STRATEGIC CHINA PANDA-USDINT 12,469,303.73 18.18Open-ended Funds
NEUBERGER BERMAN GR CH E-IAUSD 10,046,731.76 14.64Open-ended Funds
PROSPRTY CAP-RUS PROSP-S EUR 6,478,186.13 9.44Open-ended Funds
MW TOPS CHINA EQUITIES-H EUR 5,327,095.00 7.76Open-ended Funds
AVALORN-ACTINIO FD-P EUR 5,024,747.77 7.32Open-ended Funds
KOTAK-INDIA GROWTH-I ACC USD 4,780,909.17 6.97Open-ended Funds
INFUSIVE-CONS ALP GL L-BCEH 4,761,519.76 6.94Open-ended Funds
NOMURA FDS IRE-IND EQ-IUSD 4,742,908.71 6.91Open-ended Funds
JPM ASEAN EQUITY-CACC- 4,104,001.48 5.98Open-ended Funds
VERITAS CHINA-INST-A-INC-USD 3,112,039.88 4.54Open-ended Funds
EUR
Sector
Top Ten Holdings
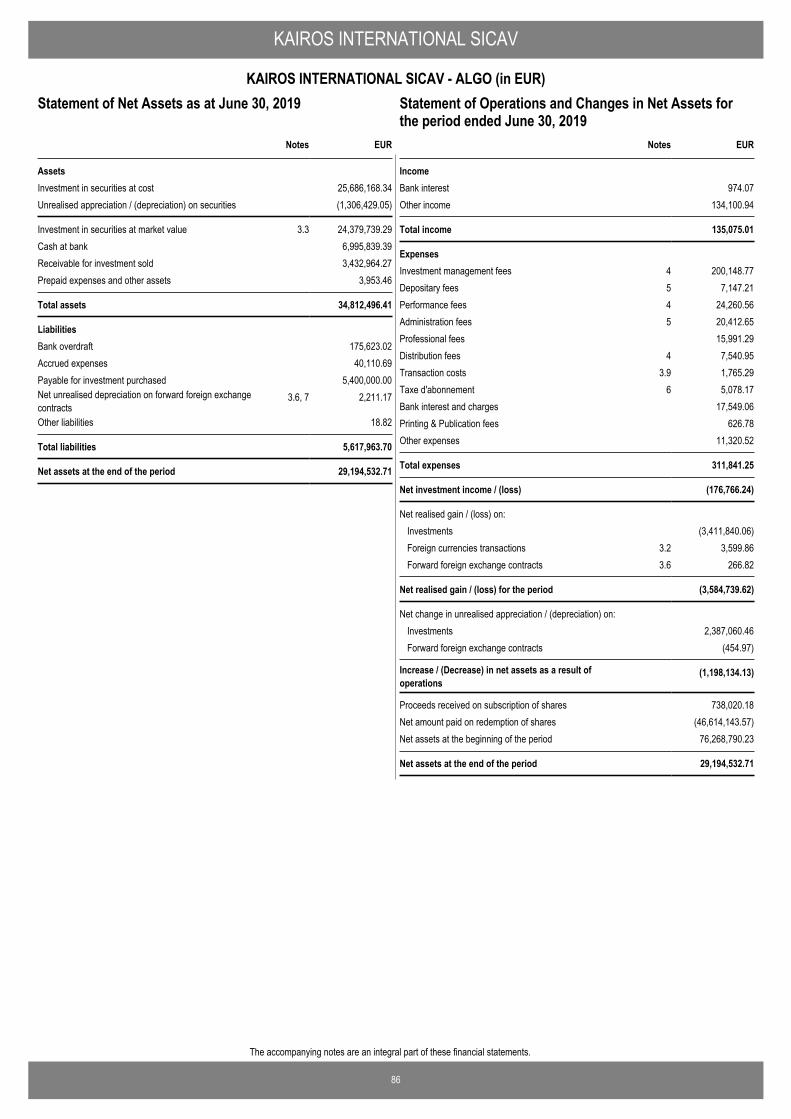
86
The accompanying notes are an integral part of these financial statements.
KAIROS INTERNATIONAL SICAV
KAIROS INTERNATIONAL SICAV - ALGO (in EUR)Statement of Operations and Changes in Net Assets for theperiod ended June 30, 2019
EUR
AssetsInvestment in securities at cost 25,686,168.34Unrealised appreciation / (depreciation) on securities (1,306,429.05)
Investment in securities at market value 3.3 24,379,739.29Cash at bank 6,995,839.39Receivable for investment sold 3,432,964.27Prepaid expenses and other assets 3,953.46
Total assets 34,812,496.41
LiabilitiesBank overdraft 175,623.02Accrued expenses 40,110.69Payable for investment purchased 5,400,000.00Net unrealised depreciation on forward foreign exchangecontracts
3.6, 7 2,211.17
Other liabilities 18.82
Total liabilities 5,617,963.70
Net assets at the end of the period 29,194,532.71
Notes
Statement of Net Assets as at June 30, 2019
IncomeBank interest 974.07Other income 134,100.94
Total income 135,075.01
ExpensesInvestment management fees 4 200,148.77Depositary fees 5 7,147.21Performance fees 4 24,260.56Administration fees 5 20,412.65Professional fees 15,991.29Distribution fees 4 7,540.95Transaction costs 3.9 1,765.29Taxe d'abonnement 6 5,078.17Bank interest and charges 17,549.06Printing & Publication fees 626.78Other expenses 11,320.52
Total expenses 311,841.25
Net investment income / (loss) (176,766.24)
Net realised gain / (loss) on: Investments (3,411,840.06)Foreign currencies transactions 3.2 3,599.86Forward foreign exchange contracts 3.6 266.82
Net realised gain / (loss) for the period (3,584,739.62)
Net change in unrealised appreciation / (depreciation) on: Investments 2,387,060.46Forward foreign exchange contracts (454.97)
Increase / (Decrease) in net assets as a result ofoperations
(1,198,134.13)
Proceeds received on subscription of shares 738,020.18Net amount paid on redemption of shares (46,614,143.57)Net assets at the beginning of the period 76,268,790.23
Net assets at the end of the period 29,194,532.71
EURNotes
Statement of Operations and Changes in Net Assets forthe period ended June 30, 2019
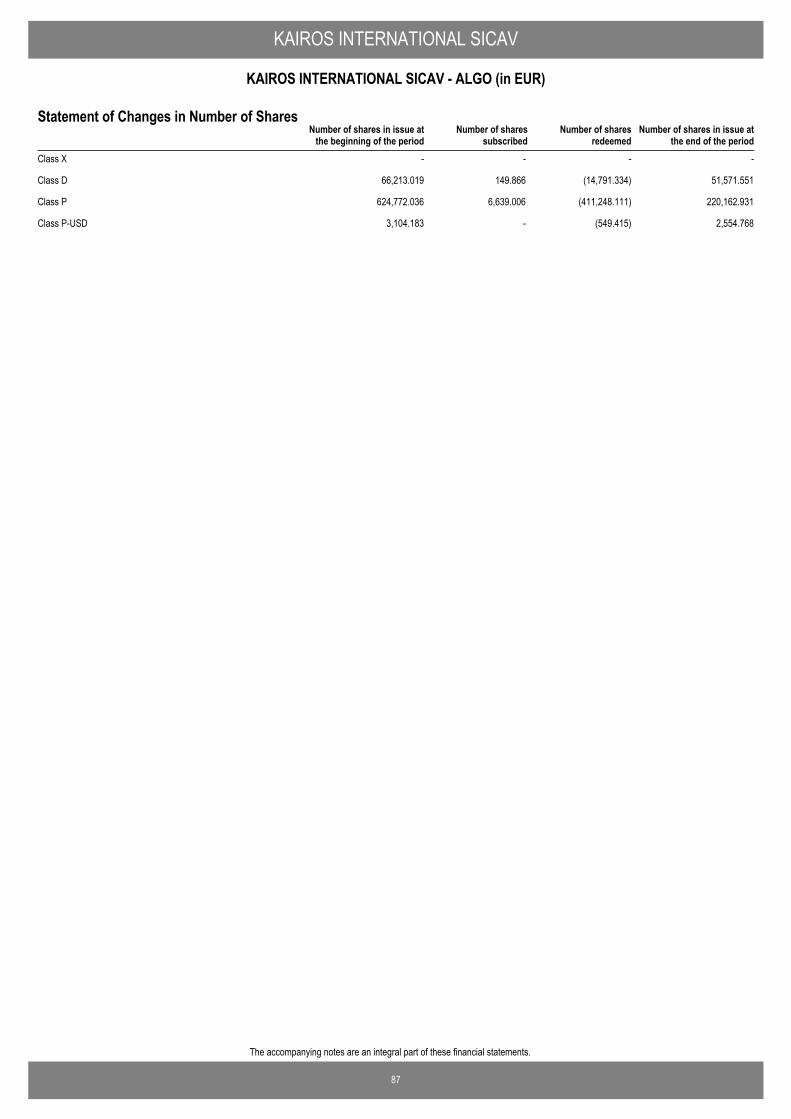
87
The accompanying notes are an integral part of these financial statements.
KAIROS INTERNATIONAL SICAV
KAIROS INTERNATIONAL SICAV - ALGO (in EUR)
Number of shares in issue atthe end of the period
Number of shares in issue atthe beginning of the period
Number of sharessubscribed
Number of sharesredeemed
Statement of Changes in Number of Shares
Class X - - - -
Class D 66,213.019 149.866 (14,791.334) 51,571.551
Class P 624,772.036 6,639.006 (411,248.111) 220,162.931
Class P-USD 3,104.183 - (549.415) 2,554.768
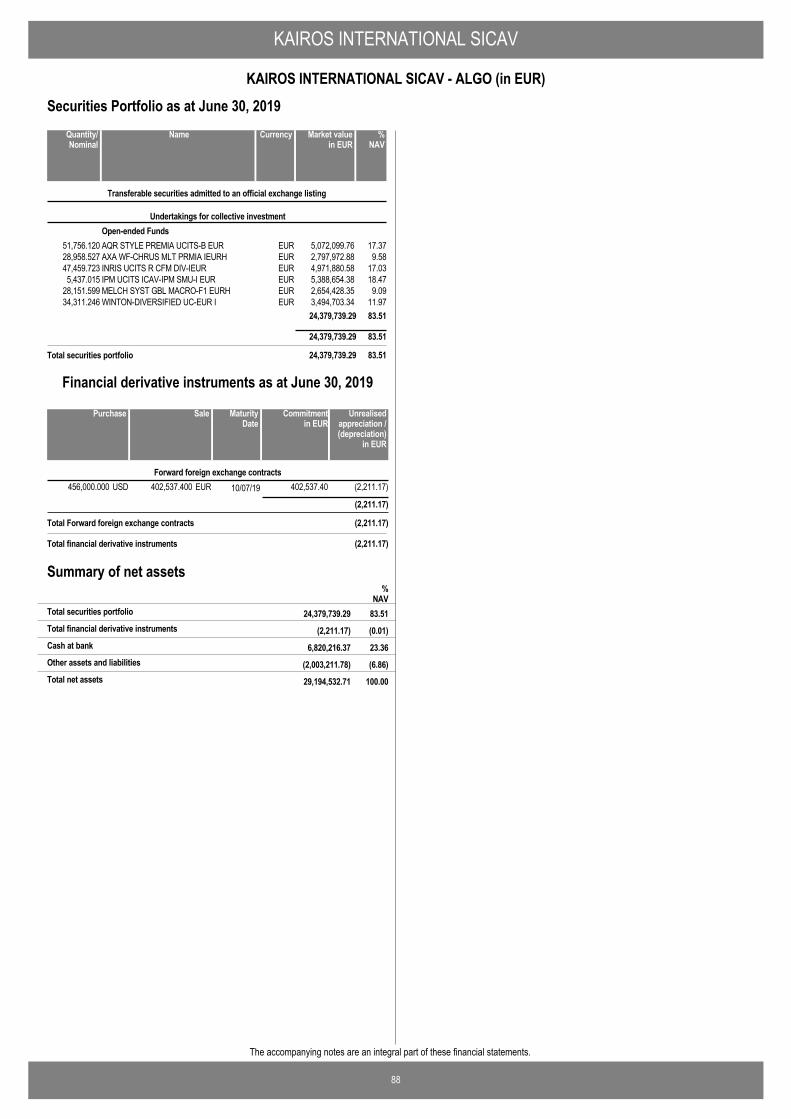
KAIROS INTERNATIONAL SICAV
88
KAIROS INTERNATIONAL SICAV - ALGO (in EUR)
The accompanying notes are an integral part of these financial statements.
Securities Portfolio as at June 30, 2019
AQR STYLE PREMIA UCITS-B EUR EUR 5,072,099.76 17.3751,756.120
Transferable securities admitted to an official exchange listing
Undertakings for collective investmentOpen-ended Funds
AXA WF-CHRUS MLT PRMIA IEURH EUR 2,797,972.88 9.5828,958.527INRIS UCITS R CFM DIV-IEUR EUR 4,971,880.58 17.0347,459.723IPM UCITS ICAV-IPM SMU-I EUR EUR 5,388,654.38 18.475,437.015MELCH SYST GBL MACRO-F1 EURH EUR 2,654,428.35 9.0928,151.599WINTON-DIVERSIFIED UC-EUR I EUR 3,494,703.34 11.9734,311.246
24,379,739.29 83.51
24,379,739.29 83.51
Total securities portfolio 24,379,739.29 83.51
NameQuantity/Nominal
Market valuein EUR
Currency %NAV
402,537.400 10/07/19456,000.000 (2,211.17)EURUSD 402,537.40Forward foreign exchange contracts
(2,211.17)
Total Forward foreign exchange contracts (2,211.17)
SalePurchase Unrealisedappreciation /(depreciation)
in EUR
MaturityDate
Commitmentin EUR
Financial derivative instruments as at June 30, 2019
Total financial derivative instruments (2,211.17)
Summary of net assets
(2,211.17) (0.01)Total financial derivative instruments
%NAV
24,379,739.29 83.51Total securities portfolio
6,820,216.37 23.36Cash at bank
(2,003,211.78) (6.86)Other assets and liabilities
29,194,532.71 100.00Total net assets
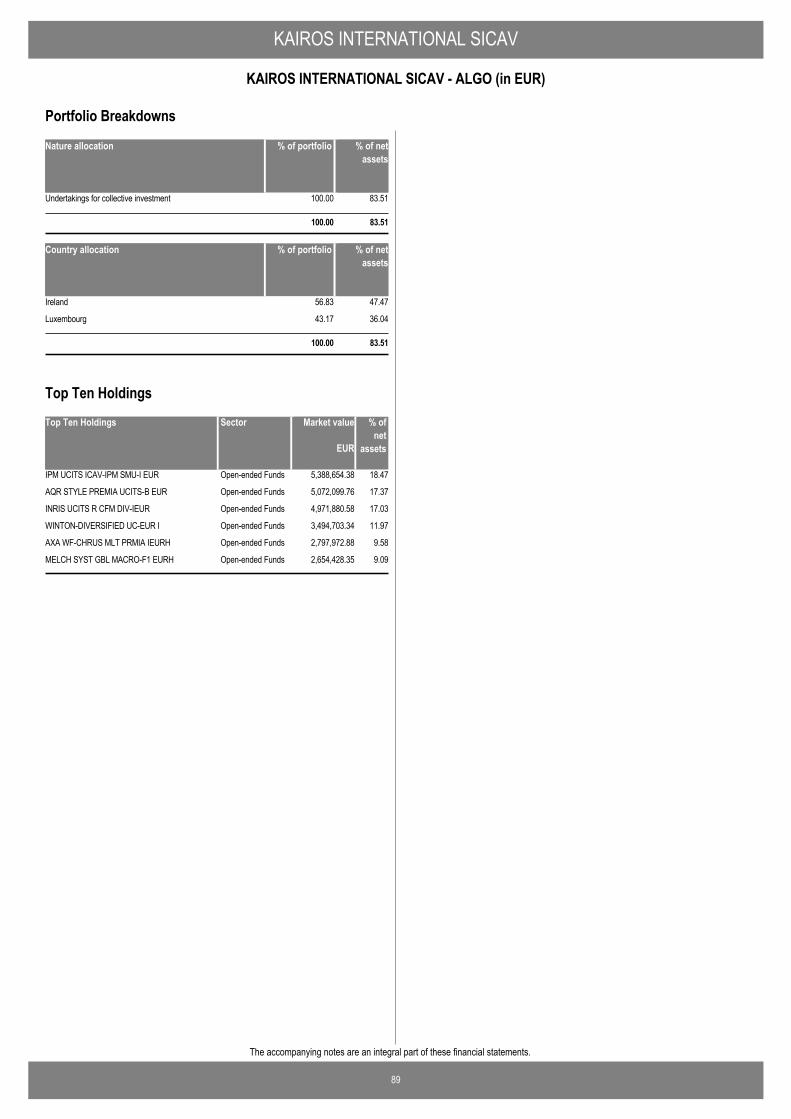
KAIROS INTERNATIONAL SICAV
89
KAIROS INTERNATIONAL SICAV - ALGO (in EUR)
The accompanying notes are an integral part of these financial statements.
Nature allocation % of portfolio % of netassets
Undertakings for collective investment 100.00 83.51
100.00 83.51
Country allocation % of portfolio % of netassets
Ireland 56.83 47.47
Luxembourg 43.17 36.04
100.00 83.51
Portfolio Breakdowns
Top Ten Holdings Market value % ofnet
assets
IPM UCITS ICAV-IPM SMU-I EUR 5,388,654.38 18.47Open-ended Funds
AQR STYLE PREMIA UCITS-B EUR 5,072,099.76 17.37Open-ended Funds
INRIS UCITS R CFM DIV-IEUR 4,971,880.58 17.03Open-ended Funds
WINTON-DIVERSIFIED UC-EUR I 3,494,703.34 11.97Open-ended Funds
AXA WF-CHRUS MLT PRMIA IEURH 2,797,972.88 9.58Open-ended Funds
MELCH SYST GBL MACRO-F1 EURH 2,654,428.35 9.09Open-ended Funds
EUR
Sector
Top Ten Holdings
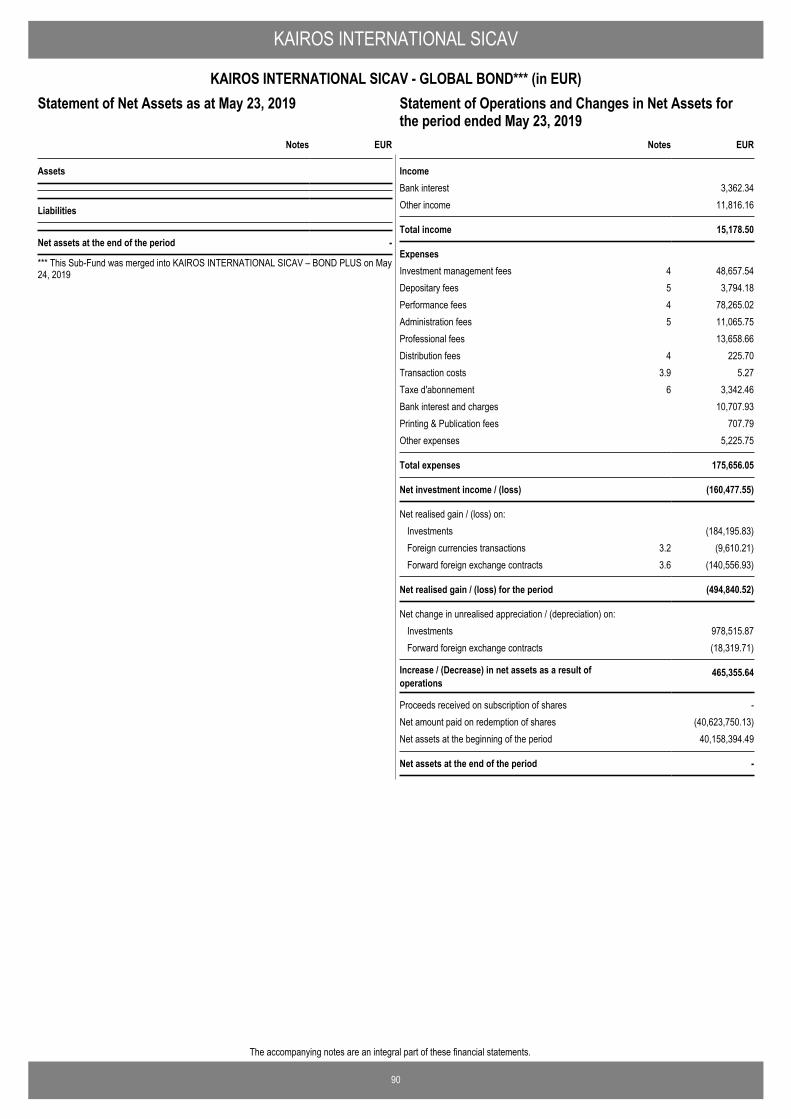
90
The accompanying notes are an integral part of these financial statements.
KAIROS INTERNATIONAL SICAV
KAIROS INTERNATIONAL SICAV - GLOBAL BOND*** (in EUR)Statement of Operations and Changes in Net Assets for theperiod ended May 23, 2019
EUR
Assets
Liabilities
Net assets at the end of the period -
Notes
Statement of Net Assets as at May 23, 2019
*** This Sub-Fund was merged into KAIROS INTERNATIONAL SICAV – BOND PLUS on May24, 2019
IncomeBank interest 3,362.34Other income 11,816.16
Total income 15,178.50
ExpensesInvestment management fees 4 48,657.54Depositary fees 5 3,794.18Performance fees 4 78,265.02Administration fees 5 11,065.75Professional fees 13,658.66Distribution fees 4 225.70Transaction costs 3.9 5.27Taxe d'abonnement 6 3,342.46Bank interest and charges 10,707.93Printing & Publication fees 707.79Other expenses 5,225.75
Total expenses 175,656.05
Net investment income / (loss) (160,477.55)
Net realised gain / (loss) on: Investments (184,195.83)Foreign currencies transactions 3.2 (9,610.21)Forward foreign exchange contracts 3.6 (140,556.93)
Net realised gain / (loss) for the period (494,840.52)
Net change in unrealised appreciation / (depreciation) on: Investments 978,515.87Forward foreign exchange contracts (18,319.71)
Increase / (Decrease) in net assets as a result ofoperations
465,355.64
Proceeds received on subscription of shares -Net amount paid on redemption of shares (40,623,750.13)Net assets at the beginning of the period 40,158,394.49
Net assets at the end of the period -
EURNotes
Statement of Operations and Changes in Net Assets forthe period ended May 23, 2019

91
The accompanying notes are an integral part of these financial statements.
KAIROS INTERNATIONAL SICAV
KAIROS INTERNATIONAL SICAV - GLOBAL BOND*** (in EUR)
Number of shares in issue atthe end of the period
Number of shares in issue atthe beginning of the period
Number of sharessubscribed
Number of sharesredeemed
Statement of Changes in Number of Shares
Class D 2,555.601 - (2,555.601) -
Class P 394,928.129 - (394,928.129) -
Class P-USD 12,123.803 - (12,123.803) -
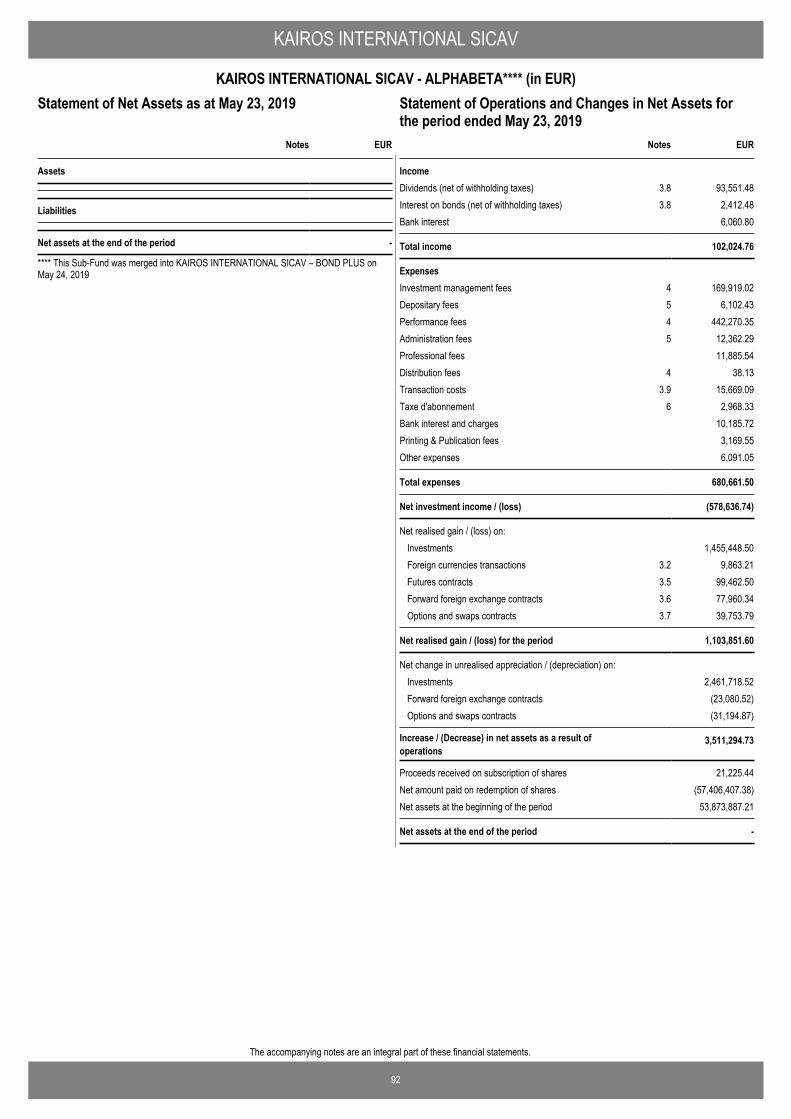
92
The accompanying notes are an integral part of these financial statements.
KAIROS INTERNATIONAL SICAV
KAIROS INTERNATIONAL SICAV - ALPHABETA**** (in EUR)Statement of Operations and Changes in Net Assets for theperiod ended May 23, 2019
EUR
Assets
Liabilities
Net assets at the end of the period -
Notes
Statement of Net Assets as at May 23, 2019
**** This Sub-Fund was merged into KAIROS INTERNATIONAL SICAV – BOND PLUS onMay 24, 2019
IncomeDividends (net of withholding taxes) 3.8 93,551.48Interest on bonds (net of withholding taxes) 3.8 2,412.48Bank interest 6,060.80
Total income 102,024.76
ExpensesInvestment management fees 4 169,919.02Depositary fees 5 6,102.43Performance fees 4 442,270.35Administration fees 5 12,362.29Professional fees 11,885.54Distribution fees 4 38.13Transaction costs 3.9 15,669.09Taxe d'abonnement 6 2,968.33Bank interest and charges 10,185.72Printing & Publication fees 3,169.55Other expenses 6,091.05
Total expenses 680,661.50
Net investment income / (loss) (578,636.74)
Net realised gain / (loss) on: Investments 1,455,448.50Foreign currencies transactions 3.2 9,863.21Futures contracts 3.5 99,462.50Forward foreign exchange contracts 3.6 77,960.34Options and swaps contracts 3.7 39,753.79
Net realised gain / (loss) for the period 1,103,851.60
Net change in unrealised appreciation / (depreciation) on: Investments 2,461,718.52Forward foreign exchange contracts (23,080.52)Options and swaps contracts (31,194.87)
Increase / (Decrease) in net assets as a result ofoperations
3,511,294.73
Proceeds received on subscription of shares 21,225.44Net amount paid on redemption of shares (57,406,407.38)Net assets at the beginning of the period 53,873,887.21
Net assets at the end of the period -
EURNotes
Statement of Operations and Changes in Net Assets forthe period ended May 23, 2019

93
The accompanying notes are an integral part of these financial statements.
KAIROS INTERNATIONAL SICAV
KAIROS INTERNATIONAL SICAV - ALPHABETA**** (in EUR)
Number of shares in issue atthe end of the period
Number of shares in issue atthe beginning of the period
Number of sharessubscribed
Number of sharesredeemed
Statement of Changes in Number of Shares
Class D 1,214.790 - (1,214.790) -
Class P 528,303.603 223.454 (528,527.057) -
Class X 59,394.652 - (59,394.652) -
KAIROS INTERNATIONAL SICAV Notes to the Financial Statements as at June 30, 2019 Note 1. General information KAIROS INTERNATIONAL SICAV (the “Fund”) was incorporated on September 28, 2006 as a “société anonyme” under the laws of the Grand Duchy of Luxembourg and qualifies as an open-ended “société d’investissement à capital variable” with UCITS status. The Articles of Incorporation were published in the Mémorial of October 9, 2006. The Fund is authorised by the Luxembourg supervisory authority as a UCITS under Part I of the amended Law of December 17, 2010 relating to undertakings for collective investment. As at June 30, 2019, the following Sub-Funds are open to investors: - KAIROS INTERNATIONAL SICAV - BOND (launched on February 2, 2009) - KAIROS INTERNATIONAL SICAV - BOND PLUS (launched on November 4, 2011) - KAIROS INTERNATIONAL SICAV - PENTAGON (launched on November 4, 2014) - KAIROS INTERNATIONAL SICAV - FINANCIAL INCOME (launched on July 3, 2017) - KAIROS INTERNATIONAL SICAV - TARGET ITALY ALPHA (launched on July 1, 2016) - KAIROS INTERNATIONAL SICAV - EUROPA (launched on September 18, 2012) - KAIROS INTERNATIONAL SICAV - ITALIA (launched on June 28, 2013) - KAIROS INTERNATIONAL SICAV - ITALIA PIR (launched on September 26, 2017) - KAIROS INTERNATIONAL SICAV - PEGASUS UCITS (launched on June 6, 2016) - KAIROS INTERNATIONAL SICAV - RISORGIMENTO (launched on October 14, 2013) - KAIROS INTERNATIONAL SICAV - PATRIOT (launched on July 5, 2017) - KAIROS INTERNATIONAL SICAV - KEY (launched on June 7, 2013) - KAIROS INTERNATIONAL SICAV - EMERGING MARKETS (launched on July 6, 2009) - KAIROS INTERNATIONAL SICAV - ALGO (launched on May 4, 2009) - KAIROS INTERNATIONAL SICAV - WORLD was merged into KAIROS INTERNATIONAL SICAV - PENTAGON on May 24, 2019 - KAIROS INTERNATIONAL SICAV - AMERICA was merged into KAIROS INTERNATIONAL SICAV - PENTAGON on May 24, 2019 - KAIROS INTERNATIONAL SICAV - GLOBAL BOND was merged into KAIROS INTERNATIONAL SICAV - BOND PLUS on May 24, 2019 - KAIROS INTERNATIONAL SICAV - ALPHABETA was merged into KAIROS INTERNATIONAL SICAV - BOND PLUS on May 24, 2019 Since September 1, 2014, the Board of Directors of the Fund has appointed Kairos Partners SGR S.p.A. to act as Management Company of the Fund. The Management Company is an incorporated company under Italian law of May 20, 1999 and controlled by Julius Baer Group Ltd. Note 2. Fund’s shares The Board of Directors may decide to issue, within each Sub-Fund, separate Classes of Shares, whose assets will be commonly invested but where a specific structure, may be applied. Each Sub-Fund may offer the following Classes of Shares: - Class P Shares, which are available to all investors; - Class C and D Shares, which are available through selected distributors; - Class N, X and Class Y Shares, which are restricted to Institutional Investors that have entered into a separate agreement with a company within Kairos Group under which such investors have agreed on specific arrangements as to the payment of fees; - Class Z Shares, which are available to both retail and Institutional Investors that have entered into a separate agreement with a company within Kairos Group under which such investors have agreed on specific arrangements as to the payment of fees; - Class S Shares, which are offered for Target Italy Alpha only; - Class W Shares, which are available to all investors in jurisdictions where the payment of commissions is prohibited, and/or to financial intermediaries who invest in their own name and on behalf of their clients within a fee-based asset management or advisory agreement, and/or to other investors as determined by the Management Company. Note 3. Significant accounting policies The financial statements are prepared on going concern basis and under Lux GAAP (Luxembourg Generally Accepted Accounting Principles) in accordance with legal and regulatory requirements in force in Luxembourg relating to Undertakings for Collective Investment and accounting principles generally accepted in Luxembourg. The Fund’s investments and other assets are valued on the basis of the latest available price prevailing on the valuation date which is June 28, 2019. The NAV which has been used to prepare the financial statements is calculated on the basis of an unofficial NAV at the period end date for the sole purposes of the financial statements. 3.1. Combined financial statements The combined financial statements are expressed in EUR and are equal to the sum of the corresponding accounts in the financial statements of each Sub- Fund converted into euro at the exchange rate prevailing at the end of the financial period.
94
KAIROS INTERNATIONAL SICAV
Notes to the Financial Statements as at June 30, 2019 (continued)
Note 3. Significant accounting policies (continued) 3.2. Foreign exchange conversions The accounts of each Sub-Fund are denominated in the currency in which its net asset value is calculated. The cost of investments denominated in currencies other than the Sub-Fund's accounting currency is converted into that currency at the exchange rate prevailing at the date of purchase. Income and expenses in currencies other than the Sub-Fund's accounting currency are converted into that currency at the exchange rate prevailing at the transaction date. At the end of the period, the investments' market value (determined as noted thereafter), the receivables, cash at banks and liabilities denominated in currencies other than the Sub-Fund's accounting currency are converted into that currency at the exchange rates prevailing at that date. The resulting realised foreign exchange gains or losses are included in the statement of operations and changes in net assets. 3.3. Valuation rules 1. The value of any cash in hand or on deposit, bills and demand notes and accounts receivable, prepaid expenses, cash dividends and interest declared or accrued as aforesaid and not yet received shall be deemed to be the full amount thereof, unless in any case the same is unlikely to be paid or received in full, in which case the value thereof shall be arrived at after making such discount as the Board of Directors may consider appropriate in such case to reflect the true value thereof; 2. The value of securities and/or financial derivative instruments which are listed or dealt in on any stock exchange shall be based, except as defined in the paragraph below, in respect of each security on the latest available dealing prices or the latest available mid market quotation (being the mid point between the latest quoted bid and offer prices) on the stock exchange which is normally the principal market for such security; 3. Where investments of the Fund are both listed on a stock exchange and dealt in by market makers outside the stock exchange, on which the investments are listed, then the Board of Directors will determine the principal market for the investments in question and they will be valued at the latest available price in that market; 4. Securities dealt in on another regulated market are valued in a manner as close as possible to that described in paragraph 2; 5. In the event that any of the securities held in the Fund's portfolio on the Valuation Day are not listed or dealt in on a stock exchange or another regulated market, or for any of such securities, no price quotation is available, or if the price as determined pursuant to sub-paragraphs 2) and/or 4) is not in the opinion of the Board of Directors representative of the fair market value of the relevant securities, the value of such securities shall be determined prudently and in good faith by the Board of Directors, based on the reasonably foreseeable sales price or any other appropriate valuation principles; 6. Units or shares in underlying open-ended investment funds shall be valued at their last available net asset value reduced by any applicable charges; 7. Liquid assets and money market instruments are valued at their nominal value plus accrued interest or on an amortised cost basis; 8. In the event that the above mentioned calculation methods are inappropriate or misleading, the Board of Directors may adjust the value of any investment or allow some other method of valuation to be used for the assets of the Fund if it considers that the circumstances justify that such adjustment or other method of valuation should be adopted to reflect more fairly the value of such investments and is in accordance with accounting practice. 3.4. Profits and losses Profits and losses on sales of securities are determined on an average cost basis. 3.5. Future contracts Future contracts are valued based on the last available market price. Profits and losses realised and unrealised are included in the statement of operations and changes in net assets. For the calculation of net holdings by currency on financial instruments, the holdings are converted at the exchange rate prevailing at the end of the period. 3.6. Forward foreign exchange contracts The forward foreign exchange contracts opened at the period-end are valued at the forward exchange rates corresponding to the termination date of the contract. The unrealised appreciation / (depreciation) are included in the Statement of Operations and Changes in Net Assets. For the calculation of the net holdings by currency, the holdings are converted at the forward exchange rate corresponding to the termination date of the contract. 3.7. Options, swaps and CFD The financial derivative instruments (swaps, options, credit default swap, contracts for difference ...) which are not listed on any official stock exchange or traded on any other organised market are valued in a reliable and verifiable manner on a daily basis and verified by a competent professional appointed by the Board of Directors of the Fund. 3.8. Dividends and interest Dividends and interest received by the Fund on its investments are in many cases subject to irrecoverable withholding taxes at source. The value of any dividends and interest declared or accrued as aforesaid and not yet received is deemed to be the full amount thereof, unless in any case the same is unlikely to be paid or received in full.
95
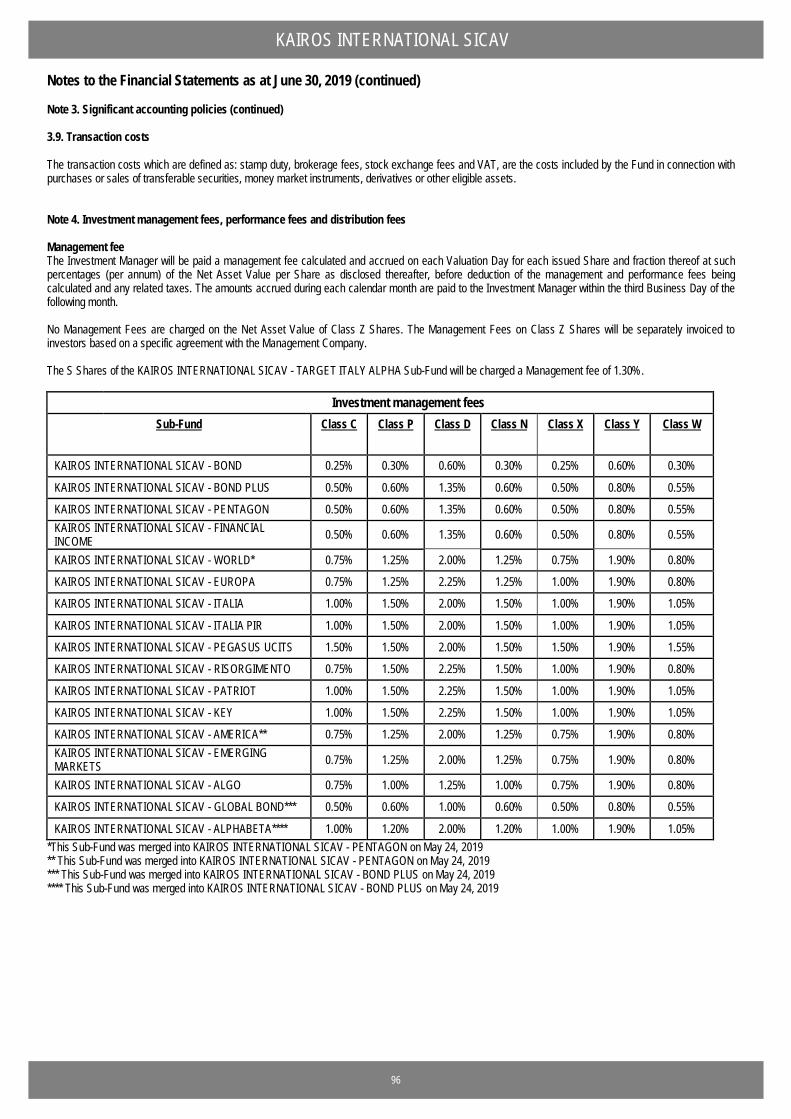
KAIROS INTERNATIONAL SICAV
Notes to the Financial Statements as at June 30, 2019 (continued)
Note 3. Significant accounting policies (continued) 3.9. Transaction costs The transaction costs which are defined as: stamp duty, brokerage fees, stock exchange fees and VAT, are the costs included by the Fund in connection with purchases or sales of transferable securities, money market instruments, derivatives or other eligible assets. Note 4. Investment management fees, performance fees and distribution fees Management fee The Investment Manager will be paid a management fee calculated and accrued on each Valuation Day for each issued Share and fraction thereof at such percentages (per annum) of the Net Asset Value per Share as disclosed thereafter, before deduction of the management and performance fees being calculated and any related taxes. The amounts accrued during each calendar month are paid to the Investment Manager within the third Business Day of the following month. No Management Fees are charged on the Net Asset Value of Class Z Shares. The Management Fees on Class Z Shares will be separately invoiced to investors based on a specific agreement with the Management Company. The S Shares of the KAIROS INTERNATIONAL SICAV - TARGET ITALY ALPHA Sub-Fund will be charged a Management fee of 1.30%.
Investment management fees Sub-Fund Class C Class P Class D Class N Class X Class Y Class W
KAIROS INTERNATIONAL SICAV - BOND 0.25% 0.30% 0.60% 0.30% 0.25% 0.60% 0.30%
KAIROS INTERNATIONAL SICAV - BOND PLUS 0.50% 0.60% 1.35% 0.60% 0.50% 0.80% 0.55%
KAIROS INTERNATIONAL SICAV - PENTAGON 0.50% 0.60% 1.35% 0.60% 0.50% 0.80% 0.55% KAIROS INTERNATIONAL SICAV - FINANCIAL INCOME 0.50% 0.60% 1.35% 0.60% 0.50% 0.80% 0.55%
KAIROS INTERNATIONAL SICAV - WORLD* 0.75% 1.25% 2.00% 1.25% 0.75% 1.90% 0.80%
KAIROS INTERNATIONAL SICAV - EUROPA 0.75% 1.25% 2.25% 1.25% 1.00% 1.90% 0.80%
KAIROS INTERNATIONAL SICAV - ITALIA 1.00% 1.50% 2.00% 1.50% 1.00% 1.90% 1.05%
KAIROS INTERNATIONAL SICAV - ITALIA PIR 1.00% 1.50% 2.00% 1.50% 1.00% 1.90% 1.05%
KAIROS INTERNATIONAL SICAV - PEGASUS UCITS 1.50% 1.50% 2.00% 1.50% 1.50% 1.90% 1.55%
KAIROS INTERNATIONAL SICAV - RISORGIMENTO 0.75% 1.50% 2.25% 1.50% 1.00% 1.90% 0.80%
KAIROS INTERNATIONAL SICAV - PATRIOT 1.00% 1.50% 2.25% 1.50% 1.00% 1.90% 1.05%
KAIROS INTERNATIONAL SICAV - KEY 1.00% 1.50% 2.25% 1.50% 1.00% 1.90% 1.05%
KAIROS INTERNATIONAL SICAV - AMERICA** 0.75% 1.25% 2.00% 1.25% 0.75% 1.90% 0.80% KAIROS INTERNATIONAL SICAV - EMERGING MARKETS 0.75% 1.25% 2.00% 1.25% 0.75% 1.90% 0.80%
KAIROS INTERNATIONAL SICAV - ALGO 0.75% 1.00% 1.25% 1.00% 0.75% 1.90% 0.80%
KAIROS INTERNATIONAL SICAV - GLOBAL BOND*** 0.50% 0.60% 1.00% 0.60% 0.50% 0.80% 0.55%
KAIROS INTERNATIONAL SICAV - ALPHABETA**** 1.00% 1.20% 2.00% 1.20% 1.00% 1.90% 1.05% *This Sub-Fund was merged into KAIROS INTERNATIONAL SICAV - PENTAGON on May 24, 2019 ** This Sub-Fund was merged into KAIROS INTERNATIONAL SICAV - PENTAGON on May 24, 2019 *** This Sub-Fund was merged into KAIROS INTERNATIONAL SICAV - BOND PLUS on May 24, 2019 **** This Sub-Fund was merged into KAIROS INTERNATIONAL SICAV - BOND PLUS on May 24, 2019
96
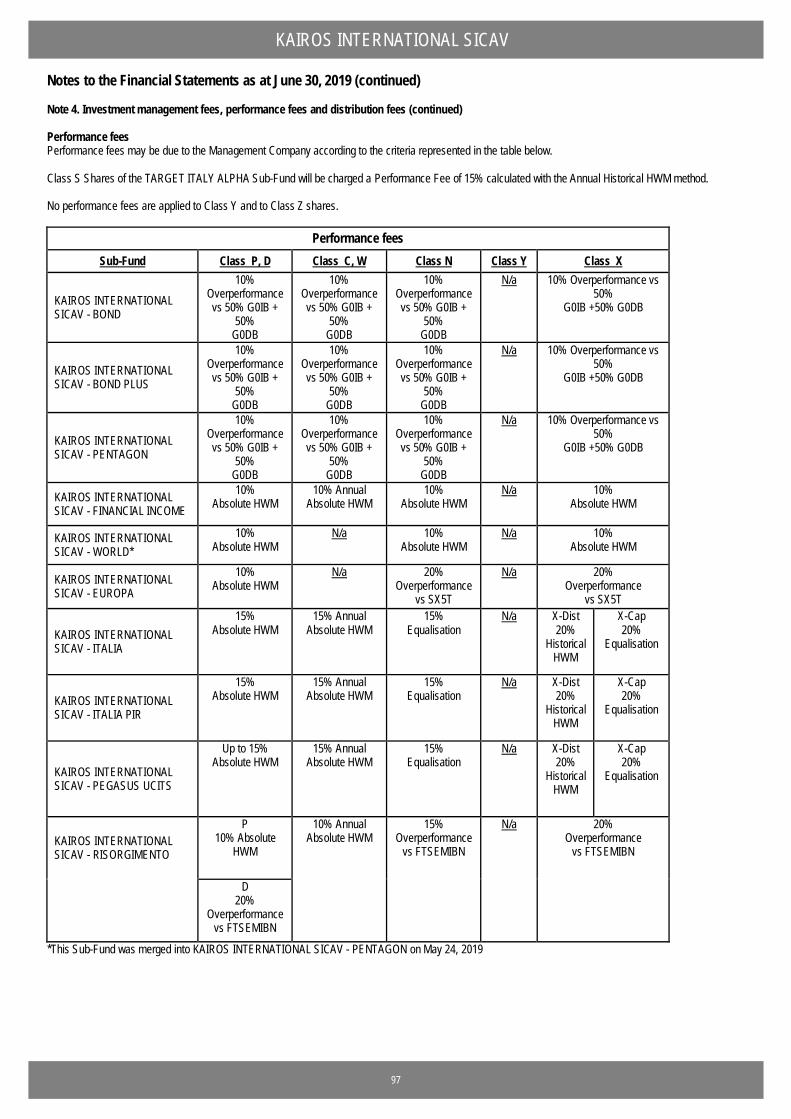
KAIROS INTERNATIONAL SICAV
Notes to the Financial Statements as at June 30, 2019 (continued)
Note 4. Investment management fees, performance fees and distribution fees (continued) Performance fees Performance fees may be due to the Management Company according to the criteria represented in the table below. Class S Shares of the TARGET ITALY ALPHA Sub-Fund will be charged a Performance Fee of 15% calculated with the Annual Historical HWM method. No performance fees are applied to Class Y and to Class Z shares.
Performance fees Sub-Fund Class P, D Class C, W Class N Class Y Class X
KAIROS INTERNATIONAL SICAV - BOND
10% Overperformance vs 50% G0IB +
50% G0DB
10% Overperformance vs 50% G0IB +
50% G0DB
10% Overperformance vs 50% G0IB +
50% G0DB
N/a 10% Overperformance vs 50%
G0IB +50% G0DB
KAIROS INTERNATIONAL SICAV - BOND PLUS
10% Overperformance vs 50% G0IB +
50% G0DB
10% Overperformance vs 50% G0IB +
50% G0DB
10% Overperformance vs 50% G0IB +
50% G0DB
N/a 10% Overperformance vs 50%
G0IB +50% G0DB
KAIROS INTERNATIONAL SICAV - PENTAGON
10% Overperformance vs 50% G0IB +
50% G0DB
10% Overperformance vs 50% G0IB +
50% G0DB
10% Overperformance vs 50% G0IB +
50% G0DB
N/a 10% Overperformance vs 50%
G0IB +50% G0DB
KAIROS INTERNATIONAL SICAV - FINANCIAL INCOME
10% Absolute HWM
10% Annual Absolute HWM
10% Absolute HWM
N/a 10% Absolute HWM
KAIROS INTERNATIONAL SICAV - WORLD*
10% Absolute HWM
N/a 10% Absolute HWM
N/a 10% Absolute HWM
KAIROS INTERNATIONAL SICAV - EUROPA
10% Absolute HWM
N/a 20% Overperformance
vs SX5T
N/a 20% Overperformance
vs SX5T
KAIROS INTERNATIONAL SICAV - ITALIA
15% Absolute HWM
15% Annual Absolute HWM
15% Equalisation
N/a X-Dist 20%
Historical HWM
X-Cap 20%
Equalisation
KAIROS INTERNATIONAL SICAV - ITALIA PIR
15% Absolute HWM
15% Annual Absolute HWM
15% Equalisation
N/a X-Dist 20%
Historical HWM
X-Cap 20%
Equalisation
KAIROS INTERNATIONAL SICAV - PEGASUS UCITS
Up to 15% Absolute HWM
15% Annual Absolute HWM
15% Equalisation
N/a X-Dist 20%
Historical HWM
X-Cap 20%
Equalisation
KAIROS INTERNATIONAL SICAV - RISORGIMENTO
P 10% Absolute
HWM
10% Annual Absolute HWM
15% Overperformance
vs FTSEMIBN
N/a 20% Overperformance
vs FTSEMIBN
D 20%
Overperformance vs FTSEMIBN
*This Sub-Fund was merged into KAIROS INTERNATIONAL SICAV - PENTAGON on May 24, 2019
97
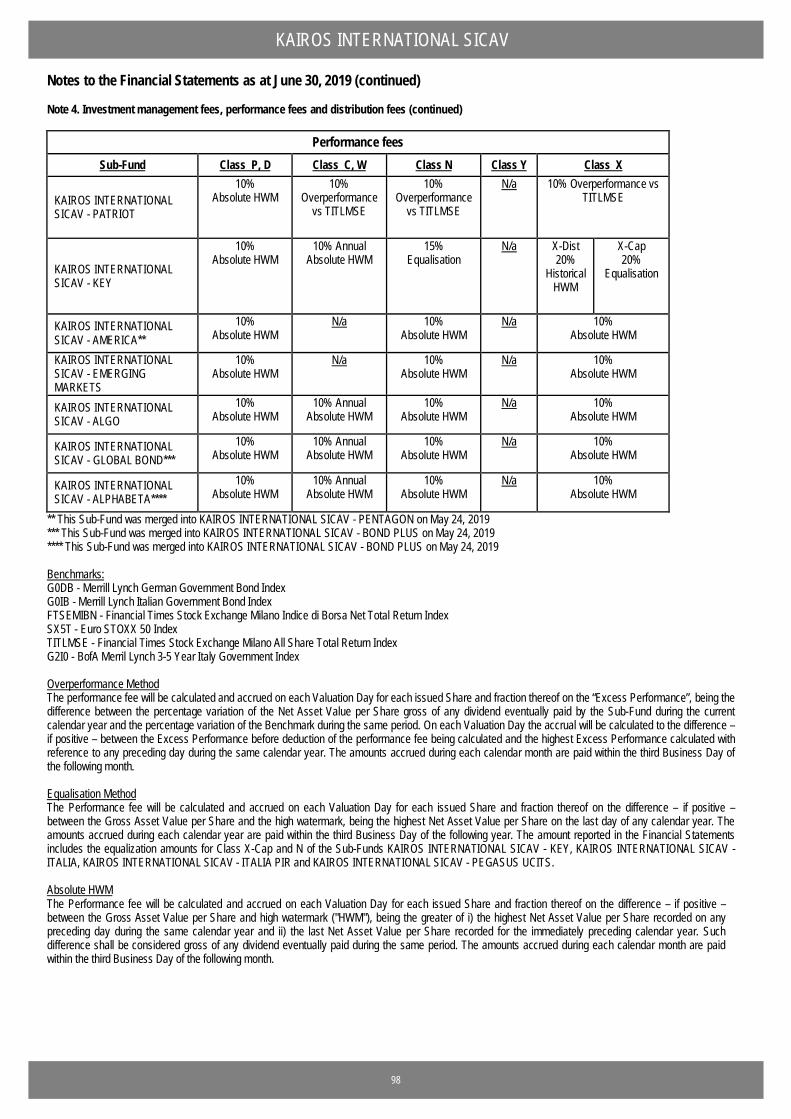
KAIROS INTERNATIONAL SICAV
Notes to the Financial Statements as at June 30, 2019 (continued)
Note 4. Investment management fees, performance fees and distribution fees (continued)
Performance fees Sub-Fund Class P, D Class C, W Class N Class Y Class X
KAIROS INTERNATIONAL SICAV - PATRIOT
10% Absolute HWM
10% Overperformance
vs TITLMSE
10% Overperformance
vs TITLMSE
N/a 10% Overperformance vs TITLMSE
KAIROS INTERNATIONAL SICAV - KEY
10% Absolute HWM
10% Annual Absolute HWM
15% Equalisation
N/a X-Dist 20%
Historical HWM
X-Cap 20%
Equalisation
KAIROS INTERNATIONAL SICAV - AMERICA**
10% Absolute HWM
N/a 10% Absolute HWM
N/a 10% Absolute HWM
KAIROS INTERNATIONAL SICAV - EMERGING MARKETS
10% Absolute HWM
N/a 10% Absolute HWM
N/a 10% Absolute HWM
KAIROS INTERNATIONAL SICAV - ALGO
10% Absolute HWM
10% Annual Absolute HWM
10% Absolute HWM
N/a 10% Absolute HWM
KAIROS INTERNATIONAL SICAV - GLOBAL BOND***
10% Absolute HWM
10% Annual Absolute HWM
10% Absolute HWM
N/a 10% Absolute HWM
KAIROS INTERNATIONAL SICAV - ALPHABETA****
10% Absolute HWM
10% Annual Absolute HWM
10% Absolute HWM
N/a 10% Absolute HWM
** This Sub-Fund was merged into KAIROS INTERNATIONAL SICAV - PENTAGON on May 24, 2019 *** This Sub-Fund was merged into KAIROS INTERNATIONAL SICAV - BOND PLUS on May 24, 2019 **** This Sub-Fund was merged into KAIROS INTERNATIONAL SICAV - BOND PLUS on May 24, 2019 Benchmarks: G0DB - Merrill Lynch German Government Bond Index G0IB - Merrill Lynch Italian Government Bond Index FTSEMIBN - Financial Times Stock Exchange Milano Indice di Borsa Net Total Return Index SX5T - Euro STOXX 50 Index TITLMSE - Financial Times Stock Exchange Milano All Share Total Return Index G2I0 - BofA Merril Lynch 3-5 Year Italy Government Index Overperformance Method The performance fee will be calculated and accrued on each Valuation Day for each issued Share and fraction thereof on the “Excess Performance”, being the difference between the percentage variation of the Net Asset Value per Share gross of any dividend eventually paid by the Sub-Fund during the current calendar year and the percentage variation of the Benchmark during the same period. On each Valuation Day the accrual will be calculated to the difference – if positive – between the Excess Performance before deduction of the performance fee being calculated and the highest Excess Performance calculated with reference to any preceding day during the same calendar year. The amounts accrued during each calendar month are paid within the third Business Day of the following month. Equalisation Method The Performance fee will be calculated and accrued on each Valuation Day for each issued Share and fraction thereof on the difference – if positive – between the Gross Asset Value per Share and the high watermark, being the highest Net Asset Value per Share on the last day of any calendar year. The amounts accrued during each calendar year are paid within the third Business Day of the following year. The amount reported in the Financial Statements includes the equalization amounts for Class X-Cap and N of the Sub-Funds KAIROS INTERNATIONAL SICAV - KEY, KAIROS INTERNATIONAL SICAV - ITALIA, KAIROS INTERNATIONAL SICAV - ITALIA PIR and KAIROS INTERNATIONAL SICAV - PEGASUS UCITS. Absolute HWM The Performance fee will be calculated and accrued on each Valuation Day for each issued Share and fraction thereof on the difference – if positive – between the Gross Asset Value per Share and high watermark ("HWM"), being the greater of i) the highest Net Asset Value per Share recorded on any preceding day during the same calendar year and ii) the last Net Asset Value per Share recorded for the immediately preceding calendar year. Such difference shall be considered gross of any dividend eventually paid during the same period. The amounts accrued during each calendar month are paid within the third Business Day of the following month.
98
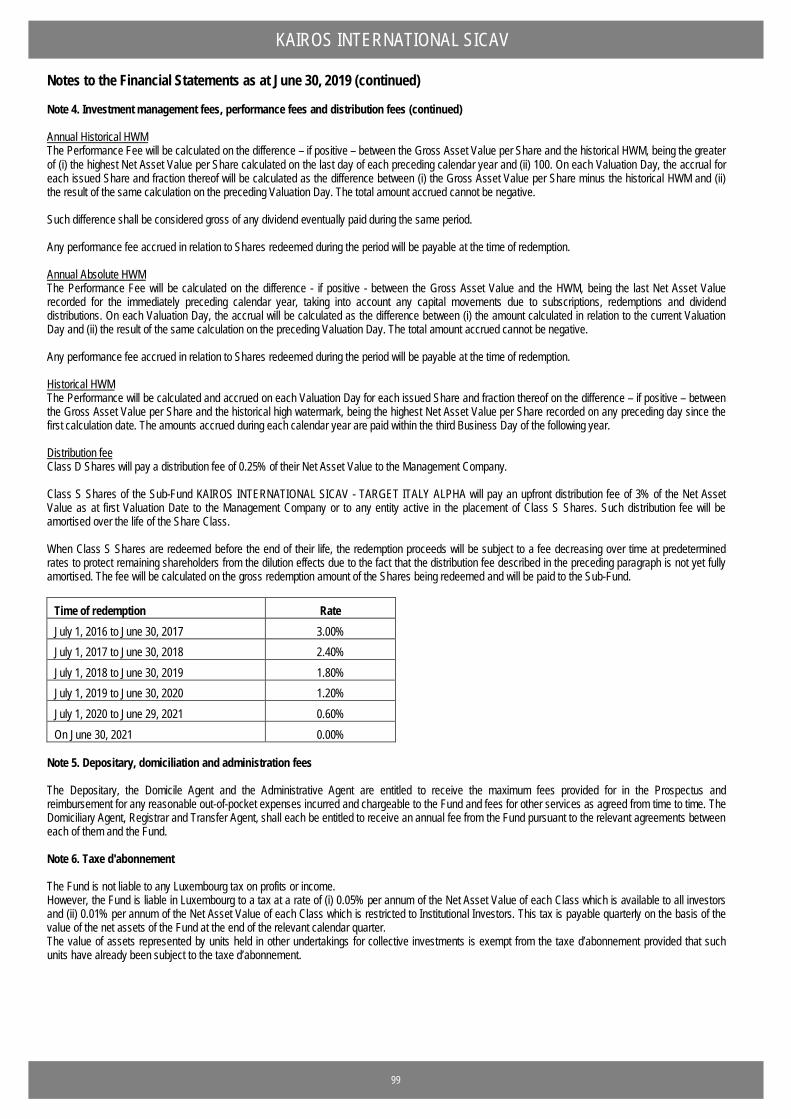
KAIROS INTERNATIONAL SICAV
Notes to the Financial Statements as at June 30, 2019 (continued)
Note 4. Investment management fees, performance fees and distribution fees (continued) Annual Historical HWM The Performance Fee will be calculated on the difference – if positive – between the Gross Asset Value per Share and the historical HWM, being the greater of (i) the highest Net Asset Value per Share calculated on the last day of each preceding calendar year and (ii) 100. On each Valuation Day, the accrual for each issued Share and fraction thereof will be calculated as the difference between (i) the Gross Asset Value per Share minus the historical HWM and (ii) the result of the same calculation on the preceding Valuation Day. The total amount accrued cannot be negative. Such difference shall be considered gross of any dividend eventually paid during the same period. Any performance fee accrued in relation to Shares redeemed during the period will be payable at the time of redemption. Annual Absolute HWM The Performance Fee will be calculated on the difference - if positive - between the Gross Asset Value and the HWM, being the last Net Asset Value recorded for the immediately preceding calendar year, taking into account any capital movements due to subscriptions, redemptions and dividend distributions. On each Valuation Day, the accrual will be calculated as the difference between (i) the amount calculated in relation to the current Valuation Day and (ii) the result of the same calculation on the preceding Valuation Day. The total amount accrued cannot be negative. Any performance fee accrued in relation to Shares redeemed during the period will be payable at the time of redemption. Historical HWM The Performance will be calculated and accrued on each Valuation Day for each issued Share and fraction thereof on the difference – if positive – between the Gross Asset Value per Share and the historical high watermark, being the highest Net Asset Value per Share recorded on any preceding day since the first calculation date. The amounts accrued during each calendar year are paid within the third Business Day of the following year. Distribution fee Class D Shares will pay a distribution fee of 0.25% of their Net Asset Value to the Management Company. Class S Shares of the Sub-Fund KAIROS INTERNATIONAL SICAV - TARGET ITALY ALPHA will pay an upfront distribution fee of 3% of the Net Asset Value as at first Valuation Date to the Management Company or to any entity active in the placement of Class S Shares. Such distribution fee will be amortised over the life of the Share Class. When Class S Shares are redeemed before the end of their life, the redemption proceeds will be subject to a fee decreasing over time at predetermined rates to protect remaining shareholders from the dilution effects due to the fact that the distribution fee described in the preceding paragraph is not yet fully amortised. The fee will be calculated on the gross redemption amount of the Shares being redeemed and will be paid to the Sub-Fund.
Time of redemption Rate July 1, 2016 to June 30, 2017 3.00% July 1, 2017 to June 30, 2018 2.40% July 1, 2018 to June 30, 2019 1.80% July 1, 2019 to June 30, 2020 1.20% July 1, 2020 to June 29, 2021 0.60% On June 30, 2021 0.00%
Note 5. Depositary, domiciliation and administration fees The Depositary, the Domicile Agent and the Administrative Agent are entitled to receive the maximum fees provided for in the Prospectus and reimbursement for any reasonable out-of-pocket expenses incurred and chargeable to the Fund and fees for other services as agreed from time to time. The Domiciliary Agent, Registrar and Transfer Agent, shall each be entitled to receive an annual fee from the Fund pursuant to the relevant agreements between each of them and the Fund. Note 6. Taxe d'abonnement The Fund is not liable to any Luxembourg tax on profits or income. However, the Fund is liable in Luxembourg to a tax at a rate of (i) 0.05% per annum of the Net Asset Value of each Class which is available to all investors and (ii) 0.01% per annum of the Net Asset Value of each Class which is restricted to Institutional Investors. This tax is payable quarterly on the basis of the value of the net assets of the Fund at the end of the relevant calendar quarter. The value of assets represented by units held in other undertakings for collective investments is exempt from the taxe d’abonnement provided that such units have already been subject to the taxe d’abonnement.
99
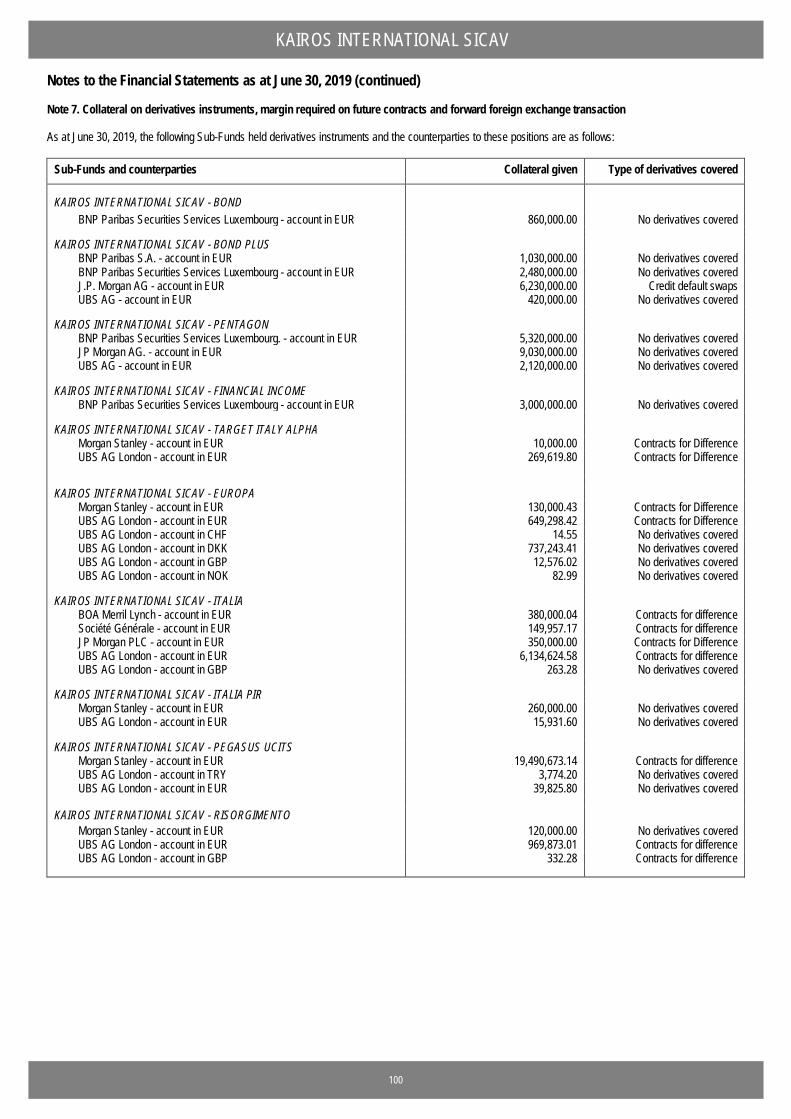
KAIROS INTERNATIONAL SICAV
Notes to the Financial Statements as at June 30, 2019 (continued)
Note 7. Collateral on derivatives instruments, margin required on future contracts and forward foreign exchange transaction As at June 30, 2019, the following Sub-Funds held derivatives instruments and the counterparties to these positions are as follows:
Sub-Funds and counterparties Collateral given Type of derivatives covered
KAIROS INTERNATIONAL SICAV - BOND BNP Paribas Securities Services Luxembourg - account in EUR 860,000.00 No derivatives covered
KAIROS INTERNATIONAL SICAV - BOND PLUS BNP Paribas S.A. - account in EUR 1,030,000.00 No derivatives covered BNP Paribas Securities Services Luxembourg - account in EUR 2,480,000.00 No derivatives covered J.P. Morgan AG - account in EUR 6,230,000.00 Credit default swaps UBS AG - account in EUR 420,000.00 No derivatives covered
KAIROS INTERNATIONAL SICAV - PENTAGON BNP Paribas Securities Services Luxembourg. - account in EUR 5,320,000.00 No derivatives covered JP Morgan AG. - account in EUR 9,030,000.00 No derivatives covered UBS AG - account in EUR 2,120,000.00 No derivatives covered
KAIROS INTERNATIONAL SICAV - FINANCIAL INCOME BNP Paribas Securities Services Luxembourg - account in EUR 3,000,000.00 No derivatives covered
KAIROS INTERNATIONAL SICAV - TARGET ITALY ALPHA Morgan Stanley - account in EUR 10,000.00 Contracts for Difference UBS AG London - account in EUR 269,619.80 Contracts for Difference
KAIROS INTERNATIONAL SICAV - EUROPA Morgan Stanley - account in EUR 130,000.43 Contracts for Difference UBS AG London - account in EUR 649,298.42 Contracts for Difference UBS AG London - account in CHF 14.55 No derivatives covered UBS AG London - account in DKK 737,243.41 No derivatives covered UBS AG London - account in GBP 12,576.02 No derivatives covered UBS AG London - account in NOK 82.99 No derivatives covered
KAIROS INTERNATIONAL SICAV - ITALIA BOA Merril Lynch - account in EUR 380,000.04 Contracts for difference Société Générale - account in EUR 149,957.17 Contracts for difference JP Morgan PLC - account in EUR 350,000.00 Contracts for Difference UBS AG London - account in EUR 6,134,624.58 Contracts for difference UBS AG London - account in GBP 263.28 No derivatives covered
KAIROS INTERNATIONAL SICAV - ITALIA PIR Morgan Stanley - account in EUR 260,000.00 No derivatives covered UBS AG London - account in EUR 15,931.60 No derivatives covered
KAIROS INTERNATIONAL SICAV - PEGASUS UCITS Morgan Stanley - account in EUR 19,490,673.14 Contracts for difference UBS AG London - account in TRY 3,774.20 No derivatives covered UBS AG London - account in EUR 39,825.80 No derivatives covered
KAIROS INTERNATIONAL SICAV - RISORGIMENTO Morgan Stanley - account in EUR 120,000.00 No derivatives covered UBS AG London - account in EUR 969,873.01 Contracts for difference UBS AG London - account in GBP 332.28 Contracts for difference
100
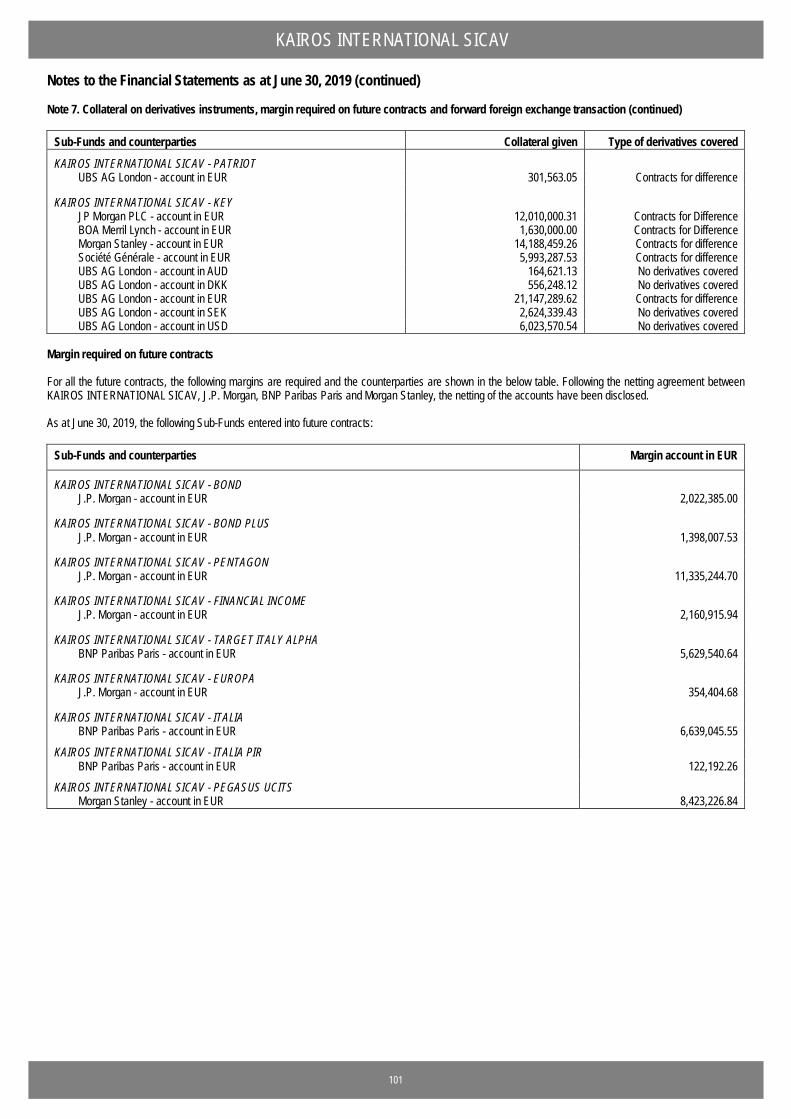
KAIROS INTERNATIONAL SICAV
Notes to the Financial Statements as at June 30, 2019 (continued)
Note 7. Collateral on derivatives instruments, margin required on future contracts and forward foreign exchange transaction (continued)
Sub-Funds and counterparties Collateral given Type of derivatives covered
KAIROS INTERNATIONAL SICAV - PATRIOT UBS AG London - account in EUR 301,563.05 Contracts for difference
KAIROS INTERNATIONAL SICAV - KEY JP Morgan PLC - account in EUR 12,010,000.31 Contracts for Difference BOA Merril Lynch - account in EUR 1,630,000.00 Contracts for Difference Morgan Stanley - account in EUR 14,188,459.26 Contracts for difference Société Générale - account in EUR 5,993,287.53 Contracts for difference UBS AG London - account in AUD 164,621.13 No derivatives covered UBS AG London - account in DKK 556,248.12 No derivatives covered UBS AG London - account in EUR 21,147,289.62 Contracts for difference UBS AG London - account in SEK 2,624,339.43 No derivatives covered UBS AG London - account in USD 6,023,570.54 No derivatives covered
Margin required on future contracts For all the future contracts, the following margins are required and the counterparties are shown in the below table. Following the netting agreement between KAIROS INTERNATIONAL SICAV, J.P. Morgan, BNP Paribas Paris and Morgan Stanley, the netting of the accounts have been disclosed. As at June 30, 2019, the following Sub-Funds entered into future contracts:
Sub-Funds and counterparties Margin account in EUR
KAIROS INTERNATIONAL SICAV - BOND J.P. Morgan - account in EUR 2,022,385.00
KAIROS INTERNATIONAL SICAV - BOND PLUS J.P. Morgan - account in EUR 1,398,007.53
KAIROS INTERNATIONAL SICAV - PENTAGON J.P. Morgan - account in EUR 11,335,244.70
KAIROS INTERNATIONAL SICAV - FINANCIAL INCOME J.P. Morgan - account in EUR 2,160,915.94
KAIROS INTERNATIONAL SICAV - TARGET ITALY ALPHA BNP Paribas Paris - account in EUR 5,629,540.64
KAIROS INTERNATIONAL SICAV - EUROPA J.P. Morgan - account in EUR 354,404.68
KAIROS INTERNATIONAL SICAV - ITALIA BNP Paribas Paris - account in EUR 6,639,045.55
KAIROS INTERNATIONAL SICAV - ITALIA PIR BNP Paribas Paris - account in EUR 122,192.26
KAIROS INTERNATIONAL SICAV - PEGASUS UCITS Morgan Stanley - account in EUR 8,423,226.84
101
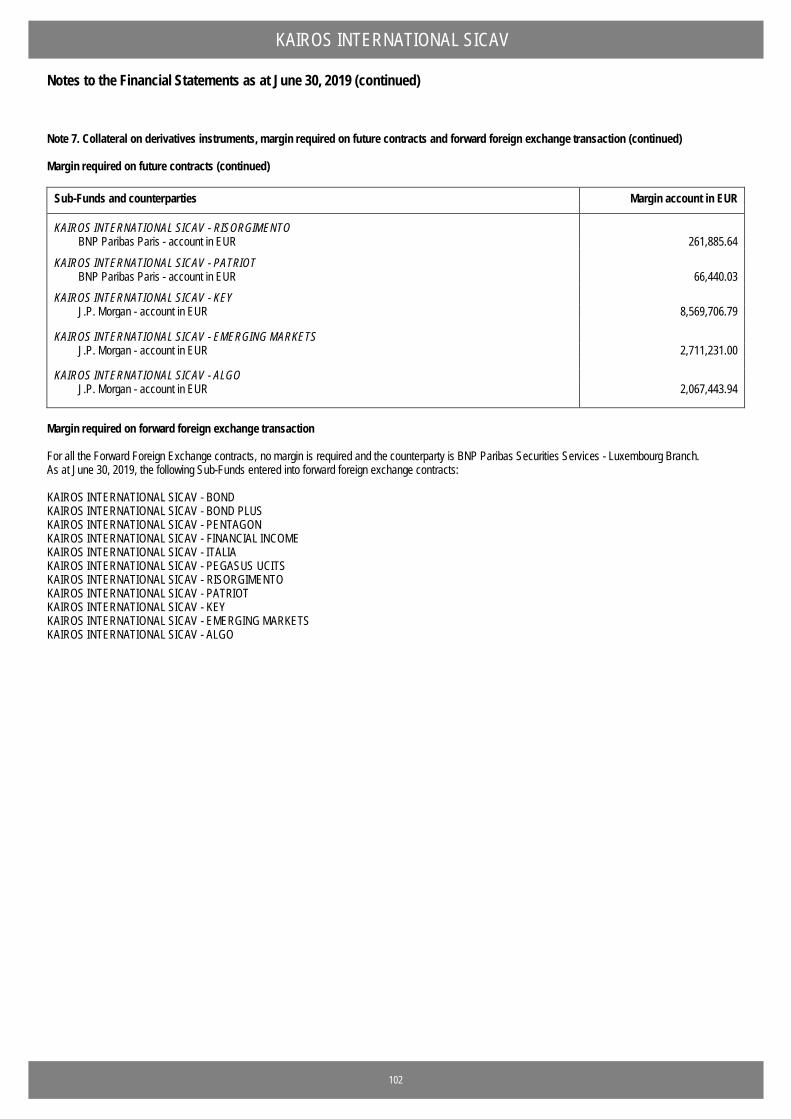
KAIROS INTERNATIONAL SICAV
Notes to the Financial Statements as at June 30, 2019 (continued)
Note 7. Collateral on derivatives instruments, margin required on future contracts and forward foreign exchange transaction (continued) Margin required on future contracts (continued)
Sub-Funds and counterparties Margin account in EUR
KAIROS INTERNATIONAL SICAV - RISORGIMENTO BNP Paribas Paris - account in EUR 261,885.64
KAIROS INTERNATIONAL SICAV - PATRIOT BNP Paribas Paris - account in EUR 66,440.03
KAIROS INTERNATIONAL SICAV - KEY J.P. Morgan - account in EUR 8,569,706.79
KAIROS INTERNATIONAL SICAV - EMERGING MARKETS J.P. Morgan - account in EUR 2,711,231.00
KAIROS INTERNATIONAL SICAV - ALGO J.P. Morgan - account in EUR 2,067,443.94
Margin required on forward foreign exchange transaction For all the Forward Foreign Exchange contracts, no margin is required and the counterparty is BNP Paribas Securities Services - Luxembourg Branch. As at June 30, 2019, the following Sub-Funds entered into forward foreign exchange contracts: KAIROS INTERNATIONAL SICAV - BOND KAIROS INTERNATIONAL SICAV - BOND PLUS KAIROS INTERNATIONAL SICAV - PENTAGON KAIROS INTERNATIONAL SICAV - FINANCIAL INCOME KAIROS INTERNATIONAL SICAV - ITALIA KAIROS INTERNATIONAL SICAV - PEGASUS UCITS KAIROS INTERNATIONAL SICAV - RISORGIMENTO KAIROS INTERNATIONAL SICAV - PATRIOT KAIROS INTERNATIONAL SICAV - KEY KAIROS INTERNATIONAL SICAV - EMERGING MARKETS KAIROS INTERNATIONAL SICAV - ALGO
102
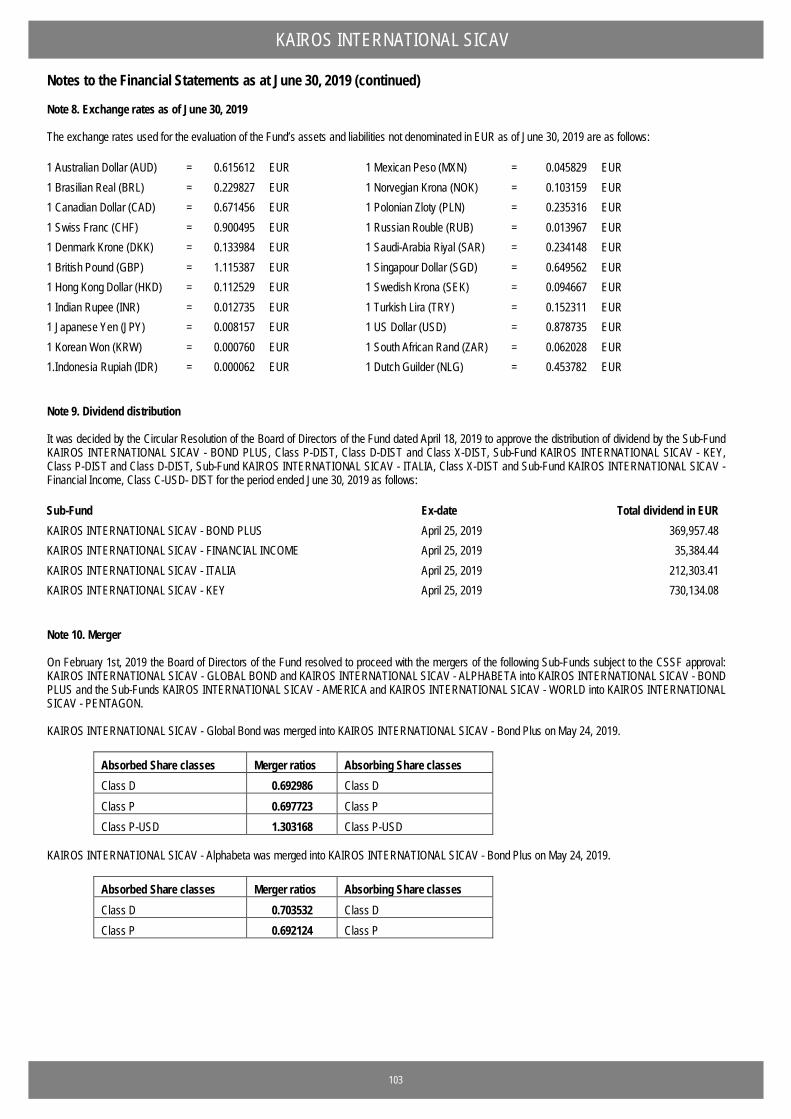
KAIROS INTERNATIONAL SICAV
Notes to the Financial Statements as at June 30, 2019 (continued)
Note 8. Exchange rates as of June 30, 2019 The exchange rates used for the evaluation of the Fund’s assets and liabilities not denominated in EUR as of June 30, 2019 are as follows: 1 Australian Dollar (AUD) = 0.615612 EUR
1 Mexican Peso (MXN) = 0.045829 EUR
1 Brasilian Real (BRL) = 0.229827 EUR
1 Norvegian Krona (NOK) = 0.103159 EUR 1 Canadian Dollar (CAD) = 0.671456 EUR
1 Polonian Zloty (PLN) = 0.235316 EUR
1 Swiss Franc (CHF) = 0.900495 EUR
1 Russian Rouble (RUB) = 0.013967 EUR 1 Denmark Krone (DKK) = 0.133984 EUR
1 Saudi-Arabia Riyal (SAR) = 0.234148 EUR
1 British Pound (GBP) = 1.115387 EUR
1 Singapour Dollar (SGD) = 0.649562 EUR 1 Hong Kong Dollar (HKD) = 0.112529 EUR
1 Swedish Krona (SEK) = 0.094667 EUR
1 Indian Rupee (INR) = 0.012735 EUR
1 Turkish Lira (TRY) = 0.152311 EUR 1 Japanese Yen (JPY) = 0.008157 EUR
1 US Dollar (USD) = 0.878735 EUR
1 Korean Won (KRW) = 0.000760 EUR
1 South African Rand (ZAR) = 0.062028 EUR 1.Indonesia Rupiah (IDR) = 0.000062 EUR 1 Dutch Guilder (NLG) = 0.453782 EUR Note 9. Dividend distribution It was decided by the Circular Resolution of the Board of Directors of the Fund dated April 18, 2019 to approve the distribution of dividend by the Sub-Fund KAIROS INTERNATIONAL SICAV - BOND PLUS, Class P-DIST, Class D-DIST and Class X-DIST, Sub-Fund KAIROS INTERNATIONAL SICAV - KEY, Class P-DIST and Class D-DIST, Sub-Fund KAIROS INTERNATIONAL SICAV - ITALIA, Class X-DIST and Sub-Fund KAIROS INTERNATIONAL SICAV - Financial Income, Class C-USD- DIST for the period ended June 30, 2019 as follows: Sub-Fund Ex-date Total dividend in EUR KAIROS INTERNATIONAL SICAV - BOND PLUS April 25, 2019 369,957.48 KAIROS INTERNATIONAL SICAV - FINANCIAL INCOME April 25, 2019 35,384.44 KAIROS INTERNATIONAL SICAV - ITALIA April 25, 2019 212,303.41 KAIROS INTERNATIONAL SICAV - KEY April 25, 2019 730,134.08 Note 10. Merger On February 1st, 2019 the Board of Directors of the Fund resolved to proceed with the mergers of the following Sub-Funds subject to the CSSF approval: KAIROS INTERNATIONAL SICAV - GLOBAL BOND and KAIROS INTERNATIONAL SICAV - ALPHABETA into KAIROS INTERNATIONAL SICAV - BOND PLUS and the Sub-Funds KAIROS INTERNATIONAL SICAV - AMERICA and KAIROS INTERNATIONAL SICAV - WORLD into KAIROS INTERNATIONAL SICAV - PENTAGON. KAIROS INTERNATIONAL SICAV - Global Bond was merged into KAIROS INTERNATIONAL SICAV - Bond Plus on May 24, 2019.
Absorbed Share classes Merger ratios Absorbing Share classes Class D 0.692986 Class D Class P 0.697723 Class P Class P-USD 1.303168 Class P-USD
KAIROS INTERNATIONAL SICAV - Alphabeta was merged into KAIROS INTERNATIONAL SICAV - Bond Plus on May 24, 2019.
Absorbed Share classes Merger ratios Absorbing Share classes Class D 0.703532 Class D Class P 0.692124 Class P
103
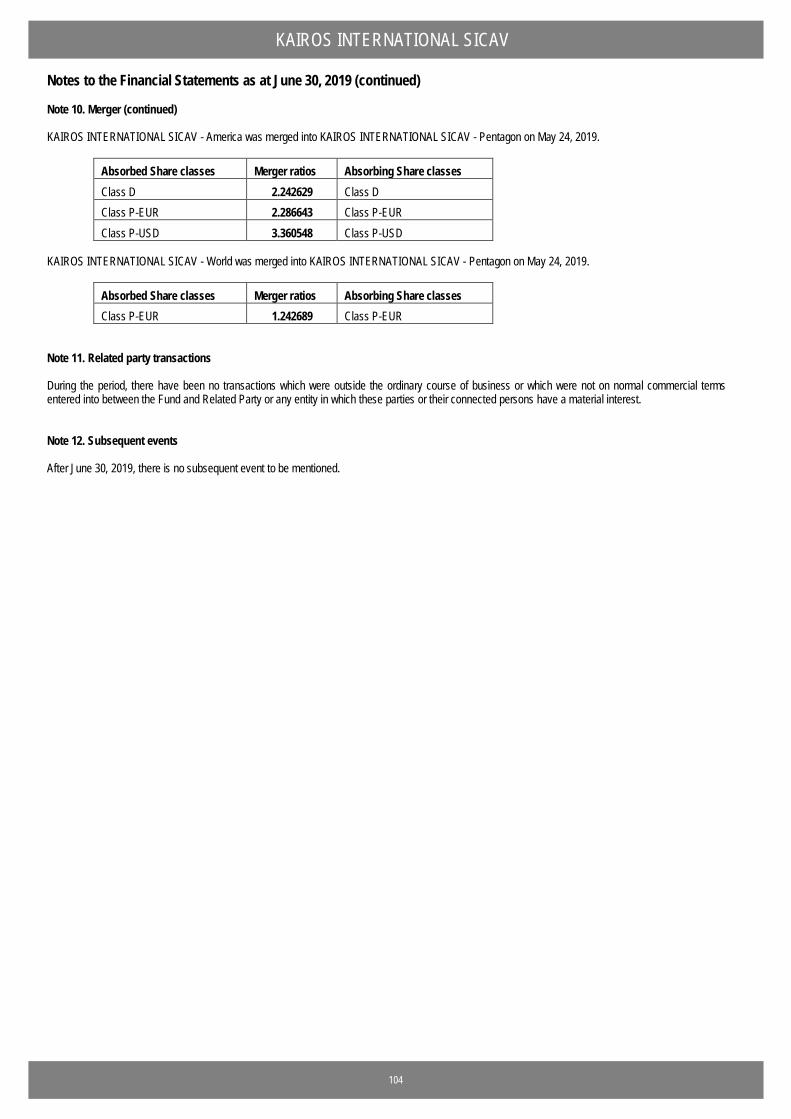
KAIROS INTERNATIONAL SICAV
Notes to the Financial Statements as at June 30, 2019 (continued)
Note 10. Merger (continued) KAIROS INTERNATIONAL SICAV - America was merged into KAIROS INTERNATIONAL SICAV - Pentagon on May 24, 2019.
Absorbed Share classes Merger ratios Absorbing Share classes Class D 2.242629 Class D Class P-EUR 2.286643 Class P-EUR Class P-USD 3.360548 Class P-USD
KAIROS INTERNATIONAL SICAV - World was merged into KAIROS INTERNATIONAL SICAV - Pentagon on May 24, 2019.
Absorbed Share classes Merger ratios Absorbing Share classes Class P-EUR 1.242689 Class P-EUR
Note 11. Related party transactions During the period, there have been no transactions which were outside the ordinary course of business or which were not on normal commercial terms entered into between the Fund and Related Party or any entity in which these parties or their connected persons have a material interest. Note 12. Subsequent events After June 30, 2019, there is no subsequent event to be mentioned.
104
KAIROS INTERNATIONAL SICAV
Additional information
SFT Regulation Information according to Regulation (EU) 2015/2365 on the transparency of securities financing transactions, and the re-use and amending Regulation (EU) No 648/2012 - Certificate in Section A. During the reporting period no securities financing transactions and total return swaps as defined in the above mentioned regulation occurred.
105