more or less ambition in the doha round: winners and losers from trade liberalisation with a...
TRANSCRIPT

The World Economy
(2007)doi: 10.1111/j.1467-9701.2007.01044.x
© 2007 The AuthorsJournal compilation © 2007 Blackwell Publishing Ltd, 9600 Garsington Road,Oxford, OX4 2DQ, UK and 350 Main St, Malden, MA, 02148, USA
1253
Blackwell Publishing LtdOxford, UKTWECWorld Economy0378-5920© 2007 The Author Journal compilation © Blackwell Publishers Ltd. 2006XXXOriginal ArticlesMORE OR LESS AMBITION IN THE DOHA ROUNDANTOINE BOUËT, SIMON MEVEL AND DAVID ORDEN
More or Less Ambition in the Doha
Round: Winners and Losers from
Trade Liberalisation with a
Development Perspective
Antoine Bouët, Simon Mevel and David Orden
International Food Policy Research Institute, Washington, DC
1. INTRODUCTION
W
HAT is at stake in the standoff that has arisen in the Doha Round of tradetalks? What impact would an agreement based on greater or lesser levels
of ambition have on developing countries, whose economies are relatively depend-ent on agriculture? Three years after the World Trade Organisation (WTO) talksbroke down in Cancún, reform of the heavily protected and subsidised agricul-tural sectors of the United States, Europe and elsewhere among developed anddeveloping countries remains a major impediment to progress. The December2005 Hong Kong Ministerial and the negotiations that took place in Geneva untilsuspended in July 2006 showed little finality to the negotiations.
Trade liberalisation is a potential stimulus for development and the DohaRound was launched with the objective of drawing developing countries morefully into the global trade system. Whether a final Doha Round trade agreementwill eventually produce something substantially positive for developing countriesremains open to question. Trade liberalisation will act especially positively ondevelopment and poverty when developing countries have a comparative advan-tage in agriculture and are penalised by restricted market access. But developingcountries are heterogeneous in terms of their own trade policies, the trade barriersthey face, and their net agricultural trade positions.
Very helpful comments have been received from an anonymous referee. The authors also thankseminar participants at the FAO and German Marshall Fund of the United States for their sugges-tions, while taking full responsibility for any errors in the analysis.
1254 ANTOINE BOUËT, SIMON MEVEL AND DAVID ORDEN
© 2007 The AuthorsJournal compilation © Blackwell Publishing Ltd. 2007
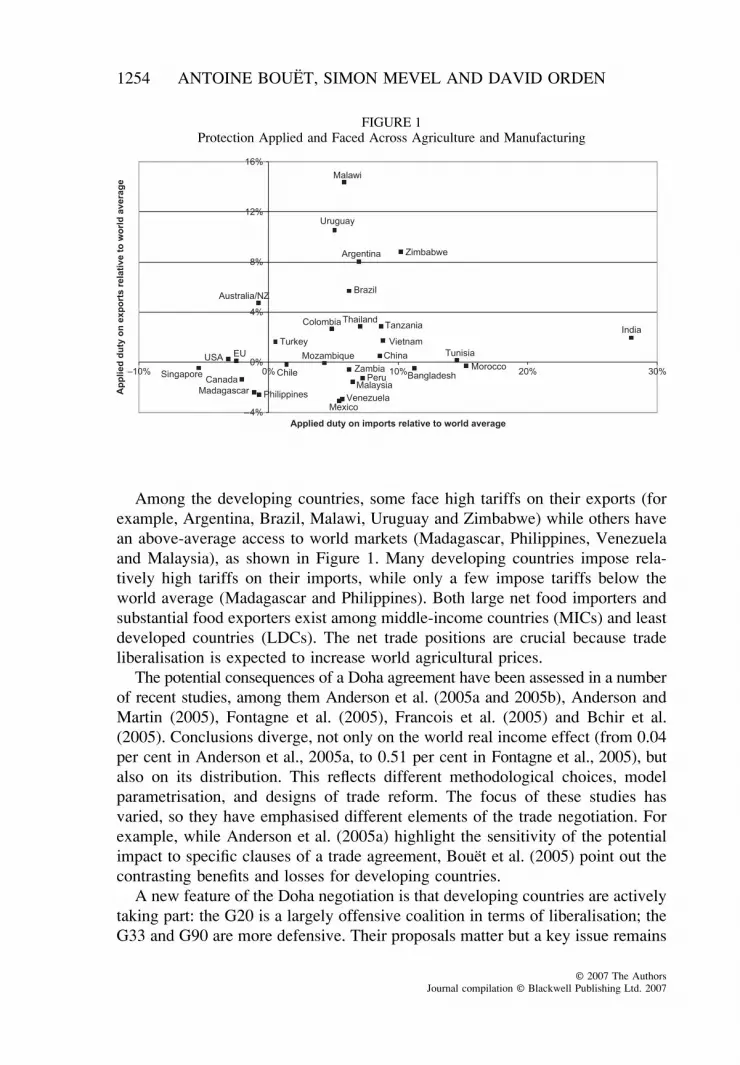
Among the developing countries, some face high tariffs on their exports (forexample, Argentina, Brazil, Malawi, Uruguay and Zimbabwe) while others havean above-average access to world markets (Madagascar, Philippines, Venezuelaand Malaysia), as shown in Figure 1. Many developing countries impose rela-tively high tariffs on their imports, while only a few impose tariffs below theworld average (Madagascar and Philippines). Both large net food importers andsubstantial food exporters exist among middle-income countries (MICs) and leastdeveloped countries (LDCs). The net trade positions are crucial because tradeliberalisation is expected to increase world agricultural prices.
The potential consequences of a Doha agreement have been assessed in a numberof recent studies, among them Anderson et al. (2005a and 2005b), Anderson andMartin (2005), Fontagne et al. (2005), Francois et al. (2005) and Bchir et al.(2005). Conclusions diverge, not only on the world real income effect (from 0.04per cent in Anderson et al., 2005a, to 0.51 per cent in Fontagne et al., 2005), butalso on its distribution. This reflects different methodological choices, modelparametrisation, and designs of trade reform. The focus of these studies hasvaried, so they have emphasised different elements of the trade negotiation. Forexample, while Anderson et al. (2005a) highlight the sensitivity of the potentialimpact to specific clauses of a trade agreement, Bouët et al. (2005) point out thecontrasting benefits and losses for developing countries.
A new feature of the Doha negotiation is that developing countries are activelytaking part: the G20 is a largely offensive coalition in terms of liberalisation; theG33 and G90 are more defensive. Their proposals matter but a key issue remains
FIGURE 1Protection Applied and Faced Across Agriculture and Manufacturing

MORE OR LESS AMBITION IN THE DOHA ROUND 1255
© 2007 The AuthorsJournal compilation © Blackwell Publishing Ltd. 2007
the stance of the United States (US) and the European Union (EU). By late 2005,these two major trading partners had put on the table proposals which have beenwidely scrutinised and criticised. These two proposals, or modifications to them,remain central to any potential negotiated outcome.
In this article, we take the US and EU proposals as points of reference forwhat a final outcome of the negotiations might contain. Using the MIRAGEcomputable general equilibrium model of the global economy we compare differentscenarios for the Doha negotiations, taking real numbers from the two proposals,which include substantial detail on agriculture. We compare these two Dohascenarios with full trade liberalisation.
1
The results for both Doha scenarios demonstrate the high stakes that remainin this negotiation given the positions articulated by the countries involved. Anambitious reform outcome, designed with the most liberalising elements containedin the US and EU proposals, delivers noticeably more benefits than an unambi-tious outcome, based on the least ambitious components of their negotiatingproposals. We scrutinise the development impact of these scenarios and highlightthe reasons why trade liberalisation may benefit some developing countries,while having ambiguous effects on others. Eroded preferences and higher worldagricultural prices for net food importing countries are critical elements for somedeveloping countries. For this reason, the precise design of the trade reforms isa key issue if the purpose of the Round is development and poverty alleviation.
Section 2 presents the MIRAGE model and analysis of the impact of full tradeliberalisation on world real income, world prices and the distribution of gainsamong countries. Section 3 describes our ambitious and unambitious Dohascenarios. The relative degree of reform of these two scenarios is assessed, firstwith respect to their impact on world protection, real income and trade volume,and second by the construction of a world Mercantilist Trade RestrictivenessIndex. Section 4 focuses on the impact of these two scenarios on developingcountries. Section 5 concludes.
2. THE MIRAGE MODEL WITH FULL TRADE LIBERALISATION
a. The MIRAGE Model
The MIRAGE (Modelling International Relationships in Applied GeneralEquilibrium) model is a multi-sector, multi-region CGEM devoted to trade policy
1
The MIRAGE model was developed at the
Centre d’Etudes Prospectives et d’InformationsInternationales
(CEPII) in Paris. Full description of the model is available at the CEPII website(www.cepii.fr) and in Bchir et al. (2002).

1256 ANTOINE BOUËT, SIMON MEVEL AND DAVID ORDEN
© 2007 The AuthorsJournal compilation © Blackwell Publishing Ltd. 2007
analysis. The model has a sequential dynamic recursive set-up. Macroeconomicdata, in particular social accounting matrices, come from the GTAP6 database(see Dimaranan, 2006).
2
Tariff averages have been re-calculated using theMacMap methodology (see Bouët et al., 2005a and 2005b). Under MacMap, tariffformulae are implemented at the HS6 level before aggregating to the model leveland the interplay between bound, MFN applied and preferential duties is fullytaken into account.
On the supply side the production function in each sector is a nesting of fiveprimary factors (capital, skilled and unskilled labour, land and natural resources)and intermediate consumption. Factor endowments (except land) are fully employed.Capital supply is modified each year by depreciation and investment. Fixed levelsof natural resources and growth rates of labour supply are set exogenously. Landsupply is endogenous; utilisation depends on the real rate of remuneration.Installed capital and natural resources are sector-specific. New capital is allocatedamongst sectors according to an investment function that depends on the rate ofreturn and the sector stock of capital. Skilled labour is the only factor perfectlymobile. Unskilled labour is imperfectly mobile between agricultural sectors andnon-agricultural sectors according to a CET function. Land is also imperfectlymobile among the agricultural sectors.
3
The demand side is modelled in each region through a representative agentwhose propensity to save is constant and whose preferences across sectors arerepresented by a LES-CES function. Products coming from the ‘North’ (developed/rich countries) and from the ‘South’ (developing/poor countries) are assumed tobelong to different quality ranges (higher in the North).
The geographic decomposition in our analysis disaggregates the world into41 countries/zones and 18 sectors in order to capture the heterogeneity amongdeveloping countries. Table 1 indicates the geographic regions which include 33developing countries or aggregated zones. The sector decomposition emphasisesthe sectors where distortions are high and numerous. Out of the 18 sectors con-sidered, 10 are agricultural and textiles and wearing apparel and leather productsare separated from other manufacturing, as shown in Table 2. The last columnin Table 2 indicates the agricultural/non-agricultural categorisation that is at thebasis of the imperfect mobility of unskilled labour.
In the model equilibrium, perfect competition is assumed in all sectors. Withour level of disaggregation, it would have been costly in terms of computational
2
The GTAP6 database provides statistical information for 2001. A pre-experiment was carried outto account for liberalising occurring from 2001 to 2005, including the end of the Uruguay Round,Chinese accession to the WTO, enlargement of the EU, and implementation of the African Growthand Opportunities Act (AGOA) and the EBA initiative.
3
In MIRAGE, the CET labour substitution elasticity is set at 2. Elasticities of land supply are atthe same level as in the LINKAGE model. We thank Dominique Van der Mensbrugghe who kindlyprovided the land supply parameters.
MORE OR LESS AMBITION IN THE DOHA ROUND 1257
© 2007 The AuthorsJournal compilation © Blackwell Publishing Ltd. 2007
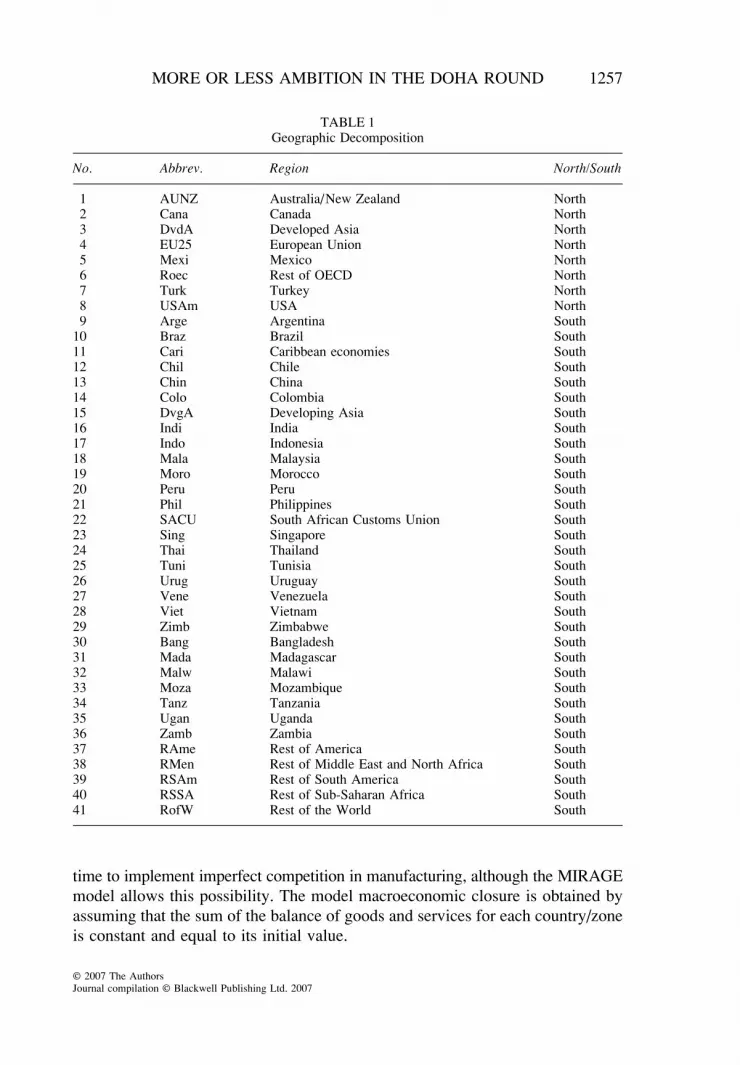
time to implement imperfect competition in manufacturing, although the MIRAGEmodel allows this possibility. The model macroeconomic closure is obtained byassuming that the sum of the balance of goods and services for each country/zoneis constant and equal to its initial value.
TABLE 1Geographic Decomposition
No. Abbrev. Region North/South
1 AUNZ Australia/New Zealand North2 Cana Canada North3 DvdA Developed Asia North4 EU25 European Union North5 Mexi Mexico North6 Roec Rest of OECD North7 Turk Turkey North8 USAm USA North9 Arge Argentina South
10 Braz Brazil South11 Cari Caribbean economies South12 Chil Chile South13 Chin China South14 Colo Colombia South15 DvgA Developing Asia South16 Indi India South17 Indo Indonesia South18 Mala Malaysia South19 Moro Morocco South20 Peru Peru South21 Phil Philippines South22 SACU South African Customs Union South23 Sing Singapore South24 Thai Thailand South25 Tuni Tunisia South26 Urug Uruguay South27 Vene Venezuela South28 Viet Vietnam South29 Zimb Zimbabwe South30 Bang Bangladesh South31 Mada Madagascar South32 Malw Malawi South33 Moza Mozambique South34 Tanz Tanzania South35 Ugan Uganda South36 Zamb Zambia South37 RAme Rest of America South38 RMen Rest of Middle East and North Africa South39 RSAm Rest of South America South40 RSSA Rest of Sub-Saharan Africa South41 RofW Rest of the World South

1258 ANTOINE BOUËT, SIMON MEVEL AND DAVID ORDEN
© 2007 The AuthorsJournal compilation © Blackwell Publishing Ltd. 2007
b. The Potential Impact of Full Trade Liberalisation
To evaluate the effects of full trade liberalisation, reform is implemented overfive years from 2006 for developed countries and over 10 years for developingcountries. Results are assessed by comparing the simulation outcomes for 2019to a baseline without any trade reform. Technology is assumed constant in thesecomparisons; trade reform does not induce productivity gains as assumed insome models.
With full liberalisation, world protection, which initially averages 5.4 per centacross agriculture and manufacturing as measured by a weighted aggregatestatistic, is eliminated. Full trade liberalisation implies an increase of world tradevolume by 12 per cent and world real income by $158 billion (in constant 2001dollar value; a gain of
+
0.5 per cent of expected 2019 world real income inthe baseline).
Table 3 indicates the distribution of this income gain among the OECD, MICsand LDCs. Full liberalisation is slightly progressive based on a comparison ofinitial income levels and income gains between developed and developing coun-tries. For developing countries as a whole, the share of welfare gains (21.2 percent) is greater than their share of initial world income (18.5 per cent). But theaggregate gain is small (and regressive) for the LDCs – only 0.1 per cent of the
TABLE 2Sector Decomposition
No. Abbrev. Sector Type of Competition
Agr./Non-agr.
1 AniP Animal products and wool Perfect Agricultural2 Meat Cattle, sheep, goats, horses Perfect Agricultural3 Milk Raw milk and dairy products Perfect Agricultural4 Plfb Plant-based fibres Perfect Agricultural5 Rice Paddy and processed rice Perfect Agricultural6 Sugr Sugar cane. sugar beet Perfect Agricultural7 VgFr Vegetables and fruits Perfect Agricultural8 Whet Wheat Perfect Agricultural9 OtFP Other food products Perfect Agricultural
10 Otag Other agricultural products Perfect Agricultural11 Mich Chemical, mineral and metal products Perfect Non-agricultural12 Text Textiles Perfect Non-agricultural13 Veeq Vehicles equipment Perfect Non-agricultural14 Weap Wearing apparel and leather products Perfect Non-agricultural15 Omnf Other manufactured products Perfect Non-agricultural16 Oprm Other primary products
(including forestry and fishing)Perfect Non-agricultural
17 OtSr Other services Perfect Non-agricultural18 TrT Transportation and trade Perfect Non-agricultural

MORE OR LESS AMBITION IN THE DOHA ROUND 1259
© 2007 The AuthorsJournal compilation © Blackwell Publishing Ltd. 2007
global income gains accrue to the LDCs compared with their initial share ofworld income of 0.9 per cent.
The gain in real income in our simulation is smaller than the gain of $287billion estimated by 2015 using the LINKAGE model by Anderson et al. (2005aand 2005b).
4
To assess the sources of this difference, three sensitivity analyseswere undertaken:
• The MIRAGE model utilises GTAP Armington elasticities. Van der Mens-brugghe (2006) calculates that they are on average 35 per cent lower thanthose utilised in the LINKAGE model, while Harrison et al. (1997) utiliseseven higher elasticities. If the GTAP Armington trade elasticities aremultiplied by 1.5, the world real income gain is $212 billion in 2015 (again of
+
0.71 per cent from the baseline) and $244 billion in 2019 (
+
0.72per cent) in our full liberalisation scenario.
• With perfect mobility of unskilled labour across sectors, the world realincome gain is only slightly changed to $136 billion in 2015 (
+
0.45 per cent)and $160 billion in 2019 (
+
0.51 per cent).• The LINKAGE model incorporates GDP growth expectations from the
World Development Indicators. Our simulations are not scaled up to matchthese GDP growth projections. Doing so amplifies the value of world realincome in the baseline. The world real income gain is $178 billion in 2015(
+
0.45 per cent) and $225 billion in 2019 (
+
0.52 per cent).
The difference in real income gains from full liberalisation between ourestimate of $158 billion in 2019 and the assessments carried out by Andersonet al. (2005a and 2005b) comes mainly from the adoption of low trade elasticities.Including GDP growth expectations in the baseline also increases the size ofworld real income and consequently the size of the gain expressed in dollarvalue.
4
In 2015, the gain in world real income is $135 billion,
+
0.45 per cent as compared to the baseline,in our simulation.
TABLE 3Impact of Full Trade Liberalisation on World Real Income
OECD MIC LDC
Real income gain ($ bn) 124.2 33.4 0.1Share in world real income gain 78.7% 21.2% 0.1%Share in initial world real income 80.6% 18.5% 0.9%Real income gain (in %) 0.49% 0.58% 0.05%
Source: Authors’ calculations.

1260 ANTOINE BOUËT, SIMON MEVEL AND DAVID ORDEN
© 2007 The AuthorsJournal compilation © Blackwell Publishing Ltd. 2007
In our simulation, full trade liberalisation implies an expected significantincrease in agricultural world prices. Price effects are largest for meat (cattle,sheep, goats, horses), wheat, raw milk and dairy products, and other agriculturalproducts, as shown in Figure 2. The indicative average price changes shown inthis figure have to be somewhat carefully interpreted. In the MIRAGE modelthere is not a single world price for a commodity but separate export prices foreach product, for each exporting country and for each destination. The resultsshown in Figure 2 are weighted average of numerous price evolutions. When thedispersion of a price distribution is high, an average does not synthesise consist-ently the separate impacts.
5
This is especially the case for rice. Initially, rice issubject to highly dispersed tariffs: 0 per cent in Australia/New Zealand, Canada,Malaysia, SACU, Singapore and Madagascar, but 117 per cent in the EU, 133per cent in Morocco and 538 per cent in Developed Asia, on average. In Figure 2,the average world price of rice decreases with full trade liberalisation. Becauseof the high dispersion of protectionism of this commodity in the world, with fullliberalisation export prices of rice exhibit large individual increases in countriesexporting to previously highly-protected markets and decreases in traditionally
5
This point is confirmed by calculating the average price changes under alternative methods(Laspeyres or Fisher index instead of Paasche index) or with different weights (consumption ofthe importing country). The alternative measures give contrasting pictures of the evolution of worldprices, sometimes with increases in the average world price of rice. Calculation of dispersionindicators of the evolution of world prices by products and exporting countries shows that dispersionis especially high in this sector.
FIGURE 2Impact of Full Liberalisation on Agricultural World Prices
Source: Authors’ calculations.

MORE OR LESS AMBITION IN THE DOHA ROUND 1261
© 2007 The AuthorsJournal compilation © Blackwell Publishing Ltd. 2007
protectionist countries for which reductions in domestic prices are linked with asignificant cut in export prices. Country-specific results are not shown, but theaverage prices of rice exports from Thailand and the US, for example, are raisedby 30 per cent, and from Mexico by 20 per cent, Malawi by 15 per cent, Malaysiaby 12 per cent and Australia /New Zealand by 10 per cent. Conversely, averageexport prices decrease by
−
41 per cent for Developed Asia, which is initially amajor rice exporter after Thailand, and by
−
12 per cent for Developing Asia.Similar dispersed results underlie the small increase of the world average sugarprice shown in Figure 2.
Table 4 highlights the diverse country impacts of full trade liberalisation,presenting the total gains, the allocation efficiency gains and the terms of tradegains. The two last columns do not necessarily add up exactly to the real incomegain because they are not the only sources of welfare variations. Real incomevariations also come from changes in land utilisation, from variation in the stockof capital, elimination of tariff-quota rents and other sources.
6
But in most casesthe allocation and terms of trade gains are the two main sources of changes toreal incomes.
Allocation efficiency gains are usually positive; terms of trade effects can bepositive or negative. This explains why some countries/zones may lose from fulltrade liberalisation (Bangladesh, China, Madagascar, Mexico, Morocco, Mozam-bique, Peru, Philippines, Venezuela, Zambia and the zone Rest of the World).Others benefit from large increases in real income (Malawi, Malaysia, Turkey,Thailand and Rest of America). Allocation efficiency gains are largest wheninitial protection is high (India and Morocco), initial protection has a highdispersion across sectors (Rest of OECD and Developed Asia), or in the case ofinitially very open economies (Malaysia) because the allocation efficiency effectis amplified when initial imports are relatively large for a given decrease in tariff.Taken overall, the size of the benefits is greater than the losses.
Terms of trade effects are positive for countries gaining access to previouslyprotected markets (for example, Australia/New Zealand for animal products,milk and dairy products, and other food products sectors toward Rest of OECD,Developed Asia, the EU, Canada and Turkey; Malawi in the other agriculturalproducts sector, which account for 65 per cent of its initial exports; Malaysiain rice toward Developed Asia and wheat toward India). On the contrary, fulltrade liberalisation can imply a deterioration of terms of trade either in the caseof erosion of preferential accesses to certain export markets, which implies morecompetition and reduced export prices, or in the case of net food importingcountries facing rising world agricultural prices. Bangladesh and Tunisia are
6
The welfare gains from increased income from reform feeding into augmented savings andcapital stock differs from the standard Haberger triangles but they would not have been realisedwithout trade reform.

1262A
NT
OIN
E B
OU
ËT
, SIMO
N M
EV
EL
AN
D D
AV
ID O
RD
EN
© 2007 T
he Authors
Journal compilation ©
Blackw
ell Publishing Ltd. 2007
TABLE 4Impact of Full Trade Liberalisation on Countries’ Real Income
Region Real Income (in per cent)
Allocation Efficiency Gains (in per cent)
Terms of Trade Gains (in per cent)
High-income countries
Australia/New Zealand 1.5 0.1 1.2Canada 0.1 0.3 0.0Developed Asia 1.1 1.4 0.1European Union 0.5 0.3 0.1Mexico
−
0.2 0.7
−
0.6Rest of OECD 3.0 8.4
−
0.7Turkey 5.2 1.0 2.2USA 0.1 0.0 0.1
Middle-income countries
Argentina 1.2 0.2 0.5Brazil 0.8 0.3 0.3Caribbean economies 0.7 0.6
−
0.1Chile 0.7 0.2 0.0China
−
0.1 1.0
−
0.8Colombia 0.2 0.2
−
0.1Developing Asia 0.8 0.8 0.1India 0.3 1.9
−
1.4Indonesia 1.5 0.2 0.3Malaysia 8.0 9.3 1.7Morocco
−
0.1 2.5
−
3.2

MO
RE
OR
LE
SS AM
BIT
ION
IN T
HE
DO
HA
RO
UN
D1263
© 2007 T
he Authors
Journal compilation ©
Blackw
ell Publishing Ltd. 2007
Peru
−
0.3 0.3
−
0.6Philippines
−
0.1 0.4
−
1.1Rest of America 4.8 7.7
−
0.3Rest of Middle East and North Africa 0.1 0.4
−
0.3Rest of South America 3.1 0.7 1.4Rest of the World
−
0.1 0.4
−
0.5South African Customs Union 1.1 0.6 0.3Singapore 2.3 0.0 2.0Thailand 4.9 2.0 0.8Tunisia 1.6 3.6
−
3.0Uruguay 1.8 0.4 0.3Venezuela
−
0.5 0.2
−
0.5Vietnam 3.3 2.7
−
1.2Zimbabwe 3.1 1.3 1.6
Low-income countries
Bangladesh
−
0.5 1.3
−
1.7Madagascar
−
0.3 0.0
−
0.4Malawi 11.2 1.4 7.3Mozambique
−
0.2 0.4
−
0.7Rest of Sub-Saharan Africa 0.1 1.4
−
1.3Tanzania 0.7 0.6
−
0.3Uganda 0.5 0.1 0.3Zambia
−
0.6 0.6
−
1.0
Source: Authors’ calculations.
Region Real Income
(in per cent)Allocation Efficiency Gains (in per cent)
Terms of Trade Gains (in per cent)

1264 ANTOINE BOUËT, SIMON MEVEL AND DAVID ORDEN
© 2007 The AuthorsJournal compilation © Blackwell Publishing Ltd. 2007
affected by a substantial deterioration of terms of trade both owing to erosionof preferences (Europe is by far their primary export destination) and higheragricultural prices.
7
Erosion of preferences also hurts Madagascar, Mexico,Morocco, Mozambique, Tanzania, Zambia, Rest of OECD, Rest of MENA andRest of Sub-Saharan Africa. As net food importing countries, China, Philippinesand Venezuela are hurt by raising world agricultural prices.
The case of China is interesting as initially China is a net exporter of vehicleequipment, textile and apparel and chemical products while it is a net importerof wheat, rice and plant-based fibres. Full trade liberalisation entails a largeincrease of its exports, but also of its imports as its initial rate of protection ismuch higher than the average duty faced on its exports. China’s domestic activityis significantly stimulated (by about five per cent) but its terms of trade deteriorateas agricultural world prices increase. In the textile and apparel sectors, Chineseexport prices decrease due to competitive effects: trade liberalisation has a largereffect on production and exports of textiles and apparel of Malaysia, Vietnam, India,Philippines and other Developing Asia countries than on Chinese production.Overall, full trade liberalisation entails a significant reorganisation of the worldproduction and trade of textiles and apparel. China increases its market share butis not by far the first beneficiary. Textile and apparel sectors in OECD countriesand LDCs (except Bangladesh) are negatively affected. In terms of total welfarefor China, with full liberalisation terms of trade deterioration is compensated byallocative efficiency gains and welfare gains are close to zero.
The deterioration in terms of trade implied by full liberalisation in the casesof India, Peru and Vietnam (initially net food exporters) and improvement in thecase of Singapore (net food importer) are less intuitive. These cases demonstratethat aggregated indicators can be misleading. The initial net food balance of acountry is not an unambiguous indicator of how national terms of trade will beaffected by trade liberalisation. Distortions are unevenly distributed across productsand import and export structure of trading partners are very different. While Peru,for example, is globally a net food exporter, its exports are highly concentratedin chemical, mineral and metal products (37 per cent of total exports in 2005)and other food products (16 per cent). The latter commodity experiences one ofthe smallest increases in world prices amongst the agro-food products. Furthermore,the price of the former is negatively affected by full trade liberalisation. As a result,Peru is affected by a deterioration of its terms of trade after full liberalisation.
A few countries also benefit especially from liberalisation-related resourceutilisation gains. For example, agricultural activity increases in Argentina, Malawiand Australia /New Zealand, raising the real remuneration of land, especially as
7
The methodology adopted here implicitly supposes that preferences are fully utilised. This mayunderestimate the importance of trade barriers in some cases, for example, in the case of Bangla-desh’s exports of apparel to the European Union on which rules of origin are known to be strict.
MORE OR LESS AMBITION IN THE DOHA ROUND 1265
© 2007 The AuthorsJournal compilation © Blackwell Publishing Ltd. 2007
it is not a very mobile primary factor. This accordingly increases land utilisationand amplifies national real income gains from trade reform.
3. AMBITIOUS VERSUS UNAMBITIOUS DOHA REFORM SCENARIOS
In the Doha Round negotiations, criticism has been directed at developedcountries for protecting and subsidising agriculture, which stifles trade opportu-nities. Yet, the US and EU follow somewhat different regimes. The US hasrelatively low tariffs, but its domestic agricultural support was increased in themost recent (2002) farm bill. The US provides relatively less preferential accessthan does the EU for selected developing-country trade partners. The EU, in con-trast, has higher agricultural (but similarly low industrial) tariffs and has recentlyrealigned its relatively high levels of agricultural support toward policy instru-ments that are less trade distorting than in the past. In these US–EU policydifferences lie the seeds of different approaches to the trade negotiations.
a. Similarities and Differences in the US and EU Proposals of 2005
The US and EU proposals of late 2005 have some broad commonalities, suchas progressive tariff and domestic support cuts and the elimination of exportsubsidies. But the specifics of the proposals diverge on matters such as rates ofreduction of tariffs and domestic agricultural support and the number of agri-cultural sensitive or special products (for developed and developing countries,respectively) that will be subject to lesser disciplines. In terms of an ambitiousagenda for agricultural trade liberalisation, strong points of the US proposal includesharper reductions in bound tariff rates and a lower cap on maximum allowabletariffs, few sensitive or special products, and moderately tough bindings ondomestic support that encourage decoupling of subsidies from production. Strongpoints of the EU proposal in terms of trade liberalisation lie in the call for freeaccess of LDCs to OECD markets, a specific initiative for cotton to help WestAfrica, and a push for lower industrial tariffs worldwide.
b. What Difference Could a Doha Outcome Make?
What difference could a Doha Round outcome make to global trade andwelfare and to developing countries in particular? To examine this question, wedefine a relatively ambitious cooperative reform scenario with strong tradeliberalisation components from the US and EU proposals using numbers onthe negotiating table at the December 2005 Hong Kong ministerial meeting,and contrast this with a less ambitious outcome drawn from the lower-endelements (see Box 1).

1266 ANTOINE BOUËT, SIMON MEVEL AND DAVID ORDEN
© 2007 The AuthorsJournal compilation © Blackwell Publishing Ltd. 2007
BOX 1Overview of Two Scenarios
AMBITIOUS SCENARIO
Tariffs:
• US tariff formula for agriculture• Tariff caps in agriculture (developed countries, 100 per cent; developing countries, 150
per cent)• US sensitive/special products clause (one per cent)• Swiss formula cuts for manufacturing tariffs (developed-country coefficient, eight per cent;
MIC coefficient, 20 per cent; LDC coefficient, 30 per cent)• EU proposal of free OECD access for LDCs
Domestic support levels cut by 20 per centExport subsidies eliminated
UNAMBITIOUS SCENARIO
Tariffs:
• EU tariff formula for agriculture• No agricultural tariff caps• EU-sensitive/special products clause (eight per cent)• Swiss formula cuts for manufacturing tariffs (developed-country coefficient, 10 per
cent; MIC coefficient, 30 per cent)• LDCs do not reduce their import duties• Additional free OECD access for LDCs, but exceptions for Japan and South Korea
(rice) and the US (sugar, textiles and apparel)
Domestic support levels unchangedExport subsidies are eliminated
On market access, our ambitious proposal includes most elements of the USformula.8 It adds the EU proposal for free access by LDCs to OECD markets,imposes tariff caps in agriculture and defines an exception regime for sensitive/
8 The US proposal prior to the December 2005 Hong Kong meeting called for cuts of 85–90per cent in agricultural tariffs above 60 per cent for developed countries and lesser cuts inthree bands of lower initial tariffs. The EU called for less ambitious cuts of 60 per cent inagricultural tariffs above 90 per cent for developed countries and similarly less ambitious cutsfor lower initial tariff bands. The US proposal involves a quadratic transformation of originaltariffs under which final tariffs go down as original tariffs go up over a substantial range.The ambitious scenario keeps this apparent ‘inconsistency’. The tariff-cutting formula fordeveloping countries is applied to LDCs as well as MICs, a point not addressed explicitly inthe US proposal.

MORE OR LESS AMBITION IN THE DOHA ROUND 1267
© 2007 The AuthorsJournal compilation © Blackwell Publishing Ltd. 2007
special products of only one per cent of agricultural tariff lines per country.9
Applied trade-distorting domestic agricultural support is cut by 20 per cent andrelatively strong manufacturing tariff reductions are imposed on developed anddeveloping countries (including LDCs) under a three-tier Swiss formula.
In contrast to the ambitious scenario, our unambitious scenario adopts the EUformula for less deep tiered tariff cuts for agriculture, does not impose any capon agricultural tariffs, exempts LDCs from agricultural tariff cuts, and adds fewerliberalising elements on sensitive/special products (exceptions for eight per centof tariff lines), the tariff-reduction Swiss formula for industry (higher tarifftargets for developed countries and MICs and no cuts by LDCs) and free OECDaccess for LDCs (some exceptions are retained). No cuts are assumed in applieddomestic agricultural support of developed countries.
c. Global Results for the Ambitious versus Unambitious Doha Scenarios
As shown in Table 5, the unambitious scenario leads to global real incomegains of only $38.3 billion, just 24 per cent of the gain from full liberalisation.World protection measured by the weighted aggregate statistic declines by 1.2per cent. This is 22 per cent of the decline (to zero protection) with full liberalisa-tion. World trade expands 1.6 per cent, which is only 13 per cent of the expansioninduced by full trade liberalisation.
A substantially greater movement is observed under the ambitious scenario.Global welfare increases by $76.7 billion, 49 per cent of the gain from fullliberalisation. World protection falls by 1.9 per cent (35 per cent of the effect of
9 Sensitive/Special Products are here defined as the lines supporting the highest bound tariffs,expressed in ad valorem terms. Our later research (Bouët et al., 2006) utilises a more sophisticateddefinition on the basis of a political economy model, like Jean et al. (2005).
TABLE 5Global Results of Alternative Liberalisation Scenarios
World Protection (Per cent)
Real Income Gain (Per cent)
World Trade (Per cent)
Full trade liberalisation −5.4 $158.0 bn 12.0Ambitious scenario −1.9 $76.7 bn 2.8
(35) (49) (23)Unambitious scenario −1.2 $38.3 bn 1.6 (22) (24) (13)
Source: MacMaps-HS6 and authors’ calculations.
1268 ANTOINE BOUËT, SIMON MEVEL AND DAVID ORDEN
© 2007 The AuthorsJournal compilation © Blackwell Publishing Ltd. 2007
full liberalisation). World trade is increased by 2.8 per cent, which is 23 per centof the expansion with free trade.
For both the trade expansion and gains of real income, the unambitiousscenario yields outcomes about half as large as the ambitious scenario (13 per cent/23 per cent for trade expansion and 24 per cent/49 per cent for real incomecompared with the free trade outcomes, respectively). These ratios provide anestimate of what is still at stake in a conclusion to the Doha negotiations. A keyfactor differentiating the ambitious from unambitious scenario is the degree ofincreased market access in agriculture. Under the ambitious scenario, agriculturalprotection decreases by 8.7 per cent from an initial global average of 17.8 per cent.Under the unambitious scenario, agricultural protection falls by only three per cent.
d. An Evaluation by an MTRI
Another way of assessing the degree of ambition of these two scenarios is theconstruction of a Mercantilist Trade Restrictiveness Index (MTRI): it is a uni-form tariff applied to all imports of a country that provides the same level ofimport volumes as the existing distortions (see Anderson and Neary, 1999). Thefocus on import volumes is consistent with the character of trade negotiationsunder the WTO. To determine the MTRI, we substitute into a static version ofthe MIRAGE model a uniform tariff on all imports of all countries from allpartners in the world for existing tariffs, domestic support and export subsidiesat the model level of aggregation. We then search for the level of this uniformtariff that generates the same world imported volume as (i) the existing distor-tions in 2005, (ii) the unambitious scenario and (iii) the ambitious scenario.
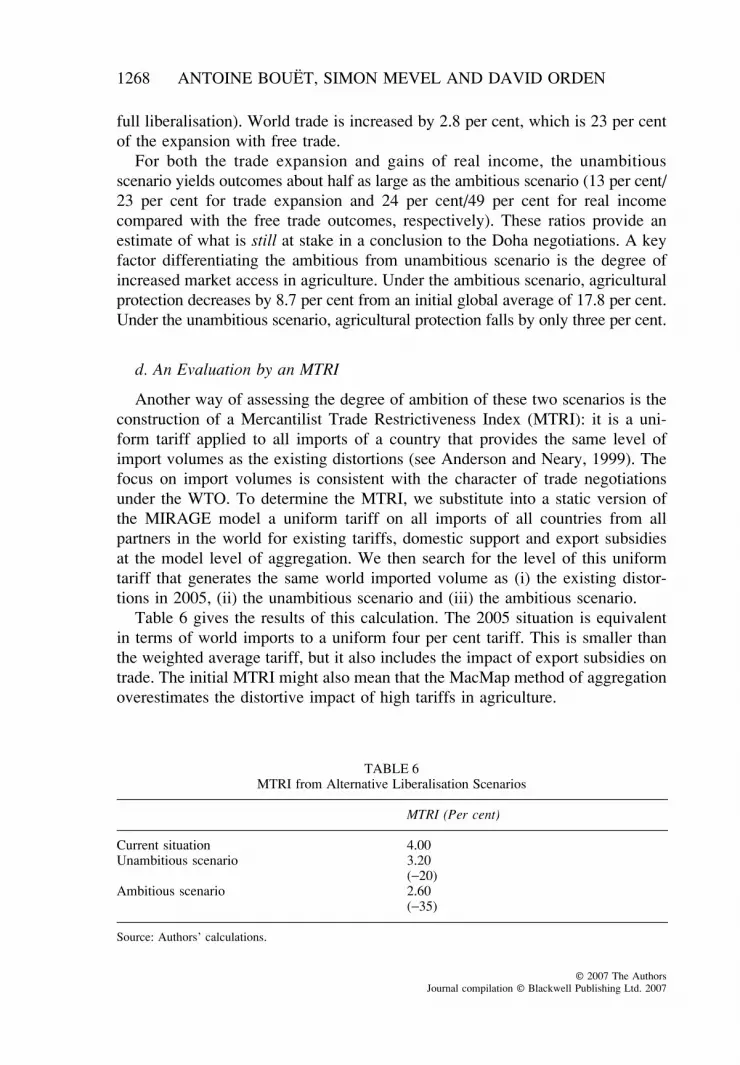
Table 6 gives the results of this calculation. The 2005 situation is equivalentin terms of world imports to a uniform four per cent tariff. This is smaller thanthe weighted average tariff, but it also includes the impact of export subsidies ontrade. The initial MTRI might also mean that the MacMap method of aggregationoverestimates the distortive impact of high tariffs in agriculture.
TABLE 6MTRI from Alternative Liberalisation Scenarios
MTRI (Per cent)
Current situation 4.00Unambitious scenario 3.20
(−20)Ambitious scenario 2.60
(−35)
Source: Authors’ calculations.

MORE OR LESS AMBITION IN THE DOHA ROUND 1269
© 2007 The AuthorsJournal compilation © Blackwell Publishing Ltd. 2007
Under the unambitious scenario the MTRI is 3.2 per cent, which is a 20per cent decline in world protection. Under the ambitious scenario the MTRI is2.6 per cent; this represents a 35 per cent drop in protection. The MTRI revisesdownwards the degree of initial distortion but the relative MTRI results for thetwo Doha scenarios are similar to the earlier estimates of reductions in averageworld protection (22 per cent reduction under the unambitious scenario and 35per cent under the ambitious scenario). This consistent distortion aggregationmeasure somewhat reduces the relative stakes in the outcome of the negotiations,because the new range is only 20 per cent/35 per cent instead of the 24 per cent/49 per cent previously calculated in terms of world real income. A possibleexplanation is that a tariff increase on a low tariff good has a large adverse impacton market access and trade because a low-tariff good implies, other things beingequal, high trade value.10 This result also verifies recent literature on the MTRI(see Anderson and Neary, 2004) which demonstrates that higher tariff variancemeans higher welfare gains, but smaller trade gains.
4. POTENTIAL IMPACT OF A DOHA AGREEMENT ON DEVELOPING COUNTRIES
The ambitious and unambitious scenarios are quite different in terms of liber-alisation effects at the world level. It remains to describe whether they implycontrasting fortunes for developing countries.
a. Impact on Market Access
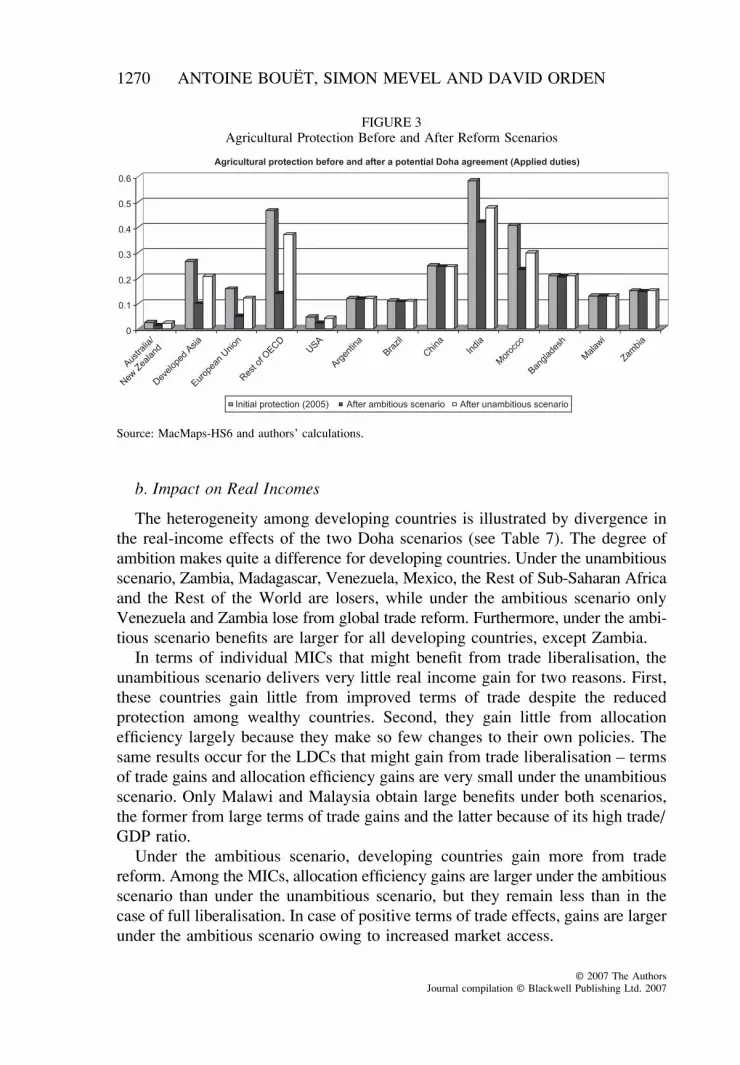
The impact of the two scenarios on agricultural market access as measured byapplied tariff levels of selected countries is illustrated in Figure 3. The ambitiousscenario implies a much larger liberalisation in rich countries where protectionis initially high and unevenly distributed. The average agricultural protection isreduced more by the ambitious compared with the unambitious scenario in theEU, Developed Asia and the Rest of OECD. This confirms that the impositionof a cap on agricultural tariffs and limited exemptions from tariff liberalisationunder sensitive/special product clauses have large consequences on market access,as discussed by Anderson and Martin (2005).
The binding overhang phenomenon is so large in developing countries thateven the ambitious scenario has a mitigated impact in agricultural protectionexcept in India and Morocco, as also discussed by Jean et al. (2005). Under theunambitious scenario protection in LDCs is unchanged; and likewise eventhe ambitious scenario implies little applied tariff reduction by LDCs.
10 Thanks to the anonymous referee who suggested this explanation.
1270 ANTOINE BOUËT, SIMON MEVEL AND DAVID ORDEN
© 2007 The AuthorsJournal compilation © Blackwell Publishing Ltd. 2007
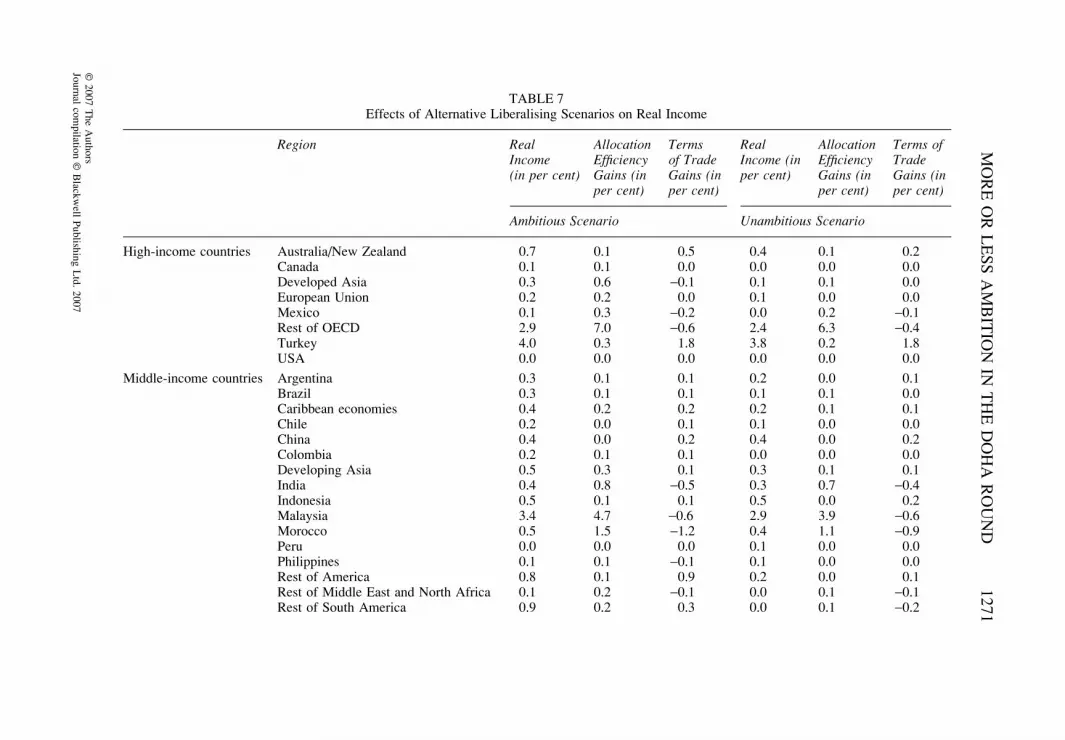
b. Impact on Real Incomes
The heterogeneity among developing countries is illustrated by divergence inthe real-income effects of the two Doha scenarios (see Table 7). The degree ofambition makes quite a difference for developing countries. Under the unambitiousscenario, Zambia, Madagascar, Venezuela, Mexico, the Rest of Sub-Saharan Africaand the Rest of the World are losers, while under the ambitious scenario onlyVenezuela and Zambia lose from global trade reform. Furthermore, under the ambi-tious scenario benefits are larger for all developing countries, except Zambia.
In terms of individual MICs that might benefit from trade liberalisation, theunambitious scenario delivers very little real income gain for two reasons. First,these countries gain little from improved terms of trade despite the reducedprotection among wealthy countries. Second, they gain little from allocationefficiency largely because they make so few changes to their own policies. Thesame results occur for the LDCs that might gain from trade liberalisation – termsof trade gains and allocation efficiency gains are very small under the unambitiousscenario. Only Malawi and Malaysia obtain large benefits under both scenarios,the former from large terms of trade gains and the latter because of its high trade/GDP ratio.
Under the ambitious scenario, developing countries gain more from tradereform. Among the MICs, allocation efficiency gains are larger under the ambitiousscenario than under the unambitious scenario, but they remain less than in thecase of full liberalisation. In case of positive terms of trade effects, gains are largerunder the ambitious scenario owing to increased market access.
FIGURE 3Agricultural Protection Before and After Reform Scenarios
Source: MacMaps-HS6 and authors’ calculations.
MO
RE
OR
LE
SS AM
BIT
ION
IN T
HE
DO
HA
RO
UN
D1271
© 2007 T
he Authors
Journal compilation ©
Blackw
ell Publishing Ltd. 2007
TABLE 7Effects of Alternative Liberalising Scenarios on Real Income
Region Real Income (in per cent)
Allocation Efficiency Gains (in per cent)
Terms of Trade Gains (in per cent)
Real Income (in per cent)
Allocation Efficiency Gains (in per cent)
Terms of Trade Gains (in per cent)
Ambitious Scenario Unambitious Scenario
High-income countries Australia/New Zealand 0.7 0.1 0.5 0.4 0.1 0.2Canada 0.1 0.1 0.0 0.0 0.0 0.0Developed Asia 0.3 0.6 −0.1 0.1 0.1 0.0European Union 0.2 0.2 0.0 0.1 0.0 0.0Mexico 0.1 0.3 −0.2 0.0 0.2 −0.1Rest of OECD 2.9 7.0 −0.6 2.4 6.3 −0.4Turkey 4.0 0.3 1.8 3.8 0.2 1.8USA 0.0 0.0 0.0 0.0 0.0 0.0
Middle-income countries Argentina 0.3 0.1 0.1 0.2 0.0 0.1Brazil 0.3 0.1 0.1 0.1 0.1 0.0Caribbean economies 0.4 0.2 0.2 0.2 0.1 0.1Chile 0.2 0.0 0.1 0.1 0.0 0.0China 0.4 0.0 0.2 0.4 0.0 0.2Colombia 0.2 0.1 0.1 0.0 0.0 0.0Developing Asia 0.5 0.3 0.1 0.3 0.1 0.1India 0.4 0.8 −0.5 0.3 0.7 −0.4Indonesia 0.5 0.1 0.1 0.5 0.0 0.2Malaysia 3.4 4.7 −0.6 2.9 3.9 −0.6Morocco 0.5 1.5 −1.2 0.4 1.1 −0.9Peru 0.0 0.0 0.0 0.1 0.0 0.0Philippines 0.1 0.1 −0.1 0.1 0.0 0.0Rest of America 0.8 0.1 0.9 0.2 0.0 0.1Rest of Middle East and North Africa 0.1 0.2 −0.1 0.0 0.1 −0.1Rest of South America 0.9 0.2 0.3 0.0 0.1 −0.2

1272A
NT
OIN
E B
OU
ËT
, SIMO
N M
EV
EL
AN
D D
AV
ID O
RD
EN
© 2007 T
he Authors
Journal compilation ©
Blackw
ell Publishing Ltd. 2007
Rest of the World 0.0 0.1 0.0 −0.1 0.0 −0.1South African Customs Union 0.4 0.3 0.1 0.2 0.2 0.0Singapore 0.3 0.0 0.3 0.1 0.0 0.1Thailand 1.4 1.0 −0.1 0.7 0.8 −0.3Tunisia 1.8 1.8 −0.8 0.8 1.0 −0.6Uruguay 0.7 0.1 0.2 0.2 0.1 0.0Venezuela −0.3 0.1 −0.3 −0.3 0.0 −0.2Vietnam 0.7 0.0 0.4 0.5 0.0 0.3Zimbabwe 0.7 0.6 0.1 0.3 0.4 −0.1
Low-income countries Bangladesh 2.3 0.9 1.0 0.3 0.0 0.2Madagascar 2.6 0.0 2.0 −0.1 0.0 −0.1Malawi 5.1 0.8 3.3 5.1 0.0 3.3Mozambique 1.4 0.1 0.9 0.1 0.0 0.0Rest of Sub-Saharan Africa 1.2 0.8 0.2 0.0 0.3 −0.3Tanzania 0.2 0.1 0.0 0.2 0.0 0.1Uganda 0.2 0.0 0.2 0.2 0.0 0.2Zambia −0.2 0.1 −0.1 −0.1 0.0 0.1
Source: Authors’ calculations.
Region Real Income (in per cent)
Allocation Efficiency Gains (in per cent)
Terms of Trade Gains (in per cent)
Real Income (in per cent)
Allocation Efficiency Gains (in per cent)
Terms of Trade Gains (in per cent)
Ambitious Scenario Unambitious Scenario
TABLE 7 Continued

MORE OR LESS AMBITION IN THE DOHA ROUND 1273
© 2007 The AuthorsJournal compilation © Blackwell Publishing Ltd. 2007
In the case of LDCs a few cases are remarkable. Bangladesh is a fullbeneficiary of the ambitious scenario. Its preferences from the EU are eroded butthe ambitious scenario gives it free access to the US in the textile and apparelmarkets. Because of this full coverage of free access by LDCs to OECD markets,Bangladesh’s exports of textiles to the US increase by 58 per cent in the ambi-tious scenario instead of 32 per cent in the unambitious scenario and apparel by46 per cent instead of 13 per cent.11 Under the ambitious scenario prices of textileand apparel exports from Bangladesh to the EU and US markets are from 9–12per cent higher than under full trade liberalisation, as it benefits from preferentialLDC access. It also gains from allocative efficiency under the ambitious scenario,so this trade reform is unambiguously more beneficial than the unambitious out-come. The same mechanisms, with different size, play out for Madagascar andRest of Sub-Saharan Africa.
On the contrary full trade liberalisation implies larger increases in agriculturalworld prices and complete erosion of preferences compared with the ambitiousDoha scenario. As a result, terms of trade losses implied by full liberalisation(shown in Table 4) are substantial among LDCs for Bangladesh (−1.7 per cent)and the Rest of Sub-Saharan Africa (−1.3 per cent) and decline also for Mozam-bique (−0.7 per cent) and Madagascar (−0.4 per cent).
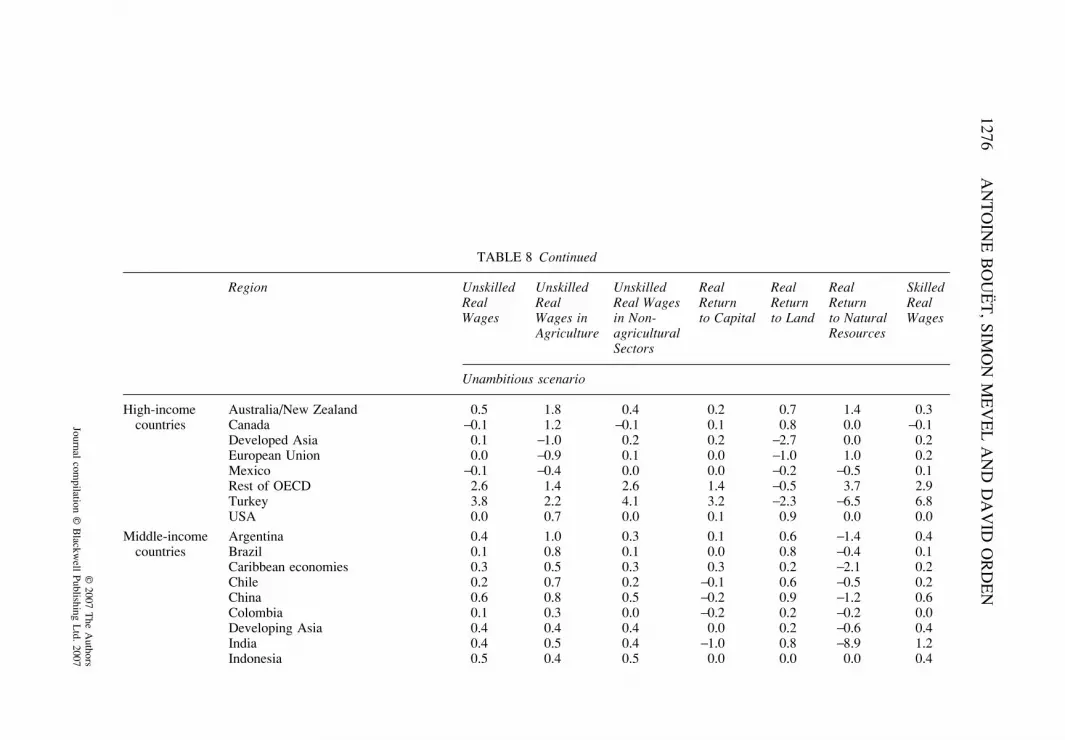
c. Impact on Productive Factors
On poverty also the degree of ambition of the Doha trade reform might makea difference. Table 8 compares the effects on remuneration of productive factorsunder the two scenarios. To the extent that the unskilled real wage is indicativeof poverty effects, the ambitious scenario delivers more poverty reduction. Unskilledworkers are better off under the ambitious outcome compared to the unambitiousoutcome in all countries/zones except Malaysia, Venezuela and Zambia. Thedifferences in gains to unskilled real wages are particularly noticeable for Bang-ladesh, Madagascar, Mozambique, Rest of Sub-Saharan Africa, Rest of America,Rest of South America, Thailand and Uruguay. There are also larger gains toagricultural real wages under the ambitious scenario in all but a few countries.
A comparison with real wage results obtained in the two Doha scenarios tofull trade liberalisation is also instructive.12 Unskilled labour benefits much morefrom full liberalisation than from partial liberalisation in Argentina, Brazil, Chile,Indonesia, SACU, Thailand, Zimbabwe, Vietnam, Uruguay and Malawi. Thesebenefits come mainly from large gains for agricultural unskilled labour.
11 These results highlight the negative consequence for LDCs of the exclusion of three per cent oftariff lines from the free-access agreement reached in Hong Kong. See Bouët et al. (2005) forquantitative analysis of this provision in isolation.12 The free trade results are not shown in Table 8 but are available from the authors on request.

1274A
NT
OIN
E B
OU
ËT
, SIMO
N M
EV
EL
AN
D D
AV
ID O
RD
EN
© 2007 T
he Authors
Journal compilation ©
Blackw
ell Publishing Ltd. 2007
TABLE 8Effects of Alternative Liberalising Scenarios on Remunerations
Region Unskilled Real Wages
Unskilled Real Wages in Agriculture
Unskilled Real Wages in Non-agricultural Sectors
Real Return to Capital
Real Return to Land
Real Return to Natural Resources
Skilled Real Wages
Ambitious scenario
High-income countries
Australia / New Zealand 1.3 5.0 1.0 0.2 2.0 −2.0 0.8Canada 0.0 1.2 0.0 0.2 −4.7 0.5 0.0Developed Asia 0.3 −7.2 0.4 0.5 −16.9 1.3 0.6European Union 0.2 −1.0 0.3 −0.3 −10.4 1.7 0.5Mexico −0.1 −1.0 0.0 0.0 −2.8 0.1 0.3Rest of OECD 2.8 −4.2 2.9 1.7 −15.3 5.3 3.5Turkey 4.0 2.1 4.4 3.4 −3.1 −6.2 7.3USA 0.0 1.7 0.0 0.1 −1.8 0.2 −0.1
Middle-income countries
Argentina 0.7 2.5 0.6 0.2 2.2 −2.5 0.6Brazil 0.4 2.2 0.3 0.2 2.4 −1.9 0.3Caribbean economies 1.0 3.3 0.7 0.3 3.4 −3.7 0.2Chile 0.5 1.4 0.3 −0.1 1.2 −0.9 0.3China 0.7 1.2 0.5 −0.3 1.4 −1.3 0.7Colombia 0.5 2.9 0.2 −0.4 3.3 −2.1 −0.2Developing Asia 0.6 0.3 0.7 0.1 0.0 −0.3 0.7India 0.5 0.5 0.5 −1.3 0.6 −11.6 1.7

MO
RE
OR
LE
SS AM
BIT
ION
IN T
HE
DO
HA
RO
UN
D1275
© 2007 T
he Authors
Journal compilation ©
Blackw
ell Publishing Ltd. 2007
Indonesia 0.6 0.7 0.6 −0.1 0.4 −0.2 0.4Malaysia −1.5 −2.1 −1.5 −4.5 −4.0 −16.3 −1.0Morocco 0.7 0.7 0.7 −0.3 0.5 −5.4 0.5Peru 0.1 0.4 0.0 0.0 0.1 −0.7 −0.1Philippines 0.5 0.5 0.5 −0.1 0.2 −0.5 0.2Rest of America 2.6 7.6 1.4 0.0 8.1 −5.2 0.2Rest of Middle East and North Africa 0.0 0.1 −0.1 0.0 0.2 1.3 −0.2Rest of South America 1.6 4.1 1.0 −0.8 3.8 −6.4 0.2Rest of the World 0.2 0.5 0.1 0.0 0.8 −0.3 −0.1South African Customs Union 0.3 1.5 0.2 0.2 1.4 2.9 0.2Singapore 0.4 7.2 0.3 0.2 −1.0 −0.3 0.2Thailand 1.5 2.5 1.2 −0.3 2.5 −5.8 1.1Tunisia 1.2 −0.5 1.6 1.5 −3.0 −1.7 2.1Uruguay 1.3 2.6 1.0 0.0 1.7 −3.0 1.1Venezuela −0.1 0.5 −0.2 −0.3 0.9 −1.8 −0.3Vietnam 1.5 2.1 1.3 0.0 2.4 1.0 1.3Zimbabwe 0.8 1.6 0.5 0.4 1.2 0.1 0.4
Low-income countries
Bangladesh 1.9 6.8 0.9 1.1 11.3 −3.3 0.7Madagascar 7.3 12.4 2.4 −4.3 7.4 −4.7 −1.4Malawi 4.6 3.8 5.1 6.2 −1.9 −11.7 5.0Mozambique 3.5 8.6 0.9 −1.0 7.5 −4.0 −3.3Rest of Sub-Saharan Africa 3.7 7.0 1.8 −1.7 5.5 −2.7 0.5Tanzania 0.3 0.4 0.2 −0.3 −0.1 −0.4 0.3Uganda 0.5 0.5 0.3 −0.3 −0.2 −0.5 0.3Zambia 0.3 0.6 0.2 −0.6 0.2 0.6 0.0
Ambitious scenario
1276A
NT
OIN
E B
OU
ËT
, SIMO
N M
EV
EL
AN
D D
AV
ID O
RD
EN
© 2007 T
he Authors
Journal compilation ©
Blackw
ell Publishing Ltd. 2007
Region Unskilled Real Wages
Unskilled Real Wages in Agriculture
Unskilled Real Wages in Non-agricultural Sectors
Real Return to Capital
Real Return to Land
Real Return to Natural Resources
Skilled Real Wages
Unambitious scenario
High-income countries
Australia/New Zealand 0.5 1.8 0.4 0.2 0.7 1.4 0.3Canada −0.1 1.2 −0.1 0.1 0.8 0.0 −0.1Developed Asia 0.1 −1.0 0.2 0.2 −2.7 0.0 0.2European Union 0.0 −0.9 0.1 0.0 −1.0 1.0 0.2Mexico −0.1 −0.4 0.0 0.0 −0.2 −0.5 0.1Rest of OECD 2.6 1.4 2.6 1.4 −0.5 3.7 2.9Turkey 3.8 2.2 4.1 3.2 −2.3 −6.5 6.8USA 0.0 0.7 0.0 0.1 0.9 0.0 0.0
Middle-income countries
Argentina 0.4 1.0 0.3 0.1 0.6 −1.4 0.4Brazil 0.1 0.8 0.1 0.0 0.8 −0.4 0.1Caribbean economies 0.3 0.5 0.3 0.3 0.2 −2.1 0.2Chile 0.2 0.7 0.2 −0.1 0.6 −0.5 0.2China 0.6 0.8 0.5 −0.2 0.9 −1.2 0.6Colombia 0.1 0.3 0.0 −0.2 0.2 −0.2 0.0Developing Asia 0.4 0.4 0.4 0.0 0.2 −0.6 0.4India 0.4 0.5 0.4 −1.0 0.8 −8.9 1.2Indonesia 0.5 0.4 0.5 0.0 0.0 0.0 0.4
TABLE 8 Continued

MO
RE
OR
LE
SS AM
BIT
ION
IN T
HE
DO
HA
RO
UN
D1277
© 2007 T
he Authors
Journal compilation ©
Blackw
ell Publishing Ltd. 2007
Malaysia −1.0 −2.1 −1.0 −3.6 −4.4 −13.6 −0.4Morocco 0.5 0.7 0.5 −0.3 0.7 −3.4 0.4Peru 0.0 0.1 0.0 0.1 0.0 −0.9 0.0Philippines 0.3 0.3 0.4 0.0 0.0 −0.4 0.2Rest of America 0.3 0.8 0.2 −0.1 0.6 −0.9 0.2Rest of Middle East and North Africa 0.0 0.3 −0.1 0.0 0.5 0.8 −0.2Rest of South America 0.2 1.0 0.0 −0.5 1.0 −1.7 −0.3Rest of the World 0.0 0.3 0.0 −0.1 0.5 −0.4 −0.2South African Customs Union 0.1 0.6 0.1 0.1 0.5 2.5 0.1Singapore 0.2 1.6 0.2 0.1 0.0 1.1 0.0Thailand 0.4 −0.3 0.5 0.0 −1.6 −4.2 0.5Tunisia 0.3 −0.8 0.6 0.6 −2.2 0.1 1.0Uruguay 0.3 0.6 0.3 −0.1 0.3 −0.9 0.4Venezuela 0.0 0.3 −0.1 −0.3 0.5 −2.5 −0.2Vietnam 1.0 1.0 1.0 0.1 0.7 0.7 1.0Zimbabwe 0.3 0.8 0.2 0.0 0.9 1.5 0.4
Low-income countries
Bangladesh 0.4 0.5 0.4 0.1 0.2 0.2 0.5Madagascar 0.1 0.4 −0.2 −0.3 0.5 0.5 −0.6Malawi 4.1 2.8 4.9 6.7 −2.6 −11.2 5.1Mozambique 0.4 1.2 0.1 −0.2 1.0 −0.1 −1.0Rest of Sub-Saharan Africa 0.0 0.2 −0.1 −0.3 0.0 0.1 −0.2Tanzania 0.3 0.4 0.3 −0.1 −0.1 0.1 0.4Uganda 0.4 0.4 0.2 −0.2 −0.1 −0.5 0.3Zambia 0.4 0.6 0.2 −0.5 0.3 0.4 0.1
Source: Authors’ calculations.
Sectors
Unambitious scenario
1278 ANTOINE BOUËT, SIMON MEVEL AND DAVID ORDEN
© 2007 The AuthorsJournal compilation © Blackwell Publishing Ltd. 2007
On the contrary unskilled labour draws more benefits from partial liberalisa-tion than from full liberalisation in China, India, Morocco, Philippines, Tunisia,Bangladesh, Madagascar, Sub-Saharan Africa and Zambia. The ambitious sce-nario gives, for example, larger gains for agricultural unskilled labour in thesecountries than full liberalisation.
The first set of countries benefit initially from a large agricultural trade surpluswhile countries from the second group have a deficit or a small surplus. Underthe two Doha scenarios special and differentiated treatment is applied and allowsfor reduced liberalisation in agriculture by developing countries: the unambitiousscenario even exempts LDCs from any liberalisation in agriculture or manufac-turing. As a consequence, import competition increases less and productivefactors attached to import-competing sectors faces less downward pressure onremuneration than under full trade liberalisation. In the case of free trade, importcompetition is increased but this is more than fully offset in the first set ofcountries by exports-driven activity in agricultural sectors: productive factorsattached to these sectors benefit from full trade reform. In the second set ofcountries full trade liberalisation increases import competition in agriculturalsectors, while exports are especially increasing in industrial sectors, so unskilledreal wages in agriculture rise more (or fall less) with the partial reforms.
Of course the previous mechanisms do not consider maximisation of nationalreal income and accompanying redistributive policies. Higher national incomesachieved by full liberalisation, or under the ambitious versus unambitious Dohascenario, allows options for poverty reduction beyond those associated directlywith remuneration of those production factors owned by poor households.
5. CONCLUDING REMARKS
We have presented an analysis of a potential ambitious versus an unambitiousDoha Round outcome. Our simulations are based on negotiating proposals by theUS and EU from the run-up to the Hong Kong ministerial meeting in December2005 around which agreement was not reached when the negotiations were sus-pended in July 2006. We compared the outcomes from our two Doha scenarioswith the estimated effects of full global trade liberalisation.
The results for the Doha scenarios demonstrate the high stakes that remainover completion of this negotiation given the positions articulated by the coun-tries involved. A successful round could deliver real gains both globally and fordeveloping countries. However, the magnitude of those gains depends on theshape of the agreement. A cooperative reform outcome based on the most ambi-tious components of the December 2005 negotiating proposals of the US and EUdelivers noticeably greater benefits than an unambitious outcome based on thelower-end elements of their proposals. The details matter in the differing proposals,

MORE OR LESS AMBITION IN THE DOHA ROUND 1279
© 2007 The AuthorsJournal compilation © Blackwell Publishing Ltd. 2007
such as the tariff and domestic support reduction formulae, tariff caps andnumber of sensitive and special products. If the Doha Round can be resuscitated,negotiating commitment and diligence will be needed to avoid a shallow out-come given the technical character of these details.
Developing countries are heterogeneous in terms of their own policies, thetrade barriers they face and their net agricultural trade. Overall, developing coun-tries gain most – and might achieve the best deal in the negotiations – when theyjoin in the reform process for a global trade agreement. Attention is needed inthe case of some of the LDCs and other poor countries that may face decliningterms of trade because of higher world agricultural prices or eroding preferences.In addition, many developing countries can achieve the full benefits of trade onlywith substantial attention to broad development needs that will enhance theircompetitiveness. This too needs to be part of a successful Doha Round outcome.
REFERENCES
Anderson, J. E. and P. Neary (1999), ‘The Mercantilist Index of Trade Policy’, NBER WorkingPaper No. 6870.
Anderson, J. E. and P. Neary (2004), ‘Welfare versus Market Access: The Implications of TariffStructure for Tariff Reform’ (http://fmwww.bc.edu/ec-p/wp601.pdf ).
Anderson, K. and W. Martin (2005), ‘Agricultural Trade Reform and the Doha DevelopmentAgenda’, The World Economy, 28, 9, 1301–27.
Anderson, K., W. Martin and D. Van der Mensbrugghe (2005a), ‘Market and Welfare Implicationsof Doha Reform Scenarios’, in K. Anderson and W. Martin (eds.), Trade Reform and the DohaAgenda (Washington, DC: The World Bank).
Anderson, K., W. Martin and D. Van der Mensbrugghe (2005b), ‘Doha Merchandise TradeReform: What’s at Stake for Developing Countries?’, Plenary Paper for the 8th Annual Confer-ence on Global Trade Analysis, Lubeck, 9–11 June (Washington, DC: The World Bank).
Bchir, M. H., Y. Decreux, J.-L. Guerin and S. Jean (2002), ‘Mirage, a General Equilibrium Modelfor Trade Policy Analysis’, CEPII Working Paper No. 2002-17 (CEPII).
Bchir, M. H., L. Fontagne and S. Jean (2005), ‘From Bound Duties to Actual Protection: IndustrialProtection in the Doha Round’, CEPII Working Paper No. 2005-12 (CEPII).
Bouët, A., J.-C. Bureau, Y. Decreux and S. Jean (2005), ‘Multilateral Agricultural Trade Liberalisa-tion: The Contrasting Fortunes of Developing Countries in the Doha Round’, The World Economy,28, 9, 1329–54.
Bouët, A., Y. Decreux, L. Fontagné, S. Jean and D. Laborde (2005a), ‘Tariff Duties in GTAP6:The MacMap-HS6 Database, Sources and Methodology’, in B. V. Dimaranan and R. A.McDougall (eds.), Global Trade, Assistance and Production: The GTAP 6 Data Base (PurdueUniversity Centre for Global Trade Analysis).
Bouët, A., Y. Decreux, L. Fontagné, S. Jean and D. Laborde (2005b), ‘A Consistent, Ad ValoremEquivalent Measure of Applied Protection Across the World: the MacMap-HS6 Database’,CEPII Working Paper No. 2004-22 (CEPII).
Bouët, A., S. Mevel and D. Orden (2006), ‘Two Opportunities to Deliver on the Doha Develop-ment Pledge’, International Food Policy Research Institute (IFPRI) Research Brief No. 6 (July).
Dimaranan, B. (2006), Global Trade Assistance and Production: The GTAP 6 Data Base (PurdueUniversity, Centre for Global Trade Analysis, Purdue University).
Fontagne, L., J.-L. Guerin and S. Jean (2005), ‘Market Access Liberalisation in the Doha Round:Scenarios and Assessment’, The World Economy, 28, 8, 1073–94.
1280 ANTOINE BOUËT, SIMON MEVEL AND DAVID ORDEN
© 2007 The AuthorsJournal compilation © Blackwell Publishing Ltd. 2007
Francois, J., H. Van Meijl and F. Van Tongeren (2005), ‘Trade Liberalisation in the Doha Devel-opment Round’, Economic Policy, 20, 42, 349–91.
Harrison, G., T. Rutherford and D. Tarr (1997), ‘Quantifying the Uruguay Round’, EconomicJournal, 107, 444, 1405–30.
Jean, S., D. Laborde and W. Martin (2005), ‘Consequences of Alternative Formulas for Agricul-tural Tariff Cuts’, in K. Anderson and W. Martin (eds.), Trade Reform and the Doha Agenda(Washington, DC: The World Bank).
Van der Mensbrugghe, D. (2006), ‘Why Numbers Change’, in R. Newfarmer (ed.), Trade, Dohaand Development: A Window into the Issues (Washington, DC: The World Bank).