monochromatic ocular wavefront aberrations in the awake-behaving cat
TRANSCRIPT

Vision Research 44 (2004) 2159–2169
www.elsevier.com/locate/visres
Monochromatic ocular wavefront aberrationsin the awake-behaving cat
Krystel R. Huxlin a,b,*,1, Geunyoung Yoon a,b,1, Lana Nagy b, Jason Porter b,David Williams a,b
a Department of Ophthalmology, University of Rochester Medical Center, Box 314, 601 Elmwood Avenue, Rochester, NY 14642, USAb Center for Visual Science, University of Rochester, Rochester, NY 14627, USA
Received 22 August 2003; received in revised form 28 January 2004
Abstract
Measurement of wavefront aberrations in human eyes has become a reliable, quantitative way of assessing the optical impact of
experimental and corrective ocular manipulations. Wavefront measures have also been performed in several other species, but never
in cats, an animal model of choice for many ocular studies. Our goal in this study was to measure wavefront aberrations reliably in
live, awake-behaving cats in a manner that is directly comparable to that used in human subjects. Six adult cats (felis cattus) were
trained to fixate small targets on a computer screen. A compact Shack–Hartmann wavefront sensor was aligned with each animal’s
pupil center and line of sight during fixation. Wavefront images were then collected from which the cats’ ocular aberrations were
measured up to tenth order Zernike polynomials over a 6 mm pupil. Results show that cat and human ocular wave aberrations were
very similar. Second order Zernike modes accounted for more than 90% of the total wave aberration. In agreement with our
observation that cat ocular optics were comparable with those of humans, the half height width of both the cat and human higher
order point spread function was about 0.95�. These results form a solid basis for future wavefront sensing studies aiming to quantifythe effects of ocular manipulations in experimental animals.
� 2004 Elsevier Ltd. All rights reserved.
Keywords: Wavefront aberrations; Cat; Human; Optical quality
1. Introduction
Monochromatic ocular aberrations can significantly
disrupt the quality of vision. Recent theoretical and
technological advances have enabled researchers to
measure and correct some of these aberrations. Wave-
front sensing technology allows quantification of ocular
aberrations, which are expressed as deviations from a
perfect spherical or plane wave, of the wavefront gen-erated by a single point source of light at the fovea.
These deviations can be broken down into many types
of aberrations or Zernike modes which are grouped into
* Corresponding author. Address: Department of Ophthalmology,
University of Rochester Medical Center, Box 314, 601 Elmwood
Avenue, Rochester, NY 14642, USA. Tel.: +1-585-275-5495; fax: +1-
585-473-3411.
E-mail address: [email protected] (K.R. Huxlin).1 Authors contributed equally to this work.
0042-6989/$ - see front matter � 2004 Elsevier Ltd. All rights reserved.
doi:10.1016/j.visres.2004.03.017
different orders (Liang, Grimm, Goelz, & Bille, 1994;Liang & Williams, 1997; Thibos, Applegate, Schwie-
gerling, Webb, & Members, 2001). The biology of lower
order wavefront aberrations such as defocus and astig-
matism is relatively well understood and the visual im-
pact of these aberrations is generally large. However,
higher order aberrations such as coma, trefoil and
spherical aberration, can also decrease the quality of
vision, particularly at large pupil sizes (Hjortdal, Olsen,& Ehlers, 2002; Liang & Williams, 1997). Ocular sur-
geries that disrupt corneal or lens structure often change
the magnitude and distribution of ocular aberrations
among the different orders (Hjortdal et al., 2002). Even
procedures such as laser in situ keratomileusis (LASIK)
and photorefractive keratectomy (PRK), which can
correct defocus and astigmatism (second order aber-
rations), often increase higher order aberrations suchas coma and spherical aberration (Endl et al.,
2001; Mierdel, Kaemmerer, Krinke, & Seiler, 1999;
Moreno-Barriuso et al., 2001; Oshika, Klyce, Applegate,
2160 K.R. Huxlin et al. / Vision Research 44 (2004) 2159–2169
Howland, & el Danasoury, 1999; Oshika et al., 2002;
Seiler, Kaemmerer, Mierdel, & Krinke, 2000).
Animal models have long been used in ocular re-
search, but to date, it has been difficult to quantify their
ocular wavefront aberrations (e.g. Coletta, Toilo, Mos-
kowitz, Nickla, & Marcos, 2003; Kisilak, Campbell,
Hunter, Irving, & Huang, 2003; Ramamirtham, Norton,
Siegwart, & Roorda, 2003; Ramamirtham et al., 2002).Part of the problem is that accurate measurement of
wavefront aberrations requires normal corneal physiol-
ogy. In particular, adequate hydration in the form of a
normal, uniform tear film needs to be maintained while
the measurements are taken, otherwise significant
changes in wavefront aberrations will result (Koh et al.,
2002). Anesthesia seriously compromises the quality and
quantity of the tear film since animals are no longer ableto blink. Artificial tears and other corneal moisturizers
do not replicate the chemical or optical qualities of the
natural tear film (Huxlin, unpublished observations).
Indeed, our early wavefront measures in anesthetized
cats treated with a range of such moisturizers exhibited
huge inter-image variability in the magnitude of Zernike
terms from the 2nd to the 5th order, both within and
between imaging sessions. This variability was so severethat we were not able to interpret the results, an out-
come that motivated our work to measure such aber-
rations in awake, fixating animals.
Accurate measurement of wave aberrations also re-
quires subjects to fixate steadily down the optical axis of
a wavefront sensor, an alignment that is difficult to
achieve in awake animals. Yet, the ability to conduct
such measurements reliably over a long period of timewould be extremely advantageous for ophthalmological
research. In this study, we have succeeded in using a
compact Shack–Hartmann wavefront sensor to measure
wavefront aberrations in awake, adult cats trained to
fixate small visual targets presented on a computer
monitor. The cat is an excellent animal model for ocular
research. Relative to other mammals (rabbits, rats, mice,
monkeys), feline corneal parameters (curvature, size,thickness, histological structure) are similar to those of
humans (reviewed in Hughes, 1977). This is important
because the cornea contributes to the majority of the
optical aberrations in the eye. Furthermore, the bio-
logical reaction of the feline cornea to injury or surgical
intervention provides a very good approximation of the
human cornea’s reaction to such manipulations (Bahn
et al., 1982; Jester, Petroll, Feng, Essepian, & Cava-naugh, 1992). The cat is thus often used in studies of
corneal healing (Petroll, Cavanagh, & Jester, 1998;
Telfair et al., 2000a, 2000b). The ability to quantify
optical wave aberrations in normal, adult cat eyes has
allowed us to better assess the quality of cat optics than
was previously possible and has set the stage for future
studies on the optical consequences of ophthalmologic
interventions.
2. Methods
2.1. Animals
Data were collected from eight eyes in six young,
adult cats, purchased from a commercial vendor. All
cats were domestic shorthairs (felis cattus), were in good
health and there was nothing unusual about theirupbringing, appearance or visual performance, other
than that they were raised and kept in cages most of
their lives. The cats were trained to fixate small spots of
light on a computer monitor. The animals were moti-
vated for the training by decreasing their body weight to
about 75% of normal. They were maintained at this
weight for the duration of the study and received the
majority of their daily food intake in the form of pureedbeef rewards for fixating spots of light during their daily
imaging or training sessions. Following each session, the
animals were supplemented with dry cat food, leaf let-
tuce and a vitamin pill to insure that their body weight
remained at about 75%, while maintaining good physi-
cal health. On week-ends or days when they did not
undergo wavefront sensing, cats were given an amount
of dry cat food calculated to maintain them at 75% bodyweight. Water was continuously available in their home
cage. All experiments were carried out according to the
guidelines of the NIH Guide for the Care and Use of
Laboratory Animals (NIH publication no. 86-23, re-
vised 1987) and of the University of Rochester’s Com-
mittee on Animal Resources.
2.2. Behavioral training protocol
Under deep surgical anesthesia, each cat was fitted
with a head-cap consisting of a set of 8 titanium
orthopedic screws (Veterinary Orthopedic Implants
Inc.) implanted into the skull and joined together bybone cement (Palacos Bone Cement) into which a brass
rod was embedded (Pasternak & Horn, 1991). A sub-
conjunctival search coil was implanted around one eye
(Judge, Richmond, & Chu, 1980) and connected to a
female plug also embedded into the bone cement of the
head-cap. The animals were allowed to recover for two
weeks before the onset of behavioral training. During
behavioral training, each cat was placed inside a mag-netic field generated by a set of 50 cm field coils (Rem-
mel, 1984). Their heads were immobilized using the
implanted head-cap while their body was loosely con-
fined in a zippered body suit. Signal from their eye coil
was detected and calibrated using an eye coil phase
detector (Riverbend Electronics). Eye position was cali-
brated prior to each daily imaging session by requiring
the cat to fixate a small (2 · 2 pixels or 0.03� visual angle)spot of light on a darkened 19
00ViewSonic PF790
computer monitor located 48 cm from its eyes. Animals
were rewarded for positioning their gaze within an
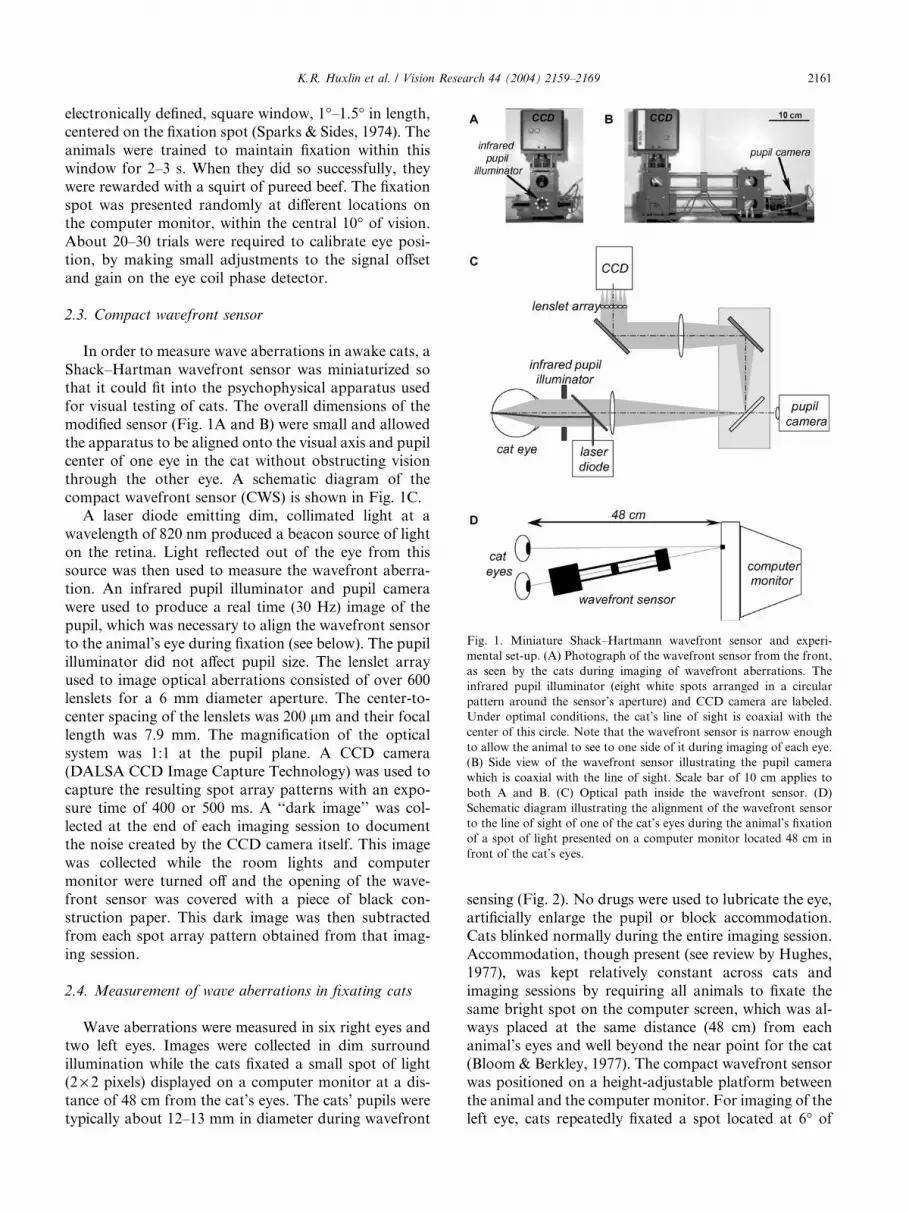
Fig. 1. Miniature Shack–Hartmann wavefront sensor and experi-
mental set-up. (A) Photograph of the wavefront sensor from the front,
as seen by the cats during imaging of wavefront aberrations. The
infrared pupil illuminator (eight white spots arranged in a circular
pattern around the sensor’s aperture) and CCD camera are labeled.
Under optimal conditions, the cat’s line of sight is coaxial with the
center of this circle. Note that the wavefront sensor is narrow enough
to allow the animal to see to one side of it during imaging of each eye.
(B) Side view of the wavefront sensor illustrating the pupil camera
which is coaxial with the line of sight. Scale bar of 10 cm applies to
both A and B. (C) Optical path inside the wavefront sensor. (D)
Schematic diagram illustrating the alignment of the wavefront sensor
to the line of sight of one of the cat’s eyes during the animal’s fixation
of a spot of light presented on a computer monitor located 48 cm in
front of the cat’s eyes.
K.R. Huxlin et al. / Vision Research 44 (2004) 2159–2169 2161
electronically defined, square window, 1�–1.5� in length,centered on the fixation spot (Sparks & Sides, 1974). The
animals were trained to maintain fixation within this
window for 2–3 s. When they did so successfully, they
were rewarded with a squirt of pureed beef. The fixation
spot was presented randomly at different locations on
the computer monitor, within the central 10� of vision.About 20–30 trials were required to calibrate eye posi-tion, by making small adjustments to the signal offset
and gain on the eye coil phase detector.
2.3. Compact wavefront sensor
In order to measure wave aberrations in awake cats, a
Shack–Hartman wavefront sensor was miniaturized sothat it could fit into the psychophysical apparatus used
for visual testing of cats. The overall dimensions of the
modified sensor (Fig. 1A and B) were small and allowed
the apparatus to be aligned onto the visual axis and pupil
center of one eye in the cat without obstructing vision
through the other eye. A schematic diagram of the
compact wavefront sensor (CWS) is shown in Fig. 1C.
A laser diode emitting dim, collimated light at awavelength of 820 nm produced a beacon source of light
on the retina. Light reflected out of the eye from this
source was then used to measure the wavefront aberra-
tion. An infrared pupil illuminator and pupil camera
were used to produce a real time (30 Hz) image of the
pupil, which was necessary to align the wavefront sensor
to the animal’s eye during fixation (see below). The pupil
illuminator did not affect pupil size. The lenslet arrayused to image optical aberrations consisted of over 600
lenslets for a 6 mm diameter aperture. The center-to-
center spacing of the lenslets was 200 lm and their focallength was 7.9 mm. The magnification of the optical
system was 1:1 at the pupil plane. A CCD camera
(DALSA CCD Image Capture Technology) was used to
capture the resulting spot array patterns with an expo-
sure time of 400 or 500 ms. A ‘‘dark image’’ was col-lected at the end of each imaging session to document
the noise created by the CCD camera itself. This image
was collected while the room lights and computer
monitor were turned off and the opening of the wave-
front sensor was covered with a piece of black con-
struction paper. This dark image was then subtracted
from each spot array pattern obtained from that imag-
ing session.
2.4. Measurement of wave aberrations in fixating cats
Wave aberrations were measured in six right eyes and
two left eyes. Images were collected in dim surround
illumination while the cats fixated a small spot of light(2· 2 pixels) displayed on a computer monitor at a dis-tance of 48 cm from the cat’s eyes. The cats’ pupils were
typically about 12–13 mm in diameter during wavefront
sensing (Fig. 2). No drugs were used to lubricate the eye,
artificially enlarge the pupil or block accommodation.
Cats blinked normally during the entire imaging session.
Accommodation, though present (see review by Hughes,
1977), was kept relatively constant across cats and
imaging sessions by requiring all animals to fixate the
same bright spot on the computer screen, which was al-ways placed at the same distance (48 cm) from each
animal’s eyes and well beyond the near point for the cat
(Bloom & Berkley, 1977). The compact wavefront sensor
was positioned on a height-adjustable platform between
the animal and the computer monitor. For imaging of the
left eye, cats repeatedly fixated a spot located at 6� of
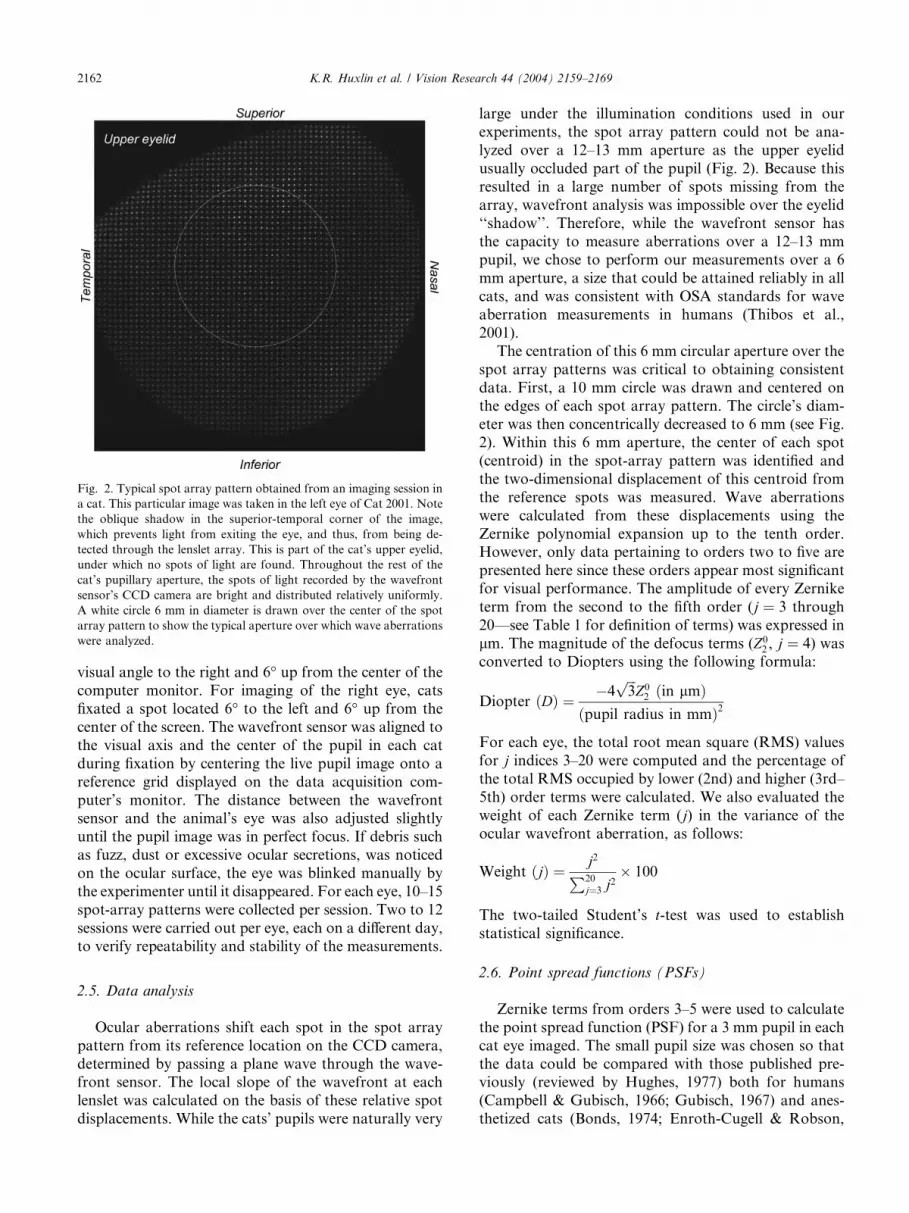
Fig. 2. Typical spot array pattern obtained from an imaging session in
a cat. This particular image was taken in the left eye of Cat 2001. Note
the oblique shadow in the superior-temporal corner of the image,
which prevents light from exiting the eye, and thus, from being de-
tected through the lenslet array. This is part of the cat’s upper eyelid,
under which no spots of light are found. Throughout the rest of the
cat’s pupillary aperture, the spots of light recorded by the wavefront
sensor’s CCD camera are bright and distributed relatively uniformly.
A white circle 6 mm in diameter is drawn over the center of the spot
array pattern to show the typical aperture over which wave aberrations
were analyzed.
2162 K.R. Huxlin et al. / Vision Research 44 (2004) 2159–2169
visual angle to the right and 6� up from the center of thecomputer monitor. For imaging of the right eye, cats
fixated a spot located 6� to the left and 6� up from the
center of the screen. The wavefront sensor was aligned to
the visual axis and the center of the pupil in each cat
during fixation by centering the live pupil image onto a
reference grid displayed on the data acquisition com-
puter’s monitor. The distance between the wavefrontsensor and the animal’s eye was also adjusted slightly
until the pupil image was in perfect focus. If debris such
as fuzz, dust or excessive ocular secretions, was noticed
on the ocular surface, the eye was blinked manually by
the experimenter until it disappeared. For each eye, 10–15
spot-array patterns were collected per session. Two to 12
sessions were carried out per eye, each on a different day,
to verify repeatability and stability of the measurements.
2.5. Data analysis
Ocular aberrations shift each spot in the spot array
pattern from its reference location on the CCD camera,
determined by passing a plane wave through the wave-front sensor. The local slope of the wavefront at each
lenslet was calculated on the basis of these relative spot
displacements. While the cats’ pupils were naturally very
large under the illumination conditions used in our
experiments, the spot array pattern could not be ana-
lyzed over a 12–13 mm aperture as the upper eyelid
usually occluded part of the pupil (Fig. 2). Because this
resulted in a large number of spots missing from the
array, wavefront analysis was impossible over the eyelid
‘‘shadow’’. Therefore, while the wavefront sensor has
the capacity to measure aberrations over a 12–13 mmpupil, we chose to perform our measurements over a 6
mm aperture, a size that could be attained reliably in all
cats, and was consistent with OSA standards for wave
aberration measurements in humans (Thibos et al.,
2001).
The centration of this 6 mm circular aperture over the
spot array patterns was critical to obtaining consistent
data. First, a 10 mm circle was drawn and centered onthe edges of each spot array pattern. The circle’s diam-
eter was then concentrically decreased to 6 mm (see Fig.
2). Within this 6 mm aperture, the center of each spot
(centroid) in the spot-array pattern was identified and
the two-dimensional displacement of this centroid from
the reference spots was measured. Wave aberrations
were calculated from these displacements using the
Zernike polynomial expansion up to the tenth order.However, only data pertaining to orders two to five are
presented here since these orders appear most significant
for visual performance. The amplitude of every Zernike
term from the second to the fifth order (j ¼ 3 through20––see Table 1 for definition of terms) was expressed in
lm. The magnitude of the defocus terms (Z02 , j ¼ 4) wasconverted to Diopters using the following formula:
Diopter ðDÞ ¼ �4ffiffiffi3
pZ02 ðin lmÞ
ðpupil radius in mmÞ2
For each eye, the total root mean square (RMS) values
for j indices 3–20 were computed and the percentage ofthe total RMS occupied by lower (2nd) and higher (3rd–
5th) order terms were calculated. We also evaluated the
weight of each Zernike term (j) in the variance of theocular wavefront aberration, as follows:
Weight ðjÞ ¼ j2P20
j¼3 j2� 100
The two-tailed Student’s t-test was used to establishstatistical significance.
2.6. Point spread functions (PSFs)
Zernike terms from orders 3–5 were used to calculate
the point spread function (PSF) for a 3 mm pupil in each
cat eye imaged. The small pupil size was chosen so that
the data could be compared with those published pre-viously (reviewed by Hughes, 1977) both for humans
(Campbell & Gubisch, 1966; Gubisch, 1967) and anes-
thetized cats (Bonds, 1974; Enroth-Cugell & Robson,
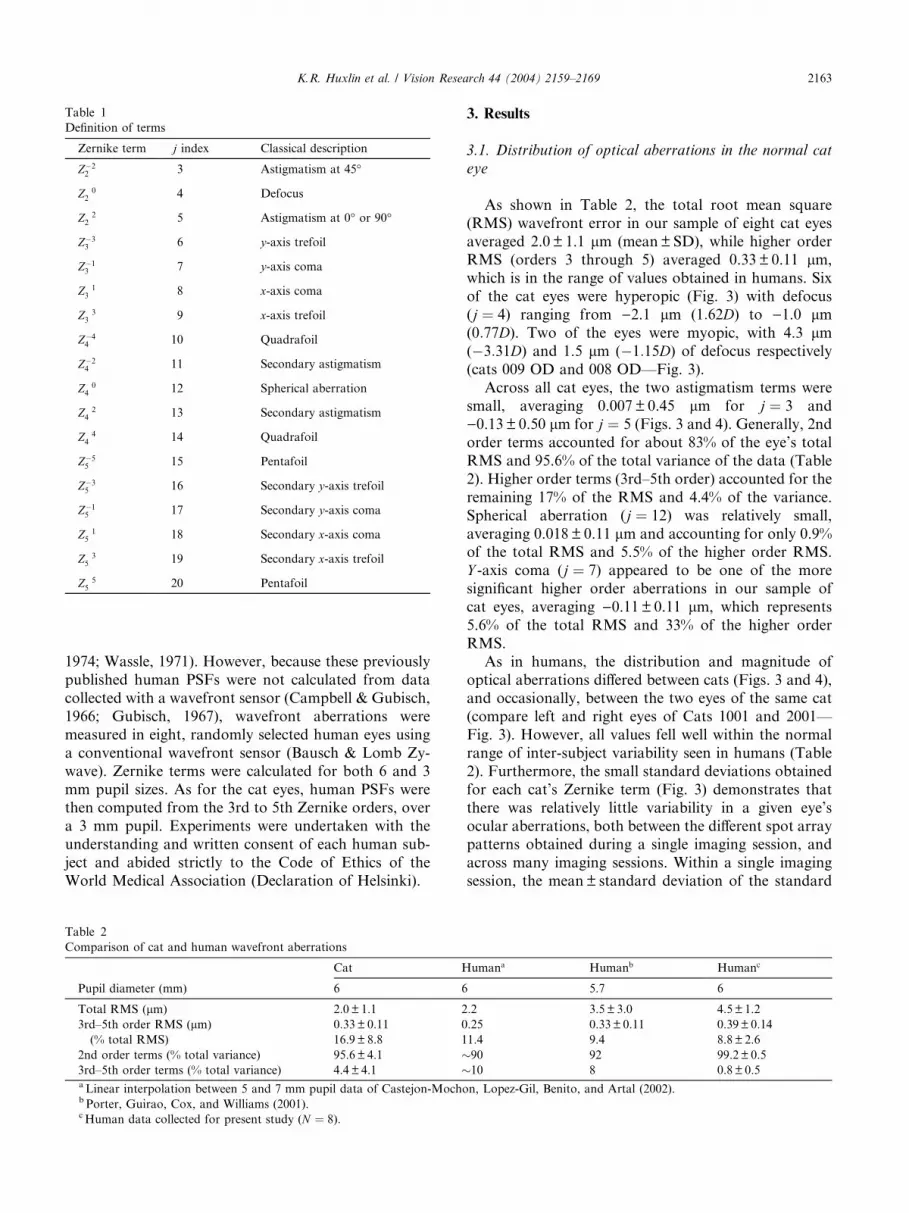
Table 1
Definition of terms
Zernike term j index Classical description
Z�22 3 Astigmatism at 45�
Z 02 4 Defocus
Z 22 5 Astigmatism at 0� or 90�
Z�33 6 y-axis trefoil
Z�13 7 y-axis coma
Z 13 8 x-axis coma
Z 33 9 x-axis trefoil
Z�44 10 Quadrafoil
Z�24 11 Secondary astigmatism
Z 04 12 Spherical aberration
Z 24 13 Secondary astigmatism
Z 44 14 Quadrafoil
Z�55 15 Pentafoil
Z�35 16 Secondary y-axis trefoil
Z�15 17 Secondary y-axis coma
Z 15 18 Secondary x-axis coma
Z 35 19 Secondary x-axis trefoil
Z 55 20 Pentafoil
K.R. Huxlin et al. / Vision Research 44 (2004) 2159–2169 2163
1974; Wassle, 1971). However, because these previously
published human PSFs were not calculated from data
collected with a wavefront sensor (Campbell & Gubisch,
1966; Gubisch, 1967), wavefront aberrations were
measured in eight, randomly selected human eyes using
a conventional wavefront sensor (Bausch & Lomb Zy-
wave). Zernike terms were calculated for both 6 and 3
mm pupil sizes. As for the cat eyes, human PSFs werethen computed from the 3rd to 5th Zernike orders, over
a 3 mm pupil. Experiments were undertaken with the
understanding and written consent of each human sub-
ject and abided strictly to the Code of Ethics of the
World Medical Association (Declaration of Helsinki).
Table 2
Comparison of cat and human wavefront aberrations
Cat H
Pupil diameter (mm) 6 6
Total RMS (lm) 2.0± 1.1 2
3rd–5th order RMS (lm)(% total RMS)
0.33± 0.11 0
16.9± 8.8 1
2nd order terms (% total variance) 95.6± 4.1 �3rd–5th order terms (% total variance) 4.4 ± 4.1 �a Linear interpolation between 5 and 7 mm pupil data of Castejon-MochobPorter, Guirao, Cox, and Williams (2001).cHuman data collected for present study (N ¼ 8).
3. Results
3.1. Distribution of optical aberrations in the normal cat
eye
As shown in Table 2, the total root mean square
(RMS) wavefront error in our sample of eight cat eyes
averaged 2.0 ± 1.1 lm (mean±SD), while higher orderRMS (orders 3 through 5) averaged 0.33± 0.11 lm,which is in the range of values obtained in humans. Six
of the cat eyes were hyperopic (Fig. 3) with defocus
(j ¼ 4) ranging from )2.1 lm (1:62D) to )1.0 lm(0:77D). Two of the eyes were myopic, with 4.3 lm(�3:31D) and 1.5 lm (�1:15D) of defocus respectively(cats 009 OD and 008 OD––Fig. 3).
Across all cat eyes, the two astigmatism terms weresmall, averaging 0.007± 0.45 lm for j ¼ 3 and
)0.13± 0.50 lm for j ¼ 5 (Figs. 3 and 4). Generally, 2ndorder terms accounted for about 83% of the eye’s total
RMS and 95.6% of the total variance of the data (Table
2). Higher order terms (3rd–5th order) accounted for the
remaining 17% of the RMS and 4.4% of the variance.
Spherical aberration (j ¼ 12) was relatively small,
averaging 0.018± 0.11 lm and accounting for only 0.9%of the total RMS and 5.5% of the higher order RMS.
Y -axis coma (j ¼ 7) appeared to be one of the moresignificant higher order aberrations in our sample of
cat eyes, averaging )0.11± 0.11 lm, which represents5.6% of the total RMS and 33% of the higher order
RMS.
As in humans, the distribution and magnitude of
optical aberrations differed between cats (Figs. 3 and 4),and occasionally, between the two eyes of the same cat
(compare left and right eyes of Cats 1001 and 2001––
Fig. 3). However, all values fell well within the normal
range of inter-subject variability seen in humans (Table
2). Furthermore, the small standard deviations obtained
for each cat’s Zernike term (Fig. 3) demonstrates that
there was relatively little variability in a given eye’s
ocular aberrations, both between the different spot arraypatterns obtained during a single imaging session, and
across many imaging sessions. Within a single imaging
session, the mean± standard deviation of the standard
umana Humanb Humanc
5.7 6
.2 3.5± 3.0 4.5± 1.2
.25 0.33± 0.11 0.39± 0.14
1.4 9.4 8.8± 2.6
90 92 99.2± 0.5
10 8 0.8± 0.5
n, Lopez-Gil, Benito, and Artal (2002).
Cat 1001 OS
Cat 1003 OD
3 4 5 6 7 8 9 10 11 12 13 14 15 16 17 18 19 20
j index
Zern
ike
coef
ficie
nt v
alue
(µm
)
Cat 2001 OS
3 4 5 6 7 8 9 10 11 12 13 14 15 16 17 18 19 20
Cat 1005 OD
Cat 008 ODCat 009 OD
Cat 1001 OD
Cat 2001 OD
-0.4
-0.3
-0.2
-0.1
0
0.1
0.20.3
6 7 8 9 10 11 12 13 14 15 16 17 18 19 20-0.4
-0.3-0.2
-0.1
0
0.1
0.2
0.3
6 7 8 9 10 11 12 13 14 15 16 17 18 19 20
-2
-1
0
1
2
3
4
5
-3
-2
-1
0
1
2
3
4
5
-3
-2
-1
0
1
2
3
4
5
-3
-2
-1
0
1
2
3
4
5
-3
-0.4
-0.3
-0.2
-0.1
0
0.1
0.2
0.3
6 7 8 9 10 11 12 13 14 15 16 17 18 19 20 -0.4
-0.3
-0.2
-0.1
0
0.1
0.2
0.3
6 7 8 9 10 11 12 13 14 15 16 17 18 19 20
-0.4
-0.3
-0.2
-0.1
0
0.1
0.20.3
6 7 8 9 10 11 12 13 14 15 16 17 18 19 20 -0.4
-0.3
-0.2
-0.1
0
0.1
0.20.3
6 7 8 9 10 11 12 13 14 15 16 17 18 19 20
-0.4
-0.3
-0.2
-0.1
0
0.10.2
0.3
6 7 8 9 10 11 12 13 14 15 16 17 18 19 20-0.4
-0.3
-0.2
-0.1
0
0.10.2
0.3
6 7 8 9 10 11 12 13 14 15 16 17 18 19 20
3rd-5th Zernike orders -6 mm pupil
2nd-5th Zernike orders6 mm pupil
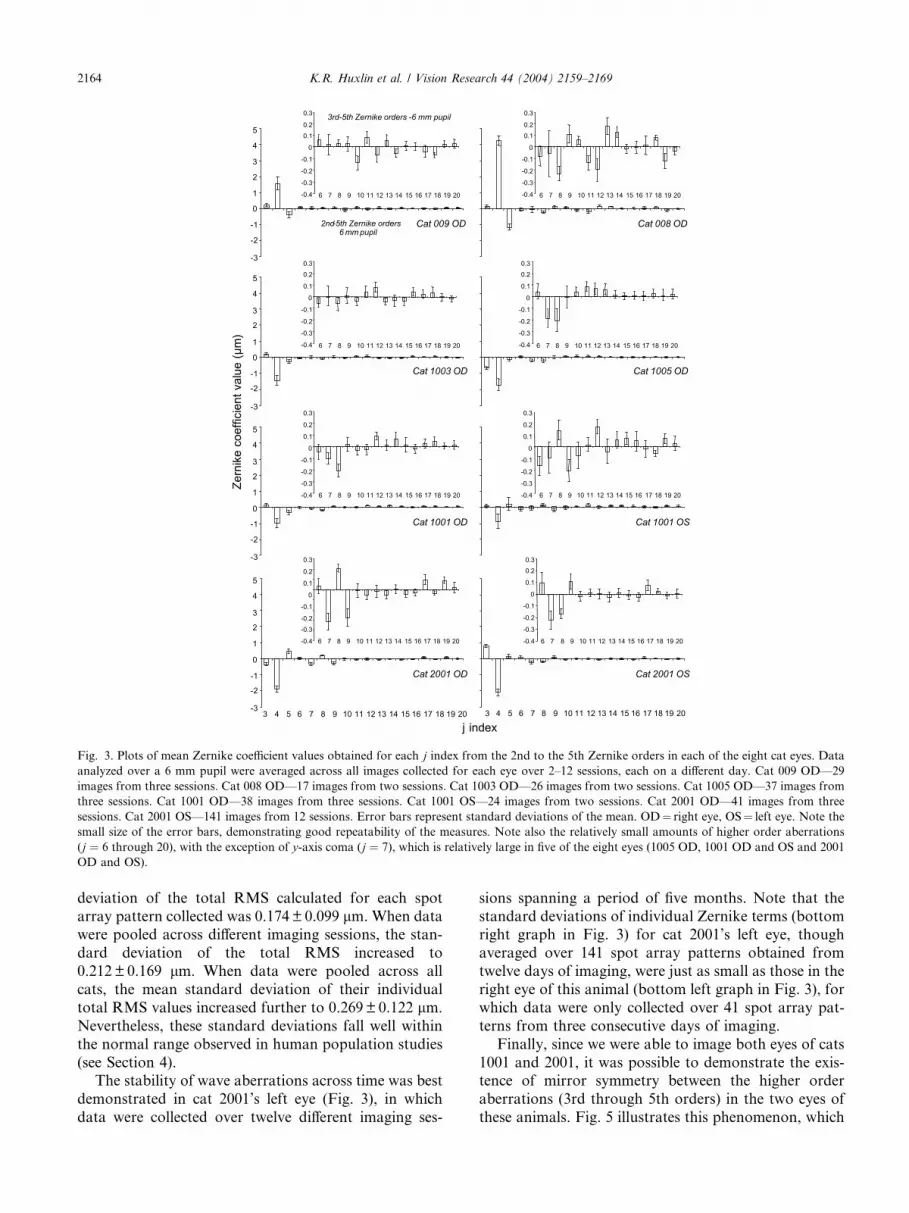
Fig. 3. Plots of mean Zernike coefficient values obtained for each j index from the 2nd to the 5th Zernike orders in each of the eight cat eyes. Dataanalyzed over a 6 mm pupil were averaged across all images collected for each eye over 2–12 sessions, each on a different day. Cat 009 OD––29
images from three sessions. Cat 008 OD––17 images from two sessions. Cat 1003 OD––26 images from two sessions. Cat 1005 OD––37 images from
three sessions. Cat 1001 OD––38 images from three sessions. Cat 1001 OS––24 images from two sessions. Cat 2001 OD––41 images from three
sessions. Cat 2001 OS––141 images from 12 sessions. Error bars represent standard deviations of the mean. OD¼ right eye, OS¼ left eye. Note thesmall size of the error bars, demonstrating good repeatability of the measures. Note also the relatively small amounts of higher order aberrations
(j ¼ 6 through 20), with the exception of y-axis coma (j ¼ 7), which is relatively large in five of the eight eyes (1005 OD, 1001 OD and OS and 2001OD and OS).
2164 K.R. Huxlin et al. / Vision Research 44 (2004) 2159–2169
deviation of the total RMS calculated for each spot
array pattern collected was 0.174± 0.099 lm. When datawere pooled across different imaging sessions, the stan-
dard deviation of the total RMS increased to
0.212± 0.169 lm. When data were pooled across allcats, the mean standard deviation of their individual
total RMS values increased further to 0.269± 0.122 lm.Nevertheless, these standard deviations fall well within
the normal range observed in human population studies
(see Section 4).The stability of wave aberrations across time was best
demonstrated in cat 2001’s left eye (Fig. 3), in which
data were collected over twelve different imaging ses-
sions spanning a period of five months. Note that the
standard deviations of individual Zernike terms (bottomright graph in Fig. 3) for cat 2001’s left eye, though
averaged over 141 spot array patterns obtained from
twelve days of imaging, were just as small as those in the
right eye of this animal (bottom left graph in Fig. 3), for
which data were only collected over 41 spot array pat-
terns from three consecutive days of imaging.
Finally, since we were able to image both eyes of cats
1001 and 2001, it was possible to demonstrate the exis-tence of mirror symmetry between the higher order
aberrations (3rd through 5th orders) in the two eyes of
these animals. Fig. 5 illustrates this phenomenon, which
-4
-3
-2
-1
0
1
2
3
3 4 5 6 7 8 9 10 11 12 13 14 15 16 17 18 19 20
-0.3
-0.2
-0.1
0
0.1
0.2
0.3
6 7 8 9 10 11 12 13 14 15 16 17 18 19 20
j index
Zern
ike
coef
ficie
nt v
alue
(µm
)
3rd-5th Zernike orders - - 6 mm pupil
2nd-5th Zernike orders6 mm pupil
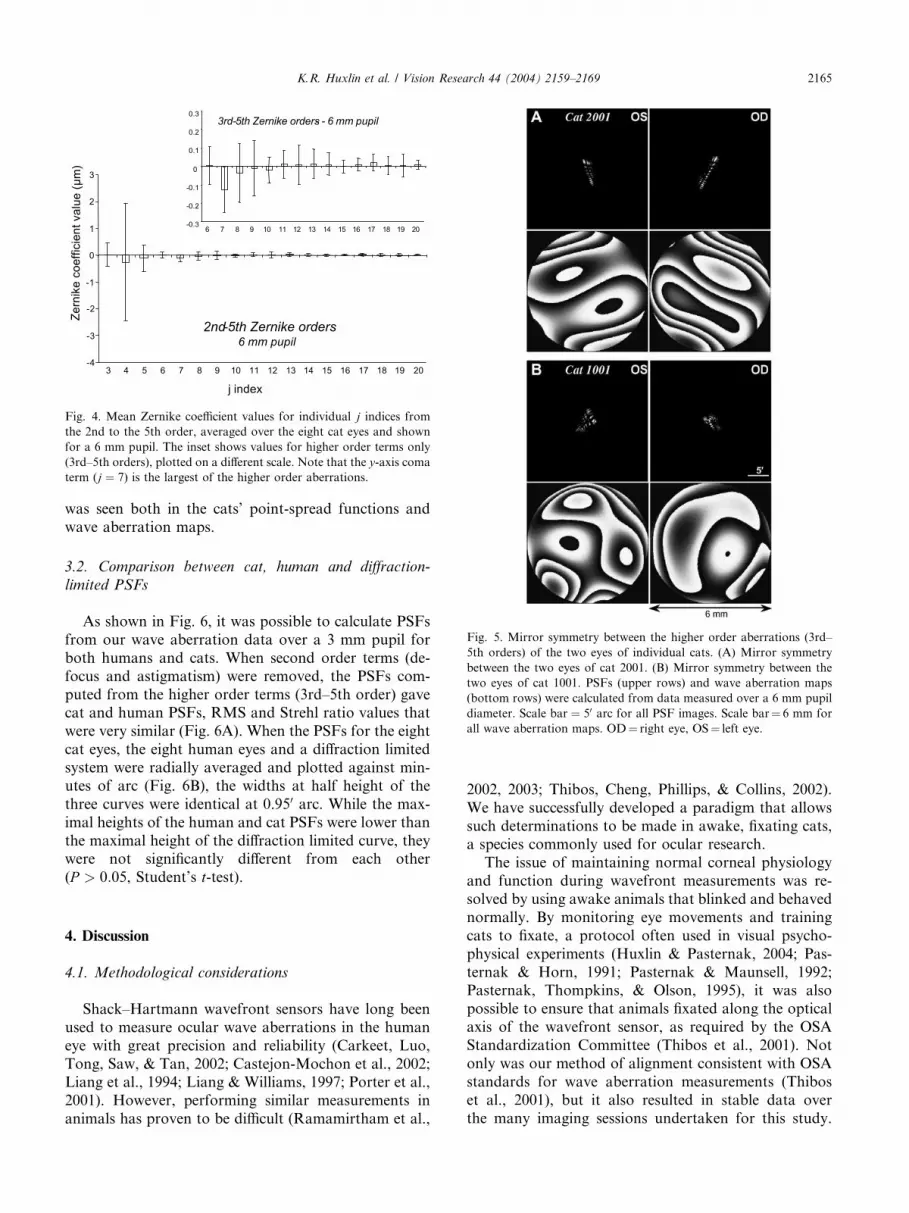
Fig. 4. Mean Zernike coefficient values for individual j indices fromthe 2nd to the 5th order, averaged over the eight cat eyes and shown
for a 6 mm pupil. The inset shows values for higher order terms only
(3rd–5th orders), plotted on a different scale. Note that the y-axis comaterm (j ¼ 7) is the largest of the higher order aberrations.
Fig. 5. Mirror symmetry between the higher order aberrations (3rd–
5th orders) of the two eyes of individual cats. (A) Mirror symmetry
between the two eyes of cat 2001. (B) Mirror symmetry between the
two eyes of cat 1001. PSFs (upper rows) and wave aberration maps
(bottom rows) were calculated from data measured over a 6 mm pupil
diameter. Scale bar ¼ 50 arc for all PSF images. Scale bar¼ 6 mm forall wave aberration maps. OD¼ right eye, OS¼ left eye.
K.R. Huxlin et al. / Vision Research 44 (2004) 2159–2169 2165
was seen both in the cats’ point-spread functions and
wave aberration maps.
3.2. Comparison between cat, human and diffraction-
limited PSFs
As shown in Fig. 6, it was possible to calculate PSFs
from our wave aberration data over a 3 mm pupil for
both humans and cats. When second order terms (de-
focus and astigmatism) were removed, the PSFs com-
puted from the higher order terms (3rd–5th order) gavecat and human PSFs, RMS and Strehl ratio values that
were very similar (Fig. 6A). When the PSFs for the eight
cat eyes, the eight human eyes and a diffraction limited
system were radially averaged and plotted against min-
utes of arc (Fig. 6B), the widths at half height of the
three curves were identical at 0.950 arc. While the max-
imal heights of the human and cat PSFs were lower than
the maximal height of the diffraction limited curve, theywere not significantly different from each other
(P > 0:05, Student’s t-test).
4. Discussion
4.1. Methodological considerations
Shack–Hartmann wavefront sensors have long been
used to measure ocular wave aberrations in the human
eye with great precision and reliability (Carkeet, Luo,
Tong, Saw, & Tan, 2002; Castejon-Mochon et al., 2002;Liang et al., 1994; Liang & Williams, 1997; Porter et al.,
2001). However, performing similar measurements in
animals has proven to be difficult (Ramamirtham et al.,
2002, 2003; Thibos, Cheng, Phillips, & Collins, 2002).
We have successfully developed a paradigm that allows
such determinations to be made in awake, fixating cats,a species commonly used for ocular research.
The issue of maintaining normal corneal physiology
and function during wavefront measurements was re-
solved by using awake animals that blinked and behaved
normally. By monitoring eye movements and training
cats to fixate, a protocol often used in visual psycho-
physical experiments (Huxlin & Pasternak, 2004; Pas-
ternak & Horn, 1991; Pasternak & Maunsell, 1992;Pasternak, Thompkins, & Olson, 1995), it was also
possible to ensure that animals fixated along the optical
axis of the wavefront sensor, as required by the OSA
Standardization Committee (Thibos et al., 2001). Not
only was our method of alignment consistent with OSA
standards for wave aberration measurements (Thibos
et al., 2001), but it also resulted in stable data over
the many imaging sessions undertaken for this study.
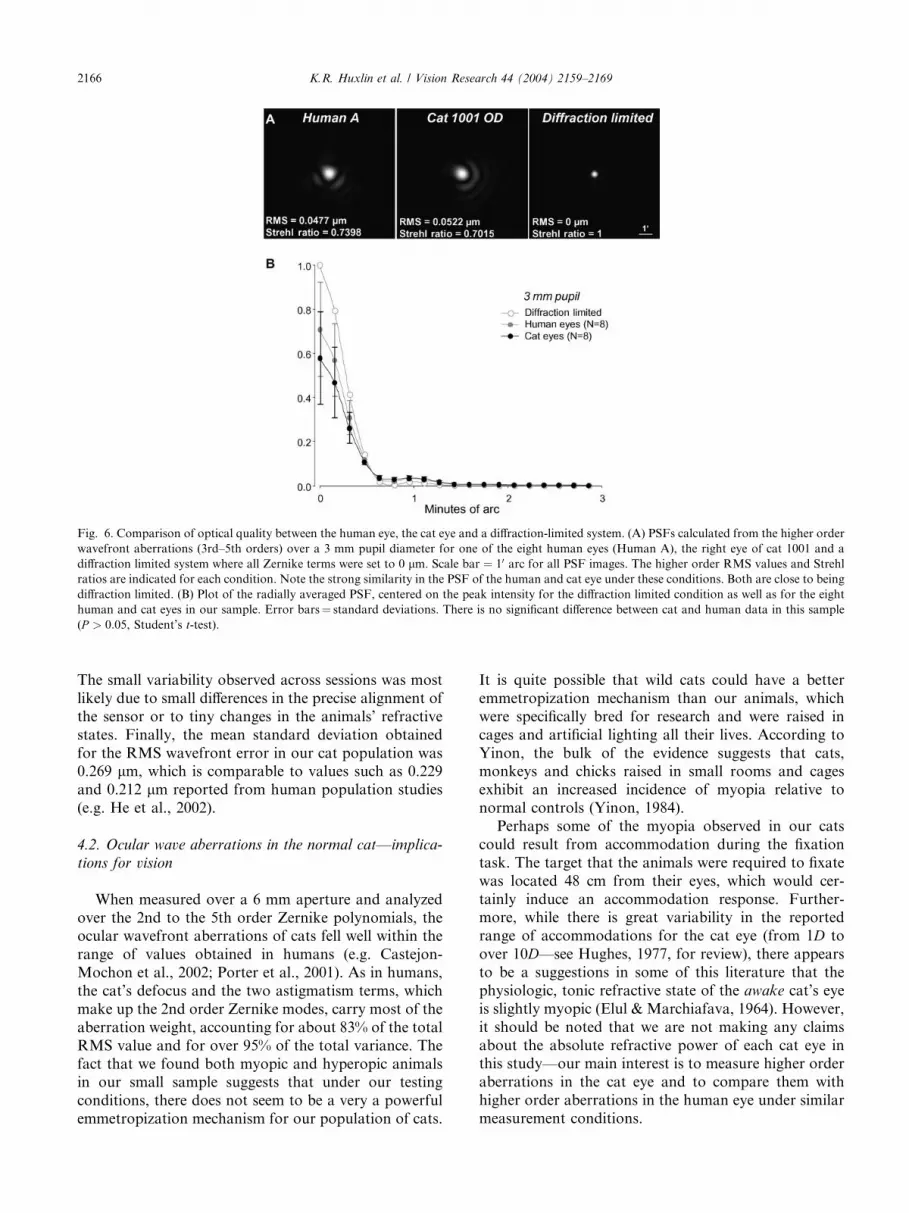
Fig. 6. Comparison of optical quality between the human eye, the cat eye and a diffraction-limited system. (A) PSFs calculated from the higher order
wavefront aberrations (3rd–5th orders) over a 3 mm pupil diameter for one of the eight human eyes (Human A), the right eye of cat 1001 and a
diffraction limited system where all Zernike terms were set to 0 lm. Scale bar ¼ 10 arc for all PSF images. The higher order RMS values and Strehlratios are indicated for each condition. Note the strong similarity in the PSF of the human and cat eye under these conditions. Both are close to being
diffraction limited. (B) Plot of the radially averaged PSF, centered on the peak intensity for the diffraction limited condition as well as for the eight
human and cat eyes in our sample. Error bars¼ standard deviations. There is no significant difference between cat and human data in this sample(P > 0:05, Student’s t-test).
2166 K.R. Huxlin et al. / Vision Research 44 (2004) 2159–2169
The small variability observed across sessions was most
likely due to small differences in the precise alignment of
the sensor or to tiny changes in the animals’ refractive
states. Finally, the mean standard deviation obtained
for the RMS wavefront error in our cat population was0.269 lm, which is comparable to values such as 0.229and 0.212 lm reported from human population studies
(e.g. He et al., 2002).
4.2. Ocular wave aberrations in the normal cat––implica-
tions for vision
When measured over a 6 mm aperture and analyzed
over the 2nd to the 5th order Zernike polynomials, theocular wavefront aberrations of cats fell well within the
range of values obtained in humans (e.g. Castejon-
Mochon et al., 2002; Porter et al., 2001). As in humans,
the cat’s defocus and the two astigmatism terms, which
make up the 2nd order Zernike modes, carry most of the
aberration weight, accounting for about 83% of the total
RMS value and for over 95% of the total variance. The
fact that we found both myopic and hyperopic animalsin our small sample suggests that under our testing
conditions, there does not seem to be a very a powerful
emmetropization mechanism for our population of cats.
It is quite possible that wild cats could have a better
emmetropization mechanism than our animals, which
were specifically bred for research and were raised in
cages and artificial lighting all their lives. According to
Yinon, the bulk of the evidence suggests that cats,monkeys and chicks raised in small rooms and cages
exhibit an increased incidence of myopia relative to
normal controls (Yinon, 1984).
Perhaps some of the myopia observed in our cats
could result from accommodation during the fixation
task. The target that the animals were required to fixate
was located 48 cm from their eyes, which would cer-
tainly induce an accommodation response. Further-more, while there is great variability in the reported
range of accommodations for the cat eye (from 1D to
over 10D––see Hughes, 1977, for review), there appearsto be a suggestions in some of this literature that the
physiologic, tonic refractive state of the awake cat’s eye
is slightly myopic (Elul & Marchiafava, 1964). However,
it should be noted that we are not making any claims
about the absolute refractive power of each cat eye inthis study––our main interest is to measure higher order
aberrations in the cat eye and to compare them with
higher order aberrations in the human eye under similar
measurement conditions.
K.R. Huxlin et al. / Vision Research 44 (2004) 2159–2169 2167
Overall, the cat does not have particularly high levels
of higher order aberrations (3rd–5th orders), but as in
humans (Howland & Howland, 1977; Porter et al., 2001;
Thibos & Cheng, et al., 2002; Walsh, Charman, &
Howland, 1984), y-axis coma (j ¼ 7, Z�13 ) in the cat ac-
counted for the highest percentage of both the total
RMS/variance and of the higher order RMS. In addi-
tion, our data showed that cats, just like humans (Liang& Williams, 1997; Porter et al., 2001), can exhibit great
similarity in the higher order monochromatic aberra-
tions of their two eyes. This similarity is evidenced
by mirror symmetry in their aberration maps, as was
shown for cats 1001 and 2001 in Fig. 5.
Contrary to early reports (Bonds, 1974; Bonds, En-
roth-Cugell, & Pinto, 1972; Enroth-Cugell & Robson,
1974; Wassle, 1971), the quality of the cat’s ocular opticsmeasured with wavefront sensing appears as good as
that of the human eye (Campbell & Gubisch, 1966;
Gubisch, 1967). Indeed, when using measures of wave-
front aberrations over the 3rd to the 5th order Zernike
polynomials obtained in this study, it was possible to
show that for a 3 mm pupil, the width at half height of
the radially averaged PSF did not differ significantly
between our sample of eight cat eyes, a sample of eight,randomly chosen human eyes, a diffraction-limited
optical system and previously published values for hu-
mans (Campbell & Gubisch, 1966; Gubisch, 1967) of
about 10 arc. We attribute the difference in optical
quality reported in the present study and those previ-
ously reported for the cat (Bonds, 1974; Bonds et al.,
1972; Enroth-Cugell & Robson, 1974; Wassle, 1971) to
several important factors. First, these previous studiesused anesthetized cats. As described earlier, anesthesia
compromises the quality and quantity of the tear film,
which in itself, induces an increase in higher order
optical aberrations (Koh et al., 2002). Secondly, the cats
used in these previous studies were fitted with contact
lenses, which corrected for defocus but not for astig-
matism. Moreover, it has recently been shown that the
placement of a corrective contact lens on the cornea canincrease higher order optical aberrations (Lu, Mao, Qu,
Xu, & He, 2003). Finally, most previous studies of cat
optics used a double-pass technique (with the exception
of Enroth-Cugell & Robson, 1974) and measured line-
spread functions, rather than PSFs. Aside from its pre-
cision, one of the many advantages of wavefront sensing
is that it allowed us to directly compute the PSF for the
measured wave aberrations, something that cannot bedone with double-pass techniques (Artal, Marcos,
Navarro, & Williams, 1995).
Our findings bring into question the assumption that
only visual systems endowed with high resolution need
high quality optics. So why does the cat need good op-
tics? Perhaps it needs them for visual detection and
discrimination at low light levels. Cats function well in
crepuscular and nocturnal environments, and depend
highly on vision for hunting and killing prey in these
environments (Hughes, 1977). Given that the cat’s pupil
(Wilcox & Barlow, 1975) can dilate to an area up to
three times that achievable in humans (DeGroot &
Gebhard, 1952) for the same light levels (Hughes, 1977),
cats should experience significantly more optical inter-
ference than humans at the same light levels. Perhaps
the cat’s optics are relatively good because any addi-tional aberrations would significantly degrade this
animal’s vision to unsustainable levels.
Measures of spatial vision taken at different ambient
luminance levels reveal that just as for owls, another
nocturnal species, the contrast sensitivity and spatial
resolution of cats and humans differ significantly at
high, but not low luminance values (Martin, 1982;
Pasternak & Merigan, 1981). At a luminance of 16cd/m2, the cat’s peak sensitivity and acuity were shifted
by 2 and 3.5 octaves respectively towards lower fre-
quencies, relative to human values (Pasternak & Meri-
gan, 1981). Over a 6 log unit range of luminance, the
cat’s sensitivity and acuity decreased by 1 log unit and
1.7 octaves respectively, while human values decreased
much more significantly, by 1.7 log units and 5 octaves
respectively (Pasternak & Merigan, 1981). The end re-sult is that at low (scotopic) light levels, cat and human
contrast sensitivities and acuities are very similar. This is
consistent with the findings that brightness increment
thresholds in humans and cats are similar at scotopic
light levels (Thorn, 1970), but not in high luminance
conditions (Berkley, 1976; Mead, 1942). The human/cat
comparative study of Pasternak and Merigan (1981)
seems to indicate that most of the differences in acuitybetween humans and cats can be explained by the denser
concentration of foveal cones in humans (Osterberg,
1935) and the nearly 1:1 ratio of cones converging to
midget ganglion cells (Missotten, 1974). Indeed, cats
seem to have about three times larger cone spacing
(0.005 mm on the retina or 1.5 min of arc––Steinberg,
Reid, & Lacy, 1973) at the retinal area of peak cone
density than humans (0.002 mm on the retina or 0.5 minof arc––Polyak, 1957) and a cone-to-beta retinal gan-
glion cell convergence ratio of about 6–8:1 (Cleland,
Harding, & Tulunay-Keesey, 1979; Hughes, 1981;
Wassle, Boycott, & Illing, 1981). A more recent psy-
chophysical study comparing the fall off in acuity and
contrast sensitivity with retinal eccentricity in the cat
(Pasternak & Horn, 1991) revealed a good match with
spatial resolution and sensitivity predictions based onthe receptive field center sizes and density of beta retinal
ganglion cells (Cleland et al., 1979; Hughes, 1981;
Wassle et al., 1981).
4.3. Conclusions
In summary, we have combined a psychophysical
approach with miniaturization of a Shack–Hartmann
2168 K.R. Huxlin et al. / Vision Research 44 (2004) 2159–2169
wavefront sensor to quantify wave aberrations in the
normal, adult cat eye. By training cats to fixate visual
targets, we were able to align the wavefront sensor to
their line of sight, while maintaining normal corneal
hydration and physiology through natural blinking.
This method enabled us to obtain consistent, repeatable
measures of Zernike coefficients over a period of time
ranging from several days to several months. We foundthat ocular aberrations in the cat were not significantly
different from those in humans, and that feline optics are
of relatively high quality. These results are intended to
form the basis of future experiments designed to study
the effect of ocular manipulations on optical quality in
this animal model.
Acknowledgements
The authors wish to thank Drs. Ian Cox and Scott
MacRae for stimulating and helpful discussions during
the course of this work and for providing the human
wavefront measurements. We also thank Emily Brandon
for her excellent technical work in behavioral training
and testing of the cats. This work was supported in partby a grant from Bausch & Lomb, Inc., the Research to
Prevent Blindness Foundation and by CEIS, a NY-
STAR-designated Center for Advanced Technology.
References
Artal, P., Marcos, S., Navarro, R., & Williams, D. R. (1995). Odd
aberrations and double-pass measurements of retinal image qual-
ity. Journal of the Optical Society of America A, 12(2), 195–201.
Bahn, C. F., Meyer, R. F., MacCallum, D. K., Lillie, J. H., Lovett, E.
J., Sugar, A., & Martonyi, C. L. (1982). Penetrating keratoplasty
in the cat. A clinically-applicable model. Ophthalmology, 89, 687–
699.
Berkley, M. A. (1976). Cat visual psychophysics: Neural correlates and
comparisons with man. Progress in Psychobiology and Physiological
Psychology, 6, 63–119.
Bloom, M., & Berkley, M. A. (1977). Visual acuity and the near point
of accommodation in cats. Vision Research, 17, 723–730.
Bonds, A. B. (1974). Optical quality of the living cat eye. Journal of
Physiology, 243, 777–795.
Bonds, A. B., Enroth-Cugell, C., & Pinto, L. H. (1972). Image quality
of the cat eye measured during retinal ganglion cell experiments.
Journal of Physiology, 220, 383–401.
Campbell, F. W., & Gubisch, R. W. (1966). Optical quality of the
human eye. Journal of Physiology, 186, 558–578.
Carkeet, A., Luo, H. D., Tong, L., Saw, S. M., & Tan, D. T. H. (2002).
Refractive error and monochromatic aberrations in Singaporean
children. Vision Research, 42, 1809–1824.
Castejon-Mochon, J. F., Lopez-Gil, N., Benito, A., & Artal, P. (2002).
Ocular wavefront aberration statistics in a normal young popula-
tion. Vision Research, 42, 1611–1617.
Cleland, B. G., Harding, T. H., & Tulunay-Keesey, U. (1979). Visual
resolution and receptive field size: Examination of two kinds of cat
retinal ganglion cell. Science, 205, 1015–1017.
Coletta, N. J., Toilo, D., Moskowitz, A., Nickla, D. L., & Marcos, S.
(2003). Wavefront aberrations of the marmoset eye. Investigative
Ophthalmology and Visual Science (Suppl).
DeGroot, S. G., & Gebhard, J. W. (1952). Pupil size as determined by
adapting luminances. Journal of the Optical Society of America, 42,
492–495.
Elul, R., & Marchiafava, P. L. (1964). Accommodation of the eye as
related to behavior in the cat. Archives Italiennes de Biologie, 102,
616–644.
Endl, M. J., Martinez, C. E., Klyce, S. D., McDonald, M. B.,
Coorpender, S. J., Applegate, R. A., & Howland, H. C. (2001).
Effect of larger ablation zone and transition zone on corneal optical
aberrations after photorefractive keratectomy. Archives of Oph-
thalmology, 119, 1159–1164.
Enroth-Cugell, C., & Robson, J. G. (1974). Direct measurement of
image quality in the cat eye. Proceedings of the Physiological
Society, 239, 30P–31P.
Gubisch, R. W. (1967). Optical performance of the human eye. Journal
of the Optical Society of America, 57(3), 407–415.
He, J. C., Sun, P., Held, R., Thorn, F., Sun, X., & Gwiazda, J. E.
(2002). Wavefront aberrations in eyes of emmetropic and moder-
ately myopic school children and young adults. Vision Research,
42, 1063–1070.
Hjortdal, J. O., Olsen, H., & Ehlers, N. (2002). Prospective random-
ized study of corneal aberrations 1 year after radial keratotomy or
photorefractive keratectomy. Journal of Refractive Surgery, 18(1),
23–29.
Howland, H. C., & Howland, B. (1977). A subjective method for the
measurement of monochromatic aberrations of the eye. Journal of
the Optical Society of America, 67(11), 1508–1518.
Hughes, A. (1977). The topography of vision in mammals of
contrasting life style: Comparative optics and retinal organization.
InHandbook of Sensory Physiology, V.II/5. Berlin: Springer Verlag.
Hughes, A. (1981). Cat retina and the sampling theorem; the relation
of transient and sustained brisk-unit cut-off frequency to alpha and
beta-mode cell density. Experimental Brain Research, 42, 196–
202.
Huxlin, K. R., & Pasternak, T. (2004). Training-induced recovery of
visual motion perception after extrastriate cortical damage in the
adult cat. Cerebral Cortex, 14, 81–90.
Jester, J. V., Petroll, W. M., Feng, W., Essepian, J., & Cavanaugh, H.
D. (1992). Radial keratotomy. 1. The wound healing process and
measurement of incisional gape in two animal models using in vivo
confocal microscopy. Investigative Ophthalmology and Visual
Science, 33, 3255–3270.
Judge, S. J., Richmond, B. J., & Chu, F. C. (1980). Implantation of
magnetic search coils for measurement of eye position: An
improved method. Vision Research, 20, 535–538.
Kisilak, M. L., Campbell, M. C. W., Hunter, J. J., Irving, E. L., &
Huang, L. (2003). Monochromatic aberrations in the chick eye
during emmetropization: Goggled vs control eyes. Investigative
Ophthalmology and Visual Science (Suppl).
Koh, S., Maeda, N., Kuroda, T., Hori, Y., Watanabe, H., Fujikado,
T., Tano, Y., Hirohara, Y., & Mihashi, T. (2002). Effect of tear
film break-up on higher-order aberrations measured with wave-
front sensor. American Journal of Ophthalmology, 134(1), 115–
117.
Liang, J., Grimm, B., Goelz, S., & Bille, J. (1994). Objective
measurement of the wave aberration of the human eye with the
use of a Hartmann–Shack wave-front sensor. Journal of the Optical
Society of America, 11, 1949–1957.
Liang, J., & Williams, D. R. (1997). Aberrations and retinal image
quality of the normal human eye. Journal of the Optical Society of
America, 14(11), 2873–2883.
Lu, F., Mao, X. J., Qu, J., Xu, D., & He, J. C. (2003). Monochromatic
wavefront aberrations in the human eye with contact lenses.
Optometry Vision Science, 80(2), 135–141.
Martin, G. R. (1982). An owl’s eye: Schematic optics and visual
performance in Strix aluco L. Journal of Comparative Physiology,
145, 341–349.
K.R. Huxlin et al. / Vision Research 44 (2004) 2159–2169 2169
Mead, L. C. (1942). Visual brightness discrimination in the cat as a
function of luminance. Journal of General Psychology, 60, 223–257.
Mierdel, P., Kaemmerer, M., Krinke, H.-E., & Seiler, T. (1999). Effects
of photorefractive keratectomy and cataract surgery on ocular
optical errors of high order. Graefes’ Archives of Clinical and
Experimental Ophthalmology, 237, 725–729.
Missotten, L. (1974). Estimation of the ratio of cones to neurons in the
fovea of the human retina. Investigative Ophthalmology and Visual
Science, 13, 1045–1049.
Moreno-Barriuso, E., Lloves, J. M., Marcos, S., Navarro, R.,
Llorente, L., & Barbero, S. (2001). Ocular aberrations before and
after myopic corneal refractive surgery: LASIK-induced changes
measured with laser ray tracing. Investigative Ophthalmology and
Visual Science, 42(6), 1396–1403.
Oshika, T., Klyce, S. D., Applegate, R. A., Howland, H. C., & el
Danasoury, M. A. (1999). Comparison of corneal wavefront
aberrations after photorefractive keratectomy and laser in situ
keratomileusis. American Journal of Ophthalmology, 127(1), 1–7.
Oshika, T., Mihyata, K., Tokanuga, T., Samejima, T., Amano, S.,
Tanaka, S., Hirohara, Y., Mihashi, T., Maeda, N., & Fujikado, T.
(2002). Higher order wavefront aberrations of cornea and magni-
tude of refractive correction in laser in situ keratomileusis.
Ophthalmology, 109(6), 1154–1158.
Osterberg, G. A. (1935). Topography of the layer of rods and cones in
the human retina. Acta Ophthalmologica, 6, 11–102.
Pasternak, T., & Horn, K. (1991). Spatial vision of the cat: Variation
with eccentricity. Visual Neuroscience, 6, 151–158.
Pasternak, T., & Maunsell, J. H. R. (1992). Spatiotemporal sensitivity
following lesions of area 18 in the cat. Journal of Neuroscience,
12(11), 4521–4529.
Pasternak, T., & Merigan, W. H. (1981). The luminance dependence of
spatial vision in the cat. Vision Research, 21, 1333–1339.
Pasternak, T., Thompkins, J., & Olson, C. (1995). The role of striate
cortex in visual function of the cat. Journal of Neuroscience, 15,
1940–1950.
Petroll, W. M., Cavanagh, H. D., & Jester, J. V. (1998). Assessment of
stress fiber orientation during healing of radial keratotomy wounds
using confocal microscopy. Scanning, 20, 74–82.
Polyak, S. (1957). The vertebrate visual system. Chicago: University of
Chicago Press.
Porter, J., Guirao, A., Cox, I. G., & Williams, D. R. (2001).
Monochromatic aberrations of the human eye in a large popula-
tion. Journal of the Optical Society of America, 18(8), 1793–1803.
Ramamirtham, R., Norton, T. T., Siegwart, J. T., & Roorda, A.
(2003). Wave aberrations of tree shrew eyes. Investigative Ophthal-
mology and Visual Science (Suppl).
Ramamirtham, R., Roorda, A., Kee, C.-S., Hung, L.-F. F., Qiao, Y.,
& Smith, E. L. (2002). Wave aberrations in the young monkey eye.
Investigative Ophthalmology and Visual Science (Suppl).
Remmel, R. S. (1984). An inexpensive eye movement monitor using the
scieral search coil technique. IEEE Transaction on Biomedical
Engineering, BME-31(4), 388–390.
Seiler, T., Kaemmerer, M., Mierdel, P., & Krinke, H.-E. (2000). Ocular
optical aberrations after photorefractive keratectomy for myopia
and myopic astigmatism. Archives of Ophthalmology, 118, 17–
21.
Sparks, D. L., & Sides, J. P. (1974). Brain stem unit activity related to
horizontal eye movements occurring during visual tracking. Brain
Research, 77, 320–325.
Steinberg, R. H., Reid, M., & Lacy, P. L. (1973). The distribution of
rods and cones in the retina of the cat (Felisdomesticus). Journal of
Comparative Neurology, 148(2), 229–248.
Telfair, W. B., Bekker, C., Hoffman, H. J., Yoder, P. R., Nordquist, R.
E., Eiferman, R. A., & Zenzie, H. H. (2000a). Healing after
photorefractive keratectomy in cat eyes with a scanning midinfra-
red Nd:YAG pumped optical parametric oscillator laser. Journal of
Refractive Surgery, 16, 32–39.
Telfair, W. B., Bekker, C., Hoffman, H. J., Yoder, P. R., Nordquist, R.
E., Eiferman, R. A., & Zenzie, H. H. (2000b). Histological
comparison of corneal ablation with ER:YAG laser, Nd:YAG
optical parametric oscillator, and excimer laser. Journal of Refrac-
tive Surgery, 16(1), 40–50.
Thibos, L. N., Applegate, R. A., Schwiegerling, J. T., Webb, R. V., &
Members, V. S. T. (2001). Standards for reporting the optical
aberrations of eyes. In S. M. MacRae, R. R. Kruger, & R. A.
Applegate (Eds.), Customized corneal ablation. The quest for
SuperVision (pp. 348–361). Thorofare: SLACK Incorporated.
Thibos, L. N., Cheng, X., Phillips, J. R., & Collins, A. (2002). Optical
aberrations of chick eyes. ARVO.
Thorn, F. (1970). Detection of luminance differences by the cat.
Journal of Comparative Physiological Psychology, 70, 326–
334.
Walsh, G., Charman, W. N., & Howland, H. C. (1984). Objective
technique for the determination of monochromatic aberrations of
the human eye. Journal of the Optical Society of America, 1(9), 987–
992.
Wassle, H. (1971). Optical quality of the cat eye. Vision Research, 11,
995–1006.
Wassle, H., Boycott, B. B., & Illing, R.-B. (1981). Morphology and
mosaic of on- and off-beta cells in the cat retina and some
functional considerations. Proceedings of the Royal Society of
London B, 212, 177–195.
Wilcox, Y. G., & Barlow, H. B. (1975). The size and shape of the pupil
in lightly anesthetized cats as a function of luminance. Vision
Research, 15, 1363–1365.
Yinon, U. (1984). Myopia induction in animals following alteration of
the visual input during development: A review. Current Eye
Research, 3, 677–690.