monitoring the association between gps pwv and lightning activity during the 2009 winter monsoon...
TRANSCRIPT
Monitoring the Association between GPS PWV and Lightning Activity during the 2009 Winter Monsoon over Bangi Malaysia
Wayan Suparta, Ja’afar Adnan, Mohd. Alauddin Mohd. Ali Institute of Space Science (ANGKASA), Universiti Kebangsaan Malaysia,
43600 Bangi, Selangor, Malaysia [email protected]
Abstract— One aspect of severe storms that can be monitored is lightning activity. There is no established and accurate model to predict the lightning occurrence and to explain their comprehensive physical mechanisms. This paper aim to monitor the lightning activity associated with water vapor changes to form convective cloud from evaporation due to solar heating. Water vapor content in term of precipitable water vapor (PWV) derived from GPS signals and the surface meteorological data is used to strengthen the GPS signals affected by the lightning. Data on November 2009 coincided with the winter monsoon (northeast monsoon) are selected, which possibly had a lot of rainfall with a high number of lightning activity. The lightning occurrence is recorded by the Surveillance et Alerte Foudre par Interférometrie Radioélectrique (SAFIR). The area for the first study is centered at radius 20 km from UKM GPS station located in Bangi, Malaysia. Results showed that major lightning activity was recorded 12 days during that month and 81% of total sample was correlated with PWV changes before the first strike, and is consistent with an increase in PWV. In most cases in that region found that the lightning activity is frequent in the afternoon between 13:00 and 18:00 local time, which preceded by PWV increase of about 5 mm. The finding suggests that the GPS data can be utilized further as a guide to predict the occurrence of lightning.
Keywords-Monitoring; Lightning activity; GPS PWV; SAFIR; Winter Monsoon
I. INTRODUCTION Tropospheric layer is an electrically neutral atmospheric
region and nondispersive medium for radio frequency below 15 GHz [1]. The delays for GPS carriers and code are identically due to frequency independent. In this layer, delay is maximized when the GPS signals propagate at a low elevation angle and vice versa [2]. The delay can be measured in terms of tropospheric delay, which is divided into hydrostatic and wet components [3]. The hydrostatic component can be measured accurately through the mathematical models, while the wet component contributes below 10% of the total of tropospheric delay is difficult to model due to its irregular distribution along the signal route depending on the geographical position and atmospheric constituents on that location. One of the interests of exploiting the tropospheric delay is beneficial for meteorology application.
Water vapor is one of the causes of delay on GPS signals. The unique structure of water molecules in the large latent heat associated with changes of phase can increase the delay in the path of GPS signals. Water vapor in the tropospheric cavity can also be attributed to the existence of lightning. Lightning incidence can present a serious threat to human life and property. Studies conducted by Holle [4] estimates total 24,000 people were killed and 240,000 injured each year due to lightning. As reported in the Lightning Safety Awareness Handbook, lightning has caused estimated losses of 5 billion dollars in the United States each year. The report also mentions that 67% of lightning injuries occur when victims do outdoor activities. Therefore, development of early warning system detects severe storm is vital to avoid the risk of accidents caused by lightning. In short, early warning information provides an opportunity for earlier prevention in relation to weather problems due to hydro-meteorological hazards associated with natural and human-induced hazards.
In this paper, we aim to monitor the lightning activity associated with water vapor changes through the precipitable water vapor (PWV) derived from GPS. The advancement of GPS receiver technology provides a cost effective for monitoring the tropospheric phenomena on a global basis with fine temporal and spatial resolution. Therefore, the purpose of this work is to utilize GPS data employed to monitor lighting activity. A winter monsoon with possible a lot occurred of rainfall in November 2009 is selected to contrast the response of GPS PWV changes on lightning events.
II. DATA AND METHODOLOGY
A. Dataset and Location The GPS and meteorological data are collected from
Institute of Space Science (ANGKASA) GPS station located at UKM Bangi 2° 55’ 23” N latitude, 101° 46’ 23” E longitude. The system using a Trimble TS5700 dual-frequency GPS receiver and equipped with a Zephyr Geodetic antenna connected to a desktop for data logging. To maximize the reception of GPS signals, the antenna is mounted on the roof of ANGKASA building with an estimated height 35.64 m above sea level. Surface meteorological data has been logged using Paroscientific
2011 International Conference on Environment Science and Engineering (ICESE 2011)
101C978-1-4244-9778-2/11/$26.00 2011 IEEE

MET3A Meteorological System. The system consists of three sensors to measure air pressure (mbar), temperature (°C) and relative humidity (percent) with a sampling rate set at 3s. The GPS signals together with the surface meteorological data are used to determine PWV. Details of PWV determination for this work can be found in Suparta et al. [3]. Fig. 1 shows the location of the study.
Figure 1. Location of GPS station at ANGKASA, UKM Bangi and Rain
gauge at RTM Kajang, Malaysia For lightning monitoring toward identifying the exact
change in PWV variations before and during the lightning, the Surveillance et Alerte Foudre par Interférometrie Radioélectrique (SAFIR) is used to detect lightning activity that occurs between the surface of the earth and the upper troposphere. The system has the capability to detect and record the lightning events such as IC and CG activities and the strength of electrostatic charge (in kA). In Malaysia, the Lightning detection systems are under the Malaysia Meteorological Department (MMD). The base of the system is located in Petaling Jaya, Kuala Lumpur and the control station is located at Kuala Lumpur International Airport (KLIA).
There were 8 SAFIR sensor stations were installed throughout Peninsular Malaysia as shown in Fig. 2.
Figure 2. Distribution of lightning activity (electric discharge) that occurs
throughout Peninsular Malaysia on the November 2, 2009
The model used is a SAFIR3000. The maximum distance between the SAFIR sensor between the stations is about 160 km to 220 km that can cover the range of detection is between 270 km and 280 km. However, the efficiency will be reduced to 90% if the distance is more than 150 km [5]. This system works by using two electrical discharge sensor, each operating at a very high frequency (VHF) and low frequency (LF). The first sensor detects the electrical discharge (pulse) at VHF radio band (114 MHz) using interferometric principles and direction finding to determine the discharges' position. The second detector was operated in LF range (300 Hz - 3 MHz) to detect the stroke of lightning discharge [5]. The study also relates the lightning activity to the rain events. Rainfall data collected at the Kajang station rain gauge, which is about 10 km away from UKM Bangi is supported by the Irrigation and Drainage Department of Malaysia.
B. Data Processing SAFIR data available in ASCII format, consisting of
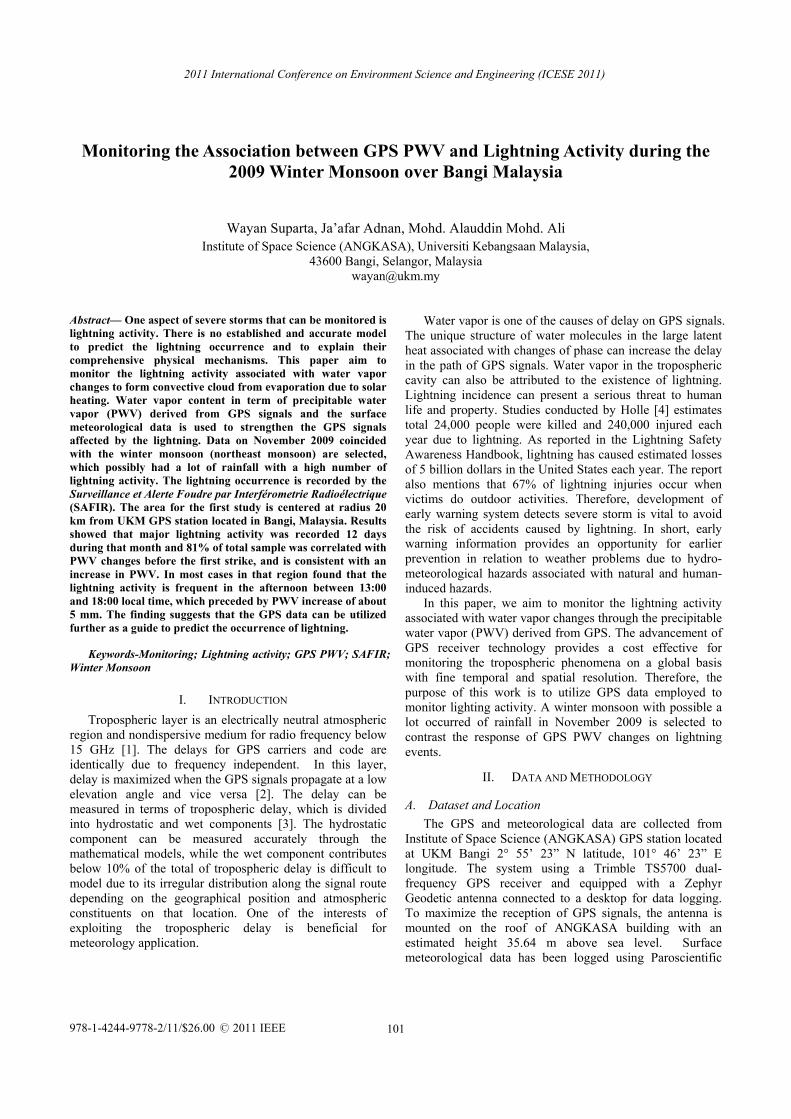
intra/inter-cloud (IC) and cloud-to-ground (CG) with the coordinates and intensity of lightning events. In this work, only data at a distance of 20 km radius centered at UKM Bangi (see Fig. 1) were selected. Fig. 3a shows the distribution of lightning activity that occurred in the study area. The next process is to ensure that the IC and CG data set can be formed and each plotted separately (see Figs. 3b and 3c). In this study, we focus only on the CG flash activity. CG flash is composed of positive (+CG) and negative (-CG) as shown in Figs. 3d and 3e. Dataset (+CG and -CG), which have been processed is plotted in the form of daily basis for a variety of flashes that occurred in November 2009. The lightning activity together with rain, surface parameters and GPS PWV were plotted on the same graph to indicate the correlation between lightning and the other parameters. The analysis carried out is then focused on PWV changes that occur prior to the lightning discharge.
(i)
(iii) (iv)
(ii)
2011 International Conference on Environment Science and Engineering (ICESE 2011)
102
(v)
Figure 3. Lightning event at 20 km radius from UKM GPS station on November 2, 2009 (i) IC and CG, (ii) IC only, (iii) CG only, (iv) –CG only,
(v) +CG only
III. RESULTS AND DISCUSSION
A. Lightning Activity over UKM Bangi Fig. 4 shows the trend of lightning activity in November
2009. From the analysis, 84% of the total lightning consists of ICs, while only 16% of CG lightning types. This means that the frequency CG discharges were occurred about one sixth compared to IC discharge. Meanwhile, the CG flashes composed of -CG of 81% and +CG only 19%, which is about a quarter compared with the CG flash. These findings are differ from the Williams [7] statement that the ratio of (+CG) and (-CG) is 1:10. Conclusively, the most lightning activity was occurred in the evening starting at 13:00 until 22:00 LT.
Figure 4. Lightning distribution on November 2009
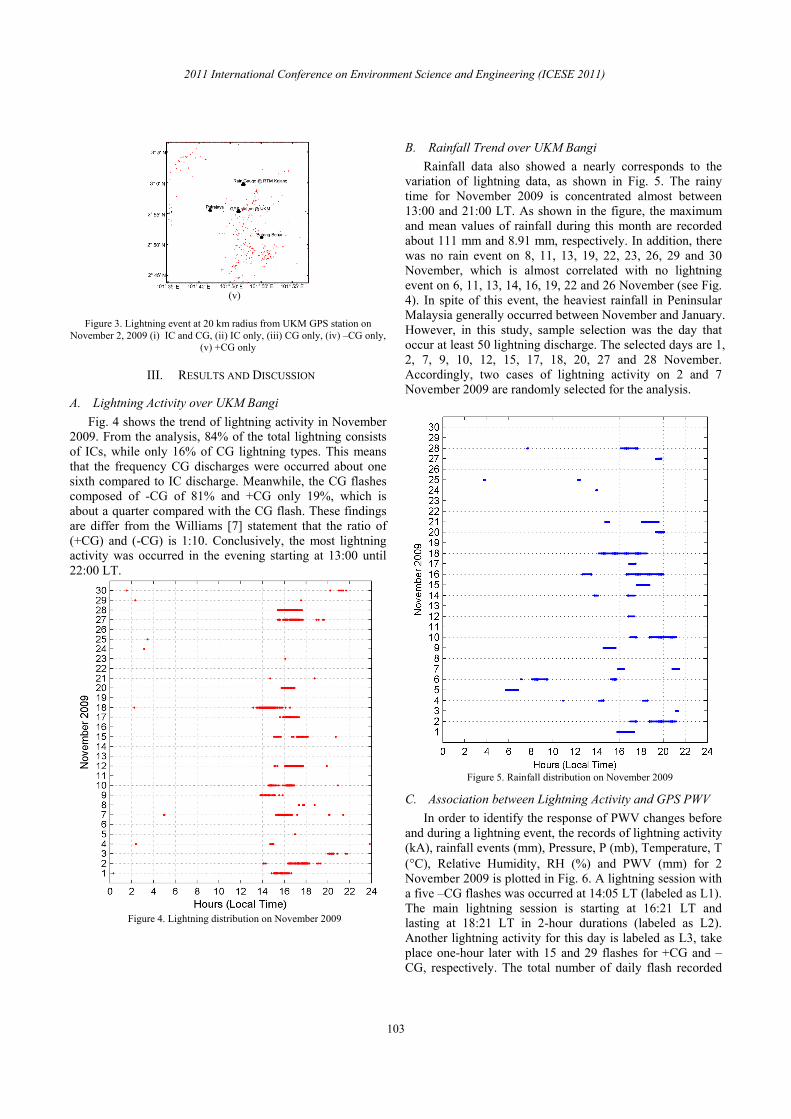
B. Rainfall Trend over UKM Bangi Rainfall data also showed a nearly corresponds to the
variation of lightning data, as shown in Fig. 5. The rainy time for November 2009 is concentrated almost between 13:00 and 21:00 LT. As shown in the figure, the maximum and mean values of rainfall during this month are recorded about 111 mm and 8.91 mm, respectively. In addition, there was no rain event on 8, 11, 13, 19, 22, 23, 26, 29 and 30 November, which is almost correlated with no lightning event on 6, 11, 13, 14, 16, 19, 22 and 26 November (see Fig. 4). In spite of this event, the heaviest rainfall in Peninsular Malaysia generally occurred between November and January. However, in this study, sample selection was the day that occur at least 50 lightning discharge. The selected days are 1, 2, 7, 9, 10, 12, 15, 17, 18, 20, 27 and 28 November. Accordingly, two cases of lightning activity on 2 and 7 November 2009 are randomly selected for the analysis.
Figure 5. Rainfall distribution on November 2009
C. Association between Lightning Activity and GPS PWV In order to identify the response of PWV changes before
and during a lightning event, the records of lightning activity (kA), rainfall events (mm), Pressure, P (mb), Temperature, T (°C), Relative Humidity, RH (%) and PWV (mm) for 2 November 2009 is plotted in Fig. 6. A lightning session with a five –CG flashes was occurred at 14:05 LT (labeled as L1). The main lightning session is starting at 16:21 LT and lasting at 18:21 LT in 2-hour durations (labeled as L2). Another lightning activity for this day is labeled as L3, take place one-hour later with 15 and 29 flashes for +CG and –CG, respectively. The total number of daily flash recorded
2011 International Conference on Environment Science and Engineering (ICESE 2011)
103
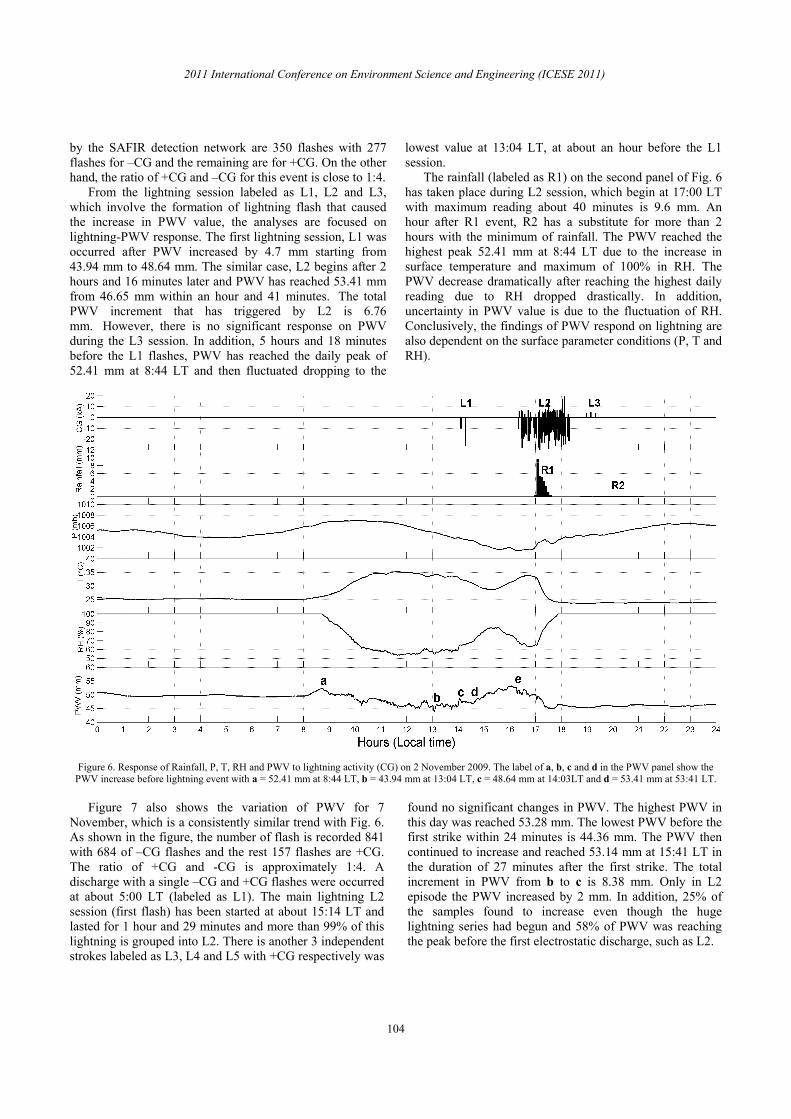
by the SAFIR detection network are 350 flashes with 277 flashes for –CG and the remaining are for +CG. On the other hand, the ratio of +CG and –CG for this event is close to 1:4.
From the lightning session labeled as L1, L2 and L3, which involve the formation of lightning flash that caused the increase in PWV value, the analyses are focused on lightning-PWV response. The first lightning session, L1 was occurred after PWV increased by 4.7 mm starting from 43.94 mm to 48.64 mm. The similar case, L2 begins after 2 hours and 16 minutes later and PWV has reached 53.41 mm from 46.65 mm within an hour and 41 minutes. The total PWV increment that has triggered by L2 is 6.76 mm. However, there is no significant response on PWV during the L3 session. In addition, 5 hours and 18 minutes before the L1 flashes, PWV has reached the daily peak of 52.41 mm at 8:44 LT and then fluctuated dropping to the
lowest value at 13:04 LT, at about an hour before the L1 session.
The rainfall (labeled as R1) on the second panel of Fig. 6 has taken place during L2 session, which begin at 17:00 LT with maximum reading about 40 minutes is 9.6 mm. An hour after R1 event, R2 has a substitute for more than 2 hours with the minimum of rainfall. The PWV reached the highest peak 52.41 mm at 8:44 LT due to the increase in surface temperature and maximum of 100% in RH. The PWV decrease dramatically after reaching the highest daily reading due to RH dropped drastically. In addition, uncertainty in PWV value is due to the fluctuation of RH. Conclusively, the findings of PWV respond on lightning are also dependent on the surface parameter conditions (P, T and RH).
Figure 6. Response of Rainfall, P, T, RH and PWV to lightning activity (CG) on 2 November 2009. The label of a, b, c and d in the PWV panel show the PWV increase before lightning event with a = 52.41 mm at 8:44 LT, b = 43.94 mm at 13:04 LT, c = 48.64 mm at 14:03LT and d = 53.41 mm at 53:41 LT.
Figure 7 also shows the variation of PWV for 7
November, which is a consistently similar trend with Fig. 6. As shown in the figure, the number of flash is recorded 841 with 684 of –CG flashes and the rest 157 flashes are +CG. The ratio of +CG and -CG is approximately 1:4. A discharge with a single –CG and +CG flashes were occurred at about 5:00 LT (labeled as L1). The main lightning L2 session (first flash) has been started at about 15:14 LT and lasted for 1 hour and 29 minutes and more than 99% of this lightning is grouped into L2. There is another 3 independent strokes labeled as L3, L4 and L5 with +CG respectively was
found no significant changes in PWV. The highest PWV in this day was reached 53.28 mm. The lowest PWV before the first strike within 24 minutes is 44.36 mm. The PWV then continued to increase and reached 53.14 mm at 15:41 LT in the duration of 27 minutes after the first strike. The total increment in PWV from b to c is 8.38 mm. Only in L2 episode the PWV increased by 2 mm. In addition, 25% of the samples found to increase even though the huge lightning series had begun and 58% of PWV was reaching the peak before the first electrostatic discharge, such as L2.
2011 International Conference on Environment Science and Engineering (ICESE 2011)
104

The most interesting to be noted to the PWV changes during the lightning event is due to the changes in the surface meteorology. This daily trend is also found in other samples and almost occurred between 08:00 and 10:00 hours in local time. In the meantime, rainfall events were also recorded after 39 minutes of lightning taking place. There are 8 out of 12 lightning day has a rainfall during the lightning event, while the rainfall occurred before or after lightning for the rest of another 4 lightning day. Moreover, all samples used in this study showed there was the rain on
that day. However, the lightning is not necessarily occurred during the rainy day. This scenario is closely related to the influence of the surface meteorological data and the process related to clouding formation. After evaporation, water vapor will move up into the tropospheric layer to form a cloud. Each group of cloud has an electrification property like a huge electronic capacitor, which consists of two different charges and separated by a dielectric. More details charge structure and cloud formation can be found in Williams [7].
Figure 7. Response of Rainfall, P, T, RH and PWV to lightning activity (CG) on 7 November 2009. The label of a, b, and c in the PWV panel show the PWV increase during lightning event with a = 53.28 mm at 8:33 LT, b = 44.36 mm at 14:50 LT, c = 53.14 mm at 15:41 LT.
IV. CONCLUSION
The association between short-term of PWV variation and lightning activity in UKM Bangi has been identified. In most samples, the lightning will occur when the PWV was increased in the evening by at least 5 mm. This shows that the GPS signals indirectly can be used to monitor the lightning activity. In contrast, the highest PWV peak between 08:00 and 10:00 LT is due to the beginning of an increasing in surface temperature and starts decreasing of relative humidity. The PWV increased during this period was a common scenario and cannot be attributed to the formation of lightning. On the other hand, the updraft level during the formation of cloud is plays an important role in determining the formation of lightning.
Rain events showed closely correlated with the lightning activity. From the total sample of lightning days, almost 100% of the sample was accompanied by the rain. In
addition, the PWV change does not show a significant relationship with rainfall events.
ACKNOWLEDGMENT This research has conducted under UKM-GGPM-ICT-
122-2010 grant. The authors would like to thanks the Department of Irrigation and Drainage Malaysia for supporting the provision of rainfall data, Malaysia Meteorology Department for lightning data and the Institute of Space Science (ANGKASA), Universiti Kebangsaan Malaysia for supporting the GPS and meteorological data.
REFERENCES [1]. Langley, R.B. 2000. GPS, the ionosphere, and the solar
maximum. GPS World 11 (7): 44-49. [2]. Brunner, F.K., Wells, W.M. 1993. Effect of the troposphere on
GPS measurements. GPS World 4(1), 42-51.
2011 International Conference on Environment Science and Engineering (ICESE 2011)
105

[3]. Suparta, W., Abdul Rashid, Z.A., Mohd. Ali, M.A., Yatim, B., Fraser, G.J. 2008. Observations of Antarctic precipitable water vapor and its response to the solar activity based on GPS sensing. J. Atmos. Sol.-Terr. Phys. 70: 1419– 1447.
[4]. Holle, R.L. 2008. Lightning-caused deaths and injuries in the vicinity of vehicles, 3rd Conf. on Meteorological Applications of Lightning Data, 19-23 Jan 08, Paper 5.4, 10 pp.
[5]. Drüe, C. A SAFIR lightning location network in Northern Germany. http://www.muk.uni-hannover.de/forschung/allge-mein/forschung/safir_en.htm. Accessed on 2 January 2011.
[6]. Fritz K. Brunner, Walter M. Welsch. 1993. Effect of the Troposphere on GPS Measurements. GPS World 4: 42 - 51.
[7]. Williams, E. 2003. Charge structure and geographical variation of thunderclouds. In The Lightning Flash, edited by V. Cooray: The Institution of Engineering and Technology, London, United Kingdom.
2011 International Conference on Environment Science and Engineering (ICESE 2011)
106