molecular phylogeography of pteronotus davyi (chiroptera: mormoopidae) in mexico
TRANSCRIPT
Molecular phylogeography of Pteronotus davyi(Chiroptera: Mormoopidae) in Mexico
LUIS M. GUEVARA-CHUMACERO, RICARDO LOPEZ-WILCHIS, FRANCISCO F. PEDROCHE, JAVIER JUSTE, CARLOS IBANEZ,AND IRENE D. L. A. BARRIGA-SOSA*
Departamento de Biologıa, Universidad Autonoma Metropolitana Iztapalapa, Avenida San Rafael Atlixco No. 186, Col.Vicentina. Del. Iztapalapa C.P. 09340, Mexico, Distrito Federal, Mexico (LMG-C, RL-W)Departamento de Hidrobiologıa, Universidad Autonoma Metropolitana Iztapalapa, Avenida San Rafael Atlixco No. 186,Col. Vicentina. Del. Iztapalapa C.P. 09340, Mexico, Distrito Federal, Mexico (FFP, IDLAB-S)Estacion Biologica de Donana (CSIC), Apartado Postal 1056, 41080, Sevilla, Espana (JJ, CI)
* Correspondent: [email protected]
Pteronotus davyi, Davy’s naked-backed bat, is a tropical bat whose current distribution in Mexico covers thewatersheds of the Pacific and the Gulf coasts of Mexico, converges at the Isthmus of Tehuantepec, andcontinues into the Yucatan peninsula. We evaluated phylogeographic relationships among 18 populations inMexico using data from the nucleotide sequence of the hypervariable II domain of the mitochondrial DNAcontrol region from 105 specimens. Extant populations were distributed over 3 geographic regions (PacificCoast, Gulf Coast, and Southeastern) that were delineated a priori according to floristic characteristics andbiogeography. Coalescent simulations supported a phylogeographic model of 2 refugia situated in the south ofMexico (Arc and Soconusco refuges) during the late Pleistocene, followed by expansion into Pacific Coast,Gulf Coast, and Southeastern groups. The populations of the Southeast were genetically divergent from thePacific and Gulf Coast populations, supporting the existence of 2 distinct lineages of P. davyi in Mexico, likelydue to the Isthmus of Tehuantepec acting as a geographical barrier. Examination of our data revealed geneticdifferentiation of the Pacific and Gulf coastal groups but at a lower level relative to the Southeast. This patternsuggests that the Sierra Madre Occidental, Sierra Madre Oriental, and Sierra Madre del Sur act as physicalbarriers to dispersal for P. davyi. DOI: 10.1644/08-MAMM-A-212R3.1.
Key words: mitochondrial DNA, phylogeography, Pleistocene, population structure, Pteronotus davyi
E 2010 American Society of Mammalogists
Pteronotus davyi (Gray, 1838), Davy’s naked-backed bat, isan insectivorous bat in the family Mormoopidae, found inCentral and South America. It is distinguished from othermormoopids by its small size (forearm , 50 mm) and byhaving the wing membrane joined over its back, which givesthe appearance of a bare back (Adams 1989). Three subspeciesare recognized (Adams 1989; Smith 1972): P. d. davyi, P. d.incae, and P. d. fulvus. In Mexico only P. d. fulvus has beenrecorded. It is distributed in 2 separate narrow strips thatextend along the Pacific coast (Sonora to Chiapas) andalong the Gulf of Mexico (Tamaulipas to Tabasco); the 2strips converge in the lowlands of the Isthmus of Tehuantepecand continue southeast into the Yucatan peninsula (Adams1989).
The distribution pattern of P. davyi is common among othertropical Mexican bats (Medellın et al. 1997) and is generallyexplained by ecological requirements (Hall 1981). However,phytogeographic findings (Gomez-Pompa 1973; Leon-Cazares
and Gomez-Pompa 1970) suggest that during the coldestperiods of the Pleistocene the tropical lowlands were displacedsouthward from their prior distribution in Mexico, and duringwarmer periods they expanded northward along coastalregions. This phenomenon is expected to have causednumerous episodes of vicariance (Sullivan et al. 2000)associated with successive contractions and expansions inthe distribution of tropical lowland fauna (Braun 1988;Hidalgo-Mihart et al. 2004; Russell 1968). Thus, areas onthe Pacific and Gulf coasts of Mexico may have acted asseparate Pleistocene refugia (Toledo 1982; Wendt 1989).Isolation between coastal regions likely persists due to theinterior mountain systems of the Sierra Madre Occidental,Sierra Madre Oriental, and Sierra Madre del Sur. Previous
w w w . m a m m a l o g y . o r g
Journal of Mammalogy, 91(1):220–232, 2010
220

studies have shown that these mountain ranges act asgeographic dispersal barriers for diverse plant and vertebratespecies (Fa and Morales 1993; Rzedowski 1978). This is likelytrue of P. dayvi.
The occurrence of P. davyi is documented from sea level to1,500 m, but most of the recorded localities are below 600 m(Jimenez-Guzman and Ceballos 2005), suggesting thatmountain peaks up to 3,000 m may act as physical barriersto the species. The Isthmus of Tehuantepec also may act as aneast–west or west–east barrier (Graham 1993; Toledo 1982).The isthmus is a transition zone between the Nearctic andNeotropical faunal regions (Escalante et al. 2004; Morroneand Marquez 2001), but the reason it acts as a barrier isunknown.
Few phylogeographic studies have dealt with the native batsof Mexico (Vazquez-Domınguez and Vega 2006), and no suchstudies examining P. davyi have been reported. Although thephylogenetic relationships of P. davyi to other taxonomicgroups have been inferred (Lewis-Oritt et al. 2001; Simmonsand Conway 2001; Van Den Bussche et al. 2002), evolution-ary processes at the intraspecific level have yet to beexamined.
This work is the 1st effort to evaluate the phylogeographyof P. davyi throughout its distribution in Mexico and is basedon sequences of the hypervariable II (HVII) domain of themitochondrial DNA (mtDNA) control region. Specifically, wesought to infer the phylogenetic and genealogic relationshipsamong populations by analyzing geographic (population andregional) genetic structure and examining the geographicassociation among haplotypes.
MATERIALS AND METHODS
Samples and study area.—Tissue samples for this studywere collected during a project on echolocation in whichanimals were captured, measured, biopsied, and released.Pteronotus davyi is abundant (not endangered [Secretarıa deMedio Ambiente y Recursos Naturales 2002] and LeastConcern [International Union for Conservation of Natureand Natural Resources 2008]) and easy to identify in thefield. Animal handling and sample collection wereconducted in accordance with the guidelines of theAmerican Society of Mammalogists (Gannon et al. 2007).
From a total sample of approximately 440 individual bats(20 each from 22 localities), 105 specimens were used in thepresent study. This sampling scheme included 18 populationsdistributed throughout the species’ range in Mexico (Fig. 1;Appendix I). Specimens were grouped according to a prioridivisions in the range: the Pacific region (n 5 45), the Gulf ofMexico region (n5 29), and the Southeastern region (n5 31).These divisions were based on the floristic provincesdescribed by Rzedowski (1978) and included the mountainsystems (Sierra Madre Occidental, Sierra Madre Oriental, andSierra Madre del Sur, and the Trans-Mexican Volcanic Belt;Fig. 1) that separate coastal populations. The Isthmus ofTehuantepec also has been considered a geographical barrier,
because it separates the northern coastal populations from theSoutheastern population.
Tissue collection, DNA extraction, amplification,and sequencing.—Biopsy samples were obtained from wingmembranes using a 3-mm biopsy punch (Fray Products Corp.,Buffalo, New York) and preserved in 70% ethanol. Biopsiesthat were not used in this study were deposited by RL-W at theLaboratory of Biology and Ecology of Mammals at theUniversidad Autonoma Metropolitana Unidad Iztapalapa.
Total DNA was extracted with a DNAeasy Tissue Kitaccording to instructions of the manufacturer (QIAGEN, Inc.,Valencia, California). We amplified the complete HVIIdomain of the mtDNA control region via polymerase chainreaction (Saiki et al. 1998), using the primers L16517 andHSC (Fumagalli et al. 1996). Primer HSC includes modifi-cations for this study (59-TGT TTT AGG GGT TTG GCA G-39). The reactions were carried out in a total volume of 25 mlwith approximately 50 ng of template DNA, 10 mM of eachprimer, 200 mM of each deoxynucleoside triphosphate, 2 mMof MgCl2, and 2.5 units of Taq DNA polymerase (QIAGEN,Inc.). Polymerase chain reaction cycles were as follows: 45 sdenaturation at 94uC; 35 cycles of denaturation at 94uC for30 s, annealing at 62uC for 30 s, and extension at 72uC for70 s; final extension of 4 min at 72uC. The amplifiedpolymerase chain reaction products were purified using theQIAquick kit (QIAGEN, Inc.) and used in sequencingreactions with the Big Dye Terminator Kit (Perkin-Elmer,Norwalk, Connecticut). Sequencing reactions were electro-phoresed in an ABI 3100 automatic sequencer (AppliedBiosystems, Foster City, California). Sequence alignmentwas conducted with the Clustal W algorithm in the SequenceNavigator 1.0.1 program (Applied Biosystems) using defaultvalues for all alignment parameters and adjusted by eye.
Phylogenetic and genealogical analyses.—Phylogeneticanalysis was performed by maximum-likelihood in PAUP*4.0b10 (Swofford 2002). The best-fit substitution model ofsequence evolution was identified with Modeltest 3.06program (Posada and Crandall 1998). The Akaike informa-tion criterion (AIC—Akaike 1974) recognized the transition-al model + invariable sites + gamma shape model(TIM+I+G—Rodrıguez et al. 1990) as optimal (2lnL 51,495, AIC 5 3,006.5300), with the following basefrequencies: A 5 0.26, C 5 0.31, G 5 0.23, and T 50.20. The proportion of invariant sites (I) was 0.8090 and thegamma distribution shape parameter (G) was 0.8037. Themaximum-likelihood topology was obtained by a 10,000-stepquartet puzzling method (Strimmer and Vonhaeseler 1996). ABayesian analysis also was conducted to assess phylogeneticrelationships using the optimal model of evolution deter-mined with Modeltest and the Markov chain Monte Carlotechnique in MrBayes 3.0 (Huelsenbeck and Ronquist 2001)with the following parameters: Nst 5 6, rates 5 gamma,Ngen 5 2,000,000, frequency 5 100, chains 5 5. Aftereliminating the first 2,000 trees as ‘‘burn-in,’’ we constructeda majority-rule consensus tree with Bayesian posteriorprobabilities for each node.
February 2010 GUEVARA-CHUMACERO ET AL.—PHYLOGEOGRAPHY OF PTERONOTUS DAVYI 221

To establish haplotype relationships, a haplotypic networkwas constructed based on statistical parsimony (Templeton etal. 1992; Templeton and Sing 1993) using TCS 1.21 software(Clement et al. 2000). This program allows the user toestimate phylogenetic relationships when there are low levelsof divergence and provides a 95% plausible set for allhaplotype connections.
Phylogeographic and genetic structure analyses.—Averagegenetic distances among regional groups were evaluated usingthe Tamura–Nei substitution model (TrN—Tamura and Nei1993) implemented in MEGA 2.1 (Kumar et al. 2001). Weused this model because it has been shown in simulations thatif the number of nucleotide substitutions is low (,20%), mostmodels of evolution will render similar genetic distances (Neiand Kumar 2000), and because it is suitable for comparisonsof closely related taxa (e.g., Palma et al. 2005).
Isolation by distance was assessed using the Mantel test(Mantel 1967) to determine associations between geneticdistances from the TrN model and geographic distancescalculated from a 1:3,500,000 scale geographic map of
Mexico. Mantel tests were implemented by the programMantel 2 (Liedloff 1999) with 1,000 permutations.
The existence of hierarchical genetic structure in P. davyithroughout its distribution was assessed by an analysis ofmolecular variance (AMOVA—Excoffier et al. 1992) withgenetic divergence values (FST), using Arlequin 2.0 (Schneideret al. 2000). Three levels of analyses were conducted: amongall populations; Gulf and Pacific Coast versus Southeast; andGulf Coast versus Pacific Coast. In the latter 2 analyses,variance levels were determined between groups, amongpopulations within groups, and within populations.
Polymorphism levels were estimated by haplotype diversity(h) and nucleotide diversity (p), which were determined foreach population and between geographic regions with DNAsp3.14 (Rozas and Rozas 1999). Using the same program, geneflow (Nm) among geographic regions was calculated asdescribed by Hudson et al. (1992).
The hypothesis of population expansion was tested usingthe following neutrality tests in combination: Tajima’s D(Tajima 1989), Fu’s F (Fu 1997), and F* and D* of Fu and Li
FIG. 1.—Geographical distribution of Pteronotus davyi in Mexico in gray (modified from Hall 1981). Closed circles show locations of thePacific region; closed squares of the Southeastern region; and open squares of the Gulf of Mexico region. The 18 populations sampled are: TI 5Tigre; SD 5 Santo Domingo; FR 5 Frontera; VI 5 Viejas; AC 5 Amatlan de Canas; OR 5 Ortices; PO 5 Pochutla; LA 5 Laguitos; CA 5Catemaco; AR 5 Arroyo del Bellaco; PU 5 Pujal; TA 5 Taninul; TR 5 Troncones; SA 5 Sardina; AB 5 Agua Blanca; CK 5 Calakmul; KA5 Kantemo; CAL 5 Calcehtok. Important orographic features of Mexico and possible Pleistocene refuges are shown. Arrows indicate the best-supported biogeographic scenario (by all the present analyses).
222 JOURNAL OF MAMMALOGY Vol. 91, No. 1

(1993). A negative D indicates population expansion. If F issignificant but F* and D* are not, then a history of populationgrowth is indicated. Population expansion also was testedusing R2 of Ramos-Onsins and Rozas (2002) and theexpansion coefficient (S/d) of von Haeseler et al. (1996).The latter is the ratio of the number of variable sites (S) to theaverage number of pairwise nucleotide differences (d), asimplemented in DNAsP. The R2 statistic (Ramos-Onsins andRozas 2002) is based on the difference between the number ofsingleton mutations and the average number of pairwisenucleotide differences. Population growth is indicated bylarger expansion coefficients, and population stationarity isindicated by smaller expansion coefficients (von Haeseler etal. 1996). The existence of population expansions wasinvestigated with the frequency distribution of pairwisedifferences between control region sequences (mismatchdistribution—Rogers and Harpending 1992); this analysiswas performed in Arlequin 2.0 (Schneider et al. 2000). Thenull hypothesis of an expanding population (Rogers andHarpending 1992) produces a unimodal distribution, and aragged distribution indicates a population in stable equilibri-um. Finally, correlation analyses between latitude andnucleotide diversities were conducted in order to evaluatepossible post-Pleistocene events.
Testing phylogeographic hypotheses using coalescent sim-ulations.—We used Mesquite 1.03 (Maddison and Maddison2007) to conduct coalescent simulations. Our approach tothese simulations was modified from previous works (An-thony et al. 2007; Knowles and Maddison 2002; Russell et al.2005; Spellman and Klicka 2006). We conducted simulationsunder 2 a priori hypotheses of Pleistocene populationstructure, using the maximum-likelihood tree for controlregion sequences (see the phylogenetic and genealogicalanalyses section): a single-refugium scenario that posits thatthe Pacific, Gulf, and Southeastern populations of P. davyiwere founded from a single ancestral population (Fig. 2A);and a dual-refugia scenario in which populations of P. davyiwere founded from 2 ancestral populations on either coast nearthe Isthmus of Tehuantepec as proposed by Toledo (1982) andWendt (1989; Fig. 2B).
The Isolation with Migration algorithm (IM—Hey 2006)was used to estimate an effective population size of Ne 5 500for the species. For P. davyi, 1 generation is equal to 2 years(Smith 1972). The branch lengths were expressed as a func-tion of effective population size (0.02Ne—T1, 0.05Ne—T2,0.1Ne—T3, 0.6Ne—T4) and of generation time x (2 3 103).Extreme values correspond to divergence times dating fromthe Wisconsin glacial maximum at ,20,000 years ago (T1) tothe mid-Pleistocene interglacial period at ,610,000 years ago(T4—DeChaine and Martin 2006). Two arbitrary times weretested for intermediate periods (T2 , 50,000 and T3 ,100,000).
Mesquite was used to simulate 10,000 coalescent geneal-ogies constrained by the population history predicted by eachhypothesis being tested. Each hypothesis was tested with the Sstatistic of Slatkin and Maddison (1989). This parameter treatspopulations as categorical variables and measures theminimum number of sorting (or migration) events impliedby the genealogy. For the observed genealogy constrained tofit either the 1-refuge or dual-refugia model, the observed S-value was calculated and compared to the distribution of S-values from the coalescent simulations. Comparison of theobserved versus null distribution of S-values was used todetermine whether the observed genealogy could have beengenerated under a given model. If the S-value of thereconstructed gene tree fell in the lower 5% tail of thedistribution of S-values from simulated gene trees, the nullmodel was rejected.
RESULTS
Composition of nucleotide sequences and haplotypes.—A555-base pair fragment that covered the complete HVIIdomain of the mtDNA control region of P. davyi wassequenced from 105 specimens of P. davyi. This fragmentcontained 56 variable positions. Sixty-seven distinct haplo-types were identified, with the most common being presentin 8.6% of tested individuals (haplotype 4). Ten otherhaplotypes (14.9%) were present in .1 individual (e.g.,haplotype 53, n 5 7; haplotype 63, n 5 7; and haplotype
FIG. 2.—Characterization of the population trees representing different models used in the coalescent simulations: A) single-refugehypothesis, and B) dual-refugia hypothesis. See Fig. 1 for sampling location designations.
February 2010 GUEVARA-CHUMACERO ET AL.—PHYLOGEOGRAPHY OF PTERONOTUS DAVYI 223
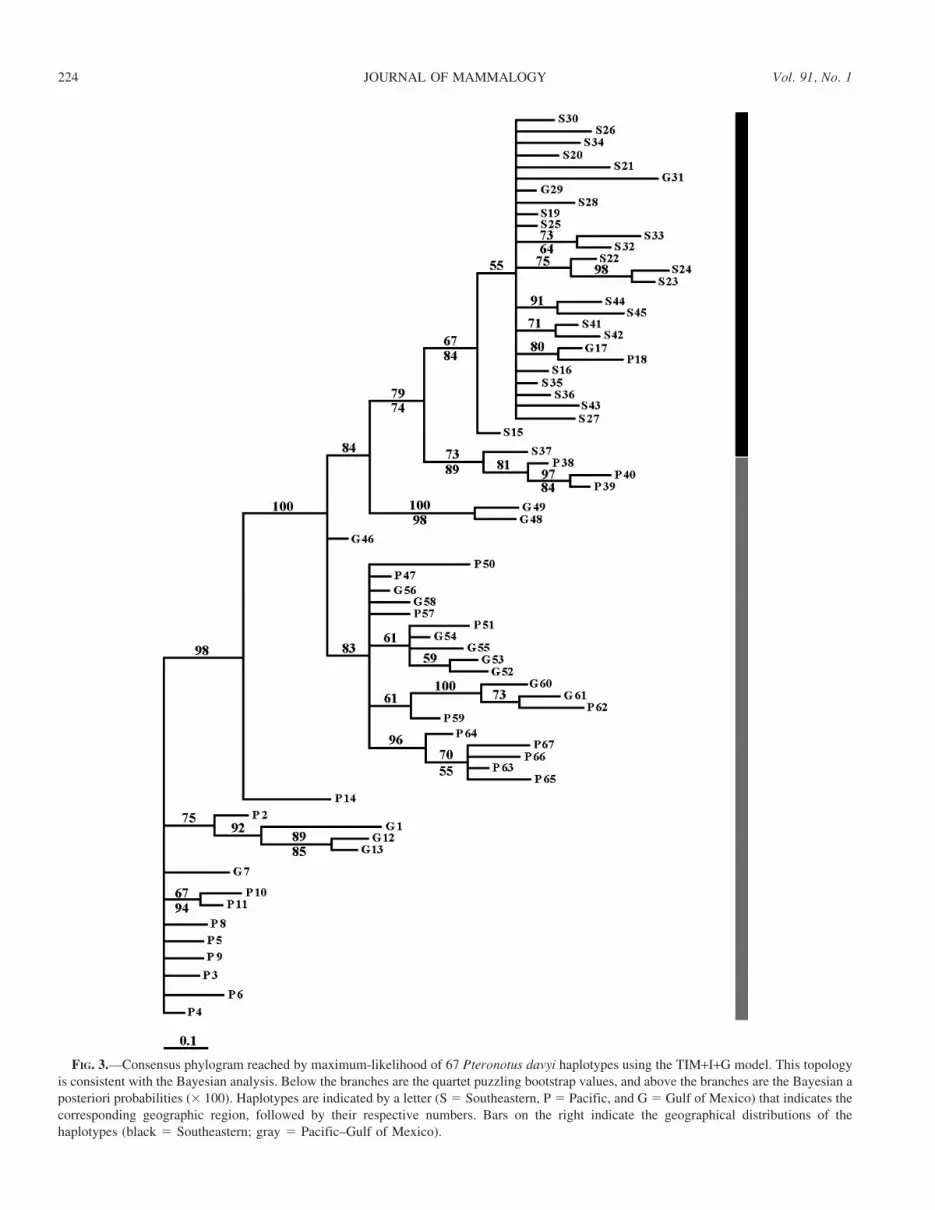
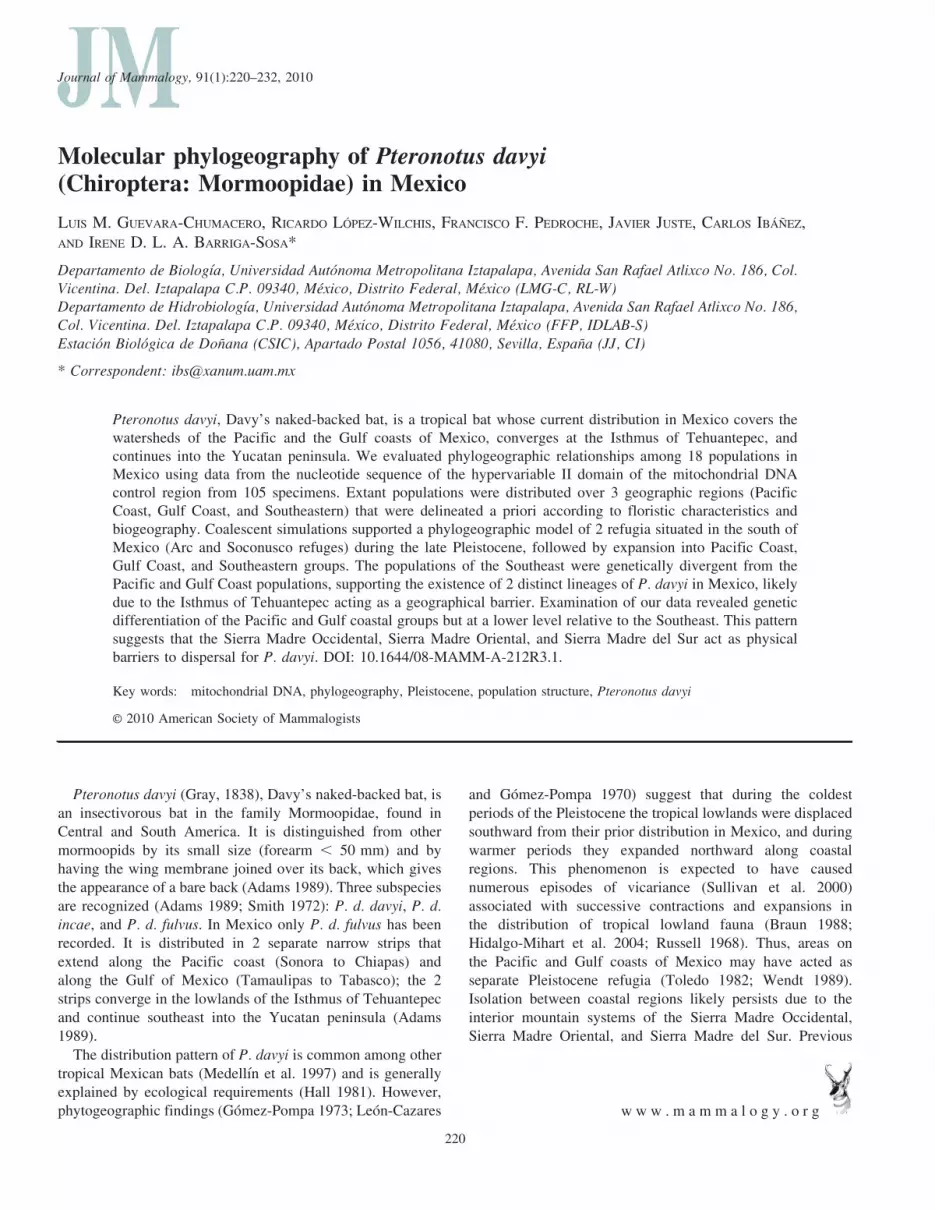
FIG. 3.—Consensus phylogram reached by maximum-likelihood of 67 Pteronotus davyi haplotypes using the TIM+I+G model. This topologyis consistent with the Bayesian analysis. Below the branches are the quartet puzzling bootstrap values, and above the branches are the Bayesian aposteriori probabilities (3 100). Haplotypes are indicated by a letter (S 5 Southeastern, P 5 Pacific, and G5 Gulf of Mexico) that indicates thecorresponding geographic region, followed by their respective numbers. Bars on the right indicate the geographical distributions of thehaplotypes (black 5 Southeastern; gray 5 Pacific–Gulf of Mexico).
224 JOURNAL OF MAMMALOGY Vol. 91, No. 1
41, n 5 5). Each haplotype was submitted to GenBank(accession numbers EF989018–EF989084 for haplotypes 1–67, respectively).
Phylogenetic and genealogical analyses.—Similar topolo-gies were generated by maximum-likelihood and Bayesiananalyses using the TIM+I+G model. The topologies indicateda near-complete isolation of the Southeastern populationsrelative to the Pacific and Gulf Coast populations, withmoderate support in bootstrap and posterior probability values.The relationship of the Pacific and Gulf populations was lessclear in that they did not resolve as separate clades (Fig. 3).The haplotype network resolves 3 groups (Fig. 4) congruentwith those on the phylogenetic tree.
Genetic and phylogeographic structure analyses.—Averagegenetic distance between groups determined using the TrNmodel was highest between populations of the Pacific–Gulfversus Southeastern (2.05%) and lower between the Pacificand Gulf Coast populations (1.77%). Mantel test resultsindicated a significant correlation between genetic andgeographic distances among the 18 populations (Mantelcoefficient: z 5 7,409.75, P , 0.05), suggesting isolationby distance. The same pattern was observed for Pacific andGulf Coast regions only (z 5 3,601.93, P , 0.05), andamong populations of the Gulf Coast region only (z 5110.79, P , 0.05). When analyzed separately, populationswithin the Pacific Coast region (z 5 964.35, P . 0.05) and
within the Southeastern region (z 5 61.84, P . 0.05) didnot show isolation by distance.
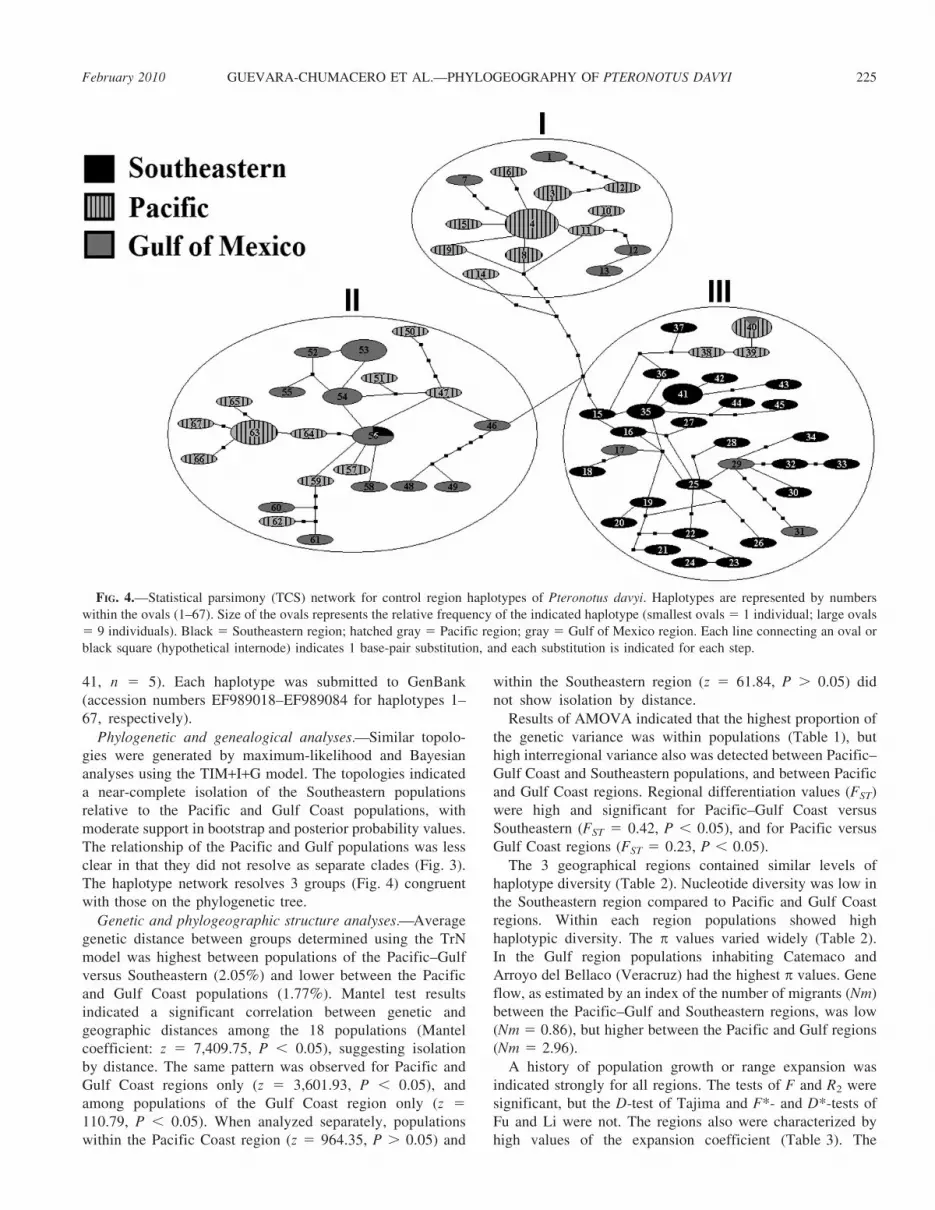
Results of AMOVA indicated that the highest proportion ofthe genetic variance was within populations (Table 1), buthigh interregional variance also was detected between Pacific–Gulf Coast and Southeastern populations, and between Pacificand Gulf Coast regions. Regional differentiation values (FST)were high and significant for Pacific–Gulf Coast versusSoutheastern (FST 5 0.42, P , 0.05), and for Pacific versusGulf Coast regions (FST 5 0.23, P , 0.05).
The 3 geographical regions contained similar levels ofhaplotype diversity (Table 2). Nucleotide diversity was low inthe Southeastern region compared to Pacific and Gulf Coastregions. Within each region populations showed highhaplotypic diversity. The p values varied widely (Table 2).In the Gulf region populations inhabiting Catemaco andArroyo del Bellaco (Veracruz) had the highest p values. Geneflow, as estimated by an index of the number of migrants (Nm)between the Pacific–Gulf and Southeastern regions, was low(Nm 5 0.86), but higher between the Pacific and Gulf regions(Nm 5 2.96).
A history of population growth or range expansion wasindicated strongly for all regions. The tests of F and R2 weresignificant, but the D-test of Tajima and F*- and D*-tests ofFu and Li were not. The regions also were characterized byhigh values of the expansion coefficient (Table 3). The
FIG. 4.—Statistical parsimony (TCS) network for control region haplotypes of Pteronotus davyi. Haplotypes are represented by numberswithin the ovals (1–67). Size of the ovals represents the relative frequency of the indicated haplotype (smallest ovals 5 1 individual; large ovals5 9 individuals). Black 5 Southeastern region; hatched gray 5 Pacific region; gray 5 Gulf of Mexico region. Each line connecting an oval orblack square (hypothetical internode) indicates 1 base-pair substitution, and each substitution is indicated for each step.
February 2010 GUEVARA-CHUMACERO ET AL.—PHYLOGEOGRAPHY OF PTERONOTUS DAVYI 225
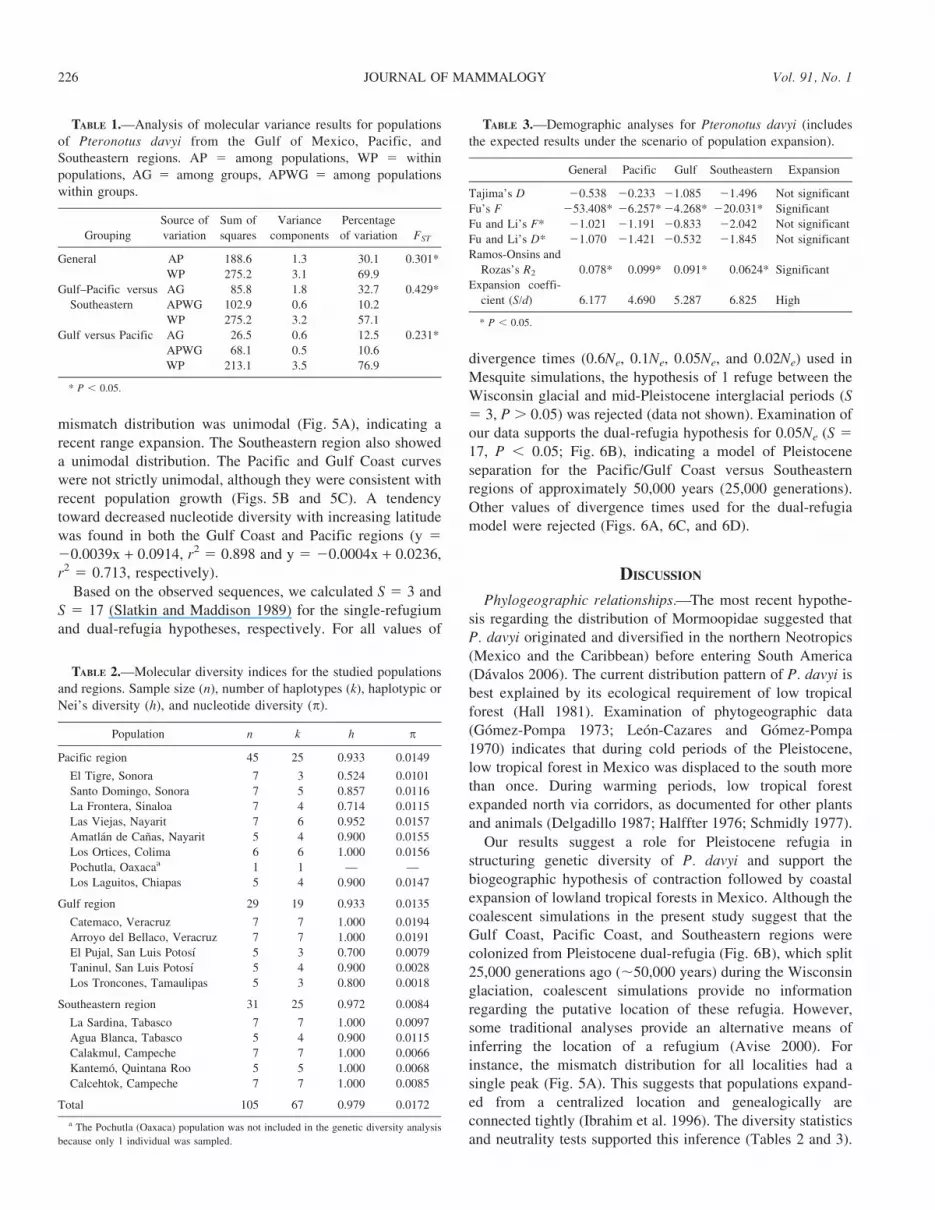
mismatch distribution was unimodal (Fig. 5A), indicating arecent range expansion. The Southeastern region also showeda unimodal distribution. The Pacific and Gulf Coast curveswere not strictly unimodal, although they were consistent withrecent population growth (Figs. 5B and 5C). A tendencytoward decreased nucleotide diversity with increasing latitudewas found in both the Gulf Coast and Pacific regions (y 520.0039x + 0.0914, r2 5 0.898 and y 5 20.0004x + 0.0236,r2 5 0.713, respectively).
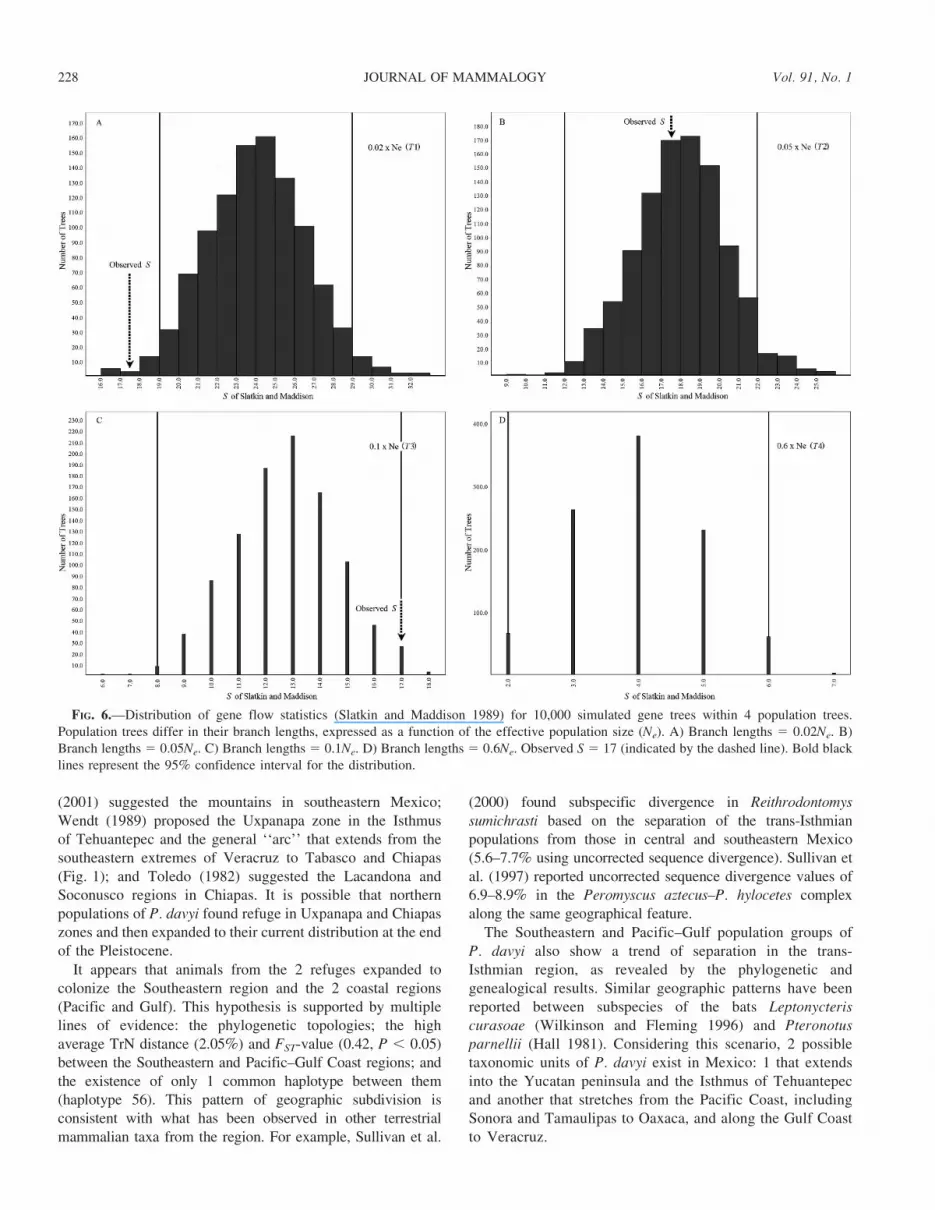
Based on the observed sequences, we calculated S 5 3 andS 5 17 (Slatkin and Maddison 1989) for the single-refugiumand dual-refugia hypotheses, respectively. For all values of
divergence times (0.6Ne, 0.1Ne, 0.05Ne, and 0.02Ne) used inMesquite simulations, the hypothesis of 1 refuge between theWisconsin glacial and mid-Pleistocene interglacial periods (S5 3, P . 0.05) was rejected (data not shown). Examination ofour data supports the dual-refugia hypothesis for 0.05Ne (S 517, P , 0.05; Fig. 6B), indicating a model of Pleistoceneseparation for the Pacific/Gulf Coast versus Southeasternregions of approximately 50,000 years (25,000 generations).Other values of divergence times used for the dual-refugiamodel were rejected (Figs. 6A, 6C, and 6D).
DISCUSSION
Phylogeographic relationships.—The most recent hypothe-sis regarding the distribution of Mormoopidae suggested thatP. davyi originated and diversified in the northern Neotropics(Mexico and the Caribbean) before entering South America(Davalos 2006). The current distribution pattern of P. davyi isbest explained by its ecological requirement of low tropicalforest (Hall 1981). Examination of phytogeographic data(Gomez-Pompa 1973; Leon-Cazares and Gomez-Pompa1970) indicates that during cold periods of the Pleistocene,low tropical forest in Mexico was displaced to the south morethan once. During warming periods, low tropical forestexpanded north via corridors, as documented for other plantsand animals (Delgadillo 1987; Halffter 1976; Schmidly 1977).
Our results suggest a role for Pleistocene refugia instructuring genetic diversity of P. davyi and support thebiogeographic hypothesis of contraction followed by coastalexpansion of lowland tropical forests in Mexico. Although thecoalescent simulations in the present study suggest that theGulf Coast, Pacific Coast, and Southeastern regions werecolonized from Pleistocene dual-refugia (Fig. 6B), which split25,000 generations ago (,50,000 years) during the Wisconsinglaciation, coalescent simulations provide no informationregarding the putative location of these refugia. However,some traditional analyses provide an alternative means ofinferring the location of a refugium (Avise 2000). Forinstance, the mismatch distribution for all localities had asingle peak (Fig. 5A). This suggests that populations expand-ed from a centralized location and genealogically areconnected tightly (Ibrahim et al. 1996). The diversity statisticsand neutrality tests supported this inference (Tables 2 and 3).
TABLE 2.—Molecular diversity indices for the studied populationsand regions. Sample size (n), number of haplotypes (k), haplotypic orNei’s diversity (h), and nucleotide diversity (p).
Population n k h p
Pacific region 45 25 0.933 0.0149
El Tigre, Sonora 7 3 0.524 0.0101
Santo Domingo, Sonora 7 5 0.857 0.0116La Frontera, Sinaloa 7 4 0.714 0.0115
Las Viejas, Nayarit 7 6 0.952 0.0157
Amatlan de Canas, Nayarit 5 4 0.900 0.0155
Los Ortices, Colima 6 6 1.000 0.0156Pochutla, Oaxacaa 1 1 — —
Los Laguitos, Chiapas 5 4 0.900 0.0147
Gulf region 29 19 0.933 0.0135
Catemaco, Veracruz 7 7 1.000 0.0194
Arroyo del Bellaco, Veracruz 7 7 1.000 0.0191El Pujal, San Luis Potosı 5 3 0.700 0.0079
Taninul, San Luis Potosı 5 4 0.900 0.0028
Los Troncones, Tamaulipas 5 3 0.800 0.0018
Southeastern region 31 25 0.972 0.0084
La Sardina, Tabasco 7 7 1.000 0.0097Agua Blanca, Tabasco 5 4 0.900 0.0115
Calakmul, Campeche 7 7 1.000 0.0066
Kantemo, Quintana Roo 5 5 1.000 0.0068
Calcehtok, Campeche 7 7 1.000 0.0085
Total 105 67 0.979 0.0172
a The Pochutla (Oaxaca) population was not included in the genetic diversity analysis
because only 1 individual was sampled.
TABLE 3.—Demographic analyses for Pteronotus davyi (includesthe expected results under the scenario of population expansion).
General Pacific Gulf Southeastern Expansion
Tajima’s D 20.538 20.233 21.085 21.496 Not significant
Fu’s F 253.408* 26.257*24.268* 220.031* Significant
Fu and Li’s F* 21.021 21.191 20.833 22.042 Not significant
Fu and Li’s D* 21.070 21.421 20.532 21.845 Not significantRamos-Onsins and
Rozas’s R2 0.078* 0.099* 0.091* 0.0624* Significant
Expansion coeffi-
cient (S/d) 6.177 4.690 5.287 6.825 High
* P , 0.05.
TABLE 1.—Analysis of molecular variance results for populationsof Pteronotus davyi from the Gulf of Mexico, Pacific, andSoutheastern regions. AP 5 among populations, WP 5 withinpopulations, AG 5 among groups, APWG 5 among populationswithin groups.
Grouping
Source of
variation
Sum of
squares
Variance
components
Percentage
of variation FST
General AP 188.6 1.3 30.1 0.301*
WP 275.2 3.1 69.9
Gulf–Pacific versusSoutheastern
AG 85.8 1.8 32.7 0.429*APWG 102.9 0.6 10.2
WP 275.2 3.2 57.1
Gulf versus Pacific AG 26.5 0.6 12.5 0.231*
APWG 68.1 0.5 10.6WP 213.1 3.5 76.9
* P , 0.05.
226 JOURNAL OF MAMMALOGY Vol. 91, No. 1
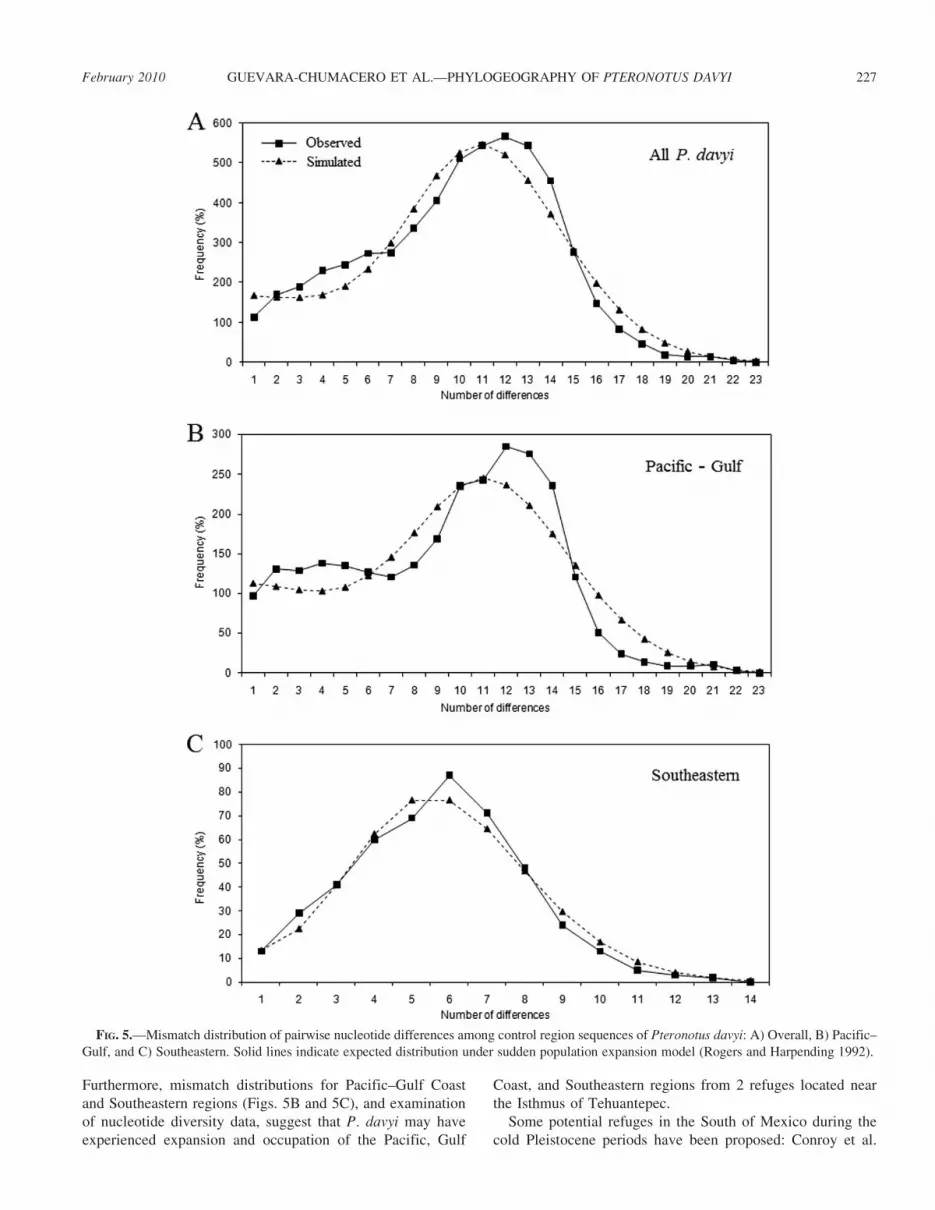
Furthermore, mismatch distributions for Pacific–Gulf Coastand Southeastern regions (Figs. 5B and 5C), and examinationof nucleotide diversity data, suggest that P. davyi may haveexperienced expansion and occupation of the Pacific, Gulf
Coast, and Southeastern regions from 2 refuges located nearthe Isthmus of Tehuantepec.
Some potential refuges in the South of Mexico during thecold Pleistocene periods have been proposed: Conroy et al.
FIG. 5.—Mismatch distribution of pairwise nucleotide differences among control region sequences of Pteronotus davyi: A) Overall, B) Pacific–Gulf, and C) Southeastern. Solid lines indicate expected distribution under sudden population expansion model (Rogers and Harpending 1992).
February 2010 GUEVARA-CHUMACERO ET AL.—PHYLOGEOGRAPHY OF PTERONOTUS DAVYI 227
(2001) suggested the mountains in southeastern Mexico;Wendt (1989) proposed the Uxpanapa zone in the Isthmusof Tehuantepec and the general ‘‘arc’’ that extends from thesoutheastern extremes of Veracruz to Tabasco and Chiapas(Fig. 1); and Toledo (1982) suggested the Lacandona andSoconusco regions in Chiapas. It is possible that northernpopulations of P. davyi found refuge in Uxpanapa and Chiapaszones and then expanded to their current distribution at the endof the Pleistocene.
It appears that animals from the 2 refuges expanded tocolonize the Southeastern region and the 2 coastal regions(Pacific and Gulf). This hypothesis is supported by multiplelines of evidence: the phylogenetic topologies; the highaverage TrN distance (2.05%) and FST-value (0.42, P , 0.05)between the Southeastern and Pacific–Gulf Coast regions; andthe existence of only 1 common haplotype between them(haplotype 56). This pattern of geographic subdivision isconsistent with what has been observed in other terrestrialmammalian taxa from the region. For example, Sullivan et al.
(2000) found subspecific divergence in Reithrodontomyssumichrasti based on the separation of the trans-Isthmianpopulations from those in central and southeastern Mexico(5.6–7.7% using uncorrected sequence divergence). Sullivan etal. (1997) reported uncorrected sequence divergence values of6.9–8.9% in the Peromyscus aztecus–P. hylocetes complexalong the same geographical feature.
The Southeastern and Pacific–Gulf population groups ofP. davyi also show a trend of separation in the trans-Isthmian region, as revealed by the phylogenetic andgenealogical results. Similar geographic patterns have beenreported between subspecies of the bats Leptonycteriscurasoae (Wilkinson and Fleming 1996) and Pteronotusparnellii (Hall 1981). Considering this scenario, 2 possibletaxonomic units of P. davyi exist in Mexico: 1 that extendsinto the Yucatan peninsula and the Isthmus of Tehuantepecand another that stretches from the Pacific Coast, includingSonora and Tamaulipas to Oaxaca, and along the Gulf Coastto Veracruz.
FIG. 6.—Distribution of gene flow statistics (Slatkin and Maddison 1989) for 10,000 simulated gene trees within 4 population trees.Population trees differ in their branch lengths, expressed as a function of the effective population size (Ne). A) Branch lengths 5 0.02Ne. B)Branch lengths 5 0.05Ne. C) Branch lengths 5 0.1Ne. D) Branch lengths 5 0.6Ne. Observed S 5 17 (indicated by the dashed line). Bold blacklines represent the 95% confidence interval for the distribution.
228 JOURNAL OF MAMMALOGY Vol. 91, No. 1
Genetic structuring: Pacific versus Gulf.—The Pacific andGulf regions showed less structure between coasts than thatobserved between both coasts combined and the Southeasternregion. They also showed lower divergence values and highlevels of gene flow, suggesting that they had a commonPleistocene origin. The neutrality tests indicated that thesepopulations later underwent expansion along each coastalslope. Inland mountain ranges with elevations above 3,000 mcould act as contemporary barriers to dispersal between thePacific and Gulf regions, given that most populations of P.davyi live between sea level and 600 m (Jimenez-Guzman andCeballos 2005). Thus, the higher similarity between east–westpopulations reflects a recent, shared past.
Although we observed only 1 shared haplotype (haplotype40) between the 2 coastal regions (Pacific and Gulf), thepossibility of gene flow occurring at lower altitudes on theIsthmus of Tehuantepec cannot be ruled out. This couldexplain the structuring of the haplotype network, particularlygroups I and II, which contained haplotypes from both regions(Fig. 4). This hypothesis also is supported by the resolvedphylogeny, where the Pacific–Gulf Coast clade showedhaplotypes from both regions.
Intraregional structure.—The observed tendency towarddecreased nucleotide diversity with increasing latitude in boththe Gulf Coast and Pacific regions is a geographic patternconsistent with a postglacial stepping stone model ofexpansion toward the north along corridors of tropical lowlandforests on both coasts. Decreased nucleotide diversity alongthe leading edge of a postglacial expansion front has beenobserved in plants (Gonzalez-Astorga et al. 2006) and otherbat species (Ruedi and Castella 2003) from Mexico. Erosionof genetic diversity also could be enhanced by the isolation ofsome populations due to habitat fragmentation (Gonzalez-Astorga and Castillo-Campos 2004), a phenomenon that couldbe particularly acute in the Gulf coast given the current rapiddecline of northern tropical forests. This scenario wouldexplain the low levels of nucleotide diversity observed in thepopulations of San Luis Potosı and Tamaulipas (Pujal,Taninul, and Troncones; Table 2) and the presence of isolationby distance in this region. Although populations in theSoutheastern region did not show isolation by distance orexhibit a latitude-related diversity pattern, it appears that theYucatan peninsula populations have lower diversity than thoseon the Isthmus of Tehuantepec, suggesting that they too arepart of a recent distributional expansion (Table 2).
Our analyses indicated that populations of P. davyi arenot panmictic but rather are structured and separated bygeographic barriers according to models of isolation andcolonization. We suggest that this occurred mainly during theWisconsin portion of the Pleistocene. More than 15 batsspecies (Medellın et al. 1997) and other mammals (Hall 1981)have a distribution pattern similar to that of P. davyi. Thispeculiar pattern has traditionally been attributed to ecologicalcharacteristics. However, it also can be attributed to complexhistorical processes. Examination of these data reveals the needto gain a perspective on the population structure of P. davyi
outside of Mexico, and the need for phylogeographic studies ofclosely related species with similar geographic patterns (e.g.,Pteronotus parnellii or P. personatus) to elucidate aspects ofcoevolution, comparative phylogeography, or both.
RESUMEN
Pteronotus davyi es un murcielago tropical que en Mexicopresenta un area de distribucion que abarca las vertientes delPacıfico y del Golfo de Mexico con union en el Istmo deTehuantepec, hasta la Penınsula de Yucatan. Evaluamos lasrelaciones filogeograficas a nivel intraespecıfico, utilizandodatos de secuencias nucleotıdicas del dominio hipervariableHVII de la region control del ADN mitocondrial en 105especımenes de 18 poblaciones en Mexico, las cuales sedividieron a priori en 3 regiones geograficas (Pacıfico, Golfo ySureste) de acuerdo a sus caracterısticas florısticas y biogeo-graficas. Las simulaciones coalescentes apoyan un modelofilogeografico de 2 refugios en el sur de Mexico (refugio delArco y del Soconusco), a partir de los cuales tuvo lugar unaexpansion durante el Pleistoceno hacia las 3 regiones geogra-ficas, seguido por una division que dio origen a la separacion delos grupos Pacıfico–Golfo y Sureste. Reconocemos unaseparacion genetica de las poblaciones de la region Surestecon respecto a las poblaciones de las regiones Pacıfico y Golfo,apoyando la posibilidad de 2 distintos linajes de P. davyi enMexico, promovido por la presencia del Istmo de Tehuantepeccomo barrera geografica. Identificamos una estructura geneticadiferenciada entre las 2 vertientes costeras (Pacıfico y Golfo)aunque a un nivel inferior respecto a la region Surena,detectando una profunda influencia de los sistemas montanososSierra Madre Occidental, Sierra Madre Oriental y Sierra Madredel Sur como barreras fısicas para la dispersion de P. davyi.
ACKNOWLEDGMENTS
This study is part of the doctoral studies for the 1st author’s Ph.D.in Biological Sciences at the Universidad Autonoma Metropolitana–Iztapalapa, Mexico City. Fellowship CONACYT 164703 was grantedto LMG-C. We thank Biologist A. Soto Castruita, MVZ R. M.Aguilar, and Dr. M. Leon-Galvan for fieldwork support. We alsothank Dr. M. A. Briones for facilitating sample collections in Oaxacaas well as Dr. A. Guillen for his theoretical and practical support. Drs.N. Belfiore and S. M. Wisely provided insightful comments andsuggestions that helped improve this manuscript.
LITERATURE CITED
ADAMS, J. K. 1989. Pteronotus davyi. Mammalian Species 346:1–5.
AKAIKE, H. 1974. A new look at the statistical model identification.IEEE Transactions on Automatic Control 19:716–723.
ANTHONY, N. M., ET AL. 2007. The role of Pleistocene refugia and riversin shaping gorilla genetic diversity in central Africa. Proceedings ofthe National Academy of Sciences 104:20432–20436.
AVISE, J. C. 2000. Phylogeography: the history and formation ofspecies. Harvard University Press, Cambridge, Massachusetts.
BRAUN, J. K. 1988. Systematics and biogeography of the southern flyingsquirrel, Glaucomys volans. Journal of Mammalogy 69:422–426.
February 2010 GUEVARA-CHUMACERO ET AL.—PHYLOGEOGRAPHY OF PTERONOTUS DAVYI 229
CLEMENT, M., D. POSADA, AND K. A. CRANDALL. 2000. TCS: acomputer program to estimate gene genealogies. MolecularEcology 9:1657–1660.
CONROY, C. J., Y. HORTELANO, F. A. CERVANTES, AND J. A. COOK. 2001.The phylogenetic position of southern relictual species ofMicrotus.Zeitschrift fur Saugetierkunde 66:332–344.
DAVALOS, L. M. 2006. The geography of diversification in themormoopids (Chiroptera: Mormoopidae). Biological Journal of theLinnean Society 88:101–118.
DECHAINE, E. G., AND A. P. MARTIN. 2006. Using coalescent simulationsto test the impact of Quaternary climate cycles on divergence in analpine plant–insect association. Evolution 60:1004–1013.
DELGADILLO, C. 1987. Moss distribution and the phytogeographicalsignificance of the Neovolcanic Belt of Mexico. Journal ofBiogeography 14:69–78.
ESCALANTE, T., G. RODRIGUEZ, AND J. J. MORRONE. 2004. Thediversification of Nearctic mammals in the Mexican transitionzone. Biological Journal of the Linnean Society 83:327–339.
EXCOFFIER, L., P. SMOUSE, AND J. QUATTRO. 1992. Analysis ofmolecular variance inferred from metric distances among DNAhaplotypes: application to human mitochondrial DNA restrictiondata. Genetics 131:479–491.
FA, J. E., AND L. M. MORALES. 1993. Patterns of mammalian diversityin Mexico. Pp. 319–361 in Biological diversity of Mexico: originsand distribution (T. P. Ramamoorthy, R. Bye, A. Lot, and J. Fa,eds.). Oxford University Press, New York.
FU, Y. X. 1997. Statistical tests of neutrality of mutations againstpopulation growth, hitchhiking, and background selection. Genet-ics 147:915–925.
FU, Y. X., AND W. H. LI. 1993. Statistical tests of neutrality ofmutations. Genetics 133:693–709.
FUMAGALLI, L., P. TABERLET, L. FAVRE, AND J. HAUSSER. 1996. Originand evolution of homologous repeated sequences in the mitochon-drial DNA control region of shrews. Molecular Biology andEvolution 13:31–46.
GANNON, W. L., R. S. SIKES, AND THE ANIMAL CAREAND USE COMMITTEE
OF THE AMERICAN SOCIETY OF MAMMALOGISTS. 2007. Guidelines ofthe American Society of Mammalogists for the use of wildmammals in research. Journal of Mammalogy 88:809–823.
GOMEZ-POMPA, A. 1973. Ecology of the vegetation of Veracruz. Pp. 73–148 in Vegetation and vegetational history of northern Latin America(A. Graham, ed.). Elsevier Publishing Company, Amsterdam,Netherlands.
GONZALEZ-ASTORGA, J., AND G. CASTILLO-CAMPOS. 2004. Geneticvariability of the narrow endemic tree Antirhea aromaticaCastillo-Campos and Lorence (Rubiaceae, Guettardeae) in atropical forest of Mexico. Annals of Botany (London) 93:521–528.
GONZALEZ-ASTORGA, J., A. P. VOVIVES, P. OCTAVIO-AGUILAR, D.AGUIRRE-FEY, F. NICOLALDE-MOREJON, AND C. IGLESIAS. 2006.Genetic diversity and structure of the cycad Zamia loddigesiiMiq. (Zamiaceae): implications for evolution and conservation.Botanical Journal of the Linnean Society 152:533–544.
GRAHAM, A. 1993. Historical factors and biological diversity inMexico. Pp. 109–127 in Biological diversity of Mexico: originsand distribution (T. P. Ramamoorthy, R. Bye, A. Lot, and J. Fa,eds.). Oxford University Press, New York.
GRAY, J. E. 1838. A revision of the genera of bats (Vespertilionidae),and the description of some new genera and species. Magazine ofZoology and Botany 2:483–505.
HALFFTER, G. 1976. Distribucion de los insectos en la zona detransicion mexicana: relaciones con la entomofauna de Norteamer-ica. Folia Entomologica Mexicana 35:1–64.
HALL, E. R. 1981. The mammals of North America. 2nd ed. Vols. Iand II. John Wiley & Sons, New York.
HEY, J. 2006. IM. http://lifesci.rutgers.edu/,heylab/HeylabSoftware.htm#IM. Accessed 21 April 2008.
HIDALGO-MIHART, M. G., L. CANTU-SALAZAR, A. GONZALEZ-ROMERO,AND C. A. LOPEZ-GONZALEZ. 2004. Historical and present distribu-tion of coyote (Canis latrans) in Mexico and Central America.Journal of Biogeography 31:2025–2038.
HUDSON, R. R., M. SLATKIN, AND W. P. MADDISON. 1992. Estimation oflevels of gene flow from DNA sequence data. Genetics 132:583–589.
HUELSENBECK, J. P., AND F. RONQUIST. 2001. MrBayes: Bayesianinference of phylogenetic trees. Bioinformatics 17:754–755.
IBRAHIM, K. M., R. A. NICHOLS, AND G. M. HEWITT. 1996. Spatialpatterns of genetic variation generated by different forms ofdispersal during range expansion. Heredity 77:282–291.
INTERNATIONAL UNION FOR CONSERVATION OF NATURE AND NATURAL
RESOURCES. 2008. 2008 IUCN Red list of threatened species.www.iucnredlist.org. Accessed 22 September 2008.
JIMENEZ-GUZMAN, A., AND G. CEBALLOS. 2005. Pteronous davyi. Pp.179–180 in Los mamıferos silvestres de Mexico (G. Ceballos andG. Oliva, eds.). Comision Nacional para el Conocimiento y Uso dela Biodiversidad, Mexico, Distrito Federal, Mexico.
KNOWLES, L. L., AND W. P. MADDISON. 2002. Statistical phylogeo-graphy. Molecular Ecology 11: 2623–2635.
KUMAR, S., K. TAMURA, I. JAKOBSEN, AND M. NEI. 2001. MEGA2:molecular evolutionary genetics analysis software. Bioinformatics17:1244–1245.
LEON-CAZARES, J. M., AND A. GOMEZ-POMPA. 1970. La vegetacion delSureste de Veracruz. Boletın Especial del Instituto Nacional deInvestigaciones Forestales, Mexico 5:13–48.
LEWIS-ORITT, N., C. A. PORTER, AND R. J. BAKER. 2001. Molecularsystematics of the family Mormoopidae (Chiroptera) based oncytochrome b and recombination activating gene 2 sequences.Molecular Phylogenetics and Evolution 20:426–436.
LIEDLOFF, A. 1999. Mantel: Mantel nonparametric test calculator,version 2.0. School of Natural Resource Science, QueenslandUniversity of Technology, Brisbane, Australia.
MADDISON, W. P., AND D. R. MADDISON. 2007. Mesquite: a modularsystem for evolutionary analysis. Version 2.0. http://mesquiteproject.org. Accessed 2 October 2008.
MANTEL, N. 1967. The detection of disease clustering and ageneralized regression approach. Cancer Research 27:209–220.
MEDELLIN, R., H. ARITA, AND O. SANCHEZ. 1997. Identificacion de losmurcielagos de Mexico, clave de campo. Asociacion Mexicana deMastozoologıa, A.C. Mexico, Distrito Federal, Mexico.
MORRONE, J. J., AND J. MARQUEZ. 2001. Halffter’s Mexican TransitionZone, beetle generalized tracks, and geographical homology.Journal of Biogeography 28:635–650.
NEI, M., AND S. KUMAR. 2000. Molecular evolution and phylogenetics.Oxford University Press, Oxford, United Kingdom.
PALMA, E. R., ET AL. 2005. Phylogeography of Oligoryzomyslongicaudatus (Rodentia: Sigmodontinae) in temperate SouthAmerica. Journal of Mammalogy 86:191–200.
POSADA, D., AND K. A. CRANDALL. 1998. Modeltest: testing the modelof DNA substitution. Bioinformatics Applications Note 14:817–818.
230 JOURNAL OF MAMMALOGY Vol. 91, No. 1

RAMOS-ONSINS, S. E., AND J. ROZAS. 2002. Statistical properties of newneutrality tests against population growth. Molecular Biology andEvolution 19:2092–2100.
RODRIGUEZ, F., J. F. OLIVER, A. MARIN, AND J. R. MEDINA. 1990. Thegeneral stochastic model of nucleotide substitution. Journal ofTheoretical Biology 142:485–501.
ROGERS, A. R., AND H. HARPENDING. 1992. Population growth makeswaves in the distribution of pairwise genetic differences. MolecularBiology and Evolution 9:552–569.
ROZAS, J., AND R. ROZAS. 1999. DnaSP version 3: an integratedprogram for molecular population genetics and molecular evolu-tion analysis. Bioinformatics 15:174–175.
RUEDI, M., AND V. CASTELLA. 2003. Genetic consequences of the iceages on nurseries of the bat Myotis myotis: a mitochondrial andnuclear survey. Molecular Ecology 12:1527–1540.
RUSSELL, A. L., R. A. MEDELLIN, AND G. F. MCCRACKEN. 2005. Geneticvariation and migration in the Mexican free-tailed bat (Tadaridabrasiliensis mexicana). Molecular Ecology 14:2207–2222.
RUSSELL, R. J. 1968. Revision of pocket gophers of the genusPappogeomys. University of Kansas Publications, Museum ofNatural History 16:581–776.
RZEDOWSKI, J. 1978. Vegetacion de Mexico. Limusa, Mexico, DistritoFederal, Mexico.
SAIKI, R. K., ET AL. 1998. Primer-directed enzymatic amplification ofDNA with a thermostable DNA polymerase. Science 239:487–491.
SCHMIDLY, D. 1977. Factors governing the distribution of mammals inthe Chihuahuan Desert region. Pp. 163–192 in Transactions of thesymposium on the biological resources of the Chihuahuan Desertregion, United States and Mexico (R. H. Wauer and D. H. Riskind,eds.). United States Department of the Interior, National ParkService Transactions and Proceedings Series 3:1–658.
SCHNEIDER, S., D. ROESSLE, AND L. EXCOFFIER. 2000. Arlequin: asoftware for population genetic data. Genetics and BiometryLaboratory, University of Geneva, Geneva, Switzerland.
SECRETARIA DE MEDIO AMBIENTE Y RECURSOS NATURALES. 2002.Proteccion ambiental—especies nativas de Mexico de flora yfauna silvestres—categorıas de riesgo y especificaciones para suinclusion, exclusion o cambio—lista de especies en riesgo. DiarioOficial, Miercoles 6 de Marzo de 2002, Norma Oficial MexicanaNOM-059-ECOL-2001:1–XX.
SIMMONS, N. B., AND T. M. CONWAY. 2001. Phylogenetic relationshipsof mormoopids bats (Chiroptera: Mormoopidae) based onmorphological data. Bulletin of the American Museum of NaturalHistory 258:1–97.
SLATKIN, M., AND W. P. MADDISON. 1989. A cladistic measure of geneflow inferred from the phylogenies of alleles. Genetics 123:603–613.
SMITH, J. D. 1972. Systematics of the chiropteran family Mormoo-pidae. Miscellaneous Publications, Museum of Natural History,University of Kansas 56:1–132.
SPELLMAN, G. M., AND J. KLICKA. 2006. Testing hypotheses ofPleistocene population history using coalescent simulations:phylogeography of the pygmy nuthatch (Sitta pygmaea). Proceed-ings of the Royal Society of London, B. Biological Sciences273:3057–3063.
STRIMMER, K., AND A. VONHAESELER. 1996. Quartet puzzling: a quartetmaximum-likelihood method for reconstructing tree topologies.Molecular Biology and Evolution 13:964–969.
SULLIVAN, J., E. ARELLANO, AND D. S. ROGERS. 2000. Comparativephylogeography of Mesoamerican highland rodents: concertedversus independent response to past climatic fluctuations. Amer-ican Naturalist 155:755–768.
SULLIVAN, J., J. A. MARKERT, AND C. W. KILPATRICK. 1997.Phylogeography and molecular systematics of the Peromyscusaztecus group (Rodentia: Muridae) inferred using parsimony andlikelihood. Systematic Biology 46:426–440.
SWOFFORD, D. L. 2002. PAUP*: phylogenetic analysis usingparsimony (*and other methods). Version 4.0b10. SinauerAssociates, Inc., Publishers, Sunderland, Massachusetts.
TAJIMA, F. 1989. The effect of change in population size on DNApolymorphism. Genetics 123:597–601.
TAMURA, K., AND M. NEI. 1993. Estimation of the number ofnucleotide substitutions in the control region of mitochondrialDNA in humans and chimpanzees. Molecular Biology andEvolution 10:512–526.
TEMPLETON, A. R., K. A. CRANDALL, AND C. F. SING. 1992. A cladisticanalysis of phenotypic associations with haplotypes inferred fromrestriction endonuclease mapping and DNA sequence data. III.Cladogram estimation. Genetics 132:619–633.
TEMPLETON, A. R., AND C. F. SING. 1993. A cladistic analysis ofphenotypic associations with haplotypes inferred from restrictionendonuclease mapping. IV. Nested analysis with cladogramuncertainty and recombination. Genetics 134:659–669.
TOLEDO, V. M. 1982. Pleistocene changes of vegetation in tropicalMexico. Pp. 93–111 in Biological diversification in the tropics (G.Prance, ed.). Columbia University Press, New York.
VAN DEN BUSSCHE, R. A., S. R. HOOFER, AND N. B. SIMMONS. 2002.Phylogenetic relationships of mormoopid bats using mitochondrialgene sequences and morphology. Journal of Mammalogy 83:40–48.
VAZQUEZ-DOMINGUEZ, E., AND R. VEGA. 2006. ¿Donde estamos y haciadonde vamos en el conocimiento genetico de los mamıferosmexicanos? Pp. 67–73 in Genetica y mamıferos mexicanos:presente y futuro (E. Vazquez-Domınguez and D. J. Hafner,eds.). New Mexico Museum of Natural History and ScienceBulletin 32:1–73.
vON HAESELER, A., A. SAJANTILA, AND S. PAABO. 1996. The geneticalarchaeology of the human genome. Nature Genetics 14:135–140.
WENDT, T. 1989. Las selvas de Uxpanapa, Veracruz–Oaxaca, Mexico:evidencia de refugios florısticos cenozoicos. Anales del Instituto deBiologıa, Universidad Nacional Autonoma de Mexico, SerieBotanica 58:29–54.
WILKINSON, G. S., AND T. H. FLEMING. 1996. Migration and evolutionof lesser long-nosed bats Leptonycteris curasoae, inferred frommitochondrial DNA. Molecular Ecology 5:329–339.
Submitted 7 July 2008. Accepted 19 May 2009.
Associate Editor was Carey Krajewski.
APPENDIX ISpecimens examined.—Collection localities, GenBank accession
numbers, and the corresponding haplotype are provided. The relativefrequency of the haplotypes per locality is indicated in squarebrackets.
Pteronotus davyi (67 haplotypes).—El Tigre, Sonora, 29u34.529N,110u49.199W (EF989080-hapl63 [5]; EF989021-hapl4 [1];EF989057-hapl40 [1]); Santo Domingo, Sonora, 27u02.649N,109u00.699W (EF989021-hapl4 [3]; EF989057-hapl40 [1];EF989026-hapl9 [1]; EF989027-hapl10 [1]; EF989056-hapl39 [1]);La Frontera, Sinaloa, 23u25.189N, 105u54.619W (EF989021-hapl4[4]; EF989020-hapl3 [1]; EF989057-hapl40 [1]; EF989081-hapl64[1]); Las Viejas, Nayarit, 21u51.409N, 105u08.819W (EF989080-
February 2010 GUEVARA-CHUMACERO ET AL.—PHYLOGEOGRAPHY OF PTERONOTUS DAVYI 231
hapl63 [2]; EF989021-hapl4 [1]; EF989022-hapl5 [1]; EF989057-hapl40 [1]; EF989083-hapl66 [1]; EF989084-hapl67 [1]); Amatlan deCanas, Nayarit, 20u48.469N, 104u23.549W (EF989025-hapl8 [2];EF989023-hapl6 [1]; EF989064-hapl47 [1]; EF989082-hapl65 [1]);Los Ortices, Colima, 19u04.819N, 103u43.599W (EF989020-hapl3[1]; EF989028-hapl11 [1]; EF989031-hapl14 [1]; EF989055-hapl38[1]; EF989067-hapl50 [1]; EF989068-hapl51 [1]); Pochutla, Oaxaca,15u48.359N, 96u29.009W (EF989079-hapl62 [1]); Los Laguitos,Chiapas, 16u49.319N, 93u08.519W (EF989076-hapl59 [2];EF989019-hapl2 [1]; EF989035-hapl18 [1]; EF989074-hapl57 [1]);Catemaco, Veracruz, 18u27.719N, 95u11.189W (EF989024-hapl7 [1];EF989029-hapl12 [1]; EF989046-hapl29 [1]; EF989048-hapl31 [1];EF989063-hapl46 [1]; EF989065-hapl48 [1]; EF989078-hapl61 [1]);Arroyo del Bellaco, Veracruz, 19u13.329N, 96u38.349W (EF989018-hapl1 [1]; EF989030-hapl13 [1]; EF989034-hapl17 [1]; EF989049-hapl66 [1]; EF989073-hapl56 [1]; EF989075-hapl58 [1]; EF989077-hapl60 [1]); El Pujal, San Luis Potosı, 21u51.609N, 98u56.309W(EF989070-hapl53 [3]; EF989057-hapl40 [1]; EF989073-hapl56 [1]);
Taninul, San Luis Potosı, 21u56.119N, 98u53.169W (EF989070-hapl53 [2]; EF989069-hapl52 [1]; EF989071-hapl54 [1]; EF989072-hapl55 [1]); Los Troncones, Tamaulipas, 23u46.209N, 99u12.179W(EF989070-hapl53 [2]; EF989071-hapl54 [2]; EF989073-hapl56 [1]);La Sardina, Tabasco, 17u27.509N, 92u46.409W (EF989036-hapl19[1]; EF989045-hapl28 [1]; EF989038-hapl21 [1]; EF989050-hapl33[1]; EF989052-hapl35 [1]; EF989054-hapl37 [1]; EF989058-hapl41[1]); Agua Blanca, Tabasco, 17u37.209N, 92u28.349W (EF989058-hapl41 [2]; EF989040-hapl23 [1]; EF989041-hapl24 [1]; EF989073-hapl56 [1]); Calakmul, Campeche, 18u31.379N, 89u49.429W(EF989033-hapl16 [1]; EF989037-hapl20 [1]; EF989049-hapl32[1]; EF989051-hapl34 [1]; EF989052-hapl35 [1]; EF989053-hapl36[1]; EF989058-hapl41 [1]); Kantemo, Quintana Roo, 19u55.849N,88u47.469W (EF989059-hapl42 [1]; EF989061-hapl44 [1]; EF989032-hapl15 [1]; EF989042-hapl25 [1]; EF989044-hapl27 [1]); Calcehtok,Campeche, 19u59.429N, 89u45.839W (EF989060-hapl43 [1];EF989062-hapl45 [1]; EF989039-hapl22 [1]; EF989043-hapl26 [1];EF989052-hapl35 [1]; EF989058-hapl41 [1]; EF989047-hapl30 [1]).
232 JOURNAL OF MAMMALOGY Vol. 91, No. 1