molecular ecology of eukaryotic symbioses in the planktonic
TRANSCRIPT

HAL Id: tel-01412337https://tel.archives-ouvertes.fr/tel-01412337
Submitted on 8 Dec 2016
HAL is a multi-disciplinary open accessarchive for the deposit and dissemination of sci-entific research documents, whether they are pub-lished or not. The documents may come fromteaching and research institutions in France orabroad, or from public or private research centers.
L’archive ouverte pluridisciplinaire HAL, estdestinée au dépôt et à la diffusion de documentsscientifiques de niveau recherche, publiés ou non,émanant des établissements d’enseignement et derecherche français ou étrangers, des laboratoirespublics ou privés.
Molecular ecology of eukaryotic symbioses in theplanktonic ecosystems of the oceanic photic zone
Nicolas Henry
To cite this version:Nicolas Henry. Molecular ecology of eukaryotic symbioses in the planktonic ecosystems of the oceanicphotic zone. Biodiversity and Ecology. Université Pierre et Marie Curie - Paris VI, 2016. English.�NNT : 2016PA066181�. �tel-01412337�

Université Pierre et Marie Curie
École doctorale Sciences de la Nature et de l'Homme : évolution et écologie
Adaptation et diversité en milieu marin UMR 7144 / Évolution des protistes et écosystèmes
pélagiques
Écologie moléculaire des symbioses eucaryotes des
écosystèmes planctoniques de la zone photique des océans
Par Nicolas Henry
Thèse de doctorat de Biologie marine
Dirigée par Colomban de Vargas et Stéphane Audic
Présentée et soutenue publiquement le 2 février 2016
Devant un jury composé de :
Dr Télesphore Sime-Ngando, Directeur de recherche, LMGE Université Blaise Pascal
Pr. Jean-Louis Jamet, Professeur des universités, PROTEE-EBMA Université du Sud Toulon-Var
Dr. Pascal Hingamp, Maître de conférences, IGS Aix Marseille Université
Dr. Yann Moalic, Maître de conférences, LM2E Université de Bretagne Occidentale
Pr. Bernard Kloareg, Professeur des universités, UPMC/CNRS Station Biologique de Roscoff
Dr. Stéphane Audic, Ingénieur de recherche, UPMC/CNRS Station Biologique de Roscoff
Dr. Colomban de Vargas, Directeur de recherche, UPMC/CNRS Station Biologique de Roscoff
Rapporteur
Rapporteur
Examinateur
Examinateur
Examinateur
Co-directeur de thèse
Directeur de thèse
Remerciements
Remerciements
Je tiens tout d'abord à remercier très chaleureusement mes directeurs de thèse,
Colomban de Vargas et Stéphane Audic qui m'ont accompagné pendant ces trois ans.
Je remercie grandement Télesphore Sime-Ngando et Jean-Louis Jamet d'avoir accepté
d'être les rapporteurs de ce manuscrit et également Pascal Hingamp, Yann Moalic et Bernard
Kloareg d'avoir accepté de faire partie de mon jury de thèse en tant qu'examinateurs.
Je remercie l'Université Pierre et Marie Curie qui a financé cette thèse.
Je remercie également tous les membres de l'équipe EPEP, anciens et actuels qui font
le dynamisme de cette équipe et toutes les personnes de la station. Je remercie plus
particulièrement Daniel, Cédric, Johan et Séb qui ont su m'accorder du temps, surtout en cette
fin de thèse.
Merci Laetitia, Daniel (encore), Lionel, Bruno, Julie et Margaux pour tout ce que vous
avez fait pour moi.
Je dédie ce manuscrit à mes parents.
1

Résumé
Résumé
Les symbioses ont un rôle majeur dans le fonctionnement et l'équilibre des
écosystèmes. Dans les océans, qui couvrent près de 70 % de la surface de la planète, vivent
une multitude d'organismes incapables de lutter contre les courants et la plupart sont
microscopiques, il s'agit du plancton. Les organismes du plancton, comme ceux d'autres
écosystèmes, entretiennent des symbioses, mais la nature et l'ampleur de ces interactions sont
encore mal connues dans le plancton du fait la petite taille de ces organismes et de la difficulté
d'échantillonnage des écosystèmes planctoniques, surtout dans les zones les plus éloignées des
côtes. Les principaux objectifs de cette thèse sont de donner un aperçu global de la place
occupée par ces symbioses dans le plancton et de proposer des méthodes originales permettant
leur détection. Les travaux présentés dans ce manuscrit s'appuient sur l'analyse des données
générées lors de l'expédition Tara Oceans (2009-2013) pendant laquelle 210 stations
océaniques ont été échantillonnées à travers le monde. Ils concernent plus précisément le jeu
de données environnemental obtenu grâce au séquençage à haut débit (Illumina) de la région
hypervariable V9 (130 nucléotides) de la sous-unité 18S de l'ADN ribosomique des
organismes eucaryotes (metabarcoding). Dans un premier temps, un état des lieux de la
diversité et de la structure des communautés du pico-nano-micro-mesoplancton (0,8-2000
μm) eucaryote de la zone photique des océans tempérés à tropicaux est réalisé. Il met en
évidence la place importante occupée par les symbiotes au sein de ces communautés. Ensuite,
l'étude de deux cas de symbiose (Blastodinium-Copépodes et Symbiodinium-Tiarina) montre
les difficultés inhérentes à la détection de couples symbiotiques à partir d’un jeu de données
issue d'études par metabarcoding du plancton (flexibilité de la spécificité des symbioses dans
le plancton), mais aussi la possibilité de distinguer les différentes phases de vie des symbiotes
(libres et symbiotiques) lorsque les échantillons étudiés ont été fractionnés. Enfin, un
ensemble de méthodes est proposé afin d'améliorer l'efficacité de la détection de symbioses
dans le cadre d'études par réseau de cooccurrences des communautés planctoniques. L'analyse
de la distribution des metabarcodes le long des fractions de taille (piconano- (0.8-5 µm),
nano- (5-20 µm), micro- (20-180 µm), et meso-plancton (180-2000 µm)) permet de
différencier ceux provenant d'organismes symbiotiques de ceux d'organismes libres, sans a
priori. De plus la comparaison de l'abondance de groupes génétiques définis à différents
niveaux de résolution permet de détecter des associations symbiotiques peu spécifiques et
d'apprécier leur niveau de spécificité.
2

Sommaire
Sommaire
Remerciements......................................................................................................................1
Résumé.....................................................................................................................................2
Sommaire................................................................................................................................3
Introduction...........................................................................................................................4
La symbiose chez les protistes planctoniques.........................................................................5
Étude du plancton océanique et des symbiotes qui le composent.........................................10
Matériel et objectifs...........................................................................................................13
Chapitre I..............................................................................................................................16
Eukaryotic plankton diversity in the sunlit ocean.................................................................22
Determinants of community structure in the global plankton interactome...........................52
Chapitre II............................................................................................................................81
The symbiotic life of Symbiodinium in the open ocean within a new species of calcifying
ciliate (Tiarina sp.)................................................................................................................85
Size-fractionated global DNA metabarcoding reveals ecological significance of the
planktonic dinoflagellate parasite Blastodinium in sunlit oceans.......................................125
Chapitre III........................................................................................................................147
Unveiling photosymbiotic associations across phylogenetic gradients in world-wide marine
plankton based on massive eukaryotic rDNA metabarcoding............................................153
Parasites diversity and abundance in the Tara Oceans dataset challenge classic views on
marine plankton ecology.....................................................................................................181
Conclusion et perspectives............................................................................................206
Bibliographie......................................................................................................................211
Liste des figures................................................................................................................218
Glossaire..............................................................................................................................219
Annexes................................................................................................................................220
Liste des communications orales........................................................................................220
3

Introduction
Introduction
Les océans, qui couvrent 70 % de la surface la planète, constituent le plus grand
écosystème de la planète. Les organismes les peuplant vivent pour la plupart en suspension
dans la colonne d'eau et sont incapables de lutter contre les courants. Il s’agit du plancton qui
est composé de virus, de bactéries, d'archées et d'eucaryotes (uni et multicellulaires). Les
organismes photosynthétiques du plancton océanique (phytoplancton), regroupant des
bactéries et des eucaryotes unicellulaires (protistes) sont à l'origine de près de la moitié de la
production globale de dioxygène et initient la pompe biologique du carbone (Falkowski,
2012). Dans un contexte de changement globaux, l'étude du plancton, acteur majeur du cycle
global du carbone, revêt une importance capitale. Il est en effet impossible d'anticiper les
effets de l'élévation de la concentration du dioxyde de carbone atmosphérique sans avoir une
connaissance fine de la structure et de la dynamique de ces écosystèmes.
Un écosystème, c'est un ensemble d'organismes vivants et de leur environnement
physico-chimique interagissant en tant que système. Jusqu'à la naissance du concept de boucle
microbienne (Azam et al., 1983), la vue des écosystèmes planctoniques se limitait aux
grandes espèces phytoplanctoniques (principalement des dinoflagellés et des diatomées), dont
la croissance est dépendante de la lumière et des nutriments disponibles et qui servent de
nourriture au zooplancton, principalement des copépodes (Steele, 1974). Depuis, l'étude du
plancton a mis à jour une forte intensité d'interactions dans ces écosystèmes, où virus,
bactéries, archées, protistes et métazoaires tiennent des rôles prépondérants (Worden et al.,
2015). Les protistes, du fait de leur large gamme de taille (4 ordres de grandeur de 10 -2 à 10-6
m) et leurs modes de nutrition diversifiés (autotrophie, mixotrophie, hétérotrophie,
symbioses) sont présents à tout les niveaux des écosystèmes planctoniques. Le développement
de techniques moléculaires permettant de s'affranchir de la mise en culture des organismes
étudiés (clonage, séquençage à haut débit, PCR quantitative) a permis de dévoiler une
immense diversité de protistes du pico- et du nanoplancton aux modes trophiques diversifiés
(Moon-van der Staay et al., 2001; Dìez et al., 2001; López-García and Rodríguez-Valera,
2001). Cependant la biogéographie et la distribution des protistes du plancton reste assez peu
connue du fait des difficultés inhérentes à leur étude, organismes microscopiques dans un
environnement gigantesque et difficilement accessible. De plus, les connaissances actuelles de
la diversité des interactions qui s'établissent entre ces protistes (symbiose, prédation,
compétition), généralement acquises suite à la mise en culture de ces organismes, sont encore
plus minces.
4

Introduction
La symbiose chez les protistes planctoniques
La symbiose est une association intime et durable entre deux espèces différentes, selon
la définition de Anton de Bary (de Bary, 1879). Elle englobe toutes les associations allant du
parasitisme au mutualisme. Les symbioses (mutualisme, parasitisme et commensalisme)
constituent avec la prédation et la compétition la majorité des interactions entre organismes.
La description, l'analyse et la compréhension de ces interactions biotiques sont indispensables
à l'étude de la structure et du fonctionnement des écosystèmes (Lidicker, 1979).
Dans le cas du parasitisme, un des partenaires (le parasite) tire profit de l'association
aux dépens de l'autre (l'hôte). Le commensalisme caractérise une association dont l'un des
partenaires tire profit sans que l'autre partenaire ne soit affecté ni positivement ni
négativement. Lorsque les deux partenaires bénéficient de la symbiose, il s'agit de
mutualisme. Il n'existe pas de frontières strictes entre ces différentes catégories, les symbioses
s'inscrivent plutôt dans un continuum. La nature d'une symbiose entre deux organismes peut
varier au cours du temps, soit du fait d'un changement des paramètres du milieu ou de l'état
physiologique d'un des partenaires (Johnson et al., 1997; van Ommeren and Whitham, 2002).
Alors que dans les environnements terrestres et aquatiques (benthiques) de nombreux
travaux ont étudié l'écologie des symbioses au sens large, le rôle écologique des symbioses
planctoniques marines est relativement peu étudié. Quelques travaux ont cependant souligné
l'importance des photosymbioses dans les cycles biogéochimiques globaux, dont celui du
carbone. Dans les déserts océaniques où l'accès aux nutriments est limité (zones oligotrophes),
de grands protistes hétérotrophes (Acanthaires, Spumellaires, Collodaires) vivent en
association avec des micro-algues (Haptophytes, Dinoflagellés, Chlorophytes). Cette
association permet à ces méta-organismes de dominer ces environnement très pauvres où ils
participent grandement à l'export de carbone vers les environnements profonds (Anderson,
1983; Lampitt et al., 2009). Peu de symbiotes ont été caractérisés à la fois
morphologiquement et génétiquement, empêchant ainsi une bonne compréhension de la
dynamique de ces écosystèmes et de leur participation au cycle global du carbone. Les
parasites semblent également tenir un rôle prépondérant dans le fonctionnement des
écosystèmes planctoniques. Alors que les vrais parasites diminuent la valeur sélective de leur
hôte comme le parasite de copépodes Blastodinium (Dinoflagellé) (Skovgaard et al., 2012),
les parasitoïdes quant à eux peuvent induire d'importantes mortalités chez les populations
5

Introduction
d'hôtes. Certaines espèces du genre Amoebophrya (Syndiniales) peuvent avoir un impact
important sur la dynamique des efflorescences de dinoflagellés jusqu'à dans certains cas les
contrecarrer (Chambouvet et al., 2008).
Phototrophie acquise
L'acquisition de la phototrophie par séquestration d'algues endosymbiontiques ou de
leurs plastes est assez répandue parmi les protistes phagotrophes du plancton. La plupart de
ces protistes sont alors capables de combiner hétérotrophie et phototrophie, ils sont alors
mixotrophes. Les protistes mixotrophes, comprenant également les protistes ayant des
chloroplastes permanents et acquérant une partie de leur énergie par phagotrophie, sont une
composante majeure des protistes planctoniques. Leur abondance remet d'ailleurs en question
l'application de la dichotomie phytoplancton-zooplancton, inspirée des écosystèmes terrestres
(dichotomie plantes-animaux) (Flynn et al., 2013), à l'écologie marine. Cependant, ces
protistes sont encore peu connus, ce qui les rend difficiles à intégrer à des modèles
écologiques. Seule une étude approfondie des différents modes de nutrition mixotrophes et de
la biogéographie de ces organismes permettrait de réaliser des modélisations des écosystèmes
planctoniques plus proches de la réalité que celles uniquement basées sur la dichotomie
phytoplancton-zooplancton (Davidson, 2014).
Rétention d'organites
La rétention d'organites est un phénomène répandu chez les protistes mais est
relativement limitée chez les métazoaires. Ce phénomène est plus fréquent dans les habitats
marins que dans les habitats dulçaquicoles et est plus souvent observé dans les écosystèmes
productifs (Stoecker et al., 2009). La rétention d'organites, implique généralement
l'enlèvement de plastides grâce à une modification du comportement de prédation et est alors
appelée kleptoplastie. Ce mécanisme peut également impliquer l'assimilation de
mitochondries, du cytoplasme, d'organites du système endomembranaires, voir du noyau des
proies (Johnson et al., 2007; Koike and Takishita, 2008). Parmi les protistes, les champions de
la rétention d'organites sont les ciliés et les dinoflagellés, tous deux appartenant aux alvéolés.
L'un des cas de rétention d'organites le plus emblématique est le complexe Cryptophyte -
Myrionecta rubra - Dinophysis spp.. Myrionecta rubra dépend de l'ingestion de cryptophyte
pour survivre. Suite à l'ingestion de proies, le cilié séquestre les plastes mais aussi le
cytoplasme et les mitochondries en les entourant d'une membrane provenant de l'hôte. L'hôte
6

Introduction
séquestre également un noyau permettant de réguler le fonctionnement des plastes.
Dynophysis spp., qui est un dinoflagellé toxique, se nourrit de Myrionecta rubra par
myzocytose. Il récupère alors les plastes de sa proie, à l'origine provenant de cryptophytes,
pour les séquestrer à son tour (Nowack and Melkonian, 2010).
Endosymbiose
Dans les écosystèmes marins planctoniques, alors que la rétention d'organites chez les
protistes est caractéristique des milieux eutrophes, les endosymbioses, pour la plupart
photosynthétiques (on parle alors de photosymbioses), sont quant à elles caractéristiques des
milieux oligotrophes (Stoecker et al., 2009). L'endosymbiose est en général à l'origine d'une
amélioration de la productivité de l'écosystème et d'une meilleure accumulation de la
biomasse algale grâce à l'hôte qui fournit une protection contre la prédation et qui permet un
recyclage plus efficace des métabolites (Trench, 1979). Les photosymbioses planctoniques
impliquent généralement de grand protistes phagotrophes (Foraminifères et Radiolaires),
hôtes de diverses micro-algues tels des dinoflagellés, des haptophytes et des prasinophytes.
Quelques espèces de dinoflagellés sont également connues pour être hôtes de micro-algues en
milieu pélagique marin. C'est le cas d'Amphisolenia spp. en symbiose avec des pelagophytes
(Daugbjerg et al., 2013) et Noctiluca scintillans en symbiose avec un prasynophyte
(Pedinomonas noctilucae). Ce dernier grâce à son symbiote peut former des efflorescences
même dans des milieux oligotrophes (Madhu and Jyothibabu, 2012). Afin de maintenir de
telles associations, l'hôte peut acquérir ses symbiotes par deux mécanismes. Soit par
transmission verticale, c'est à dire que les symbiotes sont transmis à la cellule fille par la
cellule mère lors des divisions mitotiques ou par le biais des gamètes, ou alors par
transmission horizontale auquel cas les symbiotes sont directement acquis à partir du milieux
environnant. La transmission horizontale serait le principal mode d'acquisition de symbiotes
dans les écosystèmes planctoniques étant donné que de nombreux hôtes planctoniques ne
possèdent pas de symbiotes au début et à la fin de leur cycle de vie (Shaked and de Vargas,
2006; Decelle et al., 2012). Contrairement aux photosymbioses des habitats benthiques,
comme celles entre les coraux et le dinoflagellé Symbiodinium, dans les habitats pélagiques
oligotrophes, les populations de micro-algues symbiotiques en phase libre sont plus
importantes que celles in hospite, très probablement pour faciliter la transmission horizontale
dans un milieu où les chances de rencontre entre organismes sont faibles (Decelle, 2013). Les
pressions de sélection sur les populations de micro-algues seraient donc plus importantes
lorsqu'elles sont en phase libre. Ce qui expliquerait pourquoi la spécificité des
7

Introduction
photosymbioses tend à être plus faible en milieu planctonique, où seules quelques espèces de
micro-algues ont été décrites en symbiose avec une diversité importante d'hôtes (Decelle et
al., 2012; Probert et al., 2014).
Parasitisme
Le parasitisme est considéré comme le mode de consommation le plus fréquent dans la
nature et près de la moitié des espèces sur Terre pourrait être parasitique (Meeûs and Renaud,
2002; Windsor, 1998). À l'échelle des écosystèmes, la biomasse de parasites est loin d'être
négligeable et peut dépasser celle des superpredateurs dans les ecosystèmes aquatiques (Kuris
et al., 2008). Alors que d'importants efforts ont été investis dans l'étude de l'écologie et de
l'évolution des parasitoses du phytoplancton (Kagami et al., 2007; Rasconi et al., 2012) et du
zooplancton (Burns, 1989; Decaestecker et al., 2005) dulçaquicole, assez peu d'études ont
abordé l'importance écologique du parasitisme dans le plancton marin à l'échelle des océans.
Pourtant les protistes parasites y sont abondants, diversifiés et y infectent une large gamme
d'hôtes (Skovgaard et al., 2012; Jephcott et al., 2016; Scholz et al., 2016). On distingue
généralement les vrais parasites, qui n'induisent pas directement la mort de leur hôtes, des
parasitoïdes qui induisent systématiquement la mort de leur hôte pour achever leur cycle de
vie.
Epibiontes
Dans les écosystèmes planctoniques, des protistes sont couramment observés vivant
sur d'autres organismes, généralement des crustacés planctoniques. Il s'agit généralement de
ciliés (Zoothamnium spp., Paracineta spp.) et de diatomées (Pseudohimantidium spp.). La
densité d'épibiontes par hôte peut devenir très importante réduisant ainsi la motilité de ce
dernier. Il est alors plus difficile pour l'hôte d'échapper à ses prédateurs.
Vrais parasites
Dans le plancton marin, les vrais parasites sont toujours associés à des métazoaires.
Les copépodes qui sont d'important consommateurs de protistes planctoniques (diatomées,
ciliés et dinoflagellés principalement), avec plus de 2500 espèces planctoniques marines
(Razouls et al., 2005), représentent un important réservoir d'hôtes pour ces parasites. Ils sont
associés à une diversité élevée de protistes parasites (Ho and Perkins, 1985), principalement
parmis les Alvéolés comme par exemple Blastodinium spp. (dinoflagellé) (Skovgaard et al.,
8

Introduction
2012), les Ellobiopsidae (Protalveolata) (Walkusz and Rolbiecki, 2007), les ciliés apostomes
(Ohtsuka et al., 2004; Guo et al., 2012) et Cephaloidophora spp. (Apicomplexe) (Gobillard,
1964). Alors que les espèces appartenant au genre Blastodinium ne sont associées qu'avec des
copépodes planctoniques, les autres infectent d'autres crustacés planctoniques comme le krill
(Euphausiacea) mais aussi des crustacés benthiques (Balanus spp.) dans le cas de
Cephaloidophora spp.. Même si ces parasites n'induisent pas directement la mort de leur hôte,
il diminuent la valeur sélective (fitness) de leur hôte, généralement en les privant d'une partie
de leur énergie. Certains parasites sont qualifiés de castrateurs, c'est à dire qu'ils empêchent
leur hôte de se reproduire. C'est le cas par exemple des femelles copépodes qui, lorsqu'elles
sont infectées par Blastodinium spp., ne peuvent plus produire d’œufs.
Parasitoïdes
Les protistes parasitoïdes sont très abondants et très diversifiés dans le plancton. Ils
peuvent être associés à des métazoaires et à d'autres protistes. Du fait de la vitesse de leur
développement et de leur capacité à produire un nombre important de spores, ces parasites
peuvent être très virulents et ont de ce fait un rôle très important dans la régulation des
populations de protistes et de métazoaires planctoniques (principalement les copépodes). En
environnement planctonique côtier, d'importants efforts ont été investis dans l'étude de la
diversité et de la dynamique des protistes parasitoïdes infectant des micro-algues à l'origine
d'efflorescences toxiques tel Alexandrium spp., Karenia spp. et Dinophysis spp. (Park et al.,
2004). Il a ainsi été démontré que Amoebophrya spp. (Syndiniales) et Parvilucifera spp.
(Perkinsea) sont capables d'inhiber les efflorescences de leurs hôtes (Chambouvet et al.,
2008). Des parasites morphologiquement décris comme appartenant au genre Amoebophrya
sont également connus pour infecter d'autres protistes comme des radiolaires et des ciliés
(Cachon, 1964). D'autres espèces de syndiniales ont été décrite en milieux planctonique. C'est
le cas par exemple de Syndinium turbo, parasite de copépodes et le genre Euduboscquella,
parasite de ciliés. De récentes analyses de séquences environnementales d'ADN ribosomique
ont permis de dévoiler une importante diversité de ribotypes assignés à des syndiniales, ce qui
suggère un rôle majeur de ces organismes dans les écosystèmes planctoniques à l'instar des
virus (phages) régulant les populations de bactéries.
9

Introduction
Étude du plancton océanique et des symbiotes qui le composent
Contraintes de l'environnement pélagique
L'une des raisons expliquant une meilleure connaissance des symbioses des
environnements terrestres et côtiers est la relative facilité d'échantillonnage des organismes les
peuplant. Les écosystèmes planctoniques océaniques nécessitent des moyens importants pour
être échantillonnés. Ainsi nous ne disposons généralement que de quelques instantanés de ces
écosystèmes particuliers où les organismes sont très dilués. Ces derniers sont caractérisés par
des taux métaboliques élevés et des durées de vie relativement courtes par rapport aux
organismes terrestres. Les cellules phytoplanctoniques vivent quelques jours voir quelques
semaines alors que les plantes terrestres vivent en général plusieurs mois (Smetacek, 2012). Il
est donc relativement difficile dans le plancton d'observer des associations symbiotiques,
durables à l'échelle des organismes impliqués, mais éphémères à notre échelle. La petite taille
des organismes du plancton et parfois le manque de caractères morphologiques permettant
leur identification sont également un frein à l'identification d'associations symbiotiques. Les
symbioses le plus souvent observées dans le plancton impliquent des hôtes de grande taille,
ayant une durée de vie relativement longue et/ou pour lesquels l'association est obligatoire
(Rhizariens, copépodes).
Barcoding et metabarcoding
Le barcoding moléculaire (DNA barcoding) fut proposé en 2003 comme méthode
permettant l'identification d'espèces (Hebert et al., 2003). Cette méthode utilise de très courtes
séquences génétiques d'une partie rigoureusement sélectionnée du génome (barcode) et les
compare à des bases de données de référence afin de définir l'identité de l'organisme
échantillonné. La région de gène utilisée comme barcode standard pour presque tous les
animaux est une partie de 648 paires de bases du gène mitochondrial de la cytochrome c
oxydase (COI). Chez les plantes, la COI n'évolue pas assez vite et des régions des gènes
chloroplastiques de la maturase K (matK) et de la grande unité de la Rubisco (rbcL) sont alors
classiquement utilisés. Avec l'avènement du séquençage à haut débit (454 et Illumina) le
concept de metabarcoding fut formalisé (Taberlet and Coissac, 2012). Cette technique, à la
différence du barcoding classique, vise à séquencer l'ensemble des barcodes d'un échantillon
environnemental et non d'un organisme. Les protistes se caractérisent par une très importante
10

Introduction
diversité phylogénétique, avec des lignées plus éloignées génétiquement entre elles que les
plantes des animaux. Afin de couvrir l'ensemble des eucaryotes il est nécessaire de définir un
marqueur génétique suffisamment conservé pour être présent chez tous les eucaryotes et assez
résolutif pour différencier des genres voire des espèces. Il doit être également relativement
court du fait de la faible taille des séquences obtenues par séquençage à haut débit (quelques
centaines de nucléotides). Au début des années 2010, la région V9, une région hypervariable
du gène ribosomique 18S, d'environ 130 nucléotides, est apparue comme un bon compromis
pour étudier par metabarcoding les communautés eucaryotes provenant d'échantillons
environnementaux (Amaral-Zettler et al., 2009). Cet outil utilisable pour des échantillons
anciens et actuels, a révolutionné le champ de l'écologie, et plus particulièrement les études de
la biodiversité des micro-organismes. En plus de fournir une mesure de la richesse génétique
des communautés étudiées, le metabarcoding permet, grâce au nombre de lectures associé à
chaque metabarcode, d'obtenir leur abondance relative. Il est alors possible d'adapter les
techniques d'écologie numérique à ce type de données afin d'en tirer des hypothèses sur la
diversité et la dynamiques des communautés étudiées (Ji et al., 2013).
Détection statistique des associations
Dans le contexte d'une étude de communautés naturelles par metabarcoding, il est
possible, à partir des données d'abondance, de prédire des relations entre organismes en
faisant le postulat que des patrons de distribution fortement non aléatoires sont induits par des
processus écologiques (Faust and Raes, 2012). Prédire des associations à partir de ce principe
est relativement aisé : quand deux espèces (ou entités génétiques) sont distribuées de manière
similaire parmi différents échantillons, que leurs abondances sont positivement corrélées, il
s'agit d'une association positive ; lorsque les distributions sont anti-corrélées, on parle
d'association négative. Il est cependant difficile de faire le lien entre ces deux types
d'association statistiques et les processus écologiques à leur origine. On peut cependant
présumer, sans trop de risque de se tromper, que deux organismes en symbiose, c'est à dire
formant une association intime et durable, devraient former une association statistiquement
positive. Il semble cependant difficile de capturer des associations entre des parasitoïdes et
leurs hôtes de cette manière car ils produisent un nombre considérable de propagules et leur
association est relativement courte dans le temps. Ils peuvent donc être très abondants sous
forme de propagules sans qu'il n'y ait d'hôtes à infecter. La comparaison des patrons
d'abondance des entités génétiques issus d'études par metabarcoding apparaît, malgré ses
11

Introduction
limites actuelles, comme étant une voie prometteuse pour la détection de nouvelles
symbioses, en s'affranchissant d'une partie des contraintes de temps et d'argent inhérentes à
l'étude des communautés planctoniques océaniques. Cependant ces techniques ne suffisent pas
à elles seules à décrire de nouvelles symbioses. La description de nouvelles symbioses entre
micro-organismes doit passer systématiquement par une observation directe du phénomène au
microscope. Il est donc très important, lorsque l'on souhaite détecter de nouvelles symbioses à
partir de données de metabarcoding, de disposer en parallèle d'échantillons biologiques fixés.
La validation morpho-génétique d'une association statistique peut alors être exécutée
rapidement en concentrant l'isolement et le séquençage des organismes correspondant à
l'assignation taxinomique des metabarcodes corrélés dans l'échantillon où ces metabarcodes
sont les plus abondants.
12

Matériel et objectifs
Matériel et objectifs
Le sujet de la thèse présentée dans ce manuscrit est l'étude de l'écologie des symbioses
eucaryotes des écosystèmes planctoniques de la zone photique des océans. Ce vaste sujet a pu
être abordé grâce aux données générées lors de l'expédition Tara Oceans (2009-2012) pendant
laquelle 210 stations océaniques ont été échantillonnées à travers le monde. Les analyses ont
été réalisées à partir des données obtenues à la suite du séquençage à haut débit (Illumina) de
la région hypervariable V9 (~130 nucléotides) de la sous-unité 18S de l'ADN ribosomique des
organismes eucaryotes (metabarcoding). Ce court fragment d'ADN, également appelé
metabarcode, a été séquencé à partir d'échantillons fractionnés par tailles d'organismes
couvrant la majorité des protistes du plancton, c'est à dire le piconano, le nano, le micro et le
meso-plancton correspondant respectivement aux gammes de taille 0.8-5, 5-20, 20-180 et
180-2000 µm. Les échantillons proviennent pour la plupart de deux profondeurs, la surface et
la DCM (Deep Chlorophyll Maximum), cette dernière étant la profondeur, après la surface, à
laquelle la concentration de chlorophylle est maximale. Quelques échantillons proviennent de
la zone mésopélagique des océans, mais leur analyse ne sera pas abordée dans ce manuscrit.
Pour chaque échantillon, le séquençage à haut débit a été réalisé de telle sorte qu'environ deux
millions de lectures de metabarcodes (fragment V9) soient obtenues.
Il est communément accepté de partitionner les metabarcodes en groupes
génétiquement homogènes (Blaxter et al., 2005; Caron et al., 2009) appelés OTUs
(Operational Taxonomic Units) pour mesurer la diversité des organismes étudiés. Ce
partitionnement est nécessaire car plusieurs metabarcodes peuvent être associés à une seule
espèce du fait de leur variabilité naturelle et des erreurs générées lors du séquençage à haut
débit. Les metabarcodes eucaryotes de l'expédition Tara Oceans ont été partitionnés en
utilisant l'approche originale Swarm (Mahé et al., 2014). Alors que les méthodes classiques de
partitionnement génétique utilisent généralement un seuil global de partitionnement (global
clustering threshold), incompatible avec la variabilité de la vitesse d'évolution des différentes
lignées du vivant, Swarm assemble les OTUs itérativement en utilisant un seuil local de
partitionnement jusqu'à atteindre leurs limites naturelles. Le nombre de copies du gène codant
pour l'ARN ribosomique 18S dans le génome n'est pas le même dans toutes les espèces
eucaryotes. Il est donc difficile de relier le nombre de lectures d'un metabarcode ou d'une
OTU à un nombre d'individus, d'autant plus que chez les métazoaires le nombre de cellules
13

Matériel et objectifs
constituant un individu est variable. Cependant nous avons observé qu'il existe une relation
linéaire entre le nombre de copies de ce gène et le volume des cellules des organismes (de
Vargas et al. 2015a). Le nombre de lectures d'un metabarcode est donc un indicateur du
volume biologique (biovolume) de l'organisme associé. Par commodité, dans ce manuscrit, le
terme abondance est utilisé pour faire référence au nombre de lectures.
Les travaux présentés dans les deux premiers chapitres de la thèse se basent sur
l'analyse d'un jeu de données partiel, correspondant au séquençage de 334 échantillons
provenant de 47 stations et rendu public lors de la publication des deux articles présentés dans
le premier chapitre. Les deux articles en préparation, présentés dans le dernier chapitre de
thèse, reposent sur l'analyse du même jeu de données étendu à 903 échantillons (126 stations).
Le DNA metabarcoding est une méthode majeure nous permettant d'appréhender la
complexité des écosystèmes marins planctoniques. J'ai cherché pendant ma thèse à identifier
des moyens permettant d'étudier spécifiquement la diversité et l'abondance des symbioses
eucaryotes des écosystèmes marins planctoniques à partir de données de metabarcoding. J'ai
dans un premier temps participé à la réalisation de deux articles publiés dans la revue Science
dans le cadre d'un numéro spécial consacré à la présentation des premières données acquises
suite à l'expédition Tara Oceans (2009-2012). Le premier article, « Eukaryotic plankton
diversity in the sunlit ocean » décrit la diversité et la biogéographie des eucaryotes du
plancton (0.8-2000 µm) des océans tempérés à tropicaux et le second article, « Determinants
of community structure in the global plankton interactome », décris la structure globale
des communautés planctoniques des océans à partir d'un réseau de cooccurrences
(interactome) intégrant eucaryotes, procaryotes, virus et paramètres abiotiques. Ma
participation à ces deux articles, présentés dans le chapitre I de ce présent manuscrit, a
particulièrement concerné l'étude des symbiotes eucaryotes, parasites et mutualistes, et de
leurs hôtes.
J'ai ensuite étudié l'écologie de la symbiose parasitique entre les dinoflagellés
appartenant au genre Blastodinium et leurs hôtes, les copépodes planctoniques : « Size-
fractionated global DNA metabarcoding reveals ecological significance of the planktonic
dinoflagellate parasite Blastodinium in sunlit oceans. ». En plus d'être la première étude
concernant l'écologie de cette symbiose à l'échelle des océans, ce travail a permis de mettre en
évidence le fait que le cycle de vie des symbiotes expliquerait une distribution particulière des
lectures des metabarcodes associés au travers des échantillons fractionnés par tailles
14

Matériel et objectifs
d'organismes. J'ai eu l'occasion de participer à l'étude d'un cas de mutualisme entre le cilié
Tiarina sp. et la microalgue Symbiodinium sp.. Ces travaux ont été réalisés dans le cadre du
stage de Master 2 de Solenn Mordret et publiés dans la revue The ISME Journal :
« Symbiodinium in endosymbiosis within the ciliate Tiarina ». Il s'agit du premier cas de
mutualisme décrit entre un protiste planctonique et le genre Symbiodinium. Chacun des deux
partenaires de l'association est représenté par plusieurs fragments V9 différents ayant chacun
une biogéographie distincte. Ces deux cas d'étude, présentés dans le chapitre II, montre que
des caractéristiques des symbioses tel le cycle de vie particulier des symbiotes et la spécificité
d'interaction peuvent être capturés par le metabarcoding.
Enfin, j'ai cherché à développer des méthodes, complémentaires à l'inférence de
réseaux de cooccurrences, dédiées à la détection de symbioses et de leur niveau de spécificité.
J'ai ainsi développé un filtre basé sur la distribution des lectures des metabarcodes parmi les
fractions de taille étudiées et permettant de distinguer les metabarcodes provenant
d'organismes symbiotiques de ceux provenant d'organismes non symbiotiques. J'ai également
mis au point une méthode permettant de partitionner génétiquement les metabarcodes en
groupes génétiques imbriqués définis à différents niveaux de résolution. Ces méthodes ont été
utilisées pour la préparation de deux articles, le premier visant à les valider et à identifier de
nouveaux cas de photosymbioses dans le plancton, « Unveiling photosymbiotic associations
across phylogenetic gradients in world-wide marine plankton based on massive
eukaryotic rDNA metabarcoding ». Dans le second article, les abondances des
metabarcodes assignés à des groupes taxinomiques parasitiques sont comparées à celle d'hôtes
potentiels afin de mettre en avant la diversité des interactions parasitiques dans le plancton,
« Parasites diversity and abundance in the Tara Oceans metabarcoding dataset
challenge classic views on marine plankton ecology ». Ces deux articles en préparation sont
présentés dans le chapitre III de ce manuscrit.
15
Chapitre I
Chapitre I
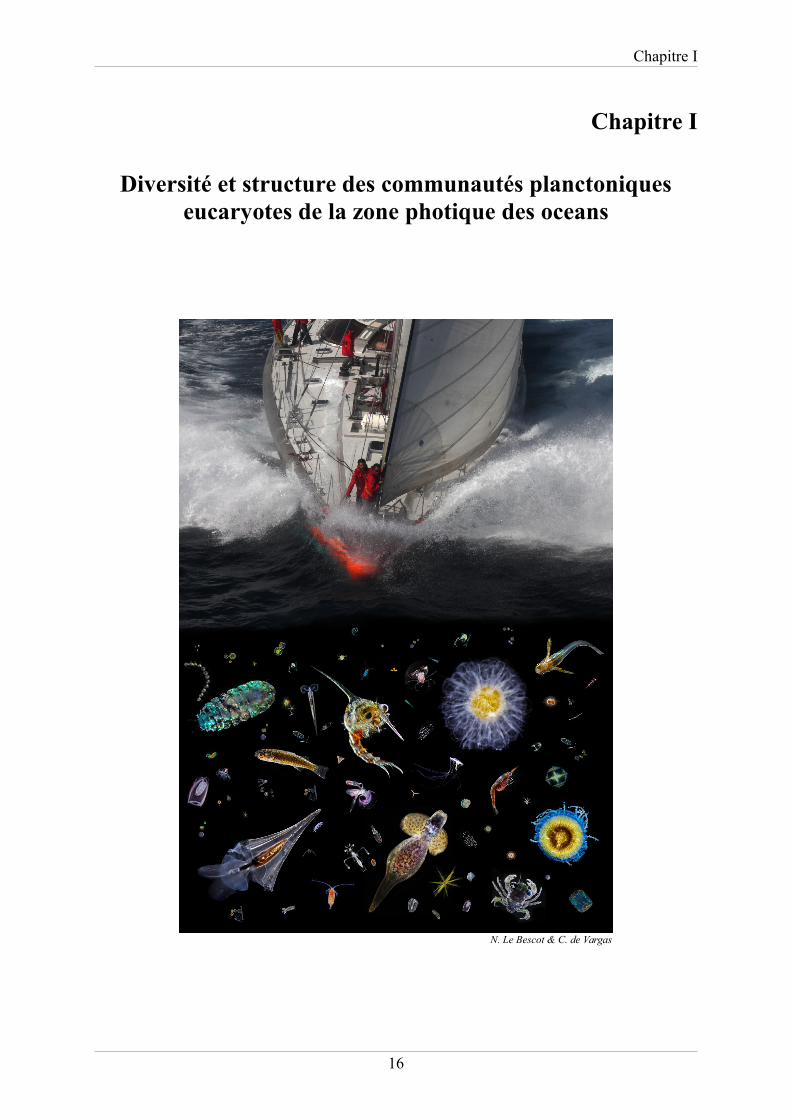
Diversité et structure des communautés planctoniqueseucaryotes de la zone photique des oceans
16
N. Le Bescot & C. de Vargas

Chapitre I
Dans ce chapitre, un état des lieux de la diversité et de la structure des communautés
du pico-nano-micro-meso-plancton (0,8-2000 μm) eucaryote de la zone photique des océans
tempérés à tropicaux a été réalisé. Ensuite une méthode de détection des interactions biotiques
à large échelle est appliquée, nous permettant ainsi de valider le concept de détection de
symbioses par metabarcoding. Afin de mieux estimer la place des interactions symbiotiques
au sein de communautés planctoniques des océans, j'ai mené un important travail
bibliographique aboutissant à la constitution d'une liste des associations symbiotiques décrites
dans le plancton impliquant des protistes comme symbiotes (non hôtes) et l'assignation
fonctionnelle de la base de références taxinomiques V9_PR2 utilisée pour l'assignation des
metabarcodes de Tara Oceans. Cette base de références découle de l'extraction des fragments
V9 de la base de références de gènes 18S PR2 (Guillou et al., 2013) à laquelle des
modifications concernant la taxinomie associée aux séquences ont été apportées. La liste
d'interactions provenant de la littérature regroupe 574 symbioses dont 408 (71 %) sont
parasitiques. Chaque association est répertoriée au maximum de résolution taxinomique et ou
génétique possible. Pour certaines interactions, la résolution taxinomique maximale retrouvée
de l'un des deux partenaires est la classe (par exemple Dinophyceae ou Pelagophyceae) alors
que dans d'autres cas la résolution atteinte est intraspécifique et la séquence 18S
correspondant au partenaire est reportée. Il y a 168 interactions différentes lorsque l'on
considère les deux partenaires au niveau du genre et dans ce cas, les interactions pour
lesquelles le genre de l'un des deux partenaires n'est pas connu ne sont pas prises en compte.
Lorsque l'on représente cette liste d'interactions sous la forme d'un réseau où chaque nœud
correspond à une espèce et chaque arrête à une association symbiotique, on peut observer la
présence de deux grandes communautés (Figure 1).
17

Chapitre I
L'une regroupe des métazoaires et leurs parasites eucaryotes et l'autre des dinoflagellés
et leurs parasitoïdes. Il semblerait que les précédents travaux concernant les symbioses se sont
principalement concentrés sur l'étude de ces groupes et que les autres cas ont été répertoriés
plus anecdotiquement. L'assignation fonctionnelle de la base de références taxinomiques a été
réalisée de la façon suivante. Chaque séquence de référence hérite de trois caractères
fonctionnels au regard de l'organisme qui lui est associé. Ces caractères sont la présence ou
non chez l'organisme de chloroplastes permanents, la capacité de celui-ci à former des
symbioses en tant que parasite, mutualiste ou commensal et la capacité de l'organisme à
héberger à l'intérieur de ses cellules des organismes photosynthétiques dont il exploite les
produits de la photosynthèse. L'assignation de ces deux dernières catégories à été grandement
facilitée par la liste d'interactions symbiotiques présentée précédemment. La combinaison de
ces trois caractères a permis de définir des fonctions trophiques pour chacune des séquences
de référence.
18
Figure 1: Réseau des associations symbiotiques entre eucaryotes du plancton marin décritesdans la littérature. Pour chaque association, au moins un des deux partenaires est un protiste.Chaque nœud en noir correspond à une espèce et chaque arrête correspond à une associationsymbiotique, parasitique en rouge ou mutualiste en vert. Les deux encarts sont les deux plusgrandes communautés de ce réseau. Dans la première, les hôtes sont exclusivement desmétazoaires et dans la seconde les hôtes sont, à l'exception de deux noeuds, des dinoflagellés.

Chapitre I
Le premier article de ce chapitre, « Eukaryotic plankton diversity in the sunlit
ocean » illustre à partir des données de metabarcoding de l'expédition Tara Oceans les
patrons de diversité des eucaryotes du pico-nano-micro-mesoplancton à l'échelle des océans
tempérés à tropicaux. Il décrit également le processus expérimental et informatique ayant
abouti à la production de ces données. Les échantillons étudiés ici proviennent de 47 stations
de la zone photique des océans, et ont été collectés à deux profondeurs différentes, la surface
et la Deep Chlorophyll Maximum (DCM) c'est à dire la profondeur à laquelle la concentration
de chlorophylle est maximale. Ces échantillons ont été fractionnés en 4 gammes de taille
d'organismes, 0,8-5, 5-20, 20-180 et 180-2000 μm. Des courbes de raréfaction représentant la
détection de nouvelles OTUs en fonction du nombre de lectures générées ont été calculées par
échantillon, par fraction ainsi que pour l'ensemble des échantillons. Leur analyse montre que
globalement un séquençage plus profond ne nous aurait pas permis de découvrir beaucoup
d'OTUs supplémentaires. Considérant notre effort de séquençage, le séquençage de 100,000
lectures supplémentaires ne produit plus qu'une OTU supplémentaire pour l'ensemble du jeu
de données. Le constat est similaire lorsque l'on considère les courbes construites pour chaque
fraction de taille, même si l'on constate qu'il resterait un nombre plus important d'OTUs à
découvrir dans le piconano-plancton où la diversité est la plus importante. Moins de 1 % des
OTUs détectées sont identiques à une séquence de référence et la majorité (85 %) est assignée
à des lignées de protistes. Ceci suggère qu'un nombre très important d'espèces de protiste reste
à décrire formellement et que le nombre d'espèces de protiste du plancton serait très loin des
~11 200 espèces décrites jusque là. Il faut garder à l'esprit que toutes les espèces décrites ne
disposent pas nécessairement de séquences de référence et que certaines de ces dernières
correspondent à des lignées environnementales, il est donc délicat de faire le lien entre le
nombre d'OTUs détectées et un nombre d'espèces. Parmi les 85 lignées eucaryotes identifiées
dans les données de metabarcoding, onze ont été caractérisées de « hyperdiversifiées », c'est à
dire qu'elles contiennent plus de 1000 OTUs. Sept de ces lignées contiennent des espèces
parasites et deux d'entre elles seraient exclusivement composées d'espèces parasites, il s'agit
des Marine Alveolates I et II (MALV I et MALV II) toutes deux appartenant aux syndiniales.
L'assignation fonctionnelle des OTUs nous permet d'explorer les modes trophiques de l'océan,
et de montrer que les protistes hétérotrophes, dont les parasites, tiennent une place importante
dans les écosystèmes planctoniques tant en terme de diversité que d'abondance.
Dans le second article de ce chapitre, «Determinants of community structure in the
global plankton interactome », la structure globale des communautés planctoniques des
19

Chapitre I
océans est étudiée à partir d'un réseau de cooccurrences global (interactome). Cet interactome
à été produit à partir des abondances provenant de différents types de données suivant le type
d'organisme considéré (virus, procaryotes ou eucaryotes) mais aussi des mesures physico-
chimiques réalisées lors de l'expédition Tara Oceans. Les données concernant les virus sont
obtenues par partitionnement de contigs metagénomiques, les données bactériennes par
extraction des séquences d'ARN 16S présentes à l'intérieur de contigs metagénomiques
(mitags), et les données eucaryotes par metabarcoding (V9) correspondent à celles décrites
dans le premier article. Différents réseaux de cooccurrences (23) ont été inférés séparément
pour deux profondeurs (surface et DCM), quatre fractions de taille (0,8-5, >0,8, 20-180 et
180-2000 µm) et leurs combinaisons, la fraction de taille procaryote (0,2-1,6 et 0,2-3 µm) et
ses combinaisons avec chaque fraction de taille eucaryote et de virus (<0,2 µm). Ces réseaux
ont été construits comme dans (Faust et al., 2012), les abondances ont été comparées en
utilisant deux mesures de dissimilarité, le rho de Spearman (ρ) et la divergence de Kullback-
Leibler, les p-values ont été calculées par permutation, renormalisation et bootstrapping,
unifiées grâce à la méthode de Brown (Brown, 1975) et corrigées pour des tests multiples par
la méthode de Benjamini-Hochberg (Benjamini & Hochberg, 1995). Ces réseaux ont été
ensuite assemblés en un réseau global, appelé interactome. L'étude de l'interactome montre
que la structure des communautés planctoniques est peu influencée par l'environnement
abiotique et qu'elles seraient donc expliquées par les associations entretenues entre les
organismes les constituant. Les associations entre eucaryotes dominent l'interactome (67 % de
l'ensemble des associations) et parmi celles-ci, 35 % impliquent des parasites. La liste
d'interactions symbiotiques constituée à partir de la littérature et présentée précédemment a
été utilisée comme étalon pour estimer la propension de ce type de réseau à détecter des
associations symbiotiques. Au niveau du genre, 42% des interactions présentes dans cette liste
ont été retrouvées. Parmi les interactions prédites par ce réseau, une association entre un
metabarcode assigné au genre Tetraselmis (microalgue chlorophyte) et un metabarcode
assigné au genre Symsagittifera (acoel), a particulièrement retenu notre attention car elle
rappelle la symbiose mutualiste entre cette microalgue et Symsagittifera roscoffensis,
observée en milieu benthique. Cette association a été validée expérimentalement par
microscopie confocale et séquençage de la région V9 à partir d'individus isolés des
échantillons biologiques de l'expédition Tara Oceans où les metabarcodes correspondants
étaient les plus abondants. Cet article met donc en évidence la possibilité, à partir d'un réseau
de cooccurrences, de retrouver des interactions symbiotiques malgré leur complexité et, en
20

Chapitre I
retournant aux échantillons biologiques, de les valider grâce à une caractérisation
morphogénétique des deux partenaires.
21

Chapitre I
Eukaryotic plankton diversity in the sunlit ocean
Colomban de Vargas1,2,†,*, Stéphane Audic1,2,†, Nicolas Henry1,2,†, Johan Decelle1,2,†, Frédéric Mahé3,1,2,†,Ramiro Logares4, Enrique Lara5, Cédric Berney1,2, Noan Le Bescot1,2, Ian Probert6,7, MargauxCarmichael1,2,8, Julie Poulain9, Sarah Romac1,2, Sébastien Colin1,2,8, Jean-Marc Aury9, LucieBittner10,11,8,1,2, Samuel Chaffron12,13,14, Micah Dunthorn3, Stefan Engelen9, Olga Flegontova15,16, LionelGuidi17,18, Aleš Horák15,16, Olivier Jaillon9,19,20, Gipsi Lima-Mendez12,13,14, Julius Lukeš15,16,21, ShrutiMalviya8, Raphael Morard22,1,2, Matthieu Mulot5, Eleonora Scalco23, Raffaele Siano24, Flora Vincent13,8,Adriana Zingone23, Céline Dimier1,2,8, Marc Picheral17,18, Sarah Searson17,18, Stefanie Kandels-Lewis25,26, Tara Oceans Coordinators‡, Silvia G. Acinas4, Peer Bork25,27, Chris Bowler8, GabrielGorsky17,18, Nigel Grimsley28,29, Pascal Hingamp30, Daniele Iudicone23, Fabrice Not1,2, HiroyukiOgata31, Stephane Pesant32,22, Jeroen Raes12,13,14, Michael E. Sieracki33,34, Sabrina Speich35,36, LarsStemmann17,18, Shinichi Sunagawa25, Jean Weissenbach9,19,20, Patrick Wincker9,19,20,*, Eric Karsenti26,8,*
1 CNRS, UMR 7144, Station Biologique de Roscoff, Place Georges Teissier, 29680 Roscoff, France. 2 Sorbonne Universités,UPMC Univ Paris 06, UMR 7144, Station Biologique de Roscoff, Place Georges Teissier, 29680 Roscoff, France. 3
Department of Ecology, University of Kaiserslautern, Erwin-Schroedinger Street, 67663 Kaiserslautern, Germany. 4
Department of Marine Biology and Oceanography, Institute of Marine Science (ICM)-CSIC, Pg. Marítim de la Barceloneta37-49, Barcelona E08003, Spain. 5 Laboratory of Soil Biology, University of Neuchâtel, Rue Emile-Argand 11, 2000Neuchâtel, Switzerland. 6 CNRS, FR2424, Roscoff Culture Collection, Station Biologique de Roscoff, Place GeorgesTeissier, 29680 Roscoff, France. 7 Sorbonne Universités, UPMC Univ Paris 06, FR 2424, Roscoff Culture Collection, StationBiologique de Roscoff, Place Georges Teissier, 29680 Roscoff, France. 8 Ecole Normale Supérieure, Institut de Biologie del’ENS (IBENS), and Inserm U1024, and CNRS UMR 8197, Paris, F-75005 France 9 CEA, Institut de Génomique,GENOSCOPE, 2 rue Gaston Crémieux, 91000 Evry, France. 10 CNRS FR3631, Institut de Biologie Paris-Seine, F-75005,Paris, France. 11 Sorbonne Universités, UPMC Univ Paris 06, Institut de Biologie Paris-Seine (IBPS), F-75005, Paris, France.12 Department of Microbiology and Immunology, Rega Institute, KU Leuven, Herestraat 49, 3000 Leuven, Belgium. 13 Centerfor the Biology of Disease, VIB, Herestraat 49, 3000 Leuven, Belgium. 14 Department of Applied Biological Sciences, VrijeUniversiteit Brussel, Pleinlaan 2, 1050 Brussels, Belgium. 15 Institute of Parasitology, Biology Centre, Czech Academy ofSciences, Branišovská 31, 37005 České Budějovice, Czech Republic. 16 Faculty of Science, University of South Bohemia,Branišovská 31, 37005 České Budějovice, Czech Republic. 17 CNRS, UMR 7093, LOV, Observatoire océanologique, F-06230, Villefranche-sur-mer, France. 18 Sorbonne Universités, UPMC Univ Paris 06, UMR 7093, LOV, ObservatoireOcéanologique, F-06230, Villefranche-sur-mer, France. 19 CNRS, UMR 8030, CP5706, Evry, France. 20 Université d'Evry,UMR 8030, CP5706, Evry, France. 21 Canadian Institute for Advanced Research, 180 Dundas Street West, Suite 1400,Toronto ON M5G 1Z8, Canada. 22 MARUM, Center for Marine Environmental Sciences, University of Bremen, 28359Bremen, Germany.23 Stazione Zoologica Anton Dohrn, Villa Comunale, 80121 Naples, Italy. 24 Ifremer, Centre de Brest,DYNECO/Pelagos CS 10070, 29280 Plouzané, France. 25 Structural and Computational Biology, European MolecularBiology Laboratory, Meyerhofstr. 1, 69117 Heidelberg, Germany. 26 Directors’ Research, European Molecular BiologyLaboratory, Meyerhofstr. 1, 69117 Heidelberg, Germany. 27 Max-Delbruck-Centre for Molecular Medicine, 13092 Berlin,Germany. 28 CNRS UMR 7232, BIOM, Avenue du Fontaulé, 66650 Banyuls-sur-Mer, France. 29 Sorbonne Universités Paris06, OOB UPMC, Avenue du Fontaulé, 66650 Banyuls-sur-Mer, France. 30 Aix Marseille Université, CNRS IGS UMR 7256,13288 Marseille, France. 31 Institute for Chemical Research, Kyoto University, Gokasho, Uji, Kyoto, 611-0011, Japan. 32
PANGAEA, Data Publisher for Earth and Environmental Science, University of Bremen, Bremen, Germany. 33 BigelowLaboratory for Ocean Sciences, East Boothbay, ME, USA. 34 National Science Foundation, Arlington, VA, USA. 35
Department of Geosciences, Laboratoire de Météorologie Dynamique (LMD), Ecole Normale Supérieure, 24 rue Lhomond,75231 Paris Cedex 05, France. 36 Laboratoire de Physique des Océans, UBO-IUEM, Place Copernic, 29820 Plouzané, France.
‡Tara Oceans coordinators and affiliations are listed at the end of this manuscript.†These authors contributed equally to this work.*Correspondence to: [email protected]; [email protected]; [email protected]
Published in Science, 2015, vol. 348, no 6237, p. 1261605.
Abstract
Marine plankton support global biological and geochemical processes. Surveys of
their biodiversity have hitherto been geographically restricted and have not accounted for the
22

Chapitre I
full range of plankton size. We assessed eukaryotic diversity from 334 size-fractionated
photic-zone plankton communities collected across tropical and temperate oceans during the
circum-global Tara Oceans expedition. We analysed 18S rDNA sequences across the
intermediate plankton size spectrum from the smallest unicellular eukaryotes (protists,
>0.8μm) to small animals of a few millimeters. Eukaryotic ribosomal diversity saturated at
~150,000 Operational Taxonomic Units (OTUs), about one third of which could not be
assigned to known eukaryotic groups. Diversity emerged at all taxonomic levels, both within
the groups comprising the ~11,200 catalogued morphospecies of eukaryotic plankton, and
amongst twice as many other deep-branching lineages of unappreciated importance in
plankton ecology studies. Most eukaryotic plankton biodiversity belonged to heterotrophic
protistan groups, particularly those known to be parasites or symbiotic hosts.
Introduction
The sunlit surface layer of the world’s oceans functions as a giant biogeochemical
membrane between the atmosphere and the ocean interior (1). This biome includes plankton
communities that fix CO2 and other elements into biological matter, which then enters the
food web. This biological matter can be remineralized or exported to the deeper ocean, where
it may be sequestered over ecological to geological time scales. Study of this biome has
typically focused on either conspicuous phyto- or zoo-plankton at the larger end of the
organismal size spectrum, or "microbes" (prokaryotes and viruses) at the smaller end. Here,
we studied the taxonomic and ecological diversity of the intermediate size spectrum (from
0.8μm to a few mm), which includes all unicellular eukaryotes (protists) and ranges from the
smallest protistan cells to small animals (2). The ecological biodiversity of marine planktonic
protists has been analyzed using Sanger (e.g. (3-5))and high-throughput (e.g. (6-7))
sequencing of mainly ribosomal DNA (rDNA) gene markers, on relatively small taxonomic
and/or geographical scales, unveiling key new groups of phagotrophs (8), parasites (9), and
phototrophs (10). We sequenced 18S rDNA metabarcodes up to local and global saturations
from size-fractionated plankton communities sampled systematically across the world tropical
and temperate sunlit oceans.
A global metabarcoding approach
To explore patterns of photic-zone eukaryotic plankton biodiversity, we generated
~766 million raw rDNA sequence reads from 334 plankton samples collected during the
23

Chapitre I
circum-global Tara Oceans expedition (11). At each of 47 stations, plankton communities
were sampled at two water-column depths corresponding to the main hydrographic structures
of the photic zone: subsurface mixed-layer waters and the Deep Chlorophyll Maximum
(DCM) at the top of the thermocline. A low-shear, non-intrusive peristaltic pump and plankton
nets of various mesh-sizes were used on board Tara to sample and concentrate appropriate
volumes of seawater to theoretically recover complete local eukaryotic biodiversity from four
major organismal size fractions: piconano-plankton (0.8-5μm), nano-plankton (5-20μm),
micro-plankton (20-180μm), and meso-plankton (180-2000μm) (see (12) for detailed Tara
Oceans field sampling strategy and protocols).
We extracted total DNA from all samples, PCR amplified the hyper-variable V9 region
of the nuclear gene that encodes 18S rRNA (13), and generated an average of 1.73±0.65
million sequence reads (paired-end Illumina) per sample (11). Strict bioinformatic quality
control led to a final dataset of 580 million reads, of which ~2.3 million were distinct,
hereafter denoted metabarcodes. We then clustered metabarcodes into biologically meaningful
OTUs (14), and assigned a eukaryotic taxonomic path to all metabarcodes and OTUs by
global similarity analysis with 77,449 reference, Sanger-sequenced V9 rDNA barcodes
covering the known diversity of eukaryotes and assembled into an in-house database called
V9_PR2 (15). Beyond taxonomic assignation, we inferred basic trophic and symbiotic
ecological modes (photo- versus hetero-trophy; parasitism, commensalism, mutualism for
both hosts and symbionts) to Tara Oceans reads and OTUs, based on their genetic affiliation
to large, monophyletic and monofunctional groups of reference barcodes. We finally inferred
large-scale ecological patterns of eukaryotic biodiversity across geography, taxonomy, and
organismal size-fractions based on rDNA abundance data and community similarity analyses,
and compared them to current knowledge extracted from the literature.
The extent of eukaryotic plankton diversity in the photic-zone of the world
ocean
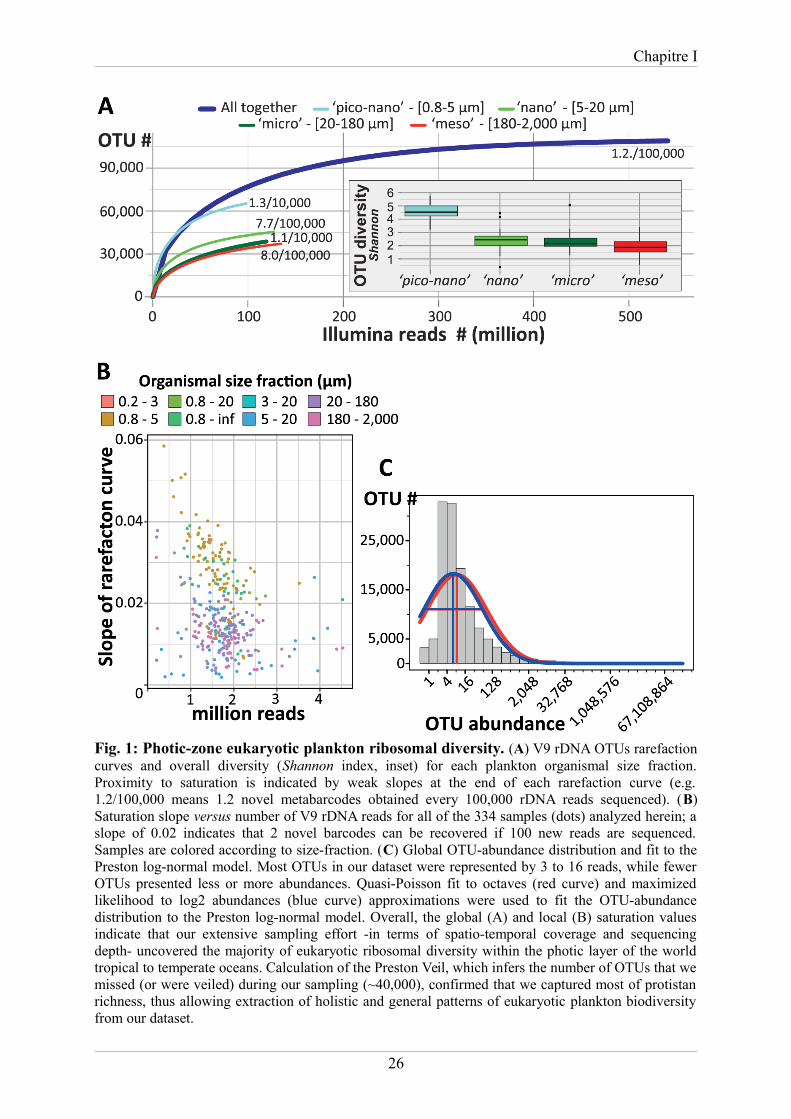
Sequencing of ~1.7 million V9 rDNA reads from each of the 334 size-fractionated
plankton samples was sufficient to approach saturation of eukaryotic richness at both local
and global scales (Fig. 1A,B). Local richness represented on average 9.7±4% of global
richness, the latter approaching saturation at ~2 million eukaryotic metabarcodes or ~110,000
OTUs (16). The global pool of OTUs displayed a good fit to the truncated Preston log-normal
distribution (17), which, by extrapolation, suggests a total photic-zone eukaryotic plankton
24

Chapitre I
richness of ~150,000 OTUs, of which ~40,000 were not found in our survey (Fig. 1C). Thus
we estimate that our survey unveiled ~75% of eukaryotic ribosomal diversity in the globally
distributed water masses analyzed. The extrapolated ~150,000 total OTUs is much higher than
the ~11,200 formally described species of marine eukaryotic plankton (see below), and likely
represents a highly conservative, lower boundary estimate of the true number of eukaryotic
species in this biome given the relatively limited taxonomic resolution power of the 18S
rDNA gene. Our data indicate that eukaryotic taxonomic diversity is higher in smaller
organismal size fractions, with a peak in the piconano-plankton (Fig. 1A), highlighting the
richness of tiny organisms that are poorly characterized in terms of morpho-taxonomy and
physiology (18). A first-order, super-group level classification of all Tara Oceans OTUs
demonstrated the prevalence, at the biome scale and across the >4 orders of size-magnitude
sampled, of protist rDNA biodiversity with respect to that of classical multicellular
eukaryotes, i.e., animals, plants, and fungi (Fig. 2A). Protists accounted for >85% of total
eukaryotic ribosomal diversity, a ratio that may well hold true for other marine, freshwater,
and terrestrial oxygenic ecosystems (19). The latest estimates of total marine eukaryotic
biodiversity based on statistical extrapolations from classical taxonomic knowledge predict
the existence of 0.5 to 2.2 million species (including all benthic and planktonic systems from
reefs to deep-sea vents (20, 21), but do not take into account the protistan knowledge gap
highlighted here. Simple application of our ‘animal to other eukaryotes’ ratio of ~13% to the
robust prediction of the total number of metazoan species from (20) would imply that 16.5
million and 60 million eukaryotic species potentially inhabit the oceans and the Earth,
respectively.
25
Chapitre I
26
Fig. 1: Photic-zone eukaryotic plankton ribosomal diversity. (A) V9 rDNA OTUs rarefactioncurves and overall diversity (Shannon index, inset) for each plankton organismal size fraction.Proximity to saturation is indicated by weak slopes at the end of each rarefaction curve (e.g.1.2/100,000 means 1.2 novel metabarcodes obtained every 100,000 rDNA reads sequenced). (B)Saturation slope versus number of V9 rDNA reads for all of the 334 samples (dots) analyzed herein; aslope of 0.02 indicates that 2 novel barcodes can be recovered if 100 new reads are sequenced.Samples are colored according to size-fraction. (C) Global OTU-abundance distribution and fit to thePreston log-normal model. Most OTUs in our dataset were represented by 3 to 16 reads, while fewerOTUs presented less or more abundances. Quasi-Poisson fit to octaves (red curve) and maximizedlikelihood to log2 abundances (blue curve) approximations were used to fit the OTU-abundancedistribution to the Preston log-normal model. Overall, the global (A) and local (B) saturation valuesindicate that our extensive sampling effort -in terms of spatio-temporal coverage and sequencingdepth- uncovered the majority of eukaryotic ribosomal diversity within the photic layer of the worldtropical to temperate oceans. Calculation of the Preston Veil, which infers the number of OTUs that wemissed (or were veiled) during our sampling (~40,000), confirmed that we captured most of protistanrichness, thus allowing extraction of holistic and general patterns of eukaryotic plankton biodiversityfrom our dataset.

Chapitre I
Phylogenetic breakdown of photic-zone eukaryotic biodiversity
About one third of eukaryotic ribosomal diversity in our dataset did not match any
reference barcode in the extensive V9_PR2 database (‘unassigned’ category in Fig. 2A). This
unassignable diversity represented only a small proportion (2.6%) of total reads, and
increased in both richness and abundance in smaller organismal size fractions, suggesting that
it may correspond in part to rare and minute taxa that have escaped previous characterization.
Some may also correspond to divergent rDNA pseudogenes, known to exist in eukaryotes
(22, 23), or sequencing artefacts (24), although both of these would be expected to be present
in equal proportion in all size-fractions (details in (16)). The remaining ~87,000 assignable
OTUs were classified into 97 deep-branching lineages covering the full spectrum of
catalogued eukaryotic diversity amongst the 7 recognized super-groups and multiple incertae
sedis lineages (15) whose origins go back to the primary radiation of eukaryotic life in the
Neo-Proterozoic. Although highly represented in the V9_PR2 reference database, several
well-known lineages adapted to terrestrial, marine benthic, or anaerobic habitats (e.g.
Embryophyta, apicomplexan and trypanosome parasites of land plants and animals,
amoeboflagellate Breviatea, several lineages of Amoebozoa, Excavata and Cercozoa) were
not detected in our metabarcoding dataset, suggesting the absence of contamination during the
PCR and sequencing steps on land, and reducing the number of deep branches of eukaryotic
plankton to 85 (Fig. 3).
27

Chapitre I
28
Fig. 2: Unknown and known components of eukaryotic plankton biodiversity. (A) Phylogeneticbreakdown of the entire metabarcoding dataset at the eukaryotic supergroup level. All Tara Oceans V9rDNA reads and OTUs were classified amongst the 7 recognized eukaryotic supergroups plus theknown but unclassified deep-branching lineages (incertae sedis). The treemaps display the relativeabundance (upper part) and richness (lower part) of the different eukaryotic supergroups in eachorganismal size fraction. Note that ~5% of barcodes were assigned to prokaryotes, essentially in thepico-nano fraction, witnessing the universality of the eukaryotic primers used. Barcodes are"unassigned" when sequence similarity to a reference sequence is <80%, and "undetermined" wheneukaryotic supergroups could not be discriminated (at similarity >80%). (B) Ribosomal DNA diversityassociated with the morphologically known and catalogued part of eukaryotic plankton. The totalnumber of morphologically described species in the literature (red bars, based on (25–27)) and thecorresponding total number of Tara Oceans V9 rDNA OTUs (blue bars) are indicated for each of the35 classical lineages of eukaryotic phyto-, protozoo-, and metazoo- plankton. The 5 classical groupsthat were found to be significantly more diverse than previously thought (from 38 to 113-fold moreOTUs than morphospecies) are highlighted. Note that in the classical, morphological view, phyto- andmetazoo-plankton comprise ~88% of total eukaryotic plankton diversity.

Chapitre I
We then extracted the metabarcodes assigned to morphologically well-known
planktonic eukaryotic taxa from our dataset, and compared them with the conventional, 150
year-old morphological view of marine eukaryotic plankton that includes ~11,200 catalogued
species divided into three broad categories: ~4,350 species of phytoplankton (microalgae),
~1,350 species of protozooplankton (relatively large, often biomineralized, heterotrophic
protists) and ~5,500 species of metazooplankton (holoplanktonic animals) (25-27). A
congruent picture of the distribution of morpho-genetic diversity amongst and within these
organismal categories emerged from our dataset (Fig. 2B), but typically 3 to 8 times more
rDNA OTUs were found than described morphospecies in the best-known lineages within
these categories. This is within the range of the number of cryptic species typically detected in
globally-distributed pelagic taxa using molecular data (28, 29). The general congruency
between genetic and morphological data in the catalogued compartment of eukaryotic
plankton suggests that the protocols used, from plankton sampling to DNA sequencing,
recovered the known eukaryotic biodiversity without significant qualitative or quantitative
biases. However, OTUs related to morphologically described taxa represented only a minor
part of the total eukaryotic plankton ribosomal and phylogenetic diversity. Overall, <1% of
OTUs were strictly identical to reference sequences, and OTUs were on average only ~86%
similar to any V9 reference sequence (Fig. 3F and (16)). This shows that most photic-zone
eukaryotic plankton V9 rDNA diversity had not been previously sequenced from cultured
strains, single-cell isolates, or even environmental clone library surveys. The Tara Oceans
metabarcode dataset added considerable phylogenetic information to previous protistan rDNA
knowledge, with an estimated mean tree length increase of 453%, reaching >100% in 43
lineages (16). Even in the best-referenced groups such as the diatoms (1,232 reference
sequences, Fig. 3B), we identified many new rDNA sequences both within known groups and
forming new clades (16).
29

Chapitre I
30
Fig. 3: Phylogenetic distribution of the assignable component of eukaryotic plankton ribosomaldiversity. (A) Schematic phylogeny of the 85 deep-branching eukaryotic lineages represented in ourglobal-oceans metabarcoding dataset, with broad ecological traits based on current knowledge: red =parasitic; green = photoautotrophic; blue = osmo/saprotrophic; black = mostly hetero/phagotrophiclineages. Lineages known only from environmental sequence data were colored in black by default.For simplicity, 3 branches (*) artificially group a few distinct lineages (details in (15). (B) Number ofreference V9 rDNA barcodes used to annotate the metabarcoding dataset (grey = with knowntaxonomy at the genus and/or species level; light blue = from previous 18S rDNA environmental clonelibraries). (C) Tara Oceans V9 rDNA OTU richness; the dark-blue thicker bars indicate the 11 hyper-diverse lineages containing >1,000 OTUs. Yellow circles highlight the 25 lineages that have beenrecognized as significant in previous marine plankton biodiversity and ecology studies usingmorphological and/or molecular data (see also (15)). (D) Eukaryotic plankton abundance expressed asnumbers of rDNA reads (the red bars indicate the 9 most abundant lineages with >5 million reads). (E)Proportion of rDNA reads per organismal size fraction, with light blue = piconano-; green = nano-;yellow = micro-; red = meso-plankton. (F) Percentage of reads and OTUs with [80-85%], [85-90%],[90-95%], [95-<100%], [100%] sequence similarity to a reference sequence. (G) Slope of OTUrarefaction curves. (H) Mean geographic occupancy (average number of stations in which OTUs wereobserved, weighted by OTU abundance).

Chapitre I
31
Fig. 4: Illustration of key eukaryotic plankton lineages. (A) Stramenopila; a phototrophic diatomChaetoceros bulbosus, with its chloroplasts in red (scale bar 10µm). (B) Alveolata; a heterotrophicdinoflagellate Dinophysis caudata harboring kleptoplasts (in red, arrow head, scale bar 20µm (75)).(C) Rhizaria; an acantharian Lithoptera sp. with endosymbiotic haptophyte cells from the genusPhaeocystis (in red, arrow head, scale bar 50µm (41)). (D) Rhizaria; inside a colonial network ofCollodaria, a cell surrounded by several captive dinoflagellate symbionts of the genusBrandtodinium (arrow head, scale bar 50µm (33)). (E) Opisthokonta; a copepod whose gut iscolonized by the parasitic dinoflagellate Blastodinium (red area are nuclei, arrow head, scale bar100µm (51)). (F) Alveolata; a cross-sectioned, dinoflagellate cell infected by the parasitoidalveolate Amoebophrya (MALV II). Each blue spot (arrow head) is the nucleus of future free-livingdinospores; their flagella are visible in green inside the mastigocoel cavity (arrow) (scale bar 5µm).The cellular membranes were stained with DiOC6 (green), DNA and nuclei with Hoechst (blue)(the dinoflagellate theca in B was also stained by this dye), chlorophyll autofluorescence is shownin red (excepted for E), an unspecific fluorescent painting of the cell surface (cyan) was used toreveal cell shape for A and F. All specimens come from Tara Oceans samples preserved for confocallaser scanning fluorescent microscopy. Images were 3D reconstructed with Imaris (Bitplane).

Chapitre I
Eleven ‘hyper-diverse’ lineages each contained >1,000 OTUs, together representing
~88% and ~90% of all OTUs and reads, respectively (Fig. 3C). Amongst these, the only
permanently phototrophic taxa were diatoms (Fig. 4A) and about a third of dinoflagellates
(Fig. 4B-F), together comprising ~15% and ~13% of hyper-diverse OTUs and reads,
respectively (30). Most hyper-diverse photic-zone plankton belonged to three super-groups,
the Alveolata, Rhizaria, and Excavata, about which we have limited biological or ecological
information. The Alveolata, which consist mostly of parasitic (MALVs, Fig. 4F) and
phagotrophic (ciliates and most dinoflagellates) taxa, were by far the most diverse super-
group, comprising ~42% of all assignable OTUs. The Rhizaria are a group of amoeboid
heterotrophic protists with active pseudopods displaying a broad spectrum of ecological
behavior from phagotrophy to parasitism and mutualism (symbioses) (31). Rhizarian diversity
peaked in the Retaria (Fig. 4C, D), a subgroup including giant protists that build complex
skeletons of silicate (Polycystinea), strontium sulfate (Acantharia, Fig. 4C), or calcium
carbonate (Foraminifera), and thus comprise key microfossils for paleoceanography.
Unsuspected rDNA diversity was recorded within the Collodaria (5,636 OTUs), polycystines
which are mostly colonial, poorly silicified or naked, and live in obligatory symbiosis with
photosynthetic dinoflagellates (Fig. 4D) (32, 33). Arguably the most surprising component of
novel biodiversity was the >12,300 OTUs related to reference sequences of diplonemids, an
excavate lineage that has only two described genera of flagellate grazers, one of which
parasitizes diatoms and crustaceans (34, 35). Their ribosomal diversity was not only much
higher than that observed in classical plankton groups such as foraminifers, ciliates, or
diatoms (50-fold, 6-fold, and 3.8-fold higher, respectively), but was also far from richness
saturation (Fig. 3E). Eukaryotic rDNA diversity peaked especially in the few lineages that
extend across larger size fractions (i.e. metazoans, rhizarians, dinoflagellates, ciliates,
diatoms; Fig. 3E). Larger cells or colonies not only provide protection against predation via
size-mediated avoidance and/or construction of composite skeletons, but also support for
complex and coevolving relationships with often specialized parasites or mutualistic
symbionts.
Beyond this hyper-diverse, largely heterotrophic eukaryotic majority, our dataset also
highlighted phylogenetic diversity of poorly known phagotrophic (e.g., 413 OTUs of
Katablepharidophyta, 240 OTUs of Telonemia), osmotrophic (e.g., 410 OTUs of Ascomycota,
322 OTUs of Labyrinthulea), and parasitic (e.g., 384 OTUs of gregarine apicomplexans, 160
OTUs of Ascetosporea, 68 OTUs of Ichthyosporea) protist groups. Amongst the 85 major
32

Chapitre I
lineages presented in the phylogenetic framework of Fig. 3, less than a third (~25) have been
recognized as significant in previous marine plankton biodiversity and ecology studies using
morphological and/or molecular data (Fig. 3C and (15)). The remaining ~60 branches had
either never been observed in marine plankton, or were detected through morphological
description of one or a few species and/or the presence of environmental sequences in
geographically restricted clone library surveys (15). This understudied diversity represents
~25% of all taxonomically assignable OTUs (>21,500) and covers broad taxonomic and
geographic scales, thus representing a wealth of new actors to integrate into future plankton
systems biology studies.
Insights into photic-zone eukaryotic plankton ecology
Functional annotation of taxonomically-assigned V9 rDNA metabarcodes was used as
a first attempt to explore ecological patterns of eukaryotic diversity across broad spatial scales
and organismal size-fractions, focusing on fundamental trophic modes (photo- vs. hetero-
trophy) and symbiotic interactions (parasitism to mutualism). Heterotroph (protists and
metazoans) V9 rDNA metabarcodes were significantly more diverse (63%) and abundant
(62%) than phototroph metabarcodes that represented <20% of OTUs and reads across all
size-fractions and geographic sites, with an increasing heterotroph to phototroph ratio in the
micro- and meso-plankton (Fig. 5A, confirmed in 17 non-size-fractionated samples (30)).
These results challenge the classical, morphological view of plankton diversity, biased by a
terrestrial ecology approach, whereby phyto- and metazoo-plankton (the plant/animal
paradigm) are thought to comprise ~88% of eukaryotic plankton diversity (Fig. 2B) and
heterotrophic protists are typically reduced in food web modeling to a single entity, often
idealized as ciliate grazers.
33

Chapitre I
34
Fig. 5: Metabarcoding inference of trophic and symbiotic ecological diversity of photic-zoneeukaryotic plankton. (A) Richness (OTU number) and abundance (read number) of rDNAmetabarcodes assigned to various trophic taxo-groups across plankton organismal size fractions andstations. Note that the nano- size fraction contained too scarce data to be used in this biogeographicalanalysis (for all size-fractions data, see (30). (B) Relative abundance of major eukaryotic taxa acrossTara Oceans stations for: (i) phytoplankton and all eukaryotes in piconano-plankton (above the map);(ii) all eukaryotes and symbiotic, sensu lato, protists in meso-plankton (below the map). Note thepattern of inverted relative abundance between between collodarian colonies (Fig. 4) and copepods inrespectively the oligotrophic and eu/meso-trophic systems. The dinoflagellates Brandtodinium andPelagodinium are endophotosymbionts in Collodaria (33) and Foraminifera (40, 42), respectively. (C)Richness and abundance of parasitic and photosymbiotic (microalgae) protists across organismal sizefractions. The relative contribution (%) of parasites to total heterotrophic protists, and photosymbiontsto total phytoplankton, are indicated above each symbol.

Chapitre I
An unsuspected richness and abundance of metabarcodes assigned to monophyletic
groups of heterotrophic protists that cannot survive without endosymbiotic microalgae was
found in larger size fractions (‘photosymbiotic hosts’ in Fig. 5A). Their abundance and even
diversity were sometimes greater than those of all metazoan metabarcodes, including those
from copepods. Most of these cosmopolitan photosymbiotic hosts were found within the
hyper-diverse radiolarians Acantharia (1,043 OTUs) and Collodaria (5,636 OTUs, Figs. 3, 4B
and 5D), which have often been overlooked in traditional morphological surveys of plankton-
net collected material because of their delicate gelatinous and/or easily dissolved structures,
but are known to be very abundant from microscope-based and in situ imaging studies(36-38).
All 95 known colonial collodarian species described since the 19th century (39) harbour
intracellular symbiotic microalgae and these key players for plankton ecology are protistan
analogues of photosymbiotic corals in tropical coastal reef ecosystems with no equivalent in
terrestrial ecology. In addition to their contribution to total primary production (36, 38), these
diverse, biologically complex, often biomineralized, and relatively long-lived giant
mixotrophic protists stabilize carbon in larger size fractions and likely increase its flux to the
ocean interior (38). Conversely, the microalgae that are known obligate intracellular partners
in open-ocean photosymbioses (33, 40-42) (Fig. 5B) were neither very diverse nor highly
abundant, and occurred evenly across organismal size fractions (Fig. 5C). However, their
relative contribution was greatest in the meso-plankton category (10%) (Fig. 5C), where the
known photosymbionts of pelagic rhizarians were found (together with their hosts Fig. 5B).
The stable and systematic abundance of photosymbiotic microalgae across size fractions (a
pattern not shown by non-photosymbiotic microalgae, see (30)) suggests that pelagic
photosymbionts maintain free-living and potentially actively growing populations in the
piconano- and nano-plankton, representing an accessible pool for recruitment by their
heterotrophic hosts. This appears to contrast with photosymbioses in coral reefs and terrestrial
systems where symbiotic microalgal populations mainly occur within their multicellular hosts
(43).
35

Chapitre I
36
Fig. 6: Community structuring of eukaryotic plankton across temperate and tropical sunlitoceans. (A) Grouping of local communities according to taxonomic compositional similarity (Bray-Curtis distances) using Non-linear Multi-Dimensional Scaling. Each symbol represents one sampleor eukaryotic community, corresponding to a particular depth (shape) and organismal size fraction(color). (B) Same as in A., but the different plankton organismal size-fractions were analyzedindependently and communities are distinguished by depth (shape) and ocean basins’ origin (color).An increasing geographic community differentiation along increasing organismal size-fractions isvisible and confirmed by Mantel test (p-value = 10-3, Rm=0.36, 0.49, 0.50, 0.51 for the highest,piconano- to meso-plankton correlations in Mantel correlograms; see also (54)). In addition,samples from the piconano-plankton only were discriminated by depth (Surface vs. DCM; p-value=0.001, r2 =0.2). The higher diversity and abundance of eukaryotic phototrophs in thisfraction (Fig. 5A) may explain overall community structuring by light, and thus depth.

Chapitre I
On the other end of the spectrum of biological interactions, rDNA metabarcodes
affiliated to groups of known parasites were ~90 times more diverse than photosymbionts in
the piconano-plankton, where they represented ~59% of total heterotrophic protistan
ribosomal richness, and ~53% of abundance (Fig. 4; Fig. 5C), although this latter value may
be inflated by a hypothetically higher rDNA copy number in some marine alveolate lineages
(18). Parasites in this size fraction were mostly (89% of diversity and 88% of abundance,
across all stations) within the MALV-I and II Syndiniales (30), which are known exclusively
as parasitoid species that kill their host and release hundreds of small (2 to 10 μm), non-
phagotrophic, dinospores (44, 9) that survive for only a few days in the water column (45).
Abundant parasite-assigned metabarcodes in small size fractions (Fig. 5B, C) suggest the
existence of a large and diverse pool of free-living parasites in photic-zone piconano-
plankton, mirroring phage ecology (46), and reflecting the extreme diversity and abundance
of their known hosts, essentially radiolarians, ciliates, and dinoflagellates (Fig. 3) (9, 47-49).
Contrasting with the pattern observed for metabarcodes affiliated to purely phagotrophic taxa,
the relative abundance and richness of putative parasite metabarcodes decreased in the nano-
and micro-planktonic size fractions, but increased again in the meso-plankton (Fig. 5C),
where parasites are most likely in their infectious stage within larger-sized host organisms.
This putative in hospite parasites richness, equivalent to only 23% of that in the piconano-
plankton, consisted mostly of a variety of alveolate taxa known to infect crustaceans: MALV-
IV such as Haematodinium and Syndinium, dinoflagellates such as Blastodinium (Fig. 4E),
and apicomplexan gregarines, mainly Cephaloidophoroidea (Fig. 5B) (9, 50, 51). This pattern
contrasts with terrestrial systems where most parasites live within their hosts, and are
typically transmitted either vertically or through vectors since they generally do not survive
outside their hosts (52). In the pelagic realm, free-living parasitic spores, like phages, are
protected from dessication, dispersed by water diffusion, and are apparently massively
produced, which likely increases horizontal transmission rate.
Community structuring of photic-zone eukaryotic plankton
Clustering of communities by their compositional similarity revealed the primary
influence of organism size (p-value = 10-3, r2 = 0.73) on community structuring, with
piconano-plankton displaying stronger cohesiveness than larger organismal size fractions
(Fig. 6A). Filtered size fraction-specific communities separated by thousands of kilometers
were more similar in composition than they were to communities from other size fractions at
37

Chapitre I
the same location. This was emphasized by the fact that ~36% of all OTUs were restricted to a
single size category (53). Further analyses within each organismal size fraction indicated that
geography plays a role in community structuring, with samples being partially structured
according to basin of origin, a pattern that was stronger in larger organismal size fractions (p-
value=0.001 in all cases, r2 = 0.255 for piconano-plankton, 0.371 for nano-plankton, 0.473 for
micro-plankton and 0.570 for meso-plankton) (Fig. 6B). Mantel correlograms comparing
Bray-Curtis community similarity to geographic distances between all samples indicated
significant positive correlations in all organismal size-fractions over the first ~6,000 km, the
correlation breaking down at larger geographic distances (54). This positive correlation
between community dissimilarity and geographic distance, expected under neutral
biodiversity dynamics (55), challenges the classical niche model for photic-zone eukaryotic
plankton biogeography (56). The significantly stronger community differentiation by ocean
basin in larger organismal size fractions (Fig. 6B) suggests increasing dispersal limitation
from piconano- to nano-, micro-, and meso-plankton. Thus, larger-sized eukaryotic plankton
communities, containing the highest abundance and diversity of metazoans (Fig. 2A and Fig.
5B), were spatially more heterogeneous in terms of both taxonomic (Fig. 6) and functional
(Fig. 5A) composition and abundance. The complex life-cycle and behaviors of
metazooplankton, including temporal reproductive and growth cycles and vertical migrations,
together with putative rapid adaptive evolution processes to mesoscale oceanographic features
(57), may explain the stronger geographic differentiation of meso-planktonic communities. By
contrast, eukaryotic communities in the piconano-plankton were richer (Fig. 1A) and more
homogeneous in taxonomic composition (Fig. 6), representing a stable compartment across
the world’s oceans (58).
Even though protistan communities were diverse, the proportions of abundant (>1%)
and rare (<0.01%) OTUs were more or less constant across communities, as has been
observed in coastal waters (6). Only 2 to 17 OTUs (i.e. 0.2 to 8% of total OTUs per and
across sample) dominated each community (54), suggesting that a small proportion of
eukaryotic taxa are key for local plankton ecosystem function. On a worldwide scale, an
occurrence vs. abundance analysis of all ~110,000 Tara Oceans OTUs revealed the hyper-
dominance of cosmopolitan taxa (Fig. 7A). The 381 (0.35% of the total) cosmopolitan OTUs
represented ~68% of the total number of reads in the dataset. Of these, 269 (71%) OTUs had
>100,000 reads and accounted for nearly half (48%) of all rDNA reads (Fig. 7A), a pattern
reminiscent of hyper-dominance in the largest forest ecosystem on Earth, where only 227 tree
38

Chapitre I
species out of an estimated total of 16,000 account for half of all trees in Amazonia (59). The
cosmopolitan OTUs belonged mainly (314 of 381) to the 11 hyper-diverse eukaryotic
planktonic lineages (Fig. 3C), and were essentially phagotrophic (40%) or parasitic (21%),
with relatively few (15%) phytoplanktonic taxa (54), 25% of the cosmopolitan OTUs, which
represent organisms that are likely amongst the most abundant eukaryotes on Earth, had poor
identity (<95%) to reference taxa, and 11 of these OTUs could not even by affiliated to any
available reference sequence (Fig. 7B and (54)).
39
Fig. 7: Cosmopolitanism and abundance of eukaryotic marine plankton. (A)Occurrence/Abundance (x/y axis) plot including the ~110,000 Tara Oceans V9 rDNA OTUs.OTUs are colored according to their identity with reference sequence, and a fitted curveindicates the median OTU size value for each OTU geographic occurrence value. The redrectangle encloses the cosmopolitan and hyper-dominant (>105 reads) OTUs. (B) Similarityto reference barcode and taxonomic purity (a measure of taxonomic assignment consistencydefined as the % of reads within an OTU assigned to the same taxon; see (13)) of the 381cosmopolitan OTUs, along their abundance (y axis).

Chapitre I
Conclusions and perspectives
We used rDNA sequence data to explore the taxonomic and ecological structure of
total eukaryotic plankton from the photic oceanic biome, and integrated these data with
existing morphological knowledge. We found that eukaryotic plankton are more diverse than
previously thought, especially heterotrophic protists which may display a wide range of
trophic modes (60) and include an unsuspected diversity of parasites and photosymbiotic taxa.
Dominance of unicellular heterotrophs in plankton ecosystems likely emerged at the dawn of
the radiation of eukaryotic cells, together with arguably their most important innovation:
phagocytosis. The onset of eukaryophagy in the Neoproterozoic (61) likely led to adaptive
radiation in heterotrophic eukaryotes through specialization of trophic modes and symbioses,
opening novel serial biotic ecological niches. The extensive co-diversification of relatively
large heterotrophic eukaryotes and their associated parasites supports the idea that biotic
interactions, rather than competition for resources and space (62), are the primary forces
driving organismal diversification in marine plankton systems. Based on rDNA, heterotrophic
protists may be even more diverse than prokaryotes in the planktonic ecosystem (63). Given
that organisms in highly diverse and abundant groups such as the alveolates and rhizarians
can have genomes more complex than those of humans (64), eukaryotic plankton may contain
a vast reservoir unknown marine planktonic genes (65). Insights are developing into how
heterotrophic protists contribute to a multi-layered and integrated ecosystem. The protistan
parasites and mutualistic symbionts increase connectivity and complexity of pelagic food
webs (66, 67) while contributing to the carbon quota of their larger, longer-lived, often
biomineralized, symbiotic hosts, which themselves contribute to carbon export when they die.
Decoding the ecological and evolutionary rules governing plankton diversity remains
essential for understanding how the critical ocean biomes contribute to the functioning of the
Earth system.
Materials & Methods
V9-18S rDNA for eukaryotic metabarcoding
We used universal eukaryotic primers (68) to PCR amplify (25 cycles in triplicate) the
V9-18S rDNA genes from all Tara Oceans samples. This barcode presents a combination of
advantages for addressing general questions of eukaryotic biodiversity over extensive
taxonomic and ecological scales: (i) it is universally conserved in length (130±4bp) and
40

Chapitre I
simple in secondary structure, thus allowing relatively unbiased PCR amplification across
eukaryotic lineages followed by Illumina sequencing, (ii) it includes both stable and highly-
variable nucleotide positions over evolutionary time frames, allowing discrimination of taxa
over a significant phylogenetic depth, (iii) it is extensively represented in public reference
databases across the eukaryotic tree of life, allowing taxonomic assignment amongst all
known eukaryotic lineages (13).
Biodiversity analyses
Our bioinformatic pipeline included quality-check (phred score filtering, elimination
of reads without perfect forward and reverse primers, chimera removal) and conservative
filtering (removal of metabarcodes present in less than 3 reads and 2 distinct samples). The
~2.3 million metabarcodes (distinct reads) were clustered using an agglomerative,
unsupervised single-linkage clustering algorithm, allowing OTUs to reach their natural limits
while avoiding arbitrary global clustering thresholds (13, 14). This clustering limited
overestimation of biodiversity due to errors in PCR amplification or DNA sequencing as well
as intragenomic polymorphism of rDNA gene copies (13). Tara Oceans metabarcodes and
OTUs were taxonomically assigned by comparison to the 77,449 reference barcodes included
in our V9_PR2 database (15). This database derives from the Protist Ribosomal Reference
(PR2) database (69) but focuses on the V9 region of the gene and includes the following re-
organizations: (i) extension of the number of ranks for groups with finer taxonomy (e.g.
animals), (ii) expert curation of the taxonomy and re-naming in novel environmental groups
and dinoflagellates, (iii) resolution of all taxonomic conflicts and inclusion of environmental
sequences only if they provide additional phylogenetic information, (iv) annotation of basic
trophic/symbiotic modes for all reference barcodes assigned to the genus level (see (53) and
(15) for details). The V9_PR2 reference barcodes represent 24,435 species and 13,432 genera
from all known major lineages of the tree of eukaryotic life (15). Metabarcodes with ≥80%
identity to a reference V9 rDNA barcode were considered assignable. Below this threshold it
is not possible to discriminate between eukaryotic supergroups given the short length of V9
rDNA sequences and the relatively fast rate accumulation of substitution mutations in the
DNA. In addition to assignment at the finest-possible taxonomic resolution, all assignable
metabarcodes were classified into a reference taxonomic framework consisting of 97 major
monophyletic groups comprising all known high-rank eukaryotic diversity. This framework,
primarily based on a synthesis of protistan biodiversity (19), also included all key, but still
unnamed planktonic clades revealed by previous environmental rDNA clone library surveys
41

Chapitre I
(70) (e.g. MALV ‘marine alveolates’, MAST ‘marine stramenopiles’, MOCH ‘marine
ochrophytes’, RAD ‘radiolarians’ (15). Details of molecular and bioinformatics methods are
available on a companion web site at http://taraoceans.sb-roscoff.fr/EukDiv/ (53).We
compiled our data into two databases including the taxonomy, abundance, and size-
fraction/biogeography information associated to each metabarcode and OTU (71).
Ecological inferences
From our Tara Oceans metabarcoding dataset, we inferred patterns of eukaryotic
plankton functional ecology. Based on a literature survey, all reference barcodes assigned to at
least the genus level that recruited Tara Oceans metabarcodes were associated to basic trophic
and symbiotic modes of the organism they come from (15), and used for a taxo-functional
annotation of our entire metabarcoding dataset with the same set of rules used for taxonomic
assignation (53). False positive were minimized by (i) assigning ecological modes to all
individual reference barcodes in V9_PR2, (ii) inferring ecological modes to metabarcodes
related to mono-modal reference barcode(s) (otherwise transfer them to a ‘NA - non
applicable’ category), and (iii) exploring broad and complex trophic and symbiotic modes that
involve fundamental reorganization of the cell structure and metabolism, emerged relatively
rarely in the evolutionary history of eukaryotes, and most often concern all known species
within monophyletic and ancient groups (see (15) for details). In case of photo- versus hetero-
trophy, >75% of the major, deep-branching eukaryotic lineages considered (Fig. 3) are ‘mono-
modal’ and recruit ~87% and ~69% of all Tara Oceans V9 rDNA reads and OTUs,
respectively. For parasitism, ~91% of Tara Oceans metabarcodes are falling within
monophyletic and major groups containing exclusively parasitic species (essentially within
the major MALVs groups). Although biases could arise in functional annotation of
metabarcodes relatively distant from reference barcodes in the few complex poly-modal
groups (e.g. the dinoflagellates that can be phototrophic, heterotrophic, parasitic, or
photosymbiotic), a conservative analysis of the trophic and symbiotic ecological patterns
presented in Fig. 3, using a ≥99% assignation threshold, shows that these are stable across
organismal size fractions and space independently of the similarity cutoff (80% or 99%),
demonstrating their robustness across evolutionary times (30).
Note that rDNA gene copy number varies from one to thousands in single eukaryotic
genomes (72, 73), precluding direct translation of rDNA read number into abundance of
individual organisms. However, the number of rDNA copies per genome correlates positively
42

Chapitre I
to the size (73) and particularly to the biovolume (72) of the eukaryotic cell it represents. We
compiled published data from the last ca. 20 years, confirming the positive correlation
between eukaryotic cell size and rDNA copy number across a wide taxonomic and organismal
size range (see (74), note however the ~1 order of magnitude of cell size variation for a given
of rDNA copy number. To verify whether our molecular ecology protocol preserved this
empirical correlation, light microscopy counts of phytoplankton belonging to different
eukaryotic supergroups (coccolithophores, diatoms, dinoflagellates) were performed from 9
Tara Oceans stations from the Indian, Atlantic, and Southern Oceans, transformed into
biomass and biovolume data and then compared with the relative number of V9 rDNA reads
found for the identified taxa in the same samples (74). Results confirmed the correlation
between biovolume and V9 rDNA abundance data (r2=0.97, p-value=1.e-16;), although we
cannot rule out the possibility that some eukaryotic taxa may not follow the general trend.
References and notes
1. FIELD, Christopher B., BEHRENFELD, Michael J., RANDERSON, James T., et
al. Primary production of the biosphere: integrating terrestrial and oceanic
components. Science, 1998, vol. 281, no 5374, p. 237-240.
2. CARON, David A., COUNTWAY, Peter D., JONES, Adriane C., et al. Marine
protistan diversity. Annual review of marine science, 2012, vol. 4, p. 467-493.
3. LÓPEZ-GARCÍA, Purificación, RODRIGUEZ-VALERA, Francisco, PEDRÓS-
ALIÓ, Carlos, et al. Unexpected diversity of small eukaryotes in deep-sea Antarctic
plankton. Nature, 2001, vol. 409, no 6820, p. 603-607.
4. MOON-VAN DER STAAY, Seung Yeo, DE WACHTER, Rupert, et VAULOT, Daniel.
Oceanic 18S rDNA sequences from picoplankton reveal unsuspected eukaryotic
diversity. Nature, 2001, vol. 409, no 6820, p. 607-610.
5. DÍEZ, Beatriz, PEDRÓS-ALIÓ, Carlos, et MASSANA, Ramon. Study of genetic
diversity of eukaryotic picoplankton in different oceanic regions by small-subunit rRNA gene
cloning and sequencing. Applied and environmental microbiology, 2001, vol. 67, no 7, p.
2932-2941.
6. LOGARES, Ramiro, AUDIC, Stéphane, BASS, David, et al. Patterns of rare and
abundant marine microbial eukaryotes. Current Biology, 2014, vol. 24, no 8, p. 813-821.
43

Chapitre I
7. EDGCOMB, Virginia, ORSI, William, BUNGE, John, et al. Protistan microbial
observatory in the Cariaco Basin, Caribbean. I. Pyrosequencing vs Sanger insights into
species richness. The ISME journal, 2011, vol. 5, no 8, p. 1344-1356.
8. MASSANA, Ramon, CASTRESANA, Jose, BALAGUÉ, Vanessa, et al. Phylogenetic
and ecological analysis of novel marine stramenopiles. Applied and Environmental
Microbiology, 2004, vol. 70, no 6, p. 3528-3534.
9. GUILLOU, Laure, VIPREY, Manon, CHAMBOUVET, A., et al. Widespread
occurrence and genetic diversity of marine parasitoids belonging to Syndiniales
(Alveolata). Environmental Microbiology, 2008, vol. 10, no 12, p. 3349-3365.
10. LIU, Hui, PROBERT, Ian, UITZ, Julia, et al. Extreme diversity in noncalcifying
haptophytes explains a major pigment paradox in open oceans. Proceedings of the National
Academy of Sciences, 2009, vol. 106, no 31, p. 12803-12808.
11. Companion website: Figure W1 and Database W1 (available at http://taraoceans.sb-
roscoff.fr/EukDiv/).
12. PESANT, Stéphane, NOT, Fabrice, PICHERAL, Marc, et al. Open science resources
for the discovery and analysis of Tara Oceans data. Scientific Data, 2015, vol. 2.
13. Companion website: Text W1 and Figure W2 (available at http://taraoceans.sb-
roscoff.fr/EukDiv/).
14. MAHÉ, Frédéric, ROGNES, Torbjørn, QUINCE, Christopher, et al. Swarm: robust
and fast clustering method for amplicon-based studies. PeerJ, 2014, vol. 2, p. e593.
15. Companion website: Database W2, Database W3 and Database W6 (available at
http://taraoceans.sb-roscoff.fr/EukDiv/).
16. Companion website: Text W3, Text W4, Text W5, Figure W4, Figure W5, Figure W6
and Figure W7 (available at http://taraoceans.sb-roscoff.fr/EukDiv/).
17. PRESTON, Frank W. The commonness, and rarity, of species. Ecology, 1948, vol. 29,
no 3, p. 254-283.
18. MASSANA, Ramon. Eukaryotic picoplankton in surface oceans. Annual review of
microbiology, 2011, vol. 65, p. 91-110.
19. PAWLOWSKI, Jan, AUDIC, Stéphane, ADL, Sina, et al. CBOL protist working
group: barcoding eukaryotic richness beyond the animal, plant, and fungal kingdoms. PLOS
Biology, 2012, vol. 10, p. e1001419.
44

Chapitre I
20. MORA, Camilo, TITTENSOR, Derek P., ADL, Sina, et al. How many species are
there on Earth and in the ocean? PLOS Biology, 2011, vol. 9, p. e1001127.
21. APPELTANS, Ward, AHYONG, Shane T., ANDERSON, Gary, et al. The magnitude
of global marine species diversity. Current Biology, 2012, vol. 22, no 23, p. 2189-2202.
22. MÁRQUEZ, Luis M., MILLER, David J., MACKENZIE, Jason B., et al.Pseudogenes
contribute to the extreme diversity of nuclear ribosomal DNA in the hard coral
Acropora. Molecular Biology and Evolution, 2003, vol. 20, no 7, p. 1077-1086.
23. SANTOS, SCOTT R., KINZIE, ROBERT A., SAKAI, KAZUHIKO, et al.Molecular
Characterization of Nuclear Small Subunit (ISS) rDNA Pseudogenes in a Symbiotic‐
Dinoflagellate (Symbiodinium, Dinophyta). Journal of Eukaryotic Microbiology, 2003, vol.
50, no 6, p. 417-421.
24. DECELLE, Johan, ROMAC, Sarah, SASAKI, Eriko, et al. Intracellular diversity of
the V4 and V9 regions of the 18S rRNA in marine protists (Radiolarians) assessed by high-
throughput sequencing. PLOS One, 2014, vol 9, p. e104297.
25. SOURNIA, Alain, CHRÉTIENNOT-DINET, Marie-Josèphe, et RICARD, Michel.
Marine phytoplankton: how many species in the world ocean?. Journal of Plankton Research,
1991, vol. 13, no 5, p. 1093-1099.
26. WIEBE, Peter H., BUCKLIN, Ann, MADIN, Laurence, et al. Deep-sea sampling on
CMarZ cruises in the Atlantic Ocean–an Introduction. Deep Sea Research Part II: Topical
Studies in Oceanography, 2010, vol. 57, no 24, p. 2157-2166.
27. BOLTOVSKOY, Demetrio, CORREA, Nancy, et BOLTOVSKOY, Andrés. Diversity
and endemism in cold waters of the South Atlantic: contrasting patterns in the plankton and
the benthos. Scientia Marina, 2005, vol. 69, no S2, p. 17-26.
28. DE VARGAS, Colomban, NORRIS, Richard, ZANINETTI, Louisette, et al.
Molecular evidence of cryptic speciation in planktonic foraminifers and their relation to
oceanic provinces. Proceedings of the National Academy of Sciences, 1999, vol. 96, no 6, p.
2864-2868.
29. HALBERT, Kristin MK, GOETZE, Erica, et CARLON, David B. High cryptic
diversity across the global range of the migratory planktonic copepods Pleuromamma piseki
and P. gracilis. PLOS one, 2013, vol. 8, no 10, p. e77011.
30. Companion website: Figure W8, Figure W9, Figure W10 and Figure W14 (available at
http://taraoceans.sb-roscoff.fr/EukDiv/).
45

Chapitre I
31. BURKI, Fabien et KEELING, Patrick J. Rhizaria. Current Biology, 2014, vol. 24, no
3, p. R103-R107.
32. SWANBERG, Neil Ralph. The ecology of colonial radiolarians: their colony
morphology, trophic interactions and associations, behavior, distribution, and the
photosynthesis of their symbionts. 1979. Doctoral dissertation. Massachusetts Institute of
Technology and Woods Hole Oceanographic Institution.
33. PROBERT, Ian, SIANO, Raffaele, POIRIER, Camille, et al. Brandtodinium gen. nov.
and B. nutricula comb. Nov.(Dinophyceae), a dinoflagellate commonly found in symbiosis
with polycystine radiolarians. Journal of Phycology, 2014, vol. 50, no 2, p. 388-399.
34. HEYDEN, Sophie, CHAO, Ema E., VICKERMAN, Keith, et al. Ribosomal RNA
phylogeny of bodonid and diplonemid flagellates and the evolution of Euglenozoa. Journal of
Eukaryotic Microbiology, 2004, vol. 51, no 4, p. 402-416.
35. SCHNEPF, Eberhard. Light and Electron Microscopical Observations in Rhynchopus
coscinodiscivorus spec. nov., a Colorless, Phagotrophic Euglenozoon with Concealed
Flagella). Archiv für Protistenkunde, 1994, vol. 144, no 1, p. 63-74.
36. DENNETT, Mark R., CARON, David A., MICHAELS, Anthony F., et al. Video
plankton recorder reveals high abundances of colonial Radiolaria in surface waters of the
central North Pacific. Journal of Plankton Research, 2002, vol. 24, no 8, p. 797-805.
37. STEMMANN, Lars, YOUNGBLUTH, Marsh, ROBERT, Kevin, et al. Global
zoogeography of fragile macrozooplankton in the upper 100–1000 m inferred from the
underwater video profiler. ICES Journal of Marine Science, 2008, vol. 65, no 3, p. 433-442.
38. MICHAELS, Anthony F., CARON, David A., SWANBERG, Neil R., et al. Planktonic
sarcodines (Acantharia, Radiolaria, Foraminifera) in surface waters near Bermuda:
abundance, biomass and vertical flux. Journal of Plankton Research, 1995, vol. 17, no 1, p.
131-163.
39. HAECKEL, Ernst. Report on the scientific results of the voyage of the HMS
Challenger during the years 1873-1876. Zoology, 1887, vol. 18.
40. SIANO, Raffaele, MONTRESOR, Marina, PROBERT, Ian, et al. Pelagodinium gen.
nov. and P. béii comb. nov., a dinoflagellate symbiont of planktonic foraminifera. Protist,
2010, vol. 161, no 3, p. 385-399.
46

Chapitre I
41. DECELLE, Johan, PROBERT, Ian, BITTNER, Lucie, et al. An original mode of
symbiosis in open ocean plankton. Proceedings of the National Academy of Sciences, 2012,
vol. 109, no 44, p. 18000-18005.
42. SHAKED, Yonathan et DE VARGAS, Colomban. Pelagic photosymbiosis: rDNA
assessment of diversity and evolution of dinoflagellate symbionts and planktonic
foraminiferal hosts. Marine Ecology Progress Series, 2006, vol. 325, p. 59-71.
43. DECELLE, Johan. New perspectives on the functioning and evolution of
photosymbiosis in plankton: Mutualism or parasitism?. Communicative & integrative biology,
2013, vol. 6, no 4, p. e24560.
44. SIANO, Raffaele, ALVES-DE-SOUZA, C., FOULON, E., et al. Distribution and host
diversity of Amoebophryidae parasites across oligotrophic waters of the Mediterranean
Sea. Biogeosciences, 2011, vol. 8, no 2, p. 267-278.
45. COATS, D. Wayne et PARK, Myung Gil. Parasitism of photosynthetic dinoflagellates
by three strains of Amoebophrya (Dinophyta): Parasite survival, infectivity, generation time,
and host specificity. Journal of Phycology, 2002, vol. 38, no 3, p. 520-528.
46. WOMMACK, K. Eric et COLWELL, Rita R. Virioplankton: viruses in aquatic
ecosystems. Microbiology and Molecular Biology Reviews, 2000, vol. 64, no 1, p. 69-114.
47. SKOVGAARD, Alf. Dirty tricks in the plankton: Diversity and Role of Marine
Parasitic Protists: diversity and role of marine parasitic protists. Acta Protozoologica, 2014,
vol. 53, no 1, p. 51-62.
48. BRÅTE, Jon, KRABBERØD, Anders K., DOLVEN, Jane K., et al. Radiolaria
associated with large diversity of marine alveolates. Protist, 2012, vol. 163, no 5, p. 767-777.
49. BACHVAROFF, Tsvetan R., KIM, Sunju, GUILLOU, Laure, et al. Molecular
diversity of the syndinean genus Euduboscquella based on single-cell PCR analysis. Applied
and environmental microbiology, 2012, vol. 78, no 2, p. 334-345.
50. RUECKERT, Sonja, SIMDYANOV, Timur G., ALEOSHIN, Vladimir V., et al.
Identification of a divergent environmental DNA sequence clade using the phylogeny of
gregarine parasites (Apicomplexa) from crustacean hosts. PloS one, 2011, vol. 6, no 3, p.
e18163-e18163.
51. SKOVGAARD, Alf, KARPOV, Sergey A., et GUILLOU, Laure. The parasitic
dinoflagellates Blastodinium spp. inhabiting the gut of marine, planktonic copepods:
47

Chapitre I
morphology, ecology, and unrecognized species diversity. Frontiers in microbiology, 2012,
vol. 3.
52. MCCALLUM, Hamish I., KURIS, Armand, HARVELL, C. Drew, et al. Does
terrestrial epidemiology apply to marine systems?. Trends in Ecology & Evolution, 2004, vol.
19, no 11, p. 585-591.
53. Companion website: Detailed Material and Methods, Database W9 and Figure W11
(available at http://taraoceans.sb-roscoff.fr/EukDiv/).
54. Companion website: Figure W12, Figure W13, Database W7 and Database W8
(available at http://taraoceans.sb-roscoff.fr/EukDiv/).
55. HOLYOAK, Marcel, LEIBOLD, Mathew A., et HOLT, Robert D.Metacommunities:
spatial dynamics and ecological communities. University of Chicago Press, 2005.
56. BAAS-BECKING, Lourens Gerhard Marinus. Geobiologie; of inleiding tot de
milieukunde. WP Van Stockum & Zoon NV, 1934.
57. PEIJNENBURG, Katja TCA et GOETZE, Erica. High evolutionary potential of
marine zooplankton. Ecology and evolution, 2013, vol. 3, no 8, p. 2765-2781.
58. SMETACEK, Victor. Microbial food webs: The ocean's veil. Nature, 2002, vol. 419,
no 6907, p. 565-565.
59. TER STEEGE, Hans, PITMAN, Nigel CA, SABATIER, Daniel, et al.
Hyperdominance in the Amazonian tree flora. Science, 2013, vol. 342, no 6156, p. 1243092.
60. VAULOT, Daniel, ROMARI, Khadidja, et NOT, Fabrice. Are autotrophs less diverse
than heterotrophs in marine picoplankton?. Trends in microbiology, 2002, vol. 10, no 6, p.
266.
61. KNOLL, Andrew H. Paleobiological perspectives on early eukaryotic evolution.Cold
Spring Harbor perspectives in biology, 2014, vol. 6, no 1, p. a016121.
62. SMETACEK, Victor. A watery arms race. Nature, 2001, vol. 411, no 6839, p. 745-745.
63. SUNAGAWA, Shinichi, COELHO, Luis Pedro, CHAFFRON, Samuel, et al.Structure
and function of the global ocean microbiome. Science, 2015, vol. 348, no 6237, p. 1261359.
64. OLIVER, Matthew J., PETROV, Dmitri, ACKERLY, David, et al. The mode and
tempo of genome size evolution in eukaryotes. Genome research, 2007, vol. 17, no 5, p. 594-
601.
65. ABIDA, Heni, RUCHAUD, Sandrine, RIOS, Laurent, et al. Bioprospecting marine
plankton. Marine drugs, 2013, vol. 11, no 11, p. 4594-4611.
48

Chapitre I
66. LIMA-MENDEZ, Gipsi, FAUST, Karoline, HENRY, Nicolas, et al. Determinants of
community structure in the global plankton interactome. Science, 2015, vol. 348, no 6237, p.
1262073.
67. LAFFERTY, Kevin D., DOBSON, Andrew P., et KURIS, Armand M. Parasites
dominate food web links. Proceedings of the National Academy of Sciences, 2006, vol. 103,
no 30, p. 11211-11216.
68. AMARAL-ZETTLER, Linda A., MCCLIMENT, Elizabeth A., DUCKLOW, Hugh
W., et al. A method for studying protistan diversity using massively parallel sequencing of V9
hypervariable regions of small-subunit ribosomal RNA genes. PLoS One, 2009, vol. 4, no 7,
p. e6372.
69. GUILLOU, Laure, BACHAR, Dipankar, AUDIC, Stéphane, et al. The Protist
Ribosomal Reference database (PR2): a catalog of unicellular eukaryote small sub-unit rRNA
sequences with curated taxonomy. Nucleic acids research, 2013, p. gks1160.
70. MASSANA, Ramon, DEL CAMPO, Javier, SIERACKI, Michael E., et al. Exploring
the uncultured microeukaryote majority in the oceans: reevaluation of ribogroups within
stramenopiles. The ISME journal, 2014, vol. 8, no 4, p. 854-866.
71. Companion website: Database W4 and Database W5 (available at http://taraoceans.sb-
roscoff.fr/EukDiv/).
72. GODHE, Anna, ASPLUND, Maria E., HÄRNSTRÖM, Karolina, et al. Quantification
of diatom and dinoflagellate biomasses in coastal marine seawater samples by real-time
PCR. Applied and environmental microbiology, 2008, vol. 74, no 23, p. 7174-7182.
73. ZHU, Fei, MASSANA, Ramon, NOT, Fabrice, et al. Mapping of picoeucaryotes in
marine ecosystems with quantitative PCR of the 18S rRNA gene. FEMS microbiology
ecology, 2005, vol. 52, no 1, p. 79-92.
74. Companion website: Text W2 and Figure W3 (available at http://taraoceans.sb-
roscoff.fr/EukDiv/).
75. KIM, Miran, NAM, Seung Won, SHIN, Woongghi, et al. Dinophysis caudata
(dinophyceae) sequesters and retains plastids from the mixotrophic ciliate prey mesodinium
rubrum. Journal of Phycology, 2012, vol. 48, no 3, p. 569-579.
49

Chapitre I
Acknowledgements
We thank the commitment of the following people and sponsors: CNRS (in particular
the GDR3280, EMBL, Genoscope/CEA, UPMC, VIB, Stazione Zoologica Anton Dohrn,
UNIMIB, Rega Institute, KU Leuven; Fund for Scientific Research – The French Ministry of
Research, the French Government 'Investissements d'Avenir' programmes OCEANOMICS
(ANR-11-BTBR-0008), FRANCE GENOMIQUE (ANR-10-INBS-09-08), MEMO LIFE
(ANR-10-LABX-54), PSL* Research University (ANR-11-IDEX-0001-02), ANR (projects
POSEIDON/ANR-09-BLAN-0348, PROMETHEUS/ANR-09-PCS-GENM-217,
PHYTBACK/ANR-2010-1709-01, TARA-GIRUS/ANR-09-PCS-GENM-218, EU FP7
(MicroB3/No.287589, IHMS/HEALTH-F4-2010-261376, ERC Advanced Grant Awards to
CB (Diatomite:294823), GBMF grant #3790 to MBS, Spanish Ministry of Science and
Innovation grant CGL2011-26848/BOS MicroOcean PANGENOMICS, and TANIT (CONES
2010-0036) grant from the AGAUR to SGA, JSPS KAKENHI Grant #26430184 to HO. We
also thank the support and commitment of Agnès b., Etienne Bourgois, and Romain Troublé,
Région Bretagne and Gilles Ricono, the Veolia Environment Foundation, Lorient
Agglomération, World Courier, Illumina, the EDF Foundation, FRB, the Prince Albert II de
Monaco Foundation, the Tara schooner and its captains and crew. We thank MERCATOR-
CORIOLIS and ACRI-ST for providing daily satellite data during the expedition. We are also
grateful to the French Ministry of Foreign Affairs for supporting the expedition and to the
countries who graciously granted sampling permissions. Tara Oceans would not exist without
continuous support from 23 institutes (http://oceans.taraexpeditions.org). We also
acknowledge excellent assistance from EBI, in particular Guy Cochrane and Petra ten
Hoopen, as well as the EMBL Advanced Light Microscopy Facility (ALMF), in particular
Rainer Pepperkok. We thank Francoise Gaill, Bernard Kloareg, Francois Lallier, Demetrio
Boltovskoy, Andy Knoll, Daniel Richter, and Emilie Médard, for their help and advice on the
manuscript. The authors further declare that all data reported herein are fully and freely
available from the date of publication, with no restrictions, and that all of the samples,
analyses, publications, and ownership of data are free from legal entanglement or restriction
of any sort by the various nations whose waters the Tara Oceans expedition sampled in. Data
described herein is available at http://taraoceans.sb-roscoff.fr/EukDiv/, at EBI under the
project ID PRJEB402 and PRJEB6610, and at PANGAEA (see Table S1). The data release
policy regarding future public release of Tara Oceans data is described in Pesant et al. (12).
50

Chapitre I
All authors approved the final manuscript. This article is contribution number 24 of Tara
Oceans. Supplement contains additional data.
Tara Oceans CoordinatorsSilvia G. Acinas1, Peer Bork2, Emmanuel Boss3, Chris Bowler4, Colomban de Vargas5,6, MichaelFollows7, Gabriel Gorsky8,9, Nigel Grimsley10,11, Pascal Hingamp12, Daniele Iudicone13, OlivierJaillon14,15,16, Stefanie Kandels-Lewis2,17, Lee Karp-Boss3, Eric Karsenti4,17, Uros Krzic18, Fabrice Not5,6,Hiroyuki Ogata19, Stephane Pesant20,21, Jeroen Raes22,23,24, Emmanuel G. Reynaud25, ChristianSardet26,27, Mike Sieracki28, Sabrina Speich29,30, Lars Stemmann8, Matthew B. Sullivan31, ShinichiSunagawa2, Didier Velayoudon32, Jean Weissenbach14,15,16, Patrick Wincker14,15,16
1Department of Marine Biology and Oceanography, Institute of Marine Science (ICM)-CSIC, Pg. Marítim de la Barceloneta,37-49, Barcelona E08003, Spain. 2Structural and Computational Biology, European Molecular Biology Laboratory,Meyerhofstr. 1, 69117 Heidelberg, Germany. 3School of Marine Sciences, University of Maine, Orono, Maine, USA. 4EcoleNormale Supérieure, Institut de Biologie de l’ENS (IBENS), and Inserm U1024, and CNRS UMR 8197, Paris, F-75005France. 5CNRS, UMR 7144, Station Biologique de Roscoff, Place Georges Teissier, 29680 Roscoff, France. 6SorbonneUniversités, UPMC Univ Paris 06, UMR 7144, Station Biologique de Roscoff, Place Georges Teissier, 29680 Roscoff,France. 7Dept of Earth, Atmospheric and Planetary Sciences, Massachusetts Institute of Technology, Cambridge, USA.8CNRS, UMR 7093, LOV, Observatoire Océanologique, F-06230, Villefranche-sur-mer, France. 9Sorbonne Universités,UPMC Univ Paris 06, UMR 7093, LOV, Observatoire Océanologique, F-06230, Villefranche-sur-mer, France. 10CNRS UMR7232, BIOM, Avenue du Fontaulé, 66650 Banyuls-sur-Mer, France. 11Sorbonne Universités Paris 06, OOB UPMC, Avenuedu Fontaulé, 66650 Banyuls-sur-Mer France. 12Aix Marseille Université CNRS IGS UMR 7256 13288 Marseille France.13Stazione Zoologica Anton Dohrn, Villa Comunale, 80121, Naples, Italy. 14CEA - Institut de Génomique, GENOSCOPE, 2rue Gaston Crémieux, 91057 Evry, France. 15CNRS, UMR 8030, CP5706, Evry France. 16Université d'Evry, UMR 8030,CP5706, Evry France. 17Directors’ Research, European Molecular Biology Laboratory, Meyerhofstr. 1, 69117 Heidelberg,Germany. 18Cell Biology and Biophysics, European Molecular Biology Laboratory, Meyerhofstr. 1, 69117 Heidelberg,Germany. 19Institute for Chemical Research, Kyoto University, Gokasho, Uji, Kyoto, 611-001, Japan. 20PANGAEA, DataPublisher for Earth and Environmental Science, University of Bremen, Bremen, Germany. 21MARUM, Center for MarineEnvironmental Sciences, University of Bremen, Bremen, Germany. 22Department of Microbiology and Immunology, RegaInstitute, KU Leuven, Herestraat 49, 3000 Leuven, Belgium. 23Center for the Biology of Disease, VIB, Herestraat 49, 3000Leuven, Belgium. 24Department of Applied Biological Sciences, Vrije Universiteit Brussel, Pleinlaan 2, 1050 Brussels,Belgium. 25Earth Institute, University College Dublin, Dublin, Ireland. 26CNRS, UMR 7009 Biodev, ObservatoireOcéanologique, F-06230 Villefranche-sur-mer, France. 27Sorbonne Universités, UPMC Univ Paris 06, UMR 7009 Biodev, F-06230 Observatoire Océanologique, Villefranche-sur-mer, France. 28Bigelow Laboratory for Ocean Sciences, East Boothbay,USA. 29Department of Geosciences, Laboratoire de Météorologie Dynamique (LMD), Ecole Normale Supérieure, 24 rueLhomond 75231 Paris Cedex 05 France. 30Laboratoire de Physique des Océan UBO-IUEM Palce Copernic 29820 Polouzané,France. 31Department of Ecology and Evolutionary Biology, University of Arizona, 1007 E Lowell Street, Tucson, AZ,85721, USA. 32DVIP Consulting, Sèvres, France.
51

Chapitre I
Determinants of community structure in the globalplankton interactome
Gipsi Lima-Mendez1,2,3,†, Karoline Faust1,2,3,†, Nicolas Henry4,5,†, Johan Decelle4,5, Sébastien Colin4,5,6,Fabrizio Carcillo2,3,7, Samuel Chaffron1,2,3, J. Cesar Ignacio-Espinosa8, Simon Roux8, Flora Vincent2,6,Lucie Bittner4,5,6, Youssef Darzi2,3, Jun Wang1,2, Stéphane Audic4,5, Léo Berline9,10, Gianluca Bontempi7,
Ana M. Cabello11, Laurent Coppola9,10, Francisco M. Cornejo-Castillo11, Francesco d'Ovidio12, Luc DeMeester13, Isabel Ferrera11, Marie-José Garet-Delmas4,5, Lionel Guidi9,10, Elena Lara11, StéphanePesant14,15, Marta Royo-Llonch11, Guillem Salazar11, Pablo Sánchez11, Marta Sebastian11, CarolineSouffreau13, Céline Dimier4,5,6, Marc Picheral9,10, Sarah Searson9,10, Stefanie Kandels-Lewis16, TaraOceans coordinators‡, Gabriel Gorsky9,10, Fabrice Not4,5, Hiroyuki Ogata17, Sabrina Speich18,19, LarsStemmann9,10, Jean Weissenbach20,21,22, Patrick Wincker20,21,22, Silvia G. Acinas11, Shinichi Sunagawa16,Peer Bork16, Matthew B. Sullivan8, Eric Karsenti6,16,*, Chris Bowler6,*, Colomban de Vargas4,5,* andJeroen Raes1,2,3,*.
1Department of Microbiology and Immunology, Rega Institute KU Leuven, Herestraat 49, 3000 Leuven, Belgium. 2VIBCenter for the Biology of Disease, VIB, Herestraat 49, 3000 Leuven, Belgium. 3Laboratory of Microbiology, VrijeUniversiteit Brussel, Pleinlaan 2, 1050 Brussels, Belgium. 4CNRS, UMR 7144, Station Biologique de Roscoff, Place GeorgesTeissier, 29680 Roscoff, France. 5Sorbonne Universités, UPMC Univ Paris 06, UMR 7144, Station Biologique de Roscoff,Place Georges Teissier, 29680 Roscoff, France. 6 Ecole Normale Supérieure, Institut de Biologie de l’ENS (IBENS), andInserm U1024, and CNRS UMR 8197, Paris, F-75005 France. 7Interuniversity Institute of Bioinformatics in Brussels (IB)2,ULB Machine Learning Group, Computer Science Department, Université Libre de Bruxelles. 8Department of Ecology andEvolutionary Biology, University of Arizona, Tucson, AZ, 85721, USA. 9CNRS, UMR 7093, LOV, Observatoireocéanologique, 06230, Villefranche/mer, France. 10Sorbonne Universités, UPMC Univ Paris 06, UMR 7093, LOV,Observatoire océanologique, 06230, Villefranche/mer, France. 11Department of Marine Biology and Oceanography, Instituteof Marine Science (ICM)-CSIC, Pg. Marítim de la Barceloneta, 37-49, Barcelona E08003, Spain. 12Sorbonne Universités,UPMC, Univ Paris 06, CNRS-IRD-MNHN, LOCEAN Laboratory, 4 Place Jussieu, 75005, Paris, France. 13KU Leuven,Laboratory of Aquatic Ecology, Evolution and Conservation, Charles Deberiotstraat 32, 3000 Leuven. 14PANGAEA, DataPublisher for Earth and Environmental Science, University of Bremen, Hochschulring 18, 28359 Bremen, Germany.15MARUM, Center for Marine Environmental Sciences, University of Bremen, Hochschulring 18, 28359 Bremen, Germany.16Structural and Computational Biology, European Molecular Biology Laboratory, Meyerhofstr. 1, 69117 Heidelberg,Germany. 17Institute for Chemical Research, Kyoto University, Gokasho, Uji, 611-0011 Kyoto, Japan. 18Department ofGeosciences, Laboratoire de Météorologie Dynamique (LMD), Ecole Normale Supérieure, 24 rue Lhomond, 75231 ParisCedex 05, France. 19Laboratoire de Physique des Océan, UBO-IUEM, Palce Copernic, 29820 Polouzané, France. 20CEA,Genoscope, 2 rue Gaston Crémieux, 91000 Evry France. 21CNRS, UMR 8030, 2 rue Gaston Crémieux, 91000 Evry, France.22Université d'Evry, UMR 8030, CP5706 Evry, France.
Published in Science, 2015, vol. 348, no 6237, p. 1262073.
‡Tara Oceans coordinators and affiliations are listed below the Acknowledgements section.†These authors contributed equally to this work.*Correspondence to: [email protected], [email protected], [email protected], [email protected]
Abstract
Species interaction networks are shaped by abiotic and biotic factors. Here, as part of
the Tara Oceans project, we studied the photic zone interactome using environmental factors
and organismal abundance profiles. We found associations across plankton functional types
and phylogenetic groups to be non-randomly distributed on the network. We identified
interactions among grazers, primary producers, viruses and (mainly parasitic) symbionts, and
52

Chapitre I
validated network-generated hypotheses using microscopy to confirm symbiotic relationships.
We have thus provided a resource to support further research on ocean food webs and
development of ocean models.
Introduction
The structure of oceanic ecosystems results from the complex interplay between
resident organisms and their environment. In the world’s largest ecosystem, oceanic plankton
(composed of viruses, prokaryotes, microbial eukaryotes, phytoplankton and zooplankton)
form trophic and symbiotic interaction networks (1-4) that are influenced by environmental
conditions. Ecosystem structure and composition are governed by abiotic as well as biotic
factors. The former include environmental conditions and nutrient availability (5), while the
latter include grazing, pathogenicity and parasitism (6, 7). Historically, abiotic factors have
been considered to have a stronger effect, but recently appreciation for biotic factors is
growing (8, 9). We sought to develop a quantitative understanding of biotic and abiotic
interactions in natural systems where the organisms are taxonomically and trophically diverse
(10). We used sequencing technologies to profile communities across trophic levels,
organismal sizes, and geographic ranges, and to predict organismal interactions across biomes
based on co-occurrence patterns (11). Previous efforts addressing these issues have provided
insights on the structure (12, 13) and dynamics of microbial communities (14-16).
Here we analyze data from 313 plankton samples the Tara Oceans expedition (17)
derived from 7 size-fractions covering collectively 68 stations at 2 depths across 8 oceanic
provinces (Table S1). The plankton samples spanned sizes that include organisms from
viruses to small metazoans. We derived viral, prokaryotic and eukaryotic abundance profiles
from clusters of metagenomic contigs, mitags and 18S rDNA V9 sequences, respectively (10,
18, 19) (Table S1) and collected environmental data from on-site and satellite measurements
(17, 20, 21). We used network inference methods and machine learning techniques to
disentangle biotic and abiotic signals shaping ocean plankton communities, and to construct
an interactome that described the network of interactions among photic zone plankton groups.
We used the interactome to focus on specific relationships, which we validated by
microscopic analysis of symbiont pairs and in silico analysis of phage-host pairings.
53
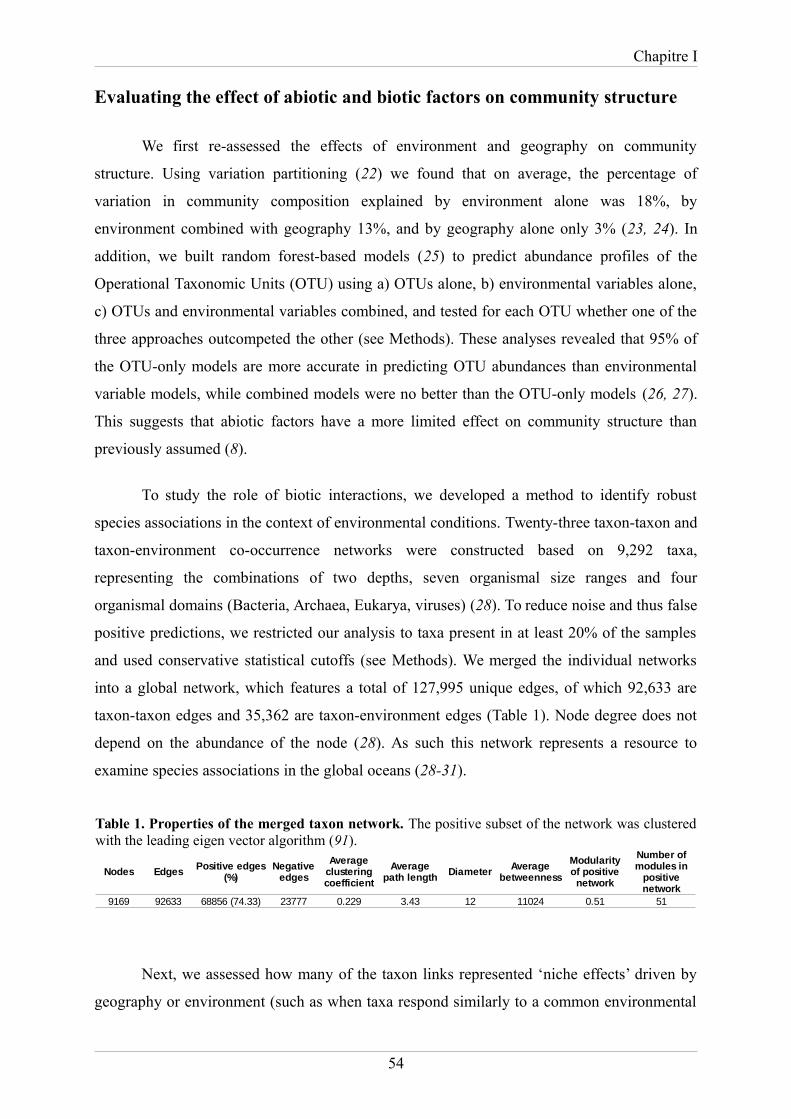
Chapitre I
Evaluating the effect of abiotic and biotic factors on community structure
We first re-assessed the effects of environment and geography on community
structure. Using variation partitioning (22) we found that on average, the percentage of
variation in community composition explained by environment alone was 18%, by
environment combined with geography 13%, and by geography alone only 3% (23, 24). In
addition, we built random forest-based models (25) to predict abundance profiles of the
Operational Taxonomic Units (OTU) using a) OTUs alone, b) environmental variables alone,
c) OTUs and environmental variables combined, and tested for each OTU whether one of the
three approaches outcompeted the other (see Methods). These analyses revealed that 95% of
the OTU-only models are more accurate in predicting OTU abundances than environmental
variable models, while combined models were no better than the OTU-only models (26, 27).
This suggests that abiotic factors have a more limited effect on community structure than
previously assumed (8).
To study the role of biotic interactions, we developed a method to identify robust
species associations in the context of environmental conditions. Twenty-three taxon-taxon and
taxon-environment co-occurrence networks were constructed based on 9,292 taxa,
representing the combinations of two depths, seven organismal size ranges and four
organismal domains (Bacteria, Archaea, Eukarya, viruses) (28). To reduce noise and thus false
positive predictions, we restricted our analysis to taxa present in at least 20% of the samples
and used conservative statistical cutoffs (see Methods). We merged the individual networks
into a global network, which features a total of 127,995 unique edges, of which 92,633 are
taxon-taxon edges and 35,362 are taxon-environment edges (Table 1). Node degree does not
depend on the abundance of the node (28). As such this network represents a resource to
examine species associations in the global oceans (28-31).
Next, we assessed how many of the taxon links represented ‘niche effects’ driven by
geography or environment (such as when taxa respond similarly to a common environmental
54
Table 1. Properties of the merged taxon network. The positive subset of the network was clusteredwith the leading eigen vector algorithm (91).
Nodes Edges Diameter
9169 92633 68856 (74.33) 23777 0.229 3.43 12 11024 0.51 51
Positive edges (%)
Negative edges
Average clustering coefficient
Average path length
Average betweenness
Modularity of positive
network
Number of modules in
positive network

Chapitre I
condition). We examined motifs consisting of two correlated taxa that also correlate with at
least one common environmental parameter (“environmental triplets” to identify associations
that were driven by environment) using three approaches (interaction information, sign
pattern analysis, and network deconvolution (32)). We identified 29,912 taxon-taxon-
environment associations (32.3% of total). Among environmental factors, we found that PO4,
temperature, NO2 and mixed layer depth were frequent drivers of network connections (Fig.
1A). While the three methodologies pinpoint indirect associations; only interaction
information directly identifies synergistic effects in these biotic-abiotic triplets. Exploiting
this property, we disentangled the 29,912 environment-affected associations into 11,043 edges
driven solely by abiotic factors (31, 33) (excluded from the network for the remainder of the
study) and 18,869 edges whose dependencies result from biotic-abiotic synergistic effects.
Thus, we find that a minority of associations can be explained by an environmental factor.
55

Chapitre I
Evaluation of predicted interactions
Co-occurrence techniques have heretofore been mainly applied to bacteria. We
detected eukaryotic interactions based on analysis of sequences at the V9 hypervariable
56
Fig. 1. Global oceanic taxon-environment interaction network properties. (A) Majorenvironmental factors affecting abundance patterns. Phosphate concentration (PO4), Temperature andNitrite concentration (NO2) are the top 3 parameters driving abiotic associations followed by MixedLayer Depth (MLD, assessed by temperature change), Particulate beam attenuation measured at 660nm, Silica concentration (Si), Nitrite+Nitrate concentration (NO2NO3), MLD-sigma (Mixed LayerDepth, assessed by density change), Pressure, Nitracline, and others corresponds to the agglomeratedcontribution of the rest of parameters tested. (B) Number of inter-domain and intra-domaincopresences and mutual exclusions. (C) Distribution of edges across size fractions: 0.2-1.6(3),prokaryote-enriched fractions 0.2-1.6 μm and 0.2-3 μm; > 08 μm, non-size-fractionated samples; 08-5μm, piconano-plankton; 20-180 μm, micro-plankton; 180-2000 μm, meso-plankton; interfrac, includesinterfraction networks 08-5 μm versus 20-180 μm, 08-5 μm versus 180-2000 μm, 20-180 μm versus180-2000 μm and 0.2-1.6(3) μm versus ≤ 0.2 μm (virus-enriched fraction).

Chapitre I
region of the 18S rRNA gene. We built a literature-curated collection (34) of 573 known
symbiotic interactions (including both parasitism and mutualism) in marine eukaryotic
plankton (30, 35). From 43 genus level interactions represented by OTUs in the abundance
pre-processed input matrices, we found 42% (18 genus pairs; 47 % when limiting to parasitic
interactions) represented in our reference list. The probability of having found each of these
interactions by chance alone was <0.01 (Fisher exact test, average pval = 4e-3, median pval =
5e-7). Based on this sensitivity and a false discovery rate averaging to 9% (computed from
null models; see Methods), we estimate the number of interactions among eukaryotes present
in our filtered input matrices to be between 53,000 and 139,000. Most of the false negative
interactions were due to the strict filtering rules we used to avoid false positives; this hampers
detection when, for example, interactions are facultative or when interaction partners may
vary among closely related groups depending on oceanic region (4). False positives could
represent indirect interactions between species (bystander effects) or environmental effects
caused by factors not captured in this study (36, 37).
Biotic interactions within and across kingdoms
The integrated network contained 81,590 predicted biotic interactions (30) that were
non-randomly distributed within and between size fractions (Figure 1B, C) (38). Positive
associations outnumbered mutual exclusions (72% versus 28%), and we observed a non-
random edge distribution with regard to phylogeny (Fig. 2A), with most associations derived
from syndiniales and other dinoflagellates (see Fig. 3A below for examples), and exclusions
involving arthropods. Certain combinations of phylogenetic groups are over-represented (39).
For instance, we found a clade of syndiniales (the MALV-II Clade 1 belonging to
Amoebophrya (3)) enriched in positive associations with tintinnids (P = 2e-4), amongst the
most abundant ciliates in marine plankton (40). The tintinnid Xystonella lohmani was
described in 1964 to be infected by Amoebophrya tintinnis (41) and tintinnids can feed on
Amoebophrya free-living stages (42). Other found host-parasite associations included the
copepod parasites Blastodinium, Ellobiopsis and Vampyrophrya (41, 43-45).
On the other hand, Maxillopoda, Bacillariophyceae and collodarians, three groups of
relatively large sized organisms whose biomass can dominate planktonic ecosystems, are rich
in negative associations among them (33). Collodarians and copepods are abundant in,
respectively, the oligotrophic tropical and eu/meso-trophic temperate systems (10, 46). The
decoupling of phyto- and zooplankton in open oceans by diatoms anti-correlating to copepods
57

Chapitre I
(47, 48) is attributed to growth rate differences and to the diatom production of compounds
harmful to their grazers (49). The combination of these effects could lie at the basis of this
observation, which contrasts with other free-living autotrophs represented in the network
(cyanobacteria and prymnesiophytes), which display primarily positive associations (Fig. 2A).
58
Fig. 2. Taxonomic and geographic patterns within the co-occurrence network. (A) Top 15interacting taxon groups depicted as colored segments in a CIRCOS plot, where ribbons connectingtwo segments indicate copresence and exclusion links, on left and right, respectively. Size of theribbon is proportional to the number of links (copresences and exclusions) between the OTUs assignedto the respective segments, and color is the one of the segment (of the two involved) with more totallinks. Links are dominated by the obligate parasites syndiniales and by Arthropoda and Dinophyceae.(B) Tara Oceans sampling stations grouped by oceanic provinces. (C) Frequency of local co-occurrence patterns across the oceanic provinces, showing that most local patterns are located in MS.(D to G) Taxonomic patterns of co-occurrences across MS (D), SPO (E), IO (F) and RS (G). Edges arerepresented as ribbons between barcodes grouped into their taxonomic order as in A. Links sharing thesame segment are affiliated to the same taxon (Order), showing that the connectivity patterns acrosstaxa are conserved at high taxonomic ranks. The local specificity of interactions at higher resolution(OTUs) is apparent by thin ribbons (edge resolution) with different starts and end positions (differentOTUs) within the shared (taxon) segment, section color and ordering correspond to those in panel A.SO-specific associations are mainly driven by bacterial interactions (53).

Chapitre I
Cross-kingdom associations between Bacteria and Archaea were limited to 24 mutual
exclusions. Within Archaea, Thermoplasmatales (Marine Group II) co-occur with several
phytoplankton clades. Links between Bacteria and protists recovered 5 out of 8 recently
discovered interactions from protist single-cell sequencing (50). Associations between
Diatoms and Flavobacteria agreed with their described symbioses (51). We also observed co-
ocurrence of uncultured dinoflagellates with members of Rhodobacterales (Ruegeria), in
agreement with a symbiosis between Ruegeria sp. TM1040 and Pfiesteria piscicida around
the ability of Ruegeria to metabolize dinoflaggelate-produced DMSP (52).
Global versus local associations
We further investigated whether our network was driven by global trends or is defined
by local signals. To this aim, we divided our set of samples into 7 main regions:
Mediterranean Sea (MS), Red Sea (RS), Indian Ocean (IO), South Atlantic (SAO), Southern
Ocean (SO), South Pacific Ocean (SPO) and North Atlantic Ocean (NAO), and assessed the
‘locality’ of associations by comparing the score with or without that region (see Methods).
We found that association patterns were mostly driven by global trends as only 14% of edges
were identified as local (Figure 2B, C). Approximately two thirds of local associations occur
in MS (7,215) followed by SPO (1,058), while the rest are contributed by SO (901), IO (894),
RS (889), SAO (163) and NAO (60) (Fig. 2C-G). MS was the region with most sampling
sites, which allowed us to recover more local patterns. Nevertheless, Figures 2C-G show that
although the same major groups (order level) interact in both the global and local networks,
each local site has its own specific interaction profile (Pval < 1e-8) (33, 39, 53).
Parasite impact on plankton functional types
Parasitic interactions are the most abundant pattern present in the network, which is
also eminent by repeated microscopic observation of parasitic interactions from the Tara
samples (Fig. 3A). We focused on predicted parasitic interactions and assessed their potential
impact on biogeochemical processes by exploring a functional sub-network (21,572 edges) of
known and novel plankton parasites (10) together with classical ‘plankton functional types’
(PFTs (54)). PFTs group taxa by trophic strategy (e.g., autotrophs vs. heterotrophs) and role in
ocean biogeochemistry (Figure 3A) (55). The relationship between the different PFTs
(network density of 0.65) highlights strong dependencies between phytoplankton and grazers.
We find that all PFTs are associated with parasites, but not always to the same extent. Most
59

Chapitre I
links involve syndiniales MALV-I and MALV-II clades associated to zooplankton and, to a
lesser extent, to microphytoplankton (excluding diatoms). This emphasizes the role of
alveolate parasitoids as top-down effectors of zooplankton and microphytoplankton
population structure and functioning (3) - although the latter group is also affected by grazing
(1). The meso-planktonic networks contain known syndiniales targets (Dinophyceae,
Ciliophora, Acantharia and Metazoa; Figure 3B) (56). In large size fractions, we found
interactions between known parasites and groups of organisms that in theory are too small to
be their hosts (57); 32% of these associations involved the abundant and diverse marine
stramenopiles (MAST) and diplonemids (other Discoba and Diplonema) (10). Eco-physiology
studies (58, 59) suggest a parasitic role for these lineages. The association of these groups
with other parasites would be explained by putative co-infection of the same hosts.
Contrasting with the above observations, we find phytoplankton silicifiers (diatoms)
displaying a variety of mutual exclusions. One possible interpretation of this is that diatom
silicate exoskeletons (60) and toxic compound production (49) could act as efficient barriers
against top-down pressures (61).
60

Chapitre I
Phage-microbe associations
We investigated phage-microbe interactions, another major top-down process affecting
global bacterial/archaeal community structure (7). Here, surface (SRF) and deep chlorophyll
61
Figure 3. Top-down interactions in plankton. (A) Three different dinoflagellate specimens fromTARA samples display an advanced infectious stage by syndiniales parasites. The cross-section of thecell shows the typical folded structure of the parasitoid chain, which fills the entire host cell. Eachnucleus (blue) of the coiled ribbon corresponds to a future free-living parasite. (DNA is stained withHoechst (blue), membranes are stained with DiOC6 (green) and specimen surface is cyan; scale bar is5 µm) (B) Subnetwork of metanodes that encapsulate barcodes affiliated to parasites or PlanktonFunctional Types (PFTs). The PFTs mapped onto the network are: phytoplankton dimethyl sulfide(DMS) producers, mixed phytoplankton, phytoplankton silicifiers, pico-eukaryotic heterotrophs,proto-zooplankton and meso-zooplankton. Edge width reflects the number of edges in the taxon graphbetween the corresponding metanodes. Over-represented links (multiple-test corrected Pval < 0.05) arecolored in green if they represent copresences and in red if they represent exclusions; grey means nonover-represented combinations. When both copresences and exclusions were significant, the edge isshown as copresence. (C) Parasite connections within micro- and zooplankton groups. (D) Number ofhosts per phage (inset: phage associations to bacterial (target) phyla). (E) Putative Bacteroidetesviruses detected by co-occurence and detection in a single-cell genome (SAG). On the left, viralsequences from a Flavobacterium SAG (top) and Tara Oceans virome (bottom), displaying an averageof 89% nucleotide identity. On the right is the correspondence between the ribosomal genes detectedin the same SAG (top) and the 16S sequence associated to the Tara Oceans contig based on co-occurence (79% nucleotide identity). For clarity, a subset of contig ARTD0100013 only (from 10,000to 16,000 nucleotides) is displayed. This sequence was also reverse-complemented. PurM:Phosphoribosylaminoimidazole synthetase, DNA Pol. A: DNA polymerase A.

Chapitre I
maximum (DCM) virus-bacteria networks revealed 1,869 positive associations between viral
populations and 7 of the 54 known bacterial phyla (specifically – Proteobacteria,
Cyanobacteria, Actinobacteria, Bacteroidetes, Deferribacteres, Verrucomicrobia and
Planctomycetes), and one archaeal phylum (Euryarchaeota). These 8 phyla represent most of
abundant bacterial/archaeal groups across 37 investigated samples (Fig. 3D), suggesting that
the networks are detecting abundant virus-host interactions. Additionally, these interactions
include phyla of microbes lacking viral genomes in RefSeq databases including
Verrucomicrobia, and non-extremophile Euryarchaeota, hinting at genomic sequences for
understudied viral taxa (Fig. 3E) (39, 62, 63). Among the phage populations in the network,
we found 8 corresponding to phage sequences available in GenBank (>50% of genes with a
>50% amino acid identity match). In all 8 cases, the predicted host from the network
corresponded to the annotated host family in the GenBank record, which is significantly
higher than expected by chance (P=0.001; see methods) (62).
Next, we evaluated viral host range, fundamental for predictive modeling and thus far
largely limited to observations of cultured virus-host systems that insufficiently map complex
community interactions (64). Our virus-host interaction data suggest that viruses are very host
specific: ~43% of the phage populations interact with only a single host OTU, and the
remaining 57% interact with only a few, often closely related OTUs (Fig. 3D). These
networks are modular at large scales (65), suggesting that viruses are host-range-limited
across large sections of host space. Nestedness analysis showed inconsistent results across
algorithms (see methods).
Microscopic validation of predicted interactions
Our data predicted a photosymbiotic interaction between an acoel flatworm
(Symsagittifera sp.) and a green microalga (Tetraselmis sp.). We validated this by Laser
Scanning Confocal Microscopy (LSCM), 3D reconstruction, and reverse molecular
identification on flatworm specimens isolated from Tara Oceans preserved morphological
samples (see Methods). We observed microalgal cells (5 to 10 µm diameter) within each of
the 15 isolated acoel specimens (Fig. 4) (66). The 18S sequence from several sorted
holobionts matched the metabarcode pair identified in the co-occurrence global network.
Thus, molecular ecology, bioinformatics and microscopic analysis can enable the discovery of
marine symbioses.
62

Chapitre I
63
Figure 4. Experimental validation of network-predicted interaction (photosymbiosis). Guided bythe predictions from the co-occurrence network and abundance patterns, acoel flatworms(Symsagittifera sp.) together with their photosynthetic green microalgal endosymbionts (Tetraselmissp.) were collected in microplankton samples from Tara Oceans Station 22 in the Mediterranean Sea.Pictures show a 3D reconstructed specimen from LSCM images (Green channel: cellular membranes(DiOC6); Blue channel: DNA and the nuclei (Hoechst33342); Red channel: chlorophyllautofluorescence). (A) Co-occurrence plot of Symsagittifera and Tetraselmis related OTUs along TaraOceans stations, showing the relatively high abundance of the holobiont at Station 22. (B) Dorsalview of the entire acoel flatworm specimen (~300µm). The epidermis (green) is completely coveredwith cilia and displays some pore holes. (C) The removal of the green channel reveals the widespreaddistribution of small unicellular algae (red areas) inside the acoel body. The worm’s nuclei display aclear signal (compact round blue shapes) while the algal nuclei are dimmer. A dinoflagellate theca(arrow head) is located in the central syncytium likely indicating predation. (D) Cross-section along aZY plane allows localization of the algae, beneath the epidermis in the parenchyma. Only the externalcell layer (green signal) from the dorsal view is visible, due to the thickness and opacity of the worm.Scale bar: 50 µm.

Chapitre I
Conclusion
The global ocean interactome can be used to predict the dynamics and structure of
ocean ecosystems. The interactome reported here spans all three organismal domains and
viruses. The analyses presented emphasize the role of top-down biotic interactions in the
epipelagic zone. This data will inform future research to understand how symbionts,
pathogens, predators and parasites interact with their target organisms, and ultimately help
elucidate the structure of the global food webs that drive nutrient and energy flow in the
ocean.
Methods
Sampling
The sampling strategy used in the Tara Oceans expedition is described in (67) and
samples used in the present study are listed in Table S1 and
http://doi.pangaea.de/10.1594/PANGAEA.840721. The Tara Oceans nucleotide sequences are
available at the European Nucleotide Archive (ENA) under projects PRJEB402 and
PRJEB6610.
Physical and environmental measurements
Physical and environmental measurements were carried out with a vertical profile
sampling system (CTD-Rosette) and data collected from Niskin bottles. We measured
temperature, salinity, chlorophyll, CDOM fluorescence (fluorescence of the colored dissolved
organic matter), particles abundance, nitrate concentration and particle size distribution (using
an Underwater Vision Profiler). In addition, mean mixed layer depth (MLD), maximum
fluorescence, vertical maximum of the Brunt-Väisälä Frequency N (s−1), vertical range of
dissolved oxygen, and of change of nitrates were determined. Satellite altimetry provided the
Okubo-Weiss parameter, Lyapunov exponent, mesoscale eddie retention and sea surface
temperature (SST) gradients at eddie fronts (19). Data are available at http://www.pangaea.de
(http://doi.pangaea.de/10.1594/PANGAEA.840718).
64

Chapitre I
Abundance table construction
Prokaryotic 16S rDNA metagenomic reads were identified, annotated and quantified
from Illumina sequenced metagenomes (hereafter mitags) as described in (68) using the SILVA
v.115 database (19, 69, 70). The abundance table was normalized using the summed read
count per sample (19, 71). Quality-checked V9 rDNA metabarcodes were clustered into
swarms as in (10, 72), and annotated using the V9 PR2 database (73). PR2 barcodes were
associated to fundamental trophic modes (auto- or hetero-trophy) and symbiotic interactions
(parasitism and mutualism) based on literature (Taxonomic and trophic mode annotations are
available at http://doi.pangaea.de/10.1594/PANGAEA.840718 and
http://doi.pangaea.de/10.1594/PANGAEA.840722). Swarm abundance and normalization was
performed as in (10, 72). Bacteriophage metagenomes were obtained from the < 0.2μm
fractions for 48 samples and contigs were annotated and quantified as in (18). The abundance
matrix was normalized by total sample read count and contig length.
In all cases, only OTUs with relative abundance > 1-8 and detected in at least 20 % of
samples were retained. Because sample number in the input tables ranged from 17 to 63,
prevalence thresholds varied (from 22% to 40%). The sum of all filtered OTU relative
abundances was kept in the tables to preserve proportions. Abundance tables are available at
http://www.raeslab.org/companion/ocean-interactome.html.
Random forest-based models
Eukaryotic, prokaryotic and environmental matrices were merged into two matrices
(Deep Chlorophyll Maximum layer (DCM) and surface water layer (SRF)). For each of the
three models (OTU versus other OTUs (MOTU), environmental factors (MENV) or
combined (MOTU+ENV)), regressions were perfomed with OTU abundance as dependent
and the abundances of other OTUs or environmental factors as independent variables. For
each regression, up to 20 independent variables were selected using the minimum
Redundancy Maximum Relevance (mRMR) filter-ranking algorithm. Random forest
regression (25) was followed by a leave-one-out cross-validation. The variable subset with the
minimum leave-one-out NMSE (Normalized Mean Square Error) was selected. To identify
the best model for a given target OTU, the significance of the NMSE difference was tested on
the absolute error values (paired Wilcoxon test adjusted by Benjamini-Hochberg FDR
65

Chapitre I
estimation (74)). NMSE computed on random data are larger than those from original data. In
addition, MENV outperformed MOTU when OTU abundances were randomized.
Variance partitioning
Environmental variables were z-score-transformed; spatial variables (MEM
eigenvectors) were calculated based on latitude and longitude (75). Forward selection (76)
was carried out with function forward.sel in R-package packfor. Significance of the selected
variables was assessed with 1000 permutations using functions rda and anova.cca in vegan.
Variance partitioning (77) was performed using function varpart in vegan on Hellinger-
transformed abundance data, the forward-selected environmental variables, and the forward-
selected spatial variables and tested for significance with 1000 permutations.
Network inference
Taxon-taxon co-occurrence networks were constructed as in (78), selecting Spearman
and Kullback-Leibler dissimilarity measures. To compute p-values, we first generated
permutation and bootstrap distributions, with 1,000 iterations each, by shuffling taxon
abundances and resampling from samples with replacement, respectively. The measure-
specific p-value was then obtained as the probability of the null value (represented by the
mean of the permutation distribution) under a Gauss curve fitted to the mean and standard
deviation of the bootstrap distribution. Permutations computed for Spearman included a
renormalization step, which mitigates compositionality bias (ReBoot). Measure-specific p-
values were merged using Brown's method (79) and multiple-testing-corrected with
Benjamini-Hochberg (74). Finally, edges with an adjusted p-value above 0.05, with a score
below the thresholds (30) or not supported by both measures after assessment of significance
were discarded.
Taxon-environment networks were computed with the same procedure, starting with
8,000 initial positive and negative edges, each supported by both methods. For computational
efficiency, we computed 23 taxon-taxon and taxon-environment networks separately, for two
depths (DCM and SRF), four eukaryotic size fractions (0.8-5 μm, >0.8 μm, 20-180 μm and
180-2000 μm) and their combinations, the prokaryotic size fraction (0.2-1.6μm and 0.2-
3.0μm) and its combination with each of the eukaryotic and virus (< 0.2 μm) size fractions.
We then generated 23 taxon-environment union networks for environmental triplet detection
and merged the taxon-taxon networks into a global network with 92,633 edges.
66

Chapitre I
Estimation of false discovery rate
We estimated the false discovery rate (FDR) of network construction with two null
models. The first shuffles counts while preserving overall taxon proportions and total sample
count sums, but removing any dependencies between taxa. For the second, we fitted a
Dirichlet-Multinomial distribution to the input matrix using the dirmult package in R (80) and
generated a null matrix by sampling from this distribution, preserving total sample count
sums. Null matrices were generated from count matrices (0.8-5μm, 20-180 μm and 180-2000
μm eukaryotic and prokaryotic size fraction as well as bacteriophage-prokaryotic composite,
SRF and DCM). Network construction was performed with the 20 null matrices and
thresholds applied to the original matrices (28). From edge numbers in the original and the
null networks, we estimated an average FDR of 9% (28).
Indirect taxon edge detection
For each taxon-environment union network, node triplets consisting of two taxa and
one environmental parameter were identified. For each triplet, interaction information II was
computed as: II CI (X,Y |Z) I (X,Y ) , where CI is the conditional mutual information
between taxa X and Y given environmental parameter Z and I the mutual information between
X and Y. CI and I were estimated using minet (81). Taxon edges in environmental triplets
were considered indirect when II<0 and within the 0.05 quantile of the random II distribution
obtained by shuffling environmental vectors (500 iterations). If a taxon was part of more than
one environmental triplet, the triplet with minimum interaction information was selected.
For each environmental triplet, we also checked whether its sign pattern (the
combination of positive and/or negative correlations) was consistent with an indirect
interaction. From 8 possible patterns, 4 indicate indirect relationships (e.g. two negatively
correlated taxa correlated with opposite signs to an environmental factor).
Network deconvolution (32) was carried out with beta=0.9. We considered an
environmental triplet as indirect according to network deconvolution if any of its edges were
removed.
All (11,043) negative interaction information triplets were consistent with an indirect
relationship according to their sign patterns and a majority (8,209) was also supported by
network deconvolution.
67

Chapitre I
Influence of ocean regions on co-occurrence patterns
Samples were divided into groups according to region membership. The impact of
each sample group on the Spearman correlation of each edge in the network was assessed by
dividing the (absolute) omission score (OS; Spearman correlation without these samples) by
the absolute original Spearman score. To account for group size, the OS was computed
repeatedly for random, same-sized sample sets. Nonparametric p-values were calculated as
the number of times random OSs were smaller than the sample group OS, divided by number
of random OS (500 for each taxon pair). Edges were classified as region-specific when the
ratio of OS and absolute original score was below 1 and multiple-testing-corrected p-values
(Benjamini-Hochberg) were below 0.05.
Over-representation analysis
Significance of taxon–taxon counts at high taxonomic ranks was assessed with the
hypergeometric distribution implemented in the R function phyper. Mutual exclusion vs
copresence analysis was performed using the binomial distribution implemented in the R
function pbinom, with the background probability estimated by the frequency of edges in the
network.
Oceanic region analysis was also assessed using R's pbinom function, with the
background probability estimated by dividing total ocean-specific edge number by total edge
number. The p-value was computed as the probability of obtaining the observed number of
ocean-specific edges among the edges of a taxon pair. The same procedure was repeated for
each oceanic region separately, with region-specific success probabilities. Edges classified as
indirect were discarded before the analysis.
In all tests, P-values were adjusted for multiple testing according to Benjamini,
Hochberg and Yekutieli (BY), implemented in the R function p.adjust.
Extracting functional groups from the global plankton interactome
Functional groups consist of a mix of major monophyletic lineages of parasites,
together with classical polyphyletic Plankton Functional Types (PFT), as defined in (10, 54,
55). Metabarcodes in the network were sorted into 15 parasite groups and 7 PFTs (55) based
on their (i) taxonomical classification, (ii) membership in a given size fraction, (iii) trophic
68

Chapitre I
mode, and (iv) biogeochemical role in DMS production or silicification. After mapping the
metabarcodes and their edges onto PFTs and parasites, edges are weighted by the number of
links they represent. Over-representation of the number of links included in each edge was
assessed with the hypergeometric distribution.
Parasite links in large fractions may point to parasite-host connections. We extracted
all edges in the large fractions (20-180µm and 180-2000µm) between barcodes annotated as
parasites and non-parasitic barcodes. Partners of parasites comprised potential hosts (Fig 3B)
but also organisms that are either too small or without size information. The former may
represent unknown parasites (e.g. co-infecting a host with known parasites) while the latter
may represent novel hosts.
Nestedness and modularity analysis
The analysis was carried out for 1,869 positively correlated phage-prokaryotic pairs.
Modularity was computed with the LP (Label propagation) BRIM algorithm (82) in BiMAT
(83) with 100 permutations. Nestedness of the host-phage network as quantified with the
NODF (nestedness with overlap and decreasing fill) algorithm (84) in BiMAT with 100
permutations (preserving edge number and degree distribution) was significant, but not with
the NTC algorithm (85). We also tested the impact of random removal or addition of 5%,
10%, 15% and 20% edges. After random addition/deletion of edges modularity and
nestedness (according to NODF) remained significant.
Confirmation of predicted viruses-host associations
Two different approaches were used to confirm virus-host associations predicted by
the co-occurrence network. First, the network host prediction was compared to the “known”
host for viral populations closely related to an isolated virus, i.e. populations with more than
50% of predicted genes affiliated to the same phage reference genome (based on a BLASTp
against RefseqVirus, threshold of 10-03 on e-value and 50 on bit score (18)). Known phages
corresponded to viruses infecting SAR11, SAR116 and Cyanobacteria, so that a predicted
host was considered correct if affiliated to Alphaproteobacteria, Alphaproteobacteria and
Cyanobacteria, respectively (the lowest rank for which there was taxonomic assignment for
those bacterial OTUs (69)). This procedure was repeated on 1000 randomized networks (with
same degree distribution) to calculate the significance of the results. Second, contigs of
69

Chapitre I
putative hosts predicted by co-occurrence analysis were compared with BLAST to a set of
viral sequences detected in draft and single-cell genomes with VirSorter
(https://pods.iplantcollaborative.org/wiki/display/DEapps/VIRSorter+1.0.1). One contig
(36DCM_3902, Figure 3E) displayed significant similarity to one contig detected in a single-
cell genome (AA160P02DRAFT_scaffold_31.32). In order to compare the putative host
associated to each contig, rRNA genes were predicted in the single-cell amplified genome
(SAG) contigs with meta-rRNA (86). Sequences were annotated based on BLAST against the
non-redundant (nr) database, and the comparison plot was generated with Easyfig (87).
Literature-based evaluation of predicted protist interactions
A panel of 4 experts, 2 specialized in the study of planktonic mutualistic protists (Dr
C. de Vargas and Dr J. Decelle) and 2 specialized in the study of planktonic parasitic protists
(Dr C. Berney and N. Henry), screened literature looking for symbiotic interactions occurring
among eukaryotic plankton. From this search, they built a list of 573 known symbiotic
interactions sensu lato (i.e., parasitism and mutualism, at least 1 protist partner) in marine
eukaryotic plankton, covering 197 eukaryotic genera, described in 76 publications since 1971.
The experts extracted only symbiotic interaction cases described either from direct
observation of both interacting partners through microscope (45%), sequence from symbiont
isolated from the observed host (14%) or both (41%). Direct observation of partners
interacting (86%) provides high confidence for the interaction, while the symbiont sequence
allows its taxonomic identification. The protocol to build the list was the following: 1) the
experts manually screened 3170 publications associated to each PR2 db sequence (http://ssu-
rrna.org/doc_bibliography.html); 2) the experts screened 293 publications retrieved from Web
of Science with the following query: 'TOPIC:(plankton* AND (marin* OR ocean*)) AND
(parasit* OR symbios* OR mutualis*)'; 3) the experts screened GenBank 18S rDNA
sequences of symbionts for which the 'host' field was known. They labeled these interactions
as 'Unpublished'. Finally, the experts discussed any observed discordance until agreement was
reached. The final table of literature-curated interactions includes a column indicating the type
of evidence gathered about the interaction: 1 for only getting symbiont sequence, 2 for direct
observation, and 3 for both. Symbiont GenBank host field belongs to category 1.
70

Chapitre I
Experimental validation of a predicted interaction
V9 pairs were searched for organisms of suitable size to allow its isolation from
morphological samples. This way, we targeted a predicted photosymbiosis between an acoel
flatworm (V9 rDNA metabarcode 83% similar to Symsagittifera psammophila (88) and a
photosynthetic microalga (Tara Oceans V9 metabarcode 100% similar to a Tetraselmis sp)
(89).
Fifteen acoel specimens (hosts) were isolated from formaldehyde-4% microplankton
samples of station 22 (A100000458), where both partner OTUs displayed high abundances.
Prior to imaging, specimens were rinsed with artificial seawater, then DNA and membrane
structures were stained for 60 minutes with 10μM Hoechst 33342 and 1.4μM DiOC6(3) (Life
Technologies). Microscopy was conducted using a Leica TCS SP8 (Leica Microsystems)
confocal laser scanning microscope and a HC PL APO 40x/1.10 W motCORR CS2 objective.
The DiOC6 signal (ex488nm/em500-520nm) was collected simultaneously with the
chlorophyll signal (ex488nm/em670-710nm), followed by the Hoechst signal (ex405
nm/em420-470nm). Images were processed with Fiji (90), and 3D specimens were
reconstructed with Imaris (Bitplane).
To obtain the sequences of the metabarcodes of each partner, seven acoels were
isolated from ethanol-preserved samples from station 22 (TARA_A100000451), individually
rinsed in filtered seawater, and stored at -20°C in absolute ethanol. DNA was extracted with
MasterPureTM DNA/RNA purification kit (Epicenter) and PCR amplified using the
universal-eukaryote primers (forward 1389F and reverse 1510R) from (10). Chlorophyte-
specific primers (Chloro2F: 5'- CGTATATTTAAGTTGYTGCAG-3' and Tetra2-rev 5'-
CAGCAATGGGCGGTGGC GAAC-3') were designed to amplify the microalgae V9 rDNA
as in (4). Purified amplicons were subjected to poly-A reaction and ligated in pCR®4-TOPO
TA Cloning vector (Invitrogen), cloned using chemically competent E. coli cells and Sanger-
sequenced with the ABI-PRISM Big Dye Terminator Sequencing kit (Applied Biosystems)
using the 3130xl Genetic Analyzer, Applied Biosystems.
References
1. AZAM, Farooq, FENCHEL, Tom, FIELD, John G, et al. The ecological role of water-
column microbes in the sea. Estuaries, 1983, vol. 50, no 2.
71

Chapitre I
2. THOMPSON, Anne W., FOSTER, Rachel A., KRUPKE, Andreas, et al. Unicellular
cyanobacterium symbiotic with a single-celled eukaryotic alga.Science, 2012, vol. 337, no
6101, p. 1546-1550.
3. CHAMBOUVET, Aurelie, MORIN, Pascal, MARIE, Dominique, et al. Control of
toxic marine dinoflagellate blooms by serial parasitic killers. Science, 2008, vol. 322, no
5905, p. 1254-1257.
4. DECELLE, Johan, PROBERT, Ian, BITTNER, Lucie, et al. An original mode of
symbiosis in open ocean plankton. Proceedings of the National Academy of Sciences, 2012,
vol. 109, no 44, p. 18000-18005.
5. SMETACEK, Victor. Making sense of ocean biota: How evolution and biodiversity of
land organisms differ from that of the plankton. Journal of biosciences, 2012, vol. 37, no 4, p.
589-607.
6. SABO, John L. et GERBER, Leah R., “Trophic ecology,” AccessScience (McGraw-
Hill Education, 2014); available at www.accessscience.com/content/trophic-ecology/711650.
7. ROHWER, Forest et THURBER, Rebecca Vega. Viruses manipulate the marine
environment. Nature, 2009, vol. 459, no 7244, p. 207-212.
8. VERITY, Peter G., SMETACEK, Victor, et al. Organism life cycles, predation, and the
structure of marine pelagic ecosystems. Marine Ecology Progress Series, 1996, vol. 130.
9. WORDEN, Alexandra Z., FOLLOWS, Michael J., GIOVANNONI, Stephen J., et
al. Rethinking the marine carbon cycle: Factoring in the multifarious lifestyles of
microbes. Science, 2015, vol. 347, no 6223, p. 1257594.
10. DE VARGAS, Colomban, AUDIC, Stéphane, HENRY, Nicolas, et al. Eukaryotic
plankton diversity in the sunlit ocean. Science, 2015, vol. 348, no 6237, p. 1261605.
11. FAUST, Karoline et RAES, Jeroen. Microbial interactions: from networks to
models. Nature Reviews Microbiology, 2012, vol. 10, no 8, p. 538-550.
12. CHAFFRON, Samuel, REHRAUER, Hubert, PERNTHALER, Jakob, et al. A global
network of coexisting microbes from environmental and whole-genome sequence
data. Genome research, 2010, vol. 20, no 7, p. 947-959.
13. RAES, Jeroen, LETUNIC, Ivica, YAMADA, Takuji, et al. Toward molecular trait‐
based ecology through integration of biogeochemical, geographical and metagenomic
data. Molecular systems biology, 2011, vol. 7, no 1, p. 473.
72

Chapitre I
14. GILBERT, Jack A., STEELE, Joshua A., CAPORASO, J. Gregory, et al. Defining
seasonal marine microbial community dynamics. The ISME journal, 2012, vol. 6, no 2, p.
298-308.
15. BEMAN, J. Michael, STEELE, Joshua A., et FUHRMAN, Jed A. Co-occurrence
patterns for abundant marine archaeal and bacterial lineages in the deep chlorophyll
maximum of coastal California. The ISME journal, 2011, vol. 5, no 7, p. 1077-1085.
16. CHOW, Cheryl-Emiliane T., KIM, Diane Y., SACHDEVA, Rohan, et al. Top-down
controls on bacterial community structure: microbial network analysis of bacteria, T4-like
viruses and protists. The ISME journal, 2014, vol. 8, no 4, p. 816-829.
17. KARSENTI, Eric, ACINAS, Silvia G., BORK, Peer, et al. A holistic approach to
marine eco-systems biology. PLoS biol, 2011, vol. 9, no 10, p. e1001177.
18. BRUM, Jennifer R., IGNACIO-ESPINOZA, J. Cesar, ROUX, Simon, et al. Patterns
and ecological drivers of ocean viral communities. Science, 2015, vol. 348, no 6237, p.
1261498.
19. SUNAGAWA, Shinichi, COELHO, Luis Pedro, CHAFFRON, Samuel, et al. Structure
and function of the global ocean microbiome. Science, 2015, vol. 348, no 6237, p. 1261359.
20. VILLAR, Emilie, FARRANT, Gregory K., FOLLOWS, Michael, et al.Environmental
characteristics of Agulhas rings affect interocean plankton transport. Science, 2015, vol. 348,
no 6237, p. 1261447.
21. Companion web site table w2 available at http://www.raeslab.org/companion/ocean-
interactome/tables/W2.xlsx
22. MEOT, Alain, LEGENDRE, Pierre, et BORCARD, Daniel. Partialling out the spatial
component of ecological variation: questions and propositions in the linear modelling
framework. Environmental and Ecological Statistics, 1998, vol. 5, no 1, p. 1-27.
23. Companion web site table w3 available at http://www.raeslab.org/companion/ocean-
interactome/tables/W3.xlsx
24. Companion web site figure w1 available at http://www.raeslab.org/companion/ocean-
interactome/figures//W1.pdf
25. BREIMAN, Leo. Random forests. Machine learning, 2001, vol. 45, no 1, p. 5-32.
26. Companion web site table w4 available at http://www.raeslab.org/companion/ocean-
interactome/tables/W4.xlsx
73

Chapitre I
27. Companion web site figure w2 available at http://www.raeslab.org/companion/ocean-
interactome/figures/W2.pdf
28. Companion web site table w5 available at http://www.raeslab.org/companion/ocean-
interactome/tables/W5.xlsx
29. Companion web site table w6 available at http://www.raeslab.org/companion/ocean-
interactome/tablesW6.xlsx
30. Companion web site table w7 available at http://www.raeslab.org/companion/ocean-
interactome/tables/W7.xlsx
31. Companion web site figure w3 available at http://www.raeslab.org/companion/ocean-
interactome/figures/W3.pdf
32. FEIZI, Soheil, MARBACH, Daniel, MÉDARD, Muriel, et al. Network deconvolution
as a general method to distinguish direct dependencies in networks. Nature biotechnology,
2013, vol. 31, no 8, p. 726-733.
33. Companion web site table w8 available at http://www.raeslab.org/companion/ocean-
interactome/tables/W8.xlsx
34. CUSICK, Michael E., YU, Haiyuan, SMOLYAR, Alex, et al. Literature-curated
protein interaction datasets. Nature methods, 2009, vol. 6, no 1, p. 39-46.
35. Companion web site table w9 available at http://www.raeslab.org/companion/ocean-
interactome/tables/W9.xlsx
36. FUHRMAN, Jed A., CRAM, Jacob A., et NEEDHAM, David M. Marine microbial
community dynamics and their ecological interpretation. Nature Reviews Microbiology, 2015.
37. Companion web site additional material available at
http://www.raeslab.org/companion/ocean-interactome/Accompanying_Material.docx
38. Companion web site figure w4 available at http://www.raeslab.org/companion/ocean-
interactome/figures/W4.pdf
39. Companion web site table w10 available at http://www.raeslab.org/companion/ocean-
interactome/tables/W10.xlsx
40. MCMANUS, George B. et SANTOFERRARA, Luciana F. Tintinnids in
microzooplankton communities. The Biology and Ecology of Tintinnid Ciliates: Models for
Marine Plankton, 2012, p. 198-213.
74

Chapitre I
41. CACHON, Jean. Contribution à l’étude des péridiniens parasites. Cytologie, cycles
évolutifs. Annales des Sciences Naturelles - Zoologie et Biologie Animale, 1964, vol. 6, p. 1-
158.
42. SALOMON, Paulo S., GRANÉLI, Edna, NEVES, Maria HCB, et al. Infection by
Amoebophrya spp. parasitoids of dinoflagellates in a tropical marine coastal area. Aquatic
microbial ecology, 2009, vol. 55, no 2, p. 143-153.
43. GÓMEZ, Fernando, LÓPEZ-GARCÍA, Purificación, NOWACZYK, Antoine, et al.
The crustacean parasites Ellobiopsis Caullery, 1910 and Thalassomyces Niezabitowski, 1913
form a monophyletic divergent clade within the Alveolata.Systematic parasitology, 2009, vol.
74, no 1, p. 65-74.
44. OHTSUKA, Susumu, HORA, Mariko, SUZAKI, Toshinobu, et al. Morphology and
host-specificity of the apostome ciliate Vampyrophrya pelagica infecting pelagic copepods in
the Seto Inland Sea, Japan. Marine Ecology Progress Series, 2004, vol. 282, p. 129-142.
45. SKOVGAARD, Alf, KARPOV, Sergey A., et GUILLOU, Laure. The parasitic
dinoflagellates Blastodinium spp. inhabiting the gut of marine, planktonic copepods:
morphology, ecology, and unrecognized species diversity. Frontiers in microbiology, 2012,
vol. 3.
46. STEMMANN, Lars, YOUNGBLUTH, Marsh, ROBERT, Kevin, et al. Global
zoogeography of fragile macrozooplankton in the upper 100-1000 m inferred from the
underwater video profiler. ICES journal of marine science, 2008, vol. 65, no 3, p. 433-442.
47. GASOL, Josep M., DEL GIORGIO, Paul A., et DUARTE, Carlos M. Biomass
distribution in marine planktonic communities. Limnology and Oceanography, 1997, vol. 42,
no 6, p. 1353-1363.
48. WARD, Ben A., DUTKIEWICZ, Stephanie, et FOLLOWS, Michael J. Modelling
spatial and temporal patterns in size-structured marine plankton communities: top–down and
bottom–up controls. Journal of Plankton Research, 2014, vol. 36, no 1, p. 31-47.
49. IANORA, Adrianna, MIRALTO, Antonio, POULET, Serge A., et al. Aldehyde
suppression of copepod recruitment in blooms of a ubiquitous planktonic diatom. Nature,
2004, vol. 429, no 6990, p. 403-407.
50. MARTINEZ-GARCIA, Manuel, BRAZEL, David, POULTON, Nicole J., et al.
Unveiling in situ interactions between marine protists and bacteria through single cell
sequencing. The ISME journal, 2012, vol. 6, no 3, p. 703-707.
75

Chapitre I
51. JOLLEY, Elizabeth T. et JONES, Alvin K. The interaction between Navicula muralis
Grunow and an associated species of Flavobacterium. British Phycological Journal, 1977,
vol. 12, no 4, p. 315-328.
52. MILLER, Todd R. et BELAS, Robert. Dimethylsulfoniopropionate metabolism by
Pfiesteria-associated Roseobacter spp. Applied and environmental microbiology, 2004, vol.
70, no 6, p. 3383-3391.
53. Companion web site figure w5 available at http://www.raeslab.org/companion/ocean-
interactome/figures/W5.pdf
54. QUERE, Corinne Le, HARRISON, Sandy P., COLIN PRENTICE, I., et al.Ecosystem
dynamics based on plankton functional types for global ocean biogeochemistry
models. Global Change Biology, 2005, vol. 11, no 11, p. 2016-2040.
55. Companion web site table w11 available at http://www.raeslab.org/companion/ocean-
interactome/tables/W11.xlsx
56. SKOVGAARD, Alf. Dirty tricks in the plankton: Diversity and Role of Marine
Parasitic Protists: diversity and role of marine parasitic protists. Acta Protozoologica, 2014,
vol. 53, no 1, p. 51-62.
57. Companion web site figure w6 available at http://www.raeslab.org/companion/ocean-
interactome/figures/W6.pdf
58. HEYDEN, Sophie, CHAO, Ema E., VICKERMAN, Keith, et al. Ribosomal RNA
phylogeny of bodonid and diplonemid flagellates and the evolution of Euglenozoa. Journal of
Eukaryotic Microbiology, 2004, vol. 51, no 4, p. 402-416.
59. GÓMEZ, Fernando, MOREIRA, David, BENZERARA, Karim, et al. Solenicola
setigera is the first characterized member of the abundant and cosmopolitan uncultured
marine stramenopile group MAST 3.‐ Environmental microbiology, 2011, vol. 13, no 1, p.
193-202.
60. HAMM, Christian E., MERKEL, Rudolf, SPRINGER, Olaf, et al. Architecture and
material properties of diatom shells provide effective mechanical protection.Nature, 2003,
vol. 421, no 6925, p. 841-843.
61. ASSMY, Philipp et SMETACEK, Victor. Algal blooms. Encyclopedia of
Microbiology/Moselio Schaechter, Editor. Oxford: Elsevier (Academic Pr.), 2009, p. 27-41.
62. Companion web site table w12 available at http://www.raeslab.org/companion/ocean-
interactome/tables/W12.xlsx
76

Chapitre I
63. Companion web site figure w7 available at http://www.raeslab.org/companion/ocean-
interactome/figures/W7.pdf
64. WEITZ, Joshua S., POISOT, Timothée, MEYER, Justin R., et al. Phage–bacteria
infection networks. Trends in microbiology, 2013, vol. 21, no 2, p. 82-91.
65. Companion web site table w13 available at http://www.raeslab.org/companion/ocean-
interactome/tablesW13.xlsx
66. Companion web site figure w9 available at http://www.raeslab.org/companion/ocean-
interactome/companion_figures/W9.pdf
67. PESANT, Stéphane, NOT, Fabrice, PICHERAL, Marc, et al. Open science resources
for the discovery and analysis of Tara Oceans data. Scientific Data, 2015, vol. 2.
68. LOGARES, Ramiro, SUNAGAWA, Shinichi, SALAZAR, Guillem, et al.
Metagenomic 16S rDNA Illumina tags are a powerful alternative to amplicon sequencing to
explore diversity and structure of microbial communities.Environmental microbiology, 2014,
vol. 16, no 9, p. 2659-2671.
69. PRUESSE, Elmar, QUAST, Christian, KNITTEL, Katrin, et al. SILVA: a
comprehensive online resource for quality checked and aligned ribosomal RNA sequence data
compatible with ARB. Nucleic acids research, 2007, vol. 35, no 21, p. 7188-7196.
70. EDGAR, Robert C. Search and clustering orders of magnitude faster than
BLAST. Bioinformatics, 2010, vol. 26, no 19, p. 2460-2461.
71. WANG, Qiong, GARRITY, George M., TIEDJE, James M., et al. Naive Bayesian
classifier for rapid assignment of rRNA sequences into the new bacterial taxonomy. Applied
and environmental microbiology, 2007, vol. 73, no 16, p. 5261-5267.
72. MAHÉ, Frédéric, ROGNES, Torbjørn, QUINCE, Christopher, et al. Swarm: robust
and fast clustering method for amplicon-based studies. PeerJ, 2014, vol. 2, p. e593.
73. GUILLOU, Laure, BACHAR, Dipankar, AUDIC, Stéphane, et al. The Protist
Ribosomal Reference database (PR2): a catalog of unicellular eukaryote small sub-unit rRNA
sequences with curated taxonomy. Nucleic acids research, 2013, p. gks1160.
74. BENJAMINI, Yoav et HOCHBERG, Yosef. Controlling the false discovery rate: a
practical and powerful approach to multiple testing. Journal of the Royal Statistical Society.
Series B (Methodological), 1995, p. 289-300.
77

Chapitre I
75. BORCARD, Daniel, LEGENDRE, Pierre, AVOIS-JACQUET, Carol, et al.Dissecting
the spatial structure of ecological data at multiple scales. Ecology, 2004, vol. 85, no 7, p.
1826-1832.
76. BLANCHET, F. Guillaume, LEGENDRE, Pierre, et BORCARD, Daniel. Forward
selection of explanatory variables. Ecology, 2008, vol. 89, no 9, p. 2623-2632.
77. BORCARD, Daniel, LEGENDRE, Pierre, et DRAPEAU, Pierre. Partialling out the
spatial component of ecological variation. Ecology, 1992, vol. 73, no 3, p. 1045-1055.
78. FAUST, Karoline, SATHIRAPONGSASUTI, J. Fah, IZARD, Jacques, et al.Microbial
co-occurrence relationships in the human microbiome. PLoS computational biology, 2012,
vol. 8, no 7, p. e1002606-e1002606.
79. BROWN, Morton B. 400: A method for combining non-independent, one-sided tests
of significance. Biometrics, 1975, p. 987-992.
80. TVEDEBRINK, Torben. Overdispersion in allelic counts and θ-correction in forensic
genetics. Theoretical population biology, 2010, vol. 78, no 3, p. 200-210.
81. MEYER, Patrick E., LAFITTE, Frederic, et BONTEMPI, Gianluca. minet: A
R/Bioconductor package for inferring large transcriptional networks using mutual
information. BMC bioinformatics, 2008, vol. 9, no 1, p. 461.
82. LIU, Xin et MURATA, Tsuyoshi. Community detection in large-scale bipartite
networks. In : Web Intelligence and Intelligent Agent Technologies, 2009. WI-IAT'09.
IEEE/WIC/ACM International Joint Conferences on. IET, 2009. p. 50-57.
83. FLORES, Cesar O., POISOT, Timothée, et WEITZ, Joshua S. BiMAT: a MATLAB
(R) package to facilitate the analysis and visualization of bipartite networks. arXiv preprint
arXiv:1406.6732, 2014.
84. BARBER, Michael J. Modularity and community detection in bipartite networks.
Physical Review E, 2007, vol. 76, no 6, p. 066102.
85. ATMAR, Wirt et PATTERSON, Bruce D. The measure of order and disorder in the
distribution of species in fragmented habitat. Oecologia, 1993, vol. 96, no 3, p. 373-382.
86. HUANG, Ying, GILNA, Paul, et LI, Weizhong. Identification of ribosomal RNA
genes in metagenomic fragments. Bioinformatics, 2009, vol. 25, no 10, p. 1338-1340.
87. SULLIVAN, Mitchell J., PETTY, Nicola K., et BEATSON, Scott A. Easyfig: a
genome comparison visualizer. Bioinformatics, 2011, vol. 27, no 7, p. 1009-1010.
78

Chapitre I
88. RUIZ-TRILLO, Iñaki, RIUTORT, Marta, LITTLEWOOD, D. Timothy J., et al. Acoel
flatworms: earliest extant bilaterian metazoans, not members of Platyhelminthes. Science,
1999, vol. 283, no 5409, p. 1919-1923.
89. GAST, Rebecca J., MCDONNELL, Tracey A., et CARON, David A. srDna based‐
taxonomic affinities of algal symbionts from a planktonic foraminifer and a solitary
radiolarian. Journal of Phycology, 2000, vol. 36, no 1, p. 172-177.
90. SCHINDELIN, Johannes, ARGANDA-CARRERAS, Ignacio, FRISE, Erwin, et
al. Fiji: an open-source platform for biological-image analysis. Nature methods, 2012, vol. 9,
no 7, p. 676-682.
91. NEWMAN, Mark EJ. Finding community structure in networks using the eigenvectors
of matrices. Physical review E, 2006, vol. 74, no 3, p. 036104.
Acknowledgements
We thank the commitment of the following people and sponsors: CNRS (in particular
Groupement de Recherche GDR3280), European Molecular Biology Laboratory (EMBL),
Genoscope/CEA, VIB, Stazione Zoologica Anton Dohrn, UNIMIB, Fund for Scientific
Research – Flanders (GLM, KF, SC, JR), Rega Institute (JR), KU Leuven (JR), The French
Ministry of Research, the French Government 'Investissements d'Avenir' programmes
OCEANOMICS (ANR-11-BTBR-0008), FRANCE GENOMIQUE (ANR-10-INBS-09-08),
MEMO LIFE (ANR-10-LABX-54), PSL* Research University (ANR-11-IDEX-0001-02),
ANR (projects POSEIDON/ANR-09-BLAN-0348, PHYTBACK/ANR-2010-1709-01,
PROMETHEUS/ANR-09-PCS-GENM-217, TARA GIRUS/ANR-09-PCS-GENM-218,
European Union FP7 (MicroB3/No.287589, IHMS/HEALTH-F4-2010-261376, ERC
Advanced Grant Awards to CB (Diatomite: 294823), Gordon and Betty Moore Foundation
grant (#3790) to MBS, Spanish Ministry of Science and Innovation grant CGL2011-
26848/BOS MicroOcean PANGENOMICS to SGA, TANIT (CONES 2010-0036) from the
Agència de Gestió d´Ajusts Universitaris i Reserca funded to SGA, JSPS KAKENHI Grant
Number 26430184 to HO, FWO, BIO5, Biosphere 2, Agnès b., the Veolia Environment
Foundation, Region Bretagne, Lorient Agglomeration, World Courier, Illumina, the EDF
Foundation, FRB, the Prince Albert II de Monaco Foundation, Etienne Bourgois, the Tara
schooner and its captain and crew. We are also grateful to the French Ministry of Foreign
Affairs for supporting the expedition and to the countries that graciously granted sampling
permissions. Tara Oceans would not exist without continuous support from 23 institutes
79

Chapitre I
(http://oceans.taraexpeditions.org). We also acknowledge the EMBL Advanced Light
Microscopy Facility (ALMF), and in particular Rainer Pepperkok. The authors further declare
that all data reported herein are fully and freely available from the date of publication, with no
restrictions, and that all of the samples, analyses, publications, and ownership of data are free
from legal entanglement or restriction of any sort by the various nations whose waters the
Tara Oceans expedition sampled in. Data described herein is available at
www.raeslab.org/companion/ocean-interactome.html, at the EBI under the projects
PRJEB402 and PRJEB6610, and at Pangaea
http://doi.pangaea.de/10.1594/PANGAEA.840721,
http://doi.pangaea.de/10.1594/PANGAEA.840718,
http://doi.pangaea.de/10.1594/PANGAEA.843018 and
http://doi.pangaea.de/10.1594/PANGAEA.843022 and on table S1. The data release policy
regarding future public release of Tara Oceans data are described in Pesant et al. (67). All
authors approved the final manuscript. This article is contribution number 25 of Tara Oceans.
The supplementary materials contain additional data.
Tara Oceans CoordinatorsSilvia G. Acinas1, Peer Bork2, Emmanuel Boss3, Chris Bowler4, Colomban De Vargas5,6, Michael Follows7, Gabriel Gorsky8,9, Nigel Grimsley10,11, Pascal Hingamp12, Daniele Iudicone13, Olivier Jaillon14,15,16, Stefanie Kandels-Lewis2, Lee Karp-Boss3, Eric Karsenti17,18, Uros Krzic19, Fabrice Not5,6, Hiroyuki Ogata20, Stephane Pesant21,22, Jeroen Raes23,24,25, Emmanuel G. Reynaud26, Christian Sardet8, Mike Sieracki27, Sabrina Speich28,29, Lars Stemmann8, Matthew B. Sullivan30, Shinichi Sunagawa2, Didier Velayoudon31, Jean Weissenbach14,15,16, Patrick Wincker14,15,16
1Department of Marine Biology and Oceanography, Institute of Marine Science (ICM)-CSIC, Barcelona, Spain. 2Structural and Computational Biology, European Molecular Biology Laboratory, Heidelberg, Germany. 3School of Marine Sciences, University of Maine, Orono, USA. 4Environmental and Evolutionary Genomics Section, Institut de Biologie de l’Ecole Normale Supérieure, Centre National de la Recherche Scientifique, Unité Mixte de Recherche 8197, Institut National de la Santé et de la Recherche Médicale U1024, Ecole Normale Supérieure, Paris, France. 5CNRS, UMR 7144, Station Biologique de Roscoff, Roscoff, France. 6Sorbonne Universités, UPMC Univ Paris 06, UMR 7144, Station Biologique de Roscoff, Roscoff, France. 7Dept of Earth, Atmospheric and Planetary Sciences, Massachusetts Institute of Technology, Cambridge, USA. 8CNRS/UPMC, UMR 70O9, BioDev, Observatoire océanologique, Villefranche/mer, France.. 9Sorbonne Universités, UPMC Univ Paris 06, UMR 7093, LOV, Observatoire océanologique, Villefranche/mer, France. 10CNRS UMR 7232, BIOM, Banyuls-sur-Mer, France. 11Sorbonne Universités, OOB, UPMC Paris 06, Banyuls-sur-Mer, France. 12Aix Marseille Université, CNRS, IGS UMR 7256, Marseille, France. 13Laboratory of Ecology and Evolution of Plankton, Stazione Zoologica Anton Dohrn, Naples, Italy. 14CEA, Genoscope, Evry France. 15CNRS, UMR 8030, Evry, France. 16Université d'Evry, UMR 8030, Evry, France. 17Environmental and Evolutionary Genomics Section, Institut de Biologie de l’Ecole Normale Supérieure, CNRS, UMR 8197, Institut National de la Santé et de la Recherche Médicale U1024, Ecole Normale Supérieure, Paris, France. 18Directors’ Research, European Molecular Biology Laboratory, Heidelberg, Germany. 19Cell Biology and Biophysics, European Molecular Biology Laboratory, Heidelberg, Germany. 20Institute for Chemical Research, Kyoto University, Kyoto, Japan. 21PANGAEA, Data Publisher for Earth and Environmental Science, University of Bremen, Bremen, Germany. 22MARUM, Center for Marine Environmental Sciences, University of Bremen, Bremen, Germany. 23Department of Microbiology and Immunology, Rega Institute KU Leuven, Leuven, Belgium. 24VIB Center for the Biology of Disease, VIB, Leuven, Belgium. 25Laboratory of Microbiology, Vrije Universiteit Brussel, Brussels, Belgium. 26School of Biology and Environmental Science, University College Dublin, Dublin, Ireland. 27Bigelow Laboratory for Ocean Sciences, East Boothbay, USA. 28Department of Geosciences, Laboratoire de Météorologie Dynamique (LMD), Ecole Normale Supérieure, Paris, France. 29Laboratoire de Physique des Océan, UBO-IUEM, Polouzané, France. 30Department of Ecology and Evolutionary Biology, University of Arizona, Tucson, USA. 31DVIP Consulting, Sèvres, France.
80

Chapitre II
Chapitre II
Cas spécifiques de symbioses eucaryotes planctoniques
81
Copépode infecté par Blastodinium spp. S. Colin

Chapitre II
Les articles présentés dans le chapitre précédent montrent que les symbiotes
représentent une part importante de la diversité et de l'abondance des eucaryotes des
écosystèmes marins planctoniques (premier article) et que les symbioses, comme les autres
interactions biotiques, seraient les forces majeures expliquant la structure des communautés
de ces écosystèmes (second article). Dans ce chapitre deux cas de symbiose eucaryote
planctonique : un cas de parasitisme entre le dinoflagellé parasite Blastodinium et des
copépodes et un cas de mutualisme (photosymbiose) entre le dinoflagellé photosynthétique
Symbiodinium et le cilié Tiarina. L'étude de cas spécifiques de symbioses m'est apparu
indispensable afin d'identifier de quelle manière se répercute les spécificités des interactions
symbiotiques dans des données de metabarcoding. Quelques unes de ces spécificités sont
identifiées dans ce chapitre et seront prises en compte dans le troisième et dernier chapitre de
ce manuscrit.
Le premier article « Symbiodinium in endosymbiosis within the ciliate Tiarina »
met en évidence une nouvelle photosymbiose impliquant le dinoflagellé Symbiodinium et une
nouvelle espèce de cilié calcifiant du genre Tiarina. Il s'agit de la première observation dans le
plancton d'une interaction symbiotique entre un protiste et le genre Symbiodinium qui, jusque
là, n'avait été observé qu'en association avec des hôtes ayant au moins une phase de leur vie
benthique, principalement des cnidaires et des mollusques. L'observation d'une division active
des symbiotes à l'intérieur des ciliés suggère que l'association est durable. De plus, à l'instar
de la plupart des photosymbioses planctoniques, cette association est principalement observée
dans les environnements oligotrophes, ce qui laisse à penser qu'il s'agit d'une association
mutualiste permettant à l'hôte cilié d'obtenir une partie de son énergie grâce à son symbiote
dans un environnement où la disponibilité en proies est limitée. Des études moléculaires
réalisées à partir de séquences d'ADN ribosomique 18S, ITS2 et 28S sur les symbiotes de
Tiarina ont permis de mettre en évidence une toute nouvelle diversité à l'intérieur du genre
Symbiodinium. Chacun de ces nouveaux génotypes a une distribution particulière à travers les
différentes stations Tara Oceans et plusieurs de ces génotypes ont été décrits avec le même
génotype hôte (Figure 2).
82

Chapitre II
Ces résultats montrent que le niveau de spécificité de cette interaction est relativement
lâche tout comme d'autres cas précédemment décrits de photosymbiose (Decelle et al., 2012;
Probert et al., 2014). Ceci renforce la nécessité de prendre en compte la présence, dans le
plancton, de symbioses peu spécifiques lors de tentatives de détections statistiques de ces
dernières, sujet qui sera abordé dans le dernier chapitre.
Le second article « Size-fractionated global DNA metabarcoding reveals ecological
significance of the planktonic dinoflagellate parasite Blastodinium in sunlit oceans. »
décrit la diversité, l'écologie et la biogéographie du dinoflagellé Blastodinium, parasite de
copépodes, à l'échelle des océans tempérés à tropicaux, à partir des données de metabarcoding
Tara Oceans. La distribution du nombre de lectures des metabarcodes assignés à
Blastodinium parmi les fractions de taille est comparée à celles d'Azadinium et d'Alexandrium
(deux genres de dinoflagellés a priori non parasites). Tandis qu'Azadinium, de petite taille
83
Figure 2: Diversité génétique (A) et biogéographie (B) des metabarcodes séquencés à partir desindividus de Tiarina et de Symbiodinium en symbiose. Les réseaux d'haplotypes (A) sont constitués denœuds correspondant aux metabarcodes et dont la taille est proportionnelle à leur nombre de lecturedans la gamme de taille 20-180 µm. Les arrêtes correspondent à une mutation génétique. Le réseaud'haplotypes de Tiarina, en violet, comprend le metabarcode associé à l'espèce non symbiotique,Tiarina fusus. Les abondances de ces metabarcodes parmi les stations Tara Oceans, dans la gamme detaille 20-180 µm, sont représentées par un gradient de couleur, les couleurs claires étant pour desfaibles abondances. Le blanc indique l'absence du metabarcode dans la station correspondante.

Chapitre II
(~10-20 µm), est abondant dans les fractions de taille 0.8-5μm et 5-20μm et décline dans la
fraction 20-180μm jusqu'à presque disparaître dans la fraction 180-2000μm, Alexandrium,
plus gros (~100 µm), est peu abondant dans la fraction 0.8-5μm, abondant dans les fractions
5-20μm et 20-180μm, et de nouveau peu abondant dans la fraction 180-2000μm.
Blastodinium, quant à lui, est abondant dans les fractions 0.8-5μm et 5-20μm, relativement
moins dans la fraction 20-180μm et de nouveau abondant en 180-2000μm. Il y a là une
signature du style de vie parasitique de Blastodinium, abondant dans sa forme libre (0.8-5μm
et 5-20μm), mais que l'on retrouve également dans la plus grande fraction de taille,
probablement associé à son hôte. Toutefois, cette distribution varie légèrement entre les
différents groupes de Blastodinium ce qui suggère une légère variabilité de leurs cycles de
vie. Lorsque les abondances des metabarcodes assignés à Blastodinium sont comparées à
celles des copépodes pour la fraction de taille correspondant à la phase parasitaire du
dinoflagellé (180-2000 µm), la spécificité d'interaction décrite dans la littérature est
globalement respectée. Cet article suggère que l'étude de la distribution des lectures associées
à un organisme parmi différentes fractions de taille adjacentes peut nous renseigner sur son
style de vie. De plus il semble pertinent, dans l'optique de détecter des associations
symbiotiques, de comparer les abondances (nombre de lectures) des metabarcodes dans les
fractions de taille où sont présents les hôtes en symbiose. Dans le cas de Blastodinium, il s'agit
de la gamme de taille 180-2000 µm.
84

Chapitre II
The symbiotic life of Symbiodinium in the open oceanwithin a new species of calcifying ciliate (Tiarina sp.)
Solenn Mordret1,2* , Sarah Romac1,2, Nicolas Henry1,2, Sébastien Colin1,2, Margaux Carmichael1,2, Cédric Berney1,2, Stéphane Audic1,2, Daniel J. Richter1,2, Xavier Pochon3,4, Colomban de Vargas1,2, Johan Decelle1,2
1- EPEP - Evolution des Protistes et des Ecosystèmes Pélagiques - team, Sorbonne Universités, UPMC Univ
Paris 06, UMR 7144, Station Biologique de Roscoff, 29680 Roscoff, France2- CNRS, UMR 7144, Station Biologique de Roscoff, 29680 Roscoff, France 3- Coastal and Freshwater Group, Cawthron Institute, 7010 Nelson, New Zealand4- Institute of Marine Science, University of Auckland, 1142 Auckland, New Zealand
Correspondence: J Decelle ([email protected]) and C de Vargas ([email protected])* Current address: Stazione Zoologica Anton Dohrn, Villa Comunale, 80121 Naples, Italy
In press, The ISME Journal
Abstract
Symbiotic partnerships between heterotrophic hosts and intracellular microalgae are
common in tropical and subtropical oligotrophic waters of benthic and pelagic marine
habitats. The iconic example is the photosynthetic dinoflagellate genus Symbiodinium that
establishes mutualistic symbioses with a wide diversity of benthic hosts, sustaining highly
biodiverse reef ecosystems worldwide. Paradoxically, while various species of photosynthetic
dinoflagellates are prevalent eukaryotic symbionts in pelagic waters, Symbiodinium has not
yet been reported in symbiosis within oceanic plankton, despite its high propensity for the
symbiotic lifestyle. Here we report a new pelagic photosymbiosis between a calcifying ciliate
host and the microalga Symbiodinium in surface ocean waters. Confocal and scanning electron
microscopy, together with an 18S rDNA-based phylogeny, showed that the host is a new
ciliate species closely related to Tiarina fusus (Colepidae). Phylogenetic analyses of the
endosymbionts based on the 28S rDNA gene revealed multiple novel closely-related
Symbiodinium clade A genotypes. A haplotype network using the high-resolution ITS2 marker
showed that these genotypes form eight divergent, biogeographically structured, sub-clade
types, which do not seem to associate with any benthic hosts. Ecological analyses using the
Tara Oceans metabarcoding dataset (V9 region of the 18S rDNA) and contextual
oceanographic parameters showed a global distribution of the symbiotic partnership in
nutrient-poor surface waters. The discovery of the symbiotic life of Symbiodinium in the open
85

Chapitre II
ocean provides new insights into the ecology and evolution of this pivotal microalga and
raises new hypotheses about coastal-pelagic connectivity.
Introduction
Symbiosis is central to the evolution and ecology of ecosystems, and is present in
virtually all living organisms (Maynard Smith, 1989; Margulis and Fester, 1991). This
intimate and long-term association between organisms of different species can range from
parasitism, where one partner benefits at the expense of the other, to mutualism, where both
partners benefit (de Bary, 1879). Photosymbiosis, defined as a close symbiotic relationship
with a photosynthetic partner (generally the symbiont), has led to the acquisition of transient
and even permanent photosynthesis in different eukaryotic lineages (Keeling, 2010). In
marine and freshwater ecosystems, this type of symbiosis is common (Stoecker et al., 2009)
and is considered mutualistic: the symbiont transfers photosynthetic products to its host,
which in turn provides a nutrient-rich micro-environment and protection from parasites and
predators (Muscatine et al., 1984; Yellowlees et al., 2008; Davy et al., 2012). One of the best-
known examples of marine photosymbiosis involves the photosynthetic dinoflagellate
Symbiodinium that lives within a wide diversity of benthic hosts, including metazoans (e.g.
corals, jellyfishes, anemones, sponges, mollusks) and protists (e.g. ciliates and foraminiferans;
LaJeunesse, 2001) in tropical reef ecosystems. Symbioses involving Symbiodinium are
ecologically and economically important as on the one hand they sustain the very productive
and biologically diverse reef ecosystems worldwide (Stanley, 2006), and on the other hand
provide close to $375 billion in goods and services each year (Costanza et al., 1997). The
genus Symbiodinium is genetically diverse, having evolved throughout the Cenozoic into nine
divergent lineages or clades (A to I), each containing several sub-clade genotypes that can
have distinct physiological capacities, spatial distribution and host spectra (Rowan, 2004;
Coffroth and Santos, 2005; Pochon and Gates, 2010).
Photosymbioses are also pervasive in planktonic ecosystems, especially in tropical and
sub-tropical oligotrophic waters (Taylor, 1982; Stoecker et al., 2009; Decelle et al., 2015), but
remain poorly studied compared to benthic ecosystems. Due to their mixotrophic capacity,
photosymbiotic protists play a significant dual role as primary producers and predators in
pelagic ecosystems (Michaels et al., 1995; Swanberg and Caron 1991). Many hosts build
mineral skeletons of calcium carbonate, silica, or strontium sulfate, hence contributing to the
biogeochemical cycles of these elements (Bernstein et al., 1987). For instance, the rhizarian
86

Chapitre II
Radiolaria and Foraminifera are known to develop obligate photosymbioses in surface waters
with diverse eukaryotic microalgae, such as photosynthetic dinoflagellates (e.g.
Brandtodinium, Pelagodinium) and haptophytes (e.g. Phaeocystis) (Gast and Caron, 2001;
Shaked and de Vargas, 2006; Decelle et al., 2012; Probert et al., 2014). Some heterotrophic
dinoflagellates have also been found to host prasinophyte (Sweeney, 1976) or pelagophyte
(Daugbjerg et al., 2013) microalgae. Paradoxically, while several photosynthetic
dinoflagellate taxa have been described to be common symbionts in the oceanic plankton, to
date the ubiquitous coastal symbiont Symbiodinium has never been found in symbiosis in the
pelagic realm.
Ciliates are also known to acquire phototrophy through photosymbiosis with
eukaryotic or prokaryotic microalgal cells (Stoecker et al., 2009; Esteban et al., 2010;
Dziallas et al., 2012). In freshwater habitats, many ciliate species (e.g. Paramecium bursaria,
Coleps hirtus viridis) are found in symbiosis with the green alga Chlorella, while in marine
ecosystems rare examples of photosymbiosis with eukaryotic microalgae have been reported
(Stabell et al., 2002; Stoecker et al., 2009; Johnson, 2011). The benthic ciliates Maristentor
dinoferus and Euplotes uncinatus host Symbiodinium endosymbionts in coral reefs (Lobban et
al., 2002, 2005) and some Oligotrichida ciliates associate with green algae (prasinophytes) in
estuarine environments (Stoecker et al., 1988-1989). These photosymbiotic ciliates almost
exclusively dwell in coastal waters or benthic habitats, whereas there are virtually no
examples of symbiotic partnerships involving eukaryotic microalgae in the surface open
ocean. In this study, we used a combination of microscopy and molecular tools to characterize
a novel pelagic photosymbiosis between a calcifying ciliate host and Symbiodinium
endosymbionts. Exploration of this symbiosis in the samples and metabarcoding dataset of the
worldwide Tara Oceans expedition (Karsenti et al., 2011; de Vargas et al., 2015) allowed us
to study the global specificity, biogeography and ecology of this novel interaction.
Materials and Methods
Morphological identification of the host
Plankton samples and metadata used in this study originated from the Tara Oceans
expedition (2009-2012) (Karsenti et al., 2011; de Vargas et al., 2015). From ethanol-
preserved plankton samples, 20 ciliate cells were isolated and cleaned under microscopy, and
individually placed on a polycarbonate filter without any chemical fixatives for scanning
87

Chapitre II
electron microscopy observations (Table 1). Additional cells (n = 11) from formaldehyde-
preserved samples were also imaged with Confocal Laser Scanning Microscope (CLSM,
Leica TCS SP8), equipped with an HC PL APO 40x/1.10 W motCORR CS2 objective.
Multiple fluorescent dyes were used sequentially to observe the cellular components of the
ciliate (host) and the intracellular microalgae (symbionts), such as the nuclei (blue) and the
cellular membranes (green) with Hoechst (Ex405/Em420-470) and DiOC6 (Ex488/Em500-
520), respectively. Red autofluorescence of the chlorophyll (Ex638/Em680-700) was also
visualized to highlight the chloroplasts of the symbiotic microalgae. Image processing and 3D
reconstructions were conducted with Fiji (Schindelin et al., 2012) and IMARIS ® (Bitplane)
software. Live observations in brightfield microscopy of several ciliate cells (> 50) from the
Mediterranean Sea (Villefranche-sur-Mer, France, and Naples, Italy) were also conducted and
two individual cells were specifically sampled for molecular investigation (Med 2 and Med
3).
Phylogenetic identification of the symbiotic partners
a) Sampling and PCR amplifications
Ciliate cells were isolated from ethanol-preserved surface samples collected by a
plankton net (20 µm mesh-size) at five Tara Oceans stations in the Red Sea and Indian,
Pacific and Atlantic Oceans (Table 2, and see Pesant et al., 2015 and de Vargas et al., 2015 for
88
Table 1 Information about the ciliate cells (Tiarina sp.) isolated in this study for morphologicalinvestigation using different transmitted light and electron microscopy techniques and molecularanalyses.
Sampling location Date
Nov. 2011 > 50 live cells 2 cells
10-20 live cells Red Sea - station Tara_32 Jan. 2010 2 cellsNorth Indian Ocean - station Tara_41 Mar. 2010 8 cells 7 cells 7 cells
South Indian Ocean -station Tara_52 May 2010 1 cell
South Indian Ocean - station Tara_64 Jul. 2010 1 cells
South Atlantic Ocean - station Tara_72 Oct. 2010 12 cells 2 cells 5 cells
Jul. 2011 2 cells
Bright_field microscopy
Scanning electron
microscopy
Confocal laser scanning
microscopy
Molecular analyses
Mediterranean Sea -Villefranche-sur-Mer (France)Mediterranean Sea - Naples MareChiara (LTER-MC)
From Nov. to Jan. 2014-2015
South Pacific Ocean - station Tara_122

Chapitre II
more details). In addition, two individual ciliates (Med 2 and Med 3) were also collected from
live samples in 2011 in the bay of Villefranche-sur-Mer (Mediterranean Sea, France). Cells
observed with scanning electron and confocal laser scanning microscopy were not subjected
to molecular studies. Ciliate cells were individually isolated using a glass micropipette,
carefully washed in three successive baths of 0.22µm-filtered and sterile seawater, transferred
into a sterile microtube, and preserved in lysis buffer (Tissue and Cell Lysis Solution from
MasterPureTM DNA and RNA Purification Kit, Epicenter) at -20°C. DNA extraction was then
performed following the protocol of the MasterPureTM DNA and RNA purification kit
(Epicenter). In order to obtain different phylogenetic ribosomal markers, single cell PCR
amplifications were conducted with the Phusion® High-Fidelity DNA Polymerase
(Finnzymes). The PCR mixture (25µL final volume) contained 0.5 ng (1µL) of DNA, 0.35
µM (final concentration) of each primer, 3% of DMSO and 2X of GC buffer Phusion
MasterMix (Finnzymes). Amplifications were conducted in a PCR thermocycler (Applied
BiosystemsTM) with the following PCR program: initial denaturation step at 98°C for 30 sec,
followed by 36-38 cycles of 10 sec at 98°C, 30 sec at the annealing temperature of the primer
sets (Supplementary Table S1), 30 sec at 72°C and final elongation step at 72°C for 10 min.
For the nested PCR approach, the amplicons obtained in the first PCR (with 25 cycles) were
re-amplified with 40 cycles using internal primers. PCR amplicons were visualized on
agarose gels, purified with the ExoStar purification kit (IllustraTM ExostarTM 1_Step, GE
Healthcare Bio-Sciences Corp.), and Sanger sequenced using the ABI-PRISM Big Dye
Terminator Sequencing kit (Applied Biosystems). Amplicon sequences were visualized and
assembled using Chromas Pro (version 1.7.5). In addition to washing and rinsing ciliate cells
to remove any contaminants, different negative controls were used during the single cell DNA
extraction (a sample with no cell) and the PCR amplifications (a sample without DNA
template) to confirm that the PCR products were only from the DNA of the ciliate and the
intracellular microalgae. DNA from different phytoplankton cultures, including
Symbiodinium, was used to control the primer specificity
For the ciliate (host), a 640 bp-long fragment of the 18S rRNA gene was PCR-
amplified using the ciliate-specific primers Cil_384F and Cil_1147R (Dopheide et al., 2008).
A second 2000 bp-long fragment, that includes the hypervariable V9 region of the 18S rRNA
gene, was obtained with a nested PCR using newly designed specific primers: TiaV4-F1 and
Cil28S-R1 (PCR 1) and the internal primers TiaV4-F2 and Cil28S-R2 (PCR 2) (see
Supplementary Table S1 and Figure S1 for more information about the primers used in this
89

Chapitre II
study). Contigs of the different amplicons were obtained and a matrix of 18S rDNA
sequences was built with these new sequences and public sequences from GenBank (release
203.0, supplementary Table S2).
In order to identify the lineage of the endosymbiotic microalgae, a cloning approach
was first adopted on the 18S and 28S rRNA genes using the TOPO TA Cloning kit
(Invitrogen) and universal eukaryotic primers: 63F and 1818R (Lepère et al., 2011) and D1R
and D2C (Scholin et al., 1994) for 18S and 28S rDNA, respectively (Figure S1). Specific
primers and direct sequencing were subsequently employed for the rest of the isolated ciliates
to obtain the 28S rRNA gene (D1-D3 domains; with primers ITS-Dino and LO from Pochon
et al., 2001) and the rDNA Internal Transcribed Spacer (ITS; with primers Din464F and ITS-
DinoRev from Gómez et al., 2001 and this study, respectively) of the microalgal symbionts
(Figure S1). For the ciliates, a matrix of 18S rDNA sequences was built with the new
sequences obtained and public sequences from GenBank (release 203.0, supplementary Table
S2). Matrices of 28S rDNA and ITS2 sequences were then constructed with reference
sequences from previous studies (Supplementary Tables S3 and S4, LaJeunesse et al., 2009,
Pochon et al., 2014). Sequences obtained in this study have been deposited in GenBank
(accession numbers are given in Table 2 and in the supplementary Tables S2 (18S rDNA), S3
(28S rDNA), S4 (ITS2), S5 (V9 rDNA).
b) Phylogenetic analyses based on ribosomal gene markers
The three matrices of 18S rDNA (host ciliate), and the 28S rDNA and ITS2
(intracellular microalgae) were aligned with MUSCLE from the Seaview software (Edgar,
2004; Gouy et al., 2010), and phylogenetic analyses were conducted with the TOPALI
software (Topali V2, Milne et al., 2009). According to Modeltest v0.1.1 (Posada, 2008), the
general time-reversible (GTR) and the Tamura-Nei (TrN) models of nucleotide substitution
were selected for the symbiont 28S rDNA (56 taxa; 795 nucleotide positions) and the ciliate
18S rDNA (34 taxa; 1419 nucleotide positions) alignments, respectively. Phylogenetic
inference by Maximum Likelihood (ML) was then performed with PhyML v3.0 (Guindon and
Gascuel, 2003), and robustness of inferred topologies was assessed by performing 100 non-
parametric bootstraps. Final trees were rooted with outgroups and visualized with FigTree (v.
1.4; http://tree.bio.ed.ac.uk/software/figtree/). For the ITS2 sequences of the symbiont (239-
bp long fragment), a statistical parsimony network was constructed with the TCS software (95
90
Chapitre II
% connection limit, 10 or less connection steps, gaps considered as fifth state) (Clement et al.,
2000), and visualized and edited with Cytoscape software (Shannon et al., 2003).
Ecological significance of the symbiosis
For both the host ciliate and endosymbiotic microalgae, the hypervariable V9 region of
the 18S rRNA gene was specifically extracted from multiple sequence alignments using the
primers 1389F and 1510R (Amaral-Zettler et al., 2009) in order to interrogate the V9
metabarcoding dataset obtained dataset from 47 stations of the Tara Oceans expedition
(Karsenti et al., 2011; de Vargas et al., 2015). This publicly available metabarcoding dataset
includes millions of V9 rDNA sequences of eukaryotic planktonic organisms obtained by
PCR with universal eukaryotic primers and sequenced with Illumina technology. In this study,
samples corresponding to the micro-plankton size fraction (20-180 µm) collected at
subsurface mixed-layer waters, where the ciliates were found and isolated, were specifically
analyzed. Only V9 reads that were 100% identical to the V9 sequence of the ciliates and the
symbiont were retrieved in the Tara Oceans barcode table (doi: 10.1594/PANGAEA.843018).
Contextual oceanographic parameters, such as temperature, salinity, nitrite and nitrate
concentrations, silica and chlorophyll a concentrations, oxygen minimum and Deep
Chlorophyll Maximum (DCM) depths, and Photosynthetically Active Radiation (PAR), were
also used for statistical analyses (Supplementary Table S6). In order to assess co-occurrence
patterns between host and symbiont, and the effect of abiotic parameters, multiple pairwise
comparisons were performed using Spearman's rank correlation tests based on environmental
physico-chemical parameters, and the distribution and abundance of V9 reads of both
partners. P-values were adjusted using the False Discovery Rate (FDR) approach (Benjamini
and Hochberg, 1995). Correlation between pairs of variables were considered significant
when p-values were lower than 0.05. Statistical analyses were performed in the R
environment (R Development Core Team 2008), and correlations between variables were
visualized as a network using the Cytoscape software (Shannon et al., 2003).
Results and Discussion
Morphological identity of the host ciliate
Live observations in light microscopy showed that the ciliates were actively
swimming with the help of numerous cilia around the cell (Supplementary Figure S2). From
91

Chapitre II
20 cells, various morphological characters were observed with scanning electron microscopy,
notably an armored skeleton composed of calcium carbonate plates (Figure 1A-B), indicating
that the ciliate belongs to the family Colepidae Ehrenberg, 1838 (class Prostomatea, order
Prorodontida; Lynn, 2008; Chen et al., 2012). A morphological comparison with six
previously described ciliate species from the family Colepidae (Coleps hirtus, Nolandia
nolandi, Apocoleps magnus, Levicoleps biwae, Tiarina meunieri and Tiarina fusus) indicated
that T. fusus is the species that most closely resembles the ciliate isolated in this study
(Supplementary Table S7). Both taxa live in marine waters and display a fusiform and
elongated body with large longitudinal rows of calcium carbonate plates arranged in six
different regions (called "tiers"), as well as a wing-like structure that is absent in other
Colepidae species (Figure 1A-B; Chen et al., 2012). These morphological commonalities,
which are typically used for genus recognition within the Colepidae (Foissner et al., 2008),
lead us to argue that the newly isolated ciliate belongs to the genus Tiarina, Berg 1881. In
addition to T. fusus, the genus Tiarina is composed of several species including T. meunieri, T.
borealis, T. antarctica and T. levigata, but these have very old, incomplete morphological
descriptions without reference microscopy images or molecular data. Only T. fusus (Chen et
al., 2012) and T. meunieri (previously named Stapperisa fusus, observed in the Arctic and the
North Sea; Meunier, 1910; Kahl, 1930) are taxonomically recognized species. Compared to T.
fusus, the newly isolated ciliate has a larger length-to-width ratio (1.5 times more), lacks
armor spines, and possesses long somatic cilia arranged in 18 or more ciliary rows (T. fusus
has 15-17 longitudinal rows; Supplementary Table S7). As shown by brightfield (on more
than 50 cells) and confocal (on 11 cells) microscopy images (Figure 1D-E; Supplementary
Figure S2), another distinct morphological character of the isolated ciliate is the presence of
10 to 25 intracellular microalgal cells, which has never been reported in T. fusus (Foissner,
2008; Lynn, 2008; Chen et al., 2012). Kahl (1930) observed “ingested dinoflagellates”
("Nahrung kleine Peredineen") in the arctic species T. meunieri but this old and succinct
description has not been confirmed in the literature. In the newly isolated ciliate, the ovoid
microalgae of about 10 µm in diameter tend to be located next to the macronucleus and the
micronucleus of the host (both highlighted in cyan), and seem to be intact as shown by the
presence of non-degraded nuclei and plastids, in blue and red respectively (Figure 1D-E).
Based on these confocal images, it is not possible to distinguish whether there is a single
reticulated or several chloroplasts in each microalgal cell. A very small fraction of cells
seemed to be degraded, possibly as a consequence of preservation biases and/or host
digestion. Several observations indicate cell division for some of the microalgae (Figure 1E;
92

Chapitre II
Supplementary Figure S2). The cellular features observed in CLSM on several host
individuals (n=11), collected in the Mediterranean Sea and Indian and Atlantic Oceans (Tara
Oceans stations 22, 41, 64, 72), suggest that the relationship between Tiarina sp. and its
symbionts of eukaryotic origin is a putative mutualistic endosymbiosis, rather than predation
or kleptoplastidy.
93

Chapitre II
94
Figure 1 Microscopy images of the photosymbiosis between the ciliate Tiarina sp. (the host) and itsintracellular symbiotic microalgae collected in surface oceanic waters. (A, B) Scanning electronmicroscopy images reveal the calcified skeleton of the ciliate composed of six different tiers:circumoral (COT), anterior secondary (AST), anterior main (AMT), posterior main (PMT), posteriorsecondary (PST) and caudal (CT). (B) The arrow indicates the wing-like structure that is amorphological feature of the genus Tiarina within the Colepidae family. (C–E) The three-dimensional(3D) reconstructions of symbiotic specimens imaged with confocal laser scanning microscopy(CLSM). (C) The ciliate exhibits numerous cilia, highlighted in green (DiOC6). (D, E) The nuclei ofthe ciliate (cyan) and the symbiotic microalgae (blue) were reconstructed from the Hoechstfluorescence signal, and the chloroplasts of the microalgae are highlighted by the red chlorophyllautofluorescence. (E) The arrows indicate putative cell division events. Scale bar=20 μm.

Chapitre II
Phylogenetic identification of the host ciliate
Partial 18S rDNA sequences (i.e. a 1419 bp-long fragment from the V3 to the V9
regions) were obtained from 15 individual ciliates collected in six oceanic regions: the
Mediterranean Sea (n=2), and the Indian (n=6), Atlantic (n=5) and Pacific (n=2) Oceans
(Table 2). The majority of the 18S rDNA sequences were identical irrespective of their
geographic location (which we subsequently call genotype 1), except for four sequences
(Med_2, Med_3, TI_381 and TI_382) that have one nucleotide difference in the V9 region
(which we call genotype 2). While Tiarina sp. genotype 1 was found in most plankton
samples, genotype 2 was specifically observed in the Mediterranean Sea and the South
Atlantic Ocean. In the latter region (e.g. station 72), both genotypes were found. Based on
BLAST analyses, we found no environmental Sanger sequences identical to the newly
isolated Tiarina sp. (both genotypes) in GenBank (release 207.0; April 2015); the closest
sequence corresponded to the ciliate Tiarina fusus (FJ858217).
In the 18S rDNA phylogenetic tree (Figure 2), sequences of genotypes 1 and 2
grouped together and were placed within a highly supported monophyletic clade (Bootstrap
values (BV) = 100%), which corresponds to the family Colepidae, confirming the
95
Table 2 Information about the geographic origin and sequence data obtained for each symbiotic ciliate(Tiarina sp., named hereafter TI_XX) and their associated endosymbiotic microalgae (thedinoflagellate genus Symbiodinium)
Sampling station Oceanic region Coordinates
ITS2 28S rRNA
TI_355 Tara_41 North Indian Ocean 14°36’N; 69°54’E KR022062 KR022044TI_356 Tara_41 North Indian Ocean 14°36’N; 69°54’E KR022031 KR022063 KR022045TI_357 Tara_41 North Indian Ocean 14°36’N; 69°54’E KR022032 KR022064 KR022046TI_358 Tara_41 North Indian Ocean 14°36’N; 69°54’E KR022065 KR022047TI_363 Tara_41 North Indian Ocean 14°36’N; 69°54’E KR022033 KR022066 KR022048TI_365 Tara_41 North Indian Ocean 14°36’N; 69°54’E KR022034TI_366 Tara_41 North Indian Ocean 14°36’N; 69°54’E KR022035 KR022067 KR022049TI_371 Tara_52 South Indian Ocean 16°53’S; 54°00’E KR022036 KR022068 KR022050TI_376 Tara_72 South Atlantic Ocean 8°35’S; 17°54’W KR022037 KR022069 KR022051TI_377 Tara_122 South Pacific Ocean 8°58’S; 139°11’W KR022038 KR022070 KR022052TI_378 Tara_122 South Pacific Ocean 8°58’S; 139°11’W KR022039 KR022071 KR022053TI_379 Tara_72 South Atlantic Ocean 8°35’S; 17°54’W KR022040 KR022072 KR022054TI_380 Tara_72 South Atlantic Ocean 8°35’S; 17°54’W KR022041 KR022073 KR022055TI_381 Tara_72 South Atlantic Ocean 8°35’S; 17°54’W KR022042 KR022074 KR022056TI_382 Tara_72 South Atlantic Ocean 8°35’S; 17°54’W KR022043 KR022075 KR022057TI_392 Tara_32 Red Sea 23°24’N; 37°12'E KR022078 KR022060TI_393 Tara_32 Red Sea 23°24’N; 37°12'E KR022079 KR022061Med_2 Villefranche-sur-Mer (France) Mediterranean Sea 43°42'N; 7°18'E KR022029 KR022076 KR022058Med_3 Villefranche-sur-Mer (France) Mediterranean Sea 43°42'N; 7°18'E KR022030 KR022077 KR022059
Holobiont ID
Host (the ciliate Tiarina sp.) 18S rDNA
Symbiont (Symbiodinium)

Chapitre II
morphological identification. The monophyly of the Colepidae was also recovered in a
previous study (Yi et al., 2010). Within this family, phylogenetic analyses showed that
sequences of our new ciliate grouped with T. fusus and an environmental clone (EF526888) in
a highly supported monophyletic sub-clade (BV= 100%) that likely corresponds to the genus
Tiarina. However, the isolated Tiarina sp. is genetically clearly different from Tiarina fusus,
as it is distinguished by 10 and 11 nucleotide differences in the 18S rDNA for genotypes 1
and 2, respectively. These molecular results corroborate the morphological dissimilarities
highlighted above and provide further evidence that the new ciliate is a novel Tiarina species
that requires formal description.
Phylogenetic identification of the microalgal symbiont
Ribosomal gene sequencing was also performed to reveal the identity and diversity of
the intracellular eukaryotic microalgae observed in the ciliate Tiarina sp.. Amplification of the
18S and 28S rRNA genes with universal eukaryotic primers followed by a cloning procedure
96
Figure 2 Maximum likelihood phylogeny inferred from partial 18S rDNA sequences of the ciliateorder Prorodontida (1419 aligned nucleotide positions) and the Tamura–Nei (TrN) model of nucleotidesubstitution. Sequences of individual cells of Tiarina sp. obtained in this study are colored accordingto their geographic origin. Bootstrap percentages based on 100 pseudoreplicates are indicated at eachnode when support values are >50%.

Chapitre II
showed that the microalgae of different isolated host cells systematically belonged to the
dinoflagellate genus Symbiodinium. Twenty partial sequences of the 28S rRNA gene (a 795
bp-long fragment covering the D1-D3 regions) were subsequently obtained with
Symbiodinium-specific primers (Figure 3). The phylogenetic tree, which has the same
topology as in previous studies (Pochon et al., 2012, 2014), demonstrated that Symbiodinium
isolated from all ciliates (genotypes 1 and 2) collected in different oceanic regions belong to
clade A (maximum support: BV=100%), the earliest branching Symbiodinium lineage. Within
this clade, the new sequences of Symbiodinium are different from any known reference
sequences, and separate analyses with shorter 28S rDNA sequences showed that they also do
not belong to the "Temperate A" sub-clade (Savage et al., 2002; Casado-Amezúa et al., 2014;
Supplementary Figure S3). These new 28S rDNA sequences of Symbiodinium display genetic
dissimilarities (five to nine polymorphic sites) according to their sampling location. This
means that the host ciliate Tiarina sp. is systematically found in symbiosis with
Symbiodinium clade A worldwide, but can associate with different types or sub-clades
depending on the oceanic region (e.g. Mediterranean Sea and South Pacific Ocean; Figure 3).
However, up to three different Symbiodinium types can also be found at the same location
(e.g. station 72 in the south Atlantic Ocean and station 41 in the North Indian Ocean). From
station 72, we note that host genotypes 1 and 2 are associated with different but genetically
close Symbiodinium types (3 nucleotide differences out of 795 bp of the 28S rDNA sequence),
indicating a symbiont specificity within the same location.
97

Chapitre II
The earliest diverging clade A is found within several benthic hosts (e.g. mollusks,
corals, anemones and jellyfish) in temperate and tropical waters of the Atlantic, Pacific,
Indian Oceans, and Red Sea (Franklin et al., 2012; Goulet et al., 2008). Our results raise the
question of whether the novel diversity of Symbiodinium associated with a planktonic ciliate
in the open ocean can also live within benthic hosts from coastal waters. A complex genetic
diversity composed of 15 common sub-clade types has been recognized in clade A with the
highly resolutive ITS2 marker (LaJeunesse et al., 2001; 2009; Franklin et al., 2012; Lee et al,.
2015). This marker was therefore used in this study to assign the new Symbiodinium
98
Figure 3 Maximum likelihood phylogeny of the genus Symbiodinium inferred from 28S rDNAsequences (D1–D3 regions) and the general time-reversible (GTR) model of nucleotide substitutions.Novel Symbiodinium sequences obtained in this study are colored according to their geographic origin,and the name of their corresponding host is given (for example, TI_363). Bootstrap percentages basedon 100 pseudoreplicates are indicated at each node when support values are >50%.

Chapitre II
sequences at the sub-clade level, and thus to provide a better understanding of the identity of
the Tiarina symbiont and the specificity of the symbiotic partnership (LaJeunesse, 2001). A
statistical parsimony network using the ITS2 sequences (239 bp-long) was constructed
including Symbiodinium sequences obtained from Tiarina sp. and those of 14 described sub-
clade types from different hosts and oceanic regions (Figure 4, Supplementary Table S3).
Sub-clade A2 was not included in the network because it was too divergent (over 10
polymorphic sites). Confirming the 28S rDNA phylogeny, ITS2 sequences of Symbiodinium
found in Tiarina sp. did not match any previously described clade A sequence types, and
instead represented 8 novel divergent sub-clade types (7 of which have ≥ 2 nucleotide
differences). Remarkably, this Symbiodinium diversity from a single host taxon is relatively
high, and equivalent to the diversity described so far from about 50 benthic host taxa in reef
ecosystems worldwide (Franklin et al., 2012). The ITS2 diversity of Symbiodinium from
Tiarina sp., like that of the 28S rRNA gene, is partly structured by geography, whereby
sequences from the same oceanic region tend to be similar (South Pacific Ocean, and
Mediterranean and Red Seas). However, the converse also occurs in the Indian and South
Atlantic oceans, where up to three highly divergent Symbiodinium sub-clade types (over 10
polymorphic sites) can co-exist at the same location. Overall, the ITS2 haplotype network
showed a clear genetic separation between Symbiodinium from benthic hosts and
Symbiodinium from the pelagic Tiarina sp.. For instance, in the Pacific Ocean, Symbiodinium
from benthic hosts (sub-clades A5, A6, A7, A8, and A12, in light blue) are very distinct from
Symbiodinium found in Tiarina sp. (TI_377 and TI_378). With two nucleotide differences in
the ITS2 sequence, the closest sub-clade type to the ciliate Symbiodinium is A4. In corals, this
sub-clade type is known for its high photosynthetic efficiency and resistance to photodamage
when exposed to temperature stress (Warner et al., 2006). Symbiodinium A4 has also been
found in the jellyfish Linuche unguiculata, which alternates between the benthic (polyp stage)
and planktonic compartments during its life history (Trench and Thinh, 1995; Montgomery
and Kremer, 1995; LaJeunesse, 2001). Therefore, sub-clade A4 could represent an
evolutionary and ecological transition between the benthic and pelagic environments, where
different selective pressures have caused evolutionary changes within Symbiodinium.
99

Chapitre II
Ecological significance of the symbiosis between the ciliate Tiarina and Symbiodinium
To explore the geographical distribution of the symbiotic relationship over large
spatial scales, the two V9 sequences of the host ciliate (genotypes 1 and 2, differentiated by a
single nucleotide) were used to interrogate the V9 rDNA Tara Oceans metabarcoding dataset
(de Vargas et al., 2015). V9 metabarcodes that were 100% identical to the V9 of genotypes 1
and 2 were detected in 32 stations across the oceans, mainly at equatorial, tropical and
subtropical latitudes (Figure 5A-B). The highest abundances of V9 reads occurred in the Red
Sea (station 32), and the Indian (station 41) and South Atlantic (station 72) Oceans, and they
were not detected in the Southern Ocean. Both genotypes co-existed in 21 stations in the
Mediterranean and Red Seas, and the Indian, Atlantic and Pacific Oceans. Genotype 1 was
more cosmopolitan and abundant (10 to 100 times more, in terms of the relative proportion of
100
Figure 4 Statistical parsimony network with ITS2 sequences of the different subclades ofSymbiodinium clade A. Published sequences and those obtained in this study from the planktonicciliate Tiarina sp. are represented by a square and a circle, respectively (see Supplementary Table S4for the GenBank accession numbers). Based on the GeoSymbio database (Franklin et al., 2012), thegeographic origin and host spectrum for each Symbiodinium subclade are indicated by a color and aletter, respectively. All of the previously described subclade types (A1–A16 in squares) were found inbenthic coastal hosts ( 50 host species).∼

Chapitre II
reads in a given sample), compared to genotype 2, which was detected in fewer stations
(Figure 5A-B).
The ecological preferences of the symbiosis between Tiarina sp. and Symbiodinium
were investigated through correlation network analyses including different contextual
oceanographic parameters and the relative abundance of V9 reads of Symbiodinium
(representing five distinct V9 sequences), Tiarina sp. (genotypes 1 and 2), and Tiarina fusus
(Figure 5C, Supplementary Tables S6 and S8). This analysis revealed a positive correlation
between Symbiodinium and both genotypes of Tiarina sp., demonstrating that there is an
intimate ecological interaction between these taxa in surface ocean waters. In addition,
101
Figure 5 Geographic distribution and ecology of the photosymbiosis between the host ciliate Tiarinaand the microalga Symbiodinium. (a, b) Mapping of the relative abundance of rDNA V9 readsidentical to the V9 sequences of Tiarina genotype 1 (a) and Tiarina genotype 2 (b) in Tara Oceansstations (surface samples in the 20–180 μm size fraction). The color gradient indicates the relativeabundance of V9 reads from green to red for low to high values, respectively. Black dots indicate thatno V9 reads were detected at the given station. (c) Network showing the different correlations(statistically significant; P<0.05) between the V9 read abundances of Symbiodinium (represented byfive distinct V9 sequences), Tiarina genotypes 1 and 2, T. fusus and several physicochemicalparameters (see Supplementary Tables S6 and S8 for the data used and the P-values of the differentcorrelations, respectively).

Chapitre II
Symbiodinium V9 reads correlated negatively to the concentration of some nutrients (NO2,
PO4) and chlorophyll a. Reads of genotypes 1 and 2 of the ciliate Tiarina sp. significantly co-
occurred and displayed negative correlation with chlorophyll a. Reads of genotype 2 also
displayed negative correlations with some nutrients (NO2, PO4, Si), while those of genotype 1
had positive correlations with the depth of the DCM. Thus, the correlation patterns between
the host, its symbiont and their abiotic environment clearly indicate that the symbiotic
partnership predominantly occurs in oligotrophic conditions (typically characterized by a deep
DCM and low chlorophyll and nutrient concentrations), mirroring the ecology of other known
planktonic photosymbioses (Stoecker et al., 2009; Decelle et al., 2012; de Vargas and
Shacked, 2006). More specifically, we note that genotype 2 positively correlated with salinity,
very likely because of its prevalence in the Mediterranean Sea. No significant correlations
were detected between T. fusus and Symbiodinium, nor between T. fusus and different
oceanographic parameters, showing that the life mode and the ecology of T. fusus and the
novel Tiarina sp. are distinct. To date, T. fusus has been reported essentially from coastal and
productive marine waters, such as European fjords (Smetacek, 1981; Dale and Dahl, 1987;
Lynn, 2008; Chen et al., 2012), where it can dominate ciliate abundance and/or biomass
(maximum density reported: 34 000 cells.m-l). T. fusus is particularly known for its significant
grazing activity on a variety of toxic and/or red-tide microalgae (Jeong et al., 2002). In this
study, V9 reads assigned to T. fusus (100% identical to the reference sequence) were only
detected in low abundance in coastal stations in the Adriatic and Red Seas, and in the Indian
and Atlantic Oceans (Supplementary Figure S4). According to the ecological species concept
(Boenigk et al., 2012), these results therefore provide additional evidence that the symbiotic
Tiarina sp. is a novel species distinct from T. fusus.
Conclusion and Perspectives
Our study identified and characterized a novel and widespread pelagic photosymbiosis
between an undescribed calcifying ciliate (Tiarina sp.) and the dinoflagellate Symbiodinium.
Consistent microscopy observations on multiple specimens, systematic PCR detection of
Symbiodinium within the ciliate, and the geographic distribution in surface oceans together
provide evidence in favor of a long-term mutualistic symbiosis rather than predation or
kleptoplastidy. This newly described partnership is relevant not only because the host is a
previously unknown planktonic protistan species, but also because the occurrence of
Symbiodinium as a symbiont in the open ocean was previously unknown, despite the fact that
102

Chapitre II
Symbiodinium is one of the most extensively studied microalgal genera. We revealed a novel
and highly diverse assemblage within Symbiodinium clade A composed of 8 sub-clade types,
which appear to be endemic to pelagic waters as they have not been reported from hosts in
benthic-coastal habitats so far (e.g. tropical reefs, temperate coastal areas). Selective pressures
inherent to the pelagic realm and host specialization might have created a distinct ecological
niche and driven the tempo and mode of Symbiodinium diversification in the open ocean.
Given that clade A is the earliest branching lineage and colepid fossils date back to the
Triassic (220 million year ago, Schmidt et al., 2006), it is possible that the Tiarina-
Symbiodinium symbiosis occurred relatively early in the evolution of the two lineages.
This cosmopolitan symbiosis likely plays multi-faceted biogeochemical roles in
pelagic ecosystems by contributing to primary production and calcium cycling through the
Symbiodinium photosynthesis and host calcification, respectively. Automatic and in situ
imaging techniques could be used in the future to properly quantify this interaction, and thus
to determine its ecological impact in the environment. The active motility of the cilia-bearing
host, which is absent in the "passive" photosymbiotic rhizarian Radiolaria and Foraminifera,
makes the partnership highly original and may indicate a chemotactic behavior for finding
symbiotic partners, suitable light conditions, and food or nutrient patches, as hypothesized in
the photosymbiotic ciliate Mesodinium rubrum (Wilkerson and Grunseich, 1990; Fenchel and
Blackburn, 1999). Given the metabolic capacities of Symbiodinium in reef ecosystems
(Yellowlees et al., 2008; Godinot et al., 2009; Pernice et al., 2012), Tiarina sp. very likely
benefits from a significant source of carbon, nitrogen, phosphate and other key nutrients for
growth and reproduction that are otherwise limiting in the open ocean. In addition to its
nutritional role, Symbiodinium could also play a critical role not only in the calcification of
the ciliate's skeleton, as shown in scleractinian corals (Allemand et al., 2011; Davy et al.,
2012), but also in UV protection in transparent open ocean waters, since clade A is known to
produce a significant amount of UV-absorbing mycosporine-like amino acids (MAAs) in
comparison with other clades (Banaszak et al., 2000). Clade A is also known for its tolerance
for high irradiance and high temperatures, likely explaining why it is commonly found in
shallow-water benthic hosts (Warner et al., 2006; Kemp et al., 2014, 2015) or in the free-
living environment (Pochon et al., 2014). Thus, the physiological features of clade A would
seem to make this Symbiodinium lineage particularly well suited to be a symbiont within
single-celled hosts in oligotrophic transparent waters. Future studies should aim to better
103

Chapitre II
understand the nature, ecological role and life cycle of this new photosymbiosis, and explore
whether other Symbiodinium clades can be found in the open ocean.
Acknowledgements
This work was supported by the project OCEANOMICS, that has received funding
from the French government, managed by the Agence Nationale de la Recherche, under the
grant agreement “Investissement d′Avenir” ANR-11-BTBR-0008. We thank the European
Molecular Biology Laboratory (EMBL, Heidelberg) and more specifically Rainer Pepperkok
for providing access to the Advanced Light Microscopy Facility (ALMF). We also thank the
coordinators and members of the Tara Oceans expedition, Diana Sarno from the Stazione
Zoologica Anton Dohrn of Naples for providing brightfield images, and the marine station
LOV from Villefranche-sur-Mer for field sampling. We are grateful to Ian Probert and Jan
Slapeta for valuable comments on the manuscript. This article is contribution number ## of
Tara Oceans.
Conflict of interest
The authors declare no conflict of interest.
Supplementary Information accompanies this paper on The ISME Journal website
References
ALLEMAND, Denis, TAMBUTTÉ, Éric, ZOCCOLA, Didier, et al. Coral calcification, cells
to reefs. In : Coral reefs: an ecosystem in transition. Springer Netherlands, 2011. p. 119-150.
AMARAL-ZETTLER, Linda A., MCCLIMENT, Elizabeth A., DUCKLOW, Hugh W., et
al. A method for studying protistan diversity using massively parallel sequencing of V9
hypervariable regions of small-subunit ribosomal RNA genes.PLoS One, 2009, vol. 4, no 7, p.
e6372.
BANASZAK, Anastazia T., LAJEUNESSE, Todd C., et TRENCH, Robert K. The synthesis
of mycosporine-like amino acids (MAAs) by cultured, symbiotic dinoflagellates. Journal of
Experimental Marine Biology and Ecology, 2000, vol. 249, no 2, p. 219-233.
BARY, Anton de. Vortrag: Uber Symbiose. Tagblatt der 51. Versammlung Deutscher
Naturforscher und Aerzte in Cassel. Baier & Lewalter, Kassel, 1878, pp. 121-126.
104

Chapitre II
BENJAMINI, Yoav et HOCHBERG, Yosef. Controlling the false discovery rate: a practical
and powerful approach to multiple testing. Journal of the Royal Statistical Society. Series B
(Methodological), 1995, p. 289-300.
BERNSTEIN, R. E., BETZER, P. R., FEELY, R. A., et al. Acantharian fluxes and strontium to
chlorinity ratios in the North Pacific Ocean. Science, 1987, vol. 237, no 4821, p. 1490-1494.
BOENIGK, Jens, ERESHEFSKY, Marc, HOEF-EMDEN, Kerstin, et al.Concepts in
protistology: species definitions and boundaries. European journal of protistology, 2012, vol.
48, no 2, p. 96-102.
CASADO-AMEZÚA, Pilar, MACHORDOM, Annie, BERNARDO, João, et al.New insights
into the genetic diversity of zooxanthellae in Mediterranean anthozoans. Symbiosis, 2014, vol.
63, no 1, p. 41-46.
CHEN, Xiangrui, GAO, Shan, LIU, Weiwei, et al. Taxonomic descriptions of three marine
colepid ciliates, Nolandia sinica spec. nov., Apocoleps caoi spec. nov. and Tiarina fusa
(Claparède & Lachmann, 1858) Bergh, 1881 (Ciliophora, Prorodontida). International
journal of systematic and evolutionary microbiology, 2012, vol. 62, no Pt 3, p. 735-744.
CLEMENT, Mark, POSADA, David., et CRANDALL, Keith A. TCS: a computer program to
estimate gene genealogies. Molecular ecology, 2000, vol. 9, no 10, p. 1657-1659.
COFFROTH, Mary Alice et SANTOS, Scott R. Genetic diversity of symbiotic dinoflagellates
in the genus Symbiodinium. Protist, 2005, vol. 156, no 1, p. 19-34.
COSTANZA Robert, D’ARGE Ralph, DE GROOT Rudolf, et al. The value of the world’s
ecosystem services and natural capital. Nature, 1997, vol. 387, p. 253-260.
DALE, Torbjørn et DAHL, Einar. Mass occurrence of planktonic oligotrichous ciliates in a
bay in southern Norway. Journal of plankton research, 1987, vol. 9, no 5, p. 871-879.
DAUGBJERG, Niels, JENSEN, Maria Hastrup, et HANSEN, Per Juel. Using nuclear-
encoded LSU and SSU rDNA sequences to identify the Eukaryotic Endosymbiont in
Amphisolenia bidentata (Dinophyceae). Protist, 2013, vol. 164, no 3, p. 411-422.
DAVY, Simon K., ALLEMAND, Denis, et WEIS, Virginia M. Cell biology of cnidarian-
dinoflagellate symbiosis. Microbiology and Molecular Biology Reviews, 2012, vol. 76, no 2,
p. 229-261.
DECELLE, Johan, COLIN, Sébastien, et FOSTER, Rachel A. Photosymbiosis in marine
planktonic protists. In : Marine Protists. Springer Japan, 2015. p. 465-500.
105

Chapitre II
DECELLE, Johan, PROBERT, Ian, BITTNER, Lucie, et al. An original mode of symbiosis in
open ocean plankton. Proceedings of the National Academy of Sciences, 2012, vol. 109, no
44, p. 18000-18005.
DE VARGAS, Colomban, AUDIC, Stéphane, HENRY, Nicolas, et al. Eukaryotic plankton
diversity in the sunlit ocean. Science, 2015, vol. 348, no 6237, p. 1261605.
DOPHEIDE, Andrew, LEAR, Gavin, STOTT, Rebecca, et al. Molecular characterization of
ciliate diversity in stream biofilms. Applied and environmental microbiology, 2008, vol. 74,
no 6, p. 1740-1747.
DZIALLAS, Claudia, ALLGAIER, Martin, MONAGHAN, Michael T., et al. Act together—
implications of symbioses in aquatic ciliates. Frontiers in microbiology, 2012, vol. 3.
EDGAR, Robert C. MUSCLE: multiple sequence alignment with high accuracy and high
throughput. Nucleic acids research, 2004, vol. 32, no 5, p. 1792-1797.
ESTEBAN, Genoveva F., FENCHEL, Tom, et FINLAY, Bland J. Mixotrophy in
ciliates. Protist, 2010, vol. 161, no 5, p. 621-641.
FENCHEL, Tom et BLACKBURN, Nicholas. Motile chemosensory behaviour of
phagotrophic protists: mechanisms for and efficiency in congregating at food patches. Protist,
1999, vol. 150, no 3, p. 325-336.
FOISSNER, Wilhelm, KUSUOKA, Yasushi, et SHIMANO, Satoshi. Morphology and gene
sequence of Levicoleps biwae n. gen., n. sp.(Ciliophora, Prostomatida), a proposed endemic
from the ancient Lake Biwa, Japan. Journal of Eukaryotic Microbiology, 2008, vol. 55, no 3,
p. 185-200.
FRANKLIN, Erik C., STAT, Michael, POCHON, Xavier, et al. GeoSymbio: a hybrid, cloud‐
based web application of global geospatial bioinformatics and ecoinformatics for
Symbiodinium–host symbioses. Molecular Ecology Resources, 2012, vol. 12, no 2, p. 369-
373.
GAST, Rebecca J. et CARON, David A. Photosymbiotic associations in planktonic
foraminifera and radiolaria. Hydrobiologia, 2001, vol. 461, no 1-3, p. 1-7.
GODINOT, C., FERRIER-PAGÈS, C., et GROVER, R. Control of phosphate uptake by
zooxanthellae and host cells in the scleractinian coral Stylophora pistillata. Limnology and
Oceanography, 2009, vol. 54, no 5, p. 1627-1633.
GOMEZ, Fernando, LÓPEZ GARCÍA, Purificación, et MOREIRA, David. Molecular‐
phylogeny of dinophysoid dinoflagellates: the systematic position of Oxyphysis oxytoxoides
106

Chapitre II
and the Dinophysis hastata group (Dinophysales, Dinophyceae) 1.Journal of phycology, 2011,
vol. 47, no 2, p. 393-406.
GOULET, Tamar L., SIMMONS, Christopher, et GOULET, Denis. Worldwide biogeography
of Symbiodinium in tropical octocorals. Marine ecology progress series, 2008, vol. 355, p.
45.
GOUY, Manolo, GUINDON, Stephane, et GASCUEL, Olivier. SeaView version 4: a
multiplatform graphical user interface for sequence alignment and phylogenetic tree
building. Molecular biology and evolution, 2010, vol. 27, no 2, p. 221-224.
GUINDON, Stéphane et GASCUEL, Olivier. A simple, fast, and accurate algorithm to
estimate large phylogenies by maximum likelihood. Systematic biology, 2003, vol. 52, no 5,
p. 696-704.
JEONG, Hae Jin, YOON, Joo Yih, KIM, Jae Seong, et al. Growth and grazing rates of the
prostomatid ciliate Tiarina fusus on red-tide and toxic algae. Aquatic microbial ecology, 2002,
vol. 28, no 3, p. 289-297.
JOHNSON, Matthew D. Acquired phototrophy in ciliates: a review of cellular interactions
and structural adaptations1. Journal of Eukaryotic Microbiology, 2011, vol. 58, no 3, p. 185-
195.
KAHL Alfred. Urtiere oder Protozoa I: Wimpertiere oder Ciliata (Infusoria) 1. Allgemeiner
Teil und Prostomata. Tierwelt Dtl, 1930, vol. 18, p. 1-180.
KARSENTI, Eric, ACINAS, Silvia G., BORK, Peer, et al. A holistic approach to marine eco-
systems biology. PLOS biology, 2011, vol. 9, no 10, p. e1001177.
KEELING, Patrick J. The endosymbiotic origin, diversification and fate of
plastids. Philosophical Transactions of the Royal Society of London B: Biological Sciences,
2010, vol. 365, no 1541, p. 729-748.
KEMP, Dustin W., HERNANDEZ-PECH, Xavier, IGLESIAS-PRIETO, Roberto,et
al. Community dynamics and physiology of Symbiodinium spp. before, during, and after a
coral bleaching event. Limnology and Oceanography, 2014, vol. 59, no 3, p. 788-797.
KEMP, Dustin W., THORNHILL, Daniel J., ROTJAN, Randi D., et al. Spatially distinct and
regionally endemic Symbiodinium assemblages in the threatened Caribbean reef-building
coral Orbicella faveolata. Coral Reefs, 2015, vol. 34, no 2, p. 535-547.
107

Chapitre II
LAJEUNESSE, Todd C. Investigating the biodiversity, ecology, and phylogeny of
endosymbiotic dinoflagellates in the genus Symbiodinium using the ITS region: in search of a
“species” level marker. Journal of Phycology, 2001, vol. 37, no 5, p. 866-880.
LAJEUNESSE, Todd C., LOH, William, et TRENCH, Robert K. Do introduced
endosymbiotic dinoflagellates ‘take’ to new hosts?. Biological invasions, 2009, vol. 11, no 4,
p. 995-1003.
LEE, Sung Yeon, JEONG, Hae Jin, KANG, Nam Seon, et al. Symbiodinium tridacnidorum
sp. nov., a dinoflagellate common to Indo-Pacific giant clams, and a revised morphological
description of Symbiodinium microadriaticum Freudenthal, emended Trench &
Blank. European Journal of Phycology, 2015, vol. 50, no 2, p. 155-172.
LEPERE, Cécile, DEMURA, Mikihide, KAWACHI, Masanobu, et al. Whole-genome
amplification (WGA) of marine photosynthetic eukaryote populations. FEMS Microbiology
Ecology, 2011, vol. 76, no 3, p. 513-523.
LOBBAN, C., SCHEFTER, M., SIMPSON, A., et al. Maristentor dinoferus n. gen., n. sp., a
giant heterotrich ciliate (Spirotrichea: Heterotrichida) with zooxanthellae, from coral reefs on
Guam, Mariana Islands. Marine Biology, 2002, vol. 140, no 2, p. 411-423.
LOBBAN, C. S., MODEO, L., VERNI, F., et al. Euplotes uncinatus (Ciliophora,
Hypotrichia), a new species with zooxanthellae. Marine Biology, 2005, vol. 147, no 5, p.
1055-1061.
LYNN, Denis H. (ed.). The ciliated protozoa: characterization, classification, and guide to
the literature. Springer Science & Business Media, 2008.
MARGULIS, Lynn et FESTER, René. Symbiosis as a source of evolutionary innovation:
speciation and morphogenesis. MIT Press, 1991.
MAYNARD SMITH John. Generating novelty by symbiosis. Nature, 1989, vol. 341, p. 284-
285.
MEUNIER, A. Microplankton des Mers de Barents et de Kara [Microplankton from the
Barents and Kara Seas]. Duc d'Orleans, Campagne Arctique de 1907. 1910.
MICHAELS, Anthony F., CARON, David A., SWANBERG, Neil R., et al. Planktonic
sarcodines (Acantharia, Radiolaria, Foraminifera) in surface waters near Bermuda:
abundance, biomass and vertical flux. Journal of Plankton Research, 1995, vol. 17, no 1, p.
131-163.
108

Chapitre II
MILNE, Iain, LINDNER, Dominik, BAYER, Micha, et al. TOPALi v2: a rich graphical
interface for evolutionary analyses of multiple alignments on HPC clusters and multi-core
desktops. Bioinformatics, 2009, vol. 25, no 1, p. 126-127.
MONTGOMERY, M. K. et KREMER, P. M. Transmission of symbiotic dinoflagellates
through the sexual cycle of the host scyphozoan Linuche unguiculata. Marine Biology, 1995,
vol. 124, no 1, p. 147-155.
MUSCATINE, L., FALKOWSKI, P. G., PORTER, J. W., et al. Fate of Photosynthetic Fixed
Carbon in Light-and Shade-Adapted Colonies of the Symbiotic Coral Stylophora
pistillata. Royal Society of London Proceedings Series B, 1984, vol. 222, p. 181-202.
PERNICE, Mathieu, MEIBOM, Anders, VAN DEN HEUVEL, Annamieke, et al.A single-cell
view of ammonium assimilation in coral–dinoflagellate symbiosis.The ISME journal, 2012,
vol. 6, no 7, p. 1314-1324.
PESANT, Stéphane, NOT, Fabrice, PICHERAL, Marc, et al. Open science resources for the
discovery and analysis of Tara Oceans data. Scientific Data, 2015, vol. 2.
POCHON, Xavier, PUTNAM, Hollie M., et GATES, Ruth D. Multi-gene analysis of
Symbiodinium dinoflagellates: a perspective on rarity, symbiosis, and evolution. PeerJ, 2014,
vol. 2, p. e394.
POCHON, Xavier, PUTNAM, Hollie M., BURKI, Fabien, et al. Identifying and
characterizing alternative molecular markers for the symbiotic and free-living dinoflagellate
genus Symbiodinium. PLOS One, 2012, vol. 7, no 1, p. e29816.
POCHON, Xavier et GATES, Ruth D. A new Symbiodinium clade (Dinophyceae) from soritid
foraminifera in Hawai’i. Molecular phylogenetics and evolution, 2010, vol. 56, no 1, p. 492-
497.
POCHON, Xavier, PAWLOWSKI, J., ZANINETTI, Louisette, et al. High genetic diversity
and relative specificity among Symbiodinium-like endosymbiotic dinoflagellates in soritid
foraminiferans. Marine Biology, 2001, vol. 139, no 6, p. 1069-1078.
POSADA, David. jModelTest: phylogenetic model averaging. Molecular biology and
evolution, 2008, vol. 25, no 7, p. 1253-1256.
PROBERT, Ian, SIANO, Raffaele, POIRIER, Camille, et al. Brandtodinium gen. nov. and B.
nutricula comb. Nov.(Dinophyceae), a dinoflagellate commonly found in symbiosis with
polycystine radiolarians. Journal of Phycology, 2014, vol. 50, no 2, p. 388-399.
109

Chapitre II
ROWAN, Rob. Coral bleaching: thermal adaptation in reef coral symbionts. Nature, 2004,
vol. 430, no 7001, p. 742-742.
SAVAGE, A. M., GOODSON, M. S., VISRAM, S., et al. Molecular diversity of symbiotic
algae at the latitudinal margins of their distribution: dinoflagellates of the genus
Symbiodinium in corals and sea anemones. Marine ecology. Progress series, 2002, vol. 244, p.
17-26.
SCHINDELIN, Johannes, ARGANDA-CARRERAS, Ignacio, FRISE, Erwin, et al. Fiji: an
open-source platform for biological-image analysis. Nature methods, 2012, vol. 9, no 7, p.
676-682.
SCHMIDT, Alexander R., RAGAZZI, Eugenio, COPPELLOTTI, Olimpia, et al. A
microworld in Triassic amber. Nature, 2006, vol. 444, no 7121, p. 835-835.
SCHOLIN, Christopher A., HERZOG, Michel, SOGIN, Mitchell, et al. Identification of
group and strain specific genetic markers for globally distributed ‐ ‐ Alexandrium
(Dinophyceae). II. Sequence analysis of a fragment of the LSU rRNA gene1.Journal of
phycology, 1994, vol. 30, no 6, p. 999-1011.
SHAKED, Yonathan et DE VARGAS, Colomban. Pelagic photosymbiosis: rDNA assessment
of diversity and evolution of dinoflagellate symbionts and planktonic foraminiferal
hosts. Marine Ecology Progress Series, 2006, vol. 325, p. 59-71.
SHANNON, Paul, MARKIEL, Andrew, OZIER, Owen, et al. Cytoscape: a software
environment for integrated models of biomolecular interaction networks. Genome research,
2003, vol. 13, no 11, p. 2498-2504.
SMETACEK, Victor The Annual Cycle of Protozooplankton in the Kiel Bight. Marine
Biology, 1981, vol. 63, p. 1-11.
STABELL, Trond, ANDERSEN, Tom, et KLAVENESS, Dag. Ecological significance of
endosymbionts in a mixotrophic ciliate-an experimental test of a simple model of growth
coordination between host and symbiont. Journal of plankton research, 2002, vol. 24, no 9, p.
889-899.
STANLEY, George D. Photosymbiosis and the evolution of modern coral reefs. Science,
2006, vol. 312, no 5775, p. 857-858.
STOECKER, Diane K., JOHNSON, Matthew D., DE VARGAS, Colomban, et al. Acquired
phototrophy in aquatic protists. Aquatic Microbial Ecology, 2009, vol. 57, p. 279-310.
110

Chapitre II
STOECKER, Diane K., SILVER, M. W., MICHAELS, A. E., et al. Enslavement of algal
chloroplasts by four Strombidium spp.(Ciliophora, Oligotrichida). Marine microbial food
webs, 1988, vol. 3, no 2, p. 79-100.
SWANBERG, Neil R. et CARON, David A. Patterns of sarcodine feeding in epipelagic
oceanic plankton. Journal of Plankton Research, 1991, vol. 13, no 2, p. 287-312.
SWEENEY, Beatrice M. Pedinomonas noctilucae (Prasinophyceae), the flagellate symbiotic
in Noctiluca (Dinophyceae) in Southeast Asia. Journal of phycology, 1976, vol. 12, no 4, p.
460-464.
TAYLOR, F. J. R. Symbioses in marine microplankton. Ann. Inst. Oceanogr.(Paris), 1982,
vol. 58, p. 61-91.
TRENCH, R. K. et THINH, Luong-van. Gymnodinium linucheae sp. nov.: The dinoflagellate
symbiont of the jellyfish Linuche unguiculata. European Journal of Phycology, 1995, vol. 30,
no 2, p. 149-154.
WARNER, Mark E., LAJEUNESSE, Todd C., ROBISON, Jennifer D., et al. The ecological
distribution and comparative photobiology of symbiotic dinoflagellates from reef corals in
Belize: potential implications for coral bleaching. Limnology and Oceanography, 2006, vol.
51, no 4, p. 1887-1897.
WILKERSON, Frances P. et GRUNSEICH, Gary. Formation of blooms by the symbiotic
ciliate Mesodinium rubrum: the significance of nitrogen uptake.Journal of Plankton Research,
1990, vol. 12, no 5, p. 973-989.
YI, Zhenzhen, DUNTHORN, Micah, SONG, Weibo, et al. Increasing taxon sampling using
both unidentified environmental sequences and identified cultures improves phylogenetic
inference in the Prorodontida (Ciliophora, Prostomatea). Molecular phylogenetics and
evolution, 2010, vol. 57, no 2, p. 937-941.
YELLOWLEES, David, REES, T. Alwyn V., et LEGGAT, William. Metabolic interactions
between algal symbionts and invertebrate hosts. Plant, cell & environment, 2008, vol. 31, no
5, p. 679-694.
111

Chapitre II
Supplementary information
112
Table S1. Information about the primer sets used in this study for PCR amplification of ribosomalgenes of the host Tiarina sp. and the symbiotic microalga Symbiodinium.
Target and Primers Sens Sequence (5’-3’) Tm (°C) SourceCiliophora 18S rRNA gene Cil-384F F YTB GAT GGT AGT GTA TTG GA 56 Dopheide et al, 2008 Cil_1147R R GAC GGT ATC TRA TCG TCT TT 60 Dopheide et al, 2008
TiaV4-F1 F CTT CTG AAT GTT GCG ACA GTG 47.3 This study Cil28S_R1 R ACG ATT TCA AGT CTT TTA ACC 41.4 This study
TiaV4-F2 F CGG TCG TTG TAA TGG CAT TCA 47.3 This study Cil28S_R2 R GCT TTA GAA GAA GTT TAT CTC 41.3 This study
Din_464F F TAA CAA TAC AGG GCA TCC AT 51 Gómez et al. 2011 ITS_dinoRev R GTG AAT TGC CAG AAC TCC GTG 49 Pochon et al., 2001Dinophyceae 28S rRNA gene ITS_dinoF F GTG AAT TGC AGA ACT CCG TG 60 Pochon et al., 2001 LO R GCT ATC CTG AGR GAA ACT TCG 49.2 Shaked & de Vargas, 2006Eukaryotic 18S rRNA gene 63F F ACG CTT GTC TCA AAG ATT 67 Lepere et al., 2011 1818R R ACG GAA ACC TTG TTA CGA 65 Lepere et al., 2011Eukaryotic 28S rRNA gene D1R F ACC CGC TGA ATT TAA GCA TA 59 Scholin et al., 1994 D2C R CCT TGG TCC GTG TTT CAA GA 56 Scholin et al., 1994
Tiarina sp. 18S rRNA gene (external primers)
Tiarina 18S rRNA gene (internal primers)
Dinophyceae 18S rRNA gene + ITS

Chapitre II
113
Table S2. 18S rDNA sequences of ciliates (order Prorodontida) used for phylogenetic analyses. GenBank accession numbers in bold indicate the sequences of Tiarina sp. produced in this study.
Gene Taxon GenBank Accession number
18S rRNA Platyophyra vorax AF06045418S rRNA Furgaosonia blachmanni X6515018S rRNA Balanion masanensis AM1252518S rRNA Crytocaryon irritans AF35157918S rRNA Holophrya ovum U9711118S rRNA Pelagothrix alveolata AB48600918S rRNA Levicoleps biwae AB35473718S rRNA Nolandia nolandi AM29231318S rRNA Coleps hirtus U9710918S rRNA Coleps spetai AM29231218S rRNA Coleps hirtus hirtus AM29231118S rRNA DQ48719418S rRNA FJ85821518S rRNA FJ85821418S rRNA HM74713718S rRNA Apocoleps magnus FJ85821318S rRNA Uncultured eukaryote NA21F11 EF52688818S rRNA Tiarina fusus FJ85821718S rRNA MMETSP047218S rRNA KR02202918S rRNA KR02203018S rRNA KR02203118S rRNA KR02203218S rRNA KR02203318S rRNA KR02203418S rRNA KR02203518S rRNA KR02203618S rRNA KR02203718S rRNA KR02203818S rRNA KR02203918S rRNA KR02204018S rRNA KR02204118S rRNA KR02204218S rRNA KR022043
Coleps sp.Nolandia like sp.Apocoleps sp.Apocoleps sp.
Tiarina fusus - Moore transcriptomeTiarina sp. Cilie 2Tiarina sp. Cilie 3Tiarina sp. TI_356Tiarina sp. TI_357Tiarina sp. TI_363Tiarina sp. TI_365Tiarina sp. TI_366Tiarina sp. TI_371Tiarina sp. TI_376Tiarina sp. TI_377Tiarina sp. TI_378Tiarina sp. TI_379Tiarina sp. TI_380Tiarina sp. TI_381Tiarina sp. TI_382

Chapitre II
114
Table S3. 28S rDNA sequences of Symbiodinium (clades A-H) used for phylogenetic analyses.GenBank accession numbers in bold indicate the sequences of Symbiodinium clade A produced inthis study.
Gene marker Clade ITS2 subclade type Host taxon GenBank Accession number28S rRNA C C91 JN55804828S rRNA C C90 JN55804528S rRNA C C15 Amphisorus hemprichii JN55804228S rRNA C C1 Amphisorus hemprichii JN55804028S rRNA H H1 JN55805128S rRNA H H1a JN55805328S rRNA F2 F2 JQ24704328S rRNA F2 F2a JQ24704428S rRNA F3 F3.2 Amphisorus hemprichii JQ24704628S rRNA F3 F3.1a Amphisorus hemprichii JQ24704528S rRNA F4 F4.8 JQ24704828S rRNA F4 F4.1 JQ24704728S rRNA F5 F5.2g Montastraea faveolata JN55807228S rRNA F5 F1 Montipora verrucosa JN55806628S rRNA F5 F5.1d JN55806928S rRNA F5 F5.1 Meandrina meandrites JN55806328S rRNA B B2 Eunicea flexuosa JN55806028S rRNA B B1 Plexaura kuna JN55805728S rRNA B B19a Plexaura kuna JN55805528S rRNA I I2 FN56156028S rRNA I I1 FN56155928S rRNA D1 D1a unknown anemone JN55807828S rRNA D1 D1 JN55807528S rRNA D2 D1.1 Marginopora vertebralis JQ24704928S rRNA D2 D1.2 Haliclona koremella JN55808128S rRNA G2 G2.2* Cliona orientalis JQ24705128S rRNA G2 G2.1* Cliona orientalis JQ24705028S rRNA G1 G2 Marginopora vertebralis JN55808928S rRNA G1 G2b Marginopora vertebralis JN55808828S rRNA E E1 Anthopleura elegantissima JN55808428S rRNA A A2_2 Gorgonia ventallina JN55810028S rRNA A A2_1 Bartholomea annulata JN55809728S rRNA A A3 Pseudoplexaura porosa JN55809128S rRNA A A13 Plexaura kuna JN55809428S rRNA A A17 KR02205128S rRNA A A17 KR02205428S rRNA A A18 KR02205628S rRNA A A18 KR02205728S rRNA A A19 KR02205528S rRNA A A20 KR02206028S rRNA A A20 KR02206128S rRNA A A21 KR02204528S rRNA A A21 KR02204628S rRNA A A21 KR02204828S rRNA A A22 KR02204428S rRNA A A22 KR02204728S rRNA A A22 KR02204928S rRNA A A22 KR02205028S rRNA A A23 KR02205828S rRNA A A23 KR02205928S rRNA A A24 KR02205228S rRNA A A24 KR02205328S rRNA Outgroup Polarella glacialis - JN55810828S rRNA Outgroup Protodinium simplex - JN55810328S rRNA Outgroup Pelagodinium beii - JN558106
Sorites sp.Sorites sp.
Sorites sp.Sorites sp.Sorites sp.Sorites sp.
Sorites sp.Sorites sp.
Sinularia sp.
Sorites sp.Sorites sp.
Acropora sp.
Tiarina Genotype 1- TI_376Tiarina Genotype 1- TI_379Tiarina Genotype 2- TI_381Tiarina Genotype 2- TI_382Tiarina Genotype 1- TI_380Tiarina Genotype 1- TI_392Tiarina Genotype 1- TI_393Tiarina Genotype 1- TI_356Tiarina Genotype 1- TI_357Tiarina Genotype 1- TI_363Tiarina Genotype 1- TI_355Tiarina Genotype 1- TI_358Tiarina Genotype 1- TI_366Tiarina Genotype 1- TI_371Tiarina Genotype 2- Med_2Tiarina Genotype 2- Med_3Tiarina Genotype 1- TI_377Tiarina Genotype 1- TI_378

Chapitre II
115
Table S4. ITS2 sequences of different Symbiodinium sub-cladetypes within clade A used for haplotype network reconstruction.
GenBank accession numbers in bold indicate the sequencesproduced in this study.
Sub-clade type Host origin GenBank Accession number
A1 - AF333505A3 - EU074857A3a - EU449035A3b - EU449043A4 - AF333508A4a - AF499778A5 - AF333508A6 - AF186058A7 - AY239360A8 - EU449038A9 - EU449028A10 - EU792882A11 - EU449041A12 - EU792883A13 - AF333504A15 - EU792884A15a - EU792885A15b - EU792886A15c - EU792887A16 - EU792888A17 KR022069A17 KR022072A18 KR022074A18 KR022075A19 KR022073A20 KR022078A20 KR022079A21 KR022063A21 KR022064A21 KR022066A22 KR022062A22 KR022065A22 KR022067A22 KR022068A23 KR022076A23 KR022077A24 KR022070A24 KR022071
Tiarina TI_376Tiarina TI_379Tiarina TI_381Tiarina TI_382Tiarina TI_380Tiarina TI_392Tiarina TI_393Tiarina TI_356Tiarina TI_357Tiarina TI_363Tiarina TI_355Tiarina TI_358Tiarina TI_366Tiarina TI_371Tiarina Med_2Tiarina Med_3Tiarina TI_377Tiarina TI_378

Chapitre II
116
Table S5. V9 rDNA sequences of Tiarina sp. (host) and the correspondingsymbiont Symbiodinium used to interrogate the Tara Oceans metabarcoding dataset.Holobiont ID
TI_355 - KR817711TI_356 KR817696 KR817712TI_357 KR817697 KR817713TI_358 - KR817714TI_361 - KR817715TI_363 KR817698 KR817716TI_365 KR817699 KR817717TI_366 KR817700 -TI_371 KR817701 KR817718TI_376 KR817702 KR817719TI_377 KR817703 KR817720TI_378 KR817704 -TI_379 KR817705 -TI_380 KR817706 KR817721TI_381 KR817709 -TI_382 KR817710 -TI_392 - -TI_393 - -Med_2 KR817707 KR817722Med_3 KR817708 KR817723
Host (the ciliate Tiarina sp.) Symbiont (Symbiodinium)

Table S6. Contextual oceanographic parameters and the relative abundance of V9 reads of Symbiodinium (representing five distinct V9 sequences), Tiarina sp. (genotypes 1 and 2), and Tiarina fusus at each Tara Oceans station to perform correlation network analyses.Station NO2 PO4 NO2NO3 SI
100 6.68E-03 0.00E+00 2.47E-03 0.00E+00 1.30E+01 6.09E+01 2.53E+01 3.46E+01 2.19E+01 7.09E+02 1.80E+00 2.16E+02 3.58E+01 4.18E+01 4.24E+01 5.14E+01 1.40E-01 6.80E-01 6.20E+00 1.20E+00102 5.73E-05 0.00E+00 1.15E-04 0.00E+00 5.25E+00 3.66E+01 2.48E+01 1.77E+01 2.35E+01 7.18E+02 8.36E-01 2.07E+02 3.47E+01 4.21E+01 4.47E+01 3.61E+01 3.20E-01 1.00E+00 1.26E+01 5.00E+00109 6.03E-05 0.00E+00 0.00E+00 0.00E+00 1.99E+00 2.84E+01 2.75E+01 9.29E+00 2.49E+01 7.32E+02 1.59E+00 2.04E+02 3.34E+01 5.16E+01 4.24E+01 4.24E+01 4.00E-02 2.70E-01 9.00E-01 1.70E+0011 1.61E-04 0.00E+00 0.00E+00 0.00E+00 4.17E+01 NA NA NA NA 7.08E+02 NA NA NA NA NA NA NA NA NA NA111 4.51E-03 0.00E+00 5.29E-03 0.00E+00 1.70E+01 8.25E+01 2.27E+01 6.70E+01 1.84E+01 6.71E+02 4.61E+00 2.09E+02 3.60E+01 3.44E+01 3.76E+01 7.99E+01 4.00E-02 5.00E-01 2.68E+00 1.00E+00122 3.00E-03 1.97E-04 5.51E-03 0.00E+00 9.00E+00 9.92E+01 2.66E+01 7.14E+01 NA 7.01E+02 2.27E+01 1.88E+02 3.54E+01 4.02E+01 4.16E+01 1.07E+02 1.20E-01 5.70E-01 5.46E+00 2.19E+00123 4.09E-03 0.00E+00 2.05E-03 0.00E+00 8.91E+00 3.50E+01 2.66E+01 8.79E+01 2.25E+01 7.03E+02 3.42E+01 1.89E+02 3.54E+01 4.52E+01 4.32E+01 1.22E+02 1.40E-01 5.30E-01 4.90E+00 2.22E+00124 4.35E-04 0.00E+00 5.22E-04 0.00E+00 9.15E+00 3.30E+01 2.65E+01 9.17E+01 NA 7.04E+02 4.31E+01 1.90E+02 3.54E+01 NA 4.33E+01 1.15E+02 1.60E-01 6.30E-01 6.18E+00 2.52E+00125 8.25E-04 0.00E+00 1.36E-03 0.00E+00 8.88E+00 4.36E+01 2.68E+01 9.50E+01 2.09E+01 7.06E+02 4.18E+01 1.88E+02 3.54E+01 NA NA 1.04E+02 1.90E-01 5.60E-01 3.73E+00 1.80E+0018 2.34E-03 3.90E-04 3.34E-03 0.00E+00 3.58E+01 8.35E+01 2.14E+01 3.85E+01 1.15E+01 6.41E+02 1.74E+02 2.35E+02 3.79E+01 2.20E+01 1.95E+01 5.70E+01 1.83E-02 2.60E-02 1.20E-01 5.60E-0120 1.56E-02 2.05E-03 1.39E-03 0.00E+00 3.45E+01 9.25E+01 2.14E+01 6.05E+01 1.97E+01 6.27E+02 2.37E+02 2.73E+02 3.84E+01 2.36E+01 2.04E+01 7.00E+01 6.30E-03 1.31E-02 2.00E-02 5.40E-0122 6.19E-03 1.47E-04 8.35E-04 6.34E-03 3.98E+01 1.77E+01 1.70E+01 9.00E+00 1.35E+01 5.98E+02 1.77E+02 2.22E+02 3.77E+01 1.61E+01 1.32E+01 5.63E+01 7.00E-02 2.00E-02 2.10E-01 2.03E+0023 1.98E-02 1.14E-04 3.63E-03 2.33E-03 4.22E+01 5.43E+01 1.69E+01 9.33E+00 1.66E+01 5.82E+02 1.92E+02 2.26E+02 3.82E+01 7.74E+00 1.03E+01 5.47E+01 1.00E-02 6.00E-03 4.00E-02 1.38E+0024 1.41E-02 3.25E-04 2.68E-03 1.30E-03 4.25E+01 4.35E+01 1.82E+01 4.00E+00 1.10E+01 5.75E+02 1.90E+02 2.25E+02 3.81E+01 6.42E+00 1.04E+01 4.70E+01 1.40E-02 6.00E-03 9.00E-02 2.18E+0025 2.19E-03 2.05E-04 6.83E-05 0.00E+00 3.94E+01 5.40E+01 1.83E+01 2.87E+01 1.30E+01 5.87E+02 1.73E+02 2.30E+02 3.82E+01 1.36E+01 1.37E+01 3.77E+01 4.50E-03 6.50E-03 3.00E-02 1.05E+0026 5.12E-03 6.87E-04 5.00E-04 0.00E+00 3.85E+01 5.60E+01 1.90E+01 4.55E+01 1.26E+01 5.90E+02 1.83E+02 2.29E+02 3.84E+01 1.76E+01 1.47E+01 5.65E+01 6.00E-03 8.50E-03 6.50E-03 1.03E+0030 1.14E-02 1.10E-03 5.27E-03 0.00E+00 3.39E+01 7.70E+01 2.03E+01 4.13E+01 1.23E+01 5.95E+02 1.66E+02 2.16E+02 3.94E+01 1.39E+01 1.53E+01 6.57E+01 0.00E+00 0.00E+00 5.00E-02 8.20E-0131 1.51E-04 0.00E+00 1.51E-04 0.00E+00 2.72E+01 8.40E+01 2.50E+01 4.50E+01 1.23E+01 6.32E+02 4.91E+01 1.91E+02 4.00E+01 2.82E+01 2.78E+01 8.95E+01 1.35E-02 2.40E-02 3.00E-02 8.20E-0132 2.81E-03 1.06E-04 2.23E-02 5.30E-05 2.34E+01 8.03E+01 2.58E+01 3.53E+01 1.13E+01 6.49E+02 2.42E+01 1.88E+02 3.97E+01 2.47E+01 2.95E+01 1.42E+02 1.40E-02 1.75E-02 0.00E+00 8.70E-0133 4.02E-04 6.69E-05 1.34E-04 1.34E-04 2.20E+01 5.25E+01 2.72E+01 2.65E+01 1.57E+01 6.54E+02 2.22E+01 1.85E+02 3.90E+01 3.18E+01 3.40E+01 7.90E+01 2.00E-03 5.30E-02 4.50E-03 1.15E+0034 4.54E-03 5.54E-05 1.66E-04 5.54E-05 1.84E+01 4.25E+01 2.76E+01 2.55E+01 1.59E+01 6.72E+02 2.15E+01 1.86E+02 3.86E+01 3.54E+01 3.52E+01 7.80E+01 2.00E-02 1.90E-01 3.00E-02 3.91E+0036 3.17E-02 1.19E-03 0.00E+00 0.00E+00 2.08E+01 2.10E+01 2.54E+01 6.67E+00 1.79E+01 7.17E+02 4.27E+00 1.89E+02 3.65E+01 4.25E+01 4.65E+01 2.30E+01 5.00E-02 3.70E-01 1.30E-01 1.20E+0038 3.16E-03 1.24E-04 0.00E+00 0.00E+00 1.90E+01 3.15E+01 2.61E+01 1.06E+01 1.79E+01 7.21E+02 2.71E+00 1.89E+02 3.66E+01 4.77E+01 4.47E+01 1.08E+02 1.40E-02 3.20E-01 6.00E-02 1.18E+0039 6.51E-03 0.00E+00 0.00E+00 0.00E+00 1.86E+01 3.49E+01 2.71E+01 8.50E+00 1.85E+01 7.24E+02 2.62E+00 1.92E+02 3.63E+01 4.69E+01 4.67E+01 8.29E+01 5.00E-03 2.30E-01 3.00E-02 1.44E+0041 1.89E-01 7.26E-05 1.90E-02 6.17E-04 1.46E+01 6.52E+01 2.91E+01 5.00E+00 1.09E+01 7.35E+02 2.65E+00 1.94E+02 3.60E+01 4.76E+01 4.85E+01 5.68E+01 3.00E-03 1.40E-01 9.00E-02 1.47E+0042 1.11E-02 1.63E-04 6.75E-03 5.44E-05 6.03E+00 7.57E+01 3.00E+01 2.13E+01 1.17E+01 7.31E+02 5.95E+00 1.91E+02 3.46E+01 5.17E+01 4.68E+01 1.03E+02 0.00E+00 8.00E-02 3.00E-02 2.21E+0045 6.44E-05 0.00E+00 0.00E+00 0.00E+00 4.57E-03 4.80E+01 3.05E+01 1.40E+01 1.31E+01 7.27E+02 4.59E+01 1.85E+02 3.52E+01 3.39E+01 4.84E+01 4.70E+01 2.00E-02 1.94E+00 2.86E+01 1.51E+0152 5.80E-03 1.13E-04 3.83E-03 0.00E+00 1.70E+01 7.10E+01 2.79E+01 4.70E+01 1.75E+01 6.78E+02 1.17E+02 2.23E+02 3.46E+01 3.39E+01 3.79E+01 6.90E+01 0.00E+00 1.20E-01 0.00E+00 2.67E+0064 3.14E-02 3.35E-03 4.38E-03 7.97E-05 2.95E+01 5.22E+01 2.22E+01 7.12E+01 1.50E+01 6.20E+02 1.51E+02 2.19E+02 3.53E+01 1.50E+01 1.86E+01 1.61E+02 4.00E-03 8.00E-02 0.00E+00 1.77E+0065 3.38E-03 2.57E-04 1.46E-03 0.00E+00 3.52E+01 2.62E+01 2.16E+01 4.70E+01 1.59E+01 5.97E+02 1.52E+02 2.11E+02 3.54E+01 9.21E+00 1.54E+01 8.92E+01 NA NA NA NA66 0.00E+00 0.00E+00 0.00E+00 5.14E-04 3.49E+01 2.20E+01 1.49E+01 9.00E+01 2.27E+01 6.01E+02 2.02E+02 2.39E+02 3.53E+01 1.43E+01 1.65E+01 1.04E+02 3.00E-01 3.40E-01 3.34E+00 2.74E+0067 0.00E+00 0.00E+00 0.00E+00 0.00E+00 3.21E+01 9.75E+00 1.28E+01 1.22E+01 2.54E+01 6.97E+02 2.90E+01 1.69E+02 3.48E+01 3.77E+01 3.41E+01 2.52E+01 1.71E-01 1.02E+00 7.09E+00 1.39E+0168 0.00E+00 0.00E+00 0.00E+00 0.00E+00 3.11E+01 3.71E+01 1.66E+01 1.87E+02 2.35E+01 7.10E+02 1.70E+02 2.34E+02 3.57E+01 3.41E+01 3.61E+01 2.00E+02 2.50E-01 2.29E-01 1.30E+00 2.60E+007 1.88E-03 3.86E-04 0.00E+00 0.00E+00 3.70E+01 4.43E+01 NA 1.80E+01 NA 7.27E+02 NA NA 3.75E+01 2.99E+01 3.52E+01 4.05E+01 0.00E+00 6.00E-02 3.00E-02 5.20E-0170 1.84E-04 4.61E-05 0.00E+00 0.00E+00 2.04E+01 5.44E+01 1.97E+01 1.47E+02 2.22E+01 7.25E+02 1.42E+02 2.15E+02 3.64E+01 4.82E+01 4.59E+01 1.54E+02 5.40E-02 3.64E-01 9.86E-01 1.36E+0072 9.66E-02 3.32E-03 9.95E-03 0.00E+00 8.78E+00 9.71E+01 2.50E+01 7.47E+01 1.23E+01 7.33E+02 8.36E+01 1.99E+02 3.64E+01 3.75E+01 4.60E+01 9.83E+01 3.00E-03 1.04E-01 1.80E-02 8.68E-0176 2.31E-03 1.61E-04 3.76E-04 0.00E+00 2.09E+01 1.29E+02 2.32E+01 3.43E+01 8.13E+00 7.55E+02 1.67E+02 2.08E+02 3.71E+01 NA NA 1.54E+02 1.00E-03 5.60E-02 NA 8.14E-0178 1.55E-03 2.42E-04 4.84E-05 0.00E+00 3.01E+01 1.13E+02 1.99E+01 3.35E+01 1.12E+01 8.02E+02 1.98E+02 2.22E+02 3.63E+01 NA NA 4.07E+01 0.00E+00 0.00E+00 1.70E-02 4.81E-0182 0.00E+00 0.00E+00 0.00E+00 0.00E+00 4.72E+01 4.53E+01 7.24E+00 2.93E+01 3.20E+01 9.45E+02 1.66E+02 3.08E+02 3.40E+01 2.75E+01 3.57E+01 6.23E+01 1.51E-01 1.30E+00 1.82E+01 1.82E+0084 0.00E+00 0.00E+00 0.00E+00 0.00E+00 6.02E+01 6.85E+01 1.50E+00 4.20E+01 2.14E+01 1.12E+03 1.68E+02 3.43E+02 3.37E+01 3.62E+01 3.21E+01 8.75E+01 2.66E-01 1.72E+00 2.53E+01 1.66E+0198 1.72E-03 5.54E-05 2.99E-03 0.00E+00 2.58E+01 1.76E+02 2.51E+01 5.32E+01 6.04E+00 7.07E+02 1.56E+02 2.22E+02 3.64E+01 4.49E+01 3.96E+01 7.25E+01 0.00E+00 2.00E-01 5.00E-02 3.80E-01
Total Symbiodinium
Tiarina 98.33% genotype2
Tiarina 99.17% genotype1
Tiarina fusus 100%
Mean Latitude
Mean Depth Max Fluo m
Mixed Layer mean temperature °C
Mean Depth MLD Sigma m
Euphotic zone depth integrated Chla g.m-2
Day duration
Oxygen Depth min O
2
Oxygen Depth max O
2
Salinity Depth 10m
AMODIS PAR8d Einsteins.m-2.d-1
AMODIS PARm Einsteins.m-2.d-1
Mean Depth Max N2 m

Table S7. Comparison of different morphological characters of seven ciliates within the Colepidae family, including the newly isolated ciliate Tiarina sp.Coleps hirtus Nolandia nolandi Levicoleps biwae Tiarina meunieri
Body Shape Oval Cylindrical Oval Fusiform Fusiform Twisted Fusiform Fusiform
Body Length (µm) 40-60 40-65 65-81 80-120 ~ 80 60-135 140.2 ± 18.1
Body Width (µm) - - 42-60 30-45 no data 28-36 23.1± 3.8
Length-Width Ratio ~ 1.9 ~ 2.5 ~1.5 ~2.5 ~ 4- 4.5 ~4 ~ 6
Tiers (n) 6 6 6 8 6 6 6
Ciliary rows 15-16 12-14 20-27 22-24 no data 15-17 ~18
Macronucleus length (µm) - - 12.4 14.4 no data 14.6 20
Wing-like structure absent absent absent absent no data present present
Armor spines present present absent present absent present absent
Symbionts no no no - no
Habitat Freshwater Marine Freshwater Marine Marine Marine Marine
Molecular data available yes yes yes yes no yes yes
References for morphology Foissner et al., 2008 Chen et al., 2009 Chen et al., 2012 This study
References for molecular data Yi et al, 2010 Barth et al., 2008 Foissner et al., 2008 Foissner et al., 2008 Yi et al., 2010 This study
Apocoleps magnus Tiarina fusus Novel ciliate
Chlorella sp. Symbiodinium clade A
Foissner,1999, 1984; Lemloh et al, 2013
Chen et al, 2010; 2012, Foissner. 2008
Kahl, 1930; Chen et al., 2012

Chapitre II
119
Table S8. Significant P-values of the different correlations between environmental physico-chemicalparameters and the distribution and relative abundance of V9 rDNA reads of ciliates and Symbiodinium.
1.1E-299 3.5E-05 3.5E-05 7.8E-02 6.9E-01 3.4E-01 2.3E-01 2.8E-01 2.7E-02 1.5E-01
3.5E-05 0.0E+00 2.9E-02 4.3E-01 1.9E-01 1.1E-01 6.3E-01 6.9E-01 6.7E-04 1.2E-01
3.5E-05 2.9E-02 1.1E-299 9.2E-02 3.0E-01 2.4E-03 1.9E-01 3.3E-01 1.5E-03 7.8E-02
7.8E-02 4.3E-01 9.2E-02 0.0E+00 3.4E-01 4.3E-01 9.9E-01 8.8E-02 1.8E-01 6.3E-02
NO2 PO4 NO2NO3 SI
8.6E-01 9.9E-01 7.1E-02 7.2E-01 9.9E-01 8.2E-01 6.9E-03 1.7E-02 7.6E-03 1.4E-01
5.9E-02 3.1E-01 1.2E-02 6.3E-02 9.9E-02 6.0E-01 1.5E-04 3.1E-05 1.2E-04 3.6E-03
9.7E-01 9.1E-01 3.2E-01 5.1E-01 6.6E-01 2.8E-01 6.3E-02 7.0E-02 7.7E-02 2.6E-01
5.4E-01 9.9E-01 2.8E-01 1.3E-01 1.0E-01 9.2E-01 6.2E-01 6.3E-02 1.8E-01 3.2E-01
Total Symbiodinium
Tiarina 98.33% genotype2
Tiarina 99.17% genotype1
Tiarina fusus 100%
Mean Latitude
Mean Depth Max Fluo m
Mixed Layer mean temperature °C
Mean Depth MLD Sigma m
Euphotic zone depth integrated Chla g.m-2
Day duration
Total Symbiodinium
Tiarina 98.33% genotype2Tiarina 99.17% genotype1Tiarina fusus 100%
Oxygen Depth min O
2
Oxygen Depth max O2
Salinity Depth 10m
AMODIS PAR8d Einsteins.m-
2.d-1
AMODIS PARm Einsteins.m-2.d-1
Mean Depth Max N2 m
Total Symbiodinium
Tiarina 98.33% genotype2Tiarina 99.17% genotype1Tiarina fusus 100%
Figure S1. Schematic diagram of the ribosomal operon (18S and 28S rRNA genes, and ITS)showing the position of the different primers used in this study to PCR amplify sequences of theciliate Tiarina and the symbiotic microalgae Symbiodinium.

Chapitre II
120
Figure S2. Microscopy images of the photosymbiosis between the ciliate Tiarina sp. (the host) and itsintracellular symbiotic microalgae collected in surface oceanic waters. A: One live cell of Tiarina sp.collected in the Mediterranean Sea (Naples, Italy) in brightfield microscopy (Image courtesy of DianaSarno). The ciliate is swimming with the help of numerous cilia at the surface of the cell, and harboursmicroalgal cells in the cytoplasm (golden cells). B-D: 3D reconstructions of symbiotic specimensimaged with Confocal Laser Scanning Microscopy (CLSM). B: Cilia of the ciliate are highlighted ingreen (DiOC6). C: The nuclei of the ciliate (cyan) and the symbiotic microalgae (blue) have beenreconstructed from the Hoechst fluorescence signal, and the chloroplasts of the microalgae arehighlighted by the red auto-fluorescence of the chlorophyll. D: Putative cell division events ofSymbiodinium cells are surrounded and could have occurred at the early (a), middle (b) and late (c)stage of the cycle.

Chapitre II
121
Figure S3. Phylogenetic tree (BioNJ) inferred from partial 28S rDNA sequences ofSymbiodinium clade A (477 aligned nucleotide positions) with 100 pseudo-replicates.Compared to the 28S rDNA phylogenetic tree in Figure 3, the "temperate clade", onlyrepresented by relatively short sequences, was specifically included here to investigatewhether Symbiodinium associated to the ciliate Tiarina (sequences in bold) belongs to thisclade.
Figure S4. Mapping of the relative abundance of rDNA V9 reads strictly identical to the V9sequence of the ciliate Tiarina fusus in Tara Oceans stations (surface samples and 20-180 µmsize fraction). The color gradient indicates the relative abundance of V9 reads from green tored for low to high values, respectively. Black dots indicate that no V9 reads have beendetected in the station.

Chapitre II
Bibliography from the Supplementary information
BARTH, Dana, TISCHER, Karolin, BERGER, Helmut, et al. High mitochondrial haplotype
diversity of Coleps sp.(Ciliophora: Prostomatida). Environmental microbiology, 2008, vol. 10,
no 3, p. 626-634.
CHEN, Xiangrui, GAO, Shan, LIU, Weiwei, et al. Taxonomic descriptions of three marine
colepid ciliates, Nolandia sinica spec. nov., Apocoleps caoi spec. nov. and Tiarina fusa
(Claparède & Lachmann, 1858) Bergh, 1881 (Ciliophora, Prorodontida). International
journal of systematic and evolutionary microbiology, 2012, vol. 62, no Pt 3, p. 735-744.
CHEN, Xiangrui, WANG, Yangang, LONG, Hongan, et al. Morphological studies on two
marine colepid ciliates from Qingdao, China, Nolandia orientalis spec. nov. and Pinacocoleps
similis (Kahl, 1933) comb. nov.(Ciliophora, Colepidae). European journal of protistology,
2010, vol. 46, no 4, p. 254-262.
CHEN, Xiangrui, WARREN, Alan, et SONG, Weibo. Taxonomic studies on a new marine
ciliate, Apocoleps magnus gen. nov., spec. nov.(Ciliophora, Colepidae), isolated from
Qingdao, China. Journal of Ocean University of China, 2009, vol. 8, no 4, p. 317-321.
DOPHEIDE, Andrew, LEAR, Gavin, STOTT, Rebecca, et al. Molecular characterization of
ciliate diversity in stream biofilms. Applied and environmental microbiology, 2008, vol. 74,
no 6, p. 1740-1747.
FOISSNER, Wilhelm, KUSUOKA, Yasushi, et SHIMANO, Satoshi. Morphology and gene
sequence of Levicoleps biwae n. gen., n. sp.(Ciliophora, Prostomatida), a proposed endemic
from the ancient Lake Biwa, Japan. Journal of Eukaryotic Microbiology, 2008, vol. 55, no 3,
p. 185-200.
FOISSNER, Wilhelm., BERGER, Helmut and SCHAUMBURG, Jochen., Identification and
ecology of limnetic plankton ciliates. Munich : Informationberichte des Bayerischen
Landesamtes furInstitut fur Wasserwirtschaft, 1999
FOISSNER, Wilhelm., Infraciliatur, Silberliniensystem und Biometrie einiger neuer und
wenig bekannter terrestrischer, limnischer und mariner Ciliaten : (Protozoa: Ciliophora) aus
den Klassen Kinetofragminophora, Colpodea und Polyhymenophora. Linz, Austria :
Botanischer Arbeitsgemeinschaft am O.Ö. Landesmuseum Linz, 1984
GOMEZ, Fernando, LÓPEZ GARCÍA, Purificación, et MOREIRA, David. Molecular‐
phylogeny of dinophysoid dinoflagellates: the systematic position of Oxyphysis oxytoxoides
122

Chapitre II
and the Dinophysis hastata group (Dinophysales, Dinophyceae) 1.Journal of phycology, 2011,
vol. 47, no 2, p. 393-406.
KAHL Alfred. Urtiere oder Protozoa I: Wimpertiere oder Ciliata (Infusoria) 1. Allgemeiner
Teil und Prostomata. Tierwelt Dtl, 1930, vol. 18, p. 1-180.
LEMLOH, Marie-Louise, MARIN, Frédéric, HERBST, Frédéric, et al. Genesis of amorphous
calcium carbonate containing alveolar plates in the ciliate Coleps hirtus (Ciliophora,
Prostomatea). Journal of structural biology, 2013, vol. 181, no 2, p. 155-161.
LEPERE, Cécile, DEMURA, Mikihide, KAWACHI, Masanobu, et al. Whole-genome
amplification (WGA) of marine photosynthetic eukaryote populations. FEMS Microbiology
Ecology, 2011, vol. 76, no 3, p. 513-523.
POCHON, Xavier, PAWLOWSKI, J., ZANINETTI, Louisette, et al. High genetic diversity
and relative specificity among Symbiodinium-like endosymbiotic dinoflagellates in soritid
foraminiferans. Marine Biology, 2001, vol. 139, no 6, p. 1069-1078.
SHAKED, Yonathan et DE VARGAS, Colomban. Pelagic photosymbiosis: rDNA assessment
of diversity and evolution of dinoflagellate symbionts and planktonic foraminiferal
hosts. Marine Ecology Progress Series, 2006, vol. 325, p. 59-71.
SCHOLIN, Christopher A., HERZOG, Michel, SOGIN, Mitchell, et al. Identification of
group and strain specific genetic markers for globally distributed ‐ ‐ Alexandrium
(Dinophyceae). II. Sequence analysis of a fragment of the LSU rRNA gene1.Journal of
phycology, 1994, vol. 30, no 6, p. 999-1011.
YI, Zhenzhen, DUNTHORN, Micah, SONG, Weibo, et al. Increasing taxon sampling using
both unidentified environmental sequences and identified cultures improves phylogenetic
inference in the Prorodontida (Ciliophora, Prostomatea). Molecular phylogenetics and
evolution, 2010, vol. 57, no 2, p. 937-941.
123


Chapitre II
Size-fractionated global DNA metabarcoding revealsecological significance of the planktonic dinoflagellate
parasite Blastodinium in sunlit oceans.
Nicolas Henry1,2, Daniel J. Richter1,2, Sébastien Colin1,2, Sarah Romac1,2, Cédric Berney1,2, Patrick Wincker3,4,5, Colomban de Vargas1,2, Stéphane Audic1,2
1 EPEP - Evolution des Protistes et des Ecosystèmes Pélagiques - team, Sorbonne Universités, UPMC Univ Paris
06, UMR 7144, Station Biologique de Roscoff, 29680 Roscoff, France2 CNRS, UMR 7144, Station Biologique de Roscoff, 29680 Roscoff, France 3 CEA, Institut de Génomique, GENOSCOPE, 2 rue Gaston Crémieux, 91000 Evry, France.4 CNRS, UMR 8030, CP5706, Evry, France.5 Université d'Evry, UMR 8030, CP5706, Evry, France
In preparation
Abstract
The recent advent of massive DNA metabarcoding surveys of environmental samples
across large spatio-temporal and taxonomic scales offers a new tool to study ecological
patterns of microbial organisms. Here we use a dataset of ~766 million raw rDNA sequence
reads generated from 47 open ocean stations from the Tara Oceans circum-global expedition
to explore the diversity and ecology of the dinoflagellate genus Blastodinium across four
organismal size fractions, from piconano- to mesoplankton, and to test patterns of co-
occurrence with their hosts (copepods). Little is known about the diversity and the host
specificity of Blastodinium in open oceans, in part because most of the limited observations
have been conducted in coastal waters, largely in the Mediterranean Sea. We describe the
biogeography of Blastodinium across oceanic basins and we produce the first world-wide
Blastodinium/copepod interactome. Our analysis reveals that the Blastodinium genus is highly
diverse, in terms of both ecology and phylogeny. The most abundant Blastodinium
metabarcodes in mesoplankton display high association scores with copepods with respect to
previously observed specificities. Overall, our analysis suggests that rDNA metabarcoding
data can be used to explore symbiont life style, diversity and host specificity amongst the
wealth of microorganisms in the world plankton.
125
Chapitre II
Introduction
The biodiversity of marine pelagic ecosystems appear to be dominated by protistan
lineages, characterized by highly diverse interaction and symbiotic patterns (Smetacek, 2012;
de Vargas et al., 2015; Lima-Mendez et al., 2015). In particular, protistan parasites have been
observed in morphological studies of plankton communities dating back over a century
(Apstein, 1911; Chatton, 1920; Cachon and Cachon, 1987), with a renewed interest associated
with the use of DNA-based, molecular ecology protocols (Kuhn et al., 2004; Figueroa et al.,
2008; Alves-de-Souza et al., 2012; Guo et al., 2012; Skovgaard et al., 2012). However,
despite significant efforts invested in detection and identification of symbionts -sensu lato- in
marine plankton, the diversity and host specificity of parasites are often poorly known, as the
discovery of new symbioses often begins with direct observations under a microscope, a time-
consuming and not easily scalable process.
The marine photosynthetic dinoflagellate genus Blastodinium was described infecting
copepods in the early 20th century by the French protozoologist Édouard Chatton (Chatton,
1906). Based on morphological characters, and later confirmed by molecular studies, the
Blastodinium genus, which is not always monophyletic in phylogenetic analysis (Skovgaard
et al., 2007; Alves-de-Souza et al., 2011), was separated into three morphologically and
genetically coherent entities: the contortum, spinulosum and mangini groups (Chatton, 1920;
Skovgaard et al., 2012). After being ingested by a copepod, the Blastodinium free-living cell
stage, called the dinospore and measuring between 5 and 30 µm, develops inside the gut
lumen host to form the parasitic stage (trophont). The trophont stage consists of an
arrangement of several hundreds of cells surrounded by a common cuticule, the whole
package reaching a length of more than 1 mm (Chatton, 1920). Since copepods are a key
trophic link in pelagic food webs (Schminke, 2007), Blastodinium infections should exert a
strong impact on plankton ecosystems (Fields et al., 2015). Only 78 copepod/Blastodinium
pairs (at the species level) have been described (Skovgaard et al., 2012) whereas there are 13
accepted species of Blastodinium and more than 2500 marine planktonic copepod species
(Razouls and de Bovée, 2005). Previous work based on morpho-genetic observations has
shown a broad pattern of specificity, in which the contortum and spinulosum groups infect
Calanoida copepods whereas the mangini group mainly infects Cyclopoida copepods
(including Poecilostomatoida (Boxshall and Halsey, 2004)) and to a lesser extent Calanoida
copepods. Little is known about its diversity and host specificity in the open ocean, in part
126

Chapitre II
because most observations of Blastodinium have been conducted in coastal waters, especially
in the Mediterranean sea (Skovgaard et al., 2012). Nevertheless, this symbiotic interaction
which occurs worldwide is one of the better described in the marine planktonic realm, in
terms of both morphology and genetics.
Nowadays, the use of environmental DNA metabarcoding is transforming the field of
microbial ecology. This approach, based on High Throughput Sequencing methods, allows
rapid and massive sequencing of a DNA fragment used as a proxy for assessing organismal
diversity in an entire community, and has been used for the study of viral, prokaryotic and
eukaryotic populations (de Vargas et al., 2015; Sunagawa et al., 2015). In addition to being
used for biodiversity studies, metabarcoding data have been increasingly used in the field of
systems ecology, especially for bacteria (Faust et al., 2012) but also for eukaryotes (Lima-
Mendez et al., 2015). In this context, a worldwide metabarcoding dataset of V9 sequences (a
region towards the 3' end of the eukaryotic 18S ribosomal DNA gene sequence) from size-
fractionated marine plankton communities has been generated as one of the outcomes of the
Tara-Oceans expedition (Karsenti et al., 2011; de Vargas et al., 2015). Here, we used this
large scale Tara-Oceans metabarcoding dataset to explore the diversity and ecology of
Blastodinium across four organismal size fractions from piconano- to meso- plankton (0.8 μm
to 2mm) piconano- to meso-plankton. We describe the phylogenetic diversity and
biogeography of Blastodinium at a worldwide scale, and show that comparing abundances of
metabarcoding data among organismal size fractions generates insights into the parasites’ life
cycles. We produce the first global Blastodinium/copepod interactome and provide directions
for future studies to detect symbiotic interactions in plankton from large scale and size-
fractionated environmental metabarcoding datasets.
Materials and methods
Data
Data used in this study is part of the primary Tara-Oceans V9 rDNA metabarcoding
dataset (de Vargas et al., 2015), which consists of ~766 million raw rDNA sequence reads
from 334 size-fractionated plankton samples collected at 47 open ocean stations and 2 depths
during the circum-global Tara Oceans expedition (Karsenti et al., 2011). Material and
methods used for plankton sampling, DNA extraction, V9 rDNA amplification and
sequencing, as well as the bioinformatic pipeline used for metabarcodes quality check
127

Chapitre II
filtering, clustering, and taxonomic assignation are described in (Pesant et al., 2015) and (de
Vargas et al., 2015). All V9 rDNA metabarcodes assigned to Blastodinium, Azadinium,
Alexandrium, Copepoda, and MALVs (Marine Alveolata) reference sequences with a
percentage identity >90% were extracted from the global dataset. Their diversity and
abundance were then studied across oceanic sites, two water-colum depths (subsurface -SUR-
and Deep Chlorophyll Maximum -DCM) and the four targeted organismal size fractions that
contain most eukaryotic plankton biodiversity: piconano-plankton (0.8-5μm), nano-plankton
(5-20μm), micro-plankton (20-180μm), and meso-plankton (180-2000μm). For a given sample
(one site, depth, and size-fraction) and a given metabarcode, the number of reads assigned to
the metabarcode divided by the total read number within the sample was used as a proxy for
abundance in further statistical analysis. In order to assess whether the distribution pattern of
abundance data amongst plankton size fractions may reflect parasitic life cycles, we compared
the patterns of Blastodinium metabarcodes abundance in piconano-, nano-, micro- and meso-
plankton to abundance data of metabarcodes assigned to copepods (the host) and two other
dinoflagellate genera, Azadinium and Alexandrium, for which there are no known cases of
parasitism. Azadinium cells and Blastodinium dinospores have similar size (Tillmann et al.,
2009, 2010), while Alexandrium cells are slightly larger (Balech, 1995).
Blastodinium phylogeny
V9 rDNA metabarcodes and reference sequences used for phylogenetic analysis were
aligned using MUSCLE v3.8.31 with default settings (Edgar, 2004). Neighbor-joining
phylogenetic trees were then constructed using the BioNJ algorithm (Gascuel, 1997)
implemented in Seaview (Gouy et al., 2010). Observed divergences (percentage residues
differing between two sequences) were used as genetic distances and bootstrap supports were
obtained from 1000 replicates. For each metabarcode, mean relative abundance and
distribution across organismal size fractions were displayed using iTOL (Letunic and Bork,
2011). Blastodinium metabarcodes were used in the phylogeny if they were represented by at
least 300 reads across the entire dataset. Copepod metabarcodes were used in the phylogeny if
at least one significant association was found with any Blastodinium metabarcode in our
analyses (see below).
128

Chapitre II
Interactome inference
We focused on relatively frequent copepod and Blastodinium metabarcodes from the
largest, meso-planktonic size fraction (180-2000μm, where Blastodinium should be in its
trophont, in hospite stage) to reconstruct co-abundance host/parasites ecological networks.
Only metabarcodes present in more than 30% of meso-plankton samples were used for
abundance comparisons. Since only associations between hosts and parasites were targeted,
bipartite multiple pairwise comparisons (Poulin, 2010) were performed. As such,
metabarcodes of one set (either Blastodinium or Copepoda metabarcodes) were compared
with metabarcodes of the other set, and not all against all. Comparisons were conducted using
Spearman's rho (ρ) tests, removing couples of zero because they are uninformative (Legendre
and Legendre, 2012). The p-values were adjusted using the False Discovery Rate (FDR)
approach (Benjamini and Hochberg, 1995). Blastodinium and copepod metabarcodes were
considered as associated when they were positively (ρ>0) and significantly (p<0.001)
correlated.
Results
Blastodinium rDNA abundance, richness, and phylogeny across plankton size fractions
Although Marine Alveolates (MALV), arguably the major group of eukaryotic
parasites in marine plankton (de Vargas et al., 2015; Lima-Mendez et al., 2015), are at least as
abundant as all dinophyceae (including Blastodinium) in the piconano-plankton (0.8-5µm)
metabarcoding dataset, the Blastodinium genus is typically more abundant than MALV in the
nano- (5-20 µm) and meso- (180-2000 µm) plankton (Figure 1). In this latter and larger
organismal size fraction, meso-plankton, the abundance of Blastodinium represents 36% of
the entire dinoflagellate diversity and exceeds even that of all other dinophyceae in some
stations (e.g. stations 7, 18, 109, Figure 1).
129

Chapitre II
Overall Blastodinium rDNA reads are particularly abundant in nano- and meso-
plankton samples (Figure 2A) with a characteristic drop in the intermediate, micro-planktonic
size fraction, expected from its parasitic lifestyle. This pattern of relative abundance across
size fractions is different from that of non-parasitic dinoflagellates such as the Alexandrium
and Azadinium genera. Alexandrium rDNA reads, coming from cell sizes of roughly 100 µm,
are more abundant in micro-plankton (20-180 µm) samples, whereas Azadinium reads, from
cell sizes roughly between 10-20 µm (similar to the Blastodinium free-living dinospores), are
more abundant in piconano- and nano-plankton samples (0.8-20 µm).
130
Figure 1: Relative abundances of dinophyceae (Blastodinium and the other dinophyceae) and MarineAlveolates (MALV) V9 rDNA reads across 4 organismal size fractions (piconano-plankton: 0.8-5 µm,nano-plankton: 5-20 µm, micro-plankton: 20-180 µm, meso-plankton: 180-2000 µm) and 45 TaraOceans stations (subsurface waters). The relative abundance is the number of rDNA reads of themetabarcode divided by the total number of rDNA reads of the sample. NAs indicate samples forwhich no data are available.

Chapitre II
232 of the 234 most abundant Blastodinium metabarcodes, (i.e. the metabarcodes
which appear more than 300 times in our dataset) are distributed across the three major
Blastodinium groups (104 from mangini, 110 from spinulosum and 18 from contortum; Figure
3). Blastodinium reads are generally relatively scarce in the micro-plankton, however, the
distribution across size fractions is different amongst Blastodinium groups. Ribosomal DNA
reads from the spinulosum group are mainly found in the nano-plankton, whereas reads from
the contortum and mangini groups are generally more abundant in the meso-plankton, and
131
Figure 2: V9 rDNA reads’ relative abundances across four organismal size fractions (piconano-plankton: 0.8-5 µm, nano-plankton: 5-20 µm, micro-plankton: 20-180 µm, meso-plankton: 180-2000µm; samples from surface waters). (A) Metabarcodes from the genus Blastodinium compared tometabarcodes affiliated to copepods and two other non-symbiotic, free-living dinophyceae genera,Azadinium and Alexandrium. Azadinium cells and Blastodinium dinospores have similar size, whileAlexandrium cells are slightly larger. (B) Metabarcodes assigned to the three known groups ofBlastodinium: spinulosum, contortum and mangini.

Chapitre II
also in one or both of the two smallest size fractions (piconano and nano-plankton) (Figures
2B and 3). Two metabarcodes, represented by only a few rDNA reads, could not be assigned
to a specific group.
Blastodinium biogeography
Blastodinium metabarcodes have been detected in all samples, except in one meso-
planktonic sample from the Southern Ocean (Figure 4A). Mediterranean sea, Red sea, North
Indian Ocean and one station from Pacific Ocean are particularly rich in Blastodinium rDNA
reads, mainly from the mangini group, which can reach up to 8% of the sample total rDNA
read abundance. In the nano-plankton (5-20 µm), Blastodinium rDNA reads are also abundant
in subtropical and equatorial part of the Atlantic and Pacific Oceans, and dominated by the
spinulosum group. With few exceptions (and except for the nano-plankton), the proportions of
Blastodinium groups are relatively stable across stations but vary depending on the considered
size fraction (Figure 4B).
Associations with copepods
Among the ~2.3 million metabarcodes generated in the Tara-Oceans V9 rDNA
metabarcoding dataset, 324,903 and 16,295 are assigned respectively to copepod and
Blastodinium reference sequences with a percentage identity above 90%. 5,580 copepod and
40 Blastodinium metabarcodes appear in more than 30% of meso-plankton samples (71
samples).
132

Chapitre II
133
Figure 3: Phylogenetic tree (Neighbor-joining) of the most abundant Blastodinium metabarcodes(>300 copies in the Tara-Oceans V9 rDNA metabarcoding dataset), together with their affiliatedreference sequences. Numbers are bootstrap values; only values above 80% are shown. Labels atbranches indicate GenBank accession numbers with species names for the reference sequences.Green dots indicate metabarcodes used for interactions study (Figures 5 and 6). The color gradientfrom white to red (Total) is proportional to the abundance of each metabarcode. Bars indicateproportion of total abundance of each metabarcode amongst the four targeted organismal sizefractions of this study (purple: piconano-plankton, green: nano-plankton, blue: micro-plankton, red:meso-plankton).
Chapitre II
23 of the Blastodinium metabarcodes (55%) are significantly correlated (p<0.001)
with 325 (6% of 5,580) copepod metabarcodes (Figure 5). Calanoida copepods tend to have
higher association scores (ρ) with the contortum group (mean=0.52) whereas Cyclopoida
copepods (including Poecilostomatoida (Boxshall and Halsey, 2004)) tend to have better
association scores with the mangini group (mean=0.56) (Figure 5). The spinulosum group has
relatively low scores with either Cyclopoida (mean=0.50) or Calanoida (mean=0.49). Several
groups of genetically highly similar metabarcodes from copepods co-occur with the same
Blastodinium metabarcodes (Figure 6). For instance, 136 metabarcodes closely related (99 to
100% of identity) to Oncaea sp. (Cyclopoida) are mainly associated with one Blastodinium
metabarcode from the mangini group, and, with lower scores, with one metabarcode from the
spinulosum group (Figure 6). 11 metabarcodes related (~92% identity) to Corycaeus sp.
(Cyclopoida) are associated with one Blastodinium metabarcode from the mangini group. On
the other hand, a group of 168 metabarcodes closely related (~98% identity) to
Pseudocalanus sp. (Calanoida), are associated with several Blastodinium metabarcodes from
the contortum group, as well as one metabarcode from the mangini group, but with lower
contortum group are characterized by higher scores. Other copepod metabarcodes from the
order Calanoida form associations with both the spinulosum and contortum groups, whereas
metabarcodes from the order Cyclopoida form associations with both the spinulosum and
mangini groups.
134

Chapitre II
135
Figure 4: Large-scale biogeography of Blastodinium across the four organismal size fractions at thesurface from 45 stations. (A) Relative abundances of the genus Blastodinium. (B) Proportions of thedifferent Blastodinium groups. Sizes of the pie charts are proportional to the relative abundance ofBlastodinium.

Chapitre II
Discussion
Dinoflagellates of the genus Blastodinium are highly abundant and diverse in global
photic open oceans
The Marine Alveolates (MALV) have been recognized as one of the major groups of
parasites playing a key ecological role in marine planktonic ecosystems (Guillou et al., 2008;
de Vargas et al., 2015; Lima-Mendez et al., 2015). Indeed, MALVs dominate the dinophyceae
metabarcodes (including Blastodinium and all other dinoflagellates) in the piconano-plankton,
which likely reflects their parasitoid life style where infections lead to the death of the host
associated with massive production of dispersive stages (de Vargas et al., 2015). However the
genus Blastodinium represents up to 20% of all dinophyceae metabarcodes in the nano-
plankton, and up to 80% in the meso-plankton. It is typically much more abundant than
MALVs in this latter, larger size fraction (Figure 1). Thus, our data suggest that Blastodinium
play an important role both as a food source for predators in the nano-plankton and as one of
the main parasites of copepods, the dominant free-living organisms, in the meso-plankton.
The dinophyceae constitute an important share of the copepod diet in the oligotrophic systems
(Saiz and Calbet, 2011) and, according to (Chatton, 1920), the infection cycle of
Blastodinium begins with the ingestion of a dinospore by a copepod. Thus, relatively high
proportions of Blastodinium amongst nanoplanktonic dinophyceae would enhance their
ability to infect copepods Blastodinium. Phylogenetic reconstructions based on V9 rDNA
sequences are limited by the small size of the fragment (around 130 base pairs), yet the
spinulosum, contortum and mangini groups tend to be well separated in the Blastodinium tree
(Figure 3), and each contains Blastodinium, many sub-clades spinulosum, contortum and
mangini groups contain abundant rDNA sequences which are not closely related to reference
sequences and most likely correspond to novel species yet to be described.
Blastodinium parasitic lifestyles unveiled by size-fractionated plankton metabarcoding
The distribution of Blastodinium reads amongst size fractions is consistent with the
parasitic life cycle of this genus (Figure 2). Metabarcodes detected in the piconano- and nano-
plankton correspond to the free-living stage, as the size of dinospores (the dispersive stage) is
usually between 5 and 20 µm (Skovgaard et al., 2007). This is confirmed by the fact that
rDNA reads belonging to Azadinium genus, which are non-parasitic dinoflagellate cells with
the same size as Blastodinium dinospores (Tillmann et al., 2010), are mainly present in the
136

Chapitre II
piconano- and nano-plankton samples. The micro-plankton samples are particularly rich in
copepod reads, yet the number of Blastodinium reads found in these samples is relatively low.
A significant fraction of copepod rDNA reads in this size fraction may thus correspond to
eggs and nauplii, life stages that precede the copepodite, which is the stage hypothesized to be
infected by Blastodinium (Alves-de-Souza et al., 2011). The copepodites and adults of small
Cyclopoida copepods like Oithona spp. and Oncaea spp., which could be found in the micro-
plankton (Gallienne and Robins, 2001), should represent only a small proportion of total
copepod life cycle stages smaller than 200 µm.
In contrast to the drop in abundance of Azadinium and Alexandrium dinoflagellates in
the meso-plankton (180 - 200 µm; Figure 2), the relatively abundant and re-increasing number
of Blastodinium rDNA observed in this size fraction should correspond to well-developed
trophonts composed by several hundred cells infecting adult copepods. Strikingly, different
patterns of size fraction distribution emerge between the three Blastodinium groups. Most
metabarcodes belonging to the spinulosum group are relatively more abundant in the nano-
plankton (Figures 2B and 3), suggesting that the life cycle of these group members might
differ from the other Blastodinium groups, with putatively longer free living stages and/or
trophonts constituted by fewer cells. Alternatively, the spinulosum trophonts may infect hosts
from larger plankton size fractions not analysed herein. Spinulosum dinospores appear to be
larger compared to other Blastodinium dinospores, as they are almost exclusively found in the
nano-plankton, whereas other contortum and mangini dinospores have similar abundances in
piconano and nano-plankton (Figure 2B).
137
Figure 5: Boxplots of Spearman's rho resulting from comparisons between copepod and Blastodiniummetabarcode abundance data. Values are aggregated by copepod orders, i.e. Cyclopoida (includingPoecilostomatoida), Calanoida, and Blastodinium groups, i.e. spinulosum, contortum and mangini.

Chapitre II
First insights into the complexity of Blastodinium-copepod interactions using
metabarcodes co-occurrence analysis
Overall, a relatively low proportion of copepod metabarcodes (6%) are associated with
Blastodinium metabarcodes, and potential hosts were found for only the half of the tested
Blastodinium metabarcodes. Several Blastodinium species are known to be able to infect more
than one species of copepod, and one species of copepod can be infected by several species of
Blastodinium (Chatton, 1920). In this context, the abundance of one partner may not be
explicable only by the abundance of the other. In our study, the relatively limited number of
samples across time and space allow detection of only the strongest and more permanent
interactions, between the most widespread copepods and Blastodinium taxa.
The Blastodinium species from the mangini group have been mainly described
infecting copepods from the Cyclopoida order (with the exception of B. galatheanum
infecting Acartia spp. (Skovgaard and Salomonsen, 2009)) whereas the Blastodinium species
from the spinulosum and contortum groups have been exclusively described infecting
copepods belonging to the Calanoida order. Comparisons between Blastodinium and copepod
metabarcode abundances lead to the same broad picture for the contortum and mangini
groups, especially when considering scores of association (Spearman's rho) (Figure 6).
However, metabarcodes from the spinulosum group are weakly associated with both
Calanoida and Cyclopoida, which is not consistent with previous observations (Chatton,
1920; Skovgaard et al., 2012). Distribution among size fractions suggests that Blastodinium
from the spinulosum group could live longer as dinospore and/or live in the host for less time
compared to other Blastodinium species. This is consistent with the lower association scores
of the spinulosum group with both the Calanoida and Cyclopoida copepods, as we would
expect a lower probability to find both partners (Blastodinium/copepod) at the same time.
138
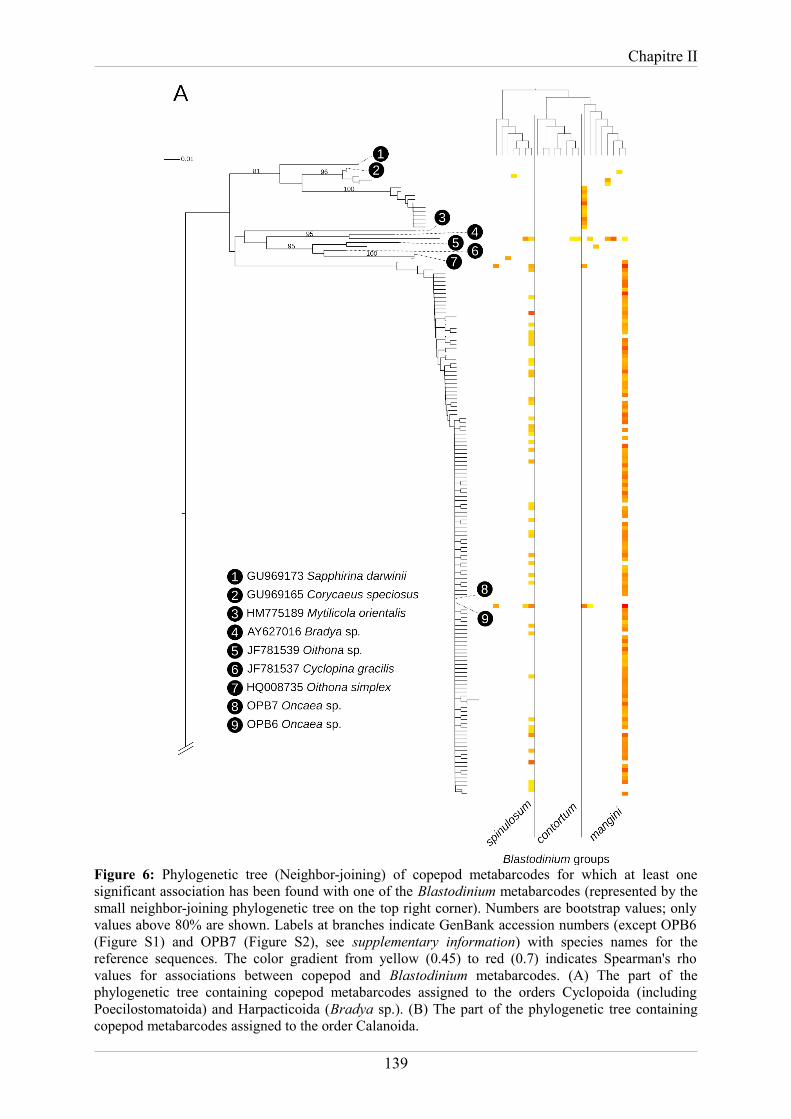
Chapitre II
139
Figure 6: Phylogenetic tree (Neighbor-joining) of copepod metabarcodes for which at least onesignificant association has been found with one of the Blastodinium metabarcodes (represented by thesmall neighbor-joining phylogenetic tree on the top right corner). Numbers are bootstrap values; onlyvalues above 80% are shown. Labels at branches indicate GenBank accession numbers (except OPB6(Figure S1) and OPB7 (Figure S2), see supplementary information) with species names for thereference sequences. The color gradient from yellow (0.45) to red (0.7) indicates Spearman's rhovalues for associations between copepod and Blastodinium metabarcodes. (A) The part of thephylogenetic tree containing copepod metabarcodes assigned to the orders Cyclopoida (includingPoecilostomatoida) and Harpacticoida (Bradya sp.). (B) The part of the phylogenetic tree containingcopepod metabarcodes assigned to the order Calanoida.

Chapitre II
140

Chapitre II
Conclusion
We show the power of extensive metabarcoding to explore symbiotic interactions in
the plankton. In the plankton, symbiotic protists are generally 10 to 100 times smaller than
their hosts (Decelle et al., 2012; Siano et al., 2010; Chambouvet et al., 2008). Metabarcoding
on carefully fractionated seawater samples can therefore distinguish free-living stages from
symbiotic ones. In the context of time series, the study of parasites in several size fractions
would permit a better understanding of infection dynamics. More generally, the distribution of
metabarcodes across size fractions provides clues about the life-style and could help to
investigate ecological role of organisms only known from environmental sequences. The
increase of spatio-temporal sampling and the development of methods to compare abundances
of hosts and symbionts, sensu lato, across their phylogenetic specificity ranges, will
dramatically increase the power of rDNA metabarcoding to unveil new interactions and to
assess their ecology.
Acknowledgments
This work was supported by the project OCEANOMICS, that has received funding
from the French government, managed by the Agence Nationale de la Recherche, under the
grant agreement “Investissement d′Avenir” ANR-11-BTBR-0008. We also thank the
coordinators and members of the Tara Oceans expedition and Jean-Louis Jamet for the
identification of the copepods.
References
ALVES-DE-SOUZA, Catharina, CORNET, Cindy, NOWACZYK, Antoine, et
al. Blastodinium spp. infect copepods in the ultra-oligotrophic marine waters of the
Mediterranean Sea. Biogeosciences, 2011, vol. 8, no 8, p. 2125-2136.
ALVES-DE-SOUZA, Catharina, VARELA, Daniel, IRIARTE, José Luis, et al. Infection
dynamics of Amoebophryidae parasitoids on harmful dinoflagellates in a southern Chilean
fjord dominated by diatoms. Aquatic Microbial Ecology, 2012, vol. 66, no 2, p. 183.
APSTEIN, Carl, Parasiten von Calanus finmarchicus. Wissenschaftliche
Meeresuntersuchungen. Abt. Kiel., 1911, vol. 13, p. 205-223.
BALECH, Enrique. The genus Alexandrium Halim (Dinoflagellata). Sherkin Island marine
station, 1995.
141

Chapitre II
BENJAMINI, Yoav et HOCHBERG, Yosef. Controlling the false discovery rate: a practical
and powerful approach to multiple testing. Journal of the Royal Statistical Society. Series B
(Methodological), 1995, p. 289-300.
BOXSHALL, Geoffrey Allan, HALSEY, Sheila H., et al. An introduction to copepod
diversity. Ray Society, 2004.
CACHON, Jean et CACHON, Monique. Parasitic dinoflagellates. The biology of
dinoflagellates, 1987, vol. 21, p. 571-610.
CHAMBOUVET, Aurelie, MORIN, Pascal, MARIE, Dominique, et al. Control of toxic
marine dinoflagellate blooms by serial parasitic killers. Science, 2008, vol. 322, no 5905, p.
1254-1257.
CHATTON, Édouard. Les Péridiniens parasites: Morphologie, reproduction, éthologie.
Archives de zoologie expérimentale et générale, 1920, vol 59, p. 1–475.
CHATTON, Édouard. Les Blastodinides, ordre nouveaux de Dinoflagellés parasites. Comptes
Rendus de l'Académie des Sciences, 1906, vol 144, p. 981–983.
DE VARGAS, Colomban, AUDIC, Stéphane, HENRY, Nicolas, et al. Eukaryotic plankton
diversity in the sunlit ocean. Science, 2015, vol. 348, no 6237, p. 1261605.
DECELLE, Johan, PROBERT, Ian, BITTNER, Lucie, et al. An original mode of symbiosis in
open ocean plankton. Proceedings of the National Academy of Sciences, 2012, vol. 109, no
44, p. 18000-18005.
EDGAR, Robert C. MUSCLE: multiple sequence alignment with high accuracy and high
throughput. Nucleic acids research, 2004, vol. 32, no 5, p. 1792-1797.
FAUST, Karoline, SATHIRAPONGSASUTI, J. Fah, IZARD, Jacques, et al. Microbial co-
occurrence relationships in the human microbiome. PLoS Computational Biology, 2012, vol.
8, no 7, p. e1002606-e1002606.
FIELDS, D. M., RUNGE, J. A., THOMPSON, C., et al. Infection of the planktonic copepod
Calanus finmarchicus by the parasitic dinoflagellate, Blastodinium spp: effects on grazing,
respiration, fecundity and fecal pellet production. Journal of Plankton Research, 2015, vol.
37, no 1, p. 211-220.
FIGUEROA, Rosa Isabel, GARCÉS, Esther, MASSANA, Ramon, et al. Description, host-
specificity, and strain selectivity of the dinoflagellate parasite Parvilucifera sinerae sp. nov.
(Perkinsozoa). Protist, 2008, vol. 159, no 4, p. 563-578.
142

Chapitre II
GALLIENNE, Chris P. et ROBINS, David B. Is Oithona the most important copepod in the
world's oceans?. Journal of Plankton Research, 2001, vol. 23, no 12, p. 1421-1432.
GASCUEL, Olivier. BIONJ: an improved version of the NJ algorithm based on a simple
model of sequence data. Molecular biology and evolution, 1997, vol. 14, no 7, p. 685-695.
GOUY, Manolo, GUINDON, Stephane, et GASCUEL, Olivier. SeaView version 4: a
multiplatform graphical user interface for sequence alignment and phylogenetic tree
building. Molecular biology and evolution, 2010, vol. 27, no 2, p. 221-224.
GUILLOU, Laure, VIPREY, Manon, CHAMBOUVET, A., et al. Widespread occurrence and
genetic diversity of marine parasitoids belonging to Syndiniales (Alveolata). Environmental
Microbiology, 2008, vol. 10, no 12, p. 3349-3365.
GUO, Zhiling, LIU, Sheng, HU, Simin, et al. Prevalent ciliate symbiosis on copepods: high
genetic diversity and wide distribution detected using small subunit ribosomal RNA
gene. PloS one, 2012, vol. 7, no 9, p. e44847.
KARSENTI, Eric, ACINAS, Silvia G., BORK, Peer, et al. A holistic approach to marine eco-
systems biology. PLoS biology, 2011, vol. 9, no 10, p. e1001177.
KÜHN, Stefanie, MEDLIN, Linda, et ELLER, Gundula. Phylogenetic position of the
parasitoid nanoflagellate Pirsonia inferred from nuclear-encoded small subunit ribosomal
DNA and a description of Pseudopirsonia n. gen. and Pseudopirsonia mucosa (Drebes) comb.
nov. Protist, 2004, vol. 155, no 2, p. 143-156.
LEGENDRE, Pierre et LEGENDRE, Louis. Numerical Ecology. Elsevier, 2012.
LETUNIC, Ivica et BORK, Peer. Interactive Tree Of Life v2: online annotation and display of
phylogenetic trees made easy. Nucleic acids research, 2011, p. gkr201.
LIMA-MENDEZ, Gipsi, FAUST, Karoline, HENRY, Nicolas, et al. Determinants of
community structure in the global plankton interactome. Science, 2015, vol. 348, no 6237, p.
1262073.
PESANT, Stéphane, NOT, Fabrice, PICHERAL, Marc, et al. Open science resources for the
discovery and analysis of Tara Oceans data. Scientific Data, 2015, vol. 2.
POULIN, Robert. Network analysis shining light on parasite ecology and diversity. Trends in
parasitology, 2010, vol. 26, no 10, p. 492-498.
RAZOULS, Claude, DE BOVÉE, Francis, KOUWENBERG, Juliana, et al. Diversity and
geographic distribution of marine planktonic copepods. Available from WWW:<
http://copepodes.obs-banyuls.fr/en>[cited 2015-10-01], 2005-2015.
143

Chapitre II
SAIZ, Enric et CALBET, Albert. Copepod feeding in the ocean: scaling patterns, composition
of their diet and the bias of estimates due to microzooplankton grazing during
incubations. Hydrobiologia, 2011, vol. 666, no 1, p. 181-196.
SCHMINKE, Horst Kurt. Entomology for the copepodologist. Journal of Plankton Research,
2007, vol. 29, no suppl 1, p. i149-i162.
SIANO, Raffaele, MONTRESOR, Marina, PROBERT, Ian, et al. Pelagodinium gen. nov. and
P. béii comb. nov., a dinoflagellate symbiont of planktonic foraminifera. Protist, 2010, vol.
161, no 3, p. 385-399.
SKOVGAARD, Alf, KARPOV, Sergey A., et GUILLOU, Laure. The parasitic dinoflagellates
Blastodinium spp. inhabiting the gut of marine, planktonic copepods: morphology, ecology,
and unrecognized species diversity. Frontiers in microbiology, 2012, vol. 3.
SKOVGAARD, Alf, MASSANA, Ramon, SAIZ, Enric, et al. Parasitic species of the Genus
Blastodinium (Blastodiniphyceae) are Peridinioid Dinoflagellates.Journal of Phycology, 2007,
vol. 43, no 3, p. 553-560.
SKOVGAARD, Alf et SALOMONSEN, Xenia M. Blastodinium galatheanum sp. nov.
(Dinophyceae) a parasite of the planktonic copepod Acartia negligens (Crustacea, Calanoida)
in the central Atlantic Ocean. European Journal of Phycology, 2009, vol. 44, no 3, p. 425-
438.
SMETACEK, Victor. Making sense of ocean biota: How evolution and biodiversity of land
organisms differ from that of the plankton. Journal of biosciences, 2012, vol. 37, no 4, p. 589-
607.
SUNAGAWA, Shinichi, COELHO, Luis Pedro, CHAFFRON, Samuel, et al.Structure and
function of the global ocean microbiome. Science, 2015, vol. 348, no 6237, p. 1261359.
TILLMANN, Urban, ELBRÄCHTER, Malte, JOHN, Uwe, et al. Azadinium obesum
(Dinophyceae), a new nontoxic species in the genus that can produce azaspiracid
toxins. Phycologia, 2010, vol. 49, no 2, p. 169-182.
TILLMANN, Urban, ELBRÄCHTER, Malte, KROCK, Bernd, et al. Azadinium spinosum
gen. et sp. nov.(Dinophyceae) identified as a primary producer of azaspiracid
toxins. European Journal of Phycology, 2009, vol. 44, no 1, p. 63-79.
144

Chapitre II
Supplementary information
Copepod reference sequences OPB6 and OPB7
Two copepod specimens have been isolated from samples collected in the roadstead of
Brest (France) with a plankton net (20µm mesh size) in September 2014. Prior to imaging,
specimens were rinsed with artificial seawater, then DNA and membrane structures were
stained for 60 minutes with 10μM Hoechst 33342 and 1.4μM DiOC6(3) (Life Technologies).
Microscopy was conducted using a Leica SP5 (Leica Microsystems) confocal laser scanning
microscope and a HC PL FLUOTAR 10x 0.3 DRY . The DiOC6 signal (ex488nm/em500-
520nm) followed by the Hoechst signal (ex405 nm/em420-470nm).
Specimens were individually rinsed in filtered seawater, and stored at -20°C in
absolute ethanol. DNA was extracted with MasterPureTM DNA/RNA purification kit
(Epicenter) and PCR amplified using a specific forward primer (Cope18S1) and an universal-
eukaryote reverse primer (Cope18S1: 5'-CGAAAGTTAGAGGYTCGAAGG-3' and reverse
1510R) from (de Vargas et al., 2015). Purified amplicons were Sanger-sequenced with the
ABI-PRISM Big Dye Terminator Sequencing kit (Applied Biosystems) using the 3130xl
Genetic Analyzer, Applied Biosystems.
Obtained sequences are listed above:
>OPB6
ACCATAACATGCTGACTAGCGATCCGTAGCTGTTTTCTATGTAGGCTCTACGGGAAGCTTCCGGGAAACCAAAGTTTTTGAGTTC
CGGGGGAAGTATGGTTGCAAAGCTGAAACTTAAAGGAATTGACGGAAGGGCACCACCAGGAGTGGAGCCTGCGGCTTAATTT
GACTCAACACGGGAAATCTCACCAGGCCCGGACACTGGAAGGATTGACAGATTGAGAGCTCTTTCTCGATTCAGTGGGTGGTG
GTGCATGGCCGTTCTTAGTTGGTGGAGTGATTTGTCTGGTTAATTCCGATAACGAACGAGACTCTTTTCTGCTAAATAGGTTTGC
CGTCTTTTTTGCGGTAAACATTCTTCTTAGAGAGACTGGCGGCGTCTAGCCGCACGAGATTGAGCAATAACAGGTCTGTGATGC
CCTTAGATGTTCTGGGCTGCACACGCGCTACACTGAATGGATCAGCGTGTTTTCCCTTCCCGAGAGGGACGGGTAACCCGCTGA
ACCCCATTCGTGGTAGGGATCGGAGCTTGCAATTATTCTCCGTGAACCAGGAATTCCCAGTAAGCGCAAGTCATAAGCTTGCGT
TGATTACGTCCCTGCCCTTTGTACACACCGCCCGTCGCTACTACCGATTGAACGTTTTAGTGAGAAATCTGGATTCGACCTCTGT
GGGTTCATTCCCACAGTGCTGTCGGAGAAGTTTTTCAAACTTGAGCGTTTAGAGGAAGTAAAAGTCGTAACAAGGTAGCTGTA
GGTGAACCTGCAGAAGG
>OPB7
CATGCTGACTAGCGATCCGTAGCTGTTTTCTATGTAGGCTCTACGGGAAGCTTCCGGGAAACCAAAGTTTTTGAGTTCCGGGGG
AAGTATGGTTGCAAAGCTGAAACTTAAAGGAATTGACGGAAGGGCACCACCAGGAGTGGAGCCTGCGGCTTAATTTGACTCAA
CACGGGAAATCTCACCAGGCCCGGACACTGGAAGGATTGACAGATTGAGAGCTCTTTCTCGATTCAGTGGGTGGTGGTGCATG
GCCGTTCTTAGTTGGTGGAGTGATTTGTCTGGTTAATTCCGATAACGAACGAGACTCTTTTCTGCTAAATAGGTTTGCCGTCTTTT
TTGCGGTAAACATTCTTCTTAGAGAGACTGGCGGCGTCTAGCCGCACGAGATTGAGCAATAACAGGTCTGTGATGCCCTTAGAT
GTTCTGGGCTGCACACGCGCTACACTGAATGGATCAGCGTGTTTTCCCTTCCCGAGAGGGACGGGTAACCCGCTGAACCCCATT
145

Chapitre II
CGTGGTAGGGATCGGAGCTTGCAATTATTCTCCGTGAACCAGGAATTCCCAGTAAGCGCAAGTCATAAGCTTGCGTTGATTACG
TCCCTGCCCTTTGTACACACCGCCCGTCGCTACTACCGATTGAACGTTTTAGTGAGAAATCTGGATTCGACCTCTGTGGGTTCAT
TCCCACAGTGCTGTCGGAGAAGTTTTTCAAACTTGAGCGTTTAGAGGAAGTAAAAGTCGTAACAAGGTAGCTGTAGGTGAACT
GCAGAAGG
Bibliography from the Supplementary information
DE VARGAS, Colomban, AUDIC, Stéphane, HENRY, Nicolas, et al. Eukaryotic plankton
diversity in the sunlit ocean. Science, 2015, vol. 348, no 6237, p. 1261605.
146
Figure S1: OPB6 specimen identified as Oncaea sp.
Figure S2: OPB7 specimen identified as Oncaea sp.

Chapitre III
Chapitre III
Détection des symbioses eucaryotes planctoniques
147
Réseau d'haplotypes des metabarcodes Tara Oceans assignés au genre Symbiodinium.
Chapitre III
Nous avons vu dans le premier chapitre que des réseaux de cooccurrences inférés à
partir de données de metabarcoding permettaient de retrouver des interactions symbiotiques.
Cependant, en l'état actuel des choses, le principal moyen à disposition pour différencier les
associations statistiques correspondant à des interactions symbiotiques de celles
correspondant à d'autres interactions biotiques est l'étude méticuleuse de l'assignation
taxinomique des metabarcodes associés. Cette manière de procéder atteint très vite ses limites,
étant donné que, dans le cadre des données de metabarcoding de Tara Oceans, moins de 1 %
des metabarcodes sont identiques à des séquences de référence. Qui plus est, elle est
chronophage et nécessite les compétences de spécialistes. L'étude de l'écologie du parasite
Blastodinium au travers des données de metabarcoding nous montre qu'il est abondant dans
les fractions qui correspondent à la taille de sa phase de dispersion mais également dans celle
correspondant à sa phase parasitaire, alors que les organismes non symbiotiques étudiés
(Azadinium spp., Alexandrium spp. et les copépodes) sont principalement retrouvés dans les
fractions concordant avec leur taille d'organisme. Pour l'ensemble des metabarcodes assignés
à l'ordre des Péridiniales (Figure 3), cette différence entre organismes symbiotiques
(Brandtodinium nutricula et Blastodinium spp.) et organismes non symbiotiques
(Protoperidinium spp. et Scrippsiella spp) est également observée.
Si l'on considère cette particularité comme étant commune à tous les symbiotes (non
hôtes) du plancton, il est alors possible de distinguer les metabarcodes correspondant à des
espèces symbiotiques des autres metabarcodes. En ne conservant que les associations
comprenant un metabarcode considéré comme potentiellement symbiotique compte tenu de
son abondance parmi les fractions de taille, la proportion d'associations correspondant
réellement à une interaction symbiotique devrait être grandement augmentée. Ainsi on pourra
accorder plus de confiance à ces associations statistiques, moins nombreuses, et entreprendre
avec un taux de réussite potentiellement plus élevé la recherche de ces symbioses dans les
échantillons biologiques.
148

Chapitre III
L'étude de la symbiose entre Symbiodinium et le cilié Tiarina montre que chacun des
deux partenaires d'une association symbiotique peut être représenté par plusieurs
metabarcodes. La diversité en metabarcodes associée a chacun des partenaires peut être
assimilée à la spécificité de l'interaction. En effet une interaction symbiotique peu spécifique
sera caractérisée par une diversité relativement importante de metabarcode chez l'hôte et ou le
symbiote. Dans cette étude, pour chacun des partenaires, les metabarcodes ont des
biogéographies différentes et le score d'association (rho de Spearman) est maximal lorsque
l'on compare la somme des abondances des metabarcodes séquencés. Ce score, calculé pour
47 stations, croit de ρ=0.59 lorsque l'on considère seulement le metabarcode le plus abondant
de chacun des partenaires, à ρ=0.77 quand on considère l'ensemble des metabarcodes. Cette
interaction n'est pas retrouvée dans l'interactome global présenté dans le premier chapitre
certainement du fait des seuils de détection stricts imposés (voir méthode Lima-Mendez et al.
149
Figure 3: Arbre phylogénétique (Neighbor-joining) des metabarcodes (fragment V9) assignés auxPéridiniales (Dinoflagellés) et représentés par plus de 300 lectures dans les données de metabarcodingTara Oceans. Pour chaque metabarcode, les barres de couleurs représentent la répartition de sonabondance dans les gammes de taille 0,8-5 µm (en violet), 5-20 µm (en vert), 20-180 µm (bleu) et180-2000 µm (rouge). La longueur des barres est proportionnelle à une valeur comprise entre 0 et 1,calculée de la façon suivante ; pour une fraction de taille donnée et pour chaque metabarcode,l'abondance moyenne du metabarcode dans cette fraction de taille est divisée par la somme desabondances moyennes de chaque fraction de taille.

Chapitre III
2015). Cependant, en conservant les mêmes seuils de détection, on peut imaginer retrouver
cette interaction en comparant les abondances des groupes génétiques regroupant
exclusivement l'ensemble de la diversité des deux partenaires. Afin d'augmenter les chances
de détection de symbioses grâce à des réseaux de cooccurrences, il serait souhaitable de
définir, sans a priori, des groupes génétiques regroupant exclusivement l'ensemble de la
diversité de partenaires en symbiose. Mais la spécificité des symbioses dans le plancton et
donc la diversité génétique des partenaires impliqués sont variables. J'ai donc décider dans
cette partie d'effectuer un partitionnement génétique des metabarcodes à différents niveaux de
résolution et de prendre en compte les metabarcodes et l'ensemble des groupes génétiques
ainsi construit lors des mesures d'association. La spécificité d'une interaction symbiotique
pourra être estimée en considérant la paire de groupes génétiques affichant le meilleur score
d'association.
Le premier article intitulé « Unveiling photosymbiotic associations across
phylogenetic gradients in world-wide marine plankton based on massive eukaryotic
rDNA metabarcoding » décrit une approche originale permettant la détection de symbioses
potentielles à partir d'un jeu de données de type metabarcoding. Cette approche repose sur
deux méthodes. La première, consiste en un filtre visant à éliminer les groupes génétiques de
metabarcodes dont la distribution de l'abondance le long de 4 fractions de tailles adjacentes
(0.8-5, 5-20, 20-180 et 180-2000 μm) ressemble aux distributions théoriques reflétant le style
de vie des organismes libres. Contrairement à ceux des symbiotes, les metabarcodes
d'organismes libres seraient principalement retrouvés dans la ou les fractions concordants
avec leur taille d'organisme libre et significativement moins abondants dans les autres. Son
principal intérêt est de réduire considérablement dans les résultats le nombre de faux positifs,
c'est à dire les associations significativement positives qui ne correspondent pas à un vrai cas
de symbiose. La seconde méthode développée dans cet article est la construction de groupes
génétiques définis à différents niveaux de résolution. Pour ce faire, deux méthodes de
partitionnement génétiques sont utilisées. La première, Swarm (Mahé et al., 2014), est utilisée
avec des valeurs de seuil local de partitionnement allant de 1 et 4. La seconde, Markov
Cluster Algorithm (MCL), est appliquée à chaque groupe génétique défini par Swarm avec un
seuil de 1 pour deux valeurs d'inflation (1.2 et 5). Ces groupes génétiques ont pour
particularité d'être imbriqués à la manière de poupées russes, et appartiennent donc tous, à
l'exception de ceux construits au plus bas niveau de résolution (Swarm avec un seuil de 4), à
un unique niveau génétique parent, c'est à dire définis à un niveau de résolution inférieur. La
150
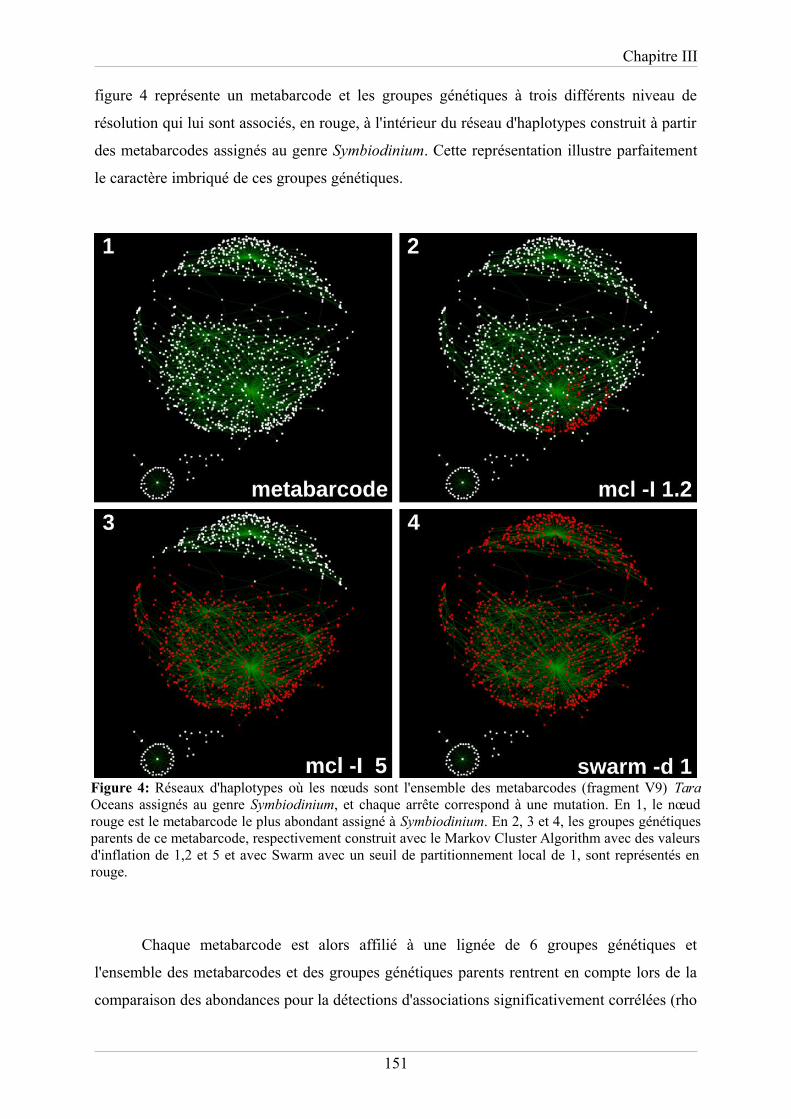
Chapitre III
figure 4 représente un metabarcode et les groupes génétiques à trois différents niveau de
résolution qui lui sont associés, en rouge, à l'intérieur du réseau d'haplotypes construit à partir
des metabarcodes assignés au genre Symbiodinium. Cette représentation illustre parfaitement
le caractère imbriqué de ces groupes génétiques.
Chaque metabarcode est alors affilié à une lignée de 6 groupes génétiques et
l'ensemble des metabarcodes et des groupes génétiques parents rentrent en compte lors de la
comparaison des abondances pour la détections d'associations significativement corrélées (rho
151
Figure 4: Réseaux d'haplotypes où les nœuds sont l'ensemble des metabarcodes (fragment V9) TaraOceans assignés au genre Symbiodinium, et chaque arrête correspond à une mutation. En 1, le nœudrouge est le metabarcode le plus abondant assigné à Symbiodinium. En 2, 3 et 4, les groupes génétiquesparents de ce metabarcode, respectivement construit avec le Markov Cluster Algorithm avec des valeursd'inflation de 1,2 et 5 et avec Swarm avec un seuil de partitionnement local de 1, sont représentés enrouge.

Chapitre III
de Spearman). L'étude des scores des associations et du niveau de résolution des groupes
génétiques nous renseigne alors sur la diversité génétique des hôtes et des symbiotes des
symbioses potentielles détectées et donc sur leur spécificité. Dans cette article, l'approche est
appliquée à la détection de photosymbioses planctoniques, c'est à dire que les abondances des
groupes génétiques et metabarcodes assignés taxinomiquement à des lignées contenant des
espèces ayant des chloroplastes permanents ont été comparées à celles de lignées contenant
des espèces connues pour être hôtes de microalgues (les Retarias et les ciliés). La détection de
photosymbioses connues de la littérature et de symbioses hautement probables à différents
niveaux de spécificité soutiennent la pertinence de cette approche. Cette dernière permet
également de retrouver la diversité décrite pour les deux partenaires de l'interaction entre
Symbiodinium et Tiarina par Mordret et al. (2015) mais aussi d'identifier une nouvelle
diversité de Symbiodinium (7 metabarcodes) impliquée dans cette symbiose.
Le second article, « Parasites diversity and abundance in the Tara Oceans
metabarcoding dataset challenge classic views on marine plankton ecology » propose une
vue globale de la diversité des parasites au sens large (vrais parasites et parasitoïdes) à travers
l'analyse de 586 communautés planctoniques eucaryotes provenant de l'échantillonnage de
126 stations océaniques de tous les océans tropicaux à tempérés du globe. Cette étude montre,
grâce à une annotation fonctionnelle des OTUs à partir de leur assignation taxinomique, que
ces parasites représentent au moins 8% de la diversité totale des protistes du plancton
océanique. Une part importante des OTUs (32%) n'a pas pu être assignée fonctionnellement
du fait du manque de connaissances des cycles de vie de certaines lignées eucaryotes
hyperdiversifiées dans le plancton, comme c'est le cas par exemple des diplonémides.
L'approche présentée dans le premier article de ce chapitre a également été appliquée dans
cette étude. Comme dans le cadre de l'étude des photosymbioses, elle permet de retrouver de
nombreuses interactions déjà connues ce qui, une fois de plus, tend à la valider. De plus, le
nombre important d'associations détectées entre les MALV-I (Syndiniales) et les acanthaires
(radiolaria) suggère que les syndiniales seraient d'important régulateurs des populations
d'acanthaires. Cette étude est encore préliminaire et nécessite des analyses phylogénétiques et
écologiques afin d'obtenir une meilleure vision de la spécificité du parasitisme dans le
plancton et définir la proportion des OTUs non assignées fonctionnellement qui pourrait être
reliée à des parasites.
152

Chapitre III
Unveiling photosymbiotic associations across phylogeneticgradients in world-wide marine plankton based on massive
eukaryotic rDNA metabarcoding
Nicolas Henry, Johan Decelle, Daniel J. Richter, Stéphance Audic, Colomban de Vargas
EPEP - Evolution des Protistes et des Ecosystèmes Pélagiques - team, Sorbonne Universités, UPMC Univ Paris
06, UMR 7144, Station Biologique de Roscoff, 29680 Roscoff, France
CNRS, UMR 7144, Station Biologique de Roscoff, 29680 Roscoff, France
In preparation
Introduction
Acquisition of photosynthetic capability by the capture of endosymbiotic microalgae
(photosymbiosis) or the sequestration of chloroplasts (kleptoplastidy) is a common
phenomenon among phagotrophic protists in the oceanic plankton. Photosymbiosis, which
tends to occur mainly in oligotrophic environments (Stoecker et al., 2009; Decelle et al.,
2015), is thought to be mutualistic, wherein the heterotrophic host benefits from the
photosynthetic products produced by one or more symbiotic microalgae, which in turn receive
protection and nutrients recycled by the host (Trench, 1979; Davy et al., 2012). In plankton,
photosymbiosis generally involves large phagotrophic protists, such as foraminiferans and
radiolarians, which host diverse microalgae like dinoflagellates (Dinophyceae), haptophytes
and prasinophytes (Stoecker et al., 2009). Kleptoplastidy is more common in productive
ecosystems and is mainly performed by dinoflagellates and ciliates (Stoecker et al., 2009).
The magnitude of phototrophy acquisition by heterotrophic protists, a process whose
distribution could challenge our view of planktonic ecosystem functioning, is poorly known.
To fill this gap, we propose to study the diversity of the organisms implicated in this process.
Co-occurrence network-based analyses are widely used in environmental genomics
(metabarcoding, metagenomics, metatranscriptomics), and can now be applied to the study of
plankton community structures in the environment (Eiler et al., 2012; Hunt and Ward, 2015).
These methods were first used to characterize bacterial communities and were subsequently
expanded to examine the other domains of life (archae, eukaryotes and viruses). In order to
have a comprehensive understanding of the main factors governing the structure and function
of communities, several previous efforts attempted to include genomic data from all four of
153

Chapitre III
these domains to provide a global view of interactions both among and within them (Steele et
al., 2011; Chow et al., 2014; Lima-Mendez et al., 2015). Moreover, as the purpose of these
methods is to detect co-occurring species, initial steps have been taken to expand them to
encompass the detection of symbiosis sensu lato, which includes commensalism, mutualism
and parasitism (de Bary, 1879; Chaffron et al., 2010; Lima-Mendez et al., 2015). Yet, the
main challenge remains the detection of "true" symbiotic partnerships among thousands of
associations that could be explained by other ecological processes (such as predation or
sharing of a similar ecological niche). Validation of true partnerships may require a substantial
amount of effort performed by specialists examining the taxonomic assignments of co-
occurring genetic entities (by manual inspection). In addition, symbiotic relationships are very
broad and occur along a continuum ranging from parasitism to mutualism without clearly
delineated categories. Symbioses can be more or less specific (e.g. species-species), may
change according to geography or, more generally, to environmental conditions, and can be
facultative or obligate for one or the other partner (Decelle et al., 2015).
One of the main difficulties in detecting photosymbiotic associations in the plankton
from co-occurrence networks is the flexible specificity of these interactions (Decelle et al.,
2012a; Probert et al., 2014). For example, in the case of the interaction between the
haptophyte genus Phaeocystis and the Acantharia, whereas the Phaeocystis genus is found
world-wide in association with acantharians, the identity of the symbiont species varies
depending on geography (P. cordata in the Mediterranean Sea and P. antarctica in the
Southern Ocean). As such, there is no specific interaction at the species level, implying that in
the case of metabarcoding-based network, the metabarcodes of the host and the symbiont will
not co-occur across all oceans, but will instead be restricted to a narrower geographic range.
To address this problem, we developed a new method to compare the abundances of genetic
entities across a phylogenetic gradient. Instead of comparing only the abundances of genetic
entities resulting from one level of clustering (OTUs), as is generally done in a co-occurrence
network based approach, our approach compares abundances of genetic groups formed by
clustering metabarcodes at different resolution levels.
In metabarcodes generated from size-fractionated planktonic samples, planktonic
organisms whose life cycles cause a significant variation in their organismal size can be
detected as abundant in non-adjacent size fractions. For instance, symbionts (parasites and
mutualists) involved in physical partnerships with their generally larger hosts may be found in
larger size fractions than their dispersal/free-living stages would be. Therefore, it is possible
154

Chapitre III
to differentiate in hospite and ex hospite stages by analyzing the data in this manner (Henry et
al. in prep). Moreover, symbiotic organisms can be differentiated from non-symbiotic
organisms based on their distribution among size fractions. The ability to distinguish
symbiotic from non-symbiotic interaction patterns would greatly enhance our ability to
distinguish associations which putatively involve symbionts from others in co-occurrence
networks.
Here, we analysed the Tara Oceans metabarcoding dataset to evaluate the applicability
of our method and to highlight potential new photosymbiotic interactions. We show that
comparing abundances between multi-level genetic groups allows us to detect known
interactions at their previously characterized level of specificity. In addition, we find many
novel and highly probable associations, including a potential case of kleptoplastidy and a
potential symbiosis involving environmental clades of Dinophyceae displaying characteristic
symbiotic distributions amongst size fractions.
Material and methods
Data
Data used in this study are part of the Tara Oceans V9 metabarcoding dataset (de
Vargas et al., 2015; Karsenti et al., 2011) extended to 126 stations. We analyze data consisting
of V9 metabarcodes sequenced from 586 samples belonging to 121 stations (all oceans except
the Arctic Ocean), four main organismal size fractions covering the majority of eukaryotic
plankton diversity: piconano-plankton (0.8-5μm), nano-plankton (5-20μm), micro-plankton
(20-180μm), and meso-plankton (180-2000μm), and 2 depths, subsurface (SUR) and Deep
Chlorophyll Maximum (DCM). For a given sample and a given metabarcode, the number of
reads assigned to the metabarcode divided by the total number of reads within the sample was
used as a proxy for its abundance (de Vargas et al., 2015).
Since the main goal of this study is the detection of photosymbioses and their
specificity, we selected barcodes from the following lineages: (1) A group of putative
photosymbionts (P) composed of lineages containing at least one planktonic species with
permanent chloroplasts (de Vargas et al., 2015), (i.e. Archaeplastida, Dinophyceae,
Ochrophyta, Cryptophyta, Haptophyta, Chlorarachnea, Glaucophyta and Chromerids) and (2)
a putative host group (H) composed of lineages containing species known to acquire
155

Chapitre III
phototrophy through symbiosis or kleptoplastidy. We exclude Dinophyceae from the H group
as some of them are known photosymbionts.
Multilevel genetic clustering
In order to investigate photosymbiotic associations across phylogenetic gradients,
metabarcodes from both subsets were clustered in genetic groups with different levels of
resolution. Metabarcodes were first grouped using swarm version 2.1.0 (Mahé et al.,
2014) with value of the local linking threshold (d) from 1 to 4 without chain-breaking. Then,
each genetic group obtained using swarm with d equal to 1 (the finest level of clustering) was
split in several groups using the Markov Cluster Algorithm (MCL) (Van Dongen,
2001) version 12-135 with two values of inflation (1.2 for the highest resolution and 5 for the
lowest). MCL was performed on graphs in which each metabarcode represents a node and
each edge represents one mutation. Genetic distance matrices used for graph construction
were computed using sumatra version 1.0.10 (Mercier et al., 2013). Following multilevel
genetic clustering, each metabarcode (the smallest genetic entities) was associated with 6
higher-level genetic groups at decreasing levels of resolution.
Distribution profiles
The per sample abundance for each genetic group was computed by summing the
abundances of its component metabarcodes that were assigned to reference sequences with a
percentage of identity above 90% and present in more than 10% of micro- or meso-plankton
samples. Only genetic groups present in more than 20% of micro- or meso-plankton samples
were used for further analysis.
Based on the assumption that metabarcodes corresponding to free-living organisms are
mainly found in the size fraction corresponding to the size of the organism itself and that the
abundance of these metabarcodes should decrease progressively and significantly in both
smaller and larger size fractions, it is possible to define a list of distribution profiles specific
to free-living organisms (Figure 1A). In contrary to the free-living organisms, symbiont
metabarcodes (parasites and mutualists) display a more particular distribution among size
fractions (de Vargas et al., 2015). This is the case for the parasitic genus Blastodinium, which
infects copepods, that is mainly abundant in piconano- nano-plankton (dispersal stage) and in
meso-plankton (infective stage) (Henry et al., in prep).
156

Chapitre III
We applied a filter to genetic groups from the P set in order to reduce the number of
inappropriately inferred associations for non-symbiotic microalgae. To this end, for each
genetic group, abundances between size fractions were compared using the Wilcoxon signed-
rank test, as follows: are abundances from piconano-plankton significantly (p-value < 0.001)
greater than abundances from nano-plankton? Are abundances from nano-plankton
significantly greater than abundances from piconano- and micro-plankton? Are abundances
from micro-plankton significantly greater than abundances from nano- and meso-plankton?
And are abundances from meso-plankton significantly greater than abundances from micro-
plankton? For each genetic group tested, p-values were adjusted using the False Discovery
Rate (FDR) approach (Benjamini and Hochberg, 1995). Therefore, all genetic groups having a
“free-living” like distribution (Figure 1A) were removed from the P group before calculting
measures of association with the H group.
List of associations
Genetic group abundances were compared separately for micro- and meso-plankton
samples between the P group and the H group and results for both size fractions were merged.
Comparisons were conducted using Spearman's rho test after removing uninformative couples
of zeros (Legendre and Legendre, 2012). The p-values were adjusted using the False
Discovery Rate (FDR) approach (Benjamini and Hochberg, 1995). Only H-P pairs with a
corrected p-value less than 0.001 and a Spearman's rho greater than 0.5 were considered to be
associated. In order to avoid redundancy in the list of interactions, we kept only H-P pairs for
which there were no other H-P pairs with a higher Spearman's rho for which both H and P
belong to related genetic groups (parent, descendant or identical). In the case of
phylogenetically related H-P pairs with equal Spearman's rho, the pair with the higher
resolution genetic groups was kept. All metabarcodes used for abundance computation of
genetic groups were considered as associated with the same partners as the genetic group to
which they belonged. Circular visualizations to summarize associations were plotted using the
R package circlize (Gu et al., 2014).
Phylogenetic tree construction
Metabarcodes and V9 reference sequences used for phylogenetic analysis were aligned
using MUSCLE v3.8.31 with default settings (Edgar, 2004). Neighbor-joining phylogenetic
trees were constructed using the BioNJ algorithm (Gascuel, 1997) in Seaview (Gouy et al.,
157

Chapitre III
2010). Observed divergences (percentage of residues differing between two sequences) were
used as genetic distances and bootstrap supports were obtained from 1000 replicates. Trees
containing metabarcodes and their associations were displayed using iTOL (Letunic and Bork,
2011). All other graphical visualizations and statistical analysis were performed using R (R
Core Team, 2015).
Results and Discussion
Validity of filtering
Characterization of abundance distribution profiles allowed us to identify genetic
groups consistent with a “free-living” lifestyle. Among 11,775 metabarcodes from the P group
which appear in more than 10% of micro- and meso-plankton samples, 8,486 (72%)
exclusively belong to genetic groups which have a “free-living” like distribution (Figure 1B).
The highest proportions (78%) and number (8,467) of “free-living” metabarcodes are
observed for Dinophyceae (both photo- and heterotrophs). Bacillariophyta, Haptophyta and
undetermined Prasinophyceae Clade 7 also contain “free-living” metabarcodes but to a lower
extent (1%, 17% and 50%, respectively). Very few cases of known protist/protist symbiosis
involve diatoms, except as hosts of parasitoids (Scholz et al., 2016) and as photosymbionts of
some Dinophyceae species (Pienaar et al., 2007). However, they display a very low
proportion of metabarcodes with a “free-living” like distribution. Many diatom species which
are able to make chains could be retained by a mesh size larger than a single individual during
sampling. These diatoms would then be abundant in a broad range of size fractions, which
explains why our method failed to filter them out. Moreover, the V9 metabarcode does not
seem to be appropriate for resolving diatom species identity, as different diatom genera may
share the same metabarcode (Figure 2A; also observed for Prymnesiophyceae). This implies
that one metabarcode can reflect several species distributed across different size fractions.
158

Chapitre III
Among Dinophyceae, the distribution of abundance profile types is not homogeneous
at the order level (Figure 1C). The majority of orders contain a majority of “free-living”
metabarcodes, except the Noctilucales, the Pyrocystales and the Suessiales, which display a
higher proportion of non “free-living” metabarcodes (respectively 75%, 53% and 87%). The
order Suessiales contains well-known symbiotic microalgal species such as Symbiodinium and
Pelagodinium. Within the orders Noctilucales and Pyrocystales, there are species known to
have particular life cycles (Elbrächter and Drebes, 1978; Fukuda and Endoh, 2006) alternating
between large and small cells. In addition, the order Pyrocystales contains the parasitic
species Dissodinium pseudolunula, which infects copepod eggs (Gómez et al., 2009) and the
species D. elegans, Pyrocystis fusiformormis and P. noctiluca which populate the gelatinous
capsule of the planktonic foraminiferan Hastigerina pelagica (Alldredge and Jones, 1973).
The distribution of profile types is also heterogeneous at the genus level within the order
159
Figure 1: Size distribution profiles consistent with a “free-living” lifestyle among lineages containingspecies with permanent chloroplasts. (A) Enumeration of possible abundance distributions among sizefractions for genetic groups characterized as entirely “free-living”. The list of profiles is ordered by thesize of the organisms considered. Each square represents the abundance of a given genetic group in thesize fraction corresponding to the position of the square along the x axis. For two adjacent squares, ifone square is above the other, it indicates that its abundance is significantly higher. If both squares areat the same level, abundances are not significantly different. Each genetic group corresponding to oneof these profiles is considered to be “free-living”. (B) Number of V9 metabarcodes present in morethan 10% of micro- or meso-plankton samples assigned to a reference sequence with a percentageidentity of 90% or greater and belonging to at least one genetic group present in more than 20% ofmicro- or meso-plankton samples. In blue, metabarcodes belonging to at least one genetic group notcharacterized as “free-living”. In red, metabarcodes which belong exclusively to “free-living” geneticgroups.

Chapitre III
Peridiniales (Figure 1D). The genera Scrippsiella (which was recently separated into
Brandtodinium and Scrippsiella) and Blastodinium contain an large proportion of non “free-
living” metabarcodes. Species from the genus Blastodinium are important parasites of
copepods (Skovgaard et al., 2012) and the species from the mutualistic genus Brandtodinium
have been found in association with diverse polycystine radiolarians (Probert et al., 2014).
Our filtering method cannot remove all free-living species, but, conversely, it is highly
conservative with respect to symbiotic species, which is crucial for detection of symbiosis.
Thus, the study of the distribution of metabarcodes can help to unveil the life style of
organisms with metabarcodes of uncertain taxonomic affiliation.
160
Figure 1 (continued): (C) “Free-living” like distribution among metabarcodes in theorder Dinophyceae. (D) “Free-living” like distribution among Peridiniales generametabarcodes.

Chapitre III
Known symbionts
193 associations between 45 P and 165 H genetic groups were detected which,
considering the number of individual metabarcodes constituting each genetic group, represent
3,555 interactions between 157 P and 554 H metabarcodes. Known photosymbionts from the
literature (Symbiodinium sp., Pelagodinium sp. and Gymnodinium sp. ex Spongotrochus
glacialis) are implicated in 39% (1,394) of the detected interactions, and involve 34% (54) of
the P and 79% (438) of the H metabarcodes.
In addition, some members of Clade A within the genus Symbiodinium have been
recently described as living in symbiosis within the ciliate Tiarina sp. (Protostomatea) in the
oceanic plankton (Mordret et al., 2015). In this study, we found that all associations involving
Symbiodinium are with the ciliate Tiarina sp. (Figures 2B and 3A), suggesting that this ciliate
may be the unique host of Symbiodinium in the plankton.
The genus Pelagodinium, known to be a symbiont of diverse foraminiferans and one
acantharian species within clade B (Siano et al., 2010; Decelle et al., 2012b) was found not
only to co-occur with planktonic foraminiferans related to the genera Globigerinoides and
Globigerinella, but it was also found associated with Tiarina sp. (Protostomatea) and
acantharians from the clades D, E et F (Figures 2B and 3). This may suggest these taxa share
a similar ecological niche, such as the oligotrophic conditions found associated with the
Symbiodinium-Tiarina symbiosis (Mordret et al., 2015). In this case, interactions between
Pelagodinium and acantharians within clade D (which are non symbiotic), E and F (which are
symbiotic) could indicate only that they are both found in the same environment (likely an
environment favorable to photosymbiosis). The Gymnodinium species found in association
with the radiolarian Spongotrochus glacialis (Spumellaria (Ishitani et al., 2014)) was detected
here in association with collodarians, foraminiferans and acantharians but not with
spumellarians (Figures 2B and 3). Further investigation is necessary to confirm the veracity of
the associations we found involving Gymnodinium sp. ex Spongotrochus glacialis. As for
Pelagodinium, these results could suggest that this symbiont establishes symbiotic
relationships with several radiolarians and foraminiferans. Conversely, as also highlighted for
Pelagodinium, these interactions could also be the result of indirect associations with
environmental parameters.
161

Chapitre III
162
Figure 2: Neighbor-joining phylogenetic tree of photosymbiont group metabarcodes involved in atleast one significant association, and related reference sequences. Numbers represent bootstrap values;values below 80% are not shown. Branch labels are GenBank accession numbers with species names.Colored circles at the leaves indicate host groups with which photosymbiont group metabarcodes areassociated. The size of the circle is proportional to the number of associated host metabarcodes. (A)First part of the tree, containing Florenciellales, diatoms (Bacillariophyta), Prymnesiophyceae andPrasinophyceae Clade 7 metabarcodes. (B) Second part of the tree, containing Dinophyceaemetabarcodes.

Chapitre III
163Figure 2 (continued)

Chapitre III
The fact that we retrieved known photosymbionts with their hosts in our results, e.g.
Symbiodinium clade A with Tiarina sp. (Mordret et al., 2015) and Pelagodinium beii with
foraminiferans (Shaked and de Vargas, 2006; Siano et al., 2010) can be considered as partially
validating the method we propose. This implies that these photosymbiotic genetic groups are
present at sufficient abundances in the micro and meso-plankton to be retained in our analysis
and that their host-symbiont associations can be considered significant using classical
statistical measures. However, known photosymbionts are also found associated with
unexpected hosts. Rather than representing the discovery of new cases of photosymbiosis,
these associations are likely only to reflect the difficulties in distinguishing associations
resulting from both direct and indirect interactions.
The method we propose allowed us to increase the score of association (Spearman's
rho) by comparing abundances at higher genetic “levels” than simply the metabarcode (level
7) (Figure 4). In the case of the association between Tiarina sp. and Symbiodinium Clade A,
the best scores were obtained when comparing a level 7 (metabarcode) H genetic group with a
level 5 (MCL with inflation value 5) P genetic group (Figure 4A), which corresponds to two
Tiarina sp. metabarcodes associated with 11 Symbiodinium Clade A metabarcodes. Mordret et
al. (2015) characterized two different V9 sequences for the Tiarina sp. (two genotypes) host
and five for the photosymbiont Symbiodinium Clade A. The 3 most abundant Symbiodinium
Clade A metabarcodes, which represent 88% of the total abundance of the group, belong to
the 5 Symbiodinium V9 sequences obtained by Mordret et al. (2015). The 8 remaining
metabarcodes of the Symbiodinium Clade A genetic group could be other Symbiodinium
genotypes that interact with Tiarina but which were not sampled by Mordret et al. (2015).
This is the case for the fourth most abundant metabarcode, which is particularly abundant in
Red Sea (station 32, in yellow, Figure 4). Mordret et al. (2015) also characterized a specific
Symbiodinium subclade interacting with Tiarina in the Red Sea (also in station 32) based on
the study of its ITS2 and 28S sequences, but unfortunately the V9 sequence could not be
obtained. We argue that this metabarcode is truly in symbiosis with Tiarina sp. as, in this case,
at least 93% of the abundance of the Symbiodinium group comes from metabarcodes with
validated interactions with Tiarina sp. Thus, we detected this interaction at the right level of
specificity, lending support to our approach of comparing the abundances of genetic groups
defined at different levels of resolution.
164

Chapitre III
165
Figure 3: Neighbor-joining phylogenetic tree of host group metabarcodes (except collodarians)involved in at least one significant association, and related reference sequences. Numbers representbootstrap values; values below 80% are not shown. Branch labels are GenBank accession numberswith species names. Colored circles atthe leaves indicate photosymbiont groups with which host groupmetabarcodes are associated. The size of the circle is proportional to the number of associatedphotosymbiont metabarcodes. (A) First part of the tree, containing ciliate and spumellarianmetabarcodes. (B) Second part of the tree, containing foraminiferan and acantharian metabarcodes.

Chapitre III
166Figure 3 (continued)

Chapitre III
Unfortunately, some photosymbiotic interactions with world-wide distributions do not
appear in our results. This is the case for the interaction between Brandtodinium nutricula
(Scrippsiella nutricula), which is known to be the photosymbiont of a wide diversity of
polycystines. The best score of association involving Brandtodinium (rho=0.49) is obtained
comparing a Brandtodinium level 5 genetic group (MCL with inflation value 5) with a
collodarian level 2 genetic group (swarm -d 3). Whereas this level of specificity, wherein a
low diversity of symbionts interacts with a high diversity of hosts, is consistent with previous
observations (Probert et al., 2014), this significant association (p-value < 0.001) was not
retained by our method because its score of association (Spearman's rho) was slightly below
the threshold of 0.5. In addition, no genetic groups related to Phaeocystis with a non “free-
living” like distribution are significantly associated (p-value < 0.001) to at least one genetic
group from the H set, although this genus is known to occur world-wide in symbiosis with
acantharians from Clade E and F (Decelle et al., 2012a). The primary explanation for this
observation is that Phaeocystis is able to form millimeters-long colonies (Chen et al., 2002),
and therefore its presence in larger size fractions cannot only be explained by its presence in
hosts as a photosymbiont, thus preventing our abundance comparisons from capturing this
interaction.
Hosts
Acantharians, ciliates and collodarians are the taxonomic groups of hosts which
display the highest number of interactions with photosymbionts. Compared to collodarians,
metabarcodes of ciliates and acantharians are connected with a larger diversity of
metabarcodes belonging to the P group (Figure 5A).
We found a single association involving a chlorophyte. Seven metabarcodes assigned
to the genus Nannochloris (Prasinophyceae clade 7A) are associated with 40 metabarcodes
assigned to the collodarian genus Acrosphaera (Figure 2A). This association merits further
investigation since two Prasinophyceae species, Pedinomonas symbiotica and Pedinomonas
noctilucae have previously been described as photosymbionts of the Collodarian
Thalassolampe margarodes (Cachon and Caram, 1979) and of the Dinoflagellate Noctiluca
scintillans in the Indian Ocean (Sweeney, 1976), respectively. Validating this association
could help to understand the role of the Prasinophyceae clade 7A in micro- and meso-
plankton.
167

Figure 4: Specificity and biogeography of two interactions identified by our analysis: the known interaction between the ciliate Tiarina sp. and the Dinophyceae Symbiodinium Clade A(A), for which values of association and abundances were computed from micro-plankton samples (20-180 µm) and the association between oligotrich ciliates and Chrysochromulina(B), for which values of association and abundances were computed from meso-plankton samples (180-2000 µm). At the top, specificity of interaction is represented by colored circles.Each pair of photosymbiont and host group genetic levels (1: swarm -d 4; 2: swarm -d 3; 3: swarm -d 2; 4: swarm -d 1; 5: mcl -I 5; 6: mcl -I 1.2; 7: metabarcode) is represented by a dotdisplaying information about the association with the highest Spearman's rho, with larger values in red. The diameter of the circle is proportional to the number of host metabarcodesmultiplied by the number of photosymbiont metabarcodes. At the bottom, we show the biogeography of the metarcodes composing the pairs of genetic groups with the highestSpearman's rho. Black lines depict the relative abundance of the entire genetic group among stations. Color bars indicate the proportion of metabarcodes composing the group at eachstation, with one color for each of the eight most abundant metabarcodes, and grey indicating the proportion of all other metabarcodes. NAtlO: North Atlantic Ocean; MedS:Mediterranean Sea; RedS: Red Sea; IndO: Indian Ocean; SAtlO: South Atlantic Ocean; SouO: Southern Ocean; SPacO: South Pacific Ocean; NPacO: North Pacific Ocean.

Chapitre III
Acantharians (mainly Clade E and F) are involved in an large number of associations
with Suessiales (Pelagodinium), as was previously known, but they are also found in
association with unidentified Dinophyceae (Dinophyceae_X) (Figure 5B). A highly divergent
unidentified Dinophyceae clade (Dinophyceae_X), consisting of 2 sub-clades assigned only to
environmental sequences (DQ103863 and GU820545) is found in interaction with 103
acantharian metabarcodes assigned to Stauracanthidae (Clade F) (Figure 2B and 3B).
Metabarcodes from these 2 sub-clades also display a particular distribution among size
fractions in stations where they are the most abundant in micro-plankton (20-180 µm), the
size fraction for which we measured the score of association (Figure 6). They are generally
more abundant in piconano-plankton (0.8-5 µm) and micro-plankton (20-180 µm) than in
nano-plankton (5-20 µm). This kind of distribution is characteristic of symbiotic organisms
which are detected in different size fractions depending on their life cycle stage (Henry et al.
in prep). Depending on the size of the host, the symbiont may be nearly absent from
intermediate size fractions (those between the size of the free-living stage of the symbiont and
the size of the host). These unidentified Dinophyceae metabarcodes likely represent a small
Dinophyceae (<5µm) which enters into symbiosis with free-living organisms from the micro-
plankton. In previous studies, unidentified putative dinoflagellate parasites (Dinophyceae)
was sequenced from individual radiolarian cells (Gast, 2006; Dolven et al., 2007;); as such,
the unidentified clade we detected could also be parasitic.
Acantharians are also found associated with some diatoms. A diatom clade composed
of 4 metabarcodes with no close reference sequence is associated with 12 acantharian
metabarcodes (11 assigned to Clade E and one to Clade D), and one group of 2 diatom
metabarcodes related to the genus Rhizosolenia are associated with 21 acantharian
metabarcodes belonging to Clades E and F (Figures 2A and 3B). The statistical association
between Clade E and F acantharians and rhizosolenid metabarcodes does not appear to be due
to a symbiotic interaction: rhizosolenids diatoms are relatively large protists known to form
chains and mats in oligotrophic waters (Kemp et al., 1999), environments that are also
populated by symbiotic acantharians (Decelle et al., 2012a). Rhizosolenid metabarcodes do
not have “free-living” like distributions and were retained in our abundance comparisons very
likely because of their ability to form mats many times larger than the size of an individual
cell.
169

Chapitre III
170
Figure 5: Global view of patterns of co-occurrence. (A) Positive and significant associations betweenhost groups (top) and photosymbiont groups (bottom) summarized at a high taxonomic level. Sizes ofribbons are proportional to the number of associations detected between the metabarcodes. (B)Associations summarized at a lower taxonomic level. For better visualization, we generated circularvisualizations for each group of hosts (acantharians, ciliates, foraminiferans and polycystines).

Chapitre III
The ciliates are the only group associated with Florenciellales (Dictyochophyceae) and
Prymnesiophyceae (Haptophyta). One group of 21 oligotrich ciliate metabarcodes is
associated with 3 prymnesiophyceae metabarcodes (from 2 genetic groups) related to the
genus Chrysochromulina. Moreover, one metabarcode assigned to several prymesiophyceae
genera (Pleurochrysis, Ochrosphaera, Isochrysis, Jomonlithus, Coccolithus, Helladosphaera,
Calyptrosphaera, Braarudosphaera, Prymnesium, Imantonia, Haptolina and
Chrychromulina) is associated with 19 of the 21 oligotrich metabarcodes described above. All
of the 21 oligotrich metabarcodes are assigned to genera within the Strombidiidae
(Novistrombidium, Omegastrombidium, Strombidium) and Tontoniidae (Pseudotontiona)
(Figures 2A and 3A). Microalgae belonging to the Prymnesiophyceae, in particular
Chrysochromulina spp., have been identified as the main source of chloroplasts for the
kleptochloroplastic dinoflagellate Dinophysis mitra (Nishitani et al., 2012). Like Dinophysis
accuminata, which acquires cryptophyte chloroplasts by feeding via myzocytosis on the
ciliate Myrionecta rubra (Nishitani et al., 2010), D. mitra is thought to acquire chloroplasts
by feeding on mixotrophic ciliates, presumably ciliates of the genera Laboea, Tontonia and
Strombidium (Nishitani et al., 2012). Our results suggest that Chrysochromulina chloroplasts
could be an important source for the Strombiidae and Tontoniidae. However, further
investigation is necessary to determine if D. mitra actually acquires its chloroplasts from these
ciliates. These results also suggest that our method is able to detect cases of kleptoplastidy
characterized by a low level of specificity (Figure 4B).
A group of 6 Dictyochophyceae metabarcodes related to the genera Pseudochattonella
and Florenciella is associated with a group of two Colpodea ciliate metabarcodes (Figures 2A
and 3A), but Colpodea ciliates have not been described in the literature as harboring micro-
algae or performing kleptoplastidy.
As in our results for the acantharians, we also detected ciliates associated with diatoms
(Figure 5). The association between 6 metabarcodes assigned to diatom species belonging to
several Bacillariophyceae families (Bacillariaceae, Cymbellaceae, Fragilariaceae,
Thalassionemataceae, Licmophoraceae, Tabellariaceae) and one metabarcode assigned to
Tintinnidium mucicola (Figures 2A and 3A) is particularly compelling because some tintinnid
species, such as Tintinnidium fluviatile, are known to be able to agglutinate diatom frustules
onto their lorica (Gold and Morales, 1976; Wasik et al., 1996). Besides highlighting the
potential diversity of diatoms that can be found on the lorica of one tintinnid species, this
171

Chapitre III
result also suggests that diatom frustules composing the lorica still contain DNA that we were
able to sequence and that, furthermore, these diatoms may continue living once attached.
172
Figure 6: Distribution among size fractions by station/depth of uncultured Dinophyceaeassociated with acantharians in Clade F. Only the 9 station/depth pairs for whichmetabarcodes are the most abundant in the size fraction in which the association was detected(micro-plankton samples (20-180 µm)) are displayed here. (A) Relative abundances of theeight metabarcodes assigned to the Dinophyceae environmental reference sequenceGU820545. (B) Relative abundances of the metabarcode assigned to the Dinophyceaeenvironmental reference sequence DQ103863.

Chapitre III
The ciliates, with the exception of Tiarina sp., are found associated with a large
number of unidentified Dinophyceae (Dinophyceae_X) and Gymnodiniales (Figure 5). Since
a substantial fraction of these Dinophyceae metabarcodes are not closely related to named
reference sequences, making conclusions about the nature of these associations is not
straightforward. However, one association, likely related to a non-symbiotic interaction,
should be noted here: a group of 7 metabarcodes related to the genus Gyrodinium
(Gymnodiniales) and an environmental reference sequence (FJ832107) is associated with the
same group of oligotrichs that is also associated with Chrysochromulina (see above) (Figures
2A and 3B). The ciliates from the families Strombidiidae and Tontoniidae are important
grazers, like Dinophyceae species of the genus Gyrodinium (Sherr and Sherr, 2009 ;Löder et
al., 2011). Thus, this association could correspond to co-occuring grazers potentially feeding
on similar prey.
Conclusion
Combining the characterization of distribution profiles among size fractions with the
comparison of abundances across size fractions has the potential to detect both known and
putative new photosymbiotic relationships within a size-fractionated metabarcoding dataset.
In terms of computation time, these two aspects of our method are complementary. Whereas
the multi-level genetic clustering increases the number of comparisons to be performed,
removing genetic groups characterized by a “free-living” distribution reduces computational
time. In addition to retrieving already known interactions, thereby validating our method, we
have also discovered potential new photosymbioses in this study, providing compelling
avenues for future research: the interactions we discovered should be validated experimentally
by observing the symbiosis and by isolating and performing genotyping (barcoding) of both
partners (Lima-Mendez et al., 2015). Our approach represents a relatively fast way to decide
how to direct microscopic observations of preserved biological samples when they are derived
from a size fractionated metabarcoding dataset.
References
ALLDREDGE, Alice L. et JONES, B. M. Hastigerina pelagica: foraminiferal habitat for
planktonic dinoflagellates. Marine Biology, 1973, vol. 22, no 2, p. 131-135.
173

Chapitre III
BENJAMINI, Yoav et HOCHBERG, Yosef. Controlling the false discovery rate: a practical
and powerful approach to multiple testing. Journal of the Royal Statistical Society. Series B
(Methodological), 1995, p. 289-300.
CACHON, Monique et CARAM, Bernadette. A symbiotic green alga, Pedinomonas
symbiotica sp. nov.(Prasinophyceae), in the radiolarian Thalassolampe
margarodes. Phycologia, 1979, vol. 18, no 3, p. 177-184.
CHAFFRON, Samuel, REHRAUER, Hubert, PERNTHALER, Jakob, et al. A global network
of coexisting microbes from environmental and whole-genome sequence data. Genome
research, 2010, vol. 20, no 7, p. 947-959.
CHEN, Yue-Qin, WANG, Ning, ZHANG, Peng, et al. Molecular evidence identifies bloom-
forming Phaeocystis (Prymnesiophyta) from coastal waters of southeast China as Phaeocystis
globosa. Biochemical Systematics and Ecology, 2002, vol. 30, no 1, p. 15-22.
CHOW, Cheryl-Emiliane T., KIM, Diane Y., SACHDEVA, Rohan, et al. Top-down controls
on bacterial community structure: microbial network analysis of bacteria, T4-like viruses and
protists. The ISME journal, 2014, vol. 8, no 4, p. 816-829.
DAVY, Simon K., ALLEMAND, Denis, et WEIS, Virginia M. Cell biology of cnidarian-
dinoflagellate symbiosis. Microbiology and Molecular Biology Reviews, 2012, vol. 76, no 2,
p. 229-261.
DE BARY, Anton. Die erscheinung der symbiose. Verlag von Karl J. Trubner, 1879.
DE VARGAS, Colomban, AUDIC, Stéphane, HENRY, Nicolas, et al. Eukaryotic plankton
diversity in the sunlit ocean. Science, 2015, vol. 348, no 6237, p. 1261605.
DECELLE, Johan, COLIN, Sébastien, et FOSTER, Rachel A. Photosymbiosis in marine
planktonic protists. In : Marine Protists. Springer Japan, 2015. p. 465-500.
DECELLE, Johan, PROBERT, Ian, BITTNER, Lucie, et al. An original mode of symbiosis in
open ocean plankton. Proceedings of the National Academy of Sciences, 2012a, vol. 109, no
44, p. 18000-18005.
DECELLE, Johan, SIANO, Raffaele, PROBERT, Ian, et al. Multiple microalgal partners in
symbiosis with the acantharian Acanthochiasma sp.(Radiolaria).Symbiosis, 2012, vol. 58, no
1-3, p. 233-244.
DOLVEN, Jane K., LINDQVIST, Charlotte, ALBERT, Victor A., et al. Molecular diversity of
alveolates associated with neritic North Atlantic radiolarians. Protist, 2007, vol. 158, no 1, p.
65-76.
174

Chapitre III
EDGAR, Robert C. MUSCLE: multiple sequence alignment with high accuracy and high
throughput. Nucleic acids research, 2004, vol. 32, no 5, p. 1792-1797.
EILER, Alexander, HEINRICH, Friederike, et BERTILSSON, Stefan. Coherent dynamics and
association networks among lake bacterioplankton taxa. The ISME journal, 2012, vol. 6, no 2,
p. 330-342.
ELBRÄCHTER, Malte et DREBES, Gerhard. Life cycles, phylogeny and taxonomy of
Dissodinium and Pyrocystis (Dinophyta). Helgoländer Wissenschaftliche
Meeresuntersuchungen, 1978, vol. 31, p. 347-366.
FUKUDA, Yasuhiro et ENDOH, Hiroshi. New details from the complete life cycle of the red-
tide dinoflagellate Noctiluca scintillans (Ehrenberg) McCartney.European journal of
protistology, 2006, vol. 42, no 3, p. 209-219.
GASCUEL, Olivier. BIONJ: an improved version of the NJ algorithm based on a simple
model of sequence data. Molecular biology and evolution, 1997, vol. 14, no 7, p. 685-695.
GAST, Rebecca J. Molecular phylogeny of a potentially parasitic dinoflagellate isolated from
the solitary radiolarian, Thalassicolla nucleata. Journal of Eukaryotic Microbiology, 2006,
vol. 53, no 1, p. 43-45.
GOLD, Kenneth et MORALES, Eleanor A. Studies on the sizes, shapes, and the development
of the lorica of agglutinated tintinnida. The Biological Bulletin, 1976, vol. 150, no 3, p. 377-
392.
GÓMEZ, Fernando, MOREIRA, David, et LÓPEZ-GARCÍA, Purificación. Life cycle and
molecular phylogeny of the dinoflagellates Chytriodinium and Dissodinium, ectoparasites of
copepod eggs. European journal of protistology, 2009, vol. 45, no 4, p. 260-270.
GOUY, Manolo, GUINDON, Stephane, et GASCUEL, Olivier. SeaView version 4: a
multiplatform graphical user interface for sequence alignment and phylogenetic tree
building. Molecular biology and evolution, 2010, vol. 27, no 2, p. 221-224.
HENRY, Nicolas, RICHTER, Daniel J., COLIN Sébastien, et al.. Size-fractionated global
DNA metabarcoding reveals ecological significance of the planktonic dinoflagellate parasite
Blastodinium in sunlit oceans. In preparation.
HUNT, Dana E. et WARD, Christopher S. A network-based approach to disturbance
transmission through microbial interactions. Frontiers in microbiology, 2015, vol. 6.
175

Chapitre III
ISHITANI, Yoshiyuki, UJIIÉ, Yurika, et TAKISHITA, Kiyotaka. Uncovering sibling species
in Radiolaria: Evidence for ecological partitioning in a marine planktonic protist. Molecular
phylogenetics and evolution, 2014, vol. 78, p. 215-222.
KARSENTI, Eric, ACINAS, Silvia G., BORK, Peer, et al. A holistic approach to marine eco-
systems biology. PLoS biol, 2011, vol. 9, no 10, p. e1001177.
KEMP, Alan ES, PEARCE, Richard B., KOIZUMI, Itaru, et al. The role of mat-forming
diatoms in the formation of Mediterranean sapropels. Nature, 1999, vol. 398, no 6722, p. 57-
61.
LEGENDRE, Pierre et LEGENDRE, Louis. Numerical Ecology. Elsevier, 2012.
LETUNIC, Ivica et BORK, Peer. Interactive Tree Of Life v2: online annotation and display of
phylogenetic trees made easy. Nucleic acids research, 2011, p. gkr201.
LIMA-MENDEZ, Gipsi, FAUST, Karoline, HENRY, Nicolas, et al. Determinants of
community structure in the global plankton interactome. Science, 2015, vol. 348, no 6237, p.
1262073.
LÖDER, Martin GJ, MEUNIER, Cédric, WILTSHIRE, Karen H., et al. The role of ciliates,
heterotrophic dinoflagellates and copepods in structuring spring plankton communities at
Helgoland Roads, North Sea. Marine biology, 2011, vol. 158, no 7, p. 1551-1580.
MAHÉ, Frédéric, ROGNES, Torbjørn, QUINCE, Christopher, et al. Swarm: robust and fast
clustering method for amplicon-based studies. PeerJ, 2014, vol. 2, p. e593
MORDRET Solenn, ROMAC Sarah, HENRY Nicolas. The symbiotic life of Symbiodinium in
the open ocean within a new species of calcifying ciliate (Tiarina sp.). The ISME journal,
2015, Press 1–13.
NISHITANI, Goh, NAGAI, Satoshi, BABA, Katsuhisa, et al. High-level congruence of
Myrionecta rubra prey and Dinophysis species plastid identities as revealed by genetic
analyses of isolates from Japanese coastal waters.Applied and environmental microbiology,
2010, vol. 76, no 9, p. 2791-2798.
NISHITANI, Goh, NAGAI, Satoshi, HAYAKAWA, Shiho, et al. Multiple plastids collected
by the dinoflagellate Dinophysis mitra through kleptoplastidy. Applied and environmental
microbiology, 2012, vol. 78, no 3, p. 813-821.
MERCIER, Céline, BOYER, Frédéric, BONIN, Aurélie, et al. SUMATRA and
SUMACLUST: fast and exact comparison and clustering of sequences. In :Programs and
Abstracts of the SeqBio 2013Satoshi, HAYAKAWA, Shiho, et al. Multiple plastids collected
176

Chapitre III
by the dinoflagellate Dinophysis mitra through kleptoplastidy. Applied and environmental
microbiology, 2012, vol. 78, no 3, p. 813-821.
PIENAAR, Richard N., SAKAI, Hiroto, et HORIGUCHI, Takeo. Description of a new
dinoflagellate with a diatom endosymbiont, Durinskia capensis sp. nov.(Peridiniales,
Dinophyceae) from South Africa. Journal of plant research, 2007, vol. 120, no 2, p. 247-258.
PROBERT, Ian, SIANO, Raffaele, POIRIER, Camille, et al. Brandtodinium gen. nov. and B.
nutricula comb. nov.(Dinophyceae), a dinoflagellate commonly found in symbiosis with
polycystine radiolarians. Journal of Phycology, 2014, vol. 50, no 2, p. 388-399.
R Core Team. R: A language and environment for statistical computing. R Foundation for
Statistical Computing, Vienna, Austria, 2015
SCHOLZ, Bettina, GUILLOU, Laure, MARANO, Agostina V., et al. Zoosporic parasites
infecting marine diatoms–A black box that needs to be opened.Fungal Ecology, 2016, vol. 19,
p. 59-76.
SHAKED, Yonathan et DE VARGAS, Colomban. Pelagic photosymbiosis: rDNA assessment
of diversity and evolution of dinoflagellate symbionts and planktonic foraminiferal
hosts. Marine Ecology Progress Series, 2006, vol. 325, p. 59-71.
SHERR, Evelyn B. et SHERR, Barry F. Capacity of herbivorous protists to control initiation
and development of mass phytoplankton blooms. Aquatic Microbial Ecology, 2009, vol. 57,
no 3, p. 253.
SIANO, Raffaele, MONTRESOR, Marina, PROBERT, Ian, et al. Pelagodinium gen. nov. and
P. béii comb. nov., a dinoflagellate symbiont of planktonic foraminifera. Protist, 2010, vol.
161, no 3, p. 385-399.
SKOVGAARD, Alf, KARPOV, Sergey A., et GUILLOU, Laure. The parasitic dinoflagellates
Blastodinium spp. inhabiting the gut of marine, planktonic copepods: morphology, ecology,
and unrecognized species diversity. Frontiers in microbiology, 2012, vol. 3.
STEELE, Joshua A., COUNTWAY, Peter D., XIA, Li, et al. Marine bacterial, archaeal and
protistan association networks reveal ecological linkages. The ISME journal, 2011, vol. 5, no
9, p. 1414-1425.
STOECKER, Diane K., JOHNSON, Matthew D., DE VARGAS, Colomban, et al.Acquired
phototrophy in aquatic protists. 2009.
177

Chapitre III
SWEENEY, Beatrice M. Pedinomonas noctilucae (Prasinophyceae), The flagellate symbiotic
in Noctiluca (Dinophyceae) in Southeast Asia. Journal of phycology, 1976, vol. 12, no 4, p.
460-464.
TRENCH, Robert K. The cell biology of plant-animal symbiosis. Annual Review of Plant
Physiology, 1979, vol. 30, no 1, p. 485-531.
VAN DONGEN, Stijn Marinus. Graph clustering by flow simulation. 2001.
WASIK, Anna, MIKOLAJCZYK, Ewa, et LIGOWSKI, Ryszard. Agglutinated loricae of
some Baltic and Antarctic Tintinnina species (Ciliophora). Journal of plankton research,
1996, vol. 18, no 10, p. 1931-1940. workshop. Abstract. 2013. p. 27-29.
178

Chapitre III
Supplementary information
179
Table S01: Summary of the positive and significant associations. When the taxonomic assignmentwas not accurate enough to link a metabarcode to a genus, the “host genus” and “symbiont genus”fields indicate the next most precise taxonomic rank available.
Symbiont taxogroup Symbiont group Symbiont genus Host taxogroup Host group Host genus
Bacillariophyta Bacillariophyta Bacillariophyceae Ciliophora Choreotrichia Tintinnidium 5Bacillariophyta Bacillariophyta Bacillariophyceae_X Ciliophora Choreotrichia uncultured tintinnid ciliate 1Bacillariophyta Bacillariophyta Bacillariophyta Acantharea Arthra_Symphy Dorataspidae_E4 16Bacillariophyta Bacillariophyta Bacillariophyta Ciliophora Choreotrichia uncultured tintinnid ciliate 5Bacillariophyta Bacillariophyta Bacillariophyta Acantharea Arthra_Symphy Acanthophracta_E3_X 4Bacillariophyta Bacillariophyta Bacillariophyta Acantharea Arthra_Symphy Hexaconus 2Bacillariophyta Bacillariophyta Biddulphia Acantharea Arthra_Symphy Dorataspidae_E4 8Bacillariophyta Bacillariophyta Biddulphia Acantharea Arthra_Symphy Acanthophracta_E3_X 2Bacillariophyta Bacillariophyta Biddulphia Acantharea Arthra_Symphy Hexaconus 1Bacillariophyta Bacillariophyta Chaetoceros Ciliophora Choreotrichia uncultured tintinnid ciliate 1Bacillariophyta Bacillariophyta Dactyliosolen Acantharea Arthra_Symphy Dorataspidae_E4 16Bacillariophyta Bacillariophyta Dactyliosolen Acantharea Arthra_Symphy Acanthophracta_E3_X 4Bacillariophyta Bacillariophyta Dactyliosolen Acantharea Arthra_Symphy Hexaconus 2Bacillariophyta Bacillariophyta Dactyliosolen Acantharea Trizonacantha_D Staurolithium 1Bacillariophyta Bacillariophyta Mediophyceae Ciliophora Choreotrichia uncultured tintinnid ciliate 3Bacillariophyta Bacillariophyta Proboscia Acantharea Trizonacantha_D Staurolithium 8Bacillariophyta Bacillariophyta Rhizosolenia Acantharea Arthra_Symphy Acanthometridae_F3 9Bacillariophyta Bacillariophyta Rhizosolenia Acantharea Arthra_Symphy Dorataspidae_E4 8Bacillariophyta Bacillariophyta Rhizosolenia Acantharea Arthra_Symphy Acanthophracta_E3_X 2Bacillariophyta Bacillariophyta Rhizosolenia Acantharea Arthra_Symphy Acanthometridae_F3_X 1Bacillariophyta Bacillariophyta Rhizosolenia Acantharea Arthra_Symphy Hexaconus 1Bacillariophyta Bacillariophyta Synedra Ciliophora Choreotrichia Tintinnidium 1
Dictyochophyceae Florenciellales Florenciella Ciliophora Colpodea-1 Colpodea-1_X 8Dictyochophyceae Florenciellales Florenciellales_X Ciliophora Colpodea-1 Colpodea-1_X 2Dictyochophyceae Florenciellales Pseudochattonella Ciliophora Colpodea-1 Colpodea-1_X 2
Dinophyceae Dinophyceae_X AY434687_gen Ciliophora Oligotrichia Strombidium 10Dinophyceae Dinophyceae_X AY434687_gen Ciliophora Oligotrichia Pseudotontonia 8Dinophyceae Dinophyceae_X AY434687_gen Ciliophora Colpodea-1 Colpodea-1_X 2Dinophyceae Dinophyceae_X AY434687_gen Ciliophora Oligotrichia Novistrombidium 1Dinophyceae Dinophyceae_X AY434687_gen Ciliophora Oligotrichia Omegastrombidium 1Dinophyceae Dinophyceae_X AY434687_gen Ciliophora Oligotrichia Strombidiidae 1Dinophyceae Dinophyceae_X AY664889_gen Ciliophora Colpodea-1 Colpodea-1_X 8Dinophyceae Dinophyceae_X AY664900_gen Ciliophora Choreotrichia Eutintinnus 72Dinophyceae Dinophyceae_X AY664900_gen Ciliophora Cyrtophoria Pithites 14Dinophyceae Dinophyceae_X AY664900_gen Acantharea Arthra_Symphy Dorataspidae_E4 8Dinophyceae Dinophyceae_X AY664900_gen Spumellaria Spumellaria Spum_group_I 5Dinophyceae Dinophyceae_X AY664900_gen Ciliophora Prostomatea_X Tiarina 4Dinophyceae Dinophyceae_X AY664900_gen Spumellaria Spumellaria Spum_group_I_X 3Dinophyceae Dinophyceae_X AY664900_gen Acantharea Arthra_Symphy Acanthophracta_E3_X 2Dinophyceae Dinophyceae_X AY664900_gen Ciliophora Prostomatea_X Colepidae 2Dinophyceae Dinophyceae_X AY664900_gen Spumellaria Spumellaria Styptosphaera 2Dinophyceae Dinophyceae_X AY664900_gen Acantharea Arthra_Symphy Hexaconus 1Dinophyceae Dinophyceae_X AY664936_gen Ciliophora Colpodea-1 Colpodea-1_X 4Dinophyceae Dinophyceae_X AY664957_gen Ciliophora Oligotrichia Strombidium 10Dinophyceae Dinophyceae_X AY664957_gen Ciliophora Oligotrichia Pseudotontonia 8Dinophyceae Dinophyceae_X AY664957_gen Ciliophora Colpodea-1 Colpodea-1_X 2Dinophyceae Dinophyceae_X AY664957_gen Ciliophora Oligotrichia Novistrombidium 1Dinophyceae Dinophyceae_X AY664957_gen Ciliophora Oligotrichia Omegastrombidium 1Dinophyceae Dinophyceae_X AY664957_gen Ciliophora Oligotrichia Strombidiidae 1Dinophyceae Dinophyceae_X Dinophyceae Ciliophora Oligotrichia Strombidium 90Dinophyceae Dinophyceae_X Dinophyceae Ciliophora Oligotrichia Pseudotontonia 72Dinophyceae Dinophyceae_X Dinophyceae Ciliophora Oligotrichia Novistrombidium 9Dinophyceae Dinophyceae_X Dinophyceae Ciliophora Oligotrichia Omegastrombidium 9Dinophyceae Dinophyceae_X Dinophyceae Ciliophora Oligotrichia Strombidiidae 9Dinophyceae Dinophyceae_X Dinophyceae Ciliophora Colpodea-1 Colpodea-1_X 8Dinophyceae Dinophyceae_X DQ103863_gen Acantharea Arthra_Symphy Stauracanthidae_F3 103Dinophyceae Dinophyceae_X DQ244019_gen Ciliophora Cyrtophoria Pithites 14Dinophyceae Dinophyceae_X DQ244019_gen Acantharea Arthra_Symphy Arthra_Symphy 4Dinophyceae Dinophyceae_X GU820276_gen Ciliophora Choreotrichia Climacocylis 4Dinophyceae Dinophyceae_X GU820276_gen Ciliophora Choreotrichia Choreotrichia 1Dinophyceae Dinophyceae_X GU820276_gen Ciliophora Choreotrichia Rhizodomus 1Dinophyceae Dinophyceae_X GU820545_gen Acantharea Arthra_Symphy Stauracanthidae_F3 824Dinophyceae Dinophyceae_X GU825114_gen Ciliophora Oligotrichia Strombidium 10Dinophyceae Dinophyceae_X GU825114_gen Ciliophora Oligotrichia Pseudotontonia 8Dinophyceae Dinophyceae_X GU825114_gen Ciliophora Colpodea-1 Colpodea-1_X 2Dinophyceae Dinophyceae_X GU825114_gen Ciliophora Oligotrichia Novistrombidium 1Dinophyceae Dinophyceae_X GU825114_gen Ciliophora Oligotrichia Omegastrombidium 1Dinophyceae Dinophyceae_X GU825114_gen Ciliophora Oligotrichia Strombidiidae 1
Number of associations

Chapitre III
180
Table S01 (continued)
Symbiont taxogroup Symbiont group Symbiont genus Host taxogroup Host group Host genus
Dinophyceae Dinophyceae_X Gyrodinium Ciliophora Oligotrichia Strombidium 30Dinophyceae Dinophyceae_X Gyrodinium Ciliophora Oligotrichia Pseudotontonia 24Dinophyceae Dinophyceae_X Gyrodinium Ciliophora Colpodea-1 Colpodea-1_X 6Dinophyceae Dinophyceae_X Gyrodinium Ciliophora Oligotrichia Novistrombidium 3Dinophyceae Dinophyceae_X Gyrodinium Ciliophora Oligotrichia Omegastrombidium 3Dinophyceae Dinophyceae_X Gyrodinium Ciliophora Oligotrichia Strombidiidae 3Dinophyceae Dinophyceae_X Uncultured Ciliophora Oligotrichia Strombidium 20Dinophyceae Dinophyceae_X Uncultured Ciliophora Oligotrichia Pseudotontonia 16Dinophyceae Dinophyceae_X Uncultured Ciliophora Colpodea-1 Colpodea-1_X 4Dinophyceae Dinophyceae_X Uncultured Ciliophora Oligotrichia Novistrombidium 2Dinophyceae Dinophyceae_X Uncultured Ciliophora Oligotrichia Omegastrombidium 2Dinophyceae Dinophyceae_X Uncultured Ciliophora Oligotrichia Strombidiidae 2Dinophyceae Gonyaulacales Acantharea Arthra_Symphy Dorataspidae_E4 6Dinophyceae Gonyaulacales Gonyaulax Ciliophora Choreotrichia Climacocylis 1Dinophyceae Gonyaulacales Neoceratium Acantharea Arthra_Symphy Stauracanthidae_F3 103Dinophyceae Gymnodiniales Gymnodinium Collodaria Collodaria Acrosphaera 617Dinophyceae Gymnodiniales Gymnodinium Acantharea Arthra_Symphy Arthra_Symphy_E1E2 7Dinophyceae Gymnodiniales Gymnodinium Acantharea Trizonacantha_D Staurolithium 7Dinophyceae Gymnodiniales Gymnodinium Acantharea Acantharia_IV Acantharia_IV_X 3Dinophyceae Gymnodiniales Gymnodinium Foraminifera Globothalamea Globigerinoides 2Dinophyceae Gymnodiniales Gymnodinium Collodaria Collodaria Collozoum 1Dinophyceae Gymnodiniales Gymnodinium Foraminifera Foraminifera_X Foraminifera 1Dinophyceae Gymnodiniales Ciliophora Oligotrichia Strombidium 30Dinophyceae Gymnodiniales Ciliophora Oligotrichia Pseudotontonia 24Dinophyceae Gymnodiniales Ciliophora Oligotrichia Novistrombidium 3Dinophyceae Gymnodiniales Ciliophora Oligotrichia Omegastrombidium 3Dinophyceae Gymnodiniales Ciliophora Oligotrichia Strombidiidae 3Dinophyceae Gymnodiniales Kareniaceae_15 Ciliophora Oligotrichia Strombidium 20Dinophyceae Gymnodiniales Kareniaceae_15 Ciliophora Oligotrichia Pseudotontonia 16Dinophyceae Gymnodiniales Kareniaceae_15 Ciliophora Colpodea-1 Colpodea-1_X 2Dinophyceae Gymnodiniales Kareniaceae_15 Ciliophora Oligotrichia Novistrombidium 2Dinophyceae Gymnodiniales Kareniaceae_15 Ciliophora Oligotrichia Omegastrombidium 2Dinophyceae Gymnodiniales Kareniaceae_15 Ciliophora Oligotrichia Strombidiidae 2Dinophyceae Gymnodiniales Lepidodinium Ciliophora Colpodea-1 Colpodea-1_X 2Dinophyceae Peridiniales Peridinium_03 Ciliophora Cyclotrichia Mesodiniidae 1Dinophyceae Peridiniales Peridinium_03 Ciliophora Cyclotrichia Mesodiniidae_X 1Dinophyceae Peridiniales Peridinium_03 Ciliophora Cyclotrichia Myrionecta 1Dinophyceae Peridiniales Protoperidinium Foraminifera Globothalamea Globigerinoides 2Dinophyceae Peridiniales Protoperidinium Acantharea Trizonacantha_D Staurolithium 2Dinophyceae Peridiniales Acantharea Trizonacantha_D Staurolithium 2Dinophyceae Peridiniales Foraminifera Globothalamea Globigerinoides 1Dinophyceae Suessiales Pelagodinium Acantharea Arthra_Symphy Arthra_Symphy_E1E2 380Dinophyceae Suessiales Pelagodinium Acantharea Arthra_Symphy Dorataspidae_E4 152Dinophyceae Suessiales Pelagodinium Acantharea Arthra_Symphy Stauracanthidae_F3 103Dinophyceae Suessiales Pelagodinium Acantharea Arthra_Symphy Acanthophracta_E3_X 38Dinophyceae Suessiales Pelagodinium Foraminifera Globothalamea Globigerinoides 19Dinophyceae Suessiales Pelagodinium Acantharea Arthra_Symphy Hexaconus 19Dinophyceae Suessiales Pelagodinium Acantharea Trizonacantha_D Staurolithium 19Dinophyceae Suessiales Pelagodinium Acantharea Arthra_Symphy Acanthometridae_F3 1Dinophyceae Suessiales Pelagodinium Acantharea Arthra_Symphy Acanthometridae_F3_X 1Dinophyceae Suessiales Pelagodinium Foraminifera Globothalamea Globigerinella 1Dinophyceae Suessiales Pelagodinium Ciliophora Prostomatea_X Tiarina 1Dinophyceae Suessiales Symbiodiniaceae Ciliophora Prostomatea_X Tiarina 2Dinophyceae Suessiales Symbiodinium Ciliophora Prostomatea_X Tiarina 6Dinophyceae Suessiales Ciliophora Prostomatea_X Tiarina 14Haptophyta Prymnesiophyceae Chrysochromulina Ciliophora Oligotrichia Strombidium 20Haptophyta Prymnesiophyceae Chrysochromulina Ciliophora Oligotrichia Pseudotontonia 16Haptophyta Prymnesiophyceae Chrysochromulina Ciliophora Oligotrichia Novistrombidium 2Haptophyta Prymnesiophyceae Chrysochromulina Ciliophora Oligotrichia Omegastrombidium 2Haptophyta Prymnesiophyceae Chrysochromulina Ciliophora Oligotrichia Strombidiidae 2Haptophyta Prymnesiophyceae Chrysochromulina_X Ciliophora Oligotrichia Strombidium 10Haptophyta Prymnesiophyceae Chrysochromulina_X Ciliophora Oligotrichia Pseudotontonia 8Haptophyta Prymnesiophyceae Chrysochromulina_X Ciliophora Oligotrichia Novistrombidium 1Haptophyta Prymnesiophyceae Chrysochromulina_X Ciliophora Oligotrichia Omegastrombidium 1Haptophyta Prymnesiophyceae Chrysochromulina_X Ciliophora Oligotrichia Strombidiidae 1Haptophyta Prymnesiophyceae Prymnesiophyceae Ciliophora Oligotrichia Pseudotontonia 8Haptophyta Prymnesiophyceae Prymnesiophyceae Ciliophora Oligotrichia Strombidium 8Haptophyta Prymnesiophyceae Prymnesiophyceae Ciliophora Oligotrichia Novistrombidium 1Haptophyta Prymnesiophyceae Prymnesiophyceae Ciliophora Oligotrichia Omegastrombidium 1Haptophyta Prymnesiophyceae Prymnesiophyceae Ciliophora Oligotrichia Strombidiidae 1
Prasinophyceae Clade 7 Prasino_clade_7 Collodaria Collodaria Acrosphaera 280
Number of associations
Alexandrium_01
Gyrodinium_05Gyrodinium_05Gyrodinium_05Gyrodinium_05Gyrodinium_05
Protoperidinium_02Protoperidinium_02
Symbiodinium CladeA
Nannochloris[7A1]

Chapitre III
Parasites diversity and abundance in the Tara Oceansdataset challenge classic views on marine plankton ecology
Cédric Berney, Nicolas Henry, Colomban de Vargas, Stéphane Audic
EPEP - Evolution des Protistes et des Ecosystèmes Pélagiques - team, Sorbonne Universités, UPMC Univ Paris
06, UMR 7144, Station Biologique de Roscoff, 29680 Roscoff, France
CNRS, UMR 7144, Station Biologique de Roscoff, 29680 Roscoff, France
In preparation
Abstract
Surveys of marine plankton biodiversity have so far been geographically restricted or
have not accounted for the full range of plankton size. As part of the Tara-Oceans project,
rDNA metabarcodes (the V9 region of 18S rDNA) were sequenced from size-fractionated
plankton communities collected at 126 stations across tropical and temperate oceans, allowing
for the first time an assessment of the entire eukaryotic biodiversity across a whole planetary
biome. Here we use the data to explore the diversity and prevalence of protists with a
parasitic/parasitoid life style in the open ocean plankton. Using the V9_PR2 reference
database derived from the 18S rDNA Protist Ribosomal Reference (PR2) database, we
attributed broad ecological functions / symbiotic modes to taxonomically assigned protist
metabarcodes, revealing that one third belongs to poorly known heterotrophic organisms
whose exact life style is unknown. We then used abundance profiles and distributions across
size-fractions to investigate the possible life style of these organisms, and identify potential
new host-symbiont relationships between planktonic eukaryotes. OTUs from selected
potential hosts were compared to OTUs belonging to both known parasites/parasitoids and
organisms of unknown life style. Many of the significant associations that we recovered
correspond to well-known symbiotic relationships (demonstrating the effectiveness of the
approach) but we also uncovered a few intriguing novel associations between protist lineages.
Overall, alveolates largely dominate open ocean plankton communities both in terms of global
diversity and in terms of symbiotic associations with other eukaryotes. Our results also
corroborate earlier suggestions that symbioses between eukaryotes are a key component of
these communities and that models of plankton ecology should better integrate them.
181

Chapitre III
Introduction
Symbiotic relationships between eukaryotic species where one organism benefits from
the association at the expense of the other are widespread in all environments. Most lineages
of eukaryotes are concerned, with both known parasitic and host species present across all
eukaryotic supergroups (Poulin and Morand, 2000; Bass et al., 2015). For the longest time,
only few key parasitic taxa were given proper attention because of their direct medical or
economic significance: parasites of humans, livestock, fisheries or crops are well studied,
their life cycle is often fully elucidated, and more recently the main species have had their
genome sequenced (Chaudhary and Roos, 2005; Stentiford et al., 2014). Meanwhile, the
global ecological and evolutionary significance of parasitism remains very poorly understood
(Poulin, 2014). Often very little is known about the wider groups to which the few highly
studied parasitic taxa belong, even though it is likely that they include a much larger diversity
of yet undescribed parasites, globally playing key roles in ecosystems (the "parasitic dark
matter", Bass et al., 2015). This lack of knowledge is particularly acute for marine parasites,
because marine diversity as a whole is much more incompletely known than terrestrial
diversity (Rohde, 2002). One of the reasons behind this knowledge gap is the fact that the
parasitic life style in itself makes these organisms difficult to study or even detect. Many
parasites spend the majority of their life cycle within a host, and when infected hosts do not
look of behave visibly differently from uninfected ones, parasitism remains inconspicuous.
Global estimates of the diversity and prevalence of parasitic organisms in a given
environment are thus impossible to achieve by direct observation as can usually be done for
free-living organisms (Bass et al., 2015). As a result, parasites are only now beginning to be
included in ecological models at the level of whole ecosystems, despite the fact that their
significance in food webs and ecosystem functions has been recognised since the turn of the
century (Marcogliese and Cone, 1997; Windsor, 1998; Hudson et al., 2006; Dobson et al.,
2008).
Over the last few decades, rapid advances in the fields of DNA isolation, amplification
and sequencing have been revolutionising the ways in which we can address the biology,
evolution, diversity and ecology of microbial eukaryotes. In particular, sequencing of
ribosomal RNA genes from organisms within environmental samples (environmental rDNA
surveys) has become a method of choice to apprehend the diversity of eukaryotes within a
given habitat (Moreira and López-García, 2002; Berney et al., 2004; Richards and Bass,
182

Chapitre III
2005). Clear advantages of environmental rDNA surveys include the detection of cryptic or
otherwise elusive organisms (including those for which classical morphological and culture
approaches typically fail), large-scale sampling with fewer biases than specimen-based
methods, and generation of data for molecular systematics and statistical ecological
inferences; their potential for the study of parasitic organisms is therefore enormous (López-
García and Moreira, 2008; Massana and Pedrós-Alió, 2008; Bass et al., 2015). However,
parasites often possess divergent genes/genomes, and may therefore escape detection in
general environmental rDNA surveys using universal, eukaryote-wide PCR primers
(Hartikainen et al., 2014b; Bass et al., 2015). Using lineage-specific PCR primers to obtain
environmental rDNA libraries enriched in a given parasitic lineage has been shown to be
highly efficient (Bråte et al., 2010; Hartikainen et al., 2014a), but it makes it impossible to
compare directly diversity and abundance of different lineages in a given habitat. High-
throughput sequencing technologies now make it possible to overcome this issue by
significantly increasing the sequencing depth of amplicons within samples (metabarcoding
approaches) and/or by generating metagenomic sequence datasets that are free from PCR-
related biases. This most recent, "environmental genomics" revolution means that eukaryotic
communities can now be addressed in their globality, including the rarest and most genetically
divergent lineages.
In this study, we take advantage of the Tara-Oceans eukaryote V9 rDNA
metabarcoding dataset to explore the global diversity and abundance of protists with a
parasitic/parasitoid life style in the open ocean plankton, and try to identify potential new
host-parasite associations. A functional annotation of taxonomically assignable protist
metabarcodes reveals that one third belongs to poorly known heterotrophic organisms whose
exact life style is unknown. We use abundance profiles and distributions across size-fractions
to investigate the possible life style of these organisms, and identify potential new host-
symbiont relationships among planktonic eukaryotes. Our results support the idea that
symbioses between eukaryotes (a large majority of which involves alveolates) are a key
component of open ocean plankton communities and should be better integrated into
ecological models of plankton ecology and food webs.
Material and Methods
Data used in this study are part of the Tara-Oceans V9 metabarcoding dataset
(Karsenti et al., 2011; de Vargas et al., 2015) extended to 126 stations (47 stations were
183

Chapitre III
included in the initial dataset). Analyses were performed on metabarcodes obtained from 586
samples belonging to 121 stations, sampled at two depths (subsurface, mixed-layer waters,
and the deep chlorophyll maximum at the top of the thermocline), and separated by serial
filtration using plankton nets of various mesh-sizes into four main organismal size-fractions
covering the majority of eukaryotic plankton diversity: piconano-plankton (0.8-5μm), nano-
plankton (5-20μm), micro-plankton (20-180μm), and meso-plankton (180-2000μm). For a
given sample and a given metabarcode, the number of reads assigned to the metabarcode
divided by the total number of reads within that sample was used as a proxy for their
abundance in further statistical analyses. Additional details on the methodology used to
generate the data can be found in de Vargas et al. (2015).
A simple functional annotation of the metabarcoding data was performed to estimate
the proportion of known parasitic protists in the sunlit ocean plankton. We followed an
approach similar to that used in de Vargas et al. (2015) to associate metabarcodes to basic bio-
ecological functions such as photo- versus heterotrophy, but focusing on the following three
functional categories: (1) free-living life style, (2) parasitic, parasitoid, or amphizoic life style,
and (3) unknown life style. First, each of the 91 taxogroups present in the Tara-Oceans data
was attributed a main functional category. Then based on an extensive literature survey, we
identified in each taxogroup all the sublineages (down to genera) known to have a different
life style than that of the majority of organisms in that taxogroup. Taxogroups that contain a
significantly higher proportion of environmental diversity than described members with a
known life style (such as Perkinsea and Diplonemida) were categorised as having an
unknown life style. Then within Perkinsea for instance the only two described genera
(Perkinsus and Parvilucifera) were recorded as having a known (in this case parasitic) life
style. Tara Oceans metabarcodes were then attributed a functional category based on their
taxonomic assignment, provided that their closest hits among the reference barcodes were
mono-functional; if not, they were annotated as having an unknown life style. This
conservative, two-step approach was designed to avoid over- or under-estimating the
prevalence of parasitic organisms in the dataset and minimise incorrect functional inferences
for metabarcodes that are relatively distant from any reference barcode, especially within
complex, poly-functional groups such as dinoflagellates.
The methodology used to investigate potential parasite-host associations across
phylogenetic gradients was developed for a parallel study addressing photosymbiosis in the
open ocean plankton (Henry et al., in prep.). Metabarcodes from both potential symbionts and
184
Chapitre III
potential hosts were clustered into increasingly inclusive genetic groups (seven levels in
total). The potential host groups we investigated were metazoans for comparisons in the
meso-plankton, and the four main protist groups (diatoms, ciliates, dinoflagellates, and
radiolarians) for comparisons in the micro-plankton. For both size-fractions, the potential
symbiont group we tested comprised all protist lineages attributed to the functional categories
2 and 3 as explained above. However for comparisons in the micro-plankton, ciliates and
dinoflagelllates were excluded from the potential symbiont group because they were being
tested as potential hosts. Then a filtering based on distribution profiles was applied to the
genetic groups of potential symbionts to limit the number of false positives in our results (see
Henry et al., in prep. for details concerning the filtering). Genetic groups abundances were
compared separately for micro- and meso-plankton samples between the potential symbionts
and the hosts and the results for both size fractions were analyzed separately.
Results and Discussion
Functional annotation of the V9 metabarcoding dataset reveals the extant of our
ignorance of the ecology of planktonic protists
Results of the functional annotation are summarised in Figure 1 (see also Suppl. Table
S1). About 60% of OTUs were attributed a free-living life style, with more than half of this
proportion due to three of the most diverse and abundant taxogroups in the Tara-Oceans data:
dinoflagellates, collodarians (Radiolaria), and diatoms. OTUs belonging to unquestionably
parasitic, parasitoid, or amphizoic protists represented 8% of the total. The four main
taxogroups concerned belong to alveolates: Apicomplexa (29% of the total parasites), MALV-
I and MALV-II Syndiniales (19% and 18%, respectively), and parasitic dinoflagellates such as
the very abundant genus Blastodinium (13%). The next most diverse taxogroups in that
functional category belong to Amoebozoa (various lineages of amphizoic lobose amoebae,
making up 6% of that categroy), opisthokonts (parasitic fungi and ichthyosporeans, making
up 5% of that category), and Rhizaria (ascetosporean parasites such as Paradinium and
paramyxids, making up 4% of that category). Other taxogroups that represent above 0.5% of
the total parasites are also parasitic ciliates and perkinsids (alveolates), oomycetes and
labyrinthulids (stramenopiles), phytomyxids (Rhizaria), and kinetoplastids (excavates).
185

Chapitre III
186
Figure 01: OTUs richness by taxogroups and functional annotation into three main categories: 1 - notparasitic life style (blue), 2 - parasitic (purple), parasitoid (green), or amphizoic (yellow) life style, and3 - unknown life style (red). The size of the rectangles is proportional to the number of OTUs.

Chapitre III
Strikingly, the remaining 32% of OTUs cannot be functionally annotated. This high
proportion mainly reflects the generally high genetic distance that exists between OTUs and
their closest morphologically described match in the reference database. Indeed a very high
proportion of entries in V9_PR2 consists of sequences from environmental surveys. Their
phylogeny is known and they allow taxonomic annotation, but many belong to entirely novel
lineages that contain no morphologically described organisms, therefore the life style of the
organisms they come from is unknown. Significantly, this is the case for the entirety of the
second most diverse protist taxogroup in the Tara Oceans data, diplonemids. Although their
assignment to diplonemids is beyond any doubt from a phylogenetic point of view, all
concerned OTUs and reference sequences form an environmental clade that is clearly separate
from Diplonema, Rhynchopus, and Hemistasia, the only three described genera in that group
for which sequences are available (Yabuki and Tame, 2015). As a result, the life style of these
open ocean planktonic diplonemids remains hypothetical; most of them are probably free-
living predators, but some could be parasitic/parasitoid (Lara et al., 2009; Lukeš et al., 2015).
This is also the case for the significant proportion of dinoflagellate OTUs that were attributed
to the unknown category because their closest match in V9_PR2 are environmental sequences
of unknown life style, as well as for OTUs attributed to environmental lineages among
Stramenopiles (the MASTs). Other significant lineages in the unknown category comprise
various cercozoans such as cryomonads or ebriids, whose known possible life styles range
from predators to parasites/parasitoids.
Investigating symbiotic associations across phylogenetic gradients to identify potential
new parasitic lineages and parasite-host pairs
Figure 2 shows the results of our analysis of distribution profiles for the 12,544
metabarcodes belonging to lineages attributed to the functional categories 2 and 3 and which
appear in more than 10% of micro- and meso-plankton samples. 4,166 metabarcodes (33%)
have a distribution profile compatible with a possible symbiont life style (blue bars in Fig. 2).
This result is congruent with the fact that many of these lineages comprise organisms of
relatively small size (for instance kinetoplastid flagellates or ascomycete yeasts) that are not
expected to be found in the two larger size-fractions unless they are closely associated with a
larger organism present in these size-fractions. The remaining 8,378 metabarcodes (67%)
exclusively belong to genetic groups which have a “free-living” like distribution (red bars in
Fig. 2); they were therefore excluded from later analyses. A majority of them belongs to only
three lineages: Dinophyceae (72% of metabarcodes with a distribution profile expected to be
187

Chapitre III
specific to free-living organisms), ciliates (51%), and diplonemids (73%). Such a result is not
unexpected for these taxogroups. The corresponding metabarcodes were attributed an
unknown function because they are only distantly related to reference sequences of identified
organisms. However we expect a significant proportion of them to correspond to free-living
organisms, present in the two larger size-fractions simply because they are larger cells.
Figure 3 presents a global view of the patterns of co-occurrence that were recovered in
our analyses. In the meso-plankton (Fig. 3A; see also Suppl. Table S3), metazoan hosts
positively associated to potential symbionts were almost exclusively comprised of copepods,
an unsurprising result given that they account for the vast majority of the diversity and
abundance of metazoans in the whole Tara-Oceans dataset (de Vargas et al., 2015). Copepods
were found to be associated in majority with the dinoflagellate genera Blastodinium and
Chytriodinium but also with gregarine Apicomplexa of the order Cephaloidophorida (related
to the genus Thiriotia) and with the ciliate genus Vampyrophrya. A small amount of positive
associations was found between copepods and Amoebophrya (MALV-II), Syndinium and
Hematodinium (MALV-IV), and neobodonid Kinetoplastida. Other metazoan hosts that
188
Figure 02: Proportion of size distribution profiles that are consistent with a “free-living” life styleamong lineages containing species in functional categories 2 (parasitic, parasitoid, or amphizoic lifestyle) and 3 (unknown life style). For all taxogroups, the bars represent numbers of V9 metabarcodespresent in more than 10% of micro- or meso-plankton samples, assigned to a reference sequence witha percentage identity of 90% or greater, and belonging to at least one genetic group present in morethan 20% of micro- or meso-plankton samples. In red, number of metabarcodes which exclusivelybelong to genetic groups with a “free-living” distribution profile. In blue, number of metabarcodesbelonging to at least one genetic group not characterized as “free-living”.

Chapitre III
produced significant associations with potential symbionts include Eumalacostraca
metabarcodes with Syndinium and Vampyrophrya, Appendicularia metabarcodes with
Vampyrophrya, and Siphonophora metabarcodes with the dinoflagellate Pyrocystis. In the
micro-plankton (Fig. 3B; see also Suppl. Table S2), protist hosts positively associated to
potential symbionts were predominantly comprised of dinoflagellates, again an unsurprising
result given that they are by far the most diverse eukaryotes in the whole Tara-Oceans dataset
(de Vargas et al., 2015). Dinoflagellates were found to be associated almost exclusively with
metabarcodes of MALV-II (Amoebophrya and relatives), but also with metabarcodes of
undetermined MALV-I and a few stramenopile metabarcodes (Labyrinthulea and MAST-1
lineage). Diatoms were next as the hosts with the highest number of positive associations with
potential symbionts. Various diatoms (both centric and pennate) were found to be significantly
associated with an enigmatic basal environmental lineage of choanoflagellates with no
described member. It corresponds to two reference sequences (clones MB04.9 and
SGYW634, GenBank accession numbers FJ176220 and KJ760652, respectively) previously
found in Pacific Ocean samples (Cheung et al., 2008; Lie et al., 2014). Other protist hosts that
produced significant associations with potential symbionts include Acantharea with diverse
MALV-I and a few MALV-II and labyrinthulean metabarcodes, and tintinnid ciliates with a
few MALV-I, MALV-II, and diplonemid metabarcodes.
The effectiveness of the approach used in this study to identify symbiont-host
associations is supported by the fact that well documented cases of symbiotic relationships in
the open ocean plankton were recovered. This holds true for many cases of known host-
parasite relationships, as evidenced by the strong associations observed in the meso-plankton
between copepods and parasites such as the dinoflagellates Blastodinium (Skovgaard et al.,
2012) and Chytriodinium (Gómez et al., 2009), the MALV-IV genus Syndinium (Skovgaard et
al., 2005), the ciliate Vampyrophrya (Grimes and Bradbury, 1992), or gregarine
apicomplexans of the order Cephaloidophorida (Rueckert et al., 2011), and in the micro-
plankton between dinoflagellate hosts and MALV-II Syndiniales (Guillou et al., 2008). This is
true as well for mutualistic photosymbioses that are the main focus of a parallel study (Henry
et al., in prep.). However, it is worth noting that the approach in itself does not allow
discrimination between the various possible types of symbiotic associations that can exist
between a host and its symbiont along the gradient from mutualism to commensalism to
parasitism. Therefore, not all of the associations we detected are expected to represent cases
of parasitism. This is the case in particular for the strong association observed in the micro-
189

Chapitre III
plankton between diatoms and an environmental lineage of choanoflagellates. Freshwater
planktonic diatoms are known to sometimes have small bacterivorous choanoflagellates and
bicoecids attached to them (Carrias et al., 1998; Šimek et al., 2004) and we believe the same
epiphytic relationship may exist in the open ocean plankton between diatoms and this
environmental choanoflagellate lineage. Significant scores could also be obtained for
associations that are only indirect, for instance through an intermediate organism that is both
the symbiont of a larger host and the host of a smaller symbiont.
190
Figure 03: Global view of the patterns of co-occurrence that were recovered inour analyses for the meso-plankton (A) and the micro-plankton (B). Positiveand significant associations between host groups (top) and putative symbiontgroups (bottom) are represented at the level of taxogroups.

Chapitre III
Inversely, the approach we have used will necessarily miss potential symbioses of
interest because of the selection process that we used. For instance, we eliminated
metabarcodes that showed a distribution profile supposedly typical of a free-living organism.
Therefore in cases where a parasite/parasitoid would be about the same size as its host and
restricted to the same size-fraction at all stages of its life cycle, it could not be detected. In
addition, for now in the meso-plankton we focused only on metazoans as potential hosts and
did not investigate large protists present in that size-fraction. Finally, to ensure statistically
significant results we restricted our search for symbiont-host associations to genetic groups
that were present in at least 20% of the samples. This implies that we are missing associations
between hosts and symbionts that involve rarer organisms. This could explain why many
documented host-parasitic relationships involving protists that we know to be present in the
Tara-Oceans dataset were not recovered. For instance, many lineages of cercozoans
(Rhizaria) are known parasites of various eukaryotes; in particular cryomonads like
Cryothecomonas spp. can be parasitoids of diatoms (Thaler and Lovejoy, 2012), while
ascetosporeans like Paradinium spp. are parasites of copepods (Skovgaard and Daugbjerg,
2008) and paramyxeans like Marteilia spp. are parasites of benthic molluscs that infect
planktonic copepods as obligatory intermediate hosts (Audemard et al., 2002). These lineages
are present and relatively diverse in the dataset (see Figure 1), but were not abundant enough
to be tested. Finally, it is important to keep in mind that associations can only be detected
when the infective stage of the parasite and the host co-occur in the samples. The Tara Oceans
sampling was mostly done in the open ocean, but some of the potential parasites identified in
the dataset could have predominantly benthic or coastal hosts (for instance perkinsids
infecting bivalves; e.g. Chambouvet et al., 2014). In that case the observed parasites may only
represent "lost" dispersal stages that never actually meet the host they need to complete their
life cycle.
Towards a better integration of parasites and parasitoids in ecological models
Many of the significant associations that we recovered correspond to well-known
symbiotic relationships, as mentioned above. However we also uncovered a few intriguing
novel associations between protist lineages that will warrant further scrutiny. The putatively
entirely parasitic MALV-I and MALV-II alveolate lineages so far contain only few described
members: Ichthyodinium (a parasite of fish; Skovgaard et al., 2009) and Euduboscquella (a
parasite of ciliates; Coats et al., 2012; Harada et al., 2007) belong to MALV-I, while
Amoebophrya (a parasite of dinoflagellates; Guillou et al., 2008) belongs to MALV-II.
191

Chapitre III
However, the known genetic diversity of both lineages extends far beyond these three genera.
Previous studies have shown that various radiolarian groups (Spumellaria, Nassellaria and
Phaeodarea) can be associated with a large diversity of alveolates symbionts belonging to
these two MALV lineages (Bråte et al., 2012; Dolven et al., 2007). Surprisingly, our results
suggest that a stronger association can actually be found in the open ocean plankton between
MALV-I symbionts and another clade of radiolarians, the Acantharea, which so far had not
been linked to alveolate symbionts.
Associations involving labyrinthulean OTUs (with dinoflagellates and Acantharea) are
also interesting: very little is known of these osmoheterotrophic, mostly marine and substrate-
bound stramenopiles in planktonic habitats (Collado-Mercado et al., 2010). Another
stramenopile lineage showed up in our associations: the environmental MAST-1, correlating
with dinoflagellates. Little is known of this stramenopile lineage, other than its members are
aplastidic (heterotrophic) and some have been shown to be bacterial grazers (Massana et al.,
2014). Perhaps the most interesting association we uncovered is that between tintinnid ciliates
and diplonemids, as the latter are the second most diverse group of protists in the open ocean
plankton but have an unknown life style. This association does only concern a limited number
of diplonemid metabarcodes, however, suggesting that if cases of parasitism exist among
these planktonic diplonemids, they are exceptions rather than the rule. More likely the
majority of these small flagellates are predators of algae. Another intriguing association
uncovered in this study is that involving copepods and neobodonid Kinetoplastida, as these
are so far not known to contain parasitic members (Simpson et al., 2006). Finally, in the
micro-plankton the second most abundant association we recovered (after that between
MALV-II parasites and their dinoflagellate hosts) was that between diatoms and an
environmental lineage of choanoflagellates, that we interpret as epiphytic mutualists or
commensals. This association doesn't seem to be specific, because the concerned
choanoflagellate metabarcodes correlated indiscriminately with both centric and pennate
diatoms; it could however be quite widespread in the open ocean plankton.
Although parasitic/parasitoid organisms are found in all eukaryotic supergroups and
all of them are represented in the Tara-Oceans dataset, myzozoan alveolates (wich include
dinoflagellates, apicomplexans and their relatives) clearly dominate this functional category in
the open ocean plankton. This could be seen as a consequence of a key adaptive feature of
Myzozoa, the apical complex, which ancestrally made these organisms able to feed by
myzocytosis, i.e. by insertion of the cell apex into the surface of the prey cell to suck out their
192

Chapitre III
cytoplasmic contents into food vacuoles, as opposed to the more widespread engulfment of
whole cells by phagocytosis (Schnepf and Deichgräber, 1984; Cavalier-Smith and Chao,
2004). The apical complex was independently modified multiple times during myzozoan
diversification in lineages that acquired a parasitic/parasitoid life style to become structures
allowing infection of the host cell, as observed for instance in perkinsids, Syndiniales, and
apicomplexans (Leander and Keeling, 2003; Gubbels and Duraisingh, 2012). This defining
morphological feature of myzozoan alveolates thus seems to have enabled them to explore
new life styles along the gradient from predators to parasites or parasitoids more successfully
than any other major group of eukaryotes, at least in the plankton. It may also explain in part
the very wide phylogenetic range of their possible prey/hosts (from other alveolates to
radiolarians and metazoans). The huge diversity and abundance of myzozoan OTUs in the
Tara-Oceans dataset confirms earlier results hinting at the unrecognised ecological
importance of these alveolates in marine habitats (Guillou et al., 2008; Lie et al., 2014).
Known types of symbiotic relationships between planktonic eukaryotes are numerous
and sometimes elude classification into discrete categories such as mutualists, commensals,
and parasites. Perhaps they would be more usefully considered as possible states along at least
two overlapping gradients, one ranging from mutually beneficial symbioses to single-sided
symbioses, and the other ranging from predator-prey relationships to parasitoid-host
relationships (Taylor, 1982; Coats, 1999). The evolutionary success of planktonic lineages
comprising relatively large organisms such as copepods, radiolarians, dinoflagellates, and
diatoms must have enabled a huge diversification of smaller organisms that prey on them,
parasitize them, live in mutually beneficial symbioses with them, or in some cases simply live
on them commensally. Inversely, the various small symbionts, parasitoids, or predators that
can be associated with these large organisms imply that multiple, contrasting evolutionary
forces kept driving their diversification. These reflections, together with our results and that of
a parallel study on photosymbioses (Henry et al., in prep.), generally corroborate earlier
suggestions that symbioses between eukaryotes are a key component of open ocean plankton
communities, and that models of plankton ecology should better integrate them (Marcogliese
and Cone, 1997; Hudson et al., 2006; Gleason et al., 2014; Bass et al., 2015; Scholz et al.,
2016). This is especially true for parasites of marine planktonic eukaryotes, which are
believed to play a key part in the regulation of host populations and general ecosystem
equilibrium (Guillou et al., 2008; Gleason et al., 2013, 2015; Jephcott et al., 2016), but
remain critically less studied than other types of symbionts.
193
Chapitre III
References
AUDEMARD, Corinne, LE ROUX, Frédérique, BARNAUD, Antoine, et al. Needle in a
haystack: involvement of the copepod Paracartia grani in the life-cycle of the oyster
pathogen Marteilia refringens. Parasitology, 2002, vol. 124, no 03, p. 315-323.
BASS, David, STENTIFORD, Grant D., LITTLEWOOD, D. T. J., et al. Diverse Applications
of Environmental DNA Methods in Parasitology. Trends in parasitology, 2015, vol. 31, no 10,
p. 499-513.
BERNEY, Cédric, FAHRNI, José, et PAWLOWSKI, Jan. How many novel eukaryotic
'kingdoms'? Pitfalls and limitations of environmental DNA surveys. BMC biology, 2004, vol.
2, no 1, p. 13.
BRÅTE, Jon, KRABBERØD, Anders K., DOLVEN, Jane K., et al. Radiolaria associated with
large diversity of marine alveolates. Protist, 2012, vol. 163, no 5, p. 767-777.
BRÅTE, Jon, LOGARES, Ramiro, BERNEY, Cédric, et al. Freshwater Perkinsea and marine-
freshwater colonizations revealed by pyrosequencing and phylogeny of environmental
rDNA. The ISME journal, 2010, vol. 4, no 9, p. 1144-1153.
CARRIAS, Jean François, AMBLARD, Christian, QUIBLIER LLOBERAS, Catherine,‐ ‐ et
al. Seasonal dynamics of free and attached heterotrophic nanoflagellates in an
oligomesotrophic lake. Freshwater Biology, 1998, vol. 39, no 1, p. 91-101.
CAVALIER-SMITH, Thomas et CHAO, Ema E. Protalveolate phylogeny and systematics and
the origins of Sporozoa and dinoflagellates (phylum Myzozoa nom. nov.).European Journal
of Protistology, 2004, vol. 40, no 3, p. 185-212.
CHAMBOUVET, Aurélie, BERNEY, Cédric, ROMAC, Sarah, et al. Diverse molecular
signatures for ribosomally ‘active’ Perkinsea in marine sediments.BMC microbiology, 2014,
vol. 14, no 1, p. 110.
CHAUDHARY, Kshitiz et ROOS, David S. Protozoan genomics for drug discovery. Nature
biotechnology, 2005, vol. 23, no 9, p. 1089-1091.
CHEUNG, Man Kit, CHU, Ka Hou, LI, Chi Pang, et al. Genetic diversity of picoeukaryotes
in a semi-enclosed harbour in the subtropical western Pacific Ocean. Aquatic Microbial
Ecology, 2008, vol. 53, no 3, p. 295.
COATS, D. Wayne. Parasitic Lite Styles of Marine Dinoflagellates. Journal of Eukaryotic
Microbiology, 1999, vol. 46, p. 402-409.
194

Chapitre III
COATS, D. Wayne, BACHVAROFF, Tsvetan R., et DELWICHE, Charles F. Revision of the
Family Duboscquellidae with Description of Euduboscquella crenulata n. gen., n. sp.
(Dinoflagellata, Syndinea), an Intracellular Parasite of the Ciliate Favella panamensis Kofoid
& Campbell. Journal of Eukaryotic Microbiology, 2012, vol. 59, no 1, p. 1-11.
COLLADO-MERCADO, Enixy, RADWAY, JoAnn C., et COLLIER, Jackie L. Novel
uncultivated labyrinthulomycetes revealed by 18S rDNA sequences from seawater and
sediment samples. Aquatic Microbial Ecology, 2010, vol. 58, no 3, p. 215.
DE VARGAS, Colomban, AUDIC, Stéphane, HENRY, Nicolas, et al. Eukaryotic plankton
diversity in the sunlit ocean. Science, 2015, vol. 348, no 6237, p. 1261605.
DOBSON, Andy, LAFFERTY, Kevin D., KURIS, Armand M., et al. Homage to Linnaeus:
How many parasites? How many hosts?. Proceedings of the National Academy of Sciences,
2008, vol. 105, no Supplement 1, p. 11482-11489.
DOLVEN, Jane K., LINDQVIST, Charlotte, ALBERT, Victor A., et al. Molecular diversity of
alveolates associated with neritic North Atlantic radiolarians. Protist, 2007, vol. 158, no 1, p.
65-76.
GLEASON, Frank H., JEPHCOTT, Thomas G., KÜPPER, Frithjof C., et al. Potential roles
for recently discovered chytrid parasites in the dynamics of harmful algal blooms. Fungal
Biology Reviews, 2015, vol. 29, no 1, p. 20-33.
GLEASON, Frank H., LILJE, Osu, MARANO, Agostina V., et al. Ecological functions of
zoosporic hyperparasites. Frontiers in Microbiology, 2014, vol. 5, p. 244.
GLEASON, Frank H., VAN OGTROP, Floris, LILJE, Osu, et al. Ecological roles of
zoosporic parasites in blue carbon ecosystems. Fungal Ecology, 2013, vol. 6, no 5, p. 319-
327.
GÓMEZ, Fernando, MOREIRA, David, et LÓPEZ-GARCÍA, Purificación. Life cycle and
molecular phylogeny of the dinoflagellates Chytriodinium and Dissodinium, ectoparasites of
copepod eggs. European journal of protistology, 2009, vol. 45, no 4, p. 260-270.
GRIMES, Barbara Hartley et BRADBURY, Phyllis Clarke. The biology of Vampyrophrya
pelagica (Chatton & Lwoff, 1930), a histophagous apostome ciliate associated with marine
calanoid copepods. The Journal of protozoology, 1992, vol. 39, no 1, p. 65-79.
GUBBELS, Marc-Jan et DURAISINGH, Manoj T. Evolution of apicomplexan secretory
organelles. International journal for parasitology, 2012, vol. 42, no 12, p. 1071-1081.
195

Chapitre III
GUILLOU, Laure, VIPREY, Manon, CHAMBOUVET, A., et al. Widespread occurrence and
genetic diversity of marine parasitoids belonging to Syndiniales (Alveolata). Environmental
Microbiology, 2008, vol. 10, no 12, p. 3349-3365.
HARADA, Ai, OHTSUKA, Susumu, et HORIGUCHI, Takeo. Species of the parasitic genus
Duboscquella are members of the enigmatic Marine Alveolate Group I. Protist, 2007, vol.
158, no 3, p. 337-347.
HARTIKAINEN, Hanna, ASHFORD, Oliver S., BERNEY, Cédric, et al. Lineage-specific
molecular probing reveals novel diversity and ecological partitioning of haplosporidians. The
ISME journal, 2014a, vol. 8, no 1, p. 177-186.
HARTIKAINEN, Hanna, STENTIFORD, Grant D., BATEMAN, Kelly S., et al. Mikrocytids
are a broadly distributed and divergent radiation of parasites in aquatic invertebrates. Current
Biology, 2014b, vol. 24, no 7, p. 807-812.
HENRY, Nicolas, DECELLE, Johan, RICHTER Daniel J., et al.. Unveiling photosymbiotic
associations across phylogenetic gradients in world-wide marine plankton based on massive
eukaryotic rDNA metabarcoding. In preparation.
HUDSON, Peter J., DOBSON, Andrew P., et LAFFERTY, Kevin D. Is a healthy ecosystem
one that is rich in parasites?. Trends in Ecology & Evolution, 2006, vol. 21, no 7, p. 381-385.
JEPHCOTT, Thomas G., ALVES-DE-SOUZA, Catharina, GLEASON, Frank H.,et
al. Ecological impacts of parasitic chytrids, syndiniales and perkinsids on populations of
marine photosynthetic dinoflagellates. Fungal Ecology, 2016, vol 19, p. 47-58.
KARSENTI, Eric, ACINAS, Silvia G., BORK, Peer, et al. A holistic approach to marine eco-
systems biology. PLoS biol, 2011, vol. 9, no 10, p. e1001177.
LARA, Enrique, MOREIRA, David, VERESHCHAKA, Alexander, et al. Pan oceanic‐
distribution of new highly diverse clades of deep sea diplonemids. ‐ Environmental
microbiology, 2009, vol. 11, no 1, p. 47-55.
LEANDER, Brian S. et KEELING, Patrick J. Morphostasis in alveolate evolution.Trends in
Ecology & Evolution, 2003, vol. 18, no 8, p. 395-402.
LIE, Alle AY, LIU, Zhenfeng, HU, Sarah K., et al. Investigating microbial eukaryotic
diversity from a global census: insights from a comparison of pyrotag and full-length
sequences of 18S rRNA genes. Applied and environmental microbiology, 2014, vol. 80, no 14,
p. 4363-4373.
196

Chapitre III
LÓPEZ-GARCÍA, Purificación et MOREIRA, David. Tracking microbial biodiversity
through molecular and genomic ecology. Research in microbiology, 2008, vol. 159, no 1, p.
67-73.
LUKEŠ, Julius, FLEGONTOVA, Olga, et HORÁK, Aleš. Diplonemids. Current Biology,
2015, vol. 25, no 16, p. R702-R704.
MARCOGLIESE, David J. et CONE, David K. Food webs: a plea for parasites. Trends in
Ecology & Evolution, 1997, vol. 12, no 8, p. 320-325.
MASSANA, Ramon, DEL CAMPO, Javier, SIERACKI, Michael E., et al. Exploring the
uncultured microeukaryote majority in the oceans: reevaluation of ribogroups within
stramenopiles. The ISME journal, 2014, vol. 8, no 4, p. 854-866.
MASSANA, Ramon et PEDRÓS-ALIÓ, Carlos. Unveiling new microbial eukaryotes in the
surface ocean. Current opinion in microbiology, 2008, vol. 11, no 3, p. 213-218.
MOREIRA, David et LÓPEZ-GARCÍA, Purificación. The molecular ecology of microbial
eukaryotes unveils a hidden world. Trends in microbiology, 2002, vol. 10, no 1, p. 31-38.
POULIN, Robert. Parasite biodiversity revisited: frontiers and constraints. International
journal for parasitology, 2014, vol. 44, no 9, p. 581-589.
POULIN, Robert et MORAND, Serge. The diversity of parasites. Quarterly Review of
Biology, 2000, p. 277-293.
RICHARDS, Thomas A. et BASS, David. Molecular screening of free-living microbial
eukaryotes: diversity and distribution using a meta-analysis. Current opinion in microbiology,
2005, vol. 8, no 3, p. 240-252.
ROHDE, Klaus. Ecology and biogeography of marine parasites. Advances in Marine Biology,
2002, vol. 43, p. 1-83.
RUECKERT, Sonja, SIMDYANOV, Timur G., ALEOSHIN, Vladimir V., et al. Identification
of a divergent environmental DNA sequence clade using the phylogeny of gregarine parasites
(Apicomplexa) from crustacean hosts. PloS one, 2011, vol. 6, no 3, p. e18163-e18163.
SCHNEPF, E. et DEICHGRÄBER, G. “Myzocytosis”, a kind of endocytosis with
implications to compartmentation in endosymbiosis. Naturwissenschaften, 1984, vol. 71, no
4, p. 218-219.
SCHOLZ, Bettina, GUILLOU, Laure, MARANO, Agostina V., et al. Zoosporic parasites
infecting marine diatoms–A black box that needs to be opened. Fungal Ecology, 2016, vol.
19, p. 59-76.
197

Chapitre III
ŠIMEK, Karel, JEZBERA, Jan, HORNÁK, Karel, et al. Role of diatom-attached
choanoflagellates of the genus Salpingoeca as pelagic bacterivores. Aquatic microbial
ecology, 2004, vol. 36, no 3, p. 257-269.
SIMPSON, Alastair GB, STEVENS, Jamie R., et LUKEŠ, Julius. The evolution and diversity
of kinetoplastid flagellates. Trends in parasitology, 2006, vol. 22, no 4, p. 168-174.
SKOVGAARD, Alf, MASSANA, Ramon, BALAGUÉ, Vanessa, et al. Phylogenetic position
of the copepod-infesting parasite Syndinium turbo (Dinoflagellata, Syndinea). Protist, 2005,
vol. 156, no 4, p. 413-423.
SKOVGAARD, Alf et DAUGBJERG, Niels. Identity and systematic position of Paradinium
poucheti and other Paradinium-like parasites of marine copepods based on morphology and
nuclear-encoded SSU rDNA. Protist, 2008, vol. 159, no 3, p. 401-413.
SKOVGAARD, Alf, KARPOV, Sergey A., et GUILLOU, Laure. The Parasitic
Dinoflagellates Blastodinium spp. Inhabiting the Gut of Marine, Planktonic Copepods:
Morphology, Ecology, and Unrecognized Species Diversity.Frontiers in Microbiology, 2012,
vol. 3, p. 305.
SKOVGAARD, Alf, MENESES, Isabel, et ANGÉLICO, Maria Manuel. Identifying the lethal
fish egg parasite Ichthyodinium chabelardi as a member of Marine Alveolate Group
I. Environmental microbiology, 2009, vol. 11, no 8, p. 2030-2041.
STENTIFORD, Grant D., FEIST, Stephen W., STONE, David M., et al. Policy, phylogeny,
and the parasite. Trends in parasitology, 2014, vol. 30, no 6, p. 274-281.
TAYLOR, F. J. R. Symbioses in marine microplankton. Ann. Inst. Oceanogr.(Paris), 1982,
vol. 58, p. 61-91.
THALER, Mary et LOVEJOY, Connie. Distribution and diversity of a protist predator
Cryothecomonas (Cercozoa) in Arctic marine waters. Journal of Eukaryotic Microbiology,
2012, vol. 59, no 4, p. 291-299.
WINDSOR, Donald A. Controversies in parasitology, Most of the species on Earth are
parasites. International journal for parasitology, 1998, vol. 28, no 12, p. 1939-1941.
YABUKI, Akinori et TAME, Akihiro. Phylogeny and Reclassification of Hemistasia
phaeocysticola (Scherffel) Elbrächter & Schnepf, 1996. Journal of Eukaryotic Microbiology,
2015, vol. 62, no 3, p. 426-429.
198

Chapitre III
Supplementary information
199
Table S01: OTUs richness by taxogroups and functional annotationinto three main categories (see Figure 1).
Category Taxogroup OTUs1 - f ree-living life style Alveolata - Dinophyceae 28,6151 - f ree-living life style Rhizaria - Collodaria 18,0321 - f ree-living life style Stramenopiles - Bacillariophyta 8,7881 - f ree-living life style Alveolata - Ciliophora 3,4281 - f ree-living life style Archaeplastida - Chlorophyceae 2,9651 - f ree-living life style Rhizaria - Foraminifera 1,4141 - f ree-living life style incertae sedis - Haptophyta 1,3891 - f ree-living life style Rhizaria - Acantharea 1,2931 - f ree-living life style Opisthokonts - Ascomycota 9601 - f ree-living life style Opisthokonts - Basidiomycota 8841 - f ree-living life style Stramenopiles - Labyrinthulea 8471 - f ree-living life style Rhizaria - other f ilosans* 7891 - f ree-living life style Rhizaria - Spumellaria 7251 - f ree-living life style Archaeplastida - Mamiellophyceae 7121 - f ree-living life style Archaeplastida - Rhodophyta 6391 - f ree-living life style incertae sedis - Katablepharidida 6271 - f ree-living life style Amoebozoa - Tubulinea 6131 - f ree-living life style Stramenopiles - Dictyochophyceae 6091 - f ree-living life style Archaeplastida - Trebouxiophyceae 5731 - f ree-living life style incertae sedis - Cryptophyta 5301 - f ree-living life style incertae sedis - Picomonadida 4951 - f ree-living life style Excavates - Kinetoplastida 4761 - f ree-living life style Stramenopiles - Chrysophyceae 4701 - f ree-living life style Rhizaria - RAD-B (Sticholonche & relatives) 4651 - f ree-living life style Archaeplastida - other core chlorophytes 4441 - f ree-living life style Excavates - Heterolobosea 4411 - f ree-living life style Archaeplastida - Ulvophyceae 4361 - f ree-living life style Rhizaria - Nassellaria & Eucyrtidium* 4351 - f ree-living life style Archaeplastida - Prasinophyceae clade 7 3911 - f ree-living life style incertae sedis - Telonemida 3891 - f ree-living life style Rhizaria - Phaeodaria 3741 - f ree-living life style Archaeplastida - Streptophyta 3681 - f ree-living life style Excavates - Euglenida 3501 - f ree-living life style Stramenopiles - other Ochrophyta* 3391 - f ree-living life style Stramenopiles - Bicoecea 2861 - f ree-living life style Rhizaria - RAD-A 2581 - f ree-living life style Stramenopiles - Pelagophyceae 2551 - f ree-living life style Opisthokonts - Choanof lagellatea 2481 - f ree-living life style Amoebozoa - Macromycetozoa 2461 - f ree-living life style incertae sedis - Centrohelida 1971 - f ree-living life style Rhizaria - Chlorarachnea 1851 - f ree-living life style Stramenopiles - Oomycota 1771 - f ree-living life style Archaeplastida - Pyramimonadales 1601 - f ree-living life style Archaeplastida - other prasinophytes 1381 - f ree-living life style Rhizaria - Cryomonadida 1221 - f ree-living life style incertae sedis - apusozoans* 1191 - f ree-living life style Rhizaria - other endomyxans* 1081 - f ree-living life style Rhizaria - Ebriida 951 - f ree-living life style Alveolata - chromerids & colpodellids* 861 - f ree-living life style Opisthokonts - Chytridiomycota 791 - f ree-living life style Stramenopiles - Bolidophyceae & relatives 741 - f ree-living life style Stramenopiles - other heterotrophic stramenopiles* 701 - f ree-living life style Amoebozoa - other Lobosa 611 - f ree-living life style Amoebozoa - Variosea 611 - f ree-living life style Stramenopiles - Phaeophyceae 451 - f ree-living life style Stramenopiles - MOCH-3 431 - f ree-living life style Opisthokonts - other low er Fungi* 411 - f ree-living life style Stramenopiles - Raphidophyceae 411 - f ree-living life style Amoebozoa - Vannellida 281 - f ree-living life style Stramenopiles - MOCH-1, 2 261 - f ree-living life style Stramenopiles - Pinguiophyceae 251 - f ree-living life style Amoebozoa - Dactylopodida 23

Chapitre III
200
Table S01 (continued)Category Taxogroup OTUs
1 - f ree-living life style Stramenopiles - MOCH-5 231 - f ree-living life style Alveolata - other myzozoans* 201 - f ree-living life style Stramenopiles - MOCH-4 161 - f ree-living life style Excavates - Jakobida 91 - f ree-living life style incertae sedis - other eukaryotes* 81 - f ree-living life style Opisthokonts - Mesomycetozoa* 21 - f ree-living life style Rhizaria - RAD-C 1
2 - parasitic, parasitoid, or amphizoic life style Alveolata - core Apicomplexa 3,4022 - parasitic, parasitoid, or amphizoic life style Alveolata - MALV-I + MALV-IV 2,2152 - parasitic, parasitoid, or amphizoic life style Alveolata - MALV-II 2,1252 - parasitic, parasitoid, or amphizoic life style Alveolata - Dinophyceae 1,5062 - parasitic, parasitoid, or amphizoic life style Rhizaria - Ascetosporea 4852 - parasitic, parasitoid, or amphizoic life style Amoebozoa - Vannellida 2642 - parasitic, parasitoid, or amphizoic life style Opisthokonts - Mesomycetozoa* 2272 - parasitic, parasitoid, or amphizoic life style Opisthokonts - Microsporidiomycota 2262 - parasitic, parasitoid, or amphizoic life style Amoebozoa - Dactylopodida 1852 - parasitic, parasitoid, or amphizoic life style Alveolata - Ciliophora 1542 - parasitic, parasitoid, or amphizoic life style Amoebozoa - other Lobosa 1522 - parasitic, parasitoid, or amphizoic life style Alveolata - Perkinsea 1182 - parasitic, parasitoid, or amphizoic life style Stramenopiles - Oomycota 1022 - parasitic, parasitoid, or amphizoic life style Stramenopiles - Labyrinthulea 962 - parasitic, parasitoid, or amphizoic life style Opisthokonts - other low er Fungi* 892 - parasitic, parasitoid, or amphizoic life style Opisthokonts - Ascomycota 762 - parasitic, parasitoid, or amphizoic life style Rhizaria - Phytomyxea & relatives 662 - parasitic, parasitoid, or amphizoic life style Excavates - Kinetoplastida 652 - parasitic, parasitoid, or amphizoic life style Amoebozoa - Tubulinea 542 - parasitic, parasitoid, or amphizoic life style Stramenopiles - Pirsonia lineage 442 - parasitic, parasitoid, or amphizoic life style Alveolata - other myzozoans* 432 - parasitic, parasitoid, or amphizoic life style Rhizaria - other f ilosans* 262 - parasitic, parasitoid, or amphizoic life style Rhizaria - Cryomonadida 132 - parasitic, parasitoid, or amphizoic life style Excavates - Heterolobosea 62 - parasitic, parasitoid, or amphizoic life style Amoebozoa - Variosea 12 - parasitic, parasitoid, or amphizoic life style Opisthokonts - Cristidiscoidea 12 - parasitic, parasitoid, or amphizoic life style Opisthokonts - Cryptomycota 1
3 - unknow n life style Excavates - Diplonemida 30,5093 - unknow n life style Alveolata - Dinophyceae 10,1593 - unknow n life style Stramenopiles - MAST-3, 12 1,1373 - unknow n life style Stramenopiles - MAST-4, 6, 7, 8, 9, 10, 11 8033 - unknow n life style Rhizaria - other f ilosans* 5233 - unknow n life style Rhizaria - Cryomonadida 4303 - unknow n life style Stramenopiles - MAST-1 3253 - unknow n life style incertae sedis - other eukaryotes* 1323 - unknow n life style Rhizaria - Ebriida 1133 - unknow n life style Opisthokonts - Choanof lagellatea 1113 - unknow n life style Stramenopiles - other MASTs* 1083 - unknow n life style Alveolata - Perkinsea 713 - unknow n life style Rhizaria - other endomyxans* 713 - unknow n life style Alveolata - MALV-III 603 - unknow n life style Alveolata - MALV-V 473 - unknow n life style Stramenopiles - MAST-16, 22, 24 463 - unknow n life style Excavates - Kinetoplastida 393 - unknow n life style Opisthokonts - Cristidiscoidea 313 - unknow n life style Rhizaria - Chlorarachnea 283 - unknow n life style Rhizaria - Phytomyxea & relatives 163 - unknow n life style Opisthokonts - Cryptomycota 153 - unknow n life style Amoebozoa - other Lobosa 133 - unknow n life style Amoebozoa - environmental lineage LKM74 113 - unknow n life style Alveolata - Ciliophora 93 - unknow n life style Alveolata - other myzozoans* 93 - unknow n life style Amoebozoa - Dactylopodida 53 - unknow n life style Rhizaria - Ascetosporea 43 - unknow n life style Alveolata - chromerids & colpodellids* 1

Chapitre III
201
Table S02: Summary of the positive and significant associations found for the meso-plancton(see Figure 3A). When the taxonomic assignment was not accurate enough to link ametabarcode to a genus, the “host genus” and “symbiont genus” fields indicate the next mostprecise taxonomic rank available.
Symbiont taxogroup Symbiont genus Host taxogroup Host genus
Ciliophora Gymnodinioides Appendicularia Appendicularia_X 146Ciliophora Gymnodinioides Copepoda Oncaea 54Ciliophora Hyalophysa Copepoda Gaetanus 124Ciliophora Hyalophysa Copepoda Calanoida 107Ciliophora Hyalophysa Copepoda Calanidae 49Ciliophora Hyalophysa Copepoda Neocalanus 11Ciliophora Hyalophysa Copepoda Euchaeta 2Ciliophora Oligohymenophorea Copepoda Oncaea 18Ciliophora Paracineta Copepoda Euchaeta 18Ciliophora Paracineta Copepoda Gaetanus 1Ciliophora Vampyrophrya Copepoda Acartia 6,414Ciliophora Vampyrophrya Copepoda Calanoida_X 5,988Ciliophora Vampyrophrya Copepoda Temora 5,085Ciliophora Vampyrophrya Copepoda Calanidae 4,122Ciliophora Vampyrophrya Copepoda Paracalanidae_X 2,631Ciliophora Vampyrophrya Appendicularia Appendicularia_X 2,190Ciliophora Vampyrophrya Copepoda Oncaea 1,602Ciliophora Vampyrophrya Copepoda Calanoida 427Ciliophora Vampyrophrya Copepoda Euchaeta 74Ciliophora Vampyrophrya Copepoda Neocalanus 30Ciliophora Vampyrophrya Maxillopoda Maxillopoda 20Ciliophora Vampyrophrya Maxillopoda Maxillopoda_X 20Ciliophora Vampyrophrya Copepoda Subeucalanus 10Ciliophora Vampyrophrya Eumalacostraca Eumalacostraca 8Ciliophora Vampyrophrya Copepoda Paracalanus 1
core Apicomplexa Piroplasmida_X Copepoda Paracalanidae_X 147core Apicomplexa Piroplasmida_X Copepoda Calanoida 16core Apicomplexa Piroplasmida_X Copepoda Calanidae 2core Apicomplexa Piroplasmida_X Copepoda Neocalanus 1core Apicomplexa Thiriotia_lineage Copepoda Oncaea 1,839core Apicomplexa Thiriotia_lineage Copepoda Copepoda_X 1,250core Apicomplexa Thiriotia_lineage Copepoda Copepoda 12core Apicomplexa Thiriotia_lineage_X Copepoda Oncaea 58,848core Apicomplexa Thiriotia_lineage_X Copepoda Copepoda_X 40,000core Apicomplexa Thiriotia_lineage_X Copepoda Copepoda 384
Dinophyceae Blastodinium Copepoda Copepoda 123,602Dinophyceae Blastodinium Copepoda Corycaeus 46,134Dinophyceae Blastodinium Copepoda Oncaea 18,880Dinophyceae Blastodinium Copepoda Copepoda_X 11,250Dinophyceae Blastodinium Copepoda Calanoida_X 183Dinophyceae Blastodinium Copepoda Acartia 68Dinophyceae Blastodinium Copepoda Calanoida 43Dinophyceae Blastodinium Copepoda Paracalanidae_X 41Dinophyceae Blastodinium Copepoda Calanidae 24Dinophyceae Blastodinium Copepoda Subeucalanus 3Dinophyceae Blastodinium_02 Copepoda Oncaea 3,678Dinophyceae Blastodinium_02 Copepoda Copepoda_X 2,500Dinophyceae Blastodinium_02 Copepoda Copepoda 24Dinophyceae Chytriodinium Copepoda Oncaea 2,892Dinophyceae Chytriodinium Copepoda Calanidae 814Dinophyceae Chytriodinium Copepoda Acartia 728Dinophyceae Chytriodinium Copepoda Paracalanidae_X 570Dinophyceae Chytriodinium Copepoda Calanoida 46Dinophyceae Chytriodinium Copepoda Calanoida_X 18Dinophyceae Chytriodinium Copepoda Neocalanus 6Dinophyceae Chytriodinium Maxillopoda Maxillopoda 4Dinophyceae Chytriodinium Maxillopoda Maxillopoda_X 4Dinophyceae Gymnodinium Copepoda Calanoida_X 11,784Dinophyceae Gymnodinium Copepoda Acartia 4,896
Number of associations

Chapitre III
202
Table S02 (continued)
Symbiont genus Host taxogroup Host genus
Dinophyceae Gymnodinium Copepoda Paracalanidae_X 3,576Dinophyceae Gymnodinium Copepoda Copepoda 1,367Dinophyceae Gymnodinium Copepoda Calanoida 576Dinophyceae Gymnodinium Copepoda Oncaea 432Dinophyceae Gymnodinium Copepoda Calanidae 48Dinophyceae Gymnodinium Copepoda Neocalanus 24Dinophyceae Pelagodinium Copepoda Oncaea 34,941Dinophyceae Pelagodinium Copepoda Copepoda 26,201Dinophyceae Pelagodinium Copepoda Copepoda_X 23,750Dinophyceae Pelagodinium Copepoda Calanidae 430Dinophyceae Pelagodinium Copepoda Acartia 428Dinophyceae Pelagodinium Copepoda Calanoida_X 187Dinophyceae Pelagodinium Copepoda Paracalanidae_X 153Dinophyceae Pelagodinium Copepoda Calanoida 43Dinophyceae Pelagodinium Copepoda Candacia 5Dinophyceae Pelagodinium Copepoda Neocalanus 3Dinophyceae Pelagodinium Maxillopoda Maxillopoda 2Dinophyceae Pelagodinium Maxillopoda Maxillopoda_X 2Dinophyceae Pelagodinium Copepoda Subeucalanus 1Dinophyceae Peridiniales Copepoda Oncaea 4,609Dinophyceae Peridiniales Copepoda Calanidae 405Dinophyceae Peridiniales Copepoda Paracalanidae_X 34Dinophyceae Peridiniales Copepoda Calanoida 3Dinophyceae Peridiniales Maxillopoda Maxillopoda 2Dinophyceae Peridiniales Maxillopoda Maxillopoda_X 2Dinophyceae Peridiniales Copepoda Neocalanus 2Dinophyceae Peridiniales Copepoda Calanoida_X 1Dinophyceae Pyrocystis Copepoda Calycophorae 68Dinophyceae Pyrocystis Siphonophora Siphonophora 1Kinetoplastida Neobodo Copepoda Corycaeus 7Kinetoplastida Neobodo Copepoda Euchaeta 7
MALV-IV Hematodinium Copepoda Gaetanus 248MALV-IV Hematodinium Copepoda Calanoida 214MALV-IV Hematodinium Copepoda Neocalanus 18MALV-IV Hematodinium Copepoda Euchaeta 4MALV-IV Syndinium Copepoda Calanidae 405MALV-IV Syndinium Copepoda Calanoida_X 65MALV-IV Syndinium Copepoda Acartia 54MALV-IV Syndinium Eumalacostraca Eumalacostraca 53MALV-IV Syndinium Copepoda Oncaea 25MALV-IV Syndinium Copepoda Calanoida 9MALV-IV Syndinium Maxillopoda Maxillopoda 2MALV-IV Syndinium Maxillopoda Maxillopoda_X 2MALV-IV Syndinium Copepoda Neocalanus 2MALV-IV Syndinium Copepoda Copepoda 1MALV-IV Syndinium Copepoda Paracalanidae_X 1MALV-II Amoebophrya Copepoda Oncaea 5,517MALV-II Amoebophrya Copepoda Copepoda_X 3,750MALV-II Amoebophrya Copepoda Copepoda 36MALV-II Malv_II_clade_04_X Copepoda Oncaea 11,034MALV-II Malv_II_clade_04_X Copepoda Copepoda_X 7,500MALV-II Malv_II_clade_04_X Copepoda Copepoda 72
Symbiont taxogroup
Number of associations

Chapitre III
203
Table S03: Summary of the positive and significant associations found for the micro-plancton (see Figure 3B). Same convention as in Table S02 for the “host genus” and“symbiont genus” fields.
Symbiont taxogroup Symbiont genus Host taxogroup Host genus
Choanof lagellatea Choanozoa_U1_X1 Bacillariophyta Bacillariophyceae 471Choanof lagellatea Choanozoa_U1_X1 Bacillariophyta Mediophyceae 342Choanof lagellatea Choanozoa_U1_X1 Bacillariophyta Chaetoceros 288Choanof lagellatea Choanozoa_U1_X1 Bacillariophyta Planktoniella 174Choanof lagellatea Choanozoa_U1_X1 Bacillariophyta Bacillariophyceae_X 153Choanof lagellatea Choanozoa_U1_X1 Bacillariophyta Thalassiosira 111Choanof lagellatea Choanozoa_U1_X1 Bacillariophyta Pseudo-nitzschia 78Choanof lagellatea Choanozoa_U1_X1 Bacillariophyta Rhizosolenids_X 63Choanof lagellatea Choanozoa_U1_X1 Bacillariophyta Proboscia 57Choanof lagellatea Choanozoa_U1_X1 Bacillariophyta Eucampia 39Choanof lagellatea Choanozoa_U1_X1 Bacillariophyta Bacillariophyta 30Choanof lagellatea Choanozoa_U1_X1 Bacillariophyta Fragilariopsis 27Choanof lagellatea Choanozoa_U1_X1 Bacillariophyta Rhizosolenia 27Choanof lagellatea Choanozoa_U1_X1 Bacillariophyta Guinardia 21Choanof lagellatea Choanozoa_U1_X1 Bacillariophyta Synedra 21Choanof lagellatea Choanozoa_U1_X1 Bacillariophyta Mediophyceae_X 18Choanof lagellatea Choanozoa_U1_X1 Bacillariophyta Navicula 15Choanof lagellatea Choanozoa_U1_X1 Bacillariophyta Corethron 9Choanof lagellatea Choanozoa_U1_X1 Bacillariophyta Cymbella 9Choanof lagellatea Choanozoa_U1_X1 Bacillariophyta Dactyliosolen 9Choanof lagellatea Choanozoa_U1_X1 Bacillariophyta Skeletonema 9Choanof lagellatea Choanozoa_U1_X1 Bacillariophyta Bacillariophytina 6Choanof lagellatea Choanozoa_U1_X1 Bacillariophyta Biddulphia 6Choanof lagellatea Choanozoa_U1_X1 Bacillariophyta Cylindrotheca 6Choanof lagellatea Choanozoa_U1_X1 Bacillariophyta Haslea 6Choanof lagellatea Choanozoa_U1_X1 Bacillariophyta Leptocylindrus 6Choanof lagellatea Choanozoa_U1_X1 Bacillariophyta Pleurosigma 6Choanof lagellatea Choanozoa_U1_X1 Bacillariophyta Rhizosolenids 6Choanof lagellatea Choanozoa_U1_X1 Bacillariophyta Amphiprora 3Choanof lagellatea Choanozoa_U1_X1 Bacillariophyta Cyclophora 3Choanof lagellatea Choanozoa_U1_X1 Bacillariophyta Ditylum 3Choanof lagellatea Choanozoa_U1_X1 Bacillariophyta Lithodesmium 3Choanof lagellatea Choanozoa_U1_X1 Bacillariophyta Minidiscus 3Choanof lagellatea Choanozoa_U1_X1 Bacillariophyta Odontella 3Choanof lagellatea Choanozoa_U1_X1 Bacillariophyta Rhaphoneis 3
Diplonemida Diplonemida_X Ciliophora Salpingella 5Diplonemida Diplonemida_X Ciliophora uncultured tintinnid ciliate 5
Labyrinthulea Labyrinthulea Dinophyceae 69Labyrinthulea Labyrinthulea Dinophyceae Dinophyceae 12Labyrinthulea Labyrinthulea Acantharea Dorataspidae_E4 8Labyrinthulea Labyrinthulea Dinophyceae Gyrodinium 3Labyrinthulea Labyrinthulea Acantharea Acanthophracta_E3_X 2Labyrinthulea Labyrinthulea Acantharea Hexaconus 1Labyrinthulea Labyrinthulea Dinophyceae Peridiniales 1Labyrinthulea Thraustochytrium Dinophyceae Peridinium_03 69Labyrinthulea Thraustochytrium Dinophyceae Dinophyceae 12Labyrinthulea Thraustochytrium Acantharea Dorataspidae_E4 8Labyrinthulea Thraustochytrium Dinophyceae Gyrodinium 3Labyrinthulea Thraustochytrium Acantharea Acanthophracta_E3_X 2Labyrinthulea Thraustochytrium Acantharea Hexaconus 1Labyrinthulea Thraustochytrium Dinophyceae Peridiniales 1
MALV-I Malv_I_clade_1_X Acantharea Heteracon 16MALV-I Malv_I_clade_1_X Acantharea Conaconidae_C3 13MALV-I Malv_I_clade_1_X Acantharea Conaconidae_C1 3MALV-I Malv_I_clade_1_X Bacillariophyta Proboscia 3MALV-I Malv_I_clade_1_X Acantharea Stauracanthidae_F3 3MALV-I Malv_I_clade_1_X Acantharea Chaunacanthida_C 2MALV-I Malv_I_clade_1_X Acantharea Acanthometridae_F3 1MALV-I Malv_I_clade_1_X Acantharea Acanthometridae_F3_X 1
Number of associations
Peridinium_03

Chapitre III
204
Table S03 (continued)
Symbiont genus Host taxogroup Host genus
MALV-I Malv_I_clade_1_X Acantharea Litholophus 1MALV-I Malv_I_clade_2_X Ciliophora Salpingella 4MALV-I Malv_I_clade_3_X Dinophyceae 345MALV-I Malv_I_clade_3_X Dinophyceae Gymnodinium 217MALV-I Malv_I_clade_3_X Dinophyceae Dinophyceae 184MALV-I Malv_I_clade_3_X Acantharea Arthra_Symphy_E1E2 160MALV-I Malv_I_clade_3_X Acantharea Heteracon 128MALV-I Malv_I_clade_3_X Acantharea Conaconidae_C3 104MALV-I Malv_I_clade_3_X Dinophyceae AY664956_gen 43MALV-I Malv_I_clade_3_X Dinophyceae Gyrodinium 31MALV-I Malv_I_clade_3_X Dinophyceae AY664890_gen 24MALV-I Malv_I_clade_3_X Acantharea Conaconidae_C1 24MALV-I Malv_I_clade_3_X Acantharea Acanthometridae_F3 18MALV-I Malv_I_clade_3_X Acantharea Chaunacanthida_C 16MALV-I Malv_I_clade_3_X Dinophyceae Peridiniales 13MALV-I Malv_I_clade_3_X Dinophyceae AY664961_gen 10MALV-I Malv_I_clade_3_X Dinophyceae AY664900_gen 8MALV-I Malv_I_clade_3_X Acantharea Litholophus 8MALV-I Malv_I_clade_3_X Acantharea Dorataspidae_E4 6MALV-I Malv_I_clade_3_X Dinophyceae AY664964_gen 5MALV-I Malv_I_clade_3_X Acantharea Acanthometridae_F3_X 2MALV-I Malv_I_clade_3_X Dinophyceae Gonyaulax 2MALV-I Malv_I_clade_3_X Acantharea Stauracanthidae_F3 2MALV-I Malv_I_clade_4_X Dinophyceae 69MALV-I Malv_I_clade_4_X Dinophyceae Gymnodinium 27MALV-I Malv_I_clade_4_X Dinophyceae Dinophyceae 25MALV-I Malv_I_clade_4_X Acantharea Dorataspidae_E4 8MALV-I Malv_I_clade_4_X Dinophyceae Gyrodinium 5MALV-I Malv_I_clade_4_X Dinophyceae AY664890_gen 3MALV-I Malv_I_clade_4_X Dinophyceae Prorocentrum 3MALV-I Malv_I_clade_4_X Acantharea Acanthophracta_E3_X 2MALV-I Malv_I_clade_4_X Dinophyceae AY664957_gen 2MALV-I Malv_I_clade_4_X Dinophyceae Peridiniales 2MALV-I Malv_I_clade_4_X Dinophyceae AY664956_gen 1MALV-I Malv_I_clade_4_X Acantharea Hexaconus 1MALV-I Malv_I_clade_5_X Dinophyceae Dinophyceae 8MALV-I Malv_I_clade_5_X Dinophyceae 6MALV-I Malv_I_clade_5_X Dinophyceae AY664957_gen 2MALV-I Malv_I_X Acantharea Stauracanthidae_F3 300MALV-I Malv_I_X Dinophyceae Pelagodinium 285MALV-II Amoebophrya Dinophyceae AY664900_gen 8,832MALV-II Amoebophrya Dinophyceae Dinophyceae 2,688MALV-II Amoebophrya Dinophyceae 2,208MALV-II Amoebophrya Dinophyceae Gyrodinium 1,312MALV-II Amoebophrya Ciliophora Eutintinnus 576MALV-II Amoebophrya Dinophyceae Noctiluca 320MALV-II Amoebophrya Dinophyceae Peridiniales 128MALV-II Amoebophrya Dinophyceae AY664890_gen 96MALV-II Amoebophrya Dinophyceae AY665026_gen 96MALV-II Amoebophrya Dinophyceae Karlodinium 96MALV-II Amoebophrya Dinophyceae Prorocentrum 96MALV-II Amoebophrya Dinophyceae AY664956_gen 64MALV-II Amoebophrya Dinophyceae AY664957_gen 32MALV-II Amoebophrya Dinophyceae Azadinium 32MALV-II Amoebophrya Dinophyceae Blastodinium 32MALV-II Amoebophrya Dinophyceae EF527108_gen 32MALV-II Amoebophrya Dinophyceae Gymnodiniales 32MALV-II Amoebophrya Dinophyceae Uncultured-X 32MALV-II Amoebophrya Acantharea Conaconidae_C3 23
Symbiont taxogroup
Number of associations
Peridinium_03
Peridinium_03
Gyrodinium_05
Peridinium_03

Chapitre III
205
Table S03 (continued)
Symbiont genus Host taxogroup Host genus
MALV-II Malv_II_clade_04 Dinophyceae AY664900_gen 2,484MALV-II Malv_II_clade_04 Dinophyceae Dinophyceae 756MALV-II Malv_II_clade_04 Dinophyceae 621MALV-II Malv_II_clade_04 Dinophyceae Gyrodinium 369MALV-II Malv_II_clade_04 Ciliophora Eutintinnus 162MALV-II Malv_II_clade_04 Dinophyceae Noctiluca 90MALV-II Malv_II_clade_04 Dinophyceae Peridiniales 36MALV-II Malv_II_clade_04 Dinophyceae AY664890_gen 27MALV-II Malv_II_clade_04 Dinophyceae AY665026_gen 27MALV-II Malv_II_clade_04 Dinophyceae Karlodinium 27MALV-II Malv_II_clade_04 Dinophyceae Prorocentrum 27MALV-II Malv_II_clade_04 Dinophyceae AY664956_gen 18MALV-II Malv_II_clade_04 Dinophyceae AY664957_gen 9MALV-II Malv_II_clade_04 Dinophyceae Azadinium 9MALV-II Malv_II_clade_04 Dinophyceae Blastodinium 9MALV-II Malv_II_clade_04 Dinophyceae EF527108_gen 9MALV-II Malv_II_clade_04 Dinophyceae Gymnodiniales 9MALV-II Malv_II_clade_04 Dinophyceae Uncultured-X 9MALV-II Malv_II_clade_04 Acantharea Conaconidae_C3 3MALV-II Malv_II_clade_04_X Dinophyceae AY664900_gen 5,244MALV-II Malv_II_clade_04_X Dinophyceae Dinophyceae 1,596MALV-II Malv_II_clade_04_X Dinophyceae 1,311MALV-II Malv_II_clade_04_X Dinophyceae Gyrodinium 779MALV-II Malv_II_clade_04_X Ciliophora Eutintinnus 342MALV-II Malv_II_clade_04_X Dinophyceae Noctiluca 190MALV-II Malv_II_clade_04_X Dinophyceae Peridiniales 76MALV-II Malv_II_clade_04_X Dinophyceae AY664890_gen 57MALV-II Malv_II_clade_04_X Dinophyceae AY665026_gen 57MALV-II Malv_II_clade_04_X Dinophyceae Karlodinium 57MALV-II Malv_II_clade_04_X Dinophyceae Prorocentrum 57MALV-II Malv_II_clade_04_X Dinophyceae AY664956_gen 38MALV-II Malv_II_clade_04_X Dinophyceae AY664957_gen 19MALV-II Malv_II_clade_04_X Dinophyceae Azadinium 19MALV-II Malv_II_clade_04_X Dinophyceae Blastodinium 19MALV-II Malv_II_clade_04_X Dinophyceae EF527108_gen 19MALV-II Malv_II_clade_04_X Dinophyceae Gymnodiniales 19MALV-II Malv_II_clade_04_X Dinophyceae Uncultured-X 19MALV-II Malv_II_clade_04_X Acantharea Conaconidae_C3 15MALV-II Malv_II_clade_22_X Acantharea Dorataspidae_E4 7MALV-II Malv_II_X Dinophyceae Gymnodinium 7MAST-1 MAST_1B_X Dinophyceae Prorocentrum 3MAST-1 MAST_1B_X Dinophyceae AY664957_gen 2MAST-1 MAST_1D_X Dinophyceae Prorocentrum 15MAST-1 MAST_1D_X Dinophyceae Dinophyceae 12MAST-1 MAST_1D_X Dinophyceae 12MAST-1 MAST_1D_X Dinophyceae AY664957_gen 10
Symbiont taxogroup
Number of associations
Peridinium_03
Peridinium_03
Gyrodinium_05

Conclusion et perspectives
Conclusion et perspectives
Les symbiotes au sens large (parasites ou mutualistes) sont des acteurs majeurs des
écosystèmes planctoniques (Skovgaard, 2014; Decelle et al., 2015). Les parasites, et plus
particulièrement les parasitoïdes, redistribuent l'énergie au sein de ces systèmes à la manière
des virus, et constituent, une force majeure permettant la remise à disposition de la matière
organique accumulée par des organismes protégés des prédateurs grâce à des protections
physiques (frustules des diatomées) ou chimiques (composés allélopathiques, composés
secondaires) (Kagami et al., 2007; Chambouvet et al., 2008). De par leur abondance, leurs
phases de dispersion peuvent représenter une part importante de l'alimentation de différents
prédateurs planctoniques (copépodes, ciliés, dinoflagellés) (Salomon et al., 2009; Siano et al.,
2011). Les photosymbiontes (mutualistes) quant à eux, permettent à des organismes
hétérotrophes, généralement de grande taille, d'obtenir une partie de leur énergie par le biais
de la photosynthèse (Decelle et al., 2012; Probert et al., 2014). Des géants du plancton de
quelques millimètres (collodaires) participent alors de manière non négligeable à la
production primaire et aux flux de carbone, particulièrement dans les environnements
oligotrophes (Michaels et al., 1995; Dennett et al., 2002).
Les études présentées dans ce manuscrit mettent en évidence l'importante diversité et
abondance des organismes en symbiose (de Vargas et al., 2015b) dans le plancton (hôtes et
symbiotes) mais illustrent aussi l'ampleur du manque de connaissance à leur sujet. L'étude par
réseaux de cooccurrences des organismes des communautés planctoniques apparaît comme
une manière rapide de détecter des associations symbiotiques (Lima-Mendez et al., 2015). En
effet, les symbiotes étant généralement de petite taille, leur présence dans les grandes
fractions de taille serait en toute logique entièrement expliquée par la présence de leur hôtes.
Cependant, du fait de la complexité des modes de vies symbiotiques et du nombre potentiel
d'interactions, il s'avère être très difficile de détecter de nouvelles symbioses grâce aux
réseaux de cooccurrences sans adaptation de la méthode au préalable. Les principaux
obstacles à la détection de symbioses sont l'impossibilité de différencier une association
symbiotique de la simple coprésence de deux organismes n'ayant aucun contact physique
(niche écologique similaire) et la présence dans le plancton de symbioses peu spécifiques
(Decelle et al., 2012).
206

Conclusion et perspectives
Le premier obstacle peut être surmonté en étudiant l'assignation taxinomique des deux
entités statistiquement associées. Il est alors possible de retrouver des symbiotes ou des hôtes
déjà connus et d'émettre des hypothèses sur la véracité des associations les impliquant avec
des partenaires jusque là non décris comme étant en symbiose. Mais cette démarche est
fastidieuse, particulièrement lorsqu'il s'agit d'analyser plusieurs milliers d'associations (Lima-
Mendez et al., 2015). De plus, lorsque le réseau de cooccurrences a été généré à partir de
données de metabarcoding, il est délicat et réducteur de travailler avec l'assignation
taxinomique car une proportion non négligeable des metabarcodes (correspondant aux nœuds
dans le réseau) est génétiquement très éloignée de séquences de référence (de Vargas et al.,
2015b), ce qui produit des assignations imprécises, pas toujours au niveau du genre ou de
l'espèce. Une idée développée dans la troisième partie de ce manuscrit permettrait de
surmonter ce problème. En effet, les symbiotes, du fait de leurs cycles de vie, présentent une
distribution particulière le long des fractions de taille. Le genre Blastodinium (dinoflagellé)
parasite de copépodes en est un parfait exemple. Il est particulièrement présent dans le
piconano-plancton (0,8-5 µm) et le nano-plancton (5-20 µm) correspondant à sa phase libre
mais aussi dans le meso-plancton (180-2000 µm), fraction de taille dans laquelle ces hôtes
(copépodes adultes) sont particulièrement abondants (Skovgaard et al., 2012; Henry et al. in
prep.). Il semble alors possible de différencier automatiquement les symbiotes des autres
organismes en analysant la distribution des metabarcodes le long des fractions de taille
(Figure 9). Il est cependant indispensable de travailler avec un jeu de données issu d'une étude
par metabarcoding d'échantillons environnementaux soigneusement séparés par fraction de
taille. Alors que cela semble relativement aisé pour des échantillons provenant
d'environnements aquatiques, il peut s'avérer plus difficile d'appliquer ce fractionnement à
d'autres types d'environnement comme les sols. Dans son état actuel la méthode proposée
dans ce manuscrit pour étudier la distribution des metabarcodes parmi les fractions de taille
(très conservative pour les symbiotes) ne permet pas de différencier les symbiotes des
organismes ayant des cycles ou mode de vie leur permettant d'être abondants dans plusieurs
fractions de taille (formation de colonies, production de gamètes) (Figure 5). Cette méthode
nécessite donc d'être affinée afin de capturer au mieux les symbiotes et donc d'éliminer au
maximum le nombre d'association non symbiotiques d'un réseau de cooccurrences.
207

Conclusion et perspectives
Afin de surmonter le second obstacle, c'est à dire la présence de symbioses peu
spécifiques dans le plancton, une solution a également été proposée dans la troisième partie du
manuscrit. Il s'agit, lors de l'inférence d'un réseau de cooccurrences de comparer l'abondance
de groupes génétiques définis à différents niveaux de résolution. Cette méthode permet par
exemple dans le cas de la symbiose entre Symbiodinium et Tiarina sp. de détecter cette
association au niveau de spécificité observé lors de la description de la symbiose. Cette
méthode permet de capturer le niveau de spécificité d'une interaction et le score d'association
qui lui est associé. Elle permet ainsi de révéler des interactions peu spécifiques qui passent
inaperçues lorsque l'on compare les abondances de metabarcodes ou d'OTUs issus d'un
clustering résolutif (97 %, 99 %, swarm -d 1).
Les solutions présentées dans ce manuscrit ne sont que les prémices d'une méthode
d'inférence de réseaux de cooccurrences alliant écologie (étude des cycles de vie) et
phylogénie (comparaison de groupes génétiques à différents niveaux de résolution) dédiée à la
détection de symbioses et de leur histoire évolutive. Les études menées dans le cadre de la
théorie des réseaux concernent de plus en plus l'analyses des réseaux multiplexes combinant
plusieurs types d'interactions (Kivelä et al., 2013; Boccaletti et al., 2014) et proposent ainsi
des solutions permettant la détection de communautés au sein de ces réseaux en prenant en
208
Figure 5: Principaux processus expliquant la détection de metabarcodes dans différentes fractions detaille (ici, le fractionnement de taille utilisé dans le cadre de Tara Oceans) représentés grâce à lamicroalgue haptophyte Phaeocystis (symbiote mutualiste d'acanthaires), le dinoflagellé Blastodinium(parasite de copépodes), les radiolaires acanthaires et les copépodes. Les principaux processusexpliquant le passage à une fraction de taille supérieure sont la croissance (Crois.), la formation decolonies (Col.), la symbiose (Symb) et la prédation (Préd) et les principaux processus expliquant lepassage à une fraction de taille inférieure sont la reproduction (Repr.) et la dégradation (Dégr.).

Conclusion et perspectives
compte tous les types d'interaction (Tang et al., 2012). A partir d'un jeu de données de type
metabarcoding il est possible de construire des réseaux génétiques où chaque nœud
correspond à un metabarcode et chaque arrête correspond à une ou plusieurs mutations. Deux
réseaux génétiques, un pour les hôtes potentiels et un pour les symbiotes potentiels, peuvent
être reliés par les cooccurrences détectées entre les metabarcodes de chaque groupe (hôtes et
symbiotes) (Figure 6). L'étude des communautés composant ce réseau multiplexe ainsi obtenu
permettrait d'apprécier les processus co-évolutifs inhérents aux associations symbiotiques
détectées.
A partir du début du XXème siècle, une diversité importante de parasites planctoniques
a été décrite morphologiquement (Apstein, 1911; Chatton, 1920 ;Cachon, 1964). Une partie
de ces parasites a continué à être étudiée grâce à des approches moléculaires permettant ainsi
de confirmer leur position dans l'arbre du vivant et de mieux connaître leur écologie, mais un
certain nombre de parasites reste encore trop peu connu. C'est le cas par exemple des parasites
de Radiolaires, pour lesquels un nombre important d'espèces de différents genres
(Amoebophrya, Apodinium, Atlanticellodinium, Keppenodinium, Oodinium, Solenodinium,
Syndinium) appartenant aux syndiniales et aux blastodiniales a été uniquement décrit
morphologiquement (Cachon and Cachon, 1987). Sans références génétiques il est délicat de
confirmer leur assignation taxinomique. Par contre ces anciennes observations sont à mettre
en relation avec l'observation récente chez des individus uniques de radiolaires d'un nombre
important de séquences assignées à des dinoflagellés et des syndiniales (MALV I et MALV
209
Figure 6: Exemple de réseau multiplexe prenant en compte deux types d'interactions (génétique etécologique)

Conclusion et perspectives
II))(Dolven et al., 2007; Bråte et al., 2012). Ces séquences proviennent-elles d'organismes
parasitant l'individu séquencé ou s'agit-il de proies? Cette question mérite une attention toute
particulière, car l'étude des parasites de radiolaires permettrait de mieux comprendre la
dynamique des populations de ces géants du plancton. De nouvelles méthodes de détection de
symbioses par réseaux de cooccurrences seront un atout majeur pour enrichir notre
connaissance des parasites des radiolaires. De manière générale, il apparaît judicieux de
profiter de la richesse d'anciennes observations afin d'axer les analyses dans leur sens. Ceci
permettrait d'accélérer la description des symbioses planctoniques et de valoriser ces
connaissances qui risquent de tomber dans l'oubli.
La généralisation de l'utilisation du metabarcoding pour l'étude de la composition et de
la structure des communautés naturelles est l'occasion de décrire de nouvelles symbioses. En
plus de l'expédition Tara Oceans (2009-2013) ayant permis l'échantillonnage de 210 stations
réparties dans tous les océans du globe, des initiatives institutionnelles et citoyennes, comme
le projet Ocean Sampling Day (Kopf et al., 2015) permettent d'augmenter significativement
l'effort d'échantillonnage des océans. Les données de metabarcoding ainsi générées
constituent un trésor pour quiconque cherche à dévoiler les rouages du fonctionnement des
écosystèmes planctoniques. L'utilisation de méthodes de détection de symbioses par réseaux
de cooccurrences sur des jeux de données provenant de l'échantillonnage de plusieurs
centaines voir milliers de stations réparties dans le temps et l'espace permettrait assurément la
description de nouvelles symbioses, car les associations sont d'autant plus faciles à détecter
que le nombre de points de mesure est élevé. L'utilisation du metabarcoding sur des
échantillons fractionnés par taille provenant de suivis temporels permettrait de mieux
connaître l'écologie des organismes symbiotiques. En effet, les organismes symbiotiques du
plancton sont généralement observés à la fois sous leur forme libre et leur forme symbiotique.
À partir du moment où l'on arrive à savoir quelles fractions de taille correspondent à chacune
de ces phases, il possible de suivre dans le temps leur évolution. Ceci est particulièrement
intéressant dans le cas des parasites pour lesquels les dynamiques d'infection sont encore
assez peu connues.
210

Bibliographie
Bibliographie
Références citées dans l'introduction, les objectifs, les parties de transition et la conclusion.
AMARAL-ZETTLER, Linda A., MCCLIMENT, Elizabeth A., DUCKLOW, Hugh W., et
al. A method for studying protistan diversity using massively parallel sequencing of V9
hypervariable regions of small-subunit ribosomal RNA genes. PLoS One, 2009, vol. 4, no 7,
p. e6372.
ANDERSON, O. ROGER. The radiolarian symbiosis. Algal Symbiosis: A Continuum of
Interaction Strategies, 1983, p. 69-89.
APSTEIN, Carl, Parasiten von Calanus finmarchicus. Wissenschaftliche
Meeresuntersuchungen. Abt. Kiel., 1911, vol. 13, p. 205-223.
AZAM, Farooq, FENCHEL, Tom, FIELD, John G, et al. The ecological role of water-column
microbes in the sea. Estuaries, 1983, vol. 50, no 2.
DE BARY, Anton. Die erscheinung der symbiose. Verlag von Karl J. Trubner, 1879.
BENJAMINI, Yoav et HOCHBERG, Yosef. Controlling the false discovery rate: a practical
and powerful approach to multiple testing. Journal of the Royal Statistical Society. Series B
(Methodological), 1995, p. 289-300.
BLAXTER, Mark, MANN, Jenna, CHAPMAN, Tom, et al. Defining operational taxonomic
units using DNA barcode data. Philosophical Transactions of the Royal Society of London B:
Biological Sciences, 2005, vol. 360, no 1462, p. 1935-1943.
BOCCALETTI, Stefano, BIANCONI, G., CRIADO, R., et al. The structure and dynamics of
multilayer networks. Physics Reports, 2014, vol. 544, no 1, p. 1-122.
BRÅTE, Jon, KRABBERØD, Anders K., DOLVEN, Jane K., et al. Radiolaria associated with
large diversity of marine alveolates. Protist, 2012, vol. 163, no 5, p. 767-777.
BROWN, Morton B. 400: A method for combining non-independent, one-sided tests of
significance. Biometrics, 1975, p. 987-992.
BURNS, Carolyn W. Parasitic regulation in a population of Boeckella hamata Brehm
(Copepoda: Calanoida). Freshwater biology, 1989, vol. 21, no 3, p. 421-426.
CACHON, Jean. Contribution à l’étude des péridiniens parasites. Cytologie, cycles évolutifs.
Annales des Sciences Naturelles - Zoologie et Biologie Animale, 1964, vol. 6, p. 1-158.
211

Bibliographie
CACHON, Jean et CACHON, Monique. Parasitic dinoflagellates. The biology of
dinoflagellates, 1987, vol. 21, p. 571-610.
CARON, David A., COUNTWAY, Peter D., SAVAI, Pratik, et al. Defining DNA-based
operational taxonomic units for microbial-eukaryote ecology. Applied and environmental
microbiology, 2009, vol. 75, no 18, p. 5797-5808.
CHAMBOUVET, Aurelie, MORIN, Pascal, MARIE, Dominique, et al. Control of toxic
marine dinoflagellate blooms by serial parasitic killers. Science, 2008, vol. 322, no 5905, p.
1254-1257.
CHATTON, Édouard. Les Péridiniens parasites: Morphologie, reproduction, éthologie.
Archives de zoologie expérimentale et générale, 1920, vol 59, p. 1–475.
DAUGBJERG, Niels, JENSEN, Maria Hastrup, et HANSEN, Per Juel. Using nuclear-
encoded LSU and SSU rDNA sequences to identify the Eukaryotic Endosymbiont in
Amphisolenia bidentata (Dinophyceae). Protist, 2013, vol. 164, no 3, p. 411-422.
DAVIDSON, Keith. The challenges of incorporating realistic simulations of marine protists in
biogeochemically based mathematical models. Acta Protozoologica, 2014, vol. 53, no 1, p.
129.
DECAESTECKER, Ellen, DECLERCK, Steven, DE MEESTER, Luc, et al. Ecological
implications of parasites in natural Daphnia populations. Oecologia, 2005, vol. 144, no 3, p.
382-390.
DECELLE, Johan. New perspectives on the functioning and evolution of photosymbiosis in
plankton: Mutualism or parasitism?. Communicative & integrative biology, 2013, vol. 6, no 4,
p. e24560.
DECELLE, Johan, COLIN, Sébastien, et FOSTER, Rachel A. Photosymbiosis in marine
planktonic protists. In : Marine Protists. Springer Japan, 2015. p. 465-500.
DECELLE, Johan, PROBERT, Ian, BITTNER, Lucie, et al. An original mode of symbiosis in
open ocean plankton. Proceedings of the National Academy of Sciences, 2012, vol. 109, no
44, p. 18000-18005.
DENNETT, Mark R., CARON, David A., MICHAELS, Anthony F., et al. Video plankton
recorder reveals high abundances of colonial Radiolaria in surface waters of the central North
Pacific. Journal of Plankton Research, 2002, vol. 24, no 8, p. 797-805.
212

Bibliographie
Text W2, Figure W3. In :DE VARGAS, Colomban, AUDIC, Stéphane, HENRY, Nicolas, et
al. Companion Website to the article: "Eukaryotic plankton diversity in the sunlit ocean". [en
ligne]. 2015a. Disponible à l'adresse: http://taraoceans.sb-roscoff.fr/EukDiv/
DE VARGAS, Colomban, AUDIC, Stéphane, HENRY, Nicolas, et al. Eukaryotic plankton
diversity in the sunlit ocean. Science, 2015b, vol. 348, no 6237, p. 1261605.
DÍEZ, Beatriz, PEDRÓS-ALIÓ, Carlos, et MASSANA, Ramon. Study of genetic diversity of
eukaryotic picoplankton in different oceanic regions by small-subunit rRNA gene cloning and
sequencing. Applied and environmental microbiology, 2001, vol. 67, no 7, p. 2932-2941.
DOLVEN, Jane K., LINDQVIST, Charlotte, ALBERT, Victor A., et al. Molecular diversity of
alveolates associated with neritic North Atlantic radiolarians. Protist, 2007, vol. 158, no 1, p.
65-76.
FALKOWSKI, Paul. Ocean science: the power of plankton. Nature, 2012, vol. 483, no 7387,
p. S17-S20.
FAUST, Karoline et RAES, Jeroen. Microbial interactions: from networks to models. Nature
Reviews Microbiology, 2012, vol. 10, no 8, p. 538-550.
FAUST, Karoline, SATHIRAPONGSASUTI, J. Fah, IZARD, Jacques, et al.Microbial co-
occurrence relationships in the human microbiome. PLoS computational biology, 2012, vol. 8,
no 7, p. e1002606-e1002606.
FLYNN, Kevin J., STOECKER, Diane K., MITRA, Aditee, et al. Misuse of the
phytoplankton–zooplankton dichotomy: the need to assign organisms as mixotrophs within
plankton functional types. Journal of Plankton Research, 2012, p. fbs062.
GOBILLARD, Marie-Odile. Cephaloidophora petiti sp. n., Grégarine parasite de Copépodes
pélagiques de la région de Banyuls (note préliminaire). Vie et Milieu Suppl, 1964, vol. 17, p.
107-113.
GUILLOU, Laure, BACHAR, Dipankar, AUDIC, Stéphane, et al. The Protist Ribosomal
Reference database (PR2): a catalog of unicellular eukaryote small sub-unit rRNA sequences
with curated taxonomy. Nucleic acids research, 2013, p. gks1160.
GUO, Zhiling, LIU, Sheng, HU, Simin, et al. Prevalent ciliate symbiosis on copepods: high
genetic diversity and wide distribution detected using small subunit ribosomal RNA
gene. PloS one, 2012, vol. 7, no 9, p. e44847.
213

Bibliographie
HEBERT, Paul DN, CYWINSKA, Alina, BALL, Shelley L., et al. Biological identifications
through DNA barcodes. Proceedings of the Royal Society of London B: Biological Sciences,
2003, vol. 270, no 1512, p. 313-321.
HO, Ju-shey et PERKINS, Penny S. Symbionts of marine copepoda: an overview. Bulletin of
marine science, 1985, vol. 37, no 2, p. 586-598.
JEPHCOTT, Thomas G., ALVES-DE-SOUZA, Catharina, GLEASON, Frank H.,et
al. Ecological impacts of parasitic chytrids, syndiniales and perkinsids on populations of
marine photosynthetic dinoflagellates. Fungal Ecology, 2016, vol 19, p. 47-58.
JI, Yinqiu, ASHTON, Louise, PEDLEY, Scott M., et al. Reliable, verifiable and efficient
monitoring of biodiversity via metabarcoding. Ecology letters, 2013, vol. 16, no 10, p. 1245-
1257.
JOHNSON, Matthew D., OLDACH, David, DELWICHE, Charles F., et al. Retention of
transcriptionally active cryptophyte nuclei by the ciliate Myrionecta rubra. Nature, 2007, vol.
445, no 7126, p. 426-428.
JOHNSON, Nancy C., GRAHAM, J. H., et SMITH, F. Andrew. Functioning of mycorrhizal‐
associations along the mutualism–parasitism continuum*. New phytologist, 1997, vol. 135, no
4, p. 575-585.
KAGAMI, Maiko, DE BRUIN, Arnout, IBELINGS, Bas W., et al. Parasitic chytrids: their
effects on phytoplankton communities and food-web dynamics.Hydrobiologia, 2007, vol.
578, no 1, p. 113-129.
KIVELÄ, Mikko, ARENAS, Alex, BARTHELEMY, Marc, et al. Multilayer
networks. Journal of Complex Networks, 2014, vol. 2, no 3, p. 203-271.
KOIKE, Kazuhiko et TAKISHITA, Kiyotaka. Anucleated cryptophyte vestiges in the
gonyaulacalean dinoflagellates Amylax buxus and Amylax triacantha
(Dinophyceae). Phycological research, 2008, vol. 56, no 4, p. 301-311.
KOPF, Anna, BICAK, Mesude, KOTTMANN, Renzo, et al. The ocean sampling day
consortium. GigaScience, 2015, vol. 4, no 1, p. 1-5.
KURIS, Armand M., HECHINGER, Ryan F., SHAW, Jenny C., et al. Ecosystem energetic
implications of parasite and free-living biomass in three estuaries. Nature, 2008, vol. 454, no
7203, p. 515-518.
LAMPITT, R. S., SALTER, I., et JOHNS, D. Radiolaria: major exporters of organic carbon to
the deep ocean. Global Biogeochemical Cycles, 2009, vol. 23, no 1.
214

Bibliographie
LIDICKER, William Z. A clarification of interactions in ecological systems.BioScience, 1979,
vol. 29, no 8, p. 475-477.
LIMA-MENDEZ, Gipsi, FAUST, Karoline, HENRY, Nicolas, et al. Determinants of
community structure in the global plankton interactome. Science, 2015, vol. 348, no 6237, p.
1262073.
LÓPEZ-GARCÍA, Purificación, RODRIGUEZ-VALERA, Francisco, PEDRÓS-ALIÓ,
Carlos, et al. Unexpected diversity of small eukaryotes in deep-sea Antarctic
plankton. Nature, 2001, vol. 409, no 6820, p. 603-607.
MADHU, Nikathithara V., JYOTHIBABU, Retnamma, MAHESWARAN, Padinjaratte A., et
al. Enhanced chlorophyll a and primary production in the northern Arabian Sea during the
spring intermonsoon due to green Noctiluca scintillans bloom. Marine Biology Research,
2012, vol. 8, no 2, p. 182-188.
MAHÉ, Frédéric, ROGNES, Torbjørn, QUINCE, Christopher, et al. Swarm: robust and fast
clustering method for amplicon-based studies. PeerJ, 2014, vol. 2, p. e593.
DE MEEÛS, Thierry et RENAUD, François. Parasites within the new phylogeny of
eukaryotes. Trends in parasitology, 2002, vol. 18, no 6, p. 247-251.
MICHAELS, Anthony F., CARON, David A., SWANBERG, Neil R., et al. Planktonic
sarcodines (Acantharia, Radiolaria, Foraminifera) in surface waters near Bermuda:
abundance, biomass and vertical flux. Journal of Plankton Research, 1995, vol. 17, no 1, p.
131-163.
MOON-VAN DER STAAY, Seung Yeo, DE WACHTER, Rupert, et VAULOT, Daniel.
Oceanic 18S rDNA sequences from picoplankton reveal unsuspected eukaryotic
diversity. Nature, 2001, vol. 409, no 6820, p. 607-610.
MORDRET Solenn, ROMAC Sarah, HENRY Nicolas. The symbiotic life of Symbiodinium in
the open ocean within a new species of calcifying ciliate (Tiarina sp.). The ISME journal,
2015, Press 1–13.
NOWACK, Eva CM et MELKONIAN, Michael. Endosymbiotic associations within
protists. Philosophical Transactions of the Royal Society B: Biological Sciences, 2010, vol.
365, no 1541, p. 699-712.
OHTSUKA, Susumu, HORA, Mariko, SUZAKI, Toshinobu, et al. Morphology and host-
specificity of the apostome ciliate Vampyrophrya pelagica infecting pelagic copepods in the
Seto Inland Sea, Japan. Marine Ecology Progress Series, 2004, vol. 282, p. 129-142.
215

Bibliographie
VAN OMMEREN, Ron J. et WHITHAM, Thomas G. Changes in interactions between
juniper and mistletoe mediated by shared avian frugivores: parasitism to potential
mutualism. Oecologia, 2002, vol. 130, no 2, p. 281-288.
PARK, Myung Gil, YIH, Wonho, et COATS, D. Wayne. Parasites and phytoplankton, with
special emphasis on dinoflagellate infections1. Journal of Eukaryotic Microbiology, 2004,
vol. 51, no 2, p. 145-155.
PROBERT, Ian, SIANO, Raffaele, POIRIER, Camille, et al. Brandtodinium gen. nov. and B.
nutricula comb. Nov.(Dinophyceae), a dinoflagellate commonly found in symbiosis with
polycystine radiolarians. Journal of Phycology, 2014, vol. 50, no 2, p. 388-399.
RASCONI, Serena, NIQUIL, Nathalie, et SIME NGANDO, Télesphore. Phytoplankton‐
chytridiomycosis: community structure and infectivity of fungal parasites in aquatic
ecosystems. Environmental microbiology, 2012, vol. 14, no 8, p. 2151-2170.
RAZOULS, Claude, DE BOVÉE, Francis, KOUWENBERG, Juliana, et al. Diversity and
geographic distribution of marine planktonic copepods. Available from WWW:<
http://copepodes.obs-banyuls.fr/en>[cited 2015-10-01], 2005-2015.
SALOMON, Paulo S., GRANÉLI, Edna, NEVES, Maria HCB, et al. Infection by
Amoebophrya spp. parasitoids of dinoflagellates in a tropical marine coastal area. Aquatic
microbial ecology, 2009, vol. 55, no 2, p. 143-153.
SCHOLZ, Bettina, GUILLOU, Laure, MARANO, Agostina V., et al. Zoosporic parasites
infecting marine diatoms–A black box that needs to be opened. Fungal Ecology, 2016, vol.
19, p. 59-76.
SHAKED, Yonathan et DE VARGAS, Colomban. Pelagic photosymbiosis: rDNA assessment
of diversity and evolution of dinoflagellate symbionts and planktonic foraminiferal
hosts. Marine Ecology Progress Series, 2006, vol. 325, p. 59-71.
SIANO, Raffaele, ALVES-DE-SOUZA, C., FOULON, E., et al. Distribution and host
diversity of Amoebophryidae parasites across oligotrophic waters of the Mediterranean
Sea. Biogeosciences, 2011, vol. 8, no 2, p. 267-278.
SKOVGAARD, Alf. Dirty tricks in the plankton: Diversity and Role of Marine Parasitic
Protists: diversity and role of marine parasitic protists. Acta Protozoologica, 2014, vol. 53, no
1, p. 51-62.
216

Bibliographie
SKOVGAARD, Alf, KARPOV, Sergey A., et GUILLOU, Laure. The parasitic dinoflagellates
Blastodinium spp. inhabiting the gut of marine, planktonic copepods: morphology, ecology,
and unrecognized species diversity. Frontiers in microbiology, 2012, vol. 3.
SMETACEK, Victor. Making sense of ocean biota: How evolution and biodiversity of land
organisms differ from that of the plankton. Journal of biosciences, 2012, vol. 37, no 4, p. 589-
607.
STEELE, John H. The structure of marine ecosystems. 1974.
STOECKER, Diane K., JOHNSON, Matthew D., DE VARGAS, Colomban, et al. Acquired
phototrophy in aquatic protists. Aquatic Microbial Ecology, 2009, vol. 57, p. 279-310.
TABERLET, Pierre, COISSAC, Eric, POMPANON, Francois, et al. Towards next generation‐
biodiversity assessment using DNA metabarcoding. Molecular Ecology, 2012, vol. 21, no 8,
p. 2045-2050.
TANG, Lei, WANG, Xufei, et LIU, Huan. Community detection via heterogeneous
interaction analysis. Data Mining and Knowledge Discovery, 2012, vol. 25, no 1, p. 1-33.
TRENCH, R. K. The cell biology of plant-animal symbiosis. Annual Review of Plant
Physiology, 1979, vol. 30, no 1, p. 485-531.
WALKUSZ, W. et ROLBIECKI, L. Epibionts (Paracineta) and parasites (Ellobiopsis) on
copepods from Spitsbergen (Kongsfjorden area). Oceanologia, 2007, vol. 49, no 3.
WINDSOR, Donald A. Controversies in parasitology, Most of the species on Earth are
parasites. International journal for parasitology, 1998, vol. 28, no 12, p. 1939-1941.
WORDEN, Alexandra Z., FOLLOWS, Michael J., GIOVANNONI, Stephen J., et
al. Rethinking the marine carbon cycle: Factoring in the multifarious lifestyles of
microbes. Science, 2015, vol. 347, no 6223, p. 1257594.
217

Liste des figures
Liste des figures
Figures de l'introduction, des objectifs, des parties de transition et de la conclusion.
Figure 1: Réseau des associations symbiotiques entre eucaryotes du plancton marin décrites dans la littérature.......................................................................................................................18
Figure 2: Diversité génétique et biogéographie des metabarcodes séquencés à partir des individus de Tiarina et de Symbiodinium en symbiose.............................................................83
Figure 3: Arbre phylogénétique (Neighbor-joining) des metabarcodes (fragment V9) assignés aux Péridiniales (Dinoflagellés) et leur distribution parmi les fractions de taille...................149
Figure 4: Réseaux d'haplotypes de Symbiodinium illustrant le caracère imbriqué des groupes génétiques construits à différents niveaux de résolution.........................................................151
Figure 5: Principaux processus expliquant la détection de metabarcodes dans différentes fractions de taille.....................................................................................................................209
Figure 6: Exemple de réseau multiplexe prenant en compte deux types d'interactions (génétique et écologique)........................................................................................................210
218

Glossaire
Glossaire
• Barcode/Metabarcode: Marqueur génétique utilisé dans une étude de
(meta)barcoding. Ce terme peut également faire référence une séquence unique de ce
marqueur.
• DNA barcoding: Méthode taxinomique utilisant un court marqueur génétique de
l'ADN d'un organisme afin de définir son appartenance à une espèce.
• DNA metabarcoding: DNA barcoding appliqué à un assemblage de populations.
• OTU: Operational Taxonomic Unit, Unité Taxonomique Opérationnelle en français.
Définition opérationnelle d'une espèce ou d'un groupe d'espèces souvent utilisée
lorsque seules des données de séquences d'ADN sont disponibles.
• Photosymbiose: Symbiose, généralement mutualiste, impliquant un partenaire
photosynthétique.
219

Annexes
Annexes
Liste des communications orales
Communications orales:
• OCEANOMICS annual meeting – Octobre 2015 – Roscoff, France - “Unveiling
photosymbiotic associations and their specificity in world-wide marine plankton based
on massive rDNA metabarcoding.”
• Ateliers en Ecologie Evolutive (Evolution de la symbiose)– Janvier 2014 – Plouzané,
France: “The use of NGS metabarcoding to unveil host-parasite relationships in
marine world plankton.”
• 2nd Colloque de Génomique Environnementale – Novembre 2013 – Rennes, France:
“The use of NGS metabarcoding to unveil host-parasite relationships in marine world
plankton.”
• Journées de l'École Doctorale Diversité du Vivant – Octobre 2013 – Roscoff, France:
“Mise en évidence de symbioses dans le plancton marin grâce au metabarcoding.”
• Tara Oceans retreat – Mai 2013 – Roscoff, France: “Highlighting biological
interactions in plankton using numerical ecology tools on metabarcodes.”
• Journées thématiques du GPLF – Octobre 2012 – La Rochelle, France: “Etude de la
physiologie et de l'enkystement d'un dinoflagellé toxique, Alexandrium minutum
Halim.”
Posters:
• Conférence Jacques Monod "Biologie marine éco-systémique" _ Juin 2015 _ Roscoff,
France: “Unveiling symbiotic relationships in marine world plankton based on
massive rDNA metabarcoding.”
220

Annexes
• Gen2Bio _ Mars 2015 _ La Baule, France: “Eukaryotic plankton diversity in the sunlit
ocean.”
221

Nicolas Henry – Thèse de doctorat - 2016
Résumé :Les symbioses ont un rôle majeur dans le fonctionnement et l'équilibre des écosystèmes. Dans les océans, quicouvrent près de 70 % de la surface de la planète, vivent une multitude d'organismes incapables de lutter contreles courants et la plupart sont microscopiques, il s'agit du plancton. Les organismes du plancton, comme ceuxd'autres écosystèmes, entretiennent des symbioses, mais la nature et l'ampleur de ces interactions sont encore malconnues dans le plancton du fait la petite taille de ces organismes et de la difficulté d'échantillonnage desécosystèmes planctoniques, surtout dans les zones les plus éloignées des côtes. Les principaux objectifs de cettethèse sont de donner un aperçu global de la place occupée par ces symbioses dans le plancton et de proposer desméthodes originales permettant leur détection. Les travaux présentés dans ce manuscrit s'appuient sur l'analysedes données générées lors de l'expédition Tara Oceans (2009-2013) pendant laquelle 210 stations océaniques ontété échantillonnées à travers le monde. Ils concernent plus précisément le jeu de données environnementalobtenu grâce au séquençage à haut débit (Illumina) de la région hypervariable V9 (130 nucléotides) de la sous-unité 18S de l'ADN ribosomique des organismes eucaryotes (metabarcoding). Dans un premier temps, un étatdes lieux de la diversité et de la structure des communautés du pico-nano-micro-mesoplancton (0,8-2000 μm)eucaryote de la zone photique des océans tempérés à tropicaux est réalisé. Il met en évidence la place importanteoccupée par les symbiotes au sein de ces communautés. Ensuite, l'étude de deux cas de symbiose (Blastodinium-Copépodes et Symbiodinium-Tiarina) montre les difficultés inhérentes à la détection de couples symbiotiques àpartir d’un jeu de données issue d'études par metabarcoding du plancton (flexibilité de la spécificité dessymbioses dans le plancton), mais aussi la possibilité de distinguer les différentes phases de vie des symbiotes(libres et symbiotiques) lorsque les échantillons étudiés ont été fractionnés. Enfin, un ensemble de méthodes estproposé afin d'améliorer l'efficacité de la détection de symbioses dans le cadre d'études par réseau decooccurrences des communautés planctoniques. L'analyse de la distribution des metabarcodes le long desfractions de taille (piconano- (0.8-5 µm), nano- (5-20 µm), micro- (20-180 µm), et meso-plancton (180-2000µm)) permet de différencier ceux provenant d'organismes symbiotiques de ceux d'organismes libres, sans apriori. De plus la comparaison de l'abondance de groupes génétiques définis à différents niveaux de résolutionpermet de détecter des associations symbiotiques peu spécifiques et d'apprécier leur niveau de spécificité.
Mots clés : symbiose, plancton, metabarcoding
Molecular ecology of eukaryotic symbioses in the planktonic ecosystems of the oceanic
photic zone
Abstract :The oceans, which cover nearly 70 % of the earth's surface, is host to a myriad of mostly microscopic organismsthat drift with the currents and are collectively called plankton. As in other ecosystems, symbioses play a majorrole in the functioning and equilibrium of the plankton. But the exact nature and strength of those symbioticinteractions are still poorly known, not only due to the small size of most planktonic organisms, but also becauseof the inherent difficulty of sampling planktonic ecosystems, especially in the high-seas. The main goals of thisthesis are to give a global view of the importance of planktonic symbioses and to propose novel methods fortheir detection. The work presented in this manuscript is based on analyses of data generated during the TaraOceans expedition (2009-2013), during which sea water was collected and size fractionated by filtration at 210sampling locations distributed across the world's oceans. The data analyses presented herein mostly focus on anenvironmental metabarcoding dataset obtained from next-generation sequencing (Illumina) of the V9hypervariable region (~130 nucleotides long) of the 18S small ribosomal subunit of eukaryotic organisms. Webegin by assessing the diversity and structure of pico-, nano-, micro and meso-planktonic eukaryoticcommunities (0.8-2000 μm) in the photic zone of tropical to temperate sea regions. Then, we present two casesof symbioses (Blastodinium-Copepods and Symbiodinium-Tiarina) to illustrate both the difficulties encounteredwhen trying to detect symbiotic relationships using metabarcoding data due to varying specificities of symbioticrelationships, but also the potential solutions offered by size-fractionated sampling to distinguish between thedifferent stages of the life cycle of symbiotic organisms (free living and symbiotic stages). Finally, we propose aset of methods to improve the detection of symbioses by studying the co-occurrence of organisms in planktoniccommunities: we use the distribution of metabarcodes along size fractions ((piconano- (0.8-5 µm), nano- (5-20µm), micro- (20-180 µm), and meso-plancton (180-2000 µm)) to distinguish likely free living organisms fromthose that have a symbiotic life style, and we compare the abundance of genetic groups constructed by clusteringmetabarcodes at different resolution levels, which allows us to detect interactions occurring above the specieslevel and to evaluate their level of specificity.
Keywords : symbiosis, plankton, metabarcoding
1