modelling and experimental characterisation of hygrothermoelastic stress in polymer matrix...
TRANSCRIPT

Modelling and experimental characterisation of the rate dependent
fracture properties of gelatine gels
A.E. Forte, F. D'Amico, M.N. Charalambides*, D. Dini, J.G. Williams
Department of Mechanical Engineering, Imperial College London, London SW7 2AZ, UK
a r t i c l e i n f o
Article history:
Received 11 July 2014
Received in revised form
21 November 2014
Accepted 22 December 2014
Available online 27 December 2014
Keywords:
Gelatine gel
Hydrogel
Fracture
Failure criterion
Strain rate
Energy release rate
Poroelasticity
Hyperelasticity
a b s t r a c t
The mechanical behaviour of gelatine gels as a function of test rate and gelatine concentration was
determined through lubricated uniaxial compression and wire cutting tests. Similar to other reported
literature, it was observed that the fracture stress and strain of the gels were strongly strain rate
dependent whereas the strain rate effect was insignificant on the deformation/stiffness properties. The
wire cutting tests led to values of energy release rate, Gc, being determined as a function of cutting rate. It
was found that at small rates (up to 10 mm/min), the value of Gc for the 10% w/w gelatine concentration
was constant at an approximate value of 1.1 J/m2. For higher values of test rate, Gc increased such that the
log Gc versus log cutting rate data were well approximated with a line of slope equal to 0.5. An analytical
model describing this behaviour is suggested which takes into account the fluid flow of the water
through the polymeric porous gel structure. In addition, a numerical simulation of the uniaxial
compression was performed using a poroelastic material model. The model enabled the effect of the
strain rate on the stress in the solid network and the pore pressure to be determined. A failure criterion
based on maximum solid stress was suggested which led to a reasonable agreement with the experi-
mental failure stress and strain data as a function of strain rate.
© 2015 The Authors. Published by Elsevier Ltd. This is an open access article under the CC BY license
(http://creativecommons.org/licenses/by/4.0/).
1. Introduction
Gelatine gels are frequently used in the food industry to thicken
and stabilise various products such as desserts, yogurts, candies
and jellies. The mechanical behaviour of gels is therefore very
important as it affects the texture of the end product, which in turn
will influence consumer acceptance and preference. Moreover,
hydrogels, which in contrast to gelatine gels contain both physical
and chemical crosslinks (Hellio & Djabourov, 2006) are popular
materials for biological and biomedical applications since they
exhibit properties similar to natural soft tissues. Due to their high
water content and the resulting biocompatibility, they have been
successfully used for soft contact lenses, wound dressings, super-
absorbents, and drug-delivery systems (Balakrishnan, Mohanty,
Umashankar, & Jayakrishnan, 2005; L�opez-Alemany, Compa~n, &
Refojo, 2002; Parida & Mishra, 2012; Saltzman & Radomsky,
1991; Zhao, Su, Fang, & Tan, 2005). Recently, hydrogels have also
been employed in studies concerning cell-based therapeutics and
soft tissue engineering for example as scaffolds in tissue regener-
ation such as cartilage replacement (Baumberger & Ronsin, 2009)
or as simulants of soft tissue in robotic surgery studies (Oldfield,
Dini, Giordano, & Rodriguez y Baena, 2013).
All gels are defined as solid like systems formed by a solid
substance finely dispersed or dissolved in a liquid phase
(Djabourov, 1991). The two phases are interconnected by a network
which extends continuously throughout the whole system. The
cross-linking in this network can be either chemical or physical
giving rise to the so-called ‘chemical’ and ‘physical’ gel terms
respectively. The structure of gelatine gel, which is the material
under study in this work, has been thoroughly investigated in the
literature (Djabourov, 1991; Hellio & Djabourov, 2006; Mc Evoy,
Ross-Murphy, & Clark, 1985 and citations therein). Gelatine is a
protein derived from the collagen inside animals' skin and bones. It
is now generally accepted that during cooling, gelation occurs via
the molecule chains rearranging into an ordered triple helix
arrangement which is typical of collagen.With time, the triple helix
regions propagate, aggregate and are separated at junctions by
disordered regions. This process effectively provides physical
crosslinks in a gelatine gel such as the one studied here which are
thermoreversible.* Corresponding author. Tel.: þ44 (0) 207 594 7246.
E-mail address: [email protected] (M.N. Charalambides).
Contents lists available at ScienceDirect
Food Hydrocolloids
journal homepage: www.elsevier .com/locate/ foodhyd
http://dx.doi.org/10.1016/j.foodhyd.2014.12.028
0268-005X/© 2015 The Authors. Published by Elsevier Ltd. This is an open access article under the CC BY license (http://creativecommons.org/licenses/by/4.0/).
Food Hydrocolloids 46 (2015) 180e190
Due to their numerous applications, the number of research
studies on the mechanical behaviour of hydrogels has increased
dramatically in the last decade (e.g. Chester, 2012; Wang & Hong,
2012; Zhang, An, Yazzie, Chawla, & Jiang, 2012). A significant part
of the published literature is concerned with the behaviour of gels
at small deformations. Large deformations alter the structure of the
gel considerably, meaning that theories describing the relationship
between small deformation properties and structure of the gel are
no longer applicable (van Vliet & Walstra, 1995). As most of the
applications mentioned above involve large deformations, fracture
or separation phenomena, there is a need to develop predictive
models for the behaviour of the gels in this large deformation
regime as well as establish failure criteria to predict fracture in
these complexmaterials. Experimental investigations show that for
most gels, the fracture behaviour depends noticeably on the strain
rate (Ross-Murphy& Todd, 1983; van Vliet, Luyten,&Walstra, 1991,
1993; Zoon, van Vliet, & Walstra, 1989) as opposed to the defor-
mation properties such as elastic modulus which are largely inde-
pendent of strain rate (Gamonpilas, Charalambides, & Williams,
2009). This is a rather odd behaviour as usually strain rate depen-
dent materials show rate dependencies in both their deformation
(i.e. stressestrain curve before fracture point, modulus) and frac-
ture properties (i.e. energy release rate, fracture stress and strain).
A number of studies have been reported with the aim of
explaining the rate dependent fracture of gels (Chester, 2012;Wang
& Hong, 2012; Zhang et al., 2012). Bonn, Kellay, Prochnow, Ben-
Djemiaa, and Meunier (1998) investigated the fracture of agarose
polymer gels and reported that in three point bending experiments
under constant load, cracks did not occur simultaneously but
happened after a time delay. This delay correlated with the
magnitude of the applied constant force, even though no visco-
elastic relaxations were observed in the storage modulus versus
frequency plot. In addition, all the gels studied had the same
moduli, in spite of the observed large difference in their fracture
behaviour. This phenomenon was attributed to the fact that the
time delay was affected by the activation energy for crack nucle-
ation; i.e. high activation energy resulted in a longer time delay. It
was argued that differences in the time delay e applied force re-
lationships for agarose gels were due to the different fractal di-
mensions of the gels that were investigated.
van Vliet and Walstra (1995) suggested that in polymer gels
which are physically cross-linked, large deformations of the gel
leads to ‘unzipping’ of the junctions. This process takes a certain
time and as a result the fracture parameters become dependent on
the deformation rate. Thermally activated ‘unzipping’ of the non-
covalent cross linked network and the associated viscous solvent
drag during chain pull-out was also suggested as a fracture mech-
anism by Baumberger and Ronsin for alginate and gelatine hydro-
gels (Baumberger& Ronsin, 2009). A study on starch gels suggested
that the rate dependent fracture behaviour might arise from energy
dissipation due to frictional processes occurring between the
granules sliding against each other at large deformation (Luyten &
van Vliet, 1995). For this reason, fracture e deformation rate re-
lationships are not simple and depend on the structure of the gel
(Gamonpilas et al., 2009; van Vliet & Walstra, 1995).
Another important aspect linked to themechanical behaviour of
gelatine is the role of the solvent diffusing through the network of
the porous matrix in the presence of pressure gradients, which has
been the focus of many recent studies. In particular, applications
using hydrogels as potential articular cartilage replacements have
placed much emphasis on the fluid pressurisation induced by
deformation. This stems from early studies showing that if cartilage
tissues were considered as simply viscoelastic, it was not possible
to explain the role of this interstitial fluid flow on the globally
observedmechanical behaviour (Hayes, Keer, Herrman, &Mockros,
1972; Hayes & Mockros, 1971; Parsons & Black, 1977). Although
Higginson, Litchfield, and Snaith (1976) and Johnson, Dowson, and
Wright (1977) observed that under uniaxial cyclic compressive
loads the short-term creep deformation response was elastic and
was unaffected by interstitial fluid flow, Elmore, Sokoloff, Norris,
and Carmeci (1963) had earlier shown that the creep response in
indentationwasmainly due to the exudation of the interstitial fluid.
Subsequently, Mow, Kuei, Lai, and Armstrong (1980) proposed a
biphasic theory to explain deformational behaviour for materials
made up of two immiscible phases: a fluid phase and a solid phase.
In particular, in articular cartilage, the fluid phase is the interstitial
fluid, which is incompressible and inviscid, while the solid phase is
the extra-cellular matrix which is made of collagen fibres, pro-
teoglycans and other components and is porous, permeable and
compressible. This model forms the basis of many of the models
developed since then to understand the role of flow-dependent and
flow-independent viscoelastic mechanisms in the response of
biphasic polymeric media, including biological tissues and hydro-
gels. For instance, Kalyanam, Yapp, and Insana (2009) have studied
the poro-viscoelastic behaviour of gelatine hydrogels under
compression to separate the flow-dependent and flow-
independent contributions to the relaxation response of gelatine.
In their studies they have also shown that creep shear strain ex-
periments using a rheometer provide information about the
viscoelastic response of the solid matrix. This is because no fluid-
flow takes place under infinitesimal dynamic shear loading which
is a constant volume process.
In this work, the mechanical behaviour of gelatine gels is
investigated; specifically their large deformation and fracture
properties. The global compressive stressestrain properties are
reported considering effects of strain rate and gelatine concentra-
tion. For fracture properties, fracture mechanics based methodol-
ogies are used in the form of wire cutting analysis (Gamonpilas
et al., 2009). A simplified analytical model is used to predict the
dependence of fracture on test rate. In addition, the gel is simulated
as a poroelastic material with a porous solid matrix fully saturated
with liquid, using Finite Element Analysis. It is shown that a simple
critical stress failure criterion in the solid matrix suffices to explain
the observed experimental trends.
2. Experiments: materials and methods
Gelatine gels were produced by mixing distilled water and beef
gelatine in powder form (SuperCookLLP, UK). Throughout the
sample preparation process, the temperature was monitored using
a thermocouple. Distilled water was heated to 80 �C and main-
tained at this temperature using a hot plate. The powdered gelatine
was stirred in the water using a magnetic stirrer for 5 min. A timer
was used to assure a repeatable process. The solutionwas left in the
beaker to cool down to 60 �C at room temperature before it was
poured into cylindrical moulds made of Polytetrafluoroethylene
(PTFE). Paraffin oil was applied on the surface of the moulds as a
lubricant in order to facilitate the subsequent removal of the fragile
samples. The moulds were then covered with cling film to prevent
drying and left in a domestic refrigerator kept at 4 �C overnight;
samples were tested on the following day. The cooling storage time
was kept as constant as possible (18 h and 30 ± 5 min) throughout
the study to ensure comparable gel properties and reproducible
data. For each series of tests, a dummy sample with a thermocouple
inserted in the centre, was used to monitor the specimen temper-
ature. The preparation of all specimens and the testing were per-
formed at controlled room conditions, 18.5 �C with 50% relative
humidity.
Uniaxial compression and wire cutting tests were performed.
Monotonic as well as cyclic loading experiments were undertaken
A.E. Forte et al. / Food Hydrocolloids 46 (2015) 180e190 181

in the uniaxial mode in order to further investigate the rheological
behaviour of the gel. Gelatine concentrations of 5% w/w, 7.5% w/w,
10% w/w, 12.5% w/w and 15% w/w were used for the compression
tests, whereas the cutting and cyclic loading tests were only per-
formed with a gelatine concentration of 10% w/w.
The uniaxial compression test is suitable for gel specimens
because it is simple and eliminates the problem of premature
failure arising from clamping as in tensile tests. An Instron 5534
with a 100 N load cell was used to perform these tests. Cylindrical
samples with a diameter and height of 20 mm, were tested at three
different constant true strain rates of 0.25, 2.5 and 25 mm�1. In
order to achieve these constant strain rates, the crosshead speed
decreased exponentially during the test. Silicon oil with a kine-
matic viscosity of 5 � 10�4 m2/s was applied at the interface be-
tween the sample and the compression platens in order to
minimise friction effects (Charalambides, Goh, Lim, & Williams,
2001; Charalambides, Goh, Wanigasooriya, Williams, & Xiao,
2005). At least six specimens were tested at each loading rate.
Since the tests involved large deformations, the true stress, s, and
true strain or Hencky strain, 3, were calculated assuming a constant
volume deformation:
s ¼F
pR2h
H(1)
3 ¼ �lnh
H(2)
where F, R, H and h are the applied load, original sample radius,
original sample height and current sample height respectively.
Loading and unloading tests in compression mode were con-
ducted using a Zwick testing machine with a 100 N load cell. The
cyclic tests were performed at constant true strain rates of 0.25, 2.5
and 25min�1. The test consisted of two steps: the sample is initially
subjected to an increasing strain up to a maximum value (loading),
followed by the strain being gradually removed (unloading) until
the stress value reaches a quasi-null value (~0.01 N). The loading
and unloading strain rates for each cyclic test were kept equal.
Wire cutting tests (Gamonpilas et al., 2009) were performed at
the five wire cutting speeds, v, of 1, 10, 100, 500 and 1000 mm/min.
A schematic of the tests is shown in the inset of Fig. 6a. The spec-
imens were rectangular blocks of length 30 mm, width 20 mm and
height 20mm. Steel wires of diameter, f, of 0.05, 0.1, 0.125, 0.25 and
0.5 mmwere used. An Instron 5534 machine was employed with a
10 N load cell since the cutting load was small. For each value of f
and v, at least three specimens were tested (apart from the case of
v ¼ 0.1 mm/min and f ¼ 0.05 mm where only sample was suc-
cessfully tested).
During the wire cutting process, fracture, large deformation and
surface friction occur simultaneously (Goh, Charalambides, &
Williams, 2005; Kamyab, Chakrabarti, & Williams, 1998; Luyten &
van Vliet, 1995). The force F required for cutting is proportional to
the wire diameter and there is a constant component arising from
the energy release rate, Gc, also referred to as fracture toughness:
F
b¼ Gc þ scð1þ mkÞf (3)
where F is the steady state cutting force, b is the width of the
sample being cut, sc is a characteristic stress of the material and mkis the kinetic coefficient of friction. By plotting F/b against f and
linearly extrapolating to zero wire diameter, Gc can be determined.
The slope of such linear fits to experimental data will be approxi-
mately be equal to sc for small values of mk.
3. Experimental results
3.1. Uniaxial compression
Fig. 1 shows the compression behaviour of gelatine at 5% w/w
and 10% w/w concentrations at three different strain rates. The
results from all replicate tests are shown to indicate the level of
scatter in the measurements; this is acceptable considering the
biological nature of the material. During the tests, it was observed
that samples did not show signs of frictional barrelling due to the
use of the silicon oil. Both gels are seen to be almost rate inde-
pendent at small deformations. However, at large deformations,
the fracture response seems to be strongly dependent on the
strain rate, with the gels reaching higher stresses and strains
before failure. This finding is in agreement with literature
(Gamonpilas et al., 2009; Gamonpilas, Charalambides, Williams,
Dooling, & Gibbon, 2010; Ikeda, Sangu, & Nishinari, 2003;
Luyten & van Vliet, 1995).
The average compression response of gelatine at various con-
centrations and a rate of 25 mm�1 is shown in Fig. 2. As expected,
the higher concentrations led to stiffer and stronger gels, due to the
denser network that is formed (Djabourov, 1991). The exception is
the 10% and 12.5% data, where the 10% gel displays higher stress
values at the larger strains. The reason for this discrepancy is
uncertain.
Using averages of the data in Fig. 1, plots of the fracture stress
and fracture strain versus strain rate for the 5% and 10% gelatine
concentrations are provided in Fig. 3a and b respectively. Once
again, it is apparent that higher rates enable the material to ‘travel’
higher up on the stressestrain curve before fracture. Fig. 4 illus-
trates the effect of gelatine concentration, using data collected at
the strain rate of 25 min�1. While the fracture stress is found to
increase with increasing concentration, the fracture strain stays
almost constant. The reason behind this observation is unclear at
present.
Fig. 5 shows the loading-unloading compression test results at a
rate of 2.5 min�1. The two loops shown correspond to two
consecutive loading-unloading cycles. The unloading and loading
paths seem to be almost overlapping. Even though some hysteresis
is observed at larger deformations, it remains very small. Similar
observations were obtained for the rest of the test rates (results not
shown). Therefore, the gels behave in a non-linear elastic manner,
at least on the global scale.
Fig. 1. Compression stressestrain response for the 5% w/w and 10% w/w gels at strain
rates of 0.25, 2.5 and 25 min�1.
A.E. Forte et al. / Food Hydrocolloids 46 (2015) 180e190182

Young's moduli of the gels as a function of gelatine concentra-
tion were determined from the initial gradient of the stressestrain
curves in Fig. 2 by using linear regression to approximate the curves
up to a strain level of 0.4. The results are shown in Table 1.
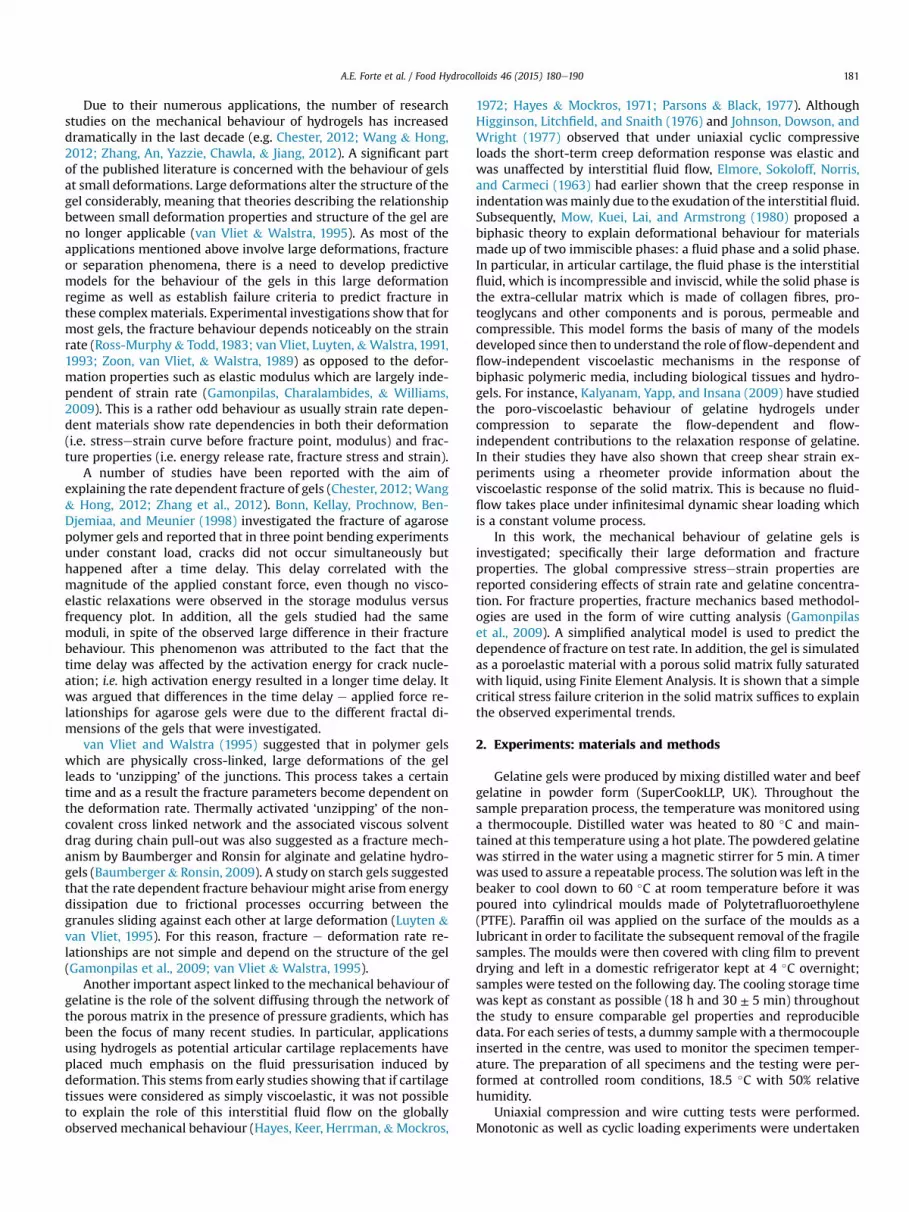
3.2. Wire-cutting
Forceedisplacement curves from the wire cutting tests on
gelatine (10% gelatine concentration) for wire diameters varying
from 0.05 mm to 0.5 mm and cutting speeds of 1e1000 mm/min
were recorded and one example is shown in Fig. 6a for a wire
diameter of 0.05 mm. The load first rises steeply. This corresponds
to the phase where the wire is simply indenting into the gel,
without any cutting or fracture occurring. This indentation part is
found to be similar for all rates in agreement with the behaviour
shown in Fig. 1. When the peak load point is reached, the gel starts
to cut and new surfaces are formed. Thereafter, the load drops to a
constant value corresponding to the steady state phase of the
cutting process. There are some differences in the peak values and
this is due to the fact the fracture initiates at flaws. Such flaws are
randomly occurring from sample to sample, hence the variation
seen. In addition in Fig. 6a, a stick-slip crack growth behaviour is
Fig. 2. Compression stressestrain response of gelatine gels of various concentrations
at a strain rate of 25 min�1.
Fig. 3. (a) Fracture stress and (b) fracture strain of 5% and 10% gelatine gels as a
function of strain rate.
Fig. 4. Fracture stress and strain of gel samples at a strain rate of 25 min�1 as a
function of gelatine concentration.
Fig. 5. Loadingeunloading compression stressestrain curves of 10% w/w gelatine gel
at a strain rate of 2.5 min�1.
A.E. Forte et al. / Food Hydrocolloids 46 (2015) 180e190 183
observed for the 1 mm/min cutting speed. This was not a system-
atic occurrence as it was not observed for the lower speed tests
performed with the other wire diameters. In all the other tests,
constant steady state force values were observed which increased
markedly with cutting speed for all wire diameters. This agrees
with the increasing trend in failure properties with rate as observed
in the uniaxial compression experiments. In Fig. 6b, the averaged
values of the steady state cutting force divided by sample width (F/
b) are plotted against the wire diameter. It is observed that the
steady state cutting force increases almost linearly with the wire
diameter (R2 > 0.94), in agreement with equation (3). By linearly
extrapolating the data to a theoretical zero wire diameter, the en-
ergy release rate, Gc, can be determined as a function of the cutting
rate. The values from Fig. 6b, as expected for this kind of materials,
are relatively small and are found to be between 1 and 12 J/m2.
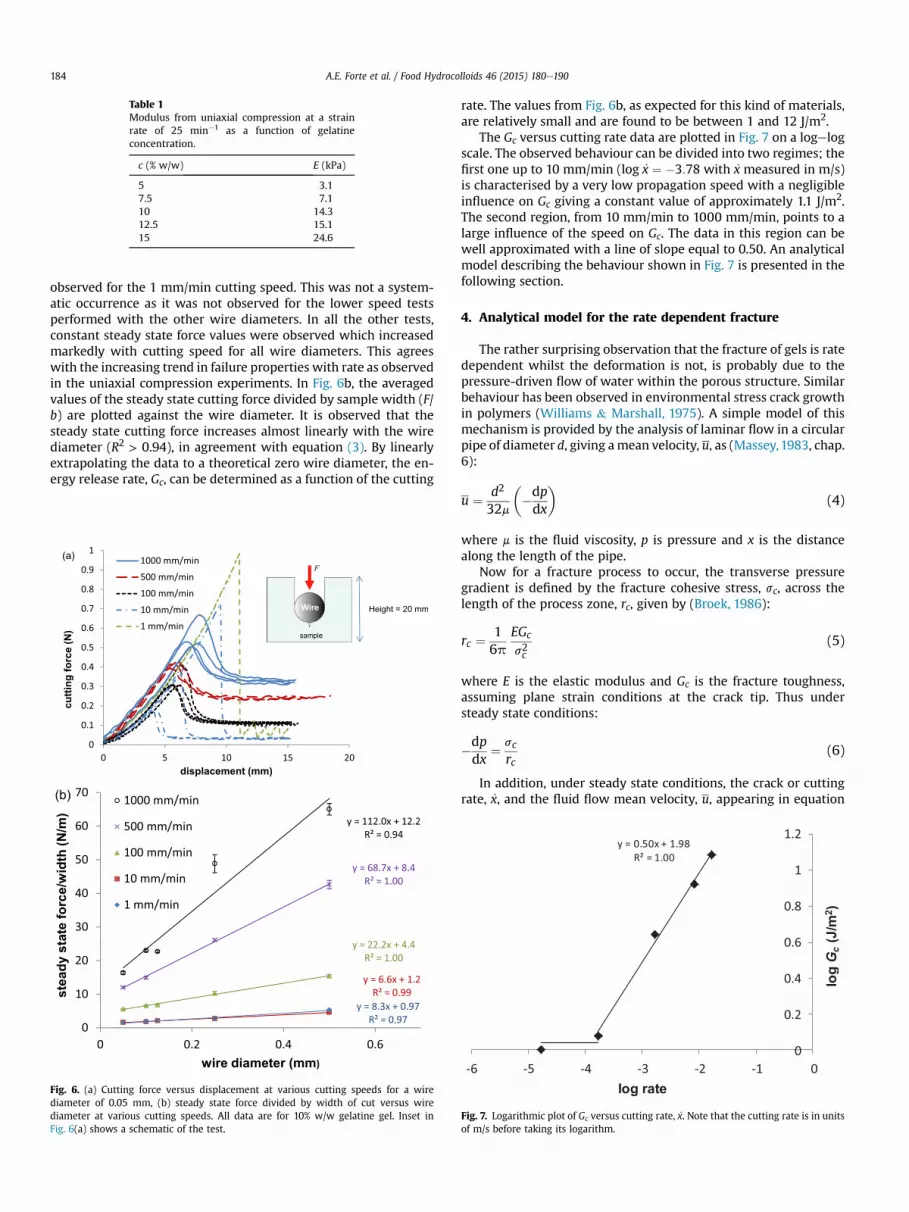
The Gc versus cutting rate data are plotted in Fig. 7 on a logelog
scale. The observed behaviour can be divided into two regimes; the
first one up to 10 mm/min (log _x ¼ �3:78 with _x measured in m/s)
is characterised by a very low propagation speed with a negligible
influence on Gc giving a constant value of approximately 1.1 J/m2.
The second region, from 10 mm/min to 1000 mm/min, points to a
large influence of the speed on Gc. The data in this region can be
well approximated with a line of slope equal to 0.50. An analytical
model describing the behaviour shown in Fig. 7 is presented in the
following section.
4. Analytical model for the rate dependent fracture
The rather surprising observation that the fracture of gels is rate
dependent whilst the deformation is not, is probably due to the
pressure-driven flow of water within the porous structure. Similar
behaviour has been observed in environmental stress crack growth
in polymers (Williams & Marshall, 1975). A simple model of this
mechanism is provided by the analysis of laminar flow in a circular
pipe of diameter d, giving amean velocity, u, as (Massey,1983, chap.
6):
u ¼d2
32m
�
�dp
dx
�
(4)
where m is the fluid viscosity, p is pressure and x is the distance
along the length of the pipe.
Now for a fracture process to occur, the transverse pressure
gradient is defined by the fracture cohesive stress, sc, across the
length of the process zone, rc, given by (Broek, 1986):
rc ¼1
6p
EGc
s2c
(5)
where E is the elastic modulus and Gc is the fracture toughness,
assuming plane strain conditions at the crack tip. Thus under
steady state conditions:
�dp
dx¼
sc
rc(6)
In addition, under steady state conditions, the crack or cutting
rate, _x, and the fluid flow mean velocity, u, appearing in equation
Table 1
Modulus from uniaxial compression at a strain
rate of 25 min�1 as a function of gelatine
concentration.
c (% w/w) E (kPa)
5 3.1
7.5 7.1
10 14.3
12.5 15.1
15 24.6
Fig. 6. (a) Cutting force versus displacement at various cutting speeds for a wire
diameter of 0.05 mm, (b) steady state force divided by width of cut versus wire
diameter at various cutting speeds. All data are for 10% w/w gelatine gel. Inset in
Fig. 6(a) shows a schematic of the test.
Fig. 7. Logarithmic plot of Gc versus cutting rate, _x. Note that the cutting rate is in units
of m/s before taking its logarithm.
A.E. Forte et al. / Food Hydrocolloids 46 (2015) 180e190184
(4), have to be equal. Therefore substituting equations (6) and (5)
into 4, we obtain:
u ¼ _x ¼3ps3cd
2
16EGcm(7)
It is also common that many polymeric systems have a rela-
tionship between Gc and sc such that the crack opening displace-
ment, dc, is independent of rate (Williams, 1984, chap. 7):
Gc ¼ dcsc (8)
where dc is constant.
Substituting equation (8) in 7 gives the result:
_x ¼3pG2
cd2
16Ed3cm¼
3ps2cd2
16Edcm
Therefore:
Gc ¼4
d
Ed3cm
3p
!0:5
_x0:5 (9)
and
sc ¼4
d
�
Edcm
3p
�0:5
_x0:5 (10)
The theoretical model described above predicts a power law rate
dependence of Gc with the value of the power being 0.5. This agrees
with the value of the exponent 0.50 derived from the experimental
data shown in Fig. 7.
In addition to Gc, the linear approximations shown in Fig. 6b can
be used to determine the values of the characteristic stress, sc. From
equation (3) the slopes of the fitted lines are equal to sc for small
coefficients of friction. The assumption is justified as the water
solvent is thought to help lubricate the wire as it cuts through the
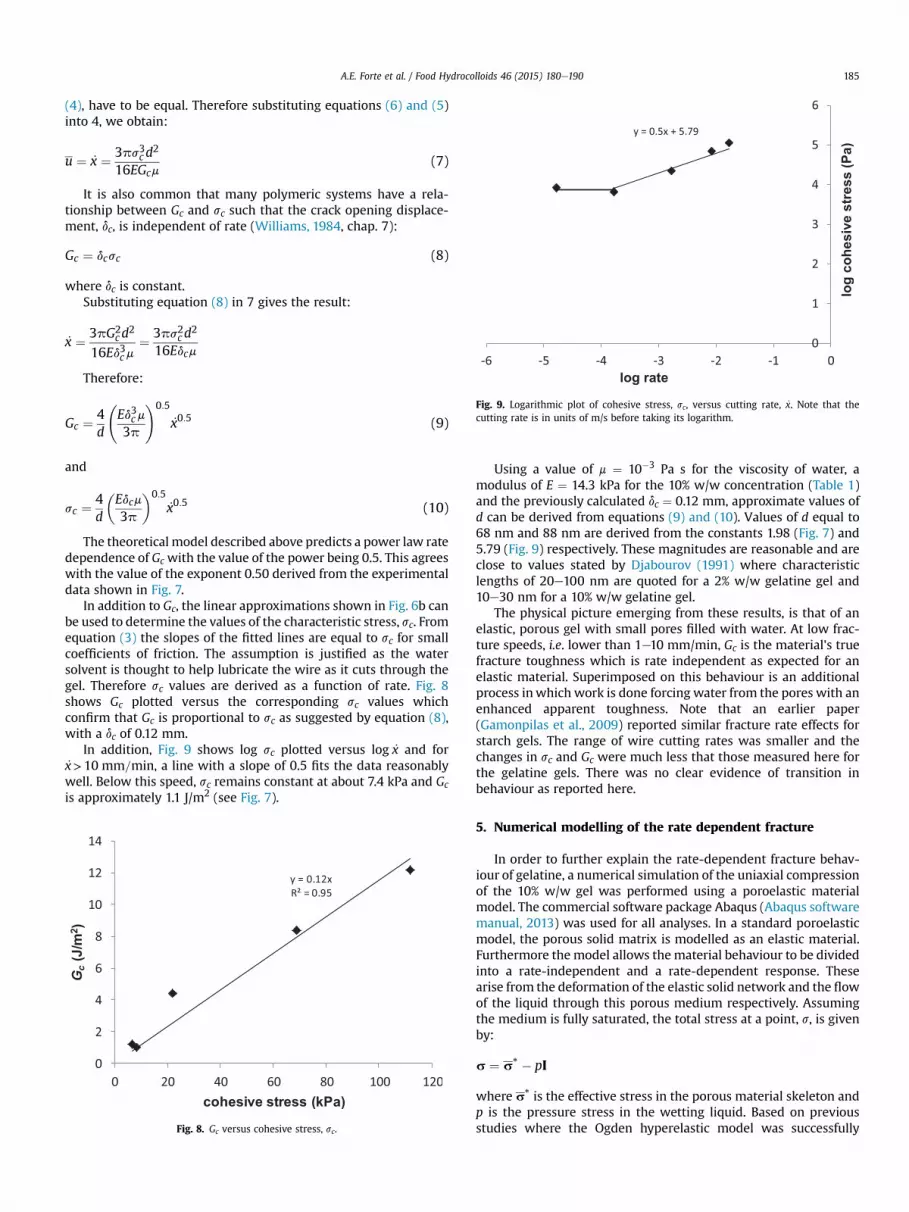
gel. Therefore sc values are derived as a function of rate. Fig. 8
shows Gc plotted versus the corresponding sc values which
confirm that Gc is proportional to sc as suggested by equation (8),
with a dc of 0.12 mm.
In addition, Fig. 9 shows log sc plotted versus log _x and for_x>10 mm=min, a line with a slope of 0.5 fits the data reasonably
well. Below this speed, sc remains constant at about 7.4 kPa and Gc
is approximately 1.1 J/m2 (see Fig. 7).
Using a value of m ¼ 10�3 Pa s for the viscosity of water, a
modulus of E ¼ 14.3 kPa for the 10% w/w concentration (Table 1)
and the previously calculated dc ¼ 0.12 mm, approximate values of
d can be derived from equations (9) and (10). Values of d equal to
68 nm and 88 nm are derived from the constants 1.98 (Fig. 7) and
5.79 (Fig. 9) respectively. These magnitudes are reasonable and are
close to values stated by Djabourov (1991) where characteristic
lengths of 20e100 nm are quoted for a 2% w/w gelatine gel and
10e30 nm for a 10% w/w gelatine gel.
The physical picture emerging from these results, is that of an
elastic, porous gel with small pores filled with water. At low frac-
ture speeds, i.e. lower than 1e10 mm/min, Gc is the material's true
fracture toughness which is rate independent as expected for an
elastic material. Superimposed on this behaviour is an additional
process inwhich work is done forcing water from the pores with an
enhanced apparent toughness. Note that an earlier paper
(Gamonpilas et al., 2009) reported similar fracture rate effects for
starch gels. The range of wire cutting rates was smaller and the
changes in sc and Gc were much less that those measured here for
the gelatine gels. There was no clear evidence of transition in
behaviour as reported here.
5. Numerical modelling of the rate dependent fracture
In order to further explain the rate-dependent fracture behav-
iour of gelatine, a numerical simulation of the uniaxial compression
of the 10% w/w gel was performed using a poroelastic material
model. The commercial software package Abaqus (Abaqus software
manual, 2013) was used for all analyses. In a standard poroelastic
model, the porous solid matrix is modelled as an elastic material.
Furthermore themodel allows thematerial behaviour to be divided
into a rate-independent and a rate-dependent response. These
arise from the deformation of the elastic solid network and the flow
of the liquid through this porous medium respectively. Assuming
the medium is fully saturated, the total stress at a point, s, is given
by:
s ¼ s* � pI
where s* is the effective stress in the porous material skeleton and
p is the pressure stress in the wetting liquid. Based on previous
studies where the Ogden hyperelastic model was successfullyFig. 8. Gc versus cohesive stress, sc.
Fig. 9. Logarithmic plot of cohesive stress, sc, versus cutting rate, _x. Note that the
cutting rate is in units of m/s before taking its logarithm.
A.E. Forte et al. / Food Hydrocolloids 46 (2015) 180e190 185

employed to characterise the global behaviour of the gel
(Gamonpilas et al., 2010; Gamonpilas et al., 2009), the rate-
independent response of the solid network which defines s* was
assumed to follow the Ogden hyperelastic model. This model has a
strain energy potential U defined as:
U ¼2j
a2
�
la
1 þ la
2 þ la
3 � 3�
þ1
DðJ � 1Þ2 (11)
where li are the deviatoric principal stretches and they are equal to
li ¼ J�1=3li, li are the principal stretches, j, a, and D are material
parameters and J is the volume strain (equal to l1l2l3). Note that j
is the initial shear modulus whereas the bulk modulus K is related
to D and Poisson's ratio, n, through:
D ¼2
K¼
3ð1� 2nÞ
jð1þ nÞ(12)
The stresses are then given by partial differentiation of equation
(11), i.e. s* ¼ dU=dl.
Furthermore, the gel is assumed to be a fully saturated, porous
medium with the water flow being governed by Darcy's law:
nv ¼ �k
gwðVp� rwgÞ (13)
where v is the fluid flow velocity vector, n is the porosity of the me-
dium,gw is the specificweight of thefluid (herewater hence equal to
9.789 kN/m3), Vp is the pressure gradient vector, k is the hydraulic
conductivity of themedium, rw is thefluid density (998.2 kg/m3) and
g is defined as the gravitational acceleration vector:
g ¼ �gVz
where g is the gravitational constant (9.812 m/s2) and z is the
elevation above some datum. Note that the hydraulic conductivity,
k (units m/s), is related to conventional permeability, P (units m/
s2), through:
P ¼ km
rwg
As already mentioned, the gelatine specimen is assumed to be
fully saturated with water, i.e. all voids in the material are filled up
with the wetting liquid, water. In addition, the void ratio, e, is
defined as the ratio of volume of wetting liquid, Vw, to the sum of
the volumes of the solid Vs and trapped liquid Vt:
e ¼Vw
Vs þ Vt
Therefore the porosity, n, in equation (13) is related to void ratio,
e, through:
n ¼e
1þ e
The analysis requires the value of the initial void ratio; this was
taken from Yakimets et al. and Kalyanam et al. (Kalyanam et al.,
2009; Yakimets, Wellner, Smith, Wilson, Farhat, & Mitchell, 2005)
to be equal to 9. Therefore 90% of the volume is free water able to
exude from the solid matrix. A hydraulic conductivity value of
1.25 � 10�6 m/s was assumed as measured by Dreesmann, Hajosch,
Ahlers, Vaz Nuernberger, and Schlosshauer (2008) from experi-
ments on gelatine. This completes the material definition for the
model.
The uniaxial compression tests were simulated using an
axisymmetric geometry as shown in Fig. 10 with a radius of 10 mm
and height 20 mm. Mesh convergence tests were performed to
validate the final mesh density which was chosen when results
deviated by only 0.12%. A 4-node, axisymmetric quadrilateral,
reduced integration, hourglass control hybrid element, which in-
cludes pore pressure was employed. The bottom surface was con-
strained in the direction of compression while it was free to move
and expand horizontally. An axisymmetric boundary conditionwas
applied to the rotational axis on the left. A free draining condition
was assigned to the outside surface to allow the fluid to drain out of
the specimen. The top surface was displaced in the vertical direc-
tion such that the three different true strain rates used in the ex-
periments were simulated, i.e. 0.25 min�1, 2.5 min�1 and 25 min�1.
The three parameters of the Ogden model (equation (11)) were
calibrated in order to obtain the best fit between the experimental
stressestrain results and those derived from the model. Table 2
summarises the final coefficients that were chosen, whilst Fig. 11
shows the comparison between the model results and the experi-
mental data. In order to obtain the model data shown in this Figure,
the nodal forces at the top surface were summed to derive the total
Fig. 10. Axisymmetric uniaxial compression model with boundary conditions. The top surface is displaced such that the true strain rate, _3, is constant.
A.E. Forte et al. / Food Hydrocolloids 46 (2015) 180e190186

force F and the true stress and true strain were then calculated
using equations (1) and (2). Note that the value of D shown in
Table 2 implies a Poisson's ratio of 0.4 and that the value of j is
close to the value of 4.8 kPa derived by dividing by three the
modulus of the 10% w/w gel shown in Table 1. It is worth empha-
sising that this Poisson's ratio of 0.4 in the numerical model is to be
considered only for the solid matrix, while the fluid in Abaqus is
considered incompressible by default. The apparent Poisson's ratio
of the poroelastic gel will depend on the applied strain rate as will
be explained below as well in literature (Brinker & Scherer, 1990).
Next, in order to model the rate-dependent fracture behaviour
of gelatine, the solid and fluid contributions were split and
visualised separately. The vertical solid stress and the pore pressure
contours are shown in Fig. 12 for the case of 25 min�1 strain rate
and a strain of 0.7. Since the vertical stresses in the solid matrix and
the fluid do not vary with depth, stress values were calculated at
the top surface as highlighted in Fig. 12. As shown in this figure the
pore pressure and solid stress do not vary in the axial direction.
Therefore a 1D model could have been sufficient in order to
simulate the material behaviour. Unfortunately this approach was
not attempted because of the lack of 1D porous elements in the
software.
These results were then normalised and plotted along the top
surface for the three different strain rates as shown in Fig. 13. Note
that the pressure and stress values were normalised by dividing by
their corresponding maximum values attained along the top sur-
face. For the pore pressure the maximum was at the centre of the
specimenwhereas for the vertical stress, the maximum occurred at
the free edge of the sample. It is observed that the two contribu-
tions to the global stress are entirely complementary, showing how
the response of the gel is effectively a sum of the solid and fluid
reactions to the applied load. As the rate increases, the pore pres-
sure rises. As a result the stress taken by the solid decreases.
Fig. 14 shows the values of the solid stress and the pore pressure
averaged along the top surface versus the applied strain, for the
three different strain rates. In order to be able to predict the strain
rate dependent fracture behaviour, the assumption is made that the
gel fractures when the solid stress reaches a critical value. The
contribution of the fluid phase is negligible at the lowest strain rate
of 0.25 min�1 (see Fig. 14). Therefore we suggest that the breaking
stress detected for the lowest strain rate is only related to the solid
matrix hence is a true material property. Further, at this low strain
rate of 0.25 min�1, the fracture strain is 0.9e1.0 (see Fig. 3b). In
Fig. 14, the strain of 0.9e1.0 corresponds to a solid stress of
approximately 16e19 kPa at 0.25 min�1, which now defines the
critical stress range. This range is illustrated by the horizontal
Table 2
Ogden model parameters (10% w/w gelatine gel) used in the numerical model.
j (kPa) a D (1/Pa)
6.21 2.64 69 � 10�6
Fig. 11. Comparison between experimental and numerical compression stressestrain
curves as a function of strain rate. All data are for 10% w/w gelatine gel.
Fig. 12. Pore pressure (MPa), p, and vertical solid stress, s* , (MPa) contours. Top surface where forces were summed is highlighted. The strain rate is 25 min�1 and the true strain is
0.7.
Fig. 13. Normalised pore pressure, p, and solid stress, s* , variation along the radius of
the sample.
A.E. Forte et al. / Food Hydrocolloids 46 (2015) 180e190 187

shaded region in Fig. 14. Using this critical stress range and looking
at the solid stress curves, the fracture strains of 1.0e1.1 and 1.2e1.3
are obtained for the rates of 2.5 min�1 and 25 min�1 respectively.
These are to be compared with the breaking strains measured
experimentally in Fig. 3b which were 1.1e1.2 for 2.5 min�1 and
around 1.6 for 25 min�1. For 2.5 min�1, the agreement is very good
whereas for the 25 min�1 rate, the predicted values are somewhat
lower than the experimental. The correct trends are however
shown, i.e. the fracture strain rises with applied strain rate.
Figs. 13 and 14 both show that the solid matrix stresses, which
are argued here to be responsible for specimen fracture, decrease as
the strain rate increases. This is as expected as the fluid contribu-
tion is almost null at quasi-static procedures (i.e. unconfined
compression at very low strain rates) and the liquid can easily move
within the solidmatrix network. However, as the rate increases, the
liquid becomes ‘trapped’ in the solid network and in so doing, it
gradually influences the material response by sharing the applied
load. This effect is illustrated clearly in Fig. 15, where the average
value of the void ratio, e, along the top surface of the sample is
plotted versus strain for the three strain rates. In fact, for the
25 min�1 curve, e remains almost constant and close to the initial
value of 9.0, since the liquid does not have sufficient time to flow
out of the sample.
The rate-dependent behaviour of the material also has mani-
festations on the change in volume of the sample during defor-
mation and hence on the contact area of the specimen. The contact
area is plotted versus applied strain as a function of strain rate in
Fig. 16. At slow strain rates, the amount of water in the sample
decreases by a larger extent than at higher rates as shown by
decreased values of e in Fig. 15. Thus, as water which is an incom-
pressible fluid leaves the sample, the gel becomes more
compressible and the contact area expands less. On the contrary, at
higher strain rates, e remains almost constant, the water is trapped
in the solid network and the specimen expands laterally, behaving
closer to an incompressible material.
The results shown in Fig. 16 highlight that the incompressibility
assumption made in equation (1) might lead to errors in the stress
calculations. Therefore the correct contact area from Fig. 16 was
used to recalculate the true compressive stress when using both
Fig. 14. Pore pressure, p, and solid stress, s* , versus strain as a function of strain rate.
Highlighted vertical regions indicate the fracture range for each strain rate.
Fig. 15. Void ratio, e, versus strain as a function of strain rate.
Fig. 16. Specimen contact area versus strain as function of strain rate. The results are
compared with the constant volume assumption data.
Fig. 17. Corrected experimental and numerical compression stressestrain curves as a
function of strain rate. These are the initial data from Fig. 11 which were corrected by
taking into account the numerically calculated contact area of the sample shown in
Fig. 16.
A.E. Forte et al. / Food Hydrocolloids 46 (2015) 180e190188

experimental and numerical force e displacement data. The results
are shown in Fig.17 and these can be compared to the curves shown
in Fig. 11. As expected, the correction was negligible for the case of
25 min�1. For the lowest rate of 0.25 min�1, the stress increased by
approximately 20% at the fracture point, i.e. at the largest strain.
This brought the average experimental stressestrain curves at
different strain rates closer to each other as well as closer to the
model results.
As already stated above, from the numerical simulation of the
uniaxial compression, the critical stress range at the lowest strain
rate is approximately 16e19 kPa. The fracture stress measured at a
rate 0.25 min�1 as shown in Fig. 3a is 11.5e13.9 kPa. However, this
stress range changes to 15.3e18.2 kPa after the contact area
correction described above. Therefore the fracture stress values
from experiment (15.3e18.2 kPa) and numerical model (16e19 kPa)
are now very close which gives further confidence to the model's
relevance. Nevertheless, in the earlier analysis of the wire cutting,
the characteristic, cohesive stress, sc, was found to be about 7.4 kPa.
This was the stress obtained at low cutting speeds, when the effect
of water flow through the network pores on the cutting process was
argued to be insignificant. It is not clear at this stage whether the scvalues quoted here are close enough for an experimental study of
this nature or whether the uniaxial compression values should
indeed be higher than the ones calculated from wire cutting. The
reason for the latter could be that in wire cutting, the stress state
under the wire is hydrostatic compression. In the uniaxial
compression test, the hydrostatic stress component is 1/3 of the
uniaxial, applied stress. Therefore, the value of sc derived from the
wire cutting analysis could well be 1/3 of the critical stress deter-
mined from the uniaxial compression test. Further studies are
needed to be able to determine this, employing further experi-
ments and possibly numerical simulations of the fracture test.
6. Conclusions
It was shown that the stressestrain characteristics of gelatine
gels are independent of rate but the fracture point varied signifi-
cantly with rate; fracture stress and strain increased as the rate
increased. Similarly, the energy release rate, Gc, measured from the
cutting experiments also increased with rate except at the lowest
crack speeds where Gc was almost constant. This effect was
explained quantitatively through modelling the gel as a poroelastic
material with fluid (water) flow through the porous solid polymer
network. An analytical model was derived which accurately
captured the power law dependence of Gc and characteristic stress
sc on rate with a power index of 0.5. At low rates, fluid flow occurs
readily and does not contribute greatly to the load carrying and
fracture resistance of the gel, therefore Gc and sc remain constant,
as would be expected of an elastic solid. At higher rates, the
contribution to the fracture resistance from the fluid flow is sig-
nificant and therefore Gc (and sc) both rise. This same rate effect
was highlighted through a numerical simulation of the compres-
sion test using a poroelastic material model. The simulation
enabled the solid stress and pore pressure contributions to the
overall stress to be quantified. In addition, a critical maximum solid
stress fracture criterion was able to show that it is possible for a gel
to exhibit a rate independent deformation (and hence approxi-
mately constant initial moduli) but a strong rate dependent frac-
ture. It is found that a simple maximum solid stress criterion
captures the dependence of fracture strain on strain rate.
References
Abaqus software and user manual version 6.13. (2013). Providence, RI, USA: Dassault
Syst�emes Simulia Corp.
Balakrishnan, B., Mohanty, M., Umashankar, P. R., & Jayakrishnan, A. (2005). Eval-
uation of an in situ forming hydrogel wound dressing based on oxidized algi-nate and gelatin. Biomaterials, 26, 6335e6342.
Baumberger, T., & Ronsin, O. (2009). From thermally activated to viscosity controlledfracture of biopolymer hydrogels. Journal of Chemical Physics, 130, 061102.
Bonn, D., Kellay, H., Prochnow, M., Ben-Djemiaa, K., & Meunier, J. (1998). Delayed
fracture of an inhomogeneous soft solid. Science, 280, 265e268.Brinker, C. J., & Scherer, G. W. (1990). Solegel science: The physics and chemistry of
solegel processing (1st ed.). (p. 387). Burlington: Elsevier Science.Broek, D. (1986). Elementary engineering fracture mechanics (4th ed.). (p. 115).
Dordrecht, The Netherlands: Kluwer Academic Publishers Group.Charalambides, M. N., Goh, S. M., Lim, S. L., & Williams, J. G. (2001). The analysis of
the frictional effect on stressestrain data from uniaxial compression of cheese.
Journal of Materials Science, 36, 2313e2321.Charalambides, M. N., Goh, S. M., Wanigasooriya, L., Williams, J. G., & Xiao, W.
(2005). Effect of friction on uniaxial compression of bread dough. Journal ofMaterials Science, 40, 3375e3381.
Chester, S. A. (2012). A constitutive model for coupled fluid permeation and large
viscoelastic deformation in polymeric gels. Soft Matter, 8, 8223e8233.Djabourov, M. (1991). Gelation e a review. Polymer International, 25, 135e143.
Dreesmann, L., Hajosch, R., Ahlers, M., Vaz Nuernberger, J., & Schlosshauer, B.(2008). Permeability testing of biomaterial membranes. Biomedical Materials, 3,
034119.
Elmore, S. M., Sokoloff, L., Norris, G., & Carmeci, P. (1963). Nature of “imperfect”elasticity of articular cartilage. Journal of Applied Physiology, 18, 393e396.
Gamonpilas, C., Charalambides, M. N., & Williams, J. G. (2009). Determination oflarge deformation and fracture behaviour of starch gels from conventional and
wire cutting experiments. Journal of Materials Science, 44, 4976e4986.Gamonpilas, C., Charalambides, M. N., Williams, J. G., Dooling, P. J., & Gibbon, S. R.
(2010). Predicting the mechanical behaviour of starch gels through inverse
analysis of indentation data. Applied Rheology, 20, 33283.Goh, S. M., Charalambides, M. N., & Williams, J. G. (2005). On the mechanics of wire
cutting of cheese. Engineering Fracture Mechanics, 72, 931e946.Hayes, W. C., Keer, L. M., Herrman, G., & Mockros, L. F. (1972). Mathematical-analysis
for indentation tests of articular-cartilage. Journal of Biomechanics, 5, 541e551.
Hayes, W. C., & Mockros, L. F. (1971). Viscoelastic properties of human articularcartilage. Journal of Applied Physiology, 31, 562e568.
Hellio, D., & Djabourov, M. (2006). Physically and chemically crosslinked gelatingels. Macromolecular Symposia, 241, 23e27.
Higginson, G. R., Litchfield, M. R., & Snaith, J. (1976). Loadedisplacementetimecharacteristics of articular-cartilage. International Journal of Mechanical Sciences,
18, 481e486.
Ikeda, S., Sangu, T., & Nishinari, K. (2003). Comparative studies on fracture char-acteristics of food gels subjected to uniaxial compression and torsion. Food
Science and Technology Research, 9, 372e377.Johnson, G. R., Dowson, D., & Wright, V. (1977). Elastic behavior of articular-cartilage
under a sinusoidally varying compressive stress. International Journal of Me-
chanical Sciences, 19, 301e308.Kalyanam, S., Yapp, R. D., & Insana, M. F. (2009). Poro-viscoelastic behavior of gelatin
hydrogels under compression e implications for bioelasticity imaging. Journalof Biomechanical Engineering e Transactions of the ASME, 131, 081005.
Kamyab, I., Chakrabarti, S., & Williams, J. G. (1998). Cutting cheese with wire. Journalof Materials Science, 33, 2763e2770.
L�opez-Alemany, A., Compa~n, V., & Refojo, M. F. (2002). Porous structure of Pure-
vision™ versus Focus® Night&Day™ and conventional hydrogel contact lenses.Journal of Biomedical Materials Research, 63, 319e325.
Luyten, H., & van Vliet, T. (1995). Fracture properties of starch gels and their ratedependency. Journal of Texture Studies, 26, 281e298.
Massey, B. S. (1983). Mechanics of fluids (5th ed.). UK: Van Nostrand Reinhold.
Mc Evoy, H., Ross-Murphy, S. B., & Clark, A. H. (1985). Large deformation and ulti-mate properties of bio-polymer gels. 1. Single bio-polymer component systems.
Polymer, 26, 1483e1492.Mow, V. C., Kuei, S. C., Lai, W. M., & Armstrong, C. G. (1980). Biphasic creep and
stress-relaxation of articular-cartilage in compression e theory and experi-ments. Journal of Biomechanical Engineering e Transactions of the ASME, 102,
73e84.
Oldfield, M., Dini, D., Giordano, G., & Rodriguez y Baena, F. (2013). Detailed finiteelement modelling of deep needle insertions into a soft tissue phantom using a
cohesive approach. Computer Methods in Biomechanics and Biomedical Engi-neering, 16, 530e543.
Parida, P., & Mishra, S. C. (2012). Synthesis, crosslinking and evaluation of graft
polymer for biomedical use. Research & Reviews: A Journal of PharmaceuticalScience, 3, 37e45.
Parsons, J. R., & Black, J. (1977). Viscoelastic shear behavior of normal rabbit artic-ular-cartilage. Journal of Biomechanics, 10, 21e29.
Ross-Murphy, B., & Todd, S. (1983). Ultimate tensile measurements of filled gelatin
gels. Polymer, 24, 481e486.Saltzman, W. M., & Radomsky, M. L. (1991). Drugs released from polymers: diffusion
and elimination in brain tissue. Chemical Engineering Science, 46, 2429e2444.van Vliet, T., Luyten, H., & Walstra, P. (1991). Fracture and yielding of gels. In
E. Dickinson (Ed.), Food polymers, gels and colloids (pp. 392e403). Cambridge:Royal Society of Chemistry.
van Vliet, T., Luyten, H., & Walstra, P. (1993). Time-dependent fracture-behavior of
food. In E. Dickinson, & P. Walstra (Eds.), Food colloids and polymers: Stability andmechanical properties (pp. 175e190). Cambridge: Royal Society of Chemistry.
A.E. Forte et al. / Food Hydrocolloids 46 (2015) 180e190 189

van Vliet, T., & Walstra, P. (1995). Large deformation and fracture behaviour of gels.
Faraday Discussions, 101, 359e370.Wang, X., & Hong, W. (2012). Delayed fracture in gels. Soft Matter, 8, 8171e8178.
Williams, J. G. (1984). Fracture mechanics of polymers (1st ed.). England, UK: EllisHorwood Series in Engineering Science.
Williams, J. G., & Marshall, G. P. (1975). Environmental crack and craze growth phe-
nomena inpolymers. Proceedings of the Royal Society of London, Series A, 342, 55e77.Yakimets, I., Wellner, N., Smith, A., Wilson, R., Farhat, I., & Mitchell, J. (2005). Me-
chanical properties with respect to water content of gelatin films in glassy state.Polymer, 46, 12577e12585.
Zhang, J., An, Y., Yazzie, K., Chawla, N., & Jiang, H. (2012). Finite element simulation
of swelling-induced crack healing in gels. Soft Matter, 8, 8107e8112.Zhao, Y., Su, H., Fang, L., & Tan, T. (2005). Superabsorbent hydrogels from poly(-
aspartic acid) with salt-, temperature- and pH-responsiveness properties.Polymer, 46, 5368e5376.
Zoon, P., van Vliet, T., & Walstra, P. (1989). Rheological properties of rennet-induced
skim milk gels. 5. Behavior at large deformation. Netherlands Milk and DairyJournal, 43, 35e52.
A.E. Forte et al. / Food Hydrocolloids 46 (2015) 180e190190