modeling oxygenation in venous blood and skeletal muscle in response to exercise using near-infrared...
TRANSCRIPT
Modeling oxygenation in venous blood and skeletal muscle in responseto exercise using near-infrared spectroscopy
Nicola Lai,1,3 Haiying Zhou,1,3 Gerald M. Saidel,1,3 Martin Wolf,5 Kevin McCully,6 L. Bruce Gladden,7
and Marco E. Cabrera1,2,3,4†1Department of Biomedical Engineering, 2Department of Pediatrics, and 3Center for Modeling Integrated Metabolic Systems,Case Western Reserve University, Cleveland; 4Rainbow Babies and Children’s Hospital, Cleveland, Ohio; 5Biomedical OpticsResearch Laboratory, University Hospital, Zurich, Switzerland; 6Department of Kinesiology, University of Georgia, Athens,Georgia; and 7Department of Kinesiology, Auburn University, Auburn, Alabama
Submitted 16 August 2008; accepted in final form 31 March 2009
Lai N, Zhou H, Saidel GM, Wolf M, McCully K, GladdenLB, Cabrera ME. Modeling oxygenation in venous blood andskeletal muscle in response to exercise using near-infrared spec-troscopy. J Appl Physiol 106: 1858 –1874, 2009. First publishedApril 2, 2009; doi:10.1152/japplphysiol.91102.2008.—Noninva-sive, continuous measurements in vivo are commonly used to makeinferences about mechanisms controlling internal and external respi-ration during exercise. In particular, the dynamic response of muscleoxygenation (SmO2
) measured by near-infrared spectroscopy (NIRS)is assumed to be correlated to that of venous oxygen saturation (SvO2)measured invasively. However, there are situations where the dynam-ics of SmO2
and SvO2 do not follow the same pattern. A quantitativeanalysis of venous and muscle oxygenation dynamics during exerciseis necessary to explain the links between different patterns observedexperimentally. For this purpose, a mathematical model of oxygentransport and utilization that accounts for the relative contribution ofhemoglobin (Hb) and myoglobin (Mb) to the NIRS signal wasdeveloped. This model includes changes in microvascular composi-tion within skeletal muscle during exercise and integrates experimen-tal data in a consistent and mechanistic manner. Three subjects (age25.6 � 0.6 yr) performed square-wave moderate exercise on a cycleergometer under normoxic and hypoxic conditions while muscleoxygenation (Coxy) and deoxygenation (Cdeoxy) were measured byNIRS. Under normoxia, the oxygenated Hb/Mb concentration (Coxy)drops rapidly at the onset of exercise and then increases monotoni-cally. Under hypoxia, Coxy decreases exponentially to a steady statewithin �2 min. In contrast, model simulations of venous oxygenconcentration show an exponential decrease under both conditionsdue to the imbalance between oxygen delivery and consumption at theonset of exercise. Also, model simulations that distinguish the dy-namic responses of oxy-and deoxygenated Hb (HbO2, HHb) and Mb(MbO2, HMb) concentrations (Coxy � HbO2 � MbO2; Cdeoxy �HHb � HMb) show that Hb and Mb contributions to the NIRS signalare comparable. Analysis of NIRS signal components during exercisewith a mechanistic model of oxygen transport and metabolism indi-cates that changes in oxygenated Hb and Mb are responsible fordifferent patterns of SmO2
and SvO2 dynamics observed under nor-moxia and hypoxia.
oxygen transport; hypoxia; mathematical modeling
NEAR-INFRARED SPECTROSCOPY (NIRS) is applied to study tissueoxygenation in brain and skeletal muscle under a variety ofexperimental conditions (3, 5, 21, 27, 46, 56, 66). The combi-nation of dynamic measurements of pulmonary oxygen uptake
(VO2p) and muscle oxygenation at the onset of exercise andduring recovery has proved to be a valuable tool for investi-gating mechanisms of regulation of oxygen consumption (16,17, 25). Oxygen saturation in the venous effluent (SvO2
) of amuscle is usually correlated to oxygenation measures obtainedin the same muscle via NIRS. Interpretation of NIRS measure-ments or NIRS-derived indexes of muscle oxygenation (SmO2
),however, are limited by uncertainties about the specific sourceof the observed signals (7, 42).
NIRS measurements are affected by several different fac-tors, including 1) heterogeneity of blood flow and oxygenconsumption distributions leading to nonuniform oxygenationin muscle (30, 43, 51, 65), 2) capillary recruitment (10, 49),and 3) muscle contraction (42, 43). In addition, the NIRSsignal from a specific muscle region depends on the fractionalvolume distribution of skin, adipose tissue, capillaries, smallarterioles, and venules. Furthermore, dynamic measurementsof oxygenation using NIRS depend on the relative contribu-tions of myoglobin (Mb) and hemoglobin (Hb) to the outputsignal (39, 40, 47), which cannot be distinguished using NIRSmethodology alone, since their absorbance spectra are similar(38, 60). The dynamic NIRS oxygenation signal is a compositeof Hb-Mb oxygenation dynamics. The relative contribution ofthese hemeproteins to the overall signal may differ duringexercise (28, 53).
Previous human (19, 38) and animal (64) studies haveshown that measures of muscle oxygenation using NIRS(SmO2
) are linearly correlated to the oxygen content in musclevenous blood (SvO2
) at steady state, but they are not highlycorrelated throughout the transient to and from exercise. Spe-cifically, discrepancies between the dynamic response of ve-nous oxygen saturation and that in muscles using NIRS hasbeen observed during rhythmic handgrip (6), cycling (12), andleg kicking (37). In the latter two studies, the SmO2
and SvO2
dynamic responses to exercise differed in normoxia and hy-peroxia but showed a parallel decrease with hypoxia.
Although combined studies of MRI and NIRS (38, 45, 60)may be helpful to quantify Hb and Mb contributions to theNIRS signal, all previous in vivo studies showed limitations inaccounting for heterogeneities of blood and tissue volumes/distributions in exercising skeletal muscles. In particular, theoxygen content in the specific region investigated by NIRSdepends on the distributions of perfusion, oxygen consump-tion, blood volume, diffusion, and microvascular composition,all of which change during rest-to-work transitions. Therefore,a physiologically based mathematical model integrated withexperimental data is needed to evaluate the effects of the
† Deceased 5 February 2009.Address for reprint requests and other correspondence: N. Lai, Dept. of
Biomedical Engineering, Case Western Reserve Univ., 10900 Euclid Ave., R309, Cleveland, OH 44106-7207 (e-mail: [email protected]).
J Appl Physiol 106: 1858–1874, 2009.First published April 2, 2009; doi:10.1152/japplphysiol.91102.2008.
8750-7587/09 $8.00 Copyright © 2009 the American Physiological Society http://www. jap.org1858

factors contributing to the dynamic responses of muscle oxy-genation by NIRS. Without an underlying model for interpre-tation, NIRS only reflects a spatial average of muscle oxygencontent in the region covered by the sensed oxygen signalunder various stimuli.
This study analyzes the effects of the tissue and microvas-cular volume distribution on the dynamic responses of muscleoxygen saturation during exercise in normoxia and hypoxia.For this purpose, a mathematical model of oxygen transportand metabolism is applied to quantify various factors thataffect oxygen exchange and utilization as well as NIRS mea-surements during exercise. The model extends an earlier modelthat describes the heterogeneity of oxygen transport and me-tabolism in canine muscle during contractions elicited byelectrical stimulation (33, 34). The extended model enables usto simulate the NIRS signal during exercise, accounting for thetemporal profile and spatial distribution of oxygen concentra-tion in tissue and capillaries in free and bound forms (oxygen-ated and deoxygenated Hb/Mb) and for the dynamic contribu-tions of arterioles and venules to oxygenation in the volume ofmuscle examined by NIRS.
No combined studies of MRI and NIRS have addressed theissue of Hb and Mb contribution to the NIRS signal duringcycle exercise under normoxia and hypoxia. Thus the modelintegrates muscle oxy- and deoxygenation experimental datafrom NIRS measurements obtained during cycling exercise totest hypotheses dealing with the nature of the NIRS signal.This exercise protocol is performed under normoxic and hyp-oxic conditions at moderate intensity to infer possible mecha-nisms underlying the difference observed between SmO2
andSvO2
dynamic responses and to facilitate comparison withprevious studies (12, 37).
Model simulated outputs are compared with dynamic re-sponses of muscle oxygenation of human vastus lateralis mus-cle during cycle exercise obtained under normoxic and hypoxicconditions. These comparisons illustrate how changes in oxy-genated and deoxygenated Hb and Mb concentrations andmicrovascular fractional composition can explain the charac-teristic dynamic responses of muscle oxygenation and venousblood observed during exercise under normoxic and hypoxicconditions.
Glossary
CAT Total concentration of ADP and ATP
(mM)CADP Concentration of ADP in tissue (mM)CATP Concentration of ATP in tissue (mM)
CCT Total concentration of phosphocreatine
(PCr) and creatine (Cr) (mM)CCr Concentration of Cr in tissue (mM)
CPCr Concentration of PCr in tissue (mM)CO2,x
B Bound oxygen concentration in artery,capillary, and tissue (mM)
CO2,xF Free oxygen concentration in artery,
capillary, and tissue (mM)CO2,x
T Total oxygen concentration in artery,capillary, and tissue (mM)
CHb, CMb Concentration of Hb and Mb in mus-cle (mM)
Cb,Hb Concentration of Hb in blood (mM)
Cc,Mb Concentration of Mb in tissue (mM)Crbc,Mb Concentration of Hb in red blood cell
(mM)Cmc,Mb Concentration of Mb in myocyte
(mM)CHbO2
, CHHb Concentration of oxy- and deoxygen-ated Hb in blood (mM)
CMbO2, CHMb Concentration of oxy- and deoxygen-
ated Mb in tissue (mM)Coxy, Cdeoxy Concentration of oxy- and deoxygen-
ated Hb/Mb forms in muscle (mM)�Coxy, �Cdeoxy Change in concentration of oxy- and
deoxygenated Hb/Mb forms inmuscle from baseline (mM)
�Coxy,Hb, �Coxy,Mb Change in concentration of oxygen-ated Hb and Mb in muscle frombaseline (mM)
�Coxy,N, �Cdeoxy,N �Coxy and �Cdeoxy normalized by themaximal oxygenated concentrationvariation obtained under ischemia
�CHeme,N Relative change of heme groups (Hb,Mb) during exercise in the regioninvestigated by NIRS
Db Effective dispersion coefficient inblood (l2/min)
fbl Blood volume fraction in musclefcap Capillary volume fraction in muscleftis Extravascular volume fraction in mus-
cleHct Hematocrit (fraction of red blood cells
in blood)HbO2, MbO2 Hb and Mb oxygenated concentration
in muscle (mM)HHb, HMb Hb and Mb deoxygenated concentra-
tion in muscle (mM)HbMbtot Total heme group concentration in
muscle (mM)HbMbO2 Total oxygenated heme group concen-
tration in muscle (mM)HHbMb Total deoxygenated heme group con-
centration in muscle (mM)kATPase ATPase rate constant (min�1)
Keq Equilibrium constant in creatine ki-nase (CK) flux
KHb Hill constant at which Hb is 50%saturated by O2 (mM�nH)
KMb Hill constant at which Mb is 50%saturated by O2 (mM�1)
KADP Michaelis-Menten constant in CKflux (mM)
Kb Michaelis-Menten constant in CKflux (mM)
Kia Dissociation constant in CK flux(mM)
Kib Dissociation constant in CK flux(mM)
Kiq Dissociation constant in CK flux(mM)
Km Michaelis-Menten constant in oxidativephosphorylation flux (mM)
1859MUSCLE OXYGENATION DYNAMICS DURING EXERCISE
J Appl Physiol • VOL 106 • JUNE 2009 • www.jap.org

Kp Michaelis-Menten constant in CK flux(mM)
n Hill coefficientPS Permeability-surface area product
(l � l�1 �min�1)PSmax Maximal value of PS (l � l�1 �min�1)
Q Cardiac output (l/min)Qm Muscle blood flow (l/min)
t Time (min)VCK
f Maximal forward flux of CK reaction(mM �min�1)
Vmax Maximal flux of oxidative phosphory-lation (mM �min�1)
Vart, Vcap, Vven Vascular volume of arterioles, capillar-ies, and venules (liters)
Vmus, Vbl, Vtis Anatomical volume of muscle, blood,and tissue (liters)
VO2m Muscle oxygen uptake (l/min)VO2p Pulmonary oxygen uptake (l/min)
VO2p,peak Maximal pulmonary oxygen uptake (l/min)
VO2p,VT Pulmonary oxygen uptake at the ven-tilatory threshold (l/min)
Wmc Myocyte volume fractionWR Work rate (W)
� P/O2 ratio��CK Net metabolic flux of CK (mM�min�1)
�ATPase ATPase metabolic flux (mM �min�1)�CK
f CK forward metabolic flux (mM�min�1)�CK
r CK reverse metabolic flux (mM�min�1)�OxPhos Oxidative phosphorylation metabolic
flux (mM �min�1)b Derivative termc Derivative term Volume coordinate (liters)
�art, �cap, �ven Arteriole, capillary, and venule vol-ume fraction in microvascularvessel
METHODS
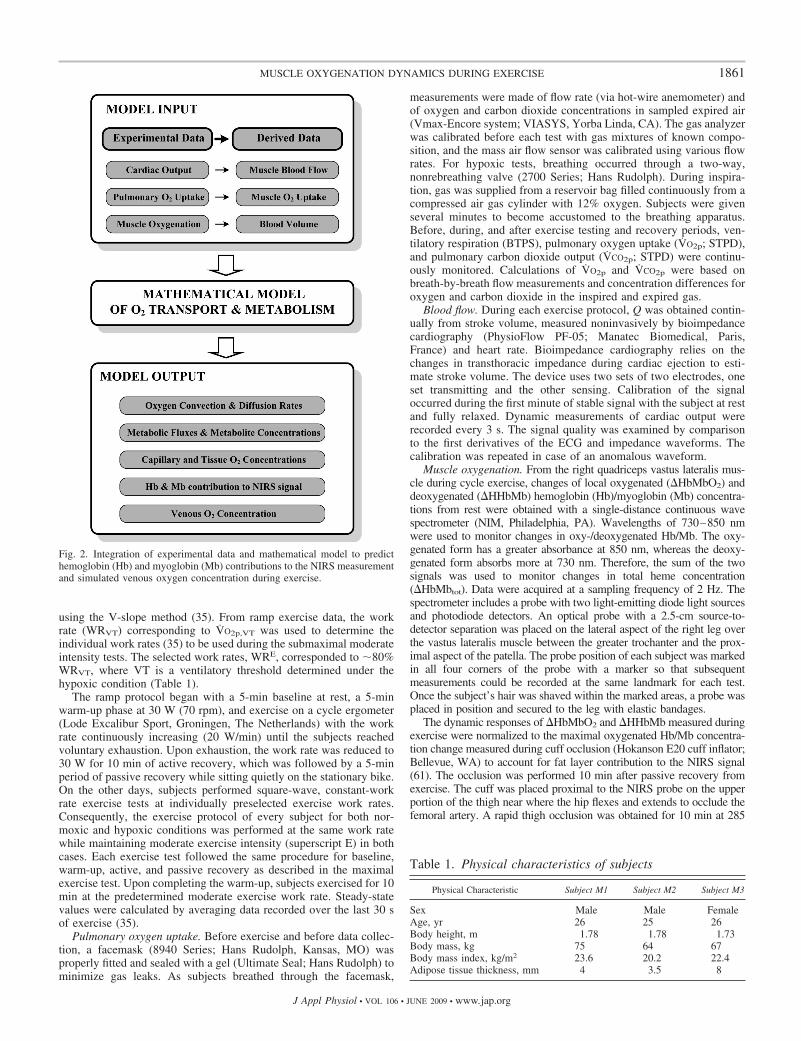
An integrated approach that combines experimental data and modelsimulations is used to analyze the oxygenation in venous blood andskeletal muscle in response to exercise. In particular, pulmonaryoxygen uptake (VO2p), cardiac output (Q), and muscle oxygenationand deoxygenation (�HbMbO2, �HHbMb) experimental data (Fig. 1)are used to derive muscle oxygen uptake (VO2m), blood flow (Qm),and blood volume (Vbl). These are the model inputs of a physiolog-ically based mathematical model necessary to simulate the dynamicresponse of oxygen transport and metabolism in skeletal muscleduring human cycling exercise (Fig. 2). The mathematical modelenables us to simulate oxygen convection and diffusion rates, metab-olite concentrations, and metabolic fluxes, as well as venous andmuscle oxygenation responses, during muscle exercise.
Experimental Study
Subjects. Subjects of this study, two males and one female, werehealthy, nonmedicated, nonsmoking adults who were not involved incompetitive athletics at the time of the study. All investigationalprocedures were approved by the University Hospitals of ClevelandInstitutional Review Board, and written informed consent was ob-tained from subjects. All anthropometric measurements were obtainedon the first day of the study, before the exercise tests. Stature wasmeasured with a calibrated stadiometer and body mass with a balancebeam scale (Seca, Vogel and Halke, Hamburg, Germany), whereasskinfold thickness was measured at four sites on the leg using skinfoldcalipers (Lange skinfold caliper; Cambridge Scientific Industries,Cambridge, MD) (Table 1).
Exercise protocol. Subjects participated in four cycle exercise testswithin a 2-wk period, two in normoxia and two in hypoxia. Allexperimental protocols performed in hypoxia, which included rampand square-wave exercise tests, were similar to those performed innormoxia and were carried out at a pedaling frequency of �70 rpm.The subjects were asked to refrain from eating and exercising for 2 hbefore the exercise tests. Instructions to begin and end testing weregiven by voice without warning. When subjects were exposed to thehypoxic condition, they had an additional 10 min of rest to allowequilibration between the breathing gas mixture and the blood beforethe exercise protocol started.
Subjects performed the first two exercise tests on separate days, oneunder hypoxic and one under normoxic conditions, using a continu-ously incremental ramp protocol to determine peak pulmonary oxygenuptake (VO2p,peak) and ventilatory threshold (VO2p,VT) as determined
Fig. 1. A: experimental apparatus to measure pulmo-nary oxygen uptake (VO2p), cardiac output (Q), andmuscle oxygenation (�HbMbO2) and deoxygenation(�HHbMb) during bicycle exercise. B: local region ofmuscle investigated by near-infrared spectroscopy(NIRS). Muscle composition was characterized by vol-ume fractions of blood (fbl) and tissue (ftis) in muscleand by volume fraction of arterioles (�art), capillaries(�cap), and venules (�ven) in blood.
1860 MUSCLE OXYGENATION DYNAMICS DURING EXERCISE
J Appl Physiol • VOL 106 • JUNE 2009 • www.jap.org
using the V-slope method (35). From ramp exercise data, the workrate (WRVT) corresponding to VO2p,VT was used to determine theindividual work rates (35) to be used during the submaximal moderateintensity tests. The selected work rates, WRE, corresponded to �80%WRVT, where VT is a ventilatory threshold determined under thehypoxic condition (Table 1).
The ramp protocol began with a 5-min baseline at rest, a 5-minwarm-up phase at 30 W (70 rpm), and exercise on a cycle ergometer(Lode Excalibur Sport, Groningen, The Netherlands) with the workrate continuously increasing (20 W/min) until the subjects reachedvoluntary exhaustion. Upon exhaustion, the work rate was reduced to30 W for 10 min of active recovery, which was followed by a 5-minperiod of passive recovery while sitting quietly on the stationary bike.On the other days, subjects performed square-wave, constant-workrate exercise tests at individually preselected exercise work rates.Consequently, the exercise protocol of every subject for both nor-moxic and hypoxic conditions was performed at the same work ratewhile maintaining moderate exercise intensity (superscript E) in bothcases. Each exercise test followed the same procedure for baseline,warm-up, active, and passive recovery as described in the maximalexercise test. Upon completing the warm-up, subjects exercised for 10min at the predetermined moderate exercise work rate. Steady-statevalues were calculated by averaging data recorded over the last 30 sof exercise (35).
Pulmonary oxygen uptake. Before exercise and before data collec-tion, a facemask (8940 Series; Hans Rudolph, Kansas, MO) wasproperly fitted and sealed with a gel (Ultimate Seal; Hans Rudolph) tominimize gas leaks. As subjects breathed through the facemask,
measurements were made of flow rate (via hot-wire anemometer) andof oxygen and carbon dioxide concentrations in sampled expired air(Vmax-Encore system; VIASYS, Yorba Linda, CA). The gas analyzerwas calibrated before each test with gas mixtures of known compo-sition, and the mass air flow sensor was calibrated using various flowrates. For hypoxic tests, breathing occurred through a two-way,nonrebreathing valve (2700 Series; Hans Rudolph). During inspira-tion, gas was supplied from a reservoir bag filled continuously from acompressed air gas cylinder with 12% oxygen. Subjects were givenseveral minutes to become accustomed to the breathing apparatus.Before, during, and after exercise testing and recovery periods, ven-tilatory respiration (BTPS), pulmonary oxygen uptake (VO2p; STPD),and pulmonary carbon dioxide output (VCO2p; STPD) were continu-ously monitored. Calculations of VO2p and VCO2p were based onbreath-by-breath flow measurements and concentration differences foroxygen and carbon dioxide in the inspired and expired gas.
Blood flow. During each exercise protocol, Q was obtained contin-ually from stroke volume, measured noninvasively by bioimpedancecardiography (PhysioFlow PF-05; Manatec Biomedical, Paris,France) and heart rate. Bioimpedance cardiography relies on thechanges in transthoracic impedance during cardiac ejection to esti-mate stroke volume. The device uses two sets of two electrodes, oneset transmitting and the other sensing. Calibration of the signaloccurred during the first minute of stable signal with the subject at restand fully relaxed. Dynamic measurements of cardiac output wererecorded every 3 s. The signal quality was examined by comparisonto the first derivatives of the ECG and impedance waveforms. Thecalibration was repeated in case of an anomalous waveform.
Muscle oxygenation. From the right quadriceps vastus lateralis mus-cle during cycle exercise, changes of local oxygenated (�HbMbO2) anddeoxygenated (�HHbMb) hemoglobin (Hb)/myoglobin (Mb) concentra-tions from rest were obtained with a single-distance continuous wavespectrometer (NIM, Philadelphia, PA). Wavelengths of 730–850 nmwere used to monitor changes in oxy-/deoxygenated Hb/Mb. The oxy-genated form has a greater absorbance at 850 nm, whereas the deoxy-genated form absorbs more at 730 nm. Therefore, the sum of the twosignals was used to monitor changes in total heme concentration(�HbMbtot). Data were acquired at a sampling frequency of 2 Hz. Thespectrometer includes a probe with two light-emitting diode light sourcesand photodiode detectors. An optical probe with a 2.5-cm source-to-detector separation was placed on the lateral aspect of the right leg overthe vastus lateralis muscle between the greater trochanter and the prox-imal aspect of the patella. The probe position of each subject was markedin all four corners of the probe with a marker so that subsequentmeasurements could be recorded at the same landmark for each test.Once the subject’s hair was shaved within the marked areas, a probe wasplaced in position and secured to the leg with elastic bandages.
The dynamic responses of �HbMbO2 and �HHbMb measured duringexercise were normalized to the maximal oxygenated Hb/Mb concentra-tion change measured during cuff occlusion (Hokanson E20 cuff inflator;Bellevue, WA) to account for fat layer contribution to the NIRS signal(61). The occlusion was performed 10 min after passive recovery fromexercise. The cuff was placed proximal to the NIRS probe on the upperportion of the thigh near where the hip flexes and extends to occlude thefemoral artery. A rapid thigh occlusion was obtained for 10 min at 285
Table 1. Physical characteristics of subjects
Physical Characteristic Subject M1 Subject M2 Subject M3
Sex Male Male FemaleAge, yr 26 25 26Body height, m 1.78 1.78 1.73Body mass, kg 75 64 67Body mass index, kg/m2 23.6 20.2 22.4Adipose tissue thickness, mm 4 3.5 8
Fig. 2. Integration of experimental data and mathematical model to predicthemoglobin (Hb) and myoglobin (Mb) contributions to the NIRS measurementand simulated venous oxygen concentration during exercise.
1861MUSCLE OXYGENATION DYNAMICS DURING EXERCISE
J Appl Physiol • VOL 106 • JUNE 2009 • www.jap.org

Torr. The total deoxygenation was assumed to be achieved when aplateau in oxygenated Hb/Mb was reached (�10 min).
Mathematical Model
Oxygen transport and metabolism. The metabolic response of skel-etal muscle to moderate exercise stimulus can be described by transportand metabolic processes associated with oxygen, ATP, and phosphocre-atine (PCr) (33, 34). The total muscle volume (Vmus � Vbl � Vtis)consists of extravascular muscle cells of tissue (Vtis) and blood fromarterioles, capillaries, and veins (Vbl � Vart � Vcap � Vven). In capillaryblood (b) and in tissue cells (c), the total (T) oxygen concentration inmuscle is the sum of the free (F) and bound (B) oxygen concentrations(CO2,x
T � CO2,x
F � CO2,x
B , x � b, c), which are related by local equilibrium(33). Total oxygen concentration in the capillary blood CO2,b
T (t, v)varies with time (t) and tissue location as indicated by the cumulativemuscle volume (v) from the arterial input v � 0 to the venous outputv � Vmus:
�CO2,bT
�t� �
Qm t�
fcap t�
�CO2,bT
�� Db
�2CO2,bT
�2
�PS t�
fcap t� CO2,b
F � CO2,cF � 0 � � Vmus
(1)
The first term on the right side represents convective transport ofoxygen in the direction of blood flow Qm in which fcap is the ratio ofcapillary blood volume to total muscle volume Vmus; the second termrepresents axial dispersion in the capillary bed; and the third termrepresents transport between capillary blood and extravascular musclecells, which depends on the permeability-surface area product (PS) andfree oxygen gradient. The boundary conditions for the capillary bloodassume that the input oxygen concentration from arterial blood is knownand that the output oxygen concentration leaving the capillaries has anegligible gradient between the end of the capillary and venous vessels:
� 0 CO2,bF � CO2,art
F � Vmus
�CO2,bF
�� 0 (2)
where CO2,artF � CO2,b
F (0, 0) and CO2,venF � CO2,b
F (t, Vmus) are arterial andvenous oxygen concentration simulated during exercise. The initialconditions for theses equations are
t � 0: CO2,bF � CO2,b
F 0, �; CO2,cF � CO2,c
F 0� (3)
In the extravascular tissue, oxygen concentration is consideredspatially lumped and changes with time according to
dCO2,cT
dt�
PS t��0
Vmus
CO2,bF � CO2,c
F �d
Vtis
� �OxPhos (4)
where �OxPhos is the oxidative phosphorylation flux. Equivalent formsof Eqs. 1 and 4 involving only CO2,b
F and CO2,cF are given in the
APPENDIX.Metabolic relationships. The metabolic reaction processes that
involve oxidative phosphorylation are associated with the concentra-tion dynamics of ATP and PCr. The dynamic mass balances of thesecellular concentrations are related to metabolic fluxes:
dCATP
dt� ��ATPase � ��OxPhos � ��CK (5)
dCPCr
dt� ���CK (6)
where �ATPase is the ATP utilization flux, � is the stoichiometriccoefficient that relates oxidative phosphorylation to ATP production,and ��CK is the net forward flux of the creatine kinase (CK) reaction.
The initial concentrations are
t � 0: CATP � CATP 0�; CPCr � CPCr 0� (7)
The concentration pairs ATP-ADP and PCr-Cr are related by massconservation of adenosine and creatine, respectively, whose totalconcentrations are constant during moderate exercise:
CAT � CADP � CATP (8)
CCT � CCr � CPCr (9)
The equations defining ��CK(t) as functions of CATP and CPCr and�OxPhos(t) as a function of CATP and CO2,c
F are given in the APPENDIX
(68). At steady state, Eqs. 5 and 6 yield �ATPase � ��OxPhos.Furthermore, we assume that at any steady state j, �ATPase
j �kATPase
j CATP(0), so kATPasej � ��OxPhos
j /CATP(0).Model variables determined by measurements. To simulate re-
sponses to exercise of human subjects, several model variables are relatedto measured variables. To simulate step changes between steady states atrest (j � R), warm-up (j � W), and moderate exercise (j � E), we assumethat �OxPhos
j � VO2mj /Vtis (34). Consequently, we can compute kATPase
j ��VO2m
j /VtisCATP(0), where muscle oxygen uptake VO2mj at steady state is
related to measured VO2pj (32) by assuming that any increase in pulmo-
nary oxygen uptake during exercise is directed to supporting the in-creased energy demand of working muscles:
VO2mR � 0.2 VO2p
R ; VO2mj � VO2p
j � 0.8 VO2pR j � W, E� (10)
Muscle blood flow at rest QmR is 15% of the cardiac output at rest QR
(57). With a step increase in work rate from rest, the blood flow inmuscle at the onset of contraction is assumed to immediately increase:Qm(0�) � Qm
R � 0.4QR � 0.55QR. The additional blood flow occursby redistribution from other organs at the onset of exercise (57). Atany time after the onset of exercise (t � 0), the muscle blood flow isassumed to be related to the cardiac output:
Qm t� � Q t� � 0.45QR (11)
This expression is consistent with the linear relationship betweenblood flow and cardiac output reported during ramp test exercise (8).In addition, Qm was assumed to have the same time course as Q basedon a study in which cardiac output and femoral blood flow displayedsimilar time profiles during muscle contraction (18). Furthermore, anincrease in the effective rate coefficient of capillary tissue diffusioncan be related to the muscle blood flow (33, 34). We assume that thepermeability-surface area response to exercise is
PS t� � PS 0� � �PSmax � PS 0�� 1 � exp� ��Qm t� � Qm 0��/qC��
(12)
where PS(0) is the steady-state rate coefficient before exercise, PSmax
� PS(0) is the change after exercise, and q is a scaling parameter (34).
Interpretation of the NIRS Signal
Oxygenated Hb and Mb concentrations. In response to exercise,blood and tissue oxygen concentrations change in skeletal muscle. Tosimulate oxygen responses to exercise as measured by NIRS, thechange of the oxygenated forms in blood and tissue is normalized bythe maximal change in the oxygenated Hb and Mb concentrationsvariation observed during ischemia:
�HbMbO2 t� � �HbO2 � �MbO2 (13)
Model simulation of �HbMbO2 is intended to reflect relativechanges of oxygenation of intravascular and extravascular musclecompartments during exercise associated with muscle volume distri-bution in the sampled region of the NIRS measurement (Fig. 1). Thesimulated HbO2 in muscle (tissue and blood) can be related to thesimulated CHbO2 in blood by the volume fraction of blood fbl:
1862 MUSCLE OXYGENATION DYNAMICS DURING EXERCISE
J Appl Physiol • VOL 106 • JUNE 2009 • www.jap.org
HbO2 t� � fbl t�CHbO2 t� (14)
where CHbO2 is related to heme-bound oxygen concentrations in themicrovascular vessels (CO2,b
B ; b � art, ven, cap) by the volumefractions in microvascular vessel (�art, �cap, and �ven) (see APPENDIX).
The simulated oxymyoglobin concentration relative to musclevolume (MbO2) is directly proportional to oxymyoglobin concentra-tion (CMbO2) in tissue by the extravascular volume fraction in muscle(ftis � 1 � fbl):
MbO2 t� � ftis t�CMbO2 t� (15)
Moreover, the simulated deoxyhemoglobin (HHb) and myoglobin(HMb) concentrations relative to blood and muscle volumes, respec-tively, also can be derived in the same manner.
To facilitate understanding of model results and experimental data,the symbols used in the text are replaced in the APPENDIX to makeclearer model developments. To quantify the contribution of Hb andMb to the total Hb and Mb heme group (HbMb) under differentexperimental conditions, the Hb and Mb fractions to the NIRS signalare defined:
yHb t� � Hb t�/HbMb t�; yMb t� � 1 � yHb t� (16)
Blood volume in muscle related to NIRS measurement. �HbMb isintended to reflect relative changes of the heme group concentration ofHb and Mb during exercise associated with blood volume changes inthe sampled region of the NIRS measurement as follows:
�HbMbtot t� � �HbO2 t� � �HHb t�� � �MbO2 t� � �HMb t��
� �HbMbO2 t� � �HHbMb(t) (17)
Since hemoglobin (�HbO2, �HHb) and myoglobin (�MbO2,�HMb) concentration forms in muscle can be related to volumefraction of blood (fbl) and tissue (ftis), blood volume change can bederived from �HbMb measurements (APPENDIX):
fbl t� � f ��HbMbtot t�� (18)
Therefore capillary volume (Vcap) can be calculated by assuming thatblood volume fraction fbl(t) change from rest takes place in capillaries,whereas extravascular tissue volume Vtis remains constant, as well asthe volumes of arteriole and venule blood (Vart, Vven):
Vcap t� �fbl t�Vtis
1 � fbl t�� �Vart � Vven� (19)
Note that from Eq. 18, the blood volume fraction fbl(t) is directlyrelated to �HbMbtot(t), which can be obtained from the measuredNIRS signal. Furthermore, during exercise, the arteriole, capillary,and venule volume fractions in blood change as
�art t� � Vart/Vbl t�, �cap t� � Vcap t�/Vbl t�, �ven t� � Vven/Vbl t�
(20)
These blood distribution fractions within muscle not only changeduring exercise but also differ among subjects.
RESULTS
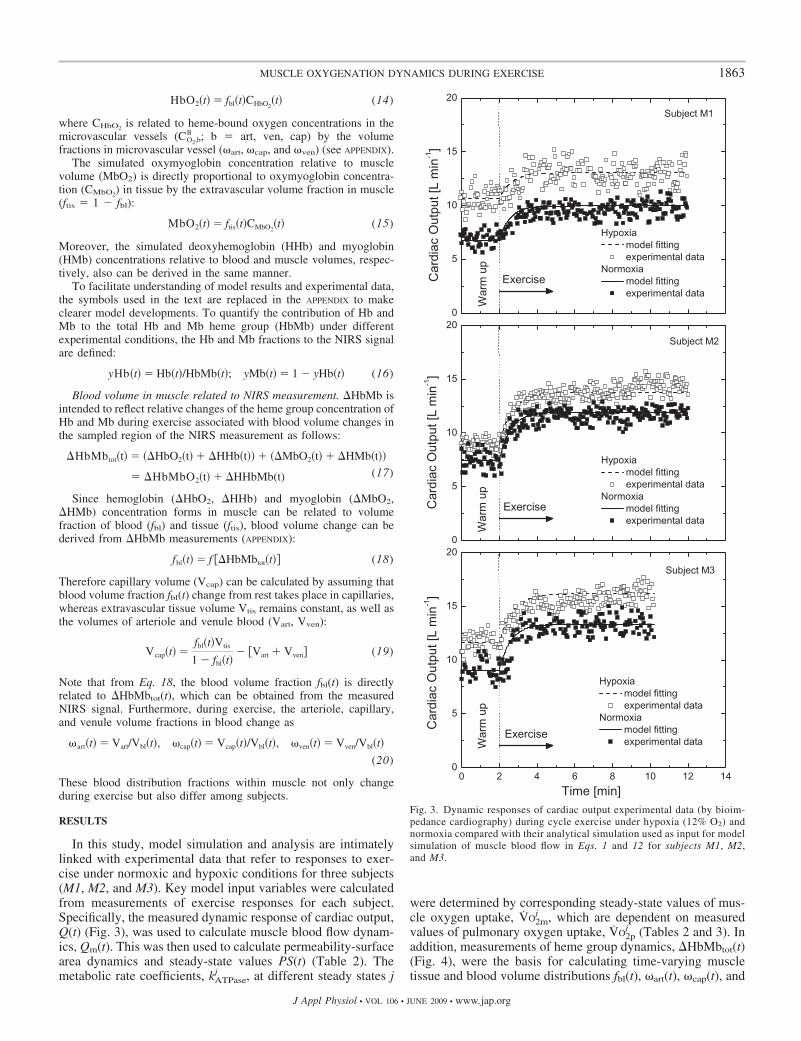
In this study, model simulation and analysis are intimatelylinked with experimental data that refer to responses to exer-cise under normoxic and hypoxic conditions for three subjects(M1, M2, and M3). Key model input variables were calculatedfrom measurements of exercise responses for each subject.Specifically, the measured dynamic response of cardiac output,Q(t) (Fig. 3), was used to calculate muscle blood flow dynam-ics, Qm(t). This was then used to calculate permeability-surfacearea dynamics and steady-state values PS(t) (Table 2). Themetabolic rate coefficients, kATPase
j , at different steady states j
were determined by corresponding steady-state values of mus-cle oxygen uptake, VO2m
j , which are dependent on measuredvalues of pulmonary oxygen uptake, VO2p
j (Tables 2 and 3). Inaddition, measurements of heme group dynamics, �HbMbtot(t)(Fig. 4), were the basis for calculating time-varying muscletissue and blood volume distributions fbl(t), �art(t), �cap(t), and
Fig. 3. Dynamic responses of cardiac output experimental data (by bioim-pedance cardiography) during cycle exercise under hypoxia (12% O2) andnormoxia compared with their analytical simulation used as input for modelsimulation of muscle blood flow in Eqs. 1 and 12 for subjects M1, M2,and M3.
1863MUSCLE OXYGENATION DYNAMICS DURING EXERCISE
J Appl Physiol • VOL 106 • JUNE 2009 • www.jap.org
�ven(t) (Fig. 5). Once these model input variables were calcu-lated, the model equations could simulate oxygen concentra-tion dynamics in blood and tissue domains. From modelsimulations of oxygenated Hb and Mb, �HbMbO2(t) couldthen be compared with experimental data (Fig. 6). Also, theindividual contributions of Hb and Mb to �HbMbO2(t) couldbe simulated (Fig. 7). Furthermore, from simulations, a com-parison between �HbMbO2(t) and the venous oxygen concen-tration, CO2,ven
T (t), could be shown (Fig. 8).
Oxygen Uptake and Blood Flows at Steady State
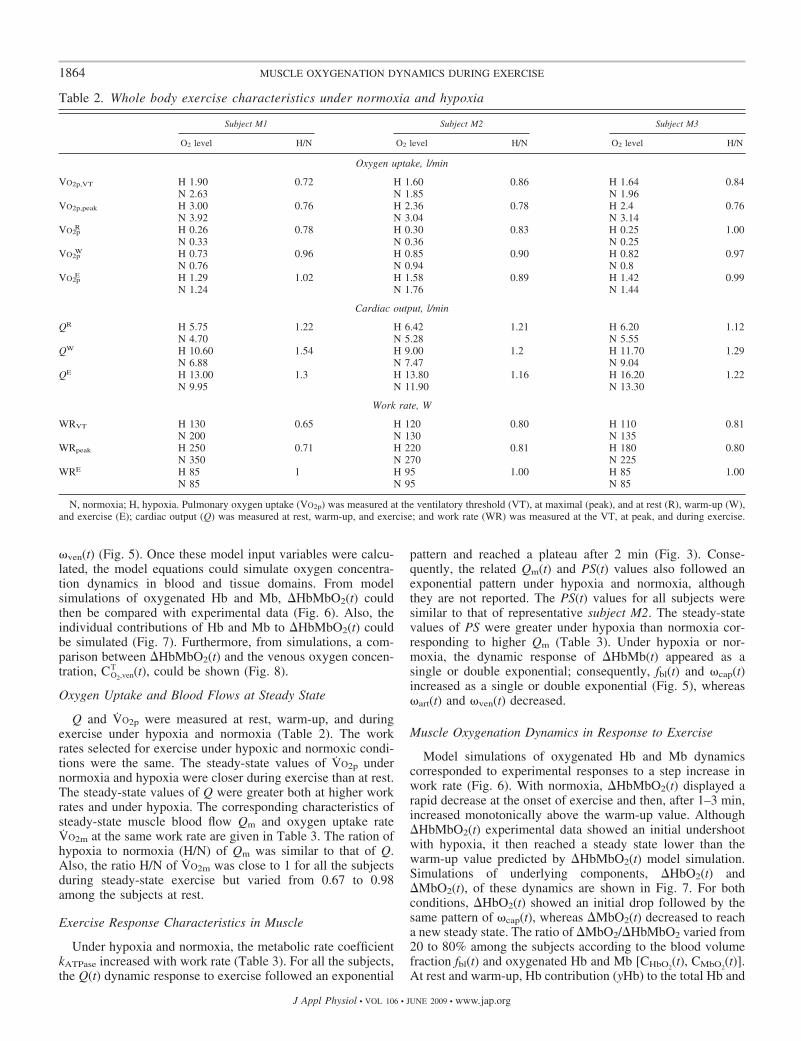
Q and VO2p were measured at rest, warm-up, and duringexercise under hypoxia and normoxia (Table 2). The workrates selected for exercise under hypoxic and normoxic condi-tions were the same. The steady-state values of VO2p undernormoxia and hypoxia were closer during exercise than at rest.The steady-state values of Q were greater both at higher workrates and under hypoxia. The corresponding characteristics ofsteady-state muscle blood flow Qm and oxygen uptake rateVO2m at the same work rate are given in Table 3. The ration ofhypoxia to normoxia (H/N) of Qm was similar to that of Q.Also, the ratio H/N of VO2m was close to 1 for all the subjectsduring steady-state exercise but varied from 0.67 to 0.98among the subjects at rest.
Exercise Response Characteristics in Muscle
Under hypoxia and normoxia, the metabolic rate coefficientkATPase increased with work rate (Table 3). For all the subjects,the Q(t) dynamic response to exercise followed an exponential
pattern and reached a plateau after 2 min (Fig. 3). Conse-quently, the related Qm(t) and PS(t) values also followed anexponential pattern under hypoxia and normoxia, althoughthey are not reported. The PS(t) values for all subjects weresimilar to that of representative subject M2. The steady-statevalues of PS were greater under hypoxia than normoxia cor-responding to higher Qm (Table 3). Under hypoxia or nor-moxia, the dynamic response of �HbMb(t) appeared as asingle or double exponential; consequently, fbl(t) and �cap(t)increased as a single or double exponential (Fig. 5), whereas�art(t) and �ven(t) decreased.
Muscle Oxygenation Dynamics in Response to Exercise
Model simulations of oxygenated Hb and Mb dynamicscorresponded to experimental responses to a step increase inwork rate (Fig. 6). With normoxia, �HbMbO2(t) displayed arapid decrease at the onset of exercise and then, after 1–3 min,increased monotonically above the warm-up value. Although�HbMbO2(t) experimental data showed an initial undershootwith hypoxia, it then reached a steady state lower than thewarm-up value predicted by �HbMbO2(t) model simulation.Simulations of underlying components, �HbO2(t) and�MbO2(t), of these dynamics are shown in Fig. 7. For bothconditions, �HbO2(t) showed an initial drop followed by thesame pattern of �cap(t), whereas �MbO2(t) decreased to reacha new steady state. The ratio of �MbO2/�HbMbO2 varied from20 to 80% among the subjects according to the blood volumefraction fbl(t) and oxygenated Hb and Mb [CHbO2
(t), CMbO2(t)].
At rest and warm-up, Hb contribution (yHb) to the total Hb and
Table 2. Whole body exercise characteristics under normoxia and hypoxia
Subject M1 Subject M2 Subject M3
O2 level H/N O2 level H/N O2 level H/N
Oxygen uptake, l/min
VO2p,VT H 1.90 0.72 H 1.60 0.86 H 1.64 0.84N 2.63 N 1.85 N 1.96
VO2p,peak H 3.00 0.76 H 2.36 0.78 H 2.4 0.76N 3.92 N 3.04 N 3.14
VO2pR H 0.26 0.78 H 0.30 0.83 H 0.25 1.00
N 0.33 N 0.36 N 0.25VO2p
W H 0.73 0.96 H 0.85 0.90 H 0.82 0.97N 0.76 N 0.94 N 0.8
VO2pE H 1.29 1.02 H 1.58 0.89 H 1.42 0.99
N 1.24 N 1.76 N 1.44
Cardiac output, l/min
QR H 5.75 1.22 H 6.42 1.21 H 6.20 1.12N 4.70 N 5.28 N 5.55
QW H 10.60 1.54 H 9.00 1.2 H 11.70 1.29N 6.88 N 7.47 N 9.04
QE H 13.00 1.3 H 13.80 1.16 H 16.20 1.22N 9.95 N 11.90 N 13.30
Work rate, W
WRVT H 130 0.65 H 120 0.80 H 110 0.81N 200 N 130 N 135
WRpeak H 250 0.71 H 220 0.81 H 180 0.80N 350 N 270 N 225
WRE H 85 1 H 95 1.00 H 85 1.00N 85 N 95 N 85
N, normoxia; H, hypoxia. Pulmonary oxygen uptake (VO2p) was measured at the ventilatory threshold (VT), at maximal (peak), and at rest (R), warm-up (W),and exercise (E); cardiac output (Q) was measured at rest, warm-up, and exercise; and work rate (WR) was measured at the VT, at peak, and during exercise.
1864 MUSCLE OXYGENATION DYNAMICS DURING EXERCISE
J Appl Physiol • VOL 106 • JUNE 2009 • www.jap.org
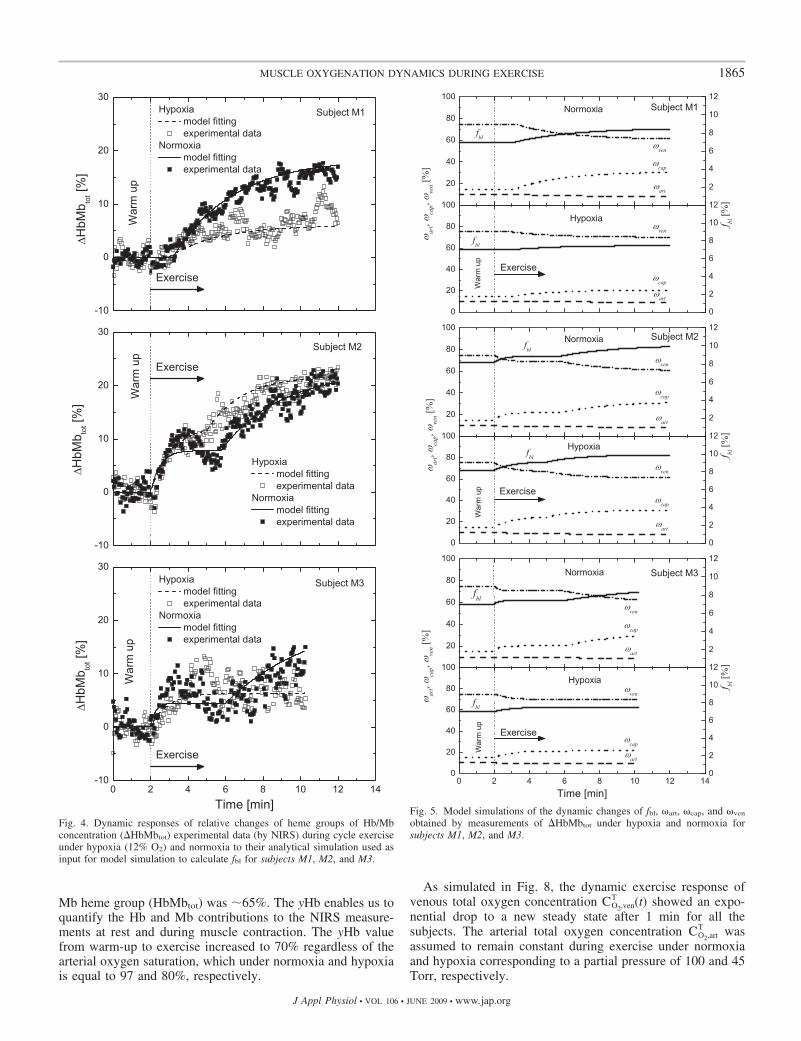
Mb heme group (HbMbtot) was �65%. The yHb enables us toquantify the Hb and Mb contributions to the NIRS measure-ments at rest and during muscle contraction. The yHb valuefrom warm-up to exercise increased to 70% regardless of thearterial oxygen saturation, which under normoxia and hypoxiais equal to 97 and 80%, respectively.
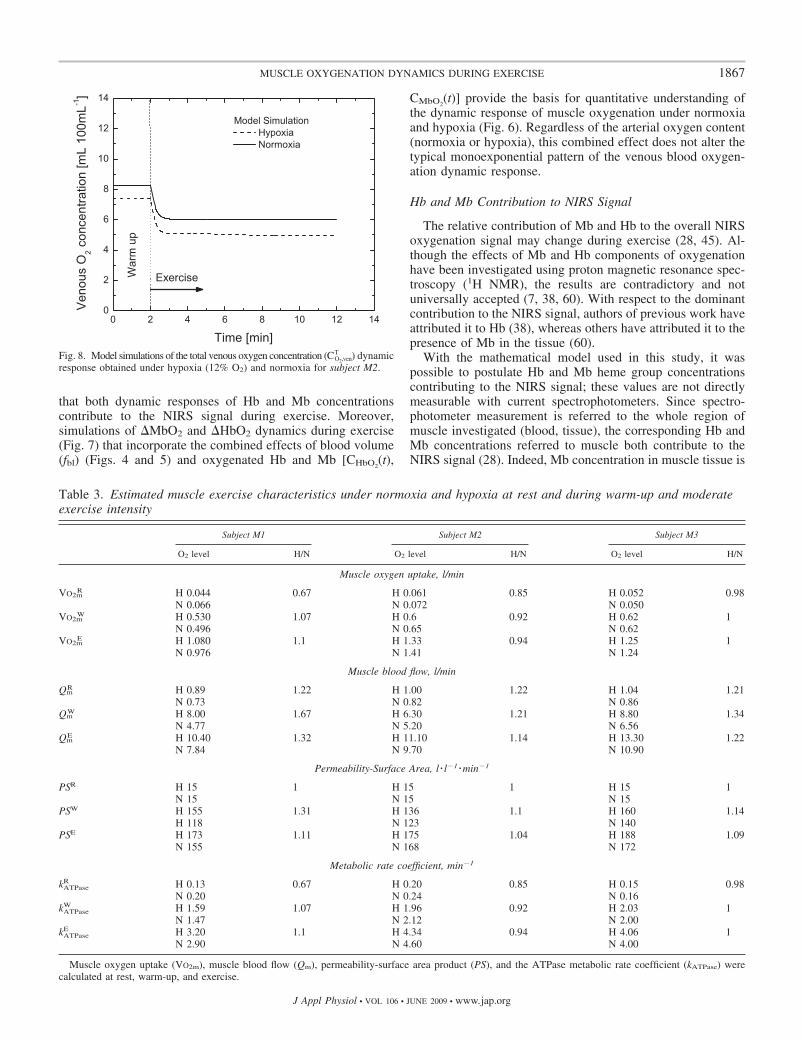
As simulated in Fig. 8, the dynamic exercise response ofvenous total oxygen concentration CO2,ven
T (t) showed an expo-nential drop to a new steady state after 1 min for all thesubjects. The arterial total oxygen concentration CO2,art
T wasassumed to remain constant during exercise under normoxiaand hypoxia corresponding to a partial pressure of 100 and 45Torr, respectively.
Fig. 4. Dynamic responses of relative changes of heme groups of Hb/Mbconcentration (�HbMbtot) experimental data (by NIRS) during cycle exerciseunder hypoxia (12% O2) and normoxia to their analytical simulation used asinput for model simulation to calculate fbl for subjects M1, M2, and M3.
Fig. 5. Model simulations of the dynamic changes of fbl, �art, �cap, and �ven
obtained by measurements of �HbMbtot under hypoxia and normoxia forsubjects M1, M2, and M3.
1865MUSCLE OXYGENATION DYNAMICS DURING EXERCISE
J Appl Physiol • VOL 106 • JUNE 2009 • www.jap.org
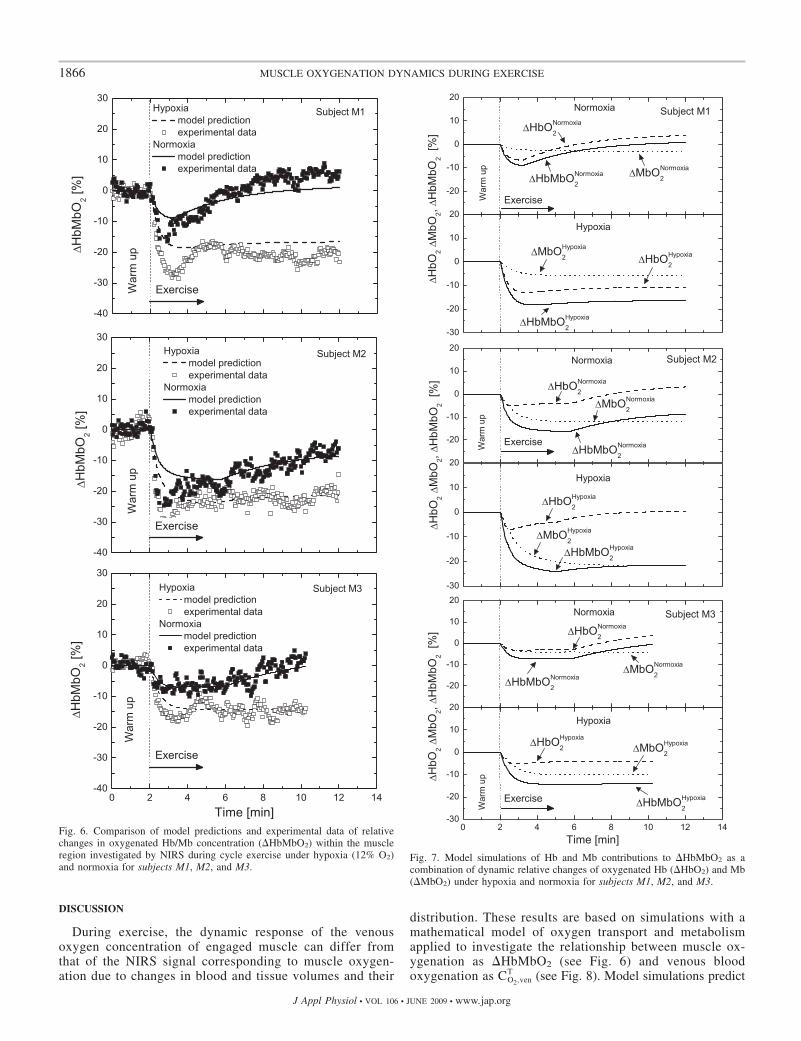
DISCUSSION
During exercise, the dynamic response of the venousoxygen concentration of engaged muscle can differ fromthat of the NIRS signal corresponding to muscle oxygen-ation due to changes in blood and tissue volumes and their
distribution. These results are based on simulations with amathematical model of oxygen transport and metabolismapplied to investigate the relationship between muscle ox-ygenation as �HbMbO2 (see Fig. 6) and venous bloodoxygenation as CO2,ven
T (see Fig. 8). Model simulations predict
Fig. 7. Model simulations of Hb and Mb contributions to �HbMbO2 as acombination of dynamic relative changes of oxygenated Hb (�HbO2) and Mb(�MbO2) under hypoxia and normoxia for subjects M1, M2, and M3.
Fig. 6. Comparison of model predictions and experimental data of relativechanges in oxygenated Hb/Mb concentration (�HbMbO2) within the muscleregion investigated by NIRS during cycle exercise under hypoxia (12% O2)and normoxia for subjects M1, M2, and M3.
1866 MUSCLE OXYGENATION DYNAMICS DURING EXERCISE
J Appl Physiol • VOL 106 • JUNE 2009 • www.jap.org
that both dynamic responses of Hb and Mb concentrationscontribute to the NIRS signal during exercise. Moreover,simulations of �MbO2 and �HbO2 dynamics during exercise(Fig. 7) that incorporate the combined effects of blood volume(fbl) (Figs. 4 and 5) and oxygenated Hb and Mb [CHbO2
(t),
CMbO2(t)] provide the basis for quantitative understanding of
the dynamic response of muscle oxygenation under normoxiaand hypoxia (Fig. 6). Regardless of the arterial oxygen content(normoxia or hypoxia), this combined effect does not alter thetypical monoexponential pattern of the venous blood oxygen-ation dynamic response.
Hb and Mb Contribution to NIRS Signal
The relative contribution of Mb and Hb to the overall NIRSoxygenation signal may change during exercise (28, 45). Al-though the effects of Mb and Hb components of oxygenationhave been investigated using proton magnetic resonance spec-troscopy (1H NMR), the results are contradictory and notuniversally accepted (7, 38, 60). With respect to the dominantcontribution to the NIRS signal, authors of previous work haveattributed it to Hb (38), whereas others have attributed it to thepresence of Mb in the tissue (60).
With the mathematical model used in this study, it waspossible to postulate Hb and Mb heme group concentrationscontributing to the NIRS signal; these values are not directlymeasurable with current spectrophotometers. Since spectro-photometer measurement is referred to the whole region ofmuscle investigated (blood, tissue), the corresponding Hb andMb concentrations referred to muscle both contribute to theNIRS signal (28). Indeed, Mb concentration in muscle tissue is
Fig. 8. Model simulations of the total venous oxygen concentration (CO2,venT ) dynamic
response obtained under hypoxia (12% O2) and normoxia for subject M2.
Table 3. Estimated muscle exercise characteristics under normoxia and hypoxia at rest and during warm-up and moderateexercise intensity
Subject M1 Subject M2 Subject M3
O2 level H/N O2 level H/N O2 level H/N
Muscle oxygen uptake, l/min
VO2mR H 0.044 0.67 H 0.061 0.85 H 0.052 0.98
N 0.066 N 0.072 N 0.050VO2m
W H 0.530 1.07 H 0.6 0.92 H 0.62 1N 0.496 N 0.65 N 0.62
VO2mE H 1.080 1.1 H 1.33 0.94 H 1.25 1
N 0.976 N 1.41 N 1.24
Muscle blood flow, l/min
QmR H 0.89 1.22 H 1.00 1.22 H 1.04 1.21
N 0.73 N 0.82 N 0.86Qm
W H 8.00 1.67 H 6.30 1.21 H 8.80 1.34N 4.77 N 5.20 N 6.56
QmE H 10.40 1.32 H 11.10 1.14 H 13.30 1.22
N 7.84 N 9.70 N 10.90
Permeability-Surface Area, l � l�1 �min�1
PSR H 15 1 H 15 1 H 15 1N 15 N 15 N 15
PSW H 155 1.31 H 136 1.1 H 160 1.14H 118 N 123 N 140
PSE H 173 1.11 H 175 1.04 H 188 1.09N 155 N 168 N 172
Metabolic rate coefficient, min�1
kATPaseR H 0.13 0.67 H 0.20 0.85 H 0.15 0.98
N 0.20 N 0.24 N 0.16kATPase
W H 1.59 1.07 H 1.96 0.92 H 2.03 1N 1.47 N 2.12 N 2.00
kATPaseE H 3.20 1.1 H 4.34 0.94 H 4.06 1
N 2.90 N 4.60 N 4.00
Muscle oxygen uptake (VO2m), muscle blood flow (Qm), permeability-surface area product (PS), and the ATPase metabolic rate coefficient (kATPase) werecalculated at rest, warm-up, and exercise.
1867MUSCLE OXYGENATION DYNAMICS DURING EXERCISE
J Appl Physiol • VOL 106 • JUNE 2009 • www.jap.org
about one-tenth the Hb concentration in blood (see Table 6),but the extravascular tissue volume fraction is 13-fold greaterthan that of muscle blood at rest (see Table 4).
The effect of Mb on the NIRS signal has been investigatedin animals. From a study of isolated canine gracilis muscle,Wilson et al. (64) found that the NIRS signal is correlated withSvO2
but did not exclude a possible Mb contribution. Combin-ing NIRS and 1H NMR in a study of isolated canine gastroc-nemius muscle, Nioka et al. (45) determined that the Mbcontribution to the NIRS signal could be close to 50% in bothhuman and dog muscles. These studies, however, did notsystematically account for blood and tissue volumes and theirdistribution, factors that affect Hb and Mb contributions to theNIRS signal. Another experimental study (40) that integratedNMR and NIRS measurements confirmed the importance ofboth Hb and Mb contributions to the NIRS signal. In fact,under some conditions, the Mb contribution to the heme groups(HbMb; Eq. 16) of NIRS measurements could be as high as80%. Under both normoxia and hypoxia, our model simulationindicated that Hb and Mb contributions to HbMbtot (yHb, yMb)have values equal to �65 and 35%, which are different but inthe range previously reported (40, 45). However, the NIRSsignal can be affected by local blood volume changes occurringduring exercise, which are taken into account by our mathe-matical model and simulations. The yHb value increases from65 to 70% during exercise regardless of the arterial oxygencontent (normoxia, hypoxia) due to an increase of bloodvolume (fbl).
The dynamic response of �HbMbO2 obtained during exer-cise under normoxia differs from that obtained under hypoxiaas a consequence of blood volume and oxygenated Hb and Mb(Fig. 7). Blood volume changes mostly affect �HbO2 ratherthan �MbO2. Under normoxia, �HbMbO2 decreases initiallyand then increases significantly, whereas under hypoxia,�HbMbO2 decreases initially even more but then does notincrease significantly. Under normoxia, the latter increase in�HbMbO2 is determined by the increase of �HbO2, which isrelated to the increase in blood volume. In contrast, underhypoxia, the change of �MbO2 can have a larger effect thanblood volume on the response of �HbMbO2 according to thesimulations of subjects M2 and M3. For these subjects, thedecrease of �HbO2 is less than the decrease of �MbO2. Forsubject M1, the decrease of �MbO2 is less than that of �HbO2.In this case, �HbMbO2 does not show an undershoot even if�HbO2 is greater than �MbO2, because the effect of bloodvolume change on �HbO2 is negligible according to modelsimulations.
Thus model simulations offer the opportunity to identifypossible causes for the dynamic responses of �HbMbO2 ac-counting for subject variability. Indeed, the simulated fractionof �MbO2 of the �HbMbO2 varies from 25 to 80% among thesubjects (Figs. 6 and 7).
The intersubject variability could be related to the subjectfitness, which influences the vascularization of muscle and thelipid concentration. Other factors that affect variability areevident from model analysis. These include muscle blood flowand permeability-surface area changes during muscle contrac-tion that affect muscle oxygenation detected by NIRS. Fromthe limited available data, model analysis does not permitquantitative estimates of variability of the responses. Never-theless, the general patterns of the responses are similar. Toprovide more quantitative evaluation of the variability amongsubjects, studies will need larger sample sizes. Furthermore,more appropriate data is needed to verify predictions by modelsimulations. Such data could include direct measurement ofmuscle blood flow from diffuse correlation spectroscopy andabsolute values of HbMbO2 and HHbMb from frequency-domain NIRS.
The effect of Mb on the NIRS signal also has been investi-gated in humans. Some authors have been able to measuresignificant increases in deoxygenated Mb during plantar flex-ion graded exercise by using the 1H NMR technique andrelating Mb saturation to exercise intensity (44, 54), showingMb desaturation even at moderate exercise intensity. Althoughthe oxygen affinity to Mb is high (P50 � 2.4 Torr), variation ofthe PO2 in tissue (5–20 Torr) during exercise affects Mbsaturation and the NIRS signal even at moderate exerciseintensity as shown from model simulations of the dynamicresponse of �MbO2 obtained in this work.
The effect of P50 on the dynamic response of muscle oxy-genation was investigated in the range of 2–5 Torr (55). Modelsimulations obtained with greater values of P50 have the sameyHb and yMb (65, 35%) and similar �HbO2 and �MbO2
dynamic changes of the model simulations obtained with P50 �2.4 Torr. In addition, a greater P50 value only affects slightlythe time profile of the model simulation of PO2 in tissue duringexercise. In particular, the higher the values of P50, the lowerthe tissue saturation (MbO2/Mb) values at warm-up (81 vs.86%) and during exercise (54 vs. 64%). However, these 5 and10% shifts at warm-up and exercise, respectively, produce aminor shift (2–3%) of the total muscle oxygenation response(�HbMbO2) compared with the case obtained with a P50 equalto 2.4 Torr. Thus model simulations demonstrate a high sen-sitivity of the model to changes in P50 values under thecondition investigated, although this difference does not alterthe main conclusion of the study.
Blood Volume Change Contribution to NIRS Signal
The muscle mass engaged during the onset of exercisechanges its extravascular and intravascular volume fractions byvasodilatation, filtration, and reabsorption (1, 11, 13, 36).Although the vasodilatory mechanisms at the basis of exercisehyperemia in contracting muscle remain not completely under-stood (11), filtration is related to the different osmolaritybetween blood and tissue domains and to hydrostatic pressure.Indeed, plasma volume decreases with increasing workloads,producing an increase of hematocrit value due to transcapillary
Table 4. Muscle volume and distribution at rest
Parameter Value
Vmus 13% body massHct 45%Wmc 80%fbl 7%ftis 93%�art 10%�cap 15%�ven 75%
Vmus, muscle volume; Wmc, myocyte volume fraction; fbl, blood volumefraction; ftis, tissue volume fraction; �art, �cap, and �ven, artery, capillary, andvenule volume fraction in microvascular vessel.
1868 MUSCLE OXYGENATION DYNAMICS DURING EXERCISE
J Appl Physiol • VOL 106 • JUNE 2009 • www.jap.org
filtration of fluid from blood to tissue. Thus muscle Hb con-centration (�CHb; Eq. A18), which affects the NIRS musclesignal, would increase with exercise hyperemia due to anincrease of fbl but would not change with transcapillary filtra-tion, since the net volume of red blood cells remains constantwithin the muscle region investigated.
A two-phase increase of the thigh volume during cycleexercise has been observed using a plethysmographic tech-nique (59). In the first 2 min, a volume increase was attributedto an intravascular volume change, and later, to an extravas-cular volume change. However, these attributions are specula-tive, since the plethysmographic technique cannot distinguishintravascular and extravascular volumes (58).
Increases in blood volume during muscle contraction can bedetermined using electrical stimulation to induce contractionsin dog muscle (1, 52). In particular, it has been found thatvascular volume increases by 6% at 2 Hz and 23% at 8 Hz(twitch contractions) relative to resting conditions. These re-sults are consistent with model simulations of a relative changein blood volume fraction fbl from warm-up to exercise (Fig. 7),which are in the range of 6–20% regardless of experimentalcondition (hypoxic or normoxic). These estimates of fbl
changes assume that heme group concentration �HbMbtot
increases with capillary volume reflected in the NIRS signal.However, NIRS measurements do not typically provide infor-mation about changes in microvascular volume distributionduring exercise, although microvascular compliance has beenmeasured using this technology (4).
The increase of heme group concentration �HbMbtot ob-served with NIRS measurement can be in part attributed to anincrease in perfusion surrounding inactive muscle fibers. At theonset of muscle contraction, an increasing number of fibers,proportional to the exercise intensity, are recruited. Thus the-oretical study of motor unit recruitment and microvascularperfusion (24) shows a rapid and nonlinear increase in thenumber of microvascular units perfused in response to recruit-ment of motor units even at moderate intensity. Depending oncapillary and fiber architecture of skeletal muscle, it is possiblethat changes in blood volume in the active fiber region detectedby NIRS are affected by perfusion of blood from the inactivefiber region.
The dynamic responses of the muscle tissue �HbMbO2
obtained during exercise at normoxia and hypoxia in thisstudy are similar to the responses of the NIRS signalobtained during cycle (12) and two-legged kicking exercise(37). These show differences between the oxygen content invenous blood (CO2,ven
T ) and muscle tissue (�HbMbO2). Simu-lations of these exercise responses with our mathematicalmodel indicate possible mechanisms to explain quantitativelythe distinctions between the CO2,ven
T and �HbMbO2 dynamicresponses.
The model predicted the dynamic response of �HbMbO2
under different physiological conditions for each of the threesubjects. In both normoxic and hypoxic conditions, modelprediction of the dynamic response of CO2,ven
T decreased in thefirst minute, reaching a new plateau, similarly to responsesmeasured during cycle (12) and two-legged kicking exercise(37). The parameters values associated with subject-specificoxygen transport and muscle metabolic variables were derivedfrom noninvasive measurements (bioimpedance cardiography,NIRS, pulmonary oxygen uptake). Values of other model
parameters (Tables 4–6) were the same for all subjects andexperimental conditions.
In the first minute of exercise under normoxic and hypoxicconditions, model simulations show that CO2,ven
T decreased to anew plateau, whereas �HbMbO2 decreased but then increased.Such responses have been observed in young and old adultsduring moderate and heavy intensity exercise (16, 17). In thesame studies, the muscle deoxygenation response �HHbMb(t)followed an exponential pattern with no overshoot. The authorsattribute this pattern to the insensitivity of the NIRS signal(measuring Hb and Mb deoxygenation) to the local bloodvolume change (15). In our study, experimental data and modelsimulation of the �HHbMb response during exercise can beobtained by subtracting �HbMbO2 from �HbMbtot (see Figs. 4and 6). Although not reported, the dynamic response of �HH-bMb for each subject showed an exponential pattern similar toprevious findings (16, 17).
The �HbMbtot increase is attributed to a combination oflocal muscle blood flow, vascular volume, vasodilatation, andcapillary recruitment. These factors are incorporated directly orindirectly in the mathematical model, which accounts forchanges in blood flow and volume that affect oxygen capillary-tissue transport. Furthermore, based on �HbMbtot measure-ment, we can estimate changes in the blood volume fractionfbl(t) at the onset of muscle contraction and relate it to thevolume fraction of capillary blood �cap(t). An increase in thisvariable is associated with an increase of the capillary surfacearea and, therefore, oxygen capillary-tissue transport.
The dynamic response of �HbMbtot indicates that the mi-crovascular blood volume change is different for subjectsdisplaying a mono- and/or double-exponential pattern (Fig. 4).However, the dissociation or association between venous bloodand muscle oxygenation under normoxic and hypoxic condi-tions remains the same.
Model Limitations
During muscle contraction, intravascular volume increasesby vasodilatation with recruitment of new microvascular ves-sels and/or increase of capillary surface area (1, 52); thus, inour simulations, blood volume changes were mainly due tochanges in Vcap and not in Vart or Vven, which were assumedconstant. The changes of Vcap during exercise also affect,indirectly, the microvascular volume fraction (�art, �cap, and�ven) changes according to Eqs. 20 (see Eqs. A23 and A20) andthus affect the NIRS signal (see Eqs. 13 and 14). The simul-taneous increase of �cap and decrease of �ven and �art (see Fig.7) change the weighting of arteriole, capillary, and venuleoxygenation to the NIRS signal (�HbMbO2) and tend to offseteach other. Thus volume shift from venules to capillary,hypothesized by McCully et al. (42) as responsible for anincrease of NIRS oxygenation during exercise, was taken intoaccount, but with the additional effect of the reduced arteriolarvolume fraction. For this reason, the volume shift effect doesnot appear to play a major role in the dissociation between thedynamic responses of �HbMbO2 and CO2,ven
T . However, theexercise-induced microvascular volume distribution changescannot be detected by NIRS in humans. We assumed micro-vascular redistribution during exercise, which may differ fromactual unknown phenomena occurring during contraction.
1869MUSCLE OXYGENATION DYNAMICS DURING EXERCISE
J Appl Physiol • VOL 106 • JUNE 2009 • www.jap.org
On the other hand, blood volume changes during exercisecan be attributed to the Vcap based on an increase in oxygen-ation from the NIRS signal (1, 14), and it is consistent with anincrease of the capillary permeability-surface area (23, 53, 54)regardless of whether blood flow increases during exercise bycapillary recruitment or through already-recruited capillaries(10, 49). Consequently, oxygen transport into the tissue in-creases at the onset of exercise to increase diffusion flux tobalance the oxygen demand (13, 23, 48, 53, 54). In this study,our model uses a phenomenological expression to describe thevariation of permeability-surface area as a function of bloodflow (33, 34). Therefore, a more comprehensive relationshipamong blood flow, microvascular volume, and permeability-surface area during muscle contraction is needed to have abetter prediction of the dynamic response of oxygen concen-tration in blood and tissue domains, as well as overall muscleoxygenation measured by NIRS.
Model simulations do not predict the initial undershootobserved under hypoxia and the extent of a rapid decrease in�HbMbO2 at the onset of exercise under normoxia. Althoughthe model can predict the overall dynamic response of muscleoxygenation, it does not account for local heterogeneity. Moreaccurate values are needed for blood and tissue volume distri-bution in the region investigated by NIRS, since this may alterthe pattern of the �HbMbO2 dynamic response. More generaland detailed models of oxygen transport in microvascularvessels have been obtained (2, 48, 50), but these are notpractical for the analysis of in vivo exercise experiments torelate muscle oxygen consumption in skeletal muscle to thewhole body oxygen uptake.
Measurement Limitations
The single-distance continuous-wave spectrometer used inthis study enabled identification of regional differences inblood volume and oxygenation in muscle during exercise (43);however, uncertainties remain regarding measures of oxygen-ated and deoxygenated Hb/Mb concentration changes. In par-ticular, assumptions of constant path length, absorption, andscattering coefficients used to convert the NIRS signal toconcentration values (20, 26) may limit the accuracy of mea-surement (22). The attenuation of the light propagating insidethe biological system is caused by scattering and absorptionmedia within the muscle region investigated by NIRS (20, 46,56). This region is composed not only of muscle, per se, butalso of adipose tissue, as well as intravascular and extravascu-lar compartments with volume distributions, which are likelyto be different among subjects. Thus scattering and absorptionproperties of light in vivo need to be estimated for eachindividual to have a better interpretation of the data (20).
The effect of adipose tissue on the NIRS signal has beentaken into account by normalizing the dynamic change in�HbMbO2 during exercise to the maximal oxygenated concen-tration variation observed during ischemia. The adipose tissuethickness (7–9 mm) of the subjects tested in this study couldaffect the amplitude of the NIRS signal (43, 61, 62). Althoughour device did not permit an absolute measurement of concen-tration of HbMbO2, it was possible to observe relative changesof oxygenated Hb/Mb, �HbMbO2, under hypoxia and nor-moxia and to test hypotheses related to the effect of bloodvolume and Hb/Mb contributions on the NIRS signal.
Another limitation is a lack of the description of bloodvolume and oxygenation changes in different regions of thewhole working muscle that may differ, especially during mus-cle contraction (30, 43, 51, 65). Although these differenceexist, they do not affect our main conclusion.
Future Direction
The combination of near-infrared diffuse-correlation spectros-copy and NIRS for continuous measurement of blood flow in themicrocirculation and oxygenation within muscle, respectively,may assist in quantifying the extent to which oxygen delivery mayaffect the muscle oxygenation dynamic response during exercise(67). This technique, however, has not been applied yet to exer-cise protocols, such as cycling, where a large muscle mass isengaged. Other techniques, such as arterial spin labeling bloodflow MRI and microbubble-assisted ultrasound offer alternativesto measure tissue perfusion during exercise (9).
Multidistance frequency-domain spectrometry yields mea-sures of absolute concentrations HbMb, HbMbO2, and HHbMband tissue oxygen saturation in vivo accounting for specificoptic characteristics of the muscle region of the subject (20, 21,46, 56). In addition, the multidistance approach subtracts theinfluence of superficial tissue, i.e., adipose tissue. However, Hband Mb contributions cannot be differentiated yet. This couldbe achieved by combining NMR and NIRS (38, 45, 60). Thesestudies, however, did not systematically take into accountblood and tissue volumes and distributions, which affect therelative Hb and Mb contributions to the NIRS signal.
Distinguishing factors affecting oxygen delivery and con-sumption in skeletal muscle during exercise using NIRS re-quires an integrative approach that combines experimental dataand model simulations. Multiscale (subcellular-cellular-tissue-organ) system models of oxygen transport and metabolismhave the potential to quantitatively analyze basic mechanismsassociated with muscle contraction in animal models andhumans (5, 31, 33, 48). Such a combination of methods couldbe used to 1) quantify Hb and Mb contributions to the NIRSsignal to distinguish oxygen partial pressure in muscle bloodand tissue, which could provide an index for assessing muscleoxygen impairment, and 2) investigate changes in underlyingmechanisms of oxygen transport and metabolism associated withdisease states. Therefore, approaches that combine NMR andNIRS measurements in animal preparations and humans (9, 41,45, 55) together with mathematical modeling and simulation forquantitative analysis (68) have the potential for major advance-ment in clinical studies of transport and metabolism in healthy anddisease states. These combined technologies for assessment ofboth circulatory and metabolic disorders could provide a basis forevaluating the efficacy of therapeutic intervention. From a phys-iological point of view, it is interesting to be able to distinguish thecontributions of Mb and Hb components of NIRS signal. There-fore, the dynamic responses of oxygenation of Hb and Mb in vivoenable us to quantify the dynamic of oxygen gradient betweencapillary and tissue and then that of the diffusion rate. In general,the possibility of estimate of the oxygen diffusion rate underdifferent physiological and pathophysiological conditions mayhave practical applications for sports medicine and may help todiagnose disorders of the muscle such as mitochondrial disease.With additional validation, the mathematical model proposedcould be used to predict oxygen delivery and use in people with
1870 MUSCLE OXYGENATION DYNAMICS DURING EXERCISE
J Appl Physiol • VOL 106 • JUNE 2009 • www.jap.org
various vascular and hemodynamic diseases. Treatments forblood and vascular disease often target one aspect (additional Hb,vascular reactivity, among others), and the model could be used topredict the effectiveness of such treatments.
Conclusion
Using an integrative systems biology approach, we ana-lyzed muscle oxygenation measurements during exerciseobtained with NIRS, using a model of oxygen transport andmetabolism in contracting muscle, to predict the extent ofHb and Mb contribution to the NIRS signal. Model predic-tions were compared with experimental data to investigatemechanisms responsible for the difference between thedynamic responses of muscle and venous oxygenation. De-convolution of NIRS signal components during normoxicand hypoxic exercise with the mechanistic model indicatesthat the Mb contribution is substantial under all conditions,but especially during hypoxia.
APPENDIX
Mathematical model of O2 transport and metabolism
For this study, the equations describing oxygen transport in skeletalmuscle are based on the model of Lai et al. (33, 34). From oxygenmass balances in capillary blood with the assumption of oxygenequilibrium between plasma and red blood cells, the dynamic spatialdistribution of total oxygen concentration in capillary blood (CO2,b
T )can be represented as
�CO2,bT
�t� �
Qm t�
fcap t�
�CO2,bT
��
D�bfcap
�2CO2,bT
�2 �PS t�
fcap t� CO2,b
F � CO2,cF �
0 � � Vmus
(A1)
where fcap � fbl(t)/�cap(t) according to Eq. 20, Qm is the bloodvolume flow, D�b is a dispersion coefficient, and PS is the effectiverate coefficient for diffusion between blood and extravascularmuscle cells. The oxygen partition coefficient between blood andcells is assumed to be 1. The total oxygen concentration in musclecells, CO2,c
T , is considered spatially lumped and changes with timeaccording to
dCO2,cT
dt�
PS t��0
Vmus
CO2,bF � CO2,c
F �d
Vtis
� �OxPhos (A2)
where �OxPhos is the oxidative phosphorylation flux and Vtis is thetissue volume, which remains constant during exercise.
The oxygen mass balances of Eqs. 1 and 4 require a relationshipbetween total oxygen (CO2,b
T , CO2,cT ) to free oxygen (CO2,b
F , CO2,cF ) in
blood and extravascular muscle. To relate the total oxygen concen-tration (Cx
T) to free oxygen concentration (CxF; x � b, c), we consider
oxygen in free and (hemoglobin) bound forms in blood (CO2,bF , CO2,c
B )and in free and (myoglobin) bound forms in muscle tissue (CO2,c
F ,CO2,c
B ). Consequently, the total oxygen concentrations in blood and intissue within the muscle are the sums of the corresponding free andbound oxygen concentration:
CO2,xT � CO2,x
B � CO2,xF , x � �b, c� (A3)
which are related by local chemical equilibrium. In blood, therelation is
CO2,bB � 4 Hct Crbc,Hb
KHb CO2,bF �n
1 � KHb CO2,bF �n (A4)
where b � art, cap, and ven in Eq. 14, whereas in extravascularmuscle cells, the relation is
CO2,cB � WmcCmc,Mb
KMbCO2,cF
1 � KMbCO2,cF (A5)
These relations depend on Hb and Mb concentrations in red blood celland myocyte (Crbc,Hb, Cmc,Mb) and their respective volume fractions(Hct, Wmc). From Eq. A3, we get the differential relationships:
dCO2,xT � d CO2,x
F � CO2,xB � � 1 � dCO2,x
B /dCO2,xF �dCO2,x
F � xdCO2,xF
x � �b, c�(A6)
where
b � 1 �4 Hct Crbc,HbKHbn CO2,b
F �n�1
�1 � KHb CO2,bF �n�2 ; c � 1 �
WmcCmc,MbKMb
�1 � KMbCO2,cF �2
(A7)
Using the relationships above, Eqs. A1 and A2 can be expressed as
fcap t��CO2,b
F
�t� �Qm t�
�CO2,bF
�� Db
�2CO2,bF
�2 �PS t�
b
CO2,bF � CO2,c
F �
0 � � Vmus � t � 0
(A8)
dCO2,cF
dt�
PS t��0
Vmus
CO2,bF � CO2,c
F �d
Vtisc
��OxPhos
c
� t � 0 (A9)
where Db is the effective dispersion coefficient.Metabolic fluxes. The flux relationships for this model have been
presented and used previously (63, 33). The oxidative phosphoryla-tion flux (�OxPhos) is nonlinearly related to the ADP and oxygenconcentrations:
�OxPhos � Vmax� CADP
KADP � CADP�� CO2,c
F
Km � CO2,cF � (A10)
The flux of the ATPase reaction is proportional to the ATP concen-tration:
�ATPase � kATPaseCATP (A11)
where kATPase changes with a metabolic stimulus. The net forward andreverse reaction fluxes of CK are nonlinearly related to concentrationsof energy phosphates:
��CK � �CKf � �CK
r �
VCKf
KbKia�CADPCPCr �
CCrCATP
Keq�
1 �CADP
Kia
�CATP
Kiq
�CPCr
Kib
�CADPCPCr
KbKia
�CCrCATP
KiqKp
(A12)
Interpretation of NIRS Signal
To have a better comprehension and clear representation of modelresults and experimental data, the symbols used in the text have beenreplaced in the APPENDIX as follows:
1871MUSCLE OXYGENATION DYNAMICS DURING EXERCISE
J Appl Physiol • VOL 106 • JUNE 2009 • www.jap.org

�HbMbtot � �HbMbO2 � �HHbMb � �CHeme,N
�HbMbO2 � �HbO2 � �MbO2; �HHbMb � �HHb � �HMb;
�HbO2 � �Coxy,Hb; �MbO2 � �Coxy,Mb;
�HHb � �Cdeoxy,Hb; �HMb � �Cdeoxy,Mb
Oxygen concentrations in muscle blood and tissue. In response toexercise, blood and tissue oxygen change in skeletal muscle. Tosimulate oxygen responses to exercise as measured by NIRS, therelative change of the oxygenated forms in blood and tissue isnormalized by the maximal change in the oxygenated Hb/Mb con-centration variation observed during ischemia:
�Coxy,N t� �Coxy t� � Coxy
R
CoxyR � Coxy
I ��Coxy,Hb t� � �Coxy,Mb t�
CoxyR (A13)
where �Coxy,X � Coxy,X(t) � Coxy,XR for X � Hb, Mb and Coxy
R �Coxy,Hb
R � Coxy,MbR , and �Coxy,Hb/Coxy
R and �Coxy,Mb/CoxyR are total
oxygenated Hb and Mb to the NIRS normalized signal. The super-script R refers to rest at t � 0, and the superscript I refers to ischemia,where the oxygenated Hb and Mb concentration is assumed to benegligible (Coxy
I � 0). Model simulation of �Coxy,N is intended toreflect relative changes of oxygenation of intravascular and extravas-cular muscle compartments during exercise associated with musclevolume distribution in the sampled region of the NIRS measurement(Fig. 1). The simulated oxyhemoglobin concentration (Coxy,Hb) inmuscle (tissue and blood) can be related to the simulated CHbO2 inblood by the volume fraction of blood, fbl:
Coxy,Hb t� � fbl t�CHbO2 t� � fbl t��CO2,art
B �art t� � �CO2,capB � �cap t�
� CO2,venB �ven t��/4
(A14)
where CHbO2 is related to the heme-bound oxygen concentrations inthe microvascular vessels (CO2,b
B , b � art, cap, and ven) and the factor4 accounts for the number of heme groups per Hb molecule (seeAppendix, Ref. 29). �art, �cap, and �ven represent arteriole, capillary,and venule volume fractions in microvascular vessels.
The average capillary concentration of oxygen from model simula-tion is
� CO2,capB � � �
0
Vcap
CO2,capB t, �d/Vcap (A15)
The simulated oxymyoglobin concentration relative to muscle volume(Coxy,Mb) is directly proportional to oxymyoglobin concentration(CMbO2) and bound oxygen concentration (CO2,c
B ) relative to tissuevolume:
Coxy,Mb � ftis t�CMbO2/4 � ftis t�CO2,cB /4 (A16)
where ftis (� 1 � fbl) is the extravascular (cells and interstitial fluid)volume fraction in muscle. Since the attenuated light detected by theNIRS device during muscle contraction depends on O2-dependentabsorption from hemoglobin and myoglobin, the NIRS signal isconsidered to represent total heme concentration in the entire muscleregion (blood and tissue) investigated by the light. Thus the NIRSsignal, as heme group concentration, is a combination of the twocontributions (Hb and Mb) present in the red blood cell and musclecell domains, which comprise the muscle domain. In addition, theNIRS signal does not discriminate between hemoglobin contribution,with four heme groups, and myoglobin contribution, with one hemegroup. The molar equivalent of Hb and Mb for optical absorption inour wavelengths is 4 and 1, respectively. Thus CMbO2 is divided by 4to take into account the extinction coefficient used in the NIRS deviceto convert light intensity to concentration, when referring to Hb.
Blood volume distribution in muscle related to heme concentration.The relative heme concentration change from rest is
�CHeme,N t� ��CHb t� � �CMb t�
CoxyR (A17)
where �CX � �Coxy,X(t) � �Cdeoxy,X(t) for X � Hb, Mb. Modelsimulation of �CHeme,N(t) is intended to reflect relative changes of theheme group concentration of Hb and Mb during exercise associatedwith blood volume changes in the sampled region of the NIRSmeasurement. The relative Hb and Mb concentration changes can berelated to the blood volume fraction at any time relative to its value atrest (fbl
R):
�CHb t� � �fbl t� � f blR�Cb,Hb (A18)
�CMb t� � ftis t� � f tisR �Cc,Mb/4 � � f bl
R � fbl t��Cc,Mb/4 (A19)
where Cc,Mb � CMbO2 � CHmb and Cb,Hb � CHbO2 � CHHb are thetotal concentrations of myoglobin in tissue and blood. CombiningEqs. A17–A19 yields
fbl t� � f blR �
�CHeme,N t�CoxyR
Cb,Hb � Cc,Mb/4(A20)
Table 5. Model parameters related to metabolism
Parameter Value
Metabolic rate, mM �min�1
VCKr 3,008.6
VCKf 6,000
Vmax 18
Total concentration, mM
CCT 42
CAT 8.2
Metabolic parameters, mM
Kb 1.11Kp 3.8Kia 0.135Kib 3.9Kiq 3.5KADP 0.058Km 7.10�4
VCKr and VCK
f , maximal rate of reverse and forward creatine kinase reactions;Vmax, maximal rate of oxidative phosphorylation; CC
T, total concentration ofphosphocreatine and creatine; CA
T, total concentration of ADP and ATP. Seeglossary for metabolic parameters.
Table 6. Model parameters related to O2/Hb and O2/Mbequilibrium relationships and transport equations
Parameter Value
Crbc,Hb, mM 5.18Cmc,Mb, mM 0.5KHb, mM�n 7800.7KMb, mM�1 308.6n 2.7Db, l2/min 2.0�10�5
PSmax, l � l�1 �min�1 200
See glossary for definition of model parameters related to oygen/hemoglobin(O2/Hb) and oxygen/myoglobin (O2/Mb) equilibrium relationships and trans-port equations (33, 34).
1872 MUSCLE OXYGENATION DYNAMICS DURING EXERCISE
J Appl Physiol • VOL 106 • JUNE 2009 • www.jap.org

Since blood volume fraction fbl(t) change from rest is assumed to takeplace in capillaries, the volume change of blood is the volume changeof capillaries:
fbl t� �Vbl t�
Vbl t� � Vtis
(A21)
where
Vbl t� � Vbl 0� � �Vcap t� � Vbl 0� � Vcap t� � Vcap 0� (A22)
During exercise, the extravascular Vtis remains constant, as well asthe volumes of arteriole and venule blood (Vart, Vven). We canrearrange Eqs. A21 and A22 to get the capillary volume:
Vcap t� �fbl t�Vtis
1 � fbl t�� �Vbl 0� � Vcap 0�� �
fbl t�Vtis
1 � fbl t�� Vart � Vven�
(A23)
Note that from Eq. A20, fbl(t) is directly related to �CHeme,N(t), whichcan be obtained from the measured NIRS signal. Furthermore, duringexercise, the arteriole, capillary, and venule volume fractions in bloodchange as
�art t� � Vart/Vbl t�, �cap t� � Vcap t�/Vbl t�, �ven t� � Vven/Vbl t�
(A24)
These blood distribution fractions within muscle not only changeduring exercise but also differ among subjects.
Parameter values for numerical solution. All model simulationsrelate to responses in step changes in exercise intensity relative towarm-up for three subjects (M1, M2, and M3). The values of param-eters kATPase
j at several steady states (j � R, W, and E) and thetime-varying quantities Qm and fbl, �art, �cap, and �ven were calcu-lated for each subject under hypoxia and normoxia (Tables 2–4).Values of the volume fractions of muscle and blood (Table 4) atresting steady state (t � 0) were applicable to all simulations. Valuesof the model parameters related to metabolic processes, transportequation, and O2/Hb and O2/Mb equilibrium relationships (Tables 5and 6) were the same for all the subjects as described previously(32–34).
Numerical solution of the partial differential equations is based onthe method of lines. Through a well-developed code, DSS/2, thespatial derivatives are discretized with efficient algorithms of fourth-order accuracy that incorporate the boundary conditions (33). Conse-quently, the model consists of a set of ordinary differential-differenceequations that constitute an initial value problem. These ordinarydifferential equations were solved numerically using a robust algo-rithm for stiff systems, DLSODE (33).
ACKNOWLEDGMENTS
We acknowledge the work of Marco E. Cabrera, senior author of this paper,who tragically died before its completion. Without the dedicated years ofservice in the fields of exercise physiology, human and animal performanceevaluation, metabolic systems biology, mathematical modeling, and computersimulation, this and many other valuable studies would not have been possible.He had an exceptional ability to unite theoretical and experimental researchersfrom different fields in studying biological systems. Marco was a dear friend,valued research collaborator, and esteemed mentor, and we will miss himgreatly.
We thank Justin J. Fiutem for helpful assistance in conducting the experi-ments and for providing thoughtful and constructive criticism.
GRANTS
This research was supported in part by National Institute of GeneralMedical Sciences Grant GM-66309-01 and National Aeronautics and SpaceAdministration Grant NNJ06HD81G.
REFERENCES
1. Baker CH, Davis DL. Isolated skeletal muscle blood flow and volumechanges during contractile activity. Blood Vessels 11: 32–44, 1974.
2. Beard DA, Bassingthwaighte JB. Modeling advection and diffusion ofoxygen in complex vascular networks. Ann Biomed Eng 29: 298–310, 2001.
3. Bhambhani YN. Muscle oxygenation trends during dynamic exercise mea-sured by near infrared spectroscopy. Can J Appl Physiol 29: 504–523, 2004.
4. Binzoni T, Quaresima V, Ferrari M, Hiltbrand E, Cerretelli P. Humancalf microvascular compliance measured by near-infrared spectroscopy.J Appl Physiol 88: 369–372, 2000.
5. Binzoni T. Human skeletal muscle energy metabolism: when a physio-logical model promotes the search for new technologies. Eur J ApplPhysiol 90: 260–269, 2003.
6. Boushel R, Pott F, Madsen P, Radegran G, Nowak M, Quistorf B,Secher N. Muscle metabolism from near infrared spectroscopy duringrhythmic handgrip in humans. Eur J Appl Physiol 79: 41–48, 1998.
7. Boushel R, Langberg H, Olesen J, Gonzales-Alonzo J, Bulow J, KjærM. Monitoring tissue oxygen availability with near infrared spectroscopy(NIRS) in health and disease. Scand J Med Sci Sports 11: 213–222, 2001.
8. Calbet JA, Gonzalez-Alonso J, Helge JW, Søndergaard H, Munch-Andersen T, Boushel R, Saltin B. Cardiac output and leg and arm bloodflow during incremental exercise to exhaustion on the cycle ergometer.J Appl Physiol 103: 969–978, 2007.
9. Carlier PG, Bertoldi D, Baligand C, Wary C, Fromes Y. Muscle bloodflow and oxygenation measured by NMR imaging and spectroscopy. NMRBiomed 19: 954–967, 2006.
10. Clark M, Rattigan S, Barrett E, Vincent M. Last Word on Point:Counterpoint: There is/is not capillary recruitment in active skeletalmuscle during exercise. J Appl Physiol 104: 900, 2008.
11. Clifford PS. Skeletal muscle vasodilatation at the onset of exercise.J Physiol 583: 825–833, 2007.
12. Costes F, Barthelemy JC, Feasson L, Busso T, Geyssant A, Denis C.Comparison of muscle near-infrared spectroscopy and femoral blood gasesduring steady-state exercise in humans. J Appl Physiol 80: 1345–1350,1996.
13. Crone C. Capillary permeability to small solutes. In: Handbook ofPhysiology. The Cardiovascular System. Microcirculation. Bethesda, MD:Am Physiol Soc, 1984, sect. 2, vol. IV, part 1, chapt. 10, p. 411–466.
14. Dawson D, Vincent MA, Barrett EJ, Kaul S, Clark A, Leong-Poi H,Lindner JR. Vascular recruitment in skeletal muscle during exercise andhyperinsulinemia assessed by contrast ultrasound. Am J Physiol Endocri-nol Metab 282: E714–E720, 2002.
15. De Blasi RA, Ferrari M, Natali A, Conti G, Mega A, Gasparetto A.Noninvasive measurement of forearm blood flow and oxygen consumptionby near-infrared spectroscopy. J Appl Physiol 76: 1388–1393, 1994.
16. DeLorey DS, Kowalchuk JM, Paterson DH. Relationship betweenpulmonary O2 uptake kinetics and muscle deoxygenation during moder-ate-intensity exercise. J Appl Physiol 95: 113–120, 2003.
17. DeLorey DS, Kowalchuk JM, Paterson DH. Adaptation of pulmonaryO2 uptake kinetics and muscle deoxygenation at the onset of heavy-intensity exercise in young and older adults. J Appl Physiol 98: 1697–1704, 2005.
18. Eriksen M, Waaler BA, Walløe L, Wesche J. Dynamics and dimensionsof cardiac output changes in humans at the onset and at the end ofmoderate rhythmic exercise. J Physiol 426: 423–437, 1990.
19. Esaki K, Hamaoka T, Rådegran G, Boushel R, Hansen J, KatsumuraT, Haga S, Mizuno M. Association between regional quadriceps oxygen-ation and blood oxygen saturation during normoxic one-legged dynamicknee extension. Eur J Appl Physiol 95: 361–370, 2005.
20. Fantini S, Franceschini-Fantini MA, Maler JS, Walker SA, BarbieriB, Gratton E. Frequency-domain multichannel optical detector for non-invasive tissue spectroscopy and oximetry. Opt Eng 34: 32–42, 1995.
21. Ferrari M, Mottola L, Quaresima V. Principles, Techniques, and limi-tations of Near infrared Spectroscopy. Can J Appl Physiol 29: 463–487,2004.
22. Ferreira LF, Hueber DM, Barstow TJ. Effects of assuming constantoptical scattering on measurements of muscle oxygenation by near-infrared spectroscopy during exercise. J Appl Physiol 102: 358–367, 2007.
23. Frisbee JC, Barclay JK. Microvascular hematocrit and permeability-surface area product in contracting canine skeletal muscle in situ. Micro-vasc Res 55: 153–164, 1998.
1873MUSCLE OXYGENATION DYNAMICS DURING EXERCISE
J Appl Physiol • VOL 106 • JUNE 2009 • www.jap.org
24. Fuglevand AJ, Segal SS. Simulation of motor unit recruitment andmicrovascular unit perfusion: spatial considerations. J Appl Physiol 83:1223–1234, 1997.
25. Grassi B, Pogliaghi S, Rampichini S, Quaresima V, Ferrari M. Muscleoxygenation and pulmonary gas exchange kinetics during cycling exerciseon-transitions in humans. J Appl Physiol 95: 149–158, 2003.
26. Gratton E, Fantini S, Franceschini MA, Gratton G, Fabiani M.Measurements of scattering and absorption changes in muscle and brain.Philos Trans R Soc Lond B Biol Sci 352: 727–735, 1997.
27. Hamaoka T, McCully KK, Quaresima V, Yamamoto K, Chance B.Near-infrared spectroscopy/imaging for monitoring muscle oxygenationand oxidative metabolism in healthy and diseased humans. J Biomed Opt12: 062105, 2007.
28. Hoofd L, Colier W, Oeseburg B. A modeling investigation to thepossible role of myoglobin in human muscle in near infrared spectroscopy(NIRS) measurements. Adv Exp Med Biol 530: 637–643, 2003.
29. Kim JG, Xia M, Liu H. Extinction coefficients of hemoglobin fornear-infrared spectroscopy of tissue. IEEE Eng Med Biol Mag 24: 118–121, 2005.
30. Koga S, Poole DC, Ferreira LF, Whipp BJ, Kondo N, Saitoh T,Ohmae E, Barstow TJ. Spatial heterogeneity of quadriceps muscledeoxygenation kinetics during cycle exercise. J Appl Physiol 103: 2049–2056, 2007.
31. Korzeniewski B, Zoladz JA. Factors determining the oxygen consump-tion rate VO2 on-kinetics in skeletal muscles. Biochem J 379: 703–710,2004.
32. Lai N, Dash RK, Nasca MM, Saidel GM, Cabrera ME. Relatingpulmonary oxygen uptake to muscle oxygen consumption at exerciseonset: in vivo and in silico studies. Eur J Appl Physiol 97: 380–394, 2006.
33. Lai N, Saidel GM, Grassi B, Gladden LB, Cabrera 2007 ME. Model ofoxygen transport and metabolism predicts effect of hyperoxia on caninemuscle oxygen uptake dynamics. J Appl Physiol 103: 1366–1378, 2007.
34. Lai N, Camesasca M, Saidel GM, Dash RK, Cabrera ME. Linkingpulmonary oxygen uptake, muscle oxygen utilization and cellular metab-olism during exercise. Ann Biomed Eng 35: 956–968, 2007.
35. Lai N, Nasca MM, Silva MA, Silva FT, Whipp BJ, Cabrera ME.Influence of exercise intensity on pulmonary oxygen uptake kinetics at theonset of exercise and recovery in male adolescents. Appl Physiol NutrMetab 33: 107–117, 2008.
36. Lundvall J, Mellander S, Westling H, White T. Fluid transfer betweenblood and tissues during exercise. Acta Physiol Scand 85: 258–269, 1972.
37. MacDonald MJ, Tarnopolsky MA, Green HJ, Hughson RL. Compar-ison of femoral blood gases and muscle near-infrared spectroscopy atexercise onset in humans. J Appl Physiol 86: 687–693, 1999.
38. Mancini DM, Bolinger L, Li H, Kendrick K, Chance B, Wilson JR.Validation of near-infrared spectroscopy in humans. J Appl Physiol 77:2740–2747, 1994.
39. Marcinek DJ, Ciesielski WA, Conley KE, Schenkman KA. Oxygenregulation and limitation to cellular respiration in mouse skeletal muscle invivo. Am J Physiol Heart Circ Physiol 285: H1900–H1908, 2003.
40. Marcinek DJ, Amara CE, Matz K, Conley KE, Schenkman KA.Wavelength shift analysis: a simple method to determine the contributionof hemoglobin and myoglobin to in vivo optical spectra. Appl Spectrosc61:665–669, 2007.
41. McCully KK, Iotti S, Kendrick K, Wang Z, Posner JD, Leigh J Jr,Chance B. Simultaneous in vivo measurements of HbO2 saturation andPCr kinetics after exercise in normal humans. J Appl Physiol 77: 5–10,1994.
42. McCully KK, Hamaoka T. Near-infrared spectroscopy: what can it tellus about oxygen saturation in skeletal muscle? Exerc Sport Sci Rev 28:123–127, 2000.
43. Miura H, McCully K, Nioka S, Chance B. Relationship between musclearchitectural features and oxygenation status determined by near infrareddevice. Eur J Appl Physiol 91: 273–278, 2004.
44. Mole PA, Chung Y, Tran TK, Sailasuta N, Hurd R, Jue T. Myoglobindesaturation with exercise intensity in human gastrocnemius muscle. Am JPhysiol Regul Integr Comp Physiol 277: R173–R180, 1999.
45. Nioka S, Wang DJ, Im J, Hamaoka T, Wang ZJ, Leigh JS, Chance B.Simulation of Mb/Hb in NIRS and oxygen gradient in the human andcanine skeletal muscles using H-NMR and NIRS. Adv Exp Med Biol 578:223–228, 2006.
46. Neary JP. Application of near infrared spectroscopy to exercise sportsscience. Can J Appl Physiol 29: 488–503, 2004.
47. Nighswander-Rempel SP, Kupriyanov VV, Shaw RA. Relative contri-butions of hemoglobin, and myoglobin to near-infrared spectroscopicimages of cardiac tissue. Appl Spectrosc 59: P190–P193, 2005.
48. Pittman RN. Oxygen transport and exchange in the microcirculation.Microcirculation 12: 59–70, 2005.
49. Poole DC, Behnke BJ, Padilla DJ. Dynamics of muscle microcirculatoryoxygen exchange. Med Sci Sports Exerc 37: 1559–1566, 2005.
50. Popel AS, Goldman D, Vadapalli A. Modeling of oxygen diffusion fromthe blood vessels to intracellular organelles. Adv Exp Med Biol 530:485–495, 2003.
51. Quaresima V, Colier WNJM, Van der Sluijs M, Ferrari M. Nonuni-form quadriceps O2 consumption revealed by near infrared multipointmeasurements. Biochem Biophys Res Commun 285: 1034–1039, 2001.
52. Renkin EM, Hudlicka O, Sheehan RM. Influence of metabolic vasodi-latation on blood-tissue diffusion in skeletal muscle. Am J Physiol 211:87–98, 1966.
53. Richardson RS, Noyszewski EA, Kendrick KF, Leigh JS, Wagner PD.Myoglobin O2 desaturation during exercise. Evidence of limited O2
transport. J Clin Invest 96: 1916–1926, 1995.54. Richardson RS, Newcomer SC, Noyszewski EA. Skeletal muscle intra-
cellular PO2 assessed by myoglobin desaturation: response to gradedexercise. J Appl Physiol 91: 2679–2685, 2001.
55. Richardson RS, Duteil S, Wary C, Wray DW, Hoff J, Carlier PG.Human skeletal muscle intracellular oxygenation: the impact of ambientoxygen availability. J Physiol 571: 415–424, 2006.
56. Rolfe P. In vivo near-infrared spectroscopy. Annu Rev Biomed Eng 2:715–754, 2000.
57. Rowell LB. Human Cardiovascular Control. New York: Oxford Univ.Press, 1993.
58. Schnizer W, Hinneberg H, Moser H, Kuper K. Intra- and extravascularvolume changes in the human forearm after static hand grip exercise. EurJ Appl Physiol Occup Physiol 41: 131–140, 1979.
59. Stick C, Heinemann W, Witzleb E. Slow volume changes in calf andthigh during cycle ergometer exercise. Eur J Appl Physiol Occup Physiol61: 428–432, 1990.
60. Tran TK, Sailasuta N, Kreutzer U, Hurd R, Chung Y, Mole, P, KunoS, Jue T. Comparative analysis of NMR and NIRS measurements ofintracellular PO2 in human skeletal muscle. Am J Physiol Regul IntegrComp Physiol 276: R1682–R1690, 1999.
61. Van Beekvelt MCP, Borghuis MS, Van Engelen BGM, Wevers RA,Colier WNJM. Adipose tissue thickness affects in vivo quantitativenear-IR spectroscopy in human skeletal muscle. Clin Sci (Lond) 101:21–28, 2001.
62. Van Beekvelt MCP, van Engelen BGM, Wevers RA, Colier WNJM. Invivo quantitative near-infrared spectroscopy in skeletal muscle duringincremental isometric handgrip exercise. Clin Physiol Funct Imaging 22:210–217, 2002.
63. Vicini P, Kushmerick MJ. Cellular energetics analysis by a mathematicalmodel of energy balance: estimation of parameters in human skeletalmuscle. Am J Physiol Cell Physiol 279: C213–C224, 2000.
64. Wilson JR, Mancini DM, McCully K, Ferraro N, Lanoce V, Chance B.Noninvasive detection of skeletal muscle underperfusion with near-infra-red spectroscopy in patients with heart failure. Circulation 80: 1668–1674, 1989.
65. Wolf U, Wolf M, Choi JH, Levi M, Choudhury D, Hull S, CoussiratD, Paunescu A, Safonova LP, Michalos A, Mantulin WW, Gratton E.Localized irregularities in hemoglobin flow and oxygenation in calfmuscle in patients with peripheral vascular disease detected with nearin-frared spectrophotometry. J Vasc Surg 37: 1017–1026, 2003.
66. Wolf M, Ferrari M, Quaresima V. Progress of near-infrared spectros-copy and topography for brain and muscle clinical applications. J BiomedOpt 12: 062104, 2007.
67. Yu G, Durduran T, Lech G, Zhou C, Chance B, Mohler ER 3rd, YodhAG. Time-dependent blood flow and oxygenation in human skeletalmuscles measured with noninvasive near-infrared diffuse optical spectros-copies. J Biomed Opt 10: 024027, 2005.
68. Zhou H, Lai N, Saidel GM, Cabrera ME. Multi-scale modeling ofrespiration: linking external to cellular respiration during exercise. IEEEEng Med Biol Mag. In press.
1874 MUSCLE OXYGENATION DYNAMICS DURING EXERCISE
J Appl Physiol • VOL 106 • JUNE 2009 • www.jap.org