modeling battery behavior for accurate state-of-charge indication
TRANSCRIPT
Journal of The Electrochemical Society, 153 �11� A2013-A2022 �2006� A2013
Modeling Battery Behavior for Accurate State-of-ChargeIndicationV. Pop,a,*,z H. J. Bergveld,b J. H. G. Op het Veld,c P. P. L. Regtien,a
D. Danilov,d,** and P. H. L. Nottenc,e,**aMeasurement and Instrumentation, University of Twente, 7500 AE, Enschede, The NetherlandsbPhilips Research Laboratories, Mixed-Signal Circuits and Systems, 5656 AE, Eindhoven,The NetherlandscPhilips Research Laboratories, System in Package Devices, 5656 AE, Eindhoven, The NetherlandsdEindhoven University of Technology, EURANDOM, 5600 MB, Eindhoven, The NetherlandseElectrochemical Energy Storage, Eindhoven University of Technology, 5600 MB, Eindhoven,The Netherlands
Li-ion is the most commonly used battery chemistry in portable applications nowadays. Accurate state-of-charge �SOC� andremaining run-time indication for portable devices is important for the user’s convenience and to prolong the lifetime of batteries.A new SOC indication system, combining the electromotive force �EMF� measurement during equilibrium and current measure-ment and integration during charge and discharge, has been developed and implemented in a laboratory setup. During discharge,apart from simple Coulomb counting, the effect of the overpotential is also considered. Mathematical models describing the EMFand the overpotential functions for a Li-ion battery have been developed. These models include a variety of parameters whosevalues depend on the determination method and experimental conditions. In this paper the battery measurement and modelingefforts are described. The method of implementing the battery model in an SOC indication system is also described. The aim is anSOC determination within 1% inaccuracy or better under all realistic user conditions, including a wide variety of load currents anda wide temperature range. The achieved results show the effectiveness of our novel approach for improving the accuracy of theSOC indication.© 2006 The Electrochemical Society. �DOI: 10.1149/1.2335951� All rights reserved.
Manuscript submitted April 3, 2006; revised manuscript received June 21, 2006. Available electronically September 6, 2006.
0013-4651/2006/153�11�/A2013/10/$20.00 © The Electrochemical Society
This paper describes new measurement and modeling solutionsto enable accurate state of charge �SOC� indication for Li-ion bat-teries. The SOC is defined as the percentage of the maximum pos-sible charge that is present inside the battery.1 There are severalpractical methods available for SOC indication. From these, the twobest known are the direct-measurement and bookkeepingmethods.1-6
The direct-measurement method is based on the measurement ofbattery variables such as the battery voltage �V�, the battery imped-ance �Z�, and the voltage relaxation time ��� after application of acurrent step. The measured battery variable is then directly trans-lated into an SOC value via, e.g., a function or look-up table.1 Aparticular method for voltage measurement is represented by theelectromotive force �EMF� method that equals the sum of the equi-librium potentials of the electrodes of the battery.1 The EMF of aLi-ion battery is observed to be a good measure for a battery’sSOC.1 It has been demonstrated that the EMF-SOC relationshipdoes not change during cycling of the battery, if SOC is expressed inrelative capacity.1 As is shown in this paper, the EMF can be directlytranslated into an SOC value using a predetermined function.
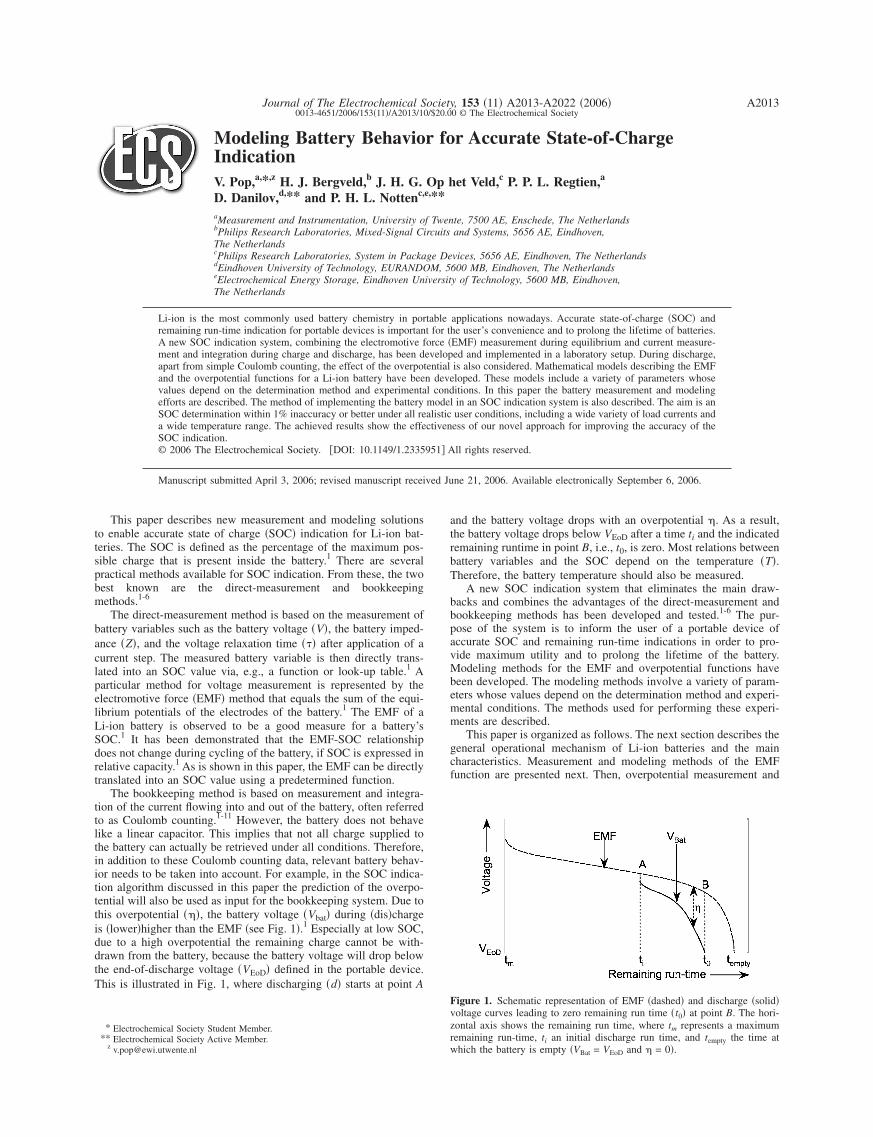
The bookkeeping method is based on measurement and integra-tion of the current flowing into and out of the battery, often referredto as Coulomb counting.1-11 However, the battery does not behavelike a linear capacitor. This implies that not all charge supplied tothe battery can actually be retrieved under all conditions. Therefore,in addition to these Coulomb counting data, relevant battery behav-ior needs to be taken into account. For example, in the SOC indica-tion algorithm discussed in this paper the prediction of the overpo-tential will also be used as input for the bookkeeping system. Due tothis overpotential ���, the battery voltage �Vbat� during �dis�chargeis �lower�higher than the EMF �see Fig. 1�.1 Especially at low SOC,due to a high overpotential the remaining charge cannot be with-drawn from the battery, because the battery voltage will drop belowthe end-of-discharge voltage �VEoD� defined in the portable device.This is illustrated in Fig. 1, where discharging �d� starts at point A
* Electrochemical Society Student Member.** Electrochemical Society Active Member.
and the battery voltage drops with an overpotential �. As a result,the battery voltage drops below VEoD after a time ti and the indicatedremaining runtime in point B, i.e., t0, is zero. Most relations betweenbattery variables and the SOC depend on the temperature �T�.Therefore, the battery temperature should also be measured.
A new SOC indication system that eliminates the main draw-backs and combines the advantages of the direct-measurement andbookkeeping methods has been developed and tested.1-6 The pur-pose of the system is to inform the user of a portable device ofaccurate SOC and remaining run-time indications in order to pro-vide maximum utility and to prolong the lifetime of the battery.Modeling methods for the EMF and overpotential functions havebeen developed. The modeling methods involve a variety of param-eters whose values depend on the determination method and experi-mental conditions. The methods used for performing these experi-ments are described.
This paper is organized as follows. The next section describes thegeneral operational mechanism of Li-ion batteries and the maincharacteristics. Measurement and modeling methods of the EMFfunction are presented next. Then, overpotential measurement and
Figure 1. Schematic representation of EMF �dashed� and discharge �solid�voltage curves leading to zero remaining run time �t0� at point B. The hori-zontal axis shows the remaining run time, where tm represents a maximumremaining run-time, ti an initial discharge run time, and tempty the time atwhich the battery is empty �V = V and � = 0�.
Bat EoD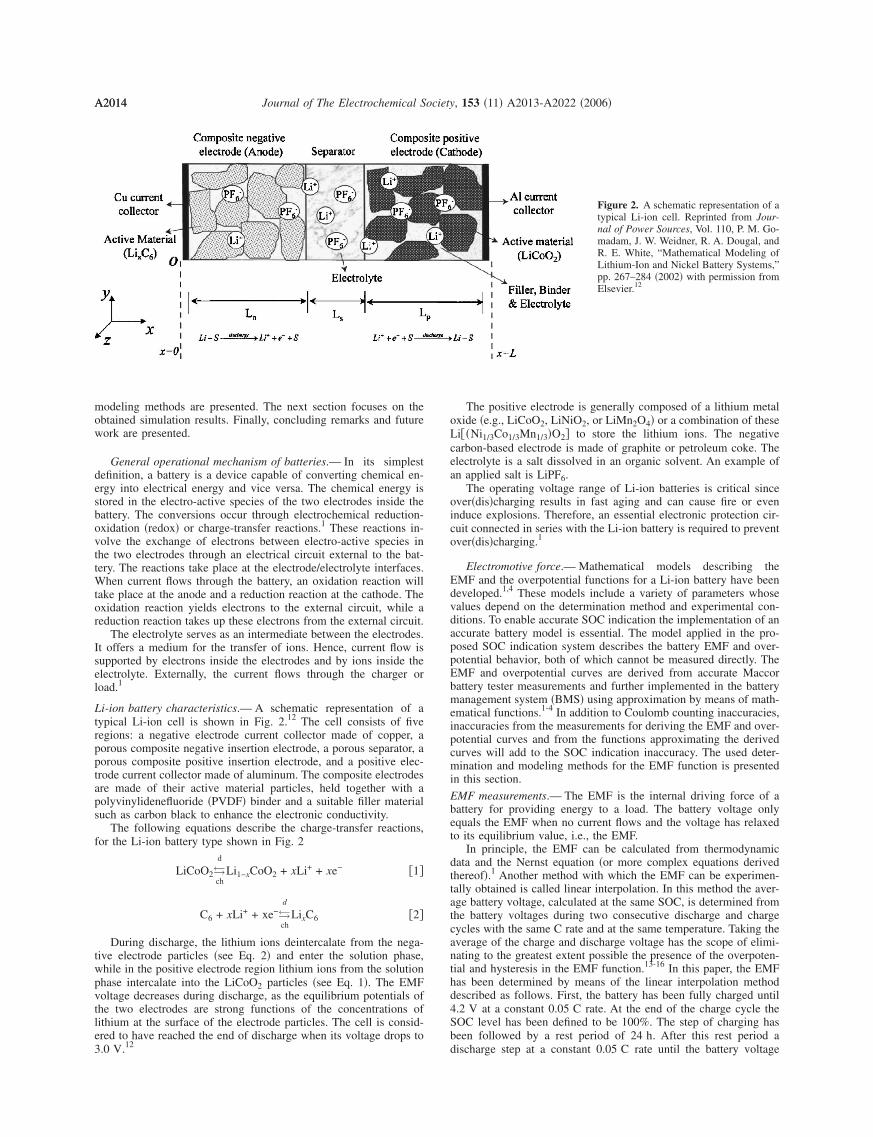
A2014 Journal of The Electrochemical Society, 153 �11� A2013-A2022 �2006�A2014
modeling methods are presented. The next section focuses on theobtained simulation results. Finally, concluding remarks and futurework are presented.
General operational mechanism of batteries.— In its simplestdefinition, a battery is a device capable of converting chemical en-ergy into electrical energy and vice versa. The chemical energy isstored in the electro-active species of the two electrodes inside thebattery. The conversions occur through electrochemical reduction-oxidation �redox� or charge-transfer reactions.1 These reactions in-volve the exchange of electrons between electro-active species inthe two electrodes through an electrical circuit external to the bat-tery. The reactions take place at the electrode/electrolyte interfaces.When current flows through the battery, an oxidation reaction willtake place at the anode and a reduction reaction at the cathode. Theoxidation reaction yields electrons to the external circuit, while areduction reaction takes up these electrons from the external circuit.
The electrolyte serves as an intermediate between the electrodes.It offers a medium for the transfer of ions. Hence, current flow issupported by electrons inside the electrodes and by ions inside theelectrolyte. Externally, the current flows through the charger orload.1
Li-ion battery characteristics.— A schematic representation of atypical Li-ion cell is shown in Fig. 2.12 The cell consists of fiveregions: a negative electrode current collector made of copper, aporous composite negative insertion electrode, a porous separator, aporous composite positive insertion electrode, and a positive elec-trode current collector made of aluminum. The composite electrodesare made of their active material particles, held together with apolyvinylidenefluoride �PVDF� binder and a suitable filler materialsuch as carbon black to enhance the electronic conductivity.
The following equations describe the charge-transfer reactions,for the Li-ion battery type shown in Fig. 2
LiCoO2�ch
d
Li1−xCoO2 + xLi+ + xe− �1�
C6 + xLi+ + xe−�ch
d
LixC6 �2�
During discharge, the lithium ions deintercalate from the nega-tive electrode particles �see Eq. 2� and enter the solution phase,while in the positive electrode region lithium ions from the solutionphase intercalate into the LiCoO2 particles �see Eq. 1�. The EMFvoltage decreases during discharge, as the equilibrium potentials ofthe two electrodes are strong functions of the concentrations oflithium at the surface of the electrode particles. The cell is consid-ered to have reached the end of discharge when its voltage drops to3.0 V.12
The positive electrode is generally composed of a lithium metaloxide �e.g., LiCoO2, LiNiO2, or LiMn2O4� or a combination of theseLi��Ni1/3Co1/3Mn1/3�O2� to store the lithium ions. The negativecarbon-based electrode is made of graphite or petroleum coke. Theelectrolyte is a salt dissolved in an organic solvent. An example ofan applied salt is LiPF6.
The operating voltage range of Li-ion batteries is critical sinceover�dis�charging results in fast aging and can cause fire or eveninduce explosions. Therefore, an essential electronic protection cir-cuit connected in series with the Li-ion battery is required to preventover�dis�charging.1
Electromotive force.— Mathematical models describing theEMF and the overpotential functions for a Li-ion battery have beendeveloped.1,4 These models include a variety of parameters whosevalues depend on the determination method and experimental con-ditions. To enable accurate SOC indication the implementation of anaccurate battery model is essential. The model applied in the pro-posed SOC indication system describes the battery EMF and over-potential behavior, both of which cannot be measured directly. TheEMF and overpotential curves are derived from accurate Maccorbattery tester measurements and further implemented in the batterymanagement system �BMS� using approximation by means of math-ematical functions.1-4 In addition to Coulomb counting inaccuracies,inaccuracies from the measurements for deriving the EMF and over-potential curves and from the functions approximating the derivedcurves will add to the SOC indication inaccuracy. The used deter-mination and modeling methods for the EMF function is presentedin this section.
EMF measurements.— The EMF is the internal driving force of abattery for providing energy to a load. The battery voltage onlyequals the EMF when no current flows and the voltage has relaxedto its equilibrium value, i.e., the EMF.
In principle, the EMF can be calculated from thermodynamicdata and the Nernst equation �or more complex equations derivedthereof�.1 Another method with which the EMF can be experimen-tally obtained is called linear interpolation. In this method the aver-age battery voltage, calculated at the same SOC, is determined fromthe battery voltages during two consecutive discharge and chargecycles with the same C rate and at the same temperature. Taking theaverage of the charge and discharge voltage has the scope of elimi-nating to the greatest extent possible the presence of the overpoten-tial and hysteresis in the EMF function.13-16 In this paper, the EMFhas been determined by means of the linear interpolation methoddescribed as follows. First, the battery has been fully charged until4.2 V at a constant 0.05 C rate. At the end of the charge cycle theSOC level has been defined to be 100%. The step of charging hasbeen followed by a rest period of 24 h. After this rest period adischarge step at a constant 0.05 C rate until the battery voltage
Figure 2. A schematic representation of atypical Li-ion cell. Reprinted from Jour-nal of Power Sources, Vol. 110, P. M. Go-madam, J. W. Weidner, R. A. Dougal, andR. E. White, “Mathematical Modeling ofLithium-Ion and Nickel Battery Systems,”pp. 267–284 �2002� with permission fromElsevier.12
A2015Journal of The Electrochemical Society, 153 �11� A2013-A2022 �2006� A2015
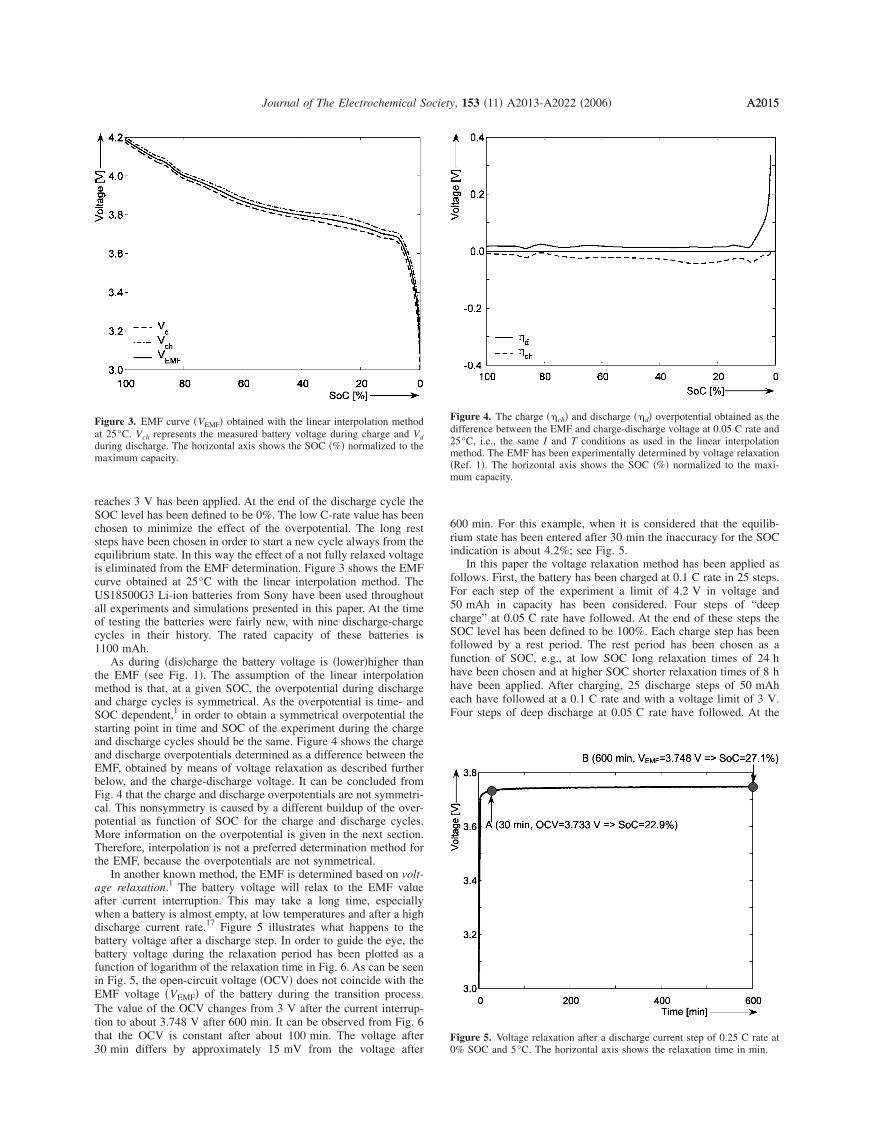
reaches 3 V has been applied. At the end of the discharge cycle theSOC level has been defined to be 0%. The low C-rate value has beenchosen to minimize the effect of the overpotential. The long reststeps have been chosen in order to start a new cycle always from theequilibrium state. In this way the effect of a not fully relaxed voltageis eliminated from the EMF determination. Figure 3 shows the EMFcurve obtained at 25°C with the linear interpolation method. TheUS18500G3 Li-ion batteries from Sony have been used throughoutall experiments and simulations presented in this paper. At the timeof testing the batteries were fairly new, with nine discharge-chargecycles in their history. The rated capacity of these batteries is1100 mAh.
As during �dis�charge the battery voltage is �lower�higher thanthe EMF �see Fig. 1�. The assumption of the linear interpolationmethod is that, at a given SOC, the overpotential during dischargeand charge cycles is symmetrical. As the overpotential is time- andSOC dependent,1 in order to obtain a symmetrical overpotential thestarting point in time and SOC of the experiment during the chargeand discharge cycles should be the same. Figure 4 shows the chargeand discharge overpotentials determined as a difference between theEMF, obtained by means of voltage relaxation as described furtherbelow, and the charge-discharge voltage. It can be concluded fromFig. 4 that the charge and discharge overpotentials are not symmetri-cal. This nonsymmetry is caused by a different buildup of the over-potential as function of SOC for the charge and discharge cycles.More information on the overpotential is given in the next section.Therefore, interpolation is not a preferred determination method forthe EMF, because the overpotentials are not symmetrical.
In another known method, the EMF is determined based on volt-age relaxation.1 The battery voltage will relax to the EMF valueafter current interruption. This may take a long time, especiallywhen a battery is almost empty, at low temperatures and after a highdischarge current rate.17 Figure 5 illustrates what happens to thebattery voltage after a discharge step. In order to guide the eye, thebattery voltage during the relaxation period has been plotted as afunction of logarithm of the relaxation time in Fig. 6. As can be seenin Fig. 5, the open-circuit voltage �OCV� does not coincide with theEMF voltage �VEMF� of the battery during the transition process.The value of the OCV changes from 3 V after the current interrup-tion to about 3.748 V after 600 min. It can be observed from Fig. 6that the OCV is constant after about 100 min. The voltage after30 min differs by approximately 15 mV from the voltage after
Figure 3. EMF curve �VEMF� obtained with the linear interpolation methodat 25°C. Vch represents the measured battery voltage during charge and Vdduring discharge. The horizontal axis shows the SOC �%� normalized to themaximum capacity.
600 min. For this example, when it is considered that the equilib-rium state has been entered after 30 min the inaccuracy for the SOCindication is about 4.2%; see Fig. 5.
In this paper the voltage relaxation method has been applied asfollows. First, the battery has been charged at 0.1 C rate in 25 steps.For each step of the experiment a limit of 4.2 V in voltage and50 mAh in capacity has been considered. Four steps of “deepcharge” at 0.05 C rate have followed. At the end of these steps theSOC level has been defined to be 100%. Each charge step has beenfollowed by a rest period. The rest period has been chosen as afunction of SOC, e.g., at low SOC long relaxation times of 24 hhave been chosen and at higher SOC shorter relaxation times of 8 hhave been applied. After charging, 25 discharge steps of 50 mAheach have followed at a 0.1 C rate and with a voltage limit of 3 V.Four steps of deep discharge at 0.05 C rate have followed. At the
Figure 4. The charge ��ch� and discharge ��d� overpotential obtained as thedifference between the EMF and charge-discharge voltage at 0.05 C rate and25°C, i.e., the same I and T conditions as used in the linear interpolationmethod. The EMF has been experimentally determined by voltage relaxation�Ref. 1�. The horizontal axis shows the SOC �%� normalized to the maxi-mum capacity.
Figure 5. Voltage relaxation after a discharge current step of 0.25 C rate at0% SOC and 5°C. The horizontal axis shows the relaxation time in min.
A2016 Journal of The Electrochemical Society, 153 �11� A2013-A2022 �2006�A2016
end of these steps the SOC level has been defined to be 0%. Eachdischarge step has been followed by a rest period. The rest periodhas been chosen as a function of SOC, e.g., at low SOC long relax-ation times of 24 h have been chosen and at higher SOC shorterrelaxation times of 8 h have been applied. The low C rate of theexperiments has been selected to obtain an equilibrium voltagefaster. The experiment has been repeated at different C rates andtemperatures.
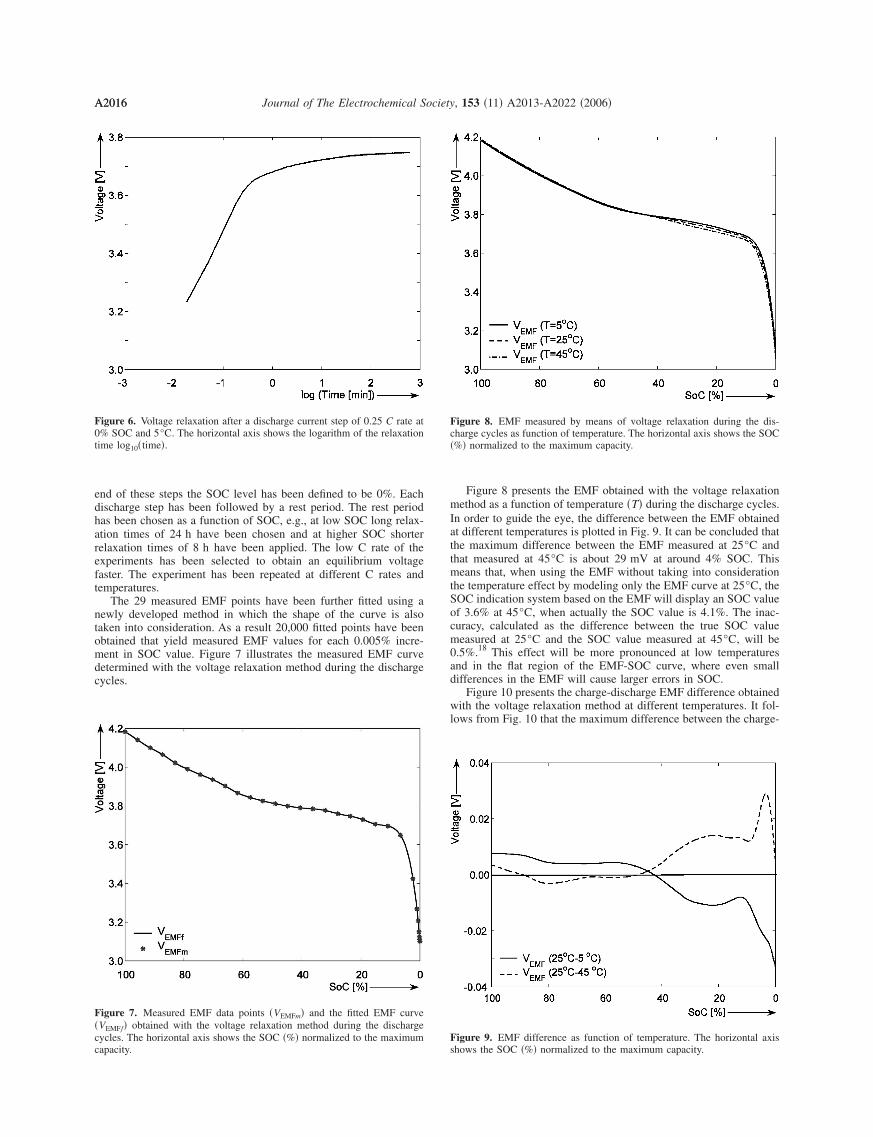
The 29 measured EMF points have been further fitted using anewly developed method in which the shape of the curve is alsotaken into consideration. As a result 20,000 fitted points have beenobtained that yield measured EMF values for each 0.005% incre-ment in SOC value. Figure 7 illustrates the measured EMF curvedetermined with the voltage relaxation method during the dischargecycles.
Figure 6. Voltage relaxation after a discharge current step of 0.25 C rate at0% SOC and 5°C. The horizontal axis shows the logarithm of the relaxationtime log10�time�.
Figure 7. Measured EMF data points �VEMFm� and the fitted EMF curve�VEMFf� obtained with the voltage relaxation method during the dischargecycles. The horizontal axis shows the SOC �%� normalized to the maximumcapacity.
Figure 8 presents the EMF obtained with the voltage relaxationmethod as a function of temperature �T� during the discharge cycles.In order to guide the eye, the difference between the EMF obtainedat different temperatures is plotted in Fig. 9. It can be concluded thatthe maximum difference between the EMF measured at 25°C andthat measured at 45°C is about 29 mV at around 4% SOC. Thismeans that, when using the EMF without taking into considerationthe temperature effect by modeling only the EMF curve at 25°C, theSOC indication system based on the EMF will display an SOC valueof 3.6% at 45°C, when actually the SOC value is 4.1%. The inac-curacy, calculated as the difference between the true SOC valuemeasured at 25°C and the SOC value measured at 45°C, will be0.5%.18 This effect will be more pronounced at low temperaturesand in the flat region of the EMF-SOC curve, where even smalldifferences in the EMF will cause larger errors in SOC.
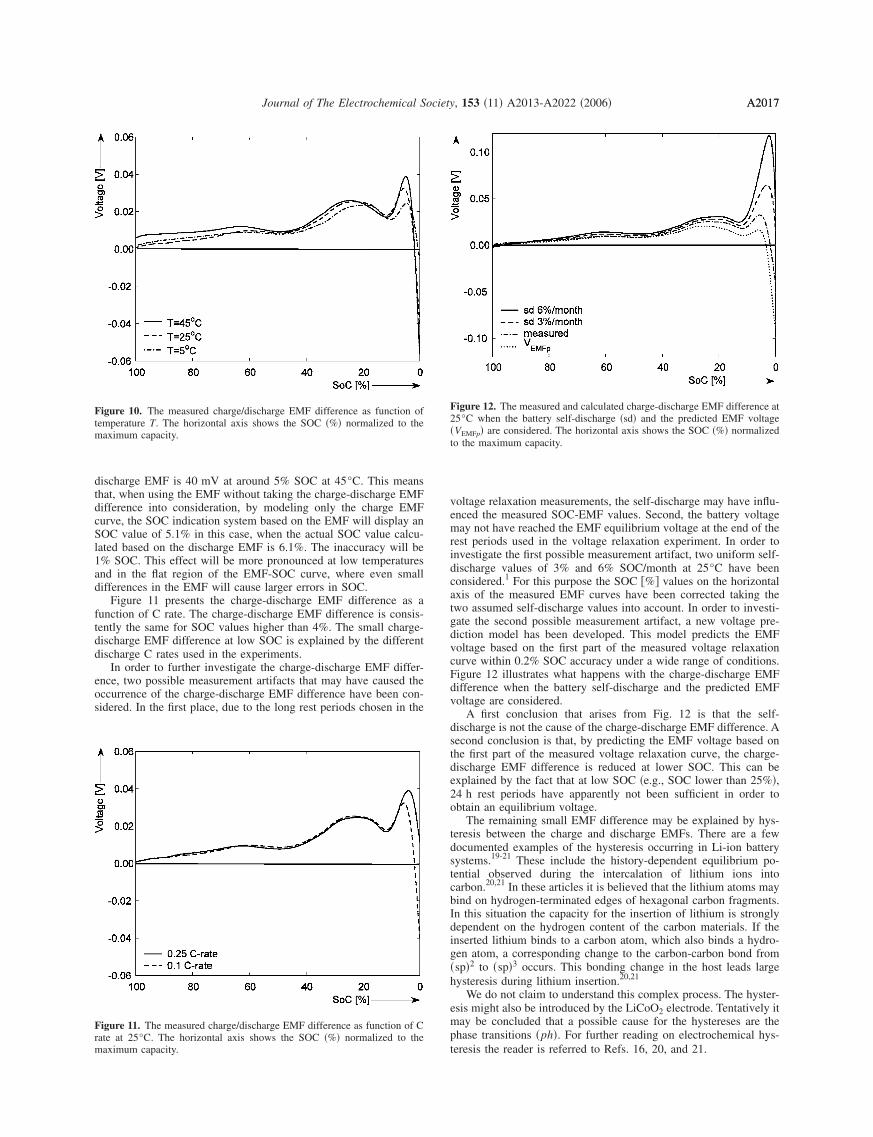
Figure 10 presents the charge-discharge EMF difference obtainedwith the voltage relaxation method at different temperatures. It fol-lows from Fig. 10 that the maximum difference between the charge-
Figure 8. EMF measured by means of voltage relaxation during the dis-charge cycles as function of temperature. The horizontal axis shows the SOC�%� normalized to the maximum capacity.
Figure 9. EMF difference as function of temperature. The horizontal axisshows the SOC �%� normalized to the maximum capacity.
A2017Journal of The Electrochemical Society, 153 �11� A2013-A2022 �2006� A2017
discharge EMF is 40 mV at around 5% SOC at 45°C. This meansthat, when using the EMF without taking the charge-discharge EMFdifference into consideration, by modeling only the charge EMFcurve, the SOC indication system based on the EMF will display anSOC value of 5.1% in this case, when the actual SOC value calcu-lated based on the discharge EMF is 6.1%. The inaccuracy will be1% SOC. This effect will be more pronounced at low temperaturesand in the flat region of the EMF-SOC curve, where even smalldifferences in the EMF will cause larger errors in SOC.
Figure 11 presents the charge-discharge EMF difference as afunction of C rate. The charge-discharge EMF difference is consis-tently the same for SOC values higher than 4%. The small charge-discharge EMF difference at low SOC is explained by the differentdischarge C rates used in the experiments.
In order to further investigate the charge-discharge EMF differ-ence, two possible measurement artifacts that may have caused theoccurrence of the charge-discharge EMF difference have been con-sidered. In the first place, due to the long rest periods chosen in the
Figure 10. The measured charge/discharge EMF difference as function oftemperature T. The horizontal axis shows the SOC �%� normalized to themaximum capacity.
Figure 11. The measured charge/discharge EMF difference as function of Crate at 25°C. The horizontal axis shows the SOC �%� normalized to themaximum capacity.
voltage relaxation measurements, the self-discharge may have influ-enced the measured SOC-EMF values. Second, the battery voltagemay not have reached the EMF equilibrium voltage at the end of therest periods used in the voltage relaxation experiment. In order toinvestigate the first possible measurement artifact, two uniform self-discharge values of 3% and 6% SOC/month at 25°C have beenconsidered.1 For this purpose the SOC �%� values on the horizontalaxis of the measured EMF curves have been corrected taking thetwo assumed self-discharge values into account. In order to investi-gate the second possible measurement artifact, a new voltage pre-diction model has been developed. This model predicts the EMFvoltage based on the first part of the measured voltage relaxationcurve within 0.2% SOC accuracy under a wide range of conditions.Figure 12 illustrates what happens with the charge-discharge EMFdifference when the battery self-discharge and the predicted EMFvoltage are considered.
A first conclusion that arises from Fig. 12 is that the self-discharge is not the cause of the charge-discharge EMF difference. Asecond conclusion is that, by predicting the EMF voltage based onthe first part of the measured voltage relaxation curve, the charge-discharge EMF difference is reduced at lower SOC. This can beexplained by the fact that at low SOC �e.g., SOC lower than 25%�,24 h rest periods have apparently not been sufficient in order toobtain an equilibrium voltage.
The remaining small EMF difference may be explained by hys-teresis between the charge and discharge EMFs. There are a fewdocumented examples of the hysteresis occurring in Li-ion batterysystems.19-21 These include the history-dependent equilibrium po-tential observed during the intercalation of lithium ions intocarbon.20,21 In these articles it is believed that the lithium atoms maybind on hydrogen-terminated edges of hexagonal carbon fragments.In this situation the capacity for the insertion of lithium is stronglydependent on the hydrogen content of the carbon materials. If theinserted lithium binds to a carbon atom, which also binds a hydro-gen atom, a corresponding change to the carbon-carbon bond from�sp�2 to �sp�3 occurs. This bonding change in the host leads largehysteresis during lithium insertion.20,21
We do not claim to understand this complex process. The hyster-esis might also be introduced by the LiCoO2 electrode. Tentatively itmay be concluded that a possible cause for the hystereses are thephase transitions �ph�. For further reading on electrochemical hys-teresis the reader is referred to Refs. 16, 20, and 21.
Figure 12. The measured and calculated charge-discharge EMF difference at25°C when the battery self-discharge �sd� and the predicted EMF voltage�VEMFp� are considered. The horizontal axis shows the SOC �%� normalizedto the maximum capacity.
A2018 Journal of The Electrochemical Society, 153 �11� A2013-A2022 �2006�A2018
EMF modeling.— The physical model used for the EMF-SOCrelationship is presented in this section. This EMF model is a part ofthe Li-ion battery model presented in Ref. 22. With this model for acertain EMF and temperature the corresponding SOC can be calcu-lated. The EMF curve, measured by means of voltage relaxation asdiscussed in the previous section, is approximated with a mathemati-cal VEMF function in which the EMF of a Li-ion battery with inter-calated electrodes is modeled as the difference in equilibrium poten-tials of the positive and negative electrodes, i.e.
VEMF = Eeq+ − Eeq
− �3�
where the equilibrium potential of the positive electrode �Eeq+ � is
given by
Eeq+ = E0
+ −RT
F�log� xLi
1 − xLi� + Uj
+xLi − � j+� �4�
�2+ = �U2
+ − U1+�xph + �1
+, j = 1,xph � xLi � 1
2,1/2 � xLi � xph�5�
in which E0+ is the standard redox potential of the LiCoO2 electrode
in �V�, Uj+ denotes the dimensionless interaction energy coefficient
in the LiCoO2 electrode, � j+ is a dimensionless constant in the
LiCoO2 electrode, xLi the molfraction of Li+ ions inside the positiveelectrode, i.e., the SOC of the LiCoO2 electrode, R the gas constant�8.314 J �mol K�−1�, F the Faraday constant �96,485 C mol−1�, andT the �ambient� temperature in �K�. In Eq. 5 a phase transition �ph�occurs at xLi = xph that results in a curvature change. According tomodern literature on Li-ion batteries with a LiCoO2 electrode �see,e.g., Ref. 1 and 23�, the main phase-transition point is located nearxph 0.75, while there is also a minor one at xph 0.93. The phasetransition is noticed as a change in the slope of the equilibriumpotential as a function of xLi. This change in the slope of the equi-librium potential is realized in the present physical model by achange in the interaction energy between the intercalated Li+ ionsfrom a value U1
+ in phase 1 to a value U2+ in phase 2.1 The values of
the dimensionless constants �1+ and �2
+ in phases 1 and 2, respec-tively, are chosen so that a continuous transition is achieved fromthe equilibrium potential in phase 1 to that in phase 2 �see Eq. 5�.
The negative electrode is modeled similarly, with only a smalldifference
Eeq− = E0
− −RT
F�log� zLi
1 − zLi� + Uj
−zLi − � j−� �6�
�2− = �U2
− − U1−�zph + �1
−, j = 1,0 � zLi � zph
2,zph � zLi � 1�7�
where E0− is the standard redox potential of the LiC6 electrode in
�V�, Uj− denotes the dimensionless interaction energy coefficient in
the LiC6 electrode, � j− is a dimensionless constant in the LiC6 elec-
trode, and zLi is the mole fraction of the Li+ ions inside the negativeelectrode, i.e., SOC of the negative electrode. In the negative elec-trode a phase transition occurring around zph 0.25 has been mod-eled. Similarly as for the positive electrode, the phase transition isnoticed as a change in the slope of the equilibrium potential as afunction of zLi. This change in the slope of the equilibrium potentialis realized in the present physical model by a change in the interac-tion energy between the intercalated Li+ ions from a value U1
− inphase 1 to a value U2
− in phase 2.1 The values of the dimensionlessconstants �1
−and �2− in phases 1 and 2, respectively, are chosen so that
a continuous transition is achieved from the equilibrium potential inphase 1 to that in phase 2 �see Eq. 7�. Under normal operationalconditions xLi will cycle between 0.5 and 1 while zLi will cyclebetween 0 and 1.1
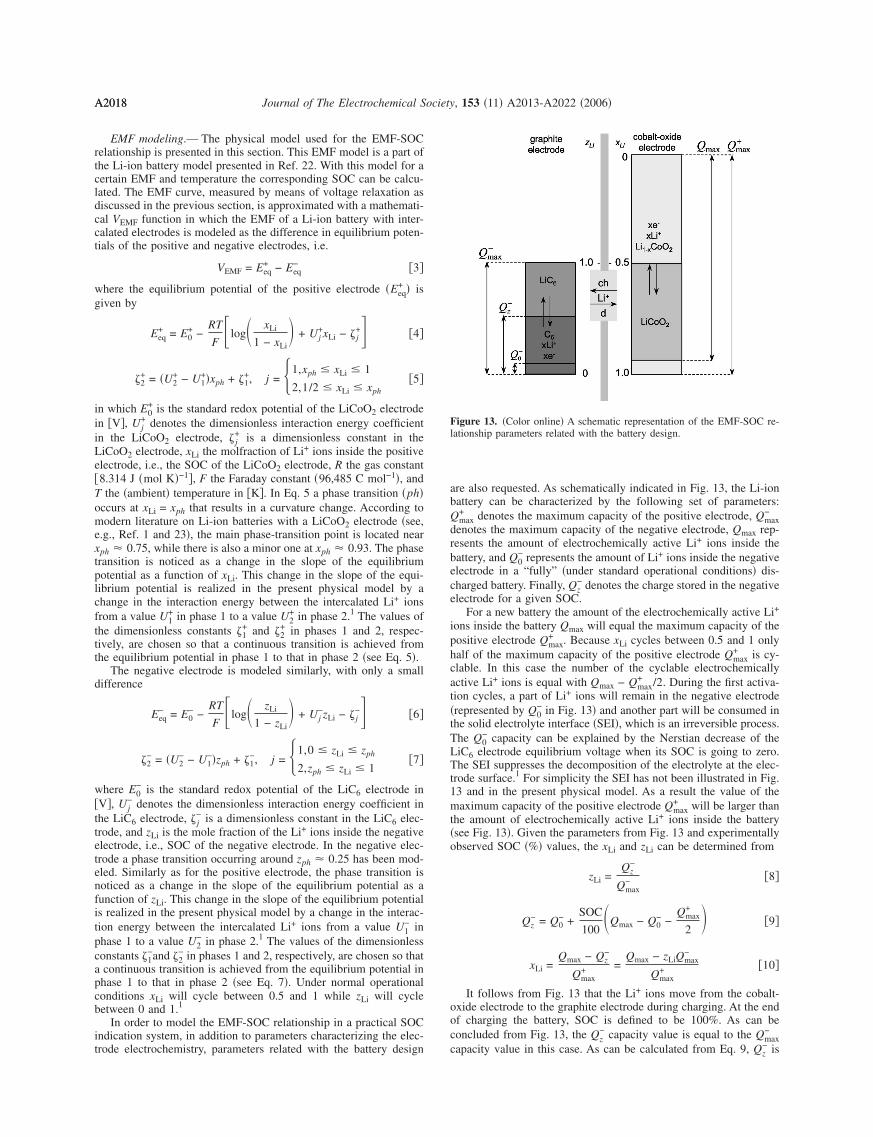
In order to model the EMF-SOC relationship in a practical SOCindication system, in addition to parameters characterizing the elec-trode electrochemistry, parameters related with the battery design
are also requested. As schematically indicated in Fig. 13, the Li-ionbattery can be characterized by the following set of parameters:Qmax
+ denotes the maximum capacity of the positive electrode, Qmax−
denotes the maximum capacity of the negative electrode, Qmax rep-resents the amount of electrochemically active Li+ ions inside thebattery, and Q0
− represents the amount of Li+ ions inside the negativeelectrode in a “fully” �under standard operational conditions� dis-charged battery. Finally, Qz
− denotes the charge stored in the negativeelectrode for a given SOC.
For a new battery the amount of the electrochemically active Li+
ions inside the battery Qmax will equal the maximum capacity of thepositive electrode Qmax
+ . Because xLi cycles between 0.5 and 1 onlyhalf of the maximum capacity of the positive electrode Qmax
+ is cy-clable. In this case the number of the cyclable electrochemicallyactive Li+ ions is equal with Qmax − Qmax
+ /2. During the first activa-tion cycles, a part of Li+ ions will remain in the negative electrode�represented by Q0
− in Fig. 13� and another part will be consumed inthe solid electrolyte interface �SEI�, which is an irreversible process.The Q0
− capacity can be explained by the Nerstian decrease of theLiC6 electrode equilibrium voltage when its SOC is going to zero.The SEI suppresses the decomposition of the electrolyte at the elec-trode surface.1 For simplicity the SEI has not been illustrated in Fig.13 and in the present physical model. As a result the value of themaximum capacity of the positive electrode Qmax
+ will be larger thanthe amount of electrochemically active Li+ ions inside the battery�see Fig. 13�. Given the parameters from Fig. 13 and experimentallyobserved SOC �%� values, the xLi and zLi can be determined from
zLi =Qz
−
Qmax− �8�
Qz− = Q0
− +SOC
100�Qmax − Q0
− −Qmax
+
2� �9�
xLi =Qmax − Qz
−
Qmax+ =
Qmax − zLiQmax−
Qmax+ �10�
It follows from Fig. 13 that the Li+ ions move from the cobalt-oxide electrode to the graphite electrode during charging. At the endof charging the battery, SOC is defined to be 100%. As can beconcluded from Fig. 13, the Qz
− capacity value is equal to the Qmax−
capacity value in this case. As can be calculated from Eq. 9, Q− is
Figure 13. �Color online� A schematic representation of the EMF-SOC re-lationship parameters related with the battery design.
z
A2019Journal of The Electrochemical Society, 153 �11� A2013-A2022 �2006� A2019
equal with Qmax − Qmax+ /2. It follows from Eq. 8 and 10, respec-
tively, that in this case the zLi value will equal 1 and the xLi valuewill equal �Qmax − �Qmax − Qmax
+ /2��/Qmax+ = 0.5. During discharge
the Li+ ions move from the graphite electrode to the cobalt-oxideelectrode �see Fig. 13�. At the end of discharging considered understandard operational conditions, the Qz
− capacity value is equal to thevalue of the Q0
− capacity �see Fig. 13�. As can be calculated from Eq.8 and 10, respectively, the zLi = Q0
−/Qmax− value will be a little bit
larger than 0 and the xLi = �Qmax − Q0−�/Qmax
+ value will be a littlebit smaller than 1 �see Fig. 13�.
Eeq+ and Eeq
− can be further calculated from Eq. 4 and 5 and Eq. 6and 7, respectively. However, from the EMF measurements it hasbeen noticed that the phase transition does not take place instanta-neously but in a certain interval around the phase transition points.1
In order to achieve a smooth phase transition of the change in theslope of the equilibrium potential, the following approximation isconsidered
Eeq+ = E0
+ −RT
Flog� xLi
1 − xLi� + �� xLi − xph
�x��U1
+xLi − �1+�
+ �1 − �� xLi − xph
�x���U2
+xLi − �2+�� �11�
Eeq− = E0
− −RT
Flog� zLi
1 − zLi� + �� zLi − zph
�z��U1
−zLi − �1−�
+ �1 − �� zLi − zph
�z���U2
−zLi − �2−�� �12�
where � denotes a standard normal cumulative distribution functionand the parameters �x and �z determine the smoothness of the phasetransitions.
In order to include the temperature influence in the EMF-SOCrelationship, a linear dependence of each of the model parametershas been assumed according to
par�T� = par�Tref� + �T − Tref��par �13�
where Tref is a reference temperature �e.g., 25°C�, T is the ambienttemperature, and par�Tref� is the value of one of the EMF-SOCmodel parameters at temperature Tref. The �par value is the sensi-tivity to temperature determined for each parameter par�Tref�.
Different values for the EMF-SOC model parameters can be usedfor the charge and discharge EMF in order to deal with the hyster-esis effect. Also, when another type of Li-ion battery with a differentEMF-SOC curve chemistry is modeled the model can be adapted byfitting, leading to new parameter values. In this way, this model maynot be only limited to the present Li-ion battery type. Taking intoconsideration factors like hysteresis and temperature, this presentedmethod is considered to be the best solution for a practical EMFimplementation.6 Simulation results of the mathematical EMFimplementation is presented in another section.
Overpotential.— The overpotential is defined as the differencebetween the EMF and the charge-discharge voltage of the battery.Due to this overpotential, the battery voltage during the dischargestate is lower than the EMF �see Fig. 1�.2 The value of the overpo-tential depends on the discharge current, the SOC, age, and tempera-ture. Especially for old cells, at low temperatures and at low SOC,due to a high overpotential the remaining charge cannot be with-drawn from the battery, because the battery voltage will drop belowthe EOD voltage defined in the portable device �e.g., 3 V�; see Fig.1. This leads to an apparent capacity loss, which at low temperaturesof, e.g., 0°C amounts up to more than 5%.1 Hence, a distinctionshould be made between available charge in the battery �i.e., SOC�and the charge that can be withdrawn from the battery under certainconditions, expressed in remaining run time. This distinction can bemade by taking the overpotential development during the discharge
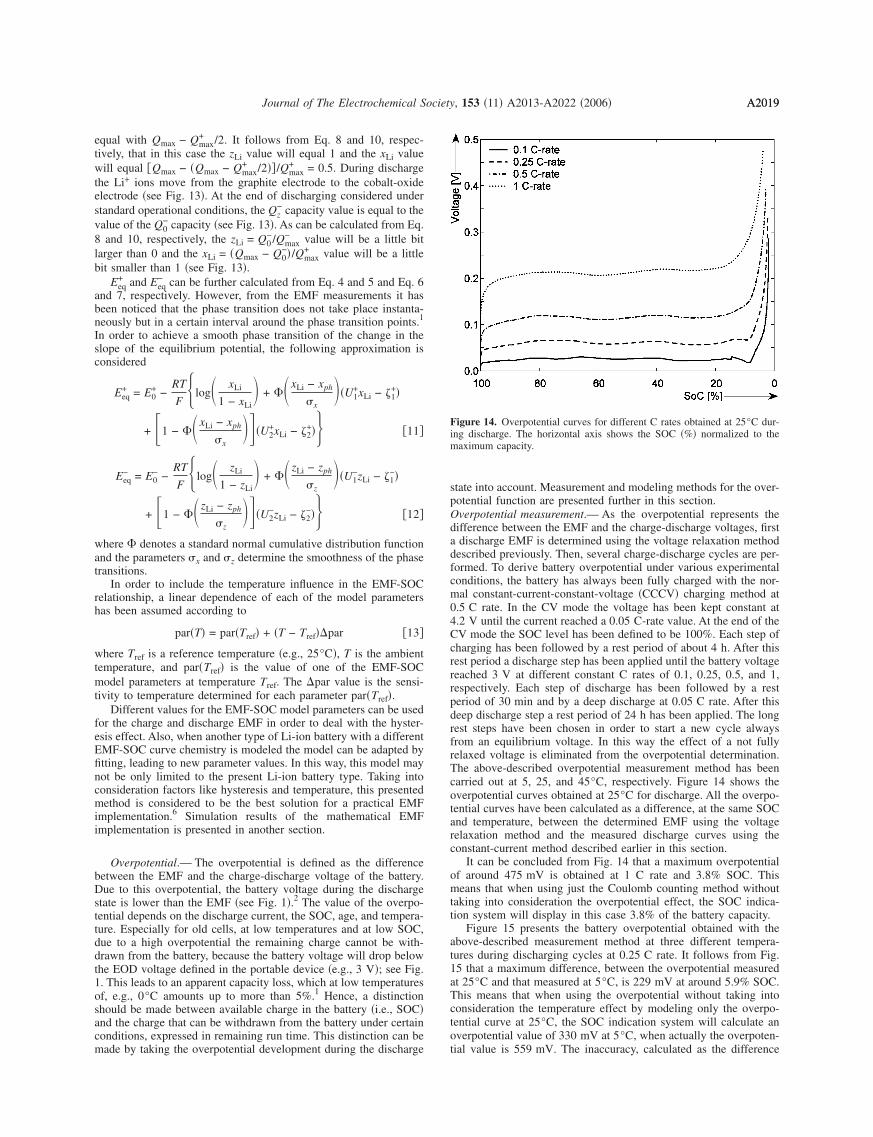
state into account. Measurement and modeling methods for the over-potential function are presented further in this section.Overpotential measurement.— As the overpotential represents thedifference between the EMF and the charge-discharge voltages, firsta discharge EMF is determined using the voltage relaxation methoddescribed previously. Then, several charge-discharge cycles are per-formed. To derive battery overpotential under various experimentalconditions, the battery has always been fully charged with the nor-mal constant-current-constant-voltage �CCCV� charging method at0.5 C rate. In the CV mode the voltage has been kept constant at4.2 V until the current reached a 0.05 C-rate value. At the end of theCV mode the SOC level has been defined to be 100%. Each step ofcharging has been followed by a rest period of about 4 h. After thisrest period a discharge step has been applied until the battery voltagereached 3 V at different constant C rates of 0.1, 0.25, 0.5, and 1,respectively. Each step of discharge has been followed by a restperiod of 30 min and by a deep discharge at 0.05 C rate. After thisdeep discharge step a rest period of 24 h has been applied. The longrest steps have been chosen in order to start a new cycle alwaysfrom an equilibrium voltage. In this way the effect of a not fullyrelaxed voltage is eliminated from the overpotential determination.The above-described overpotential measurement method has beencarried out at 5, 25, and 45°C, respectively. Figure 14 shows theoverpotential curves obtained at 25°C for discharge. All the overpo-tential curves have been calculated as a difference, at the same SOCand temperature, between the determined EMF using the voltagerelaxation method and the measured discharge curves using theconstant-current method described earlier in this section.
It can be concluded from Fig. 14 that a maximum overpotentialof around 475 mV is obtained at 1 C rate and 3.8% SOC. Thismeans that when using just the Coulomb counting method withouttaking into consideration the overpotential effect, the SOC indica-tion system will display in this case 3.8% of the battery capacity.
Figure 15 presents the battery overpotential obtained with theabove-described measurement method at three different tempera-tures during discharging cycles at 0.25 C rate. It follows from Fig.15 that a maximum difference, between the overpotential measuredat 25°C and that measured at 5°C, is 229 mV at around 5.9% SOC.This means that when using the overpotential without taking intoconsideration the temperature effect by modeling only the overpo-tential curve at 25°C, the SOC indication system will calculate anoverpotential value of 330 mV at 5°C, when actually the overpoten-tial value is 559 mV. The inaccuracy, calculated as the difference
Figure 14. Overpotential curves for different C rates obtained at 25°C dur-ing discharge. The horizontal axis shows the SOC �%� normalized to themaximum capacity.
A2020 Journal of The Electrochemical Society, 153 �11� A2013-A2022 �2006�A2020
between the true overpotential value measured at 5°C and the over-potential value measured at 25°C, will be 229 mV.18 Due to thisoverpotential, the battery voltage will drop below 3 V and the bat-tery appears to be empty for a user.1 Because the overpotential in-creases for old cells and at low temperatures �see also Fig. 15� theinaccuracy in these situations will be higher.1 Therefore, accurateoverpotential modeling is needed under these conditions.
Overpotential modeling.— In this section an overpotential equa-tion inferred from physical models previously developed ispresented.1,24 The overpotential, in which the ohmic, kinetic, diffu-sion overpotential, and the increase of the diffusion overpotentialwhen the battery becomes empty are considered, is modeled as fol-lows
��V� = I�R�k�T� + RIk�I,T� + �Rd0�T� + Rd
I �I,T���1 − e�−c2�T��t�/�d�T��
+�Eq
0�T� + EqI �I,T���1 − e�c4�T�Qin�t��/�d�T���Qin�no�T�+n1�I,T��t� � �14�
where I�A� 0 for discharge, I�A� 0 for charge, R�k�T����,RIk�I,T���� = c0�T���A−1�I�A�, denote the contributionsof the “ohmic” and “kinetic” resistance, Rd
0�T���� and RdI �I,T�
���� = c1�T��V�/I�A�, denote the contributions of the “diffusion”resistance, c2�T��s1/2� is a constant, �d�T��s� denotes the diffusiontime constant, n0�T� �dimensionless�, and n1�I,T� = c5�T��A�/I�A�are parameters related with the magnitude of the diffusion overpo-tential, Eq
0�T��J A−1� and Eq1�I,T��J A−1� = c3�T��J�/I�A�, denote
the amount of the energy that cannot be obtained from the batterywhen the current I increases, Qin�t��C� denotes the charge present inthe battery at the time t �s� and c2�s1/2� = c4�A−1� = 1 numerically.Finally, �q�T� is a time constant associated with the increase inoverpotential in an almost empty battery in �s�.1 Simulation resultsof the mathematical overpotential implementation are presentednext.
Results
The results of the mathematical implementation of the EMF andoverpotential functions in the SOC system are presented in this sec-tion. The Sony US18500G3 Li-ion battery has been used throughoutthe experiments. The EMF equations described previously need tobe fitted to a measured EMF curve.
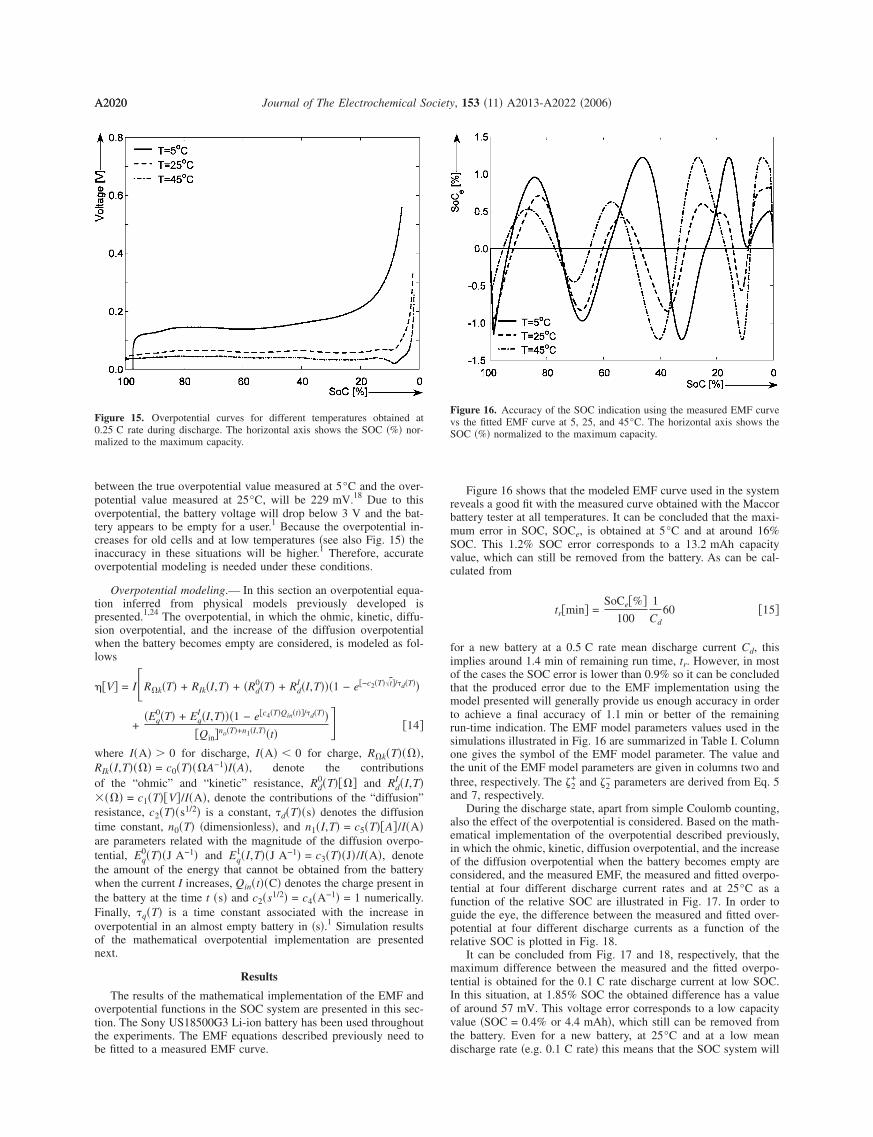
Figure 15. Overpotential curves for different temperatures obtained at0.25 C rate during discharge. The horizontal axis shows the SOC �%� nor-malized to the maximum capacity.
Figure 16 shows that the modeled EMF curve used in the systemreveals a good fit with the measured curve obtained with the Maccorbattery tester at all temperatures. It can be concluded that the maxi-mum error in SOC, SOCe, is obtained at 5°C and at around 16%SOC. This 1.2% SOC error corresponds to a 13.2 mAh capacityvalue, which can still be removed from the battery. As can be cal-culated from
tr�min� =SoCe�%�
100
1
Cd60 �15�
for a new battery at a 0.5 C rate mean discharge current Cd, thisimplies around 1.4 min of remaining run time, tr. However, in mostof the cases the SOC error is lower than 0.9% so it can be concludedthat the produced error due to the EMF implementation using themodel presented will generally provide us enough accuracy in orderto achieve a final accuracy of 1.1 min or better of the remainingrun-time indication. The EMF model parameters values used in thesimulations illustrated in Fig. 16 are summarized in Table I. Columnone gives the symbol of the EMF model parameter. The value andthe unit of the EMF model parameters are given in columns two andthree, respectively. The �2
+ and �2− parameters are derived from Eq. 5
and 7, respectively.During the discharge state, apart from simple Coulomb counting,
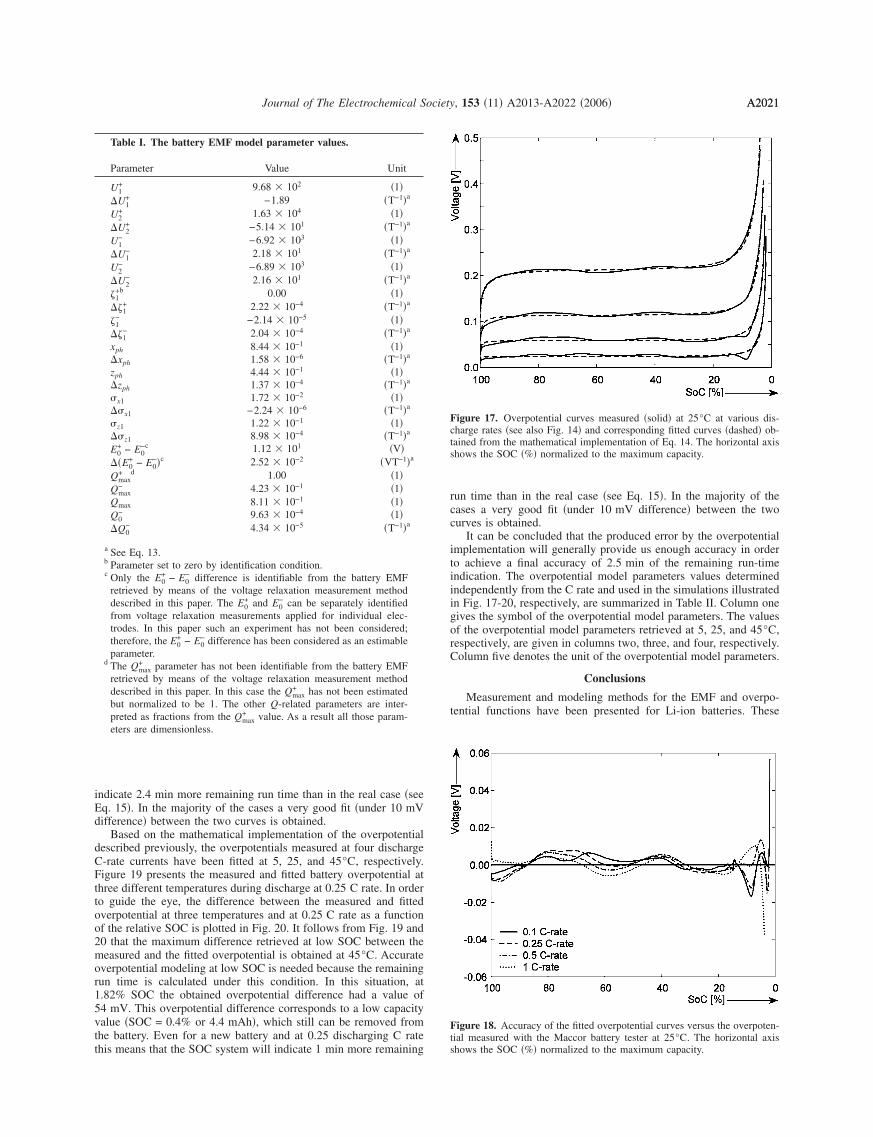
also the effect of the overpotential is considered. Based on the math-ematical implementation of the overpotential described previously,in which the ohmic, kinetic, diffusion overpotential, and the increaseof the diffusion overpotential when the battery becomes empty areconsidered, and the measured EMF, the measured and fitted overpo-tential at four different discharge current rates and at 25°C as afunction of the relative SOC are illustrated in Fig. 17. In order toguide the eye, the difference between the measured and fitted over-potential at four different discharge currents as a function of therelative SOC is plotted in Fig. 18.
It can be concluded from Fig. 17 and 18, respectively, that themaximum difference between the measured and the fitted overpo-tential is obtained for the 0.1 C rate discharge current at low SOC.In this situation, at 1.85% SOC the obtained difference has a valueof around 57 mV. This voltage error corresponds to a low capacityvalue �SOC = 0.4% or 4.4 mAh�, which still can be removed fromthe battery. Even for a new battery, at 25°C and at a low meandischarge rate �e.g. 0.1 C rate� this means that the SOC system will
Figure 16. Accuracy of the SOC indication using the measured EMF curvevs the fitted EMF curve at 5, 25, and 45°C. The horizontal axis shows theSOC �%� normalized to the maximum capacity.
A2021Journal of The Electrochemical Society, 153 �11� A2013-A2022 �2006� A2021
indicate 2.4 min more remaining run time than in the real case �seeEq. 15�. In the majority of the cases a very good fit �under 10 mVdifference� between the two curves is obtained.
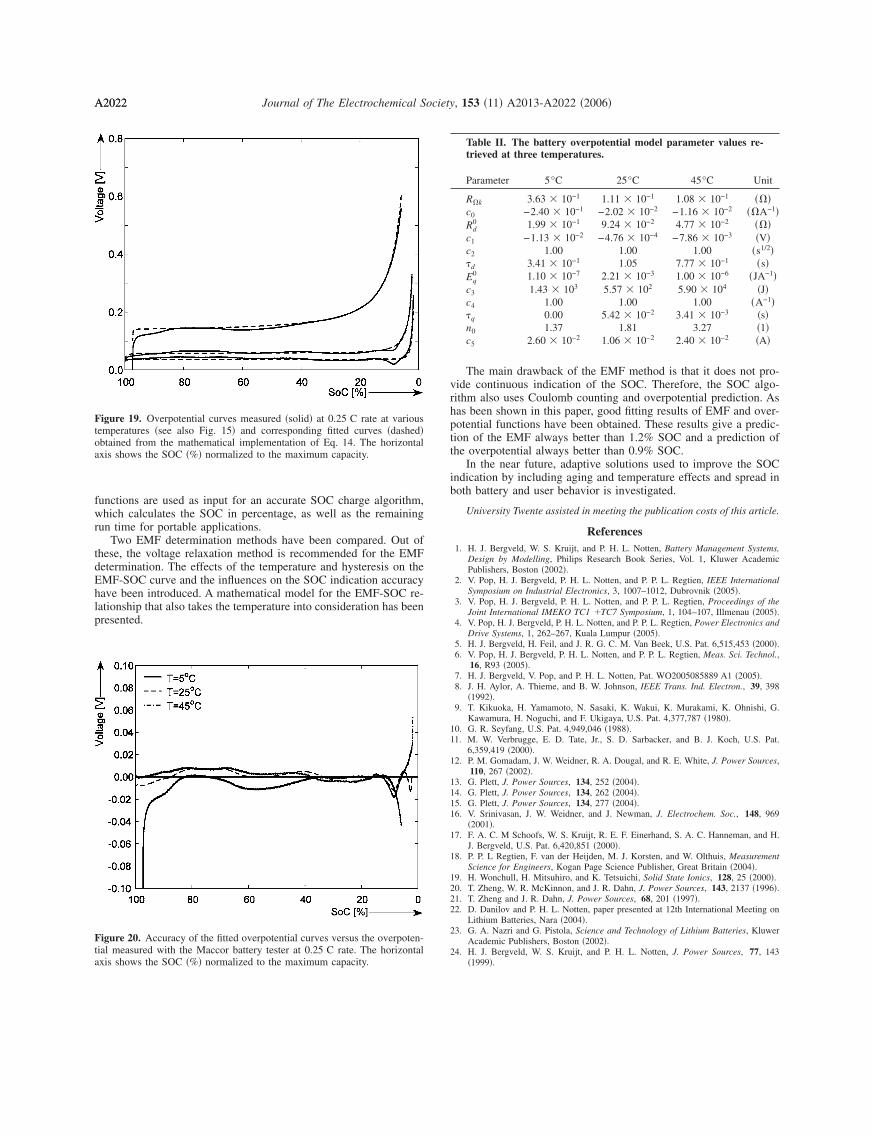
Based on the mathematical implementation of the overpotentialdescribed previously, the overpotentials measured at four dischargeC-rate currents have been fitted at 5, 25, and 45°C, respectively.Figure 19 presents the measured and fitted battery overpotential atthree different temperatures during discharge at 0.25 C rate. In orderto guide the eye, the difference between the measured and fittedoverpotential at three temperatures and at 0.25 C rate as a functionof the relative SOC is plotted in Fig. 20. It follows from Fig. 19 and20 that the maximum difference retrieved at low SOC between themeasured and the fitted overpotential is obtained at 45°C. Accurateoverpotential modeling at low SOC is needed because the remainingrun time is calculated under this condition. In this situation, at1.82% SOC the obtained overpotential difference had a value of54 mV. This overpotential difference corresponds to a low capacityvalue �SOC = 0.4% or 4.4 mAh�, which still can be removed fromthe battery. Even for a new battery and at 0.25 discharging C ratethis means that the SOC system will indicate 1 min more remaining
Table I. The battery EMF model parameter values.
Parameter Value Unit
U1+ 9.68 � 102 �1�
�U1+ −1.89 �T−1�a
U2+ 1.63 � 104 �1�
�U2+ −5.14 � 101 �T−1�a
U1− −6.92 � 103 �1�
�U1− 2.18 � 101 �T−1�a
U2− −6.89 � 103 �1�
�U2− 2.16 � 101 �T−1�a
�1+b 0.00 �1�
��1+ 2.22 � 10−4 �T−1�a
�1− −2.14 � 10−5 �1�
��1− 2.04 � 10−4 �T−1�a
xph 8.44 � 10−1 �1��xph 1.58 � 10−6 �T−1�a
zph 4.44 � 10−1 �1��zph 1.37 � 10−4 �T−1�a
�x1 1.72 � 10−2 �1���x1 −2.24 � 10−6 �T−1�a
�z1 1.22 � 10−1 �1���z1 8.98 � 10−4 �T−1�a
E0+ − E0
−c 1.12 � 101 �V�
��E0+ − E0
−�c 2.52 � 10−2 �VT−1�a
Qmax+ d 1.00 �1�
Qmax− 4.23 � 10−1 �1�
Qmax 8.11 � 10−1 �1�Q0
− 9.63 � 10−4 �1�
�Q0− 4.34 � 10−5 �T−1�a
a See Eq. 13.b Parameter set to zero by identification condition.c Only the E0
+ − E0− difference is identifiable from the battery EMF
retrieved by means of the voltage relaxation measurement methoddescribed in this paper. The E0
+ and E0− can be separately identified
from voltage relaxation measurements applied for individual elec-trodes. In this paper such an experiment has not been considered;therefore, the E0
+ − E0− difference has been considered as an estimable
parameter.d The Qmax
+ parameter has not been identifiable from the battery EMFretrieved by means of the voltage relaxation measurement methoddescribed in this paper. In this case the Qmax
+ has not been estimatedbut normalized to be 1. The other Q-related parameters are inter-preted as fractions from the Qmax
+ value. As a result all those param-eters are dimensionless.
run time than in the real case �see Eq. 15�. In the majority of thecases a very good fit �under 10 mV difference� between the twocurves is obtained.
It can be concluded that the produced error by the overpotentialimplementation will generally provide us enough accuracy in orderto achieve a final accuracy of 2.5 min of the remaining run-timeindication. The overpotential model parameters values determinedindependently from the C rate and used in the simulations illustratedin Fig. 17-20, respectively, are summarized in Table II. Column onegives the symbol of the overpotential model parameters. The valuesof the overpotential model parameters retrieved at 5, 25, and 45°C,respectively, are given in columns two, three, and four, respectively.Column five denotes the unit of the overpotential model parameters.
Conclusions
Measurement and modeling methods for the EMF and overpo-tential functions have been presented for Li-ion batteries. These
Figure 17. Overpotential curves measured �solid� at 25°C at various dis-charge rates �see also Fig. 14� and corresponding fitted curves �dashed� ob-tained from the mathematical implementation of Eq. 14. The horizontal axisshows the SOC �%� normalized to the maximum capacity.
Figure 18. Accuracy of the fitted overpotential curves versus the overpoten-tial measured with the Maccor battery tester at 25°C. The horizontal axisshows the SOC �%� normalized to the maximum capacity.
A2022 Journal of The Electrochemical Society, 153 �11� A2013-A2022 �2006�A2022
functions are used as input for an accurate SOC charge algorithm,which calculates the SOC in percentage, as well as the remainingrun time for portable applications.
Two EMF determination methods have been compared. Out ofthese, the voltage relaxation method is recommended for the EMFdetermination. The effects of the temperature and hysteresis on theEMF-SOC curve and the influences on the SOC indication accuracyhave been introduced. A mathematical model for the EMF-SOC re-lationship that also takes the temperature into consideration has beenpresented.
Figure 19. Overpotential curves measured �solid� at 0.25 C rate at varioustemperatures �see also Fig. 15� and corresponding fitted curves �dashed�obtained from the mathematical implementation of Eq. 14. The horizontalaxis shows the SOC �%� normalized to the maximum capacity.
Figure 20. Accuracy of the fitted overpotential curves versus the overpoten-tial measured with the Maccor battery tester at 0.25 C rate. The horizontalaxis shows the SOC �%� normalized to the maximum capacity.
The main drawback of the EMF method is that it does not pro-vide continuous indication of the SOC. Therefore, the SOC algo-rithm also uses Coulomb counting and overpotential prediction. Ashas been shown in this paper, good fitting results of EMF and over-potential functions have been obtained. These results give a predic-tion of the EMF always better than 1.2% SOC and a prediction ofthe overpotential always better than 0.9% SOC.
In the near future, adaptive solutions used to improve the SOCindication by including aging and temperature effects and spread inboth battery and user behavior is investigated.
University Twente assisted in meeting the publication costs of this article.
References1. H. J. Bergveld, W. S. Kruijt, and P. H. L. Notten, Battery Management Systems,
Design by Modelling, Philips Research Book Series, Vol. 1, Kluwer AcademicPublishers, Boston �2002�.
2. V. Pop, H. J. Bergveld, P. H. L. Notten, and P. P. L. Regtien, IEEE InternationalSymposium on Industrial Electronics, 3, 1007–1012, Dubrovnik �2005�.
3. V. Pop, H. J. Bergveld, P. H. L. Notten, and P. P. L. Regtien, Proceedings of theJoint International IMEKO TC1 �TC7 Symposium, 1, 104–107, Illmenau �2005�.
4. V. Pop, H. J. Bergveld, P. H. L. Notten, and P. P. L. Regtien, Power Electronics andDrive Systems, 1, 262–267, Kuala Lumpur �2005�.
5. H. J. Bergveld, H. Feil, and J. R. G. C. M. Van Beek, U.S. Pat. 6,515,453 �2000�.6. V. Pop, H. J. Bergveld, P. H. L. Notten, and P. P. L. Regtien, Meas. Sci. Technol.,
16, R93 �2005�.7. H. J. Bergveld, V. Pop, and P. H. L. Notten, Pat. WO2005085889 A1 �2005�.8. J. H. Aylor, A. Thieme, and B. W. Johnson, IEEE Trans. Ind. Electron., 39, 398
�1992�.9. T. Kikuoka, H. Yamamoto, N. Sasaki, K. Wakui, K. Murakami, K. Ohnishi, G.
Kawamura, H. Noguchi, and F. Ukigaya, U.S. Pat. 4,377,787 �1980�.10. G. R. Seyfang, U.S. Pat. 4,949,046 �1988�.11. M. W. Verbrugge, E. D. Tate, Jr., S. D. Sarbacker, and B. J. Koch, U.S. Pat.
6,359,419 �2000�.12. P. M. Gomadam, J. W. Weidner, R. A. Dougal, and R. E. White, J. Power Sources,
110, 267 �2002�.13. G. Plett, J. Power Sources, 134, 252 �2004�.14. G. Plett, J. Power Sources, 134, 262 �2004�.15. G. Plett, J. Power Sources, 134, 277 �2004�.16. V. Srinivasan, J. W. Weidner, and J. Newman, J. Electrochem. Soc., 148, 969
�2001�.17. F. A. C. M Schoofs, W. S. Kruijt, R. E. F. Einerhand, S. A. C. Hanneman, and H.
J. Bergveld, U.S. Pat. 6,420,851 �2000�.18. P. P. L Regtien, F. van der Heijden, M. J. Korsten, and W. Olthuis, Measurement
Science for Engineers, Kogan Page Science Publisher, Great Britain �2004�.19. H. Wonchull, H. Mitsuhiro, and K. Tetsuichi, Solid State Ionics, 128, 25 �2000�.20. T. Zheng, W. R. McKinnon, and J. R. Dahn, J. Power Sources, 143, 2137 �1996�.21. T. Zheng and J. R. Dahn, J. Power Sources, 68, 201 �1997�.22. D. Danilov and P. H. L. Notten, paper presented at 12th International Meeting on
Lithium Batteries, Nara �2004�.23. G. A. Nazri and G. Pistola, Science and Technology of Lithium Batteries, Kluwer
Academic Publishers, Boston �2002�.24. H. J. Bergveld, W. S. Kruijt, and P. H. L. Notten, J. Power Sources, 77, 143
�1999�.
Table II. The battery overpotential model parameter values re-trieved at three temperatures.
Parameter 5°C 25°C 45°C Unit
R�k 3.63 � 10−1 1.11 � 10−1 1.08 � 10−1 ���c0 −2.40 � 10−1 −2.02 � 10−2 −1.16 � 10−2 ��A−1�Rd
0 1.99 � 10−1 9.24 � 10−2 4.77 � 10−2 ���c1 −1.13 � 10−2 −4.76 � 10−4 −7.86 � 10−3 �V�c2 1.00 1.00 1.00 �s1/2��d 3.41 � 10−1 1.05 7.77 � 10−1 �s�Eq
0 1.10 � 10−7 2.21 � 10−3 1.00 � 10−6 �JA−1�c3 1.43 � 103 5.57 � 102 5.90 � 104 �J�c4 1.00 1.00 1.00 �A−1��q 0.00 5.42 � 10−2 3.41 � 10−3 �s�n0 1.37 1.81 3.27 �1�c5 2.60 � 10−2 1.06 � 10−2 2.40 � 10−2 �A�