mining the feature space of effective learning behavior - mdpi
TRANSCRIPT
�����������������
Citation: Qiu, F.; Zhu, L.; Zhang, G.;
Sheng, X.; Ye, M.; Xiang, Q.; Chen,
P.-K. E-Learning Performance
Prediction: Mining the Feature Space
of Effective Learning Behavior.
Entropy 2022, 24, 722. https://
doi.org/10.3390/e24050722
Academic Editors: Geert Verdoolaege
and Friedhelm Schwenker
Received: 26 January 2022
Accepted: 22 April 2022
Published: 19 May 2022
Publisher’s Note: MDPI stays neutral
with regard to jurisdictional claims in
published maps and institutional affil-
iations.
Copyright: © 2022 by the authors.
Licensee MDPI, Basel, Switzerland.
This article is an open access article
distributed under the terms and
conditions of the Creative Commons
Attribution (CC BY) license (https://
creativecommons.org/licenses/by/
4.0/).
entropy
Article
E-Learning Performance Prediction: Mining the Feature Spaceof Effective Learning Behavior
Feiyue Qiu 1,† , Lijia Zhu 1 , Guodao Zhang 2,3,*,† , Xin Sheng 1 , Mingtao Ye 3 , Qifeng Xiang1
and Ping-Kuo Chen 4,*
1 College of Education, Zhejiang University of Technology, Hangzhou 310023, China; [email protected] (F.Q.);[email protected] (L.Z.); [email protected] (X.S.); [email protected] (Q.X.)
2 Department of Digital Media Technology, Hangzhou Dianzi University, Hangzhou 310018, China3 College of Computer Science and Technology, Zhejiang University of Technology, Hangzhou 310023, China;
[email protected] Business School, Shantou University, Shantou 515000, China* Correspondence: [email protected] (G.Z.); [email protected] (P.C.); Tel.: +86-136-3423-9976 (G.Z.)† These authors contributed equally to this work.
Abstract: Learning analysis provides a new opportunity for the development of online education,and has received extensive attention from scholars at home and abroad. How to use data andmodels to predict learners’ academic success or failure and give teaching feedback in a timely manneris a core problem in the field of learning analytics. At present, many scholars use key learningbehaviors to improve the prediction effect by exploring the implicit relationship between learningbehavior data and grades. At the same time, it is very important to explore the association betweencategories and prediction effects in learning behavior classification. This paper proposes a self-adaptive feature fusion strategy based on learning behavior classification, aiming to mine the effectiveE-learning behavior feature space and further improve the performance of the learning performanceprediction model. First, a behavior classification model (E-learning Behavior Classification Model,EBC Model) based on interaction objects and learning process is constructed; second, the feature spaceis preliminarily reduced by entropy weight method and variance filtering method; finally, combinedwith EBC Model and a self-adaptive feature fusion strategy to build a learning performance predictor.The experiment uses the British Open University Learning Analysis Dataset (OULAD). Through theexperimental analysis, an effective feature space is obtained, that is, the basic interactive behavior (BI)and knowledge interaction behavior (KI) of learning behavior category has the strongest correlationwith learning performance.And it is proved that the self-adaptive feature fusion strategy proposed inthis paper can effectively improve the performance of the learning performance predictor, and theperformance index of accuracy(ACC), F1-score(F1) and kappa(K) reach 98.44%, 0.9893, 0.9600. Thisstudy constructs E-learning performance predictors and mines the effective feature space from a newperspective, and provides some auxiliary references for online learners and managers.
Keywords: E-learning performance; E-learning behavior classification; feature space; machinelearning; feature fusion
1. Introduction
In the last decade, with the concept of ”lifelong learning” and ”individualized learn-ing”, E-learning was widely developed worldwide due to its characteristics of massiveinformation, strong interaction, wide coverage, and no time and space restrictions [1], so itprovides convenience for learners. However, at the same time, compared with traditionalclassrooms, in electronic learning, it is difficult for teachers to directly obtain student perfor-mance in the course and provide timely feedback. They usually get information about thefailure of the course after the course is over. This leads to poor learning effects and lowerstudents’ confidence. Undergraduates may choose to drop out or postpone their studies inthese situations. One way to detect whether students will perform poorly in a course is
Entropy 2022, 24, 722. https://doi.org/10.3390/e24050722 https://www.mdpi.com/journal/entropy
Entropy 2022, 24, 722 2 of 22
to make early predictions of their grades [2]. At present, many scholars are committed tothe field of predictive modeling learning analysis and educational data mining. Learningbehavior data decomposes the originally complex learning behavior into operable andobtainable data indicators [3], and deepens our understanding of learning process throughthe analysis of learner-related data [4]. The purpose of learning performance prediction isto predict and understand the academic performance of students in the learning trajectory,help teachers to comprehensively understand students’ academic conditions, and imple-ment targeted intervention plans based on the predicted results to improve the learningexperience of learners [5]. However, using this method also faces multiple challenges,especially how to obtain, process and use data to build learning behavior models [6]. Itcan be seen that predicting learners’ academic performance has become a key issue in thefield of learning analysis. When mining the prediction indicators of learning achievementand academic risk, it focuses on demographic data, behavioral data, and students’ pastperformance [7]. As demographic data involves the privacy of students, the deletion ofsome information may affect the availability of data and the accuracy of the results, so thereare certain limitations. At present, there are many related studies published in the field ofstudent test score analysis, the purpose is to predict the ”high risk” of students withdrawingfrom a particular course. Although good results have been achieved, there are still somelimitations. First, many studies tend to choose multi-dimensional, fine-grained behavioraldata [8–10] and have achieved good results. However, few people consider isolated learn-ing behaviors as a whole, ignoring the internal connection of learning behaviors, or onlyconsidering single or several behavioral data are used as prediction indicators [11,12], and itis difficult to highlight the impact of core behaviors on learning performance. Second, whenusing multi-dimensional data, irrelevant variables will affect the generalization ability ofthe model and increase the computational cost of the model. With the huge increase inE-learning platform data, these problems have gradually become prominent. Third, the in-dex input method for constructing the model is single, and different types of features mayaffect the accuracy of prediction [13]. However, few people consider the combination ofdifferent types of student-related features to determine the best combination of model inputdata. Fourth, using traditional preprocessing methods to construct learning performancepredictors also has some problems, such as prediction accuracy and computation time.The high accuracy and low time-consuming rate of performance prediction can effectivelysupport teachers to track the performance of each student, and can further guarantee thequality of online learning.
Addressing these limitations can help discover effective ways to improve learninganalytics research in higher education. To this end, this paper constructs a learning per-formance predictor from a new perspective, that is, based on the E- learning behaviorclassification model (EBC Model), the E-learning behavior is divided into four categories,and different combinations of the four categories of behavior are used as input variables.Prediction analysis and performance comparison of machine learning models to mine theeffective behavioral feature space. Then, the entropy weight method, variance filteringmethod and self-adaptive feature fusion strategy are combined in the data preprocessingstage to further improve the performance and efficiency of the predictor. The contributionsof this work can be summarized as follows:
1. On the basis of teaching theory, construct an E-learning behavior classificationmodel (EBC-Model) based on E-learning process and interactive objects, and provide areference for educational researchers to standardize the classification of behavior classes.
2. The class feature space is constructed based on the EBC Model. The feature spaceis the set of behavior class features through combination and transformation. We use thevariance filtering method and the entropy weight method to filter the behavior featuresto reduce the influence of low expressive features on the predictor. Then, a variety ofalgorithms are used to analyze the feature subset with higher prediction effect in the featurespace, and then divide it into an effective feature space. It explores the feature spacethat is more related to learning performance from a new perspective, and considers the
Entropy 2022, 24, 722 3 of 22
internal correlation between behavioral features, which provides an auxiliary reference foreducators to focus on what behavioral features.
3. We propose a learning performance predictor based on a self-adaptive feature fusionstrategy. First, the features are visually clustered and two fusion strategies of differentclusters are observed. Then, the Euclidean distance between the students and the clustersis calculated, and the feature fusion strategy is adaptively selected. Finally, it is verified byexperiments that the strategy can effectively improve the performance and efficiency ofthe predictor.
This article is composed of 6 summaries, and the rest of the content is as follows:Section 2 focuses on related research, focusing on the correlation between electronic learn-ing behavior and performance, E-learning behavior classification and E-learning perfor-mance prediction indicators, data processing methods and prediction model; Section 3explains our proposed method and process; Section 4 describes two experimental designs,which are the experimental designs for mining the effective E-learning behavior featurespace and verifying the effectiveness of feature fusion; Section 5 analyzes the results of thetwo experiments separately; Section 6 gives conclusions and future directions.
2. Related Work2.1. The Correlation between E-Learning Behavior and Performance
With the continuous advancement of educational information construction, electroniclearning has achieved a blowout development, and the analysis of learning behavior isthe focus of the field of learning analysis. Electronic learning behavior has been provedto be closely related to learning performance [14,15]. Current research mainly focuses onthe online participation of the entire online learning system. Bolliger et al. [16] found thatthere is an inevitable connection between student engagement, participation awarenessand learning results. Through sampling, Shen et al. [15] gradually regressed and foundthat behaviors such as homework completion rate and video completion rate have animportant positive impact on the final online learning effect. Zheng et al. [17] found thatthe number of logins is positively correlated with academic performance, and project-based assignments and high-level knowledge activities are beneficial to learning results.Qureshi et al. [18] used structural equation model evaluation to find that learners’ socialparticipation and social interaction affect students’ enthusiasm for collaborative learningand participation, thereby affecting their academic performance. Mehmet et al. [19] foundthat the interactive behavior of the learner and the instructional learning dashboard issignificantly related to the learner’s academic performance. In addition, existing studieshave also used cluster analysis to analyze the relationship between student interaction pat-terns and learning achievement. Rebeca et al. [20] divides students into two task-orientedgroups (social or individual-centered) and two non- Task-oriented groups (procrastinatorsor non-procrastinators) for better targeted teaching. Electronic learning behavior data isused in many areas of learning analysis, including learner modeling, learning performanceprediction, etc. When exploring the relationship between electronic learning behaviorsand learning performance, research focuses on single or independent learning behaviors,and the potential between behaviors. The underlying rules of the association structure arenot significant. Therefore, some scholars have begun to explore the internal connectionsbetween behaviors to express the subtle and complex logical relationships in learning,and apply them to learning analysis.
2.2. The Development of E-Learning Behavior Classification
Regarding the study of learning behavior classification, many scholars have ex-pounded from the perspective of learning process and interactive objects. Moore [21]defines the first interaction classification framework from the perspective of interactivesenders and receivers, including three basic interactive behaviors in Electronic learning:student-student interaction, student–teacher interaction, and student–content interaction.The interaction between students and students occurs in independent learning or in a groupenvironment. The interaction between teachers and students lies in the timely guidance
Entropy 2022, 24, 722 4 of 22
and intervention of teachers in learning to promote students’ deep learning. The interactionbetween students and content is defined as the intellectual interaction between studentsand content to change learners’ understanding, viewpoints and cognitive structure. Hill-man et al. [22] further proposed the fourth type of learning behavior-student-studentinterface interaction behavior, that is, the behavior of students using electronic tools andnavigation tools. Based on the lack of explanations for teaching activities in the above twoclassifications, and in order to obtain a more general classification, Hirumi [23] divideslearning behaviors into learner-self interaction, learner-human and non-human interaction,learner-teaching interactive. Sun [24] considers that the cognitive structure of students isdynamically changing in the learning process, and divides the learner’s E-learning behaviorprocess into four stages: learning occurrence stage, knowledge acquisition stage, interac-tive reflection stage, and learning consolidation stage. Wu et al. [25] divided E-learningbehaviors into independent learning behaviors, system interaction behaviors, resourceinteraction behaviors, and social interaction behaviors based on the interrelationshipsbetween learners and the three basic elements of the electronic learning space (learningsystems, learning resources, and people). There are four types of interactive behaviors.Wu et al. [10] divides E-learning behaviors into four categories according to the interactivesubjects, namely student-student interaction, student–teacher interaction, student–contentinteraction, and student–system interaction. To sum up, current studies only consider learn-ers’ behaviors from a single perspective of learning objects or learning processes, and do notcombine complex learning processes with learners’ interactive behaviors, so as to show thecoordination and unity of dynamic changes in learning processes and interactive behaviors.
There is a significant correlation between E-learning behavior and learning perfor-mance. Using learning behavior to predict performance is a current research hotspot.However, the use of multi-dimensional data may affect the generalization ability of theprediction model and there is a high computational cost. Constructing learning behaviorclassification rules is conducive to mining the potential associations between behaviors,and provides a standard for dividing learning behaviors, which is useful for promotingthe standardization and lightweight of E-learning performance prediction models are ofgreat significance.
2.3. E-Learning Performance Prediction2.3.1. Prediction Indicators of E-Learning Performance
Learning performance indicators are generally divided into two types of commonlyused prediction indicators, propensity indicators and behavioral performance indicators.Tendency indicators refer to the students’ own attributes (including gender, age, race, etc.)and past experience [26]. After entering the learning environment, they will not changewith the progress of the learning process, so they are also called static indicators [27].Marbouti et al. [28] use previous academic performance, homework and test scores asprediction indicators to find the best prediction model. Musso et al. [5] use students’demographic background factors, learning strategies, coping strategies, cognitive factors,social support, and self-satisfaction. The construction of a prediction model found thatbackground information has the greatest predictive weight on whether a student willdrop out. These studies try to find the relationship between student attributes and pastperformance and current learning performance. However, it has not considered thatmany tendency indicators are not under the control of students and teachers. In addition,demographic and psychometric data involve privacy and data availability is limited [29].Therefore, more research should focus on using student activity data during the course.
Behavioral performance indicators refer to dynamic indicators in the learning process,including searching for resources, watching videos, and forum discussions. As learningprogresses, the role of static indicators will gradually decay, and learning performanceindicators become the core prediction indicators. Current research focuses on the use oflearning analysis methods to explore the core learning behaviors that predict learningperformance. Some scholars analyzed the prediction indicators of the model from theperspective of E-learning behavior classification. Li et al. [14] used 41 behaviors input
Entropy 2022, 24, 722 5 of 22
measurement indicators to perform regression analysis, and divided the single behaviordata into the behavior input classification. Finally, he found that homework engagement,active communication and knowledge page browsing had higher correlation with courseperformance. Wu et al. [25] used online course login times, online duration, resourcebrowsing times and other behaviors to construct six classifiers such as random forestand J48 decision tree, and proposed the structure model of electronic learning space tofurther divide behavioral indicators into categories. Finally, he concluded that independentlearning behavior has a strong predictive effect on academic performance. Some scholarsdirectly use the feature data in the E-learning platform to mine the different effects of specificlearning behaviors on the prediction model. For example, Shen et al. [15] used the learningbehavior data obtained on the MOOC platform to conduct sampling regression and foundthat homework completion ratio and video completion ratio had an important positiveimpact on learning effect. Zacharis [8] used 29 variables in the blended learning coursessupported by LMS on Moodle to find that reading and publishing information, contentcreation, resource browsing, and completion of quizzes are more important predictorsthrough multiple regression methods. Macfadyen et al. [30] believe that forum posts, emails,and quizzes are important predictors of students’ final grades.Brinton et al. [11] constructedpredictors of learning performance by using students’ video-watching behavior and testperformance on MOOC platform. Yu et al. [9] used behaviors such as interaction with peers,download times and access to resources as predictors of academic performance. Thereare also studies that use students’ homework submission behavior to predict studentswith learning difficulties and judge the tendency of procrastination through students’submission behavior to predict performance [31].
In general, many domestic and foreign scholars focus on completing quizzes, re-source browsing, content creation, resource downloading, course visiting, watching videos,submitting homework and other behavioral indicators to predict and improve students’E-learning performance. In addition, some scholars consider the correlation between be-havior and academic performance from the perspective of behavior classification, but fewstudies use behavior categories as a predictor to build a predictor of learning performance.
2.3.2. Feature Engineering
Before applying student-related data to learning analysis, you must first consider theavailability of the data. Any type of error information stored in the basic data set for deploy-ing learning analysis may have a huge negative impact on the accuracy of the model [32].Therefore, it is particularly important to fully obtain and accurately process the relevantdata and student characteristics that affect the prediction performance. All data operationsin the process of transforming the original data into the training data of the model arecollectively referred to as feature engineering. Feature engineering is generally consideredto include three parts: data preprocessing, feature selection, and feature extraction.
Data preprocessing is the first and necessary step of feature engineering, includingcleaning and standardizing the original data with different dimensions, information re-dundancy, anomalies, and missing data. Feature selection is used to screen meaningfulfeature input training models [33]. An effective feature selection process can remove re-dundant data and eliminate feature data that has a low impact on prediction, thus greatlysimplifying the structure of the prediction model, reducing the operation cost of the model,and ultimately improving the performance of the model [34]. Variance filtering method,chi-square test, the entropy weight method, correlation coefficient method, and informationgain method are usually used to remove redundant features [28]. Wu [10] and Hu [35] et al.used correlation coefficient method and information gain method to extract meaningfulfeature variables, and the results confirmed that the prediction performance of the modelhas been greatly improved after feature selection. There are also some scholars who havemade improvements to traditional feature selection methods. To solve the problem thattraditional machine learning classification algorithms have low accuracy on unbalanceddata sets, Chen et al. [36] has proposed a feature selection method (RFG− χ2) based onthe random forest Gini index and chi-square test for optimal feature subset and applied to
Entropy 2022, 24, 722 6 of 22
support vector machine algorithm model. Wang et al. [37] improved the feature selectionmethod of the random forest (RF) standard algorithm, and proposed an RF-based infraredspectrum modeling method and compared it with partial least squares regression (PLS),support vector machine (SVM) and standard RF algorithms. The results show that theimproved RF algorithm can improve the accuracy of the infrared spectrum model andreduce the complexity of the model. Wang et al. [38] proposed automatic width searchand attention search adjustment methods to further accelerate feature selection based onrandom wrappers.
Unlike feature selection that selects a better subset from the original feature data set,feature extraction generates new attributes through the relationship between attributes andchanges the original feature space [39]. Common methods include principal componentanalysis (PCA) [40] and independent component analysis (ICA) [41], linear discriminantanalysis (LDA). Considering that a single type of index may be one-sided, some studies havealso tried to use multi-dimensional features to complete academic predictions, but moreand more studies have confirmed that when machine learning modeling, multi-feature datamay bring lower prediction accuracy [42]; therefore, it is necessary to use feature extractionmethods to reduce feature dimensions to improve the prediction effect and reduce thecomputational cost of the model [43].
Different machine learning techniques and algorithms can provide satisfactory results,and the difference in performance may depend on the preprocessing process of the availableinput data. Although there are studies that optimize data processing methods, they arehardly used for learning prediction tasks. Therefore, in order to improve the performanceof the predictor, this paper uses a variety of feature engineering methods to process thelearning behavior feature data.
2.3.3. Prediction Model
With the continuous development of emerging disciplines such as learning analysisand educational data mining, the use of computing tools and methods to collect and analyzedata has attracted widespread attention. Among them, the use of machine learning tech-nology to process large and complex data in the educational environment for classificationtasks can be used for prediction analysis [44], such as student test score prediction. Tomase-vic et al. [7] divide the methods of constructing prediction models into similarity-based,model-based and probability-based methods.
Similarity-based methods identify similar patterns (for example, students with similarpast academic performance). The typical similarity-based method is K-Nearest Neighbour(KNN). The test samples are classified according to the majority vote of their neighbors,and the samples are assigned to the most common class among their nearest neighborsaccordingly. However, KNN needs to calculate a large number of sample distances, and isnot suitable for situations where sample data is not balanced. Therefore, a KNN algorithmbased on distance weighting is proposed, which assigns weights to k nearest neighbor data,and increases the weight when the distance between the test sample and the designatedneighbor decreases [45].
The model-based method is driven by the implicit correlation estimation between theinput learning data. SVM is one of the typical representatives of the model-based method.It is mainly used to solve the data classification problem in the field of pattern recognitionand belongs to a kind of the supervised learning algorithm. SVM can be regarded as theproblem of finding the effective separation hyperplane for separating data [46], and canbe used effectively for linear classification using the so-called kernel technique. When therelationship between the specified category and the input features (that is, the output andinput variables) is nonlinear, the radial basis function (RBF) is usually combined as thekernel function. Softmax classifier is also a model-based method, which is the extensionof Logistic Regression model on multiple classification problems. In multi-classificationproblems, classification labels can take more than two values.
Finally, the third is probability method that uses the probability of the feature distri-bution of the input data set to classify. One of the widely used probabilistic classification
Entropy 2022, 24, 722 7 of 22
methods is the Bayesian classifier. Bayesian decision theory considers how to select theeffective category label based on these probabilities and misjudgment losses. Bayes is afast, highly scalable algorithm that can be used for binary and multicast classification [47].In addition, Decision Tree (DT) is also a probability-based classification method. DT uses aseries of rules to classify data. It has many advantages, such as strong interpretability, fastcomputational speed, high accuracy, insensitivity to missing values, and does not requireany domain knowledge and parameter assumptions. However, when dealing with datawith strong feature correlation or continuity fields, it is weak.
All three advanced methods and their typical techniques were used to find, “highrisk” of students who leave high school before finishing and carries on the evaluation ofexamination results, in order to solve classification and regression. In order to compre-hensively analyze the effective subsets of the feature space and verify the improvement ofthe predictor performance, all the above classification models are selected for our work inthis paper.
3. Methods3.1. Problem Definition
Through measurement, collection and analysis of learning behavior process datato achieve learning performance prediction, after the beginning of the course can bebased on the predicted results for students to carry out certain teaching intervention,but also play a role of supervision and early warning to students, reduce the risk ofcourse failure. Mining excellent indicators for predicting academic performance has alwaysbeen the focus of learning analysis. This study tries to explore which combination ofbehavioral categories can better predict academic performance from the perspective oflearning behavior classification, and then excavates the effective behavioral feature space.We assume that there are M students and that each student has an E-learning behaviorset A, A{a1, a2, . . . , aN} , where an is the label of E-learning behavior, n = 1, 2, . . . , N, Nis the number of E-learning behaviors. Set the corresponding standardized E-learningbehavior A′
{a′1, a′2, . . . , a′N
}according to A{a1, a2, . . . , aN}. Define the set of characteristic
values of E-learning behavior S{s1, s2, . . . , sN}, sn represents the overall eigenvalue of thenth learning behavior.The entropy weight method and variance filtering method are usedto reduce the dimensionality of the set of eigenvalues S. Then, the E-learning classificationmodel (EBC Model) is used to divide learning behavior labels a′n into different behaviorclasses. After the classification of behavior categories, Nb behavior classes will be generated,and different behavior classes contain different learning behavior labels a′n. Define E as theset of each behavior class, such as E1
{a′1, a′3, . . . , a′i
}, a′i represents the E-learning behavior
that meets the standard. In this paper, the feature fusion strategy is adopted to improvethe performance of the predictor. sE1 is defined as the eigenvalue of the behavior classE1, and the eigenvalue set of the behavior class SE
{sE1 , sE2 , . . . , sEN
}. Table 1 shows the
notation interpretation.
3.2. Method
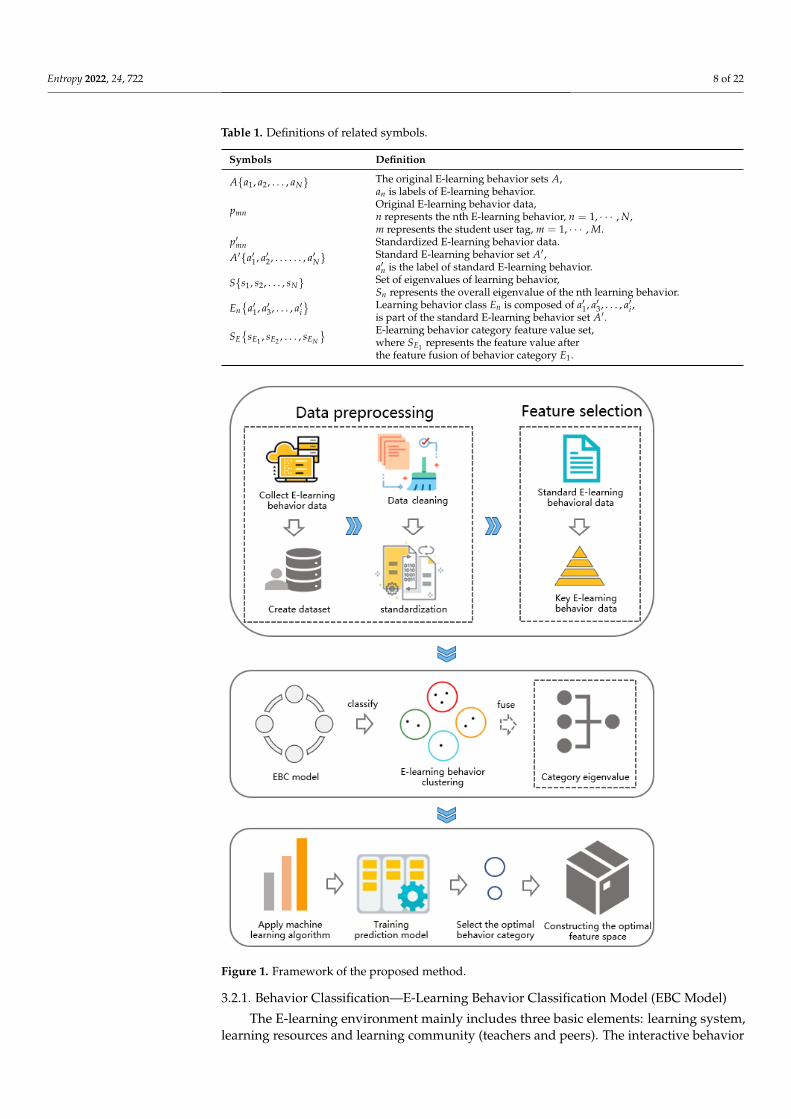
In this section, we will introduce the process of obtaining a new learning behaviorclassification based on the EBC Model, and explain the process of preprocessing, featureselection, feature fusion and model training based on the behavior classification data.Figure 1 shows the main process of the work of this paper, including five core links:(1) Data preprocessing: clean and standardize the original data of the data set. (2) Featureselection: select the more relevant learning behaviors to reduce data redundancy and featuredimensions. (3) Learning behavior classification: classify the original learning behavioraccording to the E-learning classification model (EBC Model). (4) Feature fusion: a self-adaptive feature fusion strategy is proposed to obtain categorical feature values. (5) ModelTraining: construct a learning performance predictor based on a variety of machine learningalgorithms to explore the effective behavior feature space, and a self-adaptive feature fusionstrategy is used to improve the performance of the prediction model.
Entropy 2022, 24, 722 8 of 22
Table 1. Definitions of related symbols.
Symbols Definition
A{a1, a2, . . . , aN} The original E-learning behavior sets A,an is labels of E-learning behavior.
pmnOriginal E-learning behavior data,n represents the nth E-learning behavior, n = 1, · · · , N,m represents the student user tag, m = 1, · · · , M.
p′mn Standardized E-learning behavior data.A′{a′1, a′2, . . . . . . , a′N} Standard E-learning behavior set A′,
a′n is the label of standard E-learning behavior.S{s1, s2, . . . , sN} Set of eigenvalues of learning behavior,
Sn represents the overall eigenvalue of the nth learning behavior.En{
a′1, a′3, . . . , a′i} Learning behavior class En is composed of a′1, a′3, . . . , a′i ,
is part of the standard E-learning behavior set A′.
SE{
sE1 , sE2 , . . . , sEN
} E-learning behavior category feature value set,where SE1 represents the feature value afterthe feature fusion of behavior category E1.
Figure 1. Framework of the proposed method.
3.2.1. Behavior Classification—E-Learning Behavior Classification Model (EBC Model)
The E-learning environment mainly includes three basic elements: learning system,learning resources and learning community (teachers and peers). The interactive behavior
Entropy 2022, 24, 722 9 of 22
of learners with the learning community, learning system, and learning resources is calledE-learning behavior. Constructing an E-learning behavior classification model is of greatsignificance to the collection and measurement of E-learning behavior, and the measurementof E-learning behavior directly affects the analysis of learning behavior. Therefore, thisarticle proposes the E-learning Behavior Classification Model (EBC Model), which providesa reference for standardized classification behavior.
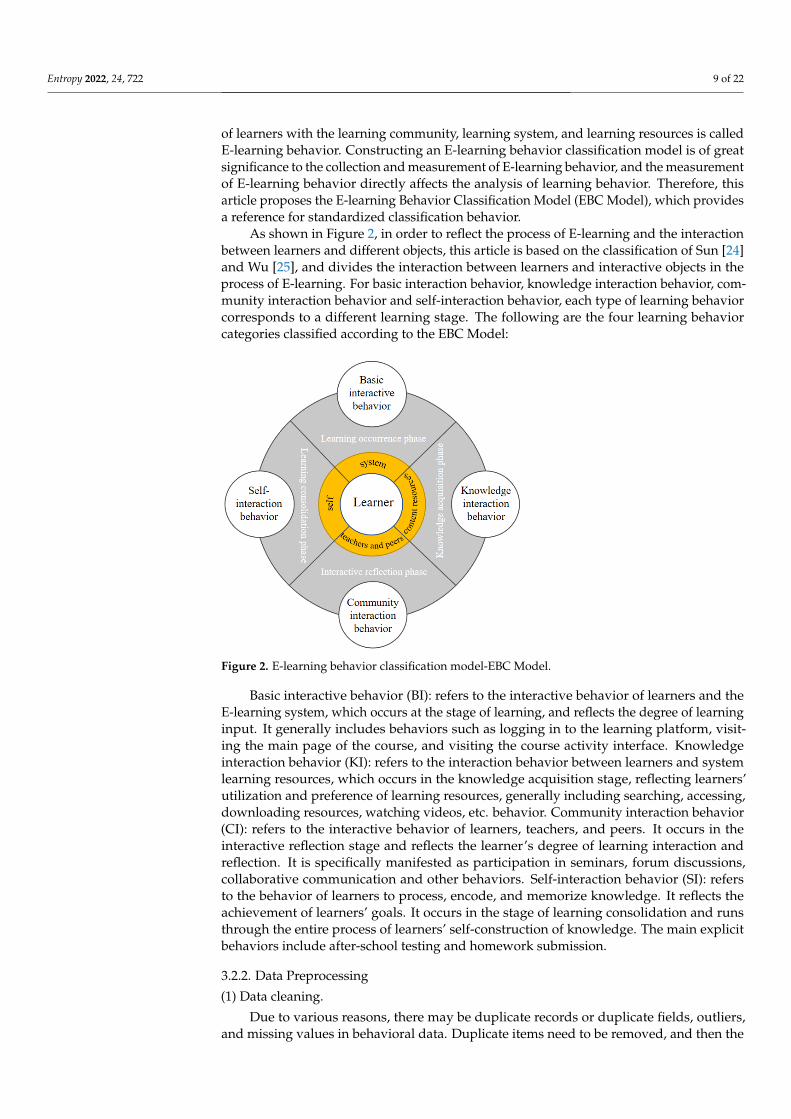
As shown in Figure 2, in order to reflect the process of E-learning and the interactionbetween learners and different objects, this article is based on the classification of Sun [24]and Wu [25], and divides the interaction between learners and interactive objects in theprocess of E-learning. For basic interaction behavior, knowledge interaction behavior, com-munity interaction behavior and self-interaction behavior, each type of learning behaviorcorresponds to a different learning stage. The following are the four learning behaviorcategories classified according to the EBC Model:
Figure 2. E-learning behavior classification model-EBC Model.
Basic interactive behavior (BI): refers to the interactive behavior of learners and theE-learning system, which occurs at the stage of learning, and reflects the degree of learninginput. It generally includes behaviors such as logging in to the learning platform, visit-ing the main page of the course, and visiting the course activity interface. Knowledgeinteraction behavior (KI): refers to the interaction behavior between learners and systemlearning resources, which occurs in the knowledge acquisition stage, reflecting learners’utilization and preference of learning resources, generally including searching, accessing,downloading resources, watching videos, etc. behavior. Community interaction behavior(CI): refers to the interactive behavior of learners, teachers, and peers. It occurs in theinteractive reflection stage and reflects the learner’s degree of learning interaction andreflection. It is specifically manifested as participation in seminars, forum discussions,collaborative communication and other behaviors. Self-interaction behavior (SI): refersto the behavior of learners to process, encode, and memorize knowledge. It reflects theachievement of learners’ goals. It occurs in the stage of learning consolidation and runsthrough the entire process of learners’ self-construction of knowledge. The main explicitbehaviors include after-school testing and homework submission.
3.2.2. Data Preprocessing
(1) Data cleaning.
Due to various reasons, there may be duplicate records or duplicate fields, outliers,and missing values in behavioral data. Duplicate items need to be removed, and then the
Entropy 2022, 24, 722 10 of 22
abnormal behavior index value of each case is replaced with missing values, and finally therespective missing values are filled in according to the average value of other students onthe corresponding behavior variables.
(2) Standardization.
The E-learning platform records multi-dimensional E-learning behaviors, and thedimensions of different behavior variables are also different, resulting in large differencesbetween actual values, which do not have the meaning of direct comparison. In order tofacilitate subsequent analysis, this study uniformly converts the values of n preset learningbehaviors into standard scores (Z-Score), discards the case of not taking the exam (periodicaltest or final exam), and replaces the remaining student behavior related data Scale andnormalize. Z-Score unifies data standards, improves data comparability, and weakensdata interpretability.
Define the original E-learning behavior data pmn, the standard learning behavior datap′mn where m represents the student user tag, such as p21 represents the first type of learningbehavior data of the second student recorded by the E-learning platform. The calculationformula of the standard E-learning behavior value p′mn is as follows:
p′mn =pmn − µan
σan(1)
Among them, an is the E-learning behavior label, µan represents the average valueof the nth E-learning behavior data, and σan represents the variance of the nth E-learningbehavior data.
3.2.3. Feature Selection
The feature selection method is to select high-quality features from the original features,delete irrelevant and redundant features, and realize the process of reducing the featuredimension of the data set. It can improve classification efficiency and accuracy, and has theeffect of denoising and preventing over-fitting. It is an important means to improve theperformance of machine learning algorithms.
(1) The entropy weight method determines the objective weight based on the vari-ability of the index. Generally speaking, the smaller the information entropy of an index,the greater the degree of variation of the representative index, and the more information itprovides, so it is used in feature selection. The greater the effect, the greater the weight,and vice versa.
First, calculate the proportion of the behavior data of the ith student in the jth E-learning behavior, the calculation formula of Qij is:
Qij =pij
∑mi=1 pij
(2)
where m represents m students, pij is the standardized E-learning behavior data. Then,calculate the information entropy ej of E-learning behavior,
ej = − ln(m)−1m
∑i=1
Qij ln Qij (3)
and the weight of each behavior ωj is calculated through the information entropy,
ωj =1− ej
∑nj=1(1− ej
) (4)
Entropy 2022, 24, 722 11 of 22
where n is the number of E-learning behaviors. Finally, calculate the comprehensive scoreFi of each E-learning behavior,
Fi =n
∑j=1
ωjkij (5)
where kij is the calculated relative deviation fuzzy matrix value.This article selects the top eight E-learning behaviors with comprehensive scores,
and the experimental results are basically consistent with the results obtained by thevariance filtering method.
(2) Variance Threshold filters features through the variance of the features themselves.For example, if the variance of a feature is small, it means that the samples have basicallyno difference in this feature, so this feature has little effect on the distinction of samples.Threshold represents the threshold of variance, that is, discarding all features with varianceless than Threshold. The calculation formula of the characteristic value Sn of the nthlearning behavior is as follows:
Sn =∑m
1 (p′mn − µa′n)2
m(6)
Among them, µa′n represents the average value of the standardized E-learning behaviordata an, m = 1, · · · , M. Compare the elements in the traversal learning behavior featurevalue set S with the variance threshold, and take the E-learning behavior feature valuegreater than the threshold.
3.2.4. Feature Fusion
In order to solve the problem of low accuracy and high computational cost of tra-ditional machine learning classification algorithms in the face of huge data sets, we usefeature fusion methods to further improve the performance of the predictor.
First, the behaviors are divided into different E-learning behavior clusters according tothe EBC Model, and n E-learning behavior clusters are generated. Any type of E-learningbehavior cluster contains different E-learning behaviors, such as En
{a′1, a′3, . . . , a′i
}etc.
Among them, a′i represents the E-learning behavior that complies with the E1 standard.Then, feature fusion is performed on each E-learning behavior cluster to obtain the
corresponding E-learning behavior category feature value. Taking E1 as an example,the calculation formula of its category eigenvalue is as follows:
SEn = λ ·max{s1, s2, . . . . . . , si}+ (1− λ) · ∑i1 sii
, λ =
{0, Pass1, Fail
(7)
Among them, si represents the feature value of a′i behavior, and SEn represents the E-learning behavior category feature value of E1. λ represents the fusion mode of the studentbehavior class.
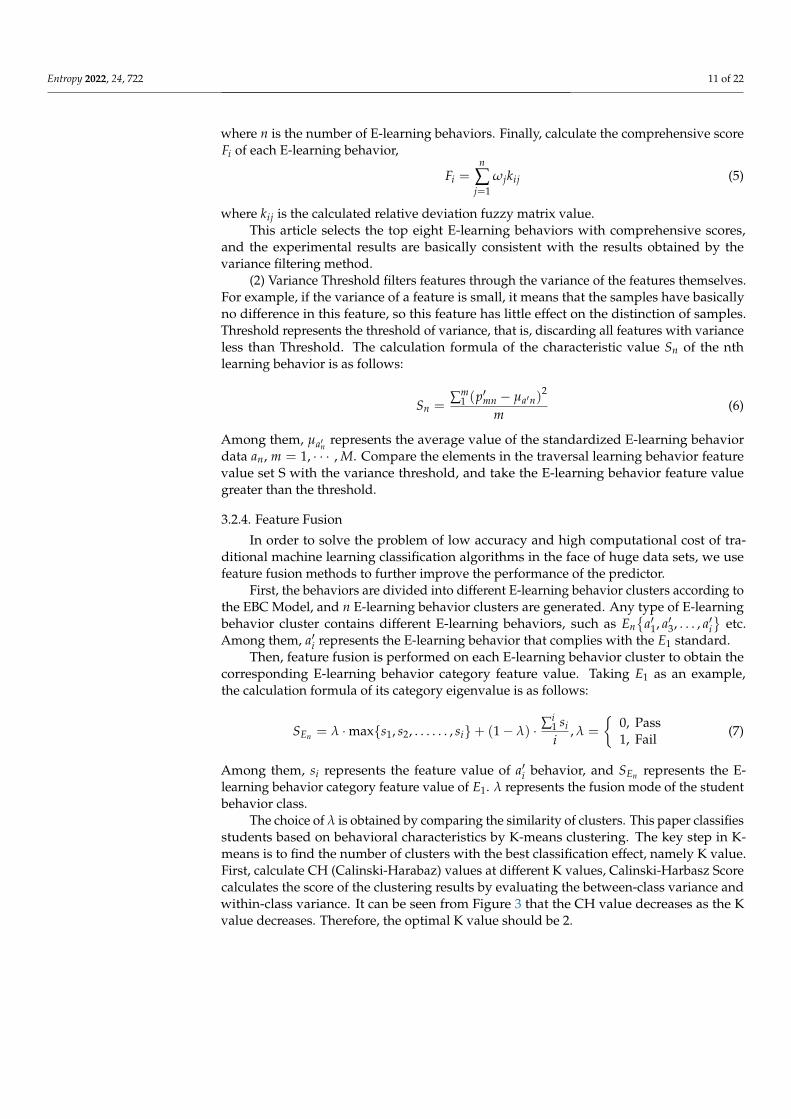
The choice of λ is obtained by comparing the similarity of clusters. This paper classifiesstudents based on behavioral characteristics by K-means clustering. The key step in K-means is to find the number of clusters with the best classification effect, namely K value.First, calculate CH (Calinski-Harabaz) values at different K values, Calinski-Harbasz Scorecalculates the score of the clustering results by evaluating the between-class variance andwithin-class variance. It can be seen from Figure 3 that the CH value decreases as the Kvalue decreases. Therefore, the optimal K value should be 2.
Entropy 2022, 24, 722 12 of 22
Figure 3. K kinds of clustering CH score chart.
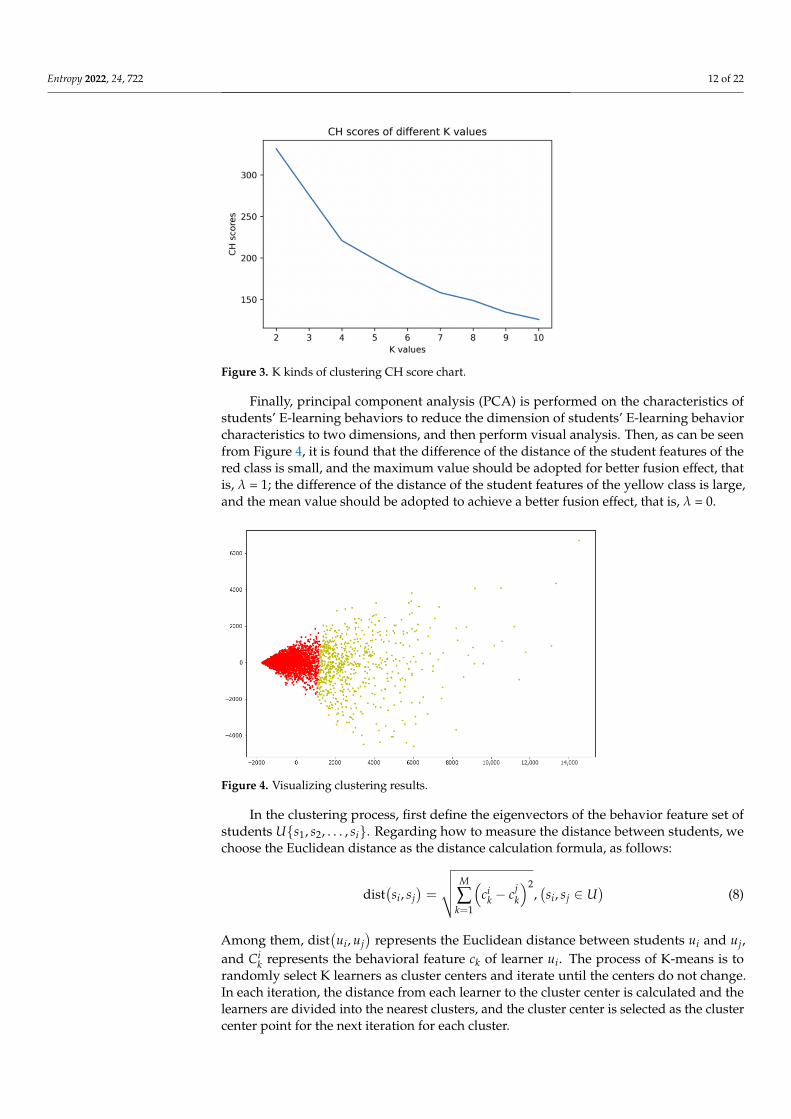
Finally, principal component analysis (PCA) is performed on the characteristics ofstudents’ E-learning behaviors to reduce the dimension of students’ E-learning behaviorcharacteristics to two dimensions, and then perform visual analysis. Then, as can be seenfrom Figure 4, it is found that the difference of the distance of the student features of thered class is small, and the maximum value should be adopted for better fusion effect, thatis, λ = 1; the difference of the distance of the student features of the yellow class is large,and the mean value should be adopted to achieve a better fusion effect, that is, λ = 0.
Figure 4. Visualizing clustering results.
In the clustering process, first define the eigenvectors of the behavior feature set ofstudents U{s1, s2, . . . , si}. Regarding how to measure the distance between students, wechoose the Euclidean distance as the distance calculation formula, as follows:
dist(si, sj
)=
√√√√ M
∑k=1
(ci
k − cjk
)2,(si, sj ∈ U
)(8)
Among them, dist(ui, uj
)represents the Euclidean distance between students ui and uj,
and Cik represents the behavioral feature ck of learner ui. The process of K-means is to
randomly select K learners as cluster centers and iterate until the centers do not change.In each iteration, the distance from each learner to the cluster center is calculated and thelearners are divided into the nearest clusters, and the cluster center is selected as the clustercenter point for the next iteration for each cluster.
Entropy 2022, 24, 722 13 of 22
After t iterations, the learner is classified into K learner clusters by the K-meansalgorithm, denoted as {P1, P2, . . . , PK}, where Pi represents the ith learner cluster. In thispaper, K = 2 is obtained through the analysis of Figures 3 and 4.
To compare the clustering similarity, define the predicted learner ut, calculate theEuclidean distance between the center point of ut and PK, and divide it into the cluster withthe closest distance. PSi indicates which cluster Si belongs to. The formula is as follows:
Psi = {dist(si, Pi), dist(si, Pi)}, i ∈ [1, 2] (9)
The final value of λ is determined according to the value of PSi . If PSi belongs to the redclass in Figure 4, then λ = 1, and vice versa.
3.2.5. Model Training
Choose from seven classic machine learning methods in model training, includingSVC (R), SVC (L), Bayes, KNN (U), KNN (D), DT and Softmax. SE is used as the traininginput data, mining the effective feature space and feature fusion are used to improve thetraining effect.
4. Experimental Design
This experiment is based on our proposed E-learning classification model (EBC Model)to construct a subset of feature behavior classes as the input variables of the model. By eval-uating the performance of machine learning algorithms, comparing the prediction perfor-mance of different feature subsets to mine the effective behavior feature space, and furtheruse feature fusion data processing methods to improve prediction performance. Datamining and machine learning techniques can be applied to various learning analysis tasks.In the case of student test score prediction, advanced classification methods are used toanalyze the “high risk” or “low risk” of students dropping out or failing the final exam.The machine learning methods used include SVC (R), SVC (L), Bayes, KNN (U), KNN(D), DT and Softmax. We design three sets of experiments. Experimental group one usesun-dimensioned feature data to train the predictor, experimental group two uses the featuredata after dimensionality reduction to train the predictor, and experimental group threeuses the feature data after dimensionality reduction and feature fusion strategy to trainthe predictor. In terms of performance evaluation indicators, we choose accuracy (ACC),F1-score (F1) and kappa (K) and computation time (Time) as quantitative indicators.
We use Lenovo xiaoxin 14pro Laptop to build the experimental environment, the CPUmodel is Intel Core i5 1135G7, the memory is 16G, the Windows 10 operating system,and the Jupyter lab software are used for the experiment.
4.1. Data Source
Before comparing the effect of learning performance prediction on different inputcombinations, it is first necessary to determine a suitable data set containing differentE-learning behavior data. The Open University Learning Analytics Dataset (OULAD) usedin this article to construct the research object is one of the most comprehensive and diverseinternational public data sets related to student learning. The data set includes 7 coursemodules from AAA to GGG, 22 courses in total, demographic data of 32,593 studentsand interaction data between students and VLE. The development of this data set hasmade a significant contribution to supporting research in the field of learning analysis,through the collection and analysis of learner data to optimize learning resources andprovide personalized feedback. This experiment selects the DDD subject of STEM coursesin OULAD, and uses E-learning behavior data of 6272 learners who study DDD courses totrain the learning performance predictor. According to EBC Model, E-learning behaviorsare divided into their respective behavior categories, as shown in Table 2 .
Entropy 2022, 24, 722 14 of 22
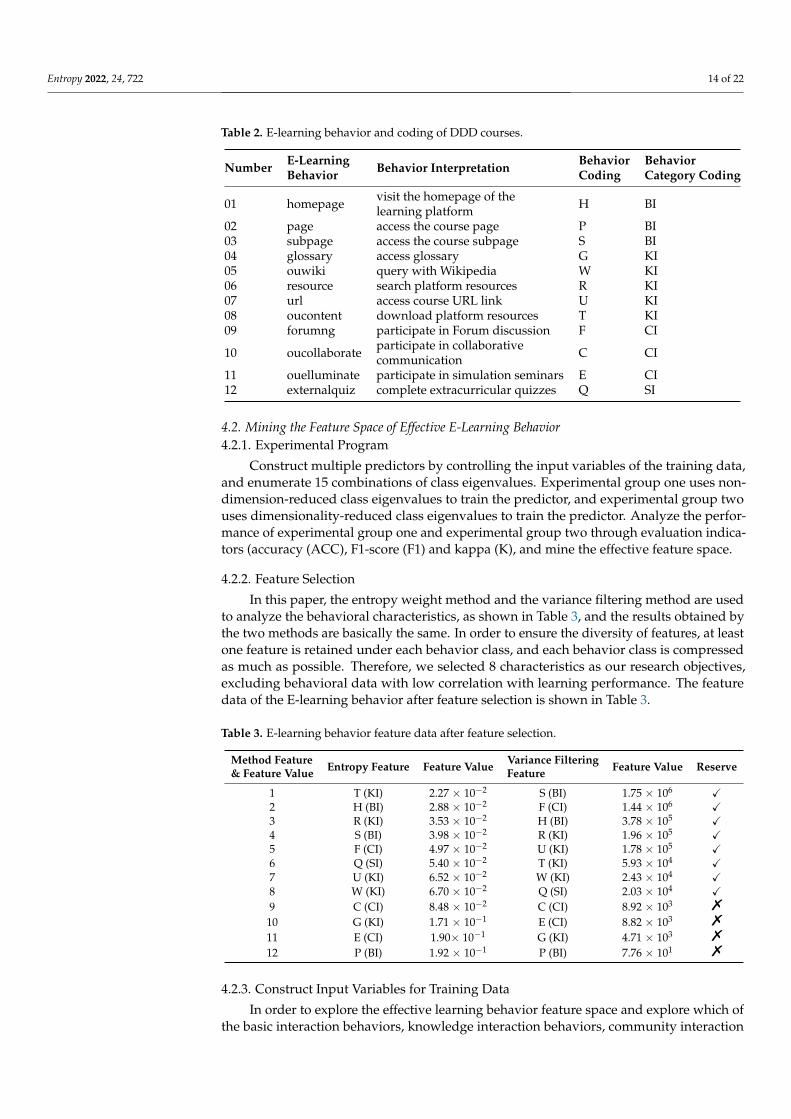
Table 2. E-learning behavior and coding of DDD courses.
Number E-LearningBehavior Behavior Interpretation Behavior
CodingBehaviorCategory Coding
01 homepage visit the homepage of thelearning platform H BI
02 page access the course page P BI03 subpage access the course subpage S BI04 glossary access glossary G KI05 ouwiki query with Wikipedia W KI06 resource search platform resources R KI07 url access course URL link U KI08 oucontent download platform resources T KI09 forumng participate in Forum discussion F CI
10 oucollaborate participate in collaborativecommunication C CI
11 ouelluminate participate in simulation seminars E CI12 externalquiz complete extracurricular quizzes Q SI
4.2. Mining the Feature Space of Effective E-Learning Behavior4.2.1. Experimental Program
Construct multiple predictors by controlling the input variables of the training data,and enumerate 15 combinations of class eigenvalues. Experimental group one uses non-dimension-reduced class eigenvalues to train the predictor, and experimental group twouses dimensionality-reduced class eigenvalues to train the predictor. Analyze the perfor-mance of experimental group one and experimental group two through evaluation indica-tors (accuracy (ACC), F1-score (F1) and kappa (K), and mine the effective feature space.
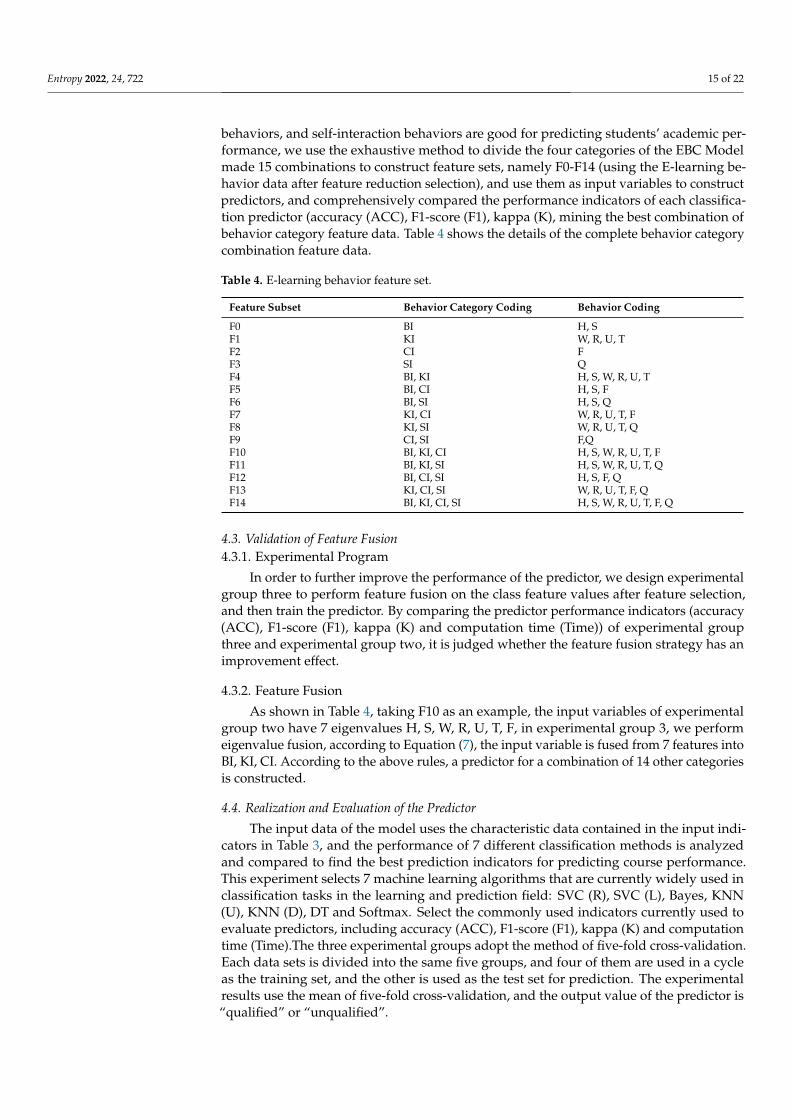
4.2.2. Feature Selection
In this paper, the entropy weight method and the variance filtering method are usedto analyze the behavioral characteristics, as shown in Table 3, and the results obtained bythe two methods are basically the same. In order to ensure the diversity of features, at leastone feature is retained under each behavior class, and each behavior class is compressedas much as possible. Therefore, we selected 8 characteristics as our research objectives,excluding behavioral data with low correlation with learning performance. The featuredata of the E-learning behavior after feature selection is shown in Table 3.
Table 3. E-learning behavior feature data after feature selection.
Method Feature& Feature Value Entropy Feature Feature Value Variance Filtering
Feature Feature Value Reserve
1 T (KI) 2.27 × 10⁻² S (BI) 1.75 × 106 X2 H (BI) 2.88 × 10⁻² F (CI) 1.44 × 106 X3 R (KI) 3.53 × 10⁻² H (BI) 3.78 × 105 X4 S (BI) 3.98 × 10⁻² R (KI) 1.96 × 105 X5 F (CI) 4.97 × 10⁻² U (KI) 1.78 × 105 X6 Q (SI) 5.40 × 10⁻² T (KI) 5.93 × 104 X7 U (KI) 6.52 × 10⁻² W (KI) 2.43 × 104 X8 W (KI) 6.70 × 10⁻² Q (SI) 2.03 × 104 X9 C (CI) 8.48 × 10⁻² C (CI) 8.92 × 10³ %
10 G (KI) 1.71 × 10⁻¹ E (CI) 8.82 × 10³ %
11 E (CI) 1.90× 10⁻¹ G (KI) 4.71 × 10³ %
12 P (BI) 1.92 × 10⁻¹ P (BI) 7.76 × 101 %
4.2.3. Construct Input Variables for Training Data
In order to explore the effective learning behavior feature space and explore which ofthe basic interaction behaviors, knowledge interaction behaviors, community interaction
Entropy 2022, 24, 722 15 of 22
behaviors, and self-interaction behaviors are good for predicting students’ academic per-formance, we use the exhaustive method to divide the four categories of the EBC Modelmade 15 combinations to construct feature sets, namely F0-F14 (using the E-learning be-havior data after feature reduction selection), and use them as input variables to constructpredictors, and comprehensively compared the performance indicators of each classifica-tion predictor (accuracy (ACC), F1-score (F1), kappa (K), mining the best combination ofbehavior category feature data. Table 4 shows the details of the complete behavior categorycombination feature data.
Table 4. E-learning behavior feature set.
Feature Subset Behavior Category Coding Behavior Coding
F0 BI H, SF1 KI W, R, U, TF2 CI FF3 SI QF4 BI, KI H, S, W, R, U, TF5 BI, CI H, S, FF6 BI, SI H, S, QF7 KI, CI W, R, U, T, FF8 KI, SI W, R, U, T, QF9 CI, SI F,QF10 BI, KI, CI H, S, W, R, U, T, FF11 BI, KI, SI H, S, W, R, U, T, QF12 BI, CI, SI H, S, F, QF13 KI, CI, SI W, R, U, T, F, QF14 BI, KI, CI, SI H, S, W, R, U, T, F, Q
4.3. Validation of Feature Fusion4.3.1. Experimental Program
In order to further improve the performance of the predictor, we design experimentalgroup three to perform feature fusion on the class feature values after feature selection,and then train the predictor. By comparing the predictor performance indicators (accuracy(ACC), F1-score (F1), kappa (K) and computation time (Time)) of experimental groupthree and experimental group two, it is judged whether the feature fusion strategy has animprovement effect.
4.3.2. Feature Fusion
As shown in Table 4, taking F10 as an example, the input variables of experimentalgroup two have 7 eigenvalues H, S, W, R, U, T, F, in experimental group 3, we performeigenvalue fusion, according to Equation (7), the input variable is fused from 7 features intoBI, KI, CI. According to the above rules, a predictor for a combination of 14 other categoriesis constructed.
4.4. Realization and Evaluation of the Predictor
The input data of the model uses the characteristic data contained in the input indi-cators in Table 3, and the performance of 7 different classification methods is analyzedand compared to find the best prediction indicators for predicting course performance.This experiment selects 7 machine learning algorithms that are currently widely used inclassification tasks in the learning and prediction field: SVC (R), SVC (L), Bayes, KNN(U), KNN (D), DT and Softmax. Select the commonly used indicators currently used toevaluate predictors, including accuracy (ACC), F1-score (F1), kappa (K) and computationtime (Time).The three experimental groups adopt the method of five-fold cross-validation.Each data sets is divided into the same five groups, and four of them are used in a cycleas the training set, and the other is used as the test set for prediction. The experimentalresults use the mean of five-fold cross-validation, and the output value of the predictor is“qualified” or “unqualified”.
Entropy 2022, 24, 722 16 of 22
5. Experimental Discussion and Analysis
This section gives the results of the above experiments, including the accuracy (ACC),F1-score (F1), kappa (K) and computation time (Time) required for each experimental groupunder 7 machine learning methods. Through the analysis of these data mining effectivebehavior feature space, and verify the effectiveness of our feature fusion method.
5.1. Mining the Feature Space of Effective E-Learning Behavior
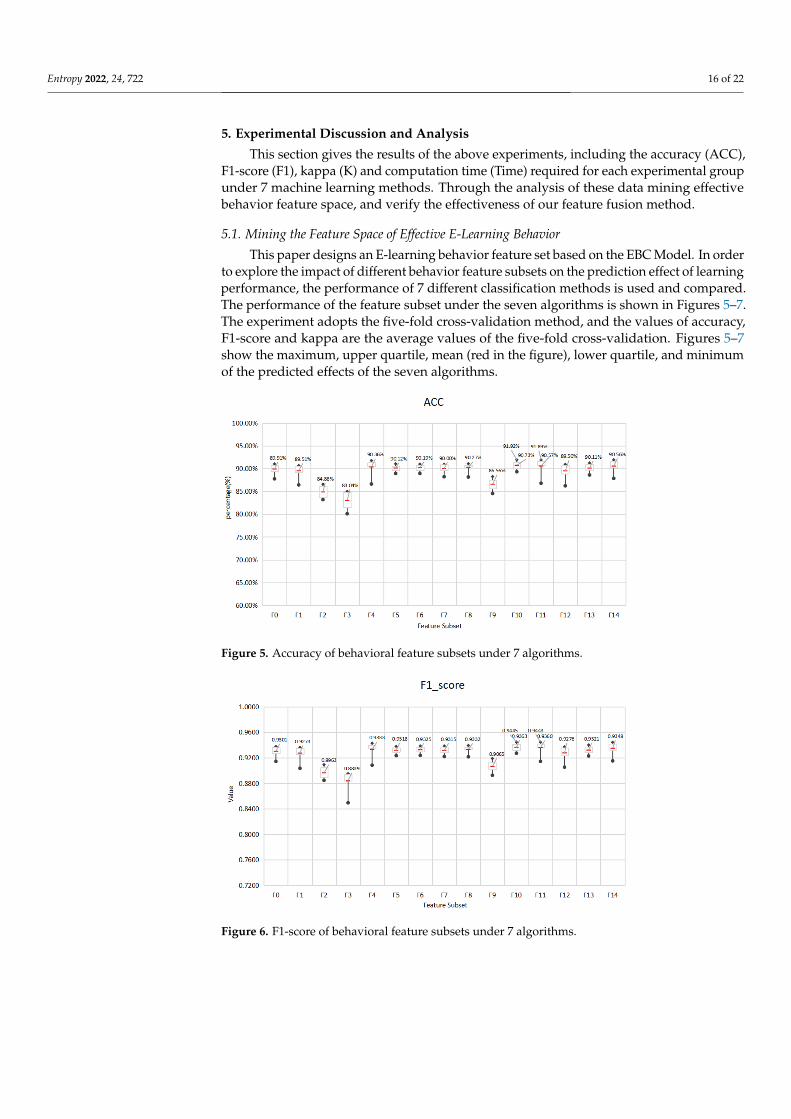
This paper designs an E-learning behavior feature set based on the EBC Model. In orderto explore the impact of different behavior feature subsets on the prediction effect of learningperformance, the performance of 7 different classification methods is used and compared.The performance of the feature subset under the seven algorithms is shown in Figures 5–7.The experiment adopts the five-fold cross-validation method, and the values of accuracy,F1-score and kappa are the average values of the five-fold cross-validation. Figures 5–7show the maximum, upper quartile, mean (red in the figure), lower quartile, and minimumof the predicted effects of the seven algorithms.
Figure 5. Accuracy of behavioral feature subsets under 7 algorithms.
Figure 6. F1-score of behavioral feature subsets under 7 algorithms.
Entropy 2022, 24, 722 17 of 22
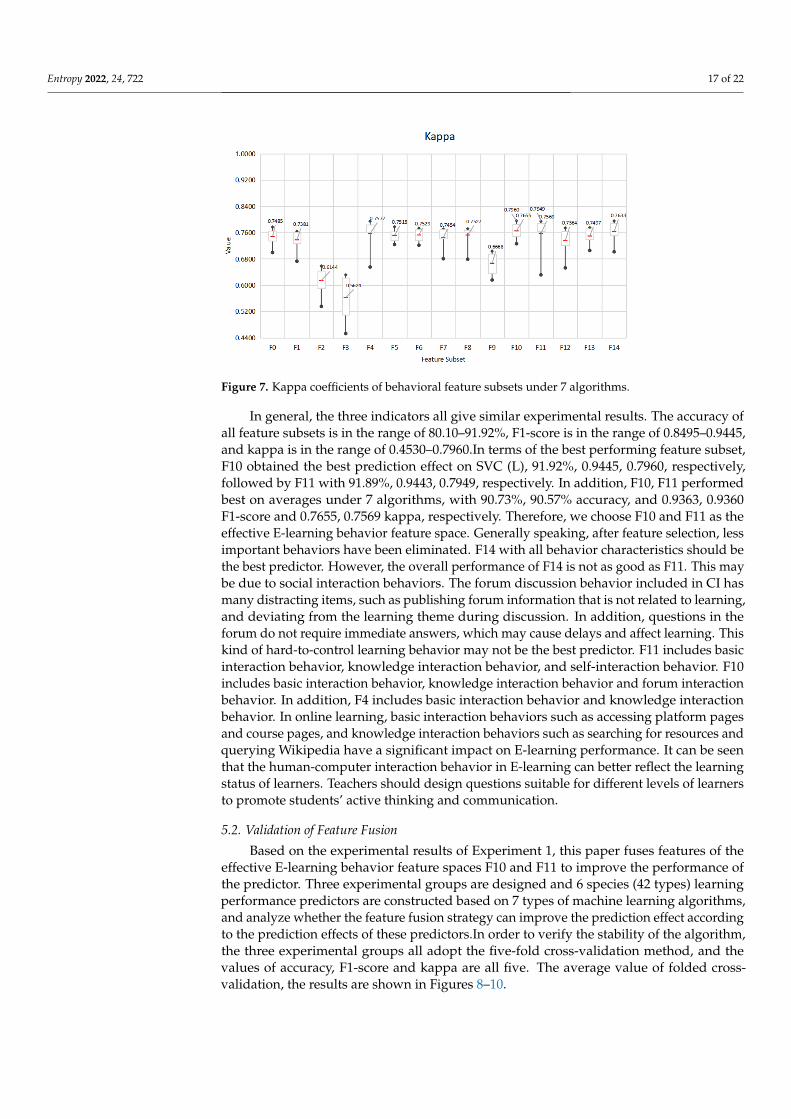
Figure 7. Kappa coefficients of behavioral feature subsets under 7 algorithms.
In general, the three indicators all give similar experimental results. The accuracy ofall feature subsets is in the range of 80.10–91.92%, F1-score is in the range of 0.8495–0.9445,and kappa is in the range of 0.4530–0.7960.In terms of the best performing feature subset,F10 obtained the best prediction effect on SVC (L), 91.92%, 0.9445, 0.7960, respectively,followed by F11 with 91.89%, 0.9443, 0.7949, respectively. In addition, F10, F11 performedbest on averages under 7 algorithms, with 90.73%, 90.57% accuracy, and 0.9363, 0.9360F1-score and 0.7655, 0.7569 kappa, respectively. Therefore, we choose F10 and F11 as theeffective E-learning behavior feature space. Generally speaking, after feature selection, lessimportant behaviors have been eliminated. F14 with all behavior characteristics should bethe best predictor. However, the overall performance of F14 is not as good as F11. This maybe due to social interaction behaviors. The forum discussion behavior included in CI hasmany distracting items, such as publishing forum information that is not related to learning,and deviating from the learning theme during discussion. In addition, questions in theforum do not require immediate answers, which may cause delays and affect learning. Thiskind of hard-to-control learning behavior may not be the best predictor. F11 includes basicinteraction behavior, knowledge interaction behavior, and self-interaction behavior. F10includes basic interaction behavior, knowledge interaction behavior and forum interactionbehavior. In addition, F4 includes basic interaction behavior and knowledge interactionbehavior. In online learning, basic interaction behaviors such as accessing platform pagesand course pages, and knowledge interaction behaviors such as searching for resources andquerying Wikipedia have a significant impact on E-learning performance. It can be seenthat the human-computer interaction behavior in E-learning can better reflect the learningstatus of learners. Teachers should design questions suitable for different levels of learnersto promote students’ active thinking and communication.
5.2. Validation of Feature Fusion
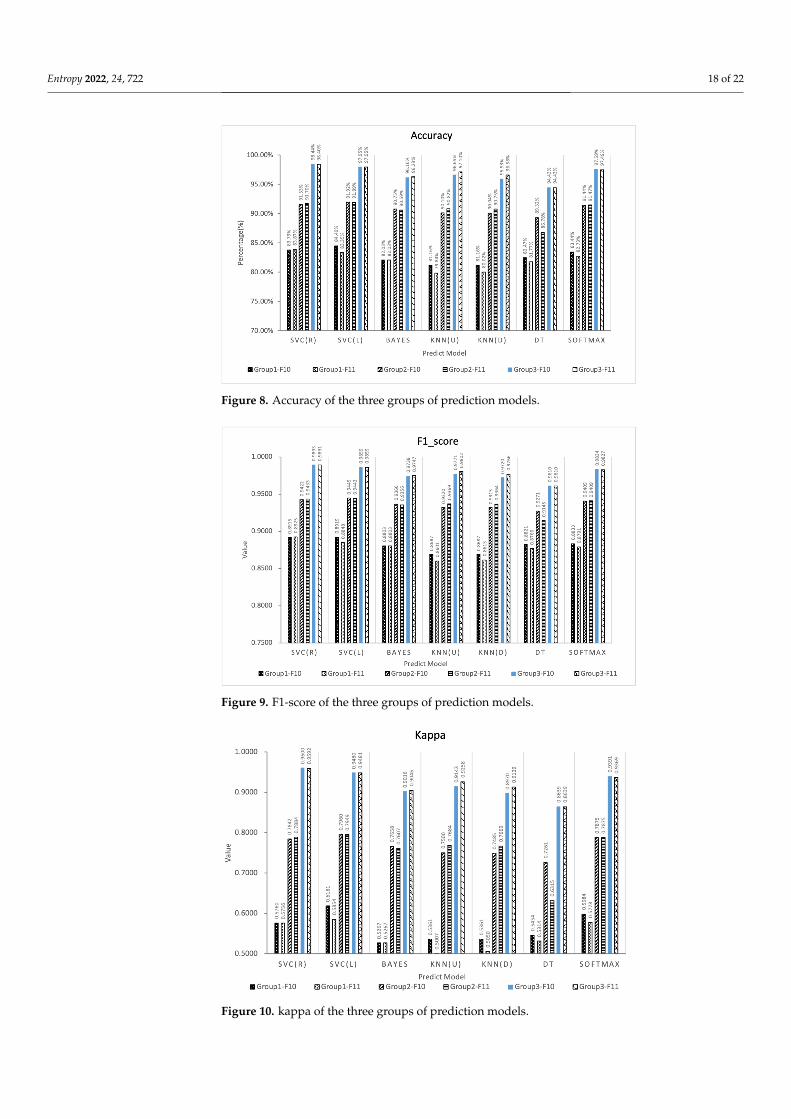
Based on the experimental results of Experiment 1, this paper fuses features of theeffective E-learning behavior feature spaces F10 and F11 to improve the performance ofthe predictor. Three experimental groups are designed and 6 species (42 types) learningperformance predictors are constructed based on 7 types of machine learning algorithms,and analyze whether the feature fusion strategy can improve the prediction effect accordingto the prediction effects of these predictors.In order to verify the stability of the algorithm,the three experimental groups all adopt the five-fold cross-validation method, and thevalues of accuracy, F1-score and kappa are all five. The average value of folded cross-validation, the results are shown in Figures 8–10.
Entropy 2022, 24, 722 18 of 22
Figure 8. Accuracy of the three groups of prediction models.
Figure 9. F1-score of the three groups of prediction models.
Figure 10. kappa of the three groups of prediction models.
Entropy 2022, 24, 722 19 of 22
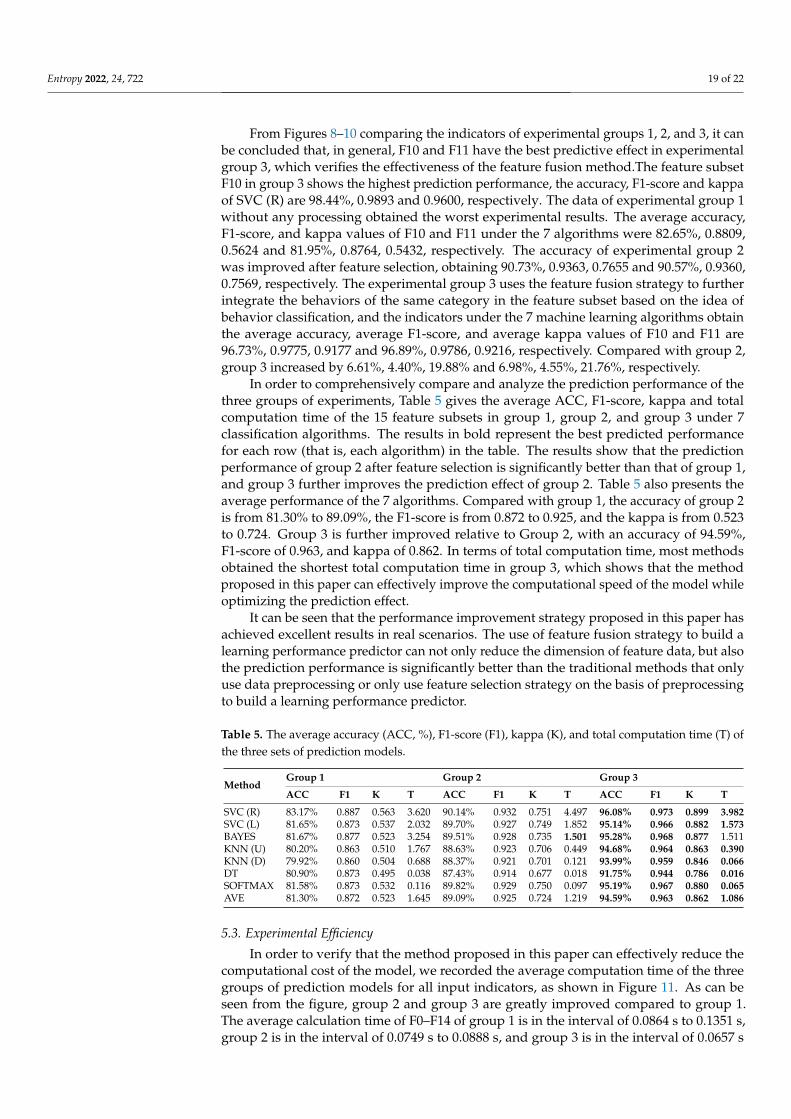
From Figures 8–10 comparing the indicators of experimental groups 1, 2, and 3, it canbe concluded that, in general, F10 and F11 have the best predictive effect in experimentalgroup 3, which verifies the effectiveness of the feature fusion method.The feature subsetF10 in group 3 shows the highest prediction performance, the accuracy, F1-score and kappaof SVC (R) are 98.44%, 0.9893 and 0.9600, respectively. The data of experimental group 1without any processing obtained the worst experimental results. The average accuracy,F1-score, and kappa values of F10 and F11 under the 7 algorithms were 82.65%, 0.8809,0.5624 and 81.95%, 0.8764, 0.5432, respectively. The accuracy of experimental group 2was improved after feature selection, obtaining 90.73%, 0.9363, 0.7655 and 90.57%, 0.9360,0.7569, respectively. The experimental group 3 uses the feature fusion strategy to furtherintegrate the behaviors of the same category in the feature subset based on the idea ofbehavior classification, and the indicators under the 7 machine learning algorithms obtainthe average accuracy, average F1-score, and average kappa values of F10 and F11 are96.73%, 0.9775, 0.9177 and 96.89%, 0.9786, 0.9216, respectively. Compared with group 2,group 3 increased by 6.61%, 4.40%, 19.88% and 6.98%, 4.55%, 21.76%, respectively.
In order to comprehensively compare and analyze the prediction performance of thethree groups of experiments, Table 5 gives the average ACC, F1-score, kappa and totalcomputation time of the 15 feature subsets in group 1, group 2, and group 3 under 7classification algorithms. The results in bold represent the best predicted performancefor each row (that is, each algorithm) in the table. The results show that the predictionperformance of group 2 after feature selection is significantly better than that of group 1,and group 3 further improves the prediction effect of group 2. Table 5 also presents theaverage performance of the 7 algorithms. Compared with group 1, the accuracy of group 2is from 81.30% to 89.09%, the F1-score is from 0.872 to 0.925, and the kappa is from 0.523to 0.724. Group 3 is further improved relative to Group 2, with an accuracy of 94.59%,F1-score of 0.963, and kappa of 0.862. In terms of total computation time, most methodsobtained the shortest total computation time in group 3, which shows that the methodproposed in this paper can effectively improve the computational speed of the model whileoptimizing the prediction effect.
It can be seen that the performance improvement strategy proposed in this paper hasachieved excellent results in real scenarios. The use of feature fusion strategy to build alearning performance predictor can not only reduce the dimension of feature data, but alsothe prediction performance is significantly better than the traditional methods that onlyuse data preprocessing or only use feature selection strategy on the basis of preprocessingto build a learning performance predictor.
Table 5. The average accuracy (ACC, %), F1-score (F1), kappa (K), and total computation time (T) ofthe three sets of prediction models.
MethodGroup 1 Group 2 Group 3
ACC F1 K T ACC F1 K T ACC F1 K T
SVC (R) 83.17% 0.887 0.563 3.620 90.14% 0.932 0.751 4.497 96.08% 0.973 0.899 3.982SVC (L) 81.65% 0.873 0.537 2.032 89.70% 0.927 0.749 1.852 95.14% 0.966 0.882 1.573BAYES 81.67% 0.877 0.523 3.254 89.51% 0.928 0.735 1.501 95.28% 0.968 0.877 1.511KNN (U) 80.20% 0.863 0.510 1.767 88.63% 0.923 0.706 0.449 94.68% 0.964 0.863 0.390KNN (D) 79.92% 0.860 0.504 0.688 88.37% 0.921 0.701 0.121 93.99% 0.959 0.846 0.066DT 80.90% 0.873 0.495 0.038 87.43% 0.914 0.677 0.018 91.75% 0.944 0.786 0.016SOFTMAX 81.58% 0.873 0.532 0.116 89.82% 0.929 0.750 0.097 95.19% 0.967 0.880 0.065AVE 81.30% 0.872 0.523 1.645 89.09% 0.925 0.724 1.219 94.59% 0.963 0.862 1.086
5.3. Experimental Efficiency
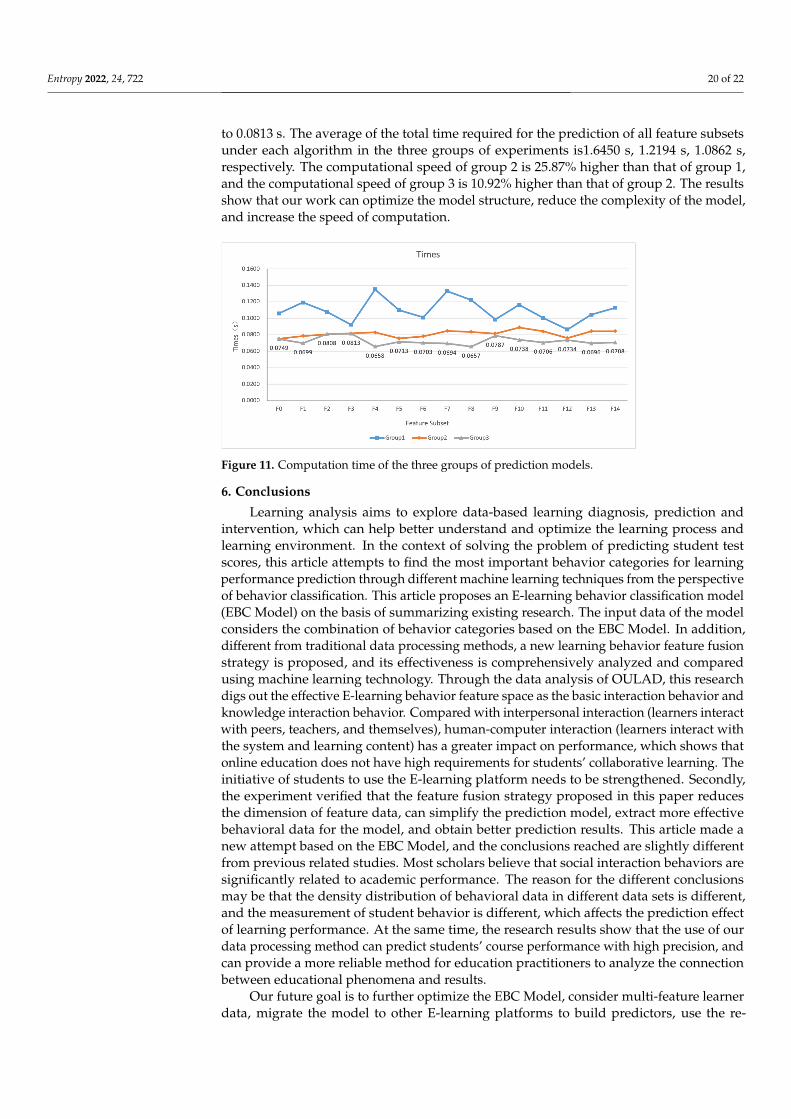
In order to verify that the method proposed in this paper can effectively reduce thecomputational cost of the model, we recorded the average computation time of the threegroups of prediction models for all input indicators, as shown in Figure 11. As can beseen from the figure, group 2 and group 3 are greatly improved compared to group 1.The average calculation time of F0–F14 of group 1 is in the interval of 0.0864 s to 0.1351 s,group 2 is in the interval of 0.0749 s to 0.0888 s, and group 3 is in the interval of 0.0657 s
Entropy 2022, 24, 722 20 of 22
to 0.0813 s. The average of the total time required for the prediction of all feature subsetsunder each algorithm in the three groups of experiments is1.6450 s, 1.2194 s, 1.0862 s,respectively. The computational speed of group 2 is 25.87% higher than that of group 1,and the computational speed of group 3 is 10.92% higher than that of group 2. The resultsshow that our work can optimize the model structure, reduce the complexity of the model,and increase the speed of computation.
Figure 11. Computation time of the three groups of prediction models.
6. Conclusions
Learning analysis aims to explore data-based learning diagnosis, prediction andintervention, which can help better understand and optimize the learning process andlearning environment. In the context of solving the problem of predicting student testscores, this article attempts to find the most important behavior categories for learningperformance prediction through different machine learning techniques from the perspectiveof behavior classification. This article proposes an E-learning behavior classification model(EBC Model) on the basis of summarizing existing research. The input data of the modelconsiders the combination of behavior categories based on the EBC Model. In addition,different from traditional data processing methods, a new learning behavior feature fusionstrategy is proposed, and its effectiveness is comprehensively analyzed and comparedusing machine learning technology. Through the data analysis of OULAD, this researchdigs out the effective E-learning behavior feature space as the basic interaction behavior andknowledge interaction behavior. Compared with interpersonal interaction (learners interactwith peers, teachers, and themselves), human-computer interaction (learners interact withthe system and learning content) has a greater impact on performance, which shows thatonline education does not have high requirements for students’ collaborative learning. Theinitiative of students to use the E-learning platform needs to be strengthened. Secondly,the experiment verified that the feature fusion strategy proposed in this paper reducesthe dimension of feature data, can simplify the prediction model, extract more effectivebehavioral data for the model, and obtain better prediction results. This article made anew attempt based on the EBC Model, and the conclusions reached are slightly differentfrom previous related studies. Most scholars believe that social interaction behaviors aresignificantly related to academic performance. The reason for the different conclusionsmay be that the density distribution of behavioral data in different data sets is different,and the measurement of student behavior is different, which affects the prediction effectof learning performance. At the same time, the research results show that the use of ourdata processing method can predict students’ course performance with high precision, andcan provide a more reliable method for education practitioners to analyze the connectionbetween educational phenomena and results.
Our future goal is to further optimize the EBC Model, consider multi-feature learnerdata, migrate the model to other E-learning platforms to build predictors, use the re-
Entropy 2022, 24, 722 21 of 22
sults of learning predictions to further build a learning diagnosis model, and carry outcorresponding level interventions according to the level of prediction.
Author Contributions: Conceptualization, G.Z. and P.-K.C.; methodology, X.S. and M.Y.; software,X.S. and M.Y.; validation, L.Z. and Q.X.; formal analysis, X.S. and G.Z.; investigation, G.Z.; resources,G.Z. and X.S.; data curation, L.Z.; writing original draft preparation, L.Z. and G.Z.; writing reviewand editing, X.S. and G.Z.; visualization, L.Z. and Q.X.; supervision, G.Z.; project administration,G.Z.; funding acquisition, F.Q. and P.-K.C. All authors have read and agreed to the published versionof the manuscript.
Funding: This study was supported by grant from National Natural Science Foundation of ChinaNo. 71872131. In addition, is also supported by grant from Shantou University SRIG No. 2007 andScience and technology project of Zhejiang Province No. 2018C01080.
Data Availability Statement: The data is available in a publicly accessible database and can be foundat https://analyse.kmi.open.ac.uk/open_dataset (accessed on 20 April 2022).
Conflicts of Interest: The authors declare that there is no conflict of interest regarding the publicationof this paper.
References1. Mallinson, B.; Sewry, D. Elearning at Rhodes University—A case study. In Proceedings of the IEEE International Conference on
Advanced Learning Technologies, 2004. Proceedings, Joensuu, Finland, 30 August–1 September 2004; pp. 708–710. [CrossRef]2. Huang, L.; Wang, C.D.; Chao, H.Y.; Lai, J.H.; Yu, P.S. A Score Prediction Approach for Optional Course Recommendation via
Cross-User-Domain Collaborative Filtering. IEEE Access 2019, 7, 19550–19563. [CrossRef]3. Zeng, J; OuYang, J.; Ji, J.; Wang, X; Qiao, B.; The Analysis of the Learning Behavior Characteristics that Influence the Qualified
MOOC Learners’ Learning Outcome. J. Open Learn. 2018, 23, 1–9. [CrossRef]4. Siemens, G. Learning Analytics: The Emergence of a Discipline. Am. Behav. Sci. 2013, 57, 1380–1400. [CrossRef]5. Musso, M.F.; Hernández, C.F.R.; Cascallar, E.C. Predicting key educational outcomes in academic trajectories: A machine-learning
approach. High. Educ. 2020, 80, 875–894. [CrossRef]6. Pardo, A.; Mirriahi, N.; Martinez-Maldonado, R.; Jovanovic, J.; Dawson, S.; Gaševic, D. Generating Actionable Prediction Models
of Academic Performance. In Proceedings of the Sixth International Conference on Learning Analytics & Knowledge, New York,NY, USA, 25–29 April 2016; pp. 474–478. [CrossRef]
7. Tomasevic, N.; Gvozdenovic, N.; Vranes, S. An overview and comparison of supervised data mining techniques for student examperformance prediction. Comput. Educ. 2020, 143, 103676. [CrossRef]
8. Zacharis, N.Z. A multivariate approach to predicting student outcomes in web-enabled blended learning courses. Internet High.Educ. 2015, 27, 44–53. [CrossRef]
9. Yu, T.; Jo, I.H. Educational Technology Approach toward Learning Analytics: Relationship between Student Online Behavior andLearning Performance in Higher Education. In Proceedings of the Fourth International Conference on Learning Analytics AndKnowledge, Indianapolis, IN, USA, 24–28 March 2014; pp. 269–270. [CrossRef]
10. Wu, F.; Tian, H. Mining Meaningful Features of Learning Behavior: Research on Prediction Framework of Learning Outcomes.Open Educ. Res. 2019, 25, 75–82. [CrossRef]
11. Brinton, C.G.; Buccapatnam, S.; Chiang, M.; Poor, H.V. Mining MOOC Clickstreams: Video-Watching Behavior vs. In-Video QuizPerformance. IEEE Trans. Signal Process. 2016, 64, 3677–3692. [CrossRef]
12. Akram, A.; Fu, C.; Li, Y.; Javed, M.Y.; Lin, R.; Jiang, Y.; Tang, Y. Predicting Students’ Academic Procrastination in BlendedLearning Course Using Homework Submission Data. IEEE Access 2019, 7, 102487–102498. [CrossRef]
13. Qiu, F.; Zhang, G.; Sheng, X.; Jiang, L.; Zhu, L.; Xiang, Q.; Jiang, B.; Chen, P.K. Predicting students’ performance in e-learningusing learning process and behaviour data. Sci. Rep. 2022, 12, 1–15. [CrossRef]
14. Li, S.; Wang, Z.; Yu, C.; Zong, Y. Mining LMS Data for Behavioral Engagement Indicators in Online Learning Environments.Open Educ. Res. 2016, 22, 77–88. [CrossRef]
15. Shen, X.; Liu, M.; Wu, J.; Dong, X. Towards a model for evaluating students’ online learning behaviors and learning performance.Distance Educ. China 2020, 10, 76–84. [CrossRef]
16. Bolliger, D.U.; Halupa, C. Online student perceptions of engagement, transactional distance, and outcomes. Distance Educ. 2018,39, 299–316. [CrossRef]
17. Zheng, B.; Lin, C.H.; Kwon, J.B. The impact of learner-, instructor-, and course-level factors on online learning. Comput. Educ.2020, 150, 103851. [CrossRef]
18. Qureshi, M.A.; Khaskheli, A.; Qureshi, J.A.; Raza, S.A.; Yousufi, S.Q. Factors affecting students’ learning performance throughcollaborative learning and engagement. Interact. Learn. Environ. 2021, 1–21. [CrossRef]
19. Kokoç, M.; Altun, A. Effects of learner interaction with learning dashboards on academic performance in an e-learningenvironment. Behav. Inf. Technol. 2021, 40, 161–175. [CrossRef]
Entropy 2022, 24, 722 22 of 22
20. Cerezo, R.; Sánchez-Santillán, M.; Paule-Ruiz, M.P.; Núñez, J.C. Students’ LMS interaction patterns and their relationship withachievement: A case study in higher education. Comput. Educ. 2016, 96, 42–54. [CrossRef]
21. Moore, M.G. Editorial: Three types of interaction. Am. J. Distance Educ. 1989, 3, 1–7. [CrossRef]22. Hillman, D.C.; Willis, D.J.; Gunawardena, C.N. Learner-interface interaction in distance education: An extension of contemporary
models and strategies for practitioners. Am. J. Distance Educ. 1994, 8, 30–42. [CrossRef]23. Hirumi, A. A framework for analyzing, designing, and sequencing planned elearning interactions. Q. Rev. Distance Educ. 2002,
3, 141–160.24. Sun, Y. Characteristics Analysis of Online Learning Behavior of Distance Learners in Open University. China Educ. Technol. 2015,
8, 64–71.25. Wu, L.; Lao, C.; Liu, Q.; Cheng, Y.; Mao, G. Online Learning Behavior Analysis Model and Its Application in Network Learning
Space. Mod. Educ. Technol. 2018, 28, 46–53.26. Nawang, H.; Makhtar, M.; Shamsudin, S.N.W. Classification model and analysis on students’ performance. J. Fundam. Appl. Sci.
2017, 9, 869–885. [CrossRef]27. Fan, Y.; Wang, Q Prediction of academic performance and risk: A review of literature on predicative indicators in learning
analytics. Distance Educ. China 2018, 1, 5–15. 44, 79. [CrossRef]28. Marbouti, F.; Diefes-Dux, H.A.; Madhavan, K. Models for early prediction of at-risk students in a course using standards-based
grading. Comput. Educ. 2016, 103, 1–15. [CrossRef]29. Hooshyar, D.; Pedaste, M.; Yang, Y. Mining educational data to predict students’ performance through procrastination behavior.
Entropy 2020, 22, 12. [CrossRef]30. Macfadyen, L.P.; Dawson, S. Mining LMS data to develop an “early warning system” for educators: A proof of concept. Comput.
Educ. 2010, 54, 588–599. [CrossRef]31. Yang, Y.; Hooshyar, D.; Pedaste, M.; Wang, M.; Huang, Y.M.; Lim, H. Predicting course achievement of university students based
on their procrastination behaviour on Moodle. Soft Comput. 2020, 24, 18777–18793. [CrossRef]32. McNeely, C.L.; Hahm, J.O. The Big (Data) Bang: Policy, Prospects, and Challenges. Rev. Policy Res. 2014, 31, 304–310. [CrossRef]33. Saha, S.; Rajasekaran, S.; Ramprasad, R. Novel Randomized Feature Selection Algorithms. Int. J. Found. Comput. Sci. 2015,
26, 321–341. [CrossRef]34. Brankovic, A.; Falsone, A.; Prandini, M.; Piroddi, L. A Feature Selection and Classification Algorithm Based on Randomized
Extraction of Model Populations. IEEE Trans. Cybern. 2018, 48, 1151–1162. [CrossRef] [PubMed]35. Hu, H.; Du, S.; Liang, J.; Kang, Z. Towards a prediction model of learning performance:informed by learning behavior big data
analytics. Distance Educ. China 2021, 4, 8–20. 76. [CrossRef]36. Chen, C.; Liang, X. Feature selection method based on Gini index and chi-square test. Comput. Eng. Des. 2019, 40, 2342–2345.
2360. [CrossRef]37. Wang, K.; Wang, J.; Xing, Z.; Han, X. Infrared spectrum modeling method based on RF algorithm of improved feature selection.
Appl. Res. Comput. 2018, 35, 3000–3002.38. Wang, Z.; Xiao, X.; Rajasekaran, S. Novel and efficient randomized algorithms for feature selection. Big Data Min. Anal. 2020,
3, 208–224. [CrossRef]39. Saha, S.S.; Rahman, S.; Rasna, M.J.; Zahid, T.B.; Islam, A.M.; Ahad, M.A.R. Feature Extraction, Performance Analysis and System
Design Using the DU Mobility Dataset. IEEE Access 2018, 6, 44776–44786. [CrossRef]40. Bian, K.; Zhou, M.; Hu, F.; Lai, W. RF-PCA: A New Solution for Rapid Identification of Breast Cancer Categorical Data Based on
Attribute Selection and Feature Extraction. Front. Genet. 2020, 11, 1082. [CrossRef]41. Kwak, N.; Choi, C.H. Feature extraction based on ICA for binary classification problems. IEEE Trans. Knowl. Data Eng. 2003,
15, 1374–1388. [CrossRef]42. Zhao, L.; Chen, K.; Song, J.; Zhu, X.; Sun, J.; Brian, C.; Brian, M.N. Academic Performance Prediction Based on Multisource,
Multifeature Behavioral Data. IEEE Access 2021, 9, 5453–5465. [CrossRef]43. Li, Y. Feature extraction and learning effect analysis for MOOCs users based on data mining. Int. J. Emerg. Technol. Learn. (iJET)
2018, 13, 108–120. Available online: https://www.learntechlib.org/p/185278 (accessed on 21 April 2022). [CrossRef]44. Vieira, C.; Parsons, P.; Byrd, V. Visual learning analytics of educational data: A systematic literature review and research agenda.
Comput. Educ. 2018, 122, 119–135. [CrossRef]45. Dudani, S.A. The Distance-Weighted k-Nearest-Neighbor Rule. IEEE Trans. Syst. Man Cybern. 1976, SMC-6, 325–327. [CrossRef]46. Brereton, R.G.; Lloyd, G.R. Support vector machines for classification and regression. Analyst 2010, 135, 230–267. [CrossRef]
[PubMed]47. Sen, P.C.; Hajra, M.; Ghosh, M. Supervised Classification Algorithms in Machine Learning: A Survey and Review. In Emerging
Technology in Modelling and Graphics; Springer: Singapore, 2020; pp. 99–111.