mineralogical distribution of some minor and trace elements during a laboratory flotation processing...
TRANSCRIPT
Mineralogical distribution of some minor and trace
elements during a laboratory flotation processing of
Neves-Corvo ore (Portugal)
M. Benzaazouaa,b,*,1, P. Mariona,1, L. Liouville-Bourgeoisa,1,R. Joussemeta,1, R. Houota,1, A. Francoc,2, A. Pintoc
aLEM, ENSG, B.P. 40, 54501 Vandœuvre-les-Nancy Cedex, FrancebUQAT—URSTM, 445 boul. de l’universite, Rouyn-Noranda, Quebec, Canada J9X 5E4
cSOMINCOR, Apartado 12, 7780 Castro Verde, Portugal
Received 24 May 2001; received in revised form 20 January 2002; accepted 15 February 2002
Abstract
Neves-Corvo mine (SOMINCOR, Portugal) is one of the most important underground mines now
operating in Europe. It treats a heterogeneous massive sulphide deposit, which is mainly copper and/
or tin rich. The extracted ore is processed to obtain two types of concentrates (Cu and Tin) whose
purity is affected by some minor (As and Sb) and trace (Hg, Se, Cd) elements. In addition to the
concentrate sales, silver is also commercialized as a bonus product. The present work intends to
identify the mineral bearer of some of these additional detrimental or bonus elements, and to develop a
mineralogical model for predicting mineral processing production profits. Many laboratory-scale tests
were conducted to study the behavior of minerals: the different steps and conditions of these tests
allow good reproduction of the industrial flotation process of the Neves-Corvo mine. The statistical
analyses of the elemental distributions give interesting results and provide the ingredients from which
we can produce a preliminary predicting tool. Thus, fahlores-minerals (tetrahedrite and tennantite),
which are considered to be veritable toxic trash minerals, can be easily localized during the process.
This will allow their separation by modifying the flow sheet to improve the concentrate quality.
D 2002 Elsevier Science B.V. All rights reserved.
Keywords: neves-corvo ore; minor and trace element mineralogy; froth flotation; statistical analysis
0301-7516/02/$ - see front matter D 2002 Elsevier Science B.V. All rights reserved.
PII: S0301 -7516 (02 )00015 -7
* Corresponding author. UQAT—URSTM, 445 boul. de l’universite, Rouyn-Noranda, Quebec, Canada J9X
5E4. Fax: +1-819-797-4727.
E-mail address: [email protected] (M. Benzaazoua).1 Tel.: +33-3-83-59-59-59.2 Fax: +351-2-1-8611-516.
www.elsevier.com/locate/ijminpro
Int. J. Miner. Process. 66 (2002) 163–181

1. Introduction
Base metal (Cu, Pb, Zn) prices have decreased during the last decade. This has led to
many mining site closures. At the remaining ones, processing flow sheet adaptations and
improvements have fortunately been introduced. Major innovations are therefore tenta-
tively implemented in plants. These changes have resulted in better concentrates, such as
those with fewer minor or trace elements like As, Sb, Bi, Se, Hg, Tl or Cd. These are well
known for their deleterious effects on metallurgy and the environment. On the other hand,
some bonus elements are tentatively recovered: precious metals or elements for the semi-
conductors industry, for example, Au, Ag, In or Ge. When it turns out to be necessary to
adapt a processing plant to new regulations or economical restraints, the role of applied
mineralogy has often been demonstrated: Petruk (1976), Henley and Steveson (1979),
Chen and Petruk (1980), Ahlrichs (1983), Henley (1983), Jacquin et al. (1984). Nowadays,
modern analytical tools, as well as statistical interpretation, are used increasingly, for
example, by Cabri (1992) and Yuan et al. (1996).
The various copper–tin-bearing facies of Neves-Corvo have been extensively studied
since its discovery and early mining. Many works point out the succession of the different
paragenesis [pyrite FeS2, sphalerite ZnS, late enrichment in chalcopyrite CuFeS2 and
tetrahedrite–tennantite series solid solution Cu12(Sb, As)4S13 also called fahlores, Ram-
dohr, 1980] and the particularities of this orebody [tin enrichment leading to cassiterite
SnO2 and stannite–kesterite Cu2(Fe,Zn)SnS4 mineralization] in comparison to other
massive volcanogenic sulphide deposits found and mined in the Iberian Pyritic Belt.
(For more details, see Gaspar and Pinto, 1991, 1993a,b; Barriga et al., 1997; Pinto et al.,
1997; Relvas et al., 1997.) Copper comes mainly from chalcopyrite and other mineral
contributors like stannite, fahlores (gray-copper) or even bornite Cu5FeS4, depending on
the mined facies. Individual mineral grains have a fine size and are highly intergrown. This
leads to the necessity of fine milling (<30 Am) to liberate the phases before flotation
(Liouville-Bourgeois, 1996).
For ore mining and processing needs, some ‘‘ore types’’ have been defined. Abridged
names of three of them are used in the following sections of the text:. MC: This ore type is characterised by disseminations and thin to thick bands of
chalcopyrite within massive pyrite. Sphalerite, less abundant than chalcopyrite, and also
minor stannite, fahlores and arsenopyrite are also present, as well as trace minerals of lead,
bismuth and tin.. MS: This ore type has a similar mineralogy, with cassiterite and stannite as major
mineral accompanying chalcopyrite.. MT: This ore type is defined when more than 7% tin is present.
When delivered to the processing units, these ‘‘ore types’’ are very often composite
blends from different parts of the mining sectors.
This paper presents part of the mineralogical studies done for the firm SOMINCOR
regarding the processing of its big complex sulphide ore deposit of Neves-Corvo (Alentejo
province—Portugal), which is currently mined for copper and tin beneficiation. The main
objective of the work was to investigate the mineralogical state and grade of contaminants
and valuable metals within Neves-Corvo ores (mainly MC). As it is very difficult to get
reliable and statistically correct data only from hand samples or even crushed products, it
M. Benzaazoua et al. / Int. J. Miner. Process. 66 (2002) 163–181164

has been decided to privilege study of products from flotation tests. These tests where led
in our laboratory in close coordination with the company to investigate possibilities of
separation of minor and trace elements within mineral concentrates. Fig. 1 illustrates the
methodology chosen to achieve this. The obtained products were at first chemically
analyzed. Mineral phases where subsequently determined and analyzed for minor and
trace contents. Then, calculation of mineral distributions combining mineralogical and
chemical data was achieved. Moreover, statistical analysis using multiple regression and
main component analysis gave access to propositions for minor and trace element
distribution among their potential bearers.
2. Samples and methods
2.1. Samples
According to the laboratory flotation protocol described in the following, the main feed
of the copper processing plant (MC ‘‘ore type’’) was given priority for investigation. One
must keep in mind that this ‘‘ore’’ is a composite derived from different copper-rich facies
of the mine: the MC feed used in this study was taken from early 1993 samples. The
results were compared to concentrates and tailings obtained from the two feed types from
the tin plant of the Neves-Corvo mine. These were taken at the same time as the first
Fig. 1. Scheme illustrating the methodology used in the study.
M. Benzaazoua et al. / Int. J. Miner. Process. 66 (2002) 163–181 165
samples (respectively obtained by industrial flotation of copper–tin MS and cassiterite-
bearing MT composite ores).
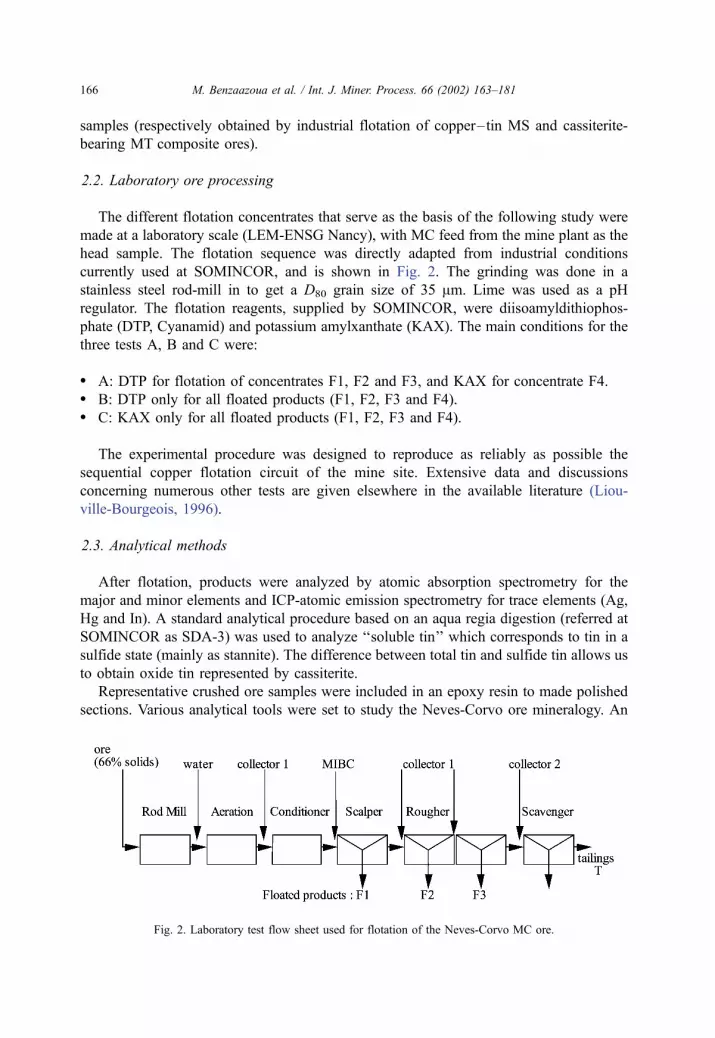
2.2. Laboratory ore processing
The different flotation concentrates that serve as the basis of the following study were
made at a laboratory scale (LEM-ENSG Nancy), with MC feed from the mine plant as the
head sample. The flotation sequence was directly adapted from industrial conditions
currently used at SOMINCOR, and is shown in Fig. 2. The grinding was done in a
stainless steel rod-mill in to get a D80 grain size of 35 Am. Lime was used as a pH
regulator. The flotation reagents, supplied by SOMINCOR, were diisoamyldithiophos-
phate (DTP, Cyanamid) and potassium amylxanthate (KAX). The main conditions for the
three tests A, B and C were:
� A: DTP for flotation of concentrates F1, F2 and F3, and KAX for concentrate F4.� B: DTP only for all floated products (F1, F2, F3 and F4).� C: KAX only for all floated products (F1, F2, F3 and F4).
The experimental procedure was designed to reproduce as reliably as possible the
sequential copper flotation circuit of the mine site. Extensive data and discussions
concerning numerous other tests are given elsewhere in the available literature (Liou-
ville-Bourgeois, 1996).
2.3. Analytical methods
After flotation, products were analyzed by atomic absorption spectrometry for the
major and minor elements and ICP-atomic emission spectrometry for trace elements (Ag,
Hg and In). A standard analytical procedure based on an aqua regia digestion (referred at
SOMINCOR as SDA-3) was used to analyze ‘‘soluble tin’’ which corresponds to tin in a
sulfide state (mainly as stannite). The difference between total tin and sulfide tin allows us
to obtain oxide tin represented by cassiterite.
Representative crushed ore samples were included in an epoxy resin to made polished
sections. Various analytical tools were set to study the Neves-Corvo ore mineralogy. An
Fig. 2. Laboratory test flow sheet used for flotation of the Neves-Corvo MC ore.
M. Benzaazoua et al. / Int. J. Miner. Process. 66 (2002) 163–181166
optical microscope (Nikon Optiphot) was used for mineral identification. To study some
very fine textures and unidentified minerals, a scanning electron microscope—SEM—
(Philips XL30) equipped with a microanalysis system (Kevex energy dispersive spec-
trometer) was also used. An electron microprobe—EPMA—(Cameca SX50) allowed to
analyze locally elemental compositions of minerals: analytical conditions, detection limits
and confidence intervals are given in Table 2. For indium analysis at the parts per million
level, EPMAwas completed by ion microprobe—SIMS—(Cameca IMS 5F). The electron
probes (SEM and EPMA) are located at UHP-Nancy 1 University and the ion probe at
LAM, Luxembourg University. Mineralogical calculations and statistical studies were
carried out using Microsoft ExcelR StatBoxk and LED (software designed at CRAN-
ENSG laboratory, Nancy, for correlation and regression analysis).
3. Results and discussions
3.1. Relationships between elements
The bulk analytical results for tests A–C are given in Table 1. Before closer
examination of the element relationships by main component analysis, some simple x–y
Table 1
Chemical analysis of feed, A, B and C laboratory flotation concentrates and tailings of MC Neves-Corvo
composite ore
Recovery
(% wt)
Fe
(% wt)
Cu
(% wt)
Zn
(% wt)
As
(% wt)
Sb
(% wt)
Sn-sa
(% wt)
Ag
(ppm wt)
Hg
(ppm wt)
In
(ppm wt)
Feed sample – 29.40 8.59 0.93 0.41 0.15 0.18 50.0 47.0 78.0
AF1 11.64 30.05 25.32 1.06 0.17 0.08 0.43 54.0 56.0 245.0
AF2 12.94 31.77 21.48 1.68 0.30 0.20 0.40 79.0 65.0 227.0
AF3 10.66 34.63 13.64 2.46 0.67 0.49 0.29 132.0 91.0 164.0
AF4 20.17 39.56 4.10 1.22 0.78 0.27 0.09 70.0 56.0 31.0
AT 44.59 23.67 0.65 0.11 0.28 0.01 0.02 13.0 8.0 0.5b
ACF 100.00 29.83 8.29 0.89 0.41 0.15 0.16 50.5 39.5 81.8
BF1 11.90 30.14 25.76 1.03 0.18 0.08 0.46 54.0 55.0 249.0
BF2 11.99 31.61 22.30 1.57 0.30 0.19 0.44 78.0 62.0 190.0
BF3 10.39 35.30 14.72 2.39 0.60 0.47 0.31 135.0 91.0 148.0
BF4 15.76 36.53 5.60 1.61 0.88 0.34 0.12 90.0 68.0 49.0
BT 49.96 25.85 0.66 0.15 0.31 0.03 0.02 14.0 14.0 5.0b
BCF 100.00 29.72 8.48 0.89 0.41 0.15 0.17 51.0 41.1 78.0
CF1 15.83 30.12 25.73 1.61 0.29 0.22 0.46 89.0 76.0 259.0
CF2 15.33 31.72 18.91 2.32 0.79 0.47 0.32 136.0 100.0 198.0
CF3 9.83 37.23 8.86 1.75 0.65 0.22 0.19 72.0 63.0 86.0
CF4 29.36 40.76 2.13 0.31 0.35 0.03 0.05 23.0 23.0 0.7b
CT 29.65 14.89 0.49 0.08 0.24 0.07 0.02 4.2 11.0 0.0b
CCF 100.00 29.67 8.61 0.90 0.40 0.16 0.16 50.0 43.6 80.0
F: floated products, T: tailings, CF: calculated feed by mass balance.a Soluble tin.b These cells contain values that are below chemical analysis detection limit and therefore estimated by mass
balance reconstitution.
M. Benzaazoua et al. / Int. J. Miner. Process. 66 (2002) 163–181 167
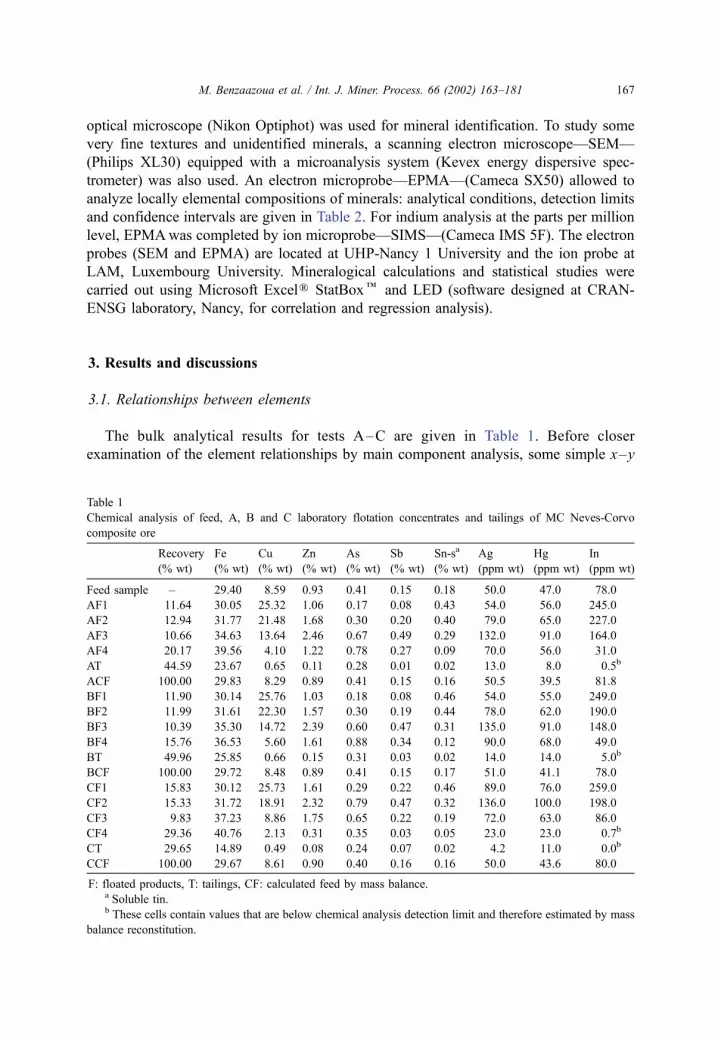
diagrams are able to indicate possible mineralogical locations of minor and trace elements
according to their well-known geochemical behavior. Fig. 3 shows a linear relationship
between silver and antimony (R2=0.9) and also a more dispersed relationship of mercury
against antimony (R2=0.79): these tendencies could be frequently attributed to the
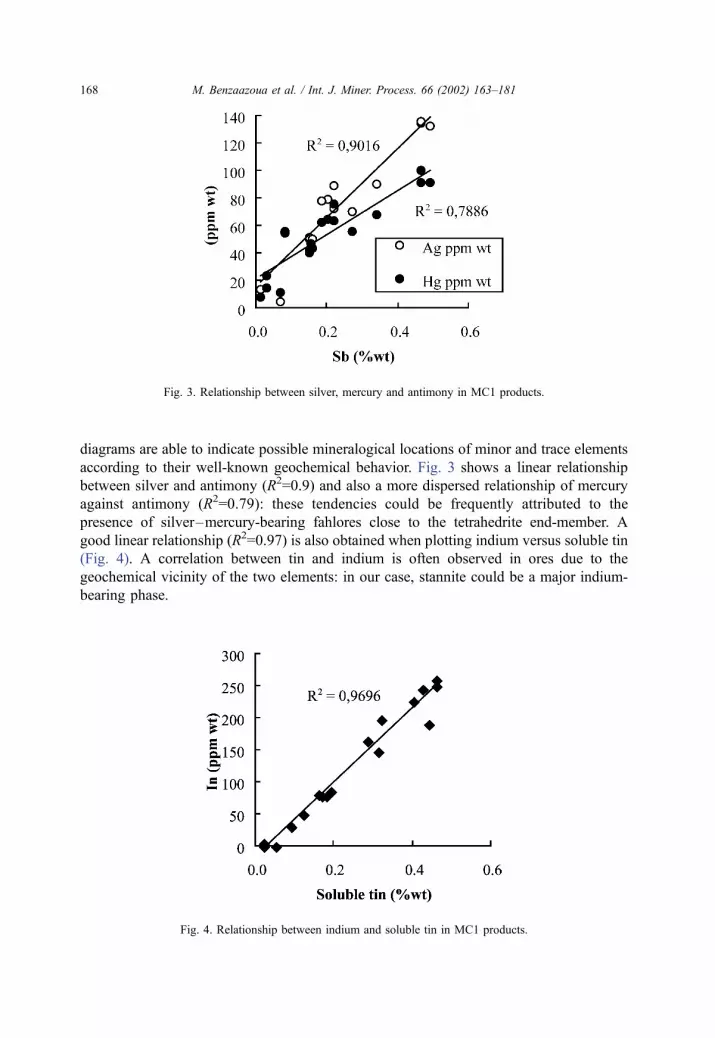
presence of silver–mercury-bearing fahlores close to the tetrahedrite end-member. A
good linear relationship (R2=0.97) is also obtained when plotting indium versus soluble tin
(Fig. 4). A correlation between tin and indium is often observed in ores due to the
geochemical vicinity of the two elements: in our case, stannite could be a major indium-
bearing phase.
Fig. 3. Relationship between silver, mercury and antimony in MC1 products.
Fig. 4. Relationship between indium and soluble tin in MC1 products.
M. Benzaazoua et al. / Int. J. Miner. Process. 66 (2002) 163–181168
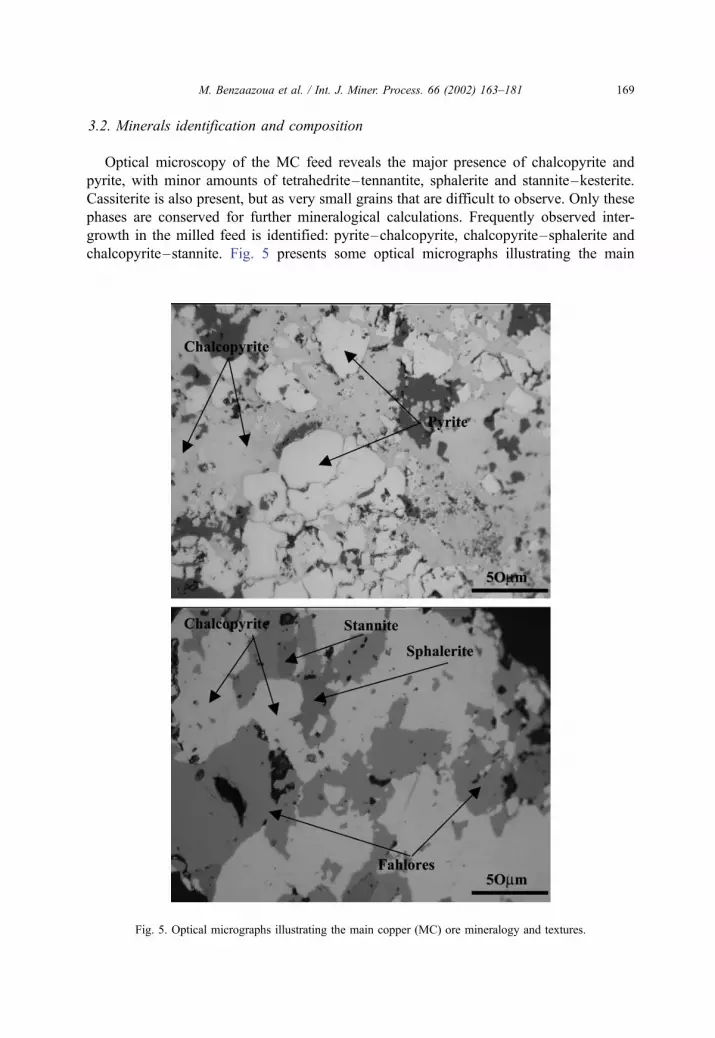
3.2. Minerals identification and composition
Optical microscopy of the MC feed reveals the major presence of chalcopyrite and
pyrite, with minor amounts of tetrahedrite–tennantite, sphalerite and stannite–kesterite.
Cassiterite is also present, but as very small grains that are difficult to observe. Only these
phases are conserved for further mineralogical calculations. Frequently observed inter-
growth in the milled feed is identified: pyrite–chalcopyrite, chalcopyrite–sphalerite and
chalcopyrite–stannite. Fig. 5 presents some optical micrographs illustrating the main
Fig. 5. Optical micrographs illustrating the main copper (MC) ore mineralogy and textures.
M. Benzaazoua et al. / Int. J. Miner. Process. 66 (2002) 163–181 169
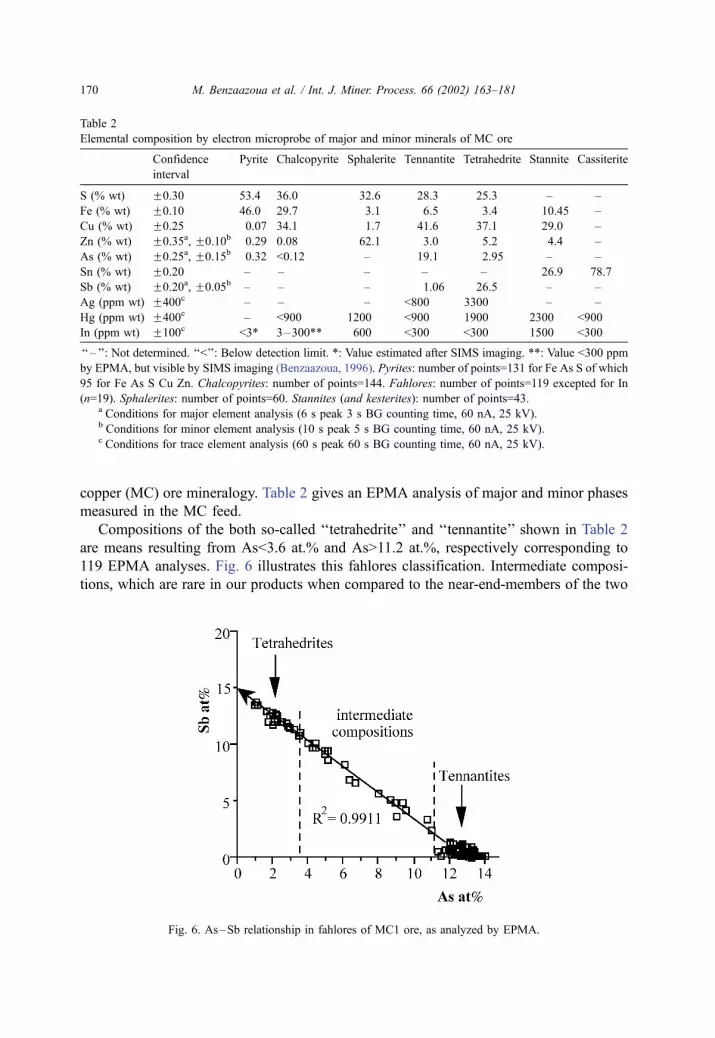
copper (MC) ore mineralogy. Table 2 gives an EPMA analysis of major and minor phases
measured in the MC feed.
Compositions of the both so-called ‘‘tetrahedrite’’ and ‘‘tennantite’’ shown in Table 2
are means resulting from As<3.6 at.% and As>11.2 at.%, respectively corresponding to
119 EPMA analyses. Fig. 6 illustrates this fahlores classification. Intermediate composi-
tions, which are rare in our products when compared to the near-end-members of the two
Table 2
Elemental composition by electron microprobe of major and minor minerals of MC ore
Confidence
interval
Pyrite Chalcopyrite Sphalerite Tennantite Tetrahedrite Stannite Cassiterite
S (% wt) F0.30 53.4 36.0 32.6 28.3 25.3 – –
Fe (% wt) F0.10 46.0 29.7 3.1 6.5 3.4 10.45 –
Cu (% wt) F0.25 0.07 34.1 1.7 41.6 37.1 29.0 –
Zn (% wt) F0.35a, F0.10b 0.29 0.08 62.1 3.0 5.2 4.4 –
As (% wt) F0.25a, F0.15b 0.32 <0.12 – 19.1 2.95 – –
Sn (% wt) F0.20 – – – – – 26.9 78.7
Sb (% wt) F0.20a, F0.05b – – – 1.06 26.5 – –
Ag (ppm wt) F400c – – – <800 3300 – –
Hg (ppm wt) F400c – <900 1200 <900 1900 2300 <900
In (ppm wt) F100c <3* 3–300** 600 <300 <300 1500 <300
‘‘– ’’: Not determined. ‘‘<’’: Below detection limit. *: Value estimated after SIMS imaging. **: Value <300 ppm
by EPMA, but visible by SIMS imaging (Benzaazoua, 1996). Pyrites: number of points=131 for Fe As S of which
95 for Fe As S Cu Zn. Chalcopyrites: number of points=144. Fahlores: number of points=119 excepted for In
(n=19). Sphalerites: number of points=60. Stannites (and kesterites): number of points=43.a Conditions for major element analysis (6 s peak 3 s BG counting time, 60 nA, 25 kV).b Conditions for minor element analysis (10 s peak 5 s BG counting time, 60 nA, 25 kV).c Conditions for trace element analysis (60 s peak 60 s BG counting time, 60 nA, 25 kV).
Fig. 6. As–Sb relationship in fahlores of MC1 ore, as analyzed by EPMA.
M. Benzaazoua et al. / Int. J. Miner. Process. 66 (2002) 163–181170
predefined groups, are not taken into account. This choice was favored for the mineral
balance calculations used for the better understanding of the flotation processes.
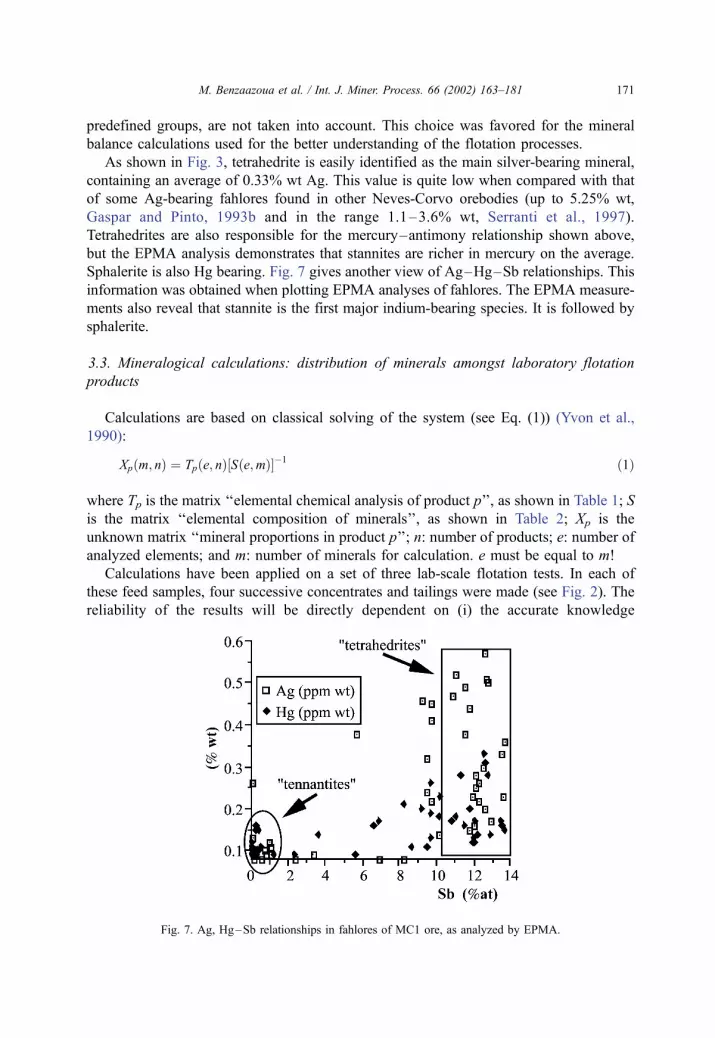
As shown in Fig. 3, tetrahedrite is easily identified as the main silver-bearing mineral,
containing an average of 0.33% wt Ag. This value is quite low when compared with that
of some Ag-bearing fahlores found in other Neves-Corvo orebodies (up to 5.25% wt,
Gaspar and Pinto, 1993b and in the range 1.1–3.6% wt, Serranti et al., 1997).
Tetrahedrites are also responsible for the mercury–antimony relationship shown above,
but the EPMA analysis demonstrates that stannites are richer in mercury on the average.
Sphalerite is also Hg bearing. Fig. 7 gives another view of Ag–Hg–Sb relationships. This
information was obtained when plotting EPMA analyses of fahlores. The EPMA measure-
ments also reveal that stannite is the first major indium-bearing species. It is followed by
sphalerite.
3.3. Mineralogical calculations: distribution of minerals amongst laboratory flotation
products
Calculations are based on classical solving of the system (see Eq. (1)) (Yvon et al.,
1990):
Xpðm; nÞ ¼ Tpðe; nÞ½Sðe;mÞ��1 ð1Þ
where Tp is the matrix ‘‘elemental chemical analysis of product p’’, as shown in Table 1; S
is the matrix ‘‘elemental composition of minerals’’, as shown in Table 2; Xp is the
unknown matrix ‘‘mineral proportions in product p’’; n: number of products; e: number of
analyzed elements; and m: number of minerals for calculation. e must be equal to m!
Calculations have been applied on a set of three lab-scale flotation tests. In each of
these feed samples, four successive concentrates and tailings were made (see Fig. 2). The
reliability of the results will be directly dependent on (i) the accurate knowledge
Fig. 7. Ag, Hg–Sb relationships in fahlores of MC1 ore, as analyzed by EPMA.
M. Benzaazoua et al. / Int. J. Miner. Process. 66 (2002) 163–181 171
concerning the product’s mineralogy, (ii) the precise analysis of individual minerals for
major and minor elements, and (iii) the reliability of the chemical analysis for major, minor
and trace elements of the products. Even if these last three criteria are met, some
hypotheses are always necessary and may not affect the calculation results. In our case,
the limitations are essentially the following:. Arsenic has been supposed to be located in pyrite and fahlores (mainly tennantite
pole) only. Arsenopyrite, which occurs as a minor mineral, has not been taken into account
owing to its similar behavior to pyrite in this flotation process.. Medium compositions of fahlores (i.e. mid-members of the tetrahedrite–tennantite
solid solution) are not considered. In fact, these compositions are rare as shown above
(Section 3.2).. The rare occurrence of almost pure kesterite Cu2ZnSnS4 (i.e. close to Zn end-member
of stannite–kesterite solid solution) grains are not taken into account for the mean stannite
composition given in Table 2.
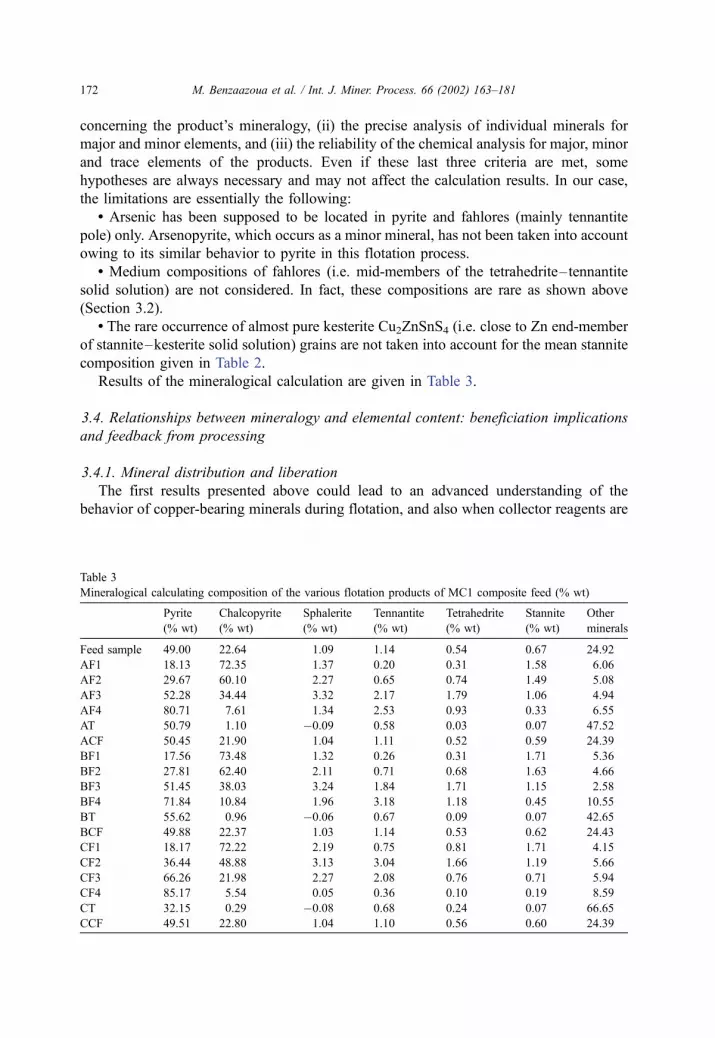
Results of the mineralogical calculation are given in Table 3.
3.4. Relationships between mineralogy and elemental content: beneficiation implications
and feedback from processing
3.4.1. Mineral distribution and liberation
The first results presented above could lead to an advanced understanding of the
behavior of copper-bearing minerals during flotation, and also when collector reagents are
Table 3
Mineralogical calculating composition of the various flotation products of MC1 composite feed (% wt)
Pyrite
(% wt)
Chalcopyrite
(% wt)
Sphalerite
(% wt)
Tennantite
(% wt)
Tetrahedrite
(% wt)
Stannite
(% wt)
Other
minerals
Feed sample 49.00 22.64 1.09 1.14 0.54 0.67 24.92
AF1 18.13 72.35 1.37 0.20 0.31 1.58 6.06
AF2 29.67 60.10 2.27 0.65 0.74 1.49 5.08
AF3 52.28 34.44 3.32 2.17 1.79 1.06 4.94
AF4 80.71 7.61 1.34 2.53 0.93 0.33 6.55
AT 50.79 1.10 �0.09 0.58 0.03 0.07 47.52
ACF 50.45 21.90 1.04 1.11 0.52 0.59 24.39
BF1 17.56 73.48 1.32 0.26 0.31 1.71 5.36
BF2 27.81 62.40 2.11 0.71 0.68 1.63 4.66
BF3 51.45 38.03 3.24 1.84 1.71 1.15 2.58
BF4 71.84 10.84 1.96 3.18 1.18 0.45 10.55
BT 55.62 0.96 �0.06 0.67 0.09 0.07 42.65
BCF 49.88 22.37 1.03 1.14 0.53 0.62 24.43
CF1 18.17 72.22 2.19 0.75 0.81 1.71 4.15
CF2 36.44 48.88 3.13 3.04 1.66 1.19 5.66
CF3 66.26 21.98 2.27 2.08 0.76 0.71 5.94
CF4 85.17 5.54 0.05 0.36 0.10 0.19 8.59
CT 32.15 0.29 �0.08 0.68 0.24 0.07 66.65
CCF 49.51 22.80 1.04 1.10 0.56 0.60 24.39
M. Benzaazoua et al. / Int. J. Miner. Process. 66 (2002) 163–181172
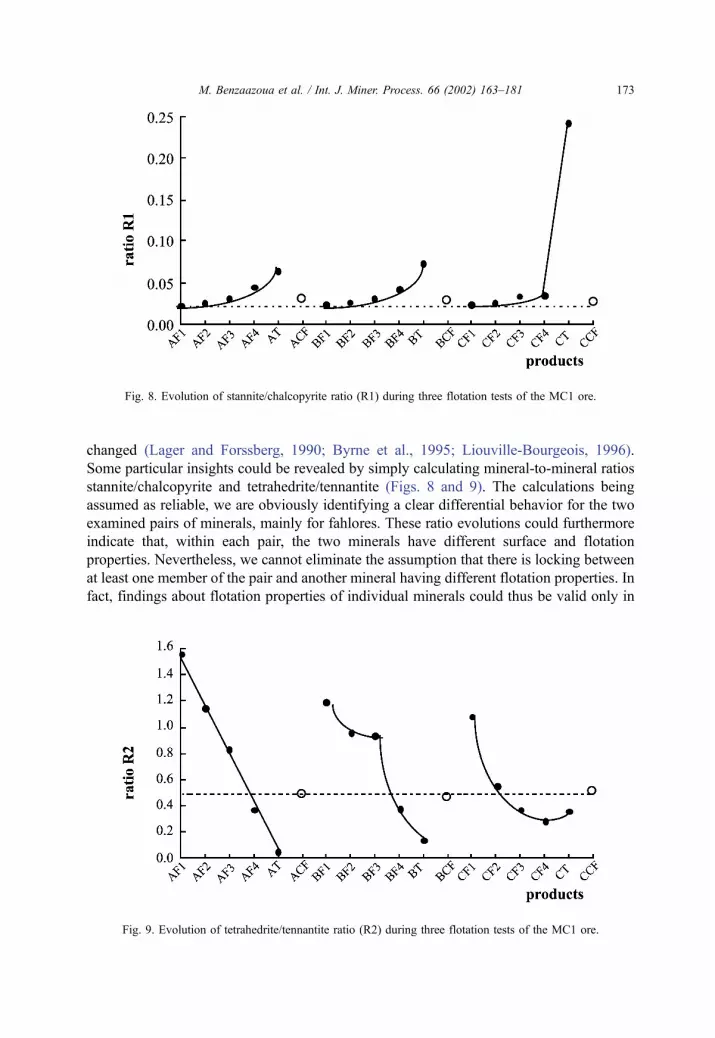
changed (Lager and Forssberg, 1990; Byrne et al., 1995; Liouville-Bourgeois, 1996).
Some particular insights could be revealed by simply calculating mineral-to-mineral ratios
stannite/chalcopyrite and tetrahedrite/tennantite (Figs. 8 and 9). The calculations being
assumed as reliable, we are obviously identifying a clear differential behavior for the two
examined pairs of minerals, mainly for fahlores. These ratio evolutions could furthermore
indicate that, within each pair, the two minerals have different surface and flotation
properties. Nevertheless, we cannot eliminate the assumption that there is locking between
at least one member of the pair and another mineral having different flotation properties. In
fact, findings about flotation properties of individual minerals could thus be valid only in
Fig. 8. Evolution of stannite/chalcopyrite ratio (R1) during three flotation tests of the MC1 ore.
Fig. 9. Evolution of tetrahedrite/tennantite ratio (R2) during three flotation tests of the MC1 ore.
M. Benzaazoua et al. / Int. J. Miner. Process. 66 (2002) 163–181 173
the case where liberation is achieved for these minerals. In our case, this could be
reasonably assumed for fahlores, for which almost complete liberation has been proven by
optical microscopy examination of the flotation product’s polished sections. Thus, our
observations confirm tetrahedrite–tennantite differential flotation behavior that has been
recently established by combined electrochemical and surface state measurements (Cases
et al., 1996; Mielczarski et al., 1996a,b,c). For the stannite–chalcopyrite pair, it seems
difficult to conclude to a differential flotation behavior because stannite and chalcopyrite
display frequent mutual intergrowth.
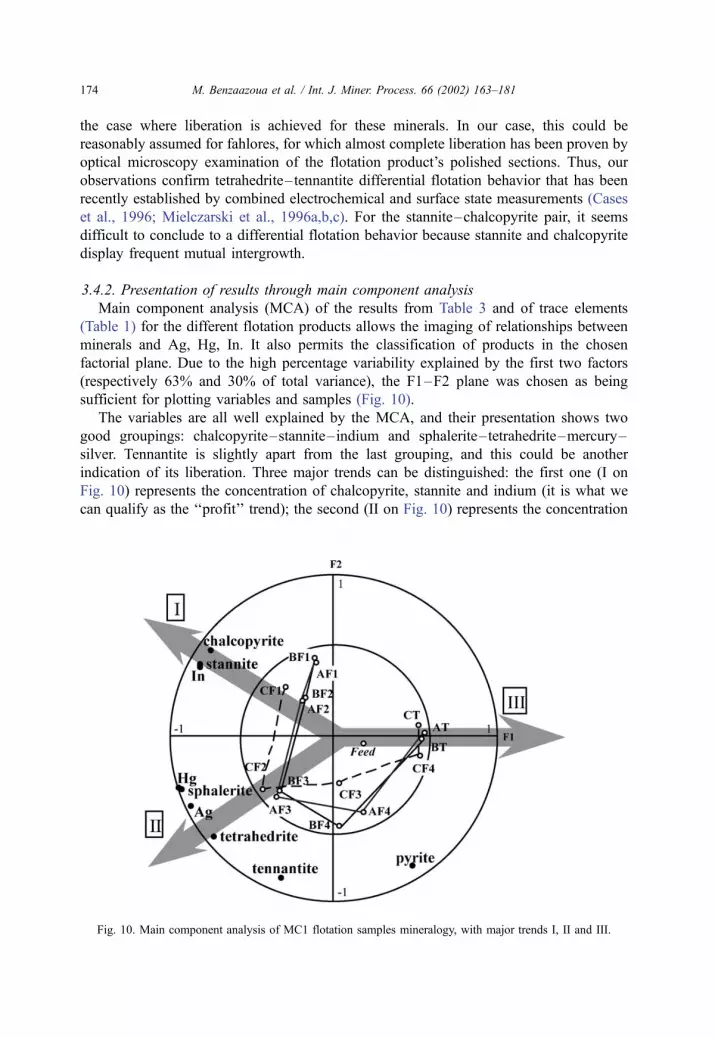
3.4.2. Presentation of results through main component analysis
Main component analysis (MCA) of the results from Table 3 and of trace elements
(Table 1) for the different flotation products allows the imaging of relationships between
minerals and Ag, Hg, In. It also permits the classification of products in the chosen
factorial plane. Due to the high percentage variability explained by the first two factors
(respectively 63% and 30% of total variance), the F1–F2 plane was chosen as being
sufficient for plotting variables and samples (Fig. 10).
The variables are all well explained by the MCA, and their presentation shows two
good groupings: chalcopyrite–stannite–indium and sphalerite–tetrahedrite–mercury–
silver. Tennantite is slightly apart from the last grouping, and this could be another
indication of its liberation. Three major trends can be distinguished: the first one (I on
Fig. 10) represents the concentration of chalcopyrite, stannite and indium (it is what we
can qualify as the ‘‘profit’’ trend); the second (II on Fig. 10) represents the concentration
Fig. 10. Main component analysis of MC1 flotation samples mineralogy, with major trends I, II and III.
M. Benzaazoua et al. / Int. J. Miner. Process. 66 (2002) 163–181174
of minor minerals—sphalerite, tetrahedrite, tennantite—and elements—Hg, Sb, As—(it
is what we can qualify as the ‘‘penalties’’ trend) and the third (III on Fig. 10) represents
the obtained tailings. Some problems arise from these observations: it seems obviously
impossible to get absolutely clean concentrates (high copper content and free of
penalties), because trend II is not anti-correlated (at the opposite) or even independent
(perpendicular) of trend I. Furthermore, the tailings are not essentially pyritiferous, and
are a direct image of the feed composition: it seems impossible to further enrich the
tailings in pyrite. The representation of samples in the Factor 1/Factor 2 plane reveals
also the similarity between products obtained with different flotation conditions. In
particular, it is obvious that flotation C (potassium amyl xanthate as collector instead of
dithiophosphate) implies a different mineral behavior when compared with flotations A
and B which are quite similar (dithiophosphate+potassium amyl xanthate or dithiophos-
phate only).
3.4.3. Multiple regression
It is of primary importance for process engineers to have access to on-line information
about some element analysis for some critical point of the flow circuits. The occurrence of
trace element measurements is still one of the remaining major problems. The one-line
XRF analyzer cannot as of yet provide grade determination of such low amounts within
the treated slurries. As a consequence of the results presented above, it appears that the
trace element feed contents of the Neves-Corvo copper plant can be easily predicted,
because of the existence of an established correlation between major/minor elements or
minerals and trace elements.
The research of a polynomial expression for the calculation of estimated trace element
contents was therefore the next step of our study. Table 4 displays the result of an
automated multiple regression calculation. Unfortunately, it is impossible to use these raw
data for mineralogical purposes, whereas they could be perfectly useful in the flotation
plant. To avoid negative coefficients, some constraints are necessary, that is, some
Table 4
Multiple regression coefficients between trace elements and major/minor elements or minerals in MC1 composite
products
Fe (% wt) Cu (% wt) Zn (% wt) As (% wt) Sb (% wt) Sn-s (% wt)
Ag (ppm wt) 0.71 2.26 14.43 �20.14 189.53 �93.58 �8.39
Hg (ppm wt) 0.33 2.36 11.71 14.22 68.98 �71.39 �3.02
In (ppm wt) �0.41 16.67 43.69 �76.95 3.00 �513.6 26.85
Pyrite
(% wt)
Chalcopyrite
(% wt)
Sphalerite
(% wt)
Tennantite
(% wt)
Tetrahedrite
(% wt)
Stannite
(% wt)
Ag (ppm wt) 0.30 0.91 9.06 �0.38 50.52 �21.04 �9.03
Hg (ppm wt) 0.23 0.88 7.00 4.91 20.16 �15.47 �3.56
In (ppm wt) �0.28 5.54 25.77 �6.49 9.26 �130.2 24.29
Results are computed from Tables 1 and 3, and must be read as follows: Ag (ppm wt)=0.71 Fe % wt+. . .�93.58
Sn-s % wt�8.39 or: Ag ppm wt=0.30 Pyrite % wt+. . .�21.04 Stannite % wt�9.03.
M. Benzaazoua et al. / Int. J. Miner. Process. 66 (2002) 163–181 175
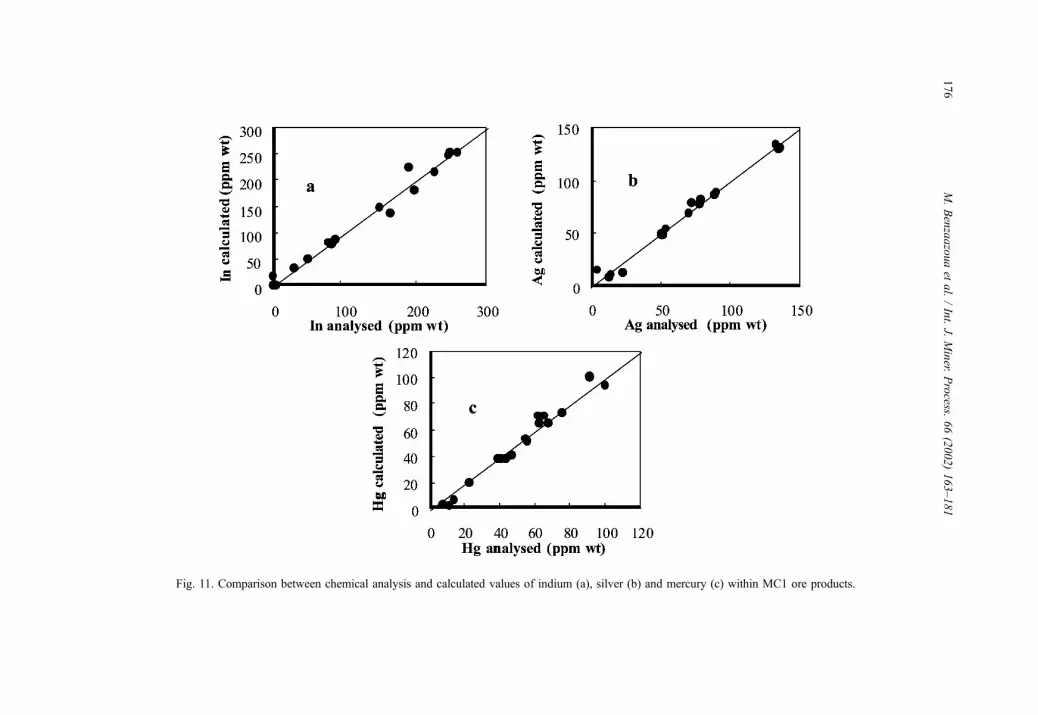
Fig. 11. Comparison between chemical analysis and calculated values of indium (a), silver (b) and mercury (c) within MC1 ore products.
M.Benzaazouaet
al./Int.J.
Miner.
Process.
66(2002)163–181
176
coefficients were fixed: these were directly taken from the EPMA analysis (Table 2). The
data were then computed again, and the following polynoms were obtained:
In ðppm wtÞ ¼ 1500 Stnþ 600 Sphþ 302 Cpy� 3 ð2Þ
Hg ðppm wtÞ ¼ 2300 Stnþ 1900 Tetþ 1200 Sphþ 30 Py� 13 ð3Þ
Ag ðppm wtÞ ¼ 3300 Tetþ 1600 Sphþ 300 Tenþ 20 Cpyþ 7 ð4Þ
where Cpy, Sph, Ten, Stn, Tet and Py are weight fractions of the different minerals in a
given product, and where the polynom coefficients are the estimated parts per million-
weight amounts of trace elements in bearing minerals. Fig. 11 gives an overview of the
quality of these polynoms applied to MC ore products. The calculated amount of indium in
chalcopyrite by calculation is 302 ppm wt, whereas SIMS imaging and quantification with
implanted standards gives approximately 50 ppm in a MC1 polished section (Benzaazoua,
1996). This last value is certainly not representative of MC1 feed, but one could suppose
that 302 ppm is an overestimated value probably due to minute inclusions of a non-
liberated indium-bearing mineral within chalcopyrite, stannite being the most probable
candidate.
Concerning a possible contribution of cassiterite to indium contents in Neves-Corvo
ores, it was concluded from the study of the MC1 composite feed and its flotation
products, that its relative weight against stannite was very low and unfortunately
impossible to estimate more precisely. This is due to severe interference between In and
Sn on EPMA as well as SIMS measurements (Benzaazoua, 1996).
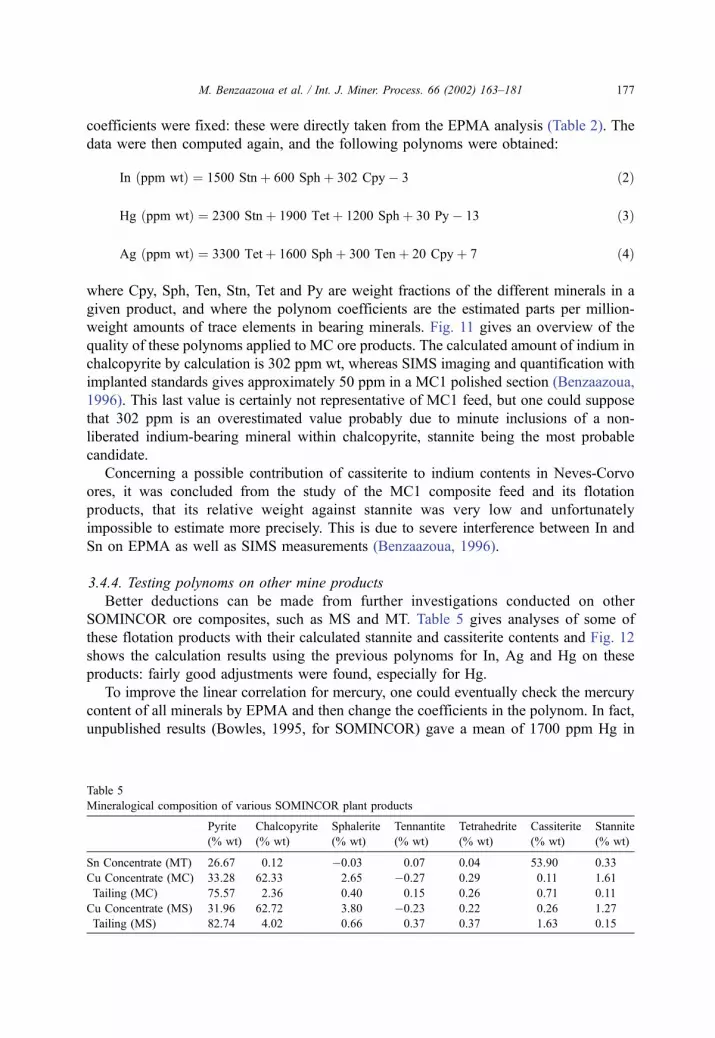
3.4.4. Testing polynoms on other mine products
Better deductions can be made from further investigations conducted on other
SOMINCOR ore composites, such as MS and MT. Table 5 gives analyses of some of
these flotation products with their calculated stannite and cassiterite contents and Fig. 12
shows the calculation results using the previous polynoms for In, Ag and Hg on these
products: fairly good adjustments were found, especially for Hg.
To improve the linear correlation for mercury, one could eventually check the mercury
content of all minerals by EPMA and then change the coefficients in the polynom. In fact,
unpublished results (Bowles, 1995, for SOMINCOR) gave a mean of 1700 ppm Hg in
Table 5
Mineralogical composition of various SOMINCOR plant products
Pyrite
(% wt)
Chalcopyrite
(% wt)
Sphalerite
(% wt)
Tennantite
(% wt)
Tetrahedrite
(% wt)
Cassiterite
(% wt)
Stannite
(% wt)
Sn Concentrate (MT) 26.67 0.12 �0.03 0.07 0.04 53.90 0.33
Cu Concentrate (MC) 33.28 62.33 2.65 �0.27 0.29 0.11 1.61
Tailing (MC) 75.57 2.36 0.40 0.15 0.26 0.71 0.11
Cu Concentrate (MS) 31.96 62.72 3.80 �0.23 0.22 0.26 1.27
Tailing (MS) 82.74 4.02 0.66 0.37 0.37 1.63 0.15
M. Benzaazoua et al. / Int. J. Miner. Process. 66 (2002) 163–181 177
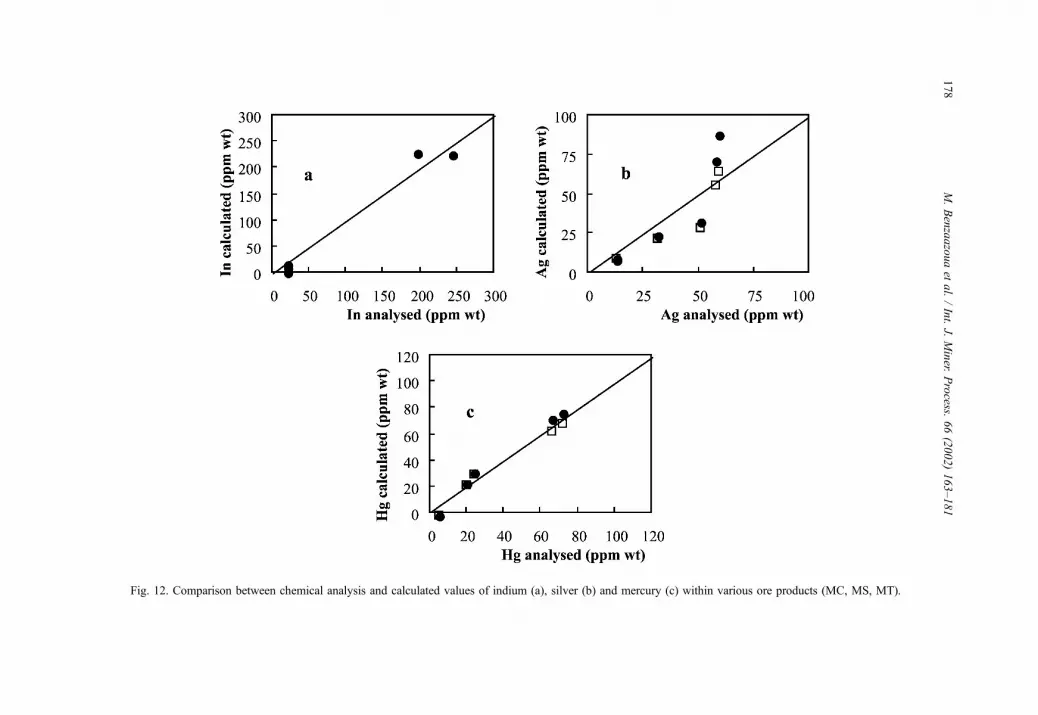
Fig. 12. Comparison between chemical analysis and calculated values of indium (a), silver (b) and mercury (c) within various ore products (MC, MS, MT).
M.Benzaazouaet
al./Int.J.
Miner.
Process.
66(2002)163–181
178
stannite. A new value of 17 (instead of 23) for the coefficient actually better aligns the
points in Fig. 12c. Concerning silver, a deviation of the linearity appears for high silver
content values (Fig. 12b). A reduction of the sphalerite coefficient (from 16.1 to 10) gives
better results: this tendency is in agreement with other unpublished results (Bowles, 1995,
for SOMINCOR), which report low values for silver in sphalerite (less than 200 ppm).
However, these necessary but speculative adjustments put in evidence the probable
variability of trace element contents in bearing minerals among the different ores currently
mined at Neves-Corvo.
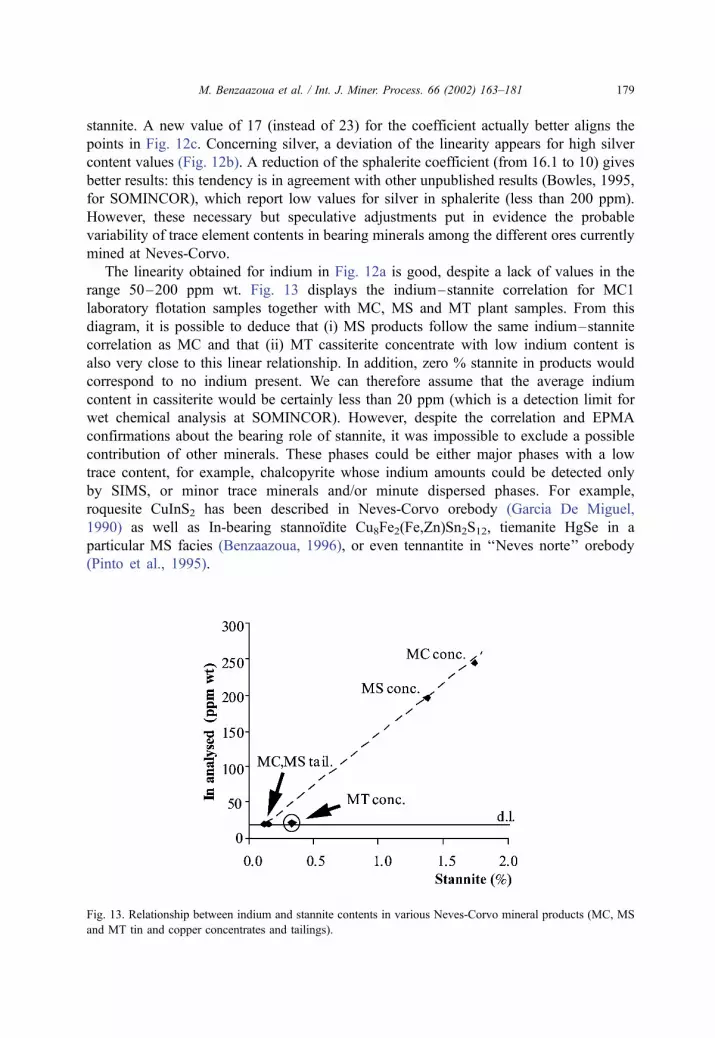
The linearity obtained for indium in Fig. 12a is good, despite a lack of values in the
range 50–200 ppm wt. Fig. 13 displays the indium–stannite correlation for MC1
laboratory flotation samples together with MC, MS and MT plant samples. From this
diagram, it is possible to deduce that (i) MS products follow the same indium–stannite
correlation as MC and that (ii) MT cassiterite concentrate with low indium content is
also very close to this linear relationship. In addition, zero % stannite in products would
correspond to no indium present. We can therefore assume that the average indium
content in cassiterite would be certainly less than 20 ppm (which is a detection limit for
wet chemical analysis at SOMINCOR). However, despite the correlation and EPMA
confirmations about the bearing role of stannite, it was impossible to exclude a possible
contribution of other minerals. These phases could be either major phases with a low
trace content, for example, chalcopyrite whose indium amounts could be detected only
by SIMS, or minor trace minerals and/or minute dispersed phases. For example,
roquesite CuInS2 has been described in Neves-Corvo orebody (Garcia De Miguel,
1990) as well as In-bearing stannoıdite Cu8Fe2(Fe,Zn)Sn2S12, tiemanite HgSe in a
particular MS facies (Benzaazoua, 1996), or even tennantite in ‘‘Neves norte’’ orebody
(Pinto et al., 1995).
Fig. 13. Relationship between indium and stannite contents in various Neves-Corvo mineral products (MC, MS
and MT tin and copper concentrates and tailings).
M. Benzaazoua et al. / Int. J. Miner. Process. 66 (2002) 163–181 179
4. Conclusions and prospects
The given results demonstrate that the process mineralogy studies reveals valuable
information especially when dealing with complex ores, as it is the case with volcanogenic
massive sulphide deposits such as Neves-Corvo ores. Combined approaches of product
characterization using classical and modern analytical tools, as well as using statistical
analysis of chemical analysis or mineralogical calculations, could lead to better under-
standing of flotation process and concentration of trace elements. At least two examples
are given here: the differential flotation behavior of fahlores and the indium localization
within sulphide bearers. However, we do not consider that such a study could be
terminated after the presentation of this work. Many more precise investigations are
necessary to gain knowledge (indium minerals) and to build simple tools for easy plant
use. For example, 119Sn Mossbauer spectroscopy seems to be promising for the rapid
estimation of the ratio of different tin minerals in fine mill products (Benzaazoua, 1996).
All these developments will therefore enable us to improve the reliability of mineral
and trace element balancing for better processing and environmental management.
Acknowledgements
This study was co-financed by the Commission of the European Communities-DG XII
under contract MA2M-CT92-0062 ‘‘New integrated flow-sheets for separation and
recovery of minor element from sulphide ores’’ (MEMNOFLOW) and SOMINCOR S.A.
(A. Franco coordinator). Particular thanks to J.M. Claude and A. Kholer (UHP Nancy 1)
and to J.F.W. Bowles (Minerals Engineering, England) for SEM and EPMA analyses and
comments, B. Engel and J. Yvon (LEM-ENSG) for flotation and statistical analysis, the
chemists of LEM-ENSG and SOMINCOR, O. Gaspar (Ministry of Energy and Mines,
Portugal), A. Ferreira and M. Fordham (SOMINCOR) for their contribution in the present
work.
References
Ahlrichs, J.W., 1983. The role of the mineralogist in the exploration and testing of gold ore. Geol. Soc. S. Afr.,
Spec. Publ. 7, 31–37.
Barriga, F.J.A.S., Carvalho, P., Ferreira, A., Fyfe, W.S., Hutchinson, R.W., Munha, J., Noronha, F., Oliveira, J.T.,
Relvas, J.M.R.S., Ribeiro, A., the Geommincor team, 1997. Geology and metallogenesis of the Neves Corvo
mine. SEG Neves Corvo Field Conference 1997. Abs. Society of Economic Geologists, Lisbon, Portugal,
p. 85.
Benzaazoua, M., 1996. Caracterisation physico-chimique et mineralogique de produits miniers sulfures en vue de
la reduction de leur toxicite et de leur valorisation. PhD thesis of the ‘‘Institut National Polytechnique de
Lorraine’’, Nancy, France.
Byrne, M., Granos, S., Ralston, J., Franco, A., 1995. Process development for the separation of tetrahedrite from
chalcopyrite in the Neves Corvo ore of Somincor. Miner. Eng. 8 (12), 1571–1578.
Cabri, L.J., 1992. The distribution of trace precious metals in minerals and mineral products. Mineral. Mag. 56
(384), 289–308.
Cases, J.M., Barres, O., Benzaazoua, M., Bouquet, E., Bourgeois, L., De Donato, P., Engel, B., Houot, R.,
Joussemet, R., Kongolo, M., Marion, P., Mielczarski, J.E., 1996. New integrated flow-sheets for separation
M. Benzaazoua et al. / Int. J. Miner. Process. 66 (2002) 163–181180
and recovery of minor element from sulphide ores. Final report of ECC Brite-Euram II contract ‘‘MEMNO-
FLOW’’ MA2M-CT92-0062.
Chen, T.T., Petruk, W., 1980. Mineralogy and characteristics that affect recoveries of metals and trace elements
from the ore at Heath Steele Mines, New Brunswick. CIM Bull. 11, 167–179.
Garcia De Miguel, J.M., 1990. Mineralogia, paragenesis y sucesion de los sulfuros masivos de la Faja Piritica en
el suroeste de la Peninsula Iberica. Bol. Geol. Min. 101-1, 73–105.
Gaspar, O.C., Pinto, A., 1991. The ore textures of the Neves-Corvo volcanogenic massive sulphides and their
implications for ore beneficiation. Mineral. Mag. 55, 417–422.
Gaspar, O.C., Pinto, A., 1993a. Mineralogy applied to metallogenesis and beneficiation of the Neves Corvo ores.
Proc. Symp. on the Polymetallic Sulphides of the Iberian Pyrite Belt, Evora (Portugal), 3–6 Oct. 1993.
Apimineral and Portuguese Industry Committee of Pyritic Belt Mineral Resources, Bull., vol. II. Associao
Portuguesa da industria mineral, Portugal, pp. 3.8-1–3.8-16.
Gaspar, O.C., Pinto, A., 1993b. Neves-Corvo, a Kuroko type deposit in the Iberian pyrite belt. Resour. Geol. 17,
249–262, Special Issue.
Henley, K.J., 1983. Ore-dressing mineralogy—a review of techniques, applications and recent developments.
Geol. Soc. S. Afr., Spec. Publ. 7, 175–200.
Henley, K.J., Steveson, B.G., 1979. Determination of distribution of gold and silver in ore and mill products.
Trans. IMM 12, C215–C219.
Jacquin, J.P., Gateau, C., Remond, G., 1984. Developpements de la mineralogie appliquee au traitement des
minerais. Rev. Ind. Miner. 4, 173–188.
Lager, T., Forssberg, K.S.E., 1990. Separation of antimony mineral impurities from complex sulphide ores. Trans.
Inst. Min. Metall., Sect. C: Mineral Process. Extr. Metall. 99, C54.
Liouville-Bourgeois, L., 1996. Elimination d’elements polluants (As, Sb) d’un concentre de cuivre. PhD thesis of
the ‘‘Institut National Polytechnique de Lorraine’’, Nancy, France.
Mielczarski, J.A., Cases, J.M., Barres, O., 1996a. In situ infrared characterization of surface products of interaction
of aqueous solution with chalcopyrite, tetrahedrite and tennantite. J. Colloid Interface Sci. 178, 740–748.
Mielczarski, J.A., Cases, J.M., Alnot, M., Ehrhardt, J.J., 1996b. XPS characterization of chalcopyrite tetrahedrite
and tennantite surface products after different conditioning: I. Aqueous solution at pH 10. Langmuir 10,
2519–2530.
Mielczarski, J.A., Cases, J.M., Alnot, M., Ehrhardt, J.J., 1996c. XPS characterization of chalcopyrite tetrahedrite
and tennantite surface products after different conditioning: II. Amyl xanthate solution at pH 10. Langmuir 10,
2531–2543.
Petruk, W., 1976. The applications of quantitative mineralogical analysis of ores to ore dressing. CIM Bull. 69
(767), 146–153.
Pinto, A., Ferreira, A., Bowles, J.F.W., 1995. Caracterizac�ao de minerais raros do jazigo de Neves-Corvo e suas
implicac�oes metalogenicas. Memoria, vol. 4. Museu e Laboratorio Mineralogico e Geologico, Faculdade de
Ciencias, Universidade do Porto, University of Porto (Portugal), pp. 665–670.
Pinto, A., Ferreira, A., Bowles, J.F.W., Gaspar, O.C., 1997. Mineralogical and textural characterization of the
Neves-Corvo ores. SEG Neves Corvo Field Conference 1997. Abs. Society of Economic Geologists, Lisbon,
Portugal, p. 90.
Ramdohr, P., 1980. The Ore Minerals and Their Intergrowths, 2nd edn. International Series in Earth Sciences,
vol. 35. Pergamon, Oxford, UK (Two volumes).
Relvas, J.M.R.S., Pinto, A., Barriga, F.J.A.S., Ferreira, A., Noiva, P.C., 1997. Geological, textural and para-
genetic relationships among copper, tin and copper tin ores from the Corvo orebody, Portugal. SEG Neves
Corvo Field Conference 1997. Abs. Society of Economic Geologists, Lisbon, Portugal, pp. 94–95.
Serranti, S., Ferrni, V., Masi, U., 1997. Micro-PIXE analyses of trace elements in ore minerals from the Neves-
Corvo deposit (Portugal): preliminary report. In: Barriga, F.J. (Ed.), Abstracts of SEG Neves-Corvo Field
Conference, Society of Economic Geologists, Lisbon, Portugal, pp. 109.
Yuan, X.M., Palsson, B.I., Forssberg, K.S.E., 1996. Statistical interpretation of flotation kinetics for a complex
sulphide ore. Miner. Eng. 9 (4), 429–442.
Yvon, J., Baudracco, J., Cases, J.M., Weiss, J., 1990. Elements de mineralogie quantitative en micro-analyse des
argiles. In: Decarreau, A. (Ed.), Materiaux argileux, Structures, Proprietes et Applications, IV, vol. 3. SFMC,
GFA, Paris, pp. 475–489.
M. Benzaazoua et al. / Int. J. Miner. Process. 66 (2002) 163–181 181