middle income trap for uniqlo - credit suisse
TRANSCRIPT
DISCLOSURE APPENDIX CONTAINS ANALYST CERTIFICATIONS AND THE STATUS OF NON US ANALYSTS. US Disclosure: Credit Suisse does and seeks to do business with companies covered in its research reports. As a result, investors should be aware that the Firm may have a conflict of interest that could affect the objectivity of this report. Investors should consider this report as only a single factor in making their investment decision.
CREDIT SUISSE SECURITIES RESEARCH & ANALYTICS BEYOND INFORMATION®
Client-Driven Solutions, Insights, and Access
28 October 2013
Asia Pacific/Japan
Equity Research
Retailing (Retail (Japan)) / MARKET WEIGHT
Fast Retailing (9983 / 9983 JP) DECREASE TARGET PRICE
Middle income trap for UNIQLO
■ Lower target price: FY8/13 results brought two key concerns into stark relief:
(1) the risk of erosion in brand value at the domestic UNIQLO business; and (2)
signs that Fast Retailing is already seeing growth slow in some semi-developed
economies. We are concerned that investors are not paying sufficient attention
to these risks and lower our earnings estimates, as well as revise down our
target price from ¥17,000 to ¥16,000 (potential return –50.2%).
■ Market in emerging economies still small: We take this opportunity to
reiterate our stance on Fast Retailing shares, not because we view the company
as a global brand with growth potential whose stock is slightly overvalued at this
moment but, rather, on the basis that we are pessimistic regarding the
company’s fundamentals over the next several years and believe the stock is
markedly overpriced. For an overseas store to provide customers capable of
purchasing UNIQLO merchandise—prices for which are roughly the same
worldwide—it must be in a country with per-capita GDP in excess of $30,000 and
have a prime location (inside a large shopping center or on a busy road in a
major city). Fast Retailing has enjoyed great success in non-Japan Asia over
recent years, but in our view it has been cherry-picking the best locations. We
think there is a substantial risk of too few suitable locations in South Korea,
major cities in China, Malaysia, and such.
■ Catalysts/risks: Downside catalysts include a slowdown in domestic same-store
sales, and an overseas performance that falls short of market expectations.
Upside risks include strong sales of cold-weather gear if the coming winter is
even colder than last year’s, and heightened expectations of earnings growth in
the event of unexpected M&A deals.
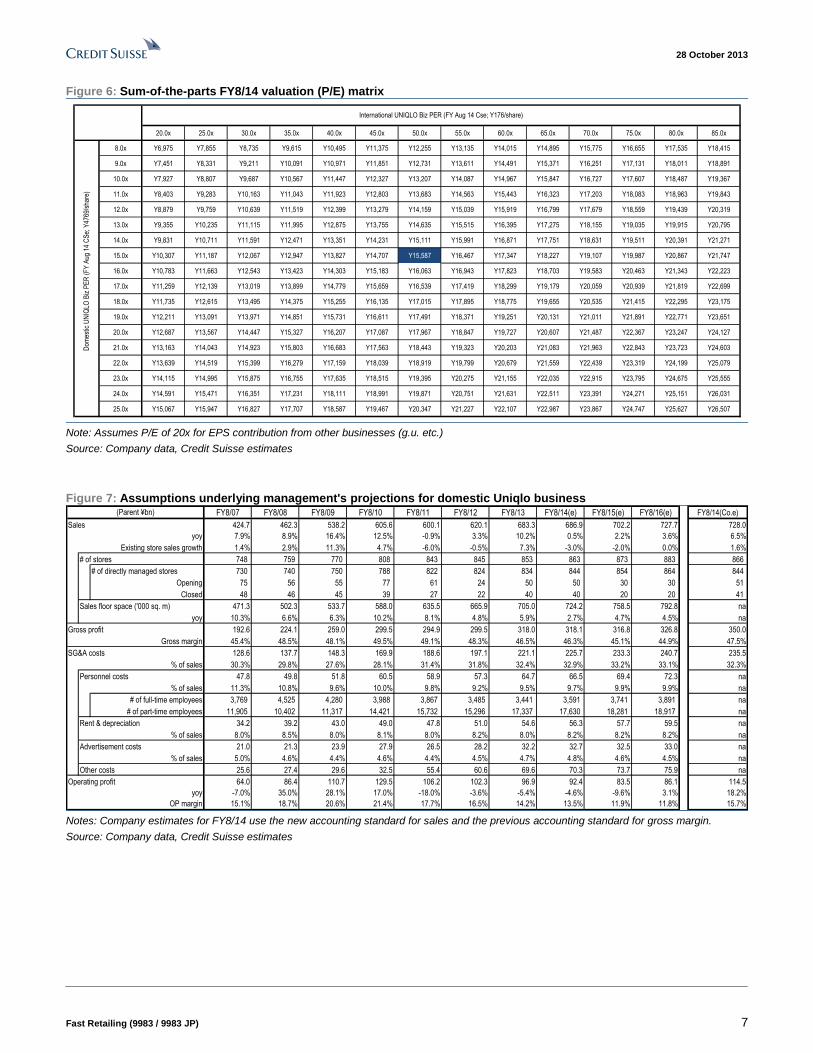
■ Valuation: We base our TP on a fair-value P/E of 23x (assuming P/Es of 15x for
the domestic UNIQLO business, 50x for the overseas UNIQLO business, and
20x for other businesses) applied to FY8/14E EPS. We previously applied a fair-
value P/E of 22x (excluding currency translation effects) to FY8/13 EPS.
Share price performance
80
130
180
010000200003000040000
Price (LHS) Rebased Rel (RHS)
The price relative chart measures performance against the
TOPIX which closed at 1178.28 on 25/10/13
On 25/10/13 the spot exchange rate was ¥97.73/US$1
Performance Over 1M 3M 12M Absolute (%) -14.8 -6.5 80.9 Relative (%) -11.6 -9.1 22.0
Financial and valuation metrics
Year 8/13A 8/14E 8/15E 8/16E Revenue (¥ bn) 1,143.0 1,311.0 1,481.0 1,661.0 Operating profit (¥ bn) 132.9 120.0 124.5 139.0 Recurring profit (¥ bn) 149.0 120.0 125.0 139.5 Net income (¥ bn) 90.4 71.3 76.5 86.6 EPS (¥) 887.1 699.7 750.8 849.9 Change from previous EPS (%) n.a. -3.9 -7.2 IBES Consensus EPS (¥) n.a. 927.0 1,049.4 1,210.5 EPS growth (%) 26.1 -21.1 7.3 13.2 P/E (x) 36.0 45.9 42.8 37.8 Dividend yield (%) 0.91 0.72 0.78 0.87 EV/EBITDA(x) 18.4 19.4 18.5 16.6 P/B (x) 5.8 5.4 5.0 4.6 ROE(%) 19.1 12.3 12.2 12.6 Net debt/equity (%) net cash net cash net cash net cash
Source: Company data, Thomson Reuters, IFIS, Credit Suisse estimates.
Rating UNDERPERFORM* Price (25 Oct 13, ¥) 32,150 Target price (¥) (from 17,000) 16,000¹ Chg to TP (%) -50.2 Market cap. (¥ bn) 3,274.25 (US$ 33.50) Enterprise value (¥ bn) 2,978.84 Number of shares (mn) 101.84 Free float (%) 35.0 52-week price range 41,400 - 16,690
*Stock ratings are relative to the coverage universe in each
analyst's or each team's respective sector.
¹Target price is for 12 months.
Research Analysts
Taketo Yamate
81 3 4550 9963
28 October 2013
Fast Retailing (9983 / 9983 JP) 2
Middle income trap for UNIQLO In our view, the company’s FY8/13 results brought two key concerns into stark relief:
(1) the risk of erosion in brand value at the domestic UNIQLO business; and (2) signs that
Fast Retailing is already seeing growth slow in some semi-developed economies. We are
concerned that investors are not paying sufficient attention to these risks and lower our
earnings estimates, as well as revise down our TP from ¥17,000 to ¥16,000 . We maintain
an UNDPERFORM rating. We also take this opportunity to reiterate our stance on Fast
Retailing shares. We do not view the stock as slightly overvalued. Rather, while we
acknowledge further scope for UNIQLO to grow as a global brand, we believe the stock is
markedly overpriced, as we expect fundamentals to decline over the next few years.
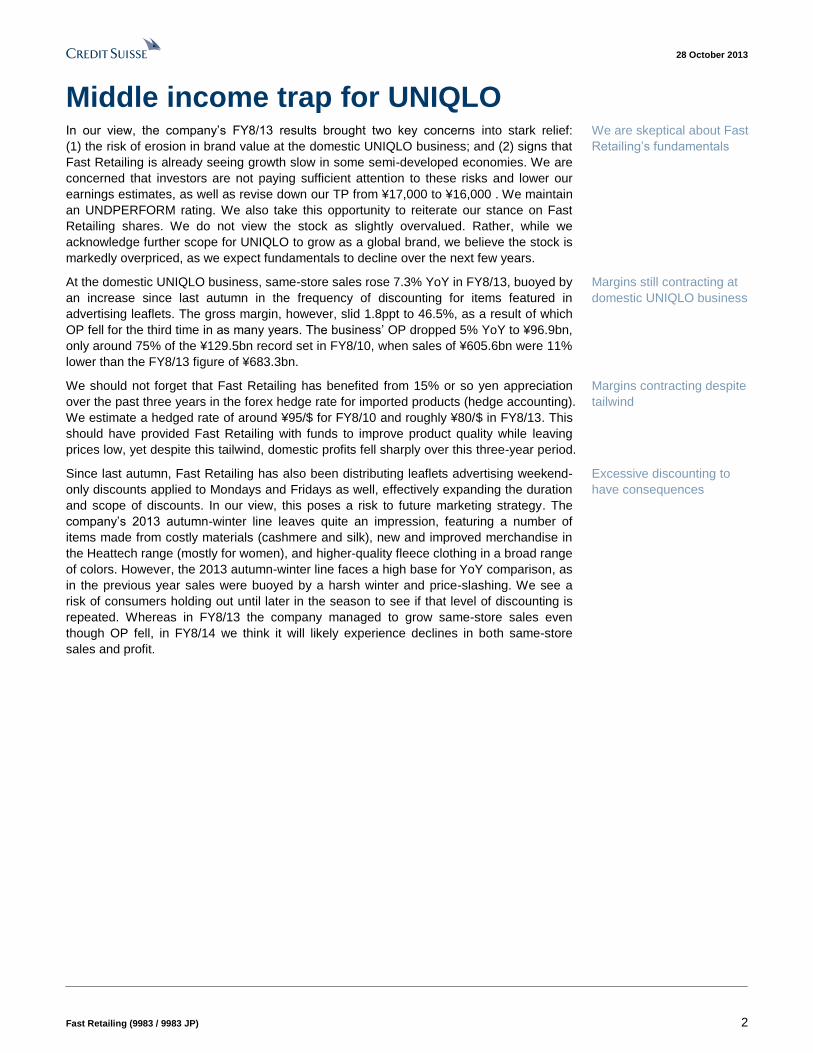
At the domestic UNIQLO business, same-store sales rose 7.3% YoY in FY8/13, buoyed by
an increase since last autumn in the frequency of discounting for items featured in
advertising leaflets. The gross margin, however, slid 1.8ppt to 46.5%, as a result of which
OP fell for the third time in as many years. The business’ OP dropped 5% YoY to ¥96.9bn,
only around 75% of the ¥129.5bn record set in FY8/10, when sales of ¥605.6bn were 11%
lower than the FY8/13 figure of ¥683.3bn.
We should not forget that Fast Retailing has benefited from 15% or so yen appreciation
over the past three years in the forex hedge rate for imported products (hedge accounting).
We estimate a hedged rate of around ¥95/$ for FY8/10 and roughly ¥80/$ in FY8/13. This
should have provided Fast Retailing with funds to improve product quality while leaving
prices low, yet despite this tailwind, domestic profits fell sharply over this three-year period.
Since last autumn, Fast Retailing has also been distributing leaflets advertising weekend-
only discounts applied to Mondays and Fridays as well, effectively expanding the duration
and scope of discounts. In our view, this poses a risk to future marketing strategy. The
company’s 2013 autumn-winter line leaves quite an impression, featuring a number of
items made from costly materials (cashmere and silk), new and improved merchandise in
the Heattech range (mostly for women), and higher-quality fleece clothing in a broad range
of colors. However, the 2013 autumn-winter line faces a high base for YoY comparison, as
in the previous year sales were buoyed by a harsh winter and price-slashing. We see a
risk of consumers holding out until later in the season to see if that level of discounting is
repeated. Whereas in FY8/13 the company managed to grow same-store sales even
though OP fell, in FY8/14 we think it will likely experience declines in both same-store
sales and profit.
We are skeptical about Fast
Retailing’s fundamentals
Margins still contracting at
domestic UNIQLO business
Margins contracting despite
tailwind
Excessive discounting to
have consequences
28 October 2013
Fast Retailing (9983 / 9983 JP) 3
Figure 1: Gross margin at Uniqlo Japan business
-4%
-3%
-2%
-1%
0%
1%
2%
3%
4%
40%
42%
44%
46%
48%
50%
52%
FY101Q
2Q 3Q 4Q FY11Q1
Q2 Q3 Q4 FY12Q1
Q2 Q3 Q4 FY13Q1
Q2 Q3 Q4
Gross Margin YoY change (rhs) Gross Margin (lhs)
Source: Company data, Credit Suisse estimates
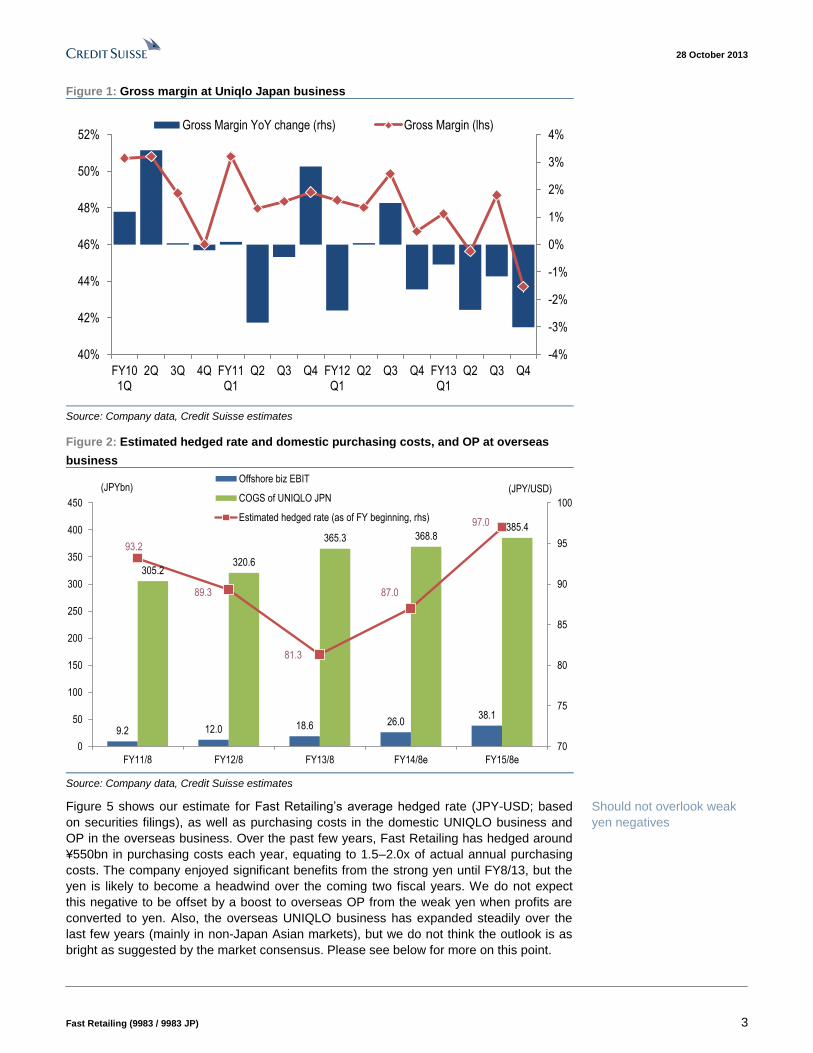
Figure 2: Estimated hedged rate and domestic purchasing costs, and OP at overseas
business
9.2 12.0 18.6 26.038.1
305.2320.6
365.3 368.8385.4
93.2
89.3
81.3
87.0
97.0
70
75
80
85
90
95
100
0
50
100
150
200
250
300
350
400
450
FY11/8 FY12/8 FY13/8 FY14/8e FY15/8e
Offshore biz EBIT
COGS of UNIQLO JPN
Estimated hedged rate (as of FY beginning, rhs)
(JPYbn) (JPY/USD)
Source: Company data, Credit Suisse estimates
Figure 5 shows our estimate for Fast Retailing’s average hedged rate (JPY-USD; based
on securities filings), as well as purchasing costs in the domestic UNIQLO business and
OP in the overseas business. Over the past few years, Fast Retailing has hedged around
¥550bn in purchasing costs each year, equating to 1.5–2.0x of actual annual purchasing
costs. The company enjoyed significant benefits from the strong yen until FY8/13, but the
yen is likely to become a headwind over the coming two fiscal years. We do not expect
this negative to be offset by a boost to overseas OP from the weak yen when profits are
converted to yen. Also, the overseas UNIQLO business has expanded steadily over the
last few years (mainly in non-Japan Asian markets), but we do not think the outlook is as
bright as suggested by the market consensus. Please see below for more on this point.
Should not overlook weak
yen negatives
28 October 2013
Fast Retailing (9983 / 9983 JP) 4
We believe the market has overlooked Fast Retailing’s “middle income trap” risk. On this
point, we probably diverge quite significantly from the market consensus. “Middle income
trap” usually refers to countries that have achieved economic growth driven by low-cost
manufacturing facing a loss of competitiveness due to even lower labor costs in other
countries that have caught up. Our use of the term “middle income trap” for UNIQLO is
slightly different.
Fast Retailing essentially sets the same prices for the UNIQLO brand in the global market
as it does in Japan (around 20% of its overseas product lineup has been specifically
developed for non-Japanese markets, but it does not always apply local pricing). Under
this pricing strategy, we estimate the brand can only generate a reasonable profit if
(1) consumers with a per capita GDP of at least $30,000 account for a large section of the
local population (in other words, wealthy consumers; middle-class consumers with a per
capita GDP of under $10,000 still lack buying power, in our view), and (2) large UNIQLO
stores are located in major shopping centers or key shopping districts in leading cities. We
therefore see the risk that an active store opening program targeting growth in middle-
class consumers in non-Japan Asia over the next 5–10 years may not generate the level
of profits the market expects. This is what we mean by UNIQLO’s “middle income trap”
risk. UNIQLO may struggle to build on the approach it has taken of “skimming off the
cream” in non-Japan Asia over the last few years: a strategy of all-out expansion in
leading Asian cities targeting wealthy consumers. In FY8/14 Fast Retailing plans to
actively open stores in South Korea, and major cities in China, Malaysia, and Indonesia,
but we think this could give it more stores than it actually needs. However, it may be the
right approach, provided a large number of middle class consumers emerge in those
countries by around 2020.
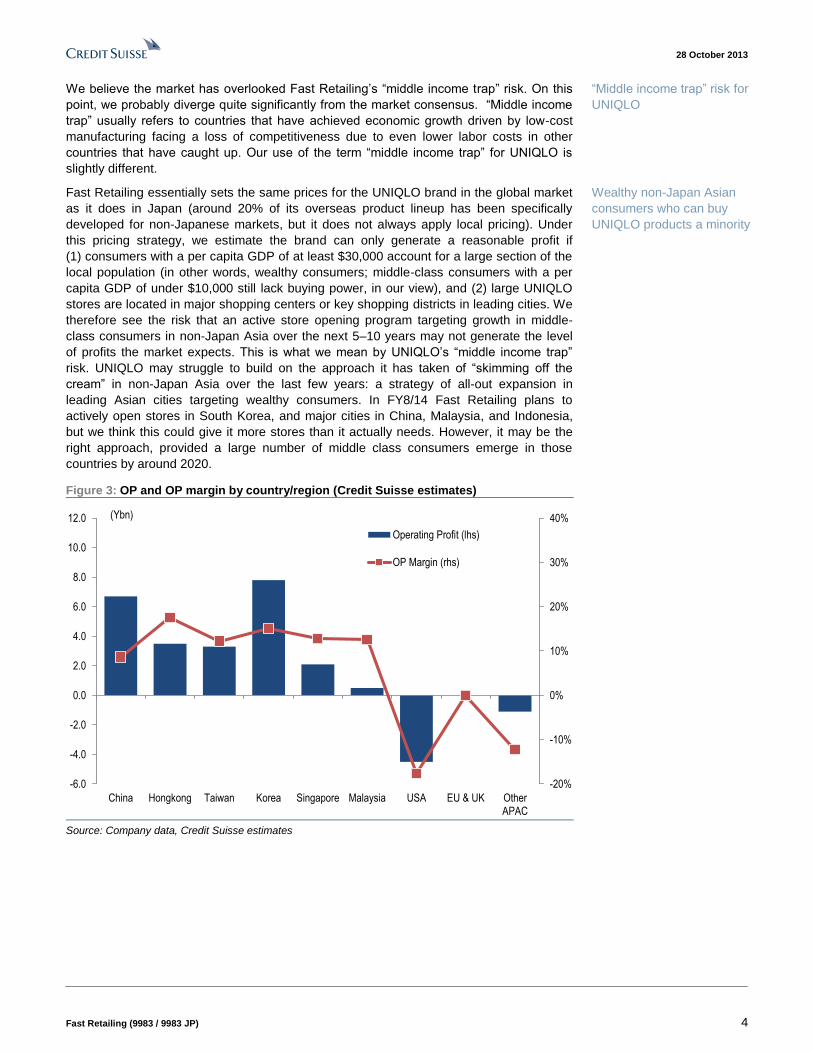
Figure 3: OP and OP margin by country/region (Credit Suisse estimates)
-20%
-10%
0%
10%
20%
30%
40%
-6.0
-4.0
-2.0
0.0
2.0
4.0
6.0
8.0
10.0
12.0
China Hongkong Taiwan Korea Singapore Malaysia USA EU & UK OtherAPAC
Operating Profit (lhs)
OP Margin (rhs)
(Ybn)
Source: Company data, Credit Suisse estimates
“Middle income trap” risk for
UNIQLO
Wealthy non-Japan Asian
consumers who can buy
UNIQLO products a minority
28 October 2013
Fast Retailing (9983 / 9983 JP) 5
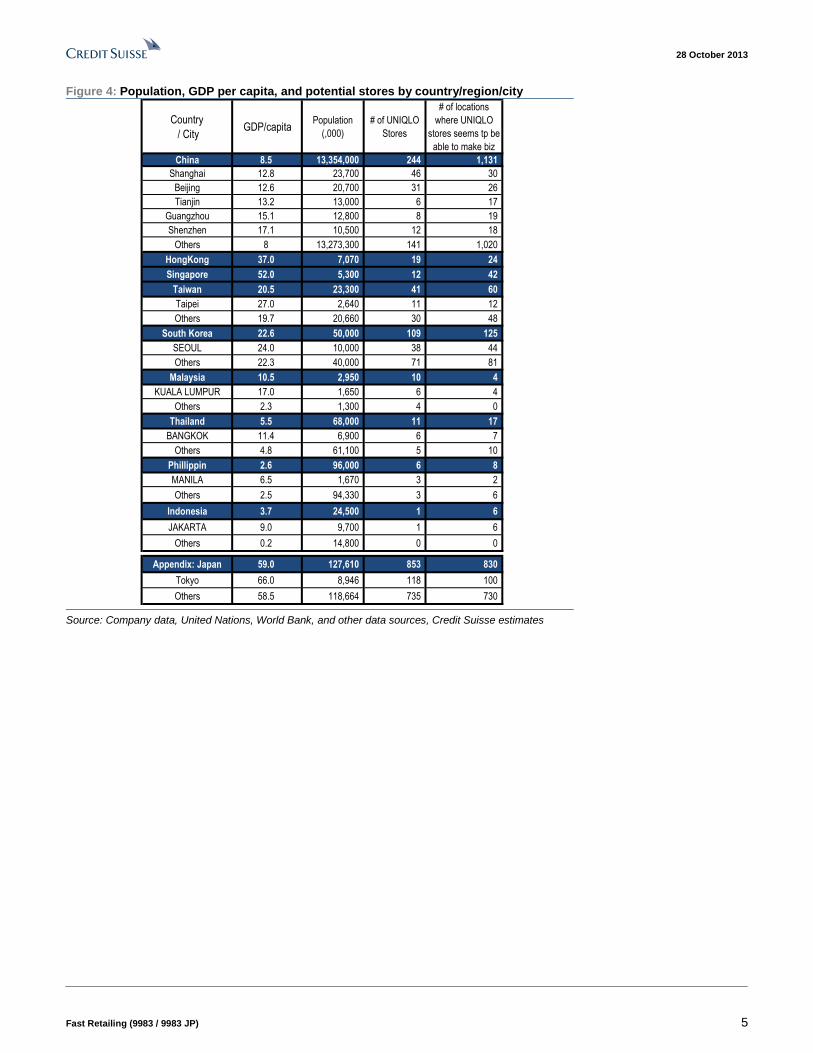
Figure 4: Population, GDP per capita, and potential stores by country/region/city
Country
/ CityGDP/capita
Population
(,000)
# of UNIQLO
Stores
# of locations
where UNIQLO
stores seems tp be
able to make biz
China 8.5 13,354,000 244 1,131
Shanghai 12.8 23,700 46 30
Beijing 12.6 20,700 31 26
Tianjin 13.2 13,000 6 17
Guangzhou 15.1 12,800 8 19
Shenzhen 17.1 10,500 12 18
Others 8 13,273,300 141 1,020
HongKong 37.0 7,070 19 24
Singapore 52.0 5,300 12 42
Taiwan 20.5 23,300 41 60
Taipei 27.0 2,640 11 12
Others 19.7 20,660 30 48
South Korea 22.6 50,000 109 125
SEOUL 24.0 10,000 38 44
Others 22.3 40,000 71 81
Malaysia 10.5 2,950 10 4
KUALA LUMPUR 17.0 1,650 6 4
Others 2.3 1,300 4 0
Thailand 5.5 68,000 11 17
BANGKOK 11.4 6,900 6 7
Others 4.8 61,100 5 10
Phillippin 2.6 96,000 6 8
MANILA 6.5 1,670 3 2
Others 2.5 94,330 3 6
Indonesia 3.7 24,500 1 6
JAKARTA 9.0 9,700 1 6
Others 0.2 14,800 0 0
Appendix: Japan 59.0 127,610 853 830
Tokyo 66.0 8,946 118 100
Others 58.5 118,664 735 730
Source: Company data, United Nations, World Bank, and other data sources, Credit Suisse estimates

28 October 2013
Fast Retailing (9983 / 9983 JP) 6
Figure 5: OP trend for Uniqlo overseas
2.9 2.6
1.8
0.6
3.7
2.9
1.8
-0.2
2.6
3.3
0.2
-3.0
4.7 4.7
1.8
-1.1
-7.0
-5.0
-3.0
-1.0
1.0
3.0
5.0
7.0
FY12 Q1 Q2 Q3 Q4 FY13 Q1 Q2 Q3 Q4
OP of Korea, Singapore, Malaysia and etc (lhs) OP of other overseas areas (lhs)
(Ybn)
Source: Company data, Credit Suisse estimates
The UNIQLO business in South Korea is already showing the first signs of the middle
income trap. In our reports since last year, we have consistently pointed out that South
Korea generates a significant proportion of profits for the overseas UNIQLO business, but
growth has been muted. Figure 5 shows our estimate of quarterly OP for: (1) overseas
consolidated subsidiaries that are not wholly owned (South Korea, Singapore, Malaysia,
Thailand, Indonesia and the Philippines) and for (2) overseas subsidiaries that are wholly
owned (China, Hong Kong, Taiwan, US, France and Russia), based on minority interests
in income as shown in the consolidated statements. The company disclosed sales
(¥125bn) and OP (¥13.5bn) for its business in the greater China area (China, Hong Kong,
Taiwan) for the first time in FY8/13 results. Until that point, using minority interests in
income was the only way of estimating regional earnings trends. We plan to continue
using this approach, as the company shows no sign of disclosing data on a country-by-
country basis for greater China, Europe, or North America. Disclosing more detailed
country and regional data on sales and profits would benefit shareholders, but overall, we
do not view the lack of disclosure as a corporate governance issue, as Fast Retailing has
only a handful of UNIQLO stores in some of those countries and markets.
We estimate South Korea generates most of the OP in the first group of subsidiaries in
Figure 5, followed by Singapore. Profits in Singapore are relatively stable, so the blue bars
likely reflect how OP is trending in South Korea. Fast Retailing also said at its FY8/13
results briefing that the South Korean business recorded an operating loss in the final
quarter. As shown in Figure 3, we believe South Korea makes the largest contribution to
profits in the overseas UNIQLO business. The company cited one-off issues such as poor
weather and inventory management errors for the fall into loss in South Korea. However,
based on our analysis of regional store capacity (Figure 4), we think sales cannibalization
due to the sustained and rapid rollout of stores is more likely to blame. We see the risk of
more serious issues emerging in 1H FY8/14 (drop in consolidated earnings), as the
company plans to open a further 30 stores in South Korea in FY8/14 and sales could fall
back YoY in reaction to strong sales of thermal wear last year, when South Korea
experienced an unprecedentedly cold winter.
Reasons behind
deterioration in South Korea
earnings
UNIQLO stores may have
reached saturation point in
South Korea
28 October 2013
Fast Retailing (9983 / 9983 JP) 7
Figure 6: Sum-of-the-parts FY8/14 valuation (P/E) matrix
20.0x 25.0x 30.0x 35.0x 40.0x 45.0x 50.0x 55.0x 60.0x 65.0x 70.0x 75.0x 80.0x 85.0x
8.0x Y6,975 Y7,855 Y8,735 Y9,615 Y10,495 Y11,375 Y12,255 Y13,135 Y14,015 Y14,895 Y15,775 Y16,655 Y17,535 Y18,415
9.0x Y7,451 Y8,331 Y9,211 Y10,091 Y10,971 Y11,851 Y12,731 Y13,611 Y14,491 Y15,371 Y16,251 Y17,131 Y18,011 Y18,891
10.0x Y7,927 Y8,807 Y9,687 Y10,567 Y11,447 Y12,327 Y13,207 Y14,087 Y14,967 Y15,847 Y16,727 Y17,607 Y18,487 Y19,367
11.0x Y8,403 Y9,283 Y10,163 Y11,043 Y11,923 Y12,803 Y13,683 Y14,563 Y15,443 Y16,323 Y17,203 Y18,083 Y18,963 Y19,843
12.0x Y8,879 Y9,759 Y10,639 Y11,519 Y12,399 Y13,279 Y14,159 Y15,039 Y15,919 Y16,799 Y17,679 Y18,559 Y19,439 Y20,319
13.0x Y9,355 Y10,235 Y11,115 Y11,995 Y12,875 Y13,755 Y14,635 Y15,515 Y16,395 Y17,275 Y18,155 Y19,035 Y19,915 Y20,795
14.0x Y9,831 Y10,711 Y11,591 Y12,471 Y13,351 Y14,231 Y15,111 Y15,991 Y16,871 Y17,751 Y18,631 Y19,511 Y20,391 Y21,271
15.0x Y10,307 Y11,187 Y12,067 Y12,947 Y13,827 Y14,707 Y15,587 Y16,467 Y17,347 Y18,227 Y19,107 Y19,987 Y20,867 Y21,747
16.0x Y10,783 Y11,663 Y12,543 Y13,423 Y14,303 Y15,183 Y16,063 Y16,943 Y17,823 Y18,703 Y19,583 Y20,463 Y21,343 Y22,223
17.0x Y11,259 Y12,139 Y13,019 Y13,899 Y14,779 Y15,659 Y16,539 Y17,419 Y18,299 Y19,179 Y20,059 Y20,939 Y21,819 Y22,699
18.0x Y11,735 Y12,615 Y13,495 Y14,375 Y15,255 Y16,135 Y17,015 Y17,895 Y18,775 Y19,655 Y20,535 Y21,415 Y22,295 Y23,175
19.0x Y12,211 Y13,091 Y13,971 Y14,851 Y15,731 Y16,611 Y17,491 Y18,371 Y19,251 Y20,131 Y21,011 Y21,891 Y22,771 Y23,651
20.0x Y12,687 Y13,567 Y14,447 Y15,327 Y16,207 Y17,087 Y17,967 Y18,847 Y19,727 Y20,607 Y21,487 Y22,367 Y23,247 Y24,127
21.0x Y13,163 Y14,043 Y14,923 Y15,803 Y16,683 Y17,563 Y18,443 Y19,323 Y20,203 Y21,083 Y21,963 Y22,843 Y23,723 Y24,603
22.0x Y13,639 Y14,519 Y15,399 Y16,279 Y17,159 Y18,039 Y18,919 Y19,799 Y20,679 Y21,559 Y22,439 Y23,319 Y24,199 Y25,079
23.0x Y14,115 Y14,995 Y15,875 Y16,755 Y17,635 Y18,515 Y19,395 Y20,275 Y21,155 Y22,035 Y22,915 Y23,795 Y24,675 Y25,555
24.0x Y14,591 Y15,471 Y16,351 Y17,231 Y18,111 Y18,991 Y19,871 Y20,751 Y21,631 Y22,511 Y23,391 Y24,271 Y25,151 Y26,031
25.0x Y15,067 Y15,947 Y16,827 Y17,707 Y18,587 Y19,467 Y20,347 Y21,227 Y22,107 Y22,987 Y23,867 Y24,747 Y25,627 Y26,507
Dom
estic
UN
IQLO
Biz
PE
R (
FY
Aug
14
CS
e; Y
4769
/sha
re)
International UNIQLO Biz PER (FY Aug 14 Cse; Y176/share)
Note: Assumes P/E of 20x for EPS contribution from other businesses (g.u. etc.)
Source: Company data, Credit Suisse estimates
Figure 7: Assumptions underlying management's projections for domestic Uniqlo business FY8/07 FY8/08 FY8/09 FY8/10 FY8/11 FY8/12 FY8/13 FY8/14(e) FY8/15(e) FY8/16(e) FY8/14(Co.e)
Sales 424.7 462.3 538.2 605.6 600.1 620.1 683.3 686.9 702.2 727.7 728.0
yoy 7.9% 8.9% 16.4% 12.5% -0.9% 3.3% 10.2% 0.5% 2.2% 3.6% 6.5%
Existing store sales growth 1.4% 2.9% 11.3% 4.7% -6.0% -0.5% 7.3% -3.0% -2.0% 0.0% 1.6%
# of stores 748 759 770 808 843 845 853 863 873 883 866
# of directly managed stores 730 740 750 788 822 824 834 844 854 864 844
Opening 75 56 55 77 61 24 50 50 30 30 51
Closed 48 46 45 39 27 22 40 40 20 20 41
Sales floor space ('000 sq. m) 471.3 502.3 533.7 588.0 635.5 665.9 705.0 724.2 758.5 792.8 na
yoy 10.3% 6.6% 6.3% 10.2% 8.1% 4.8% 5.9% 2.7% 4.7% 4.5% na
Gross profit 192.6 224.1 259.0 299.5 294.9 299.5 318.0 318.1 316.8 326.8 350.0
Gross margin 45.4% 48.5% 48.1% 49.5% 49.1% 48.3% 46.5% 46.3% 45.1% 44.9% 47.5%
SG&A costs 128.6 137.7 148.3 169.9 188.6 197.1 221.1 225.7 233.3 240.7 235.5
% of sales 30.3% 29.8% 27.6% 28.1% 31.4% 31.8% 32.4% 32.9% 33.2% 33.1% 32.3%
Personnel costs 47.8 49.8 51.8 60.5 58.9 57.3 64.7 66.5 69.4 72.3 na
% of sales 11.3% 10.8% 9.6% 10.0% 9.8% 9.2% 9.5% 9.7% 9.9% 9.9% na
# of full-time employees 3,769 4,525 4,280 3,988 3,867 3,485 3,441 3,591 3,741 3,891 na
# of part-time employees 11,905 10,402 11,317 14,421 15,732 15,296 17,337 17,630 18,281 18,917 na
Rent & depreciation 34.2 39.2 43.0 49.0 47.8 51.0 54.6 56.3 57.7 59.5 na
% of sales 8.0% 8.5% 8.0% 8.1% 8.0% 8.2% 8.0% 8.2% 8.2% 8.2% na
Advertisement costs 21.0 21.3 23.9 27.9 26.5 28.2 32.2 32.7 32.5 33.0 na
% of sales 5.0% 4.6% 4.4% 4.6% 4.4% 4.5% 4.7% 4.8% 4.6% 4.5% na
Other costs 25.6 27.4 29.6 32.5 55.4 60.6 69.6 70.3 73.7 75.9 na
Operating profit 64.0 86.4 110.7 129.5 106.2 102.3 96.9 92.4 83.5 86.1 114.5
yoy -7.0% 35.0% 28.1% 17.0% -18.0% -3.6% -5.4% -4.6% -9.6% 3.1% 18.2%
OP margin 15.1% 18.7% 20.6% 21.4% 17.7% 16.5% 14.2% 13.5% 11.9% 11.8% 15.7%
(Parent ¥bn)
Notes: Company estimates for FY8/14 use the new accounting standard for sales and the previous accounting standard for gross margin.
Source: Company data, Credit Suisse estimates

28 October 2013
Fast Retailing (9983 / 9983 JP) 8
Figure 8: Assumptions underlying Fast Retailing's earnings projections FY8/07 FY8/08 FY8/09 FY8/10 FY8/11 FY8/12 FY8/13 FY8/14(e) FY8/15(e) FY8/16(e) FY8/14(Co.e)
Sales 525.2 586.5 685.0 814.8 820.3 928.7 1,143.0 1,311.0 1,481.0 1,661.0 1,330.0
yoy 17.0% 11.7% 16.8% 18.9% 0.7% 13.2% 23.1% 14.7% 13.0% 12.2% 16.4%
Domestic UNIQLO biz 424.7 462.3 538.2 605.6 600.1 620.1 683.3 686.9 702.2 727.7 728.0
yoy 7.9% 8.9% 16.4% 12.5% -0.9% 3.3% 10.2% 0.5% 2.2% 3.6% 6.5%
Overseas UNIQLO biz 17.0 29.3 37.8 72.7 93.7 153.4 251.1 376.6 496.0 618.0 350.0
yoy 94.6% 72.6% 28.8% 92.4% 28.9% 63.7% 63.7% 50.0% 31.7% 24.6% 39.4%
Other domestic biz 46.1 49.5 51.5 45.1 - - - - - - -
yoy 99.6% 7.3% 4.1% -12.5% - - - - - - -
Global brand biz 36.7 43.8 55.6 89.8 124.1 153.0 206.2 241.6 276.7 309.6 250.0
yoy 61.5% 19.1% 27.0% 61.6% 38.1% 23.3% 34.8% 17.2% 14.5% 11.9% 21.2%
Operating profit 65.0 87.5 108.6 132.4 116.4 126.5 132.9 120.0 124.5 139.0 156.0
yoy -7.7% 34.7% 24.2% 21.9% -12.1% 8.7% 5.1% -9.7% 3.8% 11.6% 17.4%
Domestic UNIQLO biz 64.0 86.4 110.7 129.5 106.2 102.3 96.9 92.4 83.5 86.1 114.5
yoy -7.0% 35.0% 28.1% 17.0% -18.0% -3.6% -5.4% -4.6% -9.6% 3.1% 18.2%
Overseas UNIQLO biz -1.0 0.3 1.6 6.3 9.0 12.0 18.6 26.0 38.1 46.1 28.0
yoy - - 433.3% 293.8% 42.1% 34.0% 55.3% 39.4% 46.6% 21.0% 50.3%
Other domestic biz -3.5 -2.8 -0.5 -1.5 - - - - - - -
yoy - - - - - - - - - - -
Global brand biz 7.2 7.7 3.6 7.4 8.8 14.5 17.5 23.1 27.3 31.5 24.0
yoy 42.9% 6.9% -53.2% 105.6% 18.8% 65.4% 20.1% 32.1% 18.2% 15.4% 37.4%
# of stores 1,828 1,969 2,258 2,203 2,088 2,222 2,449 2,751 2,957 3,197 2,774
Domestic UNIQLO biz 748 759 770 808 843 845 853 863 873 883 866
Overseas UNIQLO biz 39 54 92 136 181 292 446 622 744 904 644
China (mainland) 9 13 33 54 80 145 225 300 385 485 305
HK 4 8 11 13 15 16 18 21 22 24 21
Taiwan - - - - 1 17 37 50 60 68 52
Korea 14 18 30 48 62 80 105 125 115 115 135
Singapore - - 2 3 5 7 12 20 21 22 20
UK 11 13 14 14 11 10 10 10 10 10 10
US 1 1 1 1 1 3 7 27 38 58 22
France - 1 1 2 1 2 3 5 8 10 5
Russia - - - 1 3 2 2 2 2 2 4
Malaysia - - - - 2 5 10 18 20 23 22
Thailand - - - - - 4 10 19 25 35 19
Philippine - - - - - 1 6 21 30 37 21
Indonesia - 1 4 8 15 4
Australia 3
Germany 1
Other domestic biz 605 658 556 402 - - - - - - -
Global brand biz 436 498 840 857 1,064 1,085 1,150 1,266 1,340 1,410 1,264
(Consolidated ¥bn)
Source: Company data, Credit Suisse estimates
28 October 2013
Fast Retailing (9983 / 9983 JP) 9
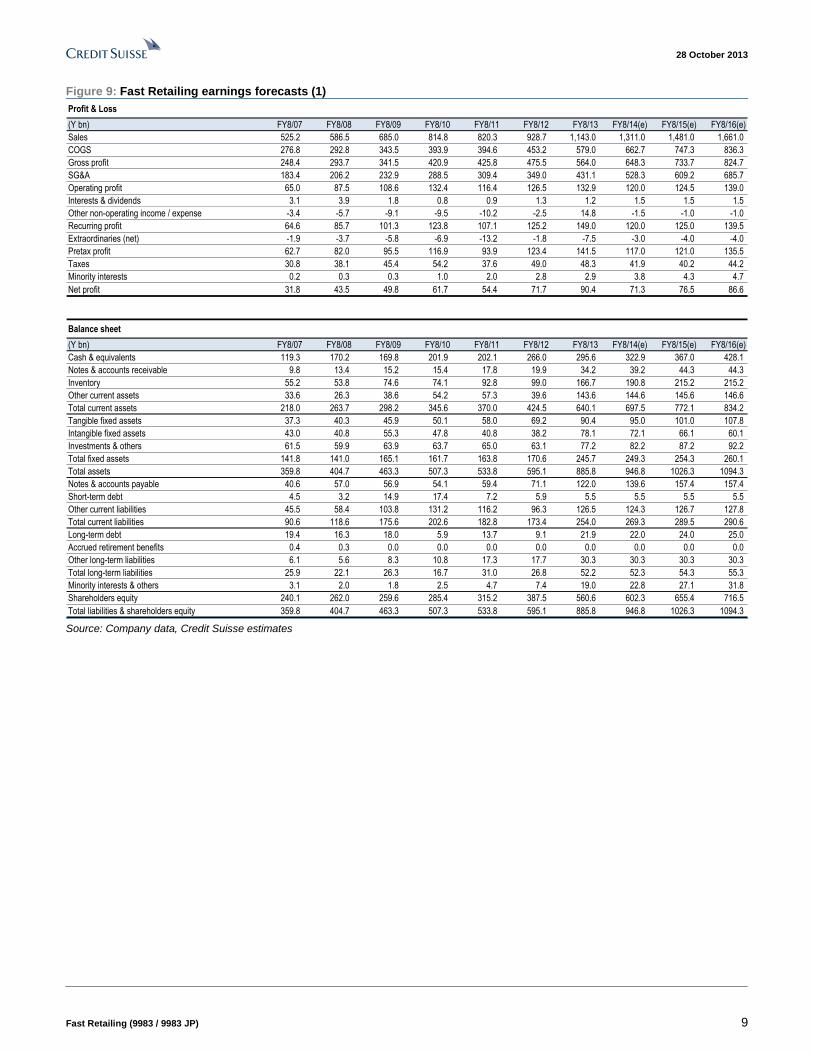
Figure 9: Fast Retailing earnings forecasts (1)
Profit & Loss
(Y bn) FY8/07 FY8/08 FY8/09 FY8/10 FY8/11 FY8/12 FY8/13 FY8/14(e) FY8/15(e) FY8/16(e)
Sales 525.2 586.5 685.0 814.8 820.3 928.7 1,143.0 1,311.0 1,481.0 1,661.0
COGS 276.8 292.8 343.5 393.9 394.6 453.2 579.0 662.7 747.3 836.3
Gross profit 248.4 293.7 341.5 420.9 425.8 475.5 564.0 648.3 733.7 824.7
SG&A 183.4 206.2 232.9 288.5 309.4 349.0 431.1 528.3 609.2 685.7
Operating profit 65.0 87.5 108.6 132.4 116.4 126.5 132.9 120.0 124.5 139.0
Interests & dividends 3.1 3.9 1.8 0.8 0.9 1.3 1.2 1.5 1.5 1.5
Other non-operating income / expense -3.4 -5.7 -9.1 -9.5 -10.2 -2.5 14.8 -1.5 -1.0 -1.0
Recurring profit 64.6 85.7 101.3 123.8 107.1 125.2 149.0 120.0 125.0 139.5
Extraordinaries (net) -1.9 -3.7 -5.8 -6.9 -13.2 -1.8 -7.5 -3.0 -4.0 -4.0
Pretax profit 62.7 82.0 95.5 116.9 93.9 123.4 141.5 117.0 121.0 135.5
Taxes 30.8 38.1 45.4 54.2 37.6 49.0 48.3 41.9 40.2 44.2
Minority interests 0.2 0.3 0.3 1.0 2.0 2.8 2.9 3.8 4.3 4.7
Net profit 31.8 43.5 49.8 61.7 54.4 71.7 90.4 71.3 76.5 86.6
Balance sheet
(Y bn) FY8/07 FY8/08 FY8/09 FY8/10 FY8/11 FY8/12 FY8/13 FY8/14(e) FY8/15(e) FY8/16(e)
Cash & equivalents 119.3 170.2 169.8 201.9 202.1 266.0 295.6 322.9 367.0 428.1
Notes & accounts receivable 9.8 13.4 15.2 15.4 17.8 19.9 34.2 39.2 44.3 44.3
Inventory 55.2 53.8 74.6 74.1 92.8 99.0 166.7 190.8 215.2 215.2
Other current assets 33.6 26.3 38.6 54.2 57.3 39.6 143.6 144.6 145.6 146.6
Total current assets 218.0 263.7 298.2 345.6 370.0 424.5 640.1 697.5 772.1 834.2
Tangible fixed assets 37.3 40.3 45.9 50.1 58.0 69.2 90.4 95.0 101.0 107.8
Intangible fixed assets 43.0 40.8 55.3 47.8 40.8 38.2 78.1 72.1 66.1 60.1
Investments & others 61.5 59.9 63.9 63.7 65.0 63.1 77.2 82.2 87.2 92.2
Total fixed assets 141.8 141.0 165.1 161.7 163.8 170.6 245.7 249.3 254.3 260.1
Total assets 359.8 404.7 463.3 507.3 533.8 595.1 885.8 946.8 1026.3 1094.3
Notes & accounts payable 40.6 57.0 56.9 54.1 59.4 71.1 122.0 139.6 157.4 157.4
Short-term debt 4.5 3.2 14.9 17.4 7.2 5.9 5.5 5.5 5.5 5.5
Other current liabilities 45.5 58.4 103.8 131.2 116.2 96.3 126.5 124.3 126.7 127.8
Total current liabilities 90.6 118.6 175.6 202.6 182.8 173.4 254.0 269.3 289.5 290.6
Long-term debt 19.4 16.3 18.0 5.9 13.7 9.1 21.9 22.0 24.0 25.0
Accrued retirement benefits 0.4 0.3 0.0 0.0 0.0 0.0 0.0 0.0 0.0 0.0
Other long-term liabilities 6.1 5.6 8.3 10.8 17.3 17.7 30.3 30.3 30.3 30.3
Total long-term liabilities 25.9 22.1 26.3 16.7 31.0 26.8 52.2 52.3 54.3 55.3
Minority interests & others 3.1 2.0 1.8 2.5 4.7 7.4 19.0 22.8 27.1 31.8
Shareholders equity 240.1 262.0 259.6 285.4 315.2 387.5 560.6 602.3 655.4 716.5
Total liabilities & shareholders equity 359.8 404.7 463.3 507.3 533.8 595.1 885.8 946.8 1026.3 1094.3 Source: Company data, Credit Suisse estimates

28 October 2013
Fast Retailing (9983 / 9983 JP) 10
Figure 10: Fast Retailing earnings forecasts (2)
Cash flow
(Y bn) FY8/07 FY8/08 FY8/09 FY8/10 FY8/11 FY8/12 FY8/13 FY8/14(e) FY8/15(e) FY8/16(e)
Cash flow from operating activities
Pretax income 62.7 82.0 95.5 116.9 93.9 123.4 141.5 117.0 121.0 135.5
Depreciation 10.8 13.8 16.2 19.8 25.4 24.2 29.0 33.4 34.0 34.5
Appraisal losses 0.8 1.8 3.1 5.2 1.4 1.1 5.6 1.0 1.0 1.0
Increase of allowance reserve -0.3 -0.4 1.3 4.2 0.5 1.7 0.5 0.0 0.0 0.0
Working capital (incr) decr -15.5 13.7 -18.7 -3.9 -17.4 2.5 -14.5 -11.5 -11.7 -9.0
Tax payment -43.2 -29.4 -40.6 -57.9 -56.0 -32.6 -55.4 -49.4 -43.0 -41.3
Other 3.5 5.8 2.4 4.4 9.4 7.3 -7.3 2.7 2.7 2.7
Subtotal (1) 18.8 87.3 59.2 88.6 57.2 127.6 99.4 93.2 104.0 123.4
Cash flow from investing activities
Capital expenditure -17.9 -15.8 -13.0 -21.3 -25.5 -31.4 -31.7 -33.5 -35.5 -36.8
Increase of guaranty money deposited (net) -3.5 0.5 -4.9 0.1 -1.3 12.2 -4.1 -3.5 -3.5 -3.5
Expenditure for purchase of securities (net) -9.4 0.0 -15.0 -0.7 -0.6 0.0 0.0 0.0 0.0 0.0
Disposal of fixed assets 2.3 0.2 0.1 0.0 0.2 0.2 0.3 0.5 0.5 0.5
Other -0.3 -0.3 -1.5 -1.5 0.6 -16.3 -28.3 0.0 0.0 1.0
Subtotal (2) -28.8 -15.4 -34.3 -23.4 -26.6 -35.3 -63.9 -36.5 -38.5 -38.8
Cash flow from financing activities
Net increase of interest-bearing debt 0.4 -4.6 -1.8 -6.5 -2.9 -4.5 7.4 0.1 2.0 1.0
Dividend payment -13.7 -12.7 -14.3 -20.4 -21.4 -21.9 -27.5 -29.5 -23.4 -25.5
Share Issues 0.8 0.0 -0.6 -0.7 0.0 -0.3 -0.9 0.0 0.0 0.0
Other -0.2 -1.7 -0.3 -1.4 -1.8 -2.4 -3.0 0.0 0.0 0.0
Subtotal (3) -12.8 -19.1 -16.8 -28.9 -26.2 -29.1 -23.9 -29.4 -21.4 -24.5
Cash and cash equivalents
Net increase of cash (1)+(2)+(3) -22.5 52.9 8.1 36.3 4.4 63.3 11.6 27.3 44.1 60.1
Exchange difference 0.5 -2.2 -8.4 -5.4 -2.7 0.6 18.0 0.0 0.0 1.0
Balance at end of year 119.2 169.9 169.6 200.5 202.1 266.0 295.6 322.9 367.0 427.1
Financial indicator
FY8/07 FY8/08 FY8/09 FY8/10 FY8/11 FY8/12 FY8/13 FY8/14(e) FY8/15(e) FY8/16(e)
Fixed asset turnover (x) 3.9 4.1 4.5 5.0 5.0 5.6 5.5 5.3 5.9 6.5
Current asset turnover (x) 2.2 2.4 2.4 2.5 2.3 2.3 2.1 2.0 2.0 2.1
Inventory turnover (days) 63.7 67.0 67.3 67.9 76.1 76.1 82.6 97.1 97.8 92.6
Receivables turnover (days) 6.3 7.1 7.5 6.8 7.3 7.3 8.5 10.1 10.1 9.6
Payables turnover (days) 51.9 60.3 56.3 50.8 49.4 51.1 53.7 68.5 69.3 67.7
Equity / assets (%) 66.7 64.7 56.0 56.3 59.1 65.1 63.3 63.6 63.9 65.5
Interest cover (x) 36.3 51.1 105.1 234.7 177.5 218.2 224.6 235.0 243.0 272.0
Net debt (cash) (Y bn) -95.4 -150.7 -136.9 -178.7 -181.2 -251.0 -268.2 -295.4 -337.5 -397.6
Net gearing (x) -0.4 -0.6 -0.5 -0.6 -0.6 -0.6 -0.5 -0.5 -0.5 -0.6
OP margin (%) 12.4 14.9 15.9 16.2 14.2 13.6 11.6 9.2 8.4 8.4
Asset turnover (x) 1.4 1.5 1.6 1.7 1.6 1.6 1.5 1.4 1.5 1.6
Return on assets (%) 17.6 22.9 25.0 27.3 22.4 22.4 18.0 13.1 12.6 13.1
Pretax profit / OP (x) 1.0 0.9 0.9 0.9 0.8 1.0 1.1 1.0 1.0 1.0
Tax burden (x) 0.5 0.5 0.5 0.5 0.6 0.6 0.6 0.6 0.6 0.6
Financial leverage (x) 1.6 1.5 1.7 1.8 1.7 1.6 1.6 1.6 1.6 1.5
Return on equity (%) 13.6 17.3 19.1 22.6 18.1 20.4 19.1 12.3 12.2 12.6
Gross margin (%) 47.3 50.1 49.9 51.7 51.9 51.2 49.3 49.5 49.5 49.7
SG&A ratio (%) 34.9 35.2 34.0 35.4 37.7 37.6 37.7 40.3 41.1 41.3
Financial balance (Y bn) -0.5 0.6 -0.1 -0.2 -0.1 0.1 0.0 0.5 0.5 0.5
Recurring margin (%) 12.3 14.6 14.8 15.2 13.1 13.5 13.0 9.2 8.4 8.4
Effective tax rate (%) 49.1 46.5 47.6 46.4 40.0 39.7 34.1 35.8 33.2 32.6
Net margin (%) 6.1 7.4 7.3 7.6 6.6 7.7 7.9 5.4 5.2 5.2
EBITDA (Y bn) 75.8 101.3 124.9 152.1 141.7 150.7 161.9 153.4 158.5 173.5
EBITDA margin (%) 14.4 17.3 18.2 18.7 17.3 16.2 14.2 11.7 10.7 10.4 Source: Company data, Credit Suisse estimates
28 October 2013
Fast Retailing (9983 / 9983 JP) 11
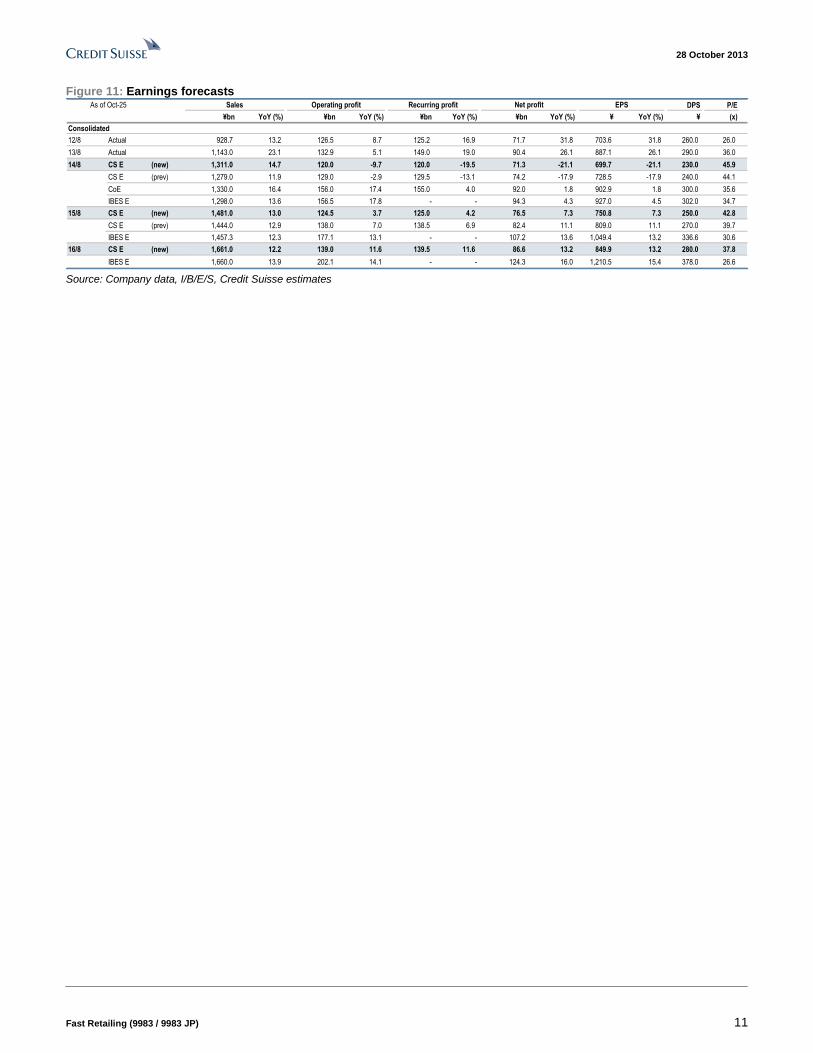
Figure 11: Earnings forecasts DPS P/E
¥bn YoY (%) ¥bn YoY (%) ¥bn YoY (%) ¥bn YoY (%) ¥ YoY (%) ¥ (x)
Consolidated
12/8 Actual 928.7 13.2 126.5 8.7 125.2 16.9 71.7 31.8 703.6 31.8 260.0 26.0
13/8 Actual 1,143.0 23.1 132.9 5.1 149.0 19.0 90.4 26.1 887.1 26.1 290.0 36.0
14/8 CS E (new) 1,311.0 14.7 120.0 -9.7 120.0 -19.5 71.3 -21.1 699.7 -21.1 230.0 45.9
CS E (prev) 1,279.0 11.9 129.0 -2.9 129.5 -13.1 74.2 -17.9 728.5 -17.9 240.0 44.1
CoE 1,330.0 16.4 156.0 17.4 155.0 4.0 92.0 1.8 902.9 1.8 300.0 35.6
IBES E 1,298.0 13.6 156.5 17.8 - - 94.3 4.3 927.0 4.5 302.0 34.7
15/8 CS E (new) 1,481.0 13.0 124.5 3.7 125.0 4.2 76.5 7.3 750.8 7.3 250.0 42.8
CS E (prev) 1,444.0 12.9 138.0 7.0 138.5 6.9 82.4 11.1 809.0 11.1 270.0 39.7
IBES E 1,457.3 12.3 177.1 13.1 - - 107.2 13.6 1,049.4 13.2 336.6 30.6
16/8 CS E (new) 1,661.0 12.2 139.0 11.6 139.5 11.6 86.6 13.2 849.9 13.2 280.0 37.8
IBES E 1,660.0 13.9 202.1 14.1 - - 124.3 16.0 1,210.5 15.4 378.0 26.6
Recurring profit Net profitAs of Oct-25 EPSSales Operating profit
Source: Company data, I/B/E/S, Credit Suisse estimates
28 October 2013
Fast Retailing (9983 / 9983 JP) 12
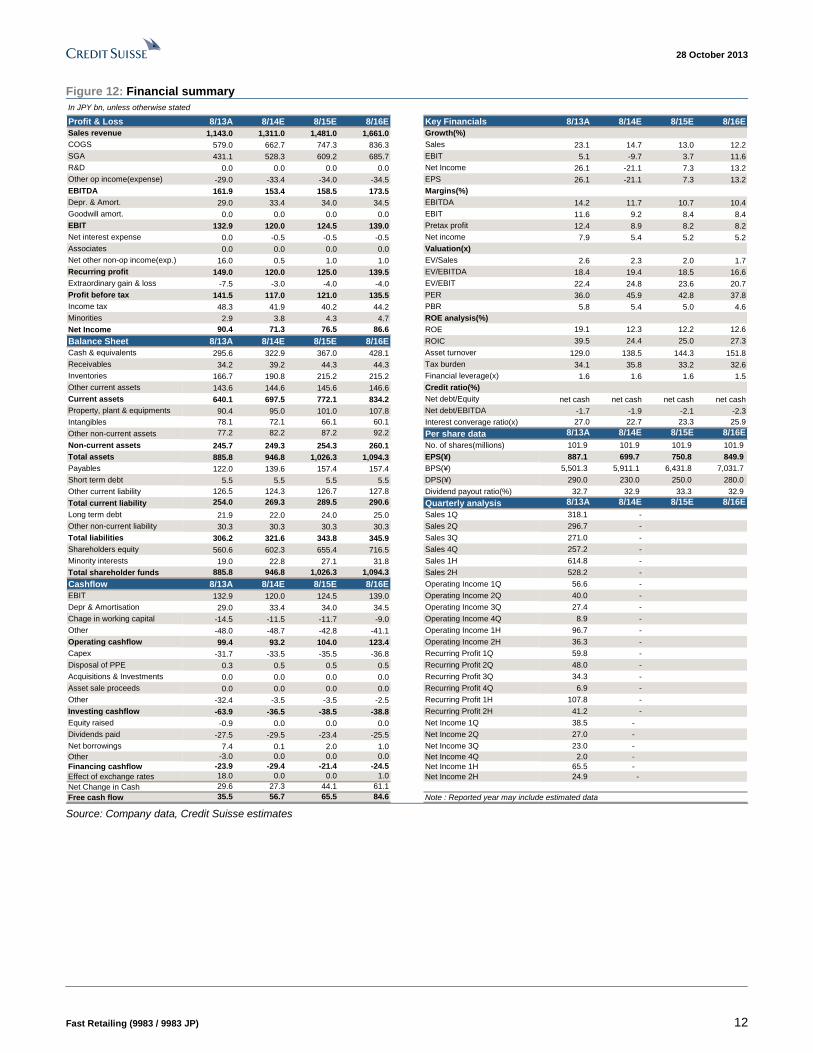
Figure 12: Financial summary
In JPY bn, unless otherwise stated
Profit & Loss 8/13A 8/14E 8/15E 8/16E Key Financials 8/13A 8/14E 8/15E 8/16E
Sales revenue 1,143.0 1,311.0 1,481.0 1,661.0 Growth(%)
COGS 579.0 662.7 747.3 836.3 Sales 23.1 14.7 13.0 12.2
SGA 431.1 528.3 609.2 685.7 EBIT 5.1 -9.7 3.7 11.6
R&D 0.0 0.0 0.0 0.0 Net Income 26.1 -21.1 7.3 13.2
Other op income(expense) -29.0 -33.4 -34.0 -34.5 EPS 26.1 -21.1 7.3 13.2
EBITDA 161.9 153.4 158.5 173.5 Margins(%)
Depr. & Amort. 29.0 33.4 34.0 34.5 EBITDA 14.2 11.7 10.7 10.4
Goodwill amort. 0.0 0.0 0.0 0.0 EBIT 11.6 9.2 8.4 8.4
EBIT 132.9 120.0 124.5 139.0 Pretax profit 12.4 8.9 8.2 8.2
Net interest expense 0.0 -0.5 -0.5 -0.5 Net income 7.9 5.4 5.2 5.2
Associates 0.0 0.0 0.0 0.0 Valuation(x)
Net other non-op income(exp.) 16.0 0.5 1.0 1.0 EV/Sales 2.6 2.3 2.0 1.7
Recurring profit 149.0 120.0 125.0 139.5 EV/EBITDA 18.4 19.4 18.5 16.6
Extraordinary gain & loss -7.5 -3.0 -4.0 -4.0 EV/EBIT 22.4 24.8 23.6 20.7
Profit before tax 141.5 117.0 121.0 135.5 PER 36.0 45.9 42.8 37.8
Income tax 48.3 41.9 40.2 44.2 PBR 5.8 5.4 5.0 4.6
Minorities 2.9 3.8 4.3 4.7 ROE analysis(%)
Net Income 90.4 71.3 76.5 86.6 ROE 19.1 12.3 12.2 12.6
Balance Sheet 8/13A 8/14E 8/15E 8/16E ROIC 39.5 24.4 25.0 27.3
Cash & equivalents 295.6 322.9 367.0 428.1 Asset turnover 129.0 138.5 144.3 151.8
Receivables 34.2 39.2 44.3 44.3 Tax burden 34.1 35.8 33.2 32.6
Inventories 166.7 190.8 215.2 215.2 Financial leverage(x) 1.6 1.6 1.6 1.5
Other current assets 143.6 144.6 145.6 146.6 Credit ratio(%)
Current assets 640.1 697.5 772.1 834.2 Net debt/Equity net cash net cash net cash net cash
Property, plant & equipments 90.4 95.0 101.0 107.8 Net debt/EBITDA -1.7 -1.9 -2.1 -2.3
Intangibles 78.1 72.1 66.1 60.1 Interest converage ratio(x) 27.0 22.7 23.3 25.9
Other non-current assets 77.2 82.2 87.2 92.2 Per share data 8/13A 8/14E 8/15E 8/16E
Non-current assets 245.7 249.3 254.3 260.1 No. of shares(millions) 101.9 101.9 101.9 101.9
Total assets 885.8 946.8 1,026.3 1,094.3 EPS(¥) 887.1 699.7 750.8 849.9
Payables 122.0 139.6 157.4 157.4 BPS(¥) 5,501.3 5,911.1 6,431.8 7,031.7
Short term debt 5.5 5.5 5.5 5.5 DPS(¥) 290.0 230.0 250.0 280.0
Other current liability 126.5 124.3 126.7 127.8 Dividend payout ratio(%) 32.7 32.9 33.3 32.9
Total current liability 254.0 269.3 289.5 290.6 Quarterly analysis 8/13A 8/14E 8/15E 8/16E
Long term debt 21.9 22.0 24.0 25.0 Sales 1Q 318.1 -
Other non-current liability 30.3 30.3 30.3 30.3 Sales 2Q 296.7 -
Total liabilities 306.2 321.6 343.8 345.9 Sales 3Q 271.0 -
Shareholders equity 560.6 602.3 655.4 716.5 Sales 4Q 257.2 -
Minority interests 19.0 22.8 27.1 31.8 Sales 1H 614.8 -
Total shareholder funds 885.8 946.8 1,026.3 1,094.3 Sales 2H 528.2 -
Cashflow 8/13A 8/14E 8/15E 8/16E Operating Income 1Q 56.6 -
EBIT 132.9 120.0 124.5 139.0 Operating Income 2Q 40.0 -
Depr & Amortisation 29.0 33.4 34.0 34.5 Operating Income 3Q 27.4 -
Chage in working capital -14.5 -11.5 -11.7 -9.0 Operating Income 4Q 8.9 -
Other -48.0 -48.7 -42.8 -41.1 Operating Income 1H 96.7 -
Operating cashflow 99.4 93.2 104.0 123.4 Operating Income 2H 36.3 -
Capex -31.7 -33.5 -35.5 -36.8 Recurring Profit 1Q 59.8 -
Disposal of PPE 0.3 0.5 0.5 0.5 Recurring Profit 2Q 48.0 -
Acquisitions & Investments 0.0 0.0 0.0 0.0 Recurring Profit 3Q 34.3 -
Asset sale proceeds 0.0 0.0 0.0 0.0 Recurring Profit 4Q 6.9 -
Other -32.4 -3.5 -3.5 -2.5 Recurring Profit 1H 107.8 -
Investing cashflow -63.9 -36.5 -38.5 -38.8 Recurring Profit 2H 41.2 -
Equity raised -0.9 0.0 0.0 0.0 Net Income 1Q 38.5 -
Dividends paid -27.5 -29.5 -23.4 -25.5 Net Income 2Q 27.0 -
Net borrowings 7.4 0.1 2.0 1.0 Net Income 3Q 23.0 -
Other -3.0 0.0 0.0 0.0 Net Income 4Q 2.0 -
Financing cashflow -23.9 -29.4 -21.4 -24.5 Net Income 1H 65.5 -
Effect of exchange rates 18.0 0.0 0.0 1.0 Net Income 2H 24.9 -
Net Change in Cash 29.6 27.3 44.1 61.1
Free cash flow 35.5 56.7 65.5 84.6 Note : Reported year may include estimated data Source: Company data, Credit Suisse estimates
28 October 2013
Fast Retailing (9983 / 9983 JP) 13
Companies Mentioned (Price as of 25-Oct-2013)
Fast Retailing (9983.T, ¥32,150, UNDERPERFORM, TP ¥16,000)
Disclosure Appendix
Important Global Disclosures
I, Taketo Yamate, certify that (1) the views expressed in this report accurately reflect my personal views about all of the subject companies and securities and (2) no part of my compensation was, is or will be directly or indirectly related to the specific recommendations or views expressed in this report.
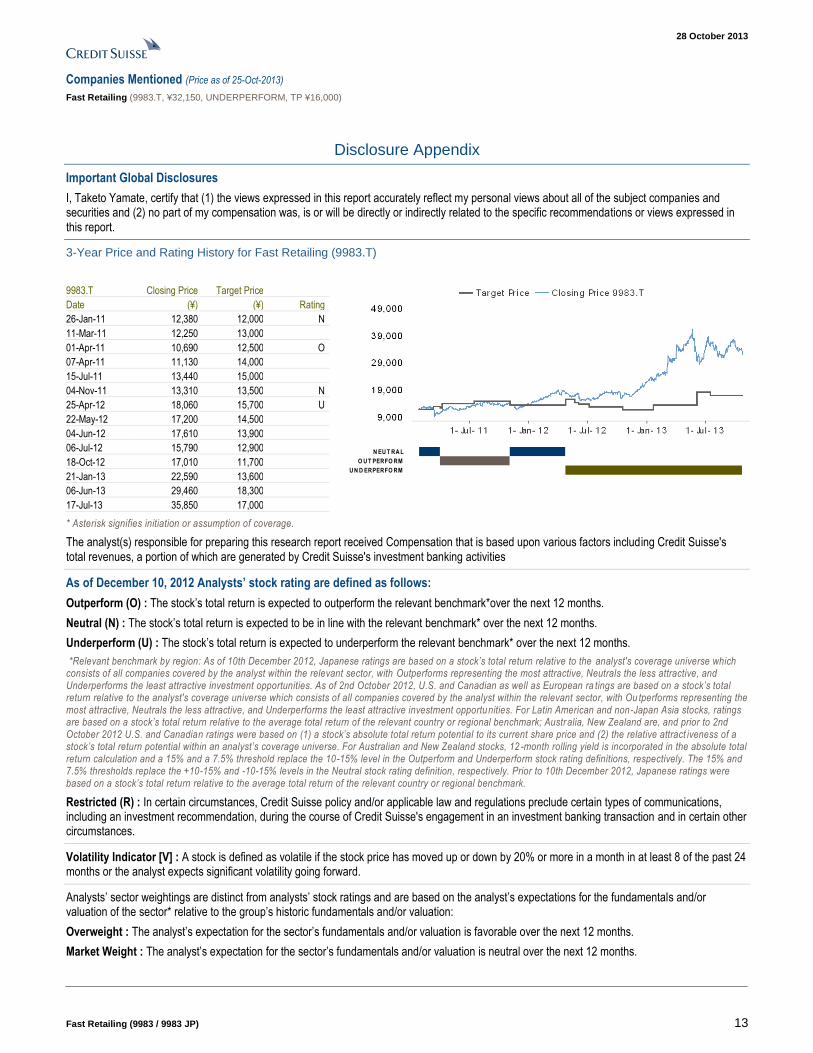
3-Year Price and Rating History for Fast Retailing (9983.T)
9983.T Closing Price Target Price
Date (¥) (¥) Rating
26-Jan-11 12,380 12,000 N
11-Mar-11 12,250 13,000
01-Apr-11 10,690 12,500 O
07-Apr-11 11,130 14,000
15-Jul-11 13,440 15,000
04-Nov-11 13,310 13,500 N
25-Apr-12 18,060 15,700 U
22-May-12 17,200 14,500
04-Jun-12 17,610 13,900
06-Jul-12 15,790 12,900
18-Oct-12 17,010 11,700
21-Jan-13 22,590 13,600
06-Jun-13 29,460 18,300
17-Jul-13 35,850 17,000
* Asterisk signifies initiation or assumption of coverage.
N EU T RA L
O U T PERFO RM
U N D ERPERFO RM
The analyst(s) responsible for preparing this research report received Compensation that is based upon various factors including Credit Suisse's total revenues, a portion of which are generated by Credit Suisse's investment banking activities
As of December 10, 2012 Analysts’ stock rating are defined as follows:
Outperform (O) : The stock’s total return is expected to outperform the relevant benchmark*over the next 12 months.
Neutral (N) : The stock’s total return is expected to be in line with the relevant benchmark* over the next 12 months.
Underperform (U) : The stock’s total return is expected to underperform the relevant benchmark* over the next 12 months.
*Relevant benchmark by region: As of 10th December 2012, Japanese ratings are based on a stock’s total return relative to the analyst's coverage universe which consists of all companies covered by the analyst within the relevant sector, with Outperforms representing the most attractive, Neutrals the less attractive, and Underperforms the least attractive investment opportunities. As of 2nd October 2012, U.S. and Canadian as well as European ra tings are based on a stock’s total return relative to the analyst's coverage universe which consists of all companies covered by the analyst within the relevant sector, with Ou tperforms representing the most attractive, Neutrals the less attractive, and Underperforms the least attractive investment opportunities. For Latin American and non-Japan Asia stocks, ratings are based on a stock’s total return relative to the average total return of the relevant country or regional benchmark; Australia, New Zealand are, and prior to 2nd October 2012 U.S. and Canadian ratings were based on (1) a stock’s absolute total return potential to its current share price and (2) the relative attract iveness of a stock’s total return potential within an analyst’s coverage universe. For Australian and New Zealand stocks, 12 -month rolling yield is incorporated in the absolute total return calculation and a 15% and a 7.5% threshold replace the 10-15% level in the Outperform and Underperform stock rating definitions, respectively. The 15% and 7.5% thresholds replace the +10-15% and -10-15% levels in the Neutral stock rating definition, respectively. Prior to 10th December 2012, Japanese ratings were based on a stock’s total return relative to the average total return of the relevant country or regional benchmark.
Restricted (R) : In certain circumstances, Credit Suisse policy and/or applicable law and regulations preclude certain types of communications, including an investment recommendation, during the course of Credit Suisse's engagement in an investment banking transaction and in certain other circumstances.
Volatility Indicator [V] : A stock is defined as volatile if the stock price has moved up or down by 20% or more in a month in at least 8 of the past 24 months or the analyst expects significant volatility going forward.
Analysts’ sector weightings are distinct from analysts’ stock ratings and are based on the analyst’s expectations for the fundamentals and/or valuation of the sector* relative to the group’s historic fundamentals and/or valuation:
Overweight : The analyst’s expectation for the sector’s fundamentals and/or valuation is favorable over the next 12 months.
Market Weight : The analyst’s expectation for the sector’s fundamentals and/or valuation is neutral over the next 12 months.
28 October 2013
Fast Retailing (9983 / 9983 JP) 14
Underweight : The analyst’s expectation for the sector’s fundamentals and/or valuation is cautious over the next 12 months.
*An analyst’s coverage sector consists of all companies covered by the analyst within the relevant sector. An analyst may cover multiple sectors.
Credit Suisse's distribution of stock ratings (and banking clients) is:
Global Ratings Distribution
Rating Versus universe (%) Of which banking clients (%)
Outperform/Buy* 42% (54% banking clients)
Neutral/Hold* 41% (50% banking clients)
Underperform/Sell* 15% (39% banking clients)
Restricted 3%
*For purposes of the NYSE and NASD ratings distribution disclosure requirements, our stock ratings of Outperform, Neutral, an d Underperform most closely correspond to Buy, Hold, and Sell, respectively; however, the meanings are not the same, as our stock ratings are determined on a relative basis. (Please refer to definitions above.) An investor's decision to buy or sell a security should be based on investment objectives, current holdin gs, and other individual factors.
Credit Suisse’s policy is to update research reports as it deems appropriate, based on developments with the subject company, the sector or the market that may have a material impact on the research views or opinions stated herein.
Credit Suisse's policy is only to publish investment research that is impartial, independent, clear, fair and not misleading. For more detail please refer to Credit Suisse's Policies for Managing Conflicts of Interest in connection with Investment Research: http://www.csfb.com/research and analytics/disclaimer/managing_conflicts_disclaimer.html
Credit Suisse does not provide any tax advice. Any statement herein regarding any US federal tax is not intended or written to be used, and cannot be used, by any taxpayer for the purposes of avoiding any penalties.
Price Target: (12 months) for Fast Retailing (9983.T)
Method: Our ¥16,000 target price for Fast Retailing is based on a FY8/14E P/E (price-to-earnings) of 23x. We arrive at our multiple using a sum-of-the parts valuation comprising 15x for the domestic Uniqlo business (on par with other domestic specialty retailers), 50x for overseas Uniqlo (PEG of 1.0x), and 20x for other businesses (g.u., etc.).
Risk: Risks to our ¥16,000 target price for Fast Retailing include: (1) strong sales of cold-weather gear if the coming winter is even colder than last year’s, and (2) heightened expectations of earnings growth in the event of unexpected M&A deals
Please refer to the firm's disclosure website at https://rave.credit-suisse.com/disclosures for the definitions of abbreviations typically used in the target price method and risk sections.
See the Companies Mentioned section for full company names
Credit Suisse expects to receive or intends to seek investment banking related compensation from the subject company (9983.T) within the next 3 months.
Important Regional Disclosures
Singapore recipients should contact Credit Suisse AG, Singapore Branch for any matters arising from this research report.
The analyst(s) involved in the preparation of this report have not visited the material operations of the subject company (9983.T) within the past 12 months
Restrictions on certain Canadian securities are indicated by the following abbreviations: NVS--Non-Voting shares; RVS--Restricted Voting Shares; SVS--Subordinate Voting Shares.
Individuals receiving this report from a Canadian investment dealer that is not affiliated with Credit Suisse should be advised that this report may not contain regulatory disclosures the non-affiliated Canadian investment dealer would be required to make if this were its own report.
For Credit Suisse Securities (Canada), Inc.'s policies and procedures regarding the dissemination of equity research, please visit http://www.csfb.com/legal_terms/canada_research_policy.shtml.
As of the date of this report, Credit Suisse acts as a market maker or liquidity provider in the equities securities that are the subject of this report.
Principal is not guaranteed in the case of equities because equity prices are variable.
Commission is the commission rate or the amount agreed with a customer when setting up an account or at any time after that.
To the extent this is a report authored in whole or in part by a non-U.S. analyst and is made available in the U.S., the following are important disclosures regarding any non-U.S. analyst contributors: The non-U.S. research analysts listed below (if any) are not registered/qualified as research analysts with FINRA. The non-U.S. research analysts listed below may not be associated persons of CSSU and therefore may not be subject to the NASD Rule 2711 and NYSE Rule 472 restrictions on communications with a subject company, public appearances and trading securities held by a research analyst account.
Credit Suisse Securities (Japan) Limited .......................................................................................................................................... Taketo Yamate
28 October 2013
Fast Retailing (9983 / 9983 JP) 15
For Credit Suisse disclosure information on other companies mentioned in this report, please visit the website at https://rave.credit-suisse.com/disclosures or call +1 (877) 291-2683.
28 October 2013
Fast Retailing (9983 / 9983 JP) 16
References in this report to Credit Suisse include all of the subsidiaries and affiliates of Credit Suisse operating under its investment banking division. For more information on our structure, please use the following link: https://www.credit-suisse.com/who_we_are/en/This report may contain material that is not directed to, or intended for distribution to or use by, any person or entity who is a citizen or resident of or located in any locality, state, country or other jurisdiction where such distribution, publication, availability or use would be contrary to law or regulation or which would subject Credit Suisse AG or its affiliates ("CS") to any registration or licensing requirement within such jurisdiction. All material presented in this report, unless specifically indicated otherwise, is under copyright to CS. None of the material, nor its content, nor any copy of it, may be altered in any way, transmitted to, copied or distributed to any other party, without the prior express written permission of CS. All trademarks, service marks and logos used in this report are trademarks or service marks or registered trademarks or service marks of CS or its affiliates. The information, tools and material presented in this report are provided to you for information purposes only and are not to be used or considered as an offer or the solicitation of an offer to sell or to buy or subscribe for securities or other financial instruments. CS may not have taken any steps to ensure that the securities referred to in this report are suitable for any particular investor. CS will not treat recipients of this report as its customers by virtue of their receiving this report. The investments and services contained or referred to in this report may not be suitable for you and it is recommended that you consult an independent investment advisor if you are in doubt about such investments or investment services. Nothing in this report constitutes investment, legal, accounting or tax advice, or a representation that any investment or strategy is suitable or appropriate to your individual circumstances, or otherwise constitutes a personal recommendation to you. CS does not advise on the tax consequences of investments and you are advised to contact an independent tax adviser. Please note in particular that the bases and levels of taxation may change. Information and opinions presented in this report have been obtained or derived from sources believed by CS to be reliable, but CS makes no representation as to their accuracy or completeness. CS accepts no liability for loss arising from the use of the material presented in this report, except that this exclusion of liability does not apply to the extent that such liability arises under specific statutes or regulations applicable to CS. This report is not to be relied upon in substitution for the exercise of independent judgment. CS may have issued, and may in the future issue, other communications that are inconsistent with, and reach different conclusions from, the information presented in this report. Those communications reflect the different assumptions, views and analytical methods of the analysts who prepared them and CS is under no obligation to ensure that such other communications are brought to the attention of any recipient of this report. CS may, to the extent permitted by law, participate or invest in financing transactions with the issuer(s) of the securities referred to in this report, perform services for or solicit business from such issuers, and/or have a position or holding, or other material interest, or effect transactions, in such securities or options thereon, or other investments related thereto. In addition, it may make markets in the securities mentioned in the material presented in this report. CS may have, within the last three years, served as manager or co-manager of a public offering of securities for, or currently may make a primary market in issues of, any or all of the entities mentioned in this report or may be providing, or have provided within the previous 12 months, significant advice or investment services in relation to the investment concerned or a related investment. Additional information is, subject to duties of confidentiality, available on request. Some investments referred to in this report will be offered solely by a single entity and in the case of some investments solely by CS, or an associate of CS or CS may be the only market maker in such investments. Past performance should not be taken as an indication or guarantee of future performance, and no representation or warranty, express or implied, is made regarding future performance. Information, opinions and estimates contained in this report reflect a judgment at its original date of publication by CS and are subject to change without notice. The price, value of and income from any of the securities or financial instruments mentioned in this report can fall as well as rise. The value of securities and financial instruments is subject to exchange rate fluctuation that may have a positive or adverse effect on the price or income of such securities or financial instruments. Investors in securities such as ADR's, the values of which are influenced by currency volatility, effectively assume this risk. Structured securities are complex instruments, typically involve a high degree of risk and are intended for sale only to sophisticated investors who are capable of understanding and assuming the risks involved. The market value of any structured security may be affected by changes in economic, financial and political factors (including, but not limited to, spot and forward interest and exchange rates), time to maturity, market conditions and volatility, and the credit quality of any issuer or reference issuer. Any investor interested in purchasing a structured product should conduct their own investigation and analysis of the product and consult with their own professional advisers as to the risks involved in making such a purchase. Some investments discussed in this report may have a high level of volatility. High volatility investments may experience sudden and large falls in their value causing losses when that investment is realised. Those losses may equal your original investment. Indeed, in the case of some investments the potential losses may exceed the amount of initial investment and, in such circumstances, you may be required to pay more money to support those losses. Income yields from investments may fluctuate and, in consequence, initial capital paid to make the investment may be used as part of that income yield. Some investments may not be readily realisable and it may be difficult to sell or realise those investments, similarly it may prove difficult for you to obtain reliable information about the value, or risks, to which such an investment is exposed. This report may provide the addresses of, or contain hyperlinks to, websites. Except to the extent to which the report refers to website material of CS, CS has not reviewed any such site and takes no responsibility for the content contained therein. Such address or hyperlink (including addresses or hyperlinks to CS's own website material) is provided solely for your convenience and information and the content of any such website does not in any way form part of this document. Accessing such website or following such link through this report or CS's website shall be at your own risk. This report is issued and distributed in Europe (except Switzerland) by Credit Suisse Securities (Europe) Limited, One Cabot Square, London E14 4QJ, England, which is authorised by the Prudential Regulation Authority ("PRA") and regulated by the Financial Conduct Authority ("FCA") and the PRA. This report is being distributed in Germany by Credit Suisse Securities (Europe) Limited Niederlassung Frankfurt am Main regulated by the Bundesanstalt fuer Finanzdienstleistungsaufsicht ("BaFin"). This report is being distributed in the United States and Canada by Credit Suisse Securities (USA) LLC; in Switzerland by Credit Suisse AG; in Brazil by Banco de Investimentos Credit Suisse (Brasil) S.A or its affiliates; in Mexico by Banco Credit Suisse (México), S.A. (transactions related to the securities mentioned in this report will only be effected in compliance with applicable regulation); in Japan by Credit Suisse Securities (Japan) Limited, Financial Instruments Firm, Director-General of Kanto Local Finance Bureau (Kinsho) No. 66, a member of Japan Securities Dealers Association, The Financial Futures Association of Japan, Japan Investment Advisers Association, Type II Financial Instruments Firms Association; elsewhere in Asia/ Pacific by whichever of the following is the appropriately authorised entity in the relevant jurisdiction: Credit Suisse (Hong Kong) Limited, Credit Suisse Equities (Australia) Limited, Credit Suisse Securities (Thailand) Limited, having registered address at 990 Abdulrahim Place, 27 Floor, Unit 2701, Rama IV Road, Silom, Bangrak, Bangkok 10500, Thailand, Tel. +66 2614 6000, Credit Suisse Securities (Malaysia) Sdn Bhd, Credit Suisse AG, Singapore Branch, Credit Suisse Securities (India) Private Limited regulated by the Securities and Exchange Board of India (registration Nos. INB230970637; INF230970637; INB010970631; INF010970631), having registered address at 9th Floor, Ceejay House, Dr.A.B. Road, Worli, Mumbai - 18, India, T- +91-22 6777 3777, Credit Suisse Securities (Europe) Limited, Seoul Branch, Credit Suisse AG, Taipei Securities Branch, PT Credit Suisse Securities Indonesia, Credit Suisse Securities (Philippines ) Inc., and elsewhere in the world by the relevant authorised affiliate of the above. Research on Taiwanese securities produced by Credit Suisse AG, Taipei Securities Branch has been prepared by a registered Senior Business Person. Research provided to residents of Malaysia is authorised by the Head of Research for Credit Suisse Securities (Malaysia) Sdn Bhd, to whom they should direct any queries on +603 2723 2020. This report has been prepared and issued for distribution in Singapore to institutional investors, accredited investors and expert investors (each as defined under the Financial Advisers Regulations) only, and is also distributed by Credit Suisse AG, Singapore branch to overseas investors (as defined under the Financial Advisers Regulations). By virtue of your status as an institutional investor, accredited investor, expert investor or overseas investor, Credit Suisse AG, Singapore branch is exempted from complying with certain compliance requirements under the Financial Advisers Act, Chapter 110 of Singapore (the "FAA"), the Financial Advisers Regulations and the relevant Notices and Guidelines issued thereunder, in respect of any financial advisory service which Credit Suisse AG, Singapore branch may provide to you. This research may not conform to Canadian disclosure requirements. In jurisdictions where CS is not already registered or licensed to trade in securities, transactions will only be effected in accordance with applicable securities legislation, which will vary from jurisdiction to jurisdiction and may require that the trade be made in accordance with applicable exemptions from registration or licensing requirements. Non-U.S. customers wishing to effect a transaction should contact a CS entity in their local jurisdiction unless governing law permits otherwise. U.S. customers wishing to effect a transaction should do so only by contacting a representative at Credit Suisse Securities (USA) LLC in the U.S. Please note that this research was originally prepared and issued by CS for distribution to their market professional and institutional investor customers. Recipients who are not market professional or institutional investor customers of CS should seek the advice of their independent financial advisor prior to taking any investment decision based on this report or for any necessary explanation of its contents. This research may relate to investments or services of a person outside of the UK or to other matters which are not authorised by the PRA and regulated by the FCA and the PRA or in respect of which the protections of the PRA and FCA for private customers and/or the UK compensation scheme may not be available, and further details as to where this may be the case are available upon request in respect of this report. CS may provide various services to US municipal entities or obligated persons ("municipalities"), including suggesting individual transactions or trades and entering into such transactions. Any services CS provides to municipalities are not viewed as "advice" within the meaning of Section 975 of the Dodd-Frank Wall Street Reform and Consumer Protection Act. CS is providing any such services and related information solely on an arm's length basis and not as an advisor or fiduciary to the municipality. In connection with the provision of the any such services, there is no agreement, direct or indirect, between any municipality (including the officials, management, employees or agents thereof) and CS for CS to provide advice to the municipality. Municipalities should consult with their financial, accounting and legal advisors regarding any such services provided by CS. In addition, CS is not acting for direct or indirect compensation to solicit the municipality on behalf of an unaffiliated broker, dealer, municipal securities dealer, municipal advisor, or investment adviser for the purpose of obtaining or retaining an engagement by the municipality for or in connection with Municipal Financial Products, the issuance of municipal securities, or of an investment adviser to provide investment advisory services to or on behalf of the municipality. If this report is being distributed by a financial institution other than Credit Suisse AG, or its affiliates, that financial institution is solely responsible for distribution. Clients of that institution should contact that institution to effect a transaction in the securities mentioned in this report or require further information. This report does not constitute investment advice by Credit Suisse to the clients of the distributing financial institution, and neither Credit Suisse AG, its affiliates, and their respective officers, directors and employees accept any liability whatsoever for any direct or consequential loss arising from their use of this report or its content. Principal is not guaranteed. Commission is the commission rate or the amount agreed with a customer when setting up an account or at any time after that.
Copyright © 2013 CREDIT SUISSE AG and/or its affiliates. All rights reserved.
Investment principal on bonds can be eroded depending on sale price or market price. In addition, there are bonds on which investment principal can be eroded due to changes in redemption amounts. Care is required when investing in such instruments.
When you purchase non-listed Japanese fixed income securities (Japanese government bonds, Japanese municipal bonds, Japanese government guaranteed bonds, Japanese corporate bonds) from CS as a seller, you will be requested to pay the purchase price only.
9983_102813_FastRetailing_E.doc