australian first edition - credit suisse | plus
TRANSCRIPT

Note: If the rating of a company shown on the cover of First Edition is in bold type, a rating change has taken place
CREDIT SUISSE SECURITIES RESEARCH & ANALYTICS BEYOND INFORMATIONTM
Client-Driven Solutions, Insights, and Access
EQUITY RESEARCH CREDIT SUISSE EQUITIES (AUSTRALIA) LIMITED ABN 35 068 232 708 ACN 068 232 708 | Participating Organisation of the Australian Stock Exchange
Australia & NZ Daily Research Friday, 14 February 2014
COMPANIES & SECTORS
AWK Airwork Holdings NEUTRAL 13 .NZ Engineering a competitive advantage
ASX ASX UNDERPERFORM 26 Revenue growth across the board
DJS David Jones NEUTRAL 39 2Q14 sales
GMG Goodman Group NEUTRAL 43 Earnings achieved in a transition period
GPT GPT Group OUTPERFORM 48 Grinding away
IRE IRESS NEUTRAL 54 Glass half empty or glass half full?
MYX Mayne Pharma NEUTRAL 58 US portfolio expanded with another acquisition
SGP Stockland NEUTRAL 60 Entering the upgrade cycle
SGN STW Communications Group NEUTRAL 73 Soft underlying result, acquisitions yet to
generate solid returns
TLS Telstra Corporation OUTPERFORM 80 Mobile performance remains strong
WEB Webjet NEUTRAL 90 Risks to the core, but becoming full service
RESULT PREVIEW
AWC Alumina Limited OUTPERFORM 95 2013 results preview; reports on 20 Feb
Australian Transport Sector 98 1H14 preview: Cost-outs will be rewarded
against volume headwinds
BEN Bendigo and Adelaide Bank NEUTRAL 115 1H14 results preview; reports on 17 Feb
FMG Fortescue Metals Group OUTPERFORM 123 1H14 results preview; reports on 19 Feb
ILU Iluka Resources NEUTRAL 125 2013 results preview and operation analysis;
reports on 21 Feb
MGX Mount Gibson Iron UNDERPERFORM 136 1H14 results preview and exploration success;
reports on 19 Feb
UGL UGL NEUTRAL 142 HY14 results preview; reports on 17 Feb
STRATEGY & ECONOMICS
Australian Investment Strategy 146 Strategy Portfolio Changes - SUN out ASX in
DISCLOSURE APPENDIX CONTAINS ANALYST CERTIFICATIONS AND THE STATUS OF NON-US ANALYSTS. FOR OTHER IMPORTANT DISCLOSURES, visit www.credit-suisse.com/ researchdisclosures or call +1 (877) 291-2683. U.S. Disclosure: Credit Suisse does and seeks to do business with companies covered in its research reports. As a result, investors should be aware that the Firm may have a conflict of interest that could affect the objectivity of this report. Investors should consider this report as only a single factor in making their investment decision.
MARKET EVENTS
Results, Automotive Hldgs Group 14 Feb
Results, Charter Hall Retail REIT 14 Feb
Results, Newcrest Mining 14 Feb
Results, Sims Metal Mgmt 14 Feb
UPCOMING CONFERENCES
2014 HOLT Conference 2014 – London
25 Feb
2014 5th Annual DC Defense Conference – Washington
25 Feb
For more scheduled conferences refer to page 2
TABLES
Credit Suisse Ratings – Australia 148
Top 100 Earnings & Dividends 151
Small Caps Earnings & Dividends 154
Sector Aggregates 157
Reporting Season Calendar 158
March 24-28, Hong Kong

Australia and NZ First Edition 2
Australia & NZ Market Reports
Australia Index +/- %Day %Wk %Mth %YrRol
All Ordinaries 5318.7 -1.1 0.0% 3.3% 1.9% 5.9% S&P/ASX 50 5478.0 -2.2 0.0% 3.3% 1.8% 7.4% S&P/ASX 200 5308.1 -2.0 0.0% 3.4% 1.8% 6.1% Financials 5790.7 -12.5 -0.2% 3.9% 1.0% 10.9% REITs 1009.6 0.6 0.1% 2.1% 1.8% -1.0% Industrials 3904.2 9.2 0.2% 3.0% 1.6% 0.8% Materials 10356.0 -0.1 0.0% 4.9% 5.7% -6.0% Cons. Discreet 1786.7 6.2 0.3% 3.4% 0.9% 18.2% NEW ZEALAND
NZX 50 4873.5 3.556 0.1% 1.4% 0.2% 15.4%
Currencies, Interest Rates & Gold
Index +/- %Day %Wk %Mth %YrRol
AUD/USD 0.893 -0.009 -1.0% -0.2% -0.4% -13.8% AUD/GBP 0.544 0.000 0.0% -0.9% -0.3% -18.3% EURAUD 1.505 0.000 0.0% -0.7% -1.3% 15.9% NZD/USD 0.830 -0.002 -0.3% 0.6% -1.0% -1.9% AUD/NZD 1.084 0.000 0.0% -0.1% 1.4% -11.5% TWI 0.697 0.003 0.4% 1.6% 0.4% -10.3% Aust 90Day 2.450 0.000 0.0% 0.0% 0.0% Aust 10Y 4.244 0.024 0.6% 2.8% 1.0% 20.7% NZ 90Day 3.220 NZ 10Y 4.630 0.005 0.1% 1.1% -1.6% 19.0% Gold Spot 1,291 -0.820 -0.1% 2.7% 3.7% -21.4%
Best Performers Worst Performers
Close % ‘000 Close % ‘000
Webjet 3.16 26.4% 1571 Sundance Rsc 0.10 27146 Nexus Energy 0.07 15.3% 11476 Goodman Fielder 0.59 -7.1% 34886 Mayne Pharma 0.87 9.5% 5662 Primary Health Care 4.55 -5.4% 8365 Qantas Airways 1.19 6.3% 31188 OM Holdings 0.56 -4.3% 4 Silver Chef 5.55 5.3% 46 Whitehaven Coal 1.61 -3.9% 8287 GMEL 0.21 5.0% 780 Skilled Group 2.97 -3.9% 2393 Teranga Gold 1.08 4.9% 180 MacMahon Hldgs 0.13 -3.8% 1559 McMillan Shakespeare 11.57 4.7% 601 Dulux Group 5.49 -3.7% 1499 Western Areas 3.14 4.7% 1654 Elemental 0.28 -3.5% 368 NewSat Limited 0.46 4.5% 1589 Intrepid Mines 0.29 -3.4% 566 Imdex 0.57 3.7% 77 Crowe Horwath 0.28 -3.4% 529 PanAust 1.85 3.7% 8403 Boart Longyear Grp 0.44 -3.3% 1675
Source: ASX, Bloomberg, Reuters
Commodity Prices Spot* Forward Curve Credit Suisse Forecasts 3mth 15mth 1Q14 2014 2015
Bulks Iron Ore $/t 121.0 125.0 111.3 95.0 Coking Coal $/t 143.0 153.3 167.5 Thermal Coal $/t 76.8 85.0 85.0 90.0 Base Metals Aluminium USc/lb 76.8 78.2 83.1 77.1 82.2 90.7 Copper USc/lb 326.5 324.5 321.5 317.5 300.5 306.2 Nickel USc/lb 651.3 653.0 656.1 635.0 629.4 646.4 Zinc USc/lb 91.6 91.7 92.6 90.7 95.3 107.7 Lead USc/lb 95.3 96.2 96.8 99.8 103.2 108.9 Tin USc/lb 1020.4 1019.5 1043.3 1071.6 1128.3
Precious Metals Gold US$/oz 1290.6 1160.0 1082.5 990.0 Silver US$/oz 20.2 18.7 18.2 18.5 Platinum US$/oz 1402.0 1380.0 1430.0 1562.5
Energy Oil (Brent) US$/bbl 108.5 108.0 102.9 107.0 101.8 97.5 Oil (WTI) US$/bbl 100.4 99.2 90.1 94.0 91.8 87.5
*Fiscal year averages used, Steel prices are contract prices. Spot as of 10PM AEST.
VIX (S&P 500 Options Implied Volatility)
0.00
10.00
20.00
30.00
40.00
50.00
60.00
70.00
80.00
90.00
Jan
-96
Au
g-9
6
Ap
r-97
Dec-9
7
Au
g-9
8
Ap
r-99
Dec-9
9
Au
g-0
0
Ap
r-01
Dec-0
1
Au
g-0
2
Ap
r-03
Dec-0
3
Au
g-0
4
Ap
r-05
Dec-0
5
Au
g-0
6
Ap
r-07
Dec-0
7
Au
g-0
8
Ap
r-09
Dec-0
9
Au
g-1
0
Ap
r-11
Nov-1
1
Jul-1
2
Dec-1
2
Jun
-13
Dec-1
3
Daily VIX (S&P 500 Options Implied Volatility)
VIX Index Average -1 StDev +1 StDev
VIX – Current 1mth rol(avg) 3mth rol(avg) 6mth rol(avg) 14.30 15.78 14.28 14.51 Freight Spot 1 wk (avg) 1 mth (avg) 3 mth (avg) 6 mth (avg) 1 yr (avg)
Baltic Dry 1091.0 1093 1219 1644 1653 1278
Source: Bloomberg
Upcoming Credit Suisse Global Conferences New additions this week in bold.
February 2014 to November 2014
Feb-Mar 2014 Q1 Media Seminar – London
25 Feb 2014 HOLT Conference 2014 – London
25 Feb 2014 5th Annual DC Defense Conference – Washington
4-5 Mar 2014 Global Healthcare Conference – London
5 Mar 2014 Geneva Autos Show 2014 – Geneva
10-12 Mar 2014 Global Services Conference – Scottsdale, Arizona
11-12 Mar 2014 European Banks Conference 2014 – London
13 Mar 2014 Global Flagship event – London
13 Mar 2014 9th Annual European Cable and Telecoms Conf – London
13-16 Mar 2014 DCM Winter Conference 2014 – Silvaplana-Surlej
19-21 Mar 2014 Prime Services 2014 Hedge Fund Leadership Conf. – Florida
24 - 28 Mar 2014 Asian Investment Conference – Hong Kong
25 Mar 2014 Asian Hedge Fund Forum 2014 – Hong Kong
26-28 Mar 2014 Global Trading Forum 2014 – Miami
8 May 2014 Stockholm Consumer IR Day – Stockholm
14-15 May 2014 Chemicals & Ag Conference – London
May-Jun 2014 Q2 Media Seminar – London
3-4 Jun 2014 Energy Conference – London
5 Jun 2014 European Gaming Companies Conference – London
11 Jun 2014 Global Small & Midcap Conference – London
12 Jun 2014 European Buildings Conference – London
Jun 2014 Swiss Midcap Healthcare Conference – Zurich
Aug-Sep 2014 Q3 Media Seminar – London
10-12 Sep 2014 Asian Technology Conference – Taiwan
15-16 Sep European Telecoms 1:1 Conference – London
17-18 Sep Pan European Capital Goods Conference – London
24-25 Sep Global Steel & Mining Conference – London
3-4 Oct Paris Auto Conference – Paris
Oct-Nov Q4 Media Seminar – London
1 Nov Global Consumer IR Day – London
Nov Swiss Midcap Conference – Zurich
If you would like to attend any of the above conferences, please contact the Australian Corporate Access team: Cathy Kermond [email protected] or your Credit Suisse sales representative
Research Production
Adam Indikt – Supervisory Analyst 61 3 9280 1659 Patricia Rocis – Supervisory Analyst 61 3 9280 1678
Web Access Research Distribution [email protected] Email: [email protected]
Database Jason Swinbourne 612 8205 4591
Bottom Liners

14 February 2014
Australia and NZ First Edition 3
At a Glance Australia/NZ equities executive summary
COMPANIES & SECTORS
Engineering a competitive advantage Airwork Holdings (AWK.NZ)
We initiate coverage on AWK with a DCF-based 12-month target price of $3.00 and a NEUTRAL rating. AWK is a specialist aviation business operating in fixed wing and helicopter leasing and maintenance. AWK owns, operates and maintains a fleet of aircraft that are supported by a world-class maintenance, repair and overhaul (MRO) capability backed by extensive local and international certification. In June 2013 AWK received European Aviation Safety Authority (EASA) certification. This has the potential to step change revenue and earnings of its Helicopter Engineering division and represents an area of upside risk to forecasts. Early benefits of EASA certification have been encouraging, with a key contract signing in Germany. Canada and South Africa are other markets that have been assessed as offering strong potential. Helicopter demand remains strong, particularly in the oil and gas sectors, and AWK’s upgrade capability positions the company for pursuing offshore leasing contracts. Potential exists to deploy further helicopters in markets such as Africa over and above what our current forecasts assume, particularly if mining related exploration and development activity expand. AWK has embarked on a programme of productivity measures within the Fixed Wing division to improve cost efficiency and fleet utilisation. Benefits from this programme are expected to commence from FY14. AWK will report its interim result on Wednesday 19 February.
Share Price 2.96 (NZD)
NEUTRAL
Target Price 3.00 (NZD)
Paul Turnbull Research Analyst 64 9 302 5559 This report is distributed in Australia by Credit Suisse Equities (Australia) Limited. Please see legal disclaimer and disclosure annex for further terms and information. Provided by First NZ Capital
Revenue growth across the board ASX (ASX.AX)
ASX reported 1H14 NPAT of $189.6mn, slightly below our $191mn (consensus $187mn) and an interim dividend of 88.2cps (consensus 89.8cps). Revenue was slightly above our expectations, however this was offset by an 8.3% increase in operating expenses. We maintain our UNDERPERFORM rating with a $35.20 target price. Key points: (1) all major ASX business lines increased revenue year-on-year in 1H14, for the first time since the end of 2008; (2) operating expenses increases 8.3% due to an increase in staff numbers; (3) capital expenditure guidance has increased from $40mn to $40-$45mn; (4) the largest business line, Derivatives, had the lowest growth and we note that the daily contract average for ASX 24 was down 11% on 2H13. Earnings changes: We have lowered our FY14 NPAT by 0.6% and increased FY15 by 1.1%. The increase in outer year revenue forecasts is driven by a base increase to information services revenue. While 1H14 expenses were higher than expected we have maintained our FY14 estimate and lowered outer years on the assumption of further cost savings in occupancy and equipment expenses. Investment view: ASX is currently trading at a ~20% PE premium to the market, the middle of the 10-30% range it has traded at over the past five years. While the 1H14 operating revenue growth was 8.0% on pcp, the growth on 2H13 was only 5.4% with the decline in activity late in 1H14 flowing through to the start of 2H14. With downside risk to earnings we consider the current share price as full and maintain our UNDERPERFORM rating.
Share Price 36.25 (AUD)
UNDERPERFORM
Target Price (from 33.20) 35.20 (AUD)
Andrew Adams Research Analyst 61 2 8205 4106

14 February 2014
Australia and NZ First Edition 4
2Q14 sales David Jones (DJS.AX)
DJS returned to positive LFL sales growth in 2Q14. Second-quarter sales of $618mn and LFL sales growth 2.1% were in line with forecast (CS $622mn, 2.0%). Online was above expectations and stands to boost total sales by 100–150bp through 2014. We have upgraded our second-half LFL sales forecasts 50bps to 3.0%. The upgrade reflects the improved run rate in on line sales and an assumption of steady growth in the market. Gross margin has been downgraded 50bp for 1H14 and 30bp for 2H14 due to higher levels of promotional activity. EPS has been downgraded 3% due to gross margin effect (-4%) and LFL sales upgrade (+1%). Online sales improved through the period: Online sales increased 150% in 2Q14 and accounted for 2.0% of group sales in the quarter. That outcome suggests online growth contributed ~60% of the total growth in comparable store sales. Commentary that online was 1.4% of first-half sales implies acceleration is ongoing and it is therefore likely to make an increasing contribution to 2H14 LFLs. There is likely to be a positive margin impact over time due to the growth of online. Promotional activity was higher than expected. Inventory issues in Target appeared to lead a period of higher-than-expected promotional expenditure. That effect is likely to be temporary due to Target's restructuring efforts. We expect some heightened promotional activity to continue through 3Q14. Earnings and valuation: We have downgraded EPS due to a reduction in gross margin. In our view, the sales lift is of greater materiality than the temporary increase in promotional activity thought 2Q14. DJS appears on the verge of successive quarters of sales and consequent profit growth.
Share Price 3.14 (AUD)
NEUTRAL
Target Price 3.14 (AUD)
Grant Saligari Research Analyst 61 3 9280 1720
Earnings achieved in a transition period Goodman Group (GMG.AX)
Not disappointed by guidance: Goodman Group reported 1H14 operating profit of $296mn roughly in line with CSe of $297.4mn. Operating EPS of 17.2c reflects 6% growth on 1H13. While some may be disappointed to note GMG merely re-iterated 6% EPS growth guidance for FY14 (34.3c) we remain slightly higher (35c) to be diluted back to guidance on inclusion of the DRP and our expectation that the Brazil deal will close towards the end of 3Q FY14. Investment case: Goodman Group trades on a 13.2x P/E representing a 0.92x P/E Rel, only slightly below the historical average of 0.96x. Growth expectations into Year Two stand at 7.3% relative to an average expectation of 7.8% over the past 12 months. For GMG to meaningfully outperform, the market will need to value the quality (sustainability) of GMG's growth, for which a market correction may be a catalyst. We also note, speculation about the "overhang" associated with the CIC block continues to weigh on pricing. Catalysts: This half saw the first meaningful Japanese development impact on the P&L. We expect the Japanese contribution will ramp up quickly from here with Osaka (~March), Nagoya (Dec Qtr) and Tokyo Bay (Dec Qtr) representing ~$550mn of completions this year. We expect WIP to remain at ~$2.5bn with these completions offset by Ichikawa commencement in 4Q and a US ramp-up to ~$250mn of WIP by year-end. Valuation: Our target price of $4.95 is struck at our June 2014 Net Asset Valuation applying: a 7.65% WACR to balance sheet NOI, 11.4x multiple to management EBIT and 12x to development EBIT. We apply an 8x multiple to unallocated expenses.
Share Price 4.76 (AUD)
NEUTRAL
Target Price 4.95 (AUD)
Stephen Rich Research Analyst 61 2 8205 4617

14 February 2014
Australia and NZ First Edition 5
Grinding away GPT Group (GPT.AX)
No magic bullets. GPT reported FY13 earnings of $471.8m as pre-released on 28 January. EPS of 25.7c represents a 6.1% increase on 2012. Having ridden a cost of debt reduction from 7.4% in 2010 to 5.1% today, we should now expect real estate type returns. To that end, 3% EPS growth is a reasonable outcome. Two concerns arise from GPT's strategy: (1) Management is incentivised to lever up to drive DPS growth and (2) the focus on tangible asset growth appears at odds with the desire to grow active earnings. OUTPERFORM rating retained due to value in real estate portfolio. Investment case. GPT owns and manages a high-quality portfolio of Australian Real Estate. At $3.66, GPT is trading on: a forward NOI yield of 7.2%, a dividend yield of 5.6% and a 13.6x FY14 FFO. While we see better value in Dexus, WRT and MGR, GPT combines inherent value with an active buyback, which we expect would be effective in a market correction. Catalysts. We note the buyback activity was not included in GPT's 3% EPS growth guidance but also note that GPT has significant capacity to buy back stocks on an earnings yield of ~7.2% versus a cost of debt of 5.1%. Operationally, we look forward to leasing success at Governor Macquarie Tower and/or MLC Centre or a recovery in retail lead indicators such as retention to refocus the market on the quality of the real estate. Valuation. We strike our target price in line with our December 2014 Net Asset Valuation at $4.00. Key inputs include: 5.8% cap rate on malls, 8.0% on industrial and a 6.56% implied cap rate on office as well as 10.0x on active earnings and 9.25x on costs. If GPT was to trade to our $4.00 NAV in 12 months, it would offer a 5.3% forward dividend yield at that time.
Share Price 3.66 (AUD)
OUTPERFORM
Target Price 4.00 (AUD)
Stephen Rich Research Analyst 61 2 8205 4617
Glass half empty or glass half full? IRESS (IRE.AX)
Pros and cons: A criticism of IRE is that for a stock with a fairly demanding multiple, it hasn't delivered much growth over the last few years. The counter to this is that for a company that has as much financial market exposure as IRE has, it has done remarkably well. As always, the forward-looking view is most important and in that regard we are starting to become more optimistic on the growth profile. This is not without its share of risks however, and for the time being we find that the pros and cons equal out at current valuation levels. We retain our Neutral rating. Paul Buys assumes coverage of IRE following a change in analyst responsibility. UK is the key driver: We have reviewed our key assumptions for IRE, but while our updated forecasts result in some revisions at a divisional level, the net impact on group EPS is fairly minor. We assume A&NZ Financial Markets remain flat into FY14 and some further growth for A&NZ Wealth Management, although at moderated levels. That leaves the UK business as the key growth driver. Key opportunities are the market size, regulatory change and IRE's competitive technology – basically, the potential to replicate IRE's XPLAN/VisiPlan experience. Key risks include integrating Avelo (the CEO has relocated to the UK to oversee this), managing legacy product and the different UK structure (greater dealer group independence). Valuation: Our target price increases from $8.75 to $9.60, due mainly to modest positive EPS revisions and a higher market multiple. On a PE basis, IRE trades in line with its long-term average premium of ~45% relative to the ASX Small Industrials (XSI). However, the stock looks more demanding on an EV/EBIT basis (~1 standard deviation expensive) given the introduction of debt to the balance sheet post the Avelo acquisition.
Share Price 9.25 (AUD)
NEUTRAL
Target Price (from 8.75) 9.60 (AUD)
Paul Buys Research Analyst 61 2 8205 4538

14 February 2014
Australia and NZ First Edition 6
US portfolio expanded with another acquisition Mayne Pharma (MYX.AX)
Brand franchises acquired: MYX has completed an A$18mn equity placement (~22.6mn shares) to fund the acquisition of the LORCET and ESGIC brands from Forest Pharmaceuticals for ~A$13.4mn (US$12mn). LORCET contains hydrocodone + paracetamol and is used to treat moderate to moderately severe pain, while ESGIC contains butalbital (a barbituate), paracetamol and caffeine and is indicated for tension headaches. Gross sales of both products were ~US$5mn in FY13 (implying a sales acquisition multiple of 2.4x). Manufacturing of both products is currently outsourced but MYX could look to bring this in-house in the medium term when contracts expire. Further, MYX will directly distribute both brands through its US Midlothian business and hence realise a high margin on sales. Management noted that investment in both products had been somewhat limited by Forest and that there was opportunity for MYX to grow share. Sound strategy: This brand acquisition is another example of MYX executing its core strategy of acquiring "unloved", complementary products to properly market and distribute with the intention of growing the brands. We suspect similar opportunities will continue to present themselves and that further acquisitions will follow. The strategy is in our view sound, prices paid are relatively undemanding and acquired assets are leveraged by MYX's existing infrastructure and business capabilities. As with all pharmaceutical companies we see some inherent regulatory risk with new products but see the company as a fundamentally attractive investment proposition. Catalysts: MYX 1H14 result (26 February) Valuation: While the acquisition is expected to be mid-single digit EPS accretive (pre-synergies) in its first full financial year (FY15), we will incorporate the transaction in our forecasts following MYX's formal 1H14 result. Our target price is based on DCF valuation.
Share Price 0.86 (AUD)
NEUTRAL
Target Price 0.86 (AUD)
Saul Hadassin Research Analyst 61 2 8205 4679

14 February 2014
Australia and NZ First Edition 7
Entering the upgrade cycle Stockland (SGP.AX)
Entering the upgrade cycle. After two years of negative consensus earnings revisions, SGP has now entered the upgrade cycle, with management lifting its previous FY14 EPS growth guidance from 4-6% to 5-6% largely on the back of stronger residential earnings. We have lifted our earnings by 0.5%, and our FY14-16E EPS CAGR of 7.6% is the highest in our universe after LLC, and sits above SGP's upper EPS growth hurdle for LTI awards of 6.5% p.a. Higher quality earnings. SGP's 1H14 EPS of 11.6¢ was flat on 1H13 and was in line with our forecast (of 11.6¢). Quality improved on several fronts: (1) Operating cash increased 60% representing 113% of NPAT; (2) Net capitalised interest moved from $20m to -$29m representing -11% of NPAT, and (3) the tax benefit reduced from 10% of pre-tax profit to 7%. On the negative side, SGP's 12¢ DPS remains above both EPS (11.6¢) and AFFO (10.6¢). Residential delivers. Residential profit grew 49% due to 8% growth in settlements (2,253) and a lift in operating margins from 7.0% to 8.9%. Net deposits of 3,197 are running well ahead of settlements driving a 67% increase in pre-sales, which support our FY13-16 EBIT CAGR of 34% for the business. Commercial still tough. While developments on 11-13% IRR's supported 10% growth in retail NOI, operations are still tough. Retail comp NOI growth declined for the fifth consecutive period to 2.6% and comp spec MAT growth was -0.8% versus +2.7% in June. Office and industrial occupancy sit at <92%. Upside priced in. Despite positive EPS growth, improving market conditions and improved earnings quality, SGP offers a TSR of 14.6% in line with the AREIT sector at 13.6%, warranting a NEUTRAL rating. SGP currently trades on a 14.7x P/E and at a 6% P/E premium to ASX versus its historic 2% discount. Our $4.23 NAV applies a 7.0% WACR (versus 7.3% book), a 12x FY15E EBIT multiple for Communities and values Retirement at a 10% discount to tangible book.
Share Price 3.90 (AUD)
NEUTRAL
Target Price (from 4.00) 4.23 (AUD)
John Richmond Research Analyst 61 2 8205 4580
Soft underlying result, acquisitions yet to generate solid returns
STW Communications Group (SGN.AX)
Event: STW Communications reported a weaker-than-expected FY13 result. NPAT increased 12.5% vs consensus and guidance for 15% growth. EPS increased 2.5% vs consensus and guidance for mid-single-digit growth. The result was impacted by a number of acquisitions as well as changing business mix to lower margin research and field marketing businesses and office relocation and consolidation. STW Communications provided FY14 guidance for mid-single-digit NPAT growth which was below market expectations for high-single-digit growth. We have reduced our forecasts following a weaker-than-expected result and outlook. Our TP moves to $1.55 (from $1.63) per share and we maintain a NEUTRAL rating. Investment case: Underlying business fairly static, acquisitions yet to generate solid returns. Most of the profit growth in FY13 came from acquisitions within Australia, and to a lesser extent acquisitions in Asia. Whilst the acquisitions make strategic sense and are likely to increase STW Communications' market share, they do not appear to be driving synergies within the group or contributing meaningful profits at this point. With a mix shift to lower margin businesses such as research and field marketing, it will become increasingly important for STW Communications to leverage its core business capabilities to drive additional revenues. We need to see a reversal in the current declining return on invested capital trend. Fair value with upside: STW Communications is trading on 11x FY14 and 10x FY15 EPS, broadly in line with its historical ratios. We forecast mid-single-digit growth p.a. for the next several years. There is upside from successful expansion in Asia and further abroad (although some upside from recent acquisitions will be offset by additional earnout payments if certain earnings targets are met).
Share Price 1.44 (AUD)
NEUTRAL
Target Price (from 1.63) 1.55 (AUD)
Samantha Carleton Research Analyst 61 2 8205 4148

14 February 2014
Australia and NZ First Edition 8
Mobile performance remains strong Telstra Corporation (TLS.AX)
Solid 1H14 result: Telstra's 1H14 EBITDA of A$5.29bn (ex Sensis) was in line with our A$5.27bn forecast and up 7% vs pcp (+5% ex A$127m Telstra Clear impairment charge in pcp and ASB119). 1H14 NPAT of A$1.93bn was 2.6% ahead of our A$1.88bn forecast on lower depreciation. FY14 guidance for 'low-single digit EBITDA growth' (incl Sensis) was maintained. We raise our FY14F EBITDA by 0.8% to A$10.86bn (ex Sensis). FY14F NPAT is increased 2.6% to A$4.1bn due to lower depreciation. The interim dividend was raised to 14.5c (fully franked) and we forecast 29c for the full year. Mobile performance remained strong: Mobile growth remained strong, with mobile revenue rising 6.4% in 1H14 (vs +6.0% in FY13). Telstra added 739k mobile SIOs (vs 608k in pcp), although the majority were prepaid (postpaid handheld +103k). Postpaid handset ARPU (ex MRO) grew 2%. Mobile margins expanded to 39% (from 37% in pcp) and mobile EBITDA was up 13%. We calculate that the total mobile market declined 0.6% in the 6m to Dec and Telstra's market share rose to 51.3% (vs 50.6% in 6m to June). Costs slightly higher than expected: Costs grew 2.1% in the half, due to investment in NAS growth and lower efficiency savings (A$230m). The company said that efficiency savings will increase in 2H14 and it continues to target A$1bn in savings per annum for the next few years. OUTPERFORM rating and A$5.70 target price unchanged: We remain positive on the Telstra investment story with strong cashflows being supported by continued mobile growth, cost savings and NBN payments. We see upside from the emerging Asian growth strategy. Finalisation of NBN negotiations should be a key catalyst.
Share Price 5.15 (AUD)
OUTPERFORM
Target Price 5.70 (AUD)
Fraser McLeish Research Analyst 61 2 8205 4069
Risks to the core, but becoming full service Webjet (WEB.AX)
Zuji and LoH positive, but core still under pressure: Zuji appears on track and the TTV result for Lots of Hotels was ahead of expectations with the run rate now $65mn (up from $40mn at FY13). Backing out of the result the $2.1mn other gains and losses and adding back the $1mn in duplicated IT costs we believe the underlying EBITDA for 1H14 was ~$11.2mn and that it is supportive of FY14 guidance. However, we remain cautious given that we believe volumes in the core flights business remain negative, that in the 2H there will be the $2mn of incremental marketing spend for Zuji and that WEB is focused on scale in LoH and not on the short-term profitability ($0.4mn 1H14 loss may be carried into 2H). NEUTRAL rating retained. Key takeaways: (1) WEB's revenue margin increased ~23% to 10.3% (revenue / TTV) due to mix shift (higher proportion of accommodation TTV), 1H14 includes the full annualisation of the September 2012 increase in booking fees and improved commercial agreements with the airlines; (2) management gave no guidance into the air booking volumes in 1H14, and we believe that the negative run rate in 2H13 has likely continued, implying that WEB's booking volumes have continued to decline in its core flights business; (3) the weakness in WEB's booking volumes is not due to a single factor, it is a combination of many (cycling strong comps, slowing shift online, increased competition from airlines and other OTAs, growth in lower conversion mobile traffic); (4) the outlook for WEB's core flights business is softer, with Zuji and other initiatives required to drive earnings growth in FY14 and beyond; and (5) Lots of
Hotels is growing ahead of expectations, but management has changed its focus from profitability to scale ($0.4mn EBITDA loss in 1H14, previous guidance was for it to be profitable). Target price: $3.25 (from $2.90) moving back to an equally blended PER and DCF-based valuation methodology. Modest EPS revisions.
Share Price 3.16 (AUD)
NEUTRAL
Target Price (from 2.90) 3.25 (AUD)
Chris Smith Research Analyst 61 2 8205 4210

14 February 2014
Australia and NZ First Edition 9
RESULT PREVIEW
2013 results preview; reports on 20 Feb Alumina Limited (AWC.AX)
Expecting a messy result. The read-through from Alcoa results to AWC is poor when profits are weak because accounting translations from GAAP to AIFRS, plus black box retirement benefits and embedded derivative valuations overwhelm low values, swinging the results. On top of these problems, this year we have the true-up of the Alba settlements between Alcoa and AWC, another swing factor. AWC's share of Alcoa's profit was $41mn, but after finance, corporate costs, and accounting translations, we believe that the underlying NPAT will be US$17mn. Consensus is $12mn. We estimate FCF was US$60mn. AWC previously announced that new debt was down to $135mn at December. Cash inflows were the agreed AWAC dividends of US$105mn over the year. We forecast no dividend, but recognise risk. AWC has not paid a dividend since 2011, but having made positive FCF and with low net debt, it may decide a modest final dividend is warranted. But with commodity prices remaining weak and capital injections into AWAC of over $30mn being likely in 2014, we believe a wiser course would be to apply cash to reducing debt and set the company up for a better future. Our DCF valuation remains A$1.60/sh, and our target price is A$1.30/sh.
Share Price 1.25 (AUD)
OUTPERFORM
Target Price 1.30 (AUD)
Matthew Hope Research Analyst 61 2 8205 4669
1H14 preview: Cost-outs will be rewarded against volume headwinds
Australian Transport Sector
1H14 cost-out and self-help candidates should be rewarded against a weak volume backdrop and top-line outlook: With weak volumes and demand impacting the bulk of the Australian transport sector, we expect that evidence of cost-outs and solid execution at 1H14 results will be rewarded with relative outperformance. All stocks (excluding Qube) have publicly announced cost-out programmes, though the biggest upside in cost-out execution remains with AIO, AZJ and QAN. Asciano and Aurizon: cost-out upside baked in for AZJ, but what about AIO? While the cost-out opportunity is well understood for Aurizon, with the market already baking in 75% operating margins from FY15 (and then some), the opportunity for AIO is perhaps less well understood, but equally still available in Ports and PN Rail. We are optimistic that management can, in time, exceed the $150mn in cost-outs initially targeted under the BIP programme. For AZJ, the upside remains bringing forward the time frame for reaching 25% EBIT margins, currently expected in FY15. "One Toll" margin improvement? In the absence of a volume-led recovery, we believe evidence of productivity improvements elsewhere in the business in the form of margin expansion will be well received. While hard to quantify "One Toll" benefits, we believe they could progressively materialise from 1H14, as we start to see the first results of management turning its focus on consolidation instead of acquisitive growth. BXB back to more appropriate multiples: With BXB now trading back in line with its historical market multiple, and with management likely to reaffirm FY14 guidance, we see the result more about the timeline for growth in emerging markets as well as RPC penetration in North America. Following this note, we have removed Recall, resulting in 12% changes to earnings over the forecast period. We lower our target price from $9.83 to $9.29 leaving a NEUTRAL rating. Airlines: With guidance already given for both stocks and a looming "transformational" strategy day for Qantas, we see 1H14 results as perhaps less meaningful than in previous years. For VAH, we have lowered earnings over the forecast period and our target price to $0.38 (from $0.42). Qube – forecasts and target price upgraded into 1H14, based on volume expectations in Ports and Bulk as Qube progressively tender for contracts on the North West Shelf. Target price raised to $2.20, previously ($1.90), NEUTRAL rating maintained.
Nicholas Markiewicz Research Analyst 61 2 8205 4107

14 February 2014
Australia and NZ First Edition 10
1H14 results preview; reports on 17 Feb Bendigo and Adelaide Bank (BEN.AX)
Credit Suisse assumptions/variance to market Our FY14E $378mn cash earnings estimate sits 1% above the IBES $376mn consensus, while our corresponding DPS estimate of $0.64 is in line with the consensus. What to look for We would look for: 1) Some relief emerging for net interest margins, with term deposit spread pressures easing and the re-pricing of parts of the Community Bank originated portfolio; 2) Accelerating operating costs, reflecting new premises costs and acceleration of the Basel advanced accreditation programme; 3) Rural Bank asset quality (given on-going deterioration within half a dozen North Queensland cattle exposures, reflecting live export bans, drought and lower stock prices); and 4) Update on medium-term issues such as the progress of the Great Southern litigation and the Basel advanced accreditation programme. Share price implications BEN currently trades on 12.4x 12-month prospective earnings (equating to a 4% discount to the major banks vs an 8% four-year average discount and compared with Bank of Queensland on 12.3x) and a corresponding book multiple of 1.1x (major banks 2.1x, Bank of Queensland 1.3x).
Share Price 11.65 (AUD)
NEUTRAL
Target Price 12.20 (AUD)
James Ellis Research Analyst 61 2 8205 4531
1H14 results preview; reports on 19 Feb Fortescue Metals Group (FMG.AX)
We already have a good estimate of the key P&L items following the DecQ results. We can estimate revenue and expenses from received prices and C1 costs, and we know net debt and gearing as FMG has kept the market informed while calling in debt for repayment. Having the exact figures will be interesting, but there is unlikely to be anything in the results to change the view. We expect EPS of 53¢ps (consensus 55¢ps). Management provided an investor call less than three weeks ago, so we doubt much has changed. We will be looking for updates on the ramp-up of the Kings OPF and status of the Cloud Break wet front-end fix due for completion this month. We expect an interim dividend of 5¢/sh, ahead of zero last year, given the strong DecH result. This would represent a payout ratio of only 9% versus the policy of 30%-40%, but we understand the first priority is debt repayment. We doubt the market would welcome a dividend above consensus while gearing remains high. We expect the dividend payout will rise towards the payout policy once gearing reaches the targeted 40% level. Our DCF valuation remains A$9.60/sh and our target price A$7.50.
Share Price 5.62 (AUD)
OUTPERFORM
Target Price 7.50 (AUD)
Matthew Hope Research Analyst 61 2 8205 4669 All material presented in this report, unless specifically indicated otherwise, is under copyright to CS. None of the material, nor its content, nor any copy of it, may be altered in any way, transmitted to, copied or distributed to any other party, without the prior express written permission of CS.

14 February 2014
Australia and NZ First Edition 11
2013 results preview and operation analysis; reports on 21 Feb
Iluka Resources (ILU.AX)
Following the quarterly results and the 11 Feb report that NPAT is $18mn after impairments, we now have the main items of the P&L. Dividend – we expect policy-breaking 5¢/sh final dividend, matching interim. Payout policy is +40% of FCF measured after all capital. Capex for DecH is uncertain, but guidance was $100mn for the year. On that basis, we estimate 2013 FCF to be -$3mn. Interim dividend of 5¢/sh (A$21mn) looked beyond a hefty tax payment towards a stronger DecH, which did not eventuate. Policy would indicate no final dividend, given it would be funded with debt, but with a comfortable balance sheet, it may match interim at 5¢. Management call and cost guidance for the current year should be key catalysts for the outlook. We believe ILU is heading for a loss in the first half of 2014 with pricing now lower than the average for 2013. We will be interested in management response, although we doubt ILU has any further useful cuts available. We look closer at this issue in this note. MAC changes – ILU has given responsibility for the MAC royalty to a development manager and may begin moves to develop and spin off the royalty business. Our DCF valuation remains A$9.10/sh and our target price is $10.
Share Price 9.22 (AUD)
NEUTRAL
Target Price 10.00 (AUD)
Matthew Hope Research Analyst 61 2 8205 4669
1H14 results preview and exploration success; reports on 19 Feb
Mount Gibson Iron (MGX.AX)
Sales revenue can be estimated from the received prices (CS: $589mn, consensus $525mn), but we have no lead on cash costs. For EBITDA, CS: $230mn, consensus $224mn. A large swing factor in reaching NPAT is D&A, particularly amortisation of stripping, which is driven by earth moving at Koolan Island. We estimate NPAT of $142mn, consensus mean is $109mn, but with a $65mn range. MGX provided its cash balance in the DecQ report (A$484mn) which implies net cash of $465mn. Interim dividend nil: MGX has a policy of providing only final dividends. MGX today announced exploration success at Iron Hill prospect, 3km from Extension Hill mine. Successful Dec drilling and historical work (drilling and adits) has provided MGX with an exploration target of 5-7Mt at a grade of 58-61% Fe, which could extend the mine life by two years. Iron Hill is one of three prospects known at Extension Hill South lease from historical work. Extension Hill mine is due to end in 2017 on most recent reserves. A two-year life extension might increase our DCF valuation by 5¢ps if there is no capex, and costs are similar to the current mine. Nevertheless, earnings will improve if the mine life could be extended to 2021 like Koolan Island. Our DCF valuation and target price remain A$1.05/sh.
Share Price 1.12 (AUD)
UNDERPERFORM
Target Price 1.05 (AUD)
Matthew Hope Research Analyst 61 2 8205 4669

14 February 2014
Australia and NZ First Edition 12
HY14 results preview; reports on 17 Feb UGL (UGL.AX)
Credit Suisse assumptions/variance to market: We forecast HY14 underlying NPAT of $52.9mn, up 4% vs. pcp. Our forecasts imply 1H earnings seasonality of 41%, below the historical average (45%). What to look for: Reiterate FY14 guidance of $120-130mn underlying NPAT. Credit Suisse FY14 forecasts ($128mn) are 4% above consensus ($123mn). Solid property result to offset engineering: We forecast 24% growth in DTZ EBIT vs pcp driven by revenue growth (+8%) & margin uplift (to 5.7%). In contrast, we forecast an 11% decline in engineering EBIT in 1H14 with stronger projects EBIT offset by a weaker rail result. Demerger on track for FY15: We expect UGL to confirm it remains on track to have its property and engineering businesses structurally separated in FY14 and the demerger completed in FY15 subject to market conditions. UGL to focus on solid outlook for property supported by the US cyclical recovery and integration of DTZ. We are still cautious on engineering outlook: UGL is likely to identify the Dec-13 LNG maintenance contract win as evidence that resources maintenance activity is picking up. However, we need to see further contract wins to turn more positive on the outlook. UGL appears fair value: Trading at 10x 12-month fwd PE, valuation upside from the demerger is likely to be offset by the weak outlook for engineering.
Share Price 7.11 (AUD)
NEUTRAL
Target Price 7.75 (AUD)
Emma Alcock Research Analyst 61 2 8205 4403
STRATEGY & ECONOMICS
Strategy Portfolio Changes - SUN out ASX in Australian Investment Strategy
Strategy Short Ideas, Suncorp Out – We are taking profits from our short Suncorp position. The stock has been in our Short Ideas list since inception. Andrew Adams has been cautious on Suncorp given the stocks lofty valuations, aggressive insurance assumptions and likelihood of cutting revenue growth targets. Andrew notes that the upcoming results
announcement could be an additional negative for the share price.
Strategy Short Ideas, ASX In – In place of Suncorp, we are adding ASX to our Short Ideas. We believe the general pressures on the equity industry will continue to weigh on ASXs share price. Meanwhile, the company currently pays out 90% of free cash-flow in the form of dividends. FCF growth is expected to remain anaemic. Andrew Adams has recently assumed coverage on the stock with an Underperform rating.
He highlights falling value per trade and lower turnover velocity.
While we expect the Australian equity market to rally from here, we still anticipate ASX to underperform. Its historical beta has been less than one. Stock Themes – A number of themes run through our stock selection
process. First, Selfies continue to dominate the Australian investor base
and we know they have an acute focus on dividends. We do not want to stand in the way of these flows. Most of our long ideas are in a position to increase dividends. While our shorts generally operate on lower FCF yields and have less capacity to return capital to share-holders. Second,
we believe Australian companies will be operating in a low growth environment. Those companies in a position to generate returns,
irrespective of the macro backdrop, should be valued more highly. For this
reason, we have many restructuring candidates amongst our Long
Ideas. Third, while we believe bottom-up factors will continue to become more important in driving stock prices, there will continue to be macro
influences. One of the most important will be the RBA to cutting rates as mining investment unwinds. This supports our long position in a
number of consumer and residential housing exposed stocks.
Hasan Tevfik ,CFA Research Analyst 61 2 8205 4284

Australia and NZ First Edition 13
14 February 2014
Asia Pacific/New Zealand
Equity Research
Transportation Infrastructure (Industrials)
■
■
Airwork Holdings
(AWK.NZ) INITIATION
Engineering a competitive advantage
■ We initiate coverage on AWK with a DCF-based 12-month target price
of $3.00 and a NEUTRAL rating. AWK is a specialist aviation business
operating in fixed wing and helicopter leasing and maintenance. AWK owns,
operates and maintains a fleet of aircraft that are supported by a world-class
maintenance, repair and overhaul (MRO) capability backed by extensive
local and international certification.
■ In June 2013 AWK received European Aviation Safety Authority (EASA)
certification. This has the potential to step change revenue and earnings of
its Helicopter Engineering division and represents an area of upside risk to
forecasts. Early benefits of EASA certification have been encouraging, with a
key contract signing in Germany. Canada and South Africa are other
markets that have been assessed as offering strong potential.
■ Helicopter demand remains strong, particularly in the oil and gas sectors,
and AWK’s upgrade capability positions the company for pursuing offshore
leasing contracts. Potential exists to deploy further helicopters in markets
such as Africa over and above what our current forecasts assume,
particularly if mining related exploration and development activity expand.
■ AWK has embarked on a programme of productivity measures within
the Fixed Wing division to improve cost efficiency and fleet utilisation.
Benefits from this programme are expected to commence from FY14.
■ AWK will report its interim result on Wednesday 19 February.
Share price performance
90.0
95.0
100.0
105.0
110.0
2.00
2.50
3.00
3.50
4.00
Dec-13 Jan-14
Airwork Holdings Limited LHS Relative to NZX50 (RHS)
The price relative chart measures performance against the
NZX50 index which closed at 4870.0 on 12 Feb 14
The spot exchange rate was NZ$1.202/US$1 on 13 Feb 14
Performance over 1M 3M 12M
Absolute (%) 8.4 N/A N/A
Rel-NZX50(%) 9.0 N/A N/A
Year to 30 Jun 2012A 2013A 2014F 2015F 2016F
Adjusted Earnings NZ$m 8.0 10.1 12.0 13.2 13.9
EPS Adjusted NZc. 18.8 23.7 23.9 26.2 27.6
EPS Grow th % -32.6 25.8 0.8 9.8 5.5
P/E x 15.7 12.5 12.4 11.3 10.7
CPS NZc. 56.5 68.7 66.3 70.6 72.5
P/CF x 5.2 4.3 4.5 4.2 4.1
EV/EBITDA x 7.6 6.2 5.6 4.8 4.4
Net DPS NZc. 7.5 7.5 13.4 14.0 15.3
Imputation % 50.0 50.0 50.0 50.0 50.0
Net Yield % 2.5 2.5 4.5 4.7 5.2
Gross Yield % 3.0 3.0 5.4 5.6 6.2
Financial and valuation metrics
Source: Company data, NZX, First NZ Capital estimates
Rating NEUTRAL* Price (13 Feb 2014, NZ$) 2.96 Target price (NZ$) 3.00¹ Market cap. (NZ$mn) 148.71 Projected return: 0 Capital gain (%) 1.4 Dividend yield (net %) 4.6 Total return (%) 6.0 52-week price range (NZ$) 2.70-3.05
* Stock ratings are relative to the relevant country
benchmark.
¹Target price is for 12 months.
Research Analysts
Paul Turnbull
+64 9 302 5559
This report is distributed in Australia by Credit Suisse
Equities (Australia) Limited. Please see legal disclaimer and
disclosure annex for further terms and information
Provided by First NZ Capital

14 February 2014
Australia and NZ First Edition 14
Figure 1: Airwork Holdings financial summary
Sector: Transportation NZX Code: AWK
PROFIT & LOSS ($m) BALANCE SHEET ($m)Year to 30 Jun 2012A 2013A 2014F 2015F 2016F Year to 30 Jun 2012A 2013A 2014F 2015F 2016F
Operating Rev enue 103 118 126 134 143 Cash & Equiv alents 2.6 4.7 4.8 7.6 15.4
Operating Ex penses -72.3 -81.3 -86.5 -90.4 -96.8 Debtors & Inv entories 14.5 18.4 15.4 16.4 17.5
Operating EBITDA 30.4 37.1 39.2 43.2 45.9 Other Current Assets 39.6 31.7 24.5 26.5 28.3
Depreciation -16.0 -19.1 -21.3 -22.3 -22.6 Current Assets 56.8 54.8 44.7 50.5 61.1
Amortisation -0.2 -0.3 -0.2 -0.6 -0.6 Fix ed Assets 122 126 135 134 130
Operating EBIT 14.2 17.7 17.8 20.4 22.7 Inv estments 0.0 0.0 0.0 0.0 0.0
Other Income 0.0 0.0 0.0 0.0 0.0 Intangibles 1.0 1.7 3.7 3.8 3.9
Abnormals -10.6 -3.7 -0.9 0.1 0.0 Other Non-Current Ass. 4.4 1.8 2.1 2.0 2.0
Reported EBIT 3.7 14.0 16.9 20.5 22.7 Total Assets 185 185 189 194 201
Net Interest -5.2 -5.3 -4.4 -3.2 -3.5
Pretax Profit -1.5 8.7 12.5 17.2 19.3 Interest Bearing Debt 87.4 84.9 67.4 65.7 65.7
Tax 0.5 -2.2 -4.0 -5.1 -5.3 Other Liabilities 31.6 30.9 31.4 31.4 32.1
Minority Interests 0.0 0.0 0.0 0.0 0.0 Total Liabilities 119 116 98.7 97.1 97.8
Equity Accounted Profit 0.0 0.0 0.0 0.0 0.0 Minorities 0.0 0.0 0.0 0.0 0.0
Reported NPAT -1.1 6.5 8.6 12.2 13.9 Conv ertible Capital 0.0 0.0 0.0 0.0 0.0
Abnormals (net of tax ) -9.1 -3.6 -3.4 -1.0 0.1 Ordinary Equity 65.6 68.8 90.2 95.5 102
Adjusted Earnings 8.0 10.1 12.0 13.2 13.9 Total Funds Emp. 185 185 189 193 200
RATIOS AND CAPITAL STRUCTURE CASH FLOW ($m)Year to 30 Jun 2012A 2013A 2014F 2015F 2016F Year to 30 Jun 2012A 2013A 2014F 2015F 2016F
Profitability & Growth
EBITDA/Op Rev % 29.6 31.3 31.2 32.4 32.2 Operating EBITDA 30.4 37.1 39.2 43.2 45.9
EBIT/Op Rev % 13.9 14.9 14.2 15.2 15.9 Other Cash Income 1.7 -2.3 -1.8 0.1 0.0
Effectiv e Tax Rate % 30.5 25.5 31.6 29.4 27.7 Interest Paid -5.2 -5.3 -4.4 -3.2 -3.5
Return On Equity % 11.8 15.0 15.1 14.2 14.1 Tax Paid 0.5 -2.2 -4.0 -5.1 -5.3
ROCE % 9.5 11.8 11.8 13.3 14.9 Working Capital / Other -3.1 -4.8 5.2 -1.9 -2.2
EPS Adjusted c. 18.8 23.7 23.9 26.2 27.6 Operating Cash Flow 24.3 22.5 34.4 33.2 34.9
EPS Grow th % -32.6 25.8 0.8 9.8 5.5
Net DPS c. 7.5 7.5 13.4 14.0 15.3 Total Capex -31.0 -16.3 -31.2 -21.1 -18.8
Div idend Cov er x 2.5 3.2 1.8 1.9 1.8 Acquisitions -0.6 -0.9 -4.9 -0.7 -0.7
Asset Backing & Capital Structure Div estments 4.9 0.7 5.2 0.0 0.0
Net Cash (Debt) $m -84.8 -80.2 -62.5 -58.1 -50.3 Div idends -3.2 -3.2 -6.7 -7.0 -7.7
NTA / Share $ 1.5 1.6 1.9 1.8 1.9 Equity Raised 0.0 0.0 20.0 0.0 0.0
Equity / Tot Assets % 35.5 37.3 47.8 49.4 50.8 Other 0.0 0.0 -0.5 0.1 0.0
Net Debt / EBITDA x 2.8 2.2 1.6 1.3 1.1 Change in Net Debt -5.6 2.7 16.2 4.5 7.7
Interest Cov er x 2.7 3.3 4.1 6.3 6.6
Shares on Issue Capex /Depn % 194 85.3 147 94.7 83.2
Ordinary m 42.6 42.6 50.2 50.2 50.2 Capex /Rev % 30.2 13.8 24.8 15.8 13.2
Fully Diluted m 42.6 42.6 46.4 50.2 50.2
EBITDA BREAKDOWNYear to 30 Jun 2012A 2013A 2014F 2015F 2016F
Fix ed Wing 22 24.22 26.58 26.36 27.1
Helicopters 11.93 17.06 18.96 22.21 24.24
Other -3.5 -4.21 -6.31 -5.33 -5.49
Group 30.43 37.07 39.23 43.24 45.85
Fix ed Wing Margin % 37.52 37.09 41.48 41.24 41.24
Helicopters Margin % 27.07 32.17 30.77 31.87 31.53
Group Margin % 29.63 31.32 31.21 32.37 32.16
Fixed Wing51%
Helicopter Leasing
17%
Helicopter Engineering
32%
SEGMENT REVENUE
Source: Company data, NZX, First NZ Capital estimates

14 February 2014
Australia and NZ First Edition 15
Introduction
Airwork Holdings Limited (AWK) is a specialist aviation business operating in two well-
defined niches of fixed wing and helicopter leasing and maintenance. AWK owns,
operates and maintains a fleet of aircraft that are supported by a world-class maintenance,
repair and overhaul (MRO) capability backed by extensive local and international
certification.
AWK’s Fixed Wing business derives most of leasing income from the provision of B737
aircraft, maintenance and crew for carriage of express freight in Australia and New
Zealand for major courier companies. Helicopter operations encompass leasing, crewing
and chartering of helicopters for emergency medical services (EMS), search and rescue
(SAR), police, military, mining, oil and gas and tourism sectors. A full helicopter MRO
service supports the helicopter leasing business and provides third-party MRO services in
New Zealand and internationally.
Figure 2: Revenue by division FY13 Figure 3: EBITDA by division FY13
Fixed Wing54%
Helicopters46%
Fixed Wing24.2m
Helicopters17.0m
Source: Company data
Source: Company data
Helicopter operations
AWK’s Helicopter business principally operates in the small- to medium-sized (5-9 pax),
twin engine, turbine powered helicopter market. These helicopters are typically used for
support services in the mining/oil and gas sector, emergency medical services (EMS),
search and rescue (SAR), police, military and tourism/charter market.
An active secondary market exists for helicopters, with around 80% of all turbine
helicopters produced since commercial production commenced in 1955 estimated to
remain in active service. Helicopters depreciate relatively modestly over a useful life that
can span several decades with appropriate service. Individual components are frequently
replaced to meet regulatory requirements or safety standards. The global fleet of twin-
engine BK117 helicopters in operation is around 295.
In FY13 helicopter leasing contributed 39% of divisional revenue compared with 61% from
maintenance, repair and overhaul (MRO). AWK’s external MRO business has roughly
doubled over the past five years.
Helicopter MRO
A healthy secondary market for helicopters together with AWK’s MRO capability provides
opportunity for AWK to source helicopters to overhaul and upgrade them and either lease
or on-sell. Upgraded helicopters are a highly cost-competitive alternative to new
helicopters. The high value of helicopter components and maintenance and low cost of
transporting components relative to their value has created a global MRO market. This
feature of the helicopter business allows AWK’s NZ-based MRO facility to support the
offshore growth aspirations of AWK’s helicopter leasing business and compete effectively
with high valued new helicopters.

14 February 2014
Australia and NZ First Edition 16
AWK’s MRO capability is supported by an increasing range of certifications which offer a
barrier to entry and international growth opportunity. Key certifications underpinning
helicopter MRO growth:
■ Only accredited service centre for Honeywell LTS-101 turbine engine in the Asia
Pacific excluding Japan (and only one of six worldwide);
■ One of two facilities in Asia Pacific approved to repair and overhaul BK117 dynamic
components (and only one of three worldwide);
■ One of three accredited service centres in Asia Pacific to repair and overhaul
Eurocopter AS350/355 dynamic components (and one of six facilities globally
excluding OEM providers);
■ The only helicopter engineering facility in the Asia Pacific with test cell capability for
Honeywell LTS-101 engines and Eurocopter AS350/355 and BK117 dynamic
components.
In addition AWK holds the only certification for BK117-850 engine upgrade, a modification
developed with Honeywell which replaces the engine on the BK117 helicopter with a more
powerful version. This upgrade has been approved by the New Zealand, European and
Canadian authorities. This significantly improves the Category A performance of the
BK117 helicopter, especially in hot and high altitude conditions to enable upgraded
helicopters to match alternative models in this area, but at a significantly lower cost.
Helicopter leasing
AWK manages a fleet of 29 helicopters which are leased or chartered on a range of terms
tailored to customer requirements. Of these helicopters 25 are owned and four are
operated on behalf of third parties. Helicopters are currently leased in New Zealand,
Australia, Papua New Guinea and Africa. The fleet in service has grown by two helicopters
over the past five years.
Figure 4: Helicopter fleet in service
Eurocopter AS 355F1
Kawasaki BK-117
Augusta Westland A109
Eurocopter AS 350BA
McDonnell Douglas 500
Robinson R44 Bell 427
Number Owned 10 12 - 2 1 - -
Number Operated - 1 1 - - 1 1
Capacity 5 passengers 9 passengers 5 passengers 6 passengers 4 passengers 3 passengers 7
passengers
Max Range 703km 500km 990km 660km 605km 560km 685km
Source: Company data
There are two types of leases:
■ “dry lease” where the helicopter is supplied (with full or partial engineering support) – in
this case the customer is responsible for crew, fuel, insurance and operation; and
■ “wet lease” where AWK provides all services (aircraft, crew, maintenance and
insurance) and the customer is only responsible for variable charges (eg. fuel).
AWK’s helicopter fleet operates in the following sectors: mining/oil and gas exploration,
tourism/charter, emergency medical services (EMS), police and search and rescue (SAR).
In addition to its long-term leasing operations AWK offers helicopter charter services on an
ad hoc basis in NZ and offshore. Around two thirds of forecast FY14 revenue is covered
by existing contracts.

14 February 2014
Australia and NZ First Edition 17
Figure 5: Helicopter leasing revenue by industry FY13
Oil & Gas48%
Mining17%
Tourism / Charter14%
Emergency / Govt Services
20%
Other1%
Source: Company data
Major customers currently include:
■ New Zealand Police.
■ Heli Niugini – a helicopter provider to the oil and gas industry in PNG.
■ Rio Tinto.
■ Bristow Group – for contracting to the offshore oil and gas industry in Australia.
■ The Helicopter Line.
AWK is in a commercial dispute with The Helicopter Line (a subsidiary of Skyline
Enterprises Ltd) with respect to the dry lease of eight Squirrel AS355 helicopters. The
Helicopter Line is not flying the helicopters and has been threatening to terminate the
lease for some months alleging that AWK has breached the contract. AWK has filed
proceedings in the High Court seeking payment of outstanding invoices amounting to
$2.5mn. The contract extends for a further nine years and provides for minimum revenue
of approximately $17mn ($1.9mn pa). While the company is confident of success in the
summary judgment, no income from this contract is allowed for in FY14 or FY15 forecasts.
Fixed Wing Operations
AWK’s Fixed Wing flight operations business is based around the provision of aircraft on a
wet lease basis (providing aircraft, crew. maintenance and insurance) in the specialist
airfreight sector in New Zealand and Australia. Over 70% of revenue is derived from
leasing and operating aircraft and related services to the airfreight industry with the
balance of revenue mainly derived from passenger charters, dry leasing of aircraft and
third party maintenance. Over 80% of revenue is secured by long-term contracts. AWK
has little direct fuel price risk or operating risk. FY13 accounts disclose that AWK’s two
largest customers were both in Fixed Wing and contributed approximately 72% of Fixed
Wing revenue.

14 February 2014
Australia and NZ First Edition 18
Figure 6: Revenue by sector FY13
Air Freight70%
Passenger Charters
18%
Dry Leasing5%
Other7%
Source: Company data
Express Freight Services
This business comprises two contracts:
■ In New Zealand, AWK Flight Operations lease a B737 to Express Couriers (NZ Post
subsidiary) on an ACMI lease and operates five turboprop aircraft on their behalf under
AWK’s New Zealand Air Operators certificate. The relationship with NZ Post extends
back to 1989.
■ In Australia, AWK Flight Operations leases five B737-300 freighters to Toll Priority for
its Australian express freight business under an ACMI lease. When the contract was
first awarded in 2007, three B737-300 aircraft were leased. Two B737-300 aircraft have
since been added as routes have grown. The contract was renegotiated in FY11 and
extended from 2014 to 2018 in conjunction with the addition of capacity. Multiple
services are operated between Brisbane, Sydney, Melbourne and Perth and additional
services are operated as required.
In both NZ and Australia the express freight market are duopolies. AWK lease and operate
the aircraft fleet for one of the two major players in each market. In NZ, AWK’s customer
NZ Express (NZ Post subsidiary) competes against Freightways. In Australia, AWK’s
customer Toll Priority competes against Qantas Freight.
Passenger services
AWK leases or operates the following passenger aircraft:
■ A B737-400 passenger aircraft was leased to Alliance Airways up until December
2013. Since then the aircraft has been redeployed for charters and short term lease. A
B737-300 passenger aircraft is based in Brisbane which is leased on short-term
contracts often in support of small airlines operating in the Pacific.
■ A Fairchild Metroliner is leased to Life Flight Trust Auckland as an air ambulance
service under an ACMI lease. AWK also uses 2 uncommitted aircraft (Metroliner and
Piper Chieftain) for commercial charters.
■ AWK also owns 50% of Infinite Charters Ltd, a corporate charter joint venture that
operates two Jetstream 32 aircraft which are crewed and operated by AWK.

14 February 2014
Australia and NZ First Edition 19
Dry leasing
AWK leases two B737-400 passenger aircraft to Romanian low-cost carrier Blue Air, which
operates services out of Bucharest. AWK receives a monthly lease fee and an hourly rate
per flight hour. Blue Air operates, insures and maintains the aircraft.
Figure 7: Fixed Wing fleet in service
Boeing 737 300
Boeing
737-400
IAI Westwind
II Jet Stream 32
Fokker
F27-500
Fairchild
SA227
Metroliner
Piper PA31
Cheiftain
Number Owned 5 freight
1 passenger
1 freight
3 passenger - - - 2 1
Number Operated - - 1 2 2 3 -
Capacity 17,000kg
136 passengers
19,500kg
162 passengers
1,155kg
7 passengers
1,908kg
19 passengers 5,500kg
2,200kg
18 passengers
800kg
8 passengers
Max Range 6,000km 6,000km 4,167km 1,875km 2,000km 2,750km 2,750km
Source: Company data
Maintenance
AWK is certified to perform the full range of engineering services on all aircraft within its
fleet including heavy maintenance C checks for B737-300 and B737-400, C and D checks
on Fokker 27 aircraft and Phase and SSV checks of Metroliner aircraft. AWK also provides
MRO services to some external customers.
The key competitive advantage of AWK’s Fixed Wing business is its cost competiveness
supported by its in-house engineering capability and certifications held to operate fixed
wing aircraft in the jurisdictions it operates. Also, through mutual recognition of Australia
and New Zealand aviation regulations, AWK can operate in Australia on a partial New
Zealand cost base.
Key opportunities
Helicopter MRO certification leverage. In June 2013 AWK received European Aviation
Safety Authority (EASA) certification of its Ardmore facility. This followed initial submission
back in October 2010 and expanded the acceptance of maintenance and engine upgrade
sales to most of jurisdictions worldwide (other than USA). This is expected to be a key
driver of further MRO growth in the years ahead. Early signs of the benefits of EASA
accreditation are encouraging. AWK recently contracted with ADAC, the largest
automotive club in Germany to progressively purchase its fleet of 14 BK117 helicopters
over the next five years while also supplying parts, engines and components during that
period. Canada and South Africa are other markets that have been assessed as offering
strong potential for BK117 upgrades. In anticipation of further sustained growth AWK is
upgrading capacity at its Ardmore facility.
EASA certification has the potential to step change BK 117 engine sales and we would
highlight this as a key area of upside risk to medium-term forecasts. We forecast
Helicopter Engineering revenue will grow to $40.5mn in FY14 up 26% on pcp. This slightly
exceeds PFI forecasts but we would highlight helicopter trading revenue as presenting
further upside risk. Between FY14 and FY18 we forecast Helicopter Engineering revenue
will grow at an average 11% p.a.
Helicopter lease fleet growth. Helicopter demand remains strong, particularly in the oil
and gas sectors, and AWK’s upgrade capability (and cost-effective products) positions the
company strongly for pursuing offshore leasing contracts. Potential exists to deploy further
helicopters in Africa, particularly if mining related exploration and development activity
expands. Our base case valuation assumes AWK grows its helicopter fleet by one BK117
p.a. through the explicit forecast period.

14 February 2014
Australia and NZ First Edition 20
Fixed Wing efficiency improvement. Expansion of the business footprint in Fixed Wing
in Australia in recent years has been accompanied by a significant lift in the capital and
cost base. Management is now focusing on consolidating the Fixed Wing business (to
extract improved ROIC) and has embarked on a programme of productivity measures to
improve cost efficiency in its Australian operation. Management is targeting annual cost
reduction of A$3mn from a variety of initiatives including more robust planning, logistics,
crewing and internalisation of staff maintenance functions. These cost-reduction benefits
will commence in FY14.
In addition to targeting greater efficiency, focus is on increasing capacity utilisation in
Fixed Wing charter. FY14 PFI forecasts assume that the expiry of a Boeing 737-400 fixed
price contract in Australia in December 2013 will only be partly offset by charter hours.
However, with current charter activity strength in Australia we believe there is upside risk
to this assumption as well as our Fixed Wing revenue forecast in FY14 of $64.1mn.
AWK has also signalled that organic growth may be supplemented with strategic
acquisitions of businesses and assets that complement its existing operations.
Key issues / risks
Key contract risk. AWK derives a significant portion of revenue from key customers. The
FY13 financial statements note that the two largest customers (both in Fixed Wing)
accounted for 72% of Fixed Wing revenue and 40% of FY13 group revenue. AWK’s
largest customer, Toll Holdings Ltd, accounted for 28% of group revenue in FY13 and
although this contract does not expire until 2018 we would nominate this renegotiation as
a key medium-term risk. To reflect this risk in our valuation we assume a 5% nominal
decline in Fixed Wing lease revenue per flying hour in FY19. We also note that a four-year
extension of the Toll contract in FY11 coincided with declining yield trends in the Fixed
Wing division. Another key Fixed Wing lease contract with NZ Post is up for renewal in
FY16.
Fixed Wing accelerated depreciation. AWK has accelerated the depreciation of its Fixed
Wing fleet such that the implied economic life of this asset base has fallen from around 15
years in FY11 to nine years currently. Fixed Wing depreciation as a percentage of revenue
increased from 13.6% in FY11 to 19.4% in FY13. This led to a significant decline in Fixed
Wing EBIT margin during the period. Rather than a change in useful life, we believe that
the key driver of the higher depreciation charge has been a significant decline in the
market value of B737 aircraft. We estimate that the present over-depreciation of Fixed
Wing assets equates to around $4mn relative to maintenance capex indicated by
management. In addition to the accelerated depreciation, an impairment of $11.8mn was
recognised in FY12. This related to adjustments in the carrying value of AWK’s Fixed Wing
engines, specifically the Boeing 737 fleet.
Supplier and accreditation risk. In conducting its MRO activities AWK relies on
accreditations and parts supply agreements with OEMS, including Eurocopter and
Honeywell. Given that OEMs can compete with AWK’s MRO business potential
commercial tension exists between AWK and MROs. While AWK proactively manages
such relationships any impairment of these relationships could negatively impact on AWK.
Cyclical industry exposure. Many of AWK’s customers are exposed to cyclical sectors
including oil and gas, mining, logistics and tourism. AWK’s helicopter leasing division has
enjoyed growth in recent years as a recovery in the oil and gas and mining sectors drove
improved fleet utilisation. Three BK-117 helicopters were added to the fleet during FY12
with two of those deployed in a full service contract to Guinea, Africa, to support Rio
Tinto’s Simandou iron ore project. While charter activity in Australia has shown recent
strength, tourism related helicopter activity in NZ has remained weak.
Foreign exchange risk. AWK transacts much of its revenue and expenses in foreign
currencies such that AWK calculates that a 1 cent appreciation of the USD against the

14 February 2014
Australia and NZ First Edition 21
NZD will increase EBITDA by around $0.343mn, while a 1 cent appreciation of the AUD
against the NZD will increase EBITDA by $0.136mn.
Accident/incident risk. An accident or incident involving any aircraft or equipment
operated, designed or maintained by AWK could incur reputational damage or financial
loss. In January 2014 the right side main landing gear of a B737 aircraft owned by AWK
and servicing Toll Holdings Ltd collapsed, causing the plane to come to a sudden halt on
the runway shortly after landing. A full investigation is in progress to determine the cause
of the incident. The aircraft was fully insured and AWK had spare capacity to continue to
fully service the Toll contract.
Historical financial information and FNZC forecasts
Figure 8: AWK revenue and earnings breakdown
Year end 30 June (NZ$mn) FY11A FY12A FY13A FY14F FY15F FY16F
Revenue
Fixed Wing 53.7 58.6 65.3 64.1 63.9 65.7
Helicopter - leasing 17.2 18.8 21.0 21.1 23.7 26.6
Helicopter - engineering 26.1 25.2 32.0 40.5 46.0 50.3
Total Revenue 97.0 102.7 118.3 125.7 133.6 142.6
Operating Expenses
Parts & material purchases -23.9 -30.4 -31.6 -33.0 -37.9 -42.3
Employee & related expenses -17.1 -28.9 -35.3 -33.9 -33.5 -34.3
Aircraft operating expenses 0.0 -4.0 -4.1 -6.2 -6.8 -7.2
Other expenses -22.1 -9.1 -10.3 -13.4 -12.1 -13.0
Total Operating Expenses -63.1 -72.3 -81.3 -86.5 -90.4 -96.7
EBITDA
Fixed Wing 24.1 22.0 24.2 26.6 26.4 27.1
Helicopters 12.2 11.9 17.1 19.0 22.2 24.2
Other -1.8 -3.5 -4.2 -6.3 -5.3 -5.5
EBITDA 34.6 30.4 37.1 39.2 43.2 45.9
Depreciation & amortisation -12.8 -16.2 -19.4 -21.4 -22.9 -23.1
EBIT
Fixed Wing 16.9 12.2 11.6 12.0 11.7 12.5
Helicopters 7.9 6.9 11.9 13.8 16.8 18.7
Other -3.0 -4.9 -5.8 -8.1 -8.2 -8.4
EBIT 21.8 14.2 17.7 17.8 20.4 22.7
Impairment expenses -1.3 -12.0 -2.0 0.0 0.0 0.0
Other gains/(losses) 11.5 1.5 -1.7 -0.9 0.1 0.0
Net Financing Expense -5.1 -5.2 -5.3 -4.4 -3.2 -3.5
Profit before tax 26.9 -1.5 8.7 12.5 17.2 19.3
Tax Expense -7.9 0.5 -2.2 -4.0 -5.1 -5.3
NPAT 19.0 -1.1 6.5 8.6 12.2 13.9
NPAT - Normalised 11.9 8.0 10.1 12.0 13.2 13.9
EBIT margin
Fixed Wing 31.4% 20.8% 17.7% 18.8% 18.3% 19.0%
Helicopters 18.2% 15.6% 22.5% 22.4% 24.1% 24.3%
Group 22.4% 13.9% 14.9% 14.2% 15.2% 16.0%
Operating Fleet
Fixed Wing 17 20 20 21 21 21
Helicopter 22 25 26 27 28 29
Source: Company data, FNZC estimates
■ Earnings in FY11 were boosted relative to other years by excellent returns achieved
from the purchase, parting and sale of two MD90 aircraft engines in the Fixed Wing
division.
■ Margin expansion was achieved in the Helicopter division between FY11 and FY13 as
scale benefits more than offset the increasing skew from higher margin leasing
revenue towards lower margin engineering revenue.

14 February 2014
Australia and NZ First Edition 22
■ FY14 and FY15 do not recognise any revenue for the eight helicopters contracted to
The Helicopter Line Limited. FY16 does assume that these helicopters are re-leased
albeit at less than the current terms of the disputed contract.
Return on Invested Capital (ROIC)
Investment in additional Boeing 737 fleet in the Fixed Wing division and higher working
capital requirements to support the growth in Helicopter engineering revenue has led to
invested capital growth of 35% between FY09 and FY13. Earnings growth was unable to
keep pace with the increasing capital base, with Group after tax ROIC declining from
11.2% in FY09 to 9.1% in FY13. Key drivers of the lower return were the accelerated
depreciation and declining yields in the Fixed Wing division. Encouragingly we estimate
that the faster growing Helicopter division saw ROIC improve from around 11.0% in FY11
to 11.7% in FY13.
After adjusting for the accelerated depreciation and elevated fleet book value in Fixed
Wing, we calculate a normalised ROIC of 12.7% in FY13. Over the explicit forecast period
we assume a gradual decline in ROIC to 12.0% in our terminal year as a declining profile
in Fixed Wing is offset by scale benefits in the Helicopter division. With a calculated
WACC of 10.0% in the terminal year, and therefore an excess return of 2.1%, we are
implicitly ascribing a value of $40mn to intangible assets within AWK that are not carried
on balance sheet. Specifically we believe this intangible value is supported by AWK’s long-
standing relationships with a number of key customers and more importantly the extensive
local and international Helicopter Engineering certification that AWK holds.
Capex
Capex of $31.2mn is forecast in FY14 with maintenance capex of $13.8mn and growth
capex of $17.4mn. Implicit within this forecast is the assumption that Fixed Wing
maintenance capex will again be lower than Fixed Wing depreciation due to the
accelerated depreciation profile of the Boeing 737 asset base. Growth capex in FY14 and
FY15 includes investment in helicopter engineering plant capacity at AWK’s Ardmore
facility as well as the initial purchase of fleet from ADAC under the terms of the new parts
supply contract.
AWK estimated in the PFI that, based on the current fleet size, the addition of one
helicopter to the leasing fleet each year and provision of plant, inventories and spare parts
to support fleet and engineering growth, net annual capex would approximate $15mn to
$17mn. This includes average maintenance capex estimated at $13.5mn ($9.5mn Fixed
Wing, $4.0mn Helicopter). Our capex forecasts exceed management guidance, with
maintenance capex averaging around $17mn p.a. over the next five years. So as to take
into consideration a fleet replacement cycle we then forecast maintenance capex lifting to
$20mn p.a. from FY19 which equates to 1.13x depreciation.
Valuation
Our 12-month target price of $3.00 is established using a DCF valuation methodology. We
also compare AWK against the metrics of a basket of listed peer stocks. We consider an
adjusted EV/EBIT methodology the most relevant comparative multiple.
DCF valuation
DCF is our preferred valuation methodology due to a lack of directly comparable peer
companies for multiple-based analysis and due to the capital intensity of the business.
AWK is also suited to DCF analysis due to the contractual nature of its revenue stream, its
inconsistent capex profile and the accelerated depreciation of its Fixed Wing assets in the
medium term.
Our spot DCF valuation of $2.70 and 12-month forward valuation of $3.00 per share
assume that one BK-117 helicopter is added each year between FY16 and FY24.

14 February 2014
Australia and NZ First Edition 23
We provide a summary below of the sensitivity of our AWK 12-month forward DCF
valuation to a change in WACC and terminal growth rate inputs under two alternative
growth scenarios.
The low scenario assumes that the operating environment for helicopter leasing is not
supportive for BK-117 fleet growth. In this instance we do not grow the BK-117 fleet and
revert to a lower long-term ROIC for the Group.
The high scenario assumes that the operating environment remains buoyant for helicopter
leasing and is supportive for BK-117 fleet growth. In this scenario we grow the BK-117
fleet by two aircraft each year between FY16 and FY24 and long-term ROIC for the Group
improves and is sustained at an elevated level.
Figure 9: Low scenario 12-mth DCF sensitivity Figure 10: High scenario 12-mth DCF sensitivity
2.0% 2.5% 3.0%
9.6% $2.87 $2.99 $3.14
10.1% $2.65 $2.75 $2.87
10.6% $2.46 $2.54 $2.64WA
CC
TGR
2.0% 2.5% 3.0%
9.6% $3.39 $3.56 $3.75
10.1% $3.11 $3.25 $3.41
10.6% $2.86 $2.98 $3.11WA
CC
TGR
Source: FNZC estimates
Source: FNZC estimates
In addition to these scenarios we would also highlight the standalone value of the $40mn
of non-balance sheet intangible that we implicitly assume in our forecast terminal year
ROIC of 12.0%. Removal of this excess return in the terminal year would lower our base-
case DCF valuation by around $0.45 per share.
Peer comparison
We believe that the following list of companies captures a mix of operations of varying
levels of strength across each of AWK’s business units:
■ Bristow Group: The leading provider of helicopter services to the worldwide offshore
energy industry with a fleet skew towards medium and large aircraft.
■ Discovery Air: Canadian operator of helicopter fleet support to mining, oil and gas
exploration and forest fire suppression and a fixed wing fleet that provides scheduled
and charter passenger and cargo services as well as air ambulance services.
■ HNZ Group: Operates a helicopter fleet supporting a range of multinational companies
and government agencies, including onshore and offshore oil and gas, mineral
exploration & military support. HNZ also engages in third-party maintenance contracts.
■ Air Transport Services Group: Provides airline operations, aircraft leases, aircraft
maintenance and other support services primarily to the cargo transportation and
package delivery industries.
■ Alliance Aviation Services: Australia's leading provider of Fly in-Fly out transport.
The company services predominantly 'blue-chip' mining companies.
■ Atlas Air Worldwide Holdings: A global provider of outsourced aircraft and aviation
solutions for commercial and military customers.
In addition to aviation peer companies we also consider the rating of NZ small caps
relative to the wider NZX market.

14 F
eb
ruary
201
4
Au
stra
lia a
nd
NZ
Firs
t Ed
ition
24
Figure 11: Peer comparison Company Code Market Cap Div Yield ROIC Debt/EBITDA
NZD$mn FY0 FY1 FY0 FY1 FY0 FY1 FY1 FY0 FY1 FY0 FY0 EBIT EPS EBIT EPS
Helicopter Operators
Bristow Group Inc BRS 2,977 10.5x 9.1x 15.8x 13.0x 18.7x 15.2x 1.5% 12.6% 14.2% 6.6% 2.0x 8.0% 4.8% 22.2% 23.5%
Discovery Air Inc DAa.TO 21 4.8x 6.9x 11.1x 15.1x 32.5x n/a n/a 7.7% 6.0% 7.8% 3.9x 6.2% n/a (26.5%) n/a
Groupe HNZ Inc HNZa.TO 304 4.3x 4.3x 5.4x 5.5x 6.5x 6.5x 5.1% 23.8% 23.7% 17.8% 0.5x 28.6% 17.2% (1.9%) (0.6%)
Helicopter Operators Median 304 4.8x 6.9x 11.1x 13.0x 18.7x 10.9x 3.3% 12.6% 14.2% 7.8% 2.0x 8.0% 11.0% (1.9%) 11.5%
Helicopter Operators Average 1,101 6.6x 6.8x 10.8x 11.2x 19.2x 10.9x 3.3% 14.7% 14.6% 10.7% 2.1x 14.3% 11.0% (2.1%) 11.5%
Fixed Wing Operators
Air Transport Services Group Inc ATSG.O 480 4.7x 4.9x 9.8x 11.6x 9.4x 12.1x n/a 13.0% 11.7% 6.6% 2.1x (3.8%) 13.2% (14.8%) (22.4%)
Alliance Aviation Services Ltd AQZ.AX 156 4.0x 3.8x 6.7x 6.3x 5.8x 6.5x 7.2% 15.5% 15.5% 13.0% 1.5x 26.9% 30.3% 5.3% (10.9%)
Atlas Air Worldw ide Holdings Inc AAWW.O 946 7.8x 7.9x 10.0x 11.1x 7.2x 9.5x 0.0% 13.6% 12.4% 5.9% 3.1x 0.0% (4.8%) (9.8%) (24.2%)
Fixed Wing Operators Median 480 4.7x 4.9x 9.8x 11.1x 7.2x 9.5x 3.6% 13.6% 12.4% 6.6% 2.1x 0.0% 13.2% (9.8%) (22.4%)
Fixed Wing Operators Average 527 5.5x 5.5x 8.8x 9.6x 7.5x 9.4x 3.6% 14.0% 13.2% 8.5% 2.2x 7.7% 12.9% (6.5%) (19.2%)
Median (excluding Bristow) 304 4.7x 4.9x 9.8x 11.1x 7.2x 8.0x 5.1% 13.6% 12.4% 7.8% 2.1x 6.2% 15.2% (9.8%) (16.6%)
Average (excluding Bristow) 381 5.1x 5.5x 8.6x 9.9x 12.3x 8.7x 4.1% 14.7% 13.9% 10.2% 2.2x 11.6% 14.0% (9.5%) (14.5%)
Airw ork Holdings Ltd AWK.NZ 149 5.5x 5.0x 11.1x 10.1x 14.8x 12.4x 4.5% 16.1% 16.7% 9.1% 1.5x 0.0% 1.2% 14.1% 9.1%
Airw ork Holdings Ltd - adjusted AWK.NZ 149 5.5x 5.0x 9.2x 8.4x 11.5x 10.0x 4.5% 19.4% 19.9% 12.7% 1.5x 6.6% 10.1% 11.4% 5.3%
Selected Small Caps
PGG Wrightson Ltd PGW.NZ 317 9.3x 7.6x 11.3x 8.9x n/a 11.1x 6.1% 3.3% 4.0% 10.5% 2.3x (9.8%) n/a 27.0% n/a
Opus International Consultants Ltd OIC.NZ 322 8.4x 7.7x 10.0x 9.2x 13.8x 14.2x 4.0% 7.2% 6.9% 22.5% (0.9x) 7.7% 7.1% 8.0% (2.5%)
Tourism Holdings Ltd THL.NZ 111 4.0x 3.4x 15.7x 9.8x 30.0x 11.7x 6.9% 6.5% 9.5% 5.5% 2.1x 14.1% (11.5%) 60.5% 155.4%
Methven Ltd MVN.NZ 95 8.6x 7.9x 12.1x 10.6x 18.5x 14.7x 6.8% 9.0% 10.2% 20.7% 1.4x (11.8%) (13.0%) 14.3% 25.9%
Hellaby Holdings Ltd HBY.NZ 295 9.5x 5.8x 12.0x 7.5x 13.6x 10.2x 4.9% 5.4% 6.8% 12.8% 1.2x 13.6% 9.5% 60.6% 33.2%
Selected Small Caps Median 295 8.6x 7.6x 12.0x 9.2x 16.2x 11.7x 6.1% 6.5% 6.9% 12.8% 1.4x 7.7% (2.2%) 27.0% 29.5%
Selected Small Caps Average 228 7.9x 6.5x 12.2x 9.2x 19.0x 12.4x 5.7% 6.3% 7.5% 14.4% 1.2x 2.7% (2.0%) 34.1% 53.0%
NZ Market 9.8x 9.2x 14.5x 13.3x 17.6x 17.2x
Small Caps relative to NZ Market 0.8x 0.7x 0.8x 0.7x 1.1x 0.7x
EV/EBITDA EV/EBIT P/E EBIT Margin 3 Yr His CAGR FY1 Growth
Source: Company data, FNZC estimates, Reuters

14 February 2014
Australia and NZ First Edition 25
Peer Group analysis
Although we have included Bristow Group in our peer analysis, we do not believe it
represents a suitable comparison to AWK on a multiple basis. An expectation of stronger
offshore oil and gas activity has driven a significant re-rating in the Bristow share price
over the past 18 months such that it now trades at a large premium to other companies in
the peer group. It could also be argued that Bristow should trade at a premium due to it
being a much larger company and having a more diverse operating platform. Comparison
with Discovery Air is also limited by its very high gearing with net debt representing 90% of
the Group’s enterprise value, in effect distorting the multiple that it trades on.
We prefer EV/EBIT over EV/EBITDA as a relative valuation approach due to the different
fleet ownership structures between peers as well as differences in lease contract terms.
AWK has a much lower lease expense than peer companies because a greater proportion
of its fleet is held on balance sheet and because the non-owned portion of the fleet that it
operates on behalf of third parties does not incur lease expense. Accordingly, AWK has
higher depreciation expense as a percentage of revenue due to the ownership structure of
its operating fleet. In addition the accelerated depreciation profile of the Fixed Wing fleet
must be considered. We therefore also compare AWK to its peer group after positively
adjusting EBIT by $4mn which is equivalent to our estimate of Fixed Wing over-
depreciation.
AWK is currently trading on a one-year forward unadjusted EV/EBIT multiple of 10.1x
(8.4x after adjusting for accelerated depreciation) which compares to the peer group
average of 10.1x, although this is distorted by positive outlier skew. On an adjusted
EV/EBIT basis, AWK is trading at a premium to HNZ Group and Alliance Aviation
Services. We believe this is justified given that HNZ has key near-term contract risk and
Alliance Aviation’s fleet is Fixed Wing and has significant exposure to the mining sector.
AWK is trading at a discount to Air Transport Services and Atlas Air. We believe both
companies should trade at a premium to AWK in part because they are significantly larger
companies and also due to their relatively lower customer cyclical exposure.
Recommendation
We consider the extensive Helicopter Engineering certification and the subsequent growth
option that this certification presents to be the primary reason to invest in AWK. Cyclical
sector exposure and a reliance on key customer contracts elevates valuation risk, however
management’s deal-making approach should lead to a more diversified revenue and
earnings platform over time. Safety and reliability is paramount to the reputation of the
AWK business model both in terms of customer retention and growth. Reputational
damage would put at risk the excess return on invested capital that AWK currently enjoys
against its tangible capital base. While the B737 landing gear failure that occurred in
January was unfortunate, we consider it to be a one-off event. Our target price of $3.00
represents a gross annual return of 6.0%. We initiate coverage on AWK with a
NEUTRAL rating.

Australia and NZ First Edition 26
14 February 2014
Asia Pacific/Australia
Equity Research
Diversified Financial Services (Diversified Financials (AU))
ASX
(ASX.AX / ASX AU) INCREASE TARGET PRICE
Revenue growth across the board
■ ASX reported 1H14 NPAT of $189.6mn, slightly below our $191mn
(consensus $187mn) and an interim dividend of 88.2cps (consensus
89.8cps). Revenue was slightly above our expectations, however this was
offset by an 8.3% increase in operating expenses. We maintain our
UNDERPERFORM rating with a $35.20 target price.
■ Key points: (1) all major ASX business lines increased revenue year-on-
year in 1H14, for the first time since the end of 2008; (2) operating expenses
increases 8.3% due to an increase in staff numbers; (3) capital expenditure
guidance has increased from $40mn to $40-$45mn; (4) the largest business
line, Derivatives, had the lowest growth and we note that the daily contract
average for ASX 24 was down 11% on 2H13.
■ Earnings changes: We have lowered our FY14 NPAT by 0.6% and
increased FY15 by 1.1%. The increase in outer year revenue forecasts is
driven by a base increase to information services revenue. While 1H14
expenses were higher than expected we have maintained our FY14
estimate and lowered outer years on the assumption of further cost savings
in occupancy and equipment expenses.
■ Investment view: ASX is currently trading at a ~20% PE premium to the
market, the middle of the 10-30% range it has traded at over the past five
years. While the 1H14 operating revenue growth was 8.0% on pcp, the
growth on 2H13 was only 5.4% with the decline in activity late in 1H14 flowing
through to the start of 2H14. With downside risk to earnings we consider the
current share price as full and maintain our UNDERPERFORM rating.
Total return forecast in perspective
Mean^CS tgt^ Sh Prc
-20%
-15%
-10%
-5%
0%
5%
10%
15%
20%
12mth Volatility* 52wk Hi-Lo IBES Consensustarget return^
Performance over 1M 3M 12M
Absolute (%) 0.4 -3.0 2.7
Relative (%) -1.4 -1.3 -3.4
Financial and valuation metrics
Year 06/13A 06/14E 06/15E 06/16E
Revenue (A$mn) 617.4 654.6 693.6 734.5
EBITDA (A$mn) 471.2 501.3 537.0 573.5
EBIT (A$mn) 440.8 468.5 503.6 539.4
Net income (A$mn) 348.2 380.4 407.8 435.6
EPS (CS adj.) (Ac) 195.54 196.90 210.65 225.02
Change from previous EPS (%) n.a. -0.6 1.1 0.8
Consensus EPS (Ac) n.a. 196.90 211.70 226.40
EPS growth (%) -1.1 0.7 7.0 6.8
P/E (x) 18.5 18.4 17.2 16.1
Dividend (Ac) 170.20 176.97 189.71 202.65
Dividend yield (%) 4.7 4.9 5.2 5.6
P/B (x) 2.0 1.9 1.9 1.8
Net debt/equity (%) net cash net cash net cash net cash
Relative performance versus S&P ASX 200.See Reference
Appendix for a description of the chart. Source: Credit Suisse
estimates, * Consensus, mean range from Thomson Reuters
Source: Company data, ASX, Credit Suisse estimates, * Adj. for goodwill, notional interest and unusual items. Relative P/E
against ASX/S&P200 based on pre GW in AUD. Company PE calculation is based on displayed EPS Currency
Rating UNDERPERFORM*
Price (13 Feb 14, A$) 36.25
Target price (A$) (from 33.20) 35.20¹
Market cap. (A$mn) 7,017.82
Yr avg. mthly trading (A$mn) 457
Last month's trading (A$mn) 393
Projected return:
Capital gain (%) -2.9
Dividend yield (net %) 5.1
Total return (%) 2.2
52-week price range 39.2 - 32.2
* Stock ratings are relative to the relevant country
benchmark.
¹Target price is for 12 months.
Research Analysts
Andrew Adams
61 2 8205 4106

14 February 2014
Australia and NZ First Edition 27
Figure 1: ASX financial summary
ASX (ASX) Year ending 30 Jun In AUDmn, unless otherwise stated2012 2013 2014 2015 2016 2012 2013 2014 2015 2016
Share Price: A$36.25 Earnings 06/12A 06/13A 06/14E 06/15E 06/16ERating UNDERPERFORM c_EPS_SHARESEquiv. FPO (period avg.) mn 175.1 178.1 193.2 193.6 193.6
Target Price A$ 35.20 c_EPS*100EPS (Normalised) c 197.7 195.5 196.9 210.7 225.0
vs Share price % -2.90 EPS_GROWTH*100EPS Growth % -1.1 0.7 7.0 6.8
DCF A$ 30.00 c_EBITDA_MARGIN*100EBITDA Margin % 76.9 76.3 76.6 77.4 78.1
c_DPS*100DPS c 177.9 170.2 177.0 189.7 202.7
c_PAYOUT*100Payout % 90.0 87.0 89.9 90.1 90.1
FRANKING*100Franking % 100.0 100.0 100.0 100.0 100.0
c_FCF_PS*100Free CFPS c 163.3 185.3 209.8 206.6 221.3
Profit & Loss 06/12A 06/13A 06/14E 06/15E 06/16E c_TAX_RATE*100Effective tax rate % 29.6 29.6 29.6 29.6 29.6
Sales revenue 610.4 617.4 654.6 693.6 734.5 ValuationEBITDA 469.3 471.2 501.3 537.0 573.5 c_PE P/E x 18.3 18.5 18.4 17.2 16.1
Depr. & Amort. (27.6) (30.4) (32.8) (33.4) (34.1) c_EBIT_MULTIPLE_CURREV/EBIT x 10.7 8.6 8.6 7.8 7.2
EBIT 441.7 440.8 468.5 503.6 539.4 c_EBITDA_MULTIPLE_CUEV/EBITDA x 10.1 8.1 8.0 7.4 6.8
Associates 0.0 0.0 0.0 0.0 0.0 c_DIV_YIELD*100Dividend Yield % 4.9 4.7 4.9 5.2 5.6
Net interest Exp. 40.6 44.1 62.6 65.7 69.1 c_FCF_YIELD*100FCF Yield % 4.5 5.1 5.8 5.7 6.1
Other 9.2 9.4 9.6 9.9 10.3 c_PB Price to Book x 2.1 2.0 1.9 1.9 1.8
Profit before tax 491.5 494.3 540.7 579.3 618.8 ReturnsIncome tax (145.3) (146.1) (160.2) (171.5) (183.2) c_ROE*100Return on Equity % 11.6 10.5 10.3 10.9 11.4
Profit after tax 346.2 348.2 380.4 407.8 435.6 c_I_NPAT/c_I_SALES*100Profit Margin % 56.7 56.4 58.1 58.8 59.3
Minorities (0.0) (0.0) (0.0) (0.0) (0.0) c_I_SALES/c_B_TOT_ASSAsset Turnover x 0.1 0.1 0.1 0.1 0.1
Preferred dividends 0.0 0.0 0.0 0.0 0.0 c_ASSETS/c_EQ_COMMONEquity Multiplier x 2.2 2.2 2.2 2.2 2.1
Associates & Other 0.0 0.0 0.0 0.0 0.0 c_ROA*100Return on Assets % 5.3 4.7 4.7 5.1 5.4
Normalised NPAT 346.2 348.2 380.4 407.8 435.6 c_ROIC*100Return on Invested Cap. % 43.4 300.9 46.7 51.6 56.8
Unusual item after tax (7.0) 0.0 0.0 0.0 0.0 GearingReported NPAT 339.2 348.2 380.4 407.8 435.6 c_GEARING*100Net Debt to Net debt + Equity % Net Cash Net Cash Net Cash Net Cash Net Cash
c_NET_DEBT/c_I_EBITDANet Debt to EBITDA x Net Cash Net Cash Net Cash Net Cash Net Cash
Balance Sheet 06/12A 06/13A 06/14E 06/15E 06/16E c_I_EBITDA/ c_I_NET_INTERESTInt Cover (EBITDA/Net Int.) x -11.6 -10.7 -8.0 -8.2 -8.3
Cash & equivalents 2,528.6 3,218.6 2,990.4 3,065.3 3,138.8 c_I_EBIT/ c_I_NET_INTERESTInt Cover (EBIT/Net Int.) x -10.9 -10.0 -7.5 -7.7 -7.8
Inventories 0.0 0.0 0.0 0.0 0.0 (c_C_CAPEX/c_I_SALES)*-100Capex to Sales % 6.7 5.9 6.3 5.9 5.6
Receivables 275.7 229.6 175.8 175.8 175.8 (c_C_CAPEX/c_I_DEPR)*-100Capex to Depreciation % 341.7 267.9 279.0 273.5 268.2
Other current assets 1,174.7 1,285.6 2,119.4 2,119.4 2,119.4
Current assets 3,979.0 4,733.8 5,285.6 5,360.5 5,434.0 MSCI IVA (ESG) Rating BBProperty, plant & equip. 65.5 56.1 52.6 52.6 52.6 TP ESG Risk (%): 0
Intangibles 2,320.5 2,393.2 2,390.0 2,371.6 2,352.9
Other non-current assets 162.2 185.6 288.7 288.7 288.7
Non-current assets 2,548.2 2,634.9 2,731.3 2,712.9 2,694.2
Total assets 6,527.2 7,368.7 8,016.9 8,073.4 8,128.2
Payables 3,102.9 3,874.7 4,006.1 4,006.1 4,006.1
Interest bearing debt 250.0 0.0 0.0 0.0 0.0
Other liabilities 179.3 172.2 314.5 314.5 314.5 MSCI IVA Risk: Neutral
Total liabilities 3,532.2 4,046.9 4,320.6 4,320.6 4,320.6
Net assets 2,995.0 3,321.8 3,696.3 3,752.8 3,807.6
Ordinary equity 2,995.0 3,321.8 3,696.3 3,752.8 3,807.6
Minority interests 0.0 0.0 0.0 0.0 0.0
Preferred capital 0.0 0.0 0.0 0.0 0.0
Total shareholder funds 2,995.0 3,321.8 3,696.3 3,752.8 3,807.6
Net debt -2,278.6 -3,218.6 -2,990.4 -3,065.3 -3,138.8 Source: MSCI ESG Research
Cashflow 06/12A 06/13A 06/14E 06/15E 06/16E Revenue composition 06/12A 06/13A 06/14E 06/15E 06/16E
EBIT 441.7 440.8 468.5 503.6 539.4 Listings and Issuer Services 133.4 139.7 146.6 157.2 168.2
Net interest 39.3 34.5 62.1 65.7 69.1 Cash Market 124.5 114.6 122.4 144.5 162.7
Depr & Amort 27.6 30.4 32.8 33.4 34.1 ASX24 Derivatives 161.0 169.0 188.5 200.8 202.3
Tax paid -174.8 -148.2 -156.2 -171.5 -183.2 ASX Derivatives 27.7 28.3 29.7 31.5 33.4
Working capital 402.0 817.9 185.2 0.0 0.0 Information Services 66.9 61.8 67.8 70.5 73.9
Other -408.8 -808.8 -145.7 9.9 10.3 Austraclear 36.0 38.6 40.8 43.3 45.9
Operating cashflow 327.0 366.6 446.6 441.2 469.7 Technical Services 45.3 49.8 54.2 58.1 61.6
Capex -41.0 -36.7 -41.2 -41.2 -41.2 Other 15.6 15.6 16.6 17.4 17.7
Acquisitions & Invest -7.1 -53.6 -84.4 -84.4 -84.4
Asset sale proceeds 0.0 0.0 0.0 0.0 0.0
Other 0.0 0.0 55.4 110.5 110.2
Investing cashflow -48.1 -90.3 -70.2 -15.1 -15.4
Dividends paid -325.2 -302.9 -330.0 -351.2 -380.9
Equity raised 0.0 261.6 277.9 0.0 0.0
Net borrowings 0.0 -250.0 0.0 0.0 0.0
Other 0.0 0.0 0.0 0.0 0.0
Financing cashflow -325.2 -291.3 -52.1 -351.2 -380.9
Total cashflow -46.3 -15.0 324.3 74.9 73.5
Adjustments 0.0 0.0 0.0 0.0 0.0
Net change in cash -46.3 -15.0 324.3 74.9 73.5
MSCI IVA Risk Comment: Following ASX's recent ESG rating
downgrade to BB we believe that the current rating reflects an
appropriate level for ASX, hence we move to a Neutral rating
(from Underperform)
13/02/2014 18:33
ASX Limited (ASX) was created by the merger of the Australian Stock Exchange and the
Sydney Futures Exchange. The Company’s principal activities consists of the provision of
securities exchange and ancillary services.
Credit Suisse View
TP Risk Comment: We have not currently factored in any change
in the current regulatory environment. Downside risk of 6% should
competition in clearing eventuate in line with regulatory change
(assuming a 50% fee reduction).
2.3
3.3
4.3
5.3
6.3
7.3
Environment Social Governance
Stock Local Sector
Country Global Sector
Listings and Issuer
Services23%
Cash Market
19%
ASX24 Derivatives
27%
ASX Derivatives
5%
Information Services
10%
Austraclear
6%
Technical Services
8%
Other
2%
Source: Company data, Credit Suisse estimates

14 February 2014
Australia and NZ First Edition 28
ASX 1H14 result
ASX reported 1H14 NPAT of $189.6mn, slightly below our $191mn estimate (consensus
$187mn) and an interim dividend of 88.2cps (consensus 89.8cps). Revenue was slightly
above our expectations, however this was offset by an 8.3% increase in operating
expenses. While most of the expense increase in 1H14 was due to higher staffing levels,
ASX have maintained their FY14 expense growth guidance of ~5%, implying only 1%
expense growth in 2H14. Management have highlighted that activity levels in the first six
weeks of 2H14 have been subdued. Overall, it appears a clean result largely within
expectations.
Figure 2: ASX actual versus expected
(A$mn) 1H13A 2H13A 1H14A vs. 1H13A vs. 2H13A CS 1H14F Var (%)
Profit & Loss (A$mn)
ASX Listings 73.6 66.1 81.5 10.7% 23.3% 79.4 2.6%
ASX Cash Market 54.9 59.7 59.2 7.8% -0.8% 57.4 3.1%
ASX24 Derivatives 79.9 89.1 89.8 12.4% 0.8% 91.3 -1.6%
ASX Derivatives 14.5 13.8 10.0 -31.0% -27.5% 11.4 -12.0%
Information Services 30.6 31.2 33.9 10.8% 8.7% 32.0 6.0%
Austraclear Services 19.1 19.5 20.5 7.3% 5.1% 20.1 2.1%
Technology infrastructure fees 24.6 25.2 26.2 6.5% 4.0% 26.5 -1.0%
Other Revenue 7.6 8.0 8.2 7.9% 2.5% 8.2 0.0%
Operating Revenue 304.8 312.6 329.3 8.0% 5.3% 326.2 1.0%
Staff Expenses -43.2 -44.0 -47.2 9.3% 7.3% -44.6 5.9%
Occupancy Expenses -6.6 -7.1 -6.9 4.5% -2.8% -7.1 -3.3%
Equipment expenses -10.5 -11.9 -11.6 10.5% -2.5% -12.1 -4.0%
Admin Expenses -7.4 -8.2 -7.3 -1.4% -11.0% -8.4 -13.6%
Variable Expenses -3.6 -3.7 -4.2 16.7% 13.5% -3.8 9.7%
Operating Expenses -71.3 -74.9 -77.2 8.3% 3.1% -76.0 1.5%
EBITDA 233.5 237.7 252.1 8.0% 6.1% 250.2 0.8%
Depreciation and amortisation -15.4 -15.0 -16.3 -15.6
EBIT 218.1 222.7 235.8 8.1% 5.9% 234.6 0.5%
Dividends 3.3 6.1 3.3 3.5
Net interest revenue 21.9 22.2 30.9 41.1% 39.2% 33.3 -7.2%
Pre-Tax Profit 243.3 251.0 270.0 11.0% 7.6% 271.3 -0.5%
Tax -72.2 -73.9 -80.4 -80.3
NPAT 171.1 177.1 189.6 10.8% 7.1% 191.0 -0.7%
Abnormals 0.0 0.0 0.0 0.0
Reported Profits 171.1 177.1 189.6 10.8% 7.1% 191.0 -0.7%
Credit Suisse EPS (cps) 97.7 101.0 98.3 0.6% -2.6% 99.1 -0.7%
Reported EPS (cps) 97.7 101.0 98.3 0.6% -2.6% 99.1 -0.7%
Dividends (cps) 87.9 82.3 88.2 0.3% 7.2% 88.8 -0.7%
Source: Company data, Credit Suisse estimates
Earnings changes
We have lowered our FY14 NPAT by 0.6% and increased FY15 by 1.1%. The increase in
outer year revenue forecasts is driven by a base increase to information services revenue.
While 1H14 expenses were higher than expected we have maintained our FY14 estimate
and lowered outer years on the assumption of further cost savings in occupancy and
equipment expenses.

14 February 2014
Australia and NZ First Edition 29
Figure 3: ASX earnings changes
FY14F FY15F
Old New Change Old New Change
Operating Revenue 650.4 654.6 0.6% 682.1 693.6 1.7%
Operating Expenses 153.1 153.3 0.1% 159.1 156.6 -1.6%
EBITDA 497.3 501.3 0.8% 522.9 537.0 2.7%
EBIT 466.0 468.5 0.5% 491.0 503.6 2.6%
NPAT 382.7 380.4 -0.6% 403.4 407.8 1.1%
Credit Suisse EPS (cps) 198.1 196.9 -0.6% 208.4 210.7 1.1%
Dividends (cps) 177.9 177.0 -0.5% 187.5 189.7 1.2%
Payout ratio 90% 90% 0.1% 90% 90% 0.1%
EBITDA margin 76.5% 76.6% 0.1% 76.7% 77.4% 0.8%
Source: Company data, Credit Suisse estimates
1H14 result key points
All major ASX business lines increased revenue year-on-year in 1H14, for the first time
since the end of 2008. The derivatives business, which is the largest business and has
assisted in offsetting the weakness in cash markets revenue in recent years, experienced
the lowest level of growth.
Figure 4: ASX revenue composition FY07 Figure 5: ASX revenue composition 1H14
ASX Listings21%
ASX Cash Market28%AX24 Derivatives
22%
ASX Derivatives6%
Information Services11%
Settlement and Dep. Fees 3%
Registry Fees1%
Tech Infra. fees4%
Other4%
ASX Listings25%
ASX Cash Market18%
AX24 Derivatives27%
ASX Derivatives3%
Information Services10%
Settlement and Dep. Fees 3%
Registry Fees3%
Tech Infra. fees8%
Other3%
Source: Company data, Credit Suisse estimates Source: Company data, Credit Suisse estimates
Derivatives and OTC markets ($99.8mn, +5.9%)
ASX 24 derivatives experienced a 12.4% increase in revenue to $89.8mn, with the
average number of daily contracts increasing 13.6%, noting that the daily contract average
was down 11% on 2H13.
ASX derivatives revenue was down 30.5% to $10.0mn as a result of a 22.2% decline in
the daily average number of contracts traded.

14 February 2014
Australia and NZ First Edition 30
Figure 6: ASX 24 monthly trading volumes and growth Figure 7: ASX derivatives trading volumes and growth
-60%
-40%
-20%
0%
20%
40%
60%
80%
100%
0.0m
2.0m
4.0m
6.0m
8.0m
10.0m
12.0m
14.0m
16.0m
Jul 01
Jan 02
Jul 02
Jan 03
Jul 03
Jan 04
Jul 04
Jan 05
Jul 05
Jan 06
Jul 06
Jan 07
Jul 07
Jan 08
Jul 08
Jan 09
Jul 09
Jan 10
Jul 10
Jan 11
Jul 11
Jan 12
Jul 12
Jan 13
Jul 13
Jan 14
Gro
wth
rat
e (%
)
SF
E f
utu
res
trad
ing
vo
lum
e
SFE - Total market volumes YoY Growth (% p.a.) 12mth rolling growth (%)
-60%
-30%
0%
30%
60%
90%
0.0m
5.0m
10.0m
15.0m
20.0m
25.0m
Jul 11
Jan 12
Jul 12
Jan 13
Jul 13
Jan 14
Gro
wth
rat
e (%
)
AS
X o
pti
on
trad
ing
vo
lum
e
ASX derivatives volumes Growth (% pcp)
Source: Company data, Credit Suisse estimates Source: Company data, Credit Suisse estimates
Listing and Issuer Services ($81.5mn, up 10.7%)
Listing revenue was up 11.3% to $66.8mn as a result of 69 IPOs (versus 41 in pcp) and
total amount raised of $36.7bn (up 40.1% on pcp). The initial listing fee revenue was the
main contributor to the increase on pcp, with this unlikely to continue in 2H14.
Figure 8: Listing and Issuer Services revenue breakdown
$000's 1H13 1H14 Change
- Annual Listing Fees 29,900 30,700 800
- Initial Listing Fees 3,400 11,200 7,800
- Subsequent Listing Fees 22,800 20,500 - 2,300
- Warrants fees 3,900 4,400 500
- Other 13,600 14,700 1,100
Total 73,600 81,500 7,900
Source: Company data, Credit Suisse estimates
Based on the new listings fees for FY15, we estimate that the annual listing fee for FY15
will increase by ~$10mn, assuming current market levels. This will assist in offsetting the
pullback in initial listing fees that may occur in FY15.
Figure 9: ASX annual listing fees, FY13 versus FY14
From To Fee FY13 + Fee FY14 + Base change
$0mn $3mn 10,500 12,500 19.0%
$3mn $10mn 10,500 0.157200% 12,500 0.161130% 19.0%
$10mn $100mn 21,504 0.018200% 23,779 0.018655% 10.6%
$100mn $1,000mn 37,884 0.003612% 40,569 0.003702% 7.1%
$1,000mn $10,000mn 70,392 0.001202% 73,889 0.001232% 5.0%
$10,000mn 178,572 0.030000% 184,774 0.000308% 3.5%
Capped at 350,000 358,750 2.5%
Source: Company data, Credit Suisse estimates
Cash market revenue ($59.2mn, +7.8%)
Fees from trading, clearing and settlement all grew as activity levels recovered from the
subdued levels in pcp. While the daily average cash on-market value traded on ASX was
up 8.8% on pcp, this was down 12.1% on last half. We note that if activity levels do
recover significantly, ASX's share of revenue is not linear in the first year of growth.

14 February 2014
Australia and NZ First Edition 31
Figure 10: ASX monthly equity trading value and growth Figure 11: ASX cash market impact of rebate on revenue
-80%
-60%
-40%
-20%
0%
20%
40%
60%
80%
100%
0
1,000
2,000
3,000
4,000
5,000
6,000
7,000
8,000
9,000
Jul 01
Jan 02
Jul 02
Jan 03
Jul 03
Jan 04
Jul 04
Jan 05
Jul 05
Jan 06
Jul 06
Jan 07
Jul 07
Jan 08
Jul 08
Jan 09
Jul 09
Jan 10
Jul 10
Jan 11
Jul 11
Jan 12
Jul 12
Jan 13
Jul 13
Gro
wth
rat
e (%
)
AS
X e
qu
ity
trad
ing
val
ue
/ day
(A$m
)
Equity trading turnover (VALUE) Growth (% pcp) Growth (% pa 12mth rolling)
0.0
50.0
100.0
150.0
200.0
250.0
-50% -40% -30% -20% -10% 0% 10% 20% 30% 40% 50%
A$m
n
Variance from base case forecasts (%)
Revenue excluding rebates Revenue including rebates
Source: Company data, Credit Suisse estimates Source: Company data, Credit Suisse estimates
Information services ($33.9mn, +10.9%)
Management noted that the increase in revenue resulted from the growth in demand for
data from retail investors and professional customers. In 1H14 the pricing for information
was adjusted to better align with user profiles, which appears to have driven a 22.6%
increase in subscriber terminal numbers.
Technical services ($26.2mn, +6.6%)
Management noted that the revenue from technical services increased following previous
significant investment in ASX’s data centre and communications network. The increase in
revenue is attributed to the growth in users of ASX technical services provided by the
Group’s primary data centre and expanding communication services provided by ASX Net
and ASX Net Global. The number of cabinets hosted in the data centre increased from
111 to 133, and the number of liquidity cross connects increased from 272 to 320.
The revenue in this division has been slowly increasing in recent periods.
Austraclear ($20.5mn, +7.4%)
The increase was driven by growth in registry revenue, up 15.5% to $9.2mn. The registry
revenue is predominantly driven by the value of new and existing securities registered.
Transaction revenue was up 3.4% to $8.2mn primarily due to a 5.5% increase in
transaction volumes.
Holdings revenue was down 3.2% to $3.1mn. While the value of securities held increased
6.8% compared to the pcp to $1.5tn, rebates for large users, and a change in the billing
methodology resulted in the revenue decline.
Expenses
Operating expenses were up 8.3% in 1H14, as a result of higher staffing levels and
equipment costs to support the new post-trade and risk management services. Despite the
increase in 1H14, management have maintained their guidance for an expense increase
of ~5% in FY14.
To achieve expense guidance, one of the expense components will need to decline on
1H14 on our calculations. Keeping the expense base flat increases the FY14 operating
expense cost by 6%.

14 February 2014
Australia and NZ First Edition 32
Figure 12: ASX operating expense analysis
1H12A 2H12A 1H13A 2H13A 1H14A 2H14F
Staff Expenses -41.7 -40.9 -43.2 -44.0 -47.2 -47.2
Occupancy Expenses -7.8 -7.7 -6.6 -7.1 -6.9 -6.9
Equipment expenses -10.2 -11.4 -10.5 -11.9 -11.6 -11.6
Admin Expenses -6.4 -7.1 -7.4 -8.2 -7.3 -7.3
Variable Expenses -4.3 -3.6 -3.6 -3.7 -4.2 -4.2
Operating Expenses -70.4 -70.7 -71.3 -74.9 -77.2 -77.2
FY -141.1 -146.2 -154.4
Source: Company data, Credit Suisse estimates
Investment view
ASX is currently trading at a ~20% PE premium to the market, the middle of the 10-30%
range it has traded at over the past five years. While the 1H14 operating revenue growth
was 8.0% on pcp, the growth on 2H13 was only 5.4% with the decline in activity late in
1H14 flowing through to the start of 2H14. With downside risk to earnings we consider the
current share price as full and maintain our UNDERPERFORM rating.
Figure 13: ASX historical PE Figure 14: ASX historical PE Rel
10.0x
12.5x
15.0x
17.5x
20.0x
22.5x
25.0x
27.5x
Jan-03
Jul-03
Jan-04
Jul-04
Jan-05
Jul-05
Jan-06
Jul-06
Jan-07
Jul-07
Jan-08
Jul-08
Jan-09
Jul-09
Jan-10
Jul-10
Jan-11
Jul-11
Jan-12
Jul-12
Jan-13
Jul-13
Jan-14
PE
(x)
ASX.AX Mean +/- SD
100%
110%
120%
130%
140%
150%
160%
170%
180%
Jan-03
Jul-03
Jan-04
Jul-04
Jan-05
Jul-05
Jan-06
Jul-06
Jan-07
Jul-07
Jan-08
Jul-08
Jan-09
Jul-09
Jan-10
Jul-10
Jan-11
Jul-11
Jan-12
Jul-12
Jan-13
Jul-13
Jan-14
PE
pre
miu
m to
XJO
(%
)
ASX PE relative (to XJO) Mean +/- SD Source: Bloomberg, IBES, Credit Suisse estimates Source: Bloomberg, IBES, Credit Suisse estimates

14 February 2014
Australia and NZ First Edition 33
ASX – key group charts
Figure 15: ASX24 derivatives largest revenue segment… ASX revenue composition (%), 1H14
Figure 16: …cash equities contribution reduced over time ASX revenue composition (A$mn)
ASX Listings25%
ASX Cash Market18%
AX24 Derivatives27%
ASX Derivatives3%
Information Services10%
Settlement and Dep. Fees 3%
Registry Fees3%
Tech Infra. fees8%
Other3%
0
50
100
150
200
250
300
350
1H08A
2H08A
1H09A
2H09A
1H10A
2H10A
1H11A
2H11A
1H12A
2H12A
1H13A
2H13A
1H14A
A$m
n
ASX Cash Market ASX Listings AX24 Derivatives
ASX Derivatives Information Services Settlement and Dep. fees
Registry Fees Tech Infra. fees Other
Figure 17: Staff costs the largest expense… ASX expense composition (%), FY13
Figure 18: …and ticking up over the past few halves ASX expense composition (A$mn)
Staff 61%
Occupancy9%
Equipment 15%
Admin 10%
Variable 5%
0
10
20
30
40
50
60
70
80
90
1H08A
2H08A
1H09A
2H09A
1H10A
2H10A
1H11A
2H11A
1H12A
2H12A
1H13A
2H13A
1H14A
A$m
n
Staff Expenses Occupancy Expenses Equipment expenses Admin Expenses Variable
Figure 19: EBITDA margin up slightly in 1H14… EBITDA (A$mn), EBITDA margin (%)
Figure 20: …capex higher in 1H14 on pcp Capex (A$mn), capex / sales (%)
60%
65%
70%
75%
80%
85%
90%
0
50
100
150
200
250
300
1H08A
2H08A
1H09A
2H09A
1H10A
2H10A
1H11A
2H11A
1H12A
2H12A
1H13A
2H13A
1H14A
EB
ITD
A m
arg
in [R
HS
]
EB
ITD
A (A
$mn
)
EBITDA EBITDA margin
0%
2%
4%
6%
8%
10%
12%
0
6
12
18
24
30
36
1H08A
2H08A
1H09A
2H09A
1H10A
2H10A
1H11A
2H11A
1H12A
2H12A
1H13A
2H13A
1H14A
Cap
ex /
sale
s
Cap
ex (A
$mn
)
Capex Capex / Sales (%) Source for all charts: Company data, Credit Suisse estimates

14 February 2014
Australia and NZ First Edition 34
ASX – key segmental charts
Figure 21: Annual fees the largest % of listing revenue… Listings revenue contribution (%), FY13
Figure 22: …initial, secondary fees up despite weak activity Initial, secondary capital raised (A$mn)
Annual listing38%
Secondary raising25%
Issuer services18%
Initial listing14%
Other5%
0
10
20
30
40
50
60
70
1H06A
2H06A
1H07A
2H07A
1H08A
2H08A
1H09A
2H09A
1H10A
2H10A
1H11A
2H11A
1H12A
2H12A
1H13A
2H13A
1H14A
A$b
n
Intial Secondary
Figure 23: Average cash equity fees a trough levels… Cash equities volumes (mn), average fee (A$)
Figure 24: …contribution from trading lower, but stable Composition of cash equities revenue (%)
0.0
0.5
1.0
1.5
2.0
2.5
3.0
3.5
4.0
4.5
5.0
0
10
20
30
40
50
60
70
80
90
100
1H08A
2H08A
1H09A
2H09A
1H10A
2H10A
1H11A
2H11A
1H12A
2H12A
1H13A
2H13A
1H14A
Avg
fees
(A
$)
Vo
lum
es (m
n)
Trading volumes Average fee
29.3% 28.6% 29.3% 29.2% 28.6% 28.6% 28.0%
37.4% 36.7% 37.5% 36.1% 35.9% 36.7% 36.7%
33.2% 34.7% 33.2% 34.7% 35.5% 34.7% 35.3%
0%
10%
20%
30%
40%
50%
60%
70%
80%
90%
100%
1H11A 2H11A 1H12A 2H12A 1H13A 2H13A 1H14A
Trading Clearing Settlement
Figure 25: ASX24 revenues outpaced cash equities… ASX cash equities, ASX24 revenue growth (% chg pcp)
Figure 26: …but average fees lower in 1H14 (on pcp) SFE derivatives volume (mn), average fee (A$)
-30.0%
-20.0%
-10.0%
0.0%
10.0%
20.0%
30.0%
40.0%
1H08A
2H08A
1H09A
2H09A
1H10A
2H10A
1H11A
2H11A
1H12A
2H12A
1H13A
2H13A
1H14A
Gro
wth
(%
ch
g p
cp)
ASX Cash Market AX24 Derivatives
1.10
1.20
1.30
1.40
1.50
1.60
1.70
1.80
-
10
20
30
40
50
60
70
1H09A
2H09A
1H10A
2H10A
1H11A
2H11A
1H12A
2H12A
1H13A
2H13A
1H14A
Avg
fee
(A$)
Vo
lum
e (m
n)
Volumes Average fee Source for all charts: Company data, Credit Suisse estimates

14 February 2014
Australia and NZ First Edition 35
Monthly activity focus charts
Figure 27: Cash equities – 12-month rolling average growth ASX monthly equity trading volumes, value growth (% prior period)
Figure 28: Total capital raised – growth ASX: total capital raised – growth (%) 12mth rolling
0
0
0
0
0
1
1
1
Jul-02
Jan-03
Jul-03
Jan-04
Jul-04
Jan-05
Jul-05
Jan-06
Jul-06
Jan-07
Jul-07
Jan-08
Jul-08
Jan-09
Jul-09
Jan-10
Jul-10
Jan-11
Jul-11
Jan-12
Jul-12
Jan-13
Jul-13
Jan-14
Variance Volume Value
-60%
-40%
-20%
0%
20%
40%
60%
80%
100%
120%
Jun-07
Dec-07
Jun-08
Dec-08
Jun-09
Dec-09
Jun-10
Dec-10
Jun-11
Dec-11
Jun-12
Dec-12
Jun-13
Dec-13
Figure 29: Cash equities volumes growth (per day) ASX monthly equity trading volumes per day growth
Figure 30: Cash equity traded value growth (per day) ASX monthly equity trading values per day growth
-40%
-20%
0%
20%
40%
60%
80%
100%
120%
140%
Jul 01
Jan 02
Jul 02
Jan 03
Jul 03
Jan 04
Jul 04
Jan 05
Jul 05
Jan 06
Jul 06
Jan 07
Jul 07
Jan 08
Jul 08
Jan 09
Jul 09
Jan 10
Jul 10
Jan 11
Jul 11
Jan 12
Jul 12
Jan 13
Jul 13
Jan 14
AS
X e
qu
ity
trad
ing
vo
lum
e / d
ay
Growth (% pcp) Growth (% pa 12mth rolling)
-60%
-40%
-20%
0%
20%
40%
60%
80%
100%
Jul 01
Jan 02
Jul 02
Jan 03
Jul 03
Jan 04
Jul 04
Jan 05
Jul 05
Jan 06
Jul 06
Jan 07
Jul 07
Jan 08
Jul 08
Jan 09
Jul 09
Jan 10
Jul 10
Jan 11
Jul 11
Jan 12
Jul 12
Jan 13
Jul 13
Jan 14
AS
X e
qu
ity
trad
ing
val
ue
/ day
Growth (% pcp) Growth (% pa 12mth rolling)
Figure 31: SFE futures volumes SFE monthly trading volumes growth (% pcp)
Figure 32: ASX derivatives volumes ASX monthly option trading volumes growth (% pcp)
-60%
-40%
-20%
0%
20%
40%
60%
80%
100%
Jul 01
Jan 02
Jul 02
Jan 03
Jul 03
Jan 04
Jul 04
Jan 05
Jul 05
Jan 06
Jul 06
Jan 07
Jul 07
Jan 08
Jul 08
Jan 09
Jul 09
Jan 10
Jul 10
Jan 11
Jul 11
Jan 12
Jul 12
Jan 13
Jul 13
Jan 14
AS
X24
fu
ture
s tr
adin
g v
olu
me
Growth (% pcp) Growth (% pa 12mth rolling)
-60%
-40%
-20%
0%
20%
40%
60%
80%
100%
Jul 01
Jan 02
Jul 02
Jan 03
Jul 03
Jan 04
Jul 04
Jan 05
Jul 05
Jan 06
Jul 06
Jan 07
Jul 07
Jan 08
Jul 08
Jan 09
Jul 09
Jan 10
Jul 10
Jan 11
Jul 11
Jan 12
Jul 12
Jan 13
AS
X o
pti
on
trad
ing
vo
lum
e
Growth (% pcp) Growth (% pa 12mth rolling)
Source for all charts: Company data, Bloomberg

14 February 2014
Australia and NZ First Edition 36
Figure 33: Primary capital raisings ASX monthly primary capital raised in A$mn
Figure 34: Secondary capital raisings ASX monthly secondary raised in A$mn
0
1,000
2,000
3,000
4,000
5,000
6,000
7,000
8,000
9,000
10,000
11,000
12,000
13,000
Jul 05
Jan 06
Jul 06
Jan 07
Jul 07
Jan 08
Jul 08
Jan 09
Jul 09
Jan 10
Jul 10
Jan 11
Jul 11
Jan 12
Jul 12
Jan 13
Jul 13
Jan 14
Init
ial C
apit
al r
aise
d (A
$m)
Average
0
2,000
4,000
6,000
8,000
10,000
12,000
14,000
16,000
Jul 05
Jan 06
Jul 06
Jan 07
Jul 07
Jan 08
Jul 08
Jan 09
Jul 09
Jan 10
Jul 10
Jan 11
Jul 11
Jan 12
Jul 12
Jan 13
Jul 13
Jan 14
Sec
on
dar
y C
apit
al r
aise
d (
A$m
)
Average
Figure 35: Average value per trade Average value / trade A$
Figure 36: Monthly liquidity – Australian market Value traded as a proportion of market capitalisation
0
5,000
10,000
15,000
20,000
25,000
30,000
35,000
40,000
45,000
Jan-04
Jul-04
Jan-05
Jul-05
Jan-06
Jul-06
Jan-07
Jul-07
Jan-08
Jul-08
Jan-09
Jul-09
Jan-10
Jul-10
Jan-11
Jul-11
Jan-12
Jul-12
Jan-13
Jul-13
Jan-14
A$
/ tra
de
60%
70%
80%
90%
100%
110%
120%
130%
140%
Jan-04
Jul-04
Jan-05
Jul-05
Jan-06
Jul-06
Jan-07
Jul-07
Jan-08
Jul-08
Jan-09
Jul-09
Jan-10
Jul-10
Jan-11
Jul-11
Jan-12
Jul-12
Jan-13
Jul-13
Jan-14
Tu
rno
ver
velo
city
(%)
Source for all charts: Company data
Figure 37: December 2013 market activity 3 mths to 12 mths to
Cash equities Dec-12 Nov-13 Dec-13 % chg MoM % chg YoY Dec-12 Dec-13 % chg Dec-12 Dec-13 % chg
Volume of trades ('000s) 10,762 14,055 14,823 5% 38% 36,348 44,286 22% 155,064 192,794 24%
Value of trades ($mn) 65,422 81,715 86,368 6% 32% 232,763 254,082 9% 1,027,465 1,079,498 5%
Average value / trade 6,079 5,814 5,827 0% -4% 6,404 5,737 -10% 6,626 5,599 -15%Trading days 19 21 21 64 65 253 255
Volume of trades / day ('000) 566 669 706 5% 25% 568 681 20% 613 756 23%
Value of trades / day 3,443 3,891 4,113 6% 19% 3,637 3,909 7% 4,061 4,233 4%
Market capitalisation 1,335,837 1,506,483 1,526,868 1% 14% 1,309,627 1,522,864 16% 1,252,666 1,446,693 15%
Turnover velocity 65% 65% 69% 3% 3% 82% 75% -7%
ASX options
Volume of trades ('000) 12,931 10,005 2,173 -78% -83% 38,677 22,987 -41% 157,758 131,372 -17%
Volume / day 681 476 103 -78% -85% 604 354 -41% 624 515 -17%
ASX24 futures
Volume of trades ('000) 8,956 8,119 12,778 57% 43% 25,208 30,789 22% 103,781 125,417 21%
Volume / day 471 387 608 57% 29% 394 474 20% 405 490 21%
Capital markets
Intial capital raised ($m) 349 792 165 -79% -53% 2,364 3,600 52% 7,146 12,413 74%
Secondary capital raised ($m) 3,817 1,611 1,288 -20% -66% 11,433 4,831 -58% 35,163 23,864 -32%
Total capital raised ($m) 4,166 2,403 1,453 -40% -65% 13,797 8,431 -39% 42,309 36,277 -14% Source: Company data

14 February 2014
Australia and NZ First Edition 37
ASX24 focus charts
Figure 38: Total futures Volume (‘000), growth (% chg pcp, 12-month rolling)
Figure 39: Interest rate futures composition Volume (‘000)
-1
-1
-0
-
0
1
1
1
1
0
2,000
4,000
6,000
8,000
10,000
12,000
14,000
16,000
Jan-00
Jan-01
Jan-02
Jan-03
Jan-04
Jan-05
Jan-06
Jan-07
Jan-08
Jan-09
Jan-10
Jan-11
Jan-12
Jan-13
Jan-14
Gro
wth
(%
)
Vo
lum
e ('0
00)
Total market Growth (% chg pcp) Growth (12-month rolling)
0
2,000
4,000
6,000
8,000
10,000
12,000
14,000
Jan-04
Jul-04
Jan-05
Jul-05
Jan-06
Jul-06
Jan-07
Jul-07
Jan-08
Jul-08
Jan-09
Jul-09
Jan-10
Jul-10
Jan-11
Jul-11
Jan-12
Jul-12
Jan-13
Jul-13
Jan-14
Vo
lum
e ('0
00)
10 yr 3 yr 90 day bank Other
Figure 40: Ten-year bond futures Volume (‘000), growth (% chg pcp, 12-month rolling)
Figure 41: Three-year bond futures Volume (‘000), growth (% chg pcp, 12-month rolling)
-0.9
-0.6
-0.3
0
0.3
0.6
0.9
0
500
1,000
1,500
2,000
2,500
3,000
3,500
Jul-03
Jul-04
Jul-05
Jul-06
Jul-07
Jul-08
Jul-09
Jul-10
Jul-11
Jul-12
Jul-13
Gro
wth
(%
)
Vo
lum
e ('0
00)
Volume Growth (% chg pcp) Growth (12-month rolling)
-1
-0.5
0
0.5
1
1.5
2
0
1,000
2,000
3,000
4,000
5,000
6,000
Jul-03
Jul-04
Jul-05
Jul-06
Jul-07
Jul-08
Jul-09
Jul-10
Jul-11
Jul-12
Jul-13
Gro
wth
(%
)
Vo
lum
e ('0
00)
Volume Growth (% chg pcp) Growth (12-month rolling)
Figure 42: 90-day bank bill futures Volume (‘000), growth (% chg pcp, 12-month rolling)
Figure 43: Equity index futures Volume (‘000), growth (% chg pcp, 12-month rolling)
-1
-0.6
-0.2
0.2
0.6
1
1.4
1.8
0
500
1,000
1,500
2,000
2,500
3,000
3,500
Jul-03
Jul-04
Jul-05
Jul-06
Jul-07
Jul-08
Jul-09
Jul-10
Jul-11
Jul-12
Jul-13
Gro
wth
(%
)
Vo
lum
e ('0
00)
Volume Growth (% chg pcp) Growth (12-month rolling)
-80%
-40%
0%
40%
80%
120%
0
400
800
1,200
1,600
2,000
Jul-03
Jul-04
Jul-05
Jul-06
Jul-07
Jul-08
Jul-09
Jul-10
Jul-11
Jul-12
Jul-13
Gro
wth
(%
)
Vo
lum
e ('0
00)
Volume Growth (% chg pcp) Growth (12-month rolling)
Source for all charts: Company data, Credit Suisse estimates

14 February 2014
Australia and NZ First Edition 38
ASX valuation screens
Figure 44: ASX PE at 17.6x (consensus)… ASX 12 month forward PE
Figure 45: …PE premium at ~20% ASX PE premium to ASX200
10.0x
12.5x
15.0x
17.5x
20.0x
22.5x
25.0x
27.5x
Jan-03
Jul-03
Jan-04
Jul-04
Jan-05
Jul-05
Jan-06
Jul-06
Jan-07
Jul-07
Jan-08
Jul-08
Jan-09
Jul-09
Jan-10
Jul-10
Jan-11
Jul-11
Jan-12
Jul-12
Jan-13
Jul-13
Jan-14
PE
(x)
ASX.AX Mean +/- SD
100%
110%
120%
130%
140%
150%
160%
170%
180%
Jan-03
Jul-03
Jan-04
Jul-04
Jan-05
Jul-05
Jan-06
Jul-06
Jan-07
Jul-07
Jan-08
Jul-08
Jan-09
Jul-09
Jan-10
Jul-10
Jan-11
Jul-11
Jan-12
Jul-12
Jan-13
Jul-13
Jan-14
PE
pre
miu
m to
XJO
(%
)
ASX PE relative (to XJO) Mean +/- SD
Figure 46: Global exchanges re-rated recently… Global exchanges PE
Figure 47: …Asian exchanges at a premium to ASX ASX PE relative to Asian exchanges
0x
5x
10x
15x
20x
25x
30x
35x
40x
45x
50x
Jul-05
Jan-06
Jul-06
Jan-07
Jul-07
Jan-08
Jul-08
Jan-09
Jul-09
Jan-10
Jul-10
Jan-11
Jul-11
Jan-12
Jul-12
Jan-13
Jul-13
Jan-14
PE
(x)
ASX Europe North America Asia
-60%
-50%
-40%
-30%
-20%
-10%
0%
10%
20%
30%
40%
0x
5x
10x
15x
20x
25x
30x
35x
40x
45x
50x
Jul-05
Jan-06
Jul-06
Jan-07
Jul-07
Jan-08
Jul-08
Jan-09
Jul-09
Jan-10
Jul-10
Jan-11
Jul-11
Jan-12
Jul-12
Jan-13
Jul-13
Jan-14
AS
X P
E p
rem
ium
/ (d
isco
un
t)
PE
(x)
PE premium / (discount) ASX Asia
Figure 48: ASX at a premium to European exchanges… ASX PE relative to European exchanges
Figure 49: …as well as North American peers ASX PE relative to US exchanges
-40%
-20%
0%
20%
40%
60%
80%
100%
120%
140%
0x
5x
10x
15x
20x
25x
30x
35x
40x
45x
Jul-05
Jan-06
Jul-06
Jan-07
Jul-07
Jan-08
Jul-08
Jan-09
Jul-09
Jan-10
Jul-10
Jan-11
Jul-11
Jan-12
Jul-12
Jan-13
Jul-13
Jan-14
AS
X P
E p
rem
ium
/ (d
isco
un
t)
PE
(x)
PE premium / (discount) ASX Europe
-60%
-44%
-28%
-12%
4%
20%
36%
52%
68%
84%
100%
0x
5x
10x
15x
20x
25x
30x
35x
40x
45x
50x
Jul-05
Jan-06
Jul-06
Jan-07
Jul-07
Jan-08
Jul-08
Jan-09
Jul-09
Jan-10
Jul-10
Jan-11
Jul-11
Jan-12
Jul-12
Jan-13
Jul-13
Jan-14
AS
X P
E p
rem
ium
/ (d
isco
un
t)
PE
(x)
PE premium / (discount) ASX North America
Source for all charts: Reuters, Bloomberg. * IBES – Cash EPS 12mth forward rolling

Australia and NZ First Edition 39
14 February 2014
Asia Pacific/Australia
Equity Research
Department Stores (Retail (AU))
David Jones
(DJS.AX / DJS AU) RESULTS
2Q14 sales
■ DJS returned to positive LFL sales growth in 2Q14. Second-quarter
sales of $618mn and LFL sales growth 2.1% were in line with forecast (CS
$622mn, 2.0%). Online was above expectations and stands to boost total
sales by 100–150bp through 2014. We have upgraded our second-half LFL
sales forecasts 50bps to 3.0%. The upgrade reflects the improved run rate in
on line sales and an assumption of steady growth in the market. Gross
margin has been downgraded 50bp for 1H14 and 30bp for 2H14 due to
higher levels of promotional activity. EPS has been downgraded 3% due to
gross margin effect (-4%) and LFL sales upgrade (+1%).
■ Online sales improved through the period: Online sales increased 150%
in 2Q14 and accounted for 2.0% of group sales in the quarter. That outcome
suggests online growth contributed ~60% of the total growth in comparable
store sales. Commentary that online was 1.4% of first-half sales implies
acceleration is ongoing and it is therefore likely to make an increasing
contribution to 2H14 LFLs. There is likely to be a positive margin impact over
time due to the growth of online.
■ Promotional activity was higher than expected. Inventory issues in
Target appeared to lead a period of higher-than-expected promotional
expenditure. That effect is likely to be temporary due to Target's
restructuring efforts. We expect some heightened promotional activity to
continue through 3Q14.
■ Earnings and valuation: We have downgraded EPS due to a reduction in
gross margin. In our view, the sales lift is of greater materiality than the
temporary increase in promotional activity thought 2Q14. DJS appears on
the verge of successive quarters of sales and consequent profit growth.
Total return forecast in perspective
Mean^CS tgt^
Sh Prc
-40%
-30%
-20%
-10%
0%
10%
20%
30%
40%
12mth Volatility* 52wk Hi-Lo IBES Consensustarget return^
Performance over 1M 3M 12M
Absolute (%) 3.1 1.8 17.0
Relative (%) 1.2 3.5 10.9
Financial and valuation metrics
Year 07/13A 07/14E 07/15E 07/16E
Revenue (A$mn) 1,845.0 1,937.5 2,031.7 2,128.6
EBITDA (A$mn) 205.8 199.9 224.8 234.8
EBIT (A$mn) 149.0 139.4 161.9 170.2
Net income (A$mn) 101.6 92.1 107.5 113.3
EPS (CS adj.) (Ac) 19.14 17.23 20.11 21.21
Change from previous EPS (%) n.a. -3.3 -3.0 -3.0
Consensus EPS (Ac) n.a. 17.00 19.00 20.70
EPS growth (%) -1.1 -10.0 16.7 5.5
P/E (x) 16.4 18.2 15.6 14.8
Dividend (Ac) 17.00 15.13 17.41 18.36
Dividend yield (%) 5.4 4.8 5.6 5.9
P/B (x) 2.1 2.1 2.0 2.0
Net debt/equity (%) 10.8 13.7 13.6 13.1
Relative performance versus S&P ASX 200.See Reference
Appendix for a description of the chart. Source: Credit Suisse
estimates, * Consensus, mean range from Thomson Reuters
Source: Company data, ASX, Credit Suisse estimates, * Adj. for goodwill, notional interest and unusual items. Relative P/E
against ASX/S&P200 based on pre GW in AUD. Company PE calculation is based on displayed EPS Currency
Rating NEUTRAL*
Price (13 Feb 14, A$) 3.14
Target price (A$) 3.14¹
Market cap. (A$mn) 1,683.93
Yr avg. mthly trading (A$mn) 171
Last month's trading (A$mn) 146
Projected return:
Capital gain (%) 0.16
Dividend yield (net %) 5.2
Total return (%) 5.4
52-week price range 3.2 - 2.3
* Stock ratings are relative to the relevant country
benchmark.
¹Target price is for 12 months.
Research Analysts
Grant Saligari
61 3 9280 1720
James O'Brien
61 3 9280 1669
Samantha Carleton
61 2 8205 4148

14 February 2014
Australia and NZ First Edition 40
Figure 1: Financial Summary
David Jones (DJS) Year ending 26 Jul In AUDmn, unless otherwise stated2012 2013 2014 2015 2016 2012 2013 2014 2015 2016
Share Price: A$3.14 Earnings 07/12A 07/13A 07/14E 07/15E 07/16ERating c_EPS_SHARESEquiv. FPO (period avg.) mn 522.3 530.9 534.4 534.4 534.4
Target Price A$ 3.14 c_EPS*100EPS (Normalised) c 19.4 19.1 17.2 20.1 21.2
vs Share price % 0.16 EPS_GROWTH*100EPS Growth % -1.1 -10.0 16.7 5.5
DCF A$ 3.20 c_EBITDA_MARGIN*100EBITDA Margin % 11.0 11.2 10.3 11.1 11.0
c_DPS*100DPS c 17.5 17.0 15.1 17.4 18.4
c_PAYOUT*100Payout % 90.4 88.8 87.8 86.6 86.6
FRANKING*100Franking % 100.0 100.0 100.0 100.0 100.0
c_FCF_PS*100Free CFPS c 25.7 21.4 14.3 18.2 19.3
Profit & Loss 07/12A 07/13A 07/14E 07/15E 07/16E c_TAX_RATE*100Effective tax rate % 29.7 27.7 29.6 29.6 29.6
Sales revenue 1,867.8 1,845.0 1,937.5 2,031.7 2,128.6 Valuation
EBITDA 206.4 205.8 199.9 224.8 234.8 c_PE P/E x 16.2 16.4 18.2 15.6 14.8
Depr. & Amort. (51.9) (56.8) (60.5) (63.0) (64.6) c_EBIT_MULTIPLE_CURREV/EBIT x 11.7 11.9 12.9 11.1 10.5
EBIT 154.4 149.0 139.4 161.9 170.2 c_EBITDA_MULTIPLE_CUEV/EBITDA x 8.7 8.6 9.0 8.0 7.6
Associates 0.0 0.0 0.0 0.0 0.0 c_DIV_YIELD*100Dividend Yield % 5.6 5.4 4.8 5.6 5.9
Net interest Exp. (10.6) (8.6) (8.5) (9.1) (9.1) c_FCF_YIELD*100FCF Yield % 8.2 6.8 4.6 5.8 6.1
Other 0.0 0.0 0.0 0.0 0.0 c_PB Price to Book x 2.1 2.1 2.1 2.0 2.0
Profit before tax 143.8 140.4 130.9 152.8 161.1 ReturnsIncome tax (42.7) (38.8) (38.8) (45.3) (47.7) c_ROE*100Return on Equity % 13.0 12.7 11.5 13.1 13.5
Profit after tax 101.1 101.6 92.1 107.5 113.3 c_I_NPAT/c_I_SALES*100Profit Margin % 5.4 5.5 4.8 5.3 5.3
Minorities (0.0) (0.0) (0.0) (0.0) (0.0) c_I_SALES/c_B_TOT_ASSAsset Turnover x 1.5 1.5 1.5 1.5 1.6
Preferred dividends 0.0 0.0 0.0 0.0 0.0 c_ASSETS/c_EQ_COMMONEquity Multiplier x 1.6 1.5 1.6 1.6 1.6
Associates & Other 0.0 0.0 0.0 0.0 0.0 c_ROA*100Return on Assets % 8.1 8.2 7.2 8.2 8.4
Normalised NPAT 101.1 101.6 92.1 107.5 113.3 c_ROIC*100Return on Invested Cap. % 18.8 19.0 17.8 19.5 20.2
Unusual item after tax 0.0 (6.4) (5.0) 0.0 0.0 Gearing
Reported NPAT 101.1 95.2 87.1 107.5 113.3 c_GEARING*100Net Debt to Net debt + Equity % 13.0 9.7 12.0 11.9 11.6
c_NET_DEBT/c_I_EBITDANet Debt to EBITDA x 0.6 0.4 0.5 0.5 0.5
Balance Sheet 07/12A 07/13A 07/14E 07/15E 07/16E c_I_EBITDA/ c_I_NET_INTERESTInt Cover (EBITDA/Net Int.) x 19.5 24.0 23.4 24.6 25.7
Cash & equivalents 20.5 13.9 20.5 18.8 20.0 c_I_EBIT/ c_I_NET_INTERESTInt Cover (EBIT/Net Int.) x 14.6 17.4 16.3 17.7 18.7
Inventories 279.1 251.5 266.2 277.5 289.7 (c_C_CAPEX/c_I_SALES)*-100Capex to Sales % 4.4 4.3 4.4 4.2 3.8
Receivables 16.4 19.1 20.3 21.3 22.3 (c_C_CAPEX/c_I_DEPR)*-100Capex to Depreciation % 162.9 148.1 151.7 145.7 135.1
Other current assets 7.2 10.2 10.2 10.2 10.2
Current assets 323.2 294.7 317.2 327.8 342.2 MSCI IVA (ESG) Rating B
Property, plant & equip. 817.4 835.4 864.2 890.5 911.1 TP ESG Risk (%): 0
Intangibles 44.0 44.6 40.4 35.4 30.4
Other non-current assets 56.2 63.1 63.1 63.1 63.1
Non-current assets 917.6 943.1 967.7 988.9 1,004.6
Total assets 1,240.9 1,237.8 1,284.8 1,316.7 1,346.8
Payables 264.6 261.8 277.0 288.9 301.5
Interest bearing debt 136.0 100.4 130.4 130.4 130.4
Other liabilities 64.6 74.5 74.5 74.5 74.5 MSCI IVA Risk: Neutral
Total liabilities 465.2 436.7 481.9 493.8 506.4
Net assets 775.7 801.1 802.9 823.0 840.4
Ordinary equity 775.7 801.1 802.9 823.0 840.4
Minority interests 0.0 0.0 0.0 0.0 0.0
Preferred capital 0.0 0.0 0.0 0.0 0.0
Total shareholder funds 775.7 801.1 802.9 823.0 840.4
Net debt 115.5 86.5 109.9 111.6 110.4 Source: MSCI ESG Research
Cashflow 07/12A 07/13A 07/14E 07/15E 07/16E Share Price Performance
EBIT 154.4 149.0 139.4 161.9 170.2
Net interest -10.5 -8.6 -8.5 -9.1 -9.1
Depr & Amort 51.9 56.8 60.5 63.0 64.6
Tax paid -59.5 -43.3 -38.8 -45.3 -47.7
Working capital 61.2 22.1 -0.6 -0.5 -0.5
Other -0.8 4.0 -5.0 0.0 0.0
Operating cashflow 196.7 180.0 146.9 169.9 177.5
Capex -81.5 -79.0 -85.3 -84.4 -80.5
Capex - expansionary -18.9 -12.3 -15.0 -12.0 -6.0
Capex - maintenance -62.5 -66.7 -70.3 -72.4 -74.5
Acquisitions & Invest 0.1 0.2 0.2 0.2 0.2
Asset sale proceeds 0.0 0.0 0.0 0.0 0.0
Other 0.0 0.0 0.0 0.0 0.0
Investing cashflow -81.4 -78.8 -85.0 -84.2 -80.3
Dividends paid -110.6 -72.3 -85.2 -87.5 -95.9
Equity raised 0.0 0.0 0.0 0.0 0.0
Net borrowings 7.0 -36.0 30.0 0.0 0.0
Other 0.0 0.0 0.0 0.0 0.0 1 Month 3 Month 12 Month
Financing cashflow -103.6 -108.3 -55.2 -87.5 -95.9 Absolute 3.1% 1.8% 17.0%
Total cashflow 11.8 -7.0 6.6 -1.8 1.3 Relative 1.2% 3.5% 10.9%
Adjustments 0.0 0.0 0.0 0.0 0.0
Net change in cash 11.8 -7.0 6.6 -1.8 1.3 Source: Reuters 52 week trading range: 2.34-3.15
MSCI IVA Risk Comment: David Jones was recently
downgraded to 'B' from 'BB' as the company lacks
transparency on its ability to manage issues such as product
safety, supply chain labour standards, and carbon reductions
in its operations. We view these issues as being
manageable, largely requiring more disclosure on their
operations alone. That said, we have not seen evidence of
DJS engaging with these problems and therefore carry a
13/02/2014 11:46
David Jones Ltd is an Australia-based company. It's principal activities are department
store retailing and a financial services alliance with American Express Australia Limited.
Credit Suisse View
TP Risk Comment: No material ESG risk
NEUTRAL
2.00
2.25
2.50
2.75
3.00
3.25
3.50
1/02/2013 1/04/2013 1/06/2013 1/08/2013 1/10/2013 1/12/2013 1/02/2014
DJS.AX XJO
2.7
3.7
4.7
5.7
6.7
7.7
Environment Social Governance
Stock Local Sector
Country Global Sector
Source: Company data, Credit Suisse estimates

14 February 2014
Australia and NZ First Edition 41
2Q14 sales
Return to positive LFLs
Second-quarter sales of $618.2mn was in line with CS forecast of $621.9mn. A return to
positive comparable store sales growth drove the improved performance. 2Q14 LFL sales
growth of 2.1% matched CS at 2.0%.
Increased discounting was present early in the quarter however abated and the company
stated it was pleased with early February trading. Gross margin will be down in 1H14 relative
to the pcp. We have upgraded our 2H14 LFL sales growth assumptions by 50bps to 3.0%.
We have downgrade gross margin assumptions by 50bp for 1H14 and 30bp for 2H14.
Figure 2: DJS quarterly sales
2Q13 3Q13 4Q13 1Q14 2Q14 2Q14F A vs F 3Q14F 4Q14F
Sales $mn 590 391 450 424 618 621.9 -0.6% 416 479
Sales growth % -1.4% -2.2% -1.3% 2.1% 4.8% 5.4% -63bp 6.3% 6.6%
LFL sales growth % -1.4% -3.4% -2.9% -0.3% 2.1% 2.0% 10bp 3.0% 3.0%
Source: Company data, Credit Suisse estimates
Online
Online sales increased 150% in 2Q14 accounted for 2.0% of group sales. That outcome
suggests online growth accounted for ~60% of the growth in comparable store sales.
Commentary that online represented 1.4% of first-half sales implies acceleration is
ongoing and it is therefore likely to make a further contribution to 2H14 LFLs.
Figure 4: DJS online contribution
2Q13 3Q13 4Q13 1Q14 2Q14 3Q14 4Q14
Store network underlying LFL -2.2% -4.4% -4.0% -1.3% 0.9% 1.6% 1.4%
Online contribution to LFL 0.8% 1.0% 1.1% 1.0% 1.2% 1.4% 1.6%
Comparable store sales growth -1.4% -3.4% -2.9% -0.3% 2.1% 3.0% 3.0%
New store sales growth 0.0% 1.2% 1.6% 2.4% 2.7% 3.3% 3.6%
Total sales growth -1.4% -2.2% -1.3% 2.1% 4.8% 6.3% 6.6%
Source: Company data, Credit Suisse estimates
Market share
DJS appears among the better placed of Australia's five major department store chains
and may therefore be in a stronger position to capitalise on a pick-up in cyclical activity.
We forecast 1.5% LFL sales growth for MYR in 2Q14, having reduced our forecast by
50bps following the website shut down during the week after Christmas.
Like-for-like sales excluding the electronics category transferred to DSH increased 3.6%.
The drag from electronics did not appear to increase in 2Q14 compared with 1Q14. The
difference serves to highlight the attractiveness of the brand management deal for DJS.

14 February 2014
Australia and NZ First Edition 42
Figure 5: Department store LFL sales growth
-16.0%
-12.0%
-8.0%
-4.0%
0.0%
4.0%
8.0%
2Q10 4Q10 2Q11 4Q11 2Q12 4Q12 2Q13 4Q13 2Q14
Myer LFL David Jones LFL
Source: Company data, Credit Suisse estimates
Valuation
We have a DCF valuation of $3.20. Our DCF is most sensitive to cost of capital
assumptions for which a 1ppt change moves our DCF by 59cps.
Our $3.14 target price is the average of our DCF and $3.10 SOP valuation.
Figure 6: DCF valuation
Valuation inputs
EBIT growth (CAGR)
Years 1 to 5 5.3%
Years 5 to 10 3.2%
ROIC
FY13A 8.7%
FY18F 9.0%
FY23F 10.1%
DCF
WACC 10.4%
Terminal grow th 1.5%
Enterprise Value ($mn) 1,793 12.6x FY14 EBIT
DCF Value ($/share) 3.20 19.2x FY14 EPS
Sensitivities
WACC 1.0% 0.59
Gross margin 1.0% 0.17
LFL sales growth 1.0% 0.22
CS FY14 metrics
Dividend yield 5.0%
Price-earnings ratio 17.6x
FCCR 2.9x Source: Company data, Credit Suisse estimates

Australia and NZ First Edition 43
14 February 2014
Asia Pacific/Australia
Equity Research
REITs (Real Estate (AU))
Goodman Group
(GMG.AX / GMGDA AU) RESULTS
Earnings achieved in a transition period
■ Not disappointed by guidance: Goodman Group reported 1H14 operating
profit of $296mn roughly in line with CSe of $297.4mn. Operating EPS of
17.2c reflects 6% growth on 1H13. While some may be disappointed to note
GMG merely re-iterated 6% EPS growth guidance for FY14 (34.3c) we remain
slightly higher (35c) to be diluted back to guidance on inclusion of the DRP
and our expectation that the Brazil deal will close towards the end of 3Q FY14.
■ Investment case: Goodman Group trades on a 13.2x P/E representing a
0.92x P/E Rel, only slightly below the historical average of 0.96x. Growth
expectations into Year Two stand at 7.3% relative to an average expectation
of 7.8% over the past 12 months. For GMG to meaningfully outperform, the
market will need to value the quality (sustainability) of GMG's growth, for which
a market correction may be a catalyst. We also note, speculation about the
"overhang" associated with the CIC block continues to weigh on pricing.
■ Catalysts: This half saw the first meaningful Japanese development impact
on the P&L. We expect the Japanese contribution will ramp up quickly from
here with Osaka (~March), Nagoya (Dec Qtr) and Tokyo Bay (Dec Qtr)
representing ~$550mn of completions this year. We expect WIP to remain at
~$2.5bn with these completions offset by Ichikawa commencement in 4Q
and a US ramp-up to ~$250mn of WIP by year-end.
■ Valuation: Our target price of $4.95 is struck at our June 2014 Net Asset
Valuation applying: a 7.65% WACR to balance sheet NOI, 11.4x multiple to
management EBIT and 12x to development EBIT. We apply an 8x multiple
to unallocated expenses.
Total return forecast in perspective
Mean^CS tgt^
Sh Prc
-30%
-20%
-10%
0%
10%
20%
30%
40%
12mth Volatility* 52wk Hi-Lo IBES Consensustarget return^
Performance Over 1M 3M 12M
Absolute (%) 2.1 -5.7 3.7
Relative (%) 0.3 -4.0 -2.4
Financial and valuation metrics
Year 06/13A 06/14E 06/15E 06/16E
Revenue (A$mn) 657.5 716.3 769.3 839.9
EBITDA (A$mn) 615.0 669.5 719.7 787.4
EBIT (A$mn) 609.0 663.5 713.7 781.4
Net income (A$mn) 544.1 603.5 635.4 675.8
EPS (CS adj.) (Ac) 32.44 35.02 36.71 38.62
Change from previous EPS (%) n.a. 0.1 -0.0 -0.0
EPS growth (%) 5.4 8.0 4.8 5.2
P/E (x) 14.7 13.6 13.0 12.3
Dividend (Ac) 19.48 20.82 22.08 23.19
Dividend yield (%) 4.1 4.4 4.6 4.9
Net debt/equity (%) 27.5 31.2 36.8 30.3
Relative performance versus S&P ASX 200.See Reference Appendix for a description of the chart. Source: Credit Suisse estimates, * Consensus, mean range from Thomson Reuters
Source: Company data, ASX, Credit Suisse estimates, * Adj. for goodwill, notional interest and unusual items. Relative P/E
against ASX/S&P200 based on pre GW in AUD. Company PE calculation is based on displayed EPS Currency
Rating NEUTRAL*
Price (13 Feb 14, A$) 4.76
Target price (A$) 4.95¹
Market cap. (A$mn) 8,181.22
Yr avg. mthly trading (A$mn) 531.15
Last month's trading (A$mn) 450.77
Projected return:
Capital gain (%) 4.0
Dividend yield (net %) 4.5
Total return (%) 8.5
52-week price range 5.5 - 4.5
* Stock ratings are relative to the relevant country
benchmark.
¹Target price is for 12 months.
Research Analysts
Stephen Rich
61 2 8205 4617
John Richmond
61 2 8205 4580
Mikhail Mohl
61 2 8205 4413
Specialist sales: Bhupen Master
61 2 8205 4792

14 February 2014
Australia and NZ First Edition 44
Figure 1: Goodman Group Summary Financials
Goodman Group ####### ###### ###### ###### ######
In AUDmn unless otherwise stated Year ending 30 Jun Share Price: A$4.7612-month target price: A$#ERR: Label not found: 'ESTIM_PP'
Profit & Loss 2012A 2013A 2014F 2015F 2016F Financial Summary 2012A 2013A 2014F 2015F 2016F
Net property income 171 159 161 172 177 Core Earnings 463.4 544.1 603.5 635.4 675.8
Investment Income 181 225 241 278 311 Core Earnings Growth 20.7% 17.4% 10.9% 5.3% 6.4%
Other Active EBIT 219 274 314 319 353 EPS (Core / underlying) 30.78 32.44 35.02 36.71 38.62
Unallocated expenses -39 -43 -47 -50 -53 EPS growth 6.5% 5.4% 8.0% 4.8% 5.2%
EBITDA 532 615 670 720 787 P/E 15.5 14.7 13.6 13.0 12.3
Depreciation & Amortisation -5 -6 -6 -6 -6 EPS (CS Basic) 30.8 32.4 35.0 36.7 38.6
EBIT 527 609 664 714 781 FFO (cents per share) 31.1 32.8 35.4 37.1 39.0
Net Interest -59 -238 -241 -41 -66 Dividends (cents per share) 18.2 19.5 20.8 22.1 23.2
PBT 517 579 639 673 716 Dividend Yield 3.8% 4.1% 4.4% 4.6% 4.9%
Tax -11 -13 -13 -14 -15 AFFO (cents per share) 31.1 32.8 35.4 37.1 39.0
Minorities & Other -42 -22 -22 -23 -25 P/AFFO 15.3 14.5 13.5 12.8 12.2
NPAT (post minorities) 463 544 604 635 676 EV/EBITDA 15.0 15.9 14.8 14.1 12.6
Balance Sheet 2012 2013 2014 2015 2016 Financial Ratios 2012 2013 2014 2015 2016
Cash & equivalents 311 645 643 801 980 Profitability Ratios
Receivables 164 339 248 248 248 ROE (%) 6.3% 7.0% 7.7% 8.1% 8.5%
Derivatives Payout Ratio (Dist / Op Earnings) 59% 60% 59% 60% 60%
Other current assets 316 193 344 344 344 Balance Sheet Ratios
Current assets 791 1,177 1,235 1,393 1,572 Debt/EBITDA 4.4 3.7 3.8 4.2 3.8
Investment Properties 2,259 2,090 2,123 2,179 2,240 Net Debt / Investment Properties 90% 77% 90% 101% 89%
Investments 2,893 3,243 3,814 4,298 4,763 Total Liabilities/ Total Assets 37% 34% 37% 40% 38%
Intangible assets 783 891 1,003 1,020 1,046
Other non-current assets 1,494 1,489 1,512 1,173 1,000 Share Items
Non-current assets 7,429 7,713 8,451 8,670 9,048 EFPOWA 1,506 1,677 1,724 1,731 1,750
Total assets 8,220 8,891 9,686 10,063 10,620 Units on Issue 1,595 1,713 1,719 1,727 1,754
Derivatives ESG Items
Interest bearing debt 2,348 2,250 2,545 3,009 2,977 Target Price Risk due to ESG (%) 0%
Other liabilities 698 805 1,051 1,051 1,051 MSCI IVA Risk Neutral
Total liabilities 3,045 3,055 3,597 4,060 4,028
Net assets 5,175 5,836 6,090 6,003 6,592
Ordinary equity 7,363 7,805 7,805 7,805 7,923
Minorities / prefered capital -319 -332 -331 -341 -351
Net Tangible Assets per share 2.55 2.69 2.77 2.69 2.96
Cashflow 2012 2013 2014 2015 2016 Share Price Performance 52 week range: $4.50 - $5.51
Net Property Income 171 159 161 172 177
Dividend Income
Change in working capital
Other operating cashflow 95 198 298 493 530
Operating cashflow 267 356 460 665 707
Disposals of Property -204 -283 -492 -1,229 -1,093
Acquisition of Property -140 -54 -27 - -
Total Capex - - -521 -1,069 -1,019
Net investment in JV's & associates
Other Investing Cashflows 124 483 889 2,128 1,902
Investing cashflow -221 146 -150 -170 -209
Proceeds from Equity Issuance
Dividend Re-investment Plan
Dividends paid -328 -327 -360 -371 -392
Net borrowings
Other 365 160 48 34 74
Financing cashflow 37 -168 -312 -337 -319
Net cashflow 83 335 -3 158 179
3.50
4.00
4.50
5.00
5.50
6.00
Jan-
13
Feb-
13
Mar
-13
Apr
-13
May
-13
Jun-
13
Jul-1
3
Aug
-13
Sep
-13
Oct
-13
Nov
-13
Dec
-13
Jan-
14
GMG.AX S&P/ASX 200 S&P/ASX 200 Property
Source: Company data, Credit Suisse estimates
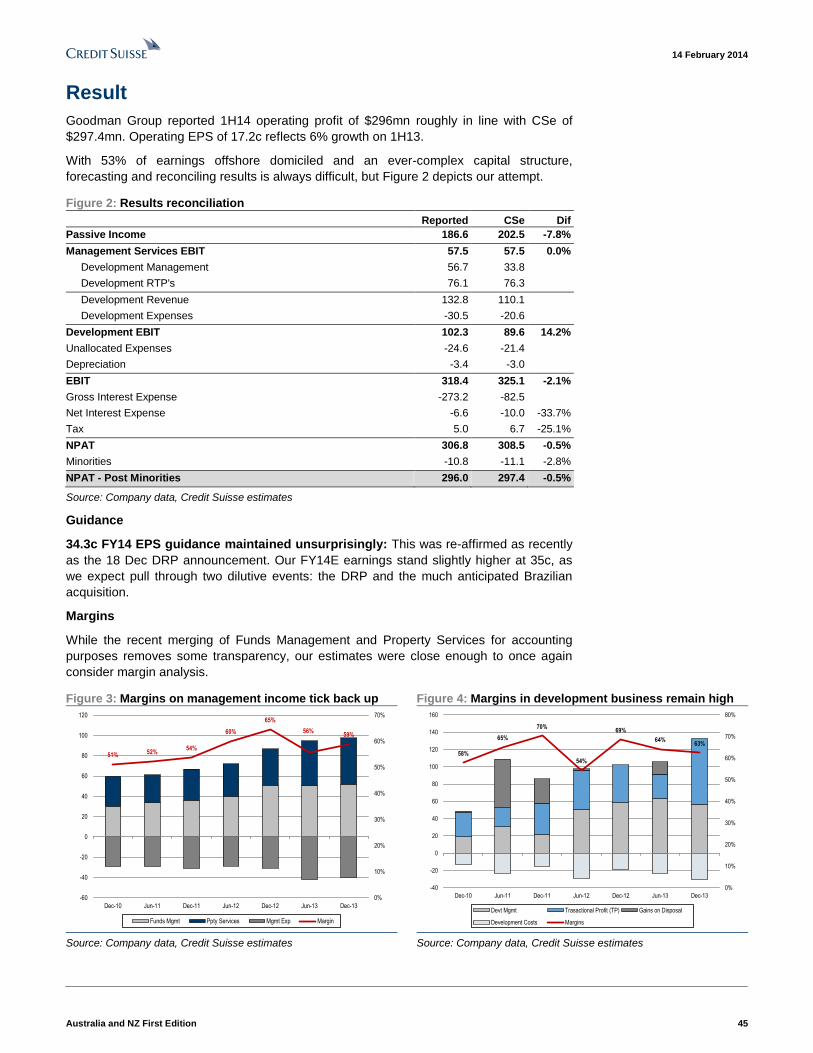
14 February 2014
Australia and NZ First Edition 45
Result
Goodman Group reported 1H14 operating profit of $296mn roughly in line with CSe of
$297.4mn. Operating EPS of 17.2c reflects 6% growth on 1H13.
With 53% of earnings offshore domiciled and an ever-complex capital structure,
forecasting and reconciling results is always difficult, but Figure 2 depicts our attempt.
Figure 2: Results reconciliation
Reported CSe Dif
Passive Income 186.6 202.5 -7.8%
Management Services EBIT 57.5 57.5 0.0%
Development Management 56.7 33.8
Development RTP's 76.1 76.3
Development Revenue 132.8 110.1
Development Expenses -30.5 -20.6
Development EBIT 102.3 89.6 14.2%
Unallocated Expenses -24.6 -21.4
Depreciation -3.4 -3.0
EBIT 318.4 325.1 -2.1%
Gross Interest Expense -273.2 -82.5
Net Interest Expense -6.6 -10.0 -33.7%
Tax 5.0 6.7 -25.1%
NPAT 306.8 308.5 -0.5%
Minorities -10.8 -11.1 -2.8%
NPAT - Post Minorities 296.0 297.4 -0.5%
Source: Company data, Credit Suisse estimates
Guidance
34.3c FY14 EPS guidance maintained unsurprisingly: This was re-affirmed as recently
as the 18 Dec DRP announcement. Our FY14E earnings stand slightly higher at 35c, as
we expect pull through two dilutive events: the DRP and the much anticipated Brazilian
acquisition.
Margins
While the recent merging of Funds Management and Property Services for accounting
purposes removes some transparency, our estimates were close enough to once again
consider margin analysis.
Figure 3: Margins on management income tick back up Figure 4: Margins in development business remain high
51% 52%54%
60%
65%
56%59%
0%
10%
20%
30%
40%
50%
60%
70%
-60
-40
-20
0
20
40
60
80
100
120
Dec-10 Jun-11 Dec-11 Jun-12 Dec-12 Jun-13 Dec-13
Funds Mgmt Ppty Services Mgmt Exp Margin
58%
65%
70%
54%
69%
64%63%
0%
10%
20%
30%
40%
50%
60%
70%
80%
-40
-20
0
20
40
60
80
100
120
140
160
Dec-10 Jun-11 Dec-11 Jun-12 Dec-12 Jun-13 Dec-13
Devt Mgmt Trasactional Profit (TP) Gains on Disposal
Development Costs Margins
Source: Company data, Credit Suisse estimates Source: Company data, Credit Suisse estimates

14 February 2014
Australia and NZ First Edition 46
Evolving In a continuous disclosure environment, there was not much in the way of "new news" on
today's call. However, we do find it interesting to trace the trajectory of the GMG business
from a geographic perspective.
Below we provide some of our favourite charts highlighting the evolution of the global
footprint.
Figure 5: Work in progress now at $2,591bn Figure 6: Led by Asia Pacific
0
500
1,000
1,500
2,000
2,500
3,000
3,500
4,000
Dec-06 Dec-07 Dec-08 Dec-09 Dec-10 Dec-11 Dec-12 Dec-13
A$
billi
on
Asia Pacifc Europe Americas
0%
10%
20%
30%
40%
50%
60%
70%
80%
90%
100%
Dec-06 Dec-07 Dec-08 Dec-09 Dec-10 Dec-11 Dec-12 Dec-13
Asia Pacifc Europe Americas
Source: Company data, Credit Suisse estimates Source: Company data, Credit Suisse estimates
Figure 7: New commitments and completions Figure 8: EU commitments moderating
-3,000
-2,000
-1,000
0
1,000
2,000
3,000
Dec-06 Dec-07 Dec-08 Dec-09 Dec-10 Dec-11 Dec-12 Dec-13
A$
mill
ion
Global Commitments Global Completions
0
200
400
600
800
1,000
1,200
1,400
1,600
Dec-06 Dec-07 Dec-08 Dec-09 Dec-10 Dec-11 Dec-12 Dec-13
A$
mill
ion
Asia Pacific commitments EU commitments
Source: Company data, Credit Suisse estimates Source: Company data, Credit Suisse estimates

14 February 2014
Australia and NZ First Edition 47
Appendix 1: Snapshot Highlights at a Glance
Investments:
■ Overall occupancy was maintained at 96% from June-13.
■ Retention rate remains slightly depressed at 77%, in line with FY13 but below the 80%
through FY12.
■ Weighted average lease expiry across the investment portfolio increased slightly from
4.7 years to 4.9 years.
■ Like-on-like rental growth of 2.2% was up on FY13 2.1% but still below FY12 2.8%.
Developments
■ WIP of $2.6bn (from $2.3bn at June) is 71% pre-committed and 88% “matched” to
third party capital.
■ Contributed $83.1m or 22% of operating EBIT (in line with FY13).
■ Development commitments of $1.2bn were 69% pre-committed (down from 72% at
June 13).
Funds management
■ $2bn of new committed third party equity raised including new €500mn initial
commitment from EPF for German fund.
■ Third party AUM increased 11% from June 13 to $21.6bn.
■ Significant capacity: GMG boasts $5.2bn of uncalled equity and debt to fund
development opportunities.
Capital
■ Gearing: continues to drift down to 32.9% look through from 33%.

Australia and NZ First Edition 48
14 February 2014
Asia Pacific/Australia
Equity Research
REITs (Real Estate (AU))
GPT Group
(GPT.AX / GPT AU) RESULTS
Grinding away
■ No magic bullets. GPT reported FY13 earnings of $471.8m as pre-released
on 28 January. EPS of 25.7c represents a 6.1% increase on 2012. Having
ridden a cost of debt reduction from 7.4% in 2010 to 5.1% today, we should
now expect real estate type returns. To that end, 3% EPS growth is a
reasonable outcome. Two concerns arise from GPT's strategy: (1)
Management is incentivised to lever up to drive DPS growth and (2) the focus
on tangible asset growth appears at odds with the desire to grow active
earnings. OUTPERFORM rating retained due to value in real estate portfolio.
■ Investment case. GPT owns and manages a high-quality portfolio of
Australian Real Estate. At $3.66, GPT is trading on: a forward NOI yield of
7.2%, a dividend yield of 5.6% and a 13.6x FY14 FFO. While we see better
value in Dexus, WRT and MGR, GPT combines inherent value with an
active buyback, which we expect would be effective in a market correction.
■ Catalysts. We note the buyback activity was not included in GPT's 3% EPS
growth guidance but also note that GPT has significant capacity to buy back
stocks on an earnings yield of ~7.2% versus a cost of debt of 5.1%.
Operationally, we look forward to leasing success at Governor Macquarie
Tower and/or MLC Centre or a recovery in retail lead indicators such as
retention to refocus the market on the quality of the real estate.
■ Valuation. We strike our target price in line with our December 2014 Net
Asset Valuation at $4.00. Key inputs include: 5.8% cap rate on malls, 8.0%
on industrial and a 6.56% implied cap rate on office as well as 10.0x on
active earnings and 9.25x on costs. If GPT was to trade to our $4.00 NAV in
12 months, it would offer a 5.3% forward dividend yield at that time.
Total return forecast in perspective
Mean^CS tgt^
Sh Prc
-20%
-10%
0%
10%
20%
30%
12mth Volatility* 52wk Hi-Lo IBES Consensustarget return^
Performance over 1M 3M 12M
Absolute (%) 1.7 -2.1 -3.9
Relative (%) -0.2 -0.4 -10.1
Financial and valuation metrics
Year 12/12A 12/13E 12/14E 12/15E
Revenue (A$mn) 580.8 593.5 606.2 632.5
EBITDA (A$mn) 558.0 567.1 579.0 604.6
EBIT (A$mn) 558.0 567.1 579.0 604.6
Net income (A$mn) 431.4 446.8 442.0 454.7
EPS (CS adj.) (Ac) 24.23 25.70 26.54 27.42
Change from previous EPS (%) n.a. — — —
EPS growth (%) 8.0 6.1 3.3 3.3
P/E (x) 15.1 14.2 13.8 13.3
Dividend (Ac) 19.39 20.44 21.23 21.94
Dividend yield (%) 5.3 5.6 5.8 6.0
Net debt/equity (%) 28.8 29.1 33.2 33.1
Relative performance versus S&P ASX 200.See Reference Appendix for a description of the chart. Source: Credit Suisse
estimates, * Consensus, mean range from Thomson Reuters
Source: Company data, ASX, Credit Suisse estimates, * Adj. for goodwill, notional interest and unusual items. Relative P/E
against ASX/S&P200 based on pre GW in AUD. Company PE calculation is based on displayed EPS Currency
Rating OUTPERFORM*
Price (13 Feb 14, A$) 3.66
Target price (A$) 4.00¹
Market cap. (A$mn) 6,186.34
Yr avg. mthly trading (A$mn) 467.27
Last month's trading (A$mn) 379.49
Projected return:
Capital gain (%) 9.6
Dividend yield (net %) 5.8
Total return (%) 15.4
52-week price range 4.2 - 3.4
* Stock ratings are relative to the relevant country
benchmark.
¹Target price is for 12 months.
Research Analysts
Stephen Rich
61 2 8205 4617
John Richmond
61 2 8205 4580
Mikhail Mohl
61 2 8205 4413
Specialist sales: Bhupen Master
61 2 8205 4792

14 February 2014
Australia and NZ First Edition 49
Figure 1: GPT Group—Financial summary
GPT Group ######## ######## ######## ######## 31/12/2012
In AUDmn unless otherwise stated Year ending 31 Dec Share Price: A$3.6612-month target price: A$#ERR: Label not found: 'ESTIM_PP'
Profit & Loss 2011A 2012A 2013F 2014F 2015F Financial Summary 2011A 2012A 2013F 2014F 2015F
Net property income 443 486 491 499 523 P/E 16.32 15.11 14.24 13.79 13.35
Management EBIT 35 80 90 93 95 Dividends (cents per share) 17.8 19.4 20.4 21.2 21.9
Other 70 -8 -14 -13 -14 Dividend growth 8.9% 5.4% 3.9% 3.3%
EBITDA 548 558 567 579 605 Dividend Yield 4.9% 5.3% 5.6% 5.8% 6.0%
Depreciation & Amortisation FFO (cents per share) 21.6 21.9 27.0 27.9 28.8
EBIT 545 558 567 579 605 P/FFO 17.0 16.7 13.6 13.1 12.7
Net Interest 118 104 95 112 125 AFFO (cents per share) 18.9 19.2 18.8 20.0 22.4
PBT 427 455 472 467 480 P/AFFO 19.3 19.1 19.5 18.3 16.3
Tax Expense / (Benefit) -12 -2 - - - EV/EBITDA 12.9 14.5 13.8 13.8 13.2
Minorities 25 25 25 25 25 ROE (%) 6.44% 6.27% 6.71% 6.69% 6.74%
NPAT (post minorities) 414 431 447 442 455 Payout Ratio (Dist / Op Earnings) 79% 80% 80% 80% 80%
Core Earnings 413.8 431.4 446.8 442.0 454.7 Financial Ratios 2011A 2012A 2013F 2014F 2015F
Core Earnings Growth 4.3% 3.6% -1.1% 2.9% Interest cover 4.0 3.4 6.0 5.2 4.8
EPS (CS underlying) 22.4 24.2 25.7 26.5 27.4 Debt/EBITDA 8.0 5.8 3.8 4.2 4.1
EPS growth 8.0% 6.1% 3.3% 3.3% Net Debt / Investment Properties 44.1% 39.4% 30.4% 33.7% 33.7%
EFPOWA 1,845.3 1,780.6 1,738.5 1,665.5 1,658.1
Units on Issue 1,813.8 1,766.8 1,688.4 1,658.1 1,658.1
Balance Sheet 2011A 2012A 2013F 2014F 2015F TP ESG Risk Due / MSCI IVA Risk 0.0% Neutral
Cash & equivalents 43 160 223 234 269 MSCI IVA Comment
Receivables 142 72 77 77 77
Derivatives 0 5 3 3 3
Other current assets - - - - -
Current assets 666 445 320 331 366
Investment Properties 6,198 6,501 6,384 6,511 6,637
Investments 1,860 2,011 1,953 2,028 2,075
Intangible assets 51 50 51 51 51
Other non-current assets 504 337 336 336 336
Non-current assets 8,613 8,899 8,724 8,927 9,100
Total assets 9,279 9,343 9,044 9,257 9,466
Derivatives 129 140 78 78 78
Interest bearing debt 2,144 2,144 2,161 2,428 2,503
Other liabilities 220 183 142 142 142
Total liabilities 2,492 2,467 2,380 2,647 2,722
Net assets 6,786 6,876 6,663 6,611 6,744
Ordinary equity 6,786 6,876 6,663 6,611 6,744
Minorities / prefered capital - - - - - Share Price Performance 52 week range: $3.39 - $4.16
Net Tangible Assets per share 3.5 3.9 3.9 4.0 4.0
Cashflow 2011A 2012A 2013F 2014F 2015F
Net Property Income 443 486 491 499 523
Other operating cashflow -30 -66 -89 -116 -101
Operating cashflow 413 420 402 383 422
Disposals (/acquisitions) of property 539.3
Specific Capex -68 -84 -6 - -
Maintenance Capex -67 -217 -55 -102 -76
Net investment in JV's & associates
Other Investing Cashflows 44 596 410 -49 -
Investing cashflow 448 295 349 -151 -76
Proceeds from Equity Issuance -127 -148 -265 -116 -
Dividend Re-investment Plan
Dividends paid -348 -366 -370 -347 -361
Net borrowings -312 -331 1 266 76
Other -76 246 -54 -25 -25
Financing cashflow -863 -598 -688 -222 -311
Net cashflow -2 117 63 11 36
We agree with MSCI's AAA rating for GPT as it
continues to lead most in its industry in the adoption of
green building certifications and its improvement trend
and targets for energy and water efficiency
2.8
3.0
3.2
3.4
3.6
3.8
4.0
4.2
Jan-
13
Feb-
13
Mar
-13
Apr
-13
May
-13
Jun-
13
Jul-1
3
Aug
-13
Sep
-13
Oct
-13
Nov
-13
Dec
-13
Jan-
14
GPT.AX S&P/ASX 200 S&P/ASX 200 Property
52%
22%
11%
12%
3%
Retail
Office
Industrial
Funds Management
Non-core
FY12 EBIT by Segment
Source: Company data, Credit Suisse estimates

14 February 2014
Australia and NZ First Edition 50
Focus on composition and growth Having pre-released its FY13 earnings of $471.8m or 25.7cps, we were focused on the
composition of today's results and guidance by GPT Group.
Composition
Figure two highlights the GPT result relative to our expectations:
Figure 2: GPT Group – FY13 results
Reported Cse Dif
Retail 264.3 267.5 -1.2%
Office 144.1 147.3 -2.2%
Industrial 76.2 76.0 0.3%
Fund distributions 74.9 71.9 4.1%
Total fees received 54.7 43.7 25.2%
Expenses (Incl tax) -33.3 -25.8 28.9%
Funds management 96.3 89.8 7.3%
Non-core 11.2 12.8 -12.4%
Corporate expenses – Unallocated expenses -22.1 -26.4 -16.2%
EBIT 570.0 567.1 0.5%
Net interest -95.5 -95.2 0.3%
Net profit before tax 474.5 471.8 0.6%
Tax -2.7 0.0
Net profit after tax / Realised operating income (ROI) 471.8 471.8 0.0%
Source: Company data, Credit Suisse estimates
Key takeaways:
■ Passive income came in somewhat weaker than expected, 1.3% across the portfolios.
■ Visibility in active earnings remains opaque and medium-term trajectory must be
reconsidered given considerable variability.
■ Unallocated expenses reduced, but aggregate expenses were 6.2% higher suggesting
there may be an element of re-allocation of expenses, especially when we consider
the $1.5m of CPA related costs expensed through the period.
■ Reflecting the profitability of the management, company tax registered $2.7m.
Guidance
In guiding to 3% EPS growth the key points to clarify include:
■ No buyback: This highlights the scope for outperformance relative to expectations,
given conservative gearing at 22.3% and a ~2.1% spread between earnings yield and
cost of debt.
■ CPA costs expensed: Will be enough to offset the incremental FM fees GPT expects
to receive on an annualised basis. We've previously estimated this at: ~$5m.
■ New funds: Are not assumed to be launched in the EPS growth guidance.
■ Cost of debt: At 5.1% may have finally troughed given the average margin now sits at
~145bps and debt is now 72% hedged with an average duration of 5.9 years.
New earnings terminology
FFO adjustments: Appear minimal but should preclude further swap breaks.
AFFO adjustments: Could introduce reasonable volatility to the dividend profile.

14 February 2014
Australia and NZ First Edition 51
Operational metrics
Retail metrics recovering but challenges remain
Comparable NOI growth lifted to 2.5% from 1.5% in December but remains well below
GPT's historical average of 4.1% (Figure 3). Occupancy remains solid at 99.6%, up 0.1%
over the past six months.
Figure 3: Comp NOI growth rebounds to 2.5% Figure 4: Comp specific MAT growth recovering
0%
1%
2%
3%
4%
5%
6%
7%
8%
Jun-06 Jun-07 Jun-08 Jun-09 Jun-10 Jun-11 Jun-12 Jun-13
WDC/WRT AU SGP CFX GPT
-2%
0%
2%
4%
6%
8%
WDC/WRT AU SGP CFX GPT
Source: Company data, Credit Suisse estimates Source: Company data, Credit Suisse estimates
Positively, GPT's specialty sales productivity increased by 5.3% to $9,458 which saw
occupancy costs fall slightly to 18.1%, Figure 5.
Figure 5: GPT's sales productivity lifted by 5.3% Figure 6: Joining the 5% WACR club
WRT
SGP
CFX
FDC
GPT
CQR
6%
8%
10%
12%
14%
16%
18%
20%
7,500 8,000 8,500 9,000 9,500 10,000 10,500
Sp
ecia
lty
occ
up
ancy
co
sts
Specialty sales ($/psm)
6.21%
6.19%6.21%
6.10%
6.07%
6.03%
5.99%
5.85%
5.90%
5.95%
6.00%
6.05%
6.10%
6.15%
6.20%
6.25%
Dec-10 Jun-11 Dec-11 Jun-12 Dec-12 Jun-13 Dec-13
GPT WACR
Source: Company data, Credit Suisse estimates Source: ABS, Credit Suisse estimates
In addition, the portfolio experienced $42.9mn in valuation uplift with the WACR falling by
8bps to 5.99% as shown in Figure 6. Despite this, we note that our key lead indicators
show little sign of improvement:
■ Re-leasing spreads remain depressed at -5.2% but improved from the 5.8% recorded in June.
■ Holdovers ticked up to 3% in December and have increased by 290bps over the past 12 months. Although, management did comment that part of this was due to tenant remixing/development and were comfortable to see holder-overs rise until better terms could be negotiated.
■ Tenant retention of 57% remains well below historic average of 70-80%
■ Yesterday's SGP update showed that retail incentives have increased markedly over the last 12 months and are now at 13.4% (as a % rent over the lease term) as compared to 7.5% at Dec-12 (in SGP's portfolio).

14 February 2014
Australia and NZ First Edition 52
Comparable office NOI could fall in 2014
The key standout from today's result was the significant fall in occupancy in GPT's office
portfolio, which at 90.6% is the lowest of GPT's peer set and is likely to be a major
headwind to achieving comparable income in 2014, Figure 8.
Figure 7: Office comp NOI growth Figure 8: GPT's occupancy is now the lowest of peer set
-4%
-2%
0%
2%
4%
6%
8%
10%
12%
14%
16%
Jun-06 Mar-07 Dec-07 Sep-08 Jun-09 Mar-10 Dec-10 Sep-11 Jun-12 Mar-13 Dec-13
IOF CPA DXS GPT MGR
86.0%
88.0%
90.0%
92.0%
94.0%
96.0%
98.0%
100.0%
IOF CPA DXS GPT MGR
Dec-11 Jun-12 Dec-12 Jun-13 Dec-13
Source: Company data, Credit Suisse estimates Source: Company data, Credit Suisse estimates
Comparable NOI growth improved slightly to 0.7% from -0.7% in June, although like retail,
remains well below the historical average of 4.7%, Figure 7.
The exit of Freehill's over 20k sqm from GPT's MLC property in January has seen
occupancy in this asset fall to 65.7% from 94.2% in June. Surprisingly, this asset
experienced $9mn (2.5%) of valuation uplift during the half, potentially a result of improved
letting up assumptions. GPT today announced a further 6k sqm of space under heads of
agreement at 111 Eagle St in Brisbane, take occupancy to 94% from 83.7% at June.
The portfolio WACR fell by 14bps to 6.72% over the half which is consistent with solid
valuation uplift recorded in Dexus (10bps), Stockland (10bps) and CPA's (26bps) portfolios
over the past six months.
Management noted the deterioration in operating fundamentals during 2013 (Figure 9)
detailed in our recent report Office - AREIT Market Forecasts – nearing the trough.
Despite this, management suggested improved market fundamentals in their preferred
markets such as Sydney and Melbourne (86% exposure), in particular, which is also
consistent with commentary from DXS' management in yesterday's 1H14 update. We note
that business conditions improved markedly in the December quarter and typically lead
office demand by around six months as shown in Figure 10.
Figure 9: Weak demand has seen vacancy rise to 11.8% Figure 10: NAB business conditions surged in December
-10%
-5%
0%
5%
10%
15%
-150
-100
-50
0
50
100
150
200
250
Dec-10 Jun-11 Dec-11 Jun-12 Dec-12 Jun-13 Dec-13
Vac
ancy
Rat
e
Squ
are
met
res
(000
)
Net additions (lhs) Net absorption (lhs) Vacancy rate (rhs)
-20
-15
-10
-5
0
5
10
15
20
25
-2%
0%
2%
4%
6%
2005 2006 2007 2008 2009 2010 2011 2012 2013
National net absorption (lhs) NAB Business Conditions, adv 6mths (rhs)
Source: Jones Lang LaSalle, Credit Suisse estimates Source: Jones Lang LaSalle, Credit Suisse estimates

14 February 2014
Australia and NZ First Edition 53
Appendix 1: CPA related FUM lift Reproduced from our 14 January note, "Not much of a consolation".
Earnings accretion
While valuations look full, GPT looks set to benefit from the ~$4.75m (1.0%) accretion in
2014, growing to $8.25m on a full-year basis.
■ GPT's third-party funds management fees: With FUM growing by $1.18bn (16.4%)
as a result of this transaction, revenue will increase by $5.3m on an annualised basis.
While fees are charged quarterly in arrears, the calculation has to be based off the
gross assets of the funds at the last balance date with audited accounts (in this case,
31 December). As such, we assume fees only commence from 1 July.
We assume minimal additional costs delivering $5m to profit annually, or $2.5m in '14.
■ Ownership interest:
While 10 Shelley Street appears likely to incur some downtime on the expiry of the
KPMG lease in January 2016, the asset appears to have been priced with reference to
the CY14 passing yield, which skews up the portfolio average to 7.0%.
After adjusting for a 45bps MER (depicted above) and a 5% all-in cost of debt (on
valuation plus costs) annual accretion stands at $3m.
With Dexus' bid due to close on 7 February, we assume GPT's funds should be
booking spread income for three quarters of 2014, i.e. $2.25m.
Figure 11: Face income estimates Figure 12: Accretion analysis
CY14
Income
Valuation CY14 Yield
Northland 28 505.0 5.6%
750 Collins St 19 249.5 7.7%
2 Southbank Ave 15 196.7 7.9%
10 Shelley St 13 130.6 9.7%
655 Collins 7 102.2 6.8%
Total 83 1,184 7.0%
Acquisitions 1,184
Yield 7.0% 83
Debt 5.5% 1,249
Cost of debt 5.0% -62
MER 0.45% -5.328
Net income 14.8
GPT share 20.3% 3.00
Part period 0.75 2.25
Source: Company data, Credit Suisse estimates Source: Company data, Credit Suisse estimates

Australia and NZ First Edition 54
14 February 2014
Asia Pacific/Australia
Equity Research
Software (Corporate services - SMID (AU))
IRESS
(IRE.AX / IRE AU) ASSUMING COVERAGE
Glass half empty or glass half full? ■ Pros and cons: A criticism of IRE is that for a stock with a fairly demanding
multiple, it hasn't delivered much growth over the last few years. The counter
to this is that for a company that has as much financial market exposure as
IRE has, it has done remarkably well. As always, the forward-looking view is
most important and in that regard we are starting to become more optimistic
on the growth profile. This is not without its share of risks however, and for
the time being we find that the pros and cons equal out at current valuation
levels. We retain our Neutral rating. Paul Buys assumes coverage of IRE
following a change in analyst responsibility.
■ UK is the key driver: We have reviewed our key assumptions for IRE, but
while our updated forecasts result in some revisions at a divisional level, the
net impact on group EPS is fairly minor. We assume A&NZ Financial
Markets remain flat into FY14 and some further growth for A&NZ Wealth
Management, although at moderated levels. That leaves the UK business as
the key growth driver. Key opportunities are the market size, regulatory
change and IRE's competitive technology – basically, the potential to
replicate IRE's XPLAN/VisiPlan experience. Key risks include integrating
Avelo (the CEO has relocated to the UK to oversee this), managing legacy
product and the different UK structure (greater dealer group independence).
■ Valuation: Our target price increases from $8.75 to $9.60, due mainly to
modest positive EPS revisions and a higher market multiple. On a PE basis,
IRE trades in line with its long-term average premium of ~45% relative to the
ASX Small Industrials (XSI). However, the stock looks more demanding on
an EV/EBIT basis (~1 standard deviation expensive) given the introduction
of debt to the balance sheet post the Avelo acquisition.
Total return forecast in perspective
Performance Over 1M 3M 12M
Absolute (%) -0.9 -7.0 10.0
Relative (%) -1.2 -6.2 2.9
Financial and valuation metrics
Year 12/12A 12/13E 12/14E 12/15E
Revenue (A$mn) 206.9 245.1 348.6 378.2
EBITDA (A$mn) 83.4 88.6 118.9 137.8
EBIT (A$mn) 77.3 81.1 111.7 131.0
Net income (A$mn) 54.4 55.0 76.6 91.6
EPS (CS adj.) (Ac) 42.49 38.94 47.77 56.43
Change from previous EPS (%) n.a. -0.7 1.4 2.9
Consensus EPS (Ac) n.a. 36.00 44.30 51.00
EPS growth (%) -10.0 -8.3 22.7 18.1
P/E (x) 21.8 23.8 19.4 16.4
Dividend (Ac) 38.00 32.50 39.23 46.27
Dividend yield (%) 4.1 3.5 4.2 5.0
P/B (x) 9.4 4.2 4.6 4.5
Net debt/equity (%) net cash 42.2 29.5 24.7
Relative performance versus S&P ASX 200.See Reference Appendix for a description of the chart. Source: Credit Suisse estimates, * Consensus, mean range from Thomson Reuters
Source: Company data, ASX, Credit Suisse estimates, * Adj. for goodwill, notional interest and unusual items. Relative P/E
against ASX/S&P200 based on pre GW in AUD. Company PE calculation is based on displayed EPS Currency
Rating NEUTRAL*
Price (13 Feb 14, A$) 9.25
Target price (A$) (from 8.75) 9.60¹
Market cap. (A$mn) 1,466.91
Yr avg. mthly trading (A$mn) 63
Last month's trading (A$mn) 64
Projected return:
Capital gain (%) 3.8
Dividend yield (net %) 4.3
Total return (%) 8.1
52-week price range 10.4 - 7.2
* Stock ratings are relative to the relevant country
benchmark.
¹Target price is for 12 months.
Research Analysts
Paul Buys
61 2 8205 4538
Bradley Clibborn
61 2 8205 4465
Chris Smith
61 2 8205 4210
Sarah Mann
61 2 8205 4610

14 February 2014
Australia and NZ First Edition 55
Figure 1: Financial summary
IRESS (IRE) Year ending 31 Dec In AUDmn, unless otherwise stated2011 2012 2013 2014 2015 2011 2012 2013 2014 2015
Share Price: A$9.22 Earnings 12/11A 12/12A 12/13E 12/14E 12/15ERating c_EPS_SHARESEquiv. FPO (period avg.) mn 126.6 128.0 141.2 160.4 162.4
Target Price A$ 9.60 c_EPS*100EPS (Normalised) c 47.2 42.5 38.9 47.8 56.4
vs Share price % 4.12 EPS_GROWTH*100EPS Growth % -10.0 -8.3 22.7 18.1
c_EBITDA_MARGIN*100EBITDA Margin % 43.6 40.3 36.1 34.1 36.4
c_DPS*100DPS c 38.0 38.0 32.5 39.2 46.3
c_PAYOUT*100Payout % 80.5 89.4 83.5 82.1 82.0
FRANKING*100Franking % 83.0 90.0 90.0 90.0 90.0
c_FCF_PS*100Free CFPS c 43.2 48.0 22.6 61.8 55.0
Profit & Loss 12/11A 12/12A 12/13E 12/14E 12/15E c_TAX_RATE*100Effective tax rate % 30.5 30.5 30.7 27.9 27.4
Sales revenue 204.5 206.9 245.1 348.6 378.2 ValuationEBITDA 89.1 83.4 88.6 118.9 137.8 c_PE P/E x 19.5 21.7 23.7 19.3 16.3
Depr. & Amort. (4.7) (6.2) (7.5) (7.2) (6.8) c_EBIT_MULTIPLE_CURREV/EBIT x 16.7 18.2 19.6 13.9 11.8
EBIT 84.4 77.3 81.1 111.7 131.0 c_EBITDA_MULTIPLE_CUEV/EBITDA x 15.9 16.9 18.0 13.1 11.2
Associates 0.0 0.0 0.0 0.0 0.0 c_DIV_YIELD*100Dividend Yield % 4.1 4.1 3.5 4.3 5.0
Net interest Exp. 1.6 1.0 (1.8) (5.5) (4.9) c_FCF_YIELD*100FCF Yield % 4.7 5.2 2.4 6.7 6.0
Other 0.0 0.0 0.0 0.0 0.0 c_PB Price to Book x 9.1 9.4 4.2 4.6 4.5
Profit before tax 86.0 78.3 79.3 106.2 126.1 ReturnsIncome tax (26.2) (23.9) (24.4) (29.6) (34.5) c_ROE*100Return on Equity % 46.8 42.9 17.6 23.7 27.1
Profit after tax 59.8 54.4 55.0 76.6 91.6 c_I_NPAT/c_I_SALES*100Profit Margin % 29.2 26.3 22.4 22.0 24.2
Minorities 0.0 0.0 0.0 0.0 0.0 c_I_SALES/c_B_TOT_ASSAsset Turnover x 1.2 1.3 0.5 0.7 0.7
Preferred dividends 0.0 0.0 0.0 0.0 0.0 c_ASSETS/c_EQ_COMMONEquity Multiplier x 1.3 1.2 1.7 1.6 1.5
Associates & Other 0.0 0.0 0.0 0.0 0.0 c_ROA*100Return on Assets % 35.3 34.6 10.7 14.8 17.8
Normalised NPAT 59.8 54.4 55.0 76.6 91.6 c_ROIC*100Return on Invested Cap. % 74.4 75.8 12.7 19.2 22.6
Unusual item after tax 0.0 0.0 0.0 0.0 0.0 GearingReported NPAT 59.8 54.4 55.0 76.6 91.6 c_GEARING*100Net Debt to Net debt + Equity % Net Cash Net Cash 29.7 22.8 19.8
c_NET_DEBT/c_I_EBITDANet Debt to EBITDA x Net Cash Net Cash 1.5 0.8 0.6
Balance Sheet 12/11A 12/12A 12/13E 12/14E 12/15E c_I_EBITDA/ c_I_NET_INTERESTInt Cover (EBITDA/Net Int.) x -56.4 -83.4 49.0 21.5 28.3
Cash & equivalents 48.9 56.0 39.1 45.4 37.3 c_I_EBIT/ c_I_NET_INTERESTInt Cover (EBIT/Net Int.) x -53.4 -77.3 44.9 20.2 26.9
Inventories 0.0 0.0 0.0 0.0 0.0 (c_C_CAPEX/c_I_SALES)*-100Capex to Sales % 0.0 0.0 0.0 0.0 0.0
Receivables 15.9 14.4 32.7 25.4 27.6 (c_C_CAPEX/c_I_DEPR)*-100Capex to Depreciation % 0.0 0.0 0.0 0.0 0.0
Other current assets 0.0 0.0 0.0 0.0 0.0
Current assets 64.8 70.4 71.8 70.8 64.9 MSCI IVA (ESG) Rating BProperty, plant & equip. 6.8 7.8 10.6 13.1 16.6 TP ESG Risk (%): 0
Intangibles 44.9 42.5 395.0 394.0 393.1
Other non-current assets 52.9 36.5 38.7 38.7 38.7
Non-current assets 104.6 86.8 444.2 445.8 448.4
Total assets 169.5 157.2 516.0 516.6 513.3
Payables 16.2 14.4 10.5 29.4 31.3
Interest bearing debt 0.0 0.0 170.7 140.7 120.7
Other liabilities 25.4 15.9 23.0 23.0 23.0 MSCI IVA Risk: Neutral
Total liabilities 41.6 30.3 204.2 193.1 175.0
Net assets 127.9 126.8 311.9 323.5 338.2
Ordinary equity 127.9 126.8 311.9 323.5 338.2
Minority interests 0.0 0.0 0.0 0.0 0.0
Preferred capital 0.0 0.0 0.0 0.0 0.0
Total shareholder funds 127.9 126.8 311.9 323.5 338.2
Net debt -48.9 -56.0 131.6 95.3 83.4 Source: MSCI ESG Research
Cashflow 12/11A 12/12A 12/13E 12/14E 12/15E Share Price Performance
EBIT 84.4 77.3 81.1 111.7 131.0
Net interest 1.5 1.3 -1.7 -5.5 -4.9
Depr & Amort 4.7 6.2 7.5 7.2 6.8
Tax paid -31.5 -21.7 -23.1 -29.6 -34.5
Working capital -1.5 -0.3 -22.2 26.2 -0.3
Other -2.9 -1.2 -9.8 -10.9 -8.9
Operating cashflow 54.7 61.5 31.9 99.1 89.3
Capex 0.0 0.0 0.0 0.0 0.0
Capex - expansionary
Capex - maintenance
Acquisitions & Invest -49.9 -6.2 -377.5 -8.7 -9.5
Asset sale proceeds 0.1 0.1 0.1 0.1 0.1
Other 0.0 0.0 0.0 0.0 0.0
Investing cashflow -49.8 -6.1 -377.4 -8.6 -9.4
Dividends paid -52.4 -47.9 -48.9 -54.1 -68.0
Equity raised 0.0 0.0 205.9 0.0 0.0
Net borrowings 0.0 0.0 170.7 0.0 0.0
Other 0.0 0.0 0.0 0.0 0.0 1 Month 3 Month 12 Month
Financing cashflow -52.4 -47.9 327.7 -54.1 -68.0 Absolute 0.5% -8.1% 10.6%
Total cashflow -47.5 7.5 -17.9 36.4 11.8 Relative -1.3% -6.3% 19.9%
Adjustments -2.7 -0.5 1.0 0.0 0.0
Net change in cash -50.1 7.0 -16.9 36.4 11.8 Source: Reuters 52 week trading range: 7.22-10.38
MSCI IVA Risk Comment: We see the rating as appropriate given
consideration of key criteria.
13/02/2014 15:30
IRESS Limited is an Australia-based company. The Company is engaged in the provision of
information, trading, compliance, order management, portfolio and financial planning systems
and related tools.
Credit Suisse View
TP Risk Comment: We have not currently factored in any change
in the current operating environment to account for privacy / data
security issues or energy efficiency.
NEUTRAL
6.20
6.70
7.20
7.70
8.20
8.70
9.20
9.70
10.20
10.70
1/02/2013 1/04/2013 1/06/2013 1/08/2013 1/10/2013 1/12/2013 1/02/2014
IRE.AX XSO
2.3
3.3
4.3
5.3
6.3
7.3
8.3
9.3
Environment Social Governance
Stock Local Sector
Country Global Sector
Source: Company data, Credit Suisse estimates

14 February 2014
Australia and NZ First Edition 56
Valuation Figure 2: Divisional EBITDA forecasts
FY10 FY11 1H12 2H12 FY12 1H13 2H13F FY13F FY14F FY15F
Financial Markets - A&NZ 58.9 56.3 27.1 27.1 54.2 25.4 25.2 50.6 50.9 53.7
Wealth - A&NZ 18.6 20.3 11.6 11.8 23.4 13.1 13.8 26.9 29.4 31.6
Financial Markets -
Canada
7.8 8.2 3.4 2.9 6.3 2.5 2.6 5.1 5.1 5.2
Asia -1.7 -2.8 -2.1 -1.9 -4.0 -1.9 -2.1 -3.9 -2.1 0.0
South Africa 2.5 7.2 3.5 3.0 6.5 3.4 3.2 6.5 6.8 7.2
UK 0.0 -0.1 -1.2 -1.7 -3.0 -1.6 5.3 3.7 28.8 40.2
Total - IRE-defined 86.1 89.1 42.2 41.2 83.4 40.9 48.1 89.1 118.9 137.8
SBP -6.9 -7.1 -3.6 -4.5 -8.5 -4.7 -4.3 -9.0 -7.3 -4.7
Total - reported 79.2 82.0 38.6 36.6 75.0 36.3 43.8 80.1 111.6 133.2
By geography
ANZ 77.5 76.6 38.7 38.9 77.6 38.5 39.0 77.5 80.3 85.3
UK 0.0 -0.1 -1.2 -1.7 -3.0 -1.6 5.3 3.7 28.8 40.2
South Africa 2.5 7.2 3.5 3.0 6.5 3.4 3.2 6.5 6.8 7.2
Canada 7.8 8.2 3.4 2.9 6.3 2.5 2.6 5.1 5.1 5.2
Asia -1.7 -2.8 -2.1 -1.9 -4.0 -1.9 -2.1 -3.9 -2.1 0.0
Total 86.1 89.1 42.2 41.2 83.4 40.9 48.1 89.1 118.9 137.8
Growth by division
Financial Markets - A&NZ 4.0% -4.4% -2.5% 0.0% -3.7% -6.2% -1.0% -6.6% 0.5% 5.5%
Wealth - A&NZ 10.1% 8.9% 9.8% 1.3% 15.2% 11.3% 5.8% 15.3% 9.3% 7.3%
Financial Markets -
Canada
11.7% 4.5% -21.3% -16.5% -23.5% -11.5% 3.9% -17.9% -1.7% 3.7%
Asia 869.9% 62.5% 25.4% -12.2% 43.1% -0.1% 11.8% -1.1% -46.3% -97.8%
South Africa 10.6% 193.0% -9.5% -13.0% -10.3% 11.1% -4.6% 1.0% 4.2% 5.0%
UK - - - - - - - - - -
Total 4.2% 3.4% -5.6% -2.6% -6.4% -0.5% 17.5% 6.8% 33.5% 15.9%
Growth by geography
ANZ 5.4% -1.2% 0.9% 0.4% 1.3% -0.9% 1.3% 0.0% 3.6% 6.2%
UK 940.3% 39.3% 2389.9% -7.4% -434.0% -226.1% 670.9% 39.5%
South Africa 10.6% 193.0% -9.5% -13.0% -10.3% 11.1% -4.6% 1.0% 4.2% 5.0%
Canada 11.7% 4.5% -21.3% -16.5% -23.5% -11.5% 3.9% -17.9% -1.7% 3.7%
Asia 869.9% 62.5% 25.4% -12.2% 43.1% -0.1% 11.8% -1.1% -46.3% -97.8%
Total 4.2% 3.4% -5.6% -2.6% -6.4% -0.5% 17.5% 6.8% 33.5% 15.9%
Contribution by division
Financial Markets - A&NZ 68% 63% 64% 66% 65% 62% 52% 57% 43% 39%
Wealth - A&NZ 22% 23% 27% 29% 28% 32% 29% 30% 25% 23%
Financial Markets -
Canada
9% 9% 8% 7% 8% 6% 5% 6% 4% 4%
Asia -2% -3% -5% -5% -5% -5% -4% -4% -2% 0%
South Africa 3% 8% 8% 7% 8% 8% 7% 7% 6% 5%
UK 0% 0% -3% -4% -4% -4% 11% 4% 24% 29%
Total 100% 100% 100% 100% 100% 100% 100% 100% 100% 100%
Contribution by geography
ANZ 90% 86% 92% 94% 93% 94% 81% 87% 68% 62%
UK 9% 9% 8% 7% 8% 6% 5% 6% 4% 4%
South Africa 3% 8% 8% 7% 8% 8% 7% 7% 6% 5%
Canada -2% -3% -5% -5% -5% -5% -4% -4% -2% 0%
Asia 0% 0% -3% -4% -4% -4% 11% 4% 24% 29%
Total 100% 100% 100% 100% 100% 100% 100% 100% 100% 100%
Source: Company data, Credit Suisse estimates

14 February 2014
Australia and NZ First Edition 57
Valuation
Figure 3: IRE PE-relative to the XSI Figure 4: IRE EV/EBIT-relative to the XSI
0%
50%
100%
150%
200%
250%
Jan-03
Jul-03
Jan-04
Jul-04
Jan-05
Jul-05
Jan-06
Jul-06
Jan-07
Jul-07
Jan-08
Jul-08
Jan-09
Jul-09
Jan-10
Jul-10
Jan-11
Jul-11
Jan-12
Jul-12
Jan-13
Jul-13
Jan-14
IRE PE relative (to XSI) Mean +SD -SD
0%
50%
100%
150%
200%
250%
Jan-03
Jul-03
Jan-04
Jul-04
Jan-05
Jul-05
Jan-06
Jul-06
Jan-07
Jul-07
Jan-08
Jul-08
Jan-09
Jul-09
Jan-10
Jul-10
Jan-11
Jul-11
Jan-12
Jul-12
Jan-13
Jul-13
Jan-14
IRE EV/EBIT relative (to XSI) Mean +SD -SD
Source: Company data, Credit Suisse estimates Source: Company data, Credit Suisse estimates

Australia and NZ First Edition 58
14 February 2014
Asia Pacific/Australia
Equity Research
Healthcare Facilities (Health Care (AU))
Mayne Pharma
(MYX.AX / MYX AU) ACQUISITION
US portfolio expanded with another acquisition
■ Brand franchises acquired: MYX has completed an A$18mn equity
placement (~22.6mn shares) to fund the acquisition of the LORCET and
ESGIC brands from Forest Pharmaceuticals for ~A$13.4mn (US$12mn).
LORCET contains hydrocodone + paracetamol and is used to treat moderate
to moderately severe pain, while ESGIC contains butalbital (a barbituate),
paracetamol and caffeine and is indicated for tension headaches. Gross sales
of both products were ~US$5mn in FY13 (implying a sales acquisition
multiple of 2.4x). Manufacturing of both products is currently outsourced but
MYX could look to bring this in-house in the medium term when contracts
expire. Further, MYX will directly distribute both brands through its US
Midlothian business and hence realise a high margin on sales. Management
noted that investment in both products had been somewhat limited by Forest
and that there was opportunity for MYX to grow share.
■ Sound strategy: This brand acquisition is another example of MYX
executing its core strategy of acquiring "unloved", complementary products to
properly market and distribute with the intention of growing the brands. We
suspect similar opportunities will continue to present themselves and that
further acquisitions will follow. The strategy is in our view sound, prices paid
are relatively undemanding and acquired assets are leveraged by MYX's
existing infrastructure and business capabilities. As with all pharmaceutical
companies we see some inherent regulatory risk with new products but see
the company as a fundamentally attractive investment proposition.
■ Catalysts: MYX 1H14 result (26 February)
■ Valuation: While the acquisition is expected to be mid-single digit EPS
accretive (pre-synergies) in its first full financial year (FY15), we will
incorporate the transaction in our forecasts following MYX's formal 1H14
result. Our target price is based on DCF valuation.
Total return forecast in perspective
Mean^CS tgt^ Sh Prc
-60%
-40%
-20%
0%
20%
40%
60%
12mth Volatility* 52wk Hi-Lo IBES Consensustarget return^
Performance Over 1M 3M 12M
Absolute (%) 24.5 21.0 121.8
Relative (%) 22.6 22.7 115.7
Financial and valuation metrics
Year 06/13A 06/14E 06/15E 06/16E
Revenue (A$mn) 83.4 145.2 186.5 269.5
EBITDA (A$mn) 17.6 40.1 54.9 89.8
EBIT (A$mn) 10.2 28.5 42.1 75.7
Net income (A$mn) 6.2 18.4 26.7 50.1
EPS (CS adj.) (Ac) 1.43 3.12 4.52 8.46
Change from previous EPS (%) n.a. — — —
Consensus EPS (Ac) n.a. 3.30 4.50 6.50
EPS growth (%) -40.7 117.7 44.9 87.1
P/E (x) 60.4 27.7 19.1 10.2
Dividend (Ac) — — 1.42 3.79
Dividend yield (%) — — 1.6 4.4
P/B (x) 4.0 3.5 2.9 2.6
Net debt/equity (%) 23.0 24.0 8.6 1.1
Relative performance versus S&P ASX 200.See Reference Appendix for a description of the chart. Source: Credit Suisse
estimates, * Consensus, mean range from Thomson Reuters
Source: Company data, ASX, Credit Suisse estimates, * Adj. for goodwill, notional interest and unusual items. Relative P/E
against ASX/S&P200 based on pre GW in AUD. Company PE calculation is based on displayed EPS Currency
Rating NEUTRAL* [V]
Price (13 Feb 14, A$) 0.86
Target price (A$) 0.86¹
Market cap. (A$mn) 487.39
Yr avg. mthly trading (A$mn) 14
Last month's trading (A$mn) 17
Projected return:
Capital gain (%) -0.58
Dividend yield (net %) 1.0
Total return (%) 0.45
52-week price range 0.86 - 0.37
* Stock ratings are relative to the relevant country
benchmark.
¹Target price is for 12 months.
[V] = Stock considered volatile (see Disclosure Appendix).
Research Analysts
Saul Hadassin
61 2 8205 4679
William Dunlop, CFA
61 2 8205 4405

14 February 2014
Australia and NZ First Edition 59
Figure 1: Financial summary
Mayne Pharma (MYX) Year ending 30 Jun In AUDmn, unless otherwise stated2012 2013 2014 2015 2016 2012 2013 2014 2015 2016
Share Price: A$0.87 Earnings 06/12A 06/13A 06/14E 06/15E 06/16ERating c_EPS_SHARESEquiv. FPO (period avg.) mn 153.0 431.6 590.1 591.5 592.7
Target Price A$ 0.86 c_EPS*100EPS (Normalised) c 2.4 1.4 3.1 4.5 8.5
vs Share price % -0.58 EPS_GROWTH*100EPS Growth % -40.7 117.7 44.9 87.1
c_EBITDA_MARGIN*100EBITDA Margin % 20.8 21.1 27.6 29.5 33.3
c_DPS*100DPS c 0.0 0.0 0.0 1.4 3.8
c_PAYOUT*100Payout % 0.0 0.0 0.0 31.4 44.8
FRANKING*100Franking % 10.0 10.0 10.0 10.0 10.0
c_FCF_PS*100Free CFPS c 7.1 0.9 1.4 3.1 5.0
Profit & Loss 06/12A 06/13A 06/14E 06/15E 06/16E c_TAX_RATE*100Effective tax rate % 30.2 25.7 26.8 31.0 31.0
Sales revenue 51.9 83.4 145.2 186.5 269.5 Valuation
EBITDA 10.8 17.6 40.1 54.9 89.8 c_PE P/E x 35.8 60.4 27.7 19.1 10.2
Depr. & Amort. (5.5) (7.4) (11.6) (12.9) (14.1) c_EBIT_MULTIPLE_CURREV/EBIT x 89.7 50.3 18.3 11.9 6.5
EBIT 5.3 10.2 28.5 42.1 75.7 c_EBITDA_MULTIPLE_CUEV/EBITDA x 44.1 29.3 13.0 9.1 5.5
Associates 0.0 0.0 0.0 0.0 0.0 c_DIV_YIELD*100Dividend Yield % 0.0 0.0 0.0 1.6 4.4
Net interest Exp. (0.0) (1.9) (3.4) (3.3) (3.1) c_FCF_YIELD*100FCF Yield % 8.2 1.0 1.6 3.6 5.8
Other 0.0 0.0 0.0 0.0 0.0 c_PB Price to Book x 4.3 4.0 3.5 2.9 2.6
Profit before tax 5.3 8.3 25.1 38.7 72.6 ReturnsIncome tax (1.6) (2.1) (6.7) (12.0) (22.5) c_ROE*100Return on Equity % 12.1 5.1 13.3 16.1 26.6
Profit after tax 3.7 6.2 18.4 26.7 50.1 c_I_NPAT/c_I_SALES*100Profit Margin % 7.1 7.4 12.7 14.3 18.6
Minorities 0.0 0.0 0.0 0.0 0.0 c_I_SALES/c_B_TOT_ASSAsset Turnover x 1.0 0.4 0.6 0.7 0.8
Preferred dividends 0.0 0.0 0.0 0.0 0.0 c_ASSETS/c_EQ_COMMONEquity Multiplier x 1.8 1.9 1.8 1.7 1.7
Associates & Other 0.0 0.0 0.0 0.0 0.0 c_ROA*100Return on Assets % 6.8 2.6 7.3 9.4 15.6
Normalised NPAT 3.7 6.2 18.4 26.7 50.1 c_ROIC*100Return on Invested Cap. % 19.5 5.1 12.1 16.1 27.5
Unusual item after tax 2.5 (9.0) (0.7) 0.0 0.0 Gearing
Reported NPAT 6.2 (2.8) 17.7 26.7 50.1 c_GEARING*100Net Debt to Net debt + Equity % Net Cash 18.7 19.3 7.9 1.1
c_NET_DEBT/c_I_EBITDANet Debt to EBITDA x Net Cash 1.6 0.8 0.3 0.0
Balance Sheet 06/12A 06/13A 06/14E 06/15E 06/16E c_I_EBITDA/ c_I_NET_INTERESTInt Cover (EBITDA/Net Int.) x 830.2 9.2 12.0 16.5 29.0
Cash & equivalents 11.6 18.9 22.2 41.2 53.4 c_I_EBIT/ c_I_NET_INTERESTInt Cover (EBIT/Net Int.) x 408.0 5.4 8.5 12.6 24.4
Inventories 7.2 13.6 20.5 24.6 37.0 (c_C_CAPEX/c_I_SALES)*-100Capex to Sales % 4.9 3.8 9.4 6.4 3.9
Receivables 3.8 24.6 28.6 39.2 53.3 (c_C_CAPEX/c_I_DEPR)*-100Capex to Depreciation % 154.1 85.8 255.9 198.2 162.4
Other current assets 0.6 4.8 4.8 4.8 4.8
Current assets 23.3 61.9 76.1 109.8 148.5 MSCI IVA (ESG) Rating
Property, plant & equip. 22.2 55.0 63.3 69.2 73.3 TP ESG Risk (%): -1
Intangibles 4.2 115.5 112.5 105.6 98.1
Other non-current assets 4.3 1.0 1.0 1.0 1.0
Non-current assets 30.7 171.5 176.7 175.8 172.4
Total assets 53.9 233.4 252.9 285.6 320.8
Payables 7.0 28.9 19.3 22.9 37.7
Interest bearing debt 0.0 46.7 55.5 55.5 55.5
Other liabilities 16.3 37.0 39.2 41.0 39.4 MSCI IVA Risk: Neutral
Total liabilities 23.3 112.5 114.1 119.4 132.6
Net assets 30.6 120.9 138.8 166.2 188.2
Ordinary equity 30.6 120.9 138.8 166.1 188.2
Minority interests 0.0 0.0 0.0 0.0 0.0
Preferred capital 0.0 0.0 0.0 0.0 0.0
Total shareholder funds 30.6 120.9 138.8 166.1 188.2
Net debt -11.6 27.8 33.3 14.3 2.1 Source: MSCI ESG Research
Cashflow 06/12A 06/13A 06/14E 06/15E 06/16E Share Price Performance
EBIT 5.3 10.2 28.5 42.1 75.7
Net interest 0.2 -1.6 -3.4 -3.3 -3.1
Depr & Amort 5.5 7.4 11.6 12.9 14.1
Tax paid 0.8 -2.0 -1.9 -9.3 -17.7
Working capital 0.0 -4.4 -13.2 -11.9 -28.6
Other 1.6 -2.8 0.0 0.0 0.0
Operating cashflow 13.4 6.8 21.6 30.4 40.5
Capex -2.5 -3.2 -13.6 -12.0 -10.6
Capex - expansionary
Capex - maintenance -2.5 -3.2 -13.6 -12.0 -10.6
Acquisitions & Invest 0.0 -103.1 -10.5 0.0 0.0
Asset sale proceeds 0.0 0.0 0.0 0.0 0.0
Other 0.0 -19.2 -3.3 0.0 0.0
Investing cashflow -2.5 -125.5 -27.4 -12.0 -10.6
Dividends paid 0.0 0.0 0.0 0.0 -18.4
Equity raised 0.0 85.6 0.2 0.6 0.6
Net borrowings
Other -5.2 39.4 8.8 0.0 0.0 1 Month 3 Month 12 Month
Financing cashflow -5.2 125.0 9.0 0.6 -17.7 Absolute 24.5% 21.0% 121.8%
Total cashflow 5.6 6.3 3.3 19.0 12.2 Relative 22.6% 22.7% 115.7%
Adjustments 0.1 1.0 0.0 0.0 0.0
Net change in cash 5.8 7.3 3.3 19.0 12.2 Source: Reuters 52 week trading range: 0.37-0.87
MSCI IVA Risk Comment: MSCI rating not available
2/13/2014 13:42
MYX is a specialty pharmaceuticals business with a globally recognised brand and a range
of proprietary and generic products currently on the market. It also provides contract
analytical/manufacturing services
Credit Suisse View
TP Risk Comment: Social, governance and environmental
history and disclosures are adequate for MYX's size. Mayne's
business operations present a low environmental risk, while
risks related to the social impact of Mayne's business are in
our view limited. Hence only a minor risk weight is in our view
applicable. Our ESG risk is calculated by adding a small risk
premium to our DCF discount rate.
NEUTRAL
37.40
42.40
47.40
52.40
57.40
62.40
67.40
1/02/2013 1/04/2013 1/06/2013 1/08/2013 1/10/2013 1/12/2013 1/02/2014
MYX.AX XJO
2.7
3.7
4.7
5.7
6.7
7.7
Environment Social Governance
Stock Local Sector
Country Global Sector
Source: Company data, Credit Suisse estimates

Australia and NZ First Edition 60
14 February 2014
Asia Pacific/Australia
Equity Research
REITs (Real Estate (AU))
Stockland
(SGP.AX / SGP AU) INCREASE TARGET PRICE
Entering the upgrade cycle ■ Entering the upgrade cycle. After two years of negative consensus
earnings revisions, SGP has now entered the upgrade cycle, with
management lifting its previous FY14 EPS growth guidance from 4-6% to 5-
6% largely on the back of stronger residential earnings. We have lifted our
earnings by 0.5%, and our FY14-16E EPS CAGR of 7.6% is the highest in
our universe after LLC, and sits above SGP's upper EPS growth hurdle for
LTI awards of 6.5% p.a.
■ Higher quality earnings. SGP's 1H14 EPS of 11.6¢ was flat on 1H13 and
was in line with our forecast (of 11.6¢). Quality improved on several fronts:
(1) Operating cash increased 60% representing 113% of NPAT; (2) Net
capitalised interest moved from $20m to -$29m representing -11% of NPAT,
and (3) the tax benefit reduced from 10% of pre-tax profit to 7%. On the
negative side, SGP's 12¢ DPS remains above both EPS (11.6¢) and AFFO
(10.6¢).
■ Residential delivers. Residential profit grew 49% due to 8% growth in
settlements (2,253) and a lift in operating margins from 7.0% to 8.9%. Net
deposits of 3,197 are running well ahead of settlements driving a 67%
increase in pre-sales, which support our FY13-16 EBIT CAGR of 34% for the
business.
■ Commercial still tough. While developments on 11-13% IRR's supported
10% growth in retail NOI, operations are still tough. Retail comp NOI growth
declined for the fifth consecutive period to 2.6% and comp spec MAT growth
was -0.8% versus +2.7% in June. Office and industrial occupancy sit at <92%.
■ Upside priced in. Despite positive EPS growth, improving market conditions
and improved earnings quality, SGP offers a TSR of 14.6% in line with the
AREIT sector at 13.6%, warranting a NEUTRAL rating. SGP currently trades
on a 14.7x P/E and at a 6% P/E premium to ASX versus its historic 2%
discount. Our $4.23 NAV applies a 7.0% WACR (versus 7.3% book), a 12x
FY15E EBIT multiple for Communities and values Retirement at a 10%
discount to tangible book.
Total return forecast in perspective
Mean^
CS tgt^
Sh Prc
-30%
-20%
-10%
0%
10%
20%
30%
12mth Volatility* 52wk Hi-Lo IBES Consensustarget return^
Performance over 1M 3M 12M
Absolute (%) 3.2 -2.7 12.1
Relative (%) 2.8 -1.9 5.0
Financial and valuation metrics
Year 06/13A 06/14E 06/15E 06/16E
Revenue (A$mn) 579.0 631.1 702.2 776.1
EBITDA (A$mn) 519.1 586.5 655.3 726.8
EBIT (A$mn) 519.1 586.5 655.3 726.8
Net income (A$mn) 494.8 550.0 596.5 644.5
EPS (CS adj.) (Ac) 22.37 23.83 25.63 27.44
Change from previous EPS (%) n.a. 0.55 0.46 0.01
EPS growth (%) -23.7 6.5 7.5 7.1
P/E (x) 17.4 16.4 15.2 14.2
Dividend (Ac) 24.00 24.00 24.00 24.00
Dividend yield (%) 6.2 6.2 6.2 6.2
Net debt/equity (%) 31.4 35.5 37.9 41.6
Relative performance versus S&P ASX 200.See Reference Appendix for a description of the chart. Source: Credit Suisse
estimates, * Consensus, mean range from Thomson Reuters
Source: Company data, ASX, Credit Suisse estimates, * Adj. for goodwill, notional interest and unusual items. Relative P/E
against ASX/S&P200 based on pre GW in AUD. Company PE calculation is based on displayed EPS Currency
Rating NEUTRAL*
Price (12 Feb 14, A$) 3.90
Target price (A$) (from 4.00) 4.23¹
Market cap. (A$mn) 8,992.43
Yr avg. mthly trading (A$mn) 729.19
Last month's trading (A$mn) 565.20
Projected return:
Capital gain (%) 8.4
Dividend yield (net %) 6.2
Total return (%) 14.6
52-week price range 4.1 - 3.4
* Stock ratings are relative to the relevant country
benchmark.
¹Target price is for 12 months.
Research Analysts
John Richmond
61 2 8205 4580
Stephen Rich
61 2 8205 4617
Mikhail Mohl
61 2 8205 4413
Specialist sales: Bhupen Master
61 2 8205 4792

14 February 2014
Australia and NZ First Edition 61
Figure 1: Stockland—Financial summary
In AUDmn unless otherwise stated Year ending 30 Jun Share Price: A$3.9012-month target price: A$#ERR: Label not found: 'ESTIM_PP'
Profit & Loss 2012A 2013A 2014F 2015F 2016F Financial Summary 2012A 2013A 2014F 2015F 2016F
Commercial Property Income 510.0 482.2 508.3 547.2 589.1 Core Earnings 676.0 494.8 550.0 596.5 644.5
Residential Income 198.0 55.8 85.8 115.9 144.9 Core Earnings Growth -26.8% 11.2% 8.5% 8.0%
Retirement Income 58.0 41.0 37.0 39.1 42.0 EPS (CS underlying) 29.3 22.4 23.8 25.6 27.4
Other Income EPS growth -23.7% 6.5% 7.5% 7.1%
Unallocated Expenses -50.0 -59.9 -44.7 -46.9 -49.2 P/E 13.31 17.44 16.36 15.22 14.21
EBITDA 716.0 519.1 586.5 655.3 726.8 FFO (cents per share) 26.8 21.6 24.6 26.8 28.1
Depreciation & Amortisation - - - - - Dividends (cents per share) 24.0 24.0 24.0 24.0 24.0
EBIT 716.0 519.1 586.5 655.3 726.8 Dividend Yield 6.2% 6.2% 6.2% 6.2% 6.2%
Interest Expense -55.0 -85.0 -77.7 -86.8 -102.4 AFFO (cents per share) 26.8 21.6 24.6 26.8 28.1
Interest Income 8.0 6.2 5.3 5.0 5.0 P/AFFO 14.6 18.1 15.8 14.5 13.9
PBT 669.0 440.3 514.1 573.5 629.5 EV/EBITDA 11.9 18.3 18.7 17.3 16.3
Tax 7.0 54.5 35.9 23.0 15.0 Prem/disc NTA 10%
Minorities - - - - -
NPAT (post minorities) 676.0 494.8 550.0 596.5 644.5 Financial Ratios 2012A 2013A 2014F 2015F 2016F
AFFO 617.8 477.5 568.5 624.6 659.4 Profitability Ratios
Development ROC 11.0% 3.3% 4.8% 6.2% 7.4%
Balance Sheet 2012A 2013A 2014F 2015F 2016F ROE (%) 8.2% 6.0% 6.6% 6.9% 7.2%
Cash & equivalents 135.6 227.1 200.8 200.8 200.8 Payout Ratio (Dist / Op Earnings) 82% 107% 101% 94% 87%
Receivables 186.0 154.3 135.1 135.1 135.1 Balance Sheet Ratios
Other current assets 1,206.1 825.5 794.6 829.7 866.5 Debt/EBITDA 4.4 5.1 5.4 5.2 5.3
Current assets 1,527.7 1,206.9 1,130.5 1,165.6 1,202.4 Net Debt / Investment Properties 47.7% 35.3% 42.7% 44.0% 46.9%
Investment Properties 6,330.6 6,875.4 6,886.3 7,362.4 7,867.5 Total Liabilities/ Total Assets 43.4% 41.8% 42.8% 43.2% 44.0%
Investments 608.9 543.0 543.7 543.7 543.7 Share Items
Intangible assets 116.6 116.6 116.6 116.6 116.6 EFPOWA 2,306.7 2,212.0 2,307.7 2,327.5 2,348.4
Other non-current assets 5,950.1 5,327.8 5,919.2 5,968.7 6,187.2 Units on Issue 2,203.5 2,305.8 2,316.9 2,338.2 2,358.7
Non-current assets 13,006.2 12,862.8 13,465.8 13,991.4 14,715.0 TP ESG Risk Due / MSCI IVA Risk 0.0% Neutral
Total assets 14,533.9 14,069.7 14,596.3 15,157.0 15,917.5 MSCI IVA Comment
Provisions 8.0 184.8 381.4 381.4 381.4
Interest bearing debt - Current 144.5 143.3 25.0 25.0 25.0
Interest bearing debt - Non-Current 3,155.5 2,656.7 3,139.9 3,440.6 3,887.6
Other liabilities 2,998.5 2,890.0 2,705.1 2,705.1 2,705.1
Total liabilities 6,306.5 5,874.8 6,251.4 6,552.1 6,999.1
Net assets 8,227.4 8,194.9 8,344.9 8,605.0 8,918.3
Ordinary equity 8,227.4 8,194.9 8,344.9 8,605.0 8,918.3
Minorities / prefered capital - - - - -
Net Tangible Assets per share 3.68 3.50 3.55 3.63 3.73
Cashflow 2012A 2013A 2014F 2015F 2016F
EBIT 716.0 519.1 586.5 655.3 726.8
Change in working capital
Other operating cashflow -317.3 106.1 -62.5 -182.6 -212.4
Operating cashflow 398.7 625.2 523.9 472.7 514.5 Share Price Performance 52 week range: $3.35 - $4.07
Disposals - - - - -
Acquisitions - - - - -
Specific Capex - - -117.9 -235.8 -412.3
Maintenance Capex -40.0 -75.4 -66.5 -65.7 -74.2
Net investment in JV's & associates
Other Investing Cashflows 315.3 179.9 -50.1 3.2 4.4
Investing cashflow 275.3 104.5 -234.5 -298.2 -482.1
Proceeds from Equity Issuance
Dividends paid - - -553.2 -558.6 -563.6
Net borrowings - - 180.8 300.7 447.1
Other -733.0 -638.2 56.7 83.4 84.2
Financing cashflow -733.0 -638.2 -315.7 -174.5 -32.4
Net cashflow -59.0 91.5 -26.3 -0.0 0.0
We agree with MSCI's AAA rating for SGP as it
continues to pursue best practice standards in green
building certifications, and energy and water efficiency
2.7
2.9
3.1
3.3
3.5
3.7
3.9
4.1
4.3
4.5
Jan-13 Feb-13 Mar-13 Apr-13 May-13 Jun-13 Jul-13 Aug-13 Sep-13 Oct-13 Nov-13 Dec-13 Jan-14
SGP.AX S&P/ASX 200 S&P/ASX 200 Property
80%
14%
6%0%
Commercial Property Income
Residential Income
Retirement Income
Other Income
FY13 Operating Profit Split
Source: Company data, Credit Suisse estimates

14 February 2014
Australia and NZ First Edition 62
1H14 result: Key differences were tax and interest
■ SGP's 1H14 EPS of 11.6¢ was flat on 1H13, was up 7% on 2H13 given the reversal of
the $12m in restructuring costs taken in the second half, and was in line with our
forecast (11.6¢). ROE fell from 6.2% to 5.7%, pulled down by lagging returns within
Residential Communities (4% ROA or 9.8% excluding the impact of workout projects)
and Retirement at 4.8%. NTA lifted marginally from $3.50 at June to $3.52 with the
portfolio WACR tightening from 7.4% to 7.3%.
■ At the divisional level, SGP's Retail and Residential earnings were within 3% of our
forecasts; however, Office fell short given dilution from assets sales (Optus Centre, 78
Waterloo Rd & 135 King St) and Retirement came in slightly below given lower
development unit sales (122 units versus 150 forecast). The result was again boosted
by a tax benefit which came in higher than our forecast and equal to 7% of pre-tax
profit albeit below 1H13 at 10% pre-tax profit. Relative to our forecast, the higher tax
benefit was offset by higher interest expense resulting from lower capitalised interest.
Figure 2: Result reconciliation
% growth CS est % diff
1H14A 1H13A on 1H13 1H13 to CSe
Retail 174.0 158.7 10% 169.7 3%
Office 53.0 60.0 -12% 59.1 -10%
Industrial 31.0 32.0 -3% 32.6 -5%
Trust overheads (net of fees) -9.0 -12.0 -25% -12.4 -27%
Total Commercial 249.0 239.7 4% 249.0 0%
Residential Communities 39.0 26.2 49% 37.9 3%
Retirement 17.0 12.0 42% 18.5 -8%
Other 1.0 2.7 -63% 0.0
Total Corporate 57.0 40.9 39% 56.5 1%
Operating EBIT 306.0 280.6 9% 305.5 0%
Corporate expenses -22.0 -23.3 -6% -22.6 -3%
EBIT 284.0 257.3 10% 282.9 0%
Net Interest expense -38.0 -30.5 25% -32.5 17%
Tax 21.0 28.2 -26% 18.6 13%
Normalised NPAT 267.0 255.0 5% 269.0 -1%
Normalised EPS 11.6 11.6 0% 11.6c 0%
Source: Company data, Credit Suisse estimates
The quality of the result improved on several fronts:
■ Operating cash flow increased from $189.4m to $302.7m, representing 113% of
NPAT. We expect operating cash flow will remain elevated while impaired residential
projects are cleared.
■ Net capitalised interest declined from $20mn in 1H13 (8% of NPAT) to -$29.1mn
(-11% of NPAT) reflecting higher capitalised interest released in residential COGS as
shown in Figure 7.
■ The tax benefit reduced from 10% of pre-tax profit to 7%, and will reduce further into
FY15+16 as residential and retirement earnings improve.

14 February 2014
Australia and NZ First Edition 63
Figure 3: Operating cash flow as % NPAT Figure 4: Net capitalised interest as a % of NPAT
0%
20%
40%
60%
80%
100%
120%
140%
2009A 2010A 2011A 2012A 2013A 1H14E
Operating cashflow % NPAT
-15%
-10%
-5%
0%
5%
10%
15%
20%
25%
2008A 2009A 2010A 2011A 2012A 1H13A 2H13E 2013A 1H14E
Net capitalised interest % NPAT
Source: Company data, Credit Suisse estimates Source: Company data, Credit Suisse estimates
Figure 5: Cash ROA split - FY13 vs. FY12 vs. 1H14 Figure 6: EPS and ROA forecasts
-8.0%
-6.0%
-4.0%
-2.0%
0.0%
2.0%
4.0%
6.0%
8.0%
10.0%
12.0%
14.0%
Retail Industrial Office Residential Retirement Other
FY12 FY13 1H14
29.1
31.6
29.3
22.423.7
25.627.4
29.5
0.0%
1.0%
2.0%
3.0%
4.0%
5.0%
6.0%
7.0%
8.0%
9.0%
10.0%
-
5.0
10.0
15.0
20.0
25.0
30.0
35.0
2010A 2011A 2012A 2013A 2014E 2015E 2016E 2017E
EPS (lhs) ROE (rhs)
Source: Company data, Credit Suisse estimates Source: Company data, Credit Suisse estimates
The key drivers of the result:
■ Residential Communities' operating profit grew 39% to $39mn (vs. CSe of $38m)
due to 8% growth in settlements to 2,253 (vs. CSe of 2,005) and a lift in operating
margins from 7.0% to 8.9% (above CSe of 8.0%).
■ Retail profit grew 10% to $174mn (vs. CSE of $170mn) given the completion of its
Townsville, Merrylands and Shellharbour developments despite lower comp NOI
growth of 2.6% (down from 3.0% at June).
■ Retirement profit grew 42% to $17m (vs. CSe of $18.5mn) driven by a 21% lift in
established unit turnover. Development sales were down 6.9% to 122 however, below
our forecast of 150.
■ Trust overheads declined from $12mn to $9mn, and unallocated overheads fell from
$23mn to $22m following the $12mn restructuring costs taken in FY13.
Detractors from growth:
■ Office income declined 12% post asset sales (Optus Centre, 78 Waterloo Rd & 135
King St) and lower occupancy (from 96% at June to 91.3%)
■ Industrial income declined 3% given lower occupancy (from 93.3% to 89.7%), with
comp NOI being down 1.6%.
■ SGP's interest expense lifted from $31m to $38m given a higher cost of debt (from
6.0% to 6.5%), and lower capitalised interest post residential impairments and retail
development completions. SGP broke swaps for a total cost of $35m in the period and
may look to break more swaps in the coming periods to offset taxable capital gains on
commercial asset sales.

14 February 2014
Australia and NZ First Edition 64
■ The tax benefit fell from $28m to $21m given the $507m capital transfer into the
corporation ($9m full-year tax impact) plus higher residential profits.
Figure 7: Higher capitalised interest released in residential COGS under new policy
0.0
20.0
40.0
60.0
80.0
100.0
120.0
140.0
160.0
180.0
200.0
2008A 2009A 2010A 2011A 2012A 2013A 2014E 2015E 2016E 2017E
Interest capitalised Capitalised interest expensed
Source: Company data, Credit Suisse estimates
FY14 guidance range increased
■ SGP tightened its EPS growth guidance from 4-6% to 5-6% largely due to stronger
residential market conditions and the settlement commencement of its Calleya
development in 2H14 which was previously at risk of slipping into 1H15. Revised
guidance of 23.5-23.7¢ is in line with our forecast of 23.7¢, but below consensus at
24.0¢, and implies a 51% skew to the second half. DPS is to be held flat at 24.0¢.
Left-field upside: M&A
■ In December, SGP's management stated that it does not hold stakes in other
companies. However, as we highlighted in our note "Australand - Block trade may
be a trigger", ALZ offers an acquirer potential EPS accretion given: (1) the high
8.05% cap rate on its investment portfolio, (2) the ability to reset hedges and reduce
its 7.5% cost of debt, and (3) the ability to repay its hybrids which cost 480bps over
90-day BBSW and (4) operating synergies (e.g. building scale in Apartments and
Industrial. We note that SGP trades on a 6.1% EPS yield vs. ALZ at 6.7%. Today SGP
management reiterated its commitment to growing residential within urban infill
locations, and has demonstrated its commitment to grow industrial portfolio through
the acquisition of the Forrester Distribution Centre and the development at Yatala.
Residential Communities
■ Residential Communities' operating profit grew 39% to $39m (vs. CSe of $38m)
due to 8% growth in settlements to 2,253 (vs. CSe of 2,005) and a lift in operating
margins from 7.0% to 8.9% (above CSe of 8.0%). ROA however, fell to 4% for the
total residential portfolio (versus 5.5% in FY13).
■ Residential net deposits up 49.7%: Positive momentum in residential sales volumes
continued in 2Q14 with Stockland achieving 1,741 net deposits (+49.7% on 2Q13), the
highest quarterly result in three years as shown in Figure 8. Contracts on hand
increased to 2,872 in Dec-13 and are up 48% since June-13 (1,946). An additional
371 net deposits in January 2014 have increased contracts on hand to 3,243. Over the
past 12 months, SGP has achieved 5,961 net deposits, 28% higher than FY13

14 February 2014
Australia and NZ First Edition 65
settlements of 4,641 supporting its targeted 5,000+ settlements for FY14. The pickup
in net deposit volumes has been broad based across SGP's major markets as
illustrated in Figure 9. Interestingly, approx. 44% of SGP's net deposits are FHB’s, well
above the national average (12.7%) as shown in Figure 11. We remained concerned
about this buyer type given affordability pressures with solid house price inflation
across most markets (Figure 14).
Figure 8: Net deposits the highest in three years Figure 9: Supported by improvement in NSW and VIC
0
200
400
600
800
1,000
1,200
1,400
1,600
1,800
2,000
1Q11 2Q11 3Q11 4Q11 1Q12 2Q12 3Q12 4Q12 1Q13 2Q13 3Q13 4Q13 1Q14 2Q14
NSW VIC QLD WA
0
100
200
300
400
500
600
700
800
900
1Q11 3Q11 1Q12 3Q12 1Q13 3Q13 1Q14
NSW VIC QLD WA
Source: Company data, Credit Suisse estimates Source: Company data, Credit Suisse estimates
Figure 10: Housing finance: Established market Figure 11: Housing finance: FHBs still non-existent
2
4
6
8
10
12
96 97 98 99 00 01 02 03 04 05 06 07 08 09 10 11 12 13
AU
D b
illio
n
Owner occupiers - established
Investor - established
Owner occupiers - new
Investor - new
-20%
-10%
0%
10%
20%
30%
40%
2009 2010 2011 2012 2013 2014
Ann
ual c
hang
e
Investor Upgrader FHB
Source: ABS, Credit Suisse estimates Source: ABS, Credit Suisse estimates
Figure 12: Building approvals: structural change at play? Figure 13: Building approvals: QLD finally recovering
2,000
4,000
6,000
8,000
10,000
12,000
96 97 98 99 00 01 02 03 04 05 06 07 08 09 10 11 12 13
Total houses Total 'other'
10,000
20,000
30,000
40,000
50,000
60,000
70,000
80,000
2004 2005 2006 2007 2008 2009 2010 2011 2012 2013
NSW VIC WA ROA QLD
Source: ABS, Credit Suisse estimates Source: ABS, Credit Suisse estimates

14 February 2014
Australia and NZ First Edition 66
Figure 14: House price recovery to date has been broad
based
Figure 15: ‘Time to buy a dwelling’ remains above
historical average of 122.5
-20%
-10%
0%
10%
20%
30%
40%
50%
05 06 07 08 09 10 11 12 13
Ann
ual c
hang
e
Sydney Melbourne Brisbane Perth
60
70
80
90
100
110
120
130
140
150
160
2005 2006 2007 2008 2009 2010 2011 2012 2013
Consumer Confidence 'Time to buy a dwelling'
Source: RP Data, Credit Suisse estimates Source: WBC-MI, Credit Suisse estimates
■ Residential recovery tempered by impaired stock and supply constraints.
Despite the more positive backdrop, margins are expected to remain moderated as
SGP trades through low-margin and impaired projects. SGP reiterated its guidance
that operating profit margins would improve from 8.9% to 11-13% by FY16. We expect
this margin recovery to be back-end loaded however, given higher capitalised interest
released through COGS, the persistent drag of impaired projects and time-frame for
new projects to reach stabilisation. Approximately 15% of lots settled will be impaired
in FY14. Our three-year operating profit CAGR for the business is 34%, which sees
profit reaching $144.9m in FY16 still well below the FY11 peak of $233m.
Figure 16: Residential Communities' operating forecasts
0%
5%
10%
15%
20%
25%
30%
35%
40%
0
1,000
2,000
3,000
4,000
5,000
6,000
7,000
Settlements Return on Inventory (EBIT) Operating Profit Margins
Source: Company data, Credit Suisse estimates
Retirement
■ Retirement profit grew 42% to $17m (vs. CSe of $18.5m) driven by a 21% lift in
established unit turnover as well as higher contract conversion profits, which increased
from $1.6m to $3.9m. Development sales were down 6.9% to 122 however, below our
forecast of 150.

14 February 2014
Australia and NZ First Edition 67
Cash ROA improved modestly from 4.5% to 4.8%, still impacted by low turnover of
development inventory and relatively high overheads. Management expects ROA to lift to
8% by FY17 given higher development profits, village maturity and economies of scale.
■ Development – Turnover of retirement development inventory is tracking at only
7.3%, which we expect to improve to 8.1% by FY16 given new project launches.
■ DMF turnover – Turnover of established units rose from 6.9% in FY13 to 7.5%, which
we forecast to improve to 7.7% by FY16. We assume 2.5% per annum price growth,
and flat DMF margins.
■ Valuation – In our NAV, we value the business at a 10% discount to tangible book
value which implies a 25.5x FY15 EBIT multiple.
Figure 17: Development volumes driven by new project
launches
Figure 18: Gradual improvement in turnover forecast
13.5%
14.0%
14.5%
15.0%
15.5%
16.0%
16.5%
17.0%
17.5%
18.0%
18.5%
-
50
100
150
200
250
300
350
2009 2010 2011 2012 2013 2014 2015 2016
Volumes of lots sold Development Margin
0%
1%
2%
3%
4%
5%
6%
7%
8%
0%
5%
10%
15%
20%
25%
30%
35%
40%
45%
50%
2009 2010 2011 2012 2013 2014 2015
DMF margin Turnover %
Source: Company data, Credit Suisse estimates Source: Company data, Credit Suisse estimates
Retail property
■ Retail still tough, but green shoots evident: Retail NOI of $174mn was slightly
ahead of CSe ($169.7) and 9% above the prior corresponding period. SGP highlighted
the general softness in consumer spending in line with recent updates from CFX and
GPT as illustrated in Figure 5. Comp NOI growth fell for the fifth consecutive period to
2.6% but remains above last reported print for SGP's major peers as shown in Figure
19. Occupancy costs declined slightly to 13.9% from 14% in June and SGP's WACR
decreased 10bps to a new low of 6.9%, reflecting the improving quality of the portfolio
with recent completions and Townsville and Shellharbour.
Figure 19: Comparable NOI growth continues to fall Figure 20: WACR time-series; portfolio quality improving
0%
1%
2%
3%
4%
5%
6%
7%
8%
Jun-06 Jun-07 Jun-08 Jun-09 Jun-10 Jun-11 Jun-12 Jun-13
WDC/WRT AU SGP CFX
7.40%
7.30%
7.20% 7.20%
7.10%
7.00% 7.00%
6.90%
6.60%
6.70%
6.80%
6.90%
7.00%
7.10%
7.20%
7.30%
7.40%
7.50%
Jun-10 Dec-10 Jun-11 Dec-11 Jun-12 Dec-12 Jun-13 Dec-13
WACR
Source: Company data, Credit Suisse estimates Source: Company data, Credit Suisse estimates

14 February 2014
Australia and NZ First Edition 68
■ Surprisingly, comparable spec MAT growth (per sqm) fell by 0.8% in December
compared with +2.7% in June. This is the lowest print for SGP since Dec-10 and is
well below CFX's December print of 1.7% (2.4% June), Figure 6. Speciality sales per
sqm also fell "over $8,500" from $8,766 in June. Total re-lease spreads were a solid
3% across 361 deals in the December half. This was underpinned by an improvement
in re-lease spreads for new leases to 3.1% from 1.8% in December. Spreads on
renewals fell slightly to 3% from 3.4% in June.
Figure 21: Discretionary and non-discretionary sales Figure 22: Comp Spec MAT growth fell sharply in Dec-13
-2%
0%
2%
4%
6%
8%
10%
12%
96 97 98 99 00 01 02 03 04 05 06 07 08 09 10 11 12 13
Discretionary Non-discretionary
-2%
-1%
0%
1%
2%
3%
4%
5%
6%
7%
8%
WDC/WRT AU SGP CFX
Source: Company data, Credit Suisse estimates Source: ABS, Credit Suisse estimates
Figure 23: Retail turnover growth at a 4-year high Figure 24: Re-leasing spreads remain healthy
-3.0%
-2.0%
-1.0%
0.0%
1.0%
2.0%
3.0%
4.0%
5.0%
6.0%
Total New Renewal
Jun-12 Dec-12 Jun-13 Dec-13
Source: Company data, Credit Suisse estimates Source: Company data, Credit Suisse estimates
■ The deterioration in SGP's performance metrics is at odds with the broader recovery in
the Australian retail sector which has now increased for eight consecutive months.
Retail trade is now 5.7% year on year in December, underpinned by strong growth in
NSW and Victoria which have increased by 7.2% and 6.0%, respectively.
■ Developments on track despite rising incentives: Re-developments at Hervey Bay
($119mn), Wetherill Park ($222mn) and Baldavis ($116mn) are under construction
and are expected to deliver an average total return of 12-14% and incremental
stabilised yields of 7-8% pre-IFRS. We note that incentives on SGP’s retail
developments have increased markedly over the last 12 months and are now 13.4%
(as a % rent over the lease term) compared with 7.5% at Dec-12.
Industrial property
■ Industrial: Industrial NOI of $31mn was slightly below CSe ($32.6) and 3% below the
pcp, reflecting lower occupancy (89.7% vs. 93.3% pcp) and comp NOI (-1.6% vs. -
10.9% at June). Net face rents increased by 0.6% on average across executed leases
in 1H14 compared with 2% at June 30. The industrial portfolio experienced moderate
valuation uplift with cap rates compressing by 20bps to 8.6%. This was supported by

14 February 2014
Australia and NZ First Edition 69
continued leasing activity which has seen the portfolio WALE increase to 3.7 years
from 3.3 years in June and 2.8 years in Dec-12.
■ SGP has executed leases over 176k sqm in the six months to December in addition to
a further 45k sqm under Heads of Agreement. Weighted average incentives over the
six months to December fell to 3.1% from 5.1% in Dec-12. Management noted that
vacancy was affected by the timing of the completion of the refurbishment at Port
Adelaide DC, and the timing of lease expires at Yennora and Brooklyn.
EPS growth lifts from 6% to 7.6% p.a. from FY15
■ Our FY14 forecast of 23.7¢ remains unchanged, and we have increased earnings by
0.5% from FY15. Our FY14-16 EPS CAGR of 7.6% sits at the top of our coverage
universe after LLC (7.8%), and sits above managements upper EPS growth hurdle for
LTI awards of 6.5% p.a.
Trading below NAV, but fully priced versus the sector
■ Despite positive EPS growth, improving market conditions and improved earnings
quality, SGP offers a TSR of 14.6% in line with the AREIT sector at 13.6%, warranting
a NEUTRAL rating. Our $4.23 target price is based on the average of our FY14 and
FY15 NAV's, which assume a 7.0% blended WACR (versus 7.3% book), values
Communities on 12x FY15E EBIT and Retirement at a 10% discount to tangible book.
On relative valuation, SGP currently trades on a 14.7x P/E and at a 6% P/E premium
to ASX versus its historic 2% discount.
Figure 25: SGP's P/E Figure 26: SGP's P/E Rel
0.00
5.00
10.00
15.00
20.00
25.00
1-Jul-06 1-Jul-08 1-Jul-10 1-Jul-12
0.00
0.20
0.40
0.60
0.80
1.00
1.20
1.40
1-Jul-06 1-Jul-08 1-Jul-10 1-Jul-12
Source: Company data, Credit Suisse estimates Source: Company data, Credit Suisse estimates
Figure 27: EPS yield and 2-yr CAGR Figure 28: DPS yield and 2-yr CAGR
0.0%
2.0%
4.0%
6.0%
8.0%
10.0%
12.0%
14.0%
16.0%
18.0%
EPS Yield 2yr EPS CAGR
0.0%
2.0%
4.0%
6.0%
8.0%
10.0%
12.0%
14.0%
16.0%
18.0%
DPS Yield 2yr DPS CAGR
Source: Company data, Credit Suisse estimates Source: Company data, Credit Suisse estimates

14 February 2014
Australia and NZ First Edition 70
Figure 29: EPS revision history Figure 30: TSR: SGP mid-pack
0.0
0.1
0.1
0.2
0.2
0.3
0.3
0.4
0.4
0.5
Jul-11 Jul-12 Jul-13
2012 2013 2014 2015
0.0%
5.0%
10.0%
15.0%
20.0%
25.0%
30.0%
Source: Company data, IBESS Source: Company data, Credit Suisse estimates
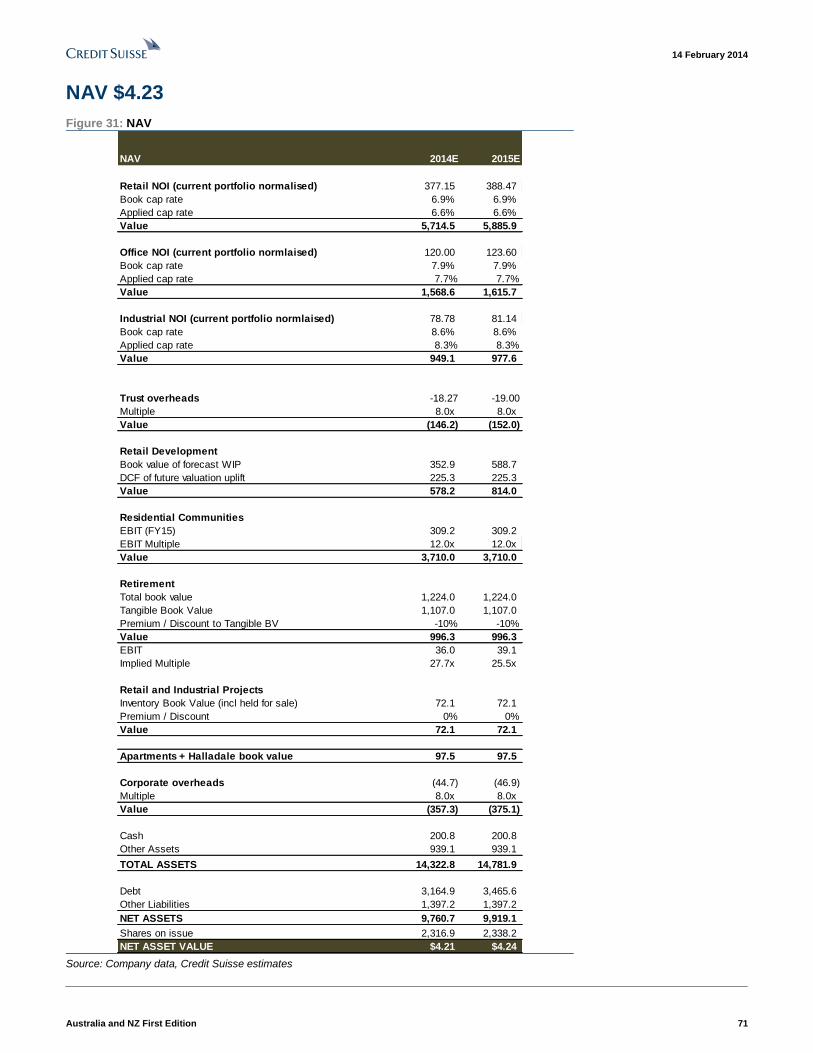
14 February 2014
Australia and NZ First Edition 71
NAV $4.23
Figure 31: NAV
NAV 2014E 2015E
Retail NOI (current portfolio normalised) 377.15 388.47
Book cap rate 6.9% 6.9%
Applied cap rate 6.6% 6.6%
Value 5,714.5 5,885.9
Office NOI (current portfolio normlaised) 120.00 123.60
Book cap rate 7.9% 7.9%
Applied cap rate 7.7% 7.7%
Value 1,568.6 1,615.7
Industrial NOI (current portfolio normlaised) 78.78 81.14
Book cap rate 8.6% 8.6%
Applied cap rate 8.3% 8.3%
Value 949.1 977.6
Trust overheads -18.27 -19.00
Multiple 8.0x 8.0x
Value (146.2) (152.0)
Retail Development
Book value of forecast WIP 352.9 588.7
DCF of future valuation uplift 225.3 225.3
Value 578.2 814.0
Residential Communities
EBIT (FY15) 309.2 309.2
EBIT Multiple 12.0x 12.0x
Value 3,710.0 3,710.0
Retirement
Total book value 1,224.0 1,224.0
Tangible Book Value 1,107.0 1,107.0
Premium / Discount to Tangible BV -10% -10%
Value 996.3 996.3
EBIT 36.0 39.1
Implied Multiple 27.7x 25.5x
Retail and Industrial Projects
Inventory Book Value (incl held for sale) 72.1 72.1
Premium / Discount 0% 0%
Value 72.1 72.1
Apartments + Halladale book value 97.5 97.5
Corporate overheads (44.7) (46.9)
Multiple 8.0x 8.0x
Value (357.3) (375.1)
Cash 200.8 200.8
Other Assets 939.1 939.1
TOTAL ASSETS 14,322.8 14,781.9
Debt 3,164.9 3,465.6
Other Liabilities 1,397.2 1,397.2
NET ASSETS 9,760.7 9,919.1
Shares on issue 2,316.9 2,338.2
NET ASSET VALUE $4.21 $4.24 Source: Company data, Credit Suisse estimates

14 February 2014
Australia and NZ First Edition 72
Figure 32: Stockland's earnings forecast
2011A 2012A 2013A 2014E 2015E 2016E 2017E
Retail 286.0 310.0 324.0 353.7 380.5 417.5 465.4
Office 183.0 142.0 119.0 107.9 112.0 114.6 119.2
Industrial 77.0 77.0 63.0 64.9 73.8 76.7 78.5
Trust overheads (net of fees) -31.0 -23.0 -23.8 -18.3 -19.0 -19.8 -20.6
Total Commercial 524.0 510.0 482.2 508.3 547.2 589.1 642.6
Residential Communities 233.0 198.0 60.0 85.8 115.9 144.9 171.9
Retirement 53.0 36.0 38.3 36.0 39.1 42.0 44.3
Other 12.3 5.0 0.0 1.0 0.0 0.0 0.0
Total Corporate 327.3 256.0 96.8 122.8 155.0 187.0 216.1
Operating EBIT 851.3 766.0 579.0 631.1 702.2 776.1 858.7
Corporate expenses -63.3 -50.0 -59.9 -44.7 -46.9 -49.2 -51.7
EBIT 788.0 716.0 519.1 586.5 655.3 726.8 807.0
Net Interest expense -14.0 -47.0 -78.8 -75.2 -81.8 -97.4 -118.6
Tax -21.6 7.0 54.5 35.9 23.0 15.0 7.6
Normalised NPAT 752.4 676.0 494.8 547.1 596.5 644.5 696.0
Normalised EPS 31.6 29.3 22.4 23.7 25.6 27.4 29.5
- growth 8.6% -7.2% -23.7% 6.0% 8.1% 7.1% 7.5%
DPS 23.7 24.0 24.0 24.0 24.0 24.0 24.0
- growth 8.7% 1.3% 0.0% 0.0% 0.0% 0.0% 0.0% Source: Company data, Credit Suisse estimates

Australia and NZ First Edition 73
14 February 2014
Asia Pacific/Australia
Equity Research
New Media (Media - SMID (AU))
STW Communications Group
(SGN.AX / SGN AU) DECREASE TARGET PRICE
Soft underlying result, acquisitions yet to
generate solid returns
■ Event: STW Communications reported a weaker-than-expected FY13
result. NPAT increased 12.5% vs consensus and guidance for 15%
growth. EPS increased 2.5% vs consensus and guidance for mid-single-
digit growth. The result was impacted by a number of acquisitions as well as
changing business mix to lower margin research and field marketing
businesses and office relocation and consolidation. STW Communications
provided FY14 guidance for mid-single-digit NPAT growth which was below
market expectations for high-single-digit growth. We have reduced our
forecasts following a weaker-than-expected result and outlook. Our TP
moves to $1.55 (from $1.63) per share and we maintain a NEUTRAL rating.
■ Investment case: Underlying business fairly static, acquisitions yet to
generate solid returns. Most of the profit growth in FY13 came from
acquisitions within Australia, and to a lesser extent acquisitions in Asia.
Whilst the acquisitions make strategic sense and are likely to increase STW
Communications' market share, they do not appear to be driving synergies
within the group or contributing meaningful profits at this point. With a mix
shift to lower margin businesses such as research and field marketing, it will
become increasingly important for STW Communications to leverage its core
business capabilities to drive additional revenues. We need to see a reversal
in the current declining return on invested capital trend.
■ Fair value with upside: STW Communications is trading on 11x FY14 and
10x FY15 EPS, broadly in line with its historical ratios. We forecast mid-
single-digit growth p.a. for the next several years. There is upside from
successful expansion in Asia and further abroad (although some upside from
recent acquisitions will be offset by additional earnout payments if certain
earnings targets are met).
Total return forecast in perspective
Mean^CS tgt^
Sh Prc
-30%
-20%
-10%
0%
10%
20%
30%
40%
50%
12mth Volatility* 52wk Hi-Lo IBES Consensustarget return^
Performance over 1M 3M 12M
Absolute (%) -4.3 -4.7 6.3
Relative (%) -6.2 -2.9 0.2
Financial and valuation metrics
Year 12/13A 12/14E 12/15E 12/16E
Revenue (A$mn) 399.0 426.5 447.6 469.7
EBITDA (A$mn) 82.6 84.4 89.0 93.8
EBIT (A$mn) 74.2 76.5 79.6 84.1
Net income (A$mn) 49.5 52.6 55.5 59.1
EPS (CS adj.) (Ac) 12.34 13.11 13.83 14.72
Change from previous EPS (%) n.a. -4.2 -10.9 -13.7
Consensus EPS (Ac) n.a. 13.30 14.70 14.20
EPS growth (%) 2.6 6.3 5.5 6.5
P/E (x) 11.6 10.9 10.4 9.7
Dividend (Ac) 8.60 8.77 9.26 9.85
Dividend yield (%) 6.0 6.1 6.5 6.9
P/B (x) 1.3 1.2 1.2 1.1
Net debt/equity (%) 26.0 14.3 10.0 3.4
Relative performance versus S&P ASX 200.See Reference
Appendix for a description of the chart. Source: Credit Suisse
estimates, * Consensus, mean range from Thomson Reuters
Source: Company data, ASX, Credit Suisse estimates, * Adj. for goodwill, notional interest and unusual items. Relative P/E
against ASX/S&P200 based on pre GW in AUD. Company PE calculation is based on displayed EPS Currency
Rating NEUTRAL*
Price (13 Feb 14, A$) 1.44
Target price (A$) (from 1.63) 1.55¹
Market cap. (A$mn) 579.49
Yr avg. mthly trading (A$mn) 32
Last month's trading (A$mn) 18
Projected return:
Capital gain (%) 8.0
Dividend yield (net %) 6.2
Total return (%) 14.2
52-week price range 1.7 - 1.3
* Stock ratings are relative to the relevant country
benchmark.
¹Target price is for 12 months.
Research Analysts
Samantha Carleton
61 2 8205 4148
Paul Buys
61 2 8205 4538
Bradley Clibborn
61 2 8205 4465
Chris Smith
61 2 8205 4210
Sarah Mann
61 2 8205 4610

14 February 2014
Australia and NZ First Edition 74
Figure 1: Financial summary
STW Communications Group (SGN) Year ending 31 Dec In AUDmn, unless otherwise stated2012 2013 2014 2015 2016 2012 2013 2014 2015 2016
Share Price: A$1.44 Earnings 12/12A 12/13A 12/14E 12/15E 12/16ERating c_EPS_SHARESEquiv. FPO (period avg.) mn 365.5 400.8 401.2 401.2 401.2
Target Price A$ 1.55 c_EPS*100EPS (Normalised) c 12.0 12.3 13.1 13.8 14.7
vs Share price % 8.01 EPS_GROWTH*100EPS Growth % 2.6 6.3 5.5 6.5
DCF A$ 1.58 c_EBITDA_MARGIN*100EBITDA Margin % 22.3 20.7 19.8 19.9 20.0
c_DPS*100DPS c 8.3 8.6 8.8 9.3 9.9
c_PAYOUT*100Payout % 69.0 69.7 66.9 67.0 66.9
FRANKING*100Franking % 100.0 100.0 100.0 100.0 100.0
c_FCF_PS*100Free CFPS c 22.2 13.4 29.0 21.2 21.7
Profit & Loss 12/12A 12/13A 12/14E 12/15E 12/16E c_TAX_RATE*100Effective tax rate % 26.2 21.7 22.0 23.0 25.0
Sales revenue 351.3 399.0 426.5 447.6 469.7 Valuation
EBITDA 78.3 82.6 84.4 89.0 93.8 c_PE P/E x 11.9 11.6 10.9 10.4 9.7
Depr. & Amort. (8.6) (8.4) (7.9) (9.3) (9.7) c_EBIT_MULTIPLE_CURREV/EBIT x 9.6 9.5 8.6 8.0 7.1
EBIT 69.7 74.2 76.5 79.6 84.1 c_EBITDA_MULTIPLE_CUEV/EBITDA x 8.6 8.6 7.8 7.1 6.4
Associates 0.0 0.0 0.0 0.0 0.0 c_DIV_YIELD*100Dividend Yield % 5.8 6.0 6.1 6.5 6.9
Net interest Exp. (11.0) (11.9) (9.5) (7.5) (4.5) c_FCF_YIELD*100FCF Yield % 15.5 9.4 20.2 14.8 15.1
Other 0.0 0.0 0.0 0.0 0.0 c_PB Price to Book x 1.2 1.3 1.2 1.2 1.1
Profit before tax 58.7 62.3 67.0 72.1 79.7 ReturnsIncome tax (15.4) (13.5) (14.7) (16.6) (19.9) c_ROE*100Return on Equity % 10.4 11.0 11.3 11.4 11.7
Profit after tax 43.3 48.8 52.2 55.5 59.7 c_I_NPAT/c_I_SALES*100Profit Margin % 12.5 12.4 12.3 12.4 12.6
Minorities (10.5) (12.2) (13.1) (13.9) (14.9) c_I_SALES/c_B_TOT_ASSAsset Turnover x 0.4 0.4 0.4 0.4 0.4
Preferred dividends 0.0 0.0 0.0 0.0 0.0 c_ASSETS/c_EQ_COMMONEquity Multiplier x 2.0 2.0 2.1 2.1 2.1
Associates & Other 11.2 12.9 13.4 13.9 14.3 c_ROA*100Return on Assets % 5.2 5.5 5.4 5.4 5.5
Normalised NPAT 44.0 49.5 52.6 55.5 59.1 c_ROIC*100Return on Invested Cap. % 9.2 9.3 9.9 10.0 10.2
Unusual item after tax 0.0 0.0 0.0 0.0 0.0 Gearing
Reported NPAT 44.0 49.5 52.6 55.5 59.1 c_GEARING*100Net Debt to Net debt + Equity % 16.7 20.7 12.5 9.1 3.3
c_NET_DEBT/c_I_EBITDANet Debt to EBITDA x 1.2 1.6 0.9 0.6 0.2
Balance Sheet 12/12A 12/13A 12/14E 12/15E 12/16E c_I_EBITDA/ c_I_NET_INTERESTInt Cover (EBITDA/Net Int.) x 7.1 6.9 8.9 11.8 21.0
Cash & equivalents 43.6 43.3 97.2 116.2 151.9 c_I_EBIT/ c_I_NET_INTERESTInt Cover (EBIT/Net Int.) x 6.3 6.2 8.0 10.6 18.8
Inventories 0.0 0.0 0.0 0.0 0.0 (c_C_CAPEX/c_I_SALES)*-100Capex to Sales % 2.4 4.0 2.6 2.5 2.5
Receivables 154.5 169.5 181.9 190.9 200.5 (c_C_CAPEX/c_I_DEPR)*-100Capex to Depreciation % 120.9 201.9 150.0 130.0 130.0
Other current assets 5.0 5.3 5.3 5.3 5.3
Current assets 203.1 218.1 284.4 312.5 357.7 MSCI IVA (ESG) Rating
Property, plant & equip. 25.5 33.7 37.4 40.0 42.7 TP ESG Risk (%): -2
Intangibles 495.5 505.2 504.6 504.0 503.5
Other non-current assets 121.8 145.8 155.8 169.8 169.8
Non-current assets 642.9 684.6 697.7 713.8 716.0
Total assets 845.9 902.7 982.1 1,026.3 1,073.7
Payables 182.3 172.1 220.8 231.9 243.5
Interest bearing debt 136.2 172.4 172.4 172.4 172.4
Other liabilities 64.0 62.3 62.3 62.3 62.3 MSCI IVA Risk:
Total liabilities 382.5 406.8 455.5 466.5 478.1
Net assets 463.4 495.9 526.6 559.7 595.6
Ordinary equity 422.7 449.2 466.9 486.1 507.0
Minority interests 0.0 0.0 0.0 0.0 0.0
Preferred capital 0.0 0.0 0.0 0.0 0.0
Total shareholder funds 463.4 495.9 526.6 559.7 595.6
Net debt 92.6 129.1 75.2 56.2 20.5 Source: MSCI ESG Research
Cashflow 12/12A 12/13A 12/14E 12/15E 12/16E Share Price Performance
EBIT 69.7 74.2 76.5 79.6 84.1
Net interest -9.8 -10.1 -9.5 -7.5 -4.5
Depr & Amort -8.6 -8.4 -7.9 -9.3 -9.7
Tax paid -19.7 -20.0 -14.7 -16.6 -19.9
Working capital 10.0 -25.2 36.3 1.9 2.0
Other 10.9 24.9 29.2 32.5 33.6
Operating cashflow 52.6 35.4 109.9 80.7 85.7
Capex -8.6 -15.9 -11.0 -11.4 -11.8
Capex - expansionary -5.6 -12.9 -8.0 -8.4 -8.8
Capex - maintenance -3.0 -3.0 -3.0 -3.0 -3.0
Acquisitions & Invest 0.0 0.0 0.0 0.0 0.0
Asset sale proceeds 5.3 2.8 0.0 0.0 0.0
Other -57.9 -18.2 -10.0 -14.0 0.0
Investing cashflow -61.2 -31.3 -21.0 -25.4 -11.8
Dividends paid -36.6 -41.9 -35.0 -36.2 -38.2
Equity raised 38.5 0.0 0.0 0.0 0.0
Net borrowings 23.1 36.1 0.0 0.0 0.0
Other 0.0 0.0 0.0 0.0 0.0 1 Month 3 Month 12 Month
Financing cashflow 25.0 -5.7 -35.0 -36.2 -38.2 Absolute -4.3% -4.7% 6.3%
Total cashflow 16.4 -1.6 53.9 19.0 35.7 Relative -6.2% -2.9% 0.2%
Adjustments 0.0 0.0 0.0 0.0 0.0
Net change in cash 16.4 -1.6 53.9 19.0 35.7 Source: Reuters 52 week trading range: 1.32-1.67
MSCI IVA Risk Comment: Not rated
13/02/2014 19:34
STW Communications Group Ltd. is engaged in offering advertising & diversified
communications services for clients through various channels, including television,
radio,print,outdoor & electronic forms.It has 2 segments:Advertising, Production & media.
Credit Suisse View
TP Risk Comment: While WPP to date has not looked to exert
undue influence on the company, as SGN expands
internationally it is possible that its interests may conflict with
those of WPP. Additionally, given that the company is
increasingly investing in South East Asia where ESG risks
may be more prevalent and harder to measure, this is
something that we will be keeping our eye on.
NEUTRAL
1.00
1.10
1.20
1.30
1.40
1.50
1.60
1.70
1.80
1/02/2013 1/04/2013 1/06/2013 1/08/2013 1/10/2013 1/12/2013 1/02/2014
SGN.AX XJO
2.7
3.7
4.7
5.7
6.7
7.7
Environment Social Governance
Stock Local Sector
Country Global Sector
Source: Company data, Credit Suisse estimates

14 February 2014
Australia and NZ First Edition 75
Assessing the moving parts in FY13 STW Communications reported a weaker-than-expected FY13 result. NPAT increased
12.5% versus consensus and guidance for 15% growth while EPS increased 2.5% versus
consensus and guidance for mid-single-digit growth. The result was impacted by a number
of acquisitions as well as changing business mix to lower margin research and field
marketing businesses and office relocation and consolidation.
Revenue boosted by acquisitions and digital
Revenue from operations increased 13.6% (or $48mn) to $399mn.
The majority of this growth came from acquisitions in Australia and Asia, which we
estimate contributed $27mn and $6mn additional revenue, respectively.
Figure 2: STW Communications acquisitions in FY13
Source: Company data, Credit Suisse estimates
Organic revenue was primarily driven by growth in digital. New Zealand and Asia were the
bright spots in the organic result.
Figure 3: STW Communications revenue build FY13
$ 351 mn
$ 27 mn
$ 6 mn
$ 11 mn$ 3 mn $ 1 mn $ 399 mn
$320 mn
$330 mn
$340 mn
$350 mn
$360 mn
$370 mn
$380 mn
$390 mn
$400 mn
FY12 Revenue Aus Acqns Asia Acqns Aus/NZOrganic
Asia Organic US/EU/OtherOrganic
FY13 Revenue
Source: Company data, Credit Suisse estimates

14 February 2014
Australia and NZ First Edition 76
Margins impacted by change in business mix and
office relocation
EBITDA margins declined 1.6% on Credit Suisse calculations (excluding interest revenue
and associates) to 21.0%.
The result was primarily impacted by a mix shift to lower margin field marketing and
research businesses, particularly following the acquisition of research firm Colmar
Brunton. 30% growth in digital revenues provided an offset. PR, design and branding
companies reported soft results whilst the key media companies recorded solid
performances.
Whilst difficult to separate each business type, the below chart provides an indication of
the types of revenues STW Communications generates, with research margins typically at
the lower end and digital revenues typically at the higher end.
Figure 4: STW Communications estimated revenue mix
Marketing
Media Planning
Production
Research
Digital
Source: Company data, Credit Suisse estimates
STW Communications relocated and consolidated several offices through the period,
resulting in duplication in lease costs for the period as leases ran off. This had a $5mn
impact for the period which we expect to normalise through FY14.
Gearing and cash flow deteriorated
Net debt including earnouts increased from $138.5mn to $165.6mn in FY13, resulting in a
ND/EBITDA of 1.7x and Gross Debt/EBITDA of 2.2x. This compares to STW
Communications' internal target of 2.0x Gross Debt/EBITDA at the upper end.
The increase in debt reflects settlement of past earnouts, acquisition expenses, higher
costs associated with office relocations and weaker cash generation. The company
expects to move to a healthier gearing position in FY14.
The operating cash flow was negatively impacted by adverse working capital movements.
The company expects cash conversion to improve in FY14 as acquisitions move past the
initial start-up phase.

14 February 2014
Australia and NZ First Edition 77
Outlook FY14 guidance for mid-single-digit NPAT growth
STW Communications provided guidance for mid-single-digit NPAT growth in FY14 (or
~$2.5mn incremental NPAT), compared with market expectations for high-single-digit
NPAT growth (consensus forecasting 8% growth).
The guidance excludes the impact on potential future acquisitions. It includes 15% organic
growth from business outside Australia and New Zealand.
We estimate businesses outside Australia and New Zealand contributed ~$5mn NPAT in
FY13. This would imply an additional ~$0.75mn NPAT in FY14 from offshore and
~$1.75mn NPAT from Australia and New Zealand.
Future growth to come from acquisitions, offshore
and creating content solutions for clients
Recent acquisitions are expected to drive reasonable growth over the next five years. The
company has $45.8mn to pay in earnouts over the next five years with peak settlements
spread over the FY14 and FY15 years. $22mn in earnouts relates to put and call options
and are tied to the achievement of incremental earnings.
Organically, we see the potential for STW Communications to continue to win contracts as
well as expanding revenue from existing clients. Traditional ad budgets that sit with CMOs,
whilst likely to remain the primary revenue source for advertising companies, are no longer
the only revenue source. We estimate ad budgets will contribute ~70% income to STW
Communications in five years. CIOs and Chief Technology Officers will become
increasingly important for advertisers and may increase the overall size of the advertising
pie (especially as retailers increase spend on websites, data and loyalty programs and
incorporate this cost into their cost of goods sold rather than cost of doing business).
'Owned' and 'earned' media where advertisers assist retailers or other clients to build
content rather than the traditional 'paid' model is likely to provide new revenue
opportunities for media companies and we see STW Communications as being well
positioned to benefit from this.

14 February 2014
Australia and NZ First Edition 78
Valuation We forecast mid-single-digit growth for STW Communications each year over the next
three years. We see upside from successful expansion into Asia and further abroad.
The valuation metrics look reasonable on our assumptions. STW Communications is
trading on 11x FY14 and 10x FY15 EPS. This is broadly in line with where the stock has
been trading over the past several years.
Figure 5: STW Communications historical P/E
0
5
10
15
20
25
30
2000 2001 2002 2003 2004 2005 2006 2007 2008 2009 2010 2011 2012 2013 2014
Source: IBES

14 February 2014
Australia and NZ First Edition 79
FY13 result financial snapshot Figure 6: SGN FY13 result summary
Actual Est. Diff. FY13A FY12A Change
Revenue
Advertising 190.4 214.6 -11.3% 190.4 181.7 4.8%
Diversified 203.0 169.8 19.6% 203.0 163.2 24.4%
Other 5.5 6.6 -17.0% 5.5 6.3 -12.7%
Total revenue 399.0 391.0 2.0% 399.0 351.3 13.6%
Proportional revenue 399.0 391.0 2.0% 399.0 351.3 13.6%
EBITDA
Advertising 50.0 57.7 -13.4% 50.0 49.9 0.2%
Diversified 40.0 39.0 2.6% 40.0 37.5 6.7%
Other (7.4) (7.9) -7.2% (7.4) (9.1) -19.2%
Total EBITDA 82.6 88.8 -6.9% 82.6 78.3 5.6%
Proportional EBITDA 88.8 88.8 0.0% 88.8 78.3 13.5%
Depreciation & amortisation (8.4) (8.6) -1.7% (8.4) (8.6) -1.6%
EBIT 74.2 80.2 -7.5% 74.2 69.7 6.5%
Net interest (11.9) (12.7) -5.9% (11.9) (11.0) 7.9%
Tax (13.5) (16.1) -16.1% (13.5) (15.4) -12.0%
Consolidated NPAT 48.8 51.4 -5.2% 48.8 43.3 12.7%
Associates 12.9 11.7 10.4% 12.9 11.2 15.2%
Minorities 12.2 12.6 -3.4% 12.2 10.5 16.2%
Significant items (post-tax) 0.0 0.0 NM 0.0 0.0 NM
NPAT (AU reported) 49.5 50.5 -2.0% 49.5 44.0 12.5%
NPAT (adjusted) 49.5 50.5 -2.0% 49.5 44.0 12.5%
EPS (AU reported) 12.3 12.7 -2.8% 12.3 12.0 2.6%
EPS (adjusted) 12.3 12.7 -2.8% 12.3 12.0 2.6%
DPS 8.6 8.5 1.8% 8.6 7.9 8.9%
EBITDA Margins
Advertising 26.2% 26.9% 26.2% 27.4%
Diversified 19.7% 23.0% 19.7% 23.0%
Total 20.7% 22.7% 20.7% 22.3%
Cash Flow
Operating 35.4 70.0 35.4 52.6
Financing (5.7) (12.4) (5.7) 25.0
Investing (31.3) (33.0) (31.3) (61.2)
Inc/Dec net cash (1.6) 24.6 (1.6) 16.4
Balance Sheet
Net Debt 129.1 94.2 129.1 92.6
Equity 495.9 493.8 495.9 463.4
ND/ND+E 20.7% 16.0% 20.7% 16.7%
ND/EBITDA 1.0x 0.7x 1.0x 0.8x
Scorecard Performance
FY13 YoY Comparison
Source: Company data, Credit Suisse estimates

Australia and NZ First Edition 80
14 February 2014
Asia Pacific/Australia
Equity Research
Integrated Telecommunication Services (Telecommunications (AU))
Telstra Corporation
(TLS.AX / TLS AU) RESULTS
Mobile performance remains strong
■ Solid 1H14 result: Telstra's 1H14 EBITDA of A$5.29bn (ex Sensis) was in
line with our A$5.27bn forecast and up 7% vs pcp (+5% ex A$127m Telstra
Clear impairment charge in pcp and ASB119). 1H14 NPAT of A$1.93bn was
2.6% ahead of our A$1.88bn forecast on lower depreciation. FY14 guidance
for 'low-single digit EBITDA growth' (incl Sensis) was maintained. We raise
our FY14F EBITDA by 0.8% to A$10.86bn (ex Sensis). FY14F NPAT is
increased 2.6% to A$4.1bn due to lower depreciation. The interim dividend
was raised to 14.5c (fully franked) and we forecast 29c for the full year.
■ Mobile performance remained strong: Mobile growth remained strong, with
mobile revenue rising 6.4% in 1H14 (vs +6.0% in FY13). Telstra added 739k
mobile SIOs (vs 608k in pcp), although the majority were prepaid (postpaid
handheld +103k). Postpaid handset ARPU (ex MRO) grew 2%. Mobile
margins expanded to 39% (from 37% in pcp) and mobile EBITDA was up
13%. We calculate that the total mobile market declined 0.6% in the 6m to Dec
and Telstra's market share rose to 51.3% (vs 50.6% in 6m to June).
■ Costs slightly higher than expected: Costs grew 2.1% in the half, due to
investment in NAS growth and lower efficiency savings (A$230m). The
company said that efficiency savings will increase in 2H14 and it continues
to target A$1bn in savings per annum for the next few years.
■ OUTPERFORM rating and A$5.70 target price unchanged: We remain
positive on the Telstra investment story with strong cashflows being
supported by continued mobile growth, cost savings and NBN payments.
We see upside from the emerging Asian growth strategy. Finalisation of
NBN negotiations should be a key catalyst.
Total return forecast in perspective
Mean^
CS tgt^
Sh Prc
-20%
-15%
-10%
-5%
0%
5%
10%
15%
20%
12mth Volatility* 52wk Hi-Lo IBES Consensustarget return^
Performance Over 1M 3M 12M
Absolute (%) -1.0 -0.4 11.0
Relative (%) -2.8 1.3 4.9
Financial and valuation metrics
Year 06/13A 06/14E 06/15E 06/16E
Revenue (A$mn) 25,502.0 25,186.2 24,555.1 25,132.4
EBITDA (A$mn) 10,740.0 10,855.9 10,885.4 11,732.3
EBIT (A$mn) 6,502.0 6,833.1 6,862.1 7,666.0
Net income (A$mn) 3,866.0 4,094.0 4,265.2 4,826.8
EPS (CS adj.) (Ac) 31.07 32.90 34.28 39.03
Change from previous EPS (%) n.a. 2.6 2.9 2.3
Consensus EPS (Ac) n.a. 32.10 32.60 33.80
EPS growth (%) 9.0 5.9 4.2 13.9
P/E (x) 16.6 15.7 15.0 13.2
Dividend (Ac) 28.00 29.00 30.00 31.00
Dividend yield (%) 5.4 5.6 5.8 6.0
P/B (x) 5.1 4.1 3.9 3.8
Net debt/equity (%) 97.7 67.3 64.8 57.7
Relative performance versus S&P ASX 200.See Reference Appendix for a description of the chart. Source: Credit Suisse
estimates, * Consensus, mean range from Thomson Reuters
Source: Company data, ASX, Credit Suisse estimates, * Adj. for goodwill, notional interest and unusual items. Relative P/E
against ASX/S&P200 based on pre GW in AUD. Company PE calculation is based on displayed EPS Currency
Rating OUTPERFORM*
Price (13 Feb 14, A$) 5.15
Target price (A$) 5.70¹
Market cap. (A$mn) 64,081.83
Yr avg. mthly trading (A$mn) 3,212
Last month's trading (A$mn) 3,673
Projected return:
Capital gain (%) 10.7
Dividend yield (net %) 5.8
Total return (%) 16.4
52-week price range 5.3 - 4.5
* Stock ratings are relative to the relevant country
benchmark.
¹Target price is for 12 months.
Research Analysts
Fraser McLeish
61 2 8205 4069
Lucas Goode
61 2 8205 4431
Bradley Clibborn
61 2 8205 4465

14 February 2014
Australia and NZ First Edition 81
Figure 1: TLS—Financial summary
Telstra Corporation (TLS) Year ending 30 Jun In AUDmn, unless otherwise stated2012 2013 2014 2015 2016 2012 2013 2014 2015 2016
Share Price: A$5.15 Earnings 06/12A 06/13A 06/14E 06/15E 06/16ERating c_EPS_SHARESEquiv. FPO (period avg.) mn 12,443.0 12,443.0 12,443.0 12,443.0 12,365.6
Target Price A$ 5.70 c_EPS*100EPS (Normalised) c 28.5 31.1 32.9 34.3 39.0
vs Share price % 10.68 EPS_GROWTH*100EPS Growth % 9.0 5.9 4.2 13.9
c_EBITDA_MARGIN*100EBITDA Margin % 41.2 42.1 43.1 44.3 46.7
c_DPS*100DPS c 28.0 28.0 29.0 30.0 31.0
c_PAYOUT*100Payout % 98.2 90.1 88.1 87.5 79.4
FRANKING*100Franking % 100.0 100.0 100.0 100.0 100.0
c_FCF_PS*100Free CFPS c 38.8 43.9 35.3 29.6 45.3
Profit & Loss 06/12A 06/13A 06/14E 06/15E 06/16E c_TAX_RATE*100Effective tax rate % 29.6 28.8 29.3 29.3 29.3
Sales revenue 25,165.0 25,502.0 25,186.2 24,555.1 25,132.4 ValuationEBITDA 10,371.0 10,740.0 10,855.9 10,885.4 11,732.3 c_PE P/E x 18.1 16.6 15.7 15.0 13.2
Depr. & Amort. (4,412.0) (4,238.0) (4,022.8) (4,023.3) (4,066.3) c_EBIT_MULTIPLE_CURREV/EBIT x 12.7 11.8 11.0 10.9 9.6
EBIT 5,959.0 6,502.0 6,833.1 6,862.1 7,666.0 c_EBITDA_MULTIPLE_CUEV/EBITDA x 7.3 7.1 6.9 6.9 6.3
Associates 0.0 0.0 0.0 0.0 0.0 c_DIV_YIELD*100Dividend Yield % 5.4 5.4 5.6 5.8 6.0
Net interest Exp. (895.0) (999.0) (951.9) (799.2) (804.4) c_FCF_YIELD*100FCF Yield % 7.5 8.5 6.9 5.7 8.8
Other 0.0 0.0 0.0 0.0 0.0 c_PB Price to Book x 5.6 5.1 4.1 3.9 3.8
Profit before tax 5,064.0 5,503.0 5,881.2 6,062.9 6,861.6 ReturnsIncome tax (1,498.0) (1,585.0) (1,722.6) (1,776.2) (2,010.5) c_ROE*100Return on Equity % 30.9 30.7 26.2 26.3 29.3
Profit after tax 3,566.0 3,918.0 4,158.6 4,286.7 4,851.1 c_I_NPAT/c_I_SALES*100Profit Margin % 14.1 15.2 16.3 17.4 19.2
Minorities (19.0) (52.0) (64.6) (21.4) (24.3) c_I_SALES/c_B_TOT_ASSAsset Turnover x 0.6 0.7 0.6 0.6 0.6
Preferred dividends 0.0 0.0 0.0 0.0 0.0 c_ASSETS/c_EQ_COMMONEquity Multiplier x 3.4 3.1 2.7 2.7 2.6
Associates & Other 0.0 0.0 0.0 0.0 0.0 c_ROA*100Return on Assets % 9.0 10.0 9.6 9.7 11.2
Normalised NPAT 3,547.0 3,866.0 4,094.0 4,265.2 4,826.8 c_ROIC*100Return on Invested Cap. % 18.2 18.2 18.1 17.8 20.4
Unusual item after tax (142.0) (127.0) 329.0 0.0 0.0 GearingReported NPAT 3,405.0 3,739.0 4,423.0 4,265.2 4,826.8 c_GEARING*100Net Debt to Net debt + Equity % 49.2 49.4 40.2 39.3 36.6
c_NET_DEBT/c_I_EBITDANet Debt to EBITDA x 1.1 1.2 1.0 1.0 0.8
Balance Sheet 06/12A 06/13A 06/14E 06/15E 06/16E c_I_EBITDA/ c_I_NET_INTERESTInt Cover (EBITDA/Net Int.) x 11.6 10.8 11.4 13.6 14.6
Cash & equivalents 3,945.0 2,479.0 5,146.8 5,854.3 5,277.7 c_I_EBIT/ c_I_NET_INTERESTInt Cover (EBIT/Net Int.) x 6.7 6.5 7.2 8.6 9.5
Inventories 260.0 431.0 405.5 377.7 404.6 (c_C_CAPEX/c_I_SALES)*-100Capex to Sales % 15.7 17.7 15.7 19.3 14.5
Receivables 4,346.0 4,557.0 4,437.7 4,353.0 4,452.5 (c_C_CAPEX/c_I_DEPR)*-100Capex to Depreciation % 119.5 146.7 136.2 170.4 128.2
Other current assets 1,399.0 436.0 3,428.0 3,428.0 3,428.0
Current assets 9,950.0 7,903.0 13,418.0 14,013.0 13,562.8 MSCI IVA (ESG) Rating BBBProperty, plant & equip. 20,504.0 20,326.0 19,987.9 19,887.4 19,885.8 TP ESG Risk (%): 0
Intangibles 7,421.0 8,202.0 6,278.7 7,095.7 6,682.2
Other non-current assets 1,650.0 2,096.0 2,798.0 2,798.0 2,798.0
Non-current assets 29,575.0 30,624.0 29,064.6 29,781.1 29,366.0
Total assets 39,525.0 38,527.0 42,482.6 43,794.1 42,928.8
Payables 4,131.0 4,241.0 4,045.6 4,031.7 4,392.8
Interest bearing debt 15,264.0 15,064.0 15,895.0 16,595.0 14,995.0
Other liabilities 8,441.0 6,347.0 6,579.6 6,589.1 6,694.7 MSCI IVA Risk: Positive
Total liabilities 27,836.0 25,652.0 26,520.2 27,215.8 26,082.5
Net assets 11,689.0 12,875.0 15,962.4 16,578.3 16,846.3
Ordinary equity 11,480.0 12,611.0 15,632.8 16,227.3 16,471.0
Minority interests 209.0 264.0 329.6 351.0 375.3
Preferred capital 0.0 0.0 0.0 0.0 0.0
Total shareholder funds 11,689.0 12,875.0 15,962.4 16,578.3 16,846.3
Net debt 11,319.0 12,585.0 10,748.2 10,740.7 9,717.3 Source: MSCI ESG Research
Cashflow 06/12A 06/13A 06/14E 06/15E 06/16E Share Price Performance
EBIT 5,959.0 6,502.0 6,833.1 6,862.1 7,666.0
Net interest -1,037.0 -801.0 -898.9 -799.2 -804.4
Depr & Amort 4,412.0 4,238.0 4,022.8 4,023.3 4,066.3
Tax paid -1,597.0 -1,500.0 -1,556.0 -1,766.7 -1,904.9
Working capital -148.0 -272.0 -50.6 98.6 234.7
Other 758.0 -453.0 -245.0 0.0 0.0
Operating cashflow 8,347.0 7,714.0 8,105.4 8,418.1 9,257.7
Capex -3,948.0 -4,509.0 -3,962.3 -4,739.9 -3,651.2
Capex - expansionary -424.9 -2,255.0 -251.9 0.0 0.0
Capex - maintenance -3,523.1 -2,254.0 -3,710.5 -4,739.9 -3,651.2
Acquisitions & Invest 17.0 48.0 -146.0 0.0 0.0
Asset sale proceeds -11.0 709.0 2,452.0 0.0 0.0
Other -362.0 25.0 18.0 0.0 0.0
Investing cashflow -4,304.0 -3,727.0 -1,638.3 -4,739.9 -3,651.2
Dividends paid -3,491.0 -3,508.0 -3,568.2 -3,670.7 -3,783.1
Equity raised 0.0 0.0 27.0 0.0 -800.0
Net borrowings 825.0 -1,968.0 -264.0 700.0 -1,600.0
Other -86.0 -13.0 -15.0 0.0 0.0 1 Month 3 Month 12 Month
Financing cashflow -2,752.0 -5,489.0 -3,820.2 -2,970.7 -6,183.1 Absolute -1.0% -0.4% 11.0%
Total cashflow 1,291.0 -1,502.0 2,646.8 707.5 -576.6 Relative -2.8% 1.3% 4.9%
Adjustments 17.0 36.0 21.0 0.0 0.0
Net change in cash 1,308.0 -1,466.0 2,667.8 707.5 -576.6 Source: Reuters 52 week trading range: 4.48-5.28
MSCI IVA Risk Comment: We see medium to long term upside
risks to TLS ESG rating driven by 1) the reduction in unionised
labor force as NBN rolls out. This will reduce risks for industrial
disputes going forward adding to TLS Social rating. 2) Secondly
after the NBN is rolled out TLS will not longer be in the business of
fixed line access, this has been a large source of regulatory
disputes / fines historically. Hence we see upside risk to TLS
governance rating as regulatory disputes become a thing of the
13/02/2014 20:33
Telstra Corporation Limited (Telstra) is an Australia-based company. The principal activity of
the Company is to provide telecommunications and information services for domestic and
international customers
Credit Suisse View
TP Risk Comment: Under a scenario, reducing beta to 0.9 from
1.0 to reflect improving ESG rating as NBN rolls out would
positively impact our valuation by 4.7%.
OUTPERFORM
0.00
1.00
2.00
3.00
4.00
5.00
6.00
1/02/2013 1/04/2013 1/06/2013 1/08/2013 1/10/2013 1/12/2013 1/02/2014
TLS.AX XJO
2.7
3.7
4.7
5.7
6.7
7.7
Environment Social Governance
Stock Local Sector
Country Global Sector
Source: Company data, Credit Suisse estimates

14 February 2014
Australia and NZ First Edition 82
1H14 results
1H14 EBITDA of A$5.29bn (ex Sensis) was in line with our A$5.27bn forecast and up 7%
vs pcp. 1H14 NPAT of A$1.93bn was 2.6% ahead of our A$1.88bn forecast due to lower
depreciation.
Figure 2: TLS 1H14 result vs 1H13 and CS forecasts
1H13
Interim Forecasts (A$m) 1H14F 1H14A Variance Restated Growth
P&L
Sales revenue 12,400 12,564 1.3% 12,124 3.6%
Other revenue 69 62 -9.6% 67 -7.5%
Total revenue 12,469 12,626 1.3% 12,191 3.6%
Other income 107 177 66.2% 110 60.9%
Total income 12,575 12,803 1.8% 12,301 4.1%
Costs (7,130) (7,514) 5.4% (7,359) 2.1%
EBITDA 5,270 5,289 0.4% 4,942 7.0%
D&A (2,095) (2,013) -3.9% (2,068) -2.7%
EBIT 3,176 3,276 3.2% 2,874 14.0%
Interest (447) (490) 9.7% (477) 2.7%
Tax (822) (825) 0.4% (758) 8.8%
Consolidated NPAT 1,907 1,961 2.8% 1,639 19.6%
Minorities (31) (36) 16.1% (26) 38.5%
NPAT (normalised) 1,877 1,925 2.6% 1,613 19.3%
NPAT (reported) 1,777 1,704 -4.1% 1,560 9.2%
Normalised EPS (c) 15.2 15.5 2.2% 13.0 19.6%
Reported EPS (c) 14.4 13.7 -4.6% 12.5 9.3%
DPS (c) 14.5 14.5 0.0% 14.0 3.6%
Segmental Revenue
PSTN 2,023 2,059 1.8% 2,220 -7.3%
Fixed Internet 1,080 1,090 1.0% 1,028 6.0%
Total Fixed 3,612 3,626 0.4% 3,680 -1.5%
Mobile 4,830 4,861 0.6% 4,567 6.4%
IP & Data 1,516 1,498 -1.2% 1,543 -2.9%
NAS 712 821 15.3% 636 29.1%
Media 560 492 -12.1% 499 -1.4%
International 1,015 1,083 6.7% 844 28.3%
Other 156 183 17.4% 356 -48.6%
Total 12,400 12,564 1.3% 12,124 3.6%
Other Financial Information
Capex 1,860 1,814 -2.5% 1,852 -2.1%
Free Cashflow 1,371 1,650 20.4% 2,155 -23.4%
KPIs
Mobile SIOs 15,628 15,811 1.2% 14,423 9.6%
Mobile net adds 556 739 32.9% 608 21.5%
Postpaid handheld ARPU ex-MRO $64.10 $66.09 3.1% $64.75 2.1%
Retail basic access lines 6,423 6,388 -0.5% 6,699 -4.6%
Retail basic access net adds (120) (155) 28.8% (178) -12.9%
Retail Broadband subscribers 2,862 2,847 -0.5% 2,684 6.1%
Retail Broadband net adds 90 75 -16.7% 85 -11.8% Source: Company data, Credit Suisse estimates

14 February 2014
Australia and NZ First Edition 83
Changes to forecasts
We raise our FY14F EBITDA by 0.8% to A$10.86bn (from A$10.78bn previously).
Figure 3: TLS changes to earnings forecasts
FY13
June Y/E Restated Previous Revised Change Previous Revised Change FY14F FY15F
P&L
Sales revenue 24,298 24,994 25,186 0.8% 24,069 24,555 2.0% 3.7% -2.5%
Other income 478 433 544 25.6% 614 711 15.8% 13.8% 30.7%
Total revenue 24,776 25,426 25,730 1.2% 24,682 25,266 2.4% 3.9% -1.8%
Costs (14,608) (14,652) (14,874) 1.5% (13,860) (14,380) 3.8% 1.8% -3.3%
EBITDA 10,168 10,775 10,856 0.8% 10,823 10,885 0.6% 6.8% 0.3%
D&A (4,078) (4,139) (4,023) -2.8% (4,105) (4,023) -2.0% -1.4% 0.0%
EBIT 6,090 6,636 6,833 3.0% 6,718 6,862 2.1% 12.2% 0.4%
Interest (933) (895) (952) 6.4% (810) (799) -1.4% 2.0% -16.0%
Tax (1,517) (1,692) (1,723) 1.8% (1,742) (1,776) 2.0% 13.6% 3.1%
Minorities (52) (58) (65) 10.6% (21) (21) 2.9% 24.2% -66.8%
NPAT (normalised, continuing ops) 3,588 3,990 4,094 2.6% 4,145 4,265 2.9% 14.1% 4.2%
Discontinued / exceptional 151 450 329 nm 0 0 nm nm nm
NPAT (reported) 3,739 4,440 4,423 -0.4% 4,145 4,265 2.9% 18.3% -3.6%
Normalised EPS (c) 28.8 32.1 32.9 2.6% 33.3 34.3 2.9% 14.1% 4.2%
Reported EPS (c) 30.0 35.7 35.5 -0.4% 33.3 34.3 2.9% 18.3% -3.6%
DPS (c) 28.0 29.0 29.0 0.0% 30.0 30.0 0.0% 3.6% 3.4%
Segmental Revenue
PSTN 4,359 3,977 4,043 1.7% 3,612 3,716 2.9% -7.2% -8.1%
Fixed Internet 2,087 2,171 2,184 0.6% 2,193 2,213 0.9% 4.6% 1.3%
Fixed 7,305 7,224 7,217 -0.1% 7,132 7,248 1.6% -1.2% 0.4%
Mobile 9,200 9,633 9,740 1.1% 10,004 10,120 1.2% 5.9% 3.9%
IP & Data 3,041 3,005 2,968 -1.2% 2,967 2,950 -0.6% -2.4% -0.6%
NAS 1,484 1,640 1,800 9.7% 1,729 1,980 14.5% 21.3% 10.0%
Media 987 1,105 976 -11.7% 1,049 967 -7.9% -1.1% -1.0%
International 1,739 2,075 2,154 3.8% 958 1,041 8.6% 23.9% -51.7%
Other 541 313 330 5.6% 229 250 9.1% -39.0% -24.2%
Total 24,298 24,994 25,186 0.8% 24,069 24,555 2.0% 3.7% -2.5%
Other Financial Information
Capex 3,749 3,962 5.7% 4,538 4,740 4.5% 5.4% 19.6%
Free Cashflow 5,041 5,016 -0.5% 5,710 5,736 0.5% 2.5% 14.4%
KPIs - Fixed
Mobile SIOs 16,333 16,883 3.4% 17,048 17,925 5.1% 10.3% 6.2%
Mobile net adds 1,020 1,570 53.9% 715 1,042 45.7% 9.0% -33.6%
Postpaid handheld ARPU ex-MRO $65.33 $65.38 0.1% $64.75 $65.38 1.0% 0.1% 0.0%
Retail basic access lines 6,380 6,310 -1.1% 6,233 6,163 -1.1% -3.6% -2.3%
Retail basic access lines net adds (163) (233) 43.0% (147) (147) 0.0% -30.3% -37.0%
Retail broadband subscribers 2,990 2,975 -0.5% 3,163 3,148 -0.5% 7.3% 5.8%
Retail broadband net adds 218 203 -6.9% 173 173 0.0% 17.6% -15.0%
FY14F FY15F Growth
Source: Company data, Credit Suisse estimates
Mobile remains strong
■ Mobile revenue grew 6.4% in 1H14 (service revenue +7.3%), which was an
acceleration from the 6.0% growth in FY13. We forecast mobile revenue to grow 5.9%
in FY14 (vs +4.7% previously).
■ Total mobile SIOs were up 9.6% to 15.8m, with 739k SIOs added in the half (vs 608k
in pcp and CS 556k forecast). However, most of the increase was in pre-pay. Postpaid
handset subs were up 103k (vs 265k in pcp) and WBB subs grew 102k
(vs 218k in pcp).
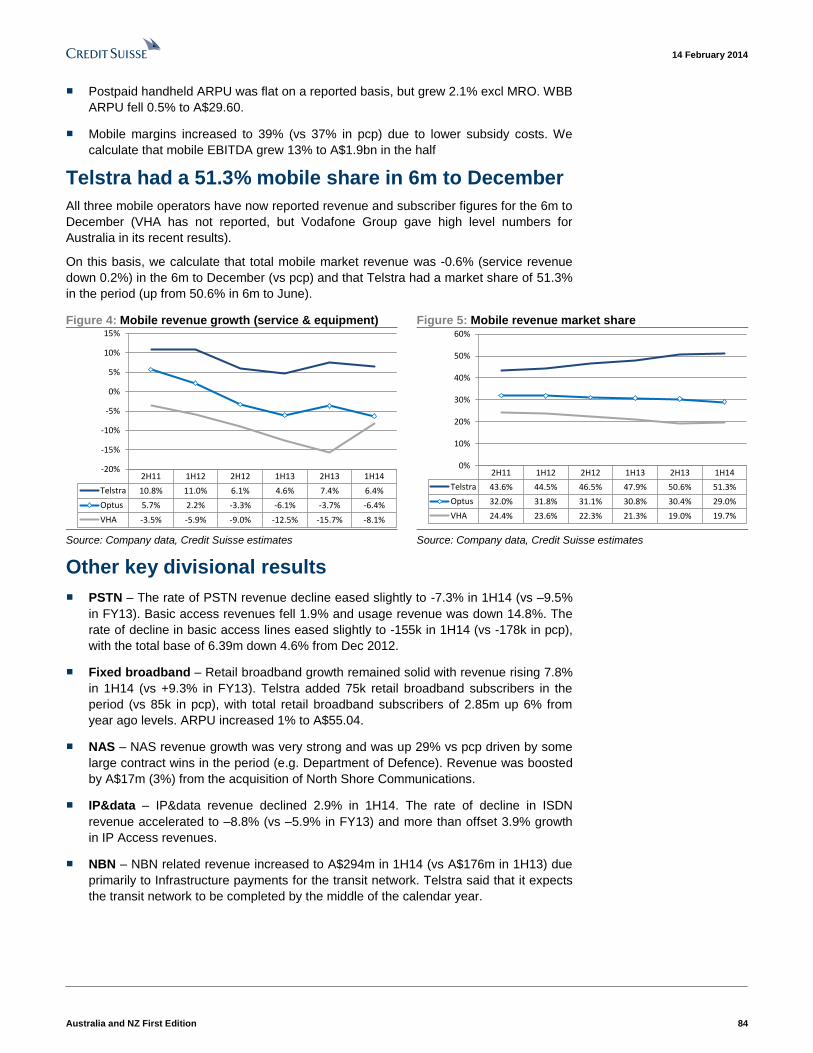
14 February 2014
Australia and NZ First Edition 84
■ Postpaid handheld ARPU was flat on a reported basis, but grew 2.1% excl MRO. WBB
ARPU fell 0.5% to A$29.60.
■ Mobile margins increased to 39% (vs 37% in pcp) due to lower subsidy costs. We
calculate that mobile EBITDA grew 13% to A$1.9bn in the half
Telstra had a 51.3% mobile share in 6m to December
All three mobile operators have now reported revenue and subscriber figures for the 6m to
December (VHA has not reported, but Vodafone Group gave high level numbers for
Australia in its recent results).
On this basis, we calculate that total mobile market revenue was -0.6% (service revenue
down 0.2%) in the 6m to December (vs pcp) and that Telstra had a market share of 51.3%
in the period (up from 50.6% in 6m to June).
Figure 4: Mobile revenue growth (service & equipment) Figure 5: Mobile revenue market share
2H11 1H12 2H12 1H13 2H13 1H14
Telstra 10.8% 11.0% 6.1% 4.6% 7.4% 6.4%
Optus 5.7% 2.2% -3.3% -6.1% -3.7% -6.4%
VHA -3.5% -5.9% -9.0% -12.5% -15.7% -8.1%
-20%
-15%
-10%
-5%
0%
5%
10%
15%
2H11 1H12 2H12 1H13 2H13 1H14
Telstra 43.6% 44.5% 46.5% 47.9% 50.6% 51.3%
Optus 32.0% 31.8% 31.1% 30.8% 30.4% 29.0%
VHA 24.4% 23.6% 22.3% 21.3% 19.0% 19.7%
0%
10%
20%
30%
40%
50%
60%
Source: Company data, Credit Suisse estimates Source: Company data, Credit Suisse estimates
Other key divisional results
■ PSTN – The rate of PSTN revenue decline eased slightly to -7.3% in 1H14 (vs –9.5%
in FY13). Basic access revenues fell 1.9% and usage revenue was down 14.8%. The
rate of decline in basic access lines eased slightly to -155k in 1H14 (vs -178k in pcp),
with the total base of 6.39m down 4.6% from Dec 2012.
■ Fixed broadband – Retail broadband growth remained solid with revenue rising 7.8%
in 1H14 (vs +9.3% in FY13). Telstra added 75k retail broadband subscribers in the
period (vs 85k in pcp), with total retail broadband subscribers of 2.85m up 6% from
year ago levels. ARPU increased 1% to A$55.04.
■ NAS – NAS revenue growth was very strong and was up 29% vs pcp driven by some
large contract wins in the period (e.g. Department of Defence). Revenue was boosted
by A$17m (3%) from the acquisition of North Shore Communications.
■ IP&data – IP&data revenue declined 2.9% in 1H14. The rate of decline in ISDN
revenue accelerated to –8.8% (vs –5.9% in FY13) and more than offset 3.9% growth
in IP Access revenues.
■ NBN – NBN related revenue increased to A$294m in 1H14 (vs A$176m in 1H13) due
primarily to Infrastructure payments for the transit network. Telstra said that it expects
the transit network to be completed by the middle of the calendar year.

14 February 2014
Australia and NZ First Edition 85
Costs: Still targeting A$1bn efficiency savings
Telstra's cost growth was slightly higher than we expected at 2.1% in the half. We
calculate that underlying cost growth was c3.2% adjusting for the Telstra Clear impairment
charge in the pcp and cA$50m of additional costs relating to the adoption of AASB119
'Employee Benefits' (which add cA$100m to cost in a full year).
The company said that cost growth was driven primarily by spend in the NAS business to
support new contract wins.
Efficiency savings of A$230m were lower than in recent periods. However, the company
said that this was mainly a timing issue and that it continues to target savings of cA$1bn
per annum for the next few years.
Figure 6: TLS cost movement 1H14 vs 1H13
Source: Company data
Investment view and valuation
We remain positive on the Telstra investment story with strong cashflows supported by
continued mobile growth, cost savings and NBN payments. We see upside from the
emerging Asian growth strategy. Finalisation of NBN negotiations should be a key catalyst
Our Telstra sum of the parts valuation (based on divisional DCF) and target price are
unchanged at A$5.70. OUTPERFORM rating retained.
Figure 7: TLS—SOTP valuation
EBITDA EV/ EBITDA
Business line EV $ps FY14f FY15f FY14f FY15f
…Run off Fixed cash flow 5,752 0.46
…NBN resale 4,303 0.35
Total Fixed Line 10,055 0.81 3,461 3,436 2.9x 2.9x
Mobile 33,010 2.65 3,845 4,027 8.6x 8.2x
IP & Data 11,661 0.94 1,856 1,770 6.3x 6.6x
Sensis (proceeds plus 30% stake) 649 0.05 52 60 12.6x 10.8x
CSL (HK) 2,000 0.16 313 8.4x nm
Autohome (66%) 2,262 0.18 75 97 30.3x 23.3x
Network applications & Services 3,265 0.26 270 327 12.1x 10.0x
Other (inc TUSMA funding & NBN build work) 2,735 0.22 695 780 3.9x 3.5x
NBN - Infrastructure Services 9,131 0.73 287 391 nm nm
Telstra Enterprise valuation 74,768 6.01 10,853 10,889 6.9x 6.9x
Add: Foxtel (50%) 3,500 0.28 1,108 1,232 8.0x 7.2x
Add: Non-recurring (migration payments) 6,496 0.52
Less: Net debt -13,873 -1.11
Equity value of TLS 70,891 5.70 Source: Company data, Credit Suisse estimates

14 February 2014
Australia and NZ First Edition 86
Telstra – Focus charts
Figure 8: Telstra's mobile revenue growth Figure 9: Mobile service revenue growth
6%
8%
5%
4%
9%8%
11% 11%
6%
5%
7%6%
0%
2%
4%
6%
8%
10%
12%
2H11 1H12 2H12 1H13 2H13 1H14
Service revenue Total mobile revenue
5%
8%
3%
1%
7% 7%
10%9%
12%
17%18%
12%
0%
4%
8%
12%
16%
20%
2H11 1H12 2H12 1H13 2H13 1H14
Handheld Wireless Broadband
Source: Company data, Credit Suisse estimates Source: Company data, Credit Suisse estimates
Figure 10: Mobile SIOs and growth Figure 11: Telstra's mobile SIOs net adds (000s)
0%
2%
4%
6%
8%
10%
12%
14%
16%
18%
0
2,000
4,000
6,000
8,000
10,000
12,000
14,000
16,000
18,000
2H11 1H12 2H12 1H13 2H13 1H14
SIOs Growth vs pcp
741
958
634 608 649739
0
200
400
600
800
1,000
1,200
2H11 1H12 2H12 1H13 2H13 1H14
Source: Company data, Credit Suisse estimates Source: Company data, Credit Suisse estimates
Figure 12: Postpaid handheld net adds (000s) Figure 13: Wireless broadband net adds (000s)
334 338
196
265
158
103
0
100
200
300
400
2H11 1H12 2H12 1H13 2H13 1H14
340
436
372
218 234
102
0
100
200
300
400
500
2H11 1H12 2H12 1H13 2H13 1H14
Source: Company data, Credit Suisse estimates Source: Company data, Credit Suisse estimates

14 February 2014
Australia and NZ First Edition 87
Figure 14: Postpaid handheld ARPU ex-MRO Figure 15: Prepaid handheld ARPU
$65.33 $66.48$63.69 $64.75 $65.39 $66.09
$0
$10
$20
$30
$40
$50
$60
$70
2H11 1H12 2H12 1H13 2H13 1H14
$15.94$16.76 $16.67
$17.79 $18.44 $18.90
$0
$2
$4
$6
$8
$10
$12
$14
$16
$18
$20
2H11 1H12 2H12 1H13 2H13 1H14
Source: Company data, Credit Suisse estimates Source: Company data, Credit Suisse estimates
Figure 16: Wireless broadband ARPU Figure 17: Blended mobile ARPU
$36.37
$32.50$29.84 $29.75 $29.93 $29.60
$0
$5
$10
$15
$20
$25
$30
$35
$40
2H11 1H12 2H12 1H13 2H13 1H14
$47.71 $47.71$43.96 $44.29 $43.47 $43.35
$0
$10
$20
$30
$40
$50
2H11 1H12 2H12 1H13 2H13 1H14
Source: Company data, Credit Suisse estimates Source: Company data, Credit Suisse estimates
Figure 18: Telstra's fixed line revenue growth Figure 19: Telstra's basic access net adds & growth
-8%
-9%
-11% -11%
-8%-7%
-6% -6% -6%
-4%
-2% -1%
-12%
-10%
-8%
-6%
-4%
-2%
0%
2H11 1H12 2H12 1H13 2H13 1H14
PSTN Total Fixed
-140-124
-157-178
-144 -155
-3.3%-3.5%
-3.7%-4.0%
-3.3%
-3.7%
-4.5%
-4.0%
-3.5%
-3.0%
-2.5%
-2.0%
-1.5%
-1.0%
-0.5%
0.0%
-200
-180
-160
-140
-120
-100
-80
-60
-40
-20
0
2H11 1H12 2H12 1H13 2H13 1H14
Net adds Growth vs pcp
Source: Company data, Credit Suisse estimates Source: Company data, Credit Suisse estimates

14 February 2014
Australia and NZ First Edition 88
Figure 20: Telstra's PSTN revenue growth Figure 21: Telstra's PSTN revenue split
-4.1% -4.7%
-6.5%-5.2%
-1.9% -1.9%
-11.3%
-13.6%
-15.8%-17.4% -16.8%
-14.9%
-20%
-18%
-16%
-14%
-12%
-10%
-8%
-6%
-4%
-2%
0%
2H11 1H12 2H12 1H13 2H13 1H14
Basic access Calling usage
0
500
1,000
1,500
2,000
2,500
3,000
2H11 1H12 2H12 1H13 2H13 1H14
Basic access Interconnect Calling usage
Source: Company data, Credit Suisse estimates Source: Company data, Credit Suisse estimates
Figure 22: NBN revenue A$m Figure 23: Broadband revenue growth
1H13 2H13 1H14
Other 60 75 84
Info campaign 90 78 52
Infrastructure 26 63 139
Migration 0 7 19
0
100
200
300
400
-2%
2%
5% 4%6% 6%
1%
7%
11%10%
9%8%
-4%
-2%
0%
2%
4%
6%
8%
10%
12%
2H11 1H12 2H12 1H13 2H13 1H14
Total Internet Retail broadband
Source: Company data, Credit Suisse estimates Source: Company data, Credit Suisse estimates
Figure 24: Retail broadband net adds (000s) Figure 25: Retail broadband ARPU
20
108
9585 88
75
0
20
40
60
80
100
120
2H11 1H12 2H12 1H13 2H13 1H14
$50.92 $52.38 $52.99 $53.45 $53.58 $54.18
$0
$10
$20
$30
$40
$50
$60
2H11 1H12 2H12 1H13 2H13 1H14
Source: Company data, Credit Suisse estimates Source: Company data, Credit Suisse estimates
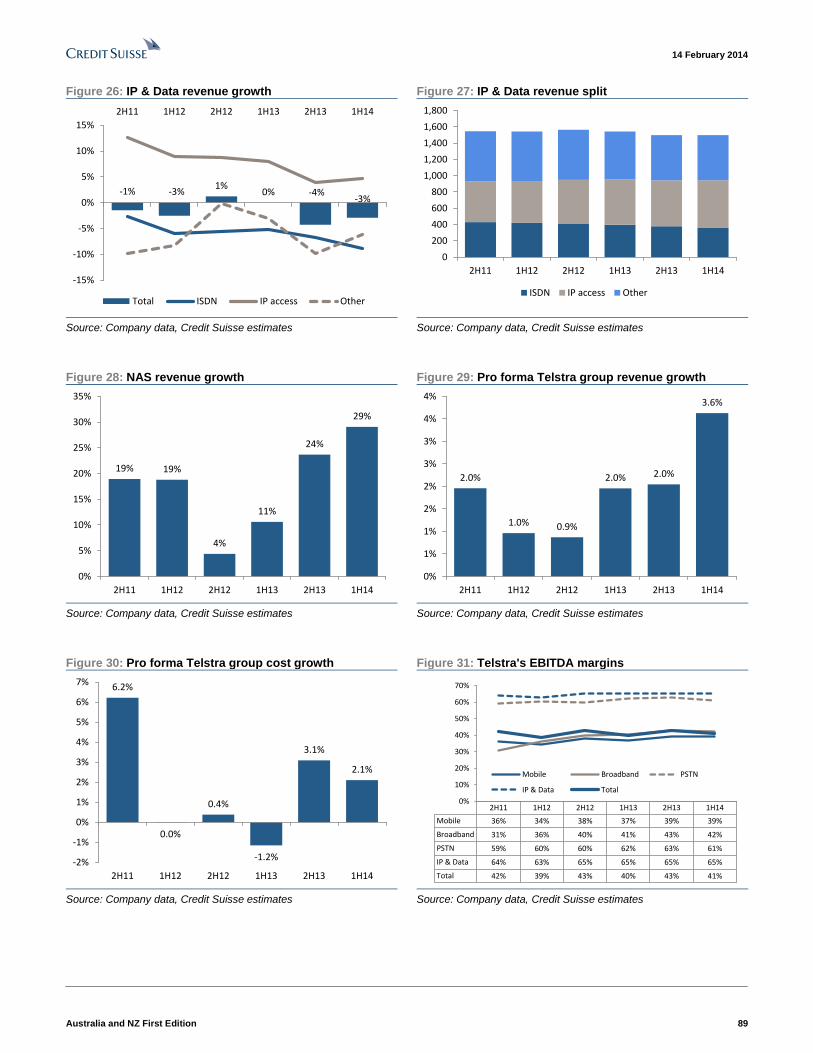
14 February 2014
Australia and NZ First Edition 89
Figure 26: IP & Data revenue growth Figure 27: IP & Data revenue split
-1% -3%1%
0% -4%-3%
-15%
-10%
-5%
0%
5%
10%
15%
2H11 1H12 2H12 1H13 2H13 1H14
Total ISDN IP access Other
0
200
400
600
800
1,000
1,200
1,400
1,600
1,800
2H11 1H12 2H12 1H13 2H13 1H14
ISDN IP access Other
Source: Company data, Credit Suisse estimates Source: Company data, Credit Suisse estimates
Figure 28: NAS revenue growth Figure 29: Pro forma Telstra group revenue growth
19% 19%
4%
11%
24%
29%
0%
5%
10%
15%
20%
25%
30%
35%
2H11 1H12 2H12 1H13 2H13 1H14
2.0%
1.0% 0.9%
2.0% 2.0%
3.6%
0%
1%
1%
2%
2%
3%
3%
4%
4%
2H11 1H12 2H12 1H13 2H13 1H14
Source: Company data, Credit Suisse estimates Source: Company data, Credit Suisse estimates
Figure 30: Pro forma Telstra group cost growth Figure 31: Telstra's EBITDA margins
6.2%
0.0%
0.4%
-1.2%
3.1%
2.1%
-2%
-1%
0%
1%
2%
3%
4%
5%
6%
7%
2H11 1H12 2H12 1H13 2H13 1H14
2H11 1H12 2H12 1H13 2H13 1H14
Mobile 36% 34% 38% 37% 39% 39%
Broadband 31% 36% 40% 41% 43% 42%
PSTN 59% 60% 60% 62% 63% 61%
IP & Data 64% 63% 65% 65% 65% 65%
Total 42% 39% 43% 40% 43% 41%
0%
10%
20%
30%
40%
50%
60%
70%
Mobile Broadband PSTN
IP & Data Total
Source: Company data, Credit Suisse estimates Source: Company data, Credit Suisse estimates

Australia and NZ First Edition 90
14 February 2014
Asia Pacific/Australia
Equity Research
Travel & Leisure (Online - SMID (AU))
Webjet
(WEB.AX / WEB AU) INCREASE TARGET PRICE
Risks to the core, but becoming full service
■ Zuji and LoH positive, but core still under pressure: Zuji appears on
track and the TTV result for Lots of Hotels was ahead of expectations with
the run rate now $65mn (up from $40mn at FY13). Backing out of the result
the $2.1mn other gains and losses and adding back the $1mn in duplicated
IT costs we believe the underlying EBITDA for 1H14 was ~$11.2mn and that
it is supportive of FY14 guidance. However, we remain cautious given that
we believe volumes in the core flights business remain negative, that in the
2H there will be the $2mn of incremental marketing spend for Zuji and that
WEB is focused on scale in LoH and not on the short-term profitability
($0.4mn 1H14 loss may be carried into 2H). NEUTRAL rating retained.
■ Key takeaways: (1) WEB's revenue margin increased ~23% to 10.3%
(revenue / TTV) due to mix shift (higher proportion of accommodation TTV),
1H14 includes the full annualisation of the September 2012 increase in
booking fees and improved commercial agreements with the airlines; (2)
management gave no guidance into the air booking volumes in 1H14, and
we believe that the negative run rate in 2H13 has likely continued, implying
that WEB's booking volumes have continued to decline in its core flights
business; (3) the weakness in WEB's booking volumes is not due to a single
factor, it is a combination of many (cycling strong comps, slowing shift
online, increased competition from airlines and other OTAs, growth in lower
conversion mobile traffic); (4) the outlook for WEB's core flights business is
softer, with Zuji and other initiatives required to drive earnings growth in
FY14 and beyond; and (5) Lots of Hotels is growing ahead of expectations,
but management has changed its focus from profitability to scale ($0.4mn
EBITDA loss in 1H14, previous guidance was for it to be profitable).
■ Target price: $3.25 (from $2.90) moving back to an equally blended PER
and DCF-based valuation methodology. Modest EPS revisions.
Total return forecast in perspective
Mean^CS tgt^ Sh Prc
-40%
-20%
0%
20%
40%
60%
80%
100%
12mth Volatility* 52wk Hi-Lo IBES Consensustarget return^
Performance over 1M 3M 12M
Absolute (%) 5.3 20.6 -32.0
Relative (%) 3.5 22.3 -38.1
Financial and valuation metrics
Year 06/13A 06/14E 06/15E 06/16E
Revenue (A$mn) 74.8 101.7 108.4 114.9
EBITDA (A$mn) 17.7 22.4 27.8 31.0
EBIT (A$mn) 15.7 19.7 24.9 28.1
Net income (A$mn) 12.0 16.0 18.9 21.3
EPS (CS adj.) (Ac) 15.75 19.19 21.77 24.52
Change from previous EPS (%) n.a. -1.7 -5.5 -4.6
Consensus EPS (Ac) n.a. 19.80 23.00 25.40
EPS growth (%) -16.2 21.8 13.4 12.7
P/E (x) 20.1 16.5 14.5 12.9
Dividend (Ac) 13.00 13.53 15.17 17.07
Dividend yield (%) 4.1 4.3 4.8 5.4
P/B (x) 4.1 4.1 3.7 3.4
Net debt/equity (%) net cash net cash net cash net cash
Relative performance versus S&P ASX 200.See Reference Appendix for a description of the chart. Source: Credit Suisse
estimates, * Consensus, mean range from Thomson Reuters
Source: Company data, ASX, Credit Suisse estimates, * Adj. for goodwill, notional interest and unusual items. Relative P/E
against ASX/S&P200 based on pre GW in AUD. Company PE calculation is based on displayed EPS Currency
Rating NEUTRAL*
Price (13 Feb 14, A$) 3.16
Target price (A$) (from 2.90) 3.25¹
Market cap. (A$mn) 250.90
Yr avg. mthly trading (A$mn) 20
Last month's trading (A$mn) 18
Projected return:
Capital gain (%) 3.0
Dividend yield (net %) 4.6
Total return (%) 7.6
52-week price range 5.2 - 2.4
* Stock ratings are relative to the relevant country
benchmark.
¹Target price is for 12 months.
Research Analysts
Chris Smith
61 2 8205 4210
Paul Buys
61 2 8205 4538
Samantha Carleton
61 2 8205 4148
Bradley Clibborn
61 2 8205 4465
Sarah Mann
61 2 8205 4610

14 February 2014
Australia and NZ First Edition 91
Figure 1: WEB financial summary
Webjet (WEB) Year ending 30 Jun In AUDmn, unless otherwise stated2012 2013 2014 2015 2016 2012 2013 2014 2015 2016
Share Price: A$3.16 Earnings 06/12A 06/13A 06/14E 06/15E 06/16ERating c_EPS_SHARESEquiv. FPO (period avg.) mn 73.2 76.1 83.3 86.8 86.8
Target Price A$ 3.25 c_EPS*100EPS (Normalised) c 18.8 15.8 19.2 21.8 24.5
vs Share price % 3.00 EPS_GROWTH*100EPS Growth % -16.2 21.8 13.4 12.7
DCF A$ 3.51 c_EBITDA_MARGIN*100EBITDA Margin % 32.5 23.7 22.1 25.6 27.0
c_DPS*100DPS c 13.0 13.0 13.5 15.2 17.1
c_PAYOUT*100Payout % 69.2 82.5 70.5 69.7 69.6
FRANKING*100Franking % 100.0 100.0 100.0 100.0 100.0
c_FCF_PS*100Free CFPS c 19.8 26.9 -16.1 17.6 22.4
Profit & Loss 06/12A 06/13A 06/14E 06/15E 06/16E c_TAX_RATE*100Effective tax rate % 29.5 29.4 23.3 27.5 27.5
Sales revenue 57.7 74.8 101.7 108.4 114.9 Valuation
EBITDA 18.7 17.7 22.4 27.8 31.0 c_PE P/E x 16.8 20.1 16.5 14.5 12.9
Depr. & Amort. (0.6) (2.0) (2.8) (2.9) (2.9) c_EBIT_MULTIPLE_CURREV/EBIT x 11.9 11.7 10.6 8.3 7.1
EBIT 18.2 15.7 19.7 24.9 28.1 c_EBITDA_MULTIPLE_CUEV/EBITDA x 11.6 10.4 9.3 7.4 6.5
Associates (0.5) (0.1) 0.0 0.0 0.0 c_DIV_YIELD*100Dividend Yield % 4.1 4.1 4.3 4.8 5.4
Net interest Exp. 1.6 1.2 0.9 0.8 0.8 c_FCF_YIELD*100FCF Yield % 6.3 8.5 -5.1 5.6 7.1
Other 0.0 0.0 0.0 0.0 0.0 c_PB Price to Book x 6.8 4.1 4.1 3.7 3.4
Profit before tax 19.3 16.8 20.5 25.7 28.9 ReturnsIncome tax (5.7) (5.0) (4.8) (7.1) (8.0) c_ROE*100Return on Equity % 41.8 19.7 23.9 25.8 26.5
Profit after tax 13.6 11.9 15.8 18.6 21.0 c_I_NPAT/c_I_SALES*100Profit Margin % 23.8 16.0 15.7 17.4 18.5
Minorities 0.1 0.1 0.2 0.3 0.3 c_I_SALES/c_B_TOT_ASSAsset Turnover x 1.1 0.6 0.9 0.9 0.9
Preferred dividends 0.0 0.0 0.0 0.0 0.0 c_ASSETS/c_EQ_COMMONEquity Multiplier x 1.6 2.2 1.8 1.7 1.7
Associates & Other 0.0 0.0 0.0 0.0 0.0 c_ROA*100Return on Assets % 25.6 8.9 13.5 15.1 15.9
Normalised NPAT 13.8 12.0 16.0 18.9 21.3 c_ROIC*100Return on Invested Cap. % -1,587.0 -182.7 62.6 65.2 69.8
Unusual item after tax 0.0 (5.4) 0.8 0.0 0.0 Gearing
Reported NPAT 13.8 6.6 16.8 18.9 21.3 c_GEARING*100Net Debt to Net debt + Equity % Net Cash Net Cash Net Cash Net Cash Net Cash
c_NET_DEBT/c_I_EBITDANet Debt to EBITDA x Net Cash Net Cash Net Cash Net Cash Net Cash
Balance Sheet 06/12A 06/13A 06/14E 06/15E 06/16E c_I_EBITDA/ c_I_NET_INTERESTInt Cover (EBITDA/Net Int.) x -11.6 -14.9 -25.9 -36.7 -38.1
Cash & equivalents 33.8 66.8 42.7 45.0 50.4 c_I_EBIT/ c_I_NET_INTERESTInt Cover (EBIT/Net Int.) x -11.2 -13.2 -22.7 -32.9 -34.5
Inventories 0.0 0.0 0.0 0.0 0.0 (c_C_CAPEX/c_I_SALES)*-100Capex to Sales % 5.5 7.4 9.7 5.6 4.4
Receivables 4.6 17.0 20.5 21.5 22.6 (c_C_CAPEX/c_I_DEPR)*-100Capex to Depreciation % 568.5 816.6 1,024.6 566.4 478.2
Other current assets 0.8 5.0 3.8 3.8 3.8
Current assets 39.2 88.8 67.0 70.3 76.8 MSCI IVA (ESG) Rating
Property, plant & equip. 1.0 1.6 7.2 12.2 16.2 TP ESG Risk (%): 0
Intangibles 10.4 39.0 40.5 38.6 36.8
Other non-current assets 3.3 4.8 4.2 4.2 4.2
Non-current assets 14.6 45.4 51.8 55.0 57.2
Total assets 53.8 134.2 118.7 125.2 134.0
Payables 16.5 63.0 36.7 37.0 38.5
Interest bearing debt 0.0 0.0 0.0 0.0 0.0
Other liabilities 4.4 10.4 15.3 15.7 16.1 MSCI IVA Risk:
Total liabilities 20.8 73.5 51.9 52.8 54.6
Net assets 33.0 60.7 66.8 72.4 79.4
Ordinary equity 32.9 60.8 66.9 73.1 80.3
Minority interests 0.1 -0.1 -0.1 -0.4 -0.7
Preferred capital 0.0 0.0 0.0 0.0 0.0
Total shareholder funds 33.0 60.7 66.8 72.7 79.6
Net debt -33.8 -66.8 -42.7 -45.0 -50.4 Source: MSCI ESG Research
Cashflow 06/12A 06/13A 06/14E 06/15E 06/16E Share Price Performance
EBIT 18.2 15.7 19.7 24.9 28.1
Net interest 1.6 1.3 0.8 0.8 0.8
Depr & Amort 0.6 2.0 2.8 2.9 2.9
Tax paid -5.4 -5.6 -4.5 -6.6 -7.6
Working capital 0.0 0.0 -2.5 -0.6 0.3
Other 2.8 12.6 -19.8 0.0 0.0
Operating cashflow 17.7 26.0 -3.6 21.3 24.5
Capex -3.2 -5.6 -9.9 -6.1 -5.1
Capex - expansionary 0.0 0.0 0.0 0.0 0.0
Capex - maintenance -3.2 -5.6 -9.9 -6.1 -5.1
Acquisitions & Invest 0.0 -4.7 0.0 0.0 0.0
Asset sale proceeds 0.0 0.0 0.0 0.0 0.0
Other 8.7 -1.4 0.1 0.0 0.0
Investing cashflow 5.5 -11.6 -9.8 -6.1 -5.1
Dividends paid -8.8 -9.7 -11.0 -12.7 -14.0
Equity raised -12.3 28.8 0.0 0.0 0.0
Net borrowings 0.0 0.0 0.0 0.0 0.0
Other 0.0 0.0 0.0 0.0 0.0 1 Month 3 Month 12 Month
Financing cashflow -21.0 19.1 -11.0 -12.7 -14.0 Absolute 5.3% 20.6% -32.0%
Total cashflow 2.1 33.4 -24.3 2.5 5.4 Relative 3.5% 22.3% -38.1%
Adjustments 0.0 -0.3 0.0 0.0 0.0
Net change in cash 2.1 33.1 -24.3 2.5 5.4 Source: Reuters 52 week trading range: 2.44-5.21
MSCI IVA Risk Comment: No MSCI rating
2/13/2014 11:44
Webjet Limited is an online travel agency that operates as an online manager and marketer
of travel and related services. It provides flight book ing services, accommodation and travel
package book ing services in Australia, Singapore and Hong Kong.
Credit Suisse View
TP Risk Comment: For WEB, outside of the travel ESG risk
factors we do not include any ESG impact in our base
valuation. We highlight key ESG risk areas for WEB as 1) the
privacy and security of customer information; and 2) contract
negotiations.
NEUTRAL
2.30
2.80
3.30
3.80
4.30
4.80
5.30
1/02/2013 1/04/2013 1/06/2013 1/08/2013 1/10/2013 1/12/2013 1/02/2014
WEB.AX XJO
2.3
3.3
4.3
5.3
6.3
7.3
8.3
9.3
Environment Social Governance
Stock Local Sector
Country Global Sector
Source: Company data, Credit Suisse estimates

14 February 2014
Australia and NZ First Edition 92
Key takeaways
■ 1H14 result is supportive of FY14 guidance: Normalised EBITDA increased
+21.5% to $12.3mn, but we note that this includes $2.1mn of other gains and losses
(which we understand comprised ~$0.9mn from the sale of part of the US business,
and the balance from an undisclosed contract). Excluding the $2.1mn of other gains
and losses and adding back the $1mn of duplicated IT costs for Zuji results in an
EBITDA for 1H14 of ~$11.2mn. We believe this is supportive of the guidance provided
at the AGM in November for EBITDA of $22.5mn ($21.5mn guidance and adding back
$1mn of IT duplication).
TTV increased 33.4% to $507mn (WEB did not disclose an underlying TTV figure).
From the review of operations in the accounts, we understand that Zuji and Lots of
Hotels contributed $18.2mn of revenue in 1H14. This implies that the residual revenue
in 1H14 was $31.8mn – flat on the pcp.
WEB declared an interim dividend of 6.3cps (6.0cps pcp).
■ Revenue margin improvement a stand out, but a doubled edged sword: The
improvement in WEB's revenue margin was again the stand out feature of the result.
The margin (revenue / TTV) increased to 10.3% from 8.4% in the pcp (8.6% FY13,
8.8% 2H13) and compares to an average of 7.3% over the past five years. However,
the rate of increase in the revenue margin was concerning since it implies a more
substantial mix shift in the business than we had anticipated. We understand that
there are four main drivers of this mix change:
o Increased contribution of higher margin accommodation: We believe that the
overall contribution of accommodation within WEB's TTV has increased due to
the integration of Zuji, as well as the decline in WEB's core booking volumes.
o Increased booking fees: In September 2012 WEB increased its booking fees on
domestic and international flights. On a weighted booking basis (domestic ~85%
transactions, international 15%), the booking fee for the group increased ~9%.
1H14 included three months of this benefit (~4.5%).
o Improved airline commercial agreements: WEB's increased scale in the airfare
market from the inclusion of Zuji allowed it to renegotiate its commissions and
overrides on improved terms.
o Selling hotels at a full margin: In the past WEB's hotel business was discounting
its hotel inventory and achieving a ~6% margin. WEB has focused on its profitability
and we understand accommodation margins are now closer to 13%.
■ Core booking volumes are declining and we have less visibility: WEB's total
number of flight bookings in FY13 increased ~1% to 1,062,000 (from 1,053,000). The
growth delivered was significantly below the historical levels (FY12 +17%, FY11
+13%, FY10 +21%). WEB did not provide direct commentary or guidance to the
booking volumes in 1H14 or for the first six weeks' trading in 2H14. We believe that
the negative run rate in 2H13 has likely continued and that WEB's booking volumes
have continued to decline in its core flights business.
■ Longer term we see no reason why WEB with its strong brand shouldn't perform
in line with the broader market growth, but risk is to the downside in the near
term: WEB's brand strength continues to improve (as shown by Hitwise data) and
WEB generates a significant amount of free traffic to the website, which in the long
term should let it grow in line with the broader market (domestic flights have trended at
~4% growth pa and international at 5% pa). The risk we see is that, in the near term
with the travel market changing, WEB will continue to underperform and that booking
volumes will continue to decline. We believe the market is changing due to:

14 February 2014
Australia and NZ First Edition 93
o Mobile growth: At this point in time mobile is primarily a price discovery tool and
is lowering conversion rates across the travel industry.
o Slowing shift online: After a number of years of growth ahead of market
volumes, it appears that the level of online penetration in the travel industry is
plateauing.
o Airlines continue to compete directly: Competition continues from airlines
who have direct distribution models in both the domestic and international flights
market; and
o OTA market remains competitive: Competition within the broader OTA market
remains elevated and there have been a number of new entrants.
We are not pointing to an immediate or large decline in WEB's core volumes, but
highlighting that there are headwinds in the core flights business which are likely to
result in continued volume declines in the short term. We do not believe that there is a
simple strategic response to return the business to the level of volume growth
achieved in recent years. This is our key concern for the WEB business.
■ Zuji – appears on track: We believe that Zuji contributed $16.8mn of revenue in
1H14 (backing out the contribution of Lots of Hotels ($1.441mn) from the $18.2 uplift
of revenue disclosed in the operating review. We understand that Zuji is now fully
integrated into WEB's cloud-based platform and that all of the cost based synergies
have now been achieved. We forecast an underlying EBITDA contribution of $3mn for
Zuji in FY14 (adding back the $1mn of duplicated IT costs).
■ Zuji's importance has increased as WEB moves to becoming a full service OTA:
WEB's core business volumes have declined since the acquisition of Zuji and with this
likely to continue in at least the short to medium term, Zuji is an important driver of
growth in terms of both its diversification in accommodation and in Asia.
■ LoH – TTV ahead of expectations, but focus is not on the short term: At the time
of the FY13 result the LoH business was running at a run-rate of $40mn of TTV. This
has increased ahead of expectations and is currently $65mn. WEB had anticipated
LoH to breakeven in 1Q and 1H14, but we understand the focus has now moved to
increasing scale in FY14, and that the positive contribution is now more of a FY15
story (1H14 EBITDA loss of $0.4mn).
■ Guidance, not confirmed, but we believe on track: WEB did not explicitly comment
on the FY14 guidance for EBITDA of $21.5mn provided at the AGM in November, but
we believe that management is tracking in line with its expectations for FY14.
■ Earnings changes: At the EBITDA level we have downgraded FY14 EBITDA 0.5% to
$22.4mn (in line with WEB’s November AGM guidance and backing out the $2mn of
one-off gains and adding back the $1mn of duplicated IT costs). We have upgraded
FY15 and FY16 EBITDA by ~3.5%-4.0% as a result of revised operating expectations
from the accommodation side of WEB’s business and higher than previously forecast
overrides in the air business. Higher-than-expected D&A drives our downgraded PBT
expectations across the forecast period. We assume that the tax rate normalised in
2H14, from the abnormally low 1H14 result. Overall, we downgrade EPS -2% in FY14,
-6% FY15 and -5% in FY16.
■ Becoming a full service OTA, but there is increased risk with the continued
underperformance of the core flights business: WEB is increasingly becoming a full
service OTA with the inclusion of Zuji and the further development of its accommodation
offering. We continue to like WEB for its growth initiatives and underlying drivers, which
are essential in continuing to diversify the business away from both Australia as well as
flights. These new initiatives are becoming increasingly important due to the disruption
that is currently occurring within WEB’s core flights business and the negative volume

14 February 2014
Australia and NZ First Edition 94
growth that we believe is being experienced at the moment. We retain our NEUTRAL
rating on WEB as we believe short-term earnings risk remains elevated as the flights
volumes decline and we are concerned that the decline in revenue will more than offset
the incremental revenue from Zuji and Lots of Hotels.
■ Target price: We move our valuation methodology back to using an equally weighted
PER and DCF valuation methodology. Our PER EBITDA valuation assumes that WEB
trades in line with the XSI on an FY14 basis. The key assumptions underpinning our
DCF include a WACC of 11.9% (beta 1.1x, risk-free rate 5.3%) and terminal growth
rate of 3.5%. Our target price increased from $2.90 to $3.25.
Figure 2: WEB PE absolute Figure 3: WEB PE relative to the XSI
0.0x
5.0x
10.0x
15.0x
20.0x
25.0x
30.0x
Mar-07
Sep-07
Mar-08
Sep-08
Mar-09
Sep-09
Mar-10
Sep-10
Mar-11
Sep-11
Mar-12
Sep-12
Mar-13
Sep-13
WEB.AX Mean +SD -SD
0%
20%
40%
60%
80%
100%
120%
140%
160%
180%
Mar-07
Sep-07
Mar-08
Sep-08
Mar-09
Sep-09
Mar-10
Sep-10
Mar-11
Sep-11
Mar-12
Sep-12
Mar-13
Sep-13
WEB PE relative (to XSI) Mean +SD -SD
Source: IBES consensus data Source: IBES consensus data

Australia and NZ First Edition 95
14 February 2014
Asia Pacific/Australia
Equity Research
Diversified Metals & Mining (Minerals (AU))
Alumina Limited
(AWC.AX / AWC AU) PRE RESULTS COMMENT
2013 results preview; reports on 20 Feb Date: 20 February 2014 Time: Pre market
Period: Full year 2013 Earnings Risk: High
Credit Suisse estimates Briefing and dial-in details
NPAT: US$17mn (consensus US$12mn) TBA
EPS: 0.6¢ps (consensus: 0.3¢ps)
DPS: nil (consensus 0.4¢ps)
■ Expecting a messy result. The read-through from Alcoa results to AWC is
poor when profits are weak because accounting translations from GAAP to
AIFRS, plus black box retirement benefits and embedded derivative
valuations overwhelm low values, swinging the results. On top of these
problems, this year we have the true-up of the Alba settlements between
Alcoa and AWC, another swing factor. AWC's share of Alcoa's profit was
$41mn, but after finance, corporate costs, and accounting translations, we
believe that the underlying NPAT will be US$17mn. Consensus is $12mn.
■ We estimate FCF was US$60mn. AWC previously announced that new
debt was down to $135mn at December. Cash inflows were the agreed
AWAC dividends of US$105mn over the year.
■ We forecast no dividend, but recognise risk. AWC has not paid a
dividend since 2011, but having made positive FCF and with low net debt, it
may decide a modest final dividend is warranted. But with commodity prices
remaining weak and capital injections into AWAC of over $30mn being likely
in 2014, we believe a wiser course would be to apply cash to reducing debt
and set the company up for a better future.
■ Our DCF valuation remains A$1.60/sh, and our target price is
A$1.30/sh.
Total return forecast in perspective
Mean^
CS tgt^ Sh Prc
-50%
-30%
-10%
10%
30%
50%
12mth Volatility* 52wk Hi-Lo IBES Consensustarget return^
Performance over 1M 3M 12M
Absolute (%) 3.1 27.9 3.9
Relative (%) 1.2 29.6 -2.2
Financial and valuation metrics
Year 12/12A 12/13E 12/14E 12/15E
Revenue (US$mn) — — — —
EBITDA (US$mn) -18.4 -14.4 -16.0 -16.0
EBIT (US$mn) -18.4 -14.4 -16.0 -16.0
Net income (US$mn) -52.5 17.0 40.2 170.6
EPS (CS adj.) (USc) -2.15 0.61 1.43 6.08
Change from previous EPS (%) n.a. — — —
Consensus EPS (USc) n.a. 0.30 2.10 5.20
EPS growth (%) -141.0 128.2 135.8 324.7
P/E (x) -52.3 185.4 78.6 18.5
Dividend (USc) — — 1.00 7.00
Dividend yield (%) — — 0.9 6.2
P/B (x) 1.0 1.1 1.1 1.1
Net debt/equity (%) 25.3 4.6 2.1 net cash
Relative performance versus S&P ASX 200.See Reference
Appendix for a description of the chart. Source: Credit Suisse
estimates, * Consensus, mean range from Thomson Reuters
Source: Company data, ASX, Credit Suisse estimates, * Adj. for goodwill, notional interest and unusual items. Relative P/E
against ASX/S&P200 based on pre GW in AUD. Company PE calculation is based on displayed EPS Currency
Rating OUTPERFORM*
Price (13 Feb 14, A$) 1.25
Target price (A$) 1.30¹
Market cap. (A$mn) 3,499.36
Yr avg. mthly trading (A$mn) 271
Last month's trading (A$mn) 362
Projected return:
Capital gain (%) 4.3
Dividend yield (net %) 1.5
Total return (%) 5.8
52-week price range 1.32 - 0.90
* Stock ratings are relative to the relevant country
benchmark.
¹Target price is for 12 months.
Research Analysts
Matthew Hope
61 2 8205 4669
Paul McTaggart
61 2 8205 4698

14 February 2014
Australia and NZ First Edition 96
Figure 1: AWC financial summary
Alumina Limited (AWC) Year ending 31 Dec In USDmn, unless otherwise stated2011 2012 2013 2014 2015 2011 2012 2013 2014 2015
Share Price: A$1.26 Earnings 12/11A 12/12A 12/13E 12/14E 12/15ERating c_EPS_SHARESEquiv. FPO (period avg.) mn 2,440.2 2,439.5 2,806.2 2,806.2 2,806.2
Target Price A$ 1.30 c_EPS*100EPS (Normalised) c 5.2 -2.2 0.6 1.4 6.1
vs Share price % 3.59 EPS_GROWTH*100EPS Growth % -141.0 128.2 135.8 324.7
DCF US$ 1.60 c_EBITDA_MARGIN*100EBITDA Margin %
c_DPS*100DPS c 6.0 0.0 0.0 1.0 7.0
c_PAYOUT*100Payout % 114.4 0.0 0.0 69.9 115.2
FRANKING*100Franking % 100.0 100.0 100.0 100.0 100.0
c_FCF_PS*100Free CFPS c 8.0 2.0 2.6 3.7 7.0
Profit & Loss 12/11A 12/12A 12/13E 12/14E 12/15E c_TAX_RATE*100Effective tax rate % -2.2 -0.8 0.0 0.0 0.0
Sales revenue 0.0 0.0 0.0 0.0 0.0 Valuation
EBITDA (17.2) (18.4) (14.4) (16.0) (16.0) c_PE P/E x 21.6 -52.6 186.6 79.1 18.6
Depr. & Amort. (0.0) (0.0) (0.0) (0.0) (0.0) c_EBIT_MULTIPLE_CURREV/EBIT x -212.2 -208.8 -230.1 -202.4 -197.5
EBIT (17.2) (18.4) (14.4) (16.0) (16.0) c_EBITDA_MULTIPLE_CUEV/EBITDA x -212.2 -208.8 -230.1 -202.4 -197.5
Associates 0.0 0.0 0.0 0.0 0.0 c_DIV_YIELD*100Dividend Yield % 5.3 0.0 0.0 0.9 6.2
Net interest Exp. (28.3) (29.3) (17.6) (7.3) (2.7) c_FCF_YIELD*100FCF Yield % 7.1 1.8 2.3 3.3 6.1
Other 0.0 0.0 0.0 0.0 0.0 c_PB Price to Book x 1.0 1.1 1.1 1.1 1.1
Profit before tax (45.5) (47.7) (32.0) (23.3) (18.7) ReturnsIncome tax (1.0) (0.4) (0.0) (0.0) (0.0) c_ROE*100Return on Equity % 4.5 -2.0 0.6 1.4 5.9
Profit after tax (46.5) (48.1) (32.0) (23.3) (18.7) c_I_NPAT/c_I_SALES*100Profit Margin %
Minorities 0.0 0.0 0.0 0.0 0.0 c_I_SALES/c_B_TOT_ASSAsset Turnover x 0.0 0.0 0.0 0.0 0.0
Preferred dividends 0.0 0.0 0.0 0.0 0.0 c_ASSETS/c_EQ_COMMONEquity Multiplier x 1.2 1.3 1.1 1.0 1.0
Associates & Other 174.5 (4.4) 49.1 63.5 189.3 c_ROA*100Return on Assets % 3.8 -1.6 0.6 1.3 5.6
Normalised NPAT 128.0 (52.5) 17.0 40.2 170.6 c_ROIC*100Return on Invested Cap. % -0.5 -0.6 -0.5 -0.5 -0.6
Unusual item after tax 0.0 0.0 0.0 0.0 0.0 Gearing
Reported NPAT 128.0 (52.5) 17.0 40.2 170.6 c_GEARING*100Net Debt to Net debt + Equity % 14.2 20.2 4.4 2.0 Net Cash
c_NET_DEBT/c_I_EBITDANet Debt to EBITDA x n.m n.m n.m n.m Net Cash
Balance Sheet 12/11A 12/12A 12/13E 12/14E 12/15E c_I_EBITDA/ c_I_NET_INTERESTInt Cover (EBITDA/Net Int.) x -0.6 -0.6 -0.8 -2.2 -5.9
Cash & equivalents 19.0 10.1 23.8 23.8 23.8 c_I_EBIT/ c_I_NET_INTERESTInt Cover (EBIT/Net Int.) x -0.6 -0.6 -0.8 -2.2 -5.9
Inventories 0.0 0.0 0.0 0.0 0.0 (c_C_CAPEX/c_I_SALES)*-100Capex to Sales %
Receivables 0.2 0.1 25.0 25.0 25.0 (c_C_CAPEX/c_I_DEPR)*-100Capex to Depreciation %
Other current assets 6.2 4.9 3.4 3.4 3.4
Current assets 25.4 15.1 52.2 52.2 52.2 MSCI IVA (ESG) Rating AA
Property, plant & equip. 0.2 0.2 0.2 0.2 0.2 TP ESG Risk (%): -4
Intangibles 0.0 0.0 0.0 0.0 0.0
Other non-current assets 3,324.8 3,296.1 3,034.0 3,000.0 2,980.2
Non-current assets 3,325.0 3,296.3 3,034.2 3,000.2 2,980.4
Total assets 3,350.4 3,311.4 3,086.3 3,052.3 3,032.5
Payables 3.1 2.7 1.5 1.5 1.5
Interest bearing debt 490.6 674.5 158.8 84.6 6.5
Other liabilities 2.7 5.7 7.6 35.7 119.8 MSCI IVA Risk: Neutral
Total liabilities 496.4 682.9 167.9 121.7 127.8
Net assets 2,854.0 2,628.5 2,918.5 2,930.6 2,904.7
Ordinary equity 2,854.0 2,628.5 2,918.5 2,930.6 2,904.8
Minority interests 0.0 0.0 0.0 0.0 0.0
Preferred capital 0.0 0.0 0.0 0.0 0.0
Total shareholder funds 2,854.0 2,628.5 2,918.5 2,930.6 2,904.8
Net debt 471.6 664.4 135.0 60.8 -17.3 Source: MSCI ESG Research
Cashflow 12/11A 12/12A 12/13E 12/14E 12/15E Share Price Performance
EBIT -17.2 -18.4 -14.4 -16.0 -16.0
Net interest -26.8 -28.2 -18.4 -7.8 -3.3
Depr & Amort 0.0 0.0 0.0 0.0 0.0
Tax paid 0.8 0.8 0.4 0.0 0.0
Working capital -2.8 -0.3 -26.1 0.0 0.0
Other 241.9 94.6 130.3 127.5 214.6
Operating cashflow 195.9 48.5 71.8 103.6 195.4
Capex 0.0 0.0 0.0 0.0 0.0
Capex - expansionary
Capex - maintenance
Acquisitions & Invest 0.0 0.0 0.0 0.0 0.0
Asset sale proceeds 17.3 0.0 0.0 0.0 0.0
Other -166.6 -171.0 -12.0 -30.0 -5.6
Investing cashflow -149.3 -171.0 -12.0 -30.0 -5.6
Dividends paid -170.6 -73.2 0.0 0.0 -112.2
Equity raised 0.0 0.0 465.9 0.0 0.0
Net borrowings 31.4 187.5 -513.2 -74.2 -78.1
Other 0.0 0.0 0.0 0.0 0.0 1 Month 3 Month 12 Month
Financing cashflow -139.2 114.3 -47.3 -74.2 -190.4 Absolute 3.7% 28.7% 4.6%
Total cashflow -92.6 -8.2 12.4 -0.5 -0.5 Relative 1.8% 30.4% -1.5%
Adjustments -0.7 -0.8 0.8 0.0 0.0
Net change in cash -93.3 -9.0 13.2 -0.5 -0.5 Source: Reuters 52 week trading range: 0.91-1.32
MSCI IVA Risk Comment: CO2 emmissions mainly from
Victorian smelters is the main high profile environmental
issue. Industry get 96.5% protection in year 1, but AWAC
smelters run on Victorian electricity generated by burning
brown coal so subsidy less than industry average. We also
note that Alcoa has moved to settle Alba's charges of
racketeering (via bribing an Alba employee to overpay for
alumina) by way of an $85mn payment and a supply contract.
13/02/2014 14:59
Alumina Limited, through its 40 % equity interest in Alcoa World Alumina and Chemicals,
engages in the bauxite mining, alumina refining, and aluminum smelting businesses. The
company also involves in the production of alumina and alumina based chemicals.
Credit Suisse View
TP Risk Comment: Carbon tax snips US$50mn from AWAC
2013 earnings which translates to $20mn for AWC. As a result
our TP is cut 5cps. We have not applied a discount for Alba
litigation as AWC has paid a 40% share of the $85mn
settlement with Alba and may obtain a refund following an
agreement with Alcoa of only 15% liability if DoJ and SEC
settlement reached.
OUTPERFORM
0.00
0.20
0.40
0.60
0.80
1.00
1.20
1.40
1/02/2013 1/04/2013 1/06/2013 1/08/2013 1/10/2013 1/12/2013 1/02/2014
AWC.AX XJO
2.7
3.7
4.7
5.7
6.7
7.7
Environment Social Governance
Stock Local Sector
Country Global Sector
Source: Company data, Credit Suisse estimates
14 February 2014
Australia and NZ First Edition 97
2013 results preview
The future is looking better for AWC. The factors that are changing the outlook are:
■ The Gove refinery closure opening an alumina sales gap in the Pacific market;
■ The Indonesian raw material ban, which is looking increasingly likely to hold firm even
after the elections, as new parliamentary laws approving export controls on
commodities have just been approved.
■ The falling AUD/USD which is lowering AWAC costs; and
■ The likely closure of the loss-making Point Henry Aluminium smelter around mid-year.
The first three points are outside AWAC's control, but are likely the points it may comment
upon, together with ongoing AWAC productivity gains. We expect no comment will be
made about Pt Henry. That is a sensitive operational issue controlled by Alcoa of Australia
and any announcement will come from that entity and probably to the governments and
workers ahead of investors.
We doubt AWC has any greater visibility into the Indonesian ban than the rest of the global
community, but it may be able to make some comments about Gove. This closure is
beginning and will remove 2.5Mt of alumina supply from the Pacific Basin this year. Our
interest is whether AWC is seeing new enquiries from previous Gove customers and
whether AWAC has the ability to lift production above the 16Mtpa rate it operated at in
2H'13 to meet demand.

Australia and NZ First Edition 98
14 February 2014
Asia Pacific/Australia
Equity Research
Airlines / Air Freight & Couriers / Trucking / Railroads (Transportation (AU))
Australian Transport Sector PRE RESULTS COMMENT
1H14 preview: Cost-outs will be rewarded
against volume headwinds
■ 1H14 cost-out and self-help candidates should be rewarded against a
weak volume backdrop and top-line outlook: With weak volumes and
demand impacting the bulk of the Australian transport sector, we expect
that evidence of cost-outs and solid execution at 1H14 results will be
rewarded with relative outperformance. All stocks (excluding Qube) have
publicly announced cost-out programmes, though the biggest upside
in cost-out execution remains with AIO, AZJ and QAN.
■ Asciano and Aurizon: cost-out upside baked in for AZJ, but what
about AIO? While the cost-out opportunity is well understood for Aurizon,
with the market already baking in 75% operating margins from FY15 (and
then some), the opportunity for AIO is perhaps less well understood, but
equally still available in Ports and PN Rail. We are optimistic that
management can, in time, exceed the $150mn in cost-outs initially targeted
under the BIP programme. For AZJ, the upside remains bringing forward
the time frame for reaching 25% EBIT margins, currently expected in FY15.
■ "One Toll" margin improvement? In the absence of a volume-led
recovery, we believe evidence of productivity improvements elsewhere in
the business in the form of margin expansion will be well received. While
hard to quantify "One Toll" benefits, we believe they could progressively
materialise from 1H14, as we start to see the first results of management
turning its focus on consolidation instead of acquisitive growth.
■ BXB back to more appropriate multiples: With BXB now trading back in
line with its historical market multiple, and with management likely to
reaffirm FY14 guidance, we see the result more about the timeline for
growth in emerging markets as well as RPC penetration in North America.
Following this note, we have removed Recall, resulting in 12% changes to
earnings over the forecast period. We lower our target price from $9.83 to
$9.29 leaving a NEUTRAL rating.
■ Airlines: With guidance already given for both stocks and a looming
"transformational" strategy day for Qantas, we see 1H14 results as perhaps
less meaningful than in previous years. For VAH, we have lowered earnings
over the forecast period and our target price to $0.38 (from $0.42).
■ Qube – forecasts and target price upgraded into 1H14, based on volume
expectations in Ports and Bulk as Qube progressively tender for contracts
on the North West Shelf. Target price raised to $2.20, previously ($1.90),
NEUTRAL rating maintained.
Research Analysts
Nicholas Markiewicz
61 2 8205 4107

14 February 2014
Australia and NZ First Edition 99
Reporting calendar
Figure 1: Reporting season details
Company Date Time Aus no. Int no. Password
AZJ 17/02/2014 10:30 1800 558 698 +612 9007 3187 731905
AIO 18/02/2014 9:30 1800 041 303 NA 242227
TOL 19/02/2014 9:45 1800 558 698 +612 9007 3187 729084
BXB 19/02/2014 TBC TBC TBC TBC
QUB 21/02/2014 10:30 1800 558 698 +612 9007 3187 729120
QAN 27/02/2014 TBC TBC TBC TBC
VAH 28/02/2014 TBC TBC TBC TBC
Source: Company data, Credit Suisse estimates
Forecasts and consensus
Figure 2: Credit Suisse 1H14 estimates
Source: Company data, Credit Suisse estimates

14 February 2014
Australia and NZ First Edition 100
Changes to earnings and valuation into 1H14
■ Brambles—removing Recall from earnings forecast and valuation: Our forecasts
are now ex. Recall. As a result, we have lowered earnings by 12% over the forecast
period (non-Recall estimates remain unchanged). Our target price is now $9.29
previously $9.83) reflecting the divestment, maintaining a NEUTRAL rating.
■ Toll: We have lowered earnings over the forecast period by an average of -6.6%,
reflecting continued volume weakness. We have also largely removed contract
amortisation from FY14 and FY15.
■ Qube—forecast period earnings and target price raised into results: We have
raised earnings over the forecast period by an average of 11% (over a relatively small
base), reflecting a review of port and bulk volume ramp-up assumptions. As a result,
our target price is raised to $2.20 (from $1.90), which given recent share price strength
remains a NEUTRAL
■ Asciano: We have also made small changes to forecast earnings, by an average of
1.5% over the forecast period.
■ Aurizon: We have upgraded forecast earnings by an average of 4.5%, weighted to
FY14, based on strong recent above rail volumes as well as comfort with the cost out
profile. We are now largely in line with consensus estimates.
■ Virgin—Lowering forecast earnings materially: This reflects assumptions around
material CASK increases (discussed below) coupled with on-going uncertainty in the
domestic market. We now forecast an FY14 PBT of -$115.2mn (previously -$2mn).
Our valuation moves from $0.42 to $0.38 per share, maintaining a NEUTRAL rating.
Price Price Rating* Target Price Year EPS EPS FY1E EPS FY2E EPS FY3E
Company ccy 13 Feb 14 Prev. Cur. Prev. Cur. End Ccy Prev. Cur. Prev. Cur. Prev. Cur.
Asciano Group (AIO.AX) A$ 5.69 — O — 6.20 Jun 13 A$ — 0.37 0.42 0.43 0.48 0.47
Aurizon (AZJ.AX) A$ 4.99 — R — — Jun 13 A$ 0.23 0.24 — 0.30 0.32 0.34
Brambles Limited (BXB.AX) A$ 8.82 — N 9.83 9.29 Jun 13 US$ 0.46 0.41 0.53 0.45 0.57 0.48
Qube Logistics (QUB.AX) A$ 2.06 — N 1.90 2.20 Jun 13 A$ 0.08 0.09 — 0.10 0.11 0.12
Toll Holdings (TOL.AX) A$ 5.62 — N — 5.49 Jun 13 A$ 0.43 0.40 0.46 0.43 0.49 0.45
Virgin Australia (VAH.AX) A$ 0.34 — N 0.42 0.38 Jun 13 A$ (0.01) (0.05) 0.01 (0.02) 0.02 0.00
*O – Outperform, N – Neutral, U – Underperform, R – Restricted [V] = Stock considered volatile (see Disclosure Appendix).
Source: Company data, Credit Suisse estimates.

14 February 2014
Australia and NZ First Edition 101
Freight and Logistics Brambles—where is the growth?
Result: Wednesday, 19 February, dial in details TBA
Figure 3: 1H14 earnings estimates
1H13 2H13 FY13 1H14
Revenue 2,486.1 2,596.8 5,082.9 2,579.1
EBIT 417.6 495.4 908.0 459.2
PBT 362.9 439.2 807.1 405.5 Source: Company data, Credit Suisse estimates
What to look for:
■ Guidance: We expect management to likely reaffirm FY14 constant currency
guidance of $930mn–$965mn, with the added potential that the range may be
tightened. We note Brambles' management's strong track record in meeting guidance
each year and as a result do not expect any surprise either way.
■ 1H14 Earnings: We are forecasting underlying 1H14 EBIT of $459.2mn (actual FX).
Given the historical seasonality of earnings (our forecasts imply a seasonal skew
between 1H and 2H of 47:53), we believe guidance will be the initial primary focus of
the result.
■ Removing Recall from earnings forecast and valuation: Following this note, our
forecasts are now ex. Recall. As a result, we have lowered earnings by 12% over the
forecast period (non-Recall estimates remain unchanged). Our target price is now
$9.29 (previously $9.83) reflecting the divestment, maintaining a NEUTRAL rating.
■ Will growth capex disappoint again? We note that in FY13, Brambles incurred
$190mn in growth capex spend compared with a previously guided figure of $300mn.
At the time, we were left slightly disappointed by this number, particularly given the
$30bn of structural revenue opportunities previously identified in addition to the strong
returns on each incremental dollar of capex spent. Should growth capex spend
underwhelm again, we believe the market could start to question both the accessibility
of growth and the timeline for reasonable returns.
■ Net new business wins: Management expects a $70mn FY14 revenue uplift as
contract wins in FY13 start to make a full FY14 contribution. Based on guided cost-
outs and opex spend, we believe the existing constant currency FY14 earnings
guidance implies a revenue uplift for the year (excluding the $70mn roll over) of up to
$175mn. We will be looking for further colour as to how contract wins are tracking in
1H14 relative to this FY14 forecast.
■ Targeted cost savings: Management has forecast $39mn in cost savings in FY14.
Importantly, cost savings are a major driver of FY14 earnings growth (implicit in
guidance), meaning implications for underling organic earnings growth should cost
savings come in ahead or below expectations, and relative to movements in guidance.
■ RPC sales growth should be a key focus, which to date has underwhelmed as a
division and has the best structural growth opportunity in developed markets.
■ Return on opex spend: We note management spent $26mn on business
development in FY13. In 1H14 we will be looking for commentary around further opex
spend ($13mn expected in FY14) as well as early signs that these development costs
are yielding some form of return, whether it be customer retention, top-line growth,
asset control, etc.

14 February 2014
Australia and NZ First Edition 102
Toll Holdings
Margin growth as One Toll yields benefits?
Wednesday, 19 February, 9:45am AEDST, phone: 1800 558 698, code: 729084
Figure 4: 1H14 earnings estimates
1H13 2H13 FY13 1H14
Revenue 4,546.1 4,173.3 8,719.4 4,547.4
EBIT 256.4 169.5 425.9 263.7
PBT 239.5 149.8 389.3 245.0 Source: Company data, Credit Suisse estimates
What to look for:
■ 1H14 earnings: We are expecting 1H14 EBIT of $263.7, representing small (+2.8%)
earnings growth over the pcp.
■ Lowering broader forecast period earnings into results, reflecting continued
volume uncertainty: We have lowered earnings over the forecast period by an
average of -6.6%, reflecting continued volume weakness. We have also largely
removed contract amortisation from FY14 and FY15.
■ A compositionally interesting result: While headline earnings growth expectations
are relatively low, we expect this result to be very interesting composition wise, with
Global Express volume and margin growth potentially offsetting weakness in Global
Resources.
■ Global Express volumes and margins could surprise to the upside: Toll remains
well placed to capitalise on the fast growing and high margin Australian B2C market.
We believe 1H14 could show some encouraging signs in terms of volume and margin
growth, as the benefits of Toll's incumbency and strong network in the space start to
materialise. A strong performance in Express would be particularly well received,
given the expected roll-off in Resources.
■ Global Resources—TOPS growth will likely offset broader weakness: While
TOPS revenue growth is likely to be reasonably stable, we are mindful of the material
slowdown experienced in other mining service providers and believe the stable growth
in TOPS could mask other areas of weakness. In addition, we will be looking for colour
on the expected wind-down of Gorgon (the single-largest group contract) and
opportunities where equipment and capital can be redeployed. In our view, Global
Resources remains the biggest risk factor to group earnings with comfort around the
earnings profile increasingly important.
■ "One Toll" margin improvement: In the absence of a volume-led recovery and with
a formal ROIC-focused cost-out plan yet to show results for Global Forwarding, we
believe that evidence of productivity improvements elsewhere in the business in the
form of margin expansion will be well received. While hard to quantify "One Toll"
benefits, we believe they could be material, as management increasingly turns its
focus on consolidation instead of acquisitive growth.
■ Capital management candidate: As a potential silver lining to the poor volume
outlook, we believe that there is scope to increase dividends as a result of the
declining need for capital expenditure, particularly in FY15 if some of TGR’s existing
contracts taper off. We forecast an average free cash flow yield over the forecast
period of 8.0%.

14 February 2014
Australia and NZ First Edition 103
Qube Logistics—raising target price to $2.20
Friday, 21 February, 10:30am AEST, 1800 558 698, passcode 729120
Figure 5: FY13 earnings estimates
1H13 2H13 FY13 1H14
Revenue 526.3 538.8 1,065.1 587.0
EBIT 61.0 67.7 122.5 69.5
PBT 52.8 51.5 104.3 60.1 Source: Company data, Credit Suisse estimates
What to look for:
■ 1H14 earnings: 1H14 EBIT forecasts of $70mn compared with $61mn in the pcp and
$67.7mn in 2H13.
■ Forecast period earnings and target price raised into results: We have raised
earnings over the forecast period by an average of 11% (over a relatively small base),
reflecting a review of logistics and bulk volume ramp up assumptions. As a result, our
target price is raised to $2.20 (from $1.90), which given recent share price strength
remains a NEUTRAL.
■ Margin growth likely mixed: With final ownership changes and acquisitions cycling
through in the underlying businesses in addition to weak visibility into volumes, we
believe margins are likely to be the best gauge of underlying business improvement.
Logistics: We are expecting muted 1H14 margin growth, with EBITDA margins
forecast at 13.9% compared with the pcp of 14.8%. Weak margins reflect below trend
container volumes. For the Bulk division, we expect further margin improvement for
1H14, with EBITDA margins forecast at 19.5% compared with the pcp at 17.8%.
■ Customer contract wins in the North West Shelf: Qube recently won a contract
with Chevron for port logistics for the Barrow Island project. We will be looking for
further earnings clarity from this contract as well as other contract opportunities,
particularly for Wheatstone and Icthys.
■ Impact of dry weather on grain: With drought conditions gripping much of
agricultural NSW and Qld, we believe grain volumes could be significantly lower than
FY13, consistent with AIO commentary. With weak volumes expected, outlook
statements for grain will be increasingly important.
■ Port Botany rail update expected: We are expecting an update on the Moorebank
project at the 1H14 result. We currently assume a 2H15 volume ramp-up, though this
is more likely to be an FY16 story.
■ Giacci performance: At the FY13 result, Giacci missed its post-acquisition targets,
resulting in an $8mn reduction in contingent consideration. We will be looking for
updates on the businesses performance, in particular volumes associated with Iluka.
■ Overall: For many investors, Qube remains a largely conceptual proposition, making
the FY14 result less important than forward commentary around volumes, growth and
development plans around key strategic assets. On this basis, we will be looking more
towards outlook statements and the expected timeline for the ramp-up of port shuttle
volumes in Sydney as well as soft commodity contracts in south-east Australia. That
said, with Qube's management increasingly less acquisitive, we will also need to see
more disclosure in terms of volumes to gain increased comfort around the underlying
business performance.

14 February 2014
Australia and NZ First Edition 104
Coal haulers and infrastructure Asciano:
Cyclical weakness to mask strong execution
Tuesday, 18 February, 9:30am EDT, Phone: 1800 041 303, passcode 242227
Figure 6: 1H14 earnings estimates
1H13 2H13 FY13 1H14
Revenue 1,853.5 1,874.2 3,727.7 1,908.5
EBIT 355.0 330.9 685.9 358.1
PBT 257.6 228.7 486.3 252.0 Source: Company data, Credit Suisse estimates
What to look for:
■ 1H14 earnings: At the 1Q14 results, AIO's management guided 1H14 earnings to be
"broadly in line with the pcp" ($355mn), implying 7.5% underlying growth when
stripping out the one-off contribution of the $21.5mn sale of Kooragang Island. Credit
Suisse's EBIT forecast is for $358.1mn. Following this note, we have also made small
changes to forecast earnings, by an average of 1.5% over the forecast period.
■ Management needs to deliver on levers within their control: With a tough macro
backdrop and in the absence of a volume-led recovery, the task for management is to
clearly outline upside from levers within their control, which are cost-outs and the
execution of already contracted coal volumes. We are optimistic that management can
in time exceed the $150mn in cost-outs initially targeted under the BIP programme
and will look for any commentary around this.
■ Margin improvement will be well received in the absence of volumes: With an
environment of flat volume growth providing poor fixed cost leverage, we see flat
margins as a potentially positive outcome for BAPS, PN Rail and Terminals. We
expect coal margins ex. the sale of Kooragang Island to increase 1.7pp to 29.5%
(previously 27.8%). We expect a small margin decline of <0.5pp in Terminals, PN Rail
and BAPS.
■ Acquisitions and capex: The acquisition of Mountain Industries at the FY13 result
highlights a distinct shift in strategy, with management being more proactive in its
broader strategy of vertical supply chain integration coupled with opportunism, the result
of an increasingly healthy balance sheet. While we believe Asciano now has an
excellent platform to make smart bolt-on acquisitions, we remain cautious about other
acquisition opportunities and capex spend further up the supply chain, particularly in the
resources space where returns and earnings are currently challenged. With the market
willing to pay a premium for stocks with a high free cash flow yield, we remain cautious
as to any announced acquisitions in the resources space over a larger dividend.
■ Pay-out ratio: In the absence of any acquisitions, which we see as only a small
possibility, we will be looking for commentary around pay-out ratio targets, currently
20%–40%. With a diminishing growth outlook, looking past the Port Botany
redevelopment, we see enough growth capex flexibility to potentially lift the pay-out ratio.
■ ROCE targets: At the FY13 result, management maintained its initial returns profile
guidance provided from the 2011 strategy briefing. We will be looking for an update on
whether returns are still on track to earn or exceed group WACC by 2015.

14 February 2014
Australia and NZ First Edition 105
Aurizon
Weak Rev/NTK may mask otherwise robust result
Monday, 17 February, 10:30am AEST, Phone 1800 558 698, passcode 731905
Figure 7: Earnings forecasts
1H13 2H13 FY13 1H14
Revenue 1,877.0 1,806.2 3,724.9 1,954.6
EBIT 356.1 397.9 754.7 431.8
PBT 314.1 337.3 651.4 360.5 Source: Company data, Credit Suisse estimates
What to look for:
■ Aurizon has materially outperformed the market in FY14, implicit in this
outperformance relative to other transport stocks is the de-risking of future tonnage
coupled with increased detail around achieving 25% EBIT margins.
■ 1H14 earnings: No 1H14 earnings guidance has been given. Credit Suisse's
estimates remain 1.6% below consensus, with EBIT at $431.8mn vs. consensus at
$439mn.
■ Forecast earnings upgraded: We have upgraded forecast earnings by an average of
4.5%, weighted to FY14, based on strong recent above rail volumes as well as comfort
with the cost-out profile. We are now largely in line with consensus estimates.
■ FY14 tonnage guidance (200–205mt) likely to be upgraded at the 1H14 result:
Based on strong 1H14 volumes and a lack of weather events (so far), we expect a
volume upgrade of ~6.5%, or 213mt to 218mt (CS now 216mt).
■ Customer mix implies Rev/NTK growth may be (temporarily) muted: Given that
the volume growth is being led by BMA, a legacy customer, coupled with new volumes
in the Gunnedah (which carries execution related risks), we do not expect the strong
volumes to transpire into earnings growth at 1H14. As a result, earnings quality at
1H14, in the form of Rev/NTK will likely appear seemingly "weak", with the uplift a
medium-term story. We note confusion around Rev/NTK and other earnings "quality"
metrics at previous results.
■ Margin improvement expected: We expect EBIT margin improvement of 1.1pp (from
19.0% to 21.1%) across the business (FY14 consensus 21.8%), driven in part by the
progressive roll over of legacy contracts, volume recovery as well as further cost-outs.
Should 1H14 margins miss consensus expectations, we believe the fallout could be
low based on the market’s apparent comfort around management’s ability to reach
25% EBIT margin by FY15, with any miss in our view likely to be perceived as a
timing, rather than a structural issue.
■ Progress on cost-outs: With 25% EBIT margins by 2015 already priced into
consensus, we believe the market will increasingly be looking for commentary around
the timing for achieving the $230mn in targeted cost savings over FY14 and FY15. We
believe management could be tracking ahead of the $90mn in cost-out opportunities
initially expected to fall in FY14.
■ Overall: With high expectations baked into both FY15 consensus earnings and
valuation, we believe this result could be more outlook focussed, particularly given
material revenue upside and cost-outs are still 12–18 months away. On this basis we
see outlook commentary as key to the market’s reception of the result.

14 February 2014
Australia and NZ First Edition 106
Airlines Qantas Airways:
Potential for exceptionally weak cash flows
Thursday, 27 February, Dial in TBA
Figure 8: Qantas earnings forecasts
1H13 2H13 FY13 1H14
Revenue 8,241.0 7,724.2 15,903.0 8,096.1
EBIT 310.0 62.0 372.0 (156.0)
PBT 223.0 (31.0) 192.0 (259.0)
Source: Company data, Credit Suisse estimates
■ Pre tax earnings guided to -$250mn to -$300mn, CS -$259mn.
■ Exceptionally weak cash flows expected: In responding to Moody's in January
2014, Qantas announced that cash reserves and undrawn committed bank facilities at
31 December 2013 totalled $3bn. Assuming undrawn facilities remained constant to
FY13 at $600mn, it implies that cash reserves were $2.4bn, a $429mn deterioration
from FY13. The weak implied free cash flow position could be a result of lop-sided
capex, a larger-than-guided loss or cash restructuring charges.
■ Looming strategy day will likely overshadow the 1H14 result: With a looming
group strategy presentation expected sometime in February/March, which has the
potential to be transformational in terms of group costs and liquidity, we see the
upcoming result as carrying less share price weight than previous years, particularly
with guidance already issued.
■ Qantas Domestic will be weak, though relativity to Virgin is the focus: With a
weak result, and potentially even a small loss expected, we believe relativity to Virgin
will be a key metric, particularly in terms of corporate market share and cost
performance. On the best available data, we believe Qantas Domestic could have up
to a 25% CASK premium to Virgin, though realistically this is more likely ~15%. We
see new cost initiatives as likely being a key focus of the upcoming group strategy day
rather than the 1H14 result.
■ Large Qantas International loss likely: We interpret the departure of Virgin Atlantic
on sectors from Australia to Hong Kong as testament to the competitive environment
of Australian International flights. However, with the bulk of Qantas's international
network repositioning done, cabin reconfigurations complete and cost-outs gathering
pace, we could see the 1H14 result as a potential low point for International (fuel and
currency aside).
■ Quantifying the Emirates alliance: In addition to cost savings, any quantification of
the early benefits from the Emirates Alliance in 1H14 would be welcomed; with
positive surprises likely to be well received given the alliance revenue opportunity is a
key unknown.
■ Jetstar Japan losses likely accelerating: Associate losses in FY13 were -$50mn,
which we believe are likely to have accelerated into 1H14 based on high competition
in the Japanese domestic market, a significant depreciation in the JPY as well as
news of up to four parked aircraft tied to the Jetstar Japan and Jetstar Hong Kong.
The commencement of Jetstar Hong Kong remains a key unknown.

14 February 2014
Australia and NZ First Edition 107
Virgin Australia
Friday, 28 February, Dial in TBA
Figure 9: Virgin earnings forecasts
1H13 2H13 FY13 1H14
Revenue 2,108.1 1,912.3 4,020.4 2,273.3
EBIT 84.7 (121.2) (36.5) (15.0)
PBT 63.7 (145.7) (82.0) (47.8) Source: Company data, Credit Suisse estimates
What to look for:
■ PBT already guided to around -$49mn, CS estimates are -$47.8mn.
■ Lowering forecast earnings materially, reflecting assumptions around material
CASK increases (discussed below) coupled with on-going uncertainty in the domestic
market. We now forecast an FY14 PBT of -$115.2mn (previously -$2mn). Our
valuation moves from $0.42 to $0.38 per share, maintaining a NEUTRAL rating.
■ Virgin cost increases likely: We expect the weak Virgin result to be predominantly
cost-led, a result of investment in the new SABRE booking system, Lounge expansion
as well as other product and customer service upgrades. A material CASK overrun
would suggest the planned $60mn in FY14 cost savings is delayed or not enough to
offset cost base investment. With Virgin's product upgrade entering its final stages of
completion, we will be looking for updated CASK estimates and more importantly
CASK relative to Qantas for a view on how sustainable the current domestic
competitive environment is.
■ Is VAH revenue growth a timing issue or a deeper problem? Clearly, costs are
running ahead of revenue at this stage, but the bigger question remains when will
Virgin receive a revenue premium for this cost base investment? Key to revenue
stability going forward, and potentially the credibility of the broader “game change”
strategy, will be whether Virgin's management can grow the proportion of corporate
and government revenue mix, which at FY12 was 20%. More clarity is needed to be
given on corporate market shares.
■ SABRE progress: While the introduction of the SABRE booking system adds to
operating costs, there should also be offsetting revenue growth in the form of better
yield management of late bookings as well as stronger International passenger
inflows. Given the extent of the SABRE investment, we believe the market will likely
need to see evidence of some green shoots in this area.
■ Updates on the “tri-brand” strategy: With Tigerair and Skywest officially integrated
into the business in recent months, outlook statements around Tiger’s planned path
back to profitability would, in our view, also be welcomed by the market given these
acquisitions raise risks around execution.
■ Overall: While the recent guidance has de-risked 1H14 earnings, the near- to
medium-term operating environment coupled with the group’s ownership structure
remains unclear. For management to maintain credibility and keep the goodwill of the
remaining free float, we will need to see strong evidence that the “Game Change”
strategy is slowly yielding results that can put the airline into a competitive position in
FY15.

14 February 2014
Australia and NZ First Edition 108
Financial summaries
Figure 10: Aurizon's financial summary
Aurizon (AZJ) Year ending 30 Jun In AUDmn, unless otherwise stated2012 2013 2014 2015 2016 2012 2013 2014 2015 2016
Share Price: A$4.99 Earnings 06/12A 06/13A 06/14E 06/15E 06/16ERating c_EPS_SHARESEquiv. FPO (period avg.) mn 2,440.0 2,256.7 2,137.2 2,137.2 2,137.2
Target Price A$ c_EPS*100EPS (Normalised) c 16.3 21.6 24.3 30.1 33.7
vs Share price % EPS_GROWTH*100EPS Growth % 32.9 12.4 23.9 11.9
c_EBITDA_MARGIN*100EBITDA Margin % 29.9 33.6 34.8 39.6 39.9
c_DPS*100DPS c 8.0 16.0 17.0 21.1 23.6
c_PAYOUT*100Payout % 49.2 73.9 70.0 70.0 70.0
FRANKING*100Franking % 0.0 15.0 20.0 25.0 30.0
c_FCF_PS*100Free CFPS c 27.6 36.0 34.8 41.5 42.7
Profit & Loss 06/12A 06/13A 06/14E 06/15E 06/16E c_TAX_RATE*100Effective tax rate % 20.4 23.2 27.2 29.0 29.5
Sales revenue 3,505.0 3,724.9 3,909.3 4,007.2 4,435.8 ValuationEBITDA 1,048.0 1,251.0 1,360.5 1,586.0 1,767.9 c_PE P/E x 30.7 23.1 20.5 16.6 14.8
Depr. & Amort. (463.0) (496.3) (497.0) (543.5) (562.0) c_EBIT_MULTIPLE_CURREV/EBIT x 20.1 17.3 15.4 12.8 10.9
EBIT 585.0 754.7 863.5 1,042.5 1,205.9 c_EBITDA_MULTIPLE_CUEV/EBITDA x 11.2 10.4 9.8 8.4 7.5
Associates 0.0 0.0 0.0 0.0 0.0 c_DIV_YIELD*100Dividend Yield % 1.6 3.2 3.4 4.2 4.7
Net interest Exp. (39.0) (103.3) (142.6) (136.5) (184.8) c_FCF_YIELD*100FCF Yield % 5.5 7.2 7.0 8.3 8.6
Other 0.0 0.0 0.0 0.0 0.0 c_PB Price to Book x 1.7 1.6 1.6 1.5 1.5
Profit before tax 546.0 651.4 720.9 906.1 1,021.1 ReturnsIncome tax (149.4) (164.0) (201.8) (262.8) (301.2) c_ROE*100Return on Equity % 5.4 7.5 7.8 9.3 10.1
Profit after tax 396.6 487.4 519.0 643.3 719.8 c_I_NPAT/c_I_SALES*100Profit Margin % 11.3 13.1 13.3 16.1 16.2
Minorities 0.0 0.0 0.0 0.0 0.0 c_I_SALES/c_B_TOT_ASSAsset Turnover x 0.3 0.4 0.4 0.4 0.4
Preferred dividends 0.0 0.0 0.0 0.0 0.0 c_ASSETS/c_EQ_COMMONEquity Multiplier x 1.4 1.6 1.7 1.6 1.6
Associates & Other (0.0) 0.0 0.0 0.0 0.0 c_ROA*100Return on Assets % 4.0 4.7 4.7 5.7 6.2
Normalised NPAT 396.6 487.4 519.0 643.3 719.8 c_ROIC*100Return on Invested Cap. % 5.1 6.4 6.7 7.8 8.8
Unusual item after tax 44.8 (40.0) (147.0) 0.0 0.0 GearingReported NPAT 441.4 447.4 372.0 643.3 719.8 c_GEARING*100Net Debt to Net debt + Equity % 13.1 26.7 28.4 27.6 26.0
84.9 96.4 112.8 c_NET_DEBT/c_I_EBITDANet Debt to EBITDA x 1.1 1.9 1.9 1.7 1.4
Balance Sheet 06/12A 06/13A 06/14E 06/15E 06/16E c_I_EBITDA/ c_I_NET_INTERESTInt Cover (EBITDA/Net Int.) x 26.9 12.1 9.5 11.6 9.6
Cash & equivalents 98.8 107.6 107.6 107.6 107.6 c_I_EBIT/ c_I_NET_INTERESTInt Cover (EBIT/Net Int.) x 15.0 7.3 6.1 7.6 6.5
Inventories 215.8 212.2 211.2 216.5 239.7 (c_C_CAPEX/c_I_SALES)*-100Capex to Sales % 33.0 25.3 24.6 20.5 14.9
Receivables 548.1 579.5 664.0 680.7 753.5 (c_C_CAPEX/c_I_DEPR)*-100Capex to Depreciation % 359.0 190.2 193.8 151.1 117.5
Other current assets 16.8 33.6 33.6 33.6 33.6
Current assets 879.5 932.9 1,016.5 1,038.4 1,134.4 MSCI IVA (ESG) Rating BBBProperty, plant & equip. 9,037.2 9,437.4 9,939.4 10,217.1 10,315.5 #VALUE!
Intangibles 16.3 11.1 11.1 11.1 11.1
Other non-current assets 87.2 98.7 98.7 98.7 98.7
Non-current assets 9,140.7 9,547.2 10,049.2 10,326.9 10,425.3
Total assets 10,020.2 10,480.1 11,065.7 11,365.3 11,559.6
Payables 349.6 320.7 428.4 439.1 486.1
Interest bearing debt 1,201.6 2,478.6 2,746.0 2,743.7 2,622.4
Other liabilities 1,175.1 1,224.2 1,242.9 1,275.6 1,296.0 MSCI IVA Risk: Neutral
Total liabilities 2,726.3 4,023.5 4,417.4 4,458.4 4,404.5
Net assets 7,293.9 6,456.6 6,648.3 6,906.9 7,155.1
Ordinary equity 7,294.2 6,495.6 6,648.6 6,907.2 7,155.4
Minority interests 0.0 0.0 0.0 0.0 0.0
Preferred capital 0.0 0.0 0.0 0.0 0.0
Total shareholder funds 7,294.2 6,495.6 6,648.6 6,907.2 7,155.4
Net debt 1,102.8 2,371.0 2,638.4 2,636.1 2,514.8 Source: MSCI ESG Research
Cashflow 06/12A 06/13A 06/14E 06/15E 06/16E Share Price Performance
EBIT 585.0 754.7 863.5 1,042.5 1,205.9
Net interest -78.2 -112.0 -142.6 -136.5 -184.8
Depr & Amort 463.0 496.3 497.0 543.5 562.0
Tax paid 0.0 -31.0 -183.1 -230.1 -280.8
Working capital 0.0 0.0 24.1 -11.2 -49.0
Other 0.0 0.0 0.0 0.0 0.0
Operating cashflow 969.8 1,108.0 1,058.9 1,208.2 1,253.3
Capex -1,156.3 -944.0 -963.0 -821.2 -660.4
Capex - expansionary -860.3 -648.0 -647.2 -499.7 -319.7
Capex - maintenance -296.0 -296.0 -315.9 -321.5 -340.6
Acquisitions & Invest
Asset sale proceeds 0.0 0.0 0.0 0.0 0.0
Other 4.7 49.0 0.0 0.0 0.0
Investing cashflow -1,151.6 -895.0 -963.0 -821.2 -660.4
Dividends paid -180.6 -200.0 -363.3 -384.7 -471.7
Equity raised
Net borrowings 17.9 -68.0 267.4 -2.4 -121.2
Other 0.0 0.0 0.0 0.0 0.0 1 Month 3 Month 12 Month
Financing cashflow -162.7 -268.0 -95.9 -387.1 -592.9 Absolute 2.7% 7.3% 22.6%
Total cashflow -344.5 -55.0 0.0 0.0 0.0 Relative 2.3% 8.2% 15.5%
Adjustments 0.0 0.0 0.0 0.0 0.0
Net change in cash -344.5 -55.0 0.0 0.0 0.0 Source: Reuters 52 week trading range: 3.80-5.06
MSCI IVA Risk Comment: No change to MSCI
12/02/2014 21:33
Aurizon is a rail freight company. The Company provides coal, bulk and general freight
haulage services, operating on the Central Queensland Coal Network (CQCN) and including
specialised track maintenance and workshop support functions.
Credit Suisse View
TP Risk Comment:
RESTRICTED
3.00
3.50
4.00
4.50
5.00
5.50
6.00
31/01/2013 31/03/2013 31/05/2013 31/07/2013 30/09/2013 30/11/2013 31/01/2014
AZJ.AX XJO
4.5
5.0
5.5
6.0
6.5
7.0
7.5
8.0
8.5
9.0
Environment Social Governance
Stock Local Sector
Country Global Sector
Source: Company data, Credit Suisse estimates

14 February 2014
Australia and NZ First Edition 109
Figure 11: Asciano's financial summary
Asciano Group (AIO) Year ending 30 Jun In AUDmn, unless otherwise stated2012 2013 2014 2015 2016 2012 2013 2014 2015 2016
Share Price: A$5.68 Earnings 06/12A 06/13A 06/14E 06/15E 06/16ERating c_EPS_SHARESEquiv. FPO (period avg.) mn 975.4 975.4 975.4 975.4 975.4
Target Price A$ 6.20 c_EPS*100EPS (Normalised) c 25.6 36.7 37.0 42.6 47.1
vs Share price % 9.15 EPS_GROWTH*100EPS Growth % 43.3 0.6 15.2 10.5
c_EBITDA_MARGIN*100EBITDA Margin % 26.3 26.6 28.1 29.4 29.7
c_DPS*100DPS c 7.7 11.1 14.8 21.3 30.6
c_PAYOUT*100Payout % 30.0 30.1 40.0 50.0 65.0
FRANKING*100Franking % 100.0 100.0 100.0 100.0 100.0
c_FCF_PS*100Free CFPS c 51.0 39.3 48.8 55.9 59.1
Profit & Loss 06/12A 06/13A 06/14E 06/15E 06/16E c_TAX_RATE*100Effective tax rate % 36.6 27.0 31.4 29.5 30.0
Sales revenue 3,456.7 3,727.7 3,842.5 4,013.5 4,191.1 ValuationEBITDA 907.7 992.7 1,078.4 1,178.7 1,245.6 c_PE P/E x 22.2 15.5 15.4 13.3 12.1
Depr. & Amort. (291.0) (291.0) (350.4) (375.0) (378.4) c_EBIT_MULTIPLE_CURREV/EBIT x 13.4 12.2 12.0 10.8 9.9
EBIT 616.7 701.7 728.0 803.7 867.1 c_EBITDA_MULTIPLE_CUEV/EBITDA x 9.1 8.6 8.1 7.4 6.9
Associates 0.0 0.0 0.0 0.0 0.0 c_DIV_YIELD*100Dividend Yield % 1.4 1.9 2.6 3.8 5.4
Net interest Exp. (220.4) (199.6) (216.5) (210.3) (207.0) c_FCF_YIELD*100FCF Yield % 9.0 6.9 8.6 9.8 10.4
Other 0.0 0.0 0.0 0.0 0.0 c_PB Price to Book x 1.7 1.5 1.4 1.4 1.3
Profit before tax 396.3 502.1 511.6 593.4 660.2 ReturnsIncome tax (144.4) (141.4) (148.4) (175.1) (198.0) c_ROE*100Return on Equity % 7.5 9.9 9.4 10.3 11.0
Profit after tax 251.9 360.7 363.2 418.3 462.1 c_I_NPAT/c_I_SALES*100Profit Margin % 7.2 9.6 9.4 10.4 11.0
Minorities (1.9) (2.3) (2.5) (2.8) (3.1) c_I_SALES/c_B_TOT_ASSAsset Turnover x 0.5 0.5 0.5 0.5 0.5
Preferred dividends 0.0 0.0 0.0 0.0 0.0 c_ASSETS/c_EQ_COMMONEquity Multiplier x 2.1 2.1 2.1 2.0 2.0
Associates & Other (0.0) 0.0 0.0 0.0 0.0 c_ROA*100Return on Assets % 3.5 4.7 4.5 5.1 5.5
Normalised NPAT 250.0 358.4 360.7 415.6 459.0 c_ROIC*100Return on Invested Cap. % 6.5 7.6 7.3 7.9 8.3
Unusual item after tax (9.2) (9.0) (26.0) 0.0 0.0 GearingReported NPAT 240.8 349.4 334.7 415.6 459.0 c_GEARING*100Net Debt to Net debt + Equity % 44.7 45.6 45.6 43.9 42.1
84.9 96.4 112.8 c_NET_DEBT/c_I_EBITDANet Debt to EBITDA x 3.0 3.1 3.0 2.7 2.5
Balance Sheet 06/12A 06/13A 06/14E 06/15E 06/16E c_I_EBITDA/ c_I_NET_INTERESTInt Cover (EBITDA/Net Int.) x 4.1 5.0 5.0 5.6 6.0
Cash & equivalents 149.4 29.7 29.8 29.8 29.8 c_I_EBIT/ c_I_NET_INTERESTInt Cover (EBIT/Net Int.) x 2.8 3.5 3.4 3.8 4.2
Inventories 24.1 29.3 30.2 31.5 32.9 (c_C_CAPEX/c_I_SALES)*-100Capex to Sales % 23.7 16.4 18.9 13.0 10.4
Receivables 375.2 392.4 404.5 422.5 441.2 (c_C_CAPEX/c_I_DEPR)*-100Capex to Depreciation % 339.2 253.9 228.4 152.0 125.6
Other current assets 26.9 43.4 43.4 43.4 43.4
Current assets 575.6 494.8 507.9 527.2 547.3 MSCI IVA (ESG) Rating BBBProperty, plant & equip. 3,581.7 3,926.4 4,302.0 4,480.0 4,568.7 TP ESG Risk (%): -3.08
Intangibles 2,750.3 2,793.8 2,793.8 2,761.2 2,728.5
Other non-current assets 254.6 428.1 428.1 428.1 428.1
Non-current assets 6,586.6 7,148.3 7,523.9 7,669.3 7,725.2
Total assets 7,162.2 7,643.1 8,031.8 8,196.5 8,272.5
Payables 366.4 393.6 397.8 408.0 423.9
Interest bearing debt 2,858.2 3,070.9 3,250.5 3,194.4 3,090.8
Other liabilities 590.2 543.8 543.8 543.8 543.8 MSCI IVA Risk: Positive
Total liabilities 3,814.8 4,008.3 4,192.0 4,146.2 4,058.5
Net assets 3,347.4 3,634.8 3,839.7 4,050.3 4,214.0
Ordinary equity 3,334.9 3,620.0 3,822.4 4,030.2 4,190.9
Minority interests 12.5 14.8 17.3 20.1 23.2
Preferred capital 0.0 0.0 0.0 0.0 0.0
Total shareholder funds 3,347.4 3,634.8 3,839.7 4,050.3 4,214.0
Net debt 2,708.8 3,041.2 3,220.7 3,164.6 3,061.0 Source: MSCI ESG Research
Cashflow 06/12A 06/13A 06/14E 06/15E 06/16E Share Price Performance
EBIT 616.7 701.7 728.0 803.7 867.1
Net interest -233.5 -219.9 -216.5 -210.3 -207.0
Depr & Amort 291.0 291.0 350.4 375.0 378.4
Tax paid -46.4 -170.4 -148.4 -175.1 -198.0
Working capital 0.0 0.0 -8.8 -9.2 -4.2
Other 17.5 18.6 0.0 0.0 0.0
Operating cashflow 645.3 621.0 704.8 784.2 836.4
Capex -819.2 -613.2 -726.1 -520.3 -434.4
Capex - expansionary -671.8 -375.2 -496.8 -281.7 -174.3
Capex - maintenance -147.4 -238.0 -229.3 -238.7 -260.1
Acquisitions & Invest
Asset sale proceeds 25.6 -37.9 0.0 0.0 0.0
Other 3.7 14.1 0.0 0.0 0.0
Investing cashflow -789.9 -637.0 -726.1 -520.3 -434.4
Dividends paid -63.5 -90.4 -144.3 -207.8 -298.4
Equity raised 0.0 0.0 0.0 0.0 0.0
Net borrowings -3.4 10.2 179.6 -56.0 -103.6
Other 0.0 0.0 0.0 0.0 0.0 1 Month 3 Month 12 Month
Financing cashflow -66.9 -80.2 35.3 -263.8 -402.0 Absolute 0.7% -0.5% 13.6%
Total cashflow -211.5 -96.2 14.0 0.0 0.0 Relative 0.4% 0.3% 6.5%
Adjustments 0.0 0.0 0.0 0.0 0.0
Net change in cash -211.5 -96.2 14.0 0.0 0.0 Source: Reuters 52 week trading range: 4.69-6.21
MSCI IVA Risk Comment: While staff engagement is a key
concern at Patrick, the conclusion of negotiations and the signing
of a new workplace agreement should result in immediate
productivity improvements and staff engagement. On this basis
we do not agree with the poor MSCI rating in this category and
believe there is scope for a re-rating.
12/02/2014 21:35
Asciano is an Australia-based company. The Company is engaged in the ownership and
management of ports and rail assets, and associated operations and services. Asciano
consists of four segments: Coal, Intermodal, Container Ports, and Auto.
Credit Suisse View
TP Risk Comment: ESG impact from low staff engagement and
poor productivity at Patrick. New EBA signed meaning potential
upside likely, but risk to delivery remain.
OUTPERFORM
4.00
4.20
4.40
4.60
4.80
5.00
5.20
5.40
5.60
5.80
6.00
31/01/2013 31/03/2013 31/05/2013 31/07/2013 30/09/2013 30/11/2013 31/01/2014
AIO.AX XJO
4.5
5.0
5.5
6.0
6.5
7.0
7.5
8.0
8.5
9.0
Environment Social Governance
Stock Local Sector
Country Global Sector
Source: Company data, Credit Suisse estimates

14 February 2014
Australia and NZ First Edition 110
Figure 12: Brambles' financial summary (ex. Recall)
Brambles Limited (BXB) Year ending 30 Jun In USDmn, unless otherwise stated2012 2013 2014 2015 2016 2012 2013 2014 2015 2016
Share Price: A$8.90 Earnings 06/12A 06/13A 06/14E 06/15E 06/16ERating c_EPS_SHARESEquiv. FPO (period avg.) mn 1,484.6 1,553.4 1,553.4 1,553.4 1,553.4
Target Price A$ 9.29 c_EPS*100EPS (Normalised) c 34.5 37.7 40.5 45.0 48.0
vs Share price % 4.38 EPS_GROWTH*100EPS Growth % 9.1 7.6 10.9 6.8
c_EBITDA_MARGIN*100EBITDA Margin % 27.7 27.6 28.1 28.2 28.2
c_DPS*100DPS c 26.8 27.7 27.2 28.1 28.2
c_PAYOUT*100Payout % 77.7 73.6 67.1 62.4 58.7
FRANKING*100Franking % 25.0 25.0 25.0 25.0 25.0
c_FCF_PS*100Free CFPS c 25.6 27.8 39.4 45.1 48.1
Profit & Loss 06/12A 06/13A 06/14E 06/15E 06/16E c_TAX_RATE*100Effective tax rate % 26.4 27.4 28.0 28.0 28.0
Sales revenue 4,780.0 5,082.9 5,369.6 5,773.1 6,109.6 ValuationEBITDA 1,324.7 1,403.0 1,506.3 1,627.2 1,722.8 c_PE P/E x 23.3 21.4 19.9 17.9 16.8
Depr. & Amort. (489.2) (495.0) (524.7) (547.7) (575.2) c_EBIT_MULTIPLE_CURREV/EBIT x 18.3 16.5 15.3 13.9 13.2
EBIT 835.5 908.0 981.6 1,079.5 1,147.7 c_EBITDA_MULTIPLE_CUEV/EBITDA x 11.5 10.6 9.9 9.2 8.8
Associates 0.0 0.0 0.0 0.0 0.0 c_DIV_YIELD*100Dividend Yield % 3.3 3.4 3.4 3.5 3.5
Net interest Exp. (139.0) (100.9) (107.4) (109.6) (112.1) c_FCF_YIELD*100FCF Yield % 3.2 3.5 4.9 5.6 6.0
Other 0.0 0.0 0.0 0.0 0.0 c_PB Price to Book x 4.4 5.0 4.6 4.2 3.9
Profit before tax 696.5 807.1 874.2 969.9 1,035.5 ReturnsIncome tax (163.1) (209.1) (244.8) (271.6) (290.0) c_ROE*100Return on Equity % 18.7 23.3 23.1 23.5 23.0
Profit after tax 533.4 598.0 629.5 698.3 745.6 c_I_NPAT/c_I_SALES*100Profit Margin % 10.7 11.5 11.7 12.1 12.2
Minorities (0.0) (0.0) (0.0) (0.0) (0.0) c_I_SALES/c_B_TOT_ASSAsset Turnover x 0.6 0.8 0.8 0.8 0.8
Preferred dividends 0.0 0.0 0.0 0.0 0.0 c_ASSETS/c_EQ_COMMONEquity Multiplier x 2.8 2.7 2.6 2.5 2.4
Associates & Other (20.9) (12.9) 0.0 0.0 0.0 c_ROA*100Return on Assets % 6.8 8.7 9.0 9.5 9.7
Normalised NPAT 512.5 585.1 629.5 698.3 745.6 c_ROIC*100Return on Invested Cap. % 11.3 13.5 13.8 14.3 14.4
Unusual item after tax (57.2) (30.1) 0.0 0.0 0.0 GearingReported NPAT 455.3 555.0 629.5 698.3 745.6 c_GEARING*100Net Debt to Net debt + Equity % 49.5 48.3 46.8 45.1 43.6
84.9 96.4 112.8 c_NET_DEBT/c_I_EBITDANet Debt to EBITDA x 2.0 1.7 1.6 1.5 1.5
Balance Sheet 06/12A 06/13A 06/14E 06/15E 06/16E c_I_EBITDA/ c_I_NET_INTERESTInt Cover (EBITDA/Net Int.) x 9.5 13.9 14.0 14.8 15.4
Cash & equivalents 174.2 53.0 53.7 54.6 48.5 c_I_EBIT/ c_I_NET_INTERESTInt Cover (EBIT/Net Int.) x 6.0 9.0 9.1 9.8 10.2
Inventories 48.2 54.0 55.1 56.2 57.3 (c_C_CAPEX/c_I_SALES)*-100Capex to Sales % 19.9 17.8 16.8 16.6 16.8
Receivables 1,054.8 972.0 991.4 1,011.3 1,031.5 (c_C_CAPEX/c_I_DEPR)*-100Capex to Depreciation % 227.2 210.0 194.3 195.5 197.4
Other current assets 75.1 55.9 55.9 55.9 55.9
Current assets 1,352.3 1,134.9 1,156.1 1,178.0 1,193.2 MSCI IVA (ESG) Rating AAAProperty, plant & equip. 4,138.6 4,036.0 4,306.9 4,601.8 4,920.2 TP ESG Risk (%): 0
Intangibles 1,969.6 1,471.0 1,471.0 1,471.0 1,471.0
Other non-current assets 85.2 64.8 64.8 64.8 64.8
Non-current assets 6,193.4 5,571.8 5,842.7 6,137.6 6,456.0
Total assets 7,545.7 6,706.7 6,998.9 7,315.6 7,649.3
Payables 1,176.8 1,093.0 1,114.9 1,137.2 1,159.9
Interest bearing debt 2,864.1 2,401.9 2,451.9 2,501.9 2,551.9
Other liabilities 764.4 701.5 701.5 701.5 701.5 MSCI IVA Risk: Neutral
Total liabilities 4,805.3 4,196.4 4,268.3 4,340.6 4,413.3
Net assets 2,740.4 2,510.3 2,730.6 2,975.0 3,236.0
Ordinary equity 2,740.4 2,510.3 2,730.6 2,975.0 3,236.0
Minority interests 0.0 0.0 0.0 0.0 0.0
Preferred capital 0.0 0.0 0.0 0.0 0.0
Total shareholder funds 2,740.4 2,510.3 2,730.6 2,975.0 3,236.0
Net debt 2,689.9 2,348.9 2,398.2 2,447.3 2,503.4 Source: MSCI ESG Research
Cashflow 06/12A 06/13A 06/14E 06/15E 06/16E Share Price Performance
EBIT 835.5 908.0 981.6 1,079.5 1,147.7
Net interest -158.4 -160.1 -125.5 -107.3 -109.8
Depr & Amort 489.2 495.0 524.7 547.7 575.2
Tax paid -215.1 -149.0 -244.8 -271.6 -290.0
Working capital 0.0 -50.0 1.3 1.4 1.4
Other 138.0 53.5 -1.3 -1.4 -1.4
Operating cashflow 1,089.2 1,097.4 1,136.0 1,248.4 1,323.1
Capex -949.4 -905.1 -901.1 -960.0 -1,023.7
Capex - expansionary -240.0 -240.0 -376.4 -412.3 -448.5
Capex - maintenance -709.4 -665.1 -524.7 -547.7 -575.2
Acquisitions & Invest 17.0 -105.2 105.5 117.4 130.0
Asset sale proceeds 0.0 0.0 0.0 0.0 0.0
Other 0.0 0.0 0.0 0.0 0.0
Investing cashflow -932.4 -1,010.3 -795.6 -842.6 -893.6
Dividends paid -397.7 -425.5 -409.1 -453.9 -484.6
Equity raised 326.6 117.4 0.0 0.0 0.0
Net borrowings 11.5 -93.9 50.0 50.0 50.0
Other 4.6 6.6 0.0 0.0 0.0 1 Month 3 Month 12 Month
Financing cashflow -55.0 -395.4 -359.1 -403.9 -434.6 Absolute -1.9% -3.8% 9.2%
Total cashflow 101.8 -308.3 -18.8 1.8 -5.2 Relative -2.2% -2.9% 2.1%
Adjustments -29.1 -11.9 0.0 0.0 0.0
Net change in cash 72.7 -320.2 -18.8 1.8 -5.2 Source: Reuters 52 week trading range: 8.17-9.71
MSCI IVA Risk Comment: While Brambles is AAA rated, we
believe the MSCI social score of 7.3 should be higher, as
concerns over the use of illegal immigrants in the IFCO business
relates to the 2003-2006 period, which was prior to its acquisition
by Brambles. Adequate provisions have been made. Furthermore,
the high risk MSCI places on Privacy and Data security as a result
of the Recall business should disappear with its impending sale.
With a higher MSCI re-rating likely, we believe this could be one
12/02/2014 21:36
Brambles Limited (Brambles) is an Australian based company. The company is engaged in
the provision of pallet, container pooling and supply chain services and information
management systems.
Credit Suisse View
TP Risk Comment: Solid ESG track record. Despite fast
expansion into emerging markets, particularly Asia, management
remain committed to sourcing lumber from sustainable sources.
NEUTRAL
7.00
7.50
8.00
8.50
9.00
9.50
10.00
31/01/2013 31/03/2013 31/05/2013 31/07/2013 30/09/2013 30/11/2013 31/01/2014
BXB.AX XJO
4.5
5.0
5.5
6.0
6.5
7.0
7.5
8.0
8.5
9.0
Environment Social Governance
Stock Local Sector
Country Global Sector
Source: Company data, Credit Suisse estimates

14 February 2014
Australia and NZ First Edition 111
Figure 13: Toll's financial summary
Toll Holdings (TOL) Year ending 30 Jun In AUDmn, unless otherwise stated2012 2013 2014 2015 2016 2012 2013 2014 2015 2016
Share Price: A$5.64 Earnings 06/12A 06/13A 06/14E 06/15E 06/16ERating c_EPS_SHARESEquiv. FPO (period avg.) mn 715.2 717.1 712.7 717.1 717.1
Target Price A$ 5.49 c_EPS*100EPS (Normalised) c 36.7 40.2 40.1 42.8 45.4
vs Share price % -2.66 EPS_GROWTH*100EPS Growth % 9.4 -0.2 6.8 6.1
c_EBITDA_MARGIN*100EBITDA Margin % 7.6 8.1 8.1 8.4 8.7
c_DPS*100DPS c 25.0 26.0 29.5 32.0 38.0
c_PAYOUT*100Payout % 68.1 64.7 73.6 74.7 83.6
FRANKING*100Franking % 100.0 100.0 100.0 100.0 100.0
c_FCF_PS*100Free CFPS c 40.2 61.2 60.8 70.1 78.7
Profit & Loss 06/12A 06/13A 06/14E 06/15E 06/16E c_TAX_RATE*100Effective tax rate % 57.3 50.3 29.4 30.1 30.6
Sales revenue 8,707.2 8,719.4 8,838.7 9,089.7 9,278.4 ValuationEBITDA 659.5 702.5 716.7 764.5 811.3 c_PE P/E x 15.4 14.0 14.1 13.2 12.4
Depr. & Amort. (254.1) (263.8) (264.3) (281.8) (298.2) c_EBIT_MULTIPLE_CURREV/EBIT x 12.8 12.1 11.4 10.7 10.1
EBIT 405.4 438.7 452.4 482.7 513.1 c_EBITDA_MULTIPLE_CUEV/EBITDA x 7.9 7.6 7.2 6.7 6.4
Associates 0.0 0.0 0.0 0.0 0.0 c_DIV_YIELD*100Dividend Yield % 4.4 4.6 5.2 5.7 6.7
Net interest Exp. (37.0) (36.6) (37.4) (32.9) (33.0) c_FCF_YIELD*100FCF Yield % 7.1 10.8 10.8 12.4 14.0
Other 0.0 0.0 0.0 0.0 0.0 c_PB Price to Book x 1.5 1.5 1.5 1.4 1.4
Profit before tax 368.4 402.1 415.0 449.8 480.1 ReturnsIncome tax (99.6) (106.9) (122.0) (135.3) (146.7) c_ROE*100Return on Equity % 9.6 10.8 10.4 10.9 11.3
Profit after tax 268.8 295.2 293.0 314.6 333.4 c_I_NPAT/c_I_SALES*100Profit Margin % 3.0 3.3 3.2 3.4 3.5
Minorities (6.3) (7.2) (7.3) (7.4) (7.5) c_I_SALES/c_B_TOT_ASSAsset Turnover x 1.4 1.5 1.5 1.5 1.5
Preferred dividends 0.0 0.0 0.0 0.0 0.0 c_ASSETS/c_EQ_COMMONEquity Multiplier x 2.2 2.2 2.1 2.1 2.1
Associates & Other 0.0 0.0 0.0 0.0 0.0 c_ROA*100Return on Assets % 4.3 4.8 4.8 5.1 5.3
Normalised NPAT 262.5 288.0 285.7 307.2 325.9 c_ROIC*100Return on Invested Cap. % 7.6 8.1 8.2 8.5 8.8
Unusual item after tax (203.4) (190.7) 0.0 0.0 0.0 GearingReported NPAT 59.1 97.3 285.7 307.2 325.9 c_GEARING*100Net Debt to Net debt + Equity % 29.3 32.1 28.5 28.0 28.1
84.9 96.4 112.8 c_NET_DEBT/c_I_EBITDANet Debt to EBITDA x 1.7 1.8 1.5 1.5 1.4
Balance Sheet 06/12A 06/13A 06/14E 06/15E 06/16E c_I_EBITDA/ c_I_NET_INTERESTInt Cover (EBITDA/Net Int.) x 17.8 19.2 19.2 23.3 24.6
Cash & equivalents 569.1 515.5 515.5 515.5 515.5 c_I_EBIT/ c_I_NET_INTERESTInt Cover (EBIT/Net Int.) x 11.0 12.0 12.1 14.7 15.5
Inventories 53.3 61.6 48.1 48.5 48.5 (c_C_CAPEX/c_I_SALES)*-100Capex to Sales % 5.5 4.5 4.2 4.2 4.2
Receivables 1,129.2 1,241.1 1,089.7 1,120.7 1,143.9 (c_C_CAPEX/c_I_DEPR)*-100Capex to Depreciation % 188.4 148.4 141.1 133.9 129.3
Other current assets 169.8 148.5 148.5 148.5 148.5
Current assets 1,921.4 1,966.7 1,801.8 1,833.1 1,856.4 MSCI IVA (ESG) Rating AProperty, plant & equip. 2,010.7 1,999.4 2,107.9 2,203.6 2,290.9 TP ESG Risk (%): 0
Intangibles 1,795.1 1,660.3 1,656.1 1,653.5 1,653.5
Other non-current assets 313.7 348.2 348.2 348.2 348.2
Non-current assets 4,119.5 4,007.9 4,112.2 4,205.3 4,292.6
Total assets 6,040.9 5,974.6 5,914.0 6,038.4 6,149.0
Payables 892.9 868.2 884.7 909.9 928.7
Interest bearing debt 1,708.3 1,788.7 1,620.2 1,624.8 1,651.0
Other liabilities 693.3 621.3 636.7 651.3 666.1 MSCI IVA Risk: Neutral
Total liabilities 3,294.5 3,278.2 3,141.6 3,186.0 3,245.8
Net assets 2,746.4 2,696.4 2,772.3 2,852.4 2,903.2
Ordinary equity 2,727.1 2,674.8 2,750.7 2,830.8 2,881.6
Minority interests 19.3 21.6 21.6 21.6 21.6
Preferred capital 0.0 0.0 0.0 0.0 0.0
Total shareholder funds 2,746.4 2,696.4 2,772.3 2,852.4 2,903.2
Net debt 1,139.2 1,273.2 1,104.7 1,109.3 1,135.5 Source: MSCI ESG Research
Cashflow 06/12A 06/13A 06/14E 06/15E 06/16E Share Price Performance
EBIT 405.4 438.7 452.4 482.7 513.1
Net interest -26.7 -28.5 -37.4 -32.9 -33.0
Depr & Amort 254.1 263.8 264.3 281.8 298.2
Tax paid -98.8 -132.7 -122.0 -135.3 -146.7
Working capital 6.5 -144.9 181.4 -6.2 -4.4
Other -2.8 146.8 -164.3 32.7 37.7
Operating cashflow 537.7 543.2 574.4 622.9 664.9
Capex -478.6 -391.6 -372.8 -377.4 -385.5
Capex - expansionary -228.1 -287.0 -231.5 -257.3 -285.1
Capex - maintenance -250.5 -104.6 -141.3 -120.1 -100.4
Acquisitions & Invest
Asset sale proceeds 0.0 0.0 0.0 0.0 0.0
Other 23.8 168.2 0.0 0.0 0.0
Investing cashflow -454.8 -223.4 -372.8 -377.4 -385.5
Dividends paid -167.3 -192.3 -214.6 -243.8 -301.2
Equity raised 0.2 0.3 0.0 0.0 0.0
Net borrowings 97.0 -13.7 -168.5 4.6 26.1
Other 0.0 -0.5 0.0 0.0 0.0 1 Month 3 Month 12 Month
Financing cashflow -70.1 -206.2 -383.0 -239.2 -275.0 Absolute -1.6% -2.1% 4.8%
Total cashflow 12.8 113.6 -181.4 6.2 4.4 Relative -1.9% -1.2% -2.2%
Adjustments 5.9 10.3 0.0 0.0 0.0
Net change in cash 18.7 123.9 -181.4 6.2 4.4 Source: Reuters 52 week trading range: 4.63-6.18
MSCI IVA Risk Comment: We are satisfied with the MSCI IVA
rating.
12/02/2014 21:38
Toll Holdings Limited is a transport and logistics provider. It operates in six segments: Toll
Global Resources; Toll Global Logistics; Toll Global Forwarding; Toll Global Express; Toll
Domestic Forwarding, and Toll Specialized and Domestic Freight.
Credit Suisse View
TP Risk Comment: Current lawsuit from US truck drivers
highlights potential workplace issues, though impact expected to
be small and isolated to the US.
NEUTRAL
4.00
4.50
5.00
5.50
6.00
6.50
31/01/2013 31/03/2013 31/05/2013 31/07/2013 30/09/2013 30/11/2013 31/01/2014
TOL.AX XJO
4.5
5.0
5.5
6.0
6.5
7.0
7.5
8.0
8.5
9.0
Environment Social Governance
Stock Local Sector
Country Global Sector
Source: Company data, Credit Suisse estimates

14 February 2014
Australia and NZ First Edition 112
Figure 14: Qube's financial summary
Qube Logistics (QUB) Year ending 30 Jun In AUDmn, unless otherwise stated2012 2013 2014 2015 2016 2012 2013 2014 2015 2016
Share Price: A$2.08 Earnings 06/12A 06/13A 06/14E 06/15E 06/16ERating c_EPS_SHARESEquiv. FPO (period avg.) mn 810.8 921.4 921.4 921.4 921.4
Target Price A$ 2.20 c_EPS*100EPS (Normalised) c -1.8 9.4 9.2 10.5 12.2
vs Share price % 5.77 EPS_GROWTH*100EPS Growth % 616.5 -1.6 13.5 17.0
c_EBITDA_MARGIN*100EBITDA Margin % 4.2 17.0 17.4 17.7 18.0
c_DPS*100DPS c 4.1 5.2 5.0 5.4 5.4
c_PAYOUT*100Payout % -226.1 55.5 54.3 51.6 44.1
FRANKING*100Franking % 50.0 100.0 100.0 100.0 100.0
c_FCF_PS*100Free CFPS c -7.3 -3.0 -1.0 7.3 9.9
Profit & Loss 06/12A 06/13A 06/14E 06/15E 06/16E c_TAX_RATE*100Effective tax rate % 2.2 24.8 30.0 30.0 30.0
Sales revenue 776.8 1,065.1 1,218.4 1,327.3 1,491.7 ValuationEBITDA 33.0 181.5 211.5 235.4 267.9 c_PE P/E x -114.7 22.2 22.6 19.9 17.0
Depr. & Amort. (36.2) (59.0) (66.5) (72.2) (80.4) c_EBIT_MULTIPLE_CURREV/EBIT x -694.4 19.6 17.0 15.1 13.0
EBIT (3.3) 122.5 145.1 163.2 187.5 c_EBITDA_MULTIPLE_CUEV/EBITDA x 68.7 13.2 11.7 10.4 9.1
Associates 0.0 15.5 14.6 15.4 16.1 c_DIV_YIELD*100Dividend Yield % 2.0 2.5 2.4 2.6 2.6
Net interest Exp. (11.8) (33.7) (33.1) (35.6) (37.2) c_FCF_YIELD*100FCF Yield % -3.5 -1.4 -0.5 3.5 4.7
Other 0.0 12.5 0.0 0.0 0.0 c_PB Price to Book x 1.9 1.8 1.7 1.7 1.6
Profit before tax (15.0) 116.8 126.6 143.0 166.4 ReturnsIncome tax 0.3 (26.8) (38.0) (42.9) (49.9) c_ROE*100Return on Equity % -1.5 8.1 7.7 8.4 9.3
Profit after tax (14.7) 90.0 88.6 100.1 116.5 c_I_NPAT/c_I_SALES*100Profit Margin % -1.9 8.1 7.0 7.3 7.6
Minorities (0.0) (3.7) (3.7) (3.7) (3.7) c_I_SALES/c_B_TOT_ASSAsset Turnover x 0.5 0.6 0.6 0.7 0.7
Preferred dividends 0.0 0.0 0.0 0.0 0.0 c_ASSETS/c_EQ_COMMONEquity Multiplier x 1.7 1.7 1.8 1.7 1.7
Associates & Other 0.0 (0.0) 0.0 0.0 0.0 c_ROA*100Return on Assets % -0.9 4.7 4.3 4.8 5.5
Normalised NPAT (14.7) 86.3 84.9 96.4 112.8 c_ROIC*100Return on Invested Cap. % -0.2 5.9 5.9 6.5 7.4
Unusual item after tax 0.0 7.2 0.0 0.0 0.0 GearingReported NPAT (14.7) 93.6 84.9 96.4 112.8 c_GEARING*100Net Debt to Net debt + Equity % 23.0 28.9 31.2 29.9 27.7
84.9 96.4 112.8 c_NET_DEBT/c_I_EBITDANet Debt to EBITDA x 9.9 2.6 2.5 2.2 1.8
Balance Sheet 06/12A 06/13A 06/14E 06/15E 06/16E c_I_EBITDA/ c_I_NET_INTERESTInt Cover (EBITDA/Net Int.) x 2.8 5.4 6.4 6.6 7.2
Cash & equivalents 118.6 57.7 57.7 57.7 57.7 c_I_EBIT/ c_I_NET_INTERESTInt Cover (EBIT/Net Int.) x -0.3 3.6 4.4 4.6 5.0
Inventories 3.6 3.5 4.0 4.4 4.9 (c_C_CAPEX/c_I_SALES)*-100Capex to Sales % 10.0 16.4 12.3 6.8 6.0
Receivables 141.8 165.8 189.7 206.7 232.3 (c_C_CAPEX/c_I_DEPR)*-100Capex to Depreciation % 214.7 296.9 225.7 124.7 111.9
Other current assets 3.9 0.0 0.0 0.0 0.0
Current assets 267.9 227.1 251.5 268.8 294.9 MSCI IVA (ESG) Rating BBBProperty, plant & equip. 362.9 513.6 597.2 615.0 624.5 TP ESG Risk (%): 0
Intangibles 599.7 605.1 605.1 605.1 605.1
Other non-current assets 468.6 495.1 503.7 516.1 516.5
Non-current assets 1,431.2 1,613.8 1,706.0 1,736.2 1,746.2
Total assets 1,699.1 1,840.9 1,957.4 2,005.0 2,041.1
Payables 94.5 96.3 110.2 120.1 134.9
Interest bearing debt 444.2 521.0 591.1 579.9 550.5
Other liabilities 67.2 81.5 81.2 77.1 58.6 MSCI IVA Risk: Positive
Total liabilities 605.9 698.8 782.6 777.0 744.1
Net assets 1,093.2 1,142.1 1,174.9 1,227.9 1,297.0
Ordinary equity 1,013.3 1,062.7 1,097.8 1,146.3 1,209.3
Minority interests 77.9 79.4 79.4 79.4 79.4
Preferred capital 0.0 0.0 0.0 0.0 0.0
Total shareholder funds 1,091.2 1,142.1 1,177.2 1,225.7 1,288.7
Net debt 325.6 463.2 533.4 522.1 492.8 Source: MSCI ESG Research
Cashflow 06/12A 06/13A 06/14E 06/15E 06/16E Share Price Performance
EBIT -3.3 122.5 145.1 163.2 187.5
Net interest -10.5 -33.1 -33.1 -35.6 -37.2
Depr & Amort 36.2 59.0 66.5 72.2 80.4
Tax paid -20.7 -11.1 -38.0 -42.9 -49.9
Working capital -22.5 -22.1 -10.5 -7.5 -11.3
Other 39.6 32.5 10.5 7.5 11.3
Operating cashflow 18.8 147.6 140.5 156.9 180.8
Capex -77.8 -175.1 -150.0 -90.0 -90.0
Capex - expansionary
Capex - maintenance
Acquisitions & Invest
Asset sale proceeds 0.0 0.0 0.0 0.0 0.0
Other -200.6 -62.8 0.0 0.0 0.0
Investing cashflow -278.3 -237.9 -150.0 -90.0 -90.0
Dividends paid -29.1 -35.9 -49.8 -47.9 -49.8
Equity raised 83.8 1.8 0.0 0.0 0.0
Net borrowings
Other 223.1 77.6 70.2 -11.3 -29.3 1 Month 3 Month 12 Month
Financing cashflow 277.8 43.5 20.4 -59.2 -79.1 Absolute 0.5% 0.5% 20.2%
Total cashflow 18.3 -46.8 10.9 7.7 11.7 Relative 0.1% 1.3% 13.2%
Adjustments 0.0 0.0 0.0 0.0 0.0
Net change in cash 18.3 -46.8 10.9 7.7 11.7 Source: Reuters 52 week trading range: 1.58-2.26
MSCI IVA Risk Comment: Given the indirect environmental
benefits of shifting up to 1 million containers from road to rail
which the Moorebank facility could provide, we believe the MSCI
environment rating should be higher.
12/02/2014 21:39
Qube Logistics is a portfolio of logistics assets covering landside logistics, as well as
stevedoring and logistics to the bulk and automotive sectors.
Credit Suisse View
TP Risk Comment: Very poor disclosure and earnings visibility as
well as low staff engagement at WA Ports. Upside from disclosure
improvement, though hard to quantify such a benefit.
NEUTRAL
0.00
0.50
1.00
1.50
2.00
2.50
31/01/2013 31/03/2013 31/05/2013 31/07/2013 30/09/2013 30/11/2013 31/01/2014
QUB.AX XJO
-1.0
-0.9
-0.8
-0.7
-0.6
-0.5
-0.4
-0.3
-0.2
-0.1
0.0
Environment Social Governance
Stock Local Sector
Country Global Sector
Source: Company data, Credit Suisse estimates

14 February 2014
Australia and NZ First Edition 113
Figure 15: QAN's financial summary
Qantas Airways (QAN) Year ending 30 Jun In AUDmn, unless otherwise stated2012 2013 2014 2015 2016 2012 2013 2014 2015 2016
Share Price: A$1.12 Earnings 06/12A 06/13A 06/14E 06/15E 06/16ERating c_EPS_SHARESEquiv. FPO (period avg.) mn 2,265.1 2,241.9 2,245.1 2,251.7 2,272.4
Target Price A$ 1.21 c_EPS*100EPS (Normalised) c -1.2 6.0 -17.0 -8.8 4.5
vs Share price % 8.52 EPS_GROWTH*100EPS Growth % 608.6 -386.1 48.6 151.3
c_EBITDA_MARGIN*100EBITDA Margin % 10.0 11.5 7.3 8.3 10.3
c_DPS*100DPS c 0.0 0.0 1.5 5.5 9.0
c_PAYOUT*100Payout % 0.0 0.0 -8.8 -62.8 200.4
FRANKING*100Franking % 100.0 100.0 100.0 100.0 100.0
c_FCF_PS*100Free CFPS c -28.9 26.0 -1.6 -8.2 17.6
Profit & Loss 06/12A 06/13A 06/14E 06/15E 06/16E c_TAX_RATE*100Effective tax rate % 17.6 66.0 30.0 30.0 30.0
Sales revenue 15,724.0 15,903.0 15,677.8 16,747.7 17,493.0 ValuationEBITDA 1,569.0 1,822.0 1,144.7 1,394.2 1,796.7 c_PE P/E x -95.3 18.7 -6.5 -12.7 24.8
Depr. & Amort. (1,384.0) (1,450.0) (1,483.0) (1,468.3) (1,436.1) c_EBIT_MULTIPLE_CURREV/EBIT x 30.3 15.3 -16.8 -80.6 15.9
EBIT 185.0 372.0 (338.3) (74.1) 360.6 c_EBITDA_MULTIPLE_CUEV/EBITDA x 3.6 3.1 5.0 4.3 3.2
Associates 0.0 0.0 0.0 0.0 0.0 c_DIV_YIELD*100Dividend Yield % 0.0 0.0 1.3 4.9 8.1
Net interest Exp. (182.0) (180.0) (205.0) (204.7) (211.9) c_FCF_YIELD*100FCF Yield % -25.9 23.3 -1.4 -7.3 15.7
Other 0.0 0.0 0.0 0.0 0.0 c_PB Price to Book x 0.4 0.4 0.4 0.5 0.5
Profit before tax 3.0 192.0 (543.2) (278.8) 148.7 ReturnsIncome tax (28.5) (57.6) 163.0 83.6 (44.6) c_ROE*100Return on Equity % -0.4 2.2 -6.9 -3.7 1.9
Profit after tax (25.5) 134.4 (380.3) (195.1) 104.1 c_I_NPAT/c_I_SALES*100Profit Margin % -0.2 0.8 -2.4 -1.2 0.6
Minorities (1.0) (1.0) (2.0) (2.0) (2.0) c_I_SALES/c_B_TOT_ASSAsset Turnover x 0.7 0.8 0.8 0.9 0.9
Preferred dividends 0.0 0.0 0.0 0.0 0.0 c_ASSETS/c_EQ_COMMONEquity Multiplier x 3.6 3.4 3.5 3.7 3.7
Associates & Other 0.0 0.0 0.0 0.0 0.0 c_ROA*100Return on Assets % -0.1 0.7 -1.9 -1.0 0.5
Normalised NPAT (26.5) 133.4 (382.3) (197.1) 102.1 c_ROIC*100Return on Invested Cap. % -69.0 7.0 2.3 5.4 9.9
Unusual item after tax (338.0) (128.6) 0.0 0.0 0.0 GearingReported NPAT (364.5) 4.8 (382.3) (197.1) 102.1 c_GEARING*100Net Debt to Net debt + Equity % 34.9 35.3 36.9 40.1 38.6
84.9 96.4 112.8 c_NET_DEBT/c_I_EBITDANet Debt to EBITDA x 2.0 1.8 2.8 2.5 1.8
Balance Sheet 06/12A 06/13A 06/14E 06/15E 06/16E c_I_EBITDA/ c_I_NET_INTERESTInt Cover (EBITDA/Net Int.) x 8.6 10.1 5.6 6.8 8.5
Cash & equivalents 3,398.0 2,829.0 2,837.4 2,558.0 2,708.8 c_I_EBIT/ c_I_NET_INTERESTInt Cover (EBIT/Net Int.) x 1.0 2.1 -1.7 -0.4 1.7
Inventories 376.0 364.0 364.0 364.0 364.0 (c_C_CAPEX/c_I_SALES)*-100Capex to Sales % 13.5 7.9 7.3 8.7 6.5
Receivables 1,111.0 1,436.0 1,436.0 1,436.0 1,436.0 (c_C_CAPEX/c_I_DEPR)*-100Capex to Depreciation % 153.8 86.8 76.7 99.2 79.5
Other current assets 575.0 616.0 616.0 616.0 616.0
Current assets 5,460.0 5,245.0 5,253.4 4,974.0 5,124.8 MSCI IVA (ESG) Rating BBProperty, plant & equip. 14,139.0 13,827.0 13,482.0 13,470.4 13,175.5 TP ESG Risk (%): -9.17
Intangibles 610.0 714.0 714.0 714.0 714.0
Other non-current assets 969.0 414.0 336.8 336.8 336.8
Non-current assets 15,718.0 14,955.0 14,532.8 14,521.2 14,226.3
Total assets 21,178.0 20,200.0 19,786.1 19,495.3 19,351.1
Payables 1,876.0 1,859.0 1,859.0 1,859.0 1,859.0
Interest bearing debt 6,549.0 6,080.0 6,080.0 6,080.0 5,980.0
Other liabilities 6,864.0 6,307.0 6,307.5 6,303.2 6,301.2 MSCI IVA Risk: Neutral
Total liabilities 15,289.0 14,246.0 14,246.5 14,242.2 14,140.2
Net assets 5,889.0 5,954.0 5,539.7 5,253.0 5,210.9
Ordinary equity 5,927.0 5,992.0 5,575.9 5,287.0 5,244.9
Minority interests 4.0 5.0 7.0 9.0 9.0
Preferred capital 0.0 0.0 0.0 0.0 0.0
Total shareholder funds 5,889.0 5,954.0 5,539.9 5,253.0 5,210.9
Net debt 3,151.0 3,251.0 3,242.6 3,522.0 3,271.2 Source: MSCI ESG Research
Cashflow 06/12A 06/13A 06/14E 06/15E 06/16E Share Price Performance
EBIT 185.0 372.0 -338.3 -74.1 360.6
Net interest -115.0 -119.0 -205.0 -204.7 -211.9
Depr & Amort 1,384.0 1,450.0 1,483.0 1,468.3 1,436.1
Tax paid -1.0 -3.0 163.0 83.6 -44.6
Working capital 50.0 -330.0 0.0 0.0 0.0
Other -28.0 472.0 0.0 0.0 0.0
Operating cashflow 1,475.0 1,842.0 1,102.8 1,273.1 1,540.2
Capex -2,129.0 -1,259.0 -1,138.0 -1,456.8 -1,141.2
Capex - expansionary
Capex - maintenance
Acquisitions & Invest 66.0 34.0 0.0 0.0 0.0
Asset sale proceeds 0.0 189.0 77.2 0.0 0.0
Other -136.0 52.0 0.0 0.0 0.0
Investing cashflow -2,199.0 -984.0 -1,060.8 -1,456.8 -1,141.2
Dividends paid -1.0 0.0 -33.6 -123.5 -202.7
Equity raised -16.0 -52.0 0.0 27.8 54.4
Net borrowings 405.0 -565.0 0.0 0.0 -100.0
Other -18.0 -336.0 0.0 0.0 0.0 1 Month 3 Month 12 Month
Financing cashflow 370.0 -953.0 -33.6 -95.7 -248.2 Absolute -0.4% -7.9% -29.4%
Total cashflow -354.0 -95.0 8.4 -279.3 150.7 Relative -0.8% -7.0% -36.5%
Adjustments 4.0 12.0 0.0 0.0 0.0
Net change in cash -350.0 -83.0 8.4 -279.3 150.7 Source: Reuters 52 week trading range: 0.97-1.90
MSCI IVA Risk Comment: Fuel burn and energy efficiency is low
relative to other airlines with newer fleets, however with $15bn of
capital expenditure on new aircraft in the medium term, we see
this risk as gradually subsiding, particularly once the B787 enters
service.
12/02/2014 21:39
Qantas Airways Limited is an airline company. It is engaged in the transportation of
passengers using two airline brands, Jetstar and Qantas. The Jetstar network includes 52
destinations. As of June 30, 2010, the Company had a fleet of 254 aircrafts.
Credit Suisse View
TP Risk Comment: Fuel efficiency remains low relative to other
airlines, though likely to improve post fleet investment. ESG
impact is the capitalised fuel efficiency upside
NEUTRAL
0.00
0.20
0.40
0.60
0.80
1.00
1.20
1.40
1.60
1.80
2.00
31/01/2013 31/03/2013 31/05/2013 31/07/2013 30/09/2013 30/11/2013 31/01/2014
QAN.AX XJO
-1.0
-0.9
-0.8
-0.7
-0.6
-0.5
-0.4
-0.3
-0.2
-0.1
0.0
Environment Social Governance
Stock Local Sector
Country Global Sector
Source: Company data, Credit Suisse estimates

14 February 2014
Australia and NZ First Edition 114
Figure 16: Virgin Australia summary
Virgin Australia (VAH) Year ending 30 Jun In AUDmn, unless otherwise stated2012 2013 2014 2015 2016 2012 2013 2014 2015 2016
Share Price: A$0.34 Earnings 06/12A 06/13A 06/14E 06/15E 06/16ERating c_EPS_SHARESEquiv. FPO (period avg.) mn 2,190.0 2,442.1 2,442.1 2,442.1 2,442.1
Target Price A$ 0.38 c_EPS*100EPS (Normalised) c 2.7 -2.4 -4.9 -2.5 0.5
vs Share price % 13.43 EPS_GROWTH*100EPS Growth % -188.0 -104.9 49.3 118.7
c_EBITDA_MARGIN*100EBITDA Margin % 9.8 5.0 5.2 6.3 7.6
c_DPS*100DPS c 0.0 0.0 0.0 0.0 0.0
c_PAYOUT*100Payout % 0.0 0.0 0.0 0.0 0.0
FRANKING*100Franking % 100.0 100.0 100.0 100.0 100.0
c_FCF_PS*100Free CFPS c 0.1 -2.4 -0.9 2.5 4.4
Profit & Loss 06/12A 06/13A 06/14E 06/15E 06/16E c_TAX_RATE*100Effective tax rate % 91.0 32.8 28.0 28.0 28.0
Sales revenue 3,919.5 4,020.4 4,371.8 4,633.1 4,835.0 ValuationEBITDA 383.5 202.2 226.9 293.1 366.5 c_PE P/E x 12.3 -14.0 -6.8 -13.5 72.1
Depr. & Amort. (232.5) (238.7) (276.6) (294.4) (300.6) c_EBIT_MULTIPLE_CURREV/EBIT x 13.6 -68.1 -48.1 -2,099.2 38.8
EBIT 151.0 (36.5) (49.7) (1.2) 65.9 c_EBITDA_MULTIPLE_CUEV/EBITDA x 5.3 12.3 10.5 8.8 7.0
Associates 0.0 0.0 0.0 0.0 0.0 c_DIV_YIELD*100Dividend Yield % 0.0 0.0 0.0 0.0 0.0
Net interest Exp. (62.1) (53.4) (65.5) (68.6) (65.8) c_FCF_YIELD*100FCF Yield % 0.2 -7.3 -2.7 7.3 13.3
Other 0.0 0.0 0.0 0.0 0.0 c_PB Price to Book x 0.8 0.8 0.6 0.7 0.7
Profit before tax 88.9 (89.9) (115.2) (69.8) 0.1 ReturnsIncome tax (4.4) 51.6 32.2 19.6 (0.0) c_ROE*100Return on Equity % 6.4 -5.6 -9.4 -5.0 0.9
Profit after tax 84.5 (38.3) (82.9) (50.3) 0.1 c_I_NPAT/c_I_SALES*100Profit Margin % 1.5 -1.5 -2.7 -1.3 0.2
Minorities 0.0 0.0 0.0 0.0 0.0 c_I_SALES/c_B_TOT_ASSAsset Turnover x 1.0 0.9 0.9 0.9 1.0
Preferred dividends 0.0 0.0 0.0 0.0 0.0 c_ASSETS/c_EQ_COMMONEquity Multiplier x 4.3 4.3 3.9 4.2 4.2
Associates & Other (25.0) (20.1) (36.7) (10.4) 11.2 c_ROA*100Return on Assets % 1.5 -1.3 -2.4 -1.2 0.2
Normalised NPAT 59.5 (58.4) (119.7) (60.7) 11.3 c_ROIC*100Return on Invested Cap. % 19.4 3.6 6.2 8.2 10.0
Unusual item after tax (58.9) (47.3) 0.0 0.0 0.0 GearingReported NPAT 0.6 (105.7) (119.7) (60.7) 11.3 c_GEARING*100Net Debt to Net debt + Equity % 48.4 55.7 48.9 53.7 53.1
c_NET_DEBT/c_I_EBITDANet Debt to EBITDA x 2.3 6.5 5.3 4.8 3.8
Balance Sheet 06/12A 06/13A 06/14E 06/15E 06/16E c_I_EBITDA/ c_I_NET_INTERESTInt Cover (EBITDA/Net Int.) x 6.2 3.8 3.5 4.3 5.6
Cash & equivalents 802.6 580.5 928.5 928.5 928.5 c_I_EBIT/ c_I_NET_INTERESTInt Cover (EBIT/Net Int.) x 2.4 -0.7 -0.8 0.0 1.0
Inventories 14.9 29.8 32.7 34.6 36.1 (c_C_CAPEX/c_I_SALES)*-100Capex to Sales % 16.6 10.9 8.3 9.8 6.1
Receivables 202.8 257.4 279.9 296.6 309.6 (c_C_CAPEX/c_I_DEPR)*-100Capex to Depreciation % 279.0 183.5 130.8 154.2 98.7
Other current assets 11.7 103.2 103.2 103.2 103.2
Current assets 1,032.0 970.9 1,344.3 1,363.0 1,377.4 MSCI IVA (ESG) Rating AProperty, plant & equip. 2,769.0 3,005.2 3,053.5 3,202.7 3,198.7 TP ESG Risk (%): 0
Intangibles 101.0 329.6 329.6 329.6 329.6
Other non-current assets 93.2 120.3 182.3 182.3 182.3
Non-current assets 2,963.2 3,455.1 3,565.4 3,714.5 3,710.6
Total assets 3,995.2 4,426.0 4,909.7 5,077.5 5,087.9
Payables 505.5 580.4 599.6 635.4 663.1
Interest bearing debt 1,674.1 1,889.9 2,141.8 2,329.5 2,307.2
Other liabilities 885.9 915.6 899.9 904.8 898.5 MSCI IVA Risk: Neutral
Total liabilities 3,065.5 3,385.9 3,641.2 3,869.7 3,868.8
Net assets 929.7 1,040.1 1,268.4 1,207.8 1,219.1
Ordinary equity 929.7 1,040.1 1,268.4 1,207.8 1,219.1
Minority interests 0.0 0.0 0.0 0.0 0.0
Preferred capital 0.0 0.0 0.0 0.0 0.0
Total shareholder funds 929.7 1,040.1 1,268.4 1,207.8 1,219.1
Net debt 871.5 1,309.4 1,213.3 1,401.0 1,378.7 Source: MSCI ESG Research
Cashflow 06/12A 06/13A 06/14E 06/15E 06/16E Share Price Performance
EBIT 151.0 -36.5 -49.7 -1.2 65.9
Net interest -50.8 -42.1 -65.5 -68.6 -65.8
Depr & Amort 232.5 238.7 276.6 294.4 300.6
Tax paid 0.0 0.0 32.2 19.6 0.0
Working capital 0.0 0.0 -21.9 22.0 7.0
Other -107.2 -67.5 0.0 0.0 11.2
Operating cashflow 225.5 92.6 171.7 266.1 318.9
Capex -648.7 -437.9 -361.7 -453.9 -296.6
Capex - expansionary -424.5 -285.8 -168.1 -247.8 -86.2
Capex - maintenance -224.2 -152.1 -193.6 -206.1 -210.4
Acquisitions & Invest 460.0 56.8 0.0 0.0 0.0
Asset sale proceeds 0.0 0.0 0.0 0.0 0.0
Other -46.1 -114.9 -62.0 0.0 0.0
Investing cashflow -234.8 -496.0 -423.6 -453.9 -296.6
Dividends paid 0.0 0.0 0.0 0.0 0.0
Equity raised 0.0 100.7 0.0 0.0 0.0
Net borrowings -0.8 87.0 251.9 187.8 -22.3
Other 0.0 8.7 0.0 0.0 0.0 1 Month 3 Month 12 Month
Financing cashflow -0.8 196.4 251.9 187.8 -22.3 Absolute -10.7% -17.3% -23.5%
Total cashflow -10.1 -207.0 0.0 0.0 0.0 Relative -12.5% -15.6% -29.6%
Adjustments -7.5 16.9 0.0 0.0 0.0
Net change in cash -17.6 -190.1 0.0 0.0 0.0 Source: Reuters 52 week trading range: 0.32-0.47
MSCI IVA Risk Comment: We are satisfied with the MSCI IVA
rating.
13/02/2014 11:53
Virgin Australia Holdings Limited is an Australia-based company. The Company is engaged in
airline industry. Its segments include short haul and long haul. Its operations use the short
haul fleet of Boeing 737 aircrafts and Embraer 170 and 190 aircraft.
Credit Suisse View
TP Risk Comment: Solid ESG track record though still scope for
improvement in disclosure.
NEUTRAL
0.30
0.32
0.34
0.36
0.38
0.40
0.42
0.44
0.46
0.48
0.50
1/02/2013 1/04/2013 1/06/2013 1/08/2013 1/10/2013 1/12/2013 1/02/2014
VAH.AX XJO
2.7
3.7
4.7
5.7
6.7
7.7
Environment Social Governance
Stock Local Sector
Country Global Sector
Source: Company data, Credit Suisse estimates

Australia and NZ First Edition 115
14 February 2014
Asia Pacific/Australia
Equity Research
Regional Banks (Regional Banks (AU))
Bendigo and Adelaide Bank
(BEN.AX / BEN AU) PRE RESULTS COMMENT
1H14 results preview; reports on 17 Feb
Date: 17 February 2014 Time: Pre-market
Period: Interim Earnings Risk: Positive
Credit Suisse estimates Briefing and dial-in details
BEN cash earnings: $192.0mn ($169.7mn 1H13) 10.00am AEDST 1800 801 825
(code: 5507 163)
Overseas: +612 8524 5042
BEN cash EPS: $0.47 ($0.42 1H13)
Interim DPS: $0.32 ($0.30 pcp)
Credit Suisse assumptions/variance to market
■ Our FY14E $378mn cash earnings estimate sits 1% above the IBES
$376mn consensus, while our corresponding DPS estimate of $0.64 is in
line with the consensus.
What to look for
■ We would look for: 1) Some relief emerging for net interest margins, with
term deposit spread pressures easing and the re-pricing of parts of the
Community Bank originated portfolio; 2) Accelerating operating costs,
reflecting new premises costs and acceleration of the Basel advanced
accreditation programme; 3) Rural Bank asset quality (given on-going
deterioration within half a dozen North Queensland cattle exposures,
reflecting live export bans, drought and lower stock prices); and 4) Update
on medium-term issues such as the progress of the Great Southern litigation
and the Basel advanced accreditation programme.
Share price implications
■ BEN currently trades on 12.4x 12-month prospective earnings (equating
to a 4% discount to the major banks vs an 8% four-year average discount
and compared with Bank of Queensland on 12.3x) and a corresponding
book multiple of 1.1x (major banks 2.1x, Bank of Queensland 1.3x).
Total return forecast in perspective
Mean^
CS tgt^
Sh Prc
-20%
-10%
0%
10%
20%
30%
12mth Volatility* 52wk Hi-Lo IBES Consensustarget return^
Performance over 1M 3M 12M Absolute (%) -0.3 5.0 20.2 Relative (%) -2.2 6.8 14.1
Financial and valuation metrics
Year 06/13A 06/14E 06/15E 06/16E Reported profit (A$mn) 352.3 371.3 390.4 415.4 Cash Earnings (CS) (A$mn) 348.0 378.3 397.4 422.4 Cash EPS (CS) (A$) 0.85 0.91 0.95 1.00 Change from previous EPS (%) n.a. — — — Cash EPS growth (CS) (%) 1.4 7.0 4.2 5.4 Cash PE (CS) (x) 13.6 12.7 12.2 11.6 Dividend (A$) 0.61 0.64 0.67 0.71 Dividend yield (%) 5.2 5.5 5.8 6.1 Franking (%) 100 100 100 100 Book value per share (A$) 10.30 10.58 10.87 11.18 Price/book (x) 1.1 1.1 1.1 1.0 Return on Equity (%) 8.5 8.8 8.9 9.1 Equity Tier 1 ratio (%) 7.8 7.8 7.7 7.6 Tier 1 Ratio (%) 9.3 9.2 9.0 8.9
Relative performance versus S&P ASX 200.See Reference Appendix for a description of the chart. Source: Credit Suisse
estimates, * Consensus, mean range from Thomson Reuters
Source: Company data, ASX, Credit Suisse estimates, * Adj. for goodwill, notional interest and unusual items. Relative P/E
against ASX/S&P200 based on pre GW in AUD. Company PE calculation is based on displayed EPS Currency
Rating NEUTRAL* Price (13 Feb 14, A$) 11.65 Target price (A$) 12.20¹ Market cap. (A$mn) 4,776.62 Yr avg. mthly trading (A$mn) 285 Last month's trading (A$mn) 287 Projected return: Capital gain (%) 4.7 Dividend yield (net %) 5.7 Total return (%) 10.4 52-week price range 11.9 - 9.4
* Stock ratings are relative to the relevant country
benchmark.
¹Target price is for 12 months.
Research Analysts
James Ellis
61 2 8205 4531
Jarrod Martin
61 2 8205 4334
James Cordukes, CFA
61 2 8205 4858

14 February 2014
Australia and NZ First Edition 116
Figure 1: Financial summary
BENDIGO & ADELAIDE BANK Year ending 30 Jun Share Price: $11.65 12-month target price: 12.20
Profit and Loss ($mn) 2012A 2013A 2014F 2015F 2016F Per Share Summary 2012A 2013A 2014F 2015F 2016F
Net interest income ## 950 1,028 1,078 1,134 1,197 Earnings:
Non-interest income ## 276 297 311 317 329 Cash EPS 0.9 $0.84 $0.85 $0.91 $0.95 $1.00
Total income ## 1,226 1,325 1,389 1,451 1,526 Cash EPS growth -8.7% 1.4% 7.0% 4.2% 5.4%
Operating expenses ## (752) (779) (813) (847) (881) Diluted cash EPS 0.9 $0.79 $0.78 $0.84 $0.88 $0.90
Underlying profit ## 474 546 576 604 644 Diluted cash EPS growth -9.4% -0.7% 7.5% 4.0% 3.1%
Bad debt charge ## (32) (70) (50) (52) (57) Company defined cash EPS 0.9 $0.84 $0.85 $0.91 $0.95 $1.00
…net write offs -37 (31) (69) (39) (42) (45) Company defined EPS growth -8.7% 1.4% 7.0% 4.2% 5.4%
…movement in provisions -7 (1) (1) (11) (10) (12)
Profit before tax ## 442 476 525 552 587 Dividends:
Income tax ## (130) (138) (154) (162) (172) Dividend per share $0.60 $0.61 $0.64 $0.67 $0.71
…Effective tax rate ## 29% 29% 29% 29% 29% Dividend payout ratio 71% 71% 70% 70% 71%
NPAT ## 312 338 371 390 415 Net dividend yield 5.2% 5.2% 5.5% 5.8% 6.1%
Minorities (4) (0) (0) (0) (0) (0) Gross dividend yield 7.4% 7.5% 7.8% 8.2% 8.7%
Preference dividends (9) (9) (7) (6) (6) (6) Franking 100% 100% 100% 100% 100%
Amortisation of intangibles 20 20 17 13 13 13
Cash earnings ## 323 348 378 397 422 Capital:
Preference dividends 9 9 7 6 6 6 Book value per share $10.02 $10.30 $10.58 $10.87 $11.18
Amortisation of intangibles ## (20) (17) (13) (13) (13) NTA per share $6.17 $6.62 $6.95 $7.31 $7.68
Significant items 17 (117) 15 0 0 0 Period end shares mn 402.2 412.0 415.7 419.1 422.5
Reported profit ## 195 352 371 390 415 Average shares mn 383.5 407.4 413.8 417.4 420.8
Company defined cash earnings ## 323 348 378 397 422
Balance Sheet 2012A 2013A 2014F 2015F 2016F Ratio Analysis 2012A 2013A 2014F 2015F 2016F
Total assets 57,238 60,282 64,546 69,300 74,403 Profitability Ratios:
Managed gross loans & acc. ## 48,832 50,679 54,341 58,450 62,859 Net interest margin 1.78% 1.86% 1.85% 1.82% 1.78%
…growth 5.0% 3.8% 7.2% 7.6% 7.5% Lending fees % average loans 0.12% 0.12% 0.13% 0.13% 0.12%
Managed housing lending ## 33,769 35,010 37,646 40,585 43,743 Group cost to income ratio 61.3% 58.8% 58.6% 58.4% 57.8%
…growth 7.1% 3.7% 7.5% 7.8% 7.8% Cash ROA 0.57% 0.60% 0.61% 0.60% 0.59%
Managed non housing lending ## 15,063 15,670 16,695 17,865 19,116 Cash ROE 8.3% 8.5% 8.8% 8.9% 9.1%
…growth 0.6% 4.0% 6.5% 7.0% 7.0%
Average interest earning assets ## 53,444 55,122 58,177 62,448 67,164 Bad Debt Charge:
…growth 5.4% 3.1% 5.5% 7.3% 7.6% Bad debt chrg % avg loans 0.08% 0.16% 0.11% 0.11% 0.11%
Risk weighted assets ## 28,310 30,530 32,615 34,975 37,503 Bad debt chrg % avg RWA 0.12% 0.24% 0.16% 0.15% 0.16%
...growth 8.7% 7.8% 6.8% 7.2% 7.2%
Impaired assets 359 390 402 424 447 Provisioning:
…% gross managed loans & acc. 0.73% 0.77% 0.74% 0.73% 0.71% Collective provisions (CP) $mn 32 35 37 40 43
GRCL $mn 184 198 211 226 242
Capital Adequacy: Individual provisions (IP) $mn 103 104 112 120 129
Tier 1 capital 2,376 2,825 2,994 3,155 3,324 Total provisions $mn 318 336 360 386 414
Equity Tier 1 capital 2,098 2,387 2,537 2,697 2,866 CP + GRCL % RWA 0.76% 0.76% 0.76% 0.76% 0.76%
Tier 1 ratio 8.4% 9.3% 9.2% 9.0% 8.9% CP + GRCL % non housing 1.43% 1.48% 1.48% 1.49% 1.49%
Equity Tier 1 ratio 7.4% 7.8% 7.8% 7.7% 7.6% CP + GRCL + IP % loans 0.75% 0.76% 0.76% 0.75% 0.75%
Valuation 2012A 2013A 2014F 2015F 2016F Share Price Performance 52 week range: $9.10 - $11.94
Investment Relatives
Cash PE 13.8x 13.6x 12.7x 12.2x 11.6x
Cash PE relative (S&P/ASX200) 85% 81% 86% 89% 89%
Cash P/Earnings growth -1.6x 9.7x 1.8x 2.9x 2.1x
Net dividend yield 5.2% 5.2% 5.5% 5.8% 6.1%
Gross dividend yield 7.4% 7.5% 7.8% 8.2% 8.7%
Price / Book 1.2x 1.1x 1.1x 1.1x 1.0x
Price / NTA 1.9x 1.8x 1.7x 1.6x 1.5x
Credit Suisse Valuation (12mth rolling forward) ESG Comment
Target Price $12.20
Sum of parts $8.87
Discounted cashflow $9.36
ESG
MSCI IVA rating BBB
Outlook Positive
Source: MSCI ESG Research Source: Iress
Rating does not consider
environmental and
community initiatives being
undertaken by BEN.
7.00
8.00
9.00
10.00
11.00
12.00
13.00
Jan-13
Feb-13
Mar-13
Apr-13
May-13
Jun-13
Jul-13
Aug-13
Sep-13
Oct-13
Nov-13
Dec-13
Jan-14
BEN.AX ASX 200 Financials
Source: ASX, Company data, Credit Suisse estimates

14 February 2014
Australia and NZ First Edition 117
Figure 2: BEN 1H14E profit announcement key financial summary in millions, unless otherwise stated
2H12A 1H13A 2H13A 1H14E vs 2H13 vs 1H13
Net Interest Income 469.0 504.9 520.0 537.6 3% 6%
Non-Interest Income 149.3 146.7 153.7 157.1 2% 7%
…Lending Fees 32.5 32.2 32.3 32.8 2% 2%
…Other Fees 54.5 54.4 46.6 47.1 1% -13%
…Trustee Fees 2.6 2.8 2.5 2.5 1% -10%
...Wealth & Insurance Commissions 23.5 21.4 23.3 23.5 1% 10%
…Equity Accounted Profits 0.7 0.5 1.1 1.1
…Homesafe Revaluation 5.0 11.9 13.2 15.0
…Other 30.5 23.5 34.7 35.0 1% 49%
Total Income 618.3 651.6 673.7 694.7 3% 7%
Operating Expenses (384.2) (390.9) (388.7) (402.3) 3% 3%
…Cost to Income Ratio 62.1% 60.0% 57.7% 57.9%
Underlying Profit 234.1 260.7 285.0 292.4 3% 12%
Bad Debt Charge (16.6) (32.1) (37.8) (25.8) -32% -20%
…Net Write-offs (16.0) (38.9) (30.5) (19.4)
…Movements in Provisions (0.6) 6.8 (7.3) (6.5)
Profit Before Tax 217.5 228.6 247.2 266.6 8% 17%
Income Tax (62.9) (65.8) (72.4) (78.1)
…Effective Tax Rate 28.9% 28.8% 29.3% 29.3%
Minorities 0.0 0.0 0.0 0.0
Distributions (4.2) (3.5) (3.0) (3.0)
Amortisation 10.0 10.4 6.5 6.5
Cash Earnings 160.4 169.7 178.3 192.0 8% 13%
Distributions 4.2 3.5 3.0 3.0
Amortisation (10.0) (10.4) (6.5) (6.5)
Significant Items (17.5) 26.6 (11.9) 0.0
Reported Profit 137.1 189.4 162.9 188.5 16% 0%
Average Shares 396.5mn 405.0mn 409.9mn 412.9mn 1% 2%
Basic Cash EPS $0.40 $0.42 $0.43 $0.47 7% 11%
DPS $0.30 $0.30 $0.31 $0.32 3% 7%
…Payout Ratio 74% 72% 71% 69%
Franking 100% 100% 100% 100%
Balance Sheet:
Average Earning Assets 54,068 54,802 55,442 57,163 3% 4%
Period End Gross Lending 48,832 49,426 50,679 52,533 4% 6%
…Housing 33,769 34,275 35,010 36,393 4% 6%
…Non-Housing 15,063 15,151 15,670 16,140 3% 7%
Reported NTA Per Share $6.16 $6.38 $6.62 $6.80 3% 7%
Cost to Average Assets 1.35% 1.36% 1.31% 1.32% -5bp -4bp
Returns:
Cash ROE (excluding hybrids) 8.2% 8.5% 8.5% 9.0%
Cash ROA 0.56% 0.59% 0.60% 0.63%
Margins:
Reported Net Interest Margin 2.08% 2.18% 2.24% 2.18% -6bp +0bp
Community Bank and Alliances -0.34% -0.35% -0.35% -0.31% +3bp +4bp
On Balance Sheet Net Interest Margin 1.74% 1.83% 1.89% 1.87% -3bp +4bp
Lending Fees % Average Loans 0.14% 0.13% 0.13% 0.13% -0bp -0bp
Bad Debt Charge:
Bad Debt Charge % Average Loans 0.07% 0.13% 0.15% 0.10% -5bp -3bp
Net Write-offs % Average Non-Housing 0.22% 0.51% 0.40% 0.24% -15bp -27bp
Source: Company data, Credit Suisse estimates

14 February 2014
Australia and NZ First Edition 118
Figure 3: BEN 1H14E profit announcement key financial summary (continued) in millions, unless otherwise stated
2H12A 1H13A 2H13A 1H14E vs 2H13 vs 1H13
Provisioning:
Collective Provisions (CP) 31.8 31.9 34.5 36.0
Specific Provisions (SP) 102.9 96.2 104.1 109.0
General Reserves (GRCL) 183.6 191.7 197.6 203.6
Total Provisions 318.3 319.8 336.2 348.7 4% 9%
CP+GRCL % Risk Weighted Assets 0.76% 0.76% 0.76% 0.76% +0bp -0bp
CP+GRCL % Non-Housing Loans 1.43% 1.48% 1.48% 1.48% +0bp +1bp
SP % Non-Accrual Loans 29% 33% 27% 28%
Total Provisions % Gross Loans 0.65% 0.65% 0.66% 0.66%
Total Provisions % Non-Accrual Loans 89% 110% 86% 89%
Asset Quality:
Non-Accrual Loans 358.5 290.0 390.2 394.0 1% 36%
…% Gross Non-Securitised Loans 0.85% 0.66% 0.88% 0.86%
Past Due Loans 807.5 721.5 742.3 764.6 3% 6%
...% Gross Non-Securitised Loans 1.90% 1.65% 1.68% 1.67%
Net Non-Accrual Loans % Net Fund. Tier 1 12.2% 8.5% 12.0% 11.5%
Capital:
Tier 1 2,376 2,732 2,825 2,924 3% 7%
Net Fundamental Tier 1 2,098 2,275 2,387 2,467 3% 8%
Risk Weighted Assets 28,310 29,354 30,530 31,529 3% 7%
Tier 1 Ratio 8.39% 9.31% 9.25% 9.27% +2bp -3bp
Net Fundamental Tier 1 Ratio 7.41% 7.75% 7.82% 7.82% +1bp +7bp
Source: Company data, Credit Suisse estimates
"Really the one area of disappointment when we look at our cash earnings is the credit
costs and that's really been driven by continued weakness in the Rural Bank cattle
property exposures we've got and also over the last 12 months there's been a number of
months where we've had significant Great Southern write-offs due to specific bankruptcies
relating to individual borrowers in that cohort of borrowers."
"One thing I think I can confidently say, I don't expect there to be our cost growth as low
this year because of the impact of the Adelaide head office, which is going to add about
$12mn per year, and additional occupancy costs plus also the Basel II advance program
… If you put those aside certainly we'd be aiming to try and keep our cost growth at
around CPI but with those two other impacts I think you're going to see an increase in our
costs but really our focus is to make sure that that cost increase is not greater than our
revenue increase so we can still maintain positive jaws, although I dare say they will be a
little narrower looking forward over the next 12 months."
"…the fact that we have passed on all of those cash rate reductions for the last two
changes I suspect that the [net interest margin] trend is likely to be down rather than up.
… I'm not sitting here thinking we're going to be looking at a NIM heading north certainly
over these six months with two cash rate reductions that we've just experienced."
Richard Fennell (CFO) at the FY13 profit announcement
■ Balance growth: In relation to 1H14E balance sheet growth, we estimate from APRA
Monthly Banking Statistics that BEN’s lending growth (+1.2%) was weaker than the
banking system (2.7%), including in housing (BEN 1.2% vs the system at 3.1%). Core
deposit growth (0.5%) also lagged the banking system (5.6%). Refer further: Bank
Market Shares: 1H14E stock-take (31 January 2014). BEN's annual report includes a
focus for 2014 on continuing to drive above-system growth in residential, business and
agri-business lending.
■ 1Q14 asset quality trends: We estimate from BEN’s Pillar 3 risk and capital data that
1Q14 impaireds percentage credit exposures increased to 0.82% (0.81% sequentially)

14 February 2014
Australia and NZ First Edition 119
although corresponding past-dues declined to 1.39% (1.50% sequentially). However,
corresponding write-offs appeared to moderate to 0.12% (0.21% sequentially, and the
series average since 2008 has been 0.15%) with specific provision coverage
percentage impaireds declining and general reserve coverage percentage credit RWA
stable. Finally, the Tier 1 ratio remained relatively stable in 1Q14 at 9.24% (9.25%
sequentially) on the back of flat sequential risk weighted asset growth / 1% credit
exposure growth:
Figure 4: Impaireds rising again… BEN impaired loans percentage credit exposures
Figure 5: …driven out of Other Retail BEN impaired loans percentage credit exposures by portfolio
0.82%
0.00%
0.10%
0.20%
0.30%
0.40%
0.50%
0.60%
0.70%
0.80%
0.90%
Sep
08
Dec
08
Mar
09
Jun
09
Sep
09
Dec
09
Mar
10
Jun
10
Sep
10
Dec
10
Mar
11
Jun
11
Sep
11
Dec
11
Mar
12
Jun
12
Sep
12
Dec
12
Mar
13
Jun
13
Sep
13
0.11%
2.50%
0.00%
0.50%
1.00%
1.50%
2.00%
2.50%
3.00%
Residential Mortgage Other Retail
Sep 08 Dec 08 Mar 09 Jun 09 Sep 09 Dec 09 Mar 10 Jun 10 Sep 10 Dec 10 Mar 11
Jun 11 Sep 11 Dec 11 Mar 12 Jun 12 Sep 12 Dec 12 Mar 13 Jun 13 Sep 13
Figure 6: Past-dues edging lower… BEN past due loans percentage credit exposures
Figure 7: …driven out of both categories BEN past due loans percentage credit exposures by portfolio
1.39%
0.00%
0.20%
0.40%
0.60%
0.80%
1.00%
1.20%
1.40%
1.60%
1.80%
Sep
08
Dec
08
Mar
09
Jun
09
Sep
09
Dec
09
Mar
10
Jun
10
Sep
10
Dec
10
Mar
11
Jun
11
Sep
11
Dec
11
Mar
12
Jun
12
Sep
12
Dec
12
Mar
13
Jun
13
Sep
13
0.46%
3.63%
0.00%
0.50%
1.00%
1.50%
2.00%
2.50%
3.00%
3.50%
4.00%
4.50%
Residential Mortgage Other Retail
Sep 08 Dec 08 Mar 09 Jun 09 Sep 09 Dec 09 Mar 10 Jun 10 Sep 10 Dec 10 Mar 11
Jun 11 Sep 11 Dec 11 Mar 12 Jun 12 Sep 12 Dec 12 Mar 13 Jun 13 Sep 13
Source for all charts: Company data, Credit Suisse estimates
BEN investment positives
■ Strong leverage to improving term-deposit spreads: As illustrated in the following
charts, BEN is pre-eminently leveraged to the term deposit market in its funding mix,
where spreads have been improving (for context, BEN's total funding composition is
also skewed towards deposits at 77% vs listed peers at 59%-66%). During the 2H13
profit announcements, both WBC and BOQ referred to term deposit spread pressures
easing, and BEN has consistently stated that they have sought to be disciplined in
terms deposit pricing (remaining within, but at the lower end of market pricing). A
further margin tailwind is the fuller period impact of the 1 April 2013 "Restoring the
Balance" re-pricing of the Community Bank TDs and fixed rate loan portfolios (trail
fees reduced from 37bp to 25bp) – which BEN sees as a 1.5-2.0bp positive FY14E
Group net interest margin impact. The offset to this is the (industry wide) issue of
endowment margin compression associated with declining cash rates, with BEN still to
fully absorb within a half-yearly operating period, the 7 August 2003 25bp cash rate
cut (with the prima facie sensitivity of -5bp impact on net interest margins from a 25bp
cash rate cut). We acknowledge here BEN's statement at the FY13 result that the
FY14E margin trend is likely to be down rather than up, with the margin certainly not
up in 1H14E, citing the endowment margin headwind of a declining cash rate
environment as a key driver of this expected outcome.

14 February 2014
Australia and NZ First Edition 120
Figure 8: BEN pre-eminently geared to term deposits… Commercial banks' composition of FY13 deposits
Figure 9: …where spreads have been improving Major banks’ deposit spreads over equivalent money market rates
51%46% 46%
60%70%
62%
45% 52%46%
33%
30%38%
4% 3%8% 7%
0%
10%
20%
30%
40%
50%
60%
70%
80%
90%
100%
ANZ CBA NAB WBC BEN BOQ
Term Deposits At Call Non-Interest Bearing
-150bp
-100bp
-50bp
0bp
50bp
100bp
150bp
200bp
Jan
07
Apr
07
Jul 0
7
Oct
07
Jan
08
Apr
08
Jul 0
8
Oct
08
Jan
09
Apr
09
Jul 0
9
Oct
09
Jan
10
Apr
10
Jul 1
0
Oct
10
Jan
11
Apr
11
Jul 1
1
Oct
11
Jan
12
Apr
12
Jul 1
2
Oct
12
Jan
13
Term Deposit 'Specials' At Call Deposits
Source: Company data, Credit Suisse estimates Note: “At Call Deposits” is the spread to the cash rate; Refers to
existing customers only; Excludes temporary bonus rates
Source: Bloomberg, RBA
■ Modest leverage to rising house prices through Homesafe Solutions: BEN's
revenues are geared to house price inflation through the Homesafe Solutions
business (2% FY13 revenues) and, according to the ABS capital city house price
indices, Sydney house prices are up 8.6% in the six months to December 2013 while
Melbourne house prices are up 5.5% over the same period. BEN's Homesafe
Solutions brings to account non-interest income principally through: 1) amortisation of
the property acquisition discounts, 2) unrealised mark-to-model gains on Sydney and
Melbourne house price movements (per the Residex house price index), and 3) any
realised gains / losses on properties upon ultimate disposal (akin to "experience
variation"). We understand that every 1% increase in the Residex home price index in
Sydney and Melbourne equates to a $3mn unrealised gain per half for BEN.
■ On-going branch maturation benefits: BEN has previously stated that, having
opened more than 300 branches in the last ten years, there was still a lot of
maturation benefits in terms of above-system footings growth coming through (an
important tailwind in an overall subdued system credit growth environment).
■ Basel advanced accreditation program: BEN has indicated $400-$450mn of
potential capital release arising from advanced accreditation (albeit there is likely to be
a 10% regulatory benefit cap upfront with the ultimate the capital benefit deriving from
increased leverage of the existing capital base rather than any capital return), albeit
from a timing sense we acknowledge that this might not occur until beyond the
forecast period. BEN has stated that the benefits of advanced accreditation were three
fold (in rising order of importance): 1) capital relief, with BEN's mortgage risk weight
currently twice the mortgage risk weight of the majors; 2) improved risk structures and
frameworks to manage market, credit and operational risk, leading to greater
consistency on decision-making; and 3) the ability to understand customer needs
better with accurate data.
BEN investment risks
■ The Great Southern exposure: BEN's litigation exposure to the failed managed
investment scheme Great Southern represents a tail risk for BEN, with a worst case
scenario (adverse judgment with no feasible avenue of appeal) representing, say, a
$300mn exposure to BEN (against which BEN holds only around $20-25mn of loan
loss provisions). While the probability of such a worst case outcome might not be high,
the quantum of downside risk is much greater than the quantum of upside risk. As
illustrated in the chart below, the balance of 90+ day past-due balances associated
with Great Southern have steadily increased to $283mn in 2H13 (albeit we
acknowledge scope for this balance to include "tactical defaulters" that are merely
awaiting the outcome of the class action).

14 February 2014
Australia and NZ First Edition 121
Figure 10: Rising Great Southern past dues… BEN Great Southern past-due balances
Figure 11: …but declining development NPLs BEN property development NPL balances
$0mn
$50mn
$100mn
$150mn
$200mn
$250mn
$300mn
1H09 2H09 1H10 2H10 1H11 2H11 1H12 2H12 1H13 2H13
Great Southern Past Due 90 Days
$0mn
$10mn
$20mn
$30mn
$40mn
$50mn
$60mn
$70mn
1H09 2H09 1H10 2H10 1H11 2H11 1H12 2H12 1H13 2H13
Property Development NPL Balances
Source for both charts: Company data, Credit Suisse estimates
■ Rural Bank asset quality: BEN's impaired asset ratios have deteriorated in recent
periods, predominantly reflecting Rural Bank Queensland cattle property exposures.
While at the FY13 result, BEN referred to $55mn of post-balance date contracted
collateral disposals (which was expected to normalise specific provision coverage
back to its long-term rate), we understand that even after these contracted sales, BEN
will still hold $35mn of impaired rural exposures. Rural Bank's exposures are also
relatively large (we understand some exposures are $30-$35mn in size) creating also
a concentration risk issue.
■ Cost inflation risk: Following strong cost discipline with flat sequential costs in the
2H13 operating period (by our reckoning, it had been 15 years since BEN had
reported sequentially flat half-yearly expenses) BEN nevertheless indicated at the
FY13 result that FY14E cost growth would accelerate YoY with costs associated with
the new Adelaide Bank head office (+$12mn in occupancy costs) and the ramping up
of the Basel advanced accreditation programme (potential tripling the FY13 spend of
$12.5mn, which for context was c70% capitalised on say, a seven-year amortisation
cycle once the advanced systems are "in use").
■ On-going balance sheet headwinds from a shrinking margin lending market: As
illustrated in the chart below on the left, margin loans outstanding declined by 2%
sequentially in the September 2013 quarter while, as illustrated in the chart below on
the right, there was also a corresponding 3% decline in the number of customer
accounts. While margin lending represents only 4% of BEN's FY13 lending portfolio,
these trends tend to reaffirm the negative momentum seen in this part of the portfolio
(e.g., -5% balance growth 2H13 sequentially)
Figure 12: Shrinking margin loan balances… Australian system margin loans and credit limits
Figure 13: …and margin lending account numbers Number of margin lending accounts in Australia
0%
10%
20%
30%
40%
50%
60%
70%
80%
$0bn
$10bn
$20bn
$30bn
$40bn
$50bn
$60bn
$70bn
$80bn
$90bn
Sep
00
Mar
01
Sep
01
Mar
02
Sep
02
Mar
03
Sep
03
Mar
04
Sep
04
Mar
05
Sep
05
Mar
06
Sep
06
Mar
07
Sep
07
Mar
08
Sep
08
Mar
09
Sep
09
Mar
10
Sep
10
Mar
11
Sep
11
Mar
12
Sep
12
Mar
13
Sep
13
Credit Limits (LHS) Margin Loans (LHS) Margin Loans % Credit Limits (RHS)
0,000
50,000
100,000
150,000
200,000
250,000
300,000
Sep
00
Mar
01
Sep
01
Mar
02
Sep
02
Mar
03
Sep
03
Mar
04
Sep
04
Mar
05
Sep
05
Mar
06
Sep
06
Mar
07
Sep
07
Mar
08
Sep
08
Mar
09
Sep
09
Mar
10
Sep
10
Mar
11
Sep
11
Mar
12
Sep
12
Mar
13
Sep
13
Source for both charts: RBA Statistical Table D10, Credit Suisse
estimates

14 February 2014
Australia and NZ First Edition 122
■ On-going acquisition risk, with BEN seeing themselves as a consolidator amongst
smaller players and having developed an integration template following the April 2013
completion of the Adelaide Bank retail merger integration.
BEN earnings and valuation
■ Multiples: BEN is currently trading on 12.4x 12-month prospective earnings (1%
premium to BOQ vs 10% four-year average premium) equating to an 5% discount to
the major banks, and a corresponding book multiple of 1.1x.
■ Credit Suisse vs consensus: Our cash earnings estimates sit 2% below the IBES
consensus in both FY15E and FY16E.
■ Earnings guidance: BEN did not issue any directed guidance at the FY13 profit
announcement, but did state: 1) the FY14E margin trend was likely to be down rather
than up, with the margin "certainly not up" in 1H14E, citing the endowment margin
headwind of a declining cash rate environment as a key driver of this expected
outcome; 2) FY14E cost growth will accelerate YoY with costs associated with the new
Adelaide Bank head office (+$12mn in occupancy costs) and ramping up of the Basel
advanced accreditation program (potential tripling of the FY13 spend), although BEN
will aim to both keep FY14E cost growth at or around CPI and maintain positive cost /
revenue "jaws" (although with this likely to be "narrower" than FY13); and 3) 10-12
Community Bank branch openings expected in FY14E.

Australia and NZ First Edition 123
14 February 2014
Asia Pacific/Australia
Equity Research
Steel (Iron Ore (AU))
Fortescue Metals Group
(FMG.AX / FMG AU) PRE RESULTS COMMENT
1H14 results preview; reports on 19 Feb
Date: 19 February 2014 Time: Midday AEDT
Period: Interim Earnings Risk: Low
Credit Suisse estimates Briefing and dial-in details
Gross profit: $163mn TBA
NPAT: US$1.65bn (Consensus: $1.72bn)
EPS: 53¢ps (consensus 55¢ps)
DPS: 5¢ interim (consensus 6.5¢ps)
■ We already have a good estimate of the key P&L items following the
DecQ results. We can estimate revenue and expenses from received prices
and C1 costs, and we know net debt and gearing as FMG has kept the
market informed while calling in debt for repayment. Having the exact figures
will be interesting, but there is unlikely to be anything in the results to change
the view. We expect EPS of 53¢ps (consensus 55¢ps).
■ Management provided an investor call less than three weeks ago, so
we doubt much has changed. We will be looking for updates on the ramp-
up of the Kings OPF and status of the Cloud Break wet front-end fix due for
completion this month.
■ We expect an interim dividend of 5¢/sh, ahead of zero last year, given
the strong DecH result. This would represent a payout ratio of only 9%
versus the policy of 30%-40%, but we understand the first priority is debt
repayment. We doubt the market would welcome a dividend above
consensus while gearing remains high. We expect the dividend payout will
rise towards the payout policy once gearing reaches the targeted 40% level.
■ Our DCF valuation remains A$9.60/sh and our target price A$7.50.
Total return forecast in perspective
Mean^
CS tgt^
Sh Prc
-50%
-30%
-10%
10%
30%
50%
12mth Volatility* 52wk Hi-Lo IBES Consensustarget return^
Performance over 1M 3M 12M
Absolute (%) 9.1 -3.8 8.7
Relative (%) 7.3 -2.0 2.6
Financial and valuation metrics
Year 06/13A 06/14E 06/15E 06/16E
Revenue (US$mn) 8,057.0 13,177.2 13,099.5 12,007.5
EBITDA (US$mn) 3,299.0 6,650.5 5,996.3 5,037.5
EBIT (US$mn) 2,836.0 5,403.7 4,523.9 3,599.6
Net income (US$mn) 1,706.4 3,279.9 2,841.9 2,283.8
EPS (CS adj.) (USc) 54.78 105.33 91.27 73.35
Change from previous EPS (%) n.a. — — —
Consensus EPS (USc) n.a. 107.40 98.20 77.90
EPS growth (%) 21.6 92.3 -13.4 -19.6
P/E (x) 9.3 4.8 5.6 6.9
Dividend (USc) 10.00 10.00 21.00 26.00
Dividend yield (%) 2.0 2.0 4.1 5.1
P/B (x) 3.0 1.9 1.5 1.3
Net debt/equity (%) 199.1 90.1 46.3 30.6
Relative performance versus S&P ASX 200.See Reference Appendix for a description of the chart. Source: Credit Suisse estimates, * Consensus, mean range from Thomson Reuters
Source: Company data, ASX, Credit Suisse estimates, * Adj. for goodwill, notional interest and unusual items. Relative P/E
against ASX/S&P200 based on pre GW in AUD. Company PE calculation is based on displayed EPS Currency
Rating OUTPERFORM* [V]
Price (13 Feb 14, A$) 5.62
Target price (A$) 7.50¹
Market cap. (A$mn) 17,499.55
Yr avg. mthly trading (A$mn) 1,741
Last month's trading (A$mn) 2,050
Projected return:
Capital gain (%) 33.5
Dividend yield (net %) 3.3
Total return (%) 36.8
52-week price range 5.9 - 2.9
* Stock ratings are relative to the relevant country
benchmark.
¹Target price is for 12 months.
[V] = Stock considered volatile (see Disclosure Appendix).
Research Analysts
Matthew Hope
61 2 8205 4669
Michael Slifirski
61 3 9280 1845
Sam Webb
61 3 9280 1716
All material presented in this report, unless
specifically indicated otherwise, is under
copyright to CS. None of the material, nor its
content, nor any copy of it, may be altered in
any way, transmitted to, copied or distributed to
any other party, without the prior express
written permission of CS.

14 February 2014
Australia and NZ First Edition 124
Figure 1: Financial summary
Fortescue Metals Group Ltd (FMG) Year ending 30 Jun In USDmn, unless otherwise stated2012 2013 2014 2015 2016 2012 2013 2014 2015 2016
Share Price: A$5.62 Earnings 06/12A 06/13A 06/14E 06/15E 06/16ERating c_EPS_SHARESEquiv. FPO (period avg.) mn 3,114.3 3,115.1 3,113.8 3,113.8 3,113.8
Target Price A$ 7.50 c_EPS*100EPS (Normalised) c 45.1 54.8 105.3 91.3 73.3
vs Share price % 33.45 EPS_GROWTH*100EPS Growth % 21.6 92.3 -13.4 -19.6
DCF US$ 9.60 c_EBITDA_MARGIN*100EBITDA Margin % 43.1 40.9 50.5 45.8 42.0
c_DPS*100DPS c 8.0 10.0 10.0 21.0 26.0
c_PAYOUT*100Payout % 17.8 18.3 9.5 23.0 35.4
FRANKING*100Franking % 100.0 100.0 100.0 100.0 100.0
c_FCF_PS*100Free CFPS c 26.0 26.0 151.0 91.5 72.2
Profit & Loss 06/12A 06/13A 06/14E 06/15E 06/16E c_TAX_RATE*100Effective tax rate % 33.4 28.3 30.0 30.0 30.0
Sales revenue 6,681.0 8,057.0 13,177.2 13,099.5 12,007.5 Valuation
EBITDA 2,879.0 3,299.0 6,650.5 5,996.3 5,037.5 c_PE P/E x 11.1 9.2 4.8 5.5 6.8
Depr. & Amort. (267.0) (463.0) (1,246.8) (1,472.4) (1,437.9) c_EBIT_MULTIPLE_CURREV/EBIT x 8.3 9.2 4.3 4.6 5.4
EBIT 2,612.0 2,836.0 5,403.7 4,523.9 3,599.6 c_EBITDA_MULTIPLE_CUEV/EBITDA x 7.6 7.9 3.5 3.4 3.8
Associates 0.0 0.0 0.0 0.0 0.0 c_DIV_YIELD*100Dividend Yield % 1.6 2.0 2.0 4.2 5.2
Net interest Exp. (505.0) (457.0) (706.1) (464.0) (336.9) c_FCF_YIELD*100FCF Yield % 5.2 5.2 30.1 18.2 14.4
Other 0.0 0.0 0.0 0.0 0.0 c_PB Price to Book x 4.2 3.0 1.9 1.5 1.3
Profit before tax 2,107.0 2,379.0 4,697.6 4,059.9 3,262.6 ReturnsIncome tax (704.0) (672.6) (1,409.3) (1,218.0) (978.8) c_ROE*100Return on Equity % 37.3 32.3 40.2 26.6 18.9
Profit after tax 1,403.0 1,706.4 3,288.3 2,841.9 2,283.8 c_I_NPAT/c_I_SALES*100Profit Margin % 21.0 21.2 24.9 21.7 19.0
Minorities (0.0) (0.0) (8.4) (0.0) (0.0) c_I_SALES/c_B_TOT_ASSAsset Turnover x 0.4 0.4 0.6 0.6 0.5
Preferred dividends 0.0 0.0 0.0 0.0 0.0 c_ASSETS/c_EQ_COMMONEquity Multiplier x 4.0 3.9 2.8 2.2 1.9
Associates & Other 0.0 0.0 0.0 0.0 0.0 c_ROA*100Return on Assets % 9.3 8.2 14.5 12.2 10.1
Normalised NPAT 1,403.0 1,706.4 3,279.9 2,841.9 2,283.8 c_ROIC*100Return on Invested Cap. % 17.5 12.9 24.2 20.1 15.9
Unusual item after tax 156.0 39.6 52.1 (0.0) 0.0 Gearing
Reported NPAT 1,559.0 1,746.0 3,332.0 2,841.9 2,283.8 c_GEARING*100Net Debt to Net debt + Equity % 62.1 66.6 47.4 31.7 23.4
c_NET_DEBT/c_I_EBITDANet Debt to EBITDA x 2.1 3.2 1.1 0.8 0.7
Balance Sheet 06/12A 06/13A 06/14E 06/15E 06/16E c_I_EBITDA/ c_I_NET_INTERESTInt Cover (EBITDA/Net Int.) x 5.7 7.2 9.4 12.9 15.0
Cash & equivalents 2,343.0 2,158.0 2,097.5 3,386.2 3,010.2 c_I_EBIT/ c_I_NET_INTERESTInt Cover (EBIT/Net Int.) x 5.2 6.2 7.7 9.8 10.7
Inventories 617.0 961.0 1,190.1 1,139.3 1,127.5 (c_C_CAPEX/c_I_SALES)*-100Capex to Sales % 88.6 78.9 15.2 7.8 8.3
Receivables 588.0 409.0 1,147.0 1,030.7 980.1 (c_C_CAPEX/c_I_DEPR)*-100Capex to Depreciation % 3,440.7 1,454.2 160.7 69.8 69.7
Other current assets 102.0 134.0 0.0 0.0 0.0
Current assets 3,650.0 3,662.0 4,434.6 5,556.2 5,117.7 MSCI IVA (ESG) Rating BB
Property, plant & equip. 11,357.0 17,159.0 17,893.3 17,447.9 17,012.0 TP ESG Risk (%): 0
Intangibles 19.0 40.0 40.0 40.0 40.0
Other non-current assets 37.0 6.0 209.0 319.0 429.0
Non-current assets 11,413.0 17,205.0 18,142.3 17,806.9 17,481.0
Total assets 15,063.0 20,867.0 22,576.9 23,363.1 22,598.7
Payables 1,303.0 1,043.0 2,026.9 1,933.8 1,912.1
Interest bearing debt 8,501.0 12,691.0 9,514.2 8,374.0 6,730.3
Other liabilities 1,497.0 1,806.0 2,765.5 2,254.5 1,743.5 MSCI IVA Risk: Neutral
Total liabilities 11,301.0 15,540.0 14,306.6 12,562.3 10,385.9
Net assets 3,762.0 5,327.0 8,270.3 10,800.9 12,212.9
Ordinary equity 3,762.0 5,285.0 8,149.9 10,680.5 12,092.5
Minority interests 0.0 4.0 12.4 12.4 12.4
Preferred capital 0.0 0.0 0.0 0.0 0.0
Total shareholder funds 3,762.0 5,289.0 8,232.3 10,762.9 12,174.9
Net debt 6,158.0 10,533.0 7,416.7 4,987.8 3,720.1 Source: MSCI ESG Research
Cashflow 06/12A 06/13A 06/14E 06/15E 06/16E Share Price Performance
EBIT 2,612.0 2,836.0 5,403.7 4,523.9 3,599.6
Net interest -531.0 -862.0 -616.0 -434.0 -275.4
Depr & Amort 267.0 463.0 1,246.8 1,472.4 1,437.9
Tax paid -123.0 -695.0 -1,207.0 -1,345.6 -1,033.9
Working capital 101.7 -425.0 16.8 74.0 40.7
Other -49.7 825.0 871.1 -413.4 -517.4
Operating cashflow 2,277.0 2,142.0 5,715.4 3,877.3 3,251.5
Capex -5,918.0 -6,355.0 -2,004.1 -1,027.0 -1,002.0
Capex - expansionary -4,452.0 -5,021.8 -990.0 0.0 0.0
Capex - maintenance -1,466.0 -1,333.3 -1,014.1 -1,027.0 -1,002.0
Acquisitions & Invest -4.0 155.0 -110.0 -110.0 -110.0
Asset sale proceeds 0.0 0.0 0.0 0.0 0.0
Other -121.0 3.0 0.0 0.0 0.0
Investing cashflow -6,043.0 -6,197.0 -2,114.1 -1,137.0 -1,112.0
Dividends paid -251.0 -131.0 -467.1 -311.4 -871.9
Equity raised 0.0 -20.0 0.0 0.0 0.0
Net borrowings 3,623.0 4,098.0 -3,194.7 -1,140.2 -1,643.7
Other 5.0 -65.0 0.0 0.0 0.0 1 Month 3 Month 12 Month
Financing cashflow 3,377.0 3,882.0 -3,661.8 -1,451.6 -2,515.6 Absolute 9.1% -3.8% 8.7%
Total cashflow -389.0 -173.0 -60.5 1,288.6 -376.0 Relative 7.3% -2.0% 2.6%
Adjustments 69.0 -12.0 0.0 0.0 0.0
Net change in cash -320.0 -185.0 -60.5 1,288.6 -376.0 Source: Reuters 52 week trading range: 2.92-5.93
MSCI IVA Risk Comment: FMG has exposure to environmental
land management issues, carbon tax, health and safety, water
use and carbon emissions, but has adequate management
oversight on the issues. Two fatalities at Christmas Creek
mine in 2013 has brought safety into focus and tarnished
FMG's reputation. The issue may relate to use of a range of
contractors at the mine and FMG will need to focus on
casacading a safety culture down intoall contractors.
13/02/2014 18:06
Fortescue Metals Group Limited (Fortescue) is engaged in the mining of iron ore from its
Cloudbreak and Christmas Creek mine sites and the operation of an integrated mine, rail
and port supply chain.
Credit Suisse View
TP Risk Comment: No ESG factors identified that have a
material impact on the valuation, although two fatalities in
2013 have brought its safety culture into the spotlight
OUTPERFORM
0.00
1.00
2.00
3.00
4.00
5.00
6.00
7.00
1/02/2013 1/04/2013 1/06/2013 1/08/2013 1/10/2013 1/12/2013 1/02/2014
FMG.AX XJO
2.7
3.7
4.7
5.7
6.7
7.7
Environment Social Governance
Stock Local Sector
Country Global Sector
Source: Company data, Credit Suisse estimates

Australia and NZ First Edition 125
14 February 2014
Asia Pacific/Australia
Equity Research
Diversified Metals & Mining (Minerals (AU))
Iluka Resources
(ILU.AX / ILU AU) PRE RESULTS COMMENT
2013 results preview and operation analysis;
reports on 21 Feb Date: 21 February 2014 Time: Pre market
Period: Full year 2013 Earnings Risk: Nil
Credit Suisse estimates Briefing and dial-in details
EBITDA: $242mn (consensus $294mn) 10am AEDT Fri 21 Feb
NPAT: $18mn (announced 11 Feb) Aust: 1800 123 296
Intl: +61 2 8038 5221
Conf ID: 34963341
EPS: 4.3¢ps
DPS: 10¢ for year (Consensus14¢)
■ Following the quarterly results and the 11 Feb report that NPAT is $18mn
after impairments, we now have the main items of the P&L.
■ Dividend – we expect policy-breaking 5¢/sh final dividend, matching
interim. Payout policy is +40% of FCF measured after all capital. Capex for
DecH is uncertain, but guidance was $100mn for the year. On that basis, we
estimate 2013 FCF to be -$3mn. Interim dividend of 5¢/sh (A$21mn) looked
beyond a hefty tax payment towards a stronger DecH, which did not
eventuate. Policy would indicate no final dividend, given it would be funded
with debt, but with a comfortable balance sheet, it may match interim at 5¢.
■ Management call and cost guidance for the current year should be key
catalysts for the outlook. We believe ILU is heading for a loss in the first
half of 2014 with pricing now lower than the average for 2013. We will be
interested in management response, although we doubt ILU has any further
useful cuts available. We look closer at this issue in this note. MAC
changes – ILU has given responsibility for the MAC royalty to a
development manager and may begin moves to develop and spin off the
royalty business.
■ Our DCF valuation remains A$9.10/sh and our target price is $10.
Total return forecast in perspective
Mean^CS tgt^Sh Prc
-50%
-30%
-10%
10%
30%
50%
12mth Volatility* 52wk Hi-Lo IBES Consensustarget return^
Performance Over 1M 3M 12M
Absolute (%) 11.9 -6.8 -7.2
Relative (%) 10.1 -5.0 -13.2
Financial and valuation metrics
Year 12/12A 12/13E 12/14E 12/15E
Revenue (A$mn) 1,069.8 763.0 915.2 1,362.6
EBITDA (A$mn) 695.1 266.7 306.7 580.5
EBIT (A$mn) 492.4 97.8 100.9 434.1
Net income (A$mn) 363.2 59.0 96.0 337.7
EPS (CS adj.) (Ac) 86.74 14.10 22.93 80.65
Change from previous EPS (%) n.a. — — —
Consensus EPS (Ac) n.a. 17.50 47.60 80.00
EPS growth (%) -28.2 -83.7 62.6 251.8
P/E (x) 10.6 65.4 40.2 11.4
Dividend (Ac) 35.00 10.00 19.00 30.00
Dividend yield (%) 3.8 1.1 2.1 3.3
P/B (x) 2.5 2.5 2.5 2.1
Net debt/equity (%) 6.1 12.0 net cash net cash
Relative performance versus S&P ASX 200.See Reference Appendix for a description of the chart. Source: Credit Suisse
estimates, * Consensus, mean range from Thomson Reuters
Source: Company data, ASX, Credit Suisse estimates, * Adj. for goodwill, notional interest and unusual items. Relative P/E
against ASX/S&P200 based on pre GW in AUD. Company PE calculation is based on displayed EPS Currency
Rating NEUTRAL* [V]
Price (13 Feb 14, A$) 9.22
Target price (A$) 10.00¹
Market cap. (A$mn) 3,860.42
Yr avg. mthly trading (A$mn) 630
Last month's trading (A$mn) 367
Projected return:
Capital gain (%) 8.5
Dividend yield (net %) 2.2
Total return (%) 10.7
52-week price range 11.9 - 8.1
* Stock ratings are relative to the relevant country
benchmark.
¹Target price is for 12 months.
[V] = Stock considered volatile (see Disclosure Appendix).
Research Analysts
Matthew Hope
61 2 8205 4669
Martin Kronborg
61 2 8205 4369

14 February 2014
Australia and NZ First Edition 126
Figure 1: Financial summary
Iluka Resources (ILU) Year ending 31 Dec In AUDmn, unless otherwise stated2011 2012 2013 2014 2015 2011 2012 2013 2014 2015
Share Price: A$9.22 Earnings 12/11A 12/12A 12/13E 12/14E 12/15ERating c_EPS_SHARESEquiv. FPO (period avg.) mn 418.7 418.7 418.7 418.7 418.7
Target Price A$ 10.00 c_EPS*100EPS (Normalised) c 120.9 86.7 14.1 22.9 80.7
vs Share price % 8.46 EPS_GROWTH*100EPS Growth % -28.2 -83.7 62.6 251.8
DCF A$ 9.10 c_EBITDA_MARGIN*100EBITDA Margin % 58.5 65.0 35.0 33.5 42.6
c_DPS*100DPS c 75.0 35.0 10.0 19.0 30.0
c_PAYOUT*100Payout % 62.0 40.3 70.9 82.9 37.2
FRANKING*100Franking % 73.3 100.0 100.0 100.0 100.0
c_FCF_PS*100Free CFPS c 145.0 19.9 -2.1 72.5 90.4
Profit & Loss 12/11A 12/12A 12/13E 12/14E 12/15E c_TAX_RATE*100Effective tax rate % 30.2 29.1 28.5 30.0 30.0
Sales revenue 1,536.7 1,069.8 763.0 915.2 1,362.6 Valuation
EBITDA 898.9 695.1 266.7 306.7 580.5 c_PE P/E x 7.6 10.6 65.4 40.2 11.4
Depr. & Amort. (224.2) (202.7) (168.9) (205.7) (146.4) c_EBIT_MULTIPLE_CURREV/EBIT x 5.5 8.0 41.4 37.6 8.1
EBIT 674.7 492.4 97.8 100.9 434.1 c_EBITDA_MULTIPLE_CUEV/EBITDA x 4.1 5.7 15.2 12.4 6.0
Associates 0.0 0.0 0.0 0.0 0.0 c_DIV_YIELD*100Dividend Yield % 8.1 3.8 1.1 2.1 3.3
Net interest Exp. (8.0) (6.6) (11.2) (7.6) 13.4 c_FCF_YIELD*100FCF Yield % 15.7 2.2 -0.2 7.9 9.8
Other 66.8 41.2 64.4 43.9 34.8 c_PB Price to Book x 2.5 2.5 2.5 2.5 2.1
Profit before tax 733.5 527.0 151.0 137.1 482.4 ReturnsIncome tax (218.9) (149.0) (23.5) (41.1) (144.7) c_ROE*100Return on Equity % 33.0 23.2 3.9 6.1 18.5
Profit after tax 514.6 378.0 127.5 96.0 337.7 c_I_NPAT/c_I_SALES*100Profit Margin % 32.9 34.0 7.7 10.5 24.8
Minorities (0.0) (0.0) (0.0) (0.0) (0.0) c_I_SALES/c_B_TOT_ASSAsset Turnover x 0.6 0.4 0.3 0.4 0.6
Preferred dividends 0.0 0.0 0.0 0.0 0.0 c_ASSETS/c_EQ_COMMONEquity Multiplier x 1.6 1.5 1.5 1.4 1.3
Associates & Other (8.5) (14.8) (68.5) 0.0 0.0 c_ROA*100Return on Assets % 20.6 15.0 2.6 4.4 13.9
Normalised NPAT 506.1 363.2 59.0 96.0 337.7 c_ROIC*100Return on Invested Cap. % 34.4 21.2 4.8 4.7 20.8
Unusual item after tax 35.6 0.0 (41.0) 0.0 0.0 Gearing
Reported NPAT 541.7 363.2 18.0 96.0 337.7 c_GEARING*100Net Debt to Net debt + Equity % Net Cash 5.8 10.7 Net Cash Net Cash
c_NET_DEBT/c_I_EBITDANet Debt to EBITDA x Net Cash 0.1 0.7 Net Cash Net Cash
Balance Sheet 12/11A 12/12A 12/13E 12/14E 12/15E c_I_EBITDA/ c_I_NET_INTERESTInt Cover (EBITDA/Net Int.) x 112.4 105.3 23.8 40.1 -43.2
Cash & equivalents 320.7 54.3 31.5 84.4 356.3 c_I_EBIT/ c_I_NET_INTERESTInt Cover (EBIT/Net Int.) x 84.3 74.6 8.7 13.2 -32.3
Inventories 376.2 522.6 555.0 461.2 404.2 (c_C_CAPEX/c_I_SALES)*-100Capex to Sales % 9.3 15.6 13.0 6.8 8.8
Receivables 256.1 139.5 114.9 156.5 233.0 (c_C_CAPEX/c_I_DEPR)*-100Capex to Depreciation % 101.0 133.8 70.6 50.2 136.6
Other current assets 0.5 0.0 0.0 0.0 0.0
Current assets 953.5 716.4 701.4 702.1 993.5 MSCI IVA (ESG) Rating BBB
Property, plant & equip. 1,430.4 1,430.3 1,338.5 1,194.7 1,168.3 TP ESG Risk (%): -3.9
Intangibles 6.7 6.3 6.1 6.1 6.1
Other non-current assets 63.2 273.6 256.4 256.4 256.4
Non-current assets 1,500.3 1,710.2 1,601.0 1,457.2 1,430.8
Total assets 2,453.8 2,426.6 2,302.3 2,159.4 2,424.4
Payables 136.7 87.3 66.4 78.0 112.0
Interest bearing debt 164.0 150.2 214.8 22.9 0.0
Other liabilities 618.4 622.0 491.7 491.7 491.7 MSCI IVA Risk: Positive
Total liabilities 919.1 859.5 772.9 592.6 603.7
Net assets 1,534.7 1,567.1 1,529.4 1,566.8 1,820.7
Ordinary equity 1,534.7 1,567.1 1,529.4 1,566.8 1,820.7
Minority interests 0.0 0.0 0.0 0.0 0.0
Preferred capital 0.0 0.0 0.0 0.0 0.0
Total shareholder funds 1,534.7 1,567.1 1,529.4 1,566.8 1,820.7
Net debt -156.7 95.9 183.3 -61.6 -356.3 Source: MSCI ESG Research
Cashflow 12/11A 12/12A 12/13E 12/14E 12/15E Share Price Performance
EBIT 674.7 492.4 97.8 100.9 434.1
Net interest -10.9 -0.7 -12.9 -7.6 13.4
Depr & Amort 224.2 202.7 168.9 205.7 146.4
Tax paid -12.5 -159.1 -150.3 -41.1 -144.7
Working capital -233.7 -79.2 -28.7 63.8 14.5
Other 107.7 -205.5 15.8 43.9 34.8
Operating cashflow 749.5 250.6 90.7 365.5 498.5
Capex -142.5 -167.3 -99.5 -62.0 -120.0
Capex - expansionary
Capex - maintenance
Acquisitions & Invest 3.9 1.4 0.7 0.0 0.0
Asset sale proceeds 0.0 0.0 0.0 0.0 0.0
Other 0.0 0.0 0.0 0.0 0.0
Investing cashflow -138.6 -165.9 -98.8 -62.0 -120.0
Dividends paid -117.0 -333.7 -62.8 -58.6 -83.7
Equity raised 0.0 -3.5 -1.8 0.0 0.0
Net borrowings -182.0 -5.0 49.4 -193.2 -23.3
Other -21.3 -8.8 0.0 0.0 0.0 1 Month 3 Month 12 Month
Financing cashflow -320.3 -351.0 -15.2 -251.8 -107.0 Absolute 11.9% -6.8% -7.2%
Total cashflow 290.6 -266.3 -23.3 51.7 271.5 Relative 10.1% -5.0% -13.2%
Adjustments 0.0 -0.1 0.5 1.3 0.4
Net change in cash 290.6 -266.4 -22.8 52.9 271.9 Source: Reuters 52 week trading range: 8.11-11.86
MSCI IVA Risk Comment: Rating primarily based on negative
impact from carbon tax - CO2 numbers quoted were for all 4
kilns, whereas only two are operational. Furthermore, Iluka
expects to being eligible for assistance making the financial
impact small.
13/02/2014 19:20
Iluka Resources Limited is an Australia-based company.The principal activities of the
Company consists of exploration,mining,concentration & separation of mineral
sands,production of ilmenite, rutile,synthetic rutile & other titaniferous concentrates etc.
Credit Suisse View
TP Risk Comment: We include rehabilitation provisions in our
TP based on environmental requirements
NEUTRAL
0.00
2.00
4.00
6.00
8.00
10.00
12.00
14.00
1/02/2013 1/04/2013 1/06/2013 1/08/2013 1/10/2013 1/12/2013 1/02/2014
ILU.AX XJO
2.7
3.7
4.7
5.7
6.7
7.7
Environment Social Governance
Stock Local Sector
Country Global Sector
Source: Company data, Credit Suisse estimates

14 February 2014
Australia and NZ First Edition 127
Changes to earnings
Reviewing the operations
We recently reviewed our operating assumption for Iluka. This was initiated because
details in the DecQ release about the expected production and timing of Balranald project
suggested that production would be too low to meet our forecast rutile sales of 320ktpa.
Further details provided in the release of 11 Feb, indicated West Australian mines – other
than the idled Tutanup South – are unlikely to restart, so we have adjusted capex and
output for these operations.
The operations we now model are shown below, with the zircon/rutile/Synthetic rutile
(Z/R/SR) production shown in Figure 3.
Figure 2: Operations that we model
1Q13 2Q13 3Q13 4Q13 1Q14 2Q14 3Q14 4Q14 1Q15 2Q15 3Q15 4Q15 1Q16 2Q16 3Q16 4Q16 1Q17 2Q17 3Q17 4Q17Jacinth Ambrosia Mining
Processing
Murray Basin Mining Processing
Balranald Mining Processing
Virginia
Tutanup South
SR1
SR2
SR3
SR4
2013 2014 2015 2016 2017
Source: Company data, Credit Suisse estimates
Figure 3: High grade production and inventory that we model
-
200
400
600
800
1,000
1,200
Jun
H 0
7
DecH
07
Jun
H 0
8
DecH
08
Jun
H 0
9
DecH
09
Jun
H 1
0
DecH
10
Jun
H 1
1
DecH
11
Jun
H 1
2
DecH
12
Jun
H 1
3
DecH
13
Jun
H 1
4e
DecH
14e
Jun
H 1
5e
DecH
15e
Jun
H 1
6e
DecH
16e
Jun
H 1
7e
Invento
ry /
Sale
s (
kt)
Rutile sales Synthetic rutile sales Zircon sales
Zircon & TiO2 Inventory HMC inventory
Source: Company data, Credit Suisse estimates
On 11 February, following ILU pre-announcement of NPAT, we provided the following
changes to our earnings, based on our revised operating assumptions.
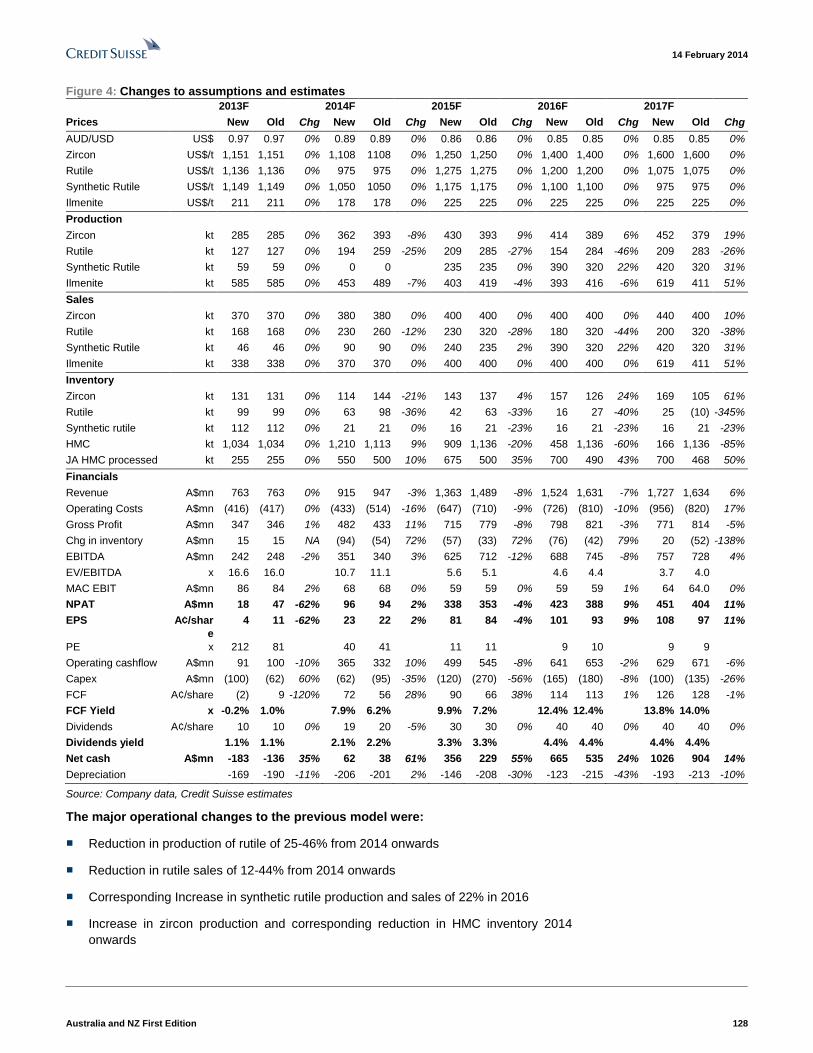
14 February 2014
Australia and NZ First Edition 128
Figure 4: Changes to assumptions and estimates
2013F 2014F 2015F 2016F 2017F
Prices New Old Chg New Old Chg New Old Chg New Old Chg New Old Chg
AUD/USD US$ 0.97 0.97 0% 0.89 0.89 0% 0.86 0.86 0% 0.85 0.85 0% 0.85 0.85 0%
Zircon US$/t 1,151 1,151 0% 1,108 1108 0% 1,250 1,250 0% 1,400 1,400 0% 1,600 1,600 0%
Rutile US$/t 1,136 1,136 0% 975 975 0% 1,275 1,275 0% 1,200 1,200 0% 1,075 1,075 0%
Synthetic Rutile US$/t 1,149 1,149 0% 1,050 1050 0% 1,175 1,175 0% 1,100 1,100 0% 975 975 0%
Ilmenite US$/t 211 211 0% 178 178 0% 225 225 0% 225 225 0% 225 225 0%
Production
Zircon kt 285 285 0% 362 393 -8% 430 393 9% 414 389 6% 452 379 19%
Rutile kt 127 127 0% 194 259 -25% 209 285 -27% 154 284 -46% 209 283 -26%
Synthetic Rutile kt 59 59 0% 0 0 235 235 0% 390 320 22% 420 320 31%
Ilmenite kt 585 585 0% 453 489 -7% 403 419 -4% 393 416 -6% 619 411 51%
Sales
Zircon kt 370 370 0% 380 380 0% 400 400 0% 400 400 0% 440 400 10%
Rutile kt 168 168 0% 230 260 -12% 230 320 -28% 180 320 -44% 200 320 -38%
Synthetic Rutile kt 46 46 0% 90 90 0% 240 235 2% 390 320 22% 420 320 31%
Ilmenite kt 338 338 0% 370 370 0% 400 400 0% 400 400 0% 619 411 51%
Inventory
Zircon kt 131 131 0% 114 144 -21% 143 137 4% 157 126 24% 169 105 61%
Rutile kt 99 99 0% 63 98 -36% 42 63 -33% 16 27 -40% 25 (10) -345%
Synthetic rutile kt 112 112 0% 21 21 0% 16 21 -23% 16 21 -23% 16 21 -23%
HMC kt 1,034 1,034 0% 1,210 1,113 9% 909 1,136 -20% 458 1,136 -60% 166 1,136 -85%
JA HMC processed kt 255 255 0% 550 500 10% 675 500 35% 700 490 43% 700 468 50%
Financials
Revenue A$mn 763 763 0% 915 947 -3% 1,363 1,489 -8% 1,524 1,631 -7% 1,727 1,634 6%
Operating Costs A$mn (416) (417) 0% (433) (514) -16% (647) (710) -9% (726) (810) -10% (956) (820) 17%
Gross Profit A$mn 347 346 1% 482 433 11% 715 779 -8% 798 821 -3% 771 814 -5%
Chg in inventory A$mn 15 15 NA (94) (54) 72% (57) (33) 72% (76) (42) 79% 20 (52) -138%
EBITDA A$mn 242 248 -2% 351 340 3% 625 712 -12% 688 745 -8% 757 728 4%
EV/EBITDA x 16.6 16.0 10.7 11.1 5.6 5.1 4.6 4.4 3.7 4.0
MAC EBIT A$mn 86 84 2% 68 68 0% 59 59 0% 59 59 1% 64 64.0 0%
NPAT A$mn 18 47 -62% 96 94 2% 338 353 -4% 423 388 9% 451 404 11%
EPS A¢/shar
e
4 11 -62% 23 22 2% 81 84 -4% 101 93 9% 108 97 11%
PE x 212 81 40 41 11 11 9 10 9 9
Operating cashflow A$mn 91 100 -10% 365 332 10% 499 545 -8% 641 653 -2% 629 671 -6%
Capex A$mn (100) (62) 60% (62) (95) -35% (120) (270) -56% (165) (180) -8% (100) (135) -26%
FCF A¢/share (2) 9 -120% 72 56 28% 90 66 38% 114 113 1% 126 128 -1%
FCF Yield x -0.2% 1.0% 7.9% 6.2% 9.9% 7.2% 12.4% 12.4% 13.8% 14.0%
Dividends A¢/share 10 10 0% 19 20 -5% 30 30 0% 40 40 0% 40 40 0%
Dividends yield 1.1% 1.1% 2.1% 2.2% 3.3% 3.3% 4.4% 4.4% 4.4% 4.4%
Net cash A$mn -183 -136 35% 62 38 61% 356 229 55% 665 535 24% 1026 904 14%
Depreciation -169 -190 -11% -206 -201 2% -146 -208 -30% -123 -215 -43% -193 -213 -10%
Source: Company data, Credit Suisse estimates
The major operational changes to the previous model were:
■ Reduction in production of rutile of 25-46% from 2014 onwards
■ Reduction in rutile sales of 12-44% from 2014 onwards
■ Corresponding Increase in synthetic rutile production and sales of 22% in 2016
■ Increase in zircon production and corresponding reduction in HMC inventory 2014
onwards

14 February 2014
Australia and NZ First Edition 129
■ All of the above changes result in revenue and Inventory changes in the financial
forecasts.
■ Alteration in costs, depreciation and capex, particularly for the remodeled Balranald
Project.
■ Removal of capex for Tutanup and WA sustaining capex, associated with ILU's
confession release.
ILU's DecQ release revealed that Balranald – if approved – may produce 170ktpa of rutile
and Jacinth Ambrosia may produce another 20-40ktpa. This would see high grade TiO2
feedstock sales drop well below historical averages. We make up some of the rutile
shortfall by assuming that three synthetic rutile kilns will restart. However, these
assumptions remain risky because we consider SR Kilns are the marginal producers of the
chloride feedstock market and will require sufficient demand and pricing to restart.
Financial impact of our operational changes
The impact of the changes is varied across the forecast years.
■ 2014 has only minor changes. The largest change was the addition of $40mn to
capex. This was to meet guidance rather than any operation we can specify.
■ 2015 has reduced EBITDA, earnings and operating cash flow, but lower capex so a
28% increase in FCF.
■ 2016 has lower EBITDA, but also lower depreciation, so earnings are 9% higher.
Operating cash flow is lower but FCF unchanged. Net cash climbs.
Positive changes but reasons to be cautious
Taken as a whole, the changes are probably mainly positive, with a stronger cash balance
and stronger FCF, which to us are the key drivers of value. However, we are aware that
we will probably receive new guidance for 2014 at next week's results, so it is premature to
be becoming to certain.
Nevertheless, on our current estimates, 2014 earnings will remain poor, with mineral
sands delivering a loss in the first half but a modest profit in the second half on expected
mineral sand price recovery. We forecast that most of the earnings in 2014 will again flow
from iron ore due to the MAC royalty.
It seems that the prospect for any strong recovery has to be pushed out further to 2015.
Feb announcement of 2013 result tells us mineral sands made a loss
ILU's 11 Feb pre-announcement of $18mn NPAT (after impairments) tells us that mineral
sands delivered an underlying loss of around $15mn, and the reversal to a positive
underlying result of ca. $55-60mn was driven by iron ore – the MAC royalty.
Same again for JunH-14?
This is a disappointing result and more so when we consider that entering 2014, mineral
sand prices have deteriorated from the 2013 average. We expect that ILU's mineral sands
business will clock up another underlying loss in the JunH-14. Our forecast of an
underlying $45mn for mineral sands for 2014 really depends on a recovery in mineral sand
prices in DecH, together with forecast lower currency.

14 February 2014
Australia and NZ First Edition 130
Figure 5: ILU key profit drivers out of its control – prices, FX and sales volumes
0.60
0.70
0.80
0.90
1.00
1.10
0
500
1,000
1,500
2,000
2,500Jun
-2007
Dec-2
007
Jun
-2008
Dec-2
008
Jun
-2009
Dec-2
009
Jun
-2010
Dec-2
010
Jun
-2011
Dec-2
011
Jun
-2012
Dec-2
012
Jun
-2013
Dec-2
013
Jun
-2014
Dec-2
014
Jun
-2015
Dec-2
015
Jun
-2016
Dec-2
016
Jun
-2017
Dec-2
017
Price (
US
$/t
)
Z/R/SR sales Zircon Price Rutile Price
Synthetic Rutile Price AUD/USD (RHS)
Source: Company data, Credit Suisse estimates
Mineral sand prices and FX are outside of ILU's control. Although the dominance of large
producers would suggest that the sector is well set up for producer discipline to uphold
profitable pricing, a loss of discipline in 2H 2012 saw pricing control slip out of the
producers grasp. It now seems there is little resistance from producers to sliding zircon
prices.
ILU can only control production and costs
ILU cannot do a lot about prices until demand recovers and nothing about FX. Its only real
controls at the moment are production and costs, and those two it had furiously wound
back over 2012 and 2013. In December it hauled cash costs all the way back to $174mn
for the half, $143 from its peaks in 2011 and only $6mn above the rate for DecH-09 in the
Global Financial Crisis, when production was at a low (Figure 6).
Figure 6: ILU cash costs – actual since 2007 and forecast -450
-400
-350
-300
-250
-200
-150
-100
Jun
-2007
Dec-2
007
Jun
-2008
Dec-2
008
Jun
-2009
Dec-2
009
Jun
-2010
Dec-2
010
Jun
-2011
Dec-2
011
Jun
-2012
Dec-2
012
Jun
-2013
Dec-2
013
Jun
-2014
Dec-2
014
Jun
-2015
Dec-2
015
Jun
-2016
Dec-2
016
Jun
-2017
Dec-2
017
A$m
n
Source: Company data, Credit Suisse estimates
But despite these extreme efforts on the costs side, ILU's mineral sands business made a
loss in 2013, and is heading for another in 1H 2014. What else can it do?

14 February 2014
Australia and NZ First Edition 131
What else can ILU do on costs?
Given costs are now at a low point it is questionable whether there is anything left to cut.
ILU has switched off all its synthetic rutile kilns, closed the small mines Eneabba and
Tutanup South, it ceased shipping HMC from Jacinth Ambrosia for an extended period –
building up 800kt of HMC at the mine, and is running the mineral separation plants on
campaign basis, with extended outages.
So all that is left are the core mineral sand operations, Jacinth Ambrosia, Murray Basin or
Virginia.
We don't believe there are production changes at Virginia or Murray Basin that would be
useful in cutting costs. The current Murray Basin operations (WRP) have only a year of
production left and then there is due to be a production outage before the new mine starts.
Stopping it now and having to restart for only one year would cause staffing issues and
therefore would probably not be cost effective. Virginia is the smallest of the operations,
but also the cheapest, costing only $65mn pa. There are no big wins in switching it off.
And as best we can determine, it is also profitable, selling a high-TiO2 ilmenite to Dupont
and feeding zircon into the US market.
JA mining looks to be the only other option
That leaves Jacinth Ambrosia, the main source of zircon. On our estimates, ILU still holds
130kt of finished zircon inventory, which amounts to three months' worth at our expected
sales levels of 400ktpa. However, we estimate the Heavy Mineral Concentrate (HMC)
balance at JA is 800kt, which was built up in 20012 and 2013 when shipments to the
mineral separation plants ceased while mining continued. Half of the HMC content is
zircon, so ILU has a year's supply of zircon already mined that is simply awaiting shipping
to the Mineral Separation Plant. With zircon production continuing from Murray Basin and
Virginia, ILU could cease mining at JA and continue to meet sales for more than 12
months.
Is a JA mining stoppage worthwhile?
Back in May 2012, ILU presented the following break-up of costs at Jacinth Ambrosia,
probably based on 2011 operations, and noted that the cash cost of the mine was around
A$170mn pa. By ceasing transporting and separating zircon when it already had a surplus
of finished material, it was able to postpone 57% of the costs. Now that demand for zircon
is picking up, but pricing is weak, perhaps it is time for ILU to cut the other 43% of costs?
Figure 7: May 2012 break-up of JA cash costs set at about $170mn pa
Source: ILU

14 February 2014
Australia and NZ First Edition 132
JA average grades have eased a little since 2011, while oil in AUD terms is more
expensive, so we expect mining and concentrating costs may be a little higher than 2011.
We estimate that around $80mn pa ($40mn per half) will be saved by suspending mining
at Jacinth Ambrosia.
Too late to prevent a loss in JunH'14, but could save $80mnpa from DecH
If a decision was made to cease mining, effective from July this year, we estimate the
outage could be sustained until 4Q15. DecH-14 cash costs on our estimate would drop to
$164mn, from $174mn in DecH-13 (Figure 8). Without a JA mining cut, we expect DecH-
14 costs to exceed $200mn as production and mineral separation increase at JA and
Murray Basin. We forecast costs will rise steeply in 2015, with or without a mining
cessation because our forecasts include the restart of two synthetic rutile kilns.
Figure 8: ILU cash costs historical and forecast -450
-400
-350
-300
-250
-200
-150
-100
Jun
-2007
Dec-2
007
Jun
-2008
Dec-2
008
Jun
-2009
Dec-2
009
Jun
-2010
Dec-2
010
Jun
-2011
Dec-2
011
Jun
-2012
Dec-2
012
Jun
-2013
Dec-2
013
Jun
-2014
Dec-2
014
Jun
-2015
Dec-2
015
Jun
-2016
Dec-2
016
Jun
-2017
Dec-2
017
A$m
n
Base Case Cash costs Cash cost with JA mining suspension
Source: Company data, Credit Suisse estimates
But flow on effects for production – lower zircon sales later
Another point that needs to be considered is the flow-on effects of a mining suspension,
beyond staffing issues and redundancy costs. With no mining, stockpiles of finished zircon
and HMC would be expended more rapidly than otherwise. If mining continues, we
estimate that ILU will lift zircon demand in later years if there is any increased market
demand, by using stockpiles of HMC and finished zircon (Figure 9). However, if mining
stopped for a period, stockpiles would be exhausted and by 2017, zircon sales would need
to be aligned with production. At that period, we expect production to be sliding as Jacinth
heads through declining grades towards its close and mining prepares to transition to the
lower-grade Ambrosia deposit.

14 February 2014
Australia and NZ First Edition 133
Figure 9: Base case zircon sales with steady JA mining Figure 10: Zircon sales if mining at JA is suspended
0
50
100
150
200
250
300
350
400
450
Jun
H 0
7
DecH
07
Jun
H 0
8
DecH
08
Jun
H 0
9
DecH
09
Jun
H 1
0
DecH
10
Jun
H 1
1
DecH
11
Jun
H 1
2
DecH
12
Jun
H 1
3
DecH
13
Jun
H 1
4e
DecH
14e
Jun
H 1
5e
DecH
15e
Jun
H 1
6e
DecH
16e
Jun
H 1
7e
DecH
17e
Zircon (k
t)
Zircon sales Zircon inventoryZircon in HMC stocks
0
50
100
150
200
250
300
350
400
450
Jun
H 0
7
DecH
07
Jun
H 0
8
DecH
08
Jun
H 0
9
DecH
09
Jun
H 1
0
DecH
10
Jun
H 1
1
DecH
11
Jun
H 1
2
DecH
12
Jun
H 1
3
DecH
13
Jun
H 1
4e
DecH
14e
Jun
H 1
5e
DecH
15e
Jun
H 1
6e
DecH
16e
Jun
H 1
7e
DecH
17e
Zircon (k
t)
Zircon sales Zircon inventoryZircon in HMC stocks
Source: Company data, Credit Suisse estimates Source: Company data, Credit Suisse estimates
So the outcome of our analysis of JA mining option is as follows:
■ A loss for the mineral sands business in JunH-14 looks unavoidable unless prices
jump. It is too late in the half now for a decision to suspend mining to take effect.
■ If a decision to suspend mining was made, cash costs and gross profit in DecH-14 and
JunH-14 could increase by $40mn each over our base case, but the offset would be a
loss of optionality around zircon output in later years. Earnings may not expand greatly
because the inventory unwind would likely represent a P&L expense.
■ Our base case is that there is no mining suspension, and that zircon sales increase to
440kt from 400kt, as market demand grows but with little increase in other supply.
Differences in cash costs and revenues
With effects to both cash costs and sales, it may be helpful to view the difference (Figure
11). If JA mining was suspended, cash costs would decline in DecH-14 as we have
already demonstrated, while sales revenue would be unchanged. However in 2016 and
2017, when we expect the zircon price to be higher and the AUD/USD lower, revenues
would be substantially lower than our base case due to the reduction rather than growth in
zircon sales, while cash costs would have closed to the original level.
Figure 11: Semi-annual mineral sand sales revenue versus cash costs -1,000
-900
-800
-700
-600
-500
-400
-300
-200
-100
00
100
200
300
400
500
600
700
800
900
1,000
Jun
-2007
Dec-2
00
7
Jun
-2008
Dec-2
00
8
Jun
-2009
Dec-2
00
9
Jun
-2010
Dec-2
01
0
Jun
-2011
Dec-2
01
1
Jun
-2012
Dec-2
01
2
Jun
-2013
Dec-2
013e
Jun
-2014e
Dec-2
014e
Jun
-2015e
Dec-2
015e
Jun
-2016e
Dec-2
016e
Jun
-2017e
Dec-2
017e
Cash c
osts
(A
$m
n)
Sale
s (
A$m
n)
Sales with JA suspension Sales
Cash cost with JA suspension (RHS) Cash cost (RHS) Source: Company data, Credit Suisse estimates

14 February 2014
Australia and NZ First Edition 134
Other expenses erode the margin between sales and cash costs
The reader may note that there remains a sizeable gap of at least $200mn per half
between mineral sands revenue and cash costs as presented in Figure 11. Unfortunately,
this margin is not profit. It is eroded by other cash and non-cash expenses. $100mn per
half is expended in additional cash costs – royalties and marketing, corporate, exploration,
R&D and restructuring. Another $80-100mn goes on D&A, and Changes in Inventory can
be positive or negative, but going forward is likely to be an expense of up to $90mn per
half as inventory is unwound.
What causes revenue to rise
An obvious feature of the revenue versus cost chart (Figure 11) is the remarkable rise in
revenue in 2011. Figure 5 illustrates that this was caused by high prices and high sales
volumes. But in future years, revenues climb again, while Figure 5 shows that our forecast
prices are only around half the levels achieved in 2011-12. So what causes this
expansion?
Again Figure 5 provides the answer. It is a combination of higher pricing with lower
AUD/USD and higher volumes. We can isolate the effect of currency by charting the costs
and revenues in the USD (Figure 12). In this chart, peak semi-annual revenue in 2017
drops by about $100mn, whereas the 2011 peak rises to $1000mn.
Figure 12: Semi-annual mineral sand sales revenue versus cash costs in USD terms
-1,000
-900
-800
-700
-600
-500
-400
-300
-200
-100
00
100
200
300
400
500
600
700
800
900
1,000
Jun
-2007
Dec-2
007
Jun
-2008
Dec-2
008
Jun
-2009
Dec-2
009
Jun
-2010
Dec-2
010
Jun
-2011
Dec-2
011
Jun
-2012
Dec-2
012
Jun
-2013
Dec-2
013
Jun
-2014
Dec-2
014
Jun
-2015
Dec-2
015
Jun
-2016
Dec-2
016
Jun
-2017
Dec-2
017
Cash c
osts
(U
S$m
n)
Sale
s (
US
$m
n)
Sales revenue Cash costs
Source: Company data, Credit Suisse estimates

14 February 2014
Australia and NZ First Edition 135
Figure 13: Financial summary Assumptions FY10 FY11 FY12 FY13F FY14F FY15F FY16F FY17F 1H13 2H13F 1H14F 2H14F 1H15F 2H15F 1H16F 2H16F 1H17F 2H17F
AUD:USD 0.92 1.03 1.03 0.97 0.89 0.86 0.85 0.85 1.02 0.93 0.90 0.88 0.86 0.86 0.85 0.85 0.85 0.85
Zircon price (US$/t) 875 1,875 2,173 1,151 1,108 1,250 1,400 1,600 1,173 1,129 1,090 1,125 1,225 1,275 1,400 1,400 1,600 1,600
Rutile price (US$/t) 550 1,055 2,405 1,136 975 1,275 1,200 1,075 1,300 972 900 1,050 1,250 1,300 1,200 1,200 1,075 1,075
Synthetic Rutile price (US$/t) 450 858 1,707 1,149 1,050 1,175 1,100 975 1,200 1,098 1,000 1,100 1,150 1,200 1,100 1,100 975 975
Ilmenite price (US$/t) 84 209 313 211 178 225 225 225 243 180 165 190 225 225 225 225 225 225
Production (kt) FY10 FY11 FY12 FY13F FY14F FY15F FY16F FY17F 1H13 2H13F 1H14F 2H14F 1H15F 2H15F 1H16F 2H16F 1H17F 2H17F
Zircon 413 602 343 285 362 430 414 452 119 167 168 194 209 220 220 194 226 226
Rutile 250 281 220 127 194 209 154 209 61 66 92 102 104 105 105 49 105 105
Sythetic Rutile 347 286 248 59 - 235 390 420 59 - - - 75 160 180 210 210 210
Ilmenite saleable 469 460 386 585 453 403 393 619 334 251 213 239 238 165 165 228 310 310
Sales (kt) FY10 FY11 FY12 FY13F FY14F FY15F FY16F FY17F 1H13 2H13F 1H14F 2H14F 1H15F 2H15F 1H16F 2H16F 1H17F 2H17F
Zircon 479 514 214 370 380 400 400 440 211 159 180 200 200 200 200 200 220 220
Rutile 240 266 106 168 230 230 180 200 56 112 100 130 100 130 100 80 100 100
Sythetic Rutile 357 258 170 46 90 240 390 420 20 26 40 50 80 160 180 210 210 210
Ilmenite saleable 374 571 443 338 370 400 400 619 147 191 170 200 200 200 200 200 310 310
HyTi / Leucoxene - - 1 - - - - - - - - - - - - - - -
Inventory (kt) FY10 FY11 FY12 FY13F FY14F FY15F FY16F FY17F 1H13 2H13F 1H14F 2H14F 1H15F 2H15F 1H16F 2H16F 1H17F 2H17F
Zircon - 87 217 131 114 143 157 169 124 131 120 114 123 143 163 157 163 169
Rutile 10 25 140 99 63 42 16 25 144 99 90 63 67 42 47 16 21 25
Sythetic Rutile -0 28 99 112 21 16 16 16 138 112 71 21 16 16 16 16 16 16
Ilmenite saleable 111 0 - 175 258 261 254 254 115 175 218 258 296 261 226 254 254 254
HMC 283 458 520 1,034 1,210 909 458 166 885 1,034 1,098 1,210 1,230 909 583 458 312 166
JA HMC processed 423 681 323 255 550 675 700 700 37 218 250 300 325 350 350 350 350 350
Consolidated P&L (A$mn) FY10 FY11 FY12 FY13F FY14F FY15F FY16F FY17F 1H13 2H13F 1H14F 2H14F 1H15F 2H15F 1H16F 2H16F 1H17F 2H17F
Sales Mineral sands 874 1,537 1,070 763 915 1,363 1,524 1,727 381.7 381.3 395.8 519.4 589.5 773.1 756.5 767.1 863.4 863.4
Cash cost of production -544 -629 -584 -376 -389 -578 -660 -862 -201.9 -174.2 -184.2 -204.9 -285.1 -292.8 -312.0 -348.2 -431.1 -431.1
Government Royalties -17 -25 -20 -15 -20 -40 -36 -51 -6.6 -8.8 -9.7 -10.1 -20.4 -19.7 -20.6 -15.3 -25.5 -25.5
Marketing and selling costs -24.1 -34.5 -30.2 -24.1 -23.9 -29.1 -29.8 -42.8 -13.1 -11.0 -11.1 -12.8 -14.7 -14.4 -14.9 -14.9 -21.4 -21.4
Total Operating Costs -585 -688 -633 -416 -433 -647 -726 -956 -221.6 -193.9 -205.0 -227.8 -320.2 -326.9 -347.5 -378.4 -477.9 -477.9
Gross Profit 289 849 436 347 482 715 798 771 160 187 191 292 269 446 409 389 385 385
Other Income 7.4 7.5 10.3 1.3 - - - - 1.3 - - - - - - - - -
Exploration expense -14.5 -19.0 -29.5 -28.5 -24.0 -24.0 -24.0 -24.0 -18.5 -10.0 -12.0 -12.0 -12.0 -12.0 -12.0 -12.0 -12.0 -12.0
R&D expenses -5.6 -13.7 -13.6 -23.5 -14.0 -10.0 -10.0 -10.0 -12.5 -11.0 -7.0 -7.0 -5.0 -5.0 -5.0 -5.0 -5.0 -5.0
Restructuring and other -23.6 -44.7 -24.6 -69.6 - - - - -32.2 -37.4 - - - - - - - -
Changes in Inventory -3 148 347 15 -94 -57 -76 20 38.4 -23.7 -41.0 -52.8 11.4 -68.4 -42.2 -33.8 9.8 9.8
Total costs -632 -618 -354 -522 -565 -738 -836 -970 -246 -276 -265 -300 -326 -412 -407 -429 -485 -485
EBITDA (Mineral Sands) 250 926 726 242 351 625 688 757 137 105 131 220 264 361 350 338 378 378
Depreciation & Amortisation -219 -224 -203 -169 -206 -146 -123 -193 -99 -70 -99 -106 -101 -45 -47 -75 -96 -97
EBIT (Mineral Sands) 31 702 523 73 145 478 565 564 38 35 32 113 163 315 302 263 282 282
Mining area C 76 88 72 86 68 59 59 64 45 41 36 31 31 28 30 30 31 33
FX & hedging 9 0.4 -4 -0 - - - - -0 - - - - - - - - -
Corporate costs -30.3 -35.5 -45.7 -43.6 -44.0 -44.0 -44.0 -44.0 -21.6 -22.0 -22.0 -22.0 -22.0 -22.0 -22.0 -22.0 -22.0 -22.0
Group EBIT before sig. items 86 755 546 115 169 493 580 584 61 54 46 123 172 321 310 270 291 293
Interest Received 0.5 6.2 7.7 3.2 3.1 14.3 48.1 83.9 1.6 1.6 1.6 1.6 4.7 9.6 19.6 28.5 36.6 47.3
Interest Paid -31.4 -14.2 -14.3 -14 -11 -1 - - -7 -8 -8 -4 -1 - - - - -
Net Interest Rec. (Paid) -31 -8.0 -7 -11 -8 14 48 84 -5 -6 -6 -2 4 10 20 28 37 47
Other finance costs -15.3 -21.6 -26.9 -21.1 -24.0 -24.0 -24.0 -24.0 -9.1 -12.0 -12.0 -12.0 -12.0 -12.0 -12.0 -12.0 -12.0 -12.0
Profit before tax 40 726 512 83 137 483 604 644 47.2 35.3 28.1 108.7 163.7 318.8 317.7 286.7 315.5 328.2
Tax -4 -219 -149 -23 -41 -145 -181 -193 -12.9 -10.6 -8.4 -32.6 -49.1 -95.6 -95.3 -86.0 -94.7 -98.5
Underlying NPAT 36 507 363 59 96 338 423 451 34.3 24.7 19.7 76.1 114.6 223.2 222.4 200.7 220.9 229.7
Abnormal Items - 35.6 - -41.0 - - - - - -41.0 - - - - - - - -
Reported NPAT 35.7 542.2 363.2 18.0 95.8 337.8 423.1 450.6 34.3 -16.3 19.7 76.1 114.6 223.2 222.4 200.7 220.9 229.7
Cashflows (A$mn) FY10 FY11 FY12 FY13F FY14F FY15F FY16F FY17F 1H13 2H13F 1H14F 2H14F 1H15F 2H15F 1H16F 2H16F 1H17F 2H17F
Operating cashflows 179 750 251 91 365 499 641 629 -11.9 102.6 159.3 205.9 214.7 283.9 324.0 317.2 312.4 316.5
Acquisition PPE -117 -143 -167 -100 -62 -120 -165 -100 -31.5 -68.0 -26.0 -36.0 -60.0 -60.0 -80.0 -85.0 -35.0 -65.0
Free cash flow 61 607 83 -9 303 379 476 529 -43.4 34.6 133.3 169.9 154.7 223.9 244.0 232.2 277.4 251.5
Other investing cashflows 9 4 1 1 - - - - 0.7 - - - - - - - - -
Financing cashflows -126 -320 -351 -18 -248 -107 -167 -167 2.3 -20.8 -133.3 -114.3 -65.1 -41.9 -83.7 -83.7 -83.7 -83.7
Net increase in cash -56 291 -266 -27 56 272 309 361 -40.4 13.8 - 55.6 89.5 182.1 160.3 148.5 193.6 167.8
Cash at end of the year 30 321 54 28 85 357 666 1,027 12.5 28.3 29.0 85.1 175.1 357.1 517.4 665.9 859.5 1,027.3
Balance Sheet (A$m) FY10 FY11 FY12 FY13F FY14F FY15F FY16F FY17F 1H13 2H13F 1H14F 2H14F 1H15F 2H15F 1H16F 2H16F 1H17F 2H17F
Cash 30 321 54 28 85 357 666 1,027 30 28 29 85 175 357 517 666 860 1,027
Receivables 165 256 140 115 157 233 231 260 131 115 119 157 178 233 228 231 260 260
Inventory 258 426 781 795 701 644 568 588 819 795 754 701 713 644 602 568 578 588
PPE 1,425 1,430 1,430 1,338 1,195 1,168 1,211 1,118 1,369 1,338 1,265 1,195 1,154 1,168 1,201 1,211 1,149 1,118
Other assets 62 21 22 23 23 23 23 23 23 23 23 23 23 23 23 23 23 23
Assets 1,940 2,454 2,427 2,299 2,160 2,425 2,698 3,016 2,371 2,299 2,190 2,160 2,242 2,425 2,571 2,698 2,870 3,016
Payables 104 137 87 66 78 112 130 164 83 66 70 78 110 112 119.0 129.6 163.7 163.7
Provisions 369 460 471 469 469 469 469 469 456 469 469 469 469 469 469.0 469.0 469.0 469.0
Tax liabilities - 158.7 150.6 22.7 22.7 22.7 22.7 22.7 38.2 22.7 22.7 22.7 22.7 22.7 22.7 22.7 22.7 22.7
Borrowings 343 164 150 215 23 - - - 227 215 103 23 - - - - - -
Liabilities 815 919 860 773 593 604 621 655 804 773 665 593 601 604 611 621 655 655
Net Assets 1,125 1,535 1,567 1,526 1,567 1,822 2,077 2,360 1,567 1,526 1,525 1,567 1,640 1,822 1,960 2,077 2,214 2,360
Gearing FY10 FY11 FY12 FY13F FY14F FY15F FY16F FY17F 1H13 2H13F 1H14F 2H14F 1H15F 2H15F 1H16F 2H16F 1H17F 2H17F
Net Debt / (cash) 312.6 -156.7 95.9 186.6 -62.3 -357.1 -665.9 -1,027.3 197.0 186.6 74.2 -62.3 -175.1 -357.1 -517.4 -665.9 -859.5 -1,027.3
Net Debt / Equity (% ) 28% NA 6% 12% NA NA NA NA 13% 12% 5% NA NA NA NA NA NA NA
Net Debt / (Equity+Net Debt) (% ) 22% NA 6% 11% NA NA NA NA 11% 11% 5% NA NA NA NA NA NA NA
Interest cover (x) (EBIT) 1.0 49.5 36.6 5.0 13.0 597.7 0.0 0.0 5.8 4.4 4.2 31.4 203.4 0.0 0.0 0.0 0.0 0.0
Key financials FY10 FY11 FY12 FY13F FY14F FY15F FY16F FY17F 1H13 2H13F 1H14F 2H14F 1H15F 2H15F 1H16F 2H16F 1H17F 2H17F
Reported EPS (diluted) 8.6 130.6 86.8 4.3 22.9 80.7 101.0 107.6 8.2 -3.9 4.7 18.2 27.4 53.3 53.1 47.9 52.8 54.9
Underlying EPS - diluted (cps) 8.6 130.6 86.8 4.3 22.9 80.7 101.0 107.6 8.2 -3.9 4.7 18.2 27.4 53.3 53.1 47.9 52.8 54.9
Free cashflow per share (cps) 16.7 145.9 20.2 -1.9 72.4 90.4 113.7 126.3 -10.2 8.3 31.8 40.6 36.9 53.5 58.3 55.5 66.2 60.1
FCF Yield 1.8% 16.0% 2.2% -0.2% 8.0% 9.9% 12.5% 13.9% -2.2% 1.8% 7.0% 8.9% 8.1% 11.7% 12.8% 12.2% 14.5% 13.2%
Diluted average shares (m) 416 419 419 419 419 419 419 419 419 419 419 419 419 419 419 419 419 419
PER (x) (reported EPS - diluted) 105.9x 7.0x 10.5x 211.2x 39.8x 11.3x 9.0x 8.5x 55.5x 0.0x 97.0x 25.1x 16.6x 8.5x 8.6x 9.5x 8.6x 8.3x
PER (x) (underlying EPS - diluted) 105.9x 7.0x 10.5x 211.2x 39.8x 11.3x 9.0x 8.5x 55.5x 0.0x 97.0x 25.1x 16.6x 8.5x 8.6x 9.5x 8.6x 8.3x
DPS (cps) 8.0 75.0 35.0 10.0 18.0 30.0 40.0 40.0 5.0 5.0 8.0 10.0 10.0 20.0 20.0 20.0 20.0 20.0
Payout ratio (% ) 93% 57% 40% 232% 79% 37% 40% 37% 24% 61% -206% 213% 55% 73% 38% 42% 38% 36%
Dividend yield (net) 0.9% 8.2% 3.8% 1.1% 2.0% 3.3% 4.4% 4.4% 1.1% 1.1% 1.8% 2.2% 2.2% 4.4% 4.4% 4.4% 4.4% 4.4%
Franking 0% 73% 100% 100% 100% 100% 100% 100% 100% 100% 100% 100% 100% 100% 100% 100% 100% 100%
Dividend yield (gross) 0.9% 10.0% 5.0% 1.4% 2.6% 4.3% 5.7% 5.7% 1.4% 1.4% 2.3% 2.9% 2.9% 5.7% 5.7% 5.7% 5.7% 5.7%
ROE (% ) 3% 35% 23% 1% 6% 19% 20% 19% 4% -2% 3% 10% 7% 12% 11% 10% 10% 10%
P / NAV (P/BV) 3.4x 2.5x 2.4x 2.5x 2.4x 2.1x 1.8x 1.6x 2.4x 2.5x 2.5x 2.4x 2.3x 2.1x 1.9x 1.8x 1.7x 1.6x
Source: Company data, Credit Suisse estimates

Australia and NZ First Edition 136
14 February 2014
Asia Pacific/Australia
Equity Research
Steel (Iron Ore (AU))
Mount Gibson Iron
(MGX.AX / MGX AU) PRE RESULTS COMMENT
1H14 results preview and exploration success;
reports on 19 Feb
Date: 19 February 2014 Time: Pre-market AEDT
Period: 1H14 Earnings risk: Medium-high
Credit Suisse estimates Briefing and dial-in details
NPAT: A$142mn (consensus A$109mn) TBA, call likely 10.30am AEDT
EPS: 13¢ps (consensus: 10¢ps)
DPS: nil
■ Sales revenue can be estimated from the received prices (CS: $589mn,
consensus $525mn), but we have no lead on cash costs. For EBITDA, CS:
$230mn, consensus $224mn. A large swing factor in reaching NPAT is
D&A, particularly amortisation of stripping, which is driven by earth
moving at Koolan Island. We estimate NPAT of $142mn, consensus mean
is $109mn, but with a $65mn range. MGX provided its cash balance in the
DecQ report (A$484mn) which implies net cash of $465mn.
■ Interim dividend nil: MGX has a policy of providing only final dividends.
■ MGX today announced exploration success at Iron Hill prospect, 3km
from Extension Hill mine. Successful Dec drilling and historical work (drilling
and adits) has provided MGX with an exploration target of 5-7Mt at a grade
of 58-61% Fe, which could extend the mine life by two years. Iron Hill is one
of three prospects known at Extension Hill South lease from historical work.
■ Extension Hill mine is due to end in 2017 on most recent reserves. A two-
year life extension might increase our DCF valuation by 5¢ps if there is no
capex, and costs are similar to the current mine. Nevertheless, earnings will
improve if the mine life could be extended to 2021 like Koolan Island.
■ Our DCF valuation and target price remain A$1.05/sh.
Total return forecast in perspective
Mean^CS tgt^Sh Prc
-70%
-50%
-30%
-10%
10%
30%
50%
70%
12mth Volatility* 52wk Hi-Lo IBES Consensustarget return^
Performance over 1M 3M 12M
Absolute (%) 23.8 2.8 28.0
Relative (%) 21.9 4.5 21.9
Financial and valuation metrics
Year 06/13A 06/14E 06/15E 06/16E
Revenue (A$mn) 843.8 1,003.4 660.9 781.8
EBITDA (A$mn) 208.2 392.5 223.2 216.8
EBIT (A$mn) 114.7 350.0 128.2 48.1
Net income (A$mn) 92.9 247.6 99.6 47.2
EPS (CS adj.) (Ac) 8.53 22.70 9.13 4.33
Change from previous EPS (%) n.a. — — —
Consensus EPS (Ac) n.a. 17.40 8.70 5.70
EPS growth (%) -50.8 166.1 -59.8 -52.6
P/E (x) 13.1 4.9 12.3 25.9
Dividend (Ac) 4.00 2.00 2.00 2.00
Dividend yield (%) 3.6 1.8 1.8 1.8
P/B (x) 1.0 0.9 0.8 0.8
Net debt/equity (%) net cash net cash net cash net cash
Relative performance versus S&P ASX 200. See Reference
Appendix for a description of the chart. Source: Credit Suisse
estimates, * Consensus, mean range from Thomson Reuters.
Source: Company data, ASX, Credit Suisse estimates, * Adj. for goodwill, notional interest and unusual items. Relative P/E
against ASX/S&P200 based on pre GW in AUD. Company PE calculation is based on displayed EPS Currency
Rating UNDERPERFORM*
Price (13 Feb 14, A$) 1.12
Target price (A$) 1.05¹
Market cap. (A$mn) 1,221.45
Yr avg. mthly trading (A$mn) 83
Last month's trading (A$mn) 103
Projected return:
Capital gain (%) -6.2
Dividend yield (net %) 1.8
Total return (%) -4.5
52-week price range 1.13 - 0.42
* Stock ratings are relative to the relevant country
benchmark.
¹Target price is for 12 months.
[V] = Stock considered volatile (see Disclosure Appendix).
Research Analysts
Matthew Hope
61 2 8205 4669
Michael Slifirski
61 3 9280 1845
Sam Webb
61 3 9280 1716

14 February 2014
Australia and NZ First Edition 137
Figure 1: Financial summary
Mount Gibson Iron (MGX) Year ending 30 Jun In AUDmn, unless otherwise stated2012 2013 2014 2015 2016 2012 2013 2014 2015 2016
Share Price: A$1.18 Earnings 06/12A 06/13A 06/14E 06/15E 06/16ERating c_EPS_SHARESEquiv. FPO (period avg.) mn 1,083.5 1,088.9 1,090.6 1,090.6 1,090.6
Target Price A$ 1.05 c_EPS*100EPS (Normalised) c 17.3 8.5 22.7 9.1 4.3
vs Share price % -10.64 EPS_GROWTH*100EPS Growth % -50.8 166.1 -59.8 -52.6
DCF A$ 1.05 c_EBITDA_MARGIN*100EBITDA Margin % 48.2 24.7 39.1 33.8 27.7
c_DPS*100DPS c 4.0 4.0 2.0 2.0 2.0
c_PAYOUT*100Payout % 23.1 46.9 8.8 21.9 46.2
FRANKING*100Franking % 100.0 100.0 100.0 100.0 100.0
c_FCF_PS*100Free CFPS c -0.9 13.8 23.2 13.9 15.8
Profit & Loss 06/12A 06/13A 06/14E 06/15E 06/16E c_TAX_RATE*100Effective tax rate % 29.1 27.7 30.0 30.0 30.0
Sales revenue 637.0 843.8 1,003.4 660.9 781.8 Valuation
EBITDA 307.0 208.2 392.5 223.2 216.8 c_PE P/E x 6.8 13.8 5.2 12.9 27.1
Depr. & Amort. (66.8) (93.5) (42.5) (95.0) (168.7) c_EBIT_MULTIPLE_CURREV/EBIT x 5.4 10.9 3.0 7.1 16.0
EBIT 240.1 114.7 350.0 128.2 48.1 c_EBITDA_MULTIPLE_CUEV/EBITDA x 4.2 6.0 2.6 4.1 3.6
Associates 0.0 0.0 0.0 0.0 0.0 c_DIV_YIELD*100Dividend Yield % 3.4 3.4 1.7 1.7 1.7
Net interest Exp. 14.1 6.7 3.7 14.1 19.3 c_FCF_YIELD*100FCF Yield % -0.8 11.7 19.8 11.8 13.4
Other 10.5 7.0 0.0 0.0 0.0 c_PB Price to Book x 1.2 1.1 0.9 0.9 0.8
Profit before tax 264.7 128.4 353.6 142.3 67.4 ReturnsIncome tax (77.0) (35.6) (106.1) (42.7) (20.2) c_ROE*100Return on Equity % 17.5 7.9 17.6 6.7 3.1
Profit after tax 187.7 92.9 247.6 99.6 47.2 c_I_NPAT/c_I_SALES*100Profit Margin % 29.5 11.0 24.7 15.1 6.0
Minorities 0.0 0.0 0.0 0.0 0.0 c_I_SALES/c_B_TOT_ASSAsset Turnover x 0.4 0.5 0.6 0.4 0.4
Preferred dividends 0.0 0.0 0.0 0.0 0.0 c_ASSETS/c_EQ_COMMONEquity Multiplier x 1.4 1.3 1.2 1.2 1.2
Associates & Other 0.0 0.0 0.0 0.0 0.0 c_ROA*100Return on Assets % 12.6 6.0 14.3 5.6 2.6
Normalised NPAT 187.7 92.9 247.6 99.6 47.2 c_ROIC*100Return on Invested Cap. % 15.8 7.2 21.1 8.0 3.4
Unusual item after tax (15.2) 64.5 0.0 0.0 0.0 Gearing
Reported NPAT 172.5 157.3 247.6 99.6 47.2 c_GEARING*100Net Debt to Net debt + Equity % 0.6 Net Cash Net Cash Net Cash Net Cash
c_NET_DEBT/c_I_EBITDANet Debt to EBITDA x 0.0 Net Cash Net Cash Net Cash Net Cash
Balance Sheet 06/12A 06/13A 06/14E 06/15E 06/16E c_I_EBITDA/ c_I_NET_INTERESTInt Cover (EBITDA/Net Int.) x -21.7 -31.2 -106.7 -15.9 -11.2
Cash & equivalents 40.7 62.0 253.6 368.2 509.3 c_I_EBIT/ c_I_NET_INTERESTInt Cover (EBIT/Net Int.) x -17.0 -17.2 -95.2 -9.1 -2.5
Inventories 210.0 152.0 129.9 110.6 145.2 (c_C_CAPEX/c_I_SALES)*-100Capex to Sales % 13.5 5.0 4.2 9.9 3.5
Receivables 23.8 47.3 36.3 28.2 35.2 (c_C_CAPEX/c_I_DEPR)*-100Capex to Depreciation % 129.0 45.4 97.9 69.2 16.3
Other current assets 260.8 316.7 316.7 316.7 316.7
Current assets 535.2 578.0 736.5 823.8 1,006.4 MSCI IVA (ESG) Rating BB
Property, plant & equip. 956.4 909.1 920.2 891.0 752.7 TP ESG Risk (%): 0
Intangibles 0.0 0.0 0.0 0.0 0.0
Other non-current assets 3.2 68.2 70.8 70.8 70.8
Non-current assets 959.7 977.3 991.1 961.8 823.6
Total assets 1,494.9 1,555.4 1,727.6 1,785.6 1,830.0
Payables 122.5 105.7 71.4 60.8 79.8
Interest bearing debt 47.0 28.4 9.2 0.0 0.0
Other liabilities 254.0 239.2 239.2 239.2 239.2 MSCI IVA Risk: Neutral
Total liabilities 423.5 373.3 319.8 300.0 319.0
Net assets 1,071.3 1,182.0 1,407.8 1,485.6 1,511.0
Ordinary equity 1,071.3 1,182.0 1,407.8 1,485.6 1,511.0
Minority interests 0.0 0.0 0.0 0.0 0.0
Preferred capital 0.0 0.0 0.0 0.0 0.0
Total shareholder funds 1,071.3 1,182.0 1,407.8 1,485.6 1,511.0
Net debt 6.3 -33.6 -244.4 -368.2 -509.3 Source: MSCI ESG Research
Cashflow 06/12A 06/13A 06/14E 06/15E 06/16E Share Price Performance
EBIT 240.1 114.7 350.0 128.2 48.1
Net interest 19.7 9.6 3.7 14.1 19.3
Depr & Amort 66.8 93.5 42.5 95.0 168.7
Tax paid -34.1 -54.1 -80.1 -68.6 -26.5
Working capital -28.2 17.7 -1.2 16.7 -22.5
Other -188.5 11.3 -20.0 31.9 12.3
Operating cashflow 75.9 192.7 294.9 217.3 199.3
Capex -86.2 -42.4 -41.6 -65.7 -27.4
Capex - expansionary
Capex - maintenance
Acquisitions & Invest -5.1 -2.7 -20.6 -6.0 -9.0
Asset sale proceeds 0.0 0.0 0.0 0.0 0.0
Other 18.0 -62.0 0.0 0.0 0.0
Investing cashflow -73.3 -107.1 -62.3 -71.7 -36.4
Dividends paid -61.9 -40.0 -21.8 -21.8 -21.8
Equity raised 0.0 0.0 0.0 0.0 0.0
Net borrowings 0.4 -0.4 -19.2 -9.2 0.0
Other -18.3 -23.1 0.0 0.0 0.0 1 Month 3 Month 12 Month
Financing cashflow -79.8 -63.5 -41.0 -31.0 -21.8 Absolute 29.8% 7.8% 34.3%
Total cashflow -77.2 22.1 191.6 114.6 141.1 Relative 28.0% 9.5% 28.2%
Adjustments 0.8 -0.7 0.0 0.0 0.0
Net change in cash -76.3 21.3 191.6 114.6 141.1 Source: Reuters 52 week trading range: 0.42-1.18
MSCI IVA Risk Comment: MSCI ESG risks related to water
mangement and carbon emission policies, whereas we are
more focussed on corporate governance, which we consider
is improving. Recent change in management may change
policy focus.
13/02/2014 12:44
Mount Gibson Iron Limited is an iron ore exploration and production company. The
Company holds mining leases covering hematite and magnetite deposits at Mount Gibson
in Western Australia.
Credit Suisse View
TP Risk Comment: Our focus has been around Governance
issues, but this appears to be receding and is not specifically
quantified.
UNDERPERFORM
0.00
0.20
0.40
0.60
0.80
1.00
1.20
1.40
1/02/2013 1/04/2013 1/06/2013 1/08/2013 1/10/2013 1/12/2013 1/02/2014
MGX.AX XJO
2.7
3.7
4.7
5.7
6.7
7.7
Environment Social Governance
Stock Local Sector
Country Global Sector
Source: Company data, Credit Suisse estimates

14 February 2014
Australia and NZ First Edition 138
More on the successful exploration
MGX has announced positive exploration results from the Iron Hill prospect adjacent to its
currently operating Extension Hill mine in the Mid-West of WA.
Operational impact of new resources
■ MGX says its target is 5-7Mt of ore at 58-61% Fe from Iron Hill.
■ Rail capacity is a constraint to further output from Extension Hill, so any new orebody
would be a mine life extension rather than higher output.
■ Extension Hill consumes around 3Mtpa, and, so a new orebody would probably be a
two year extension to mine life.
■ Under current reserves, Extension Hill will finish in early 2017.
■ Environmental sensitivities around flora on outcropping BIFs may see mining
approvals take time.
■ Iron Hill is one of the three known targets at the Extension Hill South Project.
■ Of the other two prospects, Gibson Hill is an Iron Hill look-alike, whereas Extension
Hill South is a detrital prospect. These have less historical exploration work than Iron
Hill.
Exploration results
■ MGX has historical drilling results, which provided it with a good idea of what is
available at Iron Hill. Its new work has been to infill and confirm known mineralisation
from historical work.
■ 15 of 16 holes targeting the primary mineralisation intersected ore grades with five hits
of over 60% Fe.
■ Phosphorous contents are modest and similar levels to Pilbara blends. Sulphur is a
little elevated (0.1 – 0.2%) in a few holes, but overall appears to be well below 0.1%.
Alumina is low at 0.5-2%, a favourable result.
■ The ore zone is vertical and varies in true width from 25m to 50m. It seems to be
800m long and has been tested to depths of 60m.
■ This geometry will not lend itself to the low stripping ratio (1:1) of the Extension Hill
mine. Expect higher stripping and higher costs if a mine proceeds.
■ Another 39 holes tested for the presence of detrital ore at the northern flanks. The
results were subdued, but were restricted to existing tracks. More work will be
undertaken.
Impact on DCF
■ Capex should be minimal; perhaps $1mn given Iron Hill is outcropping ore 3km from
existing infrastructure, so only a new road suitable for heavy vehicles would be
required.
■ Unfortunately the impact on the current DCF by assuming a two-year mine extension
to 2019 is modest (~5¢ps).
■ Nevertheless, by extending Extension Hill earnings towards 2020 from current FY17
close, multiples become a more useful valuation method, and cash generation at the
time would be increased.

14 February 2014
Australia and NZ First Edition 139
Figure 2: Location diagram of Mid-West projects
Source: MGX

14 February 2014
Australia and NZ First Edition 140
Figure 3: Extension Hill South Project
Source: MGX

14 February 2014
Australia and NZ First Edition 141
Figure 4: Schematic cross-section of Iron Hill
Source: MGX

Australia and NZ First Edition 142
14 February 2014
Asia Pacific/Australia
Equity Research
Engineering & Construction (Constructions & Engineering (AU))
UGL
(UGL.AX / UGL AU) PRE RESULTS COMMENT
HY14 results preview; reports on 17 Feb
Date:17 February Time: AM
Period: Interim Earnings risk: NEUTRAL
Credit Suisse estimates (pcp): Briefing and webcast details:
Underlying NPAT: $52.9mn ($51.0mn) 10am; Westin Sydney Barnet Room, 1 Martin
Pl Sydney. Dial In: +61 (0) 2 8524 5042.
Passcode: 9090318
Underlying EPS: 31.8¢ (30.7¢)
Final DPS: 22¢ (34¢)
Credit Suisse assumptions/variance to market:
We forecast HY14 underlying NPAT of $52.9mn, up 4% vs. pcp. Our forecasts
imply 1H earnings seasonality of 41%, below the historical average (45%).
What to look for:
■ Reiterate FY14 guidance of $120-130mn underlying NPAT. Credit Suisse
FY14 forecasts ($128mn) are 4% above consensus ($123mn).
■ Solid property result to offset engineering: We forecast 24% growth in
DTZ EBIT vs pcp driven by revenue growth (+8%) & margin uplift (to 5.7%).
In contrast, we forecast an 11% decline in engineering EBIT in 1H14 with
stronger projects EBIT offset by a weaker rail result.
■ Demerger on track for FY15: We expect UGL to confirm it remains on track
to have its property and engineering businesses structurally separated in
FY14 and the demerger completed in FY15 subject to market conditions.
■ UGL to focus on solid outlook for property supported by the US cyclical
recovery and integration of DTZ.
■ We are still cautious on engineering outlook: UGL is likely to identify the
Dec-13 LNG maintenance contract win as evidence that resources
maintenance activity is picking up. However, we need to see further contract
wins to turn more positive on the outlook.
■ UGL appears fair value: Trading at 10x 12-month fwd PE, valuation upside
from the demerger is likely to be offset by the weak outlook for engineering.
Total return forecast in perspective
Mean^CS tgt^
Sh Prc
-40%
-20%
0%
20%
40%
60%
80%
12mth Volatility* 52wk Hi-Lo IBES Consensustarget return^
Performance over 1M 3M 12M
Absolute (%) 6.6 -0.7 -37.4
Relative (%) 4.8 1.0 -43.5
Financial and valuation metrics
Year 06/13A 06/14E 06/15E 06/16E
Revenue (A$mn) 3,816.1 3,867.5 3,928.9 4,071.8
EBITDA (A$mn) 203.5 259.6 267.5 266.4
EBIT (A$mn) 131.9 187.5 193.7 204.8
Net income (A$mn) 81.8 117.7 119.5 126.2
EPS (CS adj.) (Ac) 49.15 70.77 71.43 74.59
Change from previous EPS (%) n.a. — — —
Consensus EPS (Ac) n.a. 68.00 75.50 81.50
EPS growth (%) -49.1 44.0 0.9 4.4
P/E (x) 14.5 10.0 10.0 9.5
Dividend (Ac) 39.00 46.00 47.00 49.00
Dividend yield (%) 5.5 6.5 6.6 6.9
P/B (x) 1.1 1.0 1.0 1.0
Net debt/equity (%) 51.4 49.5 45.9 40.5
Relative performance versus S&P ASX 200.See Reference
Appendix for a description of the chart. Source: Credit Suisse estimates, * Consensus, mean range from Thomson Reuters
Source: Company data, ASX, Credit Suisse estimates, * Adj. for goodwill, notional interest and unusual items. Relative P/E
against ASX/S&P200 based on pre GW in AUD. Company PE calculation is based on displayed EPS Currency
Rating NEUTRAL*
Price (13 Feb 14, A$) 7.11
Target price (A$) 7.75¹
Market cap. (A$mn) 1,183.89
Yr avg. mthly trading (A$mn) 192
Last month's trading (A$mn) 114
Projected return:
Capital gain (%) 9.0
Dividend yield (net %) 6.6
Total return (%) 15.6
52-week price range 11.8 - 6.1
* Stock ratings are relative to the relevant country
benchmark.
¹Target price is for 12 months.
Research Analysts
Emma Alcock
61 2 8205 4403

14 February 2014
Australia and NZ First Edition 143
Figure 1: UGL - Financial Summary
UGL Limited (UGL) Year ending 30 Jun In AUDmn, unless otherwise stated2012 2013 2014 2015 2016 2012 2013 2014 2015 2016
Share Price: A$7.11 Earnings 06/12A 06/13A 06/14E 06/15E 06/16ERating c_EPS_SHARESEquiv. FPO (period avg.) mn 166.2 166.4 166.3 167.3 169.3
Target Price A$ 7.75 c_EPS*100EPS (Normalised) c 96.6 49.1 70.8 71.4 74.6
vs Share price % 9.00 EPS_GROWTH*100EPS Growth % -49.1 44.0 0.9 4.4
DCF A$ 8.16 c_EBITDA_MARGIN*100EBITDA Margin % 6.8 5.3 6.7 6.8 6.5
c_DPS*100DPS c 70.0 39.0 46.0 47.0 49.0
c_PAYOUT*100Payout % 72.5 79.4 65.0 65.8 65.7
FRANKING*100Franking % 100.0 0.0 100.0 100.0 100.0
c_FCF_PS*100Free CFPS c 36.7 24.7 65.8 79.0 79.3
Profit & Loss 06/12A 06/13A 06/14E 06/15E 06/16E c_TAX_RATE*100Effective tax rate % 21.4 17.4 24.0 26.0 27.0
Sales revenue 4,454.4 3,816.1 3,867.5 3,928.9 4,071.8 ValuationEBITDA 302.9 203.5 259.6 267.5 266.4 c_PE P/E x 7.4 14.5 10.0 10.0 9.5
Depr. & Amort. (63.3) (71.6) (72.2) (73.8) (61.6) c_EBIT_MULTIPLE_CURREV/EBIT x 6.8 13.4 9.4 8.9 8.2
EBIT 239.6 131.9 187.5 193.7 204.8 c_EBITDA_MULTIPLE_CUEV/EBITDA x 5.3 8.7 6.8 6.4 6.3
Associates 0.0 0.0 0.0 0.0 0.0 c_DIV_YIELD*100Dividend Yield % 9.8 5.5 6.5 6.6 6.9
Net interest Exp. (24.8) (32.6) (32.4) (32.2) (31.9) c_FCF_YIELD*100FCF Yield % 5.2 3.5 9.3 11.1 11.2
Other 0.0 0.0 0.0 0.0 0.0 c_PB Price to Book x 1.0 1.1 1.0 1.0 1.0
Profit before tax 214.8 99.3 155.0 161.5 172.9 ReturnsIncome tax (45.9) (17.3) (37.2) (42.0) (46.7) c_ROE*100Return on Equity % 13.7 7.3 10.3 10.3 10.4
Profit after tax 168.9 82.0 117.8 119.5 126.2 c_I_NPAT/c_I_SALES*100Profit Margin % 3.6 2.1 3.0 3.0 3.1
Minorities (1.1) (5.3) (5.3) (5.3) (5.3) c_I_SALES/c_B_TOT_ASSAsset Turnover x 1.6 1.3 1.3 1.3 1.3
Preferred dividends 0.0 0.0 0.0 0.0 0.0 c_ASSETS/c_EQ_COMMONEquity Multiplier x 2.3 2.6 2.5 2.5 2.5
Associates & Other (7.3) 5.1 5.1 5.2 5.3 c_ROA*100Return on Assets % 5.8 2.8 4.1 4.1 4.2
Normalised NPAT 160.5 81.8 117.7 119.5 126.2 c_ROIC*100Return on Invested Cap. % 11.7 6.4 8.3 8.3 8.7
Unusual item after tax (26.2) (45.3) (17.5) (17.5) (0.0) GearingReported NPAT 134.3 36.5 100.2 102.0 126.2 c_GEARING*100Net Debt to Net debt + Equity % 27.0 33.9 33.1 31.5 28.8
c_NET_DEBT/c_I_EBITDANet Debt to EBITDA x 1.4 2.9 2.2 2.0 1.9
Balance Sheet 06/12A 06/13A 06/14E 06/15E 06/16E c_I_EBITDA/ c_I_NET_INTERESTInt Cover (EBITDA/Net Int.) x 12.2 6.2 8.0 8.3 8.4
Cash & equivalents 177.4 161.1 116.6 147.2 213.5 c_I_EBIT/ c_I_NET_INTERESTInt Cover (EBIT/Net Int.) x 9.7 4.0 5.8 6.0 6.4
Inventories 359.7 351.6 380.0 386.3 399.7 (c_C_CAPEX/c_I_SALES)*-100Capex to Sales % 1.5 2.4 1.1 1.2 1.2
Receivables 589.6 612.3 620.4 630.4 651.5 (c_C_CAPEX/c_I_DEPR)*-100Capex to Depreciation % 198.7 245.1 119.6 126.8 123.8
Other current assets 23.2 44.0 44.0 44.0 44.0
Current assets 1,150.0 1,169.0 1,161.0 1,207.8 1,308.6 MSCI IVA (ESG) Rating AProperty, plant & equip. 176.7 170.8 177.9 188.1 197.6 TP ESG Risk (%): 0
Intangibles 1,310.9 1,445.0 1,422.9 1,401.2 1,379.8
Other non-current assets 110.1 129.5 132.0 134.6 137.3
Non-current assets 1,597.7 1,745.3 1,732.8 1,723.9 1,714.7
Total assets 2,747.6 2,914.2 2,893.9 2,931.7 3,023.4
Payables 513.8 547.6 552.9 553.3 566.6
Interest bearing debt 612.7 741.7 687.3 687.3 707.3
Other liabilities 445.7 494.9 500.3 514.6 529.4 MSCI IVA Risk: Positive
Total liabilities 1,572.3 1,784.2 1,740.4 1,755.2 1,803.3
Net assets 1,175.4 1,130.0 1,153.4 1,176.6 1,220.1
Ordinary equity 1,169.7 1,118.1 1,141.5 1,164.7 1,208.2
Minority interests 5.7 11.9 11.9 11.9 11.9
Preferred capital 0.0 0.0 0.0 0.0 0.0
Total shareholder funds 1,175.4 1,130.0 1,153.4 1,176.6 1,220.1
Net debt 435.4 580.6 570.7 540.1 493.8 Source: MSCI ESG Research
Cashflow 06/12A 06/13A 06/14E 06/15E 06/16E Share Price Performance
EBIT 239.6 131.9 187.5 193.7 204.8
Net interest -26.0 -32.3 -32.4 -32.2 -31.9
Depr & Amort 63.3 71.6 72.2 73.8 61.6
Tax paid -58.4 -33.8 -44.6 -40.8 -45.5
Working capital 0.0 0.0 -18.5 -2.7 -7.6
Other -107.4 -31.9 -11.5 -11.5 2.7
Operating cashflow 111.0 105.6 152.5 180.3 184.1
Capex -68.0 -92.0 -43.1 -48.1 -49.8
Capex - expansionary -18.0 -27.4 0.0 0.0 0.0
Capex - maintenance -50.0 -64.6 -43.1 -48.1 -49.8
Acquisitions & Invest -103.4 0.0 0.0 0.0 0.0
Asset sale proceeds 1.1 26.2 0.0 0.0 0.0
Other -31.6 -17.5 -22.8 -22.8 -5.3
Investing cashflow -201.9 -83.2 -65.8 -70.9 -55.1
Dividends paid -124.3 -118.3 -76.7 -78.8 -82.7
Equity raised 2.9 0.0 0.0 0.0 0.0
Net borrowings 168.0 72.6 -54.4 0.0 20.0
Other -19.0 -2.6 0.0 0.0 0.0 1 Month 3 Month 12 Month
Financing cashflow 27.6 -48.3 -131.1 -78.8 -62.7 Absolute 6.6% -0.7% -37.4%
Total cashflow -63.3 -25.9 -44.4 30.6 66.3 Relative 4.8% 1.0% -43.5%
Adjustments 0.9 9.3 0.0 0.0 0.0
Net change in cash -62.4 -16.6 -44.4 30.6 66.3 Source: Reuters 52 week trading range: 6.13-11.80
MSCI IVA Risk Comment: UGL scores only 2.8 on corruption
purely due to lack of policy. Track record is actually good. Hence
formation of anti corruption policies would see a sharp reversal in
this indicator which is 38% of total weighting. Upside from
environment rating based on expected increase in property
services earnings as % group.
13/02/2014 16:55
United Group Ltd is focused on providing engineering construction and operations and
maintenance services to the railway rolling stock, power, water, property, resources and
defence sectors.
Credit Suisse View
TP Risk Comment: While we see upside risk to UGL ESG rating,
it is largely coming from formation of policies. Track record is
already solid, hence upside is already reflected in our valuation.
NEUTRAL
0.00
2.00
4.00
6.00
8.00
10.00
12.00
14.00
1/02/2013 1/04/2013 1/06/2013 1/08/2013 1/10/2013 1/12/2013 1/02/2014
UGL.AX XJO
2.7
3.7
4.7
5.7
6.7
7.7
Environment Social Governance
Stock Local Sector
Country Global Sector
Source: Company data, Credit Suisse estimates

14 February 2014
Australia and NZ First Edition 144
UGL – HY14 results tables Figure 2: UGL – HY14 income statement
$mn 1H13A 1H14e 1H14e
Income Statement Dec-13 CS F'cast vs. pcp
Revenue 2,082 2,081 0%
EBITDA 113.4 117.3 3%
Depreciation/ Amortisation 27.7 26.6 -4%
EBIT 85.7 90.7 6%
Net Interest Expense 16.2 17.1 5%
Profit Before Tax 69.5 73.6 6%
Income Tax Expense 16.6 18.0 9%
…tax rate % (ex associates) 23.9% 24.5% 3%
Minorities 1.9 2.6 39%
Underlying NPAT (Pre amortisation) 51.0 52.9 4%
NPAT - post amortisation 45.9 48.1 5%
Significant items -19.9 0.0 na
Reported NPAT 26.0 48.1 85%
Underlying EPS ¢ 30.7 31.8 4%
DPS ¢ 34.0 22.0 -35%
Payout % 110.8% 69% -38%
Franking % 50.0% 50% 0%
EBIT Margin 4.1% 4.4% 6%
Work in Hand ($bn) 9.3 6.8 -27% Source: Company data, Credit Suisse estimates
Figure 3: UGL – HY14 divisional analysis
Segment Analysis 1H13A 1H14e 1H14e
Dec-12 CS F'cast vs. pcp
Revenue 2,082 2,081 0%
Engineering 1,169 1,093 -7%
…Rail 466.0 425.9 -9%
…Projects 441.5 462.0 5%
…O&M 261.6 205.1 -22%
Property 920.0 993.6 8%
Other -7.6 -5.4 -29%
EBIT 85.7 90.7 6%
Engineering 59.7 53.2 -11%
…Rail 31.2 22.1 -29%
…Projects 15.9 23.1 45%
…O&M 12.5 8.0 -36%
Property 45.8 56.6 24%
Other -19.8 -19.2 -3%
EBIT Margin Analysis 4.1% 4.4% 24bps
Engineering 5.1% 4.9% -23bps
…Rail 6.7% 5.2% -149bps
…Projects 3.6% 5.0% 139bps
…O&M 4.8% 3.9% -90bps
Property 5.0% 5.7% 72bps Source: Company data, Credit Suisse estimates

14 February 2014
Australia and NZ First Edition 145
Figure 4: UGL – HY14 gearing and cash flow analysis
Balance Sheet and Cash Flow 1H13A 1H14e 1H14e
Dec-12 CS F'cast vs. pcp
Balance Sheet Summary
Cash 170.7 165.6 -3%
Debt 725.5 771.7 6%
Equity 1147.7 1186.4 3%
Net Debt 554.9 606.0 9%
Gearing 32.6% 33.8% 4%
Cash Flow Analysis
Operating cashflow -40.3 17.3 143%
Add back:
Interest & tax paid 29.7 38.4 29%
Non-recurring items 0.0 0.0 na
Operating EBITDA cash -10.6 55.7 626%
Operating EBITDA 113.4 117.3 3%
Cash Conversion -9.3% 47.5% 608% Source: Company data, Credit Suisse estimates

Australia and NZ First Edition 146
14 February 2014
Asia Pacific/Australia
Equity Research
Investment Strategy
Australian Investment Strategy ECONOMICS AND STRATEGY
Strategy Portfolio Changes - SUN out ASX in
■ Strategy Short Ideas, Suncorp Out – We are taking profits from our short
Suncorp position. The stock has been in our Short Ideas list since inception.
Andrew Adams has been cautious on Suncorp given the stocks lofty
valuations, aggressive insurance assumptions and likelihood of cutting
revenue growth targets. Andrew notes that the upcoming results
announcement could be an additional negative for the share price.
■ Strategy Short Ideas, ASX In – In place of Suncorp, we are adding ASX to
our Short Ideas. We believe the general pressures on the equity industry will
continue to weigh on ASXs share price. Meanwhile, the company currently
pays out 90% of free cash-flow in the form of dividends. FCF growth is
expected to remain anaemic. Andrew Adams has recently assumed
coverage on the stock with an Underperform rating. He highlights falling
value per trade and lower turnover velocity. While we expect the
Australian equity market to rally from here, we still anticipate ASX to
underperform. Its historical beta has been less than one.
■ Stock Themes – A number of themes run through our stock selection
process. First, Selfies continue to dominate the Australian investor base
and we know they have an acute focus on dividends. We do not want to
stand in the way of these flows. Most of our long ideas are in a position to
increase dividends. While our shorts generally operate on lower FCF yields
and have less capacity to return capital to share-holders. Second, we
believe Australian companies will be operating in a low growth
environment. Those companies in a position to generate returns,
irrespective of the macro backdrop, should be valued more highly. For this
reason, we have many restructuring candidates amongst our Long
Ideas. Third, while we believe bottom-up factors will continue to become
more important in driving stock prices, there will continue to be macro
influences. One of the most important will be the RBA to cutting rates as
mining investment unwinds. This supports our long position in a number
of consumer and residential housing exposed stocks.
.
Research Analysts
Hasan Tevfik ,CFA
61 2 8205 4284
Damien Boey
61 2 8205 4615

14 February 2014
Australia and NZ First Edition 147
Figure 1: Australian Strategy Long and Short Stock Ideas Bottom-up strategy ideas for the next 6-12 months
FY 2015
Name MCap
(bn)
Year
End
PE (x) DY
(Net, %)
FCF Yield (%) Comment
Strategy Long ideas
Rio Tinto 104.6 Dec 9.5 3.9 9.8 Selling non-core assets
Potential big DVD increase
Cheapest mega cap miner
National Australia Bank 79.6 Sep 11.7 6.5 n.a Cheapest of the mega-banks
Potential UK demerger
Attractive dividend yield
Telstra 62.9 Jun 15.2 5.9 5.8 Improving dividends
Growth opportunities
High/solid dividend yield
Fortescue Metals 15.8 Jun 5.6 4.1 18.0 Falling cash costs
Paying down debt
Attractive valuation
QBE Insurance 12.8 Dec 11.3 4.3 n.a Restructuring
Rising margins
Macro headwinds subsiding
Mirvac 6.2 Jun 13.9 5.4 n.a Larger than normal discount
Exposed to rising property prices
Further RBA rate cuts to come
Caltex Australia 5.3 Dec 11.2 5.4 8.6 Asset conversion
Improving free cash
Attractive valuation
Seek 4.2 Jun 20.7 3.4 5.6 Selling Assets
Exceptional Cash Generator
Structural Grower
David Jones 1.7 Jul 15.0 5.7 5.4 Growing on-line business
Potential for asset sales
Potential consumption recovery
CSR 1.6 Mar 17.1 4.2 4.1 Preferred housing exposure
Restructuring glass business
Sharp rebound in profits growth
Strategy Short Ideas
Santos 13.3 Dec 13.5 3.7 -2.0 Priced for perfect LNG execution
Reliant on BG delivering
Cash-flows lower than expected
Crown 12.3 Jun 18.5 2.2 2.8 Slowing domestic revenues
Slowing Macau revenues
Testing valuations
Brambles 12.3 Jun 17.5 3.5 3.1 Expensive valuations
Poor cash generator
Potential EM risk
ASX 6.7 Jun 16.7 5.4 5.9 Falling volumes and trade size
90% FCF "payout"
Testing valuations
Toll Holdings 4.0 Jun 12.0 5.8 6.9 Margins under-pressure
Peaking resource volumes
Inefficient FCF generator
Source: Company data, Credit Suisse estimates

Australia and NZ First Edition 148
14 February 2014
Asia Pacific/Australia
Equity Research
Credit Suisse Ratings – Australia
Research Analysts
Adam Indikt
61 3 9280 1659
RATINGS
As of Thursday, 13 February 2014
Figure 1: Credit Suisse stock ratings – distribution
UNDERPERFORM 23%
NEUTRAL 44%
OUTPERFORM 34%
0% 5% 10% 15% 20% 25% 30% 35% 40% 45% 50%
See Figure 3 for ratings on each stock covered by Credit Suisse, ranked by expected total return.
Source: Credit Suisse estimates
Stock ratings
Individual stock ratings are determined by the projected total return on a stock
relative to absolute return benchmarks.
Analysts project a 12-month target share price for each stock. The capital gain
or loss implied by the 12-month target share price, along with the analyst’s
projected prospective dividend yield, generates the analyst’s projected total
return for a given stock.
The absolute return required to achieve an Outperform rating is greater than or
equal to 15%, and to achieve an Underperform rating is less than 7.5%. A
Neutral rating requires a projected total return within this range.

14 February 2014
Australia and NZ First Edition 149
Figure 2: Stock ratings definitions Stock rating Projected total return
Outperform ≥ 15 % Neutral 7.5% to < 15% Underperform < 7.5% Source: Credit Suisse
Credit Suisse applies a volatility cushion of 2.5% to the 7.5% and 15% total return
benchmarks so as to minimise rating changes caused by short-lived stock price
movements. Accordingly, a stock must trade for more than four consecutive trading days
above 10% or below 12.5% total return before an automatic rating change to Neutral from
either Underperform or Outperform, respectively, is considered appropriate.
Given the dynamic nature of share prices and as expectations regarding earnings
performance are adjusted for new information, it is possible these ratings could change
with some frequency.

14 February 2014
Australia and NZ First Edition 150
Figure 3: Ranking by projected total return Code Share Price Target Price Total Return* Rating^
KGD.AX $0.09 $0.35 307% OUTPERFORM BSE.AX $0.41 $0.90 120% OUTPERFORM MDL.AX $2.19 $4.00 83% OUTPERFORM SYR.AX $2.76 $4.90 78% OUTPERFORM WHC.AX $1.61 $2.75 72% OUTPERFORM NWT.AX $0.46 $0.74 61% OUTPERFORM TIG.AX $0.16 $0.25 56% OUTPERFORM AOH.AX $0.18 $0.26 44% OUTPERFORM MSB.AX $5.71 $7.95 39% OUTPERFORM GRY.AX $0.18 $0.25 39% OUTPERFORM BND.AX $0.15 $0.20 38% NEUTRAL FMG.AX $5.62 $7.50 37% OUTPERFORM JBH.AX $18.23 $23.06 32% OUTPERFORM TGA.AX $2.01 $2.53 31% NEUTRAL TRS.AX $10.93 $13.50 29% NEUTRAL PMV.AX $7.76 $9.50 29% OUTPERFORM FLT.AX $46.49 $58.00 29% OUTPERFORM SWM.AX $2.12 $2.60 28% OUTPERFORM QBE.AX $11.23 $13.65 25% OUTPERFORM ERA.AX $1.20 $1.50 25% OUTPERFORM CTX.AX $19.67 $23.80 24% OUTPERFORM AGO.AX $1.08 $1.30 23% OUTPERFORM WRT.AX $3.05 $3.51 22% OUTPERFORM ORL.AX $4.03 $4.65 21% OUTPERFORM ANZ.AX $30.99 $35.80 21% OUTPERFORM PAN.AX $0.24 $0.29 21% NEUTRAL MQG.AX $54.77 $63.00 20% OUTPERFORM SGN.AX $1.44 $1.63 20% NEUTRAL GDI.AX $0.90 $1.01 19% OUTPERFORM PRY.AX $4.55 $5.15 18% NEUTRAL NAB.AX $34.01 $38.00 18% OUTPERFORM DUE.AX $2.10 $2.30 18% OUTPERFORM OSH.AX $8.31 $9.70 18% OUTPERFORM AMP.AX $4.45 $4.96 17% NEUTRAL SFH.AX $0.87 $1.00 17% OUTPERFORM SXY.AX $0.73 $0.85 17% OUTPERFORM CQR.AX $3.64 $3.99 17% NEUTRAL TWR.AX $1.52 $1.66 17% NEUTRAL API.AX $0.57 $0.64 17% OUTPERFORM TLS.AX $5.15 $5.70 16% OUTPERFORM WDC.AX $10.15 $11.27 16% NEUTRAL DXS.AX $1.06 $1.16 16% OUTPERFORM CGF.AX $6.23 $7.00 16% OUTPERFORM PGH.AX $3.46 $3.85 16% OUTPERFORM PRT.AX $1.01 $1.10 16% NEUTRAL UGL.AX $7.11 $7.75 16% NEUTRAL MYR.AX $2.52 $2.70 15% NEUTRAL IAG.AX $5.45 $6.00 15% NEUTRAL GPT.AX $3.66 $4.00 15% OUTPERFORM LLC.AX $11.33 $12.54 15% OUTPERFORM WOR.AX $15.57 $17.10 15% NEUTRAL NHC.AX $3.36 $3.70 15% NEUTRAL SGP.AX $3.90 $4.23 15% NEUTRAL NUF.AX $4.08 $4.55 14% NEUTRAL MGR.AX $1.72 $1.87 14% OUTPERFORM CSL.AX $66.50 $74.55 14% OUTPERFORM RIO.AX $67.83 $75.00 14% OUTPERFORM SUL.AX $10.50 $11.50 14% NEUTRAL IOF.AX $3.09 $3.33 14% NEUTRAL PBG.AX $0.71 $0.75 14% NEUTRAL DOW.AX $4.80 $5.20 14% NEUTRAL RMD.AX $5.05 $5.60 13% NEUTRAL ANN.AX $19.02 $21.00 13% NEUTRAL SIP.AX $0.63 $0.66 13% NEUTRAL BOQ.AX $11.70 $12.50 13% NEUTRAL PNA.AX $1.85 $2.00 13% OUTPERFORM WOW.AX $35.30 $38.25 12% OUTPERFORM AIO.AX $5.68 $6.20 12% OUTPERFORM HVN.AX $3.12 $3.40 12% NEUTRAL TTS.AX $2.97 $3.16 12% NEUTRAL CFX.AX $1.96 $2.04 12% NEUTRAL PPT.AX $47.72 $51.00 12% NEUTRAL CPU.AX $11.55 $12.60 12% NEUTRAL BLD.AX $5.47 $5.90 12% NEUTRAL GNC.AX $7.76 $8.36 12% UNDERPERFORM ENE.AX $5.99 $6.44 11% OUTPERFORM ALQ.AX $8.24 $8.75 11% UNDERPERFORM ILU.AX $9.22 $10.00 11% NEUTRAL SKI.AX $1.72 $1.78 10% OUTPERFORM BEN.AX $11.65 $12.20 10% NEUTRAL VAH.AX $0.35 $0.38 10% NEUTRAL
Source: ASX, Credit Suisse estimates. Correct as of 9PM AET on 13 February 2014. *Projected capital gain or loss plus gross dividend yield.
Figure3: Ranking by projected total return (continued) Code Share Price Target Price Total Return* Rating^
EHL.AX $0.26 $0.28 10% NEUTRAL IPL.AX $2.94 $3.10 10% OUTPERFORM FDC.AX $2.36 $2.43 9% NEUTRAL QUB.AX $2.06 $2.20 9% NEUTRAL ENV.AX $1.18 $1.22 9% NEUTRAL MTS.AX $3.00 $3.10 9% UNDERPERFORM WES.AX $43.17 $45.00 9% NEUTRAL BXB.AX $8.80 $9.29 9% NEUTRAL SEK.AX $13.00 $13.78 9% NEUTRAL WBC.AX $32.44 $33.50 9% UNDERPERFORM AMC.AX $10.70 $11.20 9% NEUTRAL AMX.AX $0.18 $0.19 9% NEUTRAL HGG.AX $4.27 $4.45 9% NEUTRAL GMG.AX $4.76 $4.95 9% NEUTRAL ORA.AX $1.35 $1.40 8% OUTPERFORM ORG.AX $14.61 $15.30 8% NEUTRAL SPN.AX $1.26 $1.27 8% NEUTRAL TAH.AX $3.54 $3.65 8% NEUTRAL WEB.AX $3.16 $3.25 8% NEUTRAL JHX.AX $13.19 $13.50 7% OUTPERFORM NWS.AX $19.20 $20.25 7% NEUTRAL IFL.AX $9.22 $9.35 7% NEUTRAL NEC.AX $2.22 $2.30 7% OUTPERFORM SUN.AX $12.36 $12.36 7% UNDERPERFORM DJS.AX $3.11 $3.14 6% NEUTRAL FAN.AX $1.94 $2.00 6% UNDERPERFORM BHP.AX $37.32 $38.00 6% NEUTRAL EGP.AX $2.43 $2.50 6% OUTPERFORM AGK.AX $15.57 $15.80 6% NEUTRAL CBA.AX $75.75 $76.00 6% UNDERPERFORM OZL.AX $3.79 $3.80 6% UNDERPERFORM QAN.AX $1.19 $1.21 5% NEUTRAL TME.AX $3.68 $3.70 5% UNDERPERFORM AWC.AX $1.26 $1.30 5% OUTPERFORM BPT.AX $1.51 $1.55 4% NEUTRAL APA.AX $6.17 $6.05 4% UNDERPERFORM ALZ.AX $3.90 $3.81 3% NEUTRAL SHL.AX $16.74 $16.50 3% NEUTRAL PRU.AX $0.49 $0.50 3% OUTPERFORM TOL.AX $5.63 $5.49 3% NEUTRAL CHC.AX $3.90 $3.78 3% NEUTRAL CPA.AX $1.25 $1.21 2% NEUTRAL ASX.AX $36.25 $35.20 2% UNDERPERFORM SGM.AX $10.02 $10.00 2% UNDERPERFORM REA.AX $47.15 $47.50 2% NEUTRAL RHC.AX $41.61 $41.50 2% NEUTRAL ORI.AX $23.92 $23.10 1% NEUTRAL MYX.AX $0.87 $0.86 0% NEUTRAL CCL.AX $11.91 $11.30 0% UNDERPERFORM RRL.AX $3.09 $2.90 0% NEUTRAL CRZ.AX $10.20 $9.80 -1% NEUTRAL LEI.AX $16.19 $15.20 -1% UNDERPERFORM CSR.AX $3.05 $2.90 -1% OUTPERFORM STO.AX $13.91 $13.40 -1% UNDERPERFORM BSL.AX $5.85 $5.70 -2% OUTPERFORM AUB.AX $11.07 $10.41 -2% UNDERPERFORM COH.AX $54.95 $51.10 -2% UNDERPERFORM AQA.AX $2.68 $2.60 -3% OUTPERFORM WPL.AX $38.58 $35.00 -3% UNDERPERFORM CWN.AX $16.85 $15.90 -3% UNDERPERFORM MGX.AX $1.12 $1.05 -4% UNDERPERFORM ALL.AX $4.91 $4.50 -5% UNDERPERFORM YAL.AX $0.70 $0.65 -5% UNDERPERFORM SXL.AX $1.60 $1.40 -6% UNDERPERFORM SFR.AX $6.36 $5.75 -6% UNDERPERFORM IGO.AX $4.12 $3.70 -7% OUTPERFORM ARI.AX $1.69 $1.43 -9% UNDERPERFORM PTM.AX $6.99 $6.00 -10% UNDERPERFORM GFF.AX $0.59 $0.50 -10% UNDERPERFORM ABC.AX $3.99 $3.40 -10% UNDERPERFORM SDF.AX $1.58 $1.36 -11% UNDERPERFORM TWE.AX $3.70 $3.15 -11% UNDERPERFORM WSA.AX $3.14 $2.75 -12% NEUTRAL TEN.AX $0.34 $0.29 -13% NEUTRAL BTT.AX $6.26 $5.15 -13% NEUTRAL EVN.AX $0.79 $0.64 -17% UNDERPERFORM AQG.AX $2.73 $2.25 -18% UNDERPERFORM OGC.AX $2.44 $2.00 -18% UNDERPERFORM FXJ.AX $0.70 $0.50 -26% UNDERPERFORM NCM.AX $11.26 $8.20 -27% UNDERPERFORM APN.AX $0.45 $0.30 -32% UNDERPERFORM GBG.AX $0.10 $0.06 -42% UNDERPERFORM
Source: ASX, Credit Suisse estimates. Correct as of 9PM AET on 13 February 2014. *Projected capital gain or loss plus gross dividend yield.

14 F
eb
ruary
201
4
Au
stra
lia a
nd
NZ
Firs
t Ed
ition
151
Top 100 Earnings & Dividends
Research Analyst
Jason Swinbourne
612 8205 4591
As at 13 February 2014 Year Rating Share 12M Mkt NPAT PE Relative PE Dividend Dividend Yield EBITDA Multiple F'kg
to Price Tgt Cap 2013 2014F 2015F 2013 2014F 2015F 2013 2014F 2015F 2013 2014F 2015F 2013 2014F 2015F 2013 2014F 2015F 2013 2014F 2015F 2014F
$ $ $m $m $m $m ¢ ¢ ¢ x x x % % % ¢ ¢ ¢ % % % x x x %
Energy
Aurora Oil & Gas 31-Dec RSTR 4.13 1,656 124.5 288.7 266.8 27.2 63.0 58.3 13.6 5.9 6.3 81.8 41.5 47.7 0.0 0.0 0.0 0.0 0.0 0.0 6.5 3.4 3.0 0
Beach Energy 30-Jun NTRL 1.51 1.55 1,930 140.8 264.2 235.9 10.5 19.5 17.2 14.4 7.8 8.8 87.1 55.0 66.1 2.8 2.8 2.8 1.8 1.8 1.8 5.2 3.4 3.8 100
Caltex Australia 31-Dec OPFM 19.67 23.80 5,311 320.3 433.6 475.5 118.6 160.6 176.1 16.6 12.2 11.2 100.0 86.8 84.1 40.0 48.2 105.7 2.0 2.4 5.4 8.6 6.8 6.4 100
Origin Energy 30-Jun NTRL 14.61 15.30 16,089 760.0 791.2 1,005.2 69.2 71.9 91.0 21.1 20.3 16.1 127.3 143.9 120.9 50.0 50.0 50.0 3.4 3.4 3.4 10.5 10.7 9.6 50
Oil Search 31-Dec OPFM 8.31 9.70 9,973 209.0 328.0 907.5 15.6 24.3 67.0 47.7 30.5 11.1 287.7 216.0 83.4 4.0 4.0 26.8 0.5 0.5 3.6 30.6 17.5 7.4 0
Santos Ltd 31-Dec UPFM 13.91 13.40 13,496 558.7 558.3 1,002.3 57.8 57.2 101.7 24.1 24.3 13.7 145.0 172.2 103.1 30.0 30.0 50.8 2.2 2.2 3.7 9.8 9.4 6.6 100
WorleyParsons 30-Jun NTRL 15.57 17.10 3,791 322.1 261.9 276.6 130.8 106.2 112.2 11.9 14.7 13.9 71.8 103.8 104.5 92.5 84.0 78.0 5.9 5.4 5.0 7.5 8.6 8.3 75
Woodside Petroleum 31-Dec UPFM 38.58 35.00 28,398 1,717.9 2,068.9 2,257.9 208.5 251.1 274.0 16.5 13.7 12.6 99.7 97.2 94.7 250.4 200.9 219.2 7.3 5.8 6.4 8.2 6.6 6.1 100
Sector Aggregate 20.2 16.1 12.3 4.0 3.7 4.8 9.9 7.9 6.5
Materials - Chemicals
Incitec Pivot Ltd. 30-Sep OPFM 2.94 3.10 4,836 298.4 350.9 477.7 18.3 21.5 29.3 16.0 13.6 10.0 96.8 96.7 75.5 9.2 11.9 16.1 3.1 4.0 5.5 9.6 7.9 6.1 50
Orica 30-Sep NTRL 23.92 23.10 8,856 601.6 626.7 693.6 165.2 171.8 189.6 14.5 13.9 12.6 87.3 98.6 95.0 94.0 98.0 107.0 3.9 4.1 4.5 9.1 9.0 8.0 50
Sector Aggregate 15.0 13.8 11.6 3.6 4.1 4.8 9.2 8.6 7.2
Materials - Construction Materials
Adelaide Brighton 31-Dec UPFM 3.99 3.40 2,547 148.6 153.0 158.4 23.1 23.8 24.6 17.3 16.8 16.2 104.1 118.8 122.0 17.5 18.0 18.0 4.4 4.5 4.5 10.8 10.5 10.2 100
Boral 30-Jun NTRL 5.47 5.90 4,260 104.4 174.0 224.0 13.5 22.5 28.8 40.5 24.3 19.0 244.2 171.9 143.0 11.0 17.0 23.0 2.0 3.1 4.2 11.6 9.4 9.2 80
James Hardie Industries SE 31-Mar OPFM 13.19 13.50 5,227 140.8 193.2 246.0 32.1 43.6 55.5 36.8 27.0 21.2 221.7 191.5 159.9 18.0 53.0 61.0 1.5 4.5 5.2 20.9 16.3 13.2 0
Sector Aggregate 32.4 23.8 19.6 2.2 3.9 4.6 15.0 12.2 11.1
Materials - Containers & Packaging
Amcor 30-Jun NTRL 10.70 11.20 12,912 689.5 722.8 806.1 56.3 59.0 65.8 19.0 18.1 16.3 114.6 128.4 122.5 40.0 41.3 46.7 3.7 3.9 4.4 10.5 9.9 9.2 0
Orora 30-Jun OPFM 1.35 1.40 1,629 - 98.5 112.7 8.2 9.3 n.m 16.5 14.5 117.2 108.9 5.8 6.5 4.3 4.8 n.m 8.0 7.3 0
Materials - Metals & Mining
Arrium 30-Jun UPFM 1.69 1.43 2,294 168.3 362.7 246.9 12.5 26.7 18.2 13.5 6.3 9.3 81.2 44.6 69.7 5.0 12.0 9.1 3.0 7.1 5.4 7.5 4.1 4.9 0
Alumina Limited 31-Dec OPFM 1.26 1.30 3,146 17.0 40.2 170.6 0.6 1.4 6.1 n.m 78.3 18.4 n.m 554.9 138.9 0.0 1.0 7.0 0.0 0.9 6.2 n.m n.m n.m 100
BHP Billiton 30-Jun NTRL 37.32 38.00 172,438 11,223.0 13,643.8 12,445.5 210.2 254.3 231.9 15.9 13.1 14.4 95.7 92.9 108.3 116.0 127.0 140.0 3.5 3.8 4.2 7.1 6.3 6.5 100
BlueScope Steel 30-Jun OPFM 5.85 5.70 3,269 29.7 67.8 160.1 5.2 12.1 28.7 n.m 48.2 20.4 677.2 341.1 153.6 0.0 0.0 8.8 0.0 0.0 1.5 8.2 6.5 4.8 100
Fortescue Metals Group Ltd 30-Jun OPFM 5.62 7.50 15,634 1,706.4 3,279.9 2,841.9 54.8 105.3 91.3 9.2 4.8 5.5 55.3 33.8 41.4 10.0 10.0 21.0 2.0 2.0 4.2 7.9 3.5 3.4 100
Iluka Resources 31-Dec NTRL 9.22 10.00 3,860 59.0 96.0 337.7 14.1 22.9 80.7 65.4 40.2 11.4 394.4 284.8 86.1 10.0 19.0 30.0 1.1 2.1 3.3 15.2 12.4 6.0 100
Newcrest Mining 30-Jun UPFM 11.26 8.20 8,631 451.0 291.5 540.0 58.9 38.1 70.5 19.1 29.6 16.0 115.3 209.5 120.2 12.0 0.0 0.0 1.1 0.0 0.0 9.3 10.4 7.6 0
OZ Minerals 31-Dec UPFM 3.79 3.80 1,150 62.5- 24.5- 82.2- -20.6 -8.1 -27.1 n.m n.m n.m n.m n.m n.m 20.0 20.0 20.0 5.3 5.3 5.3 6.8 6.1 6.2 0
Rio Tinto 31-Dec OPFM 67.83 75.00 108,795 10,181.2 11,067.5 11,623.1 551.2 599.1 629.2 11.0 10.1 9.6 66.3 71.6 72.5 192.1 211.3 232.4 3.2 3.5 3.8 6.2 5.7 5.3 100
Regis Resources Limited 30-Jun NTRL 3.09 2.90 1,539 145.7 112.7 179.6 30.1 22.5 35.9 10.3 13.7 8.6 61.9 97.1 64.8 15.0 11.3 21.5 4.9 3.6 7.0 6.0 7.3 4.6 0
Sims Metal Management 30-Jun UPFM 10.02 10.00 2,048 17.1 42.9 127.1 8.4 21.0 62.2 n.m 47.8 16.1 722.2 338.4 121.3 0.0 10.5 31.1 0.0 1.0 3.1 11.5 10.7 6.4 40
Sector Aggregate 15.4 11.5 11.3 2.8 3.4 4.1 7.7 6.0 5.8
Industrials - Capital Goods
Leighton Holdings 31-Dec UPFM 16.19 15.20 5,460 521.5 502.1 503.8 154.7 149.0 149.5 10.5 10.9 10.8 63.1 77.0 81.6 99.0 89.4 89.7 6.1 5.5 5.5 3.3 3.2 3.0 55
UGL Limited 30-Jun NTRL 7.11 7.75 1,184 81.8 117.7 119.5 49.1 70.8 71.4 14.5 10.0 10.0 87.2 71.2 75.0 39.0 46.0 47.0 5.5 6.5 6.6 8.7 6.8 6.4 100
Sector Aggregate 11.0 10.7 10.7 6.0 5.7 5.7 3.7 3.5 3.4
Industrials - Commercial & Professional Services
ALS Limited 31-Mar UPFM 8.24 8.75 3,249 237.9 191.5 226.2 69.4 53.4 61.3 11.9 15.4 13.4 71.6 109.4 101.3 48.0 36.6 42.9 5.8 4.4 5.2 9.0 10.9 9.0 50
Brambles Limited 30-Jun NTRL 8.80 9.29 12,280 585.1 629.5 698.3 37.7 40.5 45.0 20.9 19.4 17.5 125.9 137.4 131.7 27.0 30.0 32.0 3.5 3.5 3.6 10.4 9.7 9.1 25
Downer EDI 30-Jun NTRL 4.80 5.20 2,087 215.4 214.9 224.6 50.1 49.1 50.4 9.6 9.8 9.5 57.8 69.2 71.7 21.0 25.0 25.0 4.4 5.2 5.2 3.5 3.3 2.9 100
Seek 30-Jun NTRL 13.00 13.78 4,409 141.0 164.4 202.9 41.5 48.4 59.7 31.3 26.9 21.8 188.9 190.2 163.9 22.0 33.9 41.8 1.7 2.6 3.2 19.7 15.4 13.0 100
Sector Aggregate 19.5 18.3 16.0 3.3 3.6 3.9 10.1 9.0 7.9
Industrials - Transportation
Asciano Group 30-Jun OPFM 5.68 6.20 5,540 358.4 360.7 415.6 36.7 37.0 42.6 15.5 15.4 13.3 93.2 108.8 100.4 11.1 14.8 21.3 1.9 2.6 3.8 8.6 8.1 7.4 100
Aurizon 30-Jun RSTR 5.00 10,686 487.4 519.0 643.3 21.6 24.3 30.1 23.1 20.6 16.6 139.6 145.8 125.1 16.0 17.0 21.1 3.2 3.4 4.2 10.4 9.8 8.4 20
Qantas Airways 30-Jun NTRL 1.19 1.21 2,603 133.4 382.3- 197.1- 6.0 -17.0 -8.8 19.9 n.m n.m 120.1 n.m n.m 0.0 1.5 5.5 0.0 1.3 4.6 3.2 5.1 4.4 100
Toll Holdings 30-Jun NTRL 5.63 5.49 4,037 288.0 285.7 307.2 40.2 40.1 42.8 14.0 14.0 13.1 84.5 99.5 99.0 26.0 29.5 32.0 4.6 5.2 5.7 7.6 7.2 6.7 100
Sector Aggregate 18.5 28.8 19.5 2.8 3.3 4.4 7.6 8.0 7.1n.m n.m n.m
Note: Aggregations are weighted by market cap of the listed companies . Actuals used when available else Credit Suisse Forecasts used in calculations. PE aggregates larger than 100 or negative are shown as nm.
EPS
Source: Company data, Credit Suisse estimates

Au
stra
lia a
nd
NZ
Firs
t Ed
ition
152
14 F
eb
ruary
201
4
Top 100 Earnings & Dividends (continued) As at 13 February 2014 Year Rating Share 12M Mkt NPAT PE Relative PE Dividend Dividend Yield EBITDA Multiple F'kg
to Price Tgt Cap 2013 2014F 2015F 2013 2014F 2015F 2013 2014F 2015F 2013 2014F 2015F 2013 2014F 2015F 2013 2014F 2015F 2013 2014F 2015F 2014F
$ $ $m $m $m $m ¢ ¢ ¢ x x x % % % ¢ ¢ ¢ % % % x x x %
Consumer Discretionary - Consumer Durables & Apparel
Consumer Discretionary - Consumer Services
Aristocrat Leisure 30-Sep UPFM 4.91 4.50 2,707 107.2 130.5 144.5 19.4 23.6 26.1 25.3 20.8 18.8 152.8 147.7 141.7 14.5 16.5 20.0 3.0 3.4 4.1 15.5 12.3 11.0 0
Crown 30-Jun UPFM 16.85 15.90 12,273 472.8 614.2 663.3 64.9 84.3 91.1 26.0 20.0 18.5 156.5 141.6 139.4 37.0 37.0 37.0 2.2 2.2 2.2 18.3 17.6 17.8 60
Echo Entertainment 30-Jun OPFM 2.43 2.50 2,006 123.3 126.4 133.6 14.9 15.3 16.1 16.3 15.9 15.1 98.3 112.6 113.7 6.0 6.0 8.0 2.5 2.5 3.3 6.9 6.6 6.3 100
Flight Centre 30-Jun OPFM 46.49 58.00 4,674 240.8 272.3 307.3 239.0 270.2 305.0 19.5 17.2 15.2 117.3 121.9 114.8 137.0 160.5 190.5 2.9 3.5 4.1 9.0 7.3 6.1 100
Tabcorp Holdings 30-Jun NTRL 3.54 3.65 2,670 139.1 144.7 162.0 18.8 19.2 21.4 18.8 18.5 16.6 113.3 130.8 124.8 19.0 15.3 17.1 5.4 4.3 4.8 8.2 7.9 7.5 100
Tatts Group 30-Jun NTRL 2.97 3.16 4,209 227.4 243.0 250.2 16.4 17.2 17.4 18.1 17.3 17.0 109.0 122.5 128.2 15.5 17.0 17.0 5.2 5.7 5.7 11.6 10.4 10.2 100
Sector Aggregate 21.7 18.7 17.2 3.2 3.3 3.5 12.2 11.0 10.2
Consumer Discretionary - Media
Sector Aggregate n.m n.m n.m n.m n.m n.m
Consumer Discretionary - Retailing
David Jones 26-Jul NTRL 3.11 3.14 1,670 101.6 92.1 107.5 19.1 17.2 20.1 16.3 18.0 15.5 98.0 127.8 116.5 17.0 15.1 17.4 5.5 4.9 5.6 8.5 8.9 7.9 100
Harvey Norman 30-Jun NTRL 3.12 3.40 3,314 183.4 216.8 243.1 17.3 20.4 22.9 18.1 15.3 13.6 109.0 108.3 102.7 9.0 10.1 11.3 2.9 3.2 3.6 11.3 8.8 7.9 100
Myer Holdings 27-Jul NTRL 2.52 2.70 1,476 127.2 125.1 149.5 21.6 21.4 25.6 11.7 11.8 9.8 70.4 83.5 74.1 18.0 18.2 22.4 7.1 7.2 8.9 6.0 6.1 5.4 100
Sector Aggregate 15.7 14.9 12.9 4.5 4.6 5.3 8.8 8.0 7.1
Consumer Staples - Food & Drug Retailing
Metcash 30-Apr UPFM 3.00 3.10 2,665 268.1 254.1 215.5 31.1 28.9 24.5 9.7 10.4 12.3 58.2 73.7 92.4 28.0 20.8 17.1 9.3 6.9 5.7 6.8 7.4 8.0 100
Wesfarmers 30-Jun NTRL 43.17 45.00 49,355 2,261.0 2,340.9 2,686.6 195.6 204.8 239.7 22.1 21.1 18.0 133.1 149.3 135.7 180.0 195.4 223.0 4.2 4.5 5.2 11.4 11.2 10.2 100
Woolworths 30-Jun OPFM 35.30 38.25 44,288 2,355.7 2,524.7 2,703.9 189.5 200.4 213.3 18.6 17.6 16.6 112.3 124.8 124.7 133.0 139.7 149.0 3.8 4.0 4.2 10.4 9.9 9.2 100
Sector Aggregate 19.7 18.8 17.1 4.1 4.3 4.7 10.7 10.5 9.7
Consumer Staples - Food Beverage & Tobacco
Coca-Cola Amatil 31-Dec UPFM 11.91 11.30 9,094 508.8 515.5 522.9 66.7 67.4 68.3 17.9 17.7 17.4 107.7 125.1 131.3 59.5 61.0 58.0 5.0 5.1 4.9 10.3 10.1 9.9 70
Graincorp 30-Sep UPFM 7.76 8.36 1,776 174.5 121.1 146.7 76.2 52.2 64.1 10.2 14.9 12.1 61.4 105.3 91.2 40.0 27.6 33.6 5.2 3.6 4.3 6.1 6.8 6.1 100
Treasury Wine 30-Jun UPFM 3.70 3.15 2,395 136.8 162.4 196.4 20.7 25.0 30.2 17.9 14.8 12.3 108.0 105.0 92.3 13.0 12.0 15.0 3.5 3.2 4.1 9.2 10.1 8.1 0
Sector Aggregate 16.2 16.7 15.4 4.7 4.6 4.7 9.2 9.5 8.8
Health Care
Ansell Limited 30-Jun NTRL 19.02 21.00 2,596 139.2 161.9 194.4 106.0 111.9 125.6 16.0 15.2 13.5 96.7 107.6 101.9 38.0 40.7 46.5 2.2 2.4 2.7 14.2 12.4 10.0 0
Cochlear 30-Jun UPFM 54.95 51.10 3,136 132.6 108.0 150.5 232.4 189.2 261.7 23.6 29.1 21.0 142.6 205.8 158.1 252.0 254.0 254.0 4.6 4.6 4.6 15.9 19.5 14.1 0
CSL Ltd 30-Jun OPFM 66.50 74.55 28,762 1,216.3 1,342.3 1,425.6 243.1 276.6 296.8 24.4 21.5 20.0 147.4 152.1 150.8 102.0 113.1 125.3 1.7 1.9 2.1 17.6 15.6 14.4 0
Primary Health Care 30-Jun NTRL 4.55 5.15 2,298 150.1 167.8 188.8 29.9 33.3 37.2 15.2 13.7 12.2 91.9 96.9 92.2 17.5 22.0 24.0 3.8 4.8 5.3 8.7 8.3 7.7 100
Ramsay Health Care 30-Jun NTRL 41.61 41.50 8,409 275.4 323.1 373.0 148.0 170.3 195.4 28.1 24.4 21.3 169.5 173.1 160.4 70.5 82.7 94.9 1.7 2.0 2.3 15.0 13.2 11.7 100
ResMed Inc. 30-Jun NTRL 5.05 5.60 6,388 307.2 364.3 403.7 21.0 25.1 27.7 21.5 18.0 16.3 129.8 127.5 122.6 7.6 10.5 12.5 1.7 2.3 2.8 13.4 11.4 10.3 0
Sonic Healthcare 30-Jun NTRL 16.74 16.50 6,708 335.0 403.8 441.1 84.3 100.4 108.5 19.9 16.7 15.4 119.8 118.1 116.2 62.0 72.9 78.8 3.7 4.4 4.7 13.1 10.9 9.9 45
Sector Aggregate 25.0 20.4 18.0 2.0 2.5 2.8 16.6 13.7 12.1
Financials - Banks
ANZ Banking Group 30-Sep OPFM 30.99 35.80 85,040 6,446.0 7,036.2 7,450.6 229.6 247.8 261.9 13.5 12.5 11.8 81.4 88.6 89.1 164.0 176.0 187.0 5.3 5.7 6.0 4.7 4.0 3.5 100
Bendigo and Adelaide Bank 30-Jun NTRL 11.65 12.20 4,777 348.0 378.3 397.4 78.4 84.3 87.7 14.9 13.8 13.3 89.6 97.9 100.1 61.0 64.0 67.0 5.2 5.5 5.8 8.2 7.4 7.0 100
Bank of Queensland 31-Aug NTRL 11.70 12.50 3,774 248.2 291.3 328.1 75.8 86.5 95.7 15.4 13.5 12.2 93.1 95.8 92.1 58.0 66.0 73.0 5.0 5.6 6.2 9.5 8.4 7.5 100
Commonwealth Bank Australia 30-Jun UPFM 75.75 76.00 122,104 7,720.0 8,458.1 8,535.6 468.5 511.3 511.2 16.2 14.8 14.8 97.5 104.9 111.6 364.0 393.0 397.0 4.8 5.2 5.2 8.9 7.2 7.0 100
National Australia Bank 30-Sep OPFM 34.01 38.00 79,973 5,958.0 6,569.2 6,910.8 251.6 275.3 289.1 13.5 12.4 11.8 81.5 87.5 88.6 190.0 209.0 220.0 5.6 6.1 6.5 4.9 4.3 3.9 100
Westpac 30-Sep UPFM 32.44 33.50 100,858 7,097.0 7,307.1 7,538.8 223.0 228.2 234.9 14.5 14.2 13.8 87.7 100.7 104.0 174.0 182.0 190.0 5.4 5.6 5.9 8.1 7.8 7.5 100
Sector Aggregate 14.5 13.6 13.1 5.2 5.6 5.8 6.4 5.6 5.2
Note: Aggregations are weighted by market cap of the listed companies . Actuals used when available else Credit Suisse Forecasts used in calculations. PE aggregates larger than 100 or negative are shown as nm.
EPS
Source: Company data, Credit Suisse estimates

Au
stra
lia a
nd
NZ
Firs
t Ed
ition
153
14 F
eb
ruary
201
4
Top 100 Earnings & Dividends (continued) As at 13 February 2014 Year Rating Share 12M Mkt NPAT PE Relative PE Dividend Dividend Yield EBITDA Multiple F'kg
to Price Tgt Cap 2013 2014F 2015F 2013 2014F 2015F 2013 2014F 2015F 2013 2014F 2015F 2013 2014F 2015F 2013 2014F 2015F 2013 2014F 2015F 2014F
$ $ $m $m $m $m ¢ ¢ ¢ x x x % % % ¢ ¢ ¢ % % % x x x %
Financials - Diversified Financials
ASX 30-Jun UPFM 36.25 35.20 7,018 348.2 380.4 407.8 195.5 196.9 210.7 18.5 18.4 17.2 111.8 130.4 129.6 170.2 177.0 189.7 4.7 4.9 5.2 8.1 8.0 7.4 100
Challenger Limited 30-Jun OPFM 6.23 7.00 3,307 308.5 327.8 310.5 58.6 64.0 62.1 10.6 9.7 10.0 64.1 69.0 75.6 20.0 23.0 23.0 3.2 3.7 3.7 8.6 7.5 6.8 23
Henderson Group PLC 31-Dec NTRL 4.27 4.45 1,525 161.9 172.5 192.6 14.6 15.5 17.3 15.8 14.8 13.3 95.0 104.7 99.8 8.5 9.8 11.0 3.7 4.3 4.8 7.2 6.2 5.2 0
Macquarie Group 31-Mar OPFM 54.77 63.00 17,585 851.0 1,262.3 1,267.4 246.1 363.4 381.4 22.3 15.1 14.4 134.2 106.8 108.2 200.0 269.5 302.0 3.7 4.9 5.5 9.3 6.8 6.9 40
Perpetual Limited 30-Jun NTRL 47.72 51.00 2,220 75.9 110.9 141.0 185.1 254.0 305.3 25.8 18.8 15.6 155.5 133.1 117.7 130.0 200.0 250.0 2.7 4.2 5.2 17.3 12.6 9.8 100
Sector Aggregate 19.1 15.0 14.2 3.7 4.7 5.2 9.1 7.3 6.9
Financials - Insurance
AMP 31-Dec NTRL 4.45 4.96 13,162 646.6 827.3 969.5 25.1 31.6 34.5 17.7 14.1 12.9 106.9 99.9 97.3 24.0 25.5 28.0 5.4 5.7 6.3 24.8 20.2 18.5 65
Insurance Australia Group 30-Jun NTRL 5.45 6.00 12,762 1,063.0 1,038.9 869.0 48.7 44.6 35.3 11.2 12.2 15.5 67.4 86.5 116.4 36.0 29.0 27.0 6.6 5.3 5.0 8.5 8.4 9.5 100
QBE Insurance Group 31-Dec OPFM 11.23 13.65 12,528 249.6- 970.9 1,194.9 -19.0 73.1 89.5 n.m 13.7 11.2 n.m 97.3 84.4 34.0 41.0 50.0 3.3 3.6 4.3 21.6 11.5 9.6 70
Suncorp Group Limited 30-Jun UPFM 12.36 12.36 15,902 502.6 1,163.6 1,361.7 41.1 91.0 106.6 30.1 13.6 11.6 181.6 96.2 87.4 75.0 78.0 90.0 6.1 6.3 7.3 26.4 12.4 10.7 100
Sector Aggregate 25.8 13.4 12.4 5.3 5.3 5.8 17.3 12.0 11.1
Financials - Real Estate
CFS Retail Property Trust 30-Jun NTRL 1.96 2.04 5,900 384.6 386.7 401.7 13.6 13.7 14.2 14.4 14.3 13.8 86.7 101.3 103.7 13.6 13.7 14.2 7.0 7.0 7.3 16.9 16.3 15.5 0
Commonwealth Property Office Fund 30-Jun NTRL 1.25 1.21 2,934 204.3 206.9 207.5 8.7 8.8 8.8 14.4 14.2 14.1 86.6 100.4 106.5 6.6 6.7 6.9 5.2 5.4 5.5 15.8 15.3 15.3 0
Dexus Property Group 30-Jun OPFM 1.06 1.16 5,021 365.4 384.5 398.3 7.7 8.3 8.6 13.6 12.7 12.3 82.2 90.2 92.3 6.0 6.2 6.4 5.7 5.9 6.0 15.0 14.8 14.1 0
Federation Centres 30-Jun NTRL 2.36 2.43 3,369 224.4 237.1 249.5 15.8 16.6 17.5 14.9 14.2 13.5 90.1 100.6 101.7 13.8 14.6 15.4 5.9 6.2 6.5 13.9 14.9 15.0 0
Goodman Group 30-Jun NTRL 4.76 4.95 8,181 544.1 603.1 635.5 32.4 35.0 36.7 14.7 13.6 13.0 88.5 96.3 97.6 19.5 20.8 22.1 4.1 4.4 4.6 15.9 14.6 14.1 0
GPT Group 31-Dec OPFM 3.66 4.00 6,203 446.8 442.0 454.7 25.7 26.5 27.4 14.2 13.8 13.3 85.9 97.7 100.5 20.4 21.2 21.9 5.6 5.8 6.0 14.4 14.5 14.0 0
Investa Office Fund 30-Jun NTRL 3.09 3.33 1,897 137.5 139.8 145.0 22.4 22.8 23.6 13.8 13.6 13.1 83.2 96.1 98.6 17.7 18.5 19.0 5.7 6.0 6.2 14.6 15.0 14.9 0
Lend Lease 30-Jun OPFM 11.33 12.54 6,534 553.0 545.8 597.4 96.3 94.5 102.9 11.8 12.0 11.0 71.0 84.9 82.9 42.0 45.4 51.5 3.7 4.0 4.5 9.4 8.7 8.1 0
Mirvac Group 30-Jun OPFM 1.72 1.87 6,304 377.6 437.4 447.6 10.9 12.0 12.2 15.7 14.4 14.1 94.9 101.9 105.9 8.8 9.0 9.2 5.1 5.2 5.3 18.9 15.4 15.3 0
Stockland 30-Jun NTRL 3.90 4.23 8,992 494.8 550.0 596.5 22.4 23.8 25.6 17.4 16.4 15.2 105.1 115.9 114.6 24.0 24.0 24.0 6.2 6.2 6.2 22.3 20.4 18.7 0
Westfield 31-Dec NTRL 10.15 11.27 21,452 1,448.1 1,420.8 1,459.3 66.5 68.0 70.2 15.3 14.9 14.4 92.0 105.7 108.8 51.0 52.1 54.8 5.0 5.1 5.4 15.1 15.7 15.7 0
Westfield Retail Trust 31-Dec OPFM 3.05 3.51 9,087 605.3 619.7 641.2 20.0 20.7 21.5 15.3 14.7 14.2 92.2 104.2 107.0 19.9 20.7 21.4 6.5 6.8 7.0 15.5 15.4 15.0 0
Sector Aggregate 14.8 14.2 13.6 5.4 5.6 5.8 15.3 14.8 14.4
Information Technology
Computershare 30-Jun NTRL 11.55 12.60 5,739 304.8 335.0 376.4 54.8 60.2 67.7 18.8 17.1 15.2 113.5 121.4 114.8 28.0 28.0 31.0 2.8 2.5 2.6 13.7 12.5 10.7 20
Telecommunication Services
Telstra Corporation 30-Jun OPFM 5.15 5.70 64,082 3,866.0 3,990.0 4,145.2 31.1 32.1 33.3 16.6 16.1 15.5 100.0 113.8 116.4 28.0 29.0 30.0 5.4 5.6 5.8 7.1 6.8 6.8 100
Utilities
AGL Energy 30-Jun NTRL 15.57 15.80 8,694 598.3 603.7 704.2 108.7 108.1 124.3 14.3 14.4 12.5 86.4 102.0 94.3 63.0 65.0 66.6 4.0 4.2 4.3 8.6 8.1 7.1 100
APA Group 30-Jun UPFM 6.17 6.05 5,157 178.8 201.4 240.6 23.1 24.1 28.8 26.7 25.6 21.4 160.7 181.4 161.5 35.5 36.0 36.9 5.8 5.8 6.0 14.3 13.5 12.3 0
DUET Group 30-Jun OPFM 2.10 2.30 2,701 68.0 85.9 127.5 5.9 6.9 9.8 35.3 30.5 21.3 213.1 216.0 160.8 16.5 17.0 17.5 7.9 8.1 8.3 10.0 9.9 9.2 0
Spark Infrastructure Group 31-Dec OPFM 1.72 1.78 2,275 177.5 210.7 214.0 13.4 15.9 16.1 12.8 10.8 10.6 77.3 76.5 80.1 11.0 11.5 12.0 6.4 6.7 7.0 7.1 6.1 5.9 0
SP AusNet 31-Mar NTRL 1.26 1.27 4,250 279.1 295.4 333.5 8.5 8.7 9.5 14.7 14.5 13.2 88.6 102.7 99.2 8.2 8.4 8.5 6.5 6.7 6.8 9.2 9.1 8.9 33
Sector Aggregate 17.2 16.5 14.4 5.6 5.7 5.9 9.5 9.0 8.2
Report Average 16.6 14.1 13.3 4.1 4.5 4.9 8.3 7.1 6.6
Note: Aggregations are weighted by market cap of the listed companies . Actuals used when available else Credit Suisse Forecasts used in calculations. PE aggregates larger than 100 or negative are shown as nm.
EPS
Source: Company data, Credit Suisse estimates

14 F
eb
ruary
201
4
Au
stra
lia a
nd
NZ
Firs
t Ed
ition
154
Small Caps Earnings & Dividends
Research Analyst
Jason Swinbourne
612 8205 4591
As at 13 February 2014 Year Rating Share 12M Mkt NPAT PE Relative PE Dividend Dividend Yield EBITDA Multiple F'kg
to Price Tgt Cap 2013 2014F 2015F 2013 2014F 2015F 2013 2014F 2015F 2013 2014F 2015F 2013 2014F 2015F 2013 2014F 2015F 2013 2014F 2015F 2014F
$ $ $m $m $m $m ¢ ¢ ¢ x x x % % % ¢ ¢ ¢ % % % x x x %
Energy
Aquila Resources 30-Jun OPFM 2.68 2.60 1,104 173.4- 15.1- 19.3- -42.1 -3.7 -4.7 n.m n.m n.m n.m n.m n.m 0.0 0.0 0.0 0.0 0.0 0.0 n.m n.m n.m 100
Bandanna Energy Limited 30-Jun NTRL 0.15 0.20 77 7.6- 13.3- 14.4- -1.4 -2.5 -2.7 n.m n.m n.m n.m n.m n.m 0.0 0.0 0.0 0.0 0.0 0.0 n.m 3.5 n.m 0
Cockatoo Coal 30-Jun RSTR 0.04 158 21.8- 19.1- 13.7 -1.3 -1.1 0.8 n.m n.m 4.6 n.m n.m 26.7 0.0 0.0 0.0 0.0 0.0 0.0 52.7 20.0 4.1 100
Energy Resources of Australia 31-Dec OPFM 1.20 1.50 621 142.4- 135.8- 142.5- -27.5 -26.2 -27.5 n.m n.m n.m n.m n.m n.m 0.0 0.0 0.0 0.0 0.0 0.0 2.3 4.1 n.m 100
New Hope Corporation 31-Jul NTRL 3.36 3.70 2,792 124.4 113.7 134.1 15.0 13.7 16.1 22.4 24.6 20.8 84.8 114.2 119.9 16.0 13.7 16.1 4.8 4.1 4.8 9.5 12.2 11.2 100
Senex Energy Limited 30-Jun OPFM 0.73 0.85 830 61.0 64.7 79.0 5.3 5.6 6.9 13.6 12.9 10.6 51.4 60.0 60.9 0.0 0.0 0.0 0.0 0.0 0.0 9.0 8.4 6.7 100
Whitehaven Coal 30-Jun OPFM 1.61 2.75 1,646 60.7- 16.3- 57.8 -6.2 -1.6 5.6 n.m n.m 28.5 n.m n.m 164.1 0.0 0.0 2.5 0.0 0.0 1.5 n.m 23.8 9.9 100
Yancoal Australia 31-Dec UPFM 0.70 0.65 691 6.1 24.0- 150.0 0.6 -2.4 15.1 n.m n.m 4.6 424.8 n.m 26.5 0.0 0.3 3.8 0.0 0.5 5.4 23.3 8.4 5.6 100
Sector Aggregate n.m n.m 28.5 1.7 1.5 2.5 n.m 13.3 15.5
Materials - Chemicals
Nufarm 31-Jul NTRL 4.08 4.55 1,076 69.2 78.4 98.9 26.4 29.8 37.4 15.5 13.7 10.9 58.5 63.8 62.8 8.0 8.9 13.1 2.0 2.2 3.2 6.6 6.1 5.3 31
Materials - Construction Materials
CSR 31-Mar OPFM 3.05 2.90 1,543 32.7 67.0 91.7 6.5 13.2 18.1 47.2 23.0 16.8 178.2 107.1 97.0 5.1 11.0 13.0 1.7 3.6 4.3 10.2 8.2 6.9 0
Materials - Containers & Packaging
Pact Group Holdings 30-Jun OPFM 3.46 3.85 1,018 131.1 81.9 88.8 44.6 27.8 30.2 7.8 12.4 11.5 29.3 57.8 66.0 0.0 9.5 20.2 0.0 2.7 5.8 8.6 8.1 7.5 65
Materials - Metals & Mining
Atlas Iron 30-Jun OPFM 1.08 1.30 989 13.7 117.8 67.9 1.5 11.1 6.4 71.4 9.7 17.0 269.5 45.2 97.9 3.0 3.0 3.0 2.8 2.8 2.8 7.0 2.5 3.9 0
Ampella Mining Limited 31-Dec NTRL 0.18 0.19 43 19.6- 18.8- 19.8- -7.9 -7.6 -8.0 n.m n.m n.m n.m n.m n.m 0.0 0.0 0.0 0.0 0.0 0.0 n.m n.m n.m 0
Altona Mining Limited 30-Jun OPFM 0.18 0.26 96 12.6 13.8 11.6 2.4 2.6 2.2 7.6 7.0 8.3 28.8 32.6 48.1 0.0 0.0 0.0 0.0 0.0 0.0 8.3 3.8 5.4 0
Alacer Gold Corp. 31-Dec UPFM 2.73 2.25 708 110.3 52.3 0.9 38.2 18.1 0.3 6.4 13.5 n.m 24.1 62.7 n.m 0.0 0.0 0.0 0.0 0.0 0.0 1.8 2.9 9.3 0
Base Resources Ltd 30-Jun OPFM 0.41 0.90 230 5.7- 20.9- 88.3 -1.0 -3.7 15.7 n.m n.m 2.6 n.m n.m 15.0 0.0 0.0 0.0 0.0 0.0 0.0 n.m n.m 2.3 100
Evolution Mining Limited 30-Jun UPFM 0.79 0.64 560 44.4 47.4 38.6 6.3 6.7 5.4 12.6 11.8 14.5 47.5 54.9 83.6 1.0 1.7 1.6 1.3 2.1 2.0 3.2 3.1 3.4 0
Gindalbie Metals Ltd 30-Jun UPFM 0.10 0.06 149 138.9- 5.5- 19.9- -10.3 -0.4 -1.3 n.m n.m n.m n.m n.m n.m 0.0 0.0 0.3 0.0 0.0 2.9 n.m n.m n.m 0
Gryphon Minerals Limited 30-Jun OPFM 0.18 0.25 72 4.1- 3.0- 7.5- -1.1 -0.8 -1.9 n.m n.m n.m n.m n.m n.m 0.0 0.0 0.0 0.0 0.0 0.0 n.m n.m n.m 0
Independence Group NL 30-Jun OPFM 4.12 3.70 961 18.3 52.6 74.8 7.8 22.6 32.1 52.9 18.3 12.9 199.8 84.9 74.1 2.0 9.0 12.8 0.5 2.2 3.1 18.8 7.7 5.5 100
Kula Gold 31-Dec OPFM 0.09 0.35 11 2.1- 5.5- 32.2 -0.8 -1.3 7.8 n.m n.m 1.1 n.m n.m 6.3 0.0 0.0 0.0 0.0 0.0 0.0 16.2 n.m 0.9 0
Mineral Deposits Ltd. 31-Dec OPFM 2.19 4.00 203 1.6 2.0 70.9 1.7 2.0 68.5 n.m n.m 2.9 435.8 466.5 16.5 0.0 0.0 0.0 0.0 0.0 0.0 n.m n.m n.m 100
Mount Gibson Iron 30-Jun UPFM 1.12 1.05 1,221 92.9 247.6 99.6 8.5 22.7 9.1 13.1 4.9 12.3 49.6 22.9 70.7 4.0 2.0 2.0 3.6 1.8 1.8 5.7 2.5 3.8 100
OceanaGold Corporation 31-Dec UPFM 2.44 2.00 655 76.4 77.1 66.7 25.7 25.7 22.2 8.5 8.5 9.8 32.0 39.5 56.5 0.0 0.0 0.0 0.0 0.0 0.0 3.3 3.2 2.8 0
Panoramic Resources 30-Jun NTRL 0.24 0.29 77 26.1- 16.3- 3.4- -10.3 -5.3 -1.0 n.m n.m n.m n.m n.m n.m 1.0 0.0 0.0 4.2 0.0 0.0 4.1 1.4 0.4 100
PanAust 31-Dec OPFM 1.85 2.00 1,023 80.8 31.0 23.1 13.6 5.2 3.9 12.2 31.8 42.5 45.9 147.8 245.1 7.0 7.0 7.0 4.2 4.2 4.2 4.2 7.1 9.4 0
Perseus Mining 30-Jun OPFM 0.49 0.50 222 38.4 8.2- 12.5 8.4 -1.8 2.7 5.8 n.m 17.8 21.9 n.m 102.5 0.0 0.0 0.0 0.0 0.0 0.0 2.2 8.8 3.3 0
Sandfire Resources NL 30-Jun UPFM 6.36 5.75 990 88.0 103.5 116.4 57.4 65.4 73.1 11.1 9.7 8.7 41.9 45.2 50.1 0.0 0.0 36.6 0.0 0.0 5.7 4.5 4.1 3.5 0
Syrah Resources 30-Jun OPFM 2.76 4.90 448 4.8- 5.3- 8.1- -3.5 -3.6 -5.5 n.m n.m n.m n.m n.m n.m 0.0 0.0 0.0 0.0 0.0 0.0 n.m n.m n.m 0
Tigers Realm Coal 31-Dec OPFM 0.16 0.25 84 17.4- 6.1- 29.8- -3.2 -0.8 -3.3 n.m n.m n.m n.m n.m n.m 0.0 0.0 0.0 0.0 0.0 0.0 n.m n.m n.m 0
Western Areas 30-Jun NTRL 3.14 2.75 618 5.6 8.1 0.4 2.8 4.1 0.2 n.m 76.2 n.m 417.6 354.2 n.m 2.0 0.0 0.0 0.6 0.0 0.0 6.1 7.0 7.5 100
Sector Aggregate 26.9 14.3 15.6 1.4 1.4 2.1 5.4 4.3 4.6
Materials - Paper & Forest Products
Sector Aggregate n.m n.m n.m
Industrials - Capital Goods
Sector Aggregate n.m n.m n.m n.m n.m n.m
* Relative PE is calculated against All Industrials companies excluding the Stocks in the ASX Top 100 and Singtel.Calculation is based on Credit Suisse coverage.
Note: Aggregations are weighted by market cap of the listed companies . Actuals used when available else Credit Suisse Forecasts used in calculations. PE aggregates larger than 100 or negative are shown as nm.
EPS
Source: Company data, Credit Suisse estimates

Au
stra
lia a
nd
NZ
Firs
t Ed
ition
155
14 F
eb
ruary
201
4
Small Caps Earnings & Dividends (continued) As at 13 February 2014 Year Rating Share 12M Mkt NPAT PE Relative PE Dividend Dividend Yield EBITDA Multiple F'kg
to Price Tgt Cap 2013 2014F 2015F 2013 2014F 2015F 2013 2014F 2015F 2013 2014F 2015F 2013 2014F 2015F 2013 2014F 2015F 2013 2014F 2015F 2014F
$ $ $m $m $m $m ¢ ¢ ¢ x x x % % % ¢ ¢ ¢ % % % x x x %
Industrials - Commercial & Professional Services
Sector Aggregate n.m n.m n.m n.m n.m n.m
Industrials - Transportation
Qube Logistics 30-Jun NTRL 2.06 2.20 1,919 86.3 84.9 96.4 9.4 9.2 10.5 22.0 22.4 19.7 83.1 103.9 113.5 5.2 5.0 5.4 2.5 2.4 2.6 13.1 11.6 10.4 100
Virgin Australia 30-Jun NTRL 0.35 0.38 1,213 58.4- 119.7- 60.7- -2.4 -4.9 -2.5 n.m n.m n.m n.m n.m n.m 0.0 0.0 0.0 0.0 0.0 0.0 12.5 10.7 8.9 100
Sector Aggregate n.m n.m n.m 1.5 1.5 1.6 12.9 11.2 9.8
Consumer Discretionary - Automobiles & Components
Consumer Discretionary - Consumer Durables & Apparel
Sector Aggregate n.m n.m n.m n.m n.m n.m
Consumer Discretionary - Consumer Services
Sector Aggregate n.m n.m n.m n.m n.m n.m
Consumer Discretionary - Media
APN News & Media 30-Dec UPFM 0.45 0.30 298 49.4 50.3 55.6 7.5 7.6 8.4 6.0 5.9 5.4 22.7 27.5 31.1 0.0 0.0 5.0 0.0 0.0 11.1 4.6 3.8 3.3 33
Fairfax Media 30-Jun UPFM 0.70 0.50 1,646 128.0 111.2 106.6 5.4 4.7 4.5 12.9 14.8 15.4 48.6 68.9 89.0 2.0 2.0 2.0 2.9 2.9 2.9 4.8 6.2 6.4 100
Nine Entertainment 30-Jun OPFM 2.22 2.30 2,087 136.7 150.7 160.2 14.5 16.0 17.0 15.3 13.9 13.0 57.7 64.4 75.1 0.0 4.1 9.4 0.0 1.8 4.2 9.0 8.4 7.8 100
Prime Media Group 30-Jun NTRL 1.01 1.10 370 35.4 32.3 34.5 9.7 8.8 9.4 10.4 11.5 10.7 39.4 53.3 61.9 7.3 6.6 7.1 7.2 6.5 7.0 7.4 7.4 7.0 30
REA Group 30-Jun NTRL 47.15 47.50 6,210 109.7 145.1 177.0 83.3 110.1 134.4 56.6 42.8 35.1 213.8 199.1 202.1 41.5 56.0 67.5 0.9 1.2 1.4 36.4 26.7 21.9 100
STW Communications Group 31-Dec NTRL 1.44 1.63 579 50.5 54.9 62.2 12.7 13.7 15.5 11.3 10.5 9.2 42.7 48.7 53.3 8.5 8.9 10.1 5.9 6.2 7.0 7.6 6.6 5.6 100
Seven West Media Ltd 30-Jun OPFM 2.12 2.60 2,118 225.2 256.8 273.8 19.8 22.7 24.2 10.7 9.3 8.8 40.5 43.4 50.4 12.0 12.0 12.1 5.7 5.7 5.7 7.2 6.6 6.1 100
Southern Cross Media Group 30-Jun UPFM 1.60 1.40 1,125 90.8 103.4 108.5 12.9 14.7 15.4 12.4 10.9 10.4 46.8 50.5 59.7 9.0 10.0 10.0 5.6 6.3 6.3 8.2 7.9 7.5 100
Ten Network Holdings 31-Aug NTRL 0.34 0.29 894 5.0- 5.4- 51.8 -0.2 -0.2 2.0 n.m n.m 17.0 n.m n.m 97.9 0.0 0.0 1.3 0.0 0.0 3.8 22.0 26.5 7.6 0
Sector Aggregate 19.3 17.6 15.3 2.3 2.7 3.6 10.9 10.5 9.2
Consumer Discretionary - Retailing
Fantastic Holdings 30-Jun UPFM 1.94 2.00 199 13.5 5.4 10.2 13.1 5.3 10.0 14.7 36.8 19.4 55.6 171.2 111.9 15.0 3.2 6.2 7.8 1.7 3.2 8.1 12.9 8.6 100
JB Hi-Fi 30-Jun OPFM 18.23 23.06 1,828 116.4 131.9 149.5 117.0 129.3 147.1 15.6 14.1 12.4 58.8 65.6 71.4 72.0 81.0 97.7 3.9 4.4 5.4 8.9 8.2 7.1 100
OrotonGroup 27-Jul OPFM 4.03 4.65 165 23.4 9.6 12.4 57.3 23.5 30.3 7.0 17.2 13.3 26.6 79.8 76.5 50.0 22.0 26.0 12.4 5.5 6.5 3.3 8.8 6.9 100
Pacific Brands 30-Jun NTRL 0.71 0.75 648 73.8 69.8 68.2 8.1 7.6 7.4 8.8 9.3 9.6 33.2 43.4 55.5 5.0 5.3 5.9 7.0 7.5 8.3 5.8 6.0 6.0 100
Premier Investments Ltd 27-Jul OPFM 7.76 9.50 1,205 69.3 86.4 95.5 44.1 55.0 60.8 17.6 14.1 12.8 66.5 65.6 73.5 38.0 47.8 53.0 4.9 6.2 6.8 9.4 8.3 7.3 100
Specialty Fashion Group 30-Jun OPFM 0.87 1.00 167 13.0 10.0 17.7 6.7 5.2 9.2 13.0 16.7 9.5 49.0 77.9 54.5 2.0 2.0 2.0 2.3 2.3 2.3 3.1 3.7 2.4 100
Super Retail Group 30-Jun NTRL 10.50 11.50 2,066 114.1 117.6 142.4 57.7 59.4 72.0 18.2 17.7 14.6 68.8 82.1 84.1 38.0 41.7 50.5 3.6 4.0 4.8 16.3 16.2 14.3 100
Thorn Group 31-Mar NTRL 2.01 2.53 300 28.0 29.3 32.1 19.1 19.7 21.4 10.5 10.2 9.4 39.8 47.4 54.0 10.5 11.0 11.3 5.2 5.5 5.6 7.1 6.9 6.6 100
Trade Me Group Ltd 30-Jun UPFM 3.68 3.70 1,571 78.6 85.9 96.5 19.8 21.7 24.3 20.0 18.3 16.3 75.5 85.0 93.8 15.8 17.3 19.5 4.0 4.4 4.9 13.7 12.4 11.1 0
The Reject Shop 30-Jun NTRL 10.93 13.50 315 17.4 17.5 23.3 64.0 65.5 87.2 17.1 16.7 12.5 64.5 77.6 72.3 37.0 50.5 67.2 3.4 4.6 6.1 7.8 7.9 6.3 100
Webjet 30-Jun NTRL 3.16 3.25 251 12.0 16.0 18.9 15.8 19.2 21.8 20.1 16.5 14.5 75.8 76.6 83.7 13.0 13.5 15.2 4.1 4.3 4.8 10.4 9.3 7.4 100
Sector Aggregate 15.8 15.2 13.3 4.4 4.7 5.5 9.6 9.5 8.2
* Relative PE is calculated against All Industrials companies excluding the Stocks in the ASX Top 100 and Singtel.Calculation is based on Credit Suisse coverage.
EPS
Source: Company data, Credit Suisse estimates

Au
stra
lia a
nd
NZ
Firs
t Ed
ition
156
14 F
eb
ruary
201
4
Small Caps Earnings & Dividends (continued) As at 13 February 2014 Year Rating Share 12M Mkt NPAT PE Relative PE Dividend Dividend Yield EBITDA Multiple F'kg
to Price Tgt Cap 2013 2014F 2015F 2013 2014F 2015F 2013 2014F 2015F 2013 2014F 2015F 2013 2014F 2015F 2013 2014F 2015F 2013 2014F 2015F 2014F
$ $ $m $m $m $m ¢ ¢ ¢ x x x % % % ¢ ¢ ¢ % % % x x x %
Consumer Staples - Food Beverage & Tobacco
Goodman Fielder 30-Jun UPFM 0.59 0.50 1,144 66.2 63.2 86.1 3.4 3.2 4.4 17.4 18.2 13.4 65.7 84.8 77.1 3.0 2.4 3.0 5.1 4.1 5.1 6.7 7.0 6.2 10
Health Care
Australian Pharmaceutical Ind 31-Aug OPFM 0.57 0.64 278 24.3 26.2 27.0 5.0 5.4 5.5 11.5 10.6 10.3 43.3 49.3 59.3 3.3 3.3 3.3 5.7 5.7 5.7 5.2 5.2 4.4 100
Mesoblast 30-Jun OPFM 5.71 7.95 1,834 61.7- 81.7- 93.6- -20.3 -25.0 -28.1 n.m n.m n.m n.m n.m n.m 0.0 0.0 0.0 0.0 0.0 0.0 n.m n.m n.m 0
Mayne Pharma 30-Jun NTRL 0.87 0.86 487 6.2 18.4 26.7 1.4 3.1 4.5 60.4 27.7 19.1 228.1 129.0 110.3 0.0 0.0 1.4 0.0 0.0 1.6 29.3 13.0 9.1 10
Sigma Pharmaceuticals 31-Jan NTRL 0.63 0.66 703 53.6 49.8 51.0 4.5 4.3 4.6 13.8 14.6 13.6 52.1 68.0 78.5 4.0 4.5 4.5 6.4 7.2 7.2 8.0 8.5 8.4 100
Sector Aggregate n.m n.m n.m 1.8 2.0 2.3 44.3 49.3 35.5
Financials - Diversified Financials
BT Investment Management 30-Sep NTRL 6.26 5.15 1,770 61.9 88.3 103.4 20.9 29.4 34.5 29.9 21.3 18.2 113.1 98.9 104.6 18.0 26.0 30.0 2.9 4.2 4.8 20.7 14.5 12.3 100
IOOF Holdings 30-Jun NTRL 9.22 9.35 2,140 108.8 126.3 140.2 46.9 54.4 60.4 19.7 16.9 15.3 74.3 78.8 88.0 42.0 49.0 54.0 4.6 5.3 5.9 14.4 12.2 10.9 100
Platinum Asset Management 30-Jun UPFM 6.99 6.00 4,045 129.1 176.7 197.0 22.6 30.1 33.6 31.0 23.2 20.8 116.9 107.9 119.9 22.0 29.0 33.0 3.1 4.1 4.7 21.9 15.8 14.1 100
Sector Aggregate 26.6 20.7 18.4 3.5 4.5 5.0 19.0 14.4 12.7
Financials - Insurance
Austbrokers 30-Jun UPFM 11.07 10.41 660 28.9 32.6 35.6 50.2 55.5 60.6 22.1 19.9 18.3 83.3 92.7 105.3 35.5 39.0 42.0 3.2 3.5 3.8 16.3 13.8 12.3 100
Steadfast 30-Jun UPFM 1.58 1.36 792 35.8 38.5 40.8 7.1 7.7 8.1 22.1 20.6 19.4 83.6 95.8 111.9 0.0 4.6 5.0 0.0 2.9 3.1 21.9 21.4 20.4 100
Tower Limited 30-Sep NTRL 1.52 1.66 292 34.4 28.0 29.4 16.6 13.5 14.2 9.9 12.1 11.5 37.2 56.3 66.4 11.0 12.8 13.5 6.7 7.8 8.2 n.m 1.1 1.0 0
Sector Aggregate 19.1 18.6 17.4 2.2 3.9 4.1 33.5 7.2 6.9
Financials - Real Estate
Australand 31-Dec NTRL 3.90 3.81 2,255 146.7 156.1 168.0 25.4 27.0 29.1 15.4 14.4 13.4 58.0 67.2 77.4 21.5 21.6 23.2 5.5 5.5 6.0 13.8 13.2 12.6 0
Charter Hall Group 30-Jun NTRL 3.90 3.78 1,206 71.8 74.8 81.2 23.9 24.5 26.0 16.3 15.9 15.0 61.5 74.1 86.5 20.3 22.0 23.4 5.2 5.6 6.0 17.1 15.8 14.7 0
Charter Hall Retail REIT 30-Jun NTRL 3.64 3.99 1,321 96.4 104.4 107.1 29.8 30.5 30.7 12.2 11.9 11.9 46.2 55.5 68.4 26.8 27.5 27.9 7.4 7.6 7.7 14.7 13.8 13.4 0
GDI Property Group 30-Jun OPFM 0.90 1.01 511 - 21.6 45.1 3.8 8.0 n.m 23.7 11.3 110.1 65.2 3.5 7.5 3.9 8.3 n.m 26.1 12.7 0
Sector Aggregate 14.5 14.5 13.1 5.9 5.9 6.6 14.8 14.6 13.2
Information Technology
Sector Aggregate n.m n.m n.m n.m n.m n.m
Telecommunication Services
Sector Aggregate n.m n.m n.m n.m n.m n.m
Utilities
Energy Developments Limited 30-Jun OPFM 5.99 6.44 963 55.0 55.6 59.6 33.7 34.5 37.0 17.8 17.4 16.2 67.1 80.7 93.3 22.0 22.4 24.0 3.7 3.7 4.0 8.0 7.6 7.1 0
Envestra 30-Jun NTRL 1.18 1.22 2,111 107.8 145.2 146.8 6.6 8.1 8.2 17.8 14.5 14.4 67.1 67.6 82.9 5.9 6.4 6.6 5.0 5.4 5.7 11.5 10.4 10.1 0
Sector Aggregate 17.8 15.3 14.9 4.6 4.9 5.1 10.1 9.3 8.9
Report Average 26.5 21.5 17.4 2.8 3.1 3.9 11.5 9.2 8.7
* Relative PE is calculated against All Industrials companies excluding the Stocks in the ASX Top 100 and Singtel.Calculation is based on Credit Suisse coverage.
Note: Aggregations are weighted by market cap of the listed companies . Actuals used when available else Credit Suisse Forecasts used in calculations. PE aggregates larger than 100 or negative are shown as nm.
EPS
Source: Company data, Credit Suisse estimates

14 F
eb
ruary
201
4
Au
stra
lia a
nd
NZ
Firs
t Ed
ition
157
Sector Aggregates
Research Analyst
Jason Swinbourne
612 8205 4591
[email protected] RAVE Database 02 8205 4591
As at 13 February 2014 PE Rel vs ASX 200(1)
EPS Growth % (1)
Div Yield % (1)
EBIT Multiple (1)
EBITDA Multiple (1)
2013 2014 2015 2013 2014 2015 2013 2014 2015 2013 2014 2015 2013 2014 2015 2013 2014 2015 2013 2014 2015 Top 200 Top 300
Energy (2) 22.0 16.7 12.7 14.8 12.9 11.2 1.3 1.1 0.9 -15.7 31.6 31.9 3.8 3.5 4.6 16.1 11.9 9.2 10.4 8.2 6.7 5.30% 5.18%
Materials (2) 15.8 11.9 11.7 17.3 15.2 14.5 0.9 0.8 0.8 -20 33 2 2.8 3.4 4.1 11.3 8.6 8.4 7.9 6.2 5.9 24.36% 23.84%
Chemicals (2) 15.0 13.8 11.5 15.5 13.7 10.9 0.9 0.9 0.8 -19 9 20 3.5 3.9 4.7 12.0 11.3 9.2 9.0 8.3 7.0 0.88% 0.86%
Construction Materials (2) 33.5 23.7 19.2 41.5 23.6 17.9 2.0 1.6 1.4 -13 41 23 2.1 3.9 4.6 24.9 18.1 15.4 14.3 11.6 10.4 0.85% 0.83%
Containers & Packaging (2) 19.0 17.9 16.0 19.0 17.3 15.4 1.1 1.2 1.2 9 5 12 3.7 3.9 4.4 16.8 13.2 12.2 10.5 9.6 9.0 0.87% 0.85%
Metals & Mining (2) 15.4 11.5 11.4 13.5 13.3 14.1 0.9 0.8 0.8 -21 34 1 2.8 3.4 4.0 10.9 8.3 8.2 7.6 5.9 5.7 21.77% 21.31%
Paper & Forest Products (2) 15.0 13.8 11.5 15.5 13.7 10.9 0.9 0.9 0.8 -19 9 20 3.5 3.9 4.7 12.0 11.3 9.2 9.0 8.3 7.0 0.88% 0.86%
Industrials (2) 18.4 21.5 17.2 15.0 14.7 13.2 1.1 1.4 1.2 16 -14 25 3.3 3.6 4.2 13.8 13.7 11.7 7.6 7.4 6.6 3.34% 3.27%
Capital Goods (2) 11.0 10.7 10.7 12.5 10.5 10.4 0.6 0.7 0.8 0 3 0 6.0 5.7 5.7 7.8 7.3 7.0 3.7 3.5 3.4 0.40% 0.39%
Commercial Services & Supplies (2) 19.5 18.3 16.0 17.9 17.6 15.3 1.1 1.2 1.2 8 7 14 3.3 3.6 3.9 14.9 13.5 11.7 10.1 9.0 7.9 1.40% 1.37%
Transportation (2) 20.9 36.8 22.0 17.7 14.7 13.2 1.2 2.5 1.6 36 -43 67 2.6 3.1 4.1 15.7 18.0 14.3 8.0 8.3 7.4 1.55% 1.51%
Consumer Discretionary (2) 21.4 19.9 17.5 17.3 16.3 15.2 1.3 1.3 1.3 -13 8 14 2.7 3.1 3.6 16.2 15.1 13.2 11.2 10.3 9.2 3.95% 3.87%
Automobiles & Components (2) >100 >100 >100 >100 >100 >100
Consumer Durables & Apparel (2) >100 >100 >100 >100 >100 >100
Hotels Restaurants & Leisure (2) 21.7 18.7 17.2 19.1 17.9 16.8 1.3 1.3 1.2 -15 16 8 3.2 3.3 3.5 16.7 14.6 13.5 12.2 11.0 10.2 1.70% 1.66%
Media (2) 26.2 27.3 22.3 12.4 10.9 15.4 1.5 1.8 1.6 -20 -4 23 1.3 2.1 2.6 18.7 19.6 15.6 11.1 10.5 9.0 1.42% 1.39%
Retailing (2) 16.1 15.0 13.2 17.1 15.3 12.8 0.9 1.0 1.0 1 7 14 4.3 4.7 5.5 12.4 11.5 10.0 9.7 9.0 8.0 0.83% 0.81%
Consumer Staples (2) 19.2 18.5 16.8 17.9 17.6 13.4 1.1 1.2 1.2 3 3 10 4.2 4.4 4.7 13.4 13.3 12.2 10.5 10.3 9.5 6.59% 6.45%
Food & Drug Retailing (2) 19.7 18.8 17.1 18.6 17.6 16.6 1.1 1.3 1.2 6 5 10 4.1 4.3 4.7 13.6 13.4 12.3 10.7 10.5 9.7 5.73% 5.61%
Food Beverage & Tobacco (2) 16.3 16.8 15.2 17.6 16.3 12.8 1.0 1.1 1.1 -10 -3 11 4.8 4.5 4.7 12.0 12.8 11.6 9.0 9.2 8.5 0.86% 0.84%
Health Care (2) 26.1 21.4 19.0 19.9 16.7 15.4 1.5 1.4 1.4 18 22 13 2.0 2.5 2.8 20.8 16.9 14.8 17.3 14.3 12.6 3.89% 3.80%
Financials (2) 15.5 13.8 13.2 15.1 14.2 13.5 0.9 0.9 1.0 4 13 4 5.2 5.5 5.8 8.5 7.2 6.7 7.8 6.7 6.2 34.64% 33.90%
Banks (2) 14.5 13.6 13.1 14.7 13.7 12.8 0.8 0.9 0.9 8 7 3 5.2 5.6 5.8 6.9 6.0 5.5 6.4 5.6 5.2 23.60% 23.09%
Diversified Financials (2) 20.0 15.7 14.8 19.7 16.9 15.3 1.2 1.1 1.1 12 27 6 3.7 4.7 5.2 11.6 9.1 8.6 9.9 7.9 7.5 2.33% 2.28%
Insurance (2) 25.8 13.4 12.4 14.5 13.6 12.3 1.5 0.9 0.9 -26 93 8 5.3 5.3 5.8 26.4 12.8 11.9 17.3 12.0 11.1 3.32% 3.25%
Real Estate (2) 14.8 14.2 13.6 14.7 14.2 13.5 0.9 1.0 1.0 3 4 4 5.4 5.6 5.8 15.5 15.0 14.5 15.2 14.8 14.3 5.39% 5.28%
Information Technology (2) 20.2 18.8 16.8 22.0 21.1 19.2 1.2 1.3 1.2 12 8 12 2.9 2.7 2.9 15.8 14.5 12.5 14.7 13.5 11.8 0.47% 0.46%
Telecommunication Services (2) 16.6 16.1 15.5 16.6 16.1 15.5 1.0 1.1 1.1 9 3 4 5.4 5.6 5.8 11.8 11.1 11.0 7.1 6.8 6.8 3.81% 3.73%
Utilities (2) 17.2 16.3 14.4 16.2 14.5 13.8 1.0 1.1 1.0 8 6 13 5.5 5.7 5.8 12.3 11.6 10.5 9.7 9.1 8.4 1.50% 1.47%
20 Leaders 16.3 13.9 13.3 17.7 14.8 14.4 1.0 0.9 0.96 -8 18 4 4.2 4.6 5.0 9.7 8.2 7.7 7.8 6.6 6.2 na na
50 Leaders 16.4 14.0 13.2 17.0 14.7 13.8 1.0 0.9 1.0 -5 17 6 4.1 4.5 4.9 10.3 8.6 8.0 8.2 7.0 6.5 na na
ASX 100 17.0 14.8 13.8 16.6 14.9 13.8 1.0 1.0 1.0 -3 15 7 4.3 4.6 5.0 10.5 8.9 8.2 8.5 7.3 6.8 na na
MidCap 50 18.6 15.9 14.4 16.3 15.1 13.5 1.1 1.1 1.0 4 17 11 3.6 4.1 4.7 13.9 11.5 10.3 9.8 8.5 7.7 na na
S&P/ASX 200 - Industrials 16.9 15.3 14.3 16.3 14.9 14.1 1.0 1.0 1.0 4 10 7 4.6 4.9 5.2 10.1 8.8 8.1 8.5 7.6 7.0 na na
S&P/ASX 200 - Resources 18.2 13.4 12.4 14.4 13.2 12.3 1.1 0.9 0.9 -27 36 8 3.0 3.3 4.1 12.6 9.4 8.8 8.5 6.6 6.1 na na
S&P/ASX 200 - Ind excl BIP 19.4 18.3 16.2 18.1 16.6 15.0 1.1 1.2 1.2 4.3 5.8 12.5 3.7 4.1 4.5 14.0 13.0 11.7 10.0 9.4 8.6 na na
S&P/ASX 200 17.2 14.9 13.9 16.3 14.7 13.8 17.2 14.9 13.9 -4 15 7 4.2 4.6 5.0 10.5 8.9 8.2 8.5 7.3 6.8 na na
S&P/ASX 300 - Industrials 19.5 18.2 16.3 17.7 15.9 14.5 1.1 1.2 1.2 2 7 12 3.7 4.1 4.5 15.1 14.1 12.7 10.2 9.6 8.8 na na
S&P/ASX 300 - Resources 18.4 13.4 12.4 13.3 12.0 11.3 1.1 0.9 0.9 -27 37 8 3.0 3.3 4.1 12.8 9.5 8.9 8.5 6.6 6.1 na na
S&P/ASX 300 - Ind excl BIP 19.5 18.2 16.3 17.7 15.9 14.5 1.1 1.2 1.2 2.0 6.8 11.9 3.7 4.1 4.5 15.1 14.1 12.7 10.2 9.6 8.8 na na
S&P/ASX 300 17.2 14.9 13.9 15.7 14.6 13.6 1.0 1.0 1.0 -4 15 7 4.2 4.6 5.0 10.6 9.0 8.2 8.5 7.3 6.8 na na
Small Companies (4) 23.4 18.3 16.2 13.4 13.8 13.3 1.4 1.2 1.2 24- 28 13 3.1 3.4 4.0 16.0 13.1 12.2 9.6 8.5 8.1 na na
Small Industrials 19.3 17.5 15.6 15.4 14.6 13.4 1.1 1.2 1.1 -4 10 12 3.9 4.3 4.8 17.7 16.1 14.6 12.2 11.1 10.2 na na
Small Resources 75.9 19.7 19.1 9.2 8.4 10.6 4.4 1.3 1.4 -76 285 3 1.2 1.2 1.9 33.4 13.0 15.8 6.8 5.3 5.7 na na
(1) Includes all companies covered by Credit Suisse analysts (3) No weighting applicable
(2) All sectors are based on S&P/ASX200.Companies on restricted list are not included in aggregates (4) Small companies are all companies covered by Credit Suisse analysts excluding top 100 stocks.
Sector Weight PE (1)
Median PE (1)(3)

14 F
eb
ruary
201
4
Au
stra
lia a
nd
NZ
Firs
t Ed
ition
158
Credit Suisse’s Reporting Season Calendar Research Analyst
Adam Indikt 61 3 9280 1659
Price 12M NPAT pre-unusual* Reported NPAT* DPS (c)
Code Company Currency (A$) Tgt. Rtg Date Report Curr PCP Chg % Curr PCP Chg % Curr PCP Chg % Credit Suisse analyst comment
AHE Automotive Holdings Group
A$ 3.7 4.0 N 14-Feb Interim 41.2 38.5 6.9 41.2 37.9 8.6 8.5 8.0 6.7
CQR Charter Hall Retail REIT
A$ 3.6 4.0 N 14-Feb Interim 53.4 45.9 16.3 53.4 45.9 16.3 0.0 0.0 Australia dial in 1800 041 303. Conference ID 264116#
NCM Newcrest Mining A$ 11.3 8.2 U 14-Feb Interim 206.2 320.0 -35.6 89.0 320.0 -72.2 0.0 12.0 -100.0 Media reports suggest some proxy advisers will recommend against some resolutions put to shareholders. No quantitative guidance expected with SepQ result taking place a week prior.
PRU Perseus Mining A$ 0.5 0.5 O 14-Feb Interim -14.9 28.3 -152.8 -14.9 28.4 -152.6 0.0 0.0 No material updates expected.
SGM Sims Metal Management
A$ 10.0 10.0 U 14-Feb Interim 0.0 0.0 0.0 0.0 5.2 0.0 AGM date not yet confirmed. 1H FY14 quantitative guidance may be provided. Typically a good overview of current market conditions is discussed, we will pay particular attention to this given the continued challenges of the sector as evidenced by US peer reporting.
SGN STW Communications Group
A$ 1.4 1.6 N 14-Feb Final 50.5 44.0 14.8 50.5 44.0 14.8 5.2 4.6 12.0
TPI Transpacific Industries Group
A$ 1.1 1.0 N 14-Feb Interim 25.7 35.8 -28.3 87.8 32.3 171.8 0.0 0.0
ALZ Australand A$ 3.9 3.8 N 17-Feb Final 146.7 142.0 3.3 146.7 142.0 3.3 10.9 11.0 -0.5
ANN Ansell US$ 19.0 21.0 N 17-Feb Interim 64.3 57.1 12.6 64.3 57.1 12.6 17.4 16.0 8.9
APN APN News & Media A$ 0.5 0.3 U 17-Feb Final 49.4 54.4 -9.1 46.0 -455.8 110.1 0.0 0.0
AZJ Aurizon A$ 5.0 R 17-Feb Interim 0.0 0.0 0.0 0.0 450.0 410.0 9.8 Expect 1Q14 above rail volumes and qualitative outlook commentary, though nothing formal. Outlook commentary likely to be relatively positive given the reasonable organic volume growth in the space.
BEN Bendigo and Adelaide Bank
A$ 11.7 12.2 N 17-Feb Interim 192.0 169.7 13.1 192.0 169.7 13.1 32.0 30.0 6.7 We would look for: Some relief emerging for net interest margins (TD spread pressures easing, the re-pricing of parts of the Community Bank portfolio); Accelerating operating costs; Rural Bank asset quality; Update on medium-term issues, such as the progress of the Great Southern litigation and the Basel advanced accreditation programme.
FWD Fleetwood Corp A$ 3.0 2.4 N 17-Feb Interim 5.0 8.9 -43.5 5.0 5.2 -4.3 0.0 30.0 -100.0
UGL UGL A$ 7.1 7.8 N 17-Feb Interim 51.1 51.0 0.2 46.3 26.0 77.8 22.0 34.0 -35.3 We expect UGL to report 1H14 underlying NPAT of $51mn and to reiterate FY14 guidance of $120-130mn underlying NPAT. We expect a solid result for the property business to be overshadowed by weakness in the engineering division.
WSA Western Areas A$ 3.1 2.8 N 17-Feb Interim 6.3 6.5 -2.9 6.3 2.1 196.5 0.0 2.0 -100.0 Reporting date is an estimate.
AIO Asciano Group A$ 5.7 6.2 O 18-Feb Interim 0.0 0.0 0.0 0.0 3.0 3.0 0.0 Quarterly volumes will be released at AGM. We have a good read-through from Port and Coal stats so don't expect any material surprises. Data is showing a recovery in port vols and continued underlying growth of 5-6% of coal. Expect outlook commentary though no formal guidance likely. Management may reiterate progress towards 10-15% EPS growth targets and WACC goals.
AMC Amcor A$ 10.7 11.2 N 18-Feb Interim 5,233.1 322.0 1,525.2
5,233.1 238.3 2,096.0
18.5 19.0 -2.6
AMM Amcom Telecommunications
A$ 2.0 2.2 N 18-Feb Interim 11.3 10.0 13.9 11.3 10.0 13.9 2.3 2.0 14.6 FY14 earnings guidance for "double digit NPAT growth" expected to be maintained. Any momentum from sales here forward will be a driver for FY15 earnings. Could see announcement of first wins on CISCO HCS product. Potentially positive catalyst
ARI Arrium A$ 1.7 1.4 U 18-Feb Interim 0.0 0.0 0.0 0.0 6.0 2.0 200.0 1H FY14 quantitative guidance may be provided. We will also focus on domestic demand commentary and Iron Ore segment likely continued strong performance. First AGM for new MD Andrew Roberts.
* In A$mn, unless otherwise stated. Final DPS is 2H dividend. O = Outperform, N = Neutral, U = Underperform, R = Restricted. Source: Company data, Credit Suisse estimates

14 F
eb
ruary
201
4
Au
stra
lia a
nd
NZ
Firs
t Ed
ition
159
Currency Price 12M NPAT pre-unusual* Reported NPAT* DPS (c)
Code Company (A$) Tgt. Rtg Date Report Curr PCP Chg % Curr PCP Chg % Curr PCP Chg % Credit Suisse analyst comment
BHP BHP Billiton US$ 37.3 38.0 N 18-Feb Interim 6,912.3 4,433.0 55.9 7,072.3 2,988.0 136.7 62.0 57.0 8.7
CCL Coca-Cola Amatil A$ 11.9 11.3 U 18-Feb Final 508.8 558.4 -8.9 499.6 459.9 8.6 35.5 -17.0 308.8
CFX CFS Retail Propy Trust
A$ 2.0 2.0 N 18-Feb Interim 191.9 0.0 191.9 0.0 6.8 0.0 Australia dial in 1800 801 825. International dial in 61 2 8524 5042. Conference ID 3227176
CGF Challenger A$ 6.2 7.0 O 18-Feb Interim 164.5 148.7 10.6 200.9 222.0 -9.5 10.0 9.5 5.3
CPA Commonwealth Property Office Fund
A$ 1.3 1.2 N 18-Feb Interim 105.7 103.3 2.3 105.7 103.3 2.3 3.4 3.2 4.7 Australia dial in 1800 801 825. International dial in 61 2 8524 5042. Conference ID 8287329.
MGX Mount Gibson Iron A$ 1.1 1.1 U 18-Feb Interim 141.6 37.1 281.7 141.6 37.1 281.7 0.0 2.0 -100.0 Reporting date is an estimate
MMS McMillan Shakespeare A$ 11.6 12.3 N 18-Feb Interim 22.1 29.7 -25.6 22.1 29.7 -25.6 17.9 24.0 -25.6
OKN Oakton A$ 1.6 1.3 N 18-Feb Interim 4.6 4.5 1.6 4.6 4.5 1.6 4.5 4.8 -4.6
ORA Orora A$ 1.4 1.4 O 18-Feb Interim 1,551.6 0.0 1,551.6 0.0 3.0 0.0 November trading update, AMC/Orora indicated trading was favorable: Earnings higher than last year across Australasia and Packaging Distribution. Full-year earnings expected to be significantly higher, cost savings will be skewed toward 2H14.
SHL Sonic Healthcare A$ 16.7 16.5 N 18-Feb Interim 172.2 150.6 14.3 172.2 150.6 14.3 27.9 25.0 11.5
APA APA Group A$ 6.2 6.1 U 19-Feb Interim 0.0 0.0 0.0 0.0 17.3 17.0 1.7
ARP ARB Corp A$ 10.7 11.5 U 19-Feb Interim 19.5 20.9 -6.6 19.5 20.9 -6.6 12.0 12.5 -4.0
BXB Brambles US$ 8.8 9.3 N 19-Feb Interim 0.0 0.0 0.0 0.0 13.6 13.9 -1.9 1Q14 sales and outlook commentary expected ahead of the AGM. Potential for BXB mgmt to narrow guidance within the stated band. Given the recent negative read-through into US retail sales from Walmart, there is a chance that guidance could be narrowed to the lower end of the range. CS is currently at the top end.
FMG Fortescue Metals Grp US$ 5.6 7.5 O 19-Feb Interim 1,594.5 367.4 334.0 1,646.6 478.0 244.5 5.0 0.0
SMX SMS Management & Technology
A$ 4.2 4.4 N 19-Feb Interim 6.8 12.7 -46.3 6.8 12.9 -47.1 7.0 13.5 -48.0
SUN Suncorp Group A$ 12.4 12.4 U 19-Feb Interim 560.3 574.0 -2.4 560.3 574.0 -2.4 33.0 25.0 32.0
TOL Toll Holdings A$ 5.6 5.5 N 19-Feb Interim 0.0 0.0 0.0 0.0 15.0 12.5 20.0 Qualitative and informal outlook commentary likely. Expect the tone of outlook to be reserved, in line with commentary at FY14 result.
WES Wesfarmers A$ 43.2 45.0 N 19-Feb Interim 1,297.9 1,285.0 1.0 1,364.4 1,285.0 6.2 84.7 77.0 9.9
WPL Woodside Petroleum US$ 38.6 35.0 U 19-Feb Final 1,717.9 2,086.5 -17.7 1,763.9 2,983.0 -40.9 104.4 0.0 FY13 results and final dividend announcement.
ABC Adelaide Brighton A$ 4.0 3.4 U 20-Feb Interim 0.0 0.0 0.0 0.0 8.0 7.5 6.7
AMP AMP A$ 4.5 5.0 N 20-Feb Final 646.6 703.6 -8.1 646.6 703.6 -8.1 12.5 12.5 0.0
BRG Breville Group A$ 7.9 8.2 N 20-Feb Final 49.7 46.0 8.2 49.7 46.0 8.2 12.0 11.5 4.3
EHL Emeco Holdings A$ 0.3 0.3 N 20-Feb Interim -12.3 25.1 -149.0 -12.3 22.5 -154.6 0.0 2.5 -100.0
ENV Envestra A$ 1.2 1.2 N 20-Feb Interim 87.0 59.1 47.1 87.0 59.1 47.1 3.2 3.0 6.7
FDC Federation Centres A$ 2.4 2.4 N 20-Feb Interim 115.8 106.2 9.0 115.8 106.2 9.0 7.1 6.6 8.2
IIN iiNet A$ 7.4 8.1 O 20-Feb Interim 31.7 26.3 20.5 31.7 31.9 -0.9 9.0 8.0 12.5 Expect a strong subscriber net adds result (best for several years). Also expect to see the cost discipline from 2H13 continued with further cost out from synergies and reduction in employee costs. IIN does not provide guidance. CS is above consensus in FY14 by 3%
IOF Investa Office Fund A$ 3.1 3.3 N 20-Feb Interim 69.3 69.3 0.0 69.3 69.3 0.0 9.3 0.0
LEI Leighton Holdings A$ 16.2 15.2 U 20-Feb Final 521.5 442.5 17.9 556.4 444.7 25.1 54.0 60.0 -9.9
MGR Mirvac Group A$ 1.7 1.9 O 20-Feb Interim 210.0 194.2 8.1 210.0 194.2 8.1 4.3 4.2 2.7 Australia dial in 1800 801 825. International dial in 612 8524 5042. Conference ID 2526682.
ORG Origin Energy A$ 14.6 15.3 N 20-Feb Interim 0.0 0.0 0.0 0.0 0.0 0.0
PNA PanAust US$ 1.8 2.0 O 20-Feb Final 80.8 142.3 -43.2 80.8 142.3 -43.2 4.0 4.0 0.0 Reporting date is an estimate
PTM Platinum Asset Management
A$ 7.0 6.0 U 20-Feb Interim 88.5 62.4 41.8 88.5 62.4 41.8 11.0 8.0 37.5
SUL Super Retail Group A$ 10.5 11.5 N 20-Feb Interim 60.7 60.6 0.1 60.7 60.6 0.1 18.5 17.0 9.0
TTS Tatts Group A$ 3.0 3.2 N 20-Feb Interim 114.3 109.7 4.2 114.3 129.3 -11.6 0.0 0.0
TWE Treasury Wine A$ 3.7 3.2 U 20-Feb Interim 0.0 0.0 6.0 6.0 0.0
CWN Crown A$ 16.9 15.9 U 21-Feb Interim 0.0 0.0 0.0 0.0 0.0 0.0
DUE DUET Group A$ 2.1 2.3 O 21-Feb Interim 0.0 0.0 0.0 0.0 0.0 0.0
EVN Evolution Mining A$ 0.8 0.6 U 21-Feb Interim 28.6 40.7 -29.7 28.6 40.7 -29.7 0.9 0.0 No material updates are expected.
IAG Insurance Aus Grp A$ 5.5 6.0 N 21-Feb Interim 570.4 643.0 -11.3 570.4 461.0 23.7 16.0 11.0 45.5
* In A$mn, unless otherwise stated. Final DPS is 2H dividend. O = Outperform, N = Neutral, U = Underperform, R = Restricted. Source: Company data, Credit Suisse estimates

14 F
eb
ruary
201
4
Au
stra
lia a
nd
NZ
Firs
t Ed
ition
160
Currency Price 12M NPAT pre-unusual* Reported NPAT* DPS (c)
Code Company (A$) Tgt. Rtg Date Report Curr PCP Chg % Curr PCP Chg % Curr PCP Chg % Credit Suisse analyst comment
ILU Iluka Resources A$ 9.2 10.0 N 21-Feb Final 59.0 363.2 -83.7 18.0 363.2 -95.0 5.0 10.0 -50.0 Dividend announcement.
SFR Sandfire Resources NL
A$ 6.4 5.8 U 21-Feb Interim 31.7 79.1 -59.9 31.7 79.1 -59.9 0.0 0.0 No material updates are expected.
STO Santos A$ 13.9 13.4 U 21-Feb Final 558.7 606.0 -7.8 469.5 519.0 -9.5 0.0 0.0
AGO Atlas Iron A$ 1.1 1.3 O 24-Feb Interim 69.5 1.0 6,839.9 69.5 -256.0 127.2 0.0 0.0 Estimated date.
AQA Aquila Resources A$ 2.7 2.6 O 24-Feb Interim -7.8 -112.0 93.1 -7.8 408.9 -101.9 0.0 0.0 Reporting date is an estimate
BLY Boart Longyear Group
US$ 0.4 0.4 U 24-Feb Final -125.7 114.0 -210.3 -410.4 68.2 -702.1 0.1 1.0 -94.5 Update given in December following clarification on Canadian tax issues. However, by mid-Feb should have an idea of conversation with Northern Hemisphere customers for 2014 budgets. Guidance unlikely to be provided. We expect conditions to remain challenging given weak gold price. Focus needs to be on
reducing costs and releasing working capital to manage the balance sheet.
BPT Beach Energy A$ 1.5 1.6 N 24-Feb Interim 161.3 62.2 159.2 161.3 45.1 257.8 0.8 0.8 0.0
BSL BlueScope Steel A$ 5.9 5.7 O 24-Feb Interim 0.0 0.0 0.0 0.0 0.0 0.0 Quantitative guidance change unlikely. Our focus will be on qualitative commentary around domestic conditions and demand.
CTX Caltex Australia A$ 19.7 23.8 O 24-Feb Final 320.3 458.0 -30.1 344.5 56.8 506.7 17.0 23.0 -26.1 FY13 results, dividend announced
IGO Independence Group NL
A$ 4.1 3.7 O 24-Feb Interim 21.3 16.5 29.1 21.3 16.5 29.1 3.7 1.0 265.4 Estimated reporting week.
MCS McAleese Group A$ 1.1 1.8 O 24-Feb Interim 23.4 28.6 -17.9 15.5 27.6 -43.7 0.0 0.0 Maiden result for McAleese. Focus will be on pro forma trading results for the first 6 months to Dec-13. Stat results likely to be messy given Nov-13 listing. No surprise expected given recent prospectus forecasts given in Nov-13
MDL Mineral Deposits. US$ 2.2 4.0 O 24-Feb Final 1.6 20.1 -91.9 -11.6 16.3 -171.7 0.0 0.0 Reporting date is an estimate
PAN Panoramic Resources A$ 0.2 0.3 N 24-Feb Interim -9.1 -13.0 29.6 -9.1 -13.0 29.6 0.0 1.0 -100.0 Reporting date is an estimate
RRL Regis Resources A$ 3.1 2.9 N 24-Feb Interim 61.0 66.1 -7.6 61.0 66.1 -7.6 0.0 0.0 No material update expected.
SKI Spark Infrastructure Group
A$ 1.7 1.8 O 24-Feb Final 177.5 173.9 2.1 177.5 173.9 2.1 5.5 5.3 4.7
SXY Senex Energy A$ 0.7 0.9 O 24-Feb Interim 27.3 23.4 17.1 27.3 23.4 17.1 0.0 0.0 Reporting date is an estimate
TIG Tigers Realm Coal A$ 0.2 0.3 O 24-Feb Final -17.4 -18.8 7.2 -17.4 -18.8 7.2 0.0 0.0 Reporting date is an estimate
YAL Yancoal Australia A$ 0.7 0.7 U 24-Feb Final 6.1 30.5 -79.9 -721.8 403.1 -279.0 0.0 0.0 Reporting date is an estimate
CAB Cabcharge Australia A$ 4.1 4.0 U 25-Feb Interim 34.1 33.3 2.2 34.1 33.3 2.2 17.6 18.0 -2.0
CHC Charter Hall Group A$ 3.9 3.8 N 25-Feb Interim 37.1 33.4 11.4 37.1 33.4 11.4 11.0 9.8 12.2
ENE Energy Developments A$ 6.0 6.4 O 25-Feb Interim 24.0 29.5 -18.5 24.0 29.5 -18.5 9.7 0.0
FLT Flight Centre A$ 46.5 58.0 O 25-Feb Interim 105.8 91.8 15.3 105.8 91.8 15.3 52.5 46.0 14.1
IFL IOOF Holdings A$ 9.2 9.4 N 25-Feb Interim 61.8 50.9 21.2 49.2 33.2 48.1 24.0 19.5 23.1
MRM Mermaid Marine Australia
A$ 2.9 3.8 O 25-Feb Final 60.3 51.0 18.1 60.3 51.0 18.1 7.0 6.0 16.7
OSH Oil Search US$ 8.3 9.7 O 25-Feb Final 209.0 154.5 35.3 209.3 175.8 19.0 2.0 2.0 0.0
QBE QBE Insurance Grp US$ 11.2 13.7 O 25-Feb Final -249.6 761.0 -132.8 -249.6 761.0 -132.8 13.0 10.4 25.1
RHC Ramsay Health Care A$ 41.6 41.5 N 25-Feb Interim 159.1 140.0 13.7 149.2 130.1 14.7 33.1 29.0 14.0
SLM Salmat A$ 2.0 2.2 N 25-Feb Interim 7.4 9.8 -24.5 6.8 41.5 -83.6 7.5 25.0 -70.0
AGK AGL Energy A$ 15.6 15.8 N 26-Feb Interim 0.0 0.0 0.0 0.0 31.0 30.0 3.3
HGG Henderson Group PLC £ 4.3 4.5 N 26-Feb Final 161.9 126.8 27.7 118.9 99.7 19.2 6.3 5.1 25.1
IRE IRESS A$ 9.3 9.6 N 26-Feb Final 55.0 54.4 1.1 55.0 54.4 1.1 19.0 24.5 -22.4
LLC Lend Lease A$ 11.3 12.5 O 26-Feb Interim 253.7 302.3 -16.1 253.7 302.3 -16.1 0.0 0.0 Australia dial in 1800 354 715. Conference ID 15797117.
MYX Mayne Pharma A$ 0.9 26-Feb Interim 9.5 1.6 489.4 8.8 -2.5 446.4 0.0 0.0
PGH Pact Group Holdings A$ 3.5 3.9 O 26-Feb Interim 0.0 0.0 0.0 0.0 0.0 0.0
WHC Whitehaven Coal A$ 1.6 2.8 O 26-Feb Interim -19.0 -27.6 31.1 -19.0 -47.1 59.6 0.0 0.0
WOR Worley Parsons A$ 15.6 17.1 N 26-Feb Interim 92.2 155.1 -40.6 92.2 155.1 -40.6 42.0 41.5 1.2 We expect WOR to report 1H14 underlying NPAT of $92mn, at the bottom end of 1H14 guidance ($90-110mn). We also expect WOR to reiterate FY14 guidance of $260-300mn.
WTF Wotif.com Holdings A$ 2.7 2.9 U 26-Feb Interim 22.2 27.5 -19.4 22.2 27.5 -19.4 8.3 11.5 -27.6 AGM: We are not expecting quantified guidance, but we believe that qualitative outlook commentary is a strong possibility. We are looking for updated commentary surrounding the strategies announced at the strategic review in May. Specifically, we would be looking for more detail on the marketing plans for Asia and for a further explanation of the strategy.
* In A$mn, unless otherwise stated. Final DPS is 2H dividend. O = Outperform, N = Neutral, U = Underperform, R = Restricted. Source: Company data, Credit Suisse estimates

14 F
eb
ruary
201
4
Au
stra
lia a
nd
NZ
Firs
t Ed
ition
161
Currency Price 12M NPAT pre-unusual* Reported NPAT* DPS (c)
Code Company (A$) Tgt. Rtg Date Report Curr PCP Chg % Curr PCP Chg % Curr PCP Chg % Credit Suisse analyst comment
GBG Gindalbie Metals A$ 0.1 0.1 U 27-Feb Interim -7.6 -18.8 59.6 -7.6 -18.8 59.6 0.0 0.0
ISU iSelect A$ 1.3 1.9 O 27-Feb Interim 5.0 0.2 2,359.5 5.0 0.2 2,359.5 0.0 0.0
NEC Nine Entertainment A$ 2.2 2.3 O 27-Feb Interim 0.0 0.0 0.0 0.0 0.0 0.0 Although NEC did not release any prospectus forecasts for the first half we expect upgrades post-1H14 result to full-year numbers due to improved ad market conditions and strong performance of Nine Network over summer.
NWH NRW Holdings A$ 1.3 1.3 N 27-Feb Interim 25.7 48.6 -47.0 25.7 48.6 -47.0 4.3 8.0 -45.8 Update expected on revenue guidance of $1-1.2bn. Now have Roy Hill contract awarded, hence should give mgmt more visibility. Roy Hill should be mostly mobilized and changes to RIO work schedule should also be understood.
PPT Perpetual A$ 47.7 51.0 N 27-Feb Interim 46.9 35.7 31.2 40.8 28.0 45.6 110.0 50.0 120.0
QAN Qantas Airways A$ 1.2 1.2 N 27-Feb Interim 0.0 0.0 0.0 0.0 0.0 0.0 No formal guidance, but qualitative outlook commentary likely to be offered. Alan Joyce will likely reiterate the airline is still on track for profitability in International by FY15
TSE Transfield Services A$ 0.8 1.2 O 27-Feb Interim 0.0 0.0 0.0 0.0 0.0 5.0 -100.0 Expect re-iteration of guidance for $65-70mn NPAT consistent with December update. key focus will be on balance sheet where ND expected to peak at ~$680mn. Also expect to see TIMEC (North America) turn to positive profit contribution (major milestone). This will be the first result showing the margin improvement from major cost out initiatives. So all eyes will be on margin trends.
UXC UXC A$ 1.1 1.2 O 27-Feb Interim 6.4 7.5 -15.5 6.4 8.4 -24.1 1.5 1.8 -13.2
VOC Vocus Communications
A$ 3.3 2.8 O 27-Feb Interim 5.1 3.9 31.2 5.1 4.2 21.1 0.7 0.4 72.9 Focus will be on 1) growth in fibre customers and fibre revenue; 2) capex and FY14 capex guidance; 3) continuing to win market share in Internet? 4) cost control.We expect it to be a very strong result.
WDC Westfield A$ 10.2 11.3 N 27-Feb Final 1,448.1 1,473.7 -1.7 1,448.1 1,473.7 -1.7 25.5 24.8 3.0
WRT Westfield Retail Trust A$ 3.1 3.5 O 27-Feb Final 605.3 572.6 5.7 605.3 572.6 5.7 9.9 9.5 4.5
AOH Altona Mining A$ 0.2 0.3 O 28-Feb Interim 8.5 14.2 -39.7 8.5 14.2 -39.7 0.0 0.0
AUT Aurora Oil & Gas US$ 4.1 R 28-Feb Final 124.5 55.2 125.7 124.5 55.2 125.7 0.0 0.0 Conference call.
BSE Base Resources A$ 0.4 0.9 O 28-Feb Interim -30.0 -2.0 -1,371.4 -30.0 -2.0 -1,371.4 0.0 0.0 Reporting date is an estimate
HVN Harvey Norman A$ 3.1 3.4 N 28-Feb Interim 119.5 113.4 5.4 119.5 81.9 45.9 5.1 4.5 12.5
NWT NewSat A$ 0.5 0.7 O 28-Feb Interim 0.1 1.3 -90.6 0.1 1.3 -90.6 0.0 0.0 Result not particularly meaningful. Key focus needs to be on delivery of sales contract for Jabiru1 satellite launching mid 2015.
VAH Virgin Australia A$ 0.3 0.4 N 28-Feb Interim 0.0 0.0 0.0 0.0 0.0 0.0 Tentative date
WOW Woolworths A$ 35.3 38.3 O 28-Feb Interim 1,344.2 1,247.2 7.8 1,344.2 1,154.8 16.4 64.5 62.0 4.1
GRY Gryphon Minerals A$ 0.2 0.3 O 3-Mar Interim -1.5 -1.1 -31.3 -1.5 -1.1 -31.3 0.0 0.0
MYR Myer Holdings A$ 2.5 2.7 N 20-Mar Interim 77.0 87.9 -12.5 77.0 87.9 -12.5 10.0 10.0 0.0
TPM TPG Telecom A$ 5.3 5.0 N 24-Mar Interim 75.3 71.3 5.6 75.3 78.3 -3.8 4.6 3.5 30.1 Guidance expected to be re-iterated for $290 - $300mn EBITDA (excluding AAPT acquisition). Key focus will be on progress with FTTb project
BOQ Bank of Queensland A$ 11.7 12.5 N 11-Apr Interim 140.5 119.9 17.2 140.5 119.9 17.2 32.0 28.0 14.3
MSB Mesoblast A$ 5.7 8.0 O TBA Interim -36.5 -27.8 -31.4 -36.5 -27.8 -31.4 0.0 0.0
* In A$mn, unless otherwise stated. Final DPS is 2H dividend. O = Outperform, N = Neutral, U = Underperform, R = Restricted. Source: Company data, Credit Suisse estimates

14 February 2014
Australia and NZ First Edition 162
Companies Mentioned (Price as of 13 Feb 2014)
Air Transport Services Group (ATSG.US, US$6.17, NOT RATED) *Airwork Holdings (AWK.NZ, NZ$2.96, NEUTRAL, TP NZ$3.00) Alcoa Inc. (AA.N, $11.27) Atlas Air Worldwide Holdings (AAWW.US, US$31.43, NOT RATED) Bristow Group (BRS.US, US$68.27, OUTPERFORM, TP US$95.00) Chevron Corp. (CVX.N, $112.03) Discovery Air (DA.A, CAD$0.195, NOT RATED) *Hellaby Holdings (HBY.NZ, NZ$3.15, OUTPERFORM, TP NZ$3.90) *Methven (MVN.NZ, NZ$1.40, OUTPERFORM, TP NZ$1.50) *Opus International Consultants (OIC.NZ, NZ$2.15, OUTPERFORM, TP NZ$2.65) *PGG Wrightson (PGW.NZ, NZ$0.43, OUTPERFORM, TP NZ$0.52) Rio Tinto (RIO.AU, AU$67.83, OUTPERFORM, TP AU$75.00) Singapore Telecom (STEL.SI, S$3.57) Toll Holdings (TOL.AU, AU$5.63, NEUTRAL, TP AU$5.49) *Tourism Holdings (THL.NZ, NZ$1.00, OUTPERFORM, TP NZ$0.77) Vodafone Group (VOD.L, 221.0p)
*Denotes a First NZ Capital covered company. For details of Australian companies covered by Credit Suisse refer to the Top 100 and Small Caps earnings & dividends sheets.
Disclosure Appendix
Important Global Disclosures
The analysts identified in this report each certify, with respect to the companies or securities that the individual analyzes, that (1) the views expressed in this report accurately reflect his or her personal views about all of the subject companies and securities and (2) no part of his or her compensation was, is or will be directly or indirectly related to the specific recommendations or views expressed in this report.
The analyst(s) responsible for preparing this research report received Compensation that is based upon various factors including Credit Suisse's total revenues, a portion of which are generated by Credit Suisse's investment banking activities
As of December 10, 2012 Analysts’ stock rating are defined as follows:
Outperform (O) : The stock’s total return is expected to outperform the relevant benchmark*over the next 12 months.
Neutral (N) : The stock’s total return is expected to be in line with the relevant benchmark* over the next 12 months.
Underperform (U) : The stock’s total return is expected to underperform the relevant benchmark* over the next 12 months.
*Relevant benchmark by region: As of 10th December 2012, Japanese ratings are based on a stock’s total return relative to the analyst's coverage universe which consists of all companies covered by the analyst within the relevant sector, with Outperforms representing the most attractive, Neutrals the less attractive, and Underperforms the least attractive investment opportunities. As of 2nd October 2012, U.S. and Canadian as well as European ratings are based on a stock’s total return relative to the analyst's coverage universe which consists of all companies covered by the analyst within the relevant sector, with Outperforms representing the most attractive, Neutrals the less attractive, and Underperforms the least attractive investment opportunities. For Latin American and non -Japan Asia stocks, ratings are based on a stock’s total return relative to the average total return of the relevant country or regional benchmark; Australia, New Zealand are, and prior to 2nd October 2012 U.S. and Canadian ratings were based on (1) a stock’s absolute total return potential to its current share price and (2) the relative attractiveness of a stock’s total return potential within an analyst’s coverage universe. For Australian and New Zealand stocks, 12-month rolling yield is incorporated in the absolute total return calculation and a 15% and a 7.5% threshold replace the 10-15% level in the Outperform and Underperform stock rating definitions, respectively. The 15% and 7.5% thresholds replace the +10-15% and -10-15% levels in the Neutral stock rating definition, respectively. Prior to 10th December 2012, Japanese ratings were based on a stock’s total return relative to the average total return of the relevant country or regional benchmark.
Restricted (R) : In certain circumstances, Credit Suisse policy and/or applicable law and regulations preclude certain types of communications, including an investment recommendation, during the course of Credit Suisse's engagement in an investment banking transaction and in certain other circumstances.
Volatility Indicator [V] : A stock is defined as volatile if the stock price has moved up or down by 20% or more in a month in at least 8 of the past 24 months or the analyst expects significant volatility going forward.
Analysts’ sector weightings are distinct from analysts’ stock ratings and are based on the analyst’s expectations for the fundamentals and/or valuation of the sector* relative to the group’s historic fundamentals and/or valuation:
Overweight : The analyst’s expectation for the sector’s fundamentals and/or valuation is favorable over the next 12 months.
Market Weight : The analyst’s expectation for the sector’s fundamentals and/or valuation is neutral over the next 12 months.
Underweight : The analyst’s expectation for the sector’s fundamentals and/or valuation is cautious over the next 12 months. *An analyst’s coverage sector consists of all companies covered by the analyst within the relevant sector. An analyst may cover multiple sectors.

14 February 2014
Australia and NZ First Edition 163
Credit Suisse's distribution of stock ratings (and banking clients) is:
Global Ratings Distribution
Rating Versus universe (%) Of which banking clients (%)
Outperform/Buy* 43% (54% banking clients)
Neutral/Hold* 40% (49% banking clients)
Underperform/Sell* 15% (44% banking clients)
Restricted 2%
*For purposes of the NYSE and NASD ratings distribution disclosure requirements, our stock ratings of Outperform, Neutral, an d Underperform most closely correspond to Buy, Hold, and Sell, respectively; however, the meanings are not the same, as our stock ratings are determined on a relative basis . (Please refer to definitions above.) An investor's decision to buy or sell a security should be based on investment objectives, current holdings, and other individual factors.
Credit Suisse’s policy is to update research reports as it deems appropriate, based on developments with the subject company, the sector or the market that may have a material impact on the research views or opinions stated herein.
Credit Suisse's policy is only to publish investment research that is impartial, independent, clear, fair and not misleading. For more detail please refer to Credit Suisse's Policies for Managing Conflicts of Interest in connection with Investment Research: http://www.csfb.com/research and analytics/disclaimer/managing_conflicts_disclaimer.html
Credit Suisse does not provide any tax advice. Any statement herein regarding any US federal tax is not intended or written to be used, and cannot be used, by any taxpayer for the purposes of avoiding any penalties.
Please refer to the firm's disclosure website at www.credit-suisse.com/researchdisclosures for the definitions of abbreviations typically used in the target price method and risk sections.
Important Regional Disclosures
Singapore recipients should contact Credit Suisse AG, Singapore Branch for any matters arising from this research report.
Restrictions on certain Canadian securities are indicated by the following abbreviations: NVS--Non-Voting shares; RVS--Restricted Voting Shares; SVS--Subordinate Voting Shares.
Individuals receiving this report from a Canadian investment dealer that is not affiliated with Credit Suisse should be advised that this report may not contain regulatory disclosures the non-affiliated Canadian investment dealer would be required to make if this were its own report.
For Credit Suisse Securities (Canada), Inc.'s policies and procedures regarding the dissemination of equity research, please visit http://www.csfb.com/legal_terms/canada_research_policy.shtml.
As of the date of this report, Credit Suisse acts as a market maker or liquidity provider in the equities securities that are the subject of this report.
Principal is not guaranteed in the case of equities because equity prices are variable.
Commission is the commission rate or the amount agreed with a customer when setting up an account or at any time after that.
Please find the full reports, including disclosure information, on Credit Suisse's Research and Analytics Website (http://www.researchandanalytics.com)
Important MSCI Disclosures
The MSCI sourced information is the exclusive property of Morgan Stanley Capital International Inc. (MSCI). Without prior written permission of MSCI, this information and any other MSCI intellectual property may not be reproduced, re-disseminated or used to create and financial products, including any indices. This information is provided on an "as is" basis. The user assumes the entire risk of any use made of this information. MSCI, its affiliates and any third party involved in, or related to, computing or compiling the information hereby expressly disclaim all warranties of originality, accuracy, completeness, merchantability or fitness for a particular purpose with respect to any of this information. Without limiting any of the foregoing, in no event shall MSCI, any of its affiliates or any third party involved in, or related to, computing or compiling the information have any liability for any damages of any kind. MSCI, Morgan Stanley Capital International and the MSCI indexes are services marks of MSCI and its affiliates.
The Global Industry Classification Standard (GICS) was developed by and is the exclusive property of Morgan Stanley Capital International Inc. and Standard & Poor’s. GICS is a service mark of MSCI and S&P and has been licensed for use by Credit Suisse.
For Credit Suisse disclosure information on other companies mentioned in this report, please visit the website at https://rave.credit-suisse.com/disclosures or call +1 (877) 291-2683.

EQUITIES
Nick Selvaratnam 612 8205 4105 Head of Equities
Adam Indikt 613 9280 1659 Head of Client Relationship Management
RESEARCH
Adnan Kucukalic 612 8205 4427 Paul McTaggart 612 8205 4698 Co-Heads of Research
Resources
Energy (Oil & Gas) Mark Samter 612 8205 4537 David Hewitt 65 6212 3064 Justin Teo 612 8205 4426
Diversified Resources, Coal, Iron Ore, Nickel Paul McTaggart 612 8205 4698 Matthew Hope 612 8205 4669 Martin Kronborg 612 8205 4369
Copper, Gold, Steel Michael Slifirski 613 9280 1845 Sam Webb 613 9280 1716
Industrials
Food & Beverage, Packaging, Agriculture, Casinos & Gaming Larry Gandler 613 9280 1855 Ben Levin 613 9280 1766
Media & Telecoms Fraser McLeish 612 8205 4069 Lucas Goode 612 8205 4431
Retail Grant Saligari 613 9280 1720 James O’Brien 613 9280 1669
Health Care Saul Hadassin 612 8205 4679 William Dunlop 612 8205 4405
Utilities & Infrastructure Sandra McCullagh 612 8205 4729 David Bailey 612 8205 4739 Nicholas Markiewicz 612 8205 4107
Transport Nicholas Markiewicz 612 8205 4107
Building Materials, Chemicals Andrew Peros 612 8205 4013
Developers & Contractors Emma Alcock 612 8205 4403
email: [email protected]
Financials
Banks Jarrod Martin 612 8205 4334 James Ellis 612 8205 4531 James Cordukes 612 8205 4858
Insurance & Diversified Financials Andrew Adams 612 8205 4106 James Ellis 612 8205 4531
Real Estate Stephen Rich 612 8205 4617 John Richmond 612 8205 4580 Mikhail Mohl 612 8205 4413
Smaller Companies Paul Buys 612 8205 4538 Bradley Clibborn 612 8205 4465 Samantha Carleton 612 8205 4148 Chris Smith 612 8205 4210 Sarah Mann 612 8205 4610
Macro
Investment Strategy Hasan Tevfik 612 8205 4284 Damien Boey 612 8205 4615
ESG Sandra McCullagh 612 8205 4729 Chris Parks 612 8205 4577
Quantitative Analysis Richard Hitchens 612 8205 4467
Research Database Jason Swinbourne 612 8205 4591
CORPORATE ACCESS Cathy Kermond 612 8205 4488
EQUITY CAPITAL MARKETS Ian Arnold 612 8205 4415 Head of Syndication
Credit Suisse HOLT®
Scott Chessum 613 9280 1662 Head of Australia
Peter Jabour 613 9280 1702
SALES AND TRADING SYDNEY – Research Sales Chris Mayne 612 8205 4363 Head of Sales & SalesTrading
John Ayoub 612 8205 4636 Michael Bassett 612 8205 4326 John Fessey 612 8205 4417 Simon Footit 612 8205 4173 Michael van Elst 612 8205 4419 Tom McDonald 612 8205 4874
Sales Trading James Hogan 612 8205 4043 Jim Bromley 612 8205 4715 David Robb 612 8205 4820
Facilitation Ron Rossettin 612 8205 4479 Jason Cooper 612 8205 4364
OTC Derivatives Phil McLean 612 8205 4775
Derivative Sales Chris Mayne 612 8205 4363
Portfolio & Quant Sales Andrew Bruce 612 8205 4474
AES Sales David Broadfield 612 8205 4708
Hedge Fund Sales Peter van Beek 612 8205 4172 William Allen 612 8205 4131
Real Estate Specialist Sales Jason Cooper 612 8205 4364 Bhupen Master 612 8205 4792
MELBOURNE – Research Sales
Tom Wilson 613 9280 1727 Sales Trading
John Ryan 613 9280 1644 Joe Zhang 613 9280 1691
UK/EUROPE Edward Delany 4420 7888 0841 Head of International Sales
Sophie Rose 4420 7888 5648
USA Angus Bottrell 1 212 325 1814 Jonathan Chow 1 415 836 8686 Nicholas Humphries 1 212 325 6998
ASIA Rowan Parchi 852 2101 6763 Head of Asian Sales
Dominic Smith 852 2101 7503
EXECUTION Paul Marosa 612 8205 4425 Head DTR
Paul Bugeja 613 9280 1788 Rohan Congues 612 8205 4728
PRIME SERVICES Graeme Anderson 612 8205 4647 James Persson 612 8205 4938 Callum Gordon 612 8205 4831 Warren Goward 612 8205 4453 Nathan Trute 612 8205 4333 Stephen Morgans 612 8205 4333 Nigel Watts 612 8205 4845 Chad Heinsen 612 8205 4581 Damien Jenkins 612 8205 4864 Sophie Rasmussen 612 8205 4955
Research & Sales Responsibilities

References in this report to Credit Suisse include all of the subsidiaries and affiliates of Credit Suisse operating under its investment banking division. For more information on our structure, please use the following link: https://www.credit-suisse.com/who_we_are/en/.This report may contain material that is not directed to, or intended for distribution to or use by, any person or entity who is a citizen or resident of or located in any locality, state, country or other jurisdiction where such distribution, publication, availability or use would be contrary to law or regulation or which would subject Credit Suisse AG or its affiliates ("CS") to any registration or licensing requirement within such jurisdiction. All material presented in this report, unless specifically indicated otherwise, is under copyright to CS. None of the material, nor its content, nor any copy of it, may be altered in any way, transmitted to, copied or distributed to any other party, without the prior express written permission of CS. All trademarks, service marks and logos used in this report are trademarks or service marks or registered trademarks or service marks of CS or its affiliates. The information, tools and material presented in this report are provided to you for information purposes only and are not to be used or considered as an offer or the solicitation of an offer to sell or to buy or subscribe for securities or other financial instruments. CS may not have taken any steps to ensure that the securities referred to in this report are suitable for any particular investor. CS will not treat recipients of this report as its customers by virtue of their receiving this report. The investments and services contained or referred to in this report may not be suitable for you and it is recommended that you consult an independent investment advisor if you are in doubt about such investments or investment services. Nothing in this report constitutes investment, legal, accounting or tax advice, or a representation that any investment or strategy is suitable or appropriate to your individual circumstances, or otherwise constitutes a personal recommendation to you. CS does not advise on the tax consequences of investments and you are advised to contact an independent tax adviser. Please note in particular that the bases and levels of taxation may change. Information and opinions presented in this report have been obtained or derived from sources believed by CS to be reliable, but CS makes no representation as to their accuracy or completeness. CS accepts no liability for loss arising from the use of the material presented in this report, except that this exclusion of liability does not apply to the extent that such liability arises under specific statutes or regulations applicable to CS. This report is not to be relied upon in substitution for the exercise of independent judgment. CS may have issued, and may in the future issue, other communications that are inconsistent with, and reach different conclusions from, the information presented in this report. Those communications reflect the different assumptions, views and analytical methods of the analysts who prepared them and CS is under no obligation to ensure that such other communications are brought to the attention of any recipient of this report. CS may, to the extent permitted by law, participate or invest in financing transactions with the issuer(s) of the securities referred to in this report, perform services for or solicit business from such issuers, and/or have a position or holding, or other material interest, or effect transactions, in such securities or options thereon, or other investments related thereto. In addition, it may make markets in the securities mentioned in the material presented in this report. CS may have, within the last three years, served as manager or co-manager of a public offering of securities for, or currently may make a primary market in issues of, any or all of the entities mentioned in this report or may be providing, or have provided within the previous 12 months, significant advice or investment services in relation to the investment concerned or a related investment. Additional information is, subject to duties of confidentiality, available on request. Some investments referred to in this report will be offered solely by a single entity and in the case of some investments solely by CS, or an associate of CS or CS may be the only market maker in such investments. Past performance should not be taken as an indication or guarantee of future performance, and no representation or warranty, express or implied, is made regarding future performance. Information, opinions and estimates contained in this report reflect a judgment at its original date of publication by CS and are subject to change without notice. The price, value of and income from any of the securities or financial instruments mentioned in this report can fall as well as rise. The value of securities and financial instruments is subject to exchange rate fluctuation that may have a positive or adverse effect on the price or income of such securities or financial instruments. Investors in securities such as ADR's, the values of which are influenced by currency volatility, effectively assume this risk. Structured securities are complex instruments, typically involve a high degree of risk and are intended for sale only to sophisticated investors who are capable of understanding and assuming the risks involved. The market value of any structured security may be affected by changes in economic, financial and political factors (including, but not limited to, spot and forward interest and exchange rates), time to maturity, market conditions and volatility, and the credit quality of any issuer or reference issuer. Any investor interested in purchasing a structured product should conduct their own investigation and analysis of the product and consult with their own professional advisers as to the risks involved in making such a purchase. Some investments discussed in this report may have a high level of volatility. High volatility investments may experience sudden and large falls in their value causing losses when that investment is realised. Those losses may equal your original investment. Indeed, in the case of some investments the potential losses may exceed the amount of initial investment and, in such circumstances, you may be required to pay more money to support those losses. Income yields from investments may fluctuate and, in consequence, initial capital paid to make the investment may be used as part of that income yield. Some investments may not be readily realisable and it may be difficult to sell or realise those investments, similarly it may prove difficult for you to obtain reliable information about the value, or risks, to which such an investment is exposed. This report may provide the addresses of, or contain hyperlinks to, websites. Except to the extent to which the report refers to website material of CS, CS has not reviewed any such site and takes no responsibility for the content contained therein. Such address or hyperlink (including addresses or hyperlinks to CS's own website material) is provided solely for your convenience and information and the content of any such website does not in any way form part of this document. Accessing such website or following such link through this report or CS's website shall be at your own risk. This report is issued and distributed in Europe (except Switzerland) by Credit Suisse Securities (Europe) Limited, One Cabot Square, London E14 4QJ, England, which is regulated in the United Kingdom by The Financial Services Authority ("FSA"). This report is being distributed in Germany by Credit Suisse Securities (Europe) This report is being distributed in the United States and Canada by Credit Suisse Securities (USA) LLC; in Switzerland by Credit Suisse AG; in Brazil by Banco de Investimentos Credit Suisse (Brasil) S.A or its affiliates; in Mexico by Banco Credit Suisse (México), S.A. (transactions related to the securities mentioned in this report will only be effected in compliance with applicable regulation); in Japan by Credit Suisse Securities (Japan) Limited, Financial Instruments Firm, Director-General of Kanto Local Finance Bureau (Kinsho) No. 66, a member of Japan Securities Dealers Association, The Financial Futures Association of Japan, Japan Investment Advisers Association, Type II Financial Instruments Firms Association; elsewhere in Asia/ Pacific by whichever of the following is the appropriately authorised entity in the relevant jurisdiction: Credit Suisse (Hong Kong) Limited, Credit Suisse Equities (Australia) Limited, Credit Suisse Securities (Thailand) Limited, Credit Suisse Securities (Malaysia) Sdn Bhd, Credit Suisse AG, Singapore Branch, Credit Suisse Securities (India) Private Limited regulated by the Securities and Exchange Board of India (registration Nos. INB230970637; INF230970637; INB010970631; INF010970631), having registered address at 9th Floor, Ceejay House,Dr.A.B. Road, Worli, Mumbai - 18, India, T- +91-22 6777 3777, Credit Suisse Securities (Europe) Limited, Seoul Branch, Credit Suisse AG, Taipei Securities Branch, PT Credit Suisse Securities Indonesia, Credit Suisse Securities (Philippines ) Inc., and elsewhere in the world by the relevant authorised affiliate of the above. Research on Taiwanese securities produced by Credit Suisse AG, Taipei Securities Branch has been prepared by a registered Senior Business Person. Research provided to residents of Malaysia is authorised by the Head of Research for Credit Suisse Securities (Malaysia) Sdn Bhd, to whom they should direct any queries on +603 2723 2020. This research may not conform to Canadian disclosure requirements. In jurisdictions where CS is not already registered or licensed to trade in securities, transactions will only be effected in accordance with applicable securities legislation, which will vary from jurisdiction to jurisdiction and may require that the trade be made in accordance with applicable exemptions from registration or licensing requirements. Non-U.S. customers wishing to effect a transaction should contact a CS entity in their local jurisdiction unless governing law permits otherwise. U.S. customers wishing to effect a transaction should do so only by contacting a representative at Credit Suisse Securities (USA) LLC in the U.S. Please note that this research was originally prepared and issued by CS for distribution to their market professional and institutional investor customers. Recipients who are not market professional or institutional investor customers of CS should seek the advice of their independent financial advisor prior to taking any investment decision based on this report or for any necessary explanation of its contents. This research may relate to investments or services of a person outside of the UK or to other matters which are not regulated by the FSA or in respect of which the protections of the FSA for private customers and/or the UK compensation scheme may not be available, and further details as to where this may be the case are available upon request in respect of this report. CS may provide various services to US municipal entities or obligated persons ("municipalities"), including suggesting individual transactions or trades and entering into such transactions. Any services CS provides to municipalities are not viewed as "advice" within the meaning of Section 975 of the Dodd-Frank Wall Street Reform and Consumer Protection Act. CS is providing any such services and related information solely on an arm's length basis and not as an advisor or fiduciary to the municipality. In connection with the provision of the any such services, there is no agreement, direct or indirect, between any municipality (including the officials, management, employees or agents thereof) and CS for CS to provide advice to the municipality. Municipalities should consult with their financial, accounting and legal advisors regarding any such services provided by CS. In addition, CS is not acting for direct or indirect compensation to solicit the municipality on behalf of an unaffiliated broker, dealer, municipal securities dealer, municipal advisor, or investment adviser for the purpose of obtaining or retaining an engagement by the municipality for or in connection with Municipal Financial Products, the issuance of municipal securities, or of an investment adviser to provide investment advisory services to or on behalf of the municipality. If this report is being distributed by a financial institution other than Credit Suisse AG, or its affiliates, that financial institution is solely responsible for distribution. Clients of that institution should contact that institution to effect a transaction in the securities mentioned in this report or require further information. This report does not constitute investment advice by Credit Suisse to the clients of the distributing financial institution, and neither Credit Suisse AG, its affiliates, and their respective officers, directors and employees accept any liability whatsoever for any direct or consequential loss arising from their use of this report or its content. Principal is not guaranteed. Commission is the commission rate or the amount agreed with a customer when setting up an account or at any time after that.
Copyright © 2014 CREDIT SUISSE AG and/or its affiliates. All rights reserved.
Investment principal on bonds can be eroded depending on sale price or market price. In addition, there are bonds on which investment principal can be eroded due to changes in redemption amounts. Care is required when investing in such instruments.
When you purchase non-listed Japanese fixed income securities (Japanese government bonds, Japanese municipal bonds, Japanese government guaranteed bonds, Japanese corporate bonds) from CS as a seller, you will be requested to pay the purchase price only.