china oil & gas sector - credit suisse | plus
TRANSCRIPT
DISCLOSURE APPENDIX AT THE BACK OF THIS REPORT CONTAINS IMPORTANT DISCLOSURES, ANALYST CERTIFICATIONS, LEGAL ENTITY DISCLOSURE AND THE STATUS OF NON-US ANALYSTS. US Disclosure: Credit Suisse does and seeks to do business with companies covered in its research reports. As a result, investors should be aware that the Firm may have a conflict of interest that could affect the objectivity of this report. Investors should consider this report as only a single factor in making their investment decision.
12 January 2017 Asia Pacific/Hong Kong
Equity Research Energy
China Oil & Gas Sector Research Analysts
Horace Tse
852 2101 7379
Jessie Xu
852 2101 7650
SECTOR FORECAST
2017: A year of second-phase recovery
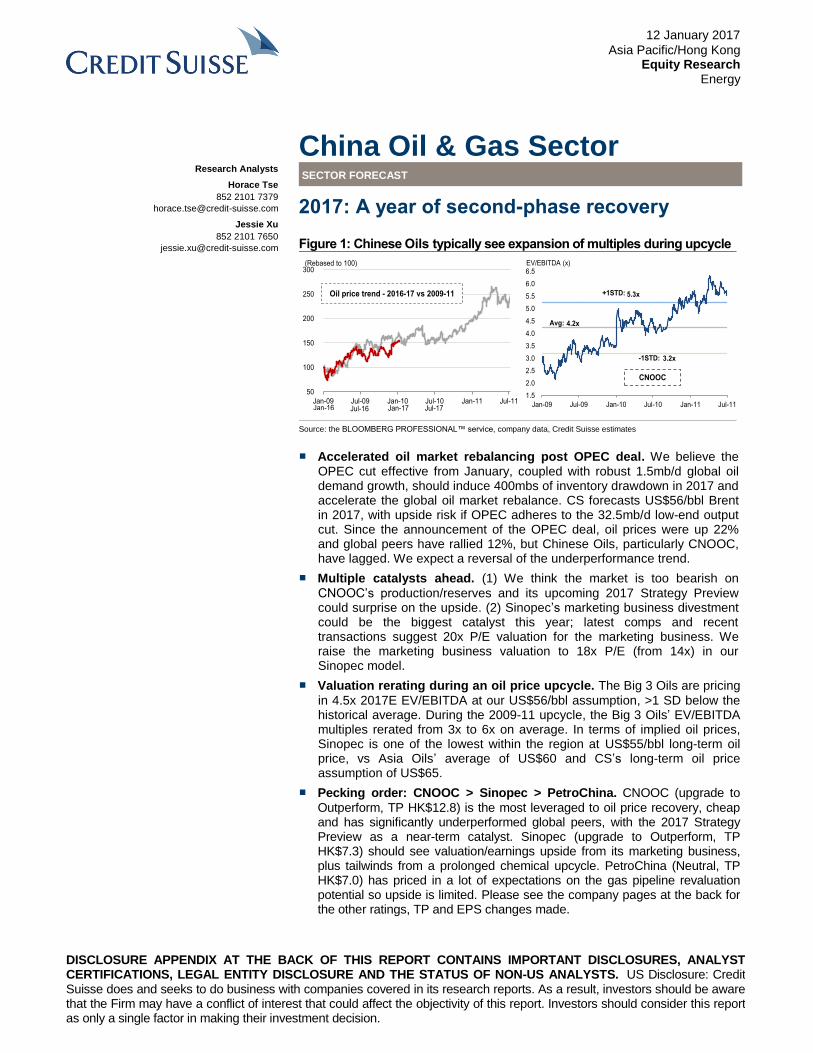
Figure 1: Chinese Oils typically see expansion of multiples during upcycle
Source: the BLOOMBERG PROFESSIONAL™ service, company data, Credit Suisse estimates
■ Accelerated oil market rebalancing post OPEC deal. We believe the OPEC cut effective from January, coupled with robust 1.5mb/d global oil demand growth, should induce 400mbs of inventory drawdown in 2017 and accelerate the global oil market rebalance. CS forecasts US$56/bbl Brent in 2017, with upside risk if OPEC adheres to the 32.5mb/d low-end output cut. Since the announcement of the OPEC deal, oil prices were up 22% and global peers have rallied 12%, but Chinese Oils, particularly CNOOC, have lagged. We expect a reversal of the underperformance trend.
■ Multiple catalysts ahead. (1) We think the market is too bearish on
CNOOC’s production/reserves and its upcoming 2017 Strategy Preview could surprise on the upside. (2) Sinopec’s marketing business divestment could be the biggest catalyst this year; latest comps and recent transactions suggest 20x P/E valuation for the marketing business. We raise the marketing business valuation to 18x P/E (from 14x) in our Sinopec model.
■ Valuation rerating during an oil price upcycle. The Big 3 Oils are pricing
in 4.5x 2017E EV/EBITDA at our US$56/bbl assumption, >1 SD below the historical average. During the 2009-11 upcycle, the Big 3 Oils’ EV/EBITDA multiples rerated from 3x to 6x on average. In terms of implied oil prices, Sinopec is one of the lowest within the region at US$55/bbl long-term oil price, vs Asia Oils’ average of US$60 and CS’s long-term oil price assumption of US$65.
■ Pecking order: CNOOC > Sinopec > PetroChina. CNOOC (upgrade to
Outperform, TP HK$12.8) is the most leveraged to oil price recovery, cheap and has significantly underperformed global peers, with the 2017 Strategy Preview as a near-term catalyst. Sinopec (upgrade to Outperform, TP HK$7.3) should see valuation/earnings upside from its marketing business, plus tailwinds from a prolonged chemical upcycle. PetroChina (Neutral, TP HK$7.0) has priced in a lot of expectations on the gas pipeline revaluation potential so upside is limited. Please see the company pages at the back for the other ratings, TP and EPS changes made.
50
100
150
200
250
300
Jan-09 Jul-09 Jan-10 Jul-10 Jan-11 Jul-11Jan-16 Jul-16 Jan-17 Jul-17
(Rebased to 100)
Oil price trend - 2016-17 vs 2009-11
4.2x
5.3x
3.2x
1.5
2.0
2.5
3.0
3.5
4.0
4.5
5.0
5.5
6.0
6.5
Jan-09 Jul-09 Jan-10 Jul-10 Jan-11 Jul-11
Avg:
+1STD:
-1STD:
EV/EBITDA (x)
CNOOC
12 January 2017
China Oil & Gas Sector 2
Focus table and charts
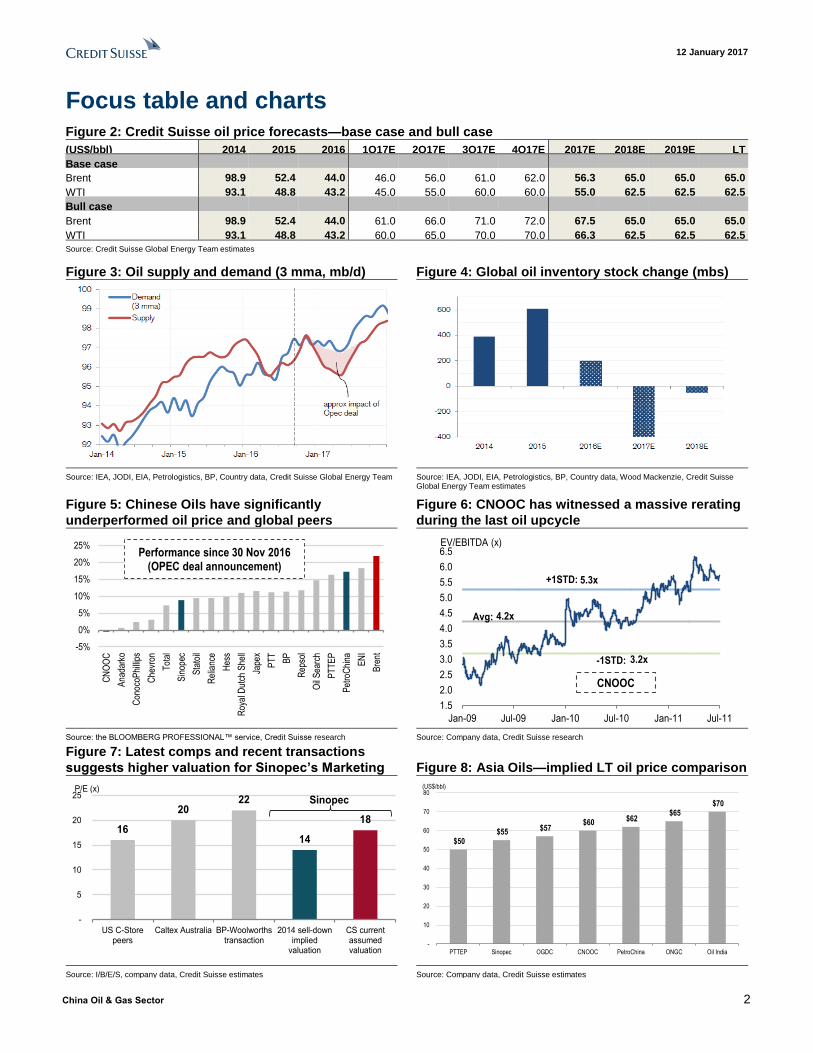
Figure 2: Credit Suisse oil price forecasts—base case and bull case
(US$/bbl) 2014 2015 2016 1Q17E 2Q17E 3Q17E 4Q17E 2017E 2018E 2019E LT
Base case
Brent 98.9 52.4 44.0 46.0 56.0 61.0 62.0 56.3 65.0 65.0 65.0
WTI 93.1 48.8 43.2 45.0 55.0 60.0 60.0 55.0 62.5 62.5 62.5
Bull case
Brent 98.9 52.4 44.0 61.0 66.0 71.0 72.0 67.5 65.0 65.0 65.0
WTI 93.1 48.8 43.2 60.0 65.0 70.0 70.0 66.3 62.5 62.5 62.5
Source: Credit Suisse Global Energy Team estimates
Figure 3: Oil supply and demand (3 mma, mb/d) Figure 4: Global oil inventory stock change (mbs)
Source: IEA, JODI, EIA, Petrologistics, BP, Country data, Credit Suisse Global Energy Team Source: IEA, JODI, EIA, Petrologistics, BP, Country data, Wood Mackenzie, Credit Suisse Global Energy Team estimates
Figure 5: Chinese Oils have significantly
underperformed oil price and global peers
Figure 6: CNOOC has witnessed a massive rerating
during the last oil upcycle
Source: the BLOOMBERG PROFESSIONAL™ service, Credit Suisse research Source: Company data, Credit Suisse research
Figure 7: Latest comps and recent transactions
suggests higher valuation for Sinopec’s Marketing Figure 8: Asia Oils—implied LT oil price comparison
Source: I/B/E/S, company data, Credit Suisse estimates Source: Company data, Credit Suisse estimates
-5%
0%
5%
10%
15%
20%
25%
CN
OO
C
Ana
dark
o
Con
ocoP
hilli
ps
Che
vron
Tot
al
Sin
opec
Sta
toil
Rel
ianc
e
Hes
s
Roy
al D
utch
She
ll
Jape
x
PT
T
BP
Rep
sol
Oil
Sea
rch
PT
TE
P
Pet
roC
hina EN
I
Bre
nt
Performance since 30 Nov 2016(OPEC deal announcement)
4.2x
5.3x
3.2x
1.5
2.0
2.5
3.0
3.5
4.0
4.5
5.0
5.5
6.0
6.5
Jan-09 Jul-09 Jan-10 Jul-10 Jan-11 Jul-11
Avg:
+1STD:
-1STD:
EV/EBITDA (x)
CNOOC
16
2022
14
18
-
5
10
15
20
25
US C-Storepeers
Caltex Australia BP-Woolworthstransaction
2014 sell-downimplied
valuation
CS currentassumedvaluation
P/E (x)
Sinopec
$50 $55 $57
$60 $62 $65
$70
-
10
20
30
40
50
60
70
80
PTTEP Sinopec OGDC CNOOC PetroChina ONGC Oil India
(US$/bbl)
12 January 2017
China Oil & Gas Sector 3
2017: A year of second-phase recovery
Accelerated oil market rebalancing post OPEC deal
In our view, the OPEC cut effective from 1 January 2017, coupled with robust 1.5mb/d
global oil demand growth, should induce 400mbs of inventory drawdown in 2017 and
accelerate the rebalance of the global oil market. CS' Global Energy Team forecasts
US$56/bbl Brent for 2017, but acknowledges that there could be upside risk to oil prices
should OPEC adhere to the 32.5mb/d low-end of the agreed cut. Despite oil prices going
up 22% since OPEC struck the deal in November 2016, the Big 3 Oils’ underperformance
is significant, particularly CNOOC. CNOOC is down 1% since then, having hugely
underperformed global peers and consistent with our Underperform stance; Sinopec and
PetroChina are up 9% and 17%, respectively. We expect a reversal of the
underperformance trend, with multiple catalysts in sight.
Multiple catalysts ahead
We expect company-specific catalysts to drive share prices, on top of an oil price
recovery: (1) The market is concerned about CNOOC’s deteriorating production and low
reserve life, and expectations are low heading into the 2017 Strategy Preview, but we
believe it should bring positive surprises. Its 2017 production decline should be limited to
low single digits vs market expectations of a 5-8% decline. Two mega-size discoveries
recently announced by its partner, ExxonMobil, suggests successful exploration effort
under a low capex environment and will address concerns on its low reserve life. (2)
Sinopec's marketing business divestment, which is coherent with the SOE reform that
China is re-emphasising, would be a big catalyst for this year. Latest comps and recent
transactions suggest 20x P/E valuation for the marketing business; hence, we raise the
marketing business valuation to 18x P/E (from 14x) in our Sinopec model. Over the next 6-
9 months, we expect Sinopec to see further development and collaboration on its non-fuel
business.
Valuation rerating during an oil price upcycle
Under our US$56/bbl base-case oil price assumption, the Big 3 Oils are currently pricing in
4.5x 2017E EV/EBITDA, which is more than 1 SD below the historical average. Our
analysis of the past oil cycles suggests that during the 2009-11 recovery, the Big 3 Oils’
EV/EBITDA multiples have rerated from 3x to 6x on average. In terms of implied oil prices,
Sinopec is one of the lowest within the region at US$55/bbl long-term oil price, vs Asia
Oils’ average of US$60/bbl and CS’s long-term oil price assumption of US$65/bbl.
Pecking order: CNOOC > Sinopec > PetroChina
■ CNOOC (0883.HK, OUTPERFORM, TP HK$12.8): We upgrade CNOOC to an
OUTPERFORM (from Underperform) and raise our TP to HK$12.8 (from HK$7.0).
CNOOC is the highest leveraged to an oil price recovery given its lowest all-in cost
(US$38/boe). At 4x 2017E EV/EBITDA, the stock is cheap relative to its own history
and global E&P peers. The 2017 Strategy Preview would be a near-term catalyst.
■ Sinopec (0386.HK, OUTPERFORM, TP HK$7.3): We upgrade Sinopec to
OUTPERFORM (from Neutral) and raise our TP to HK$7.3 (from HK$6.1). Its
marketing business sell-down targeted for 2H17 would be a market focus throughout
the year, and we expect plentiful newsflow on further non-fuel business collaborations.
The prolonged chemical upcycle should benefit Sinopec the most, where US cracker
capacity additions continue to face start-up delays and are pushed out to 2018/19.
■ PetroChina (0857.HK, NEUTRAL, TP HK$7.0): We raise our PetroChina TP to
HK$7.0 (from HK$6.3) while retaining our NEUTRAL rating. We think the market has
priced in a lot of expectations on the gas pipeline revaluation potential so further upside
is limited, in our opinion. Our TP already factors in HK$5.8/sh of pipeline valuation,
where we have benchmarked Sinopec’s implied valuation (20x P/E and 2.3x asset),
higher than the 14x P/E implied valuation from PetroChina’s revaluation in Dec-2015.
$56/bbl CS base case 2017 forecast (Brent)
We expect fundamental share price drivers over
the course of 2017 on top of an oil price
uptick
EV/EBITDA multiples expanded from 3x to 6x
during the 2009-11 upcycle
China Oil & Gas Sector 4
12 J
an
uary
201
7
Ch
ina O
il & G
as S
ecto
r 4
Sector valuation
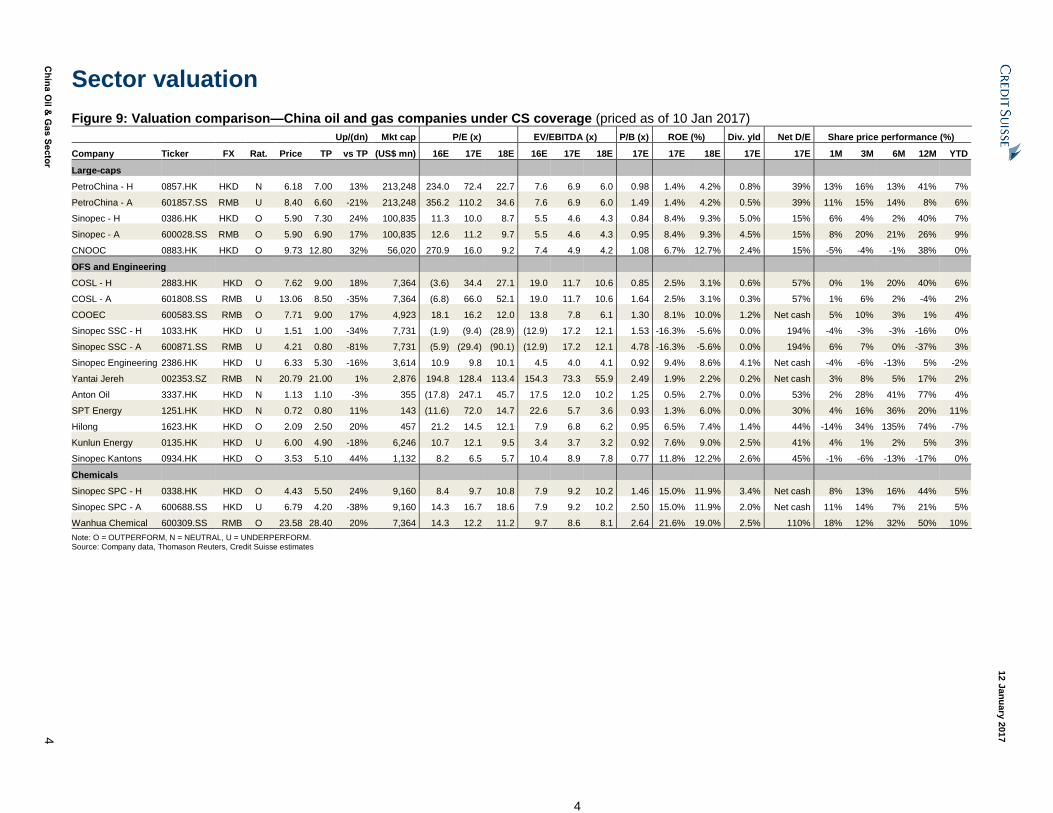
Figure 9: Valuation comparison—China oil and gas companies under CS coverage (priced as of 10 Jan 2017)
Up/(dn) Mkt cap P/E (x) EV/EBITDA (x) P/B (x) ROE (%) Div. yld Net D/E Share price performance (%)
Company Ticker FX Rat. Price TP vs TP (US$ mn) 16E 17E 18E 16E 17E 18E 17E 17E 18E 17E 17E 1M 3M 6M 12M YTD
Large-caps
PetroChina - H 0857.HK HKD N 6.18 7.00 13% 213,248 234.0 72.4 22.7 7.6 6.9 6.0 0.98 1.4% 4.2% 0.8% 39% 13% 16% 13% 41% 7%
PetroChina - A 601857.SS RMB U 8.40 6.60 -21% 213,248 356.2 110.2 34.6 7.6 6.9 6.0 1.49 1.4% 4.2% 0.5% 39% 11% 15% 14% 8% 6%
Sinopec - H 0386.HK HKD O 5.90 7.30 24% 100,835 11.3 10.0 8.7 5.5 4.6 4.3 0.84 8.4% 9.3% 5.0% 15% 6% 4% 2% 40% 7%
Sinopec - A 600028.SS RMB O 5.90 6.90 17% 100,835 12.6 11.2 9.7 5.5 4.6 4.3 0.95 8.4% 9.3% 4.5% 15% 8% 20% 21% 26% 9%
CNOOC 0883.HK HKD O 9.73 12.80 32% 56,020 270.9 16.0 9.2 7.4 4.9 4.2 1.08 6.7% 12.7% 2.4% 15% -5% -4% -1% 38% 0%
OFS and Engineering
COSL - H 2883.HK HKD O 7.62 9.00 18% 7,364 (3.6) 34.4 27.1 19.0 11.7 10.6 0.85 2.5% 3.1% 0.6% 57% 0% 1% 20% 40% 6%
COSL - A 601808.SS RMB U 13.06 8.50 -35% 7,364 (6.8) 66.0 52.1 19.0 11.7 10.6 1.64 2.5% 3.1% 0.3% 57% 1% 6% 2% -4% 2%
COOEC 600583.SS RMB O 7.71 9.00 17% 4,923 18.1 16.2 12.0 13.8 7.8 6.1 1.30 8.1% 10.0% 1.2% Net cash 5% 10% 3% 1% 4%
Sinopec SSC - H 1033.HK HKD U 1.51 1.00 -34% 7,731 (1.9) (9.4) (28.9) (12.9) 17.2 12.1 1.53 -16.3% -5.6% 0.0% 194% -4% -3% -3% -16% 0%
Sinopec SSC - A 600871.SS RMB U 4.21 0.80 -81% 7,731 (5.9) (29.4) (90.1) (12.9) 17.2 12.1 4.78 -16.3% -5.6% 0.0% 194% 6% 7% 0% -37% 3%
Sinopec Engineering 2386.HK HKD U 6.33 5.30 -16% 3,614 10.9 9.8 10.1 4.5 4.0 4.1 0.92 9.4% 8.6% 4.1% Net cash -4% -6% -13% 5% -2%
Yantai Jereh 002353.SZ RMB N 20.79 21.00 1% 2,876 194.8 128.4 113.4 154.3 73.3 55.9 2.49 1.9% 2.2% 0.2% Net cash 3% 8% 5% 17% 2%
Anton Oil 3337.HK HKD N 1.13 1.10 -3% 355 (17.8) 247.1 45.7 17.5 12.0 10.2 1.25 0.5% 2.7% 0.0% 53% 2% 28% 41% 77% 4%
SPT Energy 1251.HK HKD N 0.72 0.80 11% 143 (11.6) 72.0 14.7 22.6 5.7 3.6 0.93 1.3% 6.0% 0.0% 30% 4% 16% 36% 20% 11%
Hilong 1623.HK HKD O 2.09 2.50 20% 457 21.2 14.5 12.1 7.9 6.8 6.2 0.95 6.5% 7.4% 1.4% 44% -14% 34% 135% 74% -7%
Kunlun Energy 0135.HK HKD U 6.00 4.90 -18% 6,246 10.7 12.1 9.5 3.4 3.7 3.2 0.92 7.6% 9.0% 2.5% 41% 4% 1% 2% 5% 3%
Sinopec Kantons 0934.HK HKD O 3.53 5.10 44% 1,132 8.2 6.5 5.7 10.4 8.9 7.8 0.77 11.8% 12.2% 2.6% 45% -1% -6% -13% -17% 0%
Chemicals
Sinopec SPC - H 0338.HK HKD O 4.43 5.50 24% 9,160 8.4 9.7 10.8 7.9 9.2 10.2 1.46 15.0% 11.9% 3.4% Net cash 8% 13% 16% 44% 5%
Sinopec SPC - A 600688.SS HKD U 6.79 4.20 -38% 9,160 14.3 16.7 18.6 7.9 9.2 10.2 2.50 15.0% 11.9% 2.0% Net cash 11% 14% 7% 21% 5%
Wanhua Chemical 600309.SS RMB O 23.58 28.40 20% 7,364 14.3 12.2 11.2 9.7 8.6 8.1 2.64 21.6% 19.0% 2.5% 110% 18% 12% 32% 50% 10%
Note: O = OUTPERFORM, N = NEUTRAL, U = UNDERPERFORM. Source: Company data, Thomason Reuters, Credit Suisse estimates
China Oil & Gas Sector 5
12 J
an
uary
201
7
Ch
ina O
il & G
as S
ecto
r 5
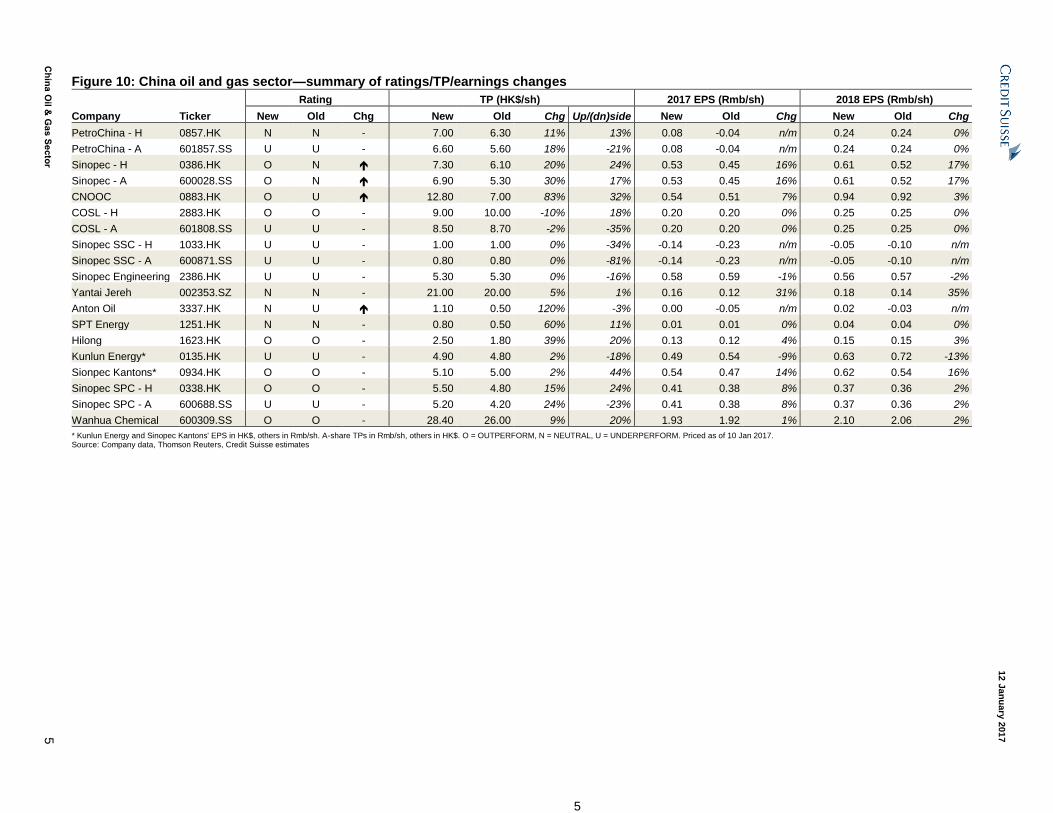
Figure 10: China oil and gas sector—summary of ratings/TP/earnings changes
Rating TP (HK$/sh) 2017 EPS (Rmb/sh) 2018 EPS (Rmb/sh)
Company Ticker New Old Chg New Old Chg Up/(dn)side New Old Chg New Old Chg
PetroChina - H 0857.HK N N - 7.00 6.30 11% 13% 0.08 -0.04 n/m 0.24 0.24 0%
PetroChina - A 601857.SS U U - 6.60 5.60 18% -21% 0.08 -0.04 n/m 0.24 0.24 0%
Sinopec - H 0386.HK O N 7.30 6.10 20% 24% 0.53 0.45 16% 0.61 0.52 17%
Sinopec - A 600028.SS O N 6.90 5.30 30% 17% 0.53 0.45 16% 0.61 0.52 17%
CNOOC 0883.HK O U 12.80 7.00 83% 32% 0.54 0.51 7% 0.94 0.92 3%
COSL - H 2883.HK O O - 9.00 10.00 -10% 18% 0.20 0.20 0% 0.25 0.25 0%
COSL - A 601808.SS U U - 8.50 8.70 -2% -35% 0.20 0.20 0% 0.25 0.25 0%
Sinopec SSC - H 1033.HK U U - 1.00 1.00 0% -34% -0.14 -0.23 n/m -0.05 -0.10 n/m
Sinopec SSC - A 600871.SS U U - 0.80 0.80 0% -81% -0.14 -0.23 n/m -0.05 -0.10 n/m
Sinopec Engineering 2386.HK U U - 5.30 5.30 0% -16% 0.58 0.59 -1% 0.56 0.57 -2%
Yantai Jereh 002353.SZ N N - 21.00 20.00 5% 1% 0.16 0.12 31% 0.18 0.14 35%
Anton Oil 3337.HK N U 1.10 0.50 120% -3% 0.00 -0.05 n/m 0.02 -0.03 n/m
SPT Energy 1251.HK N N - 0.80 0.50 60% 11% 0.01 0.01 0% 0.04 0.04 0%
Hilong 1623.HK O O - 2.50 1.80 39% 20% 0.13 0.12 4% 0.15 0.15 3%
Kunlun Energy* 0135.HK U U - 4.90 4.80 2% -18% 0.49 0.54 -9% 0.63 0.72 -13%
Sionpec Kantons* 0934.HK O O - 5.10 5.00 2% 44% 0.54 0.47 14% 0.62 0.54 16%
Sinopec SPC - H 0338.HK O O - 5.50 4.80 15% 24% 0.41 0.38 8% 0.37 0.36 2%
Sinopec SPC - A 600688.SS U U - 5.20 4.20 24% -23% 0.41 0.38 8% 0.37 0.36 2%
Wanhua Chemical 600309.SS O O - 28.40 26.00 9% 20% 1.93 1.92 1% 2.10 2.06 2%
* Kunlun Energy and Sinopec Kantons' EPS in HK$, others in Rmb/sh. A-share TPs in Rmb/sh, others in HK$. O = OUTPERFORM, N = NEUTRAL, U = UNDERPERFORM. Priced as of 10 Jan 2017. Source: Company data, Thomson Reuters, Credit Suisse estimates
12 January 2017
China Oil & Gas Sector 6
Table of contents
2017: A year of second-phase recovery 3
Sector valuation 4
Accelerated oil market rebalancing post OPEC deal 7
Multiple catalysts ahead 20
Valuation rerating during an oil price upcycle 28
Pecking order: CNOOC>Sinopec>PetroChina 31
Appendix I: Oil sub-sectors—performance over historical oil cycles 33
Appendix II: Global oil demand-supply balance 36
CNOOC (0883.HK / 883 HK) 39
Sinopec 41
PetroChina 43
COSL (2883.HK / 2883 HK) 45
Sinopec Shanghai Petrochemical (0338.HK / 338 HK) 47
Sinopec Kantons 49
Kunlun Energy (0135.HK / 135 HK) 51
Sinopec Engineering (2386.HK / 2386 HK) 53
Sinopec SSC (1033.HK / 1033 HK) 55
Hilong (1623.HK / 1623 HK) 57
Anton Oil (3337.HK / 3337 HK) 59
SPT Energy (1251.HK / 1251 HK) 61
Wanhua Chemical (600309.SS / 600309 CH) 63
Yantai Jereh (002353.SZ / 002353 CH) 65
12 January 2017
China Oil & Gas Sector 7
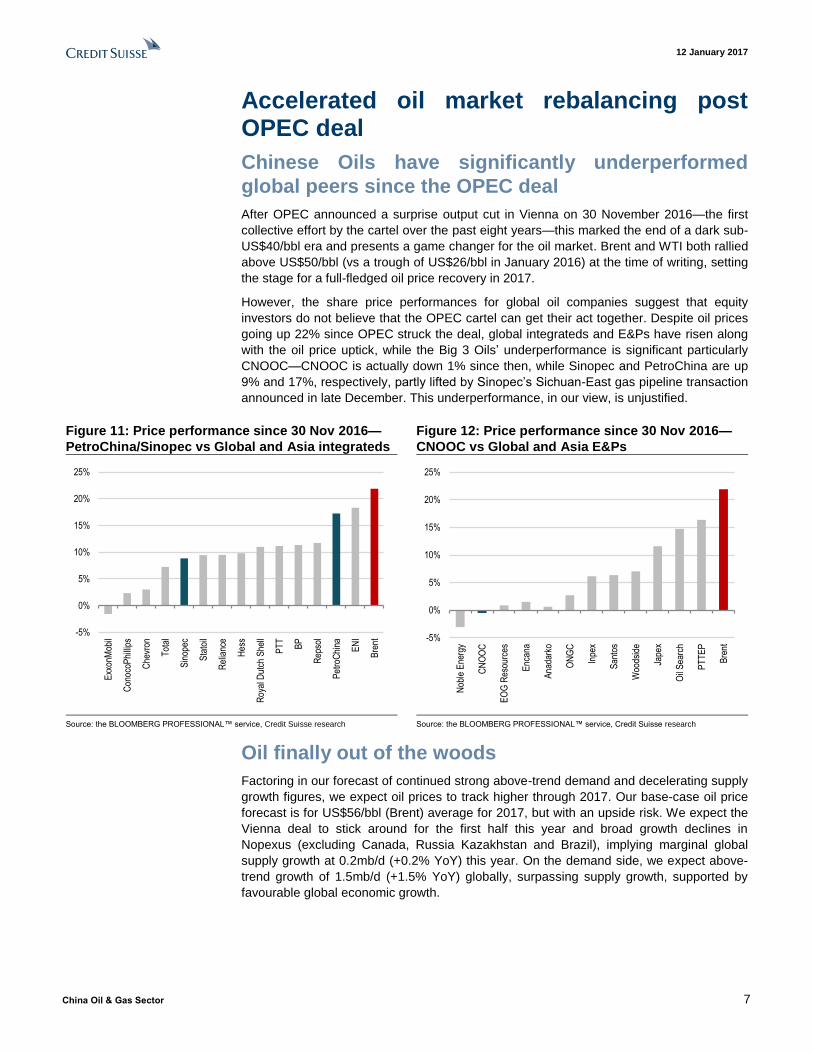
Accelerated oil market rebalancing post OPEC deal
Chinese Oils have significantly underperformed
global peers since the OPEC deal
After OPEC announced a surprise output cut in Vienna on 30 November 2016—the first
collective effort by the cartel over the past eight years—this marked the end of a dark sub-
US$40/bbl era and presents a game changer for the oil market. Brent and WTI both rallied
above US$50/bbl (vs a trough of US$26/bbl in January 2016) at the time of writing, setting
the stage for a full-fledged oil price recovery in 2017.
However, the share price performances for global oil companies suggest that equity
investors do not believe that the OPEC cartel can get their act together. Despite oil prices
going up 22% since OPEC struck the deal, global integrateds and E&Ps have risen along
with the oil price uptick, while the Big 3 Oils’ underperformance is significant particularly
CNOOC—CNOOC is actually down 1% since then, while Sinopec and PetroChina are up
9% and 17%, respectively, partly lifted by Sinopec’s Sichuan-East gas pipeline transaction
announced in late December. This underperformance, in our view, is unjustified.
Figure 11: Price performance since 30 Nov 2016—
PetroChina/Sinopec vs Global and Asia integrateds
Figure 12: Price performance since 30 Nov 2016—
CNOOC vs Global and Asia E&Ps
Source: the BLOOMBERG PROFESSIONAL™ service, Credit Suisse research Source: the BLOOMBERG PROFESSIONAL™ service, Credit Suisse research
Oil finally out of the woods
Factoring in our forecast of continued strong above-trend demand and decelerating supply
growth figures, we expect oil prices to track higher through 2017. Our base-case oil price
forecast is for US$56/bbl (Brent) average for 2017, but with an upside risk. We expect the
Vienna deal to stick around for the first half this year and broad growth declines in
Nopexus (excluding Canada, Russia Kazakhstan and Brazil), implying marginal global
supply growth at 0.2mb/d (+0.2% YoY) this year. On the demand side, we expect above-
trend growth of 1.5mb/d (+1.5% YoY) globally, surpassing supply growth, supported by
favourable global economic growth.
-5%
0%
5%
10%
15%
20%
25%
Exx
onM
obil
Con
ocoP
hilli
ps
Che
vron
Tot
al
Sin
opec
Sta
toil
Rel
ianc
e
Hes
s
Roy
al D
utch
She
ll
PT
T
BP
Rep
sol
Pet
roC
hina EN
I
Bre
nt -5%
0%
5%
10%
15%
20%
25%
Nob
le E
nerg
y
CN
OO
C
EO
G R
esou
rces
Enc
ana
Ana
dark
o
ON
GC
Inpe
x
San
tos
Woo
dsid
e
Jape
x
Oil
Sea
rch
PT
TE
P
Bre
nt

12 January 2017
China Oil & Gas Sector 8
Figure 13: Abbreviated CS base case oil balance CS Model 3Q16 4Q16E 2016E 1Q17E 2Q17E 3Q17E 4Q17E 2017E
Supply (mb/d) 96.2 97.7 96.6 96 95.6 97.2 98.2 96.7
YoY -0.4 0.6 0.1 -1.1 0.1 1 0.5 0.1
OPEC 14 39.9 40.8 40 39.7 39.8 41 41.3 40.5
YoY 0.7 1.5 1 0 0.2 1.1 0.5 0.5
Non-OPEC (includes processing gains) 56.2 56.9 56.6 56.3 55.8 56.1 56.9 56.3
YoY -1.1 -0.9 -0.9 -1.1 -0.2 -0.1 0.1 -0.3
Demand (mb/d) 96.9 97.6 96.4 97.1 96.8 98.4 99 97.8
YoY 1.1 1.8 1.6 1.4 1.2 1.5 1.4 1.4
OECD 47.2 47.2 46.8 47 46.3 47.6 47.6 47.1
YoY 0.3 0.8 0.4 0.3 0.3 0.4 0.4 0.3
Non-OECD 49.6 50.4 49.6 50 50.5 50.8 51.4 50.7
YoY 0.8 1 1.2 1.1 0.9 1.2 1 1.1
Implied inventory change (mb/d) -0.6 0.1 0.2 -1.0 -1.2 -1.1 -0.8 -1.1
Call on OPEC crude 33.9 33.9 33 34.1 34.2 35.4 35.2 34.7
YoY 2.1 2.5 2.2 2.5 1.4 1.5 1.3 1.7
OPEC crude 33.2 34 33.2 33 33 34.2 34.4 33.6
YoY 0.5 1.3 0.8 0 0.2 1 0.4 0.4 Source: Credit Suisse Global Energy Team estimates
Figure 14: CS oil price forecast and scenarios Figure 15: OPEC taking share (trended SA, mb/d)
Source: the BLOOMBERG PROFESSIONAL™ service, Credit Suisse Global Energy Team estimates
Source: IEA, JODI, EIA, Petrologistics, BP, country data, Credit Suisse Global Energy Team
Upside risk to CS’s 2017 oil price forecast, should
OPEC stick to its act
In November 2016, OPEC agreed to the outline of a deal that would cut production to
32.5mb/d from a record-high output in excess of 34mb/d in October. In addition, an
unprecedented 11 non-OPEC countries also pledged a collective 558kb/d cut in their
production. In effect, CS' Global Energy Team thinks this involves a cut of 1mb/d to
33.0mb/d, which we project as the average OPEC production in 1H17. We have also fine-
tuned our global forecasts to reflect lower oil production from Russia and Oman.
CS base case: 33.0mb/d of 2017 OPEC-14 crude production
With our modelling of an OPEC cut to 33.0mb/d in 1H17, we maintain our forecast for an
average US$56/bbl Brent oil price forecast for 2017, some 25% higher than the
~US$44/bbl of 2016 and 15% higher than the US$52/bbl of 2015. Our base case factors in
a partial implementation of the OPEC cut deal with 33.0mb/d of the 2017 OPEC-14 crude
production.
12 January 2017
China Oil & Gas Sector 9
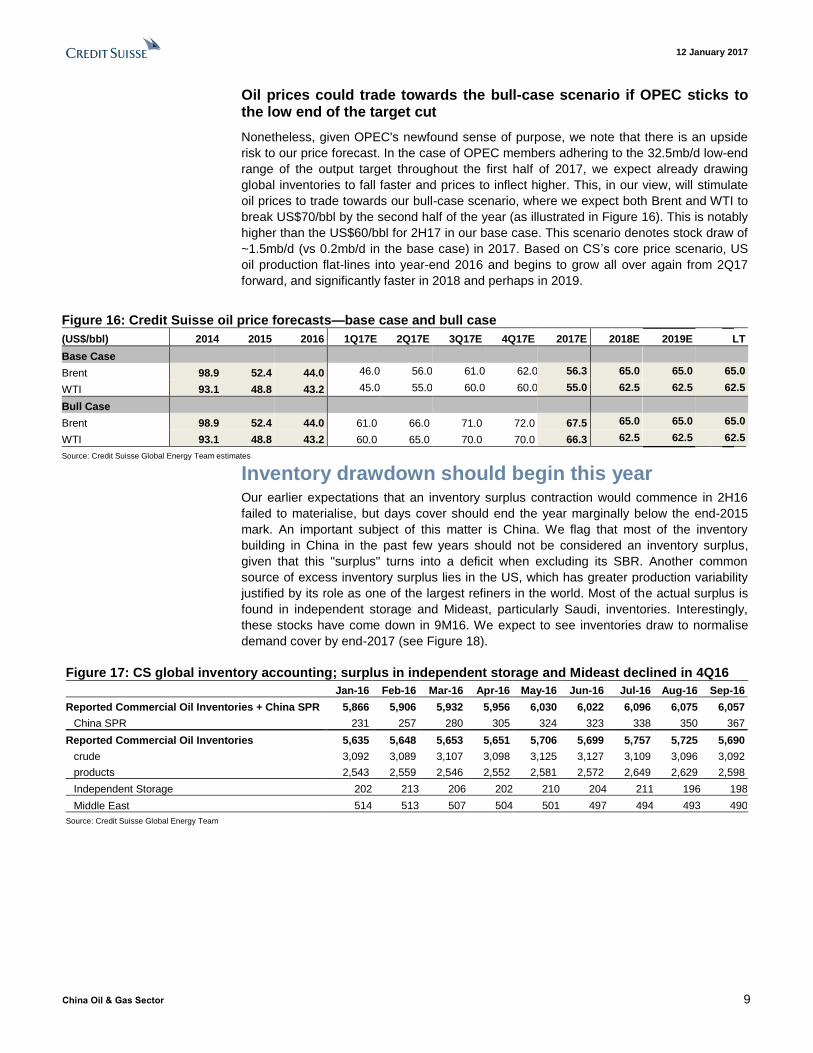
Oil prices could trade towards the bull-case scenario if OPEC sticks to the low end of the target cut
Nonetheless, given OPEC's newfound sense of purpose, we note that there is an upside
risk to our price forecast. In the case of OPEC members adhering to the 32.5mb/d low-end
range of the output target throughout the first half of 2017, we expect already drawing
global inventories to fall faster and prices to inflect higher. This, in our view, will stimulate
oil prices to trade towards our bull-case scenario, where we expect both Brent and WTI to
break US$70/bbl by the second half of the year (as illustrated in Figure 16). This is notably
higher than the US$60/bbl for 2H17 in our base case. This scenario denotes stock draw of
~1.5mb/d (vs 0.2mb/d in the base case) in 2017. Based on CS’s core price scenario, US
oil production flat-lines into year-end 2016 and begins to grow all over again from 2Q17
forward, and significantly faster in 2018 and perhaps in 2019.
Figure 16: Credit Suisse oil price forecasts—base case and bull case
(US$/bbl) 2014 2015 2016 1Q17E 2Q17E 3Q17E 4Q17E 2017E 2018E 2019E LT
Base Case
Brent 98.9 52.4 44.0 46.0 56.0 61.0 62.0 56.3 65.0 65.0 65.0
WTI 93.1 48.8 43.2 45.0 55.0 60.0 60.0 55.0 62.5 62.5 62.5
Bull Case
Brent 98.9 52.4 44.0 61.0 66.0 71.0 72.0 67.5 65.0 65.0 65.0
WTI 93.1 48.8 43.2 60.0 65.0 70.0 70.0 66.3 62.5 62.5 62.5
Source: Credit Suisse Global Energy Team estimates
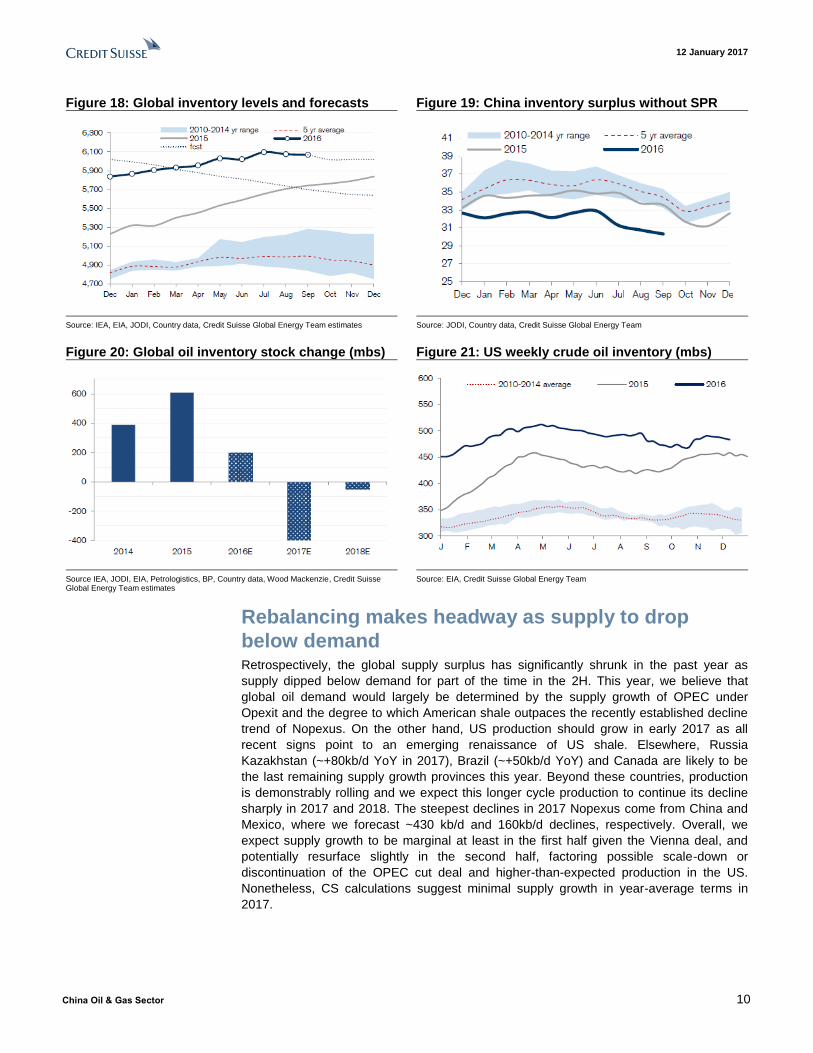
Inventory drawdown should begin this year Our earlier expectations that an inventory surplus contraction would commence in 2H16
failed to materialise, but days cover should end the year marginally below the end-2015
mark. An important subject of this matter is China. We flag that most of the inventory
building in China in the past few years should not be considered an inventory surplus,
given that this "surplus" turns into a deficit when excluding its SBR. Another common
source of excess inventory surplus lies in the US, which has greater production variability
justified by its role as one of the largest refiners in the world. Most of the actual surplus is
found in independent storage and Mideast, particularly Saudi, inventories. Interestingly,
these stocks have come down in 9M16. We expect to see inventories draw to normalise
demand cover by end-2017 (see Figure 18).
Figure 17: CS global inventory accounting; surplus in independent storage and Mideast declined in 4Q16
Jan-16 Feb-16 Mar-16 Apr-16 May-16 Jun-16 Jul-16 Aug-16 Sep-16
Reported Commercial Oil Inventories + China SPR 5,866 5,906 5,932 5,956 6,030 6,022 6,096 6,075 6,057
China SPR 231 257 280 305 324 323 338 350 367
Reported Commercial Oil Inventories 5,635 5,648 5,653 5,651 5,706 5,699 5,757 5,725 5,690
crude 3,092 3,089 3,107 3,098 3,125 3,127 3,109 3,096 3,092
products 2,543 2,559 2,546 2,552 2,581 2,572 2,649 2,629 2,598
Independent Storage 202 213 206 202 210 204 211 196 198
Middle East 514 513 507 504 501 497 494 493 490
Source: Credit Suisse Global Energy Team
12 January 2017
China Oil & Gas Sector 10
Figure 18: Global inventory levels and forecasts Figure 19: China inventory surplus without SPR
Source: IEA, EIA, JODI, Country data, Credit Suisse Global Energy Team estimates Source: JODI, Country data, Credit Suisse Global Energy Team
Figure 20: Global oil inventory stock change (mbs) Figure 21: US weekly crude oil inventory (mbs)
Source IEA, JODI, EIA, Petrologistics, BP, Country data, Wood Mackenzie, Credit Suisse Global Energy Team estimates
Source: EIA, Credit Suisse Global Energy Team
Rebalancing makes headway as supply to drop
below demand Retrospectively, the global supply surplus has significantly shrunk in the past year as
supply dipped below demand for part of the time in the 2H. This year, we believe that
global oil demand would largely be determined by the supply growth of OPEC under
Opexit and the degree to which American shale outpaces the recently established decline
trend of Nopexus. On the other hand, US production should grow in early 2017 as all
recent signs point to an emerging renaissance of US shale. Elsewhere, Russia
Kazakhstan (~+80kb/d YoY in 2017), Brazil (~+50kb/d YoY) and Canada are likely to be
the last remaining supply growth provinces this year. Beyond these countries, production
is demonstrably rolling and we expect this longer cycle production to continue its decline
sharply in 2017 and 2018. The steepest declines in 2017 Nopexus come from China and
Mexico, where we forecast ~430 kb/d and 160kb/d declines, respectively. Overall, we
expect supply growth to be marginal at least in the first half given the Vienna deal, and
potentially resurface slightly in the second half, factoring possible scale-down or
discontinuation of the OPEC cut deal and higher-than-expected production in the US.
Nonetheless, CS calculations suggest minimal supply growth in year-average terms in
2017.

12 January 2017
China Oil & Gas Sector 11
Figure 22: Oil supply and demand (3 mma, mb/d) Figure 23: US shale crude oil should now recover
Source: IEA, JODI, EIA, Petrologistics, BP, country data, Credit Suisse Global Energy Team estimates
Source: Credit Suisse Global Energy Team estimates
Figure 24: OPEC 14 crude production forecast Figure 25: China crude oil production (mb/d)
Source: IEA, JODI, EIA, Petrologistics, BP, country data, : Credit Suisse Global Energy Team estimates
Source: IEA, BP, NBS, Credit Suisse Global Energy Team research estimates
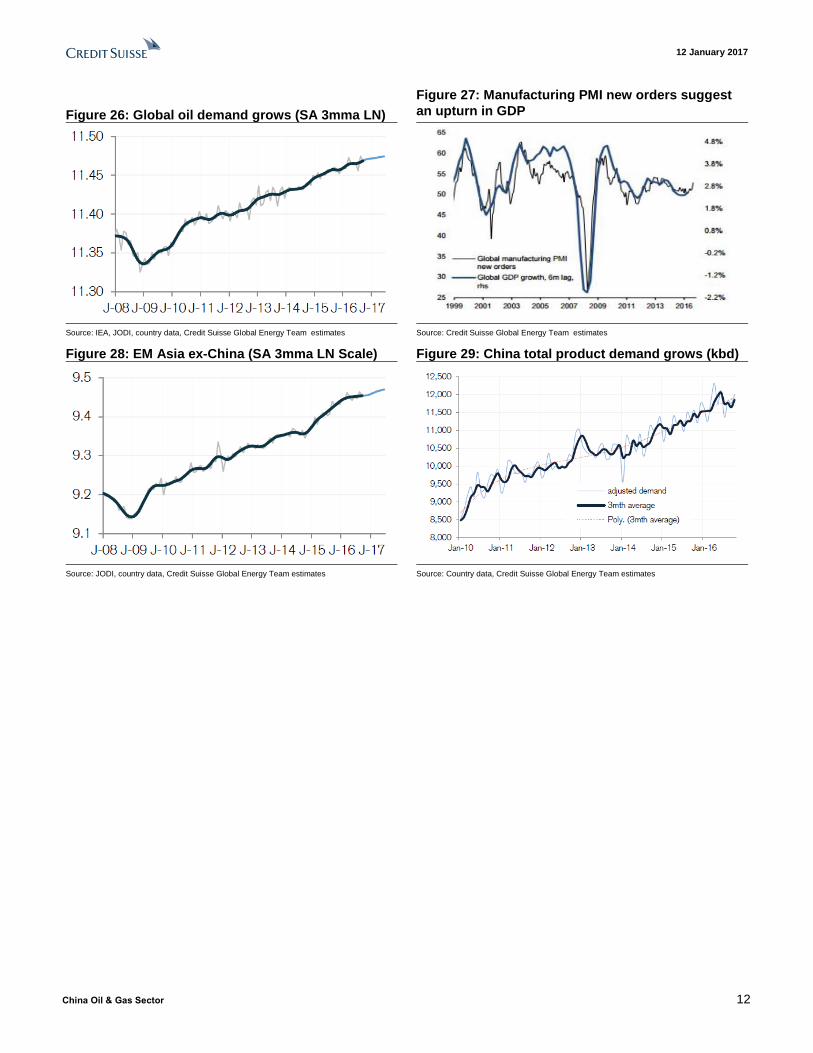
Solid demand extends into 2017; uncertainties
remain on macro volatility
With the OPEC deal locking down supply risks, demand becomes the most uncertain
component of the oil price equation. In the past three years, the market theory that an oil
price collapse would generate a fall in demand proved a fallacy as global demand soared
above the trend pace amid falling oil prices, increased EM consumers, the making of a
cyclical upturn in the US and a shallow recovery in Europe. In 2017, we expect global
growth of 1.5% YoY, which would outperform trend growth of around 1.3% YoY. We
estimate that the OECD will grow 0.9% YoY and EM demand growth will decelerate to
2.1% YoY. We flag three macro-environmental factors, crucial for shaping near-term oil
demand. (1) The latest strength of the greenback supported by rising interest rates and
inflationary promises would theoretically erode upstream costs and hence undermine the
upside to oil. (2) Accommodating easing and fiscal policies globally present upside to
oil. (3) China demands more. Notably, China's renewed increase in infrastructure
spending and an export boost due to Rmb weakness appear to be favourable to growth in
2017. We model around 3.5% YoY demand growth in the country in 2017.
In our model, we expect demand growth to decelerate slightly from ~1.6% in 2016 to
~1.5% in 2017. There are a few downside risks to our estimates, namely: (1) quicker-
than-expected demand growth deceleration owing to economic volatilities; (2) a short-
lived Trump "honeymoon"; (3) faltering consumer confidence; (4) European
elections and potentially ensuing disordered policy responses; and (5) further deflation
of global trade.
12 January 2017
China Oil & Gas Sector 12
Figure 26: Global oil demand grows (SA 3mma LN)
Figure 27: Manufacturing PMI new orders suggest
an upturn in GDP
Source: IEA, JODI, country data, Credit Suisse Global Energy Team estimates Source: Credit Suisse Global Energy Team estimates
Figure 28: EM Asia ex-China (SA 3mma LN Scale) Figure 29: China total product demand grows (kbd)
Source: JODI, country data, Credit Suisse Global Energy Team estimates Source: Country data, Credit Suisse Global Energy Team estimates
12 January 2017
China Oil & Gas Sector 13
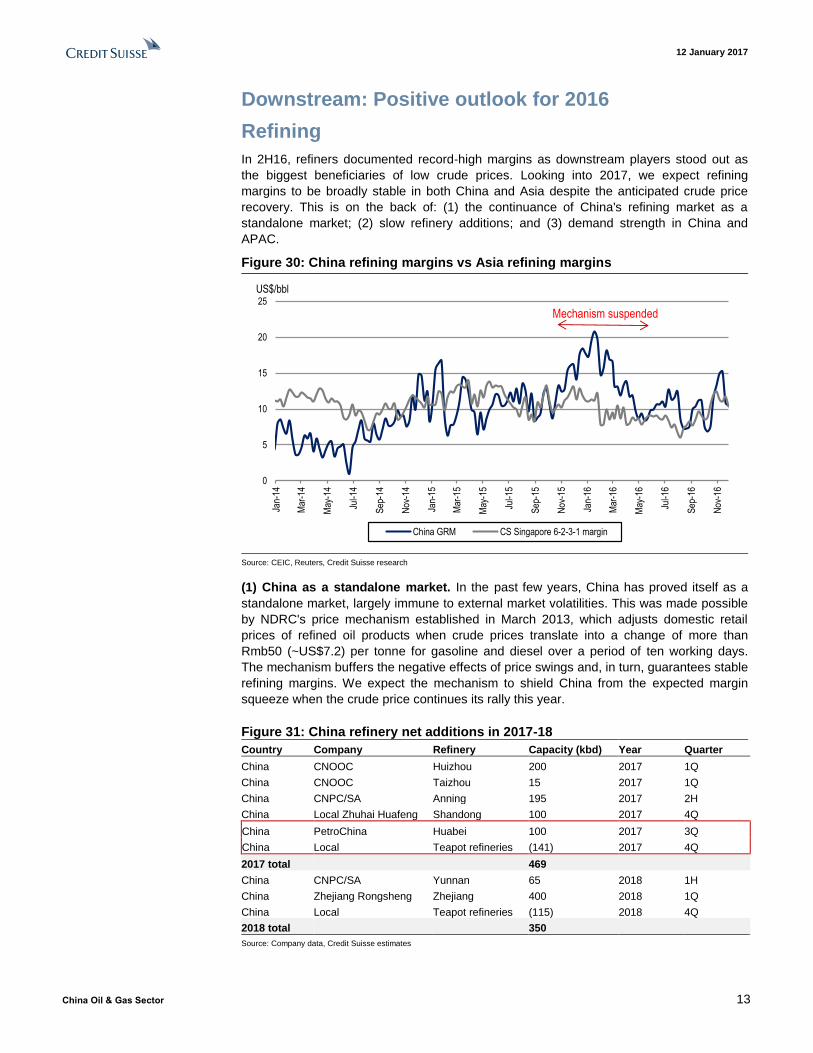
Downstream: Positive outlook for 2016
Refining
In 2H16, refiners documented record-high margins as downstream players stood out as
the biggest beneficiaries of low crude prices. Looking into 2017, we expect refining
margins to be broadly stable in both China and Asia despite the anticipated crude price
recovery. This is on the back of: (1) the continuance of China's refining market as a
standalone market; (2) slow refinery additions; and (3) demand strength in China and
APAC.
Figure 30: China refining margins vs Asia refining margins
Source: CEIC, Reuters, Credit Suisse research
(1) China as a standalone market. In the past few years, China has proved itself as a
standalone market, largely immune to external market volatilities. This was made possible
by NDRC's price mechanism established in March 2013, which adjusts domestic retail
prices of refined oil products when crude prices translate into a change of more than
Rmb50 (~US$7.2) per tonne for gasoline and diesel over a period of ten working days.
The mechanism buffers the negative effects of price swings and, in turn, guarantees stable
refining margins. We expect the mechanism to shield China from the expected margin
squeeze when the crude price continues its rally this year.
Figure 31: China refinery net additions in 2017-18
Country Company Refinery Capacity (kbd) Year Quarter
China CNOOC Huizhou 200 2017 1Q
China CNOOC Taizhou 15 2017 1Q
China CNPC/SA Anning 195 2017 2H
China Local Zhuhai Huafeng Shandong 100 2017 4Q
China PetroChina Huabei 100 2017 3Q
China Local Teapot refineries (141) 2017 4Q
2017 total 469
China CNPC/SA Yunnan 65 2018 1H
China Zhejiang Rongsheng Zhejiang 400 2018 1Q
China Local Teapot refineries (115) 2018 4Q
2018 total 350
Source: Company data, Credit Suisse estimates
0
5
10
15
20
25
Jan-
14
Mar
-14
May
-14
Jul-1
4
Sep
-14
Nov
-14
Jan-
15
Mar
-15
May
-15
Jul-1
5
Sep
-15
Nov
-15
Jan-
16
Mar
-16
May
-16
Jul-1
6
Sep
-16
Nov
-16
China GRM CS Singapore 6-2-3-1 margin
US$/bbl
Mechanism suspended
12 January 2017
China Oil & Gas Sector 14
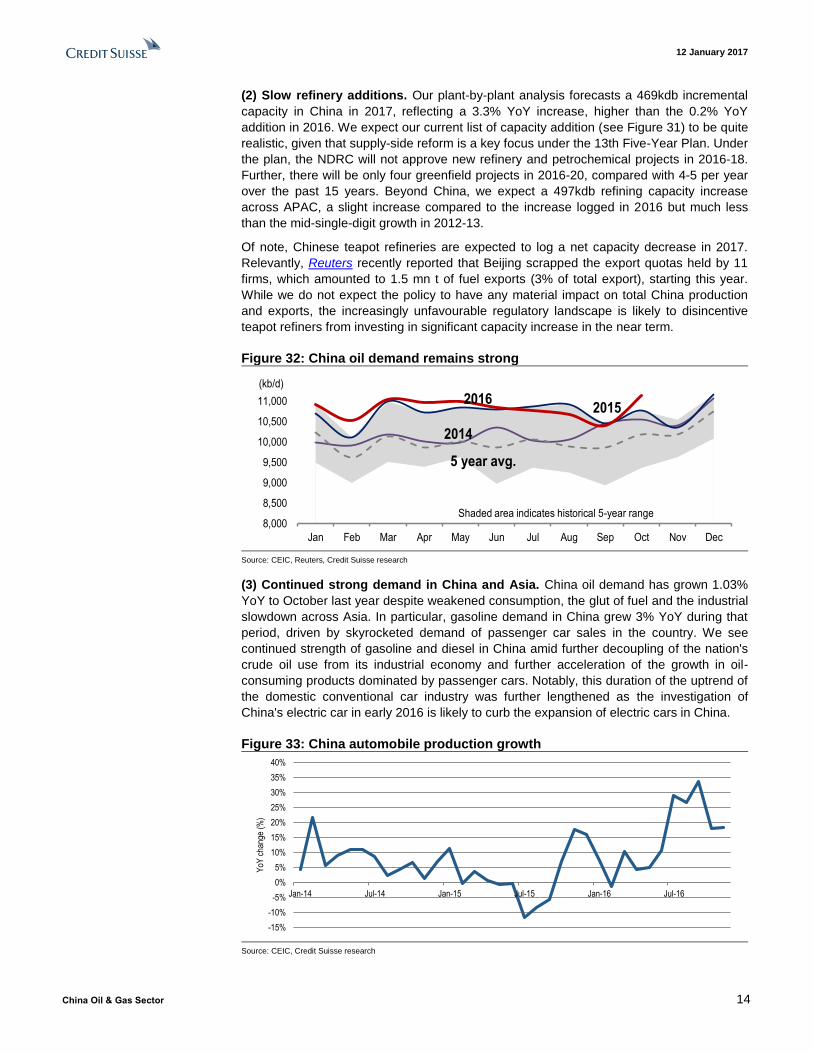
(2) Slow refinery additions. Our plant-by-plant analysis forecasts a 469kdb incremental
capacity in China in 2017, reflecting a 3.3% YoY increase, higher than the 0.2% YoY
addition in 2016. We expect our current list of capacity addition (see Figure 31) to be quite
realistic, given that supply-side reform is a key focus under the 13th Five-Year Plan. Under
the plan, the NDRC will not approve new refinery and petrochemical projects in 2016-18.
Further, there will be only four greenfield projects in 2016-20, compared with 4-5 per year
over the past 15 years. Beyond China, we expect a 497kdb refining capacity increase
across APAC, a slight increase compared to the increase logged in 2016 but much less
than the mid-single-digit growth in 2012-13.
Of note, Chinese teapot refineries are expected to log a net capacity decrease in 2017.
Relevantly, Reuters recently reported that Beijing scrapped the export quotas held by 11
firms, which amounted to 1.5 mn t of fuel exports (3% of total export), starting this year.
While we do not expect the policy to have any material impact on total China production
and exports, the increasingly unfavourable regulatory landscape is likely to disincentive
teapot refiners from investing in significant capacity increase in the near term.
Figure 32: China oil demand remains strong
Source: CEIC, Reuters, Credit Suisse research
(3) Continued strong demand in China and Asia. China oil demand has grown 1.03%
YoY to October last year despite weakened consumption, the glut of fuel and the industrial
slowdown across Asia. In particular, gasoline demand in China grew 3% YoY during that
period, driven by skyrocketed demand of passenger car sales in the country. We see
continued strength of gasoline and diesel in China amid further decoupling of the nation's
crude oil use from its industrial economy and further acceleration of the growth in oil-
consuming products dominated by passenger cars. Notably, this duration of the uptrend of
the domestic conventional car industry was further lengthened as the investigation of
China's electric car in early 2016 is likely to curb the expansion of electric cars in China.
Figure 33: China automobile production growth
Source: CEIC, Credit Suisse research
8,000
8,500
9,000
9,500
10,000
10,500
11,000
Jan Feb Mar Apr May Jun Jul Aug Sep Oct Nov Dec
20152016
2014
5 year avg.
Shaded area indicates historical 5-year range
(kb/d)
-15%
-10%
-5%
0%
5%
10%
15%
20%
25%
30%
35%
40%
Jan-14 Jul-14 Jan-15 Jul-15 Jan-16 Jul-16
YoY
cha
nge
(%)
12 January 2017
China Oil & Gas Sector 15
Chemicals
Ethylene
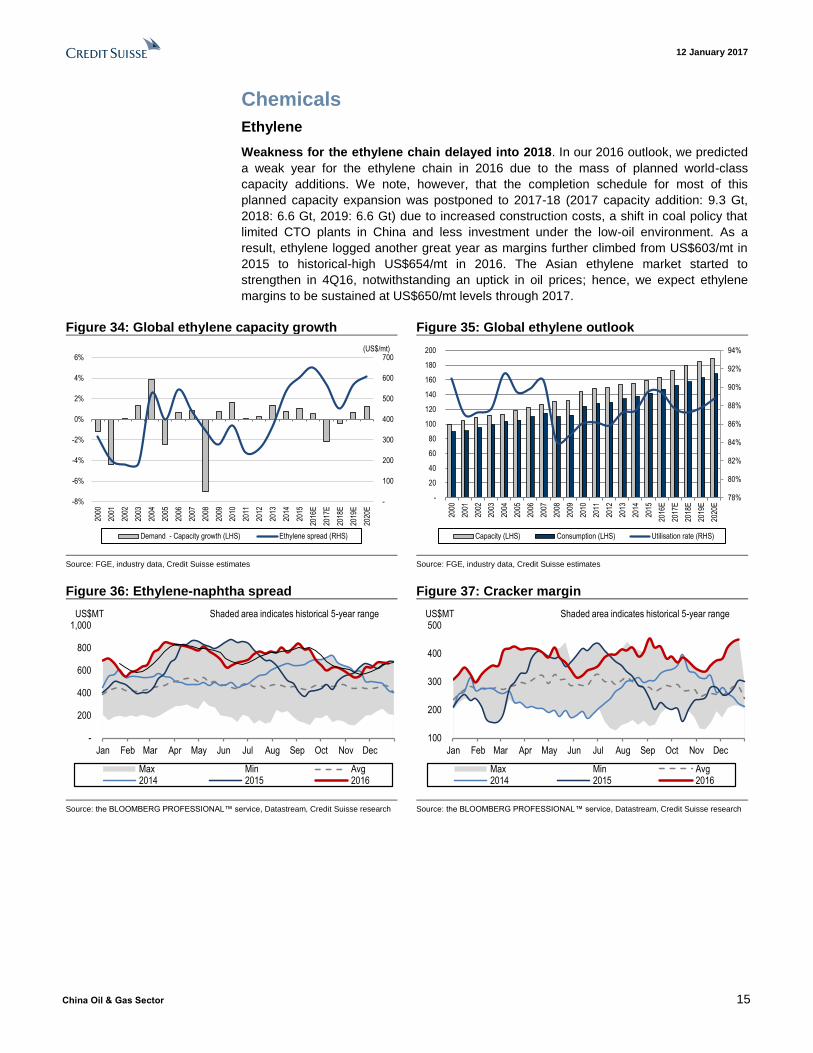
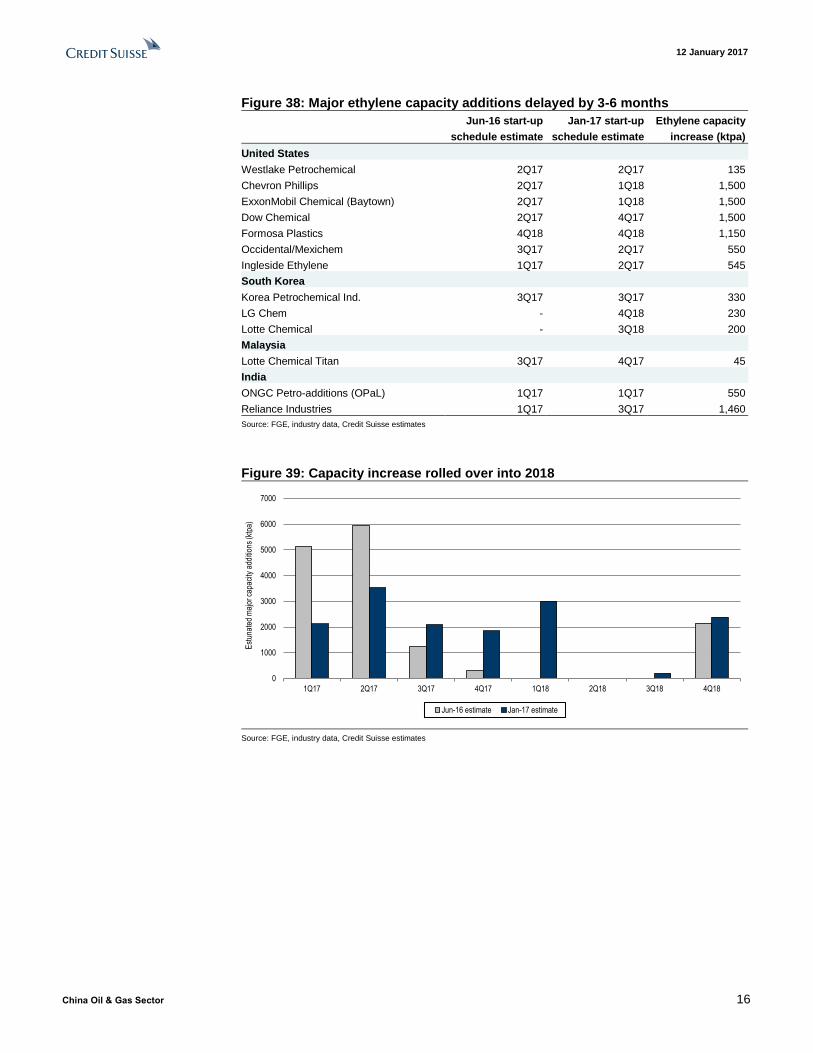
Weakness for the ethylene chain delayed into 2018. In our 2016 outlook, we predicted
a weak year for the ethylene chain in 2016 due to the mass of planned world-class
capacity additions. We note, however, that the completion schedule for most of this
planned capacity expansion was postponed to 2017-18 (2017 capacity addition: 9.3 Gt,
2018: 6.6 Gt, 2019: 6.6 Gt) due to increased construction costs, a shift in coal policy that
limited CTO plants in China and less investment under the low-oil environment. As a
result, ethylene logged another great year as margins further climbed from US$603/mt in
2015 to historical-high US$654/mt in 2016. The Asian ethylene market started to
strengthen in 4Q16, notwithstanding an uptick in oil prices; hence, we expect ethylene
margins to be sustained at US$650/mt levels through 2017.
Figure 34: Global ethylene capacity growth Figure 35: Global ethylene outlook
Source: FGE, industry data, Credit Suisse estimates Source: FGE, industry data, Credit Suisse estimates
Figure 36: Ethylene-naphtha spread Figure 37: Cracker margin
Source: the BLOOMBERG PROFESSIONAL™ service, Datastream, Credit Suisse research Source: the BLOOMBERG PROFESSIONAL™ service, Datastream, Credit Suisse research
-
100
200
300
400
500
600
700
-8%
-6%
-4%
-2%
0%
2%
4%
6%
2000
2001
2002
2003
2004
2005
2006
2007
2008
2009
2010
2011
2012
2013
2014
2015
2016
E
2017
E
2018
E
2019
E
2020
E
Demand - Capacity growth (LHS) Ethylene spread (RHS)
(US$/mt)
78%
80%
82%
84%
86%
88%
90%
92%
94%
-
20
40
60
80
100
120
140
160
180
200
2000
2001
2002
2003
2004
2005
2006
2007
2008
2009
2010
2011
2012
2013
2014
2015
2016
E
2017
E
2018
E
2019
E
2020
E
Capacity (LHS) Consumption (LHS) Utilisation rate (RHS)
-
200
400
600
800
1,000
Jan Feb Mar Apr May Jun Jul Aug Sep Oct Nov Dec
Max Min Avg2014 2015 2016
US$MT Shaded area indicates historical 5-year range
100
200
300
400
500
Jan Feb Mar Apr May Jun Jul Aug Sep Oct Nov Dec
Max Min Avg2014 2015 2016
US$MT Shaded area indicates historical 5-year range
12 January 2017
China Oil & Gas Sector 16
Figure 38: Major ethylene capacity additions delayed by 3-6 months
Jun-16 start-up
schedule estimate
Jan-17 start-up
schedule estimate
Ethylene capacity
increase (ktpa)
United States
Westlake Petrochemical 2Q17 2Q17 135
Chevron Phillips 2Q17 1Q18 1,500
ExxonMobil Chemical (Baytown) 2Q17 1Q18 1,500
Dow Chemical 2Q17 4Q17 1,500
Formosa Plastics 4Q18 4Q18 1,150
Occidental/Mexichem 3Q17 2Q17 550
Ingleside Ethylene 1Q17 2Q17 545
South Korea
Korea Petrochemical Ind. 3Q17 3Q17 330
LG Chem - 4Q18 230
Lotte Chemical - 3Q18 200
Malaysia
Lotte Chemical Titan 3Q17 4Q17 45
India
ONGC Petro-additions (OPaL) 1Q17 1Q17 550
Reliance Industries 1Q17 3Q17 1,460
Source: FGE, industry data, Credit Suisse estimates
Figure 39: Capacity increase rolled over into 2018
Source: FGE, industry data, Credit Suisse estimates
0
1000
2000
3000
4000
5000
6000
7000
1Q17 2Q17 3Q17 4Q17 1Q18 2Q18 3Q18 4Q18
Est
unat
ed m
ajor
cap
acity
add
ition
s (k
tpa)
Jun-16 estimate Jan-17 estimate
12 January 2017
China Oil & Gas Sector 17
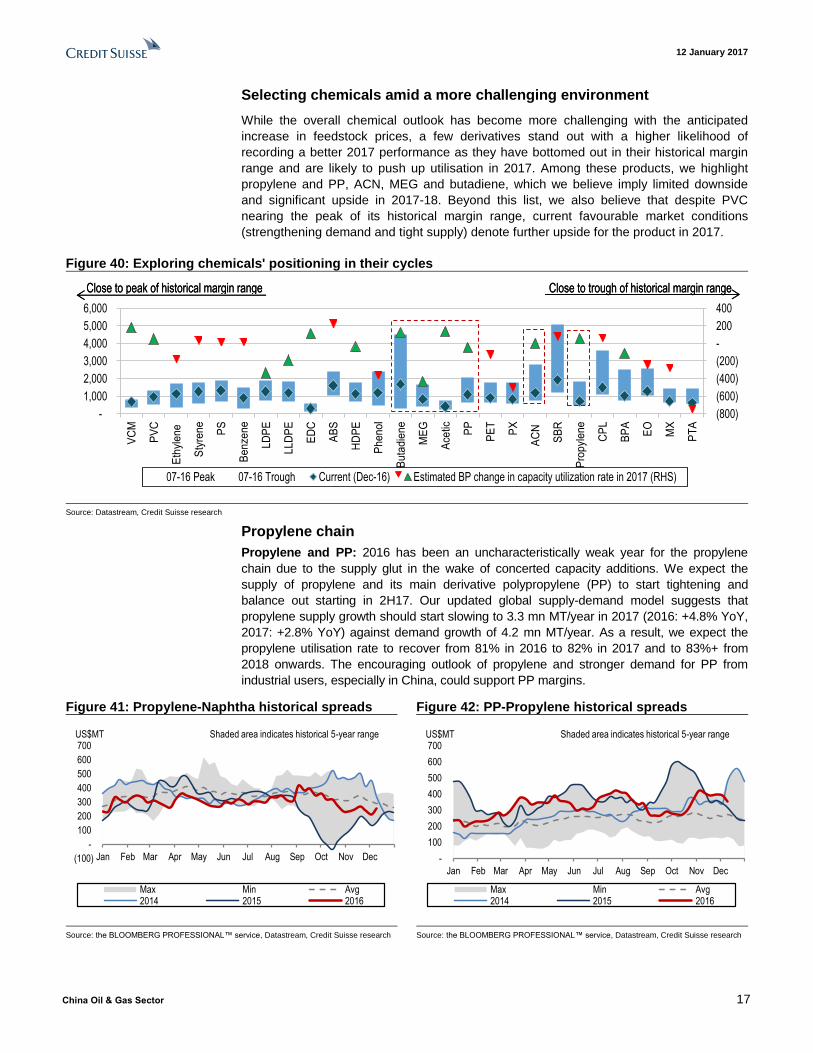
Selecting chemicals amid a more challenging environment
While the overall chemical outlook has become more challenging with the anticipated
increase in feedstock prices, a few derivatives stand out with a higher likelihood of
recording a better 2017 performance as they have bottomed out in their historical margin
range and are likely to push up utilisation in 2017. Among these products, we highlight
propylene and PP, ACN, MEG and butadiene, which we believe imply limited downside
and significant upside in 2017-18. Beyond this list, we also believe that despite PVC
nearing the peak of its historical margin range, current favourable market conditions
(strengthening demand and tight supply) denote further upside for the product in 2017.
Figure 40: Exploring chemicals' positioning in their cycles
Source: Datastream, Credit Suisse research
Propylene chain
Propylene and PP: 2016 has been an uncharacteristically weak year for the propylene
chain due to the supply glut in the wake of concerted capacity additions. We expect the
supply of propylene and its main derivative polypropylene (PP) to start tightening and
balance out starting in 2H17. Our updated global supply-demand model suggests that
propylene supply growth should start slowing to 3.3 mn MT/year in 2017 (2016: +4.8% YoY,
2017: +2.8% YoY) against demand growth of 4.2 mn MT/year. As a result, we expect the
propylene utilisation rate to recover from 81% in 2016 to 82% in 2017 and to 83%+ from
2018 onwards. The encouraging outlook of propylene and stronger demand for PP from
industrial users, especially in China, could support PP margins.
Figure 41: Propylene-Naphtha historical spreads Figure 42: PP-Propylene historical spreads
Source: the BLOOMBERG PROFESSIONAL™ service, Datastream, Credit Suisse research Source: the BLOOMBERG PROFESSIONAL™ service, Datastream, Credit Suisse research
(800)
(600)
(400)
(200)
-
200
400
-
1,000
2,000
3,000
4,000
5,000
6,000
VC
M
PV
C
Eth
yle
ne
Sty
ren
e
PS
Be
nze
ne
LD
PE
LL
DP
E
ED
C
AB
S
HD
PE
Ph
en
ol
Bu
tad
ien
e
ME
G
Ace
tic PP
PE
T
PX
AC
N
SB
R
Pro
pyl
en
e
CP
L
BP
A
EO
MX
PT
A
07-16 Peak 07-16 Trough Current (Dec-16) Estimated BP change in capacity utilization rate in 2017 (RHS)
Close to peak of historical margin range Close to trough of historical margin rangeClose to peak of historical margin range Close to trough of historical margin range
(100)
-
100
200
300
400
500
600
700
Jan Feb Mar Apr May Jun Jul Aug Sep Oct Nov Dec
Max Min Avg2014 2015 2016
US$MT Shaded area indicates historical 5-year range
-
100
200
300
400
500
600
700
Jan Feb Mar Apr May Jun Jul Aug Sep Oct Nov Dec
Max Min Avg2014 2015 2016
US$MT Shaded area indicates historical 5-year range
12 January 2017
China Oil & Gas Sector 18
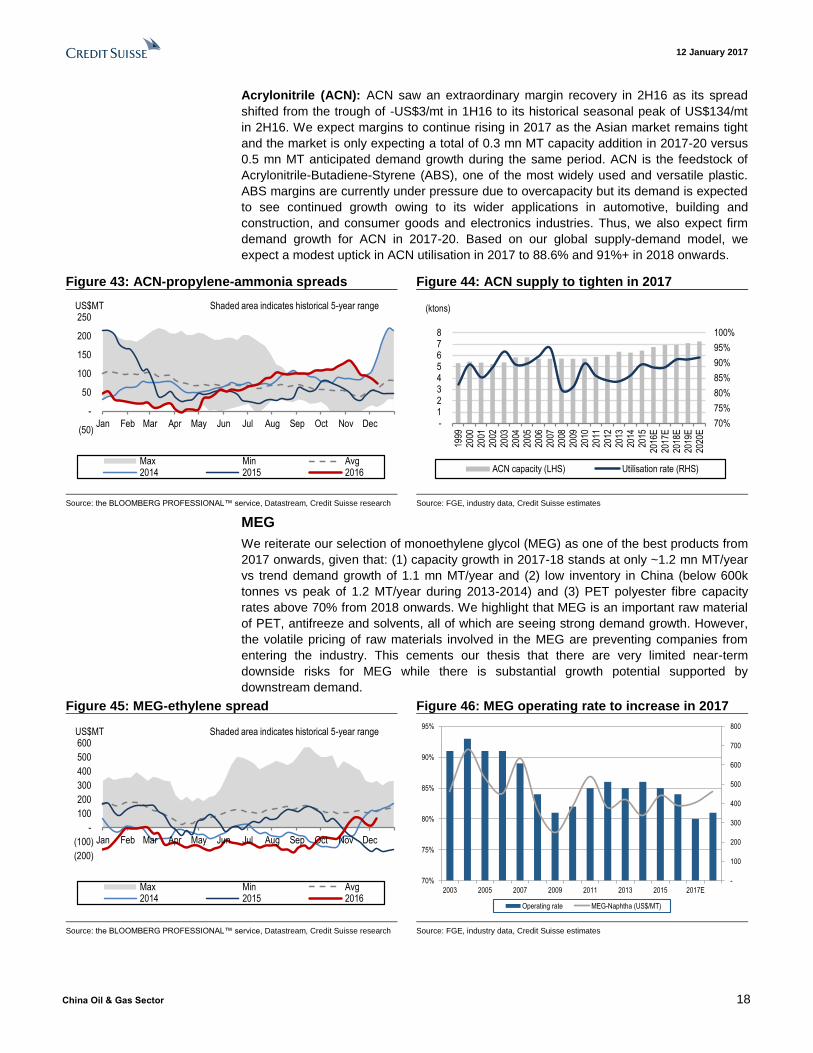
Acrylonitrile (ACN): ACN saw an extraordinary margin recovery in 2H16 as its spread
shifted from the trough of -US$3/mt in 1H16 to its historical seasonal peak of US$134/mt
in 2H16. We expect margins to continue rising in 2017 as the Asian market remains tight
and the market is only expecting a total of 0.3 mn MT capacity addition in 2017-20 versus
0.5 mn MT anticipated demand growth during the same period. ACN is the feedstock of
Acrylonitrile-Butadiene-Styrene (ABS), one of the most widely used and versatile plastic.
ABS margins are currently under pressure due to overcapacity but its demand is expected
to see continued growth owing to its wider applications in automotive, building and
construction, and consumer goods and electronics industries. Thus, we also expect firm
demand growth for ACN in 2017-20. Based on our global supply-demand model, we
expect a modest uptick in ACN utilisation in 2017 to 88.6% and 91%+ in 2018 onwards.
Figure 43: ACN-propylene-ammonia spreads Figure 44: ACN supply to tighten in 2017
Source: the BLOOMBERG PROFESSIONAL™ service, Datastream, Credit Suisse research Source: FGE, industry data, Credit Suisse estimates
MEG
We reiterate our selection of monoethylene glycol (MEG) as one of the best products from
2017 onwards, given that: (1) capacity growth in 2017-18 stands at only ~1.2 mn MT/year
vs trend demand growth of 1.1 mn MT/year and (2) low inventory in China (below 600k
tonnes vs peak of 1.2 MT/year during 2013-2014) and (3) PET polyester fibre capacity
rates above 70% from 2018 onwards. We highlight that MEG is an important raw material
of PET, antifreeze and solvents, all of which are seeing strong demand growth. However,
the volatile pricing of raw materials involved in the MEG are preventing companies from
entering the industry. This cements our thesis that there are very limited near-term
downside risks for MEG while there is substantial growth potential supported by
downstream demand.
Figure 45: MEG-ethylene spread Figure 46: MEG operating rate to increase in 2017
Source: the BLOOMBERG PROFESSIONAL™ service, Datastream, Credit Suisse research Source: FGE, industry data, Credit Suisse estimates
(50)
-
50
100
150
200
250
Jan Feb Mar Apr May Jun Jul Aug Sep Oct Nov Dec
Max Min Avg2014 2015 2016
US$MT Shaded area indicates historical 5-year range
70%
75%
80%
85%
90%
95%
100%
- 1 2 3 4 5 6 7 8
1999
2000
2001
2002
2003
2004
2005
2006
2007
2008
2009
2010
2011
2012
2013
2014
2015
2016
E20
17E
2018
E20
19E
2020
E
ACN capacity (LHS) Utilisation rate (RHS)
(ktons)
(200)
(100)
-
100
200
300
400
500
600
Jan Feb Mar Apr May Jun Jul Aug Sep Oct Nov Dec
Max Min Avg2014 2015 2016
US$MT Shaded area indicates historical 5-year range
-
100
200
300
400
500
600
700
800
70%
75%
80%
85%
90%
95%
2003 2005 2007 2009 2011 2013 2015 2017E
Operating rate MEG-Naphtha (US$/MT)
12 January 2017
China Oil & Gas Sector 19
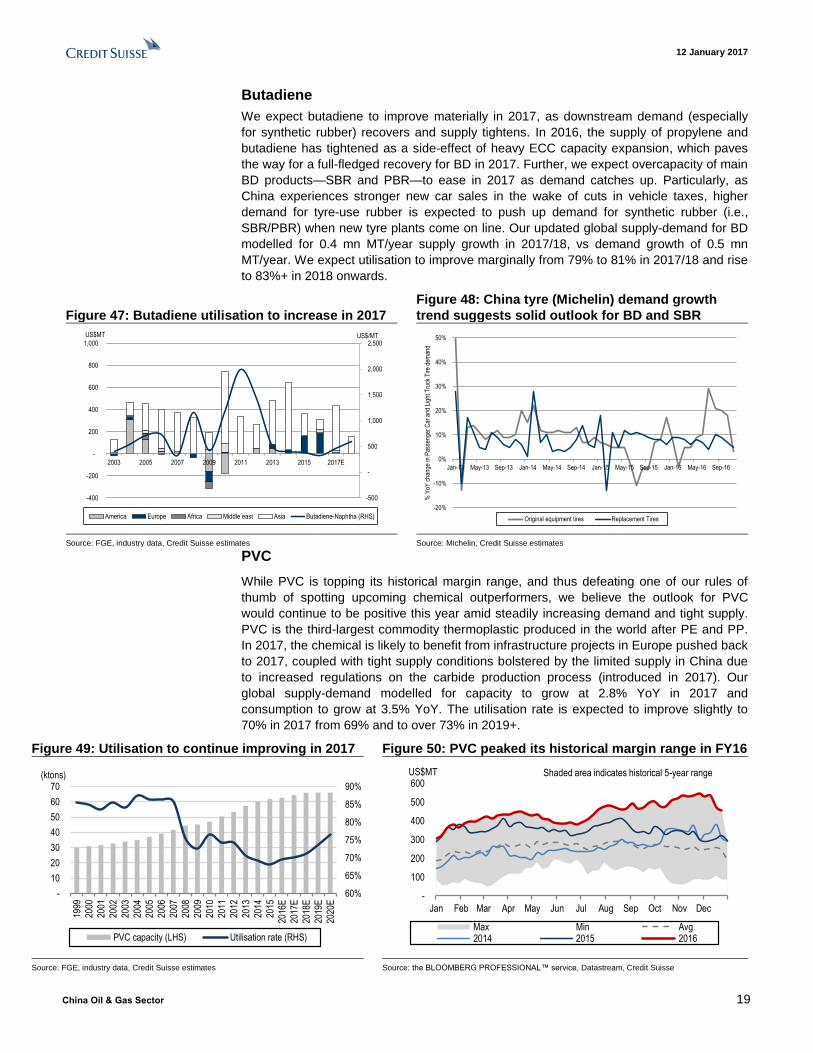
Butadiene
We expect butadiene to improve materially in 2017, as downstream demand (especially
for synthetic rubber) recovers and supply tightens. In 2016, the supply of propylene and
butadiene has tightened as a side-effect of heavy ECC capacity expansion, which paves
the way for a full-fledged recovery for BD in 2017. Further, we expect overcapacity of main
BD products—SBR and PBR—to ease in 2017 as demand catches up. Particularly, as
China experiences stronger new car sales in the wake of cuts in vehicle taxes, higher
demand for tyre-use rubber is expected to push up demand for synthetic rubber (i.e.,
SBR/PBR) when new tyre plants come on line. Our updated global supply-demand for BD
modelled for 0.4 mn MT/year supply growth in 2017/18, vs demand growth of 0.5 mn
MT/year. We expect utilisation to improve marginally from 79% to 81% in 2017/18 and rise
to 83%+ in 2018 onwards.
Figure 47: Butadiene utilisation to increase in 2017
Figure 48: China tyre (Michelin) demand growth
trend suggests solid outlook for BD and SBR
Source: FGE, industry data, Credit Suisse estimates Source: Michelin, Credit Suisse estimates
PVC
While PVC is topping its historical margin range, and thus defeating one of our rules of
thumb of spotting upcoming chemical outperformers, we believe the outlook for PVC
would continue to be positive this year amid steadily increasing demand and tight supply.
PVC is the third-largest commodity thermoplastic produced in the world after PE and PP.
In 2017, the chemical is likely to benefit from infrastructure projects in Europe pushed back
to 2017, coupled with tight supply conditions bolstered by the limited supply in China due
to increased regulations on the carbide production process (introduced in 2017). Our
global supply-demand modelled for capacity to grow at 2.8% YoY in 2017 and
consumption to grow at 3.5% YoY. The utilisation rate is expected to improve slightly to
70% in 2017 from 69% and to over 73% in 2019+.
Figure 49: Utilisation to continue improving in 2017 Figure 50: PVC peaked its historical margin range in FY16
Source: FGE, industry data, Credit Suisse estimates Source: the BLOOMBERG PROFESSIONAL™ service, Datastream, Credit Suisse
-500
-
500
1,000
1,500
2,000
2,500
-400
-200
-
200
400
600
800
1,000
2003 2005 2007 2009 2011 2013 2015 2017E
US$/MTUS$MT
America Europe Africa Middle east Asia Butadiene-Naphtha (RHS)
-20%
-10%
0%
10%
20%
30%
40%
50%
Jan-13 May-13 Sep-13 Jan-14 May-14 Sep-14 Jan-15 May-15 Sep-15 Jan-16 May-16 Sep-16
% Y
oY c
hang
e in
Pas
seng
er C
ar a
nd L
ight
Tru
ck T
ire d
eman
d
Original equipment tires Replacement Tires
60%
65%
70%
75%
80%
85%
90%
-
10
20
30
40
50
60
70
1999
2000
2001
2002
2003
2004
2005
2006
2007
2008
2009
2010
2011
2012
2013
2014
2015
2016
E
2017
E
2018
E
2019
E
2020
E
PVC capacity (LHS) Utilisation rate (RHS)
(ktons)
-
100
200
300
400
500
600
Jan Feb Mar Apr May Jun Jul Aug Sep Oct Nov Dec
Max Min Avg2014 2015 2016
US$MT Shaded area indicates historical 5-year range
12 January 2017
China Oil & Gas Sector 20
Multiple catalysts ahead
(1) CNOOC’s Strategy Preview CNOOC will be hosting its annual Strategy Preview on 19 January 2017. Over the past
year, the market has been concerned about CNOOC’s deteriorating production and low
reserve life, and expectations are low heading into the Preview, but we believe it should
surprise the market on the upside.
First, on production, we believe that CNOOC should announce a 3-5% YoY decline in
2017 volume target which is more resilient than previous projections. The market is
predicting a 5-8% YoY decline in 2017 volumes, so the guidance should be a positive
surprise to the market, in our opinion.
Second, two recent mega-size discoveries should address concerns on low reserve life.
ExxonMobil has announced/confirmed two significant discoveries in late 2016, but given
CNOOC is not the operator, the company has not made a public announcement and might
have missed by the market. Based on our initial assessment, these two discoveries alone
could bring c.250mmboe of reserve adds to CNOOC and raise its oil reserve life to nine
years (from seven currently).
■ Liza discovery: The Liza discovery is located in offshore Guyana with a potential
recoverable resource of 1.4 bn barrels. ExxonMobil is the operator with a 45% interest
in the block and CNOOC owns 25% interest. On 20 December 2016, ExxonMobil has
announced that it has submitted an application for a production licence and initial
development plan early December and will look to fast-track the development.
ExxonMobil confirmed the discovery through the Liza-2 exploration well, which has
encountered more than 58 meters of oil-bearing sandstone reservoirs in Upper
Cretaceous formations. The well was drilled to 5,475m in 1,692m of water. The second
well has confirmed the presence of high-quality oil from the high-porosity sandstone
reservoirs seen in the Liza-1 well.
■ Owowo discovery: The Owowo discovery is located in offshore Nigeria with a
potential recoverable resource of 1bn barrels. ExxonMobil announced the discovery on
27 October 2016. ExxonMobil is the operator with a 27% interest in the block and
CNOOC owns an 18% interest. The Owowo-3 exploration well encountered about 140
meters of oil-bearing sandstone reservoir. Owowo-3 extends the resource discovered
by the Owowo-2 well, which encountered about 157m of oil-bearing sandstone
reservoir.
(2) Sinopec’s marketing divestment: Paving the way
for non-fuel business expansion Reuters reported on 4 January that Sinopec has appointed investment banks for a
potential listing that could raise as much as US$12 bn. Back in 2014, Sinopec had sold
down a 30% stake in its marketing division, raising Rmb107 bn (US$17.5 bn) through a
capital injection agreement with 25 investors, with plans to make further divestment. In this
section we reiterate the potential upside of Sinopec’s non-fuel retail business, both in
terms of earnings and valuation upside.
Sinopec's marketing unit encompasses several businesses, including its 25,000 Easy Joy
convenience stores out of its 30,560 service station network, its B2C online shopping mall
(www.ejoy365.com; launched in 2011) and restaurant collaborations with McDonald's and
KFC (launched in 2009). A further divestment of the marketing unit would raise funds that
Sinopec could invest in more non-fuel businesses, such as vehicle maintenance and
advertising, which would allow Sinopec to better utilise the business potential of its existing
distribution network in China.
12 January 2017
China Oil & Gas Sector 21
Figure 51: Sinopec's major non-fuel strategic cooperation in recent years
Date Partner Terms
Jun-2006 McDonald's Agreement to set up its Drive-Thru restaurants at selected Sinopec service station sites across China
Nov-2011 Yum! Brands Agreement to open drive-through outlets at Sinopec's gas stations and expressway service stations
May-2014 China Taiping Insurance Group Sinopec Sales will leverage its network and carry out car insurance and life insurance business of China
Taiping in selected stations under Sinopec's traditional service network such as convenience stores and car
service. Meanwhile, both parties will share customer resources and cross market.
Jul-2014 Ruentex Group (Taiwan retailer) Agreement to develop non-oil businesses, including convenience stores, e-commerce and financial services
Aug-2014 Tibet Highland Natural Water Ltd Agreement to establish a glacier water brand and use Sinopec's retailing network to sell it nationwide
Aug-2014 S.F. Express Sinopec EasyJoy will connect its nationwide retail stores with S.F. Express’ logistics network to achieve
greater synergy.
Aug-2014 yhd.com The parties will start and explore the prospects of cooperation in areas such as joint procurement, O2O
(online-to-offline) business, cooperation in e-commerce platforms, oil product sales, etc.
Aug-2014 Tencent, Inc EasyJoy will cooperate with Tencent to explore business development, mobile payment, brand promotion,
online to offline, map navigation, customer loyalty management, big data application and cross marketing
opportunities.
Sep-2014 Haier Electronics Group, Sinopec would cooperate with Haier in interactive marketing and logistics. In return, Sinopec would provide
Haier with fuel for transportation and delivery operations.
Dec-2014 Beijing Aiyihang Auto Services Ltd Jointly operate automotive services business at the gas stations within the Sinopec Hubei network.
Jul-2015 Beiqi Foton Motor Co. Partnership on information and market interaction and jointly develop electric vehicle charging stations
May-2016 Zhongbai Holdings Group Co Ltd The supermarket will set up outlets in Sinopec’s charging stations
Source: Company data, Credit Suisse research
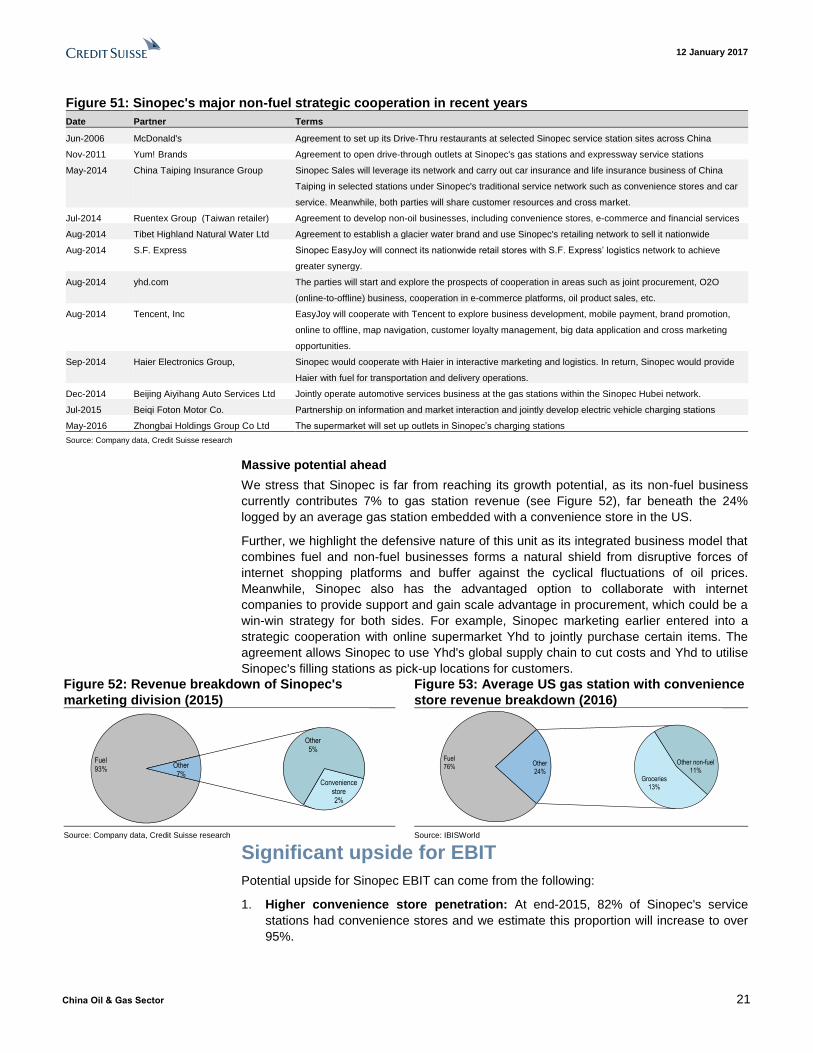
Massive potential ahead
We stress that Sinopec is far from reaching its growth potential, as its non-fuel business
currently contributes 7% to gas station revenue (see Figure 52), far beneath the 24%
logged by an average gas station embedded with a convenience store in the US.
Further, we highlight the defensive nature of this unit as its integrated business model that
combines fuel and non-fuel businesses forms a natural shield from disruptive forces of
internet shopping platforms and buffer against the cyclical fluctuations of oil prices.
Meanwhile, Sinopec also has the advantaged option to collaborate with internet
companies to provide support and gain scale advantage in procurement, which could be a
win-win strategy for both sides. For example, Sinopec marketing earlier entered into a
strategic cooperation with online supermarket Yhd to jointly purchase certain items. The
agreement allows Sinopec to use Yhd's global supply chain to cut costs and Yhd to utilise
Sinopec's filling stations as pick-up locations for customers.
Figure 52: Revenue breakdown of Sinopec's
marketing division (2015)
Figure 53: Average US gas station with convenience
store revenue breakdown (2016)
Source: Company data, Credit Suisse research Source: IBISWorld
Significant upside for EBIT
Potential upside for Sinopec EBIT can come from the following:
1. Higher convenience store penetration: At end-2015, 82% of Sinopec's service
stations had convenience stores and we estimate this proportion will increase to over
95%.
Fuel93%
Convenience store2%
Other5%
Other 7%
Fuel76%
Groceries13%
Other non-fuel11%
Other24%
12 January 2017
China Oil & Gas Sector 22
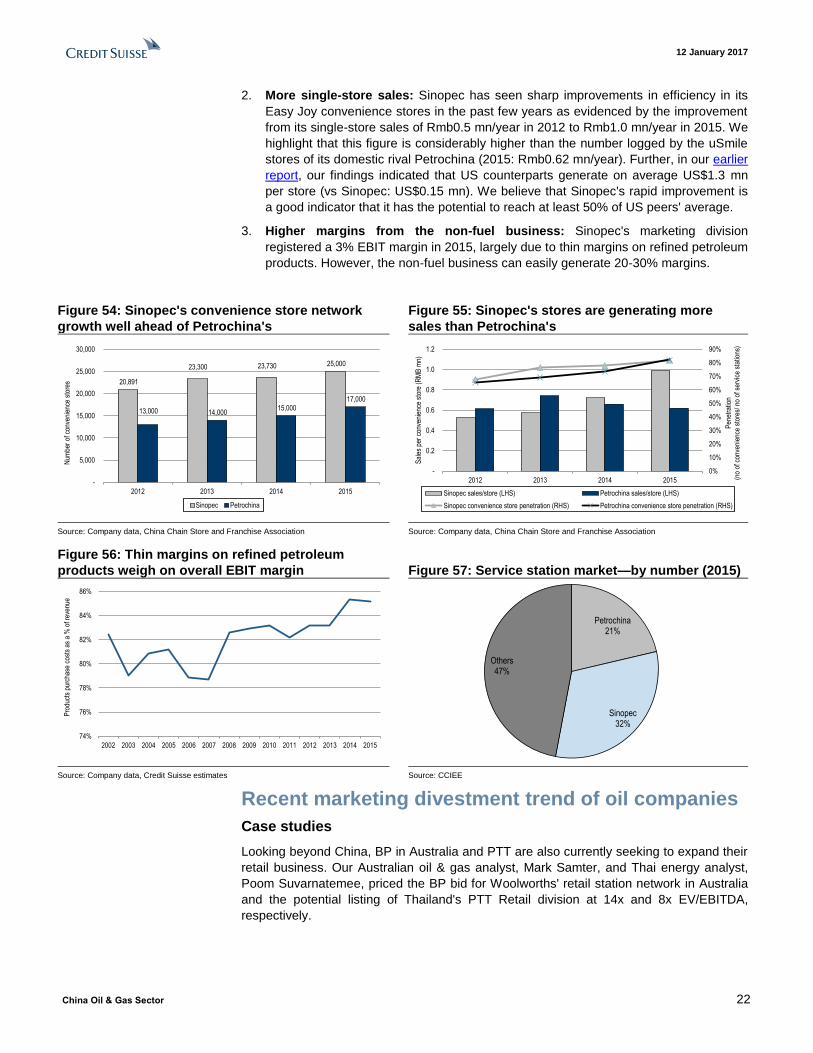
2. More single-store sales: Sinopec has seen sharp improvements in efficiency in its
Easy Joy convenience stores in the past few years as evidenced by the improvement
from its single-store sales of Rmb0.5 mn/year in 2012 to Rmb1.0 mn/year in 2015. We
highlight that this figure is considerably higher than the number logged by the uSmile
stores of its domestic rival Petrochina (2015: Rmb0.62 mn/year). Further, in our earlier
report, our findings indicated that US counterparts generate on average US$1.3 mn
per store (vs Sinopec: US$0.15 mn). We believe that Sinopec's rapid improvement is
a good indicator that it has the potential to reach at least 50% of US peers' average.
3. Higher margins from the non-fuel business: Sinopec's marketing division
registered a 3% EBIT margin in 2015, largely due to thin margins on refined petroleum
products. However, the non-fuel business can easily generate 20-30% margins.
Figure 54: Sinopec's convenience store network
growth well ahead of Petrochina's
Figure 55: Sinopec's stores are generating more
sales than Petrochina's
Source: Company data, China Chain Store and Franchise Association Source: Company data, China Chain Store and Franchise Association
Figure 56: Thin margins on refined petroleum
products weigh on overall EBIT margin Figure 57: Service station market—by number (2015)
Source: Company data, Credit Suisse estimates Source: CCIEE
Recent marketing divestment trend of oil companies
Case studies
Looking beyond China, BP in Australia and PTT are also currently seeking to expand their
retail business. Our Australian oil & gas analyst, Mark Samter, and Thai energy analyst,
Poom Suvarnatemee, priced the BP bid for Woolworths' retail station network in Australia
and the potential listing of Thailand's PTT Retail division at 14x and 8x EV/EBITDA,
respectively.
20,891
23,300 23,730 25,000
13,000 14,000 15,000
17,000
-
5,000
10,000
15,000
20,000
25,000
30,000
2012 2013 2014 2015
Num
ber
of c
onve
nien
ce s
tore
s
Sinopec Petrochina
0%
10%
20%
30%
40%
50%
60%
70%
80%
90%
-
0.2
0.4
0.6
0.8
1.0
1.2
2012 2013 2014 2015
Pen
etra
tion
(no
of c
onve
nien
ce s
tore
s/ n
o of
ser
vice
sta
tions
)
Sal
es p
er c
onve
nien
ce s
tore
(R
MB
mn)
Sinopec sales/store (LHS) Petrochina sales/store (LHS)
Sinopec convenience store penetration (RHS) Petrochina convenience store penetration (RHS)
74%
76%
78%
80%
82%
84%
86%
2002 2003 2004 2005 2006 2007 2008 2009 2010 2011 2012 2013 2014 2015
Pro
duct
s pu
rcha
se c
osts
as
a %
of r
even
ue
Petrochina21%
Sinopec32%
Others47%

12 January 2017
China Oil & Gas Sector 23
Woolworths
In Australia, BP recently acquired embattled supermarket chain Woolworths. Unlike
Sinopec, Woolworths's specialty lies in grocery retailing as the retail giant only forayed into
the petrol business in 1996. In 2016, Woolworths operated 527 petrol stations with
convenience stores, accounting for 21% share of the Australian fuel market. Prior to 2014,
Woolworths jointly operated 131 additional sites with Caltex. However, in 2015, under
changes to the Woolworths-Caltex alliance, 131 Caltex-operated sites were no longer
recognised.
In an effort to entice customers to spend money at their non-fuel stores, Woolworths
stations offer a per-litre discount off pump prices for customers who spend a qualifying
amount at its own-branded convenience stores or supermarkets, hence generating
synergy between Woolworths’s businesses. Woolworths also provides a loyalty
programme that extends across all of its chain businesses, including supermarkets and
hotels.
In a recent note, our Australian analyst, Mark Samter, noted that Woolworths is the winner
in the acquisition. BP paid A$1.785 bn upfront and would fund 2cpl of the redemption
going forward. Pre-synergies, but post Woolworths funding 2cpl of the redemption (but not
the 2cpl redemption BP will now have to fund at some of its sites), this is for A$153 mn of
EBIT. Adjusting for A$300-400 mn of lease liabilities and they are paying >14x EV/EBIT.
Mark thinks that while BP would definitely claw some back with the supply agreement,
even at 2cpl (and remember they will use a lot of third-party infrastructure) it is ~10x
EV/EBIT. We estimate that the deal is valued at approximately 22x P/E.
Figure 58: Woolworths' petrol revenue breakdown Figure 59: Stable per-store sales throughout the years
Source: Company data, Credit Suisse research Source: Company data, Credit Suisse research
Figure 60: Transaction valuation estimates
Revenue (Australia Food and Petrol segment) (A$ mn) 39,410
- Fuel 4,612
- Non-fuel 34,798
EBITDA–Fuel (A$ mn) 225
EBIT–Fuel (A$ mn) 151
Net profit–Fuel (A$ mn) 84
Implied P/E (x) 22x
Implied EV/EBITDA (x) 8x
Source: Company data, Credit Suisse estimates
PTT Retail Marketing Plc
In Thailand, PTT Public Company Limited plans to spin off its marketing arm, PTTOR
(PTT Oil and Retail Business Company Ltd in 4Q17 or 2018. PTT plans to own only 45-
50% of PTTOR after the sell-down from 100% currently. PTTOR will be PTT's flagship
company in the oil and retail business.
14% 14% 15% 15% 15% 14% 12%
86% 86% 85% 85% 85% 86% 88%
0%
10%
20%
30%
40%
50%
60%
70%
80%
90%
100%
2010 2011 2012 2013 2014 2015 2016
Fuel Non-fuel 60
70
80
90
2010 2011 2012 2013 2014 2015 2016
Per
-sto
re s
ales
(A
$ m
n)
12 January 2017
China Oil & Gas Sector 24
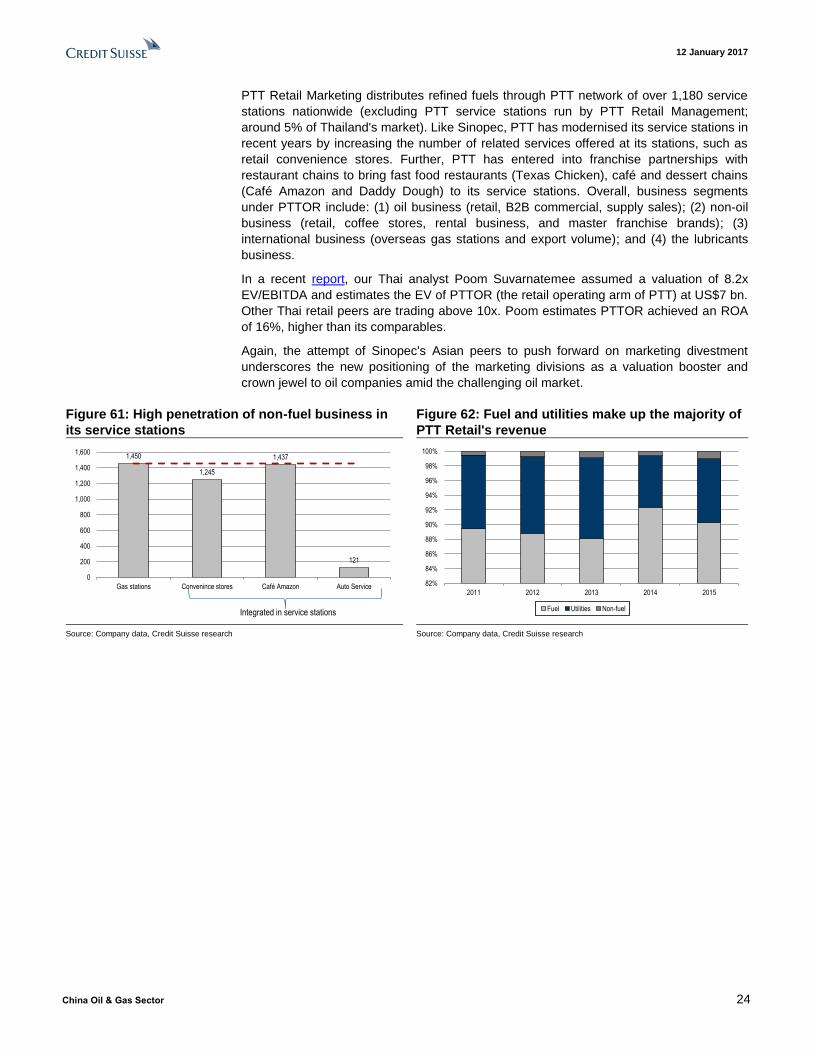
PTT Retail Marketing distributes refined fuels through PTT network of over 1,180 service
stations nationwide (excluding PTT service stations run by PTT Retail Management;
around 5% of Thailand's market). Like Sinopec, PTT has modernised its service stations in
recent years by increasing the number of related services offered at its stations, such as
retail convenience stores. Further, PTT has entered into franchise partnerships with
restaurant chains to bring fast food restaurants (Texas Chicken), café and dessert chains
(Café Amazon and Daddy Dough) to its service stations. Overall, business segments
under PTTOR include: (1) oil business (retail, B2B commercial, supply sales); (2) non-oil
business (retail, coffee stores, rental business, and master franchise brands); (3)
international business (overseas gas stations and export volume); and (4) the lubricants
business.
In a recent report, our Thai analyst Poom Suvarnatemee assumed a valuation of 8.2x
EV/EBITDA and estimates the EV of PTTOR (the retail operating arm of PTT) at US$7 bn.
Other Thai retail peers are trading above 10x. Poom estimates PTTOR achieved an ROA
of 16%, higher than its comparables.
Again, the attempt of Sinopec's Asian peers to push forward on marketing divestment
underscores the new positioning of the marketing divisions as a valuation booster and
crown jewel to oil companies amid the challenging oil market.
Figure 61: High penetration of non-fuel business in
its service stations
Figure 62: Fuel and utilities make up the majority of
PTT Retail's revenue
Source: Company data, Credit Suisse research Source: Company data, Credit Suisse research
1,450
1,245
1,437
121
0
200
400
600
800
1,000
1,200
1,400
1,600
Gas stations Convenince stores Café Amazon Auto Service
Integrated in service stations
82%
84%
86%
88%
90%
92%
94%
96%
98%
100%
2011 2012 2013 2014 2015
Fuel Utilities Non-fuel
12 January 2017
China Oil & Gas Sector 25
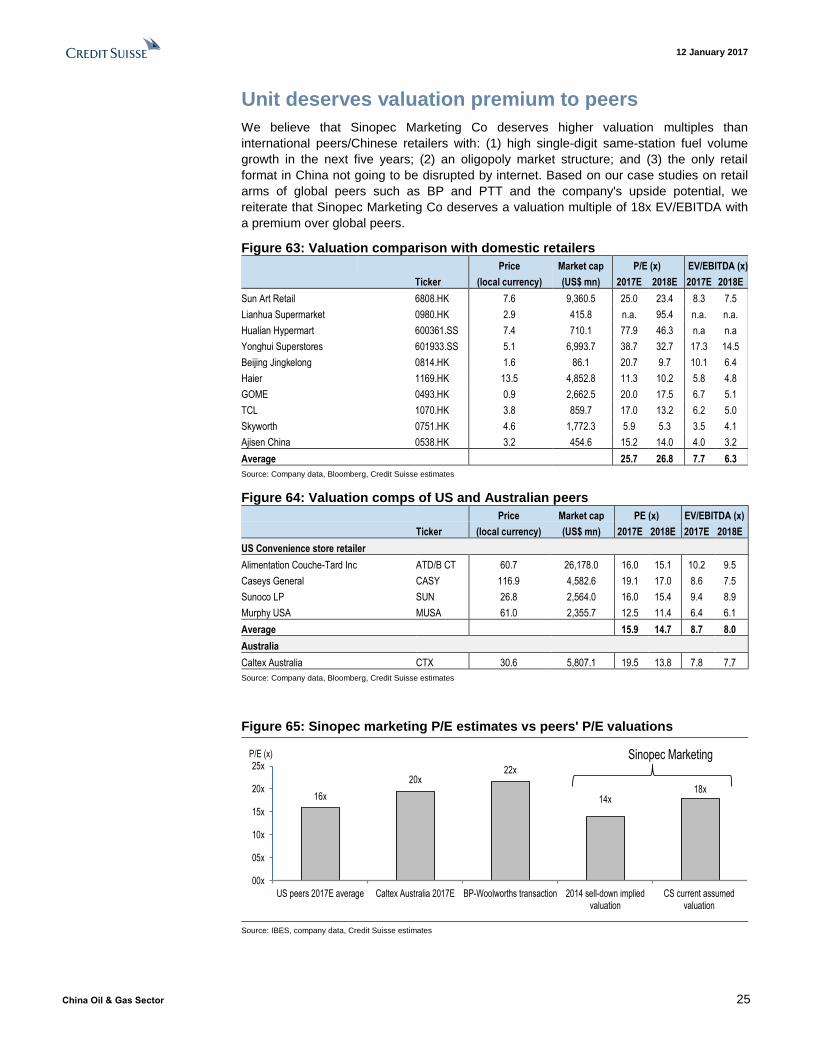
Unit deserves valuation premium to peers
We believe that Sinopec Marketing Co deserves higher valuation multiples than
international peers/Chinese retailers with: (1) high single-digit same-station fuel volume
growth in the next five years; (2) an oligopoly market structure; and (3) the only retail
format in China not going to be disrupted by internet. Based on our case studies on retail
arms of global peers such as BP and PTT and the company's upside potential, we
reiterate that Sinopec Marketing Co deserves a valuation multiple of 18x EV/EBITDA with
a premium over global peers.
Figure 63: Valuation comparison with domestic retailers
Price Market cap P/E (x) EV/EBITDA (x)
Ticker (local currency) (US$ mn) 2017E 2018E 2017E 2018E
Sun Art Retail 6808.HK 7.6 9,360.5 25.0 23.4 8.3 7.5
Lianhua Supermarket 0980.HK 2.9 415.8 n.a. 95.4 n.a. n.a.
Hualian Hypermart 600361.SS 7.4 710.1 77.9 46.3 n.a n.a
Yonghui Superstores 601933.SS 5.1 6,993.7 38.7 32.7 17.3 14.5
Beijing Jingkelong 0814.HK 1.6 86.1 20.7 9.7 10.1 6.4
Haier 1169.HK 13.5 4,852.8 11.3 10.2 5.8 4.8
GOME 0493.HK 0.9 2,662.5 20.0 17.5 6.7 5.1
TCL 1070.HK 3.8 859.7 17.0 13.2 6.2 5.0
Skyworth 0751.HK 4.6 1,772.3 5.9 5.3 3.5 4.1
Ajisen China 0538.HK 3.2 454.6 15.2 14.0 4.0 3.2
Average 25.7 26.8 7.7 6.3
Source: Company data, Bloomberg, Credit Suisse estimates
Figure 64: Valuation comps of US and Australian peers
Price Market cap PE (x) EV/EBITDA (x)
Ticker (local currency) (US$ mn) 2017E 2018E 2017E 2018E
US Convenience store retailer
Alimentation Couche-Tard Inc ATD/B CT 60.7 26,178.0 16.0 15.1 10.2 9.5
Caseys General CASY 116.9 4,582.6 19.1 17.0 8.6 7.5
Sunoco LP SUN 26.8 2,564.0 16.0 15.4 9.4 8.9
Murphy USA MUSA 61.0 2,355.7 12.5 11.4 6.4 6.1
Average 15.9 14.7 8.7 8.0
Australia
Caltex Australia CTX 30.6 5,807.1 19.5 13.8 7.8 7.7
Source: Company data, Bloomberg, Credit Suisse estimates
Figure 65: Sinopec marketing P/E estimates vs peers' P/E valuations
Source: IBES, company data, Credit Suisse estimates
16x
20x22x
14x18x
00x
05x
10x
15x
20x
25x
US peers 2017E average Caltex Australia 2017E BP-Woolworths transaction 2014 sell-down impliedvaluation
CS current assumedvaluation
P/E (x) Sinopec Marketing
12 January 2017
China Oil & Gas Sector 26
(3) Sinopec’s gas pipeline transaction and read-
through to PetroChina
Positive read-through Sinopec’s gas pipeline transaction
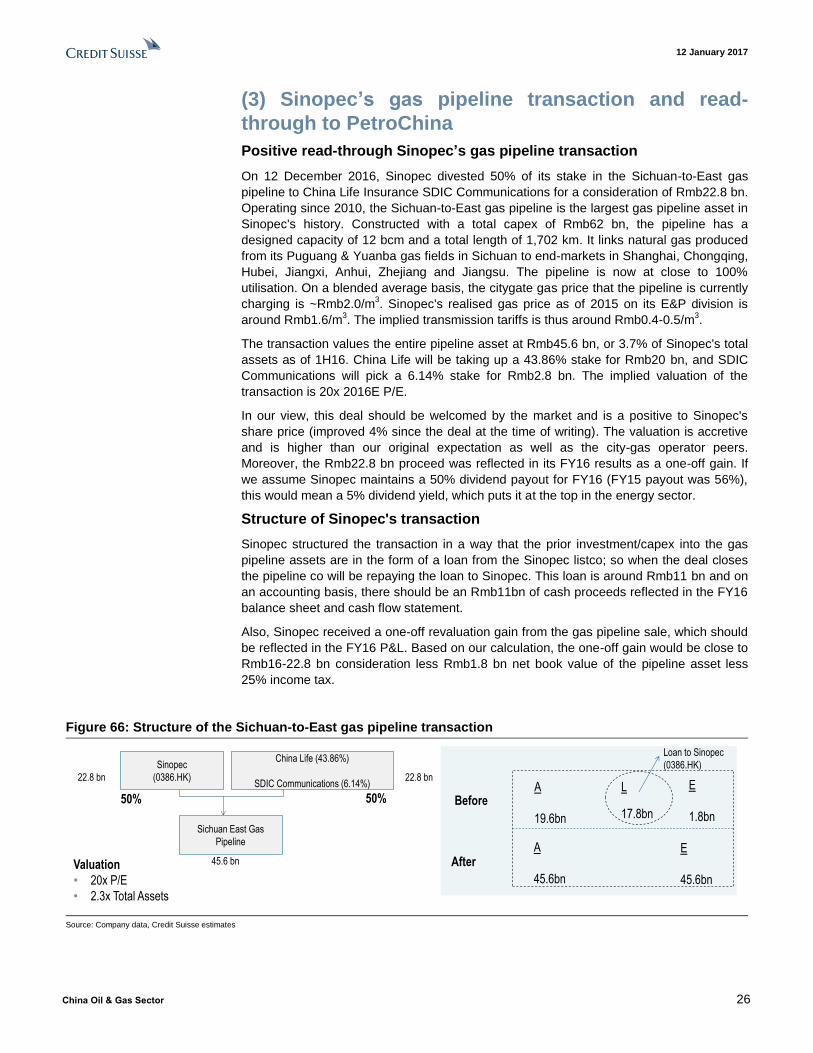
On 12 December 2016, Sinopec divested 50% of its stake in the Sichuan-to-East gas
pipeline to China Life Insurance SDIC Communications for a consideration of Rmb22.8 bn.
Operating since 2010, the Sichuan-to-East gas pipeline is the largest gas pipeline asset in
Sinopec's history. Constructed with a total capex of Rmb62 bn, the pipeline has a
designed capacity of 12 bcm and a total length of 1,702 km. It links natural gas produced
from its Puguang & Yuanba gas fields in Sichuan to end-markets in Shanghai, Chongqing,
Hubei, Jiangxi, Anhui, Zhejiang and Jiangsu. The pipeline is now at close to 100%
utilisation. On a blended average basis, the citygate gas price that the pipeline is currently
charging is ~Rmb2.0/m3. Sinopec's realised gas price as of 2015 on its E&P division is
around Rmb1.6/m3. The implied transmission tariffs is thus around Rmb0.4-0.5/m
3.
The transaction values the entire pipeline asset at Rmb45.6 bn, or 3.7% of Sinopec's total
assets as of 1H16. China Life will be taking up a 43.86% stake for Rmb20 bn, and SDIC
Communications will pick a 6.14% stake for Rmb2.8 bn. The implied valuation of the
transaction is 20x 2016E P/E.
In our view, this deal should be welcomed by the market and is a positive to Sinopec's
share price (improved 4% since the deal at the time of writing). The valuation is accretive
and is higher than our original expectation as well as the city-gas operator peers.
Moreover, the Rmb22.8 bn proceed was reflected in its FY16 results as a one-off gain. If
we assume Sinopec maintains a 50% dividend payout for FY16 (FY15 payout was 56%),
this would mean a 5% dividend yield, which puts it at the top in the energy sector.
Structure of Sinopec's transaction
Sinopec structured the transaction in a way that the prior investment/capex into the gas
pipeline assets are in the form of a loan from the Sinopec listco; so when the deal closes
the pipeline co will be repaying the loan to Sinopec. This loan is around Rmb11 bn and on
an accounting basis, there should be an Rmb11bn of cash proceeds reflected in the FY16
balance sheet and cash flow statement.
Also, Sinopec received a one-off revaluation gain from the gas pipeline sale, which should
be reflected in the FY16 P&L. Based on our calculation, the one-off gain would be close to
Rmb16-22.8 bn consideration less Rmb1.8 bn net book value of the pipeline asset less
25% income tax.
Figure 66: Structure of the Sichuan-to-East gas pipeline transaction
Source: Company data, Credit Suisse estimates
A
45.6bn
Sinopec
(0386.HK)
China Life (43.86%)
SDIC Communications (6.14%)
Sichuan East Gas
Pipeline
50% 50%
22.8 bn 22.8 bn
45.6 bnValuation
• 20x P/E
• 2.3x Total Assets
Before
After
A
19.6bn
L
17.8bn
E
1.8bn
Loan to Sinopec
(0386.HK)
E
45.6bn
12 January 2017
China Oil & Gas Sector 27
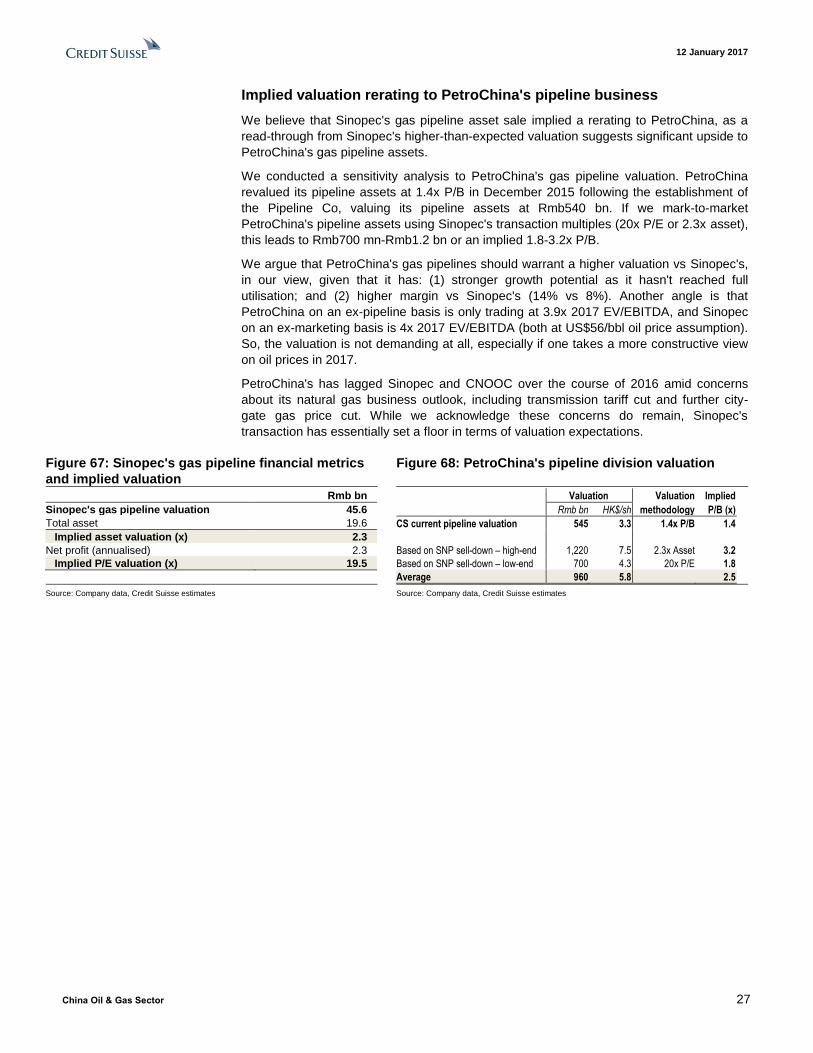
Implied valuation rerating to PetroChina's pipeline business
We believe that Sinopec's gas pipeline asset sale implied a rerating to PetroChina, as a
read-through from Sinopec's higher-than-expected valuation suggests significant upside to
PetroChina's gas pipeline assets.
We conducted a sensitivity analysis to PetroChina's gas pipeline valuation. PetroChina
revalued its pipeline assets at 1.4x P/B in December 2015 following the establishment of
the Pipeline Co, valuing its pipeline assets at Rmb540 bn. If we mark-to-market
PetroChina's pipeline assets using Sinopec's transaction multiples (20x P/E or 2.3x asset),
this leads to Rmb700 mn-Rmb1.2 bn or an implied 1.8-3.2x P/B.
We argue that PetroChina's gas pipelines should warrant a higher valuation vs Sinopec's,
in our view, given that it has: (1) stronger growth potential as it hasn't reached full
utilisation; and (2) higher margin vs Sinopec's (14% vs 8%). Another angle is that
PetroChina on an ex-pipeline basis is only trading at 3.9x 2017 EV/EBITDA, and Sinopec
on an ex-marketing basis is 4x 2017 EV/EBITDA (both at US$56/bbl oil price assumption).
So, the valuation is not demanding at all, especially if one takes a more constructive view
on oil prices in 2017.
PetroChina's has lagged Sinopec and CNOOC over the course of 2016 amid concerns
about its natural gas business outlook, including transmission tariff cut and further city-
gate gas price cut. While we acknowledge these concerns do remain, Sinopec's
transaction has essentially set a floor in terms of valuation expectations.
Figure 67: Sinopec's gas pipeline financial metrics
and implied valuation
Figure 68: PetroChina's pipeline division valuation
Rmb bn
Sinopec's gas pipeline valuation 45.6
Total asset 19.6
Implied asset valuation (x) 2.3
Net profit (annualised) 2.3
Implied P/E valuation (x) 19.5
Valuation Valuation Implied
Rmb bn HK$/sh methodology P/B (x)
CS current pipeline valuation 545 3.3 1.4x P/B 1.4
Based on SNP sell-down – high-end 1,220 7.5 2.3x Asset 3.2
Based on SNP sell-down – low-end 700 4.3 20x P/E 1.8
Average 960 5.8 2.5
Source: Company data, Credit Suisse estimates Source: Company data, Credit Suisse estimates
12 January 2017
China Oil & Gas Sector 28
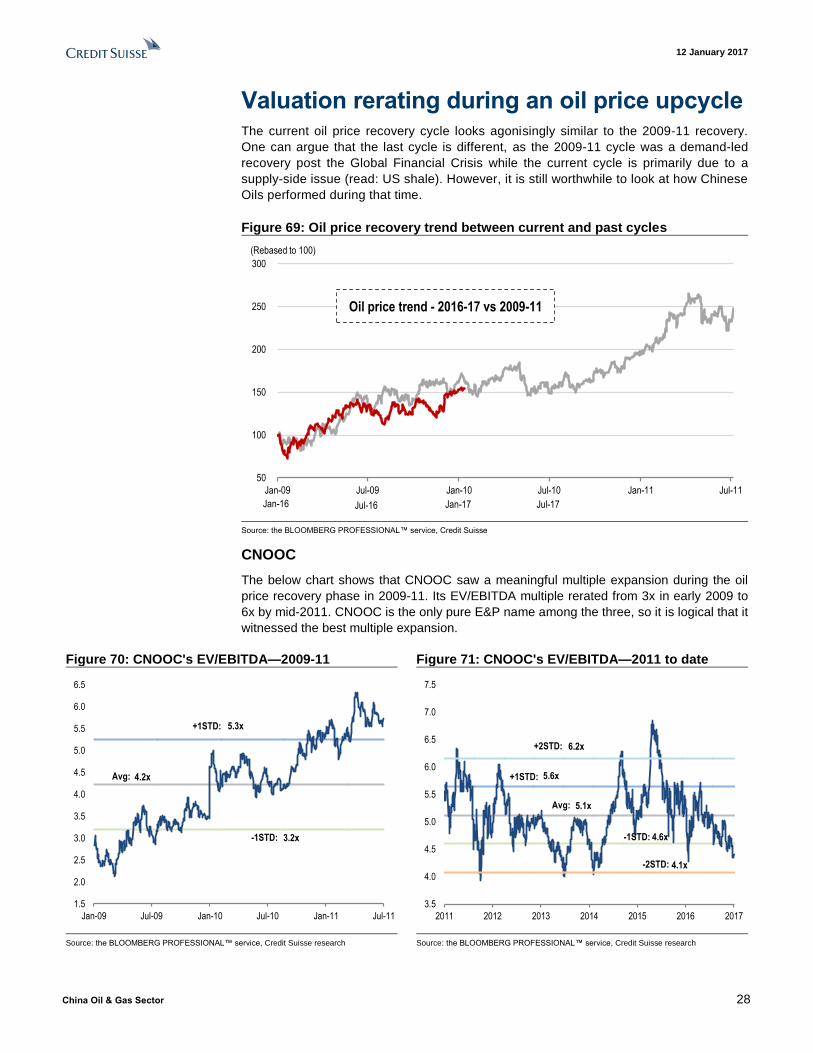
Valuation rerating during an oil price upcycle The current oil price recovery cycle looks agonisingly similar to the 2009-11 recovery.
One can argue that the last cycle is different, as the 2009-11 cycle was a demand-led
recovery post the Global Financial Crisis while the current cycle is primarily due to a
supply-side issue (read: US shale). However, it is still worthwhile to look at how Chinese
Oils performed during that time.
Figure 69: Oil price recovery trend between current and past cycles
Source: the BLOOMBERG PROFESSIONAL™ service, Credit Suisse
CNOOC
The below chart shows that CNOOC saw a meaningful multiple expansion during the oil
price recovery phase in 2009-11. Its EV/EBITDA multiple rerated from 3x in early 2009 to
6x by mid-2011. CNOOC is the only pure E&P name among the three, so it is logical that it
witnessed the best multiple expansion.
Figure 70: CNOOC's EV/EBITDA—2009-11 Figure 71: CNOOC's EV/EBITDA—2011 to date
Source: the BLOOMBERG PROFESSIONAL™ service, Credit Suisse research Source: the BLOOMBERG PROFESSIONAL™ service, Credit Suisse research
50
100
150
200
250
300
Jan-09 Jul-09 Jan-10 Jul-10 Jan-11 Jul-11
Jan-16 Jul-16 Jan-17 Jul-17
(Rebased to 100)
Oil price trend - 2016-17 vs 2009-11
4.2x
5.3x
3.2x
1.5
2.0
2.5
3.0
3.5
4.0
4.5
5.0
5.5
6.0
6.5
Jan-09 Jul-09 Jan-10 Jul-10 Jan-11 Jul-11
Avg:
+1STD:
-1STD:
5.1x
5.6x
4.6x
6.2x
4.1x
3.5
4.0
4.5
5.0
5.5
6.0
6.5
7.0
7.5
2011 2012 2013 2014 2015 2016 2017
Avg:
+1STD:
-1STD:
-2STD:
+2STD:
12 January 2017
China Oil & Gas Sector 29
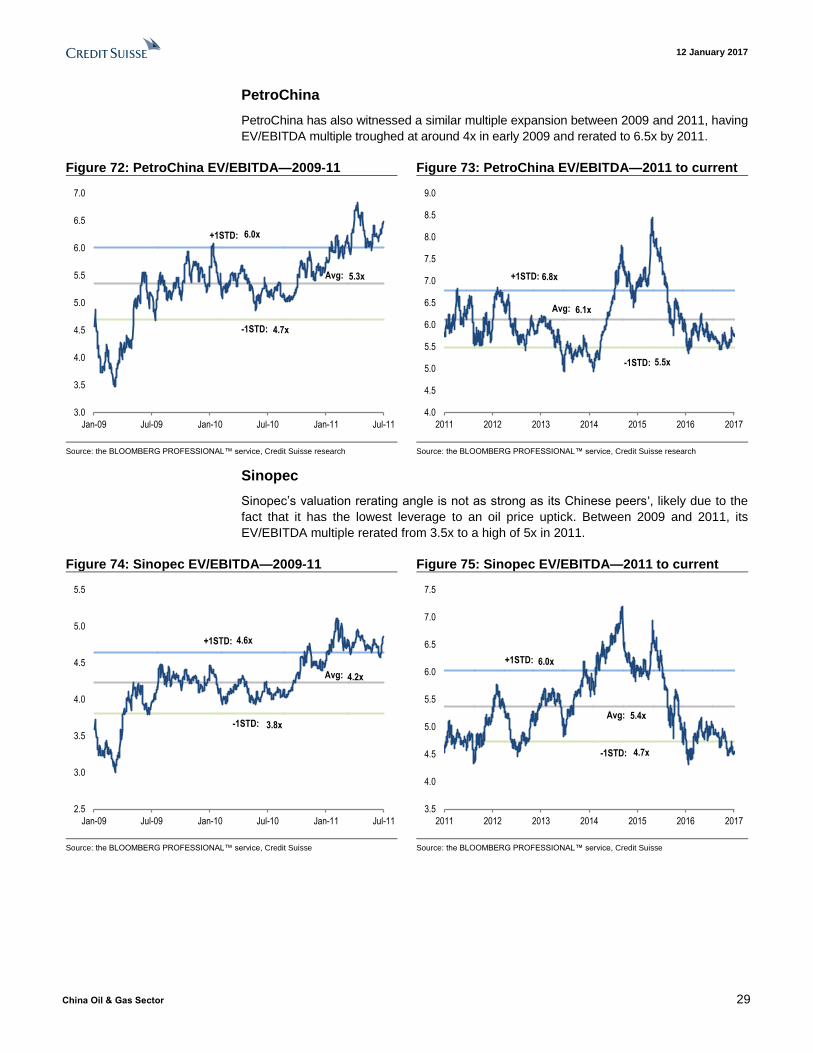
PetroChina
PetroChina has also witnessed a similar multiple expansion between 2009 and 2011, having
EV/EBITDA multiple troughed at around 4x in early 2009 and rerated to 6.5x by 2011.
Figure 72: PetroChina EV/EBITDA—2009-11 Figure 73: PetroChina EV/EBITDA—2011 to current
Source: the BLOOMBERG PROFESSIONAL™ service, Credit Suisse research Source: the BLOOMBERG PROFESSIONAL™ service, Credit Suisse research
Sinopec
Sinopec’s valuation rerating angle is not as strong as its Chinese peers', likely due to the
fact that it has the lowest leverage to an oil price uptick. Between 2009 and 2011, its
EV/EBITDA multiple rerated from 3.5x to a high of 5x in 2011.
Figure 74: Sinopec EV/EBITDA—2009-11 Figure 75: Sinopec EV/EBITDA—2011 to current
Source: the BLOOMBERG PROFESSIONAL™ service, Credit Suisse Source: the BLOOMBERG PROFESSIONAL™ service, Credit Suisse
5.3x
6.0x
4.7x
3.0
3.5
4.0
4.5
5.0
5.5
6.0
6.5
7.0
Jan-09 Jul-09 Jan-10 Jul-10 Jan-11 Jul-11
Avg:
+1STD:
-1STD:
6.1x
6.8x
5.5x
4.0
4.5
5.0
5.5
6.0
6.5
7.0
7.5
8.0
8.5
9.0
2011 2012 2013 2014 2015 2016 2017
Avg:
+1STD:
-1STD:
4.2x
4.6x
3.8x
2.5
3.0
3.5
4.0
4.5
5.0
5.5
Jan-09 Jul-09 Jan-10 Jul-10 Jan-11 Jul-11
Avg:
+1STD:
-1STD: 5.4x
6.0x
4.7x
3.5
4.0
4.5
5.0
5.5
6.0
6.5
7.0
7.5
2011 2012 2013 2014 2015 2016 2017
Avg:
+1STD:
-1STD:
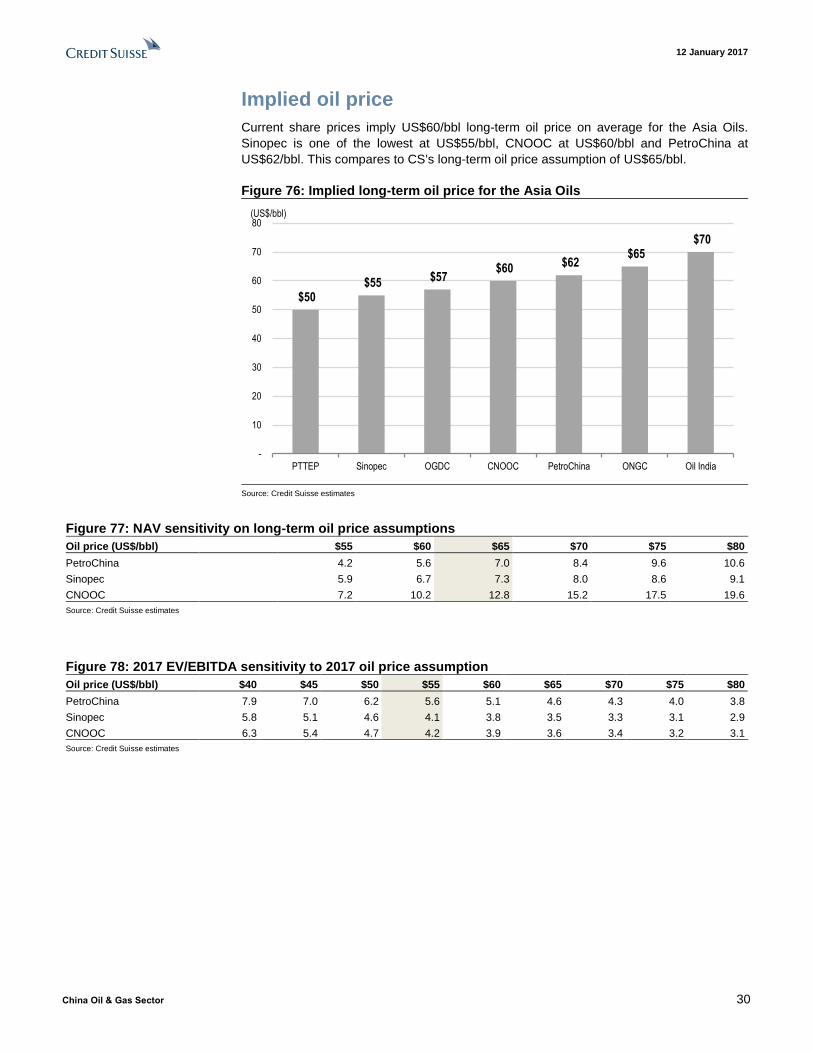
12 January 2017
China Oil & Gas Sector 30
Implied oil price
Current share prices imply US$60/bbl long-term oil price on average for the Asia Oils.
Sinopec is one of the lowest at US$55/bbl, CNOOC at US$60/bbl and PetroChina at
US$62/bbl. This compares to CS's long-term oil price assumption of US$65/bbl.
Figure 76: Implied long-term oil price for the Asia Oils
Source: Credit Suisse estimates
Figure 77: NAV sensitivity on long-term oil price assumptions
Oil price (US$/bbl) $55 $60 $65 $70 $75 $80
PetroChina 4.2 5.6 7.0 8.4 9.6 10.6
Sinopec 5.9 6.7 7.3 8.0 8.6 9.1
CNOOC 7.2 10.2 12.8 15.2 17.5 19.6
Source: Credit Suisse estimates
Figure 78: 2017 EV/EBITDA sensitivity to 2017 oil price assumption
Oil price (US$/bbl) $40 $45 $50 $55 $60 $65 $70 $75 $80
PetroChina 7.9 7.0 6.2 5.6 5.1 4.6 4.3 4.0 3.8
Sinopec 5.8 5.1 4.6 4.1 3.8 3.5 3.3 3.1 2.9
CNOOC 6.3 5.4 4.7 4.2 3.9 3.6 3.4 3.2 3.1
Source: Credit Suisse estimates
$50 $55 $57
$60 $62 $65
$70
-
10
20
30
40
50
60
70
80
PTTEP Sinopec OGDC CNOOC PetroChina ONGC Oil India
(US$/bbl)
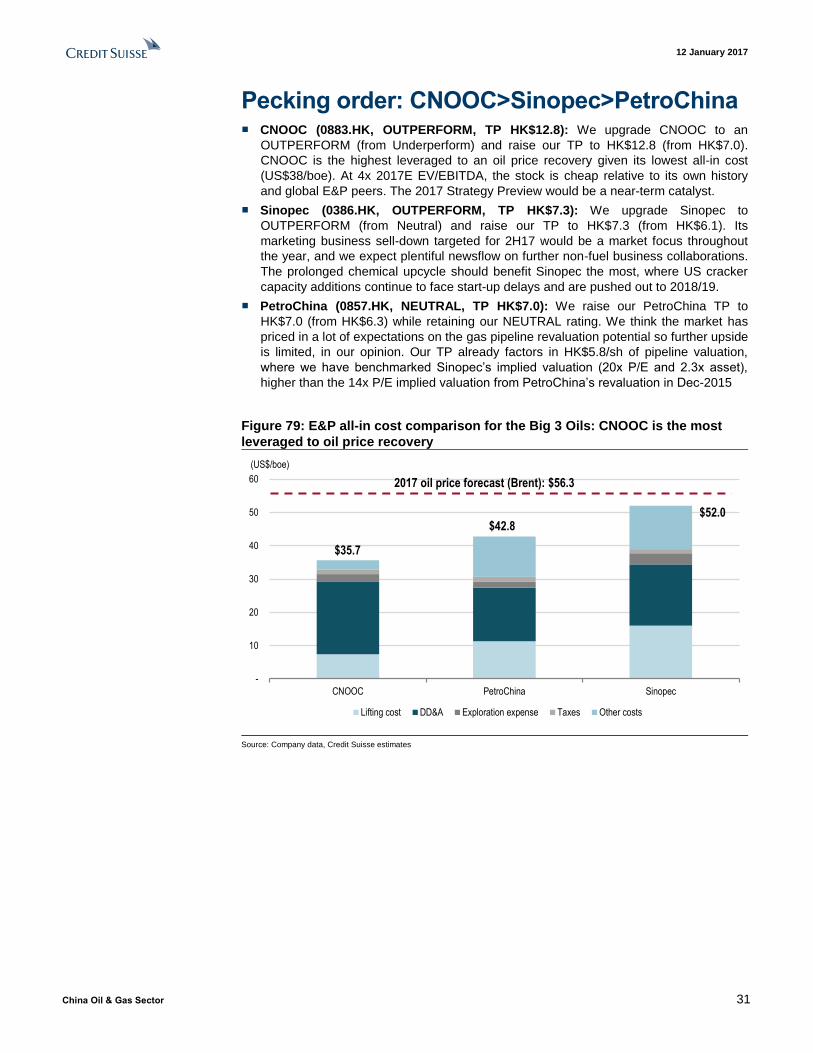
12 January 2017
China Oil & Gas Sector 31
Pecking order: CNOOC>Sinopec>PetroChina ■ CNOOC (0883.HK, OUTPERFORM, TP HK$12.8): We upgrade CNOOC to an
OUTPERFORM (from Underperform) and raise our TP to HK$12.8 (from HK$7.0).
CNOOC is the highest leveraged to an oil price recovery given its lowest all-in cost
(US$38/boe). At 4x 2017E EV/EBITDA, the stock is cheap relative to its own history
and global E&P peers. The 2017 Strategy Preview would be a near-term catalyst.
■ Sinopec (0386.HK, OUTPERFORM, TP HK$7.3): We upgrade Sinopec to
OUTPERFORM (from Neutral) and raise our TP to HK$7.3 (from HK$6.1). Its
marketing business sell-down targeted for 2H17 would be a market focus throughout
the year, and we expect plentiful newsflow on further non-fuel business collaborations.
The prolonged chemical upcycle should benefit Sinopec the most, where US cracker
capacity additions continue to face start-up delays and are pushed out to 2018/19.
■ PetroChina (0857.HK, NEUTRAL, TP HK$7.0): We raise our PetroChina TP to
HK$7.0 (from HK$6.3) while retaining our NEUTRAL rating. We think the market has
priced in a lot of expectations on the gas pipeline revaluation potential so further upside
is limited, in our opinion. Our TP already factors in HK$5.8/sh of pipeline valuation,
where we have benchmarked Sinopec’s implied valuation (20x P/E and 2.3x asset),
higher than the 14x P/E implied valuation from PetroChina’s revaluation in Dec-2015
Figure 79: E&P all-in cost comparison for the Big 3 Oils: CNOOC is the most
leveraged to oil price recovery
Source: Company data, Credit Suisse estimates
-
10
20
30
40
50
60
CNOOC PetroChina Sinopec
Lifting cost DD&A Exploration expense Taxes Other costs
(US$/boe)
$35.7
$42.8$52.0
2017 oil price forecast (Brent): $56.3
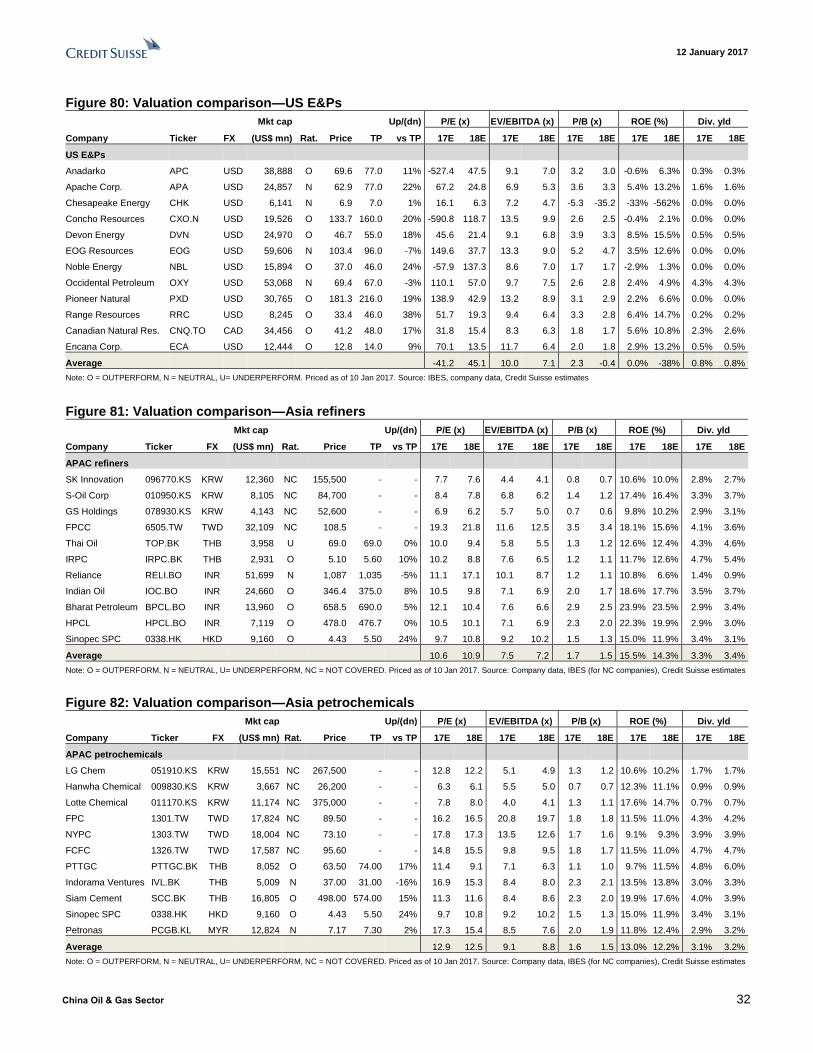
12 January 2017
China Oil & Gas Sector 32
Figure 80: Valuation comparison—US E&Ps
Mkt cap Up/(dn) P/E (x) EV/EBITDA (x) P/B (x) ROE (%) Div. yld
Company Ticker FX (US$ mn) Rat. Price TP vs TP 17E 18E 17E 18E 17E 18E 17E 18E 17E 18E
US E&Ps
Anadarko APC USD 38,888 O 69.6 77.0 11% -527.4 47.5 9.1 7.0 3.2 3.0 -0.6% 6.3% 0.3% 0.3%
Apache Corp. APA USD 24,857 N 62.9 77.0 22% 67.2 24.8 6.9 5.3 3.6 3.3 5.4% 13.2% 1.6% 1.6%
Chesapeake Energy CHK USD 6,141 N 6.9 7.0 1% 16.1 6.3 7.2 4.7 -5.3 -35.2 -33% -562% 0.0% 0.0%
Concho Resources CXO.N USD 19,526 O 133.7 160.0 20% -590.8 118.7 13.5 9.9 2.6 2.5 -0.4% 2.1% 0.0% 0.0%
Devon Energy DVN USD 24,970 O 46.7 55.0 18% 45.6 21.4 9.1 6.8 3.9 3.3 8.5% 15.5% 0.5% 0.5%
EOG Resources EOG USD 59,606 N 103.4 96.0 -7% 149.6 37.7 13.3 9.0 5.2 4.7 3.5% 12.6% 0.0% 0.0%
Noble Energy NBL USD 15,894 O 37.0 46.0 24% -57.9 137.3 8.6 7.0 1.7 1.7 -2.9% 1.3% 0.0% 0.0%
Occidental Petroleum OXY USD 53,068 N 69.4 67.0 -3% 110.1 57.0 9.7 7.5 2.6 2.8 2.4% 4.9% 4.3% 4.3%
Pioneer Natural PXD USD 30,765 O 181.3 216.0 19% 138.9 42.9 13.2 8.9 3.1 2.9 2.2% 6.6% 0.0% 0.0%
Range Resources RRC USD 8,245 O 33.4 46.0 38% 51.7 19.3 9.4 6.4 3.3 2.8 6.4% 14.7% 0.2% 0.2%
Canadian Natural Res. CNQ.TO CAD 34,456 O 41.2 48.0 17% 31.8 15.4 8.3 6.3 1.8 1.7 5.6% 10.8% 2.3% 2.6%
Encana Corp. ECA USD 12,444 O 12.8 14.0 9% 70.1 13.5 11.7 6.4 2.0 1.8 2.9% 13.2% 0.5% 0.5%
Average -41.2 45.1 10.0 7.1 2.3 -0.4 0.0% -38% 0.8% 0.8%
Note: O = OUTPERFORM, N = NEUTRAL, U= UNDERPERFORM. Priced as of 10 Jan 2017. Source: IBES, company data, Credit Suisse estimates
Figure 81: Valuation comparison—Asia refiners
Mkt cap Up/(dn) P/E (x) EV/EBITDA (x) P/B (x) ROE (%) Div. yld
Company Ticker FX (US$ mn) Rat. Price TP vs TP 17E 18E 17E 18E 17E 18E 17E 18E 17E 18E
APAC refiners
SK Innovation 096770.KS KRW 12,360 NC 155,500 - - 7.7 7.6 4.4 4.1 0.8 0.7 10.6% 10.0% 2.8% 2.7%
S-Oil Corp 010950.KS KRW 8,105 NC 84,700 - - 8.4 7.8 6.8 6.2 1.4 1.2 17.4% 16.4% 3.3% 3.7%
GS Holdings 078930.KS KRW 4,143 NC 52,600 - - 6.9 6.2 5.7 5.0 0.7 0.6 9.8% 10.2% 2.9% 3.1%
FPCC 6505.TW TWD 32,109 NC 108.5 - - 19.3 21.8 11.6 12.5 3.5 3.4 18.1% 15.6% 4.1% 3.6%
Thai Oil TOP.BK THB 3,958 U 69.0 69.0 0% 10.0 9.4 5.8 5.5 1.3 1.2 12.6% 12.4% 4.3% 4.6%
IRPC IRPC.BK THB 2,931 O 5.10 5.60 10% 10.2 8.8 7.6 6.5 1.2 1.1 11.7% 12.6% 4.7% 5.4%
Reliance RELI.BO INR 51,699 N 1,087 1,035 -5% 11.1 17.1 10.1 8.7 1.2 1.1 10.8% 6.6% 1.4% 0.9%
Indian Oil IOC.BO INR 24,660 O 346.4 375.0 8% 10.5 9.8 7.1 6.9 2.0 1.7 18.6% 17.7% 3.5% 3.7%
Bharat Petroleum BPCL.BO INR 13,960 O 658.5 690.0 5% 12.1 10.4 7.6 6.6 2.9 2.5 23.9% 23.5% 2.9% 3.4%
HPCL HPCL.BO INR 7,119 O 478.0 476.7 0% 10.5 10.1 7.1 6.9 2.3 2.0 22.3% 19.9% 2.9% 3.0%
Sinopec SPC 0338.HK HKD 9,160 O 4.43 5.50 24% 9.7 10.8 9.2 10.2 1.5 1.3 15.0% 11.9% 3.4% 3.1%
Average 10.6 10.9 7.5 7.2 1.7 1.5 15.5% 14.3% 3.3% 3.4%
Note: O = OUTPERFORM, N = NEUTRAL, U= UNDERPERFORM, NC = NOT COVERED. Priced as of 10 Jan 2017. Source: Company data, IBES (for NC companies), Credit Suisse estimates
Figure 82: Valuation comparison—Asia petrochemicals
Mkt cap Up/(dn) P/E (x) EV/EBITDA (x) P/B (x) ROE (%) Div. yld
Company Ticker FX (US$ mn) Rat. Price TP vs TP 17E 18E 17E 18E 17E 18E 17E 18E 17E 18E
APAC petrochemicals
LG Chem 051910.KS KRW 15,551 NC 267,500 - - 12.8 12.2 5.1 4.9 1.3 1.2 10.6% 10.2% 1.7% 1.7%
Hanwha Chemical 009830.KS KRW 3,667 NC 26,200 - - 6.3 6.1 5.5 5.0 0.7 0.7 12.3% 11.1% 0.9% 0.9%
Lotte Chemical 011170.KS KRW 11,174 NC 375,000 - - 7.8 8.0 4.0 4.1 1.3 1.1 17.6% 14.7% 0.7% 0.7%
FPC 1301.TW TWD 17,824 NC 89.50 - - 16.2 16.5 20.8 19.7 1.8 1.8 11.5% 11.0% 4.3% 4.2%
NYPC 1303.TW TWD 18,004 NC 73.10 - - 17.8 17.3 13.5 12.6 1.7 1.6 9.1% 9.3% 3.9% 3.9%
FCFC 1326.TW TWD 17,587 NC 95.60 - - 14.8 15.5 9.8 9.5 1.8 1.7 11.5% 11.0% 4.7% 4.7%
PTTGC PTTGC.BK THB 8,052 O 63.50 74.00 17% 11.4 9.1 7.1 6.3 1.1 1.0 9.7% 11.5% 4.8% 6.0%
Indorama Ventures IVL.BK THB 5,009 N 37.00 31.00 -16% 16.9 15.3 8.4 8.0 2.3 2.1 13.5% 13.8% 3.0% 3.3%
Siam Cement SCC.BK THB 16,805 O 498.00 574.00 15% 11.3 11.6 8.4 8.6 2.3 2.0 19.9% 17.6% 4.0% 3.9%
Sinopec SPC 0338.HK HKD 9,160 O 4.43 5.50 24% 9.7 10.8 9.2 10.2 1.5 1.3 15.0% 11.9% 3.4% 3.1%
Petronas PCGB.KL MYR 12,824 N 7.17 7.30 2% 17.3 15.4 8.5 7.6 2.0 1.9 11.8% 12.4% 2.9% 3.2%
Average 12.9 12.5 9.1 8.8 1.6 1.5 13.0% 12.2% 3.1% 3.2%
Note: O = OUTPERFORM, N = NEUTRAL, U= UNDERPERFORM, NC = NOT COVERED. Priced as of 10 Jan 2017. Source: Company data, IBES (for NC companies), Credit Suisse estimates
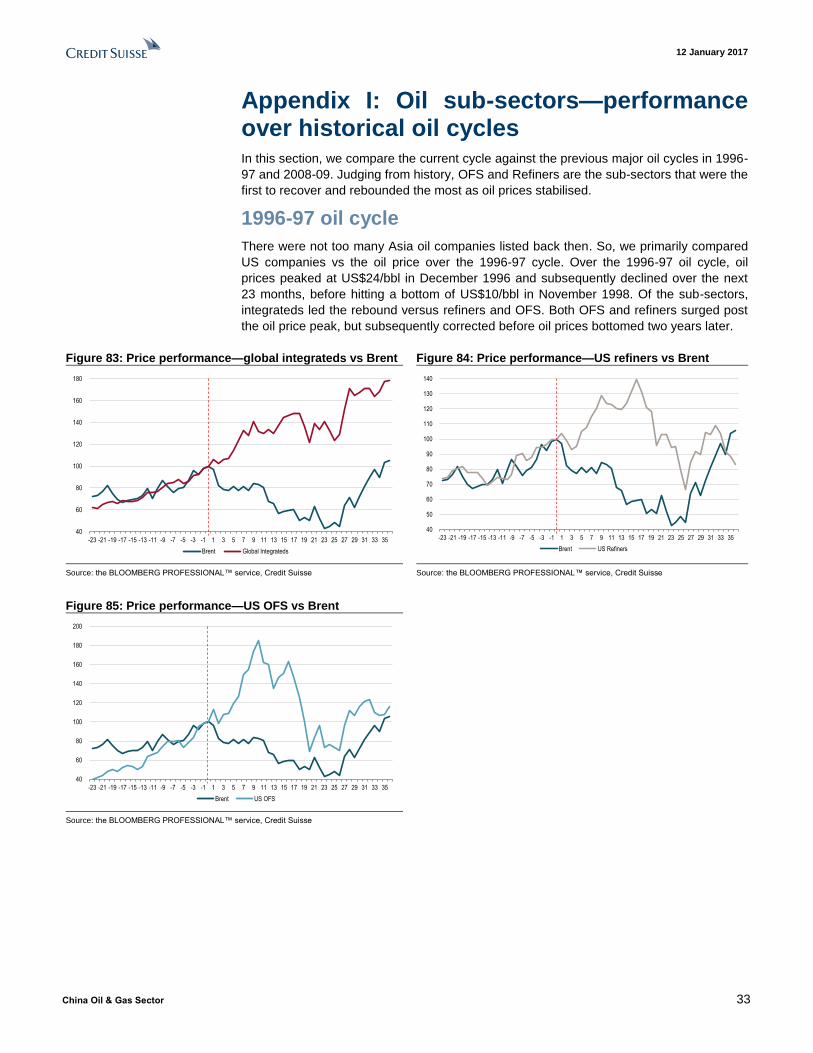
12 January 2017
China Oil & Gas Sector 33
Appendix I: Oil sub-sectors—performance over historical oil cycles In this section, we compare the current cycle against the previous major oil cycles in 1996-
97 and 2008-09. Judging from history, OFS and Refiners are the sub-sectors that were the
first to recover and rebounded the most as oil prices stabilised.
1996-97 oil cycle
There were not too many Asia oil companies listed back then. So, we primarily compared
US companies vs the oil price over the 1996-97 cycle. Over the 1996-97 oil cycle, oil
prices peaked at US$24/bbl in December 1996 and subsequently declined over the next
23 months, before hitting a bottom of US$10/bbl in November 1998. Of the sub-sectors,
integrateds led the rebound versus refiners and OFS. Both OFS and refiners surged post
the oil price peak, but subsequently corrected before oil prices bottomed two years later.
Figure 83: Price performance—global integrateds vs Brent Figure 84: Price performance—US refiners vs Brent
Source: the BLOOMBERG PROFESSIONAL™ service, Credit Suisse Source: the BLOOMBERG PROFESSIONAL™ service, Credit Suisse
Figure 85: Price performance—US OFS vs Brent
Source: the BLOOMBERG PROFESSIONAL™ service, Credit Suisse
40
60
80
100
120
140
160
180
-23 -21 -19 -17 -15 -13 -11 -9 -7 -5 -3 -1 1 3 5 7 9 11 13 15 17 19 21 23 25 27 29 31 33 35
Brent Global Integrateds
40
50
60
70
80
90
100
110
120
130
140
-23 -21 -19 -17 -15 -13 -11 -9 -7 -5 -3 -1 1 3 5 7 9 11 13 15 17 19 21 23 25 27 29 31 33 35
Brent US Refiners
40
60
80
100
120
140
160
180
200
-23 -21 -19 -17 -15 -13 -11 -9 -7 -5 -3 -1 1 3 5 7 9 11 13 15 17 19 21 23 25 27 29 31 33 35
Brent US OFS
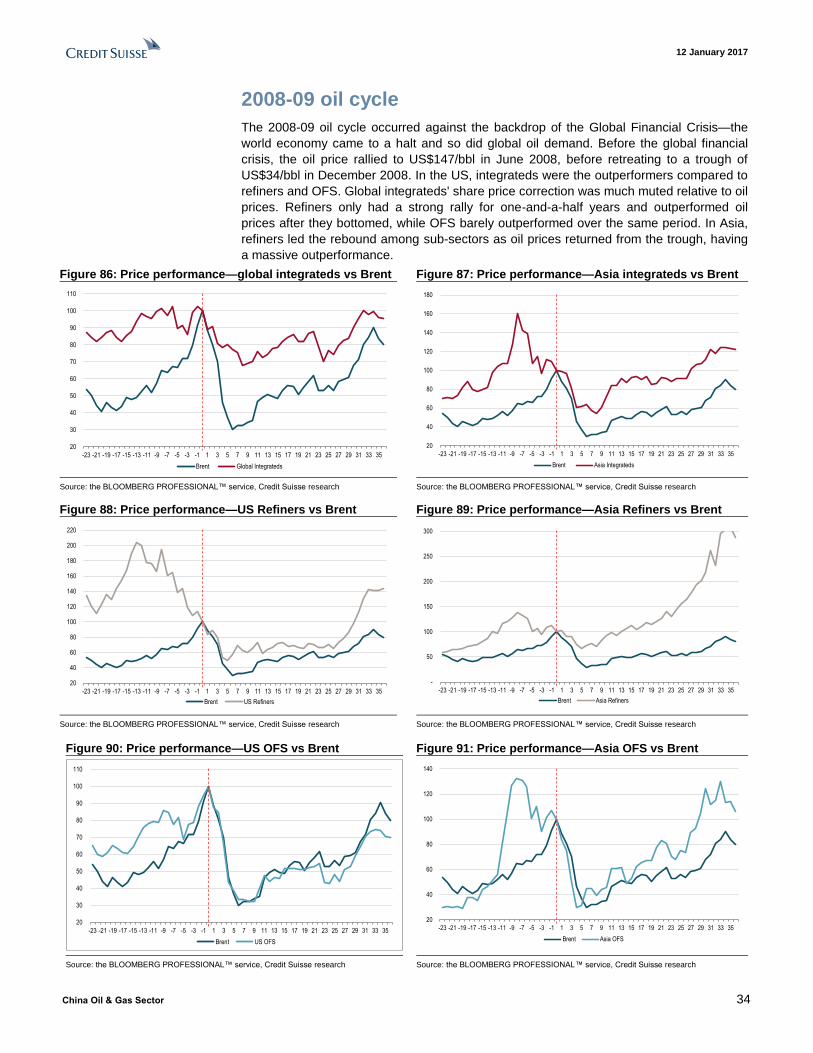
12 January 2017
China Oil & Gas Sector 34
2008-09 oil cycle
The 2008-09 oil cycle occurred against the backdrop of the Global Financial Crisis—the
world economy came to a halt and so did global oil demand. Before the global financial
crisis, the oil price rallied to US$147/bbl in June 2008, before retreating to a trough of
US$34/bbl in December 2008. In the US, integrateds were the outperformers compared to
refiners and OFS. Global integrateds' share price correction was much muted relative to oil
prices. Refiners only had a strong rally for one-and-a-half years and outperformed oil
prices after they bottomed, while OFS barely outperformed over the same period. In Asia,
refiners led the rebound among sub-sectors as oil prices returned from the trough, having
a massive outperformance.
Figure 86: Price performance—global integrateds vs Brent Figure 87: Price performance—Asia integrateds vs Brent
Source: the BLOOMBERG PROFESSIONAL™ service, Credit Suisse research Source: the BLOOMBERG PROFESSIONAL™ service, Credit Suisse research
Figure 88: Price performance—US Refiners vs Brent Figure 89: Price performance—Asia Refiners vs Brent
Source: the BLOOMBERG PROFESSIONAL™ service, Credit Suisse research Source: the BLOOMBERG PROFESSIONAL™ service, Credit Suisse research
Figure 90: Price performance—US OFS vs Brent Figure 91: Price performance—Asia OFS vs Brent
Source: the BLOOMBERG PROFESSIONAL™ service, Credit Suisse research Source: the BLOOMBERG PROFESSIONAL™ service, Credit Suisse research
20
30
40
50
60
70
80
90
100
110
-23 -21 -19 -17 -15 -13 -11 -9 -7 -5 -3 -1 1 3 5 7 9 11 13 15 17 19 21 23 25 27 29 31 33 35
Brent Global Integrateds
20
40
60
80
100
120
140
160
180
-23 -21 -19 -17 -15 -13 -11 -9 -7 -5 -3 -1 1 3 5 7 9 11 13 15 17 19 21 23 25 27 29 31 33 35
Brent Asia Integrateds
20
40
60
80
100
120
140
160
180
200
220
-23 -21 -19 -17 -15 -13 -11 -9 -7 -5 -3 -1 1 3 5 7 9 11 13 15 17 19 21 23 25 27 29 31 33 35
Brent US Refiners
-
50
100
150
200
250
300
-23 -21 -19 -17 -15 -13 -11 -9 -7 -5 -3 -1 1 3 5 7 9 11 13 15 17 19 21 23 25 27 29 31 33 35
Brent Asia Refiners
20
30
40
50
60
70
80
90
100
110
-23 -21 -19 -17 -15 -13 -11 -9 -7 -5 -3 -1 1 3 5 7 9 11 13 15 17 19 21 23 25 27 29 31 33 35
Brent US OFS
20
40
60
80
100
120
140
-23 -21 -19 -17 -15 -13 -11 -9 -7 -5 -3 -1 1 3 5 7 9 11 13 15 17 19 21 23 25 27 29 31 33 35
Brent Asia OFS
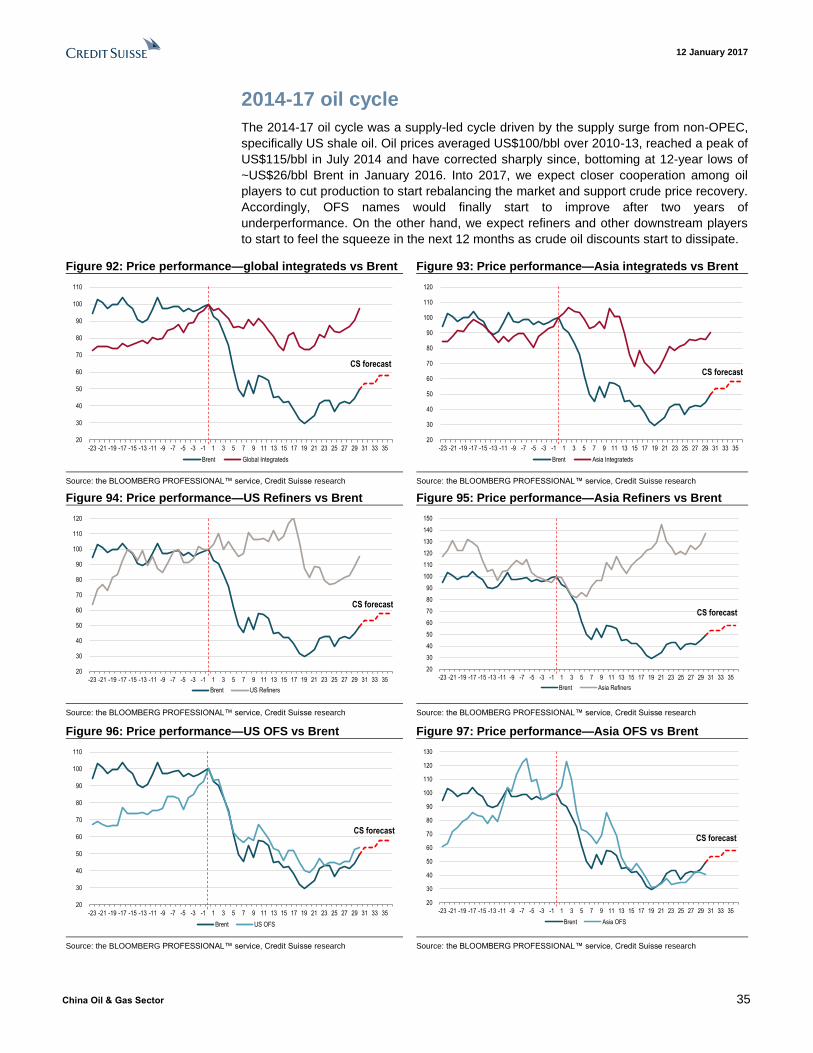
12 January 2017
China Oil & Gas Sector 35
2014-17 oil cycle
The 2014-17 oil cycle was a supply-led cycle driven by the supply surge from non-OPEC,
specifically US shale oil. Oil prices averaged US$100/bbl over 2010-13, reached a peak of
US$115/bbl in July 2014 and have corrected sharply since, bottoming at 12-year lows of
~US$26/bbl Brent in January 2016. Into 2017, we expect closer cooperation among oil
players to cut production to start rebalancing the market and support crude price recovery.
Accordingly, OFS names would finally start to improve after two years of
underperformance. On the other hand, we expect refiners and other downstream players
to start to feel the squeeze in the next 12 months as crude oil discounts start to dissipate.
Figure 92: Price performance—global integrateds vs Brent Figure 93: Price performance—Asia integrateds vs Brent
Source: the BLOOMBERG PROFESSIONAL™ service, Credit Suisse research Source: the BLOOMBERG PROFESSIONAL™ service, Credit Suisse research
Figure 94: Price performance—US Refiners vs Brent Figure 95: Price performance—Asia Refiners vs Brent
Source: the BLOOMBERG PROFESSIONAL™ service, Credit Suisse research Source: the BLOOMBERG PROFESSIONAL™ service, Credit Suisse research
Figure 96: Price performance—US OFS vs Brent Figure 97: Price performance—Asia OFS vs Brent
Source: the BLOOMBERG PROFESSIONAL™ service, Credit Suisse research Source: the BLOOMBERG PROFESSIONAL™ service, Credit Suisse research
20
30
40
50
60
70
80
90
100
110
-23 -21 -19 -17 -15 -13 -11 -9 -7 -5 -3 -1 1 3 5 7 9 11 13 15 17 19 21 23 25 27 29 31 33 35
Brent Global Integrateds
CS forecast
20
30
40
50
60
70
80
90
100
110
120
-23 -21 -19 -17 -15 -13 -11 -9 -7 -5 -3 -1 1 3 5 7 9 11 13 15 17 19 21 23 25 27 29 31 33 35
Brent Asia Integrateds
CS forecast
20
30
40
50
60
70
80
90
100
110
120
-23 -21 -19 -17 -15 -13 -11 -9 -7 -5 -3 -1 1 3 5 7 9 11 13 15 17 19 21 23 25 27 29 31 33 35
Brent US Refiners
CS forecast
20
30
40
50
60
70
80
90
100
110
120
130
140
150
-23 -21 -19 -17 -15 -13 -11 -9 -7 -5 -3 -1 1 3 5 7 9 11 13 15 17 19 21 23 25 27 29 31 33 35
Brent Asia Refiners
CS forecast
20
30
40
50
60
70
80
90
100
110
-23 -21 -19 -17 -15 -13 -11 -9 -7 -5 -3 -1 1 3 5 7 9 11 13 15 17 19 21 23 25 27 29 31 33 35
Brent US OFS
CS forecast
20
30
40
50
60
70
80
90
100
110
120
130
-23 -21 -19 -17 -15 -13 -11 -9 -7 -5 -3 -1 1 3 5 7 9 11 13 15 17 19 21 23 25 27 29 31 33 35
Brent Asia OFS
CS forecast
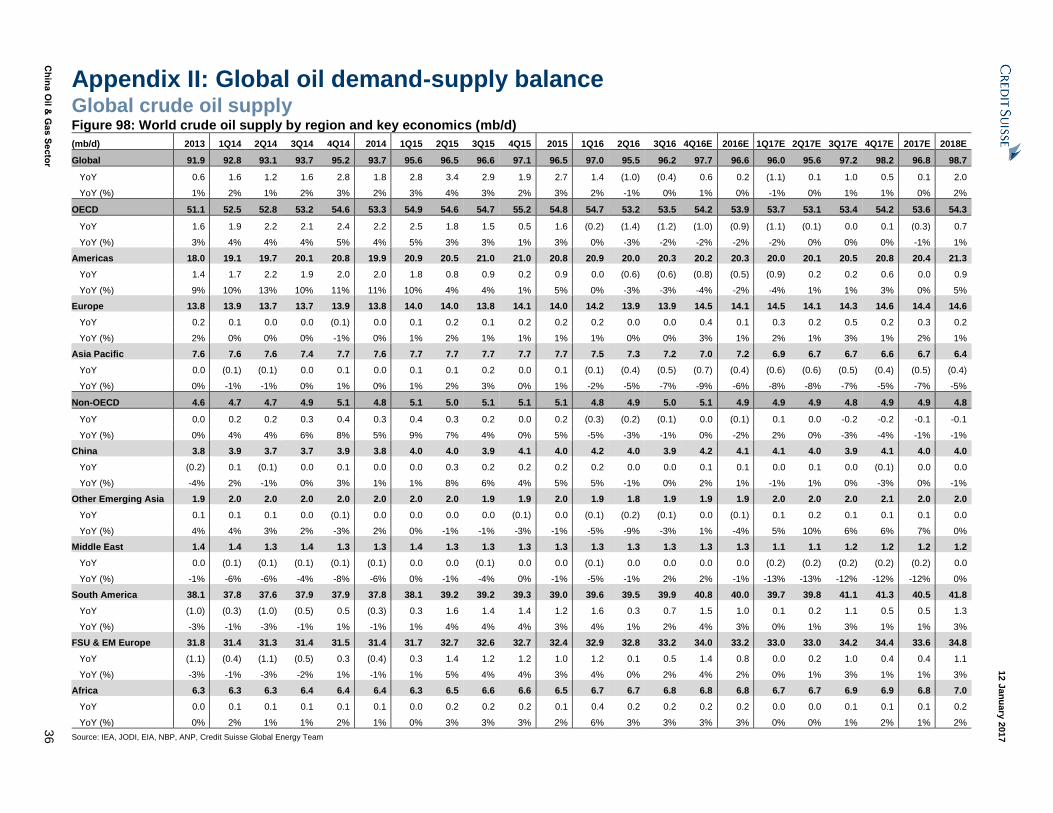
12 J
an
uary
201
7
Ch
ina O
il & G
as S
ecto
r 3
6
Appendix II: Global oil demand-supply balance Global crude oil supply Figure 98: World crude oil supply by region and key economics (mb/d)
(mb/d) 2013 1Q14 2Q14 3Q14 4Q14 2014 1Q15 2Q15 3Q15 4Q15 2015 1Q16 2Q16 3Q16 4Q16E 2016E 1Q17E 2Q17E 3Q17E 4Q17E 2017E 2018E
Global 91.9 92.8 93.1 93.7 95.2 93.7 95.6 96.5 96.6 97.1 96.5 97.0 95.5 96.2 97.7 96.6 96.0 95.6 97.2 98.2 96.8 98.7
YoY 0.6 1.6 1.2 1.6 2.8 1.8 2.8 3.4 2.9 1.9 2.7 1.4 (1.0) (0.4) 0.6 0.2 (1.1) 0.1 1.0 0.5 0.1 2.0
YoY (%) 1% 2% 1% 2% 3% 2% 3% 4% 3% 2% 3% 2% -1% 0% 1% 0% -1% 0% 1% 1% 0% 2%
OECD 51.1 52.5 52.8 53.2 54.6 53.3 54.9 54.6 54.7 55.2 54.8 54.7 53.2 53.5 54.2 53.9 53.7 53.1 53.4 54.2 53.6 54.3
YoY 1.6 1.9 2.2 2.1 2.4 2.2 2.5 1.8 1.5 0.5 1.6 (0.2) (1.4) (1.2) (1.0) (0.9) (1.1) (0.1) 0.0 0.1 (0.3) 0.7
YoY (%) 3% 4% 4% 4% 5% 4% 5% 3% 3% 1% 3% 0% -3% -2% -2% -2% -2% 0% 0% 0% -1% 1%
Americas 18.0 19.1 19.7 20.1 20.8 19.9 20.9 20.5 21.0 21.0 20.8 20.9 20.0 20.3 20.2 20.3 20.0 20.1 20.5 20.8 20.4 21.3
YoY 1.4 1.7 2.2 1.9 2.0 2.0 1.8 0.8 0.9 0.2 0.9 0.0 (0.6) (0.6) (0.8) (0.5) (0.9) 0.2 0.2 0.6 0.0 0.9
YoY (%) 9% 10% 13% 10% 11% 11% 10% 4% 4% 1% 5% 0% -3% -3% -4% -2% -4% 1% 1% 3% 0% 5%
Europe 13.8 13.9 13.7 13.7 13.9 13.8 14.0 14.0 13.8 14.1 14.0 14.2 13.9 13.9 14.5 14.1 14.5 14.1 14.3 14.6 14.4 14.6
YoY 0.2 0.1 0.0 0.0 (0.1) 0.0 0.1 0.2 0.1 0.2 0.2 0.2 0.0 0.0 0.4 0.1 0.3 0.2 0.5 0.2 0.3 0.2
YoY (%) 2% 0% 0% 0% -1% 0% 1% 2% 1% 1% 1% 1% 0% 0% 3% 1% 2% 1% 3% 1% 2% 1%
Asia Pacific 7.6 7.6 7.6 7.4 7.7 7.6 7.7 7.7 7.7 7.7 7.7 7.5 7.3 7.2 7.0 7.2 6.9 6.7 6.7 6.6 6.7 6.4
YoY 0.0 (0.1) (0.1) 0.0 0.1 0.0 0.1 0.1 0.2 0.0 0.1 (0.1) (0.4) (0.5) (0.7) (0.4) (0.6) (0.6) (0.5) (0.4) (0.5) (0.4)
YoY (%) 0% -1% -1% 0% 1% 0% 1% 2% 3% 0% 1% -2% -5% -7% -9% -6% -8% -8% -7% -5% -7% -5%
Non-OECD 4.6 4.7 4.7 4.9 5.1 4.8 5.1 5.0 5.1 5.1 5.1 4.8 4.9 5.0 5.1 4.9 4.9 4.9 4.8 4.9 4.9 4.8
YoY 0.0 0.2 0.2 0.3 0.4 0.3 0.4 0.3 0.2 0.0 0.2 (0.3) (0.2) (0.1) 0.0 (0.1) 0.1 0.0 -0.2 -0.2 -0.1 -0.1
YoY (%) 0% 4% 4% 6% 8% 5% 9% 7% 4% 0% 5% -5% -3% -1% 0% -2% 2% 0% -3% -4% -1% -1%
China 3.8 3.9 3.7 3.7 3.9 3.8 4.0 4.0 3.9 4.1 4.0 4.2 4.0 3.9 4.2 4.1 4.1 4.0 3.9 4.1 4.0 4.0
YoY (0.2) 0.1 (0.1) 0.0 0.1 0.0 0.0 0.3 0.2 0.2 0.2 0.2 0.0 0.0 0.1 0.1 0.0 0.1 0.0 (0.1) 0.0 0.0
YoY (%) -4% 2% -1% 0% 3% 1% 1% 8% 6% 4% 5% 5% -1% 0% 2% 1% -1% 1% 0% -3% 0% -1%
Other Emerging Asia 1.9 2.0 2.0 2.0 2.0 2.0 2.0 2.0 1.9 1.9 2.0 1.9 1.8 1.9 1.9 1.9 2.0 2.0 2.0 2.1 2.0 2.0
YoY 0.1 0.1 0.1 0.0 (0.1) 0.0 0.0 0.0 0.0 (0.1) 0.0 (0.1) (0.2) (0.1) 0.0 (0.1) 0.1 0.2 0.1 0.1 0.1 0.0
YoY (%) 4% 4% 3% 2% -3% 2% 0% -1% -1% -3% -1% -5% -9% -3% 1% -4% 5% 10% 6% 6% 7% 0%
Middle East 1.4 1.4 1.3 1.4 1.3 1.3 1.4 1.3 1.3 1.3 1.3 1.3 1.3 1.3 1.3 1.3 1.1 1.1 1.2 1.2 1.2 1.2
YoY 0.0 (0.1) (0.1) (0.1) (0.1) (0.1) 0.0 0.0 (0.1) 0.0 0.0 (0.1) 0.0 0.0 0.0 0.0 (0.2) (0.2) (0.2) (0.2) (0.2) 0.0
YoY (%) -1% -6% -6% -4% -8% -6% 0% -1% -4% 0% -1% -5% -1% 2% 2% -1% -13% -13% -12% -12% -12% 0%
South America 38.1 37.8 37.6 37.9 37.9 37.8 38.1 39.2 39.2 39.3 39.0 39.6 39.5 39.9 40.8 40.0 39.7 39.8 41.1 41.3 40.5 41.8
YoY (1.0) (0.3) (1.0) (0.5) 0.5 (0.3) 0.3 1.6 1.4 1.4 1.2 1.6 0.3 0.7 1.5 1.0 0.1 0.2 1.1 0.5 0.5 1.3
YoY (%) -3% -1% -3% -1% 1% -1% 1% 4% 4% 4% 3% 4% 1% 2% 4% 3% 0% 1% 3% 1% 1% 3%
FSU & EM Europe 31.8 31.4 31.3 31.4 31.5 31.4 31.7 32.7 32.6 32.7 32.4 32.9 32.8 33.2 34.0 33.2 33.0 33.0 34.2 34.4 33.6 34.8
YoY (1.1) (0.4) (1.1) (0.5) 0.3 (0.4) 0.3 1.4 1.2 1.2 1.0 1.2 0.1 0.5 1.4 0.8 0.0 0.2 1.0 0.4 0.4 1.1
YoY (%) -3% -1% -3% -2% 1% -1% 1% 5% 4% 4% 3% 4% 0% 2% 4% 2% 0% 1% 3% 1% 1% 3%
Africa 6.3 6.3 6.3 6.4 6.4 6.4 6.3 6.5 6.6 6.6 6.5 6.7 6.7 6.8 6.8 6.8 6.7 6.7 6.9 6.9 6.8 7.0
YoY 0.0 0.1 0.1 0.1 0.1 0.1 0.0 0.2 0.2 0.2 0.1 0.4 0.2 0.2 0.2 0.2 0.0 0.0 0.1 0.1 0.1 0.2
YoY (%) 0% 2% 1% 1% 2% 1% 0% 3% 3% 3% 2% 6% 3% 3% 3% 3% 0% 0% 1% 2% 1% 2%
Source: IEA, JODI, EIA, NBP, ANP, Credit Suisse Global Energy Team

12 J
an
uary
201
7
Ch
ina O
il & G
as S
ecto
r 3
7
Global crude oil demand
Figure 99: World crude oil demand by region and key economics (mb/d)
(mb/d) 2013 1Q14 2Q14 3Q14 4Q14 2014 1Q15 2Q15 3Q15 4Q15 2015 1Q16 2Q16 3Q16 4Q16E 2016E 1Q17E 2Q17E 3Q17E 4Q17E 2017E 2018E
Global 92.1 92.1 92.1 93.3 94.2 92.9 93.7 94.1 95.7 95.8 94.8 95.6 95.5 96.9 97.6 96.4 97.1 96.8 98.4 99.0 97.8 98.8
YoY 1.4 1.0 0.6 0.7 1.1 0.9 1.6 2.0 2.4 1.5 1.9 1.9 1.5 1.1 1.8 1.6 1.4 1.2 1.5 1.4 1.4 1.0
YoY (%) 1.6% 1.1% 0.7% 0.8% 1.2% 0.9% 1.7% 2.2% 2.6% 1.6% 2.0% 2.0% 1.5% 1.2% 1.9% 1.7% 1.5% 1.3% 1.6% 1.5% 1.5% 1.0%
OECD 46.1 45.9 44.9 46.0 46.4 45.8 46.6 45.6 46.9 46.4 46.4 46.7 46.0 47.2 47.2 46.8 47.0 46.3 47.6 47.6 47.1 47.0
YoY 0.3 0.1 (0.7) (0.4) (0.1) (0.3) 0.7 0.7 0.9 0.0 0.6 0.1 0.4 0.3 0.8 0.4 0.3 0.3 0.4 0.4 0.3 (0.2)
YoY (%) 0.6% 0.2% -1.6% -0.8% -0.3% -0.6% 1.5% 1.5% 1.9% 0.0% 1.2% 0.2% 0.9% 0.7% 1.7% 0.9% 0.7% 0.7% 0.8% 0.8% 0.7% -0.4%
Americas 24.2 23.9 23.8 24.4 24.6 24.2 24.5 24.4 25.0 24.5 24.6 24.5 24.4 25.0 25.0 24.7 24.8 24.8 25.4 25.5 25.1 25.2
YoY 0.4 0.1 (0.2) 0.0 0.2 0.0 0.5 0.6 0.6 (0.1) 0.4 0.0 0.0 0.0 0.5 0.1 0.3 0.4 0.4 0.5 0.4 0.1
YoY (%) 1.9% 0.3% -0.7% 0.2% 0.9% 0.2% 2.2% 2.7% 2.3% -0.4% 1.7% 0.2% -0.2% 0.1% 1.9% 0.5% 1.2% 1.7% 1.7% 1.9% 1.6% 0.3%
Europe 13.8 13.3 13.7 14.2 13.7 13.7 13.7 13.8 14.4 14.0 14.0 13.9 14.2 14.7 14.1 14.2 13.9 14.1 14.7 14.1 14.2 14.0
YoY (0.3) 0.0 (0.4) 0.0 0.0 (0.1) 0.4 0.1 0.3 0.2 0.2 0.2 0.4 0.3 0.1 0.2 0.0 (0.1) 0.0 0.0 0.0 (0.1)
YoY (%) -1.8% -0.3% -2.5% -0.2% -0.2% -0.8% 2.7% 0.8% 1.9% 1.5% 1.7% 1.5% 2.7% 1.8% 1.1% 1.8% -0.1% -0.6% -0.2% -0.1% -0.2% -1.0%
Asia Pacific 8.1 8.6 7.4 7.4 8.1 7.9 8.5 7.4 7.5 8.0 7.8 8.3 7.4 7.5 8.1 7.9 8.3 7.4 7.5 8.1 7.8 7.7
YoY 0.1 0.1 (0.2) (0.4) (0.3) (0.2) (0.2) (0.1) 0.1 (0.1) (0.1) (0.1) 0.1 0.1 0.2 0.0 0.0 0.0 0.0 (0.1) 0.0 (0.1)
YoY (%) 0.8% 0.7% -3.0% -4.7% -3.9% -2.7% -2.2% -0.9% 0.7% -1.5% -1.0% -1.7% 0.9% 0.8% 2.2% 0.5% 0.4% -0.3% -0.5% -0.8% -0.3% -1.2%
Non-OECD 46.0 46.2 47.2 47.3 47.8 47.1 47.1 48.5 48.8 49.3 48.5 48.9 49.6 49.6 50.4 49.6 50.0 50.5 50.8 51.4 50.7 51.9
YoY 1.2 0.9 1.4 1.1 1.2 1.2 0.9 1.3 1.5 1.5 1.3 1.8 1.1 0.8 1.0 1.2 1.1 0.9 1.2 1.0 1.1 1.2
YoY (%) 2.6% 2.1% 3.0% 2.3% 2.6% 2.5% 2.0% 2.8% 3.3% 3.2% 2.8% 3.9% 2.2% 1.6% 2.1% 2.4% 2.3% 1.9% 2.4% 2.1% 2.1% 2.3%
China 10.4 10.3 10.7 10.7 11.2 10.7 10.9 11.3 11.3 11.5 11.2 11.6 12.0 11.6 12.2 11.9 12.0 12.3 12.2 12.5 12.3 12.6
YoY 0.2 (0.1) 0.3 0.3 0.6 0.3 0.6 0.6 0.6 0.3 0.5 0.7 0.8 0.4 0.7 0.6 0.5 0.3 0.5 0.3 0.4 0.3
YoY (%) 2.4% -1.2% 2.8% 3.0% 5.5% 2.6% 5.4% 5.8% 5.7% 3.1% 5.0% 6.3% 6.9% 3.4% 5.6% 5.5% 4.1% 2.4% 4.5% 2.7% 3.4% 2.4%
Other Emerging Asia 11.7 12.0 12.2 11.7 11.9 11.9 12.3 12.7 12.4 12.7 12.6 13.2 13.3 12.9 13.0 13.1 13.6 13.7 13.3 13.5 13.5 13.7
YoY 0.2 0.4 0.5 0.2 0.1 0.3 0.3 0.6 0.7 0.8 0.6 0.9 0.6 0.5 0.3 0.5 0.3 0.4 0.5 0.5 0.4 0.2
YoY (%) 2.1% 3.2% 4.4% 2.0% 0.4% 2.5% 2.9% 4.6% 5.8% 7.1% 5.1% 7.0% 4.3% 4.0% 2.1% 4.3% 2.5% 2.6% 3.7% 3.6% 3.1% 1.6%
Middle East 8.6 8.5 9.0 9.2 8.7 8.9 8.6 9.3 9.6 9.1 9.2 8.7 9.0 9.4 9.3 9.1 8.7 9.0 9.4 9.2 9.1 9.4
YoY 0.2 0.3 0.3 0.2 0.4 0.3 0.0 0.3 0.4 0.4 0.3 0.1 -0.3 -0.2 0.1 -0.1 0.0 0.0 0.0 -0.1 0.0 0.3
YoY (%) 3.0% 3.4% 3.9% 2.0% 5.0% 3.5% 0.4% 3.4% 4.1% 4.8% 3.2% 1.2% -2.9% -2.0% 1.5% -0.6% 0.1% 0.2% 0.1% -0.9% -0.1% 3.7%
South America 6.5 6.4 6.6 6.8 6.7 6.6 6.4 6.5 6.6 6.5 6.5 6.2 6.4 6.5 6.3 6.3 6.3 6.4 6.5 6.4 6.4 6.5
YoY 0.2 0.2 0.1 0.2 0.1 0.1 0.0 0.0 (0.2) (0.2) (0.1) (0.2) (0.2) 0.0 (0.2) (0.2) 0.1 0.0 0.0 0.1 0.0 0.1
YoY (%) 3.6% 2.8% 2.2% 2.4% 1.4% 2.2% 0.1% -0.7% -3.0% -3.6% -1.8% -3.4% -2.8% -0.6% -2.7% -2.3% 1.5% 0.5% -0.4% 1.1% 0.7% 1.7%
FSU & EM Europe 5.1 5.0 4.9 5.2 5.4 5.1 4.7 4.7 5.1 5.3 5.0 4.9 4.7 5.1 5.3 5.0 5.0 4.8 5.1 5.3 5.0 5.1
YoY 0.0 0.3 0.0 0.0 0.0 0.1 (0.2) (0.3) (0.1) (0.1) (0.2) 0.1 0.0 0.0 0.0 0.0 0.1 0.1 0.0 0.0 0.1 0.0
YoY (%) -1.0% 5.7% 0.6% -0.7% 0.5% 1.4% -4.9% -5.1% -2.7% -1.4% -3.5% 3.1% -0.3% -0.3% -0.3% 0.5% 1.6% 1.9% 0.5% 0.9% 1.2% 0.9%
Africa 3.8 4.0 3.8 3.7 3.9 3.8 4.2 4.0 3.9 4.2 4.1 4.4 4.2 4.1 4.3 4.2 4.5 4.3 4.2 4.5 4.4 4.6
YoY 0.3 0.0 0.1 0.2 0.0 0.1 0.2 0.1 0.2 0.3 0.2 0.2 0.2 0.2 0.2 0.2 0.1 0.1 0.2 0.2 0.2 0.2
YoY (%) 7.4% -0.9% 2.2% 6.6% 1.1% 2.1% 5.0% 3.5% 6.3% 6.7% 5.4% 5.6% 4.8% 4.2% 3.6% 4.6% 2.7% 3.5% 4.2% 4.9% 3.8% 3.7%
Source: IEA, JODI, EIA, NBP, ANP, Credit Suisse Global Energy Team
12 January 2017
China Oil & Gas Sector 38
Companies
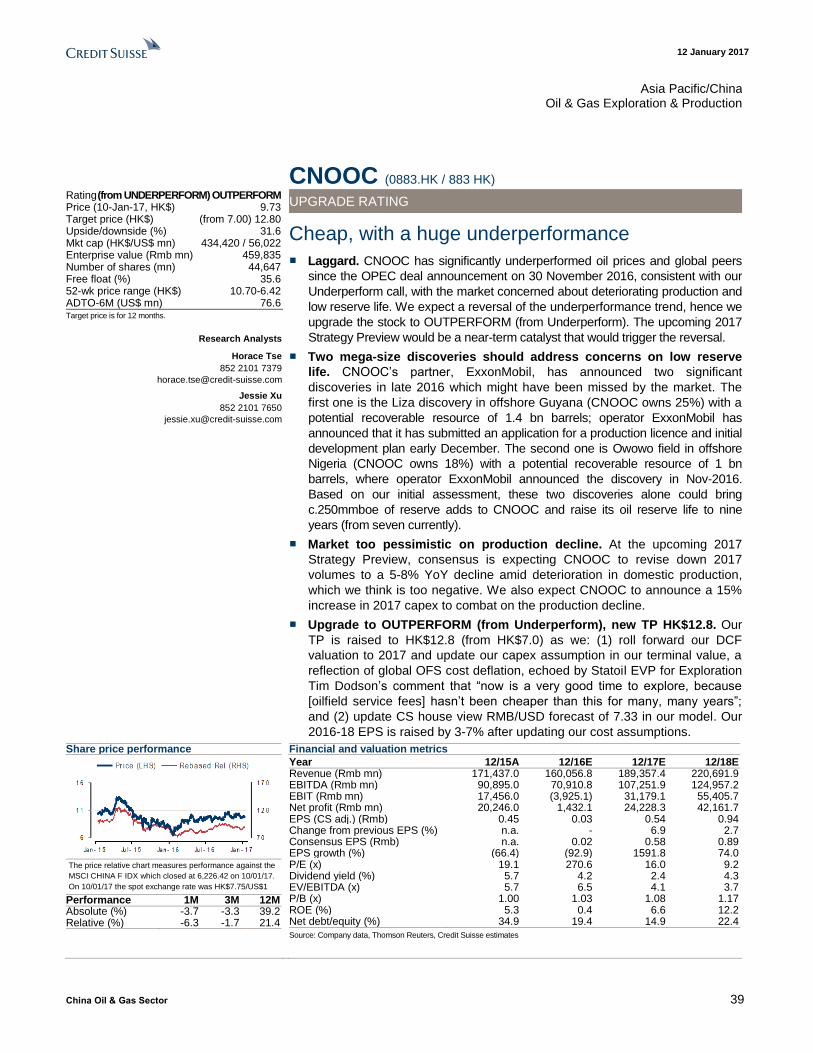
12 January 2017
China Oil & Gas Sector 39
Asia Pacific/China Oil & Gas Exploration & Production
CNOOC (0883.HK / 883 HK) Rating (from UNDERPERFORM) OUTPERFORM Price (10-Jan-17, HK$) 9.73 Target price (HK$) (from 7.00) 12.80 Upside/downside (%) 31.6 Mkt cap (HK$/US$ mn) 434,420 / 56,022 Enterprise value (Rmb mn) 459,835 Number of shares (mn) 44,647 Free float (%) 35.6 52-wk price range (HK$) 10.70-6.42 ADTO-6M (US$ mn) 76.6 Target price is for 12 months.
Research Analysts
Horace Tse
852 2101 7379
Jessie Xu
852 2101 7650
UPGRADE RATING
Cheap, with a huge underperformance
■ Laggard. CNOOC has significantly underperformed oil prices and global peers
since the OPEC deal announcement on 30 November 2016, consistent with our
Underperform call, with the market concerned about deteriorating production and
low reserve life. We expect a reversal of the underperformance trend, hence we
upgrade the stock to OUTPERFORM (from Underperform). The upcoming 2017
Strategy Preview would be a near-term catalyst that would trigger the reversal.
■ Two mega-size discoveries should address concerns on low reserve
life. CNOOC’s partner, ExxonMobil, has announced two significant
discoveries in late 2016 which might have been missed by the market. The
first one is the Liza discovery in offshore Guyana (CNOOC owns 25%) with a
potential recoverable resource of 1.4 bn barrels; operator ExxonMobil has
announced that it has submitted an application for a production licence and initial
development plan early December. The second one is Owowo field in offshore
Nigeria (CNOOC owns 18%) with a potential recoverable resource of 1 bn
barrels, where operator ExxonMobil announced the discovery in Nov-2016.
Based on our initial assessment, these two discoveries alone could bring
c.250mmboe of reserve adds to CNOOC and raise its oil reserve life to nine
years (from seven currently).
■ Market too pessimistic on production decline. At the upcoming 2017
Strategy Preview, consensus is expecting CNOOC to revise down 2017
volumes to a 5-8% YoY decline amid deterioration in domestic production,
which we think is too negative. We also expect CNOOC to announce a 15%
increase in 2017 capex to combat on the production decline.
■ Upgrade to OUTPERFORM (from Underperform), new TP HK$12.8. Our
TP is raised to HK$12.8 (from HK$7.0) as we: (1) roll forward our DCF
valuation to 2017 and update our capex assumption in our terminal value, a
reflection of global OFS cost deflation, echoed by Statoil EVP for Exploration
Tim Dodson’s comment that “now is a very good time to explore, because
[oilfield service fees] hasn’t been cheaper than this for many, many years”;
and (2) update CS house view RMB/USD forecast of 7.33 in our model. Our
2016-18 EPS is raised by 3-7% after updating our cost assumptions.
Share price performance
The price relative chart measures performance against the
MSCI CHINA F IDX which closed at 6,226.42 on 10/01/17.
On 10/01/17 the spot exchange rate was HK$7.75/US$1
Performance 1M 3M 12M Absolute (%) -3.7 -3.3 39.2 Relative (%) -6.3 -1.7 21.4
Financial and valuation metrics
Year 12/15A 12/16E 12/17E 12/18E Revenue (Rmb mn) 171,437.0 160,056.8 189,357.4 220,691.9 EBITDA (Rmb mn) 90,895.0 70,910.8 107,251.9 124,957.2 EBIT (Rmb mn) 17,456.0 (3,925.1) 31,179.1 55,405.7 Net profit (Rmb mn) 20,246.0 1,432.1 24,228.3 42,161.7 EPS (CS adj.) (Rmb) 0.45 0.03 0.54 0.94 Change from previous EPS (%) n.a. - 6.9 2.7 Consensus EPS (Rmb) n.a. 0.02 0.58 0.89 EPS growth (%) (66.4) (92.9) 1591.8 74.0 P/E (x) 19.1 270.6 16.0 9.2 Dividend yield (%) 5.7 4.2 2.4 4.3 EV/EBITDA (x) 5.7 6.5 4.1 3.7 P/B (x) 1.00 1.03 1.08 1.17 ROE (%) 5.3 0.4 6.6 12.2 Net debt/equity (%) 34.9 19.4 14.9 22.4
Source: Company data, Thomson Reuters, Credit Suisse estimates
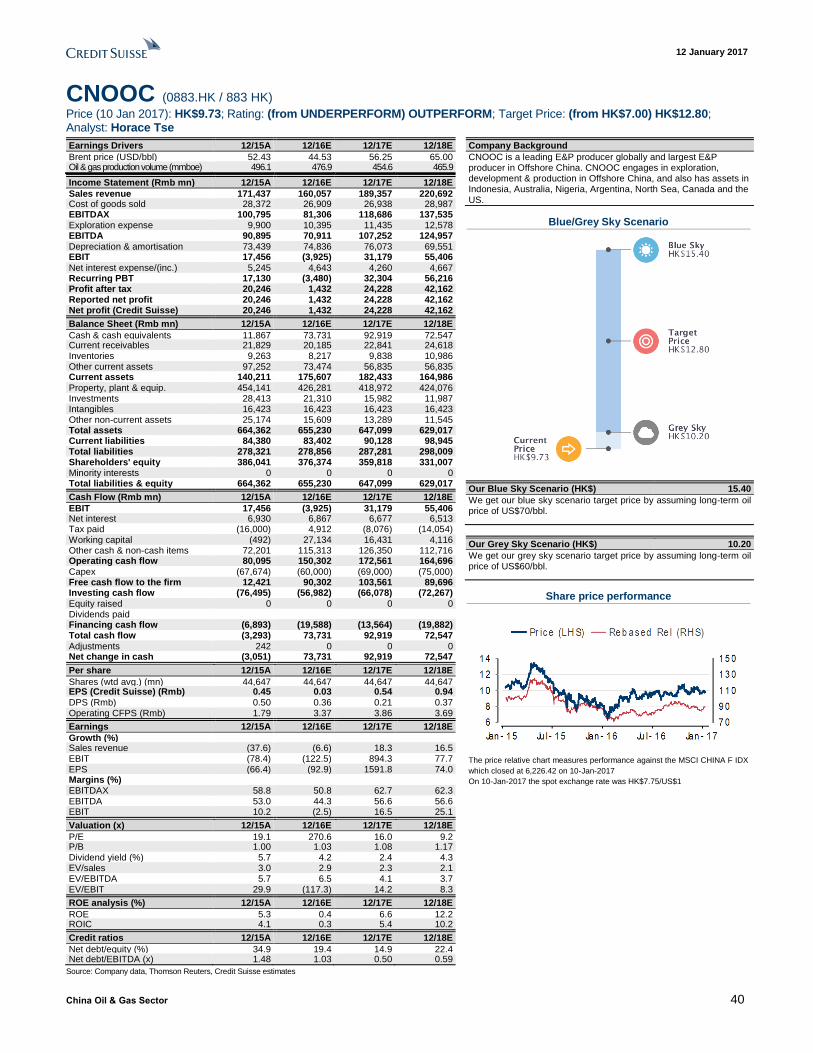
12 January 2017
China Oil & Gas Sector 40
CNOOC (0883.HK / 883 HK)
Price (10 Jan 2017): HK$9.73; Rating: (from UNDERPERFORM) OUTPERFORM; Target Price: (from HK$7.00) HK$12.80; Analyst: Horace Tse
Earnings Drivers 12/15A 12/16E 12/17E 12/18E
Brent price (USD/bbl) 52.43 44.53 56.25 65.00 Oil & gas production volume (mmboe) 496.1 476.9 454.6 465.9
Income Statement (Rmb mn) 12/15A 12/16E 12/17E 12/18E
Sales revenue 171,437 160,057 189,357 220,692 Cost of goods sold 28,372 26,909 26,938 28,987 EBITDAX 100,795 81,306 118,686 137,535 Exploration expense 9,900 10,395 11,435 12,578 EBITDA 90,895 70,911 107,252 124,957 Depreciation & amortisation 73,439 74,836 76,073 69,551 EBIT 17,456 (3,925) 31,179 55,406 Net interest expense/(inc.) 5,245 4,643 4,260 4,667 Recurring PBT 17,130 (3,480) 32,304 56,216 Profit after tax 20,246 1,432 24,228 42,162 Reported net profit 20,246 1,432 24,228 42,162 Net profit (Credit Suisse) 20,246 1,432 24,228 42,162
Balance Sheet (Rmb mn) 12/15A 12/16E 12/17E 12/18E
Cash & cash equivalents 11,867 73,731 92,919 72,547 Current receivables 21,829 20,185 22,841 24,618 Inventories 9,263 8,217 9,838 10,986 Other current assets 97,252 73,474 56,835 56,835 Current assets 140,211 175,607 182,433 164,986 Property, plant & equip. 454,141 426,281 418,972 424,076 Investments 28,413 21,310 15,982 11,987 Intangibles 16,423 16,423 16,423 16,423 Other non-current assets 25,174 15,609 13,289 11,545 Total assets 664,362 655,230 647,099 629,017 Current liabilities 84,380 83,402 90,128 98,945 Total liabilities 278,321 278,856 287,281 298,009 Shareholders' equity 386,041 376,374 359,818 331,007 Minority interests 0 0 0 0 Total liabilities & equity 664,362 655,230 647,099 629,017
Cash Flow (Rmb mn) 12/15A 12/16E 12/17E 12/18E
EBIT 17,456 (3,925) 31,179 55,406 Net interest 6,930 6,867 6,677 6,513 Tax paid (16,000) 4,912 (8,076) (14,054) Working capital (492) 27,134 16,431 4,116 Other cash & non-cash items 72,201 115,313 126,350 112,716 Operating cash flow 80,095 150,302 172,561 164,696 Capex (67,674) (60,000) (69,000) (75,000) Free cash flow to the firm 12,421 90,302 103,561 89,696 Investing cash flow (76,495) (56,982) (66,078) (72,267) Equity raised 0 0 0 0 Dividends paid Financing cash flow (6,893) (19,588) (13,564) (19,882) Total cash flow (3,293) 73,731 92,919 72,547 Adjustments 242 0 0 0 Net change in cash (3,051) 73,731 92,919 72,547
Per share 12/15A 12/16E 12/17E 12/18E
Shares (wtd avg.) (mn) 44,647 44,647 44,647 44,647 EPS (Credit Suisse) (Rmb) 0.45 0.03 0.54 0.94 DPS (Rmb) 0.50 0.36 0.21 0.37 Operating CFPS (Rmb) 1.79 3.37 3.86 3.69
Earnings 12/15A 12/16E 12/17E 12/18E
Growth (%) Sales revenue (37.6) (6.6) 18.3 16.5 EBIT (78.4) (122.5) 894.3 77.7 EPS (66.4) (92.9) 1591.8 74.0 Margins (%) EBITDAX 58.8 50.8 62.7 62.3 EBITDA 53.0 44.3 56.6 56.6 EBIT 10.2 (2.5) 16.5 25.1
Valuation (x) 12/15A 12/16E 12/17E 12/18E
P/E 19.1 270.6 16.0 9.2 P/B 1.00 1.03 1.08 1.17 Dividend yield (%) 5.7 4.2 2.4 4.3 EV/sales 3.0 2.9 2.3 2.1 EV/EBITDA 5.7 6.5 4.1 3.7 EV/EBIT 29.9 (117.3) 14.2 8.3
ROE analysis (%) 12/15A 12/16E 12/17E 12/18E
ROE 5.3 0.4 6.6 12.2 ROIC 4.1 0.3 5.4 10.2
Credit ratios 12/15A 12/16E 12/17E 12/18E
Net debt/equity (%) 34.9 19.4 14.9 22.4 Net debt/EBITDA (x) 1.48 1.03 0.50 0.59
Company Background
CNOOC is a leading E&P producer globally and largest E&P producer in Offshore China. CNOOC engages in exploration, development & production in Offshore China, and also has assets in Indonesia, Australia, Nigeria, Argentina, North Sea, Canada and the US.
Blue/Grey Sky Scenario
Our Blue Sky Scenario (HK$) 15.40
We get our blue sky scenario target price by assuming long-term oil price of US$70/bbl.
Our Grey Sky Scenario (HK$) 10.20
We get our grey sky scenario target price by assuming long-term oil price of US$60/bbl.
Share price performance
The price relative chart measures performance against the MSCI CHINA F IDX
which closed at 6,226.42 on 10-Jan-2017
On 10-Jan-2017 the spot exchange rate was HK$7.75/US$1
Source: Company data, Thomson Reuters, Credit Suisse estimates
12 January 2017
China Oil & Gas Sector 41
Asia Pacific/China Integrated Oil & Gas
Sinopec (0386.HK / 386 HK) Rating (from NEUTRAL) OUTPERFORM Price (10-Jan-17, HK$) 5.90 Target price (HK$) (from 6.10) 7.30 Upside/downside (%) 23.7 Mkt cap (HK$/US$ mn) 782,484 / 100,908 Enterprise value (Rmb mn) 856,449 Number of shares (mn) 121,071 Free float (%) 26.1 52-wk price range (HK$) 5.95-3.88 ADTO-6M (US$ mn) 60.6 Target price is for 12 months.
Research Analysts
Horace Tse
852 2101 7379
Jessie Xu
852 2101 7650
UPGRADE RATING
Marketing revaluation in sight
■ Re-focusing on divestments. We get the impression that Sinopec is re-accelerating on restructuring and reforms, which is consistent with the SOE reform that China is re-emphasising. The completion of the Sichuan-East gas pipeline transaction in December 2016 means that Sinopec can now focus on the marketing spin-off, which is the next and biggest in the pipeline. Reuters reported that Sinopec has appointed investment banks for a listing that could raise as much as US$12 bn. Over the next 6-9 months, we expect Sinopec to see further development and collaboration on its non-fuel business, which we think will be the key share price driver through 2017.
■ Undervalued marketing business. Oil retail marketing businesses are undervalued within an integrated oil particularly in a lower oil price environment; so it is becoming the norm to divest it so as to crystallise valuation. We are also seeing regional peers pushing forward on this, including PTT in Thailand and BP bidding for Woolworths' retail stations in Australia. Sinopec’s marketing division has a dominant position (60% market share), higher potential on its non-fuel business side (only 3% of total revenue vs c.30% for developed markets), and is the best vehicle to tap into the fastest growing fuel market in the world. We update our marketing division valuation estimates, applying an 18x P/E (vs 14x P/E from its divestment in 2014) which we believe reflects the market value from the latest comps (20x P/E) and the recent BP-Woolworths transaction (22x P/E).
■ Upgrade to OUTPERFORM (from Neutral); new TP HK$7.3. Our SoTP-
based TP is raised to HK$7.3 (from HK$6.1) as we: (1) raise our marketing
valuation multiple to 18x (from 14x); (2) roll forward our E&P DCF valuation
to 2017 and reduce our capex assumption in our terminal value, a reflection
of global OFS cost deflation post the downturn; (3) roll forward our
downstream valuation to 2017 multiples and keep our target multiples
unchanged—refining at 7x EV/EBITDA and chemical at 5x EV/EBITDA; (4)
update CS house view RMB/USD forecast of 7.33 in our SoTP valuation. Our
2016-18 EPS is raised by 7-17% on higher marketing non-fuel business
earnings and chemical earnings.
Share price performance
The price relative chart measures performance against the
MSCI CHINA F IDX which closed at 6,226.42 on 10/01/17. On
10/01/17 the spot exchange rate was HK$7.75/US$1
Performance 1M 3M 12M Absolute (%) 5.4 3.7 39.8 Relative (%) 2.8 5.4 22.0
Financial and valuation metrics
Year 12/15A 12/16E 12/17E 12/18E Revenue (Rmb mn) 2,018,883.0 2,056,047.9 2,419,484.0 2,736,752.4 EBITDA (Rmb mn) 153,396.0 160,768.6 190,590.0 203,837.3 EBIT (Rmb mn) 57,028.0 66,371.4 91,906.5 104,445.8 Net profit (Rmb mn) 32,438.0 56,606.1 63,682.6 73,270.5 EPS (CS adj.) (Rmb) 0.27 0.47 0.53 0.61 Change from previous EPS (%) n.a. 6.5 16.3 17.4 Consensus EPS (Rmb) n.a. 0.33 0.41 0.49 EPS growth (%) (32.5) 74.2 12.5 15.1 P/E (x) 19.6 11.3 10.0 8.7 Dividend yield (%) 2.9 4.4 5.0 5.7 EV/EBITDA (x) 5.8 5.3 4.4 3.9 P/B (x) 0.94 0.88 0.84 0.80 ROE (%) 5.1 8.1 8.6 9.5 Net debt/equity (%) 23.9 18.8 15.0 11.3
Source: Company data, Thomson Reuters, Credit Suisse estimates
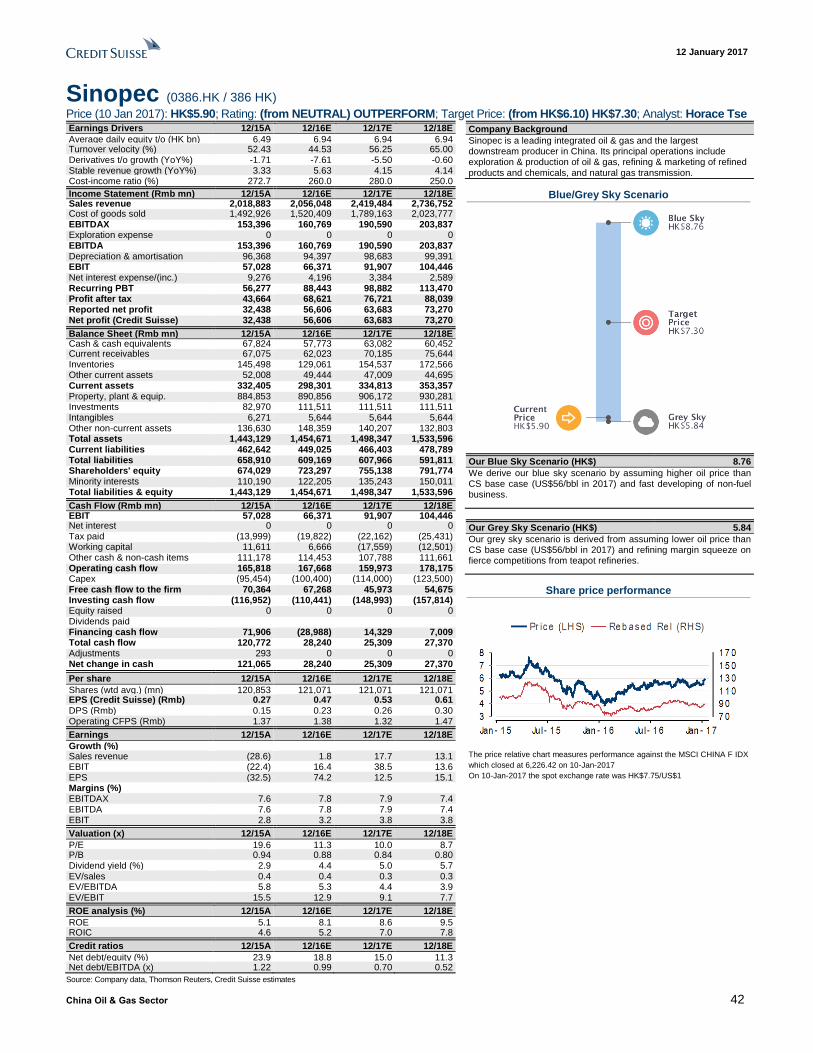
12 January 2017
China Oil & Gas Sector 42
Sinopec (0386.HK / 386 HK)
Price (10 Jan 2017): HK$5.90; Rating: (from NEUTRAL) OUTPERFORM; Target Price: (from HK$6.10) HK$7.30; Analyst: Horace Tse Earnings Drivers 12/15A 12/16E 12/17E 12/18E
Average daily equity t/o (HK bn) 6.49 6.94 6.94 6.94 Turnover velocity (%) 52.43 44.53 56.25 65.00 Derivatives t/o growth (YoY%) -1.71 -7.61 -5.50 -0.60 Stable revenue growth (YoY%) 3.33 5.63 4.15 4.14 Cost-income ratio (%) 272.7 260.0 280.0 250.0
Income Statement (Rmb mn) 12/15A 12/16E 12/17E 12/18E Sales revenue 2,018,883 2,056,048 2,419,484 2,736,752 Cost of goods sold 1,492,926 1,520,409 1,789,163 2,023,777 EBITDAX 153,396 160,769 190,590 203,837 Exploration expense 0 0 0 0 EBITDA 153,396 160,769 190,590 203,837 Depreciation & amortisation 96,368 94,397 98,683 99,391 EBIT 57,028 66,371 91,907 104,446 Net interest expense/(inc.) 9,276 4,196 3,384 2,589 Recurring PBT 56,277 88,443 98,882 113,470 Profit after tax 43,664 68,621 76,721 88,039 Reported net profit 32,438 56,606 63,683 73,270 Net profit (Credit Suisse) 32,438 56,606 63,683 73,270
Balance Sheet (Rmb mn) 12/15A 12/16E 12/17E 12/18E Cash & cash equivalents 67,824 57,773 63,082 60,452 Current receivables 67,075 62,023 70,185 75,644 Inventories 145,498 129,061 154,537 172,566 Other current assets 52,008 49,444 47,009 44,695 Current assets 332,405 298,301 334,813 353,357 Property, plant & equip. 884,853 890,856 906,172 930,281 Investments 82,970 111,511 111,511 111,511 Intangibles 6,271 5,644 5,644 5,644 Other non-current assets 136,630 148,359 140,207 132,803 Total assets 1,443,129 1,454,671 1,498,347 1,533,596 Current liabilities 462,642 449,025 466,403 478,789 Total liabilities 658,910 609,169 607,966 591,811 Shareholders' equity 674,029 723,297 755,138 791,774 Minority interests 110,190 122,205 135,243 150,011 Total liabilities & equity 1,443,129 1,454,671 1,498,347 1,533,596
Cash Flow (Rmb mn) 12/15A 12/16E 12/17E 12/18E EBIT 57,028 66,371 91,907 104,446 Net interest 0 0 0 0 Tax paid (13,999) (19,822) (22,162) (25,431) Working capital 11,611 6,666 (17,559) (12,501) Other cash & non-cash items 111,178 114,453 107,788 111,661 Operating cash flow 165,818 167,668 159,973 178,175 Capex (95,454) (100,400) (114,000) (123,500) Free cash flow to the firm 70,364 67,268 45,973 54,675 Investing cash flow (116,952) (110,441) (148,993) (157,814) Equity raised 0 0 0 0 Dividends paid Financing cash flow 71,906 (28,988) 14,329 7,009 Total cash flow 120,772 28,240 25,309 27,370 Adjustments 293 0 0 0 Net change in cash 121,065 28,240 25,309 27,370
Per share 12/15A 12/16E 12/17E 12/18E
Shares (wtd avg.) (mn) 120,853 121,071 121,071 121,071 EPS (Credit Suisse) (Rmb) 0.27 0.47 0.53 0.61 DPS (Rmb) 0.15 0.23 0.26 0.30 Operating CFPS (Rmb) 1.37 1.38 1.32 1.47
Earnings 12/15A 12/16E 12/17E 12/18E
Growth (%) Sales revenue (28.6) 1.8 17.7 13.1 EBIT (22.4) 16.4 38.5 13.6 EPS (32.5) 74.2 12.5 15.1 Margins (%) EBITDAX 7.6 7.8 7.9 7.4 EBITDA 7.6 7.8 7.9 7.4 EBIT 2.8 3.2 3.8 3.8
Valuation (x) 12/15A 12/16E 12/17E 12/18E
P/E 19.6 11.3 10.0 8.7 P/B 0.94 0.88 0.84 0.80 Dividend yield (%) 2.9 4.4 5.0 5.7 EV/sales 0.4 0.4 0.3 0.3 EV/EBITDA 5.8 5.3 4.4 3.9 EV/EBIT 15.5 12.9 9.1 7.7
ROE analysis (%) 12/15A 12/16E 12/17E 12/18E
ROE 5.1 8.1 8.6 9.5 ROIC 4.6 5.2 7.0 7.8
Credit ratios 12/15A 12/16E 12/17E 12/18E
Net debt/equity (%) 23.9 18.8 15.0 11.3 Net debt/EBITDA (x) 1.22 0.99 0.70 0.52
Company Background
Sinopec is a leading integrated oil & gas and the largest downstream producer in China. Its principal operations include exploration & production of oil & gas, refining & marketing of refined products and chemicals, and natural gas transmission.
Blue/Grey Sky Scenario
Our Blue Sky Scenario (HK$) 8.76
We derive our blue sky scenario by assuming higher oil price than CS base case (US$56/bbl in 2017) and fast developing of non-fuel business.
Our Grey Sky Scenario (HK$) 5.84
Our grey sky scenario is derived from assuming lower oil price than CS base case (US$56/bbl in 2017) and refining margin squeeze on fierce competitions from teapot refineries.
Share price performance
The price relative chart measures performance against the MSCI CHINA F IDX
which closed at 6,226.42 on 10-Jan-2017
On 10-Jan-2017 the spot exchange rate was HK$7.75/US$1
Source: Company data, Thomson Reuters, Credit Suisse estimates
12 January 2017
China Oil & Gas Sector 43
Asia Pacific/China Integrated Oil & Gas
PetroChina (0857.HK / 857 HK) Rating NEUTRAL Price (10-Jan-17, HK$) 6.18 Target price (HK$) (from 6.30) 7.00 Upside/downside (%) 13.3 Mkt cap (HK$/US$ mn) 1,654,981 / 213,425 Enterprise value (Rmb mn) 2,005,982 Number of shares (mn) 183,021 Free float (%) 98.6 52-wk price range (HK$) 6.18-4.16 ADTO-6M (US$ mn) 71.4 Target price is for 12 months.
Research Analysts
Horace Tse
852 2101 7379
Jessie Xu
852 2101 7650
INCREASE TARGET PRICE
Pipeline rerating expectations in the price
■ Losing stream. We believe that the market has priced in a lot of
expectations on the gas pipeline revaluation potential so further upside is
limited, in our opinion. PetroChina has long been open to the idea of selling
stakes in its pipeline assets to crystallise valuation, and the restructuring in
December 2015 has already set it up for further sell-down by streamlining the
complicated ownership structure. The nature of gas pipeline assets (yield
play, stable cash flow generation, minimal incremental capex required) also
fits insurance companies’ appetite. A further sell-down of the pipeline
company stake is likely in 2017, in our view.
■ We see intrinsic value in PetroChina’s pipeline. In our model we apply the
implied valuation from Sinopec’s gas pipeline transaction (20x P/E or 2.3x
Asset), valuing PetroChina’s pipeline segment at HK$5.8/sh or implying 1.8x-
3.2x P/B. Arguably, PetroChina’s gas pipelines should deserve at least an at-
par valuation on a like-for-like basis, given that PetroChina’s gas pipelines
have: (1) higher earnings growth potential as its pipelines are still at 75%
utilisation post W-E III start-up in 2017, while Sinopec’s are already at full
utilisation; (2) higher margins vs Sinopec’s, as Sinopec’s are of higher cost
due to the additional desulphurisation process for the high sulphur gas
content from Puguang.
■ Maintain NEUTRAL, new TP HK$7.0. Our SoTP-based TP is raised to
HK$7.0 (from HK$6.3) as we: (1) roll forward our E&P DCF valuation to 2017
and reduce our capex assumption in our terminal value, a reflection of global
OFS cost deflation post the downturn; (2) roll forward our downstream
valuation to 2017 multiples, with our target multiples unchanged at 4x
EV/EBITDA for refining & chemical and 3x EV/EBITDA for marketing; and (3)
update CS house view's RMB/USD forecast of 7.33 in our SoTP valuation.
Our 2016 EPS is lowered by 19% as we mark-to-market actual oil prices,
while 2017-18 EPS are unchanged.
Share price performance
The price relative chart measures performance against the
MSCI CHINA F IDX which closed at 6,226.42 on 10/01/17. On
10/01/17 the spot exchange rate was HK$7.75/US$1
Performance 1M 3M 12M Absolute (%) 12.8 16.0 41.2 Relative (%) 10.2 17.7 23.4
Financial and valuation metrics
Year 12/15A 12/16E 12/17E 12/18E Revenue (Rmb mn) 1,725,428.0 1,564,150.6 1,984,189.6 2,285,885.0 EBITDA (Rmb mn) 282,127.0 256,230.5 282,461.2 325,362.9 EBIT (Rmb mn) 79,252.0 68,111.1 83,413.4 125,426.6 Net profit (Rmb mn) 35,517.0 4,315.9 13,955.5 44,425.8 EPS (CS adj.) (Rmb) 0.19 0.02 0.08 0.24 Change from previous EPS (%) n.a. (18.8) - 0.2 Consensus EPS (Rmb) n.a. 0.05 0.28 0.44 EPS growth (%) (66.9) (87.8) 223.4 218.3 P/E (x) 28.4 233.8 72.3 22.7 Dividend yield (%) 1.6 0.9 0.8 2.0 EV/EBITDA (x) 6.9 7.8 7.1 6.1 P/B (x) 0.98 0.99 0.98 0.96 ROE (%) 3.5 0.4 1.4 4.3 Net debt/equity (%) 34.8 39.6 39.1 37.9
Source: Company data, Thomson Reuters, Credit Suisse estimates
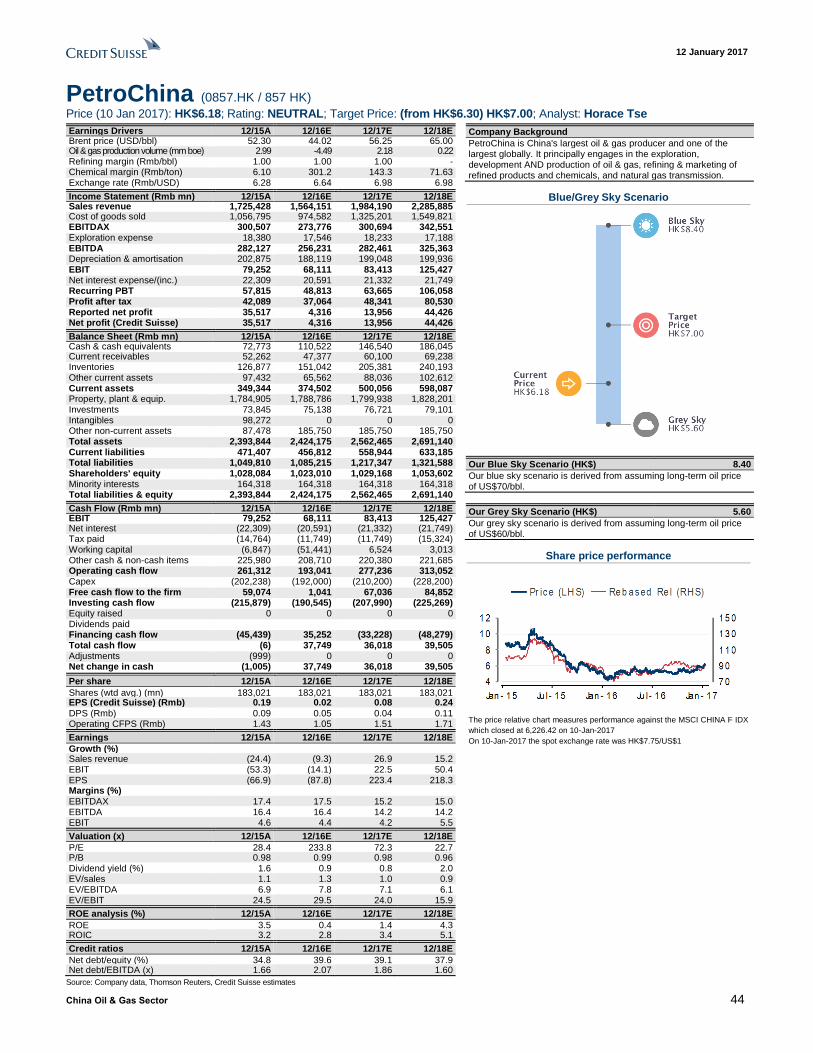
12 January 2017
China Oil & Gas Sector 44
PetroChina (0857.HK / 857 HK)
Price (10 Jan 2017): HK$6.18; Rating: NEUTRAL; Target Price: (from HK$6.30) HK$7.00; Analyst: Horace Tse
Earnings Drivers 12/15A 12/16E 12/17E 12/18E Brent price (USD/bbl) 52.30 44.02 56.25 65.00 Oil & gas production volume (mm boe) 2.99 -4.49 2.18 0.22 Refining margin (Rmb/bbl) 1.00 1.00 1.00 - Chemical margin (Rmb/ton) 6.10 301.2 143.3 71.63 Exchange rate (Rmb/USD) 6.28 6.64 6.98 6.98
Income Statement (Rmb mn) 12/15A 12/16E 12/17E 12/18E Sales revenue 1,725,428 1,564,151 1,984,190 2,285,885 Cost of goods sold 1,056,795 974,582 1,325,201 1,549,821 EBITDAX 300,507 273,776 300,694 342,551 Exploration expense 18,380 17,546 18,233 17,188 EBITDA 282,127 256,231 282,461 325,363 Depreciation & amortisation 202,875 188,119 199,048 199,936 EBIT 79,252 68,111 83,413 125,427 Net interest expense/(inc.) 22,309 20,591 21,332 21,749 Recurring PBT 57,815 48,813 63,665 106,058 Profit after tax 42,089 37,064 48,341 80,530 Reported net profit 35,517 4,316 13,956 44,426 Net profit (Credit Suisse) 35,517 4,316 13,956 44,426
Balance Sheet (Rmb mn) 12/15A 12/16E 12/17E 12/18E Cash & cash equivalents 72,773 110,522 146,540 186,045 Current receivables 52,262 47,377 60,100 69,238 Inventories 126,877 151,042 205,381 240,193 Other current assets 97,432 65,562 88,036 102,612 Current assets 349,344 374,502 500,056 598,087 Property, plant & equip. 1,784,905 1,788,786 1,799,938 1,828,201 Investments 73,845 75,138 76,721 79,101 Intangibles 98,272 0 0 0 Other non-current assets 87,478 185,750 185,750 185,750 Total assets 2,393,844 2,424,175 2,562,465 2,691,140 Current liabilities 471,407 456,812 558,944 633,185 Total liabilities 1,049,810 1,085,215 1,217,347 1,321,588 Shareholders' equity 1,028,084 1,023,010 1,029,168 1,053,602 Minority interests 164,318 164,318 164,318 164,318 Total liabilities & equity 2,393,844 2,424,175 2,562,465 2,691,140
Cash Flow (Rmb mn) 12/15A 12/16E 12/17E 12/18E EBIT 79,252 68,111 83,413 125,427 Net interest (22,309) (20,591) (21,332) (21,749) Tax paid (14,764) (11,749) (11,749) (15,324) Working capital (6,847) (51,441) 6,524 3,013 Other cash & non-cash items 225,980 208,710 220,380 221,685 Operating cash flow 261,312 193,041 277,236 313,052 Capex (202,238) (192,000) (210,200) (228,200) Free cash flow to the firm 59,074 1,041 67,036 84,852 Investing cash flow (215,879) (190,545) (207,990) (225,269) Equity raised 0 0 0 0 Dividends paid Financing cash flow (45,439) 35,252 (33,228) (48,279) Total cash flow (6) 37,749 36,018 39,505 Adjustments (999) 0 0 0 Net change in cash (1,005) 37,749 36,018 39,505
Per share 12/15A 12/16E 12/17E 12/18E
Shares (wtd avg.) (mn) 183,021 183,021 183,021 183,021 EPS (Credit Suisse) (Rmb) 0.19 0.02 0.08 0.24 DPS (Rmb) 0.09 0.05 0.04 0.11 Operating CFPS (Rmb) 1.43 1.05 1.51 1.71
Earnings 12/15A 12/16E 12/17E 12/18E
Growth (%) Sales revenue (24.4) (9.3) 26.9 15.2 EBIT (53.3) (14.1) 22.5 50.4 EPS (66.9) (87.8) 223.4 218.3 Margins (%) EBITDAX 17.4 17.5 15.2 15.0 EBITDA 16.4 16.4 14.2 14.2 EBIT 4.6 4.4 4.2 5.5
Valuation (x) 12/15A 12/16E 12/17E 12/18E
P/E 28.4 233.8 72.3 22.7 P/B 0.98 0.99 0.98 0.96 Dividend yield (%) 1.6 0.9 0.8 2.0 EV/sales 1.1 1.3 1.0 0.9 EV/EBITDA 6.9 7.8 7.1 6.1 EV/EBIT 24.5 29.5 24.0 15.9
ROE analysis (%) 12/15A 12/16E 12/17E 12/18E
ROE 3.5 0.4 1.4 4.3 ROIC 3.2 2.8 3.4 5.1
Credit ratios 12/15A 12/16E 12/17E 12/18E
Net debt/equity (%) 34.8 39.6 39.1 37.9 Net debt/EBITDA (x) 1.66 2.07 1.86 1.60
Company Background
PetroChina is China's largest oil & gas producer and one of the largest globally. It principally engages in the exploration, development AND production of oil & gas, refining & marketing of refined products and chemicals, and natural gas transmission.
Blue/Grey Sky Scenario
Our Blue Sky Scenario (HK$) 8.40
Our blue sky scenario is derived from assuming long-term oil price of US$70/bbl.
Our Grey Sky Scenario (HK$) 5.60
Our grey sky scenario is derived from assuming long-term oil price of US$60/bbl.
Share price performance
The price relative chart measures performance against the MSCI CHINA F IDX
which closed at 6,226.42 on 10-Jan-2017
On 10-Jan-2017 the spot exchange rate was HK$7.75/US$1
Source: Company data, Thomson Reuters, Credit Suisse estimates
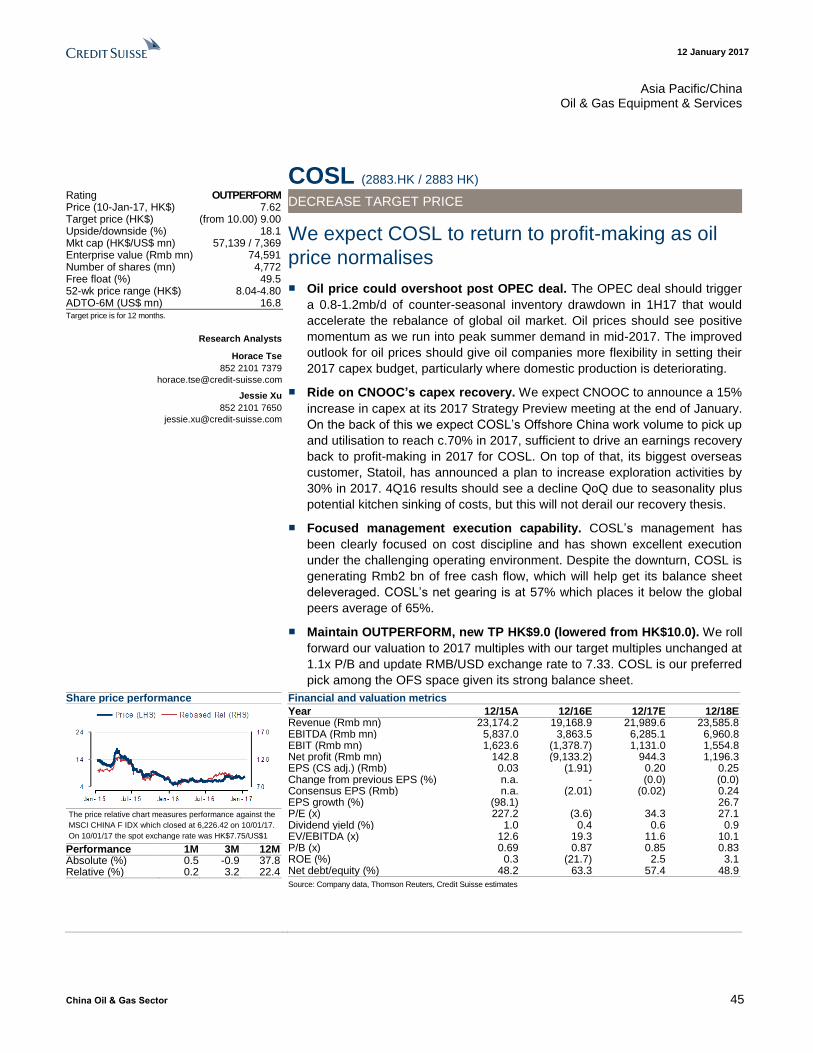
12 January 2017
China Oil & Gas Sector 45
Asia Pacific/China Oil & Gas Equipment & Services
COSL (2883.HK / 2883 HK) Rating OUTPERFORM Price (10-Jan-17, HK$) 7.62 Target price (HK$) (from 10.00) 9.00 Upside/downside (%) 18.1 Mkt cap (HK$/US$ mn) 57,139 / 7,369 Enterprise value (Rmb mn) 74,591 Number of shares (mn) 4,772 Free float (%) 49.5 52-wk price range (HK$) 8.04-4.80 ADTO-6M (US$ mn) 16.8 Target price is for 12 months.
Research Analysts
Horace Tse
852 2101 7379
Jessie Xu
852 2101 7650
DECREASE TARGET PRICE
We expect COSL to return to profit-making as oil
price normalises
■ Oil price could overshoot post OPEC deal. The OPEC deal should trigger
a 0.8-1.2mb/d of counter-seasonal inventory drawdown in 1H17 that would
accelerate the rebalance of global oil market. Oil prices should see positive
momentum as we run into peak summer demand in mid-2017. The improved
outlook for oil prices should give oil companies more flexibility in setting their
2017 capex budget, particularly where domestic production is deteriorating.
■ Ride on CNOOC’s capex recovery. We expect CNOOC to announce a 15%
increase in capex at its 2017 Strategy Preview meeting at the end of January.
On the back of this we expect COSL’s Offshore China work volume to pick up
and utilisation to reach c.70% in 2017, sufficient to drive an earnings recovery
back to profit-making in 2017 for COSL. On top of that, its biggest overseas
customer, Statoil, has announced a plan to increase exploration activities by
30% in 2017. 4Q16 results should see a decline QoQ due to seasonality plus
potential kitchen sinking of costs, but this will not derail our recovery thesis.
■ Focused management execution capability. COSL’s management has
been clearly focused on cost discipline and has shown excellent execution
under the challenging operating environment. Despite the downturn, COSL is
generating Rmb2 bn of free cash flow, which will help get its balance sheet
deleveraged. COSL’s net gearing is at 57% which places it below the global
peers average of 65%.
■ Maintain OUTPERFORM, new TP HK$9.0 (lowered from HK$10.0). We roll
forward our valuation to 2017 multiples with our target multiples unchanged at
1.1x P/B and update RMB/USD exchange rate to 7.33. COSL is our preferred
pick among the OFS space given its strong balance sheet.
Share price performance
The price relative chart measures performance against the
MSCI CHINA F IDX which closed at 6,226.42 on 10/01/17.
On 10/01/17 the spot exchange rate was HK$7.75/US$1
Performance 1M 3M 12M Absolute (%) 0.5 -0.9 37.8 Relative (%) 0.2 3.2 22.4
Financial and valuation metrics
Year 12/15A 12/16E 12/17E 12/18E Revenue (Rmb mn) 23,174.2 19,168.9 21,989.6 23,585.8 EBITDA (Rmb mn) 5,837.0 3,863.5 6,285.1 6,960.8 EBIT (Rmb mn) 1,623.6 (1,378.7) 1,131.0 1,554.8 Net profit (Rmb mn) 142.8 (9,133.2) 944.3 1,196.3 EPS (CS adj.) (Rmb) 0.03 (1.91) 0.20 0.25 Change from previous EPS (%) n.a. - (0.0) (0.0) Consensus EPS (Rmb) n.a. (2.01) (0.02) 0.24 EPS growth (%) (98.1) 26.7 P/E (x) 227.2 (3.6) 34.3 27.1 Dividend yield (%) 1.0 0.4 0.6 0.9 EV/EBITDA (x) 12.6 19.3 11.6 10.1 P/B (x) 0.69 0.87 0.85 0.83 ROE (%) 0.3 (21.7) 2.5 3.1 Net debt/equity (%) 48.2 63.3 57.4 48.9
Source: Company data, Thomson Reuters, Credit Suisse estimates

12 January 2017
China Oil & Gas Sector 46
COSL (2883.HK / 2883 HK)
Price (10 Jan 2017): HK$7.62; Rating: OUTPERFORM; Target Price: (from HK$10.00) HK$9.00; Analyst: Horace Tse
Earnings Drivers 12/15A 12/16E 12/17E 12/18E
Drilling EBIT margin 8.03 -12.43 3.54 7.45 Geophysical EBIT margin -3.42 -2.27 15.59 13.41 - - - - - - - - - - - -
Income Statement (Rmb mn) 12/15A 12/16E 12/17E 12/18E
Sales revenue 23,174 19,169 21,990 23,586 Cost of goods sold 9,535 7,707 7,712 8,189 SG & A 2,538 2,523 2,736 2,968 Other operating exp./(inc.) 5,264 5,075 5,256 5,468 EBITDAX 5,837 3,864 6,285 6,961 Exploration expense 0 0 0 0 EBITDA 5,837 3,864 6,285 6,961 Depreciation & amortisation 4,213 5,242 5,154 5,406 EBIT 1,624 (1,379) 1,131 1,555 Net interest expense/(inc.) 507 840 396 546 Associates/JV 272 367 367 367 Forex losses (gains) 0 0 0 0 Non-operating inc./(exp.) (923) (7,144) 0 0 Recurring PBT 465 (8,996) 1,102 1,376 Exceptionals/extraordinaries 0 0 0 0 Taxes 288 130 150 180 Profit after tax 178 (9,126) 952 1,196 Other after tax income 0 0 0 0 Minority interests 35 7 7 0 Preferred dividends 0 0 0 0 Reported net profit 143 (9,133) 944 1,196 Analyst adjustments 0 0 0 0 Net profit (Credit Suisse) 143 (9,133) 944 1,196
Balance Sheet (Rmb mn) 12/15A 12/16E 12/17E 12/18E
Cash & cash equivalents 12,774 9,538 11,324 500 Current receivables 8,559 6,202 6,903 7,346 Inventories 1,328 1,513 1,684 1,792 Other current assets 4,740 5,095 5,163 5,206 Current assets 27,401 22,347 25,074 14,844 Property, plant & equip. 60,388 56,419 54,892 53,114 Investments 681 880 1,247 1,614 Intangibles 3,864 435 435 435 Other non-current assets 1,190 506 506 0 Total assets 93,525 80,587 82,154 70,007 Accounts payable 8,081 7,677 8,546 9,094 Short-term debt 11,452 11,294 11,294 11,294 Current provisions 111 70 75 90 Other current liabilities 1,415 751 693 738 Current liabilities 21,059 19,792 20,608 21,215 Long-term debt 23,873 21,913 21,913 8,297 Non-current provisions 627 534 525 484 Other non-current liabilities 1,137 963 963 963 Total liabilities 46,696 43,203 44,010 30,960 Shareholders' equity 46,741 37,293 38,048 38,945
Minority interests 87 92 96 101 Total liabilities & equity 93,525 80,587 82,154 70,007
Cash Flow (Rmb mn) 12/15A 12/16E 12/17E 12/18E
EBIT 1,624 (1,379) 1,131 1,555 Net interest (595) (862) (396) (546) Tax paid (581) (265) (154) (206) Working capital 2,964 1,250 (130) (1) Other cash & non-cash items 4,213 5,242 5,154 5,406 Operating cash flow 7,624 3,987 5,605 6,208 Capex (8,621) (1,273) (3,628) (3,628) Free cash flow to the firm (997) 2,714 1,977 2,580 Disposals of fixed assets 0 0 0 0 Acquisitions 0 0 0 0 Divestments 0 0 0 0 Associate investments 0 0 0 0 Other investment/(outflows) 319 6 0 0 Investing cash flow (8,302) (1,267) (3,628) (3,628)
Equity raised 0 0 0 5 Dividends paid (324) (135) (189) (299) Net borrowings 0 0 0 0 Other financing cash flow (35) (7) (7) 0 Financing cash flow (359) (142) (196) (294) Total cash flow (1,037) 2,577 1,781 2,286 Adjustments 0 0 0 0 Net change in cash (1,037) 2,577 1,781 2,286
Per share 12/15A 12/16E 12/17E 12/18E
Shares (wtd avg.) (mn) 4,772 4,772 4,772 4,772 EPS (Credit Suisse) (Rmb)
0.03 (1.91) 0.20 0.25 DPS (Rmb) 0.07 0.03 0.04 0.06 BVPS (Rmb) 9.80 7.82 7.97 8.16 Operating CFPS (Rmb) 1.60 0.84 1.17 1.30
Valuation (x) 12/15A 12/16E 12/17E 12/18E
P/E 227.2 (3.6) 34.3 27.1 P/B 0.69 0.87 0.85 0.83 Dividend yield (%) 1.0 0.4 0.6 0.9 P/CF 4.3 8.1 5.8 5.2 EV/sales 3.2 3.9 3.3 3.0 EV/EBITDA 12.6 19.3 11.6 10.1 EV/EBIT 45.3 (54.1) 64.4 45.1
Earnings 12/15A 12/16E 12/17E 12/18E
Growth (%) Sales revenue (29.8) (17.3) 14.7 7.3 EBIT (80.7) (184.9) 182.0 37.5 Net profit (98.1) (6496.6) 110.3 26.7 EPS (98.1) (6496.6) 110.3 26.7 Margins (%) EBITDAX 25.2 20.2 28.6 29.5 EBITDA 25.2 20.2 28.6 29.5 EBIT 7.0 (7.2) 5.1 6.6 Pre-tax profit 2.0 (46.9) 5.0 5.8 Net profit 0.6 (47.6) 4.3 5.1
ROE analysis (%) 12/15A 12/16E 12/17E 12/18E
ROE 0.3 (21.7) 2.5 3.1 ROIC 0.9 (2.1) 1.6 2.3 Asset turnover (x) 0.2 0.2 0.3 0.3 Interest burden (x) 0.3 6.5 1.0 0.9 Tax burden (x) 0.4 1.0 0.9 0.9 Financial leverage (x) 2.0 2.2 2.2 1.8
Credit ratios 12/15A 12/16E 12/17E 12/18E
Net debt/equity (%) 48.2 63.3 57.4 48.9 Net debt/EBITDA (x) 3.86 6.13 3.48 2.74 Interest cover (x) 3.20 n.a. 2.85 2.85
12MF P/E multiple
12MF P/B multiple
Source: Credit Suisse, Thomson Reuters
Source: Company data, Credit Suisse estimates
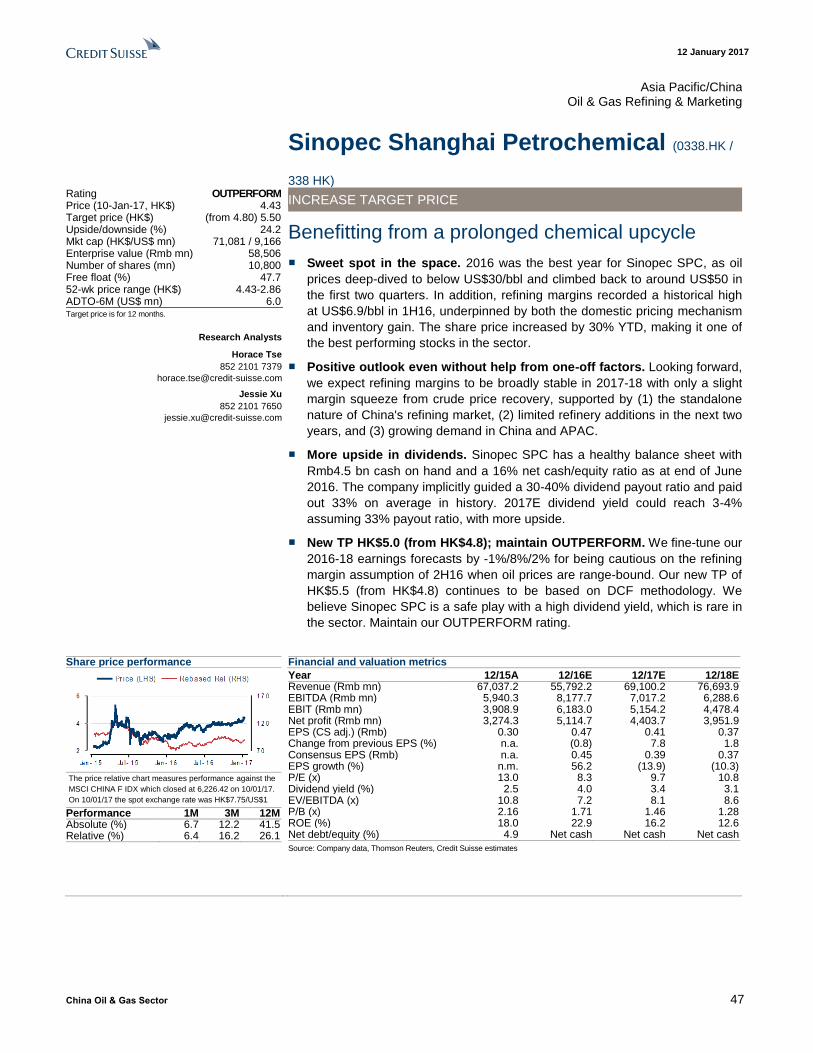
12 January 2017
China Oil & Gas Sector 47
Asia Pacific/China Oil & Gas Refining & Marketing
Sinopec Shanghai Petrochemical (0338.HK /
338 HK) Rating OUTPERFORM Price (10-Jan-17, HK$) 4.43 Target price (HK$) (from 4.80) 5.50 Upside/downside (%) 24.2 Mkt cap (HK$/US$ mn) 71,081 / 9,166 Enterprise value (Rmb mn) 58,506 Number of shares (mn) 10,800 Free float (%) 47.7 52-wk price range (HK$) 4.43-2.86 ADTO-6M (US$ mn) 6.0 Target price is for 12 months.
Research Analysts
Horace Tse
852 2101 7379
Jessie Xu
852 2101 7650
INCREASE TARGET PRICE
Benefitting from a prolonged chemical upcycle
■ Sweet spot in the space. 2016 was the best year for Sinopec SPC, as oil
prices deep-dived to below US$30/bbl and climbed back to around US$50 in
the first two quarters. In addition, refining margins recorded a historical high
at US$6.9/bbl in 1H16, underpinned by both the domestic pricing mechanism
and inventory gain. The share price increased by 30% YTD, making it one of
the best performing stocks in the sector.
■ Positive outlook even without help from one-off factors. Looking forward,
we expect refining margins to be broadly stable in 2017-18 with only a slight
margin squeeze from crude price recovery, supported by (1) the standalone
nature of China's refining market, (2) limited refinery additions in the next two
years, and (3) growing demand in China and APAC.
■ More upside in dividends. Sinopec SPC has a healthy balance sheet with
Rmb4.5 bn cash on hand and a 16% net cash/equity ratio as at end of June
2016. The company implicitly guided a 30-40% dividend payout ratio and paid
out 33% on average in history. 2017E dividend yield could reach 3-4%
assuming 33% payout ratio, with more upside.
■ New TP HK$5.0 (from HK$4.8); maintain OUTPERFORM. We fine-tune our
2016-18 earnings forecasts by -1%/8%/2% for being cautious on the refining
margin assumption of 2H16 when oil prices are range-bound. Our new TP of
HK$5.5 (from HK$4.8) continues to be based on DCF methodology. We
believe Sinopec SPC is a safe play with a high dividend yield, which is rare in
the sector. Maintain our OUTPERFORM rating.
Share price performance
The price relative chart measures performance against the
MSCI CHINA F IDX which closed at 6,226.42 on 10/01/17.
On 10/01/17 the spot exchange rate was HK$7.75/US$1
Performance 1M 3M 12M Absolute (%) 6.7 12.2 41.5 Relative (%) 6.4 16.2 26.1
Financial and valuation metrics
Year 12/15A 12/16E 12/17E 12/18E Revenue (Rmb mn) 67,037.2 55,792.2 69,100.2 76,693.9 EBITDA (Rmb mn) 5,940.3 8,177.7 7,017.2 6,288.6 EBIT (Rmb mn) 3,908.9 6,183.0 5,154.2 4,478.4 Net profit (Rmb mn) 3,274.3 5,114.7 4,403.7 3,951.9 EPS (CS adj.) (Rmb) 0.30 0.47 0.41 0.37 Change from previous EPS (%) n.a. (0.8) 7.8 1.8 Consensus EPS (Rmb) n.a. 0.45 0.39 0.37 EPS growth (%) n.m. 56.2 (13.9) (10.3) P/E (x) 13.0 8.3 9.7 10.8 Dividend yield (%) 2.5 4.0 3.4 3.1 EV/EBITDA (x) 10.8 7.2 8.1 8.6 P/B (x) 2.16 1.71 1.46 1.28 ROE (%) 18.0 22.9 16.2 12.6 Net debt/equity (%) 4.9 Net cash Net cash Net cash
Source: Company data, Thomson Reuters, Credit Suisse estimates
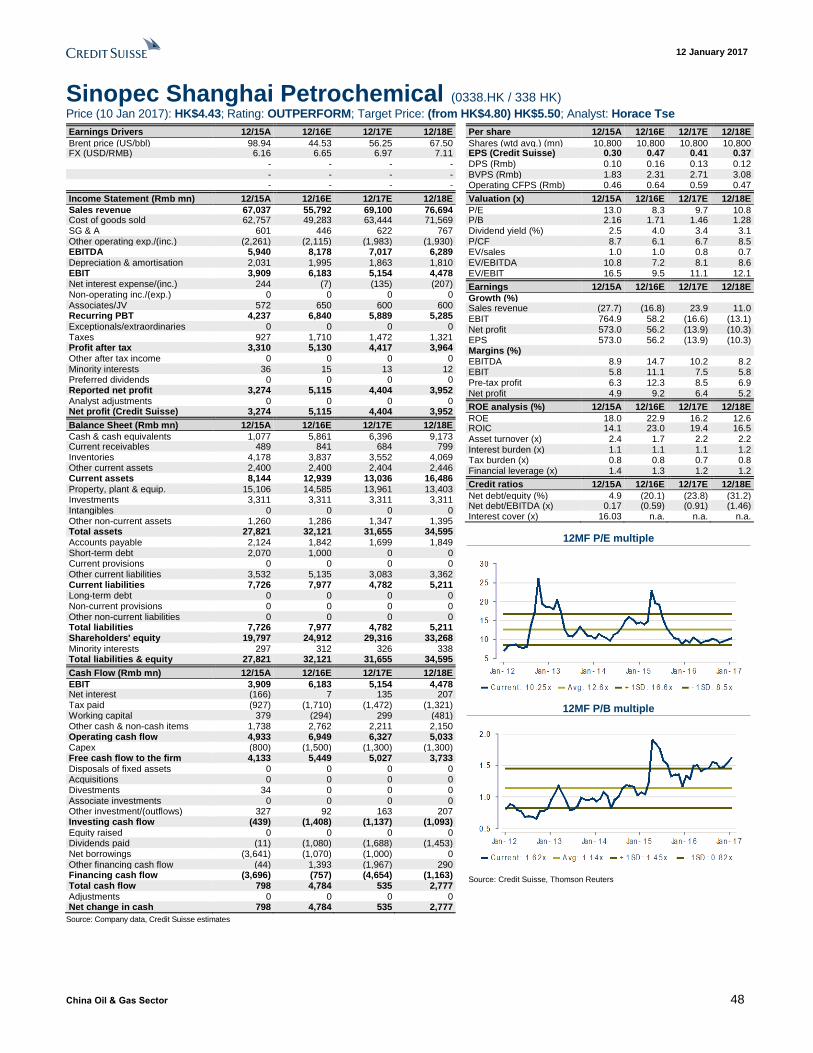
12 January 2017
China Oil & Gas Sector 48
Sinopec Shanghai Petrochemical (0338.HK / 338 HK)
Price (10 Jan 2017): HK$4.43; Rating: OUTPERFORM; Target Price: (from HK$4.80) HK$5.50; Analyst: Horace Tse
Earnings Drivers 12/15A 12/16E 12/17E 12/18E
Brent price (US/bbl) 98.94 44.53 56.25 67.50 FX (USD/RMB) 6.16 6.65 6.97 7.11 - - - - - - - - - - - -
Income Statement (Rmb mn) 12/15A 12/16E 12/17E 12/18E
Sales revenue 67,037 55,792 69,100 76,694 Cost of goods sold 62,757 49,283 63,444 71,569 SG & A 601 446 622 767 Other operating exp./(inc.) (2,261) (2,115) (1,983) (1,930) EBITDA 5,940 8,178 7,017 6,289 Depreciation & amortisation 2,031 1,995 1,863 1,810 EBIT 3,909 6,183 5,154 4,478 Net interest expense/(inc.) 244 (7) (135) (207) Non-operating inc./(exp.) 0 0 0 0 Associates/JV 572 650 600 600 Recurring PBT 4,237 6,840 5,889 5,285 Exceptionals/extraordinaries 0 0 0 0 Taxes 927 1,710 1,472 1,321 Profit after tax 3,310 5,130 4,417 3,964 Other after tax income 0 0 0 0 Minority interests 36 15 13 12 Preferred dividends 0 0 0 0 Reported net profit 3,274 5,115 4,404 3,952 Analyst adjustments 0 0 0 0 Net profit (Credit Suisse) 3,274 5,115 4,404 3,952
Balance Sheet (Rmb mn) 12/15A 12/16E 12/17E 12/18E
Cash & cash equivalents 1,077 5,861 6,396 9,173 Current receivables 489 841 684 799 Inventories 4,178 3,837 3,552 4,069 Other current assets 2,400 2,400 2,404 2,446 Current assets 8,144 12,939 13,036 16,486 Property, plant & equip. 15,106 14,585 13,961 13,403 Investments 3,311 3,311 3,311 3,311 Intangibles 0 0 0 0 Other non-current assets 1,260 1,286 1,347 1,395 Total assets 27,821 32,121 31,655 34,595 Accounts payable 2,124 1,842 1,699 1,849 Short-term debt 2,070 1,000 0 0 Current provisions 0 0 0 0 Other current liabilities 3,532 5,135 3,083 3,362 Current liabilities 7,726 7,977 4,782 5,211 Long-term debt 0 0 0 0 Non-current provisions 0 0 0 0 Other non-current liabilities 0 0 0 0 Total liabilities 7,726 7,977 4,782 5,211 Shareholders' equity 19,797 24,912 29,316 33,268 Minority interests 297 312 326 338 Total liabilities & equity 27,821 32,121 31,655 34,595
Cash Flow (Rmb mn) 12/15A 12/16E 12/17E 12/18E
EBIT 3,909 6,183 5,154 4,478 Net interest (166) 7 135 207 Tax paid (927) (1,710) (1,472) (1,321) Working capital 379 (294) 299 (481) Other cash & non-cash items 1,738 2,762 2,211 2,150 Operating cash flow 4,933 6,949 6,327 5,033 Capex (800) (1,500) (1,300) (1,300) Free cash flow to the firm 4,133 5,449 5,027 3,733 Disposals of fixed assets 0 0 0 0 Acquisitions 0 0 0 0 Divestments 34 0 0 0 Associate investments 0 0 0 0 Other investment/(outflows) 327 92 163 207 Investing cash flow (439) (1,408) (1,137) (1,093) Equity raised 0 0 0 0 Dividends paid (11) (1,080) (1,688) (1,453) Net borrowings (3,641) (1,070) (1,000) 0 Other financing cash flow (44) 1,393 (1,967) 290 Financing cash flow (3,696) (757) (4,654) (1,163) Total cash flow 798 4,784 535 2,777 Adjustments 0 0 0 0 Net change in cash 798 4,784 535 2,777
Per share 12/15A 12/16E 12/17E 12/18E
Shares (wtd avg.) (mn) 10,800 10,800 10,800 10,800 EPS (Credit Suisse) (Rmb)
0.30 0.47 0.41 0.37 DPS (Rmb) 0.10 0.16 0.13 0.12 BVPS (Rmb) 1.83 2.31 2.71 3.08 Operating CFPS (Rmb) 0.46 0.64 0.59 0.47
Valuation (x) 12/15A 12/16E 12/17E 12/18E
P/E 13.0 8.3 9.7 10.8 P/B 2.16 1.71 1.46 1.28 Dividend yield (%) 2.5 4.0 3.4 3.1 P/CF 8.7 6.1 6.7 8.5 EV/sales 1.0 1.0 0.8 0.7 EV/EBITDA 10.8 7.2 8.1 8.6 EV/EBIT 16.5 9.5 11.1 12.1
Earnings 12/15A 12/16E 12/17E 12/18E
Growth (%) Sales revenue (27.7) (16.8) 23.9 11.0 EBIT 764.9 58.2 (16.6) (13.1) Net profit 573.0 56.2 (13.9) (10.3) EPS 573.0 56.2 (13.9) (10.3) Margins (%) EBITDA 8.9 14.7 10.2 8.2 EBIT 5.8 11.1 7.5 5.8 Pre-tax profit 6.3 12.3 8.5 6.9 Net profit 4.9 9.2 6.4 5.2
ROE analysis (%) 12/15A 12/16E 12/17E 12/18E
ROE 18.0 22.9 16.2 12.6 ROIC 14.1 23.0 19.4 16.5 Asset turnover (x) 2.4 1.7 2.2 2.2 Interest burden (x) 1.1 1.1 1.1 1.2 Tax burden (x) 0.8 0.8 0.7 0.8 Financial leverage (x) 1.4 1.3 1.2 1.2
Credit ratios 12/15A 12/16E 12/17E 12/18E
Net debt/equity (%) 4.9 (20.1) (23.8) (31.2) Net debt/EBITDA (x) 0.17 (0.59) (0.91) (1.46) Interest cover (x) 16.03 n.a. n.a. n.a.
12MF P/E multiple
12MF P/B multiple
Source: Credit Suisse, Thomson Reuters
Source: Company data, Credit Suisse estimates
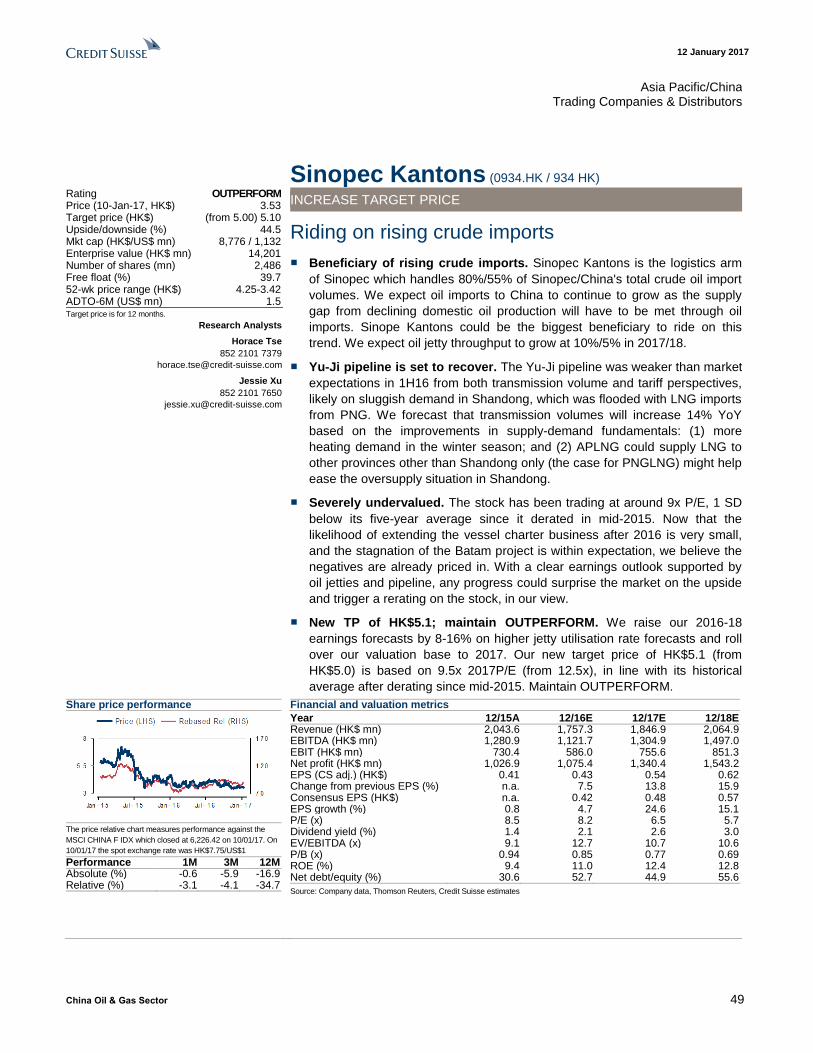
12 January 2017
China Oil & Gas Sector 49
Asia Pacific/China Trading Companies & Distributors
Sinopec Kantons (0934.HK / 934 HK) Rating OUTPERFORM Price (10-Jan-17, HK$) 3.53 Target price (HK$) (from 5.00) 5.10 Upside/downside (%) 44.5 Mkt cap (HK$/US$ mn) 8,776 / 1,132 Enterprise value (HK$ mn) 14,201 Number of shares (mn) 2,486 Free float (%) 39.7 52-wk price range (HK$) 4.25-3.42 ADTO-6M (US$ mn) 1.5 Target price is for 12 months.
Research Analysts
Horace Tse
852 2101 7379
Jessie Xu
852 2101 7650
INCREASE TARGET PRICE
Riding on rising crude imports
■ Beneficiary of rising crude imports. Sinopec Kantons is the logistics arm
of Sinopec which handles 80%/55% of Sinopec/China's total crude oil import
volumes. We expect oil imports to China to continue to grow as the supply
gap from declining domestic oil production will have to be met through oil
imports. Sinope Kantons could be the biggest beneficiary to ride on this
trend. We expect oil jetty throughput to grow at 10%/5% in 2017/18.
■ Yu-Ji pipeline is set to recover. The Yu-Ji pipeline was weaker than market
expectations in 1H16 from both transmission volume and tariff perspectives,
likely on sluggish demand in Shandong, which was flooded with LNG imports
from PNG. We forecast that transmission volumes will increase 14% YoY
based on the improvements in supply-demand fundamentals: (1) more
heating demand in the winter season; and (2) APLNG could supply LNG to
other provinces other than Shandong only (the case for PNGLNG) might help
ease the oversupply situation in Shandong.
■ Severely undervalued. The stock has been trading at around 9x P/E, 1 SD
below its five-year average since it derated in mid-2015. Now that the
likelihood of extending the vessel charter business after 2016 is very small,
and the stagnation of the Batam project is within expectation, we believe the
negatives are already priced in. With a clear earnings outlook supported by
oil jetties and pipeline, any progress could surprise the market on the upside
and trigger a rerating on the stock, in our view.
■ New TP of HK$5.1; maintain OUTPERFORM. We raise our 2016-18
earnings forecasts by 8-16% on higher jetty utilisation rate forecasts and roll
over our valuation base to 2017. Our new target price of HK$5.1 (from
HK$5.0) is based on 9.5x 2017P/E (from 12.5x), in line with its historical
average after derating since mid-2015. Maintain OUTPERFORM.
Share price performance
The price relative chart measures performance against the
MSCI CHINA F IDX which closed at 6,226.42 on 10/01/17. On
10/01/17 the spot exchange rate was HK$7.75/US$1
Performance 1M 3M 12M Absolute (%) -0.6 -5.9 -16.9 Relative (%) -3.1 -4.1 -34.7
Financial and valuation metrics
Year 12/15A 12/16E 12/17E 12/18E Revenue (HK$ mn) 2,043.6 1,757.3 1,846.9 2,064.9 EBITDA (HK$ mn) 1,280.9 1,121.7 1,304.9 1,497.0 EBIT (HK$ mn) 730.4 586.0 755.6 851.3 Net profit (HK$ mn) 1,026.9 1,075.4 1,340.4 1,543.2 EPS (CS adj.) (HK$) 0.41 0.43 0.54 0.62 Change from previous EPS (%) n.a. 7.5 13.8 15.9 Consensus EPS (HK$) n.a. 0.42 0.48 0.57 EPS growth (%) 0.8 4.7 24.6 15.1 P/E (x) 8.5 8.2 6.5 5.7 Dividend yield (%) 1.4 2.1 2.6 3.0 EV/EBITDA (x) 9.1 12.7 10.7 10.6 P/B (x) 0.94 0.85 0.77 0.69 ROE (%) 9.4 11.0 12.4 12.8 Net debt/equity (%) 30.6 52.7 44.9 55.6
Source: Company data, Thomson Reuters, Credit Suisse estimates
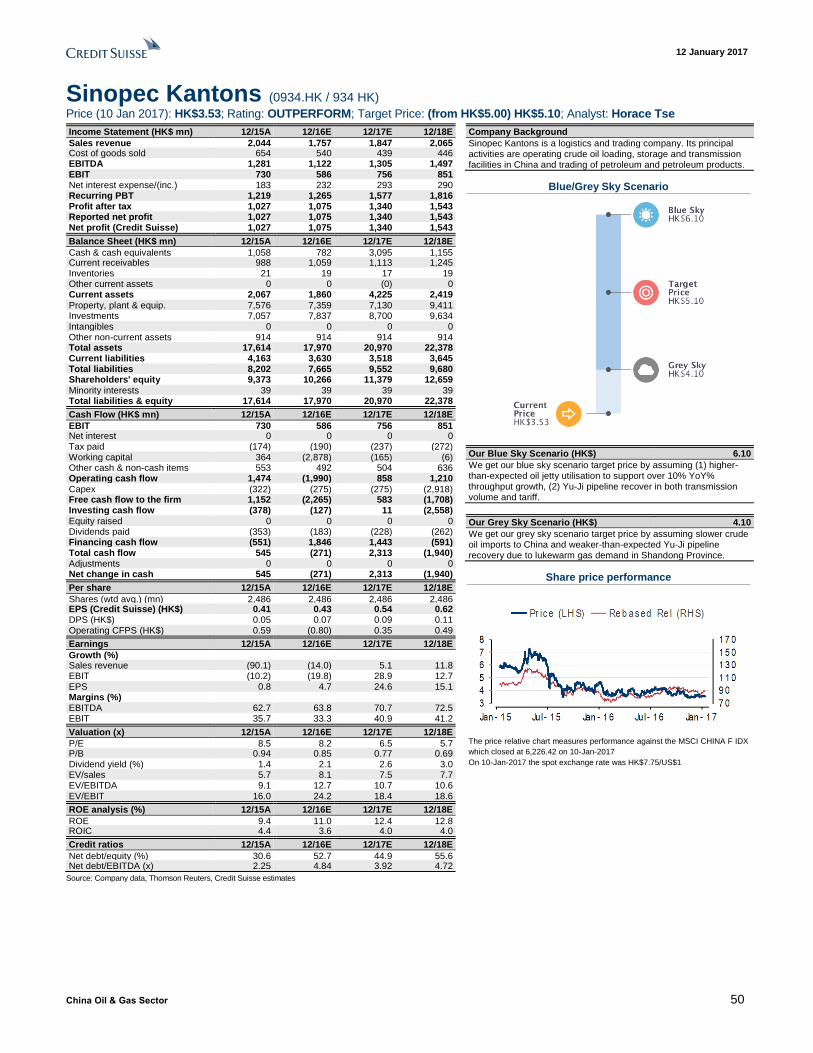
12 January 2017
China Oil & Gas Sector 50
Sinopec Kantons (0934.HK / 934 HK)
Price (10 Jan 2017): HK$3.53; Rating: OUTPERFORM; Target Price: (from HK$5.00) HK$5.10; Analyst: Horace Tse
Income Statement (HK$ mn) 12/15A 12/16E 12/17E 12/18E
Sales revenue 2,044 1,757 1,847 2,065 Cost of goods sold 654 540 439 446 EBITDA 1,281 1,122 1,305 1,497 EBIT 730 586 756 851 Net interest expense/(inc.) 183 232 293 290 Recurring PBT 1,219 1,265 1,577 1,816 Profit after tax 1,027 1,075 1,340 1,543 Reported net profit 1,027 1,075 1,340 1,543 Net profit (Credit Suisse) 1,027 1,075 1,340 1,543
Balance Sheet (HK$ mn) 12/15A 12/16E 12/17E 12/18E
Cash & cash equivalents 1,058 782 3,095 1,155 Current receivables 988 1,059 1,113 1,245 Inventories 21 19 17 19 Other current assets 0 0 (0) 0 Current assets 2,067 1,860 4,225 2,419 Property, plant & equip. 7,576 7,359 7,130 9,411 Investments 7,057 7,837 8,700 9,634 Intangibles 0 0 0 0 Other non-current assets 914 914 914 914 Total assets 17,614 17,970 20,970 22,378 Current liabilities 4,163 3,630 3,518 3,645 Total liabilities 8,202 7,665 9,552 9,680 Shareholders' equity 9,373 10,266 11,379 12,659 Minority interests 39 39 39 39 Total liabilities & equity 17,614 17,970 20,970 22,378
Cash Flow (HK$ mn) 12/15A 12/16E 12/17E 12/18E
EBIT 730 586 756 851 Net interest 0 0 0 0 Tax paid (174) (190) (237) (272) Working capital 364 (2,878) (165) (6) Other cash & non-cash items 553 492 504 636 Operating cash flow 1,474 (1,990) 858 1,210 Capex (322) (275) (275) (2,918) Free cash flow to the firm 1,152 (2,265) 583 (1,708) Investing cash flow (378) (127) 11 (2,558) Equity raised 0 0 0 0 Dividends paid (353) (183) (228) (262) Financing cash flow (551) 1,846 1,443 (591) Total cash flow 545 (271) 2,313 (1,940) Adjustments 0 0 0 0 Net change in cash 545 (271) 2,313 (1,940)
Per share 12/15A 12/16E 12/17E 12/18E
Shares (wtd avg.) (mn) 2,486 2,486 2,486 2,486 EPS (Credit Suisse) (HK$) 0.41 0.43 0.54 0.62 DPS (HK$) 0.05 0.07 0.09 0.11 Operating CFPS (HK$) 0.59 (0.80) 0.35 0.49
Earnings 12/15A 12/16E 12/17E 12/18E
Growth (%) Sales revenue (90.1) (14.0) 5.1 11.8 EBIT (10.2) (19.8) 28.9 12.7 EPS 0.8 4.7 24.6 15.1 Margins (%) EBITDA 62.7 63.8 70.7 72.5 EBIT 35.7 33.3 40.9 41.2
Valuation (x) 12/15A 12/16E 12/17E 12/18E
P/E 8.5 8.2 6.5 5.7 P/B 0.94 0.85 0.77 0.69 Dividend yield (%) 1.4 2.1 2.6 3.0 EV/sales 5.7 8.1 7.5 7.7 EV/EBITDA 9.1 12.7 10.7 10.6 EV/EBIT 16.0 24.2 18.4 18.6
ROE analysis (%) 12/15A 12/16E 12/17E 12/18E
ROE 9.4 11.0 12.4 12.8 ROIC 4.4 3.6 4.0 4.0
Credit ratios 12/15A 12/16E 12/17E 12/18E
Net debt/equity (%) 30.6 52.7 44.9 55.6 Net debt/EBITDA (x) 2.25 4.84 3.92 4.72
Company Background
Sinopec Kantons is a logistics and trading company. Its principal activities are operating crude oil loading, storage and transmission facilities in China and trading of petroleum and petroleum products.
Blue/Grey Sky Scenario
Our Blue Sky Scenario (HK$) 6.10
We get our blue sky scenario target price by assuming (1) higher-than-expected oil jetty utilisation to support over 10% YoY% throughput growth, (2) Yu-Ji pipeline recover in both transmission volume and tariff.
Our Grey Sky Scenario (HK$) 4.10
We get our grey sky scenario target price by assuming slower crude oil imports to China and weaker-than-expected Yu-Ji pipeline recovery due to lukewarm gas demand in Shandong Province.
Share price performance
The price relative chart measures performance against the MSCI CHINA F IDX
which closed at 6,226.42 on 10-Jan-2017
On 10-Jan-2017 the spot exchange rate was HK$7.75/US$1
Source: Company data, Thomson Reuters, Credit Suisse estimates
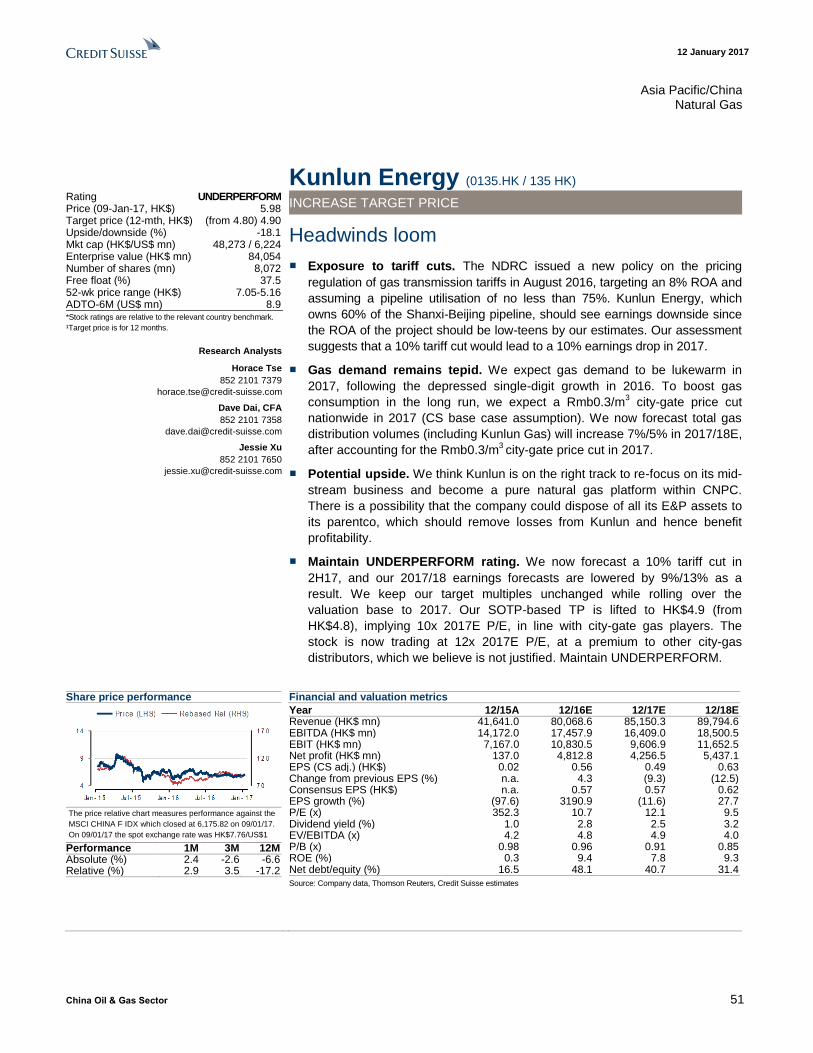
12 January 2017
China Oil & Gas Sector 51
Asia Pacific/China Natural Gas
Kunlun Energy (0135.HK / 135 HK) Rating UNDERPERFORM Price (09-Jan-17, HK$) 5.98 Target price (12-mth, HK$) (from 4.80) 4.90 Upside/downside (%) -18.1 Mkt cap (HK$/US$ mn) 48,273 / 6,224 Enterprise value (HK$ mn) 84,054 Number of shares (mn) 8,072 Free float (%) 37.5 52-wk price range (HK$) 7.05-5.16 ADTO-6M (US$ mn) 8.9 *Stock ratings are relative to the relevant country benchmark.
¹Target price is for 12 months.
Research Analysts
Horace Tse
852 2101 7379
Dave Dai, CFA
852 2101 7358
Jessie Xu
852 2101 7650
INCREASE TARGET PRICE
Headwinds loom
■ Exposure to tariff cuts. The NDRC issued a new policy on the pricing
regulation of gas transmission tariffs in August 2016, targeting an 8% ROA and
assuming a pipeline utilisation of no less than 75%. Kunlun Energy, which
owns 60% of the Shanxi-Beijing pipeline, should see earnings downside since
the ROA of the project should be low-teens by our estimates. Our assessment
suggests that a 10% tariff cut would lead to a 10% earnings drop in 2017.
■ Gas demand remains tepid. We expect gas demand to be lukewarm in
2017, following the depressed single-digit growth in 2016. To boost gas
consumption in the long run, we expect a Rmb0.3/m3 city-gate price cut
nationwide in 2017 (CS base case assumption). We now forecast total gas
distribution volumes (including Kunlun Gas) will increase 7%/5% in 2017/18E,
after accounting for the Rmb0.3/m3 city-gate price cut in 2017.
■ Potential upside. We think Kunlun is on the right track to re-focus on its mid-
stream business and become a pure natural gas platform within CNPC.
There is a possibility that the company could dispose of all its E&P assets to
its parentco, which should remove losses from Kunlun and hence benefit
profitability.
■ Maintain UNDERPERFORM rating. We now forecast a 10% tariff cut in
2H17, and our 2017/18 earnings forecasts are lowered by 9%/13% as a
result. We keep our target multiples unchanged while rolling over the
valuation base to 2017. Our SOTP-based TP is lifted to HK$4.9 (from
HK$4.8), implying 10x 2017E P/E, in line with city-gate gas players. The
stock is now trading at 12x 2017E P/E, at a premium to other city-gas
distributors, which we believe is not justified. Maintain UNDERPERFORM.
Share price performance
The price relative chart measures performance against the
MSCI CHINA F IDX which closed at 6,175.82 on 09/01/17.
On 09/01/17 the spot exchange rate was HK$7.76/US$1
Performance 1M 3M 12M Absolute (%) 2.4 -2.6 -6.6 Relative (%) 2.9 3.5 -17.2
Financial and valuation metrics
Year 12/15A 12/16E 12/17E 12/18E Revenue (HK$ mn) 41,641.0 80,068.6 85,150.3 89,794.6 EBITDA (HK$ mn) 14,172.0 17,457.9 16,409.0 18,500.5 EBIT (HK$ mn) 7,167.0 10,830.5 9,606.9 11,652.5 Net profit (HK$ mn) 137.0 4,812.8 4,256.5 5,437.1 EPS (CS adj.) (HK$) 0.02 0.56 0.49 0.63 Change from previous EPS (%) n.a. 4.3 (9.3) (12.5) Consensus EPS (HK$) n.a. 0.57 0.57 0.62 EPS growth (%) (97.6) 3190.9 (11.6) 27.7 P/E (x) 352.3 10.7 12.1 9.5 Dividend yield (%) 1.0 2.8 2.5 3.2 EV/EBITDA (x) 4.2 4.8 4.9 4.0 P/B (x) 0.98 0.96 0.91 0.85 ROE (%) 0.3 9.4 7.8 9.3 Net debt/equity (%) 16.5 48.1 40.7 31.4
Source: Company data, Thomson Reuters, Credit Suisse estimates
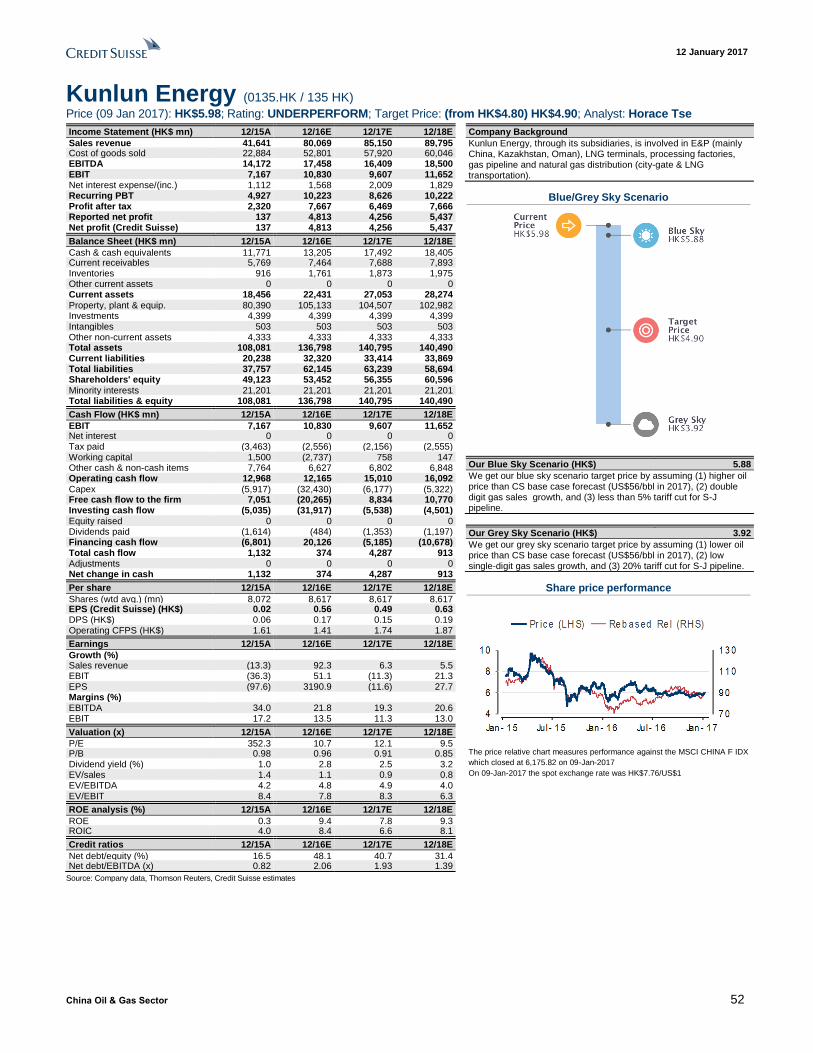
12 January 2017
China Oil & Gas Sector 52
Kunlun Energy (0135.HK / 135 HK)
Price (09 Jan 2017): HK$5.98; Rating: UNDERPERFORM; Target Price: (from HK$4.80) HK$4.90; Analyst: Horace Tse
Income Statement (HK$ mn) 12/15A 12/16E 12/17E 12/18E
Sales revenue 41,641 80,069 85,150 89,795 Cost of goods sold 22,884 52,801 57,920 60,046 EBITDA 14,172 17,458 16,409 18,500 EBIT 7,167 10,830 9,607 11,652 Net interest expense/(inc.) 1,112 1,568 2,009 1,829 Recurring PBT 4,927 10,223 8,626 10,222 Profit after tax 2,320 7,667 6,469 7,666 Reported net profit 137 4,813 4,256 5,437 Net profit (Credit Suisse) 137 4,813 4,256 5,437
Balance Sheet (HK$ mn) 12/15A 12/16E 12/17E 12/18E
Cash & cash equivalents 11,771 13,205 17,492 18,405 Current receivables 5,769 7,464 7,688 7,893 Inventories 916 1,761 1,873 1,975 Other current assets 0 0 0 0 Current assets 18,456 22,431 27,053 28,274 Property, plant & equip. 80,390 105,133 104,507 102,982 Investments 4,399 4,399 4,399 4,399 Intangibles 503 503 503 503 Other non-current assets 4,333 4,333 4,333 4,333 Total assets 108,081 136,798 140,795 140,490 Current liabilities 20,238 32,320 33,414 33,869 Total liabilities 37,757 62,145 63,239 58,694 Shareholders' equity 49,123 53,452 56,355 60,596 Minority interests 21,201 21,201 21,201 21,201 Total liabilities & equity 108,081 136,798 140,795 140,490
Cash Flow (HK$ mn) 12/15A 12/16E 12/17E 12/18E
EBIT 7,167 10,830 9,607 11,652 Net interest 0 0 0 0 Tax paid (3,463) (2,556) (2,156) (2,555) Working capital 1,500 (2,737) 758 147 Other cash & non-cash items 7,764 6,627 6,802 6,848 Operating cash flow 12,968 12,165 15,010 16,092 Capex (5,917) (32,430) (6,177) (5,322) Free cash flow to the firm 7,051 (20,265) 8,834 10,770 Investing cash flow (5,035) (31,917) (5,538) (4,501) Equity raised 0 0 0 0 Dividends paid (1,614) (484) (1,353) (1,197) Financing cash flow (6,801) 20,126 (5,185) (10,678) Total cash flow 1,132 374 4,287 913 Adjustments 0 0 0 0 Net change in cash 1,132 374 4,287 913
Per share 12/15A 12/16E 12/17E 12/18E
Shares (wtd avg.) (mn) 8,072 8,617 8,617 8,617 EPS (Credit Suisse) (HK$) 0.02 0.56 0.49 0.63 DPS (HK$) 0.06 0.17 0.15 0.19 Operating CFPS (HK$) 1.61 1.41 1.74 1.87
Earnings 12/15A 12/16E 12/17E 12/18E
Growth (%) Sales revenue (13.3) 92.3 6.3 5.5 EBIT (36.3) 51.1 (11.3) 21.3 EPS (97.6) 3190.9 (11.6) 27.7 Margins (%) EBITDA 34.0 21.8 19.3 20.6 EBIT 17.2 13.5 11.3 13.0
Valuation (x) 12/15A 12/16E 12/17E 12/18E
P/E 352.3 10.7 12.1 9.5 P/B 0.98 0.96 0.91 0.85 Dividend yield (%) 1.0 2.8 2.5 3.2 EV/sales 1.4 1.1 0.9 0.8 EV/EBITDA 4.2 4.8 4.9 4.0 EV/EBIT 8.4 7.8 8.3 6.3
ROE analysis (%) 12/15A 12/16E 12/17E 12/18E
ROE 0.3 9.4 7.8 9.3 ROIC 4.0 8.4 6.6 8.1
Credit ratios 12/15A 12/16E 12/17E 12/18E
Net debt/equity (%) 16.5 48.1 40.7 31.4 Net debt/EBITDA (x) 0.82 2.06 1.93 1.39
Company Background
Kunlun Energy, through its subsidiaries, is involved in E&P (mainly China, Kazakhstan, Oman), LNG terminals, processing factories, gas pipeline and natural gas distribution (city-gate & LNG transportation).
Blue/Grey Sky Scenario
Our Blue Sky Scenario (HK$) 5.88
We get our blue sky scenario target price by assuming (1) higher oil price than CS base case forecast (US$56/bbl in 2017), (2) double digit gas sales growth, and (3) less than 5% tariff cut for S-J pipeline.
Our Grey Sky Scenario (HK$) 3.92
We get our grey sky scenario target price by assuming (1) lower oil price than CS base case forecast (US$56/bbl in 2017), (2) low single-digit gas sales growth, and (3) 20% tariff cut for S-J pipeline.
Share price performance
The price relative chart measures performance against the MSCI CHINA F IDX
which closed at 6,175.82 on 09-Jan-2017
On 09-Jan-2017 the spot exchange rate was HK$7.76/US$1
Source: Company data, Thomson Reuters, Credit Suisse estimates
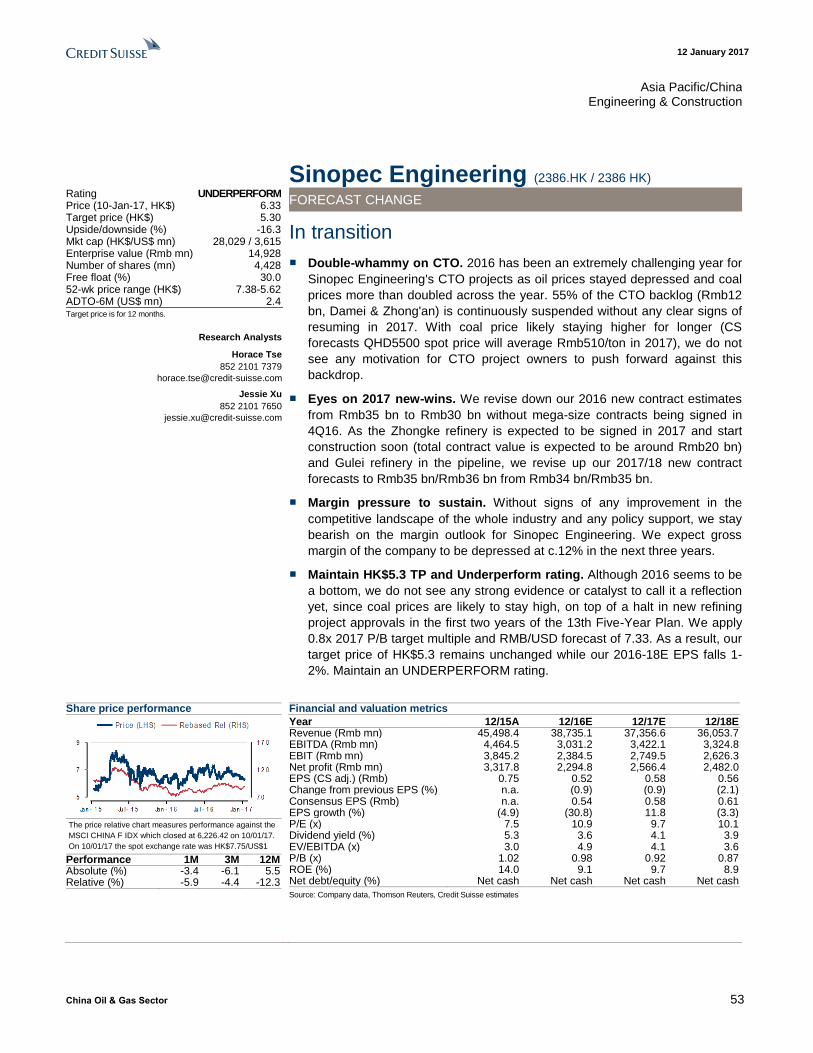
12 January 2017
China Oil & Gas Sector 53
Asia Pacific/China Engineering & Construction
Sinopec Engineering (2386.HK / 2386 HK) Rating UNDERPERFORM Price (10-Jan-17, HK$) 6.33 Target price (HK$) 5.30 Upside/downside (%) -16.3 Mkt cap (HK$/US$ mn) 28,029 / 3,615 Enterprise value (Rmb mn) 14,928 Number of shares (mn) 4,428 Free float (%) 30.0 52-wk price range (HK$) 7.38-5.62 ADTO-6M (US$ mn) 2.4 Target price is for 12 months.
Research Analysts
Horace Tse
852 2101 7379
Jessie Xu
852 2101 7650
FORECAST CHANGE
In transition
■ Double-whammy on CTO. 2016 has been an extremely challenging year for
Sinopec Engineering's CTO projects as oil prices stayed depressed and coal
prices more than doubled across the year. 55% of the CTO backlog (Rmb12
bn, Damei & Zhong'an) is continuously suspended without any clear signs of
resuming in 2017. With coal price likely staying higher for longer (CS
forecasts QHD5500 spot price will average Rmb510/ton in 2017), we do not
see any motivation for CTO project owners to push forward against this
backdrop.
■ Eyes on 2017 new-wins. We revise down our 2016 new contract estimates
from Rmb35 bn to Rmb30 bn without mega-size contracts being signed in
4Q16. As the Zhongke refinery is expected to be signed in 2017 and start
construction soon (total contract value is expected to be around Rmb20 bn)
and Gulei refinery in the pipeline, we revise up our 2017/18 new contract
forecasts to Rmb35 bn/Rmb36 bn from Rmb34 bn/Rmb35 bn.
■ Margin pressure to sustain. Without signs of any improvement in the
competitive landscape of the whole industry and any policy support, we stay
bearish on the margin outlook for Sinopec Engineering. We expect gross
margin of the company to be depressed at c.12% in the next three years.
■ Maintain HK$5.3 TP and Underperform rating. Although 2016 seems to be
a bottom, we do not see any strong evidence or catalyst to call it a reflection
yet, since coal prices are likely to stay high, on top of a halt in new refining
project approvals in the first two years of the 13th Five-Year Plan. We apply
0.8x 2017 P/B target multiple and RMB/USD forecast of 7.33. As a result, our
target price of HK$5.3 remains unchanged while our 2016-18E EPS falls 1-
2%. Maintain an UNDERPERFORM rating.
Share price performance
The price relative chart measures performance against the
MSCI CHINA F IDX which closed at 6,226.42 on 10/01/17.
On 10/01/17 the spot exchange rate was HK$7.75/US$1
Performance 1M 3M 12M Absolute (%) -3.4 -6.1 5.5 Relative (%) -5.9 -4.4 -12.3
Financial and valuation metrics
Year 12/15A 12/16E 12/17E 12/18E Revenue (Rmb mn) 45,498.4 38,735.1 37,356.6 36,053.7 EBITDA (Rmb mn) 4,464.5 3,031.2 3,422.1 3,324.8 EBIT (Rmb mn) 3,845.2 2,384.5 2,749.5 2,626.3 Net profit (Rmb mn) 3,317.8 2,294.8 2,566.4 2,482.0 EPS (CS adj.) (Rmb) 0.75 0.52 0.58 0.56 Change from previous EPS (%) n.a. (0.9) (0.9) (2.1) Consensus EPS (Rmb) n.a. 0.54 0.58 0.61 EPS growth (%) (4.9) (30.8) 11.8 (3.3) P/E (x) 7.5 10.9 9.7 10.1 Dividend yield (%) 5.3 3.6 4.1 3.9 EV/EBITDA (x) 3.0 4.9 4.1 3.6 P/B (x) 1.02 0.98 0.92 0.87 ROE (%) 14.0 9.1 9.7 8.9 Net debt/equity (%) Net cash Net cash Net cash Net cash
Source: Company data, Thomson Reuters, Credit Suisse estimates
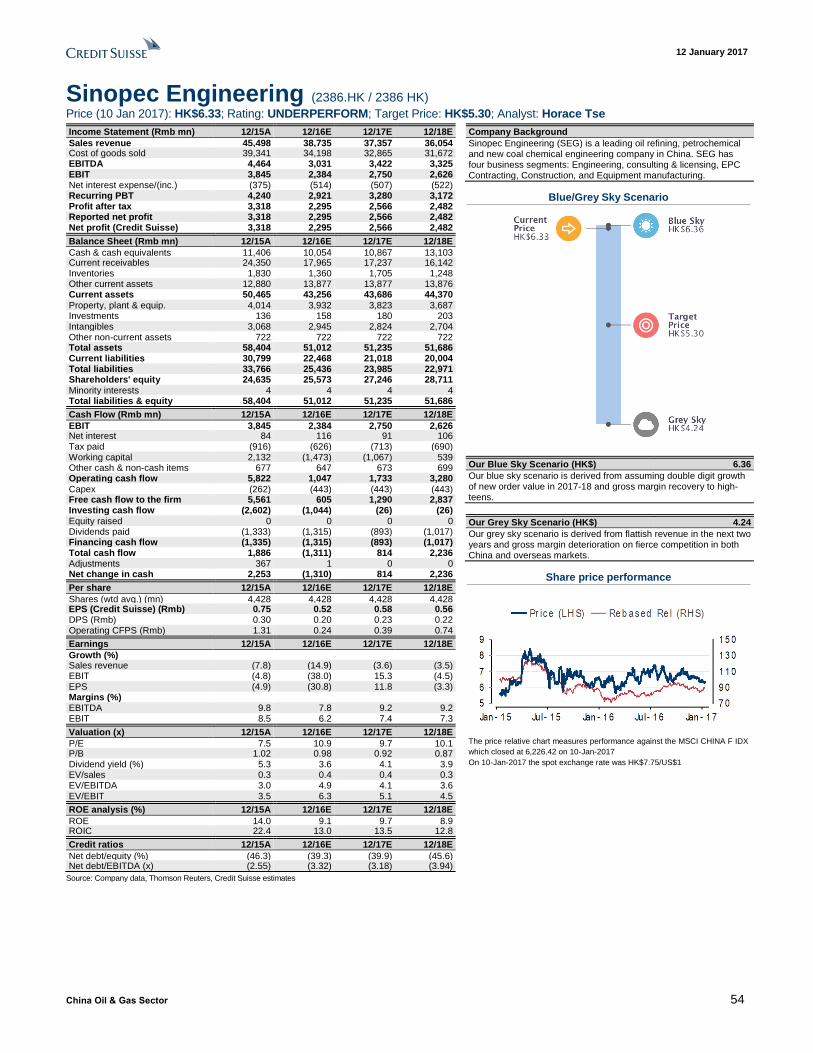
12 January 2017
China Oil & Gas Sector 54
Sinopec Engineering (2386.HK / 2386 HK)
Price (10 Jan 2017): HK$6.33; Rating: UNDERPERFORM; Target Price: HK$5.30; Analyst: Horace Tse
Income Statement (Rmb mn) 12/15A 12/16E 12/17E 12/18E
Sales revenue 45,498 38,735 37,357 36,054 Cost of goods sold 39,341 34,198 32,865 31,672 EBITDA 4,464 3,031 3,422 3,325 EBIT 3,845 2,384 2,750 2,626 Net interest expense/(inc.) (375) (514) (507) (522) Recurring PBT 4,240 2,921 3,280 3,172 Profit after tax 3,318 2,295 2,566 2,482 Reported net profit 3,318 2,295 2,566 2,482 Net profit (Credit Suisse) 3,318 2,295 2,566 2,482
Balance Sheet (Rmb mn) 12/15A 12/16E 12/17E 12/18E
Cash & cash equivalents 11,406 10,054 10,867 13,103 Current receivables 24,350 17,965 17,237 16,142 Inventories 1,830 1,360 1,705 1,248 Other current assets 12,880 13,877 13,877 13,876 Current assets 50,465 43,256 43,686 44,370 Property, plant & equip. 4,014 3,932 3,823 3,687 Investments 136 158 180 203 Intangibles 3,068 2,945 2,824 2,704 Other non-current assets 722 722 722 722 Total assets 58,404 51,012 51,235 51,686 Current liabilities 30,799 22,468 21,018 20,004 Total liabilities 33,766 25,436 23,985 22,971 Shareholders' equity 24,635 25,573 27,246 28,711 Minority interests 4 4 4 4 Total liabilities & equity 58,404 51,012 51,235 51,686
Cash Flow (Rmb mn) 12/15A 12/16E 12/17E 12/18E
EBIT 3,845 2,384 2,750 2,626 Net interest 84 116 91 106 Tax paid (916) (626) (713) (690) Working capital 2,132 (1,473) (1,067) 539 Other cash & non-cash items 677 647 673 699 Operating cash flow 5,822 1,047 1,733 3,280 Capex (262) (443) (443) (443) Free cash flow to the firm 5,561 605 1,290 2,837 Investing cash flow (2,602) (1,044) (26) (26) Equity raised 0 0 0 0 Dividends paid (1,333) (1,315) (893) (1,017) Financing cash flow (1,335) (1,315) (893) (1,017) Total cash flow 1,886 (1,311) 814 2,236 Adjustments 367 1 0 0 Net change in cash 2,253 (1,310) 814 2,236
Per share 12/15A 12/16E 12/17E 12/18E
Shares (wtd avg.) (mn) 4,428 4,428 4,428 4,428 EPS (Credit Suisse) (Rmb) 0.75 0.52 0.58 0.56 DPS (Rmb) 0.30 0.20 0.23 0.22 Operating CFPS (Rmb) 1.31 0.24 0.39 0.74
Earnings 12/15A 12/16E 12/17E 12/18E
Growth (%) Sales revenue (7.8) (14.9) (3.6) (3.5) EBIT (4.8) (38.0) 15.3 (4.5) EPS (4.9) (30.8) 11.8 (3.3) Margins (%) EBITDA 9.8 7.8 9.2 9.2 EBIT 8.5 6.2 7.4 7.3
Valuation (x) 12/15A 12/16E 12/17E 12/18E
P/E 7.5 10.9 9.7 10.1 P/B 1.02 0.98 0.92 0.87 Dividend yield (%) 5.3 3.6 4.1 3.9 EV/sales 0.3 0.4 0.4 0.3 EV/EBITDA 3.0 4.9 4.1 3.6 EV/EBIT 3.5 6.3 5.1 4.5
ROE analysis (%) 12/15A 12/16E 12/17E 12/18E
ROE 14.0 9.1 9.7 8.9 ROIC 22.4 13.0 13.5 12.8
Credit ratios 12/15A 12/16E 12/17E 12/18E
Net debt/equity (%) (46.3) (39.3) (39.9) (45.6) Net debt/EBITDA (x) (2.55) (3.32) (3.18) (3.94)
Company Background
Sinopec Engineering (SEG) is a leading oil refining, petrochemical and new coal chemical engineering company in China. SEG has four business segments: Engineering, consulting & licensing, EPC Contracting, Construction, and Equipment manufacturing.
Blue/Grey Sky Scenario
Our Blue Sky Scenario (HK$) 6.36
Our blue sky scenario is derived from assuming double digit growth of new order value in 2017-18 and gross margin recovery to high-teens.
Our Grey Sky Scenario (HK$) 4.24
Our grey sky scenario is derived from flattish revenue in the next two years and gross margin deterioration on fierce competition in both China and overseas markets.
Share price performance
The price relative chart measures performance against the MSCI CHINA F IDX
which closed at 6,226.42 on 10-Jan-2017
On 10-Jan-2017 the spot exchange rate was HK$7.75/US$1
Source: Company data, Thomson Reuters, Credit Suisse estimates
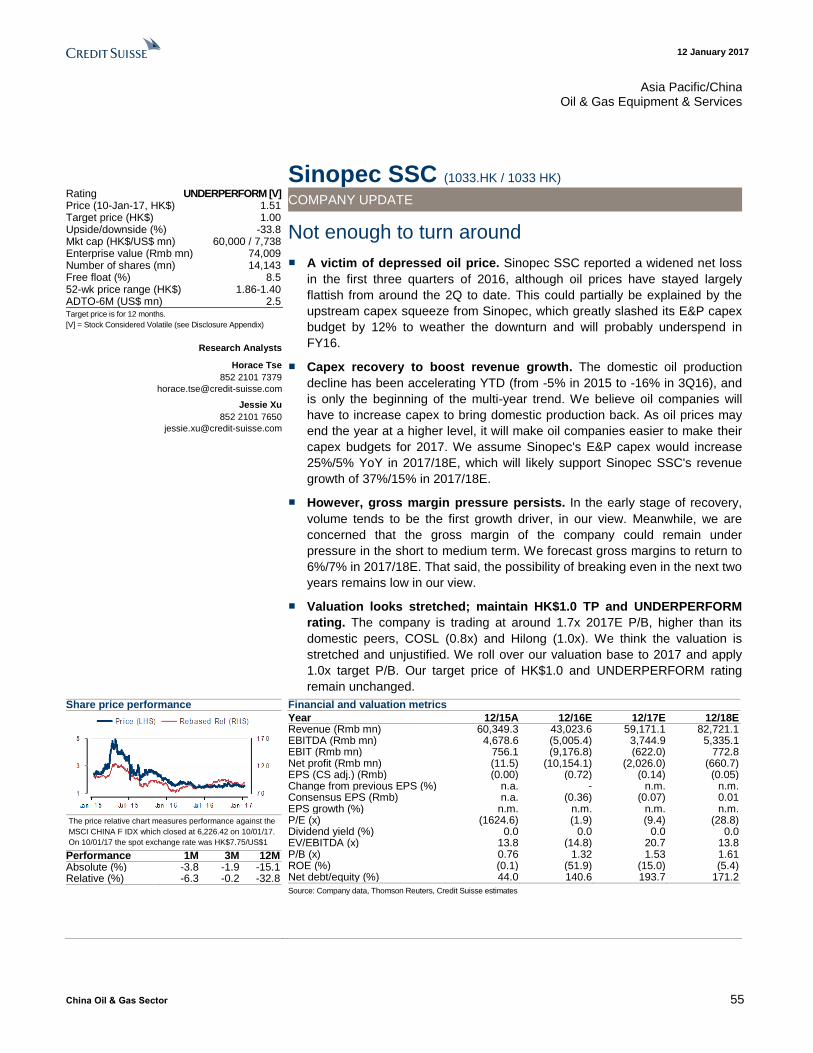
12 January 2017
China Oil & Gas Sector 55
Asia Pacific/China Oil & Gas Equipment & Services
Sinopec SSC (1033.HK / 1033 HK) Rating UNDERPERFORM [V] Price (10-Jan-17, HK$) 1.51 Target price (HK$) 1.00 Upside/downside (%) -33.8 Mkt cap (HK$/US$ mn) 60,000 / 7,738 Enterprise value (Rmb mn) 74,009 Number of shares (mn) 14,143 Free float (%) 8.5 52-wk price range (HK$) 1.86-1.40 ADTO-6M (US$ mn) 2.5 Target price is for 12 months.
[V] = Stock Considered Volatile (see Disclosure Appendix)
Research Analysts
Horace Tse
852 2101 7379
Jessie Xu
852 2101 7650
COMPANY UPDATE
Not enough to turn around
■ A victim of depressed oil price. Sinopec SSC reported a widened net loss
in the first three quarters of 2016, although oil prices have stayed largely
flattish from around the 2Q to date. This could partially be explained by the
upstream capex squeeze from Sinopec, which greatly slashed its E&P capex
budget by 12% to weather the downturn and will probably underspend in
FY16.
■ Capex recovery to boost revenue growth. The domestic oil production
decline has been accelerating YTD (from -5% in 2015 to -16% in 3Q16), and
is only the beginning of the multi-year trend. We believe oil companies will
have to increase capex to bring domestic production back. As oil prices may
end the year at a higher level, it will make oil companies easier to make their
capex budgets for 2017. We assume Sinopec's E&P capex would increase
25%/5% YoY in 2017/18E, which will likely support Sinopec SSC's revenue
growth of 37%/15% in 2017/18E.
■ However, gross margin pressure persists. In the early stage of recovery,
volume tends to be the first growth driver, in our view. Meanwhile, we are
concerned that the gross margin of the company could remain under
pressure in the short to medium term. We forecast gross margins to return to
6%/7% in 2017/18E. That said, the possibility of breaking even in the next two
years remains low in our view.
■ Valuation looks stretched; maintain HK$1.0 TP and UNDERPERFORM
rating. The company is trading at around 1.7x 2017E P/B, higher than its
domestic peers, COSL (0.8x) and Hilong (1.0x). We think the valuation is
stretched and unjustified. We roll over our valuation base to 2017 and apply
1.0x target P/B. Our target price of HK$1.0 and UNDERPERFORM rating
remain unchanged.
Share price performance
The price relative chart measures performance against the
MSCI CHINA F IDX which closed at 6,226.42 on 10/01/17.
On 10/01/17 the spot exchange rate was HK$7.75/US$1
Performance 1M 3M 12M Absolute (%) -3.8 -1.9 -15.1 Relative (%) -6.3 -0.2 -32.8
Financial and valuation metrics
Year 12/15A 12/16E 12/17E 12/18E Revenue (Rmb mn) 60,349.3 43,023.6 59,171.1 82,721.1 EBITDA (Rmb mn) 4,678.6 (5,005.4) 3,744.9 5,335.1 EBIT (Rmb mn) 756.1 (9,176.8) (622.0) 772.8 Net profit (Rmb mn) (11.5) (10,154.1) (2,026.0) (660.7) EPS (CS adj.) (Rmb) (0.00) (0.72) (0.14) (0.05) Change from previous EPS (%) n.a. - n.m. n.m. Consensus EPS (Rmb) n.a. (0.36) (0.07) 0.01 EPS growth (%) n.m. n.m. n.m. n.m. P/E (x) (1624.6) (1.9) (9.4) (28.8) Dividend yield (%) 0.0 0.0 0.0 0.0 EV/EBITDA (x) 13.8 (14.8) 20.7 13.8 P/B (x) 0.76 1.32 1.53 1.61 ROE (%) (0.1) (51.9) (15.0) (5.4) Net debt/equity (%) 44.0 140.6 193.7 171.2
Source: Company data, Thomson Reuters, Credit Suisse estimates

12 January 2017
China Oil & Gas Sector 56
Sinopec SSC (1033.HK / 1033 HK)
Price (10 Jan 2017): HK$1.51; Rating: UNDERPERFORM [V]; Target Price: HK$1.00; Analyst: Horace Tse
Earnings Drivers 12/15A 12/16E 12/17E 12/18E
Gross margin (%) 0.08 -0.12 0.06 0.07 Revenue growth (%) -0.24 -0.29 0.38 0.40 - - - - - - - - - - - -
Income Statement (Rmb mn) 12/15A 12/16E 12/17E 12/18E
Sales revenue 60,349 43,024 59,171 82,721 Cost of goods sold 55,317 48,228 55,605 76,915 SG & A 4,105 3,787 4,203 5,049 Other operating exp./(inc.) (3,752) (3,986) (4,382) (4,577) EBITDA 4,679 (5,005) 3,745 5,335 Depreciation & amortisation 3,923 4,171 4,367 4,562 EBIT 756 (9,177) (622) 773 Net interest expense/(inc.) 655 948 1,304 1,413 Non-operating inc./(exp.) 368 191 0 0 Associates/JV 0 0 0 0 Recurring PBT 470 (9,934) (1,926) (641) Exceptionals/extraordinaries 0 0 0 0 Taxes 481 220 100 20 Profit after tax (12) (10,154) (2,026) (661) Other after tax income 0 0 0 0 Minority interests (0) 0 0 0 Preferred dividends 0 0 0 0 Reported net profit (12) (10,154) (2,026) (661) Analyst adjustments 0 0 0 0 Net profit (Credit Suisse) (12) (10,154) (2,026) (661)
Balance Sheet (Rmb mn) 12/15A 12/16E 12/17E 12/18E
Cash & cash equivalents 1,993 1,461 1,693 5,633 Current receivables 31,407 22,390 30,794 43,050 Inventories 1,979 1,979 1,979 1,979 Other current assets 12,809 14,018 14,018 14,018 Current assets 48,188 39,848 48,484 64,680 Property, plant & equip. 31,718 31,011 29,644 28,082 Investments 4,991 4,991 4,991 4,991 Intangibles 77 77 77 77 Other non-current assets 333 333 333 333 Total assets 85,308 76,261 83,530 98,164 Accounts payable 30,194 26,324 30,351 41,983 Short-term debt 12,158 21,158 25,158 25,158 Current provisions 0 0 0 0 Other current liabilities 17,558 13,535 14,803 18,466 Current liabilities 59,909 61,017 70,312 85,606 Long-term debt 670 670 670 670 Non-current provisions 0 0 0 0 Other non-current liabilities 91 91 91 91 Total liabilities 60,671 61,778 71,073 86,368 Shareholders' equity 24,638 14,484 12,458 11,797 Minority interests (1) (1) (1) (1) Total liabilities & equity 85,308 76,261 83,530 98,164
Cash Flow (Rmb mn) 12/15A 12/16E 12/17E 12/18E
EBIT 756 (9,177) (622) 773 Net interest 0 0 0 0 Tax paid (481) (220) (100) (20) Working capital (4,840) (85) (3,109) 3,039 Other cash & non-cash items 4,115 4,371 4,367 4,562 Operating cash flow (451) (5,111) 536 8,354 Capex (4,730) (3,000) (3,000) (3,000) Free cash flow to the firm (5,181) (8,111) (2,464) 5,354 Disposals of fixed assets 0 0 0 0 Acquisitions 0 0 0 0 Divestments 80 (464) 0 0 Associate investments 0 0 0 0 Other investment/(outflows) 415 17 13 15 Investing cash flow (4,236) (3,447) (2,987) (2,985) Equity raised 6,000 0 0 0 Dividends paid 0 0 0 0 Net borrowings 244 9,000 4,000 0 Other financing cash flow (741) (698) (698) (698) Financing cash flow 5,503 8,302 3,302 (698) Total cash flow 817 (256) 851 4,670 Adjustments 0 0 0 0 Net change in cash 817 (256) 851 4,670
Per share 12/15A 12/16E 12/17E 12/18E
Shares (wtd avg.) (mn) 13,920 14,142 14,142 14,142 EPS (Credit Suisse) (Rmb)
(0.00) (0.72) (0.14) (0.05) DPS (Rmb) 0.00 0.00 0.00 0.00 BVPS (Rmb) 1.77 1.02 0.88 0.83 Operating CFPS (Rmb) (0.03) (0.36) 0.04 0.59
Valuation (x) 12/15A 12/16E 12/17E 12/18E
P/E (1624.6) (1.9) (9.4) (28.8) P/B 0.76 1.32 1.53 1.61 Dividend yield (%) 0.0 0.0 0.0 0.0 P/CF (41.6) (3.7) 35.5 2.3 EV/sales 1.1 1.7 1.3 0.9 EV/EBITDA 13.8 (14.8) 20.7 13.8 EV/EBIT 85.1 (8.1) (124.9) 95.4
Earnings 12/15A 12/16E 12/17E 12/18E
Growth (%) Sales revenue (23.6) (28.7) 37.5 39.8 EBIT (79.2) (1313.8) 93.2 224.2 Net profit (100.5) (87867.7
) 80.0 67.4
EPS (100.5) (86485.5)
80.0 67.4 Margins (%) EBITDA 7.8 (11.6) 6.3 6.4 EBIT 1.3 (21.3) (1.1) 0.9 Pre-tax profit 0.8 (23.1) (3.3) (0.8) Net profit (0.0) (23.6) (3.4) (0.8)
ROE analysis (%) 12/15A 12/16E 12/17E 12/18E
ROE (0.1) (51.9) (15.0) (5.4) ROIC (0.1) (26.7) (1.8) 2.3 Asset turnover (x) 0.7 0.6 0.7 0.8 Interest burden (x) 0.6 1.1 3.1 (0.8) Tax burden (x) (0.0) 1.0 1.1 1.0 Financial leverage (x) 3.5 5.3 6.7 8.3
Credit ratios 12/15A 12/16E 12/17E 12/18E
Net debt/equity (%) 44.0 140.6 193.7 171.2 Net debt/EBITDA (x) 2.32 n.a. 6.44 3.79 Interest cover (x) 1.15 n.a. n.a. 0.55
12MF P/E multiple
12MF P/B multiple
Source: Credit Suisse, Thomson Reuters
Source: Company data, Credit Suisse estimates
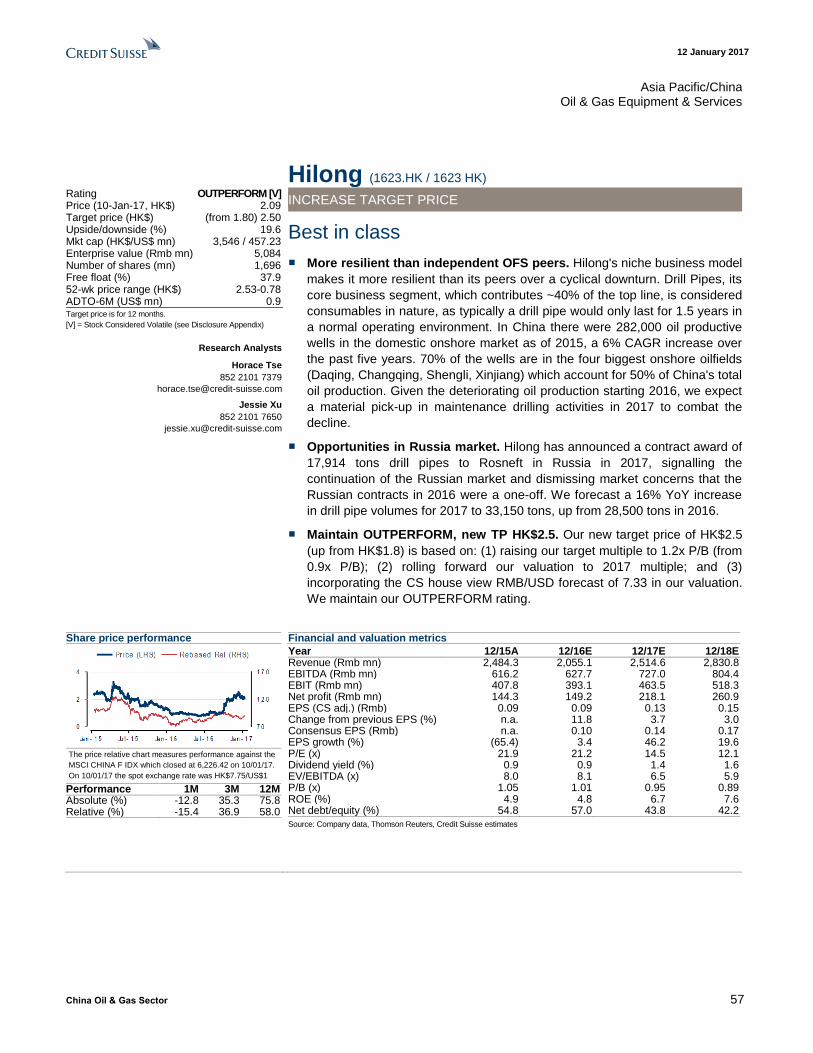
12 January 2017
China Oil & Gas Sector 57
Asia Pacific/China Oil & Gas Equipment & Services
Hilong (1623.HK / 1623 HK) Rating OUTPERFORM [V] Price (10-Jan-17, HK$) 2.09 Target price (HK$) (from 1.80) 2.50 Upside/downside (%) 19.6 Mkt cap (HK$/US$ mn) 3,546 / 457.23 Enterprise value (Rmb mn) 5,084 Number of shares (mn) 1,696 Free float (%) 37.9 52-wk price range (HK$) 2.53-0.78 ADTO-6M (US$ mn) 0.9 Target price is for 12 months.
[V] = Stock Considered Volatile (see Disclosure Appendix)
Research Analysts
Horace Tse
852 2101 7379
Jessie Xu
852 2101 7650
INCREASE TARGET PRICE
Best in class
■ More resilient than independent OFS peers. Hilong's niche business model
makes it more resilient than its peers over a cyclical downturn. Drill Pipes, its
core business segment, which contributes ~40% of the top line, is considered
consumables in nature, as typically a drill pipe would only last for 1.5 years in
a normal operating environment. In China there were 282,000 oil productive
wells in the domestic onshore market as of 2015, a 6% CAGR increase over
the past five years. 70% of the wells are in the four biggest onshore oilfields
(Daqing, Changqing, Shengli, Xinjiang) which account for 50% of China's total
oil production. Given the deteriorating oil production starting 2016, we expect
a material pick-up in maintenance drilling activities in 2017 to combat the
decline.
■ Opportunities in Russia market. Hilong has announced a contract award of
17,914 tons drill pipes to Rosneft in Russia in 2017, signalling the
continuation of the Russian market and dismissing market concerns that the
Russian contracts in 2016 were a one-off. We forecast a 16% YoY increase
in drill pipe volumes for 2017 to 33,150 tons, up from 28,500 tons in 2016.
■ Maintain OUTPERFORM, new TP HK$2.5. Our new target price of HK$2.5
(up from HK$1.8) is based on: (1) raising our target multiple to 1.2x P/B (from
0.9x P/B); (2) rolling forward our valuation to 2017 multiple; and (3)
incorporating the CS house view RMB/USD forecast of 7.33 in our valuation.
We maintain our OUTPERFORM rating.
Share price performance
The price relative chart measures performance against the
MSCI CHINA F IDX which closed at 6,226.42 on 10/01/17.
On 10/01/17 the spot exchange rate was HK$7.75/US$1
Performance 1M 3M 12M Absolute (%) -12.8 35.3 75.8 Relative (%) -15.4 36.9 58.0
Financial and valuation metrics
Year 12/15A 12/16E 12/17E 12/18E Revenue (Rmb mn) 2,484.3 2,055.1 2,514.6 2,830.8 EBITDA (Rmb mn) 616.2 627.7 727.0 804.4 EBIT (Rmb mn) 407.8 393.1 463.5 518.3 Net profit (Rmb mn) 144.3 149.2 218.1 260.9 EPS (CS adj.) (Rmb) 0.09 0.09 0.13 0.15 Change from previous EPS (%) n.a. 11.8 3.7 3.0 Consensus EPS (Rmb) n.a. 0.10 0.14 0.17 EPS growth (%) (65.4) 3.4 46.2 19.6 P/E (x) 21.9 21.2 14.5 12.1 Dividend yield (%) 0.9 0.9 1.4 1.6 EV/EBITDA (x) 8.0 8.1 6.5 5.9 P/B (x) 1.05 1.01 0.95 0.89 ROE (%) 4.9 4.8 6.7 7.6 Net debt/equity (%) 54.8 57.0 43.8 42.2
Source: Company data, Thomson Reuters, Credit Suisse estimates

12 January 2017
China Oil & Gas Sector 58
Hilong (1623.HK / 1623 HK)
Price (10 Jan 2017): HK$2.09; Rating: OUTPERFORM [V]; Target Price: (from HK$1.80) HK$2.50; Analyst: Horace Tse
Earnings Drivers 12/15A 12/16E 12/17E 12/18E
Revenue growth (YoY%) -0.04 -0.17 0.22 0.13 Operating margin (%) 0.17 0.19 0.18 0.18 - - - - - - - - - - - -
Income Statement (Rmb mn) 12/15A 12/16E 12/17E 12/18E
Sales revenue 2,484 2,055 2,515 2,831 Cost of goods sold 1,674 1,336 1,634 1,840 SG & A 192 139 81 114 Other operating exp./(inc.) 1 (48) 72 72 EBITDA 616 628 727 804 Depreciation & amortisation 208 235 263 286 EBIT 408 393 464 518 Net interest expense/(inc.) 230 193 189 189 Non-operating inc./(exp.) (0) 0 (0) 0 Associates/JV 4 4 5 5 Recurring PBT 183 204 280 335 Exceptionals/extraordinaries 0 0 0 0 Taxes 25 41 42 50 Profit after tax 157 164 238 284 Other after tax income 0 0 0 0 Minority interests 13 14 20 23 Preferred dividends 0 0 0 0 Reported net profit 144 149 218 261 Analyst adjustments 0 0 0 0 Net profit (Credit Suisse) 144 149 218 261
Balance Sheet (Rmb mn) 12/15A 12/16E 12/17E 12/18E
Cash & cash equivalents - - - - Current receivables 1,858 1,971 1,653 1,861 Inventories 804 788 964 1,086 Other current assets 926 743 902 857 Current assets 3,588 3,502 3,520 3,804 Property, plant & equip. 3,038 3,003 3,040 3,104 Investments 59 61 63 65 Intangibles 156 161 166 171 Other non-current assets 223 225 224 222 Total assets 7,064 6,953 7,011 7,365 Accounts payable 1,058 845 896 1,008 Short-term debt 1,592 1,104 1,104 1,104 Current provisions 4 4 4 4 Other current liabilities 1 1 1 1 Current liabilities 2,655 1,953 2,004 2,117 Long-term debt 1,084 1,540 1,340 1,340 Non-current provisions 45 45 45 45 Other non-current liabilities 23 23 23 23 Total liabilities 3,808 3,561 3,412 3,525 Shareholders' equity 3,022 3,143 3,331 3,548 Minority interests 234 248 268 291 Total liabilities & equity 7,064 6,953 7,011 7,365
Cash Flow (Rmb mn) 12/15A 12/16E 12/17E 12/18E
EBIT 408 393 464 518 Net interest (230) (193) (189) (189) Tax paid (50) (41) (42) (50) Working capital 140 (315) 192 (217) Other cash & non-cash items 218 235 263 286 Operating cash flow 486 80 689 349 Capex (306) (200) (300) (350) Free cash flow to the firm 180 (120) 389 (1) Disposals of fixed assets 0 0 0 0 Acquisitions 0 0 0 0 Divestments (3) (2) (2) (2) Associate investments 0 0 0 0 Other investment/(outflows) (76) 1 2 2 Investing cash flow (385) (201) (300) (350) Equity raised 0 0 0 0 Dividends paid (67) (28) (30) (44) Net borrowings 0 0 0 0 Other financing cash flow (4) 0 0 0 Financing cash flow (71) (28) (30) (44) Total cash flow 30 (149) 358 (45) Adjustments 0 0 0 0 Net change in cash 30 (149) 358 (45)
Per share 12/15A 12/16E 12/17E 12/18E
Shares (wtd avg.) (mn) 1,696 1,696 1,696 1,696 EPS (Credit Suisse) (Rmb)
0.09 0.09 0.13 0.15 DPS (Rmb) 0.02 0.02 0.03 0.03 BVPS (Rmb) 1.78 1.85 1.96 2.09 Operating CFPS (Rmb) 0.29 0.05 0.41 0.21
Valuation (x) 12/15A 12/16E 12/17E 12/18E
P/E 21.9 21.2 14.5 12.1 P/B 1.05 1.01 0.95 0.89 Dividend yield (%) 0.9 0.9 1.4 1.6 P/CF 6.5 39.7 4.6 9.1 EV/sales 2.0 2.5 1.9 1.7 EV/EBITDA 8.0 8.1 6.5 5.9 EV/EBIT 12.1 13.0 10.2 9.2
Earnings 12/15A 12/16E 12/17E 12/18E
Growth (%) Sales revenue (3.6) (17.3) 22.4 12.6 EBIT (26.6) (3.6) 17.9 11.8 Net profit (65.4) 3.5 46.2 19.6 EPS (65.4) 3.4 46.2 19.6 Margins (%) EBITDA 24.8 30.5 28.9 28.4 EBIT 16.4 19.1 18.4 18.3 Pre-tax profit 7.4 9.9 11.1 11.8 Net profit 5.8 7.3 8.7 9.2
ROE analysis (%) 12/15A 12/16E 12/17E 12/18E
ROE 4.9 4.8 6.7 7.6 ROIC 7.0 6.1 7.5 8.3 Asset turnover (x) 0.4 0.3 0.4 0.4 Interest burden (x) 0.4 0.5 0.6 0.6 Tax burden (x) 0.9 0.8 0.8 0.8 Financial leverage (x) 2.2 2.1 1.9 1.9
Credit ratios 12/15A 12/16E 12/17E 12/18E
Net debt/equity (%) 54.8 57.0 43.8 42.2 Net debt/EBITDA (x) 2.89 3.08 2.17 2.01 Interest cover (x) 1.78 2.04 2.46 2.74
12MF P/E multiple
12MF P/B multiple
Source: Credit Suisse, Thomson Reuters
Source: Company data, Credit Suisse estimates
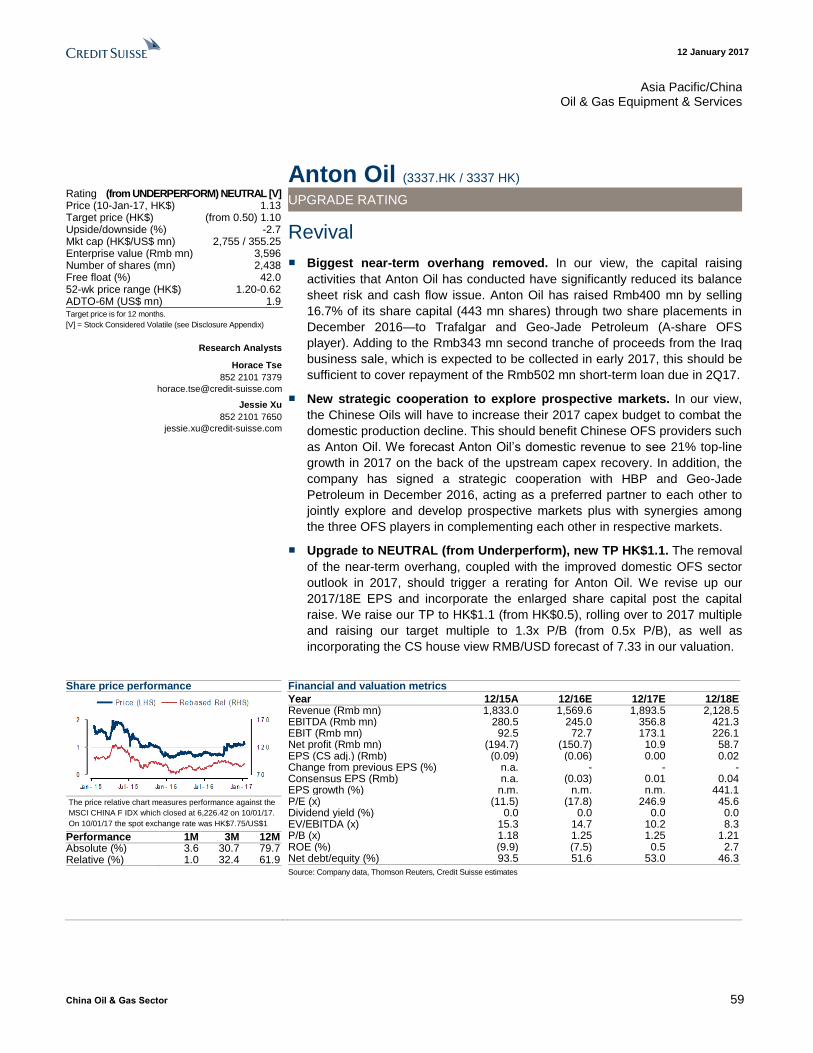
12 January 2017
China Oil & Gas Sector 59
Asia Pacific/China Oil & Gas Equipment & Services
Anton Oil (3337.HK / 3337 HK) Rating (from UNDERPERFORM) NEUTRAL [V] Price (10-Jan-17, HK$) 1.13 Target price (HK$) (from 0.50) 1.10 Upside/downside (%) -2.7 Mkt cap (HK$/US$ mn) 2,755 / 355.25 Enterprise value (Rmb mn) 3,596 Number of shares (mn) 2,438 Free float (%) 42.0 52-wk price range (HK$) 1.20-0.62 ADTO-6M (US$ mn) 1.9 Target price is for 12 months.
[V] = Stock Considered Volatile (see Disclosure Appendix)
Research Analysts
Horace Tse
852 2101 7379
Jessie Xu
852 2101 7650
UPGRADE RATING
Revival
■ Biggest near-term overhang removed. In our view, the capital raising
activities that Anton Oil has conducted have significantly reduced its balance
sheet risk and cash flow issue. Anton Oil has raised Rmb400 mn by selling
16.7% of its share capital (443 mn shares) through two share placements in
December 2016—to Trafalgar and Geo-Jade Petroleum (A-share OFS
player). Adding to the Rmb343 mn second tranche of proceeds from the Iraq
business sale, which is expected to be collected in early 2017, this should be
sufficient to cover repayment of the Rmb502 mn short-term loan due in 2Q17.
■ New strategic cooperation to explore prospective markets. In our view,
the Chinese Oils will have to increase their 2017 capex budget to combat the
domestic production decline. This should benefit Chinese OFS providers such
as Anton Oil. We forecast Anton Oil’s domestic revenue to see 21% top-line
growth in 2017 on the back of the upstream capex recovery. In addition, the
company has signed a strategic cooperation with HBP and Geo-Jade
Petroleum in December 2016, acting as a preferred partner to each other to
jointly explore and develop prospective markets plus with synergies among
the three OFS players in complementing each other in respective markets.
■ Upgrade to NEUTRAL (from Underperform), new TP HK$1.1. The removal
of the near-term overhang, coupled with the improved domestic OFS sector
outlook in 2017, should trigger a rerating for Anton Oil. We revise up our
2017/18E EPS and incorporate the enlarged share capital post the capital
raise. We raise our TP to HK$1.1 (from HK$0.5), rolling over to 2017 multiple
and raising our target multiple to 1.3x P/B (from 0.5x P/B), as well as
incorporating the CS house view RMB/USD forecast of 7.33 in our valuation.
Share price performance
The price relative chart measures performance against the
MSCI CHINA F IDX which closed at 6,226.42 on 10/01/17.
On 10/01/17 the spot exchange rate was HK$7.75/US$1
Performance 1M 3M 12M Absolute (%) 3.6 30.7 79.7 Relative (%) 1.0 32.4 61.9
Financial and valuation metrics
Year 12/15A 12/16E 12/17E 12/18E Revenue (Rmb mn) 1,833.0 1,569.6 1,893.5 2,128.5 EBITDA (Rmb mn) 280.5 245.0 356.8 421.3 EBIT (Rmb mn) 92.5 72.7 173.1 226.1 Net profit (Rmb mn) (194.7) (150.7) 10.9 58.7 EPS (CS adj.) (Rmb) (0.09) (0.06) 0.00 0.02 Change from previous EPS (%) n.a. - - - Consensus EPS (Rmb) n.a. (0.03) 0.01 0.04 EPS growth (%) n.m. n.m. n.m. 441.1 P/E (x) (11.5) (17.8) 246.9 45.6 Dividend yield (%) 0.0 0.0 0.0 0.0 EV/EBITDA (x) 15.3 14.7 10.2 8.3 P/B (x) 1.18 1.25 1.25 1.21 ROE (%) (9.9) (7.5) 0.5 2.7 Net debt/equity (%) 93.5 51.6 53.0 46.3
Source: Company data, Thomson Reuters, Credit Suisse estimates
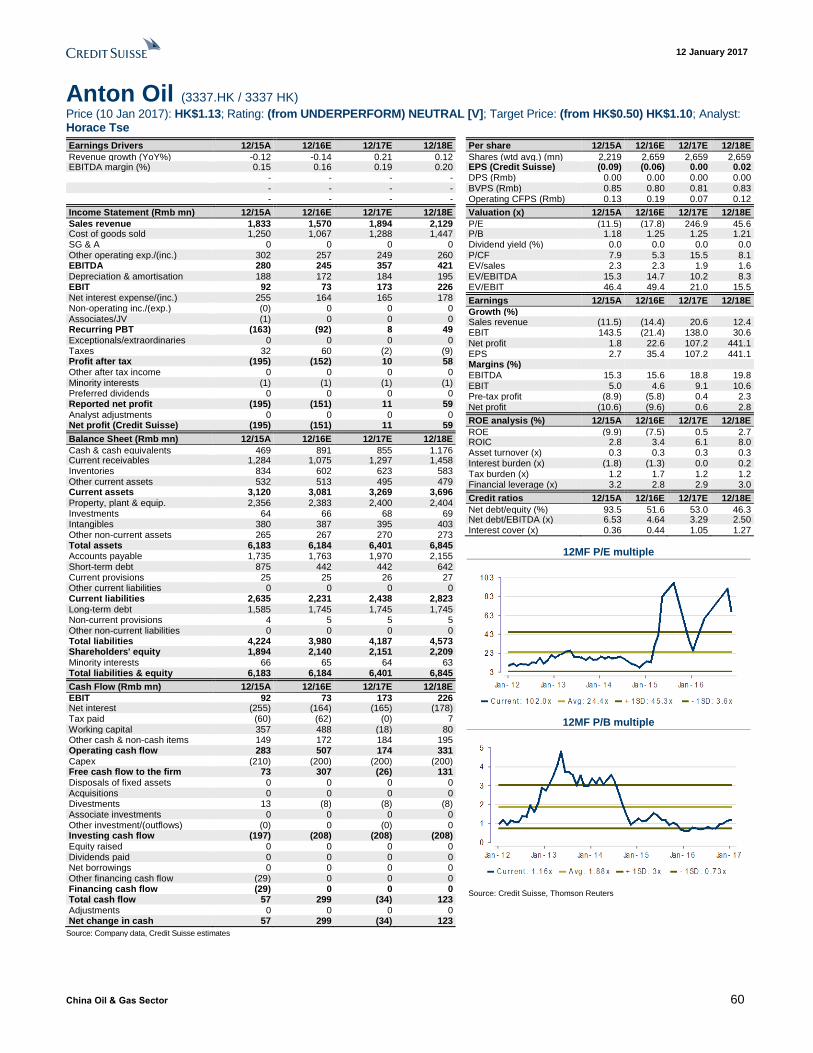
12 January 2017
China Oil & Gas Sector 60
Anton Oil (3337.HK / 3337 HK)
Price (10 Jan 2017): HK$1.13; Rating: (from UNDERPERFORM) NEUTRAL [V]; Target Price: (from HK$0.50) HK$1.10; Analyst: Horace Tse
Earnings Drivers 12/15A 12/16E 12/17E 12/18E
Revenue growth (YoY%) -0.12 -0.14 0.21 0.12 EBITDA margin (%) 0.15 0.16 0.19 0.20 - - - - - - - - - - - -
Income Statement (Rmb mn) 12/15A 12/16E 12/17E 12/18E
Sales revenue 1,833 1,570 1,894 2,129 Cost of goods sold 1,250 1,067 1,288 1,447 SG & A 0 0 0 0 Other operating exp./(inc.) 302 257 249 260 EBITDA 280 245 357 421 Depreciation & amortisation 188 172 184 195 EBIT 92 73 173 226 Net interest expense/(inc.) 255 164 165 178 Non-operating inc./(exp.) (0) 0 0 0 Associates/JV (1) 0 0 0 Recurring PBT (163) (92) 8 49 Exceptionals/extraordinaries 0 0 0 0 Taxes 32 60 (2) (9) Profit after tax (195) (152) 10 58 Other after tax income 0 0 0 0 Minority interests (1) (1) (1) (1) Preferred dividends 0 0 0 0 Reported net profit (195) (151) 11 59 Analyst adjustments 0 0 0 0 Net profit (Credit Suisse) (195) (151) 11 59
Balance Sheet (Rmb mn) 12/15A 12/16E 12/17E 12/18E
Cash & cash equivalents 469 891 855 1,176 Current receivables 1,284 1,075 1,297 1,458 Inventories 834 602 623 583 Other current assets 532 513 495 479 Current assets 3,120 3,081 3,269 3,696 Property, plant & equip. 2,356 2,383 2,400 2,404 Investments 64 66 68 69 Intangibles 380 387 395 403 Other non-current assets 265 267 270 273 Total assets 6,183 6,184 6,401 6,845 Accounts payable 1,735 1,763 1,970 2,155 Short-term debt 875 442 442 642 Current provisions 25 25 26 27 Other current liabilities 0 0 0 0 Current liabilities 2,635 2,231 2,438 2,823 Long-term debt 1,585 1,745 1,745 1,745 Non-current provisions 4 5 5 5 Other non-current liabilities 0 0 0 0 Total liabilities 4,224 3,980 4,187 4,573 Shareholders' equity 1,894 2,140 2,151 2,209 Minority interests 66 65 64 63 Total liabilities & equity 6,183 6,184 6,401 6,845
Cash Flow (Rmb mn) 12/15A 12/16E 12/17E 12/18E
EBIT 92 73 173 226 Net interest (255) (164) (165) (178) Tax paid (60) (62) (0) 7 Working capital 357 488 (18) 80 Other cash & non-cash items 149 172 184 195 Operating cash flow 283 507 174 331 Capex (210) (200) (200) (200) Free cash flow to the firm 73 307 (26) 131 Disposals of fixed assets 0 0 0 0 Acquisitions 0 0 0 0 Divestments 13 (8) (8) (8) Associate investments 0 0 0 0 Other investment/(outflows) (0) 0 (0) 0 Investing cash flow (197) (208) (208) (208) Equity raised 0 0 0 0 Dividends paid 0 0 0 0 Net borrowings 0 0 0 0 Other financing cash flow (29) 0 0 0 Financing cash flow (29) 0 0 0 Total cash flow 57 299 (34) 123 Adjustments 0 0 0 0 Net change in cash 57 299 (34) 123
Per share 12/15A 12/16E 12/17E 12/18E
Shares (wtd avg.) (mn) 2,219 2,659 2,659 2,659 EPS (Credit Suisse) (Rmb)
(0.09) (0.06) 0.00 0.02 DPS (Rmb) 0.00 0.00 0.00 0.00 BVPS (Rmb) 0.85 0.80 0.81 0.83 Operating CFPS (Rmb) 0.13 0.19 0.07 0.12
Valuation (x) 12/15A 12/16E 12/17E 12/18E
P/E (11.5) (17.8) 246.9 45.6 P/B 1.18 1.25 1.25 1.21 Dividend yield (%) 0.0 0.0 0.0 0.0 P/CF 7.9 5.3 15.5 8.1 EV/sales 2.3 2.3 1.9 1.6 EV/EBITDA 15.3 14.7 10.2 8.3 EV/EBIT 46.4 49.4 21.0 15.5
Earnings 12/15A 12/16E 12/17E 12/18E
Growth (%) Sales revenue (11.5) (14.4) 20.6 12.4 EBIT 143.5 (21.4) 138.0 30.6 Net profit 1.8 22.6 107.2 441.1 EPS 2.7 35.4 107.2 441.1 Margins (%) EBITDA 15.3 15.6 18.8 19.8 EBIT 5.0 4.6 9.1 10.6 Pre-tax profit (8.9) (5.8) 0.4 2.3 Net profit (10.6) (9.6) 0.6 2.8
ROE analysis (%) 12/15A 12/16E 12/17E 12/18E
ROE (9.9) (7.5) 0.5 2.7 ROIC 2.8 3.4 6.1 8.0 Asset turnover (x) 0.3 0.3 0.3 0.3 Interest burden (x) (1.8) (1.3) 0.0 0.2 Tax burden (x) 1.2 1.7 1.2 1.2 Financial leverage (x) 3.2 2.8 2.9 3.0
Credit ratios 12/15A 12/16E 12/17E 12/18E
Net debt/equity (%) 93.5 51.6 53.0 46.3 Net debt/EBITDA (x) 6.53 4.64 3.29 2.50 Interest cover (x) 0.36 0.44 1.05 1.27
12MF P/E multiple
12MF P/B multiple
Source: Credit Suisse, Thomson Reuters
Source: Company data, Credit Suisse estimates
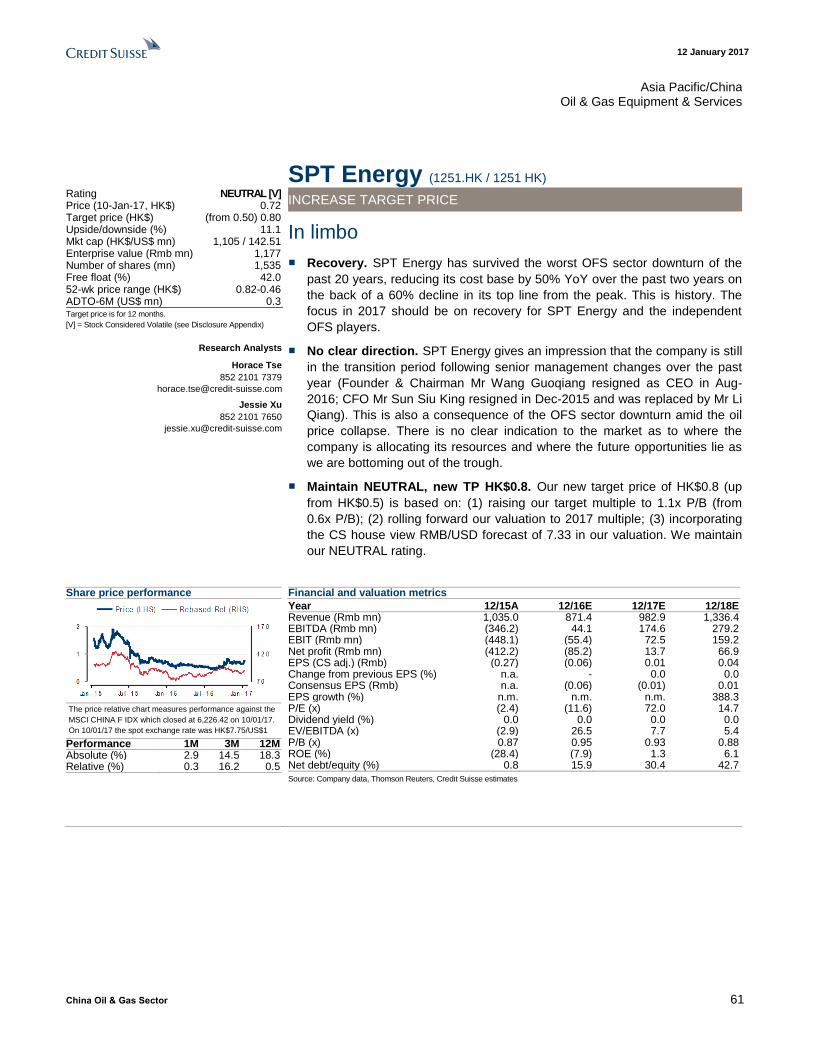
12 January 2017
China Oil & Gas Sector 61
Asia Pacific/China Oil & Gas Equipment & Services
SPT Energy (1251.HK / 1251 HK) Rating NEUTRAL [V] Price (10-Jan-17, HK$) 0.72 Target price (HK$) (from 0.50) 0.80 Upside/downside (%) 11.1 Mkt cap (HK$/US$ mn) 1,105 / 142.51 Enterprise value (Rmb mn) 1,177 Number of shares (mn) 1,535 Free float (%) 42.0 52-wk price range (HK$) 0.82-0.46 ADTO-6M (US$ mn) 0.3 Target price is for 12 months.
[V] = Stock Considered Volatile (see Disclosure Appendix)
Research Analysts
Horace Tse
852 2101 7379
Jessie Xu
852 2101 7650
INCREASE TARGET PRICE
In limbo
■ Recovery. SPT Energy has survived the worst OFS sector downturn of the
past 20 years, reducing its cost base by 50% YoY over the past two years on
the back of a 60% decline in its top line from the peak. This is history. The
focus in 2017 should be on recovery for SPT Energy and the independent
OFS players.
■ No clear direction. SPT Energy gives an impression that the company is still
in the transition period following senior management changes over the past
year (Founder & Chairman Mr Wang Guoqiang resigned as CEO in Aug-
2016; CFO Mr Sun Siu King resigned in Dec-2015 and was replaced by Mr Li
Qiang). This is also a consequence of the OFS sector downturn amid the oil
price collapse. There is no clear indication to the market as to where the
company is allocating its resources and where the future opportunities lie as
we are bottoming out of the trough.
■ Maintain NEUTRAL, new TP HK$0.8. Our new target price of HK$0.8 (up
from HK$0.5) is based on: (1) raising our target multiple to 1.1x P/B (from
0.6x P/B); (2) rolling forward our valuation to 2017 multiple; (3) incorporating
the CS house view RMB/USD forecast of 7.33 in our valuation. We maintain
our NEUTRAL rating.
Share price performance
The price relative chart measures performance against the
MSCI CHINA F IDX which closed at 6,226.42 on 10/01/17.
On 10/01/17 the spot exchange rate was HK$7.75/US$1
Performance 1M 3M 12M Absolute (%) 2.9 14.5 18.3 Relative (%) 0.3 16.2 0.5
Financial and valuation metrics
Year 12/15A 12/16E 12/17E 12/18E Revenue (Rmb mn) 1,035.0 871.4 982.9 1,336.4 EBITDA (Rmb mn) (346.2) 44.1 174.6 279.2 EBIT (Rmb mn) (448.1) (55.4) 72.5 159.2 Net profit (Rmb mn) (412.2) (85.2) 13.7 66.9 EPS (CS adj.) (Rmb) (0.27) (0.06) 0.01 0.04 Change from previous EPS (%) n.a. - 0.0 0.0 Consensus EPS (Rmb) n.a. (0.06) (0.01) 0.01 EPS growth (%) n.m. n.m. n.m. 388.3 P/E (x) (2.4) (11.6) 72.0 14.7 Dividend yield (%) 0.0 0.0 0.0 0.0 EV/EBITDA (x) (2.9) 26.5 7.7 5.4 P/B (x) 0.87 0.95 0.93 0.88 ROE (%) (28.4) (7.9) 1.3 6.1 Net debt/equity (%) 0.8 15.9 30.4 42.7
Source: Company data, Thomson Reuters, Credit Suisse estimates
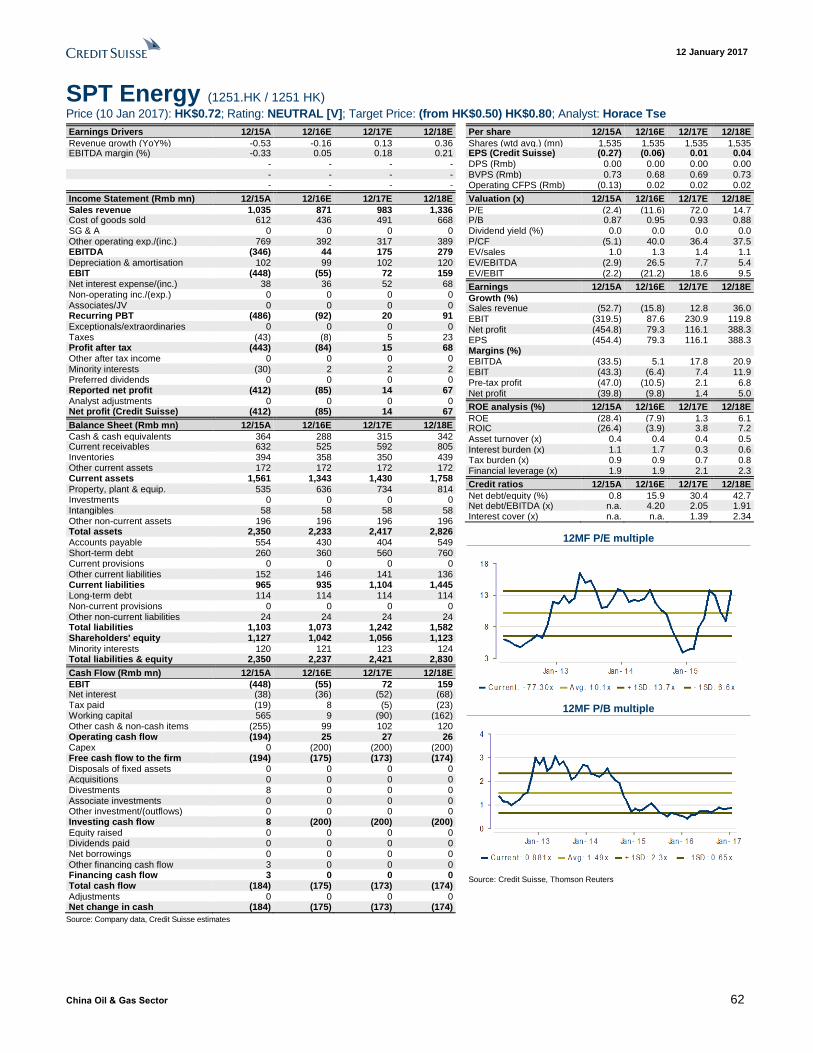
12 January 2017
China Oil & Gas Sector 62
SPT Energy (1251.HK / 1251 HK)
Price (10 Jan 2017): HK$0.72; Rating: NEUTRAL [V]; Target Price: (from HK$0.50) HK$0.80; Analyst: Horace Tse
Earnings Drivers 12/15A 12/16E 12/17E 12/18E
Revenue growth (YoY%) -0.53 -0.16 0.13 0.36 EBITDA margin (%) -0.33 0.05 0.18 0.21 - - - - - - - - - - - -
Income Statement (Rmb mn) 12/15A 12/16E 12/17E 12/18E
Sales revenue 1,035 871 983 1,336 Cost of goods sold 612 436 491 668 SG & A 0 0 0 0 Other operating exp./(inc.) 769 392 317 389 EBITDA (346) 44 175 279 Depreciation & amortisation 102 99 102 120 EBIT (448) (55) 72 159 Net interest expense/(inc.) 38 36 52 68 Non-operating inc./(exp.) 0 0 0 0 Associates/JV 0 0 0 0 Recurring PBT (486) (92) 20 91 Exceptionals/extraordinaries 0 0 0 0 Taxes (43) (8) 5 23 Profit after tax (443) (84) 15 68 Other after tax income 0 0 0 0 Minority interests (30) 2 2 2 Preferred dividends 0 0 0 0 Reported net profit (412) (85) 14 67 Analyst adjustments 0 0 0 0 Net profit (Credit Suisse) (412) (85) 14 67
Balance Sheet (Rmb mn) 12/15A 12/16E 12/17E 12/18E
Cash & cash equivalents 364 288 315 342 Current receivables 632 525 592 805 Inventories 394 358 350 439 Other current assets 172 172 172 172 Current assets 1,561 1,343 1,430 1,758 Property, plant & equip. 535 636 734 814 Investments 0 0 0 0 Intangibles 58 58 58 58 Other non-current assets 196 196 196 196 Total assets 2,350 2,233 2,417 2,826 Accounts payable 554 430 404 549 Short-term debt 260 360 560 760 Current provisions 0 0 0 0 Other current liabilities 152 146 141 136 Current liabilities 965 935 1,104 1,445 Long-term debt 114 114 114 114 Non-current provisions 0 0 0 0 Other non-current liabilities 24 24 24 24 Total liabilities 1,103 1,073 1,242 1,582 Shareholders' equity 1,127 1,042 1,056 1,123 Minority interests 120 121 123 124 Total liabilities & equity 2,350 2,237 2,421 2,830
Cash Flow (Rmb mn) 12/15A 12/16E 12/17E 12/18E
EBIT (448) (55) 72 159 Net interest (38) (36) (52) (68) Tax paid (19) 8 (5) (23) Working capital 565 9 (90) (162) Other cash & non-cash items (255) 99 102 120 Operating cash flow (194) 25 27 26 Capex 0 (200) (200) (200) Free cash flow to the firm (194) (175) (173) (174) Disposals of fixed assets 0 0 0 0 Acquisitions 0 0 0 0 Divestments 8 0 0 0 Associate investments 0 0 0 0 Other investment/(outflows) 0 0 0 0 Investing cash flow 8 (200) (200) (200) Equity raised 0 0 0 0 Dividends paid 0 0 0 0 Net borrowings 0 0 0 0 Other financing cash flow 3 0 0 0 Financing cash flow 3 0 0 0 Total cash flow (184) (175) (173) (174) Adjustments 0 0 0 0 Net change in cash (184) (175) (173) (174)
Per share 12/15A 12/16E 12/17E 12/18E
Shares (wtd avg.) (mn) 1,535 1,535 1,535 1,535 EPS (Credit Suisse) (Rmb)
(0.27) (0.06) 0.01 0.04 DPS (Rmb) 0.00 0.00 0.00 0.00 BVPS (Rmb) 0.73 0.68 0.69 0.73 Operating CFPS (Rmb) (0.13) 0.02 0.02 0.02
Valuation (x) 12/15A 12/16E 12/17E 12/18E
P/E (2.4) (11.6) 72.0 14.7 P/B 0.87 0.95 0.93 0.88 Dividend yield (%) 0.0 0.0 0.0 0.0 P/CF (5.1) 40.0 36.4 37.5 EV/sales 1.0 1.3 1.4 1.1 EV/EBITDA (2.9) 26.5 7.7 5.4 EV/EBIT (2.2) (21.2) 18.6 9.5
Earnings 12/15A 12/16E 12/17E 12/18E
Growth (%) Sales revenue (52.7) (15.8) 12.8 36.0 EBIT (319.5) 87.6 230.9 119.8 Net profit (454.8) 79.3 116.1 388.3 EPS (454.4) 79.3 116.1 388.3 Margins (%) EBITDA (33.5) 5.1 17.8 20.9 EBIT (43.3) (6.4) 7.4 11.9 Pre-tax profit (47.0) (10.5) 2.1 6.8 Net profit (39.8) (9.8) 1.4 5.0
ROE analysis (%) 12/15A 12/16E 12/17E 12/18E
ROE (28.4) (7.9) 1.3 6.1 ROIC (26.4) (3.9) 3.8 7.2 Asset turnover (x) 0.4 0.4 0.4 0.5 Interest burden (x) 1.1 1.7 0.3 0.6 Tax burden (x) 0.9 0.9 0.7 0.8 Financial leverage (x) 1.9 1.9 2.1 2.3
Credit ratios 12/15A 12/16E 12/17E 12/18E
Net debt/equity (%) 0.8 15.9 30.4 42.7 Net debt/EBITDA (x) n.a. 4.20 2.05 1.91 Interest cover (x) n.a. n.a. 1.39 2.34
12MF P/E multiple
12MF P/B multiple
Source: Credit Suisse, Thomson Reuters
Source: Company data, Credit Suisse estimates
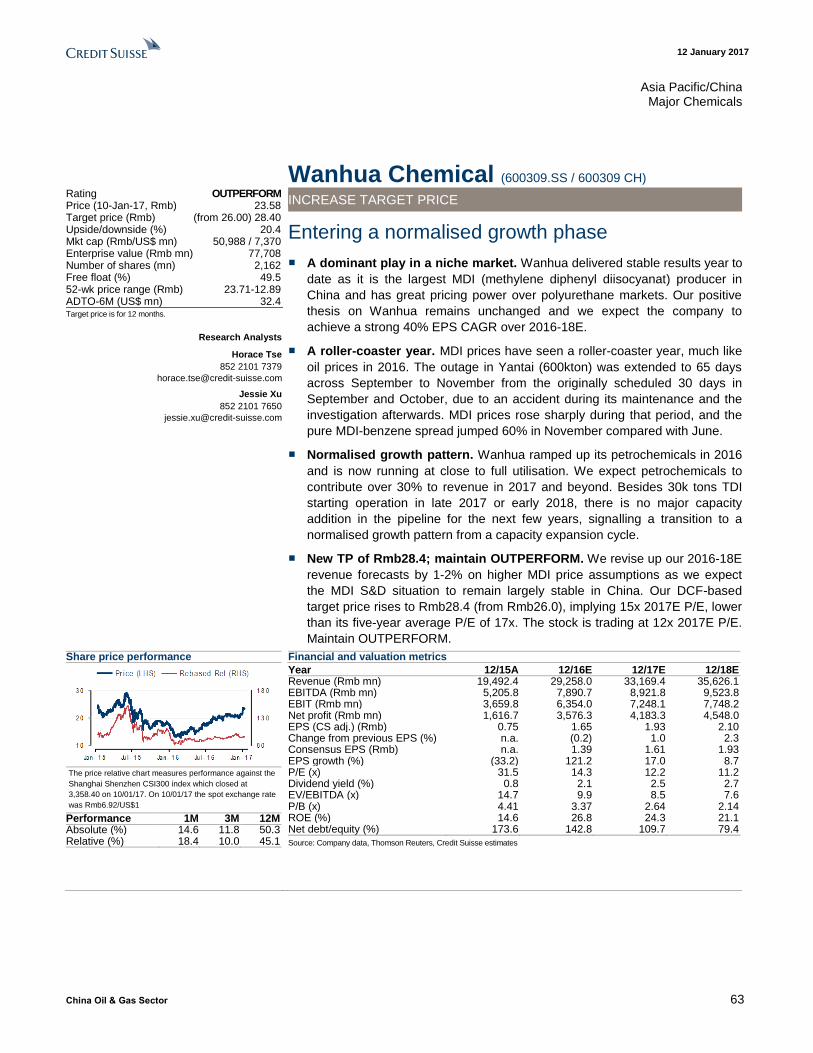
12 January 2017
China Oil & Gas Sector 63
Asia Pacific/China Major Chemicals
Wanhua Chemical (600309.SS / 600309 CH) Rating OUTPERFORM Price (10-Jan-17, Rmb) 23.58 Target price (Rmb) (from 26.00) 28.40 Upside/downside (%) 20.4 Mkt cap (Rmb/US$ mn) 50,988 / 7,370 Enterprise value (Rmb mn) 77,708 Number of shares (mn) 2,162 Free float (%) 49.5 52-wk price range (Rmb) 23.71-12.89 ADTO-6M (US$ mn) 32.4 Target price is for 12 months.
Research Analysts
Horace Tse
852 2101 7379
Jessie Xu
852 2101 7650
INCREASE TARGET PRICE
Entering a normalised growth phase
■ A dominant play in a niche market. Wanhua delivered stable results year to
date as it is the largest MDI (methylene diphenyl diisocyanat) producer in
China and has great pricing power over polyurethane markets. Our positive
thesis on Wanhua remains unchanged and we expect the company to
achieve a strong 40% EPS CAGR over 2016-18E.
■ A roller-coaster year. MDI prices have seen a roller-coaster year, much like
oil prices in 2016. The outage in Yantai (600kton) was extended to 65 days
across September to November from the originally scheduled 30 days in
September and October, due to an accident during its maintenance and the
investigation afterwards. MDI prices rose sharply during that period, and the
pure MDI-benzene spread jumped 60% in November compared with June.
■ Normalised growth pattern. Wanhua ramped up its petrochemicals in 2016
and is now running at close to full utilisation. We expect petrochemicals to
contribute over 30% to revenue in 2017 and beyond. Besides 30k tons TDI
starting operation in late 2017 or early 2018, there is no major capacity
addition in the pipeline for the next few years, signalling a transition to a
normalised growth pattern from a capacity expansion cycle.
■ New TP of Rmb28.4; maintain OUTPERFORM. We revise up our 2016-18E
revenue forecasts by 1-2% on higher MDI price assumptions as we expect
the MDI S&D situation to remain largely stable in China. Our DCF-based
target price rises to Rmb28.4 (from Rmb26.0), implying 15x 2017E P/E, lower
than its five-year average P/E of 17x. The stock is trading at 12x 2017E P/E.
Maintain OUTPERFORM.
Share price performance
The price relative chart measures performance against the
Shanghai Shenzhen CSI300 index which closed at
3,358.40 on 10/01/17. On 10/01/17 the spot exchange rate
was Rmb6.92/US$1
Performance 1M 3M 12M Absolute (%) 14.6 11.8 50.3 Relative (%) 18.4 10.0 45.1
Financial and valuation metrics
Year 12/15A 12/16E 12/17E 12/18E Revenue (Rmb mn) 19,492.4 29,258.0 33,169.4 35,626.1 EBITDA (Rmb mn) 5,205.8 7,890.7 8,921.8 9,523.8 EBIT (Rmb mn) 3,659.8 6,354.0 7,248.1 7,748.2 Net profit (Rmb mn) 1,616.7 3,576.3 4,183.3 4,548.0 EPS (CS adj.) (Rmb) 0.75 1.65 1.93 2.10 Change from previous EPS (%) n.a. (0.2) 1.0 2.3 Consensus EPS (Rmb) n.a. 1.39 1.61 1.93 EPS growth (%) (33.2) 121.2 17.0 8.7 P/E (x) 31.5 14.3 12.2 11.2 Dividend yield (%) 0.8 2.1 2.5 2.7 EV/EBITDA (x) 14.7 9.9 8.5 7.6 P/B (x) 4.41 3.37 2.64 2.14 ROE (%) 14.6 26.8 24.3 21.1 Net debt/equity (%) 173.6 142.8 109.7 79.4
Source: Company data, Thomson Reuters, Credit Suisse estimates
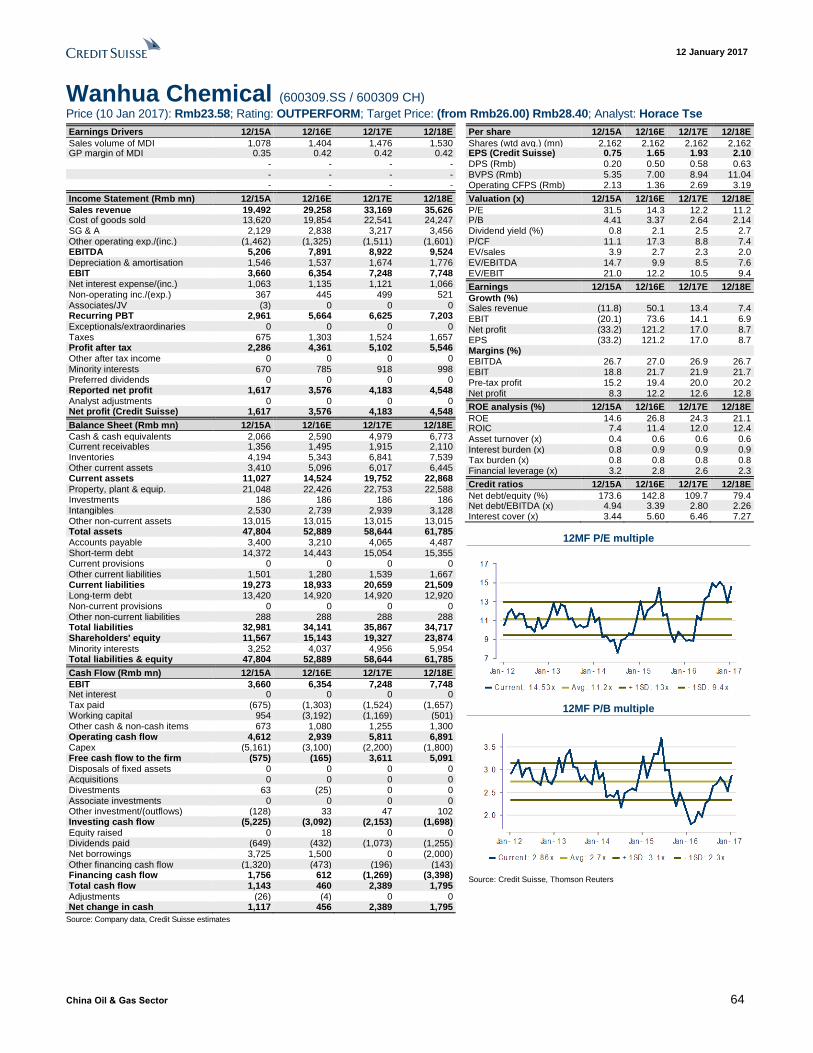
12 January 2017
China Oil & Gas Sector 64
Wanhua Chemical (600309.SS / 600309 CH)
Price (10 Jan 2017): Rmb23.58; Rating: OUTPERFORM; Target Price: (from Rmb26.00) Rmb28.40; Analyst: Horace Tse
Earnings Drivers 12/15A 12/16E 12/17E 12/18E
Sales volume of MDI 1,078 1,404 1,476 1,530 GP margin of MDI 0.35 0.42 0.42 0.42 - - - - - - - - - - - -
Income Statement (Rmb mn) 12/15A 12/16E 12/17E 12/18E
Sales revenue 19,492 29,258 33,169 35,626 Cost of goods sold 13,620 19,854 22,541 24,247 SG & A 2,129 2,838 3,217 3,456 Other operating exp./(inc.) (1,462) (1,325) (1,511) (1,601) EBITDA 5,206 7,891 8,922 9,524 Depreciation & amortisation 1,546 1,537 1,674 1,776 EBIT 3,660 6,354 7,248 7,748 Net interest expense/(inc.) 1,063 1,135 1,121 1,066 Non-operating inc./(exp.) 367 445 499 521 Associates/JV (3) 0 0 0 Recurring PBT 2,961 5,664 6,625 7,203 Exceptionals/extraordinaries 0 0 0 0 Taxes 675 1,303 1,524 1,657 Profit after tax 2,286 4,361 5,102 5,546 Other after tax income 0 0 0 0 Minority interests 670 785 918 998 Preferred dividends 0 0 0 0 Reported net profit 1,617 3,576 4,183 4,548 Analyst adjustments 0 0 0 0 Net profit (Credit Suisse) 1,617 3,576 4,183 4,548
Balance Sheet (Rmb mn) 12/15A 12/16E 12/17E 12/18E
Cash & cash equivalents 2,066 2,590 4,979 6,773 Current receivables 1,356 1,495 1,915 2,110 Inventories 4,194 5,343 6,841 7,539 Other current assets 3,410 5,096 6,017 6,445 Current assets 11,027 14,524 19,752 22,868 Property, plant & equip. 21,048 22,426 22,753 22,588 Investments 186 186 186 186 Intangibles 2,530 2,739 2,939 3,128 Other non-current assets 13,015 13,015 13,015 13,015 Total assets 47,804 52,889 58,644 61,785 Accounts payable 3,400 3,210 4,065 4,487 Short-term debt 14,372 14,443 15,054 15,355 Current provisions 0 0 0 0 Other current liabilities 1,501 1,280 1,539 1,667 Current liabilities 19,273 18,933 20,659 21,509 Long-term debt 13,420 14,920 14,920 12,920 Non-current provisions 0 0 0 0 Other non-current liabilities 288 288 288 288 Total liabilities 32,981 34,141 35,867 34,717 Shareholders' equity 11,567 15,143 19,327 23,874 Minority interests 3,252 4,037 4,956 5,954 Total liabilities & equity 47,804 52,889 58,644 61,785
Cash Flow (Rmb mn) 12/15A 12/16E 12/17E 12/18E
EBIT 3,660 6,354 7,248 7,748 Net interest 0 0 0 0 Tax paid (675) (1,303) (1,524) (1,657) Working capital 954 (3,192) (1,169) (501) Other cash & non-cash items 673 1,080 1,255 1,300 Operating cash flow 4,612 2,939 5,811 6,891 Capex (5,161) (3,100) (2,200) (1,800) Free cash flow to the firm (575) (165) 3,611 5,091 Disposals of fixed assets 0 0 0 0 Acquisitions 0 0 0 0 Divestments 63 (25) 0 0 Associate investments 0 0 0 0 Other investment/(outflows) (128) 33 47 102 Investing cash flow (5,225) (3,092) (2,153) (1,698) Equity raised 0 18 0 0 Dividends paid (649) (432) (1,073) (1,255) Net borrowings 3,725 1,500 0 (2,000) Other financing cash flow (1,320) (473) (196) (143) Financing cash flow 1,756 612 (1,269) (3,398) Total cash flow 1,143 460 2,389 1,795 Adjustments (26) (4) 0 0 Net change in cash 1,117 456 2,389 1,795
Per share 12/15A 12/16E 12/17E 12/18E
Shares (wtd avg.) (mn) 2,162 2,162 2,162 2,162 EPS (Credit Suisse) (Rmb)
0.75 1.65 1.93 2.10 DPS (Rmb) 0.20 0.50 0.58 0.63 BVPS (Rmb) 5.35 7.00 8.94 11.04 Operating CFPS (Rmb) 2.13 1.36 2.69 3.19
Valuation (x) 12/15A 12/16E 12/17E 12/18E
P/E 31.5 14.3 12.2 11.2 P/B 4.41 3.37 2.64 2.14 Dividend yield (%) 0.8 2.1 2.5 2.7 P/CF 11.1 17.3 8.8 7.4 EV/sales 3.9 2.7 2.3 2.0 EV/EBITDA 14.7 9.9 8.5 7.6 EV/EBIT 21.0 12.2 10.5 9.4
Earnings 12/15A 12/16E 12/17E 12/18E
Growth (%) Sales revenue (11.8) 50.1 13.4 7.4 EBIT (20.1) 73.6 14.1 6.9 Net profit (33.2) 121.2 17.0 8.7 EPS (33.2) 121.2 17.0 8.7 Margins (%) EBITDA 26.7 27.0 26.9 26.7 EBIT 18.8 21.7 21.9 21.7 Pre-tax profit 15.2 19.4 20.0 20.2 Net profit 8.3 12.2 12.6 12.8
ROE analysis (%) 12/15A 12/16E 12/17E 12/18E
ROE 14.6 26.8 24.3 21.1 ROIC 7.4 11.4 12.0 12.4 Asset turnover (x) 0.4 0.6 0.6 0.6 Interest burden (x) 0.8 0.9 0.9 0.9 Tax burden (x) 0.8 0.8 0.8 0.8 Financial leverage (x) 3.2 2.8 2.6 2.3
Credit ratios 12/15A 12/16E 12/17E 12/18E
Net debt/equity (%) 173.6 142.8 109.7 79.4 Net debt/EBITDA (x) 4.94 3.39 2.80 2.26 Interest cover (x) 3.44 5.60 6.46 7.27
12MF P/E multiple
12MF P/B multiple
Source: Credit Suisse, Thomson Reuters
Source: Company data, Credit Suisse estimates
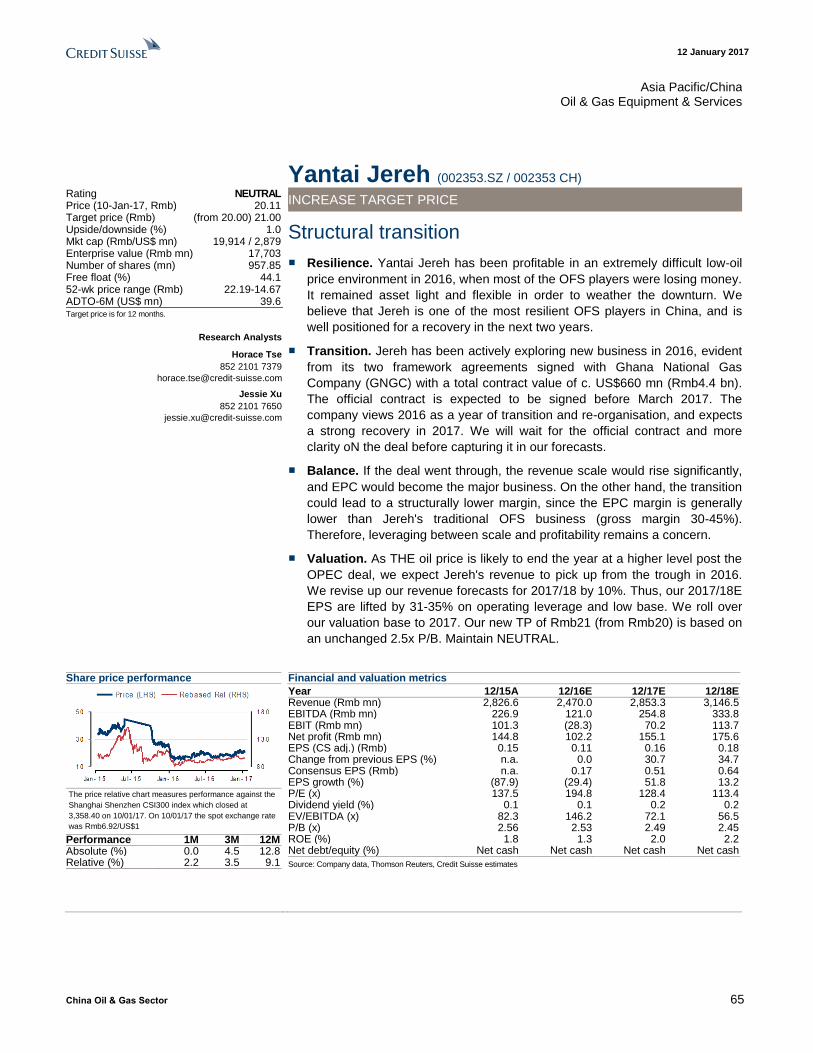
12 January 2017
China Oil & Gas Sector 65
Asia Pacific/China Oil & Gas Equipment & Services
Yantai Jereh (002353.SZ / 002353 CH) Rating NEUTRAL Price (10-Jan-17, Rmb) 20.11 Target price (Rmb) (from 20.00) 21.00 Upside/downside (%) 1.0 Mkt cap (Rmb/US$ mn) 19,914 / 2,879 Enterprise value (Rmb mn) 17,703 Number of shares (mn) 957.85 Free float (%) 44.1 52-wk price range (Rmb) 22.19-14.67 ADTO-6M (US$ mn) 39.6 Target price is for 12 months.
Research Analysts
Horace Tse
852 2101 7379
Jessie Xu
852 2101 7650
INCREASE TARGET PRICE
Structural transition
■ Resilience. Yantai Jereh has been profitable in an extremely difficult low-oil
price environment in 2016, when most of the OFS players were losing money.
It remained asset light and flexible in order to weather the downturn. We
believe that Jereh is one of the most resilient OFS players in China, and is
well positioned for a recovery in the next two years.
■ Transition. Jereh has been actively exploring new business in 2016, evident
from its two framework agreements signed with Ghana National Gas
Company (GNGC) with a total contract value of c. US$660 mn (Rmb4.4 bn).
The official contract is expected to be signed before March 2017. The
company views 2016 as a year of transition and re-organisation, and expects
a strong recovery in 2017. We will wait for the official contract and more
clarity oN the deal before capturing it in our forecasts.
■ Balance. If the deal went through, the revenue scale would rise significantly,
and EPC would become the major business. On the other hand, the transition
could lead to a structurally lower margin, since the EPC margin is generally
lower than Jereh's traditional OFS business (gross margin 30-45%).
Therefore, leveraging between scale and profitability remains a concern.
■ Valuation. As THE oil price is likely to end the year at a higher level post the
OPEC deal, we expect Jereh's revenue to pick up from the trough in 2016.
We revise up our revenue forecasts for 2017/18 by 10%. Thus, our 2017/18E
EPS are lifted by 31-35% on operating leverage and low base. We roll over
our valuation base to 2017. Our new TP of Rmb21 (from Rmb20) is based on
an unchanged 2.5x P/B. Maintain NEUTRAL.
Share price performance
The price relative chart measures performance against the
Shanghai Shenzhen CSI300 index which closed at
3,358.40 on 10/01/17. On 10/01/17 the spot exchange rate
was Rmb6.92/US$1
Performance 1M 3M 12M Absolute (%) 0.0 4.5 12.8 Relative (%) 2.2 3.5 9.1
Financial and valuation metrics
Year 12/15A 12/16E 12/17E 12/18E Revenue (Rmb mn) 2,826.6 2,470.0 2,853.3 3,146.5 EBITDA (Rmb mn) 226.9 121.0 254.8 333.8 EBIT (Rmb mn) 101.3 (28.3) 70.2 113.7 Net profit (Rmb mn) 144.8 102.2 155.1 175.6 EPS (CS adj.) (Rmb) 0.15 0.11 0.16 0.18 Change from previous EPS (%) n.a. 0.0 30.7 34.7 Consensus EPS (Rmb) n.a. 0.17 0.51 0.64 EPS growth (%) (87.9) (29.4) 51.8 13.2 P/E (x) 137.5 194.8 128.4 113.4 Dividend yield (%) 0.1 0.1 0.2 0.2 EV/EBITDA (x) 82.3 146.2 72.1 56.5 P/B (x) 2.56 2.53 2.49 2.45 ROE (%) 1.8 1.3 2.0 2.2 Net debt/equity (%) Net cash Net cash Net cash Net cash
Source: Company data, Thomson Reuters, Credit Suisse estimates
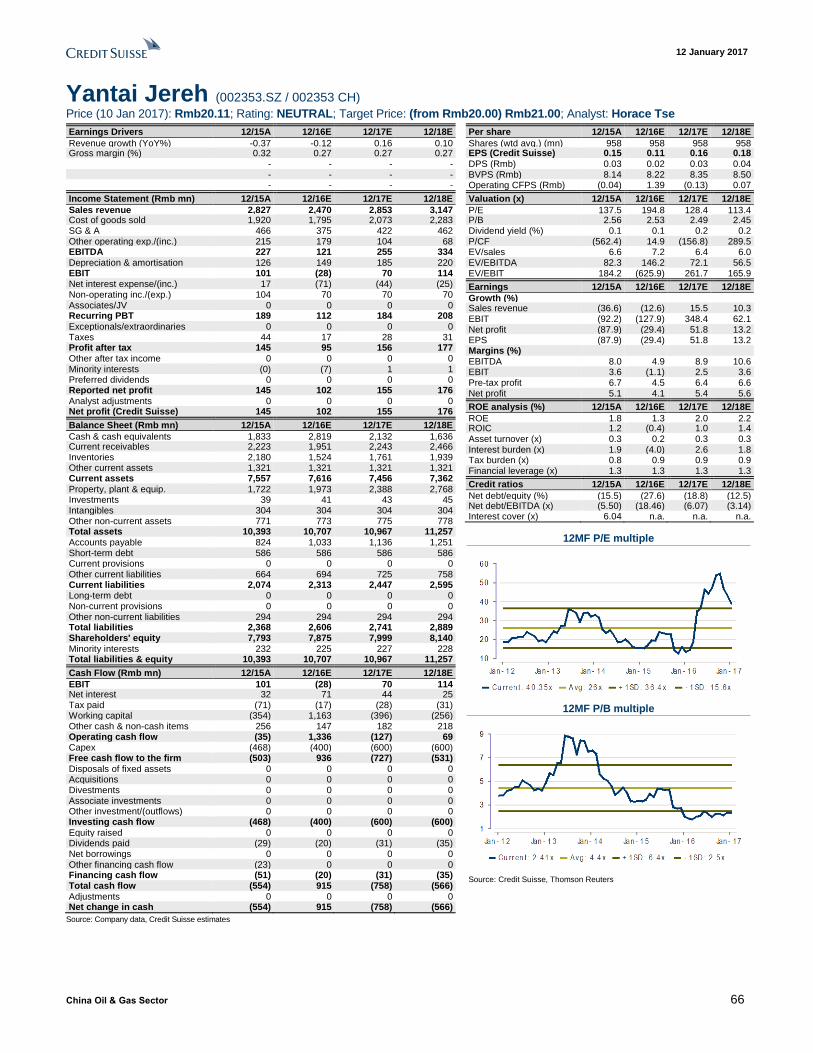
12 January 2017
China Oil & Gas Sector 66
Yantai Jereh (002353.SZ / 002353 CH)
Price (10 Jan 2017): Rmb20.11; Rating: NEUTRAL; Target Price: (from Rmb20.00) Rmb21.00; Analyst: Horace Tse
Earnings Drivers 12/15A 12/16E 12/17E 12/18E
Revenue growth (YoY%) -0.37 -0.12 0.16 0.10 Gross margin (%) 0.32 0.27 0.27 0.27 - - - - - - - - - - - -
Income Statement (Rmb mn) 12/15A 12/16E 12/17E 12/18E
Sales revenue 2,827 2,470 2,853 3,147 Cost of goods sold 1,920 1,795 2,073 2,283 SG & A 466 375 422 462 Other operating exp./(inc.) 215 179 104 68 EBITDA 227 121 255 334 Depreciation & amortisation 126 149 185 220 EBIT 101 (28) 70 114 Net interest expense/(inc.) 17 (71) (44) (25) Non-operating inc./(exp.) 104 70 70 70 Associates/JV 0 0 0 0 Recurring PBT 189 112 184 208 Exceptionals/extraordinaries 0 0 0 0 Taxes 44 17 28 31 Profit after tax 145 95 156 177 Other after tax income 0 0 0 0 Minority interests (0) (7) 1 1 Preferred dividends 0 0 0 0 Reported net profit 145 102 155 176 Analyst adjustments 0 0 0 0 Net profit (Credit Suisse) 145 102 155 176
Balance Sheet (Rmb mn) 12/15A 12/16E 12/17E 12/18E
Cash & cash equivalents 1,833 2,819 2,132 1,636 Current receivables 2,223 1,951 2,243 2,466 Inventories 2,180 1,524 1,761 1,939 Other current assets 1,321 1,321 1,321 1,321 Current assets 7,557 7,616 7,456 7,362 Property, plant & equip. 1,722 1,973 2,388 2,768 Investments 39 41 43 45 Intangibles 304 304 304 304 Other non-current assets 771 773 775 778 Total assets 10,393 10,707 10,967 11,257 Accounts payable 824 1,033 1,136 1,251 Short-term debt 586 586 586 586 Current provisions 0 0 0 0 Other current liabilities 664 694 725 758 Current liabilities 2,074 2,313 2,447 2,595 Long-term debt 0 0 0 0 Non-current provisions 0 0 0 0 Other non-current liabilities 294 294 294 294 Total liabilities 2,368 2,606 2,741 2,889 Shareholders' equity 7,793 7,875 7,999 8,140 Minority interests 232 225 227 228 Total liabilities & equity 10,393 10,707 10,967 11,257
Cash Flow (Rmb mn) 12/15A 12/16E 12/17E 12/18E
EBIT 101 (28) 70 114 Net interest 32 71 44 25 Tax paid (71) (17) (28) (31) Working capital (354) 1,163 (396) (256) Other cash & non-cash items 256 147 182 218 Operating cash flow (35) 1,336 (127) 69 Capex (468) (400) (600) (600) Free cash flow to the firm (503) 936 (727) (531) Disposals of fixed assets 0 0 0 0 Acquisitions 0 0 0 0 Divestments 0 0 0 0 Associate investments 0 0 0 0 Other investment/(outflows) 0 0 0 0 Investing cash flow (468) (400) (600) (600) Equity raised 0 0 0 0 Dividends paid (29) (20) (31) (35) Net borrowings 0 0 0 0 Other financing cash flow (23) 0 0 0 Financing cash flow (51) (20) (31) (35) Total cash flow (554) 915 (758) (566) Adjustments 0 0 0 0 Net change in cash (554) 915 (758) (566)
Per share 12/15A 12/16E 12/17E 12/18E
Shares (wtd avg.) (mn) 958 958 958 958 EPS (Credit Suisse) (Rmb)
0.15 0.11 0.16 0.18 DPS (Rmb) 0.03 0.02 0.03 0.04 BVPS (Rmb) 8.14 8.22 8.35 8.50 Operating CFPS (Rmb) (0.04) 1.39 (0.13) 0.07
Valuation (x) 12/15A 12/16E 12/17E 12/18E
P/E 137.5 194.8 128.4 113.4 P/B 2.56 2.53 2.49 2.45 Dividend yield (%) 0.1 0.1 0.2 0.2 P/CF (562.4) 14.9 (156.8) 289.5 EV/sales 6.6 7.2 6.4 6.0 EV/EBITDA 82.3 146.2 72.1 56.5 EV/EBIT 184.2 (625.9) 261.7 165.9
Earnings 12/15A 12/16E 12/17E 12/18E
Growth (%) Sales revenue (36.6) (12.6) 15.5 10.3 EBIT (92.2) (127.9) 348.4 62.1 Net profit (87.9) (29.4) 51.8 13.2 EPS (87.9) (29.4) 51.8 13.2 Margins (%) EBITDA 8.0 4.9 8.9 10.6 EBIT 3.6 (1.1) 2.5 3.6 Pre-tax profit 6.7 4.5 6.4 6.6 Net profit 5.1 4.1 5.4 5.6
ROE analysis (%) 12/15A 12/16E 12/17E 12/18E
ROE 1.8 1.3 2.0 2.2 ROIC 1.2 (0.4) 1.0 1.4 Asset turnover (x) 0.3 0.2 0.3 0.3 Interest burden (x) 1.9 (4.0) 2.6 1.8 Tax burden (x) 0.8 0.9 0.9 0.9 Financial leverage (x) 1.3 1.3 1.3 1.3
Credit ratios 12/15A 12/16E 12/17E 12/18E
Net debt/equity (%) (15.5) (27.6) (18.8) (12.5) Net debt/EBITDA (x) (5.50) (18.46) (6.07) (3.14) Interest cover (x) 6.04 n.a. n.a. n.a.
12MF P/E multiple
12MF P/B multiple
Source: Credit Suisse, Thomson Reuters
Source: Company data, Credit Suisse estimates
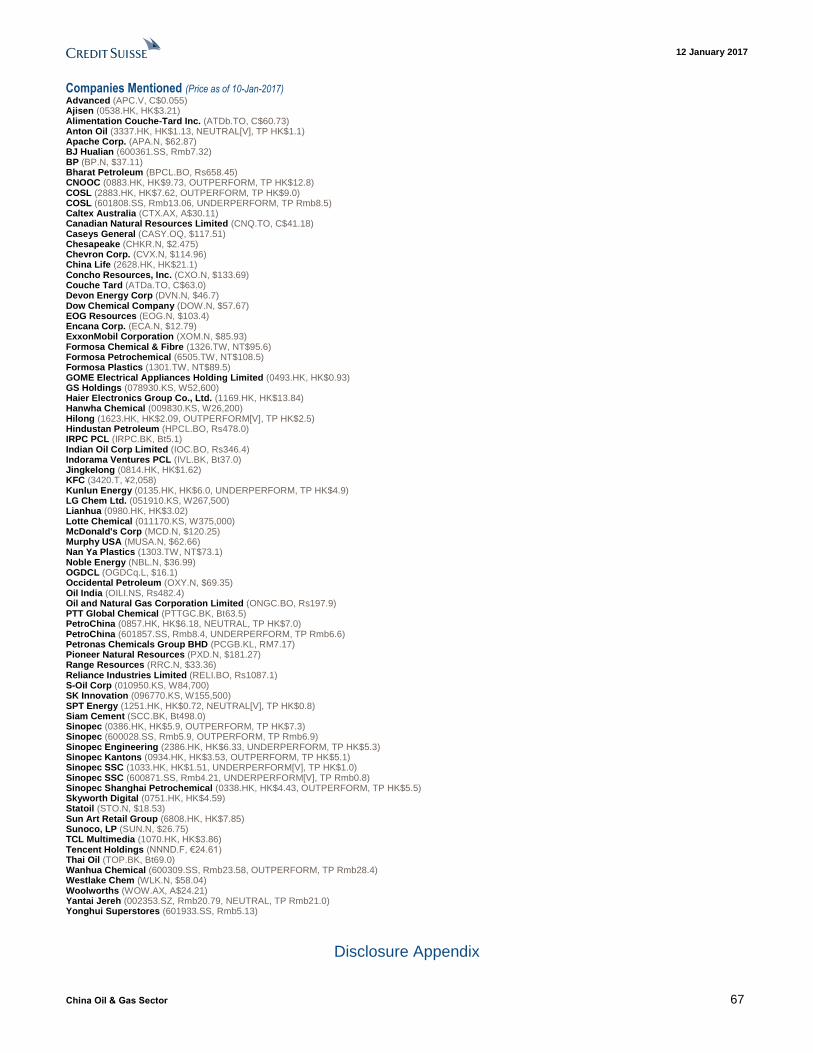
12 January 2017
China Oil & Gas Sector 67
Companies Mentioned (Price as of 10-Jan-2017) Advanced (APC.V, C$0.055) Ajisen (0538.HK, HK$3.21) Alimentation Couche-Tard Inc. (ATDb.TO, C$60.73) Anton Oil (3337.HK, HK$1.13, NEUTRAL[V], TP HK$1.1) Apache Corp. (APA.N, $62.87) BJ Hualian (600361.SS, Rmb7.32) BP (BP.N, $37.11) Bharat Petroleum (BPCL.BO, Rs658.45) CNOOC (0883.HK, HK$9.73, OUTPERFORM, TP HK$12.8) COSL (2883.HK, HK$7.62, OUTPERFORM, TP HK$9.0) COSL (601808.SS, Rmb13.06, UNDERPERFORM, TP Rmb8.5) Caltex Australia (CTX.AX, A$30.11) Canadian Natural Resources Limited (CNQ.TO, C$41.18) Caseys General (CASY.OQ, $117.51) Chesapeake (CHKR.N, $2.475) Chevron Corp. (CVX.N, $114.96) China Life (2628.HK, HK$21.1) Concho Resources, Inc. (CXO.N, $133.69) Couche Tard (ATDa.TO, C$63.0) Devon Energy Corp (DVN.N, $46.7) Dow Chemical Company (DOW.N, $57.67) EOG Resources (EOG.N, $103.4) Encana Corp. (ECA.N, $12.79) ExxonMobil Corporation (XOM.N, $85.93) Formosa Chemical & Fibre (1326.TW, NT$95.6) Formosa Petrochemical (6505.TW, NT$108.5) Formosa Plastics (1301.TW, NT$89.5) GOME Electrical Appliances Holding Limited (0493.HK, HK$0.93) GS Holdings (078930.KS, W52,600) Haier Electronics Group Co., Ltd. (1169.HK, HK$13.84) Hanwha Chemical (009830.KS, W26,200) Hilong (1623.HK, HK$2.09, OUTPERFORM[V], TP HK$2.5) Hindustan Petroleum (HPCL.BO, Rs478.0) IRPC PCL (IRPC.BK, Bt5.1) Indian Oil Corp Limited (IOC.BO, Rs346.4) Indorama Ventures PCL (IVL.BK, Bt37.0) Jingkelong (0814.HK, HK$1.62) KFC (3420.T, ¥2,058) Kunlun Energy (0135.HK, HK$6.0, UNDERPERFORM, TP HK$4.9) LG Chem Ltd. (051910.KS, W267,500) Lianhua (0980.HK, HK$3.02) Lotte Chemical (011170.KS, W375,000) McDonald's Corp (MCD.N, $120.25) Murphy USA (MUSA.N, $62.66) Nan Ya Plastics (1303.TW, NT$73.1) Noble Energy (NBL.N, $36.99) OGDCL (OGDCq.L, $16.1) Occidental Petroleum (OXY.N, $69.35) Oil India (OILI.NS, Rs482.4) Oil and Natural Gas Corporation Limited (ONGC.BO, Rs197.9) PTT Global Chemical (PTTGC.BK, Bt63.5) PetroChina (0857.HK, HK$6.18, NEUTRAL, TP HK$7.0) PetroChina (601857.SS, Rmb8.4, UNDERPERFORM, TP Rmb6.6) Petronas Chemicals Group BHD (PCGB.KL, RM7.17) Pioneer Natural Resources (PXD.N, $181.27) Range Resources (RRC.N, $33.36) Reliance Industries Limited (RELI.BO, Rs1087.1) S-Oil Corp (010950.KS, W84,700) SK Innovation (096770.KS, W155,500) SPT Energy (1251.HK, HK$0.72, NEUTRAL[V], TP HK$0.8) Siam Cement (SCC.BK, Bt498.0) Sinopec (0386.HK, HK$5.9, OUTPERFORM, TP HK$7.3) Sinopec (600028.SS, Rmb5.9, OUTPERFORM, TP Rmb6.9) Sinopec Engineering (2386.HK, HK$6.33, UNDERPERFORM, TP HK$5.3) Sinopec Kantons (0934.HK, HK$3.53, OUTPERFORM, TP HK$5.1) Sinopec SSC (1033.HK, HK$1.51, UNDERPERFORM[V], TP HK$1.0) Sinopec SSC (600871.SS, Rmb4.21, UNDERPERFORM[V], TP Rmb0.8) Sinopec Shanghai Petrochemical (0338.HK, HK$4.43, OUTPERFORM, TP HK$5.5) Skyworth Digital (0751.HK, HK$4.59) Statoil (STO.N, $18.53) Sun Art Retail Group (6808.HK, HK$7.85) Sunoco, LP (SUN.N, $26.75) TCL Multimedia (1070.HK, HK$3.86) Tencent Holdings (NNND.F, €24.61) Thai Oil (TOP.BK, Bt69.0) Wanhua Chemical (600309.SS, Rmb23.58, OUTPERFORM, TP Rmb28.4) Westlake Chem (WLK.N, $58.04) Woolworths (WOW.AX, A$24.21) Yantai Jereh (002353.SZ, Rmb20.79, NEUTRAL, TP Rmb21.0) Yonghui Superstores (601933.SS, Rmb5.13)
Disclosure Appendix
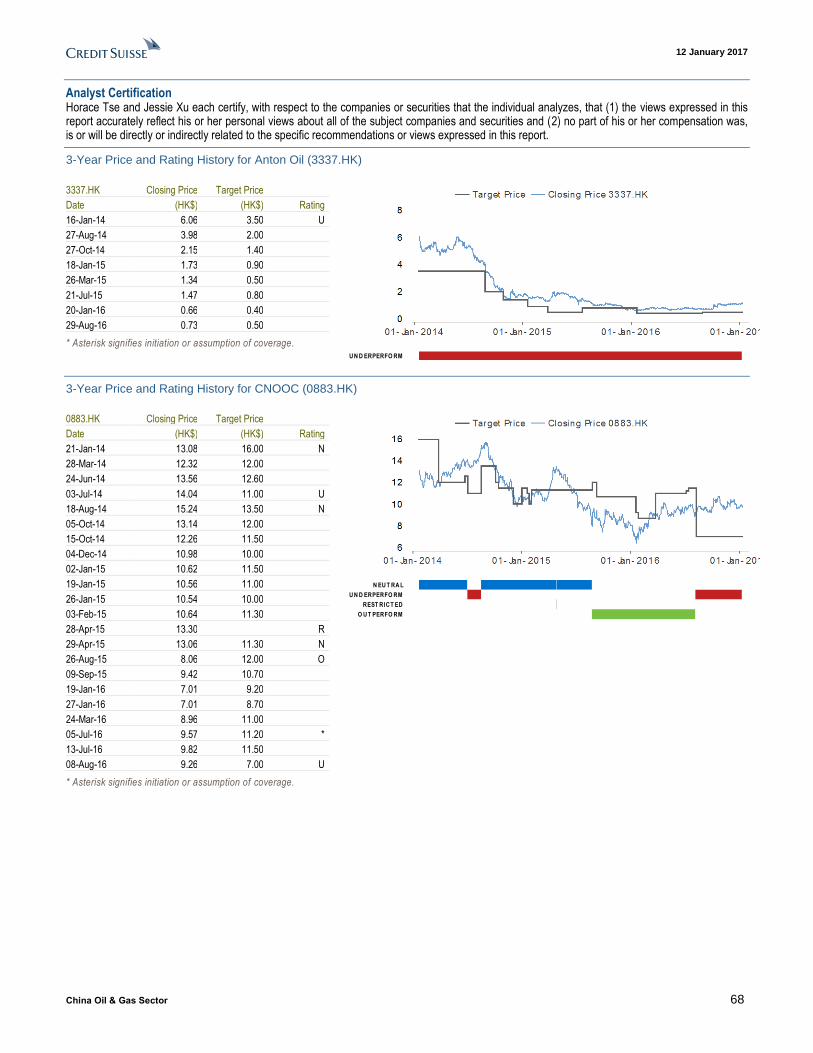
12 January 2017
China Oil & Gas Sector 68
Analyst Certification Horace Tse and Jessie Xu each certify, with respect to the companies or securities that the individual analyzes, that (1) the views expressed in this report accurately reflect his or her personal views about all of the subject companies and securities and (2) no part of his or her compensation was, is or will be directly or indirectly related to the specific recommendations or views expressed in this report.
3-Year Price and Rating History for Anton Oil (3337.HK)
3337.HK Closing Price Target Price
Date (HK$) (HK$) Rating
16-Jan-14 6.06 3.50 U
27-Aug-14 3.98 2.00
27-Oct-14 2.15 1.40
18-Jan-15 1.73 0.90
26-Mar-15 1.34 0.50
21-Jul-15 1.47 0.80
20-Jan-16 0.66 0.40
29-Aug-16 0.73 0.50
* Asterisk signifies initiation or assumption of coverage.
UN D ERPERFO RM
3-Year Price and Rating History for CNOOC (0883.HK)
0883.HK Closing Price Target Price
Date (HK$) (HK$) Rating
21-Jan-14 13.08 16.00 N
28-Mar-14 12.32 12.00
24-Jun-14 13.56 12.60
03-Jul-14 14.04 11.00 U
18-Aug-14 15.24 13.50 N
05-Oct-14 13.14 12.00
15-Oct-14 12.26 11.50
04-Dec-14 10.98 10.00
02-Jan-15 10.62 11.50
19-Jan-15 10.56 11.00
26-Jan-15 10.54 10.00
03-Feb-15 10.64 11.30
28-Apr-15 13.30 R
29-Apr-15 13.06 11.30 N
26-Aug-15 8.06 12.00 O
09-Sep-15 9.42 10.70
19-Jan-16 7.01 9.20
27-Jan-16 7.01 8.70
24-Mar-16 8.96 11.00
05-Jul-16 9.57 11.20 *
13-Jul-16 9.82 11.50
08-Aug-16 9.26 7.00 U
* Asterisk signifies initiation or assumption of coverage.
N EU T RA L
U N D ERPERFO RM
REST RICT ED
O U T PERFO RM
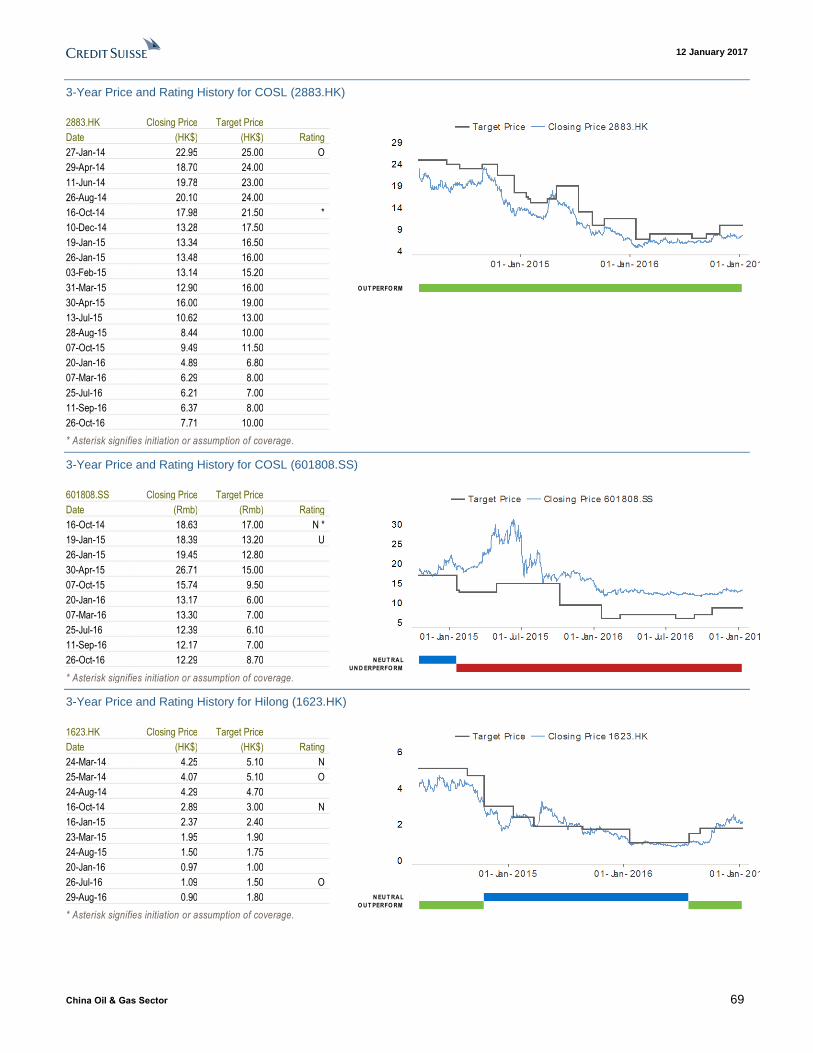
12 January 2017
China Oil & Gas Sector 69
3-Year Price and Rating History for COSL (2883.HK)
2883.HK Closing Price Target Price
Date (HK$) (HK$) Rating
27-Jan-14 22.95 25.00 O
29-Apr-14 18.70 24.00
11-Jun-14 19.78 23.00
26-Aug-14 20.10 24.00
16-Oct-14 17.98 21.50 *
10-Dec-14 13.28 17.50
19-Jan-15 13.34 16.50
26-Jan-15 13.48 16.00
03-Feb-15 13.14 15.20
31-Mar-15 12.90 16.00
30-Apr-15 16.00 19.00
13-Jul-15 10.62 13.00
28-Aug-15 8.44 10.00
07-Oct-15 9.49 11.50
20-Jan-16 4.89 6.80
07-Mar-16 6.29 8.00
25-Jul-16 6.21 7.00
11-Sep-16 6.37 8.00
26-Oct-16 7.71 10.00
* Asterisk signifies initiation or assumption of coverage.
O U T PERFO RM
3-Year Price and Rating History for COSL (601808.SS)
601808.SS Closing Price Target Price
Date (Rmb) (Rmb) Rating
16-Oct-14 18.63 17.00 N *
19-Jan-15 18.39 13.20 U
26-Jan-15 19.45 12.80
30-Apr-15 26.71 15.00
07-Oct-15 15.74 9.50
20-Jan-16 13.17 6.00
07-Mar-16 13.30 7.00
25-Jul-16 12.39 6.10
11-Sep-16 12.17 7.00
26-Oct-16 12.29 8.70
* Asterisk signifies initiation or assumption of coverage.
N EU T RA L
U N D ERPERFO RM
3-Year Price and Rating History for Hilong (1623.HK)
1623.HK Closing Price Target Price
Date (HK$) (HK$) Rating
24-Mar-14 4.25 5.10 N
25-Mar-14 4.07 5.10 O
24-Aug-14 4.29 4.70
16-Oct-14 2.89 3.00 N
16-Jan-15 2.37 2.40
23-Mar-15 1.95 1.90
24-Aug-15 1.50 1.75
20-Jan-16 0.97 1.00
26-Jul-16 1.09 1.50 O
29-Aug-16 0.90 1.80
* Asterisk signifies initiation or assumption of coverage.
N EU T RA L
O U T PERFO RM
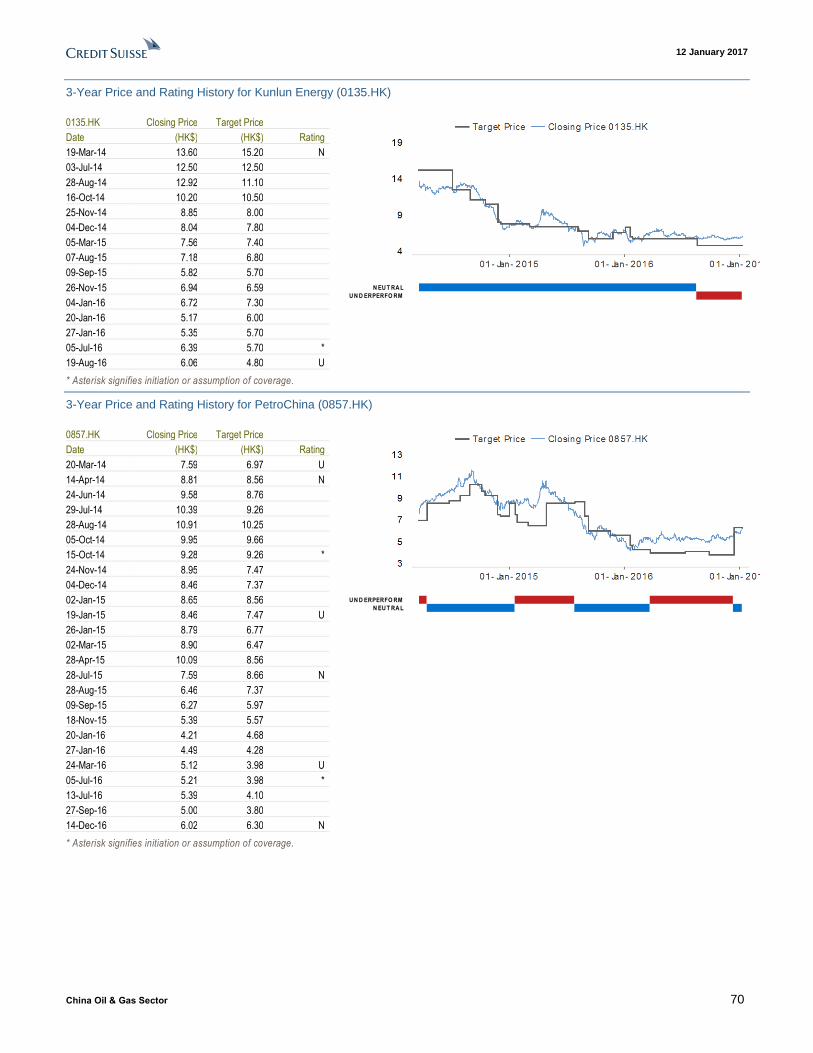
12 January 2017
China Oil & Gas Sector 70
3-Year Price and Rating History for Kunlun Energy (0135.HK)
0135.HK Closing Price Target Price
Date (HK$) (HK$) Rating
19-Mar-14 13.60 15.20 N
03-Jul-14 12.50 12.50
28-Aug-14 12.92 11.10
16-Oct-14 10.20 10.50
25-Nov-14 8.85 8.00
04-Dec-14 8.04 7.80
05-Mar-15 7.56 7.40
07-Aug-15 7.18 6.80
09-Sep-15 5.82 5.70
26-Nov-15 6.94 6.59
04-Jan-16 6.72 7.30
20-Jan-16 5.17 6.00
27-Jan-16 5.35 5.70
05-Jul-16 6.39 5.70 *
19-Aug-16 6.06 4.80 U
* Asterisk signifies initiation or assumption of coverage.
N EU T RA L
U N D ERPERFO RM
3-Year Price and Rating History for PetroChina (0857.HK)
0857.HK Closing Price Target Price
Date (HK$) (HK$) Rating
20-Mar-14 7.59 6.97 U
14-Apr-14 8.81 8.56 N
24-Jun-14 9.58 8.76
29-Jul-14 10.39 9.26
28-Aug-14 10.91 10.25
05-Oct-14 9.95 9.66
15-Oct-14 9.28 9.26 *
24-Nov-14 8.95 7.47
04-Dec-14 8.46 7.37
02-Jan-15 8.65 8.56
19-Jan-15 8.46 7.47 U
26-Jan-15 8.79 6.77
02-Mar-15 8.90 6.47
28-Apr-15 10.09 8.56
28-Jul-15 7.59 8.66 N
28-Aug-15 6.46 7.37
09-Sep-15 6.27 5.97
18-Nov-15 5.39 5.57
20-Jan-16 4.21 4.68
27-Jan-16 4.49 4.28
24-Mar-16 5.12 3.98 U
05-Jul-16 5.21 3.98 *
13-Jul-16 5.39 4.10
27-Sep-16 5.00 3.80
14-Dec-16 6.02 6.30 N
* Asterisk signifies initiation or assumption of coverage.
U N D ERPERFO RM
N EU T RA L
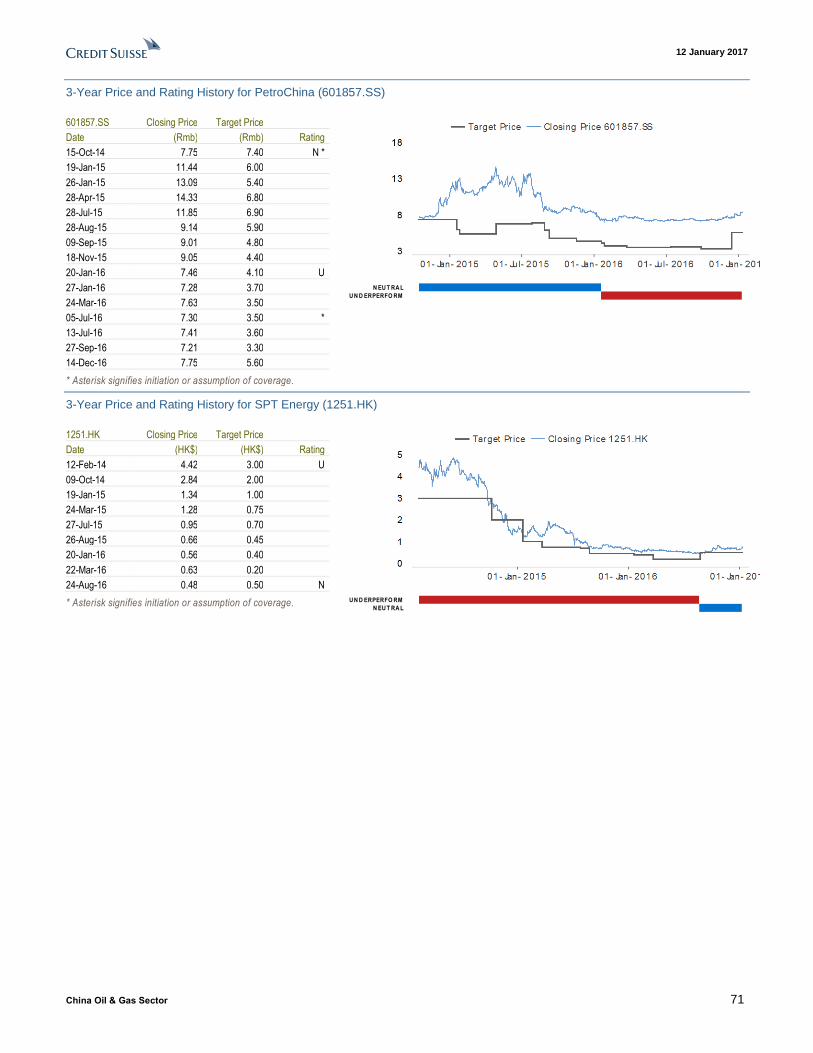
12 January 2017
China Oil & Gas Sector 71
3-Year Price and Rating History for PetroChina (601857.SS)
601857.SS Closing Price Target Price
Date (Rmb) (Rmb) Rating
15-Oct-14 7.75 7.40 N *
19-Jan-15 11.44 6.00
26-Jan-15 13.09 5.40
28-Apr-15 14.33 6.80
28-Jul-15 11.85 6.90
28-Aug-15 9.14 5.90
09-Sep-15 9.01 4.80
18-Nov-15 9.05 4.40
20-Jan-16 7.46 4.10 U
27-Jan-16 7.28 3.70
24-Mar-16 7.63 3.50
05-Jul-16 7.30 3.50 *
13-Jul-16 7.41 3.60
27-Sep-16 7.21 3.30
14-Dec-16 7.75 5.60
* Asterisk signifies initiation or assumption of coverage.
N EU T RA L
U N D ERPERFO RM
3-Year Price and Rating History for SPT Energy (1251.HK)
1251.HK Closing Price Target Price
Date (HK$) (HK$) Rating
12-Feb-14 4.42 3.00 U
09-Oct-14 2.84 2.00
19-Jan-15 1.34 1.00
24-Mar-15 1.28 0.75
27-Jul-15 0.95 0.70
26-Aug-15 0.66 0.45
20-Jan-16 0.56 0.40
22-Mar-16 0.63 0.20
24-Aug-16 0.48 0.50 N
* Asterisk signifies initiation or assumption of coverage.
U N D ERPERFO RM
N EU T RA L
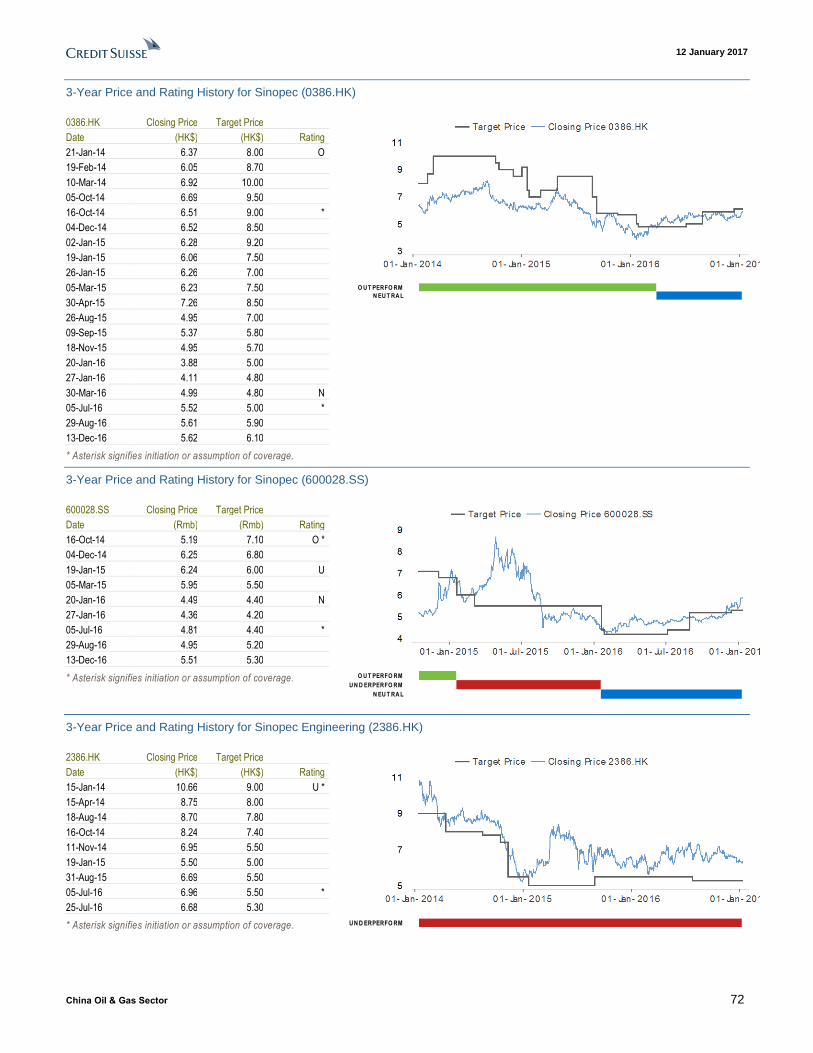
12 January 2017
China Oil & Gas Sector 72
3-Year Price and Rating History for Sinopec (0386.HK)
0386.HK Closing Price Target Price
Date (HK$) (HK$) Rating
21-Jan-14 6.37 8.00 O
19-Feb-14 6.05 8.70
10-Mar-14 6.92 10.00
05-Oct-14 6.69 9.50
16-Oct-14 6.51 9.00 *
04-Dec-14 6.52 8.50
02-Jan-15 6.28 9.20
19-Jan-15 6.06 7.50
26-Jan-15 6.26 7.00
05-Mar-15 6.23 7.50
30-Apr-15 7.26 8.50
26-Aug-15 4.95 7.00
09-Sep-15 5.37 5.80
18-Nov-15 4.95 5.70
20-Jan-16 3.88 5.00
27-Jan-16 4.11 4.80
30-Mar-16 4.99 4.80 N
05-Jul-16 5.52 5.00 *
29-Aug-16 5.61 5.90
13-Dec-16 5.62 6.10
* Asterisk signifies initiation or assumption of coverage.
O U T PERFO RM
N EU T RA L
3-Year Price and Rating History for Sinopec (600028.SS)
600028.SS Closing Price Target Price
Date (Rmb) (Rmb) Rating
16-Oct-14 5.19 7.10 O *
04-Dec-14 6.25 6.80
19-Jan-15 6.24 6.00 U
05-Mar-15 5.95 5.50
20-Jan-16 4.49 4.40 N
27-Jan-16 4.36 4.20
05-Jul-16 4.81 4.40 *
29-Aug-16 4.95 5.20
13-Dec-16 5.51 5.30
* Asterisk signifies initiation or assumption of coverage.
O U T PERFO RM
U N D ERPERFO RM
N EU T RA L
3-Year Price and Rating History for Sinopec Engineering (2386.HK)
2386.HK Closing Price Target Price
Date (HK$) (HK$) Rating
15-Jan-14 10.66 9.00 U *
15-Apr-14 8.75 8.00
18-Aug-14 8.70 7.80
16-Oct-14 8.24 7.40
11-Nov-14 6.95 5.50
19-Jan-15 5.50 5.00
31-Aug-15 6.69 5.50
05-Jul-16 6.96 5.50 *
25-Jul-16 6.68 5.30
* Asterisk signifies initiation or assumption of coverage.
UN D ERPERFO RM
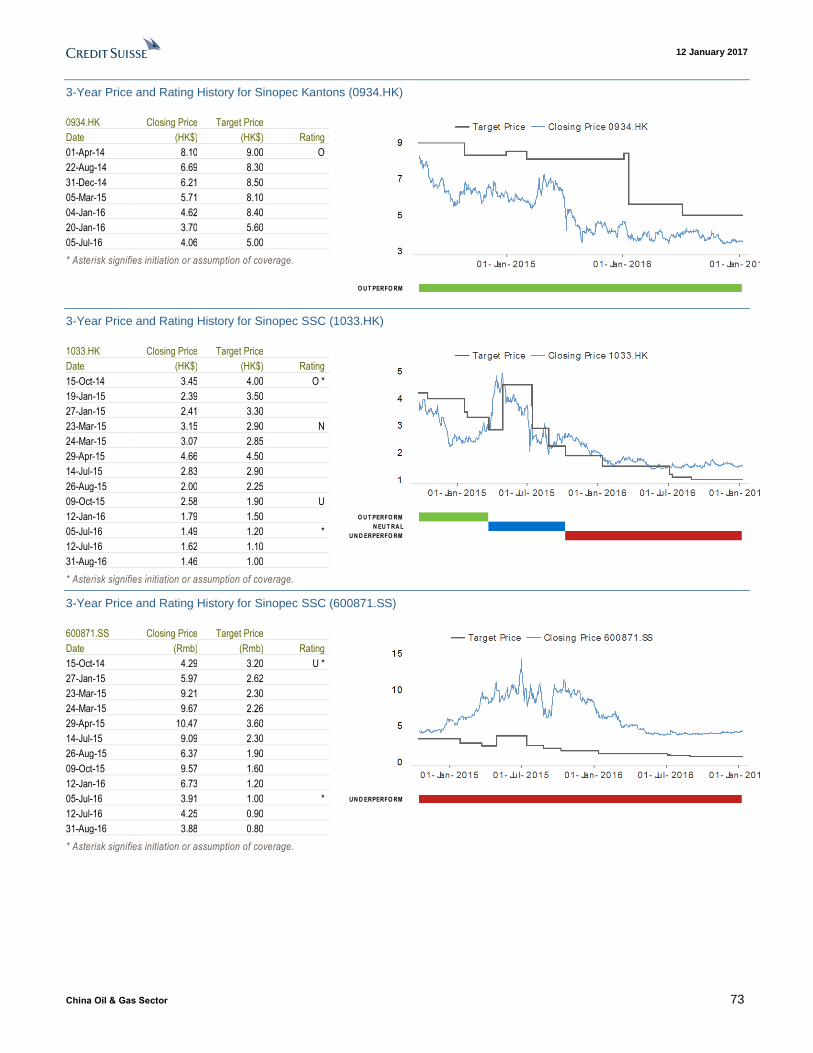
12 January 2017
China Oil & Gas Sector 73
3-Year Price and Rating History for Sinopec Kantons (0934.HK)
0934.HK Closing Price Target Price
Date (HK$) (HK$) Rating
01-Apr-14 8.10 9.00 O
22-Aug-14 6.69 8.30
31-Dec-14 6.21 8.50
05-Mar-15 5.71 8.10
04-Jan-16 4.62 8.40
20-Jan-16 3.70 5.60
05-Jul-16 4.06 5.00
* Asterisk signifies initiation or assumption of coverage.
O U T PERFO RM
3-Year Price and Rating History for Sinopec SSC (1033.HK)
1033.HK Closing Price Target Price
Date (HK$) (HK$) Rating
15-Oct-14 3.45 4.00 O *
19-Jan-15 2.39 3.50
27-Jan-15 2.41 3.30
23-Mar-15 3.15 2.90 N
24-Mar-15 3.07 2.85
29-Apr-15 4.66 4.50
14-Jul-15 2.83 2.90
26-Aug-15 2.00 2.25
09-Oct-15 2.58 1.90 U
12-Jan-16 1.79 1.50
05-Jul-16 1.49 1.20 *
12-Jul-16 1.62 1.10
31-Aug-16 1.46 1.00
* Asterisk signifies initiation or assumption of coverage.
O U T PERFO RM
N EU T RA L
U N D ERPERFO RM
3-Year Price and Rating History for Sinopec SSC (600871.SS)
600871.SS Closing Price Target Price
Date (Rmb) (Rmb) Rating
15-Oct-14 4.29 3.20 U *
27-Jan-15 5.97 2.62
23-Mar-15 9.21 2.30
24-Mar-15 9.67 2.26
29-Apr-15 10.47 3.60
14-Jul-15 9.09 2.30
26-Aug-15 6.37 1.90
09-Oct-15 9.57 1.60
12-Jan-16 6.73 1.20
05-Jul-16 3.91 1.00 *
12-Jul-16 4.25 0.90
31-Aug-16 3.88 0.80
* Asterisk signifies initiation or assumption of coverage.
UN D ERPERFO RM
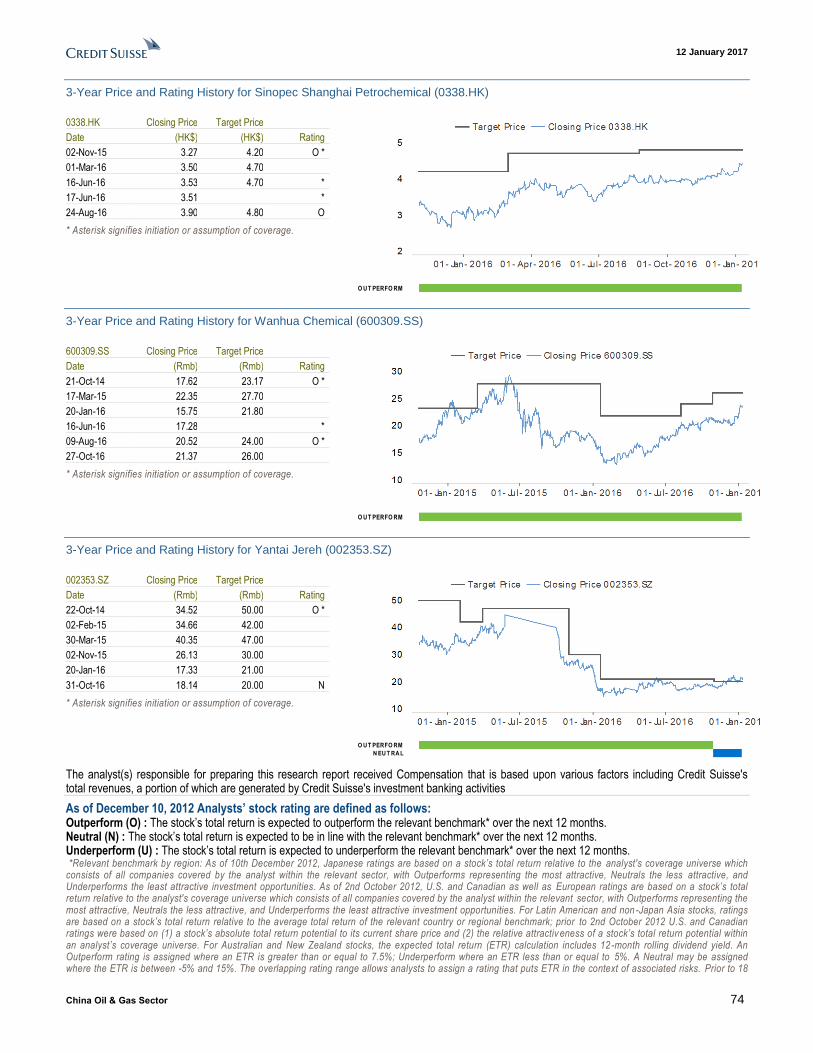
12 January 2017
China Oil & Gas Sector 74
3-Year Price and Rating History for Sinopec Shanghai Petrochemical (0338.HK)
0338.HK Closing Price Target Price
Date (HK$) (HK$) Rating
02-Nov-15 3.27 4.20 O *
01-Mar-16 3.50 4.70
16-Jun-16 3.53 4.70 *
17-Jun-16 3.51 *
24-Aug-16 3.90 4.80 O
* Asterisk signifies initiation or assumption of coverage.
O U T PERFO RM
3-Year Price and Rating History for Wanhua Chemical (600309.SS)
600309.SS Closing Price Target Price
Date (Rmb) (Rmb) Rating
21-Oct-14 17.62 23.17 O *
17-Mar-15 22.35 27.70
20-Jan-16 15.75 21.80
16-Jun-16 17.28 *
09-Aug-16 20.52 24.00 O *
27-Oct-16 21.37 26.00
* Asterisk signifies initiation or assumption of coverage.
O U T PERFO RM
3-Year Price and Rating History for Yantai Jereh (002353.SZ)
002353.SZ Closing Price Target Price
Date (Rmb) (Rmb) Rating
22-Oct-14 34.52 50.00 O *
02-Feb-15 34.66 42.00
30-Mar-15 40.35 47.00
02-Nov-15 26.13 30.00
20-Jan-16 17.33 21.00
31-Oct-16 18.14 20.00 N
* Asterisk signifies initiation or assumption of coverage.
O U T PERFO RM
N EU T RA L
The analyst(s) responsible for preparing this research report received Compensation that is based upon various factors including Credit Suisse's total revenues, a portion of which are generated by Credit Suisse's investment banking activities
As of December 10, 2012 Analysts’ stock rating are defined as follows: Outperform (O) : The stock’s total return is expected to outperform the relevant benchmark* over the next 12 months. Neutral (N) : The stock’s total return is expected to be in line with the relevant benchmark* over the next 12 months. Underperform (U) : The stock’s total return is expected to underperform the relevant benchmark* over the next 12 months. *Relevant benchmark by region: As of 10th December 2012, Japanese ratings are based on a stock’s total return relative to the analyst's coverage universe which consists of all companies covered by the analyst within the relevant sector, with Outperforms representing the most attractive, Neutrals the less attractive, and Underperforms the least attractive investment opportunities. As of 2nd October 2012, U.S. and Canadian as well as European ratings are based on a stock’s total return relative to the analyst's coverage universe which consists of all companies covered by the analyst within the relevant sector, with Outperforms representing the most attractive, Neutrals the less attractive, and Underperforms the least attractive investment opportunities. For Latin American and non -Japan Asia stocks, ratings are based on a stock’s total return relative to the average total return of the relevant country or regional benchmark; prior to 2nd October 2012 U.S. and Canadian ratings were based on (1) a stock’s absolute total return potential to its current share price and (2) the relative attractiv eness of a stock’s total return potential within an analyst’s coverage universe. For Australian and New Zealand stocks, the expected total return (ETR) calculation includes 12-month rolling dividend yield. An Outperform rating is assigned where an ETR is greater than or equal to 7.5%; Underperform where an ETR less than or equal to 5%. A Neutral may be assigned where the ETR is between -5% and 15%. The overlapping rating range allows analysts to assign a rating that puts ETR in the context of associated risks. Prior to 18

12 January 2017
China Oil & Gas Sector 75
May 2015, ETR ranges for Outperform and Underperform ratings did not overlap with Neutral thresholds between 15% and 7.5%, which was in operation from 7 July 2011. Restricted (R) : In certain circumstances, Credit Suisse policy and/or applicable law and regulations preclude certain types of communications, including an investment recommendation, during the course of Credit Suisse's engagement in an investment banking transaction and in certain other circumstances. Not Rated (NR) : Credit Suisse Equity Research does not have an investment rating or view on the stock or any other securities related to the company at this time. Not Covered (NC) : Credit Suisse Equity Research does not provide ongoing coverage of the company or offer an investment rating or investment view on the equity security of the company or related products.
Volatility Indicator [V] : A stock is defined as volatile if the stock price has moved up or down by 20% or more in a month in at least 8 of the past 24 months or the analyst expects significant volatility going forward.
Analysts’ sector weightings are distinct from analysts’ stock ratings and are based on the analyst’s expectations for the fundamentals and/or valuation of the sector* relative to the group’s historic fundamentals and/or valuation: Overweight : The analyst’s expectation for the sector’s fundamentals and/or valuation is favorable over the next 12 months. Market Weight : The analyst’s expectation for the sector’s fundamentals and/or valuation is neutral over the next 12 months. Underweight : The analyst’s expectation for the sector’s fundamentals and/or valuation is cautious over the next 12 months. *An analyst’s coverage sector consists of all companies covered by the analyst within the relevant sector. An analyst may cover multiple sectors.
Credit Suisse's distribution of stock ratings (and banking clients) is:
Global Ratings Distribution
Rating Versus universe (%) Of which banking clients (%) Outperform/Buy* 45% (64% banking clients) Neutral/Hold* 38% (59% banking clients) Underperform/Sell* 15% (54% banking clients) Restricted 3% *For purposes of the NYSE and NASD ratings distribution disclosure requirements, our stock ratings of Outperform, Neutral, and Underperform mo st closely correspond to Buy, Hold, and Sell, respectively; however, the meanings are not the same, as our stock ratings are determined on a relative basis. (Please refer to definitions above.) An investor's decision to buy or sell a security should be based on investment objectives, current holdin gs, and other individual factors.
Important Global Disclosures Credit Suisse’s research reports are made available to clients through our proprietary research portal on CS PLUS. Credit Suisse research products may also be made available through third-party vendors or alternate electronic means as a convenience. Certain research products are only made available through CS PLUS. The services provided by Credit Suisse’s analysts to clients may depend on a specific client’s preferences regarding the frequency and manner of receiving communications, the client’s risk profile and investment, the size and scope of the overall client relationship with the Firm, as well as legal and regulatory constraints. To access all of Credit Suisse’s research that you are entitled to receive in the most timely manner, please contact your sales representative or go to https://plus.credit-suisse.com . Credit Suisse’s policy is to update research reports as it deems appropriate, based on developments with the subject company, the sector or the market that may have a material impact on the research views or opinions stated herein. Credit Suisse's policy is only to publish investment research that is impartial, independent, clear, fair and not misleading. For more detail please refer to Credit Suisse's Policies for Managing Conflicts of Interest in connection with Investment Research: http://www.csfb.com/research-and-analytics/disclaimer/managing_conflicts_disclaimer.html . Credit Suisse's policy is only to publish investment research that is impartial, independent, clear, fair and not misleading. For more detail please refer to Credit Suisse's Policies for Managing Conflicts of Interest in connection with Investment Research:
Target Price and Rating Valuation Methodology and Risks: (12 months) for Anton Oil (3337.HK)
Method: Our HK$1.1/share target price for Anton Oilfield Services Ltd (Anton Oil) is based on 1.3x 2017E P/B, 1STD below its own historical average. We rate Anton Oil NEUTRAL on (1) the removal of near-term overhang, (2) improved domestic OFS sector outlook, and (3) fair valuation.
Risk: Risks to our HK$1.1/share target price and NEUTRAL rating for Anton Oilfield Services Group (Anton Oil) include: (1) Anti-corruption investigations surrounding the oil sector in China dragging on order momentum for Anton; (2) slower capex spend from international oil companies in 2017 and beyond given sharp correction in oil price, dragging on earnings growth in the next 2-3 years; (3) market share loss to competitors; and (4) order delays or cancellations.
Target Price and Rating Valuation Methodology and Risks: (12 months) for CNOOC (0883.HK)
Method: Our target price of HK$12.8/share for China National Offshore Oil Corp (CNOOC) is DCF (discounted cash flow)-based, using a WACC (weighted average cost of capital) of 8%, perpetual growth rate of 2% and long-term oil price of US$65/bbl.. We rate CNOOC as OUTPERFORM because CNOOC has thus far demonstrated faster response to the current downturn by scaling back on both capex and costs, which will protect the company over the downcycle and position it well for any potential oil price recovery.
12 January 2017
China Oil & Gas Sector 76
Risk: Risks to our target price of HK$12.8/share for China National Offshore Oil Corp (CNOOC) and OUTPERFORM rating is sustained weak oil prices. The political uncertainty in the Middle East (Iraq, Libya), concerns on Europe's debt crisis and the global economic recovery also pose risks to our oil price assumption and overall equity market.
Target Price and Rating Valuation Methodology and Risks: (12 months) for COSL (2883.HK)
Method: Our target price of HK$9.0/share for China Oilfield Services Ltd (COSL) - H is based on a target multiple of 1.1x 2017E P/B, below COSL's historical P/B trading range. COSL has a strong balance sheet relative to its peers which is critical during the current downcycle, hence we continue to rate the stock OUTPERFORM.
Risk: Risks to our HK$9.0/share target price and OUTPERFORM rating for China Oilfield Services Ltd (COSL) - H include capex reduction by global oil companies given continued oil price correction. A reduction in upstream capex means that COSL's revenue could decrease from our base case. In addition, a cutback in upstream capex spend could mean that global rig demand comes down, which in turn affects global rig dayrates.
Target Price and Rating Valuation Methodology and Risks: (12 months) for COSL (601808.SS)
Method: Our Rmb8.5/share target price for China Oilfield Services Ltd (COSL) - A is converted from our target price for China Oilfield Services Ltd H (HK$9.0/share) using CNY/HKD exchange rate assumption of 7.33. Our HK$9.0/share target price for China Oilfield Services Ltd H is derived from applying a 1.1x 2017E P/B target multiple, which is below COSL's historical P/B trading range. We believe the valuation of COSL - A is too expensive trading at around 90% premium to COSL - H, hence we continue to rate the stock UNDERPERFORM.
Risk: Risks to our Rmb8.5/share target price and UNDERPERFORM rating for China Oilfield Services Ltd (COSL) - A include a higher oil price environment vs CS expectations, which could lead to capex recovery from oil companies.
Target Price and Rating Valuation Methodology and Risks: (12 months) for Hilong (1623.HK)
Method: Our HK$2.5/share target price for Hilong Holdings Ltd (Hilong) is based on 1.2x 2017E P/B, in-line with its five-year historical average. We rate Hilong an OUTPERFORM, as Hilong's valuation discount vs peers Anton/SPT (at 1.1-1.2x) is unjustified given its earnings quality plus balance sheet strength (lowest gearing).
Risk: Risks to our HK$2.5/share target price and OUTPERFORM rating for Hilong Holdings Ltd (Hilong) include: (1) anti-corruption investigations surrounding the oil sector in China dragging on order momentum for Hilong; (2) slower capex spend from international oil companies in 2015 and beyond given sharp correction in oil price, dragging on Hilong's earnings growth in the next 2-3 years; (3) market share loss to competitors like National Oilwell Varco (NOV); and (4) order delays or cancellations.
Target Price and Rating Valuation Methodology and Risks: (12 months) for Kunlun Energy (0135.HK)
Method: We use a SOTP (sum-of-the-parts) valuation for Kunlun's target price of HK$4.9. Valuations for the E&P business, LNG refuelling/processing and Pipeline business were derived from a DCF (discounted cash flow) model, with a discount rate of 8.1% and terminal growth rate of 2%. City gas distribution business is valued at 10x 2017E P/E (price-to-earnings). LNG terminals are valued at 1x 2017E P/B. Our TP also incorporated Kunlun Gas acquisition which we assumed to be fully funded through debt. We rate Kunlun UNDERPERFORM on: (1) Operational divergence vs peers; (2) Potential E&P impairment; (3) uncertainty on S-J Pipeline transmission tariff on current gas tariff consultation.
Risk: Risks that could impede achievement of our HK$4.9 target price and our investment rating of UNDERPERFORM for Kunlun Energy include: (1) an unexpected transmission tariff increase; (2) better-than-expected gas consumption growth in China; and (3) a much faster adoption of liquefied natural gas (LNG) fuels and sharp decline in gas input cost that would boost LNG fuel business.
Target Price and Rating Valuation Methodology and Risks: (12 months) for PetroChina (0857.HK)
Method: Our HK$7.0/share target price for PetroChina – H is based on our sum-of-the-parts (SoTP) valuation. We value PetroChina’s exploration
and production business using DCF (discounted cash flow) at a 8% discount rate, 2% perpetual growth rate and a long-term crude oil price of US$65/bbl. We value the refining at 4x EV/EBITDA and chemical at 4x EV/EBITDA. We value the marketing business at 3x EV/EBITDA (enterprise value-to-earnings before interest, tax, depreciation and amortisation). We value Pipeline at Rmb960 bn, as an read-through from Sinopec pipeline transaction.. We rate PetroChina NEUTRAL because of (1) concerns on natural gas business outlook, and (2) share price is fair valued.
Risk: Key risks to our HK$7.0 share target price for PetroChina and our NEUTRAL investment call include a higher-than-expected oil price and an unexpected uptick in the chemical market. Plus, a faster-than-expected pace of the natural gas price reform roll-out would also pose upside risk to our forecasts.

12 January 2017
China Oil & Gas Sector 77
Target Price and Rating Valuation Methodology and Risks: (12 months) for PetroChina (601857.SS)
Method: Our Rmb6.6/share target price for PetroChina-A is converted from our target price for PetroChina-H (HK$7.0) using the forward CNY/USD exchange rate of 7.33 from CS FX Research. Our HK$7.0/share target price for PetroChina is based on our sum-of-the-parts (SoTP) valuation. We value PetroChina’s exploration and production business using DCF (discounted cash flow) at a 8% discount rate, 2% perpetual growth rate and a long-term crude oil price of US$65/bbl. We value the refining at 4x EV/EBITDA and chemical at 4x EV/EBITDA. We value the marketing business at 3x EV/EBITDA (enterprise value-to-earnings before interest, tax, depreciation and amortisation). We value Pipeline at Rmb960 bn, as an read-through from Sinopec pipeline transaction. We rate PetroChina (A) as UNDERPERFORM because of (1) concerns on natural gas business outlook, and (2) A-share valuation is stretched with 51% premium to H-share.
Risk: Key risks to our Rmb6.6/share target price for PetroChina-A and our UNDERPERFORM investment call include a higher-than-expected oil price and an unexpected uptick in the chemical market. Plus, a faster-than-expected pace of the natural gas price reform roll-out would also pose upside risk to our forecasts.
Target Price and Rating Valuation Methodology and Risks: (12 months) for SPT Energy (1251.HK)
Method: Our HK$0.8/share target price for SPT Energy Group Inc. (SPT Energy) is based on a 1.1x 2017E P/B (price-to-book value). This is in line with the target multiple we apply to SPT Energy's independent OFS peers in China like COSL. We rate SPT Energy NEUTRAL for (1) the company is moving toward the right direction – cost control; (2) the bankruptcy risk or concerns on working capital turnover have ease off significantly; and (3) we believe valuation is fair trading around 1.1x P/B.
Risk: Risks to our HK$0.8/share target price and NEUTRAL rating for SPT Energy Group Inc. (SPT Energy) include: (1) significant fluctuation in Kazakhstan Tenge (KZY) after moving to free-float effective 20 August 2015, given close to 50% of its revenue is generated from Kazakhstan; (2) a sharp decline or fluctuation of oil price; and (3) policies announced by the Chinese government that discourage shale capex investment by oil companies.
Target Price and Rating Valuation Methodology and Risks: (12 months) for Sinopec (0386.HK)
Method: Our target price of HK$7.3/share for Sinopec - H (China Petroleum & Chemical Corp) is based on our sum-of-the-parts (SoTP) valuation. We value Sinopec's Exploration & Production business with DCF (discounted cash flow) and an 8% discount rate, 2% perpetual growth rate and long-term crude oil price of US$65/bbl.. We value Sinopec's downstream businesses on valuation multiples: the refining business at 7x EV/EBITDA , chemicals at 6x EV/EBITDA and marketing business at Rmb357 bn, marking to market following 30% sell-down. Our OUTPERFORM rating is based on the rationale that (1) upstream to recover from rising crude oil prices, and (2) Sinopec has a large exposure to downstream business which offers stable earnings.
Risk: Risks that could impede achievement of our HK$7.3/share target price for Sinopec - H (China Petroleum & Chemical Corp) and our OUTPERFORM rating include: (1) A slowdown in the Chinese economy dragging on domestic oil demand and petrochemical demand. Sinopec as the largest downstream manufacturer in China would be impacted. (2) A sharp correction in oil price.
Target Price and Rating Valuation Methodology and Risks: (12 months) for Sinopec (600028.SS)
Method: Our target price of Rmb6.9/share for Sinopec - A (China Petroleum & Chemical Corp) is based on our sum-of-the-parts (SoTP) valuation. We value Sinopec's Exploration & Production business with DCF (discounted cash flow) and an 8% discount rate, 2% perpetual growth rate and long-term crude oil price of US$65/bbl.. We value Sinopec's downstream businesses on valuation multiples: the refining business at 7x EV/EBITDA , chemicals at 6x EV/EBITDA and marketing business at Rmb357bn, marking to market following 30% sell-down. Our OUTPERFORM rating is based on the rationale that (1) upstream to recover from rising crude oil prices, and (2) Sinopec has a large exposure to downstream business which offers stable earnings.
Risk: Risks that could impede achievement of our Rmb6.9/share target price for Sinopec - A (China Petroleum & Chemical Corp) and our OUTPERFORM rating include: (1) A slowdown in the Chinese economy dragging on domestic oil demand and petrochemical demand. Sinopec as the largest downstream manufacturer in China would be impacted. (2) A sharp correction in oil price.
Target Price and Rating Valuation Methodology and Risks: (12 months) for Sinopec Engineering (2386.HK)
Method: Our HK$5.3/shr target price for Sinopec Engineering (Group) Co Ltd is based on 0.8x 2017E P/B (price-to-book), in line with China infrastructure EPC peers. Our UNDERPERFORM rating is based on (1) limited capacity expansion from both domestic and international players on traditional refining and petrochemical and (2) domestic coal chemical projects could see further delays on lower oil price and increasing regulatory scrutiny.
Risk: Upside risks to our HK$5.3/shr target price and UNDERPERFORM rating for Sinopec Engineering (Group) Co Ltd (SEG) and our UNDERPERFORM investment call include: (1) government policy over CTC (coal-to-chemical) projects changing from “encouraging
12 January 2017
China Oil & Gas Sector 78
demonstrative projects” to “encouraging large-scale roll out”; (2) SEG showing higher-than-expected competitiveness in both domestic and international markets; and (3) Sinopec's capex for downstream increases.
Target Price and Rating Valuation Methodology and Risks: (12 months) for Sinopec Kantons (0934.HK)
Method: Our target price of HK$5.1 for Sinopec Kantons Holdings Ltd based on 9.5x 2017E P/E, in line with its own historical average since de-rated in mid-2015. We maintain OUTPERFORM rating, as (1) it will benefit from rising crude oil imports to China, (2) Yu-Ji pipeline is set to recover from the bottom in 2016, and (3) severely under-valued.
Risk: Risks that may impede achievement of our target price of HK$5.1 for Sinopec Kantons Holdings Ltd and our OUTPERFORM investment rating include delays of refinery expansion at Sinopec, greater-than-expected capex for its previous acquired assets, delays of its assets commencing operation and slow ramp up of transmission volume of the Yu-Ji pipeline due to weak demand. The domestic macro environment and unforeseen increases in domestic oil production also present risks.
Target Price and Rating Valuation Methodology and Risks: (12 months) for Sinopec SSC (1033.HK)
Method: Our HK$1.0 target price for Sinopec SSC - H is based on 0.8x 2017E P/B. It is much bigger than independent OFSs in both scale and scope. SSC's business encompasses the entire life cycle of oil & gas production, whereas independent OFSs provide technical support to only a certain a section of a drilling cycle (mostly in well completion and down-hole operation). Therefore, we think SOSC's closest peers are integrated oilfield service providers—US Land Drillers. Our UNDERPERFORM rating is based on the view of potentially continued
upstream capex cut from upstream players, especially Sinopec, in view of the depressed oil price.
Risk: Risks to our HK$1.0 target price and UNDERPERFORM rating for Sinopec SSC - H include: Sharp rebound of oil and gas price; sharp increase of Sinopec's upstream capex; Sinopec's shale gas development disturbed by either technical or other challenges; worse-than-expected margins from overseas projects.
Target Price and Rating Valuation Methodology and Risks: (12 months) for Sinopec SSC (600871.SS)
Method: Our Rmb0.8 target price for Sinopec SSC - A is based on 0.6x 2016E P/B in line the US land drillers. It is much bigger than independent OFSs in both scale and scope. SSC's business encompasses the entire life cycle of oil & gas production, whereas independent OFSs provide technical support to only a certain a section of a drilling cycle (mostly in well completion and down-hole operation). Therefore, we think SOSC's closest peers are integrated oilfield service providers—US Land Drillers. Our UNDERPERFORM rating is based on the view
of potentially continued upstream capex cut from upstream players, especially Sinopec, in view of the depressed oil price.
Risk: Risks that could impede achievement of our Rmb0.8 target price and UNDERPERFORM rating for Sinopec SSC - A include: Sharp rebound of oil and gas price; sharp increase of Sinopec's upstream capex; Sinopec's shale gas development disturbed by either technical or other challenges; worse-than-expected margins from overseas projects.
Target Price and Rating Valuation Methodology and Risks: (12 months) for Sinopec Shanghai Petrochemical (0338.HK)
Method: Our target price of HK$5.50 for Sinopec Shanghai Petrochemical-H (SPC-H) is based on discounted cash flow method. Key assumptions include 1% terminal growth rate, 8% cost of capital (based on 5% cost of debt, 2.5% risk-free rate and 5.5% equity risk premium). With governance reform in place, SPC offers a unique scope of bold shareholder distribution in coming years, given massive decline in capex, relative to its cash flow, amid revitalised GRM dynamics in China as well as a solid consumer commodity chemical cycle. We maintain our OUTPERFORM rating.
Risk: Risks that could impede achievement of our target price of HK$5.50 and OUTPERFORM rating for Sinopec Shanghai Petrochemical include: (1) high and/or volatile oil price; (2) performance is highly susceptible to governmental policy development; (3) execution delay of fuel standard upgrade project; (4) significant slowdown in China's economic growth; (5) dilutive asset injection.
Target Price and Rating Valuation Methodology and Risks: (12 months) for Wanhua Chemical (600309.SS)
Method: Our target price of Rmb28.4 for Wanhua Chemical Group is based on discounted cash flow method. Key assumptions include 1% terminal growth rate, 9.2% cost of capital (based on 5% cost of debt, 2.7% risk-free rate and 6.5% equity risk premium). Our target price implies 15x2017E P/E. Wanhua remains a quality growth story in a seller's market, given its growing share in high-margin products, along with continued integration/diversification within polyurethane chain. We maintain our OUTPERFORM rating.
Risk: Key risks to our TP of Rmb28.4 and current rating for Wanhua Chemical Group include: (1) failure to ramp up production of new expansion; (2) lower-than-expected demand growth from PU in China; (3) significant surge of raw material costs; and (4) rising net gearing ratio.
Target Price and Rating Valuation Methodology and Risks: (12 months) for Yantai Jereh (002353.SZ)
12 January 2017
China Oil & Gas Sector 79
Method: Our Rmb21.0/share target price for Yantai Jereh Oilfield Services (Jereh) is based on 2.5x 2017 P/B, which is below its historical P/B average since its IPO in 2010. The stock has been trading at a premium to its HK-listed independent OFS peers in the past given its dominant market share. We rate Jereh NEUTRAL, as we believe the company's strong balance sheet position will enable it to benefit from the industry downturn, taking on potential M&A opportunities that emerges through distressed sale, while on the other side, the recovery seems to be slower than peers and the uncertainty on new contract recognition is also a concern.
Risk: Risks to our Rmb21.0/share target price and NEUTRAL rating for Yantai Jereh Oilfield Services (Jereh) include: (1) A sharp correction in oil and gas prices which would reduce cash flows and capex spend. Jereh’s growth outlook could be drastically reduced in such a scenario given some of the resources will be rendered non-economical. (2) Competition from both domestic players (Kingdream) and international players (Schlumberger, Halliburton etc) are a threat to Jereh. Such pressure could drive ASPs down and affect Jereh’s revenue and margin.
Please refer to the firm's disclosure website at https://rave.credit-suisse.com/disclosures for the definitions of abbreviations typically used in the target price method and risk sections.
See the Companies Mentioned section for full company names The subject company (0338.HK, 0386.HK, 0857.HK, 0883.HK, 1033.HK, 2386.HK, 2883.HK, 600028.SS, 600871.SS, 601808.SS, 601857.SS) currently is, or was during the 12-month period preceding the date of distribution of this report, a client of Credit Suisse. Credit Suisse expects to receive or intends to seek investment banking related compensation from the subject company (002353.SZ, 0338.HK, 0386.HK, 0857.HK, 0883.HK, 0934.HK, 1033.HK, 1251.HK, 2386.HK, 2883.HK, 3337.HK, 600028.SS, 600871.SS, 601808.SS, 601857.SS) within the next 3 months. Please visit https://credit-suisse.com/in/researchdisclosure for additional disclosures mandated vide Securities And Exchange Board of India (Research Analysts) Regulations, 2014 Credit Suisse may have interest in (BPCL.BO, HPCL.BO, IOC.BO, RELI.BO, ONGC.BO, OILI.NS) As of the end of the preceding month, Credit Suisse beneficially own 1% or more of a class of common equity securities of (0386.HK, 0857.HK). Credit Suisse has a material conflict of interest with the subject company (0857.HK) . Any Nielsen Media Research material contained in this report represents Nielsen Media Research's estimates and does not represent facts. NMR has neither reviewed nor approved this report and/or any of the statements made herein. Credit Suisse is engaged as Financial Advisor to Shanghai Yiguo E-commerce Co., Ltd. for the purchase of shares in Lianhua Supermarket Holdings Co., Ltd. (0980.HK) from Yonghui Superstores Co., Ltd.
For date and time of production, dissemination and history of recommendation for the subject company(ies) featured in this report, disseminated within the past 12 months, please refer to the link: https://rave.credit-suisse.com/disclosures/view/report?i=277503&v=6jom7zycrv4hsy9syl21ed6ut .
Important Regional Disclosures Singapore recipients should contact Credit Suisse AG, Singapore Branch for any matters arising from this research report. The analyst(s) involved in the preparation of this report may participate in events hosted by the subject company, including site visits. Credit Suisse does not accept or permit analysts to accept payment or reimbursement for travel expenses associated with these events. Restrictions on certain Canadian securities are indicated by the following abbreviations: NVS--Non-Voting shares; RVS--Restricted Voting Shares; SVS--Subordinate Voting Shares. Individuals receiving this report from a Canadian investment dealer that is not affiliated with Credit Suisse should be advised that this report may not contain regulatory disclosures the non-affiliated Canadian investment dealer would be required to make if this were its own report. For Credit Suisse Securities (Canada), Inc.'s policies and procedures regarding the dissemination of equity research, please visit https://www.credit-suisse.com/sites/disclaimers-ib/en/canada-research-policy.html. Credit Suisse has acted as lead manager or syndicate member in a public offering of securities for the subject company (0135.HK, 0857.HK, 0883.HK, 2883.HK, 601808.SS, 601857.SS) within the past 3 years. Principal is not guaranteed in the case of equities because equity prices are variable. Commission is the commission rate or the amount agreed with a customer when setting up an account or at any time after that. This research report is authored by: Credit Suisse (Hong Kong) Limited ........................................................................................................... Horace Tse ; Jessie Xu ; Dave Dai, CFA To the extent this is a report authored in whole or in part by a non-U.S. analyst and is made available in the U.S., the following are important disclosures regarding any non-U.S. analyst contributors: The non-U.S. research analysts listed below (if any) are not registered/qualified as research analysts with FINRA. The non-U.S. research analysts listed below may not be associated persons of CSSU and therefore may not be subject to the NASD Rule 2711 and NYSE Rule 472 restrictions on communications with a subject company, public appearances and trading securities held by a research analyst account. Credit Suisse (Hong Kong) Limited ...................................................................................................................................... Horace Tse ; Jessie Xu
For Credit Suisse disclosure information on other companies mentioned in this report, please visit the website at https://rave.credit-suisse.com/disclosures or call +1 (877) 291-2683.

12 January 2017
China Oil & Gas Sector 80
This report is produced by subsidiaries and affiliates of Credit Suisse operating under its Global Markets Division. For more information on our structure, please use the following link: https://www.credit-suisse.com/who-we-are This report may contain material that is not directed to, or intended for distribution to or use by, any person or entity who is a citizen or resident of or located in any locality, state, country or other jurisdiction where such distribution, publication, availability or use would be contrary to law or regulation or which would subject Credit Suisse or its affiliates ("CS") to any registration or licensing requirement within such jurisdiction. All material presented in this report, unless specifically indicated otherwise, is under copyright to CS. None of the material, nor its content, nor any copy of it, may be altered in any way, transmitted to, copied or distributed to any other party, without the prior express written permission of CS. All trademarks, service marks and logos used in this report are trademarks or service marks or registered trademarks or service marks of CS or its affiliates.The information, tools and material presented in this report are provided to you for information purposes only and are not to be used or considered as an offer or the solicitation of an offer to sell or to buy or subscribe for securities or other financial instruments. CS may not have taken any steps to ensure that the securities referred to in this report are suitable for any particular investor. CS will not treat recipients of this report as its customers by virtue of their receiving this report. The investments and services contained or referred to in this report may not be suitable for you and it is recommended that you consult an independent investment advisor if you are in doubt about such investments or investment services. Nothing in this report constitutes investment, legal, accounting or tax advice, or a representation that any investment or strategy is suitable or appropriate to your individual circumstances, or otherwise constitutes a personal recommendation to you. CS does not advise on the tax consequences of investments and you are advised to contact an independent tax adviser. Please note in particular that the bases and levels of taxation may change. Information and opinions presented in this report have been obtained or derived from sources believed by CS to be reliable, but CS makes no representation as to their accuracy or completeness. CS accepts no liability for loss arising from the use of the material presented in this report, except that this exclusion of liability does not apply to the extent that such liability arises under specific statutes or regulations applicable to CS. This report is not to be relied upon in substitution for the exercise of independent judgment. CS may have issued, and may in the future issue, other communications that are inconsistent with, and reach different conclusions from, the information presented in this report. Those communications reflect the different assumptions, views and analytical methods of the analysts who prepared them and CS is under no obligation to ensure that such other communications are brought to the attention of any recipient of this report. Some investments referred to in this report will be offered solely by a single entity and in the case of some investments solely by CS, or an associate of CS or CS may be the only market maker in such investments. Past performance should not be taken as an indication or guarantee of future performance, and no representation or warranty, express or implied, is made regarding future performance. Information, opinions and estimates contained in this report reflect a judgment at its original date of publication by CS and are subject to change without notice. The price, value of and income from any of the securities or financial instruments mentioned in this report can fall as well as rise. The value of securities and financial instruments is subject to exchange rate fluctuation that may have a positive or adverse effect on the price or income of such securities or financial instruments. Investors in securities such as ADR's, the values of which are influenced by currency volatility, effectively assume this risk. Structured securities are complex instruments, typically involve a high degree of risk and are intended for sale only to sophisticated investors who are capable of understanding and assuming the risks involved. The market value of any structured security may be affected by changes in economic, financial and political factors (including, but not limited to, spot and forward interest and exchange rates), time to maturity, market conditions and volatility, and the credit quality of any issuer or reference issuer. Any investor interested in purchasing a structured product should conduct their own investigation and analysis of the product and consult with their own professional advisers as to the risks involved in making such a purchase. Some investments discussed in this report may have a high level of volatility. High volatility investments may experience sudden and large falls in their value causing losses when that investment is realised. Those losses may equal your original investment. Indeed, in the case of some investments the potential losses may exceed the amount of initial investment and, in such circumstances, you may be required to pay more money to support those losses. Income yields from investments may fluctuate and, in consequence, initial capital paid to make the investment may be used as part of that income yield. Some investments may not be readily realisable and it may be difficult to sell or realise those investments, similarly it may prove difficult for you to obtain reliable information about the value, or risks, to which such an investment is exposed. This report may provide the addresses of, or contain hyperlinks to, websites. Except to the extent to which the report refers to website material of CS, CS has not reviewed any such site and takes no responsibility for the content contained therein. Such address or hyperlink (including addresses or hyperlinks to CS's own website material) is provided solely for your convenience and information and the content of any such website does not in any way form part of this document. Accessing such website or following such link through this report or CS's website shall be at your own risk.
This report is issued and distributed in European Union (except Switzerland): by Credit Suisse Securities (Europe) Limited, One Cabot Square, London E14 4QJ, England, which is authorised by the Prudential Regulation Authority and regulated by the Financial Conduct Authority and the Prudential Regulation Authority. Germany: Credit Suisse Securities (Europe) Limited Niederlassung Frankfurt am Main regulated by the Bundesanstalt fuer Finanzdienstleistungsaufsicht ("BaFin"). United States and Canada: Credit Suisse Securities (USA) LLC; Switzerland: Credit Suisse AG; Brazil: Banco de Investimentos Credit Suisse (Brasil) S.A or its affiliates; Mexico: Banco Credit Suisse (México), S.A. (transactions related to the securities mentioned in this report will only be effected in compliance with applicable regulation); Japan: by Credit Suisse Securities (Japan) Limited, Financial Instruments Firm, Director-General of Kanto Local Finance Bureau ( Kinsho) No. 66, a member of Japan Securities Dealers Association, The Financial Futures Association of Japan, Japan Investment Advisers Association, Type II Financial Instruments Firms Association; Hong Kong: Credit Suisse (Hong Kong) Limited; Australia: Credit Suisse Equities (Australia) Limited; Thailand: Credit Suisse Securities (Thailand) Limited, regulated by the Office of the Securities and Exchange Commission, Thailand, having registered address at 990 Abdulrahim Place, 27th Floor, Unit 2701, Rama IV Road, Silom, Bangrak, Bangkok10500, Thailand, Tel. +66 2614 6000; Malaysia: Credit Suisse Securities (Malaysia) Sdn Bhd; Singapore: Credit Suisse AG, Singapore Branch; India: Credit Suisse Securities (India) Private Limited (CIN no.U67120MH1996PTC104392) regulated by the Securities and Exchange Board of India as Research Analyst (registration no. INH 000001030) and as Stock Broker (registration no. INB230970637; INF230970637; INB010970631; INF010970631), having registered address at 9th Floor, Ceejay House, Dr.A.B. Road, Worli, Mumbai - 18, India, T- +91-22 6777 3777; South Korea: Credit Suisse Securities (Europe) Limited,
Seoul Branch; Taiwan: Credit Suisse AG Taipei Securities Branch; Indonesia: PT Credit Suisse Securities Indonesia; Philippines:Credit Suisse Securities (Philippines ) Inc., and elsewhere in the world by the relevant authorised affiliate of the above. Additional Regional Disclaimers Hong Kong: Credit Suisse (Hong Kong) Limited ("CSHK") is licensed and regulated by the Securities and Futures Commission of Hong Kong under the laws of Hong Kong, which differ from Australian laws. CSHKL does not hold an Australian financial services licence (AFSL) and is exempt from the requirement to hold an AFSL under the Corporations Act 2001 (the Act) under Class Order 03/1103 published by the ASIC in respect of financial services provided to Australian wholesale clients (within the meaning of section 761G of the Act). Research on Taiwanese securities produced by Credit Suisse AG, Taipei Securities Branch has been prepared by a registered Senior Business Person. Australia (to the extent services are offered in Australia): Credit Suisse Securities (Europe) Limited (“CSSEL”) and Credit Suisse International (“CSI”) are authorised by the Prudential Regulation Authority and regulated by the Financial Conduct Authority (“FCA”) and the Prudential Regulation Authority under UK laws, which differ from Australian Laws. CSSEL and CSI do not hold an Australian Financial Services Licence (“AFSL”) and are exempt from the requirement to hold an AFSL under the Corporations Act (Cth) 2001 (“Corporations Act”) under Class Order 03/1099 published by the Australian Securities and Investments Commission (“ASIC”), in respect of the financial services provided to Australian wholesale clients (within the meaning of section 761G of the Corporations Act). This material is not for distribution to retail clients and is directed exclusively at Credit Suisse's professional clients and eligible counterparties as defined by the FCA, and wholesale clients as defined under section 761G of the Corporations Act. Credit Suisse (Hong Kong) Limited (“CSHK”) is licensed and regulated by the Securities and Futures Commission of Hong Kong under the laws of Hong Kong, which differ from Australian laws. CSHKL does not hold an AFSL and is exempt from the requirement to hold an AFSL under the Corporations Act under Class Order 03/1103 published by the ASIC in respect of financial services provided to Australian wholesale clients (within the meaning of section 761G of the Corporations Act). Credit Suisse Securities (USA) LLC (CSSU) and Credit Suisse Asset Management LLC (CSAM LLC) are licensed and regulated by the Securities Exchange Commission of the United States under the laws of the United States, which differ from Australian laws. CSSU and CSAM LLC do not hold an AFSL and is exempt from the requirement to hold an AFSL under the Corporations Act under Class Order 03/1100 published by the ASIC in respect of financial services provided to Australian wholesale clients (within the meaning of section 761G of the Corporations Act). Malaysia: Research provided to residents of Malaysia is authorised by the Head of Research for Credit Suisse Securities (Malaysia) Sdn Bhd, to whom they should direct any queries on +603 2723 2020. Singapore: This report has been prepared and issued for distribution in Singapore to institutional investors, accredited investors and expert investors (each as defined under the Financial Advisers Regulations) only, and is also distributed by Credit Suisse AG, Singapore Branch to overseas investors (as defined under the Financial Advisers Regulations). Credit Suisse AG, Singapore Branch may distribute reports produced by its foreign entities or affiliates pursuant to an arrangement under Regulation 32C of the Financial Advisers Regulations. Singapore recipients should contact Credit Suisse AG, Singapore Branch at +65-6212-2000 for matters arising from, or in connection with, this report. By virtue of your status as an institutional investor, accredited investor, expert investor or overseas investor, Credit Suisse AG, Singapore Branch is exempted from complying with certain compliance requirements under the Financial Advisers Act, Chapter 110 of Singapore (the “FAA”), the Financial Advisers Regulations and the relevant Notices and Guidelines issued thereunder, in respect of any financial advisory service which Credit Suisse AG, Singapore Branch may provide to you. UAE: This information is being distributed by Credit Suisse AG (DIFC Branch), duly licensed and regulated by the Dubai Financial Services Authority (“DFSA”). Related financial services or products are only made available to Professional Clients or Market Counterparties, as defined by the DFSA, and are not intended for any other persons. Credit Suisse AG (DIFC Branch) is located on Level 9 East, The Gate Building, DIFC, Dubai, United Arab Emirates. EU: This report has been produced by subsidiaries and affiliates of Credit Suisse operating under its Global Markets Division This research may not conform to Canadian disclosure requirements. In jurisdictions where CS is not already registered or licensed to trade in securities, transactions will only be effected in accordance with applicable securities legislation, which will vary from jurisdiction to jurisdiction and may require that the trade be made in accordance with applicable exemptions from registration or licensing requirements. Non-US customers wishing to effect a transaction should contact a CS entity in their local jurisdiction unless governing law permits otherwise. US customers wishing to effect a transaction should do so only by contacting a representative at Credit Suisse Securities (USA) LLC in the US. Please note that this research was originally prepared and issued by CS for distribution to their market professional and institutional investor customers. Recipients who are not market professional or institutional investor customers of CS should seek the advice of their independent financial advisor prior to taking any investment decision based on this report or for any necessary explanation of its contents. This research may relate to investments or services of a person outside of the UK or to other matters which are not authorised by the Prudential Regulation Authority and regulated by the Financial Conduct Authority and the Prudential Regulation Authority or in respect of which the protections of the Prudential Regulation Authority and Financial Conduct Authority for private customers and/or the UK compensation scheme may not be available, and further details as to where this may be the case are available upon request in respect of this report. CS may provide various services to US municipal entities or obligated persons ("municipalities"), including suggesting individual transactions or trades and entering into such transactions. Any services CS provides to municipalities are not viewed as "advice" within the meaning of Section 975 of the Dodd-Frank Wall Street Reform and Consumer Protection Act. CS is providing any such services and related information solely on an arm's length basis and not as an advisor or fiduciary to the municipality. In connection with the provision of the any such services, there is no agreement, direct or indirect, between any municipality (including the officials,management, employees or agents thereof) and CS for CS to provide advice to the municipality. Municipalities should consult with their financial, accounting and legal advisors regarding any such services provided by CS. In addition, CS is not acting for direct or indirect compensation to solicit the municipality on behalf of an unaffiliated broker, dealer, municipal securities dealer, municipal advisor, or investment adviser for the purpose of obtaining or retaining an engagement by the municipality for or in connection with Municipal Financial Products, the issuance of municipal securities, or of an investment adviser to provide investment advisory services to or on behalf of the municipality. If this report is being distributed by a financial institution other than Credit Suisse AG, or its affiliates, that financial institution is solely responsible for distribution. Clients of that institution should contact that institution to effect a transaction in the securities mentioned in this report or require further information. This report does not constitute investment advice by Credit Suisse to the clients of the distributing financial institution, and neither Credit Suisse AG, its affiliates, and their respective officers, directors and employees accept any liability whatsoever for any direct or consequential loss arising from their use of this report or its content. Principal is not guaranteed. Commission is the commission rate or the amount agreed with a customer when setting up an account or at any time after that. Copyright © 2017 CREDIT SUISSE AG and/or its affiliates. All rights reserved.
Investment principal on bonds can be eroded depending on sale price or market price. In addition, there are bonds on which investment principal can be eroded due to changes in redemption amounts. Care is required when investing in such instruments. When you purchase non-listed Japanese fixed income securities (Japanese government bonds, Japanese municipal bonds, Japanese government guaranteed bonds, Japanese corporate bonds) from CS as a seller, you will be requested to pay the purchase price only.