microwave beneficiation of coal to ... - university of birmingham
TRANSCRIPT
MICROWAVE BENEFICIATION OF COAL
TO IMPROVE GRINDABILITY
AND HANDLE ABILITY
by
Stephen Alan Marland
A thesis submitted to the Faculty of Engineering
of the University of Birmingham
for the degree of
DOCTOR OF PHILOSOPHY
School of Chemical EngineeringUniversity of BirminghamBirmingham BI5 2TTEngland21 June 2000
University of Birmingham Research Archive
e-theses repository This unpublished thesis/dissertation is copyright of the author and/or third parties. The intellectual property rights of the author or third parties in respect of this work are as defined by The Copyright Designs and Patents Act 1988 or as modified by any successor legislation. Any use made of information contained in this thesis/dissertation must be in accordance with that legislation and must be properly acknowledged. Further distribution or reproduction in any format is prohibited without the permission of the copyright holder.
ABSTRACT
Experimental results and analyses have shown that significant improvements in coal
grindability (reductions in Relative Work Index) can be achieved by exposing coals to
microwave radiation. Experimental data have indicated that low rank coals are highly
responsive to microwave radiation, possibly due to their higher inherent moisture content.
There is evidence to suggest that gaseous evolution (water vapour and volatile matter)
and localised zones of differential expansion (arising for example from occluded mineral
matter) in coal during heating give rise to crack formation and hence are the probable
causes for the measured increase in coal grindability. The composition of the various
coals treated by microwave radiation remained relatively unaltered and there was no
significant change in coal calorific value or the proximate and ultimate analyses (dry,
mineral matter free basis). Initial (laboratory-scale) microwave trials and pilot-scale test-
work demonstrated an improvement in the grindability of various coals. However, the
gross energy input for these tests were excessively high (220k WhIt) in comparison to that
used mechanically for pulverised coal production (15-20kWhlt).
Improvements in microwave cavity design and increased electric field strengths may
increase the energy efficiency of the process; however, further work would be required.
Additional studies were carried out to evaluate the potential use of microwave technology
for coal desulphurisation. The results were encouraging and show that substantial
improvements in pyrite separation can be achieved with some coals.

Abstract
Fundamental studies have shown that there is significant change in coal flowability
following microwave exposure.
11
ACKNOWLEGEMENTS
The author expresses gratitude to the European Coal and Steel Community (ECSC) for
financial support.
Special thanks goes to Dr Neil Rowson and Dr Andrew Merchant of the University of
Birmingham for supervision and guidance.
Thanks to Dr Terry Peirce, Dr Samuel Kingman, Dr Bing Han at the University of
Birmingham, Mr Brian Armstrong at the CRE Group and Dr Tom Cross at the University
of Nottingham for their advice and expertise. The author wishes to express his
appreciation to all the other students and technical staff for their technical assistance.
I would also like to thank my parents and Alison Davis for their strong support and
encouragement throughout my studies.
111
CONTENTS PAGE
AbstractAcknowledgementContents pageList of FiguresList of Tables
III
IV
IXxiii
Chapter 1Microwave beneficiation of coal to improve grindability and handleability
1.1 Introduction-Microwave beneficiation of coal to improve grindability andhandleability 1
Literature review
Chapter 2 Dielectric heating
2.1 Introduction-Dielectric heating 42.2 Electric field 62.3 Polarisation 72.4 Electric permittivity and dielectric constant 8
2.4.1 Loss factor and dielectric conductivity 102.4.2 Power absorption 112.4.3 Heating rate 122.4.4 Penetration depth 13
2.5 Factors effecting the dielectric field 142.5.1 Variation of dielectric properties with changing temperature 142.5.2 Effect of microwave frequency on dielectric properties 152.5.3 Chemical composition and distribution 15
2.5.3.1 Water content 162.5.3.2 Particle size 16
2.6 Microwave technology 162.6.1 Microwave generator (The Magnetron) 172.6.2 Waveguides 182.6.3 Incident and reflected power, circulators 182.6.4 Applicators 19
Chapter 3 Coal characteristics and physical properties
3.1 Introduction-Coal characteristics and physical properties3.2 Coal structure3.3 Porosity, Surface area and Density3.4 Hardgrove Grindability Index
21212526
iv
3.5 Flowability3.6 Coal dependent utilities3.7 The current UK coal situation
3.7.1 UK coal production3.7.2 Coal consumption in the UK3.7.3 Electrical power generation, type of fuel
3.8 Pulverised fuel power generation3.9 Size distributions for power generation3.10 Pulverised fuel (PF) generation3.11 Regulations3.12 Future coal processing technology
2828293030313334363942
Chapter 4 Review of microwave studies upon comminution
4.1 Introduction-Review of microwave studies upon comminution 444.2 Breakage theories 44
4.2.1 Comminution theory 454.2.2 Bond Work Index (Wi) 464.2.3 Relationship between Bond Work Index and Hardgrove 47Grindabiliy Index4.2.4 The Relative Work Index (RWI) 49
4.3 Affect of heat treatment on grindability 514.3.1 Thermal assisted liberation 52
4.4 Microwave assisted comminution 534.4.1 Dielectric heating rates 534.4.2 Dielectric properties of minerals 544.4.3 Microwave exposure of minerals and comminution behaviour 55
Chapter 5 The effect of microwave radiation on coal
5.1 Introduction-The effect of microwave radiation on coal 585.2 Dielectric properties and microwave heating rates of coal 585.3 Microwave drying of coal 615.4 Microwave pyrolysis of coal 625.5 Microwave desulphurisation and demineralisation of coal 63
5.5.1 Microwave conversion and separation of pyrite 645.5.2 Microwave desulphurisation of coal using caustic solutions 655.5.3 Demineralisation of coals with microwave energy 67
5.6 The influence of microwave radiation on coal grindability 685.7 Effect of conventional drying upon coal grindability 725.8 Conclusions- Review of the effect of microwave radiation on coal 74
v
Contents page
Experimental work
Chapter 6 The effect of microwave radiation on coal-preliminary study
6.1 Introduction to experimental studies 756.2 Preliminary study on microwave grindability 766.3 Repeatability of proximate analysis 766.4 Proximate analysis of group 2 coals 776.5 Ultimate analysis of group 2 coals 786.6 Ash, forms of sulphur and normative analyses of group 2 coals 796.7 Standardisation of grindability studies 816.8 Selection of rod mill operation conditions for grindability studies 82
6.8.1 Quantity of coal for batch milling 826.8.2 Number of rods 846.8.3 Mill speed 85
6.9 The effect of rod milling on coal 876.10 The effect of microwave radiation exposure on coal grindability 886.11 The effect of microwave exposure time on coal grindability 896.12 Observed coal structural changes from microwave heating 956.13 Changes in bulk temperature difference with microwave exposure 996.14 Proximate analysis of microwave treated coals 1016.15 Calorific value of microwave exposed coal 1026.16 The effect of increased microwave power (1.3kW) on coal grindability 1036.17 Coal grindability at increased input powers for a given energy input per 105
unit weight6.18 The effect of batch sample size on power absorption 1066.19 The influence of particle size to improved grindability by microwave 108
radiation6.20 Preliminary conclusions 110
Chapter 7 Dependence of coal rank response to microwave treatment
7.1 Introduction-Dependence of coal rank on coal response to microwave IIItreatment
7.2 Proximate analysis of group 1 coals 1127.3 Coal rank and groupI coals 1137.4 Relationship between Hardgrove Grindability Index and coal rank 1147.5 Development of grindability test procedure 1157.6 The effectiveness of microwave radiation on the grindability of coals of 116
different rank7.7 The effectiveness of microwave irradiation on the propensity of coal for 118
fine grinding7.8 The influence of microwave radiation on the proximate analysis of coal 1207.9 Ultimate analysis of microwave exposed coals 1227.10 The effect ofmuffie furnace drying on coal rank grindability 1237.11 The effect of microwave exposure on coal rank calorific value 125
vi
Contents page
7.12 The effect of microwave-heating on coal specific surface7.13 Microwave grindability with coal rank conclusions
126127
Chapter 8 Dielectric properties of coal
8.1 Introduction-Dielectric properties of coal 1288.2 Measuring theory 1298.3 Dielectric measuring method 1318.4 The variation in dielectric properties of coal with increasing temperatures 1358.5 Dielectric properties of coal at selected frequencies 1388.6 The variation of dielectric constant with coal rank 1398.7 Penetration and skin depth of microwave radiation 1408.8 Coefficient of absorption and conductivity 145
8.8.1 Coefficientofabsorption 1458.8.2 Dielectric conductivity 148
8.9 Dielectric properties of microwave treated P-3 coal 1518.10 Dielectric properties of selected minerals and water 1538.11 Dielectric properties of dry, mineral free coal 154
8.11.1 Evaluation of dry. mineral free coal dielectric properties using 156Landau-Lifshifz mixture equation
8.12 Theoretical heating rate and dependence on electric field strength 1598.12.1 Theoretical heating rates of coal 1648.12.2 Theoretical heating rates of selected minerals 165
8.13 Dielectric properties of coal conclusions 167
Chapter 9 Mechanisms for microwave enhanced coal grindability
9.1 Introduction-Mechanisms for microwave enhanced coal grindability 1699.2 Mechanisms for improved coal grindability 169
9.2.1 Points of structural weakness 1749.3 Improved microwave grindability 176
9.3.1 Potential to increase inherent moisture content 1769.3.2 Microwave grindability ofP-2 and P-7 coals with increased 178
moisture content9.3.3 Steam liberation restriction 1829.3.4 Enhanced microwave grindability ofP-7 coal with the addition of 183
steam to increase the inherent moisture content9.4 Conclusions-Mechanisms for microwave enhanced coal grindability 185
Chapter 10Pilot-scale considerations
10.1 Introduction-Pilot-scale considerations10.2 Process considerations10.3 Microwave treatment conditions
10.3.1 Microwave energy requirements
186187188188
vu
Contents page
10.3.2 Variation of grindability with increased power input at constant 189load
10.3.3 Grindability variation with increased load at constant power input 19010.3.4 Operating conditions used in scale-up tests 192
10.4 Coal selection for pilot-scale study 19210.4.1 Laboratory-scale (P-6, P-8) microwave treated coal grindability 193
tests10.5 Microwave affect on grindability (pilot-scale) 19610.6 Economic considerations 20110.7 Pilot-scale conclusions 201
Chapter 11Miscellaneous benefits for coal microwave treatment
11.1 Introduction-Miscellaneous benefits for coal microwave treatment 20311.2 Microwave desulphurisation of coal 203
11.2.1 The nature and mode of occurrence of pyrite in coal 20411.2.2 Pyrite phase change mechanism 21011.2.3 Sulphur reduction by magnetic separation of microwave treated 215
coal11.3 Rapid coal pyrolysis 22011.4 Microwave treated coal flowability 22111.5 Conclusions- Miscellaneous benefits for coal microwave treatment 222
Chapter 12Conclusion and recommendations for further work
12.1 Conclusion and recommendations for further work 224
NomenclatureReferences
227229
Appendix AAppendixBAppendixCAppendixDAppendixEAppendixF
Summary of analyses techniquesReference coals analysis and original size distributionStandardisation of Rod mill resultsMicrowave treated coal size distributions and analysisDielectric property resultsPublications
viii
LIST OF FIGURES
Literature review
Chapter 2 Dielectric heating
2.1 The Electro-magnetic spectrum 52.2 Electric field generator from parallel plates (Von Hippel 1954) 62.3 Water molecules exposed to microwave radiation (Rowson 1986) 82.4 Dielectric properties of vulcanised rubber with temperature 14
(Catala-Civera 1997)2.5 Magnetron electric circuit (Hulls 1992) 172.6 The progressive waveguide applicator (Hulls 1992) 192.7 The mono-mode cavity (Hulls 1992) 192.8 The domestic (multi-mode) microwave applicator (Hulls 1992) 20
Chapter 3 Coal characteristics and physical properties
3.1 Dependency of coal property on rank (Elliot 1981) 223.2 Coal rank based upon mineral matter free proximate analysis 22
(Elliot 1981)3.3 Calorific value against coal rank (mineral matter free basis) (Elliot 1981) 233.4 A proposed model of coal structure (Elliot 1981) 243.5 Coal rank against porosity (Elliot 1981) 253.6 Hardgrove Grindability Index against rank (Elliot 1981) 273.7 Electricity supplied by fuel type (D.T.I. 1999) 313.8 Coal fired boiler circuit (C.E.G.B. 1971) 333.9 Average measured product size distributions from 8 vertical spindle mills 35
and 6 ball mills (Hill2000)3.10 Tube ball mill (C.E.G.B. 1971) 363.11 lOEVertical spindle mill (C.E.G.B. 1971) 373.12 PHI Vertical spindle mill (C.E.G.B. 1971) 38
Chapter 4 Review of microwave studies upon comminution
4.1 Determination of Bond Work Index for P-2 coal4.2 Intergranular cracking (Young 1997)
4952
Chapter 5 The effect of microwave radiation on coal
5.1 Dielectric constant of coal between the frequency range O.I-6GHz 59(Harrison 1997)
ix
List of Figures
5.2 Loss factor of coal between the frequency range O.I-6GHz(Harrison 1997)
60
Experimental Work
Chapter 6 The effect of microwave radiation on coal-preliminary study
6.1 Variation in Dsowith mill load 836.2 Variation in Dso with the number of rods used 846.3 Variation in Dso with speed of rotation 866.4 Size distribution of P-l coal with increased milling time 876.5 Size distribution ofP-l coal with increasing milling time following 88
microwave exposure at a power of 0.65kW and at a frequency of2.45GHz for 8 minutes
6.6 Relative Work Index reduction with increased exposure for P-3 coal 926.7 As-received P-2 coal rod milled for 45 minutes 94
(two uniform samples, A and B)6.8 Visible fractures produced due to microwave heating (P-8 coal) 956.9 Scanning Electron Micrograph image ofP-3 microwave exposed coal 966.10 Scanning Electron Micrograph image ofP-3 untreated coal 986.11 Average bulk temperatures of microwave treated coal 996.12 Effect of sample load at constant applied microwave energy (173kWhlt) 1076.13 Microwave grindability dependence upon initial particle size 108
Chapter 7 Dependence of coal rank response to microwave treatment
7.17.27.37.4
Proximate analysis ofF-l to F-8 coals (CRE Group)The Hardgrove Grindability Index of group 1coalsRelationship between microwave grindability and coal rankVisible fractures after microwave treatment of a low rank coal
112114117118
Chapter 8 Dielectric properties of coal
8.1 Behaviour of material within a microwave field (Church 1988) 1288.2 Diagrammatic representation of the dielectric measuring system 131
(Greenache 1996)8.3 Microwave resonant cavity test equipment 1338.4 Importance of temperature and moisture content to coal (P-3) dielectric 135
properties8.5 High temperature coal (F-l) dielectric measurement 1378.6 Coal dielectric constant dependence on frequency 1388.7 Variation of dielectric constant with coal rank 1398.8 Propagation ofa plane wave in a lossy material (z direction) 141
(Metaxas 1983)8.9 Variation of microwave penetration depth with temperature F-8 coal 144
x
List of Figures
8.10 Variation of microwave penetration depth with applied microwave 145frequency
8.11 Variation of coefficient of absorption with microwave frequency 1488.12 Effect of microwave treatment on the dielectric constant of P-3 coals 1518.13 Helium density of various coals (dry, mineral matter free basis) lS6
(Elliot 1981)8.14 Calculated dielectric constant for the organic component of group I 158
and 2 coals using the Landau-Lifshitz formula(dry, mineral matter free basis)
8.15 Changes in the heating rate of water with position within a 0.6SkW 162multi-mode microwave cavity
Chapter 9 Mechanisms for microwave enhanced coal grindability
9.1 Visible crack formation following microwave heating 1729.2 Effect of crack length and radius of curvature on stress concentration 1749.3 Scanning Electron Micrograph image of coal pores (Harris 1976) 177
Chapter 10Pilot-scale considerations
10.1 Schematic diagram of continuous 0.1-6.6kW microwave cavity 186(MEB Technology Centre)
10.2 Size distribution of microwave treated (2.6kW, 2.4SGHz, 220kWhlt) and 196as-received P-8 coal following 45 minutes milling (SOOgbatch mill load)
10.3 Size distribution of as-received and microwave treated P-8 coal from 197Barmac trials (3000rpm)
10.4 Size distribution of as-received and microwave treated P-8 coal from 197Barmac trials (SOOOrpm)
10.S Effect of microwave radiation on Jaw Crusher performance (P-8 coal) 19910.6 Effect of microwave radiation on Roll Crusher performance (P-8 coal) 199
Chapter II Miscellaneous benefits for coal microwave treatment
11.1 Sulphur release from coal prior to combustion within a microwave field 20411.2 Reflected light photomicrograph illustrating pyritic framboids in coal 20511.3 Reflected light photomicrograph illustrating coal in which some 207
collapsed cells have been partially filled by pyrite11.4 False colour, backscattered electron images illustrating the appearance 209
of pyrite that has been precipitated with former openings in coal11.5 Pyritic oxidation (pyrite under atmospheric conditions, 30s microwave 211
exposure at 1.5kW, 2.4SGHz mono-mode cavity)11.6 Pyritic oxidation, x-ray dot imaging (pyrite under atmospheric conditions, 212
305microwave exposure at I.SkW, 2.4SGHz mono-mode cavity)
xi
List of Figures
11.7 213
11.8
11.911.10
Pyritic oxidation (pyrite under atmospheric conditions, 120s microwaveexposure at l.5kW, 2.45GHz mono-mode cavity)Pyritic oxidation (pyrite covered in sand under atmospheric conditions,120s microwave exposure at 1.5kW, 2.45GHz mono-mode cavity)Coal pyrolysis after microwave heatingJohanson Indicizer tests for as-received and microwave treated P-l andP-6 coals
xu
214
220221
LIST OF TABLES
Literature review
Chapter 2 Dielectric heating
2.1 Frequency ranges allocated for industrial, scientific and medical purposes 5(Metaxas 1990)
Chapter 3 Coal characteristics and physical properties
3.1 UK coal production (million tonnes) (D.T.I 1999) 303.2 Coal consumption in the UK (million tonnes)(D.T.I 1999) 313.3 Electricity supplied by fuel type and consumption (TWh) (D.T.I 1999) 323.4 Characteristics of Pulverised Fuel (Spiers 1950) 353.5 European Community sulphur dioxide emission targets (Couch 1995) 40
Chapter 4 Review of microwave studies upon comminution
4.1 Calculated Bond Work Index from the measured value of theHardgrove Grindability Index
4.2 Microwave grindability and heating rates of selected minerals(Harrison 1996)
48
56
Chapter 5 The effect of microwave radiation on coal
5.1 Measured dielectric properties utilised in the numerical models 60(frequency 2.45GHz) (Chatterjee and Misra 1991)
5.2 Comparison of product yields obtained by microwave and convective 63heating processing (Larry et al 1986)
5.3 Ash reductions after microwave NaOH pretreatment 67(Butcher and Rowson 1995)
5.4 The Relative Work Index of sub-bituminous coals with increasing 69microwave exposures (O.65kW,2.4SGHz) (Harrison 1997)
5.S The Relative Work Index of sub-bituminous coals with increasing 70microwave exposures (1.5kW, 2.45GHz) (Harrison 1997)
5.6 Chemical analysis on the samples microwaved at 0.65kW 71(Harrison 1997)
5.7 The Relative Work Index of sub-bituminous coals after muffle furnace 73treatment (Harrison 1997)
XlII
List of Tables
Experimental Work
Chapter 6 The effect of microwave radiation on coal-preliminary study
6.1 Coal reference table 756.2 Proximate analysis (as-received basis unless stated) repeatability results 77
ofP-3 and P-1 coals6.3 Proximate analysis (as-received basis unless stated)of group 2 coals 786.4 Ultimate analysis (dry, mineral matter free basis )of group 2 coals 796.5 Ash analysis (percentage based on ash content) of group 2 coals SO6.6 Forms of sulphur (dry basis) of group 2 coals SO6.7 The effect of microwave exposure time on RWI of sub-bituminous coals 90
(0.65kW, 2.4SGHz)6.S The Relative Work Index of sub-bituminous coals with conventional 93
heating after 3 hours6.9 The Relative Work Index ofP-2 coals with increasing exposures 93
(same initial size distribution)6.10 Proximate analysis (as-received basis unless stated) of microwave 101
exposed coal samples6.11 Calorific value (dry, mineral matter free basis) ofP-3 coal with 102. . .
mcreasmg microwave exposure6.12 The Relative Work indices of sub-bituminous coals with increasing 104
microwave exposure times (1.3kW, 2.45GHz)6.13 Relative Work indices ofP-2 coal with increased power input for a 105
given energy input per unit weight (220kWhlt, 2.45GHz, SOOg)6.14 Influence of particle size on microwave enhanced grindability, 109
SO%product passing size
Chapter 7 Dependence of coal rank response to microwave treatment
7.1 Proximate analysis (as-received basis unless stated) repeatability for F-1 113and F-8 coals
7.2 Classification ofF-1 to F-S coals 1137.3 Relative Work Index of group 1 coals after microwave exposure at a 116
power ofO.6SkW and at a frequency of2.45GHz for S minutes7.4 Degree of fineness after grinding 1197.S The degree of fineness after microwave treatment 1197.6 Proximate analysis (as-received basis unless stated) of group 1 coals 121
before and after microwave exposure7.7 Ultimate analysis (dry, mineral matter free basis) of group 1 coals before 122
and after microwave treatment7.S Relative coal (F-6) grindability effect from muffle furnace and 124
microwave heating7.9 Relative coal (F-7) grindability effect from muffle furnace and 124
microwave heating
xiv
List of Tables
7.10 Effect of microwave radiation upon the calorific value (dry, mineral 125matter free basis) of group 1 coals
7.11 Effect ofmuflle furnace and microwave heating on coal calorific value 126(dry, mineral matter free basis)
7.12 The effect of microwave heating on coal specific surface 126
Chapter 8 Dielectric properties of coal
8.1 Measured and theoretical resonant frequencies of the dielectric 134measurement system (Greenache 1996)
8.2 Calculated first-order Bessel function for dielectric measurement 1348.3 Microwave penetration depth for group 1 coals (Metaxas 1983) 1428.4 Microwave skin depth for group 1 coals (Florek 1995) 1438.5 Change of coefficient of absorption with coal rank (untreated coals) 1478.6 Relationship between dielectric conductivity and coal rank at 60°C 1498.7 Relationship between dielectric conductivity and coal rank at 180°C 1508.8 Dielectric properties, moisture and volatile matter contents ofP-3 152
microwave exposed coals8.9 Dielectric properties of common coal associated minerals 1538.10 Dielectric properties of water (Greenache 1996) 1548.11 Dielectric properties of coal on a dry, mineral matter free basis 1578.12 Theoretical heating rates of group 1 coals (60°C) 1648.13 Theoretical and measured heating rates of microwave treated P-3 coal 165
(60°C)8.14 Theoretical and measured heating rates of selected minerals(60°C) 166
Chapter 9 Mechanisms for microwave enhanced coal grindability
9.1 Volumetric expansion of common minerals associated with coal 170(Clark 1966)
9.2 Effect of reduced temperatures on coal grindability 1739.3 Relative Work Index ofP-2 coal after microwave and furnace treatments 1799.4 Proximate analysis (as-received basis unless stated) ofP-2 coal after 180
microwave and furnace treatments9.5 Relative Work Index ofP-? coal after microwave and furnace treatments 1819.6 Proximate analysis (as-received basis unless stated) of P-7 coal after 182
microwave and furnace treatments9.7 Relative Work Index ofP-7 coal with surfactant pretreatment addition 182
after microwave exposure (8 minutes, 0.65kW at a frequency of2.45GHz)9.8 Proximate analysis (as-received basis unless stated) ofP-7 coal with 183
surfactant pretreatment addition after microwave exposure (8 minutes,0.65kW at a frequency of 2.45GHz)
9.9 Relative Work Index ofP-? coal following the addition of steam and 184microwave treatment
xv
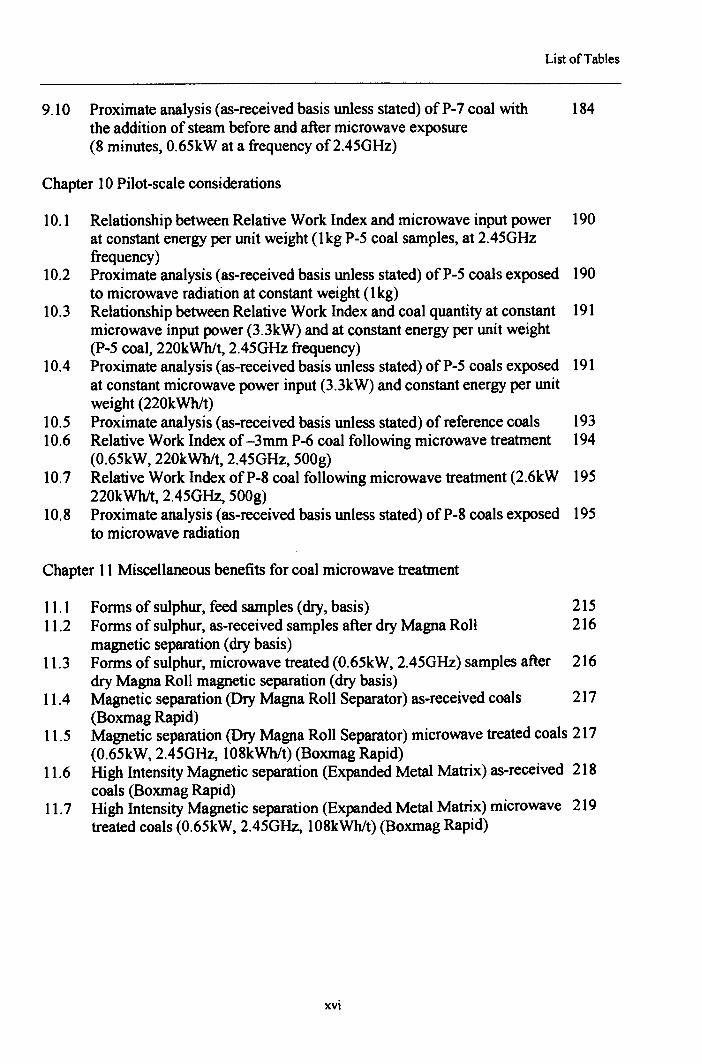
List of Tables
9.10 Proximate analysis (as-received basis unless stated) ofP-7 coal with 184the addition of steam before and after microwave exposure(8 minutes, 0.65kW at a frequency of2.45GHz)
Chapter 10 Pilot-scale considerations
10.1 Relationship between Relative Work Index and microwave input power 190at constant energy per unit weight (1kg P-5 coal samples, at 2.4SGHzfrequency)
10.2 Proximate analysis (as-received basis unless stated) ofP-S coals exposed 190to microwave radiation at constant weight (lkg)
10.3 Relationship between Relative Work Index and coal quantity at constant 191microwave input power (3.3kW) and at constant energy per unit weight(P-S coal, 220kWhlt, 2.4SGHz frequency)
10.4 Proximate analysis (as-received basis unless stated) ofP-S coals exposed 191at constant microwave power input (3.3kW) and constant energy per unitweight (220kWhlt)
10.S Proximate analysis (as-received basis unless stated) of reference coals 19310.6 Relative Work Index of -3mm P-6 coal following microwave treatment 194
(0.6SkW, 220kWhlt, 2.4SGHz, SOOg)10.7 Relative Work Index ofP-8 coal following microwave treatment (2.6kW 19S
220kWhlt, 2.4SGHz, SOOg)10.8 Proximate analysis (as-received basis unless stated) ofP-8 coals exposed 19S
to microwave radiation
Chapter 11 Miscellaneous benefits for coal microwave treatment
11.1 Forms of sulphur, feed samples (dry, basis) 21S11.2 Forms of sulphur, as-received samples after dry Magna Roll 216
magnetic separation (dry basis)11.3 Forms of sulphur, microwave treated (0.6SkW, 2.4SGHz) samples after 216
dry Magna Roll magnetic separation (dry basis)11.4 Magnetic separation (Dry Magna Roll Separator) as-received coals 217
(Boxmag Rapid)11.S Magnetic separation (Dry Magna Roll Separator) microwave treated coals 217
(0.6SkW,2.4SGHz, 108kWhlt) (Boxmag Rapid)11.6 High Intensity Magnetic separation (Expanded Metal Matrix) as-received 218
coals (Boxmag Rapid)11.7 High Intensity Magnetic separation (Expanded Metal Matrix) microwave 219
treated coals (0.6SkW, 2.4SGHz, 108kWhlt) (Boxmag Rapid)
xvi
CHAPTER ONE
MICROW AVE BENEFICIATION OF COAL TO IMPROVEGRINDABILITY AND HANDLEABILITY
1.1 Introduction-Microwave beneficiation of coal to improve grindability and
handlea bility
The principle objective of this study was to investigate the effect of microwave radiation
on the grindability and subsequent changes to the physico-chemical properties of a range
of UK coals. Additionally, a subsequent aim was to ascertain any other beneficial effects
(physical or chemical) of the microwave pretreatment of coal. In particular some
confirmatory evidence was obtained concerning the use of microwave energy as a method
of coal desulphurisation prior to combustion.
Previous studies have shown some improvements in coal grindability following pre-heat
treatment (Harrison 1997). Changes in structure were attributed to the volumetric
expansion of constituent mineral matter within coal promoting fracture propagation.
Microwave energy can be applied as a source of heat treatment and several mechanisms
can be proposed which may account for the improvements in coal grindability after
microwave exposure. The organic components of coal are relatively poor absorbers of
microwave energy. However, water is a good absorber of microwave energy and coals
naturally contain water to varying degrees depending on their microstructure, geological
location and relative humidity.
Chapter 1 Introduction-Microwave beneficiation of coal to improve grindability and handleability
Water molecules are polar and when exposed to an alternating electric field; the
molecules position themselves in the direction and at the same frequency to that of the
applied field (Hulls, 1992). When a coal is exposed to microwave energy; the water
molecules will undergo heating, change phase and expand creating internal pressures
within the coal matrix, possibly weakening the structure. Similar effects would be
expected from the expansion of some mineral constituents. However, each mineral has a
specific heating rate when exposed to microwave radiation. Hence, the energy is not used
to heat the whole of the material (in contrast to that of convective heating) but only those
constituents which are considered good absorbers. Accordingly, this may improve the
thermal efficiency.
Following the introduction of the principles of dielectric science and topics pertinent to
microwave generation (Chapter 2), the thesis objectives were described, with particular
reference to coal chemistry, applications, the generation and use of pulverised fuel and
associated environmental regulations. A review of the UK coal production and
consumption is presented in Chapter 3. Previous studies concerning comminution theory,
thermally-assisted liberation and microwave-assisted comminution are reported in
Chapter 4. Further cited literature is reviewed concerning the dielectric properties of coal,
microwave pyrolysis, microwave assisted desulphurisation and the effect of microwave
treatment on coal grindability (Chapter 5).
Chapter 6 outlines the fundamental experimental procedure for milling trials and
microwave treatment, whilst Chapter 7 reports on the effect of coal rank on microwave
2
Chapter 1 Introduction-Microwave beneficiation of coal to improve grindability and handleability
treated coal grindability. Dielectric measurements are detailed and used to determine the
penetration depth and heating rates of coals and associated minerals (Chapter 8). A
combination of results (dielectric properties and data from laboratory milling tests) and
fracture mechanics theory is use to hypothesize the possible mechanisms of structural
weakening by microwave heating in Chapter 9. Pilot-scale test results and an economic
evaluation of the microwave process are discussed in Chapter 10. The role of pyrite
desulphurisation is introduced in Chapter 11 in terms of mineralogical analysis and
magnetic separation test work; additional effects on coal following microwave treatment
(pyrolysis and flowability) are also presented. Overall conclusions are given in the final
chapter.
3
CHAPTER TWO
DIELECTRIC HEATING
2.1 Introduction-Dielectric heating
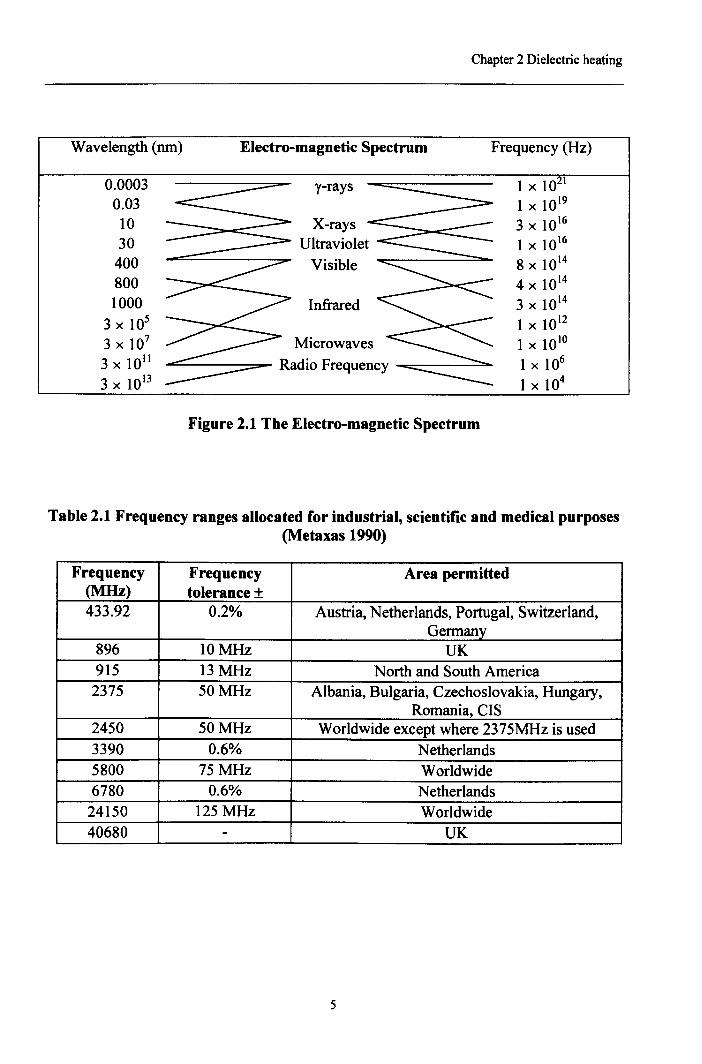
Microwaves are electromagnetic waves of a particular wavelength and frequency range
situated between infrared and radio frequencies within the electromagnetic spectrum
(Figure 2.1). Microwave technology to-date has been most often associated with
domestic food preparation. The original uses in 1921 of high power microwave energy
were for military purposes. In later years, microwave energy has been applied as an
alternative to conventional convective and conductive heating and is used in many
industrial processes. Conventional heating relies upon conductive heat transfer from the
material surface to the interior; often associated with problems of cool centres and hot
surfaces, especially with insulating materials. Microwave heating differs by means of the
in-situ method of heating providing the prospect of uniform temperature distribution and
improved heating efficiencies.
Materials differ in their ability to absorb microwave energy in an applied electric field.
Each material has a particular optimum frequency which can be measured. However, in
practice, for interference reasons the nearest practicable permitted frequency is used.
High frequencies are used for many purposes: broadcasting, communications, navigation,
and specific bands are allocated to industrial, scientific and medical purposes (Table 2.1 ).
4
Chapter 2 Dielectric heating
Wavelength (run) Electro-magnetic Spectrum Frequency (Hz)
0.0003 1 x 10²¹y-rays0.03 1 x 10¹⁹
10 X-rays 3 x 10¹⁶
30 Ultraviolet 1 x 10¹⁶
400 Visible 8 x 10¹⁴
800 4 x 10¹⁴
1000 Infrared 3 x 10¹⁴
3 x 10⁵ 1 x 10¹²
3 x 10⁷ Microwaves 1 x 10¹⁰
3 x 10¹¹ Radio Frequency 1 x 10⁶
3 x 10¹³ 1 x 10⁴
Figure 2.1 The Electro-magnetic Spectrum
Table 2.1 Frequency ranges allocated for industrial, scientific and medical purposes(Metaxas 1990)
Frequency Frequency Area permitted(MHz) tolerance ±433.92 0.2% Austria, Netherlands, Portugal, Switzerland,
Germany896 10MHz UK915 13 MHz North and South America2375 50 MHz Albania, Bulgaria, Czechoslovakia, Hungary,
Romania, CIS2450 50 MHz Worldwide except where 2375MHz is used3390 0.6% Netherlands5800 75MHz Worldwide6780 0.6% Netherlands24150 125 MHz Worldwide40680 - UK
5
Chapter 2 Dielectric heating
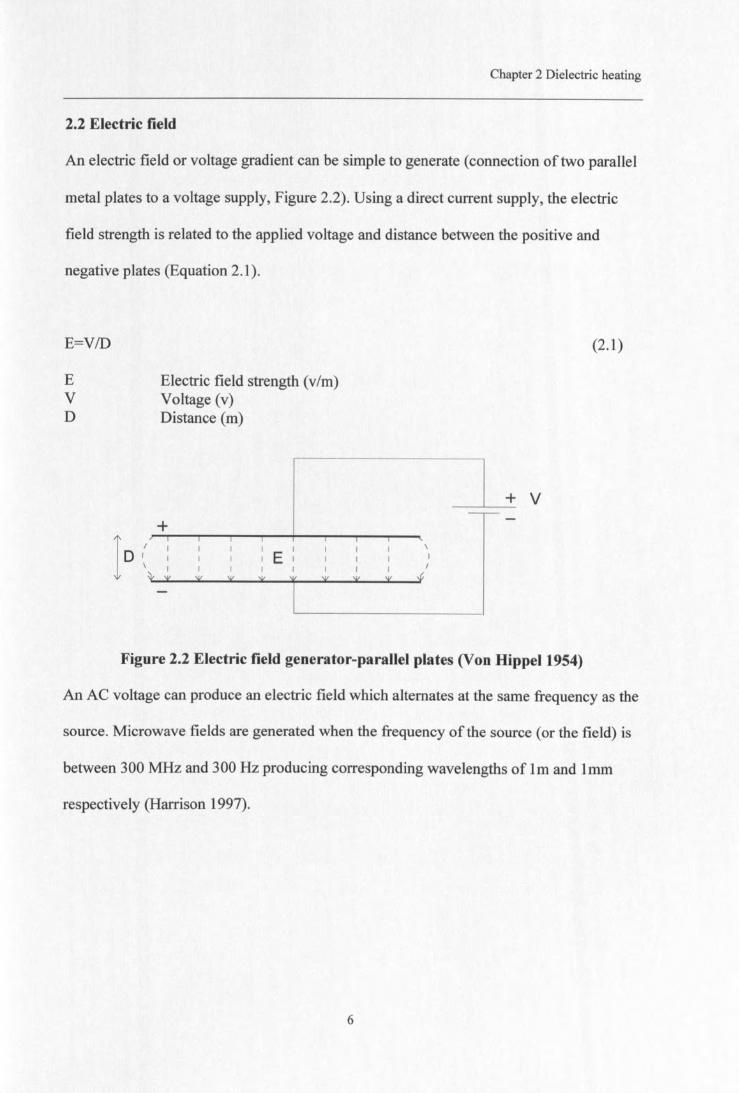
2.2 Electric field
An electric field or voltage gradient can be simple to generate (connection of two parallel
metal plates to a voltage supply, Figure 2.2). Using a direct current supply, the electric
field strength is related to the applied voltage and distance between the positive and
negative plates (Equation 2.1).
E=VID (2.1)
EVD
Electric field strength (v/m)Voltage (v)Distance (m)
+ V
+
ID ( I I I I I \
I I I I E I I I I
I I I I I I I I I
~ ':jI ':jI \I( * 1 \I( \I( \I( :f
Figure 2.2 Electric field generator-parallel plates (Von Hippel1954)
An AC voltage can produce an electric field which alternates at the same frequency as the
source. Microwave fields are generated when the frequency of the source (or the field) is
between 300 MHz and 300 Hz producing corresponding wavelengths of 1m and 1mm
respectively (Harrison 1997).
6
Chapter 2 Dielectric heating
2.3 Polarisation
When a material is placed within an alternating electric field (radio - microwave
frequencies) the material will polarise depending upon its molecular structure.
Polarisation follows the direction of the electric field and realigns at the same frequency.
This realignment of the molecules or shift of electron matrix produces a frictional in-situ
mode of heating. There are four principal forms of polarisation (dependent on material
properties and the applied electric field) that are affected the most by microwave fields
and are believed to be responsible for microwave heating.
Electron polarisation arises when the material has a positively-charged centre or nuclei
surrounded by a negatively-charged electron cloud. When the material is placed within an
electric field the electrons are displaced producing a temporary dipole movement (metallic
bonded molecules).
Atomic (or Ionic) polarisation occurs due to the distortion of atoms within molecules of
ionic molecular bonds. The applied electromagnetic field acts upon these molecules
causing their charge equilibrium position to change, inducing polarisation.
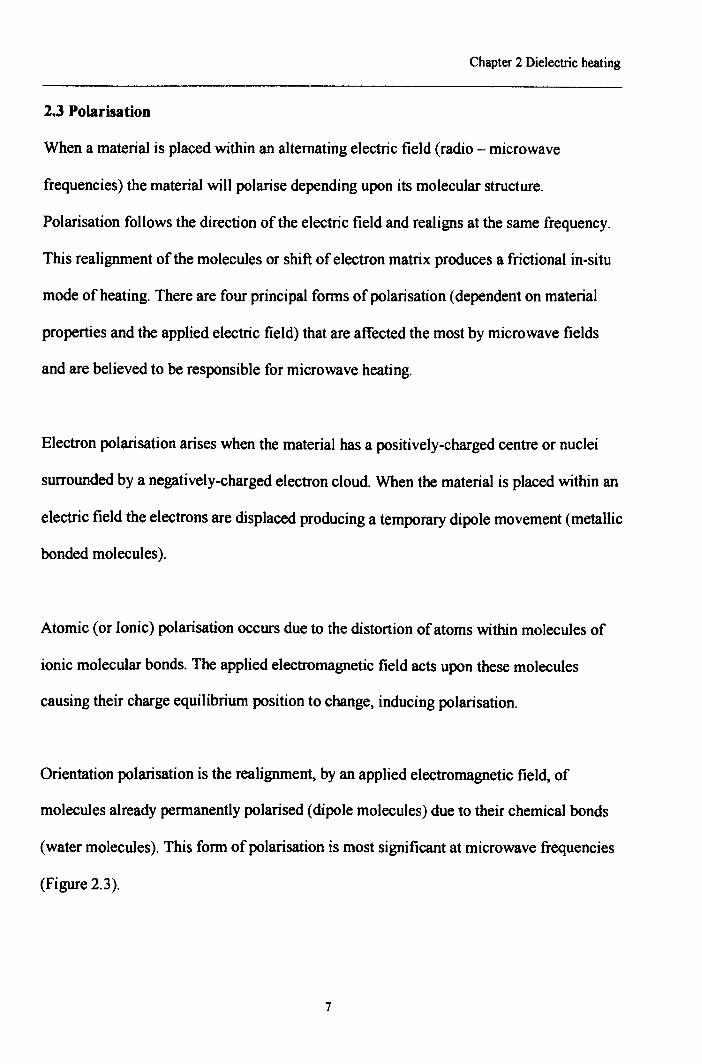
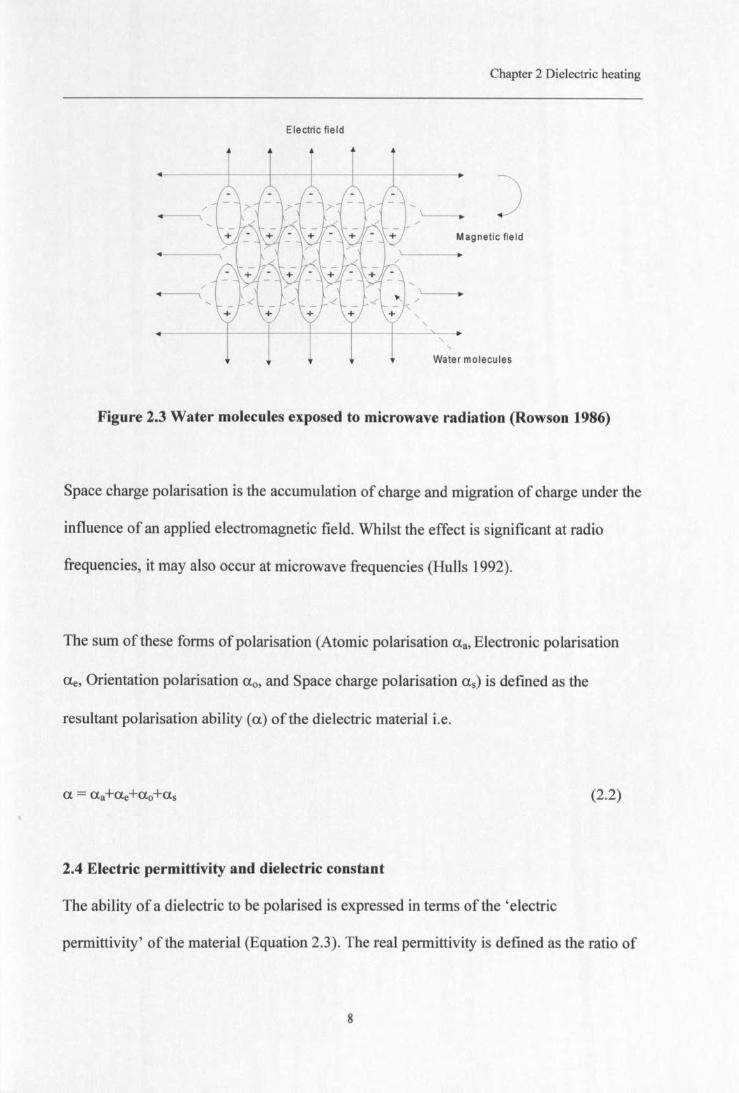
Orientation polarisation is the realignment, by an applied electromagnetic field, of
molecules already permanently polarised (dipole molecules) due to their chemical bonds
(water molecules). This form of polarisation is most significant at microwave frequencies
(Figure 2.3).
7
Chapter 2 Dielectric heating
Electric field
Magnetic field
"-,
-,
Water molecules
Figure 2.3 Water molecules exposed to microwave radiation (Rowson 1986)
Space charge polarisation is the accumulation of charge and migration of charge under the
influence of an applied electromagnetic field. Whilst the effect is significant at radio
frequencies, it may also occur at microwave frequencies (Hulls 1992).
The sum of these forms of polarisation (Atomic polarisation aa, Electronic polarisation
ae, Orientation polarisation aa, and Space charge polarisation as) is defined as the
resultant polarisation ability (a) of the dielectric material i.e.
(2.2)
2.4 Electric permittivity and dielectric constant
The ability of a dielectric to be polarised is expressed in terms of the' electric
permittivity' ofthe material (Equation 2.3). The real permittivity is defined as the ratio of
8
Chapter 2 Dielectric heating
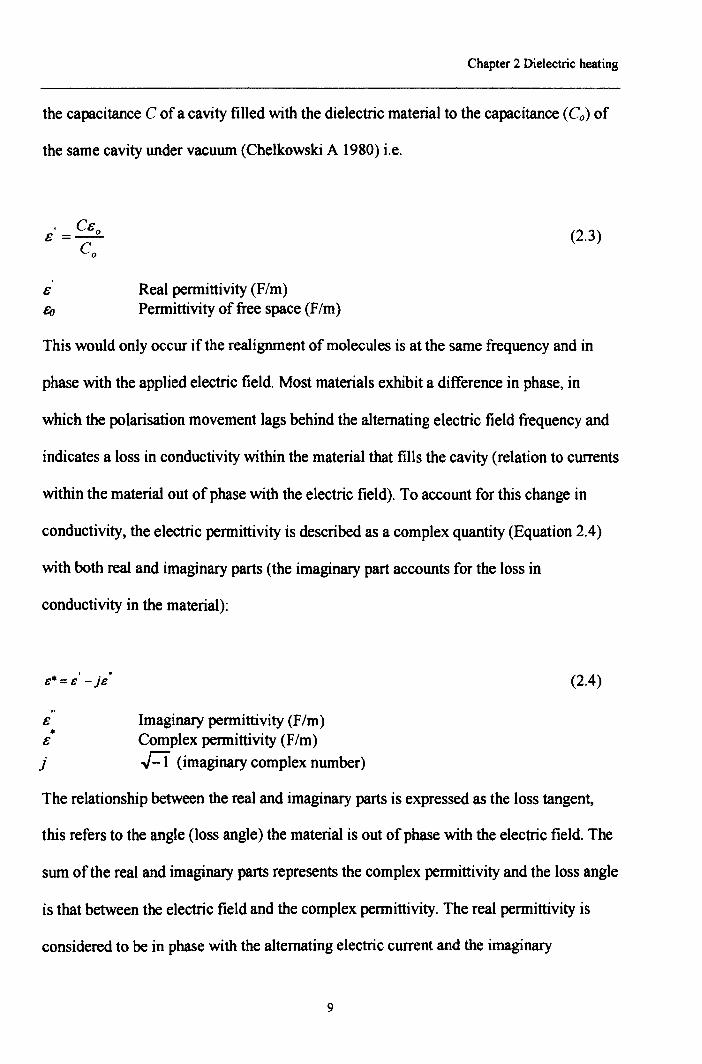
the capacitance C of a cavity filled with the dielectric material to the capacitance (Co) of
the same cavity under vacuum (Chelkowski A 1980) i.e.
(2.3)
Real permittivity (F/m)Permittivity of free space (F/m)
This would only occur if the realignment of molecules is at the same frequency and in
phase with the applied electric field. Most materials exhibit a difference in phase, in
which the polarisation movement lags behind the alternating electric field frequency and
indicates a loss in conductivity within the material that fills the cavity (relation to currents
within the material out of phase with the electric field). To account for this change in
conductivity, the electric permittivity is described as a complex quantity (Equation 2.4)
with both real and imaginary parts (the imaginary part accounts for the loss in
conductivity in the material):
s· = s' - js' (2.4)
e Imaginary permittivity (F1m)•e Complex permittivity (F/m)
j ..J-l (imaginary complex number)
The relationship between the real and imaginary parts is expressed as the loss tangent,
this refers to the angle (loss angle) the material is out of phase with the electric field. The
sum of the real and imaginary parts represents the complex permittivity and the loss angle
is that between the electric field and the complex permittivity. The real permittivity is
considered to be in phase with the alternating electric current and the imaginary
9
Chapter 2 Dielectric heating
permittivity represents the phase lag i.e. the tangent of the angle between the sum of the
two parts (complex permittivity) and the real permittivity is equal to the imaginary part
divided by the real. The loss tangent (tan d) can be used to represent the fraction of stored
energy lost per period of field oscillation:
e"= e'.tand (2.5)
The parameters can be evaluated, the real permittivity can be measured from the
capacitance ratio described in Equation 2.3, and the imaginary permittivity is evaluated
from measurements of the loss angle. However, their magnitudes are generally low
(approximately 10-10 F/m) and the components are usually re-scaled by dividing the
permittivities by that of free space (8.85xlO-12 F/m). The resulting values are termed the
relative real permittivity (or relative dielectric constant) and the relative imaginary
permittivity (or relative loss factor).
2.4.1 Loss factor and dielectric conductivity
The ability or the receptiveness of a material to heating is known as the 'loss factor', the
higher the value of the loss factor the more receptive the material is to electric fields. In
general, materials with relative loss factors greater than 0.02 are considered possibly
candidates for dielectric heating. The ability or receptiveness to microwave heating is
often expressed in terms of the dielectric conductivity (Equation 2.6), which can be
calculated from known values of the loss factor and the applied frequency.
10
Chapter 2 Dielectric heating
(2.6)
Dielectric conductivity (s/O)Angular frequency (S-I)
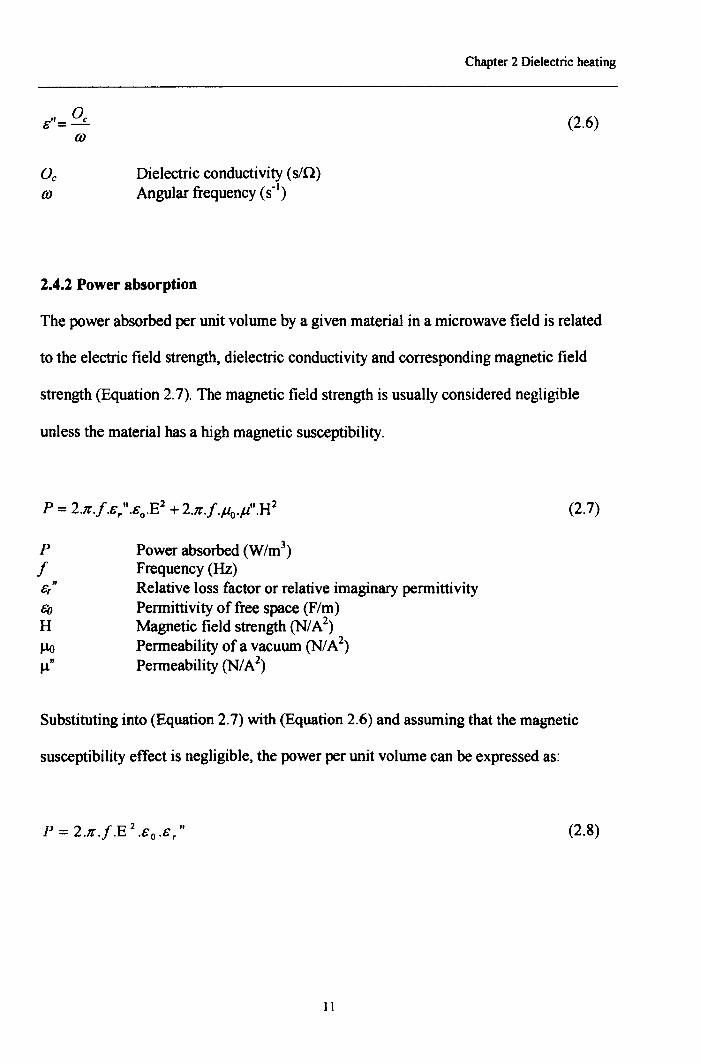
2.4.2 Power absorption
The power absorbed per unit volume by a given material in a microwave field is related
to the electric field strength, dielectric conductivity and corresponding magnetic field
strength (Equation 2.7). The magnetic field strength is usually considered negligible
unless the material has a high magnetic susceptibility.
(2.7)
Power absorbed (W/m3)Frequency (Hz)Relative loss factor or relative imaginary permittivityPermittivity of free space (F/m)Magnetic field strength (NIA2)Permeability of a vacuum (NIA2)Permeability (NIA2)
p
fEr"
Substituting into (Equation 2.7) with (Equation 2.6) and assuming that the magnetic
susceptibility effect is negligible, the power per unit volume can be expressed as:
P = 2.1t.f.E 2 .Eo .e ," (2.8)
11
Chapter 2 Dielectric heating
It is can be seen from Equation 2.8 that the power absorbed is proportional to the square
of the electric field strength i.e. PocE 2. This indicates that the generation of high electric
field strengths represents a possible method of rapidly accelerating power absorption.
2.4.3 Heating rate
The theoretical heating rate of a specific material within a microwave cavity can be
evaluated providing the dielectric and physical properties of the material and microwave
are known. Using accepted standard theories regarding heating rates i.e.
oQ = M.Cp- (2.9)t
Q Energy absorbed or produced (W)M Mass of the body heating (kg)Cp Specific heat capacity (J/kg)o Change in temperature eC)t Change in time (s)
Manipulating this (Equation 2.9) and substituting (Equation 2.8) for the power absorbed a
theoretical heating rate can be expressed in terms of dielectric properties.
(2.10)
pV
Density of material (kg/m')Volume of material (m3
)
12
Chapter 2 Dielectric heating
2.4.4 Penetration depth
Using dielectric principles, relationships for penetration depth of microwave radiation
have been proposed (Metaxas 1983).
D, Penetration depth of wave (m)Sr Relative dielectric constant or relative real permittivity'A. Wavelength (m) 'A.=c/fc Speed oflight (mls) 3x10⁸ m/s&," Relative loss factor or relative imaginary permittivity
13
Chapter 2 Dielectric heating
2.5 Factors effecting the dielectric field
A number of controlling factors affect a material's ability to absorb microwave radiation
within a dielectric field. In particular these are, the material temperature, chemical
composition and the frequency and strength of the applied electric field.
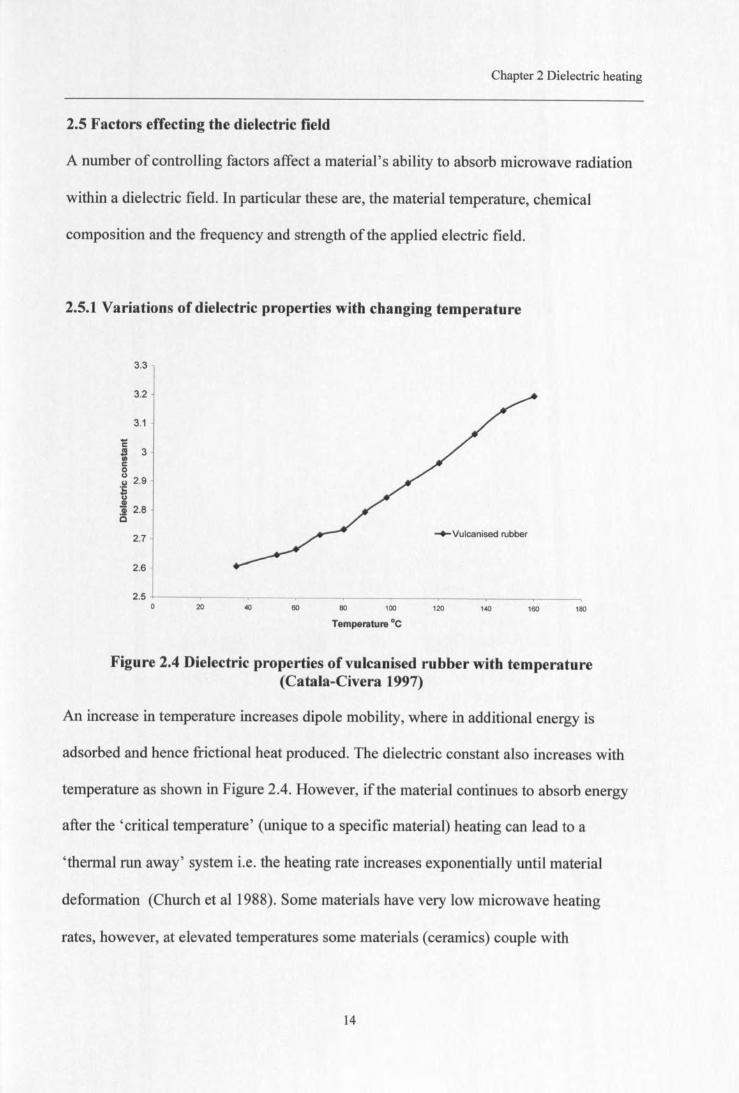
2.5.1 Variations of dielectric properties with changing temperature
~ Vulcanised rubber
60 80 100 120 140 160 180
Temperature °c
Figure 2.4 Dielectric properties of vulcanised rubber with temperature(Catala-Civera 1997)
An increase in temperature increases dipole mobility, where in additional energy is
adsorbed and hence frictional heat produced. The dielectric constant also increases with
temperature as shown in Figure 2.4. However, if the material continues to absorb energy
after the 'critical temperature' (unique to a specific material) heating can lead to a
'thermal run away' system i.e. the heating rate increases exponentially until material
deformation (Church et aI1988). Some materials have very low microwave heating
rates, however, at elevated temperatures some materials (ceramics) couple with
14
Chapter 2 Dielectric heating
microwaves and absorb microwave energy. Such materials would require initial heating
from another source until the particular temperature is reached for microwave
susceptibility, after which the material is receptive to microwaves and can be further
heated by microwave energy.
2.5.2 Effect of microwave frequency on dielectric properties
Dielectric constant varies with frequency and those for specific minerals may resonate at
a particular frequency. The latter are considered as the optimum value for the material
absorption capability. Resonant frequencies depend upon the dielectric properties of the
material, and hence it's physico-chemical characteristics (composition, moisture content,
mineral matter distribution, crystal structure, particle size, and density/voidage).
2.5.3 Chemical composition and distribution
Natural materials may contain a range of chemical compounds which may vary in their
receptiveness to microwave radiation. Hence, both the chemical composition and
distribution of receptive compounds will affect the overall heating of a material. The
latter can be enhanced by 'doping' (blending) materials which show a poor propensity for
microwave heating with those having more receptive features to improve heating.
15
Chapter 2 Dielectric heating
2.5.3.1 Water content
Water is a good absorber of microwave radiation and the drying of wet materials can be
highly efficient by microwave heating; more so than by convective heating and, in
particular, if the material contains inherent moisture and where temperatures exceeding
100°C are required. Similar principles apply with regard to net heating effects (Section
2.5.3).
2.5.3.2 Particle size
Some authors report that loss factors increase linearly with decreased particle size
(Andres 1988, Walkiewicz 1988); other workers claim their heating rates vary according
to material and particle size range. Standish et al (1989) demonstrated the effect of
particle size on heating rates on silica. Heating rates showed an initial decrease with
increasing particle size (O.2-0.5mm) and a subsequently increase with increasing particle
size, peaking at -1.5mm, particle coarser than 1.5mm showed further reductions in
heating rates.
2.6 Microwave technology
The majority of industrial microwave units consist of three components. The generator,
which converts the power supplied into microwave energy, the waveguide which carries
the energy to the applicator from which the radiation is distributed to the product.
16
Chapter 2 Dielectric heating
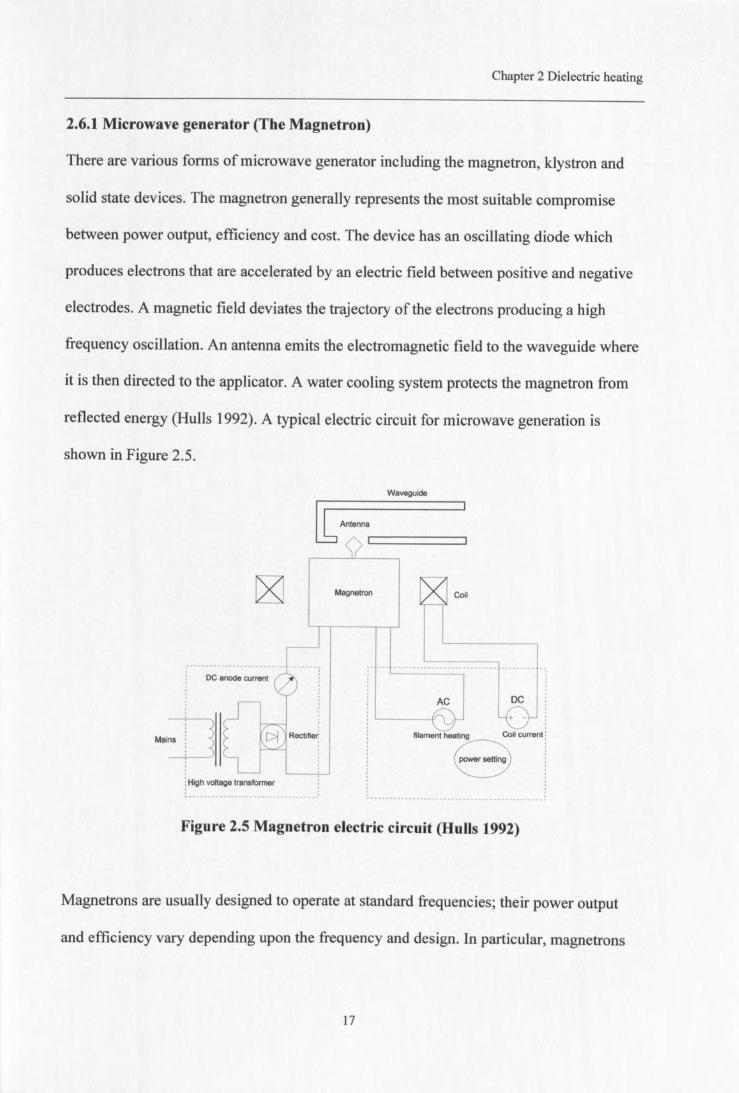
2.6.1 Microwave generator (The Magnetron)
There are various forms of microwave generator including the magnetron, klystron and
solid state devices. The magnetron generally represents the most suitable compromise
between power output, efficiency and cost. The device has an oscillating diode which
produces electrons that are accelerated by an electric field between positive and negative
electrodes. A magnetic field deviates the trajectory of the electrons producing a high
frequency oscillation. An antenna emits the electromagnetic field to the waveguide where
it is then directed to the applicator. A water cooling system protects the magnetron from
reflected energy (Hulls 1992). A typical electric circuit for microwave generation is
shown in Figure 2.5.
Waveguide
Magnetron Coil
DC anode current
AC DC
: High voltage transformer
~- - - - -- - - - - - - - - - - - - --- - - - - - - - - - - - --'
Figure 2.5 Magnetron electric circuit (Hulls 1992)
Magnetrons are usually designed to operate at standard frequencies; their power output
and efficiency vary depending upon the frequency and design. In particular, magnetrons
17
Chapter 2 Dielectric heating
with an operating frequency of 2.45GHz have a typical power output between 0.6 to 6kW
and an overall efficiency of50%-60%. A greater efficiency (80%-90%) can be achieved
with magnetrons of a frequency range 896/915MHz, these magnetrons can also provide
higher power outputs (up to 60kW).
2.6.2 Waveguides
The purpose of waveguides is to direct the incident microwave to the load (material
absorbing the microwave energy). Waveguides are generally in the form of rectangularly
shaped truncking fabricated from conducting materials (copper, brass or aluminium);
typically, metals reflect microwaves and absorb little energy.
2.6.3 Incident and reflected power, circulators
If the incident microwave is totally absorbed by the load (i.e. assuming negligible losses
in the waveguide) then the load can be considered as 'matched'. However, if some of the
incident wave is reflected from the load; then reflected radiation may travel back to the
generator and give rise to a mismatched load whereby the incident and reflected waves
interfere and produce standing waves. The latter lead to significant localised increases in
electric field strength that may cause overheating of the generator or give rise to arcing
near the antenna. As reflected microwaves can reduce the operating life of the generator,
industrial applicators are equipped with circulators. The latter redirect the reflected wave
to another absorber (another matched load, usually a water-cooled) to prevent reflected
waves reaching the generator.
18
Chapter 2 Dielectric heating
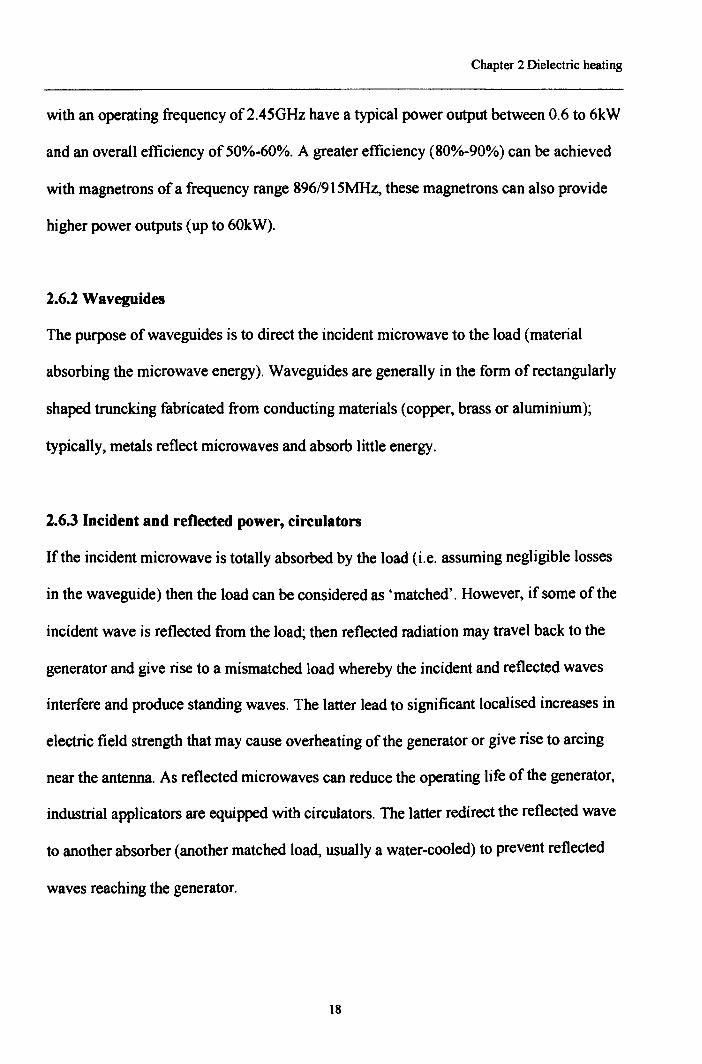
2.6.4 Applicators
An applicator is that part of the Load
microwave equipment whereby the
electromagnetic energy is transferred to
the load. The applicators vary in design
(depending on microwave use) and
Waveguideapplicator
Water cooledmatched load
operating features (size of the load and
whether the process is continuous or Figure 2.6 The progressive waveguideapplicator (Hulls 1992)batch). To prevent leakage of radiation
most applicators have the appearance are
of the form of metallic boxes designed to reflect the electromagnetic energy within them.
The progressive wave applicator (Figure 2.6), mono-mode cavity (Figure 2.7) and multi-
mode cavity (Figure 2.8) are the most common design of applicators. The progressive
wave applicator has a folded rectangular waveguide that the load continuously passes
through absorbing the energy
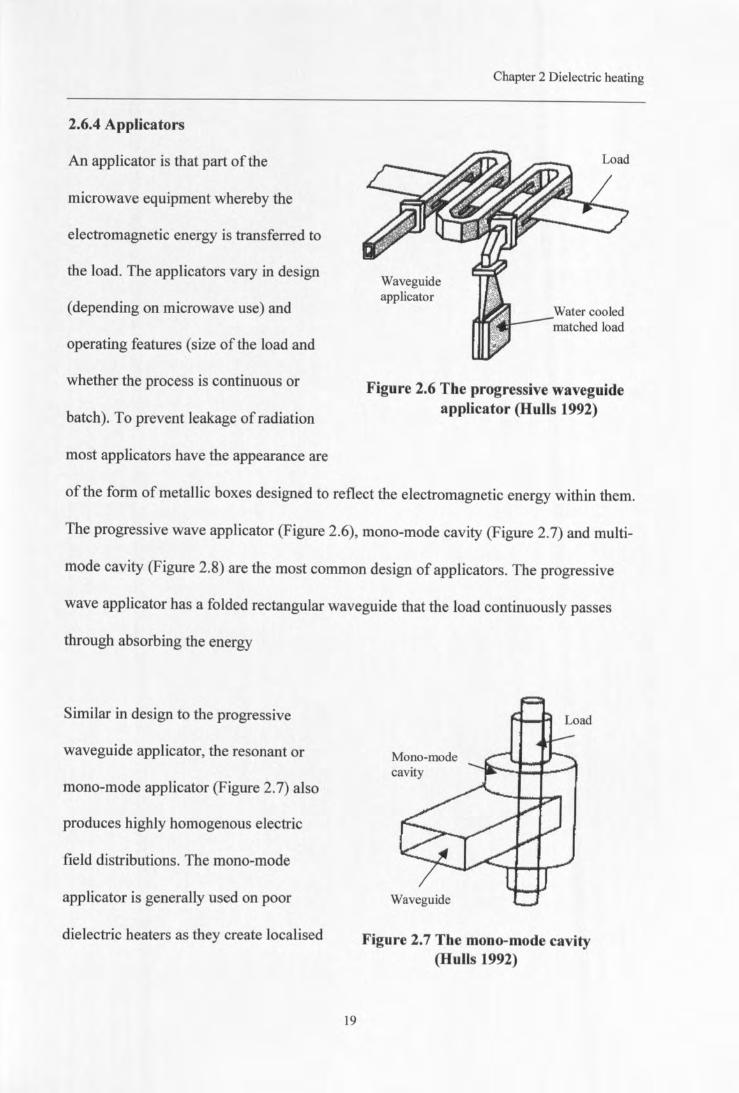
waveguide applicator, the resonant or Mono-modecavity
Similar in design to the progressive
mono-mode applicator (Figure 2.7) also
produces highly homogenous electric
field distributions. The mono-mode
applicator is generally used on poor Waveguide
dielectric heaters as they create localised Figure 2.7 The mono-mode cavity(Hulls 1992)
19
Chapter 2 Dielectric heating
increases in electric field strength within the load.
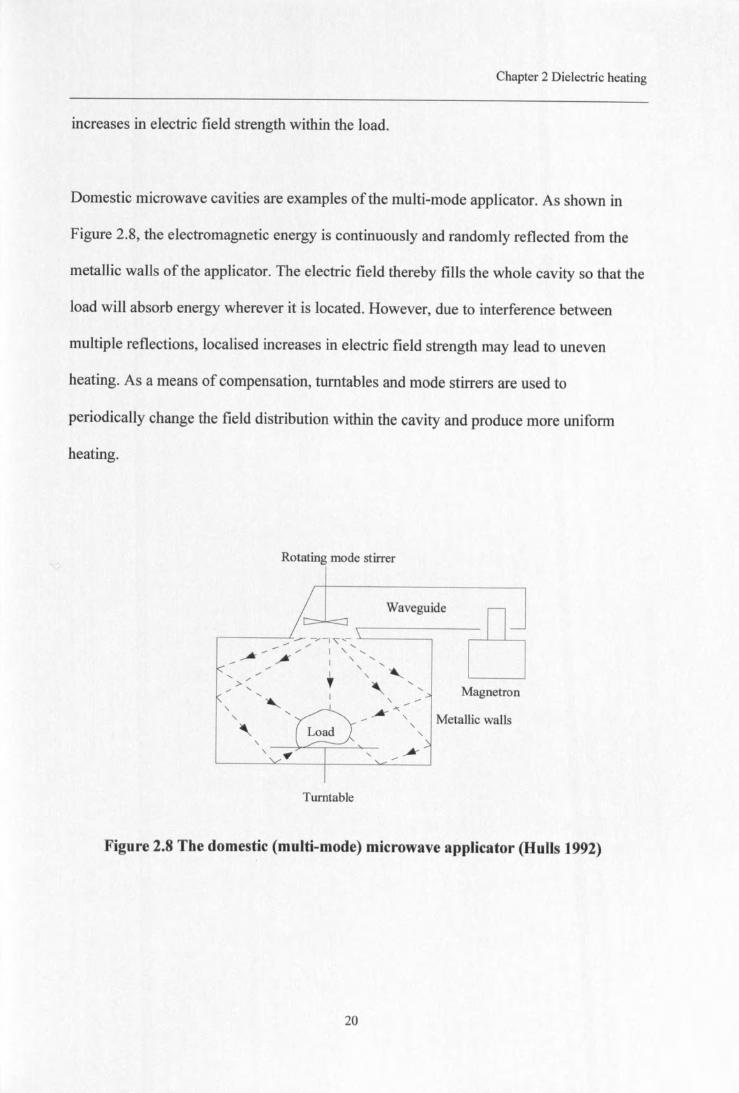
Domestic microwave cavities are examples of the multi-mode applicator. As shown in
Figure 2.8, the electromagnetic energy is continuously and randomly reflected from the
metallic walls of the applicator. The electric field thereby fills the whole cavity so that the
load will absorb energy wherever it is located. However, due to interference between
multiple reflections, localised increases in electric field strength may lead to uneven
heating. As a means of compensation, turntables and mode stirrers are used to
periodically change the field distribution within the cavity and produce more uniform
heating.
Rotating mode stirrer
- -- .......- .......-!~ -c- ......
~--;' I'"-- ~ I'"- ,, "--,
Waveguide
" /' ",,>,
-, "-- -,-,,
-,, ~
, -_Ar-'<- ,
-,,
Magnetron
Metallic walls
Turntable
Figure 2.8 The domestic (multi-mode) microwave applicator (Hulls 1992)
20
CHAPTER THREE
COAL CHARACTERISTICS AND PHYSICAL PROPERTIES
3.1 Introduction-Coal characteristics and physical properties
This section describes those principle physico-chemical properties of coals considered to
affect their structure, heating characteristics and breakage characteristics. A brief
summary of the current UK coal market and prospects are discussed.
3.2 Coal structure
Coal is a complex, heterogeneous, hydrocarbon-based mineral which has been formed
over many years by a succession of changing geological stages. The initial (diagenetic)
stage is represented by an accumulation of active peat and this is followed by a
metamorphic stage arising from changes in the geological features. In particular,
overlaying and geothermal stresses effect the coal physical structure and its chemical
properties (moisture and volatility). The metamorphic process progressively converts the
original accumulated peat to a material of a similar structure to that of graphite.
Coals are ranked according to their extent of metamorphism. Typically, the older the coal
the higher the rank, anthracite and lignite may be designated as high and low rank coals
respectively. The most useful properties of the coal which define its rank are considered
to be the carbon content, volatile matter and moisture content together with the calorific
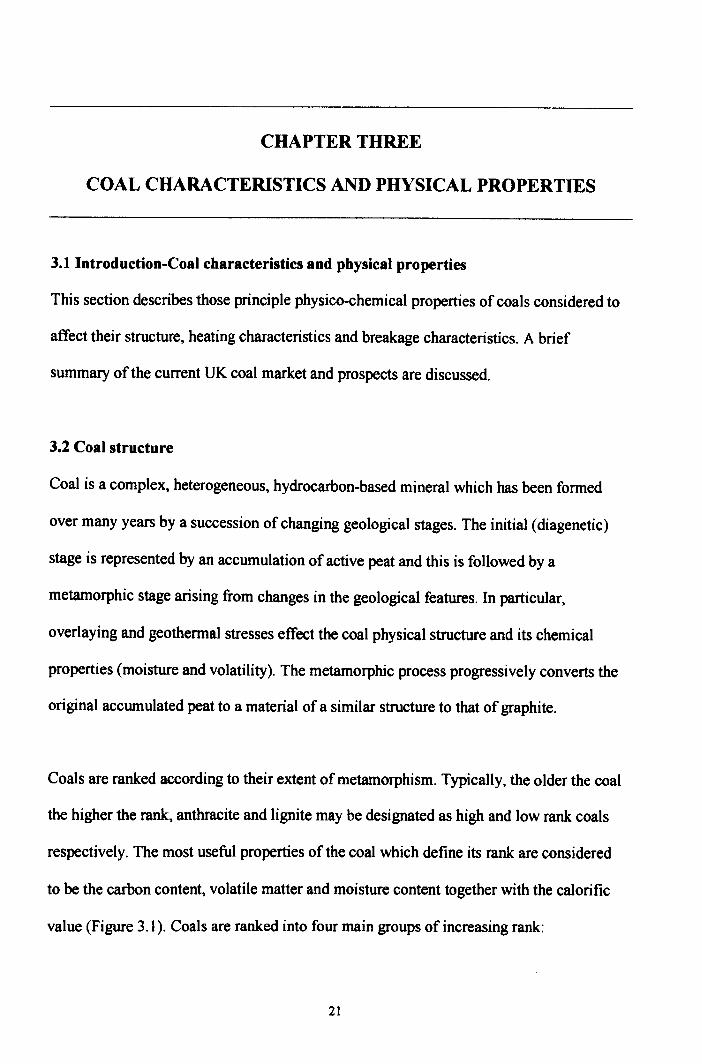
value (Figure 3.1). Coals are ranked into four main groups of increasing rank:
21
Chapter 3 Coal characteristics and physical properties
(Low rank) Lignite ~Sub-bituminous~Bituminous~Anthracite (High rank)
Low rank ./ High rankRank Lignite -+ Sub-bituminous -+ Bituminous -+ AnthraciteAge ..... Increases ....
-:: (Carbon content % ~ Increases ~Volatile matter % ,- Decreases ,-Moisture content % Decreases .....
-+ Increases,-Calorific value ..... Increases .....
./ ...
Figure 3.1 Dependency of coal property on rank(Elliot 1981)
Each of the four main groups of coal rank (Figure 3.1) are split into sub-groups which are
usually defmed according to the physical and chemical properties of the coal. Figure 3.2
shows the variation in coal moisture content, volatile matter content and fixed carbon
(ash-free basis) for a wide range of coals.
100
•,..10
I.
Coal rank (fixed carbon, mineral-free basis)
Figure 3.2 Coal rank based upon mineral matter free proximate analysis(Elliot 1981)
22
Chapter 3 Coal characteristics and physical properties
The ash content of coal although a major feature in some coal process utilisation is not
considered as a measure of coal rank. Ash content is a measure of the oxidised products
of the associated mineral matter constituents, these generally include eleven mineral
compounds: pyrite, ankerite, gypsum, dolomite, apatite, calcite, mica, kaolin, quartz,
rutile and siderite.
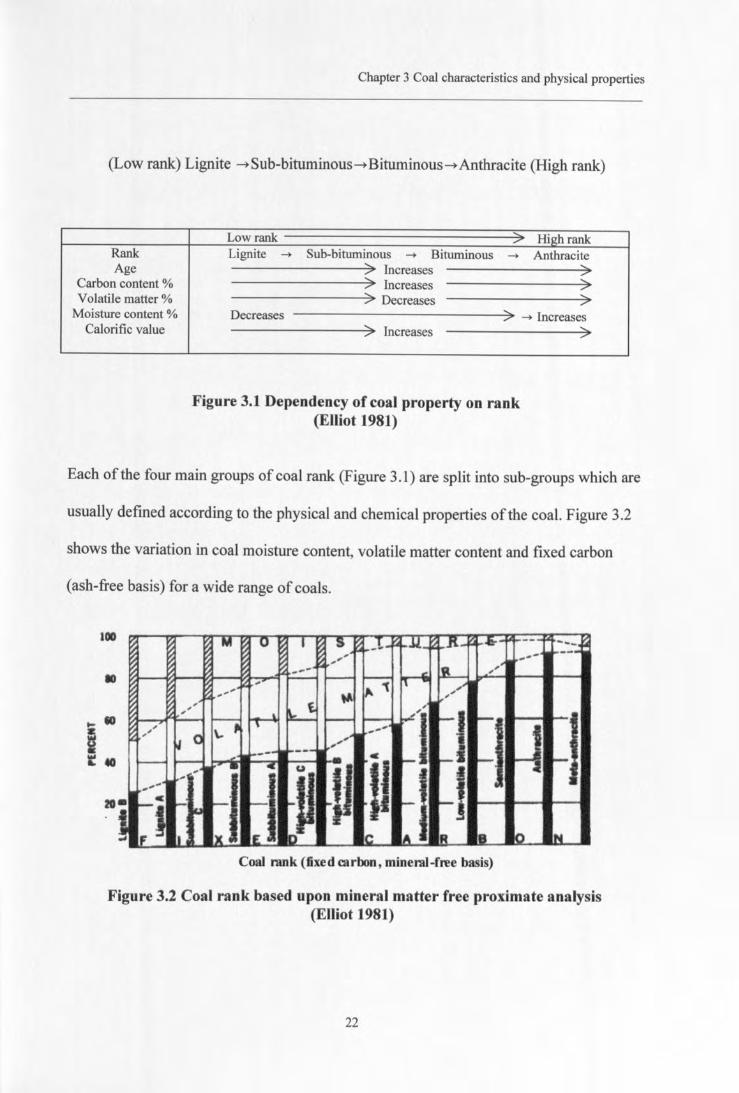
The calorific value of coal is defmed as its energy release associated with complete
combustion and represents an effective way of expressing the fuel potential of the coal.
16000
14000
12000
.l!l'§ 10000
] 8000
-fii•.:;J·c~ 6000
(!)
.8 4000ro:>o!E... 2000.QroCJ
0
..... r-........"' ....-.......
,, r-- ....,, -,
,.",',
,,".,
gj," 0.., 1 ~
0, gj gj gj J," j j j t ~ ../' .I:l .1I.., .I:l .I:l .I:l > ~ j .~ j, U I:Q «
~~ j, ..
~.. .~,
U I:Q « j I ~ ~,
rg rg g ~ "0 ~ 00>
j I J ! it« I:Q .I:l .I:l1·i -§ -§ -§fIl fIl 00
• ;.::l
Low Coal rank HIgh
Figure 3.3 Calorific value against coal rank (mineral matter free basis)(Elliot 1981)
Calorific value generally increases with coal rank (Figure 3.3). Usually the main
components controlling the energy release capabilities are moisture, volatile matter and
23
Chapter 3 Coal characteristics and physical properties
total carbon content. Increasing moisture reduces the calorific value as seen for low rank:
coals; increasing volatile matter tends to increase the calorific value and this leads to the
feature of medium rank: coals having a slightly higher heating value than high rank: coals.
II II, Io s
It"u II \/'I r~-~'IIif'"){II nuAoA ..
IIIf: It: I
H-("-II
5
IsII~Ctl)
O~N~ 11
N O'c~1t 6 'II If ,HI ~ 0H
II "H tt-('-II,
HIf
H II H 6
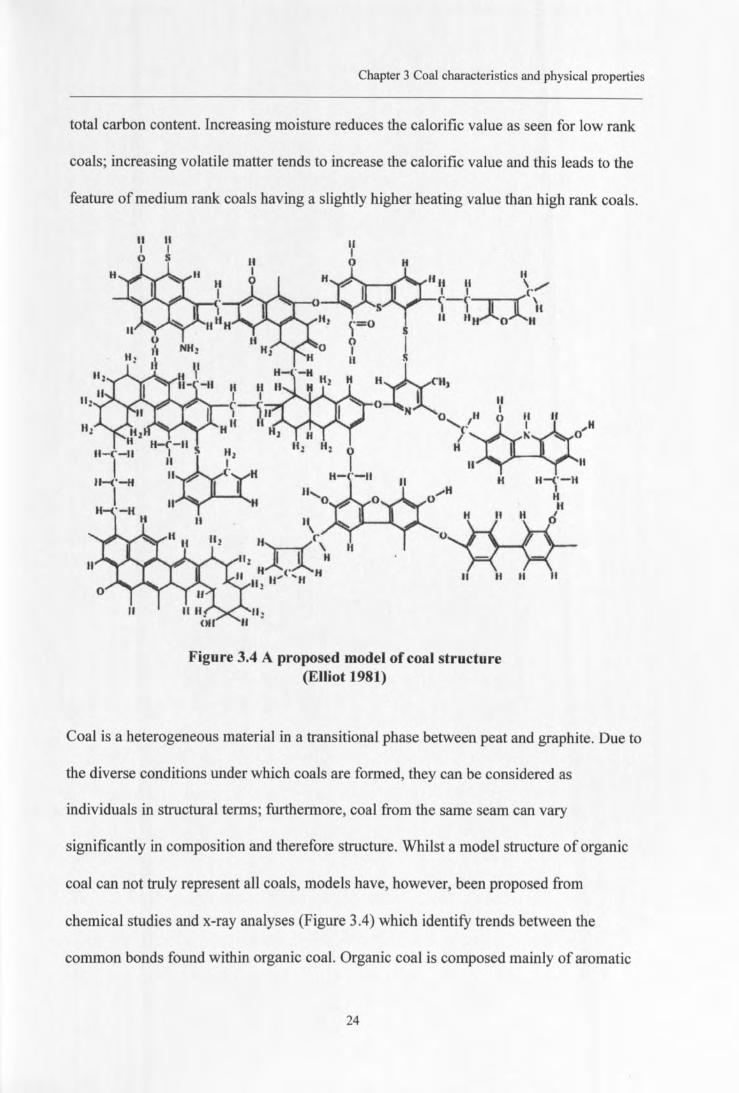
Figure 3.4 A proposed model of coal structure(Elliot 1981)
Coal is a heterogeneous material in a transitional phase between peat and graphite. Due to
the diverse conditions under which coals are formed, they can be considered as
individuals in structural terms; furthermore, coal from the same seam can vary
significantly in composition and therefore structure. Whilst a model structure of organic
coal can not truly represent all coals, models have, however, been proposed from
chemical studies and x-ray analyses (Figure 3.4) which identify trends between the
common bonds found within organic coal. Organic coal is composed mainly of aromatic
24
Chapter 3 Coal characteristics and physical properties
and hydroaromatic groups linked by functional hydrocarbons. The functional
hydrocarbon groups are believed to be the structures that break or join aromatic groups
during coal pyrolysis and coalification. Studies have indicated that the number of linked
aromatic groups increase with the rank of coal, the greatest transition being between
bituminous and anthracite coals. This may be one of the reasons why the grindability
increases with medium coal rank (Section 3.4).
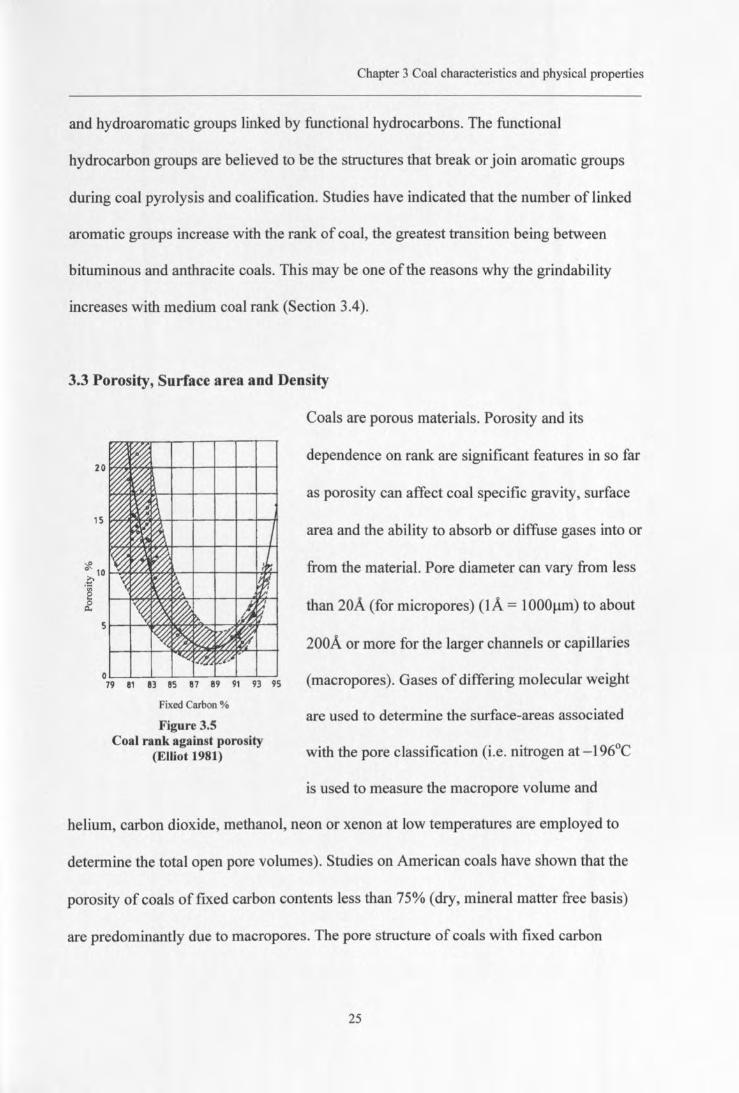
3.3 Porosity, Surface area and Density
Fixed Carbon %
Figure 3.5Coal rank against porosity
(Elliot 1981)
Coals are porous materials. Porosity and its
dependence on rank are significant features in so far
as porosity can affect coal specific gravity, surface
area and the ability to absorb or diffuse gases into or
from the material. Pore diameter can vary from less
than 20A (for micropores) (lA = lOOOJ.lm)to about
200A or more for the larger channels or capillaries
(macropores). Gases of differing molecular weight
are used to determine the surface-areas associated
with the pore classification (i.e. nitrogen at -196°C
is used to measure the macropore volume and
helium, carbon dioxide, methanol, neon or xenon at low temperatures are employed to
determine the total open pore volumes). Studies on American coals have shown that the
porosity of coals of fixed carbon contents less than 75% (dry, mineral matter free basis)
are predominantly due to macropores. The pore structure of coals with fixed carbon
25
Chapter 3 Coal characteristics and physical properties
contents between 75% and 84% are predominantly of micropore and transitional pore
sizes; for coals of a fixed carbon content greater than 85%, the pores are predominantly
of micropore sizes (Elliot 1981). Whilst the total surface areas measured by the use of
different gases are often different, similar trends with coal rank are evident and the
surface area is primarily related to coal porosity. Low rank coals have a high porosity and
high surface area, which decrease as coal rank increases to approximately 85-90% fixed
carbon content; subsequently, porosity and surface area increases with increasing rank
(Figure 3.5).
3.4 Hardgrove Grindability Index
Several methods of determining coal grindability have been proposed, all based on the
use of roll crushers or ball mills. The most frequently used methods are those of Bond
(1961) and Hardgrove (1932). The latter test has become preferred (in view of
mechanical reliability of the mill and the ease of data evaluation) and in, 1951, was
adopted in a standardised form by ASTM Standards Committee (ASTM D409). Inuse, a
sample of coal of specified size range is charged into a captive ring-loaded mill which is
subsequently operated at a constant speed for a given time. The ensuing increase in coal
specific surface area is measured and compared with that of a standard coal
(pennsylvania Upper Kittaning seam) which has an assigned Hardgrove Grindability
Index (HOI) of 100. A coal that can be broken extensively has a high HOI.
26
Chapter 3 Coal characteristics and physical properties
•
•
• ••
• • • • • ·t• •
. .: •to zo la
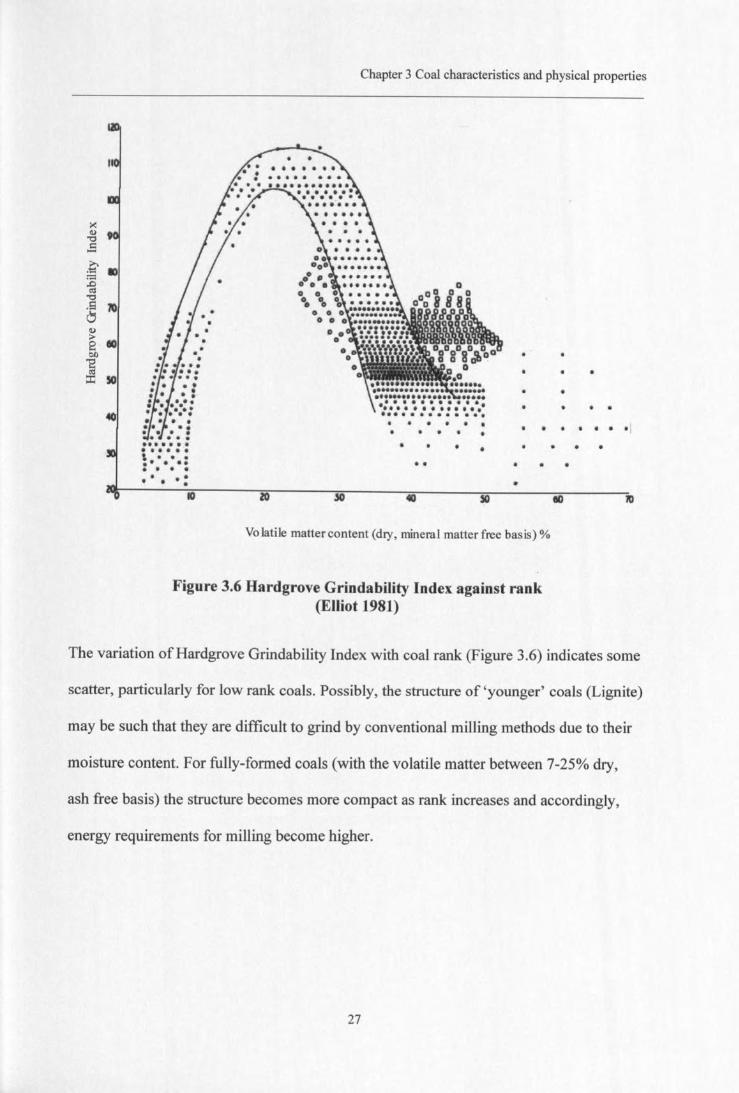
Volatile matter content (dry, mineral matter free basis) %
Figure 3.6 Hardgrove Grindability Index against rank(Elliot 1981)
The variation of Hardgrove Grindability Index with coal rank (Figure 3.6) indicates some
scatter, particularly for low rank coals. Possibly, the structure of 'younger' coals (Lignite)
may be such that they are difficult to grind by conventional milling methods due to their
moisture content. For fully-formed coals (with the volatile matter between 7-25% dry,
ash free basis) the structure becomes more compact as rank increases and accordingly,
energy requirements for milling become higher.
27
Chapter 3 Coal characteristics and physical properties
3.5 Flowability
This section describes those properties of coal which have a major effect on its bulk flow
characteristics. Particle size and shape are significant, and more generally, assemblies of
large, smooth or spherical particles flow more readily than fine, angular particles (which
can interlock or agglomerate in the presence of moisture or clay). In particular, free
moisture tends to promote agglomeration of fine particles, making the coal cohesive.
Usually, the most adversely affected coals are those oflow rank or with moisture
contents between 20-30%. Furthermore, soft (high HGI) or friable coals can break down
into fines which could collect moisture. Oxidised or weathered coals generally have
higher moisture retention abilities and finer particle sizes, which again lead to poor flow
characteristics. Mineral components may also adversely affect coal flow properties and,
in this respect, clays are significant, particularly the swelling type e.g. bentonite.
Additions of emulsions, dust suppressants and flotation reagents can also have an adverse
affect on the flow characteristics of coals and, in turn, these properties relate to the bulk
handling and storage characteristics of coals. Inparticular increased coal storage time and
consolidation pressure in bunkers and surface characteristics of coals (oxidation etc) can
promote flow problems.
3.6 Coal dependent utilities
Coal remains the principle source of foundry and metallurgical coke used in the
production of iron and steel. Other industries such as cement, brick, fireclay, refractories,
glass and other chemical industries are also consumers. However, the coal consumption
in these industries is far less than that of power generation. Additionally, domestic coal
28
Chapter 3 Coal characteristics and physical properties
combustion has declined in Europe and North America since the introduction of clean air
legislation and the use of other fuels for space heating (gas, oil and electricity).
Within the United Kingdom, the current major market for coal is power generation in
spite of competition from natural gas and oil.
3.7 The current UK coal situation
UK coal production for industrial and domestic coal combustion has declined in response
to demand. In some cases, electricity has been used directly and in others, alternative,
cleaner fuels have been used in compliance with government legislation. Power
generation (pulverised fuel firing-PF) remains the major consumer of UK coal but
tonnage have been reduced (significantly since 1995) because of competition from other
fuels.
New technologies are required to maintain competitiveness. Major outstanding problems
in fine coal combustion (particularly gas emission levels) are receiving much attention
with regard to the use of cleaner coal and/or improved combustion control technologies.
Furthermore, reductions in process energy requirements would also benefit existing
power stations. It should be appreciated that many current PF power stations have
considerable operational life expectancies and new technologies would be most suitable
if they can be integrated into existing plant.
29
Chapter 3 Coal characteristics and physical properties
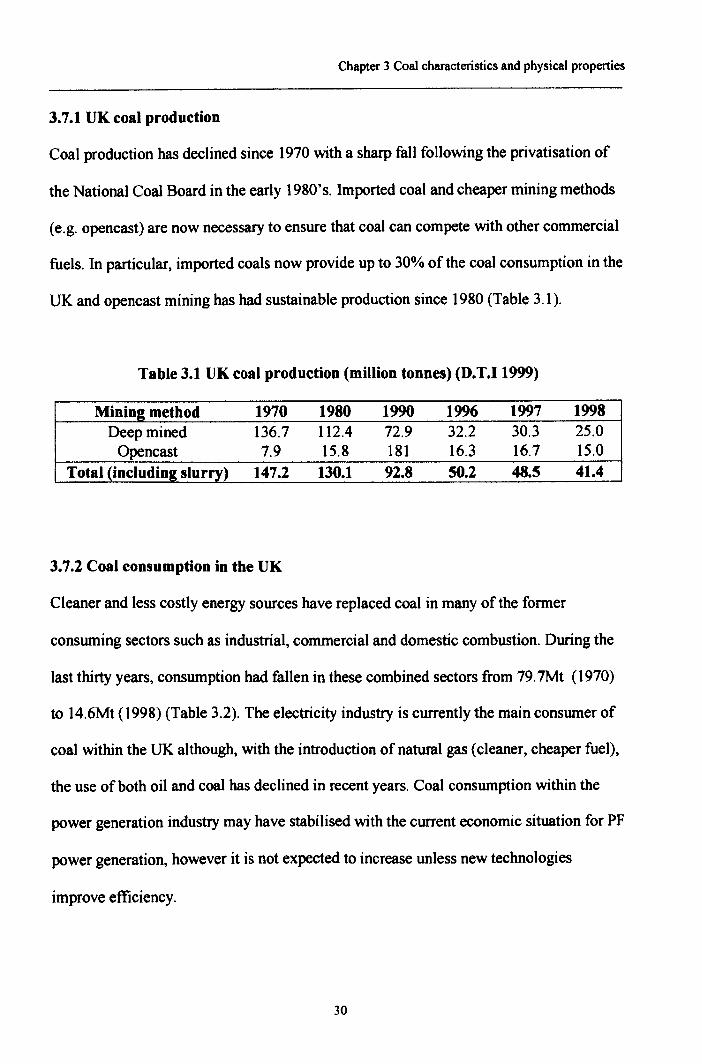
3.7.1 UK coal production
Coal production has declined since 1970 with a sharp fall following the privatisation of
the National Coal Board in the early 1980's. Imported coal and cheaper mining methods
(e. g. opencast) are now necessary to ensure that coal can compete with other commercial
fuels. In particular, imported coals now provide up to 30% of the coal consumption in the
UK and opencast mining has had sustainable production since 1980 (Table 3.1).
Table 3.1 UK coal production (million tonnes) (D.T.I 1999)
Minin2 method 1970 1980 1990 1996 1997 1998Deep mined 136.7 112.4 72.9 32.2 30.3 25.0Opencast 7.9 15.8 181 16.3 16.7 15.0
Total (including slurry) 147.2 130.1 92.8 50.2 48.5 41.4
3.7.2 Coal consumption in the UK
Cleaner and less costly energy sources have replaced coal in many of the former
consuming sectors such as industrial, commercial and domestic combustion. During the
last thirty years, consumption had fallen in these combined sectors from 79.7Mt (1970)
to 14.6Mt (1998) (Table 3.2). The electricity industry is currently the main consumer of
coal within the UK although, with the introduction of natural gas (cleaner, cheaper fuel),
the use of both oil and coal has declined in recent years. Coal consumption within the
power generation industry may have stabilised with the current economic situation for PF
power generation, however it is not expected to increase unless new technologies
improve efficiency.
30
Chapter 3 Coal characteristics and physical properties
Table 3.2 Coal consumption in the UK (million tonnes) (D.T.I 1999)
Sector 1970 1980 1990 1996 1997 1998Power stations 77.2 89.6 84.0 54.9 47.2 48.3
Domestic 20.2 8.9 4.2 2.7 2.6 2.2Industry 19.6 7.9 6.3 3.6 3.0 2.7Services 4.2 1.8 1.2 0.6 0.6 0.3
Other energy industries 35.7 15.3 12.5 9.6 9.6 9.4Total consumption 156.9 123.5 108.3 71.4 63.1 62.9
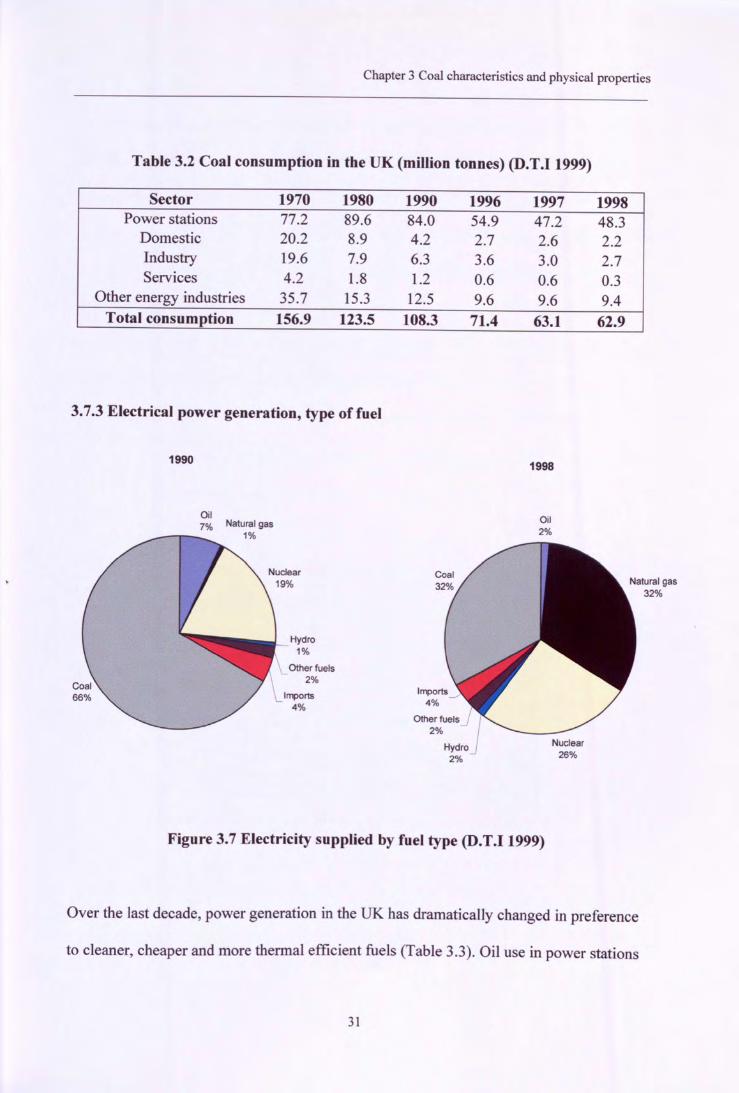
3.7.3 Electrical power generation, type of fuel
1990 1998
Oil7% Natural gas____ 1%
Oil2%
Coal66%
2%
Natural gas32%
Hydro1%
Other fuels
2%
2% 26%
Figure 3.7 Electricity supplied by fuel type (D.T.I 1999)
Over the last decade, power generation in the UK has dramatical1y changed in preference
to cleaner, cheaper and more thermal efficient fuels (Table 3.3). Oil use in power stations
31
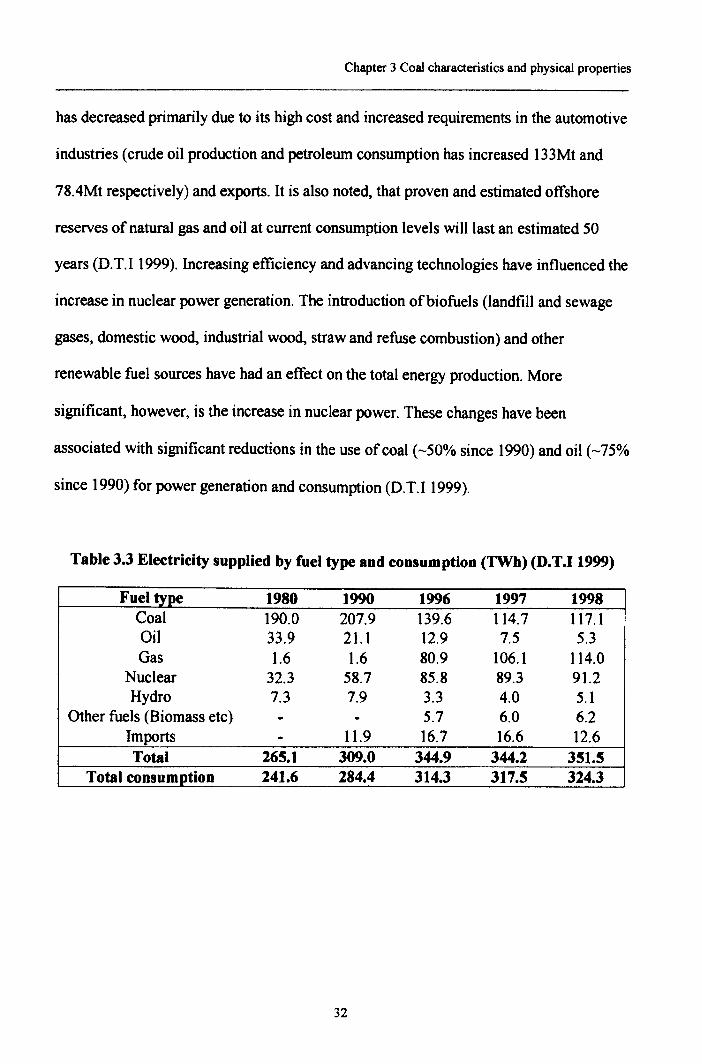
Chapter 3 Coal characteristics and physical properties
has decreased primarily due to its high cost and increased requirements in the automotive
industries (crude oil production and petroleum consumption has increased 133Mt and
78.4Mt respectively) and exports. It is also noted, that proven and estimated offshore
reserves of natural gas and oil at current consumption levels will last an estimated 50
years (D.T.I 1999). Increasing efficiency and advancing technologies have influenced the
increase in nuclear power generation. The introduction ofbiofuels (landfill and sewage
gases, domestic wood, industrial wood, straw and refuse combustion) and other
renewable fuel sources have had an effect on the total energy production. More
significant, however, is the increase in nuclear power. These changes have been
associated with significant reductions in the use of coal (-50% since 1990) and oil (-75%
since 1990) for power generation and consumption (D.T.! 1999).
Table 3.3 Electricity supplied by fuel type and consumption (TWb) (D.T.I 1999)
Fuel type 1980 1990 1996 1997 1998Coal 190.0 207.9 139.6 114.7 117.1Oil 33.9 21.1 12.9 7.5 5.3Gas 1.6 1.6 80.9 106.1 114.0
Nuclear 32.3 58.7 85.8 89.3 91.2Hydro 7.3 7.9 3.3 4.0 5.1
Other fuels (Biomass etc) - - 5.7 6.0 6.2Imports - 11.9 16.7 16.6 12.6Total 265.1 309.0 344.9 344.2 351.5
Total consumption 241.6 284.4 314.3 317.5 324.3
32
Chapter 3 Coal characteristics and physical properties
3.8 Pulverised fuel power generation
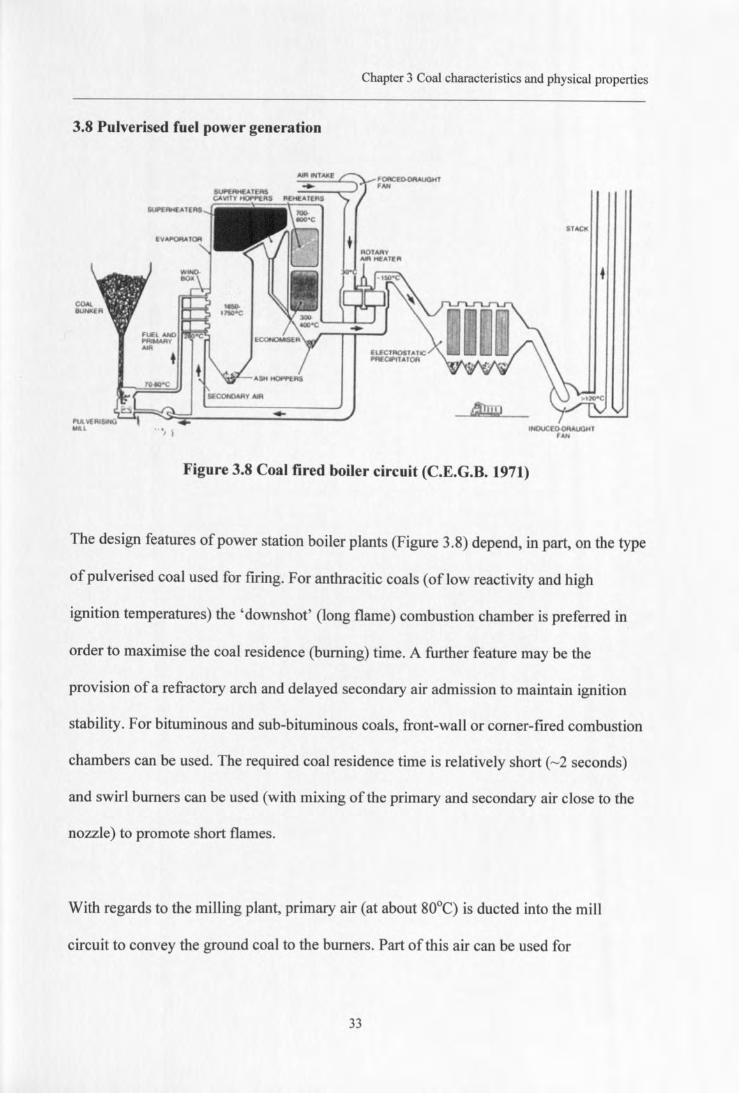
Figure 3.8 Coal fired boiler circuit (C.E.G.B. 1971)
The design features of power station boiler plants (Figure 3.8) depend, in part, on the type
of pulverised coal used for firing. For anthracitic coals (of low reactivity and high
ignition temperatures) the 'downshot' (long flame) combustion chamber is preferred in
order to maximise the coal residence (burning) time. A further feature may be the
provision of a refractory arch and delayed secondary air admission to maintain ignition
stability. For bituminous and sub-bituminous coals, front-wall or corner-fired combustion
chambers can be used. The required coal residence time is relatively short (-2 seconds)
and swirl burners can be used (with mixing of the primary and secondary air close to the
nozzle) to promote short flames.
With regards to the milling plant, primary air (at about 80°C) is ducted into the mill
circuit to convey the ground coal to the burners. Part of this air can be used for
33
Chapter 3 Coal characteristics and physical properties
classification purposes i.e. returning oversize coal to the mill for further grinding. Radiant
heat generated by the flames in the combustion chamber is absorbed, in part, by the water
walled (evaporative) surfaces of the combustion chamber and the balance being absorbed
by the radiant superheater (steam) at the chamber outlet. Consequently, exit gas
temperatures are reduced and the subsequent heat transfer to the air-preheater and
economiser are predominantly by forced convection. The exit flue gases are maintained
above 120°C to prevent corrosion i.e. S02 and S03 reacting with moisture producing
sulphuric acid.
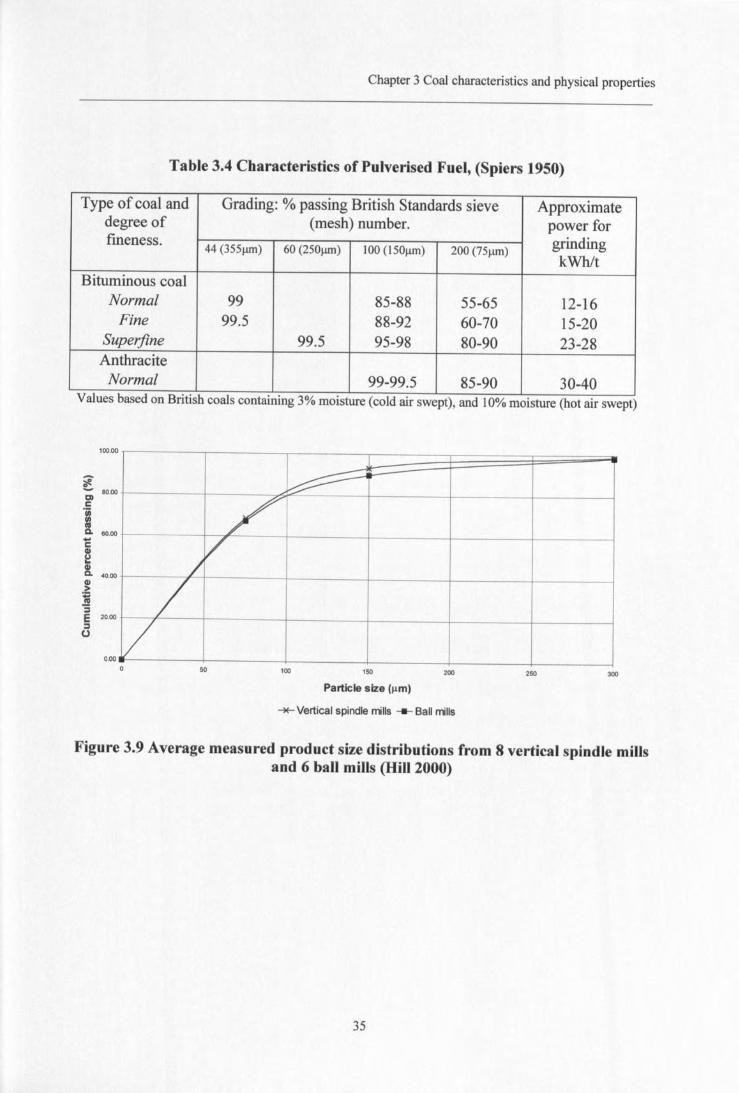
3.9 Size distributions for power generation
Typically, power station milling plants are designed for an upper limit of coal size not
exceeding 40-50mm. The majority of UK bituminous coals are milled to a fineness of
70% ~ 75~m, sufficient to ensure complete combustion. The mill power required is about
15-20kWhJt and is usually within acceptable levels (Table 3.4). For the lower volatile
characteristic coals, mills and classifier settings are such as to give a finer product (85%
passing 75~m) necessary for complete combustion. Milling energies are higher (up to
40kWhJt). The product size characteristics of coals from vertical spindle mills are shown
in Table 3.4. Figure 3.9 shows the different product size distributions for two operating
UK coal fired power station boilers (Hill 2000), the average distributions are presented
from 6 ball mills and 8 vertical spindle mills used to feed the separate boilers.
34
Chapter 3 Coal characteristics and physical properties
Table 3.4 Characteristics of Pulverised Fuel, (Spiers 1950)
Type of coal and Grading: % passing British Standards sieve Approximatedegree of (mesh) number. power forfineness.
44 (355).U11) 60 (250).U11) 100 (l50~m) 200 (75).U11) grindingkWhit
Bituminous coalNormal 99 85-88 55-65 12-16Fine 99.5 88-92 60-70 15-20
Superfine 99.5 95-98 80-90 23-28AnthraciteNormal 99-99.5 85-90 30-40
Values based on British coals containing 3% moisture (cold air swept), and 10% moisture (hot air swept)
100.00
~~ 80.00Clc'iiiIIIcaCl. 60.00-CIII~IIICl. 40.00III>~:;E 20.00
=00.00
~~
7//
/V
50 100 150 200 250 300
Particle size (urn)
""*- Vertical spindle mills Ball mills
Figure 3.9 Average measured product size distributions from 8 vertical spindle millsand 6 ball mills (Hill 2000)
35
Chapter 3 Coal characteristics and physical properties
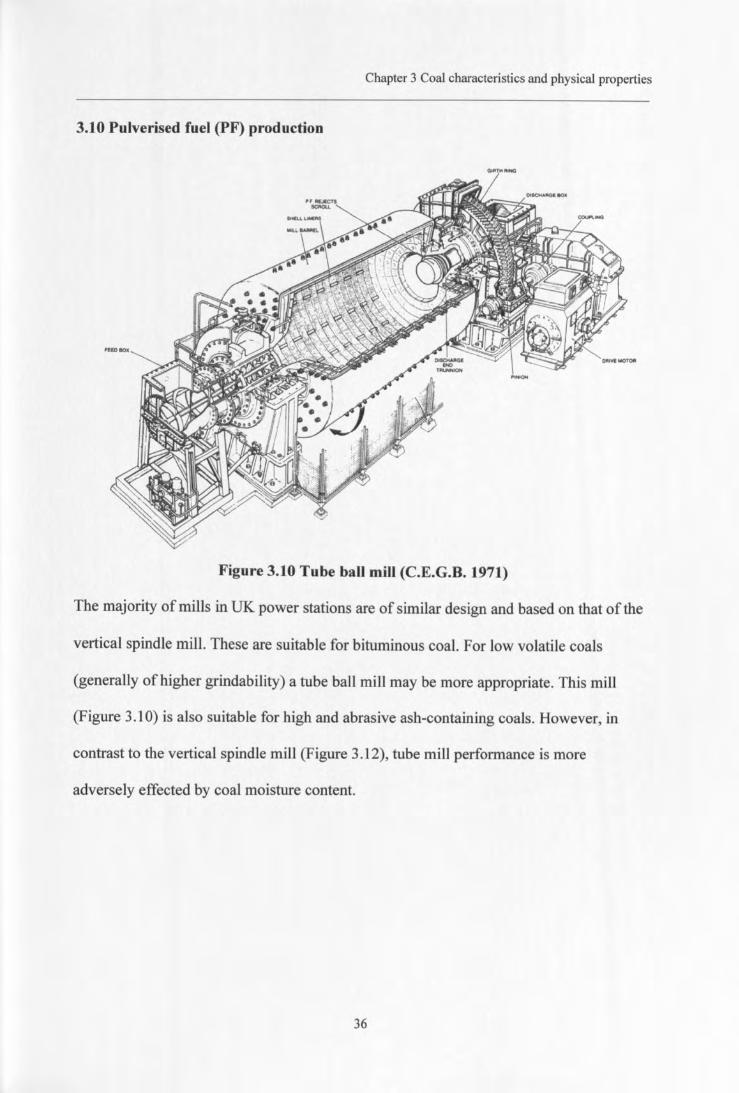
3.10 Pulverised fuel (PF) production
Figure 3.10 Tube ball mill (C.E.G.B. 1971)
The majority of mills inUK power stations are of similar design and based on that of the
vertical spindle mill. These are suitable for bituminous coal. For low volatile coals
(generally of higher grindability) a tube ball mill may be more appropriate. This mill
(Figure 3.10) is also suitable for high and abrasive ash-containing coals. However, in
contrast to the vertical spindle mill (Figure 3.12), tube mill performance is more
adversely effected by coal moisture content.
36
Chapter 3 Coal characteristics and physical properties
CLASSIFIERASSEMBLY
Plo. INLET OUCT
PLOUGH
PYRITES CHUn
TOP PLATE
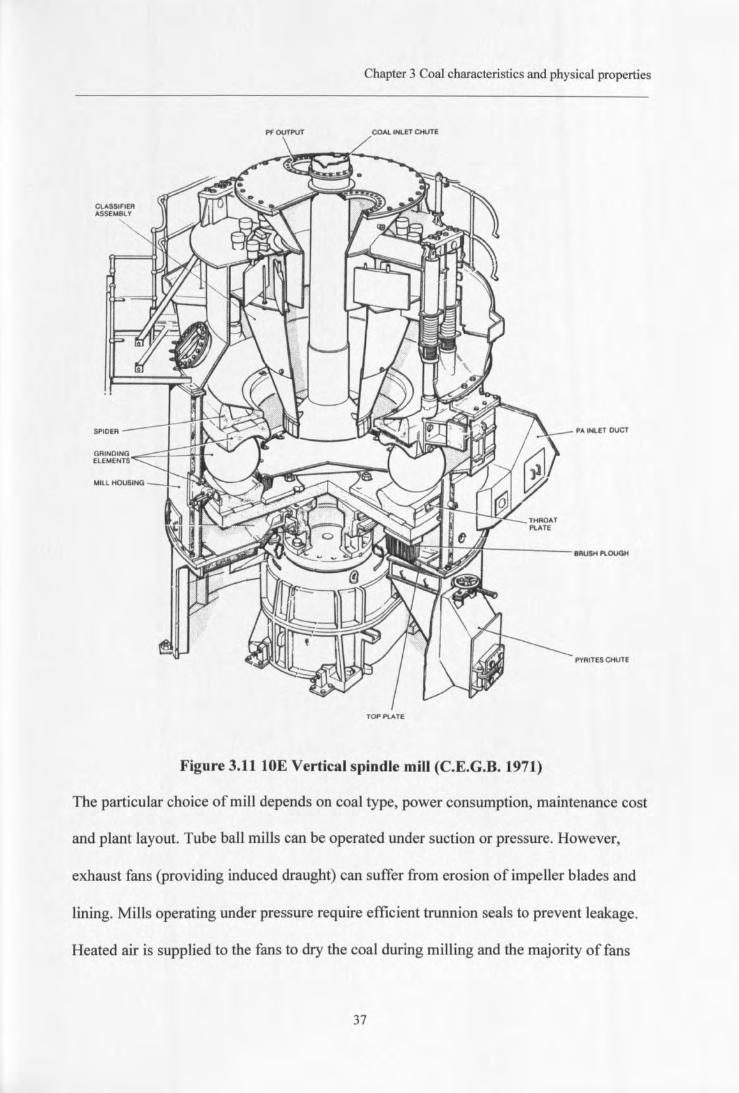
Figure 3.1110E Vertical spindle mill (C.E.G.B. 1971)
The particular choice of mill depends on coal type, power consumption, maintenance cost
and plant layout. Tube ball mills can be operated under suction or pressure. However,
exhaust fans (providing induced draught) can suffer from erosion of impeller blades and
lining. Mills operating under pressure require efficient trunnion seals to prevent leakage.
Heated air is supplied to the fans to dry the coal during milling and the majority of fans
37
Chapter 3 Coal characteristics and physical properties
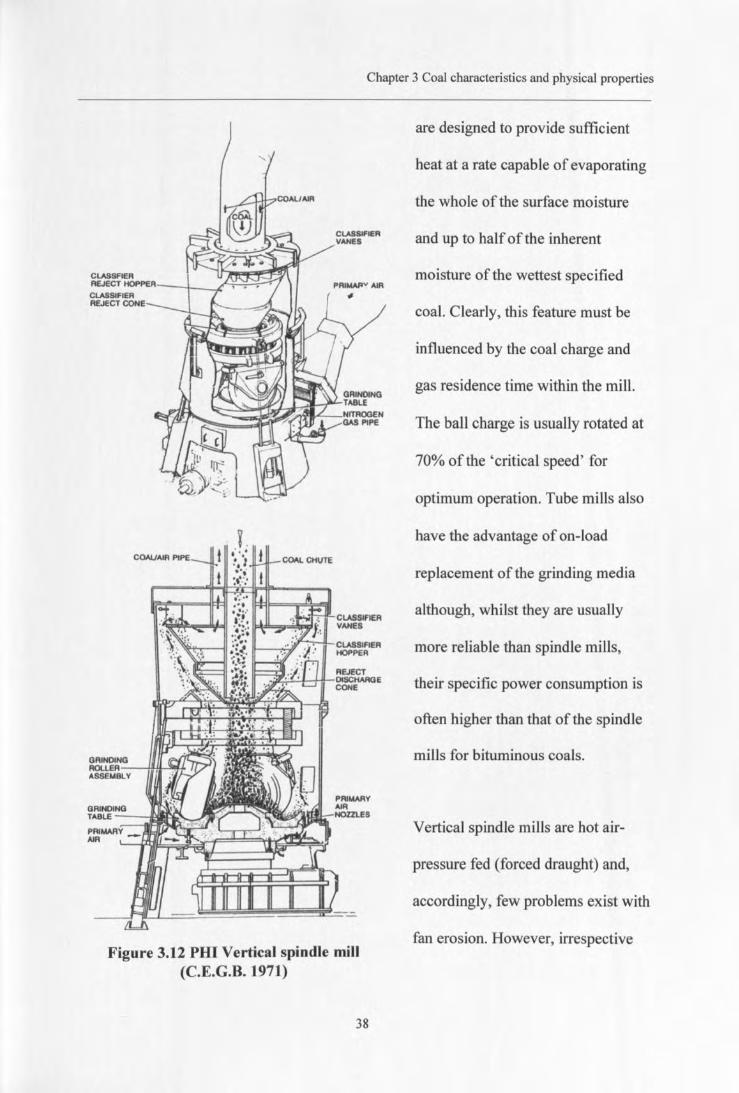
CtASSIFIERREJECT CONE
Figure 3.12 PHI Vertical spindle mill(C.E.G.B. 1971)
38
are designed to provide sufficient
heat at a rate capable of evaporating
the whole of the surface moisture
and up to half of the inherent
moisture of the wettest specified
coal. Clearly, this feature must be
influenced by the coal charge and
gas residence time within the mill.
The ball charge is usually rotated at
70% of the 'critical speed' for
optimum operation. Tube mills also
have the advantage of on-load
replacement of the grinding media
although, whilst they are usually
more reliable than spindle mills,
their specific power consumption is
often higher than that of the spindle
mills for bituminous coals.
Vertical spindle mills are hot air-
pressure fed (forced draught) and,
accordingly, few problems exist with
fan erosion. However, irrespective
Chapter 3 Coal characteristics and physical properties
of the grinding element loading (spring or hydraulic) ball and shell wear rates are
appreciable and otT-line maintenance of these elements is needed. To maintain a
symmetrical flame profile in the combustion chamber of comer-fired boilers, the coal to
each burner is fed from a number of mills located such that, if anyone mill is not in
service the (reduced) coal flow remains evenly distributed amongst the four burners.
3.11 Regulations
Regulations relating to the control of gaseous emission levels can differ between
countries and legislative limits can depend on the age and location of the plant, economic
considerations and on the best available technology.
Currently, the two main international governing bodies monitor sulphur dioxide
emissions are: - (i) The European Communities Legislation which deals with the
limitation of emissions from large combustion plant, and (ii) The United Nations
Economic Commission for Europe (UNECE) convention on long range trans-boundary
air pollution. More than thirty countries are signatories to these conventions, including
most European countries and North America. Other countries have their own standards
and limitations on S02 emissions; however, in some cases, the limits are intended only as
guidelines.
39
Chapter 3 Coal characteristics and physical properties
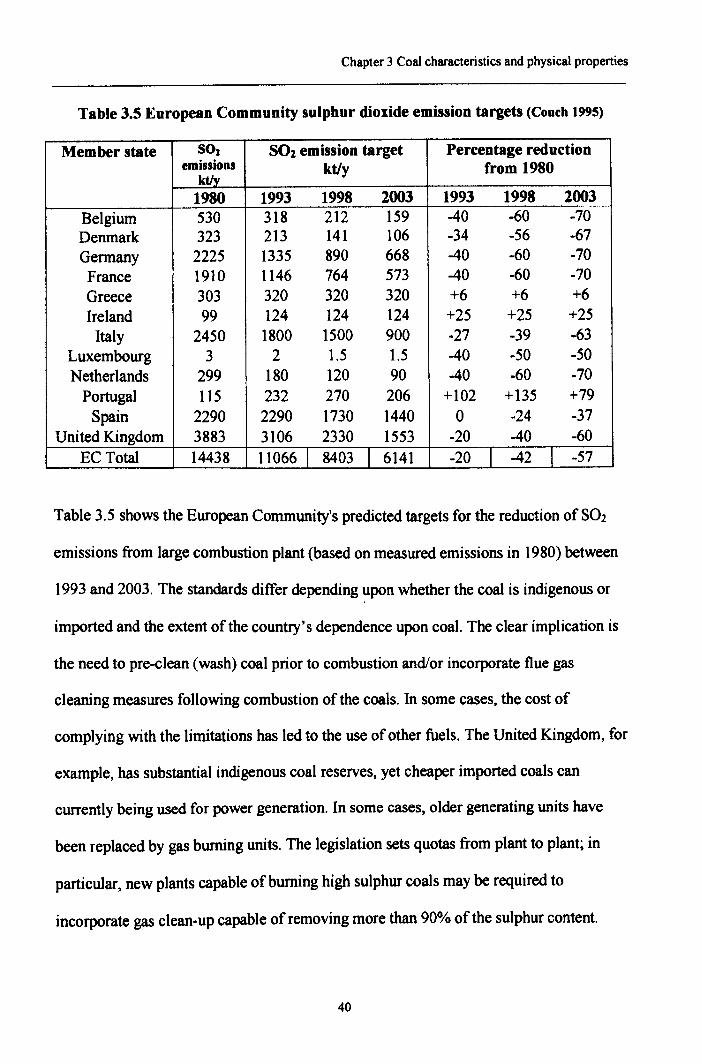
Table 3.5 European Community sulphur dioxide emission targets (Couch 1995)
Member state S02 SOz emission target Percentage reductionemissions ktly from 1980
kt/y
1980 1993 1998 2003 1993 1998 2003Belgium 530 318 212 159 -40 -60 -70Denmark 323 213 141 106 -34 -56 -67Germany 2225 1335 890 668 -40 -60 -70France 1910 1146 764 573 -40 -60 -70Greece 303 320 320 320 +6 +6 +6Ireland 99 124 124 124 +25 +25 +25Italy 2450 1800 1500 900 -27 -39 -63
Luxembourg 3 2 1.5 1.5 -40 -50 -50Netherlands 299 180 120 90 -40 -60 -70Portugal 115 232 270 206 +102 +135 +79Spain 2290 2290 1730 1440 0 -24 -37
United Kingdom 3883 3106 2330 1553 -20 -40 -60EC Total 14438 11066] 8403 I 6141 -20 I -42 I -57
Table 3.5shows the European Community's predicted targets for the reduction ofS02
emissions from large combustion plant (based on measured emissions in 1980)between1993 and 2003. The standards differ depending upon whether the coal is indigenous or
imported and the extent of the country's dependence upon coal. The clear implication is
the need to pre-clean (wash) coal prior to combustion and/or incorporate flue gas
cleaning measures following combustion of the coals. In some cases, the cost of
complying with the limitations has led to the use of other fuels. The United Kingdom, for
example, has substantial indigenous coal reserves, yet cheaper imported coals can
currently being used for power generation. In some cases, older generating units have
been replaced by gas burning units. The legislation sets quotas from plant to plant; in
particular, new plants capable of burning high sulphur coals may be required to
incorporate gas clean-up capable of removing more than 90% of the sulphur content.
40
Chapter 3 Coal characteristics and physical properties
Other countries have stricter limits, the United States of America has a maximum level of
8.9MT/y ofS02 of which 5.6MT/y is from heavy industrial units. For comparison
purposes, the UK target level (for 2003) is 1.55MT/y (Table 3.5). The U.S. system sets
allowances with a maximum emission of 3100mglm3 per electrical power station (based
upon the 110 existing plants producing more than llOMW energy). However, those
plants that do not require the full allowance are permitted to share their balance with
other plants. Japan, although not a signatory of either convention, operates what is known
as the K-value control standard and limits the plant emission levels to an extent
dependent on the total air pollution within the localized area.
Regulations are less stringent in China and India where it may be difficult to fund the
modifications and retrofit older coal-fired plants. However, it is anticipated that newer
plant will be required to operate at lower levels of S02. The majority of other developing
countries could generally import coal and hence choose those of low sulphur content
provided they were affordable.
At present, other emissions are subject to few constraints. However, legislation may be
introduced in the future depending on the outcome of research into the effect of other air
toxins. There has already been mounting pressure to reduce NOx emission levels from
power stations by modification of the combustion process e.g. staged air injection into the
boiler. Such modifications would be cheaper and easier to install than those for the
reduction in S02 emissions.
41
Chapter 3 Coal characteristics and physical properties
With regard to discharge from power station plants, strict water run-off constraints are
usually introduced by local sewage and water authorities in order to limit the volume and
concentration of waste effiuents to ground water supplies and rivers. Regulations on solid
residues again are dealt with locally and generally depend on coal ash content. The
common aim is to reduce soil contamination and any possible effects of natural leaching
of heavy metals to ground water.
3.12 Future coal processing technology
Currently, there are three areas of major research worldwide viz methods of producing
clean coal for emission reduction, improving the thermal (cycle) efficiency for coal
combustion in power plant and the use of coal bed gasification.
Emissions control research involves the removal or reduction of toxic byproducts
generated during the combustion of coal. Due to legislation and 'capping' policies
imposed by governments there is a requirement for technologies to control nitrates,
sulphurous compounds and green house gas (water vapour, carbon dioxide, methane and
nitrous oxide) emissions. Current developments in this field include flue gas
desulphurisation by means of a wet-lime or limestone process and low-No, burners
which delay the mixing of air and coal in a manner such that the capabilities of producing
nitrates is reduced.
Currently, coal-fired power station boilers use pulverised fuel for firing and operate at
thermal efficiencies limited by steaming conditions to 41% for the most modem designs
42
Chapter 3 Coal characteristics and physical properties
(the limiting feature arises from the steam to turbine energy transfer rather than heat
transfer efficiency in the boiler). More recent developments are based on supercritical
steam cycles which give increased the thermal efficiencies of up to 45% using high-
pressure superheated steam cycles. The reliability of these plants has been proven and
they are commercially available; plant designs currently in research and development
stages show promise ofthennal efficiencies above 50%. In particular, Integrated
Gasification Combined Cycle (IGCC) power generation is based on the gasification of
coal with the gas expanded subsequently into a gas turbine some 67% of the power is
generated in this way with the remainder being generated by conventional heat transfer
steam generation. Studies of hybrid cycles (gasification and combustion) in the USA,
Germany and the UK are at the research stage. The process uses high-pressure steam and
air for gasification of the coal (-80% of the fuel) and the remaining char is burnt as a
single fuel. Both gas turbine and steam-driven turbines are used.
The development of coal bed gasification is based on the theory of producing methane
from coal beds by direct injection of oxygen and water into the bed (The thermal
efficiency of natural gas is considerably higher-50-56% total efficiency-than that of
pulverised fuel coal combustion). Other advantages include little to no mining, ease of
handleability of the fuel and possible reductions in process energy requirements (milling,
coal processing). This may possibly be utilised on remaining coal commodities in
redundant mines (D.T.!. 1999).
43
CHAPTER FOUR
REVIEW OF MICROWAVE STUDIES UPON COMMINUTION
4.1 Introduction-Review of microwave studies upon comminution
This section provides a background to the grindability of materials and conventional
comminution theories. In particular, the effect of heat treatment to reduce the resistance
of a solid material to size reduction and the relative affect of microwave and convective
heating are reviewed.
4.2 Breakage theories
Whatever the reason for size reduction, whether comminution is necessary to liberate
valuable minerals from a host rock or to produce pulverised fuel from coal, the principles
of comminution are similar. Inter-atomic bonds are only effective over small distances
and can only be broken if sufficient energy is available. Many size reduction mechanisms
produce compressive or tensile stresses to generate the required force for breakage.
Breakage however, does not only depend upon the applied stress, each material has
unique structures that resist breakage. Natural materials (e.g. ores) commonly contain a
number of mineral species dispersed as grains of various sizes that are unevenly
distributed. The distribution of the applied force is then dependant upon the individual
mechanical properties of the inherent minerals and upon weaknesses (flaws) within the
matrix. Cracks act as stress concentration points, the stress at such points depending upon
the crack length and beyond a certain distance the force may be sufficient to break the
44
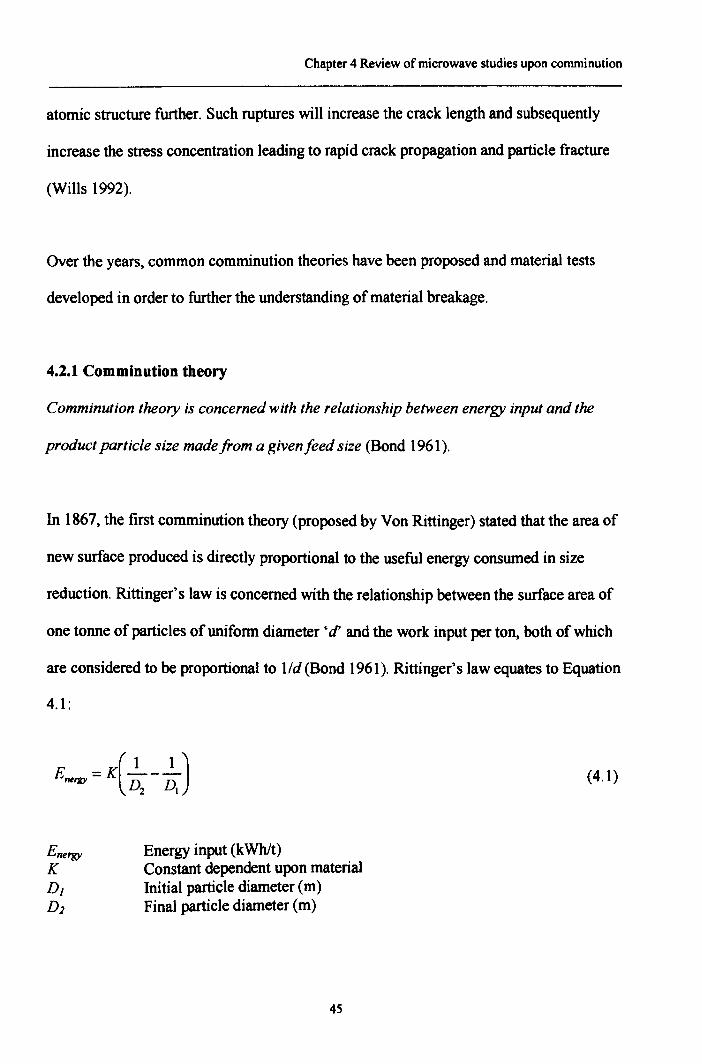
Chapter 4 Review of microwave studies upon comminution
atomic structure further. Such ruptures will increase the crack length and subsequently
increase the stress concentration leading to rapid crack propagation and particle fracture
(Wills 1992).
Over the years, common comminution theories have been proposed and material tests
developed in order to further the understanding of material breakage.
4.2.1 Comminution theory
Comminution theory is concerned with the relationship between energy input and the
product particle size madefrom a given feed size (Bond 1961).
In 1867, the first comminution theory (proposed by Von Rittinger) stated that the area of
new surface produced is directly proportional to the useful energy consumed in size
reduction. Rittinger's law is concerned with the relationship between the surface area of
one tonne of particles of uniform diameter <if and the work input per ton, both of which
are considered to be proportional to lid (Bond 1961). Rittinger's law equates to Equation
4.1:
E =K(_l __1 JMrgy D D
2 I(4.1)
Energy Energy input (kWhlt)K Constant dependent upon materialDJ Initial particle diameter (m)DJ Final particle diameter (m)
45
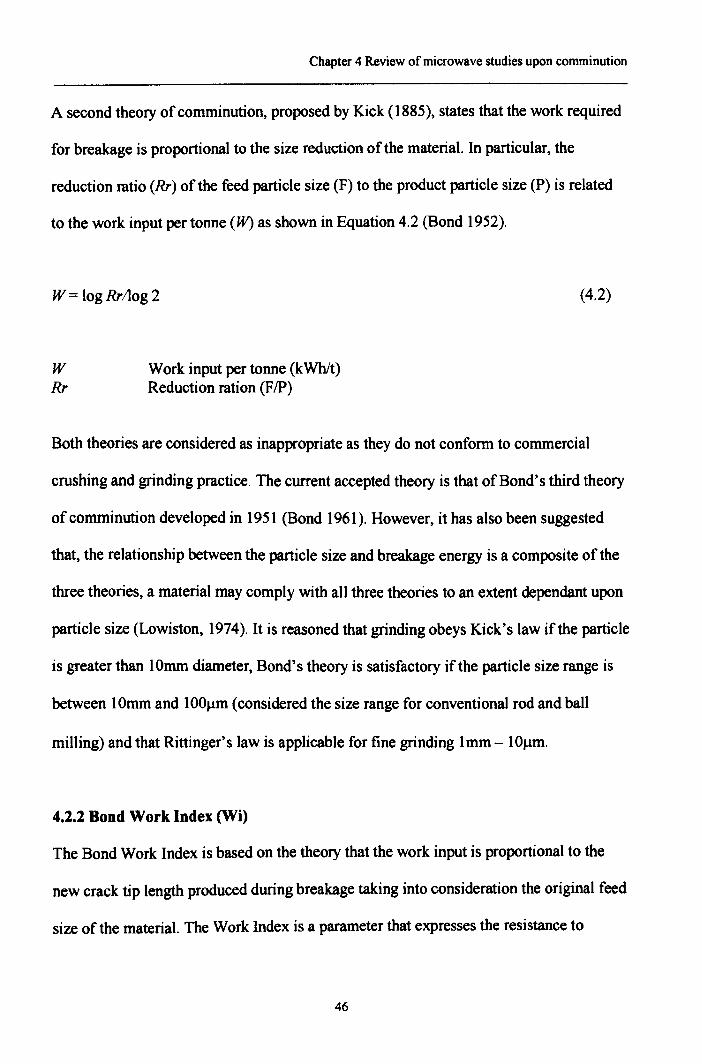
Chapter 4 Review of microwave studies upon comminution
A second theory of comminution, proposed by Kick (1885), states that the work required
for breakage is proportional to the size reduction of the material. In particular, the
reduction ratio (Rr) of the feed particle size (F) to the product particle size (P) is related
to the work input per tonne (W) as shown in Equation 4.2 (Bond 1952).
W = log Rrilog 2 (4.2)
WRr
Work input per tonne (kWh/t)Reduction ration (FIP)
Both theories are considered as inappropriate as they do not conform to commercial
crushing and grinding practice. The current accepted theory is that of Bond's third theory
of comminution developed in 1951 (Bond 1961). However, it has also been suggested
that, the relationship between the particle size and breakage energy is a composite of the
three theories, a material may comply with all three theories to an extent dependant upon
particle size (Lowiston, 1974). It is reasoned that grinding obeys Kick's law if the particle
is greater than lOmm diameter, Bond's theory is satisfactory if the particle size range is
between 10mm and 100Jlm (considered the size range for conventional rod and ball
milling) and that Rittinger's law is applicable for fine grinding 1mm - lOJlm.
4.2.2 Bond Work Index (Wi)
The Bond Work Index is based on the theory that the work input is proportional to the
new crack tip length produced during breakage taking into consideration the original feed
size of the material. The Work Index is a pammeter that expresses the resistance to
46
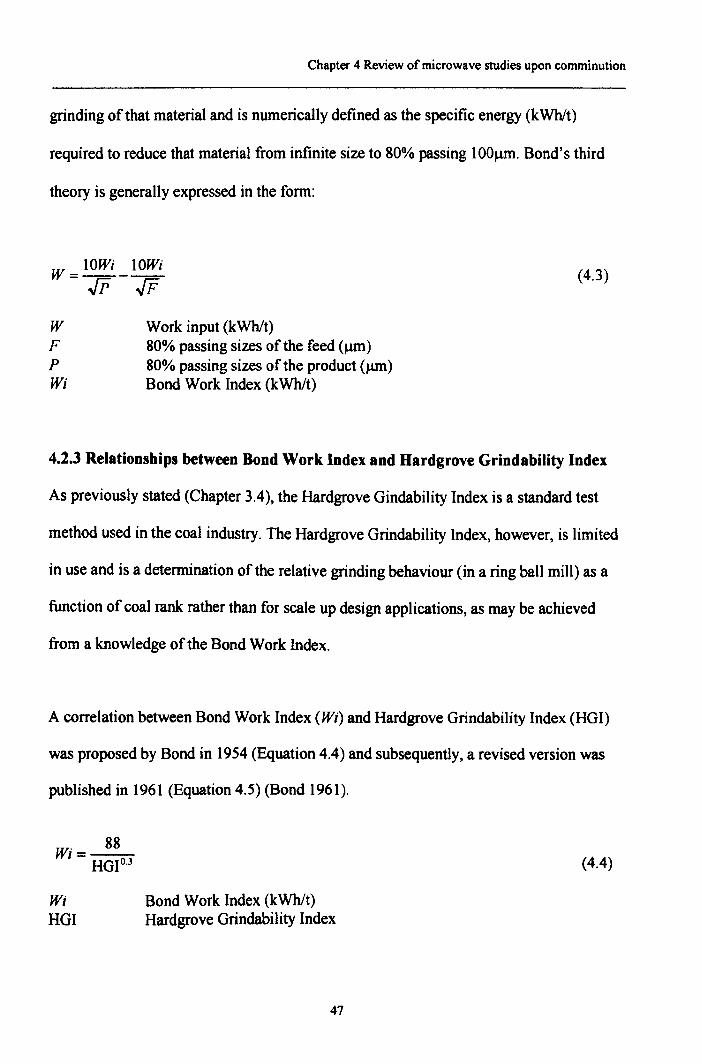
Chapter 4 Review of microwave studies upon comminution
grinding of that material and is numerically defined as the specific energy (kWhIt)
required to reduce that material from infinite size to 80% passing 100J.1m.Bond's third
theory is generally expressed in the form:
(4.3)
W Work input (kWhlt)F 80% passing sizes of the feed (J.1m)P 80% passing sizes of the product (J.1M)Wi Bond Work Index (kWhlt)
4.2.3 Relationships between Bond Work Index and Hardgrove Grindability Index
As previously stated (Chapter 3.4), the Hardgrove Gindability Index is a standard test
method used in the coal industry. The Hardgrove Grindability Index, however, is limited
in use and is a determination of the relative grinding behaviour (in a ring ball mill) as a
function of coal rank rather than for scale up design applications, as may be achieved
from a knowledge of the Bond Work Index.
A correlation between Bond Work Index (Wi) and Hardgrove Grindability Index (HGI)
was proposed by Bond in 1954 (Equation 4.4) and subsequently, a revised version was
published in 1961 (Equation 4.5) (Bond 1961).
Wi= 88HGIo.3 (4.4)
Wi Bond Work Index (kWhlt)HGI Hardgrove Grindability Index
47
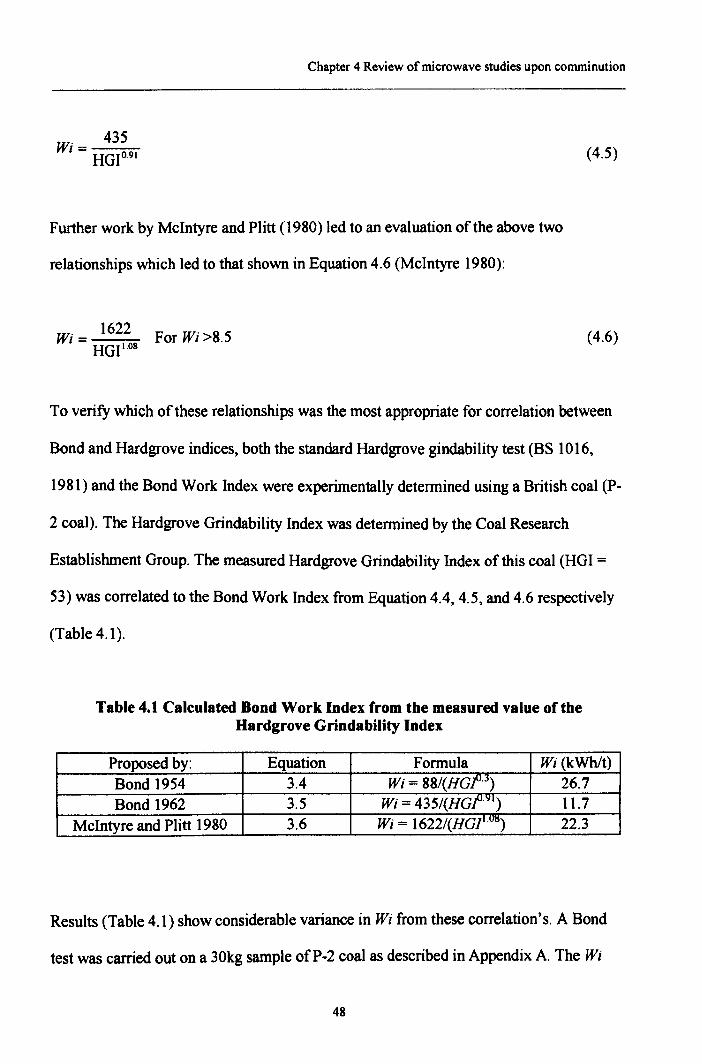
Chapter 4 Review of microwave studies upon comminution
wi- 435HGIo.91 (4.5)
Further work by McIntyre and Plitt (1980) led to an evaluation of the above two
relationships which led to that shown in Equation 4.6 (McIntyre 1980):
Wi::: 1622 For Wi >8.5HGIl.08
(4.6)
To verify which of these relationships was the most appropriate for correlation between
Bond and Hardgrove indices, both the standard Hardgrove gindability test (BS 1016,
1981) and the Bond Work Index were experimentally determined using a British coal (P-
2 coal). The Hardgrove Grindability Index was determined by the Coal Research
Establishment Group. The measured Hardgrove Grindability Index of this coal (HGI =
53) was correlated to the Bond Work Index from Equation 4.4,4.5, and 4.6 respectively
(Table 4.1).
Table 4.1 Calculated Bond Work Index from the measured value of theHardgrove GrindabiJity Index
Proposed by: Equation Formula Wi (kWh/t)Bond 1954 3.4 Wt = 88/(HG/H) 26.7Bond 1962 3.5 Wi = 43S/(HGP91) 11.7
McIntyre and Plitt 1980 3.6 Wi = 1622/(HGII.U'6) 22.3
Results (Table 4.1) show considerable variance in Wi from these correlation's. A Bond
test was carried out on a 30kg sample ofP-2 coal as described in Appendix A. The Wi
48
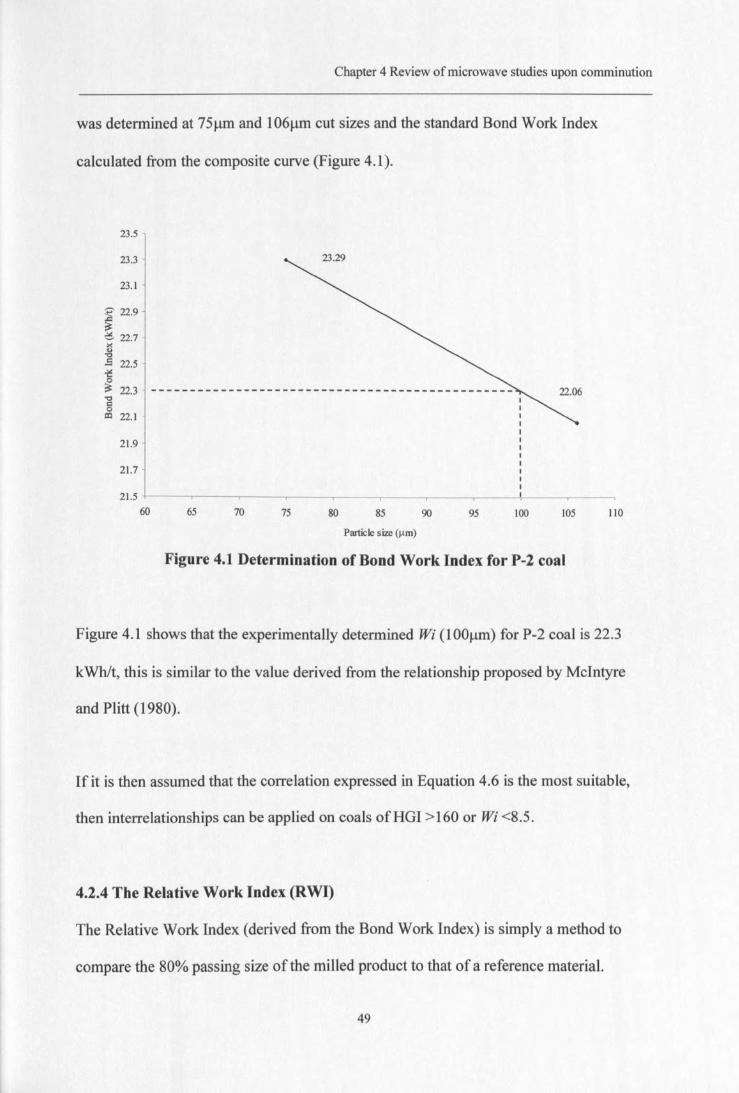
Chapter 4 Review of microwave studies upon comminution
was determined at 751lm and 1061lm cut sizes and the standard Bond Work Index
calculated from the composite curve (Figure 4.1).
23.5
23.3
23.1
f 22.9
~ 22.7
.8
.El 22.5-g~ 22.3§al 22.1
21.9
21.7
21.5 +----,----.---..------.--~-~--~--+_-__,_--~60 65 70 75 80 85 90 95 lOO 105 no
Particle size (urn)
Figure 4.1 Determination of Bond Work Index for P-2 coal
Figure 4.1 shows that the experimentally determined Wi (1OOllm) for P-2 coal is 22.3
kWhIt, this is similar to the value derived from the relationship proposed by McIntyre
and Plitt (1980).
If it is then assumed that the correlation expressed in Equation 4.6 is the most suitable,
then interrelationships can be applied on coals of HGI > 160 or Wi <8.5.
4.2.4 The Relative Work Index (RWI)
The Relative Work Index (derived from the Bond Work Index) is simply a method to
compare the 80% passing size of the milled product to that of a reference material.
49
Chapter 4 Review of microwave studies upon comminution
Due to the time required to undertake the standard Bond test Berry and Bruce (1966)
developed a comparative method to determine the Work Index of an unknown material.
The method requires the use of a reference material of known Work Index. An identical
weight of both samples are ground within a mill at constant speed so that the power
consumption is equal and can be used as the common term in a derivation of
simultaneous equations (Wr=Wt). If 'r' denotes the reference material and 't' the material
under test, using simultaneous equations as expressed in Equation 4.3, the Work Index of
the test material can be determined (Equation 4.7).
Wr =Wt = 10Wir _IOWi, = 10Wit _IOWitffrffrJPiJFi (4.7)
W Work input (kVVbVt)F 80% passing sizes of the feed (urn)P 80% passing sizes of the product (um)Wi Bond Work Index (kVVbVt)For material 'r' and 'I' respectively.
Rearranging these equations gives the Comparative Work Index (CWI):
10 10CWI = Wit = Jp; - JFr
Wir 10 10JPj-JFj
(4.8)
The equation can be converted, exclusive of the Bond Work Index of either material, to
provide a Relative Work Index i.e. relative to the reference material and expressed on a
percentage scale (Equation 4.9). This is similar in methodology to the relative
50
Chapter 4 Review of microwave studies upon comminution
grindability scale used by Hardgrove to compare the grindability of coals and represents a
simple way to ascertain whether the grindability of one material is greater than another.
Within the current study, the non-treated coal sample is classed as the reference sample
and the treated samples as the test samples, thus giving a comparison between milled coal
products of both untreated and microwave treated coals.
10 10
RWI = -;r;::;;, - JF;, 10010 10 xJMj-JFj
(4.9)
RWI Relative Work Index (%)Fn 80% passing size of the feed coal, non-treated coal (urn)Mn 80% passing size of the milled coal, non-treated coal (urn)Ft 80% passing size of the feed coal, microwave treated coal (J.1m)Mt 80% passing size of the milled coal, microwave treated coal (urn)
4.3 Affect of heat treatment on grindability
The effect of heat treatment on grindability has been studied since the beginning of the
zo" century. Inparticular, ore grindability has been investigated due to the complex
mixtures of minerals within a host ore body. Fractures have been reported as a result of
heat treatment alone and in some cases, these fractures were responsible for a reduction
in the Work Index and gave improved mineral liberation. The following sections describe
previous research concerning thermally-assisted liberation, microwave properties in
relation to mineral heating and their effect on microwave-assisted comminution.
51
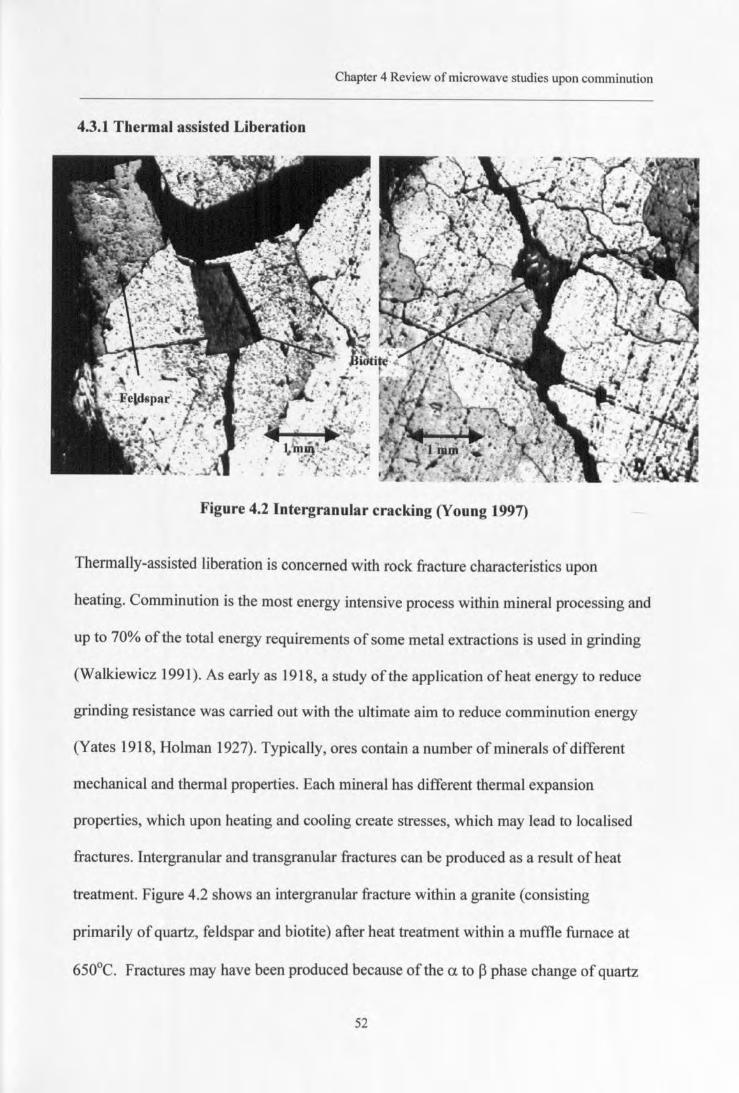
Chapter 4 Review of microwave studies upon comminution
4.3.1 Thermal assisted Liberation
Figure 4.2 Intergranular cracking (Young 1997)
Thermally-assisted liberation is concerned with rock fracture characteristics upon
heating. Comminution is the most energy intensive process within mineral processing and
up to 70% of the total energy requirements of some metal extractions is used in grinding
(Walkiewicz 1991). As early as 1918, a study of the application of heat energy to reduce
grinding resistance was carried out with the ultimate aim to reduce comminution energy
(Yates 1918, Holman 1927). Typically, ores contain a number of minerals of different
mechanical and thermal properties. Each mineral has different thermal expansion
properties, which upon heating and cooling create stresses, which may lead to localised
fractures. Intergranular and trans granular fractures can be produced as a result of heat
treatment. Figure 4.2 shows an intergranular fracture within a granite (consisting
primarily of quartz, feldspar and biotite) after heat treatment within a muffle furnace at
650°C. Fractures may have been produced because ofthe a to p phase change of quartz
52
Chapter 4 Review of microwave studies upon comminution
at 573°C resulting in a volumetric expansion ofO.86% (Young 1997). Thermally-assisted
liberation research by Fitzgibbon and Veasey (1990) reported significant reductions in
grinding resistance could be achieved. However, the benefits of heat treatment were
uneconomical on tested ore species.
4.4 Microwave assisted comminution
Thermally-assisted liberation to date is generally considered as uneconomical due to the
high energy requirements for bulk heating. However, microwave energy presents an
opportunity to reduce the overall energy requirements of thermally-assisted liberation in
so far as it provides an in-situ method of heating in contrast to conventional heating,
which relies on heat transfer by conduction. Furthermore, since not all materials absorb
microwave energy, differential heating and expansion could be produced without bulk
heating.
Subsequent sections review topics related to microwave-assisted comminution and
include the relationship between dielectric properties, heating rates and their effect on
grindability .
4.4.1 Dielectric heating rates
Early research concerning the effect of microwave energy on natural materials showed
that all materials heat at different rates. As with thermally-assisted liberation of minerals
from ore bodies, expansion rates may induce fracture propagation. Chen et al (1984)
reported the relative transparency of some minerals to microwave radiation with varying
53
Chapter 4 Review of microwave studies upon comminution
power at a frequency of2.45GHz. The study concluded by grouping the test minerals, i.e.
group 1 minerals which exhibit poor heating and relative transparency (most silicates,
carbonates, sulphates and some oxides and sulphides) and group 2 minerals which show
good heating characteristics (most sulphides, arsenides, sulphosalts and sulphoarsenides).
Following this study, Walkiewicz et al (1988) produced additional data for mineral
heating at a power of lkW and a frequency of2.45GHz. Results indicated that metal
oxides and sulphides heat rapidly, most metals generally reflect microwave radiation,
most chloride minerals are poor receptors and common gangue minerals (silicates) are
relatively transparent to microwave radiation. The study also showed that intergranular
and trans granular fractures may result in ore bodies when exposed to microwave
radiation. Similar conclusions have been made by other researchers (Dobson 1991,
Womer 1989, Harrison 1995). Further work by McGill et al (1988) indicates that
microwave power has a significant effect upon heating rates, heating rates increase for
receptive minerals. In contrast, low loss minerals showed lower heating rates.
4.4.2 Dielectric properties of minerals
Heating rates are dependent upon the material dielectric properties and those for mineral
species has been reported at frequencies between 300Hz and 1000Hz (Church 1988). The
report showed that minerals with high dielectric constants (and loss factors) have higher
heating rates than minerals of lower dielectric properties. Each mineral tested had unique
dielectric properties. However, in general, oxides, tungstates and some carbonates had
high dielectric constants (25)g'>6), whilst most silicates had much lower values (E'<6).
Nelson et al (1989) carried out a study on metal oxides and silicates at frequencies of 1.0,
S4
Chapter 4 Review of microwave studies upon comminution
2.45,5.5, 11.7, 22.0GHz and concluded that, whilst dielectric constants decrease with
increasing frequency, a resonance frequency (optimum frequency unique to material)
may exist within the microwave frequency range.
4.4.3 Microwave exposure of minerals and comminution behaviour
As different thermal expansion coefficient exist between different minerals, localised
fractures may be produced upon heating. Thermally-assisted liberation using microwave
energy has been studied by a number of researchers since the first publication
"Microwave Assisted Grinding" by Walkiewicz in 1991. Similar principles apply for
thermally-assisted liberation. However, microwave energy, depending upon the ore body,
may only be absorbed in part by the ore (transparency of some mineral species), reducing
the energy requirements when compared to conventional furnace heated thermally-
assisted liberation.
A reduction in the Bond Work Index of between 10% and 24% was reported by
Walkiewicz et al (1991) after microwave heating (at a power of3kW) of iron ore
samples. Harrison et at (1996) investigated the effect of microwave radiation on the
grindability of a number of different minerals and coals (The effect of microwave
radiation on coal grindability is discussed in Chapter 5). Samples of each mineral were
exposed to microwave radiation at a power ofO.65kW for five minutes. Minerals having
low heating rates exhibited no change in grindability, minerals with medium and high
heating rates showed increases in surface area after microwave exposure and ensuing
improvements in grindability. Minerals such as pyrite and barytes are reported to have
55
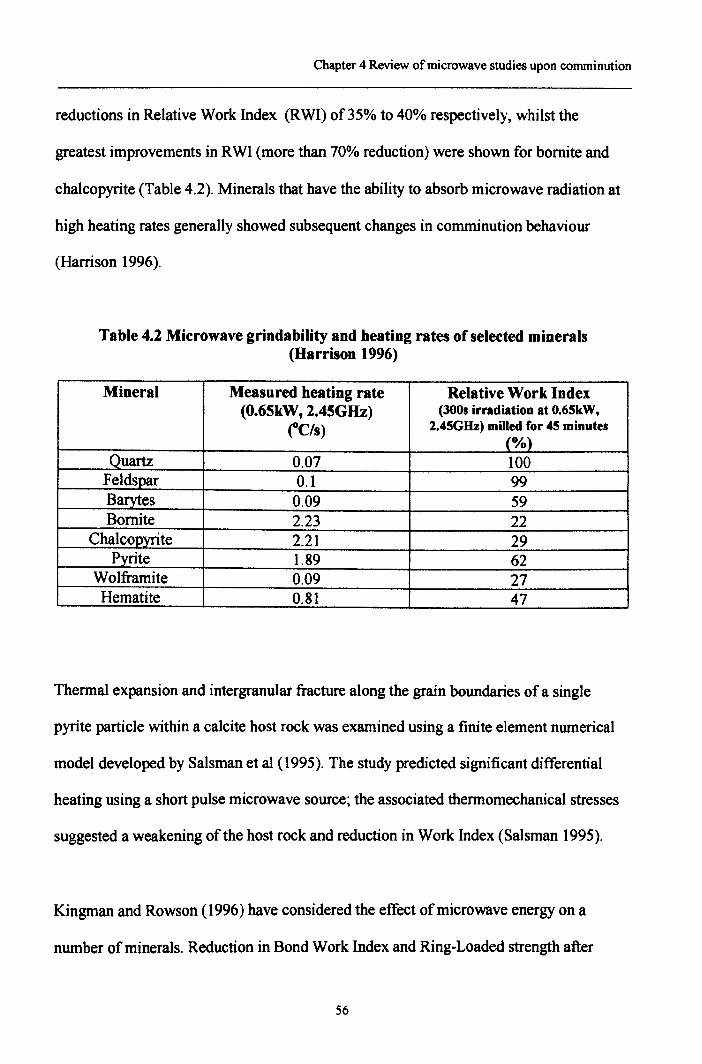
Chapter 4 Review of microwave studies upon comminution
reductions in Relative Work Index (RWI) of35% to 40% respectively, whilst the
greatest improvements in RWI (more than 70% reduction) were shown for bornite and
chalcopyrite (Table 4.2). Minerals that have the ability to absorb microwave radiation at
high heating rates generally showed subsequent changes in comminution behaviour
(Harrison 1996).
Table 4.2 Microwave grindability and heating rates of selected minerals(Harrison 1996)
Mineral Measured heating rate Relative Work Index(O.65kW,2.45GHz) (lOOsirradiation at 0.65kW.
rCfs) 2.45GHz) milled for 45 minutes(%)
Quartz 0.07 100Feldspar O.l 99Barytes 0.09 59Bornite 2.23 22
Chalcopyrite 2.21 29Pyrite 1.89 62
Wolframite 0.09 27Hematite 0.81 47
Thermal expansion and intergranular fracture along the grain boundaries of a single
pyrite particle within a calcite host rock was examined using a finite element numerical
model developed by Salsman et al (1995). The study predicted significant differential
heating using a short pulse microwave source; the associated thermomechanical stresses
suggested a weakening of the host rock and reduction in Work Index (Salsman 1995).
Kingman and Rowson (1996) have considered the effect of microwave energy on a
number of minerals. Reduction in Bond Work Index and Ring-Loaded strength after
56
Chapter 4 Review of microwave studies upon comminution
microwave exposure at powers of l.3kW and 2.6kW were reported upon massive
Norwegian ilmenite ore and Palabora carbonatite. Further studies were directed towards
evaluating the potential of microwave energy on the down stream processes- in particular
the leaching of copper and gold ores after irradiation.
Previous research has demonstrated the potential capabilities of improved grindability by
microwave energy upon particular minerals, depending upon their dielectric properties,
their position within an ore structure and the applied microwave field properties. It is
noted, however, that previous publications have considered the economics of such
microwave-assisted grinding unfavourably. Clearly, further research is necessary to
optimise process conditions and to assess the effect of material behaviour upon
microwave exposure.
57
CHAPTER FIVE
THE EFFECT OF MICROWAVE RADIATION ON COAL
5.1 Introduction-The effect of microwave radiation on coal
Much research has been carried out into the effect of microwave radiation on coal with
emphasis given to assessing the changes in coal characteristics following irradiation- in
particular, dielectric properties, desulphurisation and grindability.
5.2 Dielectric properties and microwave heating rates of coal
Investigations concerning the dielectric properties of individual minerals found in coals
show significant differences in absorption characteristics and subsequent differential
heating (Florek 1996, Batt 1992, Harrison 1996) (Chapter 4). More specifically the
dielectric properties of coal depend on a range of factors including coal rank, moisture
content, mineral composition, temperature and the frequency of microwave radiation.
The wide range in variables make measurements by various workers difficult to
collaborate (Yang 1987). For example, such studies show that the relative dielectric
constant of Chinese coal from different origins varies from 3.22 to 4.57 at an operating
frequency of2.45GHz. The report also highlights the subsequent change in favour of
microwave heating through dielectric property measurement (increasing dielectric
constants) with additions of caustic solutions.
58
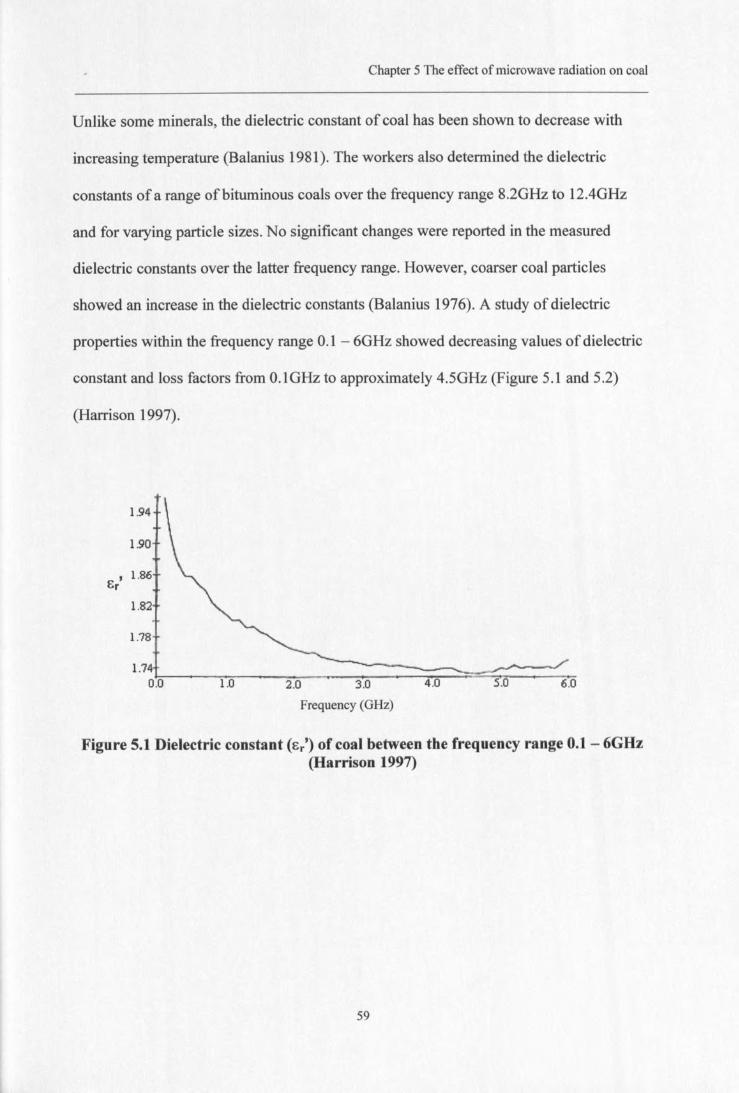
Chapter 5 The effect of microwave radiation on coal
Unlike some minerals, the dielectric constant of coal has been shown to decrease with
increasing temperature (Balanius 1981). The workers also determined the dielectric
constants of a range of bituminous coals over the frequency range 8.2GHz to 12.4GHz
and for varying particle sizes. No significant changes were reported in the measured
dielectric constants over the latter frequency range. However, coarser coal particles
showed an increase in the dielectric constants (Balanius 1976). A study of dielectric
properties within the frequency range 0.1 - 6GHz showed decreasing values of dielectric
constant and loss factors from O.lGHz to approximately 4.5GHz (Figure 5.1 and 5.2)
(Harrison 1997).
1.94
1.90
, 1.86Er
1.78
1.74t-__ :-:::-_ ___,,~_,...-=::::=:::::::;;::::::::;=:::;;;:::::::=~0.0 1.0 2.0 3.0 4.0 5.0 6.0
Frequency (GHz)
Figure 5.1 Dielectric constant (Er') of coal between the frequency range 0.1- 6GHz(Harrison 1997)
59
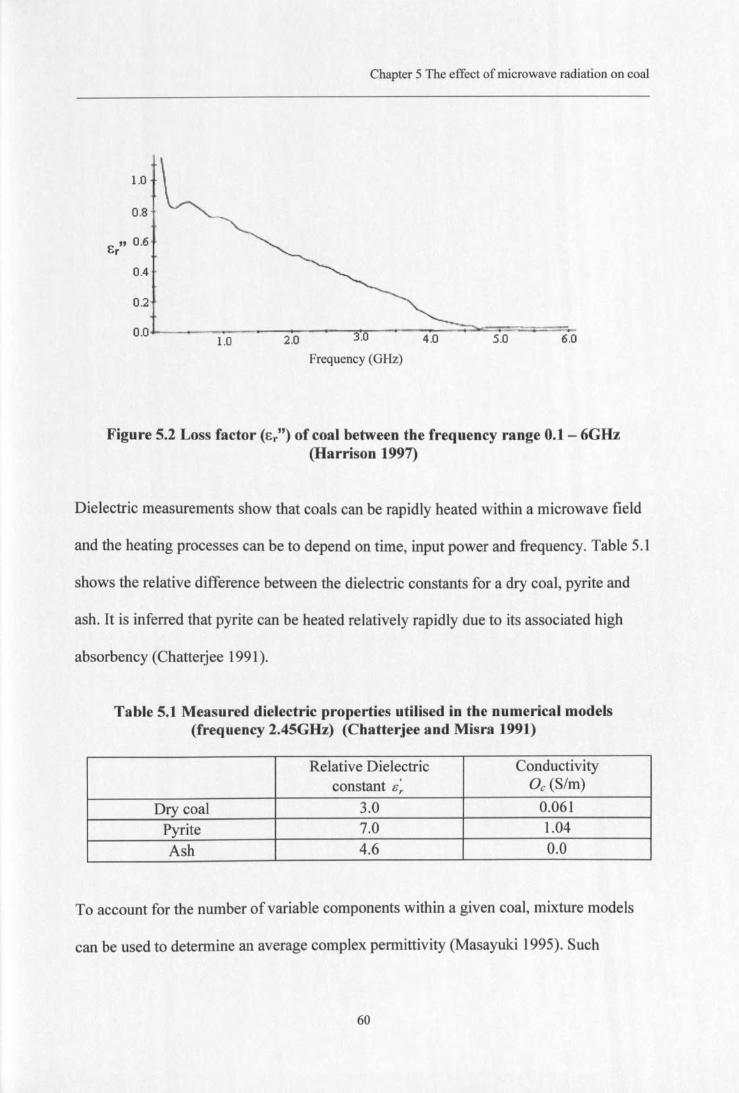
Chapter 5 The effect of microwave radiation on coal
Er" 0.6
0.4
0.8
0.2
Frequency (GHz)
Figure 5.2 Loss factor (Er") of coal between the frequency range 0.1 - 6GHz(Harrison 1997)
Dielectric measurements show that coals can be rapidly heated within a microwave field
and the heating processes can be to depend on time, input power and frequency. Table 5.1
shows the relative difference between the dielectric constants for a dry coal, pyrite and
ash. It is inferred that pyrite can be heated relatively rapidly due to its associated high
absorbency (Chatterjee 1991).
Table 5.1 Measured dielectric properties utilised in the numerical models(frequency 2.45GHz) (Chatterjee and Misra 1991)
Relative Dielectric Conductivityconstant &~ o, (S/m)
Dry coal 3.0 0.061Pyrite 7.0 1.04Ash 4.6 0.0
To account for the number of variable components within a given coal, mixture models
can be used to determine an average complex permittivity (Masayuki 1995). Such
60
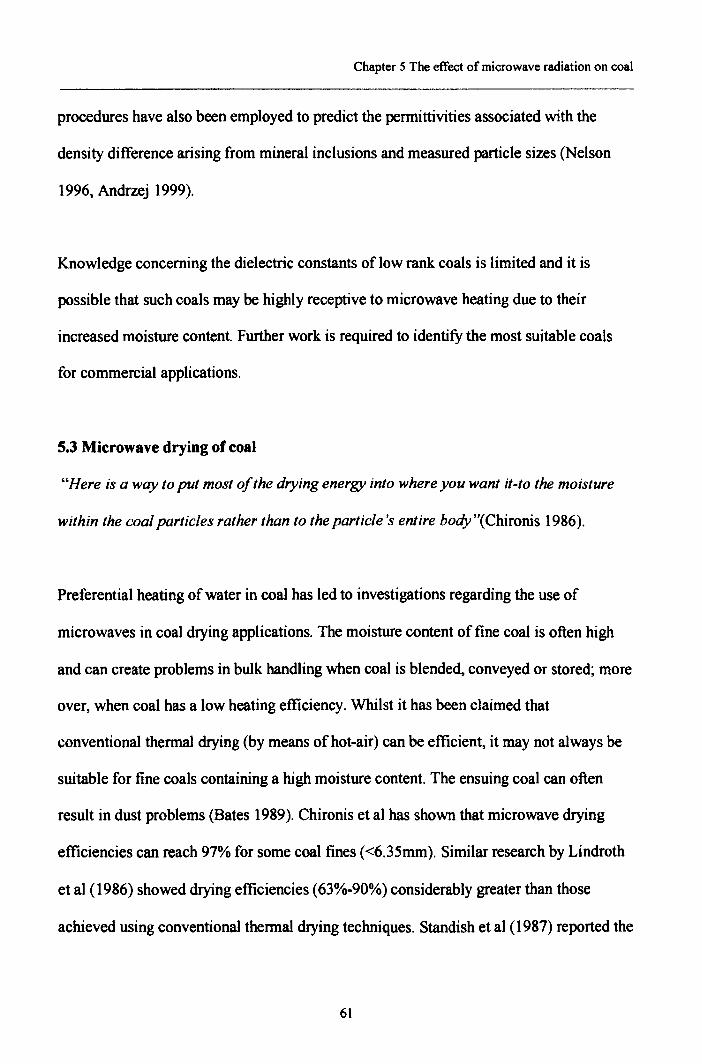
Chapter 5 The effect of microwave radiation on coal
procedures have also been employed to predict the permittivities associated with the
density difference arising from mineral inclusions and measured particle sizes (Nelson
1996, Andrzej 1999).
Knowledge concerning the dielectric constants of low rank coals is limited and it is
possible that such coals may be highly receptive to microwave heating due to their
increased moisture content. Further work is required to identify the most suitable coals
for commercial applications.
5.3 Microwave drying of coal
"Here is a way to put most of the drying energy into where you want it-to the moisture
within the coal particles rather than to the particle's entire body "(Chironis 1986).
Preferential heating of water in coal has led to investigations regarding the use of
microwaves in coal drying applications. The moisture content of fine coal is often high
and can create problems in bulk handling when coal is blended, conveyed or stored; more
over, when coal has a low heating efficiency. Whilst it has been claimed that
conventional thermal drying (by means of hot-air) can be efficient, it may not always be
suitable for fine coals containing a high moisture content. The ensuing coal can often
result in dust problems (Bates 1989). Chironis et al has shown that microwave drying
efficiencies can reach 97% for some coal fines «6.35mm). Similar research by Lindroth
et al (1986) showed drying efficiencies (63%-90%) considerably greater than those
achieved using conventional thermal drying techniques. Standish et al (1987) reported the
61
Chapter 5 The effect of microwave radiation on coal
rate of moisture removal by microwave energy in some brown coals was approximately
twice that for conventional drying. Dielectric modeling techniques have been used to
predict heating rates and suggest that at a frequency of2.45GHz and at a power of
O.663kW coal samples can reach elevated temperatures sufficient to remove moisture
(Chatterjee 1991).
Microwave drying techniques can also be used as a method of moisture content
determination comparable to the standard ASTM proximate analysis (Jacobs 1984).
Laboratory and pilot-scale trials have been used to investigate the potential for online
moisture analysis. Many researchers have studied within this field and have claimed
accuracies of± 0.5% on continuous coal flow moisture analysis (Kalinski 1978, Hall
1972, Cutmore 1987).
Research demonstrated that the reduced coal drying times could be achieved without coal
degradation in the form of ignition or volatile matter loss. On-line moisture determination
using microwave energy has also shown to be a rapid and accurate method especially for
medium, high rank coals; however, to date, no commercial on-line system is available.
5.4 Microwave pyrolysis of coal
Research has been carried out to establish whether microwave radiation (as opposed to
conventional heating) can be used for coal pyrolysis (Larry 1986, Gasner 1986).
However, it was concluded that microwave energy was not effective without the use of
plasma initiation. The purpose of the study was to determine if a higher percentage of
62
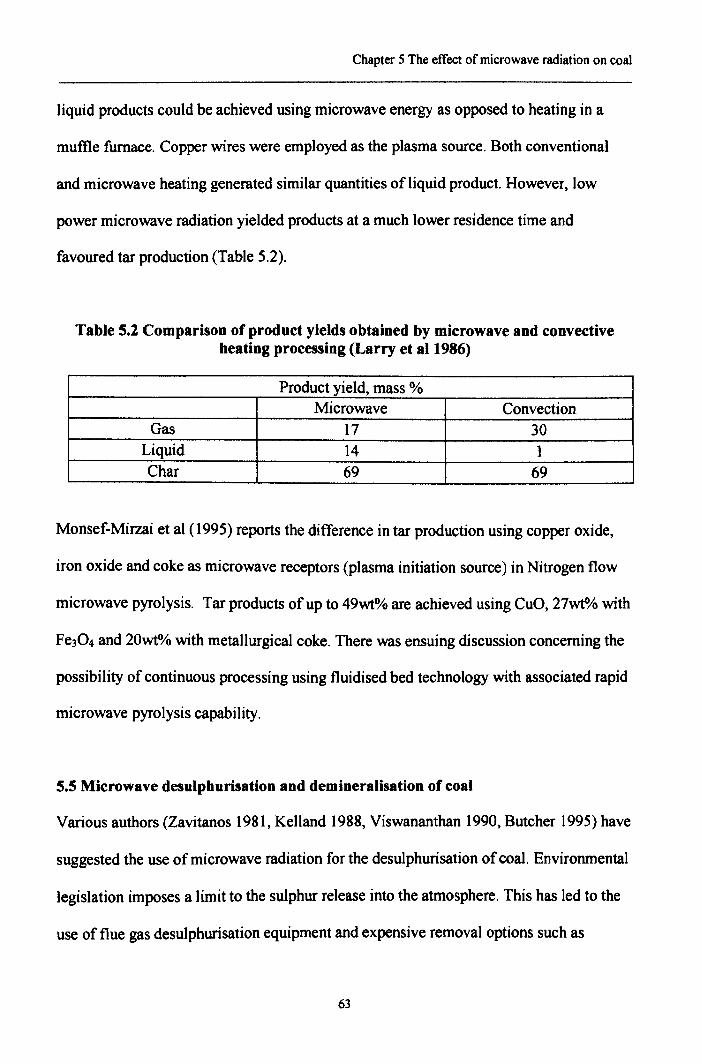
Chapter 5 The effect of microwave radiation on coal
liquid products could be achieved using microwave energy as opposed to heating in a
muffie furnace. Copper wires were employed as the plasma source. Both conventional
and microwave heating generated similar quantities of liquid product. However, low
power microwave radiation yielded products at a much lower residence time and
favoured tar production (Table 5.2).
Table 5.2 Comparison of product yields obtained by microwave and convectiveheating processing (Larry et a11986)
Product yield, mass %Microwave Convection
Gas 17 30Liquid 14 1Char 69 69
Monsef-Mirzai et al (1995) reports the difference in tar production using copper oxide,
iron oxide and coke as microwave receptors (plasma initiation source) in Nitrogen flow
microwave pyrolysis. Tar products of up to 49wt% are achieved using CuO, 27wflo with
Fe304 and 20wflo with metallurgical coke. There was ensuing discussion concerning the
possibility of continuous processing using fluidised bed technology with associated rapid
microwave pyrolysis capability.
5.5 Microwave desulphurisation and demineralisation of coal
Various authors (Zavitanos 1981, Kelland 1988, Viswananthan 1990, Butcher 1995) have
suggested the use of microwave radiation for the desulphurisation of coal. Environmental
legislation imposes a limit to the sulphur release into the atmosphere. This has led to the
use of flue gas desulphurisation equipment and expensive removal options such as
63
Chapter 5 The effect of microwave radiation on coal
flotation, it is also a significant factor influencing selective coal blending (reduce total
sulphur content by blending with a low sulphur coal). References suggest that it may be
possible to use microwave energy to remove part of the sulphur bearing material from
some coals prior to combustion. In principle, two routes are possible.
(i) Conversion of pyrite to pyrrohotite followed by magnetic separation.
(ii) Preferential dissolution of sulphur by molten caustic solutions.
Microwave radiation has also been applied to coals wetted in an acid or caustic solution
to dissolve inorganic (mineral) coal components as a means of coal cleaning.
5.5.1 Microwave conversion and separation of pyrite
Considerable research has been carried out concerning the partial oxidation of pyrite to
liberate sulphur from coal. When heated to temperatures of, typically, 300°C Pyrite
(FeS2) can phase to a form similar to that of mineral pyrrohotite (FeS) with the release of
sulphurous gases (predominantly sulphur dioxide and hyrogen sulphide). In particular, as
stated previously (Section 5.2) pyrite in coal heats at a rate of between 2 and 10 times
that of the parent coal (Zavitanos 1981). The properties of oxidised pyrite significantly
change and it is claimed that the magnetic susceptibility greatly increases. Experiments
have demonstrated that, if only 1% of the total mass of pyrite is decomposed, the
magnetic susceptibility can increases of the order of two magnitudes (Bluhm 1980,
Butcher 1995). Butcher (1995) investigated the feasibility of magnetic separation of
enhanced magnetic pyrite and concluded that low intensity magnetic separation and any
wet magnetic separation methods would not be effective due to high calorific value
64
Chapter 5 The effect of microwave radiation on coal
losses. Butcher (1995) did, however, suggest that optimum particle size ranges exist
which significantly improve the microwave enhanced magnetic properties of pyrite and
its subsequent liberation. Experiments have shown that up to 80% of the pyritic sulphur
can be removed using a high gradient semi conductor magnetic separator (15T) (Kelland
1988). Other workers (Zavitanos 1981, Viswananthan 1990) provide supporting
experimental evidence using high gradient magnetic separators.
5.5.2 Microwave desulpburisation of coal using caustic solutions
Since 1979, there have been substantial investigations into the role of caustic alkali
solutions (NaOH and KOH) in the microwave desulphurisation of coals. Zavitanos
(1979) referred to the removal of pyritic and organic sulphur from coals using alkali
caustics; such solutions were shown to be good absorbers of microwave radiation. Due to
the selective heating of the caustics in sulphur-rich areas; sulphur-bearing compounds can
readily decompose to water-soluble sulphates and acids that can be easily removed by
washing. Microwave irradiation of coal, in the presence of sodium hydroxide (16%) and
water (10-20%) gave encouraging results with a low loss of volatile matter, a high
reduction in pyritic sulphur (90%) and a reasonable reduction in organic sulphur (Yang
1987). The tests also gave an indication of the problems associated with microwave
energy distribution in so far as only approximately 3% of the total microwave energy was
required for sulphur reduction. Furthermore, an economic evaluation of the results
showed promise in comparison with data provided from other desulphurisation methods.
65
Chapter 5 The effect of microwave radiation on coal
Further research has continued with a variety of aims including whether there is an
optimum particle size for pyrite decomposition, determination of suitable microwave
operating conditions and the use of molten caustics. With the use of a low gradient
magnetic separator, a 70% separation of the total sulphur content was measured after only
one minute of microwave exposure (0.5kW, 2.45GHz) with the addition ofa molten
caustic solution to the test coal (Rowson 1990). Similar work (Butcher 1995) shows that
sulphur reduction can be achieved irrespective of particle size. However, particle sizes
ranging between lmm and 0.5mm irradiated for 60 and 90 seconds produced greatest
reductions (0.65kW, 2.45GHz). Further suggestions were made regarding the presence of
magnetic layers (Fe304) coating the pyritic inclusions that facilitate magnetic separation
(Butcher 1995). Hayashi et al (1990) investigated the potential role of molten caustics in
microwave desulphurisation of coals and showed that substantial differential heating
could be achieved with coals of low Pyrite content. Total sulphur reductions of up to 60%
were achieved and the suggestion was made that the rate-determining feature was mass
transfer from the molten caustic into the coal structure.
Other chemical microwave desulphurisation methods have been suggested based on the
use of acidic solutions (Andres 1996). Hydrochloric acid was used as a desulphurising
agent and, following an appropriate mixing time of twenty minutes, the sulphate and
pyritic sulphur could be completely removed in addition to 70% of the organic sulphur.
66
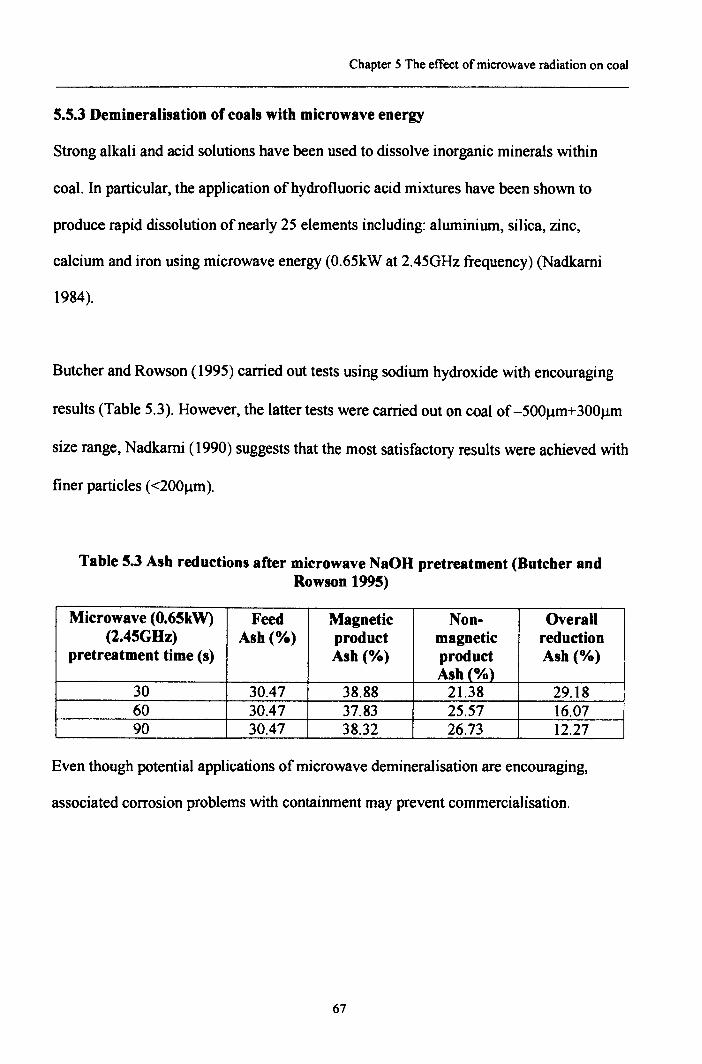
Chapter 5 The effect of microwave radiation on coal
5.5.3 Demineralisation of coals with microwave energy
Strong alkali and acid solutions have been used to dissolve inorganic minerals within
coal. In particular, the application of hydrofluoric acid mixtures have been shown to
produce rapid dissolution of nearly 25 elements including: aluminium, silica, zinc,
calcium and iron using microwave energy (0.65kW at 2.45GHz frequency) (Nadkami
1984).
Butcher and Rowson (1995) carried out tests using sodium hydroxide with encouraging
results (Table 5.3). However, the latter tests were carried out on coal of -500/-lm+ 300/-lm
size range, Nadkami (1990) suggests that the most satisfactory results were achieved with
finer particles «20011m).
Table 5.3 Ash reductions after microwave NaOn pretreatment (Butcher andRowson 1995)
Microwave (O.65kW) Feed Magnetic Non- Overall(2.45GHz) Ash(%) product magnetic reduction
pretreatment time (s) Ash (%) product Ash (%)Ash_(%l
30 30.47 38.88 21.38 29.1860 30.47 37.83 25.57 16.0790 30.47 38.32 26.73 12.27
Even though potential applications of microwave demineralisation are encouraging,
associated corrosion problems with containment may prevent commercialisation.
67
Chapter 5 The effect of microwave radiation on coal
5.6 The influence of microwave radiation on coal grinda bility
Comminution is an energy intensive and inefficient process and the major part of the
energy supplied for grinding is absorbed by the mill with only a fraction of the energy
directly utilised in breakage (Herbst 1981). Microwave irradiation has been used to alter
the comminution behaviour of coal. Viswanathan (1990) applied microwave radiation at
a power ofO.5kW and a frequency of2.45GHz to 150g samples ofa UK coking coal and
a non-coking coal each for a duration of one minute. An increase in product size range of
31% and 10% was shown for the microwave treated coking and non-coking coals
respectively, implying a significant improvement in coal grindability due to microwave
exposure.
Harrison (1997) has carried out substantial work using coal supplied from National
Power's West Burton Power Station. The grindability characteristics of three coal blends
were measured before and after microwave exposure. To this end, representative samples
(500g) were prepared and exposed to microwave radiation at a power ofO.65kW and a
frequency of2.45GHz. The average temperatures of these samples were recorded
immediately after irradiation and the samples were ground for 45 minutes in an
appropriately-sized rod mill. The coal size distributions were evaluated after 5,20 and 45
minutes of milling and the data reported as Relative Work indices with regard to that of
the non-treated milled sample (Table 5.4).
68
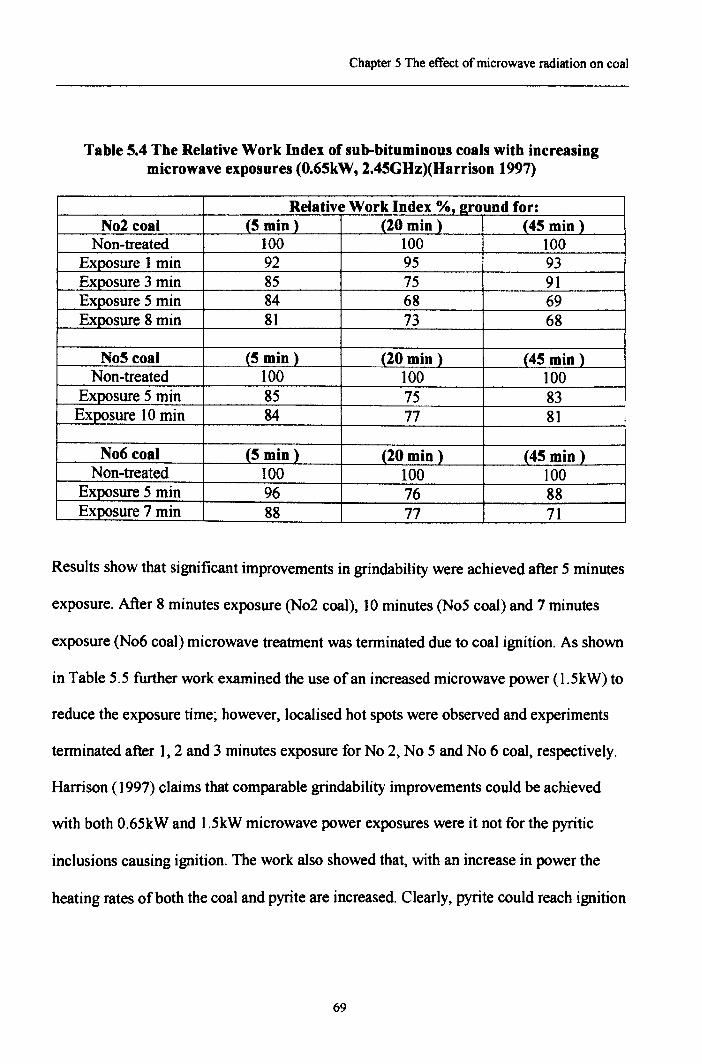
Chapter 5 The effect of microwave radiation on coal
Table S.4 The Relative Work Index of sub-bituminous coals with increasingmicrowave exposures (0.6SkW, 2.4SGHz)(Harrison 1997)
Relative Work Index %, ground for:No2 coal (5 min) (20 min) (45 min)
Non-treated 100 100 100Exposure 1 min 92 95 93Exposure 3 min 85 75 91Exposure S min 84 68 69Exposure 8 min 81 73 68
NoS coal (S min) (20 min) (45 min)Non-treated 100 100 100
Exposure 5 min 85 75 83Exposure 10 min 84 77 81
No6 coal (5 min) (20 min) (45 min)Non-treated 100 100 100
Exposure 5 min 96 76 88Exposure 7 min 88 77 71
Results show that significant improvements in grindability were achieved after 5 minutes
exposure. After 8 minutes exposure (N02 coal), 10 minutes (NoS coal) and 7 minutes
exposure (No6 coal) microwave treatment was terminated due to coal ignition. As shown
in Table S.S further work examined the use of an increased microwave power (1.SkW) to
reduce the exposure time; however, localised hot spots were observed and experiments
terminated after 1,2 and 3 minutes exposure for No 2, No 5 and No 6 coal, respectively.
Harrison (1997) claims that comparable grindability improvements could be achieved
with both 0.6SkW and 1.SkW microwave power exposures were it not for the pyritic
inclusions causing ignition. The work also showed that, with an increase in power the
heating rates of both the coal and pyrite are increased. Clearly, pyrite could reach ignition
69
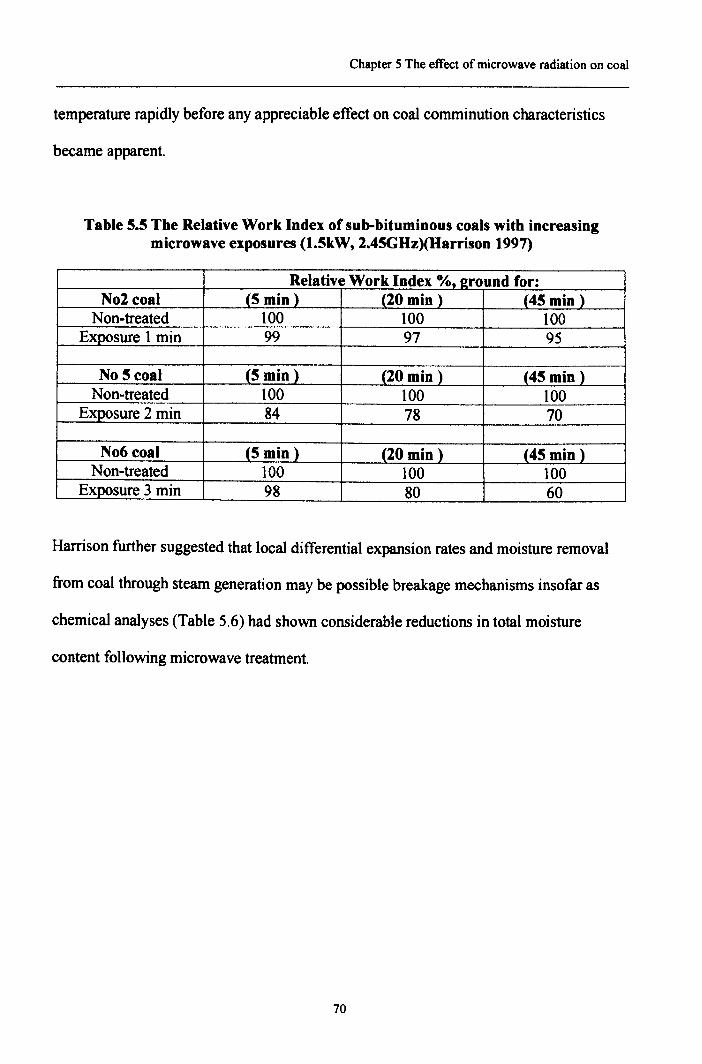
Chapter 5 The effect of microwave radiation on coal
temperature rapidly before any appreciable effect on coal comminution characteristics
became apparent.
Table ~.~ The Relative Work Index of sub-bituminous coals with increasingmicrowave exposures (1.~kW, 2.4~GHz)(Harrison 1997)
Relative Work Index %, 2round for:No2 coal (~min ) (20 min) (4~ min)
Non-treated 100 100 100Exposure 1 min 99 97 95
No s coal 15min_) (20 min) (45 min)Non-treated 100 100 100
Exposure 2 min 84 78 70
No6 coal 15 min) (20 min) (45 min)Non-treated 100 100 100
Exposure 3 min 98 80 60
Harrison further suggested that local differential expansion rates and moisture removal
from coal through steam generation may be possible breakage mechanisms insofar as
chemical analyses (Table 5.6) had shown considerable reductions in total moisture
content following microwave treatment.
70
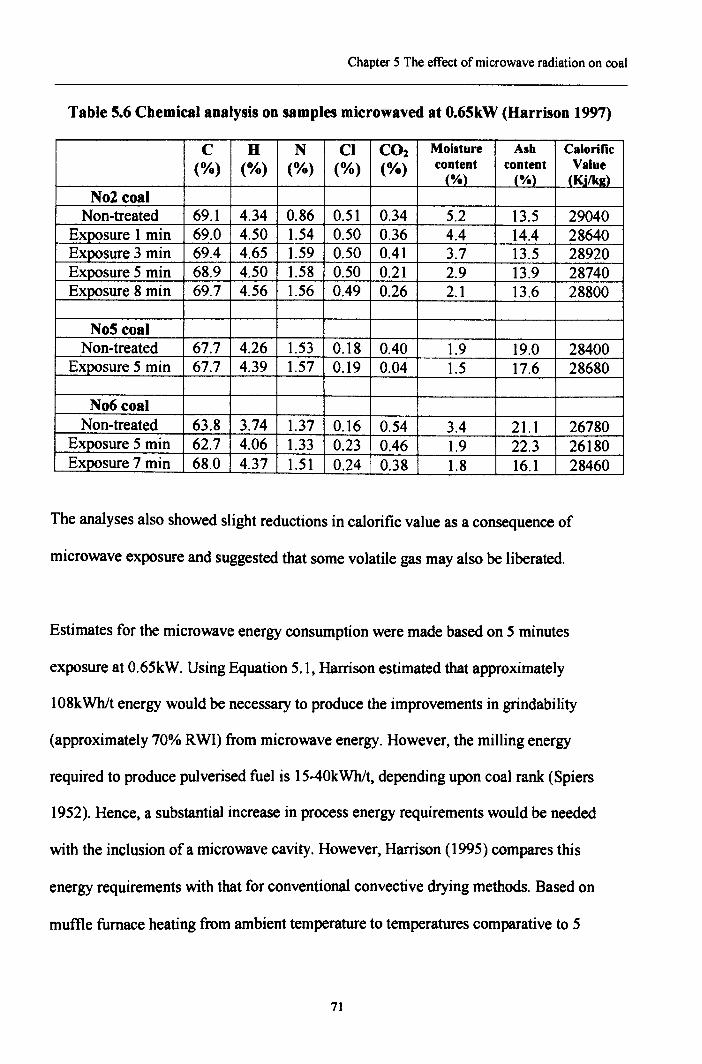
Chapter 5 The effect of microwave radiation on coal
Table S.6 Chemical analysis on samples microwaved at O.6SkW (Harrison 1997)
C H N Cl CO2 Moisture Asb Calorific(%) (%) (0/0) (%) (%) content content Value
(%) _{_o/~ 1_K~N02 coal
Non-treated 69.1 4.34 0.86 0.51 0.34 5.2 13.5 29040Exposure 1 min 69.0 4.50 1.54 0.50 0.36 4.4 14.4 28640Exposure 3 min 69.4 4.65 1.59 0.50 0.41 3.7 13.5 28920Exposure 5 min 68.9 4.50 1.58 0.50 0.21 2.9 13.9 28740Exposure 8 min 69.7 4.56 1.56 0.49 0.26 2.1 13.6 28800
NoS coalNon-treated 67.7 4.26 1.53 0.18 0.40 l.9 19.0 28400
Exposure 5 min 67.7 4.39 1.57 0.19 0.04 1.5 17.6 28680
N06 coalNon-treated 63.8 3.74 1.37 0.16 0.54 3.4 21.1 26780
Exposure 5 min 62.7 4.06 1.33 0.23 0.46 1.9 22.3 26180Exposure 7 min 68.0 4.37 1.51 0.24 0.38 1.8 16.1 28460
The analyses also showed slight reductions in calorific value as a consequence of
microwave exposure and suggested that some volatile gas may also be liberated.
Estimates for the microwave energy consumption were made based on 5 minutes
exposure at 0.6SkW. Using Equation 5.1, Harrison estimated that approximately
108kWhlt energy would be necessary to produce the improvements in grindability
(approximately 70% RWI) from microwave energy. However, the milling energy
required to produce pulverised fuel is 15-40kWhlt, depending upon coal rank (Spiers
1952). Hence, a substantial increase in process energy requirements would be needed
with the inclusion of a microwave cavity . However, Harrison (1995) compares this
energy requirements with that for conventional convective drying methods. Based on
muffle furnace heating from ambient temperature to temperatures comparative to 5
71
Chapter 5 The effect of microwave radiation on coal
minutes exposure to microwave radiation at 0.65kW (290°C), a total of 94kWhit energy
(assuming 100% heat transfer) would be necessary (Equation 5.2). Whilst microwave-
assisted is more costly than the use of commercial plant alone, one advantage of the
former is the potential for ash and sulphur reduction.
Q =Pt (5.1)
Q = uc.o« (5.2)
Q Energy absorbed or produced (J/s)M Weight of sample (kg)Cp Specific heating capacity (kJ/kg)01t Heating rate eC/s)
5.7 Effect of conventional drying upon coal grindability
Conventional vertical spindle mills producing pulverised fuel are swept with hot transport
air at 80°C. Coal surface moisture is thereby reduced. However at higher temperatures,
inherent moisture can also be removed. Lytle et al (1992) found that by subjecting
medium volatile coals to convective heating at 204°C, grindability could be improved.
Pretreated and non-treated coals were each ground in a steel ball mill for 60 minutes,
results show a relative reduction ratio of 1.4 indicating a significant change in
comminution behaviour due to preheating.
Harrison (1995) heated three-coal blends in a muffle furnace at temperatures above
200°C to compare their grindability with microwave treated samples (Section 5.6). The
coals were ground for 5,20 and 45 minutes in a rod mill and the size distributions
compared using the Relative Work Index (Berry 1966).
72
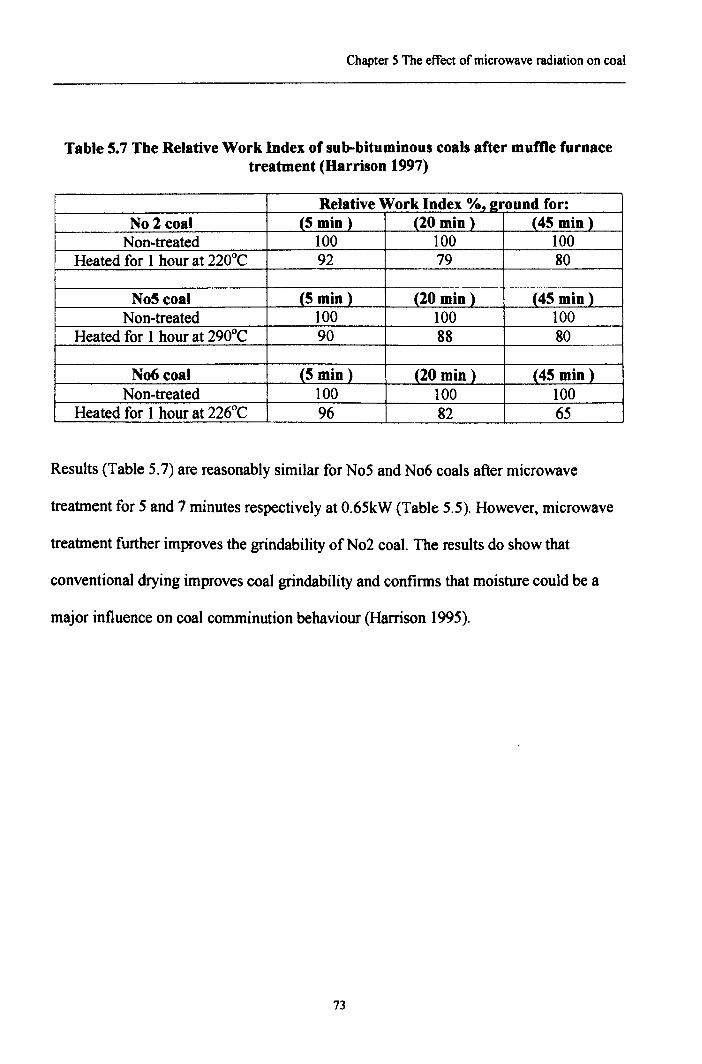
Chapter 5 The effect of microwave radiation on coal
Table 5.7 The Relative Work Index of sub-bttuminous coals after muffle furnacetreatment (Harrison 1997)
Relative Work Index %t 2round for:No 2 coal (5 min) (20 min) (45 min)
Non-treated 100 100 100Heated for 1 hour at 220°C 92 79 80
NoS coal (5 min) _f20 min} 145 min}Non-treated 100 100 100
Heated for 1 hour at 290°C 90 88 80
N06 coal (5 minl (20 min) 145 minlNon-treated 100 100 100
Heated for 1 hour at 226°C 96 82 65
Results (Table 5.7) are reasonably similar for No5 and No6 coals after microwave
treatment for 5 and 7 minutes respectively at 0.65kW (Table 5.5). However, microwave
treatment further improves the grindability ofN02 coal. The results do show that
conventional drying improves coal grindability and confirms that moisture could be a
major influence on coal comminution behaviour (Harrison 1995).
73
Chapter 5 The effect of microwave radiation on coal
5.8 Conclusions-Review of the effect of microwave radiation on coal
Research has shown that improvements with coal drying, grindability, desulphurisation
potential and pyrolysis can occur from the use of microwave technology. The
investigations suggest differential heating and associated differential expansion rates of
coal and mineral inclusions combined with steam generation as significant features of aU
of these processes. Microwave technology has also been applied to on-line moisture
determination (Bates 1989) and as an aid to iron reduction using coal as the reducing
agent (Zhong 1996).
Previous studies have shown great potential for application of microwave technology
within the coal industry i.e. desulphurisation, demineralisation and drying. Despite
substantial work reported in these fields, further research is required to quantify the effect
of microwave radiation on coal processing. In particular, what effect does microwave
radiation have on coals of different rank, under what conditions can higher powers be
used and is there an optimum coal size for microwave exposure with regards to both
desulphuisation and grindability. There is also a need to verify theories on breakage
mechanisms and optimisation of microwave conditions. Most importantly, milling plant
simulation and full economic evaluation of these processes are necessary to realise the
potential for microwave beneficiation of coal.
74
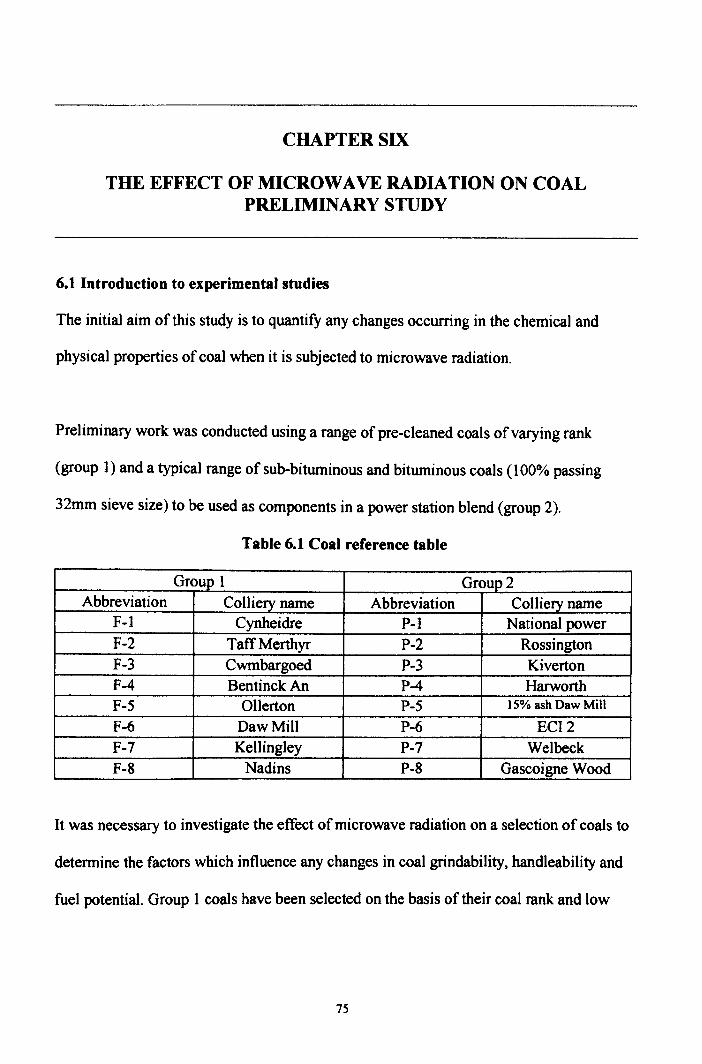
CHAPTER SIX
THE EFFECT OF MICROWAVE RADIATION ON COALPRELIMINARY STUDY
6.1 Introduction to experimental studies
The initial aim of this study is to quantify any changes occurring in the chemical and
physical properties of coal when it is subjected to microwave radiation.
Preliminary work was conducted using a range of pre-cleaned coals of varying rank
(group 1) and a typical range of sub-bituminous and bituminous coals ( 100% passing
32mm sieve size) to be used as components in a power station blend (group 2).
Table 6.1 Coal reference table
Group 1 Group2Abbreviation Colliery name Abbreviation CoIl iery name
F-I Cynheidre P-I National powerF-2 TaffMerthyr P-2 RossingtonF-3 Cwmbargoed P-3 KivertonF-4 Bentinck An P-4 HarworthF-5 Ollerton P-5 1S% ash Daw Mill
F-6 DawMill P-6 ECI2F-7 Kellingley P-7 WelbeckF-8 Nadins P-8 Gascoigne Wood
Itwas necessary to investigate the effect of microwave radiation on a selection of coals to
determine the factors which influence any changes in coal grindability, handleability and
fuel potential. Group 1 coals have been selected on the basis of their coal rank and low
75
Chapter 6 The effect of microwave radiation on coal-Preliminary study
ash content. The relationship between microwave grindability and coal rank (group 1) is
discussed in Chapter 7.
Group 2 coals have been selected to determine the effect of microwave exposure on
typical power station blends.
6.2 Preliminary study on microwave grindability
This section reports the preliminary investigation into the effects that microwave
radiation may have upon the grindability of coal. A series of sub-bituminous coals
(typical UK power station feed) have been exposed to microwave radiation at varying
times of exposure, microwave power and sample load at an operating frequency of
2.4SGHz to investigate whether any grindability improvements can be achieved. The
milling capabilities, chemical and physical properties of the coals following their
exposure to microwave radiation are compared to non-treated samples to ascertain the
potential use of microwave heating as a method of reducing pulverised fuel processing
energy requirements.
6.3 Repeatability of proximate analysis
Proximate analyses of group 2 coals have been experimentally determined by the CRE
(Coal Research Establishment) Group and by The University of Birmingham CUB) in
accordance to 8S1016 part 3 (outlined in Appendix A). Results (shown in Appendix B
and Table 6.2) show a sample analysis and demonstrates the accuracy of the test
procedure. The differences are mainly in the moisture and ash contents. The tests were
76
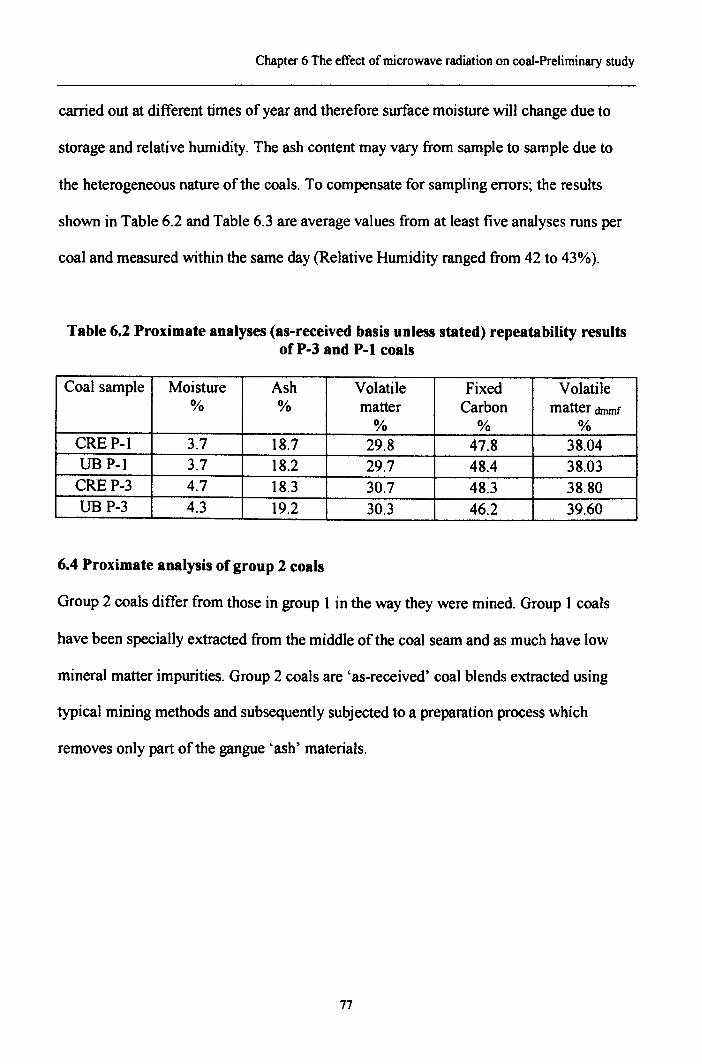
Chapter 6 The effect of microwave radiation on coal-Preliminary study
carried out at different times of year and therefore surface moisture will change due to
storage and relative humidity. The ash content may vary from sample to sample due to
the heterogeneous nature of the coals. To compensate for sampling errors; the results
shown in Table 6.2 and Table 6.3 are average values from at least five analyses runs per
coal and measured within the same day (Relative Humidity ranged from 42 to 43%).
Table 6.2 Proximate analyses (as-received basis unless stated) repeatability resultsof P-3 and P-I coals
Coal sample Moisture Ash Volatile Fixed Volatile% % matter Carbon matter dnunf
% % %CREP-I 3.7 18.7 29.8 47.8 38.04UBP-I 3.7 18.2 29.7 48.4 38.03CREP-3 4.7 18.3 30.7 48.3 38.80UBP-3 4.3 19.2 30.3 46.2 39.60
6.4 Proximate analysis of group 2 coals
Group 2 coals differ from those in group 1 in the way they were mined. Group 1 coals
have been specially extracted from the middle of the coal seam and as much have low
mineral matter impurities. Group 2 coals are 'as-received' coal blends extracted using
typical mining methods and subsequently subjected to a preparation process which
removes only part of the gangue 'ash' materials.
77
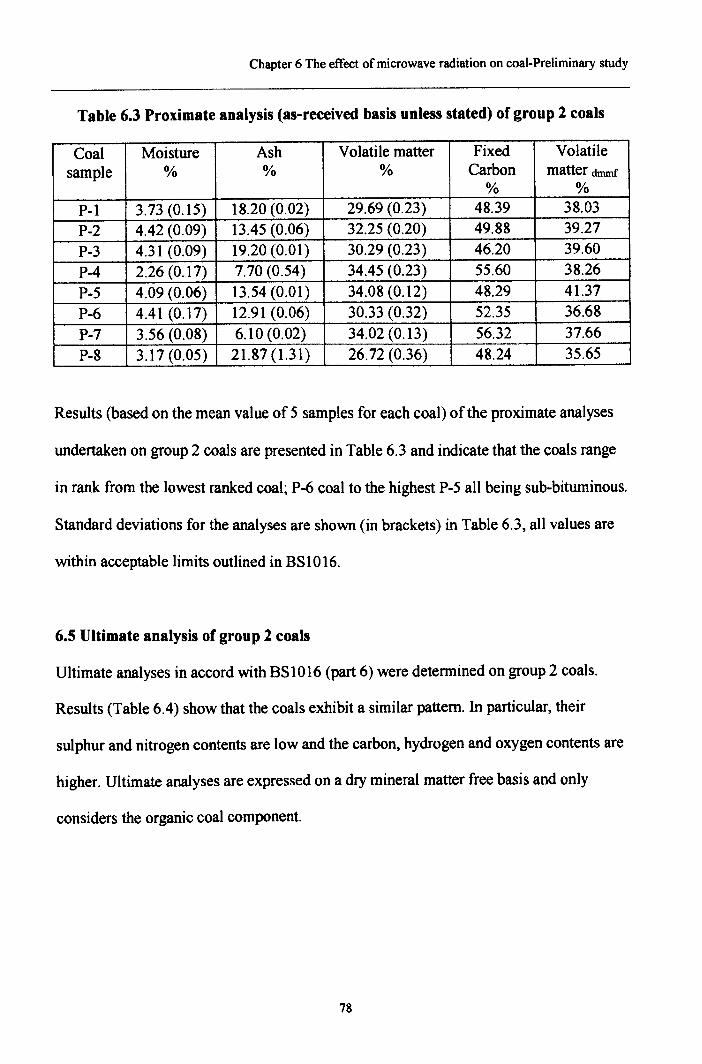
Chapter 6 The effect of microwave radiation on coal-Preliminary study
Table 6.3 Proximate analysis (as-received basis unless stated) of group 2 coals
Coal Moisture Ash Volatile matter Fixed Volatilesample % % % Carbon matter dmmf
% %P-1 3.73 (0.15) 18.20 (0.02) 29.69 (0.23) 48.39 38.03P-2 4.42 (0.09) 13.45 (0.06) 32.25 (0.20) 49.88 39.27P-3 4.31 (0.09) 19.20 (0.01) 30.29 (0.23) 46.20 39.60P-4 2.26 (0.17) 7.70 (0.54) 34.45 (0.23) 55.60 38.26P-5 4.09 (0.06) 13.54 (0.01) 34.08 (0.12) 48.29 41.37P-6 4.41 (0.17) 12.91 (0.06) 30.33 (0.32) 52.35 36.68P-7 3.56 (0.08) 6.10 (0.02) 34.02 (0.13) 56.32 37.66P-8 3.17 (0.05) 21.87 (1.31) 26.72 (0.36) 48.24 35.65
Results (based on the mean value of 5 samples for each coal) of the proximate analyses
undertaken on group 2 coals are presented in Table 6.3 and indicate that the coals range
in rank from the lowest ranked coal; P-6 coal to the highest P-5 all being sub-bituminous.
Standard deviations for the analyses are shown (in brackets) in Table 6.3, all values are
within acceptable limits outlined in BSI016.
6.5 Ultimate analysis of group 2 coals
Ultimate analyses in accord with BS1016 (part 6) were determined on group 2 coals.
Results (Table 6.4) show that the coals exhibit a similar pattern. In particular, their
sulphur and nitrogen contents are low and the carbon, hydrogen and oxygen contents are
higher. Ultimate analyses are expressed on a dry mineral matter free basis and only
considers the organic coal component.
78
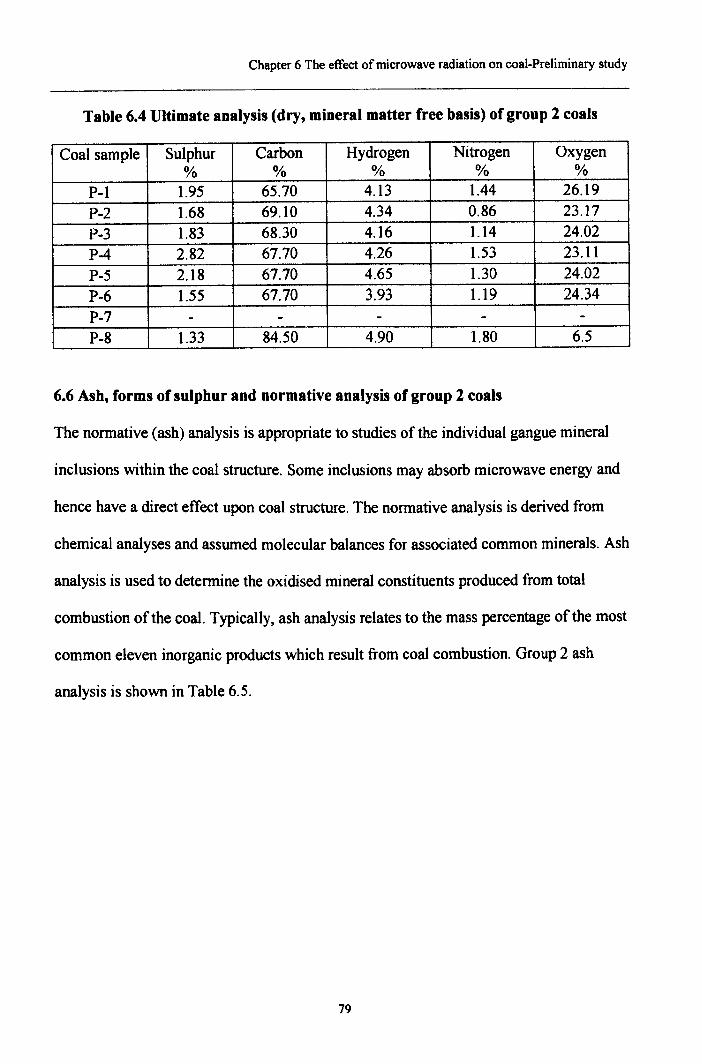
Chapter 6 The effect of microwave radiation on coal-Preliminary study
Table 6.4 Ultimate analysis (dry, mineral matter free basis) of group 2 coals
Coal sample Sulphur Carbon Hydrogen Nitrogen Oxygen% % % % %
P-l 1.95 65.70 4.13 1.44 26.19P-2 1.68 69.10 4.34 0.86 23.17P-3 1.83 68.30 4.16 1.14 24.02P-4 2.82 67.70 4.26 1.53 23.11P-5 2.18 67.70 4.65 1.30 24.02P-6 1.55 67.70 3.93 1.19 24.34P-7 - - - - -P-8 1.33 84.50 4.90 1.80 6.5
6.6 Ash, forms of sulphur and normative analysis of group 2 coals
The normative (ash) analysis is appropriate to studies of the individual gangue mineral
inclusions within the coal structure. Some inclusions may absorb microwave energy and
hence have a direct effect upon coal structure. The normative analysis is derived from
chemical analyses and assumed molecular balances for associated common minerals. Ash
analysis is used to determine the oxidised mineral constituents produced from total
combustion of the coal. Typically, ash analysis relates to the mass percentage of the most
common eleven inorganic products which result from coal combustion. Group 2 ash
analysis is shown in Table 6.5.
79
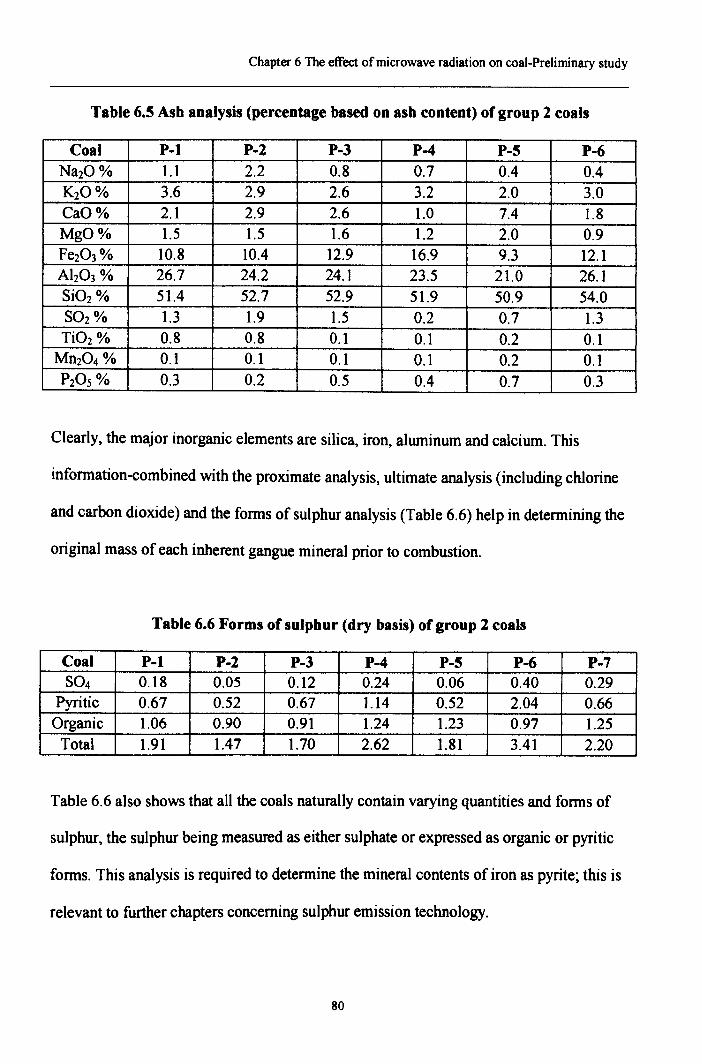
Chapter 6 The effect of microwave radiation on coal-Preliminary study
Table 6.5 Ash analysis (percentage based on ash content) of group 2 coals
Coal P-l P-2 P-3 P-4 P-5 P-6Na20% 1.1 2.2 0.8 0.7 0.4 0.4K2O% 3.6 2.9 2.6 3.2 2.0 3.0CaO% 2.1 2.9 2.6 1.0 7.4 1.8MgO% 1.5 1.5 1.6 1.2 2.0 0.9Fe203% 10.8 10.4 12.9 16.9 9.3 12.1Ah03% 26.7 24.2 24.1 23.5 21.0 26.1Si02% 51.4 52.7 52.9 51.9 50.9 54.0S02% 1.3 1.9 1.5 0.2 0.7 1.3Ti02% 0.8 0.8 0.1 0.1 0.2 0.1Mn204 % 0.1 0.1 0.1 0.1 0.2 0.1P20S% OJ 0.2 0.5 0.4 0.7 0.3
Clearly, the major inorganic elements are silica, iron, aluminum and calcium. This
information-combined with the proximate analysis, ultimate analysis (including chlorine
and carbon dioxide) and the forms of sulphur analysis (Table 6.6) help in determining the
original mass of each inherent gangue mineral prior to combustion.
Table 6.6 Forms of sulphur (dry basis) of group 2 coals
Coal P-l P-2 P-3 P-4 P-5 P-6 P-7S04 0.18 0.05 0.12 0.24 0.06 0.40 0.29
Pyritic 0.67 0.52 0.67 1.14 0.52 2.04 0.66Organic 1.06 0.90 0.91 1.24 1.23 0.97 1.25Total 1.91 1.47 1.70 2.62 1.81 3.41 2.20
Table 6.6 also shows that all the coals naturally contain varying quantities and forms of
sulphur, the sulphur being measured as either sulphate or expressed as organic or pyritic
forms. This analysis is required to determine the mineral contents of iron as pyrite; this is
relevant to further chapters concerning sulphur emission technology.
80
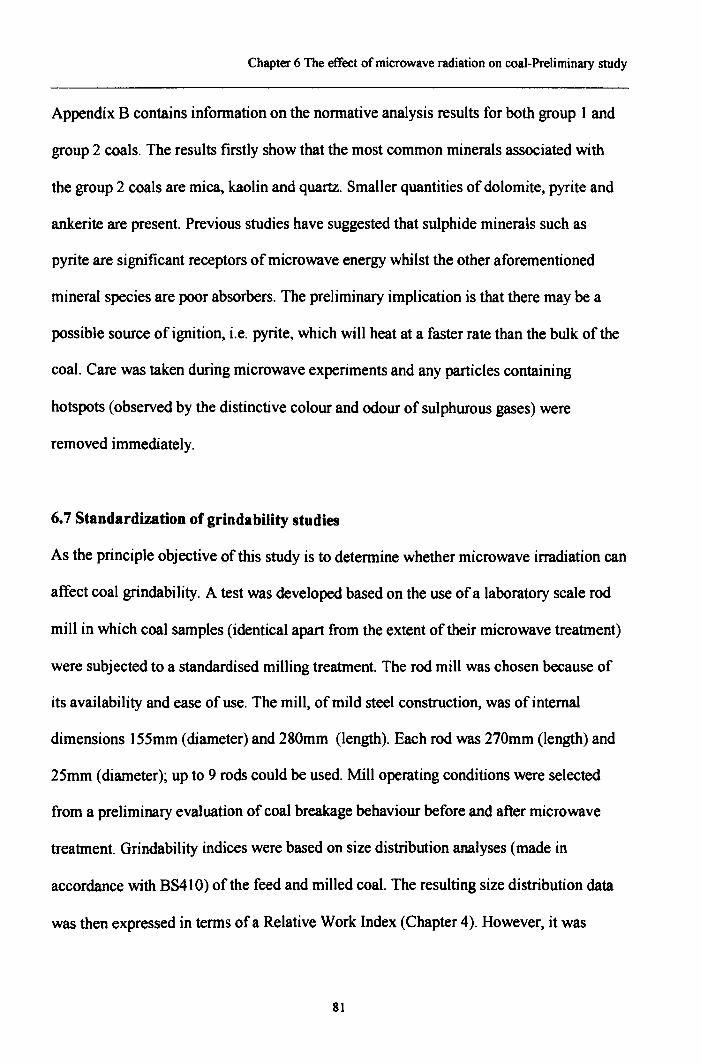
Chapter 6 The effect of microwave radiation on coal-Preliminary study
Appendix B contains information on the normative analysis results for both group 1 and
group 2 coals. The results firstly show that the most common minerals associated with
the group 2 coals are mica, kaolin and quartz. Smaller quantities of dolomite, pyrite and
ankerite are present. Previous studies have suggested that sulphide minerals such as
pyrite are significant receptors of microwave energy whilst the other aforementioned
mineral species are poor absorbers. The preliminary implication is that there may be a
possible source of ignition, i.e. pyrite, which will heat at a faster rate than the bulk of the
coal. Care was taken during microwave experiments and any particles containing
hotspots (observed by the distinctive colour and odour of sulphurous gases) were
removed immediately.
6.7 Standardization of grinda bility studies
As the principle objective of this study is to determine whether microwave irradiation can
affect coal grindability. A test was developed based on the use of a laboratory scale rod
mill in which coal samples (identical apart from the extent of their microwave treatment)
were subjected to a standardised milling treatment. The rod mill was chosen because of
its availability and ease of use. The mill, of mild steel construction, was of internal
dimensions 155mm (diameter) and 280mm (length). Each rod was 270mm (length) and
25mm (diameter); up to 9 rods could be used. Mill operating conditions were selected
from a preliminary evaluation of coal breakage behaviour before and after microwave
treatment. Grindability indices were based on size distribution analyses (made in
accordance with BS410) of the feed and milled coal. The resulting size distribution data
was then expressed in terms ofa Relative Work Index (Chapter 4). However, it was
81
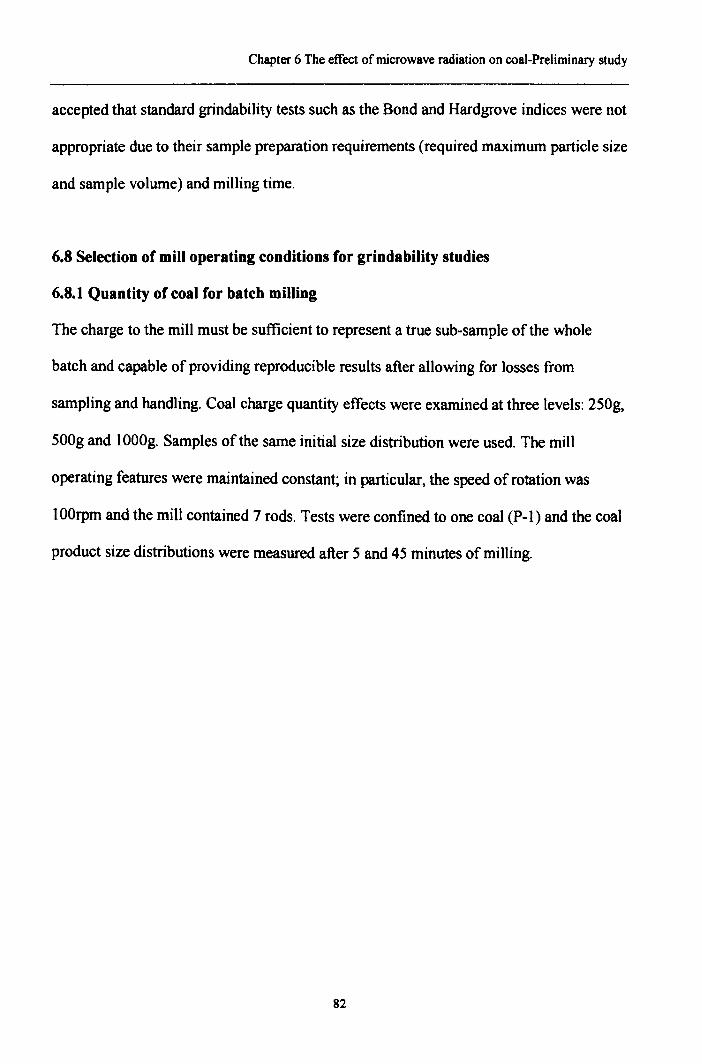
Chapter 6 The effect of microwave radiation on coal-Preliminary study
accepted that standard grindability tests such as the Bond and Hardgrove indices were not
appropriate due to their sample preparation requirements (required maximum particle size
and sample volume) and milling time.
6.8 Selection of mill operating conditions for grindability studies
6.8.1 Quantity of coal for batch milling
The charge to the mill must be sufficient to represent a true sub-sample of the whole
batch and capable of providing reproducible results after allowing for losses from
sampling and handling. Coal charge quantity effects were examined at three levels: 250g,
500g and 1000g. Samples of the same initial size distribution were used. The mill
operating features were maintained constant; in particular, the speed of rotation was
lOOrpm and the mill contained 7 rods. Tests were confined to one coal (P-I) and the coal
product size distributions were measured after 5 and 45 minutes of milling.
82
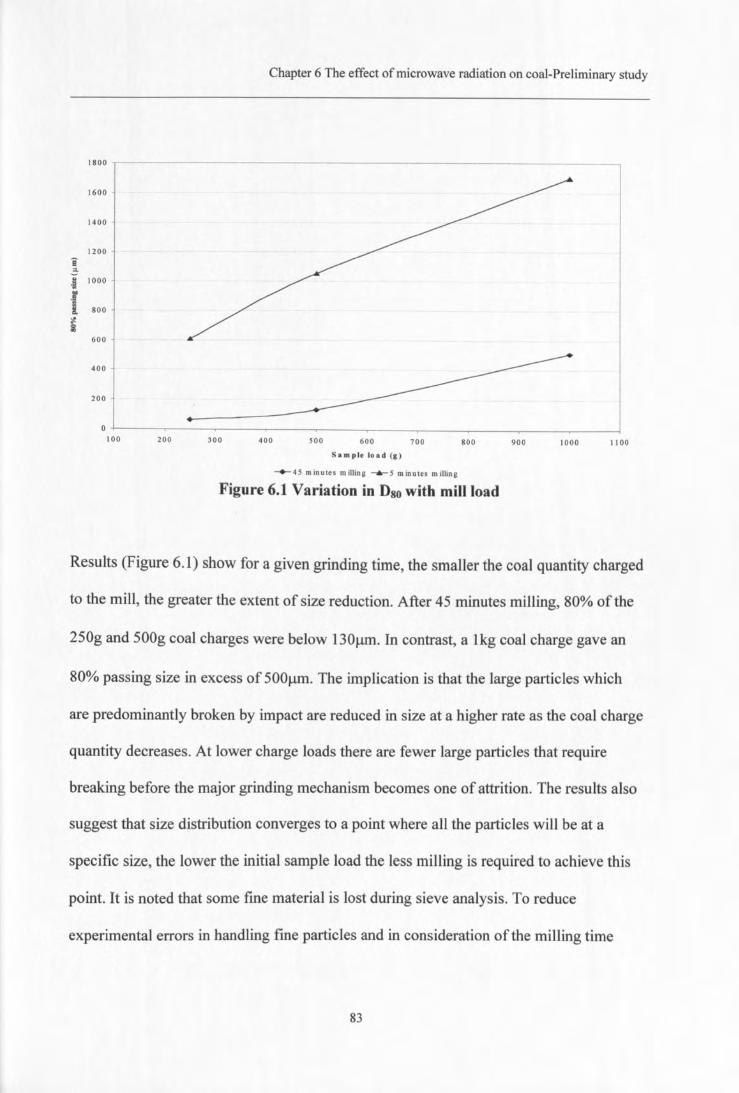
Chapter 6 The effect of microwave radiation on coal-Preliminary study
1800
1600
1400
1200e2-.g 1000..1 800'ti
600
400
200
lOO 200 300 400 500 600Sample load (g)
700 800 900 1000 1 100
-+-45 minutes milling _""_S minutes milling
Figure 6.1 Variation in Dso with mill load
Results (Figure 6.1) show for a given grinding time, the smaller the coal quantity charged
to the mill, the greater the extent of size reduction. After 45 minutes milling, 80% of the
250g and 500g coal charges were below 130j.lID.In contrast, a lkg coal charge gave an
80% passing size in excess of 500j.lm. The implication is that the large particles which
are predominantly broken by impact are reduced in size at a higher rate as the coal charge
quantity decreases. At lower charge loads there are fewer large particles that require
breaking before the major grinding mechanism becomes one of attrition. The results also
suggest that size distribution converges to a point where all the particles will be at a
specific size, the lower the initial sample load the less milling is required to achieve this
point. It is noted that some fme material is lost during sieve analysis. To reduce
experimental errors in handling fine particles and in consideration of the milling time
83
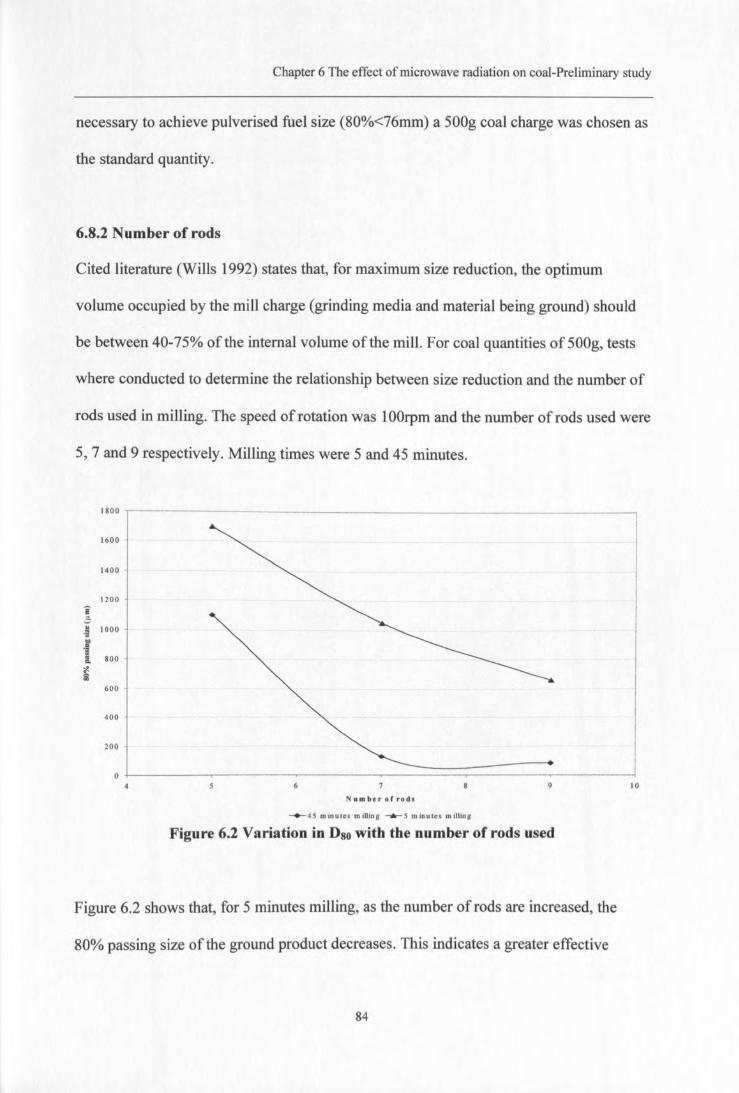
Chapter 6 The effect of microwave radiation on coal-Preliminary study
necessary to achieve pulverised fuel size (80%<76mm) a 500g coal charge was chosen as
the standard quantity.
6.8.2 Number of rods
Cited literature (Wills 1992) states that, for maximum size reduction, the optimum
volume occupied by the mill charge (grinding media and material being ground) should
be between 40-75% of the internal volume ofthe mill. For coal quantities of 500g, tests
where conducted to determine the relationship between size reduction and the number of
rods used in milling. The speed of rotation was 100rpm and the number of rods used were
5, 7 and 9 respectively. Milling times were 5 and 45 minutes.
1800
1600
1400
1200e.;;.~ 1000
·r. 800...'/.~
600
400
200
09 10
Number of rods
-+-45 minutes milling .....,.__s minutes milling
Figure 6.2 Variation in Dso with the number of rods used
Figure 6.2 shows that, for 5 minutes milling, as the number of rods are increased, the
80% passing size of the ground product decreases. This indicates a greater effective
84
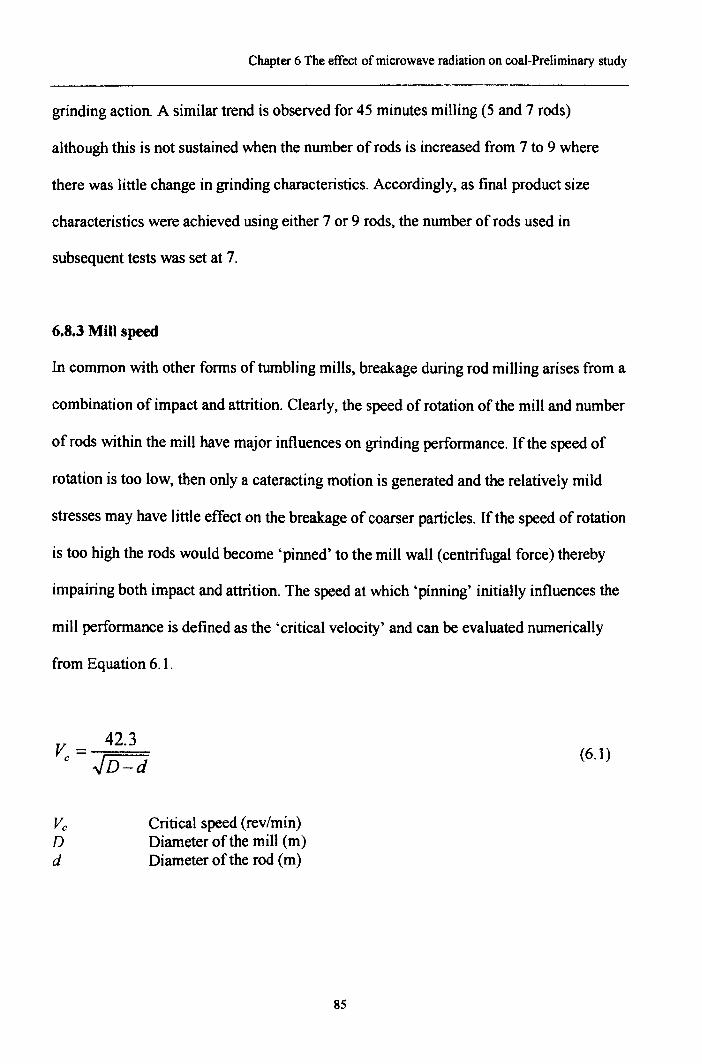
Chapter 6 The effect of microwave radiation on coal-Preliminary study
grinding action. A similar trend is observed for 45 minutes milling (5 and 7 rods)
although this is not sustained when the number of rods is increased from 7 to 9 where
there was little change in grinding characteristics. Accordingly, as final product size
characteristics were achieved using either 7 or 9 rods, the number of rods used in
subsequent tests was set at 7.
6.S.3 Mill speed
In common with other forms of tumbling mills, breakage during rod milling arises from a
combination of impact and attrition. Clearly, the speed of rotation of the mill and number
of rods within the mill have major influences on grinding performance. If the speed of
rotation is too low, then only a cateracting motion is generated and the relatively mild
stresses may have little effect on the breakage of coarser particles. If the speed of rotation
is too high the rods would become 'pinned' to the mill wall (centrifugal force) thereby
impairing both impact and attrition. The speed at which 'pinning' initially influences the
mill performance is defined as the 'critical velocity' and can be evaluated numerically
from Equation 6.l.
v = 42.3c ~D-d
(6.1)
VcDd
Critical speed (rev/min)Diameter of the mill (m)Diameter of the rod (m)
85
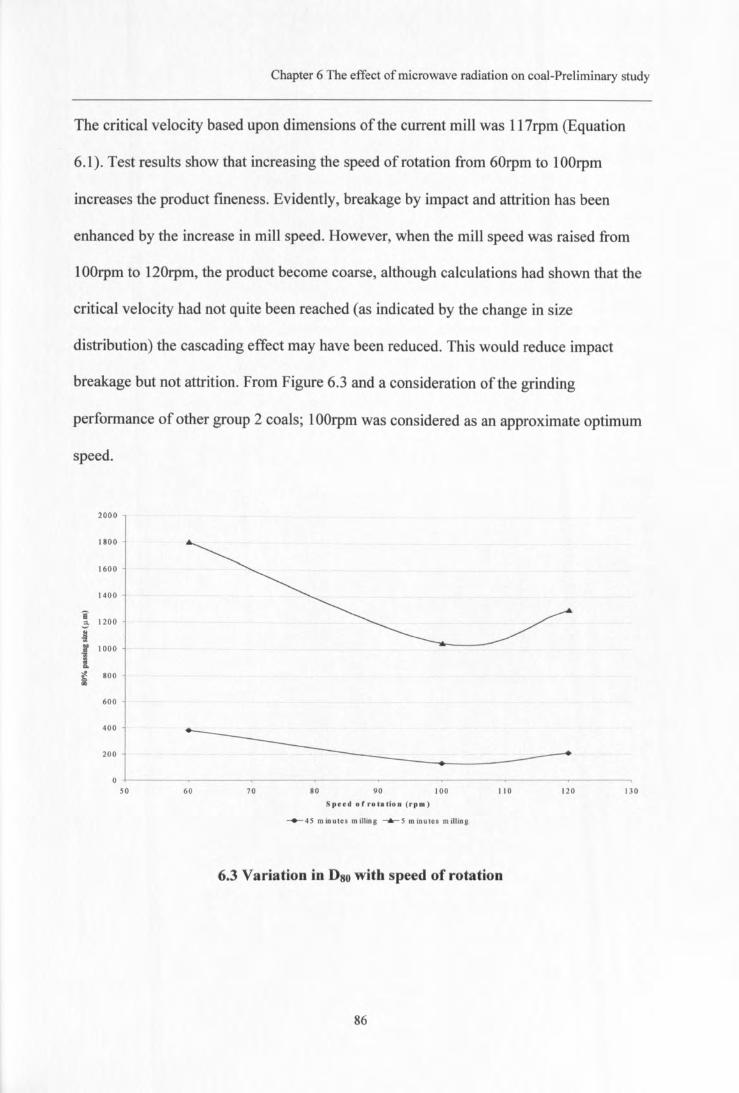
Chapter 6 The effect of microwave radiation on coal-Preliminary study
The critical velocity based upon dimensions of the current mill was 117rpm (Equation
6.1). Test results show that increasing the speed of rotation from 60rpm to 100rpm
increases the product fmeness. Evidently, breakage by impact and attrition has been
enhanced by the increase in mill speed. However, when the mill speed was raised from
100rpm to 120rpm, the product become coarse, although calculations had shown that the
critical velocity had not quite been reached (as indicated by the change in size
distribution) the cascading effect may have been reduced. This would reduce impact
breakage but not attrition. From Figure 6.3 and a consideration of the grinding
performance of other group 2 coals; 1OOrpmwas considered as an approximate optimum
speed.
2000
1800
1600
1400
'i 1200-=.~.~ 1000a..-;. 800i
600
400
200
050 60 70 80 90 100 110 120 130
Speed o'rotatio. (rpm)
-+-45 minutes milling _"""S minutes milling
6.3 Variation in Dso with speed of rotation
86
Chapter 6 The effect of microwave radiation on coal-Preliminary study
6.9 The effect of rod milling on coal
100.00
90.00
80.00
~ 70.00t-...9:: 60.00..."5I: 50.00.....1i 40.00ee..u 30.00
20.00
10.00
0.0010 100 1000 10000 100000
Particl. sUe (JUlI)-+- 5 min -+- 10mil -.- 20 mil -II- As received -II- 30 mil --<>- 40 mil -+- 45 mil 50 mi'I -+- 60 mil __ 70 mil
Figure 6.4 Size distribution of P-l coal with increasing milling time
Two (500g) representative samples ofP-1 coal were used to determine if microwave
radiation has any effect on coal grindability and to determine the size distribution effects
produced by rod milling over time. The original size distribution from a batch sample of
approximately 30kg was determined, the two SOOgP-l coal sub-samples were made
representative to the original size distribution. Size distribution measurements were made
after every 10 minutes of milling. Milling conditions were as described previously (7 rods
used at a rotational speed of IOOrpm). Figure 6.4 shows the size distributions of an as-
received P-I coal sample with increasing milling time. Figure 6.4 also shows that initially
the Dso is reduced rapidly over the ftrst five minutes of milling; this is expected due to the
selected impact (and hence breakage) of coarse particles. As attrition become the more
87
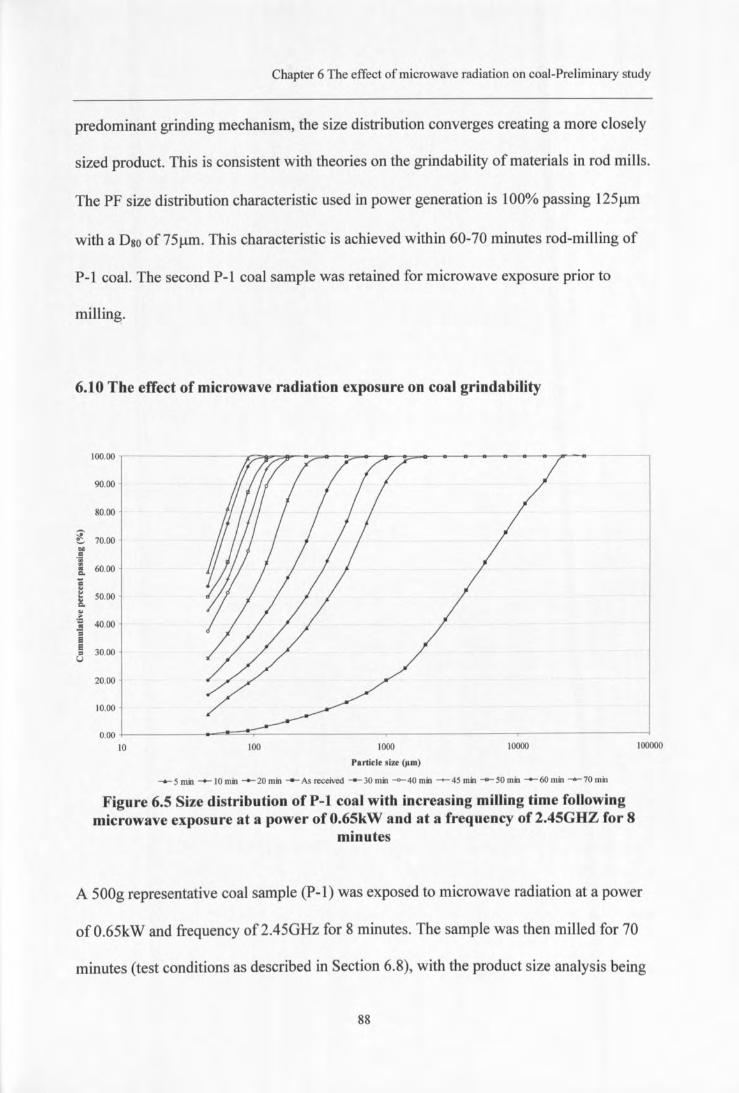
Chapter 6 The effect of microwave radiation on coal-Preliminary study
predominant grinding mechanism, the size distribution converges creating a more closely
sized product. This is consistent with theories on the grindability of materials in rod mills.
The PF size distribution characteristic used in power generation is 100% passing 125urn
with a Dso of 75urn. This characteristic is achieved within 60-70 minutes rod-milling of
P-1 coal. The second P-1 coal sample was retained for microwave exposure prior to
milling.
6.10 The effect of microwave radiation exposure on coal grindability
100.00
90.00
80.00
~~ 70.00....'ill
60.00..Co
;;..~ 50.00~..,~
40.00~ElEl 30.00=U
20.00
10.00
0.0010 100 1000 10000 ]00000
Particle size (11m)
....... 5 min -+- ]0 min -- 20 min -- As received --- 30 min -<>- 40 min _,_ 45 min -- 50 min -- 60 min --70 mal
Figure 6.5 Size distribution of P-l coal with increasing milling time followingmicrowave exposure at a power of O.65kWand at a frequency of 2.45GHZ for 8
minutes
A 500g representative coal sample (P-l) was exposed to microwave radiation at a power
ofO.65kW and frequency of2.45GHz for 8 minutes. The sample was then milled for 70
minutes (test conditions as described in Section 6.8), with the product size analysis being
88
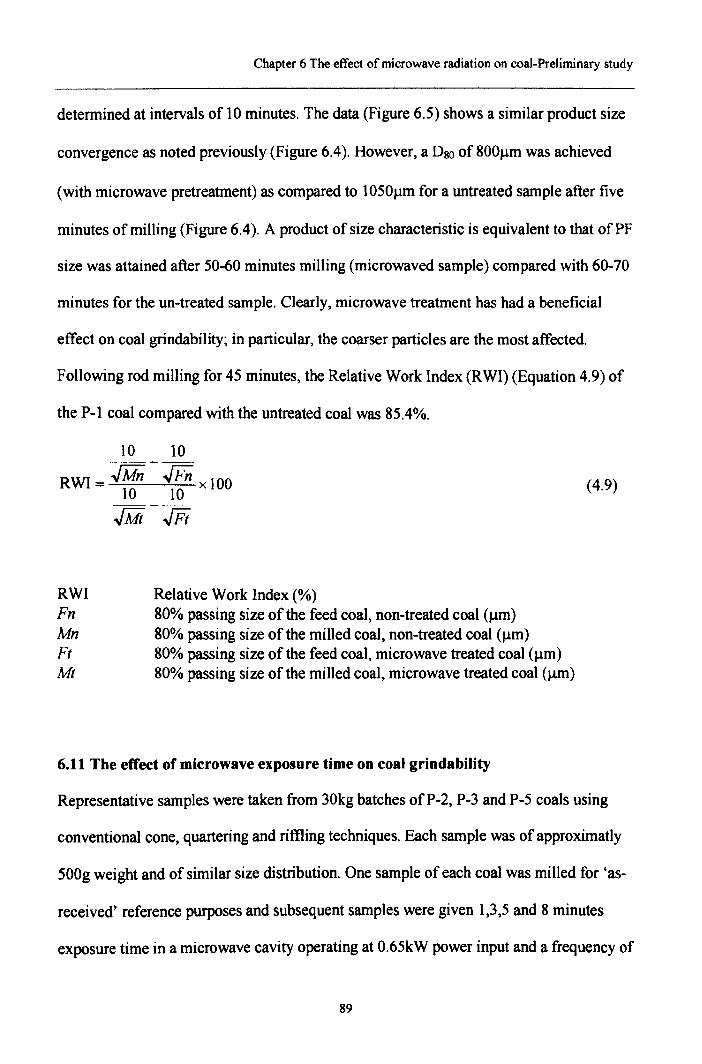
Chapter 6 The effect of microwave radiation on coal-Preliminary study
determined at intervals of 10 minutes. The data (Figure 6.5) shows a similar product size
convergence as noted previously (Figure 6.4). However, a Dse of 800).lm was achieved
(with microwave pretreatment) as compared to I050).lm for a untreated sample after five
minutes of milling (Figure 6.4). A product of size characteristic is equivalent to that ofPF
size was attained after 50-60 minutes milling (microwaved sample) compared with 60-70
minutes for the un-treated sample. Clearly, microwave treatment has had a beneficial
effect on coal grindability; in particular, the coarser particles are the most affected.
Following rod milling for 45 minutes, the Relative Work Index (RWI) (Equation 4.9) of
the P-l coal compared with the untreated coal was 85.4%.
10 10
RWI = IMn -Fn 10010 10 x
Jiji-JFi(4.9)
RWI Relative Work Index (%)Fn 80% passing size of the feed coal, non-treated coal (urn)Mn 80% passing size of the milled coal, non-treated coal (J.1m)Ft 80% passing size of the feed coal, microwave treated coal (urn)Mt 80% passing size of the milled coal, microwave treated coal (urn)
6.11 The effect of microwave exposure time on coal grindability
Representative samples were taken from 30kg batches ofP-2, P-3 and P-5 coals using
conventional cone, quartering and riffling techniques. Each sample was of approximatly
500g weight and of similar size distribution. One sample of each coal was milled for 'as-
received' reference purposes and subsequent samples were given 1,3,5 and 8 minutes
exposure time in a microwave cavity operating at 0.65kW power input and a frequency of
89
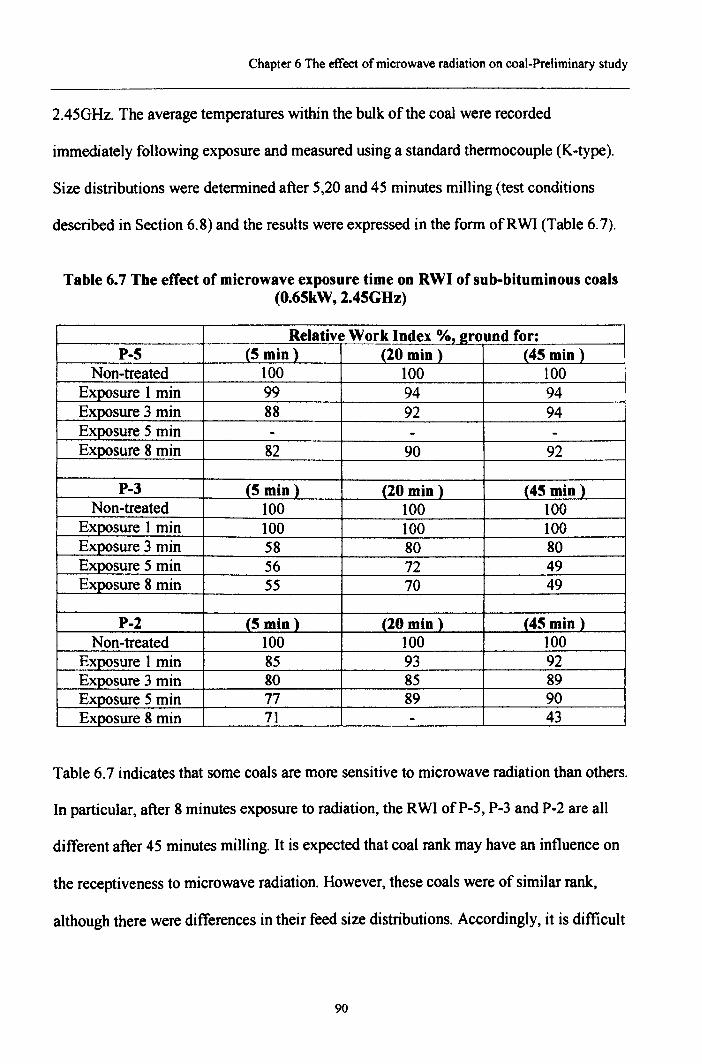
Chapter 6 The effect of microwave radiation on coal-Preliminary study
2.45GHz. The average temperatures within the bulk of the coal were recorded
immediately following exposure and measured using a standard thermocouple (K-type).
Size distributions were determined after 5,20 and 45 minutes milling (test conditions
described in Section 6.8) and the results were expressed in the form ofRWI (Table 6.7).
Table 6.7 The effect of microwave exposure time on RWI of sub-bituminous coals(0.65kW, 2.45GHz)
Relative Work Index %, eround for:P-5 (5 min) (20 min) (45 min)
Non-treated 100 100 100Exposure 1 min 99 94 94Exposure 3 min 88 92 94Exposure 5 min - - -Exposure 8 min 82 90 92
P-3 (5 min) (20 min) (45 min)Non-treated 100 100 100
Exposure 1 min 100 100 100Exposure 3 min 58 80 80Exposure 5 min 56 72 49Exposure 8 min 55 70 49
P-2 (5 min) (20 min) (45 min)Non-treated 100 100 100
Exposure 1 min 85 93 92Exposure 3 min 80 85 89Exposure 5 min 77 89 90Exposure 8 min 71 - 43
Table 6.7 indicates that some coals are more sensitive to microwave radiation than others.
In particular, after 8 minutes exposure to radiation, the RWI ofP-5, P-3 and P-2 are all
different after 45 minutes milling. It is expected that coal rank may have an influence on
the receptiveness to microwave radiation. However, these coals were of similar rank,
although there were differences in their feed size distributions. Accordingly, it is difficult
90
Chapter 6 The effect of microwave radiation on coal-Preliminary study
to draw detailed comparisons between coals. This specific issue is addressed in later
sections (Chapter 7).
Results presented in Table 6.7 indicate that the RWI after 5 minutes milling are
significantly lower than those determined after 45 minutes of milling. Accordingly, it is
possible that microwave treatment has more of an influence on impactive modes of
grinding and hence maybe of greater significance for use on coarser particles. Rod
milling generally result in a narrow product size distribution and this convergence may be
responsible for the increase in RWI between 5 and 45 minutes milling.
Results (Table 6.7) show that after a microwave exposure period of 1 minute, there is
relatively little change in RWI and hence little improvement in grindability. After 3
minutes, the RWI shows a more positive reduction, indicating an improvement in
grindability which is broadly sustained for longer grinding periods. Each coal behaves
differently. Whilst P-5 shows little change in grindability for microwave exposure
periods of up to 5 minutes, the RWI ofP-2 coal exhibits a continuous reduction with
increasing exposure times and P-3 indicates that grindability maybe at an optimum
between 3 and 5 minutes microwave exposure time. The 80% passing size (D80) of feed
coals (P-5, P-3 and P-2) introduced into the mill are 10500~m, 13000~m and 16000~m
respectively. It appears that the microwave exposure initially has no or little effect, after a
period of time an effect upon grindability becomes evident that increases with exposure
time. However, this improvement reaches a maximum and any further exposure has no
effect on the grindability, this trend appears to depend upon the initial size distribution of
91
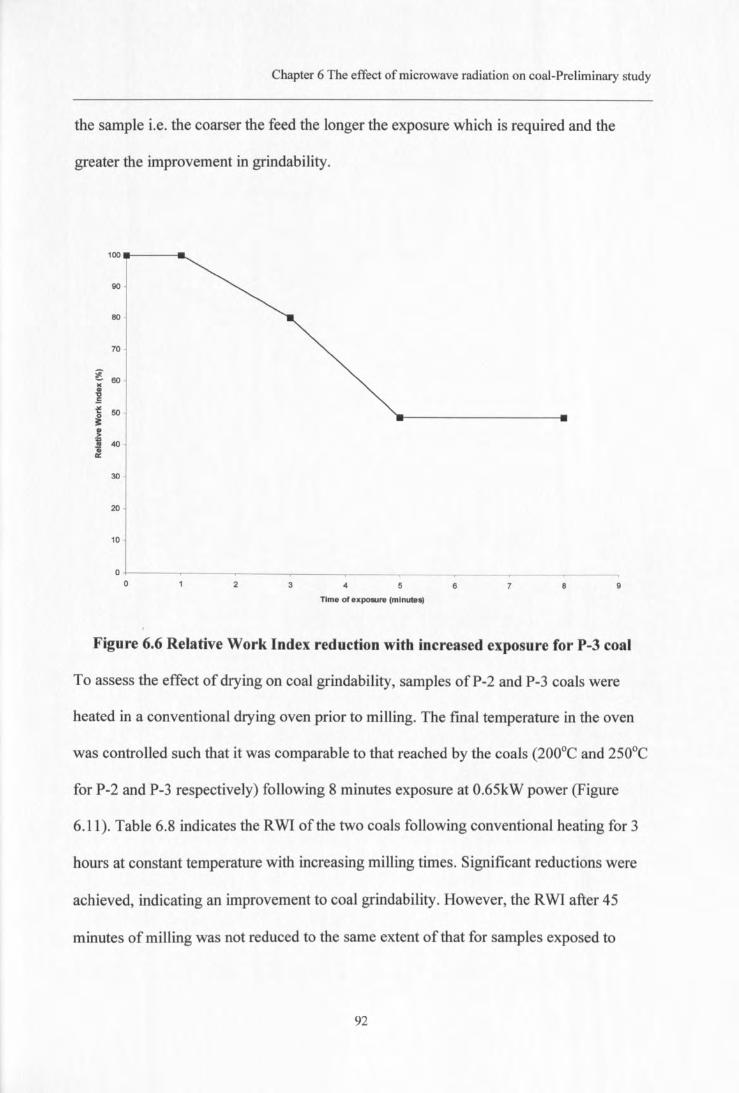
Chapter 6 The effect of microwave radiation on coal-Preliminary study
the sample i.e. the coarser the feed the longer the exposure which is required and the
greater the improvement in grindability.
100
90
80
70
~ 60~'tI.5f: 50~~i 40~
30
20
10
00 2 3 4 5 6 7 9
Time of exposure (minutes)
Figure 6.6 Relative Work Index reduction with increased exposure for P-3 coal
To assess the effect of drying on coal grindability, samples ofP-2 and P-3 coals were
heated in a conventional drying oven prior to milling. The fmal temperature in the oven
was controlled such that it was comparable to that reached by the coals (2000e and 2500efor P-2 and P-3 respectively) following 8 minutes exposure at O.65kW power (Figure
6.11). Table 6.8 indicates the RWI of the two coals following conventional heating for 3
hours at constant temperature with increasing milling times. Significant reductions were
achieved, indicating an improvement to coal grindability. However, the RWI after 45
minutes of milling was not reduced to the same extent of that for samples exposed to
92
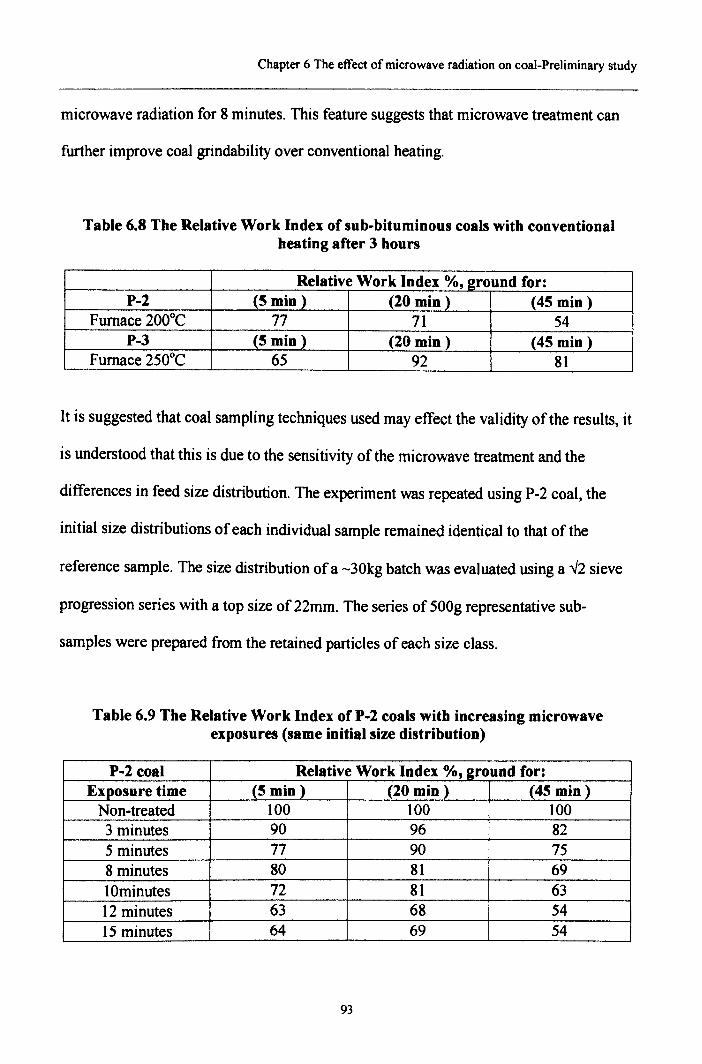
Chapter 6 The effect of microwave radiation on coal-Preliminary study
microwave radiation for 8 minutes. This feature suggests that microwave treatment can
further improve coal grindability over conventional heating.
Table 6.8 The Relative Work Index of sub-bituminous coals with conventionalheating after 3 bours
Relative Work Index %, ground for:P-2 (5 min_) (20 min) (45 min)
Furnace 200°C 77 71 54P-3 (5 min) (20 min) (45 min)
Furnace 250°C 65 92 81
It is suggested that coal sampling techniques used may effect the validity of the results, it
is understood that this is due to the sensitivity of the microwave treatment and the
differences in feed size distribution. The experiment was repeated using P-2 coal, the
initial size distributions of each individual sample remained identical to that of the
reference sample. The size distribution of a -30kg batch was evaluated using a ..J2 sieve
progression series with a top size of 22mm. The series of 500g representative sub-
samples were prepared from the retained particles of each size class.
Table 6.9 The Relative Work Index of P-2 coals witb increasing microwaveexposures (same initial size distribution)
P-2 coal Relative Work Index %, ground for:Exposure time 15minl (20 min) (45 min)_Non-treated 100 100 1003 minutes 90 96 825 minutes 77 90 758 minutes 80 81 6910minutes 72 81 6312 minutes 63 68 5415 minutes 64 69 54
93
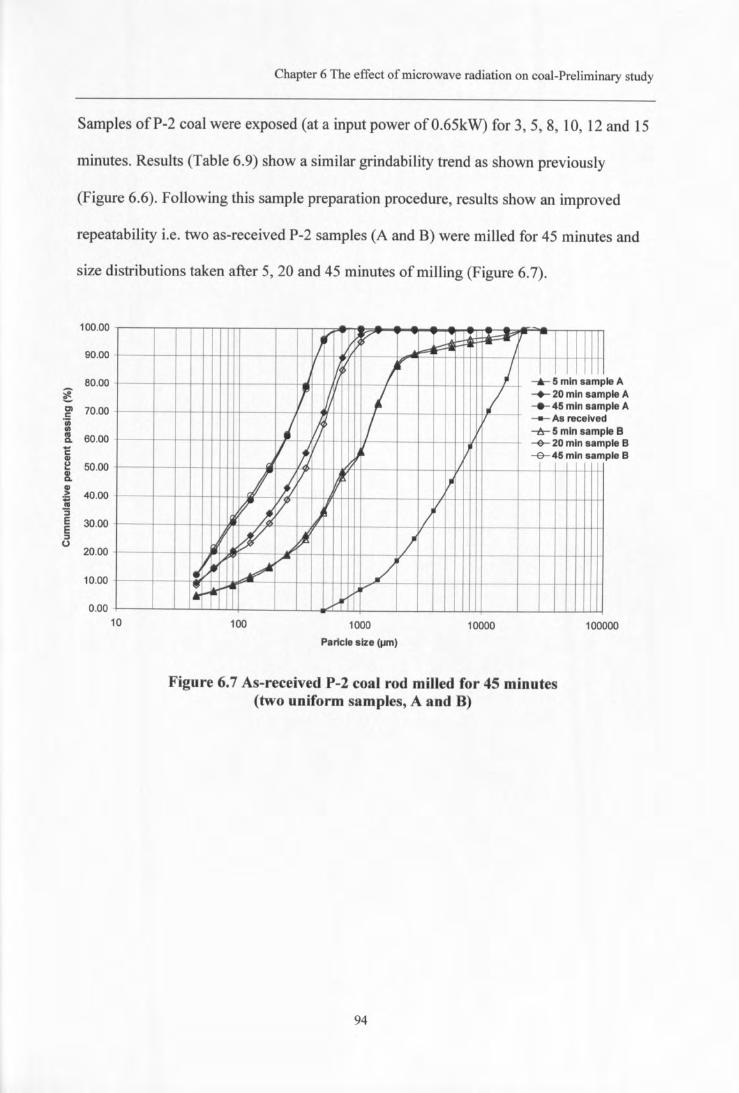
Chapter 6 The effect of microwave radiation on coal-Preliminary study
Samples ofP-2 coal were exposed (at a input power ofO.65kW) for 3,5,8, 10, 12 and 15
minutes. Results (Table 6.9) show a similar grindability trend as shown previously
(Figure 6.6). Following this sample preparation procedure, results show an improved
repeatability i.e. two as-received P-2 samples (A and B) were milled for 45 minutes and
size distributions taken after 5, 20 and 45 minutes of milling (Figure 6.7).
100.00
90.00
- 80.00:.!1~Cl 70.00e'iiiIIIa 60.00+'CIIIe 50.00a.~ 40.00-;'3E 30.00E~o
20.00
10.00
-Jr F ~....~ ~flI
jI/~ )'t' I -Ir- 5 min sampl
If ~ I :/ -+- 20 min sam___ 45 min sam,
~ / -- As received-tr- 5 min sampl
V I~ ~20mlnsam~ --e- 45 min sam
d II
/ /;V ~ I,,,~V I)'iVI
Iii ~ .)~ /~~y ~
v-/I!
I: ~ .....l-"
eApleApleA
eBpleBpleB
0.0010 100 1000
Paricle size (J.lm)
10000 100000
Figure 6.7 As-received P-2 coal rod milled for 45 minutes(two uniform samples, A and B)
94
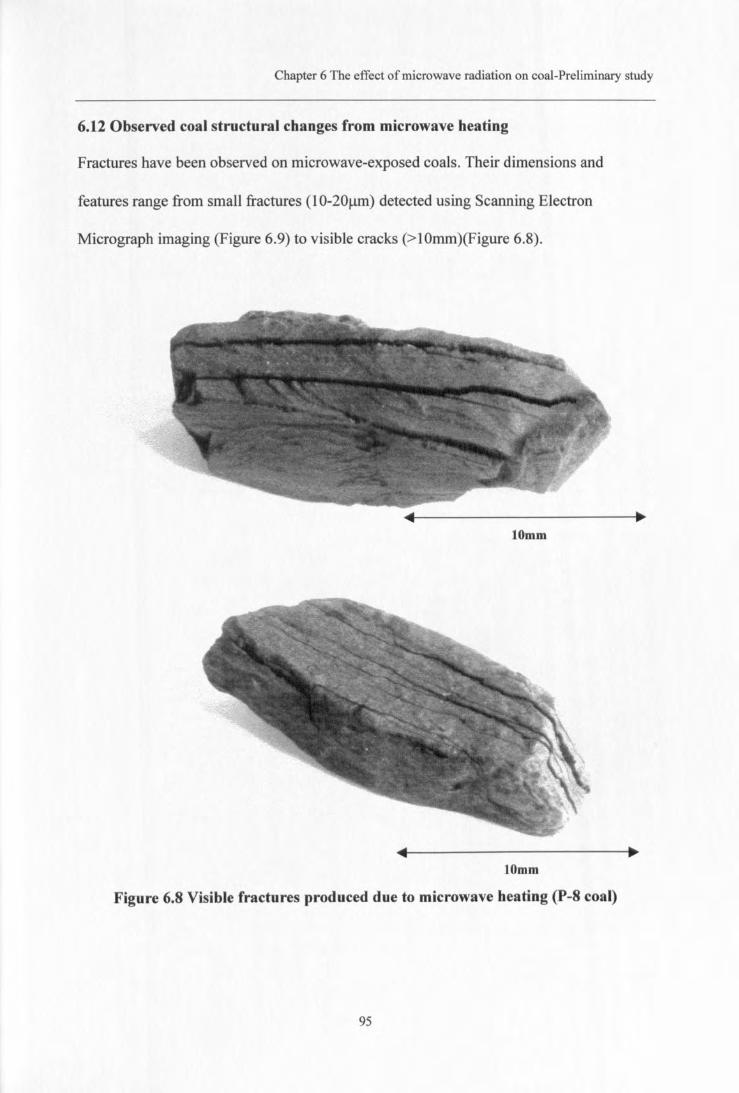
Chapter 6 The effect of microwave radiation on coal-Preliminary study
6.12 Observed coal structural changes from microwave heating
Fractures have been observed on microwave-exposed coals. Their dimensions and
features range from small fractures (10-20llm) detected using Scanning Electron
Micrograph imaging (Figure 6.9) to visible cracks (>10mm)(Figure 6.8).
tOmm
tOmm
Figure 6.S Visible fractures produced due to microwave heating (P-S coal)
95
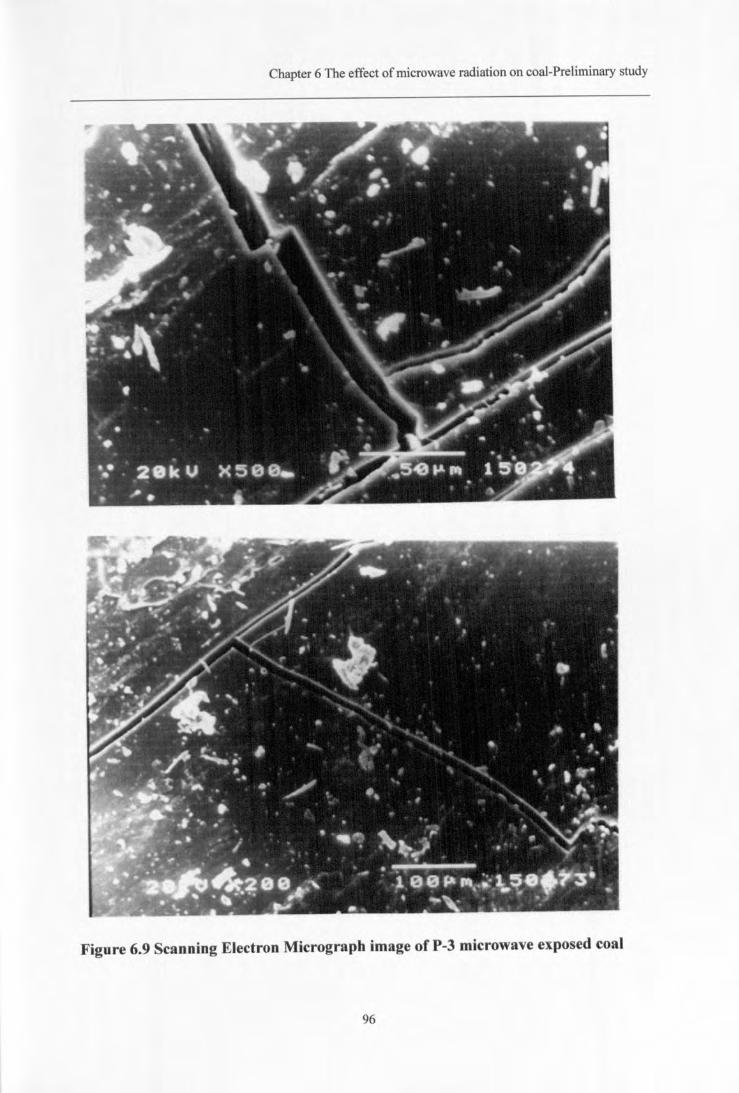
Chapter 6 The effect of microwave radiation on coal-Preliminary study
Figure 6.9 Scanning Electron Micrograph image of P-3 microwave exposed coal
96
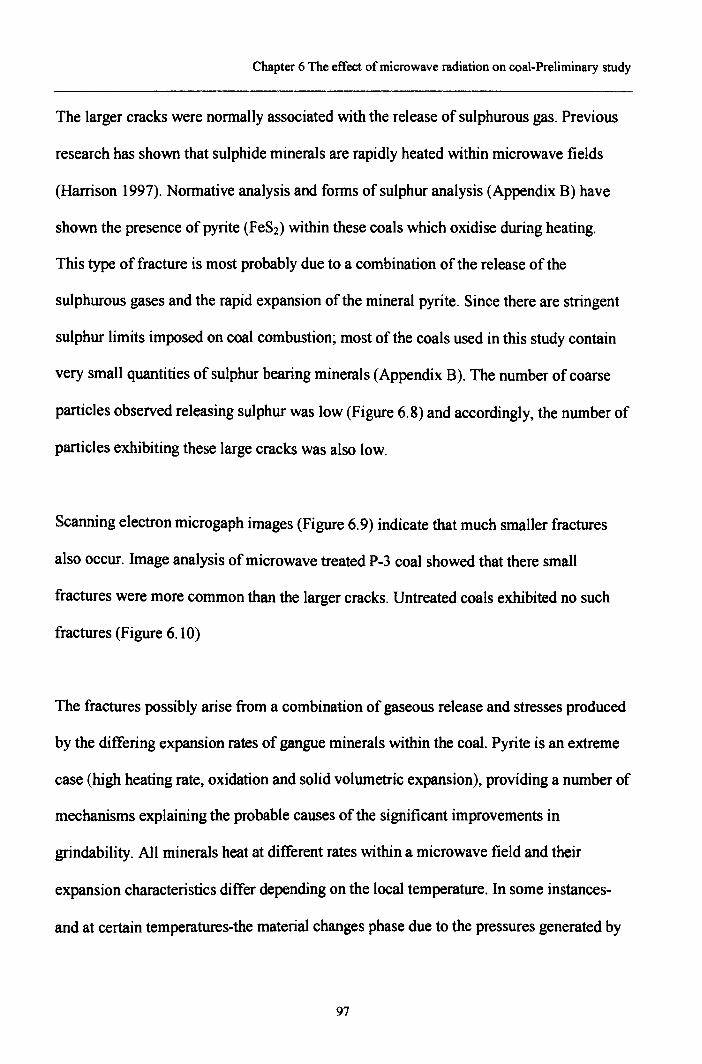
Chapter 6 The effect of microwave radiation on coal-Preliminary study
The larger cracks were normally associated with the release of sulphurous gas. Previous
research has shown that sulphide minerals are rapidly heated within microwave fields
(Harrison 1997). Normative analysis and forms of sulphur analysis (Appendix B) have
shown the presence of pyrite (FeS2) within these coals which oxidise during heating.
This type of fracture is most probably due to a combination of the release of the
sulphurous gases and the rapid expansion of the mineral pyrite. Since there are stringent
sulphur limits imposed on coal combustion; most of the coals used in this study contain
very small quantities of sulphur bearing minerals (Appendix B). The number of coarse
particles observed releasing sulphur was low (Figure 6.8) and accordingly, the number of
particles exhibiting these large cracks was also low.
Scanning electron microgaph images (Figure 6.9) indicate that much smaller fractures
also occur. Image analysis of microwave treated P-3 coal showed that there small
fractures were more common than the larger cracks. Untreated coals exhibited no such
fractures (Figure 6.10)
The fractures possibly arise from a combination of gaseous release and stresses produced
by the differing expansion rates of gangue minerals within the coal. Pyrite is an extreme
case (high heating rate, oxidation and solid volumetric expansion), providing a number of
mechanisms explaining the probable causes of the significant improvements in
grindability. All minerals heat at different rates within a microwave field and their
expansion characteristics differ depending on the local temperature. In some instances-
and at certain temperatures-the material changes phase due to the pressures generated by
97
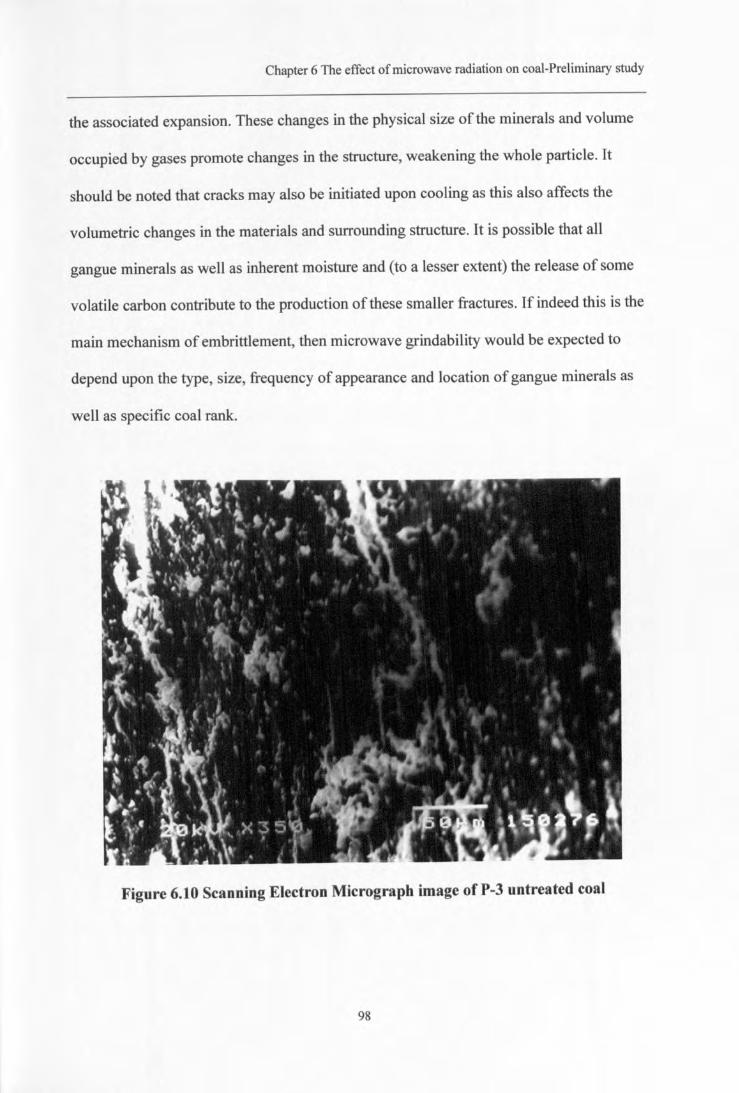
Chapter 6 The effect of microwave radiation on coal-Preliminary study
the associated expansion. These changes in the physical size of the minerals and volume
occupied by gases promote changes in the structure, weakening the whole particle. It
should be noted that cracks may also be initiated upon cooling as this also affects the
volumetric changes in the materials and surrounding structure. It is possible that all
gangue minerals as well as inherent moisture and (to a lesser extent) the release of some
volatile carbon contribute to the production of these smaller fractures. If indeed this is the
main mechanism of embrittlement, then microwave grindability would be expected to
depend upon the type, size, frequency of appearance and location of gangue minerals as
well as specific coal rank.
Figure 6.10 Scanning Electron Micrograph image of P-3 untreated coal
98
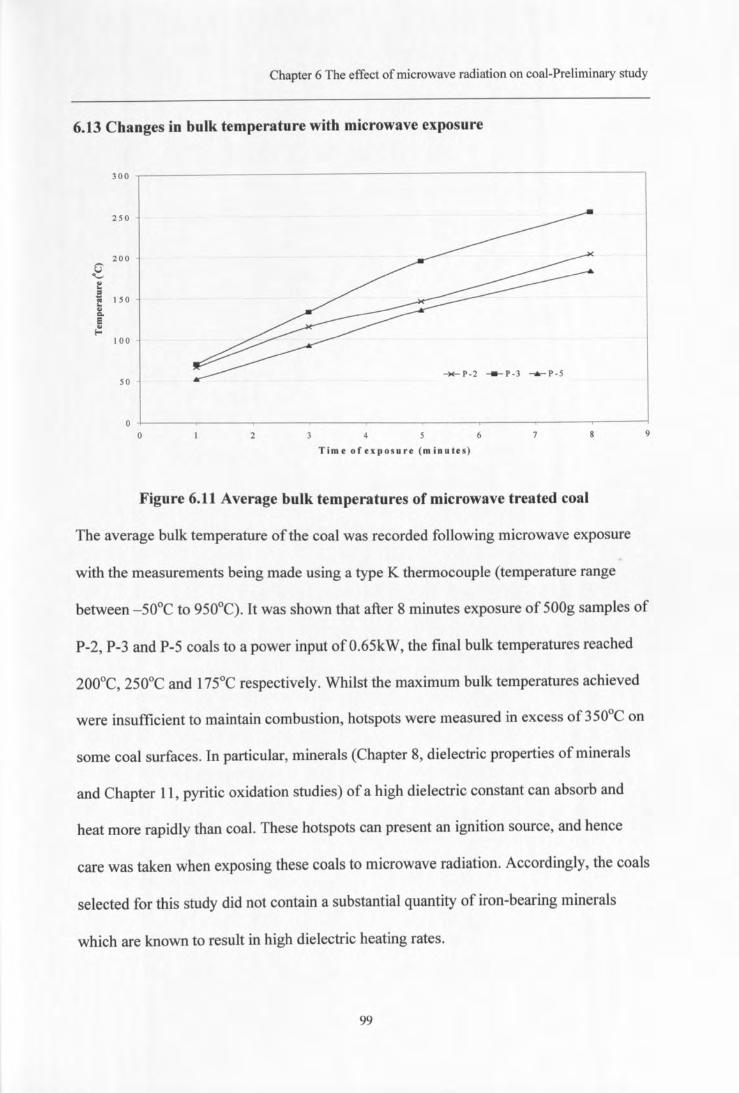
Chapter 6 The effect of microwave radiation on coal-Preliminary study
6.13 Changes in bulk temperature with microwave exposure
300
250
200U.._,....~ J 50....Coe..,..
100
50
00
~P-2 P-3 __ P-5
4 62
Time of exposure (minutes)
Figure 6.11 Average bulk temperatures of microwave treated coal
The average bulk temperature of the coal was recorded following microwave exposure
with the measurements being made using a type K thermocouple (temperature range
9
between -SO°C to 9S0°C). It was shown that after 8 minutes exposure of SOOgsamples of
P-2, P-3 and P-S coals to a power input ofO.6SkW, the final bulk temperatures reached
200°C, 2S0°C and 17SoC respectively. Whilst the maximum bulk temperatures achieved
were insufficient to maintain combustion, hotspots were measured in excess of 3S0°C on
some coal surfaces. In particular, minerals (Chapter 8, dielectric properties of minerals
and Chapter 11, pyritic oxidation studies) of a high dielectric constant can absorb and
heat more rapidly than coal. These hotspots can present an ignition source, and hence
care was taken when exposing these coals to microwave radiation. Accordingly, the coals
selected for this study did not contain a substantial quantity of iron-bearing minerals
which are known to result in high dielectric heating rates.
99
Chapter 6 The effect of microwave radiation on coal-Preliminary study
Figure 6.11 indicates that after 1minute exposure the bulk temperatures of the three coals
remained below 100°C. Consequently, it is expected that insignificant quantities of
moisture can be removed from the coal structure. Table 6.7 indicates that little effect on
coal grindability is achieved after 1 minute microwave exposure. However, after 3
minutes exposure, the grindability was improved. This suggests that the drying effect of
the microwaves may be partially responsible for the improvements in coal grindability
and, if this is true, then the total coal moisture content is another variable that must be
considered in accounting for the improved grindability of coals following microwave
treatment.
100
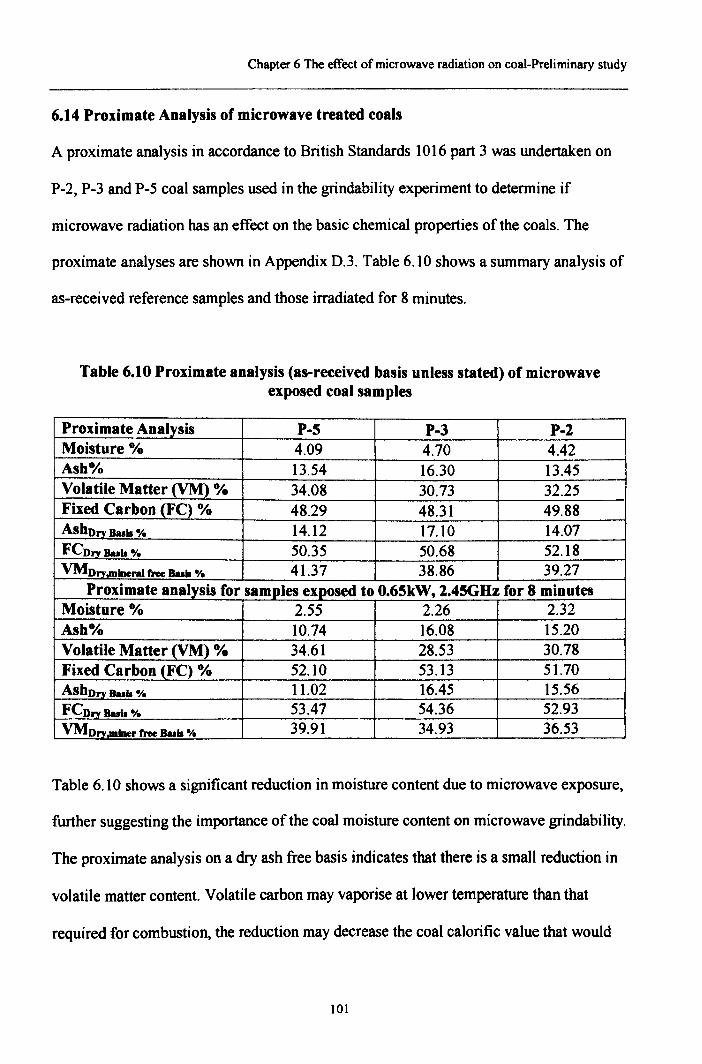
Chapter 6 The effect of microwave radiation on coal-Preliminary study
6.14 Proximate Analysis of microwave treated coals
A proximate analysis in accordance to British Standards 1016 part 3 was undertaken on
P-2, P-3 and P-5 coal samples used in the grindability experiment to determine if
microwave radiation has an effect on the basic chemical properties of the coals. The
proximate analyses are shown in Appendix 0.3. Table 6.10 shows a summary analysis of
as-received reference samples and those irradiated for 8 minutes.
Table 6.10 Proximate analysis (as-received basis unless stated) of microwaveexposed coal samples
Proximate Analysis P-5 P-3 P-2Moisture % 4.09 4.70 4.42Ash% 13.54 16.30 13.45Volatile Matter (VM) % 34.08 30.73 32.25Fixed Carbon (FC) % 48.29 48.31 49.88AshDI'YBull "I. 14.12 17.10 14.07FCDryBuIl"l. 50.35 50.68 52.18VMDI'Y.mlneraifree Bull"I. 41.37 38.86 39.27
Proximate analysis for samples exposed to 0.65kW, 2.45GHz for 8 minutesMoisture 0/0 2.55 2.26 2.32Ash% 10.74 16.08 15.20Volatile Matter (VM) % 34.61 28.53 30.78Fixed Carbon (FC) % 52.10 53.13 51.70AshDI'YBull% 11.02 16.45 15.56FCDnBui,"l. 53.47 54.36 52.93VMDry,mJnerfree Buil% 39.91 34.93 36.53
Table 6.10 shows a significant reduction in moisture content due to microwave exposure,
further suggesting the importance of the coal moisture content on microwave grindability.
The proximate analysis on a dry ash free basis indicates that there is a small reduction in
volatile matter content. Volatile carbon may vaporise at lower temperature than that
required for combustion, the reduction may decrease the coal calorific value that would
101
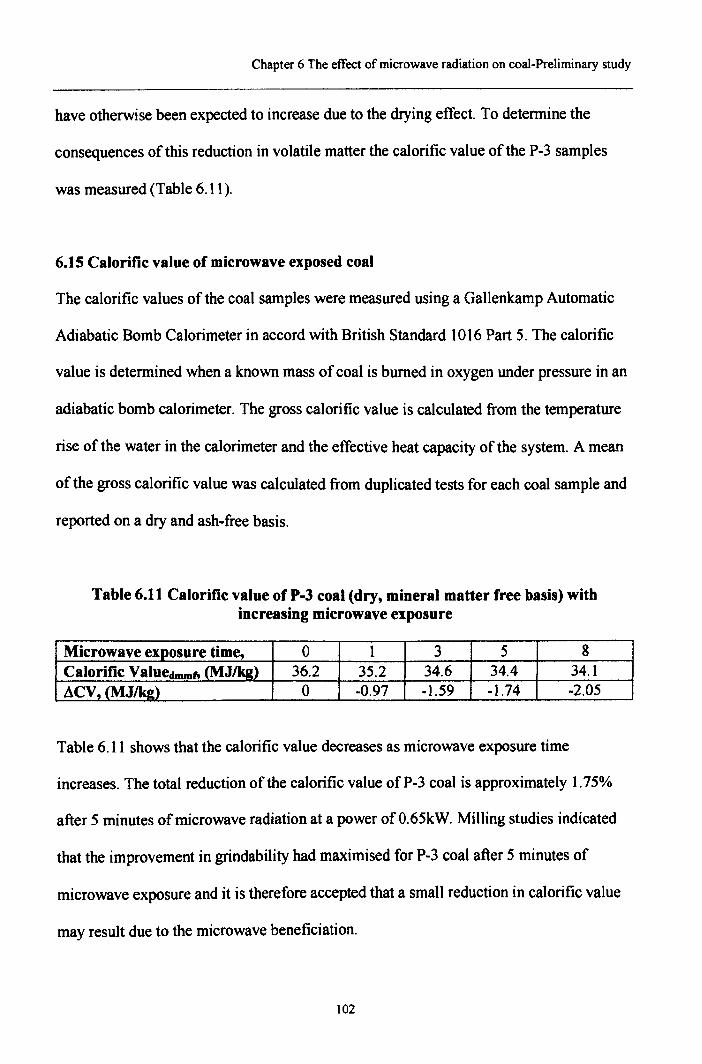
Chapter 6 The effect of microwave radiation on coal-Preliminary study
have otherwise been expected to increase due to the drying effect. To determine the
consequences of this reduction in volatile matter the calorific value of the P-3 samples
was measured (Table 6.11).
6.15 Calorific value of microwave exposed coal
The calorific values of the coal samples were measured using a GaUenkamp Automatic
Adiabatic Bomb Calorimeter in accord with British Standard 1016 Part 5. The calorific
value is determined when a known mass of coal is burned in oxygen under pressure in an
adiabatic bomb calorimeter. The gross calorific value is calculated from the temperature
rise of the water in the calorimeter and the effective heat capacity of the system. A mean
of the gross calorific value was calculated from duplicated tests for each coal sample and
reported on a dry and ash-free basis.
Table 6.11 Calorific value of P-3 coal (dry, mineral matter free basis) withincreasing microwave exposure
Microwave exposure time, 0 1 3 5 8Calorific Valuedmm" (MJIkg) 36.2 35.2 34.6 34.4 34.1ACV, (MJIkg) 0 -0.97 -1.59 -1.74 -2.05
Table 6.11 shows that the calorific value decreases as microwave exposure time
increases. The total reduction of the calorific value of P-3 coal is approximately 1.75%
after 5 minutes of microwave radiation at a power ofO.65kW. Milling studies indicated
that the improvement in grindability had maximised for P-3 coal after 5 minutes of
microwave exposure and it is therefore accepted that a small reduction in calorific value
may result due to the microwave beneficiation.
102
Chapter 6 The effect of microwave radiation on coal-Preliminary study
6.16 The effect of increased microwave power (1.3kW) on coal grindability
Similar grindability experiments were carried out on P-5, P-3 and P-2 coals using an
increased microwave power input (1.3kW microwave power instead ofO.6SkW). Results
show that similar improvements in grindability can be achieved within shorter exposure
periods. In accord with results given in Section 6.11, grindability improves with
increasing exposure time.
During the tests, it was noted that the samples did not reach an average bulk temperature
in excess of l30°C. However, localised hotspots resulted in ignition after exposure times
of 2.5 minutes for P-5 and P-2 coals and 3 minutes for P-3 coal. Due to partial
combustion, the tests were terminated and it was not possible to demonstrate the full
beneficial effect of microwave radiation. The results imply that the use of coals
containing materials which are highly absorbent to microwaves is limited by the heating
rates of these materials and not the heating rate of the coal. Pyrite may have been the
source of ignition, reaching elevated temperatures after a relatively short time. Mineral
properties are discussed in subsequent chapters (Chapter 8). However, it is noted that the
heating rates of the mineral components do not increase linearly with increasing
microwave power input. Clearly, the above experiment indicates the problems associated
with the use of increased microwave powers. In particular, ignition may be prevented
with the use of inert gas atmospheres but the loss of volatile matter may not be overcome.
103
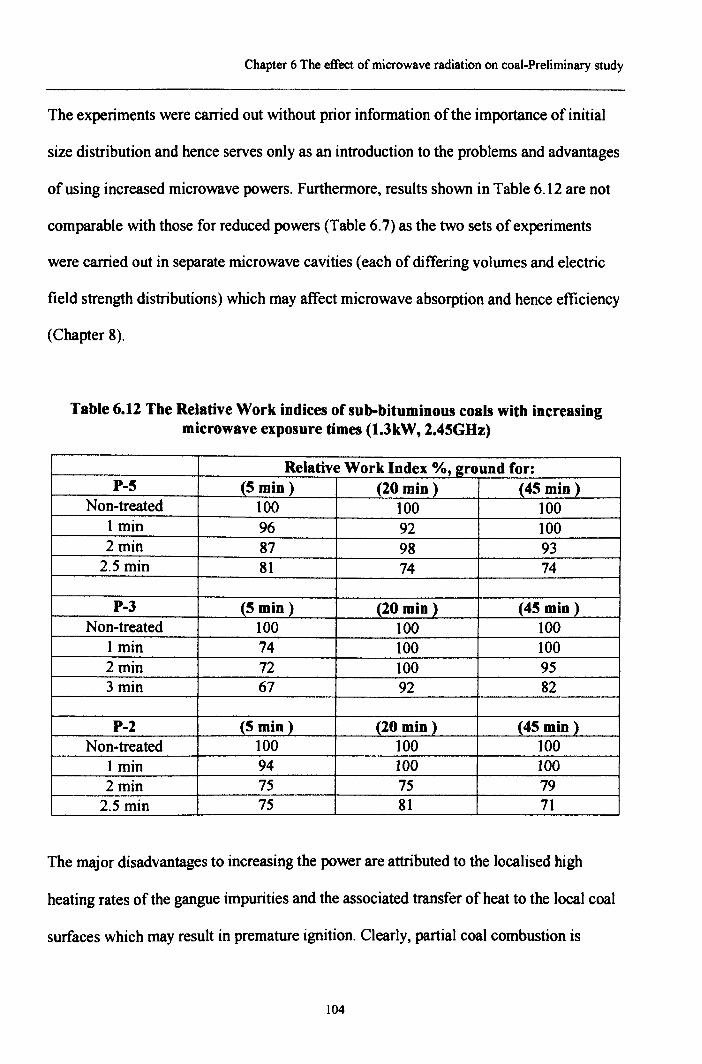
Chapter 6 The effect of microwave radiation on coal-Preliminary study
The experiments were carried out without prior information of the importance of initial
size distribution and hence serves only as an introduction to the problems and advantages
of using increased microwave powers. Furthermore, results shown in Table 6.12 are not
comparable with those for reduced powers (Table 6.7) as the two sets of experiments
were carried out in separate microwave cavities (each of differing volumes and electric
field strength distributions) which may affect microwave absorption and hence efficiency
(Chapter 8).
Table 6.12 The Relative Work indices of sub-bituminous coals with increasingmicrowave exposure times (1.3kW, 2.43GHz)
Relative Work Index %, ground for:P-5 (5 min) (20 min) (45 min)
Non-treated 100 100 1001 min 96 92 1002 min 87 98 932.5 min 81 74 74
P-J (5 min) (20 min) (45 min)Non-treated 100 100 100
1 min 74 100 1002min 72 100 953 min 67 92 82
P-2 (5 min) (20 min) (45 min)Non-treated 100 100 100
1 min 94 100 1002 min 75 75 792.5 min 75 81 71
The major disadvantages to increasing the power are attributed to the localised high
heating rates of the gangue impurities and the associated transfer of heat to the local coal
surfaces which may result in premature ignition. Clearly, partial coal combustion is
104
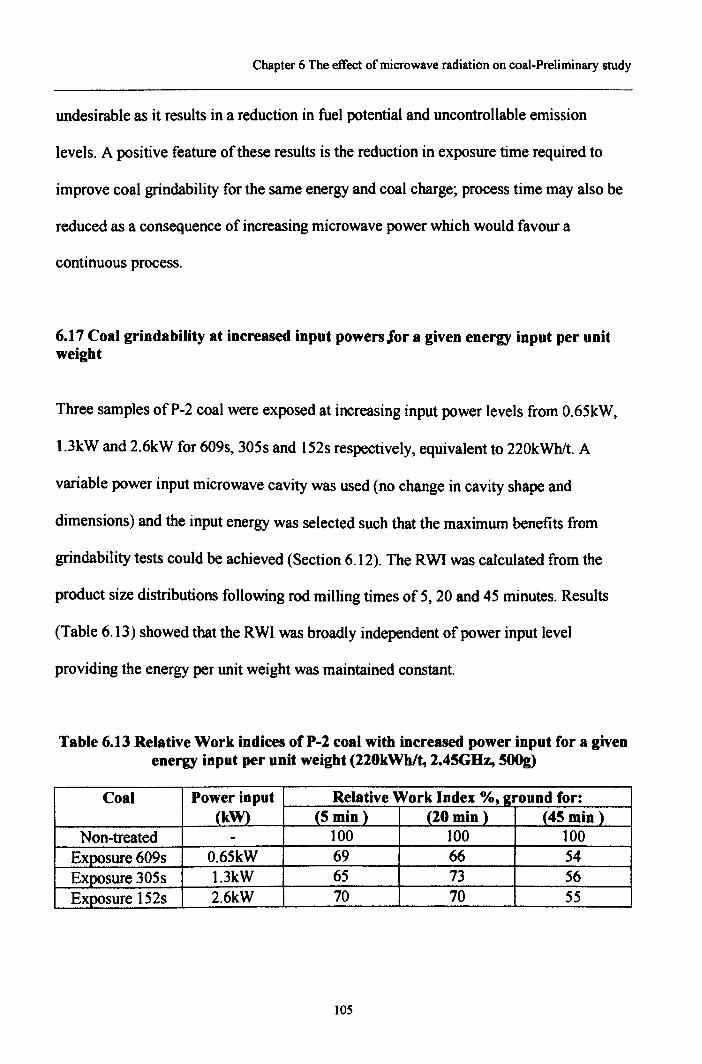
Chapter 6 The effect of microwave radiation on coal-Preliminary study
undesirable as it results in a reduction in fuel potential and uncontrollable emission
levels. A positive feature of these results is the reduction in exposure time required to
improve coal grindability for the same energy and coal charge; process time may also be
reduced as a consequence of increasing microwave power which would favour a
continuous process.
6.17 Coal grindability at increased input pewers for a given energy input per unitweight
Three samples ofP-2 coal were exposed at increasing input power levels from 0.65kW.
1.3kW and 2.6kW for 609s, 305s and 152s respectively. equivalent to 220kWhlt. A
variable power input microwave cavity was used (no change in cavity shape and
dimensions) and the input energy was selected such that the maximum benefits from
grindability tests could be achieved (Section 6.12). The RWI was calculated from the
product size distributions following rod milling times of 5. 20 and 45 minutes. Results
(Table 6.13) showed that the RWI was broadly independent of power input level
providing the energy per unit weight was maintained constant.
Table 6.13 Relative Work indices of P-2 coal with increased power input for a givenenergy input per unit weight (220kWh/t, 2.45GHz, ~00g)
Coal Power input Relative Work Index %,~ound for:(kW) (5 min] (20 min) (45 min)
Non-treated - 100 100 100Exposure 609s 0.65kW 69 66 54Exposure 305s 1.3kW 65 73 56Exposure 152s 2.6kW 70 70 55
105
Chapter 6 The effect of microwave radiation on coal-Preliminary study
6.18 The effect of batch sample size on power absorption
During preliminary investigations, no attempt was made to optimise the quantity of the
coal within the microwave cavity. The tests detailed below show that the microwave
cavity in current use (dimensions: length 340mm, width 330mm and height 330mm) can
accommodate larger volumes of coal than previously used without affecting coal
grindability efficiency.
In particular, batch loads of2S0g, SOOgand lkg P-l coal were used for this study. The
microwave power input was 0.6SkW. Product size distributions were determined for each
load after 4S minutes milling, the 80% passing size characteristics are shown in Figure
6.12.
Duplicate loads were exposed to microwave radiation for 4,8 and 16 minutes respectively
so that each sample was irradiated with the same energy per unit weight of coal
(173kWhlt). The 80% size characteristics of these (microwave-treated) samples are
shown in Figure 6.12. Results indicate that grindability efficiency increases with sample
volume.
It is noted that the Relative Work indices are dependent upon mill load (mass of coal and
mill medium). The test procedure for RWI calculation was standardised and correlations
were made for the SOOgsamples only (mill load optimum capacity). To calculate RWI for
microwave exposed samples of250g and lkg a duplicate set of samples were exposed for
4 and 16 minutes respectively (173kWhlt). Two independent 250g samples were treated
106
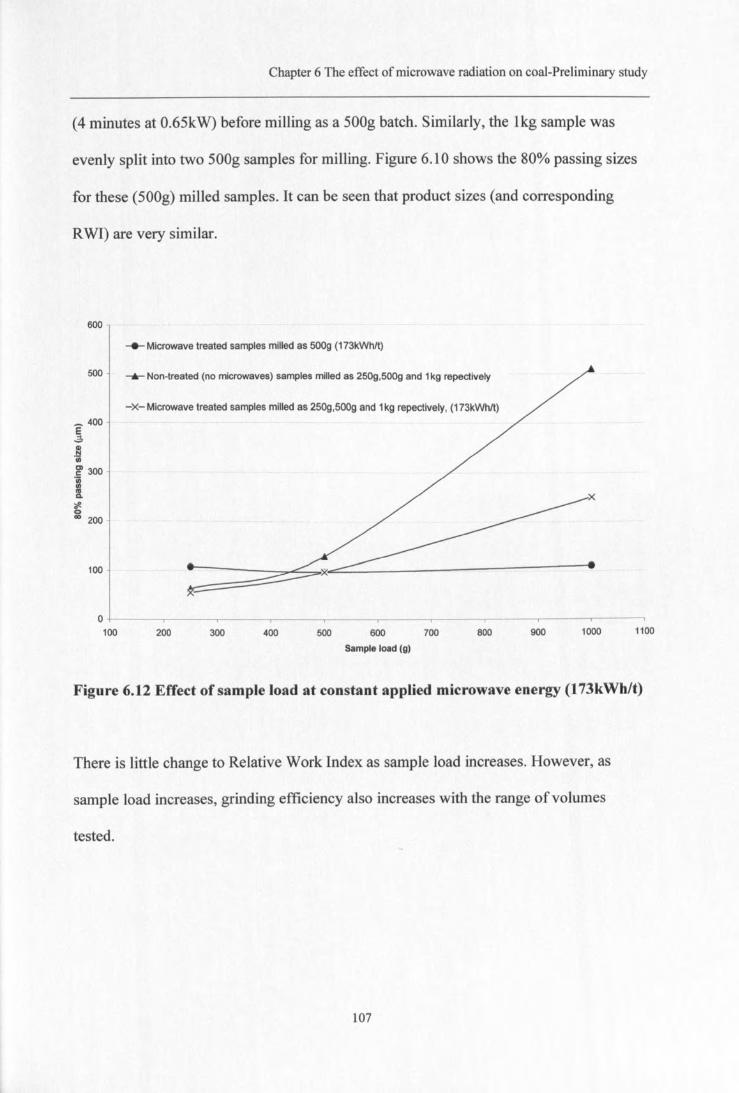
Chapter 6 The effect of microwave radiation on coal-Preliminary study
(4 minutes at 0.6SkW) before milling as a 500g batch. Similarly, the 1kg sample was
evenly split into two 500g samples for milling. Figure 6.10 shows the 80% passing sizes
for these (SOOg)milled samples. It can be seen that product sizes (and corresponding
RWI) are very similar.
600
100
....... Non-treated (no microwaves) samples milled as 250g,500g and 1kg repectively
...__ Microwave treated samples milled as 5009 (173kWh/t)
500
-x- Microwave treated samples milled as 250g,500g and 1kg repectively, (173kWh/t)_ 400E~.~III
g> 300
1:.!!sCl> 200
O+------.----~------._----~------~----~----_,------r_----~-----.100 200 300 400 500 600
Sample load (g)
700 800 900 1000 1100
Figure 6.12 Effect of sample load at constant applied microwave energy (173kWh/t)
There is little change to Relative Work Index as sample load increases. However, as
sample load increases, grinding efficiency also increases with the range of volumes
tested.
107
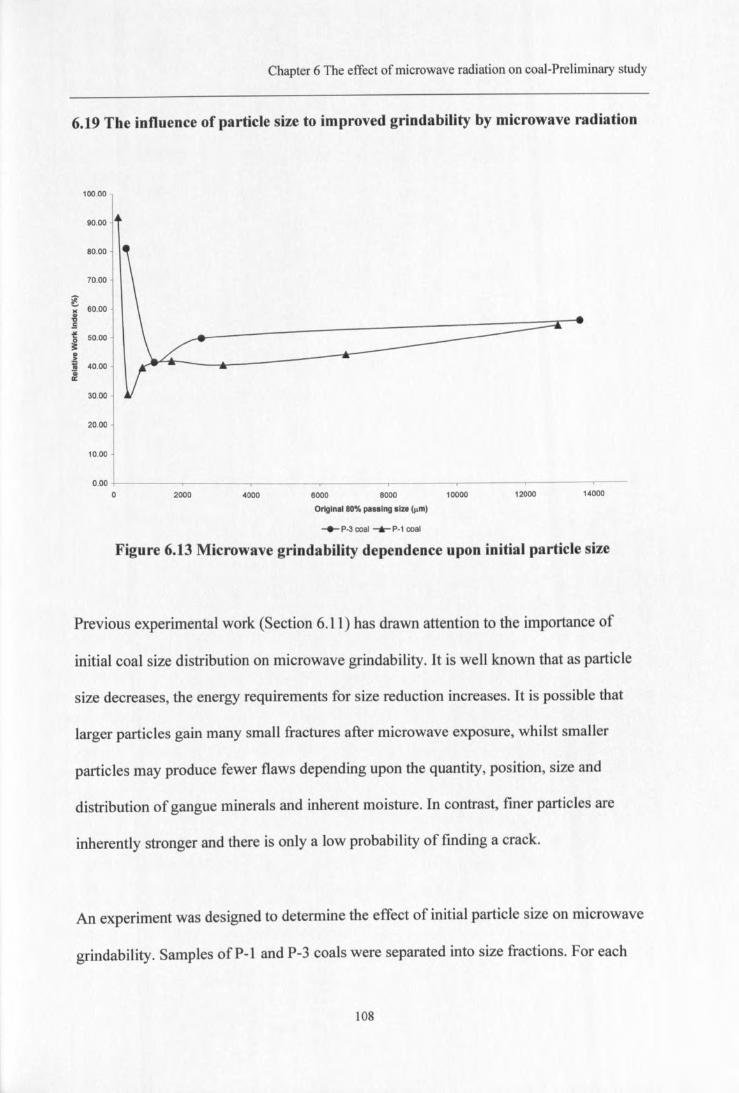
Chapter 6 The effect of microwave radiation on coal-Preliminary study
6.19 The influence of particle size to improved grindability by microwave radiation
100.00
90.00
80.00
70.00
~ 60.00......,.5i! 50.00~
i 40.00
30.00
20.00
10.00
0.000 2000 4000 6000 8000 10000 12000 14000
Original 80% pasllng size (I'm)
.._ P-3 coal ...... P-1 coal
Figure 6.13 Microwave grindability dependence upon initial particle size
Previous experimental work (Section 6.11) has drawn attention to the importance of
initial coal size distribution on microwave grindability. It is well known that as particle
size decreases, the energy requirements for size reduction increases. It is possible that
larger particles gain many small fractures after microwave exposure, whilst smaller
particles may produce fewer flaws depending upon the quantity, position, size and
distribution of gangue minerals and inherent moisture. In contrast, finer particles are
inherently stronger and there is only a low probability of fmding a crack.
An experiment was designed to determine the effect of initial particle size on microwave
grindability. Samples ofP-l and P-3 coals were separated into size fractions. For each
108
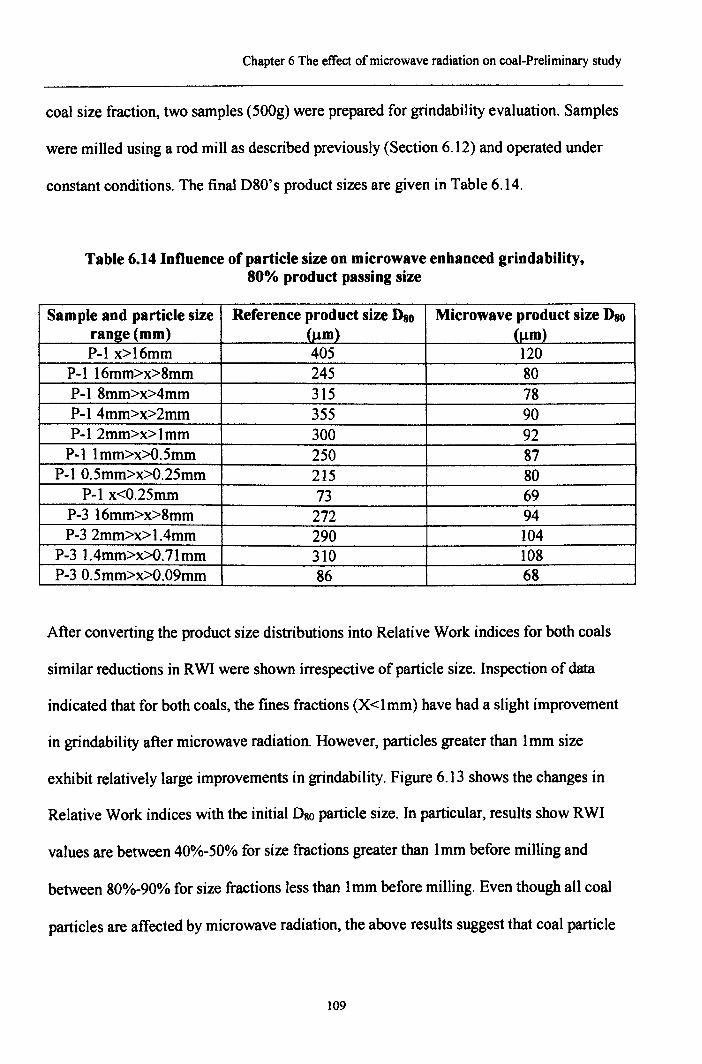
Chapter 6 The effect of microwave radiation on coal-Preliminary study
coal size fraction, two samples (500g) were prepared for grindability evaluation. Samples
were milled using a rod mill as described previously (Section 6.12) and operated under
constant conditions. The final DSO's product sizes are given in Table 6.14.
Table 6.14 Influence of particle size on microwave enhanced grindability,80% product passing size
Sample and particle size Reference product size Dso Microwave product size D80
range (mm) (J,l.m) (um)P-l x>16mm 405 120
P-l 16mm>x>Smm 245 80P-l 8mm>x>4mm 315 78P-14mm>x>2mm 355 90P-12mm>x>lmm 300 92P-I Imm>x>0.5mm 250 87
P-I 0.5mm>x>O.25mm 215 80P-I x<0.25mm 73 69
P-316mm>x>8mm 272 94P-3 2mm>x> l.4mm 290 104
P-3 1.4mm>x>0.71mm 310 108P-3 0.5mm>x>0.09mm 86 68
After converting the product size distributions into Relative Work indices for both coals
similar reductions in RWI were shown irrespective of particle size. Inspection of data
indicated that for both coals, the fines fractions (X<lmm) have had a slight improvement
in grindability after microwave radiation. However, particles greater than lmm size
exhibit relatively large improvements in grindability. Figure 6.13 shows the changes in
Relative Work indices with the initial Dso particle size. In particular, results show RWI
values are between 40%-50% for size fractions greater than lrnm before milling and
between 80%-90% for size fractions less than 1mm before milling. Even though all coal
particles are affected by microwave radiation, the above results suggest that coal particle
109
Chapter 6 The effect of microwave radiation on coal-Preliminary study
size of above lrnm may be most suitable for microwave-induced grindability. It is noted
however, that this characteristic may be specific to rod milling.
6.20 Preliminary study conclusions
Laboratory experiments have shown that substantial reductions in Relative Work Index
(RWI) can be achieved by microwave exposure of coals. There is evidence to suggest
that gaseous evolution (water and volatile matter) as well as gangue mineral expansion
are the probable causes for the improvement in coal grindability. The properties of the
various coals treated by microwave radiation remained relatively unaltered. No
significant change in proximate, ultimate analyses or calorific value were reported. Initial
laboratory-scale microwave trials proved successful in weakening the structure of various
coal types. However, fine particles «lmm) were less susceptible to enhanced microwave
grindability. Bulk temperatures of up to 250°C could be reached as a result of microwave
treatment and localised hotspots may be responsible for some losses in volatile matter
content. During preliminary test work no samples were exposed to conditions such as
those for coal ignition or combustion.
110
CHAPTER SEVEN
DEPENDENCE OF COAL RANK RESPONSE TO MICROWAVETREATMENT
7.1 Introduction-Dependence of coal rank response to microwave treatment
Analyses of results from preliminary studies (Chapter 6) suggest that a combination of
factors influence the effectiveness of microwave pretreatment on coal grindability. In
particular gas release (in the form of steam, volatile matter and sulphur) and differential
expansion of occluded minerals may be controlling features in the propagation of
fractures within the coal structure. Coals vary in moisture content depending on their rank
(inherent moisture) and (independently of rank) their relative humidity (surface
moisture). The gangue mineral content and composition also depend upon the geological
location and age of the coal.
Group 1 coals have been selected to evaluate the dependence of coal rank on their
response to microwave treatment. It is noted that mineral matter content can vary
significantly from coal to coal and even within the same coal seam irrespective of coal
rank. Some minerals may attribute (through volumetric expansion) to fracture
propagation. and for the purpose of this test, low mineral content coal is preferred. The
mineral matter can be minimised by selecting coal samples cut from mid-seam. Group 1
coals refer to such samples (Chapter 6.1) which embrace a wide range of ranks and can
therefore differ in carbon structure, inherent moisture content and grindability. It is noted
III
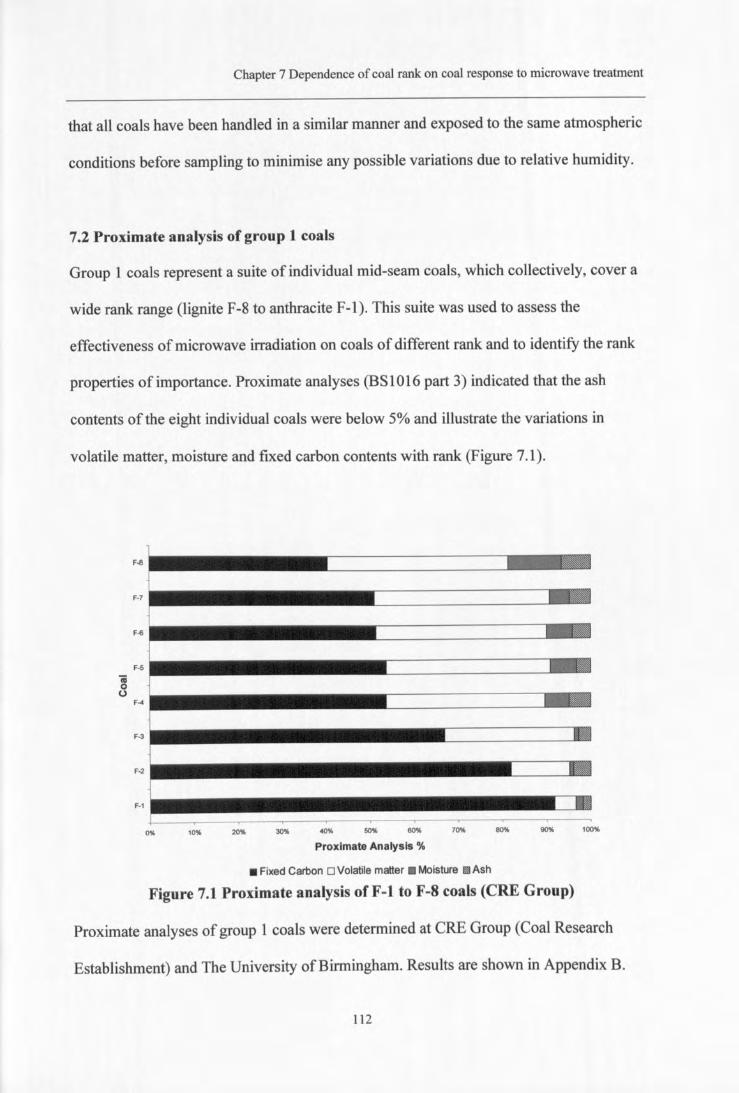
Chapter 7 Dependence of coal rank on coal response to microwave treatment
that all coals have been handled in a similar manner and exposed to the same atmospheric
conditions before sampling to minimise any possible variations due to relative humidity.
7.2 Proximate analysis of group 1 coals
Group 1 coals represent a suite of individual mid-seam coals, which collectively, cover a
wide rank range (lignite F-8 to anthracite F-l). This suite was used to assess the
effectiveness of microwave irradiation on coals of different rank and to identify the rank
properties of importance. Proximate analyses (BSI016 part 3) indicated that the ash
contents of the eight individual coals were below 5% and illustrate the variations in
volatile matter, moisture and fixed carbon contents with rank (Figure 7.1).
F-8
F-7
F-6
F-5
Ci00
F-4
F-3
F-2
F-1
0% 10% 20% 30% 40% 50% 60%
Proximate Analysis %
• Fixed Carbon 0 Volatile matter. Moisture I1\l Ash
Figure 7.1 Proximate analysis ofF-! to F-8 coals (eRE Group)
Proximate analyses of group 1 coals were determined at CRE Group (Coal Research
Establishment) and The University of Birmingham. Results are shown in Appendix B.
112
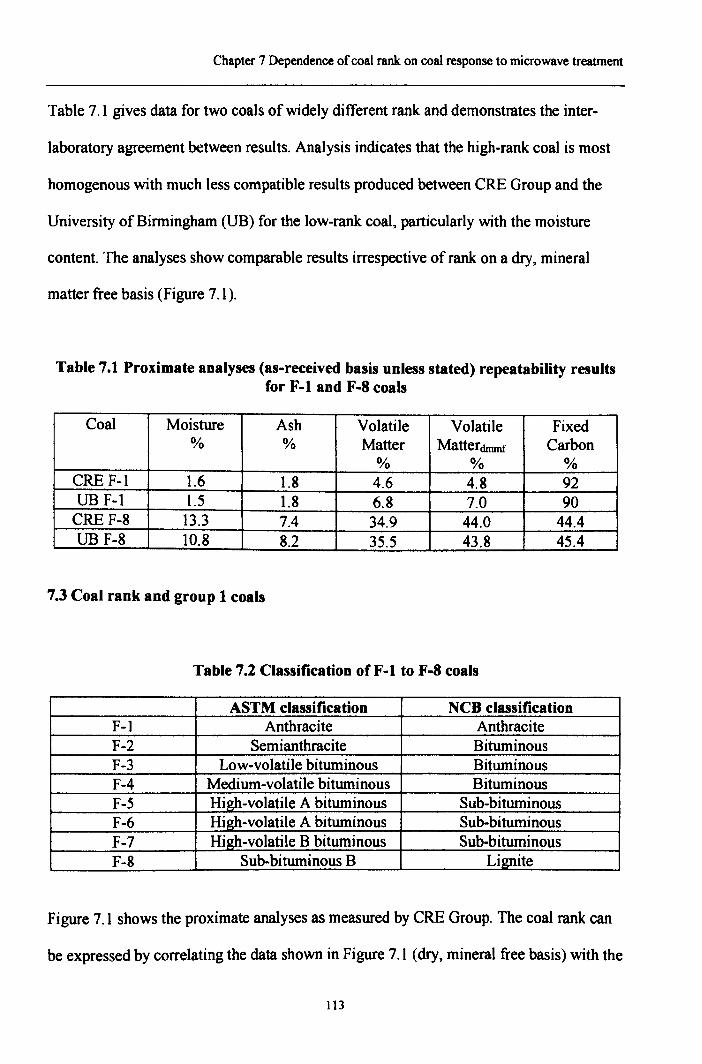
Chapter 7 Dependence of coal rank on coal response to microwave treatment
Table 7.1 gives data for two coals of widely different rank and demonstrates the inter-
laboratory agreement between results. Analysis indicates that the high-rank coal is most
homogenous with much less compatible results produced between CRE Group and the
University of Binning ham (UB) for the low-rank coal, particularly with the moisture
content. The analyses show comparable results irrespective of rank on a dry, mineral
matter free basis (Figure 7.1).
Table 7.1 Proximate analyses (as-received basis unless stated) repeatability resultsfor F-l and F-8 coals
Coal Moisture Ash Volatile Volatile Fixed% % Matter Matterdmmf Carbon
% % %CRE F-l 1.6 I.S 4.6 4.S 92UB r-: 1.5 I.S 6.S 7.0 90CREF-S 13.3 7.4 34.9 44.0 44.4UB F-S 1O.S S.2 35.5 43.S 45.4
7.3 Coal rank and group 1 coals
Table 7.2 Classification of F-l to F-8 coals
ASTM classification NCB classificationF-l Anthracite AnthraciteF-2 Semianthracite BituminousF-3 Low-volatile bituminous BituminousF-4 Medium-volatile bituminous BituminousF-5 High-volatile A bituminous Sub-bituminousF-6 High-volatile A bituminous Sub-bituminousF-7 High-volatile B bituminous Sub-bituminousF-8 Sub-bituminous B Lignite
Figure 7.1 shows the proximate analyses as measured by eRE Group. The coal rank can
be expressed by correlating the data shown in Figure 7.1 (dry, mineral free basis) with the
113
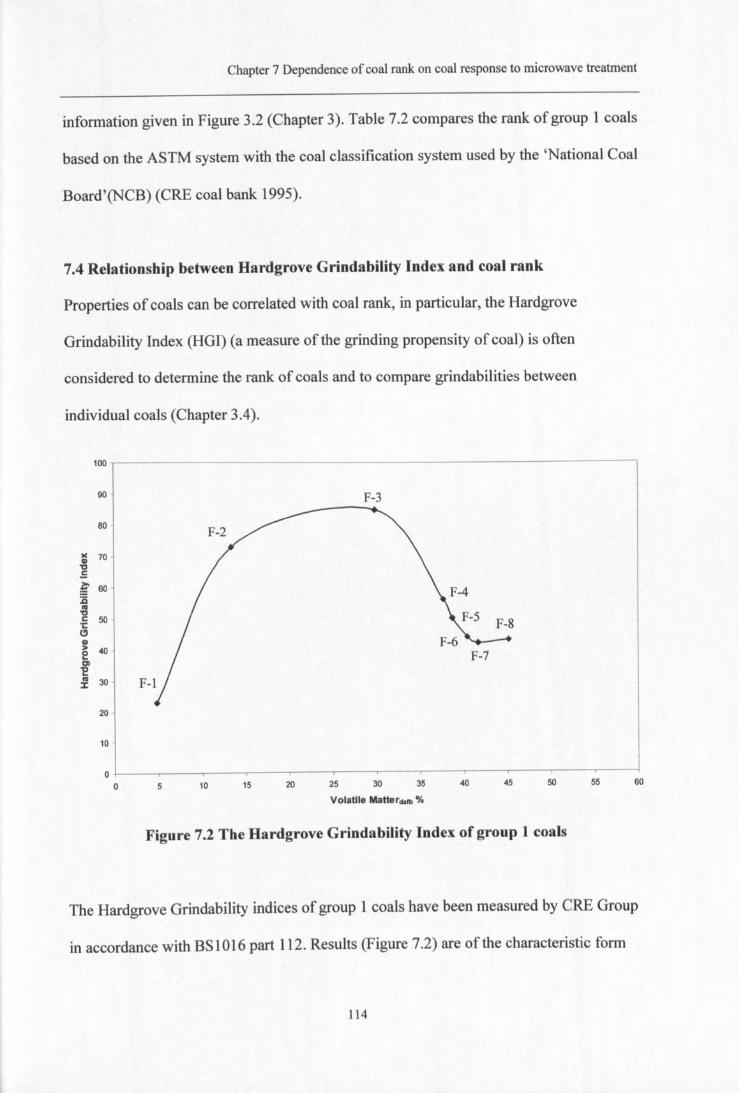
Chapter 7 Dependence of coal rank on coal response to microwave treatment
information given in Figure 3.2 (Chapter 3). Table 7.2 compares the rank of group 1 coals
based on the ASTM system with the coal classification system used by the 'National Coal
Board'(NCB) (CRE coal bank 1995).
7.4 Relationship between Hardgrove Grindability Index and coal rank
Properties of coals can be correlated with coal rank, in particular, the Hardgrove
Grindability Index (HGI) (a measure of the grinding propensity of coal) is often
considered to determine the rank of coals and to compare grindabilities between
individual coals (Chapter 3.4).
100
90
80
)( 70II)'tI.E
~ 60:c1'4'tIC 50'1:eII)> 402Cl'E1'4 30:I:
20
10
00
F-3
5 10 15 20 25 30 35 40 45 50 55 60
Volatile Matterdllb %
Figure 7.2 The Hardgrove Grindability Index of group 1 coals
The Hardgrove Grindability indices of group 1 coals have been measured by CRE Group
in accordance with BS 1016 part 112. Results (Figure 7.2) are of the characteristic form
114
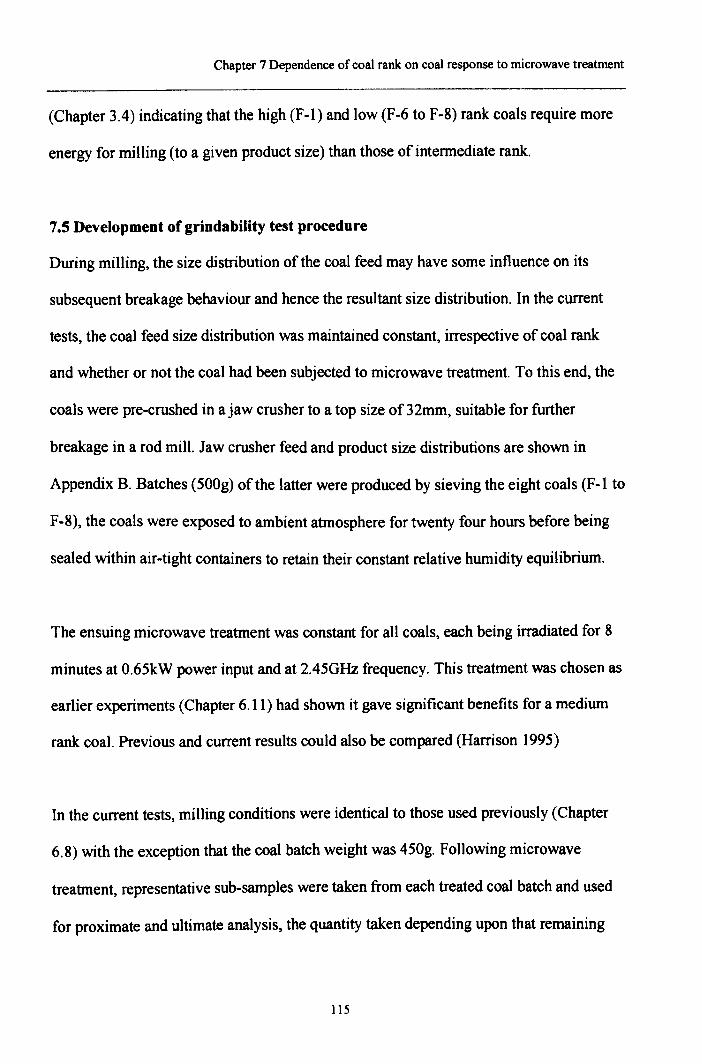
Chapter 7 Dependence of coal rank on coal response to microwave treatment
(Chapter 3.4) indicating that the high (P-I) and low (F-6 to F-8) rank coals require more
energy for milling (to a given product size) than those of intermediate rank.
7.5 Development of grindability test procedure
During milling, the size distribution of the coal feed may have some influence on its
subsequent breakage behaviour and hence the resultant size distribution. In the current
tests, the coal feed size distribution was maintained constant, irrespective of coal rank
and whether or not the coal had been subjected to microwave treatment. To this end, the
coals were pre-crushed in a jaw crusher to a top size of 32mm, suitable for further
breakage in a rod mill. Jaw crusher feed and product size distributions are shown in
Appendix B. Batches (500g) of the latter were produced by sieving the eight coals (F-l to
F-8), the coals were exposed to ambient atmosphere for twenty four hours before being
sealed within air-tight containers to retain their constant relative humidity equilibrium.
The ensuing microwave treatment was constant for all coals, each being irradiated for 8
minutes at O.65kW power input and at 2.45GHz frequency. This treatment was chosen as
earlier experiments (Chapter 6.11) had shown it gave significant benefits for a medium
rank coal. Previous and current results could also be compared (Harrison 1995)
In the current tests, milling conditions were identical to those used previously (Chapter
6.8) with the exception that the coal batch weight was 450g. Following microwave
treatment, representative sub-samples were taken from each treated coal batch and used
for proximate and ultimate analysis, the quantity taken depending upon that remaining
115
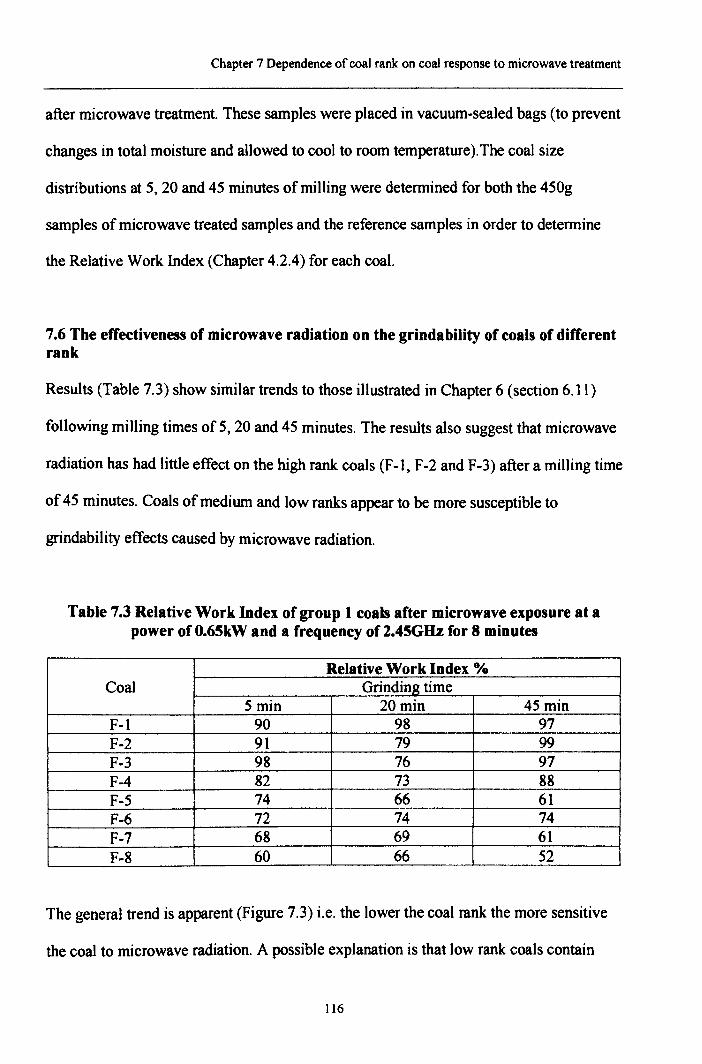
Chapter 7 Dependence of coal rank on coal response to microwave treatment
after microwave treatment. These samples were placed in vacuum-sealed bags (to prevent
changes in total moisture and allowed to cool to room temperature). The coal size
distributions at 5, 20 and 45 minutes of milling were determined for both the 450g
samples of microwave treated samples and the reference samples in order to determine
the Relative Work Index (Chapter 4.2.4) for each coal.
7.6 The effectiveness of microwave radiation on the grindability of coals of differentrank
Results (Table 7.3) show similar trends to those illustrated in Chapter 6 (section 6.11)
following milling times of 5,20 and 45 minutes. The results also suggest that microwave
radiation has had little effect on the high rank coals (F-l, F-2 and F-3) after a milling time
of 45 minutes. Coals of medium and low ranks appear to be more susceptible to
grindability effects caused by microwave radiation.
Table 7.3 Relative Work Index of group 1 coals after microwave exposure at apower of O.65kW and a frequency of 2.45GHz for 8 minutes
Relative Work Index %Coal Grinding time
5 min 20min 45 minF-l 90 98 97F-2 91 79 99F-3 98 76 97F-4 82 73 88F-5 74 66 61F-6 72 74 74F-7 68 69 61F-8 60 66 52
The general trend is apparent (Figure 7.3) i.e. the lower the coal rank the more sensitive
the coal to microwave radiation. A possible explanation is that low rank coals contain
116
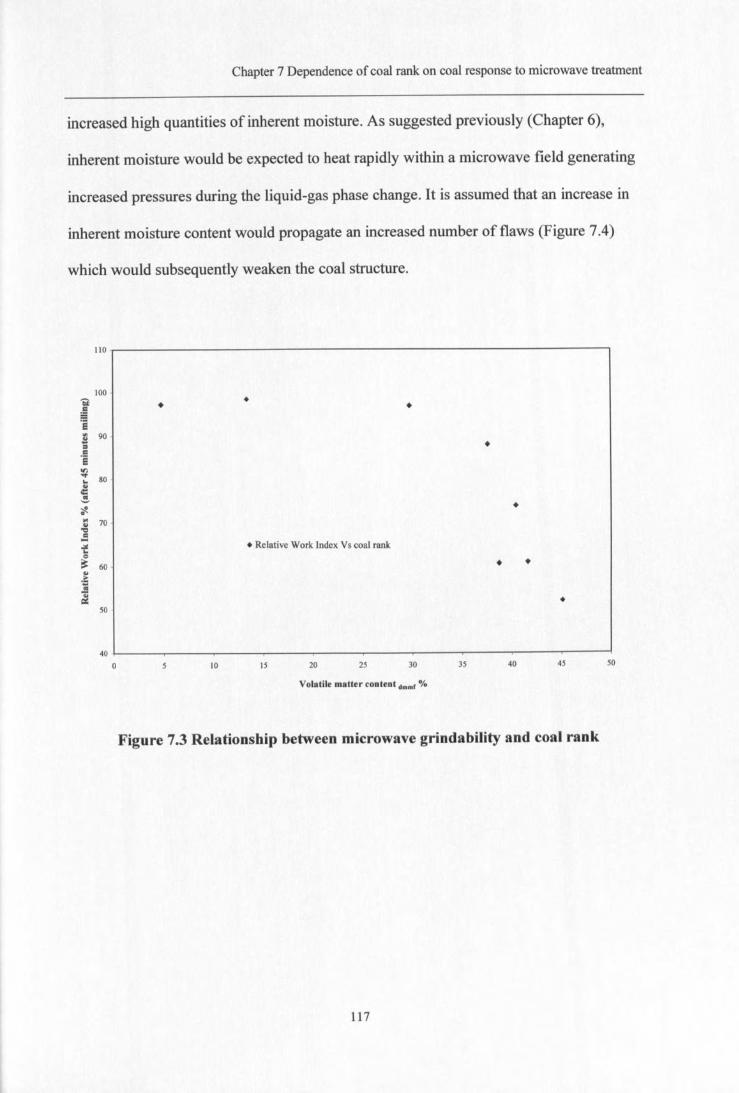
Chapter 7 Dependence of coal rank on coal response to microwave treatment
increased high quantities of inherent moisture. As suggested previously (Chapter 6),
inherent moisture would be expected to heat rapidly within a microwave field generating
increased pressures during the liquid-gas phase change. It is assumed that an increase in
inherent moisture content would propagate an increased number of flaws (Figure 7.4)
which would subsequently weaken the coal structure.
110
100-;0 •,51 • •='s! 90
= •,51eon... 80..~~~ ••.. 70 -....,"..... • Relative Work Index Vs coal rank...:..e~ 60 • •..oS..!!&! •
SO -
400 10 IS 20 25 30 35 40 4S SO
Volatile matter content dmmr 0/.
Figure 7.3 Relationship between microwave grindability and coal rank
117
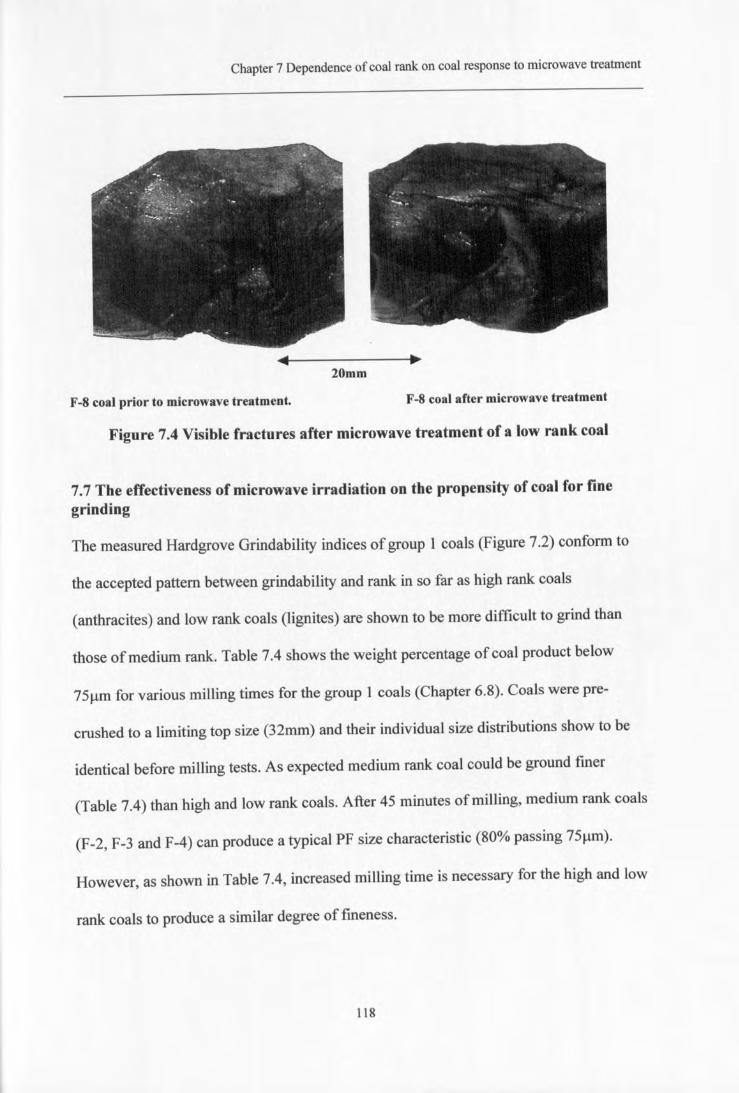
Chapter 7 Dependence of coal rank on coal response to microwave treatment
F-8 coal prior to microwave treatment.
20mm
F-8 coal after microwave treatment
Figure 7.4 Visible fractures after microwave treatment of a low rank coal
7.7 The effectiveness of microwave irradiation on the propensity of coal for finegrinding
The measured Hardgrove Grindability indices of group 1 coals (Figure 7.2) conform to
the accepted pattern between grindability and rank in so far as high rank coals
(anthracites) and low rank coals (lignites) are shown to be more difficult to grind than
those of medium rank. Table 7.4 shows the weight percentage of coal product below
75J.!mfor various milling times for the group 1 coals (Chapter 6.8). Coals were pre-
crushed to a limiting top size (32mm) and their individual size distributions show to be
identical before milling tests. As expected medium rank coal could be ground finer
(Table 7.4) than high and low rank coals. After 45 minutes of milling, medium rank coals
(F-2, F-3 and F-4) can produce a typical PF size characteristic (80% passing 75J..UIl).
However, as shown in Table 7.4, increased milling time is necessary for the high and low
rank coals to produce a similar degree of fineness,
118
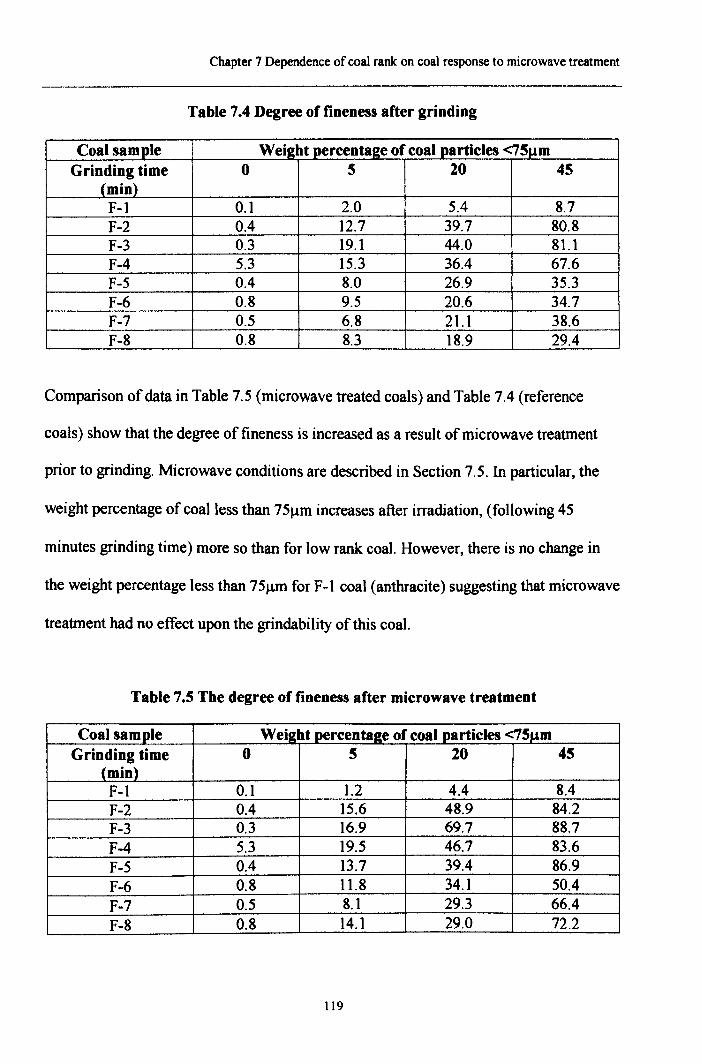
Chapter 7 Dependence of coal rank on coal response to microwave treatment
Table 7.4 Degree of fineness after grinding
Coal sample Weight percentag_eof coal _l!_articles<75J!mGrinding time 0 5 20 45
(min)F-l 0.1 2.0 S.4 8.7F-2 0.4 12.7 39.7 80.8F-3 0.3 19.1 44.0 81.1F-4 S.3 IS.3 36.4 67.6F-S 0.4 8.0 26.9 3S.3F-6 0.8 9.S 20.6 34.7F-7 0.5 6.8 21.1 38.6F-8 0.8 8.3 18.9 29.4
Comparison of data in Table 7.5 (microwave treated coals) and Table 7.4 (reference
coals) show that the degree of fineness is increased as a result of microwave treatment
prior to grinding. Microwave conditions are described in Section 7.S. In particular, the
weight percentage of coal less than 7SJ.lm increases after irradiation, (following 4S
minutes grinding time) more so than for low rank coal. However, there is no change in
the weight percentage less than 75J.lm for F-l coal (anthracite) suggesting that microwave
treatment had no effect upon the grindability of this coal.
Table 7.5 The degree of fineness after microwave treatment
Coal sample Weight ~rcenta_ge of coal~articles <75,....mGrinding time 0 5 20 45
(min)F-l 0.1 1.2 4.4 8.4F-2 0.4 15.6 48.9 84.2F-3 0.3 16.9 69.7 88.7F-4 5.3 19.5 46.7 83.6F-S 0.4 13.7 39.4 86.9F-6 0.8 11.8 34.1 50.4F-7 0.5 8.1 29.3 66.4F-8 0.8 14.1 29.0 72.2
119
Chapter 7 Dependence of coal rank on coal response to microwave treatment
The results also show that, for some medium and low rank coals, the volume of coal;
milled to PF size has doubled in these batch samples (F-S) because of microwave
exposure.
Further work would be necessary to investigate the effect shown by batch rod milling on
fines production with regard to continuous air-swept ring ball mills.
7.8 The influence of microwave radiation on the proximate analysis of coal
Table 7.6 shows the proximate analyses for group I coals before and after microwave
treatment (at O.6SkW power input and a frequency of2.4SGHz for 8 minutes).
Due to the heterogeneous nature of coal the before and after irradiation, ash contents are
all within accepted experimental error range and should not be considered significant.
More specifically, the moisture and volatile contents of the high rank coals (F-I, F-2 and
F-3) were unaffected by irradiation. In contrast, the moisture content has been reduced on
all other microwaved coals-showing evidence of drying which is particularly significant
with low rank coals. Similarly, coal volatile content decreased on microwave treated
coals, with the effect again being particularly marked on the low rank coals. Grindability
studies on group I coals also indicate that low rank coals are particularly sensitive to
microwave radiation. All results given, are mean values and within accepted standard
deviations (Table 7.6, in brackets) as outlined in accord with 8S1016.
120
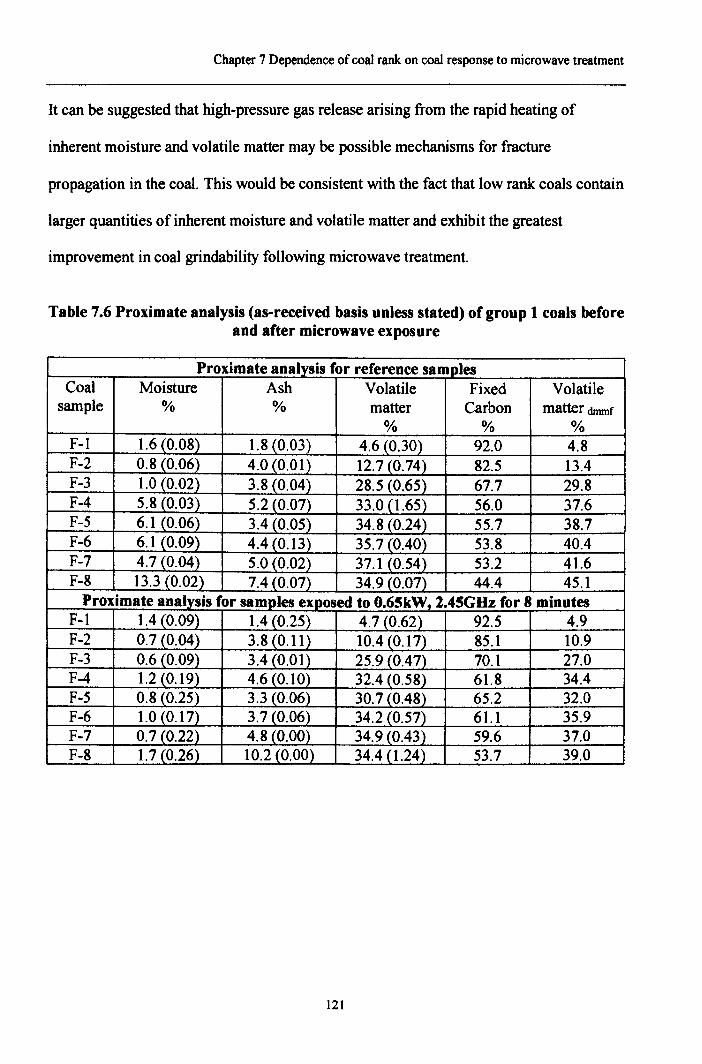
Chapter 7 Dependence of coal rank on coal response to microwave treatment
It can be suggested that high-pressure gas release arising from the rapid heating of
inherent moisture and volatile matter may be possible mechanisms for fracture
propagation in the coal. This would be consistent with the fact that low rank coals contain
larger quantities of inherent moisture and volatile matter and exhibit the greatest
improvement in coal grindability following microwave treatment.
Table 7.6 Proximate analysis (as-received basis unless stated) of group 1 coals beforeand after microwave exposure
Proximate analysis for reference samplesCoal Moisture Ash Volatile Fixed Volatile
sample % % matter Carbon matter dmrnf
% % %r-t 1.6 (0.08) 1.8 (0.03) 4.6 (0.30) 92.0 4.8F-2 0.8 (0.06) 4.0 (0.01) 12.7 (0.74) 82.5 13.4F-3 1.0 (0.02) 3.8 (0.04) 28.5 (0.65) 67.7 29.8F-4 5.8 (0.03) 5.2 (0.07) 33.0 (1.65) 56.0 37.6F-5 6.1 (0.06) 3.4 (0.05) 34.8 (0.24) 55.7 38.7F-6 6.1 (0.09) 4.4 (0.13) 35.7 (0.40) 53.8 40.4F-7 4.7 (0.04) 5.0 (0.02) 37.1 (0.54) 53.2 41.6F-8 13.3 (0.02) 7.4 (0.07) 34.9 (0.07) 44.4 45.1Proximate analysis for samples exposed to O.65kW, 2.45GHz for 8 minutes
F-l 1.4 (0.09) 1.4(0.25) 4.7 (0.62) 92.5 4.9F-2 0.7 (0.04) 3.8 (0.11) 10.4 (0.17) 85.1 10.9F-3 0.6 (0.09) 3.4 (0.01) 25.9 (0.47) 70.1 27.0F-4 1.2 (0.19) 4.6 (0.10) 32.4 (0.58) 61.8 34.4F-5 0.8 (0.25) 3.3 (0.06) 30.7 (0.48) 65.2 32.0F-6 1.0 (0.17) 3.7 (0.06) 34.2 (0.57) 61.1 35.9F-7 0.7 (0.22) 4.8 (0.00) 34.9 (0.43) 59.6 37.0F-8 1.7(0.26) 10.2 (0.00) 34.4 (1.24) 53.7 39.0
121
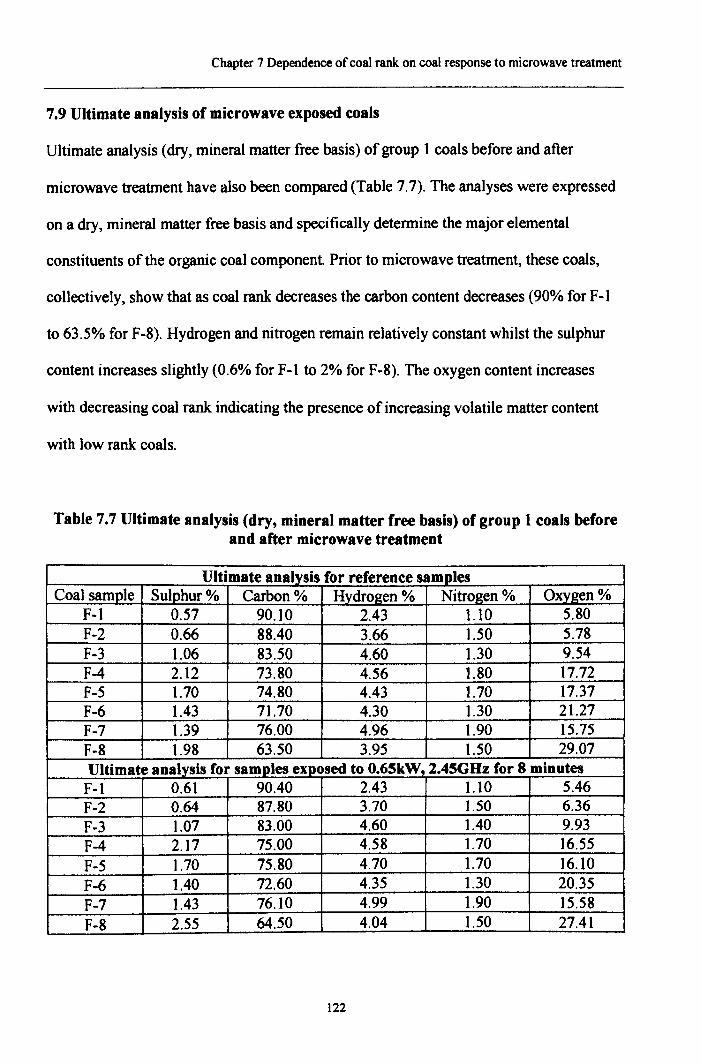
Chapter 7 Dependence of coal rank on coal response to microwave treatment
7.9 Ultimate analysis of microwave exposed coals
Ultimate analysis (dry, mineral matter free basis) of group 1 coals before and after
microwave treatment have also been compared (Table 7.7). The analyses were expressed
on a dry, mineral matter free basis and specifically determine the major elemental
constituents of the organic coal component Prior to microwave treatment, these coals,
collectively, show that as coal rank decreases the carbon content decreases (90% for F-J
to 63.5% for F-S). Hydrogen and nitrogen remain relatively constant whilst the sulphur
content increases slightly (0.6% for F-l to 2% for F-S). The oxygen content increases
with decreasing coal rank indicating the presence of increasing volatile matter content
with low rank coals.
Table 7.7 Ultimate analysis (dry, mineral matter free basis) of group 1 coals beforeand after microwave treatment
Ultimate analysis for reference samplesCoal sample Sulphur% Carbon % Hydrogen % Nitrogen % Oxygen %
F-l 0.57 90.10 2.43 1.10 5.80F-2 0.66 8S.40 3.66 1.50 5.78F-3 1.06 83.50 4.60 1.30 9.54F-4 2.12 73.S0 4.56 1.80 17.72F-5 1.70 74.80 4.43 1.70 17.37F-6 1.43 71.70 4.30 1.30 21.27F-7 1.39 76.00 4.96 1.90 15.75F-8 1.98 63.50 3.95 1.50 29.07Ultimate analysis for samples exposed to O.65kW! 1.45GHz for 8 minutesF-l 0.61 90.40 2.43 1.10 5.46F-2 0.64 87.80 3.70 1.50 6.36F-3 1.07 83.00 4.60 1.40 9.93F-4 2.17 75.00 4.58 1.70 16.55F-5 1.70 75.80 4.70 1.70 16.10F-6 1.40 72.60 4.35 1.30 20.35F-7 1.43 76.10 4.99 1.90 15.58F-8 2.55 64.50 4.04 1.50 27.41
122
Chapter 7 Dependence of coal rank on coal response to microwave treatment
Ultimate analyses of the microwave-treated coals show negligible changes between
sulphur, nitrogen and hydrogen. However, some slight differences occur between the
carbon and oxygen content of low rank coal (F-8). The oxygen content has reduced from
29% to 27.5% and a subsequent increase of 1% in carbon content for the microwave
treated coal. Whilst these differences are small, they may reflect the changes possible due
to the reduction of volatile and carbon content following heating as indicated in the
proximate analyses (Table 7.6). The ultimate analyses showed that there was little change
in the coal following microwave treatment; this feature implies that there are properties
of coal (e.g. moisture and mineral content) which may predominantly contribute to the
microwave grindability effect.
7.10 The effect of muffle furnace drying on coal rank grindability
Additional samples ofF-6 and F-7 coals were conventionally heated prior to milling to
examine whether or not the microwave grindability effects (Table 7.3) could be
duplicated by convective thermal drying. These particular coals were chosen in so far as
they showed significant improvements in grindability with microwave exposure. Milling
conditions were identical to those for the microwaved coals (Section 7.6), and before
milling. the coals were exposed to conventional heating for one hour to ensure their bulk
temperature was in equilibrium with the furnace temperature.
123
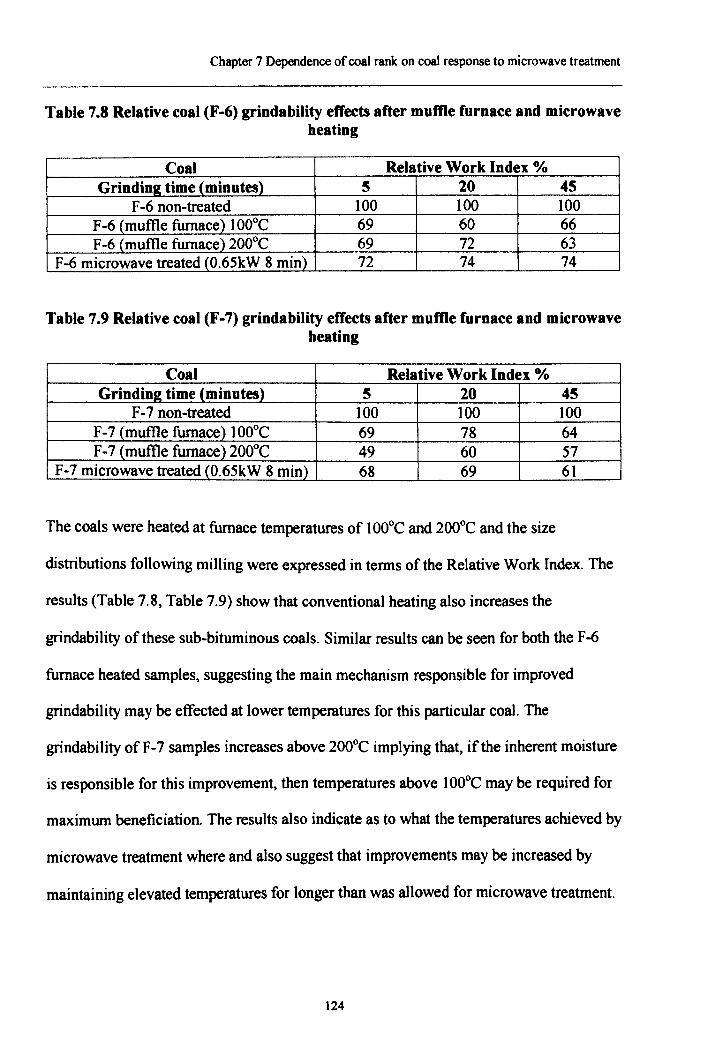
Chapter 7 Dependence of coal rank on coal response to microwave treatment
Table 7.8 Relative coal (F-6) grindability effects after muffle furnace and microwavebeating
Coal Relative Work Index %Grinding time (minutes) 5 20 45
F-6 non-treated 100 100 100F-6 (muffle furnace) 1000e 69 60 66F-6 (muffle furnace) 2000e 69 72 63
F-6 microwave treated (O.65kW 8 min) 72 74 74
Table 7.9 Relative coal (F-7) grindability effects after muffle furnace and microwavebeating
Coal Relative Work Index %Grindin2 time (minutes) 5 20 45
F-7 non-treated 100 100 100F-7 (muffle furnace) 1000e 69 78 64F-7 (muftle furnace) 2000e 49 60 57
F-7 microwave treated (O.65kW 8 min) 68 69 61
The coals were heated at furnace temperatures of 1000e and 2000e and the size
distributions following milling were expressed in terms of the Relative Work Index. The
results (Table 7.8, Table 7.9) show that conventional heating also increases the
grindability of these sub-bituminous coals. Similar results can be seen for both the F-6
furnace heated samples, suggesting the main mechanism responsible for improved
grindability may be effected at lower temperatures for this particular coal. The
grindability of F-7 samples increases above 2000e implying that, if the inherent moisture
is responsible for this improvement, then temperatures above 1000e may be required for
maximum beneficiation. The results also indicate as to what the temperatures achieved by
microwave treatment where and also suggest that improvements may be increased by
maintaining elevated temperatures for longer than was allowed for microwave treatment.
124
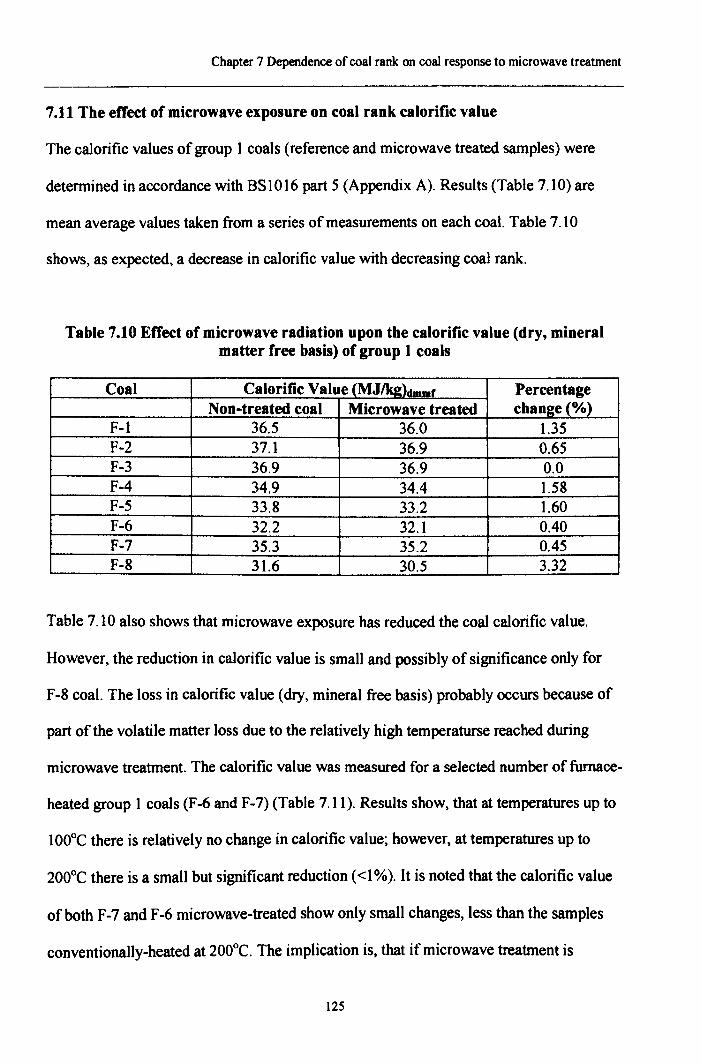
Chapter 7 Dependence of coal rank on coal response to microwave treatment
7.11 The effect of microwave exposure on coal rank calorific value
The calorific values of group 1 coals (reference and microwave treated samples) were
determined in accordance with BS 1016 part 5 (Appendix A). Results (Table 7.10) are
mean average values taken from a series of measurements on each coal. Table 7.10
shows, as expected, a decrease in calorific value with decreasing coal rank.
Table 7.10 Effect of microwave radiation upon the calorific value (dry, mineralmatter free basis) of group 1 coals
Coal Calorific Value (MJIk2)dmmf PercentageNon-treated coal Microwave treated chao2e(%)
F-l 36.5 36.0 1.35F-2 37.l 36.9 0.65F-3 36.9 36.9 0.0F-4 34.9 34.4 1.58F-5 33.8 33.2 1.60F-6 32.2 32.1 0.40F-7 35.3 35.2 0.45F-8 31.6 30.5 3.32
Table 7.10 also shows that microwave exposure has reduced the coal calorific value.
However, the reduction in calorific value is small and possibly of significance only for
F-8 coal. The loss in calorific value (dry, mineral free basis) probably occurs because of
part of the volatile matter loss due to the relatively high temperaturse reached during
microwave treatment. The calorific value was measured for a selected number of furnace-
heated group 1 coals (F-6 and F-7) (Table 7.11). Results show, that at temperatures up to
100°C there is relatively no change in calorific value; however, at temperatures up to
200°C there is a small but significant reduction «1 %). It is noted that the calorific value
of both F-7 and F-6 microwave-treated show only small changes, less than the samples
conventionally-heated at 200°C. The implication is, that if microwave treatment is
125
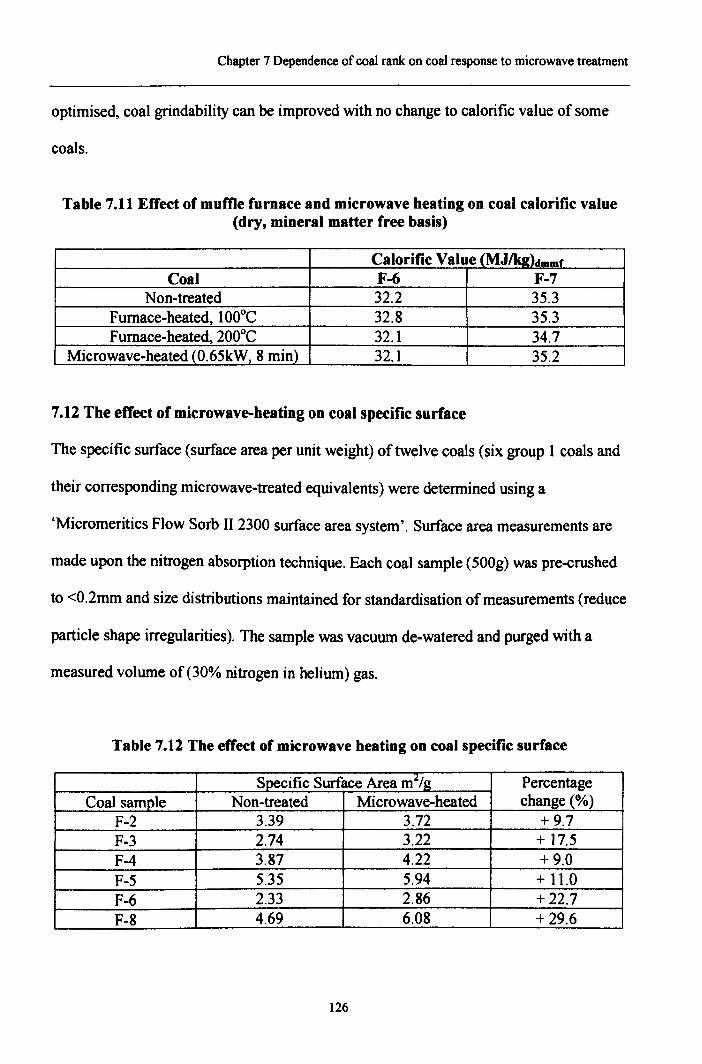
Chapter 7 Dependence of coal rank on coal response to microwave treatment
optimised, coal grindability can be improved with no change to calorific value of some
coals.
Table 7.11 Effect of muffle furnace and microwave heating on coal calorific value(dry, mineral matter free basis)
Calorific Value (MJ/q)dmmfCoal F-6 F-7
Non-treated 32.2 35.3Furnace-heated, 100°C 32.8 35.3Furnace-heated, 200°C 32.1 34.7
Microwave-heated (0.65kW, 8 min) 32.1 35.2
7.12 The effect of microwave-beating on coal specific surface
The specific surface (surface area per unit weight) of twelve coals (six group 1 coals and
their corresponding microwave-treated equivalents) were determined using a
'Micromeritics Flow Sorb II 2300 surface area system'. Surface area measurements are
made upon the nitrogen absorption technique. Each coal sample (SOOg)was pre-crushed
to <0.2mm and size distributions maintained for standardisation of measurements (reduce
particle shape irregularities). The sample was vacuum de-watered and purged with a
measured volume of (30% nitrogen in helium) gas.
Table 7.12 The effect of microwave heating on coal specific surface
Specific Surface Area m.l/g PercentageCoal sample Non-treated Microwave-heated change (%)
F-2 3.39 3.72 + 9.7F-3 2.74 3.22 + 17.5F-4 3.87 4.22 + 9.0F-5 5.35 5.94 + 11.0F-6 2.33 2.86 + 22.7F-8 4.69 6.08 + 29.6
126
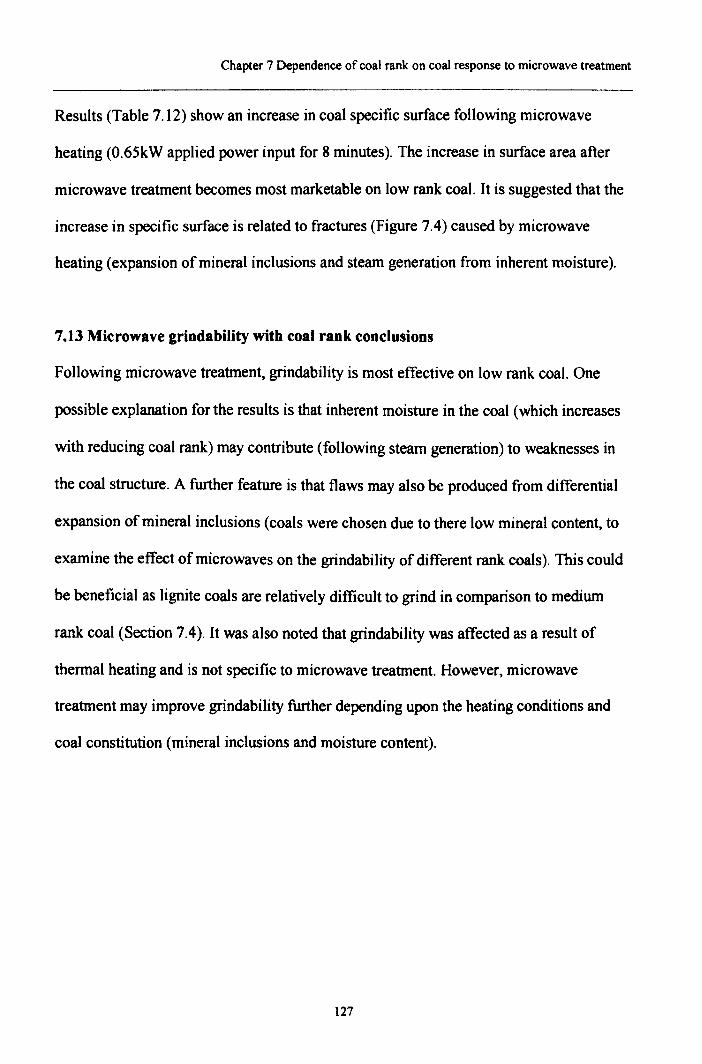
Chapter 7 Dependence of coal rank on coal response to microwave treatment
Results (Table 7.12) show an increase in coal specific surface following microwave
heating (O.65kW applied power input for 8 minutes). The increase in surface area after
microwave treatment becomes most marketable on low rank coal. It is suggested that the
increase in specific surface is related to fractures (Figure 7.4) caused by microwave
heating (expansion of mineral inclusions and steam generation from inherent moisture).
7.13 Microwave grindability with coal rank conclusions
Following microwave treatment, grindability is most effective on low rank coal. One
possible explanation for the results is that inherent moisture in the coal (which increases
with reducing coal rank) may contribute (following steam generation) to weaknesses in
the coal structure. A further feature is that flaws may also be produced from differential
expansion of mineral inclusions (coals were chosen due to there low mineral content, to
examine the effect of microwaves on the grindability of different rank coals). This could
be beneficial as lignite coals are relatively difficult to grind in comparison to medium
rank coal (Section 7.4). It was also noted that grindability was affected as a result of
thermal heating and is not specific to microwave treatment. However, microwave
treatment may improve grindability further depending upon the heating conditions and
coal constitution (mineral inclusions and moisture content).
127
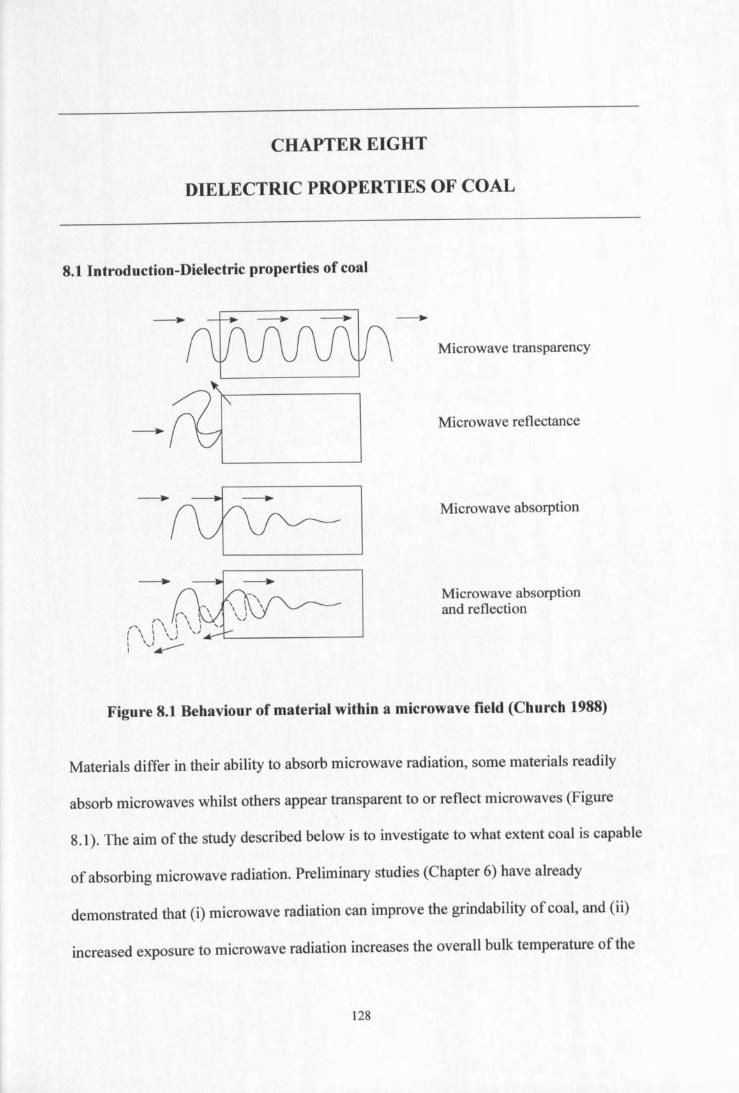
CHAPTER EIGHT
DIELECTRIC PROPERTIES OF COAL
8.1 Introduction-Dielectric properties of coal
Microwave transparency
Microwave reflectance
Microwave absorption
Microwave absorptionand reflection
Figure 8.1 Behaviour of material within a microwave field (Church 1988)
Materials differ in their ability to absorb microwave radiation, some materials readily
absorb microwaves whilst others appear transparent to or reflect microwaves (Figure
8.1). The aim of the study described below is to investigate to what extent coal is capable
of absorbing microwave radiation. Preliminary studies (Chapter 6) have already
demonstrated that (i) microwave radiation can improve the grindability of coal, and (ii)
increased exposure to microwave radiation increases the overall bulk temperature of the
128
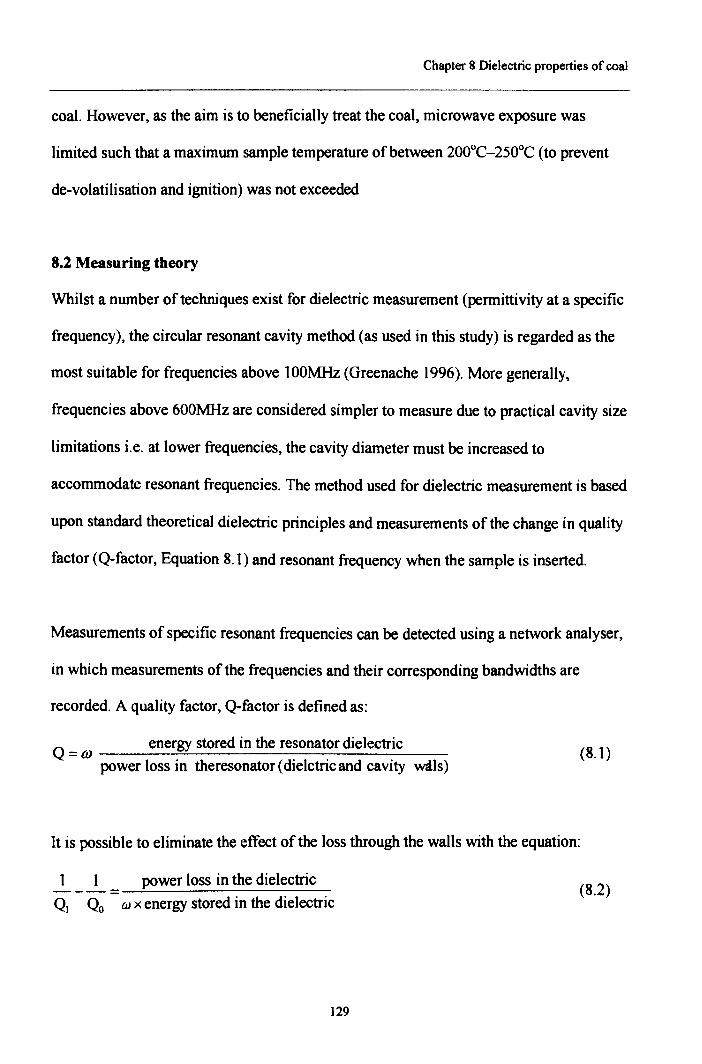
Chapter 8 Dielectric properties of coal
coal. However, as the aim is to beneficially treat the coal, microwave exposure was
limited such that a maximum sample temperature of between 200°C-250°C (to prevent
de-volatilisation and ignition) was not exceeded
8.1 Measuring theory
Whilst a number of techniques exist for dielectric measurement (permittivity at a specific
frequency), the circular resonant cavity method (as used in this study) is regarded as the
most suitable for frequencies above lOOMHz (Greenache 1996). More generally,
frequencies above 600MHz are considered simpler to measure due to practical cavity size
limitations i.e. at lower frequencies, the cavity diameter must be increased to
accommodate resonant frequencies. The method used for dielectric measurement is based
upon standard theoretical dielectric principles and measurements of the change in quality
factor (Q-factor, Equation 8.1) and resonant frequency when the sample is inserted.
Measurements of specific resonant frequencies can be detected using a network analyser,
in which measurements of the frequencies and their corresponding bandwidths are
recorded. A quality factor, Q-factor is defined as:
Q = OJ energy stored in the resonator dielectricpower loss in theresonator (dielctric and cavity wdls)
(8.1)
It is possible to eliminate the effect of the loss through the walls with the equation:
1 I power loss in the dielectric---=QJ Qo ta x energy stored in the dielectric
(8.2)
129
Chapter 8 Dielectric properties of coal
In which, Qo the quality factor for the air-filled cavity and QI is that for the material
inserted into the cavity. The Q-factor is simply determined as the ratio of the resonant
centre frequency to the resonant bandwidth.
This method can be used as a means of calibrating the dielectric properties of the inserted
sample to the measured properties (due to air, cavity walls and sample holder) prior to the
sample insertion. The left-hand side of Equation 8.2 is, by definition, equal to the loss
tangent (Chapter 2) and can be optimally used to determine the imaginary part of the
complex permittivity.
The real permittivity is evaluated from measurements of the change in resonant frequency
following the sample introduction into the cavity and depends upon the sample to cavity
volume ratio. The classical perturbation equation for the real component is given by
Equation 8.3 (Greenache 1996).
(8.3)
Where.
&'Vcavity
Vsample
foofJ/( function)(x/,m)
Real permittivity (F1m)Volume of cavity (m2)
Volume of sample (m')Resonant centre frequency (air filled) (Hz)Change in centre frequency when sample is inserted (Hz)First order Bessel function (Perry 1984)Function of the air filled cavity equated by Equation 7.4 (Greenache 1996)
130
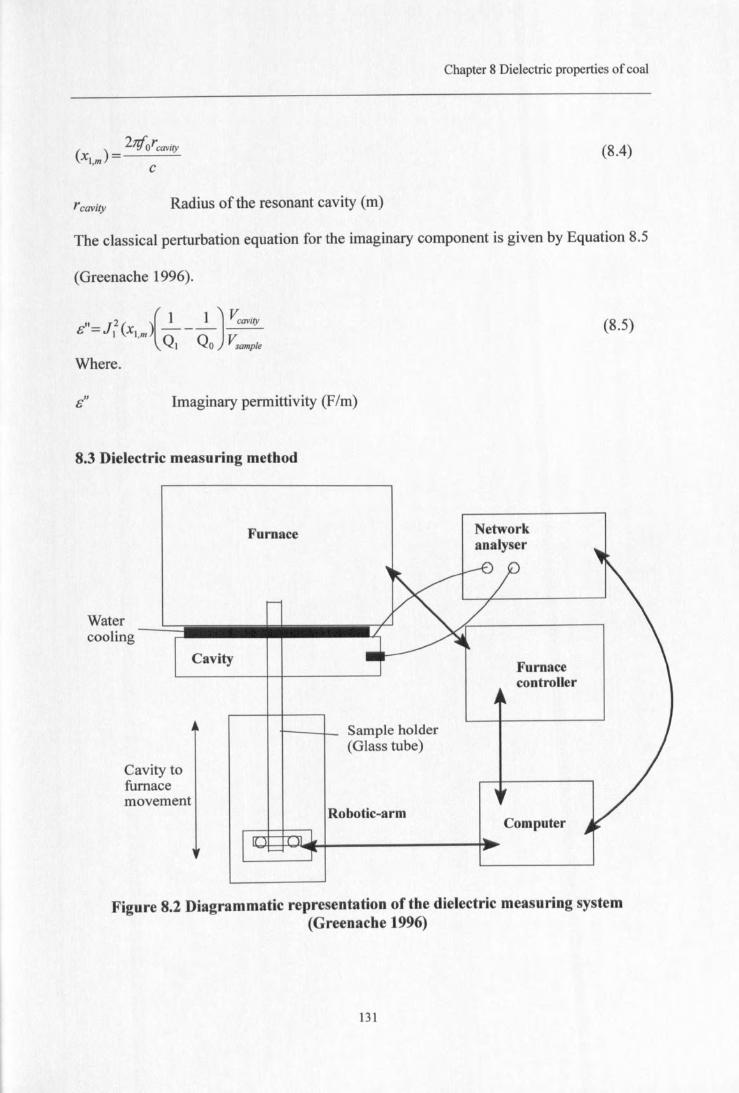
Chapter 8 Dielectric properties of coal
(8.4)
Tcavity Radius of the resonant cavity (m)
The classical perturbation equation for the imaginary component is given by Equation 8.5
(Greenache 1996).
n_J2( )( 1 1 ) ~avityc- 1 X1,m -----Q1 o, Vsample
Where.
(8.5)
c" Imaginary permittivity (F/m)
8.3 Dielectric measuring method
Cavity
Furnace Networkanalyser
Furnacecontroller
Cavity tofurnacemovement
Sample holder(Glass tube)
Robotic-armComputer
Figure 8.2 Diagrammatic representation of the dielectric measuring system(Greenache 1996)
131
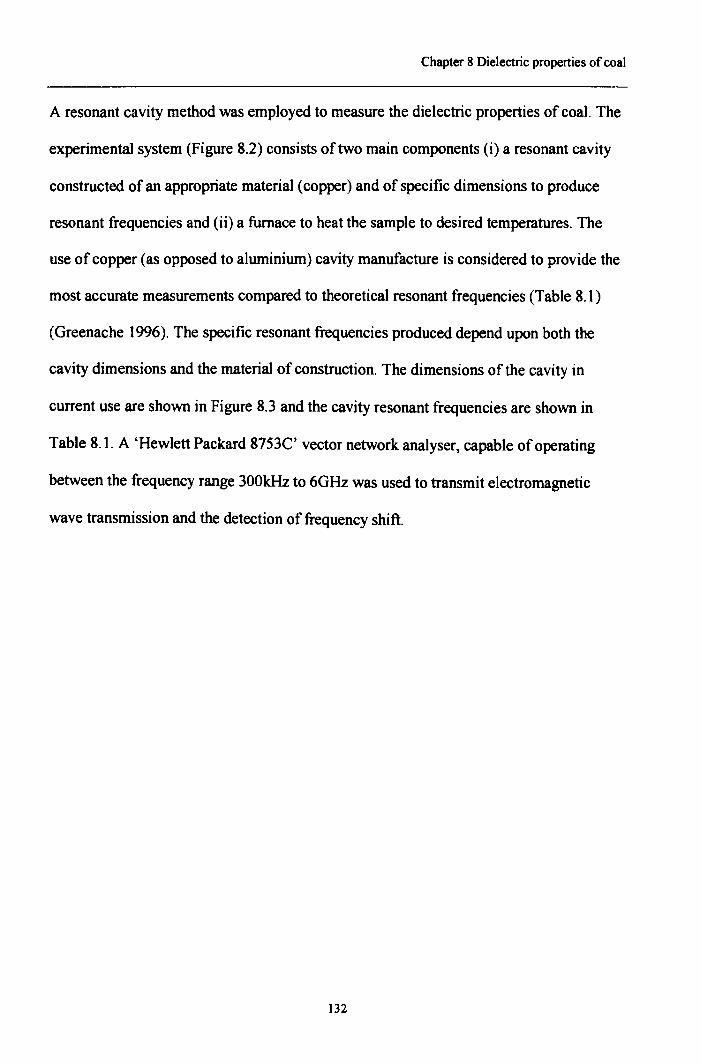
Chapter 8 Dielectric properties of coal
A resonant cavity method was employed to measure the dielectric properties of coal. The
experimental system (Figure 8.2) consists of two main components (i) a resonant cavity
constructed of an appropriate material (copper) and of specific dimensions to produce
resonant frequencies and (ii) a furnace to heat the sample to desired temperatures. The
use of copper (as opposed to aluminium) cavity manufacture is considered to provide the
most accurate measurements compared to theoretical resonant frequencies (Table 8.1)
(Greenache 1996). The specific resonant frequencies produced depend upon both the
cavity dimensions and the material of construction. The dimensions of the cavity in
current use are shown in Figure 8.3 and the cavity resonant frequencies are shown in
Table 8.1. A 'Hewlett Packard 8753C' vector network analyser, capable of operating
between the frequency range 300kHz to 6GHz was used to transmit electromagnetic
wave transmission and the detection of frequency shift.
132
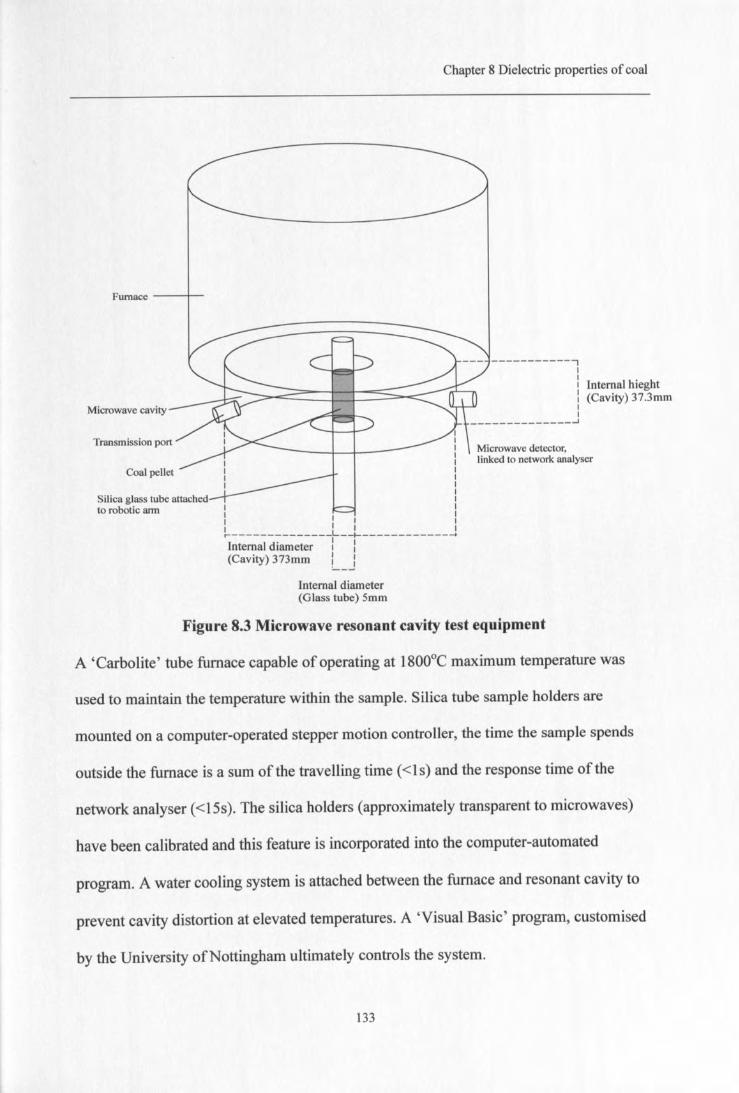
Chapter 8 Dielectric properties of coal
Furnace --+--
Transmission port
-----------,II: Internal biegbtI (Cavity) 37.3mmII---------------'Microwave cavity
Silica glass tube attachedto robotic arm
IIIIIIIIIII
I I I :I I I Ir--------- L__~------------4Internal diameter : :(Cavity) 373mm L_J
Internal diameter(Glass tube) 5mm
Microwave detector,linked to network analyser
Figure 8.3 Microwave resonant cavity test equipment
A 'Carbolite' tube furnace capable of operating at I800°C maximum temperature was
used to maintain the temperature within the sample. Silica tube sample holders are
mounted on a computer-operated stepper motion controller, the time the sample spends
outside the furnace is a sum ofthe travelling time «Is) and the response time of the
network analyser «15s). The silica holders (approximately transparent to microwaves)
have been calibrated and this feature is incorporated into the computer-automated
program. A water cooling system is attached between the furnace and resonant cavity to
prevent cavity distortion at elevated temperatures. A 'Visual Basic' program, customised
by the University of Nottingham ultimately controls the system.
133
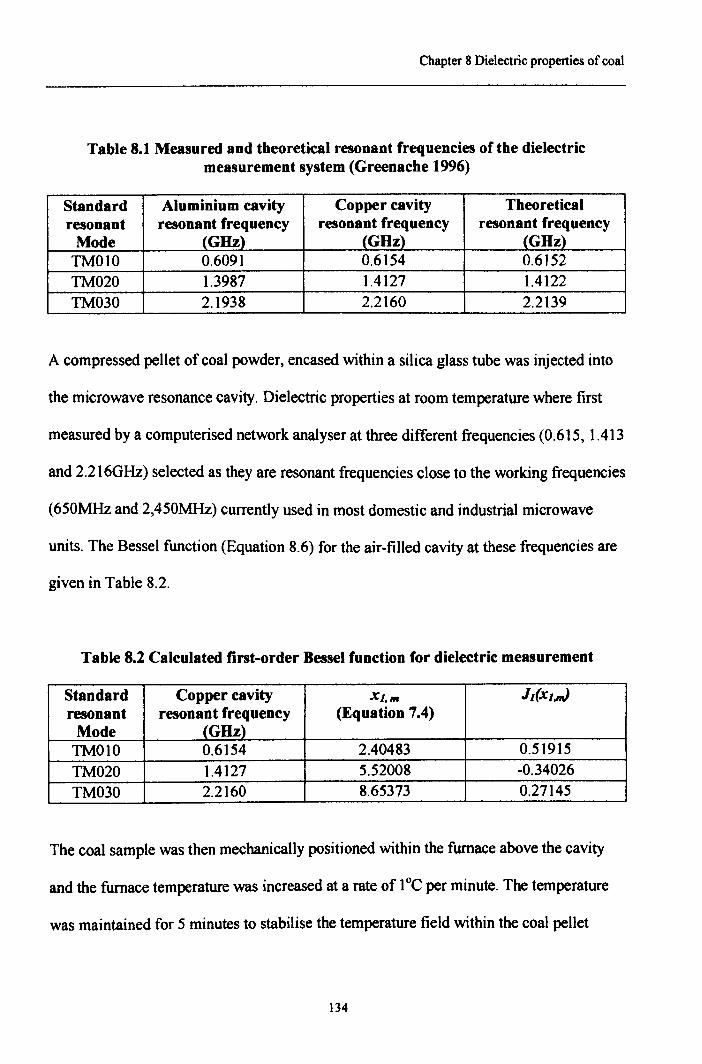
Chapter 8 Dielectric properties of coal
Table 8.1 Measured and theoretical resonant frequencies of the dielectricmeasurement system (Greenache 1996)
Standard Aluminium cavity Copper cavity Theoreticalresonant resonant frequency resonant frequency resonant frequencyMode (GHz) (GHz) (GHz)TMOI0 0.6091 0.6154 0.6152TM020 1.3987 1.4127 1.4122TM030 2.1938 2.2160 2.2139
A compressed pellet of coal powder, encased within a silica glass tube was injected into
the microwave resonance cavity. Dielectric properties at room temperature where first
measured by a computerised network analyser at three different frequencies (0.615, 1.413
and 2.2160Hz) selected as they are resonant frequencies close to the working frequencies
(650MHz and 2,450MHz) currently used in most domestic and industrial microwave
units. The Bessel function (Equation 8.6) for the air-filled cavity at these frequencies are
given in Table 8.2.
Table 8.2 Calculated first-order Bessel function for dielectric measurement
Standard Copper cavity Xl,,,, h(Xl",Jresonant resonant frequency (Equation 7.4)Mode (GHz)TMOI0 0.6154 2.40483 0.51915TM020 1.4127 5.52008 -0.34026TM030 2.2160 8.65373 0.27145
The coal sample was then mechanically positioned within the furnace above the cavity
and the furnace temperature was increased at a rate of 1°C per minute. The temperature
was maintained for 5 minutes to stabilise the temperature field within the coal pellet
134
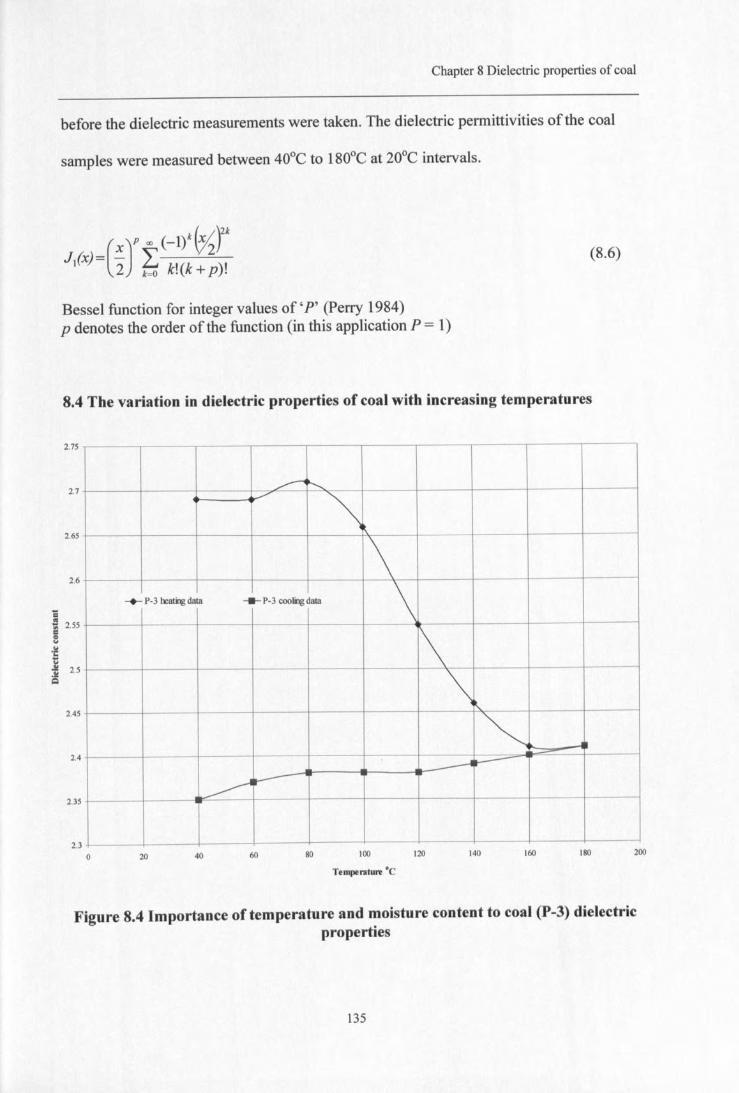
Chapter 8 Dielectric properties of coal
before the dielectric measurements were taken. The dielectric permittivities of the coal
samples were measured between 40°C to 180°C at 20°C intervals.
(x)P 00 (-1)k~r
J/x) = - L---..:......;=---2 k=O k!(k + p)!
(8.6)
Bessel function for integer values of' P' (Perry 1984)p denotes the order of the function (in this application P = 1)
8.4 The variation in dielectric properties of coal with increasing temperatures
2.75
2.7
2.65
2.6
;;~ 2.55.,c:=......·c...j 2.5.!!~
2.45
2.4
2.35
2.3
~ r-,,./ -.
\-+- P·3 heating data ...... P·3 cooling data \
\\
~ -II___..---~
.--
20 40 60 80 100
Temperature ·C
140 160 180 200120
Figure 8.4 Importance of temperature and moisture content to coal (P-3) dielectricproperties
135
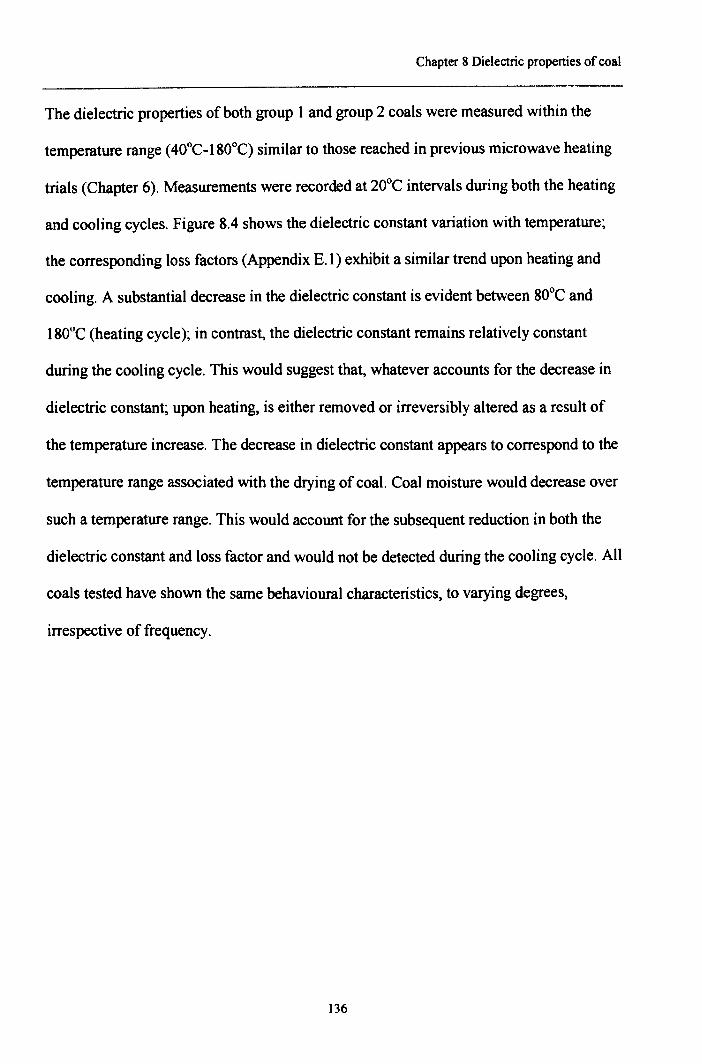
Chapter 8 Dielectric properties of coal
The dielectric properties of both group 1 and group 2 coals were measured within the
temperature range (40°C-180°C) similar to those reached in previous microwave heating
trials (Chapter 6). Measurements were recorded at 20°C intervals during both the heating
and cooling cycles. Figure 8.4 shows the dielectric constant variation with temperature;
the corresponding loss factors (Appendix E.1) exhibit a similar trend upon heating and
cooling. A substantial decrease in the dielectric constant is evident between 80°C and
180°C (heating cycle); in contrast, the dielectric constant remains relatively constant
during the cooling cycle. This would suggest that, whatever accounts for the decrease in
dielectric constant; upon heating, is either removed or irreversibly altered as a result of
the temperature increase. The decrease in dielectric constant appears to correspond to the
temperature range associated with the drying of coal. Coal moisture would decrease over
such a temperature range. This would account for the subsequent reduction in both the
dielectric constant and loss factor and would not be detected during the cooling cycle. All
coals tested have shown the same behavioural characteristics, to varying degrees,
irrespective of frequency.
136
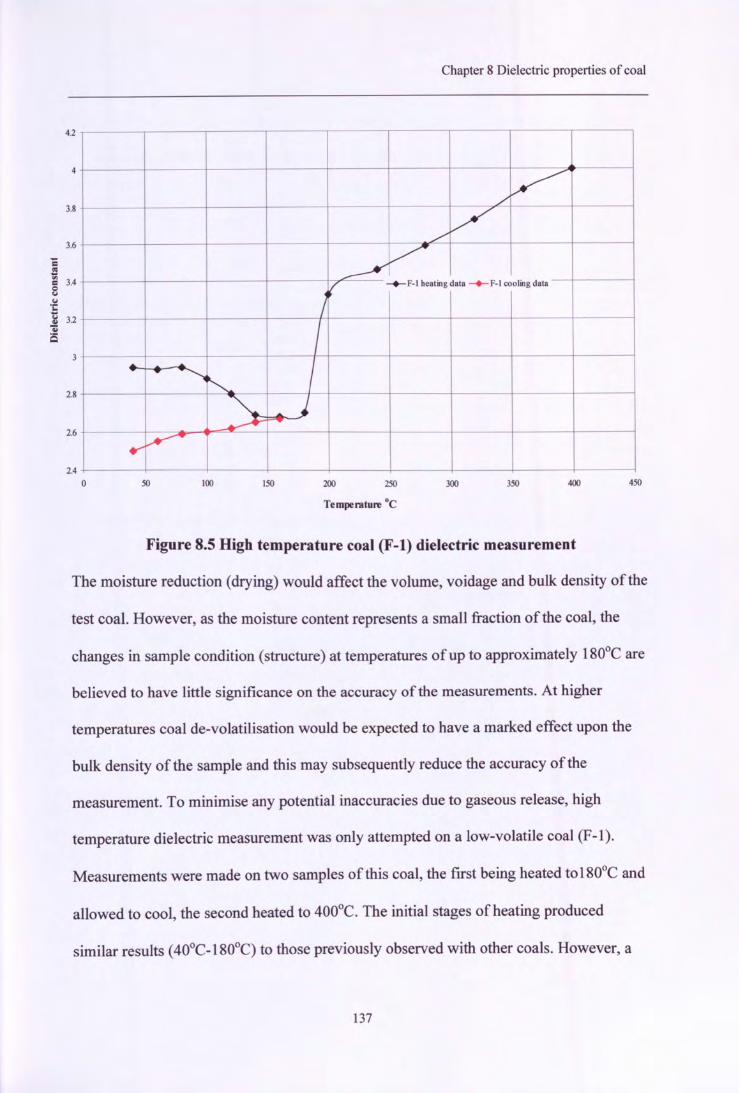
Chapter 8 Dielectric properties of coal
2.6
/'/
»:V__-KV/ -+-F-I heating data -+- F-l cooling data
I
I..... _.....
I'0'" <,-,
<, ...... j___.........»>:
4.2
4
3.8
3.6
-=S'" 3.4=0....·Ctl 3.2..Qj
is
2.8
2.4o 50 lOO 150 200 250 300 350 400 450
Temperature DC
Figure 8.5 High temperature coal (F-l) dielectric measurement
The moisture reduction (drying) would affect the volume, voidage and bulk density of the
test coal. However, as the moisture content represents a small fraction of the coal, the
changes in sample condition (structure) at temperatures of up to approximately 180°C are
believed to have little significance on the accuracy of the measurements. At higher
temperatures coal de-volatilisation would be expected to have a marked effect upon the
bulk density of the sample and this may subsequently reduce the accuracy of the
measurement. To minimise any potential inaccuracies due to gaseous release, high
temperature dielectric measurement was only attempted on a low-volatile coal (F-I).
Measurements were made on two samples of this coal, the first being heated to 180°C and
allowed to cool, the second heated to 400°C. The initial stages of heating produced
similar results (40°C-180°C) to those previously observed with other coals. However, a
137
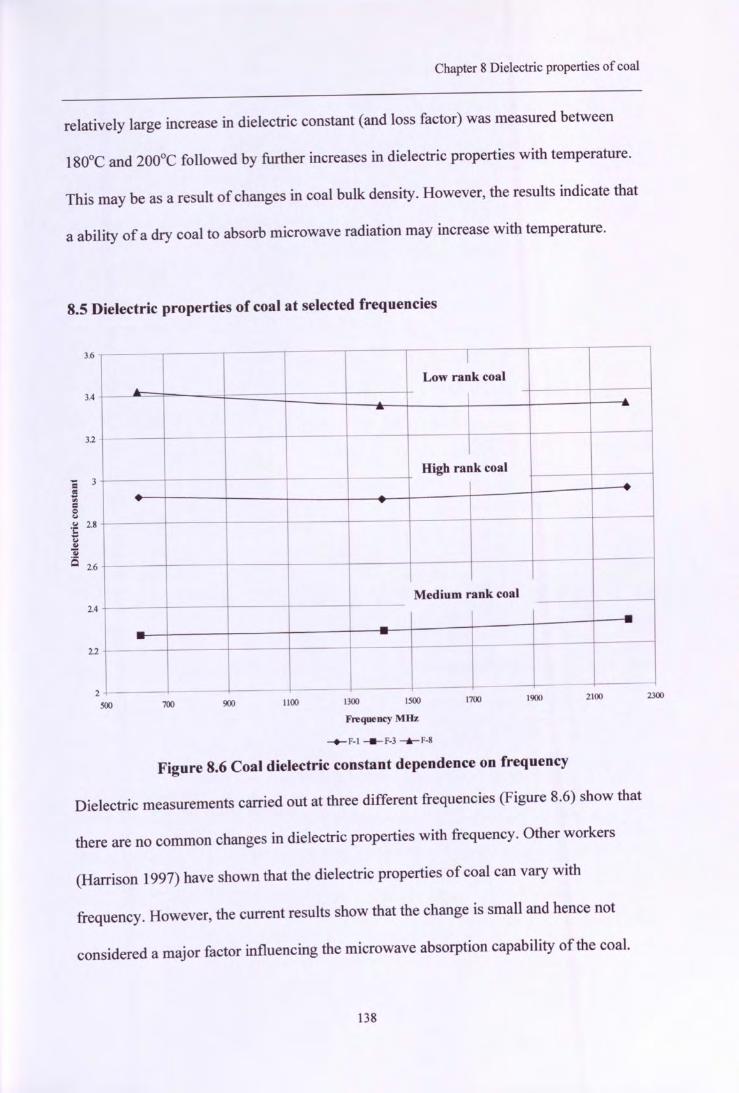
Chapter 8 Dielectric properties of coal
relatively large increase in dielectric constant (and loss factor) was measured between
1800C and 200°C followed by further increases in dielectric properties with temperature.
This may be as a result of changes in coal bulk density. However, the results indicate that
a ability of a dry coal to absorb microwave radiation may increase with temperature.
8.5 Dielectric properties of coal at selected frequencies
2.4
I
~Low rank coal
- --
Higb rank coal-""
Medium rank coal
- ----- --
3.6
3.4
3.2
= 3.s.,=8.~ 2.8
i~~ 2.6
2.2
2500 700 900 BOO BOO 1500 1700 1900 2100 2300
Frequency MHz
-+-F·1 __ F·3_....F·8
Figure 8.6 Coal dielectric constant dependence on frequency
Dielectric measurements carried out at three different frequencies (Figure 8.6) show that
there are no common changes in dielectric properties with frequency. Other workers
(Harrison 1997) have shown that the dielectric properties of coal can vary with
frequency. However, the current results show that the change is small and hence not
considered a major factor influencing the microwave absorption capability of the coal.
138
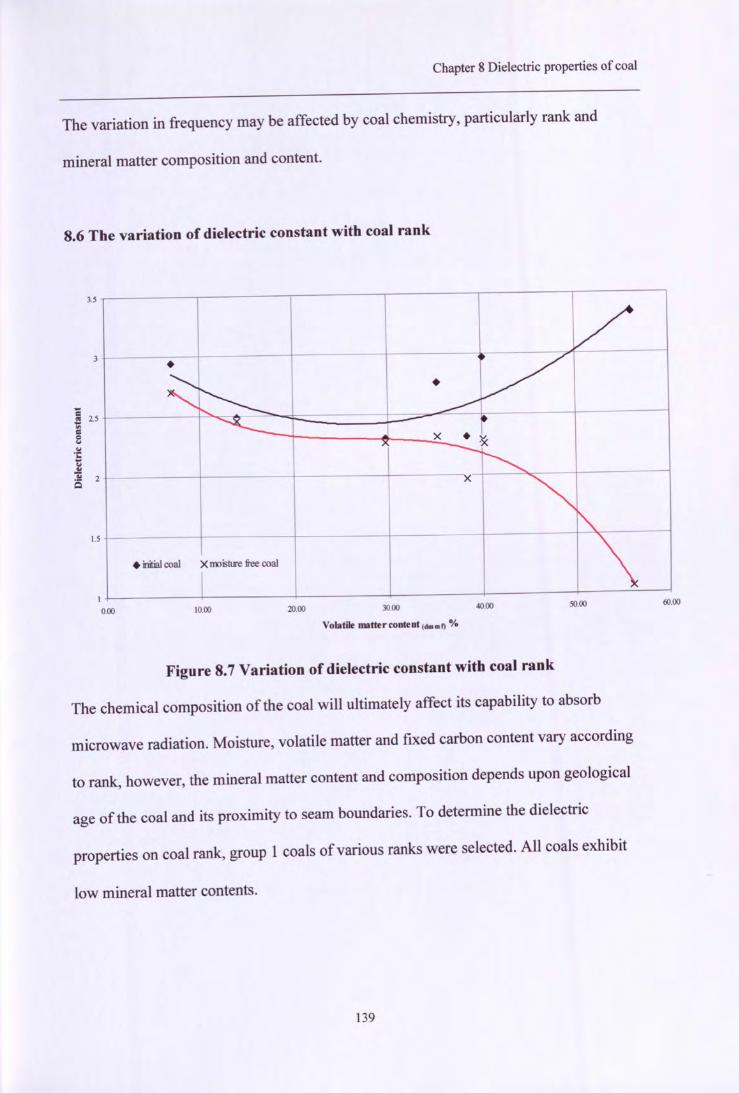
Chapter 8 Dielectric properties of coal
The variation in frequency may be affected by coal chemistry, particularly rank and
mineral matter composition and content.
8.6 The variation of dielectric constant with coal rank
1.5
v• V~ t-:-_ •
----~t--- ~
» X • v<:»~
x -.~
• inifuJ coal X moisture free coal \I
3.5
c~ 2.5
=8.-1::iQ 2
I
000 10.00 20.00 30.00
Volatile matter content (dmml) %
40.00 50.00 60.00
Figure 8.7 Variation of dielectric constant with coal rank
The chemical composition of the coal will ultimately affect its capability to absorb
microwave radiation. Moisture, volatile matter and fixed carbon content vary according
to rank, however, the mineral matter content and composition depends upon geological
age of the coal and its proximity to seam boundaries. To determine the dielectric
properties on coal rank, group 1 coals of various ranks were selected. All coals exhibit
low mineral matter contents.
139
Chapter 8 Dielectric properties of coal
The dielectric properties of group 1 coals before and after drying are shown in Figure 8.7.
Prior to drying the highest dielectric constants and therefore the greatest absorption
capabilities are attributable to low (F-8 to F-6) and high (F-l to F-3) rank coals. Medium
ranked coals exhibit lower dielectric constant values. After drying, the low rank coals
exhibit the lowest dielectric constant and account for the greatest change in dielectric
property due to moisture removal. Medium rank coals show relatively similar dielectric
constant values whilst high ranking coals show the least change due to drying and the
highest values. This implies that the moisture content significantly increases the coals
dielectric constant and microwave absorption ability, however, dielectric constants and
loss factor increase with increasing rank on a dry basis. This suggests that dielectric
properties are influenced by coal structure, higher absorption capabilities with increased
fixed carbon to volatile matter contents.
In contrast, group 2 coals exhibit no common dielectric characteristics with relation to
carbon content (rank). A possible explanation is that the significant variations are due to
the coal mineral matter content and composition, which mask the coal rank effect.
8.7 Penetration depth of microwave radiation
The penetration depth is defined as the distance from the surface of the material at which
the power reduces to the number eol from the value at the surface. The penetration depth
has been derived from Maxwell's wave equation of the electromagnetic field in the z
direction (Figure 8.8, Von Hippell954).
140
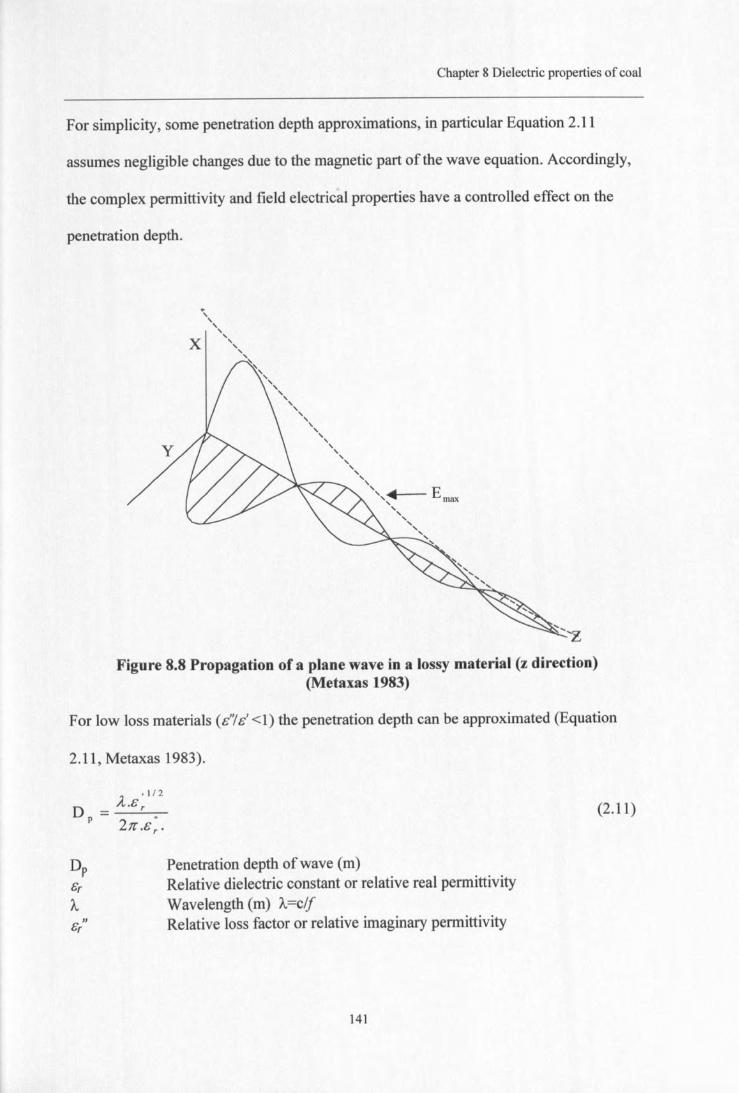
Chapter 8 Dielectric properties of coal
For simplicity, some penetration depth approximations, in particular Equation 2.11
assumes negligible changes due to the magnetic part of the wave equation. Accordingly,
the complex permittivity and field electrical properties have a controlled effect on the
penetration depth.
x~,,,,
""""""",,,,,,,,,,,,,,,,,,,"",
',,,~Emax,,,"""~--"""
Figure 8.8 Propagation of a plane wave in a lossy material (z direction)(Metaxas 1983)
For low loss materials (e''le' <1) the penetration depth can be approximated (Equation
2.11, Metaxas 1983).
(2.11)
JJer
Penetration depth of wave (m)Relative dielectric constant or relative real permittivityWavelength (m) A=c/fRelative loss factor or relative imaginary permittivity
141
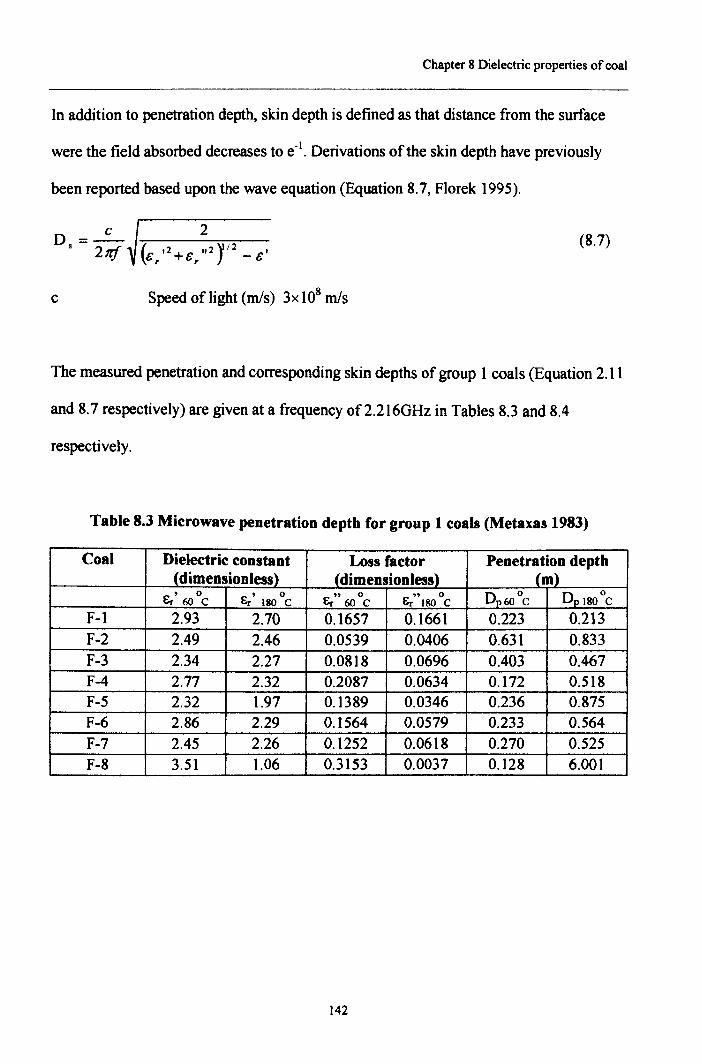
Chapter 8 Dielectric properties of coal
In addition to penetration depth, skin depth is defined as that distance from the surface
were the field absorbed decreases to e-I.Derivations of the skin depth have previously
been reported based upon the wave equation (Equation 8.7, Florek 1995).
(8.7)
c Speed of light (mls) 3x10⁸ mls
The measured penetration and corresponding skin depths of group 1 coals (Equation 2.11
and 8.7 respectively) are given at a frequency of2.216GHz in Tables 8.3 and 8.4
respectively.
Table 8.3 Microwave penetration depth for group 1 coals (Metaxas 1983)
Coal Dielectric constant Loss factor Penetration depth.(dimensionless) (dimensionles~ (m)
Er' ° Er'I80oC Er" ° Er" ° Dp60 °c o, 180°C60C 60C ISO CF-l 2.93 2.70 0.1657 0.1661 0.223 0.213F-2 2.49 2.46 0.0539 0.0406 0.631 0.833F-3 2.34 2.27 0.0818 0.0696 0.403 0.467F-4 2.77 2.32 0.2087 0.0634 0.172 0.518F-5 2.32 1.97 0.1389 0.0346 0.236 0.875F-6 2.86 2.29 0.1564 0.0579 0.233 0.564F-7 2.45 2.26 0.1252 0.0618 0.270 0.525F-8 3.51 1.06 0.3153 0.0037 0.128 6.001
142
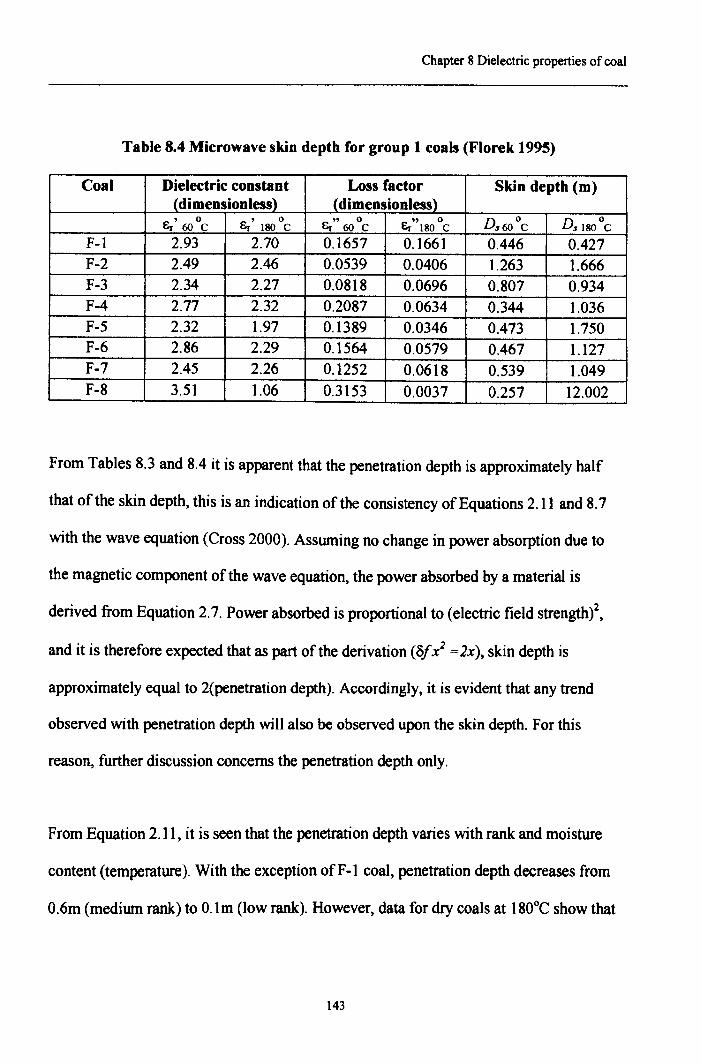
Chapter 8 Dielectric properties of coal
Table 8.4 Microwave skin depth for group 1 coals (Florek 1995)
Coal Dielectric constant Loss factor Skin depth (m)(dimensionless) (dimensionless)
Er' ° Er'lsooC Er" ° Er" 180°C Ds60 °c o, ISO °c60C 60CF-l 2.93 2.70 0.1657 0.1661 0.446 0.427F-2 2.49 2.46 0.0539 0.0406 1.263 1.666F-3 2.34 2.27 0.0818 0.0696 0.807 0.934F-4 2.77 2.32 0.2087 0.0634 0.344 1.036F-5 2.32 1.97 0.1389 0.0346 0.473 1.750F-6 2.86 2.29 0.1564 0.0579 0.467 1.127F-7 2.45 2.26 0.1252 0.0618 0.539 1.049F-8 3.51 1.06 0.3153 0.0037 0.257 12.002
From Tables 8.3 and 8.4 it is apparent that the penetration depth is approximately half
that of the skin depth, this is an indication of the consistency of Equations 2.11 and 8.7
with the wave equation (Cross 2000). Assuming no change in power absorption due to
the magnetic component of the wave equation, the power absorbed by a material is
derived from Equation 2.7. Power absorbed is proportional to (electric field strength)',
and it is therefore expected that as part of the derivation (81x2 =2x), skin depth is
approximately equal to 2(penetration depth). Accordingly, it is evident that any trend
observed with penetration depth will also be observed upon the skin depth. For this
reason, further discussion concerns the penetration depth only.
From Equation 2.11, it is seen that the penetration depth varies with rank and moisture
content (temperature). With the exception of F-I coal, penetration depth decreases from
0.6m (medium rank) to O.lm (low rank). However, data for dry coals at ISO°C show that
143
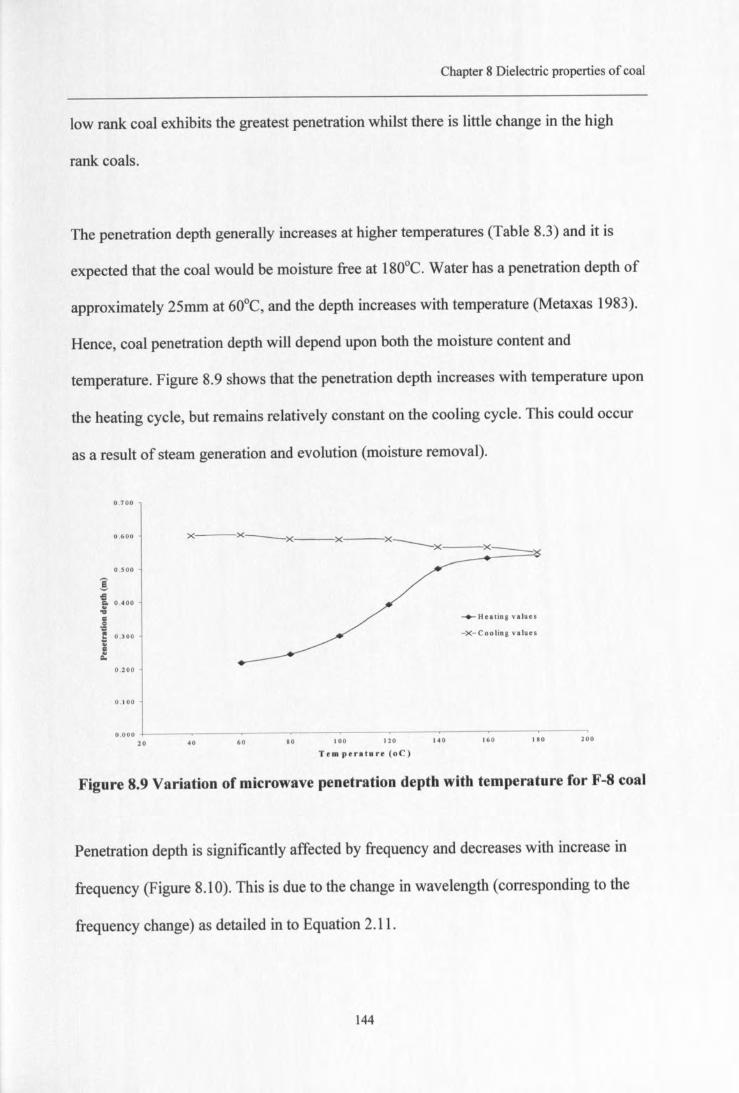
Chapter 8 Dielectric properties of coal
low rank coal exhibits the greatest penetration whilst there is little change in the high
rank coals.
The penetration depth generally increases at higher temperatures (Table 8.3) and it is
expected that the coal would be moisture free at 180°C. Water has a penetration depth of
approximately 25mm at 60°C, and the depth increases with temperature (Metaxas 1983).
Hence, coal penetration depth will depend upon both the moisture content and
temperature. Figure 8.9 shows that the penetration depth increases with temperature upon
the heating cycle, but remains relatively constant on the cooling cycle. This could occur
as a result of steam generation and evolution (moisture removal).
0.700
0.200
x:---x-x.--x:---x x__ x_0.600
os oo
!oS~ 0.400...,8.,t; 0.300
:let:
-+-Hcating values
-X-Cool1ng values
0.100
0.000 -l---~- __ -~--~--------~----~20 40 60 80 100 120 140 160 180 200
Tern perature (oC)
Figure 8.9 Variation of microwave penetration depth with temperature for F-8 coal
Penetration depth is significantly affected by frequency and decreases with increase in
frequency (Figure 8.10). This is due to the change in wavelength (corresponding to the
frequency change) as detailed in to Equation 2.11.
144
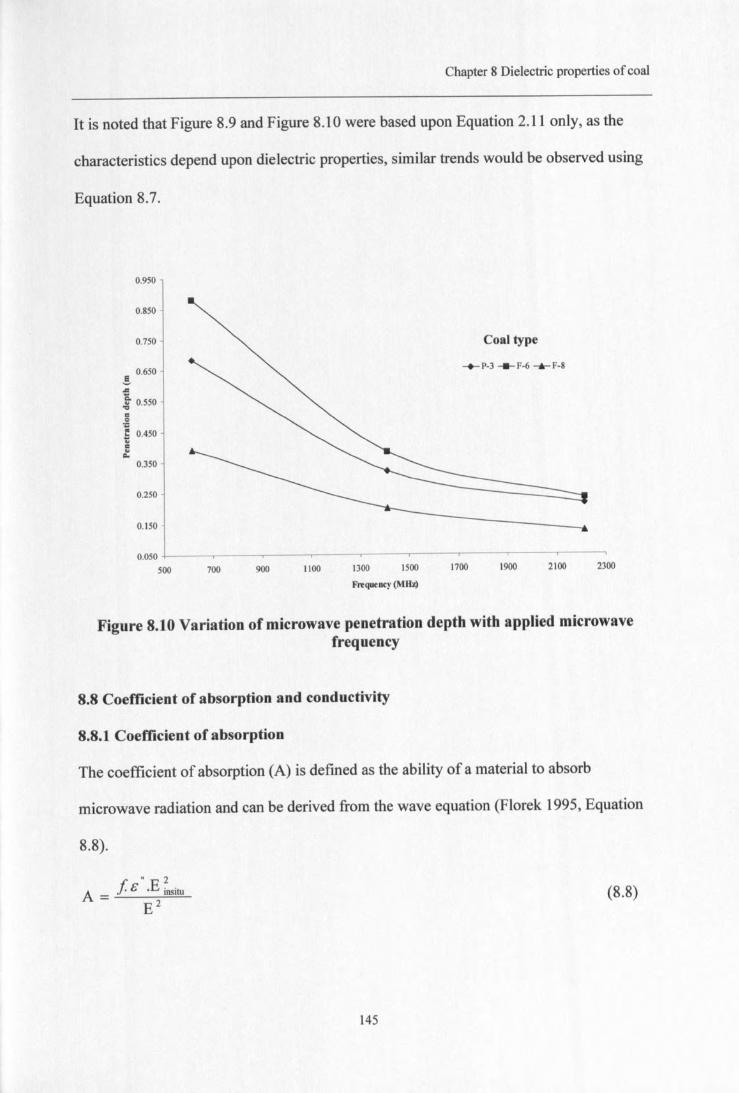
Chapter 8 Dielectric properties of coal
It is noted that Figure 8.9 and Figure 8.10 were based upon Equation 2.11 only, as the
characteristics depend upon dielectric properties, similar trends would be observed using
Equation 8.7.
0.950
0.850
0.750
0.650.!t~ 0.550
"e.::~ 0.450.."t:.
0.350
0.250
0.150
Coal type
-+-P·3 -s-r-s .....F·8
0.050 -l---r------,----,-----.------.---,---.,..---,----500 700 900 1100 1300 1500 1700 1900 2100 2300
Freque ney (MHz)
Figure 8.10 Variation of microwave penetration depth with applied microwavefrequency
8.8 Coefficient of absorption and conductivity
8.8.1 Coefficient of absorption
The coefficient of absorption (A) is defmed as the ability of a material to absorb
microwave radiation and can be derived from the wave equation (Florek 1995, Equation
8.8).
" 2A = f 8 .E insitu
E2(8.8)
145
Chapter 8 Dielectric properties of coal
Where.
A Coefficient of absorption (F/m2)E" Imaginary permittivity (F/m)E Electric field strength (vim)Einsitu Electric field strength inside material (vim)
EmsinIEby definition is the coefficient of reflection (derivation of' Snell's law and
Fresnel's equations) (Von Hippe11954), and represents the relationship between the
electric field absorbed by the material to that of the cavity. The coefficient of reflection is
unique to a given material and is used for theoretical heating rate calculations, which are
discussed in further detail in subsequent sections. There have been many approximations
for the relationship between cavity and material electric field strength i.e. Equation 8.9
(Mayer 1983).
E
3E .(8.9)E insitu
Er' Dielectric constantE Electric field strength (vim)Einsitu Electric field strength within the material (average) (vim)re Coefficient of reflection
However, Equation 8.9 is considered a crude approximation (Mayer 1983) and a more
accurate method of deriving the coefficient of absorption (Equation 8.10) incorporates the
particle size and shape (assumed spherical). The coefficient of absorption is by definition
the fraction of incident energy not reflected, as such, the coefficient of absorption is (1-
coefficient of reflection). It is claimed the most accurate relationship is that given by
Equation 8.10 (Metaxas 1983).
A = (1- e-2rID, ) (8.10)
146
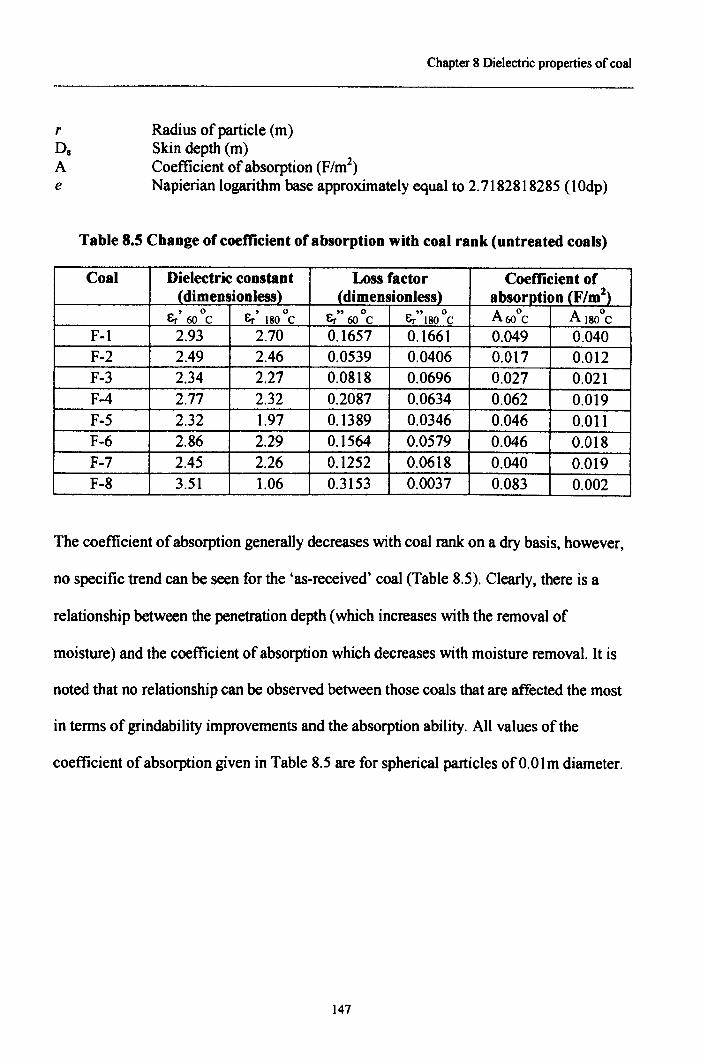
Chapter 8 Dielectric properties of coal
rDsAe
Radius of particle (m)Skin depth (m)Coefficient of absorption (F/m2)Napierian logarithm base approximately equal to 2.7182818285 (LOdp)
Table 8.5 Change of coefficient of absorption with coal rank (untreated coals)
Coal Dielectric constant Loss factor Coefficient of(dimensionless) (dimensionless) absor.l!_tioniFIm1_
Er' ° , ° Er" ° " ° A 60°C A 180°C60 C &r 180 C 60C &r 180 CF-l 2.93 2.70 0.1657 0.1661 0.049 0.040F-2 2.49 2.46 0.0539 0.0406 0.017 0.012F-3 2.34 2.27 0.0818 0.0696 0.027 0.021F-4 2.77 2.32 0.2087 0.0634 0.062 0.019F-5 2.32 1.97 0.1389 0.0346 0.046 0.011F-6 2.86 2.29 0.1564 0.0579 0.046 0.018F-7 2.45 2.26 0.1252 0.0618 0.040 0.019F-8 3.51 1.06 0.3153 0.0037 0.083 0.002
The coefficient of absorption generally decreases with coal rank on a dry basis, however,
no specific trend can be seen for the 'as-received' coal (Table 8.5). Clearly, there is a
relationship between the penetration depth (which increases with the removal of
moisture) and the coefficient of absorption which decreases with moisture removal. It is
noted that no relationship can be observed between those coals that are affected the most
in terms of grindability improvements and the absorption ability. All values of the
coefficient of absorption given in Table 8.5 are for spherical particles of 0.0 1m diameter.
147
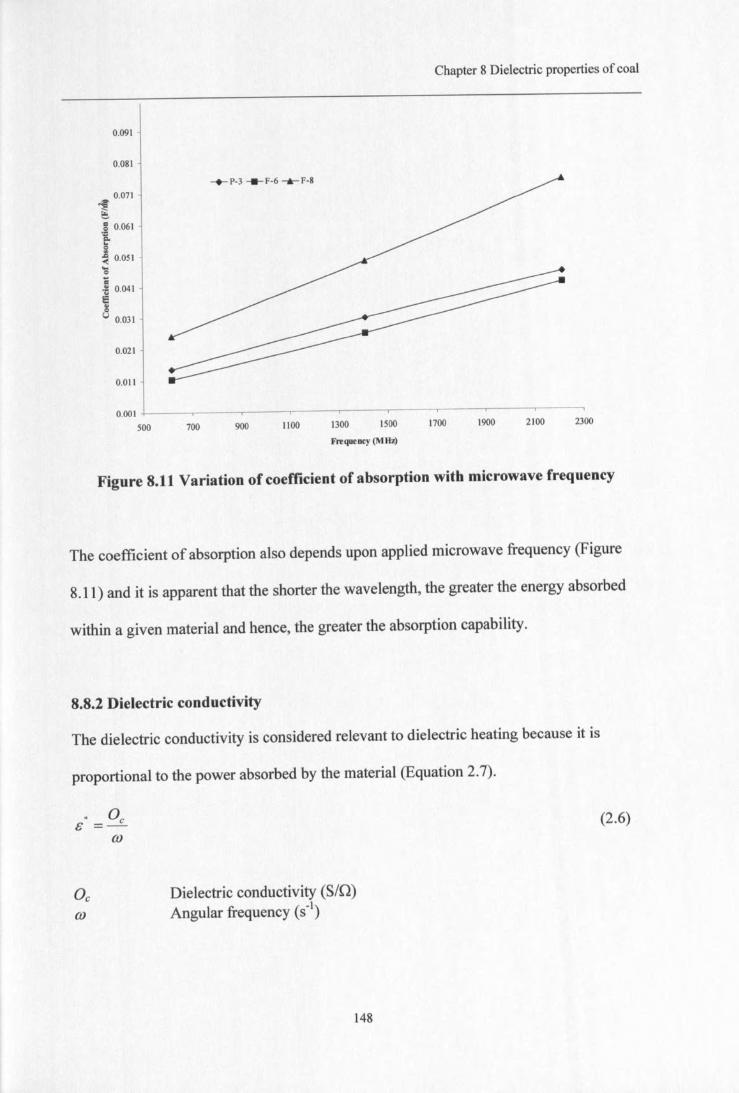
Chapter 8 Dielectric properties of coal
0.091
0.081
0.071
1§ 0.061:::
i0.051's~Cl
.~ 0.041ISa:u 0.031
0.021
0.011
--+-- P-3 F-6 ........ F-g
0.001 +-__ .--_-----,__ --.__ -r- __ -,-- __ ..,.--__ .--_---., __ .
500 700 900 1100 1300 1500 1700 1900 2100 2300
Frequency (MHz)
Figure 8.11 Variation of coefficient of absorption with microwave frequency
The coefficient of absorption also depends upon applied microwave frequency (Figure
8.11) and it is apparent that the shorter the wavelength, the greater the energy absorbed
within a given material and hence, the greater the absorption capability.
8.8.2 Dielectric conductivity
The dielectric conductivity is considered relevant to dielectric heating because it is
proportional to the power absorbed by the material (Equation 2.7).
(2.6)
Dielectric conductivity (Sin)Angular frequency (s-l)
148
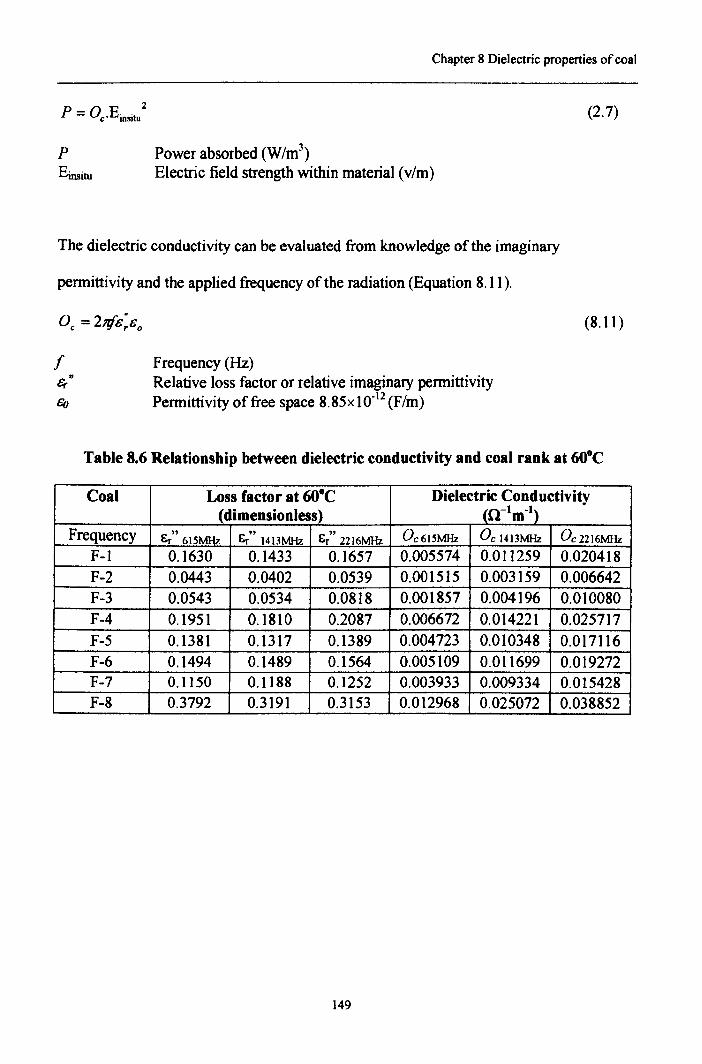
Chapter 8 Dielectric properties of coal
P Power absorbed (W/m3)Einsitu Electric field strength within material (vim)
The dielectric conductivity can be evaluated from knowledge of the imaginary
permittivity and the applied frequency of the radiation (Equation 8.11).
f Frequency (Hz)Er" Relative loss factor or relative imaginary permittivity60 Permittivity of free space 8.85x 10⁻¹² (F/m)
Table 8.6 Relationship between dielectric conductivity and coal rank at 60°C
Coal Loss factor at 60°C Dielectric Conductivity(dimensionless) (Cl-Im-I)
Frequency Er" 615MHz Er" 1413MHz Er" 2216MHz O;615MHz o, 1413MHz O:2216MHz
F-l 0.1630 0.1433 0.1657 0.005574 0.011259 0.020418F-2 0.0443 0.0402 0.0539 0.001515 0.003159 0.006642F-3 0.0543 0.0534 0.0818 0.001857 0.004196 0.010080F-4 0.1951 0.1810 0.2087 0.006672 0.014221 0.025717F-5 0.1381 0.1317 0.1389 0.004723 0.010348 0.017116F-6 0.1494 0.1489 0.l564 0.005109 0.011699 0.019272F-7 0.1150 0.1188 0.1252 0.003933 0.009334 0.015428F-8 0.3792 0.3191 0.3153 0.012968 0.025072 0.038852
149
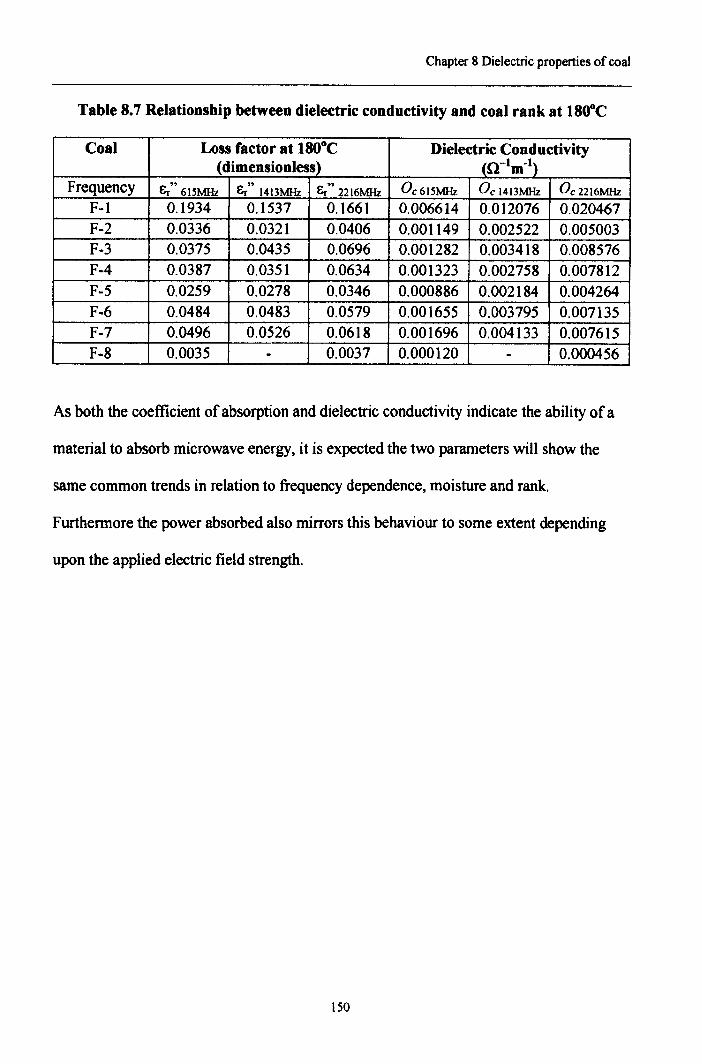
Chapter 8 Dielectric properties of coal
Table 8.7 Relationship between dielectric conductivity and coal rank at 180°C
Coal Loss factor at 180°C Dielectric Conductivity(dimensionless) (n-1m-l)
Frequency Er" 61SMHz Er" 1413MHz Er" 2216MHz Oc61SMHz Oc 1413MHz Oc2216MHz
F-l 0.1934 0.1537 0.1661 0.006614 0.012076 0.020467F-2 0.0336 0.0321 0.0406 0.001149 0.002522 0.005003F-3 0.0375 0.0435 0.0696 0.001282 0.003418 0.008576F-4 0.0387 0.0351 0.0634 0.001323 0.002758 0.007812F-5 0.0259 0.0278 0.0346 0.000886 0.002184 0.004264F-6 0.0484 0.0483 0.0579 0.001655 0.003795 0.007135F-7 0.0496 0.0526 0.0618 0.001696 0.004133 0.007615F-8 0.0035 - 0.0037 0.000120 - 0.000456
As both the coefficient of absorption and dielectric conductivity indicate the ability of a
material to absorb microwave energy, it is expected the two parameters will show the
same common trends in relation to frequency dependence, moisture and rank.
Furthermore the power absorbed also mirrors this behaviour to some extent depending
upon the applied electric field strength.
ISO
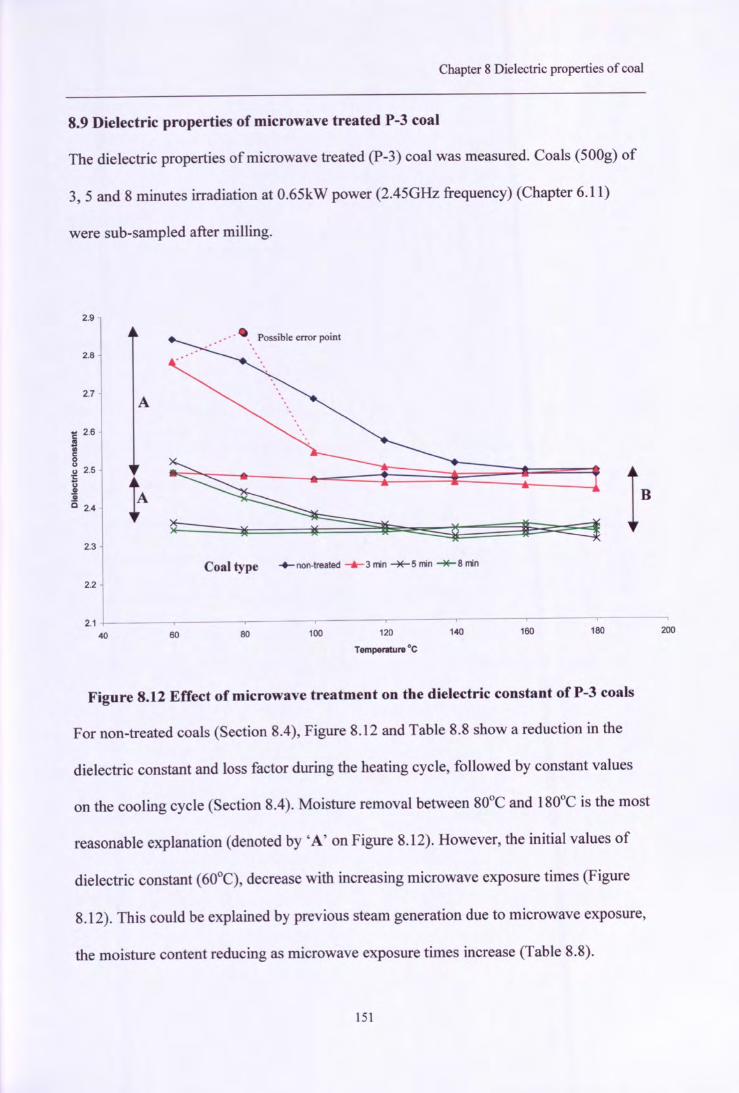
Chapter 8 Dielectric properties of coal
8.9 Dielectric properties of microwave treated P-3 coal
The dielectric properties of microwave treated (P-3) coal was measured. Coals (SOOg)of
3, Sand 8 minutes irradiation at O.6SkW power (2.4SGHz frequency) (Chapter 6.11)
were sub-sampled after milling.
2.9
2.8
2.7
'i! 2.6l!..e0uu 2.5
ti.9!.!!!c 2.4
2.3
2.2
2.140
.....• " Possible error point
A
Coal type -+-non-treated ""'-3 min ""*""5 min ""*""8 min
60 80 100 120Temperature ·C
140 160 180 200
Figure 8.12 Effect of microwave treatment on the dielectric constant of P-3 coals
For non-treated coals (Section 8.4), Figure 8.12 and Table 8.8 show a reduction in the
dielectric constant and loss factor during the heating cycle, followed by constant values
on the cooling cycle (Section 8.4). Moisture removal between 80°C and 180°C is the most
reasonable explanation (denoted by 'A' on Figure 8.12). However, the initial values of
dielectric constant (60°C), decrease with increasing microwave exposure times (Figure
8.12). This could be explained by previous steam generation due to microwave exposure,
the moisture content reducing as microwave exposure times increase (Table 8.8).
151
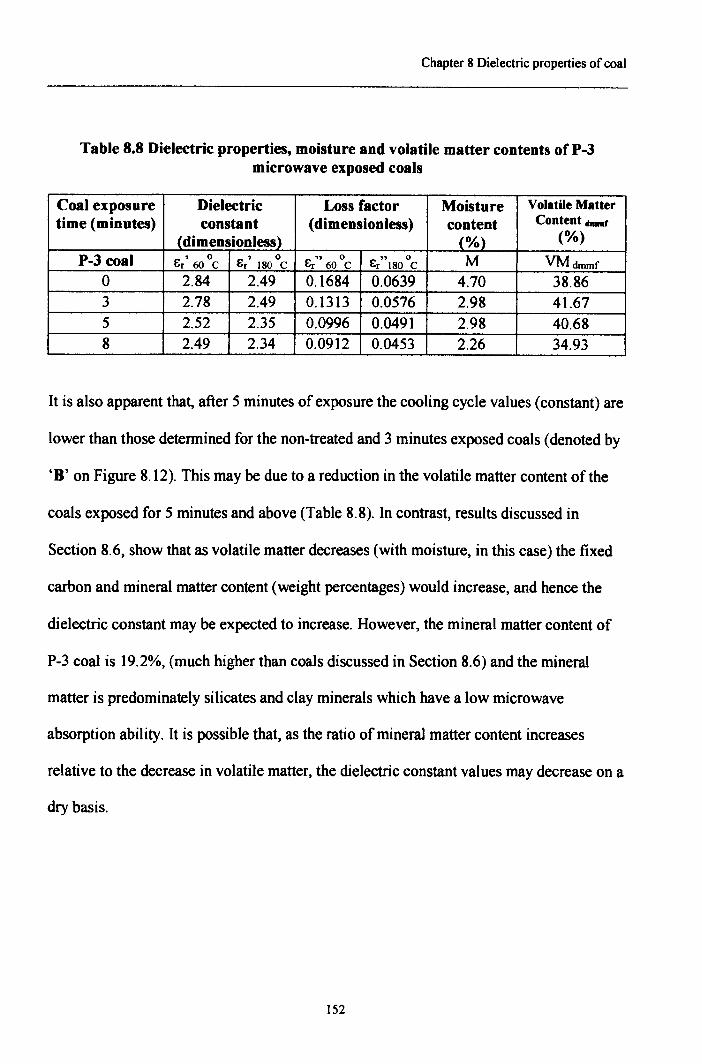
Chapter 8 Dielectric properties of coal
Table 8.8 Dielectric properties, moisture and volatile matter contents of P-3microwave exposed coals
Coal exposure Dielectric Loss factor Moisture Volatile Mattertime (minutes) constant (dimensionless) content Content tImmf
(dimensionless) (%}_ (%)
P-3 coal &r' 60 Qc s,' 180 Qc S" Q &r" 1800c M VMdmmfr 60 C
0 2.84 2.49 0.1684 0.0639 4.70 38.863 2.78 2.49 0.1313 0.0576 2.98 41.675 2.52 2.35 0.0996 0.0491 2.98 40.688 2.49 2.34 0.0912 0.0453 2.26 34.93
It is also apparent that, after 5 minutes of exposure the cooling cycle values (constant) are
lower than those determined for the non-treated and 3 minutes exposed coals (denoted by
'8' on Figure 8.12). This may be due to a reduction in the volatile matter content of the
coals exposed for 5 minutes and above (Table 8.8). In contrast, results discussed in
Section 8.6, show that as volatile matter decreases (with moisture, in this case) the fixed
carbon and mineral matter content (weight percentages) would increase, and hence the
dielectric constant may be expected to increase. However, the mineral matter content of
P-3 coal is 19.2%, (much higher than coals discussed in Section 8.6) and the mineral
matter is predominately silicates and clay minerals which have a low microwave
absorption ability. It is possible that, as the ratio of mineral matter content increases
relative to the decrease in volatile matter, the dielectric constant values may decrease on a
dry basis.
152
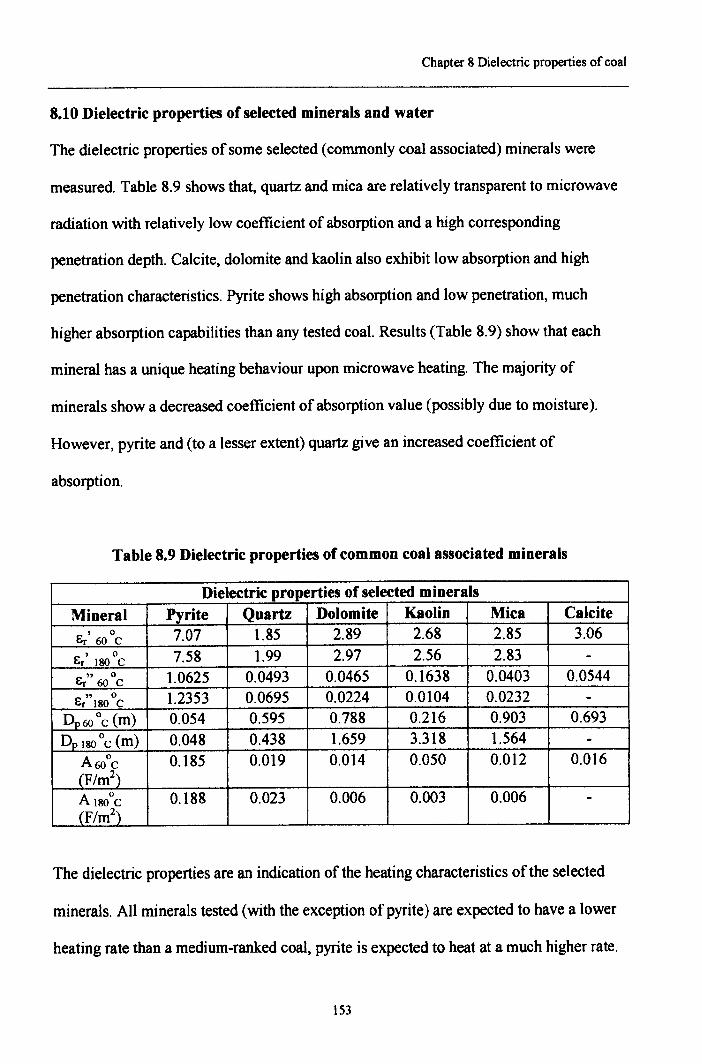
Chapter 8 Dielectric properties of coal
8.10 Dielectric properties of selected minerals and water
The dielectric properties of some selected (commonly coal associated) minerals were
measured. Table 8.9 shows that, quartz and mica are relatively transparent to microwave
radiation with relatively low coefficient of absorption and a high corresponding
penetration depth. Calcite, dolomite and kaolin also exhibit low absorption and high
penetration characteristics. Pyrite shows high absorption and low penetration, much
higher absorption capabilities than any tested coal. Results (Table 8.9) show that each
mineral has a unique heating behaviour upon microwave heating. The majority of
minerals show a decreased coefficient of absorption value (possibly due to moisture).
However, pyrite and (to a lesser extent) quartz give an increased coefficient of
absorption.
Table 8.9 Dielectric properties of common coal associated minerals
Dielectric properties of selected mineralsMineral Pyrite Quartz Dolomite Kaolin Mica CalciteEr' ° 7.07 l.85 2.89 2.68 2.85 3.0660C, ° 7.58 l.99 2.97 2.56 2.83 -Er ISO C
Er" ° 1.0625 0.0493 0.0465 0.1638 0.0403 0.054460Ce/'I80 °c 1.2353 0.0695 0.0224 0.0104 0.0232 -
Dp60 °c (m) 0.054 0.595 0.788 0.216 0.903 0.693n, ISO°c (m) 0.048 0.438 1.659 3.318 l.564 -
A 60°C 0.185 0.019 0.014 0.050 0.012 0.016(F/m2)A 180°C 0.l88 0.023 0.006 0.003 0.006 -(F/m2)
The dielectric properties are an indication of the heating characteristics of the selected
minerals. All minerals tested (with the exception of pyrite) are expected to have a lower
heating rate than a medium-ranked coal, pyrite is expected to heat at a much higher rate.
153
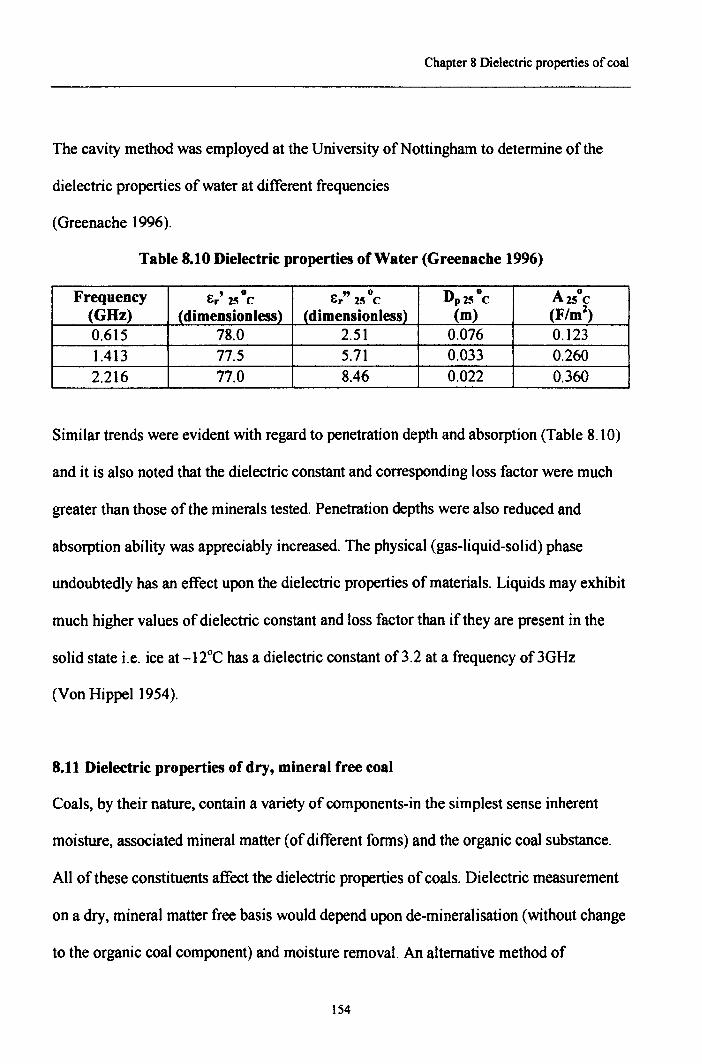
Chapter 8 Dielectric properties of coal
The cavity method was employed at the University of Nottingham to determine of the
dielectric properties of water at different frequencies
(Greenache 1996).
Table 8.10 Dielectric properties or Water (Greenacbe 1996)
Frequency Er' 25"c " ° n, 25°C A 25°CBr 25 C(GHz) (dimensionless) (dimensionless) (m) (F/m2)0.615 78.0 2.51 0.076 0.1231.413 77.5 5.71 0.033 0.2602.216 77.0 8.46 0.022 0.360
Similar trends were evident with regard to penetration depth and absorption (Table 8.10)
and it is also noted that the dielectric constant and corresponding loss factor were much
greater than those of the minerals tested. Penetration depths were also reduced and
absorption ability was appreciably increased. The physical (gas-liquid-solid) phase
undoubtedly has an effect upon the dielectric properties of materials. Liquids may exhibit
much higher values of dielectric constant and loss factor than if they are present in the
solid state i.e. ice at -l2oe has a dielectric constant of 3.2 at a frequency of 3GHz
(Von HippeI1954).
8.11 Dielectric properties or dry, mineral free coal
Coals, by their nature, contain a variety of components-in the simplest sense inherent
moisture, associated mineral matter (of different forms) and the organic coal substance.
All of these constituents affect the dielectric properties of coals. Dielectric measurement
on a dry, mineral matter free basis would depend upon de-mineralisation (without change
to the organic coal component) and moisture removal. An alternative method of
154
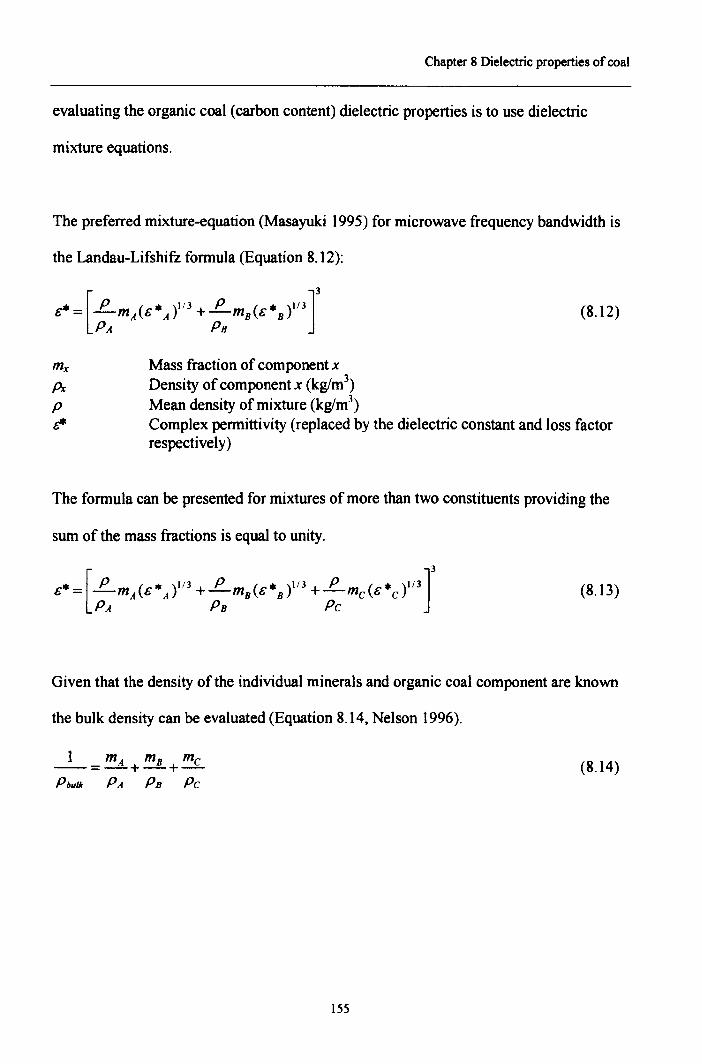
Chapter 8 Dielectric properties of coal
evaluating the organic coal (carbon content) dielectric properties is to use dielectric
mixture equations.
The preferred mixture-equation (Masayuki 1995) for microwave frequency bandwidth is
the Landau-Lifshifz formula (Equation 8.12):
(8.12)
PxPE!*
Mass fraction of component xDensity of component x (kg/m')Mean density of mixture (kg/m")Complex permittivity (replaced by the dielectric constant and loss factorrespectively)
The formula can be presented for mixtures of more than two constituents providing the
sum of the mass fractions is equal to unity.
(8.13)
Given that the density of the individual minerals and organic coal component are known
the bulk density can be evaluated (Equation 8.14, Nelson 1996).
I mA mB me--=-+-+-Pbul/c PA Pe Pc
(8.14)
155
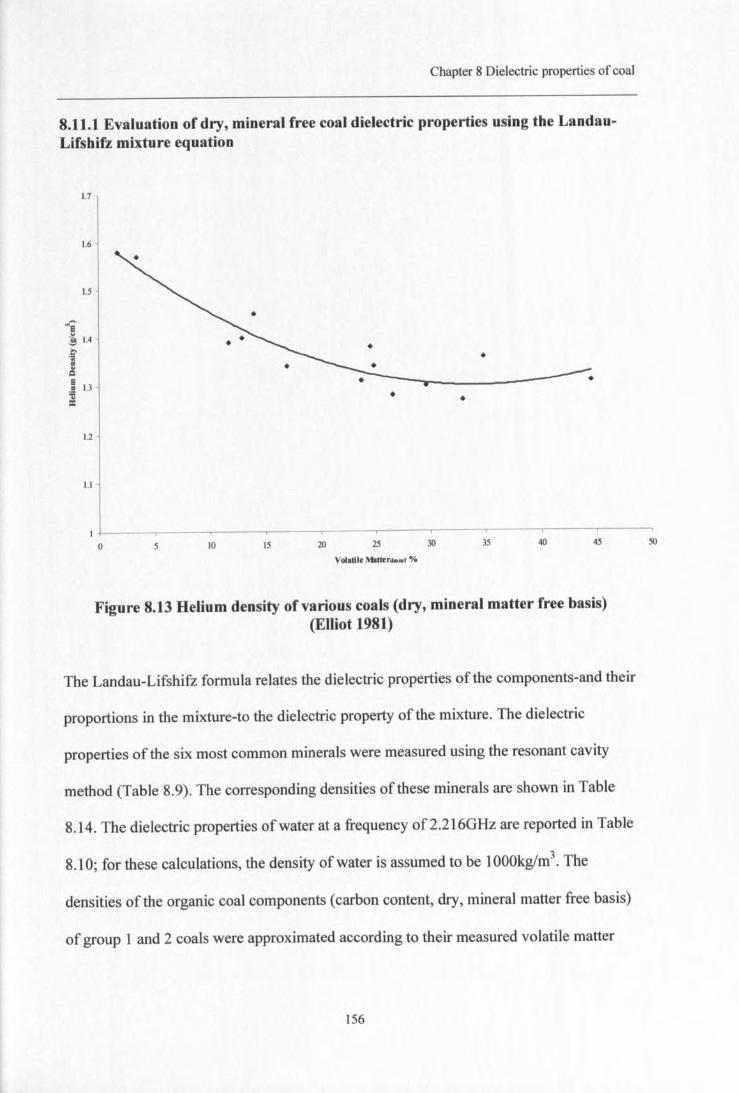
Chapter 8 Dielectric properties of coal
8.11.1 Evaluation of dry, mineral free coal dielectric properties using the Landau-Lifshifz mixture equation
1.6
1.5
..re~ 1.4
·i •"..Qa 1.3
~ • •
1.2
1.7
1.1
o 5 10 15 20 25 30 35 40 45 50
Volatile Matterdmmf %
Figure 8.13 Helium density of various coals (dry, mineral matter free basis)(Elliot 1981)
The Landau-Lifshifz formula relates the dielectric properties of the components-and their
proportions in the mixture-to the dielectric property of the mixture. The dielectric
properties of the six most common minerals were measured using the resonant cavity
method (Table 8.9). The corresponding densities of these minerals are shown in Table
8.14. The dielectric properties of water at a frequency of2.216GHz are reported in Table
8.10; for these calculations, the density of water is assumed to be 1000kglm3. The
densities of the organic coal components (carbon content, dry, mineral matter free basis)
of group 1 and 2 coals were approximated according to their measured volatile matter
156
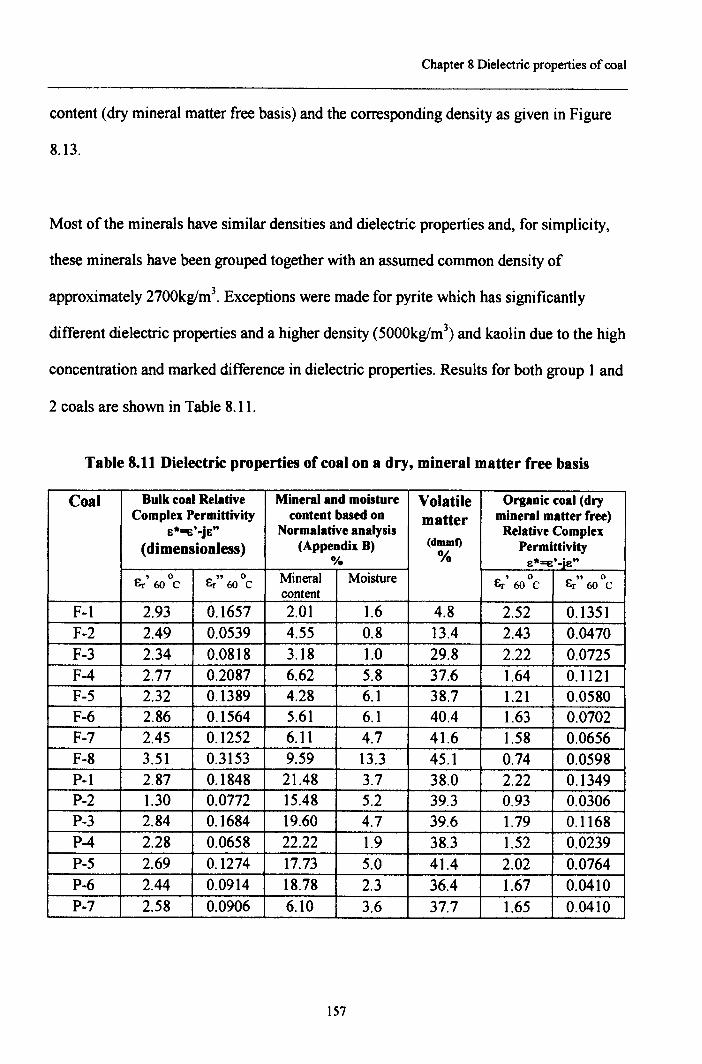
Chapter 8 Dielectric properties of coal
content (dry mineral matter free basis) and the corresponding density as given in Figure
8.13.
Most of the minerals have similar densities and dielectric properties and, for simplicity,
these minerals have been grouped together with an assumed common density of
approximately 2700kglm3. Exceptions were made for pyrite which has significantly
different dielectric properties and a higher density (5000kglm3) and kaolin due to the high
concentration and marked difference in dielectric properties. Results for both group 1 and
2 coals are shown in Table 8.11.
Table 8.11 Dielectric properties of coal on a dry, mineral matter free basis
Coal Bulk coal Relative Mineral and moisture Volatile Organic coal (dryComplex Permittivity content based on matter mineral matter free)
e*==s'-je" Normalative analysis Relative Complex(dimensionless) (Appendix B) (dmmf) Permittivity
OJ. % e*==s':ie", ° Er" ° Mineral Moisture Er' 600C Er" 0Er 60 C 60 C 60C
content
F-I 2.93 0.1657 2.01 1.6 4.8 2.52 0.1351F-2 2.49 0.0539 4.55 0.8 13.4 2.43 0.0470F-3 2.34 0.0818 3.18 1.0 29.8 2.22 0.0725F-4 2.77 0.2087 6.62 5.8 37.6 1.64 0.1121F-5 2.32 0.1389 4.28 6.1 38.7 1.21 0.0580F-6 2.86 0.1564 5.61 6.1 40.4 1.63 0.0702F-7 2.45 0.1252 6.11 4.7 41.6 1.58 0.0656F-8 3.51 0.3153 9.59 13.3 45.1 0.74 0.0598P-l 2.87 0.1848 21.48 3.7 38.0 2.22 0.1349P-2 1.30 0.0772 15.48 5.2 39.3 0.93 0.0306P-3 2.84 0.1684 19.60 4.7 39.6 1.79 0.1168P-4 2.28 0.0658 22.22 1.9 38.3 1.52 0.0239P-5 2.69 0.1274 17.73 5.0 41.4 2.02 0.0764P-6 2.44 0.0914 18.78 2.3 36.4 1.67 0.0410P·7 2.58 0.0906 6.10 3.6 37.7 1.65 0.0410
157
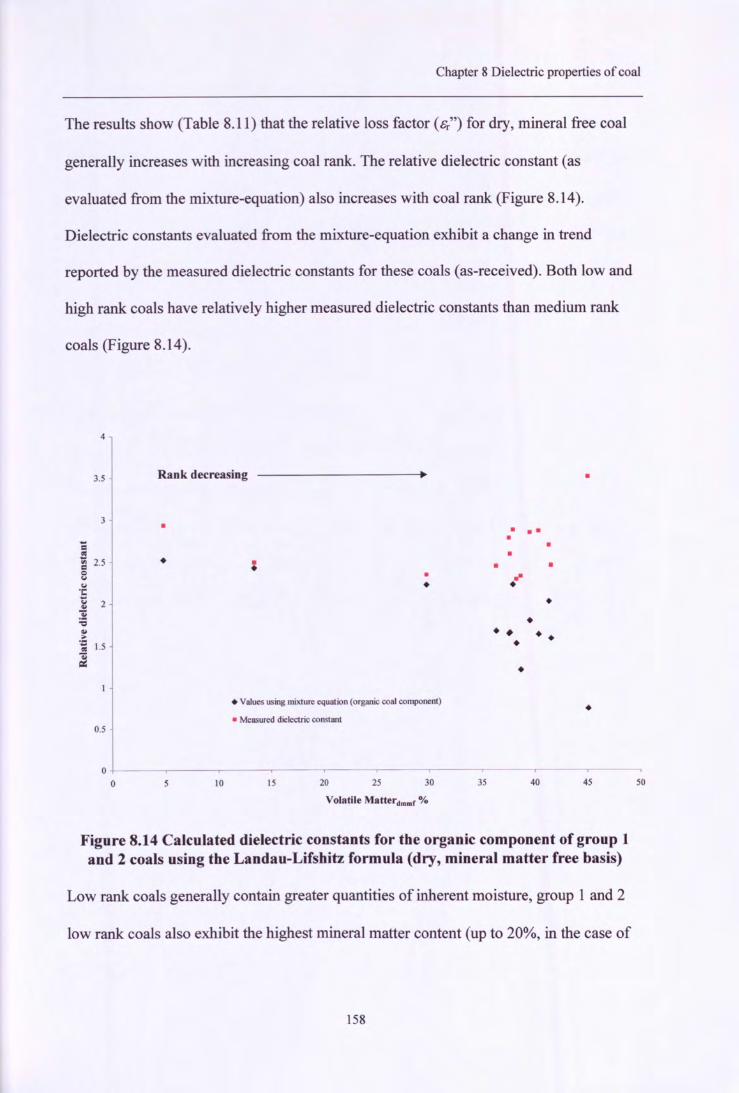
Chapter 8 Dielectric properties of coal
The results show (Table 8.11) that the relative loss factor (s") for dry, mineral free coal
generally increases with increasing coal rank. The relative dielectric constant (as
evaluated from the mixture-equation) also increases with coal rank (Figure 8.14).
Dielectric constants evaluated from the mixture-equation exhibit a change in trend
reported by the measured dielectric constants for these coals (as-received). Both low and
high rank coals have relatively higher measured dielectric constants than medium rank
coals (Figure 8.14).
4
3.5
....=<OSa 2.5o....'1:~ 2..=6..~<OS 1.5
~
0.5
Rank decreasing •
• • ••• ••• •..•
•••• • •••
•
• •• ••
• Values using mixture equation (organic coal component)
• Measured dielectric constant
o+-----~----~------~----~----~------.-----~----~------~----.o 10 IS 20 40 504525 30 35
Volatile Matterdmmf %
Figure 8.14 Calculated dielectric constants for the organic component of group 1and 2 coals using the Landau-Lifshitz formula (dry, mineral matter free basis)
Low rank coals generally contain greater quantities of inherent moisture, group 1 and 2
low rank coals also exhibit the highest mineral matter content (up to 20%, in the case of
158
Chapter 8 Dielectric properties of coal
group 2 coals). The increase in moisture and mineral matter in low rank coals increases
the dielectric constant value and the evaluated dry, mineral free coal dielectric constants
are shown to decrease with decreasing rank. Similar measured results were reported from
(moisture-free) group 1 coals at lS0°C (Figure S.7) indicating that the moisture content
may be a major contributing factor to measured and calculated (by mixture equation)
dielectric constant variation.
8.12 Theoretical heating rate and dependence on electric field strength
Through the manipulation of standard dielectric and physical equations both the
theoretical heating rate and the electric field strength can be estimated with a knowledge
of a particular material's dielectric and physical properties (Florek 1995). The power
absorbed by a material is expressed in (terms of dielectric properties) Equation 2.8, and
the power absorbed per unit volume can be evaluated by Equation 8.15.
(2.S)
(S.15)
p Power absorbed (W/m3)
159
Chapter 8 Dielectric properties of coal
The energy lost or gained by a material with changes in temperature (heat energy) can be
expressed as:
Q = m.C p .08 (8.16)
M Mass of the body heating (kg)Cp Specific heat capacity (Jzkg)8 Change in temperature (QC)r Change in time (s)Q Energy absorbed or produced (W)
The power absorbed is therefore (Q. ~):
m.C .sep =-~-
a Of(8.17)
Power absorbed (W)Mass of the body heating (kg)Specific heat capacity (J/kg)Change in temperature (lC)Change in time (s)
Combining Equation 8. 15 and 8.17 gives an expression for the heating rate within a
microwave field (Harrison 1997):
2 .K .f .E insitu 2'&0'&; .V-= «c,08or
(8.18)
Rearranging Equation 8.18, making the electric field strength inside the material the
subject:
160
Chapter 8 Dielectric properties of coal
E insitu = (8.19)
However, this assumes no gain or loss of energy from conduction or convection and
uniform heating. Previous studies imply that, if a small load is heated within a cavity and
the skin depth is high, dielectric heating is the predominant mode of heating and
conduction may be negligible (Ishii 1995).
Assuming the density (1000kglm3) and specific heat capacity (4200J/kgK) for water do
not change significantly over a temperature range 25<T<75°C, and assuming that the loss
factor for water between this temperature range equates to (3201T) (T is in Celcius)
(Metaxas 1983). Then by measuring the heating rate of water within a microwave cavity,
the electric field strength inside the water can be approximated. Equation 8. 19 can be
summarised as the following assuming no evaporation of water:
E insitu =27r x 2.45 x 10 9'&0 »; .at
1000 x 4200 so (8.19)
It is known that the electric field strength may vary within a multi-mode cavity, with the
use of a silica glass container, and maintaining the water volume, the cavity electric field
strength can be estimated upon measurements of the heating rate and relationships
between the electric field strength inside the water and the external field. A grid was
marked out on the base of a 0.65kW power microwave cavity (2.45GHz frequency). The
heating rate was measured at various positions within the cavity and the average electric
161
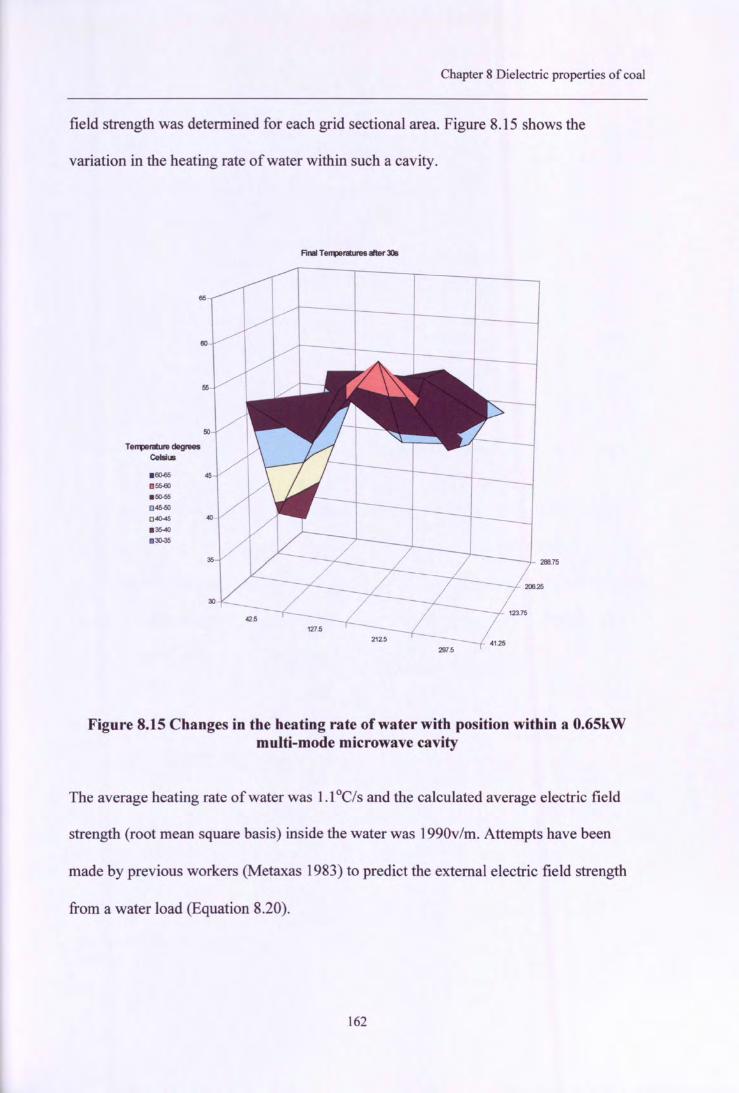
Chapter 8 Dielectric properties of coal
field strength was determined for each grid sectional area. Figure 8.15 shows the
variation in the heating rate of water within such a cavity.
Final Te"1l9ratures alter lOs
Figure 8.15 Changes in the heating rate of water with position within a O.6SkWmulti-mode microwave cavity
The average heating rate of water was 1.1°C/s and the calculated average electric field
strength (root mean square basis) inside the water was 1990v/m. Attempts have been
made by previous workers (Metaxas 1983) to predict the external electric field strength
from a water load (Equation 8.20).
162
Chapter 8 Dielectric properties of coal
(8.20)
Eext Electric field strength of microwave cavity (vIm)P Power absorbed (W/m3)c Speed oflight (mls) 3x10⁸ mlsEo Permittivity of free space 8.85 x l 0-12 (F1m)'[' Constant approximated as 0.25A Coefficient of absorption (F/m2) given by Equation 8.10
A = (1- e-2rID.) (8.10)
rDse
Radius of particle (m)Skin depth (m)Napierian logarithm base approximately equal to 2.7182818285 (10dp)
Following this procedure and applying Equation 8.20, the average cavity electric field
strength was 9980v/m. Assuming the cavity electric field strength is constant, theoretical
heating rates (within this cavity) for other materials can be derived from a combination of
Equation 8.20 (material's internal electric field strength) and Equation 8.18 (heating rate)
providing the density, specific heat capacity and particle size are known.
163
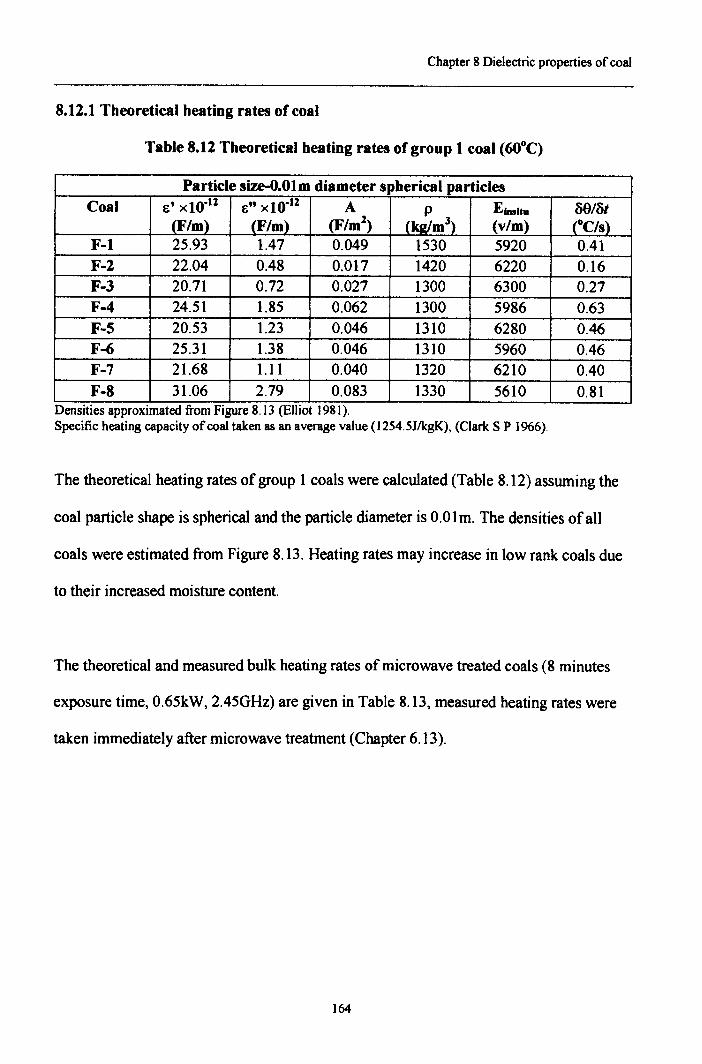
Chapter 8 Dielectric properties of coal
S.12.1 Theoretical heating rates of coal
Table S.12 Theoretical heating rates of group 1 coal (60°C)
Particle size-O.Olmdiameter spherical particlesCoal E' xlO-12 E" xlO-ll A P E....1fu aa/at
(F/m) (F/m) (F/ml) (kg/ml) (vIm) _rC/s_}F-l 25.93 1.47 0.049 1530 5920 0.41F-2 22.04 0.48 0.017 1420 6220 0.16F-3 20.71 0.72 0.027 1300 6300 0.27F-4 24.51 1.85 0.062 1300 5986 0.63F-5 20.53 1.23 0.046 1310 6280 0.46F-6 25.31 1.38 0.046 1310 5960 0.46F-7 21.68 1.11 0.040 1320 6210 0.40F-S 31.06 2.79 0.083 1330 5610 0.81. .
Densities approximated from FIgure 8.13 (Elhot 1981) .Specific heating capacity ofcoal taken as an average value (1254.sJlkgK), (Clark S P 1966).
The theoretical heating rates of group 1 coals were calculated (Table 8.12) assuming the
coal particle shape is spherical and the particle diameter is 0.01m. The densities of all
coals were estimated from Figure 8.13. Heating rates may increase in low rank coals due
to their increased moisture content.
The theoretical and measured bulk heating rates of microwave treated coals (8 minutes
exposure time, 0.65kW, 2.45GHz) are given in Table 8.13, measured heating rates were
taken immediately after microwave treatment (Chapter 6.13).
164
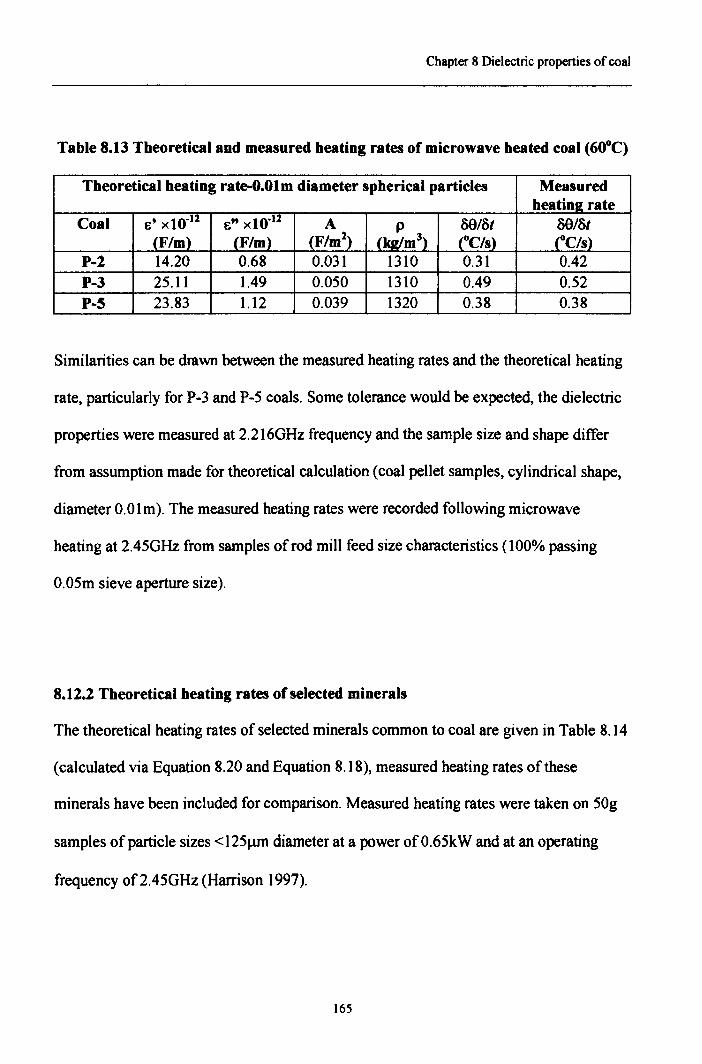
Chapter 8 Dielectric properties of coal
Table 8.13 Theoretical and measured heating rates of microwave heated coal (60°C)
Theoretical heating rate-O.Olm diameter spherical particles Measuredheating rate
Coal &' xlO-12 s" xlO·u A p 80/8t 80/8t(F/m) (F/m) (F/m2) (kg/m3) (OC/s) rC/s)
P-l 14.20 0.68 0.031 1310 0.31 0.42P-3 25.11 1.49 0.050 1310 0.49 0.52P-~ 23.83 1.12 0.039 1320 0.38 0.38
Similarities can be drawn between the measured heating rates and the theoretical heating
rate, particularly for P-3 and P-5 coals. Some tolerance would be expected, the dielectric
properties were measured at 2.216GHz frequency and the sample size and shape differ
from assumption made for theoretical calculation (coal pellet samples, cylindrical shape,
diameter O.Olm). The measured heating rates were recorded following microwave
heating at 2.45GHz from samples of rod mill feed size characteristics (100% passing
0.05m sieve aperture size).
8.12.2 Theoretical heating rates of selected minerals
The theoretical heating rates of selected minerals common to coal are given in Table 8.14
(calculated via Equation 8.20 and Equation 8.18), measured heating rates of these
minerals have been included for comparison. Measured heating rates were taken on 50g
samples of particle sizes <125J..lmdiameter at a power ofO.65kW and at an operating
frequency of2.45GHz (Harrison 1997).
165
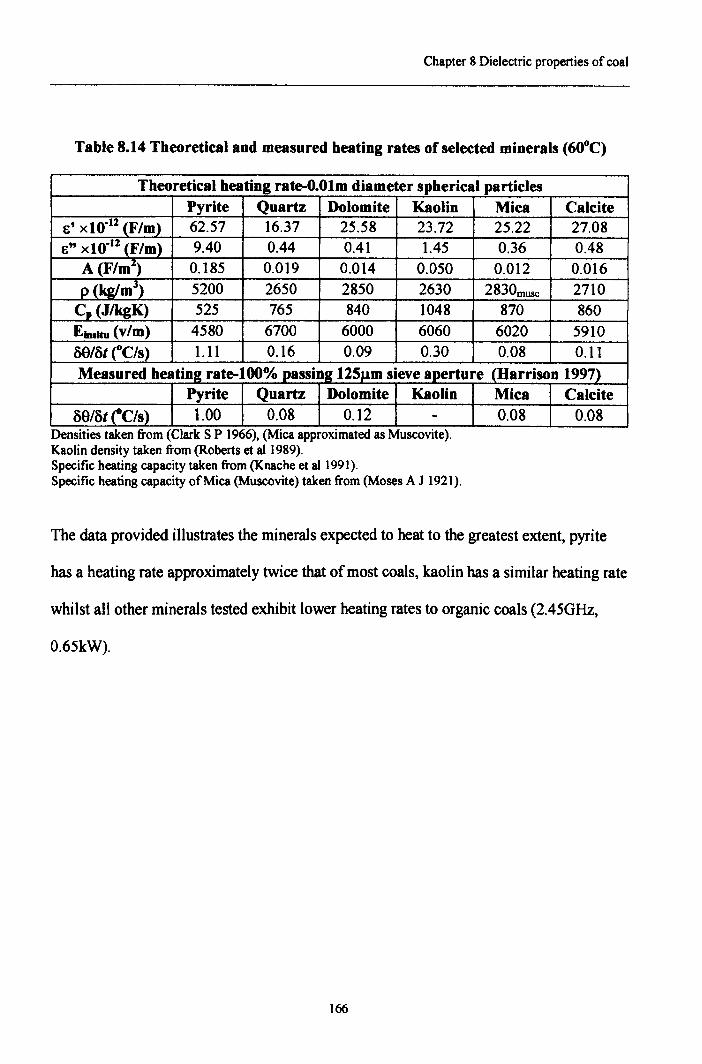
Chapter 8 Dielectric properties of coal
Table 8.14 Theoretical and measured heating rates of selected minerals (60°C)
Theoretical heating rate-O.Olm diameter spherical particlesPyrite Quartz Dolomite Kaolin Mica Calcite
&' xl0·12 (F/m) 62.57 16.37 25.58 23.72 25.22 27.08e" xl0·12 (F/m) 9.40 0.44 0.41 1.45 0.36 0.48
A (F/mz) 0.185 0.019 0.014 0.050 0.012 0.016P (kg/m3) 5200 2650 2850 2630 2830musc 2710c, (JIkgK) 525 765 840 1048 870 860Elnl1tu (vIm) 4580 6700 6000 6060 6020 5910t,{)/at rC/s) 1.11 0.16 0.09 0.30 0.08 0.11Measured heating rate-l00% passing 125J.1msieve aperture (Harrison 1997)
Pyrite Quartz Dolomite Kaolin Mica CalciteoS/otrCfs) 1.00 0.08 0.12 - 0.08 0.08..Densities taken from (Clark S P 1966), (Mica approximated as Muscovite).
Kaolin density taken from (Roberts et al1989),Specific heating capacity taken from (Knache et alI991).Specific heating capacity of Mica (Muscovite) taken from (Moses A J 1921),
The data provided illustrates the minerals expected to heat to the greatest extent, pyrite
has a heating rate approximately twice that of most coals, kaolin has a similar heating rate
whilst all other minerals tested exhibit lower heating rates to organic coals (2.45GHz,
0.65kW).
166
Chapter 8 Dielectric properties of coal
8.13 Dielectric properties of coal conclusions
Through dielectric measurement of these coals and a selection of associated minerals, the
principle heating sources were identified as pyrite and water.
Dielectric properties (dielectric constant and loss factor) are affected by both coal
temperature and microwave frequency. The latter exhibits no specific trend, however, the
dielectric properties do change but not to any appreciable extent with frequency.
Substantial reductions in coal dielectric constant and loss factor values occur between 80-
180°C and are attributed to moisture removal. The dielectric properties of coal are
dependent on coal rank, both high and low rank as-received coals exhibiting the greatest
values of dielectric constant and loss factor. These properties decrease with low rank
coals on a dry, mineral matter free basis (calculated dielectric properties from Landau-
Liftshifz mixture equation). Hence, the increase in permittivities of low rank as-received
coal is due to the increase in moisture of low rank coals. Microwave treated samples
result in reductions in the permittivites with increased microwave exposure time, similar
reduced values are presented following drying.
The penetration depth of the microwave (which decreases with increase frequency) field
ranged from O.2m to O.Sm depending on coal properties (independent of rank) and
substantially increased, particularly for low rank coals on a dry basis.
High and low rank as-received coals exhibit the greatest values of dielectric conductivity
and coefficient of absorption, and as such are considered to absorb (as opposed to
167
Chapter 8 Dielectric properties of coal
reflection and transmission) microwave energy to the greatest extent. Absorption
capability increases with rank on a dry basis.
From the selection of minerals and measured dielectric properties of water, pyrite and
water show substantial absorption capabilities (greater than coal), however, as a result
have much shorter penetration depth values. Both water and pyrite heat at twice or more
than the heating rate of coal (range between 0.2 to 0.8°C/s). Quartz, mica, dolomite,
kaolin and calcite heat at a lower rate (approximately O.l°C/s) and are expected to
transmit microwave radiation.
Dielectric properties provide a basis for preliminary grindability theories (Chapter 6),
(expansion of specific minerals and associated stress development from steam
production) in so much that steam production would clearly occur following prolonged
exposure and coal components would expand at different rates depending upon their
heating rates. Results from this investigation show that the heating rates of coal are
relatively low within a 0.65kW power input multi-mode cavity. Clearly the heating rate
would increase with increasing microwave power input, but the most substantial affect to
heating rates may occur at higher cavity electric field strengths.
168
CHAPTER NINE
MECHANISMS FOR MICROWAVE ENHANCED COALGRINDABILITY
9.1 Introduction-Mechanisms for microwave enhanced coal grindability
This section discusses the possible mechanisms accounting for the changes in coal
grindability upon heating. Analyses of microwave and muffle furnace heating data has
shown reductions in coal moisture and volatile matter content after heating (Chapter 6
and 7). In particular, there is evidence to suggest that coals of a high mineral matter and
moisture content exhibit the most significant improvement in grindability when heated.
Accordingly, it is possible that these two features may control the changes in coal
grindability following microwave treatment.
9.2 Mechanisms for improved coal grindability
The bulk temperature of microwave treated coals were measured (Chapter 6.13) at
temperatures up to 250°C and an analysis of theoretical heating rates suggest that the
temperatures of some inherent minerals (in particular, pyrite) may exceed the coal bulk
temperature. As discussed (Chapter 8), the constituents of a coal heat at different rates
within a microwave field. They may expand or contract with temperature as each material
has a unique expansion coefficient rate with temperature. The volumetric expansion of a
solid is related to material specific properties (Coefficient of thermal expansion) and
temperature by Equation 9.1.
169
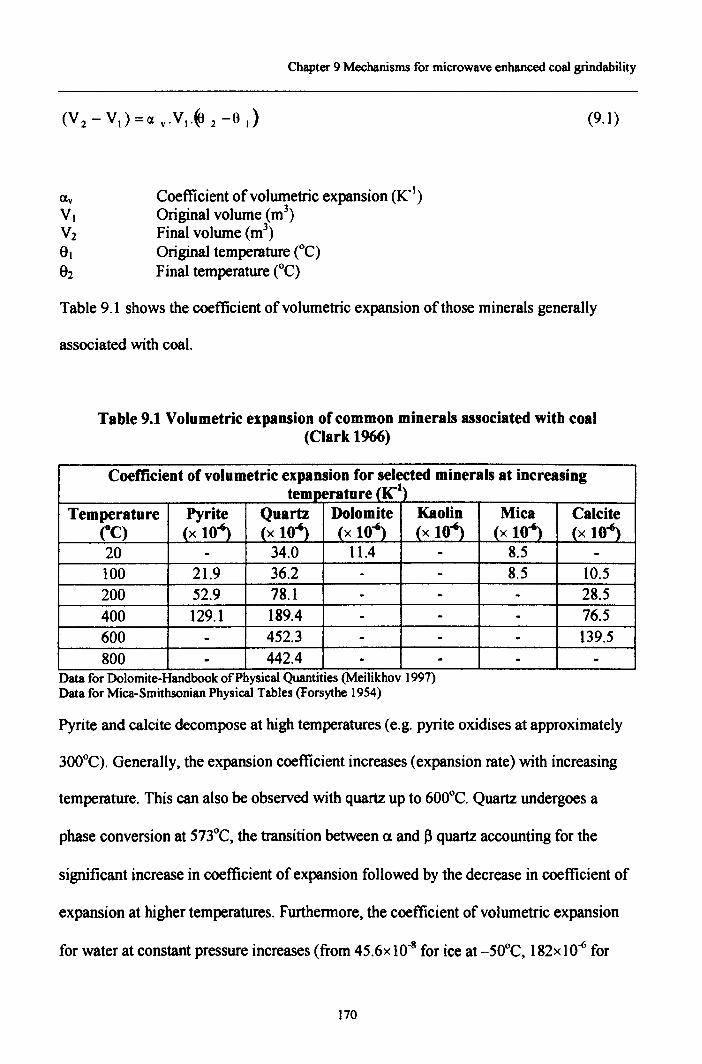
Chapter 9 Mechanisms for microwave enhanced coal grindability
(9.1)
Coefficient of volumetric expansion (Ko)Original volume (m")Final volume (m')Original temperature (OC)Final temperature (OC)
Table 9.1 shows the coefficient of volumetric expansion of those minerals generally
associated with coal.
Table 9.1 Volumetric expansion of common minerals associated with coal(Clark 1966)
Coefficient of volumetric expansion for selected minerals at increasingtemperature (J("t)
Temperature Pyrite Quartz Dolomite Kaolin Mica CalciterC) (x 104) (x 104) (x 104) (x 104) (x 10"') (x 10"')20 - 34.0 11.4 - 8.5 -100 21.9 36.2 - - 8.5 10.5200 52.9 78.l - - - 28.5400 129.1 189.4 - - - 76.5600 - 452.3 - - - 139.5800 - 442.4 - - - -.. ..
Data for Dolomite-Handbook of Physical Quantities (Meilikhov 1997)Data for Mica-Smithsonian Physical Tables (Forsythe 1954)
Pyrite and calcite decompose at high temperatures (e.g. pyrite oxidises at approximately
300°C). Generally, the expansion coefficient increases (expansion rate) with increasing
temperature. This can also be observed with quartz up to 600°C. Quartz undergoes a
phase conversion at S73°C, the transition between (I and 13 quartz accounting for the
significant increase in coefficient of expansion followed by the decrease in coefficient of
expansion at higher temperatures. Furthermore, the coefficient of volumetric expansion
for water at constant pressure increases (from 45.6x 10⁻⁸for ice at -SO°C, 182x 10-6 for
170
Chapter 9 Mechanisms for microwave enhanced coal grindability
water at 20°C and 4187xl0~ for steam at 120°C, Meilikhov 1997, Forsythe 1954) to a
greater extent than most mineral inclusions over the temperature range 20°C-120°C.
The reductions in total moisture and volatile matter content (Chapter 6) of treated coals
suggest that there is steam generation and volatile gas production with increasing
temperature. There may be associated changes in coal structure and internal pressures
may be generated as a result of gas and steam evolution from within the structure. In
particular, once a gas is produced, it can be assumed that internal stresses would increase
from increasing gas pressure with temperature. If the gas is confined i.e. no volume
change, and assuming ideal gas laws (Equation 9.2), as temperature increases the
pressure increases linearly. The pressure will continue to increase until either the heating
ceases or the volume increases. Internal structural stress would increase as a result of the
increasing pressure and may initiate crack propagation.
PgVg = nRTg (9.2)
Pg Pressure of gas (N/m2)Vg Volume of gas (m')Tg Temperature of gas (K)n Number of moles in fluid (kmol)R Universal gas constant (S.314kJ/kmol K)
There is evidence to show cracks are produced when coal is heated, possibly as a result of
internal stresses generated by the volumetric expansion of both solid and gas components
in the coal.
171
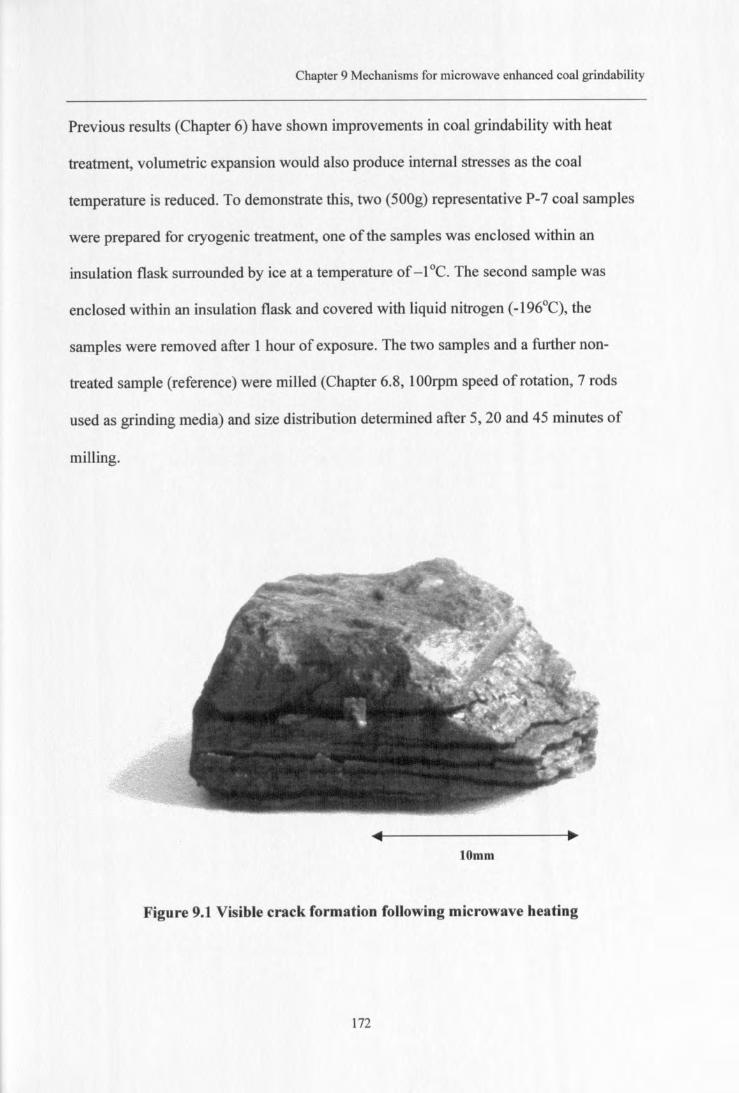
Chapter 9 Mechanisms for microwave enhanced coal grindability
Previous results (Chapter 6) have shown improvements in coal grindability with heat
treatment, volumetric expansion would also produce internal stresses as the coal
temperature is reduced. To demonstrate this, two (500g) representative P-7 coal samples
were prepared for cryogenic treatment, one of the samples was enclosed within an
insulation flask surrounded by ice at a temperature of -1°C. The second sample was
enclosed within an insulation flask and covered with liquid nitrogen (-196°C), the
samples were removed after 1 hour of exposure. The two samples and a further non-
treated sample (reference) were milled (Chapter 6.8, 100rpm speed of rotation, 7 rods
used as grinding media) and size distribution determined after 5,20 and 45 minutes of
milling.
tOmm
Figure 9.1 Visible crack formation following microwave heating
172
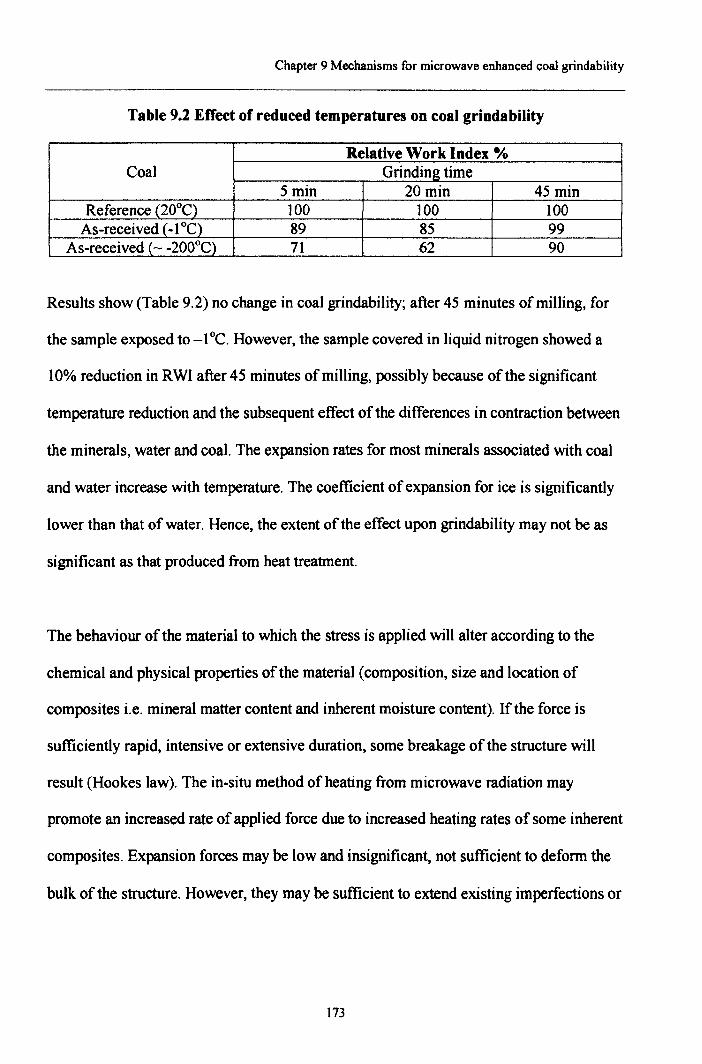
Chapter 9 Mechanisms for microwave enhanced coal grindability
Table 9.2 Effect of reduced temperatures on coal grindability
Relative Work Index %Coal Grinding time
5min 20 min 45 minReference (20°C) 100 100 100As-received (_1°C) 89 85 99
As-received (- -200°C) 71 62 90
Results show (Table 9.2) no change in coal grindability; after 45 minutes of milling, for
the sample exposed to _1°C. However, the sample covered in liquid nitrogen showed a
10% reduction in RWI after 45 minutes of milling, possibly because of the significant
temperature reduction and the subsequent effect of the differences in contraction between
the minerals, water and coal. The expansion rates for most minerals associated with coal
and water increase with temperature. The coefficient of expansion for ice is significantly
lower than that of water. Hence, the extent of the effect upon grindability may not be as
significant as that produced from heat treatment.
The behaviour of the material to which the stress is applied will alter according to the
chemical and physical properties of the material (composition, size and location of
composites i.e. mineral matter content and inherent moisture content). If the force is
sufficiently rapid, intensive or extensive duration, some breakage of the structure will
result (Hookes law). The in-situ method of heating from microwave radiation may
promote an increased rate of applied force due to increased heating rates of some inherent
composites. Expansion forces may be low and insignificant, not sufficient to deform the
bulk of the structure. However, they may be sufficient to extend existing imperfections or
173
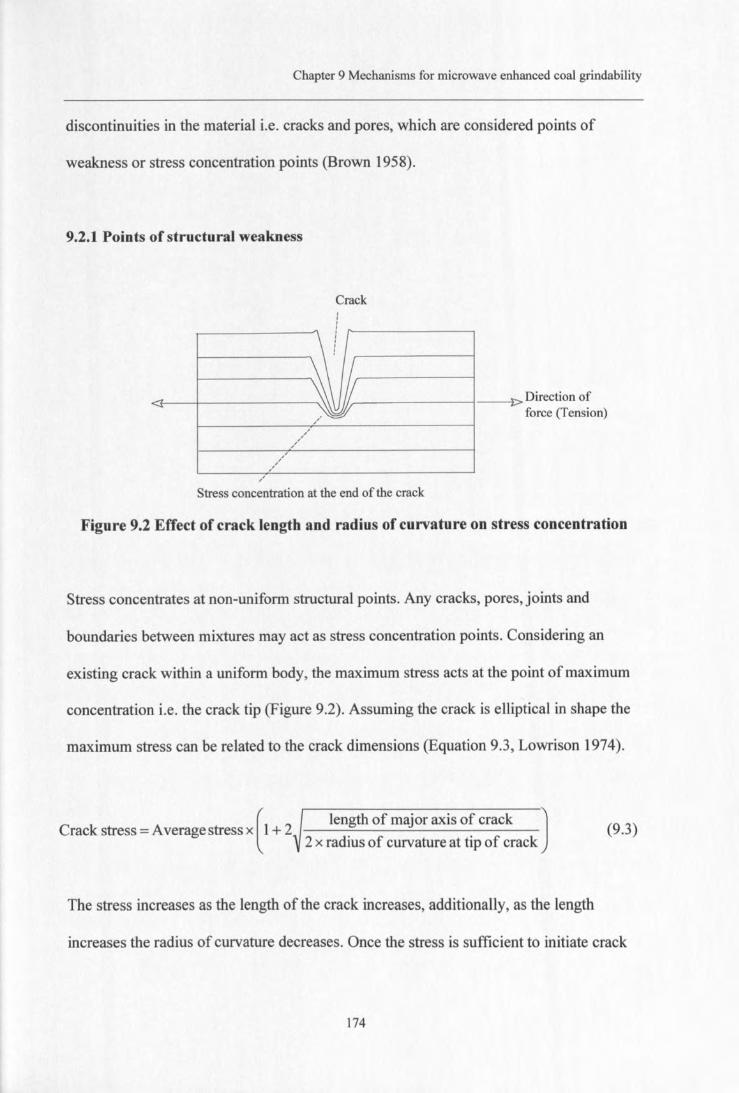
Chapter 9 Mechanisms for microwave enhanced coal grindability
discontinuities in the material i.e. cracks and pores, which are considered points of
weakness or stress concentration points (Brown 1958).
9.2.1 Points of structural weakness
Crack
.r---------i--I> Direction offorce (Tension)
,//'
/
Stress concentration at the end of the crack
Figure 9.2 Effect of crack length and radius of curvature on stress concentration
Stress concentrates at non-uniform structural points. Any cracks, pores, joints and
boundaries between mixtures may act as stress concentration points. Considering an
existing crack within a uniform body, the maximum stress acts at the point of maximum
concentration i.e. the crack tip (Figure 9.2). Assuming the crack is elliptical in shape the
maximum stress can be related to the crack dimensions (Equation 9.3, Lowrison 1974).
(length of major axis of crack JCrack stress =Average stress x 1+ 2
2 x radius of curvature at tip of crack(9.3)
The stress increases as the length of the crack increases, additionally, as the length
increases the radius of curvature decreases. Once the stress is sufficient to initiate crack
174
Chapter 9 Mechanisms for microwave enhanced coal grindability
elongation (crack tip stress = crack initiation stress) and provided that the stress is then
maintained throughout the body, the crack will be self-propagating. However, a particular
crack requires a minimum energy for elongation initiation. This may be measured
assuming the crack initiation stress is related to the potential energy of the crack
(Equation 9.4, Lowrison 1974).
C k initi . ~2.G.rrae tnmanon stress = -1- (9.4)
GIy
Young's modulus (N/m2)
length of crack (m)Surface energy per unit surface area (J/m2)
The crack initiation is related to the crack length, if the crack length is very small then the
crack stress initiation can be larger than the stress required to deform the bulk material
(phase change as an extreme). The minimum crack length is considered to be that to
which Van Der Waal's forces no longer effectively act (Lowrison 1974). Hence, cracks
or pores below the minimum length are not generally considered points of weakness.
In natural heterogeneous materials, the stress throughout the body is non-uniform and
cracks may propagate and cease before catastrophic structural failure (breakage) as the
crack interacts with other cracks, pores or inclusions that act as 'crack stoppers' (Brown
1958).
Cracks and pores are considered the major source of material fracture points and as such
their importance is unquestionable. Particle size is considered an influencing factor on
grindability, smaller particles may not produce cracks to the same extent as larger
175
Chapter 9 Mechanisms for microwave enhanced coal grindability
particles and as such resist grinding more effectively i.e. the smaller the particle the
greater the resistance to grindability (Lowrison 1974).
To this end, grindability will be improved providing the heat treatment supplies sufficient
energy (to the rate and intensity of the force from expansion) to propagate crack
formation. The location, size and quantity of such cracks and their propagation depend
upon the inherent constituents and there affect as a consequence to heat treatment and
volumetric expansion.
9.3 Improved microwave grindability
Results (Chapter 6 and 7) indicate that microwave enhanced grindability improves with
decreasing coal rank and increasing mineral matter content. The most significant
improvements in coal grindability have been measured on low rank coal (Chapter 7),
which may result from the high inherent moisture content of such coals. The question
may be asked: could the grindability be improved further by increasing the inherent
moisture content ofa coal? Clearly it would be impractical to increase the mineral matter
content of a coal as the benefits from heat treatment require the minerals to be enclosed
within or attached to coal particles.
9.3.1 Potential to increase inherent moisture content
All coals contain both surface moisture and inherent moisture. The surface moisture
would originate from exposure to the atmosphere (Relative Humidity); this type of
moisture would absorb microwave radiation, rapidly heat, change phase and evaporate
176
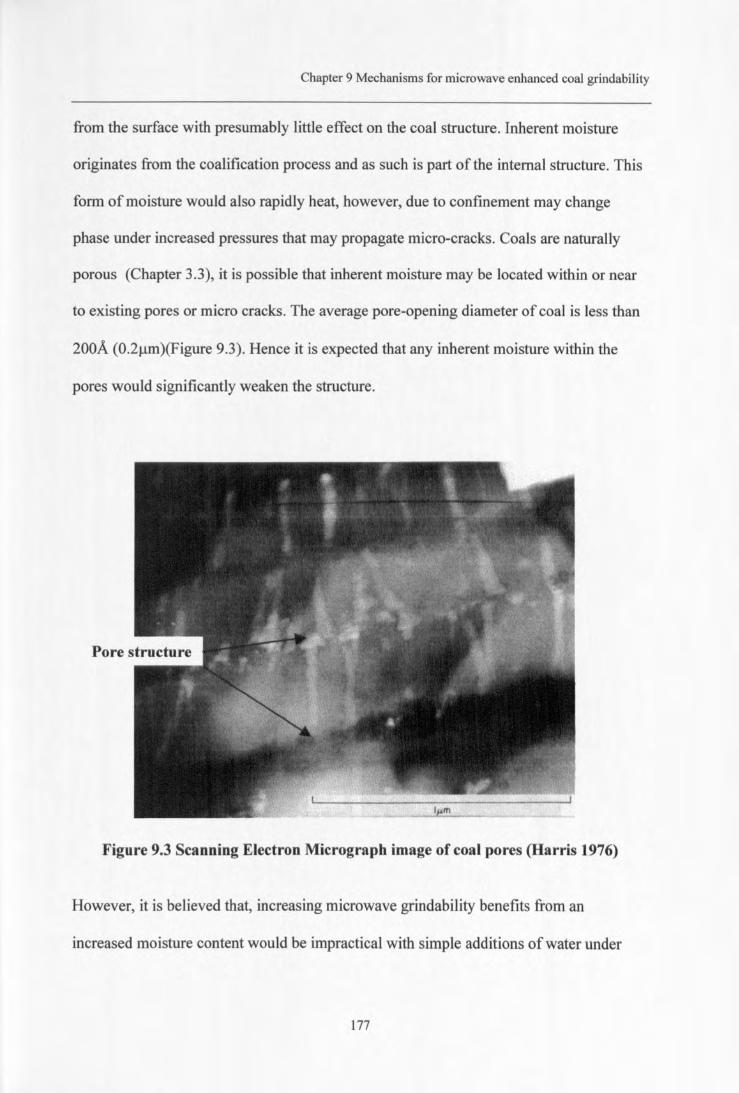
Chapter 9 Mechanisms for microwave enhanced coal grindability
from the surface with presumably little effect on the coal structure. Inherent moisture
originates from the coalification process and as such is part of the internal structure. This
form of moisture would also rapidly heat, however, due to confinement may change
phase under increased pressures that may propagate micro-cracks. Coals are naturally
porous (Chapter 3.3), it is possible that inherent moisture may be located within or near
to existing pores or micro cracks. The average pore-opening diameter of coal is less than
200A (O.2J..Lm)(Figure9.3). Hence it is expected that any inherent moisture within the
pores would significantly weaken the structure.
Figure 9.3 Scanning Electron Micrograph image of coal pores (Harris 1976)
However, it is believed that, increasing microwave grindability benefits from an
increased moisture content would be impractical with simple additions of water under
177
Chapter 9 Mechanisms for microwave enhanced coal grindability
atmospheric conditions as the pore opening would be too small to allow water
penetration.
9.3.2 Microwave grindability of P-2 and P-7 coals with increased moisture content
Representative (500g) samples ofP-2 and P-7 coals were prepared in a similar method to
that described in Chapter 7.5, size distributions range between -50mm +500J..lm.Both
coals were of medium rank, P-2 is a typical power station feed coal whilst P-7 was
chosen because of its low ash content which may affect heat treatment results. The coals
were exposed to ambient atmosphere for twenty four hours before being enclosed within
air-tight containers to retain their constant relative humidity equilibrium.
Two of the samples from each coal were submerged in 400ml of distilled water for 48
hours, the samples were irradiated following excess water drainage. The ensuing
microwave treatment was constant for all coals (samples exposed to microwave radiation
for 8 minutes at 0.65kW power input and at 2.45GHz frequency). Microwave conditions
were selected to produce reasonable grindability improvements for medium rank coals
(Chapter 6.11).
A sample from each coal tested was heated within a muffle furnace maintained at 110°C
for 180 minutes to ascertain the effect of drying upon coal grindability. A further sample
from each coat was treated by both the furnace and by microwave heating methods to
compare grindability effects after subsequent milling tests (comparison between furnace
and microwave treatment).
178
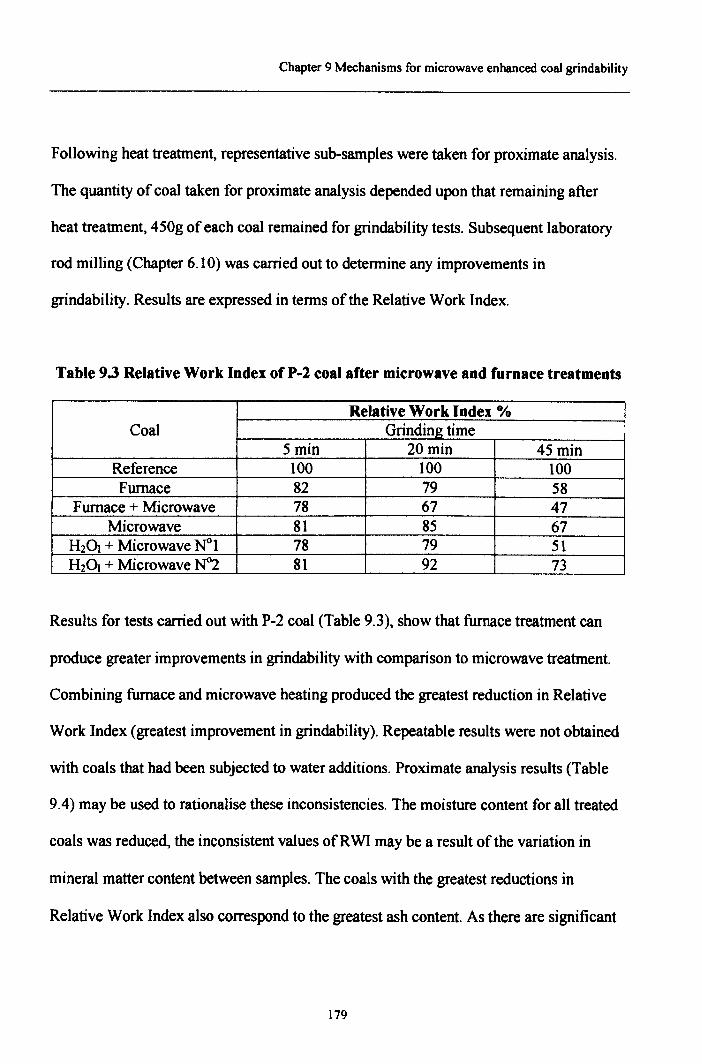
Chapter 9 Mechanisms for microwave enhanced coal grindability
Following heat treatment, representative sub-samples were taken for proximate analysis.
The quantity of coal taken for proximate analysis depended upon that remaining after
heat treatment, 450g of each coal remained for grindability tests. Subsequent laboratory
rod milling (Chapter 6.10) was carried out to determine any improvements in
grindability. Results are expressed in terms of the Relative Work Index.
Table 9.3 Relative Work Index of P-2 coal after microwave and furnace treatments
Relative Work Index %Coal Grinding time
5 min 20min 45 minReference 100 100 100Furnace 82 79 58
Furnace + Microwave 78 67 47Microwave 81 85 67
H2~ + Microwave ~l 78 79 51H2~ + Microwave ~ 81 92 73
Results for tests carried out with P-2 coal (Table 9.3), show that furnace treatment can
produce greater improvements in grindability with comparison to microwave treatment.
Combining furnace and microwave heating produced the greatest reduction in Relative
Work Index (greatest improvement in grindability). Repeatable results were not obtained
with coals that had been subjected to water additions. Proximate analysis results (Table
9.4) may be used to rationalise these inconsistencies. The moisture content for all treated
coals was reduced, the inconsistent values ofRWI may be a result of the variation in
mineral matter content between samples. The coals with the greatest reductions in
Relative Work Index also correspond to the greatest ash content. As there are significant
179
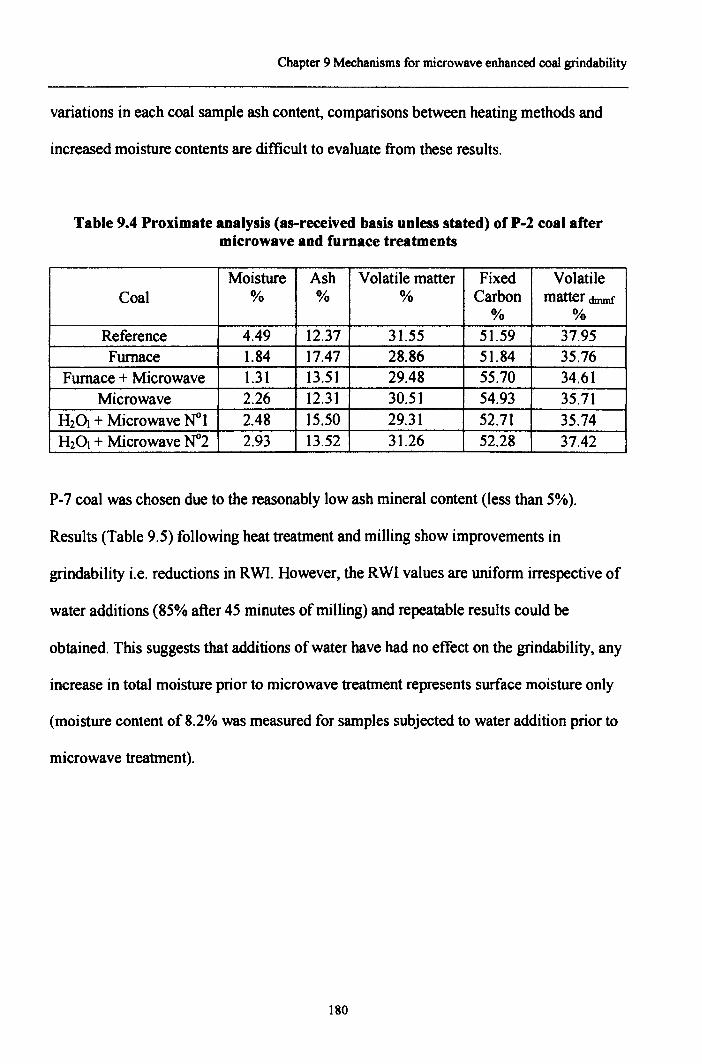
Chapter 9 Mechanisms for microwave enhanced coal grindability
variations in each coal sample ash content, comparisons between heating methods and
increased moisture contents are difficult to evaluate from these results.
Table 9.4 Proximate analysis (as-received basis unless stated) of P-2 coal aftermicrowave and furnace treatments
Moisture Ash Volatile matter Fixed VolatileCoal % % % Carbon matter dmmf
% %Reference 4.49 12.37 31.55 51.59 37.95Furnace 1.84 17.47 28.86 51.84 35.76
Furnace + Microwave 1.31 13.51 29.48 55.70 34.61Microwave 2.26 12.31 30.51 54.93 35.71
H20J + Microwave ~1 2.48 15.50 29.31 52.71 35.74H20} + Microwave ~2 2.93 13.52 31.26 52.28 37.42
P-7 coal was chosen due to the reasonably low ash mineral content (less than 5%).
Results (Table 9.5) following heat treatment and milling show improvements in
grindability i.e. reductions in RWI. However, the RWI values are uniform irrespective of
water additions (85% after 45 minutes of milling) and repeatable results could be
obtained. This suggests that additions of water have had no effect on the grindability, any
increase in total moisture prior to microwave treatment represents surface moisture only
(moisture content of 8.2% was measured for samples subjected to water addition prior to
microwave treatment).
180
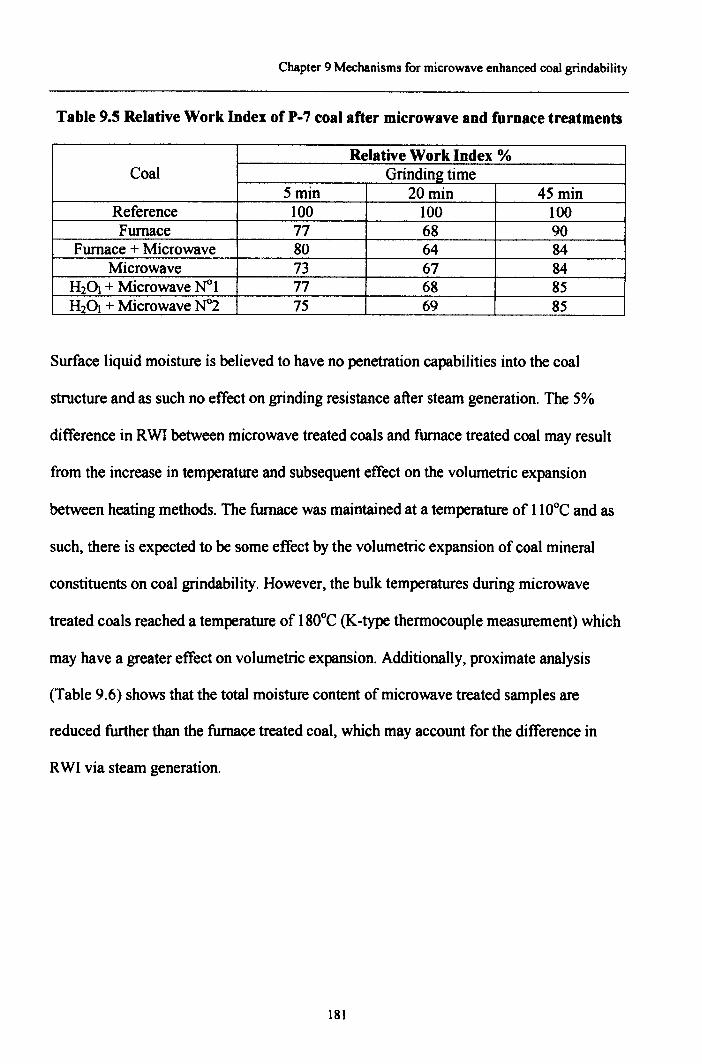
Chapter 9 Mechanisms for microwave enhanced coal grindability
Table 9.5 Relative Work Index of P-7 coal after microwave and furnace treatments
Relative Work Index %Coal Grinding_time
5min 20min 45minReference 100 100 100Furnace 77 68 90
Furnace +Microwave 80 64 84Microwave 73 67 84
H20} +Microwave ~1 77 68 85H201 +Microwave ~2 75 69 85
Surface liquid moisture is believed to have no penetration capabilities into the coal
structure and as such no effect on grinding resistance after steam generation. The 5%
difference in RWI between microwave treated coals and furnace treated coal may result
from the increase in temperature and subsequent effect on the volumetric expansion
between heating methods. The furnace was maintained at a temperature of 110°C and as
such, there is expected to be some effect by the volumetric expansion of coal mineral
constituents on coal grindability. However, the bulk temperatures during microwave
treated coals reached a temperature of 180°C (K-type thermocouple measurement) which
may have a greater effect on volumetric expansion. Additionally, proximate analysis
(Table 9.6) shows that the total moisture content of microwave treated samples are
reduced further than the furnace treated coal, which may account for the difference in
RWI via stearn generation.
181
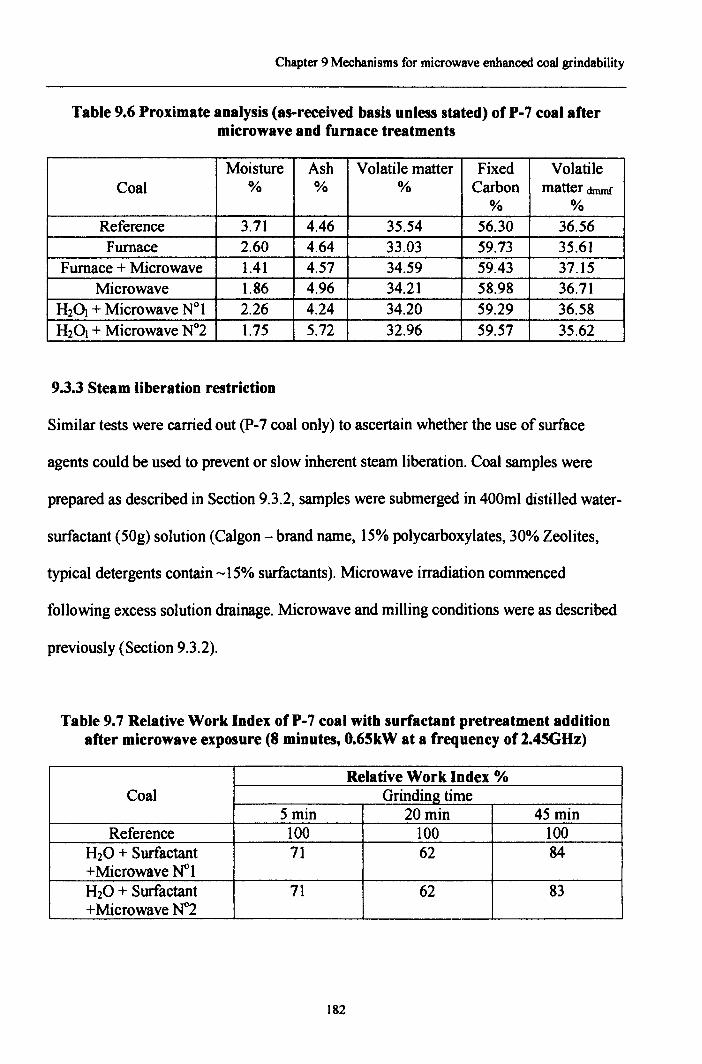
Chapter 9 Mechanisms for microwave enhanced coal grindability
Table 9.6 Proximate analysis (as-received basis unless stated) ofP-7 coal aftermicrowave and furnace treatments
Moisture Ash Volatile matter Fixed VolatileCoal % % % Carbon matter dmmf
% %Reference 3.71 4.46 35.54 56.30 36.56Furnace 2.60 4.64 33.03 59.73 35.61
Furnace + Microwave 1.41 4.57 34.59 59.43 37.15Microwave 1.86 4.96 34.21 58.98 36.71
H20) + Microwave ~1 2.26 4.24 34.20 59.29 36.58H20) + Microwave ~2 1.75 5.72 32.96 59.57 35.62
9.3.3 Steam liberation restriction
Similar tests were carried out (P-7 coal only) to ascertain whether the use of surface
agents could be used to prevent or slow inherent steam liberation. Coal samples were
prepared as described in Section 9.3.2, samples were submerged in 400ml distilled water-
surfactant (50g) solution (Calgon - brand name, 15% polycarboxylates, 30% Zeolites,
typical detergents contain -15% surfactants). Microwave irradiation commenced
following excess solution drainage. Microwave and milling conditions were as described
previously (Section 9.3.2).
Table 9.7 Relative Work Index ofP-7 coal with surfactant pretreatment additionafter microwave exposure (8 minutes, O.6SkW at a frequency of 2.4SGHz)
Relative Work Index %Coal Grinding time
5 min 20min 45 minReference 100 100 100
H20 + Surfactant 71 62 84+Microwave ~1H20 + Surfactant 71 62 83+Microwave m
182
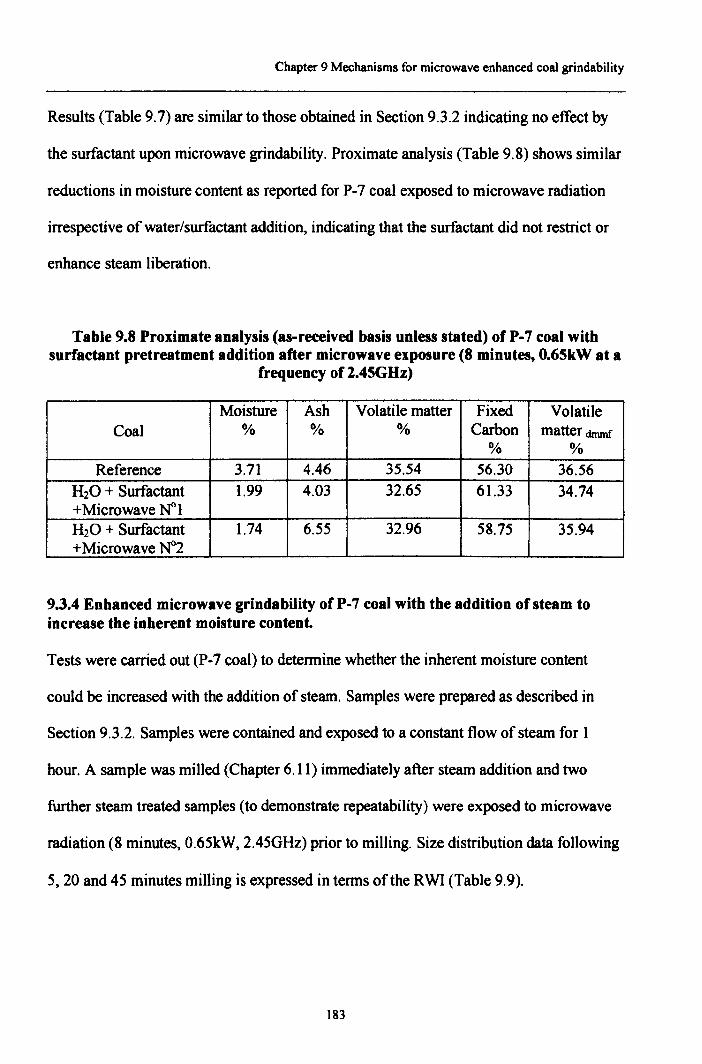
Chapter 9 Mechanisms for microwave enhanced coal grindability
Results (Table 9.7) are similar to those obtained in Section 9.3.2 indicating no effect by
the surfactant upon microwave grindability. Proximate analysis (Table 9.8) shows similar
reductions in moisture content as reported for P-7 coal exposed to microwave radiation
irrespective ofwaterlsurfactant addition, indicating that the surfactant did not restrict or
enhance steam liberation.
Table 9.8 Proximate analysis (as-received basis unless stated) of P-7 coal withsurfactant pretreatment addition after microwave exposure (8 minutes, O.65kWat a
frequency of 2.45GHz)
Moisture Ash Volatile matter Fixed VolatileCoal % % % Carbon matter dmmf
% %Reference 3.71 4.46 35.54 56.30 36.56
H20 + Surfactant 1.99 4.03 32.65 6l.33 34.74+Microwave ~1H20 + Surfactant 1.74 6.55 32.96 58.75 35.94+Microwave ~2
9.3.4 Enhanced microwave grindability of P-7 coal with the addition of steam toincrease the inherent moisture content.
Tests were carried out (P-7 coal) to determine whether the inherent moisture content
could be increased with the addition of steam. Samples were prepared as described in
Section 9.3.2. Samples were contained and exposed to a constant flow of steam for 1
hour. A sample was milled (Chapter 6.11) immediately after steam addition and two
further steam treated samples (to demonstrate repeatability) were exposed to microwave
radiation (8 minutes, 0.65kW, 2.45GHz) prior to milling. Size distribution data following
5,20 and 45 minutes milling is expressed in terms of the RWI (Table 9.9).
183
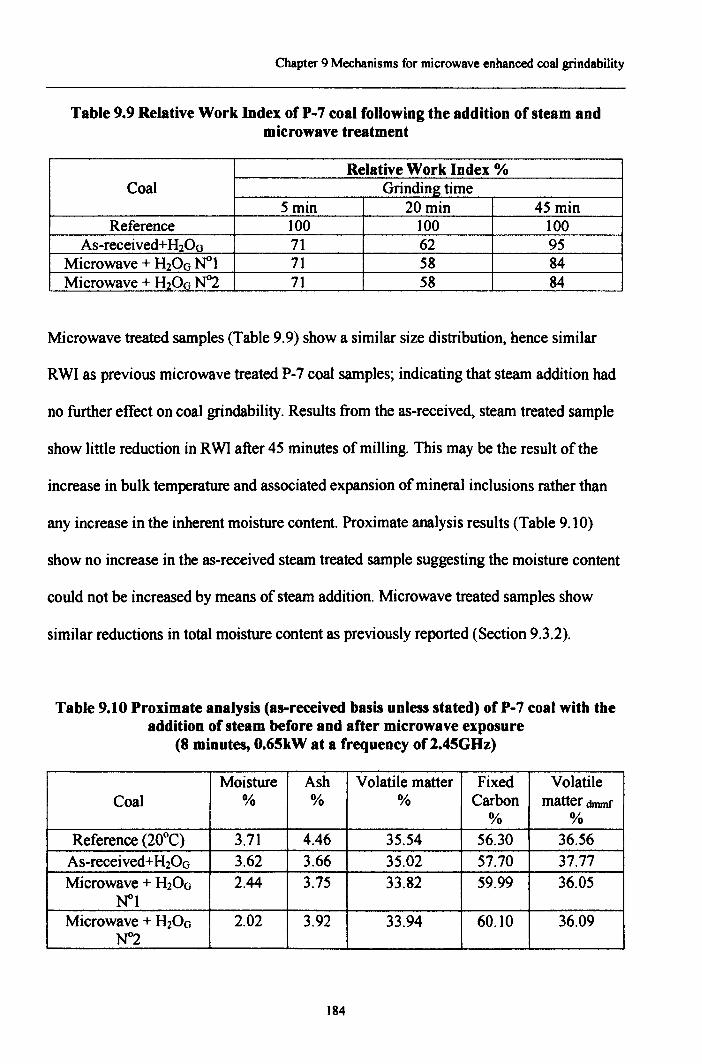
Chapter 9 Mechanisms for microwave enhanced coal grindability
Table 9.9 Relative Work Index of P-7 coal following the addition of steam andmicrowave treatment
Relative Work Index %Coal Grinding time
5min 20min 45 minReference 100 100 100
As-received+Hgx, 71 62 95Microwave + H200 ~1 71 58 84Microwave + H200 ~2 71 58 84
Microwave treated samples (Table 9.9) show a similar size distribution. hence similar
RWI as previous microwave treated P-7 coal samples; indicating that steam addition had
no further effect on coal grindability. Results from the as-received. steam treated sample
show little reduction in RWI after 45 minutes of milling. This may be the result of the
increase in bulk temperature and associated expansion of mineral inclusions rather than
any increase in the inherent moisture content. Proximate analysis results (Table 9.10)
show no increase in the as-received steam treated sample suggesting the moisture content
could not be increased by means of steam addition. Microwave treated samples show
similar reductions in total moisture content as previously reported (Section 9.3.2).
Table 9.10 Proximate analysis (as-received basis unless stated) of P-7 coal with theaddition of steam before and after microwave exposure
(8 minutes, 0.65kW at a frequency of 2.45GHz)
Moisture Ash Volatile matter Fixed VolatileCoal % % % Carbon matter dmmf
% %Reference (20°C) 3.71 4.46 35.54 56.30 36.56As-received+Hso., 3.62 3.66 35.02 57.70 37.77Microwave + H200 2.44 3.75 33.82 59.99 36.05
N"lMicrowave + H200 2.02 3.92 33.94 60.10 36.09
N"2
184
Chapter 9 Mechanisms for microwave enhanced coal grindability
9.4 Conclusions-Mechanisms for microwave enhanced coal grindability
The expansion of inherent minerals and moisture are believed to promote fracture
propagation upon coal heating. Results (Chapter 6, 7 and 9) have shown that both
microwave and convective heating may improve grindability as a result of different
thermal expansion rates of coal inclusions. Microwave heating can induce a weakening of
the coal structure to a greater and a lesser extent to that of convective heating depending
upon the mineral composition and associated heating rates. Microwave irradiation may
promote high heating rates from within the coal structure that is not dependent upon
conduction. The extent of the reduction to grinding resistance depends upon the quantity,
grain size, proximity and heating rate of the inclusion. Hence, high heating rates and
increasing quantities of mineral matter and moisture content may promote the most
significant change to coal grindability. Clearly it is not feasible to increase the inherent
mineral matter content. Furthermore, results (Chapter 9) suggest that it is impractical to
increase the inherent moisture content. Accordingly, when employing microwave
radiation as a method of pretreatment, the choice of coal is vital in achieving significant
improvements in grindability. Further investigation would be necessary to determine the
specific minerals that promote the greatest structural defects and their optimum grain size
with relation to coal particle size and grindability.
185
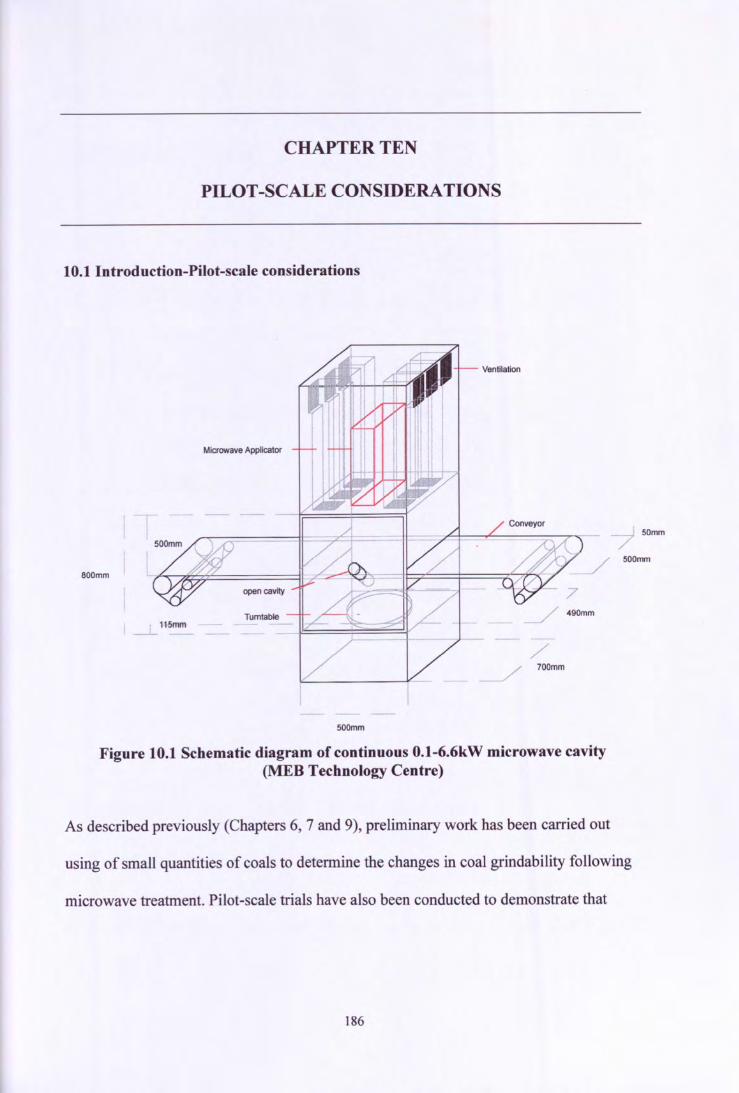
CHAPTER TEN
PILOT-SCALE CONSIDERATIONS
10.1 Introduction-Pilot-scale considerations
600mm
Ventilation
Microwave Applicator
-7 50mm
_/ 500mm
7
I _j_H5mm
/700mm
500mm
Figure 10.1 Schematic diagram of continuous 0.1-6.6kW microwave cavity(MEB Technology Centre)
As described previously (Chapters 6, 7 and 9), preliminary work has been carried out
using of small quantities of coals to determine the changes in coal grindability following
microwave treatment. Pilot-scale trials have also been conducted to demonstrate that
186
Chapter 10 Pilot-scale considerations
sizeable quantities of coal could be irradiated and to (i) identify any scale-up problems
and (ii) provide a basis for a feasibility analysis.
To this end, a microwave cavity capable of operating at both batch and continuous
process modes and at power levels between O.lkW-6.6kW, was used for pilot-scale trials
(Figure 10.1). The operating frequency of the cavity was fixed at 2.45GHz.
10.2 Process considerations
The basis of the microwave pilot-scale trials was to demonstrate the potential applications
within the coal industry for microwave technology. Industrial PF production for power
generating plant would require a continuous microwave process between feed storage and
mills, prior to boiler entry. Such a process would maintain a constant throughput (without
sustained coal ignition) and produce uniform heating characteristics and associated
improved grindability. Any gases released as a by-product of microwave treatment would
be removed for cleaning. A batch process may prove impractical as industrial PF
production for power generation relatively high feed rates of coal; this feature may limit
batch cavity dimensions, in principle, high loads may result in non-uniform heating
(localised heating) and difficulties with handling and storage.
To provide flexibility, the current cavity allows for both continuous (conveyor belt)
operation and batch (turntable operation) processing. Cavity ventilation could remove all
emissions and reduce hot-air congregation.
187
Chapter 10 Pilot-scale considerations
10.3 Microwave treatment conditions
The purpose of the current study was to demonstrate that preliminary work can be carried
out on sizeable quantities of coal and to assess the variables which need to be considered
for industrial-scale microwave treatment. The pilot-scale tests were conducted in two
stages, the first being concerned with investigating the practical range of experimental
parameters and operating conditions and the second stage with a study of the effect of
microwave radiation on an appropriate quantity (0.5 tonne) of coal. Cavity optimisation
was primarily concerned with defining the most practical balance between coal quantity,
power input and microwave exposure time for the energy required for maximum
grindability improvement. Cavity conditions were based on the use of a batch process and
it was assumed that a continuous feed could be represented as a succession of batches.
10.3.1 Microwave energy requirements
Each microwave cavity has a unique electric field strength distribution and, in particular,
the cavity dimensions (shape) will affect the power absorption efficiency. Accordingly,
energy requirements can be expected to differ between cavities for a given reduction in
RWI (Relative Work Index) of a coal. Furthermore, coals differ in their composition and
structure and each coal will have a different energy requirement for achieving maximum
reduction in RWI (Chapter 6.11). Preliminary work (Chapter 6) has also demonstrated
that the coal feed size distribution (which clearly would not be uniform for a continuous
process) would affect the grindability change arising from microwave treatment. For
these reasons, microwave energy per unit weight of coal was not optimised, but energy
input was more than sufficient to show considerable improvement in coal grindability.
188
Chapter 10 Pilot-scale considerations
The final bulk temperature of the coal has been shown to be an indication of the
maximum improvement in grindability (Chapter 6.13) and preliminary studies have
shown that the maximum reduction in RWI occurred at bulk coal temperatures within the
range of 160°C-200°C. A group of samples were irradiated at various power input levels
and sample loads. The bulk temperature of the coal (following microwave treatment) was
measured using a K-type thermocouple (temperature range -50°C-900°C). For all coals
tested (P-5, P-6 and P-8), a power input of approximately 220kWhlt was required to
produce temperatures consistently ranging from 160°C-200°C, independent of sample
load and input power. On this basis, all subsequent tests were carried out at constant
energy input (220kWhlt).
10.3.2 Variation of grindability with increased power input at constant load
Batch (lkg) samples ofP-5 coal were exposed to microwave radiation to investigate the
effect of increased microwave power input on coal grindability. All samples were of
uniform feed size distribution and exposed at constant energy per unit weight
(220kWhlt). The microwave power input was set at levels 1.1,3.3 and 6.6kW
corresponding to exposure times of 8,4 and 2 minutes respectively. Sub-samples (500g)
from the three microwave-treated samples and a non-treated sample were prepared and
subjected to RWI grindability tests (Chapter 6.11).
Results (Table 10.1) show that the RWl decreased by 30-40% (45 minutes of milling)
following microwave treatment. Furthermore, grindability improved with increasing
input power from 1.1kW to 3.3kW with similar effects exhibited for the 3.3kW and
189
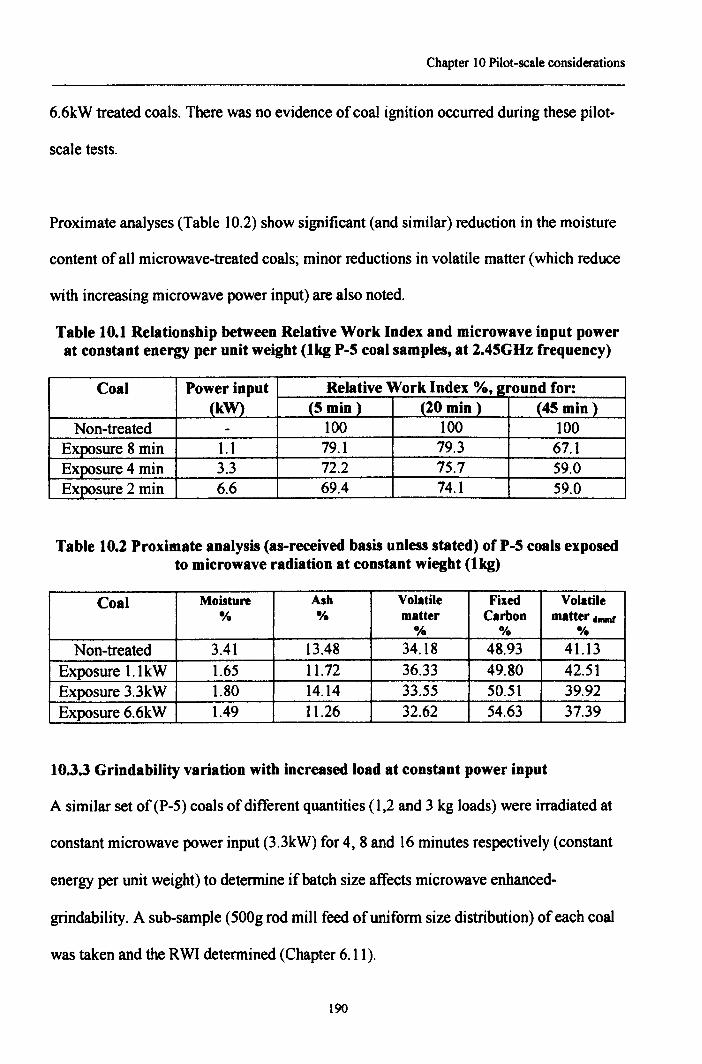
Chapter 10 Pilot-scale considerations
6.6kW treated coals. There was no evidence of coal ignition occurred during these pilot-
scale tests.
Proximate analyses (Table 10.2) show significant (and similar) reduction in the moisture
content of all microwave-treated coals; minor reductions in volatile matter (which reduce
with increasing microwave power input) are also noted.
Table 10.1 Relationship between Relative Work Index and microwave input powerat constant energy per unit weight (lkg P-5 coal samples, at 2.45GHz frequency)
Coal Power input Relative Work Index %, e;round for:(kW) (5 min) (20 min) (45 min)
Non-treated - 100 100 100Exposure 8 min 1.1 79.1 79.3 67.1Exposure 4 min 3.3 72.2 75.7 59.0Exposure 2 min 6.6 69.4 74.1 59.0
Table to.2 Proximate analysis (as-received basis unless stated) ofP-5 coals exposedto microwave radiation at constant wiegbt (tkg)
Coal Moisture Ash Volatile Fixed Volatile% oAt matter Carbon matter daunt
0/0 % 1If.
Non-treated 3.41 13.48 34.18 48.93 41.13Exposure 1.1kW 1.65 11.72 36.33 49.80 42.51Exposure 3.3kW 1.80 14.14 33.55 50.51 39.92Exposure 6.6kW 1.49 11.26 32.62 S4.63 37.39
10.3.3 Grindability variation with increased load at constant power input
A similar set of (P-5) coals of different quantities (1,2 and 3 kg loads) were irradiated at
constant microwave power input (3.3kW) for 4,8 and 16 minutes respectively (constant
energy per unit weight) to determine if batch size affects microwave enhanced-
grindability. A sub-sample (SOOgrod mill feed of uniform size distribution) of each coal
was taken and the RWI determined (Chapter 6.11).
190
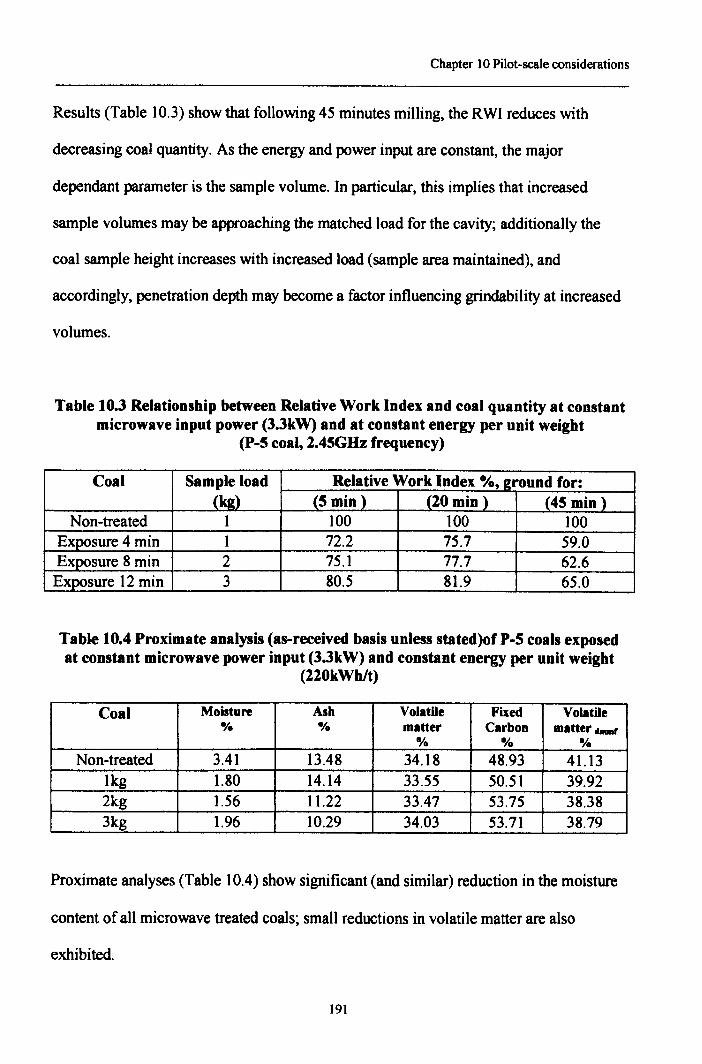
Chapter 10 Pilot-scale considerations
Results (Table 10.3) show that following 45 minutes milling, the RWI reduces with
decreasing coal quantity. As the energy and power input are constant, the major
dependant parameter is the sample volume. In particular, this implies that increased
sample volumes may be approaching the matched load for the cavity; additionally the
coal sample height increases with increased load (sample area maintained), and
accordingly, penetration depth may become a factor influencing grindability at increased
volumes.
Table 10.3 Relationship between Relative Work Index and coal quantity at constantmicrowave input power (3.3kW) and at constant energy per unit weight
(P-5 coal, 2.45GHz frequency)
Coal Sample load Relative Work Index %,_g_round for:(kg) (5 min) .(20 min) J45 min)
Non-treated 1 100 100 100Exposure 4 min 1 72.2 75.7 59.0Exposure 8 min 2 75.1 77.7 62.6Exposure 12 min 3 80.5 81.9 65.0
Table 10.4 Proximate analysis (as-received basis unless stated)of P-5 coals exposedat constant microwave power input (3.3kW) and constant energy per unit weight
(220kWhlt)
Coal Moisture Ash Volatile Fixed Volatilee;. % matter Carbon matter.._,.
0/0 I/o %Non-treated 3.41 13.48 34.18 48.93 41.13
lkg 1.80 14.14 33.55 50.51 39.922kg 1.56 11.22 33.47 53.75 38.383kg 1.96 10.29 34.03 53.71 38.79
Proximate analyses (Table 10.4) show significant (and similar) reduction in the moisture
content of all microwave treated coals; small reductions in volatile matter are also
exhibited.
191
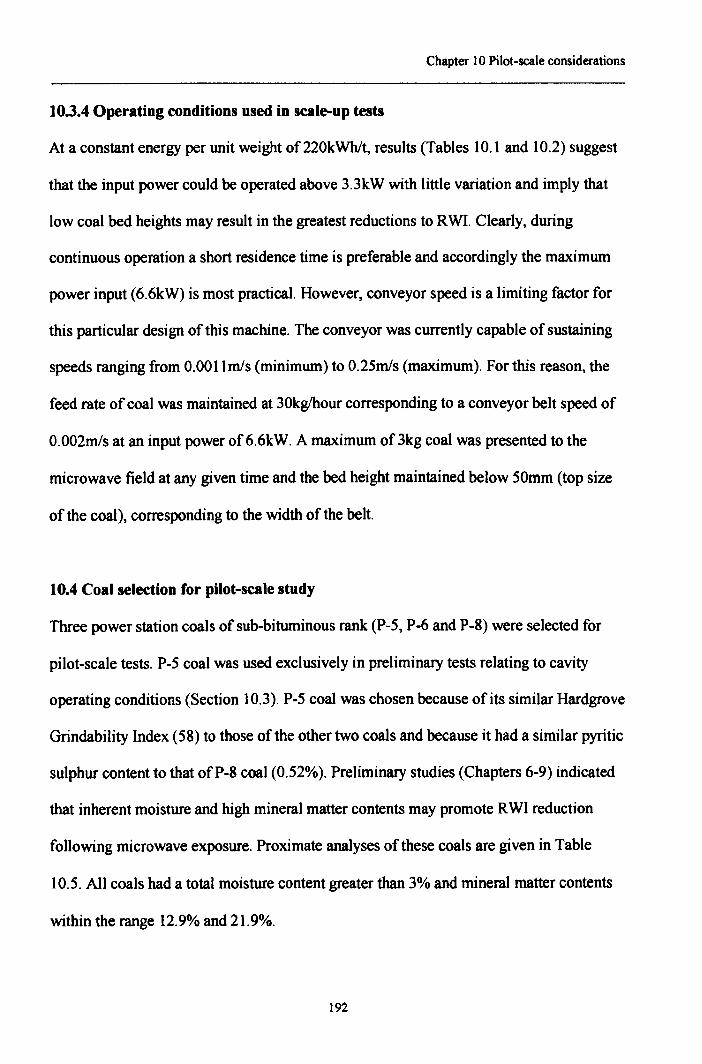
Chapter 10 Pilot-scale considerations
10.3.4 Operating conditions used in scale-up tests
At a constant energy per unit weight of 220kWhlt, results (Tables 10.1 and 10.2) suggest
that the input power could be operated above 3.3kW with little variation and imply that
low coal bed heights may result in the greatest reductions to RWI. Clearly, during
continuous operation a short residence time is preferable and accordingly the maximum
power input (6.6kW) is most practical. However, conveyor speed is a limiting factor for
this particular design of this machine. The conveyor was currently capable of sustaining
speeds ranging from 0.0011m1s (minimum) to 0.2Smls (maximum). For this reason, the
feed rate of coal was maintained at 30kglhour corresponding to a conveyor belt speed of
0.002m1s at an input power of6.6kW. A maximum of3kg coal was presented to the
microwave field at any given time and the bed height maintained below 50mm (top size
of the coal), corresponding to the width of the belt.
10.4 Coal selection for pilot-scale study
Three power station coals of sub-bituminous rank (P-S, P-6 and P-8) were selected for
pilot-scale tests. P-S coal was used exclusively in preliminary tests relating to cavity
operating conditions (Section 10.3). P-S coal was chosen because of its similar Hardgrove
Grindability Index (58) to those of the other two coals and because it had a similar pyritic
sulphur content to that ofP-8 coal (0.52%). Preliminary studies (Chapters 6-9) indicated
that inherent moisture and high mineral matter contents may promote RWI reduction
following microwave exposure. Proximate analyses of these coals are given in Table
10.5. All coals had a total moisture content greater than 3% and mineral matter contents
within the range 12.9% and 21.9%.
192
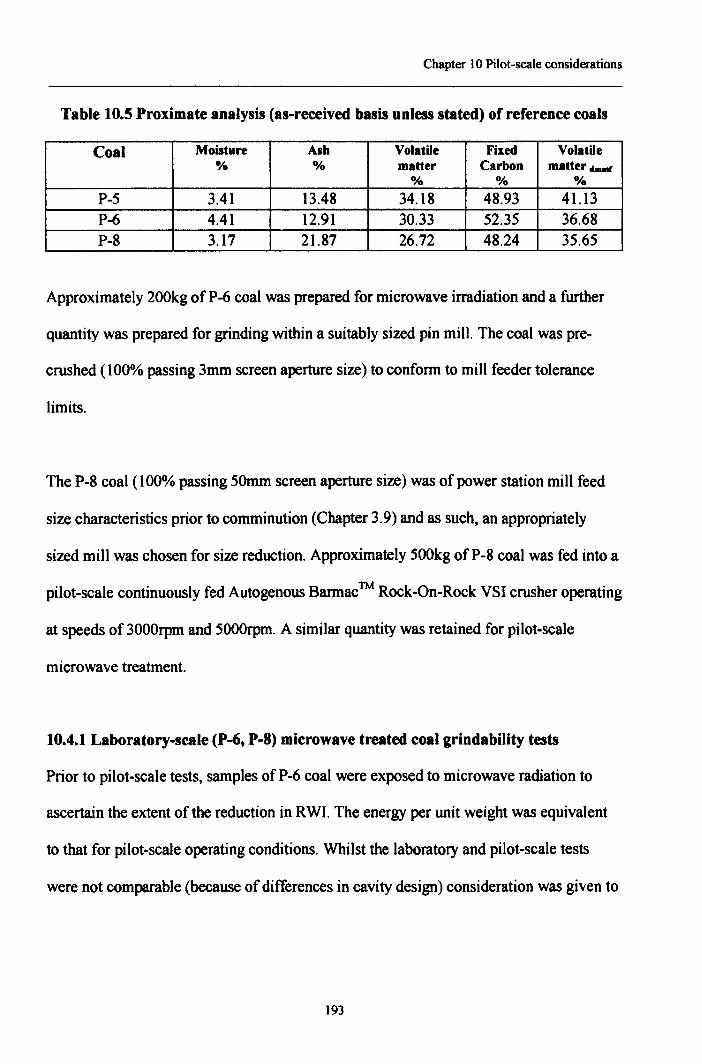
Chapter 10 Pilot-scale considerations
Table 10.5 Proximate analysis (as-received basis unless stated) of reference coals
Coal Moisture Ash Volatile Fixed Volatile% % matter Carbon matter obamI
% 0/0 0/.P-5 3.41 13.48 34.18 48.93 41.13P-6 4.41 12.91 30.33 52.35 36.68P-8 3.17 21.87 26.72 48.24 35.65
Approximately 200kg of P-6 coal was prepared for microwave irradiation and a further
quantity was prepared for grinding within a suitably sized pin mill. The coal was pre-
crushed (100% passing 3mm screen aperture size) to conform to mill feeder tolerance
limits.
The P-8 coal (100% passing 50mm screen aperture size) was of power station mill feed
size characteristics prior to comminution (Chapter 3.9) and as such, an appropriately
sized mill was chosen for size reduction. Approximately 500kg ofP-8 coal was fed into a
pilot-scale continuously fed Autogenous Barmac™ Rock-On-Rock VSI crusher operating
at speeds of 3000rpm and 5000rpm. A similar quantity was retained for pilot-scale
microwave treatment.
10.4.1 Laboratory-scale (P-6, P-8) microwave treated coal grindability tests
Prior to pilot-scale tests, samples ofP-6 coal were exposed to microwave radiation to
ascertain the extent of the reduction in RWI. The energy per unit weight was equivalent
to that for pilot-scale operating conditions. Whilst the laboratory and pilot-scale tests
were not comparable (because of differences in cavity design) consideration was given to
193
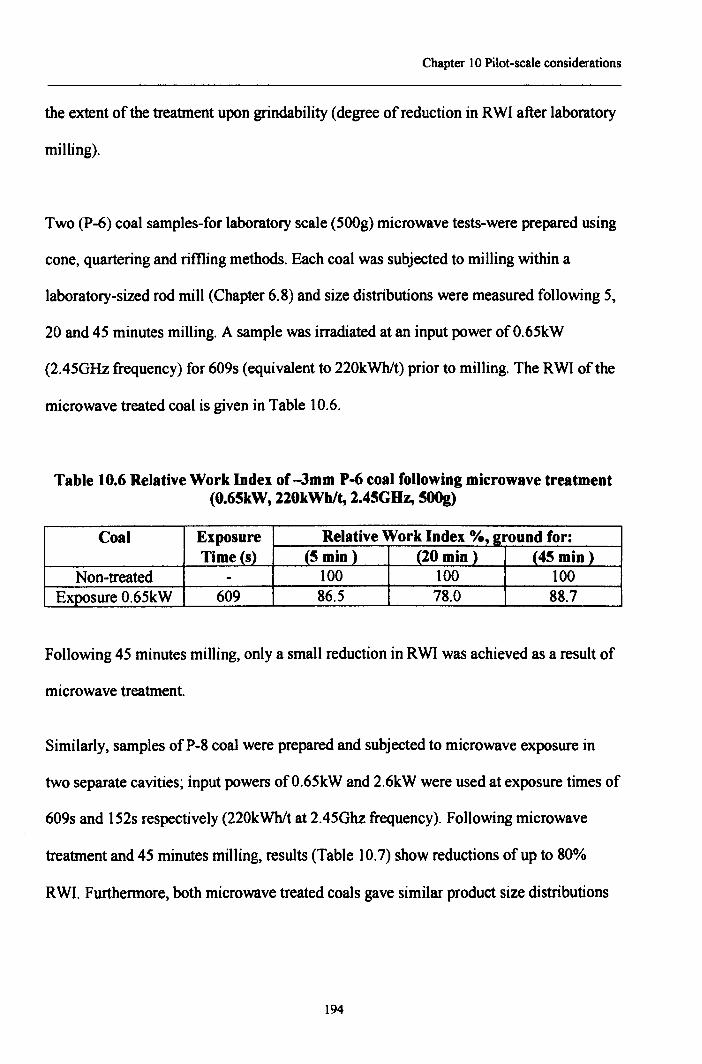
Chapter 10 Pilot-scale considerations
the extent of the treatment upon grindability (degree of reduction in RWI after laboratory
milling).
Two (P-6) coal samples-for laboratory scale (500g) microwave tests-were prepared using
cone, quartering and riming methods. Each coal was subjected to milling within a
laboratory-sized rod mill (Chapter 6.8) and size distributions were measured following 5,
20 and 45 minutes milling. A sample was irradiated at an input power ofO.65kW
(2.45GHz frequency) for 609s (equivalent to 220kWhlt) prior to milling. The RWI of the
microwave treated coal is given in Table 10.6.
Table 10.6 Relative Work Index of -3mm P-6 coal following microwave treatment(0.6SkW, 220kWhlt, 2.45GHz, SOOg)
Coal Exposure Relative Work Index 0/0, a:round for:Time (s) (S min) (20 min) (45 min)
Non-treated - 100 100 100Exposure 0.65kW 609 86.5 78.0 88.7
Following 45 minutes milling, only a small reduction in RWI was achieved as a result of
microwave treatment.
Similarly, samples ofP-8 coal were prepared and subjected to microwave exposure in
two separate cavities; input powers ofO.65kW and 2.6kW were used at exposure times of
609s and 152s respectively (220kWhlt at 2.45Ghz frequency). Following microwave
treatment and 45 minutes milling, results (Table 10.7) show reductions of up to 80%
RWI. Furthermore, both microwave treated coals gave similar product size distributions
194
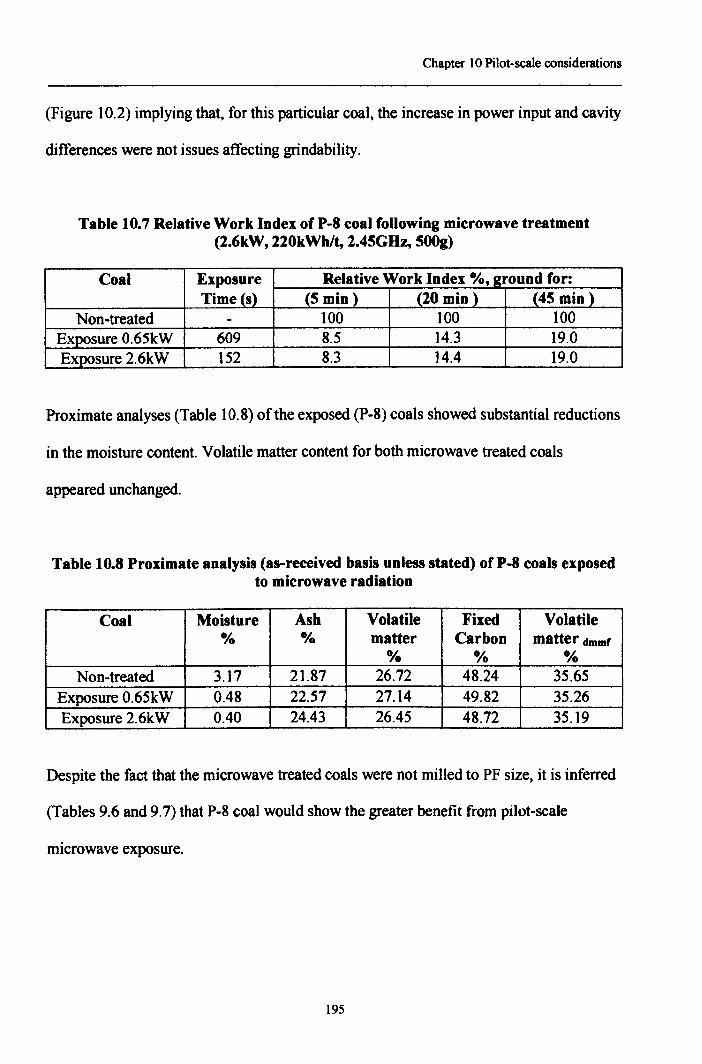
Chapter 10 Pilot-scale considerations
(Figure 10.2) implying that. for this particular coal, the increase in power input and cavity
differences were not issues affecting grindability.
Table 10.7 Relative Work Index ofP-8 coal following microwave treatment(2.6kW, 220kWhlt, 2.45GHz, 500g)
Coal Exposure Relative Work Index %, e:round for:Time (s) (5 min) (20 min) -(45 min j
Non-treated - 100 100 100Exposure 0.65kW 609 8.5 14.3 19.0Exposure 2.6kW 152 8.3 14.4 19.0
Proximate analyses (Table 10.8) of the exposed (P-8) coals showed substantial reductions
in the moisture content. Volatile matter content for both microwave treated coals
appeared unchanged.
Table 10.8 Proximate analysis (as-received basis unless stated) of P-8 coals exposedto microwave radiation
Coal Moisture Ash Volatile Fixed Volatile% % matter Carbon matter dmml
% % 0/0Non-treated 3.17 21.87 26.72 48.24 35.65
Exposure 0.65kW 0.48 22.57 27.14 49.82 35.26Exposure 2.6kW 0.40 24.43 26.45 48.72 35.19
Despite the fact that the microwave treated coals were not milled to PF size, it is inferred
(Tables 9.6 and 9.7) that P-8 coal would show the greater benefit from pilot-scale
microwave exposure.
195
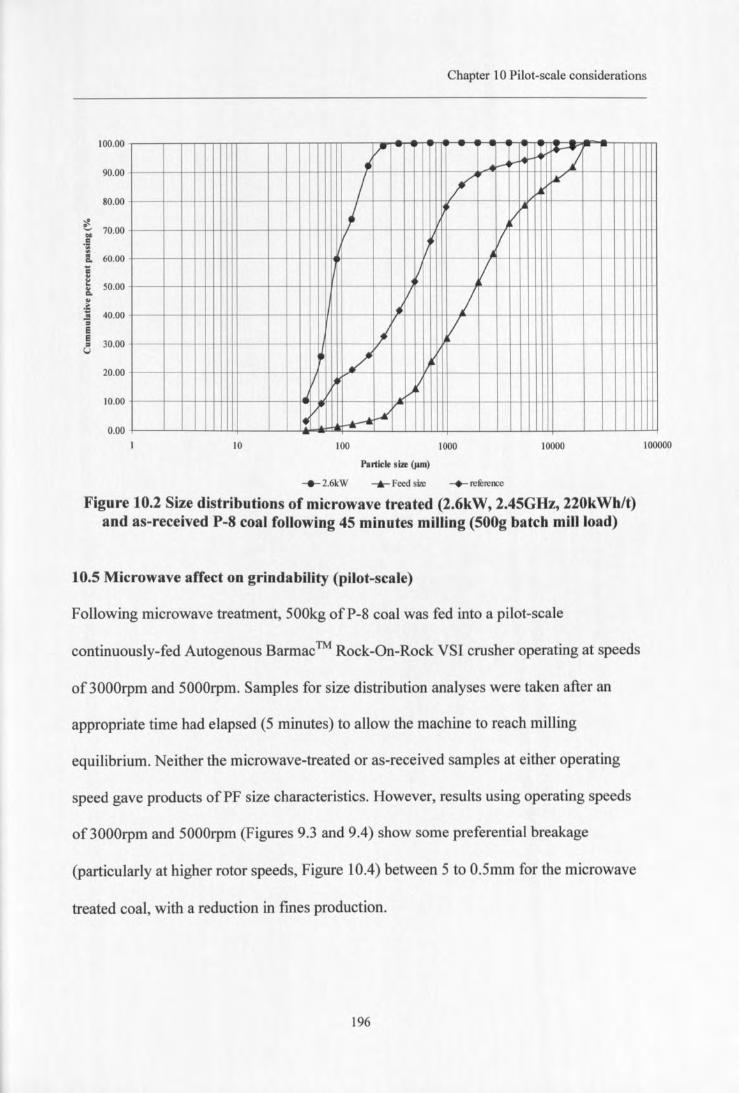
Chapter 10 Pilot-scale considerations
100.00
90.00
80.00
~~ 70.00.."*:l.. 60.00........~ 50.00....."'S 40.00.!!=ee 30.00=c;,.)
20.00
10.00
0.00
- - -~ - ~,., _.~ ~~ j
/ / ~
I ../
II II.II
/ V/ I•
" V~ ./ I)
II 11)-'
I~'/ ~~
10 100000100 1000 10000
Particle size (I'm)
-+-2.6kW -'-Feed size -+-referetK:e
Figure 10.2 Size distributions of microwave treated (2.6kW, 2.45GHz, 220kWh/t)and as-received P-8 coal following 45 minutes milling (500g batch mill load)
10.5 Microwave affect on grindability (pilot-scale)
Following microwave treatment, 500kg ofP-8 coal was fed into a pilot-scale
continuously-fed Autogenous Barmac™ Rock-On-Rock VSI crusher operating at speeds
of3000rpm and 5000rpm. Samples for size distribution analyses were taken after an
appropriate time had elapsed (5 minutes) to allow the machine to reach milling
equilibrium. Neither the microwave-treated or as-received samples at either operating
speed gave products of PF size characteristics. However, results using operating speeds
of3000rpm and 5000rpm (Figures 9.3 and 9.4) show some preferential breakage
(particularly at higher rotor speeds, Figure 10.4) between 5 to 0.5mm for the microwave
treated coal, with a reduction in fines production.
196
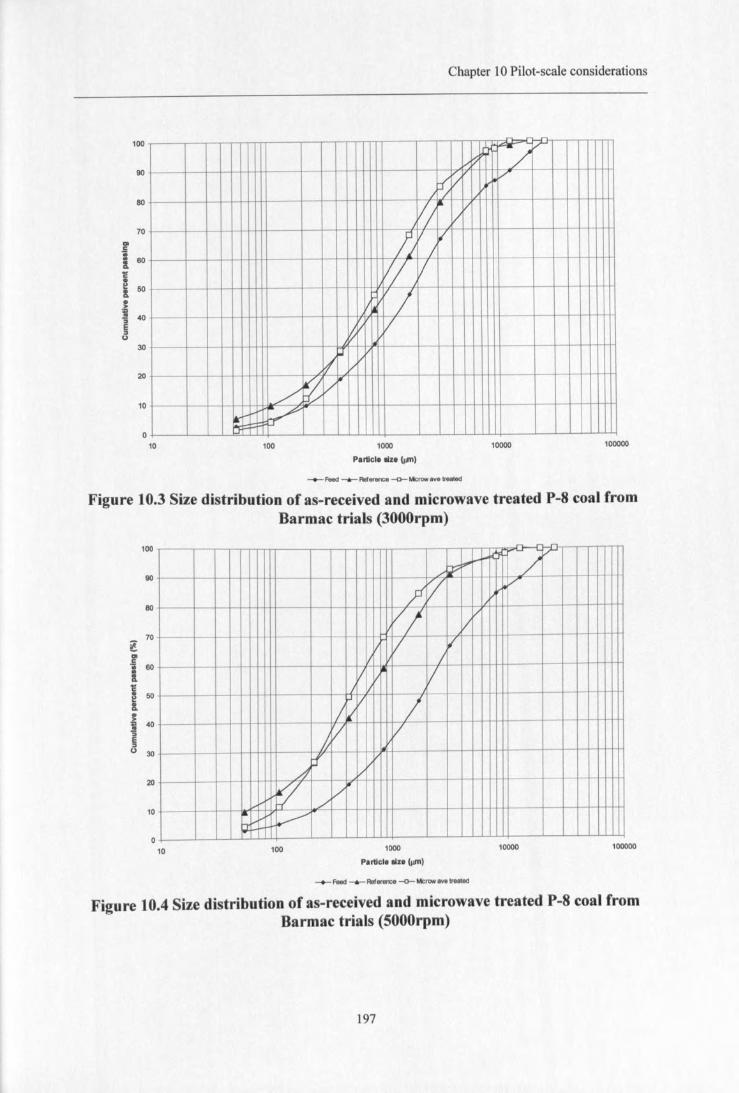
Chapter 10 Pilot-scale considerations
10
~j4r/V/b;l/ V
VI .". 1/i/
/; V/
II II
/~
II
V fJ vV
.>~V
!l- ~:r
100
90
80
70
rI 60
1;;
I50
:~ 40~::IU
30
20
o10 100 1000
Particle a1ze IJlI'l)10000 100000
--+- Feed _,._ Reference --0- Mcrow avo treated
Figure 10.3 Size distribution of as-received and microwave treated P-8 coal fromBarmac trials (3000rpm)
100
20
-~ V/~
[,..1-- /YV v
// ~V
II / IV /
V II II_j
/ l! /~
/;V V
A1 v
~ /'V
tt' ~
90
80
70
~I 60
1;;~ 50!.::e 40'SECl 30
10
o10 100 1000
Particle liz. IJlI'l)10000 100000
_._ Feed .......... Reference -0-- Mcrow BYe treated
Figure 10.4 Size distribution of as-received and microwave treated P-8 coal fromBarmac trials (5000rpm)
197
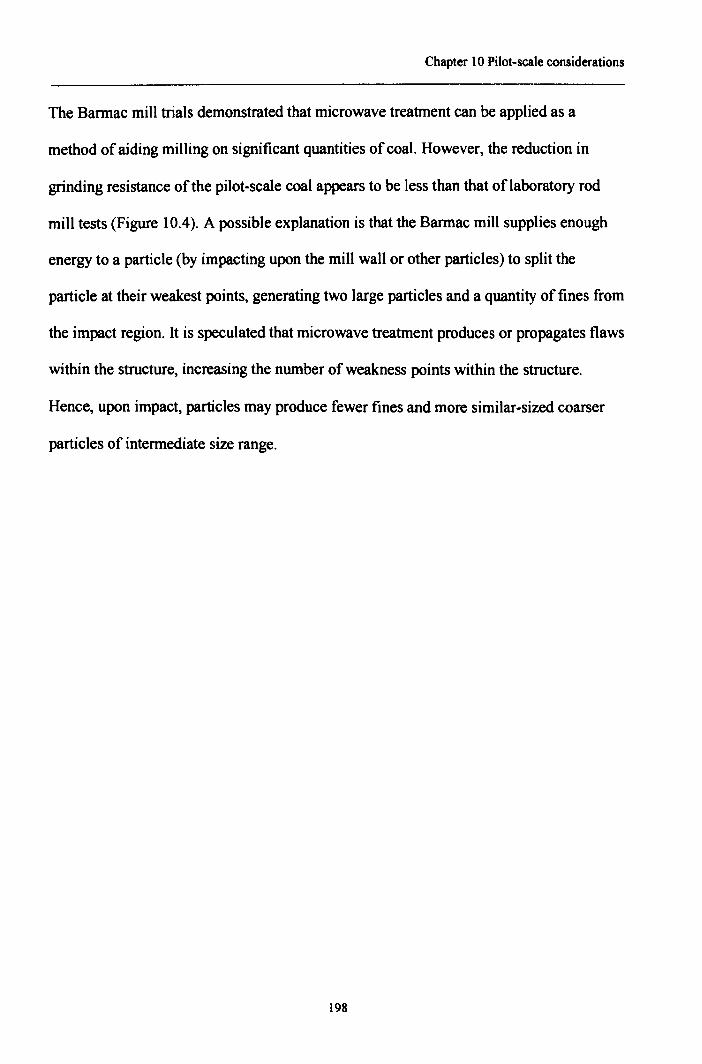
Chapter 10 Pilot-scale considerations
The Barmac mill trials demonstrated that microwave treatment can be applied as a
method of aiding milling on significant quantities of coal. However, the reduction in
grinding resistance of the pilot-scale coal appears to be less than that of laboratory rod
mill tests (Figure 10.4). A possible explanation is that the Barmac mill supplies enough
energy to a particle (by impacting upon the mill wall or other particles) to split the
particle at their weakest points, generating two large particles and a quantity of fines from
the impact region. It is speculated that microwave treatment produces or propagates flaws
within the structure, increasing the number of weakness points within the structure.
Hence, upon impact, particles may produce fewer fines and more similar-sized coarser
particles of intermediate size range.
198
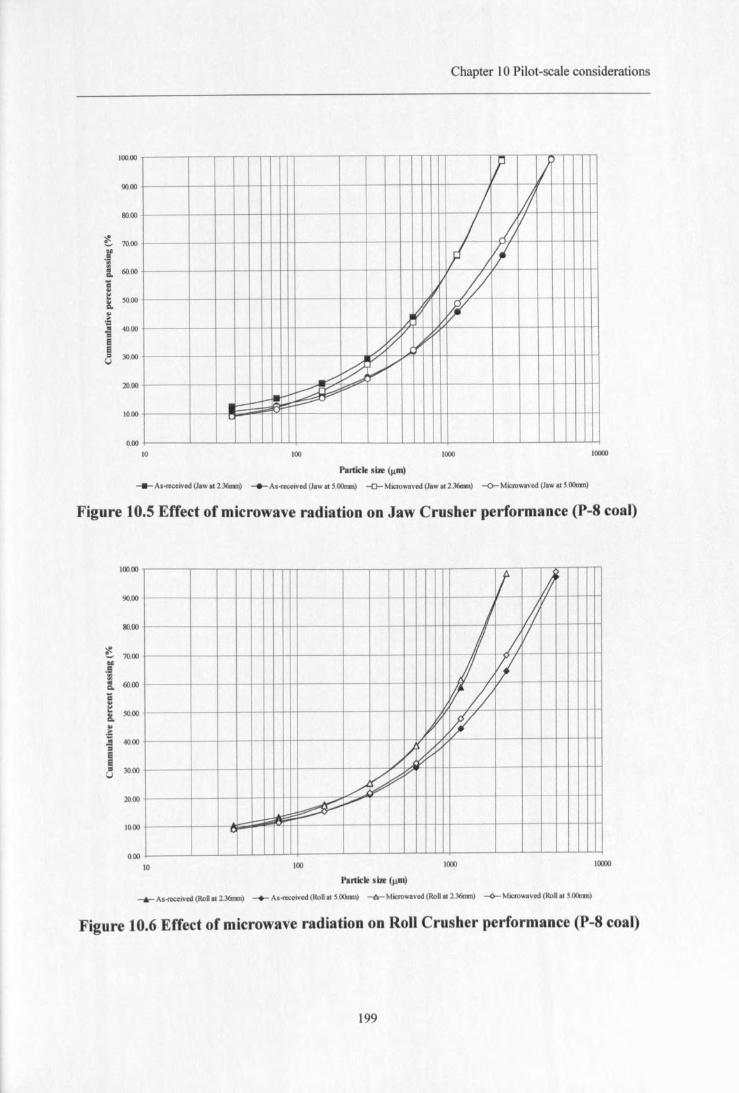
Chapter 10 Pilot-scale considerations
100.00
90.00
SO.OO
~e. 70.00
·rIS 60.00...'i..i: 50.008....~IS 40.00;;ee= 30.00U
20.00
10.00
0.00
! // j/ );'1
II /IjI //
A~~
~
~{P
h ~
~ ~,/
_....-:
~<9".-,..--"
u
10 10000100 1000
Particle size (11m)___ As-received (Jaw at 2.36mn) As-received (Jaw at 5.00nm) -0-Microwaved (Jaw at 2.36mn) -<>-Microwaved (Jaw atl.OOnm)
Figure 10.5 Effect of microwave radiation on Jaw Crusher performance (P-8 coal)
100.00
90.00
SO.OO
C 70.00...9:J 60.00...iiis.. SO.OO8.i.!! 40.00..ee.. 30.00U
20.00
10.00
II ~
I III ;;V
JI !JIf//
II f/./l)~~
~ ~~~
~.,.....,.
0
0.00
10 100 1000 10000
.....-- As -rece ived (Roll at 2.36mn) -+- As-received (Roll at 5.00nm) --A-- Microwaved (Roll at 2360111) ~ Microwaved (Roll at 5.00nm)
Figure 10.6 Effect of microwave radiation on Roll Crusher performance (P-8 coal)
199
Chapter 10 Pilot-scale considerations
Clearly the method of size reduction (impact, attrition, compression etc.) significantly
affect any comparison between as-received and microwave treated coal. Rod milling is
attributed to both impact and attrition milling and results imply that P-8 coal grindability
is considerably improved with prior microwave treatment (Figure 10.2). The Barmac
crusher relies upon particle on particle impact and pilot-scale results show some selective
improvements in P-8 coal grindability. Further tests have been carried out upon
microwave treated and as-received P-8 coal by the University of Nottingham using a
(Dodge) jaw crusher and roll crusher with product discharge limited to 2.36mm and 5mm
respectively. Size distributions were taken for -1kg representative batch samples
following comminution. A finer product was achieved with samples presented to both
crushers with discharge setting of2.36mm irrespective of microwave treatment. Results
(Figure 10.5) show that microwave treatment had little effect upon the grindability ofP-8
coal within a jaw crusher with similar size distributions to as-received coal. Similarly,
results (Figure 10.6) also show little difference between the product size distributions of
microwave treated and as-received samples following comminution in a roll crusher.
However, results from both jaw and roll crushers show slight reduction in fines
production from microwave treated samples. Both machines utilise compression for size
reduction. Clearly the type of mill or crusher used is of significant importance to an
economic feasibility study and further work would be required upon a more suitable PF
generating mill i.e. vertical spindle or lopulco mill.
200
Chapter 10 Pilot-scale considerations
10.6 Economic considerations
The Bannac mill is not used for PF production in power stations and the use of a PF
generating mill i.e. vertical spindle mill, would clearly be a more accurate comparison of
the feasibility of microwave treated coal grindability. However, despite the fact that
neither the microwave cavity or the mill were operated entirely under optimum
conditions, the energy required for microwave treatment was 220kWhlt, far greater
(milling energy estimated as 22kWhlt) than that required to produce PF size
characteristics from the milling of as-received coal. Furthermore, the microwave
treatment energy was based upon power input to load (6.6kW) and not from power draw.
The power draw of the pilot-scale cavity corresponding to pilot-scale operating
conditions was measured at 12.4kW using a LEM HEME Ltd LHI050 ACIDC Clamp-
On Power Meter. The total energy consumption in the microwave stage equates to
414kWhlt. Preliminary work (Chapter 6.11) showed that a reduction in RWI of50% for
the microwave treated sample corresponded to half the batch milling time required to that
ofa as-received sample (to PF size characteristic). Assuming that RWI can be applied to
Bond Work Index (Chapter 4) and using laboratory rod mill results (Table 10.7), 5kWhlt
energy would be required at the milling stage. Hence, the total energy requirements for
the microwave treated milled coal product is approximately 420kWhlt.
10.7 Pilot-scale conclusions
Pilot-scale testwork was carried out to give a better understanding of scale-up criteria and
a more accurate energy balance. The study has demonstrated that microwave processing
of coal could be scaled-up. The input power distribution and exposure time for a given
201
Chapter 10 Pilot-scale considerations
load are suggested as being the major limiting factors for the current pilot-scale
microwave cavity. Penetration depth is not considered an influencing factor as coal bed
depth was maintained less than 0.005m (penetration depth of coals range from 0.2 to
0.6m, Chapter 8.7). The current laboratory and pilot-scale data indicates that the
microwave energy required to reduce the resistance to grinding of the coal to any
significant degree (i.e. 20% RWI for P-8 coal) far outweighs any energy saving in a
subsequent mechanical milling system.
Improvements in cavity design (with regard to energy transfer efficiency and the
arrangement of high electric field strength) may reduce the energy requirement
considerably. However, it is considered that the use of microwave energy as a means of
weakening the coal prior to milling may not prove an economically viable proposition.
202
CHAPTER ELEVEN
MISCELLANIOUS BENEFITS FOR COAL MICROWAVETREATMENT
11.1 Introduction-Miscellaneous benefits (or coal microwave treatment
Previous workers (Chapter 5) have reported the application of microwave radiation as a
potential method of coal desulphurisation and rapid coal pyrolysis. These applications
and microwave treated-coal flow results are presented within this study.
11.2 Microwave desulphurisation o( coal
The heating rate of pyrite was measured and calculated from dielectric measurements
(Chapter 8) at approximately I°C/s at 0.65kW input power (2.45GHz). Clearly, during
preliminary coal microwave heating tests (Chapter 6,7,9 and 10) inherent pyrite would
reach temperatures above that required for oxidation (300°C)(Figure 11.1). As shown
(Figure 11.1), gaseous sulphur may be released prior to overall coal combustion (all coals
tested remain below 250°C), after 8 minutes microwave exposure and providing the
heating rate remains constant (l°C/s at O.6SkW input power, Chapter 8), discrete pyrite
particles may reach temperature exceeding 480°C. Pyrite changes phase releasing
sulphurous gas and reducing the total sulphur content of the coal. Previous work
(Zavitanos 1981, Butcher 1995, Bluhm 1980) has demonstrated that this 'alteredpyrite
has an increased magnetic susceptibility (in the order of two magnitudes greater) and
could be reduced by low gradient magnetic separation.
203
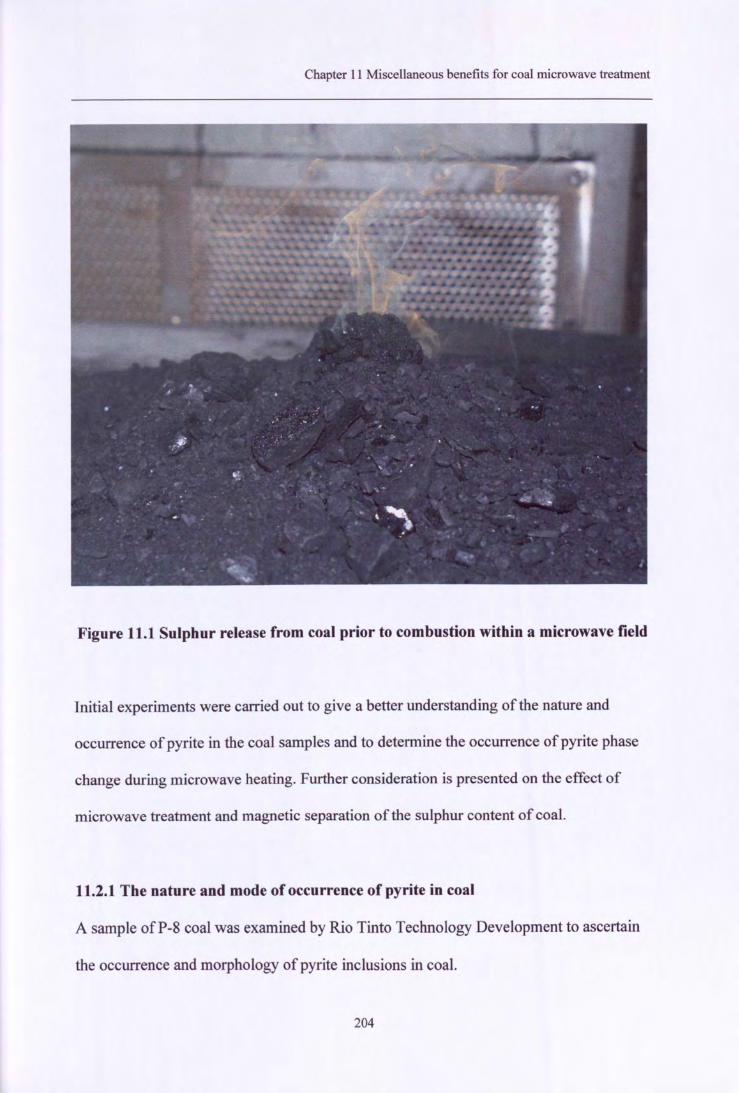
Chapter 11 Miscellaneous benefits for coal microwave treatment
Figure 11.1 Sulphur release from coal prior to combustion within a microwave field
Initial experiments were carried out to give a better understanding of the nature and
occurrence of pyrite in the coal samples and to determine the occurrence of pyrite phase
change during microwave heating. Further consideration is presented on the effect of
microwave treatment and magnetic separation of the sulphur content of coal.
11.2.1 The nature and mode of occurrence of pyrite in coal
A sample ofP-8 coal was examined by Rio Tinto Technology Development to ascertain
the occurrence and morphology of pyrite inclusions in coal.
204
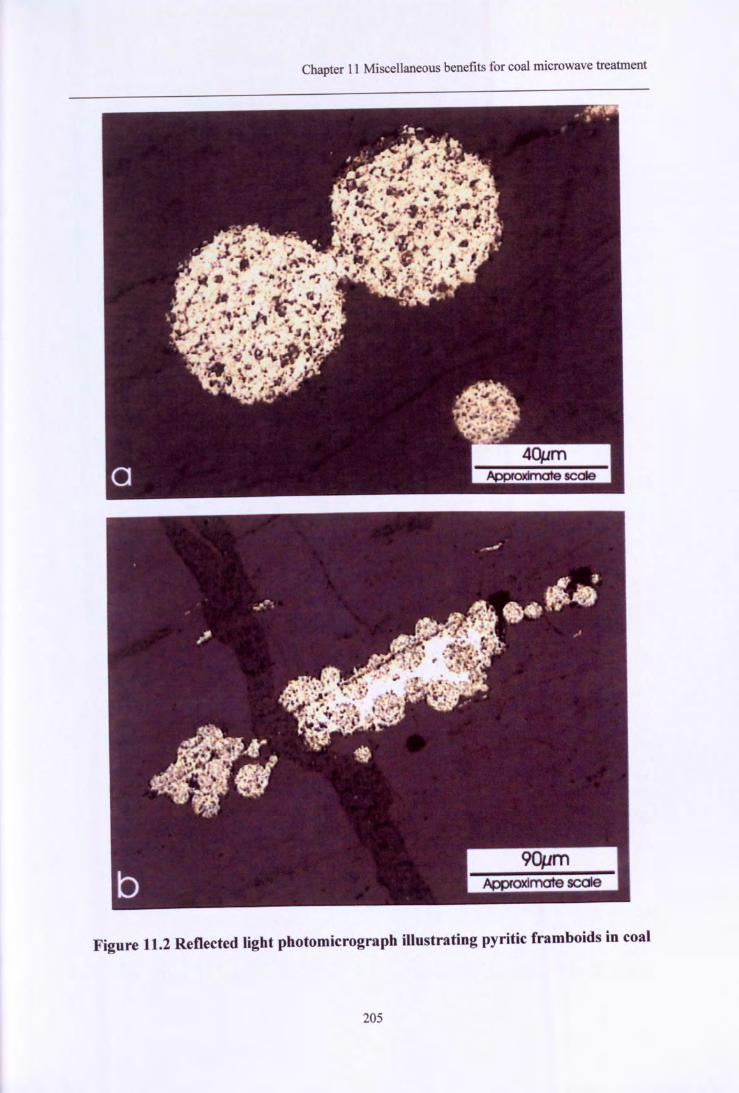
Chapter 11 Miscellaneous benefits for coal microwave treatment
Figure 11.2 Reflected light photomicrograph illustrating pyritic framboids in coal
205
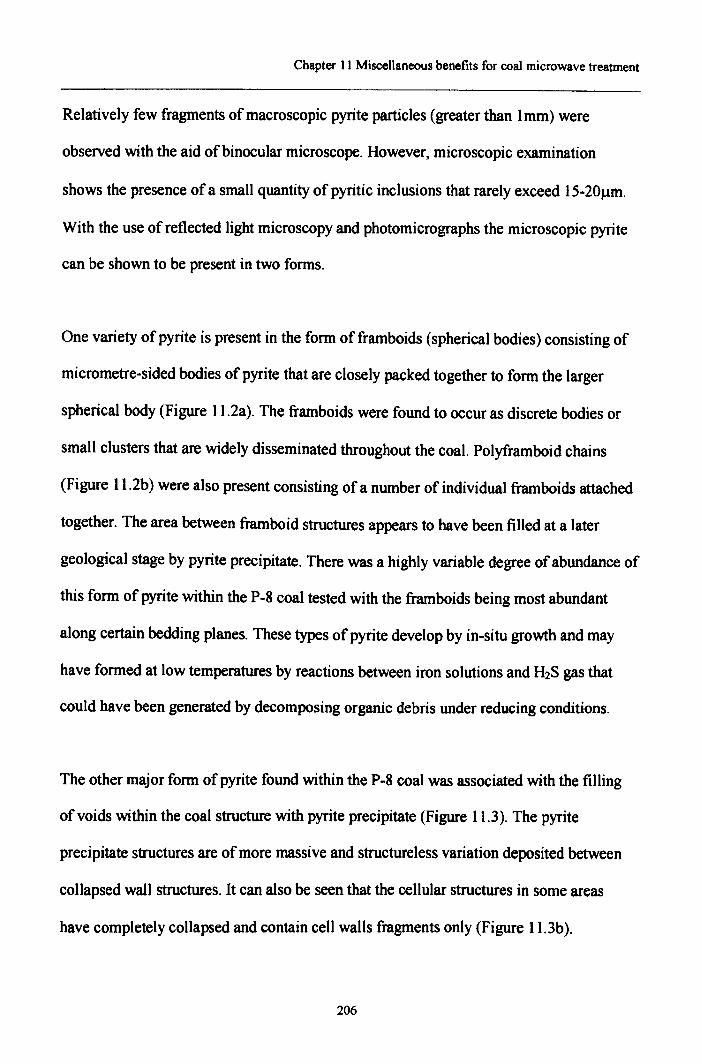
Chapter 11 Miscellaneous benefits for coal microwave treatment
Relatively few fragments of macroscopic pyrite particles (greater than Imm) were
observed with the aid of binocular microscope. However, microscopic examination
shows the presence of a small quantity of pyritic inclusions that rarely exceed 15-20J.1m.
With the use of reflected light microscopy and photomicrographs the microscopic pyrite
can be shown to be present in two forms.
One variety of pyrite is present in the form offramboids (spherical bodies) consisting of
micrometre-sided bodies of pyrite that are closely packed together to form the larger
spherical body (Figure 11.2a). The framboids were found to occur as discrete bodies or
small clusters that are widely disseminated throughout the coal. Polyframboid chains
(Figure 11.2b) were also present consisting of a number of individual framboids attached
together. The area between framboid structures appears to have been filled at a later
geological stage by pyrite precipitate. There was a highly variable degree of abundance of
this form of pyrite within the P-8 coal tested with the framboids being most abundant
along certain bedding planes. These types of pyrite develop by in-situ growth and may
have formed at low temperatures by reactions between iron solutions and H2S gas that
could have been generated by decomposing organic debris under reducing conditions.
The other major form of pyrite found within the P-8 coal was associated with the filling
of voids within the coal structure with pyrite precipitate (Figure 11.3). The pyrite
precipitate structures are of more massive and structureless variation deposited between
collapsed wall structures. It can also be seen that the cellular structures in some areas
have completely collapsed and contain cell walls fragments only (Figure 11.3b).
206
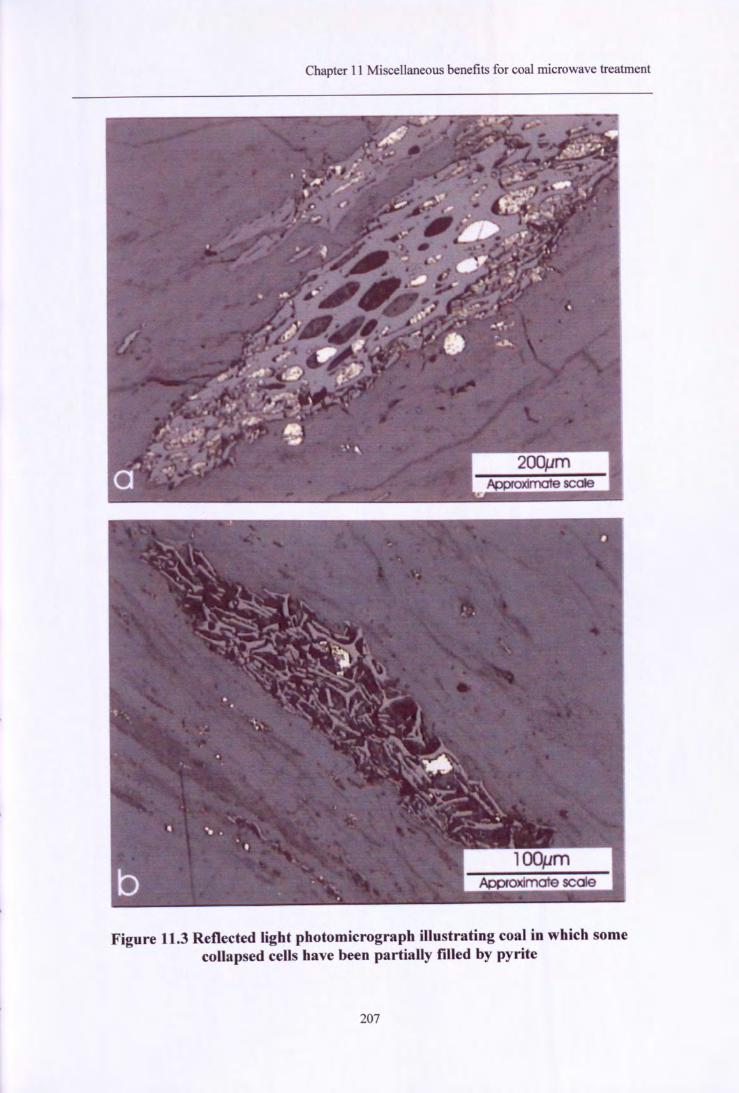
Chapter 11 Miscellaneous benefits for coal microwave treatment
Figure 11.3 Reflected light photomicrograph illustrating coal in which somecollapsed cells have been partially filled by pyrite
207
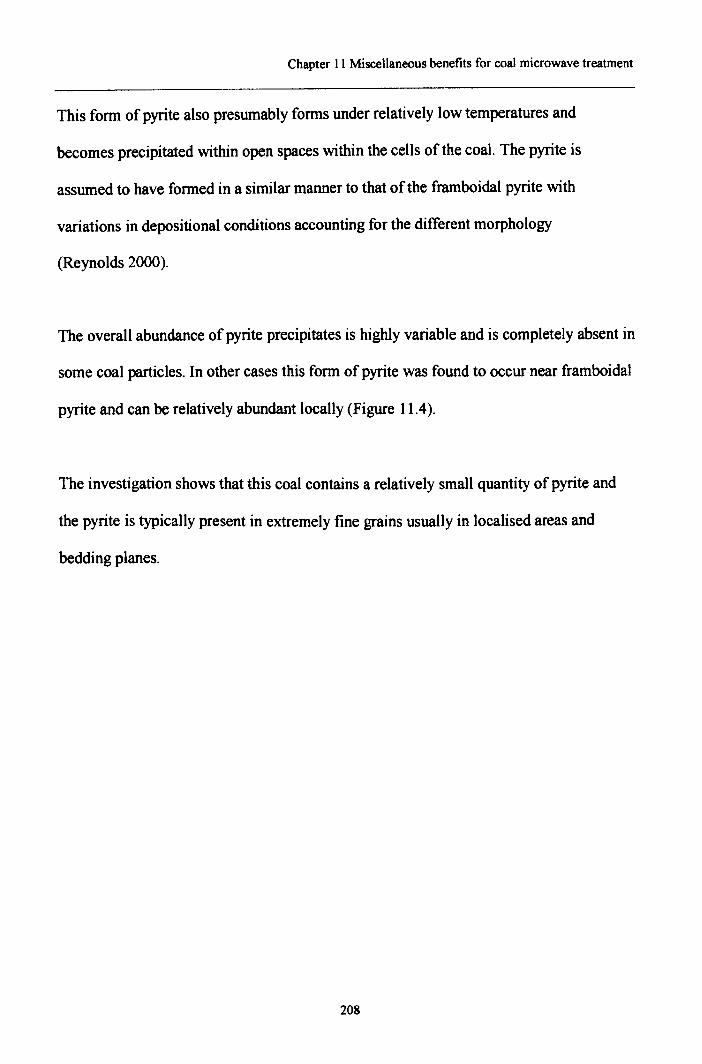
Chapter 11 Miscellaneous benefits for coal microwave treatment
This form of pyrite also presumably forms under relatively low temperatures and
becomes precipitated within open spaces within the cells of the coal. The pyrite is
assumed to have formed in a similar manner to that of the framboidal pyrite with
variations in depositional conditions accounting for the different morphology
(Reynolds 2000).
The overall abundance of pyrite precipitates is highly variable and is completely absent in
some coal particles. In other cases this form of pyrite was found to occur near framboidal
pyrite and can be relatively abundant locally (Figure 11.4).
The investigation shows that this coal contains a relatively small quantity of pyrite and
the pyrite is typically present in extremely fine grains usually in localised areas and
bedding planes.
208
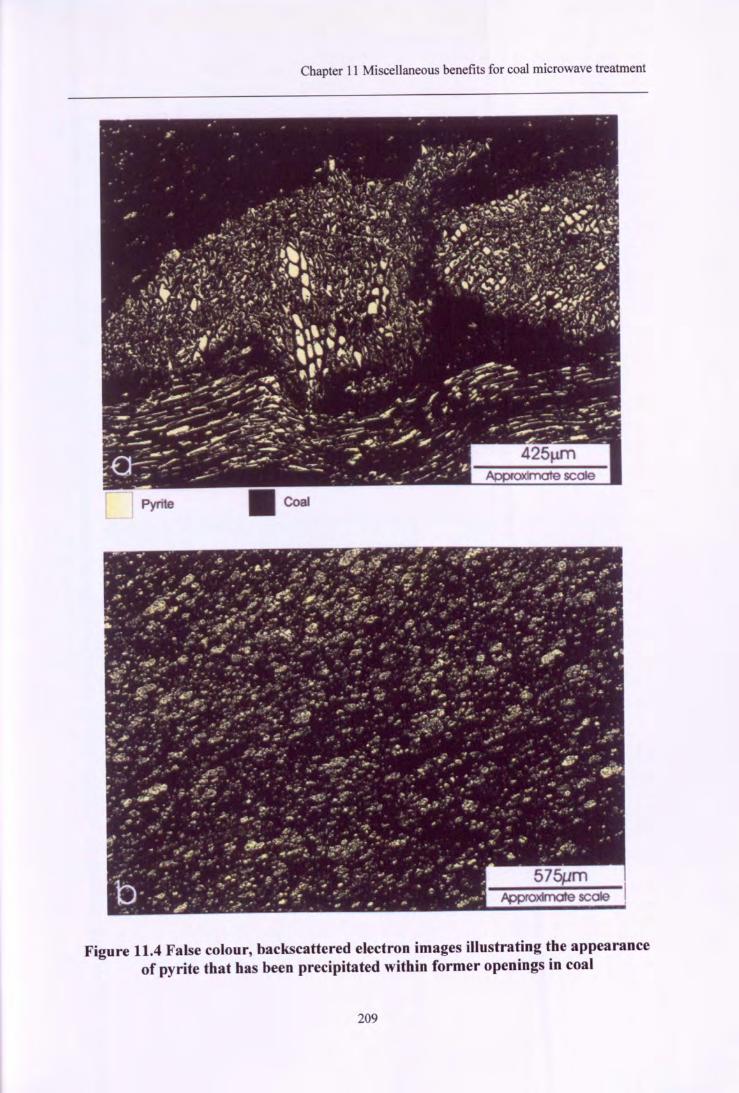
Chapter 11 Miscellaneous benefits for coal microwave treatment
Approximate $Cole
Figure 11.4 False colour, backscattered electron images illustrating the appearanceof pyrite that has been precipitated within former openings in coal
209
Chapter 11 Miscellaneous benefits for coal microwave treatment
11.2.2 Pyrite phase change mechanism
Three 50g «2mm) 99% pyrite samples were exposed to microwave radiation at 1.5kW
for 30s, 120s and 120s (covered in fine particulate feldspar) respectively. The samples
were subsequently tested by means of false coloured scanning electron micrograph image
analysis to determine the effect of microwave exposure and any oxidation reactions
(Reynolds 2000) during heating. The bulk of the pyrite samples appear relatively
unaltered indicating that most of the microwave energy is reflected from the pyrite
surface. To compensate for this and to simulate inclusion distribution within the coal, a
sample was covered with microwave transparent feldspar. In consequence, oxidation
appeared to be more extensive than that for the uncovered samples.
Previous studies have concluded that the earlier stages of heating (300°C) result in a
decomposition of mineral pyrite (FeS2) to form pyrrohotite (Fel-l:S) as expressed in
Equation 11.1. Further heating in the presence of oxygen result in total oxidation as
expressed in Equation 11.2.
2FeSz + 20z ~ 2FeS + 2S0z (11.1)
(11.2)
210
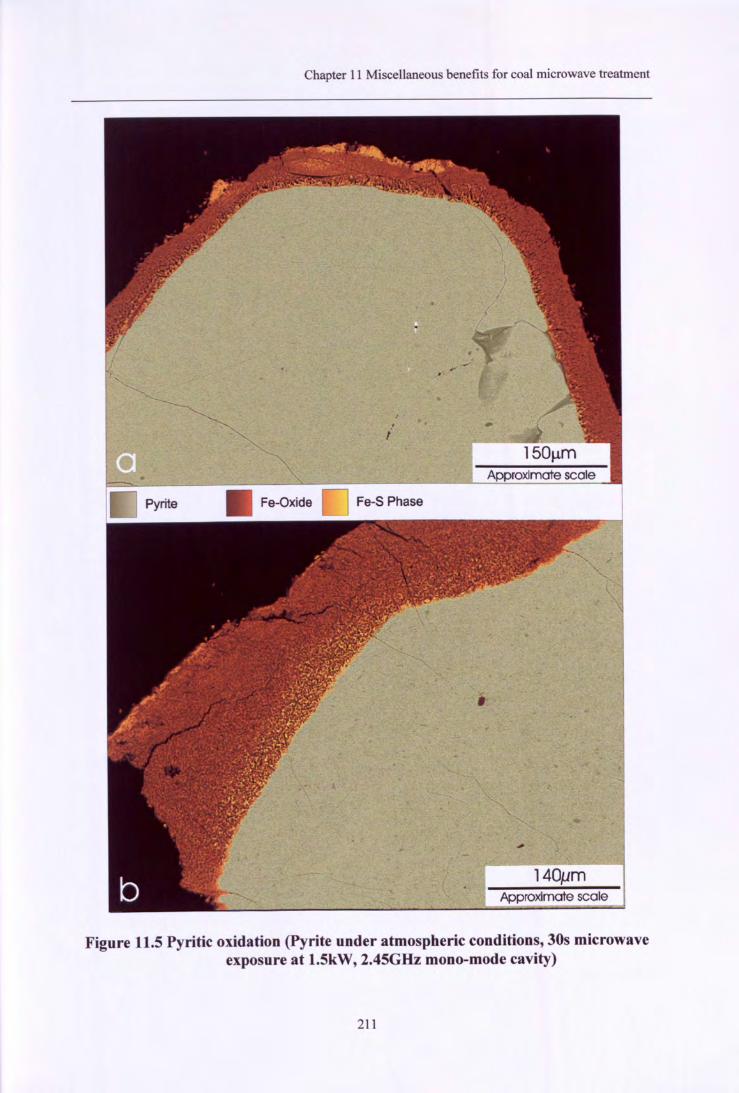
Chapter 11 Miscellaneous benefits for coal microwave treatment
•
140JimApproximate scale
Figure 11.5 Pyritic oxidation (Pyrite under atmospheric conditions, 30s microwaveexposure at 1.5kW, 2.45GHz mono-mode cavity)
211
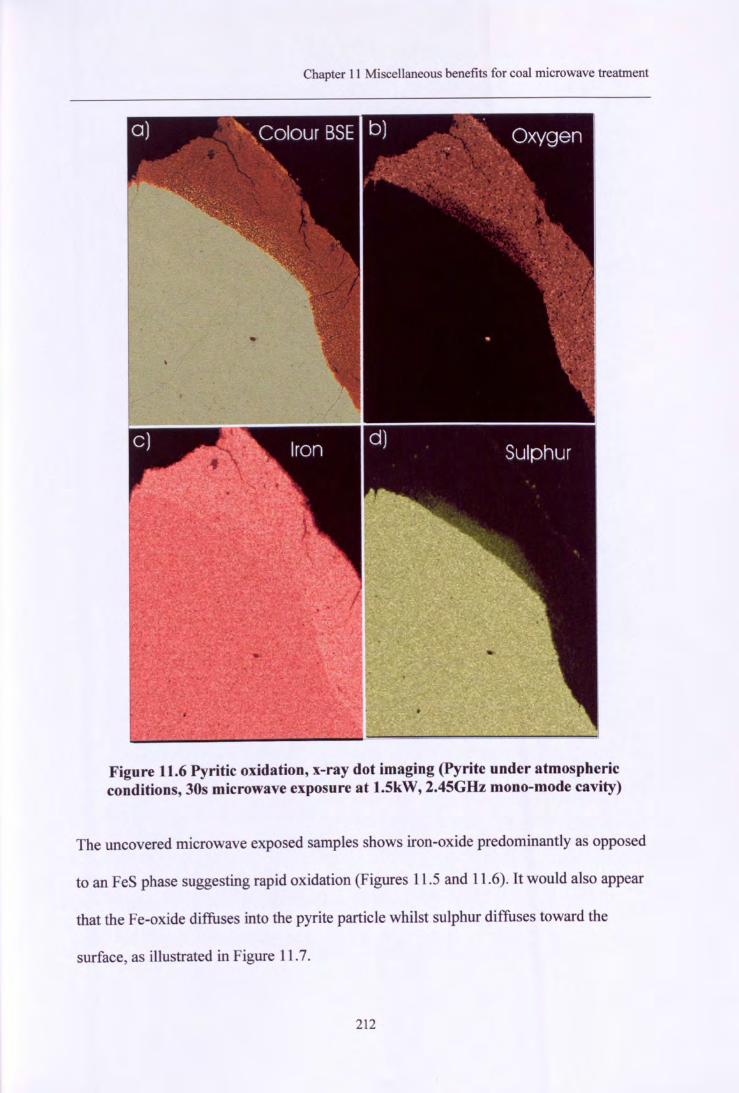
Chapter 11 Miscellaneous benefits for coal microwave treatment
Figure 11.6 Pyritic oxidation, x-ray dot imaging (Pyrite under atmosphericconditions, 30s microwave exposure at 1.5kW, 2.45GHz mono-mode cavity)
The uncovered microwave exposed samples shows iron-oxide predominantly as opposed
to an FeS phase suggesting rapid oxidation (Figures 11.5 and 11.6). It would also appear
that the Fe-oxide diffuses into the pyrite particle whilst sulphur diffuses toward the
surface, as illustrated in Figure 11.7.
212
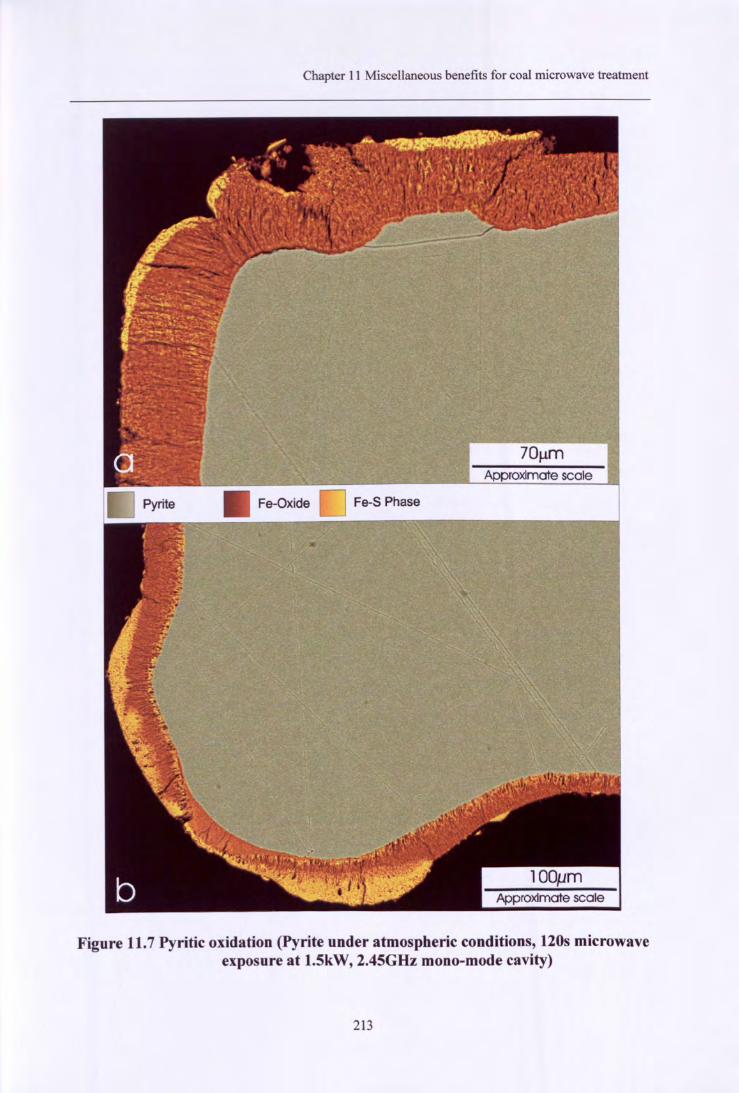
Chapter 11 Miscellaneous benefits for coal microwave treatment
Fe-S Phase
Figure 11.7 Pyritic oxidation (Pyrite under atmospheric conditions, 120s microwaveexposure at 1.5kW, 2.45GHz mono-mode cavity)
213
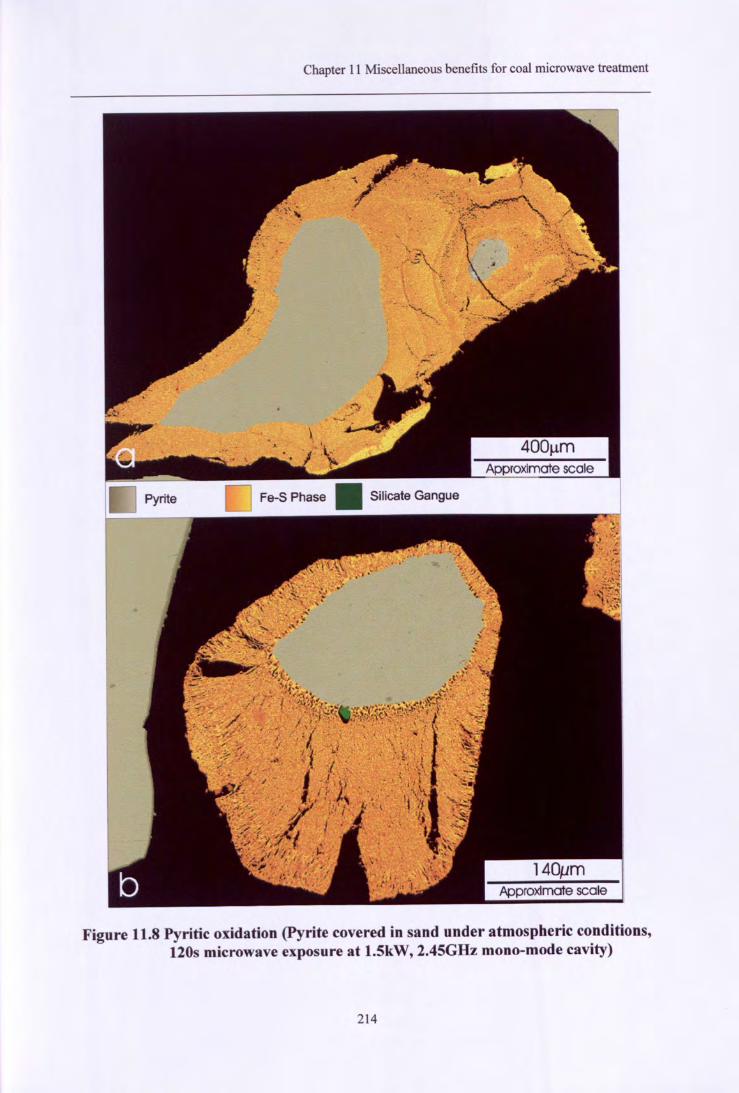
Chapter 11 Miscellaneous benefits for coal microwave treatment
,>?\l'~ ;
"""-"
Approximate scale
Figure 11.8 Pyritic oxidation (Pyrite covered in sand under atmospheric conditions,120s microwave exposure at 1.5kW, 2.45GHz mono-mode cavity)
214
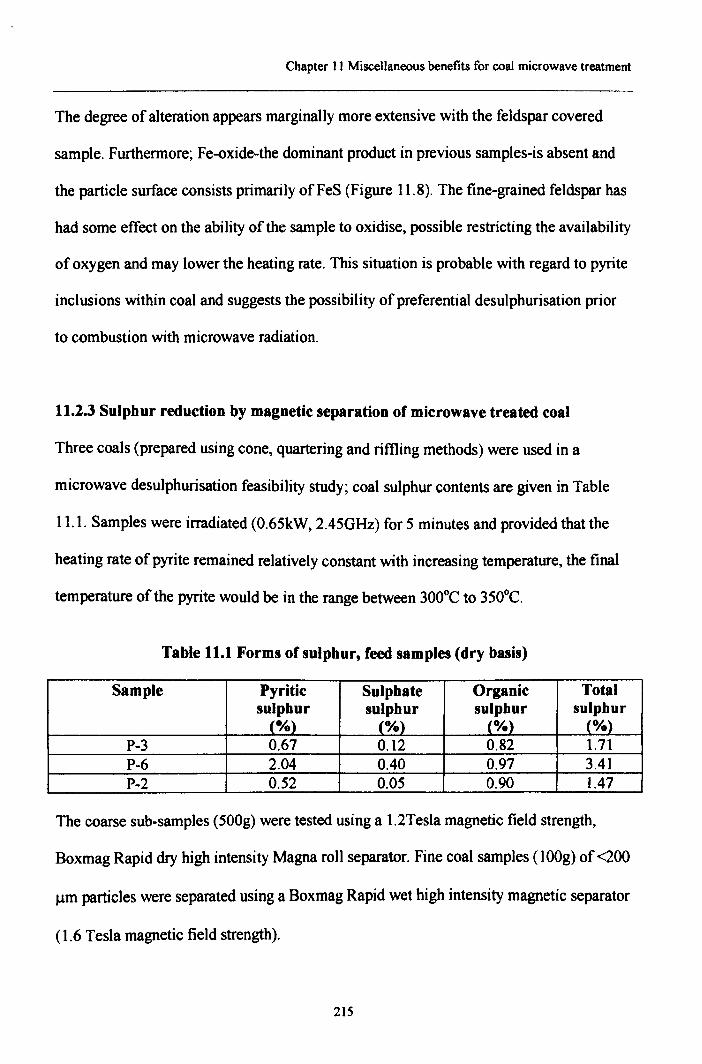
Chapter 11 Miscellaneous benefits for coal microwave treatment
The degree of alteration appears marginally more extensive with the feldspar covered
sample. Furthermore; Fe-oxide-the dominant product in previous samples-is absent and
the particle surface consists primarily ofFeS (Figure 11.8). The fine-grained feldspar has
had some effect on the ability of the sample to oxidise, possible restricting the availability
of oxygen and may lower the heating rate. This situation is probable with regard to pyrite
inclusions within coal and suggests the possibility of preferential desulphurisation prior
to combustion with microwave radiation.
11.2.3 Sulphur reduction by magnetic separation of microwave treated coal
Three coals (prepared using cone, quartering and riming methods) were used in a
microwave desulphurisation feasibility study; coal sulphur contents are given in Table
11.1. Samples were irradiated (0.65kW, 2.45GHz) for 5 minutes and provided that the
heating rate of pyrite remained relatively constant with increasing temperature, the final
temperature of the pyrite would be in the range between 300°C to 350°C.
Table 11.1 Forms of sulphur, feed samples (dry basis)
Sample Pyritic Sulphate Organic Totalsulphur sulphur sulphur sulphur(%) (%) (%1 (%)
P-3 0.67 0.12 0.82 1.71P-6 2.04 0.40 0.97 3.41P-2 0.52 0.05 0.90 1.47
The coarse sub-samples (SOOg)were tested using a 1.2Tesla magnetic field strength,
Boxmag Rapid dry high intensity Magna roll separator. Fine coal samples (1OOg)of <200
um particles were separated using a Boxmag Rapid wet high intensity magnetic separator
(1.6 Tesla magnetic field strength).
215
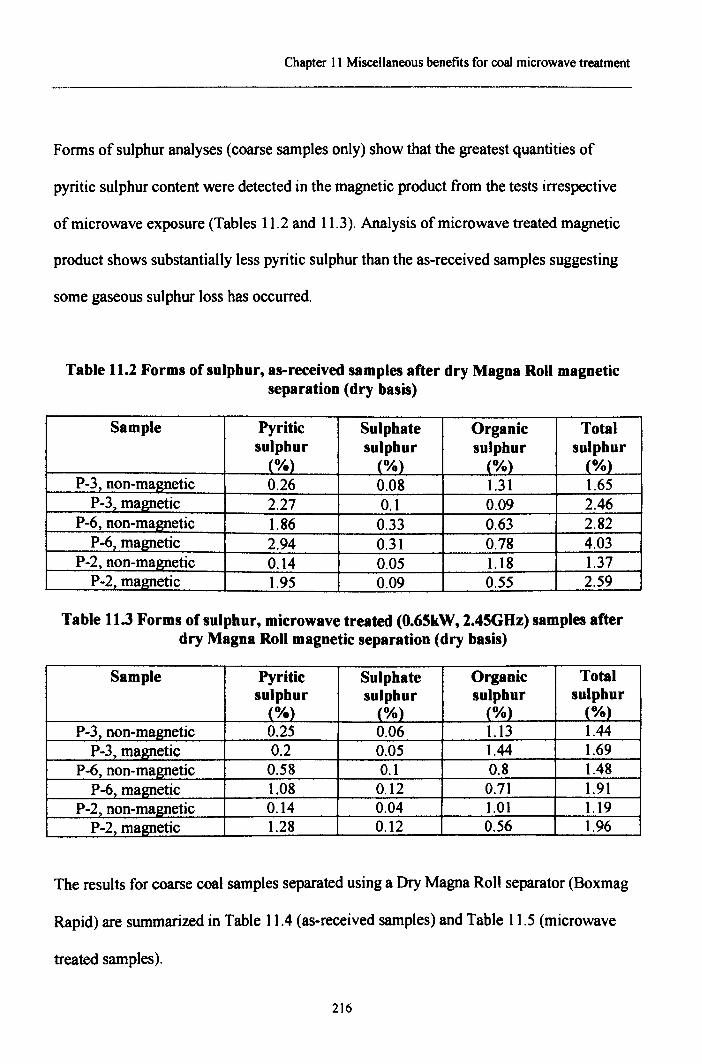
Chapter 11 Miscellaneous benefits for coal microwave treatment
Forms of sulphur analyses (coarse samples only) show that the greatest quantities of
pyritic sulphur content were detected in the magnetic product from the tests irrespective
of microwave exposure (Tables 11.2 and 11.3). Analysis of microwave treated magnetic
product shows substantially less pyritic sulphur than the as-received samples suggesting
some gaseous sulphur loss has occurred.
Table 11.2 Forms of sulphur, as-received samples after dry Magna Roll magneticseparation (dry basis)
Sample Pyritic Sulphate Organic Totalsulphur sulphur sulphur sulphur(%) (%) (%) (%)
P-3, non-magnetic 0.26 0.08 1.31 1.65P-3, magnetic 2.27 0.1 0.09 2.46
P-6, non-magnetic 1.86 0.33 0.63 2.82P-6, magnetic 2.94 0.31 0.78 4.03
P-2, non-magnetic 0.14 0.05 1.18 1.37P-2, magnetic 1.95 0.09 0.55 2.59
Table 11.3 Forms of sulphur, microwave treated (O.6SkW, 1.4SGHz) samples afterdry Magna Roll magnetic separation (dry basis)
Sample Pyritic Sulphate Organic Totalsulphur sulphur sulphur sulphur(%) (%} (%) (%)
P-3, non-magnetic 0.25 0.06 1.13 1.44P-3, magnetic 0.2 0.05 1.44 1.69
P-6, non-magnetic 0.58 0.1 0.8 1.48P-6, magnetic 1.08 0.12 0.71 1.91
P-2, non-magnetic 0.14 0.04 1.01 1.19P-2, magnetic 1.28 0.12 0.56 1.96
The results for coarse coal samples separated using a Dry Magna Roll separator (Boxmag
Rapid) are summarized in Table 11.4 (as-received samples) and Table 11.5 (microwave
treated samples).
216
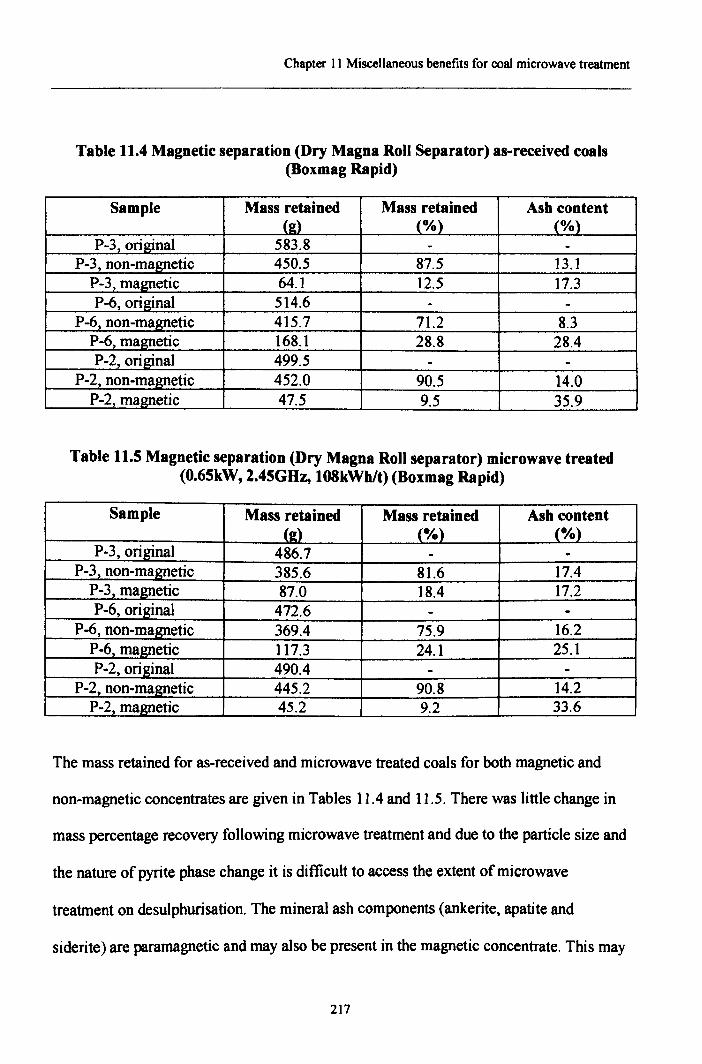
Chapter 11Miscellaneous benefits for coal microwave treatment
Table 11.4 Magnetic separation (Dry Magna Roll Separator) as-received coals(Boxmag Rapid)
Sample Mass retained Mass retained Ash content(g) (%) (%)
P-3, original 583.8 - -P-3, non-magnetic 450.5 87.5 13.1
P-3, magnetic 64.1 12.5 17.3P-6, original 514.6 - -
P-6, non-magnetic 415.7 71.2 8.3P-6, magnetic 168.1 28.8 28.4P-2, original 499.5 - -
P-2, non-magnetic 452.0 90.5 14.0P-2, magnetic 47.5 9.5 35.9
Table 11.5 Magnetic separation (Dry Magna Roll separator) microwave treated(O.6SkW,2.4SGHz, l08kWhlt) (Boxmag Rapid)
Sample Mass retained Mass retained Ash content(2) (%) (%)
P-3, original 486.7 - -P-3, non-magnetic 385.6 81.6 17.4
P-3, magnetic 87.0 18.4 17.2P-6, original 472.6 - -
P-6, non-magnetic 369.4 75.9 16.2P-6. magnetic 117.3 24.1 25.1P-2, original 490.4 - -
P-2, non-magnetic 445.2 90.8 14.2P-2, magnetic 45.2 9.2 33.6
The mass retained for as-received and microwave treated coals for both magnetic and
non-magnetic concentrates are given in Tables 11.4 and 11.5. There was little change in
mass percentage recovery following microwave treatment and due to the particle size and
the nature of pyrite phase change it is difficult to access the extent of microwave
treatment on desulphurisation. The mineral ash components (ankerite, apatite and
siderite) are paramagnetic and may also be present in the magnetic concentrate. This may
217
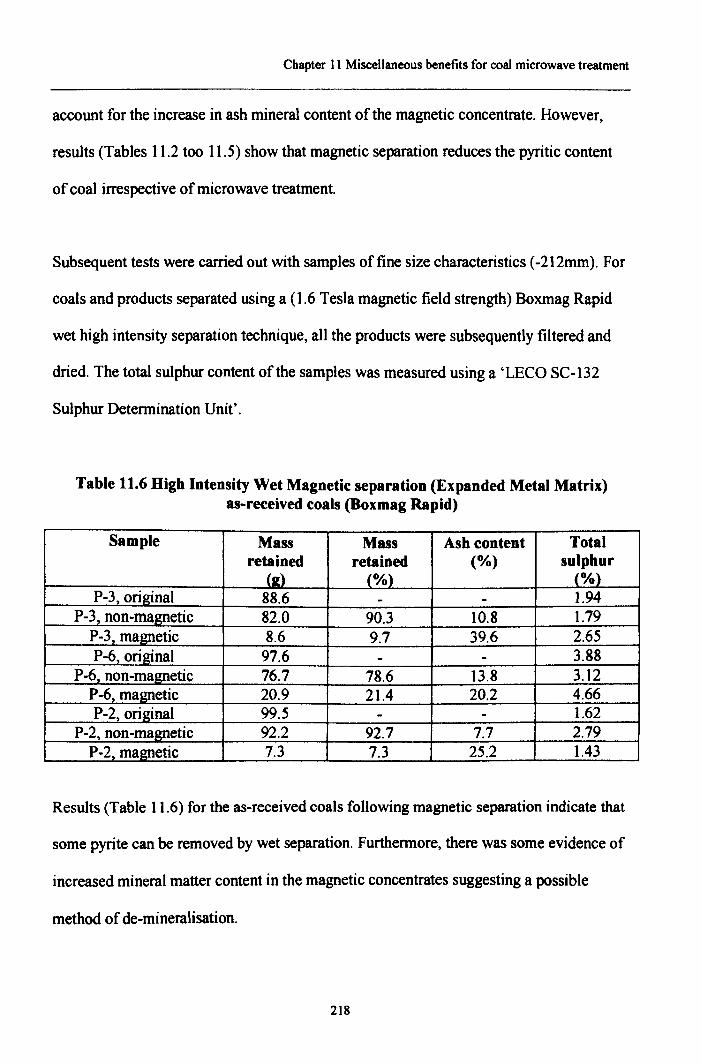
Chapter 11Miscellaneous benefits for coal microwave treatment
account for the increase in ash mineral content of the magnetic concentrate. However,
results (Tables 11.2 too 11.5) show that magnetic separation reduces the pyritic content
of coal irrespective of microwave treatment.
Subsequent tests were carried out with samples of fine size characteristics (-212mm). For
coals and products separated using a (1.6 Tesla magnetic field strength) Boxmag Rapid
wet high intensity separation technique, all the products were subsequently filtered and
dried. The total sulphur content of the samples was measured using a 'LECO SC-132
Sulphur Determination Unit'.
Table 11.6 High Intensity Wet Magnetic separation (Expanded Metal Matrix)as-received coals (Boxmag Rapid)
Sample Mass Mass Ash content Totalretained retained (0/0) sulphur
CId (%) (%)P-3. original 88.6 - - 1.94
P-3, non-magnetic 82.0 90.3 10.8 1.79P-3, magnetic 8.6 9.7 39.6 2.65P-6, original 97.6 - - 3.88
P-6, non-magnetic 76.7 78.6 13.8 3.12P-6, magnetic 20.9 21.4 20.2 4.66P-2. original 99.5 - - 1.62
P-2, non-magnetic 92.2 92.7 7.7 2.79P-2. magnetic 7.3 7.3 25.2 1.43
Results (Table 11.6) for the as-received coals following magnetic separation indicate that
some pyrite can be removed by wet separation. Furthermore. there was some evidence of
increased mineral matter content in the magnetic concentrates suggesting a possible
method of de-mineralisation.
218
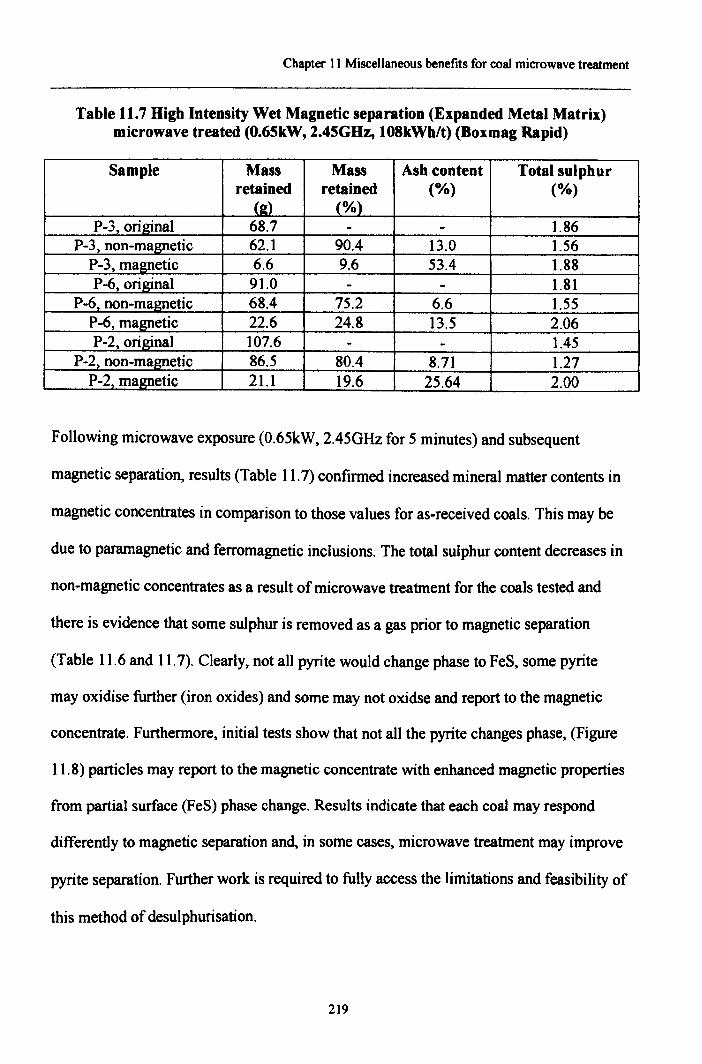
Chapter 11Miscellaneous benefits for coal microwave treatment
Table 11.7 High Intensity Wet Magnetic separation (Expanded Metal Matrix)microwave treated (O.65kW,2.45GHz, l08kWh/t) (Boxmag Rapid)
Sample Mass Mass Ash content Total sulphurretained retained (%) (%)
(ad (%)P-3. original 68.7 - - 1.86
P-3, non-magnetic 62.1 90.4 13.0 1.56P-3, magnetic 6.6 9.6 53.4 1.88P-6. original 91.0 - - 1.81
P-6. non-magnetic 68.4 75.2 6.6 1.55P-6, magnetic 22.6 24.8 13.5 2.06P-2, original 107.6 - - 1.45
P-2, non-magnetic 86.5 80.4 8.71 1.27P-2, magnetic 21.1 19.6 25.64 2.00
Following microwave exposure (0.65kW, 2.45GHz for 5 minutes) and subsequent
magnetic separation, results (Table 11.7) confirmed increased mineral matter contents in
magnetic concentrates in comparison to those values for as-received coals. This may be
due to paramagnetic and ferromagnetic inclusions. The total sulphur content decreases in
non-magnetic concentrates as a result of microwave treatment for the coals tested and
there is evidence that some sulphur is removed as a gas prior to magnetic separation
(Table 11.6 and 11.7). Clearly, not all pyrite would change phase to FeS, some pyrite
may oxidise further (iron oxides) and some may not oxidse and report to the magnetic
concentrate. Furthermore, initial tests show that not all the pyrite changes phase, (Figure
11.8) particles may report to the magnetic concentrate with enhanced magnetic properties
from partial surface (FeS) phase change. Results indicate that each coal may respond
differently to magnetic separation and, in some cases, microwave treatment may improve
pyrite separation. Further work is required to fully access the limitations and feasibility of
this method of desulphurisation.
219
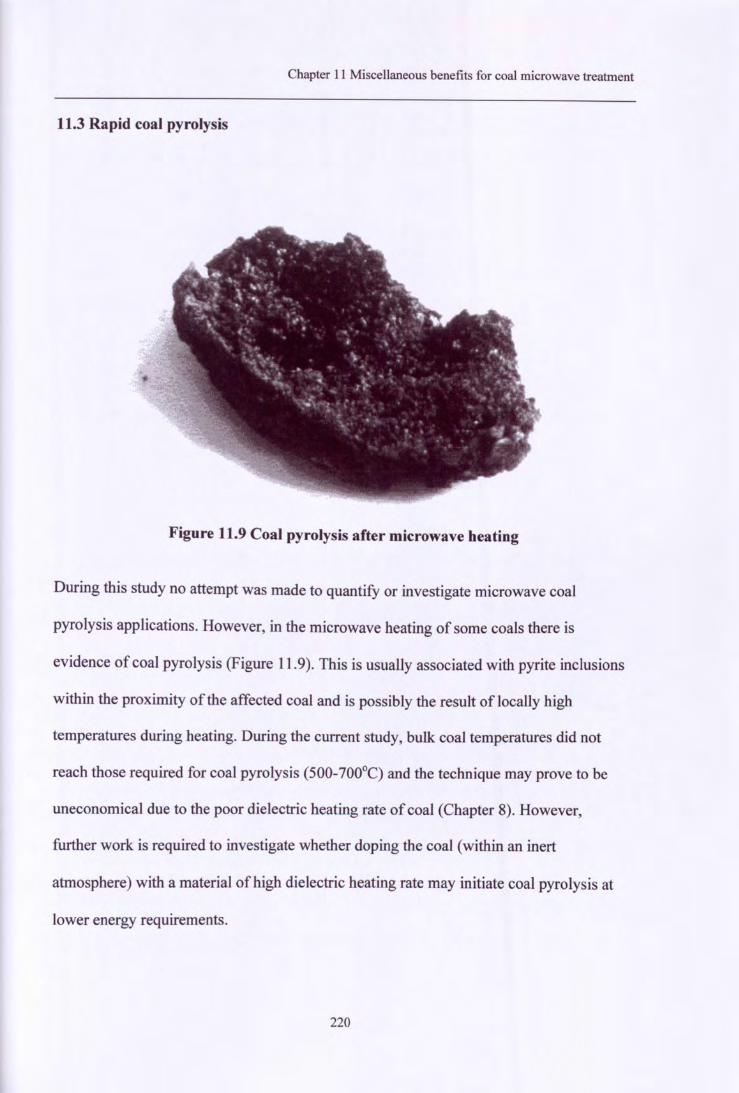
Chapter 11 Miscellaneous benefits for coal microwave treatment
11.3 Rapid coal pyrolysis
Figure 11.9 Coal pyrolysis after microwave heating
During this study no attempt was made to quantify or investigate microwave coal
pyrolysis applications. However, in the microwave heating of some coals there is
evidence of coal pyrolysis (Figure 11.9). This is usually associated with pyrite inclusions
within the proximity of the affected coal and is possibly the result of locally high
temperatures during heating. During the current study, bulk coal temperatures did not
reach those required for coal pyrolysis (500-700°C) and the technique may prove to be
uneconomical due to the poor dielectric heating rate of coal (Chapter 8). However,
further work is required to investigate whether doping the coal (within an inert
atmosphere) with a material of high dielectric heating rate may initiate coal pyrolysis at
lower energy requirements.
220
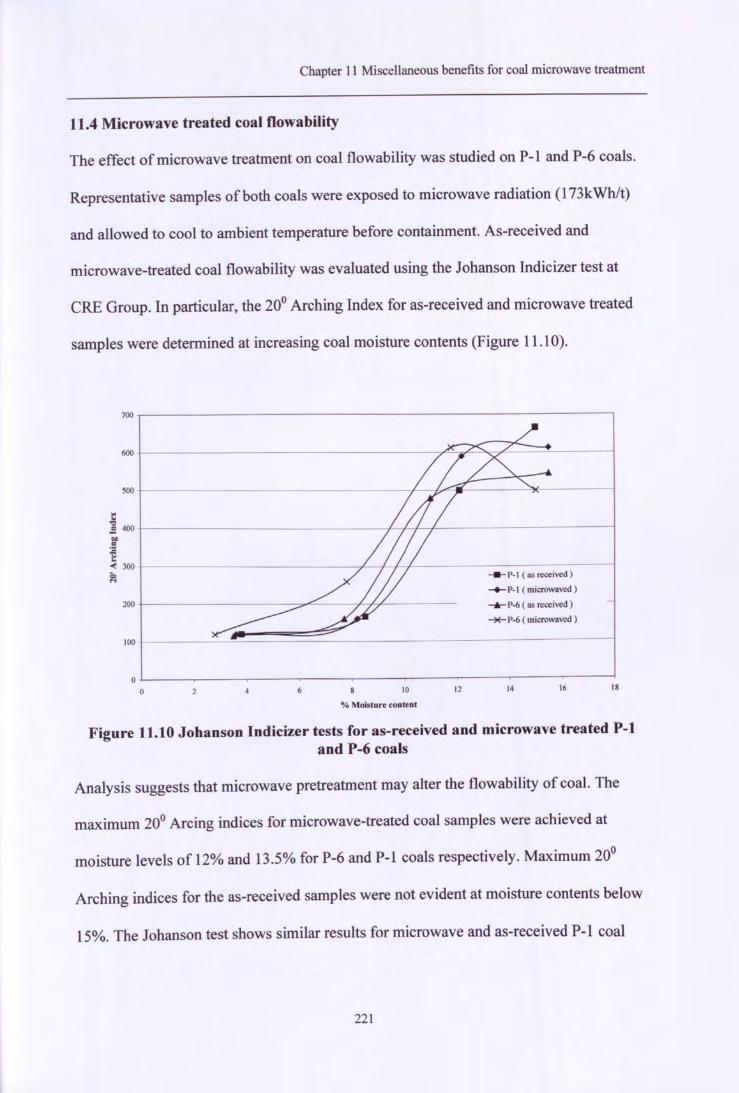
Chapter 11 Miscellaneous benefits for coal microwave treatment
11.4 Microwave treated coal flowability
The effect of microwave treatment on coal flowability was studied on P-l and P-6 coals.
Representative samples of both coals were exposed to microwave radiation (173kWhlt)
and allowed to cool to ambient temperature before containment. As-received and
microwave-treated coal flowability was evaluated using the Johanson Indicizer test at
eRE Group. In particular, the 20° Arching Index for as-received and microwave treated
samples were determined at increasing coal moisture contents (Figure 11.10).
700
600
500
~..,oS 400..":s....< 300;:,....
200
100
00
____ P-1 ( as received)
-+-P-l (microwaved)_._ P-6 ( as received)
-"*"" P-6 (microwaved)
10 12 14
0/. Moisture content
16 18
Figure 11.10 Johanson Indicizer tests for as-received and microwave treated P-land P-6 coals
Analysis suggests that microwave pretreatment may alter the flowability of coal. The
maximum 20° Arcing indices for microwave-treated coal samples were achieved at
moisture levels of 12% and 13.5% for P-6 and P-l coals respectively. Maximum 20°
Arching indices for the as-received samples were not evident at moisture contents below
15%. The Johanson test shows similar results for microwave and as-received P-l coal
221
Chapter II Miscellaneous benefits for coal microwave treatment
initially with as-received samples exhibiting a higher 200 Arching Index at increased
moisture levels due to the microwaved sample reaching a maximum. In contrast,
microwave treated P-6 coal exhibited an increasing 20° Arching Index at lower moisture
levels compared to as-received P-6 coal. Results (Figure 11.10) for P-6 coal also shows
that P-6 microwaved coal exhibited a lower 20° Arching Index at moisture levels greater
than 14%. A possible explanation may be associated to particle surface area which
increases following microwave exposure (Chapter 7). The generation of surface cracks on
coal by microwave radiation may affect particle flowability as the particles may be
capable of retaining greater quantities of moisture; forming 'bridges' to other particles.
Hence, the microwave treated coal would become 'sticky' at lower moisture levels than
as-received coal. The effect of microwave treatment on coal flowability would therefore
depend on the generation of cracks produced by the heat treatment. It would be expected
that the greater the quantity of surface cracks produced by pretreatment the more
significant the deviation in flowability characteristics from the as-received coal.
11.5 Conclusion- Microwave beneficiation to improve handleability
Experimental work has shown that the use of microwave treatment may have some use in
partial desulphurisation of coals with high pyrite contents. In particular, the potential
mechanism for partial oxidation has been discussed and shows that not all the pyrite
inclusion need be oxidised for magnetic separation. Mineralogical analysis has indicated
that not all coal particles contain pyritic inclusions and shows the average grain size of
pyrite inclusion were between 20-40J.lm for the tested coal. Further work would be
needed with selecting suitable coals, which may benefit from microwave pyritic
222
Chapter 11 Miscellaneous benefits for coal microwave treatment
reduction and the optimisation of a microwave enhanced magnetic separation process. In
particular the feed size, pyrite particle size, microwave operating conditions and magnetic
separation conditions require further investigation to gain a better understanding of this
method of desulphurisation.
Fundamental studies have shown that there is a significant change in the flow
characteristics of coals following microwave exposure. The possibility may exist for
improved coal flow and further work is necessary to access the viability of such a
process.
Coal pyrolysis has been observed during microwave tests, previous work has suggested
the use of microwave energy as a method of rapid coal pyrolysis (Monsef-Mirzai 1995)
and may present a method of coal removal from shale tailings.
223
CHAPTER TWELVE
CONCLUSION AND RECOMMENDATIONS FOR FURTHERWORK
12.1 Conclusions and recommendations for further work
Experimental results (Chapter 6 and 7) have shown that microwave irradiation can
significantly affect the grindability of coals. Results have shown a 40-50% reduction in
Relative Work Index, particularly for low rank coals (Chapter 7). Fundamental studies
indicate that each individual coal has an optimum microwave energy requirement for
maximum improvement in coal grindability. Analysis (Chapter 6 and 7) suggest that coal
composition, in particular, mineral matter and inherent moisture contribute to the
mechanisms responsible for producing the weaknesses within the coal structure during
microwave exposure. The differential heating rates and associated expansion rate of the
constituent mineral matter in coal is believed to be the principle mechanism for
microwave-improved grindability (Chapter 9). Results (Chapter 6) have also shown that
microwave grindability also depends upon initial particle size and feed size distribution;
but factors may effect mill performance. Microwave input power, sample load and
exposure time may be varied with little change in the reduction in RWI at constant
energy per unit mass (Chapter 10).
Dielectric measurement (Chapter 8) has shown that electric permittivity decreases with
coal rank (dry, mineral free basis). However, the moisture and mineral matter content
may increase the bulk electric permittivity of the coal. Permittivity is relatively high for
224
Chapter 12 Conclusion and recommendations for further work
low rank coals as a result of the increased inherent moisture levels for such coals. The
relative real permittivity of coal is greater than that of many of the mineral matter forms
associated with coals. However, one exception is pyrite which if present in sufficient
quantity, may increase the bulk permittivity of coal. Dielectric properties and
mineralogical composition could be used to indicate how a coal would respond to
microwave treatment i.e. in terms of heating rate and changes in grindability.
Pilot-scale tests demonstrated that the microwave treatment process could be scaled up
providing a better understanding of the process. Results (Chapter 10) showed some
improvement between the 5 to O.5mm size range and generated less fines during Barmac
Rock on Rock tests. Mill performance varied depending upon the predominant breakage
mode in the different mills and the extent of microwave treatment of the coals. Any
further tests should take into consideration the mill design and operating features. An
economic evaluation based upon the pilot-scale data and rod mill grindability tests
indicated that a gross energy input of 420kWhlt was required for the microwave
treatment. This current economic balance is not favourable in comparison to mill energy
requirements of 20-40kWhlt for PF generating mills in industry (Spiers 1950). However,
the microwave treatment process has not been optimised and further work is necessary in
this field.
The current tests were carried out using multi-mode microwave cavity units which
exhibit low electrical to microwave power conversion efficiencies. In particular, the pilot-
scale microwave unit required 12.4kW power draw to supply 6.6kW to the cavity. Higher
225
Chapter 12 Conclusion and recommendations for further work
efficiencies (80-90%) may be possible using mono-mode cavity designs and tests are
needed to determine if grindability improvements can be duplicated or enhanced within
such cavities. The factors which influence the microwave power absorption include, (i)
the choice of a coal with a high loss factor and (ii) increased electric field strength
distribution possibly at lower applied frequencies. For current tests. the applied frequency
was 2.4SGHz. dielectric measurements (Chapter 8) show little variation of the dielectric
properties of coal with increased frequency. However. penetration depth decreases with
increasing frequency and appropriate sample presentation may become necessary. Cavity
design has a significant influence on power absorption and a specification meeting the
requirements of coal treatment may result in an improvement in the efficiency of coal
microwave processing and reduce capital and operating costs.
The current study has also demonstrated the potential use of microwave energy as a
method of coal desulphurisation. Further work is required to investigate the feasibility
and optimisation of this technique for the desulphurisation and demineralisation of coal.
226
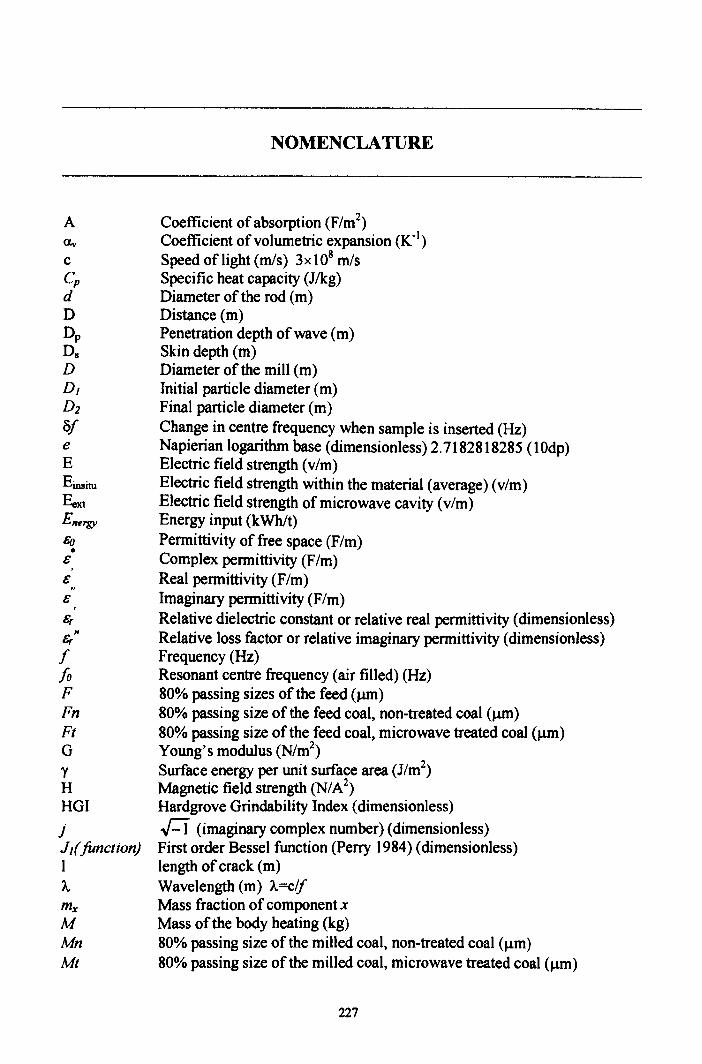
NOMENCLATURE
A<Xv
C
c,dDDpDsDDJDJSfeEEinsituEext
Energy
Eo•eeeSrSrn
f/0FFnFtG'(HHOIjJ/( function)IA.mxMMnMt
Coefficient of absorption (F1m2)Coefficient of volumetric expansion (K" 1)Speed of light (mls) 3x10⁸ mlsSpecific heat capacity (J/kg)Diameter of the rod (m)Distance (m)Penetration depth of wave (m)Skin depth (m)Diameter of the mill (m)Initial particle diameter (m)Final particle diameter (m)Change in centre frequency when sample is inserted (Hz)Napierian logarithm base (dimensionless) 2.7182818285 (1Odp)Electric field strength (vim)Electric field strength within the material (average) (vim)Electric field strength of microwave cavity (vim)Energy input (kWhlt)Permittivity of free space (F/m)Complex permittivity (F1m)Real permittivity (F/m)Imaginary permittivity (F/m)Relative dielectric constant or relative real permittivity (dimensionless)Relative loss factor or relative imaginary permittivity (dimensionless)Frequency (Hz)Resonant centre frequency (air filled) (Hz)80% passing sizes of the feed (J.UIl)80% passing size of the feed coal, non-treated coal (J.UIl)80% passing size of the feed coal, microwave treated coal (J.U1l)Young's modulus (N/m2)
Surface energy per unit surface area (J/m2)Magnetic field strength (NIA2)Hardgrove Grindability Index (dimensionless)R (imaginary complex number) (dimensionless)First order Bessel function (Perry 1984) (dimensionless)length of crack (m)Wavelength (m) A.=c/fMass fraction of component xMass of the body heating (kg)80% passing size of the milled coal, non-treated coal (J.1m)80% passing size of the milled coal, microwave treated coal (J.1m)
227
Nomenclature
J.1o Permeability of a vacuum (NIA2)J.l" Permeability (N/A2)N Number of moles in fluid (kmol)Qc Dielectric conductivity (Sin)P 80% passing sizes of the product (urn)P Power absorbed (W/m3)Po Power absorbed (W)Pg Pressure of gas (N/m2)Q Energy absorbed or produced (W)91 Original temperature (OC)92 Final temperature eC)() Change in temperature (DC)R Universal gas constant (8.314kJlkmol K)RWl Relative Work Index (%)r Radius of particle (m)rcavity Radius of the resonant cavity (m)re Coefficient of reflection (dimensionless)Rr Reduction ration (FIP)p Density of material (kg/m')Px Density of component x (kg/m')t Change in time (s)Tg Temperature of gas (K)t' Constant approximated as 0.25 (dimensionless)V Voltage (v)Vg Volume of gas (m')VI Original volume (m')V2 Final volume (rrr')V Volume of material (nr')Vc Critical speed (rev/min)Vcavity Volume of cavity (m')V"ample Volume of sample (m2)
W Work input per tonne (kWhlt)Wi Bond Work Index (kWhlt)(J) Angular frequency (s -1)(Xl,m) Function of the air filled cavity (dimensionless)
228
REFERENCES
Andres K. et a1.Electrical Properties ofMetal Filled Composites. ASM Internationalmeeting. Chicago. (1988).
Andres J.M. et al.Chemical Desulphurization oJCoal with Hydroiodic Acid. Energy &Fuels. Vo-lO, No-2, pp425-430. (1996).
Balanius C.A et a1.Microwave measurements oJcoal. Radio Science. Vo-II. No-4,pp413-418. (1976).
Balanius C.A Electrical properties oj coal at microwave frequencies for monitoring.American Institute of Physics. Vo-5, ppI75-195. (1981).
Bates AJ. The Interaction oJCoal with Microwave Energy - A Literature Review. FirstAustralian Symposium on Microwave Power. pp84-115. (1989).
Batt J. et at A parallel measurement programme in high temperature dielectric propertymeasurements: an update. Microwaves III. pp243-250. (1992).
Berry T.F. Bruce R.W. A simple method oj determining the grindability of ores. CanadianMining Journal. July. (1966).
Bluhm D.O. Selective magnetic enhancement of pyrite in coal by dielectric heating.Patent No 15-4766 EDB-01300. (1982).
Bond F.C. The Third Theory of Comminuuon. Mining Engineering-Transactions AIME.May. pp484-494. (1952).
Bond F.C. Crushing & grinding calculations - Part I. British Chemical Engineering. Vo-6, No-6, June. pp378-385. (1961).
Bond F.C. Crushing and grinding calculations - Part II. British Chemical Engineering.Vo-6, No-8, August. pp543-548. (1961).
British Standards 1016. British Standards Institution. 2 Park St, London, WIA 2B8,England. (1981).
British Standards 1017. British Standards Institution. 2 Park St. London. WIA 2BS,England. (1981).
Brown J.H. Intergranular Comminution by Heating. Mining Engineering. Vo-IO. pp490.(1958).
229
References
Butcher D.A. Desulphurisation of coal in intensified fields. Ph.D. Thesis. University ofBirmingham. Birmingham, B15 2TT, England. (1994).
Butcher D.A. The Desulphurisation of Coal Using Microwave Energy. The 1995 IChemEResearch Event. Vo-I. pp-580-582. (1995).
C.E.G.B. (Central Electricity Generating Board). Modern Power Station Practice.Publisher-Pergamon Press. Vo-B. (1971).
C.E.G.B. (Central Electricity Generating Board). Modern Power Station Practice.Publisher-Pergamon Press. Vo-G. (1971).
Catala-Civera lM. et al. Microwaves in GCM Valencia. Ampere Newsletter. Issue 15,December, ppl-S, (1997).
Chatterjee I. & Misra M. Electromagnetic and thermal modeling of microwave drying offine coal. Minerals and Metallurgical Processing. May. ppllO-114. (1991).
Chelkowski A. Dielectric Physics. Publisher-Elsevier Science. (1980).
Chen T.T. et al. The relative transparency of minerals to microwaves. CanadianMetallurgical Quarterly. Vo-23. No-3. pp349-35I. (1984).
Chironis N.P. Microwave dry fine coal. Coal age. December. ppI60-176. (1986).
Church RH. et al. Dielectric properties of low loss materials. US Bureau of MiningReport of Investigations 9194. (1993).
Clark S.P. Handbook of Physical Constants. Publishers-The Geographical Society ofAmerica. (1966).
Couch G.R Power from coal-where to remove impurities? lEA Coal Research.IEACRl82. (1995).
Cross T. Personal Communication. University of Nottingham. Nottingham, NG7 2RD,England. (2000).
Cutmore N.G. and Sowerby B.D. On-line determination of moisture in coal and coke.Coal Power-AUSIMM annual conference. pp397-406. (1987).
Dobson RM. et al. A Review of Microwaves in the Minerals Industry. MEngDissertation. University of Birmingham, B IS 2TT, England. (1991).
D.T.1. (Department of Trade and Industry). Cleaner Coal Technologies-Energy Paper 67.Publisher-The Stationary Office. London, England. (1999).
230
References
D.T.I. (Department of Trade and Industry). Digest of UK Energy Statistics. Publisher-Government Statistical Service. London, England. (1999).
Elliot M.A. Chemistry of Coal Utilization. Publisher-Wiley-Iterscience. (1981).
Florek 1et al. The Influence of Complex Electric Permittivity and Grain size onMicrowave Drying of Fine Grained Minerals. Fizykochemicze Problemy Mineralurgii.No-29. ppI27-133. (1995).
Florek 1et al. The measurement of complex electric permittivity of fine grained mineralsat microwave frequencies. 31st Microwave Power Symposium. Boston, USA. (1996).
Gasner L.L. et al. Microwave and conventional pyrolysis of a bituminous coal. ChemicalEngineering Communication. Vo-48. pp349-354. (1986).
Greenache N.R. Measurement of the high temperature dielectric properties of ceramicsat microwave frequencies. Ph.D. Thesis. University of Nottingham. Nottingham,NG7 2RD, England. (1996).
Hall D.A. et al. The Rapid Determination of Moisture in Coal Using Microwaves-Part 2.Journal of the Institute of Fuel. ppI63-167. (1972).
Hardgrove R.M. Standard test methodfor the grind ability of coal by the Hardgrovemachine method. ASTM. No-14.02.D409.93a. (1932).
Harris L.A. and Yust C.S. Transmission electron microscope observations of porosity incoal. Fuel. Vo-55. pp233-236. (1976).
Harrison P.C. and Rowson N.A. A Fundamental Study of the Effects of2.45GHzMicrowave Radiation on the Properties of Minerals. IChemE Research Event. (1995)
Harrison P.C. and Rowson N.A. The use of dielectric heating to alter mineral properties.IChemE Research Event. (1996)
Harrison P.C. and Rowson N.A. The effect of microwave and conventional heat treatmenton the comminution of coal. IChernE Research Event. (1997)
Harrison P.C. A Fundamental Study of the Effects of2.45GHz Microwave Radiation onthe Properties of Minerals. Ph.D. Thesis. University of Birmingham. Birmingham, B 152TT, England. (1997).
Hayashi 1.1 et al. The role of microwave irradiation in coal desulphurisation with moltencaustics. Fuel. Vo-69. June. (1990),
231
References
Herbst J.A Communication and Energy Consumption. National Advisory Board-364.Washington DC, USA (1981).
Hill R. Personal Communication. Powergen, Power Technology. Ratcliffe-on-Soar,Nottingham, NG 11 OEE, England. (2000).
Holman B.W. Heat Treatment as an Agent in Rock Breaking. Transactions !MM. Vo-26.pp219-256. (1927).
Hulls P. Dielectric Heatingfor Industrial Processes. Publisher-U.I.E. (1992).
Ishii T.K. Handbook of Microwave Technology. Vo-2. Publisher- Academic Press.(1995).
Jacobs M.L. A Preliminary Investigation ofmicrowave Drying of Coal samplesforLaboratory Analysis. Instrumentation. pp 12-16. (1984).
Kalinski J. An industrial Microwave Attenuation Monitor (MAM). Journal of MicrowavePower. Vo-l3. pp275-281. (1978).
Kelland D.R. et at HGMS coal desulphurization with microwave magnetizationenhancement. IEEE Transactions on Magnetics. Vo-24. No-6. pp2434-2436. (1988).
Kick F. Des Gesetz der Proportionalem widerstand und Seine Anwendung. Felix.Leipzig. (1885).
Kingman S.W. The effect of microwave radiation upon the comminution andbeneficiation of minerals. Ph.D. Thesis. University of Birmingham. Birmingham, B 152TT, England. (1998).
Kingman S.W. and Rowson N.A Microwave Treatment of Minerals-A Review. MineralsEngineering. Vo-l1. No-II. pp 1081-1 087. (1998).
Kingman S.W. et at The Influence of Mineralogy on Microwave Assisted Grinding.Minerals Engineering. Vo-l3. No-3. pp313-327. (1999).
Knache O. et al. Thermochemical Properties of Inorganic Compounds. Publishers-Springer-Verlag. (1991).
Kraszewski AW. and Nelson S.D. Microwave properties of powdered coal mixtures. 7thInternational Conference on Microwave and High Frequency Heating. pp71-73. (1999).
Larry L. et aI. Microwave and Conventional Pyrolysis of a Bituminous Coal. ChemicalEngineering Communication. Vo-48. pp349.354. (1986).
232
References
Lindroth D.P. Microwave drying affine coal. US Bureau of Mines Report. No-9005.(1986).
Lowrison G.C. Crushing and Grinding. Publishers-Butterworths. London. (1974).
Lytle J. et al. Influence of Preheating on Grindability of Coal. International Journal ofMineral Processing. Vo-36. ppl07-112. (1992).
Masayuki A et al. Use of Mixture Equations for Estimating Theoretical ComplexPermittivities from Measurements on Porous or Powder Ceramic Specimens. Journal ofApplied Physics. Vo-34. No-12A pp6463-6467. (1995).
Mayer. et al. The methods of the solution of electrical and magnetic fields. SNTLIALFA.Praha. (1983).
McGill S.L. et al. The effect of Power Level on the Microwave Heating of SelectedChemicals and Minerals. Materials Research Society Proceedings. Vo-124. pp247-252.(1988).
McIntyre A. and Plitt L.R. The interrelationship between Bond and Hardgrovegrind abilities. Mineral Engineering Bulletin. ppI49-155. (1980).
Metaxas A.C. and Meredith RC. Industrial microwave heating. lEE Power EngineeringSeries 4. Publishers-Peter Peregrimms. (1983).
Metaxas,A.C. and BinnerJ.G.P, Advanced ceramic processing and Technology. (1990)
Monsef-Mirzai P. and Ravindran M. The use of microwave heatingfor the pyrolysis ofcoal via inorganic receptors of microwave energy. Fuel. Vo-71. pp716-717. (1992).
Monsef-Mirzai P. et al. Rapid microwave pyrolysis of coal. Fuel. Vo-74. pp20-27.(1995).
Moses AJ. Practical Field Geology. Publishers-McGraw Hill. (1912).
Nadkarni R.A. Applications of microwave oven sample dissolution in analysis. AnalyticalChemistry. Vo-56. pp2233-2237. (1984).
Nelson S.O. et al. Dielectric properties of selected and purified minerals at 1 to 22GHz.Journal of Microwave Power. Vo-24. No-4. pp213-231. (1989).
Nelson S.O. Determining Dielectric Properties of Coal and Limestone by Measurementson Pulverized Samples. Journal of Microwave Power & Electromagnetic Energy. Vo-3!.No-4. pp215-220. (1996).
233
References
Perry R.H. Perry's Chemical Engineering Handbook. 6th Edition. Publisher-McGrawHill. (1984).
Reynolds I.M. Personal Communication. Rio Tinto Technology Development, Clevedon,North Somerset, BS21 6XU, England. (2000).
Roberts. Molecular recognition: Chemical and Biochemical problems. Royal Society ofChemistry. (1989).
Rowson N.A. Coal Desulphurisation by Microwave Energy. Ph.D. Thesis. University ofBirmingham. Birmingham, B15 2TT, England. (1986).
Rowson N.A. and Rice N.M. Technical note, desulphurisation of coal using low powermicrowave energy. Minerals Engineering. Vo-3. No-314. pp363-368. (1990).
Rowson N.A. and Rice N.M. Magnetic enhancement of pyrite by caustic microwavetreatment. Minerals Engineering. Vo-3. No-3/4. pp355-361. (1990).
Salsman J.B. Short pulse microwave treatment of disseminated sulfide ores. MineralsEngineering. Vo-9. pp43-54. (1996).
Spiers HM. Technical data onfuel. Publishers-The British National Committee-WorldPower Conference. (1950).
Standish N. et al. Microwave drying of brown coal agglomerates. Coal Corporation ofVictoria. (1989).
Standish N. Unusual effects of microwave irradiation in granular materials. FirstAustralian Symposium on Microwave Power Applications. Wollongong. pp227-234.(1989).
Veasey T.J. and Fitzgibbon K.E. Thermally assisted liberation. Minerals Engineering.Vo-3. No-1I2. ppI81-185. (1990).
Viswanathan M. Investigation on the effect of microwave pretreatment oncomminution/beneficiation and desulphurisation of coals. International Coal PreparationCongress. Tokyo 1990. ppI51-155. (1990).
Von Hippel A. Dielectric Materials and Applications. Publishers-John Wiley and Sons.New York, USA. (1954).
Walkiewicz J.W. et al. Microwave Heating Characteristics of Selected Minerals andCompounds. Minerals and Metallurgical Processing. (1988).
Walkiewicz J.W. et al. Microwave Assisted Grinding. IEEE Transactions on IndustryApplications. Vo-27. No-2. pp239-242. (1991).
234
References
Wills B.A. Mineral Processing Technology. 5th Edition. Publishers-Pergamon. (1992).
Yang J.K. and Wu Y.M. Relationship between dielectric property and desulphurisationof coal by microwaves. Fuel. Vo-66. ppI745-1747. (1987).
Yates A. Effect of heating and quenching Cornish Tin ores before crushing. TransactionsIMM. Vo-28. pp41-44. (1919).
Young R. J. Thermally Assisted Commiution. MRes Dissertation. University ofBirmingham. B 15 2TT, England. (1997)
Young R.J. and Veasey TJ. Application of the Ring-Loaded Strength (RLS) disc test tomonitor the effects of thermal pre-treatments on ore grindability. Mineral Processing. Vo-13, No-7. pp783-787. (2000).
Zhong S. et al. Reduction of iron ore with coal by microwave heating. Minerals andMetallurgical Processing. pp 174-179. (1996).
Zavitsansos P.O. Coal desulphurization using microwave energy. Patent No EPA-60017-70-089. (1979).
Zavitsansos P.D. Coal desulphurization by a microwave process. Patent No DOE.PC30142-71. (1981).
235
APPENDIX A
SUMMARY OF ANALYSIS TECHNIQUES
Proximate analysis (BS 101 part 3)
Calorific Value (BS 1016 part 5)
Ultimate analysis (BS 1016 part 6)
Forms of sulphur analysis (BS 1016 part 11)
Ash analysis (BS 1016 part 15)
Normative analysis
A-2
A-4
A-6
A-7
A-8
A-8
A-I
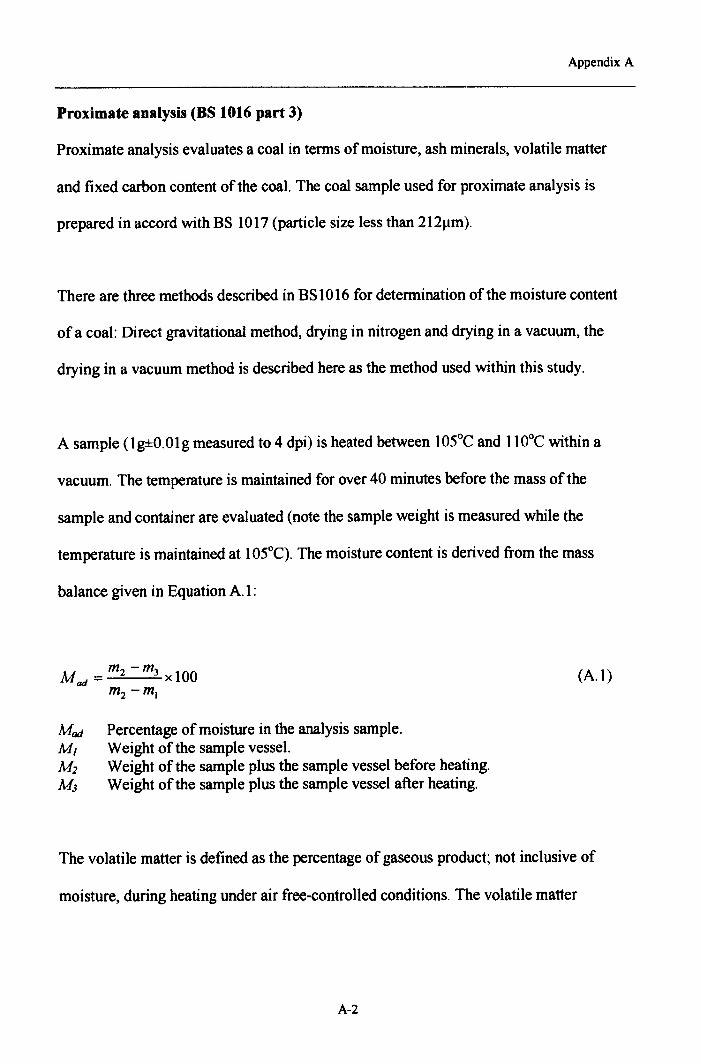
Appendix A
Proximate analysis (BS 1016 part 3)
Proximate analysis evaluates a coal in terms of moisture, ash minerals, volatile matter
and fixed carbon content of the coal. The coal sample used for proximate analysis is
prepared in accord with BS 1017 (particle size less than 212J.1m).
There are three methods described in BS 1016 for determination of the moisture content
of a coal: Direct gravitational method, drying in nitrogen and drying in a vacuum, the
drying in a vacuum method is described here as the method used within this study.
A sample (lg±O.OIg measured to 4 dpi) is heated between IOSoCand 110°C within a
vacuum. The temperature is maintained for over 40 minutes before the mass of the
sample and container are evaluated (note the sample weight is measured while the
temperature is maintained at IOSoC). The moisture content is derived from the mass
balance given in Equation Al :
(AI)
Mad Percentage of moisture in the analysis sample.MJ Weight of the sample vessel.M] Weight of the sample plus the sample vessel before heating.M3 Weight of the sample plus the sample vessel after heating.
The volatile matter is defined as the percentage of gaseous product; not inclusive of
moisture, during heating under air free-controlled conditions. The volatile matter
A-2
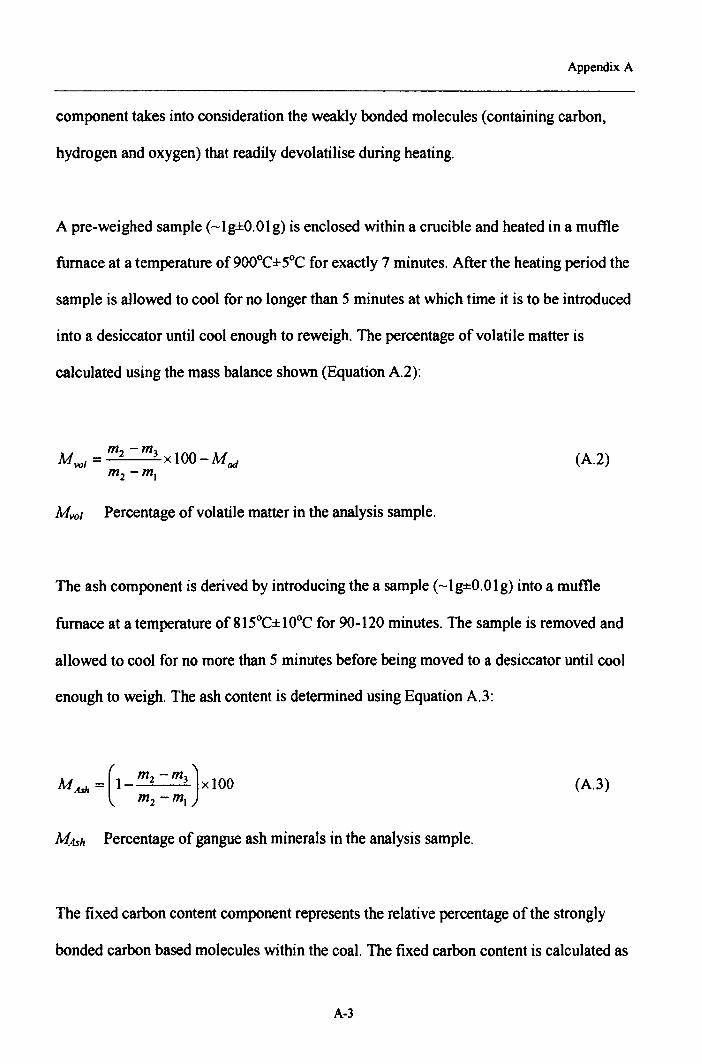
Appendix A
component takes into consideration the weakly bonded molecules (containing carbon,
hydrogen and oxygen) that readily devolatilise during heating.
A pre-weighed sample (-lg±O.Olg) is enclosed within a crucible and heated in a muffle
furnace at a temperature of 900°C±5°C for exactly 7 minutes. After the heating period the
sample is allowed to cool for no longer than S minutes at which time it is to be introduced
into a desiccator until cool enough to reweigh. The percentage of volatile matter is
calculated using the mass balance shown (Equation A2):
(A2)
Mvol Percentage of volatile matter in the analysis sample.
The ash component is derived by introducing the a sample (-I g±0. 01g) into a muffle
furnace at a temperature of 8ISoC± 10°C for 90-120 minutes. The sample is removed and
allowed to cool for no more than S minutes before being moved to a desiccator until cool
enough to weigh. The ash content is determined using Equation A3:
(A3)
MAsh Percentage of gangue ash minerals in the analysis sample.
The fixed carbon content component represents the relative percentage of the strongly
bonded carbon based molecules within the coal. The fixed carbon content is calculated as
A-3
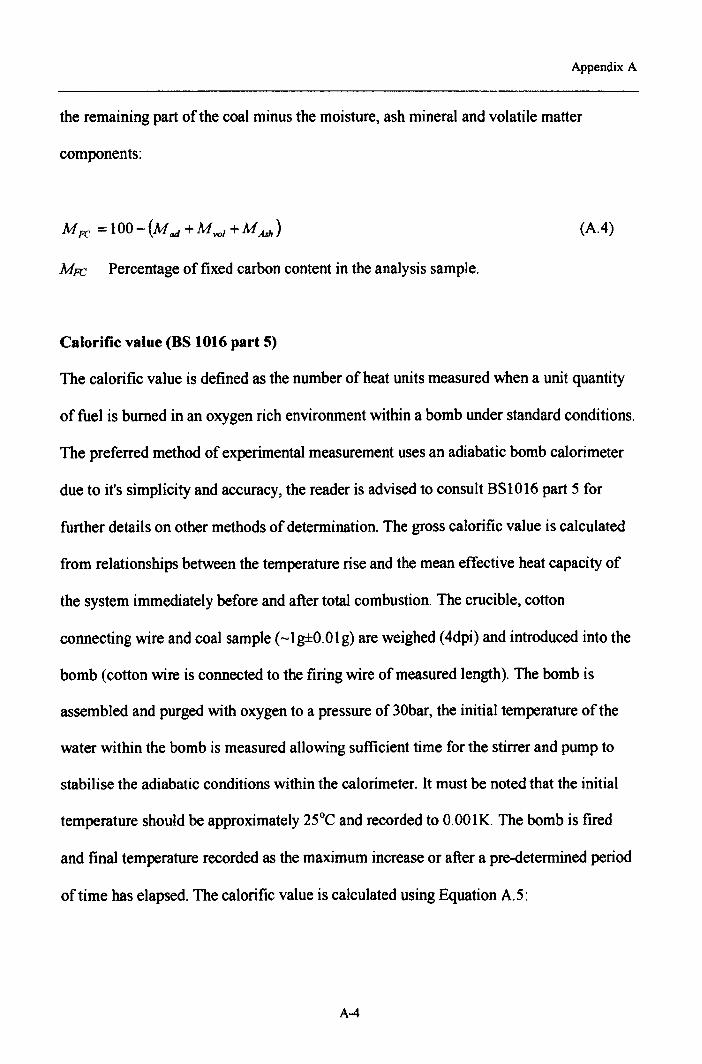
Appendix A
the remaining part of the coal minus the moisture, ash mineral and volatile matter
components:
M FC = 100-(Mad +MvoI +MAsh)
MFC Percentage of fixed carbon content in the analysis sample.
(A.4)
Calorific value (BS 1016 part 5)
The calorific value is defined as the number of heat units measured when a unit quantity
of fuel is burned in an oxygen rich environment within a bomb under standard conditions.
The preferred method of experimental measurement uses an adiabatic bomb calorimeter
due to it's simplicity and accuracy, the reader is advised to consult BS 10 16 part 5 for
further details on other methods of determination. The gross calorific value is calculated
from relationships between the temperature rise and the mean effective heat capacity of
the system immediately before and after total combustion. The crucible, cotton
connecting wire and coal sample (-Ig±O.Olg) are weighed (4dpi) and introduced into the
bomb (cotton wire is connected to the firing wire of measured length). The bomb is
assembled and purged with oxygen to a pressure of30bar, the initial temperature of the
water within the bomb is measured allowing sufficient time for the stirrer and pump to
stabilise the adiabatic conditions within the calorimeter. It must be noted that the initial
temperature should be approximately 25°C and recorded to O.OOIK.The bomb is fired
and final temperature recorded as the maximum increase or after a pre-determined period
of time has elapsed. The calorific value is calculated using Equation A.5:
A-4
Appendix A
(A5)
Qgr.v Gross calorific value at constant volume (kJ/kg)Cp5 Mean effective heat capacity of the calorimeter (J/K)~8 Change in temperature (K)m Mass of coal (g)et Correction for the heat of combustion of the cotton (J)e2 Correction for the heat of combustion of the firing wire (J)es Correction for the heat offonnation of sulphuric acid (J)e4 Correction for the heat of formation of nitric acid (J)
Ultimate analysis (BS 1016 part 6)
The ultimate analysis or some times referred to as elemental analysis is an analysis of the
coal in terms of the carbon, hydrogen, nitrogen and sulphur content (usually carbon
dioxide content is reported as well as the elemental constituents). The analysis technique
takes into consideration both the organic coal material as well as the inorganic material
deposited with the coal. The nitrogen is assumed to be part of the organic coal substance,
the total sulphur includes both organic sulphur as well as inorganic sulphates and
minerals. The carbon content includes the presence of mineral carbonates as well as in
the coal, the hydrogen content includes the hydrogen present in hydrocarbon chains and
rings as well as within the moisture and mineral components.
A brief description of the experimental process is described here and the reader is advised
to consult as 10 16 part 6 for further details.
The carbon and hydrogen contents are measured simultaneously. The coal sample (0.2-
0.3g) is combusted at 800°C in an oxygen atmosphere for over 2 hours and the gas is
A-5
Appendix A
passed over copper oxide. It is assumed that this converts all of the carbon to carbon
dioxide and hydrogen to water vapour. The moisture content is assessed simultaneously
in accordance to BS 1016 part 3. Oxides of sulphur and chlorine are retained in the
combustion tube by lead chromate and silver gauze. The water vapour is adsorbed by
manganese dioxide, the carbon dioxide by soda asbestos, their relative content is
evaluated by a mass balance over the procedure.
The nitrogen content is determined by heating O.lg of sample with sulphuric acid in the
presence of a catalyst to destroy the organic material and convert the nitrogen to
ammonium sulphate. The ammonia is removed by the addition of sodium hydroxide and
steam distillation with boric acid. The ammonia solution is directly titrated with O.OIN
sulphuric acid.
The total sulphur is determined by a high temperature method. The coal sample (O.5g) is
combusted at 1350°C in a high current of oxygen, this converts all the sulphur to its
oxides which is adsorbed in hydrogen peroxide to form sulphuric acid. The total acidity is
determined by titration and content evaluated.
The carbon dioxide content is determined by a process of desolving a sample of coal in
hydrochloric acid and adsorbing the carbon dioxide in benzylamine solution. The salt
formed is titrated with potassium methoxide in toluene using thymol blue as an indicator.
A-6
Appendix A
Forms of sulphur analysis (BS 1016 part 11)
The total sulphur content of a coal is determined as described by BS 1016 part 6. The
reader is advised that the following is a brief summary of the experimental procedures
and should consult BS 10 16 part 11 for further details.
The sulphate sulphur is determined by desolving -Sg±O.Olg of coal (prepared in
accordance to BS 10 17) in 60ml hydrochloric acid just below boiling. The filtered extract
is made alkaline to precipitate the non-pyritic iron. Once filtered the sulphate sulphur is
precipitated with barium sulphate and determined gravimetrically.
Similarly the pyritic sulphur content is evaluated by desolving -1 g of the coal sample in
l Sml hydrochloric acid just below boiling. After the non-pyritic iron is removed the
filtered extract is titrated against ammonia to determine the pyritic sulphur content.
The organic sulphur is mathematically determined from the total sulphur minus the
sulphate and pyritic sulphur contents.
A·7
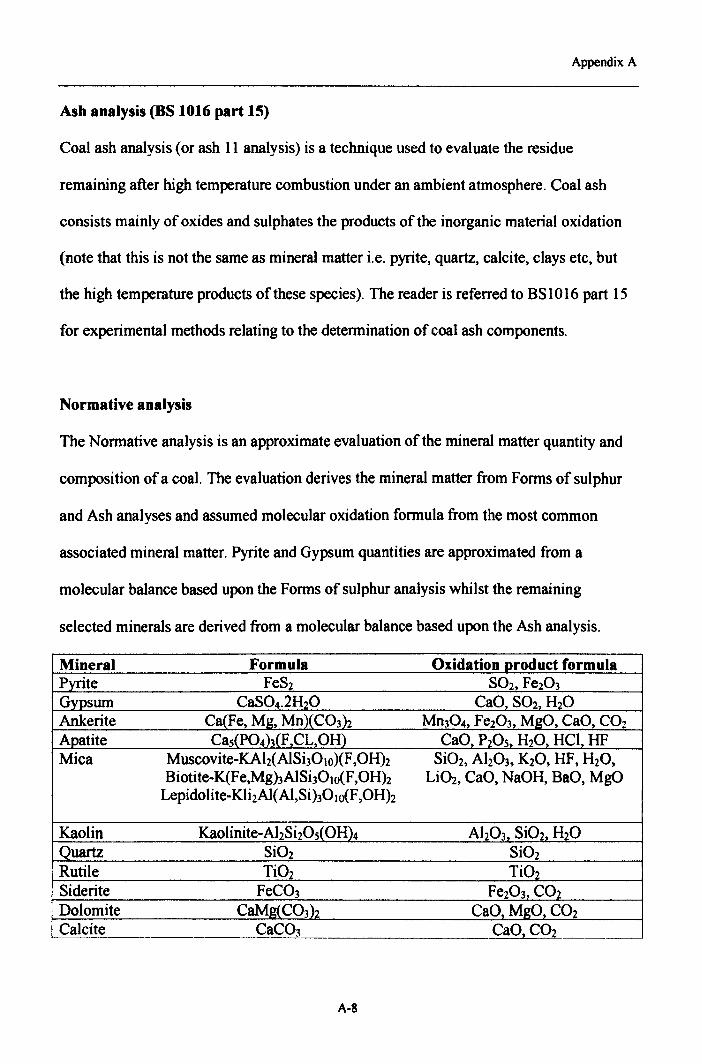
Appendix A
Ash analysis (BS 1016 part 15)
Coal ash analysis (or ash 11 analysis) is a technique used to evaluate the residue
remaining after high temperature combustion under an ambient atmosphere. Coal ash
consists mainly of oxides and sulphates the products of the inorganic material oxidation
(note that this is not the same as mineral matter i.e. pyrite, quartz, calcite, clays etc, but
the high temperature products of these species). The reader is referred to BS 10 16 part 15
for experimental methods relating to the determination of coal ash components.
Normative analysis
The Normative analysis is an approximate evaluation of the mineral matter quantity and
composition of a coal. The evaluation derives the mineral matter from Forms of sulphur
and Ash analyses and assumed molecular oxidation formula from the most common
associated mineral matter. Pyrite and Gypsum quantities are approximated from a
molecular balance based upon the Forms of sulphur analysis whilst the remaining
selected minerals are derived from a molecular balance based upon the Ash analysis.
Mineral Formula Oxidation product formulaPyrite FeS2 S02, Fe203Gypsum CaS04.2H20 CaO S02 H2OAnkerite Ca(Fe, Mg, Mn)(C03)2 Mn304, Fe203, MgO, CaO, CO2
Apatite Cas(P04)3(F,CL,OH) CaO, P20s H20, HCI HFMica Muscovite-KAh( AIShOlO)(F ,0H)2 Si02, Ah03, K20, HF, H2O,
Biotite-K(F e,Mg)3AIShOlO(F ,OH)2 Li02, CaO, NaOH, BaO, MgOLepidolite-Kli-Alt AI,Si)301o(F ,0Hh
Kaolin Kaolinite-AhShOs(OH)4 Ah03 Si02, H2O_Quartz Si02 Si02Rutile Ti02 Ti02Siderite FeC03 Fe203, CO2Dolomite CaMg(C03)2 CaD. MgO, CO2Calcite CaC03 CaOz CO~
A-8
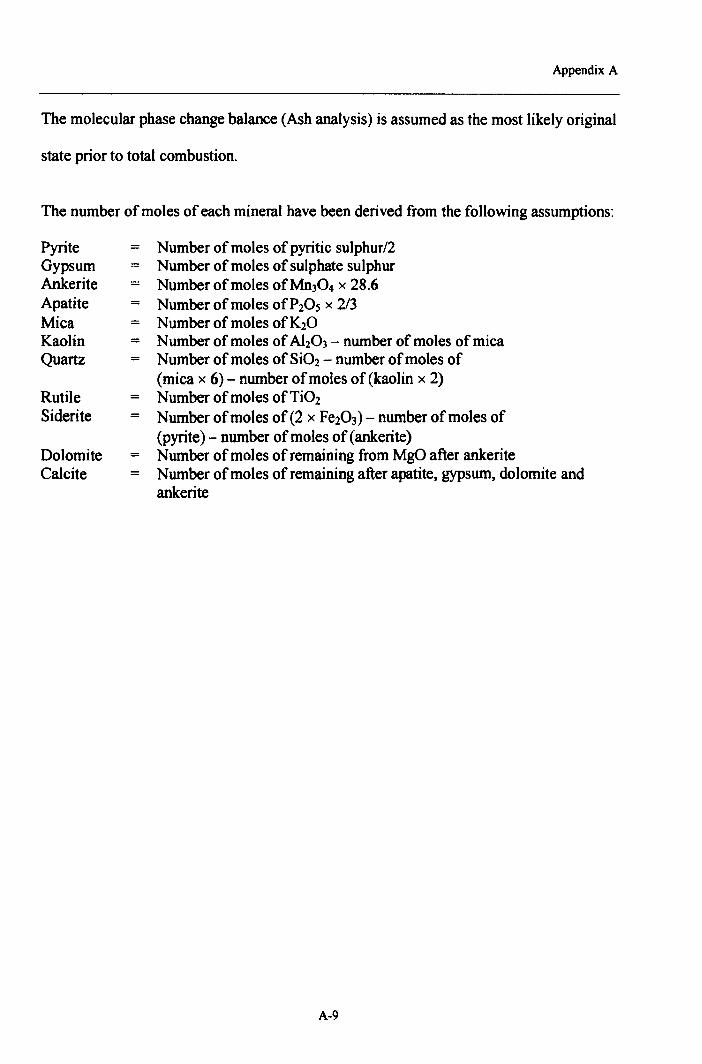
Appendix A
The molecular phase change balance (Ash analysis) is assumed as the most likely original
state prior to total combustion.
The number of moles of each mineral have been derived from the following assumptions:
Pyrite = Number of moles of pyritic sulphur/2Gypsum Number of moles of sulphate sulphurAnkerite = Number of moles ofMn304 x 28.6Apatite = Number of moles ofPzOs x 2/3Mica = Number of moles ofK2OKaolin = Number of moles of Ah03 - number of moles of micaQuartz Number of moles of Si02 - number of moles of
(mica x 6) - number of moles of (kaolin x 2)Rutile = Number of moles of Ti02Siderite = Number of moles of(2 x Fe203) - number of moles of
(pyrite) - number of moles of (ankerite)Dolomite = Number of moles of remaining from MgO after ankeriteCalcite = Number of moles of remaining after apatite, gypsum, dolomite and
ankerite
A-9
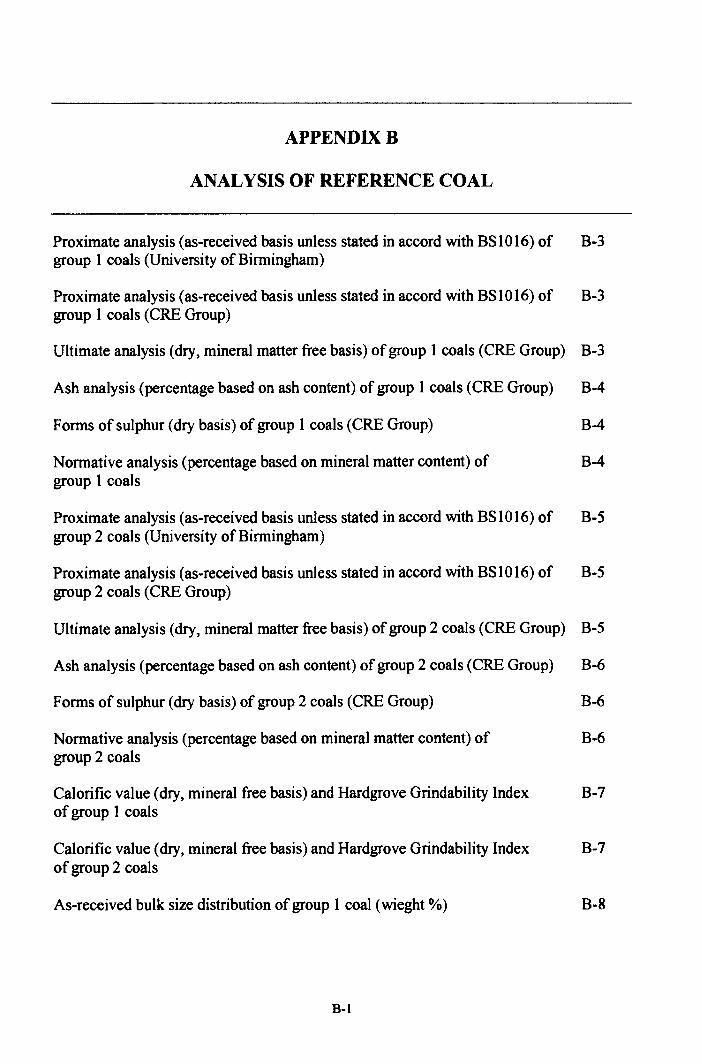
APPENDIXB
ANALYSIS OF REFERENCE COAL
Proximate analysis (as-received basis unless stated in accord with BSI016) of B-3group 1 coals (University of Birmingham)
Proximate analysis (as-received basis unless stated in accord with BSI016) of B-3group 1 coals (CRE Group)
Ultimate analysis (dry, mineral matter free basis) of group 1coals (CRE Group) B-3
Ash analysis (percentage based on ash content) of group 1coals (CRE Group) B-4
Forms of sulphur (dry basis) of group 1coals (CRE Group) B-4
Normative analysis (percentage based on mineral matter content) of B-4group 1 coals
Proximate analysis (as-received basis unless stated in accord with BSI016) of B-5group 2 coals (University of Birmingham)
Proximate analysis (as-received basis unless stated in accord with BSI016) of B-5group 2 coals (CRE Group)
Ultimate analysis (dry, mineral matter free basis) of group 2 coals (CRE Group) B-5
Ash analysis (percentage based on ash content) of group 2 coals (CRE Group) B-6
Forms of sulphur (dry basis) of group 2 coals (CRE Group) B-6
Normative analysis (percentage based on mineral matter content) of B-6group 2 coals
Calorific value (dry, mineral free basis) and Hardgrove Grindability Index B-7of group 1 coals
Calorific value (dry, mineral free basis) and Hardgrove Grindability Index B-7of group 2 coals
As-received bulk size distribution of group 1 coal (wieght %) B-8
B-1
AppendixB
Jaw Crusher product size distribution of group 1 coal (wieght %)
As-received bulk size distribution of group 2 coal (wieght %)
Bond test on P-2 coal, Jaw crusher (-2.8mm) product size distribution
Bond test on P-2 coal, equilibrium condition product undersize
B-9
B-IO
B-ll
B-12
B-2
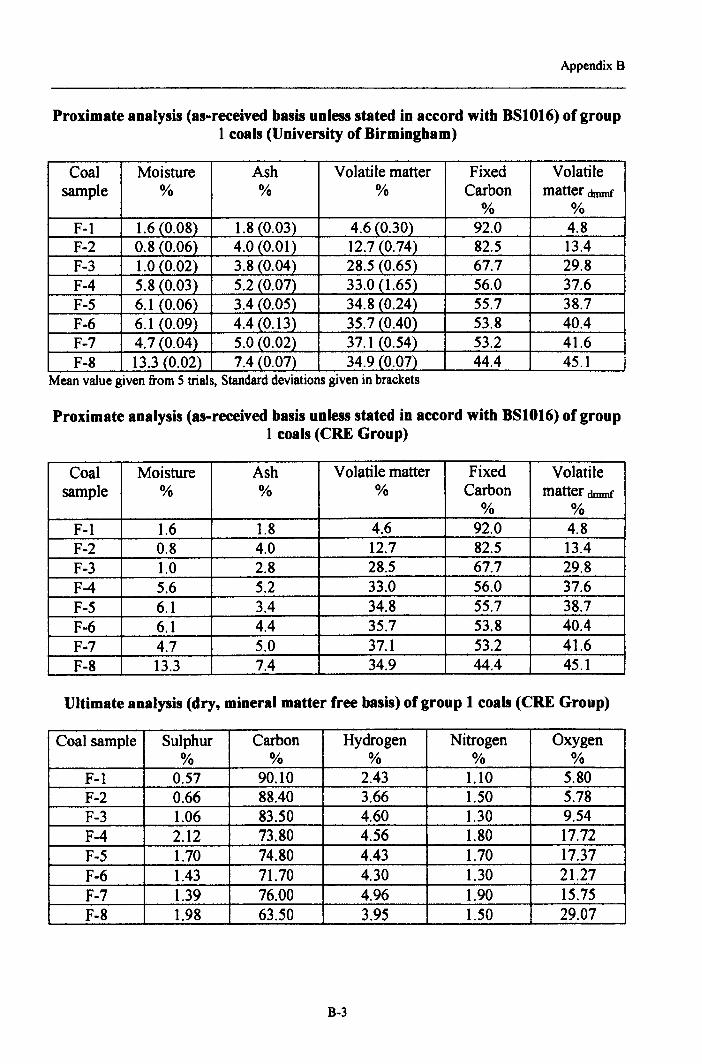
Appendix 8
Proximate analysis (as-received basis unless stated in accord with BSI016) of group1 coals (University of Birmingham)
Coal Moisture Ash Volatile matter Fixed Volatilesample % % % Carbon matter dmmf
% %F-I 1.6 (0.08) 1.8 (0.03) 4.6 (0.30) 92.0 4.8F-2 0.8 (0.06) 4.0 (0.01) 12.7 (0.74) 82.5 13.4F-3 1.0 (0.02) 3.8 (0.04) 28.5 (0.65) 67.7 29.8F-4 5.S (0.03) 5.2 (0.07) 33.0 (1.65) 56.0 37.6F-5 6.1(0.06) 3.4 (0.05) 34.8 (0.24) 55.7 3S.7F-6 6.1 (0.09) 4.4 (0.13) 35.7 (0.40) 53.8 40.4F-7 4.7 (0.04) 5.0 (0.02) 37.1 (0.54) 53.2 41.6F-S 13.3 (0.02) 7.4 (0.07) 34.9 (0.07) 44.4 45.1..Mean value given from 5 tnals, Standard deviations given In brackets
Proximate analysis (as-received basis unless stated in accord with BSI016) of group1 coals (CRE Group)
Coal Moisture Ash Volatile matter Fixed Volatilesample % % % Carbon matter dmmf
% %F-I 1.6 1.8 4.6 92.0 4.SF-2 0.8 4.0 12.7 82.5 13.4F-3 1.0 2.8 28.5 67.7 29.8F-4 5.6 5.2 33.0 56.0 37.6F-5 6.1 3.4 34.8 55.7 38.7F-6 6.1 4.4 35.7 53.8 40.4F-7 4.7 5.0 37.1 53.2 41.6F-8 13.3 7.4 34.9 44.4 45.1
Ultimate analysis (dry, mineral matter free basis) o( group 1 coals (CRE Group)
Coal sample Sulphur Carbon Hydrogen Nitrogen Oxygen% % % % %
F-I 0.57 90.10 2.43 1.10 5.80F-2 0.66 88.40 3.66 1.50 5.78F-3 1.06 83.50 4.60 1.30 9.54F-4 2.12 73.80 4.56 1.80 17.72F-5 1.70 74.80 4.43 1.70 17.37F-6 1.43 71.70 4.30 1.30 21.27F-7 1.39 76.00 4.96 1.90 15.75F-S 1.98 63.50 3.95 1.50 29.07
8-3
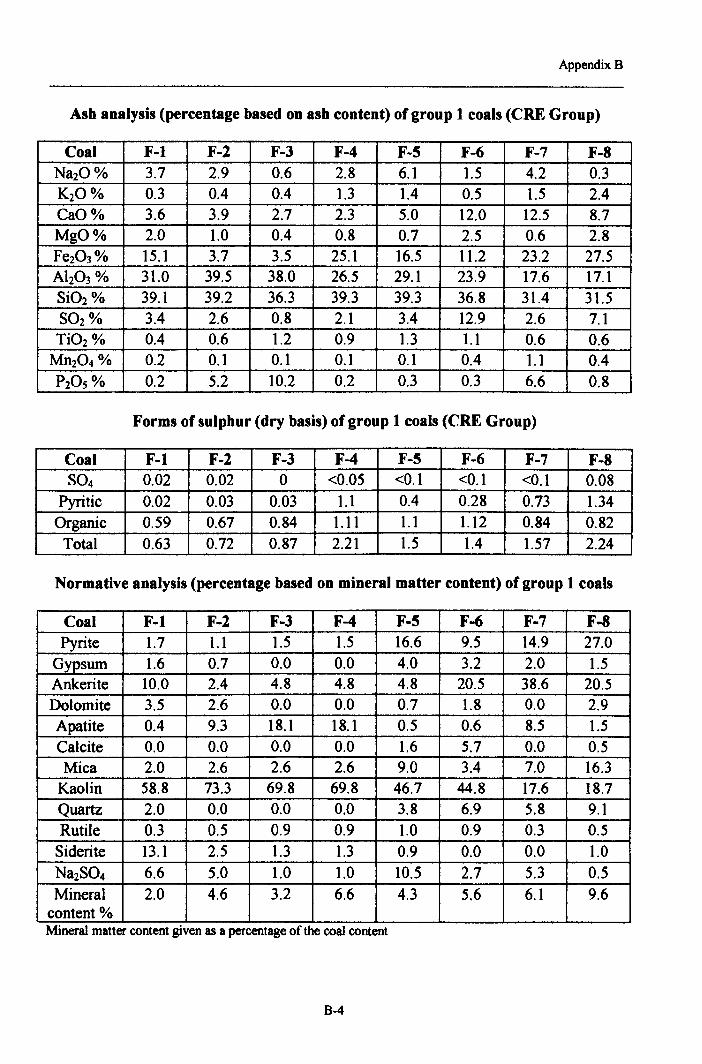
Appendix B
Ash analysis (percentage based on ash content) of group 1 coals (CRE Group)
Coal F-l F-2 F-J F-4 F-5 F-6 F-7 F-8Na20% 3.7 2.9 0.6 2.8 6.1 1.5 4.2 0.3K2O% 0.3 0.4 0.4 1.3 1.4 0.5 1.5 2.4CaO% 3.6 3.9 2.7 2.3 5.0 12.0 12.5 8.7MgO% 2.0 1.0 0.4 0.8 0.7 2.5 0.6 2.8Fe203% 15.1 3.7 3.5 25.l 16.5 11.2 23.2 27.5Ah03% 31.0 39.5 38.0 26.5 29.1 23.9 17.6 17.1Si02% 39.1 39.2 36.3 39.3 39.3 36.8 31.4 31.5S02% 3.4 2.6 0.8 2.1 3.4 12.9 2.6 7.1Ti02% 0.4 0.6 1.2 0.9 1.3 1.1 0.6 0.6Mn204% 0.2 0.1 0.1 O.l 0.1 0.4 1.1 0.4P2OS% 0.2 5.2 10.2 0.2 0.3 0.3 6.6 0.8
Forms of sulphur (dry basis) of group 1 coals (CRE Group)
Coal F-l F-2 F-J F-4 F-5 F-6 F-7 F-8S04 0.02 0.02 0 <0.05 <O.l <0.1 <0.1 0.08
Pyritic 0.02 0.03 0.03 1.1 0.4 0.28 0.73 1.34Organic 0.59 0.67 0.84 1.11 1.1 1.12 0.84 0.82Total 0.63 0.72 0.87 2.21 1.5 1.4 1.57 2.24
Normative analysis (percentage based on mineral matter content) of group 1 coals
Coal F-l F-2 F-3 F-4 F-5 F-6 F-7 F-8Pyrite 1.7 1.1 1.5 1.5 16.6 9.5 14.9 27.0Gypsum 1.6 0.7 0.0 0.0 4.0 3.2 2.0 1.5Ankerite 10.0 2.4 4.8 4.8 4.8 20.5 38.6 20.5Dolomite 3.5 2.6 0.0 0.0 0.7 1.8 0.0 2.9Apatite 0.4 9.3 18.1 18.1 0.5 0.6 8.5 1.5Calcite 0.0 0.0 0.0 0.0 1.6 5.7 0.0 0.5Mica 2.0 2.6 2.6 2.6 9.0 3.4 7.0 16.3Kaolin 58.8 73.3 69.8 69.8 46.7 44.8 17.6 18.7Quartz 2.0 0.0 0.0 0.0 3.8 6.9 5.8 9.1Rutile OJ 0.5 0.9 0.9 1.0 0.9 0.3 0.5Siderite 13.l 2.5 1.3 1.3 0.9 0.0 0.0 1.0Na2S04 6.6 5.0 1.0 1.0 10.5 2.7 5J 0.5Mineral 2.0 4.6 3.2 6.6 4.3 5.6 6.1 9.6content %Mmeral matter content given as a percentage of the coal content
B-4
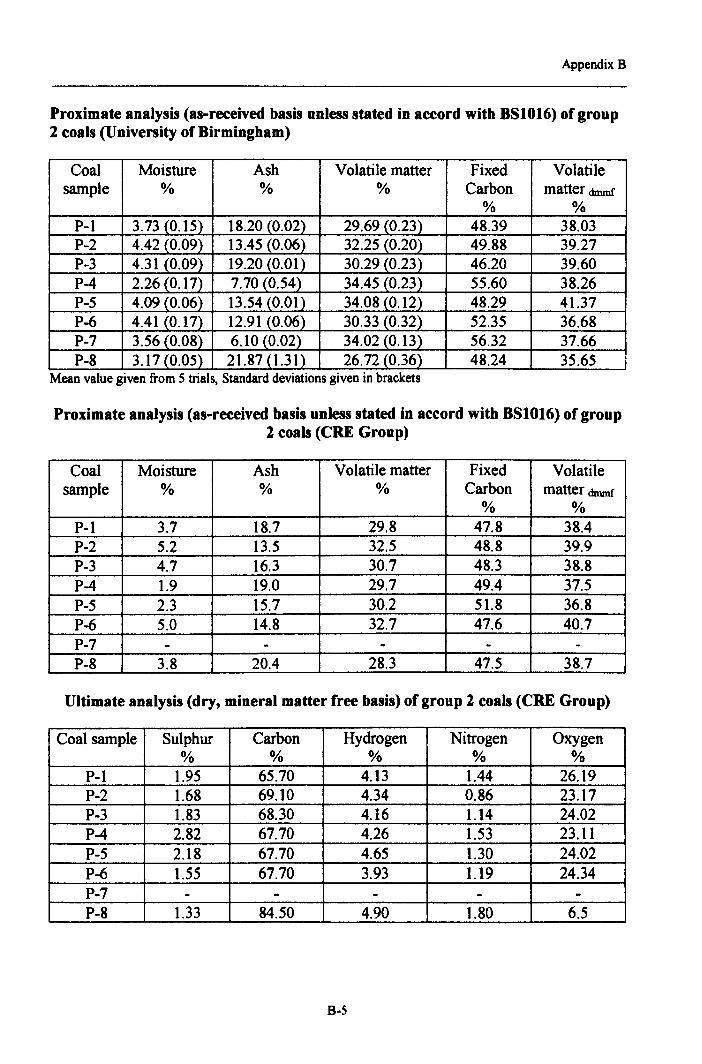
Appendix B
Proximate analysis (as-received basis unless stated in accord with BSI016) of group2 coals (University of Birmingham)
Coal Moisture Ash Volatile matter Fixed Volatilesample % % % Carbon matter dmmf
% %P-l 3.73 (0.15) 18.20 (0.02) 29.69 (0.23) 48.39 38.03P-2 4.42 (0.09) 13.45 (0.06) 32.25 (0.20) 49.88 39.27P-3 4.31 (0.09) 19.20 (0.01) 30.29 (0.23) 46.20 39.60P-4 2.26 (0.17) 7.70 (0.54) 34.45 (0.23) 55.60 38.26P-5 4.09 (0.06) 13.54 (0.01) 34.08 (0.12) 48.29 41.37P-6 4.41 (0.17) 12.91 (0.06) 30.33 (0.32) 52.35 36.68P-7 3.56 (0.08) 6.10 (0.02) 34.02 (0.13) 56.32 37.66P-8 3.17 (0.05) 21.87 (1.31) 26.72 (0.36) 48.24 35.65
..Mean value given from 5 tnals, Standard deviations given In brackets
Proximate analysis (as-received basis unless stated in accord with BSI016) of group2 coals (CRE Group)
Coal Moisture Ash Volatile matter Fixed Volatilesample % % % Carbon matter dmmf
% %P-l 3.7 18.7 29.8 47.8 38.4P-2 5.2 13.5 32.5 48.8 39.9P-3 4.7 16.3 30.7 48.3 38.8P-4 1.9 19.0 29.7 49.4 37.5P-5 2.3 15.7 30.2 51.8 36.8P-6 5.0 14.8 32.7 47.6 40.7P-7 - - - - -P-8 3.8 20.4 28.3 47.5 38.7
Ultimate analysis (dry, mineral matter free basis) of group 2 coals (CRE Group)
Coal sample Sulphur Carbon Hydrogen Nitrogen Oxygen% % % % %
P-l 1.95 65.70 4.13 1.44 26.19P-2 1.68 69.10 4.34 0.86 23.17P-3 1.83 68.30 4.16 1.14 24.02P-4 2.82 67.70 4.26 1.53 23.11P-5 2.18 67.70 4.65 1.30 24.02P-6 1.55 67.70 3.93 1.19 24.34P-7 - - - - -P-8 1.33 84.50 4.90 1.80 6.5
B-5
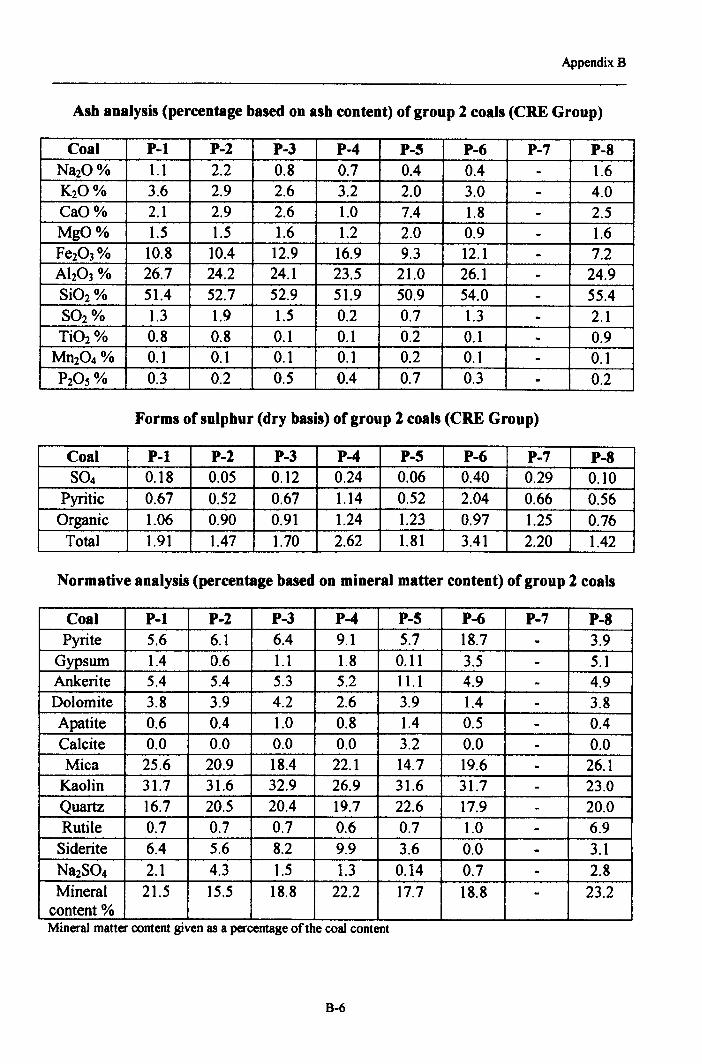
AppendixB
Ash analysis (percentage based on ash content) of group 2 coals (CRE Group)
Coal P-l P-2 P-3 P-4 P-5 P-6 P-7 P-8Na20% 1.1 2.2 0.8 0.7 0.4 0.4 - 1.6K2O% 3.6 2.9 2.6 3.2 2.0 3.0 - 4.0CaO% 2.1 2.9 2.6 1.0 7.4 1.8 - 2.5MgO% 1.5 1.5 1.6 1.2 2.0 0.9 - 1.6Fe203% 10.8 10.4 12.9 16.9 9.3 12.1 - 7.2Ah03% 26.7 24.2 24.1 23.5 21.0 26.1 - 24.9Si02% 51.4 52.7 52.9 51.9 50.9 54.0 - 55.4S02% 1.3 1.9 1.5 0.2 0.7 1.3 - 2.1Ti02% 0.8 0.8 0.1 0.1 0.2 0.1 - 0.9Mn204 % 0.1 0.1 0.1 0.1 0.2 0.1 - 0.1P20S% 0.3 0.2 0.5 0.4 0.7 0.3 - 0.2
Forms of sulphur (dry basis) of group 2 coals (CRE Group)
Coal P-l P-2 P-3 P-4 P-5 P-6 P-7 P-8S04 0.18 0.05 0.12 0.24 0.06 0.40 0.29 0.10
Pyritic 0.67 0.52 0.67 1.14 0.52 2.04 0.66 0.56Organic 1.06 0.90 0.91 1.24 1.23 0.97 1.25 0.76Total 1.91 1.47 1.70 2.62 1.81 3.41 2.20 1.42
Normative analysis (percentage based on mineral matter content) of group 2 coals
Coal P-l P-2 P-3 P-4 P-5 P-6 P-7 P-8Pyrite 5.6 6.1 6.4 9.1 5.7 18.7 - 3.9
Gypsum 1.4 0.6 1.1 1.8 0.11 3.5 - 5.1Ankerite 5.4 5.4 5.3 5.2 11.1 4.9 - 4.9Dolomite 3.8 3.9 4.2 2.6 3.9 1.4 - 3.8Apatite 0.6 0.4 1.0 0.8 1.4 0.5 - 0.4Calcite 0.0 0.0 0.0 0.0 3.2 0.0 - 0.0Mica 25.6 20.9 18.4 22.1 14.7 19.6 - 26.1Kaolin 31.7 31.6 32.9 26.9 31.6 31.7 - 23.0Quartz 16.7 20.5 20.4 19.7 22.6 17.9 - 20.0Rutile 0.7 0.7 0.7 0.6 0.7 1.0 - 6.9Siderite 6.4 5.6 8.2 9.9 3.6 0.0 - 3.1Na2S04 2.1 4.3 1.5 1.3 0.14 0.7 - 2.8Mineral 21.5 15.5 18.8 22.2 17.7 18.8 - 23.2content%Mineral matter content given as a percentage of the coal content
B-6
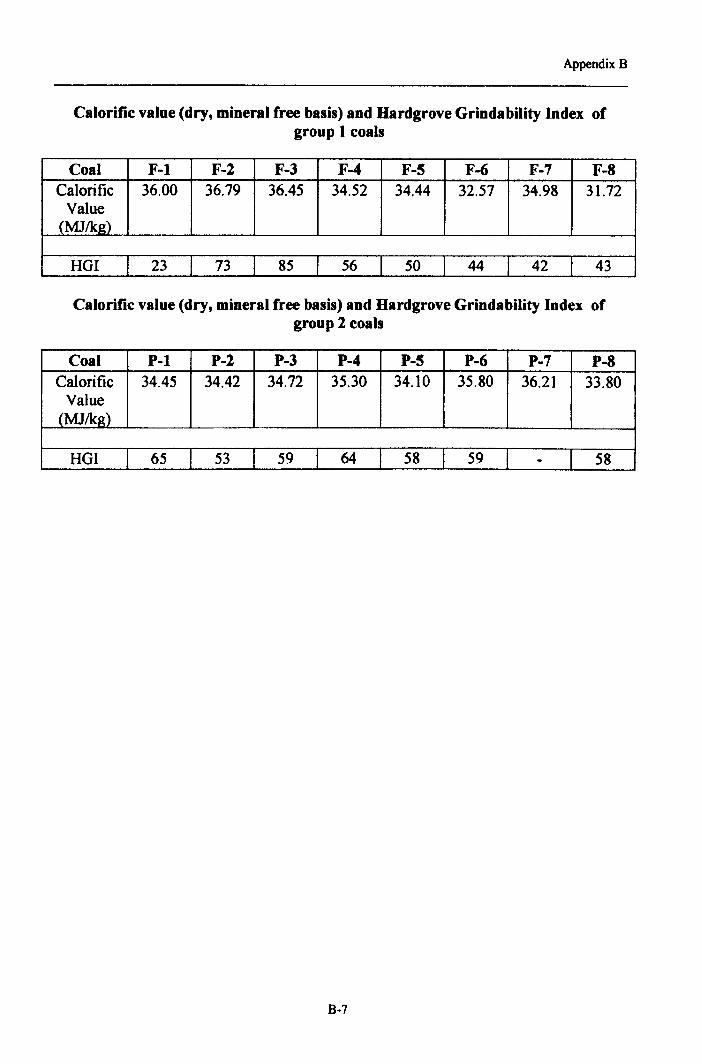
AppendixB
Calorific value (dry, mineral free basis) and Hardgrove Grindability Index ofgroup 1 coals
Coal F-l F-2 F-3 F-4 F-5 F-6 F-7 F-8Calorific 36.00 36.79 36.45 34.52 34.44 32.57 34.98 31.72Value(MJlkg)
HGI 23 73 85 56 50 44 42 43
Calorific value (dry, mineral free basis) and Hardgrove Grindability Index ofgroup 2 coals
Coal P-l P-2 P-3 P-4 P-5 P-6 P-7 P-8Calorific 34.45 34.42 34.72 35.30 34.10 35.80 36.21 33.80Value(MJlkg)
HGI 65 53 59 64 58 59 - 58
B-7
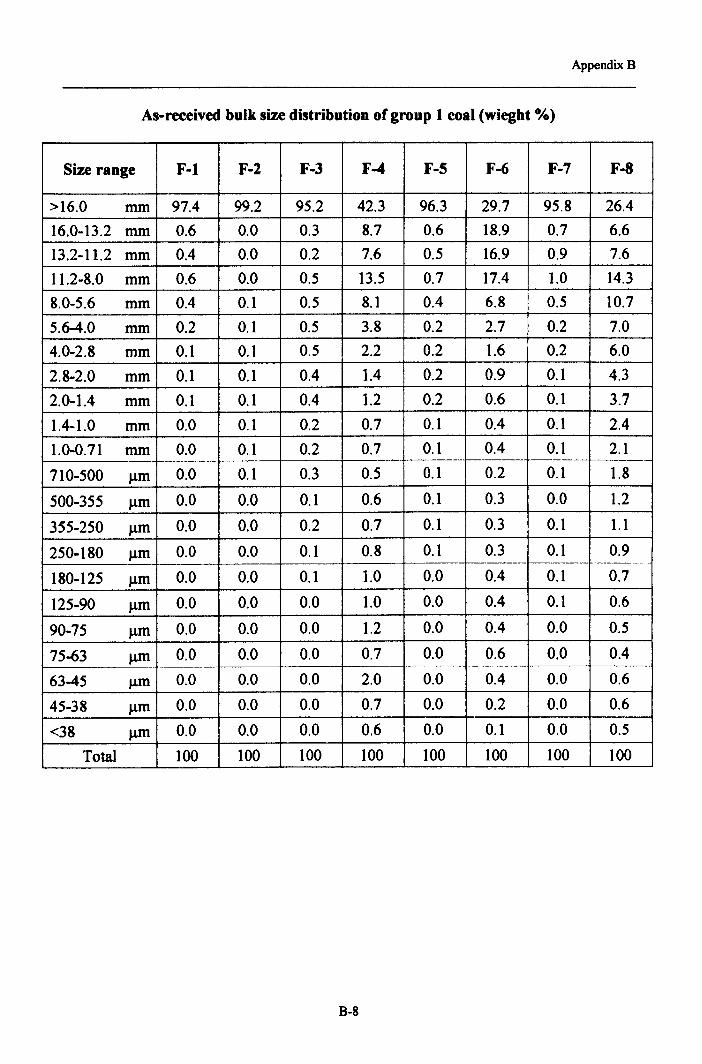
Appendix B
As-received bulk size distribution of group 1 coal (wiegbt %)
Size range r-r F-2 F-3 F-4 F-5 F-6 F-7 F-8
>16.0 mm 97.4 99.2 9S.2 42.3 96.3 29.7 95.8 26.416.0-13.2 mm 0.6 0.0 0.3 8.7 0.6 18.9 0.7 6.613.2-11.2 mm 0.4 0.0 0.2 7.6 0.5 16.9 0.9 7.611.2-8.0 mm 0.6 0.0 0.5 13.5 0.7 17.4 1.0 14.38.0-5.6 mm 0.4 0.1 0.5 8.1 0.4 6.8 O.S 10.75.6-4.0 mm 0.2 0.1 0.5 3.8 0.2 2.7 0.2 7.04.0-2.8 mm 0.1 0.1 0.5 2.2 0.2 1.6 0.2 6.02.8-2.0 mm 0.1 0.1 0.4 1.4 0.2 0.9 0.1 4.32.0-1.4 mm 0.1 0.1 0.4 1.2 0.2 0.6 0.1 3.71.4-1.0 mm 0.0 0.1 0.2 0.7 0.1 0.4 0.1 2.41.0-0.71 mm 0.0 0.1 0.2 0.7 0.1 0.4 0.1 2.1710-500 J.lm 0.0 0.1 0.3 0.5 0.1 0.2 0.1 1.8500-355 J.lm 0.0 0.0 0.1 0.6 0.1 0.3 0.0 1.2355-250 J.lm 0.0 0.0 0.2 0.7 0.1 0.3 0.1 1.1
250-180 J.lm 0.0 0.0 0.1 0.8 0.1 0.3 0.1 0.9..-
180-125 J.lm 0.0 0.0 0.1 1.0 0.0 0.4 0.1 0.7125-90 J.lm 0.0 0.0 0.0 1.0 0.0 0.4 0.1 0.690-75 J.lm 0.0 0.0 0.0 1.2 0.0 0.4 0.0 0.575-63 J.lm 0.0 0.0 0.0 0.7 0.0 0.6 0.0 0.463-45 f.lm 0.0 0.0 0.0 2.0 0.0 0.4 0.0 0.645-38 J.lm 0.0 0.0 0.0 0.7 0.0 0.2 0.0 0.6<38 J.lm 0.0 0.0 0.0 0.6 0.0 0.1 0.0 0.5
Total 100 100 100 100 100 100 100 100
B-8
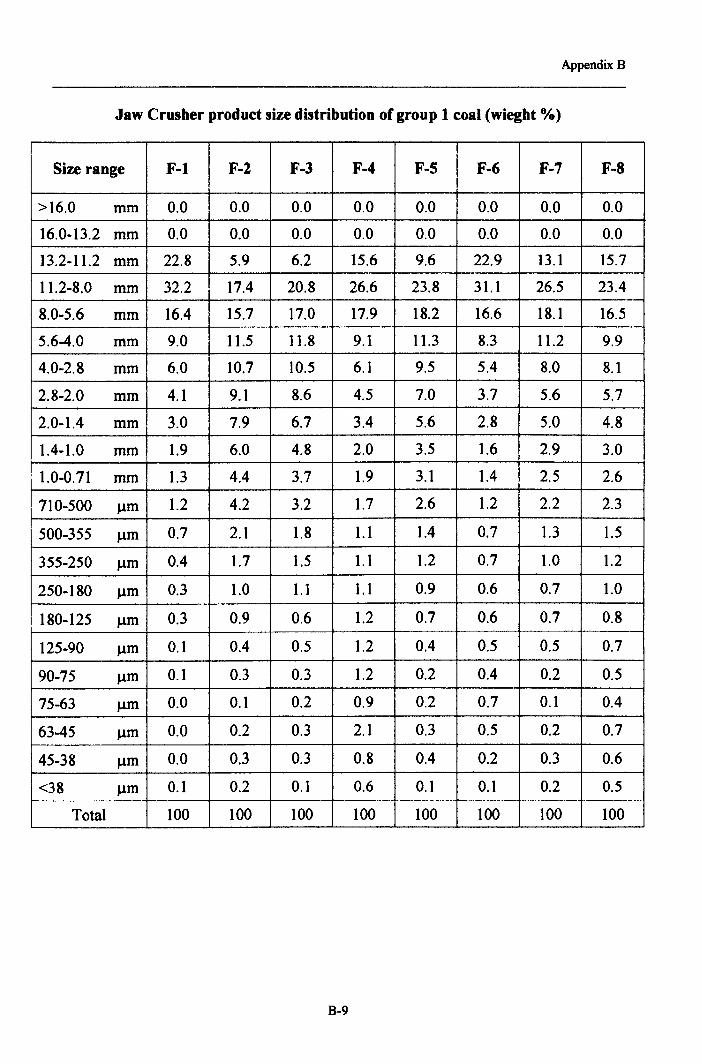
Appendix B
Jaw Crusher product size distribution of group 1 coal (wiegbt %)
Size range r-r F-2 F-3 F-4 F-5 F-6 F-7 F-8
>16.0 mm 0.0 0.0 0.0 0.0 0.0 0.0 0.0 0.016.0-13.2 mm 0.0 0.0 0.0 0.0 0.0 0.0 0.0 0.013.2-11.2 mm 22.8 5.9 6.2 15.6 9.6 22.9 13.1 15.711.2-8.0 mm 32.2 17.4 20.8 26.6 23.8 31.1 26.5 23.48.0-5.6 mm 16.4 15.7 17.0 17.9 18.2 16.6 18.1 16.55.6-4.0 mm 9.0 11.5 11.8 9.1 11.3 8.3 11.2 9.94.0-2.8 mm 6.0 10.7 10.5 6.1 9.5 5.4 8.0 8.12.8-2.0 mm 4.1 9.1 8.6 4.5 7.0 3.7 5.6 5.72.0-1.4 mm 3.0 7.9 6.7 3.4 5.6 2.8 5.0 4.81.4-1.0 mm 1.9 6.0 4.8 2.0 3.5 1.6 2.9 3.01.0-0.71 mm 1.3 4.4 3.7 1.9 3.1 1.4 2.5 2.6710-500 J..lm 1.2 4.2 3.2 1.7 2.6 1.2 2.2 2.3500-355 J..lm 0.7 2.1 1.8 1.1 1.4 0.7 1.3 1.5355-250 urn 0.4 1.7 1.5 1.1 1.2 0.7 1.0 1.2250-180 J..lm 0.3 1.0 1.1 1.1 0.9 0.6 0.7 1.0180-125 um 0.3 0.9 0.6 1.2 0.7 0.6 0.7 0.8125-90 J..lm 0.1 0.4 0.5 1.2 0.4 0.5 0.5 0.790-75 J..lm 0.1 0.3 0.3 1.2 0.2 0.4 0.2 0.575-63 urn 0.0 0.1 0.2 0.9 0.2 0.7 0.1 0.463-45 J..lm 0.0 0.2 OJ 2.1 0.3 0.5 0.2 0.745-38 J..lm 0.0 OJ 0.3 0.8 0.4 0.2 0.3 0.6<38 J..lm 0.1 0.2 0.1 0.6 0.1 0.1 0.2 0.5
Total 100 100 100 100 100 100 100 100
B-9
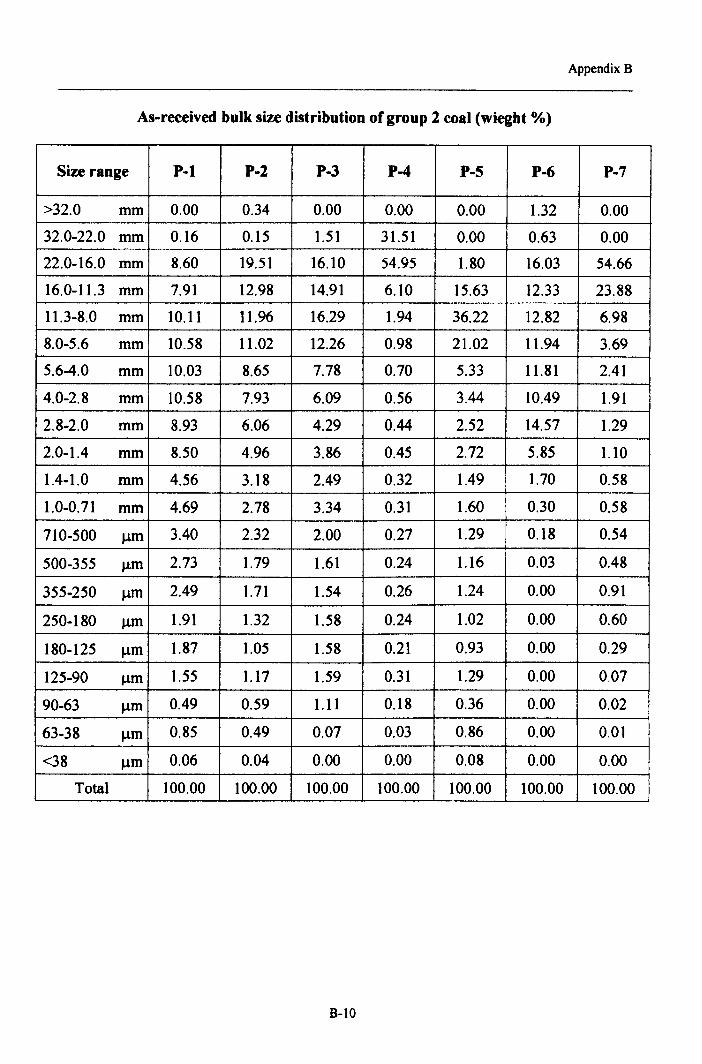
AppendixB
As-received bulk size distribution of group 2 coal (wieght %)
Size range P-l P-2 P-3 P-4 P-5 P-6 P-7
>32.0 mm 0.00 0.34 0.00 0.00 0.00 1.32 0.00
32.0-22.0 mm 0.16 0.15 1.51 31.51 0.00 0.63 0.00
22.0-16.0 mm 8.60 19.51 16.10 54.95 1.80 16.03 54.66
16.0-11.3 mm 7.91 12.98 14.91 6.10 15.63 12.33 23.88
11.3-8.0 mm 10.11 11.96 16.29 1.94 36.22 12.82 6.98
8.0-5.6 mm 10.58 11.02 12.26 0.98 21.02 11.94 3.69
5.6-4.0 mm 10.03 8.65 7.78 0.70 5.33 11.81 2.41
4.0-2.8 mm 10.58 7.93 6.09 0.56 3.44 10.49 1.91
2.8-2.0 mm 8.93 6.06 4.29 0.44 2.52 14.57 1.29
2.0-1.4 mm 8.50 4.96 3.86 0.45 2.72 5.85 1.10
1.4-1.0 mm 4.56 3.18 2.49 0.32 1.49 1.70 0.58
1.0-0.71 mm 4.69 2.78 3.34 0.31 1.60 0.30 0.58
710-500 J..lm 3.40 2.32 2.00 0.27 1.29 0.18 0.54
500-355 J..lm 2.73 1.79 1.61 0.24 1.16 0.03 0.48
355-250 J..lm 2.49 1.71 1.54 0.26 1.24 0.00 0.91
250-180 urn 1.91 1.32 1.58 0.24 1.02 0.00 0.60
180-125 J..lm 1.87 1.05 1.58 0.21 0.93 0.00 0.29
125-90 J,.lm 1.55 1.17 1.59 0.31 1.29 0.00 0.07
90-63 J..lm 0.49 0.59 1.11 0.18 0.36 0.00 0.02
63-38 J..lm 0.85 0.49 0.07 0.03 0.86 0.00 0.01
<38 J..lm 0.06 0.04 0.00 0.00 0.08 0.00 0.00
Total 100.00 100.00 100.00 100.00 100.00 100.00 100.00
B-IO
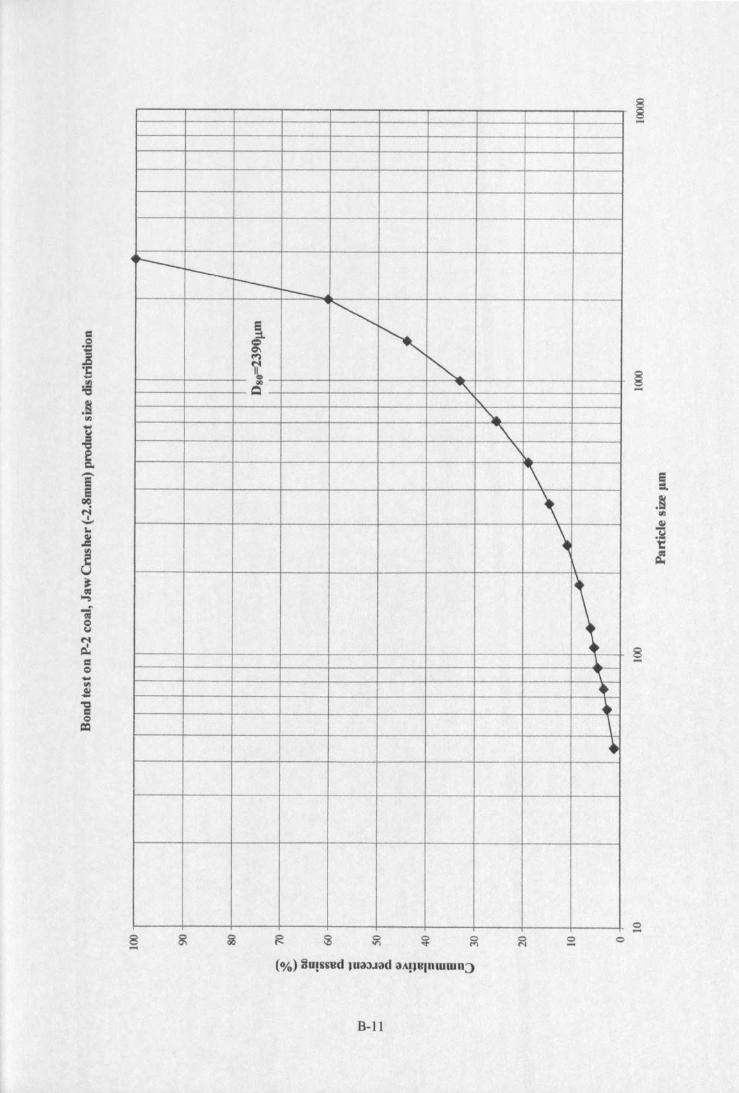
~~ ------r---§. r-.
'"~~ r-,~QC) <,Q
l\.\..
"\....
1\.'\\
1\.\..
"••\•
8- oIf"\
a-n
8-
o-o
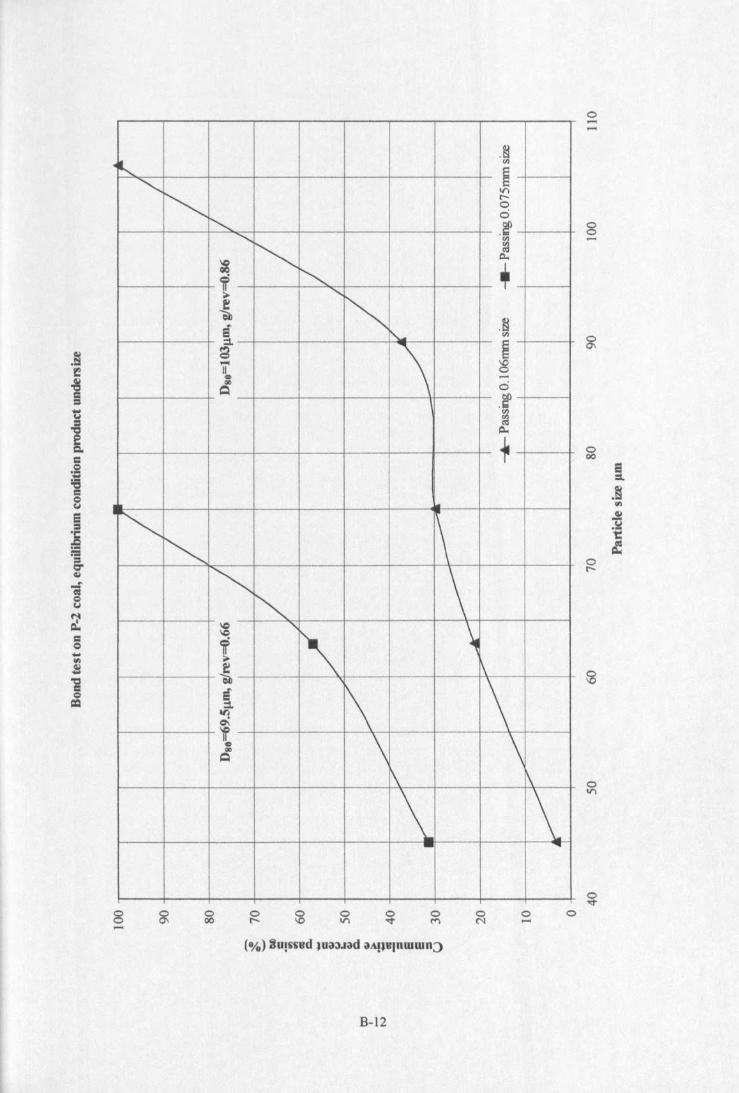
·~.~ rh
m<,<. 11"1
r-0
r-, 0.~<, rh
<, ~~
~r-, +t <,
~~
.§Ii ~ rh::1
~a \~ sII0 ........ 0= .~
~~
1-
r-.<, \~ -. \
IC " \IC
~if~
~~
~ 1\ \III0\'If \ \•..~
\ 1\
\ \- ...
8 o00
o\0
o11"1
o.....
B-12
o-
8
000
I.~'"~.st1::~
0r-
o
APPENDIXC
ROD MILL OPTIMISATION
P-I coal. rod mill, number ofrods-7, operating speed-IOOrpm,sample load-500g, As-received coal
e-2
P-l coal, rod mill, number ofrods-7, operating speed-IOOrpm,sample load-250g, As-received coal
e-a
P-l coal, rod mill, number ofrods-7, operating speed-lOOrpm,sample load-lOOOg, As-received coal
e-4
P-l coal, rod mill, number ofrods-5, operating speed-IOtlrpm,sample load-500g, As-received coal
c.s
P-I coal, rod mill, number ofrods-9, operating speed-lOOrpm,sample load-500g, As-received coal
c-s
P-l coal, rod mill, number ofrods-7, operating speed-l20rpm,sample load-500g, As-received coal
e-7
P-l coal, rod mill, number ofrods-7, operating speed-60rpm,sample load-500g, As-received coal
c-s
P-l coal, rod mill, number ofrods-7, operating speed-lOOrpm,sample load-500g, As-received coal(distribution after consecutive 10 minute intervals)
e-9
P-I coal, rod mill, number of rods-7, operating speed-lOOrpm, e-IOsample load-500g, microwave input power-O.65kW, applied frequency-2.45GHz,exposure time-S minutes, (distribution after consecutive 10 minute intervals)
C-l
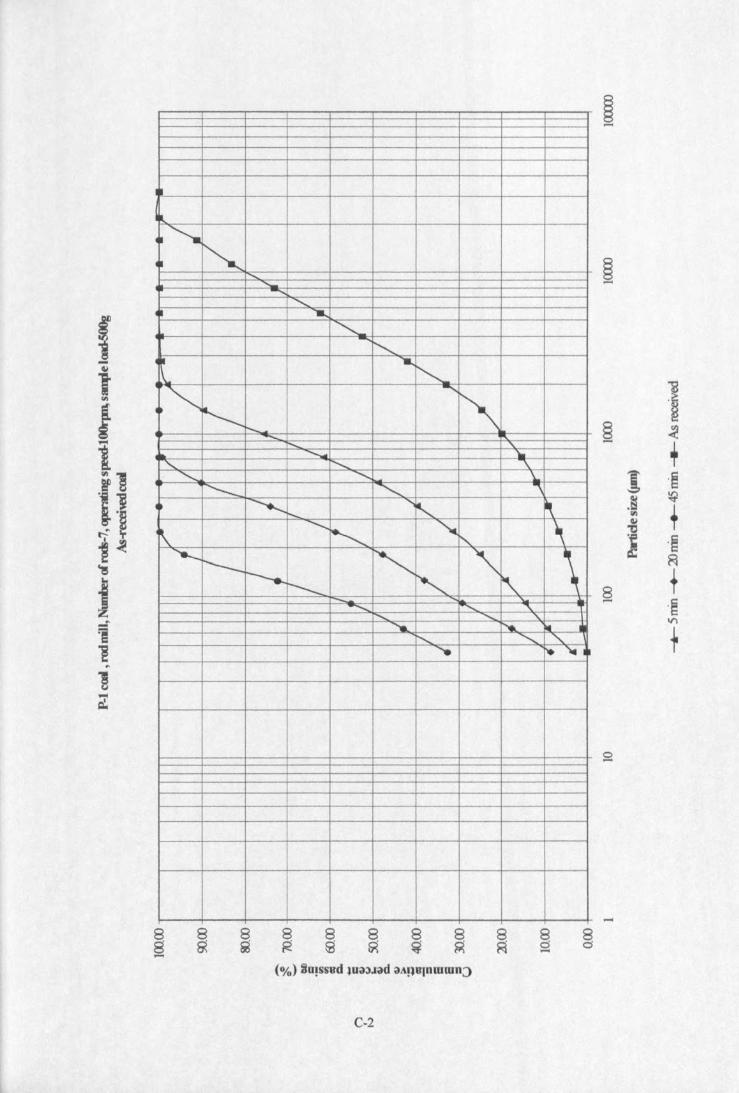
II
I~~~ r-,~
r-,........ .....
<,j~ ......
~r-,
411 ...~.\.~ ......
1'\~ t---.r-..... ........, \0
<, I"'" ~<, r--... __l.........__
-.............. "'\4. ---..... ......
~ ~r--..
1\~
~~ ,
r-,....._r-- r-. -. \J--.. ~ r\I--
.-......" <, "'.:--". ..... "...... I" !It1"'-.... ~ ~'- ... ~
8o.....
C-2
~1~
+1 .~
.~ ~III +G.I"C
~.~~
8 +..... .~II'l
+
o.....
.....8o
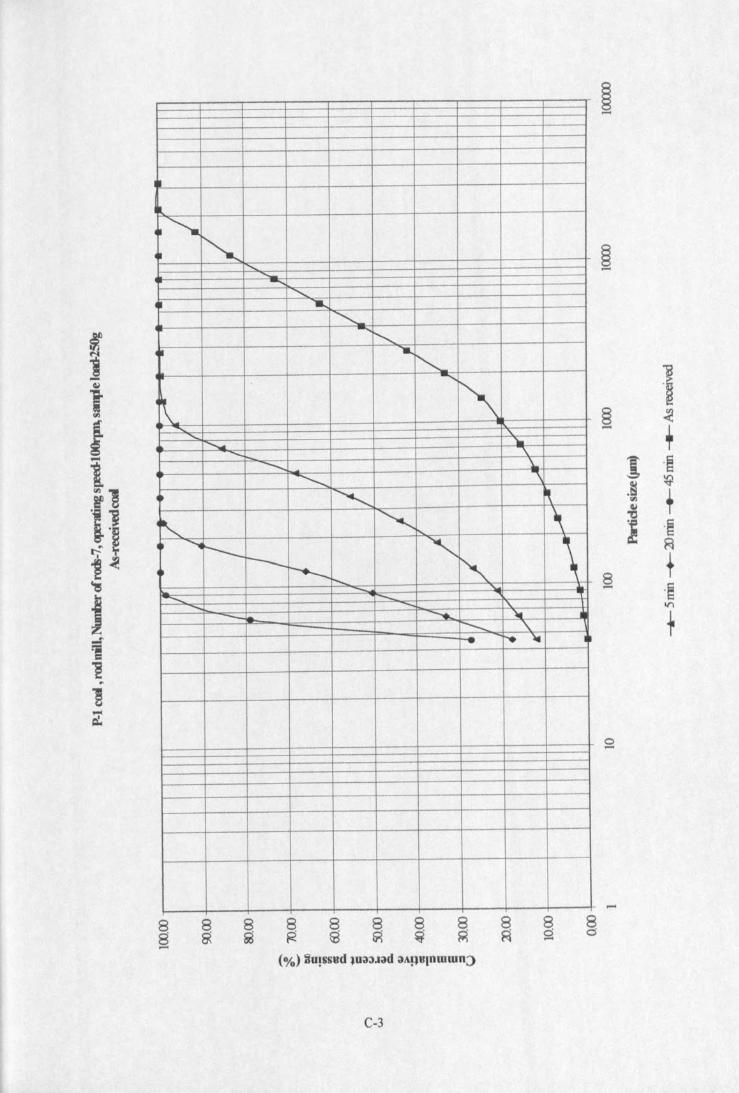
·1
Ilr-,r-.~:"'.;: -" ....
<,<,
4~ .....<,....__
1\\....... "............ )",
<, "\.-....... \..
<, "\
<, \-. " ,II ~ I--- <, \r--- "~ i"+--. t......... ~
.......... --......... -- """"--!... -..... '\I •............... \....~ - '.
8 8~ ~
8~
8s 8 8~ ~
C-3
1§ ~- +1 .~
.~ ~~ +Q,I"C
~.~~
§ +.§tr\
+
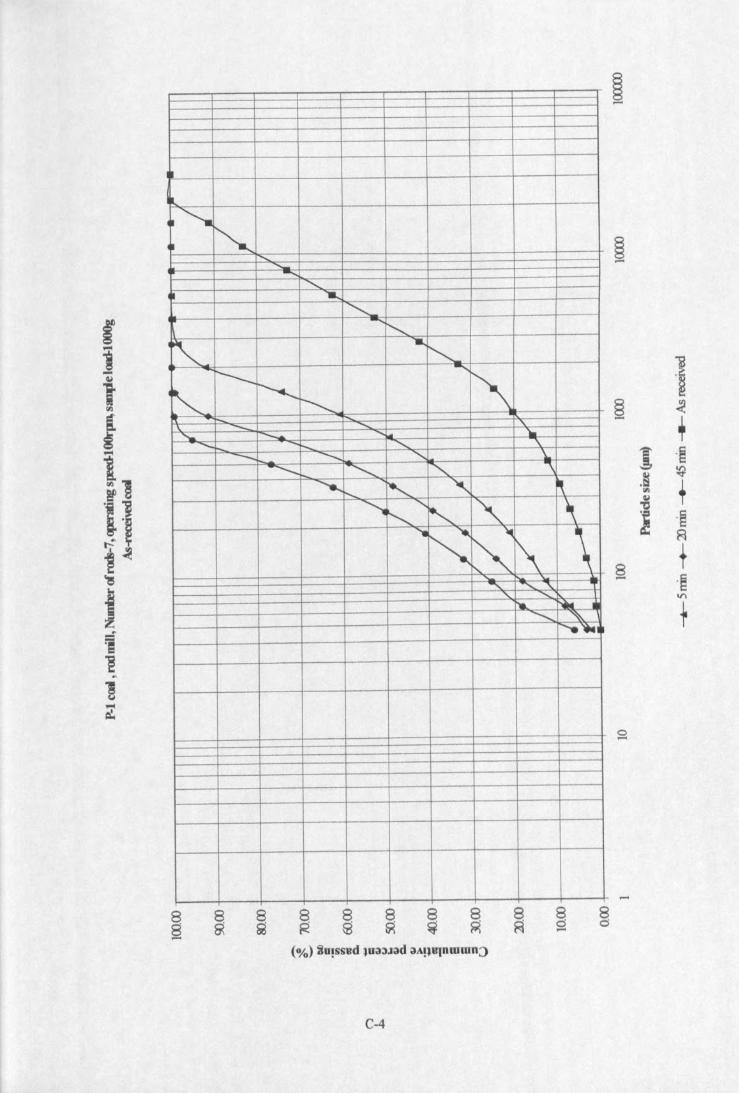
~
~"'-<,~<,
.............<,
........<,
.....,r-. ..r-,
---- -....>.-. ~ r-,
\...._ <;
......... --- ...... L.., \.......... f...... ......~ <, ""\.-- ............. <, \.
............... <, <, "\........... ...._ <, " ~
.........."'......... r-, '" ,......<:~ r\ \
'\,
"' '""- .........Fill: I'w. •<, ~
.......~I
8~
8~
8d-
C-4
~.~
~ ~
+1 .~
.~ ~
"" +~
~.~a
8 +- .§'"+
o-
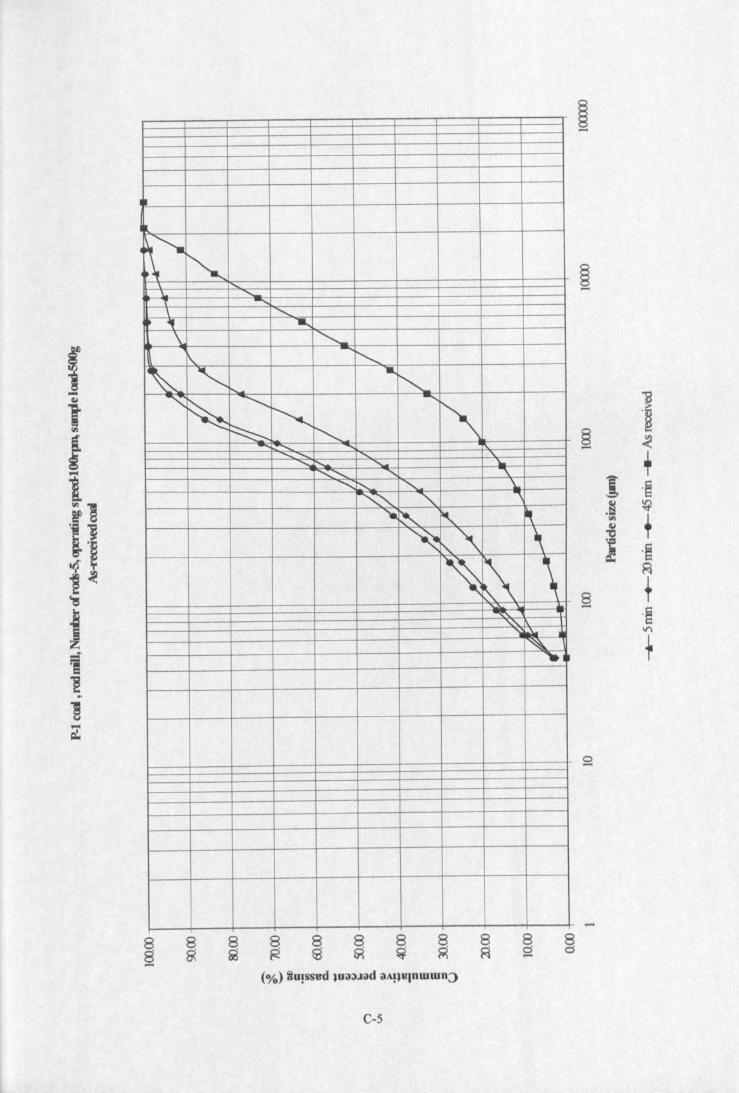
•...~,,-~
......... -...\ <,., ......\ <;
II \. <;
~<, ....
~:-...
"~
<; -..
1'\~~ ~
......... .....-- <,<, :--.... --..... \..,-......... <, "\.,--, <, \..
"'" <, "\...,.~ " ~
~ t\.'" \~ ~ \
\..~ _or,,-,"lI~I~ ....
-
8~
8~
8Ci-
C-5
-8Ci
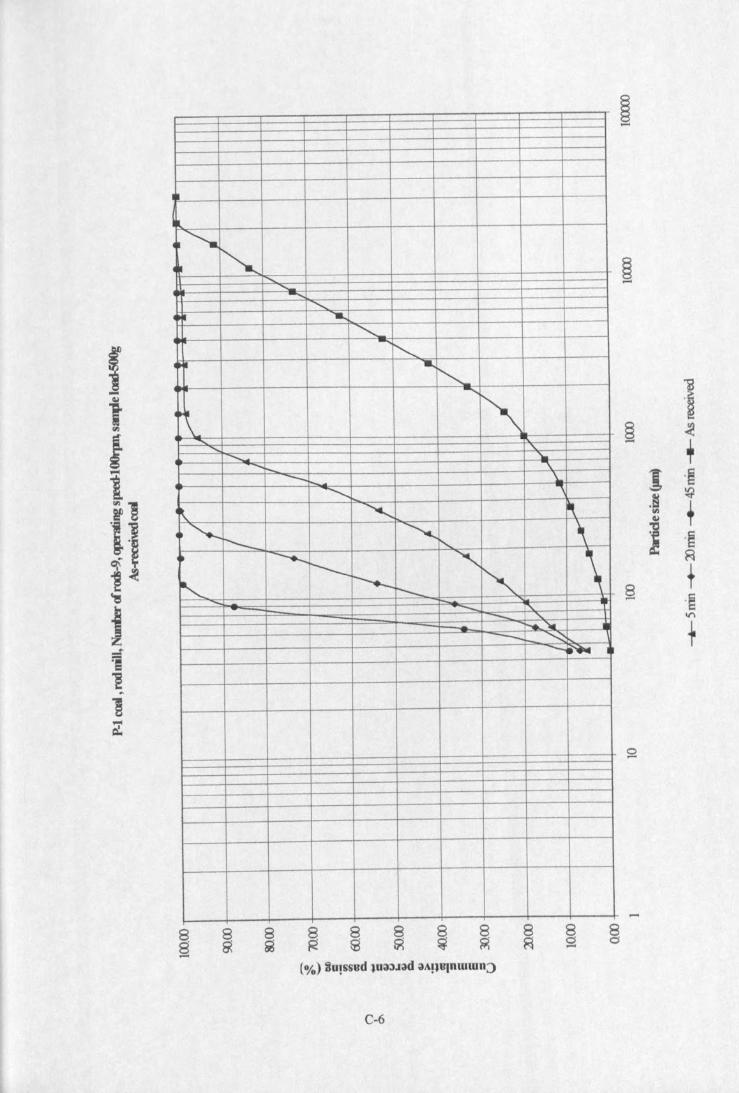
I.~r-,<;
......-<, --...<,
-...r-,~ .....
"" .......
1'\• \I\....... -
<, '"....._ ............1- "'\--- \
<, "~ ~ ~"'-.....r-- ~ r-, \
It -,._ '<, \r--r-, r-.- '"r--i-- - <,- <,
r-. "lot ..---~-~
88- 8 8g 1il
8~
§-8 8I< Ea
8~
8~
C-6
1~ <
+J .~.~ ~
'" +~
"! .~R
8 +- .~V"\
+
.....8o
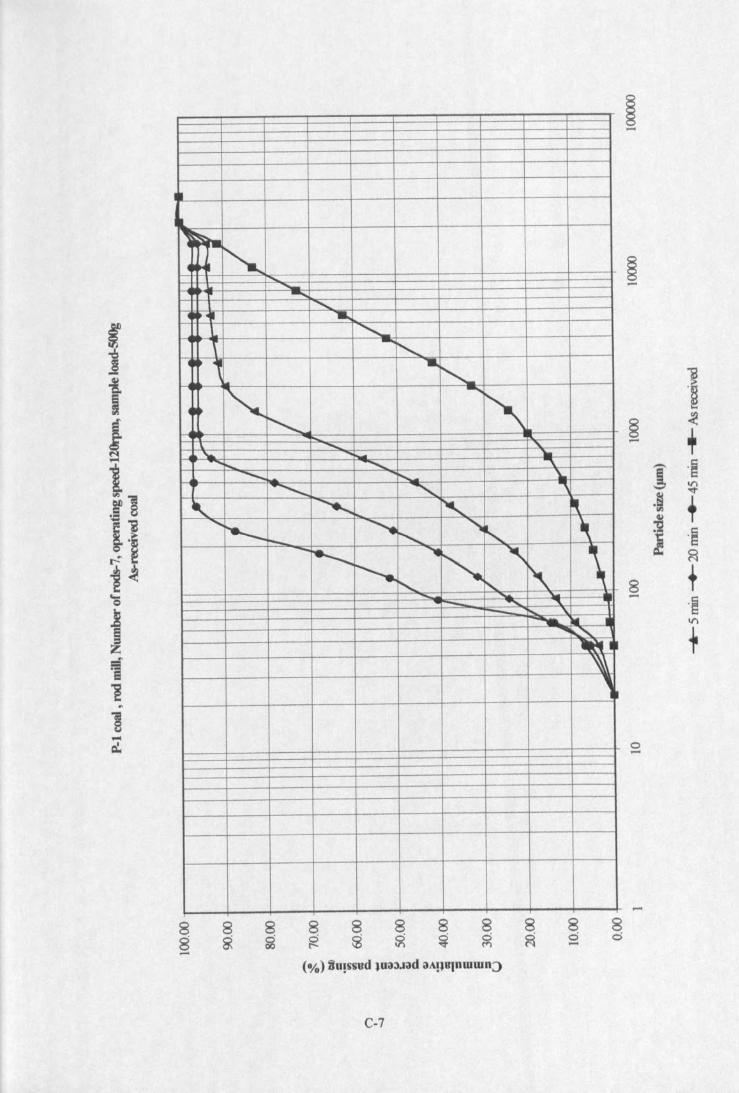
..Il,
~ <,4 ~......-....
<,.... ........._\ r-,
4 , ....r-,<, -..
~~~ r-;
-- "..... - "'"......... .........:.. ""\............ r-- \.
............... <, ,~ ~ '" ..
......... I--- ........... '"~ ~t-- !'...-----....... ......r-, ~<,~r--.... "" ........_ ...... .,.--- .... "......... IiII III.........,
lklt I~\~.
888@ g g 8ci......
C-7
1..§ -<
+-1 "S
~.g+II)
~"S~
8 +-"~
V"I
+
o.....
.....8ci
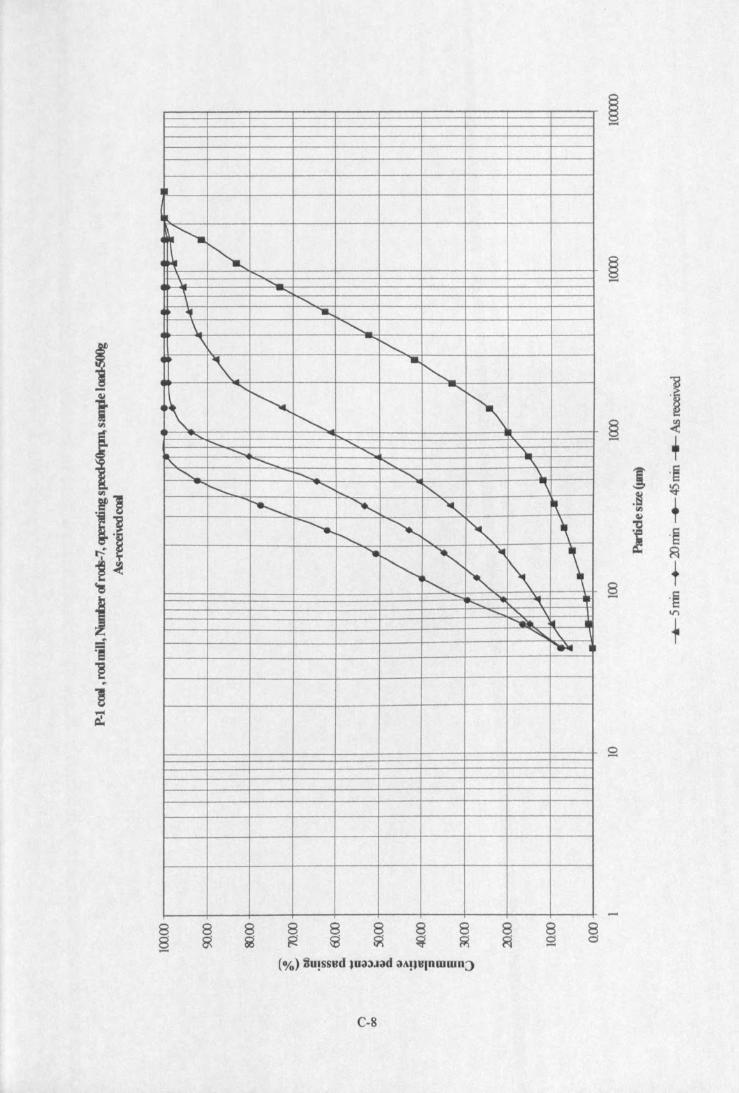
III
I,~"-..<,
.......I' ""\ <,· .; ......\ <,\ r-,
• " -r-,<,<, '''\\ <,
r-.... <, ................. <, "\..
"\. -....... r-, "\<, .......... <, \.
i"-....... ......... ....... <, "\~ ~ "<, ~
--...... I'-....... ~ I'-... -. "......r-. <, ~ \~ 1\r-,....... ""\....... ~ \
""-"). . Ii
"\.~
88- 8 8
~ ~8~
C-8
1§ ..(- +J .§
~.~+~~
I .§~
8 +- .~V"l
+
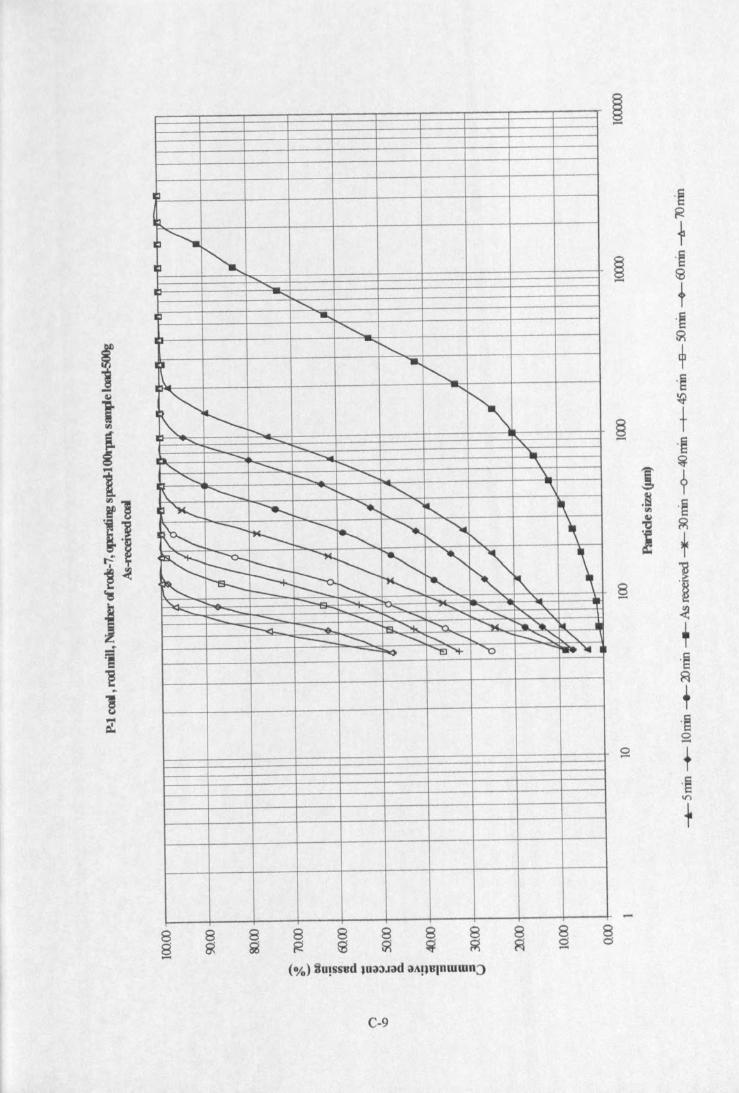
~
<,<,~
<,<;
? ...................
i".......I~ ..."-.x
~
<,
'"~ r-.....""'- - "- ~
.......... ........... ~<, ....__ '-. "'"<, -...... <, \.
r\ ........__ <,I'-... <, "\, --......,.._ ........ r-, ~
s.. --""-.._ -....<, ~ ~~ \-. -,
~ ~ r:::::: ~i'..........r. -.~ \~~ ~ I'-.. r-, ~--......: -......; ..... '-- - ~ - -.-......... - ....... ""- - .......... .......<; - '- "
--..:I. --.. "S.. '-t..._ '0.. ~ ....._...._, .. III-- -...... -...........:: r-....., .......... --'" <,~ ~'+- '0 -.;::.~
88-
§-
C-9
.~~
+~
.~Ea
+.~~
+.§~
~ t.~
1~
?.§ .~'"~"C ?iil
! +§ 1
~
+.§~
+.~s
s+.§tr\
+
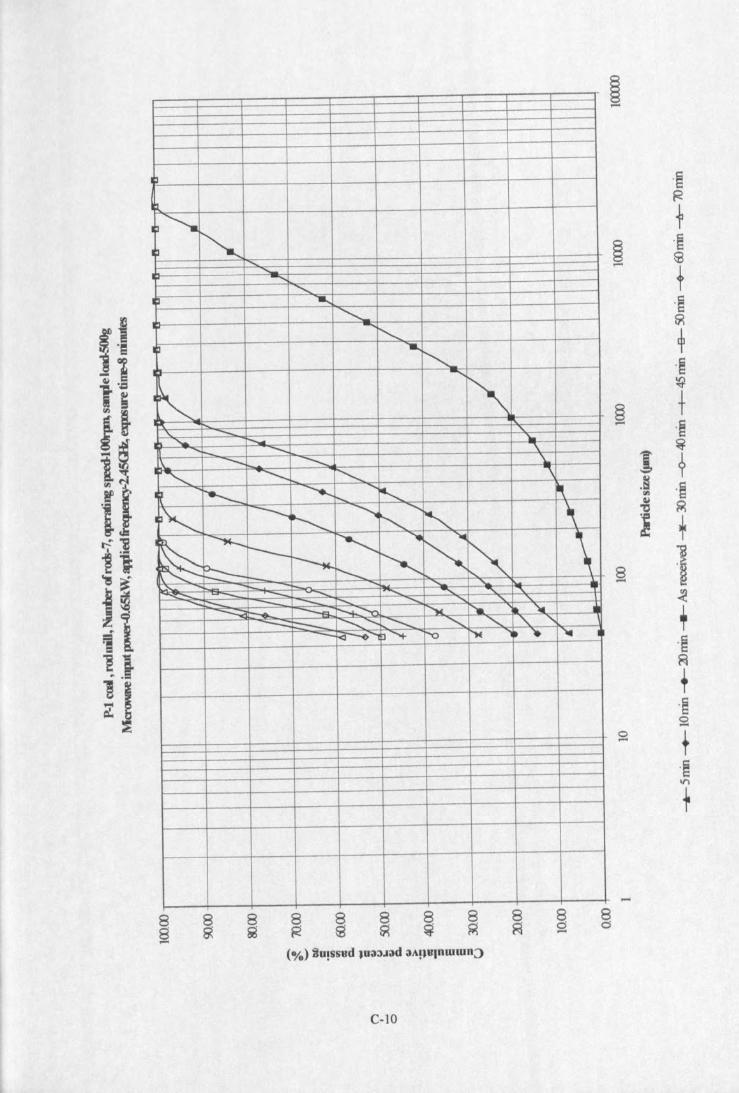
:I
I?~ r-.I~
....... ......<,
~ ......<,
t'....I~ -~ -..
1'\~r'\'\. - '\.
'- r-.... .....- -..... \.x -.... ............._ \.<, ""-... ...... r-, \I~r---..... ........_
r-.. I'-.... ~I~" ---....,~
~ ",'"~,
'~"'-I--- ~ """
~ ~ \~~ r-..... ~r-
..),. -. J.
""'" ='--<, ""- "' ..... -.,- ..._ - <; - -........ <, "- "-
~ r-..~ ~ ..... III .. Ii..............<, <, <, <, " "-1"<1 -v J""'+- r-o ')E ~ . ..
88-
8~
8Ci-8
~
C-IO
.~~
+~
.§9
+.~~
+.~~
~ +.§!
~
+.§ .~"-'~~"C
! +§ 1
~
+.~R
+.~0-0
+-.~I/')
+
-8cs
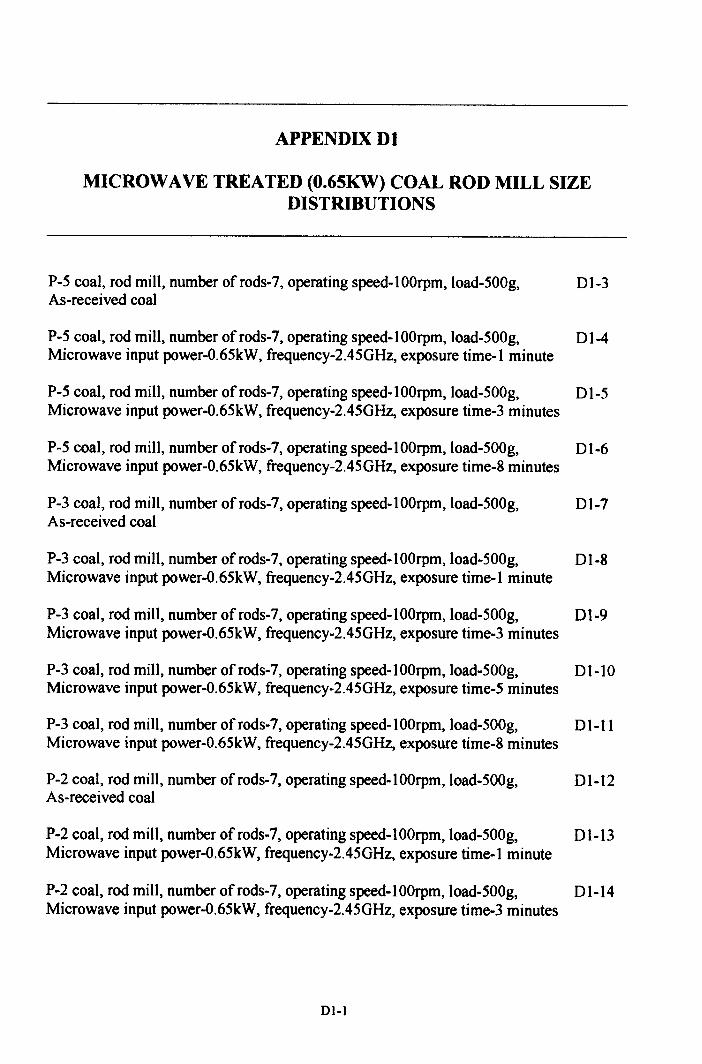
APPENDIXDI
MICROWAVE TREATED (O.6SKW) COAL ROD MILL SIZEDISTRIBUTIONS
P-5 coal, rod mill, number ofrods-7, operating speed-IOOrpm, load-500g, 01-3As-received coal
P-5 coal, rod mill, number of rods-Z, operating speed-IOOrpm, load-500g, 01-4Microwave input power-O.65kW, frequency-2.45GHz, exposure time-I minute
P-5 coal, rod mill, number ofrods-7, operating speed-IOOrpm, load-500g, DI-SMicrowave input power-O.65kW, frequency-2.4SGHz, exposure time-3 minutes
P-5 coal, rod mill, number ofrods-7, operating speed-IOOrpm, load-500g, 01-6Microwave input power-O.65kW, frequency-2.45GHz, exposure time-S minutes
P-3 coal, rod mill, number ofrods-7, operating speed-IOOrpm, load-500g, 01-7As-received coal
P-3 coal, rod mill, number of rods-Z, operating speed-IOOrpm, load-500g, 01-8Microwave input power-O.65kW, frequency-2.45GHz, exposure time-l minute
P-3 coal, rod mill, number ofrods-7, operating speed-lOOrpm, load-500g, Dl-9Microwave input power-O.65kW, frequency-2.45GHz, exposure time-3 minutes
P-3 coal, rod mill, number of rods-7, operating speed-I OOrpm, load-500g, 0 1-10Microwave input power-O.65kW, frequency-2.45GHz, exposure time-S minutes
P-3 coal, rod mill, number ofrods-7, operating speed-IOOrpm, load-500g, 01-11Microwave input power-O.65kW, frequency-2.45GHz, exposure time-8 minutes
P-2 coal, rod mill, number ofrods-7, operating speed-IOOrpm, load-500g, 01-12As-received coal
P-2 coal, rod mill, number ofrods-7, operating speed-lOOrpm, load-500g, 01-13Microwave input power-O.65kW, frequency-2.45GHz, exposure time-I minute
P-2 coal, rod mill, number of rods-7, operating speed-I OOrpm, load-500g, 01-14Microwave input power-O.65kW, frequency-2.45GHz, exposure time-S minutes
01-1
Appendix D1
P-2 coal, rod mill, number ofrods-7, operating speed-IOOrpm,load-500g, DI-15Microwave input power-O.65kW,frequency-2.45GHz, exposure time-S minutes
P-2 coal, rod mill, number ofrods-7, operating speed-lOOrpm,load-500g, Dl-16Microwave input power-O.65kW,frequency-2.45GHz, exposure time-8 minutes
P-3 coal, rod mill, number of rods-7, operating speed-IOOrpm,load-500g, D1-17Muffle furnace temperature-250°C, exposed for Ihr
P-2 coal, rod mill, number ofrods-7, operating speed-IOOrpm,load-500g, DI-18Muffie furnace temperature-200°C, exposed for Ihr
Dl-2
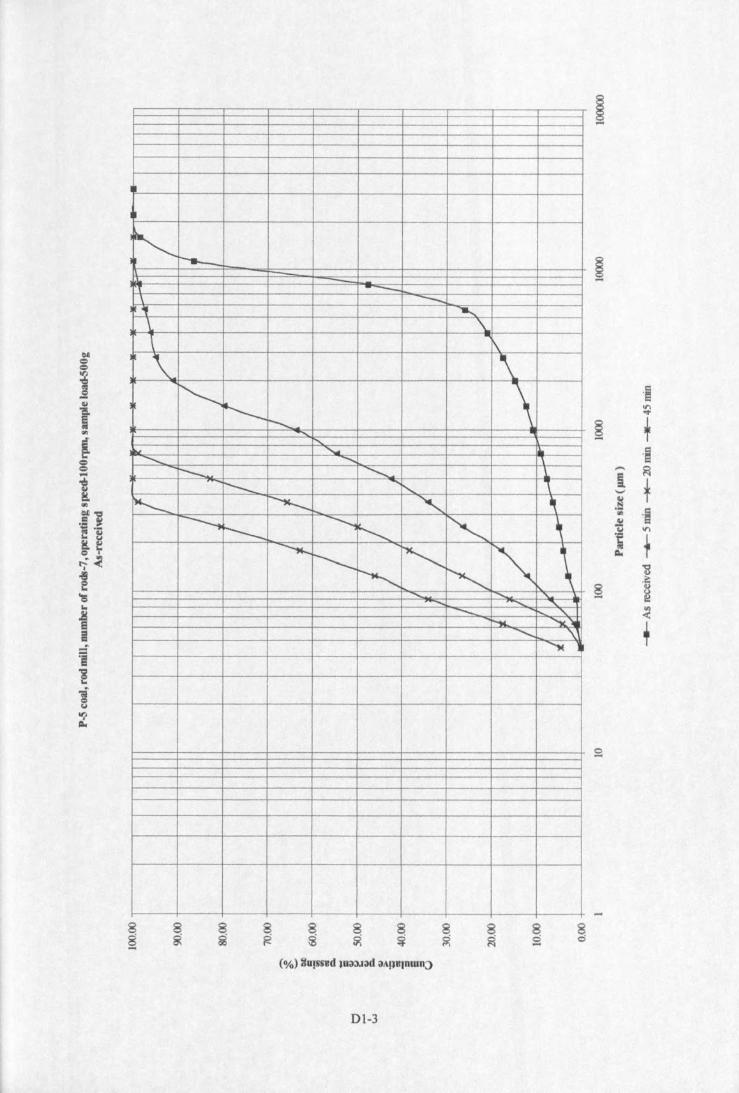
-.r--- ---\ --..." ........\ \.\ ~
\
\ \~ <; \r-..
....... ....... I.<, <, \r--- <; l
1"--- ...... r-, '\~ ~ -. ,----.,r---- ............. r-, <, ,
~ r----. <, r-, \~ ~....... .......- --- t-.. "1"-M. '1t.. ,............. \
~
8S
01·3
.~11'\~
~ f'~
""" ~i f'-'
.M'" ·S.!lu 11'\.~ 1~
'S.~
~GJ
~III«,
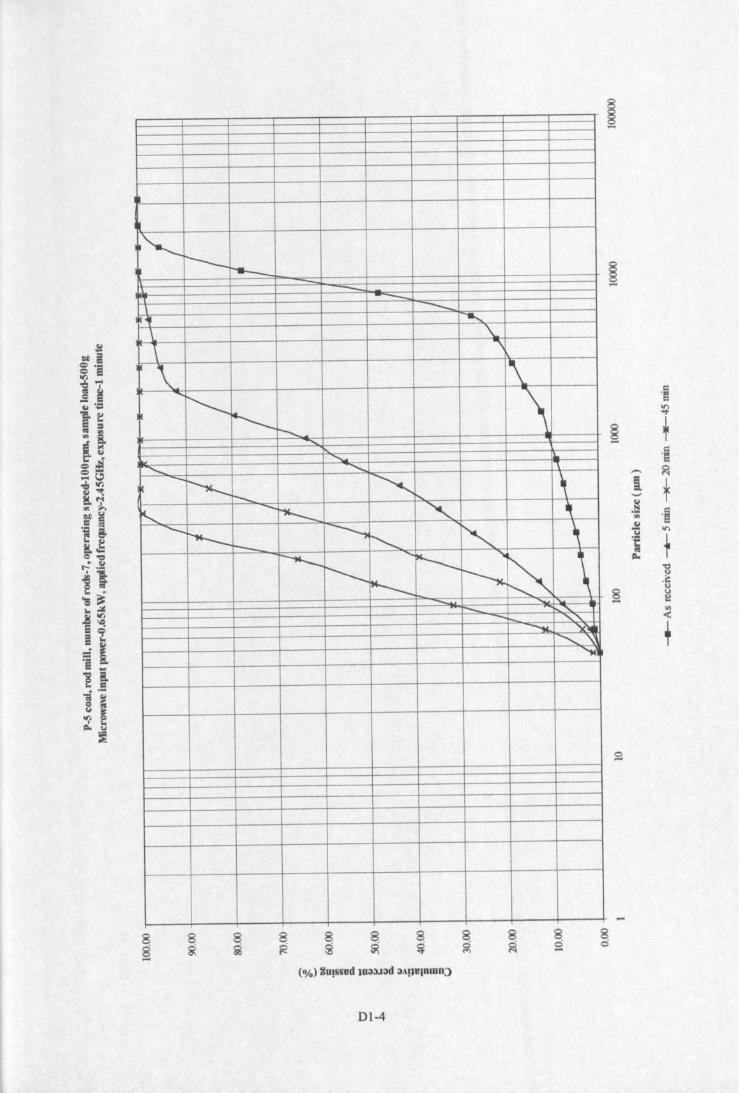
I~ ---- ---- -'T --\ --" ..........\ \.\ "\
\ 1\~
~ \-- ......<, 110.
~ <, "1-~ '" ,-.... .....
<, -~ "<, ~..._~ ~ <, '<, ,- ~
....:;,F-- ""~ \..___
~~ - ""'- ,"~ Y'l.l
.............. "~
8g
Dl-4
·s.,..,"!t
§ f- .~....... ~i +._.,
.~ .~..Go!<3 .,..,.~ t~
-g
8.~
- ~III..(,
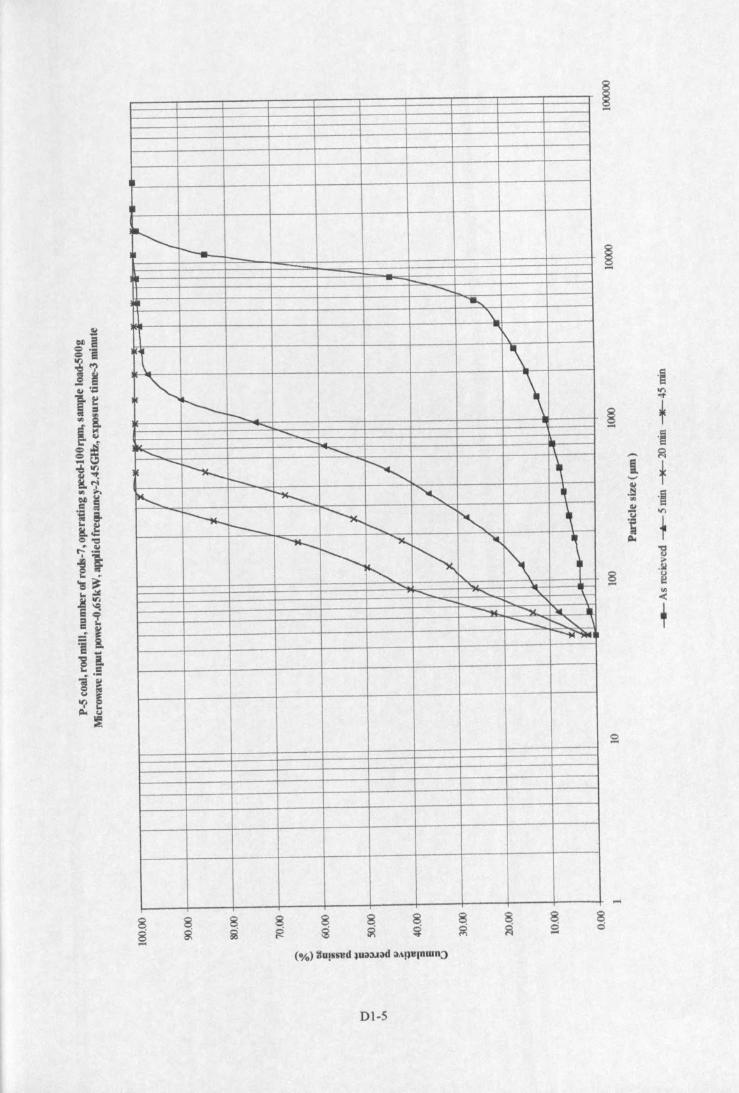
~ r---f---I- -- .......
\.""1\
~ \\.-.I---- \r--... ....... -Ir.t - Jl,;.
..........." -- ".......~ ~ ~
~~ ~ <, ~
~ r--- ~
'" r-, ~~
~""--r-, "1\
,r-, "- ....... '"- "\
--- ~ ),( ..--- r--...._" \-"..,.1
8g
Dl-5
·s11'\
"'"§ f- ·S-. ~i +'-'
.~ .~...G,j
~ 11'\
~ f~'I:iv~.W
8 0- ~'"<,
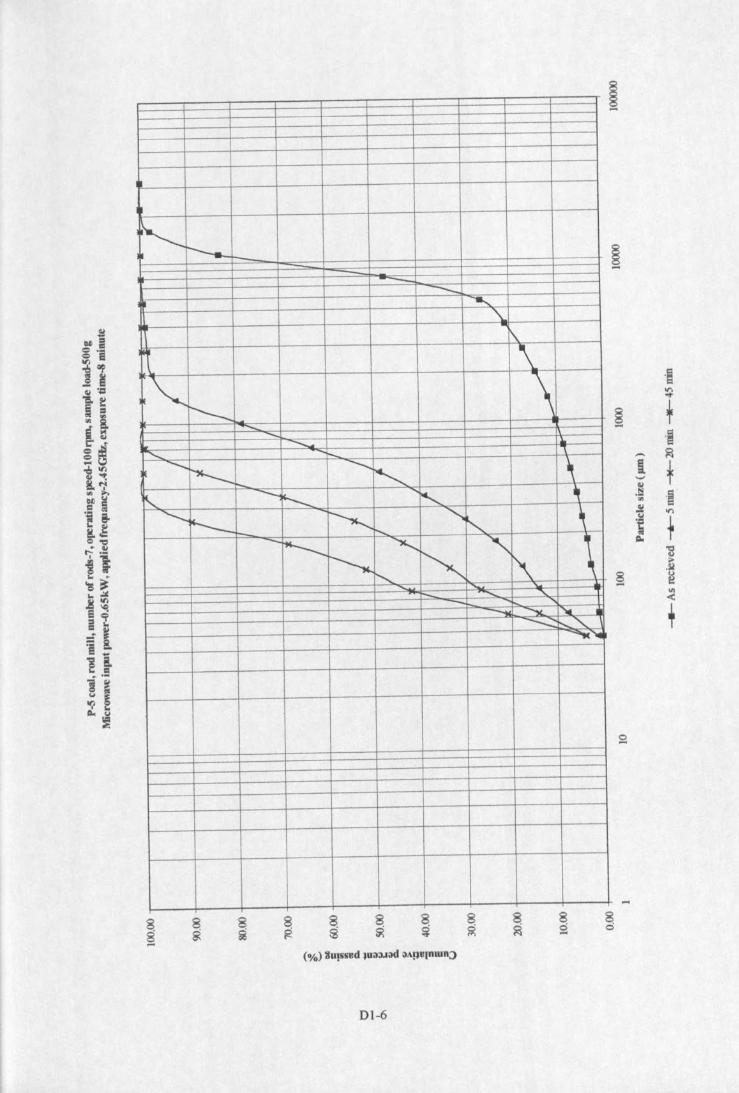
r-.I----t-- - -- -..... -,f\
.,. \\.-;I--- \
....... ......."""'- ~
<, ............. "1............I"---
-......... r-, \-, --f-- ........
~ ~"-..f--- ~
<,i'-- !........-F "" -, \~ ~ 1\r--....
r-- ........ "- -- ~ "-~ :-....'"-,c ......
01-6
'S~
§ f-'~
.- ~i t._,
.~'~
..,.£ I('l...
+~~"S,~
8 2.....'"<:,
.....
8<:)
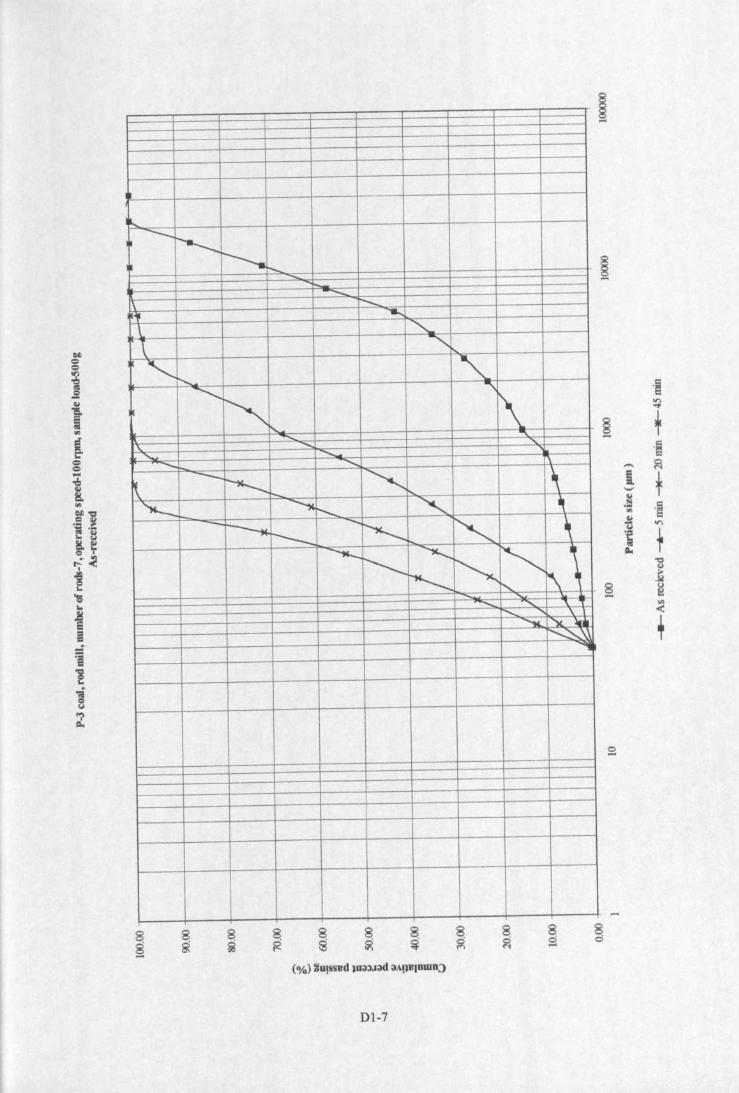
..... ---I----~ .....
....._1\ r-~ ......1 <,'\ """-,=;
r-... <,-......... ......
1\r-.-,i\. ....... "<; .........- <, r\
~ ----~ "" ,t-
~'-'-,c1'"'-..... <, ...~
-~ -~ r-, ,I---
~ I--....... "'-.......~r-.r--.- ~r-,- <, "'\I"'-... '" \
~ ~ :..r----...........,\..,
Dl-7
o~~
~ ~oS
".... ~i f._,.~ 0;."~U V'l
.~ 1Q""aCl);>o~
8 <.)- e'".(
+

k -t---r--.----..__ -- <, ......<,."~
~
'<, \r--...... \.-- <; \
r-; <,~ }",.........._ ~
,.-. ~ r-.., ~ -.;
<,
""---- ~ -- .......... <, ~-----.., -~<, ..r--._ '<,..............._
~
<, '"~ ~
<. '" i
-- ....... ......-.... ........._"~ ~--- ........,.
-
Dl-8
.~~
~ f.~
'"" ~I f._,.§ .~..41<3 ""~ +0..
~...~§ ~
<,
8c:::i
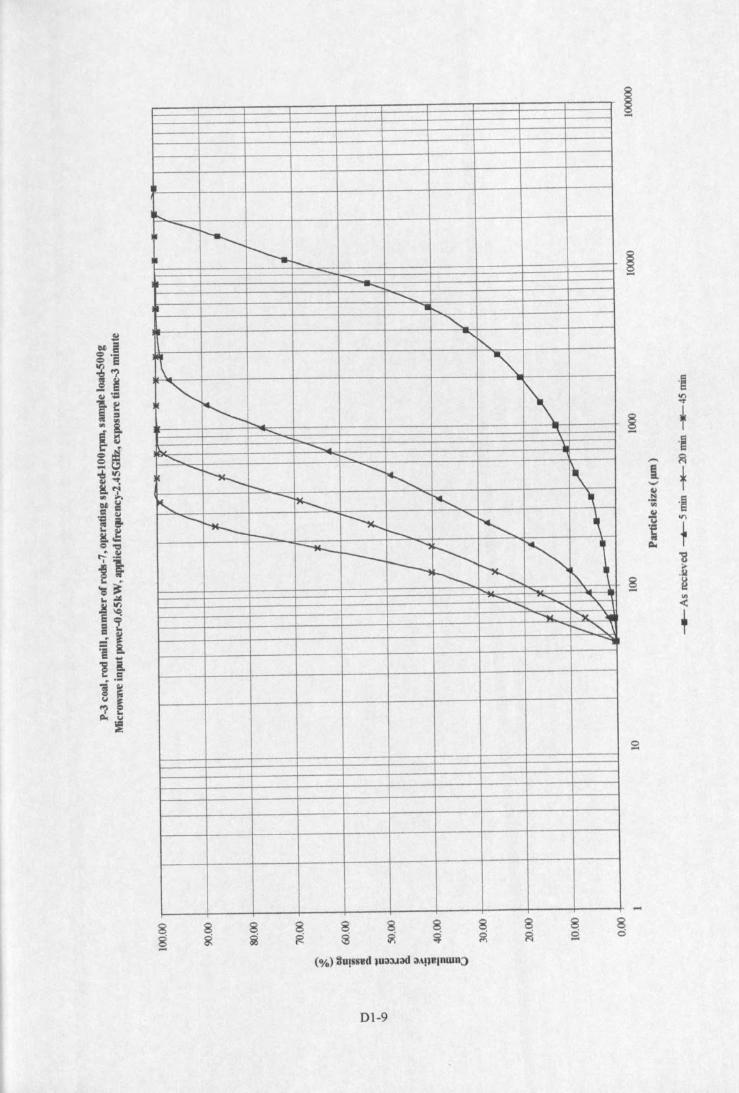
~ --~ ----..~ r-....-.;;;:: -.....
.................. t-...
'<;-....I'..
~<,
<,~
-1\~
........
~ ...........""-. ......--~ <,<, ,
IE t-...
~ -r-...... ~ "....._~ ~
<,
~,
r--- r-...~ .......r-. ~ -I--
~ ~r-..... ~i -....... """ "\.'w.. 'v. ,......_~
~
8i
8.s
Dl-9
.~~
§ f- .~,.... ~i t'-'
.~ .~..~ .,.,~ t110<
'3.t
§ ~'"-(,
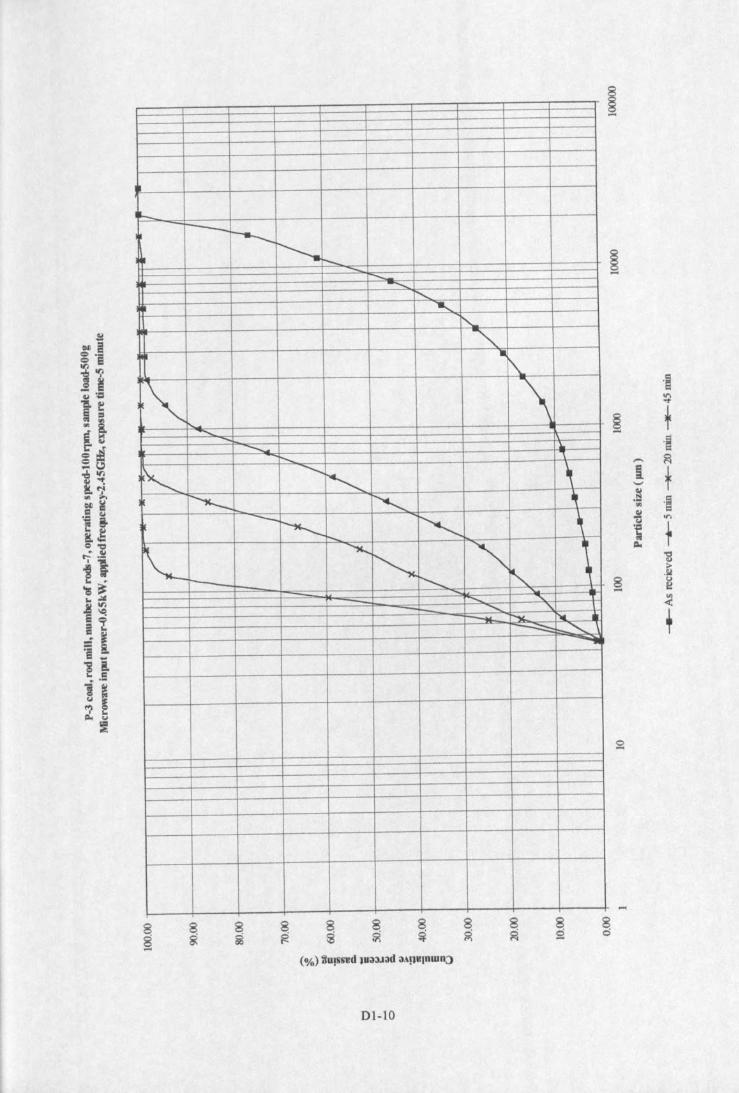
IJ-.
I-- l---r-,p - - ............r-, ...::::
r-,<,
-I\.
-, \....... ......
............ ~r....... i
r~ --........r-; ,i"'--- ["-.. ~
~ --~ '<. ,r-r.. "'-...
~
j
r-, -.t--- r................... <,-i-- <, ""'"~ ~ r'loI. •~ ~ \
~
DI-IO
.;11'1-e-
~ f·s
.-.. ~t t._,
.~ .~..~ 11'1(j
f~~-g>.iII
8 ~- '"<T
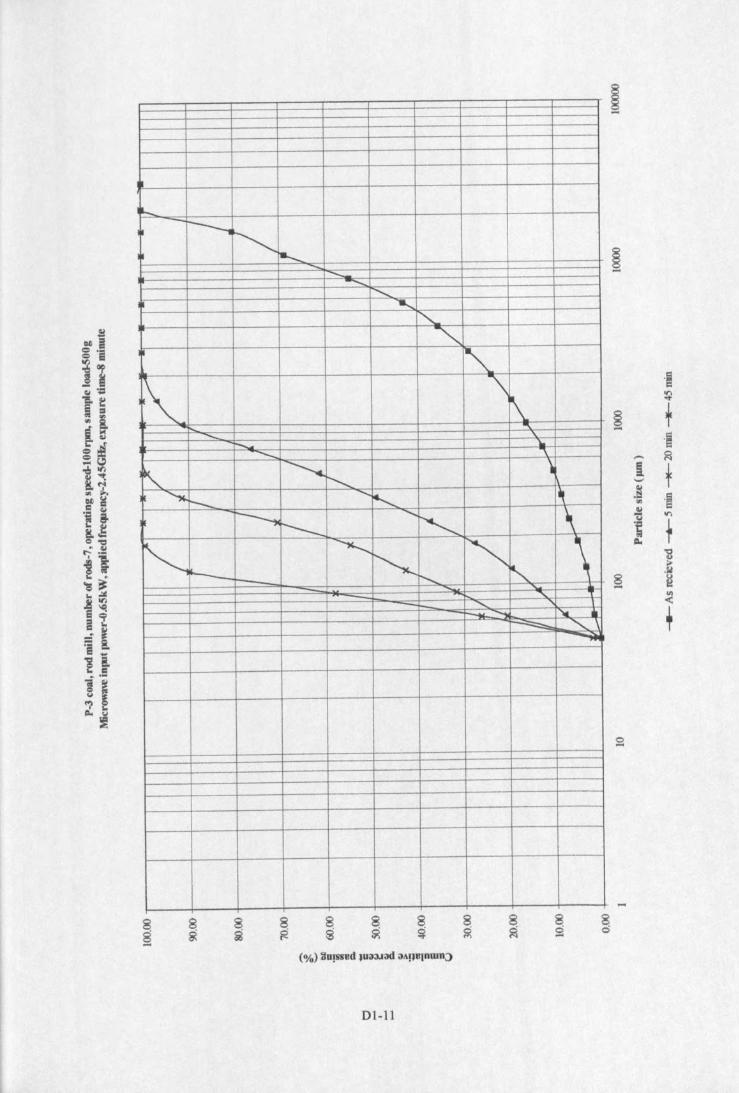
.._ -!---tr-,.......... -...........
<, ......'"<,
I~\ \
\...'"' '\.
r--... "'i:-.. "\
~~ I'-........
)
"'--- <,~ ~
~........<; \----<. ~
~<, \f--- t-,- <,
.....-- <, "~ ......... ~ .~ <, \
~
--
8§
8g8g
Dl-ll
'S~
§ f-'~
,.... ~i t'-"
.~ 'e..~ II'>
'; f~'i,~
8 ~- !II«,
8o
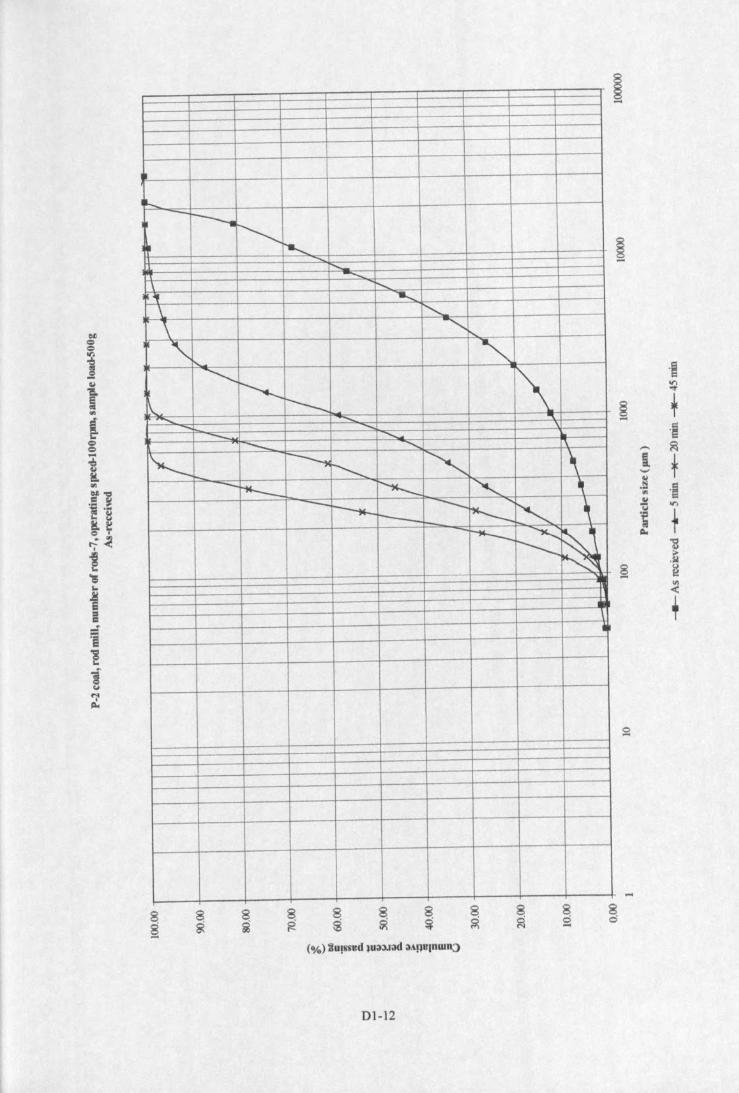
k -----.~ r---.. ....._
<,
\ r.........-If ..........\ r-,\ <,
r-,
<, <.<,
~ \-----\......... .....:
........--.. <,-- <, v
~~ r-.......... <, \-"""--- ~ <, ~
~~ --~ <,
...~-- ~ -:::~
Dl-12
.~VI..,.
§ +.....~
,..., ~I +._,.§ .;..61"0 If')
~ +0.13....~
§ ~'"<:,
....8o
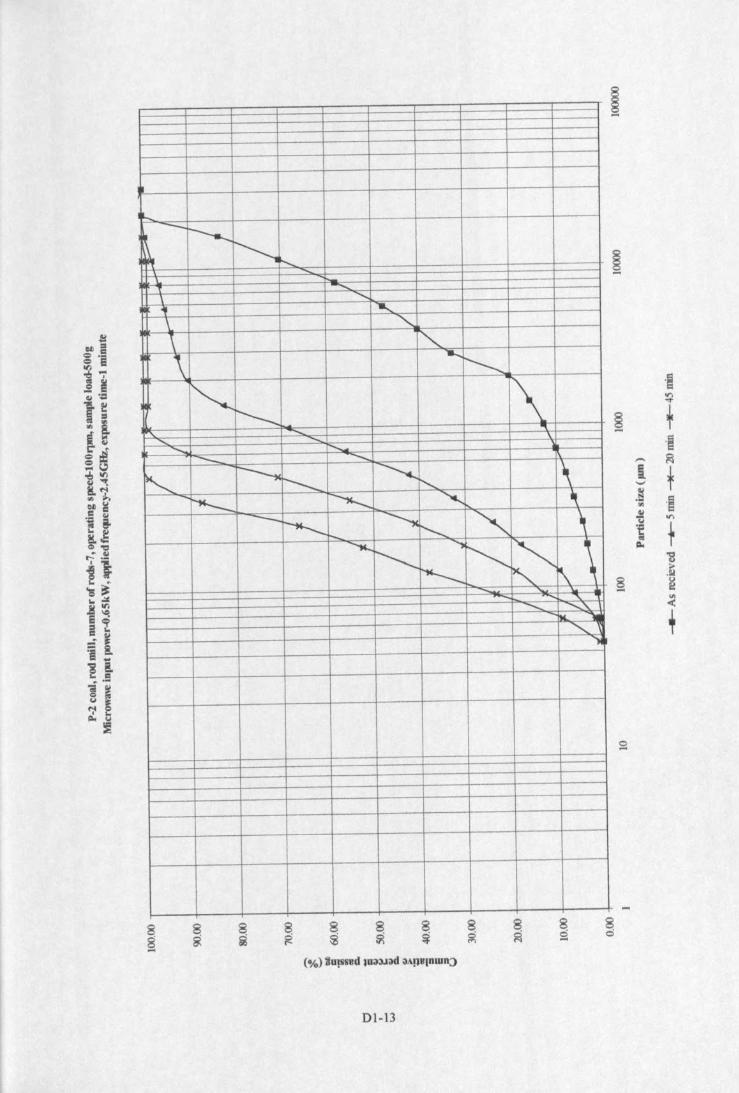
h.oo;;;;,._ ---.....
~~ r-, -.......
\" ............~ "-\. <,
\ ~
\ -:....j--.........
<,i'-....... 1\
"- - "I.
"' ..._ <,-- ...........
~~ I--.. ~ -, \
t=-.; ~ "'- ~--~ ~r.............. <, ,- "'-.
~
.....,
i'-.......~ ~\r--- ,
"<; .......... "'k -.<;
")
Dl-13
.~~
§ ~- .~,-.. ~i t.._,.~ .~'"Qi
'ti 0I'l
i +~'3.t
§ ~III«
+
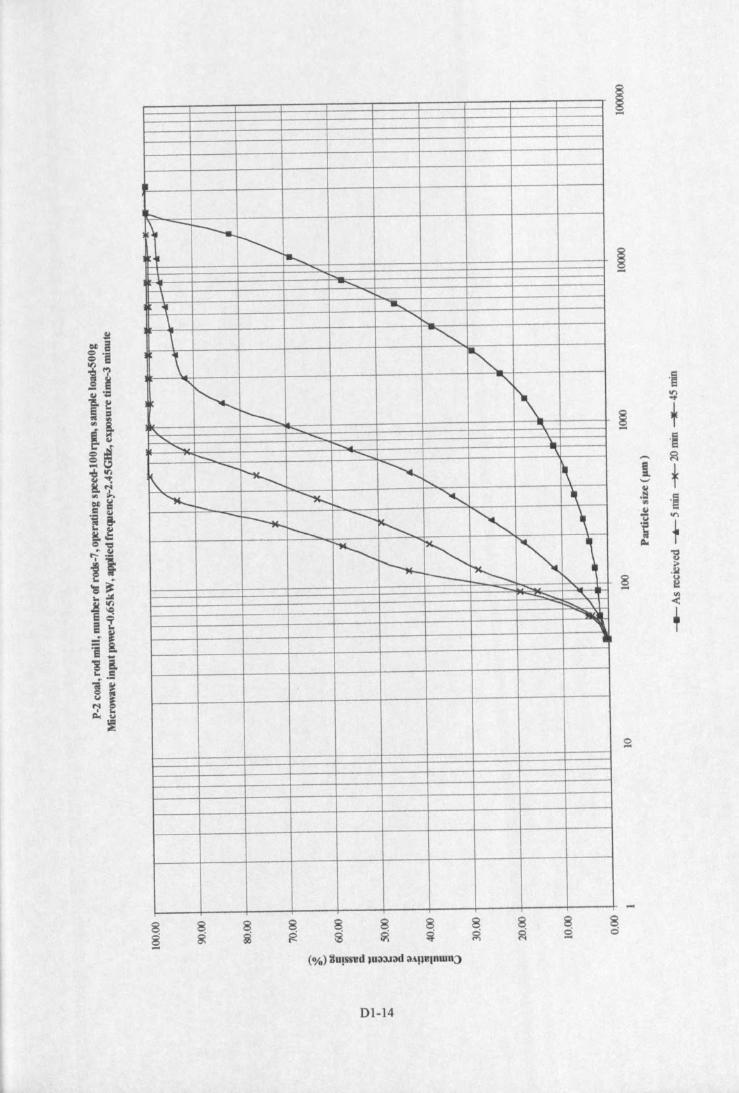
s-,
~ -r-----~ fa......
"""---......1 ......
'If .......\. .......
1 <,\ ~
........
~ """i'--.....: - "\, \.._ .......... 'I.
r- ...........-...~
~ ~r\. r-,
""- r-. ~ '"<; ~-~
...............~ <, "....__
~~r-. ~
,t--- t--.- ~
I'\.~ "...... :::::,., "\
~II ,I
Dl-14
.~.,.,"'"
~ T.~
,._ ~i +,_,
.~ 'S..J! .,.,.~ 1~
13.~
~ ~'"-<,
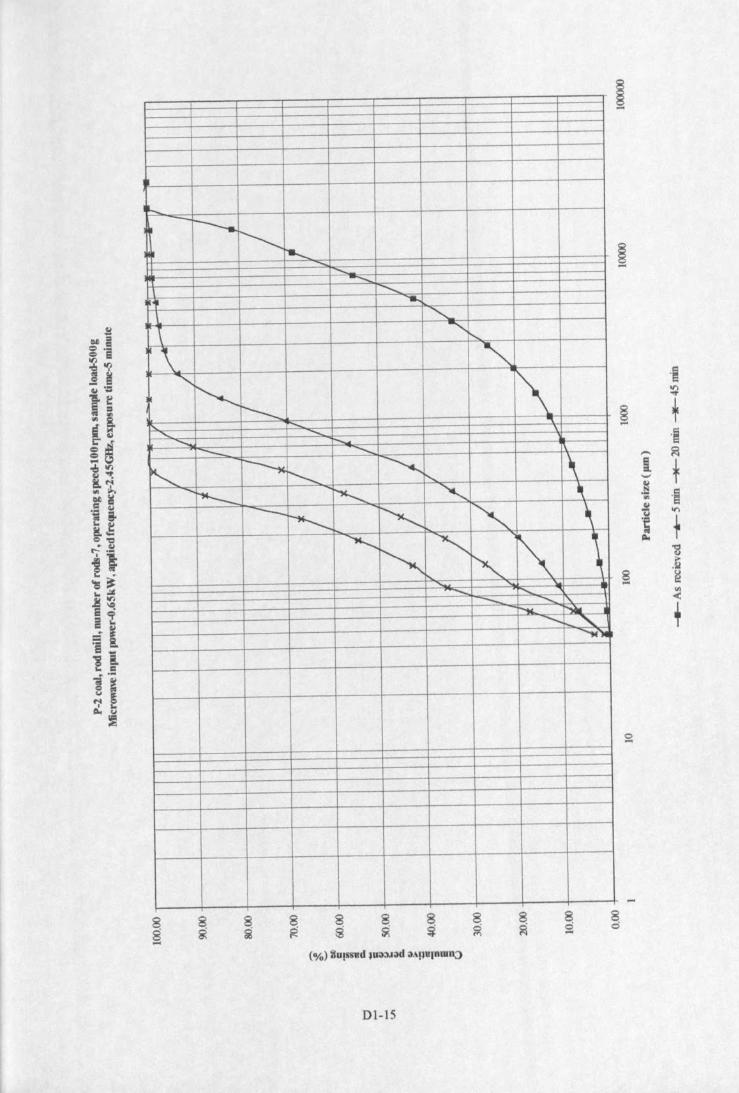
~ -r+--~ r--
""'" ......................., .....
T <,
"\ <,r-,
\. <,<,
'" 1\t---I'.. ......"- ......
........ r-...--- .......... 1\
r-, ~ r-........ ~ r-,,
......r'-- ~ '" ~--r-.......... ~ ~
,~
~~ -, \"<,
........ .................. <, !'\.
NoL I"'W............. ""-"M"),!
8g
DI-lS
"~
~§ +....
"~
--- ~l +'-'~.!:!
"e'"~"0
.,...
~ +~"S"~
8 ~- <II.(
T
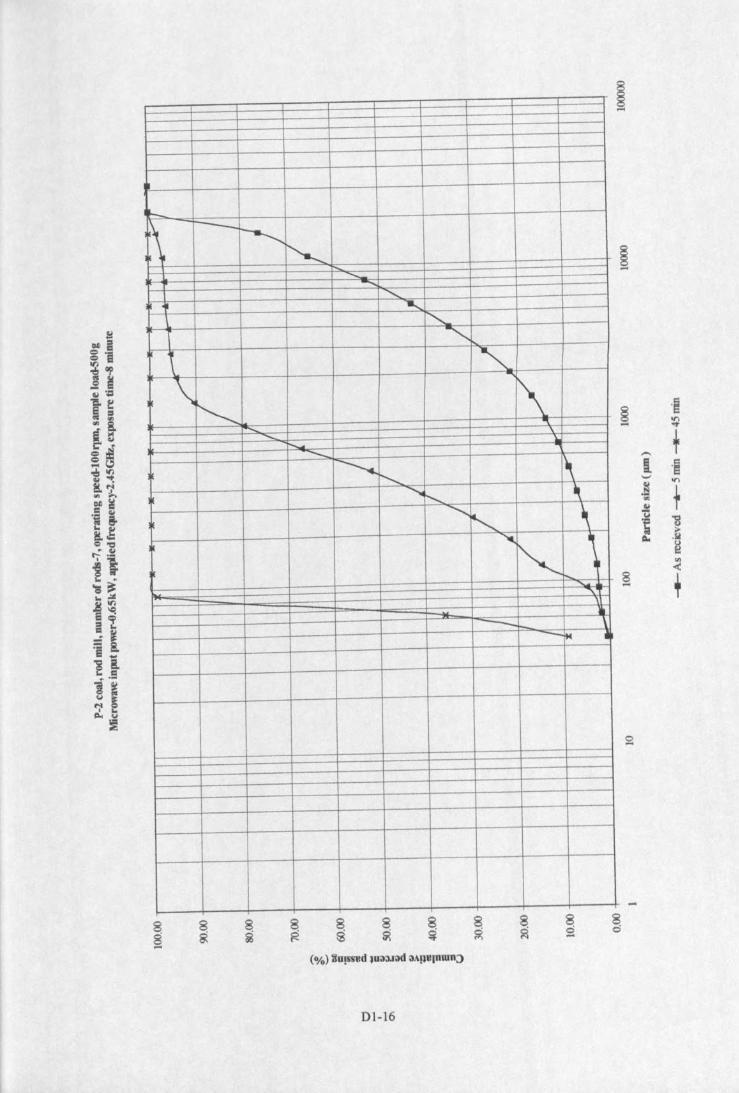
,_
~
-___r---....
~'- - .......
<,
"<,"""'P <,
\.\<, \
J-.,. '\
r-- \.- ~ r--...... \<,I'..... ~
<,<, ,~
........
~~
""'.'"Ii-- \-1M •
8g
01-16
§ ·S- ~
,.... +I .~'-' on.~
+'"~
I '3.~110~::
8 ,-
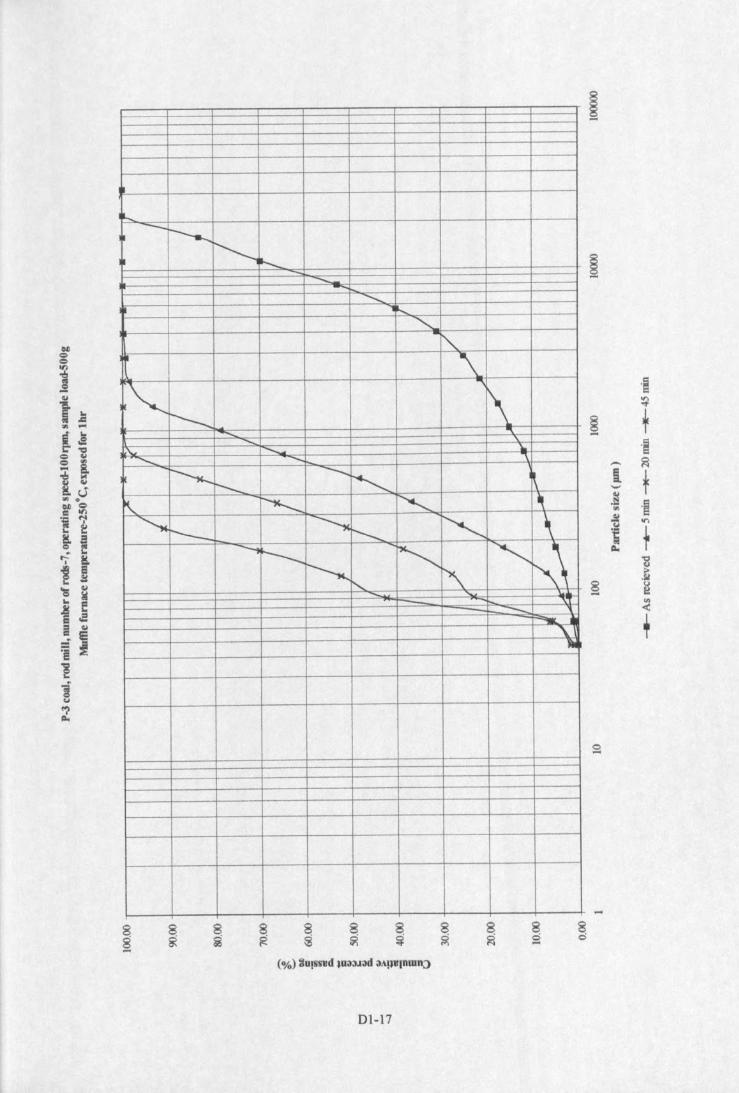
a.... -J--....~~ ...._
<-;
<,......<,-",
~ \
""\
---- \- "'\-:.... - \,.
<, - "'\
~ --<, ~r--~ ~ "<, ~<,--- ~ ........__ ~
,---...____ <, ~ "'\~ <, ~
\..1.
"'"-- ,~ ill
'-\'JIll
01-17
.§~
§ +- .~
-- ~i t,_...~
·m..~ ....i t~
'3;..Si
8 ~- '"<:
+
-ao
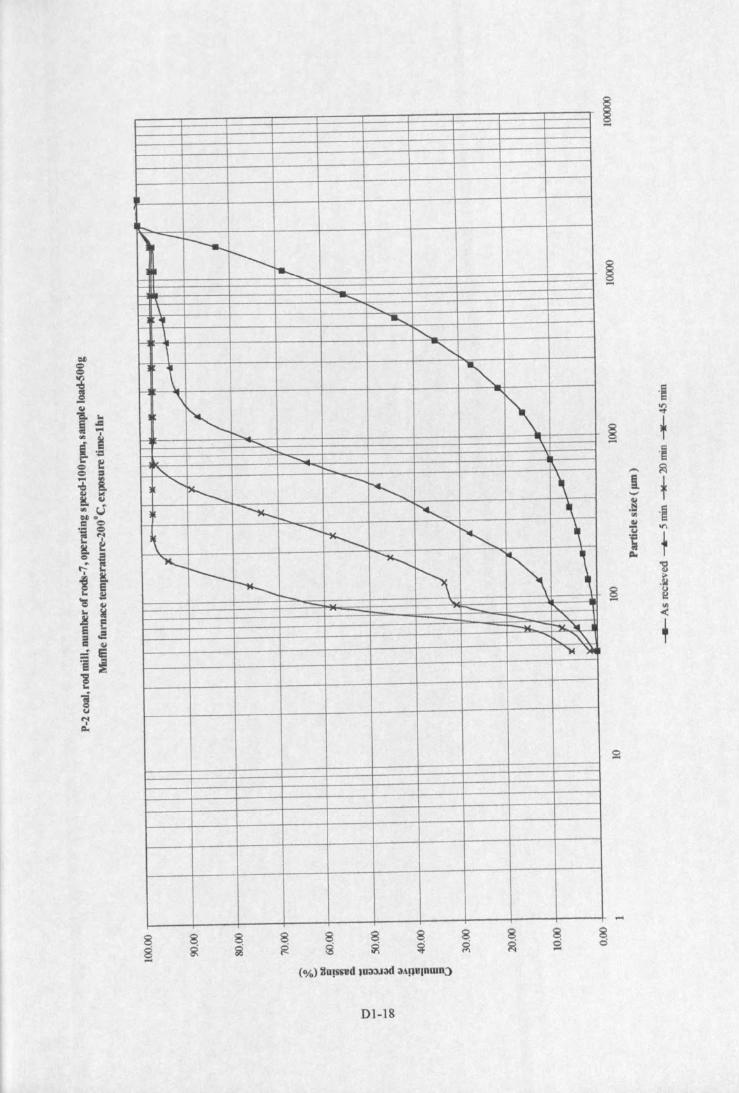
-
•t--.
I~ - I----~ ....._
<; ......_.....
\ ........, ..........\ ""-
~
l \ <." ~"\~ <;
........" .........
<, r-....<,
~~ <; \
I ~- <, ~
j...............
~
<,
i'........ -~
\~i---
~
~ '" \~- - - "---.c.. ~~,~
8g8g
DI-I8
.§~
~,.~
,.... ~1 t._,<II.~
·m~~
" '"'; f~13..• 101
§ ~.'2,
APPENDIXD2
MICROWA VE TREATED (O.65KW) P-2 COAL ROD MILL SIZEDISTRIBUTIONS (UNIFORM FEED CHARACTERISTICS)
P-2 coal, rod mill, number ofrods-7, operating speed-IOOrpm, load-500g, 02-2Size distribution of two as-received samples (uniform initial size distribution)
P-2 coal, rod mill, number ofrods-7, operating speed-IOOrpm, load-500g, 02-3Microwave input power-O.65kW, frequency-2.45GHz, exposure time-3 minute(uniform initial size distribution)
P-2 coal, rod mill, number ofrods-7, operating speed-IOOrpm, load-500g, 02-4Microwave input power-O.65kW, frequency-2.45GHz, exposure time-S minute(uniform initial size distribution)
P-2 coal, rod mill, number ofrods-7, operating speed-IOOrpm, 10ad-SOOg, 02-5Microwave input power-O.65kW, frequency-2.45GHz, exposure time-8 minute(uniform initial size distribution)
P-2 coal, rod mill, number ofrods-7, operating speed-IOOrpm, load-500g, 02-6Microwave input power-O.65kW, frequency-2.45GHz, exposure time-IO minute(uniform initial size distribution)
P-2 coal, rod mill, number ofrods-7, operating speed-IOOrpm, load-500g, 02-7Microwave input power-O.65kW, frequency-2.45GHz, exposure time-I2 minute(uniform initial size distribution)
P-2 coal, rod mill, number ofrods-7, operating speed-IOOrpm, load-500g, 02-8Microwave input power-O.65kW, frequency-2.45GHz, exposure time-IS minute(uniform initial size distribution)
D2-1
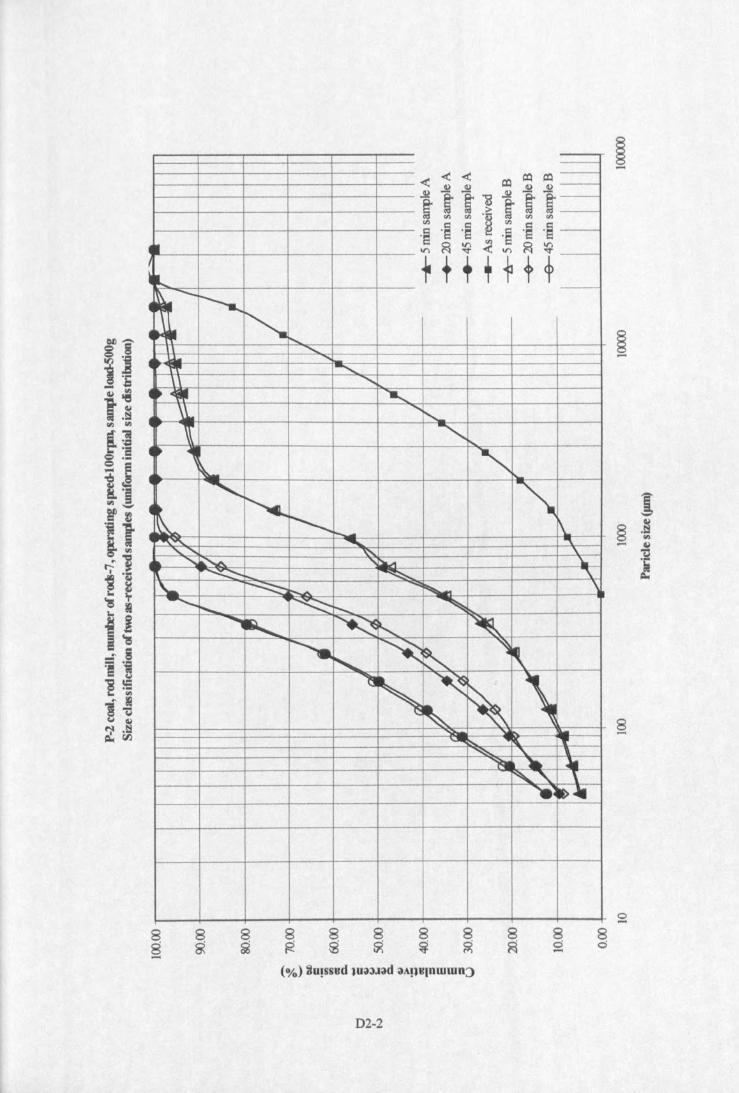
-< .(.( ~ ~ ~~ ~ ..s2 .,g
~~~~~~~~ '" '" o~ ~ Cl> Cl>o~ o~ o~ ~ o~ os o~dl 'f"l~~<'f"l~~:~ + + + T + + +4~ -- ~ r-,O· • t-.....
.........
1-"""..........
4~ ~ "a....loo ......~
~ <,i'o..
0 1 <,IL""-
~..~4l
~ '-- i\_~ ......... """'"
"\,....... ~ \.<, ~ "'~ \.
~ ~ ,\.. ~ ~ """-=~ \-............... ~ .........
,.......,
~ ~ <, ~
I"-~ ~ ~~
~
'"-, ~
~ '\~.'-l TI\.o
'-"l1lI "- r-,~ '-
~ ~ 1II~, ,.~~-48 8 888 8 8888 g ~ g 9 ~ ~ ~ ~-
8 8<:) <:)-
D2-2
~-
~......
o-
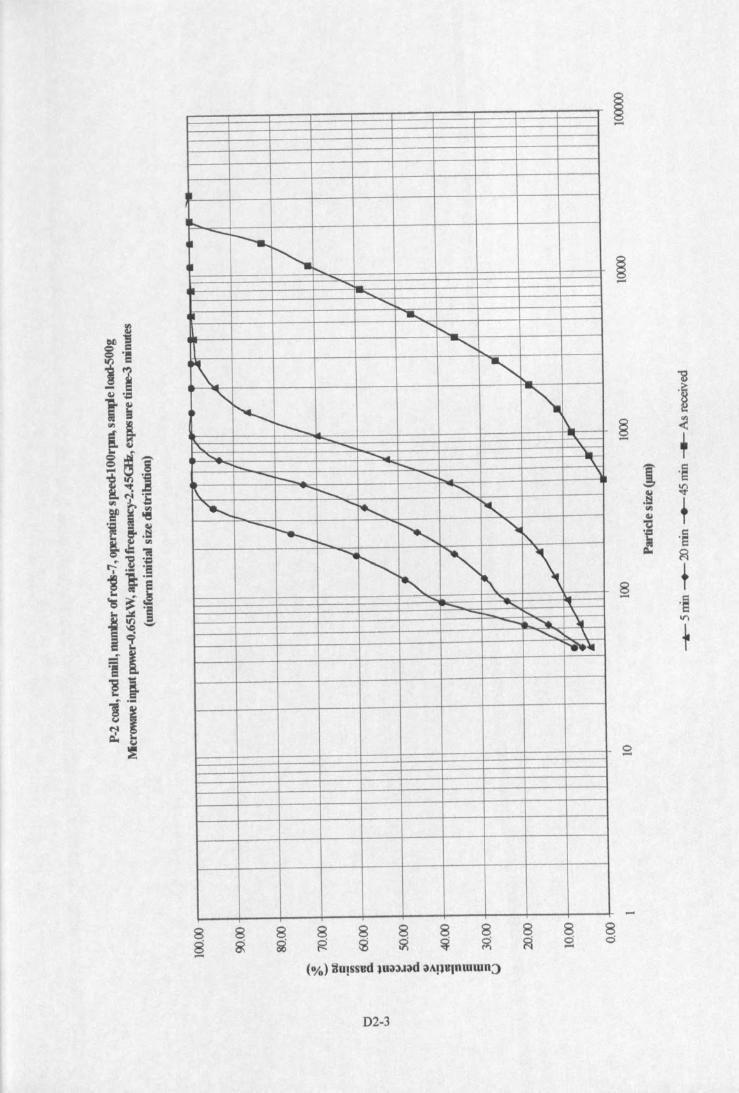
I
~ -r-...i'-.• ....... ...............
~ ...............1'..<,
~<,
", ~r--__ \ -"'\.
"- "'" "........ ......_ """" r-.... "'\.-r- <, \
~ ......_ <,, ......., "---r---... '" ~- -,--.
" ~ \r-, ,....._ - --= \..._,.._~. -<, \
r--.....-
8g 8~
8d!'"
8~
8~
8~
8~
8o-D2-3
13'~
§ <- +J ,~
~ ~.I::l fII)
~
I '~
~ ~
8 t- 'S'"+
o-
8o
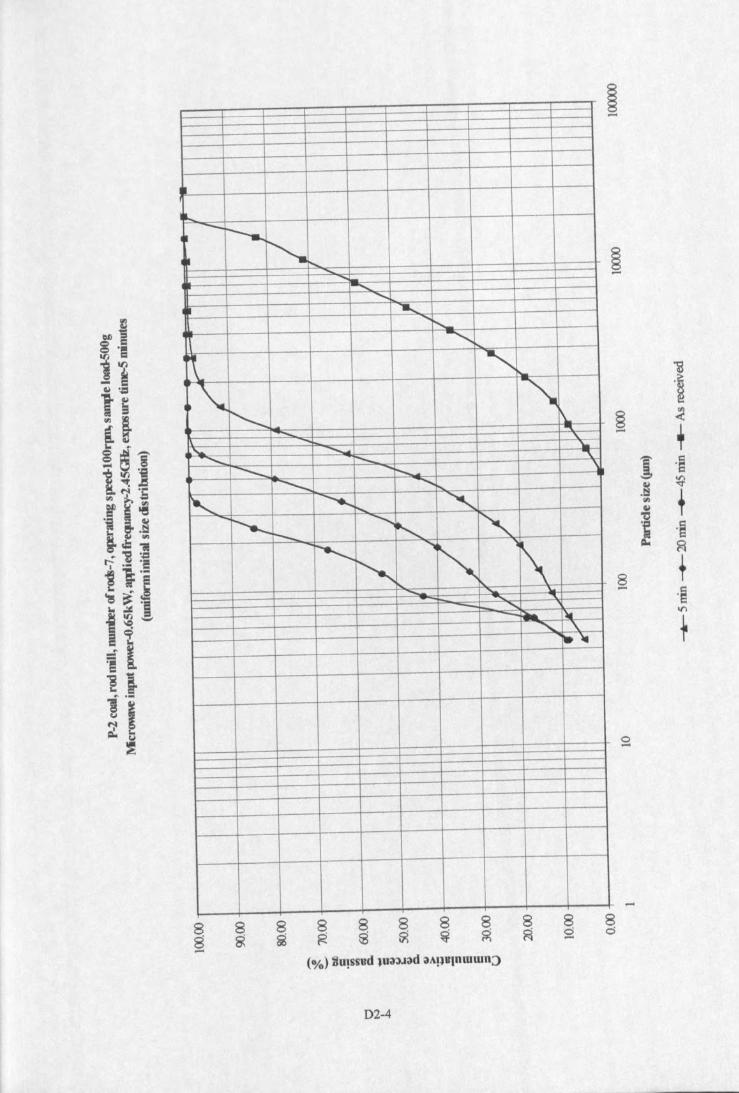
I
IL... --r--..r-,~ ...... ......_
<;...........
• ................ ......._
...........
t '".._-,r-. ~
1\..- -~
:~ ".........~ '\.
............ ~ "\
"""- ~ r--.... \............... .........
~ ~ ....... "'--..........._ .............~ r-.r-s-,
~......._
<, \"... " \.,
-;;.... -- <,-... -....<, \.--....
......
8 8 8 8~
8 8 8 8 8 8g g ~ R f1( ~ ~ ~ Ci Ci-....
(%) 8u!ssud lU3;)J3d 3AHUlnwwn:>
D2-4
~-
1S.~
§ <....+
1 .~
.§ ~
'" +G.l"0I .~~ ~
8 +- ·SI()
+
o-
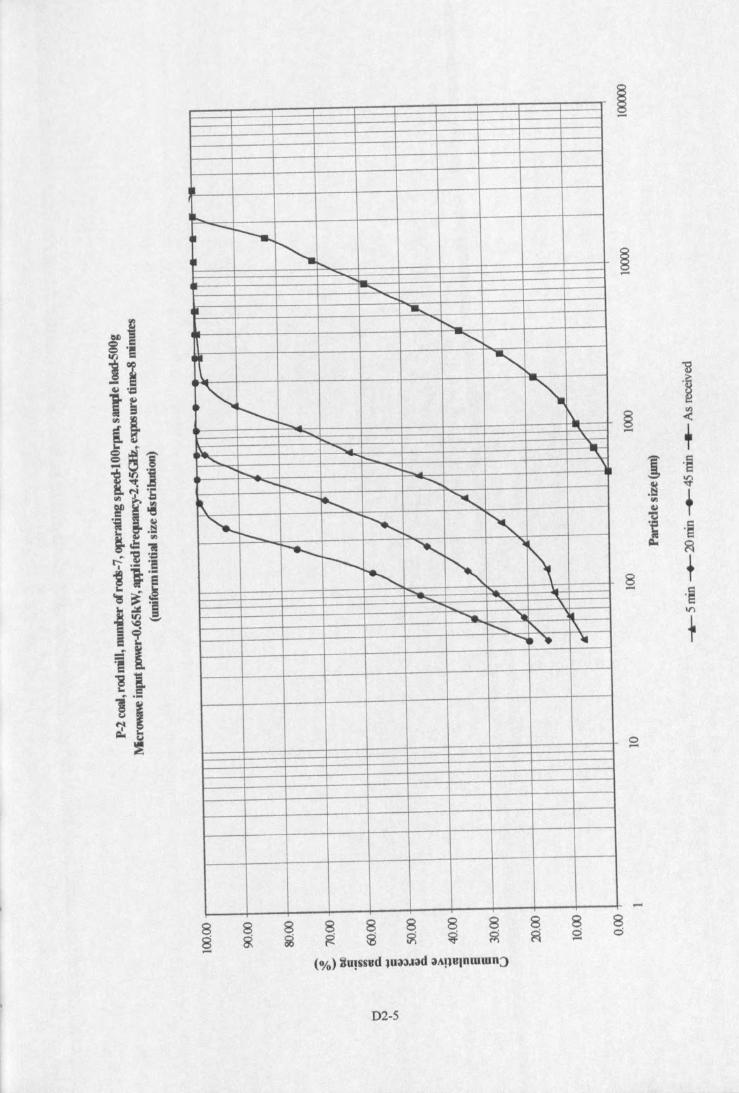
..... -..r--..~ I'-...
......r-.....
<,~. ......
........r-...._<,
<,<,
~1"-
f........ I\.- '"'~ '\.
,:.,.. ........ ....<; :-..... ~
......i'.. i'.. .... \
""- f........ -.....~
.........~ <;
"-.... ...._ ~ <,~ !--...
<,r-, ~\~ ,......, 1"1...- ......f,.,. '- v........ .... ..
r-; "- ,\......,~."
8 8 8 8 888 888 88 g ~ ~ $ ~ ~ ~ ~ ~ 0-D2-5
as.~
~.(
+J ·s.~ ~
'" +u"C.~ ·s~ ~
8 +...... ·SIT)
+
-
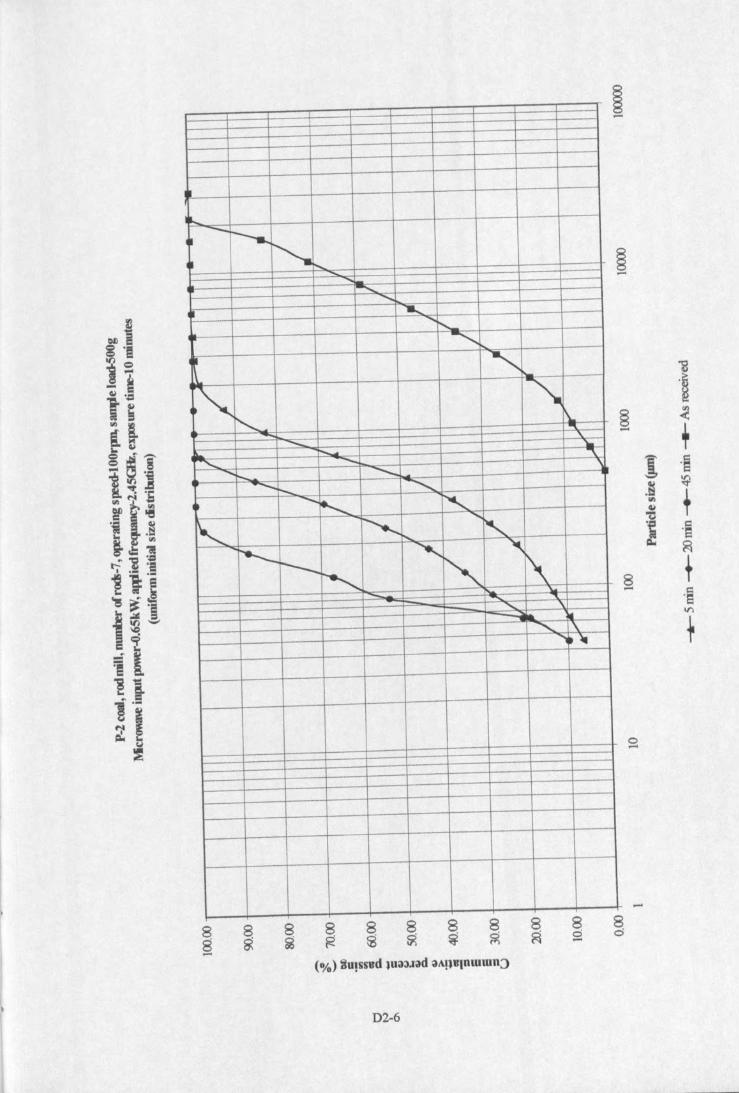
..._............r--..r-,~ r-...
......--...........
I ......."'-<,
r '"1. ......~ -,I'--..... \.
"---...;..
"\.
:I.. :--..-..,,_
<, ........ '"\
...... I:--...... ~\
-........... ....................
~ I'-~
.......................
~........
~ "- "1'\r---.~ ~ -
...... '\.0
"'<; ~..... III<, \
......~~
88....
8cl....
D2-6
~....
"Eo~
§ <- +J o§.§ ~fIl
+~'TJ
~ o§~ ~
8 +- o§'"+
o.....
....8cl
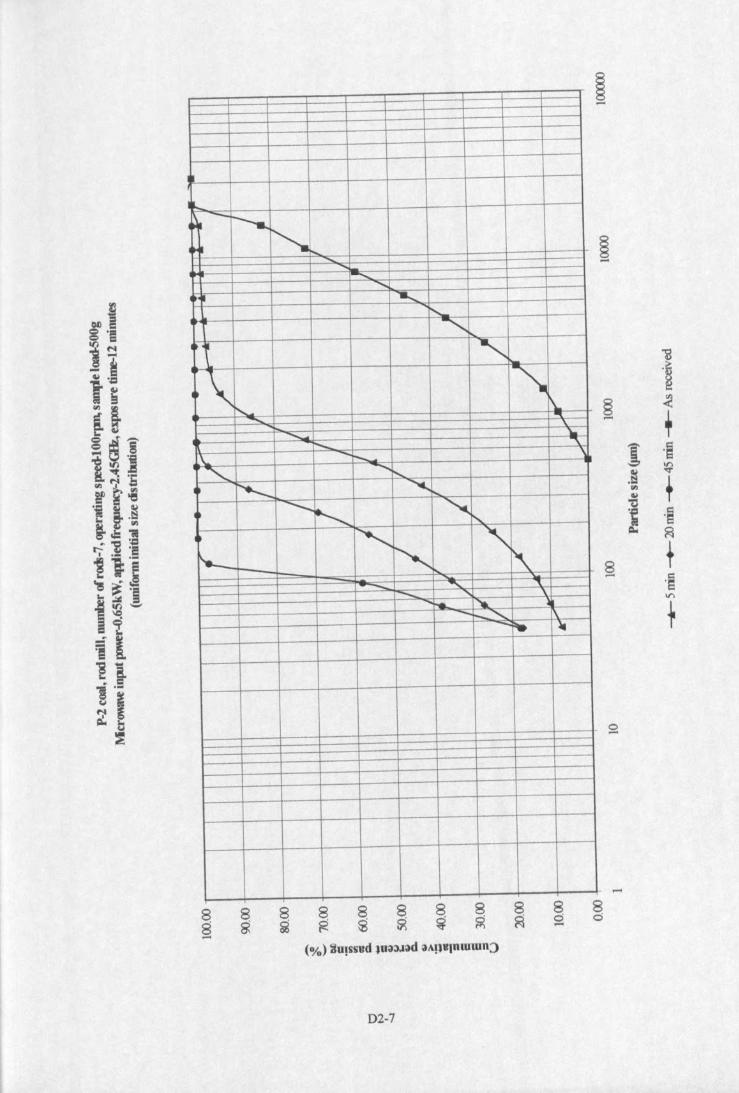
II
---~. ~ -.• r-,....... _
..................
.........I'.....<,
~ <,\. .....
\ <,r-.- r\.
..... ~'\
~ ~r-.. "\
.\.. --..... \<, -.... .......
• I*--... "c._
---~ ~ -,
"~
-.~ K- "' "'{-- ........ "......... ~ 11-1-....""-... \
r- le
-8 8 8 8 8 8 8 8 8 8 88 ~ g R ~ ~ ~ g ~ ~ 0-
D2-7
~-
~.~
§ <:- +i ·s.§ ~
'" ~Go)
"ti.~ ·s~ ~
8 +..... ·SV')
+
o.....
.....
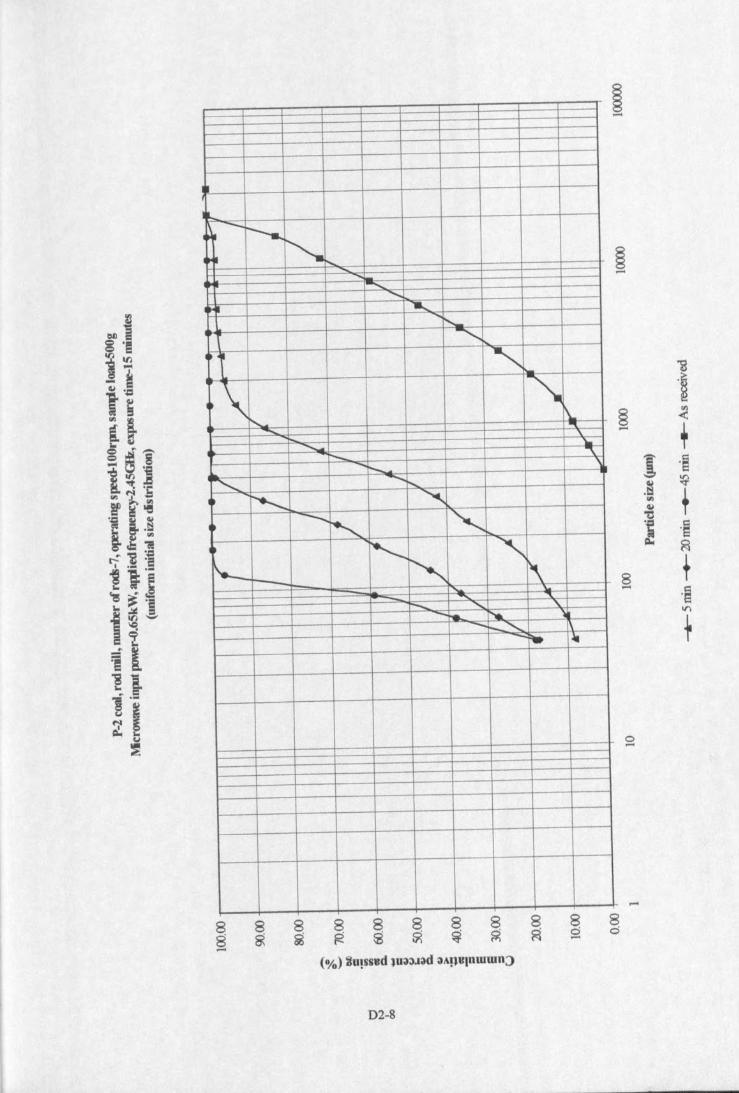
II,I
-..;;,... r-..<,II r-.......1-.......
........
• "-r--...--...._
l '",._
1\ \~r-, ~- ...."...._ '-,.._ ""\
.....~ .."r=; -.... r-....~ ~
.........1 -.....r-, ,I'-.
~
-,~ r--- 1\+-- 1-""
""'\
~ ........ "-.....\-& I'a )-r-_, ~-~ 14
888g ~ ~-8 8g g
8cl-
D2-8
'i.~
§ <- +J .§
.~ ~
'" +~"C.~ ·S~ ~
8 +- ·SV)
+
o-
8cl
APPENDIXD3
PROXIMA TE ANALYSIS OF MICROWAVE TREATED COALS
Proximate analysis (as-received basis unless stated in accord with BS1016) of D3-2Microwave treated P-S coal, Microwave input power-0.6SkW,applied frequency-2.4SGHz
Proximate analysis (as-received basis unless stated in accord with BSI016) of D3-2Microwave treated P-3 coal, Microwave input power-0.65kW,applied frequency-2.45GHz
Proximate analysis (as-received basis unless stated in accord with BS1016) of D3-2Microwave treated P-2 coal, Microwave input power-O.6SkW,applied frequency-2.4SGHz
D3-1
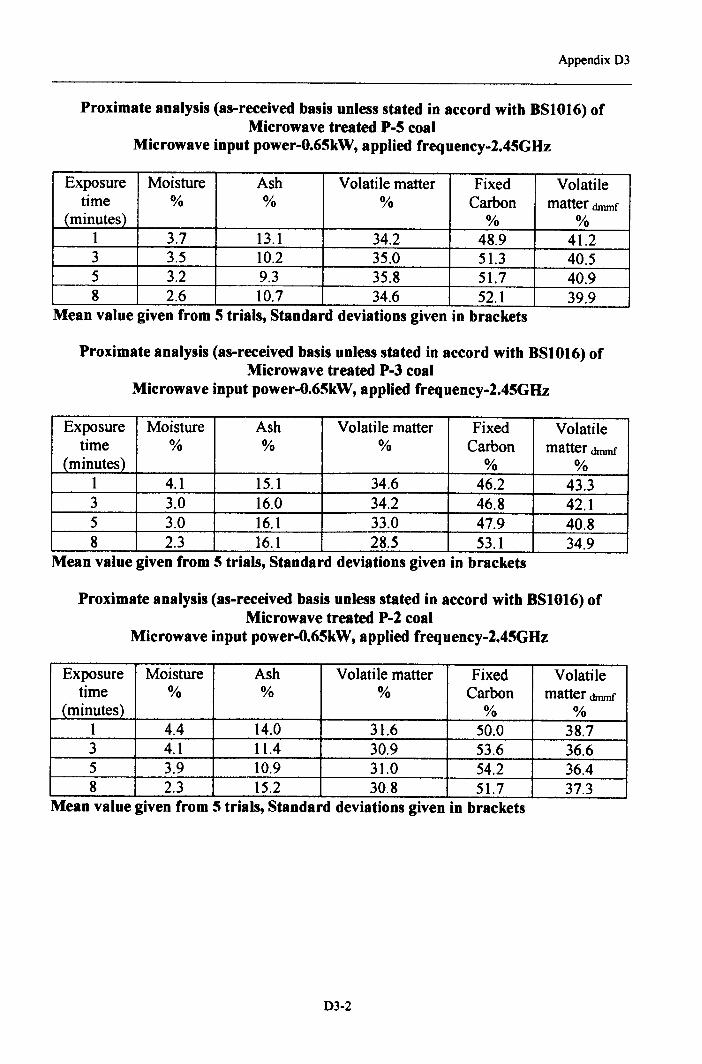
Appendix D3
Proximate analysis (as-received basis unless stated in accord with BSI016) ofMicrowave treated P-5 coal
Microwave input power-0.65kW, applied frequency-l.45GHz
Exposure Moisture Ash Volatile matter Fixed Volatiletime % % % Carbon matter drnmf
(minutes) % %1 3.7 13.1 34.2 48.9 41.23 3.5 10.2 35.0 51.3 40.55 3.2 9.3 35.8 51.7 40.98 2.6 10.7 34.6 52.1 39.9
Mean value given from 5 trials, Standard deviations given in brackets
Proximate analysis (as-received basis unless stated in accord with BSI016) ofMicrowave treated P-3 coal
Microwave input power-0.65kW, applied frequency-l.45GHz
Exposure Moisture Ash Volatile matter Fixed Volatiletime % % % Carbon matter drnmf
(minutes) % %1 4.1 15.1 34.6 46.2 43.33 3.0 16.0 34.2 46.8 42.15 3.0 16.1 33.0 47.9 40.88 2.3 16.1 28.5 53.1 34.9
Mean value given from 5 trials, Standard deviations given in brackets
Proximate analysis (as-received basis unless stated in accord with BSI016) ofMicrowave treated P-l coal
Microwave input power-0.65kW, applied frequency-l.45GHz
Exposure Moisture Ash Volatile matter Fixed Volatiletime % % % Carbon matter drnmf
(minutes) % %1 4.4 14.0 31.6 50.0 38.73 4.1 11.4 30.9 53.6 36.65 3.9 10.9 31.0 54.2 36.48 2.3 15.2 30.8 51.7 37.3
Mean value given from 5 trials, Standard deviations given in brackets
D3-2
APPENDIXD4
MICROWAVE TREATED (1.3KW) COAL ROD MILL SIZEDISTRIBUTIONS
P-S coal, rod mill, number ofrods-7, operating speed-lOOrpm, 10ad-SOOg, D4-2Microwave input power-l.3kW, frequency-2.4SGHz. exposure time-l minute
P-S coal, rod mill. number ofrods-7, operating speed-lOOrpm, load-500g, D4-3Microwave input power-l.3kW, frequency-2.4SGHz. exposure time-2 minutes
P-S coal, rod mill, number of rods-Z, operating speed-lOOrpm, 10ad-SOOg, D4-4Microwave input power-1.3kW. frequency-2.45GHz, exposure time-2.5 minutes
P-3 coal, rod mill, number ofrods-7, operating speed-lOOrpm, 10ad-SOOg, D4-SMicrowave input power-1.3kW, frequency-2.4SGHz, exposure time-l minute
P-3 coal, rod mill, number ofrods-7, operating speed-lOOrpm, 10ad-SOOg, D4-6Microwave input power-l.3kW, frequency-2.4SGHz, exposure time-2 minutes
P-3 coal, rod mill, number ofrods-7, operating speed-lOOrpm, 10ad-SOOg, D4-7Microwave input power-l.3kW, frequency-2.4SGHz. exposure time-3 minutes
P-2 coal, rod mill, number ofrods-7, operating speed-lOOrpm, load-SOOg, D4-8Microwave input power-l.3kW, frequency-2.4SGHz, exposure time-I minute
P-2 coal, rod mill, number ofrods-7, operating speed-lOOrpm, 10ad-SOOg, D4-9Microwave input power-l.3kW, frequency-2.45GHz, exposure time-2 minutes
P-2 coal, rod mill, number ofrods-7, operating speed-lOOrpm, 10ad-SOOg, D4-1OMicrowave input power-1.3kW. frequency-2.45GHz, exposure time-3 minutes
04-1
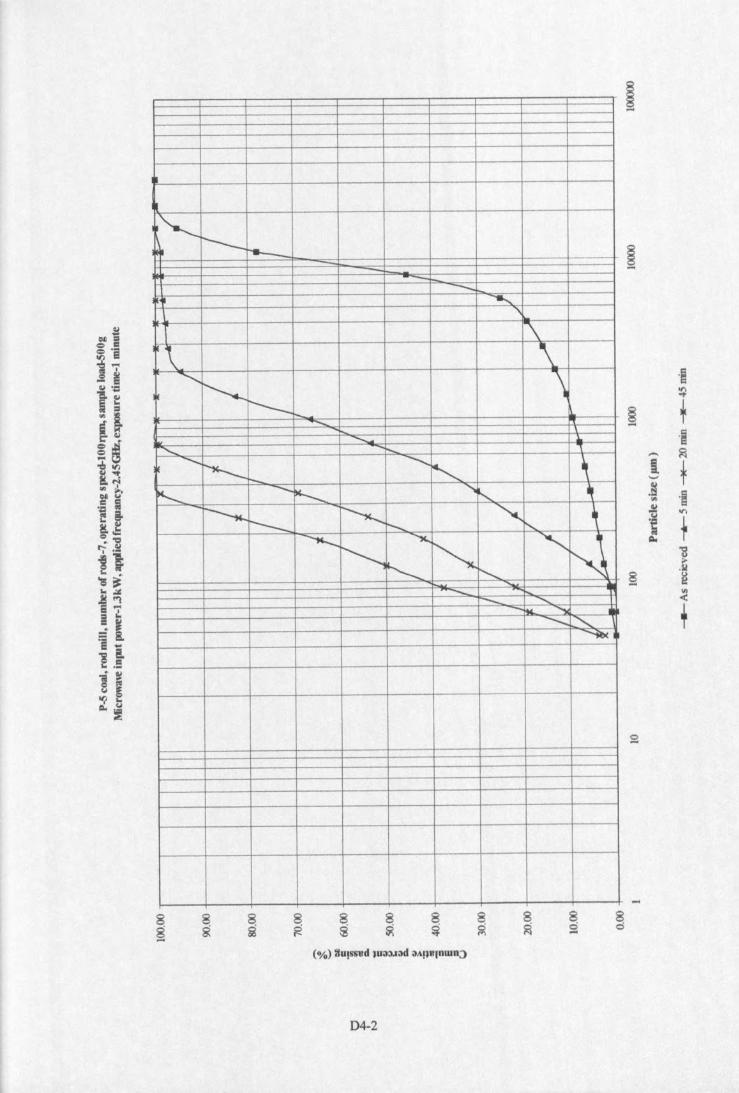
t'- r----~ r-..... - -- -- -.......'\
"\\ \<,
~ \r----.......
........._ .I.......... ....... i-....i"--.
<,~
,r-
r-, ..........--; "'" '" ~
~ r--.. ~ r-, ~ I'-... ~~
~
'-x..<, <,N~ r--..................... -... <,--~ """"-........ <,
~
8g8g
04-2
·e~
§ f- .~~
i t.._.,
.~ .~..uc::I .,....~ 1Qc
'3...Sol
8 ~- III<,
.....
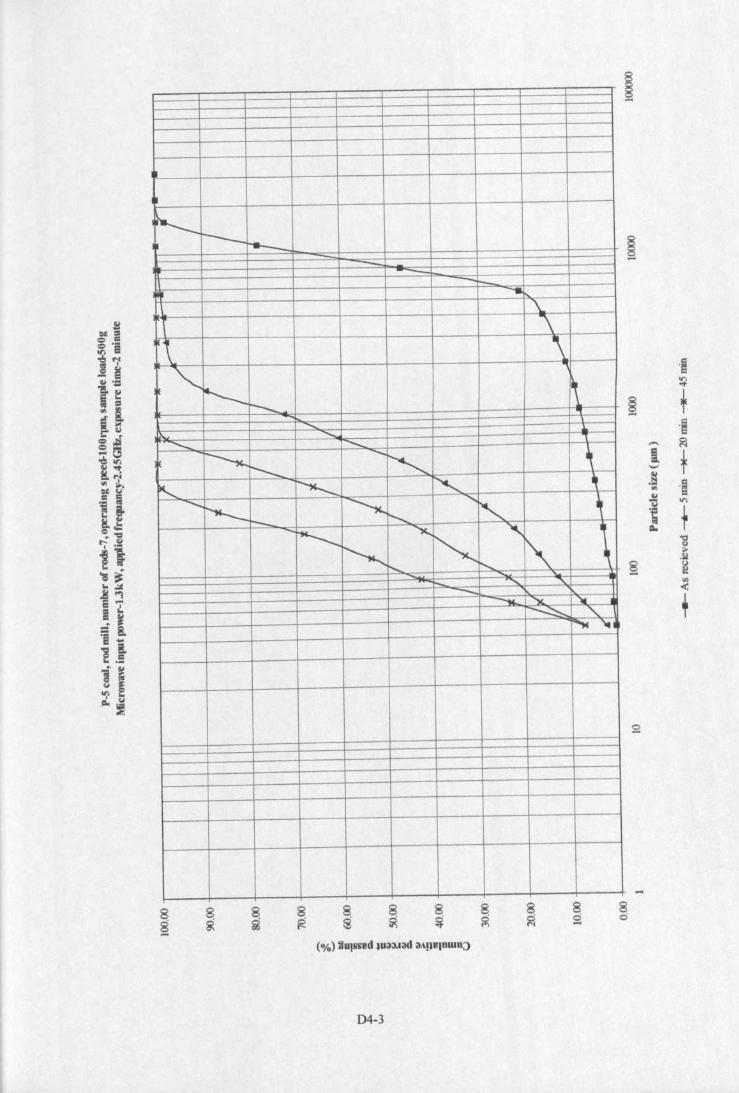
..___r-- ...__ - - ----- ,.
\.\
\ \<,
~ '\-- .,........
I., ...........I...._ --.. "1
~<,
~ ~r-.._~ ~ "<, ~
--..~
~<,, ,
r0- t'-......<; 'x..r-, '" \~ ~r-, <,
,..... ....... '--- .......... ~ '41<cs, "-~'"
D4-3
·s~
~ f.;,-. ~i f._,.~ .~'"~ II'l
'; 10.13;..~
§ ~III
<
T
...
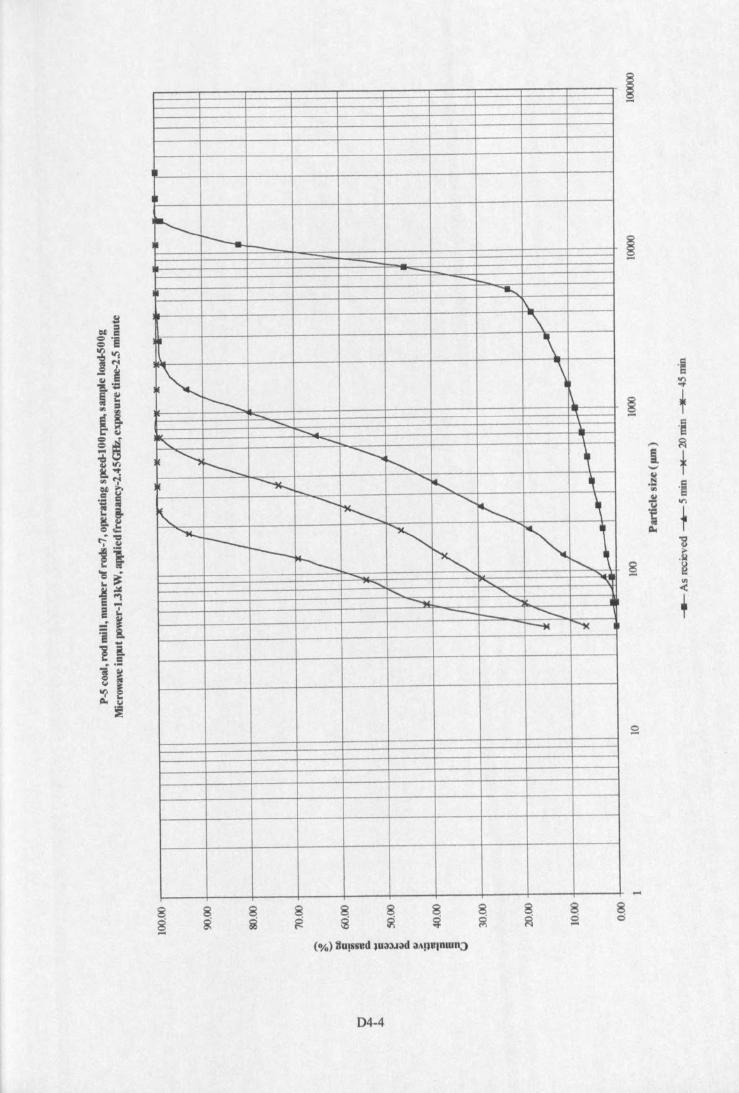
~ r--...r---. - -- ~,\.
"\~ \-; "\
I'--- ~
-- ......... .I.
<, ......... i
<,'--
--......."- ~~,... ......<, ~
"--....
~<,<, ~
""'-t---- ~ "<,.~
t---r--_ '<, r-,,
<, ........ -...:<, <,--. --- -.........
~ ~
8R
D4-4
.;'"0:1'
~ f·S
.-, ?ili f....,.~ .~..,j! '"IJ
f~~'S....101
~ ~III«,
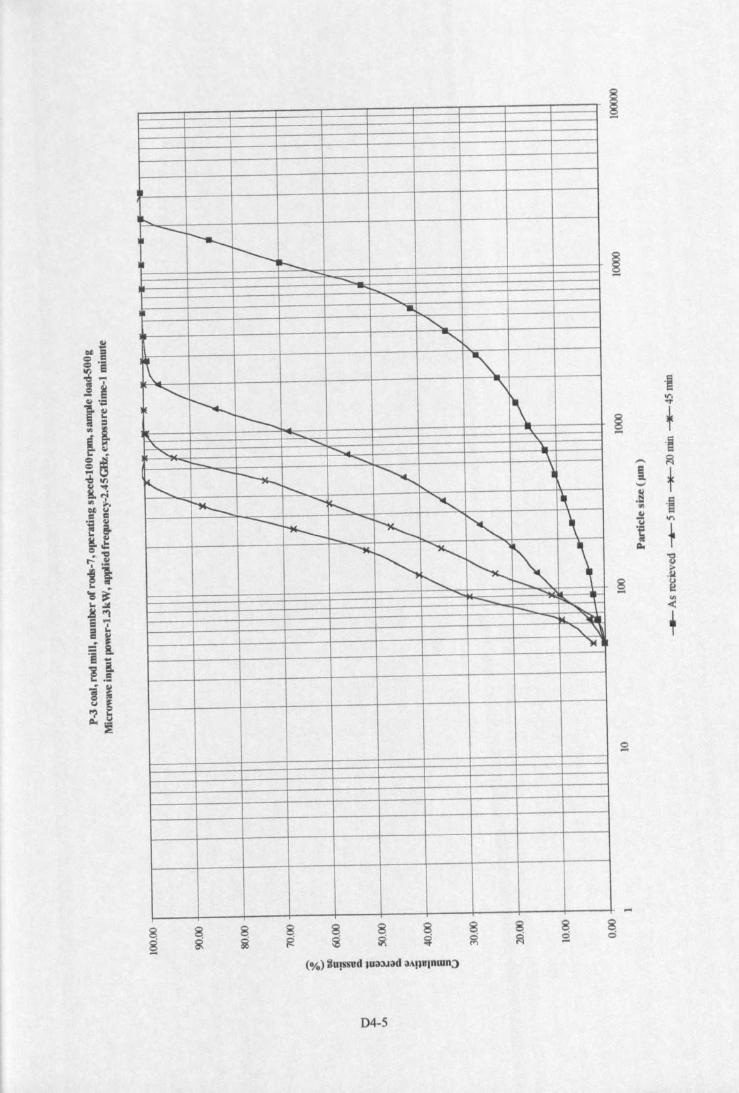
....... --I"----~ ...._
......-<, ....
<,<,
\ <,<,
~
'\
---..... \--......
" "<, ~ \.
i--. ..........
r-, -~ ~)
<, ........
""--<, f-......... <, \---~ ~
~ ~,
f-.
""-<, ~
~ \~'<, - ~ ,- "-~~~~
')cl
D4-5
.~11'1
"'"~ +
.~,-, ~i f._,
.~ ·s...41c:l 11'1
~ +~~>.Aol
§ ~'".(,
8.:;;
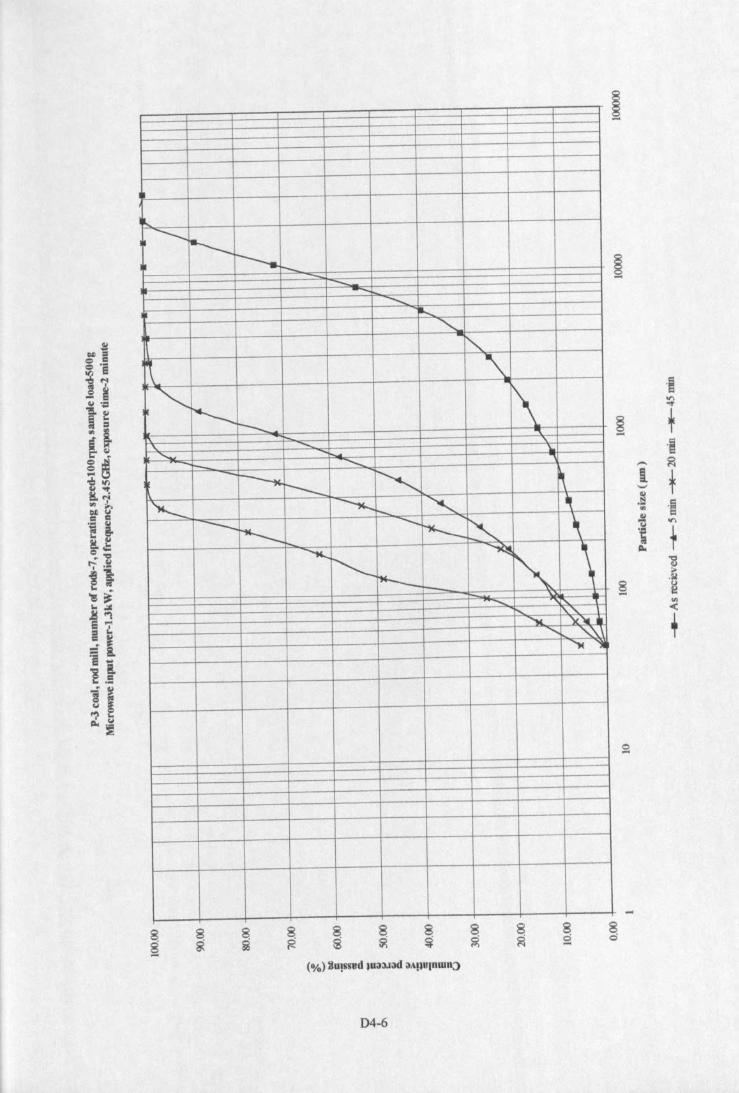
~I. ...____ r----.r---."- - .....
.........~<,
r-,\ ~
<,~ \r--- "'\
'- ......."'-
..... \.
-f-._ .........
~ -~ r-. ~r---'M....._ ~ r-. <, ~--I"---~ ....._
i"--- ~ \'M.....i'--
~ -. \i"--- t---...........
r-, "~ 'X'lc.JI_<, "-\.\
'M"iI
8g
D4-6
'~.,.,..,.§ f....
'm...... ~i +._,.~
'~GO
.!i '"t f1:10
"8>,Sol
8 ~....II)
.(,
....
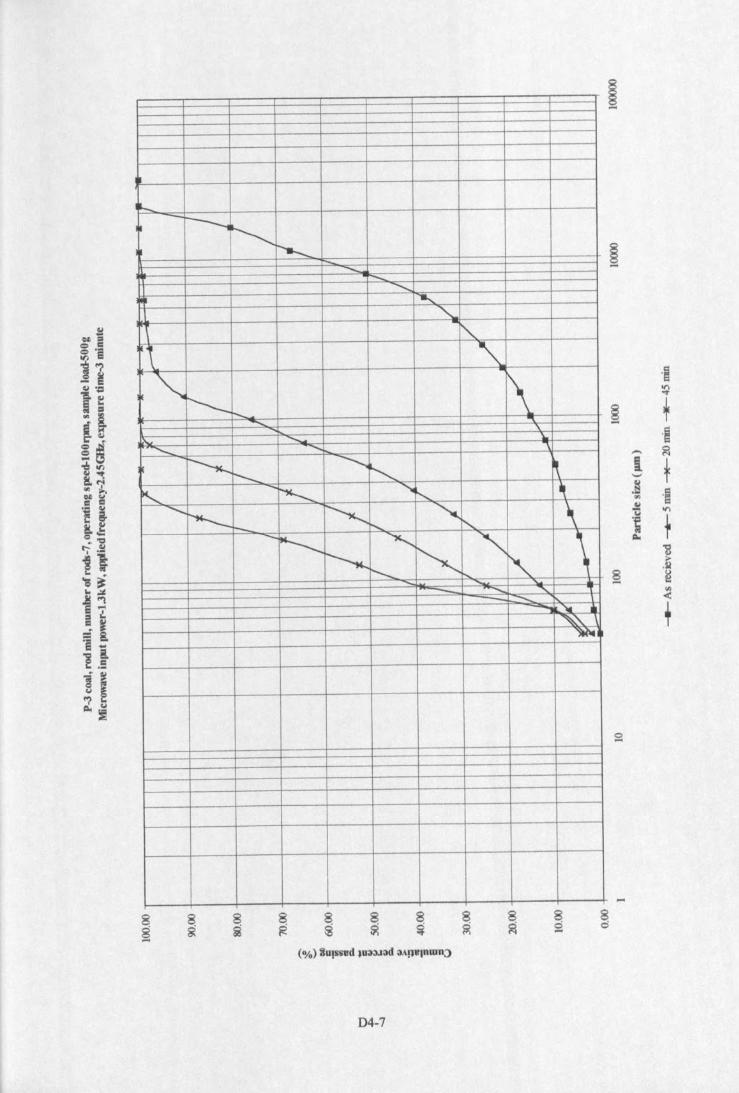
~ -I--.t~~
~........ - -..........
~<,
\-,
,\ -,<,
I--- \t-...... ............ '\
~ ......_ \,
<, ......... "\
~ --."
,~
r-.... .... ~ ""-...-, ~............ i"'-- ~ ~ '\t--.. <, -,--r--- ~ <, \~ ~ I'-........._ - ...... "-- ...... --, ..._. ..
"''' \~
8S
04-7
.~11'\.".
§ f- .~.-, ~i t._,.~ .~..,~ 11'\
~ 1~"B~.~
§ ~III<:
T
-
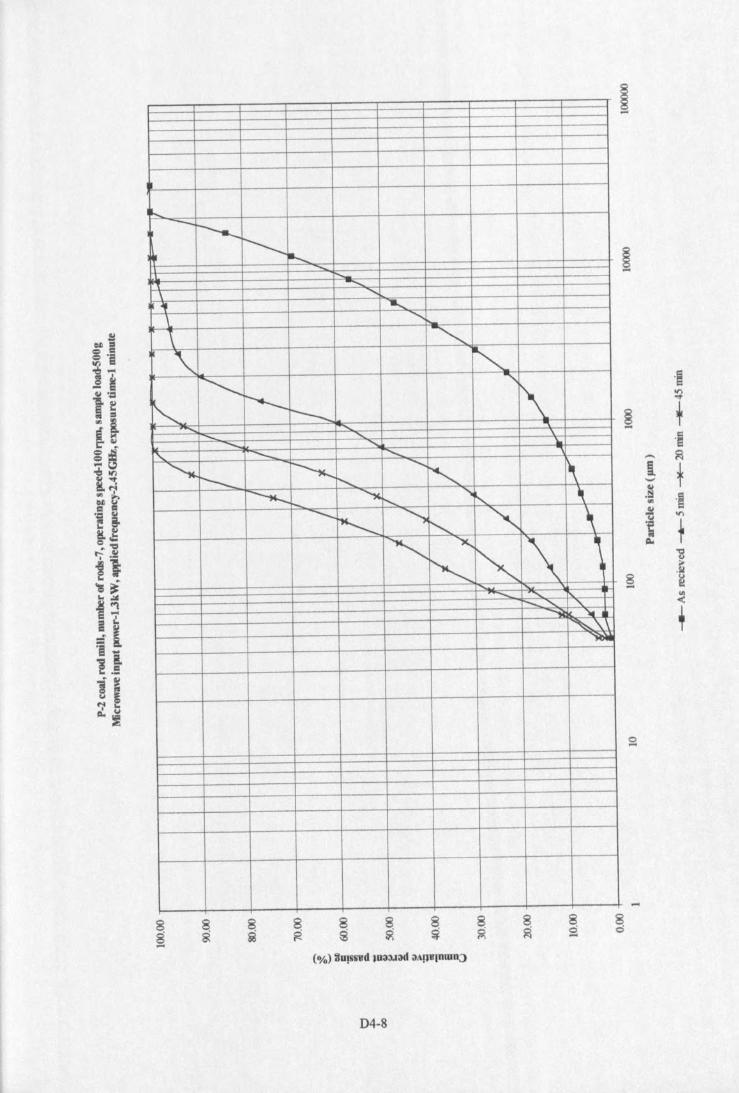
II
~ -r----~ ~
<; .......\ <,
~. ........\ <,
\ <,, <.<; <,
1\r-, ~ I--- -........ ....... ....
......... "-....._ <, \.
<, ........_ ..........
<, ~<,'<, 1\r--- l'-......
~ '"t--.... '"r-, ~r-.... --~ <,~ \r-,
<, 'X..
~ \ ~
~I- <,
:-... .~ "-~ ..~\.
~
D4-8
.~~
§ ,...
.~-. ~I f--.~ .~..~ V'I
~ 1Q.
13
8.~- ~'"<:,
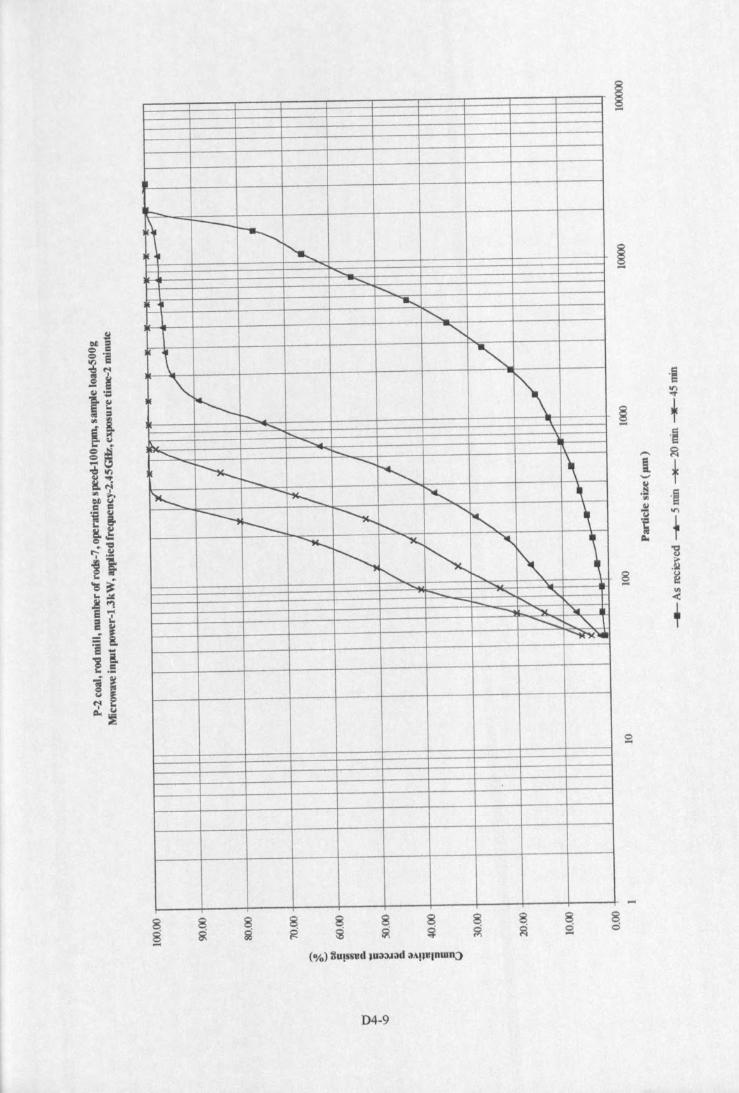
k~\ r---
~~
.................
<,..........<,
<,, <.\.
"'~ -1\r--... ...
"'<,""'-.. r-
~-....r-, \r--..
'M...._ -~ r-,.~.----., ~
..........r-, ,I--- t-........
~ <,"'x..r-, "- \r-, r-, ~- ........ "-
-I-. K-...... ""w. ~~ ~'\..
~~ ..
88-
D4·9
.~~
§ +- .~,..... 1ial f--.~ 'S..~ .....'; +"'" '5
.~8 ~....
til-e,
....8es
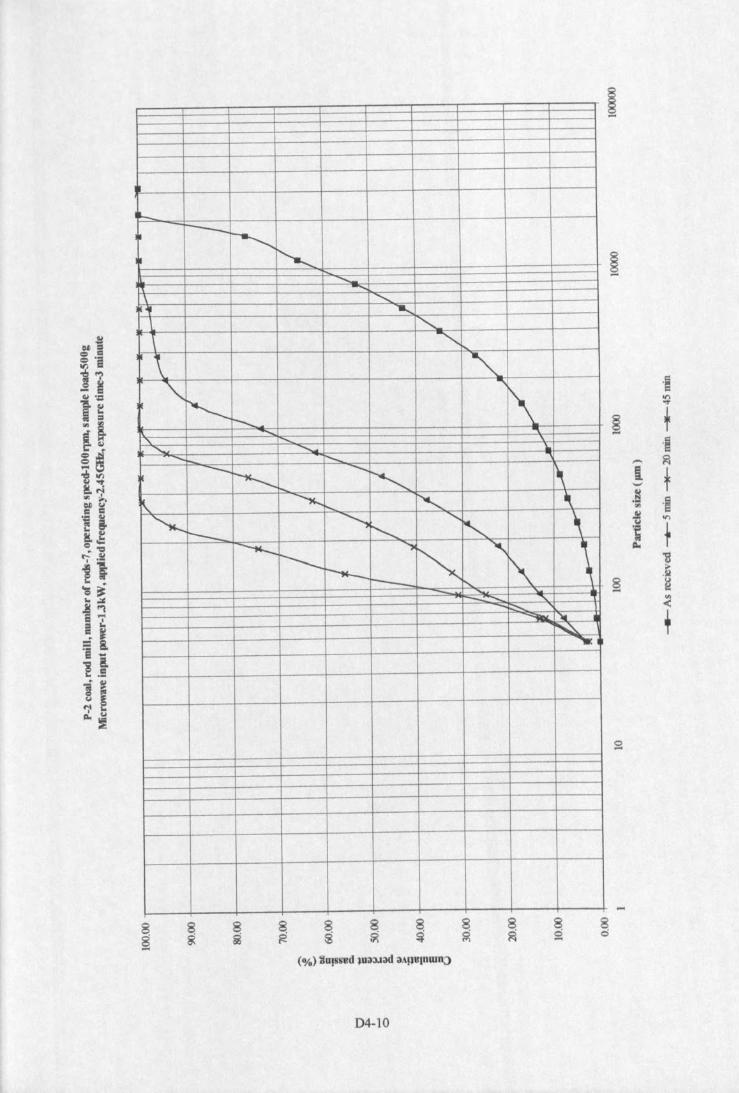
._t---
~~ ......._
\ <,I" .......L r-,\ '<,
\ <,"- '"f\~ r--.... - "'\
" -...... ,<, <, .~
<, r-.._---~ .............
~ 1\K. ~i'-... ~
.~
<, <, .........
~ ~t--- <;~ r--- '"
~~
"'- \~ -,r--- --- -...... "'";:-.....~ )oj
N!...~
D4-10
.~!9
§ f- .~,-. ~I t'-'
.~ .~..~ tI'l
~ t..11..• 101
§ ~III
<:,
8o
APPENDIXD5
MICROWAVE TREATED COAL AT CONSTANT ENERGY INPUT-VARYING POWER AND EXPOSURE TIMEROD MILL SIZE DISTRIBUTIONS
P-2 coal, rod mill, number ofrods-7, operating speed-IOOrpm, load-500g, D5-2Microwave input power-O.65kW, frequency-2.45GHz, exposure time-609s, 220kWhlt
P-2 coal, rod mill, number of rods-7, operating speed-l OOrpm, load-500g, D5-3Microwave input power-l.3kW, frequency-2.45GHz, exposure time-305s, 220kWhlt
P-2 coal, rod mill, number ofrods-7, operating speed-IOOrpm, load-500g, D5-4Microwave input power-2.6kW, frequency-2.45GHz, exposure time-l 52s, 220kWh/t
D5-1
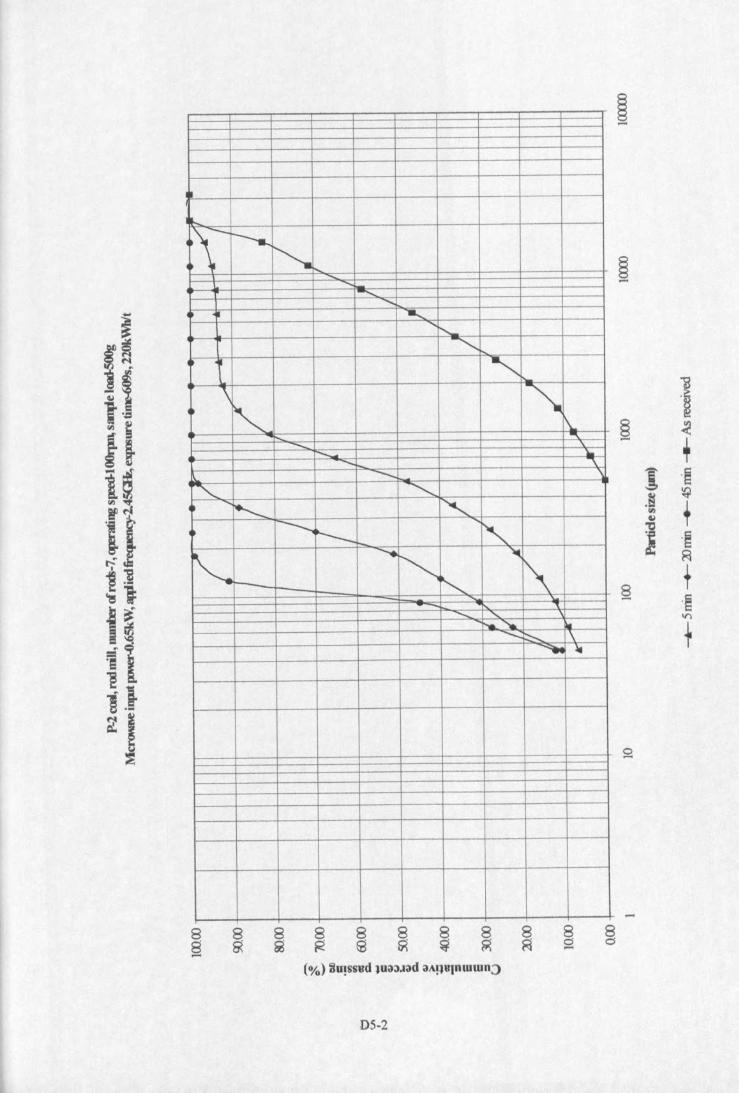
....:\~t---...r-,.......
<;<,
~ ..............,<,,. <,
I"-
'\~~ r-. I\.~- '\- \.
.......... "\s,
....._ \
<, <,~ "'----.,r--- ""~,.....-, -.
~~
1\I--- r-.- "l.<, <,-~ ~
-..._:: ~ \~ 1II
88- 8
Ci-
D5·2
]~
~ ~
+1 .~
.§ ~til +401
~.~~
8 +- .~l/)
+
-8Ci
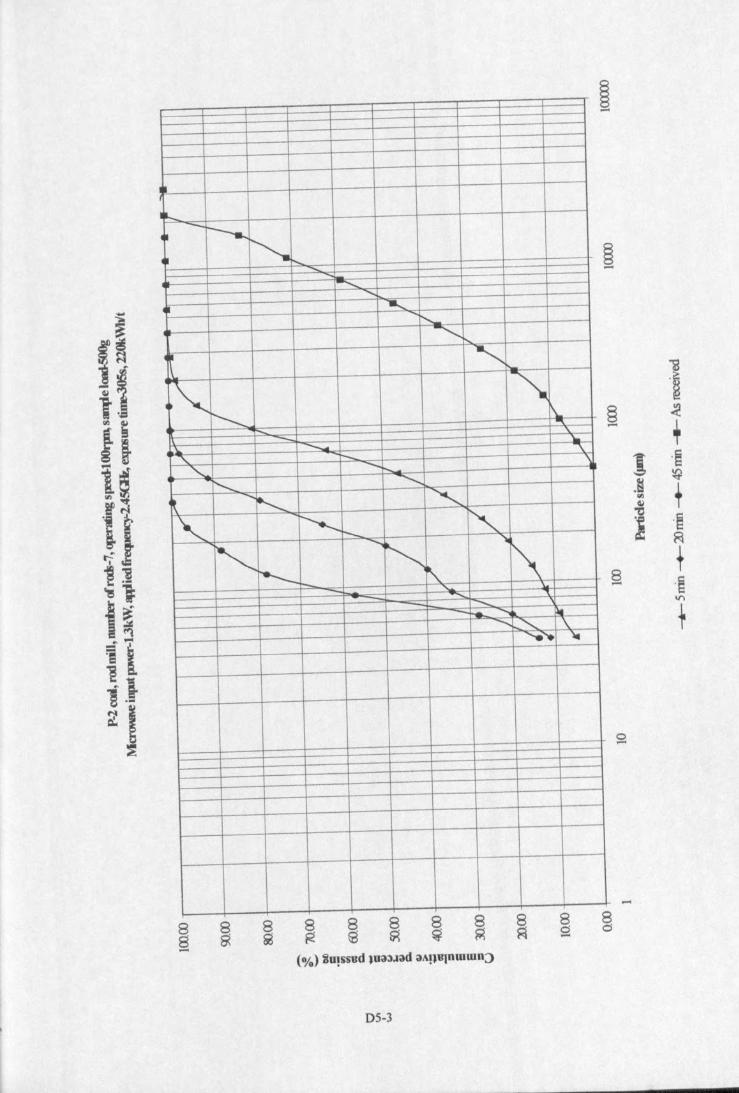
•IlL-.. ~ r---.~
~~,........
1-.....,<;
, ......'t---
~~fII <.L\.
,~ ~
i'--.. 1\roo;;; "~ ~
\.
"- t--"\.
<, ............t-....\
1'........ ~
~......~
<,-, r--.......... t-.... ~
<. .........-. ~
\\r---- ~t-- - \.- ........--,_ .........-Fe... -........ ~-....... <, \........". '-
8 88 g- 8~
8~
§.....
D5-3
1§ -<.-
+1 .§
~.~+'"4.l
" .§I l=il
§ +.§VI
+
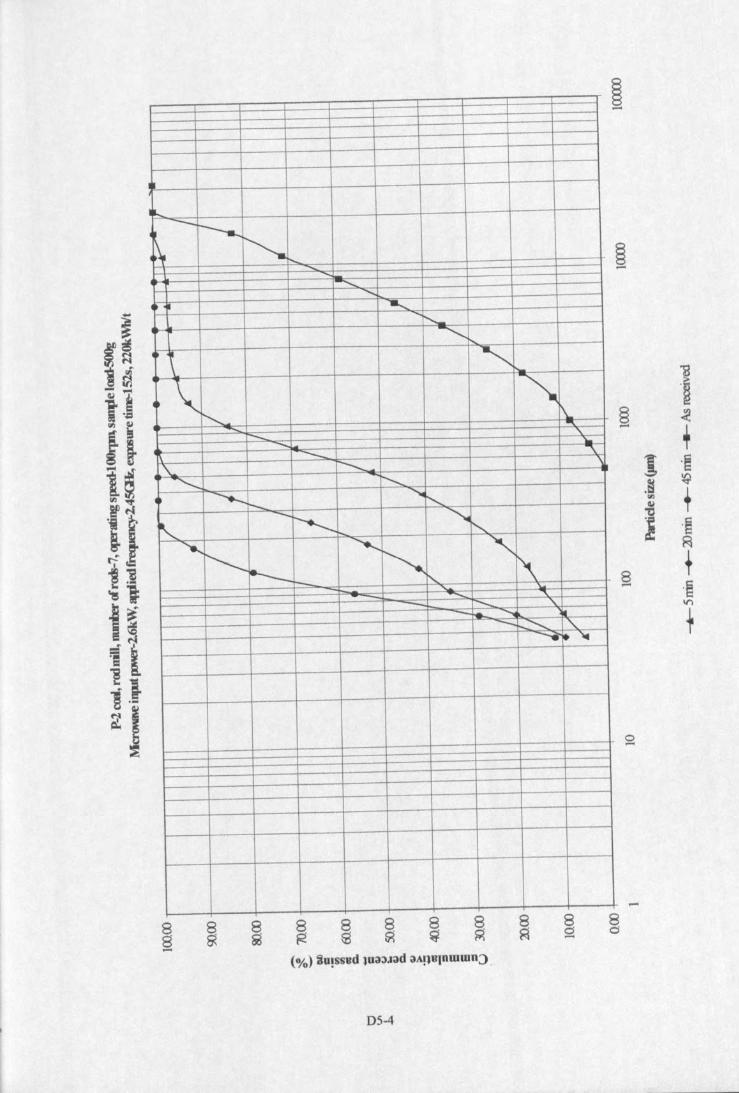
II
IlL.... --[--...,~~~ ........
'--.......<,
4......,
.......1"-<,~
II <,\_0\ <,
I\_l'-........... ....
r--- "......... '\.
1\....__ "\
'\: ............... \
=<; r----4 ~ r---
......... r-,
~-~,._
<,r-,~ I'--
..............r-, ~
~ 1\- I'...- -= -- <,- ~ "--f.e... ........ ill--....~ ............ "'--......~"ii
88-
8~
8 8~ ~
8~
8~
DS-4
1301
§ ~-+
J o~.~ ~..,
+~"C
! o~~
§ +o§II"l
+
8Ci
APPENDIXD6
MICROWAVE TREATED COAL AT CONSTANT ENERGY INPUTVARYING SAMPLE LOAD
ROD MILL SIZE DISTRIBUTIONS
P-l coal, rod mill, number of rods-7, operating speed-lOOrpm, load-500g, D6-2Microwave input power-O.65kW, frequency-2.45GHz, exposure time-S minutes,173kWhlt, milled as 500g
P-l coal, rod mill, number of rods-7, operating speed-I OOrpm, load-250g, D6-3Microwave input power-O.65kW, frequency-2.45GHz, exposure time-4 minutes,173kWhlt, milled as 250g
P-l coal, rod mill, number of rods-7, operating speed-I OOrpm, load-lOOOg, D6-4Microwave input power-O.65kW, frequency-2.45GHz, exposure time-16 minutes,173kWhlt, milled as lOOOg
P-l coal, rod mill, number ofrods-7, operating speed-lOOrpm, load-250g, 06-5Microwave input power-O.65kW, frequency-2.45GHz, exposure time-4 minutes,173kWhlt, 2 samples milled as 500g
P-l coal, rod mill, number ofrods-7, operating speed-IOOrpm, load-IOOOg, D6-6Microwave input power-O.65kW, frequency-2.45GHz, exposure time-If minutes,173kWhlt, sample divided by 2, milled as 500g
D6-1
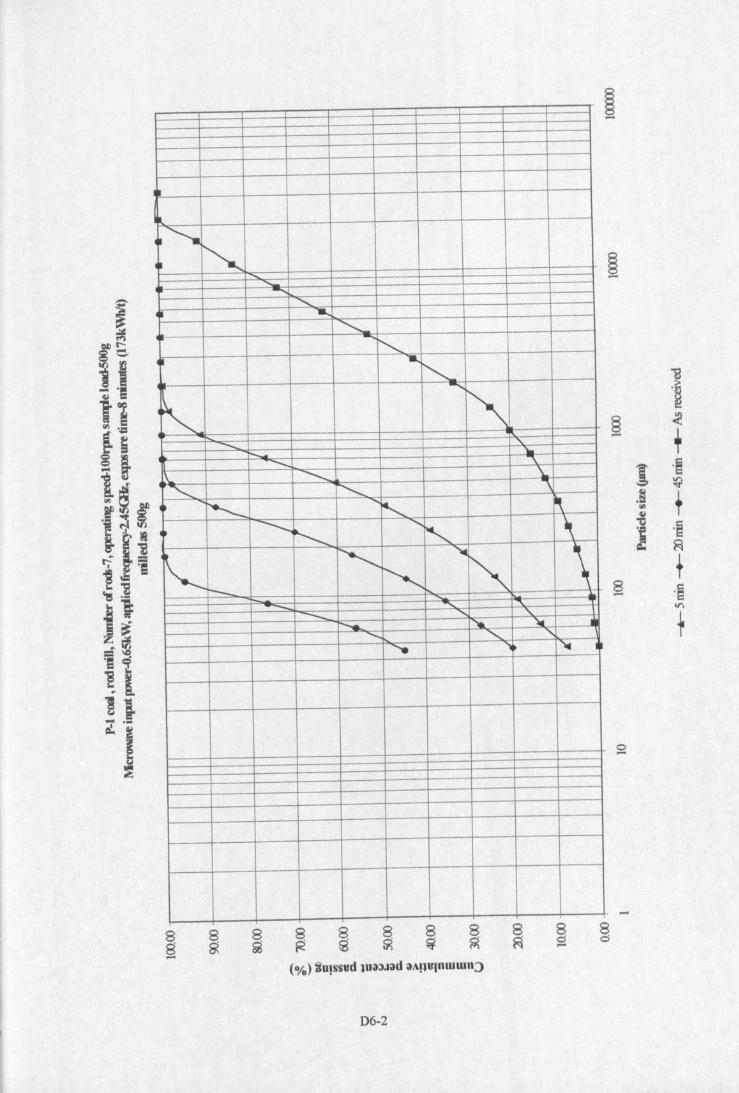
~
I..
~"'-~~
<,- <,~ '"'a.. ..........._
i'-........~ .....
~ -~r-. -- "r--. '-......._ ""\
x, <, \<, I'--..... \
~ ~ '~ ~, ---.
~<,<, ,
~
i'..........~ -. \~r-- ~ -;J;- ...... """ 'T- "'- " \
.......... ...... ~ . iii<, <, <,, " ......
8g....8o....
D6-2
as.~
§ -<....+
1 .~~.~ +III
~
! .~~
+§ .~VI
f
-
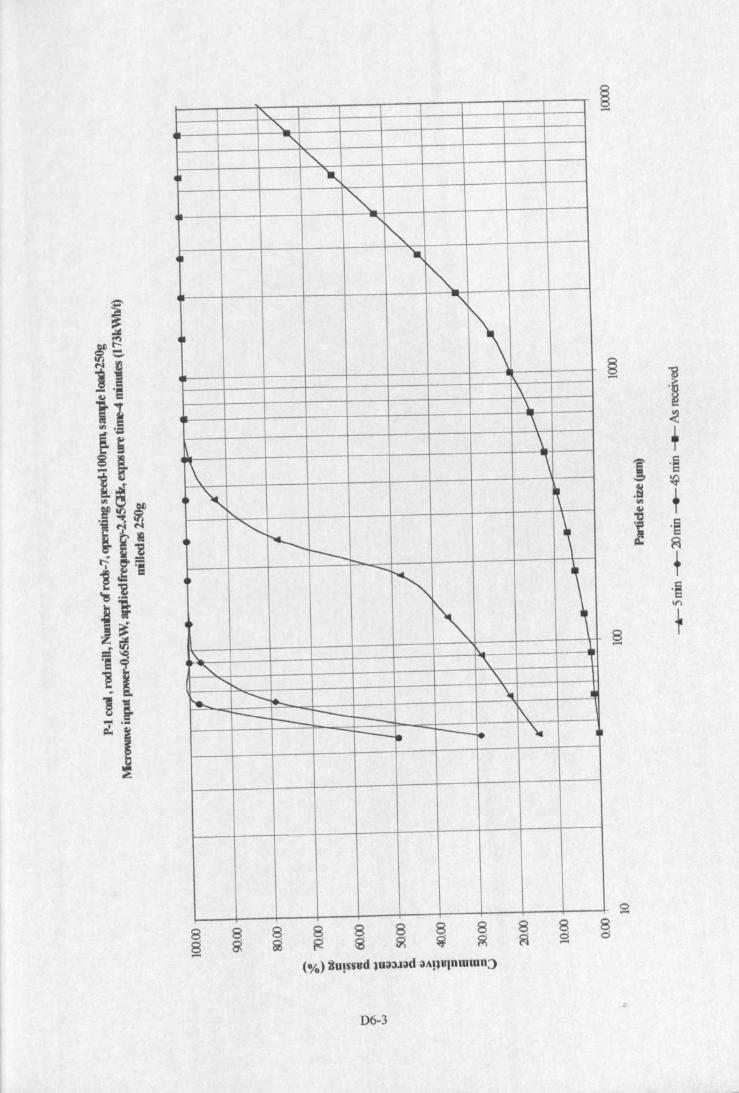
1""'-<;<,
-,4~
._-,
"'""..-,<,
1\,'\\."\\:
1\ \.",
"-~
• <,r--- "t----~
-.....<, \~.\ 1\.
<, ""\<,
1'....'\
f'-.. """-.~.....
I
t-- -F-- 1\t-- I'----1'---1- -t---r. ~.
88.....
8~
8o.....
D6-3
§ 13......~..(
+J .~
~.§
+'"~-e.~ .~~ R
+.~lI'l
§ +
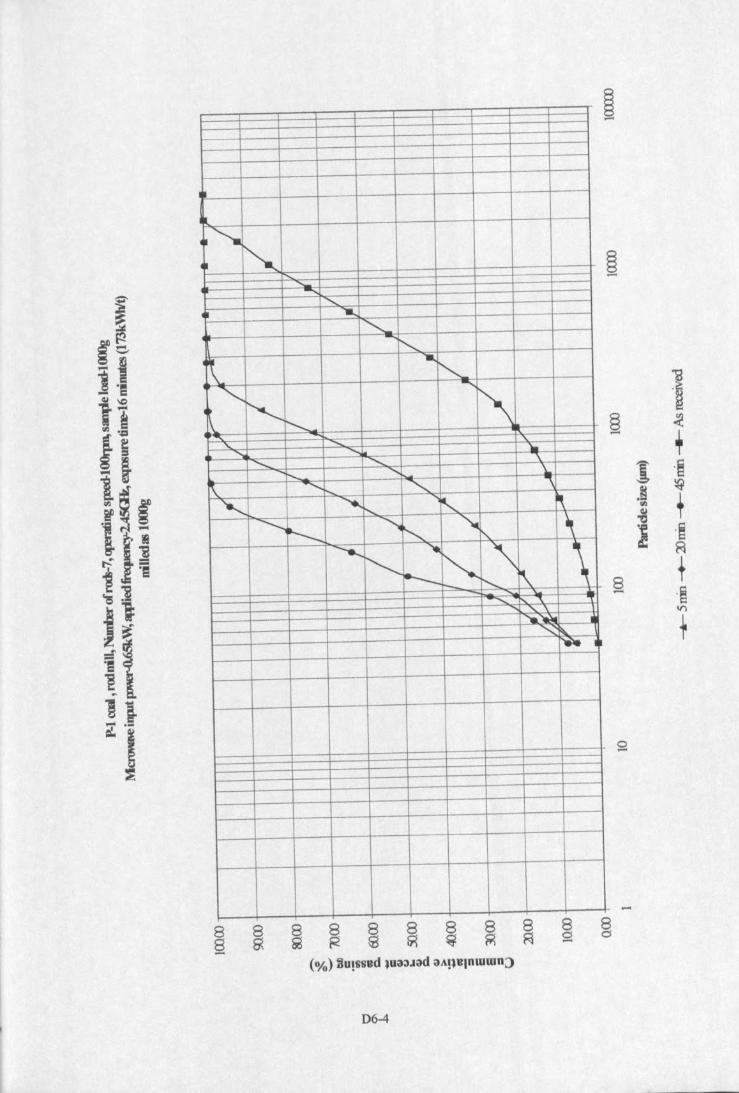
II
IIII~~ -,1
r-,-......<,
~ 'la...<,-_ r-,
\"'ill
~<,
.-..,
1\I., Kl\.. I'......."""""- ........ '\.
-.;;;; ........ 'la........... <, \.
t"-. <, \
"\ ......... <, "\
'- .......-; r-, ~........._,r--- ~ I"-... ~ ,
r-...-......~
'-~
-, \r-- 1\r-. r-,<, , "T
<, \........~ i
""~'W ~
-
888 8~ ~ R 9
8~
8cs....8§
D6-4
1§ <- +1 .~
.~ ~fIJ +~
~.~~
8 +.... .§I/)
+
-
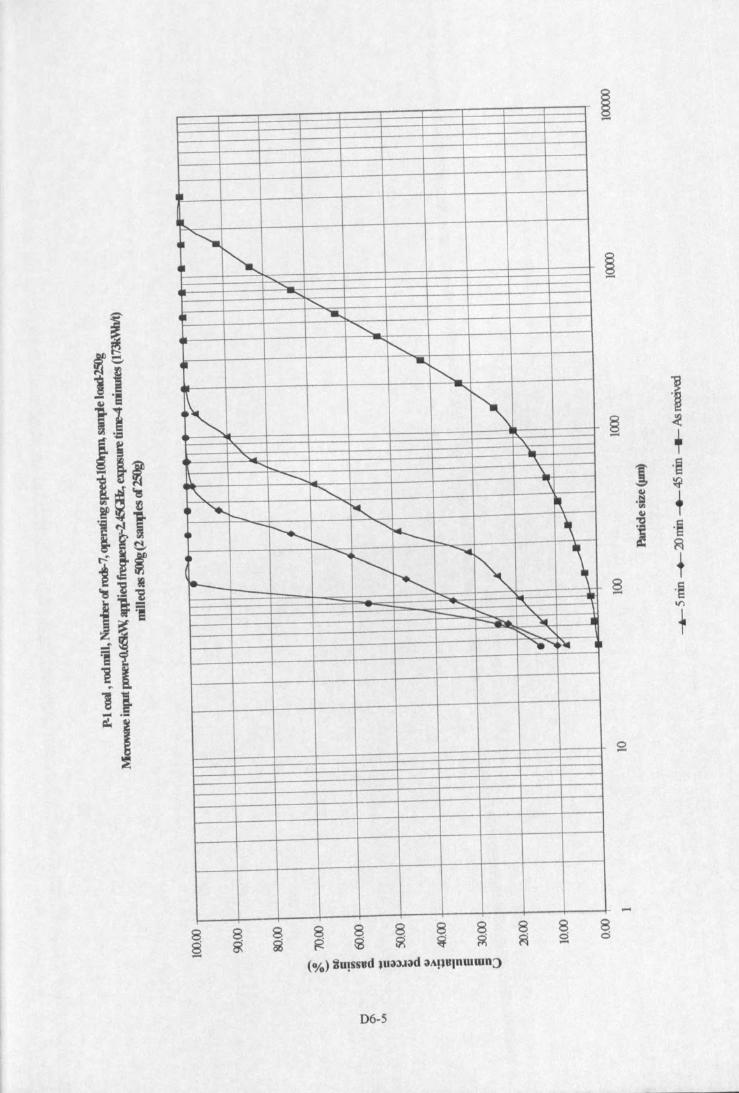
II
r=,<,II.......-<; .....
<;r-, ..
~
r'"--..
~
"'I.." \.
...... t-.,""\
L\...___ \.
<, <; '\
~ t--. ~ ~-~ <,r--- 1\t--...... l-.~ r-. ...........
~ \~ ~+-- -.1........ '"t--- ,......__ "~ l.I I~"............. ~ ~
8g-8~
8 81< g
D6-5
1~
~
+J .§
~.~ +'"Gj-e .~i ~
8 +- .~V\
+
-8o
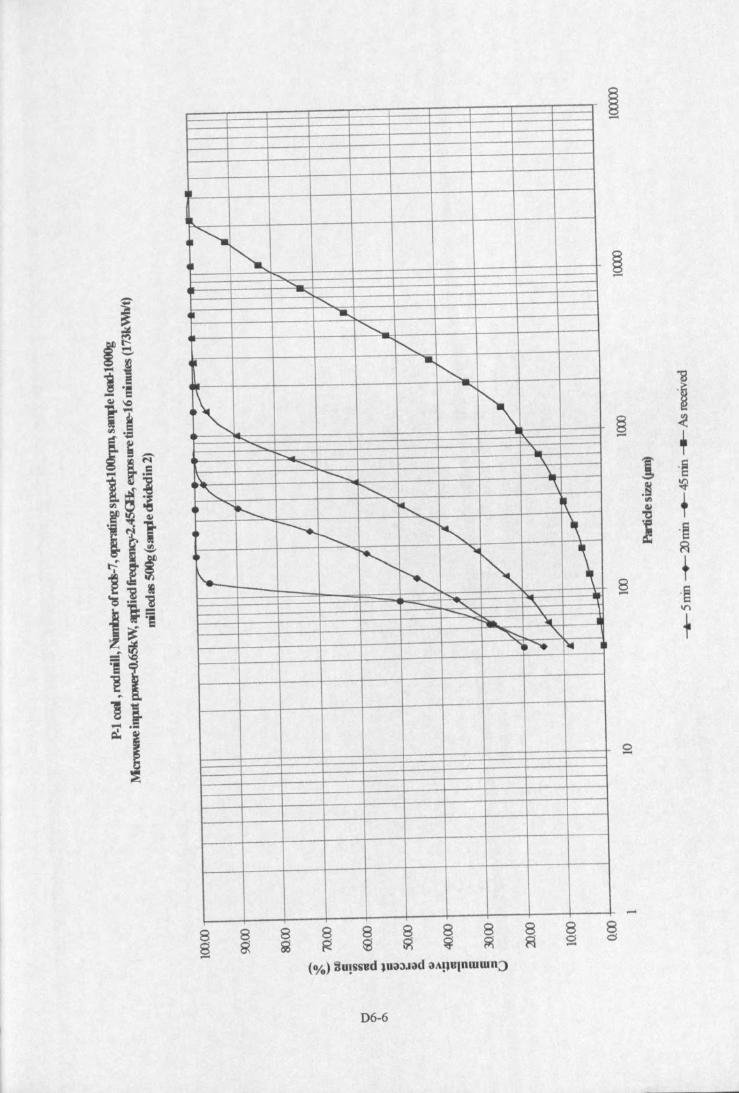
I
r=;r-,<;<,-....
<,
• -....<,
r-,~ .....r-,
~
-...
i\r--.. .......
~ x;............ "\
.\. -.... \<, r-, "\
~ '~ '~ ~
~ ~..........<, "r-........... r-, "'-r-, \'._ "-- <, "'"
.,.__ .........\.
RiII._ -.._ i~ -,
~~ ~ ~
88.....
8 8g ~ §-8~
888g ~ ~ 8~
D6-6
13.~
~.(
+J .~.§ ~."
+III'tI
! .~~
§ +.~10
+
-8d
APPENDIXD7
MICROWAVE TREATED COAL AT CONSTANT ENERGY INPUTPARTICLE SIZE RANGE TESTS
ROD MILL SIZE DISTRIBUTIONS
P-l coal, rod mill, number ofrods-7, operating speed-lOOrpm,load-500g, 07-4As-received, size range> 16mm
P-I coal, rod mill, number ofrods-7, operating speed-lOOrpm,load-500g, D7-5Microwave input power-0.65kW, frequency-2.45GHz, exposure time-S minutes,size range> 16mm
P-l coal, rod mill, number of rods-7, operating speed-IOOrpm,load-500g, 07-6As-received, size range -16 +8mm
P-l coal, rod mill, number ofrods-7, operating speed-lOOrpm,load-500g, 07-7Microwave input power-0.65kW, frequency-2.45GHz, exposure time-8 minutes,size range -16 +8mm
P-l coal, rod mill, number ofrods-7, operating speed-lOOrpm,load-500g, 07-8As-received, size range -8 +4mm
P-I coal, rod mill, number ofrods-7, operating speed-IOOrpm,load-SOOg, 07-9Microwave input power-0.65kW, frequency-2.45GHz, exposure time-8 minutes,size range -8 +4mm
P-I coal, rod mill, number ofrods-7, operating speed-lOOrpm,load-500g, 07-10As-received, size range -4 +2mm
P-I coal, rod mill, number of rods-Z,operating speed-IOOrpm,load-500g, 07-11Microwave input power-O.65kW,frequency-2.45GHz, exposure time-8 minutes,size range -4 +2mm
P-l coal, rod mm, number ofrods-7, operating speed-lOOrpm,load-SOOg, 07-12As-received, size range -2 +lmm
P-l coal, rod mill, number ofrods-7, operating speed-lOOrpm,load-500g, 07-13Microwave input power-O.65kW,frequency-2.45GHz, exposure time-8 minutes,size range -2 +Imm
07-1
Appendix D7
P-I coal, rod mill, number ofrods-7, operating speed-IOOrpm, load-500g, 07-14As-received, size range -I +O.5mm
P-I coal, rod mill, number ofrods-7, operating speed-IOOrpm, load-500g, D7-15Microwave input power-O.65kW, frequency-2.45GHz, exposure time-S minutes,size range -I +O.5mm
P-I coal, rod mill, number ofrods-7, operating speed-lOOrpm, load-500g, 07-16As-received, size range -0.5 +O.25mm
P-I coal, rod mill, number ofrods-7, operating speed-l00rpm, load-500g, 07-17Microwave input power-O.65kW, frequency-2.45GHz, exposure time-S minutes,size range -0.5 +O.25mm
P-l coal, rod mill, number ofrods-7, operating speed-lOOrpm, 10ad-SOOg, 07-18As-received, size range -O.2Smm
P-l coal, rod mill, number ofrods-7, operating speed-IOOrpm, 10ad-SOOg, D7-19Microwave input power-O.6SkW, frequency-2.4SGHz, exposure time-8 minutes,size range -O.2Smm
P-3 coal, rod mill, number ofrods-7, operating speed-IOOrpm, 10ad-SOOg, D7-20As-received, size range -16 +8mm
P-3 coal, rod mill, number ofrods-7, operating speed-l00rpm, load-SOOg, 07-21Microwave input power-O.6SkW, frequency-2.45GHz, exposure time-8 minutes,size range -16 +8mm
P-l coal, rod mill, number ofrods-7, operating speed-IOOrpm, load-SOOg, D7-22As-received, size range -2.8 +2mm
P-l coal, rod mill, number ofrods-7, operating speed-lOOrpm, load-500g, D7-23Microwave input power-O.65kW, frequency-2.45GHz, exposure time-8 minutes,size range -2.8 +2mm
P-l coal, rod mill, number ofrods-7, operating speed-lOOrpm, 10ad-SOOg, D7-24As-received, size range -1.4 +O.71mm
P-l coal, rod mill, number ofrods-7, operating speed-l00rpm, load-SOOg, 07-25Microwave input power-O.65kW, frequency-2.45GHz, exposure time-S minutes,size range -1.4 +O.71mm
D7-2
Appendix D7
P-I coal, rod mill, number ofrods-7, operating speed-lOOrpm,load-500g, D7-26As-received, size range -0.5 +O.09mm
P-I coal, rod mill, number ofrods-7, operating speed-IOOrpm,load-500g, D7-27Microwave input power-0.65kW, frequency-2.45GHz, exposure time-S minutes,size range -0.5 +0.09mm
D7-3
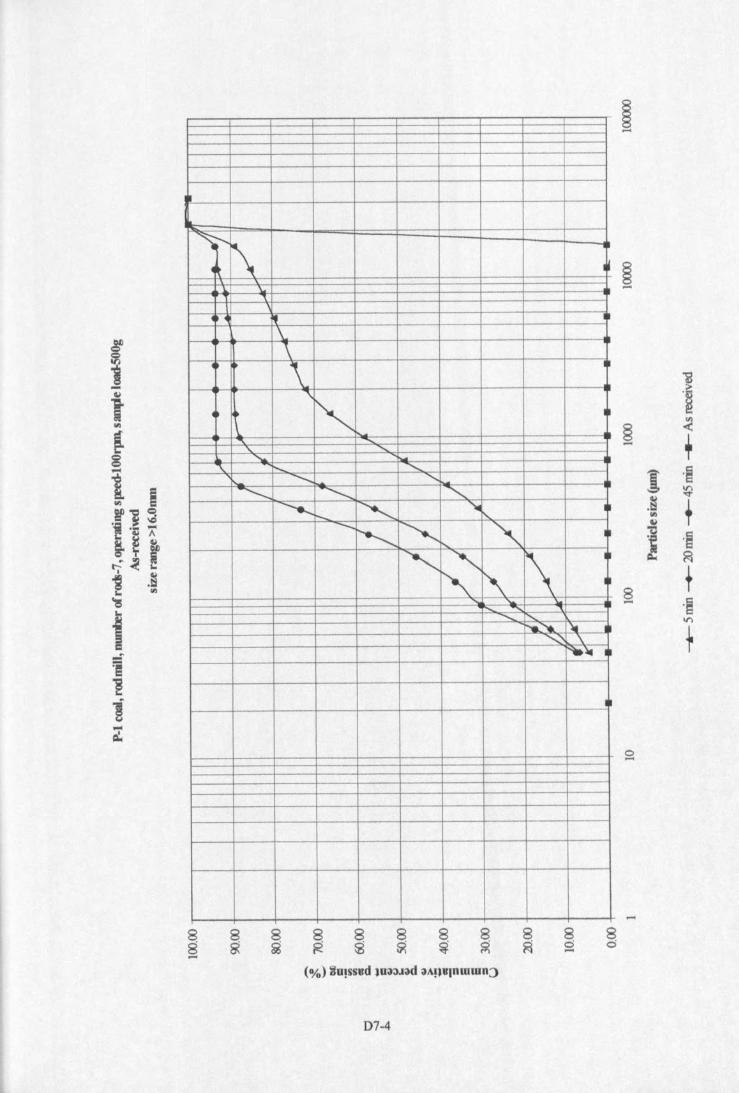
~ i\4~ -~""
~ "'\\\
""\
~.. ~\.
<,<, ...~
"\. I--.... <,<, <,
~ ~ <,--....... I---. ~ ~r--..
-........~ ~,
'"::::~ ~...." '-......
<, <,r--.._...... ..
'-...0 \~
•
88-
8g 8g 8~
8d-
D7-4
~.~
§ <- +r ·S~.~ ,
'"~
I ·S~ ~
8 +- .§I/')
+
o-
8d
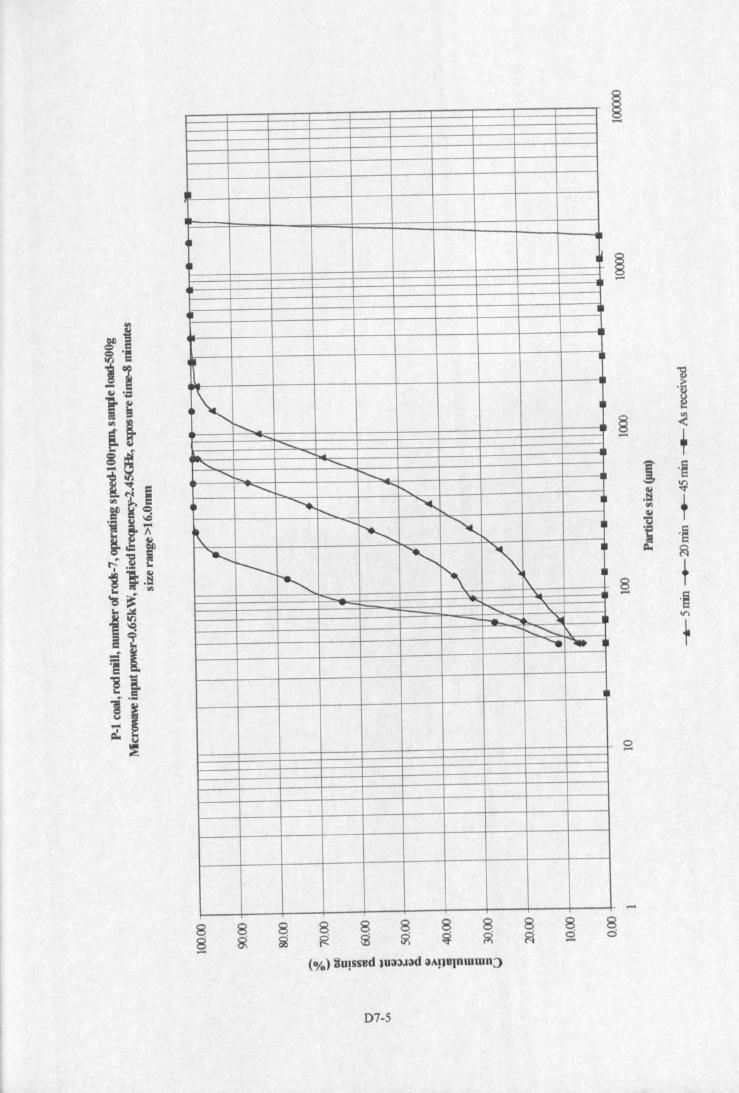
II
~~ •
~
,~
I
I'--...<,
......<, ............
.......... r-.... I".:................. .....~
........... r-...... .......... t-...
~
.........
~~ I
"-... '" -, I
I---<, ~ r\~ "
-- -- ~....<, '\......._ t-... .......... "-
I"--.................. r\.......... .,.- .
8g-8g
D7-5
i.~
§ .(.-
Ti .~.~ ~III
+~"C.~ .~~ ~
8 t- .~<rI
~
o....
....
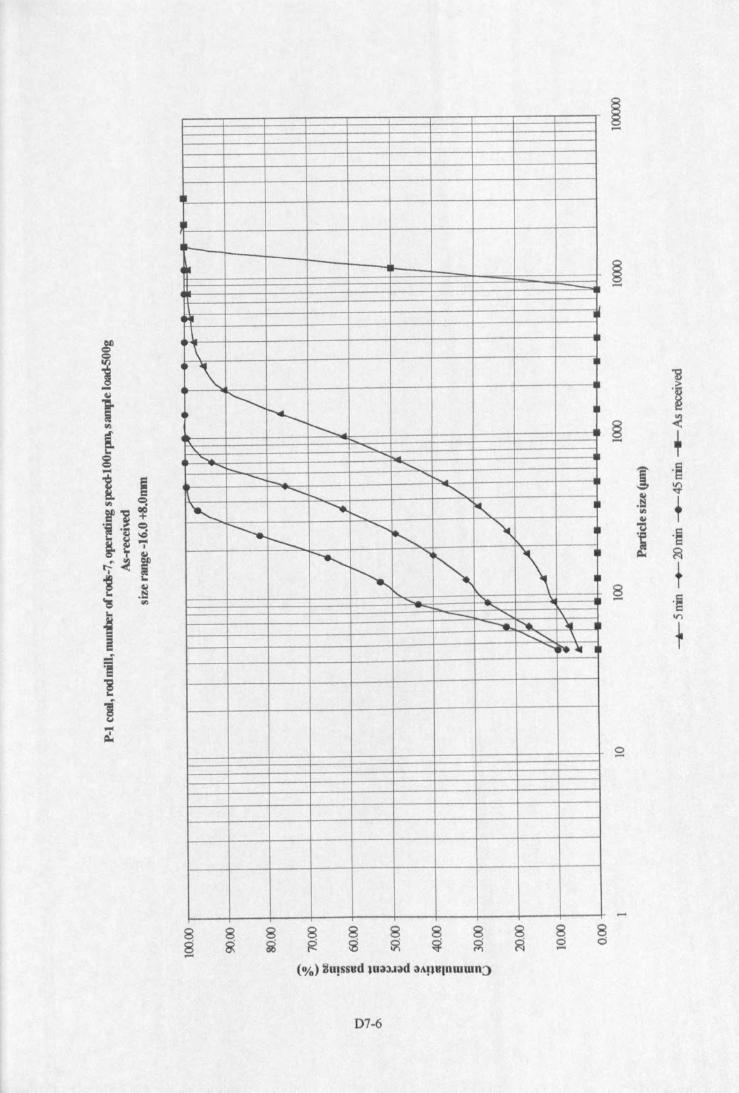
III
t-
~t--
4 ~
\I. '"
II
~ I'--. I
r--."- ........
.......... ....................... <,
............- ...... '"--r-... <,I' ............. r-, ~............... ..............
~ ~t--- r=;~~
~~ \.......- ...... "-.... ....... ~. I
.......................... \....., .... ~
8g
D7-6
"B<~
~.;:
+1 <~
~.§+'"~
'tI <§.~~ ~
8 +- .~.,..
+
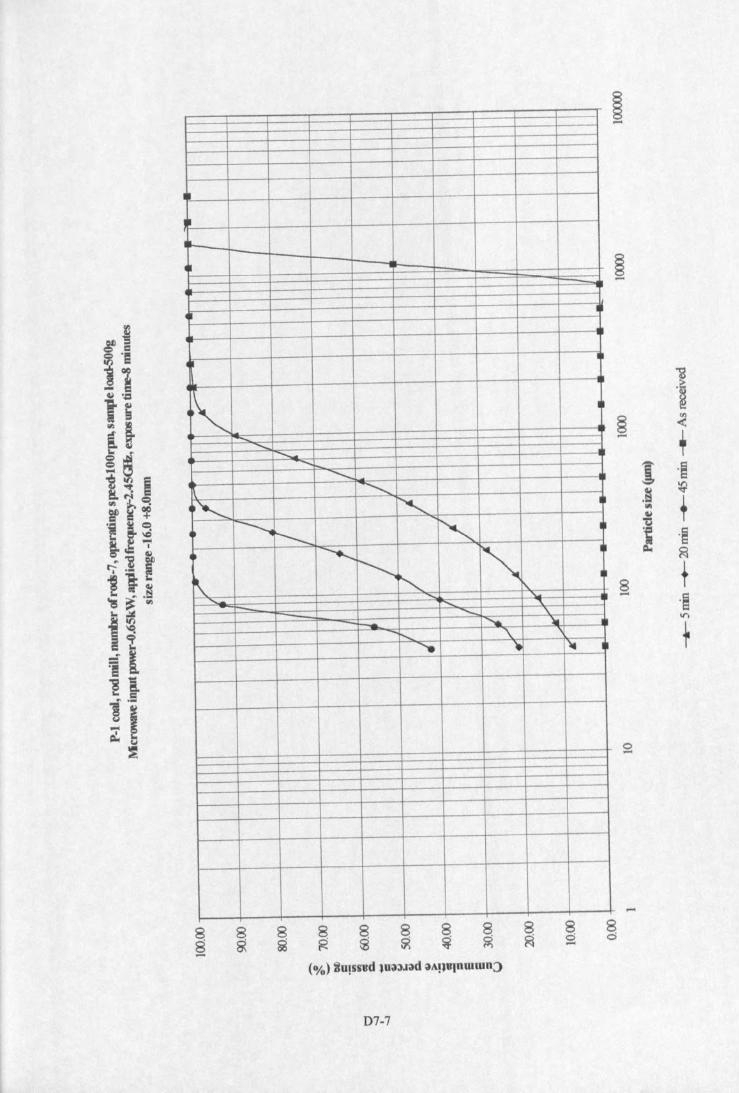
..
.....I~
I
U"L. I
..........................
........................
.............
<; ~
I ~ I---.. ~I
I -.......~ r-, ~
~-, ~
r\."- ....... "'............ \.
~ .......... ':1.1-.r-..... \.'e ,. \i ~
~ ~ ~ ~ ~ ~ ~ ~ ~ ~ ~(010) ~o,sslld ~UOl:UOld OlAHuln rurun:>
D7-7
13
'1§ .(.-
+1 .~
.§ ~
"" T~"tI
~ .~~ ~
§ +.~.,..
1
-
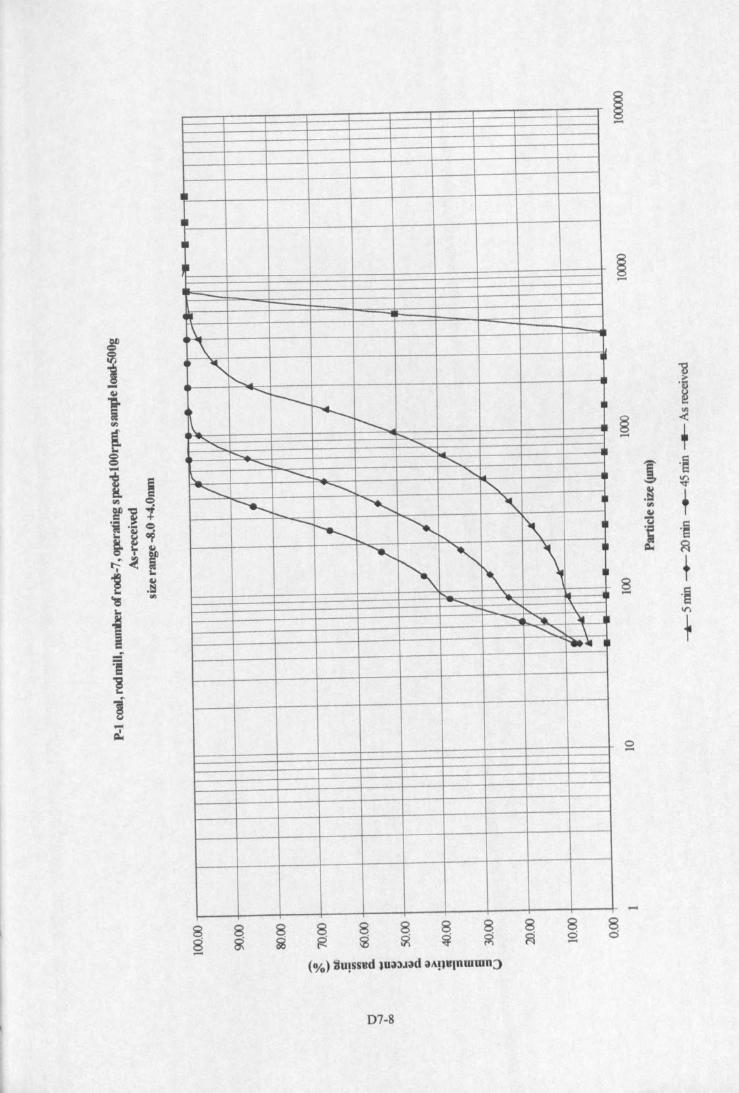
II
I~
~
!~
Iff.\\It,
r-,-........I--•• ~
I
l\. r--." ~
........ <,
....... "'"-............ .........-........_ <,
--............ -.............. <,--"""_f... "<, "- ~--~ """ ~
I
1'-...~ -. \ I
~ ~I
.'"........ "t-.... \-..... ......... ~..........." \
~li
8S
D7-8
-s.~
§ ..(..... ,J .§
~.§
T'"~"C .~~~ ~
8 r- .§11'\
+
o.....
8d
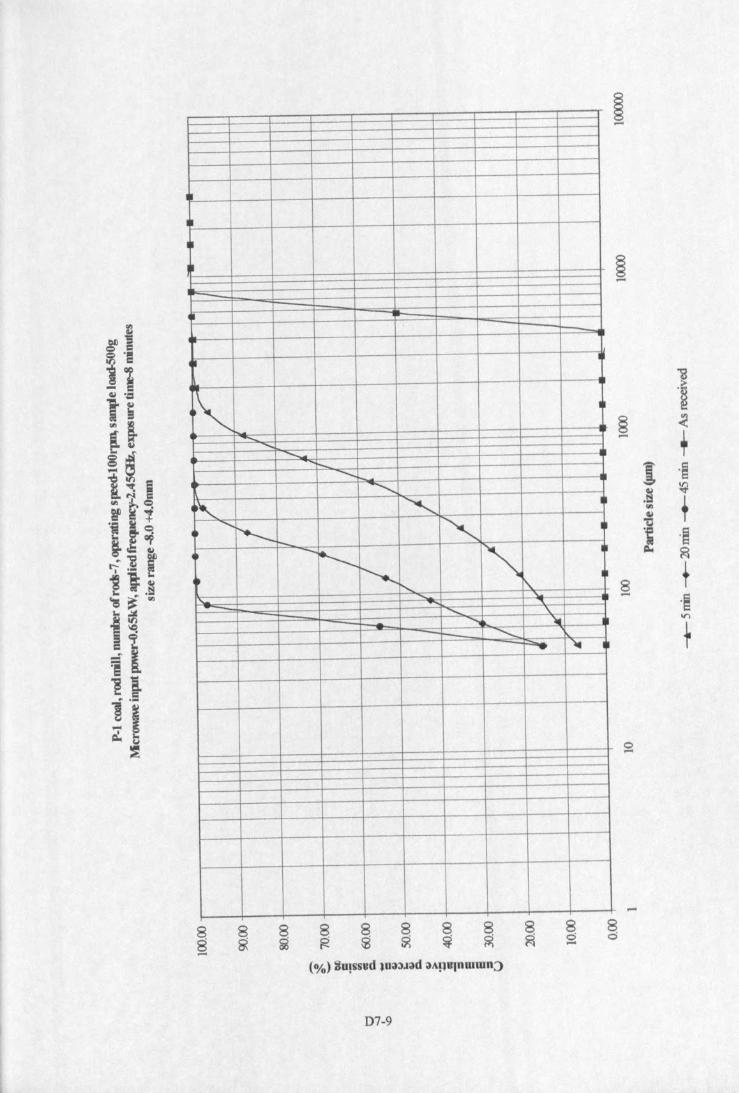
I
•I-I
~
~
I
,\__ •<, ....._
<,<,., " I
• <,
~ "<, I-• -i----~~~,
r-,1'- ........- ""<, \.
....... '\I->- <, .... ~ •
8o-D7-9
1J'~
§ ..(- ,~ 'S~ ~.t:l ,'"~"C
I 'a=-- ~
8 +- .§11"\
1
o-
-8o
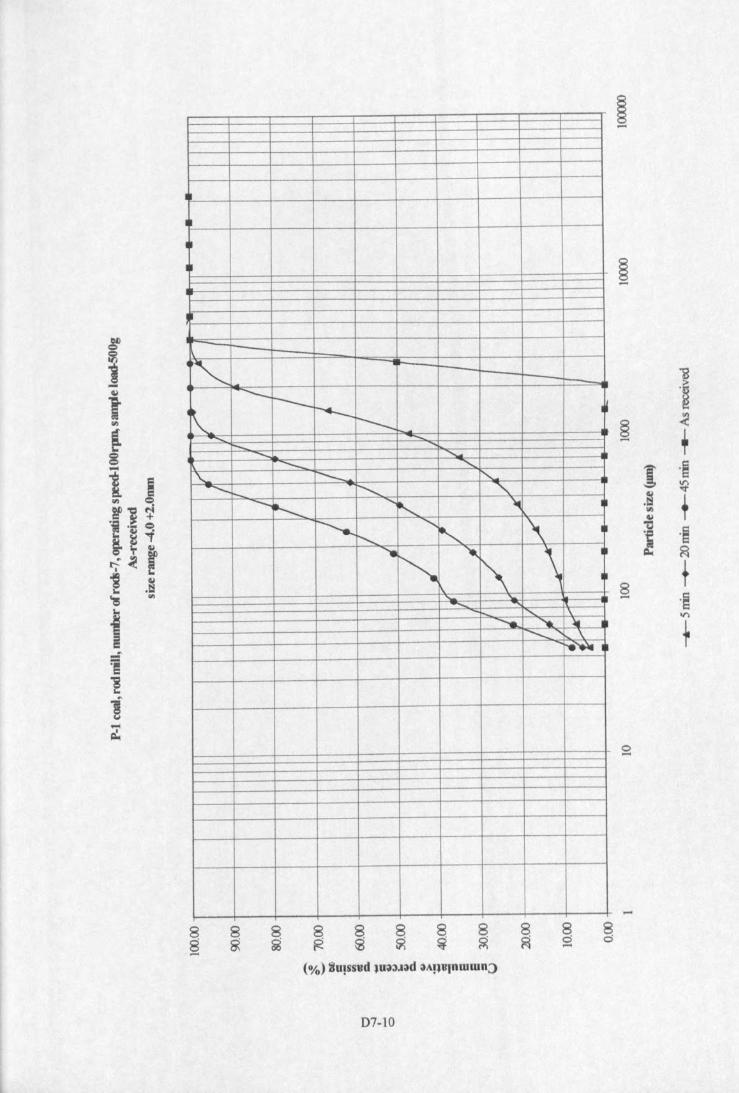
I
~-
-<.~---r---- W~~ ~ I--.
r--.......... ""--........._ <,, ....__ r-,
........... f-..._ <, <;..........
~...." ~ I
r-..........._ <,-. \ II"-. .....I"- ~ \ I
1\<, \......._ ~ liI I............... \r-.~ ~
8888 ~ ~-
D7-10
~-
~.~
~<+
i .§~.~ T'"~
'tS .§~~ ~
§ t.~.....
1
8c::::i
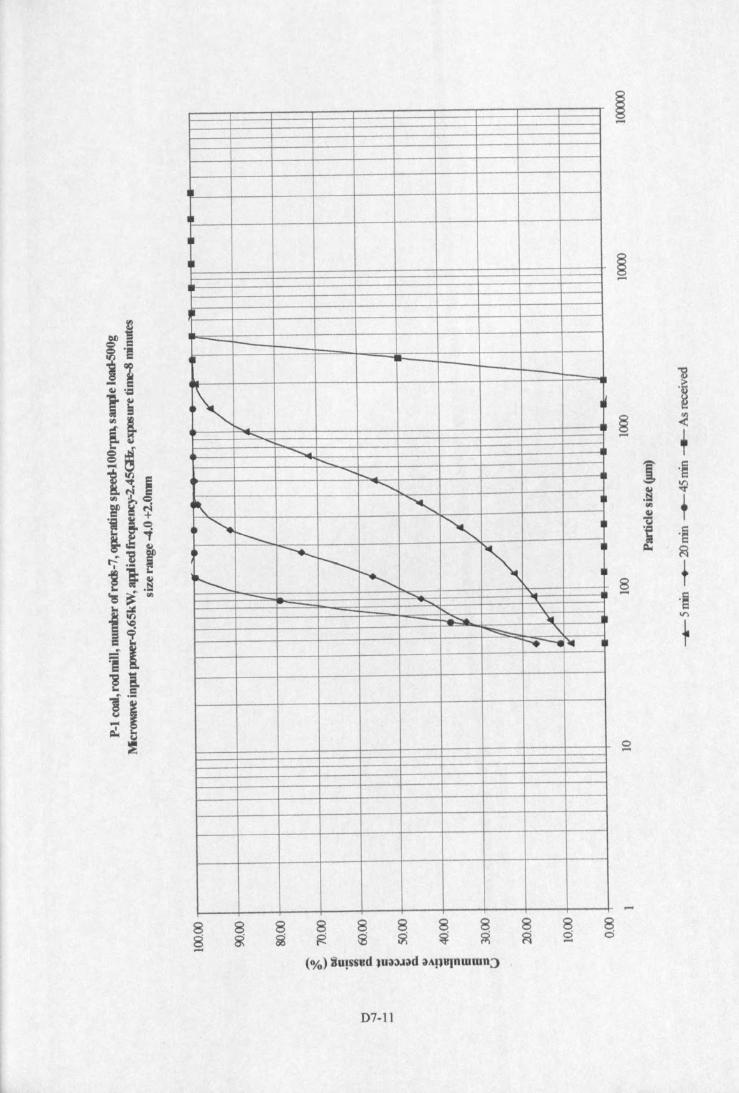
I
••
-rl.. -~
~
<,
<;<,
.......... t--..<,
"- <,~'-....___ r-.
~
~
I
~r---r<, I
"" '\..
~ ...... "'\."-
~ "-......---. .._. ~
8g 8g 8 8$ ~8ci....
D7-11
-g.~
§ <....+
1 .~.~ ~'" T~'ti
~ .~~ ~
8 r- ·SV')
1
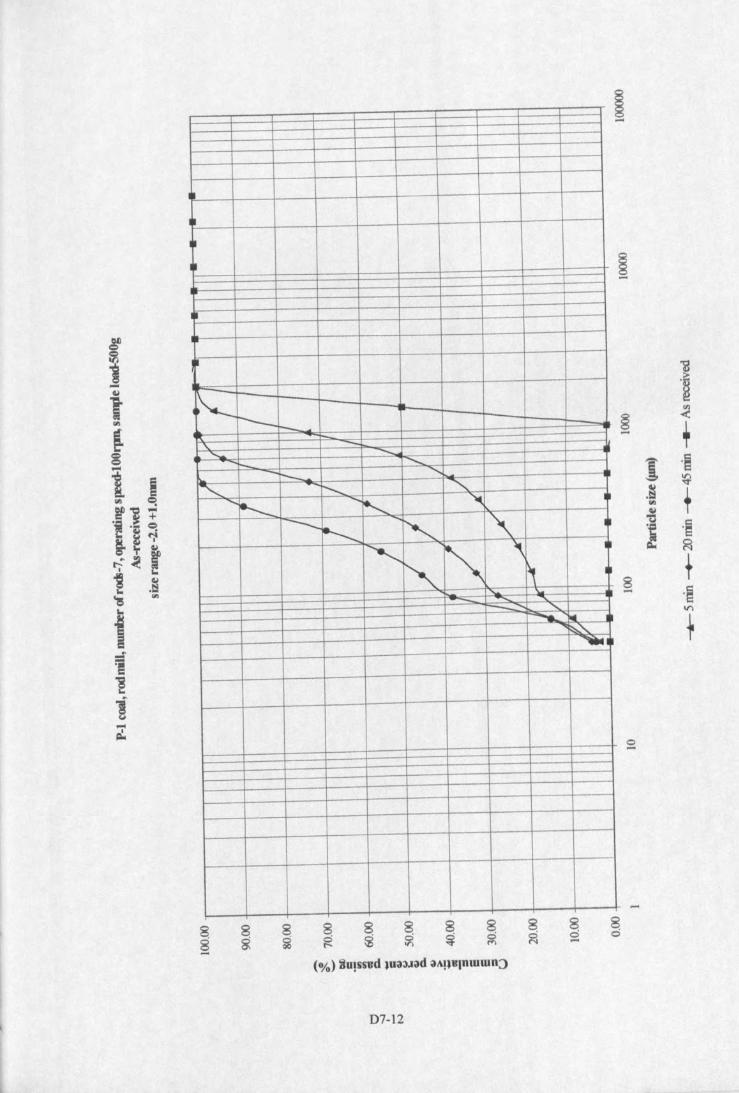
I
•I
II
~ I---f--t-., -""'
........_i-- .............
r-.. <, -r-, .... i"---... <,....... ~
.........<, ~
---.____ ~ -,<,
~
'\ I
.>."
~
- ......F"'-- ...... <,
........... -.1:::,..,'"'* ~
D7-12
~-
'"8.~
§ ;::- ,1 .§
~.~ f'"t.l~,~.~
~ ~
8 +- 'aV)
+
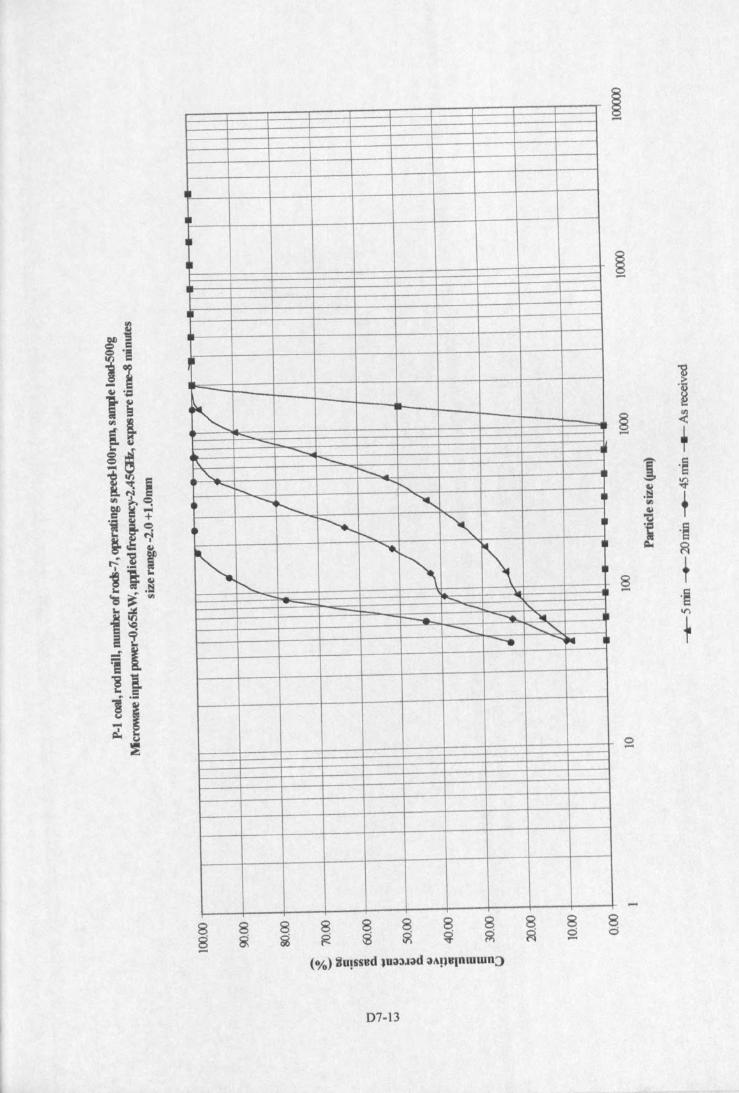
I
•I
I -
--. -'""" - ............
'\...._
<, r-...~ t--..... '"~ -....~ "' I
~ ~ r--.... -.t-. ......
~ ~<, --- -..... I"..--.. -..... '\t •............... <, <,-. -...;~ ~
88-
8g8sa
D7-13
-s.~
§ ~......
+I .§.§ ~III fGl'tl.; .§~ ~
8 +- .~tr>
+
o-
-8o
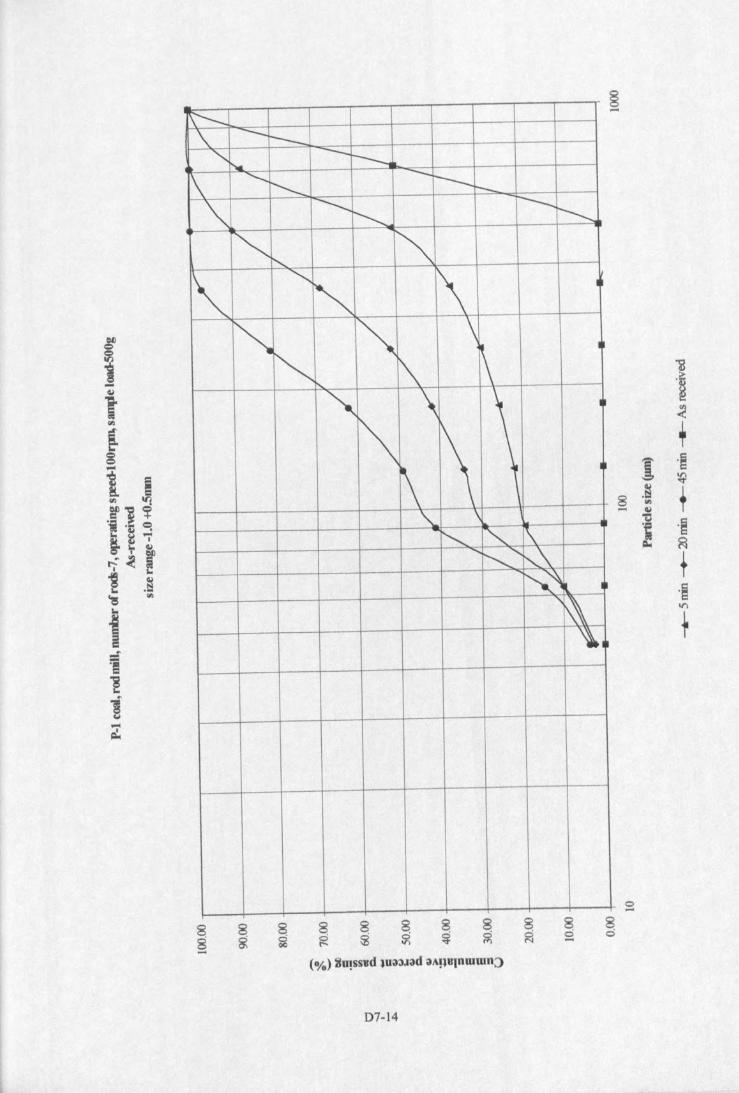
~\ --1"----<, ---t--.~
f\......_
l'---- --r---r--..~
-............. r-, r--.~
<.r-, ~
~
<;r-, 1\ I
~ I~ \~
I"'~ 1\<, \ I
1\~ -, \
~ <, r\...... '-..........."""~\~.
"~
~
0-8 S 8 8 S 8 S 8 S S S~ &; d d $ ~ ~ ~ ~ S 0
QC I:'-
(010) ~u!ssvd .u;)3J;)d ;)A!l"lnmmn;:>
D7-14
§-
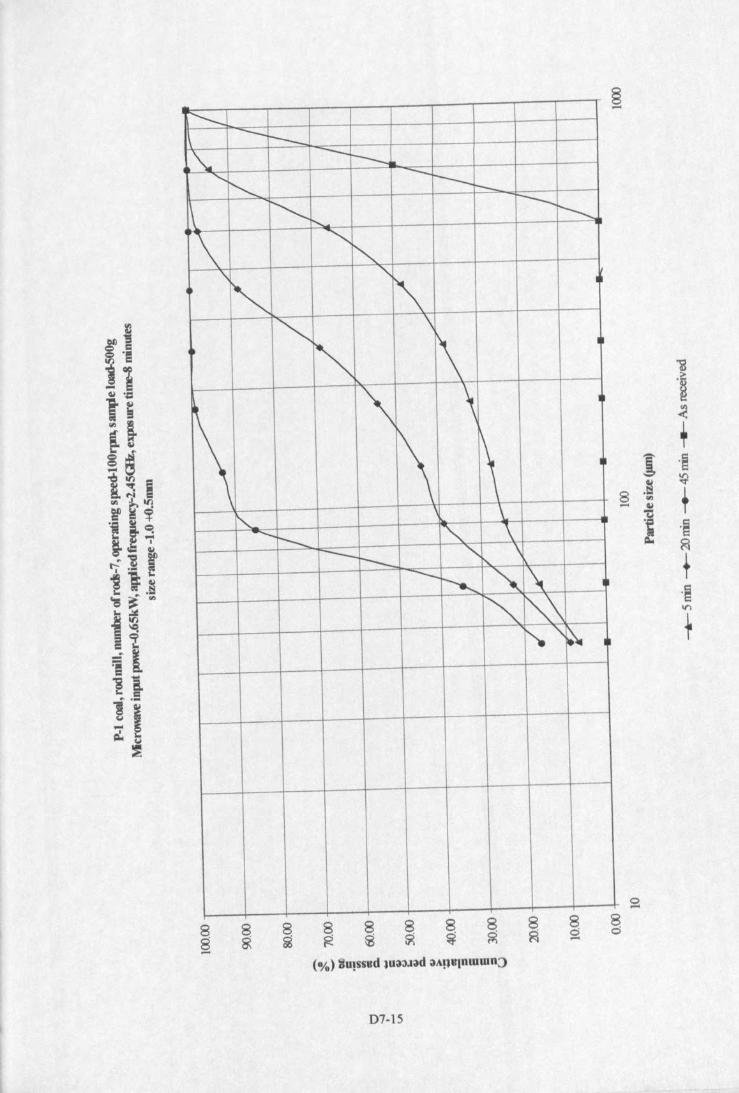
r<,\ --t----.\. --t---<,
~
...__t---- r-
.\ ~r:::-.r---.._
t--......
\ <,-."
~
<,
1"\ I
<, \
~ 1\-, ,~ ~-. \ \
--.t-- <, "\--t--- <,1'.. \
----~ -.\ ~
r-,~\i'- ."~ ~
88-
8g 8~
D7·15
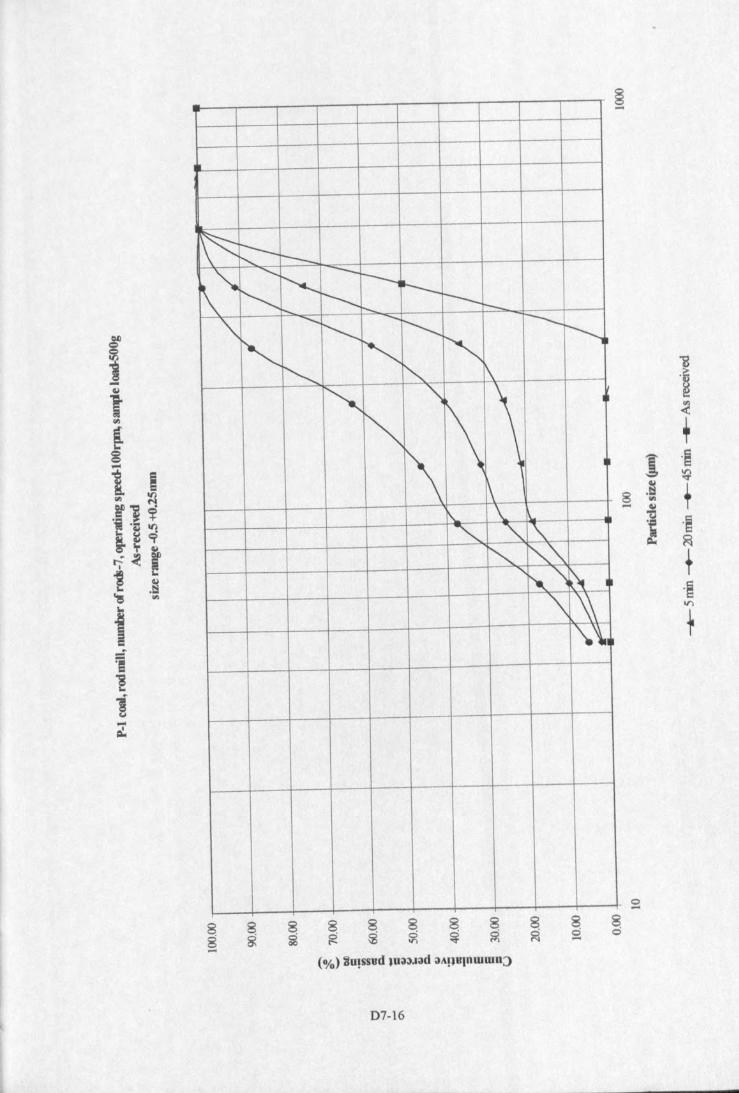
•
\"c:::-----\~ <,
~ ------.r-, ~~ r---...... ........ r--
" ..............<,........
r--.........-....._
r-. ~ '" --..............
r-. r-, i\<, -,r-, \
~ 1\I' \<, -."r-,
""''''<,,'\~I-,,\\\.\J
8 8g ~.....
D7-16
§.....
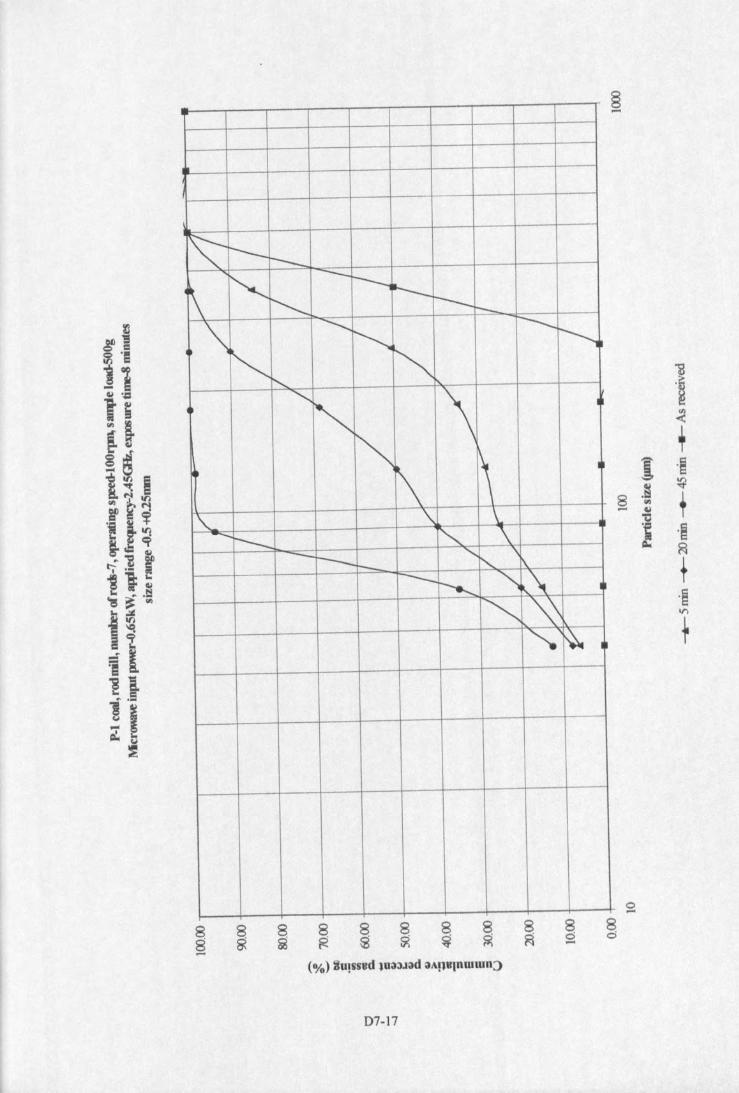
~ I---i--~ ---r--..
~
..___~
r---r--
~\ -.........r-, ---r-.-. ~r-,~
<,<, \-." ~
,\-. -, \----- r-, '\-r-- <,r-, \f\I--- r---I-...... ~ ~\r-. ~
<,~
88-
D7-17
§-
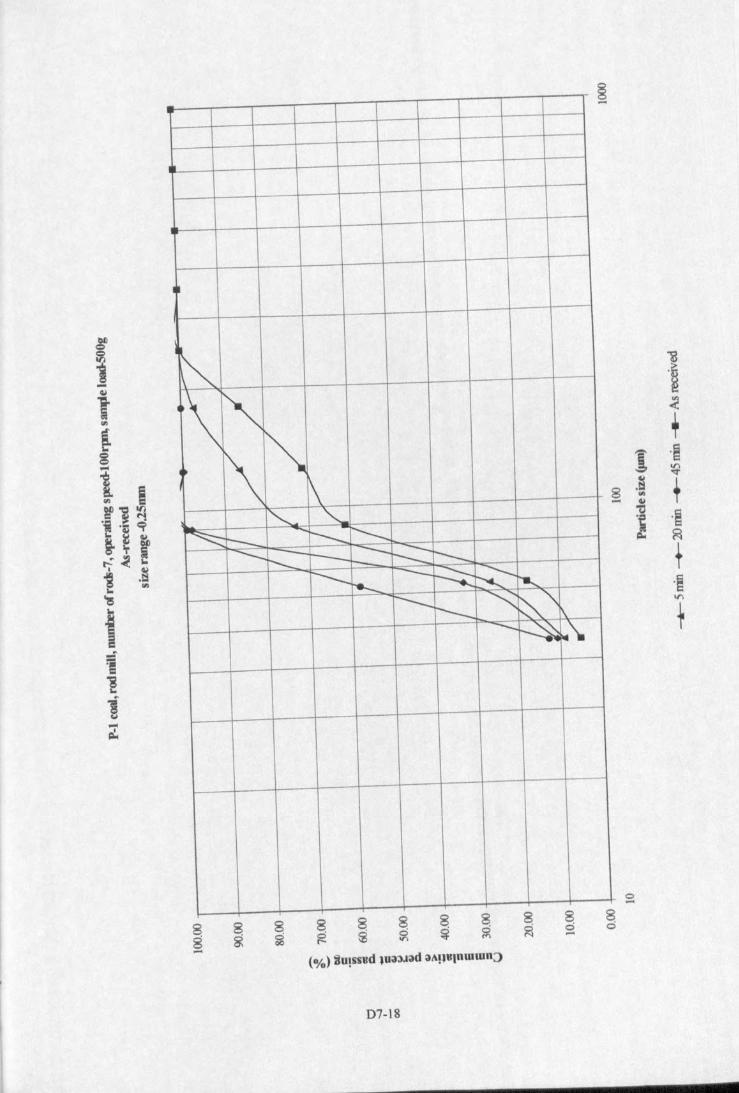
•
I~
~
'\~ -,\\4.~
- <; <;~ t--- '~ ~
--.....:~ r-- ~ ~ r-----r---~ ~
~ ~ r--r---
~~
~ ",'- ~~ ~'\.
0-8 8
~a a $ a a 8 a 8
g g (e s 0 ~ ~ ~ 0 0on -
(%) iUlssud lua:>J3d a"llulnmmn::>
07-18
§-
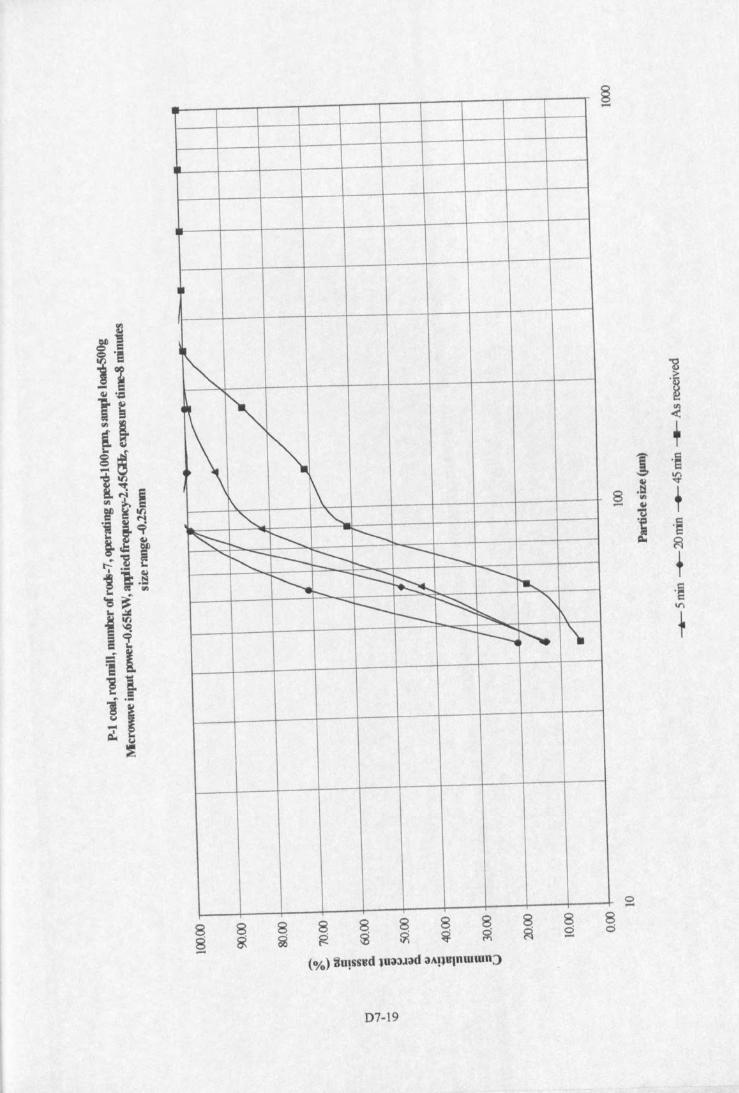
I
II
~
~
I"'.I \\1\<, <,~ ~ ~ r---..
"~- 1----t:-- ~ t---t--
<, t--=::~..___
ra...t- -t--- ~<,
t--- ~ 1\--~ r-, -,
88-
8g
D7-19
§-
8ci
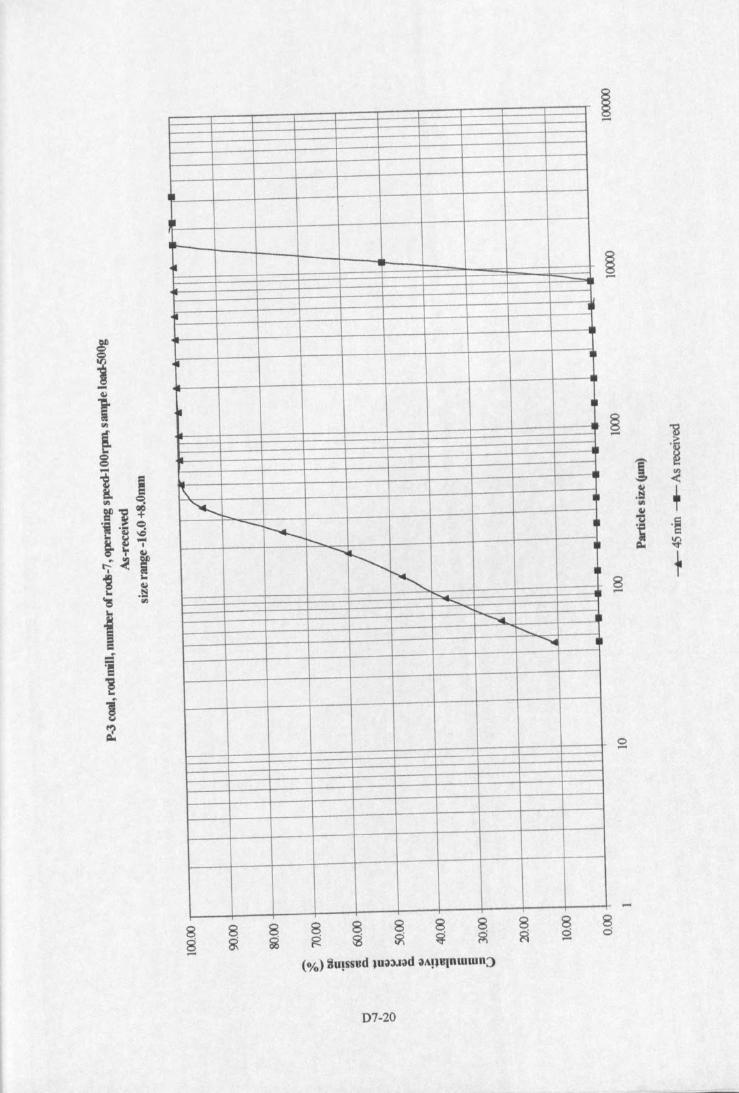
I
~
~ -
~.
I
~~
~ •
1\, --j-.._ I
t-..............
~~
~I
r-, ..... ..... -... -.f:::....
......... I
8§
8ci-
D7-20
§-
8-
o.....
-
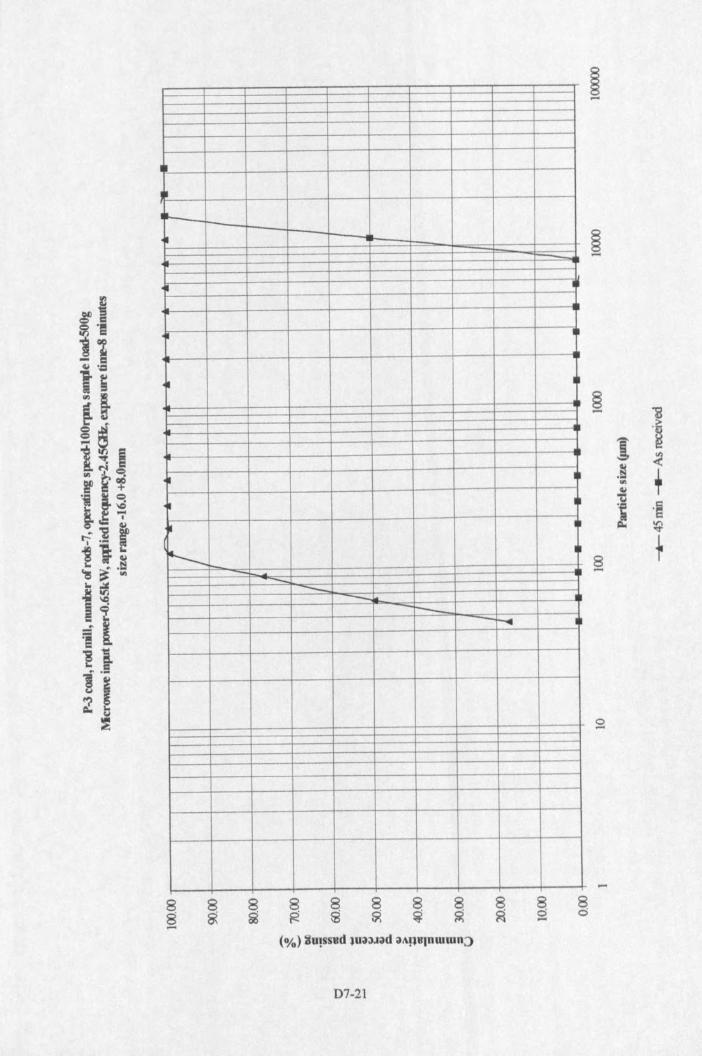
.11
!~
-
I
I
~
~I
~ II
~ - ~ --. ...-r-_ -~ I
8o....
D7-21
§....
8....
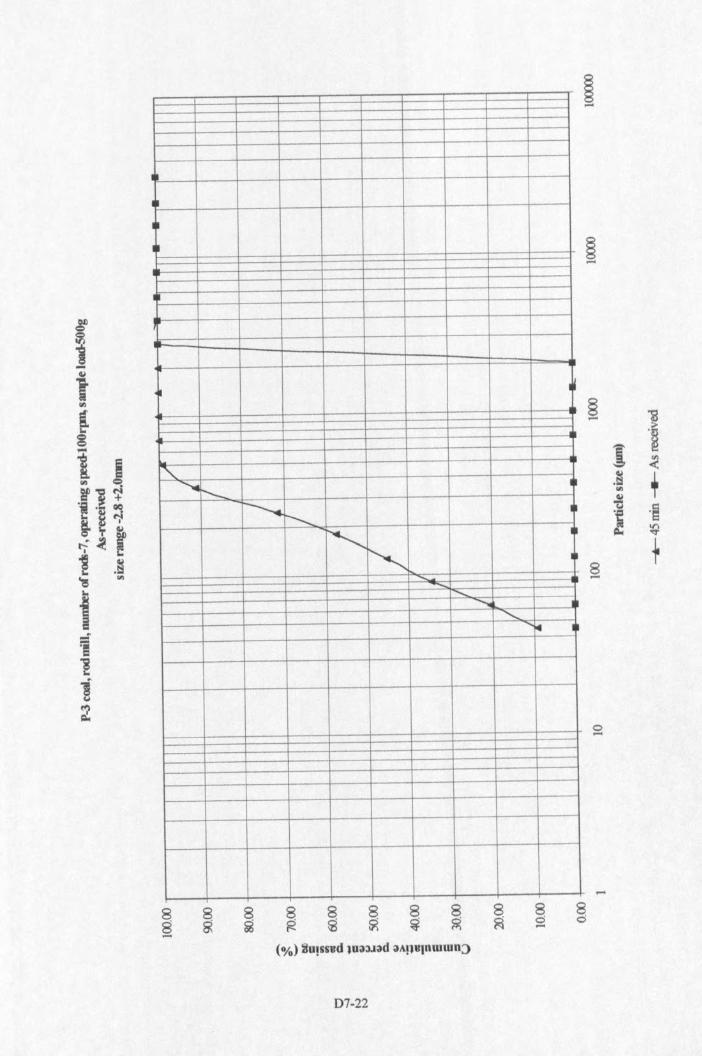
II
I
~
I
~I"..
.......... r--- I
r--. -....... ~,~ -
........<,
............<,
f4
888§ g ~8 8S 0
D7-22
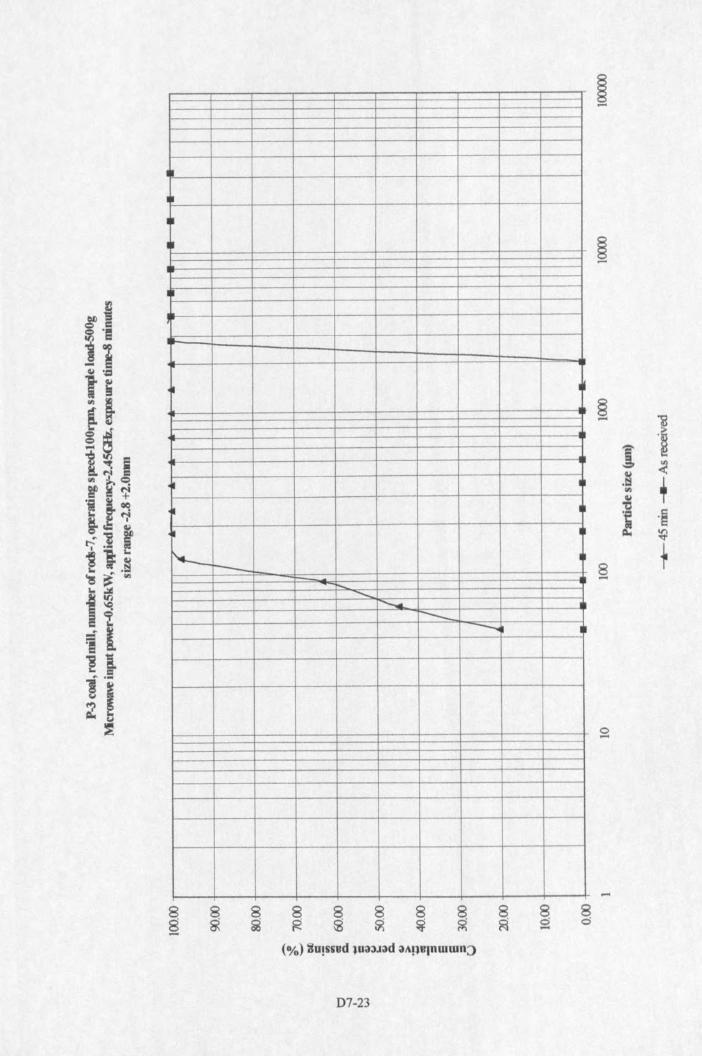
•IiiI~
I~
II
I
~ I
~ I
~ r--- - -..... -- --
D7-23
8<0
§-
o-
.....
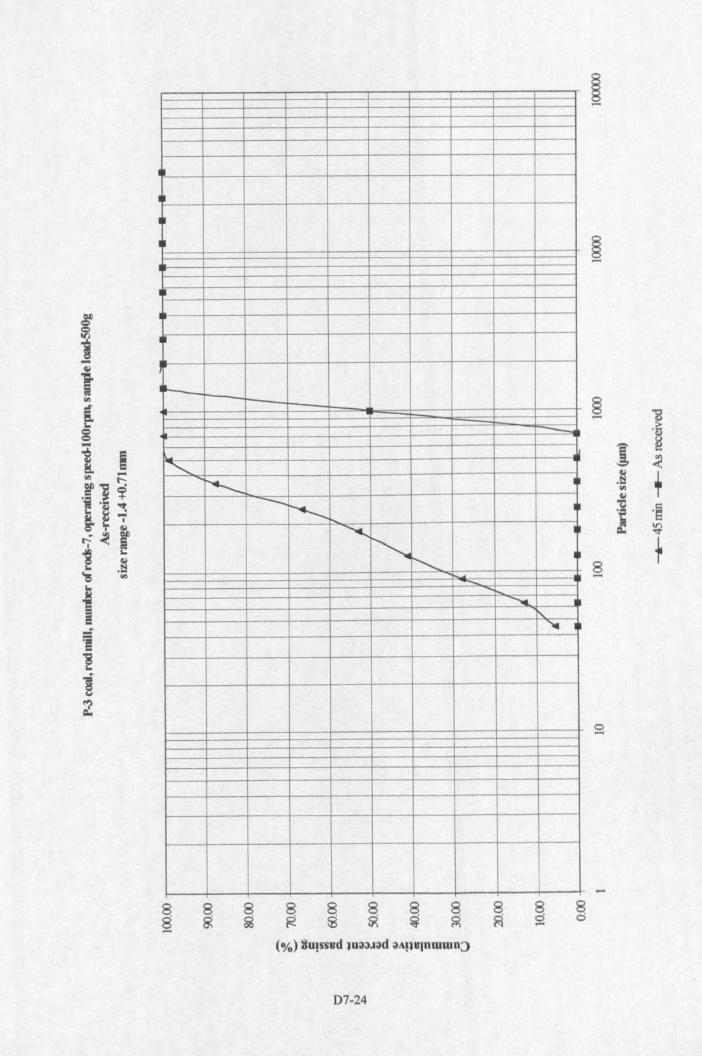
..I~
...__
<,~ -- .......__
~ <,<,
........._-,~.
D7-24
§-
-
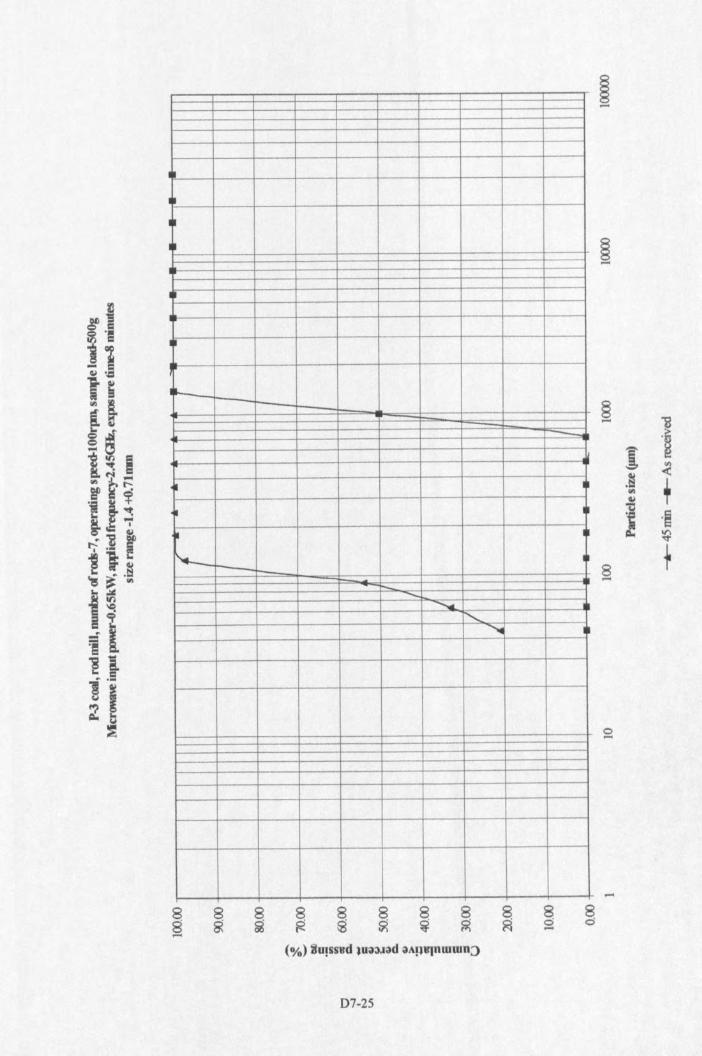
I
I~
I~
II
._ -'--
--...;.;,.,.._
~
~
~
~ t--'-
""" ............. r-,........ ~
8o-8~
D7-25
8o
§,....
o,....
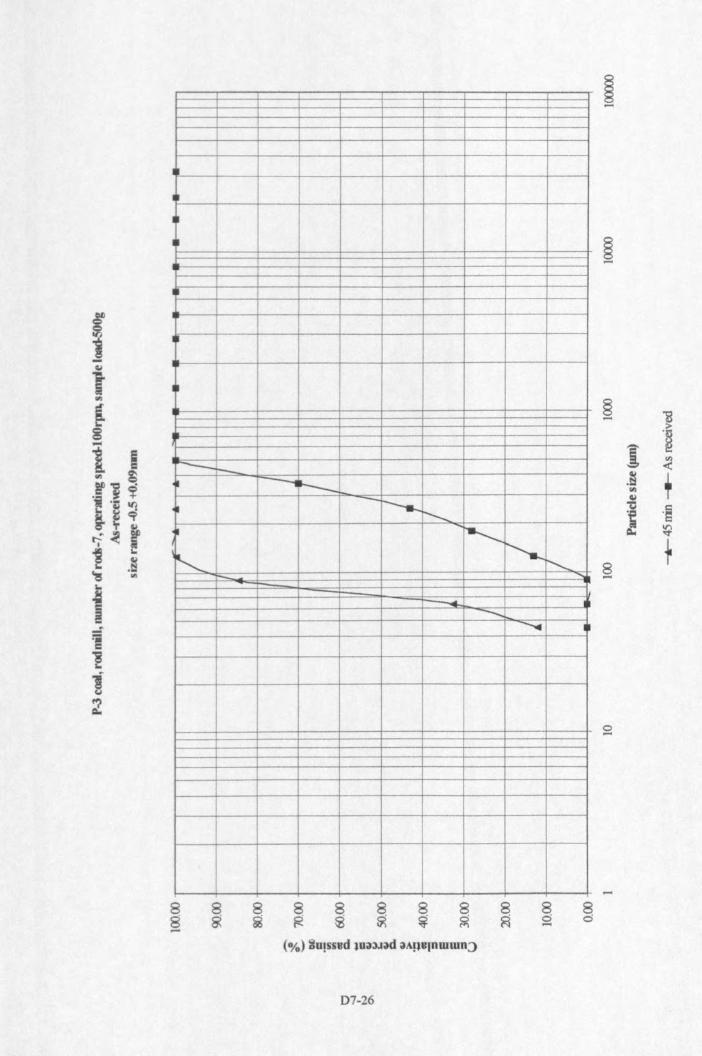
~
~
~
--t--~ +-«.___~ -r-.---~ ',,--: i'----r-, r-;
...;;:- -.....~
8 8o 0.....
D7-26
§.....
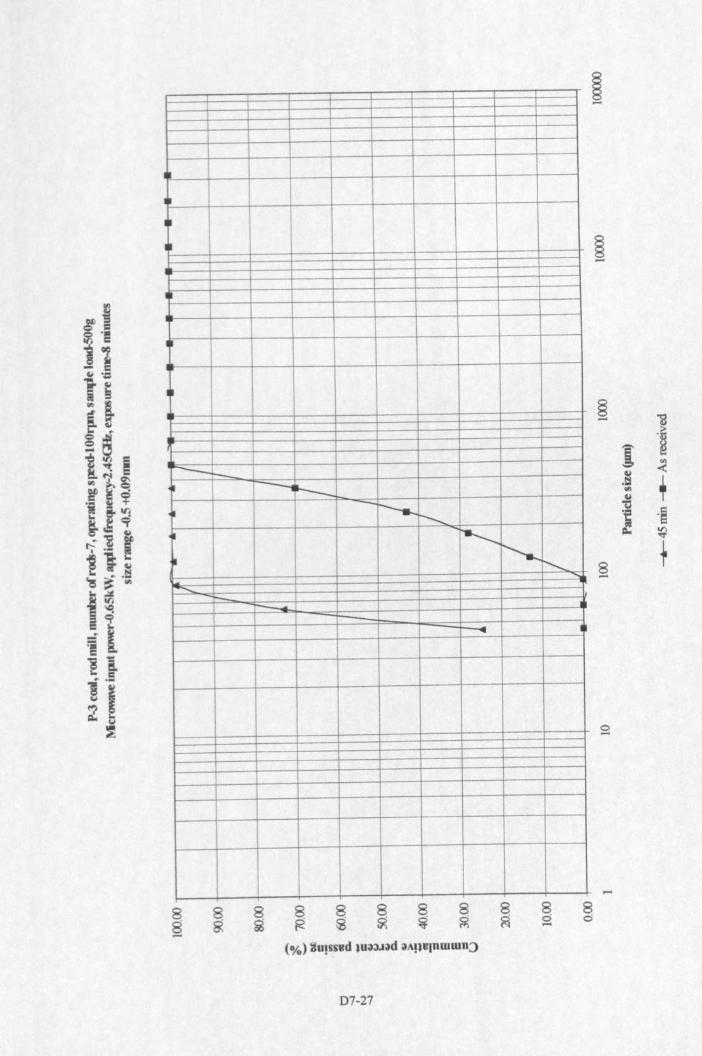
III
I~
~
I
I~
--r-- ~ ~
~ -r---- r---...~ ~~
r-;~ ......,- t-- r---...
......
888888888g ~ g g ~ ~ ~ ~ ~(%) ~u!ss"dlU0l3JOld OlA!l"lnmmn::>
8o-
D7-27
§13.....
i.~
.::~.1:iI ,<II~
I .~~ ~
8 1-
-
APPENDIXD8
MICROWA VE TREATED GROUP 1 COALSCOAL RANK TESTS
ROD MILL SIZE DISTRIBUTIONS
F-l coal, rod mill, number ofrods-7, operating speed-lOOrpm, load-500g, DS-3As-received coal
F-I coal, rod mill, number ofrods-7, operating speed-lOOrpm, load-500g, DS-4Microwave input power-O.65kW, frequency-2.45GHz, exposure time-S minute
F-2 coal, rod mill, number ofrods-7, operating speed-IOOrpm, load-500g, DS-5As-received coal
F-2 coal, rod mill, number ofrods-7, operating speed-lOOrpm, load-500g, DS-6Microwave input power-O.65kW, frequency-2.45GHz, exposure time-S minute
F-3 coal, rod mill, number ofrods-7, operating speed-lOOrpm, load-500g, DS-7As-received coal
F-3 coal, rod mill, number ofrods-7, operating speed-lOOrpm, load-500g, D8-8Microwave input power-O.65kW, frequency-2.45GHz, exposure time-S minute
F-4 coal, rod mill, number ofrods-7, operating speed-lOOrpm, load-500g, D8-9As-received coal
F-4 coal, rod mill, number ofrods-7, operating speed-IOOrpm, load-500g, DS-IOMicrowave input power-O.65kW, frequency-2.45GHz, exposure time-S minute
F-5 coal, rod mill, number ofrods-7, operating speed-lOOrpm, load-500g, DS-IlAs-received coal
F-5 coal, rod mill, number ofrods-7, operating speed-IOOrpm, load-500g, D8-12Microwave input power-O.65kW, frequency-2.45GHz, exposure time-S minute
F-6 coal, rod mill, number ofrods-7, operating speed-IOOrpm, load-500g, D8-13As-received coal
F-6 coal, rod mill, number ofrods-7, operating speed-lOOrpm, load-500g, D8-14Microwave input power-O.65kW, frequency-2.45GHz, exposure time-S minute
D8-1
AppendixD8
F-7 coal, rod mill, number ofrods-7, operating speed-lOOrpm, load-500g, DS-15As-received coal
F-7 coal, rod mill, number ofrods-7, operating speed-IOOrpm, load-500g, DS-16Microwave input power-O.65kW, frequency-2.45GHz, exposure time-8 minute
F-8 coal, rod mill, number ofrods-7, operating speed-lOOrpm, load-500g, DS-17As-received coal
F-8 coal, rod mill, number ofrods-7, operating speed-lOOrpm, load-500g, DS-ISMicrowave input power-O.65kW, frequency-2.45GHz, exposure time-S minute
F-6 coal, rod mill, number of rods-7, operating speed-IOOrpm, load-500g, D8-19Muffle furnace temperature-l OO°C,exposure time-l hour
F-6 coal, rod mill, number ofrods-7, operating speed-lOOrpm, load-SOOg, DS-20Muffle furnace temperature-200°C, exposure time-I hour
F-7 coal, rod mill, number ofrods-7, operating speed-lOOrpm, load-SOOg, DS-21Muffle furnace temperature-100°C, exposure time-l hour
F-7 coal, rod mill, number ofrods-7, operating speed-lOOrpm, load-SOOg, DS-22Muffle furnace temperature-200°C, exposure time-l hour
D8-2
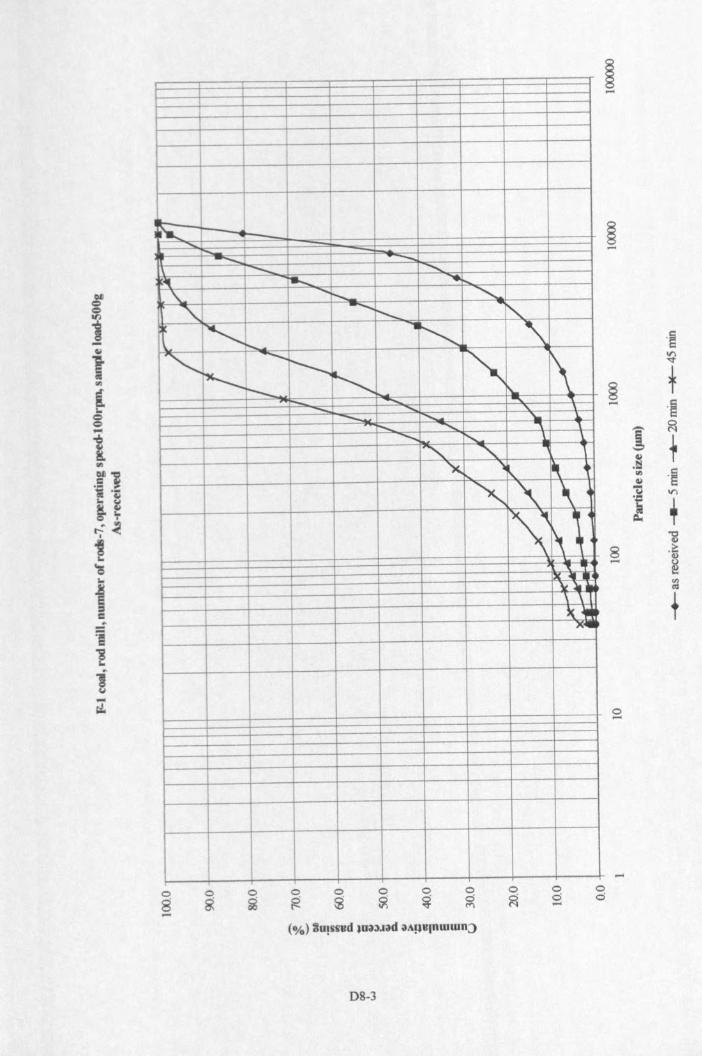
~- -....... ........_ ---\......._ <,
~..._ ...
"= ...... I'--.... <,
".........
~ -,~ <, +-, -.~<, .............
...............~~ ~~ '"r-- - - "'(- ........ "--- ....._ '- l..
........ <, "\ "\......... <, l. \.<, <, .,x ~
~ -,.~
~ "~x ....\t ~.\ \%. ..x...
o8.....
og og ogoci.....
08-3
.~.,..~
§ +..... .~
I ~
+-~.!:i'" .~~c::I .,..~ +~
"'0~8 .i::
a>..... o~<II~
t
o.....
oci
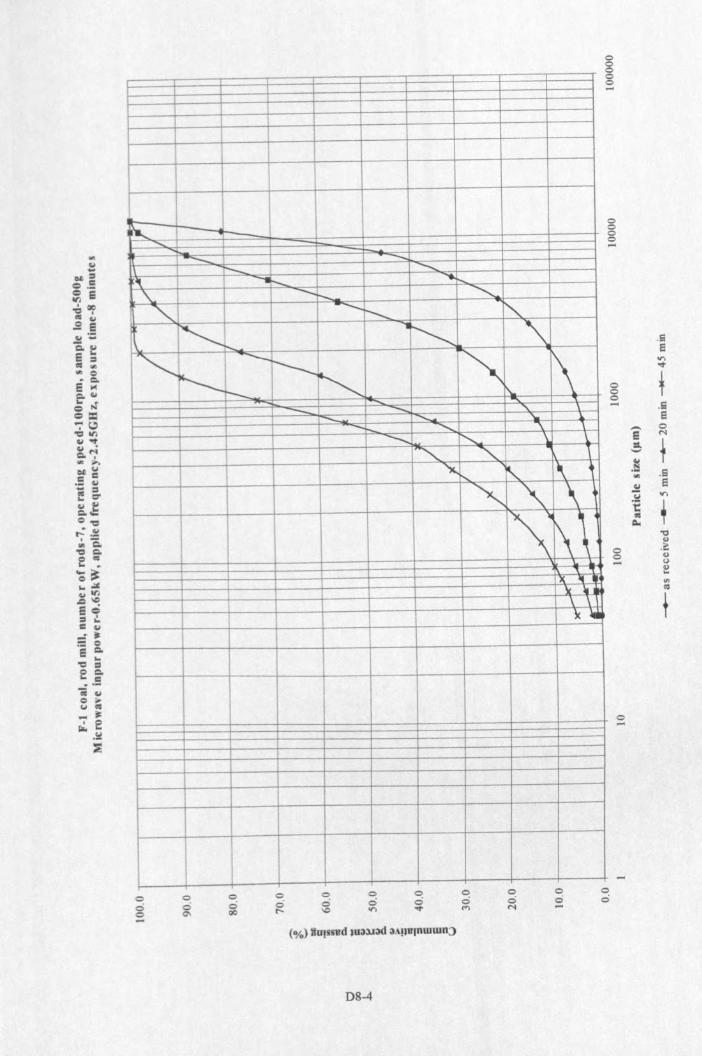
l-
i'..... - -<; ---- --t-- .............:~ -...._ .......~\. --r- <,<, ......._
.............. -,<, .....,
<, -.,<, ----......._ r-, 1\~ ~-- t\.- - "- ........ '\"
-. <, "\ "\-........ r-, \ \.
<, <, I
'x..r-.., ~ ,\ ~
<,,\\ \\
~'\ "!X It.~ ·11\ \xli
ooo-
ooQO
ooe--
oo.,.,
oo..,.ooM
ooN
oo
D8-4
o8oo-
oooo-
.1'1e.,.,..,.0 f00- .Se-- 0e N
::l
~_,
.~'" .S~ e.~ .,.,1: ,~=-
"Q.,0 .~0 4)- 0
Q,)....,<IS
t
o-
oo
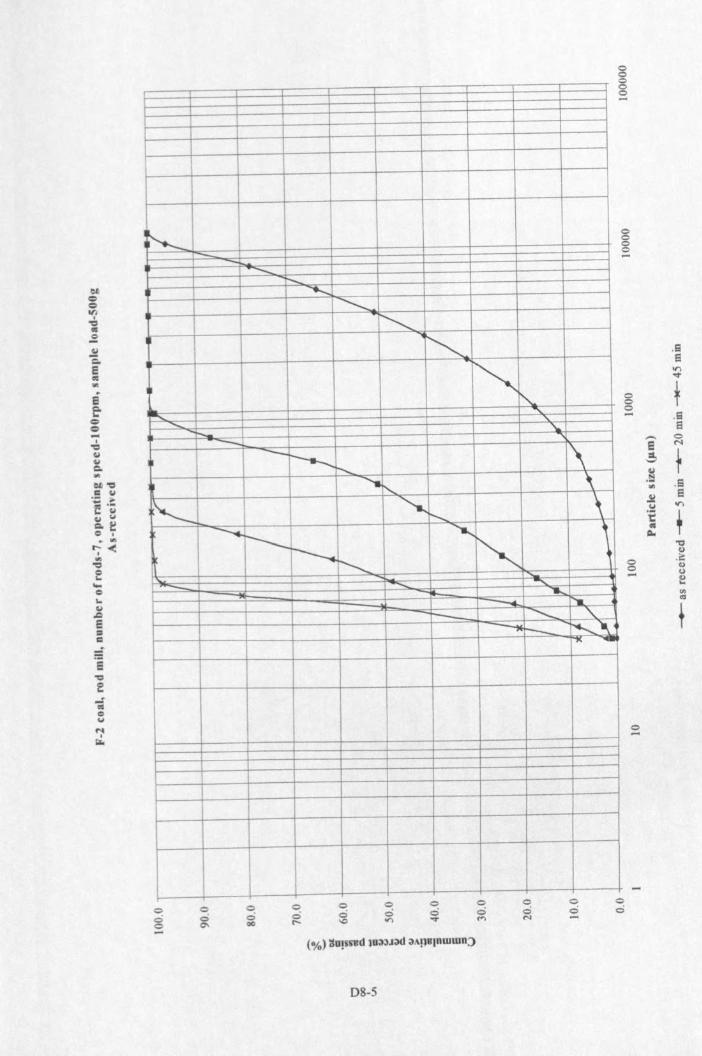
i-,-- ......_
t-.............
.............~
""r-,'"~...... "'-........ "'........i--._ '\........_ --t----- :\j--.,..
~ ........1'....,
f': ~1"--....... '\
~ I--- '--.. ,~ ~~ r-;
~
-..;: ......- -............. .......-- r-..-t--- -- "+--«t-- ~ ...~ ~
ooo....
oo0()
ooN
oo....
D8-5
ooooo......
oso-
.ElS.,.,.,..
0 f00
.SS
--. 0e N
:::l. f--u.~ .S'"J! Elu .,.,i ,«I
=- "0!.)
0.i:
0!.)- ()eCl><IS
t
o-
....oo
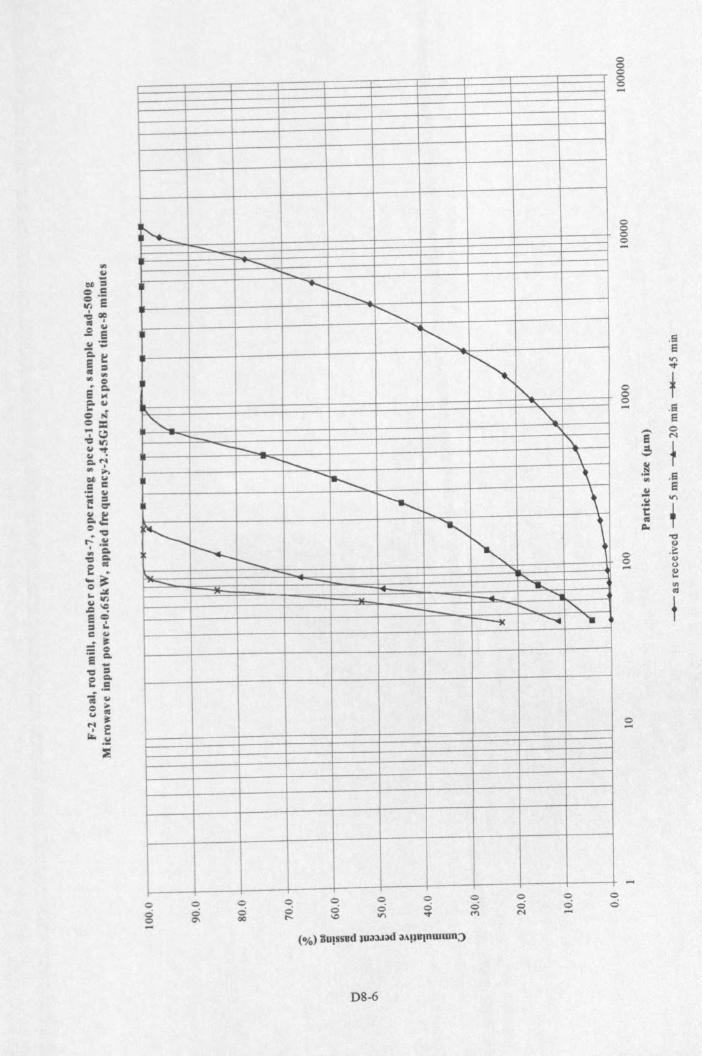
~ - ...............1---
~ .......... r--.......~
~~
'"t-,
<;,"=-t- ,'\.
-.._ r--. \p
......... r---... ,'"f-..... \
f'---~ '"~
-,t--- "- ~ .......
.......-+---... i"-..... <;
~ ~ .......
....0 0 0 0 0 0 0 0 0 0 0
0 0 0 0 0 0 0 0 0 0 00 0\ 00 r-- \0 II"> ~ M N ....- (%) 3UlSsvd lU;);)J3<i aAp8lnmWn;)
D8-6
ooos
oooo.....
,SElII">~
0 f00..... .S
El.- 0
El N
:t. f._,
.~'" .EIJt eCol II">
t!~fiI
lIoc'"dU
0 .1:0 u- 0
~tilfiI
t
o....
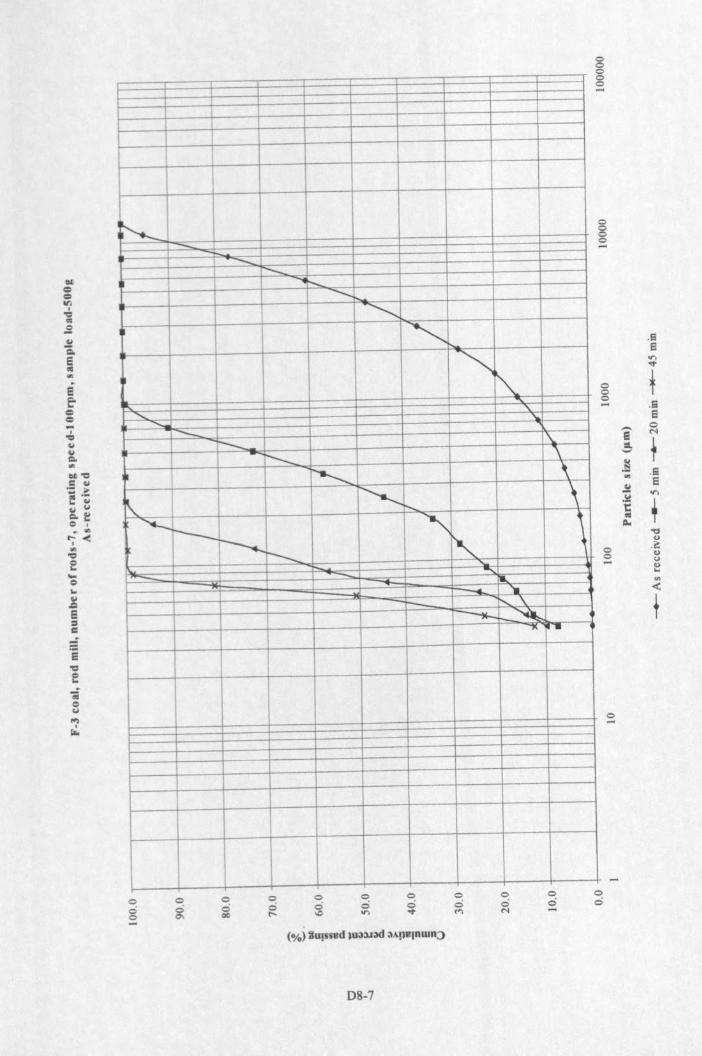
ee==~,"='~~Cl.
'"Cl"='Cl ~.':: .....e':~ ~~~~ ..r;-<""-eEto.e'"~.Qe:::sCl
~ -- -- ~ I-........ -.......-.........
~r-.
<,-.....<, "
........."\....__
r-- \.- r-- \~ \
"- ~ I-........ \,....._r---. "<, \~ t--. ""- .....- - ~
lL......... ....-~ t-... \.
~ I-~""1< 1"
ooo....ooC7\
oo00
oo\0
ooM
oo
08-7
sooo-
oos-
.EIe.,..,"""
0 t00 .EI- a-- 0
ea N
:s. f.._,
.~ .5'" eJt .,..,.!::! ,1::cos=- 'C
<)
0.~
0<)- <><)...en-c
t
o-
oo
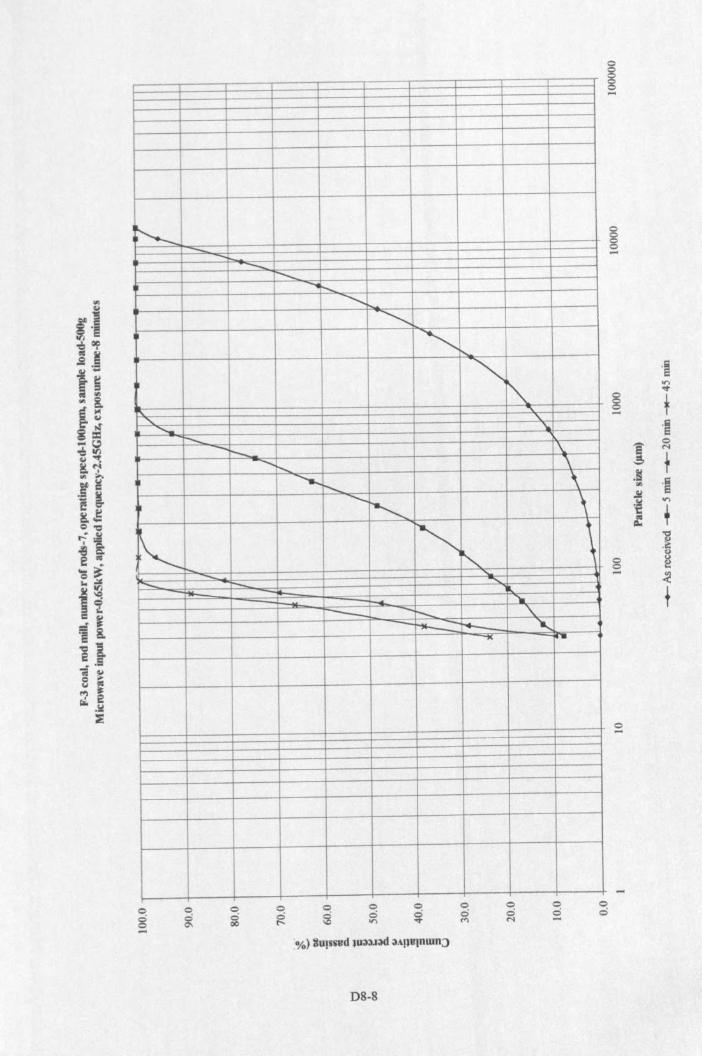
~-... - ...........
~t--...<;
~<,
"-<;~
<,"\.
"\.
""- '10.r- -r- \.
<, t--... \............
<, \....._<, \
~r-.r-, \
.......-- r-- .......~ - -!--. "'"-- -I-- "--~ ~ "-'"i( I.
....0 0 0 0 0 0 0 0 0 0 0
.;; .;; .;; 0 0 0 0 0 0 8 00 0\ 00 e-- \l;) on ~ c<l N....
'%) So!strnd )U33.1;)(1 3Apulnwn::>
D8-8
B....
§....
';on'ot
8 f~'~
J0N
f.!1'" 'mJt~ '"
+~]0)
0 ~0.... :!f
o-
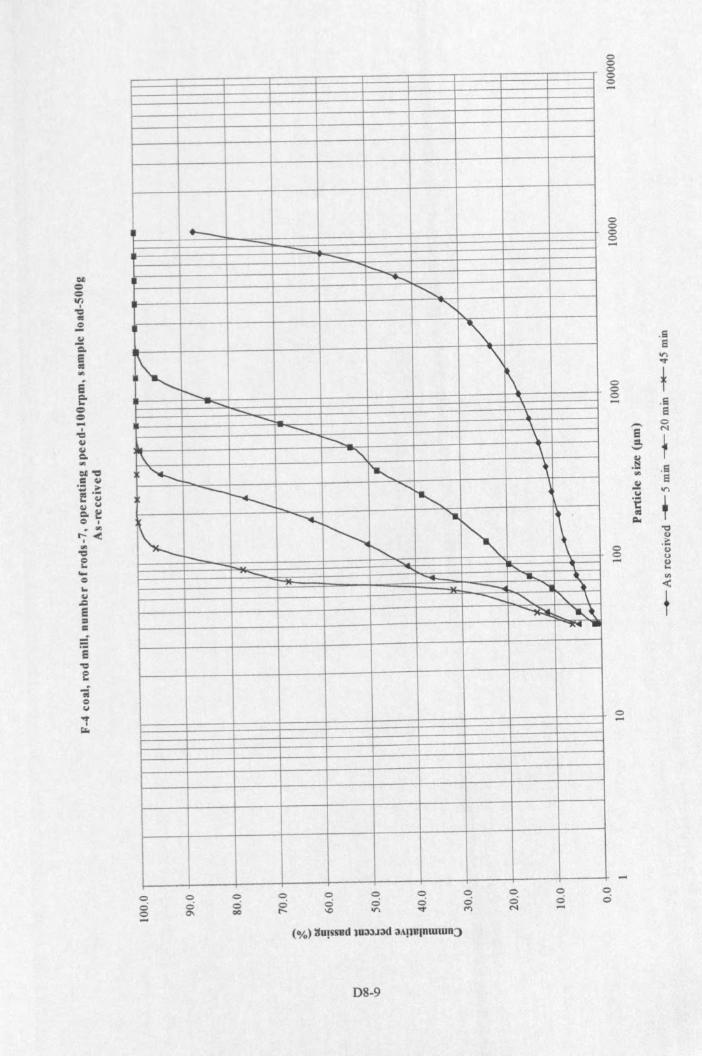
ssa~e
._ - - -- .......1----...........
<,<,
~
~
\r--...... ~
-.... '\- -... i- \.-- \r-.... \
1\ <, \
~'-, ,--~'-
..........r-,--.....r-. "
~ \I~ I'-..r- - '"{-- '"...... ..... t~ " ..-- <, " \~ ~ '1(\~ ...
ooo-oo'"
ooQC
ooN
oo
D8-9
ogo-
oooo-
.SElV"\~
0 f00- .S
El,-. 0
e N
:l f'-'
,~ .S'" ElJ!Col V"\
'i ,~
'0Q)
0.~Q)
0 0- Q)...'"-c
t
o-
oo
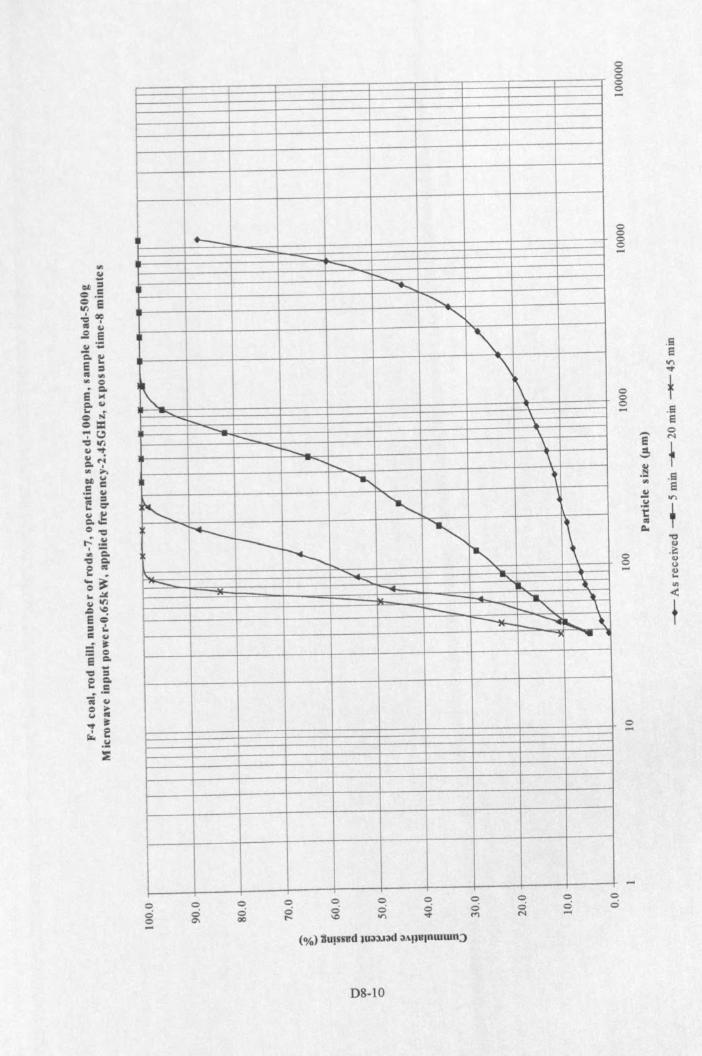
..__ -- - ........<,
<, -.~
'"\~
h. ..._ \.
F:;;;:::. \...._ r-... \
........... .._ "........_ ,~ ~
1
~i--- ~ \~ -.
\.. "' >:.._ ......... -...... "r._,.___ Il.. ~...... .... ..r--- ........... r-_, \
~ I--~ ~ \.~ ...
og-o<:>00
o<:>II">
o<:>M
o<:>M
o<:>-
DS-IO
ooooo....
oooo....
.SeII">..,.
0 f00 .S- e-. <:>Si N
::s. f._,
.~ .S'" a~-;: II">
'€~lIS
=- ~u0
.~0
u.... (,)Uloo<Il
<
f
o....
<:><:>
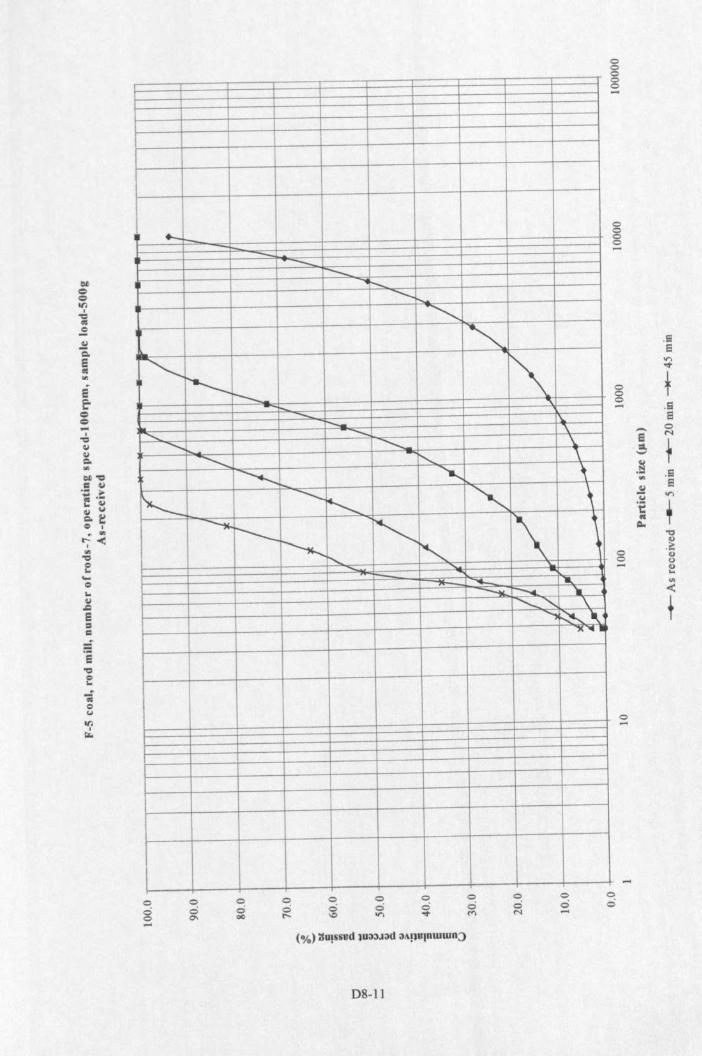
El
.";jQ...VlI
"'"
._I-- - .....~ -- ""-'4r- --.. ,......
<,<,
I~~ ~r-- ,-... t-- I\,
............_ '\
<,........_ \
<, -, '\-.......... "a... ,
~
..._..._r-; <, ,
~ I--- r-. 1\ )~ r-,r-......
t-- __,.__ ...._ "iI.:--. r-- ................<, '\
~ ~\~"'41
.....
0 0 0 0 0 <0 0 <0 <0 <0 <0
<:) <:) <:) <:) <:) <:) <:) <:) <:) <:) <:)
0 0- 00 r- \0 '".,.. M N .....
.....(%) ~U!SSlld lU3;,).I3d 3A!llllnlUWn~
D8-11
o<0<0oo.....
<0<0<0<0
.ElEl.......,..
0 f<0<0 .S- El-- 0
El N
::l. 1'-'
.~ .53..,El~... '"'€+til~ ...,0
0.e00 oeell
<:
f
o.....
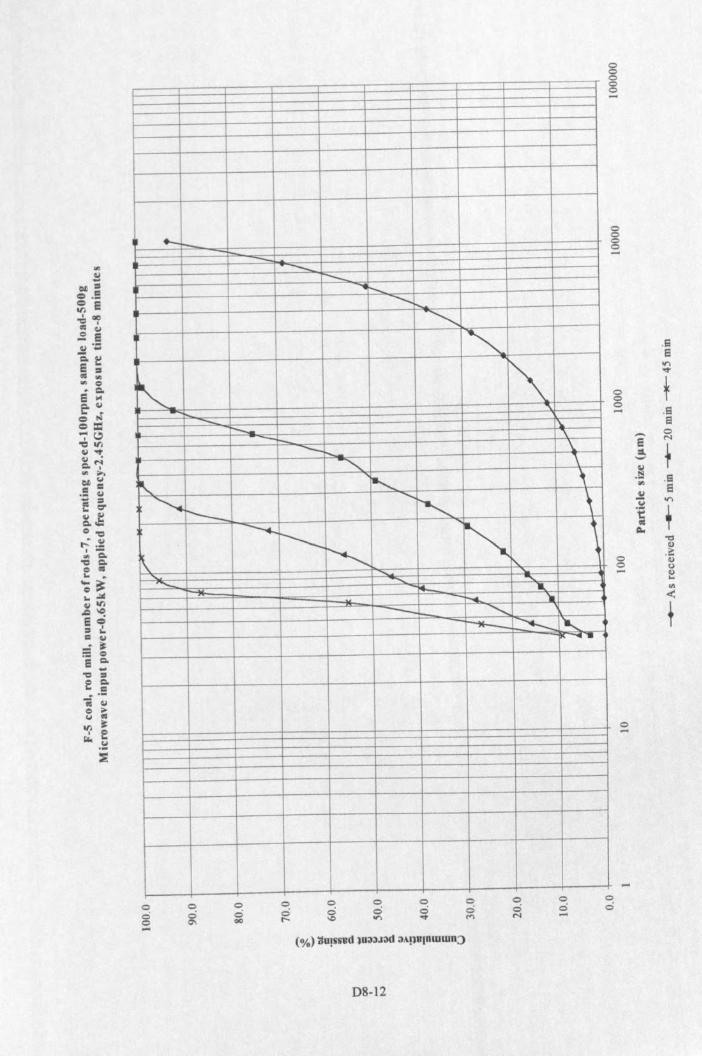
._- -- --- .... ...._............ ......<,<,
<. ~"- --- I\"-- '\--k.. \
<, \
"-, ,
<, <,
'" \---- -........I--- -, ~
~ ~~
\........_ "4- ..-r-.... ..---_ <,-~ ~
...._I" ....,.
-0 0 0 0 0 0 0 0 0 0 0
0 0 0 0 0 0 0 0 0 0 00 0\ 00 t-- -.0 ""' '<t .... N -- (%) ~U!sS1Jd lU;)JJOld OlA!lUlnwmn::>
D8-12
ooooo-
ogo
.Sa""'<d"
0 t00 .8- e-- 0
e N
=. f_..
.~ .9'" a~";:i ""'.€ ,fSc:I.
"0V
0.=:v
0 ov..""«(
t
o....
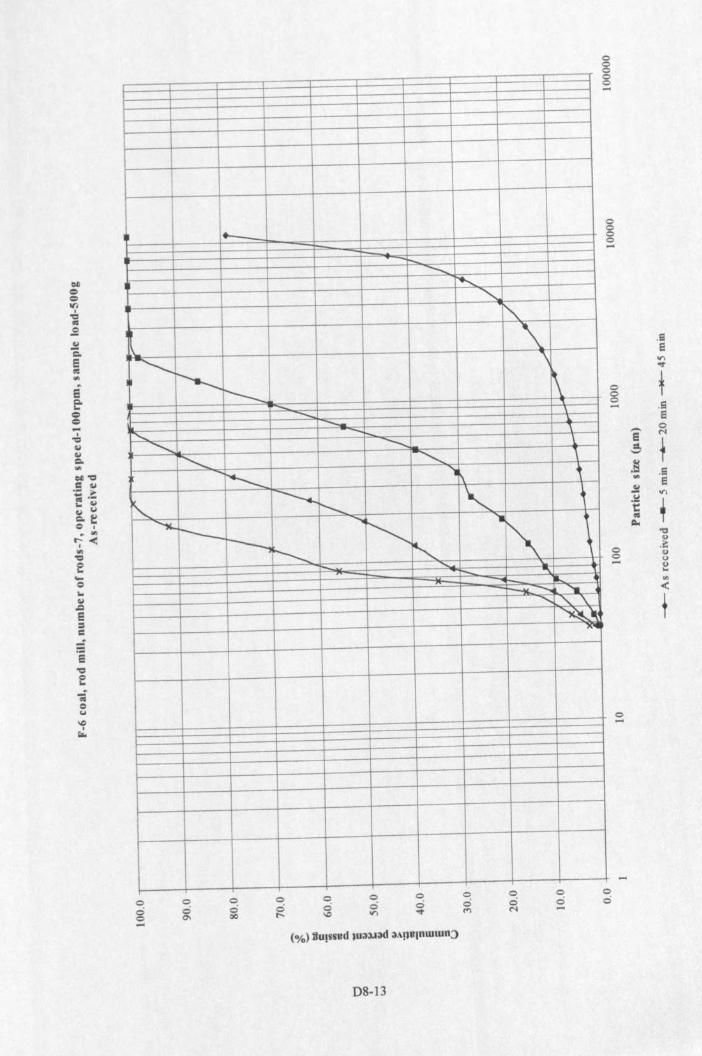
--'Ea'Ce
, .....
..............I ~ <;
~
e,-,
<;~
"\
r---. ~
"'"""I-- .I..
r"-.. - \<; -...,_ ~
r--; ~ \~ 11\ ,
~~
~ ~l
"""-r--- .......
~
'I
r----, r--.. -. ~,._ "-- ,._ "'t- ...~-... "'-........ ,'\~~
1(111
ooo...oo.., o
oIrl
ooN
oo...
D8·13
ogoo...
oooo...
.Se.,.,~
0 t00 .Se
--- 0
El N
::I. 1._,
,~ .S..,El
.£IJ
Irl
:e~<0~"00
0.~
00- (,)
0..II>
.(
t
o...
oo
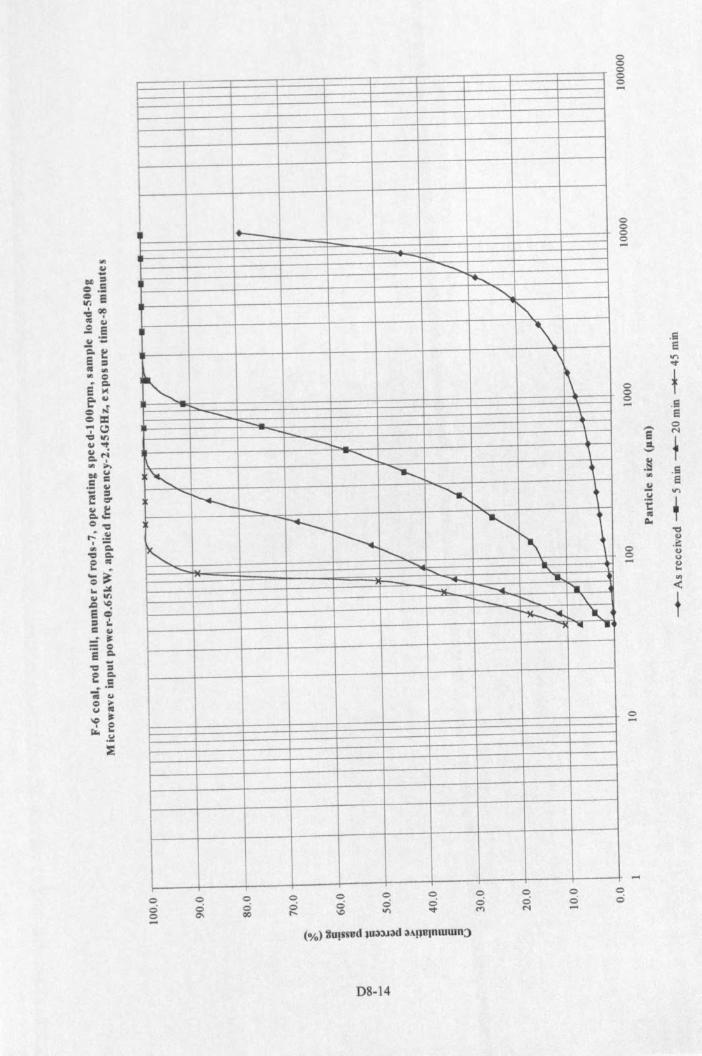
. ..___...........
.........<,
I"-'\\
t-. ~"'{-- - -~-- '\
-....... 1:..............
,-, ~
-,......I---- ~,r--_
~
~ I--..<,
~r-; 1\- r-.. ""...._ lI.. i
~ --- r'iIr- <, \.-~~ .._
...,,. ... '
ooo--oo00
oo\(;>
ooM
ooM
oo
D8-14
ooooo--
oooo--
.Elaor>....
0 l00 .13
El,_ 0
e M
:I. 1.......~ .13... e~ or>.!:! ,1:«ICl.. ~
Q.)
0.~Q.)
0 <>-- Q.)...'"<t
o
.....oo
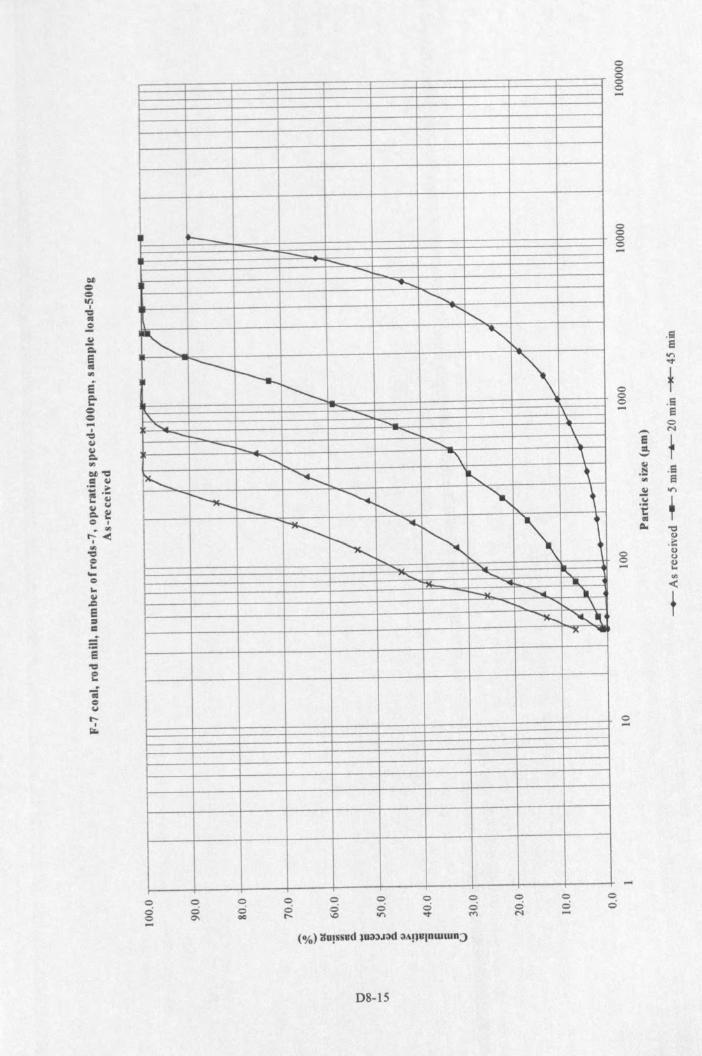
-...e-ee
~ - r-. ...._+-
..........................
....... r-,
<. <,I---
~ \~"- -<, .......... lo.
...._,_ -........... \-,_ <, \............. ""\ '\
~ <, ~,
~ r---.......r-, " \
~~ <. -, ,
~ ,............ '- ~
F%. ...... •~ ............ ......... r-...... "' \"'-... ~~"'" ,..
....0 0 0 0 0 0 0 0 0 0 0
<:> 0 0 0 0 0 0 0 0 0 00 0'> 00 r-- \0 on '<t M N -- (%) ~U!SStld lUilJJ3d ilAllllIDWWD:>
D8-1S
ooos....
oooo-
.ElEl'"'<t
0 t00 .9- El
0
"""' N
e 1:t.._,.~ .EIee a.!:1 '"... ,.€CIS~ '"Cl
G)
.f!0
G)
0 0- eCl.>
-<t
o-
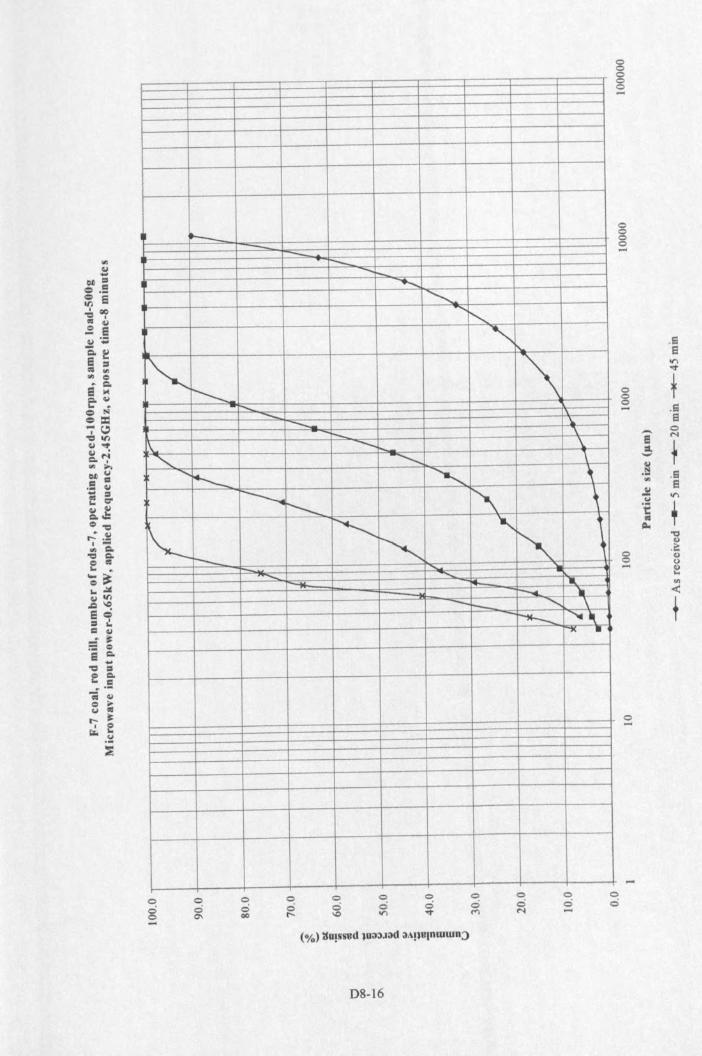
~ - - ~ -I-. ...........'......
.......!'-...<,
r-,r--_ "\r-..... 1\-- r.;.::::_ \
.x ......_ '\
" -......_ \<,r-- , ,
----..I--.. l>, \
I~ ~ "~~ ~r-- x;- .......
14--- •r--. -11--i--- .......... \--~ ~'-.~ .
-
o<:>o-
oo0\
o<:>00
o<:>M
o<:>N
o<:>
D8-16
8ooo-
oooo.....
.SElon"""
0 f00 .S.....
El
"""'0
e N
:s.~
,_.
,~ .S'" ElJ!... on
'f ,00~
"c:III)
0.j::II)
0 (,)..... etil..(
t
o
o<:>
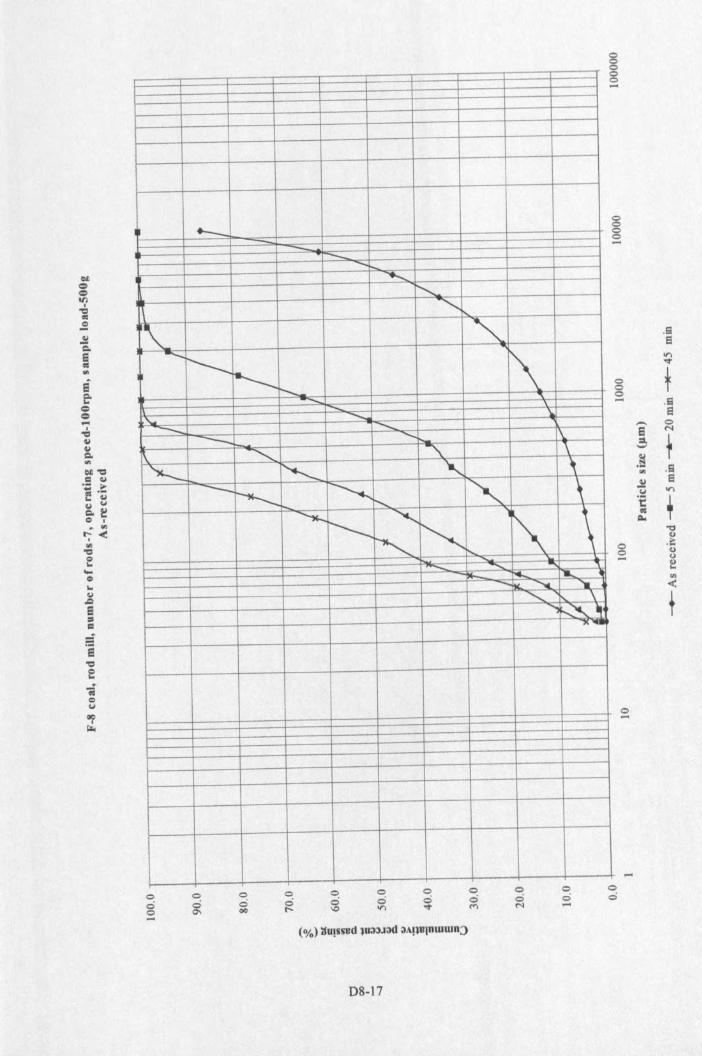
.__ - - .......i-..............
<;
\'-...
.~-.
<,
I--- \.___--- ....... "\-x, ....._ \.
--- -..~ --- <, 1\
~ <, '\. '\
"'--- ~ "- ,--~ ~ '" ,....... r-,""--.
~ '-~, ~ \~<; ...... "\
le-. ..... ...... .~-~ .......... ...<, \
......~~ """'ill.
ooo....
ooC>O
ooM
oo
D8-17
osg
goo-
.SaII">..r
0 t00- .El
S.-. 0B t'oI
:s. 1_,Q,I
.1:: .S,.,
.!l ay II">.€ ,"~
"t:I~0 .i?;0 ~- oe
'"<t
o-
oo
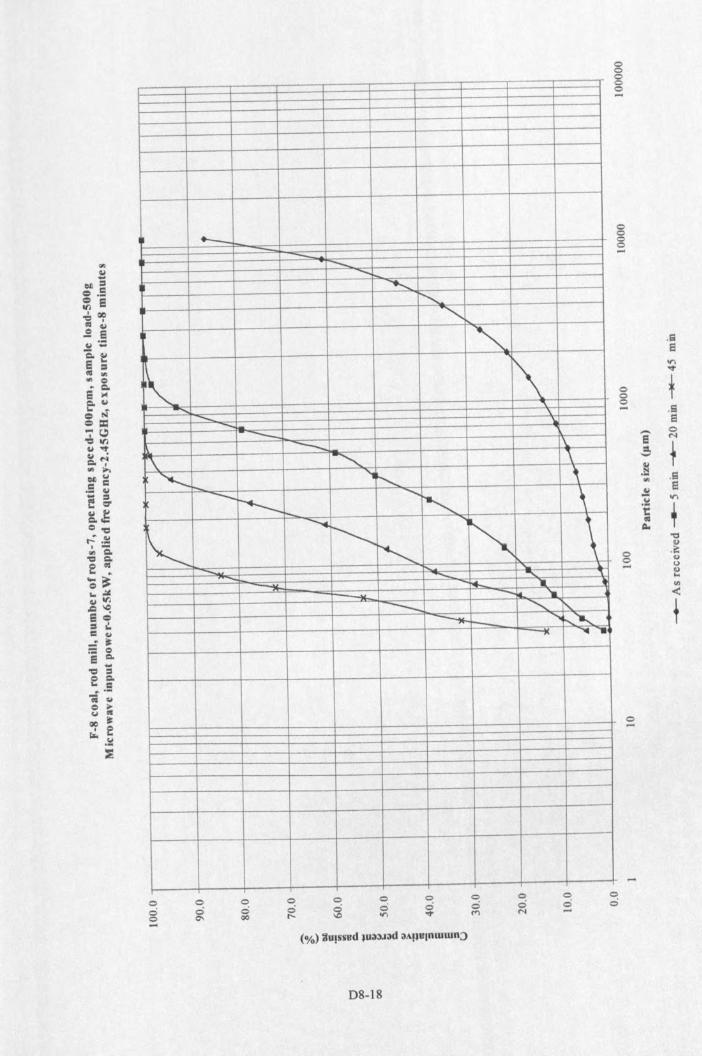
..__ - ................. r-,
<,
<.-, 1\- <-,
'\- -'\;
r--~ ........__ 1\
'\ <, \<; "r-, ,
+- --~ ..........~ \
I--.. ..........~ -, '\I~ ~- ....::- _"
~ 1-4.. .. ~-....._ -Ie. "a
~ ........._f'.~ r-- ......~~
--,c .... ~
ooo-
oo00
oo.,.,
ooN
~o-
D8-18
ooso-
ogo-
.Sa.....'<t
0 l00- .Se
,_ 0El N
,:, f.~'"
.S
.£ eCol
.,.,'€ f1'$lIo ~
(I)
0 .i=0
(I)
..... <.)(I)loo
lA
<:
t
o-
oo
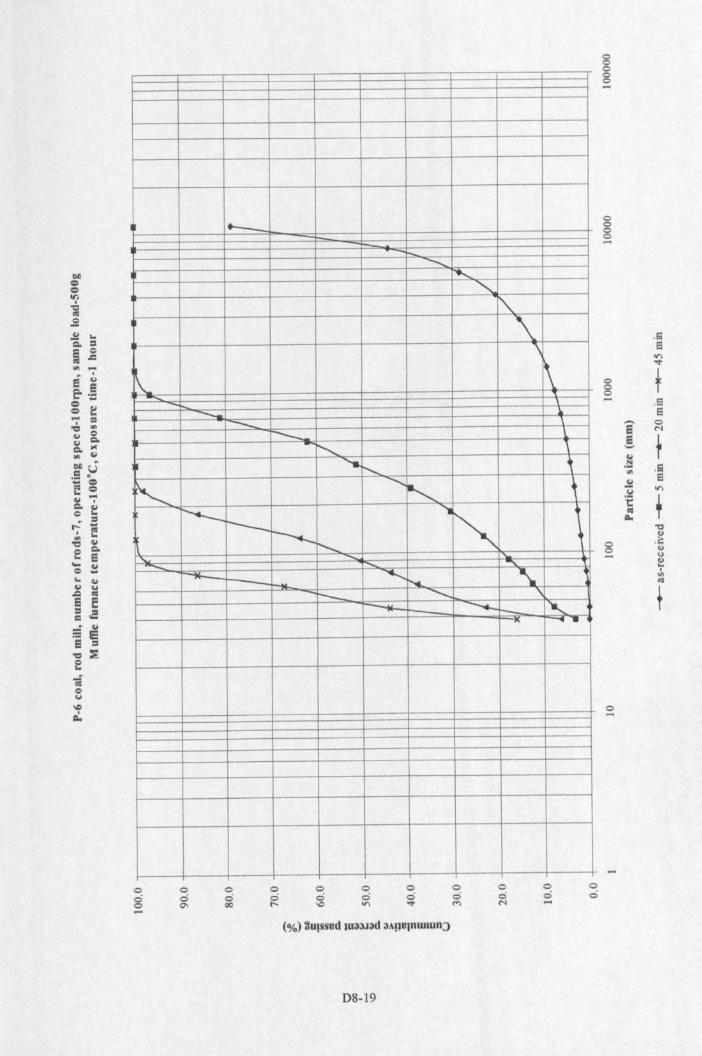
I+-- -_<,
..........<,
~
'\\
\. \"I- -- •-- \--- \.
r-, '\........<, ,
'<,<,
~,
r----- .....<, 4----~ --;"- <;
~ ........... -, ~-- ........:-- .............. '\
~ -._- '-..,.. .....
og......
oo00
ooM
8g.....
gs-
.5a.,.,'<t
0 f8..... .Se"'" 0e M
e t'-'
.~til .~.Si!Col
.,.,of f"A.
"0II)
s .~II)
..... (,)Cl)..III)
«I
t
o......
oo
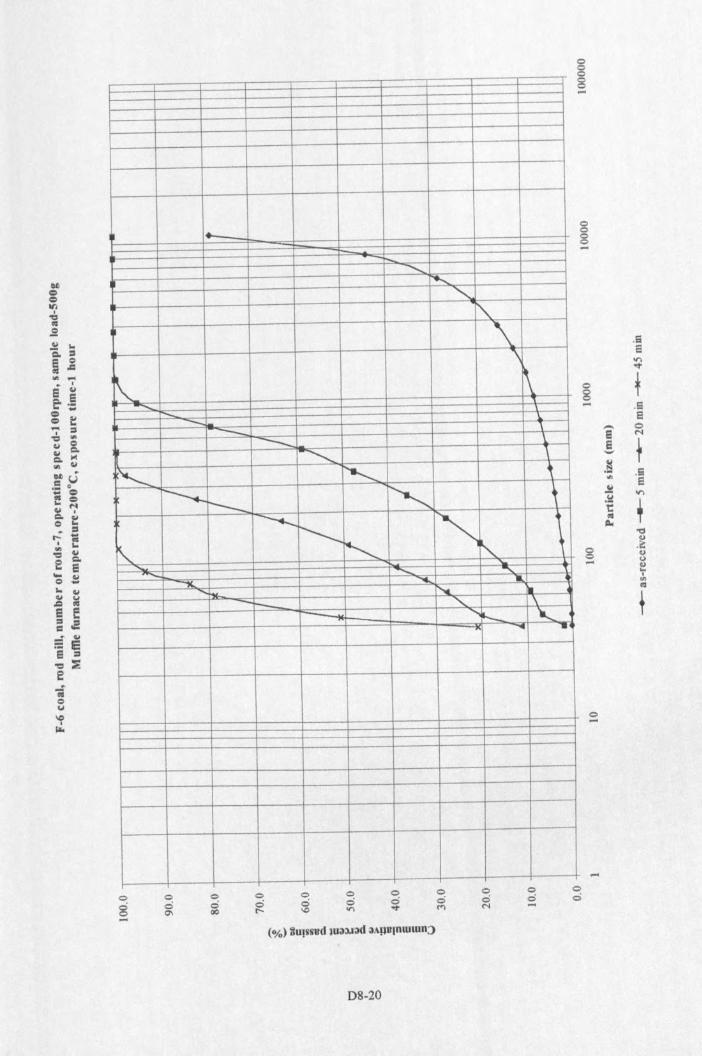
j....._
+-................
p ~'<;-,-,
"\
~ ~.........
'\'...... -- l.- ,
--- \.1-......... \
r-; t---- ,r--...t---- <. ,
'-._~ ~
~
l\ ~ r"..~ <, ......
"""1C. ......... .........hi.. l'.t til-I--. <, \
........ I'---....___- .... ,.
og-oo0'1
oo00
oo
08-20
ooos-
oooo-
.SS'1'\..,.
0,
g- .Se.- 0e M
! f.~ .S'" e~ 11"\.!::! ,t:er:!i:Io
"d.,0
.il;0
.,- Co)Cl)...ICl)
er:!
t
o-
-oo
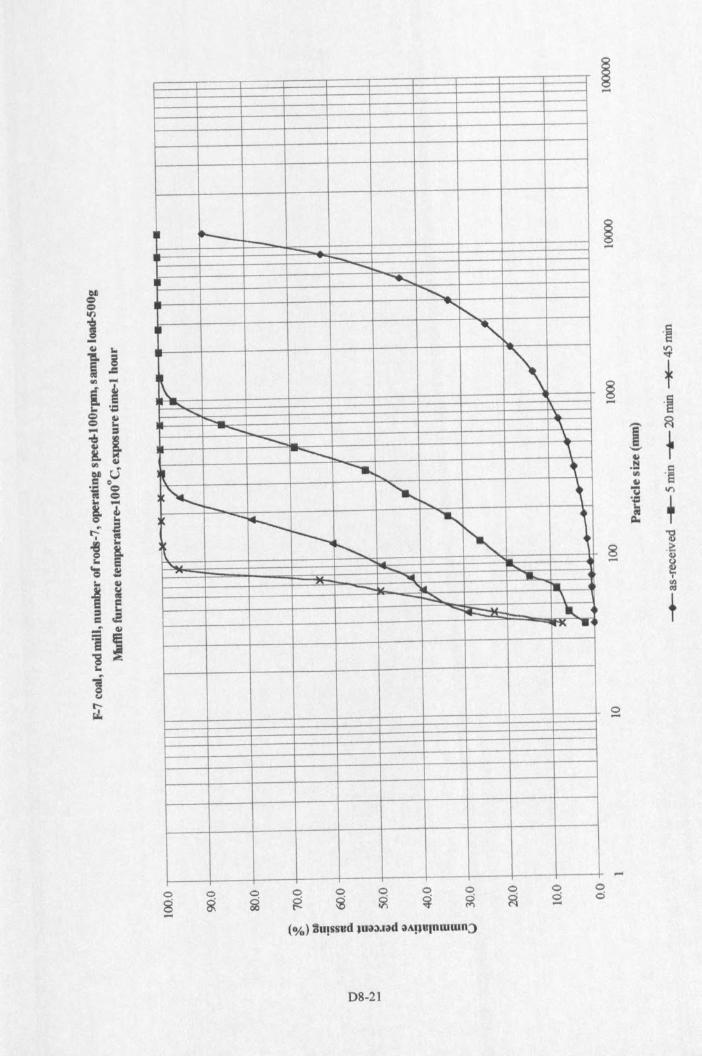
~ r--t--- -- -...............
'"......r-,~ -,
~ i\--...;:
....... - \..__
"\--.. -\:r-- "• ........ t:,
r-.. "a...r-... ~-....r--- '" ~
~ ~<,......- roo........ ..........._~ loll :.
~ \..'"" ~.
o9-
ogog
o.0-
D8-21
·miii..,.
§ +- .~
i ~
1-cu.!:l ·sfIj
cu- VIIJ'-!:
+~'i
8 .~- ~I<I)<IS
t
o.-
oo
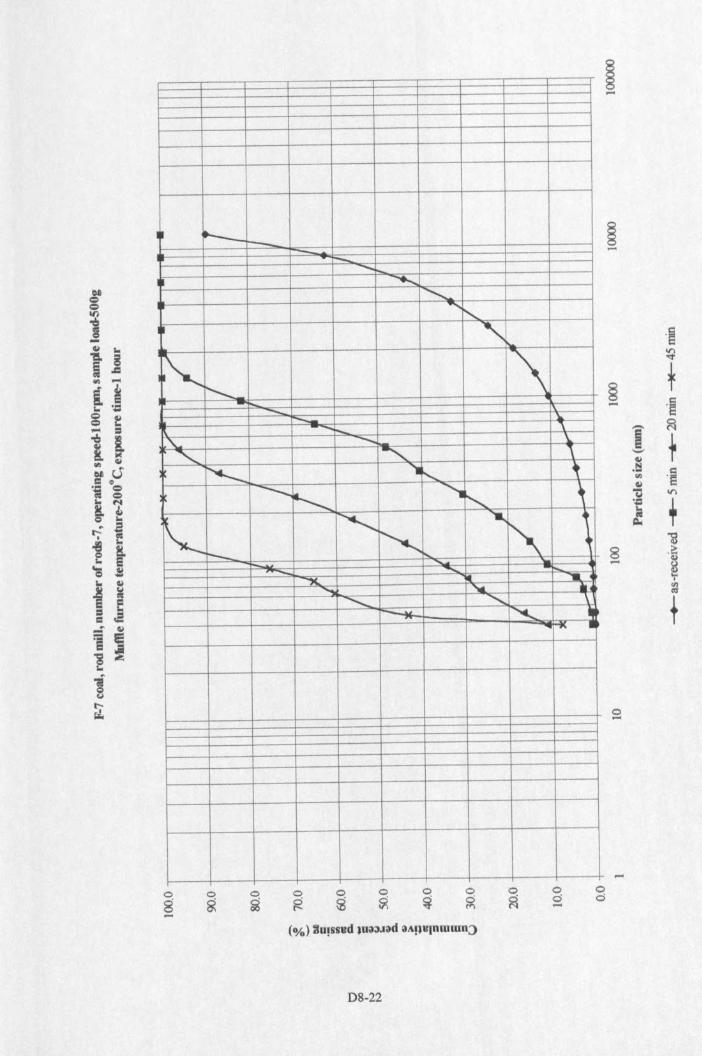
I~ r--r-- -.... t"'-. - ..........<,
........r-,I "~
~ '\-too.. - - loo........ 1-0.. "'\
."\.. ........... \.<, 1-...... '\r-., '1-, ~
-........,--, "'1r-, ~
~
<, ......~
~
~I-- ,._ ~- --"""- "'""""
..._. ................ <, \
r--~ ~ -...~ .
os....og
oo....og
D8-22
.~I/)'<t
§ t.... .~
1 ~
+'-'110>
.!:l ·s<II
110>- I/)Cool.~+~"B
8 .l!:....~I<II
'"t
o....
....oo
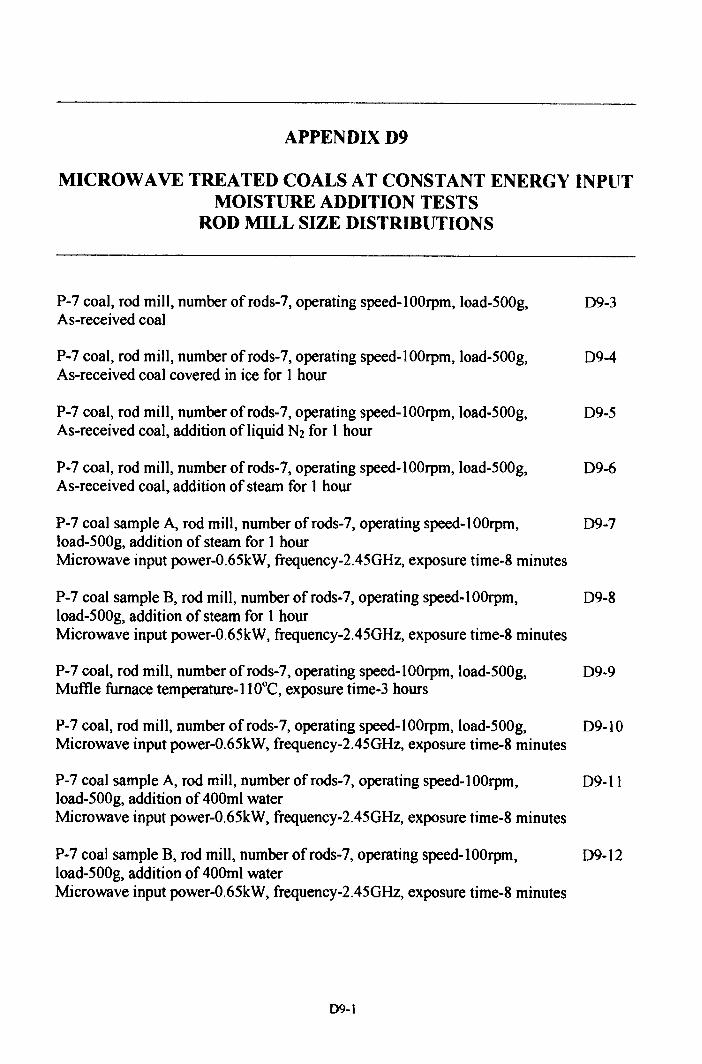
APPENDIXD9
MICROW AVE TREATED COALS AT CONSTANT ENERGY INPUTMOISTURE ADDITION TESTS
ROD MILL SIZE DISTRIBUTIONS
P-7 coal, rod mill, number ofrods-7, operating speed-l00rpm, load-500g, 09-3As-received coal
P-7 coal, rod mill, number ofrods-7, operating speed-lOOrpm, load-500g, 09-4As-received coal covered in ice for 1 hour
P-7 coal, rod mill, number of rods-7, operating speed-l00rpm, load-500g, 09-5As-received coal, addition of liquid N2 for 1 hour
P-7 coal, rod mill, number ofrods-7, operating speed-lOOrpm, load-500g, 09-6As-received coal, addition of steam for 1 hour
P-7 coal sample A, rod mill, number ofrods-7, operating speed-IOOrpm, 09-7load-500g, addition of steam for 1 hourMicrowave input power-O.65kW, frequency-2.45GHz, exposure time-S minutes
P-7 coal sample B, rod mill, number ofrods-7, operating speed-IOOrpm, 09-8load-500g, addition of steam for 1 hourMicrowave input power-0.65kW, frequency-2.45GHz, exposure time-S minutes
P-7 coal, rod mill, number of rods-7, operating speed-I OOrpm, load-SOOg, 09-9Muffle furnace temperature-l lOaC, exposure time-3 hours
P-7 coal, rod mill, numberofrods-7, operating speed-IOOrpm, load-500g, 09-10Microwave input power-0.65kW, frequency-2.45GHz, exposure time-S minutes
P-7 coal sample A, rod mill, number ofrods-7, operating speed-IOOrpm, 09-11load-500g, addition of 400ml waterMicrowave input power-O.65kW, frequency-2.45GHz, exposure time-S minutes
P-7 coal sample B, rod mill, number of rods-7, operating speed-I OOrpm, 09-12load-SOOg, addition of 400ml waterMicrowave input power-O.65kW, frequency-2.45GHz, exposure time-S minutes
D9-1
Appendix 09
P-7 coal, rod mill, number ofrods-7, operating speed-iOOrpm, load-SOOg, 09-13Muffle furnace temperature-110°C, exposure time-3 hoursMicrowave input power-0.6SkW, frequency-2.4SGHz, exposure time-S minutes
P-7 coal sample A, rod mill, number ofrods-7, operating speed-l00rpm, 09-14load-SOOg, addition of 400ml water 50g Calgon solutionMicrowave input power-O.65kW, frequency-2.4SGHz, exposure time-8 minutes
P-7 coal sample B, rod mill, number of rods-7, operating speed-l OOrpm, 09-15load-500g, addition of 400ml water 50g Calgon solutionMicrowave input power-0.6SkW, frequency-2.45GHz, exposure time-8 minutes
P-2 coal, rod mill, number ofrods-7, operating speed-lOOrpm, load-SOOg, 09-16As-received coal
P-2 coal, rod mill, number of rods-7, operating speed-l OOrpm. load-500g, 09-17Muflle furnace temperature-110°C, exposure time-S hours
P-2 coal, rod mill, number ofrods-7, operating speed-IOOrpm, load-500g, 09-18Microwave input power-0.65kW, frequency-2.45GHz, exposure time-S minutes
P-2 coal sample A, rod mill, number of rods-7, operating speed-l00rpm, 09-19load-500g, addition of 400ml waterMicrowave input power-O.65kW, frequency-2.45GHz, exposure time-S minutes
P-2 coal sample B, rod mill, number ofrods-7, operating speed-IOOrpm, 09-20load-500g, addition of 400ml waterMicrowave input power-0.65kW, frequency-2.45GHz, exposure time-8 minutes
P-2 coal, rod mill, number of rods-7, operating speed-l OOrpm, load-500g, 09-21Muflle furnace temperature-l l O''C, exposure time-3 hoursMicrowave input power-0.65kW, frequency-2.45GHz. exposure time-8 minutes
09-2
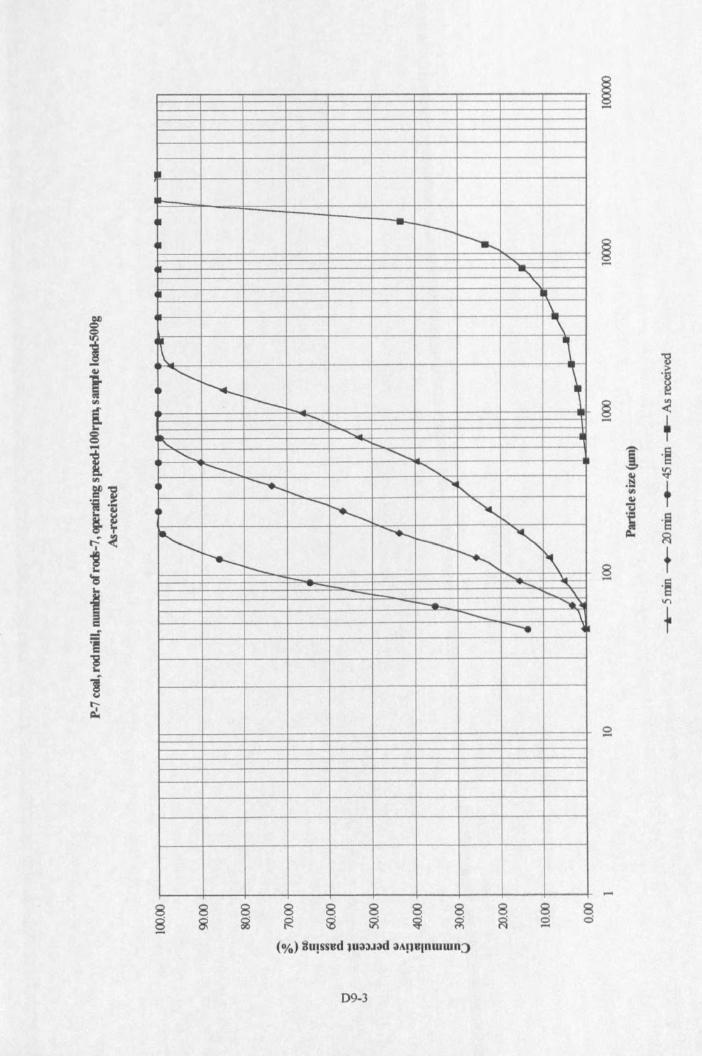
•I-
~ --I---~ ~
'\.:<,'\.
~ "\\
~-~
<,~ \---- - t.... ...........
., ~<, <,--- <,--...... ~ r-,....... -.....
~ '", ............ l--- <,r-....__
~ 1\r---l- f': Y
r---... ........"-- \-. ~
D9-3
--g.~
§ <- +J .~
.§ ~'" TCl,)
i:I
~ ·s~ ~
8 +- .~.,...
+
o-
-
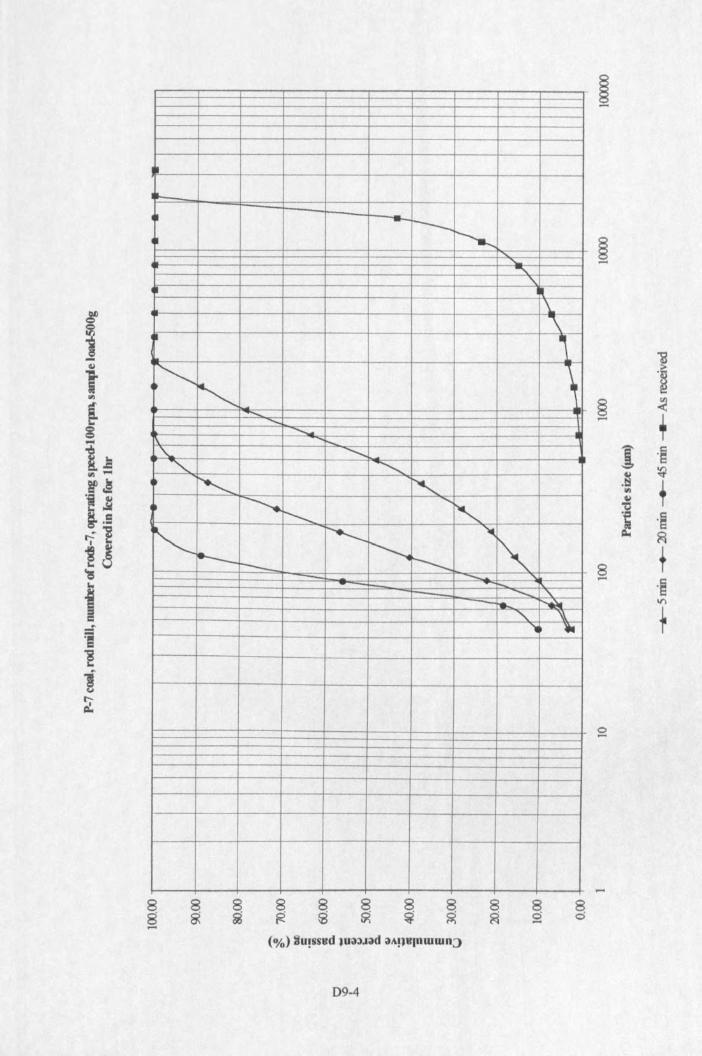
-
I
....I --r---
~
""'\.~\.\1r-.r-. \
........... ...................
~~ <,<, <,
~ ~~ r----... '~
<, ~ ~
'".___ ~ i--...t--'"<-, '\.-.... ~
<, ~..... ..
88.....
D9-4
1§ <:- +1 ·s~ ~.!:il
T"J~'tI.~ .§~ ~
§l t.§l/'\
f
o.....
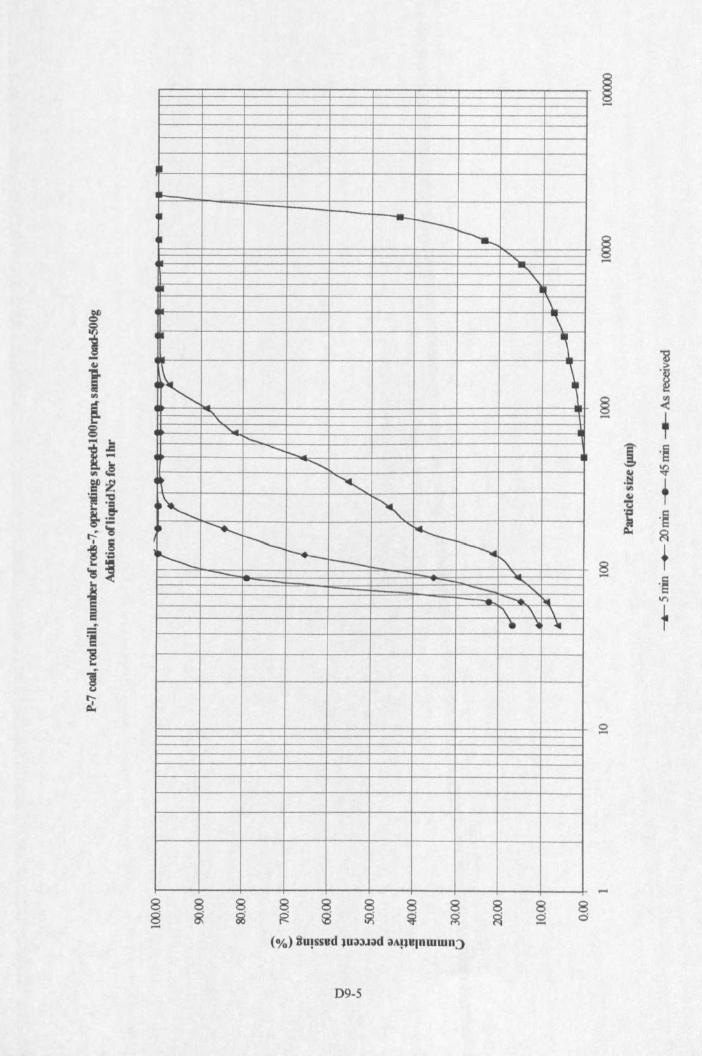
II
,.._
-----~""""III lit
\
"~ 1r-. ,
"-"-
f'-............ r--.
<,~ <,r-. '"" --....... I"-
~ ~r-; ~ I--. r-,:----. -I-
--- _:-..--. !'I.I1\ \ \. ~ ~
~ ~ ~ ~ ~ ~ ~ ~ ~ ~ ~(%) ftu!sS8d lU<l;)J;)d;)A!l8Inwwn3
D9-5
"S.~
§ <..... ,1 .~.~ ~
'" f4.1't:l.~ .~~ ~
8 +- .~I/")
+
o.....
.....
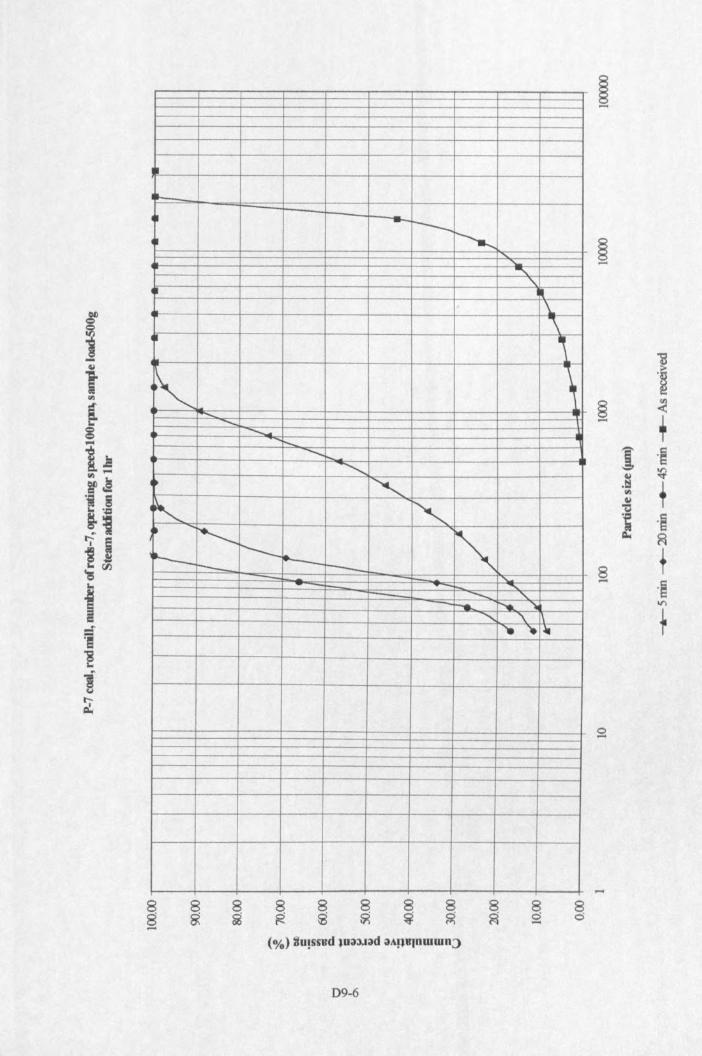
II
I-
4 ---r----.~
"'"'""~\\
~ ~- -........r--.. ....._
~~ <,~ r-.• ...__......_ <,I---.____
~-- -- "I-.. ~- -........ ,-r.... r---.. "10<; \... .-r.-
8§
8o-
D9-6
"B'~
§ <.....T
1 '94,j ~,ta f(I>4,j
~~ '~~ ~
8 t.....'~
l/')
f
8o
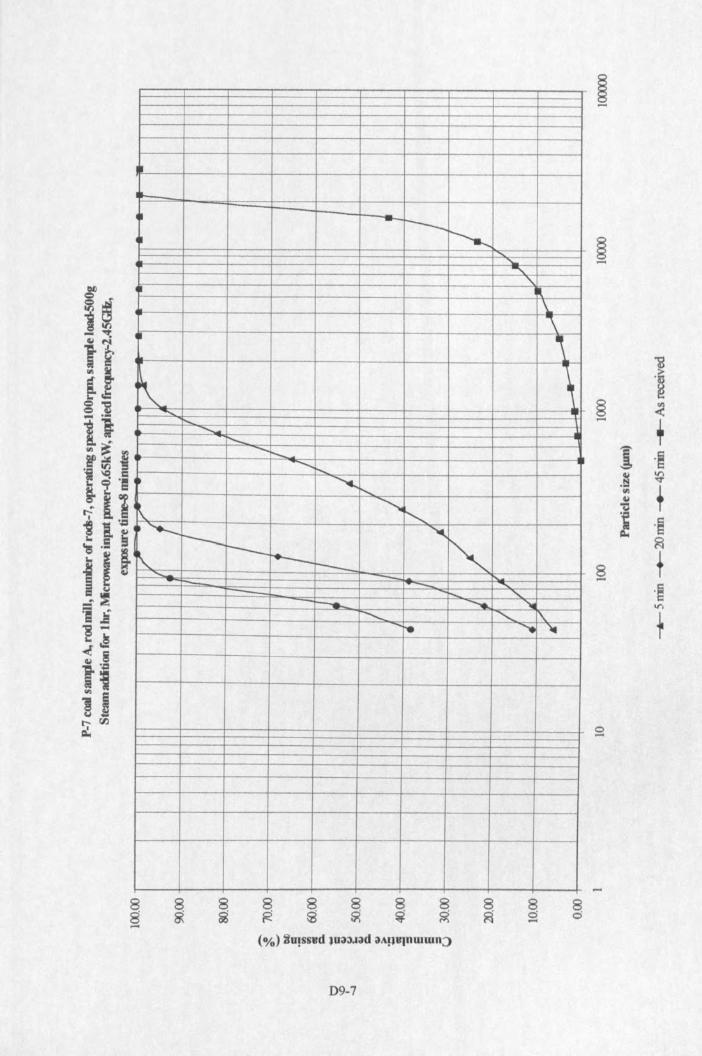
-I--r-.___<,-,
"\."\
I \-, ,
-
~r---...
........ ..._........_,
........~ .............. r-,
~<,r-,
~ r---- ""'-
'"\. ---I+---t---<,
""-- ........ <,t::-.... -.... ...._.
............... <, \... ..... '-
8s......8~
8d......
8s 8s;: 8~
8~
8~
D9-7
13'~
§ -<...... ,1 ·s.~ ~til
~~
".~'~~~
8 f......
'9I./)
1
o......
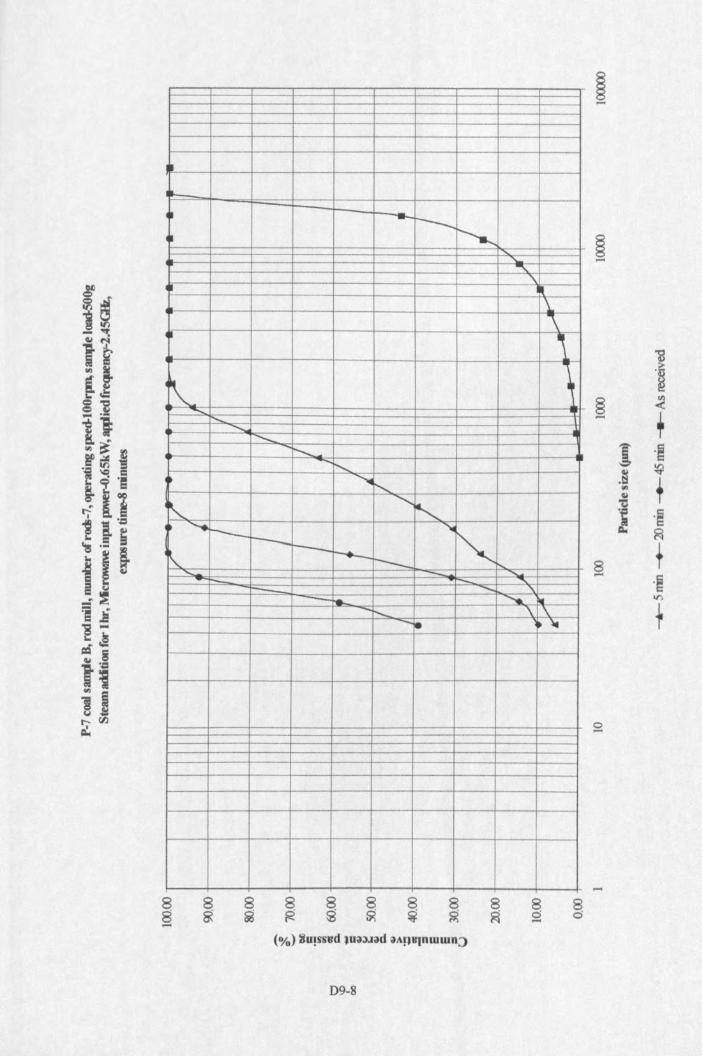
It-
~ .,._ r----~ ~
'"-="-'\.
II' "_l."'\
~ i\ 1
:::-,.,I........
~~
c:-..........r--..,
.......... '"~
<,r-,..........r----. ......r-;r---r--r-+--~ I----
-"'- -...,I:::::::= -...... "- -........ ~--r--... \ \-le ~
8 888 8 8§ g ~ g ~ ~ 8
~8~
8ci-
D9-8
13.~
§ ~......
+1 .~.~ ~
'" T41'U
~ .~t:Io; ~
8 +...... .~V)
1
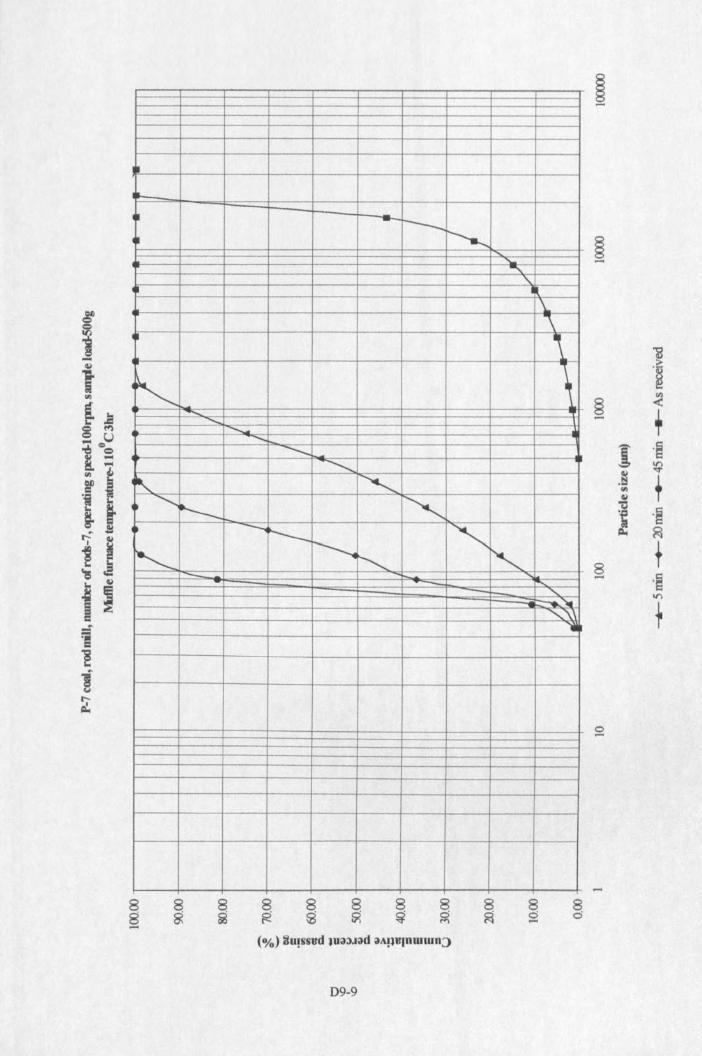
II
Iii-
4~ ,.._,r---4~ ~
""'"-,
\\--r
r-. \ --<,..............
.......... --- <,-, <,~.......__,
~ r-.--.~ -.
~r-; <, '<,"'"'-- ~ 'w.
<,'\.\"i
8S......
8g 8~
D9-9
~.~
§ ..(......
+i .~
~.~ f!illW"U .~~~ ~
8 +- ·SII')
1
-
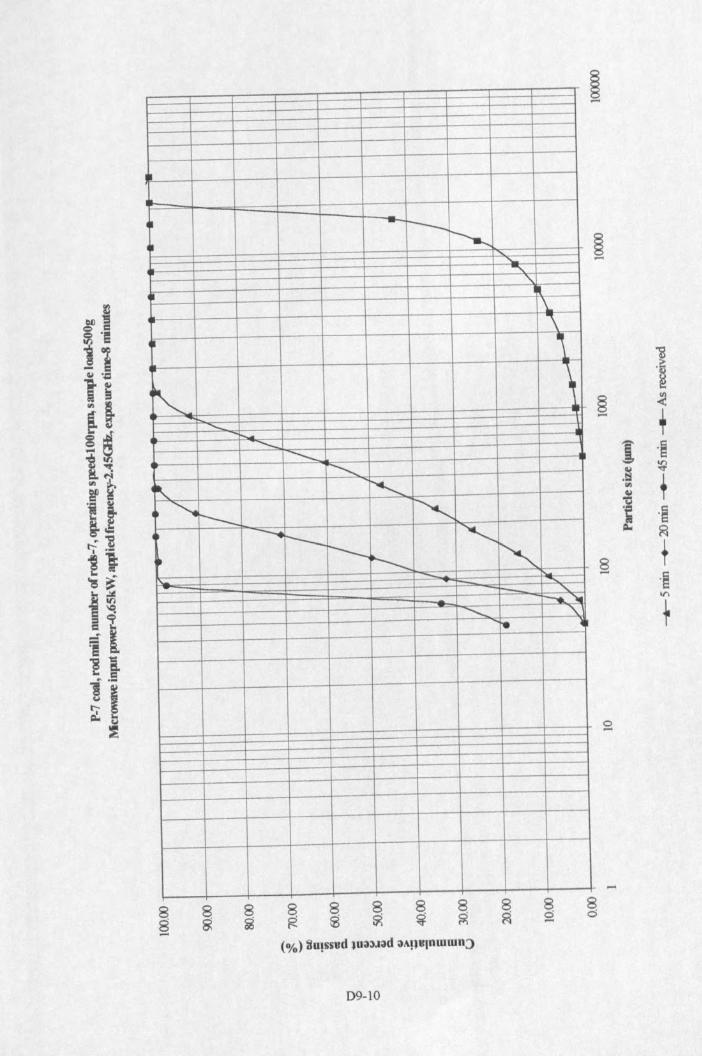
~
I--
----t---II ~
~'"-"
'"\\J \
-. ~
- .............t-.. ......._ ........_
---.....I~ ~~ ~ t--- ~
4 ---.t--- <,• l---
~ ~~ "".....~ <;
r-.~<, '\.
f1t .~
-~ ~
8 8 8 8 8 8 8 8 8~ g ~ ~ ~ ~ ~ <:) <:)-- (010) 8u!ssud lU33J;ld 3"!lUlnwwn:>
D9-10
~.~
§ <- ,J .~.§ ~III ,~'tI'; .~~ ~
8 t- .~V"\
~
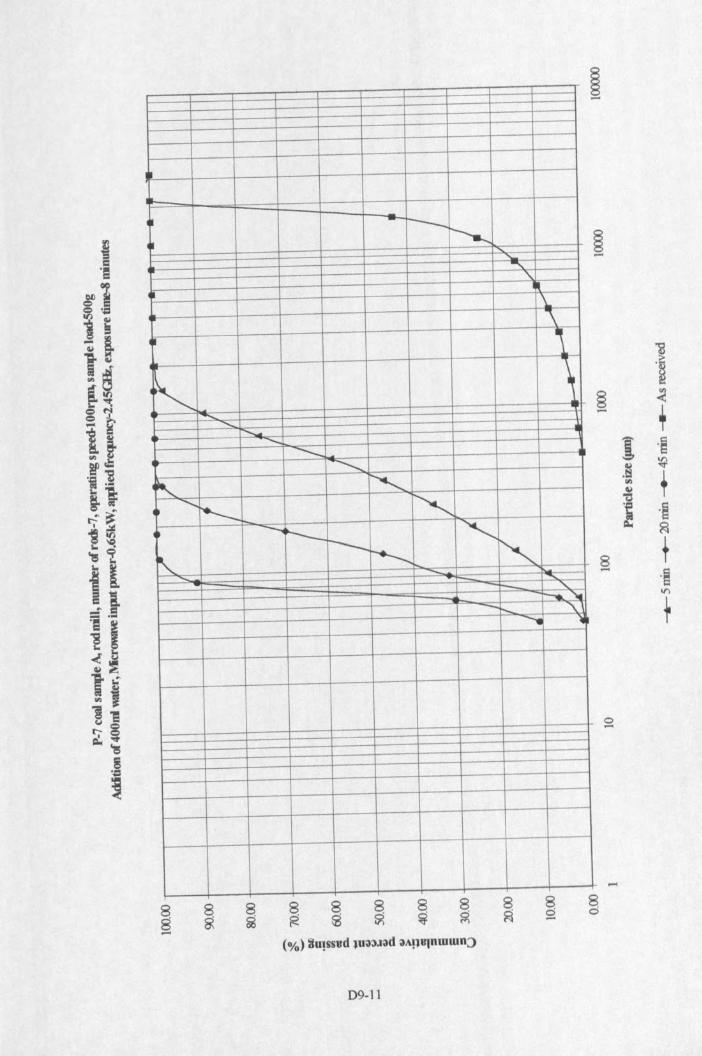
........._r---
~ ~'-"-~
~ -\.\~ \.~ ~
\<,
<,~ --- -.........
~r-,.~............
~"- r-.~ ....__"
~ <.--- i<,~ ~
<, - - -_ "F.."'ioI.-r-.... '\.,.......... ,
8oI"-
8$
8S
D9-11
]
.~
§ ~- ,I .§.~ ~
"" T4.1..,.~ .§~ ~
8 t.... .§I(')
f
o....
8o
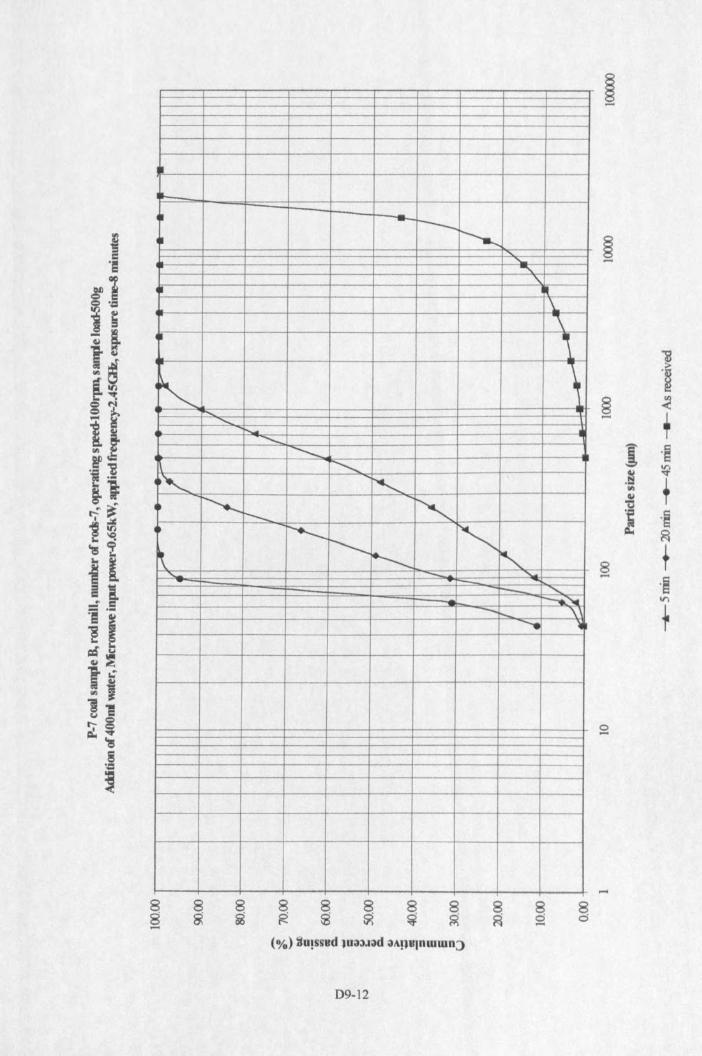
~
II-
-r----I---........<,'\.
~ ~\"\
~ 1r-, ,
r-...."- - ........... -..._
<,r-, '-~ ~ r-- "r-..,r--- '"~ <. t-, -
r-- <,
r--...."'--- t--.. \,-... ~
$8-
8g 8g(%) Su!ssud Jua;u;)d ;)AHulnwwn::>
D9-12
l.~
§ ~- T1 .~
.~ ~III T~"C
~ .~=- ~
8 +- .~'"+
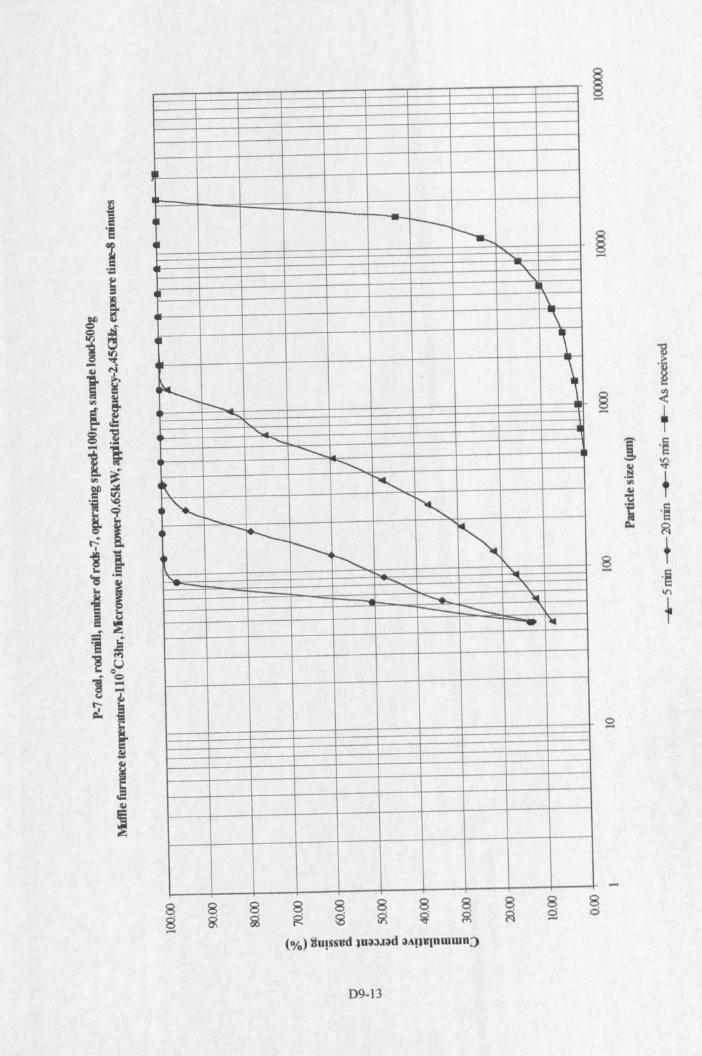
I-
----t----I~ ~ -
......~
'\.K\'\-~
~~
1--..........<;
~"-.....
'~ ~~,,.._ '~
II -r---~r---.
~...... ---"""" '\.
............ 'Wr--- ::-- 'I.. I~
-
~ ~ ~ ~ ~ ~ ~ ~ ~ ~ ~(%) 3u!ssud lU33J\ld \lA!lUlnwwn::>
D9-13
'i'~
§ <- +r 'a,~
~." T401"C
~ ,~
~ ~
8 t....'~
In
+
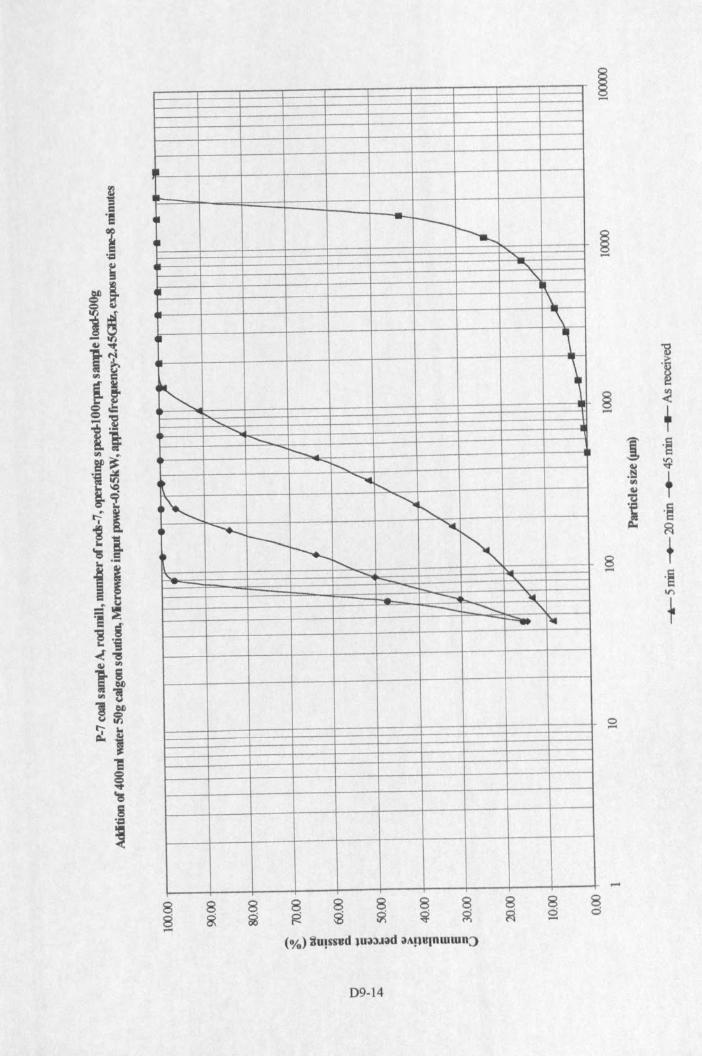
I ---i--~
......'"' -,
l ~\."\
~. \r-, ,
"'" ....... ......... ......._r---
r--....~ ..........
r--.....
<. <,~
l --.......I---. '"~~ r-._ r-;
"- ......... "._ "----... ~--- -- '\r=- ~
8 8R g 8g
8S
D9·14
13'~
~ <+
J 'S,~
~
'" T~.~ 'S~ ~
8 T..... ·S.,.,+
o.....
.....8ci
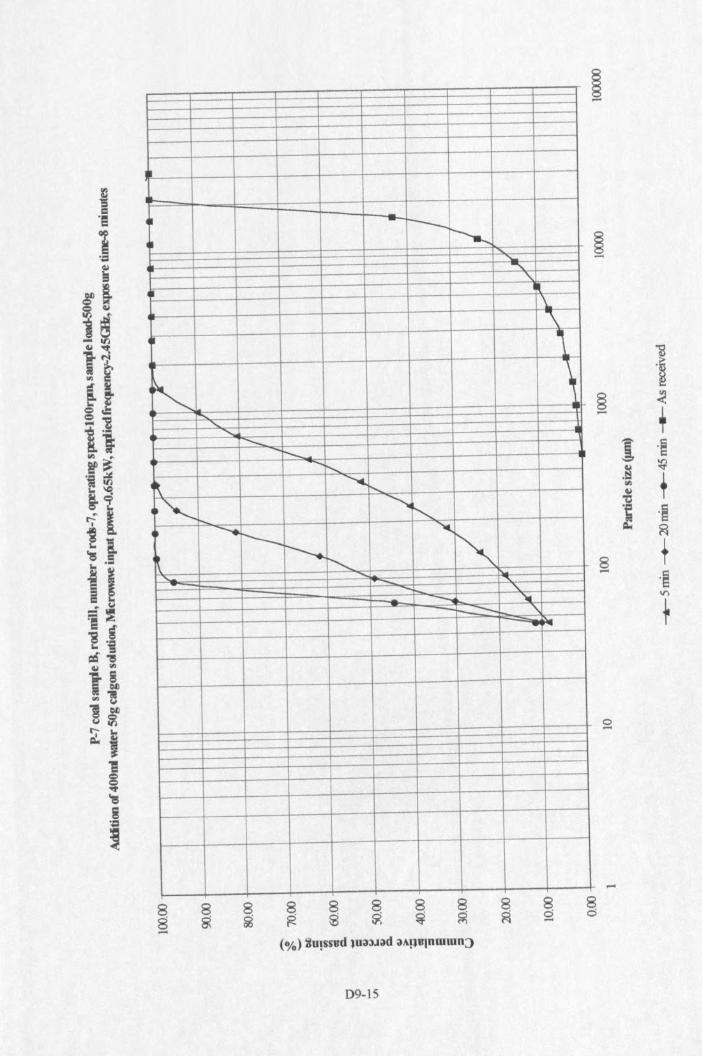
I
I-
--------.
-II ~<,........
-,
- "\."\
~ \r-, ,
.......<, ....._
r-........ t-,
~........ r-,
- '" <,~--.r----.- ~
~~r--..r-,
........ ~ ............... "\..--...... '\I-t--....-- '\..... ,..
D9-1S
1~ <
Ti '~
~ ~.t:l
T'"~'tI.~
'~~ ~
8 +-' 'SV'>
1
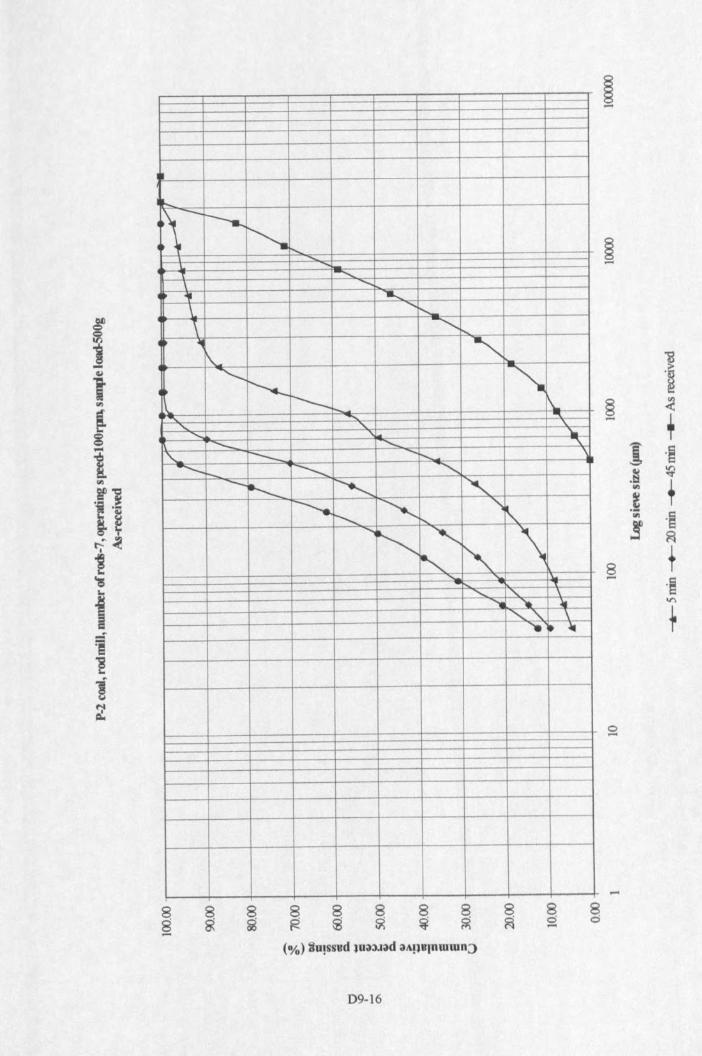
•If,.. ----...
~ f............ -.....
\ ..........
" .......~
<,<,
\ -.........!-...'ill! =;~'--
~ I~~ r-- \........" " \.
........ " "'-...._ <, "\.
-, ---- ................... \--- -.......... <,--..........._ ............... -,--.......... r-.........._ <, '\
~........r-. <, \<, l>.
""<; ............. " 4
"''''' \..... • •
-
8o-8 8~ ~
D9-16
1'~
§ <- ,J 'S.§ ~III
+.~III 'S5 ~
8 +- ·sV)
+
o-
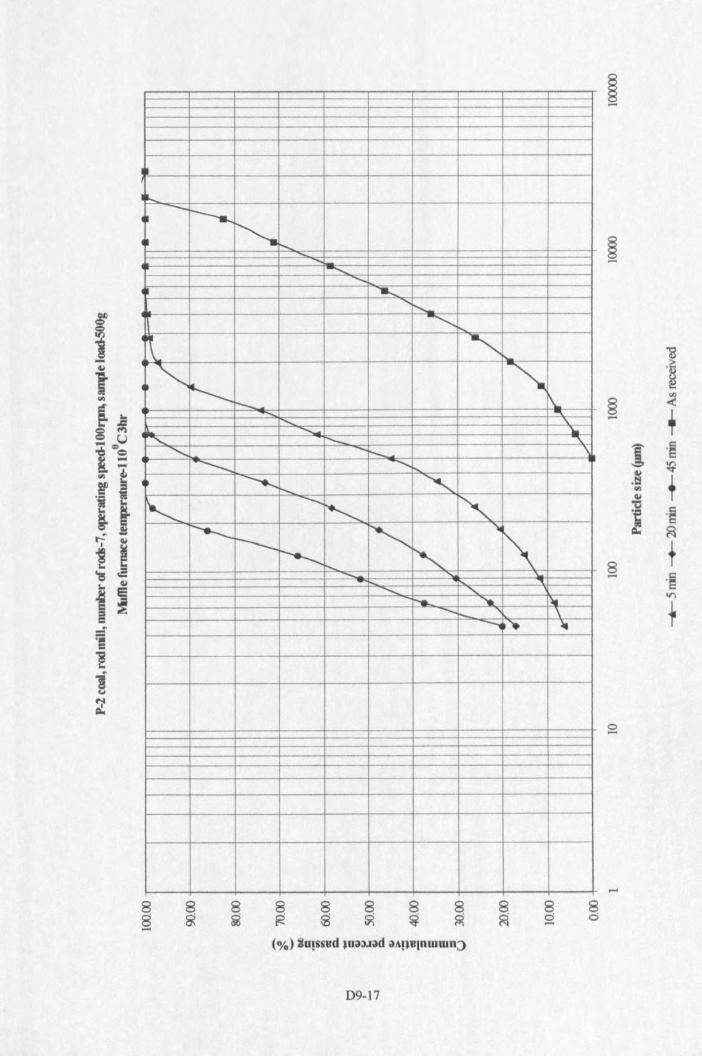
II
~ --I----.• r-,~ !'-............
<,<,
........' ..........
<,
\ <,<,
~<,
I--. \.......... '"\...... "oM..
...._ \00<, ......_ "'\.<, ......r-. \-......... <,
-....... r-... <,~
--..<; r-.r------- r-. l\r---......... '<,..... ........ \..
""'<, "-~ ...... -......... - \-. .... ~
88-
8~
8~
8Ci-8g 8
~
D9-17
'io~~
§ <....+
1 os~o~T~~
'tl oso~~ ~
8 +- osVl
+
o....
-
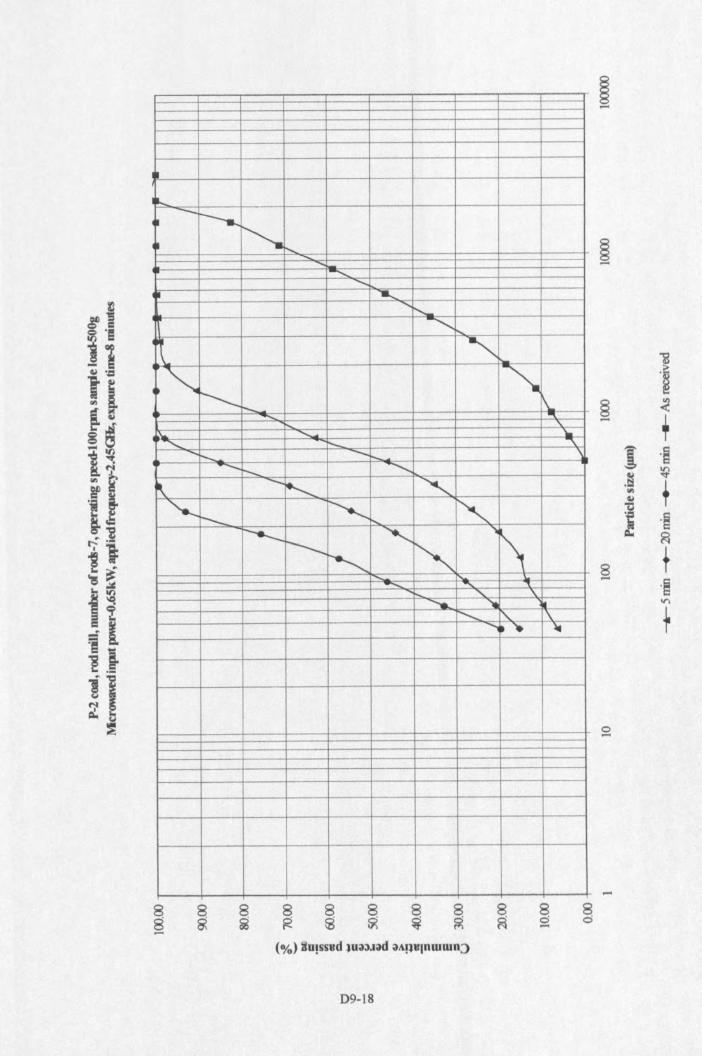
I
...... -~• <, ......_
,-....._..........
• '11.............<,
<,, <,\_
<,r----. <,I-..... \
"'\
~ ~ \0,
<, r---.. '\....... r-...... -- ..... \--r....... <,
~...._
~ <,~ r-- ~ "<,
~ r--...... '--'" ~",~
'" \........... , •<, -, \......... '-
88-
8s 8~
8~
8s
09-18
~.~
§ <- ,i ·S,~
~
'" f40l"C'. 'S~ ~
8 +- 'a.,..,+
.....
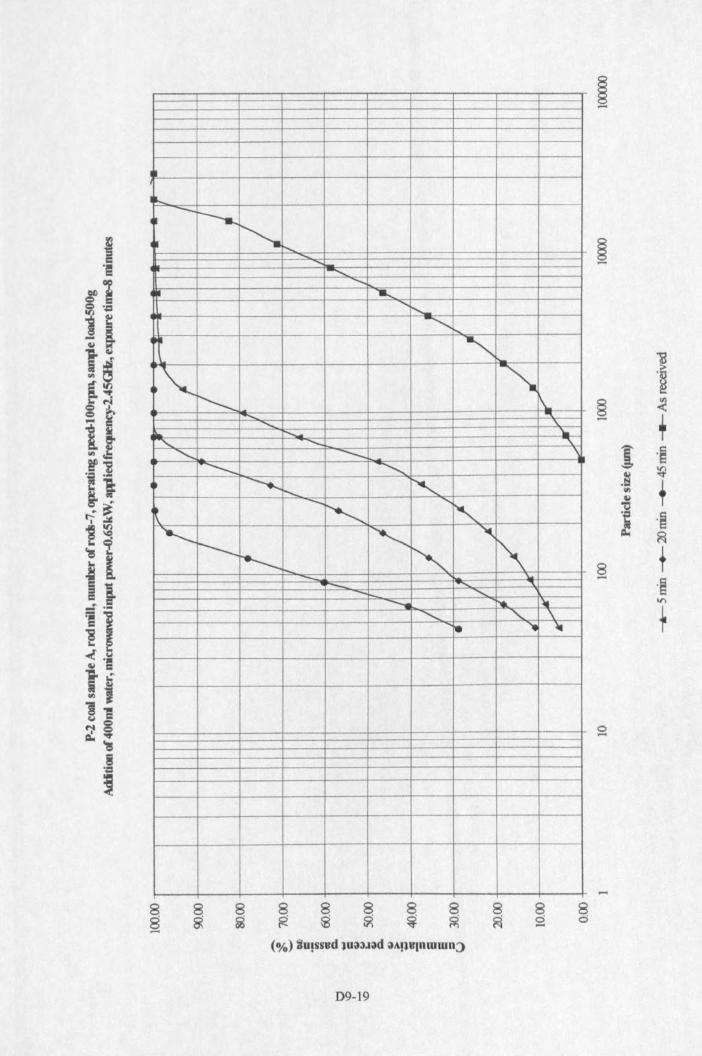
IIII
IlL. -I-...4~
"'-~
1-"".........
"II....""'" r-.... "t-..~ <,
-;f'-............
I~~......
.~
<,iIo. r---.... '\..<, ....._ "\..
<, -- \,............._ <,
4 --......~ "'"~ -~ '",-<; <, ~
'"I--- <.r-............__ ...... <,-.. ~ I\,
<, <, \:e '4 ~
D9-19
1§ <.-.
+1 'S.~ ~<II ,ui:I'~ 'S~ ~
8 +- 'SVI
+
-
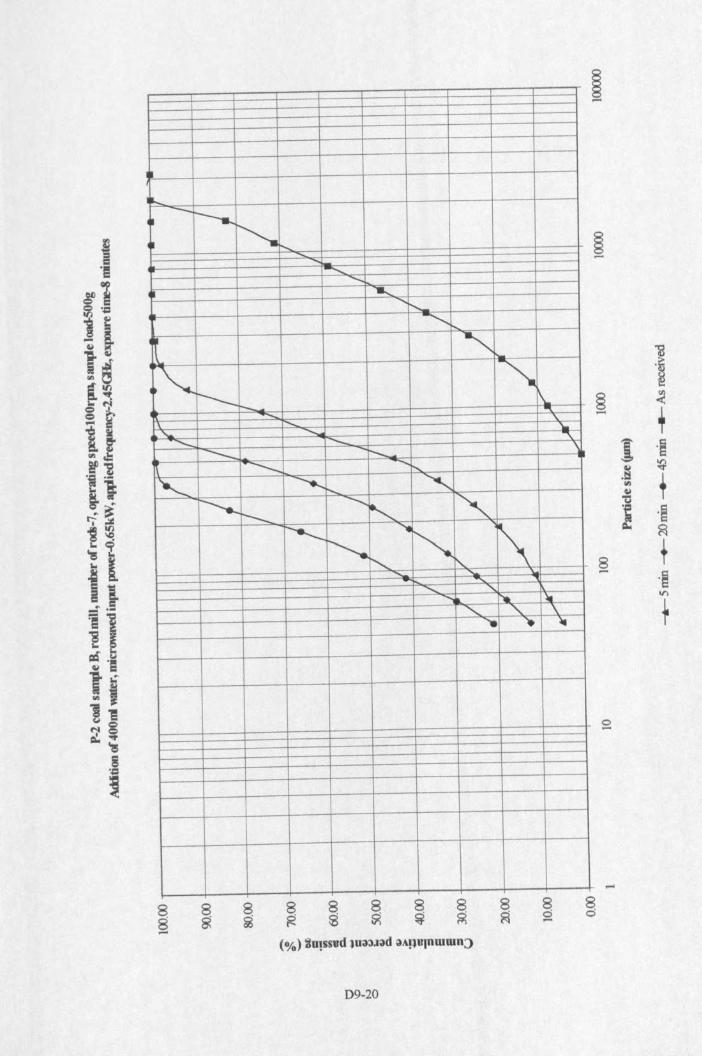
..... -r-...<,r--,
.......<,
<,
~ .......<,r--.....
<,1(1 <;.\. ......
r-,I---
<,r- \.
~ "'I.
"\ ............'\.
"- ......, '-0;;;;;:::: ....._ '\.--- -.... \
--- -....... r-,'<. -........ ....... <,
~...........,<, -.r--_ -........._ ....._
~ \<,r-, -,
<,.~- <, <,
....... r-. ..<, '" \--. .. ~
-
8g8ci....
D9-20
1§ <.....
+i ·s.§ ~til ,~..,~ .§~ ~
8 +.... ·eV'\
+
o....
.....
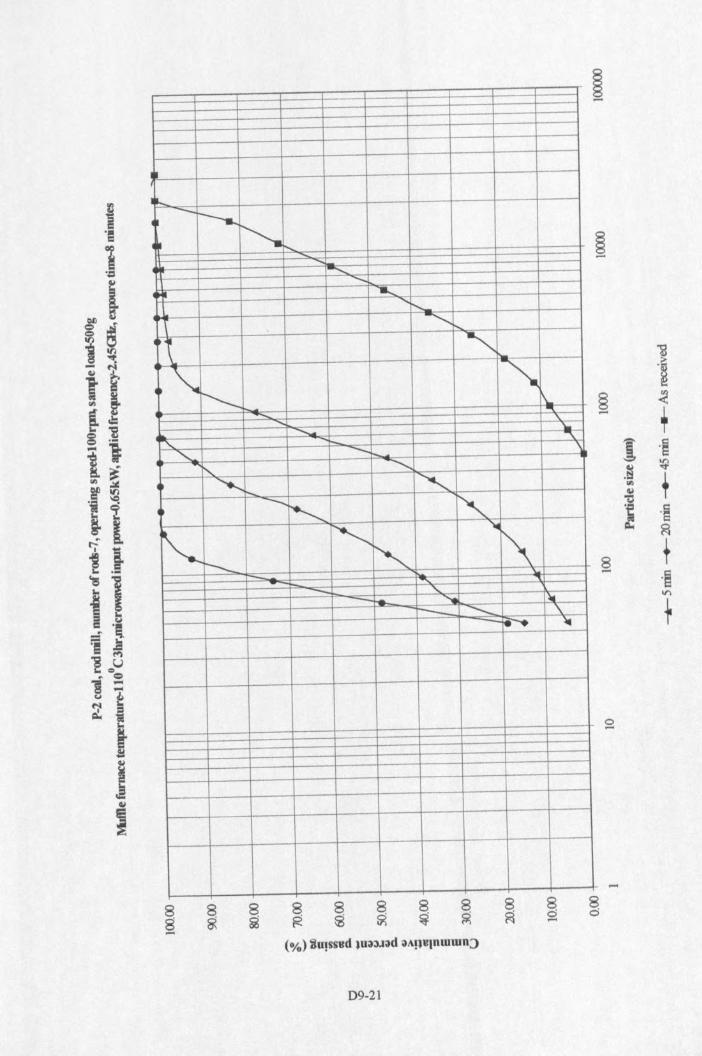
II
II--, ---~• \'.• '" .....<,
........11 .........
",.....__ -....... ~1\ <,I~ i'----
I'.I\,
--.... "'\
<,'\
........... ......
"' -+- "'\.
<; --- ....,
r-, <,
~ I-.... "'--..........r-. '"~
~'-1\~1--- \.
.....~ "'--!-a ...... I.
1----......_ '\
re'" '-
-
D9-21
-s.~
§ <.... ,E .§.~ ~'" tu
".~ .§~ ~
8 +.... .§I/)
+
-
APPENDIX DI0
MICROW AVE TREATED COALSPILOT -SCALE PRELIMINARY TESTSROD MILL SIZE DISTRIBUTIONS
P-S coal, rod mill, number ofrods-7, operating speed-IOOrpm, load-500g, DlO-3As-received coal
P-5 coal, rod mill, number ofrods-7, operating speed-iOOrpm, load-500g, DIO-4Microwave input power-O.65kW, frequency-2.45GHz, exposure time-l Ominutes,220kWhlt
P-5 coal, rod mill, number of rods-7, operating speed-I OOrpm, load-500g, D! 0-5Microwave input power-2.6kW, frequency-2.45GHz, exposure time-IS2s, 220kWhlt
P-6 coal (-3mm), rod mill, number ofrods-7, operating speed-100rpm,load-500g, As-received coal
010-6
P-6 coal (-3mm), rod mill, number ofrods-7, operating speed-IOOrpm,load-500g, microwave input power-O.65kW, frequency-2.45GHzexposure time-I 0 minutes, 220kWhlt
010-7
P-5 coal, rod mill, number ofrods-7, operating speed-IOOrpm, load-500g,As-received coal (Pilot-scale)
DIO-8
P-5 coal, rod mill, number ofrods-7, operating speed-lOOrpm, load-Ikg, 010-9Microwave input power-l.lkW, frequency-2.45GHz, exposure time-S minutes, 220kWhitMilled as SOOgsub-sample
P-S coal, rod mill, number ofrods-7, operating speed-lOOrpm, load-Ikg, 010-10Microwave input power-3.3kW, frequency-2.45GHz, exposure time-4 minutes, 220kWhltMilled as SOOgsub-sample
P-S coal, rod mill, number ofrods-7, operating speed-IOOrpm, load-Ikg, DIO-11Microwave input power-6.6kW, frequency-2.45GHz, exposure time-2 minutes, 220kWhltMilled as 500g sub-sample
P-5 coal, rod mill, number ofrods-7, operating speed-lOOrpm, load-2kg, 010-12Microwave input power-3.3kW, frequency-2.45GHz, exposure time-8 minutes, 220kWhltMilled as 500g sub-sample
010-1
Appendix D 10
P-5 coal, rod mill, number ofrods-7, operating speed-lOOrpm, load-3kg, DIO-13Microwave input power-3.3kW, frequency-2.45GHz, exposure time-12 minutes,220kWhlt, milled as 500g sub-sample
010-2
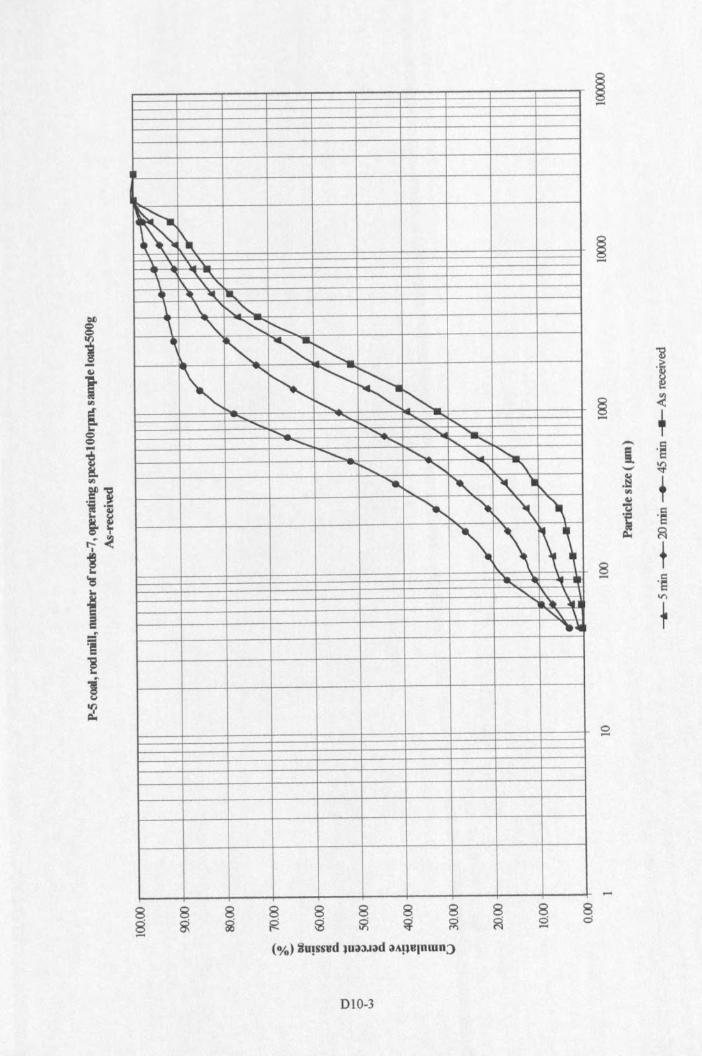
It'"Jt'"
~ :..1. \, '\. '\.,'"\ I\, \. "-4t , 11( ...\. \. ~~'\ "- "<,, r-. ~ r-,-, <,
'"~ :::::::<, <;"'...... ..... ........ ............_ ........... ......... ....._......_ ........ " <,
............. <, <, <,<, <, "" "\
'"" -, " .~~ '\,,\ "-,\~\
"-......_ ., .,....... \. \ \.a lui
~ \".Ii
8 8 8 8 8888 g ~ ~ g ~ ~-
8 8g ~8 8ci ci-
DIO-3
~.~
§ <- +- ·Si-- ~.~ T'"4.1"C
·El.~~ ~
8 t- ·SV">
+
o-
-
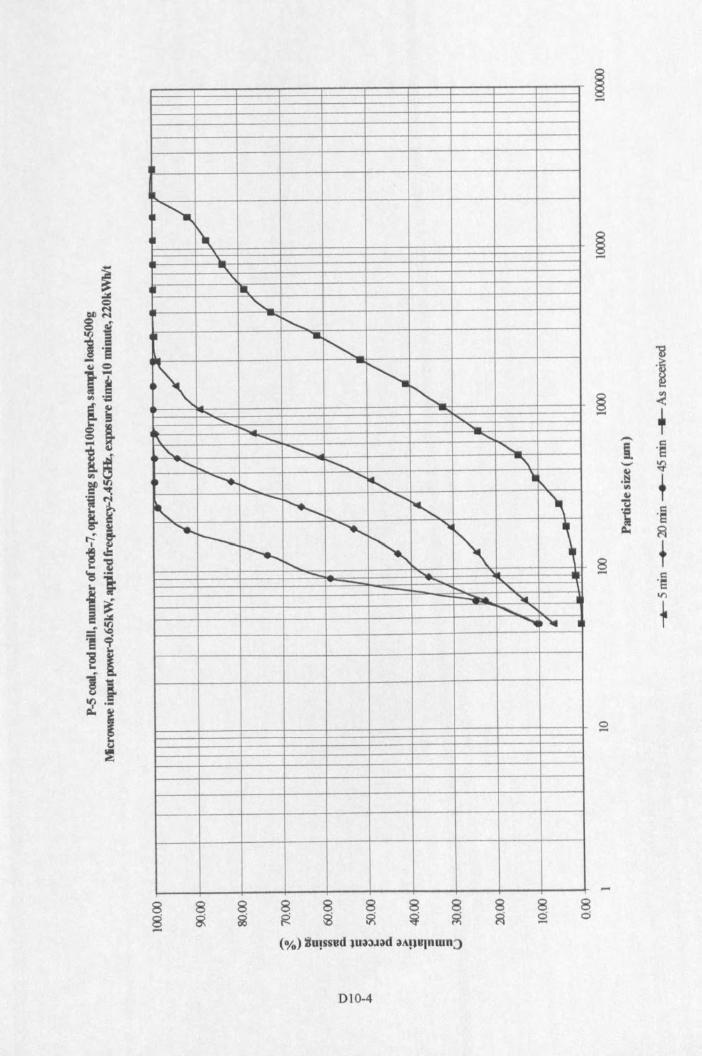
~
i'-.'\."'\.
"..<;-<,II ...r-,-. -r-,
<,--- -....... .......
...... ........"\. ...._ ........
"- .......__ <,<, ..... <, ""\
~ -.... .......~ ...,
r.........
-, -~~...........
~ ~'--!--- .......... ....._r- \~ r-,
t--....... ........... "--- "- i
...............-.. ..._. I
8§
8 8~ ~
8 8~ ~
8~
8 8~ ~
8o.....
8~
D10-4
13'~
§ <- +- 'SI- ~.§ ,'"41'tI.~ 'S~ ~
8 +- 'S.,..
+
o-
.....8o
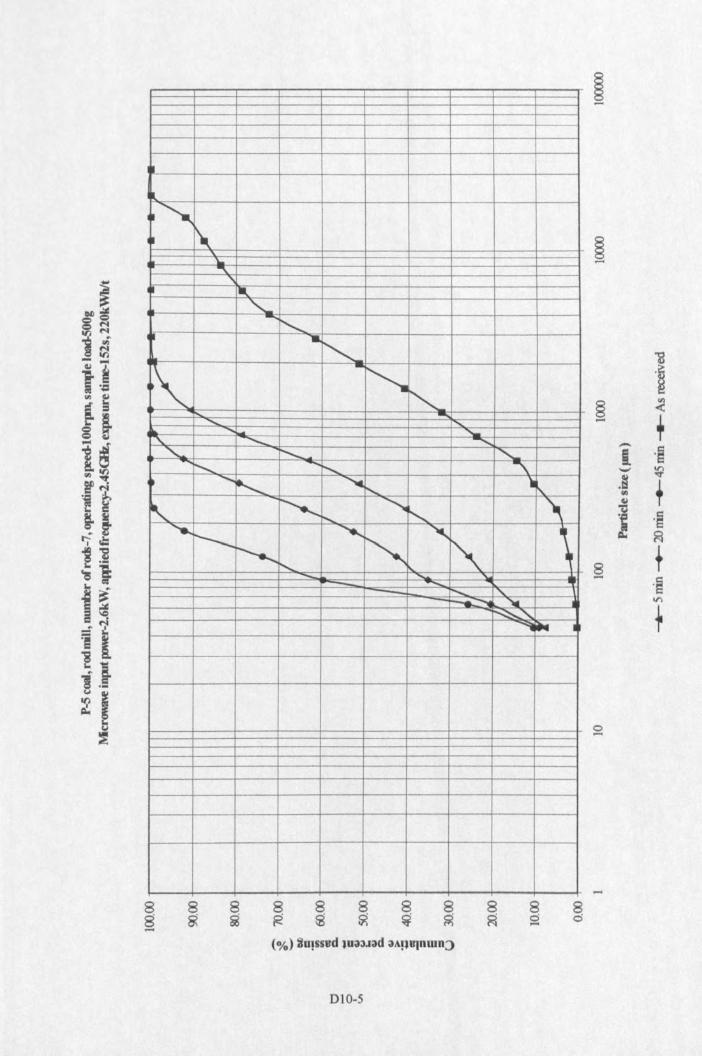
II
II...~r\ -
\.
"""\I ...<,
r-,~ ..r-,\,_ r-,r-,
........ ........ "'-""\. .......... <,<, <, ~
r-, ......r--.... "\~ ..........<, ......_. \,<,
~ ~<;r-, ~.................I--- ........r-, ~ \~ "r-;
........ '"- ........ "'--........_~ """ Ii~'"'"~.
8s.....8 8g ~ 8o-8 8~ $
D10-5
as.~
§ <.....+- .~I- ~
.§+'"~
I ·S~ ~
8 +..... ·SVl
+
8o
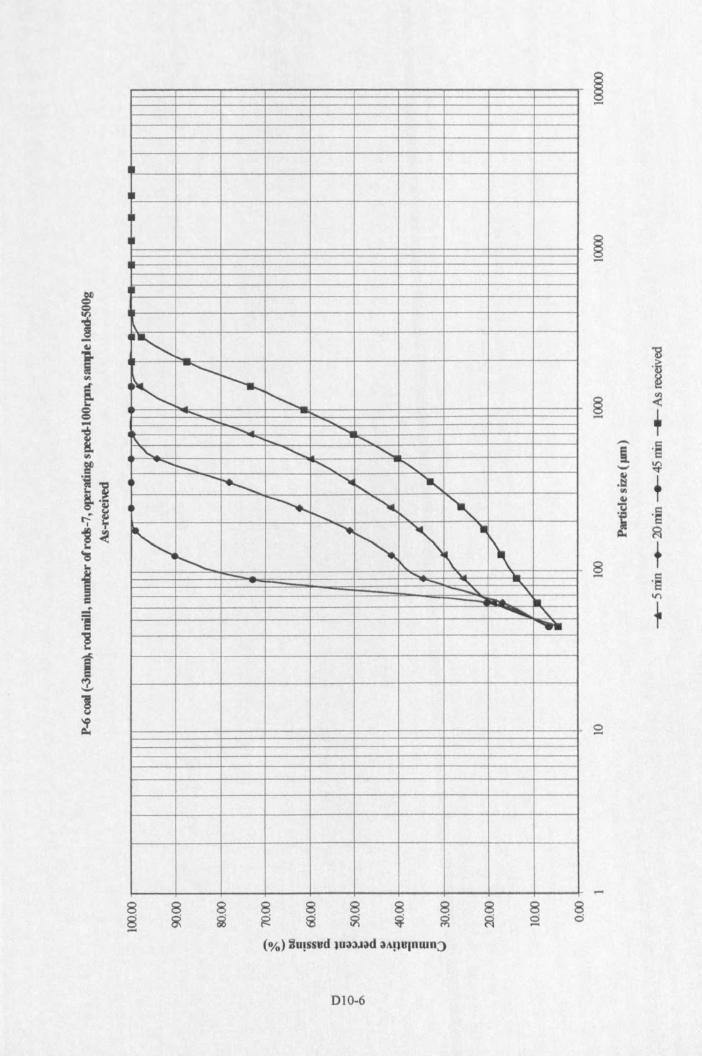
<,"'--...._
~r-. <;....... ......
.......... .........i\ t.... <,
<, <, <,........ r-- r-, r-,-I'......... ........ "<,
~ r-;<,
~ "-~
........r-, -, •1\I'........ ~~.......__, ,..
"'-. '"~
8 8§ &(
8 8~ g 888$ &i ~8 8Si 0
8 8~ ~
D10-6
"E'~
~ <+- 'Si- ~.~+fIl
Gj
"0,~
~~ ~
8 +- '~
lr\
+
o-
-
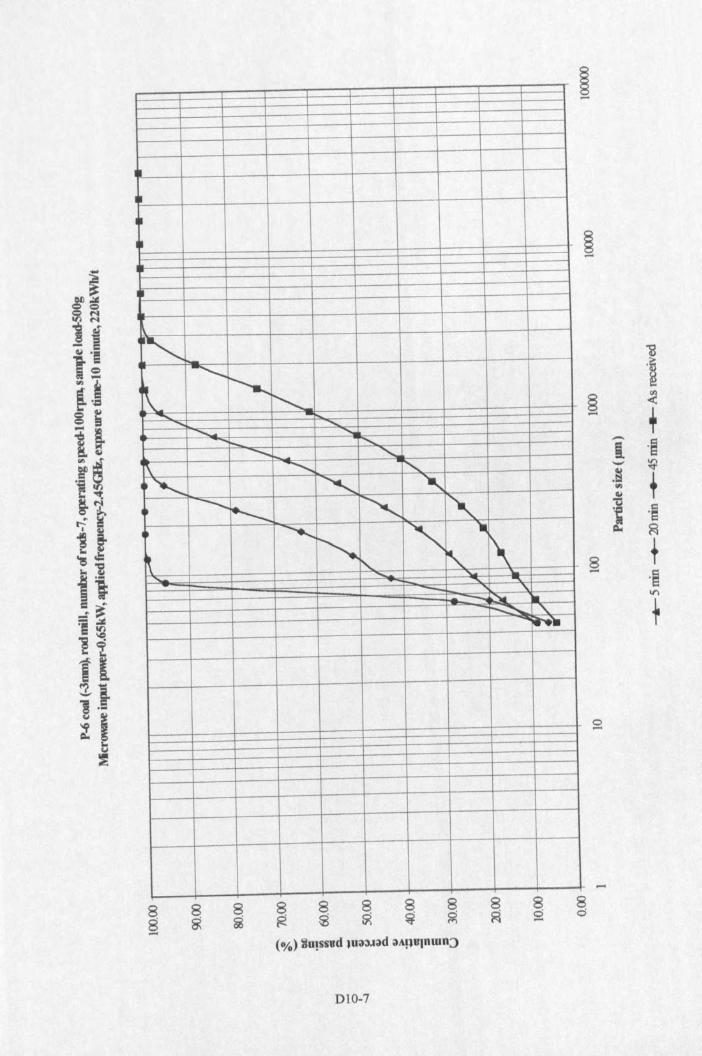
••
<.-~
i'--.\ I'-.....-- ...... ............. .......
...... t.... '"......... <,[\ -......... ~
r--, <, "•-.......
~ "- -.~ ............. " -..~
r-,~ i\r-,
...... ...... -.... ~....__ "-.... ~ iii-f'...._~ "-Ihll
8§
8 8g ~8o-8 8g g
DIO-7
~-
13
'1~
<+,-.. ·Si- ~
.§+<I)
~'ti.~ ·S~ ~
8 +- ·El11'\
+
8o
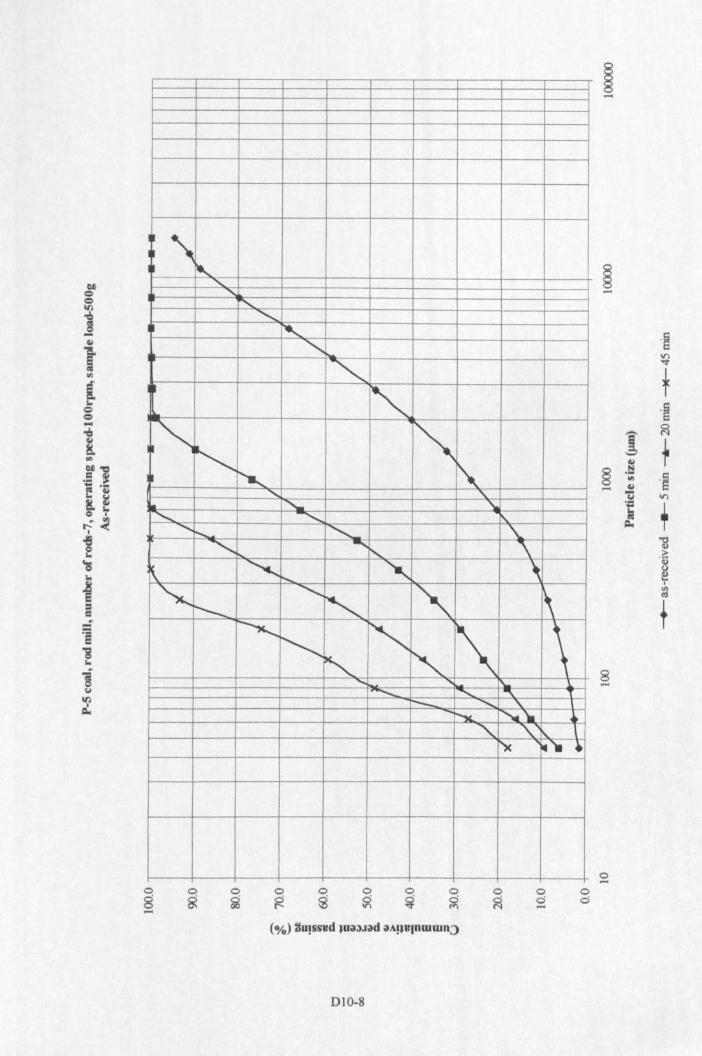
-,"-<,
.......<,<,
I'-..<,<,
~ <,;a",
~ r-, r-,~~ 'a._
...... ".. '- ~<, <, ~-....... r--.. <, '\<, -... r-, '\
K. ~ r-.... " ~<; <,r-, '" /\r--...
"'" -. -, jr-, r-,...... I"~ <, "r-- ........... "-
"'- ""'-'iii ._~ ~ \
"}( ~..0-0 0 0 0 0 0 0 0 0 0 0s g ~ g ~ ~ ~ ~ ?ii S d-
(%) 3u!snd lU.,3J.,d .,A!l1J(Ilwwn::>
DIO-8
~-·a~
t.~
! ~
1'-"~§ .S:! ·s'"- ~
U II"l.~ ,~
"0CD.1:
~.~
t8-
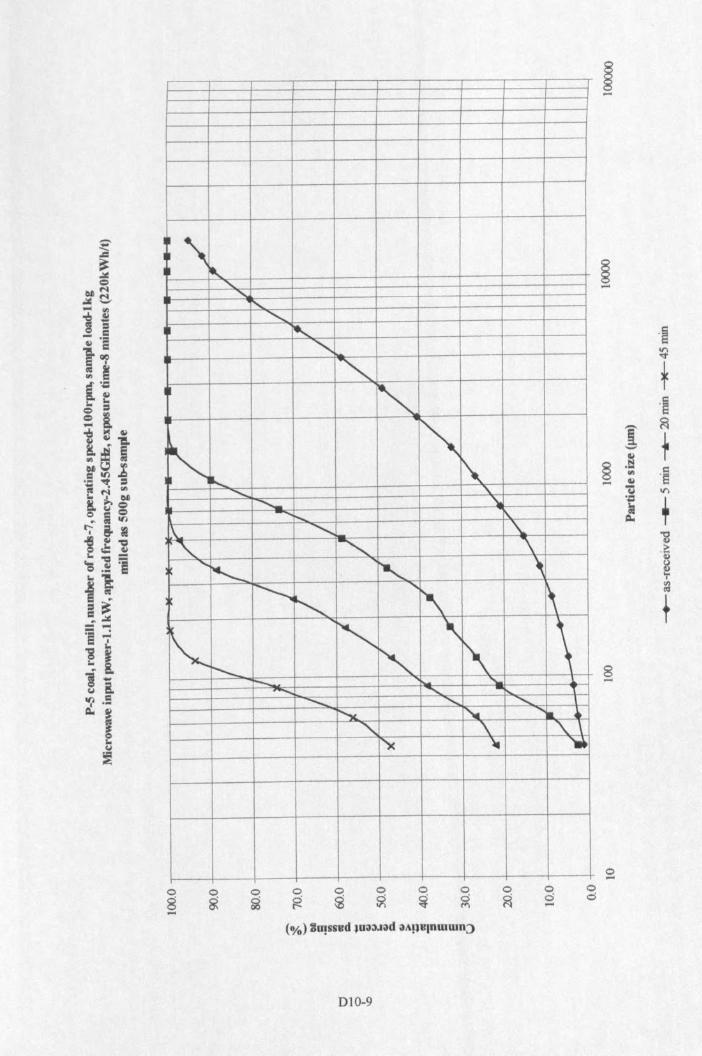
:"~"""-=<;
r-,<, .....
'"<,<,
r. -.L....
-,......... "........_ "\:
...... ....... '"x <, -,<, I~ \
......<; "- "..........___ .......
'" \"-, <, '\\ \'"r---- r-. -..;;:
....... <; ---.... <, <;~ ~ .......... .
<, \ "\.\"X --
~
0-0 0 0 0 0 0 0 0 0 0 0
s ~ ~ g ~ ~ ~ g ~ ci 0.........
(%) !D!ssud JU\l3.l.,d 3AJJulnwwn::>
010-9
~-.~~
t.§
1 ~
+-~§ .!:i ·s..,- ~
"C 11'\'';::
~~"B.a:<II
~I
:a
t8.....
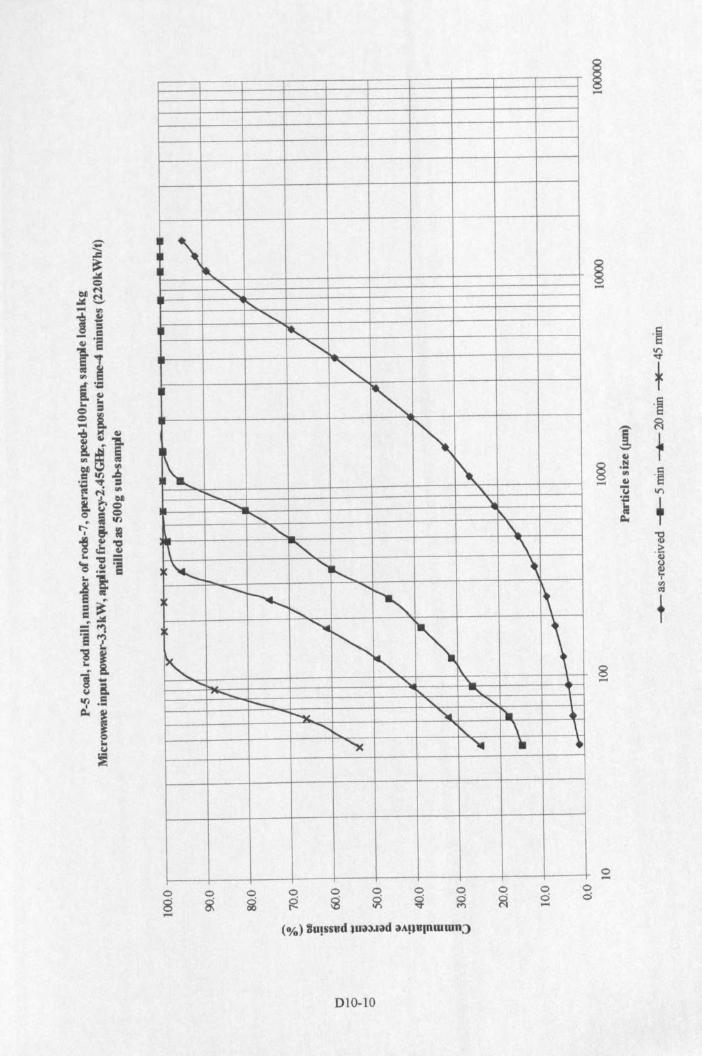
,\ .............
'" I'...<,
*'<,<,
I~ r-,,~
r-,-,
I'--... '\.<, '\,<;
'<; -,'\ <, \'<, "-,
~ "....._~
......
'" ~I'-...~ ~
~ t-, \~ <, 1\...... ....... '\. 1:
.......... ""t-- <, ........~ 'w .... ~
........ ~ \ -y"x 'lit • •
0-0 0 0 0 0 0 0 0 0 0 0
9 g s g $ ~ ~ 0 ~ ci 0("') ....- (%) fJu!ssud lUaJ.lad aA!lUIRmmR;)
D10-10
~-.~
~
+.~
'[ ~
+'-'~§ .!:I ·SIII- ~
U 11"1".::I
+la~"3.~
~I
~
f8....
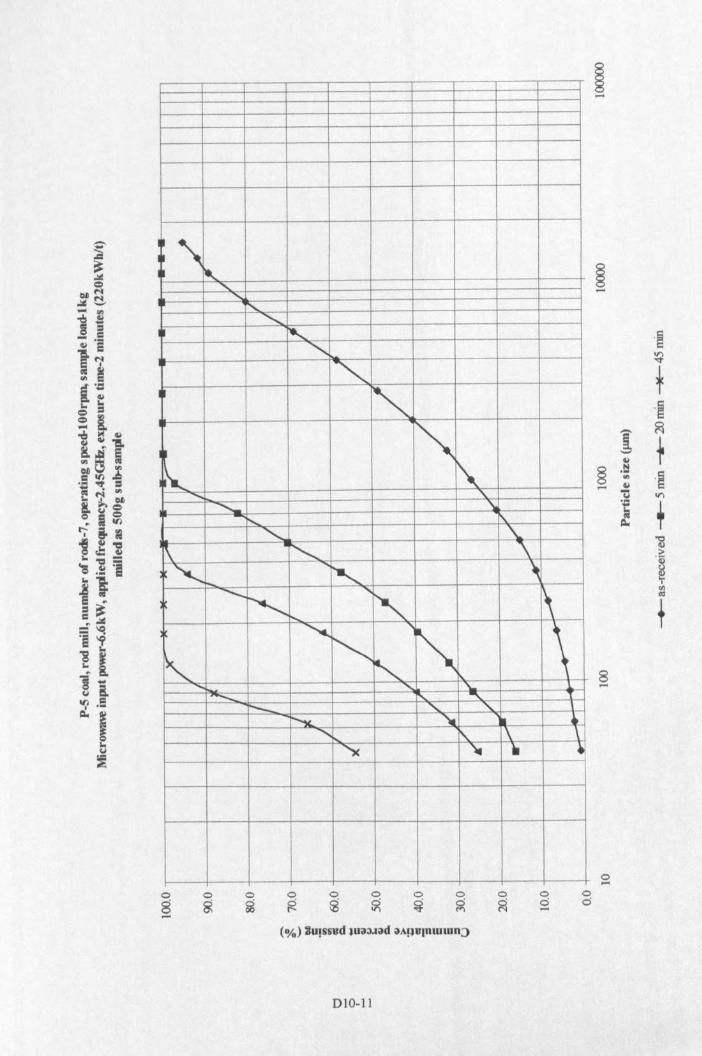
·"-...<,"'-<,
<;
"-<,<,<,
, -,~
-,....... "\........_ "\,
'- \.<, \..
\ <, '\
"'- "II...... ~- ......._<, ~" ~......
~
~ t-, \-, <,...... "'- "\.. 1-...... 1"0.. "'\. .,
r-- <, "'~ ...... .. ~<, i\. \ \
~ ~ ~ •
0....0 0 0 0 0 0 0 0 0 0 0s ~ ~ g g ~ ~ ~ ~ 0 0........
(%) :JU!SSUd lUil3.1ild ilAp8lnwwn:)
D1O-11
~....
.~~
f.~
1: ~
f-401§ N.. ·S'".... 401
'ti I/)
--= ,~
"3.~
~I
:q
t8....
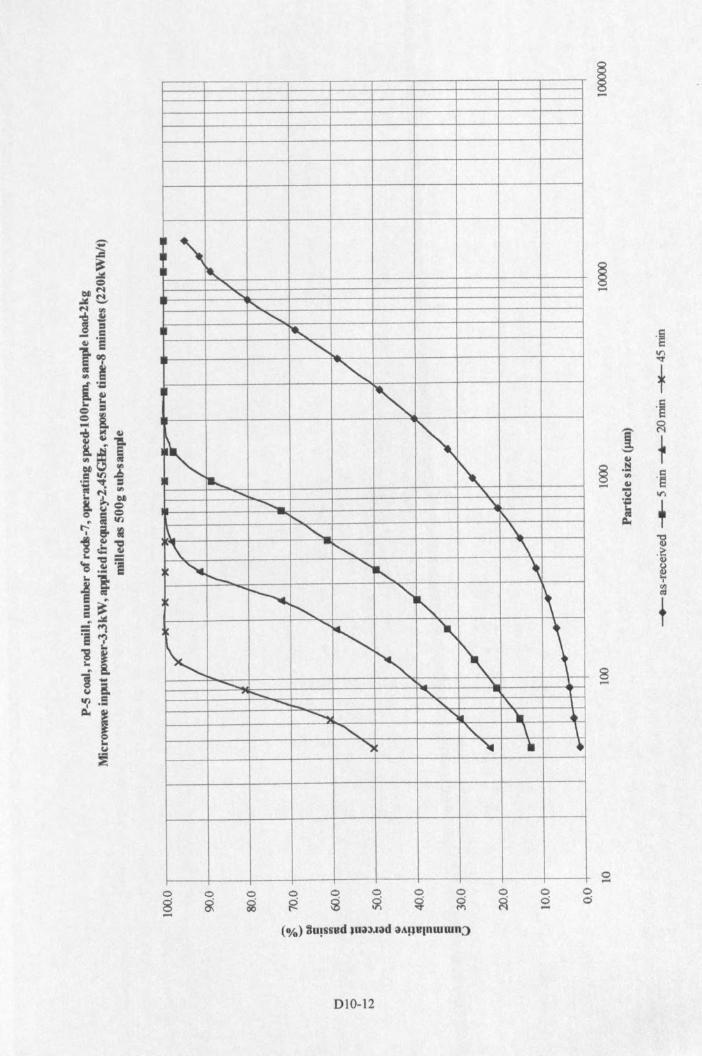
"~<,"-r-,
<,
'"<,I'"• r-.
~
r.-,~ -..... "-
"- '\,r-, I\.
~ <, \.\. -r--...... \
"'Ie. "'-, "....._~ I"-...
"l-, ~t
......r-, " \-. '<, "-- ""r--.... " ..........- <, "........, '-. ~ •<, -, \ \
~ ~ • .~
os-og
oo....
010-12
~-.~
~
t.~
1 ?:\
+'-'~§ .!::! ·s~- ~
'7j trl
i ,~
"'0III.i'!:III
~r/J~
t8-
o....oo
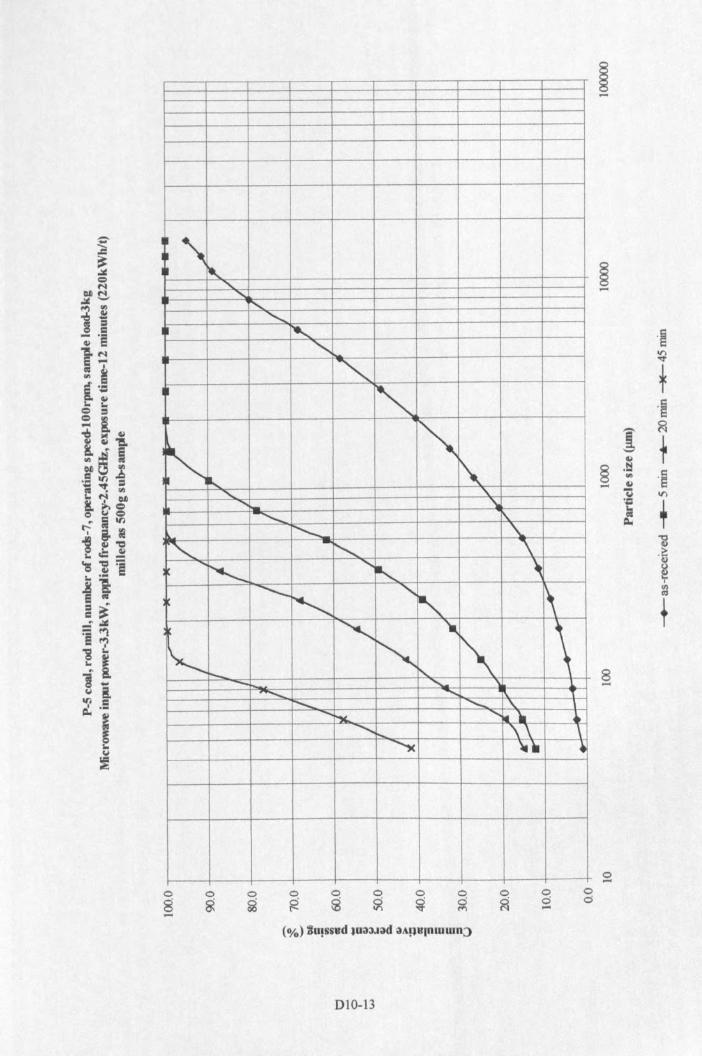
~I ~
"-........<;<,
I '-<,<,
~ r-,-. r-,
"~<, '\.
...... .... '\,<; r\.<; '\..
<, -<, "\'~ "<, ""'--<,
<,-, ~~ <, "'\ \~ i---
<,~- <,
......... ""-r---.. <, \........ I'%. ....... 1Il~ .............. " \\ \
~ ~.•0-0 0 0 0 0 0 0 0 0 0 0
g ~ s g 9 ~ ~ g ~ d 0--(%) Xu!ssud lU\l3.l"d \lA!lUlnmmn~
010-13
~-.~I/')
"'"t.~
1 ~
f-~§ .!:! ·s..,- ~
"0 I/').~T~'i.~~~I
~
t8-
APPENDIX Dll
MICROWAVE TREATED COAL PILOT -SCALE TESTSBARMAC MILL, JAW AND ROLL CRUSHER SIZE
DISTRIBUTIONS
P-8 coal, Barmac Rock on Rock crusher, as-received and microwave treated DII-2Samples, operating speed-3000rpm, sample load-250kgMicrowave input power-6.6kW, frequency-2.45GHz, 220kwhit
P-8 coal, Barmac Rock on Rock crusher, as-received and microwave treated DII-3Samples, operating speed-5000rpm, sample load-250kgMicrowave input power-6.6kW, frequency-2.45GHz, 220kwhit
P-8 coal, Jaw crusher, as-received and microwave treated samples (l kg load) Dll-4Microwave input power-O.65kW, frequency-2.45GHz, exposure time-If minutes
P-8 coal, Roll crusher, as-received and microwave treated samples (lkg load) D11-5Microwave input power-O.65kW, frequency-2.45GHz, exposure time-IS minutes
Dll-l
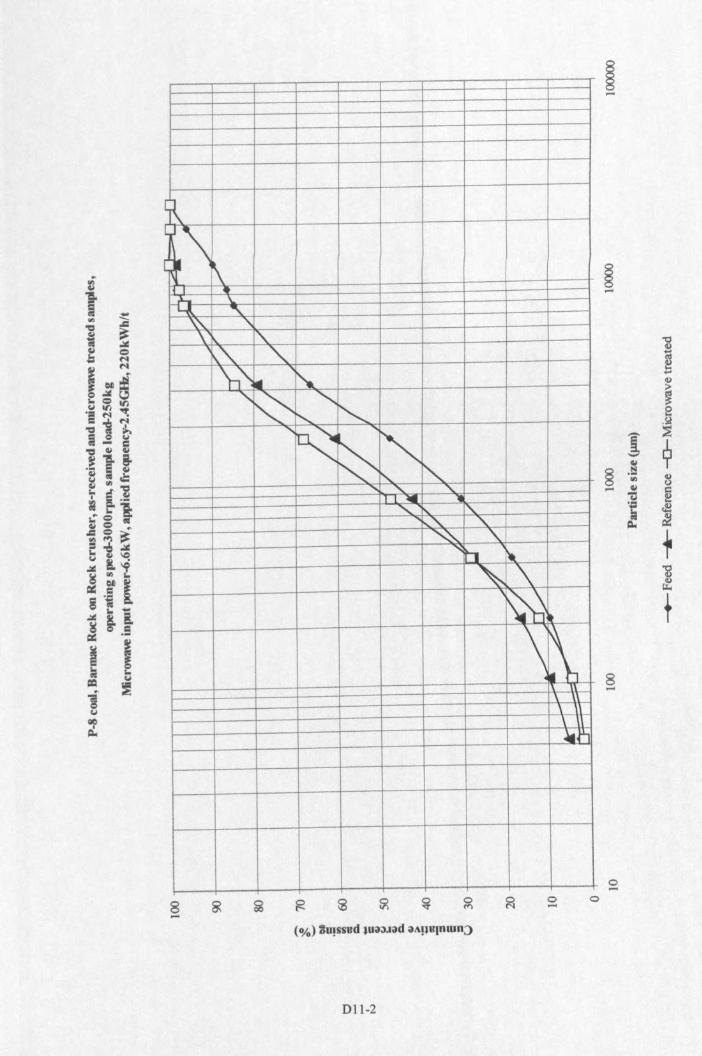
~
lll\~ •-tt \:
"\."\. "\
\ 1,\r-. -,\''' III -,
<,
~
<,r-, r-,
......
~
.....
""~ -.r-,..... "' '".. ~
" I,., '\.",-, -,
.......b r.~ -,,
~t
\~1\ I'\,\\ 1\lI,t]
8....o....
Dl1-2
-g~...4)
ie1 ~
?4)
§ .t:!'" 8.... 4)
~-Cool~ ~~ ~
+asQ)
~
t8....
o....o
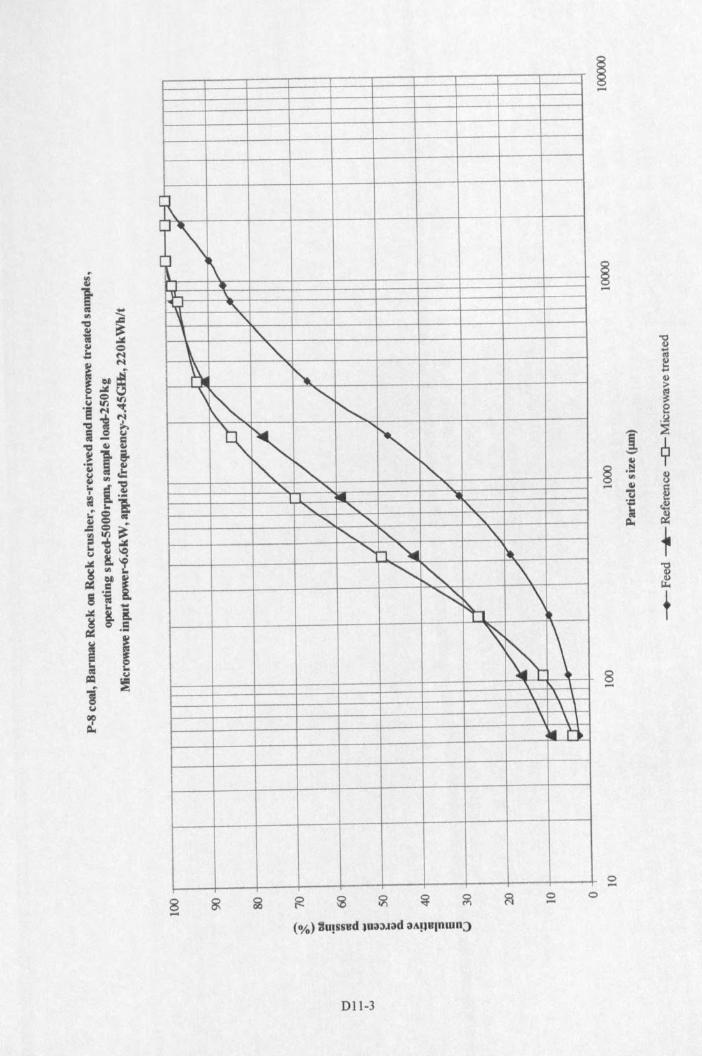
1\6\~ •
~\
"-, ", ."\.., -,~ f'-.\~
<,-,'t\
~
r-,r-, r-,
"" '" "'• 11<, <, f\..<, <, "<, r-, -,
"":t~ r-.<,t-, -,
~~ \.
~
~ \\ \\ \ \\ \\\ \r..h
8.....o.....
nn-s
"0Q)s.t:Q)
~e
I ~
9--41§ .t:l
'" 8..... " §'ti~ ~~ ~
+13~
t8.....
o.....o
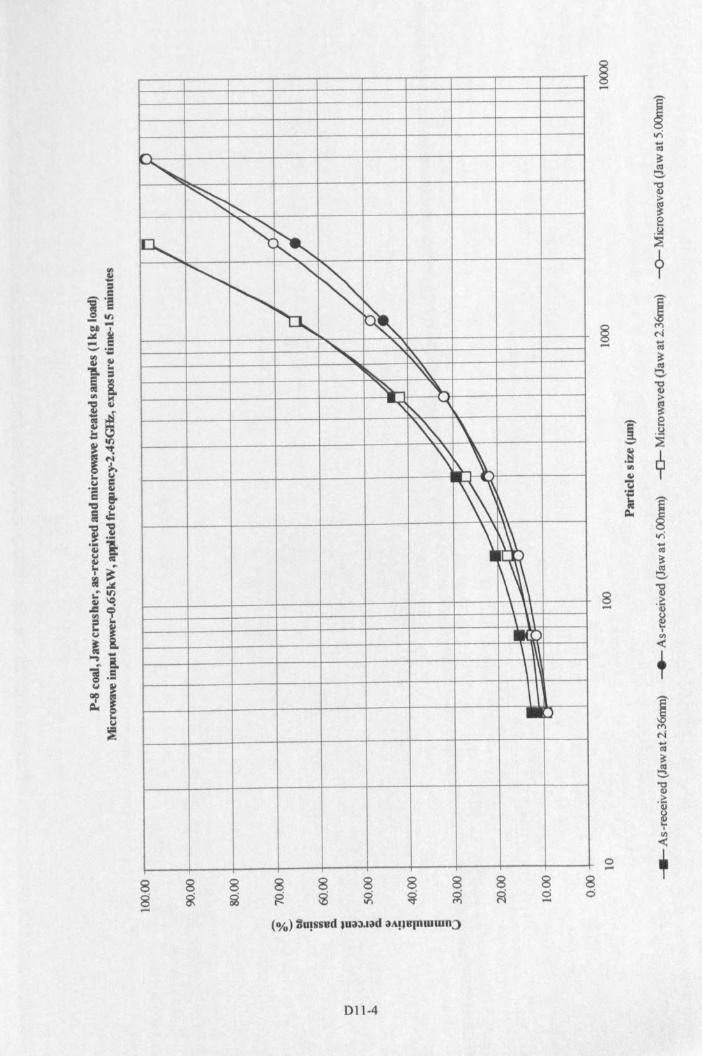
~
~ r-,
r-; ~~r=; <,
~<,
~ ~<, "'"- ~
"- "~ ~
~ \~
~ ~
\ ~ ~
1\\\\ \\ 1~
\\ I~
8s-8g 8o-
D11-4
§-
I.,.;~~~0-"'dII)
ie.g::s
?IMN~~~0--0II)
~
1 e.~- ::s
,~ 9"J4.1"C'-= I;Q,;
.,.;....~~~'-"
~.~G)
~Itil
<:
+IMN....~~~.._.].~~Itil
<:
+
8-
o.-.8o
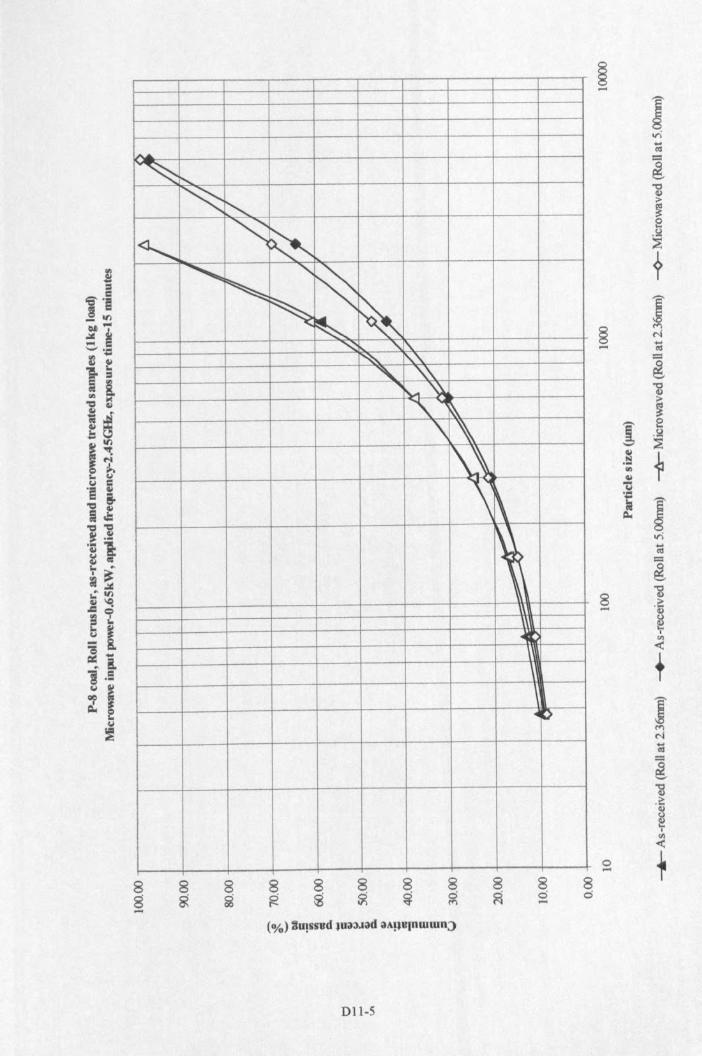
; ...........~ r--..
~ ~
<, ~~
~ r-, <,
~~
~~~ "'\.~ "'" '\.'\.
~~~
\ '\I~\'\\,
\1
D
8g....8g
8g 8ci....
nu-s
§-
Iori~=~-0~>~e
,~
~
?IMN....t'Il=~-0QJ
~
! e,~- ~
.§
+....~'tZ'':
I~ori~;::;
~as>'as~til<:
+1MN~=~13,~QJ
~Itil<:
+
8....
o....8d
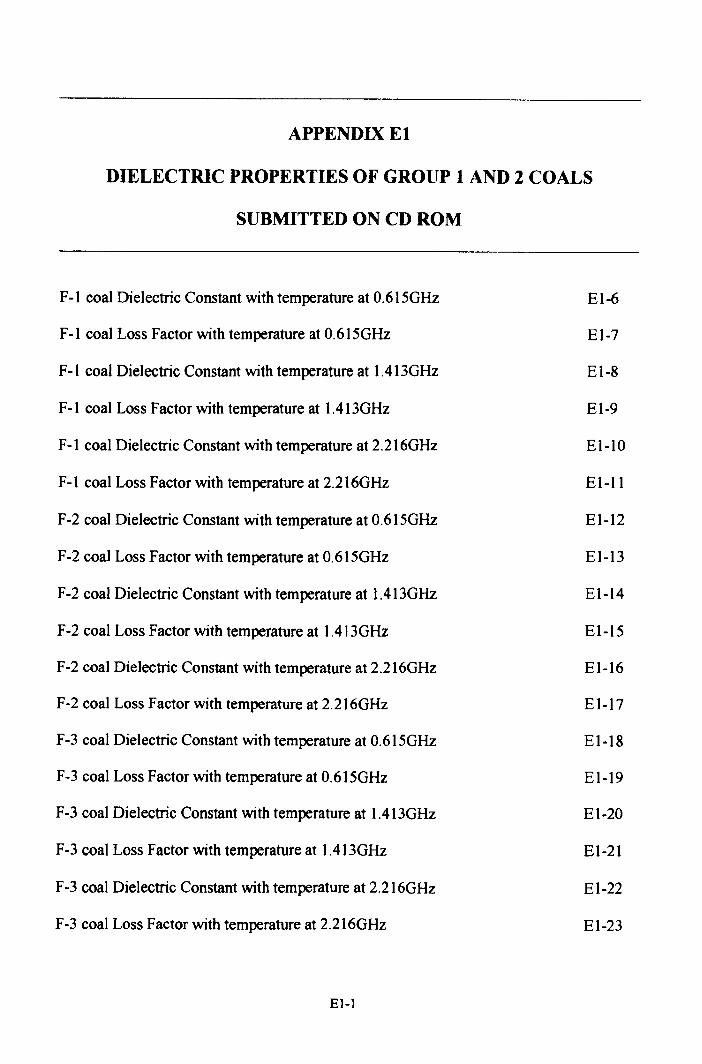
APPENDIXEl
DIELECTRIC PROPERTIES OF GROUP 1 AND 2 COALS
SUBMITTED ON CD ROM
F-I coal Dielectric Constant with temperature at O.615GHz
F-I coal Loss Factor with temperature at O.615GHz
F-I coal Dielectric Constant with temperature at 1.413GHz
F-I coal Loss Factor with temperature at 1.413GHz
F-I coal Dielectric Constant with temperature at 2.216GHz
F-I coal Loss Factor with temperature at 2.216GHz
F-2 coal Dielectric Constant with temperature at O.615GHz
F-2 coal Loss Factor with temperature at O.615GHz
F-2 coal Dielectric Constant with temperature at 1.413GHz
F-2 coal Loss Factor with temperature at 1.413GHz
F-2 coal Dielectric Constant with temperature at 2.216GHz
F-2 coal Loss Factor with temperature at 2.216GHz
F-3 coal Dielectric Constant with temperature at O.615GHz
F-3 coal Loss Factor with temperature at O.615GHz
F-3 coal Dielectric Constant with temperature at 1.413GHz
F-3 coal Loss Factor with temperature at 1.413GHz
F-3 coal Dielectric Constant with temperature at 2.216GHz
F-3 coal Loss Factor with temperature at 2.216GHz
El-6
El-7
El-8
EI-9
EI-lO
EI-l1
El-12
EI-13
El·14
EI-I5
EI-16
El-17
EI·18
EI-19
EI·20
EI-21
EI-22
EI-23
E1-1
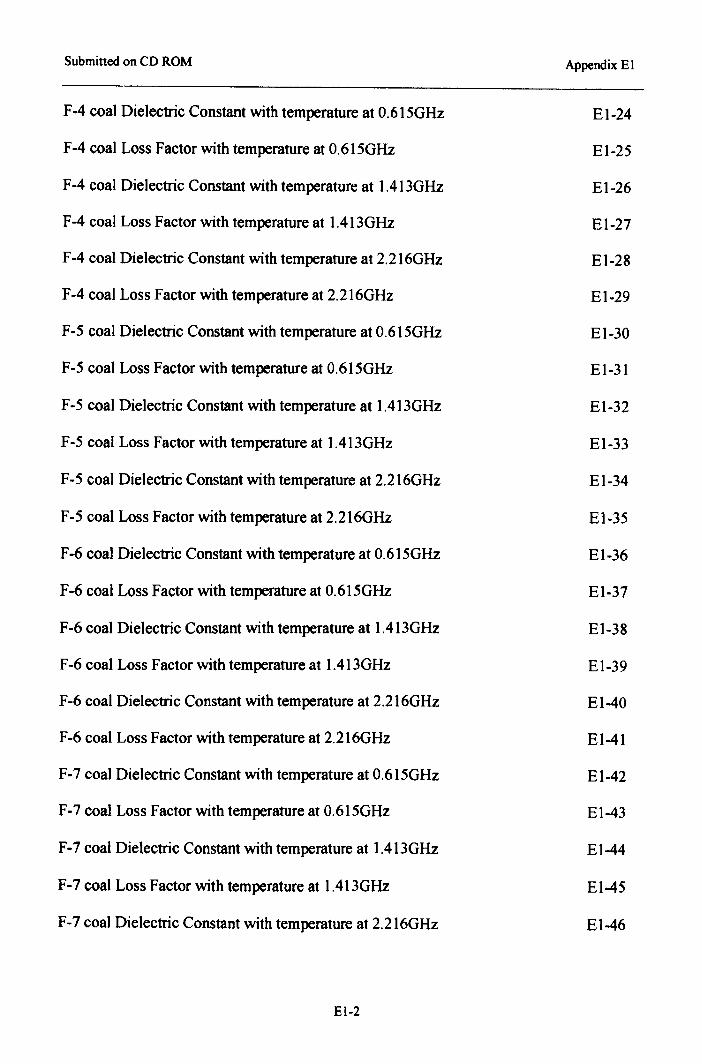
Submitted on CD ROM Appendix El
F-4 coal Dielectric Constant with temperature at O.615GHz
F-4 coal Loss Factor with temperature at O.615GHz
F-4 coal Dielectric Constant with temperature at 1.413GHz
F-4 coal Loss Factor with temperature at 1.413GHz
F-4 coal Dielectric Constant with temperature at 2.216GHz
F-4 coal Loss Factor with temperature at 2.216GHz
F-5 coal Dielectric Constant with temperature at O.615GHz
F-5 coal Loss Factor with temperature at O.615GHz
F-5 coal Dielectric Constant with temperature at 1.413GHz
F-5 coal Loss Factor with temperature at 1.413GHz
F-5 coal Dielectric Constant with temperature at 2.216GHz
F-5 coal Loss Factor with temperature at 2.216GHz
F-6 coal Dielectric Constant with temperature at O.615GHz
F-6 coal Loss Factor with temperature at O.615GHz
F-6 coal Dielectric Constant with temperature at 1.413GHz
F-6 coal Loss Factor with temperature at 1.413GHz
F-6 coal Dielectric Constant with temperature at 2.216GHz
F-6 coal Loss Factor with temperature at 2.216GHz
F-7 coal Dielectric Constant with temperature at O.615GHz
F-7 coal Loss Factor with temperature at O.615GHz
F-7 coal Dielectric Constant with temperature at 1.413GHz
F-7 coal Loss Factor with temperature at 1.413GHz
F-7 coal Dielectric Constant with temperature at 2.216GHz
El-24
El-25
El-26
El-27
EI-28
El-29
El-30
El-31
El-32
El-33
El-34
El-35
El-36
El-37
El-38
El-39
El-40
El-41
El-42
El-43
El-44
El-45
El-46
EI-2
Submitted on CD ROM Appendix El
F-7 coal Loss Factor with temperature at 2.2160Hz
F-8 coal Dielectric Constant with temperature at O.6150Hz
F-8 coal Loss Factor with temperature at O.615GHz
F-8 coal Dielectric Constant with temperature at 1.413GHz
F-8 coal Loss Factor with temperature at 1.413GHz
F-8 coal Dielectric Constant with temperature at 2.216GHz
F-8 coal Loss Factor with temperature at 2.2160Hz
P-l coal Dielectric Constant with temperature at O.615GHz
P-l coal Loss Factor with temperature at O.615GHz
P-l coal Dielectric Constant with temperature at 1.413GHz
P-l coal Loss Factor with temperature at 1.413GHz
P-l coal Dielectric Constant with temperature at 2.216GHz
P-I coal Loss Factor with temperature at 2.2160Hz
P-2 coal Dielectric Constant with temperature at O.615GHz
P-2 coal Loss Factor with temperature at O.615GHz
P-2 coal Dielectric Constant with temperature at 1.413GHz
P-2 coal Loss Factor with temperature at 1.413GHz
P-2 coal Dielectric Constant with temperature at 2.216GHz
P-2 coal Loss Factor with temperature at 2.2160Hz
P-3 coal Dielectric Constant with temperature at O.615GHz
P-3 coal Loss Factor with temperature at O.615GHz
P-3 coal Dielectric Constant with temperature at 1.413GHz
P-3 coal Loss Factor with temperature at 1.413GHz
EI-47
EI-48
EI-49
El-50
El-51
El-52
El-53
EI·54
El-55
El-56
El-57
El-58
El-59
EI-60
EI·61
EI-62
EI-63
EI-64
EI-65
EI-66
EI-67
EI-68
EI-69
EI-3
Submitted on CD ROM Appendix El
P-3 coal Dielectric Constant with temperature at 2.2160Hz
P-3 coal Loss Factor with temperature at 2.2160Hz
P-4 coal Dielectric Constant with temperature at O.6150Hz
P-4 coal Loss Factor with temperature at O.6150Hz
P-4 coal Dielectric Constant with temperature at 1.4130Hz
P-4 coal Loss Factor with temperature at I.4130Hz
P-4 coal Dielectric Constant with temperature at 2.2160Hz
P-4 coal Loss Factor with temperature at 2.2160Hz
P-5 coal Dielectric Constant with temperature at O.6150Hz
P-5 coal Loss Factor with temperature at O.6150Hz
P-5 coal Dielectric Constant with temperature at 1.4130Hz
P-5 coal Loss Factor with temperature at 1.4130Hz
P-5 coal Dielectric Constant with temperature at 2.2160Hz
P-5 coal Loss Factor with temperature at 2.2160Hz
P-6 coal Dielectric Constant with temperature at O.6150Hz
P-6 coal Loss Factor with temperature at O.6150Hz
P-6 coal Dielectric Constant with temperature at 1.4130Hz
P-6 coal Loss Factor with temperature at 1.4130Hz
P-6 coal Dielectric Constant with temperature at 2.2160Hz
P-6 coal Loss Factor with temperature at 2.2160Hz
P-7 coal Dielectric Constant with temperature at O.6150Hz
P-7 coal Loss Factor with temperature at O.6150Hz
P-7 coal Dielectric Constant with temperature at I.4130Hz
EI-70
EI-71
El-72
El-73
EI-74
EI-75
El-76
El-77
El-78
EI-79
EI-80
EI-81
El-82
EI-83
El-84
EI-85
EI-86
EI-87
EI-88
EI-89
EI-90
EI-9}
EI-92
El-4
Submitted on CD ROM Appendix El
P-7 coal Loss Factor with temperature at 1.413GHz
P-7 coal Dielectric Constant with temperature at 2.216GHz
P-7 coal Loss Factor with temperature at 2.216GHz
El-93
El-94
El-95
EI-5
APPENDIXE2
HIGH TEMPERATURE DIELECTRIC PROPERTIES OF F-l COAL
SUBMITTED ON CD ROM
F-I coal Dielectric Constant with a temperature range of200-400°C
F-I coal Loss Factor with a temperature range of200-400°C
E2-2
E2-3
E2-1
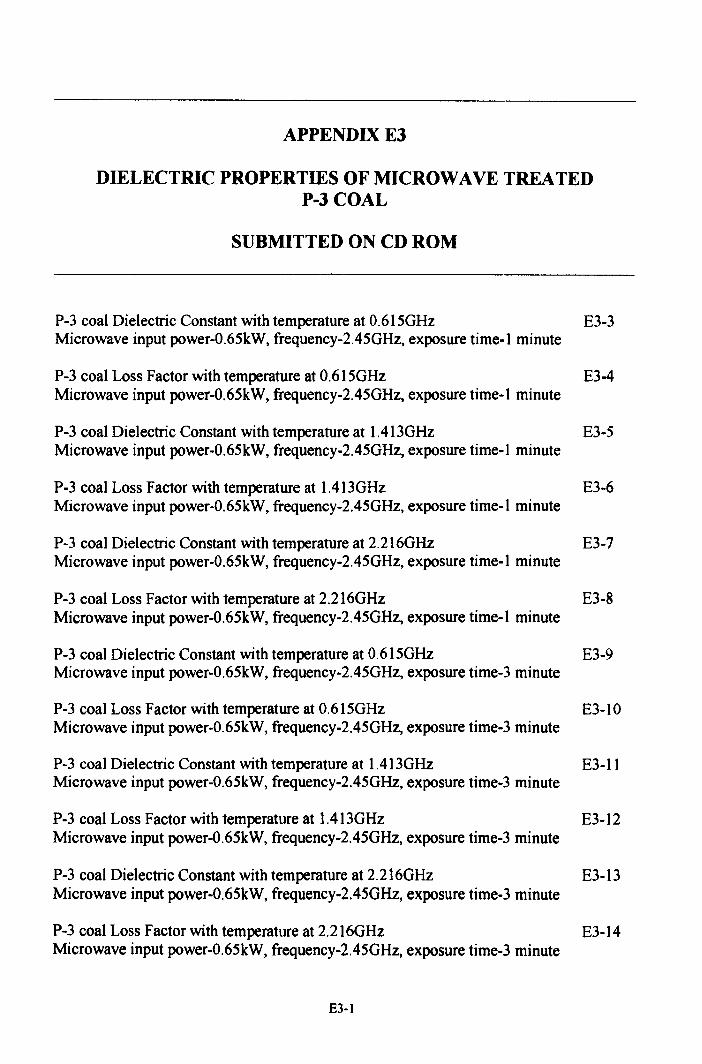
APPENDIXE3
DIELECTRIC PROPERTIES OF MICROWAVE TREATEDP..3 COAL
SUBMITTED ON CD ROM
P-3 coal Dielectric Constant with temperature at O.6ISGHz E3-3Microwave input power-O.6SkW, frequency-2.4SGHz, exposure time-I minute
P-3 coal Loss Factor with temperature at O.615GHz E3-4Microwave input power-O.65kW, frequency-2.4SGHz, exposure time-t minute
P-3 coal Dielectric Constant with temperature at 1.413GHz E3-5Microwave input power-O.6SkW, frequency-2.45GHz, exposure time-l minute
P-3 coal Loss Factor with temperature at 1.413GHz E3-6Microwave input power-O.65kW, frequency-2.45GHz, exposure time-I minute
P-3 coal Dielectric Constant with temperature at 2.216GHz E3-7Microwave input power-O.65kW, frequency-2.45GHz, exposure time-I minute
P-3 coal Loss Factor with temperature at 2.216GHz E3-8Microwave input power-O.65kW, frequency-2.45GHz, exposure time-I minute
P-3 coal Dielectric Constant with temperature at O.615GHz E3-9Microwave input power-O.65kW, frequency-2.4SGHz, exposure time-s minute
P-3 coal Loss Factor with temperature at O.6ISGHz E3-IOMicrowave input power-O.65kW, frequency-2.45GHz, exposure time-3 minute
P-3 coal Dielectric Constant with temperature at 1.413GHz E3-IIMicrowave input power-O.65kW, frequency-2.45GHz, exposure time-3 minute
P-3 coal Loss Factor with temperature at 1.413GHz E3-12Microwave input power-O.65kW, frequency-2.45GHz, exposure time-3 minute
P-3 coal Dielectric Constant with temperature at 2.216GHz E3-13Microwave input power-O.65kW, frequency-2.45GHz, exposure time-3 minute
P-3 coal Loss Factor with temperature at 2.216GHz E3-14Microwave input power-O.65kW, frequency-2.45GHz, exposure time-3 minute
E3-1
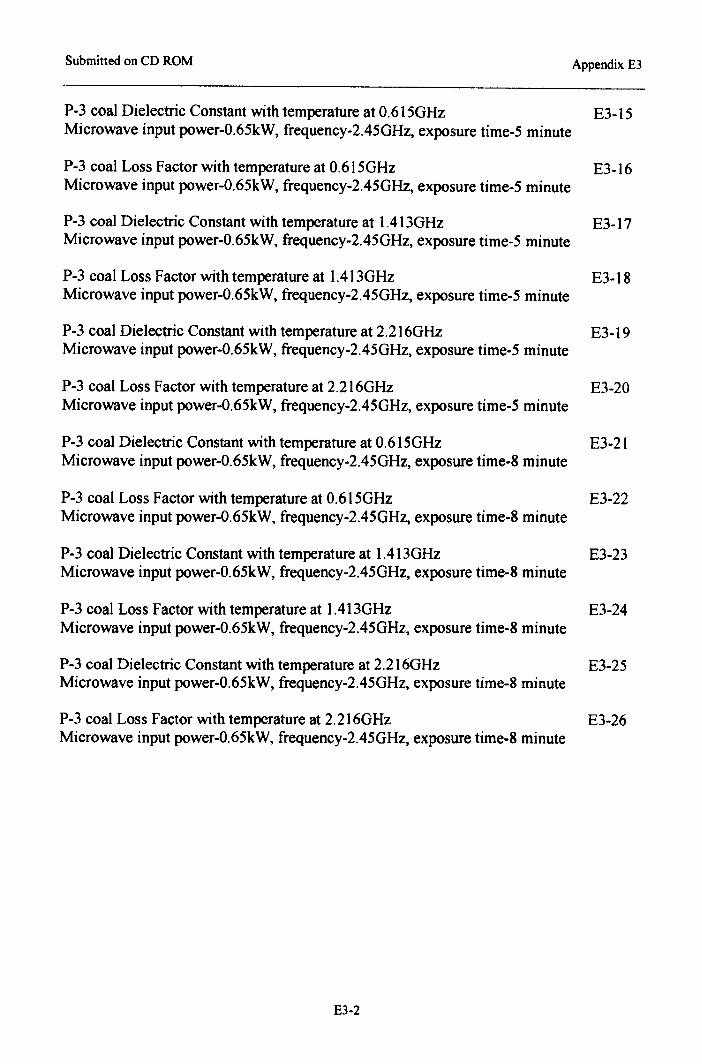
Submitted on CD ROM Appendix E3
P-3 coal Dielectric Constant with temperature at O.615GHz E3-I5Microwave input power-O.65kW, frequency-2.4SGHz, exposure time-S minute
P-3 coal Loss Factor with temperature at O.6ISGHz E3-16Microwave input power-O.6SkW, frequency-2.4SGHz, exposure time-S minute
P-3 coal Dielectric Constant with temperature at I.4I3GHz E3-17Microwave input power-O.6SkW, frequency-2.4SGHz, exposure time-S minute
P-3 coal Loss Factor with temperature at 1.413GHz E3-I8Microwave input power-O.6SkW, frequency-2.4SGHz, exposure time-S minute
P-3 coal Dielectric Constant with temperature at 2.2I6GHz E3-I9Microwave input power-O.6SkW, frequency-2.4SGHz, exposure time-S minute
P-3 coal Loss Factor with temperature at 2.216GHz E3-20Microwave input power-O.6SkW, frequency-2.4SGHz, exposure time-S minute
P-3 coal Dielectric Constant with temperature at O.61SGHz E3-21Microwave input power-O.6SkW, frequency-2.4SGHz, exposure time-8 minute
P-3 coal Loss Factor with temperature at O.615GHz E3-22Microwave input power-O.6SkW, frequency-2.45GHz, exposure time-S minute
P-3 coal Dielectric Constant with temperature at 1.413GHz E3-23Microwave input power-O.6SkW, frequency-2.45GHz, exposure time-S minute
P-3 coal Loss Factor with temperature at 1.413GHz E3-24Microwave input power-O.6SkW, frequency-2.45GHz, exposure time-8 minute
P-3 coal Dielectric Constant with temperature at 2.2I6GHz E3-2SMicrowave input power-O.6SkW, frequency-2.4SGHz, exposure time-8 minute
P-3 coal Loss Factor with temperature at 2.216GHz E3-26Microwave input power-O.6SkW, frequency-2.45GHz, exposure time-8 minute
E3-2
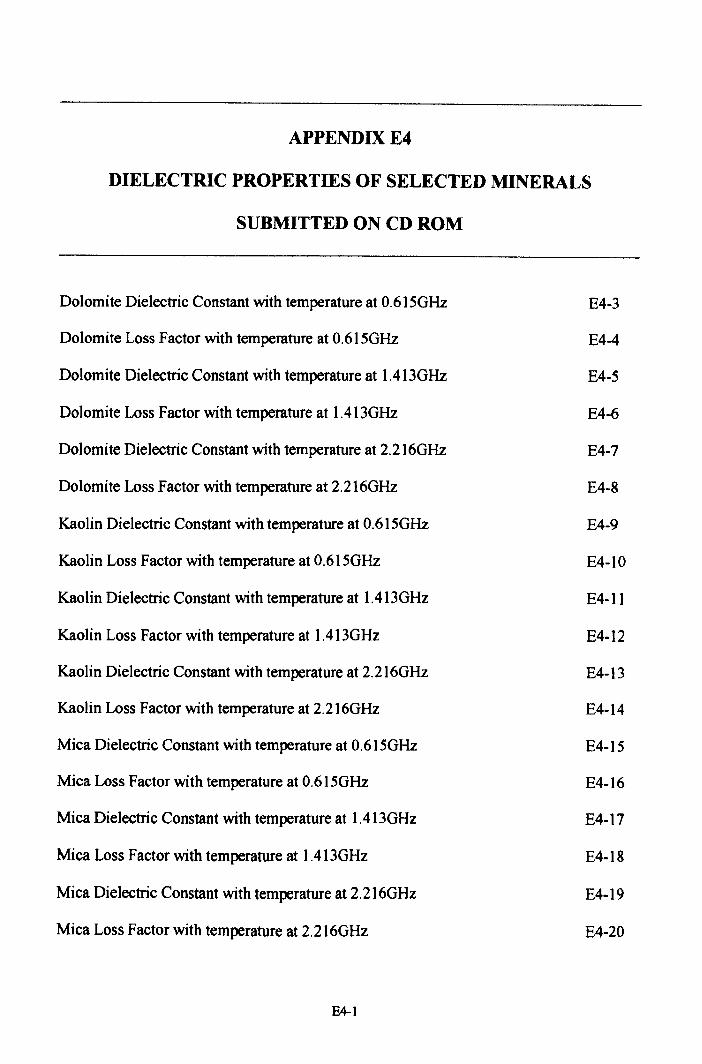
APPENDIXE4
DIELECTRIC PROPERTIES OF SELECTED MINERALS
SUBMITTED ON CD ROM
Dolomite Dielectric Constant with temperature at O.615GHz
Dolomite Loss Factor with temperature at O.615GHz
Dolomite Dielectric Constant with temperature at 1.413GHz
Dolomite Loss Factor with temperature at 1.413GHz
Dolomite Dielectric Constant with temperature at 2.216GHz
Dolomite Loss Factor with temperature at 2.216GHz
Kaolin Dielectric Constant with temperature at O.615GHz
Kaolin Loss Factor with temperature at O.615GHz
Kaolin Dielectric Constant with temperature at 1.413GHz
Kaolin Loss Factor with temperature at 1.413GHz
Kaolin Dielectric Constant with temperature at 2.216GHz
Kaolin Loss Factor with temperature at 2.216GHz
Mica Dielectric Constant with temperature at O.615GHz
Mica Loss Factor with temperature at O.615GHz
Mica Dielectric Constant with temperature at 1.4130Hz
Mica Loss Factor with temperature at 1.413GHz
Mica Dielectric Constant with temperature at 2.216GHz
Mica Loss Factor with temperature at 2.216GHz
E4-3
E4-4
E4-5
E4-6
E4-7
E4-8
E4-9
E4-10
E4-11
E4-12
E4-13
E4-14
E4-15
E4-16
E4-17
E4-18
E4-19
E4-20
E4-J
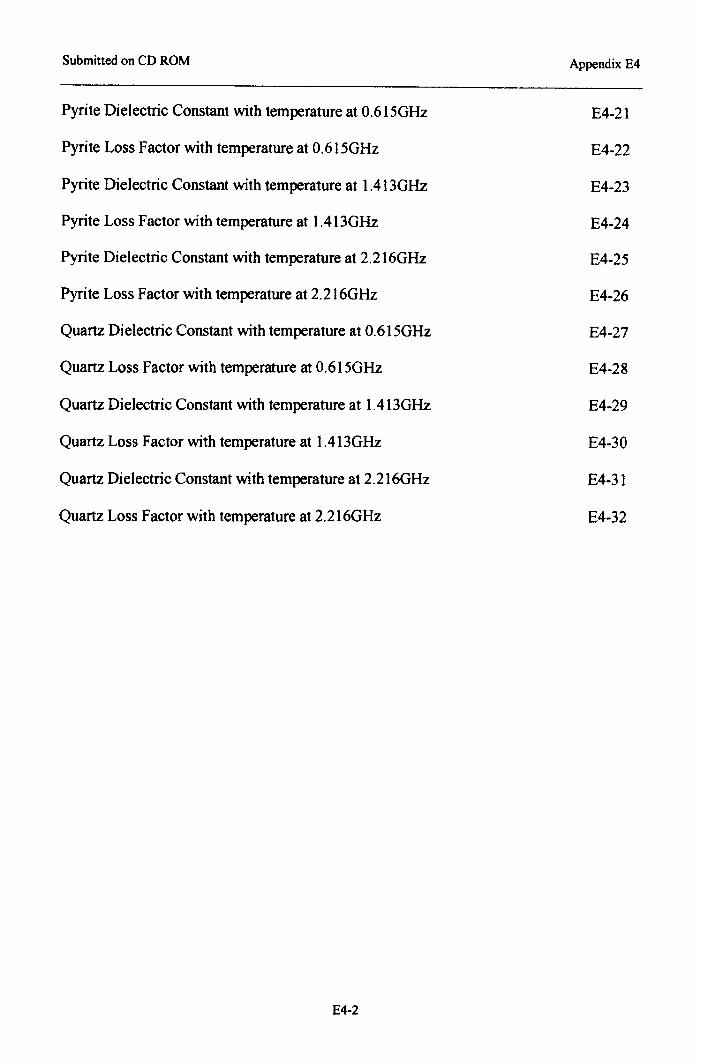
Submitted on CD ROM Appendix E4
Pyrite Dielectric Constant with temperature at O.615GHz
Pyrite Loss Factor with temperature at O.615GHz
Pyrite Dielectric Constant with temperature at 1.413GHz
Pyrite Loss Factor with temperature at IA 13GHz
Pyrite Dielectric Constant with temperature at 2.216GHz
Pyrite Loss Factor with temperature at 2.216GHz
Quartz Dielectric Constant with temperature at O.615GHz
Quartz Loss Factor with temperature at O.6150Hz
Quartz Dielectric Constant with temperature at IA 130Hz
Quartz Loss Factor with temperature at 1.4130Hz
Quartz Dielectric Constant with temperature at 2.2160Hz
Quartz Loss Factor with temperature at 2.2160Hz
E4-21
E4-22
E4-23
E4-24
E4-25
E4-26
E4-27
E4-28
E4-29
E4-30
E4-31
E4-32
E4-2
PAGE/PAGESEXCLUDED
UNDERINSTRUCTION
FROMUNIVERSITY