ice cream - university of birmingham etheses repository
TRANSCRIPT
ICE CREAM: AN APPROACH CONSIDERING
FORMULATION MICROSTRUCTURE AND EATING
BEHAVIOUR
By
SARAH MARIA SANTOS-MURPHY
A thesis submitted to
The University of Birmingham
for the degree of
DOCTOR OF PHILOSOPHY
School of
Chemical Engineering
The University of Birmingham
March 2014
University of Birmingham Research Archive
e-theses repository This unpublished thesis/dissertation is copyright of the author and/or third parties. The intellectual property rights of the author or third parties in respect of this work are as defined by The Copyright Designs and Patents Act 1988 or as modified by any successor legislation. Any use made of information contained in this thesis/dissertation must be in accordance with that legislation and must be properly acknowledged. Further distribution or reproduction in any format is prohibited without the permission of the copyright holder.
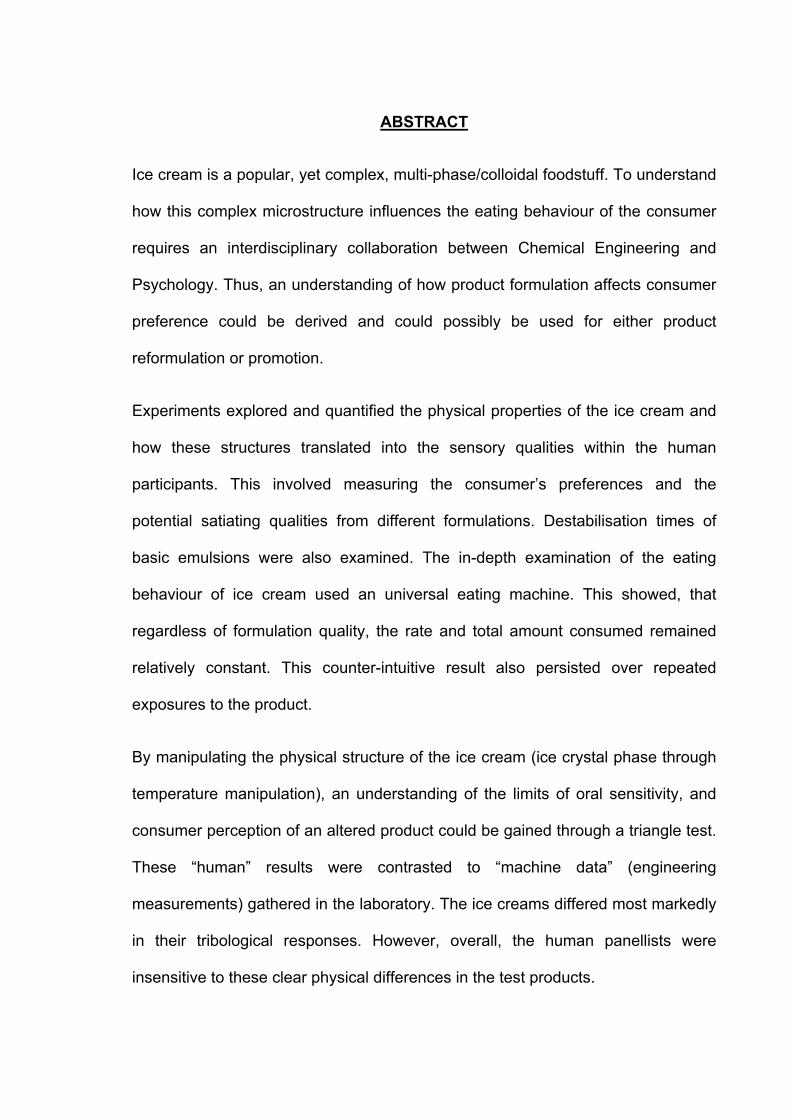
ABSTRACT
Ice cream is a popular, yet complex, multi-phase/colloidal foodstuff. To understand
how this complex microstructure influences the eating behaviour of the consumer
requires an interdisciplinary collaboration between Chemical Engineering and
Psychology. Thus, an understanding of how product formulation affects consumer
preference could be derived and could possibly be used for either product
reformulation or promotion.
Experiments explored and quantified the physical properties of the ice cream and
how these structures translated into the sensory qualities within the human
participants. This involved measuring the consumer’s preferences and the
potential satiating qualities from different formulations. Destabilisation times of
basic emulsions were also examined. The in-depth examination of the eating
behaviour of ice cream used an universal eating machine. This showed, that
regardless of formulation quality, the rate and total amount consumed remained
relatively constant. This counter-intuitive result also persisted over repeated
exposures to the product.
By manipulating the physical structure of the ice cream (ice crystal phase through
temperature manipulation), an understanding of the limits of oral sensitivity, and
consumer perception of an altered product could be gained through a triangle test.
These “human” results were contrasted to “machine data” (engineering
measurements) gathered in the laboratory. The ice creams differed most markedly
in their tribological responses. However, overall, the human panellists were
insensitive to these clear physical differences in the test products.
“Begin at the beginning, and go on until you come to the end; then stop”
- Lewis Carroll, Alice’s Adventures in Wonderland
ACKNOWLEDGEMENTS
I’d like to thank Dr Phil Cox for all your help, support and encouragement you have
given me over the past 4 years of studying.
Thank you to Dr Suzanne Higgs for your guidance, support and allowing me to use
the facilities to conduct the eating behaviour studies.
Thank you to all those in the Ingestive Behaviour group, especially Jason Thomas
and Iraida Neira.
A huge thanks to Jon O’Sullivan for all the laboratory and data assistance.
To my parents for their support and unwavering belief in me.
To Adam, for everything. The past 4 years of studying haven’t been easy but
you’ve always believed in me and supported me, through the ups and the downs.
And Parker, Penny and Max. For the head bumps, wet paws on my work and
constant company during the lonely time that was writing up.
TABLE OF CONTENTS
CHAPTER 1: Literature Review............................................................................ 1
1.1 Engineering literature review...................................................................... 1
1.1.1 What is ice cream? .................................................................................. 1
1.1.2 Definition of terms.................................................................................... 1
1.1.3 How much is the industry worth?............................................................. 2
1.1.4 Factors influencing ice cream purchase .................................................. 3
1.2 The structure of Ice cream .......................................................................... 4
1.2.1 Ice Crystals .............................................................................................. 4
1.2.2 Fat Globules ............................................................................................ 6
1.2.3 Air Cells ................................................................................................... 7
1.2.4 Air destabilisation processes ................................................................... 8
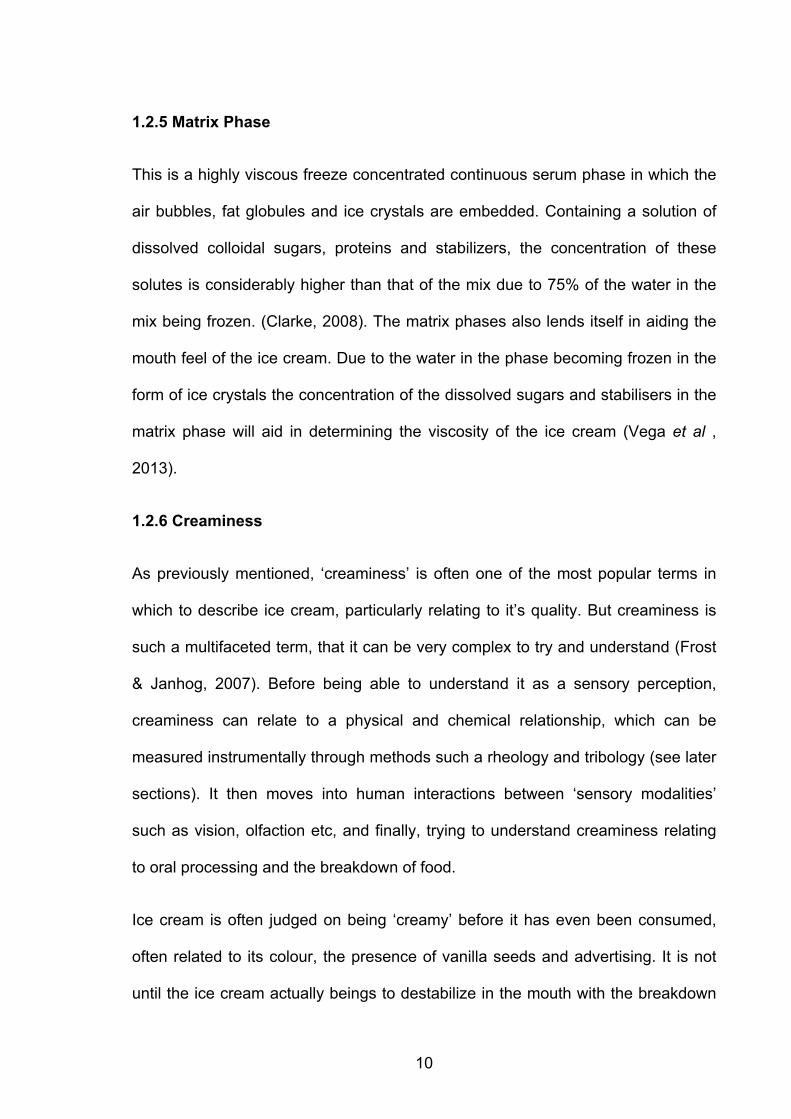
1.2.5 Matrix Phase.......................................................................................... 10
1.2.6 Creaminess............................................................................................ 10
1.3 Ice cream manufacture .............................................................................. 11
1.3.1 Blending................................................................................................. 12
1.3.2 Pasteurization ........................................................................................ 13
1.3.3 Homogenization..................................................................................... 13
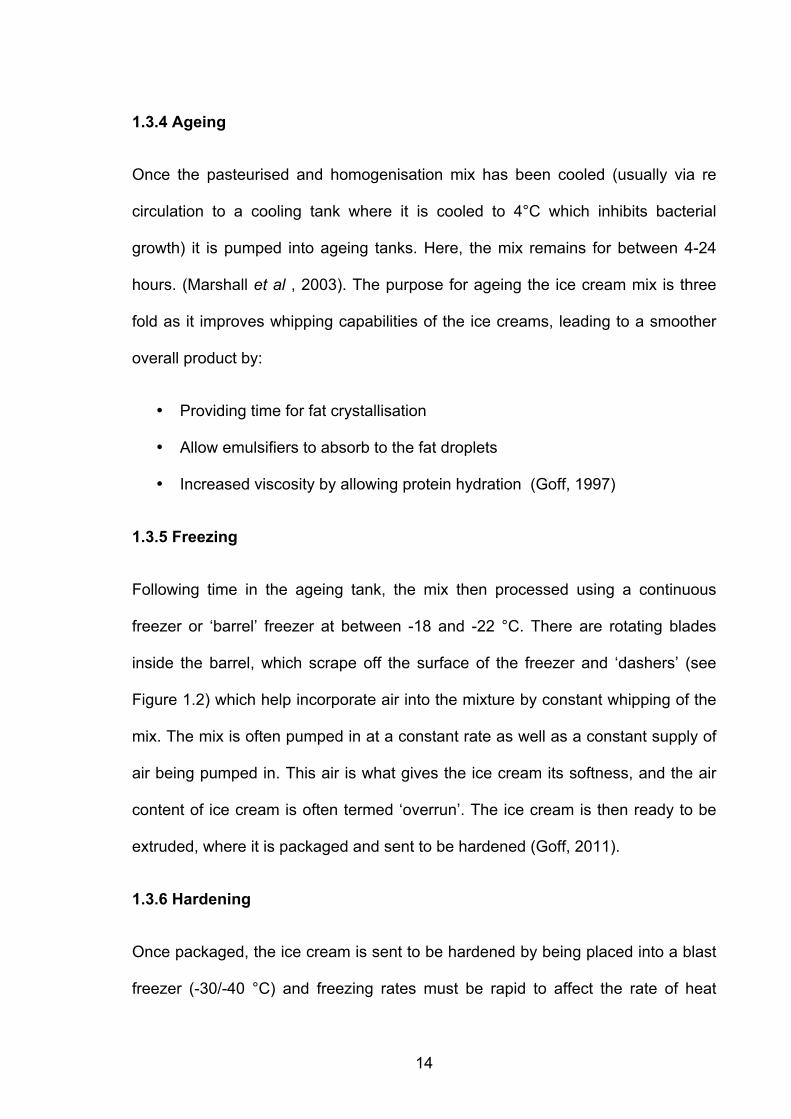
1.3.4 Ageing.................................................................................................... 14
1.3.5 Freezing................................................................................................. 14
1.3.6 Hardening .............................................................................................. 14
1.4 Reformulating ice cream ........................................................................... 16
1.4.1 Reducing fat........................................................................................... 16
1.4.2 Milk Fat replacements............................................................................ 16
1.4.3 Disadvantages of Milk fat replacements ................................................ 17
1.4.4 Replacing sugars ................................................................................... 18
1.4.5 Introducing more air ............................................................................... 18
1.5 Instrumental measurements of ice cream structure............................... 19
1.5.1 Tribology ................................................................................................ 19
1.5.2 Differential scanning microscopy ........................................................... 21
1.5.3 Rheology................................................................................................ 22
1.5.4 Particle size ........................................................................................... 22
1.6 Eating behaviour literature review ........................................................... 23
1.6.1 Why study eating behaviour? ................................................................ 24
1.6.2 Satiation and Satiety.............................................................................. 25
1.6.3 Eating rate ............................................................................................. 27
1.6.4 Laboratory vs. Free-living ...................................................................... 28
1.6.5 Self-reporting measures ........................................................................ 28
1.6.6 Measuring intake ................................................................................... 29
1.6.7 Effect of palatability and portion size on eating rate .............................. 30
1.6.8 Confounding variables in eating behaviour research............................. 32
Chapter 2: Questionnaire And Taste Tests....................................................... 34
2.1 Ice cream questionnaire study ................................................................. 34
2.1.1 Methodology .......................................................................................... 35
2.1.2 Results................................................................................................... 37
2.1.3 Discussion ............................................................................................. 48
2.2 Ice cream palatability taste test and portion size test ............................ 50
2.2.1 Methodology .......................................................................................... 51
2.2.2 Results................................................................................................... 56
2.2.3 Discussion ............................................................................................. 61
Chapter 3: Material Properties And Characterisation Of Ice Cream............... 64
3.1 Material and methods ................................................................................ 65
3.1.1 Emulsion preparation............................................................................. 65
3.2 Instrumental measurement methods ....................................................... 69
3.2.1 Particle size measurement .................................................................... 69
3.2.2 Microscopy............................................................................................. 70
3.2.3 Creaming Profiles .................................................................................. 70
3.2.4 Tribology ................................................................................................ 70
3.3 Results and discussion ............................................................................. 71
3.3.1 Basic emulsions with no e/s mix ............................................................ 71
3.3.2 Microscopy of Shear time experiments.................................................. 74
3.3.3 Basic emulsions with E/S mix (0.5% and 1%) ....................................... 74
3.3.4 Influence of emulsifier/stabilizer mixture on creaming profile of emulsions
........................................................................................................................ 77
3.3.5 Influence of homogenization on fat particle size of emulsions............... 79
3.3.6 Homogenization on creaming profiles of emulsions .............................. 81
3.3.7 Tribology results .................................................................................... 83
Chapter 4: Eating Behaviour Investigations..................................................... 86
4.1 Analysis of commercially available ice cream eating behaviour through
a repeated measures design........................................................................... 86
4.1.1 Hypothesis ............................................................................................. 87
4.1.2 Methodology .......................................................................................... 87
4.1.3 Results................................................................................................... 93
4.1.4 Discussion ........................................................................................... 103
4.2 Analysis of commercially available ice cream eating behaviour through
a Mixed-between Analysis of Variance experimental design .................... 105
4.2.1 Hypothesis ........................................................................................... 105
4.2.2 Methodology ........................................................................................ 106
4.2.3 Results................................................................................................. 107
4.2.4 Discussion ........................................................................................... 130
4.3 Additional triangle tests in which commercially available ice creams
are manipulated through the process of temperature cycling to alter ice
crystal size...................................................................................................... 132
4.3.1 Hypothesis ........................................................................................... 133
4.3.2 Methodology ........................................................................................ 133
4.3.3 Results and discussion ........................................................................ 135
Chapter 5: Engineering Investigations............................................................ 138
5.1 Material and methods .............................................................................. 139
5.1.1 Ingredients and nutritional information for commercial ice creams...... 139
5.1.2 Slumping.............................................................................................. 140
5.1.3 Rheology measurements..................................................................... 141
5.1.4 Tribology measurements ..................................................................... 141
5.1.5 Differential Scanning Calorimetry ........................................................ 142
5.1.6 Particle size analysis ........................................................................... 143
5.2 Results and discussion ........................................................................... 144
5.2.1 Rhelology measurements .................................................................... 144
5.2.2 Tribology measurements ..................................................................... 146
5.2.3 Particle droplet size ............................................................................. 150
5.2.4 Differential scanning calormity............................................................. 152
5.2.5 Meltdown and Slumping ...................................................................... 156
5.3 Thesis conclusions and future work...................................................... 162
Appendix ............................................................................................................ 164
References ......................................................................................................... 198
LIST OF FIGURES
Figure 1.1.: Breakdown of ice cream sale ............................................................... 3
Figure 1.2: Diagram of a dasher.............................................................................. 4
Figure 1.3: Blending diagram ................................................................................ 12
Figure 1.4: Process flow diagram of ice cream manufacutre process................... 15
Figure 1.5: Tribometer schematic.......................................................................... 21
Figure 2.1: Photographs of ice cream portion size................................................ 55
Figure 2.2: Visual analogue scores for taste tests ................................................ 59
Figure 3.1: Shear time 1 minute ............................................................................ 73
Figure 3.2: Shear time 5 minutes .......................................................................... 73
Figure 3.3: Shear time 10 minutes ........................................................................ 74
Figure 4.1: Mood ratings pre/post sessions .......................................................... 95
Figure 4.2: Palatability VAS ratings....................................................................... 96
Figure 4.3: Engery density of ice creams .............................................................. 97
Figure 4.4: Average rate of intake ......................................................................... 99
Figure 4.5: Within meal Enjoyment ..................................................................... 102
Figure 4.6: Within meal hunger ........................................................................... 102
Figure 4.7: Within meal Fullness ......................................................................... 103
Figure 4.8: Palatability VAS ratings across 3 sessions Sainsburys .................... 114
Figure 4.9: Palatability VAS ratings across 3 sessions Mackies ......................... 114
Figure 4.10: Palatability VAS ratings session 1................................................... 115
Figure 4.11: Palatability VAS ratings session 2................................................... 115
Figure 4.12: Palatability VAS ratings session 3................................................... 116
Figure 4.13: Average overall intake for 3 sessions ............................................. 117
Figure 4.14: Average ED over three sessions..................................................... 119
Figure 4.15: Rate of intake session 1.................................................................. 121
Figure 4.16: Rate of intake session 2.................................................................. 121
Figure 4.17: Rate of intake session 3.................................................................. 122
Figure 4.18: Within meal enjoyment VAS ratings over quartiles ......................... 126
Figure 4.19: Within meal hunger VAS ratings over quartiles............................... 128
Figure 4.20: Within meal fullness VAS ratings over quartiles.............................. 130
Figure 5.1: Schematic of tribometer .................................................................... 142
Figure 5.2: Rheological measurments................................................................. 145
Figure 5.3: Sainsburys normal and Sainsburys cycled tribometre data .............. 147
Figure 5.4: Mackies normal/cycled tribometer results ......................................... 148
Figure 5.5: Sainsburys normal/cycled vs Mackies normal/cycled tribometer results
...................................................................................................................... 148
Figure 5.6: Particle size for normal and cycled samples ..................................... 152
Figure 5.7: Heating/melting point of ice creams .................................................. 155
Figure 5.8: Cooling/freezing point of ice creams ................................................. 156
Figure 5.9: Slumping of ice creams over time ..................................................... 158
Figure 5.10: Slumping of ice creams at 37°c over time....................................... 160
LIST OF TABLES
Table 2.1: Smoke/diet/health................................................................................. 39
Table 2.2: Do you eat ice cream? ......................................................................... 40
Table 2.3: Frequency of eating ice cream ............................................................. 40
Table 2.4: Where do you purchase ice cream?..................................................... 41
Table 2.5: Brand purchase .................................................................................... 42
Table 2.6: Ice cream texture preference ............................................................... 42
Table 2.7: Types of ice cream consumed ............................................................. 43
Table 2.8: Method in which ice cream is consumed.............................................. 44
Table 2.9: When ice cream is consumed .............................................................. 45
Table 2.10: Factors influencing ice cream purchase............................................. 46
Table 2.11: Ice cream brand association .............................................................. 47
Table 2.12: Ice cream brand association .............................................................. 47
Table 2.13: Ice cream quality ................................................................................ 48
Table 2.14: Ice cream composition ....................................................................... 53
Table 2.15: Descriptive statistics for taste test 1 ................................................... 57
Table 2.16: Descriptive statistics for taste test 2 ................................................... 58
Table 2.17: Descriptive statistics for highest scoring premium and basic ice
creams ............................................................................................................ 60
Table 2.18: Portion size exercise .......................................................................... 60
Table 3.1: Basic emulsion no emulsifier/stabliser mix........................................... 66
Table 3.2: Basic emulsion (0.5% emulsifier/stabliser mix) .................................... 66
Table 3.3: Basic emulsion (1% emulsifier/stabliser mix) ....................................... 67
Table 3.4: Homogenised samples......................................................................... 68
Table 3.5: Commercially avaliable ice creams ...................................................... 69
Table 3.6: Particle size (Voulme/weight) for basic emulsions no e/s mix.............. 72
Table 3.7: Particle size (volume/weight) for basic emulsions 0.5% and 1% e/s mix
........................................................................................................................ 75
Table 3.8: Creaming profiles of 0.5% e/s mix on basic emulsions ........................ 77
Table 3.9: Creaming profile for 1% e/s mix on basic emulsions............................ 77
Table 3.10: Particle size (volume/weight) Homogenised 30% fat basic emulsion 80
Table 3.11: Homogenisation on creaming profiles of 30% fat emulsions.............. 81
Table 4.1: Age/BMI/DEBQ results......................................................................... 88
Table 4.2: Nutritional composition of ice creams................................................... 89
Table 4.3: Mood ratings pre session ..................................................................... 93
Table 4.4: Mood ratings post session.................................................................... 94
Table 4.5: Palatability ratings ................................................................................ 96
Table 4.6: Average rate of intake .......................................................................... 98
Table 4.7: Pre meal hunger/fullness ratings.......................................................... 99
Table 4.8: Within meal data in quartiles .............................................................. 100
Table 4.9: Age/BMI/DEBQ scale ......................................................................... 106
Table 4.10: Pre session mood ratings (sessions1/2/3) ....................................... 110
Table 4.11: Post session mood ratings (session1/2/3)........................................ 111
Table 4.12: Palatability ratings across 3 sessions............................................... 112
Table 4.13: Average amount of ice cream consumed over 3 sessions............... 117
Table 4.14: Engery density cosumed over 3 sessions ........................................ 118
Table 4.15: Rate of intake over 3 sessions ......................................................... 120
Table 4.16: Pre session enjoyment/hunger/fullness VAS ratings........................ 123
Table 4.17: Descriptive statistics for enjoyment VAS scores over quartiles........ 125
Table 4.18: Descriptive statistics for hunger VAS ratings over quartiles............ 127
Table 4.19: Descriptive statistics for fullness over quartiles................................ 129
Table 4.20: Triangle test results .......................................................................... 135
Table 4.21: List of descriptors used by participants ............................................ 136
Table 5.1: Composition of ice creams ................................................................. 140
Table 5.2: Particle size (Volume/weight) for normal and cycled samples ........... 151
Table 5.3: Heating peak analysis of thermal properties of ice cream.................. 154
Table 5.4: Cooling peak analysis of thermal properties of ice cream.................. 154
Table 5.5: Representative photographs of ice cream samples at 25°c ............... 157
Table 5.6: Representative photographs of ice cream samples at 37°c ............... 159
SUMMARY OF THESIS
Chapter 1: Literature reviews encompassing areas of engineering (formulation)
and psychology (eating behaviour) regarding the nature of ice cream formulation
through laboratory-based data and eating behaviour, leading to discussion on
satiation and satiety.
Chapter 2: Questionnaire and taste test experiments of a variety of commercially
available ice creams with human participants.
Chapter 3: Investigations into ice cream to better understand time scales of
destabilisation and material change, gathered from preliminary experiments, such
as basic emulsions and creaming profiling.
Chapter 4: Eating behaviour investigations
Separated into three sections for ease of reading:
4.1: Analysis of commercially available ice cream eating behaviour through a
repeated measures design
4.2: Analysis of commercially available ice cream eating behaviour through a
Mixed-between Analysis of Variance experimental design
4.3: Additional triangle tests in which commercially available ice creams are
manipulated through the process of temperature cycling to alter ice crystal size.
Chapter 5: Formulation analysis of commercially available ice cream studied in
Chapter 4 through the use of engineering methods and thesis conclusions.
1
CHAPTER 1: LITERATURE REVIEW
1.1 Engineering literature review
1.1.1 What is ice cream?
Ice cream is a commonly consumed frozen dessert, the term of which is used to
cover a broad range of different types. These range from dairy ice creams, which
are a frozen aerated mixture of diary ingredients sugars and flavours, to sorbets,
which are fruit based aerated sugar syrup solutions that contain neither fat nor
milk.
1.1.2 Definition of terms
The legal definition of an ice cream varies from country to country. In America, for
a product to be called an ice cream, the product must contain no less than 10%
milk fat, and Canada, no less than 8% (Goff & Hartel, 2013). However, in the UK,
the industry is a little more complicated, with several categories of ice cream being
available to consumers. For a product to be legally named an ‘ice cream’ the
definition is as follows:
‘Shall not be applied to any food other than frozen product containing not less than
2.5% milk protein, not necessarily in natural proportions and which is obtained by
subjecting an emulsion of fat, milk solids and sugar, with or without the addition of
other substances, to heat treatment and either to subsequent freezing or
evaporation, addition of water and subsequent freezing.’ (Food Labelling
regulations, 1996)
2
A ‘Dairy ice cream’ has the following definition:
‘Shall not be applied to any food other than one which fulfils the conditions relating
to application of the description “ice cream” to a food (provided that the fat in
respect of which a minimum 5% is specified shall here consist exclusively of milk
fat) and which contains no fat other than milk fat or any fat present by reason of
the use as an ingredient of such ice cream of any egg, any flavouring or any
emulsifier or stabilizer.’ (Food Labelling regulations, 1996)
1.1.3 How much is the industry worth?
The global market for ice cream is estimated to be worth £35 billion, with the USA
accounting for £13 billion and the UK £1.48 billion, and the largest producers of ice
cream are Unilever and Nestle, which in unison hold 29% of the market share
(Clarke, 2008). The USA is the largest producer of ice cream, producing around 6
billion litres per annum and has a per captia annual consumption of 18.3 Litres. In
the UK the consumption rate is lower, with the average person consuming 6 litres
(Stones, 2012)
In practice, this indicates that the global desire for ice cream is huge, and the
market is constantly evolving, seeking new and exciting products to sell to the
consumer. It may also indicate that there is scope for new and improved healthy
formulations with the ever-growing obesity epidemic that is sweeping the globe.
However, it is imperative that these formulations, whilst improving on health, do
not compromise on taste and texture.
3
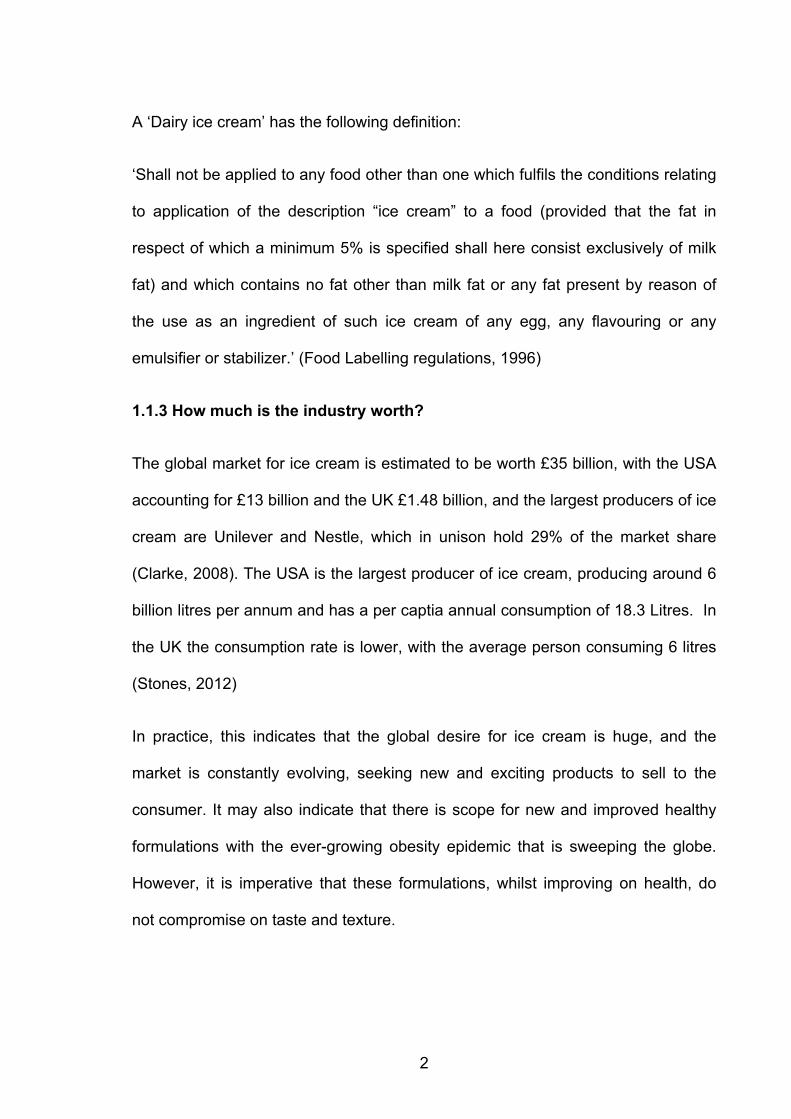
1.1.4 Factors influencing ice cream purchase
There are several factors that influence the consumer to buy ice cream, none
more so than time of year and the type of ice cream they wish to purchase.
Demand for impulse purchases is highly seasonal in the UK. It is estimated that
sales in the summer months can be as much as five times higher than in the
winter months (Goff & Hartel, 2013; Clarke, 2008). Boniface & Umberger (2012)
found that in Malaysia, ice cream was purchased most frequently, with 34% of the
cohort tested purchasing it weekly. It was hypothesised that this may be due to the
increase in the amount of supermarkets now present in Malaysia, which is where
most of the subjects purchased the ice creams
Figure 1.1: Breakdown of ice cream sale
53%
21%
21% 5%
UK Ice cream market sales (£million) Impulse £787m
Hand held mul6 packs £308m
Dessert ice creams £306m
Foodservice packs £83m
4
1.2 The structure of Ice cream
The structure of ice cream is highly complex and of great importance to the
perception of in mouth texture when it is consumed (Varela, Pinter & Fiszman,
2014). This complex structure is formed during the aeration and freezing
processes. The structural phases of ice cream include ice crystals, fat globules, air
bubbles and a serum phase known as the matrix consisting of sugars and
stabilizers. Please see appendix for a detailed diagram of the microstructure of ice
cream.
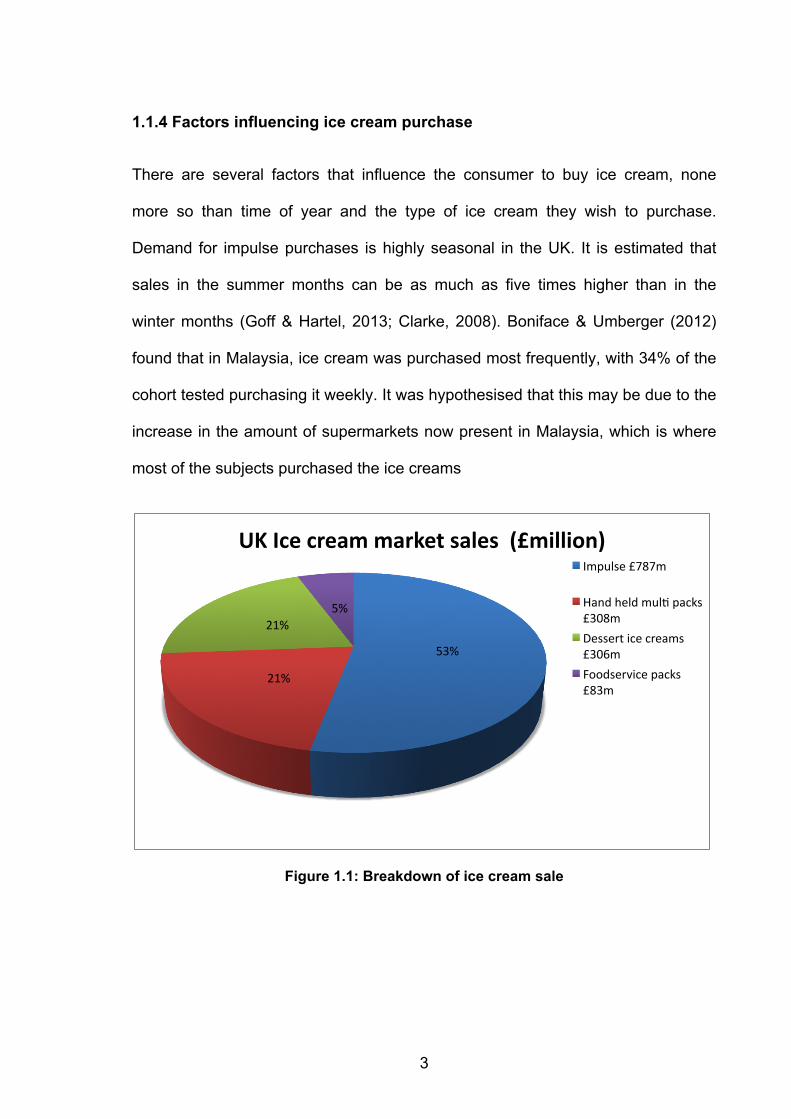
1.2.1 Ice Crystals
This discrete phase is formed by secondary nucleation in a scraped surface
freezer. Diagram 1.2 is a cross section example of a scraped surface freezer used
in the manufacture of ice cream and integral to the formation of ice crystals.
Please see page 14 for more detail.
Figure 1.2: Diagram of a scraped surface freezer
5
Ice crystals can vary in size from 1µm to 150µm (Cook & Hartel, 2009). It is vital to
the mouth feel and texture of the ice cream that the sizes of the ice crystals are
small, with a diameter of no more than 50µm, preferably around 35µm, for limited
detection. Above this, the ice crystals will be detected in the mouth and the ice
cream will have a gritty mouth feel (Marshall et al , 2003). The desired quality of an
ice cream is to have small ice crystals to give a smooth and palatable texture. It is
therefore vital to control the rate of crystallization in order to develop ice crystals
with correct size, shape and distribution qualities. This can be achieved during the
nucleation freezing process, which takes place during the freezing stage of
manufacture (Clarke, 2008). In order to produce small ice crystals, the nucleation
must take place at a low temperature. The shorter time the ice cream mixture is
present in the freezer, coupled with slower dasher speeds also aid in producing ice
crystals with smaller mean size. This is the reason that Freon and ammonia are
used as a jacketed refrigerant in the freezing process, as it promotes rapid
nucleation (Goff, 1995). The whipping process also allows the ice crystals to
remain discrete.
Re-crystallisation is the process of changes in the ice crystal size and distribution
due to temperature change during storage (Goff, 1997). The effect of re-
crystallization on ice crystal size and distribution is important; as this can alter the
microstructure leading to an ice cream with a coarse mouth feel. Re-crystallization
occurs via two mechanisms: Ostwald ripening and accretion. Water vapour can
also alter the ice crystal structure (Clarke, 2008). There has been recent research
into trying to overcome the issue of re-crystallization (Clarke, Buckley & Lindner,
2002; Goff & Regand, 2006).
6
When an ice cream melts in the mouth, the structural elements change, as the ice
melts and the fat stabilized foam structure collapses. The outside temperature and
also the rate of heat transfer affect the rate at which the ice melts. However, this
cannot occur until the fat stabilized foam collapses, which is a function of the
partial coalescence of the fat globules.
1.2.2 Fat Globules
The fat structure is formed during homogenization in the manufacturing process,
and is vital to stabilizing the air phase of the formulation (Clarke, 2008).
During homogenization a pre-emulsion is formed by dispersing molten liquid fat in
order to obtain droplet sizes below 2µm (Eisner et al ., 2007). However, research
has indicated that the role of pasteurization also helps to melt the fat in order to
create a well-homogenized fat emulsion (Marshall & Arbuckle, 1996). Following
high-pressure homogenization, discrete and partially coalesced fat droplets are
present in both the matrix phase and at the surface of the air phase. High-pressure
homogenization (200atm) and double homogenization can produce smaller fat
droplets allowing for an increased fat surface area (Clarke, 2008). This is
beneficial in low fat ice cream mixes as the air bubbles become more stable.
The emulsifiers control the structure of these fat globules and the degree of the
partial coalescence in the system. Emulsifiers are added to the ice cream mix to
increase the stability of the fat emulsion during freezing, and improve desirable
qualities in the ice cream such as whipping ability and allow for a slower meltdown
(Baer, Wolkow & Kasperson, 1997;Goff 1997). Meltdown rate can be described as
the rate at which the ice cream melts, which can be heavily influenced through the
7
ingredients used in the ice cream. Also, the type of emulsifier, such as lecithin
found in egg yolks, or Polysorbate 80 and level of incorporation used can impact
on the partial coalescence (Goff, 1997;Davies ,Dickinson & Bee, 2000). Generally,
according to Tharp & Young (2012), in higher fat ice creams, lower levels of
emulsifier are needed. Above a fat content of 15% no emulsifier is usually
required. Polysorbate 80 has a restriction of incorporation at around 0.06% due to
it potential to taint flavour. Mono dygliceride/Polysorbate blends are common to
address this problem (Tharp & Young, 2012), as are stabiliser and emulsifier
blends. The concentration of the total solids of the ice cream influence the amount
of the blend that can be incorporated into the ice cream mix, and also depends on
the type of ice cream desired i.e. soft serve or low fat. Typical levels of
emulsifier/stabiliser blend are between 1% (non fat ice creams) and 0.4% (soft
scoop ice creams) (Naresh & Merchant, 2006)
Fat has a profound impact upon flavour and mouth coating of ice creams. Some
volatiles are soluble in oil and not in water and the solid fat particles allow an
increase in viscosity of the matrix phase, which contributes to a decreased
meltdown rate (Koxholt, 2001).
1.2.3 Air Cells
As ice cream is both an emulsion and foam, the size and distribution of air cells
play a vital role in the structure of ice cream (Ronteltap & Prins, 1990). It is also
intrinsic to the sensorial aspect of creaminess, a heavily desirable quality of ice
cream (Wildmoser Sheiwiller & Windhab, 2004), with smaller bubbles sizes
8
producing a more pronounced sensation of creaminess. Defining ‘creaminess’ is
complex, and defining human sensitivity to creaminess is even more complex. It is
generally accepted that creaminess has a hedonic level and is a key component of
sensory appeal, especially in foods such as ice cream and yoghurt (Folkenberg &
Martens, 2003). Kokini (1987) suggested a relationship between thickness as a
shear stress on the palate. The perception of creaminess is a function of
smoothness and thickness, which is related to rheological properties (Frost &
Janhoj,2007). Air is incorporated into the mixture during the freezing stage in the
scraped surface heat exchanger, and small air bubbles (around 20-80µm in
diameter) are produced. The fat droplets are vital to the air interface, and during
the freezing and aeration of the mix, the homogenized milk fat emulsion
undergoes partial coalescence, causing the fat droplets to cluster and aggregate,
which then form around the air bubbles and stabilize them.
1.2.4 Air destabilization processes
The purpose of air in ice cream is to soften it. Without air, it would be hard and
inedible. The air phase also allows for light to scatter, affecting colour and
appearance, and also hinders the separation of ice crystals reducing the risk of
accretion, such as Ostwald ripening (Clarke, 2008).
There are two coarsening mechanisms that involve the air cells in ice cream:
Disproportionation and coalescence. These two mechanisms are somewhat
interconnected, due to the rate of one on another (Walstra, 1996).
Disproportionation is analogous to Ostwald ripening of ice crystals; the Laplace
pressure inside an air bubbles is larger than that of the outside. The smaller the
9
bubbles the larger the pressure, hence there is a net transfer of air from the
smaller bubbles to the larger, causing the smaller bubbles to disappear.
Coalescence occurs when two bubbles come into contact and the film separating
them ruptures.
A way of inhibiting disproportionation is increasing the viscosity of the matrix
phase (Sofjan & Hartle, 2003). This increased viscosity reduces the rate of
diffusion between bubbles, eliminating disproportionation. The absorption of
emulsifiers at the bubble surface interface reduces coalescence by lowering the
surface tension (Clarke, 2008)
Overrun is the measurement of air whipped into the ice cream mix during freezing
and is calculated as a percentage increase of the finished product. For example, 1
litre of ice cream mix post whipping and freezing may yield 1.5 litres of finished
product, therefore, the overrun is 50%. Hartel (1996) stated that low overrun
causes coarser ice crystal formation compared the same formulation made with a
higher overrun. This is because the air cells may aid the impediment of ice crystals
during freezing. Flores and Goff (1999) suggested that a low amount overrun does
not influence ice crystal size and but that around 70% is necessary to have a
noticeable impact on microstructure. However when the volume of air reached
critical volume, increasing overrun had less impact on the overall ice cream
structure.
An excess in overrun can have a negative impact on ice cream quality: too much
air will dissipate flavour and produce ice cream that is fluffy in texture and light in
weight (Porto, 2012).
10
1.2.5 Matrix Phase
This is a highly viscous freeze concentrated continuous serum phase in which the
air bubbles, fat globules and ice crystals are embedded. Containing a solution of
dissolved colloidal sugars, proteins and stabilizers, the concentration of these
solutes is considerably higher than that of the mix due to 75% of the water in the
mix being frozen. (Clarke, 2008). The matrix phases also lends itself in aiding the
mouth feel of the ice cream. Due to the water in the phase becoming frozen in the
form of ice crystals the concentration of the dissolved sugars and stabilisers in the
matrix phase will aid in determining the viscosity of the ice cream (Vega et al ,
2013).
1.2.6 Creaminess
As previously mentioned, ‘creaminess’ is often one of the most popular terms in
which to describe ice cream, particularly relating to it’s quality. But creaminess is
such a multifaceted term, that it can be very complex to try and understand (Frost
& Janhog, 2007). Before being able to understand it as a sensory perception,
creaminess can relate to a physical and chemical relationship, which can be
measured instrumentally through methods such a rheology and tribology (see later
sections). It then moves into human interactions between ‘sensory modalities’
such as vision, olfaction etc, and finally, trying to understand creaminess relating
to oral processing and the breakdown of food.
Ice cream is often judged on being ‘creamy’ before it has even been consumed,
often related to its colour, the presence of vanilla seeds and advertising. It is not
until the ice cream actually beings to destabilize in the mouth with the breakdown
11
of its structure that human perception of creaminess takes place. Brockhoff (2001)
found that overall, creaminess can only be moderately predicted through the use
of instrumental measurements such as rheology. But others have found that this is
dependent on the type of food being tested. Weak gels, such as yoghurts, cannot
have their creaminess predicted accurately when compared to other dairy
products such as cream cheese (Janhoj, Petersen et al , 2006; Janhoj, Frost &
Anderson, 2006)
1.3 Ice cream manufacture
Ice cream is a complex polyphasic system that comprises of ice crystals, fat
globules, air bubbles and an unfrozen serum phase known as the matrix. These
individual phases when combined provide the properties of the underlying
microstructure to an ice cream. Ice crystals and air bubbles usually range between
20-50µm, whilst the air bubbles are partially coated with fat droplets, which
themselves are coated with an emulsified layer. The matrix phase consists of
sugars and polysaccharides in a freeze concentrated solution. Structural
development then continues during manufacturing processes such as blending,
pasteurization, homogenization, aging, freezing and hardening (Clarke, 2008).
These manufacturing processes are vital to the development and stability of the
microstructure. Generally the manufacturing can be broken down into two stages:
Mix preparation and freezing operations (Clarke, 2008; Marshal et al l, 2003). The
mixing preparation consists of blending ingredients, batch or continuous
pasteurization, homogenization, cooling and aging. The freezing operations then
begin once the mixture has aged. This creates two discrete phases, millions of tiny
12
air bubbles and ice crystals are dispersed into the concentrated mix via batch or
continuous freezing, and then the ice cream is packaged, left to harden and then
stored, ready to be distributed. Below is a brief description of each of the
manufacturing stages. Please see Figure 1.4 for an overall process flow diagram
of ice cream manufacture.
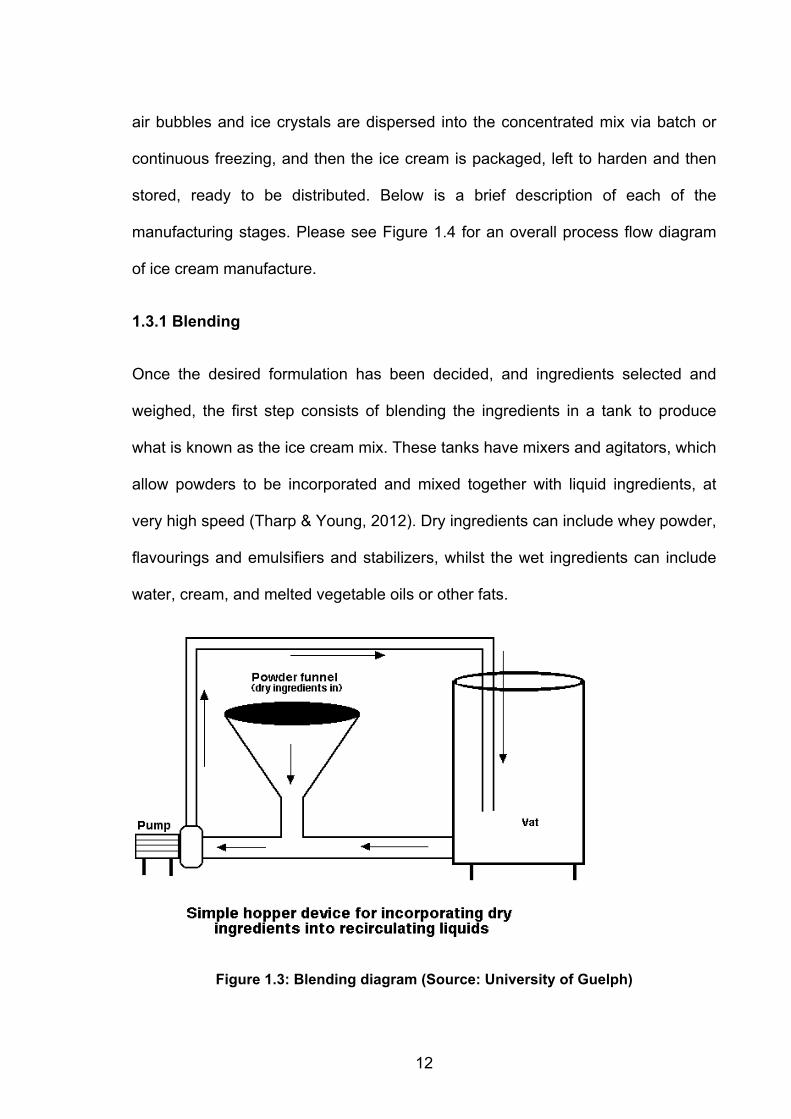
1.3.1 Blending
Once the desired formulation has been decided, and ingredients selected and
weighed, the first step consists of blending the ingredients in a tank to produce
what is known as the ice cream mix. These tanks have mixers and agitators, which
allow powders to be incorporated and mixed together with liquid ingredients, at
very high speed (Tharp & Young, 2012). Dry ingredients can include whey powder,
flavourings and emulsifiers and stabilizers, whilst the wet ingredients can include
water, cream, and melted vegetable oils or other fats.
Figure 1.3: Blending diagram (Source: University of Guelph)
13
1.3.2 Pasteurization
Once blended, the mix then goes on to be pasteurized. This reduces the number
of microorganisms to a level that is acceptable and safe for human consumption.
Pasteurization can differ from manufacture to manufacture and also country to
country, depending on the health and safety laws. For example, in factories in
America, the pasteurisation of their mix takes place at HTST (high temperature
and short time), which equates to the ice cream mix being heated to 83 °C for 20
seconds (Heuer, 2009). However, the mix should not exceed 85 °C as this will
negatively affect the milk proteins present. (Clarke, 2008)
1.3.3 Homogenization
Homogenization then takes place. The hot pasteurised mixture is pressurised
through a small valve at 2000psi and this causes the large fat droplets present in
the mix to become broken up and a fine emulsion is produced. These smaller fat
droplets (usually 1µm or less in diameter) lead to a greater surface area of fat for
the given volume. A two stage homogenization is preferred with ice cream mixes
(Rajah, 2002) as this reduces clumping and clustering of the fat, leading to an
improved thinner emulsion, which aids meltdown rate and creates better air
stability. The main purpose of the homogenisation step is reduce the size of the
flat globules (to around 2µm) resulting in the greater stability of the fat during
ageing (Biasutti et al , 2013)
14
1.3.4 Ageing
Once the pasteurised and homogenisation mix has been cooled (usually via re
circulation to a cooling tank where it is cooled to 4°C which inhibits bacterial
growth) it is pumped into ageing tanks. Here, the mix remains for between 4-24
hours. (Marshall et al , 2003). The purpose for ageing the ice cream mix is three
fold as it improves whipping capabilities of the ice creams, leading to a smoother
overall product by:
• Providing time for fat crystallisation
• Allow emulsifiers to absorb to the fat droplets
• Increased viscosity by allowing protein hydration (Goff, 1997)
1.3.5 Freezing
Following time in the ageing tank, the mix then processed using a continuous
freezer or ‘barrel’ freezer at between -18 and -22 °C. There are rotating blades
inside the barrel, which scrape off the surface of the freezer and ‘dashers’ (see
Figure 1.2) which help incorporate air into the mixture by constant whipping of the
mix. The mix is often pumped in at a constant rate as well as a constant supply of
air being pumped in. This air is what gives the ice cream its softness, and the air
content of ice cream is often termed ‘overrun’. The ice cream is then ready to be
extruded, where it is packaged and sent to be hardened (Goff, 2011).
1.3.6 Hardening
Once packaged, the ice cream is sent to be hardened by being placed into a blast
freezer (-30/-40 °C) and freezing rates must be rapid to affect the rate of heat
15
transfer, which impacts on the final ice cream product. The purpose of hardening
is to remove heat at quickly as possible from the ice cream (Hui, 2006) in order to
inhibit the ripening/recrystalization of the ice crystals. Certain factors that can
influence this are:
• Temperature of the blast freezer
• Size and container type
• Temperature of ice cream when placed in the blast freezer
• Air circulation of the blast freezer
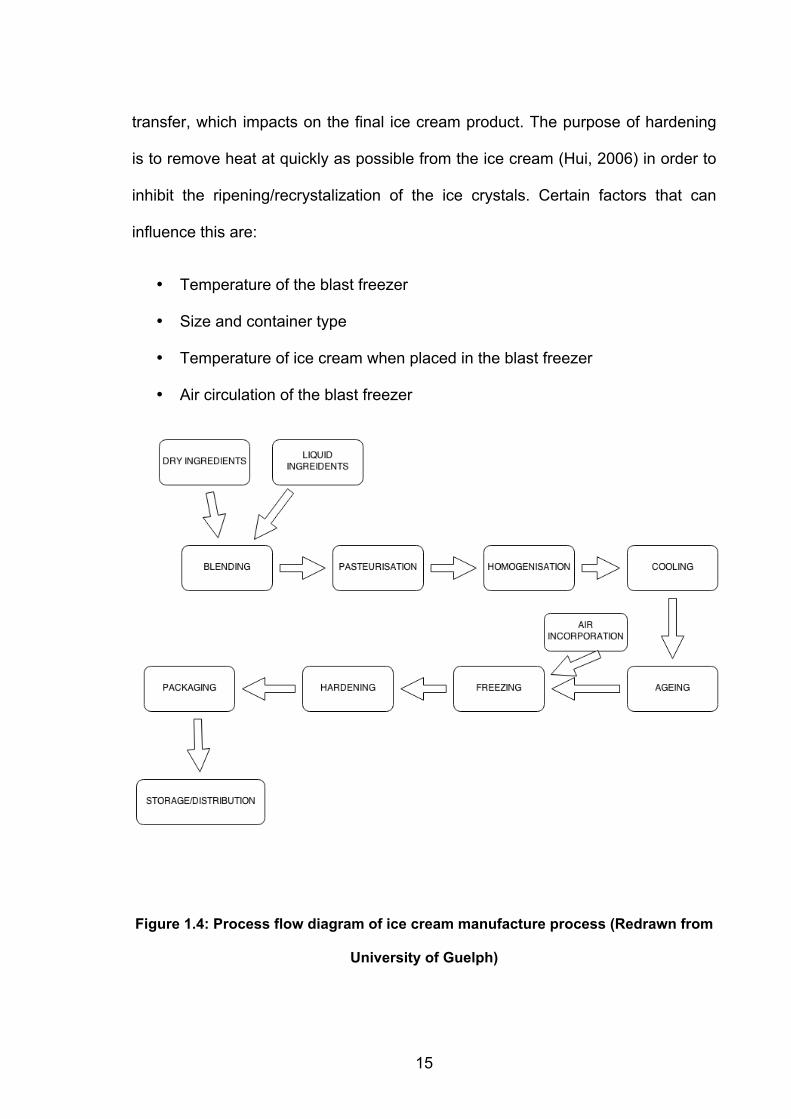
Figure 1.4: Process flow diagram of ice cream manufacture process (Redrawn from
University of Guelph)
16
1.4 Reformulating ice cream
1.4.1 Reducing fat
Fat is vital to the structural and sensorial properties of ice cream. The fat in dairy
products increase richness of flavour, carries flavour compounds, allows for
lubrication of the palette, aids the desirable melting properties and provides
structure for foam stabilisation (Marshall, Goff & Hartle, 2003). Whilst premium ice
creams contains between 10-18% fat, low fat alternatives are now being sought
out by consumers. However, consumers still wish to have all the perceived and
sensory qualities of a premium full fat ice cream, as was seen in Yilsay et al
(2005) study into fat replacers. Results emphasised the importance of fat as a
flavour enhancer.
Fat in dairy ice creams come from milk fat, such as cream, buttermilk and
anhydrous milk fats (Marshall et al , 2003). It is the volatile fatty acid chains of the
triglycerides in the milk fat that lead to the flavour of milk fat, and allows for a wide
melting range. (Goff, 2008). This melting range causes the ice crystals to melt and
the fat stabilised foam structure to collapse. When this occurs in the mouth, it aids
the mouth coating properties of the ice cream, leading to an increased sensation
of creaminess.
1.4.2 Milk Fat replacements
Alternatives to milk fat used in ice cream production in the UK are commonly
vegetable fats. However, the vegetable fats used need to replicate the melting
profile of the milk fat ice cream, as fats that melt at higher temperatures leave a
17
waxy and 'claggy' mouth feel and those with a low melting point are unable to
maintain the foam structure (Clarke, 2008). Vegetable fats that have been used in
ice creams include palm oil, and coconut oil. Goff (2007) found that vegetable fat
was acceptable to the consumer in the production of ice creams when substituted
milk fat either partially or completely with vegetable fats. These fats administered a
clean flavour, crystallised rapidly and contributed positively to the overall structure.
It was concluded that the most suitable blends came from a formulation of 5%
fractionated palm kernel oil and 25% high oleic sunflower oil. Proteins such as
whey, or carbohydrates such as microcrystalline cellulose can be used in low fat
ice creams to mimic fat droplets (Clarke, 2008) but cannot completely reproduce
the same mouth feel as milk fat.
1.4.3 Disadvantages of Milk fat replacements
Whilst there are many health benefits to replacing milk fat in ice cream with
alternative fats, there are also structural and chemical disadvantages that must be
overcome to produce a viable product. Some vegetable fats can leave a waxy and
unpleasant mouth feel (Goff, 2007) and also the fat globule phase can become
disrupted, which impacts upon the structure (Aime et al , 2001). Schmidt et al
(1993) found that the use of carbohydrate based fat replacers in low fat ice creams
produced mixes with a greater viscosity, and incorporated much less air into the
mixes. Adapa et al (2000) found that milk fat replacements increased the viscosity
of mixes yet lowered the elasticity, and concluded that rather than replacing milk
fat with one product alone, a balanced mixture of fats, carbohydrates and proteins
were needed to maintain the delicate and complex structure of ice cream.
18
1.4.4 Replacing sugars
Sugar has several vital functions in ice cream: Not only does it give the product a
sweet flavour and desirable taste and it affects the viscosity of the matrix phase,
but it also depresses the freezing point of the matrix phase (Clarke, 2008).
Commonly used sugars include sucrose. By manipulating the quantity and type of
sugar, a harder or softer ice cream can be produced. Literature has indicated that
polyols may be used as a sugar replacement in ice cream formulation (Bordi et al ,
2004). Polyols are sugar alcohols that still structurally resemble sugars, but have
the advantage of lower a calorific value when compared to sucrose and a reduced
insulin response (Livesey, 2003;Zumbe, Lee & Storey 2001). However, Koutsou et
al. (1996) and Clarke (2008) have both documented that the use of polyols in food
can lead to gastro enteric problems when consumed in large amounts.
1.4.5 Introducing more air
Dressaire et al (2008) describes incorporating more air into an ice cream mix may
be a way to increase the volume of ice cream without adding caloric value. The
incorporation of air is vital to the overall eventual microstructure of the ice cream,
and the smaller the air bubbles, the more palatable it is to the consumer. It
therefore would be beneficial to consider the use of micro bubbles in ice cream.
The use of micro bubbles, which can be described as bubbles smaller than 1mm
in diameter, in foods has lead to research that indicates improved and longer shelf
life of products.
19
1.5 Instrumental measurements of ice cream structure
Instrumental measurements of a complex muti-phasic food such as ice cream is
complicated. From an engineering stance it is desirable to take instrumental
measurements to gain a better understanding of structure. But with food, this is not
possible due to psychological impact of innate liking. It is vital to understand the
physical interaction between the structure and the mechanisms used to break this
down, and how this can be related back to human perception and interaction with
food. For example, with regards measuring ‘creaminess’ a combination of both
static and dynamic process is recommended (Frost & Janhog, 2007)
1.5.1 Tribology
Tribology (or thin film rheology) can be described as the science of friction and
lubrication and whilst most commonly used in metal processing, has been used to
correlate in mouth responses to food (Malone et al , 2003). This study of friction
and lubrication between interacting surfaces in relative motion, and the number of
interacting surfaces in the mouth during food consumption is plentiful: teeth–teeth,
tongue–palate, tongue–teeth, teeth–food, tongue–food, tongue–bolus, lips, lips–
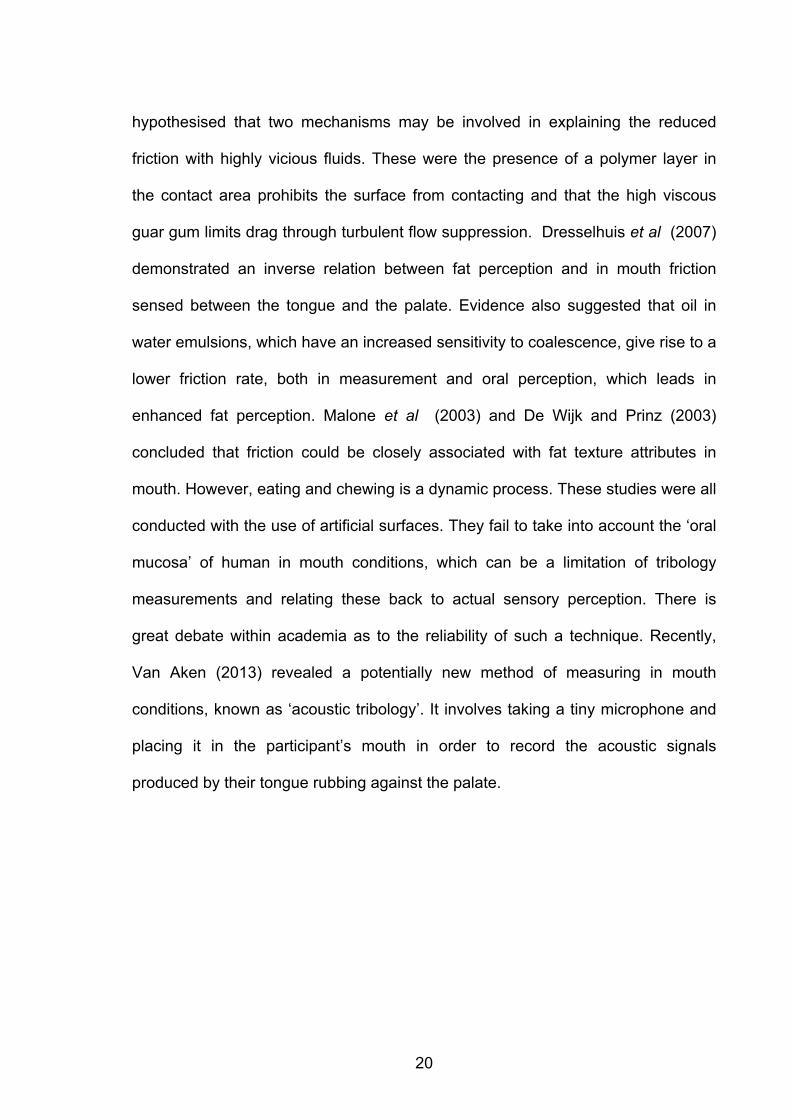
food, bolus–palate, food particles–oral surfaces (Stokes, 2013). A tribometer
works by measuring the friction and wear between two surfaces. These surfaces
often consist of a flat surface (the disc) and a spherical surface (the pin)
repeatedly moving across each other with a material between them. Extensive
detail on tribology fundamentals and food lubrication can be found in a recent
review on ‘oral tribology’ (Stokes, 2012). Malone et al (2003), who use guar gum
to correlate friction measurements with perceived lubrication in mouth,
20
hypothesised that two mechanisms may be involved in explaining the reduced
friction with highly vicious fluids. These were the presence of a polymer layer in
the contact area prohibits the surface from contacting and that the high viscous
guar gum limits drag through turbulent flow suppression. Dresselhuis et al (2007)
demonstrated an inverse relation between fat perception and in mouth friction
sensed between the tongue and the palate. Evidence also suggested that oil in
water emulsions, which have an increased sensitivity to coalescence, give rise to a
lower friction rate, both in measurement and oral perception, which leads in
enhanced fat perception. Malone et al (2003) and De Wijk and Prinz (2003)
concluded that friction could be closely associated with fat texture attributes in
mouth. However, eating and chewing is a dynamic process. These studies were all
conducted with the use of artificial surfaces. They fail to take into account the ‘oral
mucosa’ of human in mouth conditions, which can be a limitation of tribology
measurements and relating these back to actual sensory perception. There is
great debate within academia as to the reliability of such a technique. Recently,
Van Aken (2013) revealed a potentially new method of measuring in mouth
conditions, known as ‘acoustic tribology’. It involves taking a tiny microphone and
placing it in the participant’s mouth in order to record the acoustic signals
produced by their tongue rubbing against the palate.
21
Figure 1.5: Tribometer schematic
1.5.2 Differential Scanning Calorimetry
Differential scanning microscopy is the most widely used method to determine
specific heat and enthalpy data of food materials. The technique is based on
differential heat flow measurements between an empty reference pan and sample
pan, and is used to measure the difference in the amount of heat required to
increase the temperature of the sample and reference is measured as a function
of temperature. Cogne et al (2003) found that the main advantages of the DSC
rely on rapid and simple measurement obtained by a single ‘thermo-gram’.
However, sample sizes are minute and care and attention is needed when
carrying out experiments accurately with the DSC. Sastry & Datta (1984) found
that when conducting studies into commercial ice creams thermal conductivity
depended greatly on the ice cream density. Goff et al (1993) found that during
storage, ice cream and suffer ice crystal growth and structural collapse and that
these detritions become more prevalent with higher freezer temperatures,
increased storage time and greater temperature fluctuations.
22
1.5.3 Rheology
Rheology is the study of two material properties such as an elastic solid and a
vicious liquid (Schmidt, 2000). The behaviour of these ‘visco elastic’ substances is
measured by applying a controlled amount of shear stress or strain to a sample
and measuring the response of the sample. Goff et al (1995) found that ice cream
mixes with stabilisers exhibited longer storage and loss module at temperatures of
less than -8°c. Authors such as Subramanian et al (2006) and Adapa et al (2000)
concluded that fat reduction in dairy products resulted in increased visco-elastic
properties and that the amount of fat and degree of fat destabilization affected the
elasticity. Adapa et al (2000) also found that fat replacers (both protein and
carbohydrate based) did not enhance the elastic properties but did increase the
viscosity of frozen ice cream mixes.
1.5.4 Particle size
The particle size of fat droplets present in food emulsions such as ice cream mixes
is vital in defining properties such as flavour release, mouth feel and emulsion
stability. Large droplets can lead to poor flavour release, greasy mouth feel and
poor emulsion stability leading to creaming. Using a particle size analyzer such a
mastersizer is an excellent tool for measuring characteristics of food emulsions.
With wide dynamic range (0.02-2000µm) it permits both fine emulsion droplets and
larger flocculated or coalesced droplets to be characterized. This range also
allows for the measurement of large protein micelles, such as casein, enabling the
interaction between the protein and emulsified fat phase to be understood.
(Malvern instruments 2013). Koxholt (2001) investigated the effect of fat globule
23
size on the meltdown of ice cream, and found that meltdown was dependent on fat
agglomerate size in the unfrozen serum phase.
1.6 Eating behavior literature review
Literature shows that people develop expectations about the taste and effects of
certain foods and that those expectations can guide future behaviour, cognitions,
and affect (Bowen et al , 1992). Certain characteristics of food, such as its energy
density, can be indicators of perceived satiety. If these characteristics of foods,
such as the energy density of ice cream, can be manipulated through formulation,
this may have an impact on the perceived satiety and perceived satiation of the
product. Therefore, understanding the phenomena of the human appetite has
become a vital tool in trying to combat obesity and advocating a healthier lifestyle
(Blundell et al , 2009). The selection of foods, its optimal consumption rates and
amounts is central to the regulation of body weight. This has become increasingly
necessary to enable accurate measurement of appetite and eating behaviour
under differing conditions.
Eating behaviour is controlled by numerous factors and includes internal
physiological signals and external signals that may arise from social factors,
cultural rules, as well as cognitive cues (Rodin, 1992). In 1922, Richter first
demonstrated this in rats. He found that when he recorded each time they ate, it
revealed their circadian rhythm of 12 meals a day. Le Magnen (1973) then went to
on to show that analysis of such meal patterns in rats could show the operation of
hunger and satiety processes. Eating behaviour can also be described in terms of
24
macrostructure and microstructure (Elfhag et al , 2003). The microstructure1 of
eating refers to how an individual eats within the framework of one single meal and
can be measured and studied experimentally by eating monitors. The
macrostructure of eating refers to what is consumed over a long period of time and
the manner in which it is consumed.
1.6.1 Why study eating behaviour?
The importance of laboratory based investigations into eating behaviour cannot be
stressed enough. The ever-expanding problem of obesity in the Western world
highlights the need to better understand eating behaviour, particularly in the UK
and the US, where obesity levels are at an all time high (Royal College of
Physicians, 2010). There are also other reasons for controlled studies of eating
behaviour. For instance, in the development of ‘functional foods’ for appetite
control, and the reformulation of current market products to become ‘healthier’.
Also, the impact of anti-obesity drugs may have on eating behaviour (Blundell,
2006) has and will need to be assessed. Under these circumstances, a precise
assessment of eating behaviour, food intake, rate of intake, satiation and satiety, is
essential to define and support the efficiency of the food or drug. In the case of
analysis, eating rate and its cumulative intake curves has been shown to be useful
1 There is a difference between the disciplines, engineering and psychology, with the use of the
term ‘Microstructure’. It is important to point differentiate between the two, and within this
document, the term microstructure is used to describe formulation, rather than the psychological
use to describe eating behaviour.
25
in detecting both the effects of experimental manipulation and individual
differences in eating behaviour (Blundell et al , 2009).
1.6.2 Satiation and Satiety
Satiation and satiety are part of the body’s appetite control system and are
involved in limiting energy intake when an individual consumes food (Benelam,
2009). Satiation is the process that causes an individual to terminate the
consumption of food/meal; it therefore incorporates all of those events that operate
during the meal itself. Satiation appears to be a very basic animal function that
even rats with only a hindbrain exhibit (Ritter 2004).
In contrast, satiety is the feeling of fullness that persists after eating, suppressing
further consumption. Both are controlled by a ‘cascade’ (Blundell, 1995) of
differing factors that start once a food has been consumed, and continues as it
enters the gastrointestinal tract and is digested and absorbed (Benelam, 2009). In
response to sensory and cognitive perceptions of the food eaten, signals about the
energy spark areas of the brain involved with regulation of energy intake. Satiation
is then stimulated. Once the intestines have absorbed the nutrients, signals reach
the brain to induce satiety.
Both satiation and satiety are important in determining energy intake. These
include rate of intake and total intake, a better understanding of the processes of
satiation and satiety, and how they can be influenced and manipulated. Both
satiation and satiety can vary in duration and intensity. Satiation can be particularly
well measured within the terms of the ‘microstructure of eating behaviour’ as it is
influenced by a number of aspects of food that can be measured in one sitting.
26
(Blundell et al , 2009). These include portion size, energy density of food, taste,
texture, palatability and previous exposure. Measuring satiety incorporates more
macro structural attributes such as macronutrient composition, viscosity, resistant
starch and presence and type of fibre (Blundell et al , 2009). Whilst satiation and
satiety are intrinsically linked to one another- for example if satiation is modulated
by food properties that lead to a change in meal size, then the food in that meal
will modulate satiety in the subsequent post meal period-it is important to
recognize that they have different experimental procedures.
The satiating effects of foods, such as ice cream, can be measured by allowing
participants to consume them ad libitum and monitor how much is eaten before
satiation is reached (Benelam, 2009). The ad libitum consumption of food varies
widely, dependent on the food. Weenen et al (2005) found that participants ate on
average 80g of savoury biscuits, but that they ate almost 5 times as much of pears
in syrup. Often measured in a lab environment, this allows for control of foods
offered and manipulation of the palatability of the food (Yeomans, 2000).
Hetherington (1995) found that ‘fullness’ and ‘boredom with taste’ are two reasons
for the termination of eating. However, this often depends on what food had been
consumed, as the consumption of a single food rather than a meal, is more likely
to result in termination due to ‘boredom of taste’. Measuring satiety can be
achieved by allowing participants to record feelings of hunger or satiety and by
measuring food intake directly (Benalam, 2009).
27
1.6.3 Eating rate
The rate of eating is generally considered to be a sign of appetite and is defined as
the amount of food eaten time period usually measured in grams per minute
(Elfhag et al , 2003). This eating rate is indicative of satiation and not satiety.
Eating rate duration could be a vital characteristic of eating behaviour that
predisposes an individual to eat excessively. Eating at a faster rate may allow the
individual to consume more before the physiological satiation signals can
terminate eating. This is has often been suggested to be 20minutes after the meal
has started (Spitzer et al , 1981). However, Yeoman’s et al (1997) argued that
there is little scientific proof for such a delay.
In experimental situations, favoured meals or foods generate larger, longer meals,
with an accelerated rate of eating (Westerterp-Platenga et al , 1991). Hill &
McCutcheon (1975) suggested that a more rapid eating rate could be associated
with the increase in obesity because food intake might be occurring at a rate,
which outpaces the normal development of satiation and satiety. However,
behaviour in such situations may clearly be dominated by, underlying factors such
as state of hunger, eating restraint and palatability.
An indication of the existence of the ‘eating curve’, the rate at which individuals
decelerate consumption during the meal, has been proven to be stable within
individuals (Westerterp-Plantenga, 2000). Meyer & Pudel (1972) refer to the eating
curve as the ‘biological satiation curve’ as satiation usually slows down the eating
rate in the second part of the meal. Some obese patients find they have an
28
inability to feel satiation, and these participants show an accelerated eating curve
in the second part of the meal.
1.6.4 Laboratory vs. Free-living
As has already been mentioned, it is necessary to accurately measure eating
behaviour under a variety of conditions and in different environments. The
laboratory is one such environment that allows for eating behaviour measurements
to be taken under a controlled atmosphere. The purpose of studying eating
behaviour in a lab is not to replicate exactly the outside world, with its many
variables and distractions, but to gather data through controlled procedures free
from social chaos.
The main distinction between the ‘free living’ and laboratory methods of gathering
data is between accuracy and precision (lab based method) and natural living (free
living). Eating under free conditions, whilst being considered natural, is not
accurate enough, with individuals being asked to self report intake, and often
underreporting energy intake (Black et al , 1993) and eating in a laboratory, whilst
not been seen as natural, allows for precise data to be collected.
1.6.5 Self-reporting measures
The visual analogue scale (VAS) is an important tool when conducting research
into eating behaviour and appetite (See chapter 2 appendix for VAS example).
Being a method for measuring subjective appetite, it provides insights into eating
behaviour that may not be ascertained by voluntary food intake data alone
(Blundell et al , 2009). Whilst being used in other areas of psychology, such as
29
pain research, VAS has been accepted as a usual method for measuring
subjective appetite. The self-reporting style of the VAS being used in appetite
research was first use by Silverstone & Stunkard (1968) whilst Rogers & Blundell
(1979) developed a version of VAS questions that are still used today.
Typically a 10cm horizontal line, unmarked apart from two extreme anchors at
either end by a question associated with a particular state, it is often administered
using a pen and paper. VAS are relatively easy to use and process and have been
found to be reproducible and valid on a short- term basis, in that the satiety/hunger
ratings correlate with energy intake (Flint et al . 2000). However, there are
concerns that this association with food intake is modest and that caution should
be taken in interpreting the results of studies by using VAS, especially if this is the
only measure of appetite used (Mattes et al . 2005). Experimental studies, such as
that of Stubbs et al (2000) have shown that the VAS method of assessing
subjective appetite sensations is sensitive to manipulations and interference.
Studies such as Delargy et al , (1996) have also demonstrated the high
reproducibility of VAS, whilst a series of reviews have been dedicated to looking at
the validity and reliability of VAS (Reid et al , 1999).
1.6.6 Measuring intake
Visually coded eating behaviour has been used to measure eating rate (Rogers &
Blundell, 1979) whilst others have developed automated ways of assessing intake,
such as the Universal Eating Machine (UEM) Guss & Kissileff, 2000). These
UEMs generate cumulative intake curves from which within meal changes in
eating rate can be identified (Halford et al , 2003). Standard mechanized
30
approaches measure food intake via the use of a hidden balance placed
underneath the participants plate or bowl, which is linked to a computer to allow
continuous recording of the intake of the food. Further development by Yeomans
(1996) has enabled the UEM to automatically solicit subjective ratings (much like a
computerized VAS) of appetite from participants during regular intervals during the
meal. However, the choices of foods that can be measured in a UEM are limited to
liquids or semi solid foods such as pasta dishes, soups and yoghurts (Hill et al,
1995).
Various data sets have shown that the UEM curves are influenced by gender and
food deprivation, as well as the palatability of meals, demonstrating that they are
valid representations of the changes in eating behaviour that can occur during
meals (Westerterp-Plantenga, 2000). Yeomans (2000) found that manipulating
hunger and palatability and measuring these changes with a within meal appetite
rating may be useful. Modern UEMs provide good test retest reliability for within
individual UEM curves and many authors have commented on the consistency
and stability of cumulative intake curves (Hubel et al , 2006; Jordan et al , 1996)
1.6.7 Effect of palatability and portion size on eating rate
Palatability has been difficult to define in recent years, as it is not an inherent
characteristic of food (Yeomans, 1998). It can refer to the pleasurable experience
when consuming food (Benalam, 2003) or the effect on immediate ingestion
(Booth, 1990). It is generally measured using rating scales. Yeomans (1998) found
that by increasing the palatability if food by adding fat, not only increase appetite,
but also increase eating rate and meal size.
31
Palatability had a strong effect on ad libitum food intake, both in free-living
experiments (De Graff et al , 2005) and controlled lab based experiments (De
Graff, 1999). Texture is also an important sensory quality that influences satiation,
as individuals tend to consume more ad libitum liquid based foods, than solid. This
could relate to the rate of eating, which is of course higher with liquids (Zijlstra et al
, 2008). Berridge & Robinson (2003) stated that food was a natural reward
consisting of three components; a hedonic component, a motivational competent
and a learned component. The sensory characteristics that contribute towards
palatability affect both food choice and intake. Simply by altering the flavour of a
food increases the amount consumed (Yeomans et al, 1997). Drewnowski (1998)
found that there is a direct correlation between palatability and energy density of
food, with energy dense foods lending themselves to be more palatable. However,
this is not a fixed relationship. Manipulating and reformulating foods can alter the
association between energy density and palatability altered through taste and
texture. Yeomans et al (1997) coined the phrase ‘the appetiser effect’ in his
oregano palatability study. Comparing a bland (no oregano) and a palatable
(containing oregano) plate of pasta, he found that hunger increased in the first
stage of eating the palatable dish and then declined, whilst in comparison, the
bland dish showed consumption to decline throughout all the stages of the meal.
He also found that participants ate the palatable plate of pasta at a faster rate that
the bland plate.
With portion size, it is generally considered that a greater portion size increases
energy intake (Benelam, 2003). Ello-Matin et al (2005) found that when
participants were presented with larger portions, they ate more. Large portion
32
sizes may override the internal homeostatic mechanisms that regulate satiety and
satiation. This may be due to decreasing awareness of food consumption, or the
distortion of visual cues (Rolls et al , 2007). Consumers also find self-regulation of
large portions difficult at the moment of consumption (Willemijn, 2009). The effects
of large portion sizes on energy intake may also be attributable to a rapid eating
rate (Fisher et al , 2003). Rapid eating rate may confuse and distort the
physiological signals involved in meal termination (Kral et al , 2001). This
measuring is innately difficult and requires careful study and interpretation of data.
1.6.8 Confounding variables in eating behaviour research
When researching eating behaviour, it is important to consider any potential
confounding variables that may impact on any results. These variables can often
be categorized into behavioural variables and psychological variables. Dietary
restraint, prior knowledge or beliefs about the test foods and physical activity are
all behavioural variables which should be considered before any work into eating
behaviour takes place. Dietary restraint refers to the restriction of food intake, or
the elimination of certain food from the diet, in order to maintain or lose
bodyweight (Benelam, 2009). This type of behaviour could be particularly
damaging to results (unless of course, you are specifically seeking out patricians
who restrict their diet) and experimenters will often use a pre screening dieting
questionnaire to assess participant’s possible dietary restraints. Regarding prior
knowledge about the test foods, Livingstone et al (2000) found that if several visits
to the laboratory are needed to gather results, participants will become
accustomed to the conditions and what is expected of them, which may influence
33
their response. With regards ice cream, with it being such a popular food, many
people will have come in contact with it. It also is not a food that people tend to eat
as a meal, rather a snack, or desert type food.
The main aims and objectives were to gain an understanding of how product
formulation affects consumer preference and if this knowledge could possibly be
used for either product reformulation or promotion. Also, to try and understand the
limits of human sensitivity regarding absolute structure of a product.
34
CHAPTER 2: QUESTIONNAIRE AND TASTE TESTS
The decision to take a more in depth look at current commercial ice creams was
taken for a number of reasons. These included practical and regulatory problems
resulting in a difficulty in producing and replicating large quantities of freshly
prepared ice cream due to lack of food grade laboratory equipment and time
constraints. It was important that any ice creams used for this research was able
to be fed to participants for the sensory/satiation areas of interest. Further
investigation into commercially available ice creams was conducted through
questionnaires and taste tests. From these results, a more detailed approach to
the eating behaviour of these ice creams could be gained. Following this,
formulation based investigations were enacted in order to confirm or deny/back up/
reinforce the eating behaviour results.
Firstly, an ice cream questionnaire study was undertaken. Following this an ice
cream palatability taste test was conducted.
2.1 Ice cream questionnaire study
The objective of this study was to gain knowledge into the ice cream eating and
purchasing habits of young adults (between the ages of 18-22) in order to design
an ice cream taste test experiment, which was to be carried out which was to be
carried out following the results gathered.
35
2.1.1 Methodology
2.1.1.1 Participants
100 participants took part in the ice cream questionnaire study, however; only 95
questionnaires could be used for analysis. From these 95, 62 males and 33
females. 73 participants were undergraduate students, and 21 were postgraduate
students, and 1 member of staff. All were based in the Chemical Engineering
Department of Birmingham University.
Participants were chosen using a purposive sampling method. Galloway (1997)
describes purposive sampling methods as “A purposive sample is one which is
selected by the researcher subjectively. The researcher attempts to obtain sample
that appears to him/her to be representative of the population and will usually try to
ensure that a range from one extreme to the other is included “. The primary
reason for purposively selecting these participants was that the answers that they
gave were to be used in a following taste test experiment, and participants for that
experiment could be chosen from the answers they gave in this experiment. A
subsequent reason in selecting these participants to take part in answering the
questionnaire as there were a range of ages within the group. Typically, children
between the ages of 2-12 years old drive the ice cream market, with households
with children leading consumer intake of ice cream at 34%. This is compared to
20% of households consuming where there were no children. (Barrette, 2004).
Therefore, by selecting participants between the ages of 17-28 results can be
gained into the ice cream eating and purchasing habits this particular age range.
36
Subsequent to verbal consent being obtained from the participants, the
questionnaires were handed out.
2.1.1.2 Questionnaire Design
The questionnaire was designed to be simple and quick to answer. Participants
were asked to write down their name, age (in years and months) –this was to gain
a more accurate account of age range- their sex, which was a fixed-choice
question, and their university email address.
The questionnaire then consisted of 13 questions, which were a mix of open
ended (i.e. Question 10) fixed choice (i.e. Question 1) and a series of balanced
scale questions (i.e. Question 3). Please see Chapter 2 appendix for
questionnaire.
2.1.1.3 Procedure
77 undergraduate chemical engineering students were approached at the end of a
lecture in a chemical engineering lecture hall. The study and its aims were clearly
explained to them, and before being given a questionnaire, verbal consent was
gained from each participant. The participants then proceeded to answer the
questionnaire, and when they had finished, were told to pass it to the end of the
row, where it would collect. They were then thanked, and debriefed.
21 postgraduate students and 1 member of staff were then approached on a
random basis. The study and its aims were explained once again, as well as
verbal consent being gained before questionnaires were answered. When they
had finished, they were thanked and debrief. The postgraduate students were also
37
told that they may be called upon to take part in ice cream taste test that the
results of the questionnaire study was aiding to design. However, it was clearly
explained that participation in this was not compulsory.
2.1.1.4 Ethics
All British Psychological Society (2005) guidelines were adhered to, and informed
and verbal consent was gained from each participant. All participants were
verbally informed, and it was explained that participation was not compulsory. All
participants were told that they had the right to withdraw from the study at any
time, without consequence. Participants were also debriefed after the study. All
were thanked for their participation in the study. All information gathered was kept
confidential and anonymity was observed.
2.1.2 Results
100 questionnaires were given out to individuals in the chemical engineering
Department of Birmingham University. From these 100 given out, 95 could be
used for analysis. The purpose of this questionnaire was to gauge a better
understanding of consumers eating and purchasing habits of ice cream. The
results gained were to be used to shape future experimental design into the
palatability of ice cream.
2.1.2.1 Sex
From the results, we could see that 62 males and 33 females took part in
answering the questionnaire.
38
2.1.2.2 Age
Ages ranged from 17 years 8 months to 43 years 1 month. The average age was
19 years 7 months, and that the most frequent age were 18 years 5 months.
2.1.2.3 Smoke/diet/health
From the table below, it is clear to see that eight of the participants smoke, four
have been on a strict diet in the past six months and seven participants are
potential health risks due to medical conditions/allergies. These participants will be
filtered out and not be included in future experiments.
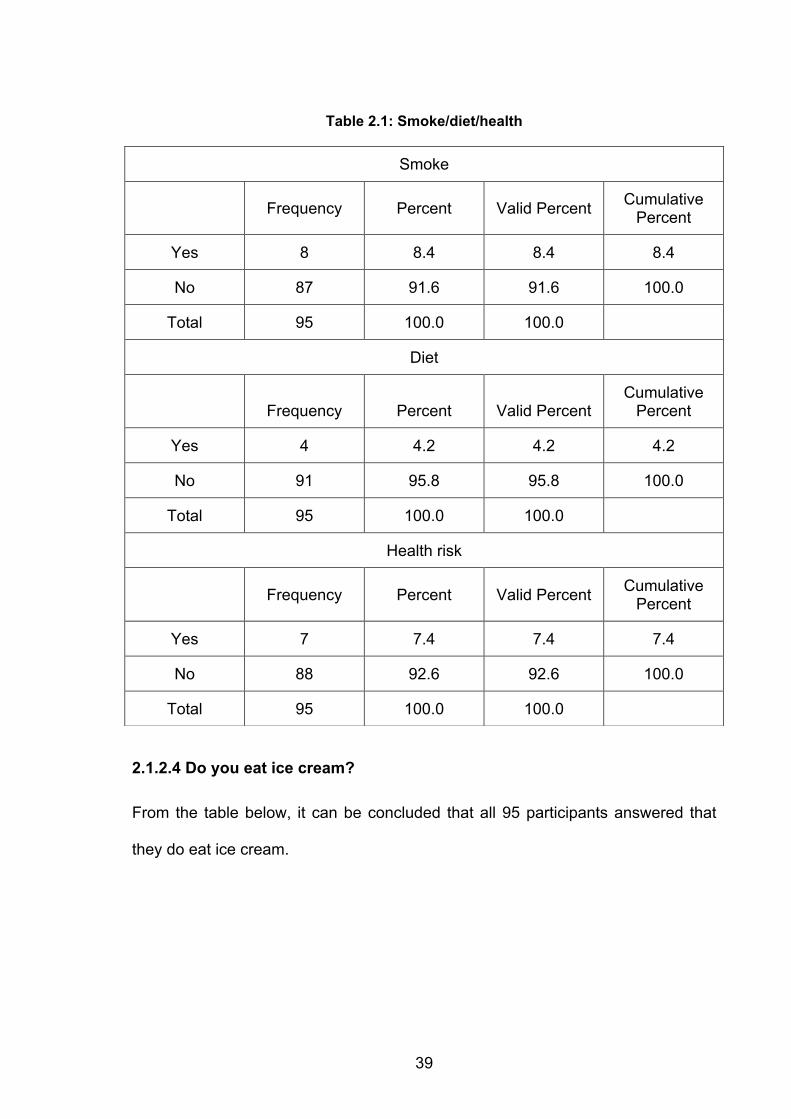
39
Table 2.1: Smoke/diet/health
2.1.2.4 Do you eat ice cream?
From the table below, it can be concluded that all 95 participants answered that
they do eat ice cream.
Smoke
Frequency Percent Valid Percent Cumulative Percent
Yes 8 8.4 8.4 8.4
No 87 91.6 91.6 100.0
Total 95 100.0 100.0
Diet
Frequency Percent Valid Percent Cumulative
Percent
Yes 4 4.2 4.2 4.2
No 91 95.8 95.8 100.0
Total 95 100.0 100.0
Health risk
Frequency Percent Valid Percent Cumulative Percent
Yes 7 7.4 7.4 7.4
No 88 92.6 92.6 100.0
Total 95 100.0 100.0
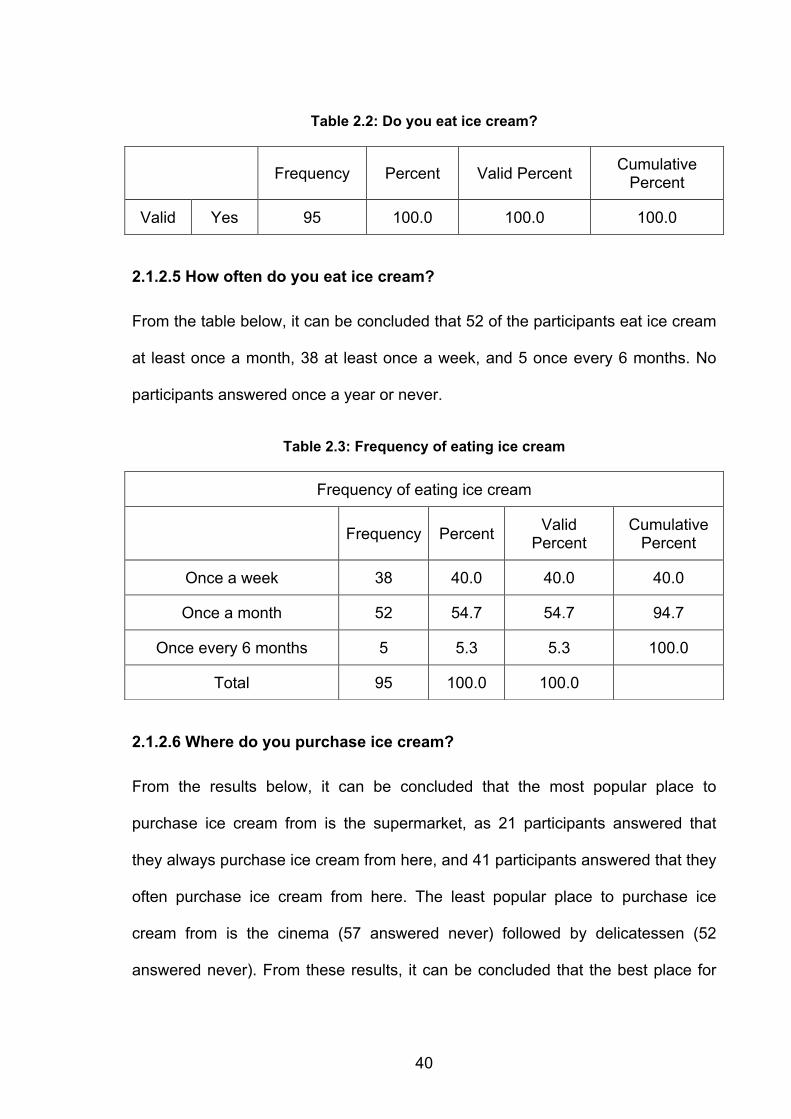
40
Table 2.2: Do you eat ice cream?
2.1.2.5 How often do you eat ice cream?
From the table below, it can be concluded that 52 of the participants eat ice cream
at least once a month, 38 at least once a week, and 5 once every 6 months. No
participants answered once a year or never.
Table 2.3: Frequency of eating ice cream
2.1.2.6 Where do you purchase ice cream?
From the results below, it can be concluded that the most popular place to
purchase ice cream from is the supermarket, as 21 participants answered that
they always purchase ice cream from here, and 41 participants answered that they
often purchase ice cream from here. The least popular place to purchase ice
cream from is the cinema (57 answered never) followed by delicatessen (52
answered never). From these results, it can be concluded that the best place for
Frequency Percent Valid Percent Cumulative Percent
Valid Yes 95 100.0 100.0 100.0
Frequency of eating ice cream
Frequency Percent Valid Percent
Cumulative Percent
Once a week 38 40.0 40.0 40.0
Once a month 52 54.7 54.7 94.7
Once every 6 months 5 5.3 5.3 100.0
Total 95 100.0 100.0
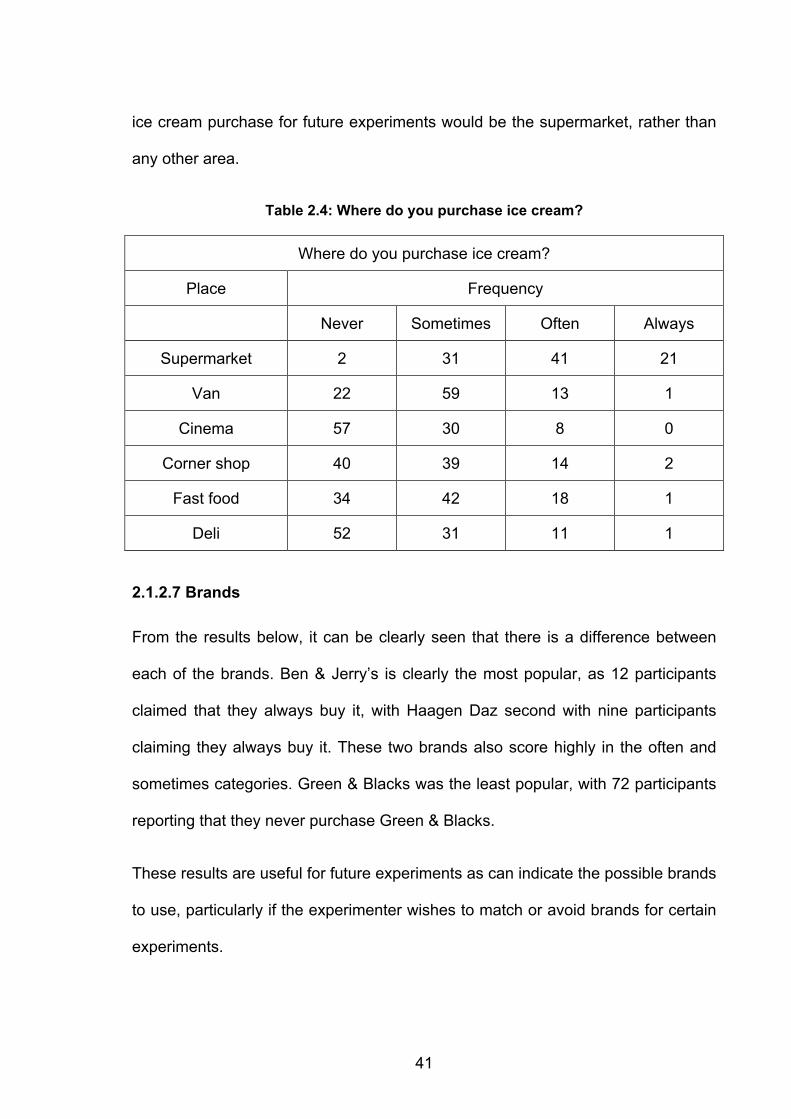
41
ice cream purchase for future experiments would be the supermarket, rather than
any other area.
Table 2.4: Where do you purchase ice cream?
2.1.2.7 Brands
From the results below, it can be clearly seen that there is a difference between
each of the brands. Ben & Jerry’s is clearly the most popular, as 12 participants
claimed that they always buy it, with Haagen Daz second with nine participants
claiming they always buy it. These two brands also score highly in the often and
sometimes categories. Green & Blacks was the least popular, with 72 participants
reporting that they never purchase Green & Blacks.
These results are useful for future experiments as can indicate the possible brands
to use, particularly if the experimenter wishes to match or avoid brands for certain
experiments.
Where do you purchase ice cream?
Place Frequency
Never Sometimes Often Always
Supermarket 2 31 41 21
Van 22 59 13 1
Cinema 57 30 8 0
Corner shop 40 39 14 2
Fast food 34 42 18 1
Deli 52 31 11 1
42
Table 2.5: Brand purchase
2.1.2.8 Ice cream texture
From the table below, it is clear to see that 40 of the participants prefer hard ice
cream, followed by 32 that had no preference.
Table 2.6: Ice cream texture preference
Brand purchase
Brand Frequency
Never Sometimes Often Always
Ben and Jerry’s 16 39 28 12
Cart Dor 27 37 25 6
Haagen Daz 26 46 14 9
Green & Blacks 74 18 2 1
Supermarket own brand 32 33 27 3
Baskin Robbins 66 23 5 1
McDonalds 26 40 22 7
Other 72 12 7 4
Ice cream texture
Frequency Percent Valid Percent Cumulative Percent
Soft 23 24.2 24.2 24.2
Hard 40 42.1 42.1 66.3
No preference 32 33.7 33.7 100.0
Total 95 100.0 100.0
43
2.1.2.9 Types of ice cream
From the results below, it is clear that most common type of ice cream purchased
is a tub of ice cream, as 17 participants claimed that they always buy ice cream
this way. The least popular way was both cup and stick. This indicates that when
designing an experiment with different types of ice cream, the most popular choice
to use would be ice cream from a tub/container.
Table 2.7: Types of ice cream consumed
2.1.2.10 How do you eat ice cream?
From the results below, understanding the manner in which participants consume
ice cream can be drawn. This is important to know for future experiments as it can
aid the design of how ice cream may be presented to the participants, whether that
be a familiar way, or an unfamiliar way. The results indicate that the most popular
way to eat ice cream is scooped from a tub into a bowl. This is clear as 17
participants answered that they always eat ice cream this way, and 47 and 31
indicated that they often and sometimes eat it in this manner. Also, no one
participant answered that they never eat ice cream this way. The least popular
Types of ice cream
Type Frequency
Never Sometimes Often Always
Stick 35 43 14 3
Cone 5 52 29 9
Cup 35 38 15 7
Tub 8 30 40 17
44
way to consume ice cream is clearly with a cold pudding, with 43 participants
answering that they never eat ice cream in this way. It was also reasonable
common to eat ice cream as a stand-alone pudding when compared to eating it
with a pudding.
Table 2.8: Method in which ice cream is consumed
2.1.2.11 When do you eat ice cream?
This was a vital question that needed to be answered for the design of future
experiments. This is because if ice cream is offered to participants at the wrong
time of day, this could impact heavily on results. From these results in the below
table, it is clear to see that 43 of the participants never eat ice cream after lunch,
and 36 never eat it as a snack. The highest number of participants ate ice cream
sometimes after dinner. These answers need to be considered carefully for future
experimental design.
How ice cream is eaten?
Manner in which it is eaten Frequency
Never Sometimes Often Always
Bowl 0 31 47 17
Cone 32 42 21 0
Hot pudding 28 43 22 2
Cold pudding 43 44 8 0
On its own 21 39 32 3
45
Table 2.9: When ice cream is consumed
2.1.2.12 Factors when purchasing ice cream
This question sought to discover what factors participants take into consideration
when purchasing ice cream, and how important they deem these factors to be.
From the table below, it can be concluded that taste is the most important factor as
73 participants answered this is a very important factor, followed by brand (56),
followed by 33 participants deeming mouth feel as the next very important factor.
The least important factors that gained the most answers were the calorie content
of the ice cream and whether or not the ice cream was soft scoop.
When is ice cream eaten?
When Frequency
Never Sometimes Often Always
Snack 36 32 21 6
After lunch 43 37 12 3
After dinner 7 51 30 7
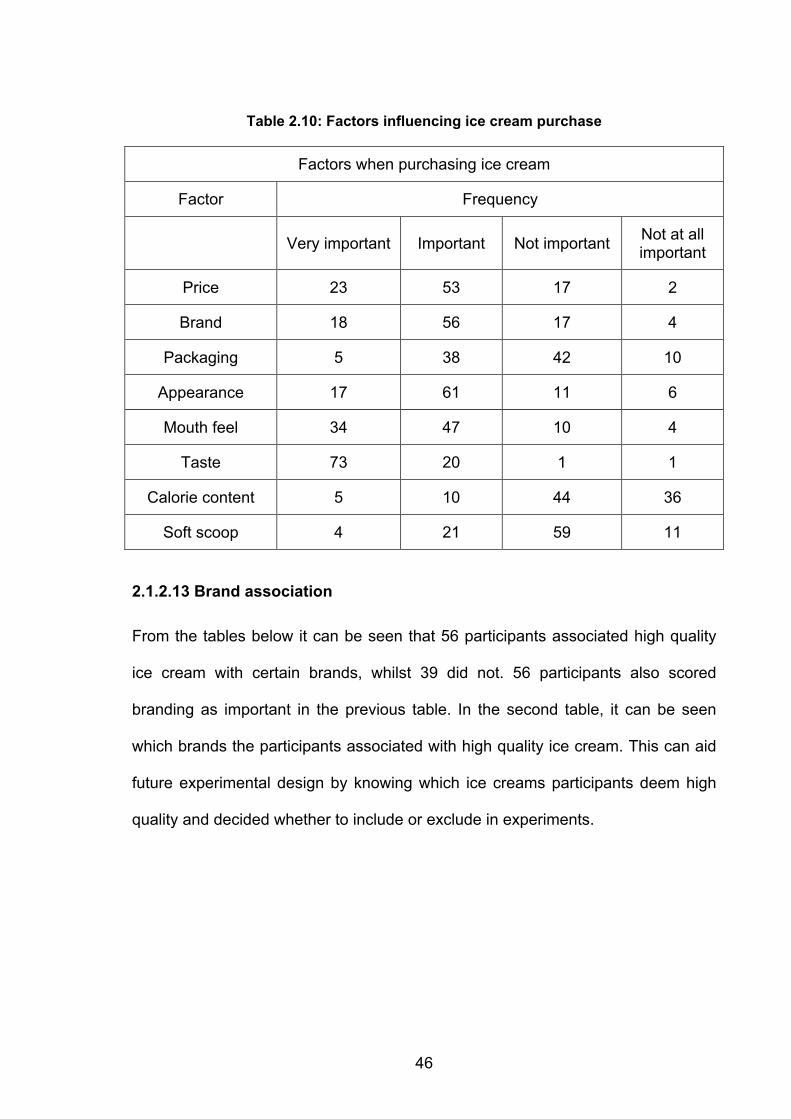
46
Table 2.10: Factors influencing ice cream purchase
2.1.2.13 Brand association
From the tables below it can be seen that 56 participants associated high quality
ice cream with certain brands, whilst 39 did not. 56 participants also scored
branding as important in the previous table. In the second table, it can be seen
which brands the participants associated with high quality ice cream. This can aid
future experimental design by knowing which ice creams participants deem high
quality and decided whether to include or exclude in experiments.
Factors when purchasing ice cream
Factor Frequency
Very important Important Not important Not at all important
Price 23 53 17 2
Brand 18 56 17 4
Packaging 5 38 42 10
Appearance 17 61 11 6
Mouth feel 34 47 10 4
Taste 73 20 1 1
Calorie content 5 10 44 36
Soft scoop 4 21 59 11
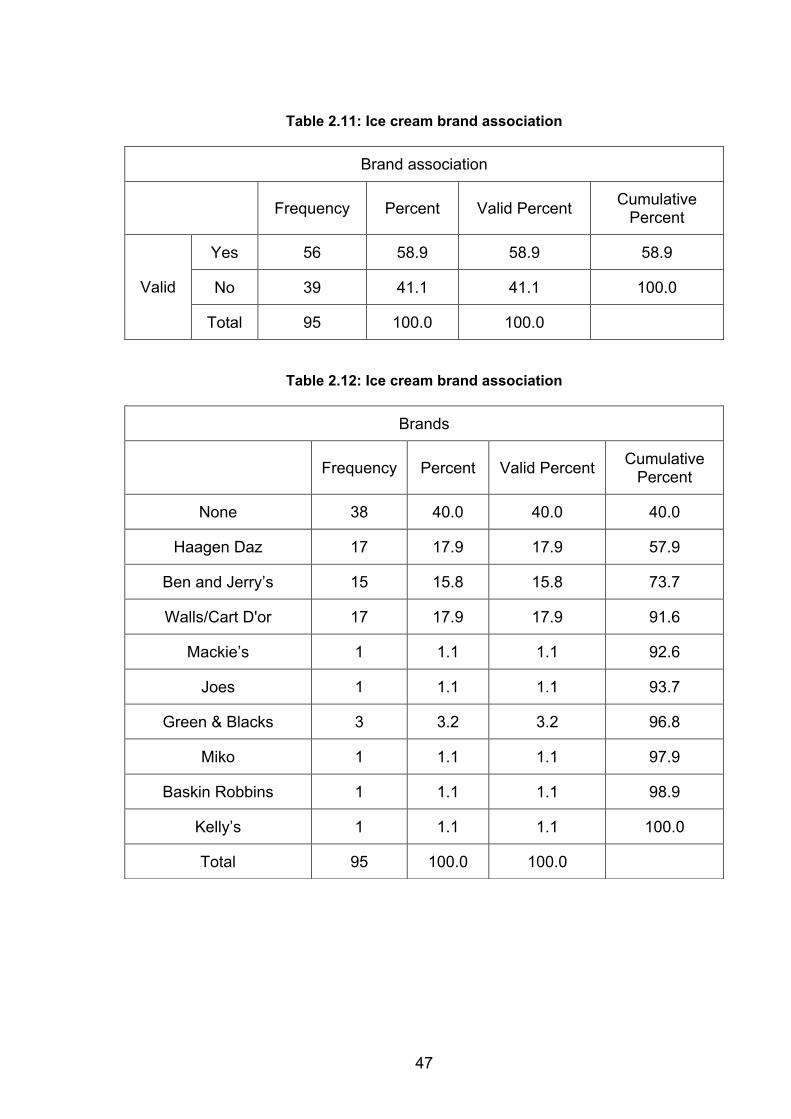
47
Table 2.11: Ice cream brand association
Table 2.12: Ice cream brand association
Brand association
Frequency Percent Valid Percent Cumulative Percent
Yes 56 58.9 58.9 58.9
No 39 41.1 41.1 100.0 Valid
Total 95 100.0 100.0
Brands
Frequency Percent Valid Percent Cumulative Percent
None 38 40.0 40.0 40.0
Haagen Daz 17 17.9 17.9 57.9
Ben and Jerry’s 15 15.8 15.8 73.7
Walls/Cart D'or 17 17.9 17.9 91.6
Mackie’s 1 1.1 1.1 92.6
Joes 1 1.1 1.1 93.7
Green & Blacks 3 3.2 3.2 96.8
Miko 1 1.1 1.1 97.9
Baskin Robbins 1 1.1 1.1 98.9
Kelly’s 1 1.1 1.1 100.0
Total 95 100.0 100.0
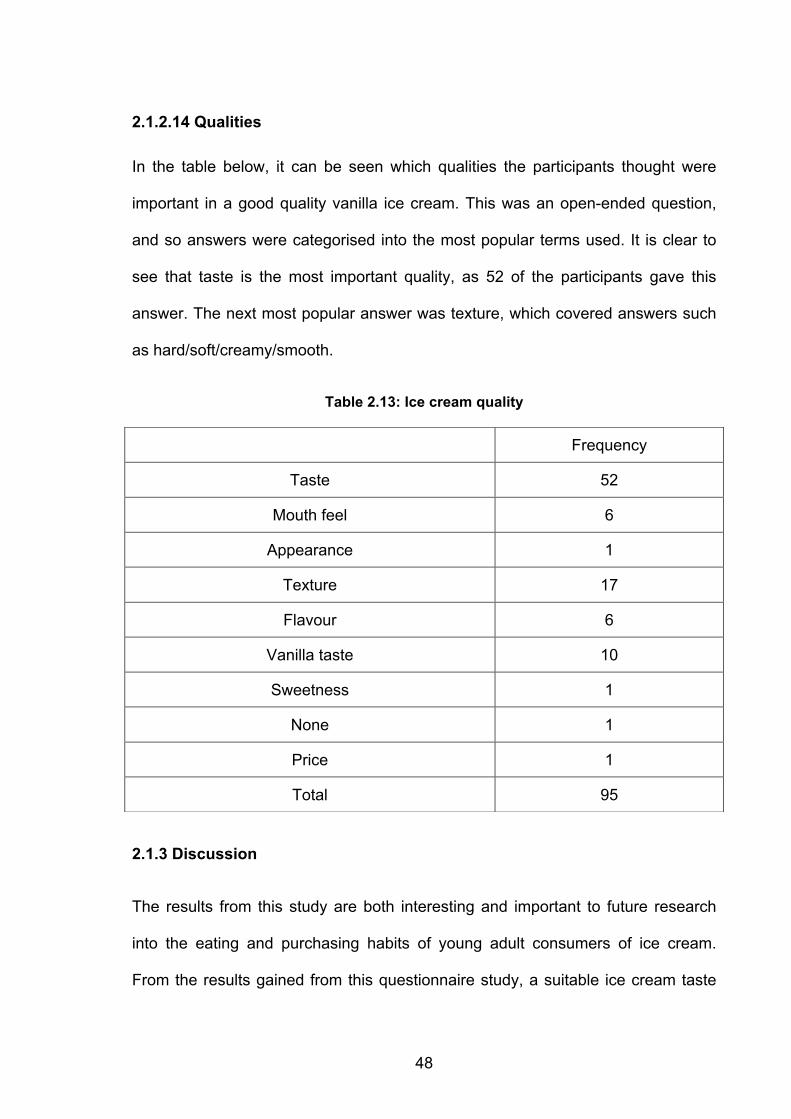
48
2.1.2.14 Qualities
In the table below, it can be seen which qualities the participants thought were
important in a good quality vanilla ice cream. This was an open-ended question,
and so answers were categorised into the most popular terms used. It is clear to
see that taste is the most important quality, as 52 of the participants gave this
answer. The next most popular answer was texture, which covered answers such
as hard/soft/creamy/smooth.
Table 2.13: Ice cream quality
2.1.3 Discussion
The results from this study are both interesting and important to future research
into the eating and purchasing habits of young adult consumers of ice cream.
From the results gained from this questionnaire study, a suitable ice cream taste
Frequency
Taste 52
Mouth feel 6
Appearance 1
Texture 17
Flavour 6
Vanilla taste 10
Sweetness 1
None 1
Price 1
Total 95
49
test can be carried out. The results from both this study and the ice cream taste
test study were used to finalize an experimental design and obtain data with which
to better understand the palatability of vanilla ice cream.
Results are in keeping with that of Rea (2004) who found that branded ice creams
such as Ben & Jerry’s are most popular (15.8%) and that branded ice creams are
in fact associated with a higher and better quality of ice cream (58.9%). As
children are the main consumers of ice cream, it would be beneficial if more
research into the eating habits of adults were carried out, as future trends, such as
low fat and low sugar ice creams appear on the market. The consumer is
increasingly conscious about what they eat, both in terms of evolved health, i.e.
natural and functional foods, and in terms of ethics and provenance. Innovations
from the ice cream industry have improved greatly through extensions of the
Green & Black’s brand and more ethical products from Ben & Jerry’s (Food and
Drink International, 2006).
With regards moulding an experimental design for a taste test into the palatability
of ice cream, these results have been incredibly useful. Results indicate that taste,
texture and vanilla taste are all vital to a well-balanced high quality ice cream.
Whilst appearance did not score particularly highly on the ‘important qualities in a
vanilla ice cream question’, it may be wise to avoid ice creams that contain visible
vanilla seeds in the ice cream. This is because it is often associated with a higher
quality of ice cream, and if wanting to compare low and high quality ice creams in
the taste test experiment, the vanilla seeds may act as a visual cue. The results
also show that the most popular place to purchase ice cream from is the
50
supermarket, so ice creams that will be used in the taste test should be bought
from the supermarket.
2.2 Ice cream palatability taste test and portion size test
The objective of this study was to discover which ice creams were more palatable
to participants from two sets of ice cream; Basic ice creams and premium ice
creams. These ice creams were chosen based on price and ingredients i.e. an ice
cream that used vegetable oil, as the fat was considered basic, whilst one that
included cream as its fat component was considered premium. A subsequent
objective was to better understand portion sizes by asking participants to choose
their optimal portion size of ice cream from photographs. Below are the
hypotheses to be tested. H0 is considered to be the null hypothesis.
H1: It is predicted that there will be a significant difference in the enjoyment of
taste scores between the two basic ice creams (two tailed)
H0: There will be no difference between the enjoyments of taste scores of the two
basic ice creams
H2: It is predicted that there will be a significant difference in the enjoyment of
taste scores between the two premium ice creams (two tailed)
H0: There will be no difference between the enjoyment of taste scores of the two
premium ice creams
51
H3: It is predicted that there will be a significant difference between the enjoyment
of taste scores of the highest scoring premium ice cream and highest scoring
basic ice cream (two tailed)
H0: There will be no difference between the enjoyment of taste scores of the
highest scoring premium ice cream and the highest scoring basic ice cream
H4: The largest portion size (200g) will be the most popular chosen portion size
(one tailed)
H4: The largest portion size (200g) will not be the most popular chosen portion
size.
2.2.1 Methodology
2.2.1.1 Participants
16 participants took part in the ice cream palatability taste test study. From these
10 were male and 6 were female. All were postgraduate students based in the
chemical engineering Department of Birmingham University. Participants were
chosen using a simple random sampling technique. Easton & McColl (1997) define
this sampling technique as ‘basic sampling technique where we select a group of
subjects (a sample) for study from a larger group (a population). Each individual is
chosen entirely by chance and each member of the population has an equal
chance of being included in the sample’. An advantage of this type of sampling is
that it should be free from bias as it is totally random.
30 participants took part in the portion size exercise. 16 of these were the same
participants that took part in the ice cream taste test, and the other 14 participants
52
were chosen at random. Some of these participants took part in the questionnaire
study, whilst some others did not.
2.2.1.2 Design
A repeated measures design was employed for the ice cream palatability taste
test. A repeated measures (or paired samples) design is defined as ‘ a technique
used when you test the same people on more than one occasion’ (Pallent, 2007).
Two basic ice creams were compared, as were two premium ice creams. The
dependent variables in this study were the VAS scores given for the ice creams,
whilst the independent variable was the type of ice cream.
For the portion size exercise, the dependent variable was the portion size chosen
(A, B, C, D), whilst the independent variable was the photographs of the portion
size that the participants were shown.
2.2.1.3 Materials
For the ice cream taste test, materials included the two basic ice creams and two
premium ice creams. The basic ice creams were Sainsbury’s basic vanilla ice
cream, and Waitrose essentials vanilla ice creams. These were chosen as the
basic ice creams due to their fat content type-vegetable fat rather than dairy fat
and their price. The premium ice creams were Duchy’s original organic vanilla ice
cream, and Mackie’s Scottish ice cream. These were chosen as the premium ice
creams because of their total fat content, and fat content type- sourced from diary
fat rather than vegetable fat. Their cost of purchase was also an indication of their
premium status. These ice creams were also specially chosen from results gained
in the ice cream questionnaire study. It had been decided that the premium ice
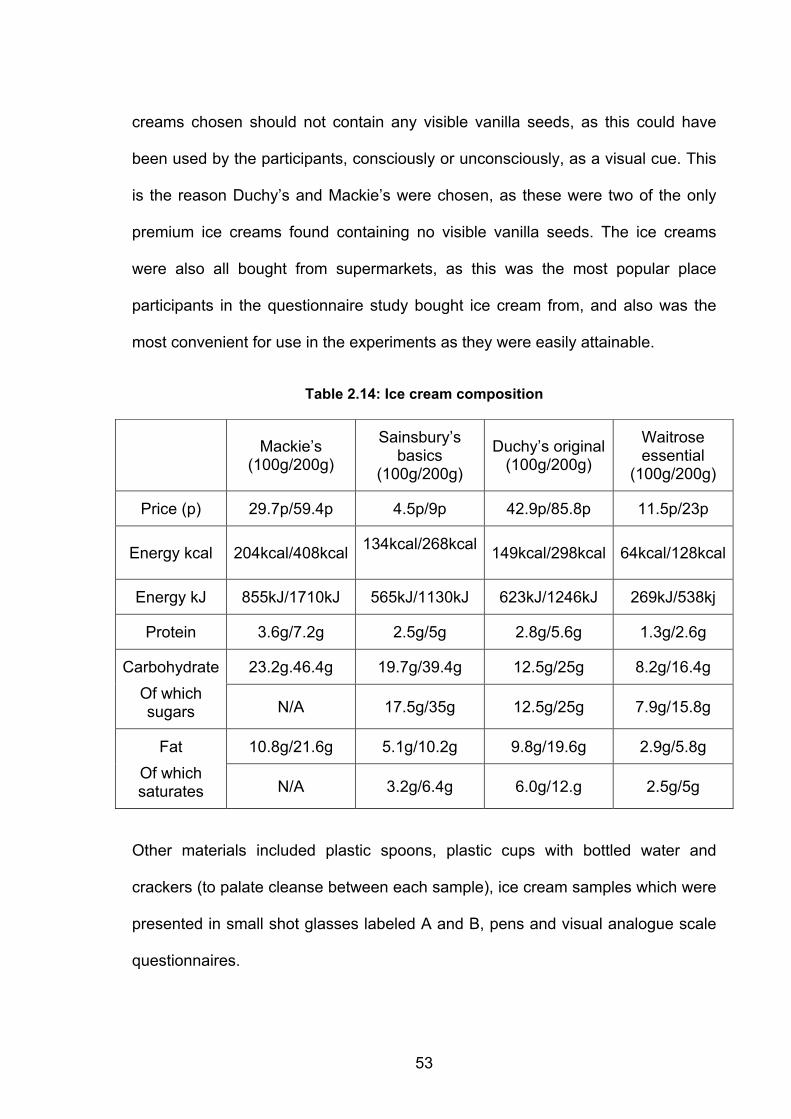
53
creams chosen should not contain any visible vanilla seeds, as this could have
been used by the participants, consciously or unconsciously, as a visual cue. This
is the reason Duchy’s and Mackie’s were chosen, as these were two of the only
premium ice creams found containing no visible vanilla seeds. The ice creams
were also all bought from supermarkets, as this was the most popular place
participants in the questionnaire study bought ice cream from, and also was the
most convenient for use in the experiments as they were easily attainable.
Table 2.14: Ice cream composition
Other materials included plastic spoons, plastic cups with bottled water and
crackers (to palate cleanse between each sample), ice cream samples which were
presented in small shot glasses labeled A and B, pens and visual analogue scale
questionnaires.
Mackie’s (100g/200g)
Sainsbury’s basics
(100g/200g)
Duchy’s original (100g/200g)
Waitrose essential
(100g/200g)
Price (p) 29.7p/59.4p 4.5p/9p 42.9p/85.8p 11.5p/23p
Energy kcal 204kcal/408kcal 134kcal/268kcal 149kcal/298kcal 64kcal/128kcal
Energy kJ 855kJ/1710kJ 565kJ/1130kJ 623kJ/1246kJ 269kJ/538kj
Protein 3.6g/7.2g 2.5g/5g 2.8g/5.6g 1.3g/2.6g
23.2g.46.4g 19.7g/39.4g 12.5g/25g 8.2g/16.4g Carbohydrate Of which sugars N/A 17.5g/35g 12.5g/25g 7.9g/15.8g
10.8g/21.6g 5.1g/10.2g 9.8g/19.6g 2.9g/5.8g Fat Of which saturates N/A 3.2g/6.4g 6.0g/12.g 2.5g/5g
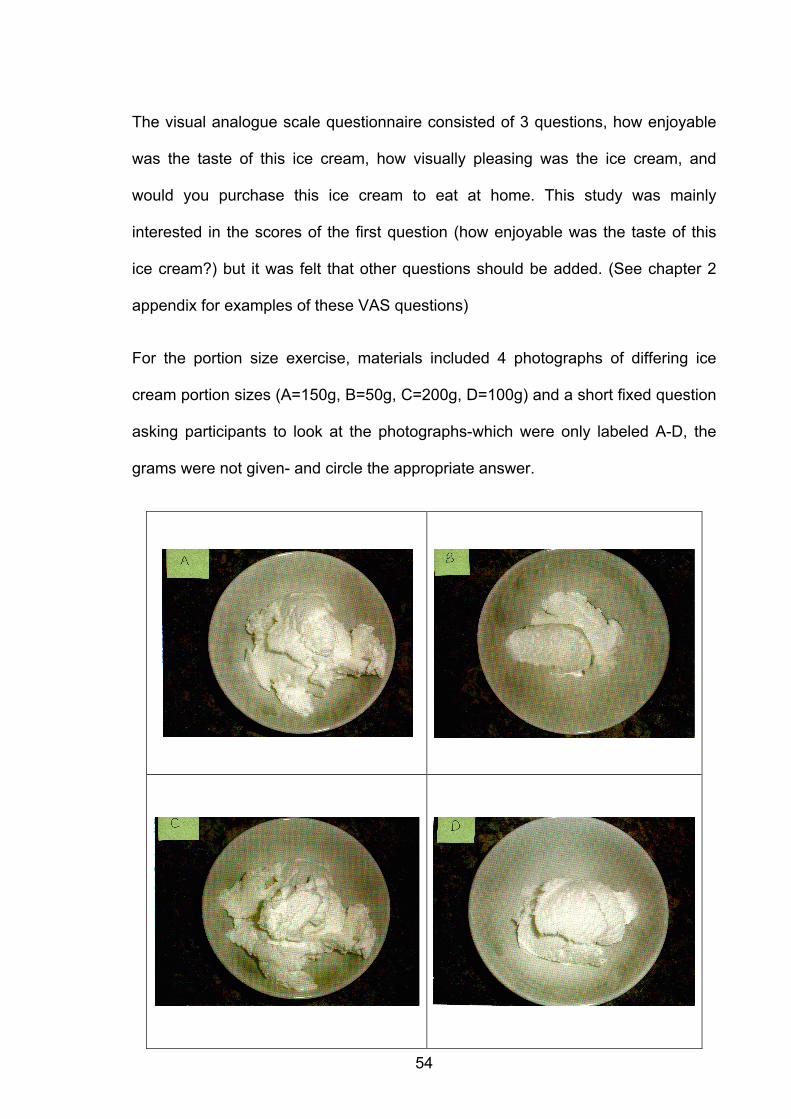
54
The visual analogue scale questionnaire consisted of 3 questions, how enjoyable
was the taste of this ice cream, how visually pleasing was the ice cream, and
would you purchase this ice cream to eat at home. This study was mainly
interested in the scores of the first question (how enjoyable was the taste of this
ice cream?) but it was felt that other questions should be added. (See chapter 2
appendix for examples of these VAS questions)
For the portion size exercise, materials included 4 photographs of differing ice
cream portion sizes (A=150g, B=50g, C=200g, D=100g) and a short fixed question
asking participants to look at the photographs-which were only labeled A-D, the
grams were not given- and circle the appropriate answer.
55
Figure 2.1: Photographs of ice cream portion size
2.2.1.4 Procedure
16 postgraduate students were approached in the chemical engineering
Department of Birmingham University. The study and its aims were clearly
explained to them; however, they were not told that they would be eating basic
and premium ice creams. Verbal consent was gained from each participant before
the taste test began. Participants were invited to a room, and asked to sit down,
pour themselves a cup of water, and eat a small water cracker. They were then
asked to read the top page of the VAS scale questionnaire, which contained an
example of how to fill in a VAS. Whilst the participants were doing this, the
experimenter went behind a screen to obtain the first set of ice cream samples, -
Taste test 1-which were the basic ice creams. Sample A was the Sainsbury’s
basics vanilla ice cream, and Sample B was the Waitrose essential vanilla ice
cream, but the participants were not told this. Sample A was brought out first, and
participants were asked to turn the VAS questionnaire over to the first question,
eat some of sample A and then answer the questions. After they has completed
the questions for sample A, they were asked to palette cleanse with the water and
crackers, whilst Sample B was prepared. Sample B was then brought out to the
participants, and the same procedure for sample A was repeated. Following the
completion of these questions, they were asked to turn the VAS questionnaire
over to taste test 2, participants were once again asked to palette cleanse. The
premium ice cream samples were then prepared. Sample A was the Mackie ice
cream, and sample B was the Duchy’s vanilla ice cream- however, once again, the
participants didn’t know this. The same procedure as taste test 1 was then
56
repeated. After participants had completed the VAS questionnaire, they were
asked to turn to the last page of the questionnaire, which contained the portion
size exercise. They were asked to look at four photographs of differing size
portions of ice cream in bowls. They were not told the weight of the differing
portions, but just asked a fixed question as to which portion size they would prefer.
All participants were then thanked and debriefed.
The remaining 14 participants that took part in the portion size exercise were then
selected at random, and once again asked to look at the photographs of ice cream
portions, and asked to select which portion they would prefer. These participants
were then thanked and debriefed.
2.2.2 Results
The experimental hypotheses being tested were:
H1: It is predicted that there will be a significant difference in the taste scores
between the two basic ice creams (two tailed)
H2: It is predicted that there will be a significant difference in the taste scores
between the two premium ice creams (two tailed)
H3: It is predicted that there will be a significant difference between the taste
scores of the highest scoring premium ice cream and highest scoring basic ice
cream (two tailed)
H4: The largest portion size (200g) will be the most frequently chosen portion size
(one tailed)
57
In order to assess whether there was a significant difference in the taste scores
between the two basic ice creams, a repeated measures comparisons of means t
test was carried out. This was in order to analyze the data collected from the VAS
questionnaire complete for taste test 1.
The purpose for choosing a repeated measures test was due to the data collected
being at interval level, and a repeated measures comparisons of means test looks
for a difference between two related groups (Banister, 1997). The parametric
assumptions were met; data was at interval level, the data was normally
distributed and the repeated measures comparison of means test makes no
assumptions of homogeneity of variance.
2.2.2.1 Taste test 1-Basic ice creams
A repeated measures comparison of means t test was conducted to evaluate the
enjoyment of taste VAS scores of two basic ice cream samples.
Table 2.15 shows the descriptive statistics (Means and SD) for the VAS scores for
enjoyment of taste for taste test 1.
Table 2.15: Descriptive statistics for taste test 1
Descriptive statistics (Means and SD) for the enjoyment of taste VAS scores for taste test 1
Mean VAS score Standard deviation
Sainsbury’s Basic Vanilla Ice cream 58.3 21.6
Waitrose essentials vanilla ice cream 45.3 20.1
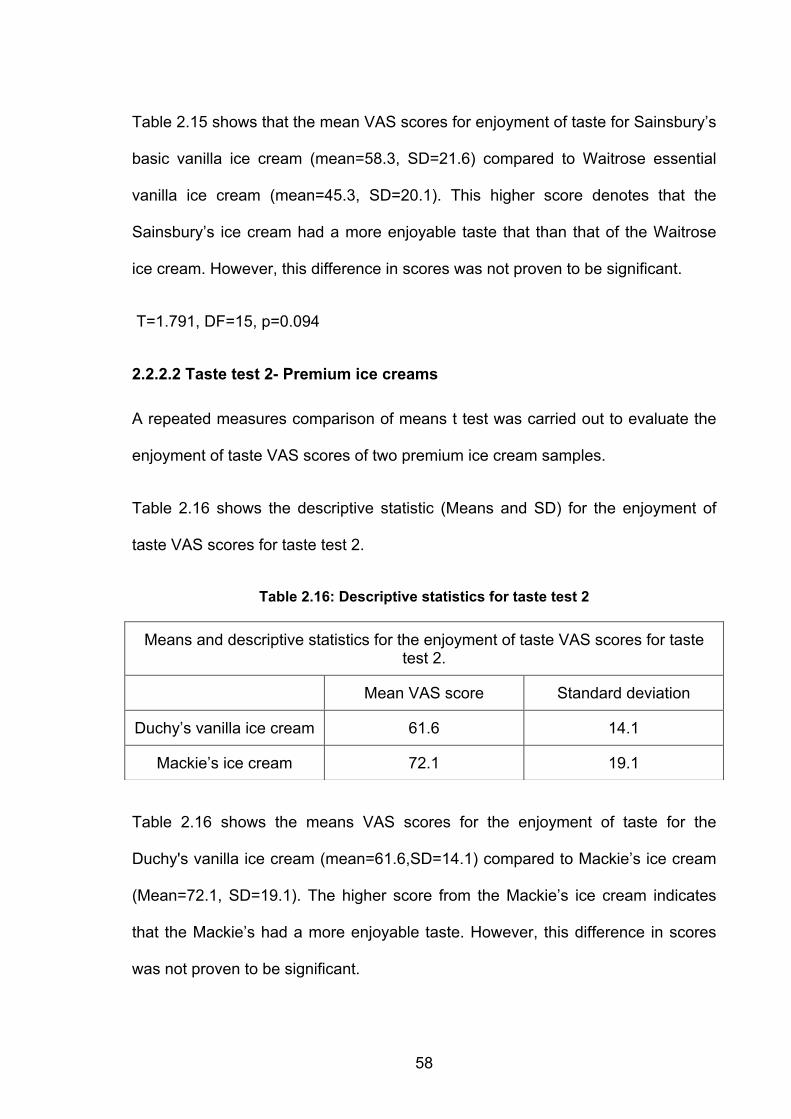
58
Table 2.15 shows that the mean VAS scores for enjoyment of taste for Sainsbury’s
basic vanilla ice cream (mean=58.3, SD=21.6) compared to Waitrose essential
vanilla ice cream (mean=45.3, SD=20.1). This higher score denotes that the
Sainsbury’s ice cream had a more enjoyable taste that than that of the Waitrose
ice cream. However, this difference in scores was not proven to be significant.
T=1.791, DF=15, p=0.094
2.2.2.2 Taste test 2- Premium ice creams
A repeated measures comparison of means t test was carried out to evaluate the
enjoyment of taste VAS scores of two premium ice cream samples.
Table 2.16 shows the descriptive statistic (Means and SD) for the enjoyment of
taste VAS scores for taste test 2.
Table 2.16: Descriptive statistics for taste test 2
Table 2.16 shows the means VAS scores for the enjoyment of taste for the
Duchy's vanilla ice cream (mean=61.6,SD=14.1) compared to Mackie’s ice cream
(Mean=72.1, SD=19.1). The higher score from the Mackie’s ice cream indicates
that the Mackie’s had a more enjoyable taste. However, this difference in scores
was not proven to be significant.
Means and descriptive statistics for the enjoyment of taste VAS scores for taste test 2.
Mean VAS score Standard deviation
Duchy’s vanilla ice cream 61.6 14.1
Mackie’s ice cream 72.1 19.1
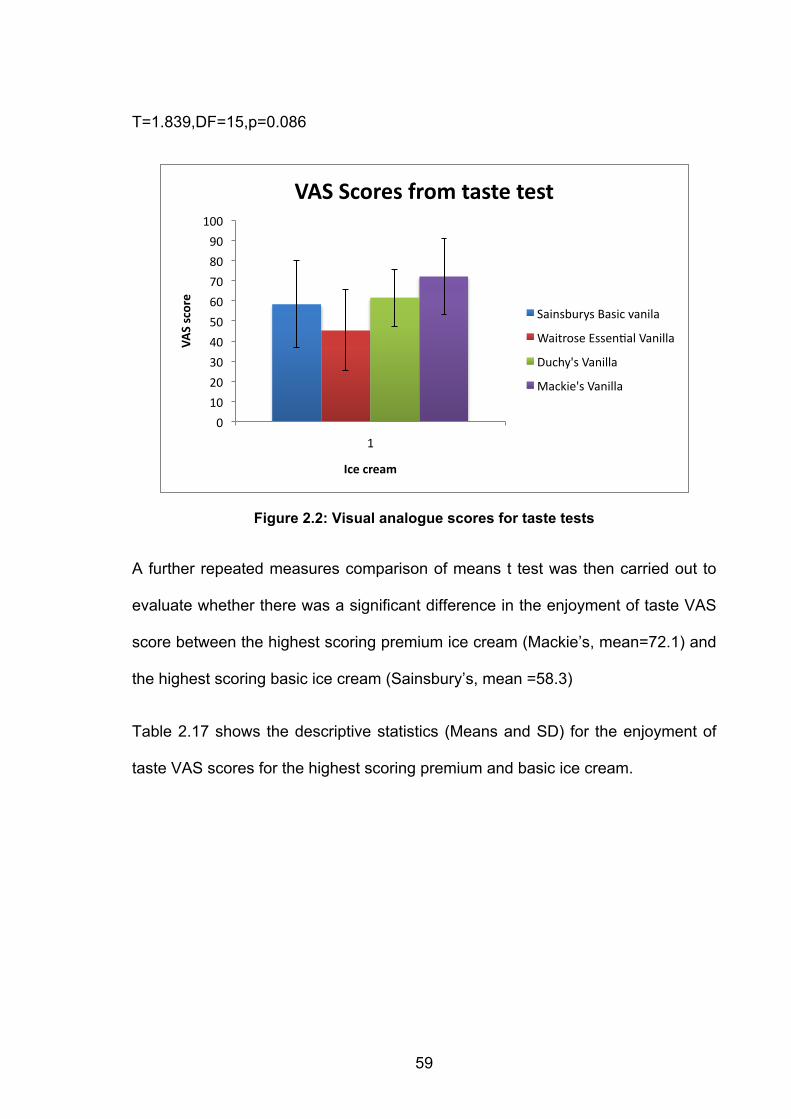
59
T=1.839,DF=15,p=0.086
Figure 2.2: Visual analogue scores for taste tests
A further repeated measures comparison of means t test was then carried out to
evaluate whether there was a significant difference in the enjoyment of taste VAS
score between the highest scoring premium ice cream (Mackie’s, mean=72.1) and
the highest scoring basic ice cream (Sainsbury’s, mean =58.3)
Table 2.17 shows the descriptive statistics (Means and SD) for the enjoyment of
taste VAS scores for the highest scoring premium and basic ice cream.
0
10
20
30
40
50
60
70
80
90
100
1
VAS score
Ice cream
VAS Scores from taste test
Sainsburys Basic vanila
Waitrose Essen6al Vanilla
Duchy's Vanilla
Mackie's Vanilla
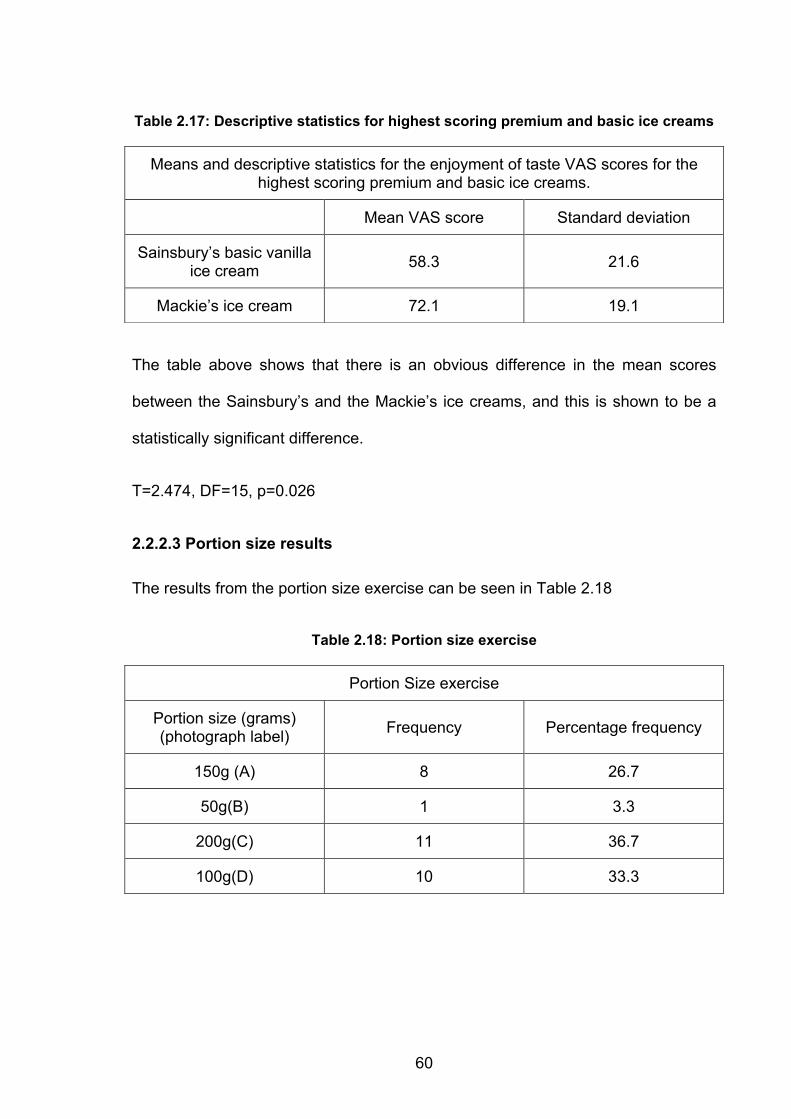
60
Table 2.17: Descriptive statistics for highest scoring premium and basic ice creams
The table above shows that there is an obvious difference in the mean scores
between the Sainsbury’s and the Mackie’s ice creams, and this is shown to be a
statistically significant difference.
T=2.474, DF=15, p=0.026
2.2.2.3 Portion size results
The results from the portion size exercise can be seen in Table 2.18
Table 2.18: Portion size exercise
Means and descriptive statistics for the enjoyment of taste VAS scores for the highest scoring premium and basic ice creams.
Mean VAS score Standard deviation
Sainsbury’s basic vanilla ice cream 58.3 21.6
Mackie’s ice cream 72.1 19.1
Portion Size exercise
Portion size (grams) (photograph label) Frequency Percentage frequency
150g (A) 8 26.7
50g(B) 1 3.3
200g(C) 11 36.7
100g(D) 10 33.3
61
From this table of frequencies, it can be concluded that the most frequently chosen
portion size was 200g, closely followed by 100g.
2.2.3 Discussion
The experimental hypotheses being tested were:
H1: It is predicted that there will be a significant difference in the taste scores
between the two basic ice creams (two tailed)
H2: It is predicted that there will be a significant difference in the taste scores
between the two premium ice creams (two tailed)
The results from the ice cream taste study showed that whilst there was a slight
difference between these scores, they were not of a significant level. Therefore we
cannot reject the null hypothesis.
H3: It is predicted that there will be a significant difference between the taste
scores of the highest scoring premium ice cream and highest scoring basic ice
cream (two tailed)
H4: The largest portion size (200g) will be the most popular chosen portion size
(one tailed)
Both of these hypotheses were proven and therefore the null hypothesis can be
rejected.
The results from this study have indicated potential ice creams, both basic and
premium that could be used in future research into ice cream palatability. It has
62
also indicated potential portion sizes that could be used. As portion size is so
closely related to energy intake and rate of intake, this may be a sensible direction
to focus future work.
Results showed that whilst there was not a significant difference between the two
basic and two premium ice creams, there was a significant difference between the
highest scoring premium and highest scoring basic ice creams. The purpose for
comparing these two ice creams was that the lower scoring basic ice cream
(Waitrose essential) scored so low that any future experiments that used this ice
cream may find that participants dislike its taste so much, that they refuse to eat it,
which would skew research results into eating rate for example.
The use of the VAS was of great benefit to this study. Verbal feedback from
participants indicated that they found it easy to use and easier to answer than a
numbered Likert scale. The taste test panel was representative of the consumer
market of interest and that test procedures were kept simple and the number of
items compared were small, which were in keeping with Bradley (1955)
instructions on a taste panel for consumer testing.
The results from the portion size exercise were interesting and in keeping with
previous research. A large proportion of the participants chose the largest portion
size (200g), and future research may benefit from examining the link between
large portion size and rate of intake as Matin et al (2005) found that when
participants were presented with larger portions, they ate more. It may also be
interesting to examine the idea of Willemijn (2009) who stated that consumers find
self-regulation of large portions difficult at the moment of consumption. The

63
examining of the effects of large portion sizes on energy intake on rapid eating
rate could also take place. The idea that rapid eating rate may confuse and distort
the physiological signals involved in meal termination could also be examined, but
the practicalities of measuring of this must be considered carefully.
64
CHAPTER 3: MATERIAL PROPERTIES AND CHARACTERISATION OF ICE
CREAM
Following on from the previous chapters results regarding taste preference and the
clear differences in preferences in relation to structural perception, and the future
eating behaviour experiments that were due to be carried out with participants, it
was felt that a broader knowledge of the crucial principles and fundamentals of
basic ice cream emulsions was needed. This was primarily due to the fact that any
future eating experiments that were carried out would be done over a prolonged
period of time (15minutes+) and it was important to establish time scales of
destabilisation for these experiments. There needed to be confidence that the
material would be stable for the future time scales needed.
Therefore, the decision was taken to prepare and test some basic ice cream
emulsions to in order to gain understanding of material stability.
A model system of four basic oil in water emulsions were prepared. All consisted
of the equal amounts of milk protein (2.5% sodium caseinate) but differed in ratios
of fat (Vegetable oil) and water (double distilled). The purpose of a model system
was to provide boundary limits to the responses of real materials and industry
relevant trends in data.
These emulsions were then investigated in relation to influence of shear time on
fat particle size with no emulsifier or stabilizer mixture, then influence of emulsifier
and stabilizer mixture (e/s) (0.5% and 1%) on fat particle size and effect of
homogenization on fat particle size.
65
Experiments were then carried out which looked at current ice cream available on
the market, and dealt with the rate at which the fat in these ice creams melted and
the tribology of the ice creams.
3.1 Material and methods
3.1.1 Emulsion preparation
3.1.1.1 No emulsifier or stabiliser
For the first experiment, no emulsifier or stabilizer was added, as the amount of
emulsifier and stabilizer and its affect on fat particle size and fat stability was
investigated in a following experiment.
Protein was weighed out, as was distilled water and vegetable oil. Protein was
then dispersed in the cold distilled water and mixed under stirring using a magnetic
stirrer for 10 minutes. This mixture was then finely mixed with the vegetable oil in a
glass beaker in a Silverson high shear mixer at 10700Rpm for 1 minute.
This procedure was then repeated for another four basic o/w emulsions of the
same compositions as above; however, these were mixed at 10700Rpm in a
Silverson high shear mixer for 5 minutes.
The procedure was then repeated for a third time, following the same composition
as before, but the emulsions this time were high shear mixed for 10 minutes.
Post high shear mixing, each emulsion was then observed under a light
microscope and mastersizer in order to determine the fat droplet size and
distribution.
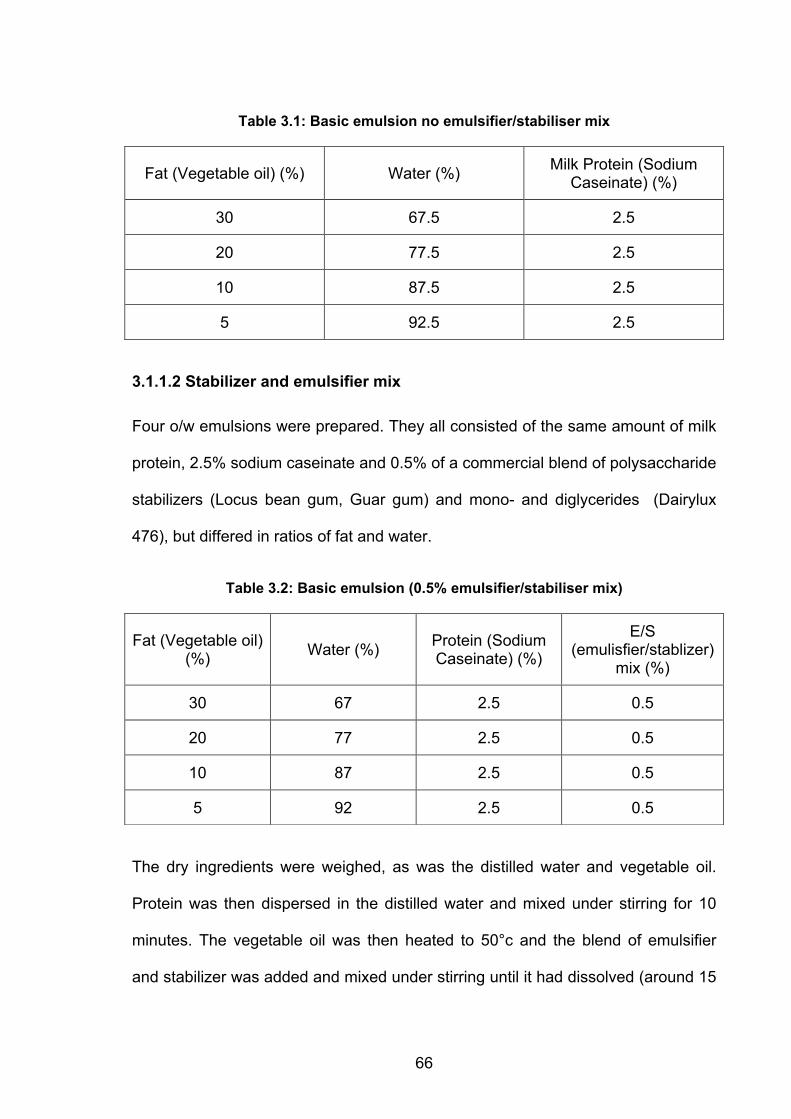
66
Table 3.1: Basic emulsion no emulsifier/stabiliser mix
3.1.1.2 Stabilizer and emulsifier mix
Four o/w emulsions were prepared. They all consisted of the same amount of milk
protein, 2.5% sodium caseinate and 0.5% of a commercial blend of polysaccharide
stabilizers (Locus bean gum, Guar gum) and mono- and diglycerides (Dairylux
476), but differed in ratios of fat and water.
Table 3.2: Basic emulsion (0.5% emulsifier/stabiliser mix)
The dry ingredients were weighed, as was the distilled water and vegetable oil.
Protein was then dispersed in the distilled water and mixed under stirring for 10
minutes. The vegetable oil was then heated to 50°c and the blend of emulsifier
and stabilizer was added and mixed under stirring until it had dissolved (around 15
Fat (Vegetable oil) (%) Water (%) Milk Protein (Sodium Caseinate) (%)
30 67.5 2.5
20 77.5 2.5
10 87.5 2.5
5 92.5 2.5
Fat (Vegetable oil) (%) Water (%) Protein (Sodium
Caseinate) (%)
E/S (emulisfier/stablizer)
mix (%)
30 67 2.5 0.5
20 77 2.5 0.5
10 87 2.5 0.5
5 92 2.5 0.5
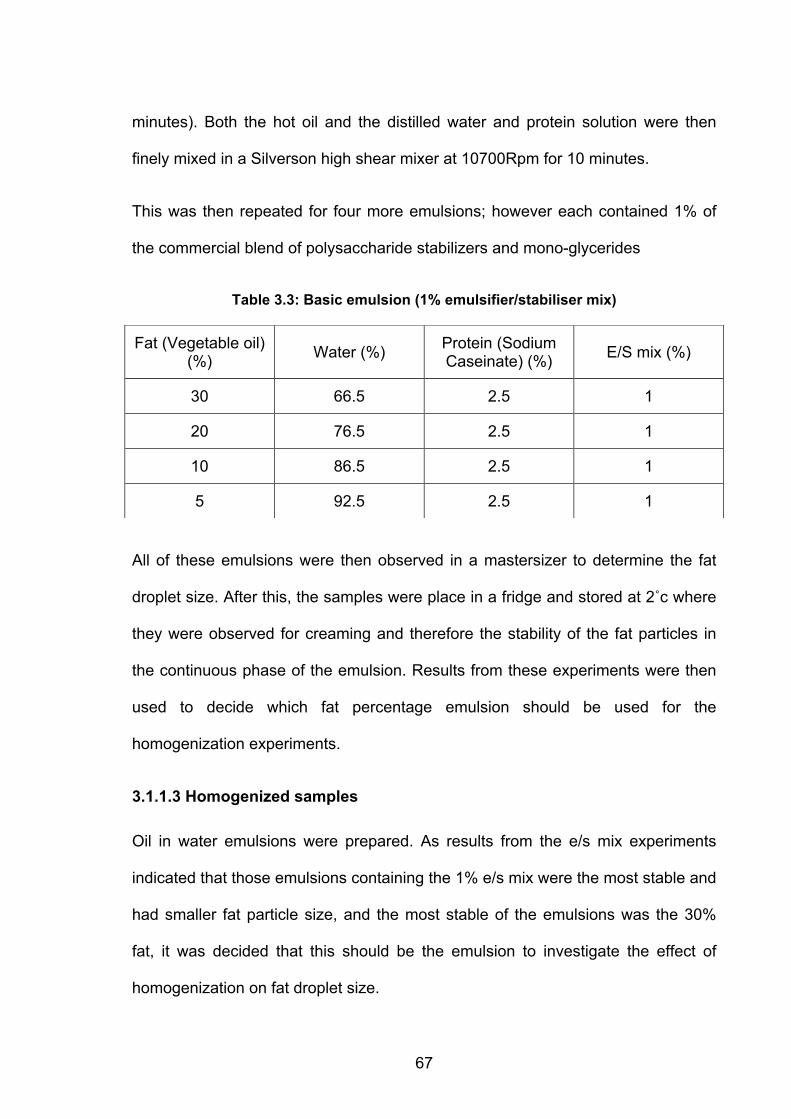
67
minutes). Both the hot oil and the distilled water and protein solution were then
finely mixed in a Silverson high shear mixer at 10700Rpm for 10 minutes.
This was then repeated for four more emulsions; however each contained 1% of
the commercial blend of polysaccharide stabilizers and mono-glycerides
Table 3.3: Basic emulsion (1% emulsifier/stabiliser mix)
All of these emulsions were then observed in a mastersizer to determine the fat
droplet size. After this, the samples were place in a fridge and stored at 2˚c where
they were observed for creaming and therefore the stability of the fat particles in
the continuous phase of the emulsion. Results from these experiments were then
used to decide which fat percentage emulsion should be used for the
homogenization experiments.
3.1.1.3 Homogenized samples
Oil in water emulsions were prepared. As results from the e/s mix experiments
indicated that those emulsions containing the 1% e/s mix were the most stable and
had smaller fat particle size, and the most stable of the emulsions was the 30%
fat, it was decided that this should be the emulsion to investigate the effect of
homogenization on fat droplet size.
Fat (Vegetable oil) (%) Water (%) Protein (Sodium
Caseinate) (%) E/S mix (%)
30 66.5 2.5 1
20 76.5 2.5 1
10 86.5 2.5 1
5 92.5 2.5 1
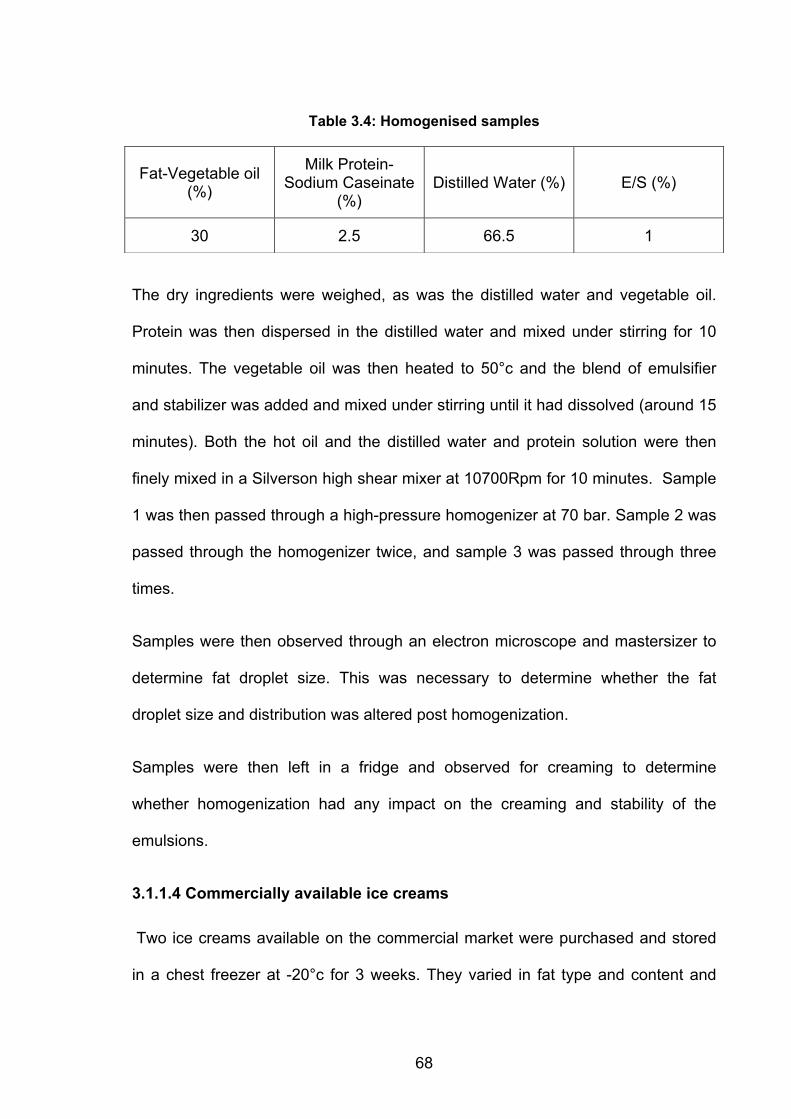
68
Table 3.4: Homogenised samples
The dry ingredients were weighed, as was the distilled water and vegetable oil.
Protein was then dispersed in the distilled water and mixed under stirring for 10
minutes. The vegetable oil was then heated to 50°c and the blend of emulsifier
and stabilizer was added and mixed under stirring until it had dissolved (around 15
minutes). Both the hot oil and the distilled water and protein solution were then
finely mixed in a Silverson high shear mixer at 10700Rpm for 10 minutes. Sample
1 was then passed through a high-pressure homogenizer at 70 bar. Sample 2 was
passed through the homogenizer twice, and sample 3 was passed through three
times.
Samples were then observed through an electron microscope and mastersizer to
determine fat droplet size. This was necessary to determine whether the fat
droplet size and distribution was altered post homogenization.
Samples were then left in a fridge and observed for creaming to determine
whether homogenization had any impact on the creaming and stability of the
emulsions.
3.1.1.4 Commercially available ice creams
Two ice creams available on the commercial market were purchased and stored
in a chest freezer at -20°c for 3 weeks. They varied in fat type and content and
Fat-Vegetable oil (%)
Milk Protein-Sodium Caseinate
(%) Distilled Water (%) E/S (%)
30 2.5 66.5 1
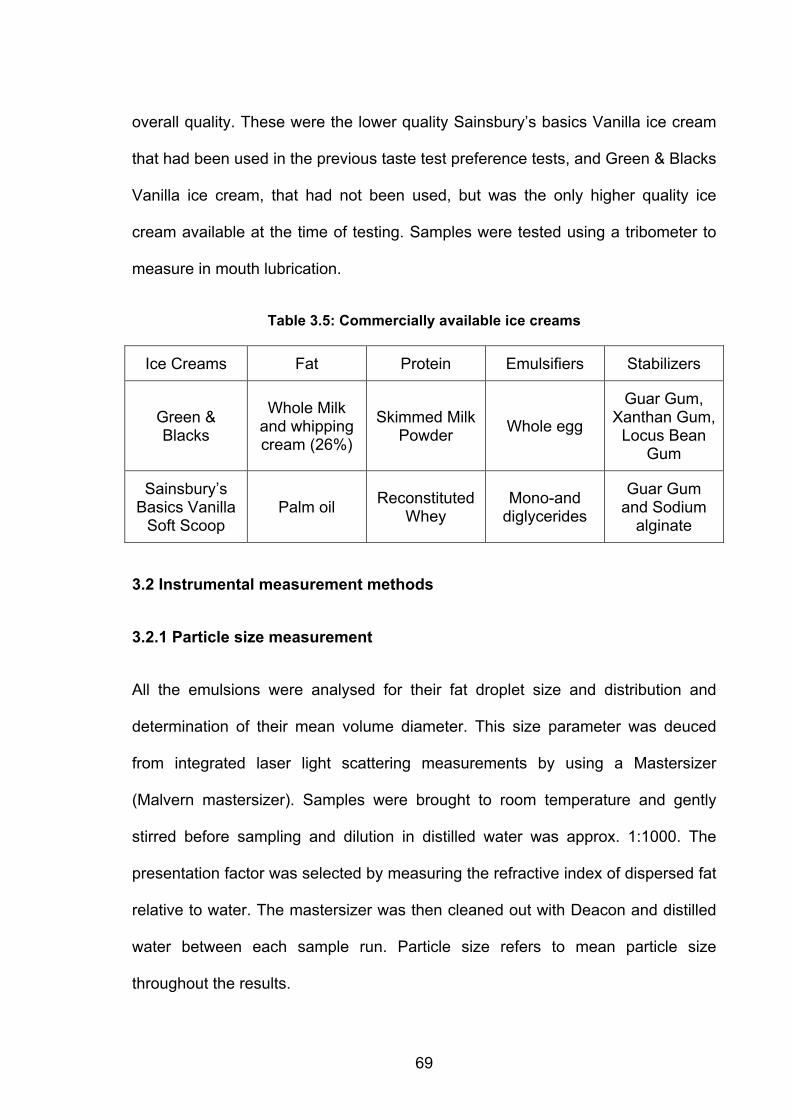
69
overall quality. These were the lower quality Sainsbury’s basics Vanilla ice cream
that had been used in the previous taste test preference tests, and Green & Blacks
Vanilla ice cream, that had not been used, but was the only higher quality ice
cream available at the time of testing. Samples were tested using a tribometer to
measure in mouth lubrication.
Table 3.5: Commercially available ice creams
3.2 Instrumental measurement methods
3.2.1 Particle size measurement
All the emulsions were analysed for their fat droplet size and distribution and
determination of their mean volume diameter. This size parameter was deuced
from integrated laser light scattering measurements by using a Mastersizer
(Malvern mastersizer). Samples were brought to room temperature and gently
stirred before sampling and dilution in distilled water was approx. 1:1000. The
presentation factor was selected by measuring the refractive index of dispersed fat
relative to water. The mastersizer was then cleaned out with Deacon and distilled
water between each sample run. Particle size refers to mean particle size
throughout the results.
Ice Creams Fat Protein Emulsifiers Stabilizers
Green & Blacks
Whole Milk and whipping cream (26%)
Skimmed Milk Powder Whole egg
Guar Gum, Xanthan Gum,
Locus Bean Gum
Sainsbury’s Basics Vanilla
Soft Scoop Palm oil Reconstituted
Whey Mono-and
diglycerides
Guar Gum and Sodium
alginate
70
3.2.2 Microscopy
A light microscope (Reichert-Yung light microscope) was used to observe the fat
globules and distribution in the emulsions. The emulsions were prepared for the
microscopy by stirring the emulsions with a fine pipette and a small amount
(approx. 1ml) was then spread on a glass microscope slide. To obtain a flat image,
a glass cover slip was placed over the sample prior to observation.
3.2.3 Creaming Profiles
In order to observe the stability of the emulsions, a visual assessment of them was
carried out. This was performed by placing the emulsion in a plastic volumetric test
tube with a total graduation of 14ml in 1ml steps. The samples were left in a fridge
at 2˚c and serum volume was noted for a total time of 24hrs. This was a vital
mechanism for testing the primary destabilization mechanism of that fat phase of
ice cream over prolonged testing time scales.
3.2.4 Tribology
As discussed in the literature review, tribology is the science of friction and
lubrication and whilst most commonly used in the context of metal processing, has
been used to correlate in mouth responses to food (Malone et al , 2003).
Dresselhuis et al (2007) demonstrated an inverse relation between fat perception
and in mouth friction sensed between the tongue and the palate. Tribology
therefore would be a beneficial way of relating the fat perception and content of
the bought ice creams and in mouth friction.
71
A mini traction machine developed by PCS instruments was used. Data were
gathered at 37°c to replicate in mouth conditions of melted ice cream. A Stribeck
curve formed of variable speeds from 1mm/s to 1000mm/s in ascending order and
using a ball on disc method. A precision steel ball was used together with a 46mm
diameter silicone disc. Before the sample reached the required temperature,
dependent on which experiment was being carried out, the machine was set at an
idle speed and the ball applied no load to the sample or the disc. One the
temperature was equilibrated the ball applied a load of 2N and the test run began.
Each test carried out twice, once with the Green & Blacks sample, and the second
with the Sainsbury’s basics.
3.3 Results and discussion
3.3.1 Basic emulsions with no e/s mix
Below is a table showing the fat particle size results of the shear time experiments
for the basic emulsions containing no e/s mix.
72
Table 3.6: Particle size (Volume/weight) for basic emulsions no e/s mix
As the fat content of the emulsions increases, shear time becomes less influential
on mean particle size, as all three 30% emulsions are similar in particle size
(d(0.5) (1minute 14.6µm, 5 minutes 12.1µm and 10 minutes 11.4 µm). However,
the results still show that increased shear time leads to smaller particle size, as the
results show that all the emulsions were high shear mixed from 10 minutes,
regardless of fat quantity, resulted in decreased particle size when compared to
the 1 minute shearing time. From these results, it is clear to see that the less fat
Fat content
Shear time
D [4,3]
D [3,2] µm d (0.1) d(0.5)
d(0.9)
1minute 33.2 9.9 6.0 16.6 33.9
5 minutes 29.2 5.5 2.8 9.1 21.1 5% 10
minutes 9.1 4.4 2.2 7.6 18.2
1minute 18.3 10.4 6.6 16.8 32.5
5 minutes 13.6 7.1 3.9 11.2 23.5 10% 10
minutes 12.4 6.6 3.5 10.6 22.7
1minute 17.1 10.7 7.1 15.7 29.5
5 minutes 13.7 8.2 4.9 12.4 24.5 20% 10
minutes 13.8 8.5 5.4 12.7 24.3
1minute 15.7 11.1 7.3 14.6 26.2
5 minutes 13.1 9.5 6.2 12.1 21.8 30% 10
minutes 12.4 9.1 5.8 11.4 20.6
73
present in an emulsion, the greater influence shear time has on resulting smaller
particle size, as is apparent in the 5% fat emulsion, which gave the smallest fat
particle size of 7.6µm.
The data below shows the particle size distribution per time scale.
Figure 3.1: Particle Size Analysis At Shear Time 1 Minute
Figure 3.2: Particle Size Analysis At Shear Time 5 Minutes
Particle Size
Distribution
0.01
0.1
1
10
100
1000
3000 Particle Size
(µm)
0
5
10
Volu
me
(%)
5%oi
l 10%oi
l
20%oil 30%oi
l
Particle Size
Distribution
0.01
0.1
1
10
100
1000
3000 Particle Size
(µm)
0
5
10
Volu
me
(%)
5%oi
l 10%oi
l 20%oi
l 30%oi
l
74
Figure 3.3: Particle Size Analysis At Shear Time 10 Minutes
Please see Chapter 3 appendix for more particle size graphs and detailed results.
3.3.2 Microscopy of Shear time experiments
Some low magnification micrographs were taken at 10x magnification of the
samples at their different shear speeds. The micrographs for the 5% fat samples
and the 30% fat samples are seen in the appendix. As can be seen, the increase
of shear speeds leads to smaller and more uniformed fat droplets, and the
increase of droplets between 5% and 30% is clear.
3.3.3 Basic emulsions with E/S mix (0.5% and 1%)
The influence of an emulsifier/stabilizer mixture on fat particle size of 4 emulsions
was investigated. Two different quantities of an emulsifier/stabilizer mixture were
added to 4 emulsions containing differing quantities of fat (5%, 10%, 20% and
30%). All emulsions were sheared at 10 minutes, as it was found from the results
of the previous shear time experiment that increased shear time leads to smaller
particle size, particularly in the case of decreased fat in emulsions.
Particle Size
Distribution
0.01
0.1
1
10
100
1000
3000 Particle Size
(µm)
0
5
10
Volu
me
(%)
5%oi
l 10%
oil 20%oi
l 30
%
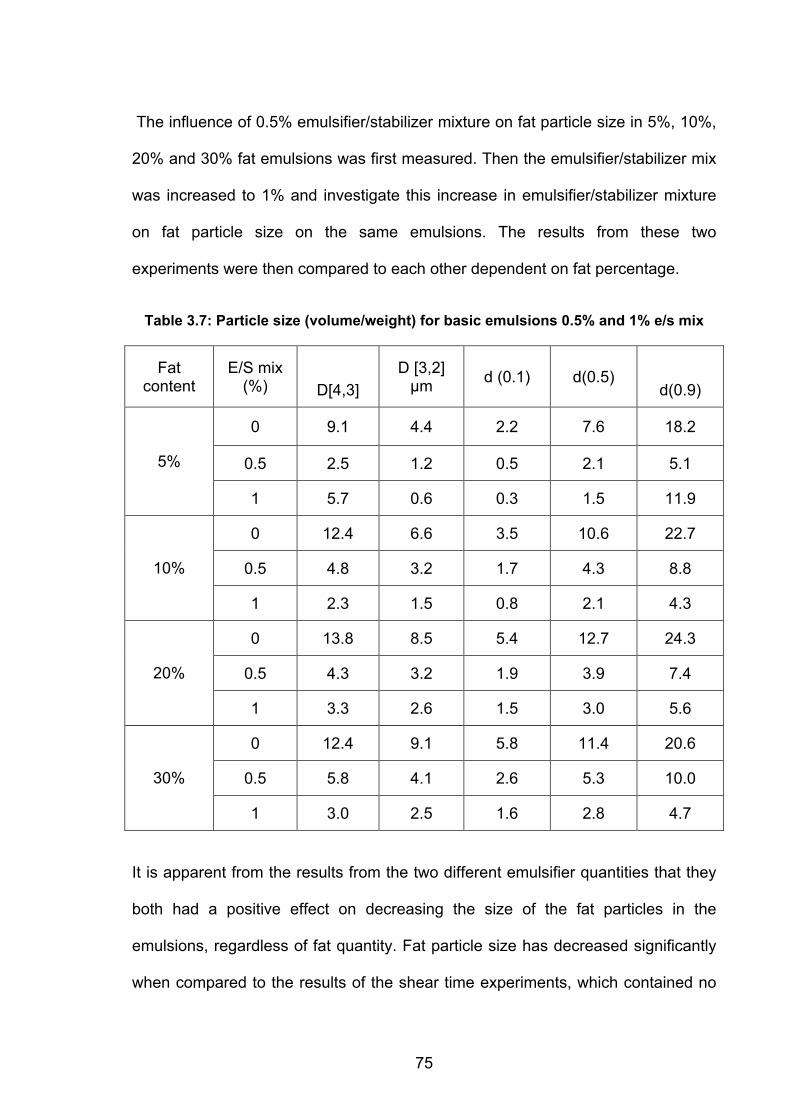
75
The influence of 0.5% emulsifier/stabilizer mixture on fat particle size in 5%, 10%,
20% and 30% fat emulsions was first measured. Then the emulsifier/stabilizer mix
was increased to 1% and investigate this increase in emulsifier/stabilizer mixture
on fat particle size on the same emulsions. The results from these two
experiments were then compared to each other dependent on fat percentage.
Table 3.7: Particle size (volume/weight) for basic emulsions 0.5% and 1% e/s mix
It is apparent from the results from the two different emulsifier quantities that they
both had a positive effect on decreasing the size of the fat particles in the
emulsions, regardless of fat quantity. Fat particle size has decreased significantly
when compared to the results of the shear time experiments, which contained no
Fat content
E/S mix (%)
D[4,3]
D [3,2] µm d (0.1) d(0.5)
d(0.9)
0 9.1 4.4 2.2 7.6 18.2
0.5 2.5 1.2 0.5 2.1 5.1 5%
1 5.7 0.6 0.3 1.5 11.9
0 12.4 6.6 3.5 10.6 22.7
0.5 4.8 3.2 1.7 4.3 8.8 10%
1 2.3 1.5 0.8 2.1 4.3
0 13.8 8.5 5.4 12.7 24.3
0.5 4.3 3.2 1.9 3.9 7.4 20%
1 3.3 2.6 1.5 3.0 5.6
0 12.4 9.1 5.8 11.4 20.6
0.5 5.8 4.1 2.6 5.3 10.0 30%
1 3.0 2.5 1.6 2.8 4.7
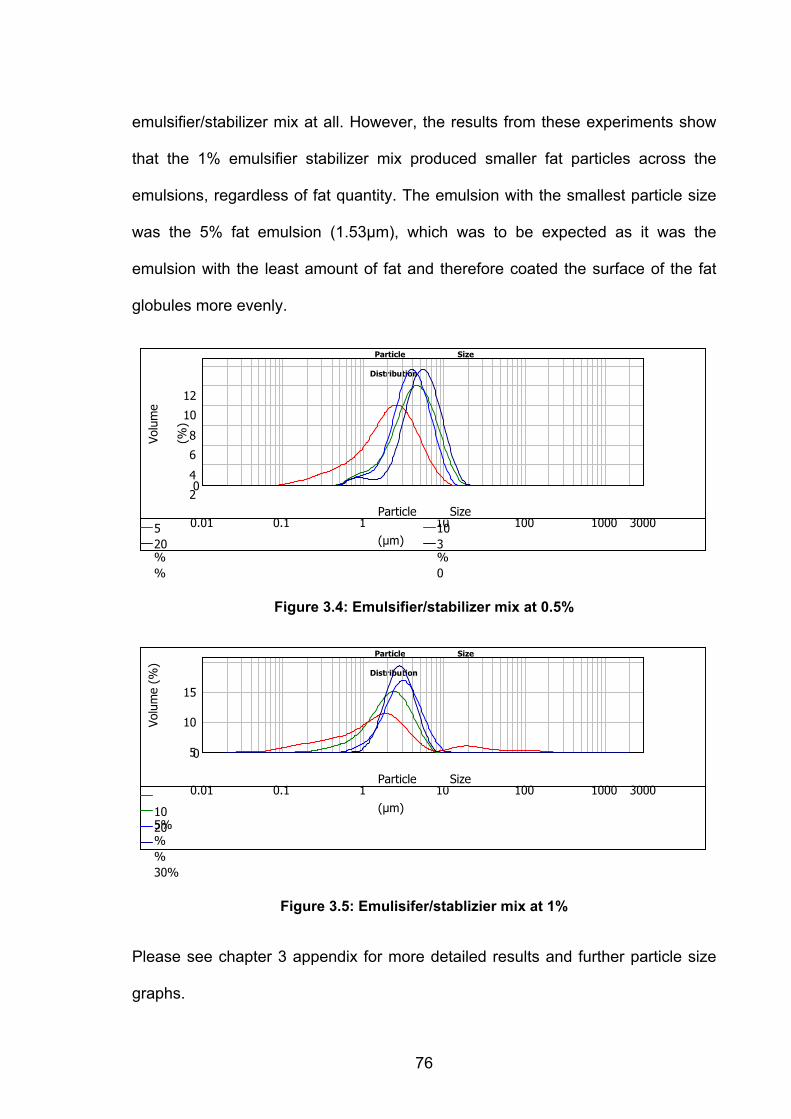
76
emulsifier/stabilizer mix at all. However, the results from these experiments show
that the 1% emulsifier stabilizer mix produced smaller fat particles across the
emulsions, regardless of fat quantity. The emulsion with the smallest particle size
was the 5% fat emulsion (1.53µm), which was to be expected as it was the
emulsion with the least amount of fat and therefore coated the surface of the fat
globules more evenly.
Figure 3.4: Emulsifier/stabilizer mix at 0.5%
Figure 3.5: Emulisifer/stablizier mix at 1%
Please see chapter 3 appendix for more detailed results and further particle size
graphs.
Particle Size
Distribution
0.01
0.1
1
10
100
1000
3000 Particle Size
(µm)
0
2
4
6
8
10
12
Volu
me
(%)
5
%
10
% 20
%
3
0
Particle Size
Distribution
0.01
0.1
1
10
100
1000
3000 Particle Size
(µm)
0
5
10
15
Volu
me
(%)
5% 10
% 20
%
30%
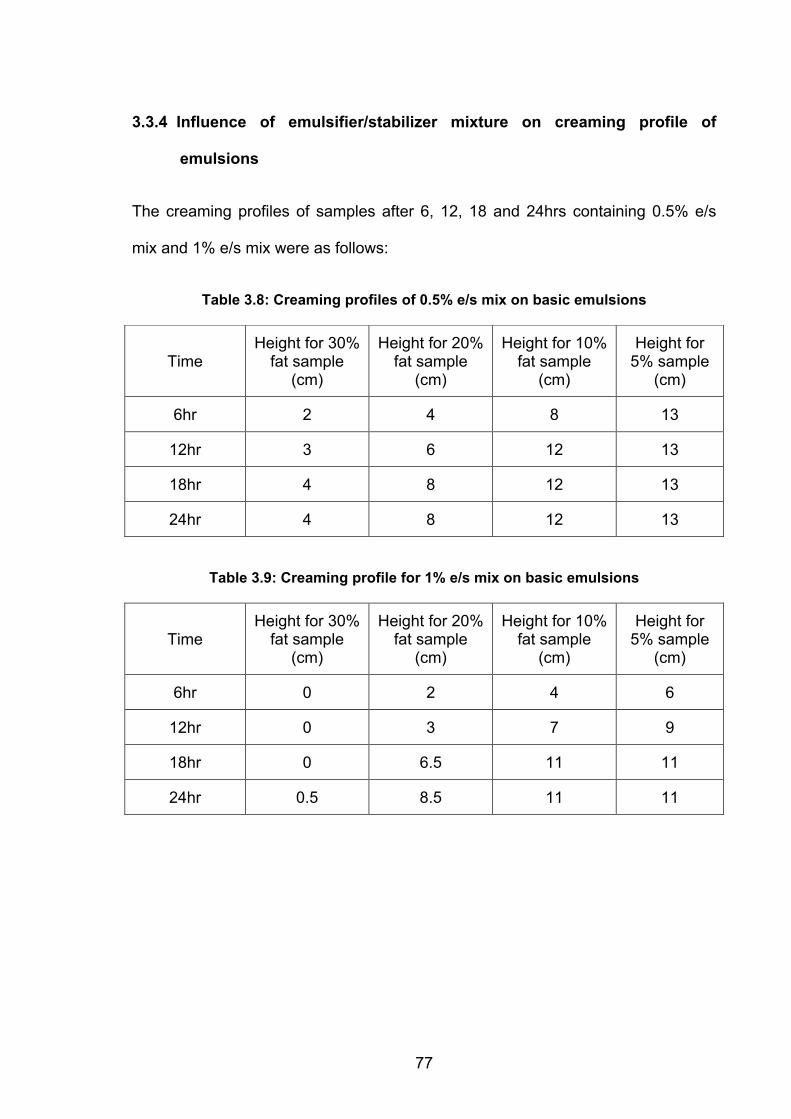
77
3.3.4 Influence of emulsifier/stabilizer mixture on creaming profile of
emulsions
The creaming profiles of samples after 6, 12, 18 and 24hrs containing 0.5% e/s
mix and 1% e/s mix were as follows:
Table 3.8: Creaming profiles of 0.5% e/s mix on basic emulsions
Table 3.9: Creaming profile for 1% e/s mix on basic emulsions
Time Height for 30%
fat sample (cm)
Height for 20% fat sample
(cm)
Height for 10% fat sample
(cm)
Height for 5% sample
(cm)
6hr 2 4 8 13
12hr 3 6 12 13
18hr 4 8 12 13
24hr 4 8 12 13
Time Height for 30%
fat sample (cm)
Height for 20% fat sample
(cm)
Height for 10% fat sample
(cm)
Height for 5% sample
(cm)
6hr 0 2 4 6
12hr 0 3 7 9
18hr 0 6.5 11 11
24hr 0.5 8.5 11 11
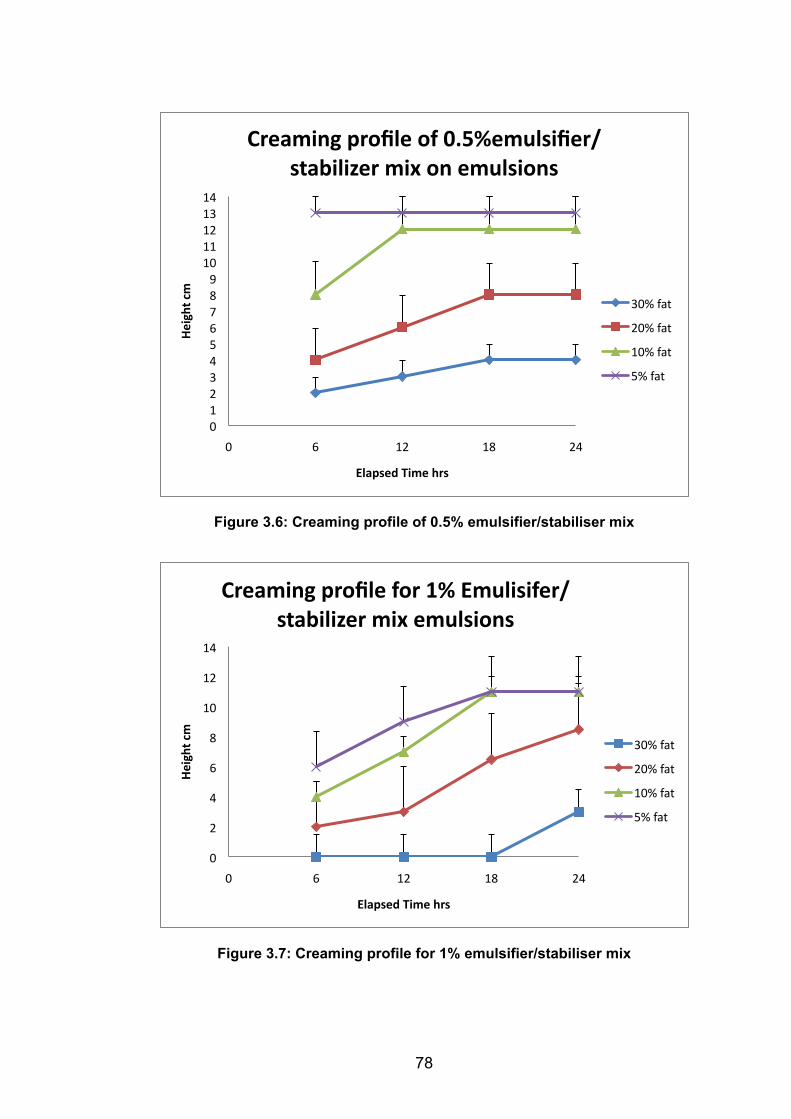
78
Figure 3.6: Creaming profile of 0.5% emulsifier/stabiliser mix
Figure 3.7: Creaming profile for 1% emulsifier/stabiliser mix
0 1 2 3 4 5 6 7 8 9
10 11 12 13 14
0 6 12 18 24
Height cm
Elapsed Time hrs
Creaming profile of 0.5%emulsifier/stabilizer mix on emulsions
30% fat
20% fat
10% fat
5% fat
0
2
4
6
8
10
12
14
0 6 12 18 24
Height cm
Elapsed Time hrs
Creaming profile for 1% Emulisifer/stabilizer mix emulsions
30% fat
20% fat
10% fat
5% fat
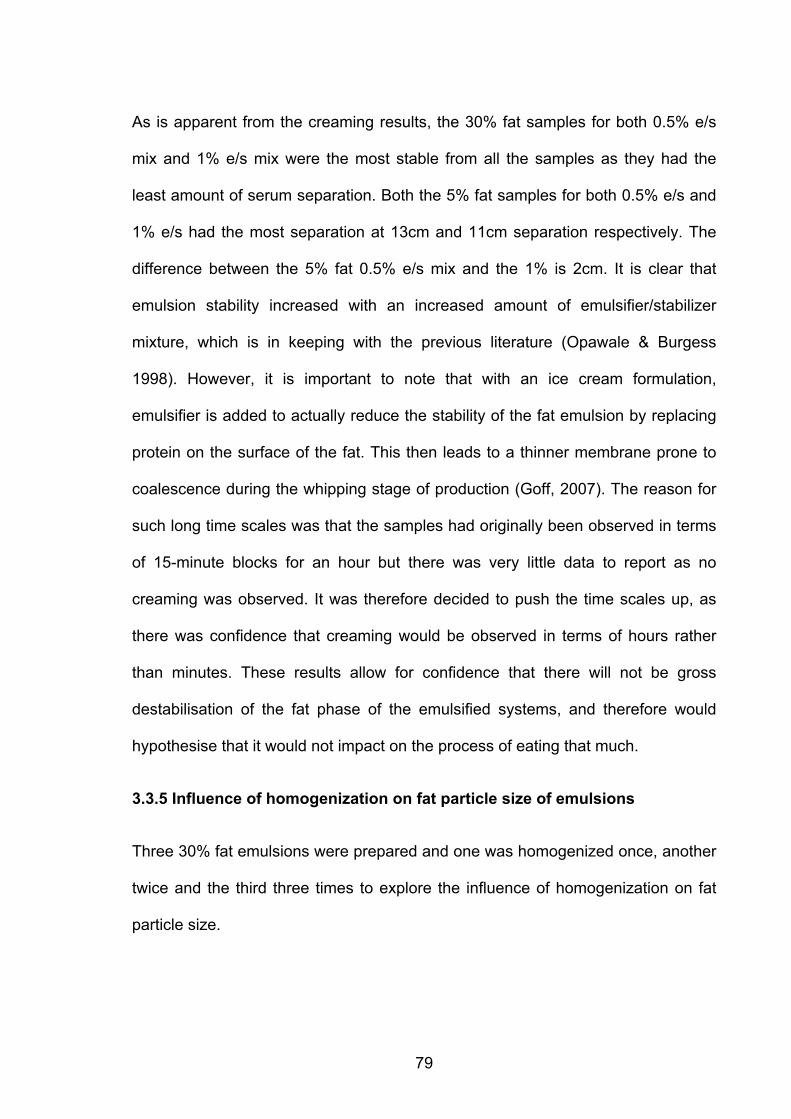
79
As is apparent from the creaming results, the 30% fat samples for both 0.5% e/s
mix and 1% e/s mix were the most stable from all the samples as they had the
least amount of serum separation. Both the 5% fat samples for both 0.5% e/s and
1% e/s had the most separation at 13cm and 11cm separation respectively. The
difference between the 5% fat 0.5% e/s mix and the 1% is 2cm. It is clear that
emulsion stability increased with an increased amount of emulsifier/stabilizer
mixture, which is in keeping with the previous literature (Opawale & Burgess
1998). However, it is important to note that with an ice cream formulation,
emulsifier is added to actually reduce the stability of the fat emulsion by replacing
protein on the surface of the fat. This then leads to a thinner membrane prone to
coalescence during the whipping stage of production (Goff, 2007). The reason for
such long time scales was that the samples had originally been observed in terms
of 15-minute blocks for an hour but there was very little data to report as no
creaming was observed. It was therefore decided to push the time scales up, as
there was confidence that creaming would be observed in terms of hours rather
than minutes. These results allow for confidence that there will not be gross
destabilisation of the fat phase of the emulsified systems, and therefore would
hypothesise that it would not impact on the process of eating that much.
3.3.5 Influence of homogenization on fat particle size of emulsions
Three 30% fat emulsions were prepared and one was homogenized once, another
twice and the third three times to explore the influence of homogenization on fat
particle size.
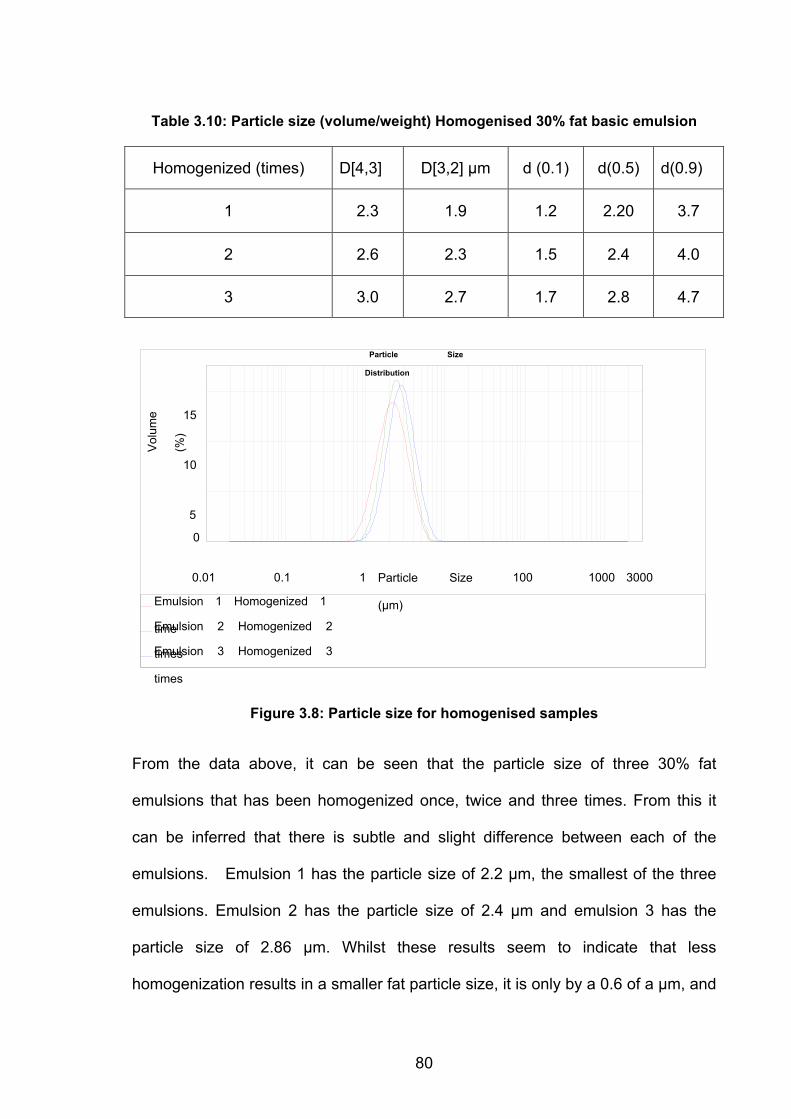
80
Table 3.10: Particle size (volume/weight) Homogenised 30% fat basic emulsion
Figure 3.8: Particle size for homogenised samples
From the data above, it can be seen that the particle size of three 30% fat
emulsions that has been homogenized once, twice and three times. From this it
can be inferred that there is subtle and slight difference between each of the
emulsions. Emulsion 1 has the particle size of 2.2 µm, the smallest of the three
emulsions. Emulsion 2 has the particle size of 2.4 µm and emulsion 3 has the
particle size of 2.86 µm. Whilst these results seem to indicate that less
homogenization results in a smaller fat particle size, it is only by a 0.6 of a µm, and
Homogenized (times) D[4,3] D[3,2] µm d (0.1) d(0.5) d(0.9)
1 2.3 1.9 1.2 2.20 3.7
2 2.6 2.3 1.5 2.4 4.0
3 3.0 2.7 1.7 2.8 4.7
Particle Size
Distribution
0.01
0.1
1
10
100
1000
3000 Particle Size
(µm)
0
5
10
15
Vol
ume
(%)
Emulsion 1 Homogenized 1
time Emulsion 2 Homogenized 2
times Emulsion 3 Homogenized 3
times
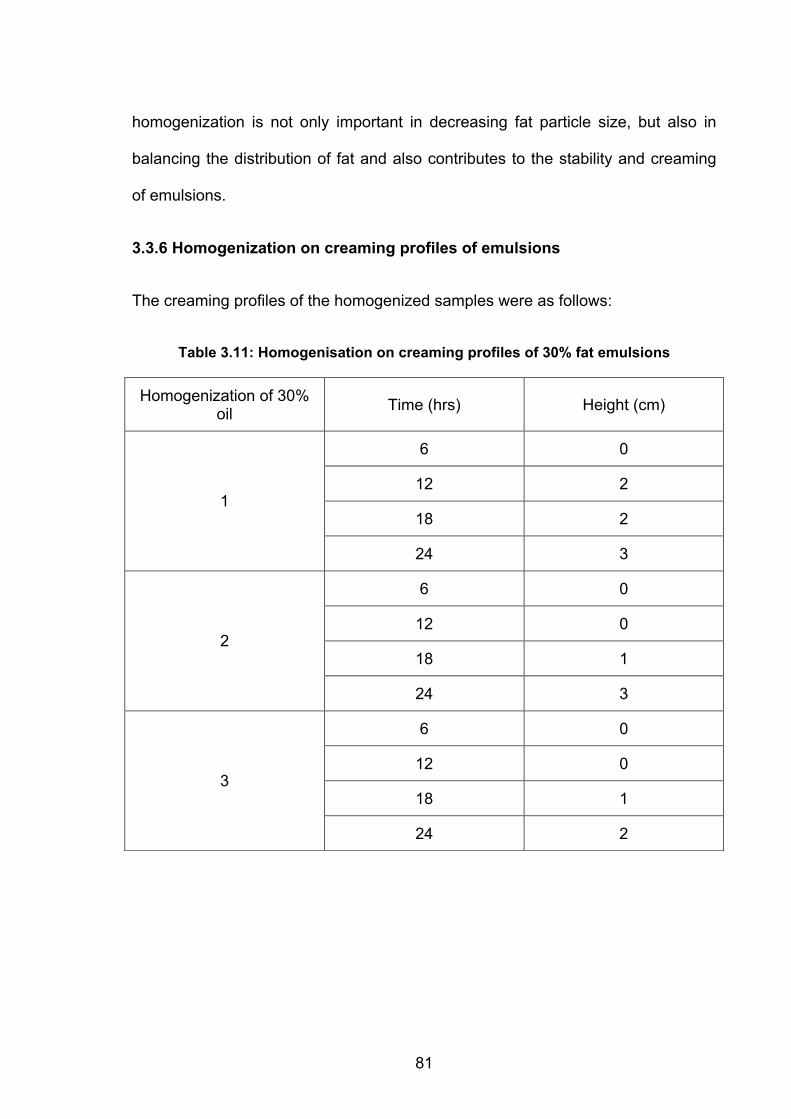
81
homogenization is not only important in decreasing fat particle size, but also in
balancing the distribution of fat and also contributes to the stability and creaming
of emulsions.
3.3.6 Homogenization on creaming profiles of emulsions
The creaming profiles of the homogenized samples were as follows:
Table 3.11: Homogenisation on creaming profiles of 30% fat emulsions
Homogenization of 30% oil Time (hrs) Height (cm)
6 0
12 2
18 2 1
24 3
6 0
12 0
18 1 2
24 3
6 0
12 0
18 1 3
24 2
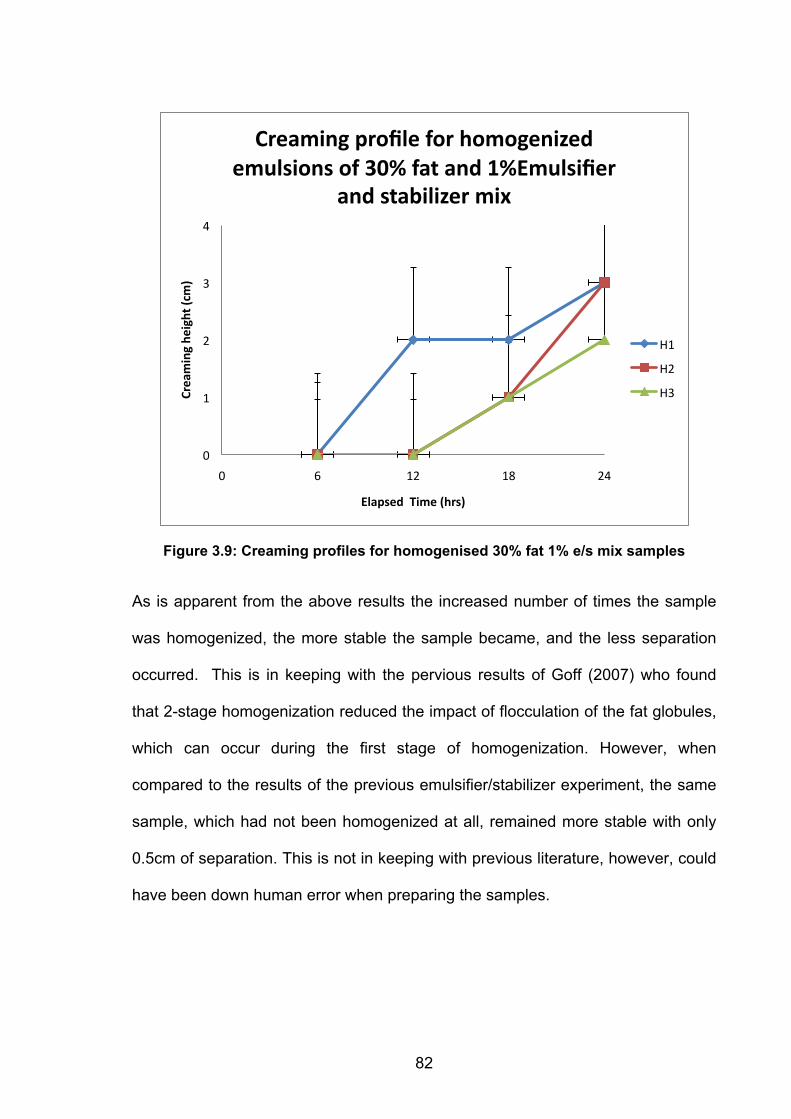
82
Figure 3.9: Creaming profiles for homogenised 30% fat 1% e/s mix samples
As is apparent from the above results the increased number of times the sample
was homogenized, the more stable the sample became, and the less separation
occurred. This is in keeping with the pervious results of Goff (2007) who found
that 2-stage homogenization reduced the impact of flocculation of the fat globules,
which can occur during the first stage of homogenization. However, when
compared to the results of the previous emulsifier/stabilizer experiment, the same
sample, which had not been homogenized at all, remained more stable with only
0.5cm of separation. This is not in keeping with previous literature, however, could
have been down human error when preparing the samples.
0
1
2
3
4
0 6 12 18 24
Creaming he
ight (cm)
Elapsed Time (hrs)
Creaming profile for homogenized emulsions of 30% fat and 1%Emulsifier
and stabilizer mix
H1
H2
H3
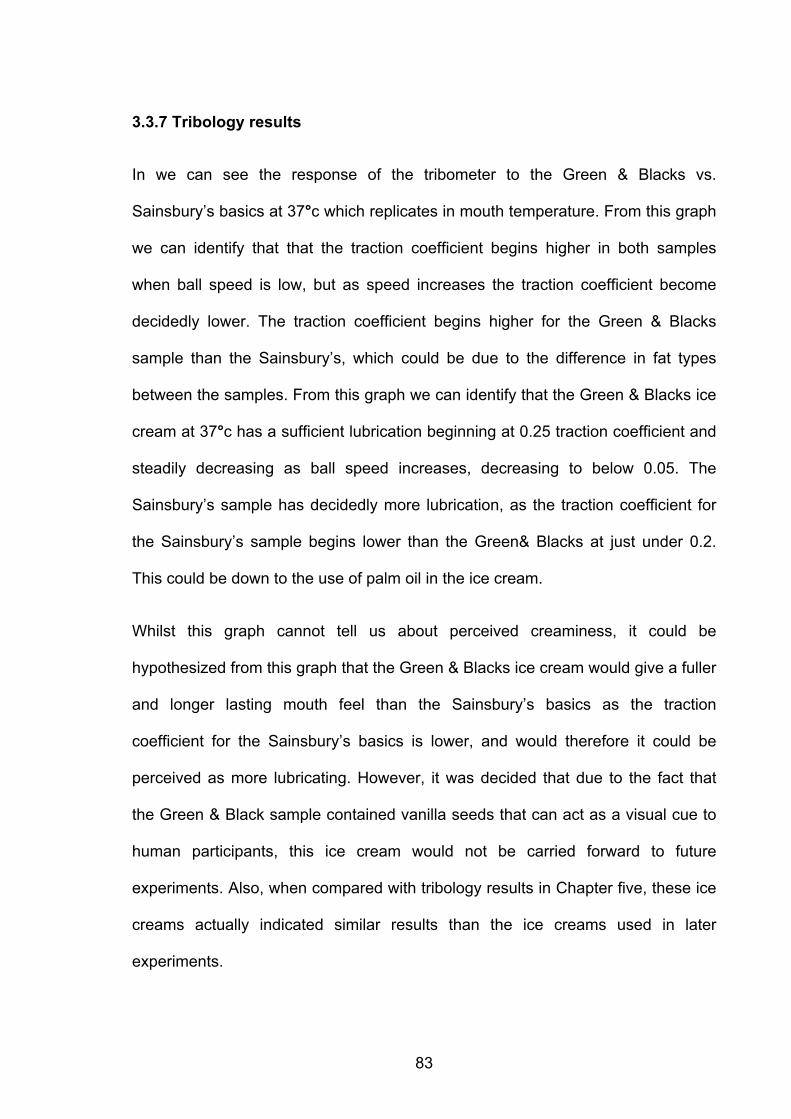
83
3.3.7 Tribology results
In we can see the response of the tribometer to the Green & Blacks vs.
Sainsbury’s basics at 37°c which replicates in mouth temperature. From this graph
we can identify that that the traction coefficient begins higher in both samples
when ball speed is low, but as speed increases the traction coefficient become
decidedly lower. The traction coefficient begins higher for the Green & Blacks
sample than the Sainsbury’s, which could be due to the difference in fat types
between the samples. From this graph we can identify that the Green & Blacks ice
cream at 37°c has a sufficient lubrication beginning at 0.25 traction coefficient and
steadily decreasing as ball speed increases, decreasing to below 0.05. The
Sainsbury’s sample has decidedly more lubrication, as the traction coefficient for
the Sainsbury’s sample begins lower than the Green& Blacks at just under 0.2.
This could be down to the use of palm oil in the ice cream.
Whilst this graph cannot tell us about perceived creaminess, it could be
hypothesized from this graph that the Green & Blacks ice cream would give a fuller
and longer lasting mouth feel than the Sainsbury’s basics as the traction
coefficient for the Sainsbury’s basics is lower, and would therefore it could be
perceived as more lubricating. However, it was decided that due to the fact that
the Green & Black sample contained vanilla seeds that can act as a visual cue to
human participants, this ice cream would not be carried forward to future
experiments. Also, when compared with tribology results in Chapter five, these ice
creams actually indicated similar results than the ice creams used in later
experiments.
84
Figure 3.10: Tribometer results for Sainsbury's basics and Green & Blacks samples
at 37°c
These experiments sought to gain a better knowledge of the material properties of
ice cream emulsions, and to test the stability of these emulsions over time. The
inclusion and use of emulsifiers and stabilizers solidified their necessity in these
emulsions, leading to increased emulsions stability. Also, the importance of
homogenisation was corroborated and in keeping with the findings of previous
authors such as Goff (2007), and shows that homogenisation is not only important
for decreasing mean fat particle size, but also contributes to emulsion stability.
0
0.05
0.1
0.15
0.2
0.25
0.3
1 10 100 1000
TracLon
Coe
fficent
Ball Speed mm/s
Sainsbury's Basics Vanilla Ice cream vs Green&Blacks Vanilla Ice cream at 37°c
Sainsburys
Green&Blacks

85
From these experiments it can be concluded that the material properties of basic
ice cream emulsions over the time scales were stable enough to carry forward to
future experiments, and confidence was gained in the background of the material
properties and their purpose.
86
CHAPTER 4: EATING BEHAVIOUR INVESTIGATIONS
4.1 Analysis of commercially available ice cream eating behaviour through a
repeated measures design
The results gathered in the previous chapters has allowed the scope for further
investigation into ice cream eating behaviour and to gauge an understanding into
whether different formulated ice creams impact on consumer responses such as
rate of intake. Results from Chapter 2 also indicated which ice creams would be
best to carry forward for future research. From this, a repeated measures design
was carried out between Sainsbury’s basics ice cream (low quality) and Mackie’s
of Scotland (high quality) with the portion size 200g being used.
From this, a repeated measures investigation into the palatability and sensory
attributes of two demonstrably different ice creams can be better understood,
which could lead to improvements in formulations and adding to research within
the eating behaviour sector as research into ice cream and on a whole,
sweet/dessert foods, is sparse. Whilst there has been a plethora of research into
meal-based foods, such as pasta, researching the effects of satiety, there is little
known about ‘treat’ foods, such as ice cream. These types of foods are not best
understood in terms of satiety (the time between one meal and the next), but
perhaps better related to satiation (the decision to terminate eating at a specific
time due to feeling full).
The significance of using the Mackie’s was that it scored the highest on the taste
test, and the Sainsbury’s as it was the better of the lower qualities variants. The
reason the absolute lowest scoring ice cream was not chosen, was that there was
87
a concern due to the very low quality that participant, as on the taste test, i.e. poor
scores, would reject it. By separating these ice creams into slightly subjective
‘quality’ categories, it is attempting to encompass the spectrum of
taste/texture/palatability/formulation/ingredients/nutritional value of the ice creams
into one term. It was decided that due to the interdisciplinary nature of the
experiments carried out, the results would be set out in both tabular and figure
form for ease of reading and understanding from both disciplines.
4.1.1 Hypothesis
H1: There will be significant difference in the palatability scores, rate of intake and
total intake between two commercially available ice creams, one of demonstrable
high quality and one of lower quality with the higher quality ice cream scoring
higher than the lower quality. Within meal VAS scores for enjoyment, hunger and
fullness will also be investigated. Energy density differences between the ice
creams will also be looked at.
4.1.2 Methodology
4.1.2.1 Participants
A total of 38 participants (all female, all students) were selected from Birmingham
University. However, due to errors, which only became apparent during data
analysis, only 31 data sets could be brought forward for analysis. The participants
were obtained using a purposive sampling method. An advert was placed on the
University of Birmingham online participation scheme where students could sign
up to the study. Restricted eaters and males were excluded. This was because
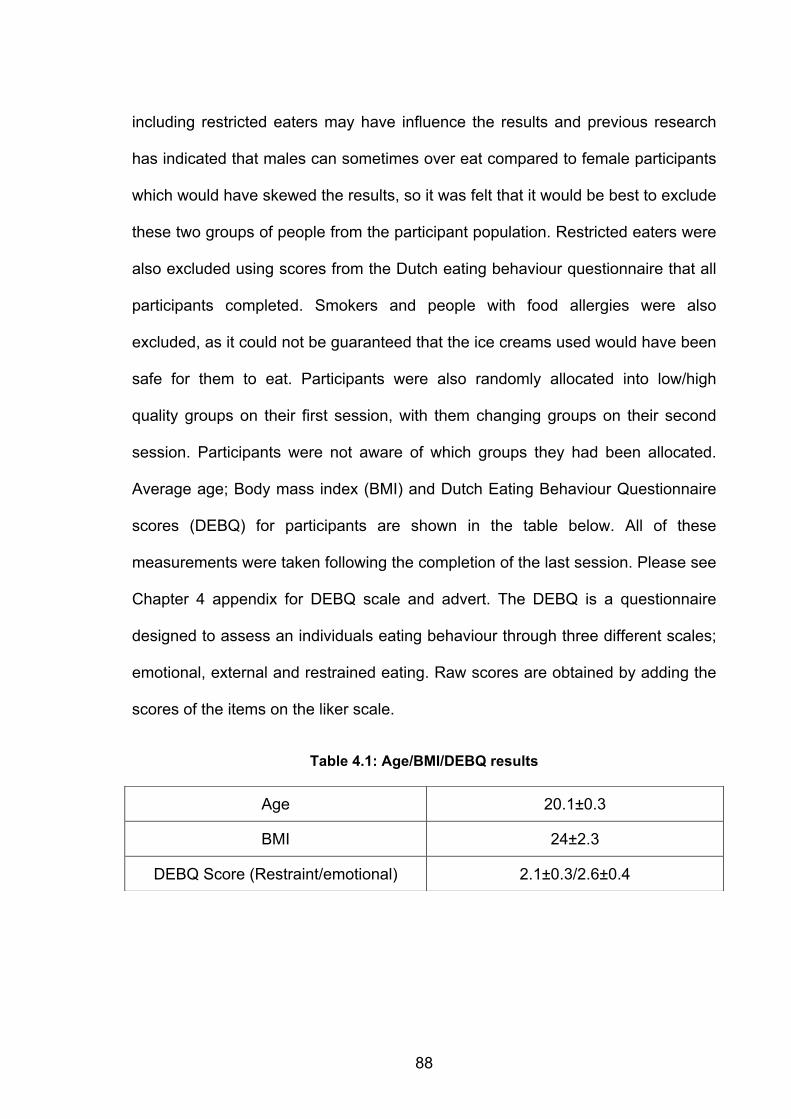
88
including restricted eaters may have influence the results and previous research
has indicated that males can sometimes over eat compared to female participants
which would have skewed the results, so it was felt that it would be best to exclude
these two groups of people from the participant population. Restricted eaters were
also excluded using scores from the Dutch eating behaviour questionnaire that all
participants completed. Smokers and people with food allergies were also
excluded, as it could not be guaranteed that the ice creams used would have been
safe for them to eat. Participants were also randomly allocated into low/high
quality groups on their first session, with them changing groups on their second
session. Participants were not aware of which groups they had been allocated.
Average age; Body mass index (BMI) and Dutch Eating Behaviour Questionnaire
scores (DEBQ) for participants are shown in the table below. All of these
measurements were taken following the completion of the last session. Please see
Chapter 4 appendix for DEBQ scale and advert. The DEBQ is a questionnaire
designed to assess an individuals eating behaviour through three different scales;
emotional, external and restrained eating. Raw scores are obtained by adding the
scores of the items on the liker scale.
Table 4.1: Age/BMI/DEBQ results
Age 20.1±0.3
BMI 24±2.3
DEBQ Score (Restraint/emotional) 2.1±0.3/2.6±0.4
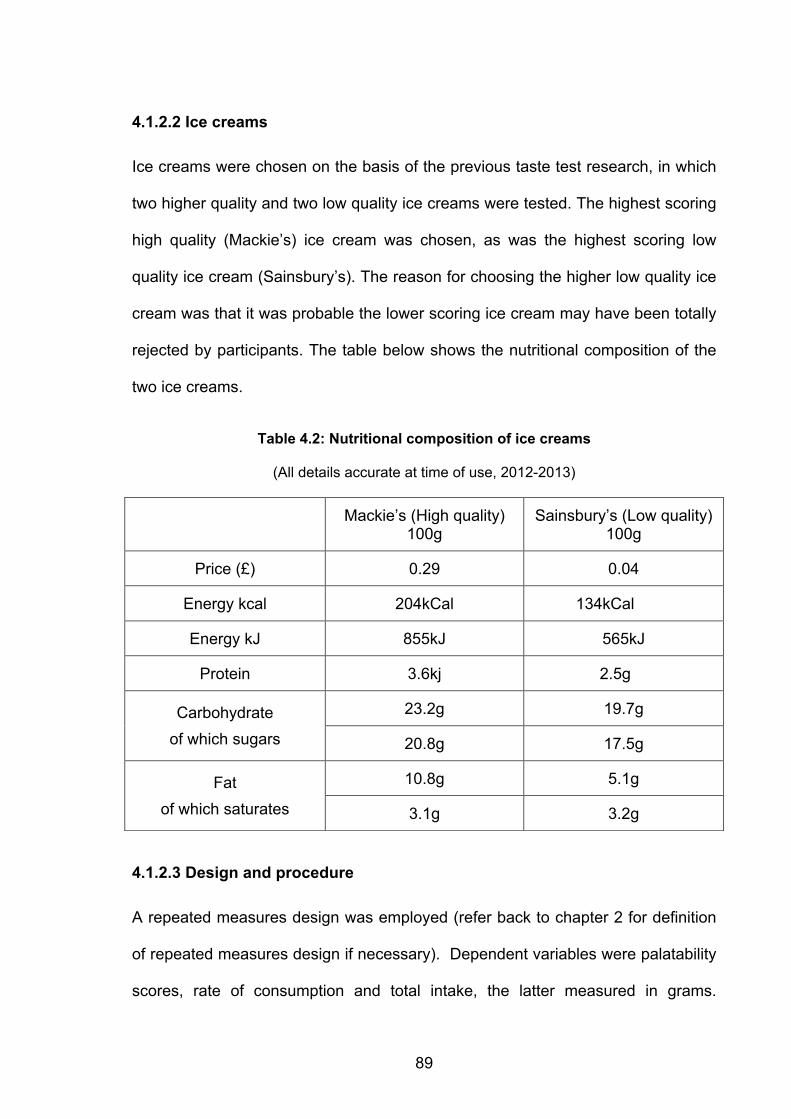
89
4.1.2.2 Ice creams
Ice creams were chosen on the basis of the previous taste test research, in which
two higher quality and two low quality ice creams were tested. The highest scoring
high quality (Mackie’s) ice cream was chosen, as was the highest scoring low
quality ice cream (Sainsbury’s). The reason for choosing the higher low quality ice
cream was that it was probable the lower scoring ice cream may have been totally
rejected by participants. The table below shows the nutritional composition of the
two ice creams.
Table 4.2: Nutritional composition of ice creams
(All details accurate at time of use, 2012-2013)
4.1.2.3 Design and procedure
A repeated measures design was employed (refer back to chapter 2 for definition
of repeated measures design if necessary). Dependent variables were palatability
scores, rate of consumption and total intake, the latter measured in grams.
Mackie’s (High quality) 100g
Sainsbury’s (Low quality) 100g
Price (£) 0.29 0.04
Energy kcal 204kCal 134kCal
Energy kJ 855kJ 565kJ
Protein 3.6kj 2.5g
23.2g 19.7g Carbohydrate of which sugars 20.8g 17.5g
10.8g 5.1g Fat of which saturates 3.1g 3.2g
90
Independent variable remained the quality of ice cream, high or low. Two ice
creams, the ‘low quality’ Sainsbury's Basics Vanilla ice cream (Kcal 134/100g, fat
5.1g/100g, Price 0.045/litre) and ‘high quality’ Mackie’s vanilla ice cream (Kcal
204/100g, fat 10.8/100g price 2.97p/litre) were defined. Participants were given a
200g portion of the ice cream, unlabelled, in a bowl with a tablespoon. A Sussex
Ingestion Pattern Monitor/universal eating monitor (SIMP/UEM) was used to
gather micro structural eating behaviour data, and Visual Analogue Scales
gathered data on palatability, sensory ratings and appetite. Participants were
unaware of the universal eating machine presence until completion of the
experiments. Samples were weighed automatically on a concealed digital balance
(Sartorius BP 4100), connected through a serial connected dell desktop computer,
which was custom-programmed using Future Basic (Staz Software) to read the
balance weight to 0.1 g accuracy during the consumption of the test meal. Student
information pack-consent form, ethics sheet, volunteer information sheet were also
handed out. Please see Chapter 4 appendix for these. Participants arrived at
testing room and were asked to read a volunteer information sheet and asked to
read and sign a consent form. They were then taken into a small room and asked
to sit in front of the computer screen. In front of them was a placemat, which has
the universal eating monitor concealed underneath it. The participants were
unaware of the universal eating monitor. The experimenter then explained that the
participant should follow the on screen instructions. This included a brief
introduction to the experiment and a series of pre sample appetite and mood scale
questions on a sliding visual analogue scale between 1-100. These were rated in
the form of ‘How <word> are you feeling?’ and the words were
91
‘sad/happy/excited/relaxed bloated/nervous/stressed ‘ which appeared in a
random order, with ‘Not at all’ and ‘Extremely’ being live anchors. All ratings were
scored automatically from 0(not at all) to 100 (extremely). After these had been
completed, an instruction appeared to ‘call the experimenter’ by ringing a doorbell
that was placed to the right of the table and samples would be brought to them.
This was followed by participants being presented with a small taste test sample of
the ice cream related to which group they had been placed in-low or high quality.
Following the taste test sample, sensory attribute and enjoyment questions were
asked, again on a sliding visual analogue scale of between 1-100. These
questions were rated in the form of ‘How <word> is this ice cream’? Participants
were then given an undisclosed amount of unlabelled sample of the same ice
cream (200g) and asked to eat ad libitum. Whilst eating, participants were
signalled to answer further appetite and enjoyment visual analogue scale
questions every 25grams of ice cream eaten. These appeared in the form of ‘How
<word> are you feeling now? The words were ‘hungry and full’ and ‘How much are
you enjoying this ice cream?’ This repeated pattern of consuming 25g portions and
then completing appetite ratings continued until the total weight consumed, or until
the participant terminated eating, whichever came first. Participants were also
asked not to leave their spoon in the bowl at any time. Meal termination was
signalled by participants using the computer mouse to click on a button marked
“Finished”, which was present on the screen throughout the meal. Once eating
was completed, participants re-rated their mood and appetite using the same
scales as at the start of the test. Two other questions were also added to this
series of visual analogue scale questions, which were ‘how likely would you be to
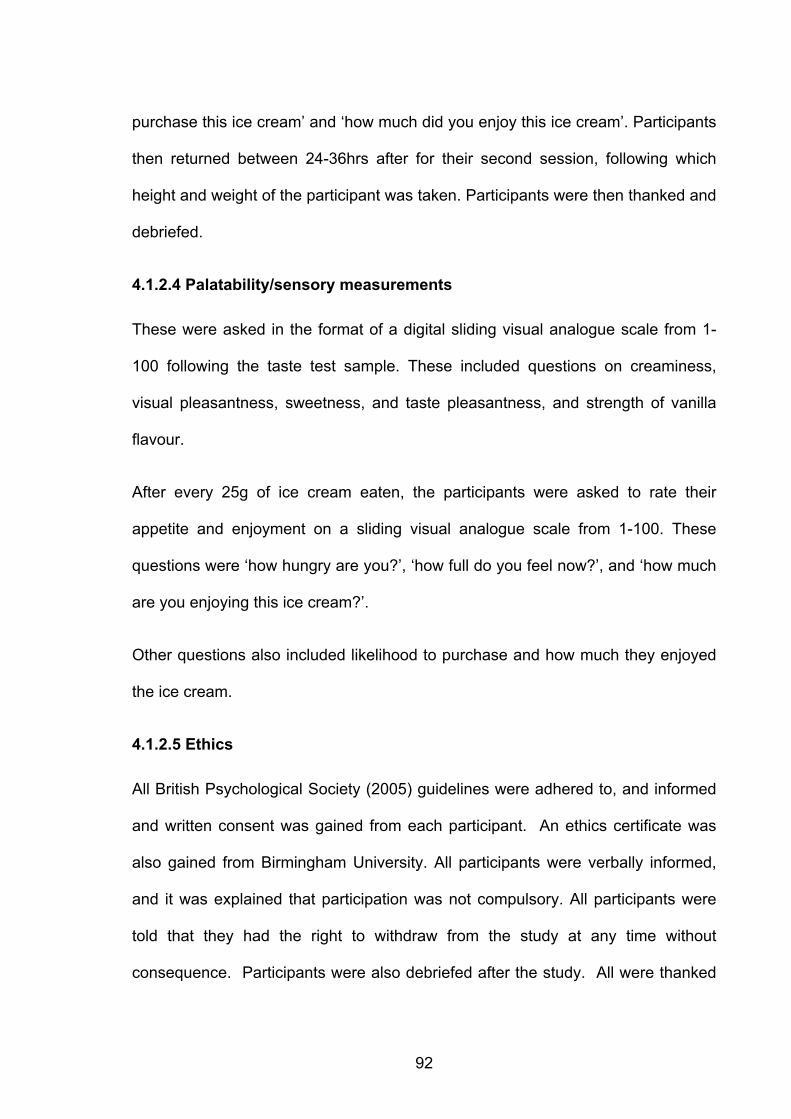
92
purchase this ice cream’ and ‘how much did you enjoy this ice cream’. Participants
then returned between 24-36hrs after for their second session, following which
height and weight of the participant was taken. Participants were then thanked and
debriefed.
4.1.2.4 Palatability/sensory measurements
These were asked in the format of a digital sliding visual analogue scale from 1-
100 following the taste test sample. These included questions on creaminess,
visual pleasantness, sweetness, and taste pleasantness, and strength of vanilla
flavour.
After every 25g of ice cream eaten, the participants were asked to rate their
appetite and enjoyment on a sliding visual analogue scale from 1-100. These
questions were ‘how hungry are you?’, ‘how full do you feel now?’, and ‘how much
are you enjoying this ice cream?’.
Other questions also included likelihood to purchase and how much they enjoyed
the ice cream.
4.1.2.5 Ethics
All British Psychological Society (2005) guidelines were adhered to, and informed
and written consent was gained from each participant. An ethics certificate was
also gained from Birmingham University. All participants were verbally informed,
and it was explained that participation was not compulsory. All participants were
told that they had the right to withdraw from the study at any time without
consequence. Participants were also debriefed after the study. All were thanked
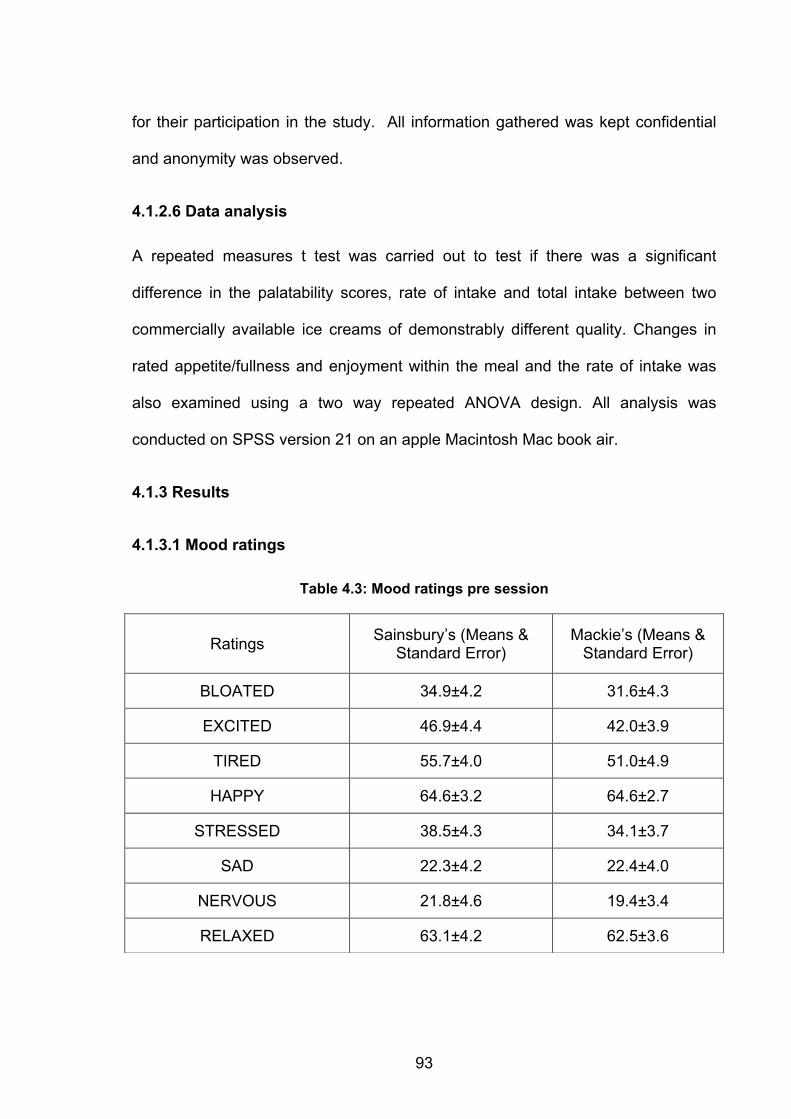
93
for their participation in the study. All information gathered was kept confidential
and anonymity was observed.
4.1.2.6 Data analysis
A repeated measures t test was carried out to test if there was a significant
difference in the palatability scores, rate of intake and total intake between two
commercially available ice creams of demonstrably different quality. Changes in
rated appetite/fullness and enjoyment within the meal and the rate of intake was
also examined using a two way repeated ANOVA design. All analysis was
conducted on SPSS version 21 on an apple Macintosh Mac book air.
4.1.3 Results
4.1.3.1 Mood ratings
Table 4.3: Mood ratings pre session
Ratings Sainsbury’s (Means & Standard Error)
Mackie’s (Means & Standard Error)
BLOATED 34.9±4.2 31.6±4.3
EXCITED 46.9±4.4 42.0±3.9
TIRED 55.7±4.0 51.0±4.9
HAPPY 64.6±3.2 64.6±2.7
STRESSED 38.5±4.3 34.1±3.7
SAD 22.3±4.2 22.4±4.0
NERVOUS 21.8±4.6 19.4±3.4
RELAXED 63.1±4.2 62.5±3.6
94
Table 4.3 shows the means and standard deviation for mood ratings taken at the
start of both ice cream sessions. There were no significant differences found in
these ratings at the start of either session. Here are the statistical results from the
pre meal mood ratings comparing the two ice creams. BLOATED [t(30)=0.706,
P>0.05], EXCITED[t(30)=-.122, P>0.05], TIRED[t(30)=0.642, P>0.05], HAPPY
[t(30)=-1.06P>0.05], STRESSED [t(30)=0.79, P>0.05], SAD[t(30)=-0.015 P>0.05],
NERVOUS[t(30)=0.48, P>0.05], RELAXED[t(30)=0.121, P>0.05]
Table 4.4 shows the mood ratings taken at the end of both sessions, and indicates
a significant difference on RELAXED rating, [t(30)=-2.2, P<0.05], but no significant
difference in any of the other ratings. BLOATED [t(30)=1.23, P>0.05],
EXCITED[t(30)=-.71, P>0.05], TIRED[t(30)=0.07, P>0.05], HAPPY [t(30)=-
0.98,P>0.05], STRESSED [t(30)=1.15, P>0.05], SAD[t(30)=0.49 P>0.05],
NERVOUS[t(30)=0.31, P>0.05]
Table 4.4: Mood ratings post session
Rating Sainsbury’s (Mean &Standard Error
Mackie’s (Mean & Standard Error)
BLOATED 51.8±4.5 46.8±4.9
EXCITED 46.1±4.1 49.9±3.8
TIRED 50.4±4.3 49.8±5.2
HAPPY 70.3±3.4 74.3±3.0
STRESSED 28.6±4.2 23.6±3.5
SAD 17.4±3.6 15.5±3.1
NERVOUS 16.1±3.5 14.9±3.3
RELAXED 69.3±3.7 77.9±2.6
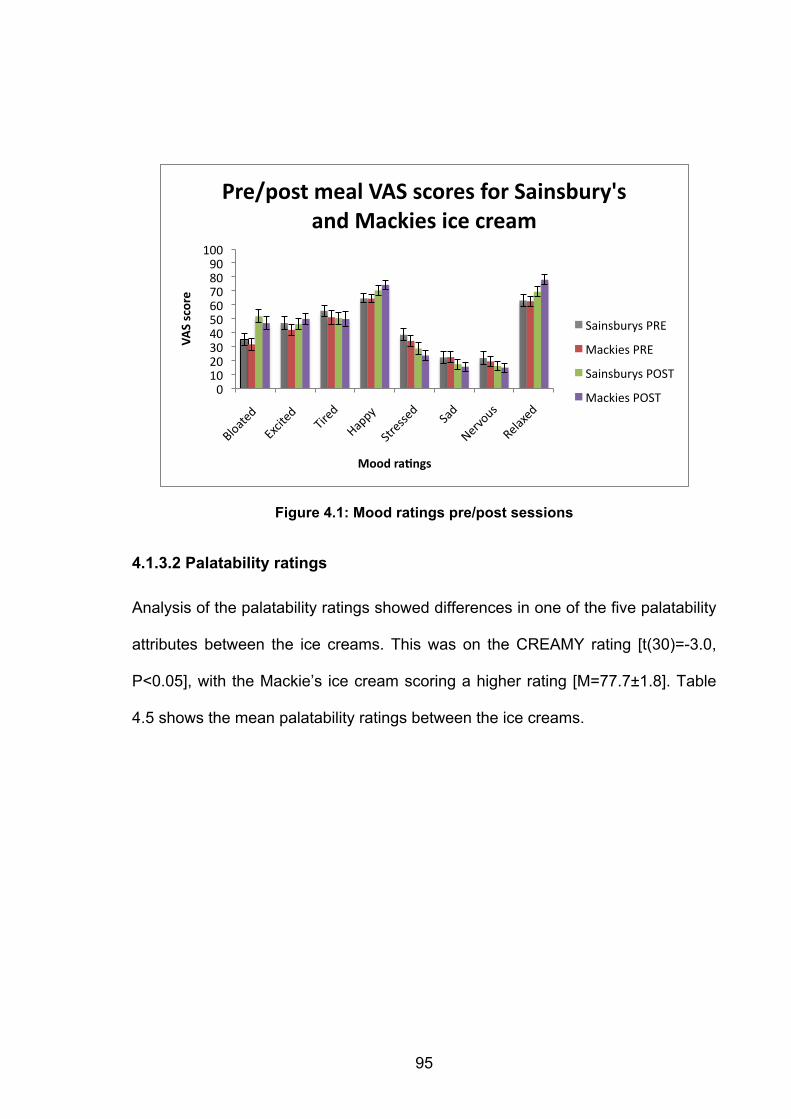
95
Figure 4.1: Mood ratings pre/post sessions
4.1.3.2 Palatability ratings
Analysis of the palatability ratings showed differences in one of the five palatability
attributes between the ice creams. This was on the CREAMY rating [t(30)=-3.0,
P<0.05], with the Mackie’s ice cream scoring a higher rating [M=77.7±1.8]. Table
4.5 shows the mean palatability ratings between the ice creams.
0 10 20 30 40 50 60 70 80 90
100
VAS score
Mood raLngs
Pre/post meal VAS scores for Sainsbury's and Mackies ice cream
Sainsburys PRE
Mackies PRE
Sainsburys POST
Mackies POST
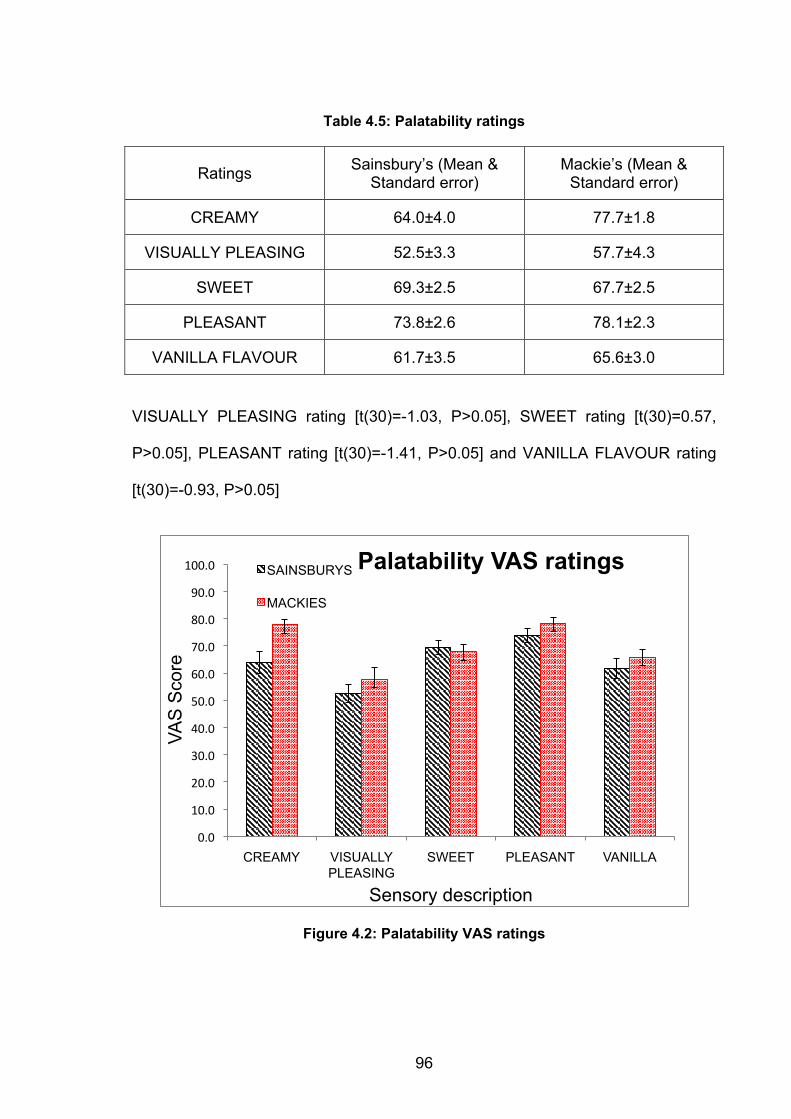
96
Table 4.5: Palatability ratings
VISUALLY PLEASING rating [t(30)=-1.03, P>0.05], SWEET rating [t(30)=0.57,
P>0.05], PLEASANT rating [t(30)=-1.41, P>0.05] and VANILLA FLAVOUR rating
[t(30)=-0.93, P>0.05]
Figure 4.2: Palatability VAS ratings
0.0
10.0
20.0
30.0
40.0
50.0
60.0
70.0
80.0
90.0
100.0
CREAMY VISUALLY PLEASING
SWEET PLEASANT VANILLA
VAS
Sco
re
Sensory description
Palatability VAS ratings SAINSBURYS
MACKIES
Ratings Sainsbury’s (Mean & Standard error)
Mackie’s (Mean & Standard error)
CREAMY 64.0±4.0 77.7±1.8
VISUALLY PLEASING 52.5±3.3 57.7±4.3
SWEET 69.3±2.5 67.7±2.5
PLEASANT 73.8±2.6 78.1±2.3
VANILLA FLAVOUR 61.7±3.5 65.6±3.0
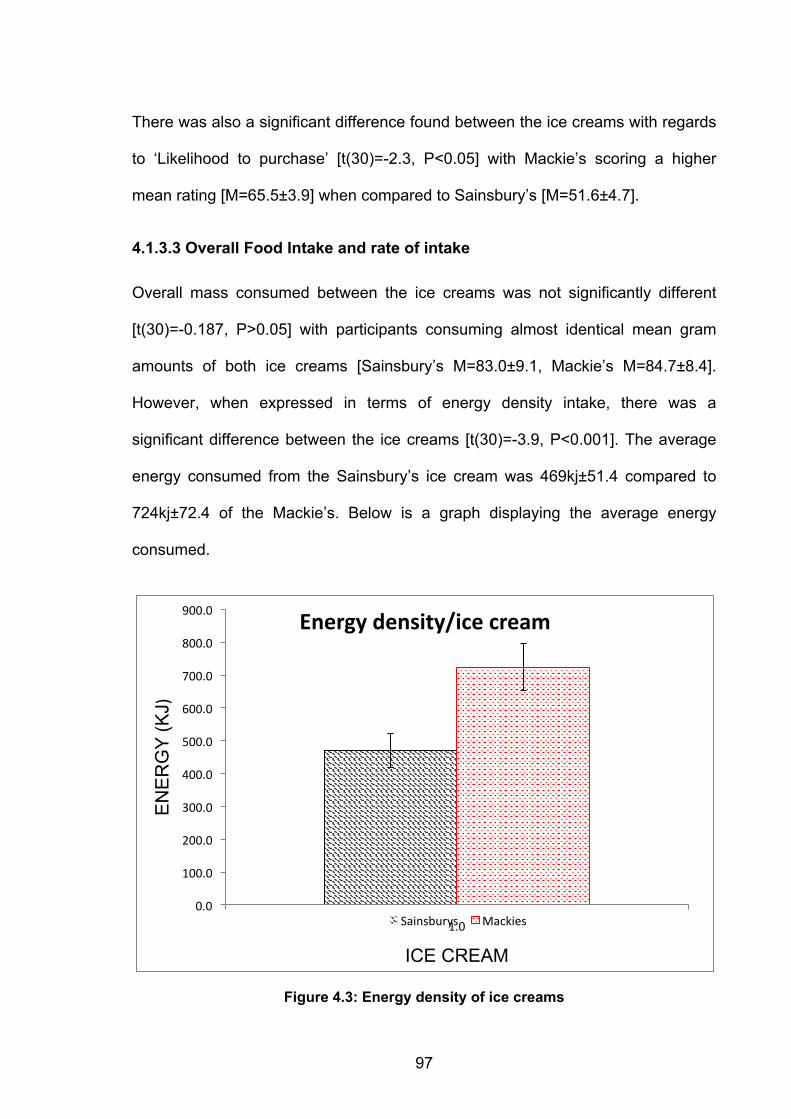
97
There was also a significant difference found between the ice creams with regards
to ‘Likelihood to purchase’ [t(30)=-2.3, P<0.05] with Mackie’s scoring a higher
mean rating [M=65.5±3.9] when compared to Sainsbury’s [M=51.6±4.7].
4.1.3.3 Overall Food Intake and rate of intake
Overall mass consumed between the ice creams was not significantly different
[t(30)=-0.187, P>0.05] with participants consuming almost identical mean gram
amounts of both ice creams [Sainsbury’s M=83.0±9.1, Mackie’s M=84.7±8.4].
However, when expressed in terms of energy density intake, there was a
significant difference between the ice creams [t(30)=-3.9, P<0.001]. The average
energy consumed from the Sainsbury’s ice cream was 469kj±51.4 compared to
724kj±72.4 of the Mackie’s. Below is a graph displaying the average energy
consumed.
Figure 4.3: Energy density of ice creams
0.0
100.0
200.0
300.0
400.0
500.0
600.0
700.0
800.0
900.0
1.0
EN
ER
GY
(KJ)
ICE CREAM
Energy density/ice cream
Sainsburys Mackies
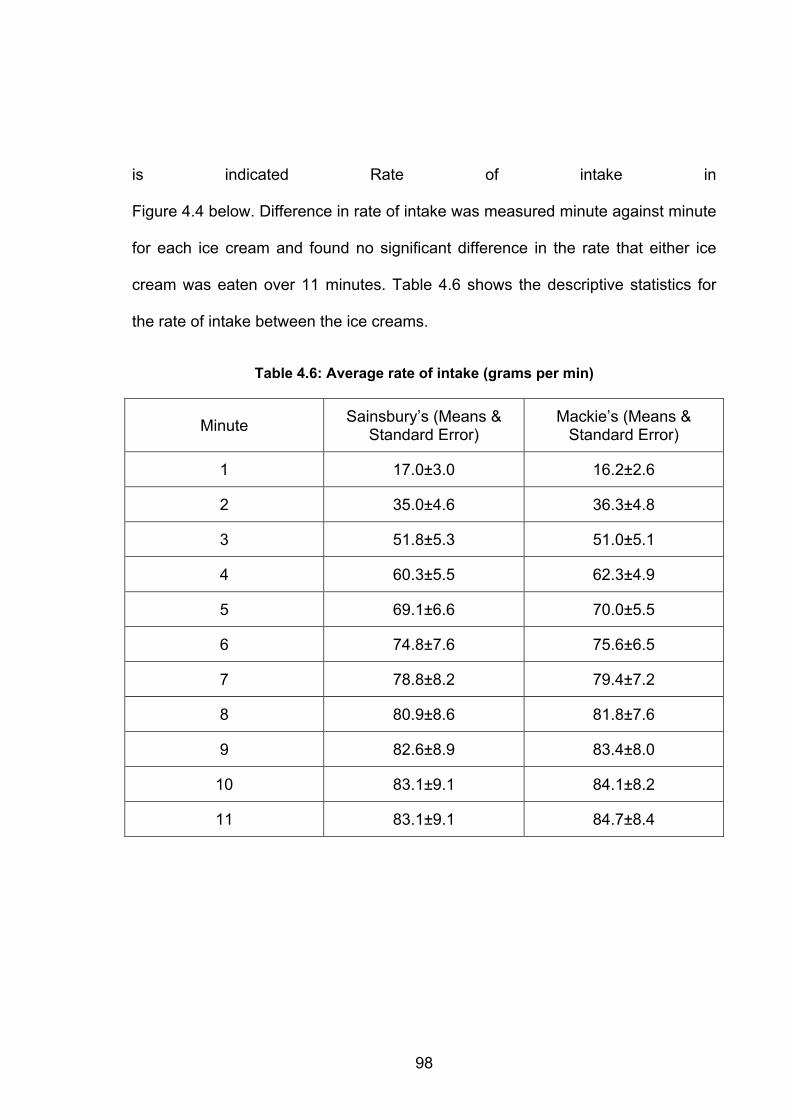
98
is indicated Rate of intake in
Figure 4.4 below. Difference in rate of intake was measured minute against minute
for each ice cream and found no significant difference in the rate that either ice
cream was eaten over 11 minutes. Table 4.6 shows the descriptive statistics for
the rate of intake between the ice creams.
Table 4.6: Average rate of intake (grams per min)
Minute Sainsbury’s (Means & Standard Error)
Mackie’s (Means & Standard Error)
1 17.0±3.0 16.2±2.6
2 35.0±4.6 36.3±4.8
3 51.8±5.3 51.0±5.1
4 60.3±5.5 62.3±4.9
5 69.1±6.6 70.0±5.5
6 74.8±7.6 75.6±6.5
7 78.8±8.2 79.4±7.2
8 80.9±8.6 81.8±7.6
9 82.6±8.9 83.4±8.0
10 83.1±9.1 84.1±8.2
11 83.1±9.1 84.7±8.4
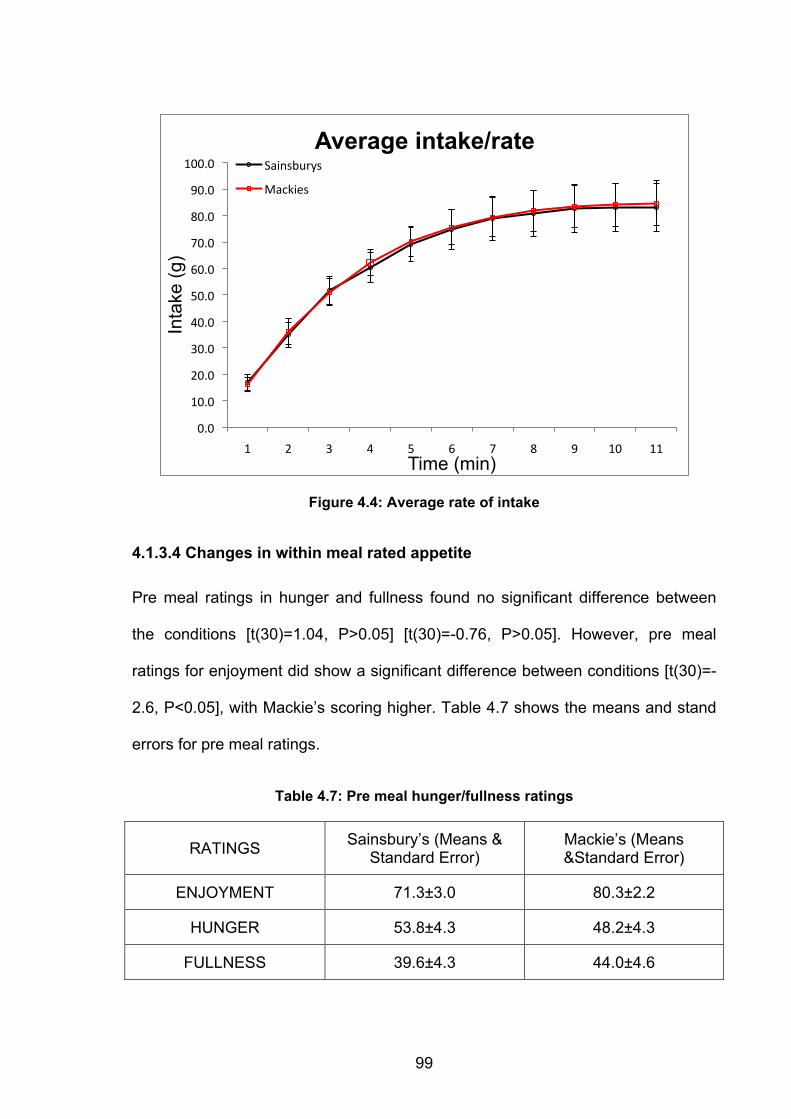
99
Figure 4.4: Average rate of intake
4.1.3.4 Changes in within meal rated appetite
Pre meal ratings in hunger and fullness found no significant difference between
the conditions [t(30)=1.04, P>0.05] [t(30)=-0.76, P>0.05]. However, pre meal
ratings for enjoyment did show a significant difference between conditions [t(30)=-
2.6, P<0.05], with Mackie’s scoring higher. Table 4.7 shows the means and stand
errors for pre meal ratings.
Table 4.7: Pre meal hunger/fullness ratings
0.0
10.0
20.0
30.0
40.0
50.0
60.0
70.0
80.0
90.0
100.0
1 2 3 4 5 6 7 8 9 10 11
Inta
ke (g
)
Time (min)
Average intake/rate Sainsburys
Mackies
RATINGS Sainsbury’s (Means & Standard Error)
Mackie’s (Means &Standard Error)
ENJOYMENT 71.3±3.0 80.3±2.2
HUNGER 53.8±4.3 48.2±4.3
FULLNESS 39.6±4.3 44.0±4.6
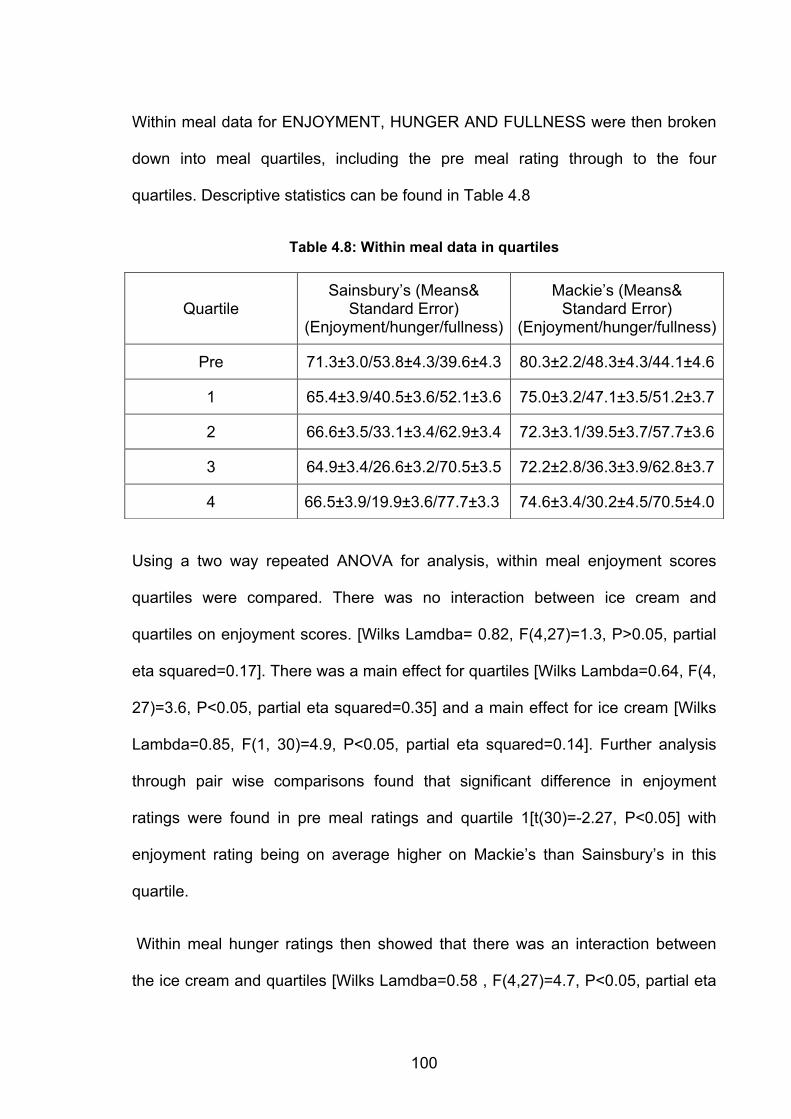
100
Within meal data for ENJOYMENT, HUNGER AND FULLNESS were then broken
down into meal quartiles, including the pre meal rating through to the four
quartiles. Descriptive statistics can be found in Table 4.8
Table 4.8: Within meal data in quartiles
Using a two way repeated ANOVA for analysis, within meal enjoyment scores
quartiles were compared. There was no interaction between ice cream and
quartiles on enjoyment scores. [Wilks Lamdba= 0.82, F(4,27)=1.3, P>0.05, partial
eta squared=0.17]. There was a main effect for quartiles [Wilks Lambda=0.64, F(4,
27)=3.6, P<0.05, partial eta squared=0.35] and a main effect for ice cream [Wilks
Lambda=0.85, F(1, 30)=4.9, P<0.05, partial eta squared=0.14]. Further analysis
through pair wise comparisons found that significant difference in enjoyment
ratings were found in pre meal ratings and quartile 1[t(30)=-2.27, P<0.05] with
enjoyment rating being on average higher on Mackie’s than Sainsbury’s in this
quartile.
Within meal hunger ratings then showed that there was an interaction between
the ice cream and quartiles [Wilks Lamdba=0.58 , F(4,27)=4.7, P<0.05, partial eta
Quartile Sainsbury’s (Means&
Standard Error) (Enjoyment/hunger/fullness)
Mackie’s (Means& Standard Error)
(Enjoyment/hunger/fullness)
Pre 71.3±3.0/53.8±4.3/39.6±4.3 80.3±2.2/48.3±4.3/44.1±4.6
1 65.4±3.9/40.5±3.6/52.1±3.6 75.0±3.2/47.1±3.5/51.2±3.7
2 66.6±3.5/33.1±3.4/62.9±3.4 72.3±3.1/39.5±3.7/57.7±3.6
3 64.9±3.4/26.6±3.2/70.5±3.5 72.2±2.8/36.3±3.9/62.8±3.7
4 66.5±3.9/19.9±3.6/77.7±3.3 74.6±3.4/30.2±4.5/70.5±4.0
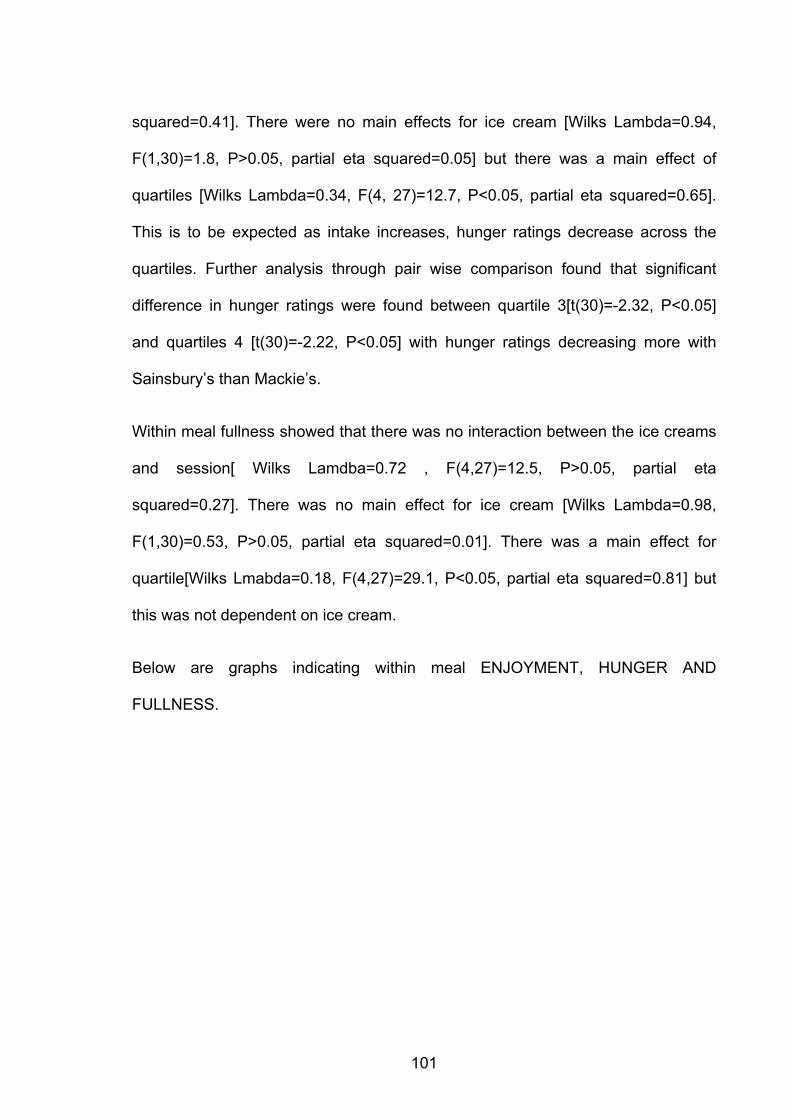
101
squared=0.41]. There were no main effects for ice cream [Wilks Lambda=0.94,
F(1,30)=1.8, P>0.05, partial eta squared=0.05] but there was a main effect of
quartiles [Wilks Lambda=0.34, F(4, 27)=12.7, P<0.05, partial eta squared=0.65].
This is to be expected as intake increases, hunger ratings decrease across the
quartiles. Further analysis through pair wise comparison found that significant
difference in hunger ratings were found between quartile 3[t(30)=-2.32, P<0.05]
and quartiles 4 [t(30)=-2.22, P<0.05] with hunger ratings decreasing more with
Sainsbury’s than Mackie’s.
Within meal fullness showed that there was no interaction between the ice creams
and session[ Wilks Lamdba=0.72 , F(4,27)=12.5, P>0.05, partial eta
squared=0.27]. There was no main effect for ice cream [Wilks Lambda=0.98,
F(1,30)=0.53, P>0.05, partial eta squared=0.01]. There was a main effect for
quartile[Wilks Lmabda=0.18, F(4,27)=29.1, P<0.05, partial eta squared=0.81] but
this was not dependent on ice cream.
Below are graphs indicating within meal ENJOYMENT, HUNGER AND
FULLNESS.
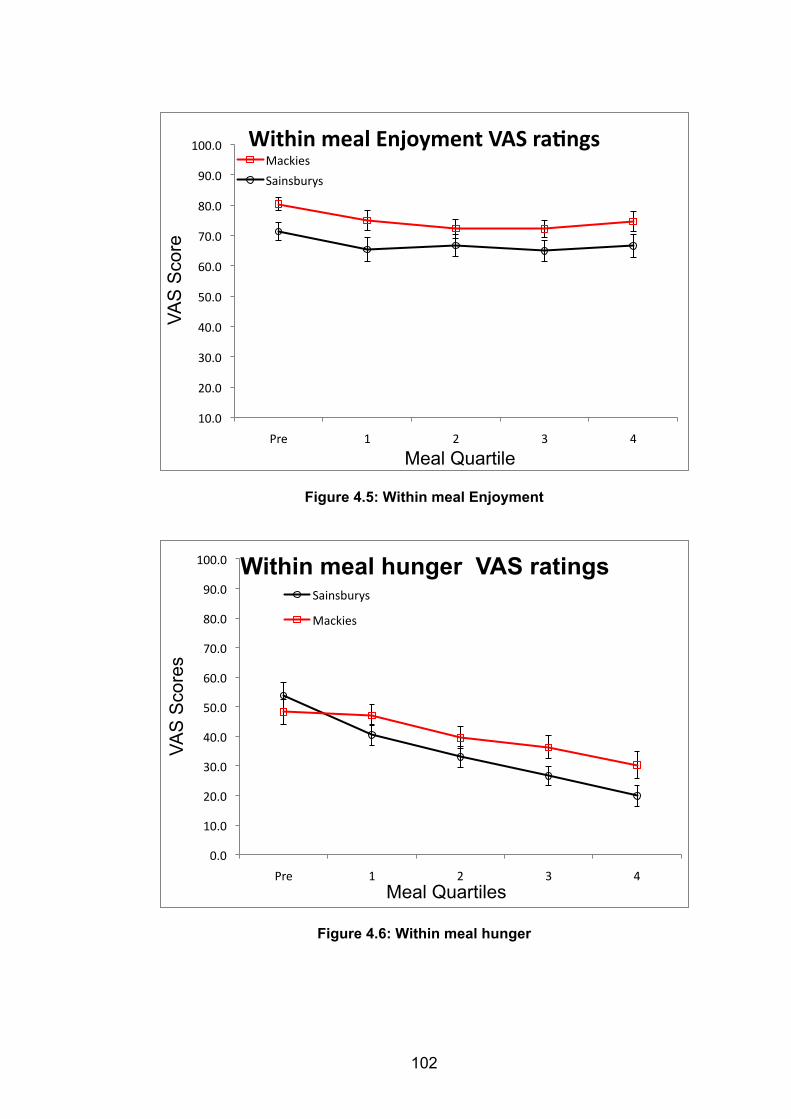
102
Figure 4.5: Within meal Enjoyment
Figure 4.6: Within meal hunger
10.0
20.0
30.0
40.0
50.0
60.0
70.0
80.0
90.0
100.0
Pre 1 2 3 4
VAS
Sco
re
Meal Quartile
Within meal Enjoyment VAS raLngs Mackies
Sainsburys
0.0
10.0
20.0
30.0
40.0
50.0
60.0
70.0
80.0
90.0
100.0
Pre 1 2 3 4
VAS
Sco
res
Meal Quartiles
Within meal hunger VAS ratings Sainsburys
Mackies
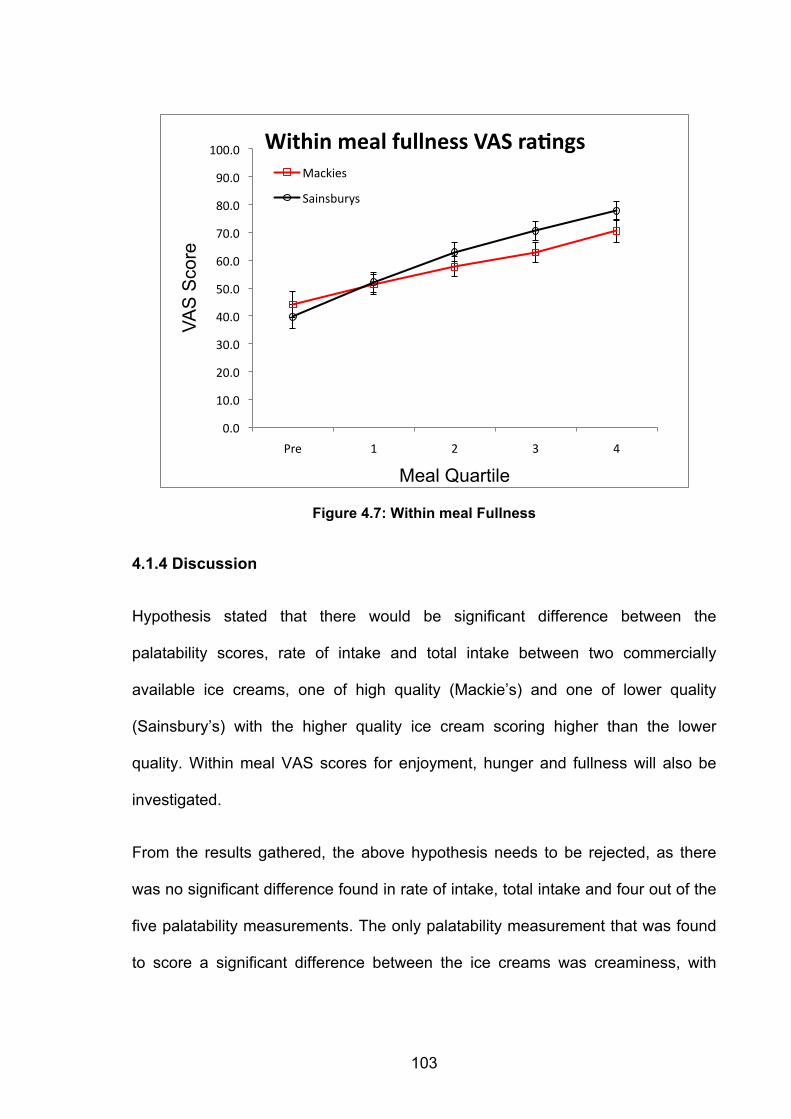
103
Figure 4.7: Within meal Fullness
4.1.4 Discussion
Hypothesis stated that there would be significant difference between the
palatability scores, rate of intake and total intake between two commercially
available ice creams, one of high quality (Mackie’s) and one of lower quality
(Sainsbury’s) with the higher quality ice cream scoring higher than the lower
quality. Within meal VAS scores for enjoyment, hunger and fullness will also be
investigated.
From the results gathered, the above hypothesis needs to be rejected, as there
was no significant difference found in rate of intake, total intake and four out of the
five palatability measurements. The only palatability measurement that was found
to score a significant difference between the ice creams was creaminess, with
0.0
10.0
20.0
30.0
40.0
50.0
60.0
70.0
80.0
90.0
100.0
Pre 1 2 3 4
VAS
Sco
re
Meal Quartile
Within meal fullness VAS raLngs Mackies
Sainsburys
104
Mackie’s scoring significantly higher rating than the Sainsbury’s. Creaminess is a
difficult term to define, however physical data gathered in Chapter 5 allows some
understanding to be gathered about the difference in ‘creaminess’ between the ice
creams. Results also indicated that whilst there was a significant difference in the
energy density consumed between the ice creams, this did not affect the overall
amount eaten. This means that participants did not adjust the amount they
consumed dependent the energy density of the ice cream. This failure to adjust
the amount eaten to regulate energy intake is also seen in research conducted by
Bell et al (1998) found that when normal-weight women consumed test lunch or
dinner foods, which varied in energy density, the total weight of food consumed did
not vary, resulting in significantly higher energy intake in the higher energy density
condition. This is therefore satiation and not satiety. There was also a significant
difference found with regards participants scores regarding ‘likelihood to
purchase’, with Mackie’s, the higher quality ice cream, scoring higher. Within meal
hunger ratings also showed a significant interaction between ice cream and
quartiles within the meal, with hunger decreasing more with the Sainsbury’s ice
cream, which was the less energy dense ice cream, which was not expected.
There are several possibilities as to why the creaminess scores were different
between the ice creams. Firstly, as Goff (2008) previously indicated, that fat is vital
to the structure and delivery of flavour and mouth feel. The two ice creams used in
this experiment not only had different types of fat, but also different overall fat
contents, with the higher quality ice cream having the higher fat content, and also,
the more highly desirable type of fat (cream) for a ‘creamy’ mouth feel, when
compared to the vegetable fat of the lower quality ice cream. This could indicate
105
as to why the scores for the higher quality ice cream were significantly different on
creaminess and likelihood to purchase. But it was expected that the higher quality
ice cream would score higher on other sensory/palatability attributes, such as
sweetness, visual pleasantness and vanilla flavour. The evidence that it there
were no significant differences is intriguing and warrants further investigation, as
does the effect on rate of eating and intake if participants were exposed to the ice
cream over several sessions, as again, there were no significant difference
between these either. Previous research indicates that the more palatable a food
is, the greater the increase in intake amount and rate. Even though the palatability
scores were only significant for creaminess, this did not seem to impact on rate or
total intake of the ice creams. This led to a second, mixed-between design study to
be carried out to test the effect of ice cream formulation and time (exposure to ice
cream) on palatability and rate of eating.
4.2 Analysis of commercially available ice cream eating behaviour through a
Mixed-between Analysis of Variance experimental design
4.2.1 Hypothesis
H2: There will be significant difference in the palatability scores, rate of intake and
total intake between two commercially available ice creams, one of demonstrable
high quality and one of lower quality over time and number of exposures. Within
meal VAS scores for enjoyment, hunger and fullness will also be investigated.
Energy density in relation to total intake will also be investigated.
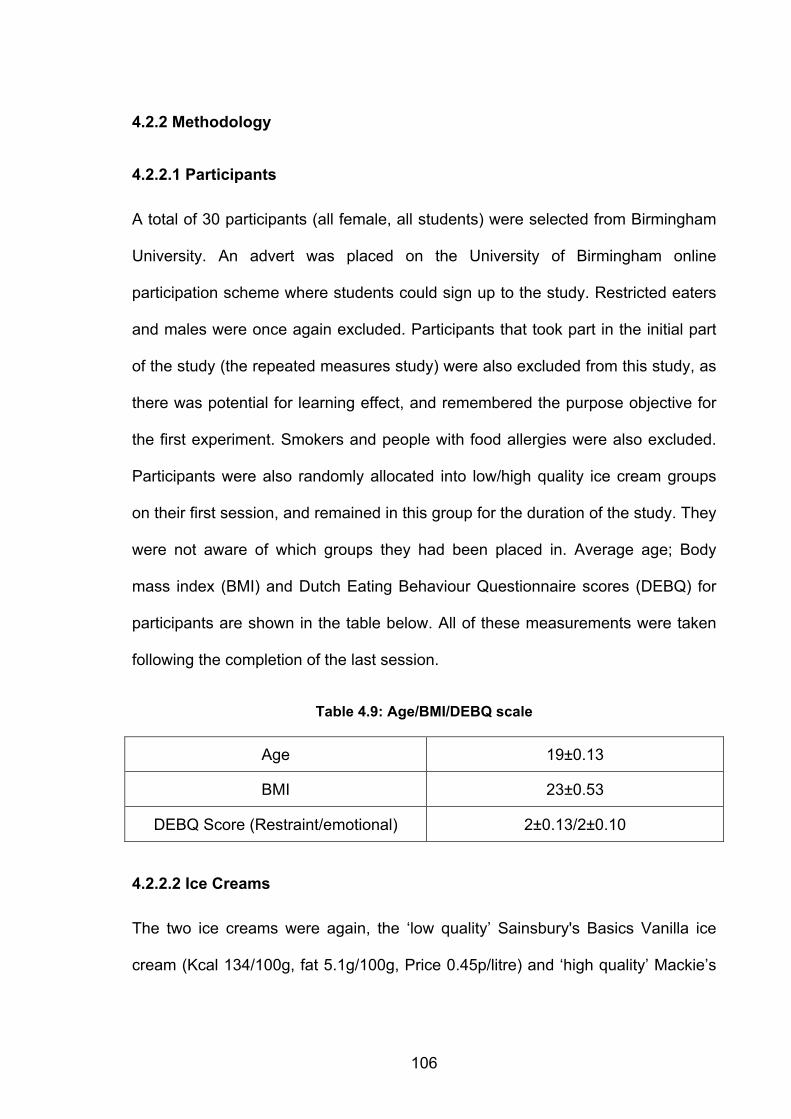
106
4.2.2 Methodology
4.2.2.1 Participants
A total of 30 participants (all female, all students) were selected from Birmingham
University. An advert was placed on the University of Birmingham online
participation scheme where students could sign up to the study. Restricted eaters
and males were once again excluded. Participants that took part in the initial part
of the study (the repeated measures study) were also excluded from this study, as
there was potential for learning effect, and remembered the purpose objective for
the first experiment. Smokers and people with food allergies were also excluded.
Participants were also randomly allocated into low/high quality ice cream groups
on their first session, and remained in this group for the duration of the study. They
were not aware of which groups they had been placed in. Average age; Body
mass index (BMI) and Dutch Eating Behaviour Questionnaire scores (DEBQ) for
participants are shown in the table below. All of these measurements were taken
following the completion of the last session.
Table 4.9: Age/BMI/DEBQ scale
4.2.2.2 Ice Creams
The two ice creams were again, the ‘low quality’ Sainsbury's Basics Vanilla ice
cream (Kcal 134/100g, fat 5.1g/100g, Price 0.45p/litre) and ‘high quality’ Mackie’s
Age 19±0.13
BMI 23±0.53
DEBQ Score (Restraint/emotional) 2±0.13/2±0.10
107
vanilla ice cream (Kcal 204/100g, fat 10.8/100g price 2.97/litre) remained the same
as the previous repeated measures study.
4.2.2.3 Design and procedure
A ‘mixed within-between design’ was employed. This is defined as being used
when ‘there are a mixture of one between group variables, one within group
variable and dependent variable’ (Pallent, 2007). Participants were randomly
allocated into one of two ice cream groups (High quality vs. Low quality,) and were
tested over 3 days. The order of testing was counterbalanced, with between 24-
36hrs between each session. Between group factor was the ice cream (high
quality vs. low quality) and within group factor was time (session1/2/3). Dependent
variables included mood scores, palatability scores, rate of consumption and total
intake, the latter measured in grams. Experimental procedure remained the same
as the previous repeated measures study, but participants attended a third
session, 24-36hrs after the second. The palatability/sensory measurements also
remained the same.
4.2.3 Results
4.2.3.1 Mood Ratings
A mixed between-within ANOVA was conducted to assess if there were any
difference present in pre meal mood ratings across the three sessions between
the ice cream conditions.
For BLOATED rating, there was no significant interaction between session and
ice cream [Wilks Lambda=0.907, F(2, 27)=1.37, P>0.05, partial eta squared=0.93].
108
There was no significant main effect for session [Wilks Lambda=0.910, F(2,
27)=2.80, P>0.05, partial eta squared=0.90]. The main effect for ice cream was
also not significant [F(1, 28)=0.155, P>0.05, partial eta squared=0.005]suggesting
no difference in BLOATED rating between the two ice creams.
For EXCITED rating there was no significant interaction between session and ice
cream [Wilks Lambda=0.986, F(2, 27)=0.19, P>0.05, partial eta squared=0.01].
There was no significant main effect for session [Wilks Lambda=0.981, F(2,
27)=2.56, P>0.05, partial eta squared=0.19]. The main effect for ice cream was
significant [F(1, 28)=4.53, P<0.05, partial eta squared=0.13]suggesting there was
difference in EXCITED rating between the two ice creams, with participants in the
Sainsbury’s group being on average more excited than the Mackie’s group (Please
see DS table). However, pre meal excitement drops for the Sainsbury’s group on
the third session, but not at a statistically significant level, whereas pre meal
excitement for the Mackie’s is much more linear across the three sessions.
For TIRED rating there was a significant interaction between session and ice
cream [Wilks Lambda=0.74, F(2, 27)=4.5, P<0.05, partial eta squared=2.53].
There was no significant main effect for session [Wilks Lambda=0.84, F(2,
27)=2.41, P>0.05, partial eta squared=0.15]. The main effect for ice cream was
not significant [F(1, 28)=3.93, P>0.05, partial eta squared=0.13]suggesting there
was not a difference in TIRED rating between the two ice creams.
For HAPPY rating there was not a significant interaction between session and ice
cream [Wilks Lambda=0.96, F(2, 27)=0.54, P>0.05, partial eta squared=0.03].
There was no significant main effect for session [Wilks Lambda=0.96, F(2,
109
27)=0.51, P>0.05, partial eta squared=0.37]. The main effect for ice cream was not
significant [F(1, 28)=0.09, P>0.05, partial eta squared=0.03]suggesting there was
not a difference in HAPPY rating between the two ice creams.
For STRESSED rating there was not a significant interaction between session and
ice cream [Wilks Lambda=0.98, F(2, 27)=0.19, P<0.05, partial eta squared=0.01].
There was no significant main effect for session [Wilks Lambda=0.98, F(2,
27)=0.20, P>0.05, partial eta squared=0.01]. The main effect for ice cream was not
significant [F(1, 28)=0.22, P>0.05, partial eta squared=0.00]suggesting there was
not a difference in STRESSED rating between the two ice creams.
For SAD rating there was not a significant interaction between session and ice
cream [Wilks Lambda=0.89, F(2, 27)=1.5, P>0.05, partial eta squared=0.1]. There
was no significant main effect for session [Wilks Lambda=0.94, F(2, 27)=0.84,
P>0.05, partial eta squared=0.05]. The main effect for ice cream was not
significant [F(1, 28)=0.01, P>0.05, partial eta squared=0.00]suggesting there was
not a difference in SAD rating between the two ice creams.
For NERVOUS rating there was not a significant interaction between session and
ice cream [Wilks Lambda=0.93, F(2, 27)=0.90, P>0.05, partial eta squared=0.06].
There was no significant main effect for session [Wilks Lambda=0.83, F(2,
27)=2.58, P>0.05, partial eta squared=0.16]. The main effect for ice cream was not
significant [F(1, 28)=0.39, P>0.05, partial eta squared=0.01]suggesting there was
not a difference in NERVOUS rating between the two ice creams.
For RELAXED rating there was not a significant interaction between session and
ice cream [Wilks Lambda=0.97, F(2, 27)=0.30, P>0.05, partial eta squared=0.02].
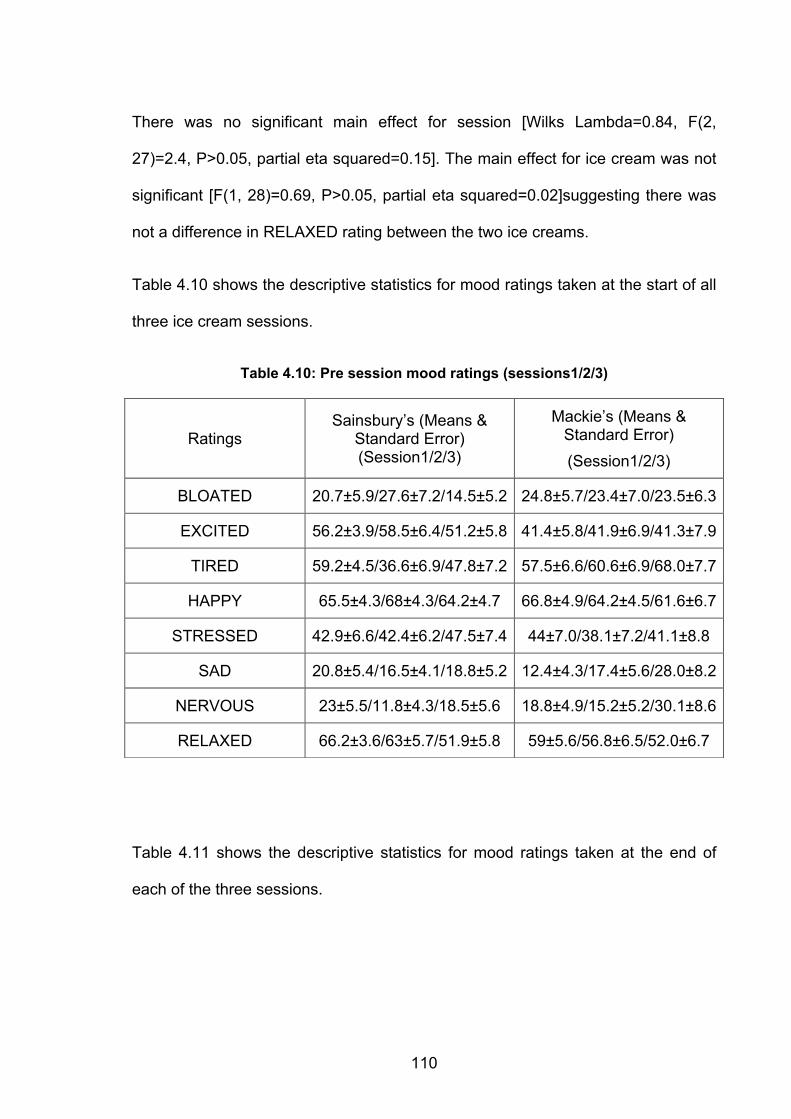
110
There was no significant main effect for session [Wilks Lambda=0.84, F(2,
27)=2.4, P>0.05, partial eta squared=0.15]. The main effect for ice cream was not
significant [F(1, 28)=0.69, P>0.05, partial eta squared=0.02]suggesting there was
not a difference in RELAXED rating between the two ice creams.
Table 4.10 shows the descriptive statistics for mood ratings taken at the start of all
three ice cream sessions.
Table 4.10: Pre session mood ratings (sessions1/2/3)
Table 4.11 shows the descriptive statistics for mood ratings taken at the end of
each of the three sessions.
Ratings Sainsbury’s (Means &
Standard Error) (Session1/2/3)
Mackie’s (Means & Standard Error) (Session1/2/3)
BLOATED 20.7±5.9/27.6±7.2/14.5±5.2 24.8±5.7/23.4±7.0/23.5±6.3
EXCITED 56.2±3.9/58.5±6.4/51.2±5.8 41.4±5.8/41.9±6.9/41.3±7.9
TIRED 59.2±4.5/36.6±6.9/47.8±7.2 57.5±6.6/60.6±6.9/68.0±7.7
HAPPY 65.5±4.3/68±4.3/64.2±4.7 66.8±4.9/64.2±4.5/61.6±6.7
STRESSED 42.9±6.6/42.4±6.2/47.5±7.4 44±7.0/38.1±7.2/41.1±8.8
SAD 20.8±5.4/16.5±4.1/18.8±5.2 12.4±4.3/17.4±5.6/28.0±8.2
NERVOUS 23±5.5/11.8±4.3/18.5±5.6 18.8±4.9/15.2±5.2/30.1±8.6
RELAXED 66.2±3.6/63±5.7/51.9±5.8 59±5.6/56.8±6.5/52.0±6.7
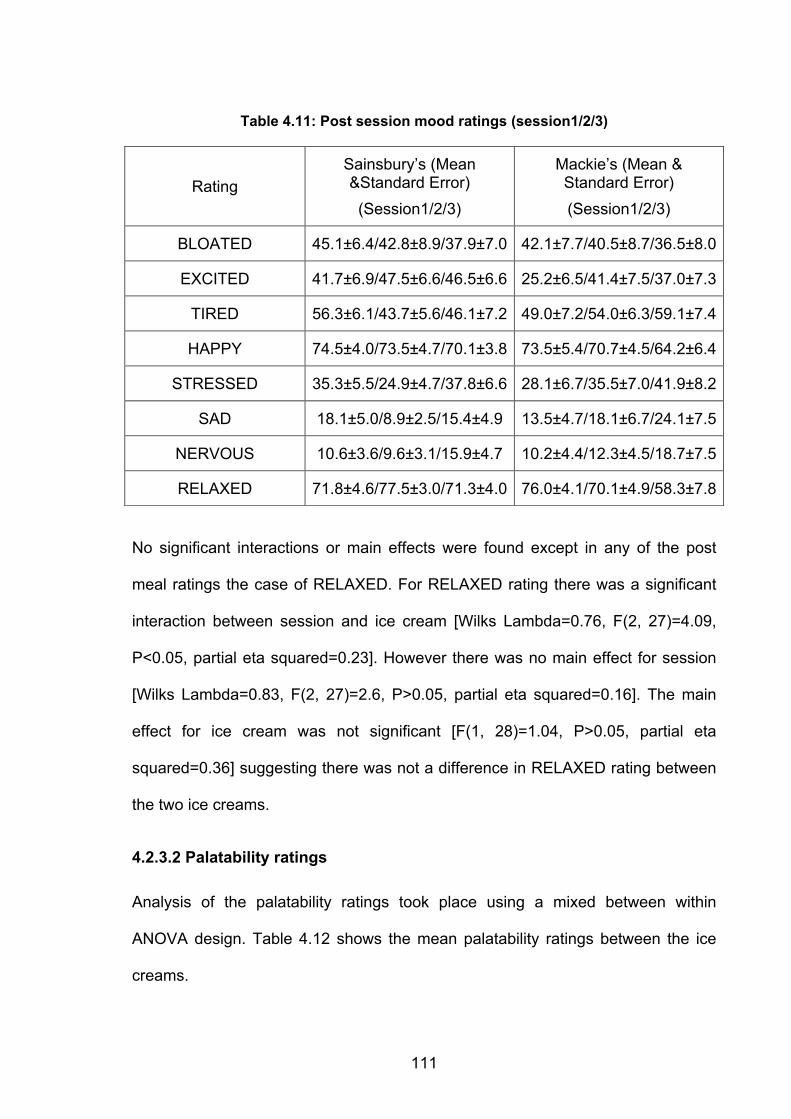
111
Table 4.11: Post session mood ratings (session1/2/3)
No significant interactions or main effects were found except in any of the post
meal ratings the case of RELAXED. For RELAXED rating there was a significant
interaction between session and ice cream [Wilks Lambda=0.76, F(2, 27)=4.09,
P<0.05, partial eta squared=0.23]. However there was no main effect for session
[Wilks Lambda=0.83, F(2, 27)=2.6, P>0.05, partial eta squared=0.16]. The main
effect for ice cream was not significant [F(1, 28)=1.04, P>0.05, partial eta
squared=0.36] suggesting there was not a difference in RELAXED rating between
the two ice creams.
4.2.3.2 Palatability ratings
Analysis of the palatability ratings took place using a mixed between within
ANOVA design. Table 4.12 shows the mean palatability ratings between the ice
creams.
Rating Sainsbury’s (Mean &Standard Error) (Session1/2/3)
Mackie’s (Mean & Standard Error) (Session1/2/3)
BLOATED 45.1±6.4/42.8±8.9/37.9±7.0 42.1±7.7/40.5±8.7/36.5±8.0
EXCITED 41.7±6.9/47.5±6.6/46.5±6.6 25.2±6.5/41.4±7.5/37.0±7.3
TIRED 56.3±6.1/43.7±5.6/46.1±7.2 49.0±7.2/54.0±6.3/59.1±7.4
HAPPY 74.5±4.0/73.5±4.7/70.1±3.8 73.5±5.4/70.7±4.5/64.2±6.4
STRESSED 35.3±5.5/24.9±4.7/37.8±6.6 28.1±6.7/35.5±7.0/41.9±8.2
SAD 18.1±5.0/8.9±2.5/15.4±4.9 13.5±4.7/18.1±6.7/24.1±7.5
NERVOUS 10.6±3.6/9.6±3.1/15.9±4.7 10.2±4.4/12.3±4.5/18.7±7.5
RELAXED 71.8±4.6/77.5±3.0/71.3±4.0 76.0±4.1/70.1±4.9/58.3±7.8
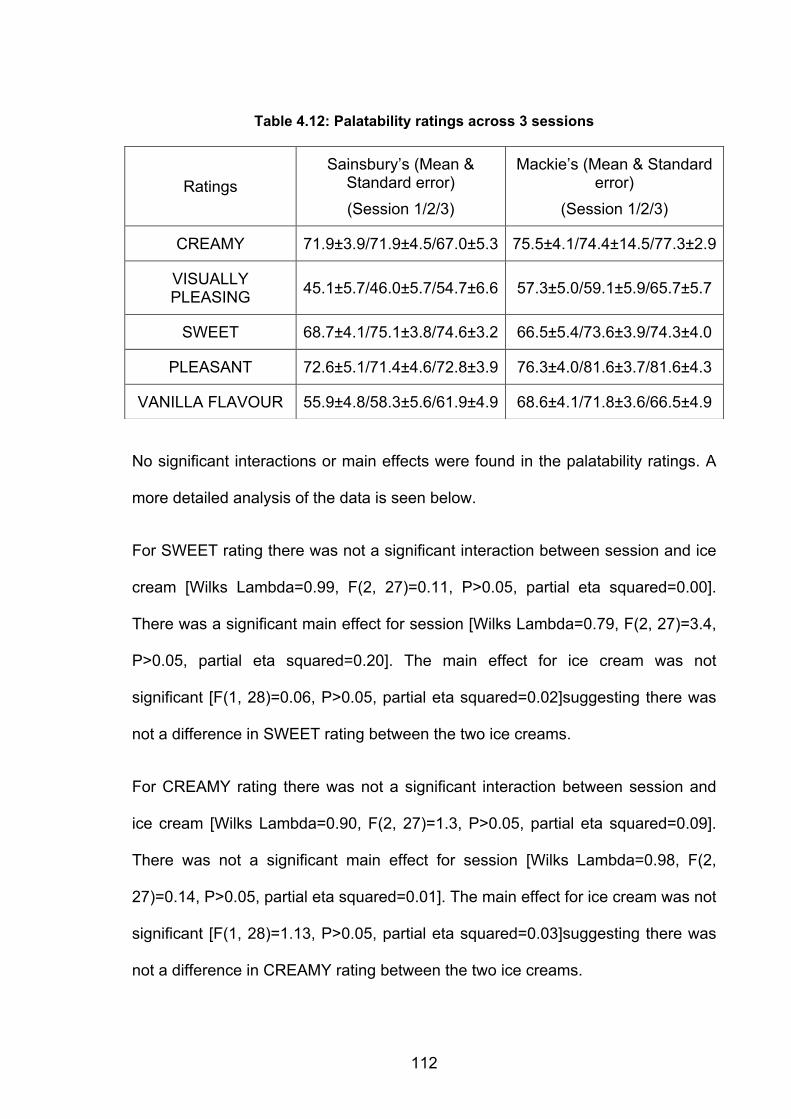
112
Table 4.12: Palatability ratings across 3 sessions
No significant interactions or main effects were found in the palatability ratings. A
more detailed analysis of the data is seen below.
For SWEET rating there was not a significant interaction between session and ice
cream [Wilks Lambda=0.99, F(2, 27)=0.11, P>0.05, partial eta squared=0.00].
There was a significant main effect for session [Wilks Lambda=0.79, F(2, 27)=3.4,
P>0.05, partial eta squared=0.20]. The main effect for ice cream was not
significant [F(1, 28)=0.06, P>0.05, partial eta squared=0.02]suggesting there was
not a difference in SWEET rating between the two ice creams.
For CREAMY rating there was not a significant interaction between session and
ice cream [Wilks Lambda=0.90, F(2, 27)=1.3, P>0.05, partial eta squared=0.09].
There was not a significant main effect for session [Wilks Lambda=0.98, F(2,
27)=0.14, P>0.05, partial eta squared=0.01]. The main effect for ice cream was not
significant [F(1, 28)=1.13, P>0.05, partial eta squared=0.03]suggesting there was
not a difference in CREAMY rating between the two ice creams.
Ratings Sainsbury’s (Mean &
Standard error) (Session 1/2/3)
Mackie’s (Mean & Standard error)
(Session 1/2/3)
CREAMY 71.9±3.9/71.9±4.5/67.0±5.3 75.5±4.1/74.4±14.5/77.3±2.9
VISUALLY PLEASING 45.1±5.7/46.0±5.7/54.7±6.6 57.3±5.0/59.1±5.9/65.7±5.7
SWEET 68.7±4.1/75.1±3.8/74.6±3.2 66.5±5.4/73.6±3.9/74.3±4.0
PLEASANT 72.6±5.1/71.4±4.6/72.8±3.9 76.3±4.0/81.6±3.7/81.6±4.3
VANILLA FLAVOUR 55.9±4.8/58.3±5.6/61.9±4.9 68.6±4.1/71.8±3.6/66.5±4.9
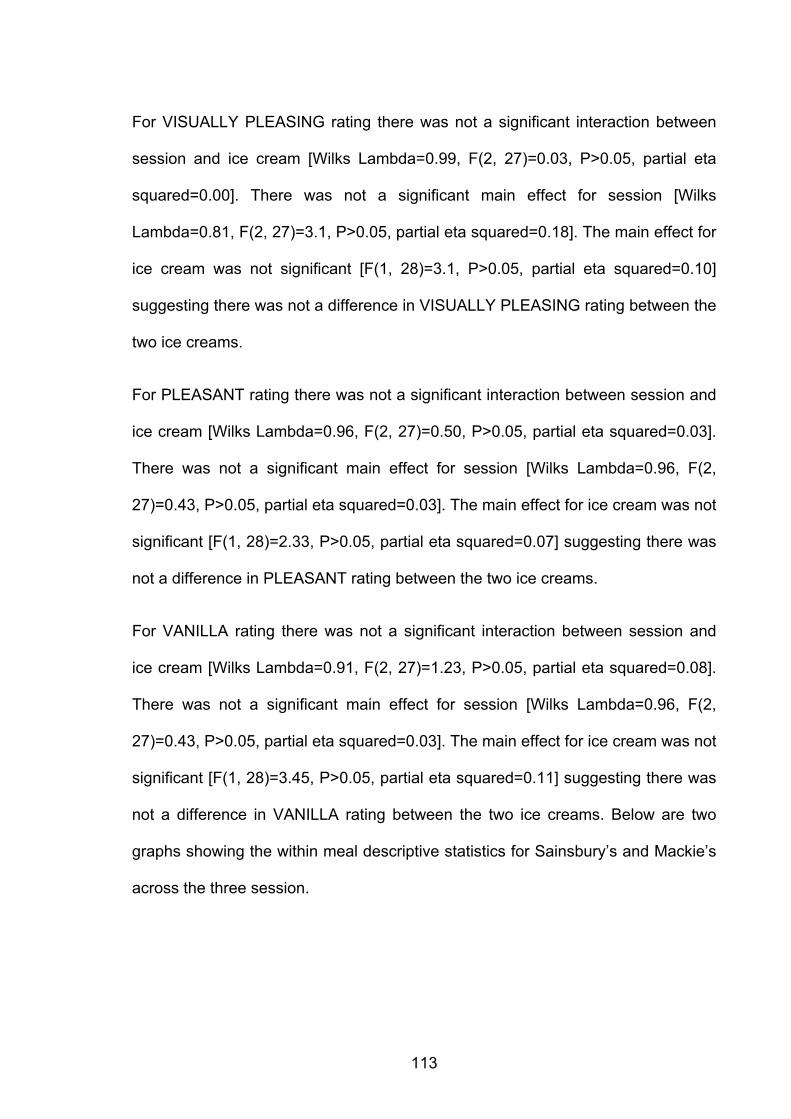
113
For VISUALLY PLEASING rating there was not a significant interaction between
session and ice cream [Wilks Lambda=0.99, F(2, 27)=0.03, P>0.05, partial eta
squared=0.00]. There was not a significant main effect for session [Wilks
Lambda=0.81, F(2, 27)=3.1, P>0.05, partial eta squared=0.18]. The main effect for
ice cream was not significant [F(1, 28)=3.1, P>0.05, partial eta squared=0.10]
suggesting there was not a difference in VISUALLY PLEASING rating between the
two ice creams.
For PLEASANT rating there was not a significant interaction between session and
ice cream [Wilks Lambda=0.96, F(2, 27)=0.50, P>0.05, partial eta squared=0.03].
There was not a significant main effect for session [Wilks Lambda=0.96, F(2,
27)=0.43, P>0.05, partial eta squared=0.03]. The main effect for ice cream was not
significant [F(1, 28)=2.33, P>0.05, partial eta squared=0.07] suggesting there was
not a difference in PLEASANT rating between the two ice creams.
For VANILLA rating there was not a significant interaction between session and
ice cream [Wilks Lambda=0.91, F(2, 27)=1.23, P>0.05, partial eta squared=0.08].
There was not a significant main effect for session [Wilks Lambda=0.96, F(2,
27)=0.43, P>0.05, partial eta squared=0.03]. The main effect for ice cream was not
significant [F(1, 28)=3.45, P>0.05, partial eta squared=0.11] suggesting there was
not a difference in VANILLA rating between the two ice creams. Below are two
graphs showing the within meal descriptive statistics for Sainsbury’s and Mackie’s
across the three session.
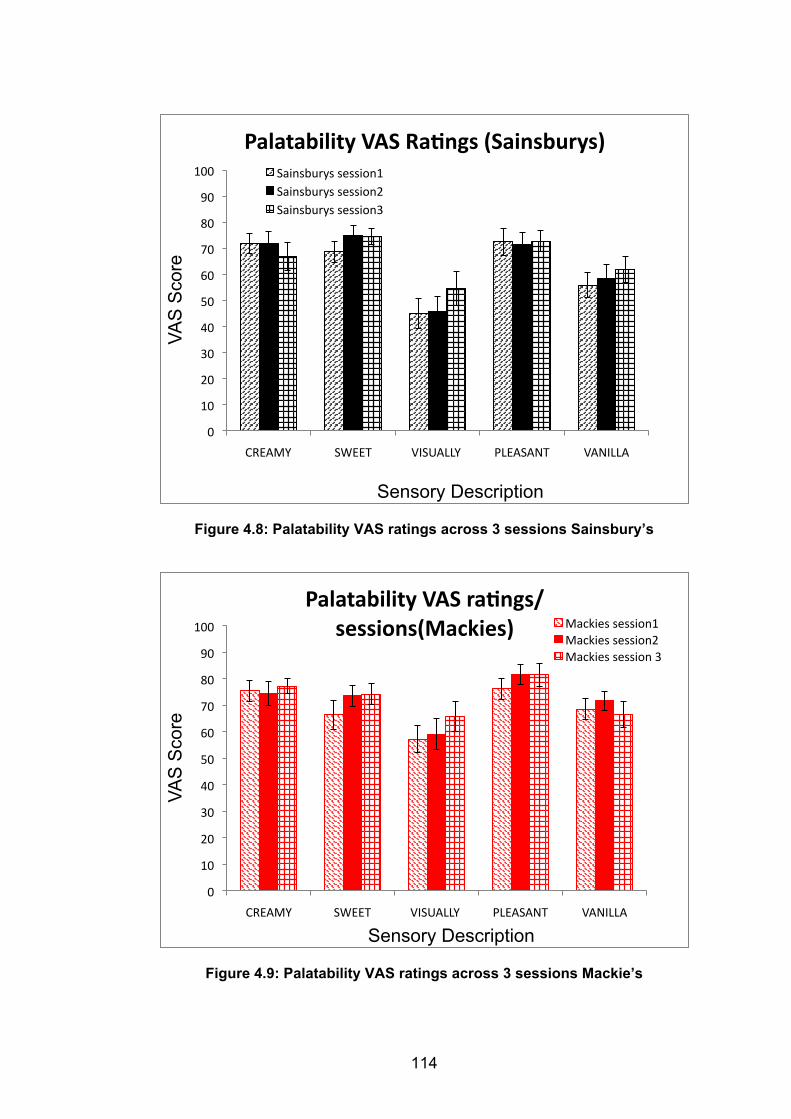
114
Figure 4.8: Palatability VAS ratings across 3 sessions Sainsbury’s
Figure 4.9: Palatability VAS ratings across 3 sessions Mackie’s
0
10
20
30
40
50
60
70
80
90
100
CREAMY SWEET VISUALLY PLEASANT VANILLA
VAS
Sco
re
Sensory Description
Palatability VAS RaLngs (Sainsburys) Sainsburys session1 Sainsburys session2 Sainsburys session3
0
10
20
30
40
50
60
70
80
90
100
CREAMY SWEET VISUALLY PLEASANT VANILLA
VAS
Sco
re
Sensory Description
Palatability VAS raLngs/sessions(Mackies) Mackies session1
Mackies session2 Mackies session 3
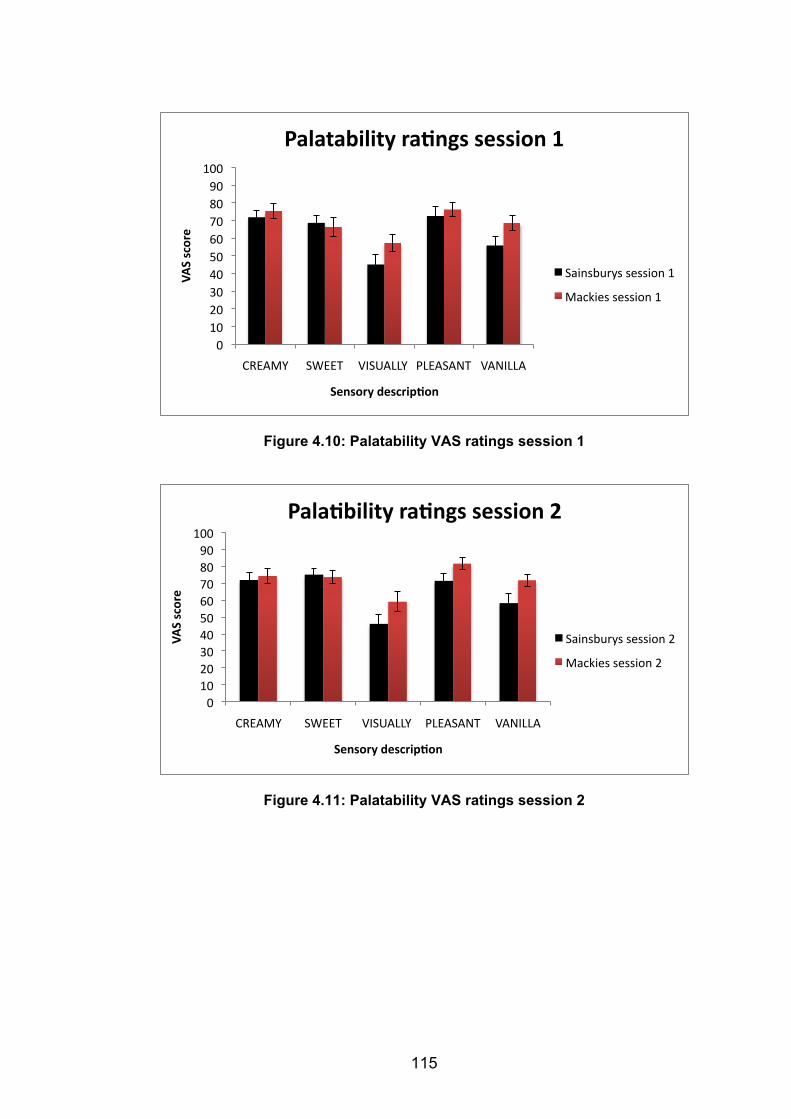
115
Figure 4.10: Palatability VAS ratings session 1
Figure 4.11: Palatability VAS ratings session 2
0 10 20 30 40 50 60 70 80 90
100
CREAMY SWEET VISUALLY PLEASANT VANILLA
VAS score
Sensory descripLon
Palatability raLngs session 1
Sainsburys session 1
Mackies session 1
0 10 20 30 40 50 60 70 80 90 100
CREAMY SWEET VISUALLY PLEASANT VANILLA
VAS score
Sensory descripLon
PalaLbility raLngs session 2
Sainsburys session 2
Mackies session 2
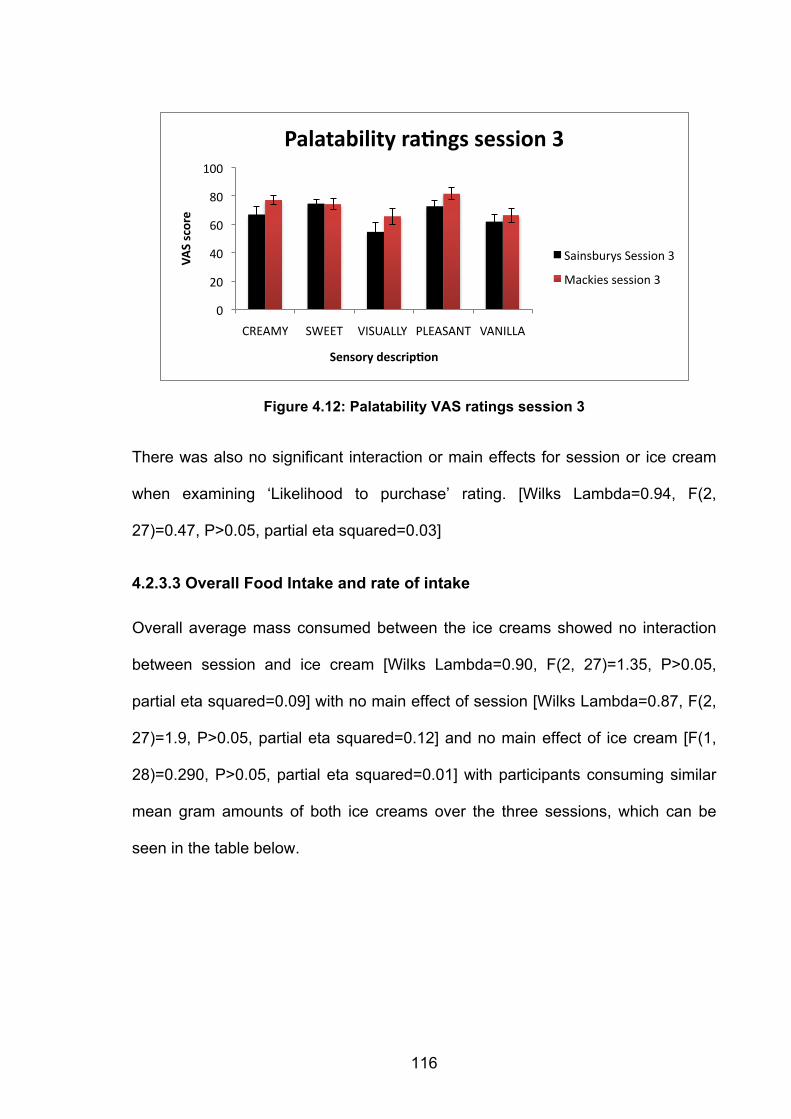
116
Figure 4.12: Palatability VAS ratings session 3
There was also no significant interaction or main effects for session or ice cream
when examining ‘Likelihood to purchase’ rating. [Wilks Lambda=0.94, F(2,
27)=0.47, P>0.05, partial eta squared=0.03]
4.2.3.3 Overall Food Intake and rate of intake
Overall average mass consumed between the ice creams showed no interaction
between session and ice cream [Wilks Lambda=0.90, F(2, 27)=1.35, P>0.05,
partial eta squared=0.09] with no main effect of session [Wilks Lambda=0.87, F(2,
27)=1.9, P>0.05, partial eta squared=0.12] and no main effect of ice cream [F(1,
28)=0.290, P>0.05, partial eta squared=0.01] with participants consuming similar
mean gram amounts of both ice creams over the three sessions, which can be
seen in the table below.
0
20
40
60
80
100
CREAMY SWEET VISUALLY PLEASANT VANILLA
VAS score
Sensory descripLon
Palatability raLngs session 3
Sainsburys Session 3
Mackies session 3
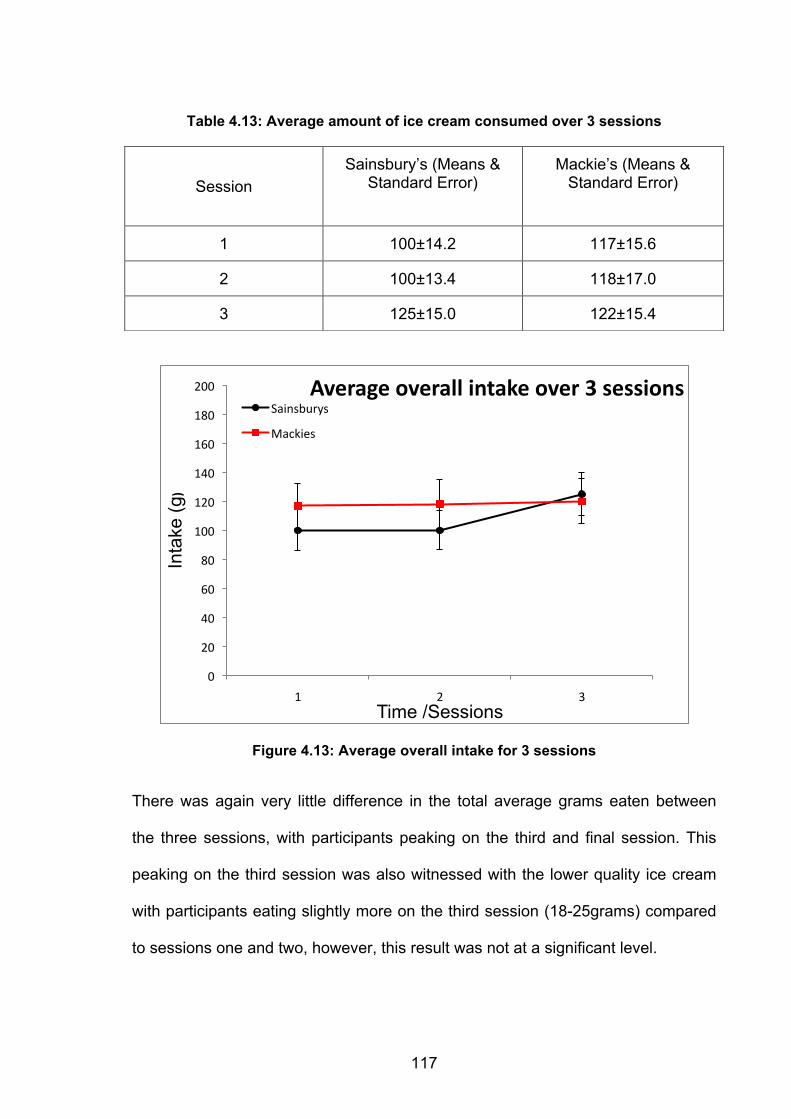
117
Table 4.13: Average amount of ice cream consumed over 3 sessions
Figure 4.13: Average overall intake for 3 sessions
There was again very little difference in the total average grams eaten between
the three sessions, with participants peaking on the third and final session. This
peaking on the third session was also witnessed with the lower quality ice cream
with participants eating slightly more on the third session (18-25grams) compared
to sessions one and two, however, this result was not at a significant level.
0
20
40
60
80
100
120
140
160
180
200
1 2 3
Inta
ke (g
)
Time /Sessions
Average overall intake over 3 sessions Sainsburys
Mackies
Session Sainsbury’s (Means &
Standard Error)
Mackie’s (Means & Standard Error)
1 100±14.2 117±15.6
2 100±13.4 118±17.0
3 125±15.0 122±15.4
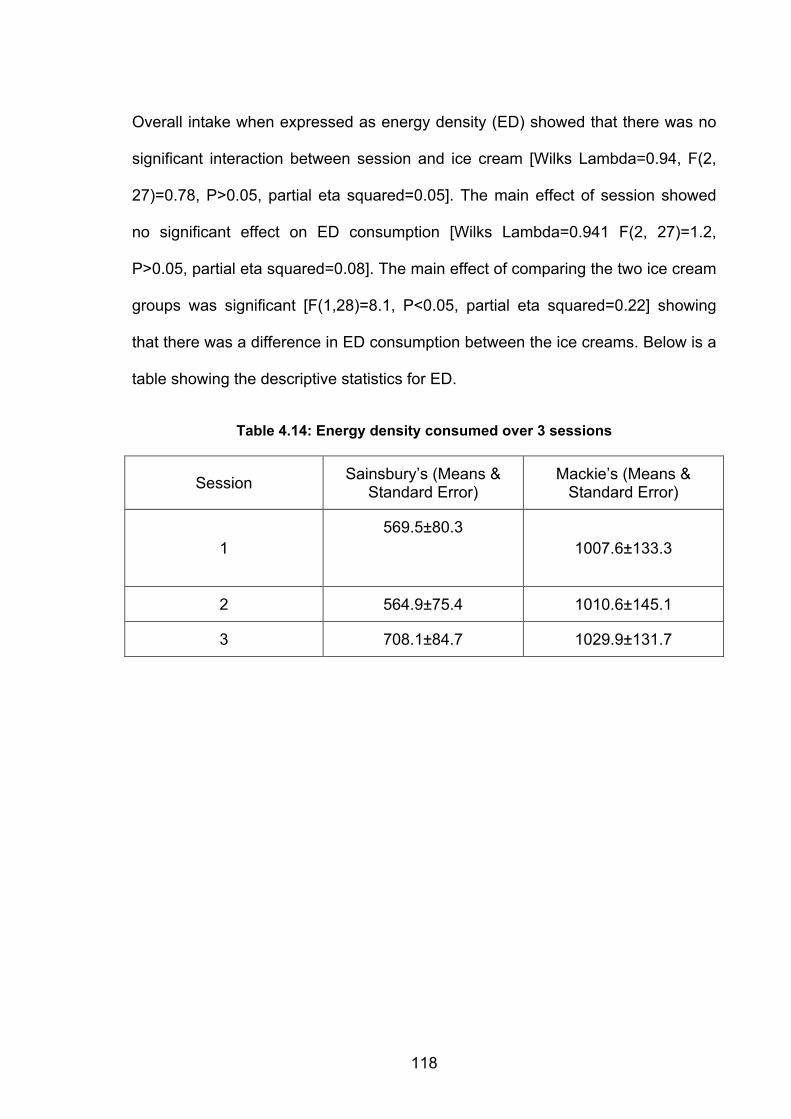
118
Overall intake when expressed as energy density (ED) showed that there was no
significant interaction between session and ice cream [Wilks Lambda=0.94, F(2,
27)=0.78, P>0.05, partial eta squared=0.05]. The main effect of session showed
no significant effect on ED consumption [Wilks Lambda=0.941 F(2, 27)=1.2,
P>0.05, partial eta squared=0.08]. The main effect of comparing the two ice cream
groups was significant [F(1,28)=8.1, P<0.05, partial eta squared=0.22] showing
that there was a difference in ED consumption between the ice creams. Below is a
table showing the descriptive statistics for ED.
Table 4.14: Energy density consumed over 3 sessions
Session Sainsbury’s (Means & Standard Error)
Mackie’s (Means & Standard Error)
1 569.5±80.3
1007.6±133.3
2 564.9±75.4 1010.6±145.1
3 708.1±84.7 1029.9±131.7
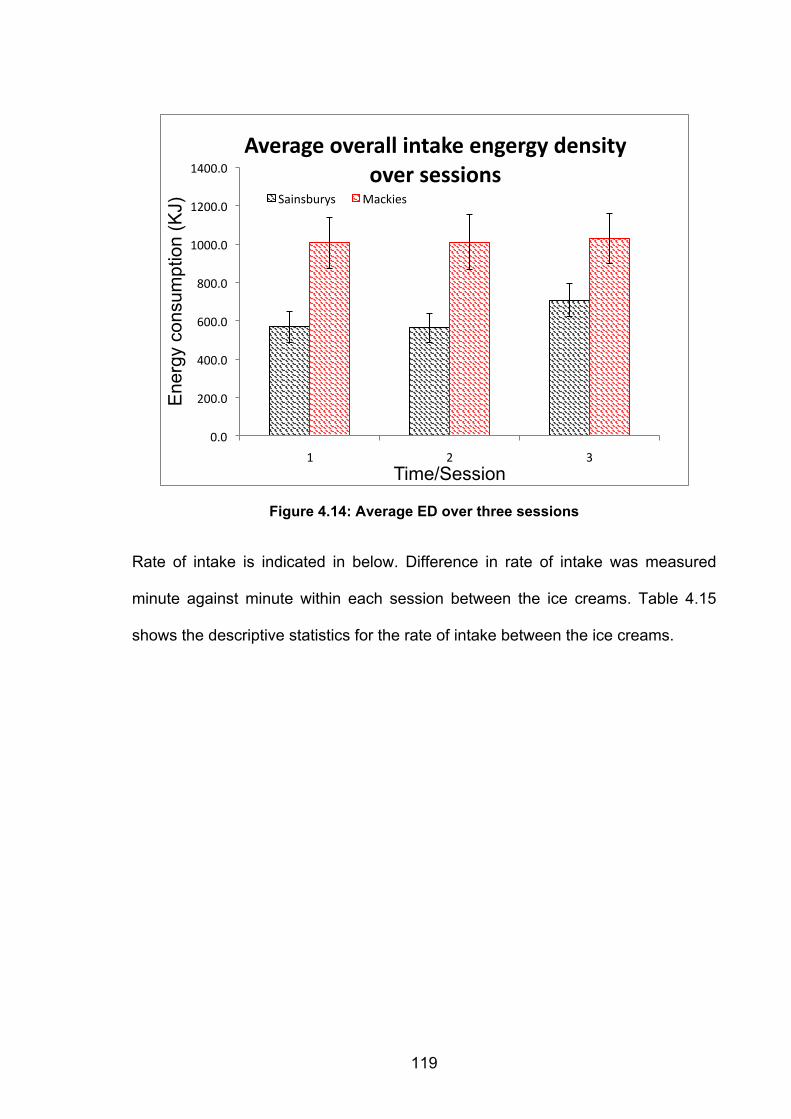
119
Figure 4.14: Average ED over three sessions
Rate of intake is indicated in below. Difference in rate of intake was measured
minute against minute within each session between the ice creams. Table 4.15
shows the descriptive statistics for the rate of intake between the ice creams.
0.0
200.0
400.0
600.0
800.0
1000.0
1200.0
1400.0
1 2 3
Ene
rgy
cons
umpt
ion
(KJ)
Time/Session
Average overall intake engergy density over sessions
Sainsburys Mackies
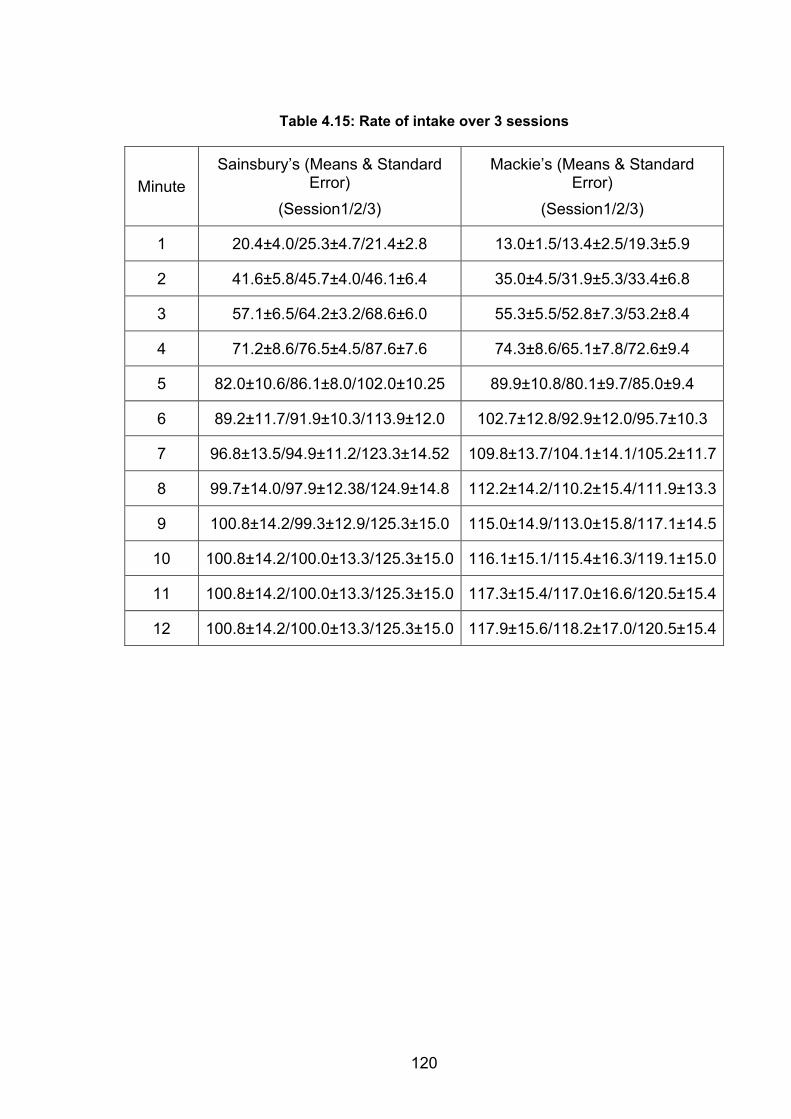
120
Table 4.15: Rate of intake over 3 sessions
Minute Sainsbury’s (Means & Standard
Error) (Session1/2/3)
Mackie’s (Means & Standard Error)
(Session1/2/3)
1 20.4±4.0/25.3±4.7/21.4±2.8 13.0±1.5/13.4±2.5/19.3±5.9
2 41.6±5.8/45.7±4.0/46.1±6.4 35.0±4.5/31.9±5.3/33.4±6.8
3 57.1±6.5/64.2±3.2/68.6±6.0 55.3±5.5/52.8±7.3/53.2±8.4
4 71.2±8.6/76.5±4.5/87.6±7.6 74.3±8.6/65.1±7.8/72.6±9.4
5 82.0±10.6/86.1±8.0/102.0±10.25 89.9±10.8/80.1±9.7/85.0±9.4
6 89.2±11.7/91.9±10.3/113.9±12.0 102.7±12.8/92.9±12.0/95.7±10.3
7 96.8±13.5/94.9±11.2/123.3±14.52 109.8±13.7/104.1±14.1/105.2±11.7
8 99.7±14.0/97.9±12.38/124.9±14.8 112.2±14.2/110.2±15.4/111.9±13.3
9 100.8±14.2/99.3±12.9/125.3±15.0 115.0±14.9/113.0±15.8/117.1±14.5
10 100.8±14.2/100.0±13.3/125.3±15.0 116.1±15.1/115.4±16.3/119.1±15.0
11 100.8±14.2/100.0±13.3/125.3±15.0 117.3±15.4/117.0±16.6/120.5±15.4
12 100.8±14.2/100.0±13.3/125.3±15.0 117.9±15.6/118.2±17.0/120.5±15.4
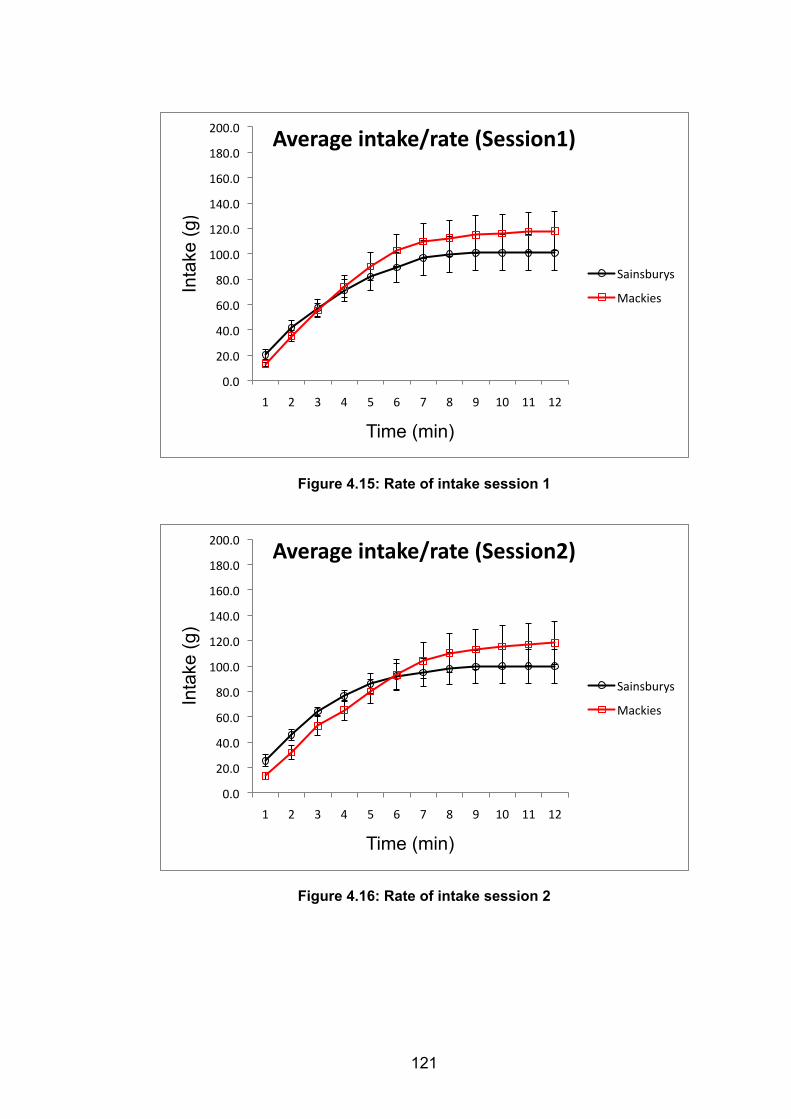
121
Figure 4.15: Rate of intake session 1
Figure 4.16: Rate of intake session 2
0.0
20.0
40.0
60.0
80.0
100.0
120.0
140.0
160.0
180.0
200.0
1 2 3 4 5 6 7 8 9 10 11 12
Inta
ke (g
)
Time (min)
Average intake/rate (Session1)
Sainsburys
Mackies
0.0
20.0
40.0
60.0
80.0
100.0
120.0
140.0
160.0
180.0
200.0
1 2 3 4 5 6 7 8 9 10 11 12
Inta
ke (g
)
Time (min)
Average intake/rate (Session2)
Sainsburys
Mackies
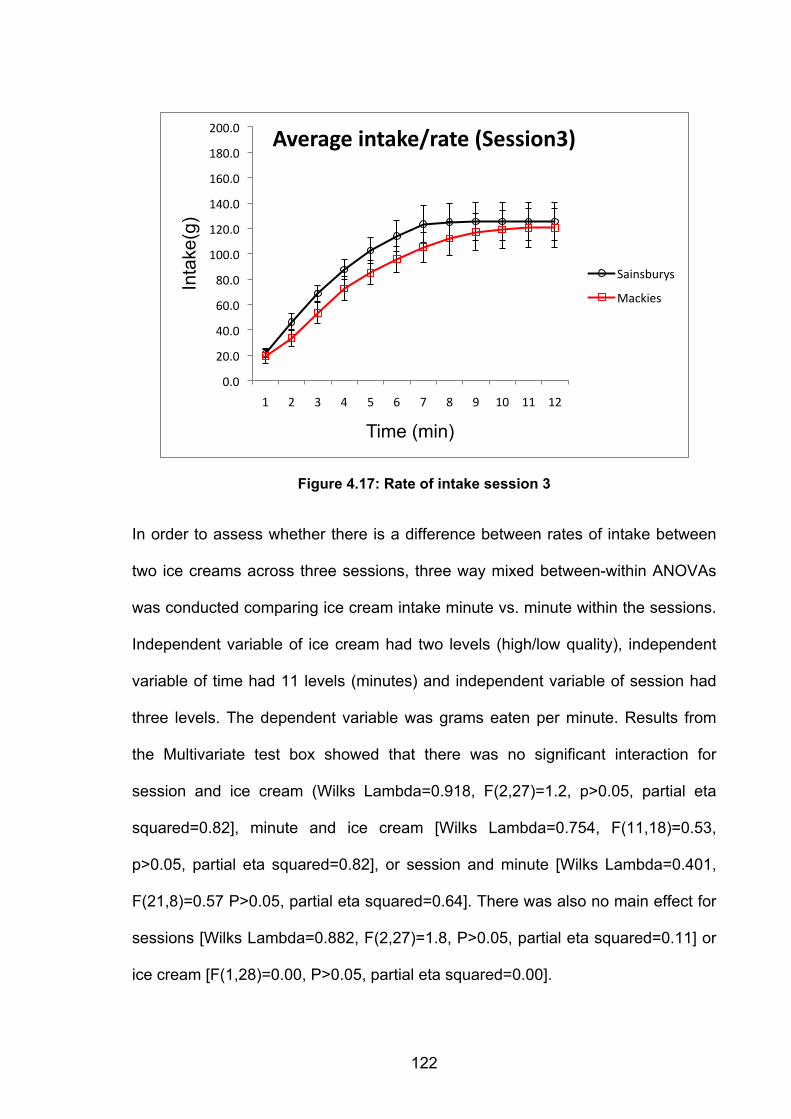
122
Figure 4.17: Rate of intake session 3
In order to assess whether there is a difference between rates of intake between
two ice creams across three sessions, three way mixed between-within ANOVAs
was conducted comparing ice cream intake minute vs. minute within the sessions.
Independent variable of ice cream had two levels (high/low quality), independent
variable of time had 11 levels (minutes) and independent variable of session had
three levels. The dependent variable was grams eaten per minute. Results from
the Multivariate test box showed that there was no significant interaction for
session and ice cream (Wilks Lambda=0.918, F(2,27)=1.2, p>0.05, partial eta
squared=0.82], minute and ice cream [Wilks Lambda=0.754, F(11,18)=0.53,
p>0.05, partial eta squared=0.82], or session and minute [Wilks Lambda=0.401,
F(21,8)=0.57 P>0.05, partial eta squared=0.64]. There was also no main effect for
sessions [Wilks Lambda=0.882, F(2,27)=1.8, P>0.05, partial eta squared=0.11] or
ice cream [F(1,28)=0.00, P>0.05, partial eta squared=0.00].
0.0
20.0
40.0
60.0
80.0
100.0
120.0
140.0
160.0
180.0
200.0
1 2 3 4 5 6 7 8 9 10 11 12
Inta
ke(g
)
Time (min)
Average intake/rate (Session3)
Sainsburys
Mackies
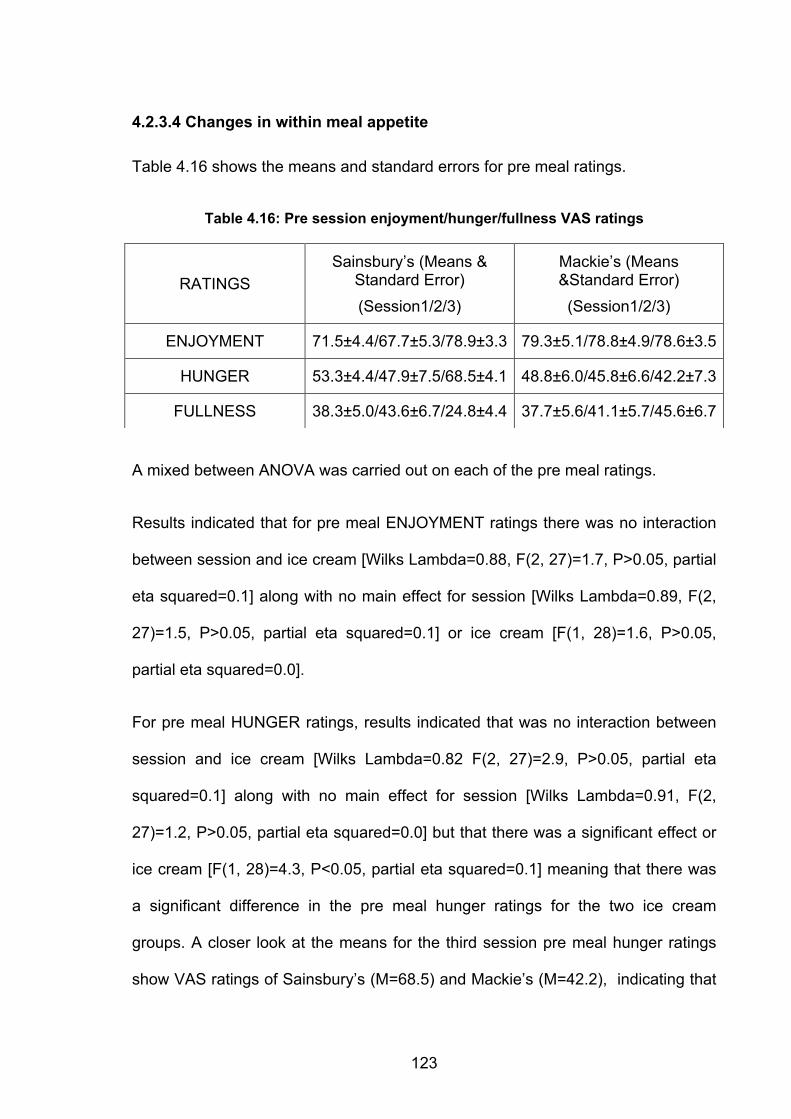
123
4.2.3.4 Changes in within meal appetite
Table 4.16 shows the means and standard errors for pre meal ratings.
Table 4.16: Pre session enjoyment/hunger/fullness VAS ratings
A mixed between ANOVA was carried out on each of the pre meal ratings.
Results indicated that for pre meal ENJOYMENT ratings there was no interaction
between session and ice cream [Wilks Lambda=0.88, F(2, 27)=1.7, P>0.05, partial
eta squared=0.1] along with no main effect for session [Wilks Lambda=0.89, F(2,
27)=1.5, P>0.05, partial eta squared=0.1] or ice cream [F(1, 28)=1.6, P>0.05,
partial eta squared=0.0].
For pre meal HUNGER ratings, results indicated that was no interaction between
session and ice cream [Wilks Lambda=0.82 F(2, 27)=2.9, P>0.05, partial eta
squared=0.1] along with no main effect for session [Wilks Lambda=0.91, F(2,
27)=1.2, P>0.05, partial eta squared=0.0] but that there was a significant effect or
ice cream [F(1, 28)=4.3, P<0.05, partial eta squared=0.1] meaning that there was
a significant difference in the pre meal hunger ratings for the two ice cream
groups. A closer look at the means for the third session pre meal hunger ratings
show VAS ratings of Sainsbury’s (M=68.5) and Mackie’s (M=42.2), indicating that
RATINGS Sainsbury’s (Means &
Standard Error) (Session1/2/3)
Mackie’s (Means &Standard Error) (Session1/2/3)
ENJOYMENT 71.5±4.4/67.7±5.3/78.9±3.3 79.3±5.1/78.8±4.9/78.6±3.5
HUNGER 53.3±4.4/47.9±7.5/68.5±4.1 48.8±6.0/45.8±6.6/42.2±7.3
FULLNESS 38.3±5.0/43.6±6.7/24.8±4.4 37.7±5.6/41.1±5.7/45.6±6.7
124
Sainsbury’s participants were more hungry than their Mackie’s counterparts, and
whilst they did consume more of the Sainsbury’s ice cream on the third session,
this was not at a significant level (please see previous pages).
For pre meal FULLNESS ratings, results showed no interaction between session
and ice cream [Wilks Lambda=0.86, F(2, 27)=2.1, P>0.05, partial eta squared=0.1]
and no main effect of session [Wilks Lambda=0.94, F(2,27)=0.79, P>0.05, partial
eta squared=0.0] and no main effect for ice cream [F(1,28)=1.4, P>0.05, partial eta
squared=0.0].
A three way mixed ANOVA was then carried out to compare the within subject
variables of session and quartiles with the between subject variables of ice cream
on ENJOYMENT VAS scores.
Descriptive statistics for ENJOYMENT can be seen in the table below.
125
Table 4.17: Descriptive statistics for enjoyment VAS scores over quartiles
Results indicate that there is no interaction between session and ice cream [Wilks
Lambda=0.98, F(2, 27)=0.26, P>0.05, partial eta squared=0.01] on enjoyment
scores, but that there is a main effect for session [Wilks lambda=0.76, F(2,27)=4.1,
P<0.05, partial eta squared 0.23] with both ice creams showing a difference in
enjoyment scores across the three sessions. There is no interaction between
quartile and ice cream [Wilks Lambda=0.96, F(3, 26)=0.27, P>0.05, partial eta
squared=0.3] and no main effect for quartile [Wilks Lambda=0.84, F(3,26)=1.5,
P>0.05, partial eta squared 0.1] indicating that enjoyment scores did not differ
significantly across the quartiles between the ice creams. There was also no
interaction between session and quartile [Wilks Lambda=0.84, F(6, 23)=0.68,
Session Quartiles Sainsbury’s Mackie’s
1 70.3±4.0 79.1±5.9
2 68.4±4.5 73.4±6.1
3 67.5±4.7 70.2±6.8 1
4 68.3±5.1 67.5±7.5
1 67.7±5.6 72.9±5.3
2 66.5±5.4 71.3±5.0
3 65.9±5.8 70.6±5.4 2
4 63.9±6.2 71.4±5.9
1 78.8±3.1 81.5±4.0
2 76.4±3.6 79.4±4.6
3 74.3±4.0 74.4±5.1 3
4 73.7±4.0 75.0±5.1
126
P>0.05, partial eta squared=0.1], and no main effect for quartile [Wilks
Lambda=0.84, F(3,26)=1.5, P>0.05, partial eta squared 0.1]. There was also no
main effect for ice cream on enjoyment scores [F(1,28)=0.41, P>0.05, partial eta
squared=0.1]. Below is a graph displaying the within meal enjoyment scores
across the three sessions. Closer inspection of the graph and the means of the
enjoyment scores indicate that enjoyment was higher for both ice creams on the
third session.
Figure 4.18: Within meal enjoyment VAS ratings over quartiles
A three way mixed ANOVA was then carried out to compare the within subject
variables of session and quartiles with the between subject variables of ice cream
on HUNGER VAS scores.
0.0
10.0
20.0
30.0
40.0
50.0
60.0
70.0
80.0
90.0
100.0
Pre 1 2 3 4
VAS
Sco
re
Quartile
Within meal Enjoyment VAS raLngs
Sainsburys session1 Sainsburys session2 Sainsburys session3 Mackies session1 Mackies session2 Mackies session3
127
Descriptive statistics for HUNGER can be seen in the table below.
Table 4.18: Descriptive statistics for hunger VAS ratings over quartiles
Results indicate that there is no interaction between session and ice cream [Wilks
Lambda=0.87, F(2, 27)=1.9, P>0.05, partial eta squared=0.1] on hunger scores,
but that there is a main effect for session [Wilks lambda=0.74, F(2,27)=4.7,
P<0.05, partial eta squared 0.2] with both ice creams showing a difference in
hunger scores across the three sessions. There is no interaction between quartile
and ice cream [Wilks Lambda=0.87, F(3, 26)=1.2, P>0.05, partial eta squared=0.1]
but there is a significant effect for quartile [Wilks Lambda=0.30, F(3,26)=19.9,
P<0.05, partial eta squared 0.6] indicating that hunger scores differed significantly
across the quartiles between the ice creams, which is to be expected, as more
Session Quartiles Sainsbury’s Mackie’s
1 42.2±3.8 41.4±5.5
2 32.8±3.9 32.0±5.5
3 26.0±4.5 25.5±5.1 1
4 15.4±3.7 18.5±5.7
1 44.2±7.2 39.3±5.4
2 40.1±7.0 32.5±5.5
3 35.4±7.0 23.8±4.5 2
4 28.0±6.8 14.9±4.1
1 57.3±4.1 42.2±5.9
2 55.5±6.5 36.7±5.4
3 51.6±7.1 30.3±4.8 3
4 40.1±7.1 23.8±4.6
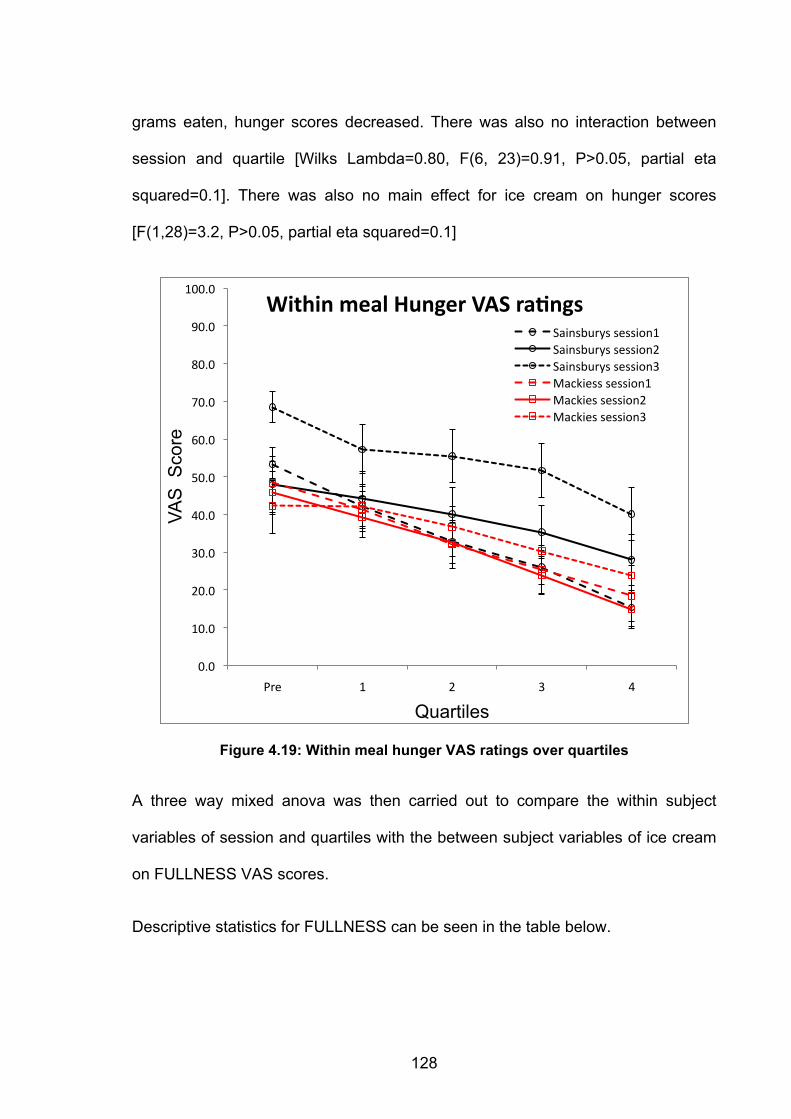
128
grams eaten, hunger scores decreased. There was also no interaction between
session and quartile [Wilks Lambda=0.80, F(6, 23)=0.91, P>0.05, partial eta
squared=0.1]. There was also no main effect for ice cream on hunger scores
[F(1,28)=3.2, P>0.05, partial eta squared=0.1]
Figure 4.19: Within meal hunger VAS ratings over quartiles
A three way mixed anova was then carried out to compare the within subject
variables of session and quartiles with the between subject variables of ice cream
on FULLNESS VAS scores.
Descriptive statistics for FULLNESS can be seen in the table below.
0.0
10.0
20.0
30.0
40.0
50.0
60.0
70.0
80.0
90.0
100.0
Pre 1 2 3 4
VAS
Sco
re
Quartiles
Within meal Hunger VAS raLngs Sainsburys session1 Sainsburys session2 Sainsburys session3 Mackiess session1 Mackies session2 Mackies session3
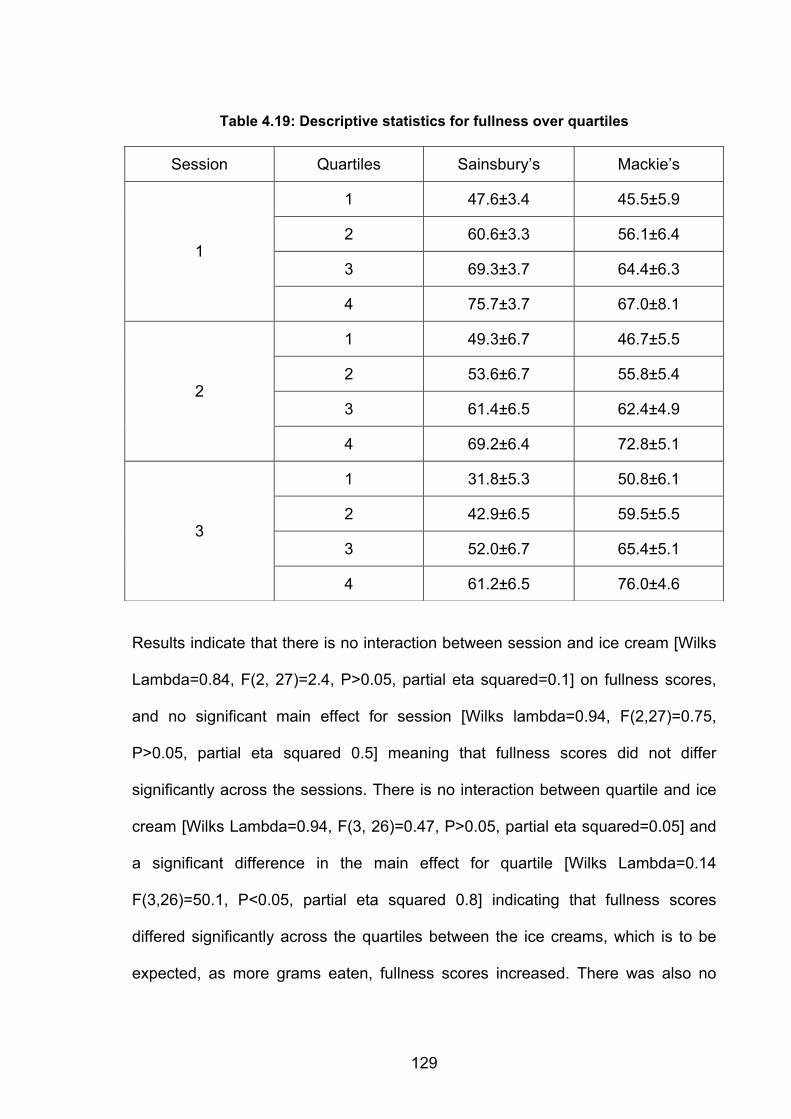
129
Table 4.19: Descriptive statistics for fullness over quartiles
Results indicate that there is no interaction between session and ice cream [Wilks
Lambda=0.84, F(2, 27)=2.4, P>0.05, partial eta squared=0.1] on fullness scores,
and no significant main effect for session [Wilks lambda=0.94, F(2,27)=0.75,
P>0.05, partial eta squared 0.5] meaning that fullness scores did not differ
significantly across the sessions. There is no interaction between quartile and ice
cream [Wilks Lambda=0.94, F(3, 26)=0.47, P>0.05, partial eta squared=0.05] and
a significant difference in the main effect for quartile [Wilks Lambda=0.14
F(3,26)=50.1, P<0.05, partial eta squared 0.8] indicating that fullness scores
differed significantly across the quartiles between the ice creams, which is to be
expected, as more grams eaten, fullness scores increased. There was also no
Session Quartiles Sainsbury’s Mackie’s
1 47.6±3.4 45.5±5.9
2 60.6±3.3 56.1±6.4
3 69.3±3.7 64.4±6.3 1
4 75.7±3.7 67.0±8.1
1 49.3±6.7 46.7±5.5
2 53.6±6.7 55.8±5.4
3 61.4±6.5 62.4±4.9 2
4 69.2±6.4 72.8±5.1
1 31.8±5.3 50.8±6.1
2 42.9±6.5 59.5±5.5
3 52.0±6.7 65.4±5.1 3
4 61.2±6.5 76.0±4.6
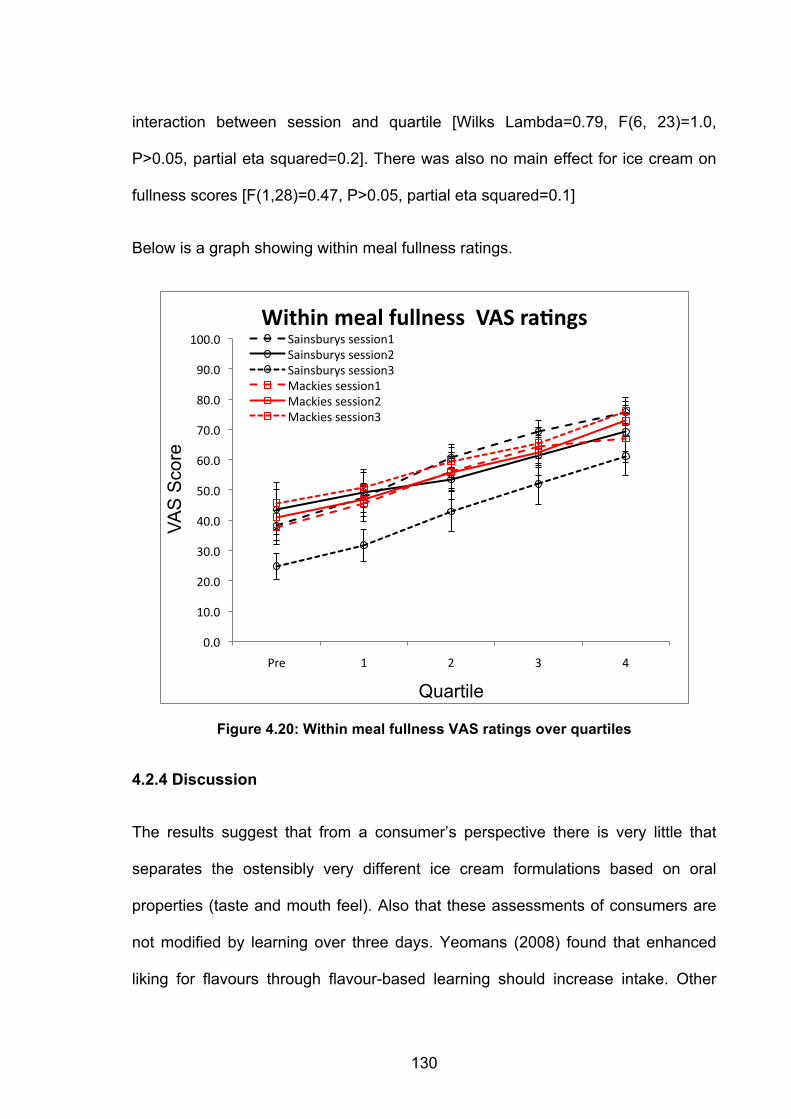
130
interaction between session and quartile [Wilks Lambda=0.79, F(6, 23)=1.0,
P>0.05, partial eta squared=0.2]. There was also no main effect for ice cream on
fullness scores [F(1,28)=0.47, P>0.05, partial eta squared=0.1]
Below is a graph showing within meal fullness ratings.
Figure 4.20: Within meal fullness VAS ratings over quartiles
4.2.4 Discussion
The results suggest that from a consumer’s perspective there is very little that
separates the ostensibly very different ice cream formulations based on oral
properties (taste and mouth feel). Also that these assessments of consumers are
not modified by learning over three days. Yeomans (2008) found that enhanced
liking for flavours through flavour-based learning should increase intake. Other
0.0
10.0
20.0
30.0
40.0
50.0
60.0
70.0
80.0
90.0
100.0
Pre 1 2 3 4
VAS
Sco
re
Quartile
Within meal fullness VAS raLngs Sainsburys session1 Sainsburys session2 Sainsburys session3 Mackies session1 Mackies session2 Mackies session3
131
investigations into the appetizer effect and learned behaviour found that this was
not the case for this study. However, this could have been due to the participants
only being tested over three days, and learning may occur through prolonged
exposure.
Investigations indicate that increased eating rate is associated with increased
intake, and that more palatable foods should also increase intake. Previous
studies have shown that with pasta for example, increasing the palatability of a
sauce leads to increased consumption of the meal (Yeomans, 2008), and that
often, there is a direct correlation between palatability and the energy density of
the food, with the higher energy dense foods lending themselves to be more
palatable (Drewnowski, 1998). However, this was not the case in this instance, as
there was no significant difference in the total intake or rate of intake between the
two ice creams. This may be due to the fact that ice cream is often seen as an
indulgent food, and therefore consumers will continue to eat even a poorly
formulated product, due to a predisposition for liking to the food. It may also be the
case that with ice cream, consumers rely more heavily on packaging and labelling
to make an informed choice. The little difference found between the total intake
and rate of intake between the ice creams may also be related to the findings of
Willemijn (2009) who stated that consumers often find self-regulation of large
portions difficult at the moment of consumption. The eating rate of ice cream is
complex due to multiple food properties being involved, and the fact that it is a
highly processed food. It would have been expected that the higher fat ice cream
would have a higher eating rate due to not only the fact it was chosen as it was
more palatable but also due to the fat content, as fat provides oral properties such
132
as creaminess and softness, enabling quicker passage through the oral cavity.
Physical measurements such as tribology and rheology, discussed in Chapter 5,
were able to show the difference between the fat properties of the ice cream.
4.3 Additional triangle tests in which commercially available ice creams are
manipulated through the process of temperature cycling to alter ice
crystal size
Following the results gained from the two investigations into commercially
available ice creams, the decision to examine the effects of manipulating these ice
creams on sensory and palatability was taken. This came in the form of
temperature manipulation through temperature abuse. Initially, through information
gained through research into temperature abuse (Clarke, 2008) and food, it was
considered that temperature abuse would take place through means of
temperature cycling from frozen to unfrozen back to frozen as this would best alter
the ice crystal structure of the ice creams, therefore leading to more obvious
sensory alterations being detected. This also replicates the very real consumer
issue of buying ice cream in the real world and transporting it home. However, due
to food safety issues surrounding bacteria growth and possible contamination, it
was decided that whilst this may be fine for conducting engineering based
measurements into the ice creams, this would not be safe for human participants
to ingest, and therefore no accurate sensory/palatability measurements could be
gained. Therefore, the temperature abuse would take place through super freezing
cycling, moving the ice creams between regular household freezers of -18°c to a
low temperature freezer of -80°c for the period of a week. A triangle test was
133
carried out to determine whether participants could tell which sample was different
from the other two. This is a discriminatory style design used within sensory
science to try and gauge if an overall difference is present between products
Hypothesis
H1: Participants will successfully be able to indicate which one ice cream is
different to the other two ice creams.
4.3.1 Methodology
4.3.1.1 Participants
A total of 30 participants (all female, all students) were selected from Birmingham
University. An advert was placed on the University of Birmingham online
participation scheme where students could sign up to the study. Please see
Chapter 4 appendix for advert. Restricted eaters and males were once again
excluded. Participants that took part in the previous ice cream studies were also
excluded from this study. Smokers and people with food allergies were also
excluded. Participants were randomly allocated into high quality/low quality groups
and remained in that group, and were not aware of which group they had been
placed in.
4.3.1.2 Ice creams
The ice creams remained the same as in the previous studies; however, batches
of both ice creams had been structurally manipulated through temperature abuse.
For one week, the ice creams were moved between an -18°c freezer and an -80°c
freezer every 24hrs (apart from at the weekend when they remained in the -80°c
134
freezer). Therefore sample consisted of ‘normal’ ice creams (ice creams normally
stored at home freezer temperature, and the temperature-abused ice creams.
4.3.1.3 Design and procedure
A triangle test design was employed for this study. This is a discriminatory style
design used within sensory science to try and gauge if an overall difference is
present between products and determining whether shifts in processing for
ingredients have significantly altered the sensory qualities of the product. In this
case, the purpose is to test the limit of sensitivity to ice crystal deformation in the
ice cream samples.
Participants arrived at testing room and were asked to read a volunteer
information sheet and asked to read and sign a consent form. They were then
taken into a small room and asked to sit down whilst the samples were prepared.
Samples were prepared in the test kitchen, and each of the three ice cream
samples were presented in identical containers and coded using 3 digit codes
(754/341/427), following a balanced experimental test design, and the order of the
ice cream placement was randomised. The participant was then presented with
three samples (two are the same and one is different) and asked to evaluate the
samples from left to right, select the "different" sample and describe the difference
perceived. Participants were instructed to use palate cleansers of water and plain
crackers to clean the palate between samples to minimise flavour carry–over. The
participant was asked to select a sample even if they believed there was no
difference between the samples. The participants were asked to state if their
answer was a guess in the comments section, which is standard practice.
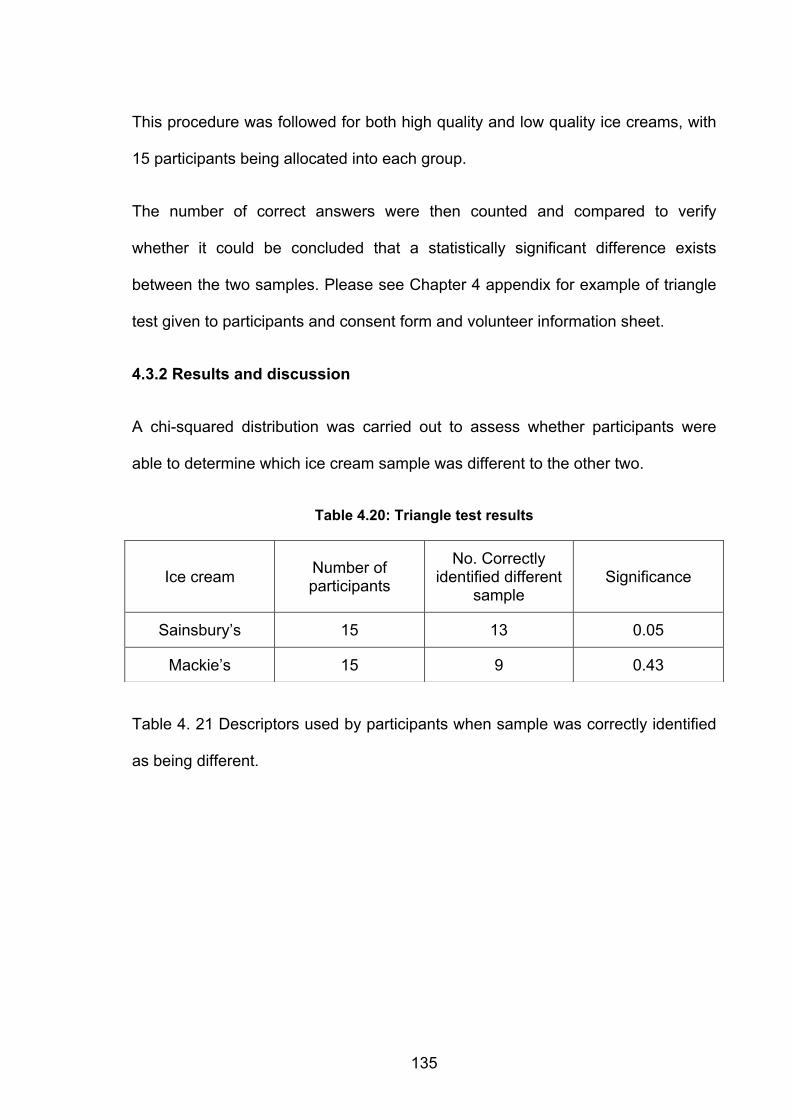
135
This procedure was followed for both high quality and low quality ice creams, with
15 participants being allocated into each group.
The number of correct answers were then counted and compared to verify
whether it could be concluded that a statistically significant difference exists
between the two samples. Please see Chapter 4 appendix for example of triangle
test given to participants and consent form and volunteer information sheet.
4.3.2 Results and discussion
A chi-squared distribution was carried out to assess whether participants were
able to determine which ice cream sample was different to the other two.
Table 4.20: Triangle test results
Table 4. 21 Descriptors used by participants when sample was correctly identified
as being different.
Ice cream Number of participants
No. Correctly identified different
sample Significance
Sainsbury’s 15 13 0.05
Mackie’s 15 9 0.43
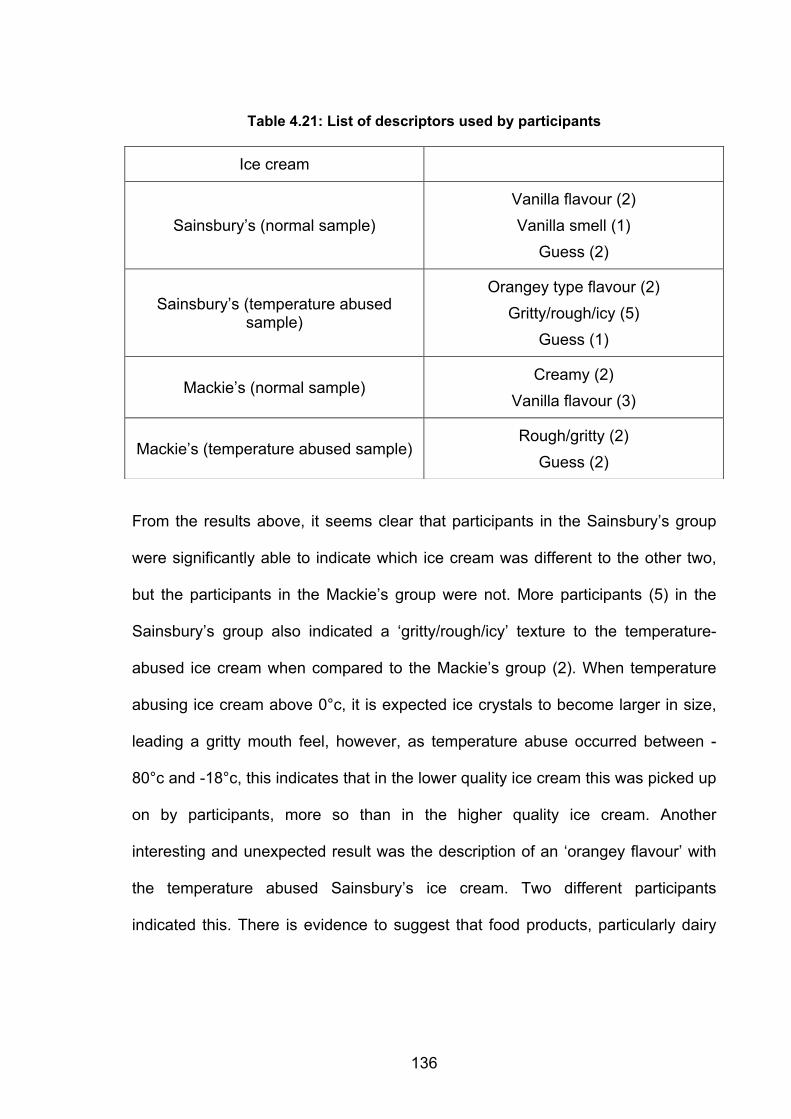
136
Table 4.21: List of descriptors used by participants
From the results above, it seems clear that participants in the Sainsbury’s group
were significantly able to indicate which ice cream was different to the other two,
but the participants in the Mackie’s group were not. More participants (5) in the
Sainsbury’s group also indicated a ‘gritty/rough/icy’ texture to the temperature-
abused ice cream when compared to the Mackie’s group (2). When temperature
abusing ice cream above 0°c, it is expected ice crystals to become larger in size,
leading a gritty mouth feel, however, as temperature abuse occurred between -
80°c and -18°c, this indicates that in the lower quality ice cream this was picked up
on by participants, more so than in the higher quality ice cream. Another
interesting and unexpected result was the description of an ‘orangey flavour’ with
the temperature abused Sainsbury’s ice cream. Two different participants
indicated this. There is evidence to suggest that food products, particularly dairy
Ice cream
Sainsbury’s (normal sample) Vanilla flavour (2) Vanilla smell (1)
Guess (2)
Sainsbury’s (temperature abused sample)
Orangey type flavour (2) Gritty/rough/icy (5)
Guess (1)
Mackie’s (normal sample) Creamy (2)
Vanilla flavour (3)
Mackie’s (temperature abused sample) Rough/gritty (2)
Guess (2)
137
products can ‘pick up’ other flavours around which they are stored (Goff, 2009)
however, all the samples were sealed and not opened until sampling.
There are limitations to the triangle test, which may have impacted on the test.
Triangle tests only give indication of a difference, not the direction of the
difference, nature of the difference or the size of the difference. This is why the
descriptive are so important when looking at the results. The results gathered in
this chapter certainly were not as expected, and further physical engineering
measurements of the ice creams, both high and low quality, temperature abused
and non-temperatures abused were carried out.
138
CHAPTER 5: ENGINEERING INVESTIGATIONS
The following section will describe the materials and methods used to develop
understanding and analysis of commercially available ice creams used in the
previous chapters, which is achieved through a range of different laboratory based
tests. All samples were stored in a -20°c Beko chest freezer prior to analysis and
some samples were cycled between a -80°c and -20°c food grade freezer. These
samples will be differentiated as ‘cycled’ samples. The commercial ice creams
were split into two groups, high (Mackie’s) and low (Sainsbury’s) quality -20°c
samples, referred to as normal samples, and high and low quality -80°c cycled
samples, referred to as cycled samples.
As results from the triangle test in Chapter 4 showed there was a very definitive
sensory difference between -80°c cycled sampled of ice creams, these samples
were incorporated into laboratory analysis where it could be accommodated.
Following the methods outlined in this section should enable a complete
formulative and comparative study of high and low quality commercially available
ice creams used in previous sensory experiments in Chapter 4. The ultimate goal
of these laboratory-based experiments was to compare engineering based results
with results gathered from human participants, so an overall picture of ice cream
formulation and its sensory interpretation by the consumer could be better
understood.
139
5.1 Material and methods
5.1.1 Ingredients and nutritional information for commercial ice creams
Mackie’s of Scotland Traditional Luxury Dairy Ice cream (High quality)
• Fresh Whole Milk, Double Cream (16%),
• Sugar
• Skimmed Milk Powder
• Glycerine
• Eggs
• Emulsifier (Mono- and Diglycerides of Fatty Acids)
• Stabilisers (Sodium Alginate and Guar Gum).
• Contains No Artificial Flavours, Colours or Preservatives.
Sainsbury’s Basic Vanilla Ice Cream (Low quality)
• Partially Reconstituted Lactose Reduce Whey Powder (From Cows' Milk)
• Sugar
• Vegetable Oil
• Glucose Syrup
• Emulsifier (Mono-and Diglycerides of Fatty Acids)
• Stabilisers (Guar Gum, Sodium Alginate)
• Flavouring
• Colours (Curcumin, Annatto
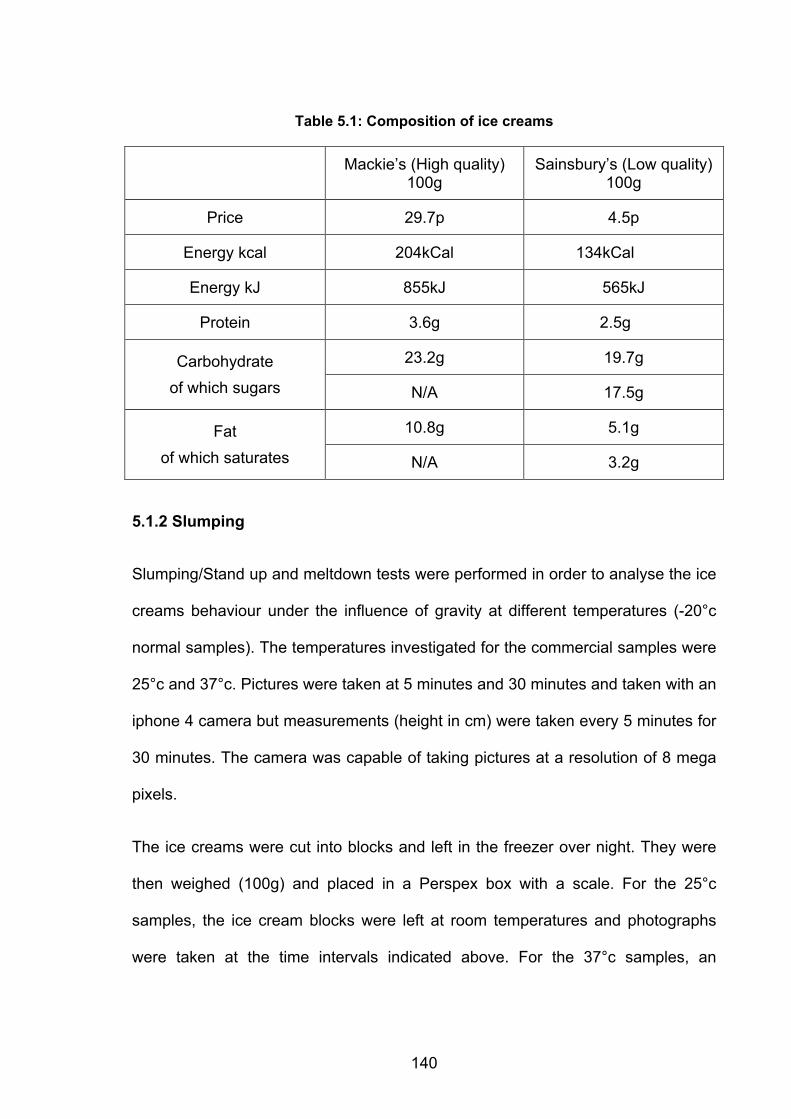
140
Table 5.1: Composition of ice creams
5.1.2 Slumping
Slumping/Stand up and meltdown tests were performed in order to analyse the ice
creams behaviour under the influence of gravity at different temperatures (-20°c
normal samples). The temperatures investigated for the commercial samples were
25°c and 37°c. Pictures were taken at 5 minutes and 30 minutes and taken with an
iphone 4 camera but measurements (height in cm) were taken every 5 minutes for
30 minutes. The camera was capable of taking pictures at a resolution of 8 mega
pixels.
The ice creams were cut into blocks and left in the freezer over night. They were
then weighed (100g) and placed in a Perspex box with a scale. For the 25°c
samples, the ice cream blocks were left at room temperatures and photographs
were taken at the time intervals indicated above. For the 37°c samples, an
Mackie’s (High quality) 100g
Sainsbury’s (Low quality) 100g
Price 29.7p 4.5p
Energy kcal 204kCal 134kCal
Energy kJ 855kJ 565kJ
Protein 3.6g 2.5g
23.2g 19.7g Carbohydrate of which sugars N/A 17.5g
10.8g 5.1g Fat of which saturates N/A 3.2g
141
incubator was used. The relative loss of visible sample was expressed as cm
squared.
5.1.3 Rheology measurements
Viscometery tests on the commercial ice creams both normal and cycled samples
were performed on a Bohlin HR Nano 150 Rheometer from Malvern Instruments
(Malvern, Worcestershire, UK). Gap loading was between 2mm and 1mm
dependent on sample thickness and the temperature of each of the test runs was
37°c. The sample viscosity was tested as a function of shear stress. The samples
were tested shear stresses from 1 to 1000Pa.
5.1.4 Tribology measurements
In order to mimic in mouth conditions, a mini traction machine developed by PCS
Instruments (London, UK) was used at 37°c. A Stribeck curve formed of variable
speeds from 1mm/s to 1000mm/s in ascending order and using a ball on disc
method. A precision steel ball was used together with a 46mm diameter silicon
disc. Before the sample reached the required temperature of 37°c, the machine
was set at an idle speed and the ball applied no load to the sample or the disc.
Once the temperature was equilibrated the ball applied a load of 2N and the test
run began. Test were carried out on all samples in triplicate, -20°c normal samples
and -80°c cycled samples. A new silicone disc was used for each new triplicate.
Before the tests were carried out, the discs were cleaned using detergent to
remove any grease residue that may have been left from manufacture. The steel
ball was cleaned using an ultrasonic cleaner between each triplicate. The sample
pot of the tribometer was also rinsed with hot water and ethanol after each run.
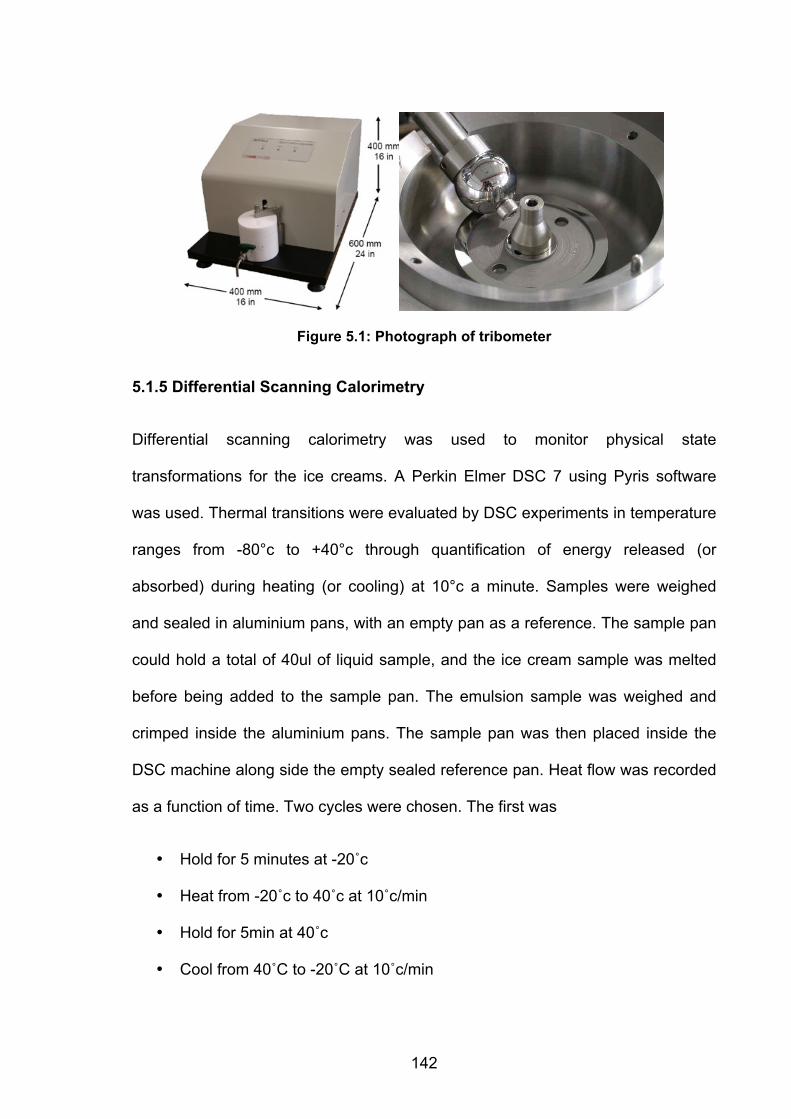
142
Figure 5.1: Photograph of tribometer
5.1.5 Differential Scanning Calorimetry
Differential scanning calorimetry was used to monitor physical state
transformations for the ice creams. A Perkin Elmer DSC 7 using Pyris software
was used. Thermal transitions were evaluated by DSC experiments in temperature
ranges from -80°c to +40°c through quantification of energy released (or
absorbed) during heating (or cooling) at 10°c a minute. Samples were weighed
and sealed in aluminium pans, with an empty pan as a reference. The sample pan
could hold a total of 40ul of liquid sample, and the ice cream sample was melted
before being added to the sample pan. The emulsion sample was weighed and
crimped inside the aluminium pans. The sample pan was then placed inside the
DSC machine along side the empty sealed reference pan. Heat flow was recorded
as a function of time. Two cycles were chosen. The first was
• Hold for 5 minutes at -20˚c
• Heat from -20˚c to 40˚c at 10˚c/min
• Hold for 5min at 40˚c
• Cool from 40˚C to -20˚C at 10˚c/min
143
These were done for all samples, both -20°c normal and -80°c cycled. However,
early results indicted that -20°c was not a low enough temperature to gauge
cooling rate, therefore all samples were then run again cooling down to -80°c. That
cycle was
• Hold for 5 minutes at -80˚c
• Heat from -80˚c to 40˚c at 10˚c/min
• Hold for 5min at 40˚c
• Cool from 40˚C to -80˚C at 10˚c/min
Both of these cycles were then repeated in triplicate with the same sample. The
purpose for such a rapid temperature change was to try and mimic in mouth
temperature change when eating ice cream.
5.1.6 Particle size analysis
All the ice cream samples were analyzed for their fat droplet size and distribution
and determination of their mean volume diameter. This size parameter was
deuced from integrated laser light scattering measurements by using a
Mastersizer (Malvern mastersizer). Samples were brought to room temperature
and gently stirred before sampling and dilution in distilled water was approx
1:1000. The presentation factor was selected by measuring the refractive index of
dispersed fat relative to water. The mastersizer was then cleaned out with deacon
and distilled water between each sample run
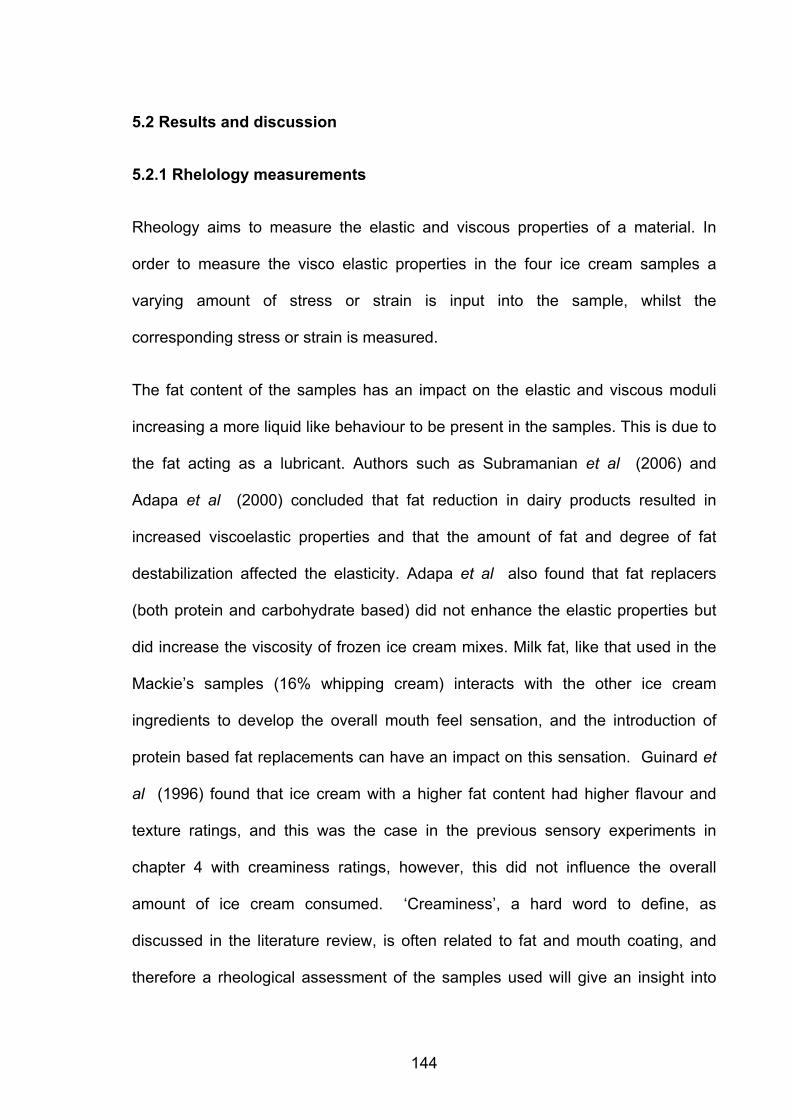
144
5.2 Results and discussion
5.2.1 Rhelology measurements
Rheology aims to measure the elastic and viscous properties of a material. In
order to measure the visco elastic properties in the four ice cream samples a
varying amount of stress or strain is input into the sample, whilst the
corresponding stress or strain is measured.
The fat content of the samples has an impact on the elastic and viscous moduli
increasing a more liquid like behaviour to be present in the samples. This is due to
the fat acting as a lubricant. Authors such as Subramanian et al (2006) and
Adapa et al (2000) concluded that fat reduction in dairy products resulted in
increased viscoelastic properties and that the amount of fat and degree of fat
destabilization affected the elasticity. Adapa et al also found that fat replacers
(both protein and carbohydrate based) did not enhance the elastic properties but
did increase the viscosity of frozen ice cream mixes. Milk fat, like that used in the
Mackie’s samples (16% whipping cream) interacts with the other ice cream
ingredients to develop the overall mouth feel sensation, and the introduction of
protein based fat replacements can have an impact on this sensation. Guinard et
al (1996) found that ice cream with a higher fat content had higher flavour and
texture ratings, and this was the case in the previous sensory experiments in
chapter 4 with creaminess ratings, however, this did not influence the overall
amount of ice cream consumed. ‘Creaminess’, a hard word to define, as
discussed in the literature review, is often related to fat and mouth coating, and
therefore a rheological assessment of the samples used will give an insight into
145
physical measurements such as the viscolelasticty of the samples, and whether
these correlate with the sensory information gathered previously.
The results are shown for the viscosity as a function of shear rate in
Figure 5.2. These were carried out for each of the four samples (‘normal’
Sainsbury’s and Mackie’s, and ‘cycled’ Sainsbury’s and Mackie’s) at 37°c (mouth
temperature).
Figure 5.2: Rheological measurements
As identified the from the results gathered, there is an initial difference in the
viscosity of both the normal Mackie’s and normal Sainsbury’s samples, with the
normal Sainsbury’s sample having an initially higher viscosity than the Mackie’s.
This is inline with previous findings of and Adapa et al (2000) who concluded that
fat reduction in dairy products resulted in increased viscoelastic properties. This
was also apparent in the temperature-cycled samples. The biggest different
however, seems to lie between the cycled vs. normal samples, with the
0.0E+00
1.0E+00
2.0E+00
3.0E+00
4.0E+00
5.0E+00
6.0E+00
7.0E+00
0.0 0.5 1.0 1.5 2.0
Viscosity (G
')
Shear stress (Pa)
Sainsburys/Mackies rheology measurments
Mackies cycled
Mackie normal
Sainsburys cycled
Sainsburys normal
146
temperature cycled samples showing higher initial viscosity than the normal
sample counterparts. As viscosity can be related to in mouth creaminess, it is
interesting to note that with the normal samples in previous chapters, that it was
the Mackie’s that scored higher than the Sainsbury’s for creaminess rating.
Stokes (2013) describes rheology as a technique “used to develop constitutive
relationships between stress and strain rate, and foods are generally more
complex than most materials because they are also strongly dependent on time
scales of the deformation process (thixotropy, elasticity, etc.) as well as shear and
thermal history (processing).” The triangle of ‘rheology-structure-processing’ still
requires much research and more in depth study is required to better develop
models for intact food and further more to understand how food behaves under the
conditions that are present during oral processing.
5.2.2 Tribology measurements
Tribology is the study of friction and lubrication between interacting surfaces in
motion. These interacting surfaces in the mouth during food consumption is
plentiful: teeth–teeth, tongue–palate, tongue–teeth, teeth–food, tongue–food, etc.
Dresselhuis et al (2007) demonstrated an inverse relation between fat perception
and in mouth friction sensed between the tongue and the palate. Evidence also
suggested that oil in water emulsions, which have an increased sensitivity to
coalescence, give rise to a lower friction rate, both in measurement and oral
perception, which leads in enhanced fat perception.
While setting up the tribometer, triplicate experiments were first carried out with
distilled water to test the tribometer response to simple systems. Through this, it
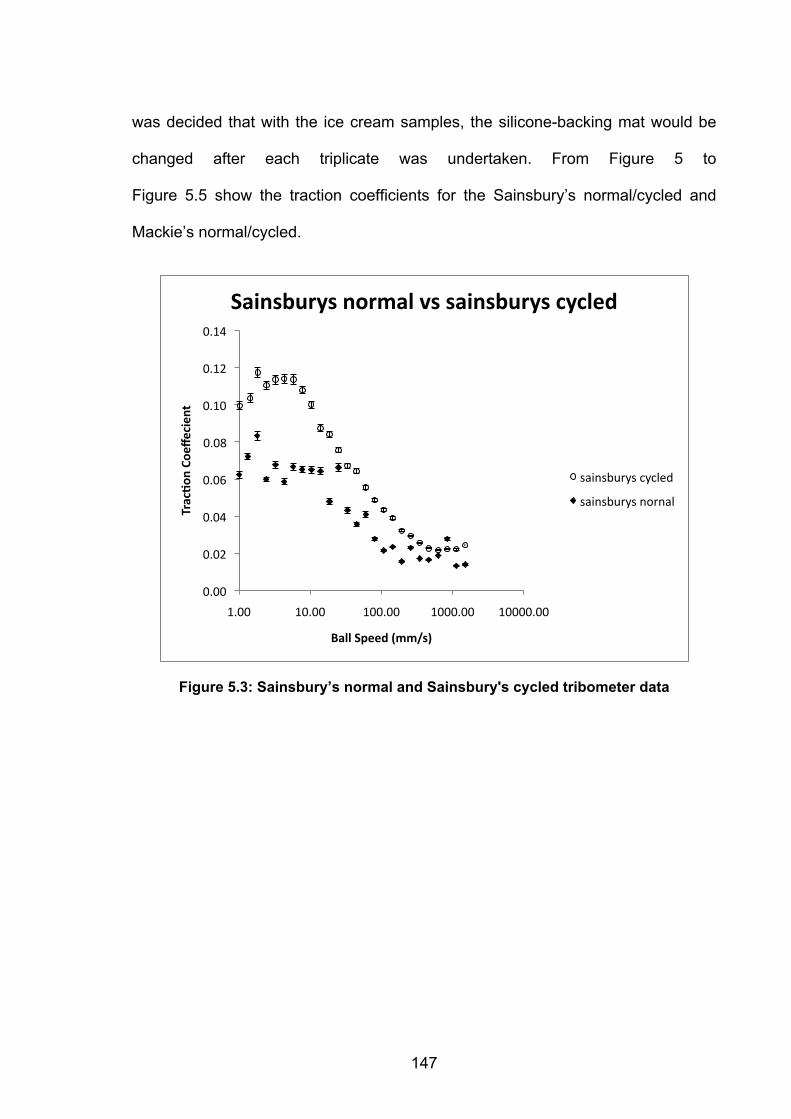
147
was decided that with the ice cream samples, the silicone-backing mat would be
changed after each triplicate was undertaken. From Figure 5 to
Figure 5.5 show the traction coefficients for the Sainsbury’s normal/cycled and
Mackie’s normal/cycled.
Figure 5.3: Sainsbury’s normal and Sainsbury's cycled tribometer data
0.00
0.02
0.04
0.06
0.08
0.10
0.12
0.14
1.00 10.00 100.00 1000.00 10000.00
TracLon
Coe
ffecient
Ball Speed (mm/s)
Sainsburys normal vs sainsburys cycled
sainsburys cycled
sainsburys nornal
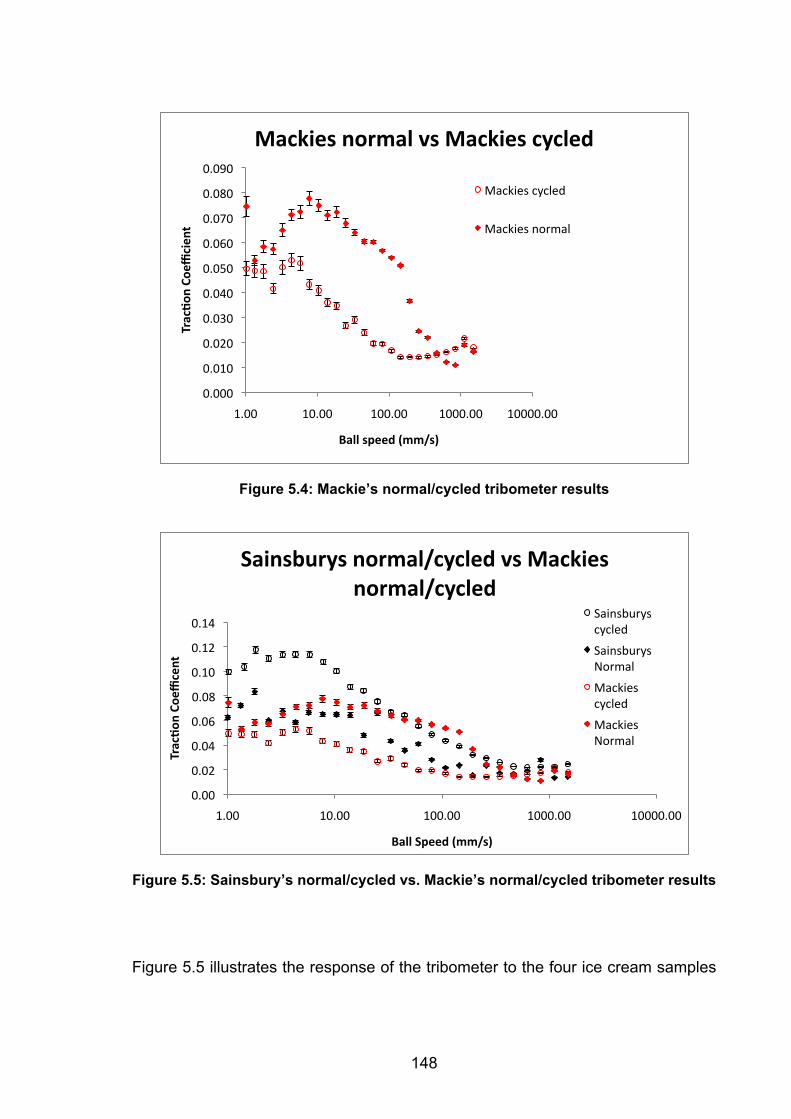
148
Figure 5.4: Mackie’s normal/cycled tribometer results
Figure 5.5: Sainsbury’s normal/cycled vs. Mackie’s normal/cycled tribometer results
Figure 5.5 illustrates the response of the tribometer to the four ice cream samples
0.000
0.010
0.020
0.030
0.040
0.050
0.060
0.070
0.080
0.090
1.00 10.00 100.00 1000.00 10000.00
TracLon
Coe
fficien
t
Ball speed (mm/s)
Mackies normal vs Mackies cycled
Mackies cycled
Mackies normal
0.00
0.02
0.04
0.06
0.08
0.10
0.12
0.14
1.00 10.00 100.00 1000.00 10000.00
TracLon
Coe
fficent
Ball Speed (mm/s)
Sainsburys normal/cycled vs Mackies normal/cycled
Sainsburys cycled
Sainsburys Normal
Mackies cycled
Mackies Normal
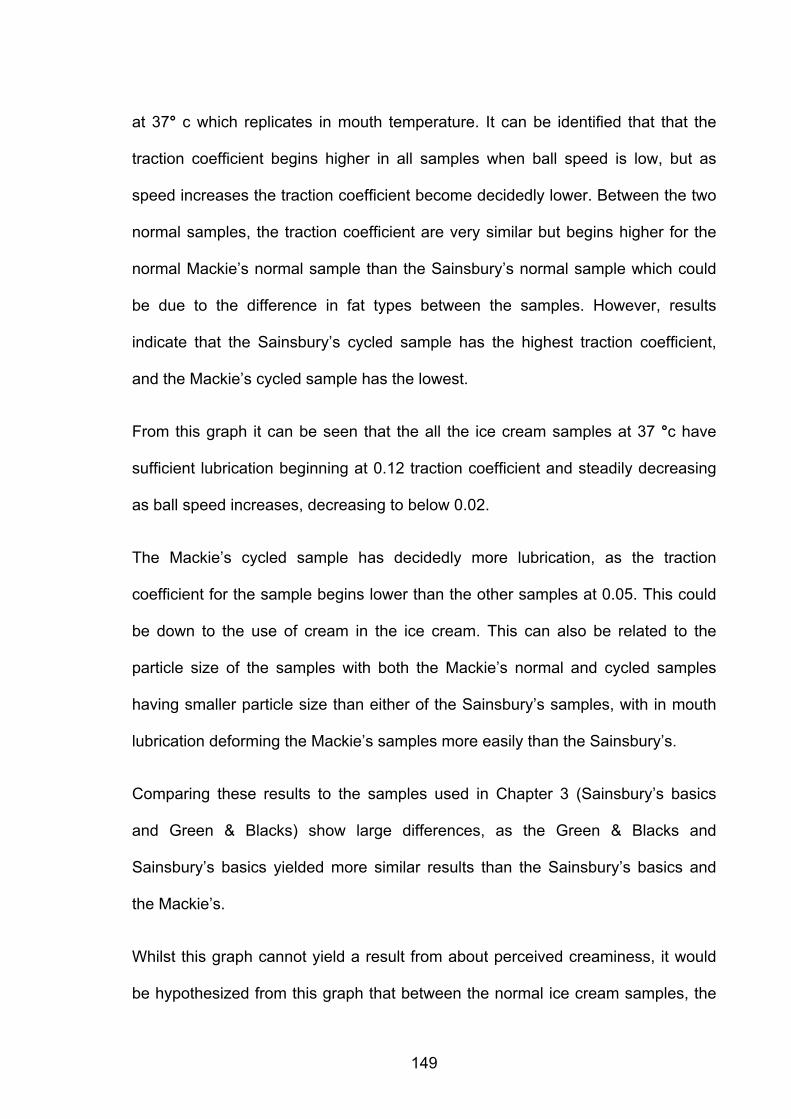
149
at 37° c which replicates in mouth temperature. It can be identified that that the
traction coefficient begins higher in all samples when ball speed is low, but as
speed increases the traction coefficient become decidedly lower. Between the two
normal samples, the traction coefficient are very similar but begins higher for the
normal Mackie’s normal sample than the Sainsbury’s normal sample which could
be due to the difference in fat types between the samples. However, results
indicate that the Sainsbury’s cycled sample has the highest traction coefficient,
and the Mackie’s cycled sample has the lowest.
From this graph it can be seen that the all the ice cream samples at 37 °c have
sufficient lubrication beginning at 0.12 traction coefficient and steadily decreasing
as ball speed increases, decreasing to below 0.02.
The Mackie’s cycled sample has decidedly more lubrication, as the traction
coefficient for the sample begins lower than the other samples at 0.05. This could
be down to the use of cream in the ice cream. This can also be related to the
particle size of the samples with both the Mackie’s normal and cycled samples
having smaller particle size than either of the Sainsbury’s samples, with in mouth
lubrication deforming the Mackie’s samples more easily than the Sainsbury’s.
Comparing these results to the samples used in Chapter 3 (Sainsbury’s basics
and Green & Blacks) show large differences, as the Green & Blacks and
Sainsbury’s basics yielded more similar results than the Sainsbury’s basics and
the Mackie’s.
Whilst this graph cannot yield a result from about perceived creaminess, it would
be hypothesized from this graph that between the normal ice cream samples, the
150
Mackie’s would give a fuller and longer lasting mouth feel than the Sainsbury’s as
the traction coefficient for the Sainsbury’s basics is lower, and would therefore it
could be perceived as more greasy, and this is what was found in Chapter 4
results, however, this did not seem to impact on how much participants ate overall.
However, this changes for the cycled samples, indicating that once cycled, the
Mackie sample drops in lubricating properties, whilst the Sainsbury’s cycled
increases due to ice crystal. This may be due to crystal size is a gross change and
air cell disruption. Participants in the triangle test indicated grittiness and rough
textures when describing the cycled samples, which indicates that whilst they are
insensitive to fat change, they are sensitive to changes in ice, which is not good
when trying to limit fat intake. The air cell disruption caused by the cycling could
also have lead to the ‘orangey flavour’ that some participants indicated, due to
large fat droplets and the vanilla delivery in mouth.
5.2.3 Particle droplet size
The influence of ice cream type and cycle on particle size was considered, and
‘particle size’ discussed in the following section refers to mean particle size. Fig
5.6 shows that particle size distribution is demonstrably different between the ice
cream types with the Mackie’s normal and cycled showing distribution <2µm,
compared the to Sainsbury’s normal and cycled >20µm for volume weight (D4, 3).
This could be down to the different fat type and content between the ice creams.
Whilst both the Sainsbury’s normal and cycled have larger particle sizes than the
Mackie’s samples, in mouth detection levels are still low (<50µm). However, when
considering the results gathered in Chapter 4, it is important to remember that in
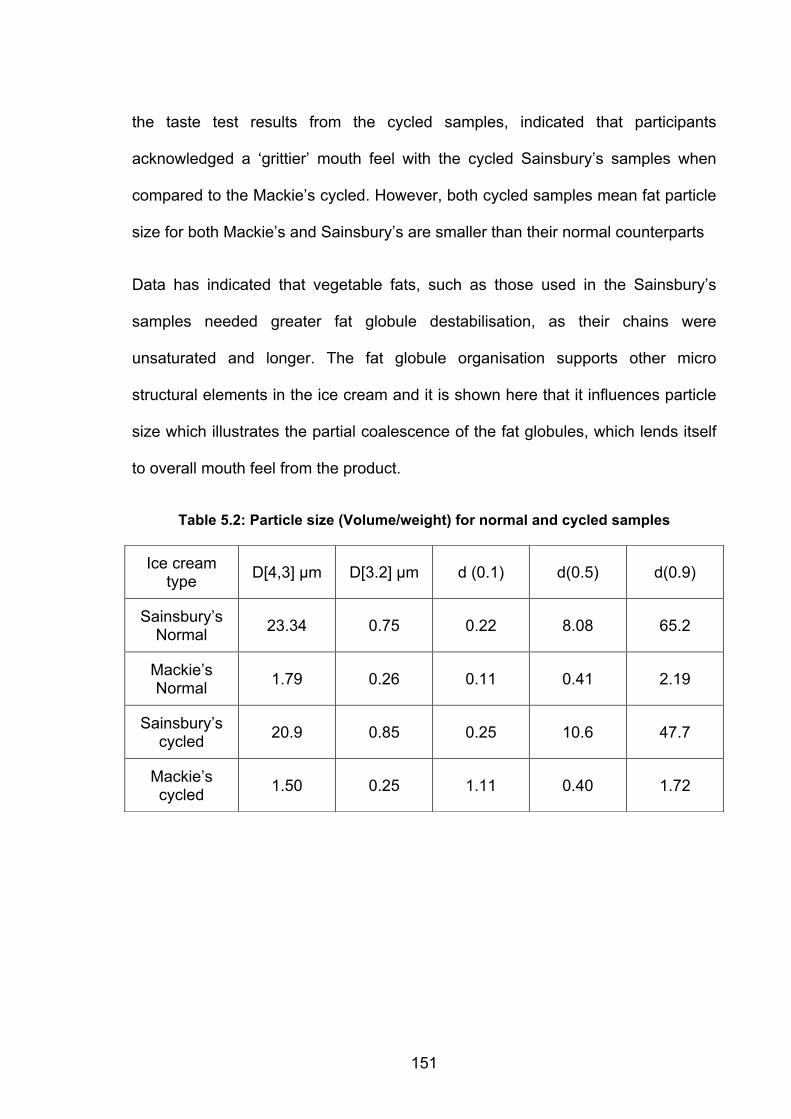
151
the taste test results from the cycled samples, indicated that participants
acknowledged a ‘grittier’ mouth feel with the cycled Sainsbury’s samples when
compared to the Mackie’s cycled. However, both cycled samples mean fat particle
size for both Mackie’s and Sainsbury’s are smaller than their normal counterparts
Data has indicated that vegetable fats, such as those used in the Sainsbury’s
samples needed greater fat globule destabilisation, as their chains were
unsaturated and longer. The fat globule organisation supports other micro
structural elements in the ice cream and it is shown here that it influences particle
size which illustrates the partial coalescence of the fat globules, which lends itself
to overall mouth feel from the product.
Table 5.2: Particle size (Volume/weight) for normal and cycled samples
Ice cream type D[4,3] µm D[3.2] µm d (0.1) d(0.5) d(0.9)
Sainsbury’s Normal 23.34 0.75 0.22 8.08 65.2
Mackie’s Normal 1.79 0.26 0.11 0.41 2.19
Sainsbury’s cycled 20.9 0.85 0.25 10.6 47.7
Mackie’s cycled 1.50 0.25 1.11 0.40 1.72
152
Figure 5.6: Particle size for normal and cycled samples
5.2.4 Differential scanning calormetry
The samples were heated to 40°c and then cooled from 40°c to -80°c. Heat flow
was recorded as a function of increasing or decreasing temperature. For each
sample, the experiment was conducted in triplicate. The percentage of crystalline
matter had hoped to be calculated, however, due to the exact nature of the fats
being unknown- as companies were not willing to divulge such information- this
could not be done.
Heating and cooling curves were obtained from the normal and cycled ice cream
samples. The initial stage was to warm the ice cream and take it to around body
temperature (between 37°c-40°c) before then cooling it again back down to -80°c.
Both fat droplet size and emulsion stability can influence fat crystallisation. Table
5.3 shows the peak analysis of the thermal behaviour for the normal and cycled
Particle Size
Distribution
0.01
0.1
1
10
100
1000
3000 Particle Size
(µm)
0
2
4
6 Volume
(%)
Mackies normal Averaged
Result Mackies cycled Averaged
Result sainsburys normal Averaged
Result sainsburys cycled Averaged
Result
153
ice cream samples. The DSC was used to characterise the thermal behaviour of
the ice cream samples on heating and cooing DSC exhibited peak ranging from -
20°c to 10°c, some of which can be attributed to free water.
Figure 5.7 shows that both the normal samples when heated required greater heat
flow to cause the samples to melt, when compared to the cycled samples. Below -
20°c the heat capacity of the entire sample is nearly constant. Between -20°c and -
2°c the ice content of the samples decreases rapidly, which appears as the peaks
in the graph. The heat capacity of melted ice cream is larger than that of frozen ice
cream because the heat capacity of water is larger than that of ice (Clarke, 2008).
The cycled samples melting point was slightly higher than the normal samples.
This could be due to the increased ice crystal size taking longer to melt, as it
would be expected that some form of Ostwald ripening would have taken place
during the cycling of the ice creams between -80°c and -20°c, even if it was just a
small amount. This would in turn affect the fat phase of the ice creams. It is well
accepted that the type of fat used in ice cream formulation influences ice cream
characteristics, and these characterises would have been further changed through
the temperature abuse that took place.
With regards cooling of the samples, re-freezing of the samples peaked initially for
the cycled Sainsbury’s sample before any of the other samples.
154
Table 5.3: Heating peak analysis of thermal properties of ice cream
Table 5.4: Cooling peak analysis of thermal properties of ice cream
Ice cream Heating peak
Onset temperature (°c) Peak End of peak (°c) Area (Jg-1)
Sainsbury’s normal -29.48 -2.00 5.22 187.82
Mackie’s normal -28.26 2.01 7.01 180.93
Sainsbury’s cycled -23.80 1.78 11.43 217.72
Mackie’s cycled -27.38 0.45 10.29 196.05
Ice cream Cooling peak
Onset temperature (°c) Peak End of peak
(°c) Area (Jg-
1)
Sainsbury’s normal -19.77 -
17.84 -33.09 -197.41
Mackie’s normal -19.87 -17.76 -29.58 -201.87
Sainsbury’s cycled -16.64 -15.68 -28.89 -221.32
Mackie’s cycled -20.13 19.06 -29.58 -206.81
155
Figure 5.7: Heating/melting point of ice creams
-‐10
0
10
20
30
40
50
60
70
80
-‐90 -‐85 -‐80 -‐75 -‐70 -‐65 -‐60 -‐55 -‐50 -‐45 -‐40 -‐35 -‐30 -‐25 -‐20 -‐15 -‐10 -‐5 0 5 10 15 20 25 30 35 40 45 50
Heat fl
ow (m
w)
Temp (° c)
DSC HeaLng/mealLng point
Sainsburys normal
Mackies normal
Sainsburys cycled
Mackies cycled
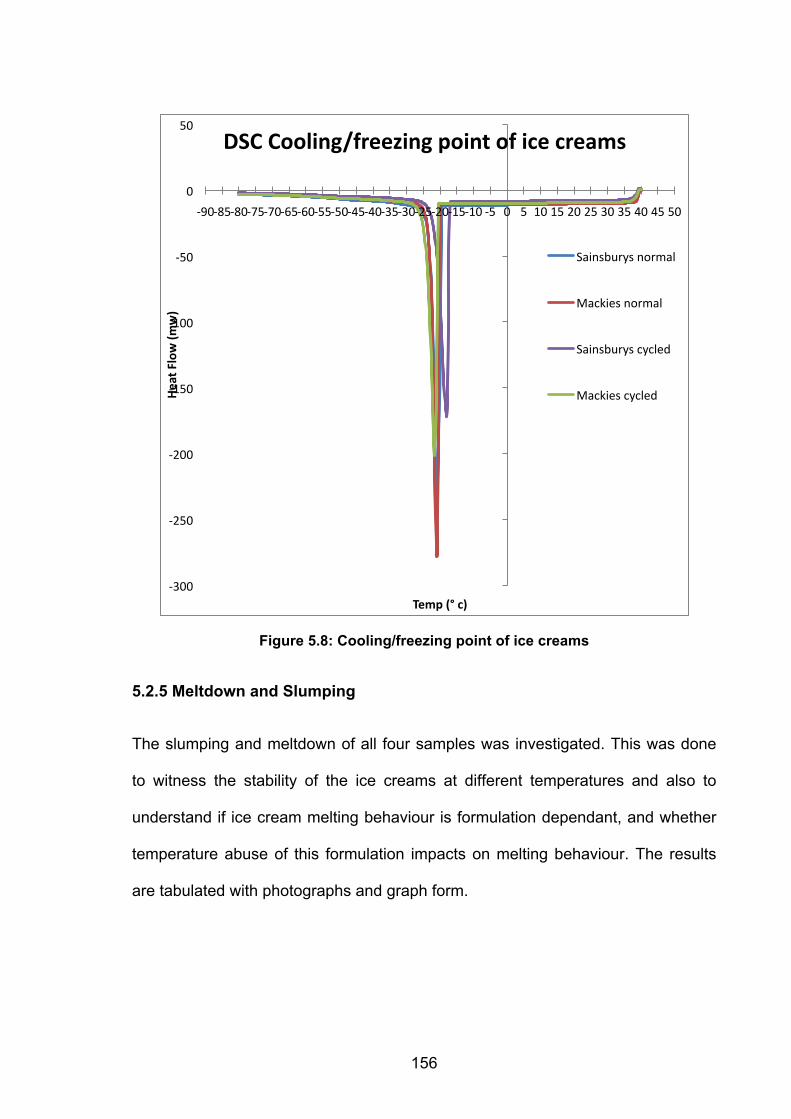
156
Figure 5.8: Cooling/freezing point of ice creams
5.2.5 Meltdown and Slumping
The slumping and meltdown of all four samples was investigated. This was done
to witness the stability of the ice creams at different temperatures and also to
understand if ice cream melting behaviour is formulation dependant, and whether
temperature abuse of this formulation impacts on melting behaviour. The results
are tabulated with photographs and graph form.
-‐300
-‐250
-‐200
-‐150
-‐100
-‐50
0
50
-‐90 -‐85 -‐80 -‐75 -‐70 -‐65 -‐60 -‐55 -‐50 -‐45 -‐40 -‐35 -‐30 -‐25 -‐20 -‐15 -‐10 -‐5 0 5 10 15 20 25 30 35 40 45 50
Heat F
low (m
w)
Temp (° c)
DSC Cooling/freezing point of ice creams
Sainsburys normal
Mackies normal
Sainsburys cycled
Mackies cycled
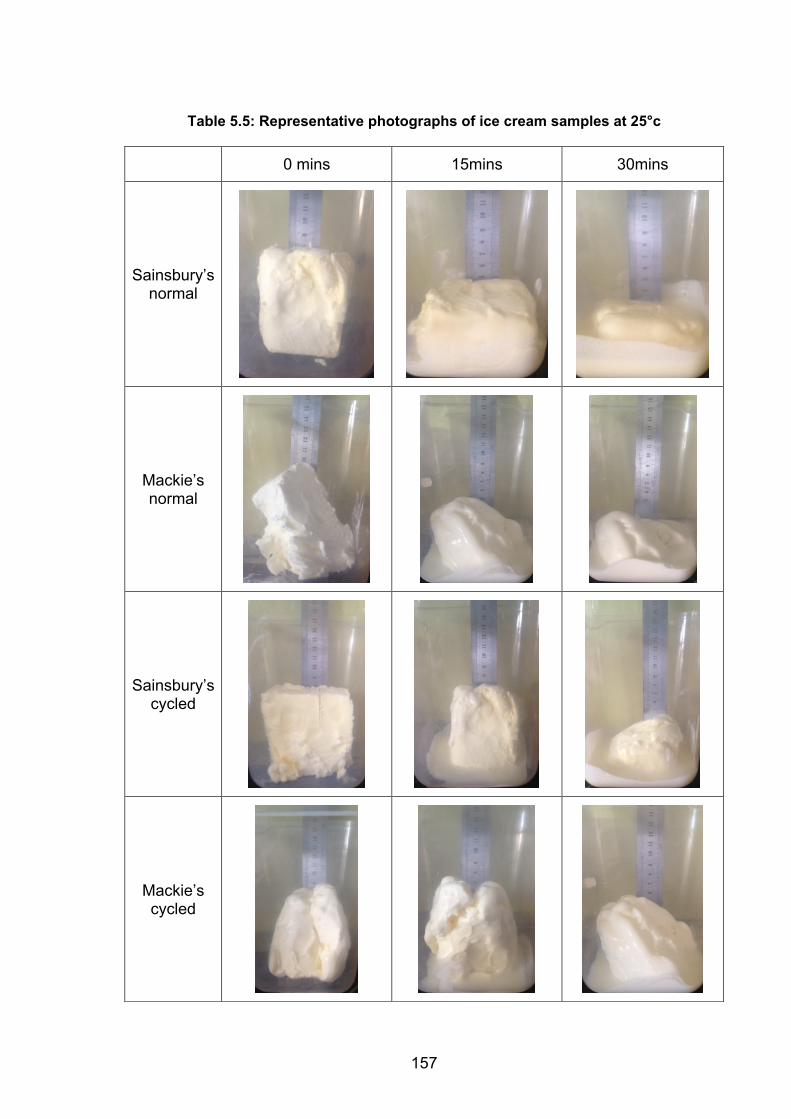
157
Table 5.5: Representative photographs of ice cream samples at 25°c
0 mins 15mins 30mins
Sainsbury’s normal
Mackie’s normal
Sainsbury’s cycled
Mackie’s cycled
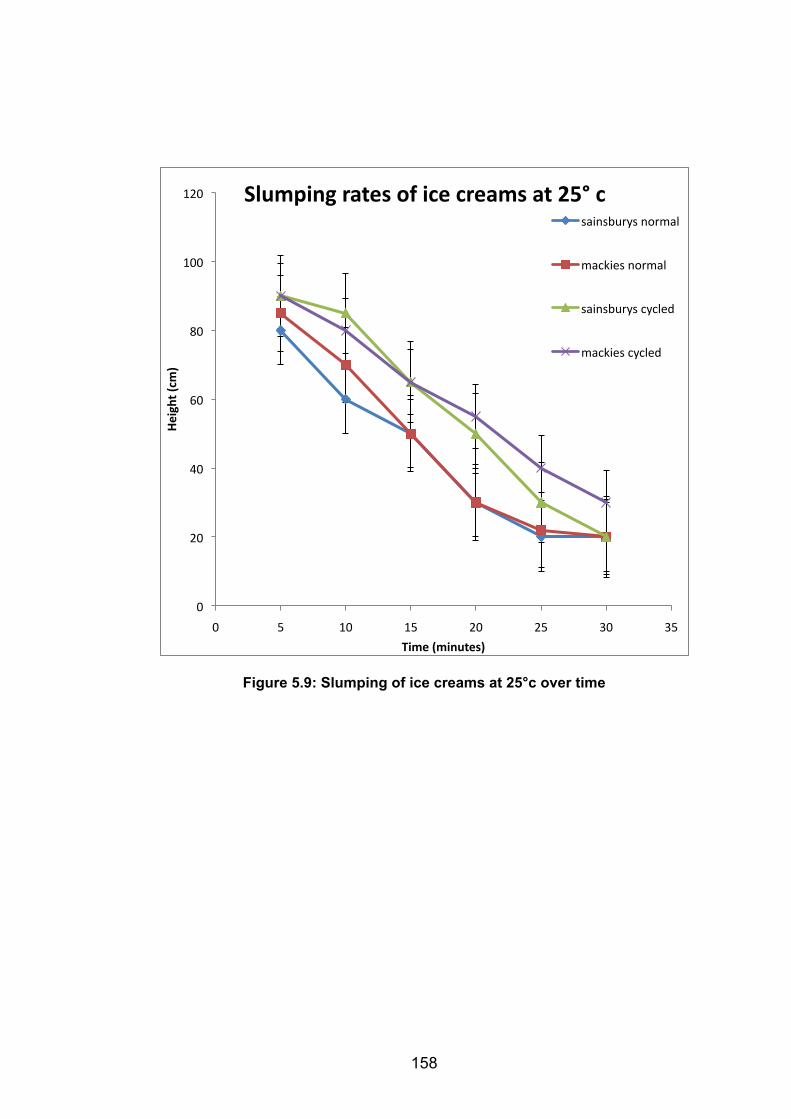
158
Figure 5.9: Slumping of ice creams at 25°c over time
0
20
40
60
80
100
120
0 5 10 15 20 25 30 35
Height (cm
)
Time (minutes)
Slumping rates of ice creams at 25° c sainsburys normal
mackies normal
sainsburys cycled
mackies cycled
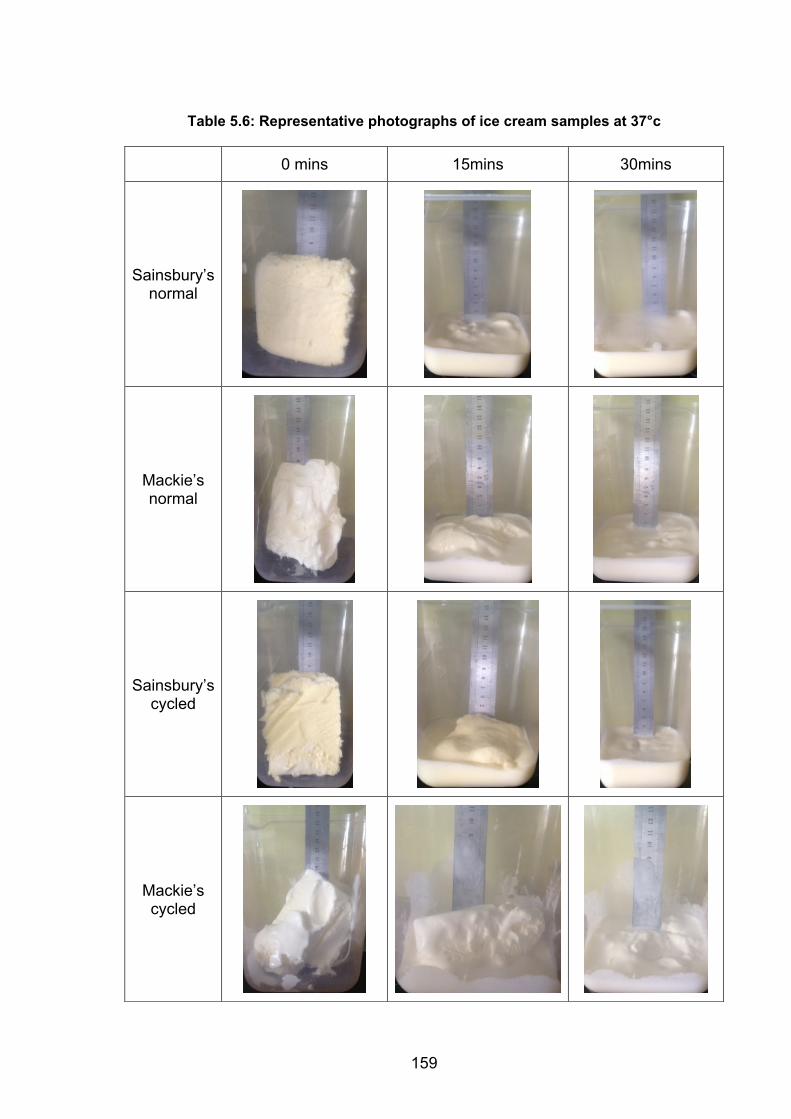
159
Table 5.6: Representative photographs of ice cream samples at 37°c
0 mins 15mins 30mins
Sainsbury’s normal
Mackie’s normal
Sainsbury’s cycled
Mackie’s cycled
160
Figure 5.10: Slumping of ice creams at 37°c over time
In the slumping and meltdown experiments at room temperature (25°c) all four
samples had not melted completely by the 30 minutes, and there was still semi
solid ice cream present. However, it is clear from the photographs taken than
slumping did take place. At 37°c by 15 minutes, all samples had slumped and by
30 minutes, all samples had melted into a liquid. In both temperature experiments,
the cycled samples took longer to melt than their normal counterparts, indicating
that there may be potential larger ice crystal sizes present, which are taking longer
to melt. The amount and type of stabilizer used in each formulation may also
contribute to the melting capabilities. Even though the stabilizers were in fact the
same in both formulations (Guar gum and sodium alginate) this would indicate the
0
10
20
30
40
50
60
70
0 5 10 15 20 25 30
Height (cm
)
Time (minutes)
Slumping rates of ice cream at 37° c
sainsburys normal
mackies normal
sainsburys cycled
mackies cycled
161
that it would be the amounts used. Whilst the emulsion of ice cream is relatively
robust, as seen in the creaming profiles in Chapter 2, it is the presence of the ice
crystals melting that is causing the slumping. However, even though these
samples slumped by 30 minutes, this did not seen to impact upon the eating rate
data previously shown as all the participants had eaten the samples within 15
minutes. The error bars show the standard deviation between the samples.
During ice cream manufacture, Drewett and Hartel (2007) found that residence
time in the freezer had the largest impact on ice crystal size. When the ice cream
was frozen quicker, smaller ice crystals were formed, and also, that lower draw
temperatures reduced recrystalization rates, which aided in keeping the ice
crystals at a smaller size. They also found that sweeteners did not adversely affect
ice crystal formation in the ice cream.
Wildmoser et al (2004) investigated the impact of using low temperature extrusion
freezer process on the influence of ice crystal size when compared to conventional
freezing methods. Low temperature extrusion was found to have a beneficial
impact on the ice crystal size by keeping the ice crystal size small. This was then
shown to have improved the sensorial properties of the ice cream, such as scoop
ability, melting behaviour and creaminess.
These result indicate that the Mackie’s ice cream took longer to slump and
meltdown in both the normal and cycled samples at 37°c, which would show that
they take longer to melt in mouth, leading to a creamier mouth feel, which was
shown in the first experiment in Chapter 4 with human participants.
162
5.3 Thesis conclusions and future work
Ice cream remains one of the most complex foodstuffs currently available. Not just
from a structural, formulation and manufacturing level, but also in the context of
consumer perception and eating behaviour. Results show that even though ice
cream can vary drastically in ingredients and formulation, this does not necessarily
translate to drastic structural changes, meaning that robust manufacturing process
must be in place for commercial ice creams. Also, that there is a general lack of
overall sensitivity to absolute structure, but a preference to flavour and
presentation. By testing the limits of human sensitivity, in terms of eating
behaviour, i.e. humans are very insensitive to levels of incorporated fat, which
gives scope for a huge potential for calorific intake. This can however, be affected
through gross structural change of the ice crystal phase, certainly in terms of
preference. Further work needs to be conducted into the possibility of this affecting
eating rate and total intake. Future work could also include development of own
formulations, perhaps in conjunction with industry. Following on form the results
gathered from the triangle test, an exploration of the ‘orangey’ flavour that was
described by some participants could be investigated. The impact of visual cues,
such as vanilla seeds and colour differences in vanilla ice cream brands on eating
behaviour could also be investigated.
Another interesting conclusion was the limitation of tribology. Over recent years,
tribology has become a method of which, it has been believed, could mimic human
in mouth conditions. However, results gathered show that the machine is much
163
more sensitive to lubrication than human participants. Also that participant’s
perception was to a ‘gritty/icy’ mouth feel, rather than to lubricity.
Limitations include the lack of ice crystal measurement data. Whilst some Cryo
SEM was conducted, this data was lost. Ice crystal size is by its very nature
difficult to measure. Typically ice cream cycling will yield an ice crystal size of
upwards of 100µm, compared to a fresh ice cream sample where the ice crystal
size is around 40µm. However there was a clear difference in ice crystal size
between the ‘normal’ and ‘cycled’ samples and gross increase in ice crystal size
was present due to cycling. Phase transition is rapid due to heating in mouth and
difficult measure. There is a continued need for decent methods of detangling
when dealing with such a complex formulation and is also restrictive as cold
temperatures are needed. There was also the issue of no cryo laboratory being
available.
It is also important to address the issue to collaboration between two different
areas of research. It was not something had been tried before. There was a great
synergy in levels of care taken throughout, however, regards presentation of data
there was a total disconnect. Although there are psychology elements imbedded,
an engineering perspective to the thesis was taken.
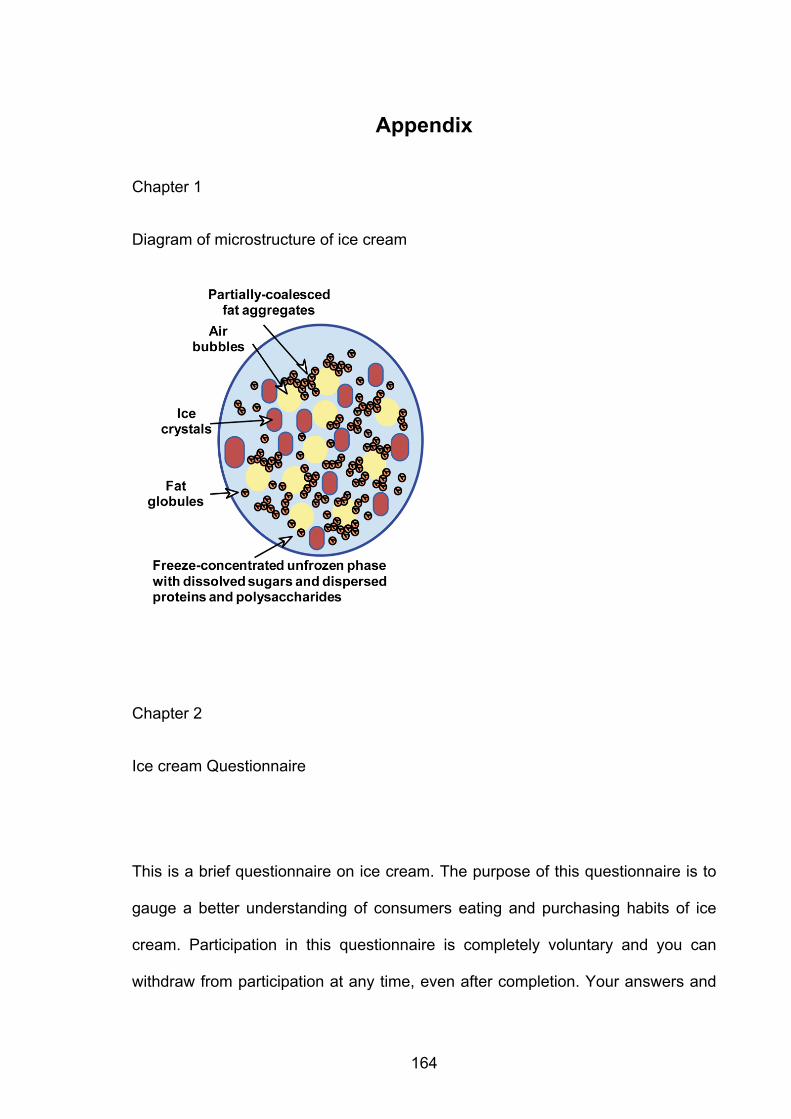
164
Appendix
Chapter 1
Diagram of microstructure of ice cream
Chapter 2
Ice cream Questionnaire
This is a brief questionnaire on ice cream. The purpose of this questionnaire is to
gauge a better understanding of consumers eating and purchasing habits of ice
cream. Participation in this questionnaire is completely voluntary and you can
withdraw from participation at any time, even after completion. Your answers and
165
personal details will be kept strictly confidential, and will be kept for the purposes
of contacting you for possible further experiments regarding this study. It should
take around 5 minutes to complete.
Please complete each field as best as you can, and tick or circle answers when
asked.
If you have any questions regarding this questionnaire, please feel free to contact
me at .
Thank you for your participation in this study.
Sarah Santos-Murphy
PhD Student
Name:
Age (in years and months):
Sex (please circle): Male/Female
University email address:
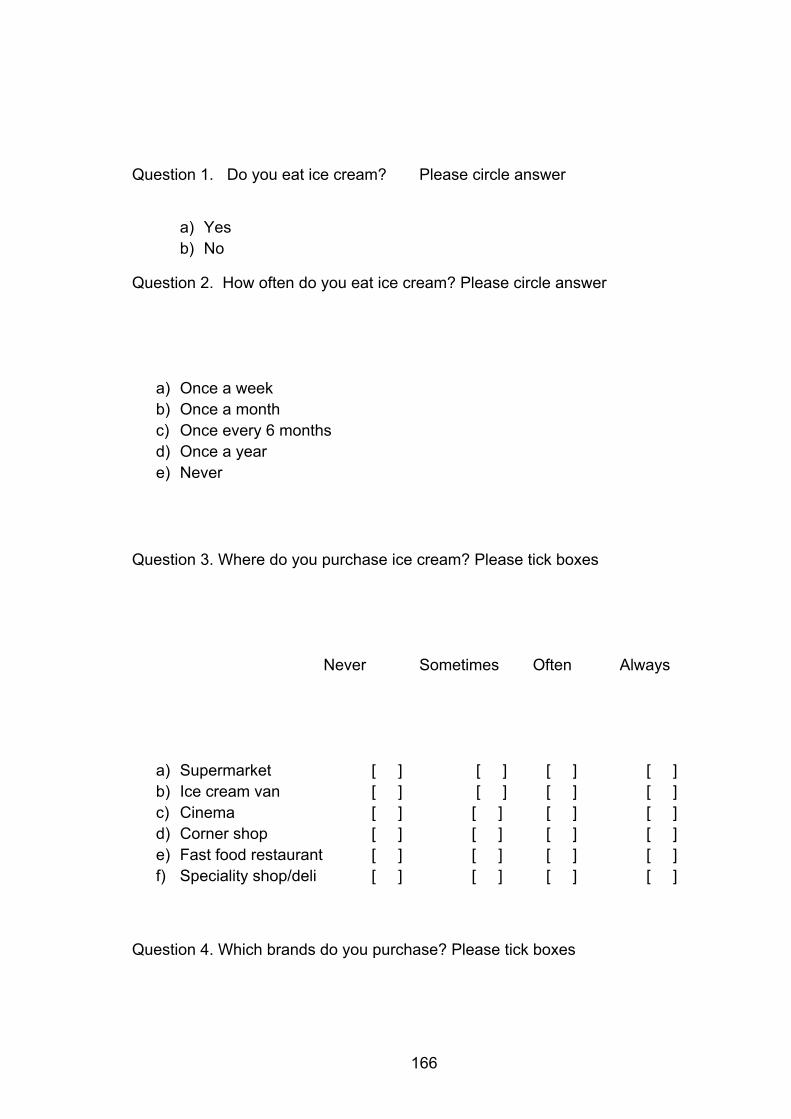
166
Question 1. Do you eat ice cream? Please circle answer
a) Yes b) No
Question 2. How often do you eat ice cream? Please circle answer
a) Once a week b) Once a month c) Once every 6 months d) Once a year e) Never
Question 3. Where do you purchase ice cream? Please tick boxes
Never Sometimes Often Always
a) Supermarket [ ] [ ] [ ] [ ] b) Ice cream van [ ] [ ] [ ] [ ] c) Cinema [ ] [ ] [ ] [ ] d) Corner shop [ ] [ ] [ ] [ ] e) Fast food restaurant [ ] [ ] [ ] [ ] f) Speciality shop/deli [ ] [ ] [ ] [ ]
Question 4. Which brands do you purchase? Please tick boxes
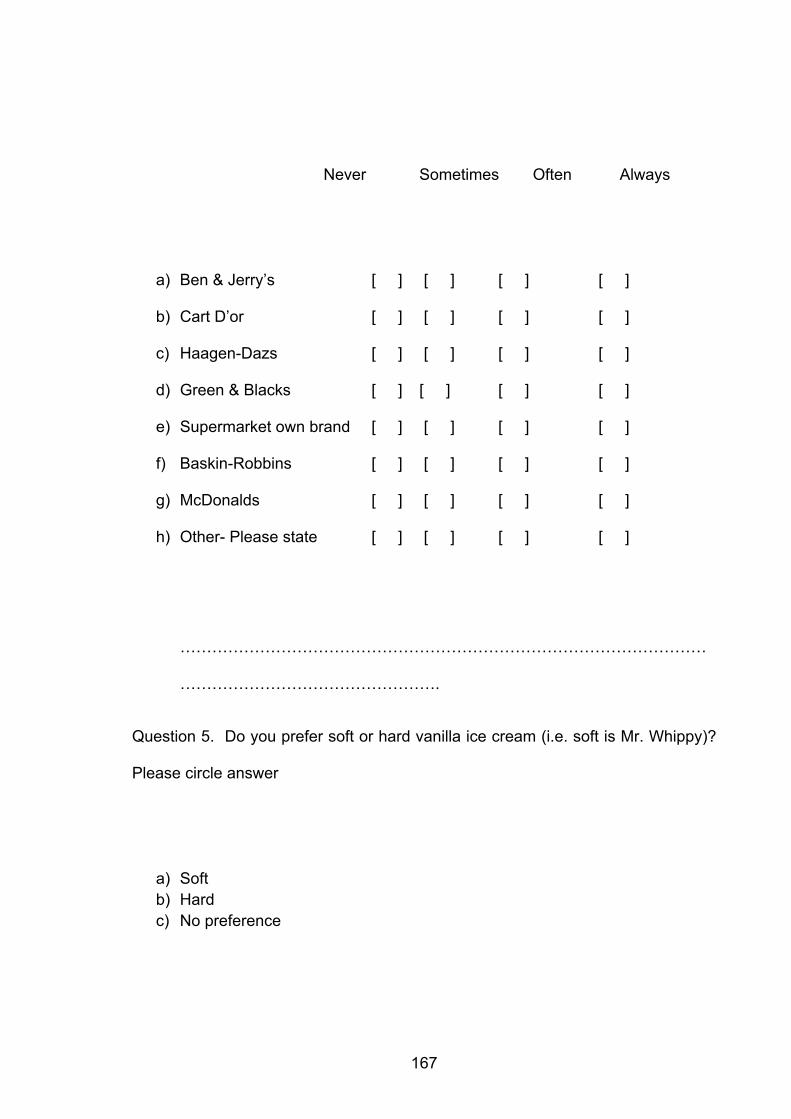
167
Never Sometimes Often Always
a) Ben & Jerry’s [ ] [ ] [ ] [ ]
b) Cart D’or [ ] [ ] [ ] [ ]
c) Haagen-Dazs [ ] [ ] [ ] [ ]
d) Green & Blacks [ ] [ ] [ ] [ ]
e) Supermarket own brand [ ] [ ] [ ] [ ]
f) Baskin-Robbins [ ] [ ] [ ] [ ]
g) McDonalds [ ] [ ] [ ] [ ]
h) Other- Please state [ ] [ ] [ ] [ ]
………………………………………………………………………………………
………………………………………….
Question 5. Do you prefer soft or hard vanilla ice cream (i.e. soft is Mr. Whippy)?
Please circle answer
a) Soft b) Hard c) No preference
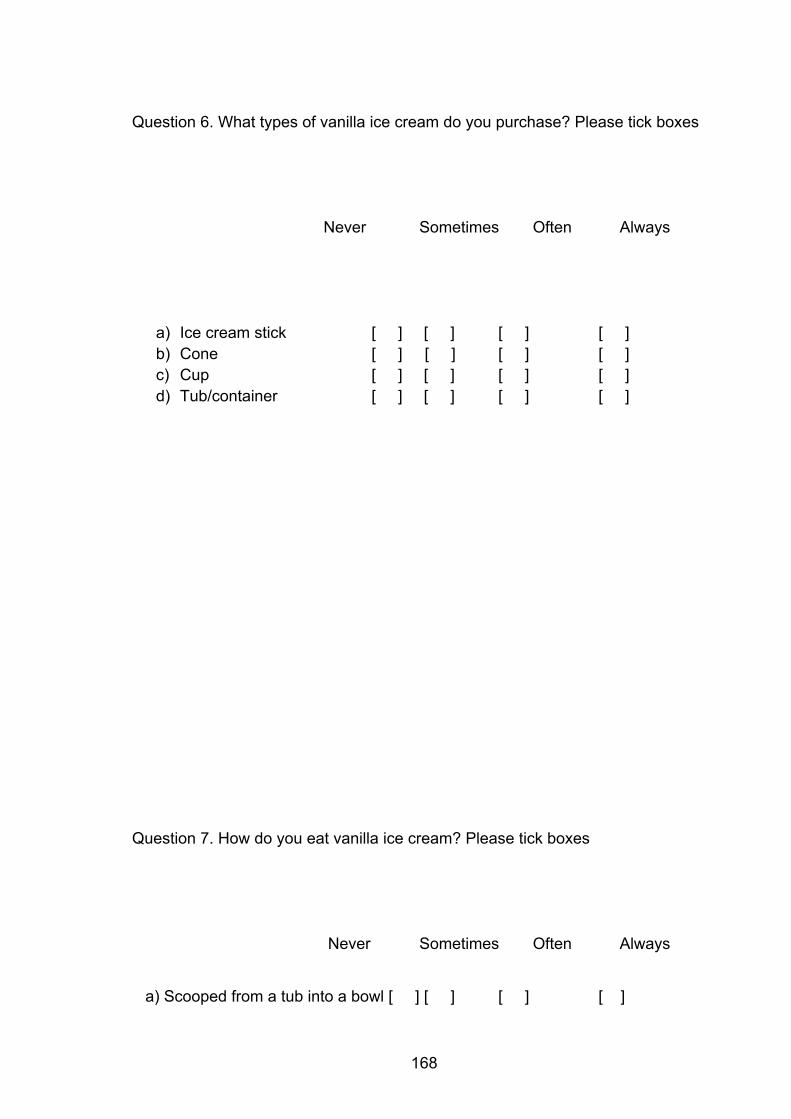
168
Question 6. What types of vanilla ice cream do you purchase? Please tick boxes
Never Sometimes Often Always
a) Ice cream stick [ ] [ ] [ ] [ ] b) Cone [ ] [ ] [ ] [ ] c) Cup [ ] [ ] [ ] [ ] d) Tub/container [ ] [ ] [ ] [ ]
Question 7. How do you eat vanilla ice cream? Please tick boxes
Never Sometimes Often Always
a) Scooped from a tub into a bowl [ ] [ ] [ ] [ ]
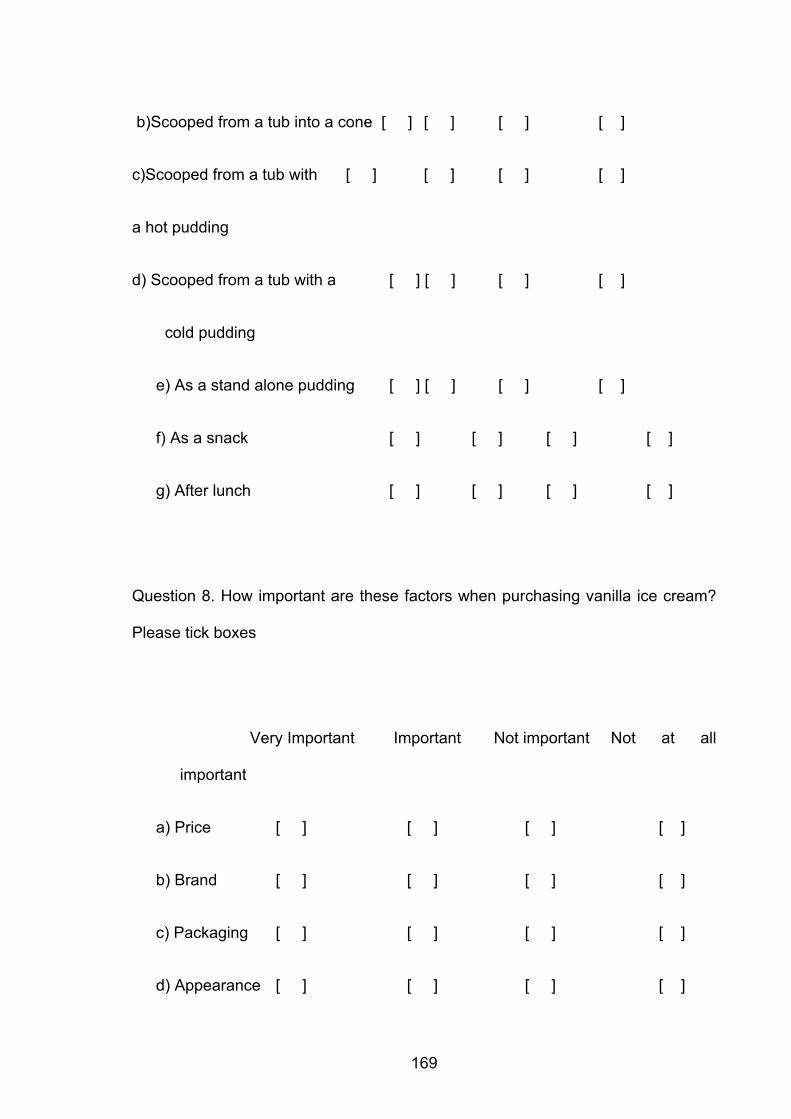
169
b)Scooped from a tub into a cone [ ] [ ] [ ] [ ]
c)Scooped from a tub with [ ] [ ] [ ] [ ]
a hot pudding
d) Scooped from a tub with a [ ] [ ] [ ] [ ]
cold pudding
e) As a stand alone pudding [ ] [ ] [ ] [ ]
f) As a snack [ ] [ ] [ ] [ ]
g) After lunch [ ] [ ] [ ] [ ]
Question 8. How important are these factors when purchasing vanilla ice cream?
Please tick boxes
Very Important Important Not important Not at all
important
a) Price [ ] [ ] [ ] [ ]
b) Brand [ ] [ ] [ ] [ ]
c) Packaging [ ] [ ] [ ] [ ]
d) Appearance [ ] [ ] [ ] [ ]
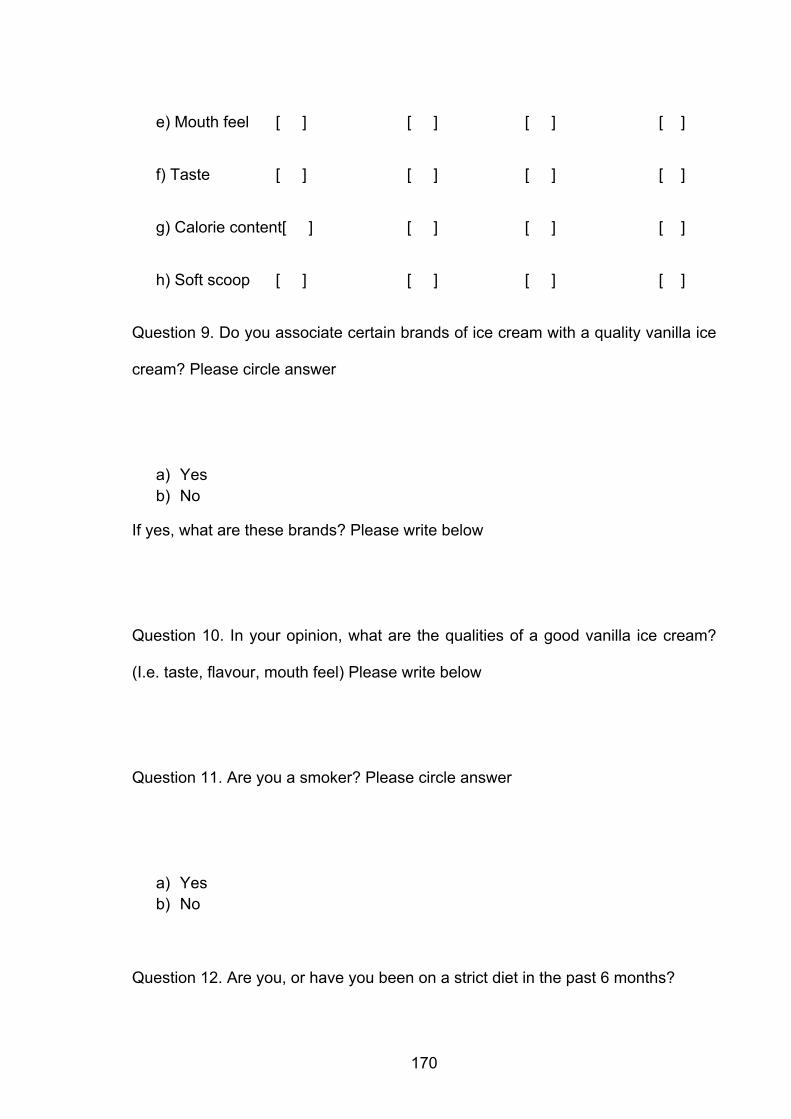
170
e) Mouth feel [ ] [ ] [ ] [ ]
f) Taste [ ] [ ] [ ] [ ]
g) Calorie content[ ] [ ] [ ] [ ]
h) Soft scoop [ ] [ ] [ ] [ ]
Question 9. Do you associate certain brands of ice cream with a quality vanilla ice
cream? Please circle answer
a) Yes b) No
If yes, what are these brands? Please write below
Question 10. In your opinion, what are the qualities of a good vanilla ice cream?
(I.e. taste, flavour, mouth feel) Please write below
Question 11. Are you a smoker? Please circle answer
a) Yes b) No
Question 12. Are you, or have you been on a strict diet in the past 6 months?
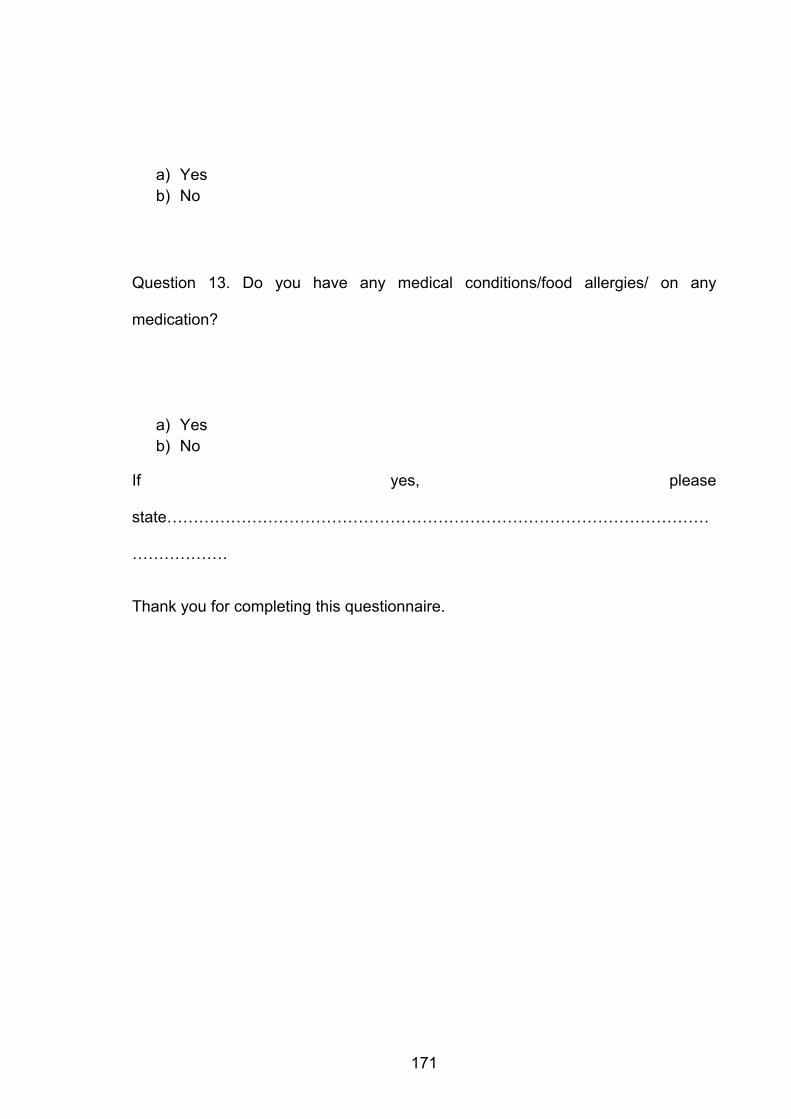
171
a) Yes b) No
Question 13. Do you have any medical conditions/food allergies/ on any
medication?
a) Yes b) No
If yes, please
state…………………………………………………………………………………………
………………
Thank you for completing this questionnaire.
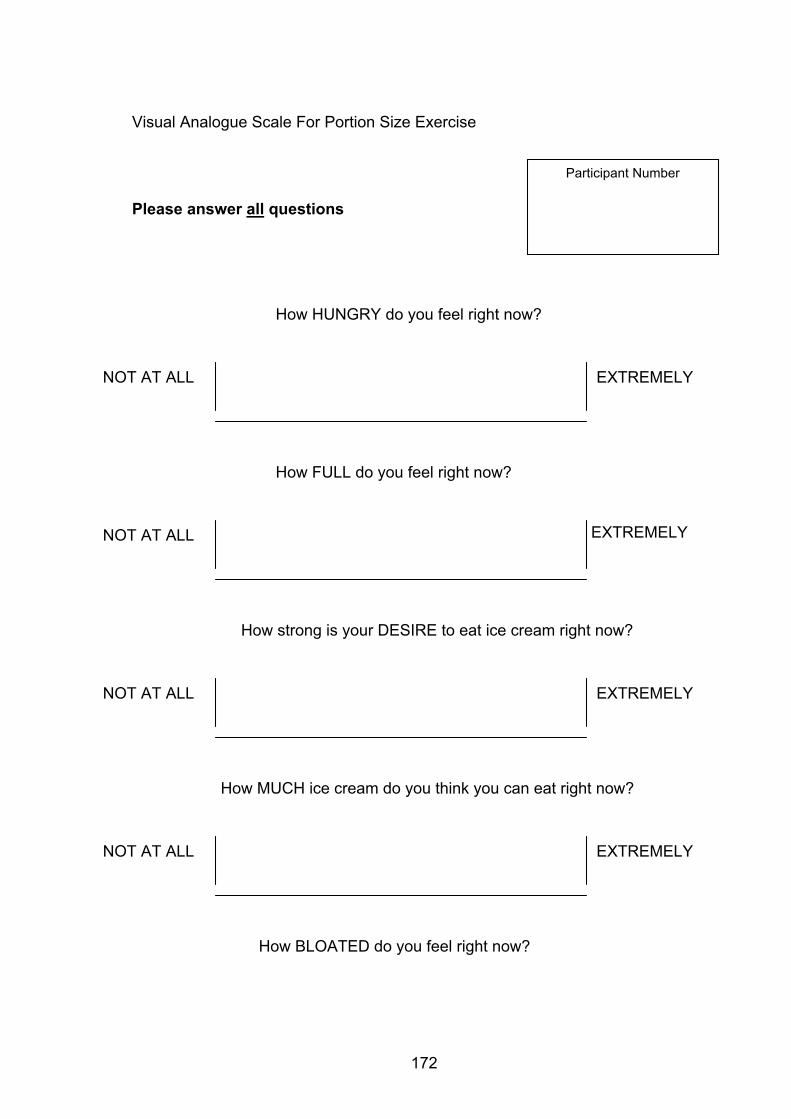
172
Visual Analogue Scale For Portion Size Exercise
Please answer all questions
How HUNGRY do you feel right now?
How FULL do you feel right now?
How strong is your DESIRE to eat ice cream right now?
How MUCH ice cream do you think you can eat right now?
How BLOATED do you feel right now?
EXTREMELY
hungry
NOT AT ALL
hungry
EXTREMELY
full
NOT AT ALL
full
EXTREMELY
strong
NOT AT ALL
strong
EXTREMELY
alot
NOT AT ALL
much
Participant Number
Time
173
How TASTY was this ice cream?
How VISUALLY PLEASING was this ice cream?
How ACCURATE was the serving of this portion size?
How would you have CHANGED this portion size?
Would you PURCHASE this ice cream to eat at home?
SERVED
MORE
EXTREMELY
bloated
NOT AT ALL
bloated
EXTREMELY
tasty
NOT AT ALL
tasty
EXTREMELY
Visually
pleasing
NOT AT ALL
Visually pleasing
EXTREMELY
Accurate
NOT AT ALL
Accurate
EXTREMELY
LIKELY
To purchase
NOT AT ALL LIKELY
To purchase
SERVED LESS
174
How HAPPY do you feel right now?
How SAD do you feel right now?
How STRESSED do you feel right now?
How RELAXED do you feel right now?
How NERVOUS do you feel right now?
How EXCITED do you feel right now?
EXTREMELY
happy
NOT AT ALL
happy
EXTREMELY
sad
NOT AT ALL
sad
EXTREMELY
stressed
NOT AT ALL
stressed
EXTREMELY
nervous
NOT AT ALL
nervous
EXTREMELY
excited
NOT AT ALL
excited
EXTREMELY
relaxed
NOT AT ALL
relaxed

175
How TIRED do you feel right now?
Thank you
EXTREMELY
tired
NOT AT ALL
tired
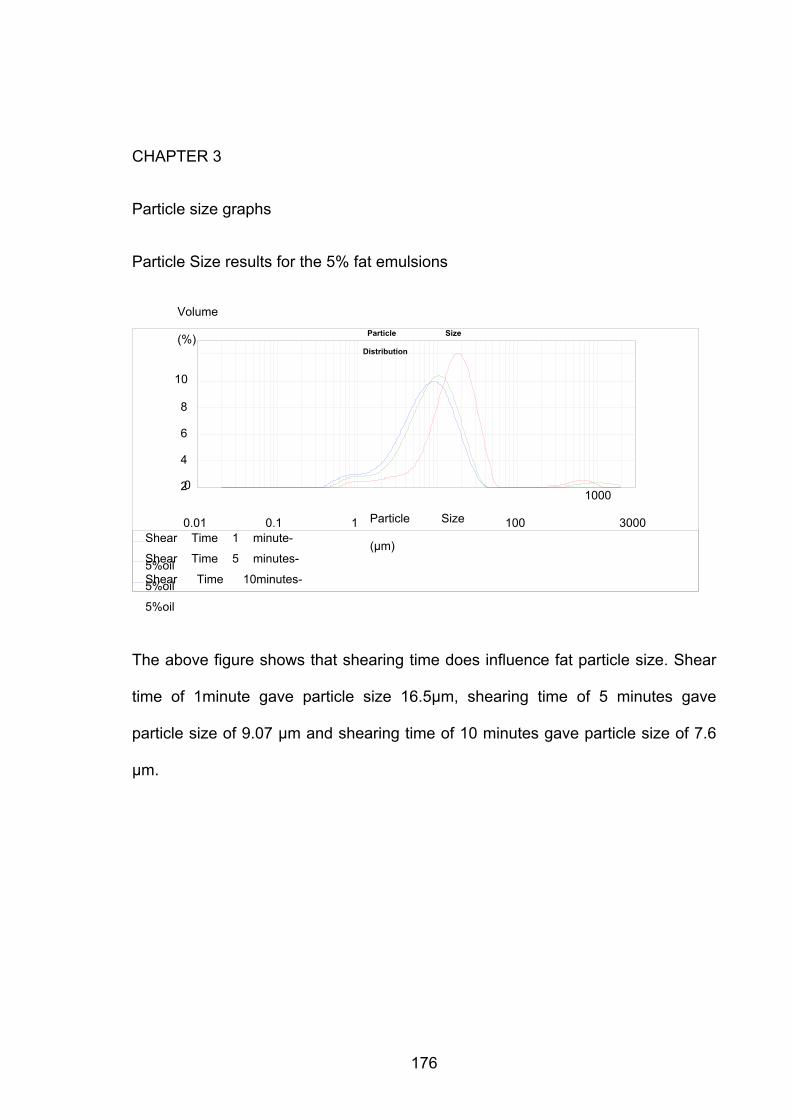
176
CHAPTER 3
Particle size graphs
Particle Size results for the 5% fat emulsions
The above figure shows that shearing time does influence fat particle size. Shear
time of 1minute gave particle size 16.5µm, shearing time of 5 minutes gave
particle size of 9.07 µm and shearing time of 10 minutes gave particle size of 7.6
µm.
Particle Size
Distribution
0.01
0.1
1
10
100
1000
3000 Particle Size
(µm)
0
2
4
6
8
10
Volume
(%)
Shear Time 1 minute-
5%oil Shear Time 5 minutes-
5%oil Shear Time 10minutes-
5%oil
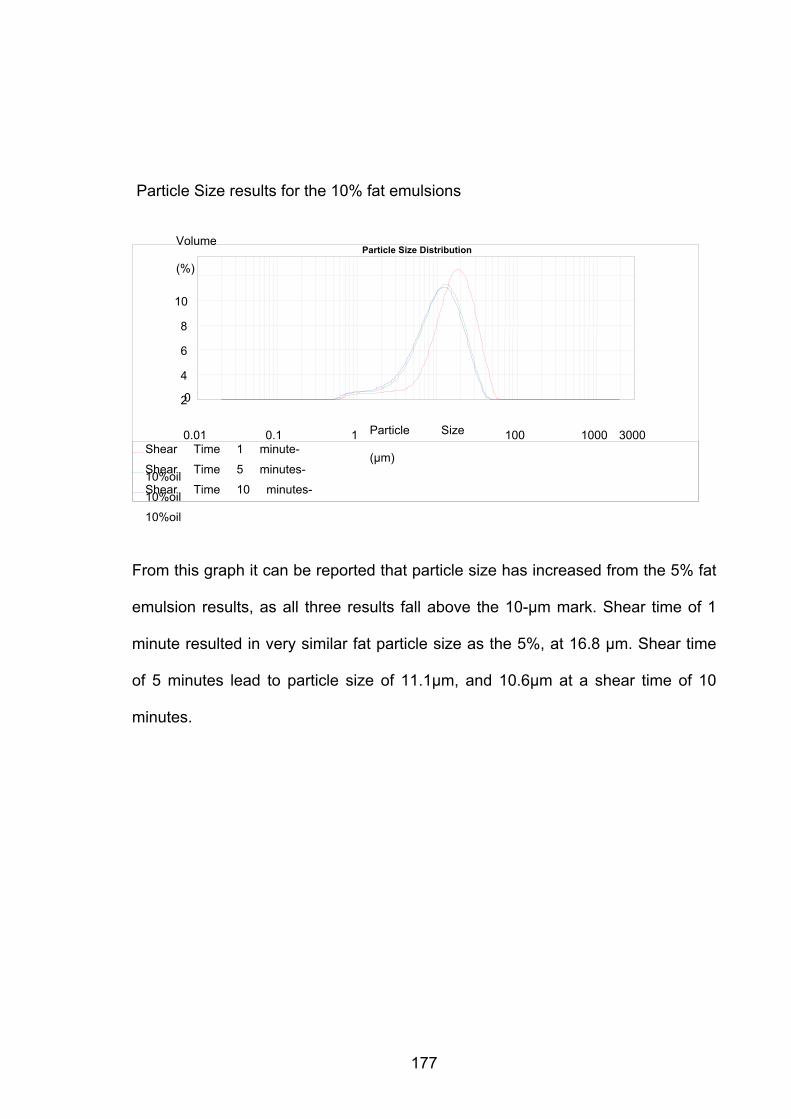
177
Particle Size results for the 10% fat emulsions
From this graph it can be reported that particle size has increased from the 5% fat
emulsion results, as all three results fall above the 10-µm mark. Shear time of 1
minute resulted in very similar fat particle size as the 5%, at 16.8 µm. Shear time
of 5 minutes lead to particle size of 11.1µm, and 10.6µm at a shear time of 10
minutes.
Particle Size Distribution
0.01
0.1
1
10
100
1000
3000 Particle Size
(µm)
0
2
4
6
8
10
Volume
(%)
Shear Time 1 minute-
10%oil Shear Time 5 minutes-
10%oil Shear Time 10 minutes-
10%oil
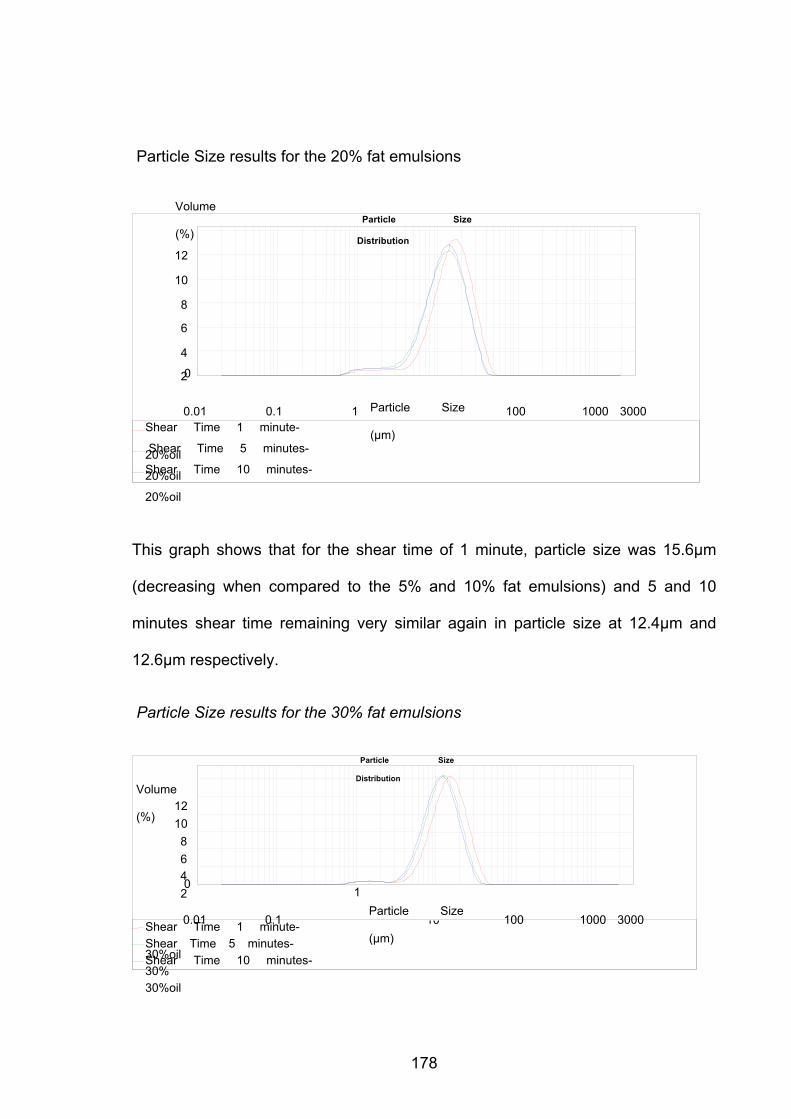
178
Particle Size results for the 20% fat emulsions
This graph shows that for the shear time of 1 minute, particle size was 15.6µm
(decreasing when compared to the 5% and 10% fat emulsions) and 5 and 10
minutes shear time remaining very similar again in particle size at 12.4µm and
12.6µm respectively.
Particle Size results for the 30% fat emulsions
Particle Size
Distribution
0.01
0.1
1
10
100
1000
3000 Particle Size
(µm)
0
2
4
6
8
10
12
Volume
(%)
Shear Time 1 minute-
20%oil Shear Time 5 minutes-
20%oil Shear Time 10 minutes-
20%oil
Particle Size
Distribution
0.01
0.1
1
10
100
1000
3000 Particle Size
(µm)
0
2
4
6
8
10
12 Volume
(%)
Shear Time 1 minute-
30%oil Shear Time 5 minutes-
30% Shear Time 10 minutes-
30%oil
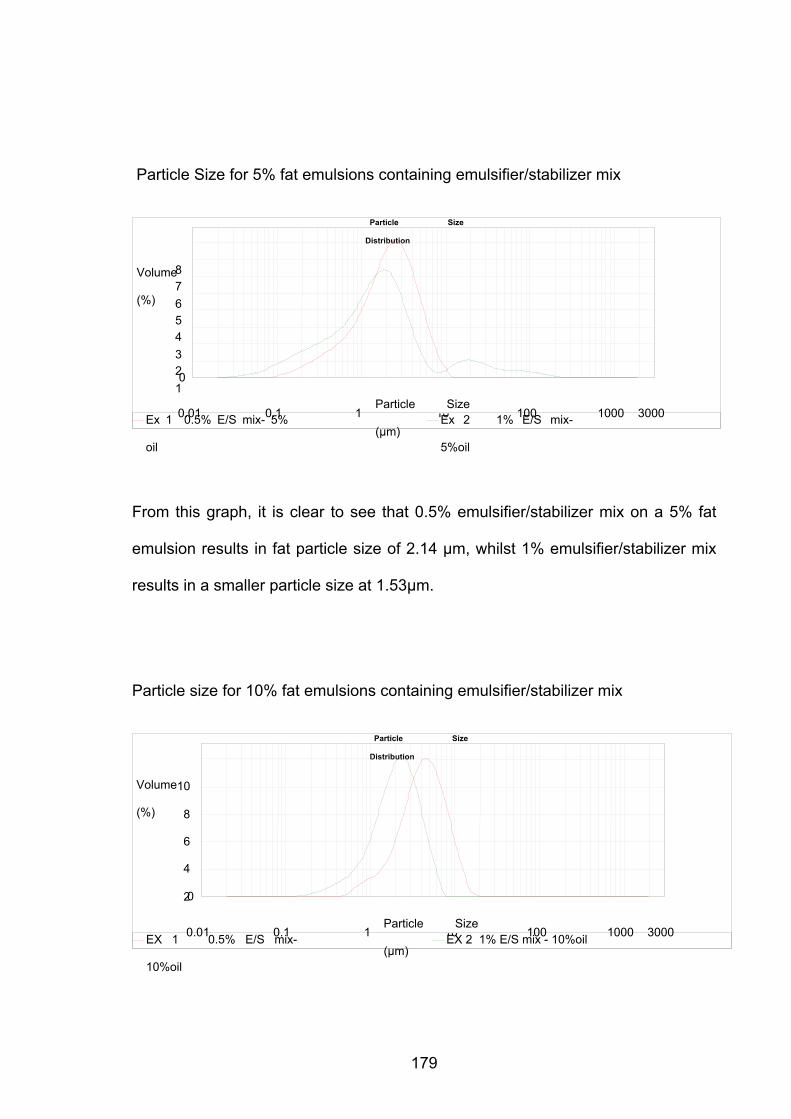
179
Particle Size for 5% fat emulsions containing emulsifier/stabilizer mix
From this graph, it is clear to see that 0.5% emulsifier/stabilizer mix on a 5% fat
emulsion results in fat particle size of 2.14 µm, whilst 1% emulsifier/stabilizer mix
results in a smaller particle size at 1.53µm.
Particle size for 10% fat emulsions containing emulsifier/stabilizer mix
Particle Size
Distribution
0.01
0.1
1
10
100
1000
3000 Particle Size
(µm)
0
1
2
3
4
5
6
7
8 Volume
(%)
Ex 1 0.5% E/S mix- 5%
oil
Ex 2 1% E/S mix-
5%oil
Particle Size
Distribution
0.01
0.1
1
10
100
1000
3000 Particle Size
(µm)
0
2
4
6
8
10 Volume
(%)
EX 1 0.5% E/S mix-
10%oil
EX 2 1% E/S mix - 10%oil
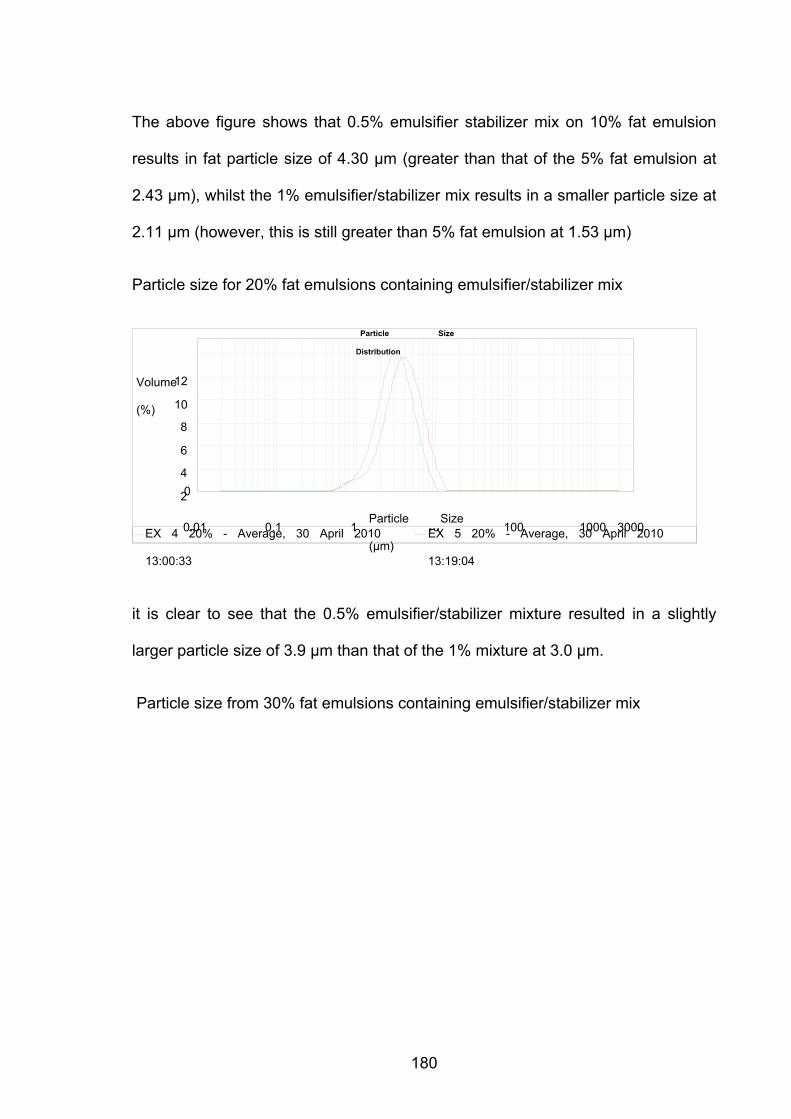
180
The above figure shows that 0.5% emulsifier stabilizer mix on 10% fat emulsion
results in fat particle size of 4.30 µm (greater than that of the 5% fat emulsion at
2.43 µm), whilst the 1% emulsifier/stabilizer mix results in a smaller particle size at
2.11 µm (however, this is still greater than 5% fat emulsion at 1.53 µm)
Particle size for 20% fat emulsions containing emulsifier/stabilizer mix
it is clear to see that the 0.5% emulsifier/stabilizer mixture resulted in a slightly
larger particle size of 3.9 µm than that of the 1% mixture at 3.0 µm.
Particle size from 30% fat emulsions containing emulsifier/stabilizer mix
Particle Size
Distribution
0.01
0.1
1
10
100
1000
3000 Particle Size
(µm)
0
2
4
6
8
10
12 Volume
(%)
EX 4 20% - Average, 30 April 2010
13:00:33
EX 5 20% - Average, 30 April 2010
13:19:04
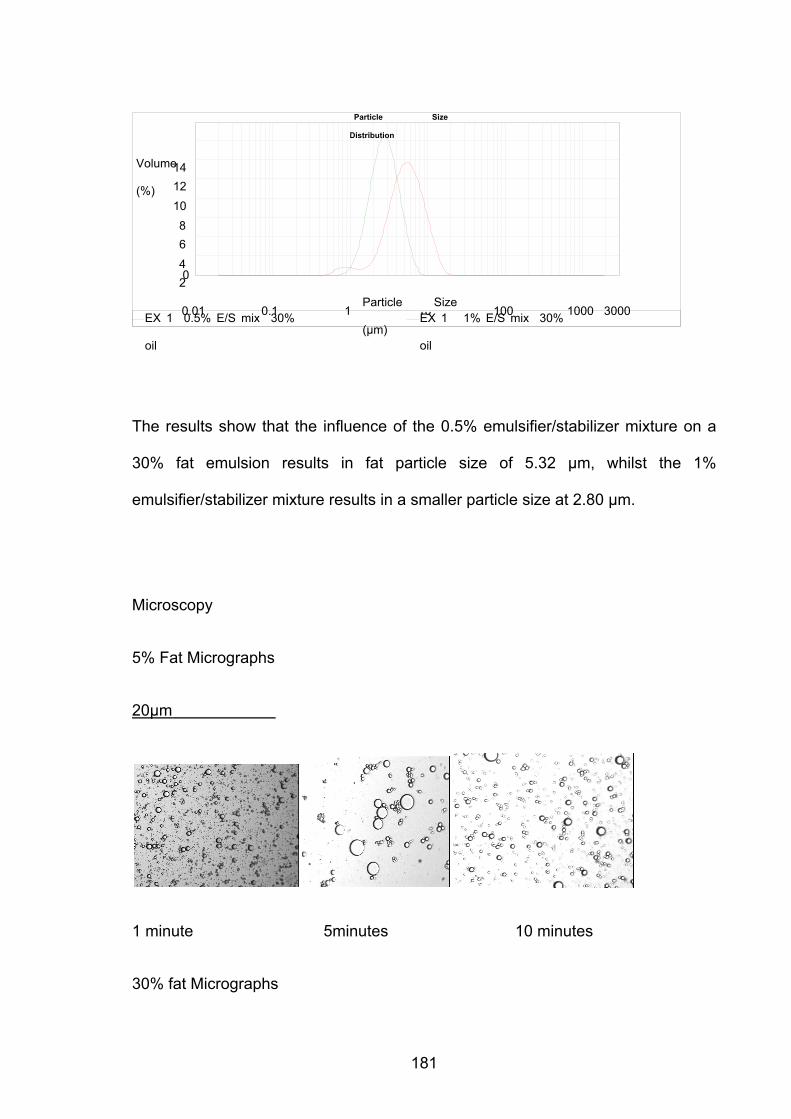
181
The results show that the influence of the 0.5% emulsifier/stabilizer mixture on a
30% fat emulsion results in fat particle size of 5.32 µm, whilst the 1%
emulsifier/stabilizer mixture results in a smaller particle size at 2.80 µm.
Microscopy
5% Fat Micrographs
20µm
1 minute 5minutes 10 minutes
30% fat Micrographs
Particle Size
Distribution
0.01
0.1
1
10
100
1000
3000 Particle Size
(µm)
0
2
4
6
8
10
12
14 Volume
(%)
EX 1 0.5% E/S mix 30%
oil
EX 1 1% E/S mix 30%
oil
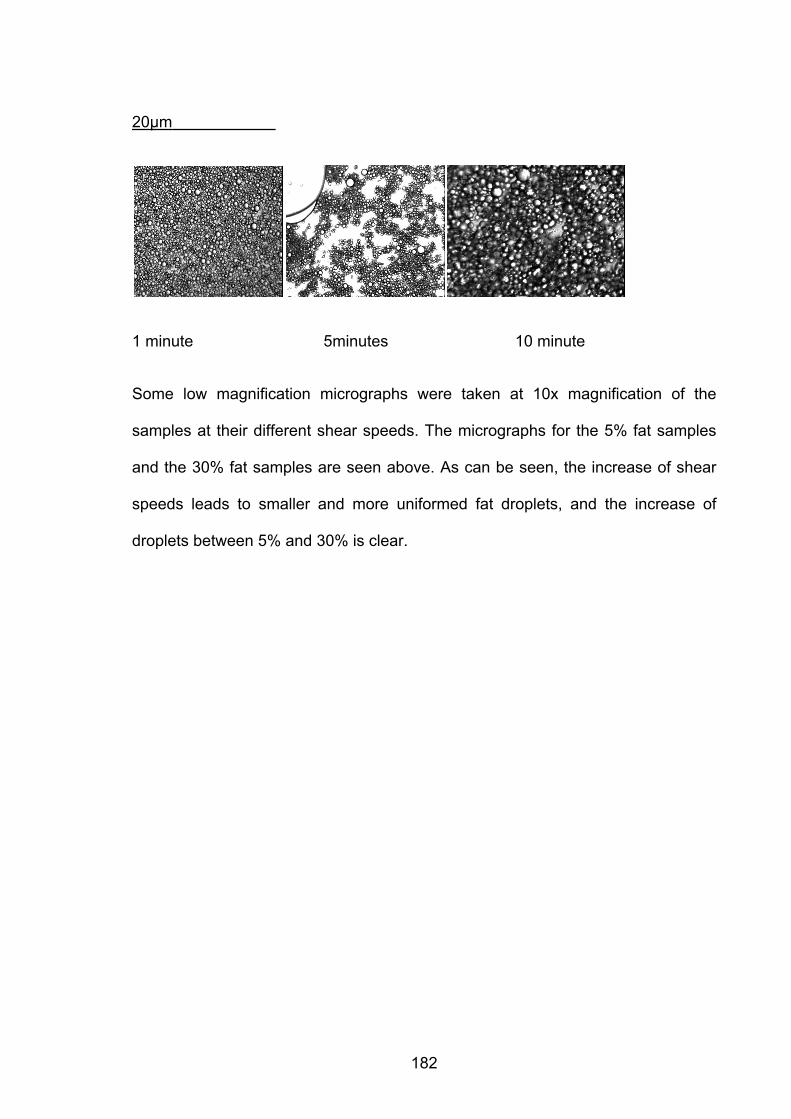
182
20µm
1 minute 5minutes 10 minute
Some low magnification micrographs were taken at 10x magnification of the
samples at their different shear speeds. The micrographs for the 5% fat samples
and the 30% fat samples are seen above. As can be seen, the increase of shear
speeds leads to smaller and more uniformed fat droplets, and the increase of
droplets between 5% and 30% is clear.
183
Chapter 4
DEBQ scale questionnaire
Please answer all questions. Circle the appropriate response
When you have put on weight do
you eat less than you usually do?
not
relevant never seldom sometimes often
very
often
Do you try to eat less at mealtimes
than you would like to eat?
not
relevant never seldom sometimes often
very
often
How often do you refuse food or
drink offered to you because you
are concerned about your weight?
not
relevant never seldom sometimes often
very
often
Do you watch exactly what you
eat?
not
relevant never seldom sometimes often
very
often
Do you deliberately eat foods that
are slimming?
not
relevant never seldom sometimes often
very
often
When you have eaten too much, do
you eat less than usual the
following day?
not
relevant never seldom sometimes often
very
often
Do you deliberately eat less in
order not to become heavier?
not
relevant never seldom sometimes often
very
often
How often do you try not to eat
between meals because you are
watching your weight?
not
relevant never seldom sometimes often
very
often
184
How often in the evenings do you
try not to eat because you are
watching your weight?
not
relevant never seldom sometimes often
very
often
Do you take your weight into
account with what you eat?
not
relevant never seldom sometimes often
very
often
If food tastes good to you, do you
eat more than usual?
not
relevant never seldom sometimes often
very
often
If food smells good, do you eat
more than usual?
not
relevant never seldom sometimes often
very
often
If you smell something delicious,
do you have a desire to eat it?
not
relevant never seldom sometimes often
very
often
If you have something delicious to
eat, do you eat it straight away?
not
relevant never seldom sometimes often
very
often
If you walk past a baker, do you
have a desire to buy something
delicious?
not
relevant never seldom sometimes often
very
often
If you walk past a snackbar or café,
do you have a desire to buy
something delicious?
not
relevant never seldom sometimes often
very
often
If you see others eating, do you
also have a desire to eat?
not
relevant never seldom sometimes often
very
often
Can you resist eating delicious not never seldom sometimes often very
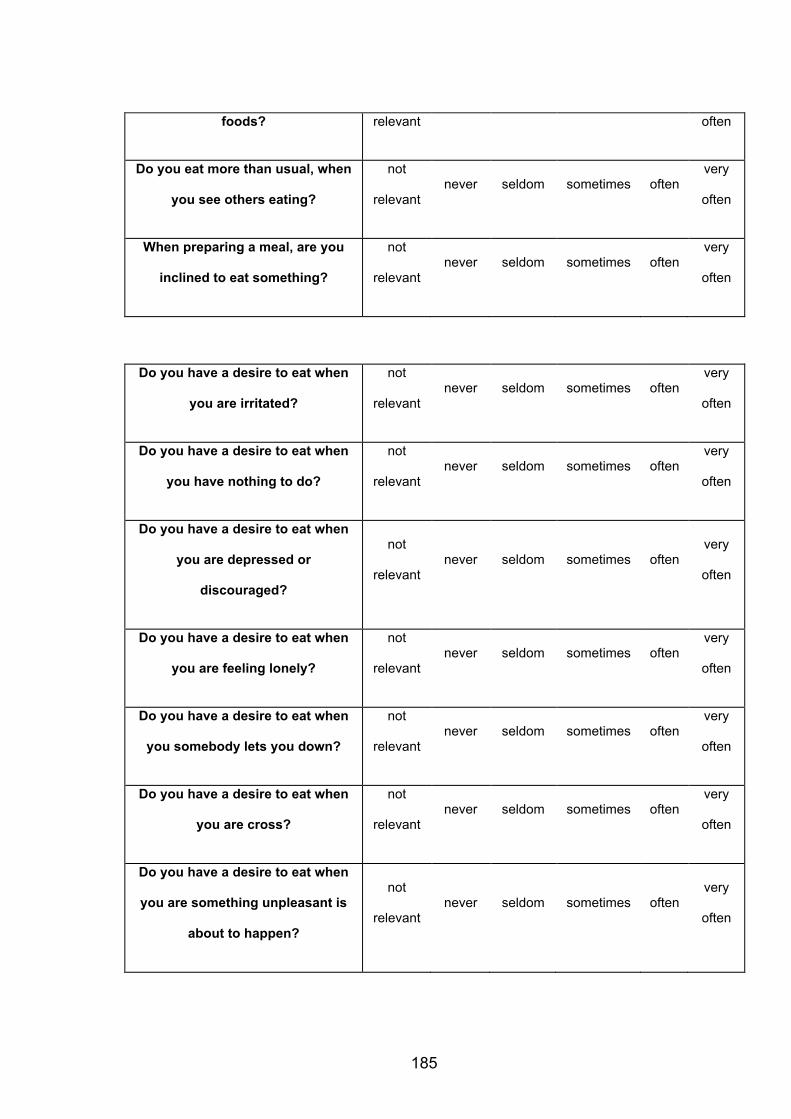
185
foods? relevant often
Do you eat more than usual, when
you see others eating?
not
relevant never seldom sometimes often
very
often
When preparing a meal, are you
inclined to eat something?
not
relevant never seldom sometimes often
very
often
Do you have a desire to eat when
you are irritated?
not
relevant never seldom sometimes often
very
often
Do you have a desire to eat when
you have nothing to do?
not
relevant never seldom sometimes often
very
often
Do you have a desire to eat when
you are depressed or
discouraged?
not
relevant never seldom sometimes often
very
often
Do you have a desire to eat when
you are feeling lonely?
not
relevant never seldom sometimes often
very
often
Do you have a desire to eat when
you somebody lets you down?
not
relevant never seldom sometimes often
very
often
Do you have a desire to eat when
you are cross?
not
relevant never seldom sometimes often
very
often
Do you have a desire to eat when
you are something unpleasant is
about to happen?
not
relevant never seldom sometimes often
very
often
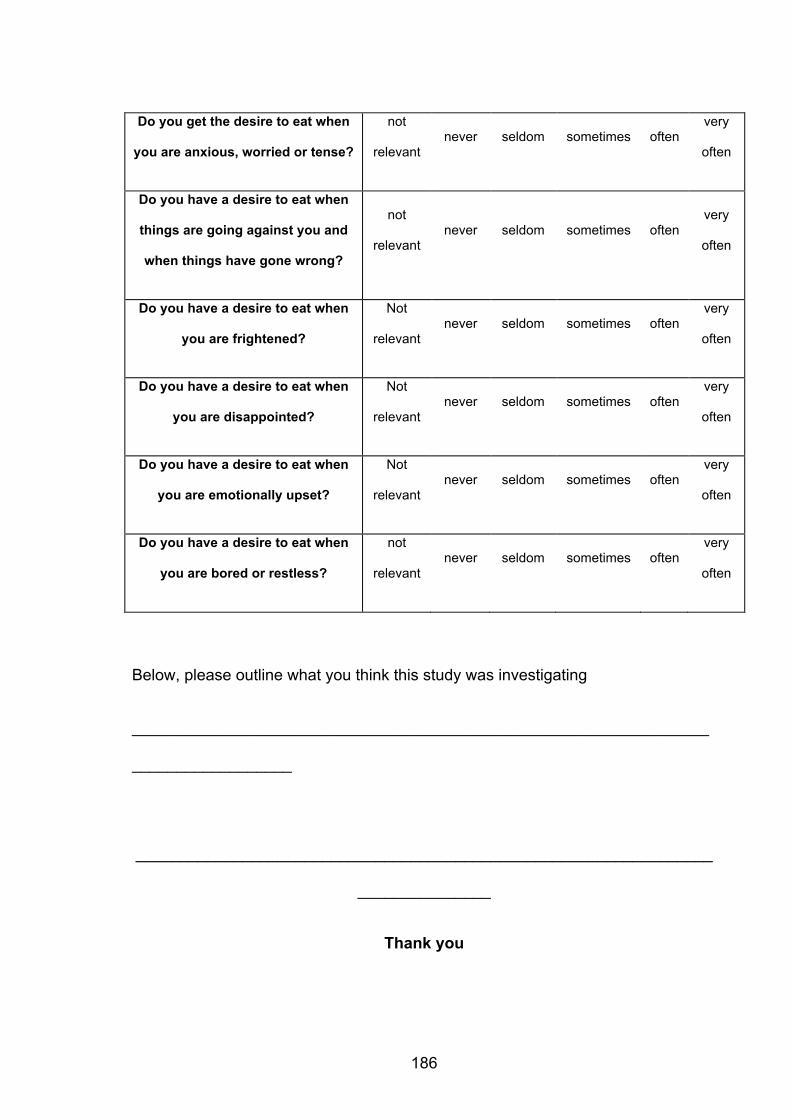
186
Do you get the desire to eat when
you are anxious, worried or tense?
not
relevant never seldom sometimes often
very
often
Do you have a desire to eat when
things are going against you and
when things have gone wrong?
not
relevant never seldom sometimes often
very
often
Do you have a desire to eat when
you are frightened?
Not
relevant never seldom sometimes often
very
often
Do you have a desire to eat when
you are disappointed?
Not
relevant never seldom sometimes often
very
often
Do you have a desire to eat when
you are emotionally upset?
Not
relevant never seldom sometimes often
very
often
Do you have a desire to eat when
you are bored or restless?
not
relevant never seldom sometimes often
very
often
Below, please outline what you think this study was investigating
_________________________________________________________________
__________________
_________________________________________________________________
_______________
Thank you
187
Volunteer information sheet
VOLUNTEER INFORMATION SHEET
An investigation into the palatability of vanilla ice cream
What is the study about?
The aim of the study is to investigate the palatability of vanilla ice cream.
Who is taking part?
Participants are undergraduate and postgraduate students at Birmingham
University; there are no inclusion or exclusion criteria, apart from health grounds.
What will I have to do?
188
You will be required to attend 2 sessions lasting no more than 30 minutes, roughly
2-3 days between the first and second session. You will be required to attend the
second session around the same time of day the first session. You will be asked to
fill out questionnaires about previous food experiences and required to eat 2
different types of vanilla ice cream.
What are the risks?
These are no perceived potential risks in an experiment of this nature.
What are the benefits?
The study will aid our understanding of the palatability of ice cream and whether
this palatability impacts on food preference and they way in which consumers
choose and eat ice cream. There will be no direct benefits to you from participating
but the information will contribute to wider knowledge about food choice regarding
ice cream preference and ways in which these choices could be changed (i.e.
promoting healthier food choices).
What if I do not wish to continue at any stage?
You are free to withdraw from the study at any time. You can refuse to answer any
question, and may refuse to do anything requested of you.
189
What happens to the information?
All information is completely confidential to the researcher. All information will be
identified by code number, and will be seen only by the researcher. It will not be
possible to identify you in any published reports that result from the study.
What else can I expect from the researcher?
You can ask any questions about the study that occur to you during your
participation and request a copy of any of the results.
Principle investigators:
Sarah Santos-Murphy
School of Chemical Engineering
University of Birmingham
Edgbaston
Birmingham
B15 2TT
190
Dr. Phil Cox
Lecturer
Bio-Food Engineering Group
Chemical Engineering
University of Birmingham
Edgbaston
Birmingham
B15 2TT
(+44) (0) 121 414 5304
Dr Suzanne Higgs
School of Psychology
University of Birmingham
Edgbaston
Birmingham
B15 2TT

192
Consent Form
Investigation into the palatability of vanilla ice cream
Consent Form
I have read the Information Sheet for this study and have had the details of the
study explained to me. My questions about the study have been answered to my
satisfaction, and I understand that I may ask further questions at any time.
I also understand that I am free to withdraw from the study at any time that I can
decline to answer any particular questions in the study, and can decline to
complete any task requested of me. I agree to provide information to the
researchers on the understanding that it is completely confidential. I understand
that the information will be stored in manual and electronic files and is subject to
the provisions of the Data Protection Act. I acknowledge that the information
provided is being used by the University in accordance with the Act.

193
I confirm that I wish to participate in this study under the conditions set out here
and in the Information Sheet.
Signed: ________________________________________
Name: ________________________________________
Date: _________________________
Researcher: ________________________________________
Thank you
194
Consent Form
Consent Form
Triangle test of vanilla ice cream
I have read the Information Sheet for this study and have had the details of the
study explained to me. My questions about the study have been answered to my
satisfaction, and I understand that I may ask further questions at any time.
I also understand that I am free to withdraw from the study at any time that I can
decline to answer any particular questions in the study, and can decline to
complete any task requested of me. I agree to provide information to the
researchers on the understanding that it is completely confidential. I understand
that the information will be stored in manual and electronic files and is subject to
the provisions of the Data Protection Act. I acknowledge that the information
provided is being used by the University in accordance with the Act.

195
I confirm that I wish to participate in this study under the conditions set out here
and in the Information Sheet.
Signed: ________________________________________
Name: ________________________________________
Date: _________________________
Researcher: ________________________________________
Thank you
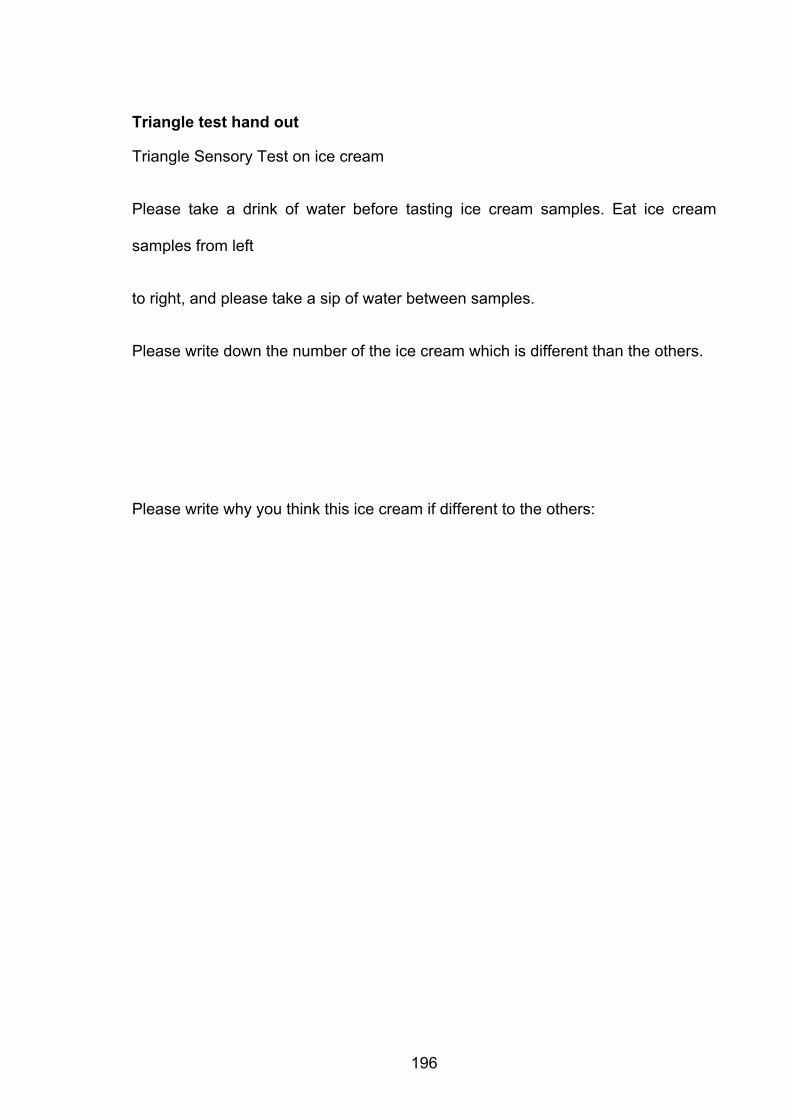
196
Triangle test hand out
Triangle Sensory Test on ice cream
Please take a drink of water before tasting ice cream samples. Eat ice cream
samples from left
to right, and please take a sip of water between samples.
Please write down the number of the ice cream which is different than the others.
Please write why you think this ice cream if different to the others:

197
198
REFERENCES
Adapa, S., Dingeldein, H., Schmidt, K.A., Herald, T.J. (2000) ‘Rheological
properties of ice cream mixes and frozen ice creams containing fat and fat
replacers’ J. Dairy Sci. (83), 2224–2229.
Aime, D.B., ArntWeld, S.D., Malcolmson, L.J., Ryland, D. (2001) ‘Textural analysis
of fat reduced vanilla ice cream products’ Food Res. Int. (34), 237–246.
Baer, R. J., Wolkow, M. D., Kasperson, K. M. (1997) ‘Effect of Emulsifiers on the
Body and Texture of Low Fat Ice Cream’ [online] J. Dairy Sci. (80) 3123-3132
Available at http://jds.fass.org/cgi/content/abstract/80/12/3123 (Accessed on
25/4/10)
Banister, P; Burman, E (1997) “Qualitative methods in psychology: A researchers
guide” Open University Press, Milton Keynes
Barrette, S (2004) ‘Ice cream Parlor’ [online] available at
http://www.sbdcnet.org/Snaphots/icecreamSnapshot.pdf Accessed on 03/01/11
199
Bell, E.A ‘ Castellanos, V.H, Pelkman, C.L, Thowart, M,L & Rolls, B.J (1998)
‘Engery density of foods affects energy intake in normal weight women’ Am J Clin
Nutr March 1998vol. 67 no. 3 412-420
Benelam, B (2009) ‘ Satiation, satiety and their effect on eating behaviour’
Nutrition Bulletin, vol 34 (2) 126-173 [online] available at
http://onlinelibrary.wiley.com/doi/10.1111/j.1467-3010.2009.01753.x/pdf accessed
on 07/01/11
Berridge, K.C & Robinson T.E(2003) ‘Parsing reward’ Trends in
neuroscience,26,507-513
Biasutti, M; Venir, E ; Marino, M ; Maifreni, M & Innocente, N (2013) ‘Effects of
high pressure homogenisation of ice cream mix on the physical and structural
properties of ice cream’ International Dairy Journal (32) [online] available at
http://www.sciencedirect.com/science/article/pii/S0958694613000745 Accessed
on 11/2/14
Black AE, Prentice AM, Goldberg GR, et al. (1993) ‘Measurements of total energy
expenditure provide insights into the validity of dietary assessments of energy
intake’ Journal of the American Dietetic Association. 93: 572–9. In Benelam, B
200
(2009) ‘ Satiation, satiety and their effect on eating behaviour’ Nutrition Bulletin, vol
34 (2) 126-173 [online] available at
http://onlinelibrary.wiley.com/doi/10.1111/j.1467-3010.2009.01753.x/pdf accessed
on 07/01/11
Blundell, J.E (1995) ‘The psychobiological approach to appetite and weight
control. In K.D. Brownell & C.G Fairburn (eds) ‘Eating disorders and obesity: A
comprehensive handbook’ New York. Guilford
Blundell, J.E, Jebb, S., Stubbs, R.J, Wilding,J.R, Lawton,C.L, Browning, L et
al(2006) ‘Effect of rimonabant on energy intake, motivation to eat and body weight
and without hypocaloric diet: The REBA study’ Obesity Reviews, 7, 104 [online]
available at http://onlinelibrary.wiley.com/doi/10.1111/j.1467-
7881.2006.00282.x/pdf accessed on 04/01/11
Blundell, J, DeGraff, K, Finlayson, G, Halford, J.C.G, Hetherington, M, King,N and
Stubbs, J (2009) ‘Measuring food intake, hunger, satiety and satiation in the
laboratory’ In: Allison, David B. & Baskin, Monica L (Eds.) Handbook of
Assessment Methods for Eating Behaviours and Weight-Related Problems:
Measures, Theory and Research (2nd. ed.). Sage, Newbury Park, California, pp.
283-325.
201
Booth, D.A (1990) ‘How not to think about immediate dietary and post ingestion
influences on appetites and satieties’ Appetite, 14, 171-9.
Boniface, B & Umberger, W.J (2012) ‘Factors influencing Malaysian consumer
consumption of dairy products’ Australian agricultural and resource economics
society [online] available at
http://ageconsearch.umn.edu/bitstream/124243/2/2012AC%20Boniface%20CP.pd
f Accessed on 14/2/14
Bordi, P., Cranage, D., Stokols, J., Palchak, T., and Powell, L. (2005). ‘Effect of
polyols versus sugar on acceptability of ice cream amoung a student and adult
population’ [online] Foodservice Research International, 15(1), 41-50. Available
at http://www3.interscience.wiley.com/cgi-
bin/fulltext/118816647/PDFSTART?CRETRY=1&SRETRY=0 (Accessed on
1/5/10)
Bowen, D.J., Tomoyasu, N., Anderson, M., Carney, M., & Kristal, A. (1992).’
Effects of expectancies and personalized feedback on fat consumption, taste, and
preference’ Journal of Applied Social Psychology, 22, 1061–1079.
202
Bradley , R.A(1955) ‘Rank analysis of incomplete block designs’ Bio Metrika, 42,
450-470
British Psychological Society (2005) “Ethical principals for conducting research
with human participants” [online] Available at
http://www.bps.org.uk/downloadfile.cfm?file_uuid=5084A882-1143-DFD0-7E6C-
F1938A65C242&ext=pdf (Accessed on 15/03/10)
Brockhoff, P. B. (2001). “Sensory profile average data: Combining mixed
model ANOVA with measurement error methodology.” Food Quality
and Preference, 12, 413–426.
Clarke, C (2008) ‘The science of ice cream’ Ed.3 Cambridge RSC Publishing
Clarke, C. L., S. L. Buckley, and N. Lindner. (2002). ‘Ice structuring proteins—A
new name for antifreeze proteins’ [online] Cryo. Lett. 23:89–92. Available at
http://www.ncbi.nlm.nih.gov/pubmed/12050776?dopt=Abstract (Accessed on
27/3/10)
203
Cogne, C, Laurent, P, Andreiu, J., Besson, A., Nocquet, J (2003) ‘Experimental
data and modeling in ithermal proertie of ice cream’ Journal of food engineering
58 p331-341
Cook, K.L.K. and Hartel, R.W. (2010) “Mechanisms of Ice Crystallization in Ice
Cream Production” Comprehensive Reviews in Food Science and Food
Safety, 9: 213–222
Davies, E., Dickinson, E. & Bee, R.D. (2000). ‘Shear stability of sodium caseinate
emulsions con- taining monoglyceride and triglyceride crystals’ Food
Hydrocolloids, 14, 145–153.
De Graff, C., de long,L.S & Lambers,A.C (1999) ‘Palatability affects satiation but
not satiety’ Physiology & behaviour, 66,681-688
De Graff, C. Cardello,A.V, Kramer,F.M. Lesher,L.L.,Meiselman,H.L. & Schutz,H.G
(2005) ‘Food acceptability in field studies with US army men and women:
Relationship with food intake and food choice after repeated exposure’.
Appetite,44,23-31
204
Delargy, H.J , Lawton, C.L, Smith, F.C, King, N.A & Blundell, J.E(1996) ‘Electronic
appetite ratings system: validation of continuous automated monitoring of
motivation to eat’. International journal of obesity,20 104.
Dresselhuis, D.M, Klok, H.J, Cohen Stuart, M.A, et al (2007) ‘Tribology of o/w
Emulsions Under Mouth-like Conditions: Determinants of Friction’ [online] Food
biophysics, Spring New york Vol 2(4) available at
http://www.springerlink.com/content/5h76137g25377514/ (Accessed on 12/4/10)
Dressaire, E, Bee, R,Bell,D.C Lips, A and Stone, H.A (2008)’ Interfacial Polygonal
Nanopatterning of Stable Microbubbles’ Science 320 (5880), 1198. [DOI:
10.1126/science.1154601]
Drewett, E.M ; Hartel R.W(2007) I”ce crystallization in a scraped surface freezer”
Journal of Food Engineering, v. 78, p. 1060-1066,
Drewnowski A (1998) Energy density, palatability and satiety: implications for
weight control. Nutrition Reviews 56: 347–53.
205
Eisner, M.D, Jeelani, S.A.K.,Bernhard, L and Windhab, E.J (2007) ‘Stability of
foams containing proteins, fat particles and non-ionic surfactants.’ Chemical
engineering science 62: 1974-1987
Elfhag, K; Barkeling, B; Carlsson,A.M; Rossner,S (2003) ‘Microstructure of eating
behaviour asscoaited with Rorschach characteristic in obesity’ Journal of
Personality assessment , 81(1) 40-50 [online] available at
http://www.rorschach.nu/forskning/kristina_elfhag/JPA%202003%20Microstructure
%20of%20eating.pdf Accessed on 17/12/10
Easton, V.J. & McColl, JH. (1997) ‘Statistics glossary’ [online].. Available
http://www.stats.gla.ac.uk/steps/glossary/ Accessed on 8/1/14
Ello-Martin JA, Ledikwe JH, Rolls BJ. (2005) The influence of food portion size and
energy density on energy intake: implications for weight management. Am J Clin
Nutr;82(suppl) :236S –241S
Fisher JO, Rolls BJ, Birch LL. (2003) “Children's bite size and intake of an entree
are greater with large portions than with age-appropriate or self-selected portions”
Am J Clin Nutr. 77 :1164 –1170
206
Flint A, Raben A, Blundell JE et al. (2000a) “Reproducibility, power and validity of
visual analogue scales in assessment of appetite sensations in single test meal
studies” International Journal of Obesity 24: 38–48.
Flores, A. A., and H. D. Goff (1999)’Ice crystal size distributions in dynamically
frozen model solutions and ice cream as affected by stabilizers’ J. Dairy Sci.
82:1399-1407.
Folkenberg DM, Martens M. (2003) “Sensory properties of low fat yoghurts. Part B:
Hedonic evaluations of plain yoghurts by consumers correlated to fat content,
sensory profile and consumer attitudes” Milchwissenschaft-Milk Sci Int.58:154–
157
Food and Drink international (2006) ‘Has premium become standard?’ [Online]
available at http://oxygen.mintel.com/sinatra/oxygen/display/id=220224 Accessed
on 15/12/10
Food Labelling regulations (2010) ‘Food Labelling regulations SI 1996 No. 1499
4-6th January 2010’[online] Available at
http://www.reading.ac.uk/foodlaw/label.htm Reading UK (Accessed 20/1/10)
207
Frøst, M.B & Janhøj, T(2007) ‘Understanding creaminess’ International Dairy
Journal (17) 1298-1311 [online] available at sciencedirect.com (accessed on
14/2/14)
Galloway, K (1997) “Non-probability samples” [online] Available at
http://www.tardis.ed.ac.uk/~kate/qmcweb/s8.htm (Accessed on 12/03/10)
Goff, H.D. (1993)’interactions and contributions of stabilizers and emulsifiers to
development of structure in ice cream’ in Food Colloids and Polymers: Stability
and Mechanical Properties. E. Dickinson and P. Walstra, eds. Royal Society of
Chemistry, Cambridge, UK. pp. 70-74.
Goff, H.D (1995) ‘Dairy Science and technology education’ University of
Guelph, Canada Available at
http://www.foodsci.uoguelph.ca/dairyedu/icmanu.html (Accessed 20/2/13)
Goff, H. D. (1997) ‘Partial coalescence and structure formation in dairy emulsions’.
Food Proteins and LipidsAmer. Chem. Soc. John E. Kinsella Memorial. S.
Damodaran, ed. Plenum Press, NY, pp. 137-148.
208
Goff,H. D & Regand, A (2006) ‘Ice Recrystallization Inhibition in Ice Cream as
Affected by Ice Structuring Proteins from Winter Wheat Grass’ [online] American
Dairy science association J. Dairy Sci. 89:49-57 Available at http://www.dairy-
science.org/cgi/content/full/89/1/49 (Accessed on 27/3/10)
Goff, H. D. and C. Vega. (2007) ‘Structure-engineering of ice-cream and foam-
based foods’ Understanding and Controlling the Microstructure of Complex
Foods, D. J. McClements, ed. CRC Press, Boca Raton, FL, pp. 557-574.
Goff, Douglas. (2008) ‘Dairy Science and Technology Education Series’
University of Guelph, Canada. [online]
Retrievedwww.foodsci.uoguelph.ca/dairyedu/home.html (Accessed on 04/10/13)
Goff, H. D. 2009. Significance of Lactose in Ice cream. In: "Advanced Dairy
Chemistry. 3. Lactose, Water and Minor Constituents, 3rd Edn." P. F. Fox and P.
L. H. McSweeney, eds. Springer, New York, pp. 69-79.
Goff, H.D. and R. W. Hartel. (2013) Ice Cream, 7th Edn. New York: Springer.
Varela, Pinter & Fiszman, 2014)
209
Guinard, J.X., Zoumas-Morse, C., Mori, L., Panyam, D., And Kilara, A1996. Effect
Of Sugar And Fat On The Acceptability Of Vanilla Ice Cream. J. Dairy Sci. 79,
1922-1927
Guss, J.L & Kissileff,H.R (2000) ‘Microstructural analysis of human ingestive
patterns: From description to mechanistic hypotheses’ Neuroscience &
Biobehavioual reviews, 24,261-268
Halford,J.C.G., Boyland,E.J., Dovey,T.M et al (2010) ‘The effects of sibutramine
on the microstructure of eating behaviour and energy expenditure in obese
women’ journal of psychopharmacology
Hartel, R. W.(1996) ‘Ice Crystallization During the Manufacture of Ice Cream.’
Trends Food Sci. Technol. 7:315-321
Hetherington. M.M (1995) ‘Sensory specific satiety and its importance in meal
termination’ Neuroscience & Behavioural reviews, 20,113-117
Heuer, E (2009) ‘Formulation and stability of model food foam microstructures’
EngD thesis, University of Birmingham
210
Hill,S. W. & McCutcheon, N. B. (1975). Eating responses of obese and non-obese
humans during dinner meals. Psychosomatic Medicine 37, 395401. In Mela. D
(1996) ‘Eating behaviour, food preferences and dietary intake in relation to obesity
and body weight status’ Proceedings of the nutrition society,55.803-816
Hill,A.J, Rogers,P.J & Blundell, J.E (1995) ‘Techniques for the experimental
measurements off human eating behaviour and food intake: A practical guide.’
International journal of obesity, 19,361-375
Hubel, R., Laessle, R.G, Lehrke, S & Jass, J (2006) ‘Laboratory measurements of
cumulative food intake in humans: Result on the reliability’ Appetite,6,57-62
Hui, Y.H (2006) ‘Handbook of food science, technology and engineering’ Volume
4, CRC Press
International dairy food association (2010) ‘International diary food association’
[online] Washington DC. Available from http://www.idfa.org (Accessed 20/1/10)
211
Jordan,H.A,Wieland,W.F, Zebley,S.P,Stellar, E., & Stunkard,A.J (1996) ‘Direct
measurement of food intake in man: A method for objective study of eating
behaviour.’ Psychosomatic medicine,28,836-842
Janhøj, T., Petersen, C. B., Ipsen, R., & Frøst, M. B. (2006). Sensory and
rheological characterization of low-fat stirred yoghurt. Journal of
Texture Studies, 37, 276–299.
Janhøj, T., & Frøst, M. B, Anderson, C. M, Vireck, N, Ipsen, R & Edrud, S (2006)
‘Sensory, rheological and spectroscopic characterization of low fat and non fat
cream cheese’. In P. Fischer, P. Erni & E.J Windhab (Eds) Proceedings from the
fourth international symposium on food rhelology and structure (pp. 383-387)
Zurich, Switzerland.
Koutsou, G.A., Storey, D.M., Lee, A., Zumbe, A., Flourie, B., Lebot, Y. and Olivier
P. (1996) ‘Dose-related gastrointestinal response to the ingestion of either isomalt,
lactitol, or maltitol in milk chocolate’ Eur. J. Clin. Nutr. 50(1), 17–21.
Koxholt, M. M. R., B. Eisenmann, and J. Hinrichs. (2001). ‘Effect of
212
the fat globule sizes on the meltdown of ice cream’. J. Dairy Sci.
84:31–37.
Kokini, J (1987) ‘Viscoelastic properties of semi soild foods and their biopolymeric
components’ Food techonology 41:89-95. In Norton, I; Cox P.W & Spyropoulos
(2010) ‘Practical Food Rheology: An Interpretive Approach’ John Wiley & Sons,
Kral JG, Buckley MC, Kissileff HR, Schaffner F. (2001) ‘Metabolic correlates of
eating behavior in severe obesity’ Int J Obes Relat Metab Disord;25 :258 –264
Le Magnen J(1973) ‘Advances in studies on the physiological control and
regulation of food intake. In Steller E. Sprague JM eds. ‘Progress in physiological
psychology’ Vol 4. New York NY. Academic press office 1973: 203-61. In Stellar
and EE Shrager Chews and swallows and the microstructure of eating Am J Clin
Nutr 1985 42: 5 973-982 [online] Available at
http://www.ajcn.org/content/42/5/973.full.pdf+html accessed on 04/01/11
Livesey G (2003) ‘Health potential of polyols as sugar replacers,
with emphasis on low glycaemic properties’. Nutrition Research
Reviews 16, 163–191.;

213
Livingstone BE, Robson PJ, Welch RW et al. (2000) Methodological issues in the
assessment of satiety. Scandinavian Journal of Nutri-tion 44: 98–103.
Malone, M.E, Appelqvist, I.A.M and Norton, I.T (2003) ‘Oral behaviour of food
hydrocolloids and emulsions. Part 1. Lubrication and depsotion considerations’
Food hydrocolloids 17: 763-773
Marshall, R. T., and W. S. Arbuckle. (1996) ‘ice Cream’. 5th ed. International
Thomson Publ., New York
Marshall, R.T., Goff, H.D., Hartel, R.W. (2003). ‘Ice Cream’ 6th edn, Kluwer
Academic/Plenum Publishers, New York.
Mattes RD, Hollis J, Hayes D et al. (2005) Appetite: measurement and
manipulation misgivings. Journal of the American Dietetic Association 105:
S87–97.
Meyer, J.E & Pudel,V (1972) ‘Experimental studies on food intake in obese and
normal weight subjects’ Journal of psychosomatic research,16,305-308 In
214
Blundell, J, DeGraff, K, Finlayson, G, Halford, J.C.G, Hetherington, M, King,N and
Stubbs, J (2009) ‘Measuring food intake, hunger, satiety and satiation in the
laboratory’ In: Allison, David B. & Baskin, Monica L (Eds.) Handbook of
Assessment Methods for Eating Behaviours and Weight-Related Problems :
Measures, Theory and Research (2nd. ed.). Sage, Newbury Park, California, pp.
283-325.
Naresh, L & Merchant, S.U (2006) ‘ Stablizier blends and their importance in the
ice cream industry- A review’ New Zeland food magazine [online] available at
http://www.lucidcolloids.com/pdf/775854685_stabilizer.pdf Accessed on 12/2/14
Opawale, F.O. & Burgess, D.J. (1998) “Influence of interfacial rheological
properties of mixed emulsifier films on the stability of water-in-oil-in-water
emulsions. Journal of Pharmacology 50, 965–973.
Pallent, J (2007) ‘SPSS Survival Manual: A step by step guide to data analysis
using SPSS’ Open University Press; 4 edition
Rea, A.C (2004) ‘screaming for ice cream: a rapidly growing market, ice cream
nevertheless faces its shares of possible demons. What will be the effect of
changing demographics on the frozen treat, and how will manufactures respond?’
215
Prepared foods; [online] Available at
http://findarticles.com/p/articles/mi_m3289/is_4_173/ai_115490578/ Accessed on
15/12/10
Reid, C.A., Johnstone, A.M & Ryan, L.M(1999) ‘what are psychometric
assessments of appetite asking? A preliminary multivariate analysis’ international
journal of obesity,3,151
Ritter RC (2004) “Gastrointestinal mechanisms of satiation for food”.
Physiology & Behavior 81: 249–73. In Benelam, B (2009) ‘ Satiation, satiety and
their effect on eating behaviour’ Nutrition Bulletin, vol 34 (2) 126-173 [online]
available at http://onlinelibrary.wiley.com/doi/10.1111/j.1467-
3010.2009.01753.x/pdf accessed on 07/01/11
Rodin J.(1992) ‘Determinants of food intake regulation in obesity’ In:
Bjorntorp P, Brodoff B, eds. Obesity. Philadelphia, PA: JB Lippincott Company; ,
pp. 220–30.
Rogers. P.J & Blundell,J.E (1979) ‘Effect of anorexic drugs on food intake and the
microstrucutre of eating in human subjects’. Psychopharmacology, 66, 159-165.
216
In Blundell, J, DeGraff, K, Finlayson, G, Halford, J.C.G, Hetherington, M, King,N
and Stubbs, J (2009) ‘Measuring food intake, hunger, satiety and satiation in the
laboratory’ In: Allison, David B. & Baskin, Monica L (Eds.) Handbook of
Assessment Methods for Eating Behaviours and Weight-Related Problems :
Measures, Theory and Research (2nd. ed.). Sage, Newbury Park, California, pp.
283-325.
Rolls BJ, Roe LS, Meengs JS. (2007) The effect of larger portion sizes on energy
intake is sustained for 11 days. Obesity;15:1535–43.
Ronteltap, A.D and Prins ,A.(1990) ‘The role of surface viscosity in gas diffusion in
aqueous foams’. II. Experimental. Colloids and Surfaces 47 pp. 285–298.
Royal College of Physicians, (2010) ‘The training of health professionals for the
prevention and treatment of overweight and obesity’ Foresight Government
office for science [online] available at http://www.rcplondon.ac.uk/professional-
Issues/Documents/Obesity-report-2010.pdf accessed on 04/01/11
RTS Resource (no date) ‘UK Consumption lags behind other countries’
[online] West Midlands. Available at http://www.rts-resource.com (Accessed
20/1/10)
217
Sastry, S. K., & Datta, A. K. (1984). Thermal properties of frozen peas, clams and
ice cream. Canadian Institute of Food Science and Technology, 17(4), 242–
246.
Schmidt, K. A., A. Lundy, J. Reynolds, and L. N. Yee (1993) ‘Carbohydrate or
protein based fat mimicker effects on ice milk properties’J. Food Sci. 58(4):761–
763, 779.
Sofjan, R.P & Hartle, R.W (2003) ‘Effects of overrun on structural and physical
characteristics of ice cream’ [online] international dairy Jorunal, Vol 14, issue 3,
255-262 Available at
http://www.sciencedirect.com/science?_ob=ArticleURL&_udi=B6T7C-4B0NY2G-
1&_user=122868&_coverDate=03%2F31%2F2004&_rdoc=1&_fmt=high&_orig=se
arch&_sort=d&_docanchor=&view=c&_searchStrId=1337883912&_rerunOrigin=go
ogle&_acct=C000010083&_version=1&_urlVersion=0&_userid=122868&md5=658
2c592bd23f003f537b22363e582c0 (Accessed on 25/4/10)
Silverstone , J.T & Stunkard, A.J (1968) ‘The anorectic effect of dexamphetamine
sulphate.’ British journal of pharmacology and chemotherapy, 33, 513-522. In
Blundell, J, DeGraff, K, Finlayson, G, Halford, J.C.G, Hetherington, M, King,N and
218
Stubbs, J (2009) ‘Measuring food intake, hunger, satiety and satiation in the
laboratory
Spitzer L & Rodin J (1981) Human eating behavior: a critical review of studies in
normal weight and overweight individuals. Appetite 2: 293–329.
Stokes, J.R, Boehm,M.W and Baier, S.K (2013) ‘Oral processing, texture and
mouthfeel: From rheology to tribology and beyond’ Current opinion in colloid
and interface science 18 349-359
Stones, M (2012) ‘ Scoop of the year: Ice cream sales top £1bn’ Article on
Food manufacture.co.uk [online] available at
http://www.foodmanufacture.co.uk/Manufacturing/Scoop-of-the-year-ice-cream-
sales-top-1bn Accessed on 14/2/14
Stubbs,R.J., Hughes,D.A, Johnstone,A.M, Rowley,E. Reid, C et al (2000) ‘The use
of visual analogue scales to assess motivation to eat in human subjects: A review
of their reliability and validity with an evelatuion of new hand held computerized
systems for temporal tracking of appetite ratings’. British journal of nutirition,
84,405-415 In Blundell, J, DeGraff, K, Finlayson, G, Halford, J.C.G, Hetherington,
M, King,N and Stubbs, J (2009) ‘Measuring food intake, hunger, satiety and
219
satiation in the laboratory’ In: Allison, David B. & Baskin, Monica L (Eds.)
Handbook of Assessment Methods for Eating Behaviours and Weight-Related
Problems : Measures, Theory and Research (2nd. ed.). Sage, Newbury Park,
California, pp. 283-325.
Subramanian, R., Muthukumarappan, K., and Gunasekaran, S. (2006) ‘Linar
viscoelastic properties of regular and reduced fat pasturised process cheese
during heating and cooling’ Intenational journal of food properties 9: 377-393.
Tharp, B.W & Young, S.L(2012) ‘Tharp & Young on Ice Cream: An Encyclopedic
Guide to Ice Cream Science and Technology’ DEStech Publications
University of Guelph (2009) ‘Homogenisation of mix’ [online] Avaliable from
https://www.uoguelph.ca/foodscience/dairy-science-and-technology/dairy-
products/ice-cream/ice-cream-manufacture/homogenization (Accessed 20/2/13)
Van Aken, G.A (2013) ‘Acoustic emission measurement of rubbing and tapping
contacts of skin and tongue surfaces in relation to tactile perception’ Food
hydrocolloids Vol 31, Issue 2 [online] available at
http://www.sciencedirect.com.ezproxye.bham.ac.uk/science/article/pii/S0268
005X12002858?np=y Accessed on 10/2/14
220
Walstra , P (1996) ‘Dispersed systems: basic consideration’ O.R. Fennema,
Editor, Food chemistry 3d Marcel Dekker, New York,pp. 95–155.
Weenen, H, Stafleu, A., & de Graaf, C (2005) ‘Dynamic aspects of liking: Post
prandial persistence of sensory specific satiety’ Food quality and preference,
16,528-535 [online] available at
http://cat.inist.fr/?aModele=afficheN&cpsidt=16784601 accessed on 07/01/11
Westerterp-Plantenga, M. S., Wouters, L. & ten Hoor, F. (1991). Restrained
eating, obesity, and cumulative food intake curves during four-course meals.
Appetite 16, 149-158. In Mela. D (1996) ‘Eating behaviour, food preferences and
dietary intake in relation to obesity and body weight status’ Proceedings of the
nutrition society,55.803-816 [online] available at
http://journals.cambridge.org/download.php?file=%2FPNS%2FPNS55_03%2FS00
29665196000250a.pdf&code=862ff52782959fb4bcc11dafcdd37ae9 accessed on
08/01/11
Westerterp-Plantenga, M. S. (2000). Eating behavior in humans, character- ized
by cumulative food intake curves—A review. Neuroscience and Biobehavioral
Reviews, 24, 239–248.
221
Wildmoser, H., J. Sheiwiller, and E. J. Windhab (2004) ‘Impact of disperse
microstructure on rheology and quality aspects of ice cream’ Lebensm. Wiss.
Technol. 37:881–891
Willemijn M. Vermeer, Esther Alting, Ingrid H. M. Steenhuis, and Jacob C. Seidell
(2009)’Value for money or making the healthy choice: the impact of proportional
pricing on consumers’ portion size choices’ Eur J Public Health (2010) 20(1): 65-
69 [online] Available at
http://eurpub.oxfordjournals.org/content/20/1/65.full.pdf+html Accessed on
03/01/11
Yeomans. M.R (1996) ‘Palatability and the microstructure of feeding in humans:
the appetizer effect’. Appetite,27,119-133
Yeomans MR, Gray RW, Mitchell CJ et al. (1997) Independent effects of
palatability and within-meal pauses on intake and subjective appetite in human
volunteers. Appetite 29: 61–76.
Yeomans MR (1998) Taste, palatability and the control of appetite. Proceedings
of the Nutrition Society 57: 609–15.
222
Yeomans, M.R (2000) ‘Ratings changes over the course of meals: what do they
tell us about motivation to eat?’ Neuroscience and biobehavioural reviews, 24,
249-259
Yilsay, T,O; Yilzman, L; Bayizit, A.A (2005) ‘The effect of using whey protein fat
replacer on textural and sensory charatcerisation of low fat vanilla ice cream’
European Food Research and Technology222(1):171-175. [online] available at
http://www.researchgate.net/publication/226950626_The_effect_of_using_a_whey
_protein_fat_replacer_on_textural_and_sensory_characteristics_of_low-
fat_vanilla_ice_cream Accessed on 14/2/14
Zijlstra, N., Mars, M., de Wijk,R.A et al (2008) ‘The effect of viscosity on ad libitum
food intake’ International Journal of obesity,34,676-683.
Zumbe, A., Lee, A. and Storey, D. (2001) ‘Polyols in confectionery: the route to
sugar-free, reduced sugar, and reduced calorie confectionery’ Brit. J. Nutr.
85(Suppl 1), S31–S45.