microstructurally mediated changes in fracture characteristics for electrochemically hydrogenated...
TRANSCRIPT
Materials Performance andCharacterization
Mobbassar Hassan Sk1 and Ruel A. Overfelt2
DOI: 10.1520/MPC20140026
MicrostructurallyMediated Changesin FractureCharacteristics forElectrochemicallyHydrogenated4340 Steel
VOL. 4 / NO. 2 / 2015
Mobbassar Hassan Sk1 and Ruel A. Overfelt2
Microstructurally Mediated Changesin Fracture Characteristics forElectrochemically Hydrogenated4340 Steel
Reference
Hassan Sk, Mobbassar and Overfelt, Ruel A., “Microstructurally Mediated Changes
in Fracture Characteristics for Electrochemically Hydrogenated 4340 Steel,” Materials
Performance and Characterization, Vol. 4, No. 2, 2015, pp. 68–83, doi:10.1520/
MPC20140026. ISSN 2165-3992
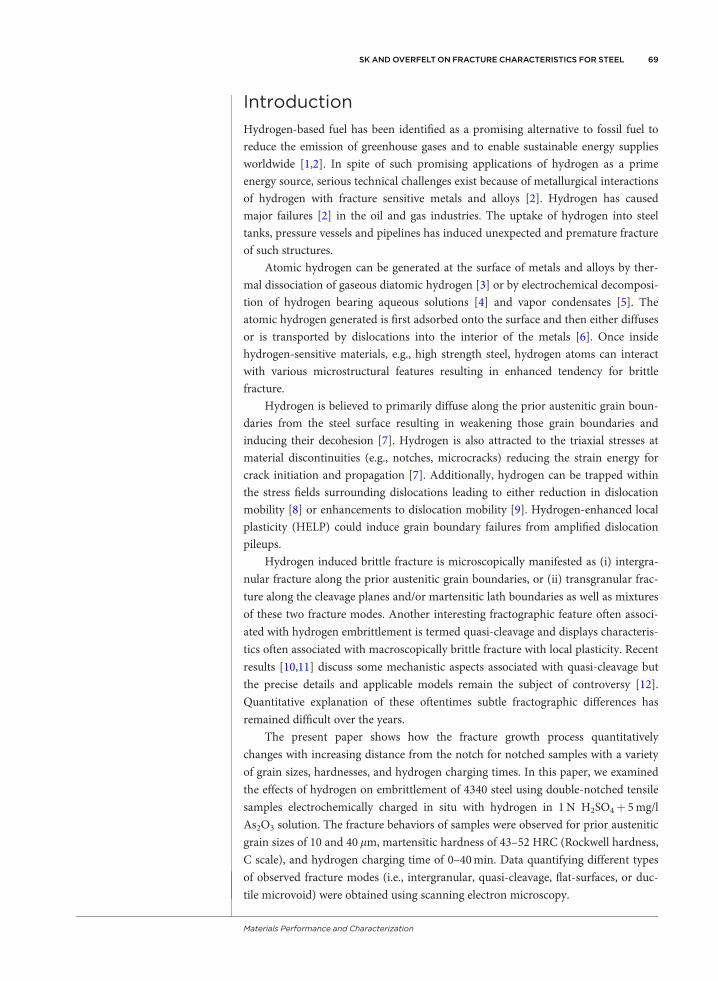
ABSTRACT
The effect of hydrogen on the fracture characteristics of low alloy 4340 steel
was studied using double-notched tensile samples electrochemically charged
in situ with hydrogen in 1 N H2SO4þ 5 mg/l As2O3 solution. Fracture behaviors
of samples with prior austenitic grain sizes of 10 and 40 lm and martensitic
hardness of 43–52 HRC (Rockwell hardness, C scale) were examined after
hydrogen charging times of 0–40 min. As expected, increases in hydrogen
charging time and hardness resulted in decreased failure strains and decreased
evidence of ductile fracture. Harder samples showed predominant
intergranular fracture close to the notch and a combination of ductile and flat
surfaces away from the notch. Softer samples showed mixed mode
intergranular and quasi-cleavage fracture close to the notch and predominant
ductile fracture as distance from the notch increased.
Keywords
hydrogen embrittlement, intergranular fracture, quasi-cleavage, fracture mode change,
prior austenitic grain size, 4340 steel, electrolytic hydrogen charging
Manuscript received February 18,
2014; accepted for publication
June 26, 2014; published online
August 28, 2014.
1
National Center of Excellence
for Research in the Intermodal
Transport Environment,
Materials Engineering, Auburn
Univ., Auburn, AL 36849,
United States of America,
e-mail: [email protected]
2
National Center of Excellence
for Research in the Intermodal
Transport Environment,
Materials Engineering, Auburn
Univ., Auburn, AL 36849, United
States of America,
e-mail: [email protected]
Copyright VC 2014 by ASTM International, 100 Barr Harbor Drive, P.O. Box C700, West Conshohocken, PA 19428-2959 68
Materials Performance and Characterization
doi:10.1520/MPC20140026 / Vol. 4 / No. 2 / 2015 / available online at www.astm.org
Introduction
Hydrogen-based fuel has been identified as a promising alternative to fossil fuel to
reduce the emission of greenhouse gases and to enable sustainable energy supplies
worldwide [1,2]. In spite of such promising applications of hydrogen as a prime
energy source, serious technical challenges exist because of metallurgical interactions
of hydrogen with fracture sensitive metals and alloys [2]. Hydrogen has caused
major failures [2] in the oil and gas industries. The uptake of hydrogen into steel
tanks, pressure vessels and pipelines has induced unexpected and premature fracture
of such structures.
Atomic hydrogen can be generated at the surface of metals and alloys by ther-
mal dissociation of gaseous diatomic hydrogen [3] or by electrochemical decomposi-
tion of hydrogen bearing aqueous solutions [4] and vapor condensates [5]. The
atomic hydrogen generated is first adsorbed onto the surface and then either diffuses
or is transported by dislocations into the interior of the metals [6]. Once inside
hydrogen-sensitive materials, e.g., high strength steel, hydrogen atoms can interact
with various microstructural features resulting in enhanced tendency for brittle
fracture.
Hydrogen is believed to primarily diffuse along the prior austenitic grain boun-
daries from the steel surface resulting in weakening those grain boundaries and
inducing their decohesion [7]. Hydrogen is also attracted to the triaxial stresses at
material discontinuities (e.g., notches, microcracks) reducing the strain energy for
crack initiation and propagation [7]. Additionally, hydrogen can be trapped within
the stress fields surrounding dislocations leading to either reduction in dislocation
mobility [8] or enhancements to dislocation mobility [9]. Hydrogen-enhanced local
plasticity (HELP) could induce grain boundary failures from amplified dislocation
pileups.
Hydrogen induced brittle fracture is microscopically manifested as (i) intergra-
nular fracture along the prior austenitic grain boundaries, or (ii) transgranular frac-
ture along the cleavage planes and/or martensitic lath boundaries as well as mixtures
of these two fracture modes. Another interesting fractographic feature often associ-
ated with hydrogen embrittlement is termed quasi-cleavage and displays characteris-
tics often associated with macroscopically brittle fracture with local plasticity. Recent
results [10,11] discuss some mechanistic aspects associated with quasi-cleavage but
the precise details and applicable models remain the subject of controversy [12].
Quantitative explanation of these oftentimes subtle fractographic differences has
remained difficult over the years.
The present paper shows how the fracture growth process quantitatively
changes with increasing distance from the notch for notched samples with a variety
of grain sizes, hardnesses, and hydrogen charging times. In this paper, we examined
the effects of hydrogen on embrittlement of 4340 steel using double-notched tensile
samples electrochemically charged in situ with hydrogen in 1N H2SO4þ 5mg/l
As2O3 solution. The fracture behaviors of samples were observed for prior austenitic
grain sizes of 10 and 40 lm, martensitic hardness of 43–52 HRC (Rockwell hardness,
C scale), and hydrogen charging time of 0–40min. Data quantifying different types
of observed fracture modes (i.e., intergranular, quasi-cleavage, flat-surfaces, or duc-
tile microvoid) were obtained using scanning electron microscopy.
SK AND OVERFELT ON FRACTURE CHARACTERISTICS FOR STEEL 69
Materials Performance and Characterization
Materials and Methods
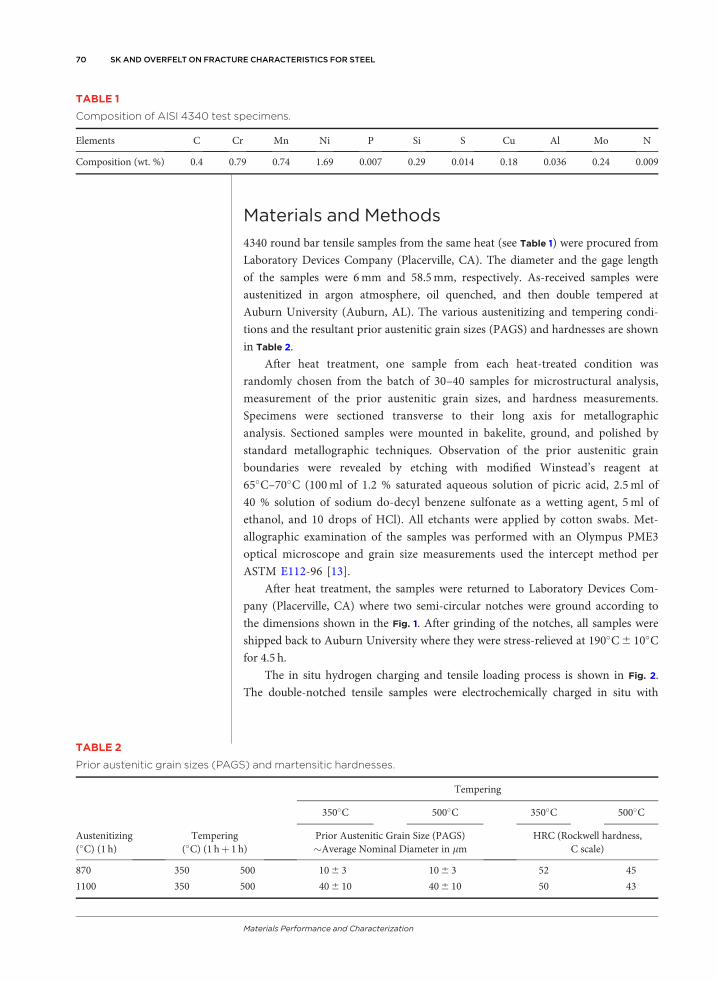
4340 round bar tensile samples from the same heat (see Table 1) were procured from
Laboratory Devices Company (Placerville, CA). The diameter and the gage length
of the samples were 6mm and 58.5mm, respectively. As-received samples were
austenitized in argon atmosphere, oil quenched, and then double tempered at
Auburn University (Auburn, AL). The various austenitizing and tempering condi-
tions and the resultant prior austenitic grain sizes (PAGS) and hardnesses are shown
in Table 2.
After heat treatment, one sample from each heat-treated condition was
randomly chosen from the batch of 30–40 samples for microstructural analysis,
measurement of the prior austenitic grain sizes, and hardness measurements.
Specimens were sectioned transverse to their long axis for metallographic
analysis. Sectioned samples were mounted in bakelite, ground, and polished by
standard metallographic techniques. Observation of the prior austenitic grain
boundaries were revealed by etching with modified Winstead’s reagent at
65�C–70�C (100ml of 1.2 % saturated aqueous solution of picric acid, 2.5ml of
40 % solution of sodium do-decyl benzene sulfonate as a wetting agent, 5ml of
ethanol, and 10 drops of HCl). All etchants were applied by cotton swabs. Met-
allographic examination of the samples was performed with an Olympus PME3
optical microscope and grain size measurements used the intercept method per
ASTM E112-96 [13].
After heat treatment, the samples were returned to Laboratory Devices Com-
pany (Placerville, CA) where two semi-circular notches were ground according to
the dimensions shown in the Fig. 1. After grinding of the notches, all samples were
shipped back to Auburn University where they were stress-relieved at 190�C6 10�C
for 4.5 h.
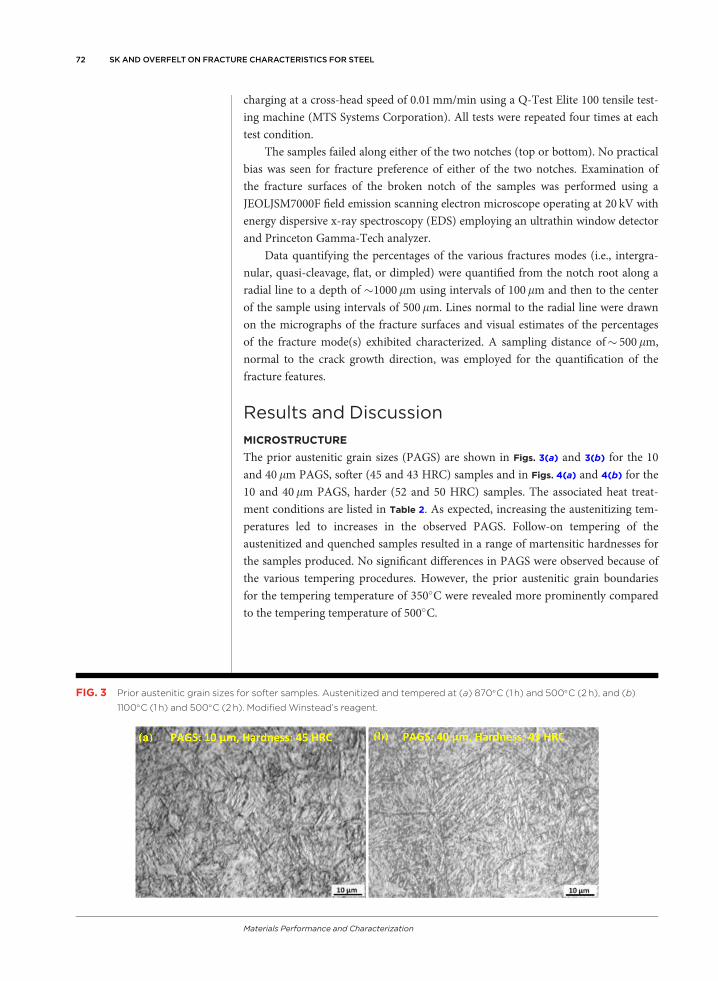
The in situ hydrogen charging and tensile loading process is shown in Fig. 2.
The double-notched tensile samples were electrochemically charged in situ with
TABLE 1
Composition of AISI 4340 test specimens.
Elements C Cr Mn Ni P Si S Cu Al Mo N
Composition (wt. %) 0.4 0.79 0.74 1.69 0.007 0.29 0.014 0.18 0.036 0.24 0.009
TABLE 2
Prior austenitic grain sizes (PAGS) and martensitic hardnesses.
Tempering
350�C 500�C 350�C 500�C
Austenitizing(�C) (1 h)
Tempering(�C) (1 hþ 1 h)
Prior Austenitic Grain Size (PAGS)�Average Nominal Diameter in lm
HRC (Rockwell hardness,C scale)
870 350 500 106 3 106 3 52 45
1100 350 500 406 10 406 10 50 43
70 SK AND OVERFELT ON FRACTURE CHARACTERISTICS FOR STEEL
Materials Performance and Characterization
hydrogen in 1N H2SO4þ 5ml/g As2O3 solution for different time durations (0, 5,
10, 20, 30, and 40min) with a current density of 10mA/cm2 (characterized with
respect to the surface area of the sample exposed to electrolyte). 99.95 % pure plati-
num wire with nominal diameter of 0.5mm (from Alfa Acer) was used as the anode.
The samples were always located at the central position of the platinum coil with a
coil diameter of approximately 4 cm. To facilitate uniformity in this arrangement
and maintain a constant distance between the platinum coil and the sample, the
location of the platinum wire was permanently established by winding the wire
against a fixed support. To maintain electrical isolation between the sample and the
fixture of the Q-Test machine, the portions of the fixtures (bolt heads) inside the
electrolyte were sealed by using electrolyte-resistant and leak-resistant silicone
rubber sealant. After the samples were screwed into the fixture thread, junctions
between the sample and the bolt heads were also sealed using RTV silicone rubber.
This arrangement ensured the physical as well as electrical isolation of electrolyte
from the tensile machine and the entire electrochemical charging arrangement was
isolated from the tensile machine.
After electrochemical charging was completed, the electrolyte was quickly
removed from the charging cell and tensile testing started within 5 s from the end of
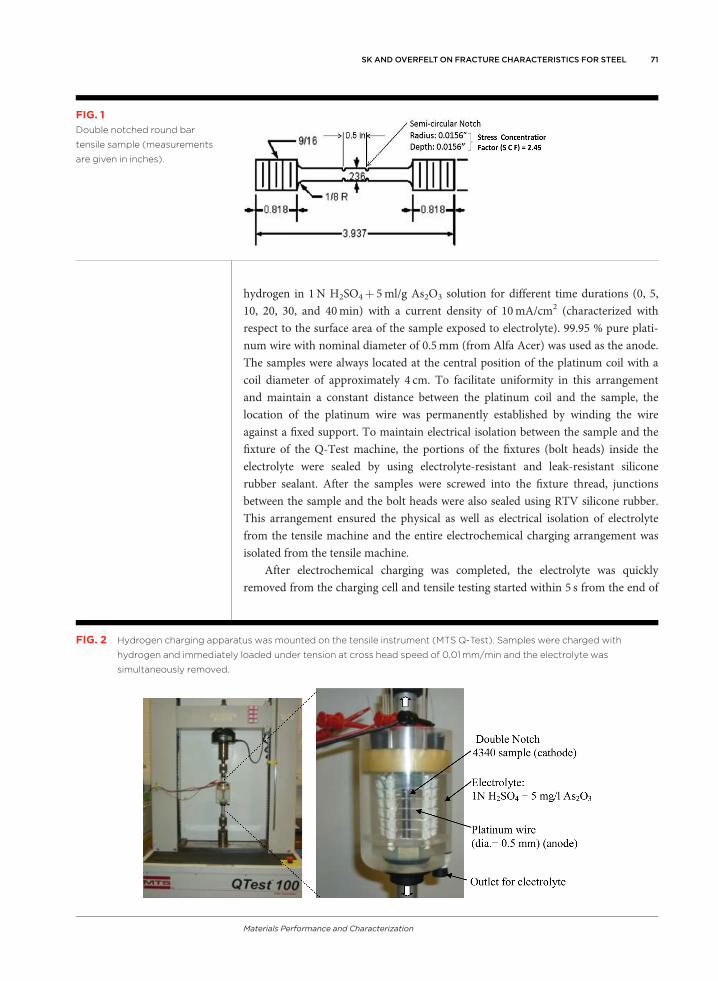
FIG. 1
Double notched round bar
tensile sample (measurements
are given in inches).
FIG. 2 Hydrogen charging apparatus was mounted on the tensile instrument (MTS Q-Test). Samples were charged with
hydrogen and immediately loaded under tension at cross head speed of 0.01 mm/min and the electrolyte was
simultaneously removed.
SK AND OVERFELT ON FRACTURE CHARACTERISTICS FOR STEEL 71
Materials Performance and Characterization
charging at a cross-head speed of 0.01mm/min using a Q-Test Elite 100 tensile test-
ing machine (MTS Systems Corporation). All tests were repeated four times at each
test condition.
The samples failed along either of the two notches (top or bottom). No practical
bias was seen for fracture preference of either of the two notches. Examination of
the fracture surfaces of the broken notch of the samples was performed using a
JEOLJSM7000F field emission scanning electron microscope operating at 20 kV with
energy dispersive x-ray spectroscopy (EDS) employing an ultrathin window detector
and Princeton Gamma-Tech analyzer.
Data quantifying the percentages of the various fractures modes (i.e., intergra-
nular, quasi-cleavage, flat, or dimpled) were quantified from the notch root along a
radial line to a depth of �1000 lm using intervals of 100lm and then to the center
of the sample using intervals of 500lm. Lines normal to the radial line were drawn
on the micrographs of the fracture surfaces and visual estimates of the percentages
of the fracture mode(s) exhibited characterized. A sampling distance of� 500lm,
normal to the crack growth direction, was employed for the quantification of the
fracture features.
Results and Discussion
MICROSTRUCTURE
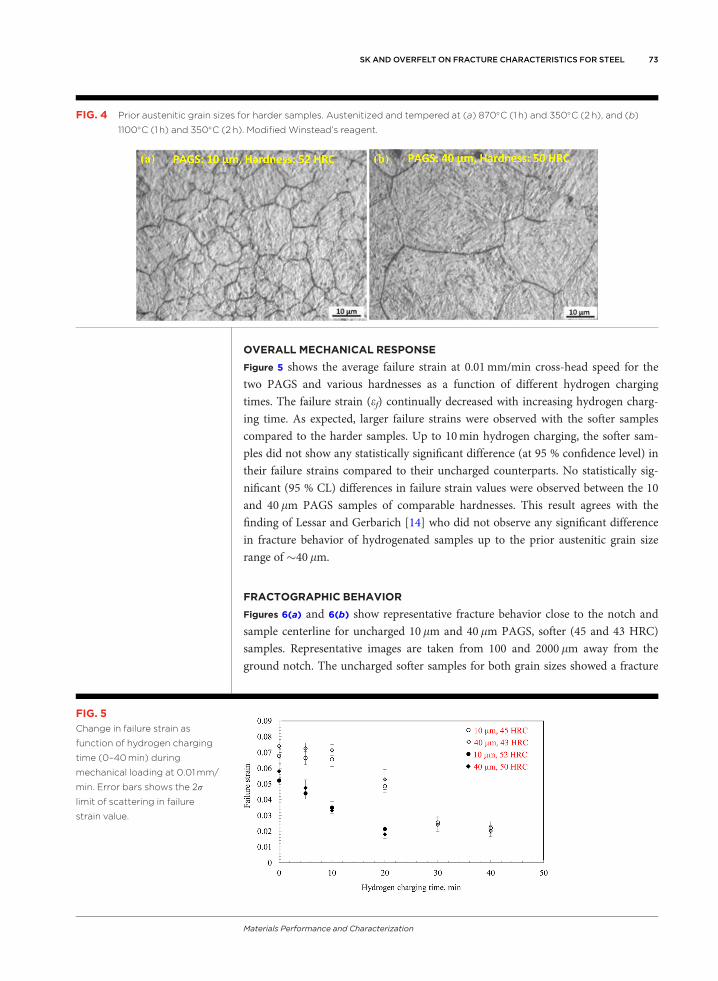
The prior austenitic grain sizes (PAGS) are shown in Figs. 3(a) and 3(b) for the 10
and 40 lm PAGS, softer (45 and 43 HRC) samples and in Figs. 4(a) and 4(b) for the
10 and 40lm PAGS, harder (52 and 50 HRC) samples. The associated heat treat-
ment conditions are listed in Table 2. As expected, increasing the austenitizing tem-
peratures led to increases in the observed PAGS. Follow-on tempering of the
austenitized and quenched samples resulted in a range of martensitic hardnesses for
the samples produced. No significant differences in PAGS were observed because of
the various tempering procedures. However, the prior austenitic grain boundaries
for the tempering temperature of 350�C were revealed more prominently compared
to the tempering temperature of 500�C.
FIG. 3 Prior austenitic grain sizes for softer samples. Austenitized and tempered at (a) 870�C (1 h) and 500�C (2 h), and (b)
1100�C (1 h) and 500�C (2 h). Modified Winstead’s reagent.
72 SK AND OVERFELT ON FRACTURE CHARACTERISTICS FOR STEEL
Materials Performance and Characterization
OVERALL MECHANICAL RESPONSE
Figure 5 shows the average failure strain at 0.01mm/min cross-head speed for the
two PAGS and various hardnesses as a function of different hydrogen charging
times. The failure strain (ef) continually decreased with increasing hydrogen charg-
ing time. As expected, larger failure strains were observed with the softer samples
compared to the harder samples. Up to 10min hydrogen charging, the softer sam-
ples did not show any statistically significant difference (at 95 % confidence level) in
their failure strains compared to their uncharged counterparts. No statistically sig-
nificant (95 % CL) differences in failure strain values were observed between the 10
and 40 lm PAGS samples of comparable hardnesses. This result agrees with the
finding of Lessar and Gerbarich [14] who did not observe any significant difference
in fracture behavior of hydrogenated samples up to the prior austenitic grain size
range of �40lm.
FRACTOGRAPHIC BEHAVIOR
Figures 6(a) and 6(b) show representative fracture behavior close to the notch and
sample centerline for uncharged 10lm and 40 lm PAGS, softer (45 and 43 HRC)
samples. Representative images are taken from 100 and 2000 lm away from the
ground notch. The uncharged softer samples for both grain sizes showed a fracture
FIG. 4 Prior austenitic grain sizes for harder samples. Austenitized and tempered at (a) 870�C (1 h) and 350�C (2 h), and (b)
1100�C (1 h) and 350�C (2 h). Modified Winstead’s reagent.
FIG. 5
Change in failure strain as
function of hydrogen charging
time (0–40 min) during
mechanical loading at 0.01 mm/
min. Error bars shows the 2r
limit of scattering in failure
strain value.
SK AND OVERFELT ON FRACTURE CHARACTERISTICS FOR STEEL 73
Materials Performance and Characterization
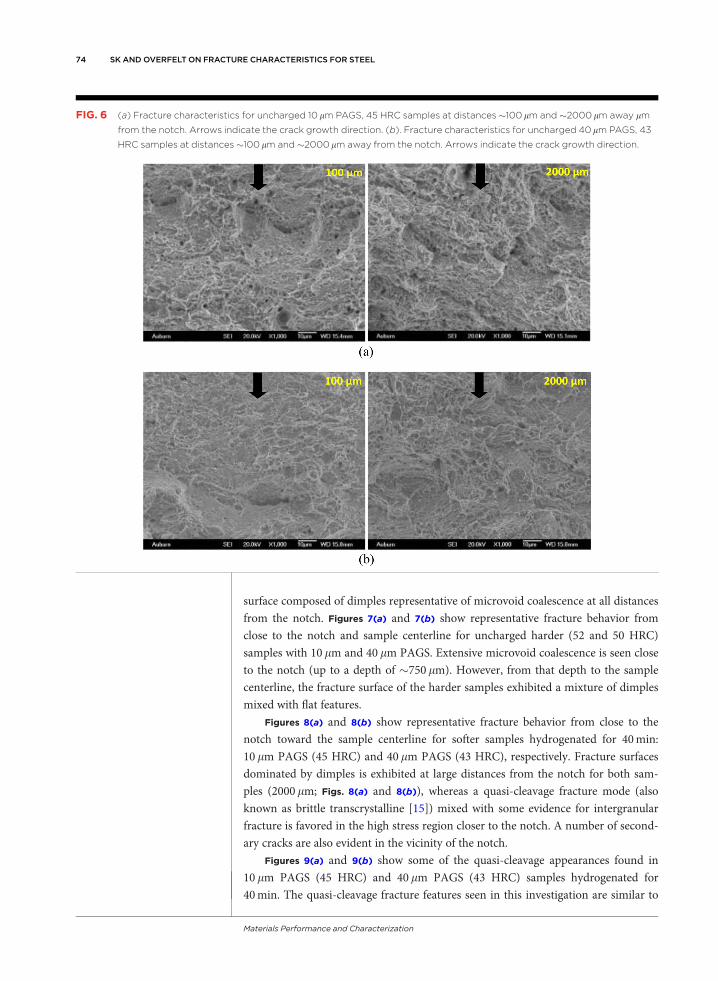
surface composed of dimples representative of microvoid coalescence at all distances
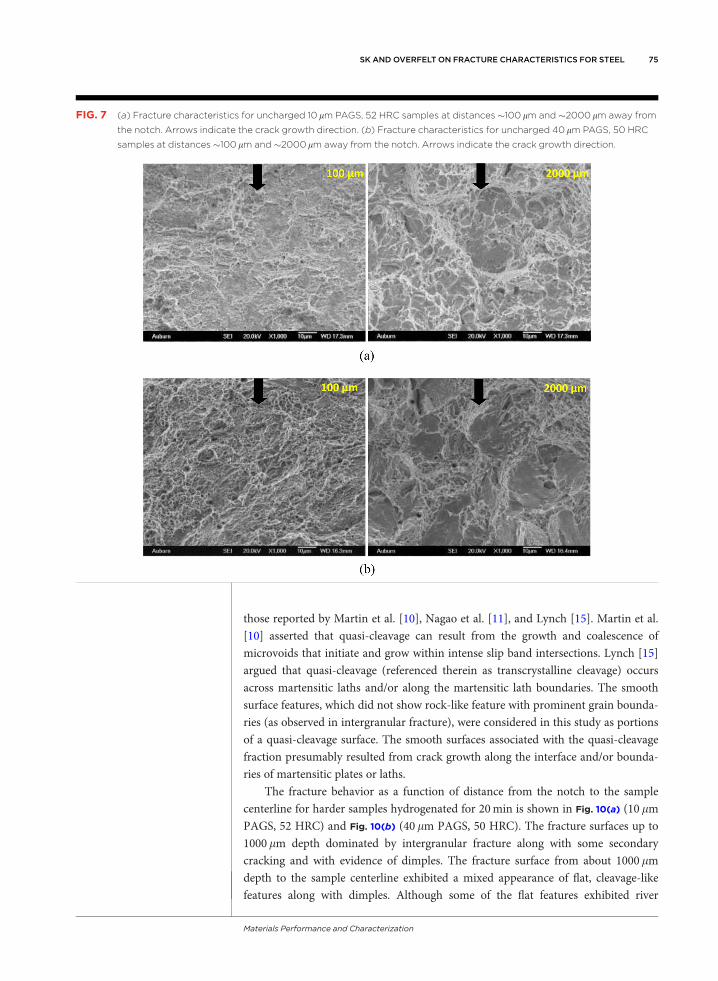
from the notch. Figures 7(a) and 7(b) show representative fracture behavior from
close to the notch and sample centerline for uncharged harder (52 and 50 HRC)
samples with 10lm and 40 lm PAGS. Extensive microvoid coalescence is seen close
to the notch (up to a depth of �750lm). However, from that depth to the sample
centerline, the fracture surface of the harder samples exhibited a mixture of dimples
mixed with flat features.
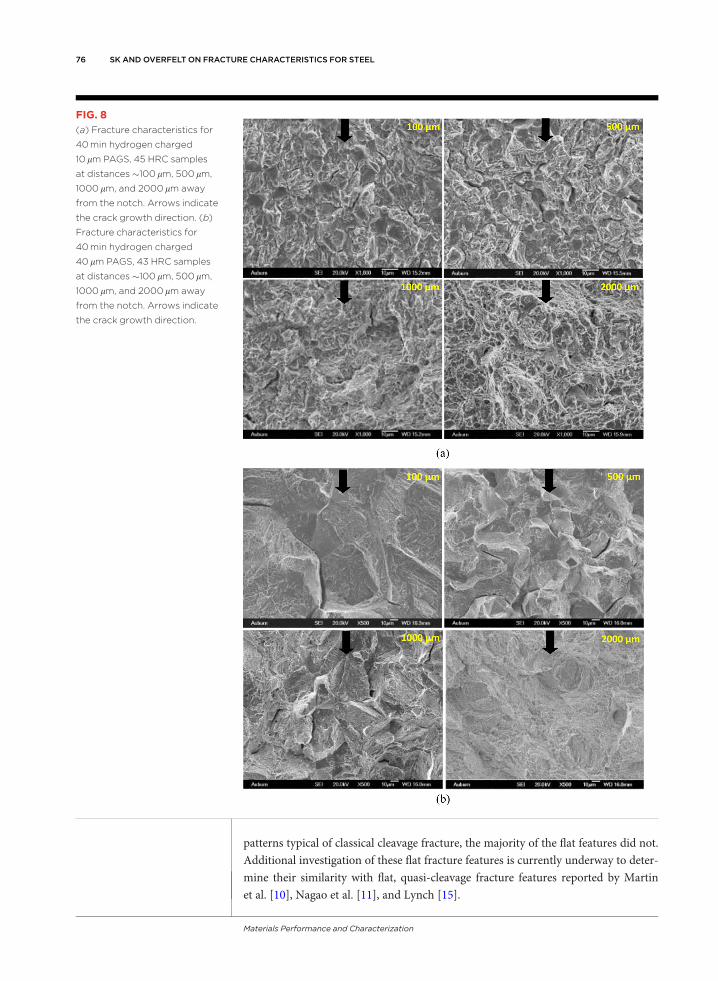
Figures 8(a) and 8(b) show representative fracture behavior from close to the
notch toward the sample centerline for softer samples hydrogenated for 40min:
10lm PAGS (45 HRC) and 40 lm PAGS (43 HRC), respectively. Fracture surfaces
dominated by dimples is exhibited at large distances from the notch for both sam-
ples (2000lm; Figs. 8(a) and 8(b)), whereas a quasi-cleavage fracture mode (also
known as brittle transcrystalline [15]) mixed with some evidence for intergranular
fracture is favored in the high stress region closer to the notch. A number of second-
ary cracks are also evident in the vicinity of the notch.
Figures 9(a) and 9(b) show some of the quasi-cleavage appearances found in
10lm PAGS (45 HRC) and 40lm PAGS (43 HRC) samples hydrogenated for
40min. The quasi-cleavage fracture features seen in this investigation are similar to
FIG. 6 (a) Fracture characteristics for uncharged 10 lm PAGS, 45 HRC samples at distances �100 lm and �2000 lm away lm
from the notch. Arrows indicate the crack growth direction. (b). Fracture characteristics for uncharged 40 lm PAGS, 43
HRC samples at distances �100 lm and �2000 lm away from the notch. Arrows indicate the crack growth direction.
74 SK AND OVERFELT ON FRACTURE CHARACTERISTICS FOR STEEL
Materials Performance and Characterization
those reported by Martin et al. [10], Nagao et al. [11], and Lynch [15]. Martin et al.
[10] asserted that quasi-cleavage can result from the growth and coalescence of
microvoids that initiate and grow within intense slip band intersections. Lynch [15]
argued that quasi-cleavage (referenced therein as transcrystalline cleavage) occurs
across martensitic laths and/or along the martensitic lath boundaries. The smooth
surface features, which did not show rock-like feature with prominent grain bounda-
ries (as observed in intergranular fracture), were considered in this study as portions
of a quasi-cleavage surface. The smooth surfaces associated with the quasi-cleavage
fraction presumably resulted from crack growth along the interface and/or bounda-
ries of martensitic plates or laths.
The fracture behavior as a function of distance from the notch to the sample
centerline for harder samples hydrogenated for 20min is shown in Fig. 10(a) (10 lm
PAGS, 52 HRC) and Fig. 10(b) (40lm PAGS, 50 HRC). The fracture surfaces up to
1000lm depth dominated by intergranular fracture along with some secondary
cracking and with evidence of dimples. The fracture surface from about 1000lm
depth to the sample centerline exhibited a mixed appearance of flat, cleavage-like
features along with dimples. Although some of the flat features exhibited river
FIG. 7 (a) Fracture characteristics for uncharged 10 lm PAGS, 52 HRC samples at distances �100 lm and �2000 lm away from
the notch. Arrows indicate the crack growth direction. (b) Fracture characteristics for uncharged 40 lm PAGS, 50 HRC
samples at distances �100 lm and �2000 lm away from the notch. Arrows indicate the crack growth direction.
SK AND OVERFELT ON FRACTURE CHARACTERISTICS FOR STEEL 75
Materials Performance and Characterization
patterns typical of classical cleavage fracture, the majority of the flat features did not.
Additional investigation of these flat fracture features is currently underway to deter-
mine their similarity with flat, quasi-cleavage fracture features reported by Martin
et al. [10], Nagao et al. [11], and Lynch [15].
FIG. 8
(a) Fracture characteristics for
40 min hydrogen charged
10 lm PAGS, 45 HRC samples
at distances �100 lm, 500 lm,
1000 lm, and 2000 lm away
from the notch. Arrows indicate
the crack growth direction. (b)
Fracture characteristics for
40 min hydrogen charged
40 lm PAGS, 43 HRC samples
at distances �100 lm, 500 lm,
1000 lm, and 2000 lm away
from the notch. Arrows indicate
the crack growth direction.
76 SK AND OVERFELT ON FRACTURE CHARACTERISTICS FOR STEEL
Materials Performance and Characterization
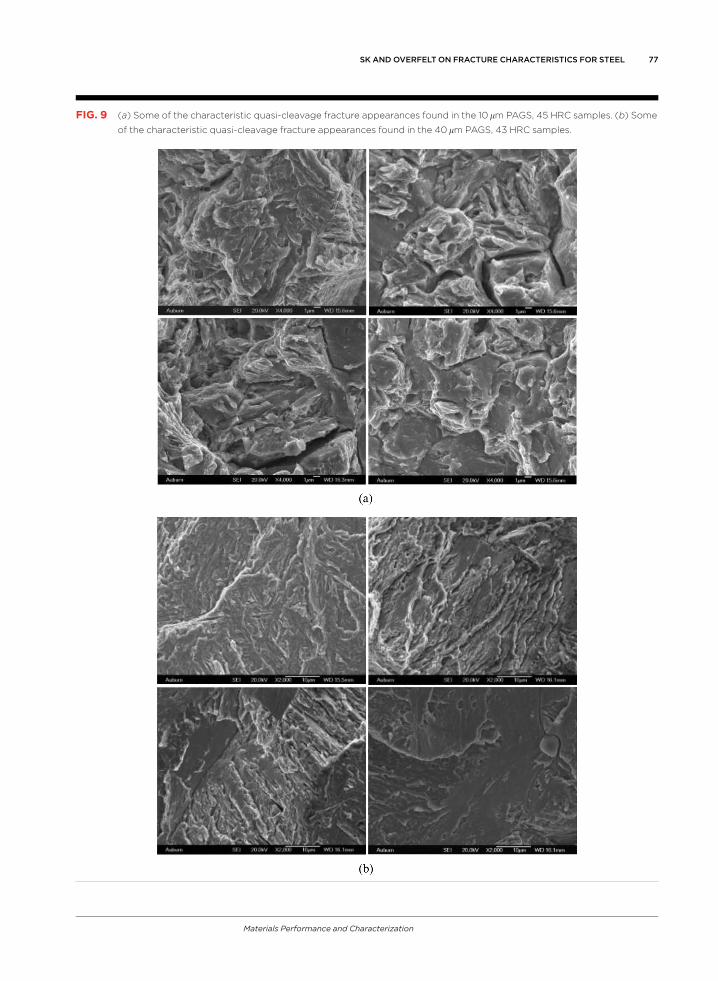
FIG. 9 (a) Some of the characteristic quasi-cleavage fracture appearances found in the 10 lm PAGS, 45 HRC samples. (b) Some
of the characteristic quasi-cleavage fracture appearances found in the 40 lm PAGS, 43 HRC samples.
SK AND OVERFELT ON FRACTURE CHARACTERISTICS FOR STEEL 77
Materials Performance and Characterization
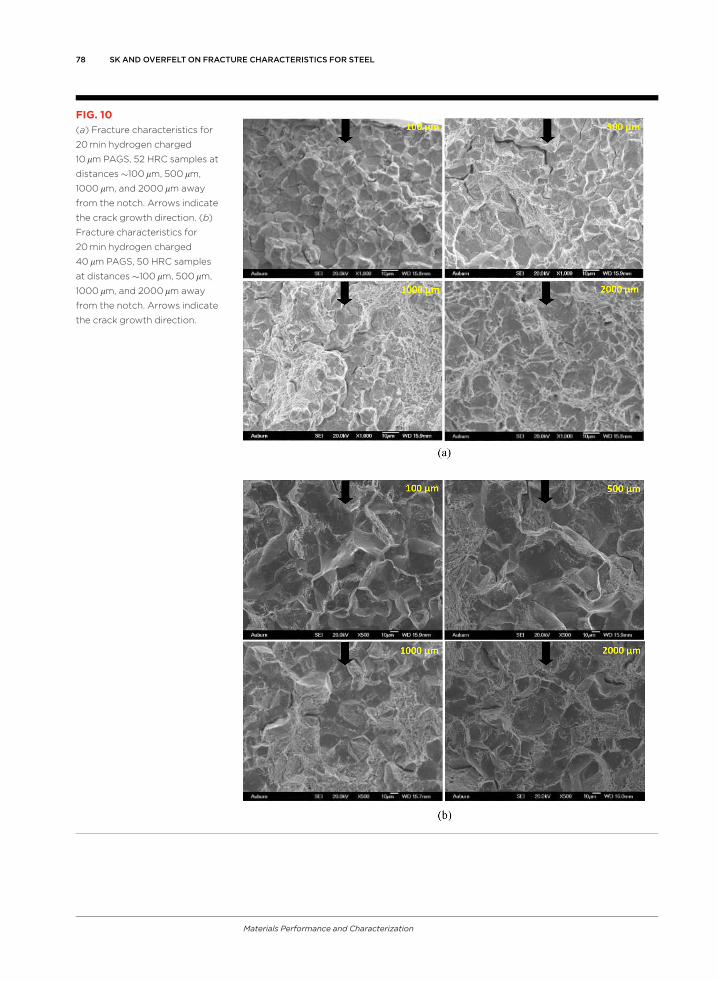
FIG. 10
(a) Fracture characteristics for
20 min hydrogen charged
10 lm PAGS, 52 HRC samples at
distances �100 lm, 500 lm,
1000 lm, and 2000 lm away
from the notch. Arrows indicate
the crack growth direction. (b)
Fracture characteristics for
20 min hydrogen charged
40 lm PAGS, 50 HRC samples
at distances �100 lm, 500 lm,
1000 lm, and 2000 lm away
from the notch. Arrows indicate
the crack growth direction.
78 SK AND OVERFELT ON FRACTURE CHARACTERISTICS FOR STEEL
Materials Performance and Characterization
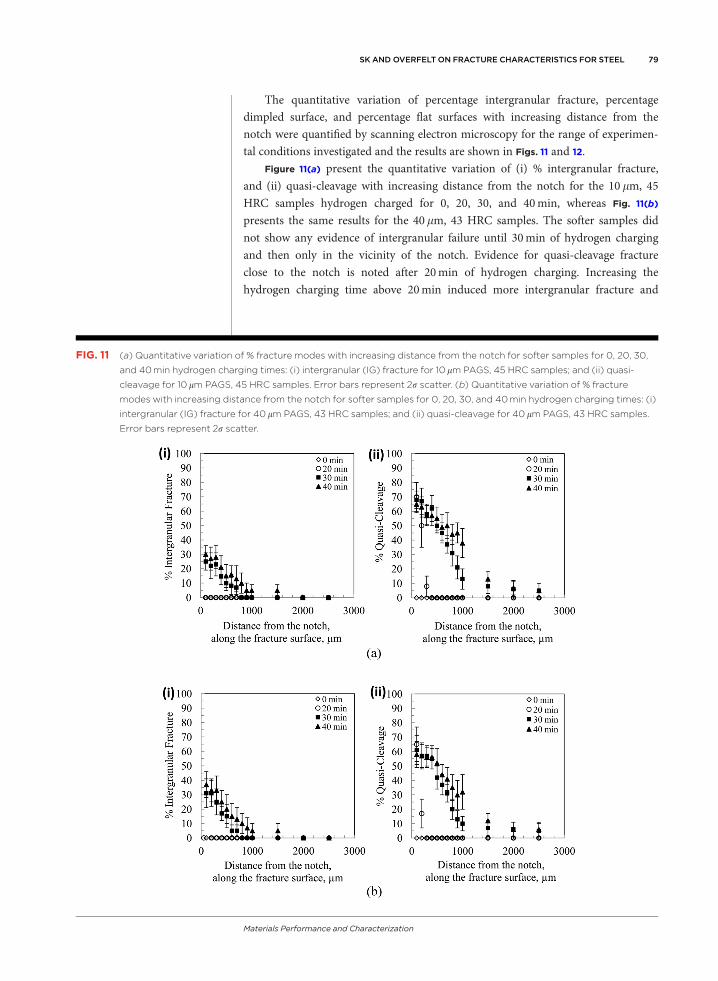
The quantitative variation of percentage intergranular fracture, percentage
dimpled surface, and percentage flat surfaces with increasing distance from the
notch were quantified by scanning electron microscopy for the range of experimen-
tal conditions investigated and the results are shown in Figs. 11 and 12.
Figure 11(a) present the quantitative variation of (i) % intergranular fracture,
and (ii) quasi-cleavage with increasing distance from the notch for the 10 lm, 45
HRC samples hydrogen charged for 0, 20, 30, and 40min, whereas Fig. 11(b)
presents the same results for the 40lm, 43 HRC samples. The softer samples did
not show any evidence of intergranular failure until 30min of hydrogen charging
and then only in the vicinity of the notch. Evidence for quasi-cleavage fracture
close to the notch is noted after 20min of hydrogen charging. Increasing the
hydrogen charging time above 20min induced more intergranular fracture and
FIG. 11 (a) Quantitative variation of % fracture modes with increasing distance from the notch for softer samples for 0, 20, 30,
and 40 min hydrogen charging times: (i) intergranular (IG) fracture for 10 lm PAGS, 45 HRC samples; and (ii) quasi-
cleavage for 10 lm PAGS, 45 HRC samples. Error bars represent 2r scatter. (b) Quantitative variation of % fracture
modes with increasing distance from the notch for softer samples for 0, 20, 30, and 40 min hydrogen charging times: (i)
intergranular (IG) fracture for 40 lm PAGS, 43 HRC samples; and (ii) quasi-cleavage for 40 lm PAGS, 43 HRC samples.
Error bars represent 2r scatter.
SK AND OVERFELT ON FRACTURE CHARACTERISTICS FOR STEEL 79
Materials Performance and Characterization
quasi-cleavage. However, quasi-cleavage was predominant. The intensity and
depth of both these fracture modes away from the notch was generally observed
to increase with increasing charging time. The softer samples, unlike their harder
counterparts, did not show any featureless flat surfaces away from the notch and
rather showed fracture involving predominant microvoid coalescence. Additional
investigation of these fracture features is currently underway.
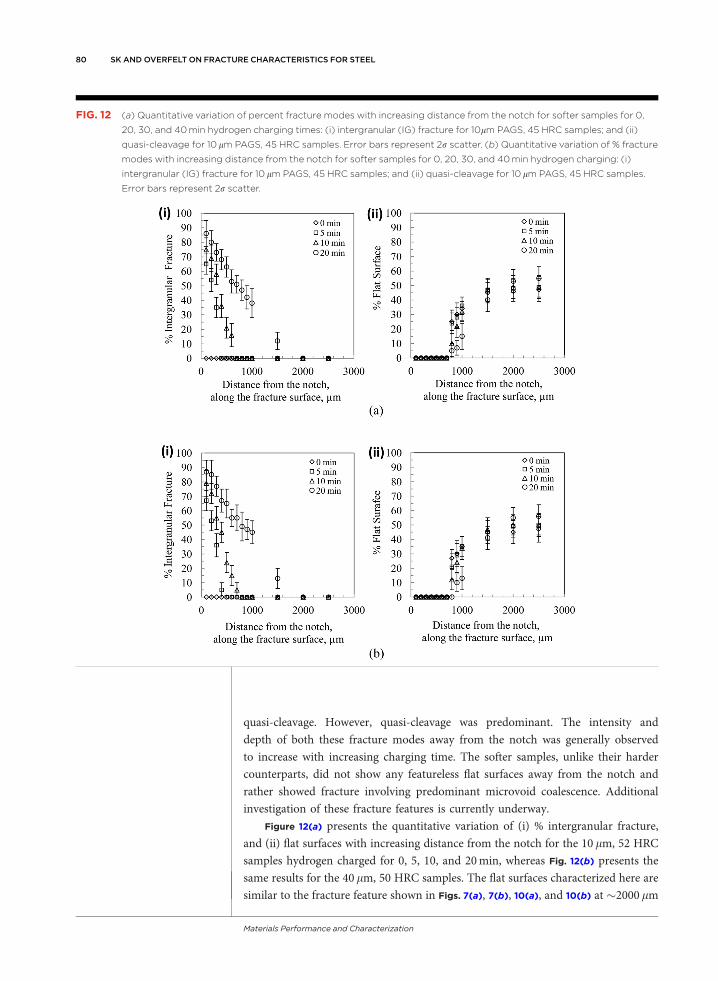
Figure 12(a) presents the quantitative variation of (i) % intergranular fracture,
and (ii) flat surfaces with increasing distance from the notch for the 10 lm, 52 HRC
samples hydrogen charged for 0, 5, 10, and 20min, whereas Fig. 12(b) presents the
same results for the 40lm, 50 HRC samples. The flat surfaces characterized here are
similar to the fracture feature shown in Figs. 7(a), 7(b), 10(a), and 10(b) at �2000 lm
FIG. 12 (a) Quantitative variation of percent fracture modes with increasing distance from the notch for softer samples for 0,
20, 30, and 40 min hydrogen charging times: (i) intergranular (IG) fracture for 10lm PAGS, 45 HRC samples; and (ii)
quasi-cleavage for 10 lm PAGS, 45 HRC samples. Error bars represent 2r scatter. (b) Quantitative variation of % fracture
modes with increasing distance from the notch for softer samples for 0, 20, 30, and 40 min hydrogen charging: (i)
intergranular (IG) fracture for 10 lm PAGS, 45 HRC samples; and (ii) quasi-cleavage for 10 lm PAGS, 45 HRC samples.
Error bars represent 2r scatter.
80 SK AND OVERFELT ON FRACTURE CHARACTERISTICS FOR STEEL
Materials Performance and Characterization
away from the notch. Each condition represents four different samples that were
tested. The unhydrogenated samples did not show any evidence of intergranular fail-
ure, whereas increasing the hydrogenation times showed an increasing level of inter-
granular failure, which was observed to be most intense closer to the notch. The
maximum % intergranular fracture close to the notch is presumably the result of
stress-induced diffusion of hydrogen [16], which would increase the hydrogen con-
centration close to the notch where the triaxial stresses are a maximum. The
observed similarities in mechanical and fracture behavior for the 10 and 40lm
PAGS samples indicates independency of grain size within this PAGS range, in
agreement with the results of Lessar and Gerbarich [14].
The harder samples exhibited intergranular fracture at much lower hydrogen
charging times compared to the softer samples because of the commonly observed
tempered martensitic embrittlement in commercial low-alloy, high-strength steel
after tempering in the temperature range of 250�C–400�C [17,18]. Samples tem-
pered in this temperature range typically show grain boundary embrittlement
because of the singular or combined effects of alloying elements (P, S, N, Sn, Sb) seg-
regation and/or post-tempering (>250�C) carbide precipitation in the form of finely
dispersed cementite particles. However, the tempering temperature used for the
softer samples in this work (500�C) was too high to cause tempered martensitic
embrittlement. Above the temperature range of 400�C, the carbides would tend to
form spheroids and occupy a much smaller fraction of the grain boundary area [18].
Grain boundary segregation of the alloying elements is also not favorable above
400�C [17]. Thus, the loss of ductility observed for samples tempered at 500�C was
presumed to be caused predominantly by hydrogen.
Conclusions
1. The observed failure strain (ef) generally decreased with increasing hydro-gen charging time. Failure strains of the softer samples were noticeablylarger than the failure strains of the harder samples. Softer samples didnot show statistically significant difference in failure strains compared totheir uncharged counterparts for hydrogen charging times less than10min. Additionally, no statistically significant difference in failure strainswere observed between the 10 and 40 lm PAGS samples of comparablehardnesses.
2. Harder samples showed increases in % intergranular fracture with increase inhydrogen charging time. Intergranular fracture was predominant close to thenotch, whereas a combination of ductile and flat surfaces were exhibited inthe fracture surfaces away from the notch.
3. Softer samples showed a noticeable difference in fracture behavior withrespect to their uncharged counterparts after 20min of hydrogen charging.Softer samples charged above 20min showed mainly quasi-cleavage mixedwith intergranular fracture close to the notch and predominately ductile frac-ture as the distance from notch increased.
4. 10 lm and 40lm samples showed similar fractographic behavior, which is inagreement with their failure strain results. Similarities in mechanical behavioras well as fracture behavior between 10 and 40 lm PAGS samples indicatesindependency of grain size within this range.
SK AND OVERFELT ON FRACTURE CHARACTERISTICS FOR STEEL 81
Materials Performance and Characterization
References
[1] Kafle, J. and Qu, D., “Enhancement of Hydrogen Insertion into Carbon Inter-
layers by Surface Catalytic Poisoning,” J. Phys. Chem. C, Vol. 114, No. 44, 2010,
pp. 19108–19115.
[2] Louthan, M. R., Jr., “The Effect of Hydrogen on Metals,” Corrosion Mechanism,
F. Mansfield, Ed., Marcel Dekker, New York, 1987.
[3] Novak, P., Yuan, R., Somerday, B. P., Sofronis, P., Ritchie, R. O., “A
Statistical, Physical- Based, Micro-Mechanical Model of Hydrogen-Induced
Intergranular Fracture in Steel,” J. Mech. Phys. Solids, Vol. 58, No. 2, 2010, pp.
206–226.
[4] Shim, I. O. and Byrne, J. G., “A Study of Hydrogen Embrittlement in
4340 Steel I: Mechanical Aspects,” Mater. Sci. Eng. A, Vol. 123, No. 2, 1990, pp.
169–180.
[5] Sk, M. H., Overfelt, R. A., Haney, R. L., and Fergus, J. W., “Hydrogen
Embrittlement of 4340 Steel due to Condensation During Vaporized
Hydrogen Peroxide Treatment,” Mater. Sci. Eng. A, Vol. 528, Nos. 10–11, 2011,
pp. 3639–3645.
[6] Thompson, A. W. and Bernstein, I. M., Advances in Corrosion Science and Tech-
nology, Vol. 7, R. W. Staehle and M. Fontana, Eds., Plenum, New York, 1980.
[7] McMahon, C. J., Jr., “Hydrogen-Induced Intergranular Fracture of Steels,” Eng.
Fract. Mech., Vol. 68, No. 6, 2001, pp. 773–788.
[8] Gourmelon, A., “Effect of Hydrogen on the Plastic Deformation and Fracture
of Iron,” Memoires Scientifiques de la Revue de Metallurgie, Vol. 72, 1975, pp.
475–489.
[9] Birnbaum, H. K. and Sofronis, P., “Hydrogen Enhanced Localized Plasticity—A
Mechanism for Hydrogen Related Fracture,” Mater. Sci. Eng A, Vol. 176, Nos.
1–2, 1994, pp. 191–202.
[10] Martin, M., Fenske, A., Liu, G., Sofronis, P., and Robertson, I., “On the Forma-
tion and Nature of Quasi-Cleavage Fracture Surfaces in Hydrogen Embrittled
Steels,” Acta Mater., Vol. 59, No. 4, 2011, pp. 1601–1606.
[11] Nagao, A., Smith, C. D., Dadfarnia, M., Sofronis, P., and Robertson, I. M., “The
Role of Hydrogen in Hydrogen Embrittlement Fracture of Lath Martensitic
Steel,” Acta Mater., Vol. 60, Nos. 13–14, 2012, pp. 5182–5189.
[12] Lynch, S. P., “Interpreting Hydrogen-Induced Fracture Surfaces in Terms of
Deformation Processes: A New Approach,” Scripta Mater., Vol. 65, No. 10,
2011, pp. 851–854.
[13] ASTM E112-96: Standard Test Methods for Determining Average Grain Size,
Annual Book of ASTM Standards, ASTM International, West Conshohocken,
PA, 1996.
[14] Lessar, J. F. and Gerbarich, W. W., “Grain Size Effects in Hydrogen-Assisted
Cracking,” Metall. Trans., Vol. 7, No. 7, 1976, pp. 953–960.
[15] Lynch, S. P., “A Fractographic Study of Gaseous Hydrogen Embrittlement and
Liquid-Metal Embrittlement in a Tempered-Martensitic Steel,” Acta Metall.,
Vol. 32, No. 1, 1984, pp. 79–90.
[16] Li, J. C. M., Oriani, R. A., and Darken, L. S., “The Thermodynamics of Stressed
Solids,” Z. Physik. Chem. Neue Folge, Vol. 49, 1966, pp. 271–290.
82 SK AND OVERFELT ON FRACTURE CHARACTERISTICS FOR STEEL
Materials Performance and Characterization
[17] Banerji, S. K., McMahon, C. J., Jr., and Feng, H. C., “Intergranular Fracture in
4340-Type Steels: Effects of Impurities and Hydrogen,” Metall. Trans A, Vol.
9A, 1978, pp. 237–247.
[18] Eliaz, N., Shachar, A., Tal, B., and Eliezer, D., “Characteristics of
Hydrogen Embrittlement, Stress Corrosion Cracking and Tempered Marten-
sitic Embrittlement in High Strength Steels,” Eng. Failure Anal., Vol. 9, No. 2,
2002, pp. 167–184.
SK AND OVERFELT ON FRACTURE CHARACTERISTICS FOR STEEL 83
Materials Performance and Characterization
Copyright by ASTM Int’l (all rights reserved); Tue Nov 18 18:38:26 EDT 2014Downloaded/printed byMobbassar Sk (Auburn University, Materials Engineering, Auburn, Alabama, United States)Pursuant to License Agreement. No further reproduction authorized.