charge redistribution in electrochemically actuated mechanical sensors
TRANSCRIPT

Charge redistribution in electrochemically-actuated
mechanical sensors
Fabien Amiot, F. Kanoufi, F. Hild, J.P. Roger
To cite this version:
Fabien Amiot, F. Kanoufi, F. Hild, J.P. Roger. Charge redistribution in electrochemically-actuated mechanical sensors. Sensors & Actuators : A. Physical, 2009, 152, pp.88-95.<10.1016/j.sna.2009.03.009>. <hal-00388422>
HAL Id: hal-00388422
https://hal.archives-ouvertes.fr/hal-00388422
Submitted on 11 Jun 2009
HAL is a multi-disciplinary open accessarchive for the deposit and dissemination of sci-entific research documents, whether they are pub-lished or not. The documents may come fromteaching and research institutions in France orabroad, or from public or private research centers.
L’archive ouverte pluridisciplinaire HAL, estdestinee au depot et a la diffusion de documentsscientifiques de niveau recherche, publies ou non,emanant des etablissements d’enseignement et derecherche francais ou etrangers, des laboratoirespublics ou prives.
Charge redistribution in
electrochemically-actuated mechanical sensors
F. Amiot a,∗ F. Kanoufi b F. Hild c J.P. Roger d
aInstitut FEMTO-ST, CNRS-UMR 6174 / UFC / ENSMM / UTBM,
24, chemin de l’Epitaphe, F-25030 Besancon, France.
bPECSA, CNRS-UMR 7195 / ESPCI,
10 rue Vauquelin, F-75231 Paris Cedex 05, France.
cLMT Cachan, ENS de Cachan / CNRS-UMR 8535 / Univ. Paris 6 / PRES
UniverSud Paris
61 avenue du President Wilson, F-94235 Cachan Cedex, France.
dInstitut Langevin / ESPCI ParisTech / CNRS UMR 7587,
Laboratoire d’Optique Physique,
10 rue Vauquelin, F-75231 Paris Cedex 05, France.
Preprint submitted to Elsevier Science 21 March 2009

Abstract
Many proofs of concept studies have established the mechanical sensitivity of func-
tionalized microcantilevers to a large spectrum of target molecules. However, moving
to real-life applications also requires the monitored mechanical effect to be highly
specific. Moving towards more specificity in cantilever-based sensing, monitoring the
mechanical response of electrochemically actuated microcantilevers is then thought
to provide a fast, reliable and complementary experimental information to the long-
time cantilever bending measurement for the detection of target molecules. Full-field
measurements are therefore used to investigate the way the electro-elastic coupling
is altered when a microcantilever undergoes decane-thiol adsorption. The proposed
technique reveals that the latter results in a charge density redistribution along the
cantilever in addition to the local surface passivation. Focusing on the cantilever tip
displacement under electrochemical actuation, this redistribution partially compen-
sates the electro-elastic coupling alteration due to the surface passivation, therefore
possibly yielding an ambiguous detection result. This effect should be taken into
account for the optimal design of specific electrochemically actuated mechanical
sensors.
Key words: Cantilever-based sensors, Full-field measurements, Identification
problem, Microscopy of surfaces, Surface strains
∗ Corresponding author, [email protected]
Email addresses: [email protected] (F. Amiot),
[email protected] (F. Kanoufi), [email protected] (F. Hild),
[email protected] (J.P. Roger).
2

1 Introduction
Decreasing the size of mechanical objects induces an increase of their sur-
face / volume ratio, and thus their ability to interact with their environment.
That is the main reason for the development of MEMS-based bio-chemical sen-
sors. One of the object surfaces is functionalized to allow for chemical recog-
nition of a target molecule. When bonding occurs (regardless of its type), two
types of detection schemes are possible [1], namely, one monitors the resonance
frequency shift induced by mass changes, or one measures the quasi-static in-
duced bending arising from surface free-strains.
The measurement of the resonance frequency shift is used to detect mass
variations [2,4,3] and then to resolve small amounts of biological material [5].
This resonant frequency shift appears in conjunction with a surface free-strain,
which is preferably measured in liquids to detect DNA hybridization [6] for
instance. In low viscosity media, this quasi-static bending measurement is
carried out together with the resonance frequency shift to provide a more
robust detection procedure [7]. On the one hand, the detection specificity may
be improved by tailoring the used coatings. On the other hand, a fast and
user-controlled query mechanism of the cantilever mechanical state is highly
desirable to move towards real-life applications.
The coupling between electrochemical and mechanical effects involves small
elastic strains, thus requiring the measurement of very small strains [8], so
that electrochemical effects have been investigated through the mechanical
loading they induce on microcantilevers. An investigation of the double-layer
region [10–13] (i.e., when no electrochemical reaction occurred) as well as
3

adsorption reactions [14–17] and electrodeposition [18] have been carried out
using the standard optical lever technique [1].
In order to further describe electrochemical phenomena at solid electrodes,
several interferometric techniques have been used to provide descriptions of
the electrochemically driven topographic or chemical changes occurring in
the layer adjacent to an electrode [19–21]. In the special case of microcan-
tilever inspection, it has been proven that using full-field interferometric mea-
surements [22] to investigate the electro-elastic coupling provides redundant
enough experimental information to build a model of the coupled interfacial
phenomena [23]. Using such a spatially resolved information is then necessary,
since a micro-cantilever is expected to behave as an “antenna”, thus yielding
a charge localization near geometric singularities.
It is therefore proposed to adapt such a tool to describe at the local level as
well as at the cantilever scale the way the electro-elastic coupling is altered
by molecular adsorption. As the mechanical reaction to an electrochemical
stimulus is found to be highly adsorption rate dependent, one considers the
concept of electrochemically-actuated micromechanical sensors as a potential
candidate for various real-life target molecules recognition problems. After a
description of the experimental set-up and procedures, the adsorption pro-
cess is described from the electrochemical and mechanical point of view. A
dedicated framework is then proposed to analyze phase maps acquired when
the cantilever undergoes an electrochemical actuation at different adsorption
rates. This analysis shows that both the coupling intensity and the charge
distribution are significantly altered by adsorption, so that using a device as
simple as a cantilever is not optimal to provide a reliable detection scheme
when the global mechanical response of the sensor is monitored.
4
2 Experimental procedure
2.1 Experimental set-up
A home-made fluid-cell is used to host an array of gold coated microcantilevers.
This sample is fastened to a copper substrate with a conducting epoxy glue.
The temperature of this copper substrate is controlled through Peltier effect
modules and a temperature sensor. Another copper part, whose temperature
is also controlled through Peltier modules, encapsulates this fluid-cell, whose
content is modified with a fluid inlet and outlet.
The objects under consideration are micro-cantilevers (70 × 20 × 0.84 µm3)
that are made of 770-nm thick silica obtained by thermal oxidation of a silicon
wafer. Titanium (20-nm thick) and 50-nm thick gold layers are then deposited
onto the sample. The gold layer on top of the cantilevers is utilized as a
working electrode in a KCl solution. All the connections are insulated with a
thin PDMS layer to ensure that only the gold surface of the working electrode
is in contact with the solution. It has a total area of almost 1 cm2 in constant
contact with the electrolytic solution.
2.2 Surface activation
After bubbling nitrogen, the fluid cell is then filled with a KCl solution (10−2 M),
prepared from milliQ water. The gold surface is then cleaned electrochemically
by performing successive cyclic voltammograms between 0 and 0.8 V at a rate
of 10 mV/s. Gold is then successively oxidized and reduced, until a stable
voltammogram (i.e., after a few cycles) is obtained, thus ensuring a clean and
5
reproducible metallic surface. The fluid cell is then purged and filled again
with a 10−2 M KCl deoxygenated solution.
2.3 Cyclic voltammetry
The potential window was chosen so that the electrode processes are not per-
turbed by any substance or electrochemical transformation of the electrode
material. For potentials less than -0.1 V vs. Ag/AgCl, oxygen reduction may
occur while a peak, presumably related to Au oxidation, is observed for po-
tentials greater than 0.5 V. During three potential cycles, an optical phase
map [22] is recorded every 0.05-V step , thus providing a set of 61 phase
maps, that is a 15 × 111 × 61 phase measurements stack covering the can-
tilever through the three potential cycles. The choice of the potential scan
rate (2 mV/s) ensures that the electrode equilibrium is established in times
much shorter than the time interval between two snapshots (25 s). The phase
map acquisition is carried out during almost 1 s. Therefore the potential of the
electrode is considered constant during this observation. Such cyclic voltamme-
try cycles have been performed before (CV0), during (CV1) and after (CV2)
decane-thiol adsorption.
2.4 Displacement field measurement
The cantilever bending is monitored using a phase-modulated Nomarski imag-
ing shear-interferometer [22]. The interference pattern is obtained as the dif-
ference of two topographies of the surface, shifted by a Wollaston prism by
a distance d. The Wollaston shear-direction is chosen to be parallel to the
6
cantilever axis, denoted by x, so that the topographies involved in the inter-
ference pattern are views of the cantilever shifted along the direction of its
larger dimension (Fig. 1). The distance d is chosen to be similar in magnitude
with the cantilever length.
Monitoring the induced quasi-static cantilever bending, the recorded phase
map changes φmes are purely mechanical as long as there is no heterogeneous
chemical surface modification [22], and is thus described solely by φmec, which
arise from both surface out-of-plane displacement and rotation
φmec(x, y)=4πnl
ιλ(v(x, y) − v(x − d, y))
+∂φW
∂γ
(
dv
dx(x, y) −
dv
dx(x − d, y)
)
(1)
v(x, y) is the out-of-plane displacement field and ∂φW
∂γis an experimentally
identified coefficient, nl the average refractive index of the ambient medium,
λ the used wavelength, and ι a scaling coefficient depending on the numerical
aperture of the objective lens. Section 3.3 deals with the case where hetero-
geneous surface reaction is expected. Throughout the reported experiments,
the displacement field was observed to be homogeneous across the cantilever
width, so that it is expanded onto a user-defined functions basis of the longi-
tudinal coordinate x
v(x, n) =R∑
r=1
ζr(n)fr(x) (2)
where {ζr(n)} for r ∈ {1 . . . R} is the projection of the displacement field v
onto the basis {fr(x)} for the time step n. The displacement is then obtained
from the measured phase stack by minimizing
7

η2 =1
Np
∑
x,y,n
χ(x, y, n)2 (3)
=1
Np
∑
x,y,n
1
µ(x, y, n)2(φtest(x, y, n) − φtest(x, y, n − 1)
−φmes(x, y, n) + φmes(x, y, n − 1))2 (4)
where φmes(x, y, n) − φmes(x, y, n − 1) is the measured phase change between
two consecutive loading steps, φtest(x, y, n)−φtest(x, y, n−1) the phase change
estimated from the test parameters ζr, Np the number of measurement points
and µ(x, y, n)2 the estimated phase change variance at the considered point.
The optimal parameters set then provides the cantilever displacement field.
2.5 Decane-thiol adsorption
Decane-thiol from Sigma-Aldrich was diluted in ethanol to get a 7 mM decane-
thiol solution. The latter was then diluted (1 % in volume) in the support-
ing electrolyte, namely 10−2 M KCl, before injection in the above-described
fluid-cell. The refractive index change induced when mixing the decane-thiol
solution with 10−2 M KCl is then negligible and does not perturb the imag-
ing properties of the microscope. The cantilever quasi-static bending is then
monitored (step 1: 1 image every 2 minutes during 5 hours; step 2: 1 image
each 3 minutes during 7h30). In order to monitor the adsorption process, AC
voltammetry scans have been carried before (DC0), during (DC1) and after
(DC2) the decane-thiol adsorption. The electrode impedance was measured
between -0.1 and 0.4 V vs. Ag/AgCl, at 20 Hz with a modulation amplitude
of 25 mV. These AC voltammetry scans are performed prior to the three
above-described voltammetry cycles. The experiment took place following the
sequence DC0, CV0, adsorption step 1, DC1, CV1, adsorption step 2, DC2,
8
CV2, so that the consequence of decane-thiol adsorption on the electro-elastic
coupling is assessed (Fig. 2).
3 Results and discussion
3.1 Electrochemical response of the microcantilevers array
Figure 3 shows the change of the measured overall capacitance during the
adsorption process. The capacitance value decreases by a factor of 2 between
the experiment start (DC0) and the first stop (DC1). The capacitance then
does not evolve as fast, reaching a minimum value at the end of the adsorption
process, thereby proving the electrode passivation (DC2). The potential of zero
charge is obtained from the minimum of the differential capacity (DC0), and
is about −0.05 V vs. Ag/AgCl, in agreement with values already reported
for Au(111)/KCl 10−2 M systems [24]. In addition, the coverage ratio may
be roughly estimated from the minimum capacitance values, assuming that
the coverage ratio is 0 for DC0, and 1 at the end of the experiment (DC2).
Considering that the electrode behavior is described by a capacitor [25,26]
(representing the clean part of the electrode) in a branch parallel to a serial
capacitors assembly [27] (representing the covered part of the electrode), the
coverage ratio is estimated to be 0.71 for DC1, and the decane-thiol layer
capacitance is estimated to be about 0.8 µF/cm2, in agreement with reported
values [28]. The current flowing through the electrode is recorded during cyclic
voltammetry scans.
9
3.2 Adsorption-induced cantilever bending
The adsorption process (i.e., moving the molecules closer to the surface and
considering their interaction) is highly favorable from a thermodynamics point
of view, so that the interfacial system provides relatively large surface strains
to reach mechanical equilibrium. This corresponds to the minimum overall en-
thalpy, leading to a decreased chemical enthalpy (because of decane-thiol ad-
sorption process) and an increased elastic energy (because of cantilever bend-
ing) [29]. Adsorption is assumed to occur uniformly along the cantilever, so
that it does not induce any additional phase contribution. The procedure de-
tailed in Section 2.4 then holds. The identified quasi-static displacement fields
along the median line of the cantilever using a polynomial basis fr(x) = xr for
r ranging from 1 to R = 3 are shown as functions of time in Fig. 4 for both
adsorption steps. The minimum value of√
η2min is found to be around 10−10
for both adsorption steps, thereby proving that the displacement field is well
described by a cubic polynomial. As already reported [30,31], upon adsorp-
tion of thiol the cantilever experiences a downward bending, suggesting that
this adsorption is accompanied by a gold surface expansion. The maximum
displacement is about 80 nm after 5 h (end of step 1) and 160 nm after step
2 (the initial states correspond to the beginning of adsorption steps 1 and
2, respectively). Let us underline the different time scales the displacement
follows for the two adsorption steps:
• on the one hand, adsorption on a clean surface (step 1) yields a unique
characteristic time scale;
• on the other hand, adsorption on a pre-adsorbed surface (step 2) exhibits
a mechanical effect following two very different time scales, namely, a first
10

mechanical contribution takes place during a few minutes, whereas the full
mechanical effect develops during several hours.
According to the literature, the formation kinetics of alkane-thiol self-assembled
monolayer were investigated using various physico-chemical techniques includ-
ing electrochemical [26], AFM [32], surface plasmon resonance (SPR) [33] and
ellipsometry [34,35]. Even though there are some contradictions concerning
the rate of formation of the layer, most of the studies deal with a two-stage
adsorption process in agreement with what is observed herein. In principle,
the present results may be compared with the two time scales identified by
ellipsometric monitoring of adsorption process [35], even though it has been
reported that the mechanical effect and the optical thickness of the adsorbed
layer growth kinetics are not simply related [36]. For this reason and also be-
cause the adsorption process homogeneity along the micro-cantilever is difficult
to assess, a deeper description of the kinetics of formation of the monolayer lies
beyond the scope of the present paper. It is worth noting that this long-term
monitoring of the mechanical effect induced by adsorption is achieved using
differential interferometric measurements and all possible precautions to avoid
any significant drift, which are not easily implemented in real-life applications.
3.3 Electrochemically-induced cantilever bending
In order to bypass the difficulty of performing long time measurements, which
are likely to be subjected to significant drifts (e.g., thermal), the displacement
of the cantilever is modulated at a user-defined frequency. This is achieved by
using the electro-elastic coupling that is stimulating electrochemically, during
a cyclic voltammetry experiment, the deformation of the cantilever (Subsec-
11
tion 2.3). In that case, the measured phase map arises from both mechanical
deformation of the cantilever and change in the interface composition owing
to changes in the chemical composition of the double layer adjacent to the
electrode, so that the procedure presented in Section 2.4 has to be modified.
Because of the presence of a (partially) adsorbed layer, the method proposed
in Ref. [23] has to be enriched. The thin electrolyte layer close to the sur-
face, whose thickness scales as the Debye length λD, is significantly modified
when charging the electrode. The concentration shift induced in this layer
modifies locally the refractive index of the solution. In addition, charging the
interface modifies the free electrons density in the metal, thus changing the
complex refractive index of the metal [37]. Both contributions (as well as
decane-thiol adsorption) modify the complex reflection coefficient of the inter-
face, and therefore generate a non-mechanically induced optical phase change
φmes = φmec + φec (5)
The measured phase φmes results from the mechanical contribution φmec and
an additional electrochemical term φec that is obtained by assuming that re-
flection occurs at the interface between two homogeneous layers:
• on the metallic side, the thickness is arbitrarily chosen to be 1 nm [37], and
the refractive index is obtained according to Drude’s model;
• the thickness of the liquid phase layer is chosen to be equal to 2λD + ϑλads,
where λads is the adsorbed decane-thiol film thickness, and ϑ is a mixing
ratio. The parameter ϑ is not a coverage ratio but describes how much the
ions penetrate the decane-thiol adsorbed layer during the cyclic voltamme-
try. The case when ϑ = 0 may thus result either from a clean electrode (i.e.,
no adsorption) or from an impenetrable adsorbed layer. The composition of
12
this layer is determined to ensure the same surface excess than predicted by
the Gouy-Chapman theory, and the refractive index of this homogeneous
layer is obtained from the Lorentz-Lorenz formula [38]. This significant en-
richment, compared with the modeling we proposed in Ref. [23], allows one
to deal with partially covered surfaces.
For ions, the molar volumes and refractivities are taken from the literature [39,40],
namely, λads = 1.5 nm is obtained from published estimates [28], while the
molar refractivity for the decane-thiol is obtained from Ref. [41]. The above
assumptions allow one to compute the electrochemical contribution as a func-
tion of the surface charge density field and the mixing ratio, using Fresnel’s
equations for a given equivalent incidence angle θe and both TE and TM
polarizations [42]
φec(x, y, ϑ, θe) = φTE,TM(σm(x, y), ϑ, θe) − φTE,TM(σm(x − d, y), ϑ, θe) (6)
The influence of θe is found to be negligible when compared with ϑ. In previous
investigations of the electro-elastic coupling on clean cantilevers [23] the mi-
crocantilever bending was observed to result from a non-uniform mechanical
loading. It was interpreted as a singular charging of the microcantilever edge
in agreement with non-uniform current distribution at microelectrodes [43,44].
The integration of the current with respect to time then provides the overall
charge carried by the working electrode Q as a function of the potential. A
good correlation between the mechanical behavior of the cantilever and the
surface electrochemical response was obtained when considering that the local
charge density σm at a distance x from the field border on the substrate is
13

distributed according to
σm(x, Q) = D(x) × Q (7)
where Q is the overall surface charge of the entire electrode, and the localiza-
tion function is written as
D(x) =cq(x0)
(x0 − x)p(8)
where the constant cq(x0) is defined so that D(x) = 1 when x tends to the
field border on the substrate, x0 and p are used to describe the position and
order of the singular charge density field, respectively. A similar framework is
used herein.
In addition, the mechanical contribution is obtained by assuming that the can-
tilever is subjected to a shear-stress field τ(x), which is a continuous function
of the local charge density σm. This local relationship is then expanded onto
a polynomial basis
τ(x) =T∑
t=1
δtσtm(x) (9)
where {δt} are the coefficients describing the local coupling relationship to be
found. For a given charge density field, the displacement field induced by each
component of Eq. (9) is derived by using the Euler-Bernoulli beam theory [45],
thus yielding the functions basis ft(x) defined in Eq.2. To summarize, each
cross-section is assumed to remain planar during deformation, so that the local
beam curvature is obtained from the bending moment Mb generated by the
14

shear-stress τ applied to the cantilever
Mb = EId2v(x)
dx2= −
L∫
x
beτ(ξ)dξ (10)
where b denotes the cantilever width, EI its flexural stiffness, and e the dis-
tance from the neutral axis to the gold surface. Setting arbitrarily the equiv-
alent incidence angle to θe = 0.3 rad (this does not significantly affect the
following results), one is then able to compute a trial phase field, and thus to
find the optimal set of parameters {p, x0, ϑ, δt} describing the electro-elastic
test under scrutiny by minimizing the function defined by Eq. (3). Linearizing
this latter function with respect to its parameters close to the solution, an
estimate for the standard deviation of the identified parameters is obtained
from the measurement reproducibility.
Table 1 shows the identified parameters for the three electro-elastic tests,
namely, CV0, CV1 and CV2. For all the considered tests, T = 3 is found
to provide the best compromise between the coupling description and the
minimization robustness. Changing the arbitrarily chosen θe value has no sig-
nificant effect on the following results. The residual η2
min is small compared
to 1, meaning that the phase change fields all over the 3 potential cycles are
well described by the proposed modeling. In addition, an upper bound Γϑ for
the standard deviation on ϑ resulting from the measurement uncertainties is
provided to assess its identifiability.
Figure 5 shows the identified displacement field along the cantilever as a func-
tion of the loading step during the potential cycles for CV0 and CV2. Con-
trary to decane-thiol adsorption, the cantilever subjected to the electro-elastic
coupling experiences an upward bending, as already reported [10,11,23]. The
15
displacement amplitude is significantly decreased when moving from the clean
electrode (CV0: above 100 nm maximum displacement) to the blocked elec-
trode (CV2: 45 nm maximum displacement). In addition, the displacement
field and its change during the test are altered, and a mechanical description
of the measured effect is obtained through the identification procedure.
The identified localization functions D(x), describing the surface charge sin-
gularity on the cantilever edge and modeled by the p and x0 parameters, are
plotted in Fig. 6. Similarly to the clean electrode case [23], the surface charge
density is highly localized close to the cantilever edge, thereby proving that
one should use local shear-stress fields instead of a global “surface stress” con-
cept to describe mechanical effects at the micro-cantilever scale. Similarly, it
is preferable to deal with charge densities measured at the level of a single
cantilever instead of the global charge density measured on a large electrode.
This is not possible with the current experimental set-up, it is currently at-
tempted to improve this issue. Alkane-thiol adsorption induces a significant
change in the surface charge distribution, namely, even though the overall
electrode charge range decreases when moving to blocked surfaces, the charge
distribution tends to be more and more uniform. One should underline that
this tendency is not satisfied for CV1, where the “antenna” effect seems to
be first enhanced by the adsorption process, probably because of an easier
electrode blockage far from the edges.
The significant change in the electrochemical behavior of the electrode is also
obtained in Fig. 7, where the identified electro-elastic coupling relationships
(defined in Eq. (9) and the identified δt coefficients reported in Table 1) are
shown in their identification range, that is in the identified charge density
range. The decrease in the overall charge together with the decrease in sin-
16
gularity of the localization function yield a dramatically reduced local charge
density range for fully adsorbed state (CV2) compared to the early steps (CV0
and CV1). It is also worth noting that the deformation accumulation observed
for CV2 is well described by the charge accumulation on the electrode.
The identified ϑ value for CV0 is close to zero, which is consistent with the
fact that the electrode is initially free of thiols. The residual is not significantly
affected by enforcing ϑ = 0 during minimization. On the other hand, the
identified mixing parameter ϑ remains fairly low for the intermediate step, even
though the electrode is partially covered (Subsection 3.1), thereby proving
that the ions do not penetrate the added layer, which is thus hydrophobic.
This is known as a characteristic feature of alkane-thiol films [46]. Again, the
identification results are not significantly modified by setting ϑ = 0. For the
last step (CV2), because the charge density field becomes uniform, the optical
properties of the surface no longer influence the measured (i.e., differential)
phase field, so that the mixing parameter is no longer identifiable with the
proposed technique, as shown by the large value obtained for Γϑ (the ϑ value
is therefore not displayed in Table 1). There is therefore room for experimental
improvements.
If the coupling relationship is not significantly modified by the first adsorption
step (i.e., the identified relationship for CV0 lies within the confidence range
around the identified relationship for CV1), the increase in the initial slope
of the coupling relationship is significant after the second adsorption step,
thereby providing an information complementary to the quasi-static bending
of the cantilever (Fig. 7). Qualitatively, the alkane-thiol film increases the
closest approach distance of ions from the electrode, thereby decreasing the
charge carried by the electrode at a given potential. On the other hand, the
17

dielectric constant of the surface is increased by the adsorption process, so that
the electrostatic free energy of the surface is significantly higher, for a given
charge density, when adsorption occurs. The stored electrochemical energy
is then higher for a given surface charge density, so that the electro-elastic
coupling (at a given charge) is enhanced [29]. The quantitative evaluation of
the electro-elastic coupling modification as a function of the adsorbed layer
would require a more detailed characterization of the interface [17].
Using full-field measurements to investigate the effects of decane-thiol adsorp-
tion, it is shown that the significant decrease in the maximum shear-stress (by
a factor of 10 as seen from Fig. 7) is partially compensated by the surface
charge redistribution induced by adsorption, thus resulting in a limited can-
tilever tip displacement ratio before and after adsorption (almost equal to 2
as seen from Fig. 5). It is therefore necessary to take into account these global
and local effects when designing electrochemically-actuated sensors in order to
save their tremendous potential compared with the long-term, drift sensitive,
and purely mechanical measurements developed for micro-cantilever sensors.
4 Conclusion
A metal coated micro-cantilever was utilized simultaneously as a micro-electrode
and a micromechanical sensor. Electrochemical and full-field interferometric
measurements were carried out to monitor both surface composition changes
and cantilever displacements during cyclic voltammetry, before, during and
after decane-thiol adsorption. The use of full-field measurements and a dedi-
cated identification technique allows one to monitor the effects of decane-thiol
adsorption on the electro-elastic coupling, namely, the charge density quasi-
18

singularity on the cantilever edge vanishes, and the electro-elastic coupling
relationship is significantly modified. This result shows that the mechanisms
involved in the adsorption-induced electro-elastic coupling alteration on a mi-
crocantilever need to be described at the local as well as at the cantilever
scale, thus revealing the local and global nature of the alteration. The results
reported herein show that even though the local passivation decreases by a
factor 10 the maximum stress acting on the cantilever, the tip displacement is
reduced by only a factor 2 because of the simultaneous charge redistribution.
These effects should therefore be considered when designing optimized electro-
chemically actuated sensors in order to make the most of their potential.
19

References
[1] N.V. Lavrik, M.J. Sepaniak and P.G. Datskos, Cantilever transducers as a
platform for chemical and biological sensors, Rev. Sci. Instrum. 75 (2004) 2229-
2253.
[2] B. Ilic, D. Czaplewski, H.G. Craighead, P. Neuzil, C. Campagnolo and C. Batt,
Mechanical resonant immunospecific biological detector Appl. Phys. Lett. 77
(2000) 450-452.
[3] N.V. Lavrik and P.G. Datskos, Femtogram mass detection using photothermally
actuated nanomechanical resonators Appl. Phys. Lett. 82 (2003) 2697-2699.
[4] B. Ilic, H.G. Craighead, S. Krylov, W. Senaratne, C. Ober and P. Neuzil,
Attogram detection using nanoelectromechanical oscillators J. Appl. Phys. 95
(2004) 3694-3703.
[5] A. Gupta, D. Akin and R. Bashir, Single virus particle mass detection using
microresonators with nanoscale thickness Appl. Phys. Lett. 84 (2004) 1976-
1978.
[6] J. Fritz, M.K. Baller, H.P. Lang, H. Rothuizen, P. Vettiger, E. Meyer,
H. Guntherodt, C. Gerber and J.K. Gimzewski, Translating biomolecular
recognition into nanomechanics Science 288 (2000) 316-318.
[7] L.A. Pinnaduwage, V. Boiadjiev, J.E. Hawk
and T. Thundat, Sensitive detection of plastic explosives with self-assembled
monolayer-coated microcantilevers Appl. Phys. Lett. 83 (2003) 1471-1473.
[8] V.A. Marichev, Partial charge transfer during anion adsorption Methodological
aspects Surf. Sci. Rep. 56 (2005) 277-324.
[9] L. Jaeckel, G. Lang and K.E. Heusler, New interferometric method to investigate
surface energies at solid electrodes Electrochim. Acta 39 (1994) 1031-1038.
20
[10] R.A. Fredlein and J.O.M. Bockris, An electrocapillary study of the gold-
perchloric acid solution interface Surf. Sci. 46 (1974) 641-652.
[11] R. Raiteri and H.J. Butt, Measuring electrochemically induced surface stress
with an atomic force microscope J. Phys. Chem. 99 (1995) 15728-15732.
[12] F. Tian, J.H. Pei, D.L. Hedden, G.M. Brown and T. Thundat, Observation of
the surface stress induced in microcantilevers by electrochemical redox processes
Ultramicroscopy 100 (2005) 217-223. See also the comment by G.G. Lang, T.A.
Rokob and G. Horanyi, Ultramicroscopy 104 (2005) 104, 330-332.
[13] D. Lee, T. Thundat and S. Jeon, Electromechanical identification of molecules
adsorbed on microcantilevers Sensors and Actuators B 124 (2007) 143-146.
[14] V. Tabard-Cossa, M. Godin, L. Y. Beaulieu and P. Grutter, A differential
microcantilever-based system for measuring surface stress changes induced by
electrochemical reactions Sens. Act. B 107 (2005) 233-241.
[15] H. Ibach, C.E. Bach, M. Giesen and A. Grossman, Potential-induced stress in
the solid-liquid interface: Au(111) and Au(100) in an HCl04 electrolyte Surf.
Sci. 375 (1997) 107-119.
[16] W. Haiss, Surface stress of clean and adsorbate-covered solids Rep. Prog. Phys.
64 (2001) 591-648.
[17] V. Tabard-Cossa, M. Godin, I.J. Burgess, T. Monga, R.B. Lennox and P.
Grutter, Microcantilever-based sensors: effect of morphology, adhesion, and
cleanliness of the sensing surface on surface stress Anal. Chem. 79 (2007) 8136-
8143.
[18] T.A. Brunt, T. Rayment, S.J. O’Shea and M.E. Welland, Measuring the surface
stresses in an electrochemically deposited metal monolayer: Pb on Au (111)
Langmuir 12 (1996) 5942-5946.
21

[19] H.S. White, D.J. Earl, J.D. Norton and H.J. Kragt, In situ topographical
imaging of electrode surfaces using high-resolution phase measurement
interferometric microscopy Anal. Chem. 62 (1990) 1130-1134.
[20] C.P. Smith, H.L. Kennedy, H.J. Kragt, H.S. White and J.F. Biegen, Phase-
measurement interferometric microscopy of microlithographically fabricated
platinum electrodes Anal. Chem. 62 (1990) 1135-1138.
[21] Q. Li and H.S. White, Interferometric measurement of a depletion layer
structure and volumetric data in concentrated organic redox solutions Anal.
Chem. 67 (1995) 561-569.
[22] F. Amiot and J.P. Roger, Nomarski imaging interferometry to measure the
displacement field of micro-electro-mechanical systems Appl. Optics 45 (2006)
7800-7810.
[23] F. Amiot, F. Hild, F. Kanoufi and J.P. Roger, Identification of the electroelastic
coupling from multi-physical fields measured at the micrometre scale J. Phys.
D: Appl. Phys. 40 (2007) 3314-3325.
[24] J. Clavilier and N. Van Huong, Etude de la structure de la couche double sur
les electrodes d’or J. Electroanal. Chem. 41 (1973) 193-199.
[25] B.B. Damaskin, O.A. Petrii, and V.V. Batrakov, in Adsorption of Organic
Compounds on Electrodes, Plenum Press, New York, 1971.
[26] R. Subramanian and V. Lakshminarayanan, Study of kinetics of adsorption of
alkanethiols on gold using electrochemical impedance spectroscopy Electrochim.
Acta 45 (2000) 4501-4509.
[27] A.M. Becka and C.J. Miller, Electrochemistry at ω-hydroxy thiol coated
electrodes. 4. Comparison of the double-layer at ω-hydroxy thiol and alkanethiol
monolayer coated Au electrodes J. Phys. Chem. 97 (1993) 6233-6239.
22

[28] M.D. Porter, T.B. Bright, D.L. Allara and C.E.D. Chidsey, Spontaneously
organized molecular assemblies. 4. Structural characterization of n-alkyl
thiol monolayers on gold by optical ellipsometry, infrared spectroscopy, and
electrochemistry J. Am. Chem. Soc. 109 (1987) 3559-3568.
[29] F. Amiot, A model for chemically-induced mechanical loading on MEMS
JoMMS (2) 9 (2007) 1787-1803.
[30] R. Berger, E. Delamarche, H.P. Lang, C. Gerber, J.K. Gimzewski, E. Meyer
and H. Guntherodt, Surface stress in the self-assembly of alkanethiols on gold
probed by a force microscopy technique Appl. Phys. A. 66 (1998) S55-S59.
[31] R. Berger, E. Delamarche, H.-P. Lang, C. Gerber, J.K. Gimzewski, E. Meyer
and H.-J. Guntherodt Surface stress in the self-assembly of alkanethiols on gold
Science 276 (1997) 2021-2024.
[32] K. Hu and A.J. Bard, In situ monitoring of kinetics of charged thiol adsorption
on gold using an atomic force microscope Langmuir 14 (1998) 4790-4794.
[33] R.F. DeBono, G.D. Loucks, D.D. Manna and U.J. Krull, Self-assembly of short
and long-chain n-alkyl thiols onto gold surfaces: A real-time study using surface
plasmon resonance techniques Can. J. Chem. 74 (1996) 677-688.
[34] C.D. Bain, E.B. Troughton, Y.-T. Tao, J. Evall, G.M. Whitesides and R.G.
Nuzzo, Formation of monolayer films by the spontaneous assembly of organic
thiols from solution onto gold J. Am. Chem. Soc. 111 (1989) 321-335.
[35] F.S. Damos, R.C.S. Luz and L.T. Kubota, Determination of thickness, dielectric
constant of thiol films, and kinetics of adsorption using surface plasmon
resonance Langmuir 21 (2005) 602-609.
[36] M. Godin, O. Laroche, V. Tabard-Cossa, L.Y. Beaulieu, P. Grutter and
P.J. Williams, Combined in-situ micromechanical cantilever-based sensing and
ellipsometry Rev. Sci. Instrum. 74 (2003) 4902-4907.
23

[37] W.-P. Paik, M.A. Genshaw and J.O.M. Bockris, The adsorption of anions at
the solid-solution interface J. Phys. Chem. 74 (1970) 4266-4275.
[38] M. Stedman, Reflectance and ellipsometry of Metal/Electrolyte Interfaces
Trans. Faraday Soc. (1970) 64-71.
[39] T.C. Waddington, Ionic radii and the method of the undetermined parameter
Trans. Faraday Soc. 62 (1966) 1482.
[40] R. Zana and E. Yeager, Ultrasonic vibration potentials and their use in the
determination of ionic partial molal volumes J. Phys. Chem. 71 (1967) 521-
536.
[41] E.J. Kupchik, General treatment of the heteroatoms with the randic molecular
connectivity index Quant. Struct.-Act. Relat. 8 (1989) 98-103.
[42] M. Born and E. Wolf, in Principles of optics, 6th edition, Pergamon Press, 1980.
[43] R.G. Maus, E.M. McDonald and R.M. Wightman, Imaging of nonuniform
current density at microelectrodes by electrogenerated chemiluminescence Anal.
Chem. 71 (1999) 4944-4950.
[44] C. Combellas, S. Nunige, and F. Kanoufi, Surface modification of
halogenated polymers. 10. Redox catalysis induction of the polymerization
of vinylic monomers. Application to the localized graft copolymerization of
poly(tetrafluoroethylene) surfaces by vinylic monomers Chem. Mater. 19 (2007)
3830-3839.
[45] S.P. Timoshenko and J.N. Goodier in Theory of Elasticity, 3rd edition, McGraw-
Hill, New York (USA), 1970.
[46] Finklea, H.O.; in Electroanalytical chemistry, A.J. Bard and I Rubinstein (Eds.)
Marcel Dekker Inc (New York), 1996.
24

List of Tables
1 Identified parameters for the different cyclic voltammetry
experiments, describing the surface charge density, the
interface composition, the coupling relationship and the
identification quality. The coupling relationship coefficients
are normalized with respect to the cantilever flexural stiffness:
δi = beδi
EI26
25

Table 1
Identified parameters for the different cyclic voltammetry experiments, describing
the surface charge density, the interface composition, the coupling relationship and
the identification quality. The coupling relationship coefficients are normalized with
respect to the cantilever flexural stiffness: δi = beδi
EI
CV test CV0 CV0 CV1 CV1 CV2
p 2.28 2.51 3.55 3.68 4.47
x0
L1.08 1.07 1.20 1.14 2.11
ϑ 7 × 10⁻² 0 9 × 10⁻² 0 ♯
(unitless) identified prescribed identified prescribed
Γϑ 0.32 0.19 107
δ1 (C−1) −3.13 × 10³ −3.18 × 10³ −5.25 × 10³ −5.76 × 10³ −2.18 × 10⁵
δ2 (m2.C−2) −2.04 × 10² −2.05 × 10² −1.18 × 10² −1.31 × 10² 1.66 × 10⁵
δ3 (m4.C−3) 1.07 × 10⁻¹ 1.09 × 10⁻¹ 8.40 × 10⁻² 9.40 × 10⁻² −1.48 × 10⁵
residual η2min 6.3 × 10⁻² 6.3 × 10⁻² 5.8 × 10⁻² 5.8 × 10⁻² 8.5 × 10⁻²
26
List of Figures
1 Schematic view of the imaging set-up and typical interference
pattern. The shear direction is parallel to the cantilever
direction, and the shear distance d is almost equal to the
cantilever length. The axis system is shifted for the sake of
clarity and the origin is set at point O. 29
2 Schematic view of the system considered to assess the effect of
decane-thiol adsorption on the electro-elastic coupling at both
the local and cantilever scales. 30
3 Measured differential capacity of the microcantilevers array
in a 10−2M KCl solution before (DC0), during (DC1) and
after (DC2) decane-thiol adsorption; starting potential −0.1 V
vs. Ag/AgCl. 31
4 Identified out-of-plane quasi-static displacement field along the
median line of the cantilever as a function of adsorption time:
a) step 1, b) step 2. 32
5 Identified out-of-plane displacement field along the median line
of the cantilever during cyclic voltammetry cycles: a) CV0, b)
CV2. 33
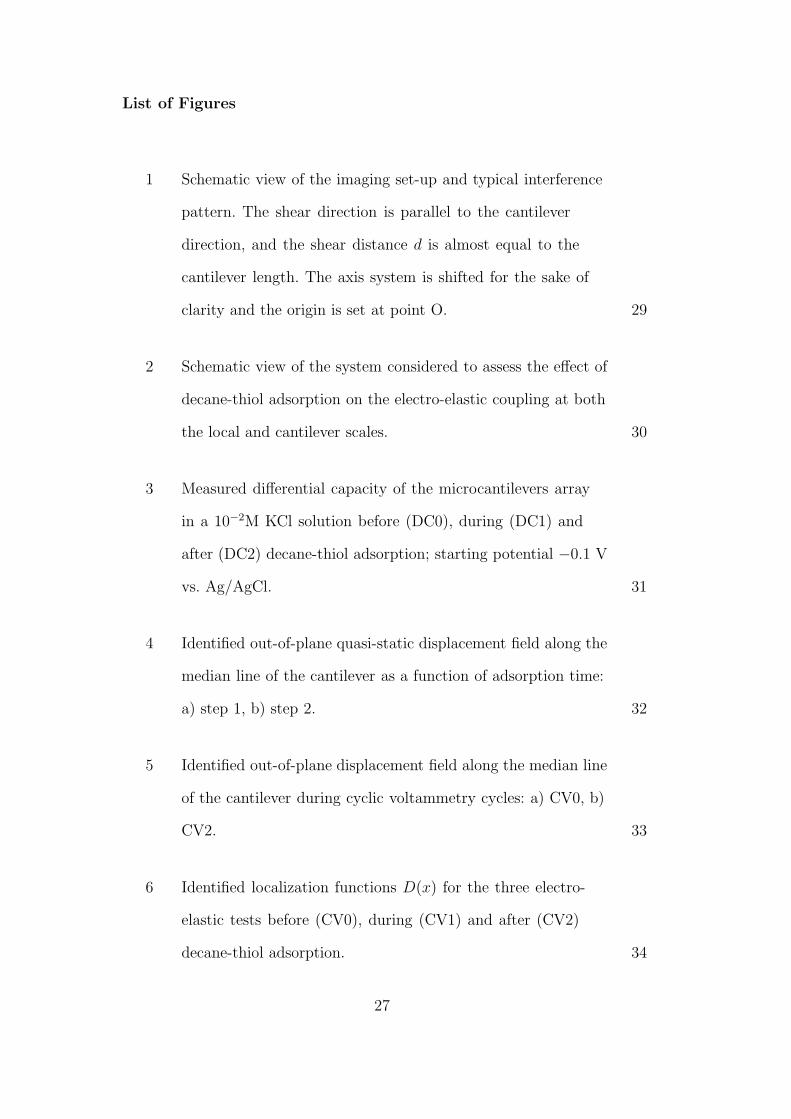
6 Identified localization functions D(x) for the three electro-
elastic tests before (CV0), during (CV1) and after (CV2)
decane-thiol adsorption. 34
27
7 Identified electro-elastic coupling relationships before (CV0),
during (CV1) and after (CV2) decane-thiol adsorption, with
estimated confidence range from the standard deviation on the
identified parameters for step CV1. 35
28
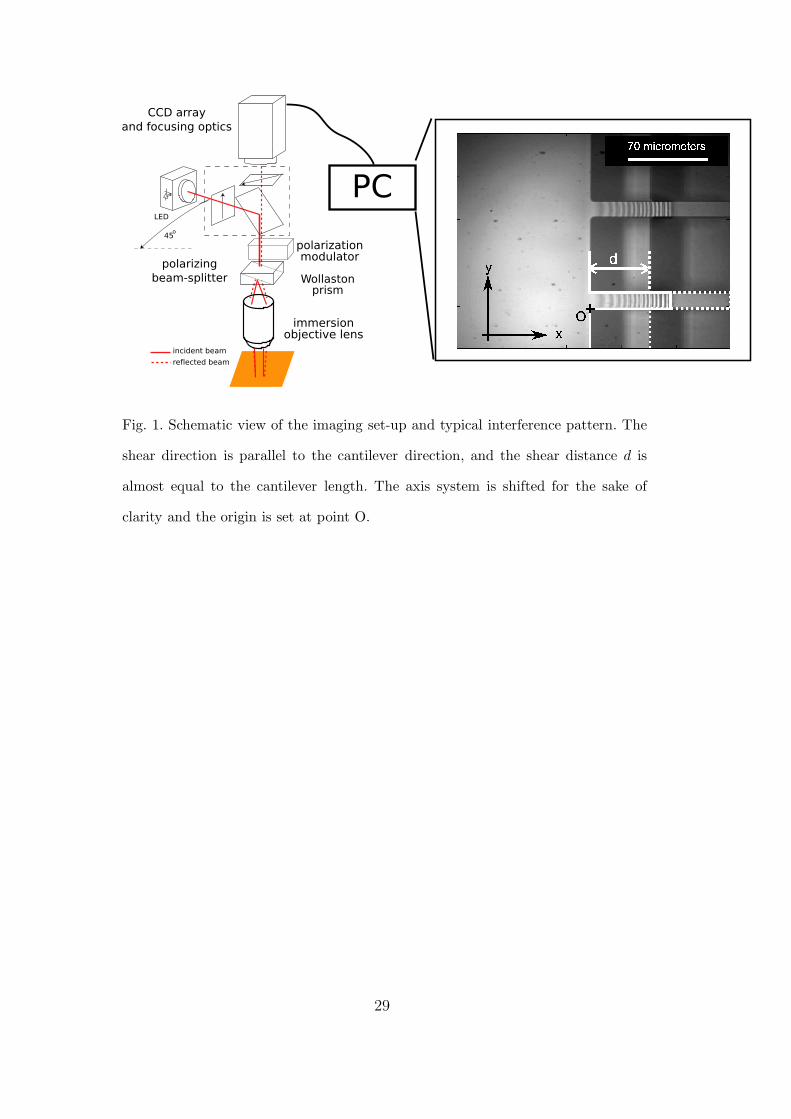
Fig. 1. Schematic view of the imaging set-up and typical interference pattern. The
shear direction is parallel to the cantilever direction, and the shear distance d is
almost equal to the cantilever length. The axis system is shifted for the sake of
clarity and the origin is set at point O.
29
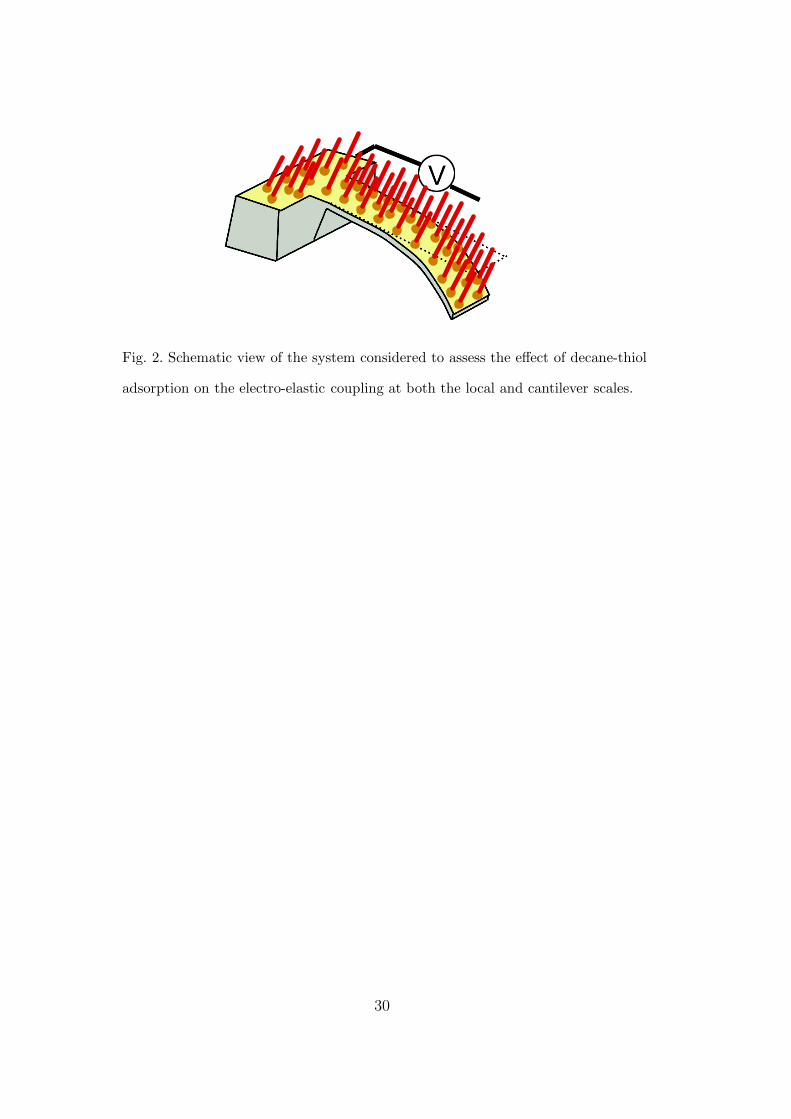
Fig. 2. Schematic view of the system considered to assess the effect of decane-thiol
adsorption on the electro-elastic coupling at both the local and cantilever scales.
30

Fig. 3. Measured differential capacity of the microcantilevers array in a 10−2M KCl
solution before (DC0), during (DC1) and after (DC2) decane-thiol adsorption; start-
ing potential −0.1 V vs. Ag/AgCl.
31

Fig. 4. Identified out-of-plane quasi-static displacement field along the median line
of the cantilever as a function of adsorption time: a) step 1, b) step 2.
32
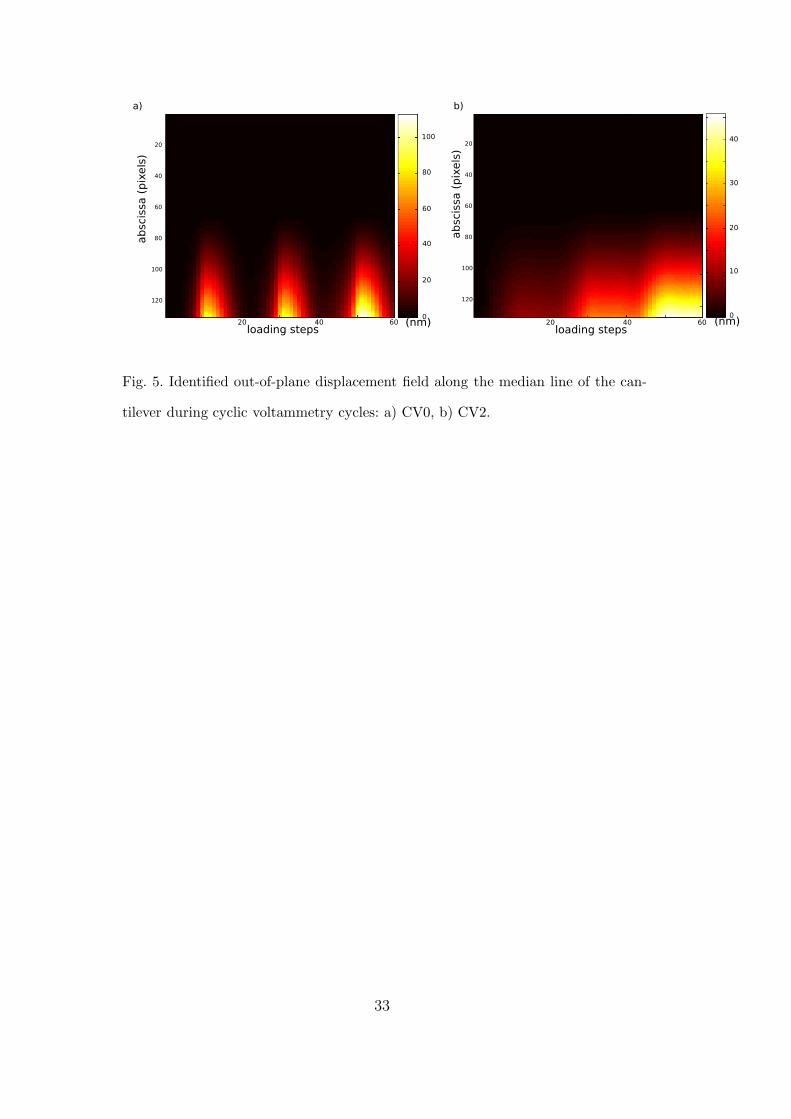
Fig. 5. Identified out-of-plane displacement field along the median line of the can-
tilever during cyclic voltammetry cycles: a) CV0, b) CV2.
33

Fig. 6. Identified localization functions D(x) for the three electro-elastic tests before
(CV0), during (CV1) and after (CV2) decane-thiol adsorption.
34

Fig. 7. Identified electro-elastic coupling relationships before (CV0), during (CV1)
and after (CV2) decane-thiol adsorption, with estimated confidence range from the
standard deviation on the identified parameters for step CV1.
35