microevolution in island water snakes
TRANSCRIPT
Microevolution in Island Water Snakes
What processes influence calor pattern differences in Lake Erie island and mainland water snakes?
EVolutionary change can result from a variety of processes, including natural selection, gene
flow, random genetic drift, and mutation. The potential importance ofthese processes became clear with the development of mathematical population genetics beginning in the early 19005 (for a historical account, see Provine 1971). Examples demonstrating the effectiveness of these processes in promoting evolutionary change ha vc since accumulated. However, such examples often emphasize a single pro(;ess, most frequently natural selection (Endler 1986 l; only in a few examples of microevolutionary change afe the simultaneous effects of multiple processes well understood (e.g., NlcNeilly 1968, Riechert 1993, Rass and Keller 1995). 1vlode of inheritance of a trait (number ofloci, degree of dominance, and epistatic and pleiotropic effects) and population history (changes in distribution and abundance) can also influence evolutionary change, but again, only in a few examples of microevolutionary change are the effects of mode of inheritance and population historv \vell understood. The Lake Erie w~ter snake N erodia sipedon insularum is an example of such a rare case: Calor pattern variation in
Richard B. King is an a:;sisrant professor in the Department of Biological Sciences, Northern Illinois L'niversity, DeKalb, IL 60115. Robin La\vson is director of the Osher Foundation Laboratory for Molecular Systematics, California Academy of Sciences, Golden Gate Park, Sun Francisco, CA 94118. © 1997 American Institute of Biological Sciences.
May 1997
Richard B. King and Robin Lawson
Evolutionary outcomes
depend not only on those
processes that operate
within populations (e.g., selection) but
also on interactions
(via gene flow)
among populations
island populatians of this snake provide a classic example of microevolutionary change in which the effects of selection, gene flow, inheritance, and population history are unusually well understood (King 1992, 1993a, 1993b, King and Lawson 1995).
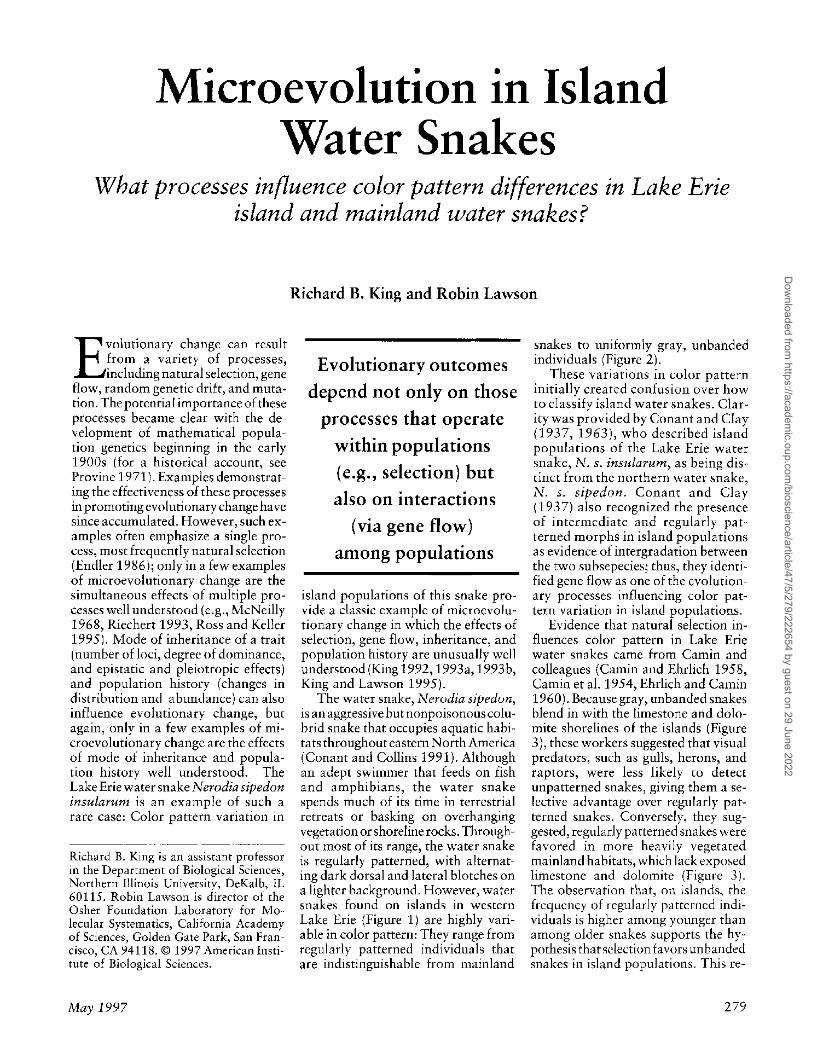
The water snake, Nerodia sipedon, is an aggressive but nonpoisonouscolubrid snake that occupies aquatic habita ts throughout eas tern North A mefica (Conant and Collins 1991). Although an adept swimmer that feeds on fish and amphibians, the water snake spends much of its time in terrestrial retreats or basking on overhanging vegetation orshoreHne rocks. Throughout most of its range, the water ~make is regularly patterned, with alternating dark dorsal and lateral blotches on a lighter background, However, water snakes found on island .. in western Lake Erie (Figure 1) are highly variable in calor pattern: They range from regularly patterned individuals that are indistinguishable from mainland
snakes to uniformly gray, unbanded individuals (Figure 2).
These variations in color pattern initially created confusion over how to classify island water snakes. Claritywas provided hy Conant and Clay (1937, 1963), who described island populations of the Lake Erie water snake, N. s. insularum, as being distinct from the northern water l>nake, N. s. sipedon. Conant and Clay (1937) also recognized the presence of intermediate and regularly patterned morphs in island populations as evidence of intergradation between the two suhscpecic1>; thus, they identified gene flow as one of the evolutionary processes influencing calor pattern variation in island populations.
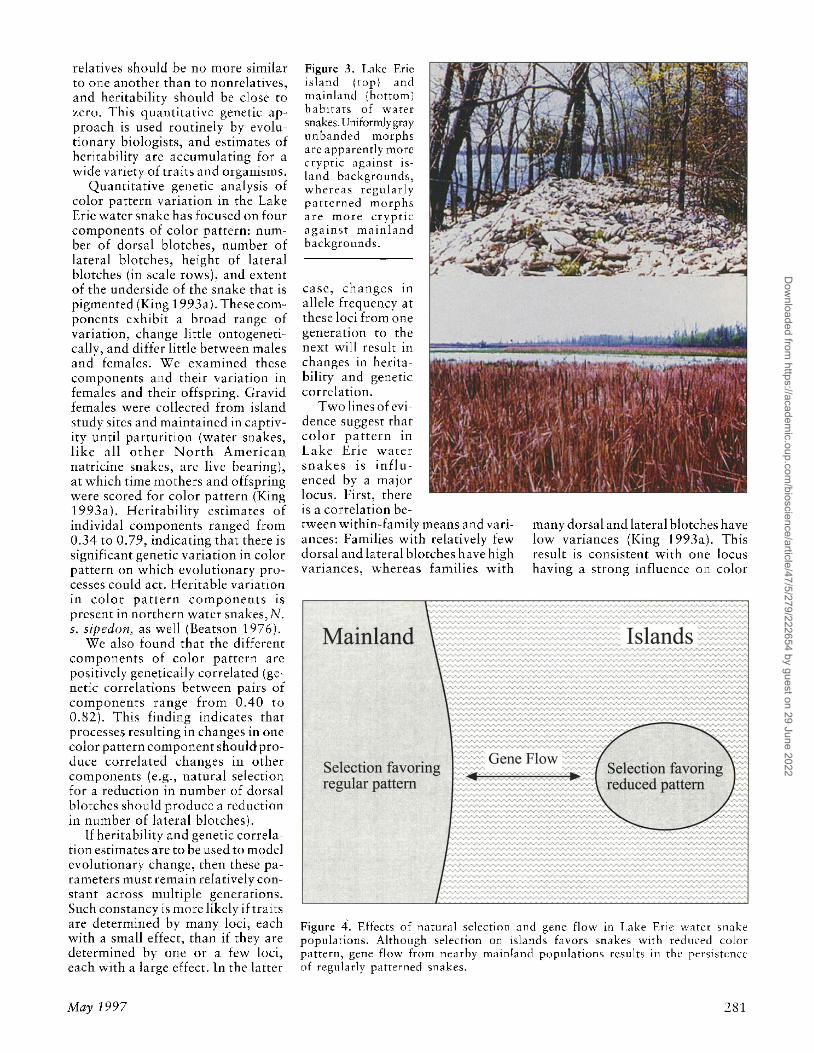
Evidence that natural selection influences calor pattern in Lake Erie water snakes came from Camin and colleagues (Camin and Ehrlich 1958, Camin et a1. 1954, Ehrlich and Camin 1960). Because gray, unbanded snakes blend in with the limestone and dolomite shorelines of the islands (Figure 3), these workers suggested that visual predators, such as gulls, herons, and raptors, were less likely to detect unpatterned snakes, giving them a seb.:tive advantage over regularly patterned snakes. Conversely, they suggested, regularly patterned snakes \.-vere favored in more heavily vegetated mainland habitats, which lack expo~ed limestone and dolomite (Figure 3). The observation that, on islands, the frequency of regularly patterned individuals is higher among younger than among older snakes supports the hypothesis that sdection favors un banded snakes in island popuJations. This re-
279
Dow
nloaded from https://academ
ic.oup.com/bioscience/article/47/5/279/222654 by guest on 29 June 2022
C '. < ' 0 -::;" ', .,.. 0 ' < G~~ ~\ }~ ~ '0> \
L A '.
Ohio
Ontario
K E E R _ Middk Si .. «
'" Nonh Harbo< .... .... ''''''"" r , H~n
N~' ~ii>" '" ,,'~ S
Middl.Il." "',
I
ftillman M.!"$h .
E
"~,---~ ." M\ld1 R'"li<;snak.''' 1j • Ban... ..<> • • • ' ••• ". ••• ___ • ••• ••• • •• • •
G,b<allor ~ Soulh Ila" Green ·
•
, SI''''O
f'-1Kell<ys
Moo.. '-J
Will"w Poin!
•
Figure 1. The island region of western Lake Erie. Lake Erie water snakes are known historically from all of the islands shown on the map. Tissue samples used in estimating gene flow came from Hillman Marsh (on the Ontario mainland), Pelee Island, North Ba!\.~ Island, Middle Bass Id and, Rattlesnake Island, Middle Island, and Willow Point (on the Ohio mainland),
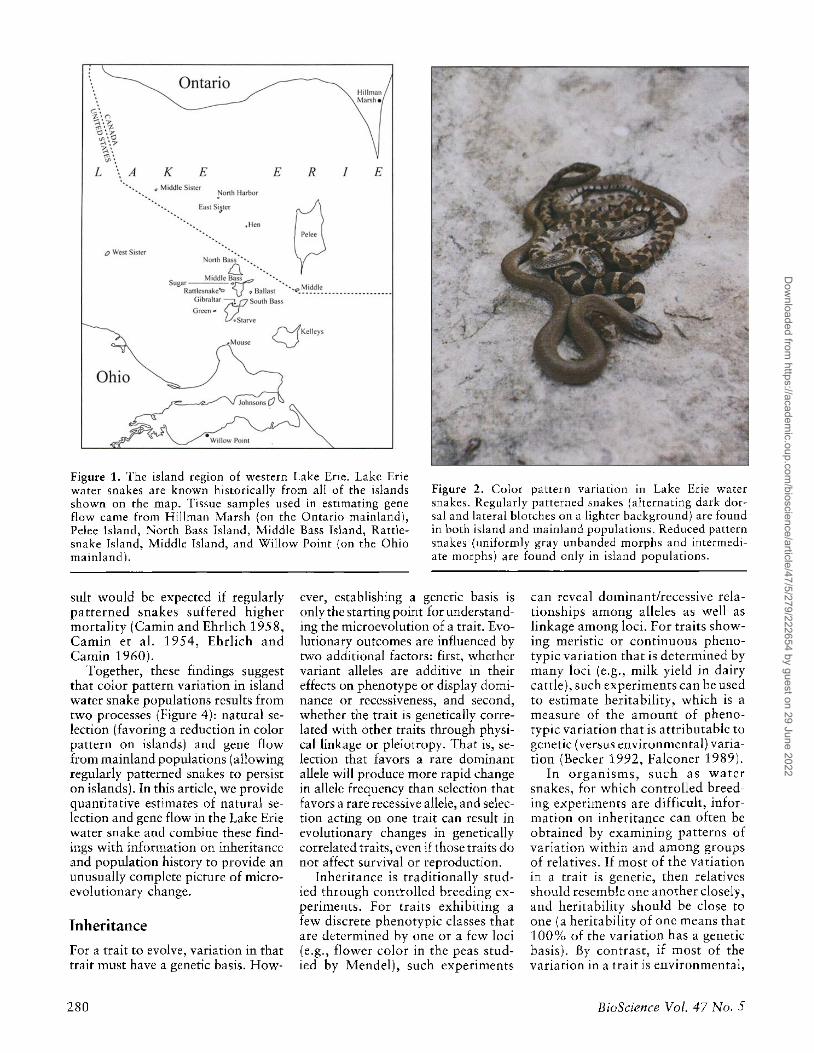
Figure 2. Col or pattern variation in Lake Erie \\-'ater snakes. Regularly patterned snakes (alternating dark dorsal and lateral blotches on a lighter background) are found in both island and mainland populations. Reduced pattern snakes (uniformly gray unhanded morphs and intermediate morphs) are found only in island populations.
suIt would be expected if regularly patterned snakes suffered higher mortality (Camin and Ehrlich 1958, Camin er a1. 1954, Ehrlich and Camin 19(0).
Together, these findings suggest that eolor pattern variation in island water snake populations results from two processes {Figure 4): natural selection (favoring a reduction in calor pattern on islands) and gene flow from mainland populations (allowing regularly patterned snakes to persist on islands). In this article, we provide quantitative estimates of natural selection and gene flow in the Lake Erie water snake and comhine these findings with information on inheritance and population history to provide an unusually complete picture of microevolutionary change.
Inheritance
for a trait to evolve, variation in that trait must have a genetic basis. How-
280
ever, establishing a genetic basis is only the starting point for understanding the microevolution of a trait. Evolutionary outcomes are influenced by two additional factors: first, whether variant alleles are additive III their effects on phenotype or display dominance or recessiveness, and second, whether the trait IS genetically correlated with other traits through physicallinkage or pleiotropy. That is, selection that favors a rare dominant allele will produce more rapid change in allele frequency than selection that favors a rare recessive allele, and selection acting on one trait can result in evolutionary changes in genetically correlated traits, even if those traits do not affect survival or reproduction.
Inheritance is traditionallv studied through cont'r{)lled breeling experiments. For traits exhibiting a fe\v discrete phenotypic classes that are dekrmined by one or a few loci (e.g., flower calor in the peas studied by Mendel), such experiments
can reveal dominant/recessive relationships among alleles as well as linkage among loci. for traits showing meristic or continuous phenotypic variation that is determined by many loci (e.g., milk yield in dairy cattle), such experiments can be used to estimate heritability, which is a measure of the amount of phenotypic variation that is attributahle to genetic (versus en vironmental) variation (Beeker 1992, Falconer 1989).
In organisms, such as water snakes, for which controlled breeding experiments are difficult, information on inheritance can often be obtained by examining patterns of variation within and among groups of relatives. If most of the variation in a trait is genetic, then relatives should resemble one another closely, and heritability should be dose to one {a heritability of onc means that 100% of the variation has a genetic basis}. By contrast, if most of the variation in a trait is environmental,
BioScience Vol. 47 No. 5
Dow
nloaded from https://academ
ic.oup.com/bioscience/article/47/5/279/222654 by guest on 29 June 2022
relatives should be no more similar to one another than to nonrelatives, and heritability should be close to zero. This quantitative genetic approach is used routinely by evolutionary biologists, and estimates of heritability are accumulating for a wide variety of traits and organisms.
Quantitative genetic analysis of color pattern variation in the Lake Eric \vater snake has focused on four components of color pattern: number of dorsal blotches, number of lateral blotches, height of lateral blotches ('in scale rows), and extent of the underside of the snake that is pigmented (King 1993a). These components exhibit a broad range of variation, change little ontogenetically, and differ little between males and females. \x:Te examined these components and their variation in females and their offspring. Gravid females were collected from island study sites and maintained in captivity until parturition (water snakes, like all other North American natricine snakes, arc live bearing), at which time mothers and offspring were scored for color pattern (King 1993a). Heritability estimates of individal components ranged from 0.34 to 0.79, indicating that there is significant genetic variation in calor pattern on which evolutionary processes could act. Heritable variation in color pattern components is present in northern water snakes, N. s. sipedon, as well (Beatson 1976).
We also found that the different components of color pattern are positively genetically correlated (genetic correlations bet\veen pairs of components range from 0.40 to CUQ). This finding indicates that processes resulting in changes in one color pattern component shouldproduce correlated changes in other components (e.g., natural selection for a reduction in number of dorsal blotches should produce a reduction in number of lateral blotches).
1£ heritability and genetic correlation estimates arc to be used to model evolutionary change) Lhen these parameters must remain relatively constant across multiple generations. Such constancy is more likely if traits are determined by many loci, each with a small effect, than if they are determined by one or a few loci, each with a large effect. In the latter
May 1997
Figure 3. Lake Erie island (rap) and mainland (bottom:, habitats of water snakes. Uniformly gmy unbanded morphs arc apparently more cryptic agalllst IS
land backgrounds, whereas regularly patterned morphs are more cryptic against main l and backgronnds.
case, changes in allele frequency at these loci from one generation to the next will result in changes in heritability and genetic correlation.
Two linesofevidence suggest that color pattern in Lake Erie water snakes is influenced by a major locus. Pirst, there is a correlation be-tween within-family means and variances: Families with relatively few dorsal and lateral blotches have high variances, whereas families with
Mainland
many dorsal and lateral blotches have low variances (King 1993a). This result is consistent with one locus having a strong influence 0 11 color
Islands
Selection favoring F= Gene Flow = Selection favorin:'1
regular pattern "'- reduced pattern ~
L~
Figure 4. Effects of natural selection and gene flow in Lake Erie W:1.tcr snake popularions. Although selection on islands favors sl1dkes with reduced calor pattern, gene flo,'.' from nearby mainland popu1ations results in the rersistencc of regularly patterned snakes.
281
Dow
nloaded from https://academ
ic.oup.com/bioscience/article/47/5/279/222654 by guest on 29 June 2022
pattern because if one major locus is involved variation should be greater in famili~s consisting of mjx~ures ~f genotypes at this locu" than III ~3mr lies consisting mostly of a sing e
t th,' s locus. By contrast, genotype a . .1 b ·f I" r pattern were lilfluenceu y , co 0 ·1· h Id
ID,·nor loci, fam) les S all many . .. show similar amounts at varIatIOn in color pattern. .
The second line of nndence comes from the progeny of la bocame), cros~es between a regularly patterned mamland male and two reduced-pattern island females; these progeny all had the regular calor patterns typical of mainland snakes (King 199.1a). Onc way that a major locus might produce the~e results is if a dominant allele \vere to result in a regular (mainlandlike) pattern, and a recessive allele in a reduced pattern. Families in vvhich most members posses", the dominant allele would then have high means and low variances, whereas families in which some members possess this allele and others do not would have lower means and higher variances. Moreover, if the male used in laboratory crosses was homozygous for the dominant allele, then his offspring should all be regularly patterned, regardless of the mother's genotypeexactly the results we obtained. By contrast, if color pattern \vere controlled by many loci, then offspring should exhibit calor patterns intermediate to those of their parents.
Natural selection
Evolution by natural selection is a remarkably simple process: if individuals within a population vary, if this variation has a genetic basis, and if this variation affects survival and reproduction, then the characteristics of that poputation may change in a predictable way from generation to generation. Despite this simplicity, methods for detecting natural selection in operation are diverse. Some methods identify targets and mechanisms of selection, others distinguish past from ongoing selection, and still others estimate the strength of selecrion (Rrodie et al. 1995, End!er 1986).
One line of evidence that natural selecrion influences color pattern in Lake Erie water snakes is tbat differences in color pattern are associated
282
0.85 . .' ••• ••
r-----~~.;!.~-~. ~ • 0.65 • _ ~ • , • • 1045j <I) 0.25 ~ 0.85 C
• Il::: 0.65
0.45
•
•
-.-...: . • • •
• • • . .' -• • '" •
10 2D 30 40 50 0.25 ±--=---::<:---o;:---,;:---;:
° Lateral Blotches
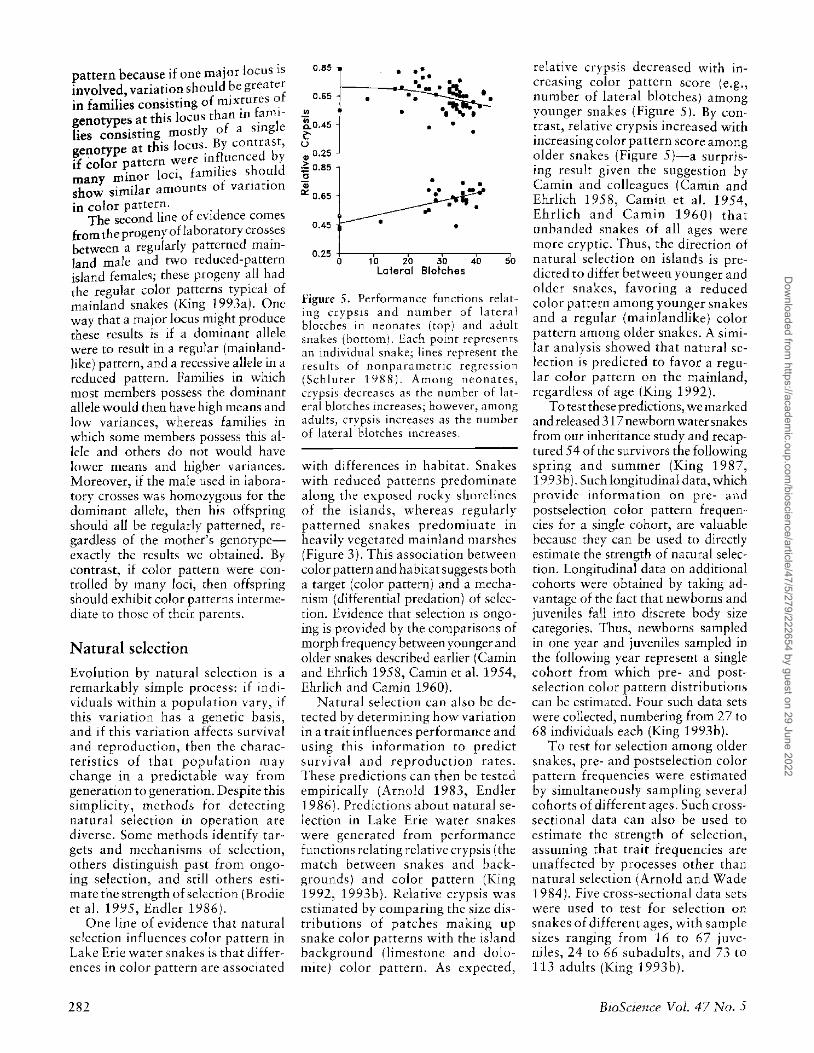
figure 5. Performance functions relating crypsis and number of lateral blotches in ntOll"tes (top) and adult snakes (bottoml. Each point rrprc<;enrs an indlVidlwl snake; lines n~present the results of nonparametrlc regression (Scbluter 1 ')88). Among neonates, crypsis decreases as the number of lateral blotches increases; however, among adults, crypsis increases as the number of lateral blotches increases.
with differences in habitat. Snakes with reduced patterns predominate along the exposed rm:ky shorelines of the lslands, whereas regularly patterned snakes predominate in heavily vegetated mainland marshes (Figure 3). This association between color pattern and habitat suggests both a target (col or pattern) and a mechanism (differential predation) of selection. Evidence that selection is ongoing is proyided by the comparisons of morph frequency between younger and older snakes described earlier (Camin and Ehrlich 1958, Camin et al. 1954, Ehrlich and Camin 1960).
Natural selection can also be detected by determining how variation in a trait influences performance and using this information to predict wrvival and reproduction rates. These predictions can then be tested empirically (Arnold 1983, Endler 1986). Predictions about natural selection in Lake Erie water snakes were generated from performance functions relating relative erypsis (the match between snakes and backgrounds) and calor pattern (King 1992, 1993b). Relative crypsis \vas estimated by comparing the size distributions of patches making up snake color patterns with the island background (limestone and dolomite) calor pattern. As expected,
relatiye crypsis decreased with incre<1!'.ing col or pattern score (e.g., number of lateral blotches) among younger snakes (Figure 5). By contrast, relative crypsis increased with increasing calor pattern score among older snakes {Figure 5)~a surprising result given the suggestion by Camin and colleagues (Camin and Ehrlich 1958, Camin et a!. 1954, Ehrlich and Camin 1960) that unbamled snakes of all age~ were more cryptic. Thus, the direction of natural selection on islands is predicted to differ bet\lIleen younger and older snakes, fayoriug a reduced color pattern among younger snakes and a regular (mainlandlike) color pattern among older snakes. A similar analysis showed that natural selection is predicted to favor a regular calor pattern on the mainland, regardless of age (King 1992).
To test these predictions, we marked and released 317 newborn water snakes from our inheritance study and recaptured 54 of the survivors the following spring and summer (King 1987, 199 3b). Such longitudinal data, which provide information on prc- and postselection color pattern frequen· cies for a single cohott, are valuable because they can be used to directly estimate the strength of natural selection. Longitudinal data on additional cohorts were obtained by taking advantage of the fact that new barns and juveniles fall into discrete body size categories. Thus, newborns sampled in one year and juveniles sampled in the following year represent a single cohort from which pre- and postselection color pattern distributions can be estimated. Four such data sets were collected, numbering from 27 to 68 individual; each (King 199:lh).
To test for selection among older snakes, pre- and posts election col or pattern frequencies were estimated by simultaneously sampling several cohorts of different ages. Such crosssectional data can also be used to estimate the strength of selection, assuming that trait frequencies are unaffected by processes other than natural selection (Arnold and Wade 1984). Five cross-sectional Jata sets \vere used to test for selection on snakes of different ages, with sample sizes ranging from 1 h to h7 juveniles, 24 to 66 subadults, and 73 to 113 adults (Kll1g 1993b).
BioScience Vol. 47 No. 5
Dow
nloaded from https://academ
ic.oup.com/bioscience/article/47/5/279/222654 by guest on 29 June 2022
Tests for natural selection center on <1 simple question: 00 trait distributions differ in mean or variance before and after an episode of selection? We found significant color pattern differences between pre- and postselection samples in the mass release experiment and between neonates and juveniles (multivariate analysis of variance,r = 0.033 and P = O.OOJ, respectively): Snakes in postselection samples had fewer dorsal and lateral blotches than snakes in preselection samples. Differences bet,veen juveniles and subadults and hetween subadults and adults were not significant (P = 0.052 and P = 0.071, respectively; King 1993b).
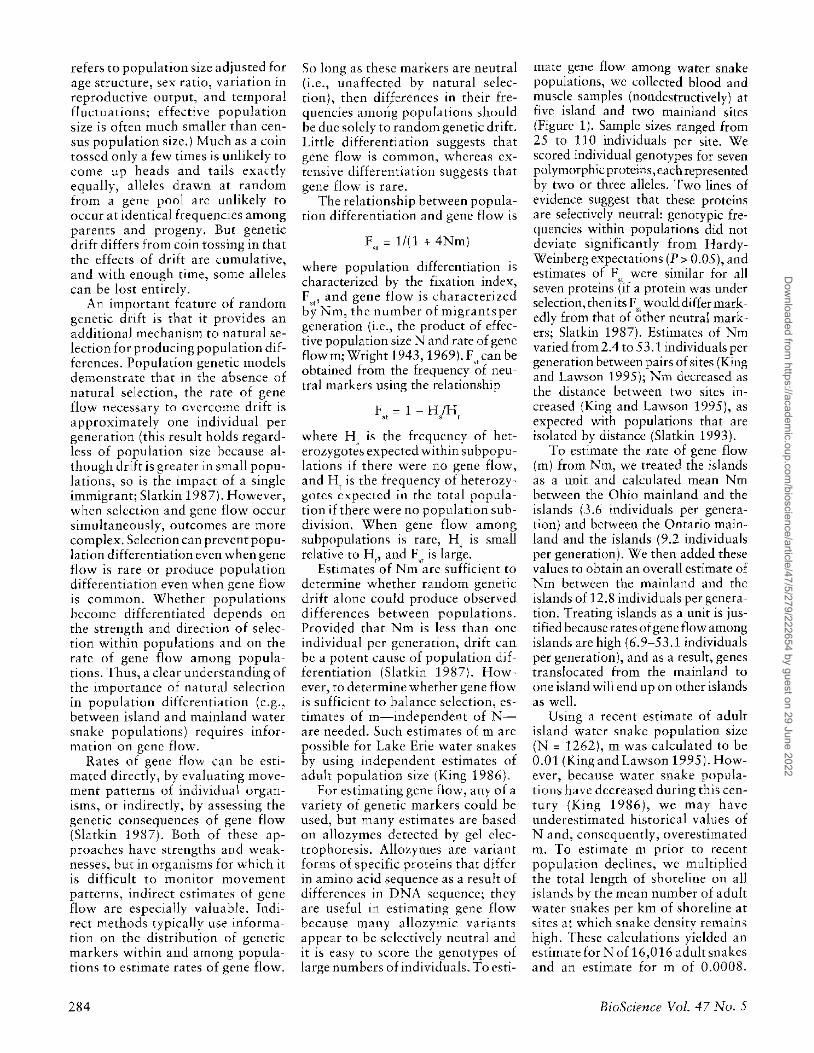
Quantitative information on the form (e.g" directional or stabilizing) and strength of natural selection is provided by selection gradients (I.ande-and Arnold 1983). These gradients are obtained by using multiple regression to assess the independent effects of each of several traits (in this case, the four calor pattern components) on fitness (e.g., whether a snake survived to be recaptured in the mass release experiment). As Table 1 indicates, when we analyzed snake color pattern in this \-vay, we detected the presence of directional selection favoring a decrease in the number of dorsal and lateral blotches among younger snakes (King 1993b). In the mass release experiment, directional selection ,vas sufficient to produce a decrease of approximately 0.3 standaru deviation units (i.e.) approximately l.S blotches) in the number of dorsal and lateral blotches per generation. By contrast, selection gradients among older snakes were close to zero.
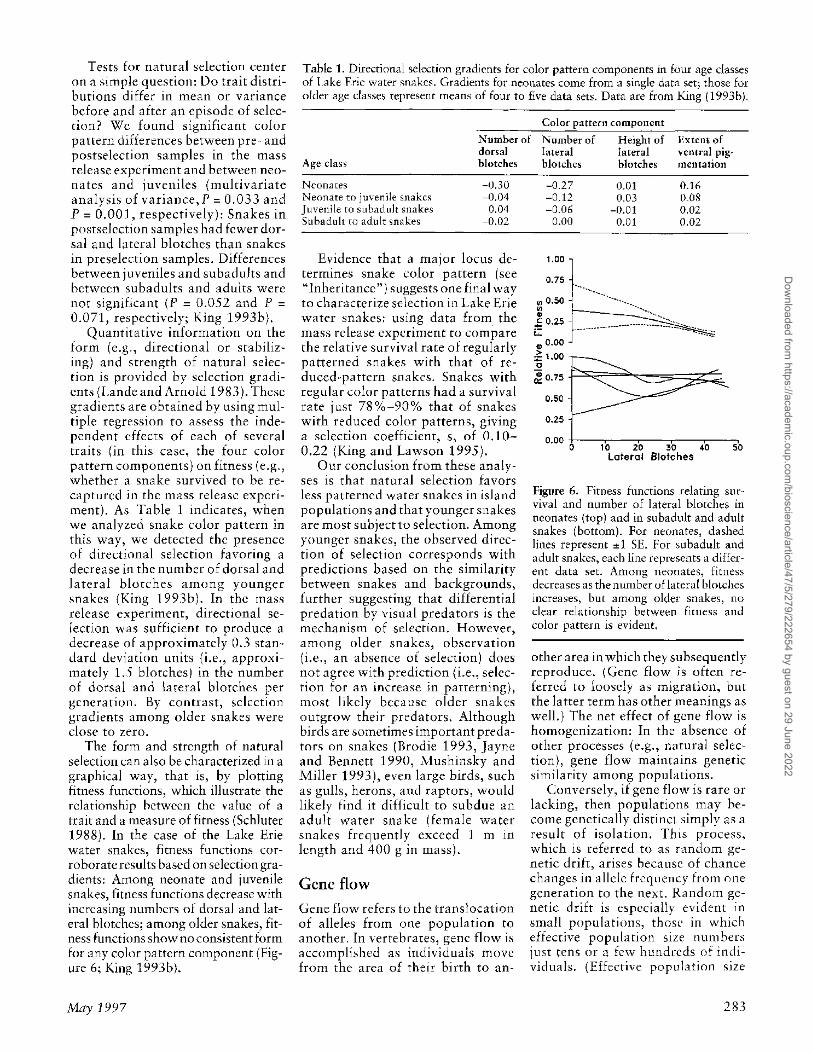
The form and strength of natural selection can also be characterized in a graphical way, that is) by plotting fitness functions) which illustrate the relationship between the value of a trait and a measure of fitness (Schluter 1988). In the case of the Lake Erie water snakes, fitness functions corroborate results based on selection gradients: Among neonate and juvenile snakes, fitness functions decrease with increasing numbers of dorsal and lateral blotches; among older snakes, fitness functions showno consistent form for any calor pattern component (Figure 6; King 1993bl.
May 1997
Table 1. Directional selection gradients for calor pattern components in four age classes of Lake Frlt watt'r I'.n:1kes. Gradients for neonates come from a single ciat:1 set; those for older age classes represem means of four to five data sets. Data are from King (1993b),
Color pattern component
Number of ~umber of Height of Extent of dorsal
Age cia,s blotchc~
Nconares -0.30 Neonate to juvenile snakes -0.04 Juvenile to subadult snakes 0.04 Subadul1 to adult snakes -0.02
Evidence that a major locus determines snake color pattern (see "Inheritance") suggests one final way to characterize selection in Lake Erie water snakes: using data from the mass release experiment to compare the relative survival rate of regularly patterned snakes with that of reduced-pattern snakes. Snakes with regular calor patterns had a survival rate just 78%-90% that of snakes \",ith reduced col or patterns, giving a selection coefficient, s, of 0.10-0.22 (King and La,,,,son 1995).
Our conclusion from these analyses is that natural selection favors less patterned water snakes in island populations and that younger snakes are most subject to selection. Among younger snakes) the observed direction of selection corresponds with predictions based on the similarity between snakes ::md backgrounds, further suggesting that differential predation by visual predators is the mechanism of selection. However, among older snakes) observation (i.e., an absence of selection) does not agree with prediction {i.e., selecrion for an increase in panerning}, most likely because older snakes outgrow their predators. Although birds are sometimes important predators on snakes (Brodie 1993, Jayne and Bennett 1990, ~lushinsky and l\.1iller 1993), even large birds, such as gulls, herons, and Taptors, would likelv find it difficult to subdue an adult water snake (female water snakes frequently exceed ] m in length and 400 g in mass).
Gene flow
Gene flow refers to the translocation of aUdes from one population to another. In vertebrates) gene flow i,o:., accomplished as individuals move from the area of their birth to an-
lateral lateral ,"'cntral pig-blotches blotches mentation
-0.27 0,01 0.1 ti -0.12 0.03 O.OS -0.06 -0.01 0.02
0,00 0.01 0,02
1.00 J 0.75 ]
~050~ .... e 0.25 J-... -... --.-------.-----------.~ iD 0.00
:E: 1.00 c
~ O. 75 ~"''-'''~;;''':::5=:z;~~ 0.50
0.25
0.00 to--"1Oc---2"Oc---""c---~40c---"050. Lateral Blotches
Figure 6. Fitness functions relating surviyal and number of lakral blotcht:s in neonates (top) and in subadult and adult snakes (bottom). For neonates, dashed lines represent ::!:1 SE. For subadult and adult snakes, each line rt:prt:sents a different data set. Among neonates, fitness decreases as the nWllbt:r u£lateral blolches increases, but among older snakes, no dear relationship betwt:t:n fitness and calor pattern is evident,
other area in which they subsequently reproduce. (Gene flow is often referred to loosely a5 migration, bur the latter term has other meanings as \-vell.) The net effect of gene flow is homogenization: In the absence of other processes (e.g., natural selection), gene flow maintains genetic similarity among populations.
Conversely, if gene flow is rare or lacking, then populations may become genetically distinct simply as a result of isolation. This process, which is referred to as random genetic drift, arises because of chance changes in allele frequency from one generation to the next. Random genetic drift is especially evident in small populations, those in which effective population size numbers just tens or a few hundreds of individuals. (Effective population size
283
Dow
nloaded from https://academ
ic.oup.com/bioscience/article/47/5/279/222654 by guest on 29 June 2022
refers to population size adjusted for age structure, sex ratio, variation in reproductive output, and temporal fluctuations; effective population size is often much smaller than census population size.) Much as a coin tossed only a few times is unlikely to come up heads and tails exactly equally, alleles drawn at random from a gene pool arc unlikely to occur at identical frequencies among parents and progeny. But genetic drift differs from coin tossing in that the effects of drift are cumulative, and with enough time, some alleles can be lost entirely.
A n important f~atllrc of random genetic drift is that it provides an additional mechanism to natural selection for producing population differences. Population genetic models demonstrate that in the absence of natural selection, the rate of gene flow necessary to overcome drift is approximately one individual per generation (this result holds regardless of poplllalion size hecause although drift is greater in small populations, so is the impact of a single immigrant; Slatkin 1987). Hov,'ever, \vnen selection and gene flow occur simultaneously, outcomes are more complex. Selection can prevent population differentiation even when gene flow is rate or produce population differentiation even \"ihen gene flow is common. Whether poplllation~ hecome differentiated depends on the strength and direction of seJection within populations and on the rate of gene flow among populations. Thus, a clear understanding of the lmportance of natural selection in population differentiation (e.g., between island and mainland water snake populations) requires information on gene flO\v.
Rates of gene flow can be estimated directly, by evaluating movement patterns of individual organisms, or indirectly, by assessing the genetic consequences of gene flow ISlatkin 1987). Both of these approaches have strengths and weaknesses, but in organisms for wh ich it is difficult to monitor movement patterns, indirect estimates of gene flow are especially valuable. Indirect methods typically use information on the distrihution of genetic markers within and among populations to estimate rates of gene flO\v.
284
So long as these markers are neutral (i.e., unaffected by natural selection), then differences in their frequencies among populations should he due solely to random genetic drift. Little differentiation suggests that gene flow is common, whereas extensive differentiation suggests that gene flmv is rare_
The relationship between population differentiation and gene flow is
F" 0 1111 + 4Nm)
where population differentiation lS
characterized by the fixation index, F , and gene flow is chatacterized ., by Nm, the numher of migrants per generation (i.e., the product of effective population size).j and rate of gene flowm; Wright 1943, 1969). F" can be obtained from the frequency of neutral markers using; the relationship
f ol-H/H ,t "
where H., is the frequency of heterozygotes expecfed within subpopulations if there were no gene flow, and H, is the frequency of heterozygotes expected in the total population if there were no population subdivision. \Xrhen gene flow among suhpopulatiom is tare, H, is small relative to H, and F is large.
Estimatest of Nm'tare sufficient [0
determine whether random genetic drift alone could produce observed differences between populations. Provided that Nm is less than onc individual per generation, drift can be a potent cause of population differentiation (Slatkin 1987). However, to determine whether gene flow is sufficient to balance selection, estimates of m-ll1dependent of Nare needed. Such estimates of m arc po,'"sible for Lake Erie water snakes by using independent estimates of adult population size (King 1986).
For estimating gene flow, any of a variety of genetic markers could be used, but many estimates are based 011 al\ozymes detected hy gel electrophoresis. Allozymes are variant forms of specific proteins that differ in amino acid sequence as a result of differences in DNA sequence; they are useful 111 estimating gene How because many allozymic variants appear to be selectively neutral and it is easy to score the genotypes of large numbers of mdividuals. To esti-
mate gene flow among water snake populations, \"le collected blood and muscle samples (nondestructively) at five island and two mainland sites (Figure 1). Sample sizes ranged from 25 to 110 individuals per site. We scored individual genotypes for seven polymorphic proteins, each represented by tVi'O or three alleles. Two lines of e~'idence suggest that these proteins are selectively neutral: genotypic frequencies within populations did not deviate significantly from Hardy\'I/einberg expectations (P > 0.05), and estimates of F were similar for all seven proteins (if a protelll \vas under selection, then its f
st would differ mark
edly from that of other neutral markers; Slatkin 1987}. Estimates of Nm vatied from 2.4 to 53.1111dividuals per generation between pairs of sites (King and Lawson 1995); Nm decreased as the distance between two sites increased (King and Lawson 1995), as expected \vith populations that are isolated by distance (Slatkin 1993).
To estimate the rate of gene flow (m) from t\Tm, we treated the islands as a unit and calculated mean Nm between the Ohio mainland and the islands (3.6 individuals per generation) and between the Ontario mainland and the islands (9.2 individuals per generation). We then added these values to obtain an overall estimate of Nm between the mainland and the lslands of 12.8 individuals per generation. Treating islands as a unit is justified because rates of gene flmv among islands are high (6.9-53.1 individuals per generation), and as a result, genes translocated from the mainland to one island will end up on other islands as vi'ell.
Using a recent estimate of adult island water snake population size (N = 1262), m was calculated to be 0.01 (King and Lawson 1995). However, because water snake populations have decreased during this century (King 1986), we may have underestimated historical values of N and, consequently, overestimated m. To estimate m prior to recent population declines, we multiplied the total length of shoreline on all islaTld~ by the mean number of adult water snakes per km of shoreline at sites at which snake density remains high. These calculations yielded an estimate for N of 16,0 16 adult snakes and an estimate for m of 0.0008.
BioScience Vo!. 47 Nu. 5
Dow
nloaded from https://academ
ic.oup.com/bioscience/article/47/5/279/222654 by guest on 29 June 2022
Thus, our analysis of allozyme variation indicates that at each generation, 0.08%)-1 % of the island water snake population is replaced by main land individuals.
Synthesis
Do inheritance, selection, gene flow, and population history adequately explain color pattern differences benveen island and mainland water snake populations? To answer this question, we used a simple islandcontinent model, in which islands were treated as a single genetic unit, to simulate color pattern evolution in island populations (King and La\vson 1995). Different forms of this model \vere used to examine two alternative modes of color pattern inheritance: Mendelian inheritance, in which a reduced color pattern is recessive to a regular color pattern (see "Inheritance"), and quantitative inheritance, in which the color pattern components represent four genetically correlated heritable traits. Estimates of the strength of selection and rate of gene flow came from the analyses described in the previous sections.
The geologica I history of the Lake Erie region indicates that io;land and mainland water snake populations were separated by rising water levels approximately 4000 years ago (Calkin and Feenstra 1985). This time period translates into approximately 1000 water snake generations and provide~ a time frame hoth for the evolution of island-mainland color pattern differences and for our simulations.
With l'vIendelian inheritance, if the frequency of the reduced pattern allele on the islands in any generation is q, then the change in allelic frequency from one generation to the next, Aq, is given by the following equation (I lard and Clark 19R9, p. 310),
[q - hq' J
<'>q = - q - mq 1 - hql
where h (a measure of the ~tn:ngth of selection) = 1 - (11[1 - sl); s is the selection coefficient, and m is the rate of gene flow. When the previously calculated values for s (0.1-0.22) and m (0.0008-0.01) are used, wc found that after 1000 genera-
May 1997
tions, the frequency of the reduced pattern allele ~hould exceed 50% (, our lowest estimate of the freq uency of the reduced pattern allele on any island). Hmvever, this was true only when we used all initial frequency for the reduced pattern allele of 0.5 % or greater. This initial allele frequency is greater than that expected from mutation alone, suggesting that some other evolutionary process (e.g., random genetic drift, inbreeding, or founder events) may have been necessary to "kick start" the process of island-mainland differentiation. One possibility is that island formation resulted both in a habitat change that favored reduction in color pattern and in a population subdivision that was necessary for the lllitial increase in the frequency of the reduced-pattern allele. This combination of random genetic drift followed by directional selection is much like the process cnvi<;ioned by \Xl right (1931, 1988) in his shifting balance theory of evolution.
With quantitative inheritance, the change in a suite of character values from one generation to the n~xt is
<'>z = G[~( 1 - Ill) - dm]
\vhere I1z is a vector of change 1Il
trait means; G is the genetic variancc-covariance matrix, which describes heritabilities and genetic cor~ relations among a suite of characters; ~ is a vector of standardized selection gradients; m is the rate of gene flow; and cl is a vector of trait differences between island and mainland populations. U"ing G from the analysis of inheritance, ~ from the mass release experiment, and m = 0.01-0.0008, we found that after 1000 generatiotl1> the mean number of dorsal and lateral blotches was expected to be lo\ver in island than in mainland watcr snake popll1a.tions.
Although the direction of this expected difference \\'as consistent with observed differences between the is~ land and mainland populations, its magnitude was much greater than observed differences. One reason for this inconsistency may he that lfl our simulation, genetic variances and covariances, selection gradients, and gene flmv remained constant througll time. This may not be true in nature. For
example, if a major locus influences color pattern, and if the freq uency of the reduced pattern allele was initially low at this locus, then heritability of calor pattern (and, consequently, the rate of color pattern evolution) would have been lower immediately following isolation of island populations than at present. Alternatively, the effects of selection on color pattern may be more complex than the directional selection gradients descrihed here "uggcst. For example, in some garter snakes, color pattern and escape behavior are genetically correlated, and the direction of selection on calor pattern depends on the type of escape behavlOf an animal uses (Rrodie 1992).
Our simulations demonstrate that the differences in color pattern observed hetween island and mainland \vater snake populations could have arisen as a result of observed patterns of selection and gene flow. IIowever, these simulatiom also suggest that our understanding of the processes influencing color pattern differences in Lake Erie island and mainland water snake populations is incomplete. For differentiation to occur under the !vlendeIian inheritance model, some other process (e.g., drift) is required for the frequency of the favored allele to increase sufficiently for selection to be effective. Under the quantitative genetic model, expected differentiation between island and mainland populations far exceeds that observed, Clearly, additionallllformation {e.g., on mode of inheritance, on the temporal constancy of selection, and on gene flow) would aid in refining these modcl~.
The example of calor pattern evolution in Lake Ene water snakes is unusual in that we have quantitative measures of inheritance, natural selection, gene fio"v, and population history. Although it is rare to have such complete data on multiple evolutionary processes for a single species, the simultaneous effects of multiple proceo;ses prohably infhlence patterns of variation in many organisms. Lake Erie island and mainland garter snake populations are also variable in calor paltern, consisting of tYPICal striped morphs and jet-black melanistic morphs. A~ in Lake Ene water "nakes, gene flO\v is common among garter snake pOpllla~ tiom; hmvcvcr, despite high rates of gene fJO\v, frequencies of striptd and
285
Dow
nloaded from https://academ
ic.oup.com/bioscience/article/47/5/279/222654 by guest on 29 June 2022
melanistic garter snakes differ between populations, suggesting that selection favors differenct morphs in different habitats (Lawson and King 1996).
Opposing effects of natural selection and gene flow are also evident in desert spiders and perennial grasses. Natural selection favors different behavioral genotypes in spiders and different metal-tolerance alleles in grasses in adjacent habitats, but in both cases gene flow between habitats prevents fixation of alleles favored in one habitat or the other (MeNeilly 1968, Riechert 1993). Similarly, social interactions result in strong directional selection on alleles at the PGM-3 locus (which encodes phosphoglucomutase) in some fire ant colonies, but again, gene flow, in this case from colonies of a different social form, prevents fixation of the favored allele (Ross and KeJler 1995).
These examples demonstrate that evolutionary outcomes depend not only on those processes that operate within populations (e.g., selection) but also on interactions (via gene flow) among populations. Thus, factors affecting rates of gene flow are likely to produce evolutionary change even when within-population proce~ses remain constant. These examples also illustrate that the combined effects of selection and gene flow are not restricted to organisms found on islands like those in western Lake Erie but may be important in any organism ... vhose distribution spans a range of habitat types. As human activities produce changes in habitat characteristics and distribution (e.g., by fragmenting formerly continuous habitats), changes in selection regimes and rates of gene fIo ... v may produce microevolutionary changes in other organisms that mirror those seen in island water snakes.
References cited
Arnold 5]. 1983. Morphology, performance, and fitness. American Zoologi~t 23: 347-361.
286
ArnolJ SJ, Wade loll 1984. On the me;1 Sll rement of natural and sexual selection: applications. Evolution .1H: 720-7.'34.
Btaboll RR. 1976. En vironmental and genetical correlates of disruprive coloration in the water snake, Natrix s. sipedolt. Evolution .10: 241-252.
Becker WA. 1992. Manual of quantitative genetics. 5th ed.l'ullman (WAj: Academic Enterprises.
Brodie ED ITI. 1992. Corrdational selection for color pattern and u:1tipredator hehavior in the garter snake Thanmophis ordinoides. Evolution 46: 1284-129R.
___ . 1993. Differential avoidance of coral snake handed pattern, hy free-ranging avian prellators ill Costa Rica. Evolution 47:227-235.
Brodie ED Ill, Moore AI, .fanzen FJ. 1995. ViSLUllizing and quantifying natural selection. Trends in Ecology & Evolulion 10: .113-31tl.
Calkin PE, Feenstr<] BH. 1985. Evoltltion of the Erie-basin Great Lakes. Pages 149-170 in Karrow Pf, Calk in PE, eds. Quaternary evolution of the GreJt Lakes. Gcological Association of Canada: speCIal paper nr 30.
CaminJH, Fhrli(:h PR. 195!L Natural selection in water snakes (Natrix siprdon L) on islands in Lake Eric. Evolution] 2: 504-511.
CaminJH,EhrlichPR, Triplehorn C, Waiter H. 1954. Some indicacions of suniv;)1 vallle in the type" A TI pattern of the IslanJ wakr snakes in Lake Erie. Chicago Academy of S,:iences Nalural History Miscellanea 1 31: 1-3.
Conant R, Clay W. 1937. A new subspecies of watennake from the island, in Lake Erie. O<.·l·asional papers of the University of Michigan Museum of Zoology 346: 1-9.
19f13. A re;1sse-ssment of The taxonomic statu~ of tho:- Lake Erie w~Her snake. Herpetologica 19: 179-184.
Conanl. R, Clay W, Collins JT. 1991. A field g..tide to reptiles and amphibians: ea~tt'rn and central North America. 3rd cd. Boston (MA): Hougl1ton Mifflin.
Ehrlkh PR, Camin J. 1960. Natural selection in Middle Island water snake, (Natrix sipedon L.). Evolution 14: 136.
Endler .fA. 1986. Natural selection in tbe wild. Princetolll: NJ): Princeton University Press.
Faleoner US. 198~. lntroduction to quantitative genetic~ .. 1rd ed. New York: Jobn Wile)" and Son~.
Hard DL, Clark AG. J 989. Principles of population genetics. 2nd ed. Sunderland (MA): Sinaller Associates.
Jaync BC, Bennett AF. 1990. Sekction Oil
locomotor performance capacity in a natural poplll ation of garter snakes. Fvolution 44: 1204-1229.
King RH. 1986. Population ecology of the Lake Erie water snake, Nerodia sipedon insltlarum. Copeia: 757-772.
___ . 1987. Color p<lttern polymorphism in the Lake Erie wate)" ~nake,Nerodia sipedon insularum.lwolution 41: 241-255.
___ .1992. Morph- and age-specific cry psis in Lak.e Erie water snakes. Evolutionary Ecology 6: 115-124.
___ .199-1a. Colorpattern V8 riationinLake Erie water SIIakes: inheritance. Canadian Journal of Zoology 71: 1985-1990.
___ . 1993b. Color pattern variation in Lake Erie water sn<lkes: prediction and measurement of natural ~clection. Evolution 47: 1819-1833.
King RB, Lawson R. 1995. Color pattern variation in Lake Erie water snakes: the role of gene How. Evolution 49: 885-896.
Lande R, Arnuld SJ. 1983. The measurement of selection on correlated characters. Evolution 37: 1210-'1126 .
Lawson R, Kir.g RR. 19%. Gene flow and melanism in Lake Eril;' garter make populations. Biological Journal of the Linnean Society S9: 1-19.
McNeilly T. 1968. Evolution in closely adjacent plant populations III: .1grostis tenius on a small copper mine. Heredity 23: 99-108.
Mushinsk.y HR, Miller DE. 1993. Prl;'dation on water snakes: ontogenetic and interspeciflc consideIJtions. Copeia: 660-665.
Provine WHo 1971. The origins of theoretical population gtnetics. Chicago (IL}: University of Chicago Press.
Ricchert SA. 1991. Tnve~tig<ltion of potentwl gene flow limitation of behavioral aJapta" tion in an ariJlands spider. Beha\- ioral Ecology and Sociobiology 32: 355-363.
Ross KG, Keller L. 19.95. Joint influence of gene flow and selcction on a rcproductively important genetic polymorphism in the fire ant Solenopsis inuicta. American NaturalIst 146: 32S-.348.
.)chluter U. In:.::. Estimatingthe form ofnatu r<11 selection on a (',lla n,:itjlti ve trait. Evolution 42: 836-849.
.)latkin ':-"1. 1987. Gene flow and the geographic strllctllre of n<1tllral poplllations. Science 136: 787-792.
___ .1993. Isolation by distance in equilibrium and non-equilibrium populations. Evolution47: 264-279.
Wright S. 1931. Evolution in Mendelian POPLllatiom. Genetics 16: 97-159.
___ .1943. Isolation by distance. Genetics IS: 114-138.
___ .1969. Evolution and genetics of pop Illation'i. Vol. 2. The analysis of gene frequen cie~. Chicago IlL): University of Chicago Press .
. 1988. Sllrfact~ of selective nine revisit;;d. American !\;aturalist 131: 115-123.
BioScience Vo!. 47 No. 5
Dow
nloaded from https://academ
ic.oup.com/bioscience/article/47/5/279/222654 by guest on 29 June 2022