microbiological safety of fresh and fresh-cut produce: description of the situation and economic...
TRANSCRIPT

Vol. 2 (Supplement), 2003—COMPREHENSIVE REVIEWS IN FOOD SCIENCE AND FOOD SAFETY 13
Chapter IMicrobiological Safety of
Fresh and Fresh-CutProduce: Description of
the Situation andEconomic Impact
E.H. Garrett, J.R. Gorny, L.R. Beuchat, J.N. Farber, L.J. Harris, M.E. Parish, T.V. Suslow, F.F. Busta
1. IntroductionFresh produce has become one of our most desirable foods be-
cause today’s consumer perceives it as being healthy, tasty, con-venient, and fresh. All of these characteristics are strong sellingpoints to a busy and health-conscious consumer. The fruit andvegetable industry has experienced solid growth over the past 10years as illustrated by increasing consumption and sales data andincreasing space devoted to these products in supermarkets andon restaurant menus around the country.
However, with a growing fresh produce market, the industry isfacing new challenges that require attention, such as the protec-tion of consumers against microbiological hazards. How do theindustry structure and market pressures influence the safety ofproduce? What are the costs of food safety protection systemsand who will be financially able to implement them successfully?These are important questions to address in this overview of thefresh produce industry.
2. Fresh produce market structureThe movement and distribution of fresh produce through the
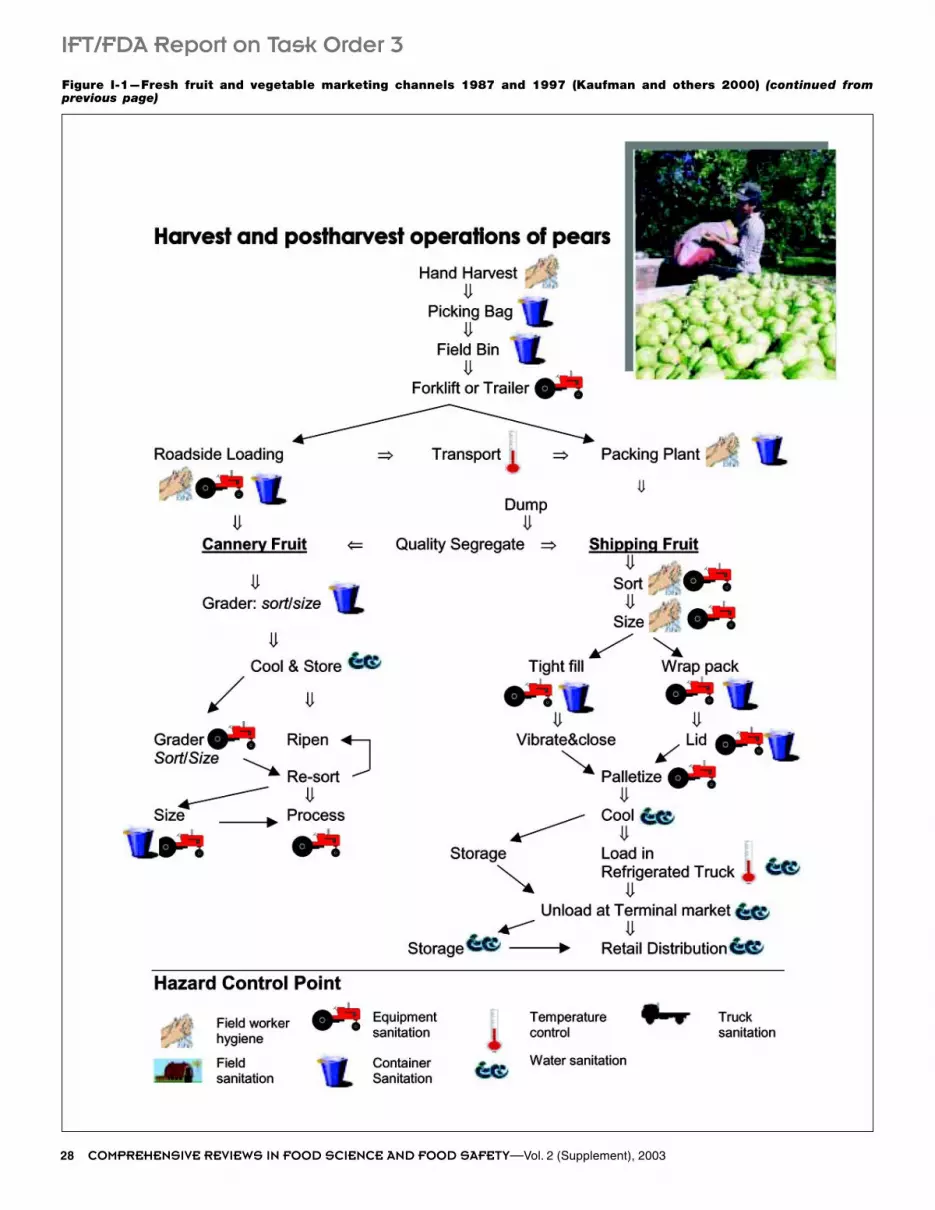
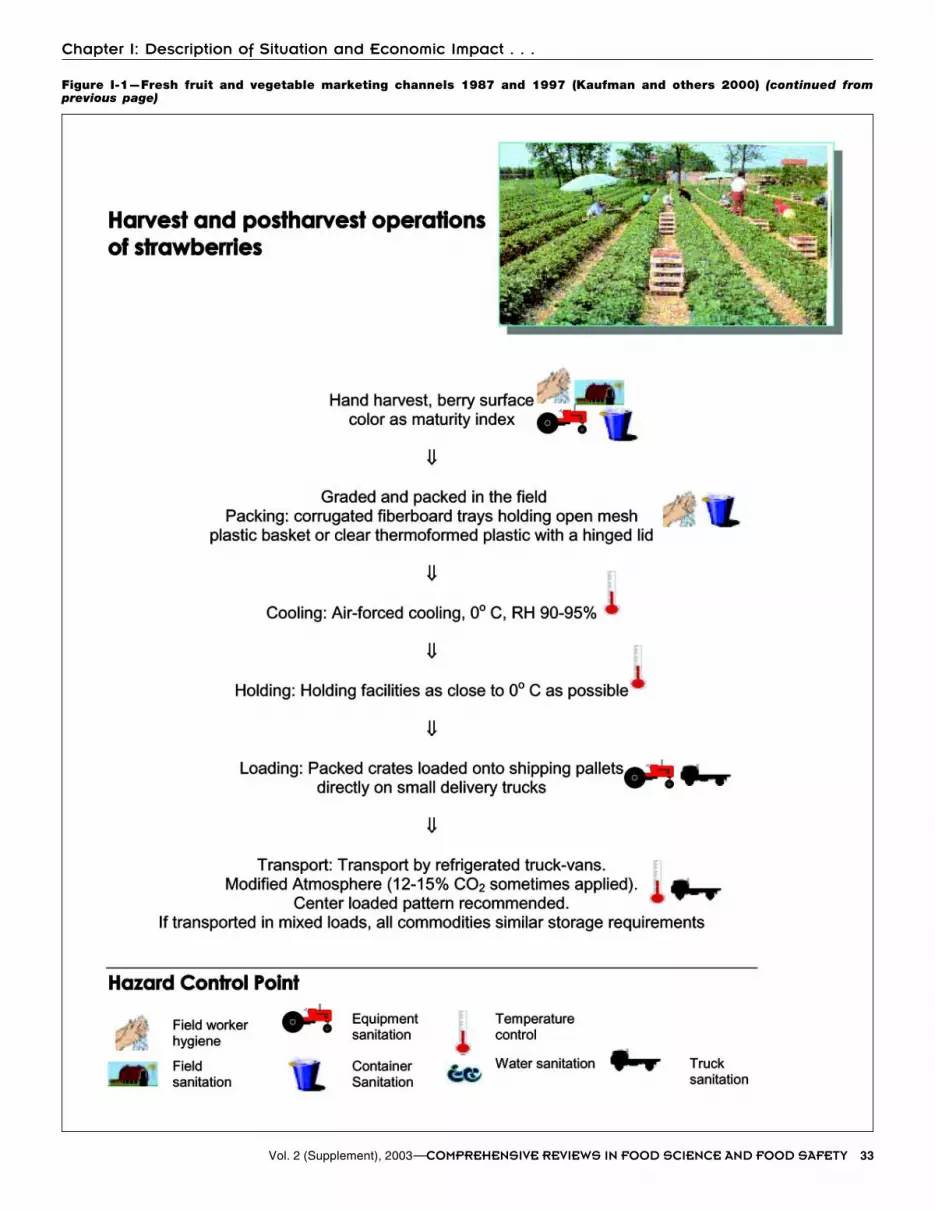
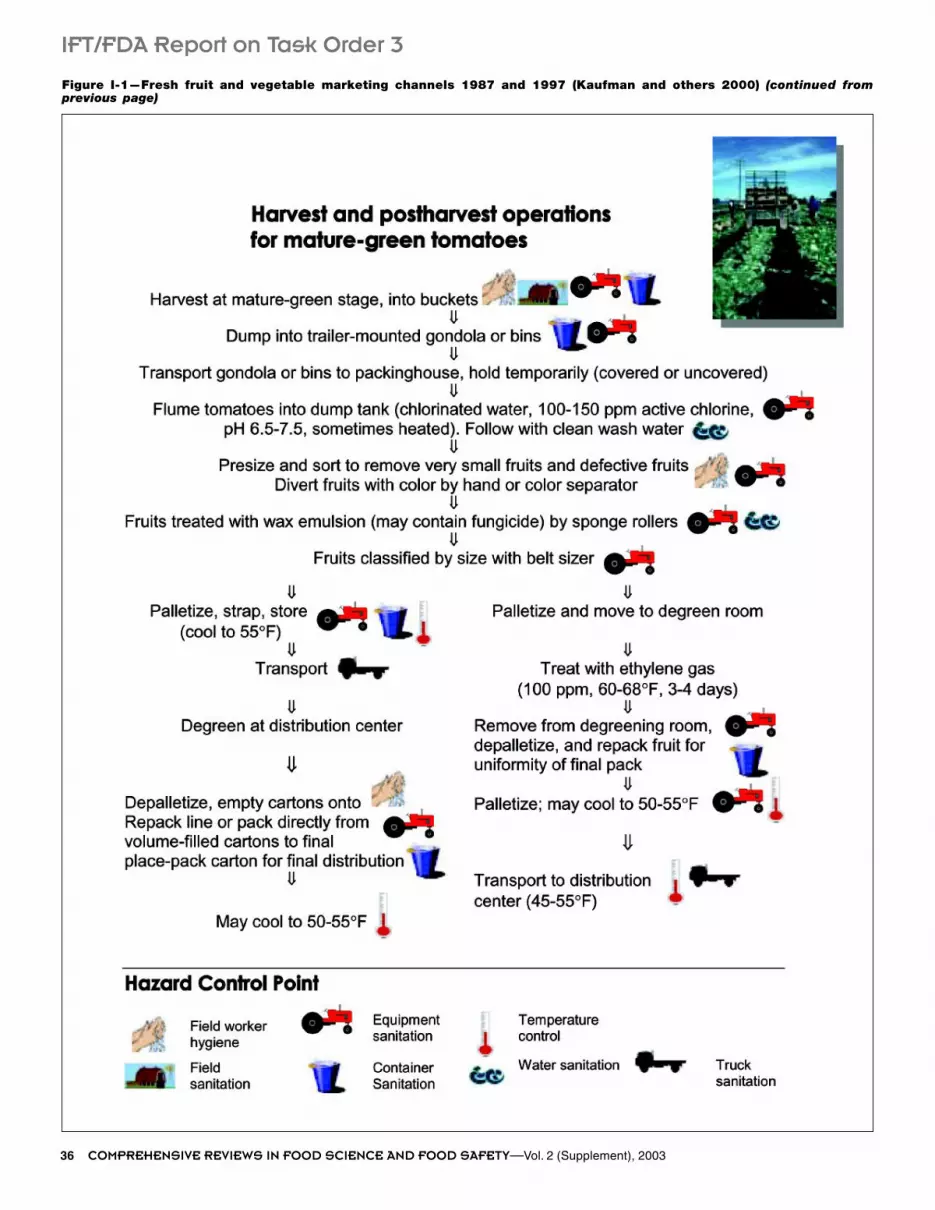
various markets are variable and diverse, as it is depicted in de-tail in Figure I-1 (see end of this chapter) (Kaufman and others2000). The diversification of this market may have an impact onfood safety of produce because there are many steps in its distri-bution, thereby increasing the opportunity for potential contami-nation. In addition, systems to track product through the differ-ent distribution channels during food safety investigations orproduct recalls are variable, which could hinder efforts to identi-fy the source of any microbiological contamination. Today, thefresh produce industry is focusing much of its efforts on trainingemployees about the importance of traceback plans, as well asdeveloping and implementing traceback systems. There are alsoseveral guideline documents for reducing hazards in fruit andvegetable production available through the U.S. Food & DrugAdministration (FDA) and industry associations such as the Inter-national Fresh-cut Produce Association (IFPA). These guidelinesare highlighted in more detail later in the chapter.
2.1 Current size of the industryThe total fresh produce market reached $70.8 billion in retail
and foodservice sales in 1997, up from $34.6 billion in 1987(Kaufman and others 2000). Out of that total, the share of producesales through foodservice outlets has risen 15% over the decade,while retail sales of produce dropped by 16% over the same peri-od (Kaufman and others 2000). This decrease in retail sales is notsurprising since consumers are busier, have higher incomes and
consequently they are preparing less food at home. There has alsobeen an increase in consumption of fresh produce from 284pounds per capita in 1987 to 319 pounds per capita in 1997(Kaufman and others 2000). As indicated previously, these growthtrends are spurring the need for improved food safety systems forgrowing, harvesting, packing, processing and distributing of freshproduce from the field to the consumer at the restaurant and gro-cery store.
Within the fresh produce market, fresh-cut produce has beendefined by IFPA (2001) as “any fresh fruit or vegetable or anycombination thereof that has been physically altered from its orig-inal form, but remains in a fresh state”. Estimated at $11 billion inretail and foodservice sales in 2000 (IFPA 2001), the fresh-cutproduce market has grown exponentially since its infancy in theearly 1980s. The demand for convenience is driving the growth ofvalue-added produce and the fresh-cut produce market expan-sion will most likely continue in the near future. As this marketcontinues to grow, the fresh-cut industry is challenged to workwith growers, shippers and distributors to obtain high quality, safeproduce, as well as continue to process fresh-cut products undersafe and sanitary conditions.
U.S. imports of fruits and vegetables have grown from $2.0 bil-lion in sales in 1987 to $4.1 billion in 1997 (Kaufman and others2000). Today, there is an average of 345 different produce itemsto choose from in a typical grocery store, up from 173 in 1987(Litwak 1998). Consumers have become accustomed to havingthis level of choice on a year-round basis. In order to maintainthis current consumer demand for variety, U.S. retailers rely onproduce imports when U.S. or locally grown produce is not avail-able. The increase in import volume represents an additional op-portunity for exposure to contamination if the product is grownunder poor production standards or mishandled during the longdistribution cycle.
A third niche within the fresh produce category, organic pro-duce has experienced major growth in the past 10 years as well.Estimated at $4 billion in sales in 2000 (PMA 2000), the organicproduce industry is projected to have an increase in sales of 7%over the next three years. Clearly, some consumers have foundthat organic produce meets their desires for “environmentallyfriendly” foods. As the demand for these commodities increases,the volume of production goes up and the per unit costs will like-ly come down, making them even more affordable for the restau-rant or grocery store. The recent introduction of national regula-tions governing the certification of organic produce finally harmo-nizes many state and local standards (USDA 2000). These stan-dards, however, do not address food safety or nutrition. Therefore,the organic producers, similar to conventional producers, need to

14 COMPREHENSIVE REVIEWS IN FOOD SCIENCE AND FOOD SAFETY—Vol. 2 (Supplement), 2003
IFT/FDA Report on Task Order 3
utilize Good Agricultural Practices (GAP) and Good Manufactur-ing Practices (GMP) throughout production.
2.2 Consolidation trendsOne major trend affecting the industry is consolidation at the
buyer’s end of the business. This consolidation is, in turn, drivingconsolidation at the supplier’s end. In 1999, sales at the top eightU.S. retail chains topped out at an estimated $227 billion (FI2000, Jan 31), which represented a 49% share of the entire foodretail business, estimated at $461 billion (FI 2000, Jan 17). Indus-try estimates project that in several years, or less, there could befive top-selling chains with 50% of the retail business. In foodser-vice distribution, the trend toward a few companies owning alarge proportion of the business is already a reality. According toRefrigerated & Frozen Foods Magazine (Anonymous 2000), theshare of the top three foodservice distributors has grown from32% to 43% of total foodservice sales in 2000. Clearly, the trendtoward chain dominance in the food trade is here to stay.
The current tendency to buyer’s consolidation has several con-sequences for the industry: (1) more sophisticated accounting andinventory technologies are needed; (2) new quality and safetystandards must be fulfilled; (3) elimination of brokers to controltruckloads is inevitable; and (4) products need to be inexpensiveand consistent to meet the demands of ever-larger buyers. The in-creased volumes, new technologies, and loss of experienced bro-kers or middlemen will have a noticeable impact in the distribu-tion system. For example, large buyers want more direct control oftheir products for greater accuracy, cost savings, better quality sys-tems, and safety controls. The pressure is on the grower to expandtheir services to meet these production and food safety demands.The buyers are setting the pace for quality and safety improve-ments and will continue to influence the growers, packers, pro-cessors and distributors to meet their product specifications.
To continue marketing products, growers will need to consoli-date, form partnerships or invest resources to expand their servic-es. The current consolidation trend is driving mid-sized and largegrowers to combine their resources by merging, forming co-ops,acquiring other growers to form larger corporate farms, or creatingcommodity-based conglomerates capable of meeting the needs ofthe large corporate buyers of both retail and foodservice chains.Small farming companies, on the other hand, may not be market-ing directly to retail or foodservice buyers in this atmosphere ofcorporate expansion and will be looking for other marketing nich-es. The success of small farms will depend on supplying specialtyproduce items to shippers, to state and local farmers’ markets, u-pick sites, and larger farm conglomerates. Regardless of size,though, all agricultural operations will benefit if food safety be-comes part of their operational plan, and shared through industrygroups to effect change.
2.3 Global distribution trendsAs mentioned earlier, there is a trend toward greater importation
of fresh fruits and vegetables into the United States. Wholesalersare the primary source for imported produce because a retail orfoodservice chain does not order enough of any one commodityto assemble a load. When commodities are imported by largewholesale operations and arrive in the United States, their journeyhas just begun. They may be exposed to many environments be-cause of storage transfers, increased handling because somecommodities are repacked to match U.S. requirements, or to long-er storage time because some loads must go through quarantineprocedures. Global procurement of fruits and vegetables meetsthe need for year-round access to most commodities but providesample additional opportunities for possible exposure to contami-nation.
Several efforts are currently underway to harmonize the food
safety standards for global production. The FDA has establishedminimum guidance recommendations known as Good Agricultur-al Practices (GAP) for the U.S. industry as well as the internationalmarketplace supplying the United States with fruits and vegeta-bles. These guidelines will be useful in minimizing contaminationof fruits and vegetables for both domestic and overseas opera-tions involved in production of produce.
In another global harmonization effort, the Codex AlimentariusFood Hygiene Committee of the Food & Agriculture Organization(FAO) and the World Health Organization (WHO) is developing astandard for the production of fresh produce, fresh-cut produce,and sprouts (CAC 2000). This code is similar to the FDA guidanceand has been negotiated through a committee comprised of dele-gations from more than 50 countries.
2.4 Computer technologyNot only has importation influenced food production in the
U.S., the technology revolution is also having a major impact onfood manufacturing, distribution and purchasing. The world mar-ketplace is being globalized through innovative and rapid techno-logical changes. Perhaps, more important, technology is changingthe way companies manufacture and trade their products. Withthe worldwide spread of computer technology through telecom-munication advancements and miniaturization, a company’s pro-duction of goods and services can still take place locally but aresupported by systems that operate globally. For example, a smallagricultural farm may produce their commodities on their farmbut they are able to sell the products over the Internet and shipthe product within days anywhere in the world.
Conversely, large corporations are moving their production op-erations around the globe looking for the best low-cost locationor the expertise that can drive the development of a specific prod-uct or service. Consider this story about IBM that appeared in the“Lexus and the Olive Tree” by Thomas Friedman: “A group ofcomputer programmers at Tsinghua University in Beijing is writingsoftware using Java technology. They work for IBM. At the end ofeach day, they send their work over the Internet to an IBM facilityin Seattle. There, programmers build on it and use the Internet tozap it 5,222 miles to the Institute of Computer Science in Belarusand the Software House Group in Latvia. From there, the work issent east to India’s Tata Group, which passes the software back toTsinghua by morning in Beijing, back to Seattle and so on in agreat global relay that never ceases until the project is done”(Friedman 2000). Given these kinds of advancements, it stands toreason that even office work, such as training or payroll, may op-erate outside the office in centralized low-cost locations bytrained experts on the other side of the globe in the near future.
The produce industry has adopted new technology in produc-tion and marketing, but has been slow to embrace new sales trans-action systems through third party e-Commerce technologies prob-ably because of the prevalence of more personal buying relation-ships due to the perishability of fruits and vegetables. But becauseof consolidation and the cost savings gained through greater use oftelecommunications and computers, the industry will continue toembrace technology in the future.
Business practices and food safety programs can be improvedthrough computerization. For instance, new systems may includean enhanced traceback system through computerized labeling; bet-ter sanitation procedures through automatic chemical feed systemsfor water disinfection; and direct communications between grow-ers/packers/processors/distributors to improve handling practices.There is no question, however, that this new level of communica-tion through technology will continue to contribute to the expan-sion of food distribution from the grower to the consumer.
In addition to improving business practices, communicationtechnologies are impacting the shopping habits of consumers. To-

Vol. 2 (Supplement), 2003—COMPREHENSIVE REVIEWS IN FOOD SCIENCE AND FOOD SAFETY 15
Chapter I: Description of Situation and Economic Impact . . .
day, consumers can order groceries over the Internet and havethem delivered to their homes. Popular produce commodities fitinto this system, but maintaining food safety standards is impera-tive in building consumer confidence and repeat orders. In addi-tion, retailers are designing new stores with drive-through win-dows for customers who have placed their orders over the Inter-net. The pickup area has to be convenient and must accommo-date three storage areas: dry, refrigerated, and frozen (Anonymous2001). Therefore, storage and handling will have to take on a newrole to preserve consumer confidence in this system.
3. Food safety systems in the produce industryFruits and vegetables are unique foods in that they are often
consumed raw or with minimal preparation. To date, effective in-tervention strategies have been developed, but they cannot com-pletely eliminate microbial food safety hazards associated withconsumption of uncooked produce. Therefore, preventing con-tamination of fresh fruits and vegetables with microbial patho-gens, dangerous levels of chemical residues, or physical contami-nants is the most effective strategy to assure that these foods arewholesome and safe for human consumption.
3.1 Government food safety oversight for produceSystems that assure the safety and wholesomeness of fruits and
vegetables during growing, harvesting, postharvest handling, andfresh-cut processing fall into three prevention program categories:
• Good Agricultural Practices (GAPs);• Good Manufacturing Practices (GMPs);• Hazard Analysis Critical Control Points (HACCP).
For food safety, the FDA has published GAP guidelines to re-duce or eliminate pathogen contamination in the field or packing-house operations. FDA has also promulgated GMP regulationsthat apply to all food processing facilities, including fresh-cut op-erations. Currently, the use of HACCP is voluntary, but is widelyused in the food processing industry as a successful componentof a comprehensive food safety program.
3.1.1. Good Agricultural Practices. The GAP guidelines are ge-neric in nature because of the wide variety of fruit and vegetablecommodities, and they do not contain specific testing and moni-toring guidelines because very little data are available to use in es-tablishing recommendations for the field. Additional informationon how to assess the microbiological hazards would be helpful.For instance, the guidelines recommend that growers confirm theyare using microbiologically safe irrigation water, but there are nodata available to identify the best procedures to confirm watersafety in the field.
The execution of GAP programs falls into three distinct phases.The following is a description of the phases and an estimate of thecost involved. The costs are based on a farm described as a con-tiguous piece of land with one or more sources of water.
System Evaluation and Needs Assessment—A needs assess-ment comprises: (1) an assessment of the systems currently inplace; (2) an initial needs assessment or audit to determine whatactions need to be taken to prevent chemical, physical and micro-biological contamination; and (3) determination of what docu-mentation is needed to assure continuous compliance and trace-ability of specific product lots.
Costs: Needs Assessment � $300 to $500 per audit per farmImplementation—Once the initial evaluation has been per-
formed, the grower must take steps to implement new practices toreduce the risks identified. Although it is not possible to estimateall costs because of the variability of operational changes overtime, the following steps are typical examples of what an averagesize farm may encounter. Training and documentation costs may
be minimized if generic packages could be developed for useacross the country.
• Employee training and monitoring (pruning, irrigation, har-vest, packing crews)
• Testing and/or monitoring of soil amendments, water and fin-ished products (microbes and pesticides) may include:
• Multi-residue pesticide screen in the field� E. coli water test in the field or packinghouse� Environmental Listeria swabs in the packinghouse
• Development of documentation• Maintenance of documentation• Labor cost
� Cleaning and sanitation� Food safety program administration� Record keeping
• Capital Expenditures� Water treatment� Cleaning and sanitation equipment� Employee equipment (gloves, boots, hairnets, smocks)� Cleaning and sanitation chemicals� Fencing to exclude animals� Changes due to manure management, such as compost-
ing, and so on� Field latrines� Record keeping systems (computers, manual)
Food Safety Program Verification—Once the program is imple-mented, independent third party audits for verification are valu-able on a random basis. Procedures are based on visual observa-tion, documentation review, employee interviews, and finishedproduct testing.
Costs: $300 to 500 per audit per farm3.1.2. GAP cost variables. The costs associated with implement-
ing a GAP food safety program vary considerably based on anumber of factors. Large grower/shippers may have in-housetechnical expertise to evaluate risks and design programs to re-duce food safety risks. Smaller growers may not have in-house ex-pertise and must outsource technical expertise to do risk assess-ments and design food safety programs. The cost of designing andimplementing an on-farm food safety program will vary depend-ing upon:
• Number and size of ranches (contiguous piece of growingground) involved,
• Number of water sources used for irrigation, spray applica-tions and so on,
• Ability of growers to develop food safety program documen-tation themselves,
• Increased labor costs associated with administering stepssuch as record keeping,
• Cost of chemical (pesticide, heavy metals, organics and soon) and microbiological tests needed to assure preventionof point contamination sources,
• Employee and/or harvest crew training session costs (directlabor, administration costs),
• Capital equipment costs to assure that people, water, and soilamendments do not contaminate produce.
Independent Third Party auditors (ITP) are playing a major roleat the behest of food retailers and foodservice buyers in monitor-ing produce suppliers for compliance to GAPs as well as helpinggrowers develop food safety programs. Direct costs of ITP auditsand food safety design and implementation are largely beingborne exclusively by grower/shippers because there is no evi-dence that farm-gate prices are rising beyond historical marketprices. Even though there are many factors that work to keep thefarm-gate price low, there is some evidence that buyers are begin-ning to partner with the grower to share in responsibility for the

16 COMPREHENSIVE REVIEWS IN FOOD SCIENCE AND FOOD SAFETY—Vol. 2 (Supplement), 2003
IFT/FDA Report on Task Order 3
development of food safety programs. Unless there is a contractprice established for the commodity, or the grower can reduceproduction costs in another category, there is no mechanism foradditional food safety costs to normally be passed on to the buyeron the open market.
Currently, compliance with the FDA’s GAPs is not mandatorybecause they are guidelines. This may give growers who are notimplementing GAPs or food safety programs competitive advan-tage in the marketplace, since they do not incur the costs of devel-oping or sustaining a food safety program. However, with thegrowing food safety awareness, these farms may eventually havedifficulties continuing in the marketplace because many custom-ers from the foodservice and retail markets are demanding evi-dence of these programs from their suppliers.
Horticultural crops have drastically different farm gate values of-ten due to the direct costs associated with production, supply anddemand forces, and location of the grower. The cost of implement-ing a food safety or GAP program for any given commodity willvary significantly depending upon what cultural practices are in-volved in production. Thus, GAP implementation costs will be ahigher percentage of farm gate prices for lower priced commodities.
3.1.3. GMPs and HACCP. GMPs are FDA regulations directed atfood processors and are located in the U.S. Code of Federal Regu-lations 21(CFR) Part 110.1 to 110.99. GMPs cover all aspects of aprocessing environment from the design of a sanitary facility torules forbidding jewelry on workers. Unlike GAPs, GMPs are rulesthat are clearly defined and easy to apply because a processingenvironment has easily defined boundaries and the processingactivities can be contained and controlled.
Even though HACCP is not mandatory, it has been embracedby the fresh-cut processing industry as a useful tool for imple-menting food safety practices in the production environment.HACCP is well suited to identify hazards, monitor production foradherence to operational standards, and develop an effectiverecord keeping system in a fresh-cut produce facility. With closeattention to prerequisite programs, a processor can implementHACCP to round out their food safety program.
The terms HACCP and food safety are used interchangeably inthe food industry, implying that HACCP may be the only ap-proach to food safety. But HACCP is merely a component or toolin an overall food safety program and cannot be implementedwithout prerequisite programs such as GAPs, GMPs, and a Sanita-tion Plan firmly in place. This “cafeteria” style approach to foodsafety has served the fruit and vegetable industry well because thevariety matches the multiple needs of the various produce busi-ness models from the fields to the fresh-cut processing facilities.
Estimates of the cost of HACCP and GMP implementation re-quire a thorough analysis by expert economists. As an example,Table I-1 indicates the average costs of HACCP and GMP imple-mentation in a typical medium sized fresh-cut processing facilityas compared to recent fresh juice figures generated by the FDA inthe final rule for fresh juice regulations (FDA 2001). The fresh-cutfacility costs were derived from a medium-sized operation locatedin the middle of the United States and based on real costs aver-aged over the last 2 years. Costs were estimated based on the cur-rent practices in that facility.
Even though these operations use similar raw products, andhave similar production activities, juice plant costs differed fromthe fresh-cut operation costs in several areas. One example is inthe line item for pathogen controls. The cost differential occurs be-cause pathogens must be controlled in the juice throughout theproduction process whereas pathogen control is only applicablein the wash-water step for a fresh-cut processor. Also, the start-upcosts for installation of a pasteurization system will be much high-er than the cost of a chlorination system, but the recurring annualcosts are similar. Another area of difference occurs in item 3,
Monitoring the Standard Operating Procedures (SOP). The fresh-cut processor’s food safety program relies almost exclusively onthe prerequisite programs such as sanitation and GMPs to preventcontamination whereas the juice processors rely on pathogencontrols such as pasteurization as illustrated in item 6 in Table I-1.In item 9 in Table I-1, outside testing costs are different becausethe fresh-cut processor has elected not to have an in-house labo-ratory; therefore, they send all the microbiological tests to an out-side lab. Other differences are generally due to different philoso-phies of management.
4. Economics of intervention strategies to reduce oreliminate pathogens
4.1 In the fieldCurrently, the depth of implementation of intervention strate-
gies to reduce pathogens in the produce industry depends onsafety awareness and resource capability. Very often the largergrower/shippers with large economies of scale are the compa-nies that can meet stricter requirements imposed by some cus-tomers because they have the most resources to invest in theneeded equipment, training and monitoring procedures. Forgrowers, in general, additional resources are needed in field op-erations for food safety programs including more employeetraining, a focus on sanitary facilities for the workers and anawareness of the sources of pathogenic bacteria. The testing ofvarious matrices in the field for hazard potential has not been re-quired by GAPs, but testing can determine the risks associatedwith various steps in produce operations. Additional research isalso needed before adequate recommendations can be made togrowers about preventive measures and effective treatments toremedy hazards in the field.
4.2 In the packinghousesPackinghouses act as a central location for large volumes of
fruits and vegetables to be combined before being redistributed tothe marketplace. They play a very important role in cooling, wash-ing, trimming, and packing the product for shipment. These oper-ations may be owned by individual grower/shippers, or co-opsowned by many small farmers. Good sanitation procedures areessential for these operations as pathogens, if present, couldspread through pooling of product.
Packinghouses need to put resources into the development ofsanitation programs for equipment and buildings, employee train-ing, and preservation of water quality. The GAP document out-lines employee hygiene and sanitation processes that are impor-tant for packinghouse operations.
4.3 In the fresh-cut produce plantIn contrast to the farm, food safety guidelines have been well
documented for the fresh-cut produce processors by the industry.GMPs are part of the FDA’s regulations for all food processors andapply to fresh-cut produce as well. The industry has published itsown “Food Safety Guidelines for the Fresh-cut Produce Industry”through IFPA (Gorny 2001). The IFPA guidelines incorporateGMPs as well as other food safety standards such as a modelHACCP plan, sanitary facility design, and proper use of antimicro-bials.
Chapter V on intervention strategies to reduce or eliminatepathogen contamination covers, in detail, the approved antimi-crobials for processors to use in the production of safe fresh-cutproducts as well as the advantages and the disadvantages as ofthis writing. These antimicrobials are used primarily to keep theprocessing water free from pathogens and are not intended forsanitizing the surface of fruits and vegetables. Table I-2 details

Vol. 2 (Supplement), 2003—COMPREHENSIVE REVIEWS IN FOOD SCIENCE AND FOOD SAFETY 17
Chapter I: Description of Situation and Economic Impact . . .
costs associated with most antimicrobials in wash water for smallto mid-sized fresh-cut operations. These wash-water disinfectionprocesses are essentially equivalent to each other with regard toefficacy.
Table I-2 is a cost matrix of the capital and operating costs forthe most commonly used wash-water disinfection systems used inproduce operations such as hydro-cooling and washing. The costmatrix was developed to allow comparison of the costs associatedwith various wash-water disinfection systems and it should benoted that there are many confounding cost variables. Therefore,this data should be looked at as a starting point for cost compari-son. The data presented in Table I-2 are valid only in relation tothe following assumptions and changing these assumptions willdirectly affect the costs associated with any given operation.
Assumptions. To reduce the confounding affects and dynamicsystem specific variables such as the organic load, water quality,and so on, it was assumed that:
• The water used in this example is not recirculated.• There is no organic demand in the water such as produce,
mud or dirt.• The disinfectant levels stated are at levels of disinfectant nec-
essary to assure that the water will not support the survivalof vegetative cells of human pathogens such as Escherichiacoli O157:H7 or Salmonella spp.
In this cost matrix a volume of 20,000 per day was chosen tosimulate what a small or medium sized fresh-cut or whole pro-duce operation may use in a day. It was also assumed that opera-tions would be carried out 6 days per week 52 weeks per year for
a total of 312 operating days/year. This means that approximately6,000,000 gallons of water/year would be utilized by such an op-eration. This cost matrix is constructed in such a way as to com-pare the cost of treating 6,000,000 gallons of water to the follow-ing disinfectant levels:
• 2 ppm free chlorine• 1 ppm chlorine dioxide• 1 ppm ozone• 50 ppm peroxyacetic acid
Cost factors such as reduced sewage user fees, water use feesand other local considerations have not been factored into thiscost matrix due to the wide variance in these fees on a per opera-tion basis.
Assumptions. The following assumptions were made: 6 days/week operations; 312 operating days per year (6 days/week � 52weeks/year), 20,000 gallons of fresh water used per day(6,000,000 gallons per year); operational labor costs � $40/hour� 6 hours/week � 52 weeks/year.
Conversion Factors. The conversion factors used were: 8.3 lbsequals one gallon of water; and 2.2 lbs equals 1 Kg.
Disinfection equivalents were 2-ppm free chlorine � 1-ppmchlorine dioxide � 1-ppm ozone � 50-ppm peroxyacetic acidbased on oxidation reduction potential (ORP). Lethality Equiva-lents are more like 3.5 ppm HOCl � 1-ppm ClO2 � 0.05-ppmO3 � 2-ppm peroxyacetic acid
On the basis of these assumptions, the cost calculations are asfollows:
Table I-2—Wash-water antimicrobial cost matrix (see below for details of calculations)
Reagent Costs Total CostCapital Active Ingredient Operating Costs Labor Costs per Annum
Treatment Costs Additives Per Year Per Year (6,000,000 gals.)
Chlorine—Gas $1,500 $43 $0 $100 $12,480 $14,023Chlorine—NaOCl $2,500 $172 $1000 $100 $12, 480 $16,252Chlorine—Ca(OCl)2 $2,500 $150 $1000 $100 $12, 480 $16,230Chlorine Dioxide $2,500 $2,600 $80 $100 $12, 480 $17,760Peroxyacetic Acid $2,500 $41,429 0 $100 $12, 480 $56,509Ozone $14,000 0 0 $2400 $12, 480 $28,880UV $10,000 0 0 $333.33 $12, 480 $22,813
Table I-1—Comparison of food safety program costs for fresh-cut produce versus juice processing
Initial Cost Initial Cost Recurring Annual Cost Recurring Annual Cost# Activity (Juice) (Fresh-cut) (Juice) (Fresh-cut)
1 Develop SOPs $813.33 $450 $0.00 $0.002 Prerequisite program SOPs $575.00 $500 $0.00 $0.003 Monitoring/documenting SOPs $396.67 $12,140 $396.67 $12,140.004 Hazard Analysis $958.33 $600 $0.00 $0.005 HACCP plan $1,950.00 $1,900 $0.00 $40.006 Pathogen controls $17,863.05 $2,500 $13,333.33 $13,752.007 Natural toxin controls $173.33 $0 $173.33 $0.008 Pesticide controls $163.33 $0 $163.33 $0.009 Outside testing $0.00 $20,000 $0.00 $20,000.0010 Corrective action plan $130.00 $80 $0.00 $0.0011 Corrective actions $1,288.33 $2,500 $313.33 $800.0012 Verification $1,201.67 $650 $1,201.67 $650.0013 Validation $3,605.00 $2,600 $2,670.00 $2,600.0014 Process verification $1,273.33 $700 $1,273.33 $700.0015 HACCP monitoring/ recordkeeping $2,888.33 $3,500 $2,888.33 $3,500.0016 Record maintenance $1,156.67 $1,000 $1,156.67 $1,000.0017 HACCP coordinator $4,983.33 $2,000 $0.00 $100.0018 Employee training $860.00 $3,000 $0.00 $600.0019 Importers $2,000.00 $0 $1,000.00 $0.0020 Foreign processors $13,333.33 $0 $11,666.67 $0.0021 TOTALS $55,613.05 $54,120.00 $36,236.67 $55,882.00

18 COMPREHENSIVE REVIEWS IN FOOD SCIENCE AND FOOD SAFETY—Vol. 2 (Supplement), 2003
IFT/FDA Report on Task Order 3
Cost of Chlorine ReagentAvailable Chlorine Per Pound—Chlorine is commercially avail-
able in a number of different forms. Chlorine gas is commerciallyavailable as a compressed gas in 150 lb compressed or larger gascylinders. Sodium hypochlorite is typically commercially avail-able as a bulk liquid solution that is 10–15% NaOCl. Calcium hy-pochlorite is typically commercially available in a powder or pel-let form which is 65–70% Ca(OCl)2
Chlorine Gas (100% Cl2)Sodium Hypochlorite (10% NaOCl)
Therefore: 1.2 lbs. NaOCl � 1.0 lbs. Cl2 gas
Calcium Hypochlorite (65-70% Ca(OCl)2)Therefore: 1.5 lbs. Ca(OCL)2 � 1.0 lbs. Cl2 gas
Cost of Available Chlorine Per PoundCl2 $ 0.27 to 0.41 per lbNaOCl $1.64 per Lb. � $1.20 per gallon �
1.2 Equivalent Concentration FactorCa(OCl)2 $1.44 per Lb. = $1.09 per Lb. �
1.5 Equivalent Concentration Factor
Chlorine Demand Per D (Residual of 2 ppm)14 Gallons per minute (GPM) � 840 gallons per hour
�20,000 gallons per day � 6,000,000 gallons per annum0.336 lbs/day � 0.012 � 14 (GPM) � 2 ppm(0.012 is a dimensional conversion factor to attain the final
units of lbs/day)
Cl2 $0.41 per lb � 0.336 lbs/day � 312 days per year � $ 43.00/year
NaOCl $1.64 per lb � 0.336 lbs./day � 312 days per year � $172.00/year
Ca(OCl)2 $1.44 per lb � 0.336 lbs./day � 312 days per year � $151.00/year
Cost of Citric or Phosphoric AcidFoodgrade acids are routinely used to buffer the pH of hydro-
cooling and wash water because addition of NaOCl to water willincrease its pH. Wash-water systems are routinely buffered to apH of 6.5 to 7.5 to keep chlorine in it most active bactericidalform of hypochlorous acid (HOCl).
Citric Acid � $4 to 5 per gallonPhosphoric Acid � $1.50 per gallon
• Buffering Acids are used at about a quarter of the rate ofNaOCl
• Citric Acid most commonly used due to its food grade statusand its low cost
Assume about 1 gallon per day used � 312 gallons/year312 � $5.00 per gallon citric acid � $1,560.00/year312 � $1.50 per gallon of phosphoric acid � $468.00/year
The cost of an actuated pump is $2,500 for a basic unit forNaOCl and Citric Acid and $500 for alarm systems (low pressure,no water, no chemical and so on).
Cost of OzoneCapital Costs: $14,000Capacity: 15 GPM to deliver 1.5 ppm O3Electrical Usage: 3.6 kW
15 GPM � 900 GPH � 6666.66 operating hoursto treat 6,000,000 gallons
6666.66 h � 3.6 kW � 24,000 kW h24,000 kW h � $0.10 per kW h � $2,400 (where the cost of
kW h is averaged from dif-ferent states)
Cost of Peroxyacetic Acid40 to 60 ppm used (80 ppm Max by Law)Wholesale Price: $17 per gallonBulk Price: $12 per gallonAverage Price: $14.50 per gallon
1 fluid ounce Peroxyacetic Acid (PA) per 16.4 gallons1 gallon PA per 2,100 gallons2,857 gallons of PA per 6,000,000 gallons
$41,429 to treat 6,000,000 gallons
Commercial wash-water disinfection systems are targeted forminimum oxidation reduction potential (ORP) of 650 mV to as-sure almost instantaneous destruction of most vegetative patho-gen cells. However, peroxyacetic acid wash-water disinfectionsystems normally have a lower minimum ORP set point of 400-450 mV because peroxyacetic acetic acid’s bactericidal mode ofaction is both by oxidation reduction potential and as metabolicpoison. Peroxyacetic acid wash-water systems also may utilizeboth ORP and time actuated control dose concentration becauseit has been observed that use of ORP alone may be insufficient tocontrol peroxyacetic acid concentrations in produce wash-watersystems.
ORP of 400 to 450 for PA (650 for NaOCl basedsystem)
May require ORP � time actuated control due to over shootingby ORP measurement. Therefore, not good for multiple applica-tion lines.
Significant cost savings in sewer use fees if water can be dis-charged.
Cost of Ultra-Violet Light (UV)Capital costs: $10,000Electrical Usage: 0.5 kW
15 GPM � 900 GPH � 6,666.66 operating hoursto treat 6,000,000 gallons
6,666.66 h � 0.5 kW � 3,333.33 kW hours3,333.33 kW/h � $0.10 per kW h � $333.33 (where the cost
of kW h is averaged fromseveral states)
UV-light wash-water disinfection systems may also require anadditional capital cost of a filtration system to remove particulatematter from the wash-water stream if water is recirculated. Howev-er, filtration systems commonly used to protect recirculationpump integrity are often sufficient to remove large particulate mat-ter that may interfere with the efficacy of UV wash-water disinfec-tion units.
Cost of Chlorine DioxideThere are currently four types of common commercially avail-
able chlorine dioxide wash-water sanitation systems.• Three Part Generation System: NaOCl/NaChlorite (NaClO2)/
Acid• Two Part Generation System: Cl2 gas, and NaClO2

Vol. 2 (Supplement), 2003—COMPREHENSIVE REVIEWS IN FOOD SCIENCE AND FOOD SAFETY 19
Chapter I: Description of Situation and Economic Impact . . .
• NaClO2 and Electricity• Stabilized NaOCl2 2% Solution Buffered Mixed with Phos-
phoric Acid on site
Chlorine dioxide generators are generally leased and not sold.The stabilized form was recommended for our application.
Estimated that:• 1 gallon per day of 2% NaOCl2 would be needed per day• $8.34 per gallon or $1 per pound for the 2% NaOCl2 Solution• 312 days X $8.34 per Gallon = $2,600 per year for 2%
NaOCl2Activation Acid:• Need approximately 1/4 volume of acid per volume of 2%
NaOCl2 used, therefore 0.25 gallons per day• 312 days X 0.25 gallons of Phosphoric Acid per day = $80
5. SummaryA complicating factor in determining the economics of produce
food safety systems is the diversity in business models currentlyused. Large produce companies may be completely vertically in-tegrated enterprises to include growers (farmland owners or les-sors)/shippers/processors completely in control of all aspects ofproduction, marketing and distribution. Other companies maysimply grow specific crops and sell them to a marketer or distribu-tor who in turn sells to foodservice or retail accounts. Or a mar-keter/distributor may not grow any of the crops that they marketand distribute, but may own the label or brand and the packing-house in which the products are packed in.
Like produce farms, packinghouse operations are not alwayscontrolled by large corporations that may have the resources toapply effective safety procedures. Co-ops or commodity groupsrepresenting a group of small farmers may not have the same levelof resources as a corporation, yet they operate packing systemsfor many commodities. Packinghouse operations are designed topreserve and package produce commodities and are currently in-cluded under the GAP guidelines and exempted from the GMPregulations. Irrespective of the size of operation, food safety pro-grams must be implemented at all packinghouses.
In an attempt to reduce liability, some buyers are promotingstrict safety expectations through purchasing specifications andthird party audit requirements for their suppliers before any stan-dards have been identified and tested for effectiveness. These re-quirements continue to drive the supply side of the produce in-dustry to seek proper safety programs but the industry needsmore scientific answers to reduce risk. Effective steps for reducingcontamination can be implemented throughout the distributionsystem through cooperation between each segment of the supplychain.
In the next decade, mid-sized and large companies in the pro-duce industry may experience unprecedented growth throughconsolidation by merging in an attempt to reduce costs and in-
crease production. On the other hand, small companies may flour-ish because of the demand for more unique and readily availablechoices for niche markets. Diversity in marketing through in-creased imports, the use of biotechnology for development ofnew varieties, continued demand for convenience foods and thequest for longer shelf life all affect the food safety aspects of fruitand vegetable production. Intervention strategies developed to re-duce and eliminate contamination must be flexible to serve smalland large farming and processing operations while assuring thatthey are affordable, effective and efficient controls. Otherwise,food safety will continue to be a confusing mix of old wives tales,scientific jargon, and sales pitches for the produce industry.
6. Research needs• Evaluate the cost of measures to ensure fresh produce safety
and to minimize public health hazards. The evaluationshould take into consideration the size of the industry, andhow company size may play a role in the extent of the im-pact of strict implementation of these measures.
• Research and develop feasible pathogen prevention and con-trol strategies, especially in the case of small size compa-nies with limited financial resources.
References[Anonymous]. 2000 Oct. Market Watch/Foodservice. Refrigerated & Frozen Foods
(Stagnito Communications, Deerfield, IL):18.[Anonymous]. 2001 Jan. Putting stores online. Store Equipment & Design Magazine
(Macfadden Communications Group, LLC, New York, NY):10.[CAC] Codex Alimentarius Commission. 2000 Nov. Proposed draft code of hygienic
practice for primary production, harvesting and packaging of fresh fruits andvegetables [Report of the thirty second session of the Codex Committee on FoodHygiene; 1999 Nov 29-Dec 4]. Rome: Codex Alimentarius Commission. Report nrALINORM 01/13. paras 71-86. Available from: <ftp://ftp.fao.org/codex/ALI-NORM01/A101_13e.pdf>.
[FDA] Food and Drug Administration. 2001 Jan 19. Hazard analysis and criticalcontrol point (HACCP); procedures for the safe and sanitary processing and im-porting of juice; final rule. Fed Register 66(13):6137.
[FI] Food Institute. 2000 Jan 17. Sales up 5.2% more than double food at-homeinflation. The Food Institute Report (Fairlawn, NJ):24. Available from: DanielleBreuel at (201)791-5570, ext. 16; ([email protected]).
[FI] Food Institute. 2000 Jan 31. Top 25 food retailers, 1999. The Food InstituteReport (Fairlawn, NJ):7. Available from: Danielle Breuel at (201)791-5570, ext.16; ([email protected]).
Friedman TL. 2000. The lexus and the olive tree. New York: Anchor Books. 133-4 p.Gorny J, editor. 2001. Food safety guidelines for the fresh-cut produce industry. 4th
ed. Alexandria (VA): IFPA. Available from: IFPA; 1600 Duke St., Ste. 440; Alex-andria, Va 22314; 703-299-6282/703-299-6288.
[IFPA] International Fresh-cut Produce Association. 2001. Fresh-cut produce: get thefacts! IFPA home page. See link from: <http://www.fresh-cuts.org>. Accessed2001 Aug 24.
Kaufman PR, Handy CR, McLaughlin EW, Park K, Green GM. 2000 Aug. Understand-ing the dynamics of produce markets: consumption and consolidation grow.USDA, Economic Research Service [Agriculture Information Bulletin No. 758].<http://www.ers.usda.gov/publications/aib758/aib758.pdf>. Accessed 2001 Aug24.
Litwak D. 1998 Oct. Is bigger better? Supermarket Business (New York, NY).[PMA] Produce Marketing Association. 2000. Organic fresh produce industry [Fact
Sheet]. Newark (DE): PMA. 8 p. Available from: P.O. Box 6036, Newark, DE,USA, 19714-6036; (302)738-7100; www.pma.com.
[USDA] U.S. Dept. of Agriculture, Agriculture Marketing Service. 2000 Dec 21.National organic program; final rule. Fed Register 65(246):80547-96.
On following pages: Figure I-1—Fresh fruit and vegetable marketing channels 1987 and 1997 (Kaufman and others 2000)

20 COMPREHENSIVE REVIEWS IN FOOD SCIENCE AND FOOD SAFETY—Vol. 2 (Supplement), 2003
IFT/FDA Report on Task Order 3
Figure I-1—Fresh fruit and vegetable marketing channels 1987 and 1997 (Kaufman and others 2000) (continued on nextpage)

Vol. 2 (Supplement), 2003—COMPREHENSIVE REVIEWS IN FOOD SCIENCE AND FOOD SAFETY 21
Figure I-1—Fresh fruit and vegetable marketing channels 1987 and 1997 (Kaufman and others 2000) (continued fromprevious page)
Chapter I: Description of Situation and Economic Impact . . .

22 COMPREHENSIVE REVIEWS IN FOOD SCIENCE AND FOOD SAFETY—Vol. 2 (Supplement), 2003
IFT/FDA Report on Task Order 3
Figure I-1—Fresh fruit and vegetable marketing channels 1987 and 1997 (Kaufman and others 2000) (continued fromprevious page)

Vol. 2 (Supplement), 2003—COMPREHENSIVE REVIEWS IN FOOD SCIENCE AND FOOD SAFETY 23
Figure I-1—Fresh fruit and vegetable marketing channels 1987 and 1997 (Kaufman and others 2000) (continued fromprevious page)
Chapter I: Description of Situation and Economic Impact . . .

24 COMPREHENSIVE REVIEWS IN FOOD SCIENCE AND FOOD SAFETY—Vol. 2 (Supplement), 2003
IFT/FDA Report on Task Order 3
Figure I-1—Fresh fruit and vegetable marketing channels 1987 and 1997 (Kaufman and others 2000) (continued fromprevious page)

Vol. 2 (Supplement), 2003—COMPREHENSIVE REVIEWS IN FOOD SCIENCE AND FOOD SAFETY 25
Figure I-1—Fresh fruit and vegetable marketing channels 1987 and 1997 (Kaufman and others 2000) (continued fromprevious page)
Chapter I: Description of Situation and Economic Impact . . .

26 COMPREHENSIVE REVIEWS IN FOOD SCIENCE AND FOOD SAFETY—Vol. 2 (Supplement), 2003
IFT/FDA Report on Task Order 3
Figure I-1—Fresh fruit and vegetable marketing channels 1987 and 1997 (Kaufman and others 2000) (continued fromprevious page)

Vol. 2 (Supplement), 2003—COMPREHENSIVE REVIEWS IN FOOD SCIENCE AND FOOD SAFETY 27
Figure I-1—Fresh fruit and vegetable marketing channels 1987 and 1997 (Kaufman and others 2000) (continued fromprevious page)
Chapter I: Description of Situation and Economic Impact . . .
28 COMPREHENSIVE REVIEWS IN FOOD SCIENCE AND FOOD SAFETY—Vol. 2 (Supplement), 2003
IFT/FDA Report on Task Order 3
Figure I-1—Fresh fruit and vegetable marketing channels 1987 and 1997 (Kaufman and others 2000) (continued fromprevious page)

Vol. 2 (Supplement), 2003—COMPREHENSIVE REVIEWS IN FOOD SCIENCE AND FOOD SAFETY 29
Figure I-1—Fresh fruit and vegetable marketing channels 1987 and 1997 (Kaufman and others 2000) (continued fromprevious page)
Chapter I: Description of Situation and Economic Impact . . .

30 COMPREHENSIVE REVIEWS IN FOOD SCIENCE AND FOOD SAFETY—Vol. 2 (Supplement), 2003
IFT/FDA Report on Task Order 3
Figure I-1—Fresh fruit and vegetable marketing channels 1987 and 1997 (Kaufman and others 2000) (continued fromprevious page)

Vol. 2 (Supplement), 2003—COMPREHENSIVE REVIEWS IN FOOD SCIENCE AND FOOD SAFETY 31
Figure I-1—Fresh fruit and vegetable marketing channels 1987 and 1997 (Kaufman and others 2000) (continued fromprevious page)
Chapter I: Description of Situation and Economic Impact . . .

32 COMPREHENSIVE REVIEWS IN FOOD SCIENCE AND FOOD SAFETY—Vol. 2 (Supplement), 2003
IFT/FDA Report on Task Order 3
Figure I-1—Fresh fruit and vegetable marketing channels 1987 and 1997 (Kaufman and others 2000) (continued fromprevious page)
Vol. 2 (Supplement), 2003—COMPREHENSIVE REVIEWS IN FOOD SCIENCE AND FOOD SAFETY 33
Figure I-1—Fresh fruit and vegetable marketing channels 1987 and 1997 (Kaufman and others 2000) (continued fromprevious page)
Chapter I: Description of Situation and Economic Impact . . .

34 COMPREHENSIVE REVIEWS IN FOOD SCIENCE AND FOOD SAFETY—Vol. 2 (Supplement), 2003
IFT/FDA Report on Task Order 3
Figure I-1—Fresh fruit and vegetable marketing channels 1987 and 1997 (Kaufman and others 2000) (continued fromprevious page)

Vol. 2 (Supplement), 2003—COMPREHENSIVE REVIEWS IN FOOD SCIENCE AND FOOD SAFETY 35
Figure I-1—Fresh fruit and vegetable marketing channels 1987 and 1997 (Kaufman and others 2000) (continued fromprevious page)
Chapter I: Description of Situation and Economic Impact . . .
36 COMPREHENSIVE REVIEWS IN FOOD SCIENCE AND FOOD SAFETY—Vol. 2 (Supplement), 2003
IFT/FDA Report on Task Order 3
Figure I-1—Fresh fruit and vegetable marketing channels 1987 and 1997 (Kaufman and others 2000) (continued fromprevious page)

Vol. 2 (Supplement), 2003—COMPREHENSIVE REVIEWS IN FOOD SCIENCE AND FOOD SAFETY 37
Figure I-1—Fresh fruit and vegetable marketing channels 1987 and 1997 (Kaufman and others 2000) (continued fromprevious page)
Chapter I: Description of Situation and Economic Impact . . .