mi articulo 2013
TRANSCRIPT
This article was downloaded by: [148.240.245.218]On: 04 December 2013, At: 09:13Publisher: Taylor & FrancisInforma Ltd Registered in England and Wales Registered Number: 1072954 Registeredoffice: Mortimer House, 37-41 Mortimer Street, London W1T 3JH, UK
Communications in Soil Science andPlant AnalysisPublication details, including instructions for authors andsubscription information:http://www.tandfonline.com/loi/lcss20
Comparative Analyses of Lead andCopper in Metal-Accumulating Plantswith and without MycorrhizaeC. J. Alvarado a , W. A. Abuhani b , T. Whelan III c , O. S. Castillo a ,L. M. Villaseñor b , S. E. Borjas b , S. Landsberger d , S. L. Bribiesca e
, S. Alexander f & N. Dasgupta-Schubert aa Universidad Michoacana, Instituto de Investigaciones QuimicoBiologicas , Morelia , Michoacan , Mexicob Universidad Michoacana, Instituto de Física y Matemáticas ,Morelia , Michoacan , Mexicoc Department of Chemistry , University of Texas Pan-American ,Edinburg , Texas , USAd Nuclear Engineering Teaching Laboratory, University of Texas ,Austin , Texas , USAe Instituto de Investigaciones Metalurgicas, Universidad Michoacana ,Morelia , Michoacán , Mexicof Department of Physics , Southwestern University , Georgetown ,Texas , USAAccepted author version posted online: 23 Sep 2013.Publishedonline: 02 Dec 2013.
To cite this article: C. J. Alvarado , W. A. Abuhani , T. Whelan III , O. S. Castillo , L. M. Villaseñor ,S. E. Borjas , S. Landsberger , S. L. Bribiesca , S. Alexander & N. Dasgupta-Schubert (2013)Comparative Analyses of Lead and Copper in Metal-Accumulating Plants with and withoutMycorrhizae, Communications in Soil Science and Plant Analysis, 44:22, 3293-3309, DOI:10.1080/00103624.2013.839698
To link to this article: http://dx.doi.org/10.1080/00103624.2013.839698
PLEASE SCROLL DOWN FOR ARTICLE
Taylor & Francis makes every effort to ensure the accuracy of all the information (the“Content”) contained in the publications on our platform. However, Taylor & Francis,our agents, and our licensors make no representations or warranties whatsoever as tothe accuracy, completeness, or suitability for any purpose of the Content. Any opinionsand views expressed in this publication are the opinions and views of the authors,

and are not the views of or endorsed by Taylor & Francis. The accuracy of the Contentshould not be relied upon and should be independently verified with primary sourcesof information. Taylor and Francis shall not be liable for any losses, actions, claims,proceedings, demands, costs, expenses, damages, and other liabilities whatsoever orhowsoever caused arising directly or indirectly in connection with, in relation to or arisingout of the use of the Content.
This article may be used for research, teaching, and private study purposes. Anysubstantial or systematic reproduction, redistribution, reselling, loan, sub-licensing,systematic supply, or distribution in any form to anyone is expressly forbidden. Terms &Conditions of access and use can be found at http://www.tandfonline.com/page/terms-and-conditions
Dow
nloa
ded
by [
148.
240.
245.
218]
at 0
9:13
04
Dec
embe
r 20
13
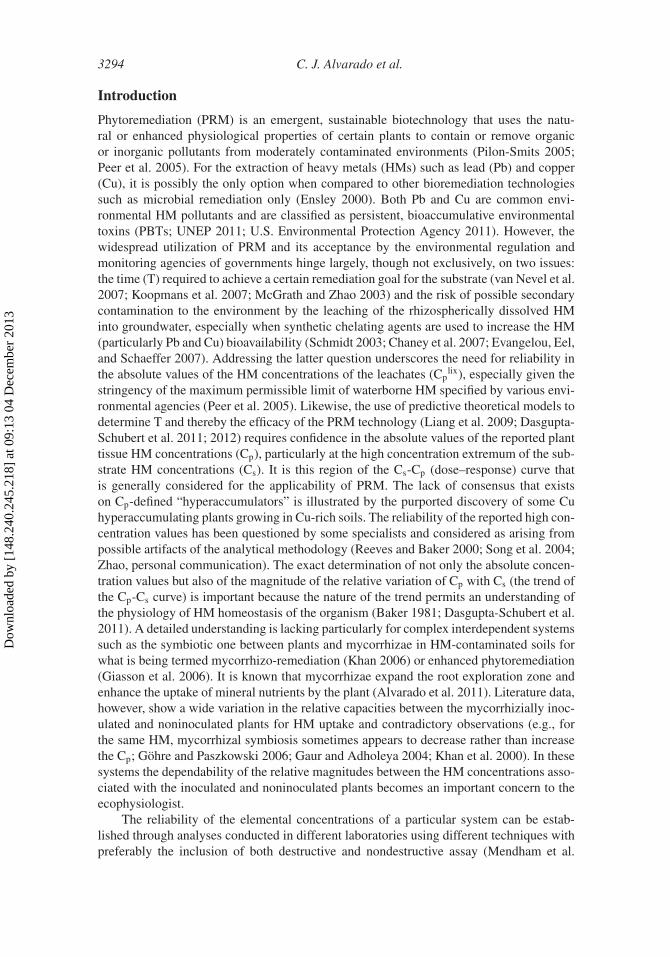
Communications in Soil Science and Plant Analysis, 44:3293–3309, 2013Copyright © Taylor & Francis Group, LLCISSN: 0010-3624 print / 1532-2416 onlineDOI: 10.1080/00103624.2013.839698
Comparative Analyses of Lead and Copperin Metal-Accumulating Plants with and without
Mycorrhizae
C. J. ALVARADO,1 W. A. ABUHANI,2 T. WHELAN III,3
O. S. CASTILLO,1 L. M. VILLASEÑOR,2 S. E. BORJAS,2
S. LANDSBERGER,4 S. L. BRIBIESCA,5 S. ALEXANDER,6
AND N. DASGUPTA-SCHUBERT1
1Universidad Michoacana, Instituto de Investigaciones Quimico Biologicas,Morelia, Michoacan, Mexico2Universidad Michoacana, Instituto de Física y Matemáticas, Morelia,Michoacan, Mexico3Department of Chemistry, University of Texas Pan-American, Edinburg, Texas,USA4Nuclear Engineering Teaching Laboratory, University of Texas, Austin, Texas,USA5Instituto de Investigaciones Metalurgicas, Universidad Michoacana, Morelia,Michoacán, Mexico6Department of Physics, Southwestern University, Georgetown, Texas, USA
Absolute and relative concentrations of heavy metals (HMs) in plant tissue (Cp)and substrate leachate (Cp
lix) are required for phytoremediation and ecophysiology.We report the interlaboratory comparison of the absolute and relative Cp and Cp
lix
for copper (Cu) and lead (Pb) for different soil/substrate HM concentrations (Cs) forTagetes erecta L.–Glomus intraradices and Aldama dentata using atomic absorptionspectrometry, neutron activation analysis, and polarized x-ray fluorescence spectrome-try, utilizing standard statistical validation. The intertechnique absolute concentrationdifferences at each Cs were statistically significant with the global average relativedeviations being 0.5 ± 0.3 to 1.1 ± 0.9. However, the intertechnique Cp correla-tions across the Cs, were excellent. Therefore, the relative concentration variation isa robust index, reliably measured by all analytical methods as long as the techniquesare applied self-consistently. The absolute concentration exactitudes are discussed withrespect to the measurement aspects of each technique, sample presentation, and samplematrix effects. The findings also suggest the need for standard reference materials forcomplex/symbiotic systems.
Keywords Copper, interlaboratory comparison, lead, mycorrhiza, phytoremediation
Received 21 April 2012; accepted 28 December 2012.Address correspondence to Nabanita Dasgupta-Schubert, Universidad Michoacana, Instituto de
Investigaciones Quimico Biologicas, Cd. Universitaria Edificio B-1, Morelia, Michoacan 58060,Mexico. E-mail: [email protected]
3293
Dow
nloa
ded
by [
148.
240.
245.
218]
at 0
9:13
04
Dec
embe
r 20
13
3294 C. J. Alvarado et al.
Introduction
Phytoremediation (PRM) is an emergent, sustainable biotechnology that uses the natu-ral or enhanced physiological properties of certain plants to contain or remove organicor inorganic pollutants from moderately contaminated environments (Pilon-Smits 2005;Peer et al. 2005). For the extraction of heavy metals (HMs) such as lead (Pb) and copper(Cu), it is possibly the only option when compared to other bioremediation technologiessuch as microbial remediation only (Ensley 2000). Both Pb and Cu are common envi-ronmental HM pollutants and are classified as persistent, bioaccumulative environmentaltoxins (PBTs; UNEP 2011; U.S. Environmental Protection Agency 2011). However, thewidespread utilization of PRM and its acceptance by the environmental regulation andmonitoring agencies of governments hinge largely, though not exclusively, on two issues:the time (T) required to achieve a certain remediation goal for the substrate (van Nevel et al.2007; Koopmans et al. 2007; McGrath and Zhao 2003) and the risk of possible secondarycontamination to the environment by the leaching of the rhizospherically dissolved HMinto groundwater, especially when synthetic chelating agents are used to increase the HM(particularly Pb and Cu) bioavailability (Schmidt 2003; Chaney et al. 2007; Evangelou, Eel,and Schaeffer 2007). Addressing the latter question underscores the need for reliability inthe absolute values of the HM concentrations of the leachates (Cp
lix), especially given thestringency of the maximum permissible limit of waterborne HM specified by various envi-ronmental agencies (Peer et al. 2005). Likewise, the use of predictive theoretical models todetermine T and thereby the efficacy of the PRM technology (Liang et al. 2009; Dasgupta-Schubert et al. 2011; 2012) requires confidence in the absolute values of the reported planttissue HM concentrations (Cp), particularly at the high concentration extremum of the sub-strate HM concentrations (Cs). It is this region of the Cs-Cp (dose–response) curve thatis generally considered for the applicability of PRM. The lack of consensus that existson Cp-defined “hyperaccumulators” is illustrated by the purported discovery of some Cuhyperaccumulating plants growing in Cu-rich soils. The reliability of the reported high con-centration values has been questioned by some specialists and considered as arising frompossible artifacts of the analytical methodology (Reeves and Baker 2000; Song et al. 2004;Zhao, personal communication). The exact determination of not only the absolute concen-tration values but also of the magnitude of the relative variation of Cp with Cs (the trend ofthe Cp-Cs curve) is important because the nature of the trend permits an understanding ofthe physiology of HM homeostasis of the organism (Baker 1981; Dasgupta-Schubert et al.2011). A detailed understanding is lacking particularly for complex interdependent systemssuch as the symbiotic one between plants and mycorrhizae in HM-contaminated soils forwhat is being termed mycorrhizo-remediation (Khan 2006) or enhanced phytoremediation(Giasson et al. 2006). It is known that mycorrhizae expand the root exploration zone andenhance the uptake of mineral nutrients by the plant (Alvarado et al. 2011). Literature data,however, show a wide variation in the relative capacities between the mycorrhizially inoc-ulated and noninoculated plants for HM uptake and contradictory observations (e.g., forthe same HM, mycorrhizal symbiosis sometimes appears to decrease rather than increasethe Cp; Göhre and Paszkowski 2006; Gaur and Adholeya 2004; Khan et al. 2000). In thesesystems the dependability of the relative magnitudes between the HM concentrations asso-ciated with the inoculated and noninoculated plants becomes an important concern to theecophysiologist.
The reliability of the elemental concentrations of a particular system can be estab-lished through analyses conducted in different laboratories using different techniques withpreferably the inclusion of both destructive and nondestructive assay (Mendham et al.
Dow
nloa
ded
by [
148.
240.
245.
218]
at 0
9:13
04
Dec
embe
r 20
13
Comparative Analyses of Pb and Cu 3295
2000). While extensive literature exists on such studies in other areas of environmentalresearch, e.g., water quality and management, similar interlaboratory analyses are seldomencountered in the area of HM uptake by complex biotic systems and PRM. Since 2008 amultitechnique collaborative effort between five laboratories in Michoacán, Mexico, andTexas, USA, has been initiated to determine and compare the Cu and Pb contents in thedifferent morphological parts of two metal-tolerant plants, Aldama dentata (Asateraceae,common name flor amarilla) and Tagetes erecta L. (Asteraceae, common name Mexicanmarigold) endemic to Latin America and also found in southern Texas. The studies withT. erecta included inoculation with the arbuscular mycorrhizal fungus (AMF) Glomusintraradices as well as the analysis of the dissolved Cu in the solution leached out fromthe substrate (Cp
lix) of the symbiotic system. The interest in the plant–fungal system wasto investigate the ability of the symbiotic association to enhance Pb and Cu plant uptakegiven the well-known difficulty of the phytoextraction of these two elements. In the case ofPb, plants have not evolved specific membrane transporters for cellular absorption becauseit is a nonessential element (Peer et al. 2005). However, plants do absorb Cu because ofits property as an essential micronutrient, but strongly suppress the loading of Cu ontothe xylem at greater ambient concentrations because of its severe toxicity (Yruela 2005).Symbiosis with mycorrhizal fungi has been proposed as a means of improving HM uptakebecause mycorrhizae are known to enhance mineral uptake by the host plant even in thecase of relatively immobile rhizospheric nutrients (Taiz and Zeiger 2006; Barea, Azcón,and Azcón-Aguilar 2002; Alvarado et al. 2011). Because mycorrhizae are sensitive togrowth conditions (which may perhaps be the underlying cause for the aforementionedcontradictory observations), the analyses included the concentration measurements of sys-tems grown in different soil volumes that corresponded to different volumes of the rootexploratory zone.
As far as specific analytical techniques are concerned, most reported studies have usedatomic absorption spectrometry (AAS), especially flame-AAS (FAAS) (Sperling 2000),both because AAS is a good trace analysis technique and because it is a relatively eco-nomical instrument. Budgetary restrictions on research, however, mean that older FAASmodels will continue to be used. When older models are used, the reliability of the mea-surement might be compromised because their detection limits could be relatively higher,due to the older technology of the components and/or wear and tear. Measurement qual-ity could be an issue for example in the measurement of the lowest levels of Cp
lix, givenits importance to environmental monitoring and regulatory bodies. In this work the ques-tion is addressed by comparing the results of an older model and a modern model of thePerkin-Elmer (Waltham, Mass.) AAS spectrometer for the Cp
lix analysis.The Cp values of metalophilic plants span a rather large concentration range (Baker
1981). For analytes with the greater concentrations, techniques that have a more restrictedrange of linearity, such as the FAAS, necessitate additional sample conditioning (e.g.,dilution) and/or mode of operation (e.g., a different wavelength), which imply additionalprocessing steps that run the risk of exposure to possible systematic or random errors.In such cases, verification with a technique that involves fewer processing steps, is non-destructive, and possesses a larger dynamic range, such as an x- or γ -radiation-basedtechnique, is prudent. Conversely, for analytes whose concentration range is low, the AASmeasurement can serve to benchmark the analytical results obtained by new techniques.In this work the comparative Cp analysis of the aforementioned biotic systems were car-ried out using AAS, γ spectrometric analysis post thermal neutron activation (INAA),and energy dispersive x-ray fluorescence analysis (EDXRF) using the new technique ofincident x-ray beam polarization (pEDXRF).
Dow
nloa
ded
by [
148.
240.
245.
218]
at 0
9:13
04
Dec
embe
r 20
13
3296 C. J. Alvarado et al.
The objectives of the present work are to compare the absolute concentrations as wellas the relative variation of Cu and Pb in (i) the tissues of metalophilic plants with andwithout arbuscular mycorrhizal colonization and (ii) the Cu concentrations in the leachatesolutions. Multiple analytical techniques performed in different laboratories are utilizedfor this purpose. The comprehensive investigation of the concentration indices would helpto benchmark their trends with respect to soil Pb and Cu concentration for the futureecophysiological studies of these systems. The study would also highlight the importanceof the multitechnique interlaboratory analysis of the HM concentrations in complex bioticsystems needed for the latter’s effective deployment in PRM.
Materials and Methods
Details of the methodology can be found in Castillo et al. (2011) and Dasgupta-Schubertet al. (2011).
Plant Growth: T. erecta Inoculated with G. intraradices
Seeds of T. erecta were surface sterilized with a 1% (v/v) solution of sodium hypochlorite(NaClO). The substrate consisted of a 2:1 ratio by volume of expanded perlite (Hortiperl,Termolita, Mexico) and peat moss (Premier, Premier Horticulture Inc., USA). The seedswere germinated and grown in the sterilized substrate. After 15 days, robust seedlings weretransferred to sterilized column pots containing the sterilized substrate (50 g per pot) thathad also been spiked with selected concentrations of Cu. The seedlings were inoculatedwith the AMF at transplantation (Castillo et al. 2011).
There were three sets of distinct experiments. In the first set, Cu in the form of insolu-ble copper(II) oxide (JT Baker 1814-50) was added to the substrate before its sterilization.The substrate was divided into the separate subsets containing the HM concentrations, Cs,of 0 (control), 500, 1000, 1500 2000, and 2500 (mg Cu kg−1 dry substrate). The experi-mental design consisted of 12 treatments each with five replicates (60 plants in total). The12 treatments consisted of the six Cu concentrations of the substrate without AMF inoc-ulation and six with the same Cu concentrations with AMF inoculation. The plants weregrown for 9 weeks in a controlled growth chamber (25 ◦C, relative humidity of 60%, 16-hphotoperiod), irrigated to field capacity with distilled water and fertilized weekly by theLong–Ashton nutrient solution. Leachates from each column were collected at the end ofeach week and cumulatively added until the end of the growth period for the analysis of dis-solved Cu and pH. Plants (P) and their corresponding leachates (PL) of this experimentalset (S) are designated as PS-a and PLS-a respectively.
The second experimental set consisted of the identical starting biological materials.However, in this case, the substrate was mixed with Pb in the form of lead (II, IV) tetroxide(Sigma Aldrich, St. Louis, Mo.; 241547-100G) at the Cs values of 0 (control) and 1000 mgPb kg−1 dry substrate. The four treatments each with five replicates (i.e., 20 plants in all)consisted of the two Pb concentrations of the substrate without AMF inoculation and twowith the same Pb concentrations with AMF inoculation. The same type of column potswere used with the same protocols as described previously. The growth chamber condi-tions were 23 ◦C, RH 71%, and 16-h photoperiod. The plants of this experimental set aredesignated as PS-b.
The third experimental set was identical to the second except that the plants were nowgrown in larger column pots (135 g substrate per pot). The purpose of using the latterwas to observe how the increased rhizospheric growth area with its possible enhancementof extraradical mycorrhizal structures and root architecture would affect the absolute and
Dow
nloa
ded
by [
148.
240.
245.
218]
at 0
9:13
04
Dec
embe
r 20
13
Comparative Analyses of Pb and Cu 3297
comparative magnitude of the Pb uptake by the inoculated and noninoculated plants. Plantsof this set are designated as PS-c.
In all three sets the HM was introduced in its insoluble form bonded to oxygen becausethis form simulates the insoluble Cu-O and Pb-O affixed species in contaminated soil andbecause this approach allows the observation of the role of the AMF in rhizospheric HMdissolution (Castillo et al. 2011). In fact, the relatively insoluble Pb3O4 is the dominantcomponent of Pb-based primer paint and other Pb-based products. Sites contaminated bysuch products are therefore likely to introduce Pb into the contamination chain via itstetroxide.
Plant Growth: A. Dentata
A. dentata seeds were collected from the wild, surface sterilized, germinated in the darkon a sterile substrate and grown in standard sterilized flower pots in a controlled laboratoryenvironment for a total growth period of 10.6 weeks. The substrate was commercial pottingsoil with known physicochemical characteristics. The soil in the pots was spiked with Cuin the form of the sparingly soluble fungicide copper(II) oxychloride (Cupravit, BayerAG, Germany) at 0 (control), 108.1, 1801, 2702, 3602, and 4503 mg Cu kg−1 dry soil.There were five replicate plants for each Cs (total of 30 plants). The plants were irrigatedwith distilled water alone at the rate of an average of 48 ml per week. The maximumand minimum temperatures, the average relative humidity, and the photoperiod during theperiod of plant growth were 26 and 14 ◦C, 45%, and 13 h respectively. Plants of thisexperimental set are designated PS-d.
The sum total of all analyzable samples generated by the plant growths in 2.1 and2.2 was 210.
Sample Preparation for the Different Analytical Techniques
After the given growth periods, the plants were harvested and cleaned, and the freshweights of the whole plant, roots, stems, and leaves were taken. Plant parts were then driedat 60 ◦C until constant weights were obtained and their dry biomasses were recorded. Thedried plant parts were ground and homogenized using a Thomas Scientific 3383L10 plantgrinder and later sieved (SS sieve, mesh size 40). Dried powders of plant tissue (aerialparts and roots) were weighed. The substrate leachates PLS-a were centrifuged (DamonIEC HN.SII) at 4000 rpm for 45 min and later filtered (Whatman filter no. 41).
For PS-d the dried plant powders were further homogenized by stirring with a glassrod and then divided into two representative subsets, one assigned for FAAS using theinstrument PE-3100 (UMSNH) and the other for INAA (UT-A and SWU). For the sets PS-a and PLS-a, only the latter is relevant to the work reported here. For the solutions PLS-a,the samples were divided into two subsets, one designated for FAAS by the PE-3100 andthe other by FAAS using the PE-800 (UTPA). In the cases of PS-b and PS-c, the dried plantpowders were further ground in a mortar and pestle for approximately 5 min per sampleuntil the entire mass appeared as a fine uniform powder. These samples were then assignedfor analysis on the pEDXRF instrument (UMSNH) SpectroXepos III (Spectro AnalyticalInstruments GmbH, Kleve, Germany). After the nondestructive analysis by pEDXRF, thesamples were recovered, reweighed, and assigned for analysis by FAAS on the PE-100(Universidad Tecnológica de Morelia, Mexico, UTM). This operation was possible becausethe pEDXRF is a truly nondestructive technique, unlike nuclear analytical methods suchas the INAA, which preserve the physical mass of the sample but render it radioactive fora variable period of time.
Dow
nloa
ded
by [
148.
240.
245.
218]
at 0
9:13
04
Dec
embe
r 20
13
3298 C. J. Alvarado et al.
Copper and Pb Analysis by AAS
The dried plant powders (PS-d, PS-b, and PS-c) were digested according to the U.S.Environmental Protection Agency Protocol SW-846, Method 3050B (U.S. EnvironmentalProtection Agency 1996). The filtered and volume-adjusted digested plant-matter solutionsand the substrate leachates (PLS-a) were then analyzed by the PE-3100, PE-800, and PE-100. The PE-3100 is an older model compared to the newer PE-800 and the PE-100. Whileit possesses some features in common with the later models (deuterium background cor-rection, efficient burner) its signal transducer is the photomultiplier tube. Method blanksand spikes were run with each analytical batch and were found to be within general guide-lines for validating the analytical data (New England EPA / U.S. EPA, Quality SystemsUnit, Revised Data Validation Guidance). This analytical method had previously been val-idated using plant standard reference materials (SRM) (SRM1570a spinach leaves) fromthe National Institute of Standards and Technology (NIST, Gaithersburg, Md.), where theagreement (PE-800) was found to be about 84% with respect to the published values.In addition, spike and duplicate recoveries for Cu were in the range 100–104%.
Copper Analysis by Instrumental Neutron Activation Analysis (INAA)
The powdered PS-d samples were irradiated by the thermal neutron flux approximately2.7 × 1012 n cm−2 s−1 of the TRIGA 1.1MW research reactor (UT-A) for short dura-tions (30 and 60 s) at 100 kW and cooled for 5–10 min. Thereafter, gamma photonsfrom 66Cu (5.10 min) obtained in the 65Cu(n,γ )66Cu reaction were counted on a Comptonbackground-suppressed gamma-ray spectrometer consisting of a 35% HPGe detector(Canberra Inc., Meriden, USA) and a NaI active shield (St. Gobain Crystals, Hiram, USA).The elemental concentrations were calculated using the standard comparative methodemploying the program NADA (Landsberger, Cizek, and Domagala 1992). Quality controlhad previously been established using dry plant and mollusk powder SRMs (NIST-1515,1566a and 1573a) wherein the agreement was found to be within 10–20% of the publishedvalues.
Following Reeves and Baker (2000), the shoot translocation factor, TLF, was deter-mined as the ratio Cp(shoot):Cp(root), for the different Cs values.
Lead Analysis by pEDXRF
pEDXRF was developed in the mid-1990s as a refinement of energy dispersive x-rayfluorescence (EDXRF) instrumentation (Heckel and Ryon 2002) and commercial spec-trometers have been sold since the early years of this century. The features consist of thepolarization of the exciting x-ray beam by a combination of Bragg crystal reflectors andBarkla scatterers and three-dimensional (3D) optics whose notable aspect is the orthog-onality of the optical path between the exciting x-ray and the beam of fluoresced x-rayscollected at the detector. These features, among others, allow a reduction of the backgroundradiation, particularly from bremmstrahlung, so that greater sensitivities and resolution ofthe EDXRF spectra can now be achieved. The pEDXRF spectrometer used in this work, theSpectroXepos III, combines eight polarization and secondary targets, a high-performanceSi-drift detector, and He gas flush. This spectrometer permits direct (standardless) analy-sis through the Fundamental Parameters routine, Turboquant (TQ), whereby detector andsample matrix characteristics and background photon counts are automatically corrected(Schramm and Heckel 1998).
Dow
nloa
ded
by [
148.
240.
245.
218]
at 0
9:13
04
Dec
embe
r 20
13
Comparative Analyses of Pb and Cu 3299
Dried powders of the PS-b and PS-c sets were directly mounted onto the 24-mm-i.d.sample holders of the SpectroXepos III pEDXRF spectrometer (Pd tube, maximum powerand voltage, 50 W, 48 kV) that had thin prolene sheets (4 μm) as the sample x-ray window.Particle sizes in the samples were < 400 μm. No further discrimination of particle sizeby sieving to the ideal ≤ 100 μm as recommended (SpectroXepos III user’s manual) wasperformed in the interest of conserving the low dry biomasses. The average sample weightwas 0.869 g, which is substantially less than the ideal of 4 g suggested by the manufacturer.The samples were spun during the runs to aid homogenization. It was expected that theenhanced sensitivity and high spectral resolution effected by the spectrometer’s favorablecharacteristics would permit reliable Pb analysis in the samples despite their coarse particlesize and small sample weight. The standardless spectrum analysis software TQ-powderwas used. The analytical method had previously been validated for more than 13 elementsof the third to sixth periods of the periodic table using eight SRMs from NIST (1c, 70a,78a, 88a, 98a, 103a 198, 330) and the SRMs, GBW-07401 and GBW-07112, supplied bythe manufacturer. The average particle size of the powders in all these SRMs was 3.52 ±0.27 μm. With the recommended weight of 4 g, the results for the elements (excludingNa) matched those of the published values to an average of 94% (ratio of experimentalto published values), with the average coefficient of variation (CV, the precision factor)being 3%. When the SRM weights were reduced to values below 1 g, the match betweenthe experimental and the published values diminished somewhat, with relatively greaterdiscrepancy occurring for the sixth period elements (∼61%).
Data Analysis
Precisions for primary experimental results for all analyses (2.4–2.6) were computed asstandard errors. The statistical figures of merit (FOM) (Mandel 1984) were taken to be thefollowing: the relative deviation (RD) between the concentrations of the given analyticaltechnique X and the reference technique R [Eq. (1)]; the mean of the RD for all the con-centrations of the morphological part over the given Cs range and/or the global mean ofRD; the global mean of the ratio of X to R; and the square of the correlation coefficient (r2)of the linear regression between the X and R values. The reference (R) was designated asthe technique with a history of application (FAAS and INAA) and within FAAS, the newermodels (PE-800, PE-100):
RD = (R − X)/R (1)
The comparison of the differences between the absolute concentration values betweenthe X and R techniques was performed statistically through the Student’s t-test (Mandel1984).The magnitudes of the relative variations of the concentrations in each analysisacross the range of Cs were estimated qualitatively by the visual inspection of the trendsof the plots. The quantitative comparison of these trends between the X and R techniqueswas performed through the analysis of the statistical goodness of the linear correlation (r2)between X and R.
Results and Discussion
The results of all analyses are summarized in Tables 1–3, and the graphical trends areshown in the Figures 1–3. The statistical analyses described in the data analysis section areshown in the tables and figures.
Dow
nloa
ded
by [
148.
240.
245.
218]
at 0
9:13
04
Dec
embe
r 20
13
3300 C. J. Alvarado et al.
Table 1Concentrations of Cu in the substrate leachates, Cp
lix (mg Cu l−1) corresponding to thetotal Cu concentration in the substrate, Cs (mg Cu kg−1 dry substrate) obtained using thePE-800 (newer) and PE-3100 (older) models of the flame atomic absorption spectrometer(FAAS) for the plants Tagetes erecta and Tagetes erecta incolulated with the arbuscular
mycorrhizal fungus (AMF) Glomus intraradices
Cs
Cplix , (R) FAAS(PE-800)
Cplix, (X) FAAS(PE-3100)
Relativedeviation (RD)
Averageabsolute RD
Tagetes erecta0 0.042 ± 0.001 0.000 ± 0.000 1.00500 0.468 ± 0.014 0.218 ± 0.007 0.541000 0.690 ± 0.021 0.387 ± 0.012 0.44 0.48 ± 0.281500 1.09 ± 0.033 0.807 ± 0.024 0.262000 0.920 ± 0.028 0.600 ± 0.018 0.352500 1.13 ± 0.034 0.823 ± 0.025 0.27Linear correlation:X = 0.78 R – 0.09 ; r2 = 0.97
Tagetes erecta–Glomus intraradices0 0.033 ± 0.001 0.000 ± 0.000 1.00500 0.441 ± 0.013 0.137 ± 0.004 0.691000 0.732 ± 0.022 0.433 ± 0.013 0.41 0.52 ± 0.271500 0.982 ± 0.029 0.580 ± 0.017 0.412000 1.22 ± 0.037 0.797 ± 0.024 0.352500 1.22 ± 0.036 0.863 ± 0.026 0.29Linear correlation:X = 0.73 R – 0.09 ; r2 = 0.97
Notes. R and X refer to the reference and experimental analyses. The t-test between X andR indicated that all values differ significantly (n = 5, P < 0.02). Global average ratio X toR: 0.50 ± 0.26.
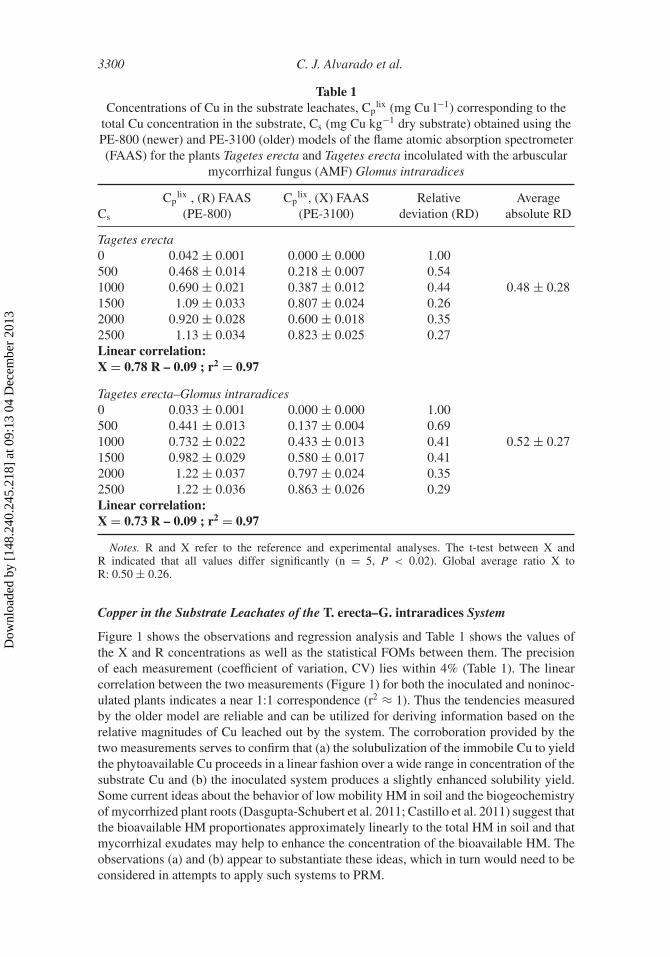
Copper in the Substrate Leachates of the T. erecta–G. intraradices System
Figure 1 shows the observations and regression analysis and Table 1 shows the values ofthe X and R concentrations as well as the statistical FOMs between them. The precisionof each measurement (coefficient of variation, CV) lies within 4% (Table 1). The linearcorrelation between the two measurements (Figure 1) for both the inoculated and noninoc-ulated plants indicates a near 1:1 correspondence (r2 ≈ 1). Thus the tendencies measuredby the older model are reliable and can be utilized for deriving information based on therelative magnitudes of Cu leached out by the system. The corroboration provided by thetwo measurements serves to confirm that (a) the solubulization of the immobile Cu to yieldthe phytoavailable Cu proceeds in a linear fashion over a wide range in concentration of thesubstrate Cu and (b) the inoculated system produces a slightly enhanced solubility yield.Some current ideas about the behavior of low mobility HM in soil and the biogeochemistryof mycorrhized plant roots (Dasgupta-Schubert et al. 2011; Castillo et al. 2011) suggest thatthe bioavailable HM proportionates approximately linearly to the total HM in soil and thatmycorrhizal exudates may help to enhance the concentration of the bioavailable HM. Theobservations (a) and (b) appear to substantiate these ideas, which in turn would need to beconsidered in attempts to apply such systems to PRM.
Dow
nloa
ded
by [
148.
240.
245.
218]
at 0
9:13
04
Dec
embe
r 20
13
Comparative Analyses of Pb and Cu 3301
Table 2Concentrations of Cu in the roots, stems, and leaves, Cp (mg Cu kg−1 dry tissue), with
respect to the total concentration of Cu in the soil, Cs (mg Cu kg−1 dry soil) for the plantAldama dentata
Cs Cp , R INAACp , X FAAS
(PE-3100)Relative
deviation (RD)Average
absolute RD
Root0.00 4.47 × 101 ± 6.60 6.71 × 101 ± 2.01 −0.50108.06 1.06 × 10² ± 7.50 6.85 × 101 ± 2.06 0.351800.90 7.35 × 10² ± 17.3 4.02 × 10² ± 12.1 0.45 0.36 ± 0.172701.60 1.14 × 10³ ± 22.0 5.58 × 10² ± 16.4 0.523601.80 1.28 × 10³ ± 23.0 9.23 × 10² ± 27.7 0.284502.50 2.26 × 10³ ± 37.0 2.08 × 10³ ± 62.3 0.08
Stem0.00 4.72 × 100 ± 1.99 0.00 × 100 ± 0.00 1.00108.06 1.69 × 101 ± 1.98 2.55 × 101 ± 0.76 −0.501800.90 0.00 × 100 ± 0.00 2.78 × 101 ± 0.83 — 0.86 ± 0.502701.60 4.19 × 101 ± 5.30 1.08 × 10² ± 3.24 −1.583601.80 2.27 × 101 ± 7.40 2.93 × 101 ± 0.88 −0.294502.50 3.74 × 101 ± 4.40 7.19 × 101 ± 2.16 −0.92
Leaves0.00 0.00 × 100 ± 0.00 6.37 × 100 ± 0.19 —108.06 2.73 × 101 ± 3.10 1.70 × 101 ± 0.51 0.381800.90 3.63 × 101 ± 4.22 6.25 × 101 ± 1.87 −0.72 0.65 ± 0.742701.60 (3.74 × 101 ± 5.28)∗ (3.66 × 101 ± 1.10)∗ 0.023601.80 3.60 × 101 ± 5.38 1.04 × 10² ± 3.12 −1.894502.50 9.94 × 101 ± 4.59 7.75 × 101 ± 2.33 0.22
Notes. Cp was measured by instrumental neutron activation analysis (INAA) (R) and by FAAS (X)using the PE-3100 model. The t-test between X and R indicated that all values differ significantly(n = 5, P < 0.02), except the pair marked by an asterisk (∗). Global average absoluteRD: 0.62 ± 0.25. Global average ratio X to R: 1.19 + 0.78. Linear correlation: X = 0.80 R – 3.20;r2 = 0.94.
The invariably positive RD values between the absolute concentration values indicatethat the Cplix values determined by the older FAAS (PE-3100, X) are consistently lessthan those determined by the newer FAAS (PE-800, R) (Table 1). By the standard defini-tion of calibration sensitivity (Skoog 1985) the newer FAAS was seen to be nearly 25-foldmore sensitive than the older machine (data not shown). Consequently, the older machineis unable to discriminate low concentrations as seen, for instance, for the control sam-ples (Table 1). The degradation of minimum detectability in older detectors such as in thephotomultiplier tube used in the PE-3100 possibly accounts for these observations. Theimproved features of the newer systems (PE-800 and PE-100), such as higher performanceburners and nebulizers and especially greater sensitivity detection by solid-state detectors,lead to improvements in detection limits so that low absorbances can be discriminated.As the analyte density in the flame increases (greater concentrations), the magnitudes ofthe RD between the two measurements decrease, which indicates that the detection quality
Dow
nloa
ded
by [
148.
240.
245.
218]
at 0
9:13
04
Dec
embe
r 20
13
3302 C. J. Alvarado et al.
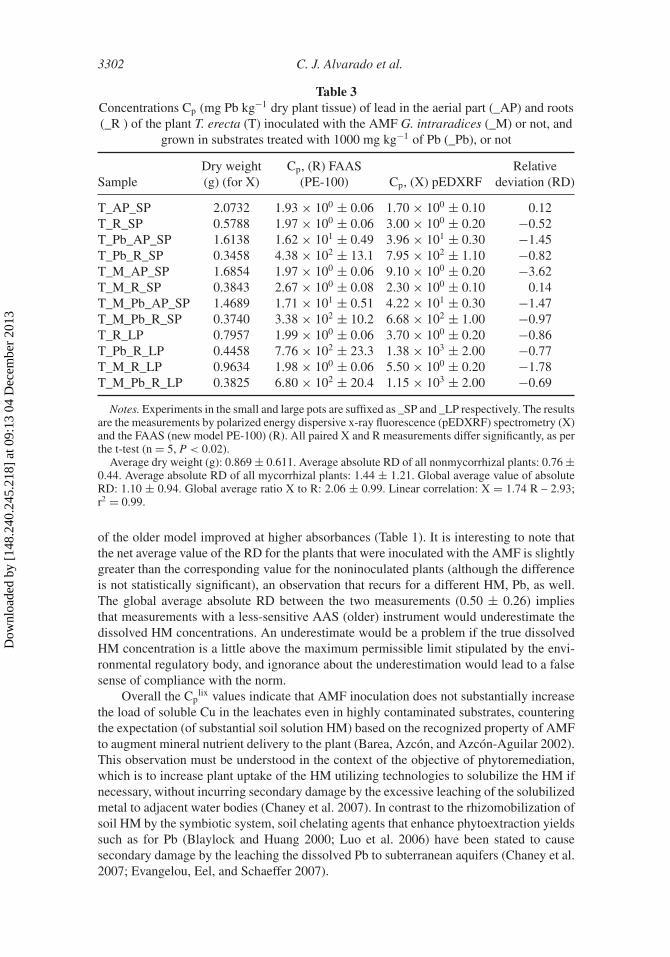
Table 3Concentrations Cp (mg Pb kg−1 dry plant tissue) of lead in the aerial part (_AP) and roots(_R ) of the plant T. erecta (T) inoculated with the AMF G. intraradices (_M) or not, and
grown in substrates treated with 1000 mg kg−1 of Pb (_Pb), or not
SampleDry weight(g) (for X)
Cp, (R) FAAS(PE-100) Cp, (X) pEDXRF
Relativedeviation (RD)
T_AP_SP 2.0732 1.93 × 100 ± 0.06 1.70 × 100 ± 0.10 0.12T_R_SP 0.5788 1.97 × 100 ± 0.06 3.00 × 100 ± 0.20 −0.52T_Pb_AP_SP 1.6138 1.62 × 101 ± 0.49 3.96 × 101 ± 0.30 −1.45T_Pb_R_SP 0.3458 4.38 × 10² ± 13.1 7.95 × 10² ± 1.10 −0.82T_M_AP_SP 1.6854 1.97 × 100 ± 0.06 9.10 × 100 ± 0.20 −3.62T_M_R_SP 0.3843 2.67 × 100 ± 0.08 2.30 × 100 ± 0.10 0.14T_M_Pb_AP_SP 1.4689 1.71 × 101 ± 0.51 4.22 × 101 ± 0.30 −1.47T_M_Pb_R_SP 0.3740 3.38 × 10² ± 10.2 6.68 × 10² ± 1.00 −0.97T_R_LP 0.7957 1.99 × 100 ± 0.06 3.70 × 100 ± 0.20 −0.86T_Pb_R_LP 0.4458 7.76 × 10² ± 23.3 1.38 × 10³ ± 2.00 −0.77T_M_R_LP 0.9634 1.98 × 100 ± 0.06 5.50 × 100 ± 0.20 −1.78T_M_Pb_R_LP 0.3825 6.80 × 10² ± 20.4 1.15 × 10³ ± 2.00 −0.69
Notes. Experiments in the small and large pots are suffixed as _SP and _LP respectively. The resultsare the measurements by polarized energy dispersive x-ray fluorescence (pEDXRF) spectrometry (X)and the FAAS (new model PE-100) (R). All paired X and R measurements differ significantly, as perthe t-test (n = 5, P < 0.02).
Average dry weight (g): 0.869 ± 0.611. Average absolute RD of all nonmycorrhizal plants: 0.76 ±0.44. Average absolute RD of all mycorrhizal plants: 1.44 ± 1.21. Global average value of absoluteRD: 1.10 ± 0.94. Global average ratio X to R: 2.06 ± 0.99. Linear correlation: X = 1.74 R – 2.93;r2 = 0.99.
of the older model improved at higher absorbances (Table 1). It is interesting to note thatthe net average value of the RD for the plants that were inoculated with the AMF is slightlygreater than the corresponding value for the noninoculated plants (although the differenceis not statistically significant), an observation that recurs for a different HM, Pb, as well.The global average absolute RD between the two measurements (0.50 ± 0.26) impliesthat measurements with a less-sensitive AAS (older) instrument would underestimate thedissolved HM concentrations. An underestimate would be a problem if the true dissolvedHM concentration is a little above the maximum permissible limit stipulated by the envi-ronmental regulatory body, and ignorance about the underestimation would lead to a falsesense of compliance with the norm.
Overall the Cplix values indicate that AMF inoculation does not substantially increase
the load of soluble Cu in the leachates even in highly contaminated substrates, counteringthe expectation (of substantial soil solution HM) based on the recognized property of AMFto augment mineral nutrient delivery to the plant (Barea, Azcón, and Azcón-Aguilar 2002).This observation must be understood in the context of the objective of phytoremediation,which is to increase plant uptake of the HM utilizing technologies to solubilize the HM ifnecessary, without incurring secondary damage by the excessive leaching of the solubilizedmetal to adjacent water bodies (Chaney et al. 2007). In contrast to the rhizomobilization ofsoil HM by the symbiotic system, soil chelating agents that enhance phytoextraction yieldssuch as for Pb (Blaylock and Huang 2000; Luo et al. 2006) have been stated to causesecondary damage by the leaching the dissolved Pb to subterranean aquifers (Chaney et al.2007; Evangelou, Eel, and Schaeffer 2007).
Dow
nloa
ded
by [
148.
240.
245.
218]
at 0
9:13
04
Dec
embe
r 20
13
Comparative Analyses of Pb and Cu 3303
Figure 1. Concentrations of Cu in the substrate leachates, Cplix (mg Cu l−1) corresponding to
the total Cu concentration in the substrate, Cs (mg Cu kg−1 dry substrate), obtained using thePE-800 FAAS for the plant T. erecta and T. erecta incolulated with the AMF, G. intraradices.
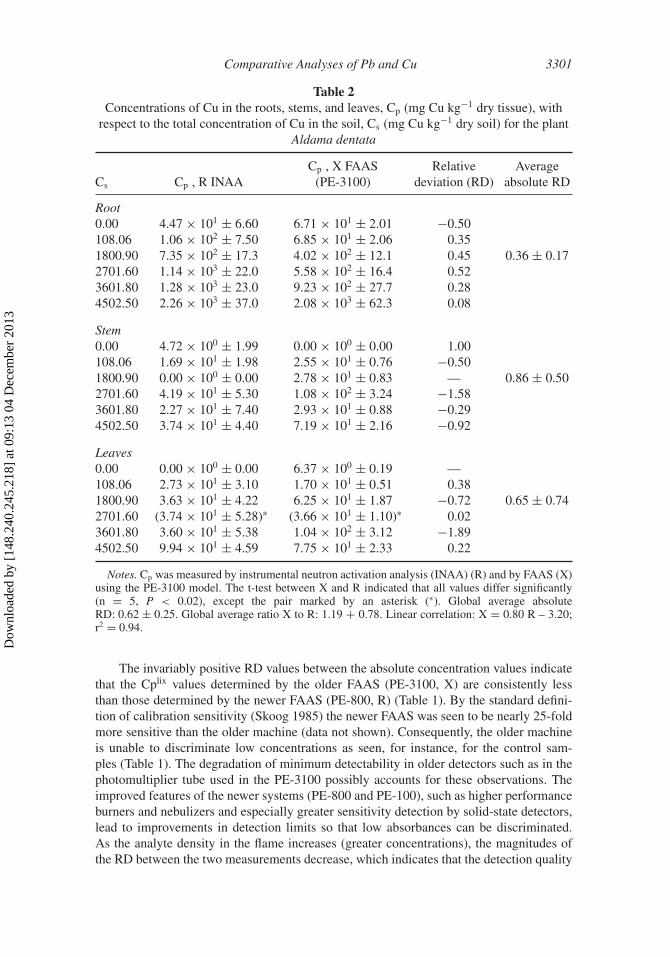
Figure 2. Concentrations of Cu in the roots, stems, and leaves, Cp (mg Cu kg−1 dry tissue), asmeasured by INAA, with respect to the concentration of Cu in the soil, Cs (mg Cu kg−1 dry soil), forthe plant A. dentata.
Copper in Plant Tissue of A. dentata
The average value of the magnitudes of the RDs between X (FAAS, PE-3100) and R(INAA) is the least for the roots, whose Cp values are the greatest and relatively the greatestfor the stems whose Cp values are the lowest (Table 2). Thus, as before, the older model’sFAAS performance improves at greater analyte concentrations (greater absorbances). The
Dow
nloa
ded
by [
148.
240.
245.
218]
at 0
9:13
04
Dec
embe
r 20
13
3304 C. J. Alvarado et al.
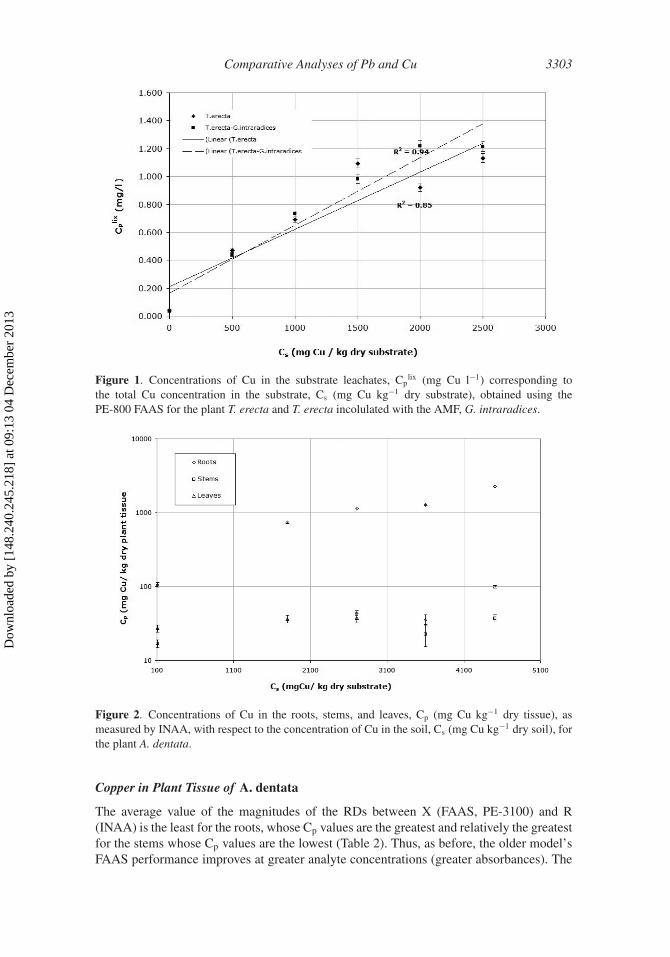
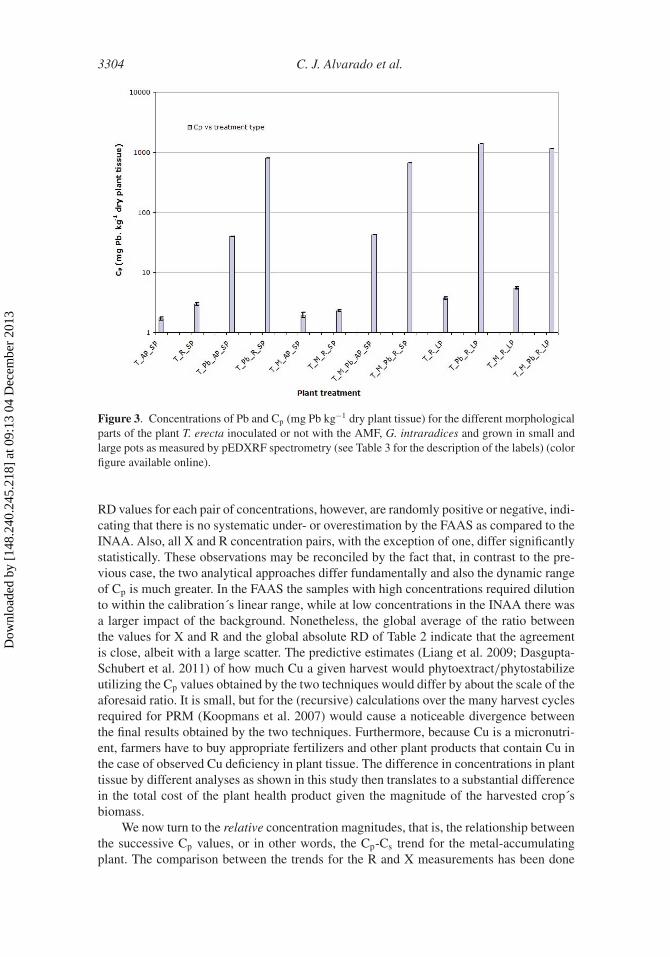
Figure 3. Concentrations of Pb and Cp (mg Pb kg−1 dry plant tissue) for the different morphologicalparts of the plant T. erecta inoculated or not with the AMF, G. intraradices and grown in small andlarge pots as measured by pEDXRF spectrometry (see Table 3 for the description of the labels) (colorfigure available online).
RD values for each pair of concentrations, however, are randomly positive or negative, indi-cating that there is no systematic under- or overestimation by the FAAS as compared to theINAA. Also, all X and R concentration pairs, with the exception of one, differ significantlystatistically. These observations may be reconciled by the fact that, in contrast to the pre-vious case, the two analytical approaches differ fundamentally and also the dynamic rangeof Cp is much greater. In the FAAS the samples with high concentrations required dilutionto within the calibration´s linear range, while at low concentrations in the INAA there wasa larger impact of the background. Nonetheless, the global average of the ratio betweenthe values for X and R and the global absolute RD of Table 2 indicate that the agreementis close, albeit with a large scatter. The predictive estimates (Liang et al. 2009; Dasgupta-Schubert et al. 2011) of how much Cu a given harvest would phytoextract/phytostabilizeutilizing the Cp values obtained by the two techniques would differ by about the scale of theaforesaid ratio. It is small, but for the (recursive) calculations over the many harvest cyclesrequired for PRM (Koopmans et al. 2007) would cause a noticeable divergence betweenthe final results obtained by the two techniques. Furthermore, because Cu is a micronutri-ent, farmers have to buy appropriate fertilizers and other plant products that contain Cu inthe case of observed Cu deficiency in plant tissue. The difference in concentrations in planttissue by different analyses as shown in this study then translates to a substantial differencein the total cost of the plant health product given the magnitude of the harvested crop´sbiomass.
We now turn to the relative concentration magnitudes, that is, the relationship betweenthe successive Cp values, or in other words, the Cp-Cs trend for the metal-accumulatingplant. The comparison between the trends for the R and X measurements has been done
Dow
nloa
ded
by [
148.
240.
245.
218]
at 0
9:13
04
Dec
embe
r 20
13
Comparative Analyses of Pb and Cu 3305
via their (statistical) linear correlation, which, across the large Cs range involved in thiswork, is seen to be good (Table 2). This indicates that for the study of concentration trendsin metal-accumulating plants, the older model of the FAAS is still reliable. Figure 2 showsthe Cp-Cs trend for the different morphological parts obtained from the R (INAA) measure-ments. Cp for the roots is seen to be much greater relative to the Cp of the leaves and stems.The plant was seen to remain quite healthy even at the greatest Cs values, demonstratinga high degree of tolerance to rhizospheric Cu contamination. A. dentata is found to farequite well in extremely metaliferous soils such as those found in mine tailings (Rzedowskiand Rzedowski 2008). Across the Cs range, the TLF value was much less than 1, whichmarks this plant out as a metal excluder (ME) rather than a metal hyperaccumulator (MHA)(Callahan et al. 2006). The protection mechanism in Cu ME plants is to sequester the Cuin the roots and prevent its transport to the aerial parts to protect the photosynthetic organsfrom Cu toxicity (Castillo et al. 2011). Because both measurements corroborate the rela-tive magnitudes of the Cp (through their linear correlation), one concludes that A. dentatais definitely not a Cu MHA in spite of its MHA-like tolerance to soil highly rich in HM.
Lead Concentrations in the Plant Tissue of the T. erecta–G. intraradices System
These results pertain to the intercomparison between the pEDXRF and FAAS (PE-100) techniques. The intention is to examine the efficacy of the TQ-powder routine forthe analysis of Pb in the symbiotic system in the context of the low sample masses yieldedby this experiment. The nature of experiments in biology makes this a frequently encoun-tered situation. Furthermore, the larger than recommended particle size meant that therewould have been inhomogeneities in the sample that would have induced variations in thesignal due to the random scatter of the fluoresced x-rays. Consequently, the global aver-age value of the absolute RD and the global average ratio between X (pEDXRF) and R(FAAS) were larger than those encountered previously. The low masses imply a reduc-tion in the analysis depth and therefore in the net absorption of the incident x-rays. Thelow average atomic number of the sample matrix on the other hand implies a lower cut-off of the fluoresced x-rays from the analyte atoms. The instrument’s operating voltage of≤40 kV meant that the sixth-period elements are identified by their (lower energy) L lines.The lower matrix cutoff therefore particularly benefits these lower energy lines. However,because L electrons display lower fluorescence yields than K electrons, the low analysisdepths would be a substantial disadvantage. In earlier EDXRF instruments the low anal-ysis depth, sample inhomogeneity, and high background from the scattered source x-rayswould seriously impact the detection limit and the accuracy of the analysis. The attributesof the relatively new pEDXRF technique enable the reduction of the scattered photonbackground of the primary x-rays, allowing high-sensitivity and high-resolution analysis(Heckel and Ryon 2002). Both these factors also benefit mathematical peak analysis asis involved in the TQ powder. Its standardless aspect is a distinct advantage for complexsystems such as the present one where exact matrix replication in standards becomes diffi-cult. However, the theoretical nature of the spectral analysis implies the possibility of someover- or undercorrections particularly when the dynamic range is large.
Taking all the aforesaid into account, Table 3 shows that the pEDXRF-TQ system wasable to measure Pb concentrations that spanned three orders of magnitude, in a standardlessmanner, with the global average FOMs of about a factor of 2 greater than those obtainedin the previous sections for Cu. Taking only the set of nonmycorrhized plants, the aver-age absolute RD was substantially lower than the global average value, whereas the value
Dow
nloa
ded
by [
148.
240.
245.
218]
at 0
9:13
04
Dec
embe
r 20
13
3306 C. J. Alvarado et al.
for the set of mycorrhized plants was substantially greater. The variability in the mycor-rhized plants is curious and may point to sample background effects brought in by a greaterdiversity and richness of species present in the mycorrhized plants. Accurate absolute con-centrations can be obtained by introducing appropriate standards and a calibration routine,for example, the Lucas–Tooth–Price method (Molt and Schramm 1997). However, per-fect matrix replication and the obtainment of a large linear calibration range may presentsignificant challenges, especially across a large dynamic range and for complex systems.In context, one notes that when sample conditions are close to the ideal, the TQ-powderroutine provides absolute concentrations of a high degree of accuracy as demonstrated forthe powder SRMs.
Table 3 further shows that the linear correlation between the pEDXRF and FAAS wasexcellent. Thus the relative magnitudes of the Cp values obtained from the pEDXRF arereliable and can be used to derive information on the responses of the system subjected tothe various treatments such as those of this work. Figure 3 shows the differences betweenthe nonmycorrhized and mycorrhized systems to substrate Pb contamination at 1000 mgtotal Pb kg−1 dry substrate given the two physical growth conditions of a small volumedand a large volumed pot. It was expected that the larger volume of the root zone wouldenable higher Pb absorption particularly by the mycorrhizal system, because the extra rad-ical mycelia can now extend further. Through the linear correspondence between the Xand R analytical measurements the following response of the system to soil Pb contam-ination stands validated: (a) increasing the rhizospheric volume does indeed increase theCp of Pb in both the mycorrhized and nonmycorhized plant roots; that (b) the Cp of theroot is much larger than the Cp of the shoots for both noninoculated and inoculated plants;and finally, (c) in both the small and large pots, the mycorrhized plant roots displayed alower Cp compared to the nonmycorrhized plants. The last result might possibly be dueto the attachment of the metal to the cells of the extra radical mycelia, thus reducing itsingress into the plant root. The decreased HM uptake by the mycorrhized plant is contraryto expectation, though it has sometimes been reported (Khan et al. 2000). Such unexpectedresults are not uncommon in the area of plant–AMF interactions in the presence of HM(Khan et al. 2000; Göhre and Paszkowski 2006; Gaur and Adholeya 2004) and demon-strate the sensitivity of this complex multicomponent system to ambient conditions. Thissusceptibility underscores the need for intercomparative analysis to verify the response ofthe system, as done in this work. The result in (b) is as expected because Pb is a nonessen-tial element for which the plant lacks specific transporters for xylem loading and transportto the aerial parts.
The pEDXRF-TQ technique has not been sufficiently explored in the area of the HMuptake by plants. Despite the nonoptimal conditions for pEDXRF-TQ in the case of theplant samples of this experiment, the comparison with the well-tested FAAS shows thatit is a remarkably robust technique, giving correct results for the concentration trends andreasonably reliable results for the absolute concentrations.
Conclusion
The comparative analysis has served to check and validate the qualitative (the relativemagnitudes) and the quantitative (the absolute values) of the Pb and Cu concentrations ofthe complex biotic systems represented by the plants and mycorrhiza studied in this work.It has shown that all the techniques studied produce identical qualitative features whenthe methodology is applied self-consistently. This finding is in spite of the nonoptimalconditions in some cases such as a less-sensitive instrument or the constraints in sample
Dow
nloa
ded
by [
148.
240.
245.
218]
at 0
9:13
04
Dec
embe
r 20
13
Comparative Analyses of Pb and Cu 3307
quantity and form. This finding has important consequences for ecophysiological studiesbecause there it is the reliability of the relative variations or response curves upon whichthe interpretations are based. This work shows that all techniques are able to maintain theverity of the trends.
The comparison between the different techniques for the absolute concentration mag-nitudes shows that there are statistically significant differences in all cases. The FOMsdiffer to a larger extent when the analysis from two entirely different techniques (suchas destructive versus nondestructive) are compared and again when there are constraintstoward achieving ideal sample characteristics. The differences are also slightly greater forthe mycorrhizal plant samples. It is concluded that both the sample matrix and the signalacquisition and processing in each technique contribute to the overall difference in con-centration values. This finding is important for the application of absolute concentrationvalues to quantitative estimates for the applicability of phytoremediation, for the compli-ance of regulatory norms, and for the farmer to aid his calculation of the correct quantityof plant nutritional product containing the HM micronutrient to purchase. Moreover, thelarger differences for the mycorrhizal system point to a necessity of developing plant SRMscorresponding to complex symbiotic systems.
While the necessity for checks on analytical results especially for complex bioticsystems is well known, the detailed investigation conducted in this work quantifies thequestion. It is possibly the first report of a multitechnique interlaboratory verification ofthe elemental analysis of a HM accumulating complex biotic system conducted over arange of substrate HM concentrations. Further work of its kind needs to be carried out onsimilar systems and over larger ranges of the substrate HM concentration to better under-stand how the accuracy and precision of the concentration measurement varies with thespecific conditions of the system (complexity, heavy metal, type of substrate, etc.).
Acknowledgments
The authors extend their gratitude to L. Reyes Luna (UTM) for permission to use the PE-100 spectrometer, to H. J. Villegas Moreno (IIQB-UMSNH) for advice on the mycorrhizalexperiments, and to M. R. Cisneros (IIM-UMSNH) and L. Carreto (IIQB-UMSNH) fortechnical assistance. C. J. A., W. A. A., and O. S. C. thank CONACyT of Mexico fortheir doctoral scholarships, numbered 168355, 350251 and 169682, respectively. N. D.S. is grateful to CONACyT for funding her sabbatical fellowship to the USA by Grant(Proyecto) No. 173076.
References
Alvarado, C. J., N. Dasgupta-Schubert, E. Ambriz, J. M. Sanchez-Yañez, and H. J. Villegas. 2011.Hongos micorrizicos arbusculares y la fitoremediación de plomo. Revista Internacional deContaminación Ambiental 27: 357–364.
Baker, A. J. M. 1981. Accumulators and excluders: Strategies in the response of plants to heavymetals. Journal of Plant Nutrition 3: 643–654.
Barea, J. M., R. Azcón, and C. Azcón-Aguilar. 2002. Mycorrhizosphere interactions to improve plantfitness and soil quality. Antonie Van Leeuwenhoek Journal of Microbiology 81: 343–351.
Blaylock, M., and J. W. Huang. 2000. The phytoextraction of metals. In Phytoremediation of toxicmetals: Using plants to clean up the environment, ed. I. Raskin and B. D. Ensley, 53–70. NewYork: Wiley.
Callahan, D. L., A. J. M. Baker, S. D. Kolev, and A. G. Wedd. 2006. Metal ion ligands inhyperaccumulating plants. Journal of Bio-inorganic Chemistry 11: 2–12.
Dow
nloa
ded
by [
148.
240.
245.
218]
at 0
9:13
04
Dec
embe
r 20
13
3308 C. J. Alvarado et al.
Castillo, O. S., N. Dasgupta-Schubert, C. J. Alvarado, E. M. Zaragoza, and H. J. Villegas. 2011.The effect of the symbiosis between Tagetes erecta L. (marigold) and Glomus intraradicesin the uptake of copper(II) and its implications for phytoremediation. New Biotechnology 29:156–164.
Chaney, R. L., J. Scott Angle, C. Leigh Broadhurst, C. A. Peters, R. V. Tappero, and D. L. Sparks.2007. Improved understanding of hyperaccumulation yields, commercial phytoextraction, andphytomining technologies. Journal of Environmental Quality 36: 1429–1443.
Dasgupta-Schubert, N., M. G. Barrera, C. J. Alvarado, O. S. Castillo, E. M. Zaragoza, S.Alexander, S. Landsberger, and S. Robinson. 2011. The uptake of copper by Aldama dentata:Ecophysiological response, its modeling and the implication for phytoremediation. Water Airand Soil Pollution 220: 37–55.
Dasgupta-Schubert, N. 2012. A systems model of the eco-physiological response of plants to envi-ronmental heavy metal concentrations. Paper presented at the 22nd Annual Conference of theInternational Environmetrics Society (TIES), January 3–7, Hyderabad, India.
Ensley, B. D. 2000. Rational for use of phytoremediation. In Phytoremediation of toxic metals: Usingplants to clean up the environment, ed. I. Raskin and B. D. Ensley, 3–12. New York: Wiley.
Evangelou, M. W. H., M. Eel, and A. Schaeffer. 2007. Chelate-assisted phytoextraction of heavymetals from soil: Effect, mechanism, toxicity, and fate of chelating agents. Chemosphere 9:257–268.
Gaur, A., and A. Adholeya. 2004. Prospects of arbuscular mycorrhizal fungi in phytoremediation ofheavy metal–contaminated soils. Current Science India 86: 528–534.
Giasson, P., A. Jaouich, P. Cayer, S. Gagne, P. Moutoglis, and L. Massicotte. 2006. Enhancedphytoremediation: A study of mycorrhizoremediation of heavy metal–contaminated soil.Remediation 17: 97–110.
Göhre, V., and U. Paszkowski. 2006. Contribution of the arbuscular mycorrhizal symbiosis to heavymetal phytoremediation. Planta 223: 1115–1122.
Heckel, J., and R. W. Ryon. 2002. Polarized beam x-ray fluorescence analysis. In Handbook of x-rayspectrometry, 2nd ed., ed. R. Van Griecken and A. Markowicz, 603–630. New York: MarcelDekker.
Khan, A. G. 2006. Mycorrhizoremediation, an enhanced form of phytoremediation. Journal ofZhejiang University of Science B 7: 503–514.
Khan, A. G., C. Kuek, T. M. Chaudhry, C. S. Khoo, and W. J. Hayes. 2000. Role of plants,mycorrhizae, and phytochelators in heavy metal–contaminated land remediation. Chemosphere41 (2000): 197–207.
Koopmans, G. F., P. F. A. M. Römkens, J. Song, E. J. M. Temminghoff, and J. Japenga. 2007.Predicting the phytoextraction duration to remediate heavy metal–contaminated soils. Water,Air and Soil Pollution 181: 355–371.
Landsberger., S., W. D. Cizek, and P. Domagala. 1992. NADA: A versatile PC-based programfor neutron activation data analysis. Journal of Radioanalytical and Nuclear Chemistry 160:277–287.
Liang, H. M., T. H. Lin, J. M. Chiou, and K. C. Yeh. 2009. Model evaluation of the phytoextractionpotential of heavy metal hyperaccumulators and non-accumulators. Environmental Pollution157: 1945–1952.
Luo, C., Z. Shen, X. Li, and A. J. M. Baker. 2006. Enhanced phytoextraction of Pb and other metalsfrom artificially contaminated soils through the combined application of EDTA and EDDS.Chemosphere 63: 1773–84.
Mandel, J. 1984. The statistical analysis of experimental data. New York: Dover.McGrath, S. P., and F. J. Zhao. 2003. Phytoextraction of metals and metalloids from contaminated
soil. Current Opinions in Biotechnology 14: 277–282.Mendham, J., R. C. Denney, J. D. Barnes, and M. J. K. Thomas. 2000. Vogel’s textbook of
quantitative chemical analysis, 6th ed. Edinburgh: Prentice-Hall.Molt, K., and R. Schramm. 1997. Application of factor analysis in EDXRF. Fresenius Journal of
Analytical Chemistry 359: 61–66.
Dow
nloa
ded
by [
148.
240.
245.
218]
at 0
9:13
04
Dec
embe
r 20
13
Comparative Analyses of Pb and Cu 3309
New England EPA / U.S. EPA. Quality Systems Unit, revised data validation guidance 12/96.Available at http://www.epa.gov/ne/oeme/index.html
Peer, W. A., I. R. Baxter, E. L. Richards, J. L. Freeman, and A. S. Murphy. 2005. Phytoremediationand hyperaccumulator plants. Topics in Current Genetics 14: 299–340.
Pilon-Smits, E. 2005. Phytoremediation. Annual Review of Plant Biology 56: 15–39.Reeves, R. D., and A. J. M. Baker. 2000. Metal-accumulating plants. In Phytoremediation of toxic
metals: Using plants to clean up the environment, ed. I. Raskin and B. D. Ensley, 193–231. NewYork: Wiley.
Rzedowski, G. C., and J. Rzedowski. 2008. Compositae. Flora del Bajío y de Regiones Adyacentes.Fascículo 157. Instituto de Ecología-Centro Regional del Bajío. Consejo Nacional de Ciencia yTecnología y comisión Nacional para el Conocimiento y Uso de la Biodiversidad. Michoacán,México: Pátzcuaro.
Schmidt, U. 2003. Enhancing phytoextraction: The effect of chemical soil manipulation on mobil-ity, plant accumulation, and leaching on heavy metals. Journal of Environmental Quality 32:1939–1954.
Schramm, R., and J. Heckel. 1998. Fast analysis of traces and major elements with ED(P)XRF usingpolarized x-rays: TURBOQUANT. Journale de Physique IV 8: 335–342.
Skoog, D. A. 1985. Principles of instrumental analysis. Philadelphia: Saunders.Song, J., F. J. Zhao, Y. M. Luo, S. P. McGrath, and H. Zhang. 2004. Copper uptake by Elsholtzia
splendens and Silene vulgaris and assessment of copper phytoavailability in contaminated soils.Environmental Pollution 128: 307–315.
Sperling, M. 2000. Flame and graphite furnace atomic absorption spectrometry in environmentalanalysis. In Encyclopaedia of analytical chemistry. New York: Wiley.
Taiz, L., and E. Zeiger. 2006. Plant physiology, 4th ed. Sunderland, Mass.: Sinauer Associates.United Nations Environmental Programme (UNEP). 2011. Harmful substances and hazardous waste
factsheet. Available at http://www.unep.org/hazardoussubstances/U.S. Environmental Protection Agency. 1996. Test methods for evaluating solid waste. Vol. IA:
Laboratory manual physical/chemical methods, SW 846, 3rd ed. Washington, D.C.: U.S.Government Printing Office.
U.S. Environmental Protection Agency. 2011. List of PBTs (persistent bioaccumulative toxins).Available at http://wsppn.org/?s=PBT
Yruela, I. 2005. Copper in plants. Brazilian Journal of Plant Physiology 17: 145–156.Van Nevel, L., J. Mertens, K. Oorts, and K. Verheyen. 2007. Phytoextraction of metals from soils:
How far from practice? Environmental Pollution 150: 34–40.
Dow
nloa
ded
by [
148.
240.
245.
218]
at 0
9:13
04
Dec
embe
r 20
13