methodological challenges of digital divide measurements
TRANSCRIPT
The Information Society, 22: 279–290, 2006
Copyright c© Taylor & Francis Group, LLC
ISSN: 0197-2243 print / 1087-6537 online
DOI: 10.1080/01972240600904076
Methodological Challenges of Digital DivideMeasurements
Vasja Vehovar
Faculty of Social Sciences, University of Ljubljana, Ljubljana, Slovenia
Pavle Sicherl
Faculty of Law, University of Ljubljana, Ljubljana, Slovenia
Tobias Husing
Gesellschaft fur Kommunikations- und Technologieforschung, Bonn, Germany
Vesna Dolnicar
Faculty of Social Sciences, University of Ljubljana, Ljubljana, Slovenia
The term “digital divide” has been used for almost a decade and
typically relates to sociodemographic differences in the use of infor-
mation and communication technology. However, the correspond-
ing measurement is still relatively imprecise. Very often it is simply
reduced to comparisons of Internet penetration rates. This article
extends the measurements above the usual bivariate comparisons.
Within this context, three essential approaches are presented and
critically evaluated. First, loglinear modeling is used to address the
interactions among the factors affecting the digital divide. Second,
compound measures (i.e., the Digital Divide Index) that integrate
a number of variables into a single indicator are discussed. Third,
time-distance methodology is applied to analyze changes in the
digital divide. The article argues that these approaches often yield
entirely different conclusions compared to simple bivariate anal-
ysis. The examples are presented as a general warning against an
oversimplified methodological approach to digital divide studies.
Keywords digital divide, multivariate analysis, time-distance
methodology
The digital divide concept initially appeared in me-dia and government reports (e.g. “Falling Through the
Received 22 August 2005; accepted 3 June 2006.
Address correspondence to Vasja Vehovar, Project RIS, Faculty of
Social Sciences, University of Ljubljana, Kardeljeva ploscad 5, 1000
Ljubljana, Slovenia. E-mail: [email protected]
Net” and “A Nation Online”; NTIA, 1995; 1997, 1999,2000, 2002, 2004). In February 1996, the then U.S. Vice-President Al Gore was one of the first to mention this termwhen emphasizing that the United States was “beginningto close the digital divide” (Office of the Vice-President,1996). As a consequence, the U.S. government formulatedrelatively active policies on computer literacy as well as onthe general facilitation of information and communicationtechnology (ICT) usage.
Development of the information society has also be-come an important priority for many other countries, in-cluding those of the European Union (EU). The ActionPlan “eEurope 2005: An Information Society for All” con-tains numerous measures for facilitating modern publicservices (e.g., e-government, e-learning, e-health, etc.) anda dynamic e-business environment. Giving every citizenthe possibility to participate in the global information so-ciety was also a goal that formed part of the strategy set outat the Lisbon European Council in March 2000 (EuropeanCommission, 2000).
Digital divide issues have also become an attractivesubject for academic research. The first scholarly papersappeared around 1997 (e.g., Katz & Aspden, 1997) andwere followed by a growing series of publications. For ex-ample, at the beginning of 2006 the ISI Web of Sciencedatabase contained over 440 papers related to the digi-tal divide. We can also find various monographs address-ing specific dimensions of the digital divide, from racial(Lawson Mack, 2001) and global divides (Norris, 2001) to
279
280 V. VEHOVAR ET AL.
multidimensional aspects (Compaine, 2001; Mossbergeret al., 2003). Some authors also cover the relationship be-tween ICT and social inclusion (Warschauer, 2003a) orthey address the digital divide as a problem of persistentinequality (Servon, 2002).
Despite these efforts, there is a clear lack of a generalconceptual framework. In principle, certain theories fromother areas can be applied here, for instance, diffusionof innovation (Rogers, 1995), audience theories, particu-larly the uses and gratifications theory (Blumler & Katz,1974), or the general knowledge gap theory (Tichenoret al., 1970). Theories studying the individual and struc-tural levels of social exclusion and social inequality (e.g.,economic, gender, racial, and ethnic inequality) can alsobe used (e.g., Atkinson & Hill, 1998; Muffels et al., 2002;Rodgers et al., 1995; Silver, 1994). However, the relation-ship between old (social) and new (digital) divides stillhas to be explained (Husing, 2004): Namely, it is unclearwhether the digital divide is a particular type of social di-vide or ICT functions here as a factor that bridges socialdivides. Unfortunately, it often seems that the explosivegrowth of the Internet is exacerbating the existing inequal-ities (Menou, 2001; Norris, 2001; Vehovar, 2001). Further,Parayil (2005) argues that the digital divide is both a symp-tom and a cause of broader social and economic inequality.In any case, it is generally agreed in the academic literaturethat the digital divide is closely related to social inequality(e.g., Attewell, 2001; Bonfadelli, 2002; DiMaggio et al.,2001; Menou, 2001; Warschauer, 2003b).
Contrary to the absence of theoretical discussions,we can observe many empirical studies that typically relateto Internet usage. The usual control variables are income,level of education, type of household, age, gender, race,and language (Primo Braga et al., 2000). The digital di-vide can also be regarded as a consequence of varying in-dividual capabilities or digital experiences (e.g., Nurmela& Vihera, 2000; van Dijk & Hacker, 2003). In addition,the differences can be studied in terms of the relevanceof information and services to users (e.g., Stanley, 2003;Welling & Kubicek, 2000).
In any case, the existing digital divide literature pre-dominantly focuses on substantial issues, and we rarelyfind work discussing corresponding research methodolo-gies. It is true that methodological aspects are in large partcovered within the fields of comparative research, generalsocial science methodology, and statistics. Nevertheless,we should clearly state at the very beginning that in thisarticle we do concentrate on methodology. The conceptualissues are addressed only to the extent needed to deal withmethodological questions.
We focus here on some well-elaborated methodologi-cal approaches where several variables are simultaneouslyobserved (i.e., multivariate analysis, compound measures,and time distance). We demonstrate that these approaches
cannot be ignored when conducting proper empirical re-search on digital divide phenomena. At the same time,we summarize typical problems that occur in digital di-vide studies when an oversimplified approach is applied.In other words, the article systematically overviews thekey methodological fallacies of digital divide research.
In the following sections we start off by discussing theconceptual complexity of digital divide measurements. Wereview the corresponding typologies and address generalmethodological problems. Next, we concentrate on threeadvanced statistical methods (loglinear modeling, com-pound index measurements, and time distance) and illus-trate them. Finally, we summarize the findings and evalu-ate the role of methodology in digital divide research. Thediscussion is mainly (but not exclusively) restricted to thecase of the Internet. However, by a simple analogy we canalso apply these principles to other ICT.
DEFINING THE DIGITAL DIVIDE
The OECD (2001) defines the digital divide as differencesbetween individuals, households, companies, or regionsrelated to the access to and usage of ICT. The divide mayappear due to historical, socioeconomic, geographic, ed-ucational, behavioral, or generation factors, or due to thephysical incapability of individuals (Cullen, 2001, p. 311).Such an understanding of the digital divide is generallyunproblematic. Difficulties arise from the lack of a morestandardized and elaborated operationalization. As a con-sequence, the measurement process may lead to the devel-opment of incomplete and misleading indicators.
One aspect of the complexity lies in the multiple tech-nologies that are involved. It is true that the term “digitaldivide” only appeared after the Internet’s expansion in themid-1990s; however, it does not refer exclusively to theInternet. Other important ICTs (e.g., personal computers,cellular phones, [“cell”] etc.) are also highly relevant todigital divide issues.
Even if we narrow down the focus to Internet-relateddifferences, the topic remains relatively complex. This ispartly due to difficulties in defining Internet usage itself.One of the most general definitions describes the Inter-net as “a network of computer networks and systems thatallows computers to communicate with one another on aglobal basis” (Elliott & Starkings, 1997). However, usersare not merely passive recipients of technology—they ac-tively engage in it, thus giving meaning to ICTs. In otherwords, the Internet is socially shaped. When defining In-ternet usage, the main methodological problems arise fromquestions related to the frequency of usage (e.g., weekly,monthly etc.), age of the target population (e.g., 10–75,15–65), services used (e.g., e-mail, Web, instant messag-ing, etc.), relation to ICT (e.g., access, usage, perception,etc.) and devices employed (e.g., PC, cell phones, WebTV,
DIGITAL DIVIDE MEASUREMENTS 281
personal digital assistant [PDA], etc.). Similar problemsaccompany technical measurements such as the number of“hosts” or number of “unique users” measured by so-called“cookies.” For a further discussion of these problems, seeVehovar and Dolnicar (2004).
We should also draw attention to the fact that the digitaldivide is not a simple binary Yes/No question (Chen &Wellman, 2003). Rather, the digital divide is a continuumranging from physical, cognitive, and content access topolitical access (Wilson, in Chen & Wellman, 2003). Thenotion of a binary divide is thus inaccurate as it fails tovalue the social resources of diverse groups (Warschauer,2003b, p. 297). DiMaggio and Hargittai (2001) point outthat there are at least five dimensions of digital inequality:equipment, autonomy of use, skill, social support, and thepurpose of using the Internet. Similarly, Mossberger, Tol-bert, and Stansbury (2003) distinguish between an accessdivide, a skills divide, an economic opportunity divide, anda democratic divide.
The multiplicity of divides can be roughly structuredin a few core categories. The first and more “usual” (alsolabeled first or basic) digital divide is typically defined assimple differences with respect to the availability of Inter-net access (or any other ICT) or the frequency of usage.
Taking a second step, nonusers can be further differ-entiated with respect to the obstacles for not using theInternet, such as a lack of interest or lack of awarenessof what computers can offer. Research indicates that com-puter nonusers would be more willing to engage with newtechnology if their assumptions, fears, and preconceivedideas about computers were properly addressed (Stanley,2003, p. 413). The divide among nonusers is sometimeslabeled a dual digital divide (Reddick et al., 2000).
On the other side, Internet users can be also further seg-mented on the basis of skills and experience. This is oftenlabeled as the second digital divide (e.g., Gartner Group,2001; Hargittai, 2002). Those who know how to use moreadvanced options have an advantage over those who onlyuse simple services. The first digital divide—which refersto differences in access and usage—will inevitably dis-appear when the Internet becomes universally accessible.However, the digital divide relating to experience and ad-vanced usage will exist after this takes place. Carvin (2000)identifies six types of literacy skills needed by a user inorder to take full advantage of the Internet: basic literacy(the ability to read and write), functional literacy (the abil-ity to apply basic literacy to everyday tasks), occupationalliteracy (the skills necessary to succeed in a professionalsetting), technological literacy (the ability to use techno-logical tools), information literacy (the ability to determinethe quality of informational resources), and adaptive lit-eracy, that is, the ability to develop new skills (Davila,2004). Moreover, van Dijk and Hacker (2003) distinguishbetween informational, instrumental, and strategic skills.
In addition, Mossberger, Tolbert, and Stansbury (2003)developed two different indices of skill, one for techni-cal competence and one for information literacy. Internetusers can also be differentiated according to the technologyused. Users with fast (e.g., broadband) and more conve-nient (e.g., wireless, cell phone) access or those with moreadvanced (and expensive) devices can take full advantageof the new generations of services and technologies. Onthe other hand, users with slow access (e.g., ordinary dial-up access) and/or those with more primitive devices are ata disadvantage.
From the preceding discussion we can clearly see thatthere are many ways to conceptualize the digital divide.Nevertheless, whichever concept of the digital divide weuse—theoretically grounded or not, simple or complex—itwill inevitably face some standard methodological prob-lems. We thus focus on these essential methodological is-sues that accompany any empirical research on the digitaldivide. Consequently, conceptual issues only take secondplace in this article, behind methodological issues.
In the remainder of the article we present three ad-vanced methods that are highly relevant to any type ofdigital divide measurements. We demonstrate that the sim-ple comparisons (e.g., percentage differences of Internetusage between segments) that often prevail in empiricalstudies may not be sufficient and can sometimes be evendirectly misleading.
For practical reasons, we have limited our discussionto the first (i.e., basic) digital divide and predominantlyto Internet usage. However, the approach can be equallyapplied to other measures related to any type of digitaldivide, any type of population (e.g., persons, households,companies, education institutions, countries, etc.) and anytype of ICT.
ADVANCED APPROACHES TO MEASURING THEDIGITAL DIVIDE
When studying the digital divide we often compare In-ternet usage across various population segments, wherebivariate analysis may not reveal the true relation-ships. At this point, we demonstrate how advancedstatistical measures—which incorporate more variablessimultaneously—can dramatically change the researchfindings.
Interactions Among Variables: MultivariateLoglinear Modeling
Let us observe the complexity of multivariate interactionsin the example of the rural–urban effect from the Slove-nian General Social Survey (GSS)1 2000 (Tos, 2004).As in other countries, the digital divide in Sloveniavaries according to standard control variables: age, gender,
282 V. VEHOVAR ET AL.
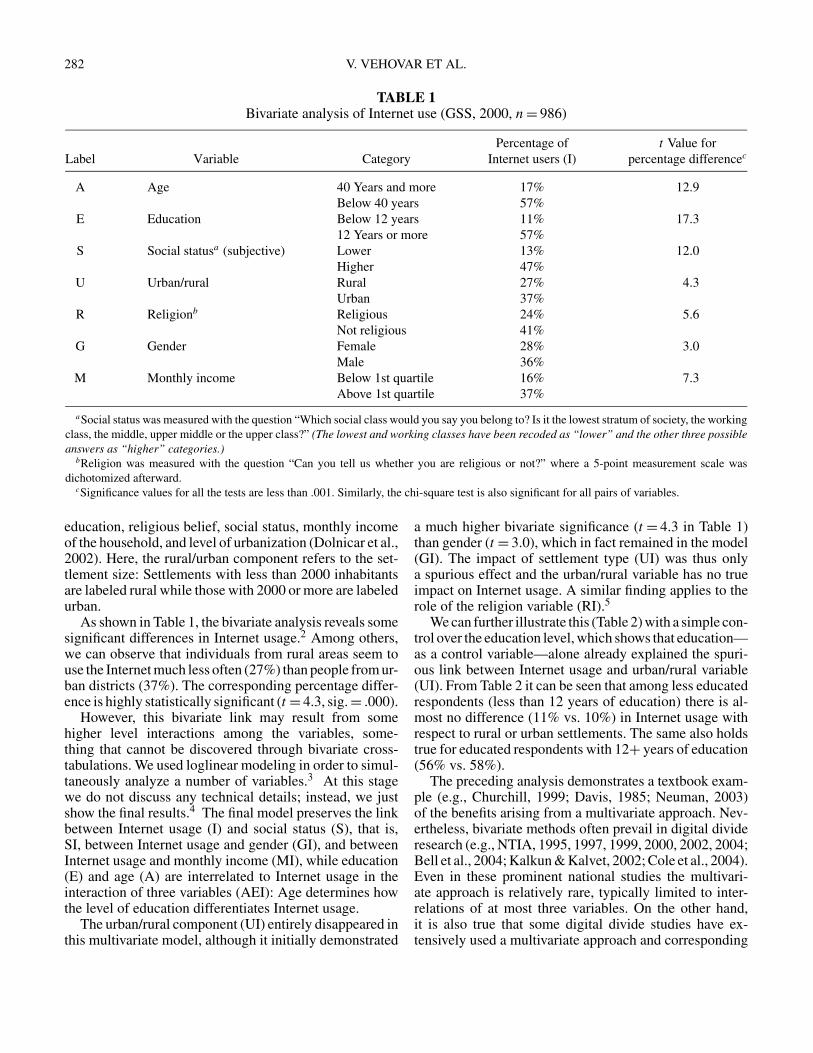
TABLE 1Bivariate analysis of Internet use (GSS, 2000, n = 986)
Percentage of t Value for
Label Variable Category Internet users (I) percentage differencec
A Age 40 Years and more 17% 12.9
Below 40 years 57%
E Education Below 12 years 11% 17.3
12 Years or more 57%
S Social statusa (subjective) Lower 13% 12.0
Higher 47%
U Urban/rural Rural 27% 4.3
Urban 37%
R Religionb Religious 24% 5.6
Not religious 41%
G Gender Female 28% 3.0
Male 36%
M Monthly income Below 1st quartile 16% 7.3
Above 1st quartile 37%
aSocial status was measured with the question “Which social class would you say you belong to? Is it the lowest stratum of society, the working
class, the middle, upper middle or the upper class?” (The lowest and working classes have been recoded as “lower” and the other three possible
answers as “higher” categories.)bReligion was measured with the question “Can you tell us whether you are religious or not?” where a 5-point measurement scale was
dichotomized afterward.cSignificance values for all the tests are less than .001. Similarly, the chi-square test is also significant for all pairs of variables.
education, religious belief, social status, monthly incomeof the household, and level of urbanization (Dolnicar et al.,2002). Here, the rural/urban component refers to the set-tlement size: Settlements with less than 2000 inhabitantsare labeled rural while those with 2000 or more are labeledurban.
As shown in Table 1, the bivariate analysis reveals somesignificant differences in Internet usage.2 Among others,we can observe that individuals from rural areas seem touse the Internet much less often (27%) than people from ur-ban districts (37%). The corresponding percentage differ-ence is highly statistically significant (t = 4.3, sig. = .000).
However, this bivariate link may result from somehigher level interactions among the variables, some-thing that cannot be discovered through bivariate cross-tabulations. We used loglinear modeling in order to simul-taneously analyze a number of variables.3 At this stagewe do not discuss any technical details; instead, we justshow the final results.4 The final model preserves the linkbetween Internet usage (I) and social status (S), that is,SI, between Internet usage and gender (GI), and betweenInternet usage and monthly income (MI), while education(E) and age (A) are interrelated to Internet usage in theinteraction of three variables (AEI): Age determines howthe level of education differentiates Internet usage.
The urban/rural component (UI) entirely disappeared inthis multivariate model, although it initially demonstrated
a much higher bivariate significance (t = 4.3 in Table 1)than gender (t = 3.0), which in fact remained in the model(GI). The impact of settlement type (UI) was thus onlya spurious effect and the urban/rural variable has no trueimpact on Internet usage. A similar finding applies to therole of the religion variable (RI).5
We can further illustrate this (Table 2) with a simple con-trol over the education level, which shows that education—as a control variable—alone already explained the spuri-ous link between Internet usage and urban/rural variable(UI). From Table 2 it can be seen that among less educatedrespondents (less than 12 years of education) there is al-most no difference (11% vs. 10%) in Internet usage withrespect to rural or urban settlements. The same also holdstrue for educated respondents with 12+ years of education(56% vs. 58%).
The preceding analysis demonstrates a textbook exam-ple (e.g., Churchill, 1999; Davis, 1985; Neuman, 2003)of the benefits arising from a multivariate approach. Nev-ertheless, bivariate methods often prevail in digital divideresearch (e.g., NTIA, 1995, 1997, 1999, 2000, 2002, 2004;Bell et al., 2004; Kalkun & Kalvet, 2002; Cole et al., 2004).Even in these prominent national studies the multivari-ate approach is relatively rare, typically limited to inter-relations of at most three variables. On the other hand,it is also true that some digital divide studies have ex-tensively used a multivariate approach and corresponding
DIGITAL DIVIDE MEASUREMENTS 283
TABLE 2Education, type of settlement, and Internet use (GSS 2000, n = 1067)
Education Type of Use of t Value for percentage Significance
(E) settlement (R) Internet (I) difference (p Value)
Less than 12 years Rural 11% 0.39 .535
Urban 10%
12 Years and more Rural 56% 0.19 .659
Urban 58%
model testing (Cava-Ferreruela & Alabau-Munoz, 2004;Cho et al., 2003; Corocher & Ordanini, 2002; Grigoroviciet al., 2004b; Martin, 2003; Mossberger et al., 2003;Quibria et al., 2003; Wilhelm, 2000).
Of course, in nonexperimental research we can neverreally know whether another (additional) variable existsthat would change all of the findings. Therefore, besidesan appropriate methodological approach, the correspond-ing theory-driven variables should be carefully selected.We should add that multivariate models are sometimesvery sensitive to manipulations carried out by the inves-tigators. Nevertheless, proper modeling and the inclusionof the right variables are two key elements for successfulempirical research.
Compound Measurements: Digital Divide Index
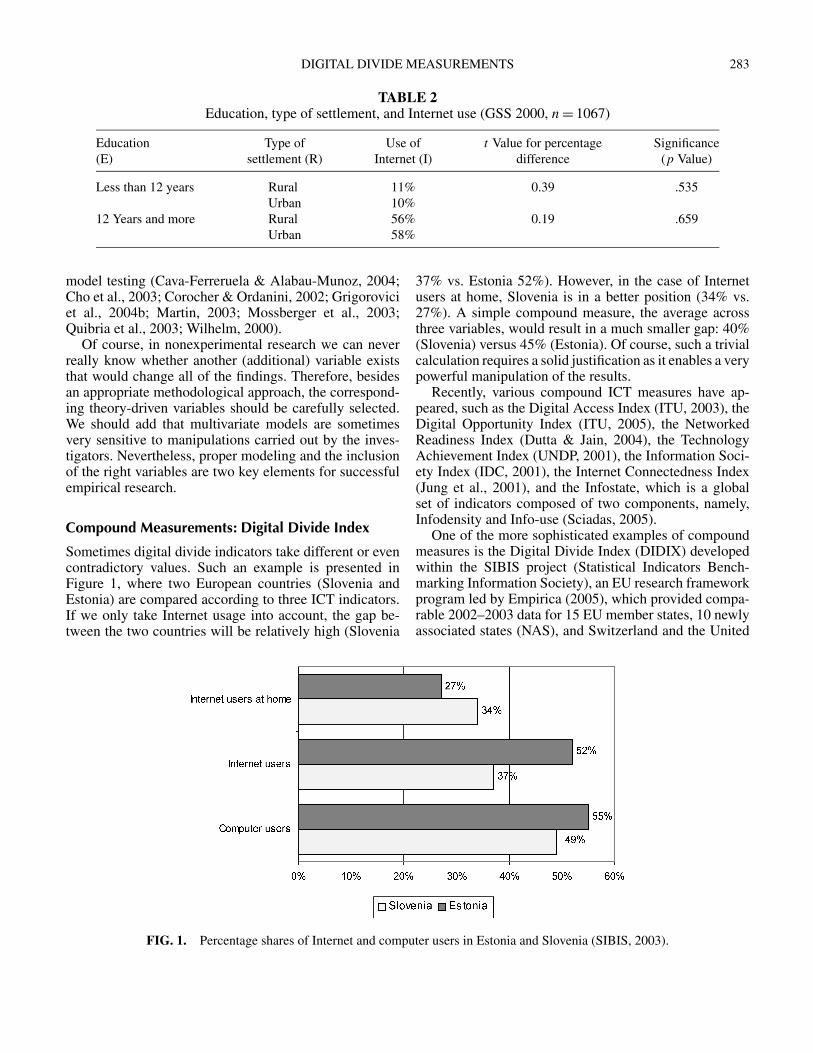
Sometimes digital divide indicators take different or evencontradictory values. Such an example is presented inFigure 1, where two European countries (Slovenia andEstonia) are compared according to three ICT indicators.If we only take Internet usage into account, the gap be-tween the two countries will be relatively high (Slovenia
FIG. 1. Percentage shares of Internet and computer users in Estonia and Slovenia (SIBIS, 2003).
37% vs. Estonia 52%). However, in the case of Internetusers at home, Slovenia is in a better position (34% vs.27%). A simple compound measure, the average acrossthree variables, would result in a much smaller gap: 40%(Slovenia) versus 45% (Estonia). Of course, such a trivialcalculation requires a solid justification as it enables a verypowerful manipulation of the results.
Recently, various compound ICT measures have ap-peared, such as the Digital Access Index (ITU, 2003), theDigital Opportunity Index (ITU, 2005), the NetworkedReadiness Index (Dutta & Jain, 2004), the TechnologyAchievement Index (UNDP, 2001), the Information Soci-ety Index (IDC, 2001), the Internet Connectedness Index(Jung et al., 2001), and the Infostate, which is a globalset of indicators composed of two components, namely,Infodensity and Info-use (Sciadas, 2005).
One of the more sophisticated examples of compoundmeasures is the Digital Divide Index (DIDIX) developedwithin the SIBIS project (Statistical Indicators Bench-marking Information Society), an EU research frameworkprogram led by Empirica (2005), which provided compa-rable 2002–2003 data for 15 EU member states, 10 newlyassociated states (NAS), and Switzerland and the United
284 V. VEHOVAR ET AL.
States. This index had no scientific pretensions but was ini-tially developed for a policymaker audience. Nevertheless,it has attracted the attention of the scientific community,which indicates the growing need for compound measures.
DIDIX combines the divides with four sociodemo-graphic factors (gender, age, education, and income) inrelation to three ICT-related indicators. The initial com-pound ICT adoption indicator is constructed as follows:
� Percentage of computer users6 (50% weight).� Percentage of Internet users7 (30% weight).� Percentage of Internet users from home8 (20%
weight).
This compound ICT adoption indicator thus expresses therelative adoption of ICTs, which is further observed withinthe four potentially deprived societal groups (SIBIS,2003a, pp. 152, 185; SIBIS, 2003b, p. 13):
� Women.� People aged 50 years and over.� The low-education group (i.e., people who fin-
ished formal school education at the age of 15years or below).
� The low-income group (i.e., the lowest incomequartile of survey respondents).
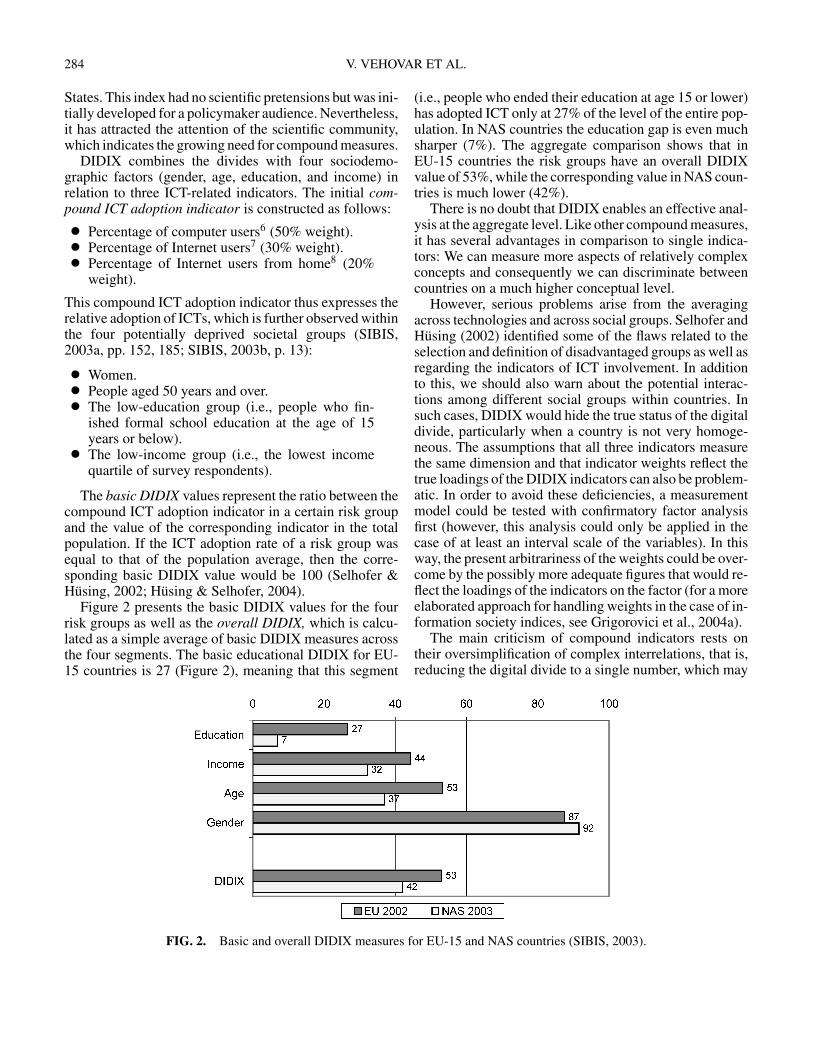
The basic DIDIX values represent the ratio between thecompound ICT adoption indicator in a certain risk groupand the value of the corresponding indicator in the totalpopulation. If the ICT adoption rate of a risk group wasequal to that of the population average, then the corre-sponding basic DIDIX value would be 100 (Selhofer &Husing, 2002; Husing & Selhofer, 2004).
Figure 2 presents the basic DIDIX values for the fourrisk groups as well as the overall DIDIX, which is calcu-lated as a simple average of basic DIDIX measures acrossthe four segments. The basic educational DIDIX for EU-15 countries is 27 (Figure 2), meaning that this segment
FIG. 2. Basic and overall DIDIX measures for EU-15 and NAS countries (SIBIS, 2003).
(i.e., people who ended their education at age 15 or lower)has adopted ICT only at 27% of the level of the entire pop-ulation. In NAS countries the education gap is even muchsharper (7%). The aggregate comparison shows that inEU-15 countries the risk groups have an overall DIDIXvalue of 53%, while the corresponding value in NAS coun-tries is much lower (42%).
There is no doubt that DIDIX enables an effective anal-ysis at the aggregate level. Like other compound measures,it has several advantages in comparison to single indica-tors: We can measure more aspects of relatively complexconcepts and consequently we can discriminate betweencountries on a much higher conceptual level.
However, serious problems arise from the averagingacross technologies and across social groups. Selhofer andHusing (2002) identified some of the flaws related to theselection and definition of disadvantaged groups as well asregarding the indicators of ICT involvement. In additionto this, we should also warn about the potential interac-tions among different social groups within countries. Insuch cases, DIDIX would hide the true status of the digitaldivide, particularly when a country is not very homoge-neous. The assumptions that all three indicators measurethe same dimension and that indicator weights reflect thetrue loadings of the DIDIX indicators can also be problem-atic. In order to avoid these deficiencies, a measurementmodel could be tested with confirmatory factor analysisfirst (however, this analysis could only be applied in thecase of at least an interval scale of the variables). In thisway, the present arbitrariness of the weights could be over-come by the possibly more adequate figures that would re-flect the loadings of the indicators on the factor (for a moreelaborated approach for handling weights in the case of in-formation society indices, see Grigorovici et al., 2004a).
The main criticism of compound indicators rests ontheir oversimplification of complex interrelations, that is,reducing the digital divide to a single number, which may
DIGITAL DIVIDE MEASUREMENTS 285
be misleading in some instances. However, it should alsobe recognized that compound indicators can function asimportant eye openers outside of the scientific commu-nity (which does not release the researcher from usingadequate and disclosed methodologies). The audience ofprojects such as SIBIS includes policymakers as well asthe public at large.
We could also speculate here about a robust compounddigital divide measure, which would identify all key seg-ments and incorporate all relevant ICTs and thus reflectthe “true” digital divide. Besides technologies that havealready reached saturation (e.g., TV, fixed telephone) orare slowly approaching it (e.g., PC, the Internet), newemerging ICTs (e.g., broadband, videophone) are becom-ing increasingly important determinants of digital dividemeasures. In addition, new technologies should be con-tinuously incorporated in the indices. The challenge ofconstructing such a general (i.e., ultimate) compound in-dicator of the digital divide seems to be both very fruitfuland also very problematic.
Time-Distance Methodology
Digital divide indicators are often presented as static mea-sures. However, static measures of disparities (e.g., per-centage difference, ratio, Gini coefficient, Theil index, co-efficient of variation, etc.) are insensitive to changes in thecorresponding absolute magnitude of the indicator growthrates. In order to overcome this problem, an advanced time-distance methodology was developed at conceptual andapplied levels (Sicherl, 1973, 1978, 2003). This is a newstatistical measure in dynamic gap analysis (Sicherl, 2004)where the levels of variable(s) are used as identifiers andtime is the focus of comparison. This generic idea can beused for numerous additional applications; for example,Granger and Jeon (1997, 2003) further elaborated it foruse as a criterion for evaluating forecasting models.
FIG. 3. Digital divide in the EU-15: How many months earlier was the level of Internet penetration of the selected segment (as
measured in April 2002) attained by the average Internet user in the total population.
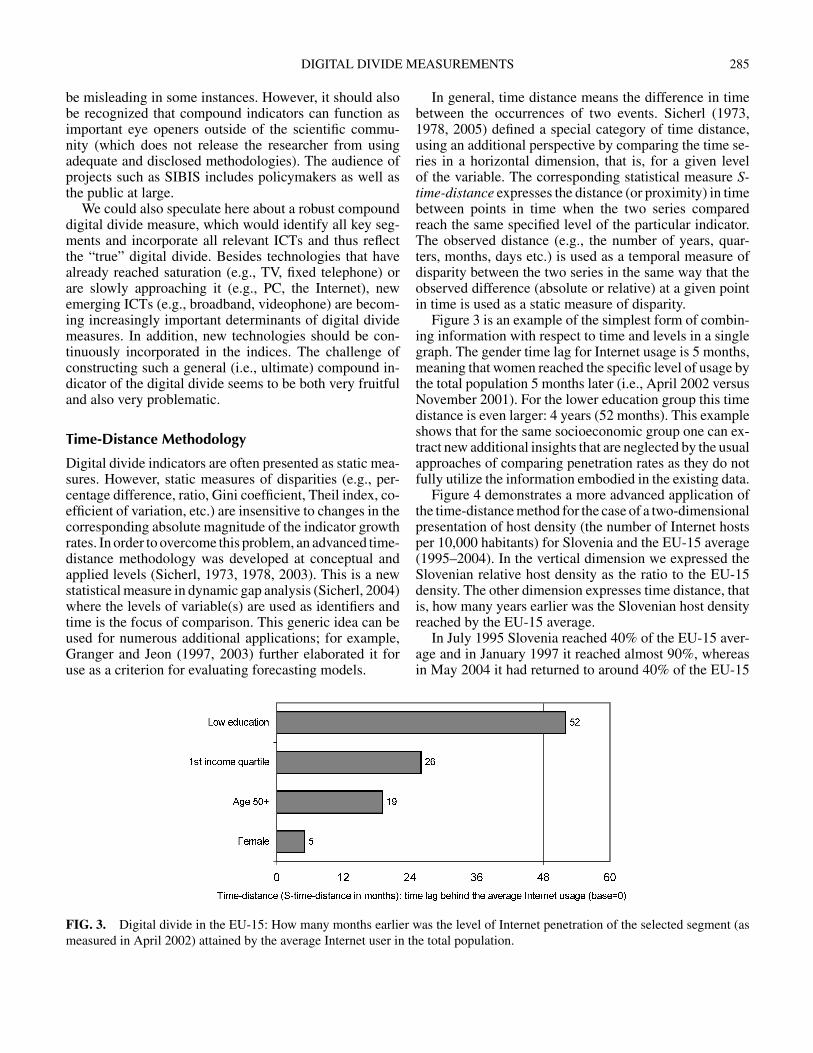
In general, time distance means the difference in timebetween the occurrences of two events. Sicherl (1973,1978, 2005) defined a special category of time distance,using an additional perspective by comparing the time se-ries in a horizontal dimension, that is, for a given levelof the variable. The corresponding statistical measure S-time-distance expresses the distance (or proximity) in timebetween points in time when the two series comparedreach the same specified level of the particular indicator.The observed distance (e.g., the number of years, quar-ters, months, days etc.) is used as a temporal measure ofdisparity between the two series in the same way that theobserved difference (absolute or relative) at a given pointin time is used as a static measure of disparity.
Figure 3 is an example of the simplest form of combin-ing information with respect to time and levels in a singlegraph. The gender time lag for Internet usage is 5 months,meaning that women reached the specific level of usage bythe total population 5 months later (i.e., April 2002 versusNovember 2001). For the lower education group this timedistance is even larger: 4 years (52 months). This exampleshows that for the same socioeconomic group one can ex-tract new additional insights that are neglected by the usualapproaches of comparing penetration rates as they do notfully utilize the information embodied in the existing data.
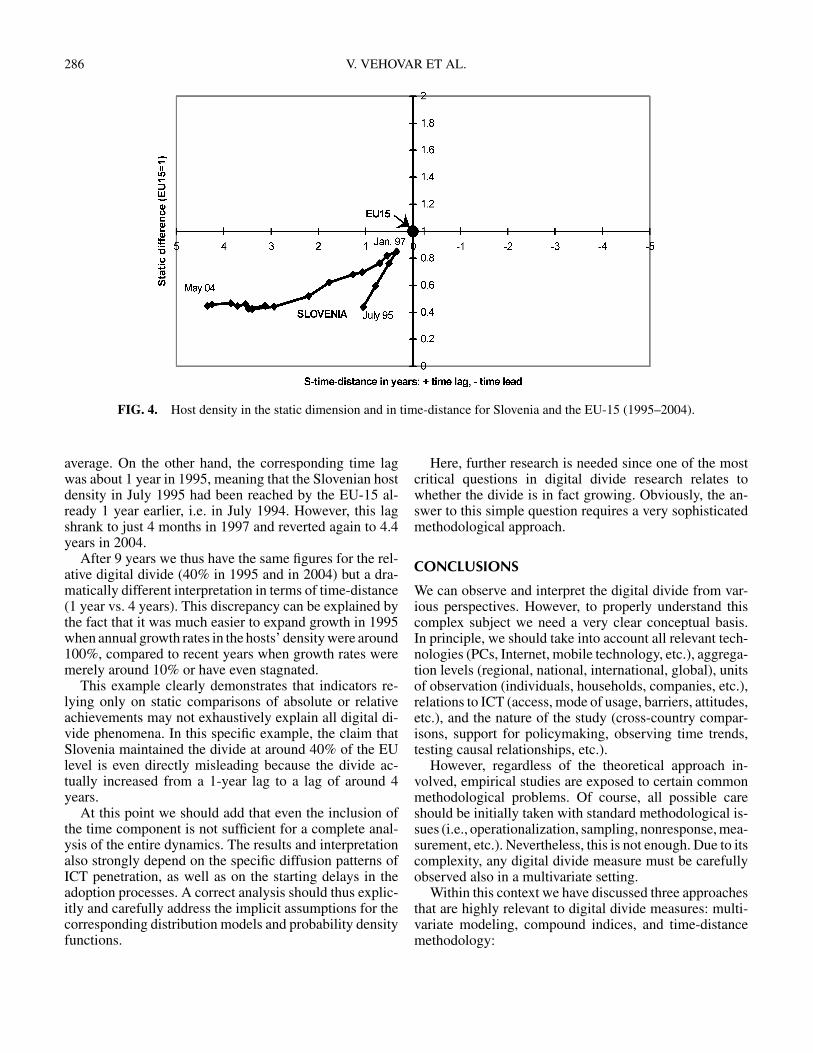
Figure 4 demonstrates a more advanced application ofthe time-distance method for the case of a two-dimensionalpresentation of host density (the number of Internet hostsper 10,000 habitants) for Slovenia and the EU-15 average(1995–2004). In the vertical dimension we expressed theSlovenian relative host density as the ratio to the EU-15density. The other dimension expresses time distance, thatis, how many years earlier was the Slovenian host densityreached by the EU-15 average.
In July 1995 Slovenia reached 40% of the EU-15 aver-age and in January 1997 it reached almost 90%, whereasin May 2004 it had returned to around 40% of the EU-15
286 V. VEHOVAR ET AL.
FIG. 4. Host density in the static dimension and in time-distance for Slovenia and the EU-15 (1995–2004).
average. On the other hand, the corresponding time lagwas about 1 year in 1995, meaning that the Slovenian hostdensity in July 1995 had been reached by the EU-15 al-ready 1 year earlier, i.e. in July 1994. However, this lagshrank to just 4 months in 1997 and reverted again to 4.4years in 2004.
After 9 years we thus have the same figures for the rel-ative digital divide (40% in 1995 and in 2004) but a dra-matically different interpretation in terms of time-distance(1 year vs. 4 years). This discrepancy can be explained bythe fact that it was much easier to expand growth in 1995when annual growth rates in the hosts’ density were around100%, compared to recent years when growth rates weremerely around 10% or have even stagnated.
This example clearly demonstrates that indicators re-lying only on static comparisons of absolute or relativeachievements may not exhaustively explain all digital di-vide phenomena. In this specific example, the claim thatSlovenia maintained the divide at around 40% of the EUlevel is even directly misleading because the divide ac-tually increased from a 1-year lag to a lag of around 4years.
At this point we should add that even the inclusion ofthe time component is not sufficient for a complete anal-ysis of the entire dynamics. The results and interpretationalso strongly depend on the specific diffusion patterns ofICT penetration, as well as on the starting delays in theadoption processes. A correct analysis should thus explic-itly and carefully address the implicit assumptions for thecorresponding distribution models and probability densityfunctions.
Here, further research is needed since one of the mostcritical questions in digital divide research relates towhether the divide is in fact growing. Obviously, the an-swer to this simple question requires a very sophisticatedmethodological approach.
CONCLUSIONS
We can observe and interpret the digital divide from var-ious perspectives. However, to properly understand thiscomplex subject we need a very clear conceptual basis.In principle, we should take into account all relevant tech-nologies (PCs, Internet, mobile technology, etc.), aggrega-tion levels (regional, national, international, global), unitsof observation (individuals, households, companies, etc.),relations to ICT (access, mode of usage, barriers, attitudes,etc.), and the nature of the study (cross-country compar-isons, support for policymaking, observing time trends,testing causal relationships, etc.).
However, regardless of the theoretical approach in-volved, empirical studies are exposed to certain commonmethodological problems. Of course, all possible careshould be initially taken with standard methodological is-sues (i.e., operationalization, sampling, nonresponse, mea-surement, etc.). Nevertheless, this is not enough. Due to itscomplexity, any digital divide measure must be carefullyobserved also in a multivariate setting.
Within this context we have discussed three approachesthat are highly relevant to digital divide measures: multi-variate modeling, compound indices, and time-distancemethodology:
DIGITAL DIVIDE MEASUREMENTS 287
� Multivariate (e.g., loglinear) modeling allows usto analyze and control a complex set of variablesthat constitute a model. By simultaneously exam-ining several variables we may discover that theybehave differently compared to bivariate analysis.Even if this seems to be trivial, in digital dividestudies this is easily overlooked because it is rel-atively complicated to implement a proper multi-variate analysis.
� Similarly, compound measures offer a more com-plex insight into the digital divide. Instead of manyseparated indicators we only deal with one in-clusive figure, which simplifies interpretation andcommunication. Compound measures are particu-larly relevant in comparative research where onlyone partial indicator can be directly misleading.
� Another oversimplification in digital divide re-search occurs when one neglects the specifics ofthe time dimension. A simplified time analysisbased only on absolute or relative differences mayoffer completely different outcomes compared tothe true trends based on proper time-distance ob-servations.
The discrepancies arising from suboptimal method-ological approaches may create the room for tailoring re-search findings to a certain interest group. Luyt (2004),for example, argues that the promotion of the digital di-vide as a policy issue benefits four major groups: infor-mation capital, developing country governments, the de-velopment “industry,” and global civil society. Along withthe national governmental bodies, various international or-ganizations, agencies, and nongovernmental organizations(NGOs; e.g., the World Bank, IMF, UN, UNESCO, ITU,OECD) are also involved in discussions on the digital di-vide within and across nations. Multinational companies,particularly ICT suppliers, also have very specific interestin the interpretation of digital divide measures. As digitaldivide trends interfere with complex economic, social, andpolitical issues, it is extremely important to minimize allpotential methodological shortcomings.
Of course, all three approaches we presented here havetheir own disadvantages and limitations, which deservefurther research. They also represent only one compo-nent within an entire methodological instrument. Otheraspects of quantitative social science methodology areequally important. In addition, qualitative research meth-ods should be applied much more often in digital dividestudies.
Finally, we should reiterate that due to the methodolog-ical profile of our article we have only briefly addressedtheoretical problems, the relevance of various types of dig-ital divide, and the importance of conceptual approaches.We are also fully aware that there is a strong need toovercome the technologically deterministic approach in
digital divide studies (for more here, see Petric, this is-sue; Pruulmann-Vengerfeldt, this issue; Barzilai-Nahon &Rafaeli, this issue). In particular, the substantial questionsof why, how, and with what benefits and consequences toindividuals using ICTs will have to be addressed moreprofoundly in future research.
However, to provide a competent answer to substan-tial questions, empirical analyses have to use the advancedmethodological approaches outlined here. A serious warn-ing should thus be directed at simplified indicators, espe-cially bivariate tabulations. This is particularly true whenaddressing the relationship of the digital divide to the gen-eral social divide and when dealing with the question ofwhether the digital divide is growing or shrinking.
NOTES
1. The Slovenian GSS is a face-to-face probability sample survey
and has been regularly conducted since 1968. The response rate in GSS
2000 was 80% and the sample size was n = 1097.
2. Internet usage was measured with the question “Do you person-
ally use the Internet?”
3. Loglinear analysis is a relatively sophisticated multivariate tech-
nique developed for categorical variables and models the logarithms of
cells frequencies. The main advantage of the loglinear models is the
ability to analyze three-way and higher interactions. For a complete
discussion of loglinear modeling, see, for example, Agresti (1990).
4. If only links (i.e., interactions) that include the Internet usage
are presented, the model written in the standard notation of loglinear
models is the following: SI/GI/MI/AEI (p = .12).
5. All variables have been dichotomized in order to allow a sharper
presentation of the conceptual issues.
6. This indicator was operationalized as “Have you used a PC, Mac,
or any other computer for work or private purposes in the last four
weeks?”
7. This indicator was operationalized as “Have you used the Internet
at least once during the last four weeks at home, school, work or in any
other place?” (“Internet users” are defined as those who use Internet in
at least one of the given locations, e.g. “at work,” “at home,” etc.).
8. This indicator was operationalized as, “Do you have access to the
Internet from your home?”
REFERENCES
Agresti, A. 1990. Categorical data analysis. New York: John Wiley &
Sons.
Atkinson, A. B., and Hill, J., eds. 1998. Exclusion, employment and op-
portunity. CASE paper 4. London: Centre for the Analysis of Social
Exclusion, London School of Economics.
Attewell, P. 2001. The first and the second digital divides. Sociology of
Education 74:252–259.
Barzilai-Nahon, Karine. 2006. Gaps and bits: Conceptualizing mea-
surements for digital divide/s. The Information Society 22(5):269–
278.
Bell, P., Reddy, P., and Rainie, L. 2004. Rural areas and the In-
ternet. Washington, DC: Pew Internet & American Life Project.
http://www.pewinternet.org/pdfs/PIP Rural Report.pdf
288 V. VEHOVAR ET AL.
Blumler, J. G., and Elihu, K. 1974. The uses of mass communications:
Current perspectives on gratifications research. Beverly Hills, CA:
Sage.
Bonfadelli, H. 2002. The Internet and knowledge gaps: A theoretical
and empirical investigation. European Journal of Communication 17
(1):65–84.
Carvin, A. 2000. More than just access: Fitting literacy and
content into the digital divide equation. EDUCAUSE Review.
http://www.educause.edu/pub/er/erm00/articles006/erm0063.pdf
Cava-Ferreruela, I., and Alabau-Munoz, A. 2004. Key constraints
and drivers for broadband development: A cross-national empir-
ical analysis. Presented at the 15th European Regional Confer-
ence of the International Telecommunications Society (ITS), Berlin,
Germany, September. http://userpage.fu-berlin.de/∼jmueller/its/
conf/berlin04/Papers/cava-ferreruela alabau-munoz.pdf
Chen, W., and Wellman, B. 2003. Charting and bridging digital divides:
Comparing socio-economic, gender, life stage and rural-urban
internet access and use in eight countries. AMD Global Consumer
Advisory Board. http://www.amd.com/us-en/assets/content type/
DownloadableAssets/FINAL REPORT CHARTING DIGI
DIVIDES.pdf
Cho, J., de Zuniga, H. G., Rojas, H., and Shah, D. V. 2003. Beyond ac-
cess: The digital divide and Internet uses and gratifications. IT & So-
ciety 1(4):46–72. http://www.stanford.edu/group/siqss/itandsociety/
v01i04/v01i04a04.pdf
Churchill, G. A. 1999. Marketing research: Methodological founda-
tions. Fort Worth, TX: Dryden Press.
Cole, J. I., Suman, M., Schramm, P., Lunn, R., Aquino, J.–S., and Lebo,
H. (2004). The digital future report: Surveying the digital future,
year four. Ten years, Ten trends. Los Angeles, CA: USC Annenberg
School Center for the Digital Future. http://www.digitalcenter.org/
downloads/DigitalFutureReport-Year4-2004.pdf
Compaine, B. M., ed. 2001. The digital divide: Facing a crisis or cre-
ating a myth? Cambridge, MA: MIT Press.
Corrocher, N., and Ordanini, A. 2002. Measuring the digital divide: A
framework for the analysis of cross-country differences. Journal of
Information Technology 17:9–19.
Cullen, R. 2001. Addressing the digital divide. Online Information Re-
view 5:311–320.
Davila, J. J. 2004. Digital Divide. In The Internet encyclopae-
dia, ed. H. Bidgoli, pp. 468–476. Hoboken, NJ: John Wiley &
Sons.
Davis, J. A. 1985. The logic of causal order. Beverly Hills, CA: Sage.
DiMaggio, P., and Hargittai, E. 2001. From the “digital divide” to
digital inequality: Studying Internet use as penetration increases.
Working Paper 15. Princeton, NJ: Center for Arts and Cultural Policy
Studies, Princeton University.
DiMaggio, P., Hargittai, E., Neuman, W. R., and Robinson, J. P. 2001.
Social Implications of the Internet. Annual Review of Sociology
27:307–336.
Dolnicar, V., Vukcevic, K., Kronegger, L., and Vehovar, V. 2002.
Digitalni razkorak v Sloveniji. Druzboslovne razprave 18(40):83–
106.
Dutta, S., and Jain, A. 2004. The Networked Readiness Index 2003–
2004: Overview and analysis framework. http://www.development-
gateway.org/download/222656/Networked Readiness Index.pdf
Elliot, G., and Starkings, S. 1997. Business information technology
systems, Theory and practice. London: Prentice Hall.
Empirica—Communication and Technology Research. 2005. http://
www.empirica.biz
European Commission. 2000. The Lisbon Special European Council
(March 2000): Towards a Europe of innovation and knowledge.
Summaries of the Union’s legislation. http://europa.eu.int/scadplus/
leg/en/cha/c10241.htm
Gartner Group. 2002. The second digital divide—The “Haves” and
the “Have Hads.” The Digital Divide and American Society. www.
gartnerweb.com/public/static/techies/digital d/national/ 6.pdf
Granger, C. W. J., and Jeon, Y. 1997. Measuring lag structure in fore-
casting models—The introduction of time distance. Discussion Paper
97–24. San Diego: University of California.
Granger, C. W. J., and Jeon, Y. 2003. A time-distance criterion for
evaluating forecasting models. International Journal of Forecasting
19:199–215.
Grigorovici, D. M., Schement, J. R., and Taylor, R. D. 2004a. Weigh-
ing the intangible: Towards a theory-based framework for informa-
tion society indices. In Global economy and digital society, eds. E.
Bohlin, S. Levin, N. Sung, and C.-H. Yoon, pp. 169–202. Boston:
Elsevier Science.
Grigorovici, D. M., Constantin, C., Jayakar, K., Taylor, R. D., and
Schement, J. R. 2004b. InfoMetrics: A structural equation modeling
approach to information indicators and “e-readiness” measurement.
Paper presented at the 15th Biennial Conference of the International
Telecommunication Society (ITS), Berlin, Germany, September.
http://userpage.fhw-berlin.de/∼jmueller/its/conf/berlin04/Papers/
Grigorovici Constantin Jayakar Taylor Schement.pdf
Hargittai, E. 2002. Second-level digital divide: Differences in peo-
ple’s online skills. First Monday 7(4). http://www.firstmonday.
org/issues/issue7 4/hargittai
Husing, T. 2004. The impact of ICT on social cohesion: Beyond the dig-
ital divide. Paper presented at the 14th Economic Forum, September,
Krynica Zdroj, Poland.
Husing, T., and Selhofer, H. 2004. DIDIX: A digital divide index
for measuring social inequality in IT diffusion. IT&Society 1(7):
26–42. http://www.stanford.edu/group/siqss/itandsociety/v01i07/
v01i07a02.pdf
IDC. 2001. The IDC/World Times Information Society Index: The future
of the information society. Framingham, MA: IDC.
International Telecommunication Union. 2003. World telecommunica-
tion development report 2003: Access indicators for the information
society (Executive Summary). ITU. http://www.itu.int/ITU-D/ict/
publications/wtdr 03/material/WTDR2003Sum e.pdf
International Telecommunication Union. 2005. Measuring digital op-
portunity. Paper presented at the WSIS Thematic Meeting on
Multi-Stakeholder Partnerships for Bridging the Digital Divide,
Seoul, Republic of Korea, June. http://www.itu.int/itu-wsis/2005/
DOI%20V2.pdf
Jung, J.-Y., Qiu, J. L., and Kim, Y.-C. 2001. Internet connected-
ness and inequality: Beyond the “divide.” Communication Research
28(4):507–535.
Kalkun, M., and Kalvet, T. 2002. Digital divide in Estonia and how
to bridge it. Tallinn: Emor and PRAXIS Center for Policy Studies.
http://econwpa.wustl.edu:8089/eps/dev/papers/0401/0401004.pdf
Katz, J. E., and Aspden, P. 1997. Motivations for and barriers to
Internet usage: Results of a national public opinion survey. In-
ternet Research—Electronic Networking Applications and Policy
7(3).
DIGITAL DIVIDE MEASUREMENTS 289
Lawson Mack, R. 2001. The digital divide: Standing at the intersection
of race & technology. Durham, NC: Carolina Academic Press.
Luyt, B. 2004. Who benefits from the digital divide? First Monday 9(8).
http://www.firstmonday.org/issues/issue9 8/luyt
Martin, S. P. 2003. Is the digital divide really closing? A critique
of inequality measurement in a nation online. IT&Society 1(4):
1–13. http://www.stanford.edu/group/siqss/itandsociety/v01i04/
v01i04a01.pdf
Menou, M. J. 2001. Digital and social equity? Opportunities and
threats on the road to empowerment. Paper presented at the LIDA
(Libraries in the Digital Age) 2001 Annual Course and Confer-
ence, Dubrovnik, Croatia, May. http://www.cnam.fr/instituts/INTD/
Menou intd-er.pdf
Mossberger, K., Tolbert, C. J., and Stansbury, M. 2003. Virtual in-
equality: Beyond the digital divide. Washington, DC: Georgetown
University Press.
Muffels, R. J. A., Tsakloglou, P., and Mayes, D. G., eds. 2002. Social
exclusion in European welfare states. Cheltenham: Edward Elgar.
National Telecommunications and Information Administration. 1995.
Falling through the Net: A survey of the “have nots” in rural and
urban America. Washington, DC: Economics and Statistics Ad-
ministration, and the National Telecommunications and Information
Administration.
National Telecommunications and Information Administration. 1997.
Falling through the Net II: New data on the digital divide. Washing-
ton, DC: Economics and Statistics Administration, and the National
Telecommunications and Information Administration.
National Telecommunications and Information Administration. 1999.
Falling through the Net III: Defining the digital divide. Washing-
ton, DC: Economics and Statistics Administration, and the National
Telecommunications and Information Administration.
National Telecommunications and Information Administration. 2000.
Falling through the Net: Towards digital inclusion. Washington, DC:
Economics and Statistics Administration, and the National Telecom-
munications and Information Administration.
National Telecommunications and Information Administration. 2002.
A nation online: How Americans are expanding their use of
the Internet. Washington, DC: Economics and Statistics Admin-
istration, and the National Telecommunications and Information
Administration.
National Telecommunications and Information Administration. 2004.
A Nation Online: Entering the Broadband Age. Washington, DC:
Economics and Statistics Administration, and the National Telecom-
munications and Information Administration.
Neuman, W. L. 2003. Social research methods: Qualitative and quan-
titative approaches. Boston: Allyn and Bacon.
Norris, P. 2001. Digital divide: Civic engagement, information poverty,
and the Internet worldwide. Cambridge, MA: Cambridge University
Press.
Nurmela, J., and Vihera, M.-L. 2000. Communication capability is
an intrinsic determinant for the information society. (Unpublished
manuscript). Helsinki.
OECD. 2001. Understanding the digital divide. Paris: OECD. http://
www.oecd.org/dataoecd/38/57/1888451.pdf
Office of the Vice-President. 1996. Prepared Remarks of Vice-President
Al Gore at the White House Conference on Community Empower-
ment, Washington, DC, February 23. http://wkn.org/gov1.htm
Parayil, G. 2005. Digital divide and increasing returns: Contradictions
of informational capitalism. The Information Society 21(1):41–51.
Petric, G. 2006. Conceptualizing and measuring the social uses of the
internet: The case of personal web sites. The Information Society
22(5):291–301.
Primo Braga, C. A., Kenny, C., Qiang, C., Crisafulli, D., Di Mar-
tino, D., Eskinazi, R., Schware, R., and Kerr-Smith, W. 2000. The
networking revolution: Opportunities and challenges for develop-
ing countries. Global Information and Communication Technolo-
gies Department, The World Bank Group. http://www.infodev.org/
library/WorkingPapers/NetworkingRevolution.pdf
Pruulmann-Vengerfeldt, P. 2006. Exploring social theory as a frame-
work for social and cultural measurements of the Information Soci-
ety. The Information Society 22(5):303–310.
Quibria, M. G., Shamsun, A. N., Tschang, T., and Reyes-Macasaquit,
M.-L. 2003. Digital divide: Determinants and policies with spe-
cial reference to Asia. Journal of Asian Economics 13:811–
825.
Reddick, A., Boucher, C., and Groseilliers, M. 2000. The dual dig-
ital divide—The information highway in Canada. Ottawa: Public
Interest Advocacy Centre. http://olt-bta.hrdc-drhc.gc.ca/download/
oltdualdivide e.pdf
Rodgers, G., Gore, C., and Figueiredo, J. B., eds. 1995. Social exclu-
sion: Rhetoric, reality, responses. Geneva: International Institute for
Labour Studies.
Rogers, E. M. 1995. Diffusion of innovations, 4th ed. New York: Free
Press.
Sciadas, G., ed. 2005. From the digital divide to digital opportuni-
ties: Measuring infostates for development. Montreal: NRC Press.
http://www.orbicom.uqam.ca/projects/ddi2005/index ict opp.pdf
Selhofer, H., and Husing, T. 2002. The digital divide index—A measure
of the social inequalities in the adoption of ICT. Paper presented at
the IST 2002 Conference, Copenhagen.
Servon, L. J. 2002. Bridging the digital divide: Technology, community,
and public policy. Malden, MA: Blackwell.
SIBIS. 2003a. SIBIS pocket book 2002/03: Measuring the informa-
tion society in the EU, the EU accession countries, Switzerland
and the US. Bonn: SIBIS Project and European Communities.
http://www.empirica.biz/sibis/publications/pocketbook.htm
SIBIS. 2003b. SIBIS synthesis report 2003: Matching up to the infor-
mation society. Bonn: SIBIS Project and European Communities.
http://www.empirica.biz/sibis/files/SIBIS Synthesis-Report.pdf
Sicherl, P. 1973. Time-distance as a dynamic measure of disparities in
social and economic development. Kyklos 26(3):559–575.
Sicherl, P. 1978. S-distance as a measure of time dimension of dispar-
ities. In The social ecology of change, eds. Z. Mlinar and H. Teune,
pp. 237–268. Beverly Hills, CA: Sage.
Sicherl, P. 2003. Different statistical measures provide differ-
ent perspectives on digital divide. Paper presented at the 6th
Conference of the European Sociological Association, Murcia.
http://www.sicenter.si/pub/Sicherl Digital divide Murcia.pdf
Sicherl, P. 2004. A new generic statistical measure in dynamic gap
analysis. The European e-Business Report. Luxembourg: European
Commission.
Sicherl, P. 2005. Analysis of information society indicators with time
distance methodology. Journal of Computing and Information Tech-
nology 13(4):293–298.
Silver, H. 1994. Social exclusion and social solidarity: Three paradigms.
International Labour Review 44(2):219–231.
Stanley, L. D. 2003. Beyond access: Psychological barriers to computer
literacy. The Information Society 19:407–416.
290 V. VEHOVAR ET AL.
Tichenor, P. J., Donohue, G. A., and Olien, C. N. 1970. Mass media
flow and differential growth in knowledge. Public Opinion Quarterly
2:159–170.
Tos, N., ed. 2004. Vrednote v prehodu III. Slovensko javno mnenje
1999–2004. Ljubljana: Fakulteta za druzbene vede, IDV–CJMMK.
United Nations Development Program. 2001. Human development re-
port 2001. New York: Oxford University Press. http://hdr.undp.org/
reports/global/2001/en/pdf/techindex.pdf
Van Dijk, J., and Hacker, K. 2003. The digital divide as a complex and
dynamic phenomenon. The Information Society 19:315–326.
Vehovar, V. 2001. Prospects of small countries in the age of the Internet.
In Cyberimperialism? Global relations in the new electronic frontier,
ed. B. Ebo, pp. 123–138. Westport, CT: Praeger.
Vehovar, V., and Dolnicar, V. 2004. Benchmarking Internet. In The
Internet encyclopaedia, ed. H. Bidgoli, pp. 57–71. Hoboken, NJ:
John Wiley & Sons.
Warschauer, M. 2003a. Technology and social inclusion: Rethinking
the digital divide. Cambridge, MA: MIT Press.
Warschauer, M. 2003b. Dissecting the “digital divide”: A case study in
Egypt. The Information Society 19:297–304.
Welling, S., and Kubicek, H. 2000. Measuring and bridging the digital
divide in Germany. Report presented at the International Confer-
ence, Stepping-Stones into the Digital World, September, Bremen.
http://www.digitale-chancen.de/transfer/downloads/MD35.pdf
Wilhelm, A. G. 2000. Democracy in the digital age: Challenges to
political life in cyberspace. New York: Routledge.