method, apparatus and computer program for analysing medical image data
TRANSCRIPT

(19) United US 20100142775A1
(12) Patent Application Publication (10) Pub. No.: US 2010/0142775 A1 Ganeshan et al.
States
(43) Pub. Date: Jun. 10, 2010
(54) METHOD, APPARATUS AND COMPUTER PROGRAM FOR ANALYSING MEDICAL IMAGE DATA
(76) Inventors: Balaji Ganeshan, Hove (GB); Kenneth Alan Miles, Kingston (GB); Rupert Charles David Young, Brighton (GB); Christopher Reginald ChatWin, Hove (GB)
Correspondence Address: Ballard Spahr LLP SUITE 1000, 999 PEACHTREE STREET ATLANTA,
(21) Appl.No.:
(22) PCT Filed:
(86) PCT No.:
§ 371 (0X1), (2), (4) Date:
Filtered
GA 30309-3915 (US)
12/450,234
Mar. 19, 2008
PCT/GB2008/000977
Jan. 15, 2010
(30) Foreign Application Priority Data
Mar. 19, 2007 (GB) ................................. .. 0705223.6
Publication Classi?cation
(51) Int. Cl. G06K 9/00 (2006.01)
(52) US. Cl. ...................................................... .. 382/128
(57) ABSTRACT
Medical image data is analysed to produce a biomarker. The data is ?ltered With a plurality of band-pass ?lters each having a different bandwidth. A texture parameter is then determined from the ?ltered data from each ?lter and the biomarker is determined as at a ratio of the texture parameters. When the biomarker is obtained from a CT image of a liver, it can be predictive of poor survival, disease extent and liver physiol ogy of a patient following resection of colorectal cancer. When obtained from a mammographic image, the biomarker can be indicative of cancer invasion and receptor status Within mammographic abnormalities. When obtained from a CT image of a lung nodule, the biomarker can be predictive of tumour stage (or grading) and tumour metabolism of a patient With non-small cell lung carcinoma (lung cancer). When obtained from an MRI image of the brain, the biomarker can be indicative of schizophrenia and/or other brain disorders.
Unfiltered Hepatic CT
mum
Sigma 0.5
in e
I iterSigma 1.5
inmmlanmm?'ha mil-w
M radium
Filtered Sigma 2.5 V
2121‘ an an mil/Tin " m in:
Coarse

Patent Application Publication Jun. 10, 2010 Sheet 1 0f 10 US 2010/0142775 A1
Fig. 2

Patent Application Publication
WIDTH I2
I‘ EELS
NORMALI‘SEO MAGNITUDE OF THE FILTER MASK
DIETS ~
0.625
0.5 -
0.375 -
0.25
0.125 -
43.125 -
4125
SPATIAL DOMAIN
SPATIAL DOMAIN - IMAGE FORMAT
(Image Format)
SPATIAL DOMAIN - CROSS SECTION I l r w
I l
WIDTH 12 PDGZIB
Jun. 10, 2010 Sheet 2 0f 10
NORMAUSED MAGNITUDE OF THE FILTER MASK
FREQUENCY IN Y-DIRECTIUN (Fy) [PER PIXEL)
US 2010/0142775 A1
FREQUENCY DOMAIN
1,256 FREQUENCY DOMAIN - IMAGE FORMAT
1654
N758
4/354 4/158 u was 11364 was FREQUENCY IN X-DIRECIION (Fx) (PER PIXEL)
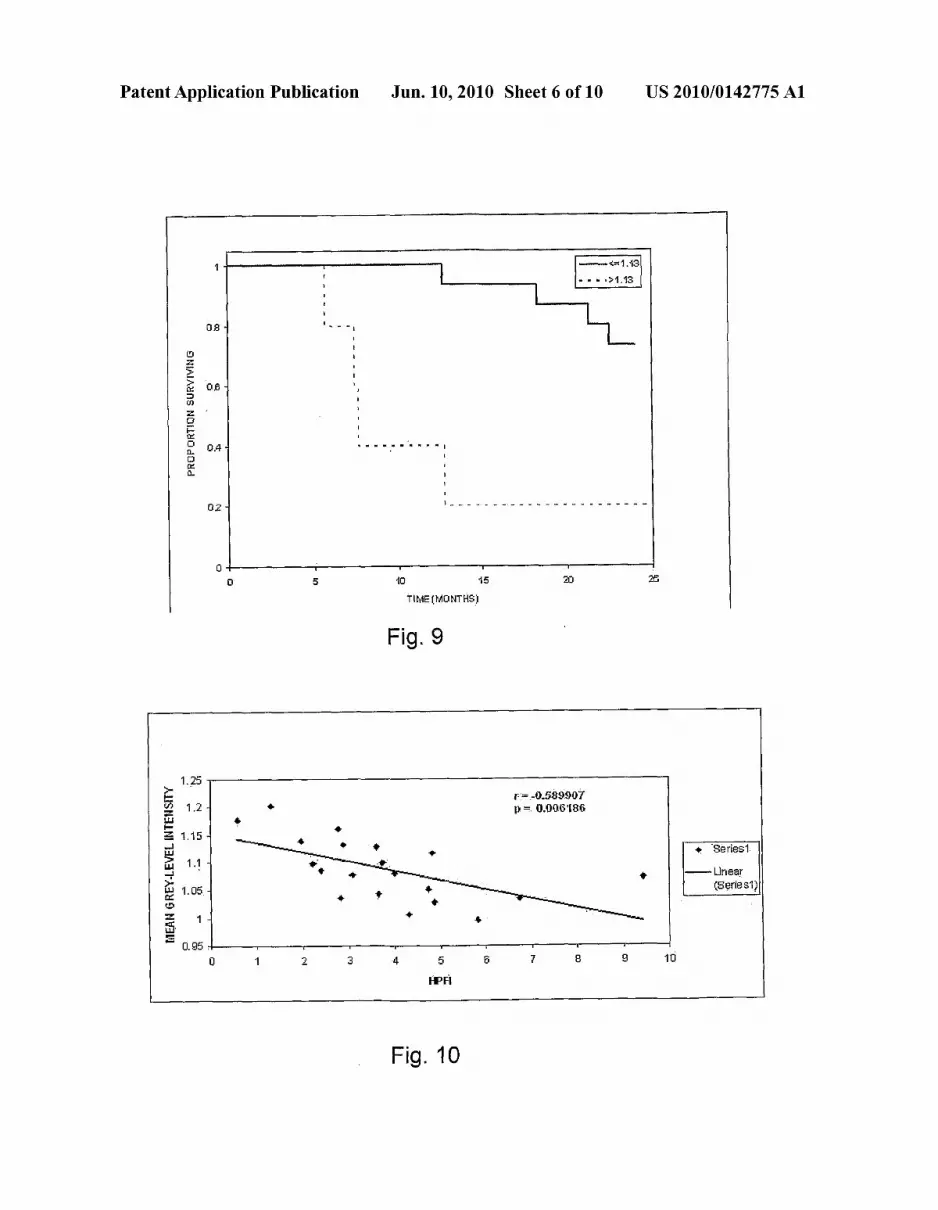
(Image Format)
FREQUENCY DOMAIN - CROSS-SECTION 1 ‘r - f
I159 -
117B - _
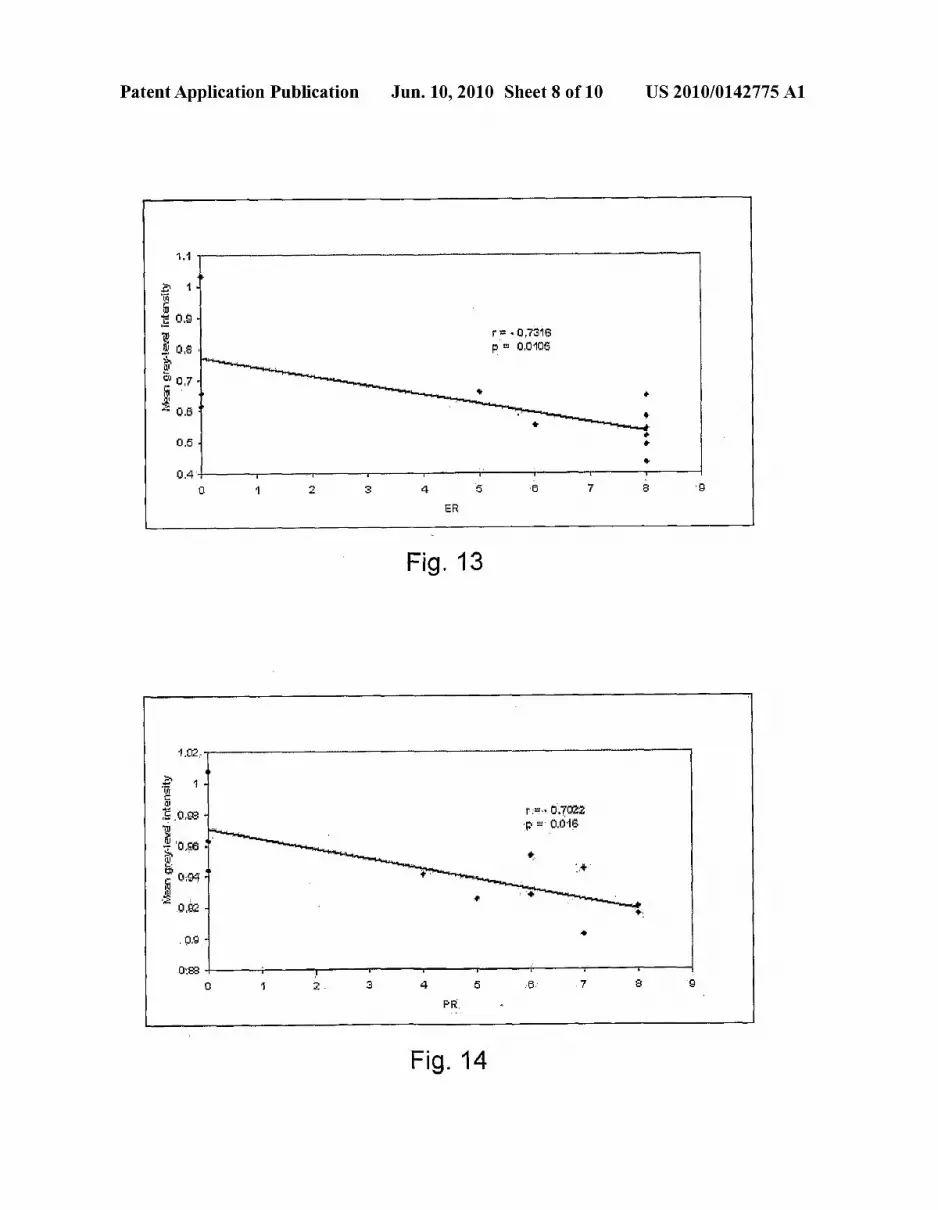
I144 - -
1256 4/384 -1 I788 D 11758 11384 1&55 FREQUENCY (PER PIXEL)

Patent Application Publication Jun. 10, 2010 Sheet 3 0f 10 US 2010/0142775 A1
z-axis
128
Fig. 4

Patent Application Publication Jun . 10, 2010 Sheet 4 0f 10 US 2010/0142775 A1
SIGMA ( a ) FILTER WIDTH (PIXELS I VOXELS)
0.5 2
1.0 4
1.5 6
1.8 8
2.0 10
2.5 12
Fiiiered Sigma 0.5
Fine
ru: 111 mu #11 all m:
Fig. 5
Unfiltered Hepa‘cic CT
Lam
Filtered Sigma 1.5 V
mzwmswiazlmdwwl
Filtered Sigma 2,5
uni Tm ‘lib an m In!" 1m 1m In:
M eclium Coarse
Fig. 6

Patent Application Publication Jun. 10, 2010 Sheet 5 0f 10 US 2010/0142775 A1
1 Texture Parameter GROUP A GROUP B GROUP 6 1 Median Median Median §Fine (o=0.5) Mean 6.0004 5.5249 5.46295 ‘ Entropy 3.2648 3.2131 3.1756
Uniformity 0.31033 0.31343 0.30914 Medium (o=1.5) Mean 2.8296 2.6531 3.1023
Entropy 2.5853 2.521 2.64225 1 Uniformity 0.40014 0.40043 0.37238 Coarse (o=2.5) Mean 1.9789 1.8777 2.7034 a*
i Entropy 2.0138 2.032 22377 a* 1 Uniformity 0.51072 0.48171 0.472375 Fine / Mean 2.197785 2.049123. 1.698856a*
Entropy 1.298338 1.280643 1.183054a**,b** Medium Uniformity 0.769779 0.781044 0.8111 17b*** Fine/ Mean 3.148519 2.969172 1.89672 a", b*
» Entropy 1.611122 1.563338 1.383165 a*, b* Coarse Uniformity 0.613353 0.607295 0.657135 xMedium / Coarse Mean 7 1.532863 1.448996 1.20652 a*, b**
Entropy 1.244492 1.211374 1.173022 Uniformity 0.788798 0.815011 0.800232
a, b - statistically significant difference in value from group A and group B patients respectively (*, 0.03<p<0.05; **, 0.02<p<=0.03; ***, p=0.01)
Fig. 7
Group A Group‘ B ‘ Group C {Fine texture (0.5) 6.5409 6.6596 » 5.9645 Medium texture (1.0) 5.3631 5.8688 4.7749 Medium texture (1 .5) 4.7004 4.4183 4.0908 Coarse texture (2.0) 4.4375 3.8224 3.7242 Normalised Fine texture (0.5/ 2.5) 4 1.8534 1.9624 I 1.5893 Normalised Medium texture (1.0 I 2.5) 1.4725 1.6277 1.3103 Normalised Medium texture (1.5 / 2.5) 1.2215 1.3237 a* ' 1.1318 (Normalised Coarse texture (2.0 / 2.5) 1.0631 1.1358 a** 1 1.0619
a - statistically significant difference in value from group A patients (*, 0.04<p<0.05; **, p<0.04)
Fig. 8

Patent Application Publication Jun. 10, 2010 Sheet 7 0f 10 US 2010/0142775 A1
COMPARISON OF suRvlvAL CURVES
1 .
0.3 J - I
2 -_ 5 .
E 0.6-‘ w I
5 . . . . . . . . . .1
g 0.4 - m 1 . . . . . . . . . . . . . . . . . _ . . -
0.2 -
—-—--—SU\/> 1.875
- - - -SU\/<= 1.875
O .
0 5 1O 15 2O 25
TlNEWDN'?-IS)
Fig. 1 1
0.8 O
0.76 # r= caress 5 p = omse
‘if. ‘0-71 9:
5 ‘SE6 1 m
5% 0.6 .1;
‘0.56 G
0-5 I ‘I’ l
U ‘I 2 3
__ ' Tumour Type __.
1 = DCIS only, 2 = 16 with DCIS, 3 = 16 only
Fig. 12
Patent Application Publication Jun. 10, 2010 Sheet 8 0f 10 US 2010/0142775 A1
1.1
I
1 1
Us? -
r= -'U.?$16 p =1 0.0105 Mean grey-laws! intensity
0 cs hl 7o:
E5231 91:21 vlam-é intensity P v 3
.119 - f‘
01% '. ,
PR7
Fig. 14

Patent Application Publication Jun. 10, 2010 Sheet 9 0f 10 US 2010/0142775 A1
Texture ratio (2.0 I 2.5) vs tumour grade 0 Series1 -—-Linear (Series1) \
1
O
0.95 “ O
O . .
0.9 -
Z‘ 0
E 0.85 - ‘ g \ * rs = 0.6585
0.8 ' p = 0.005586
0
0.75 —
0.7 I I I
O 1 2l'umour grade3 4 5
Fig. 15
SUV vls tumour grade 0 Series1 -—Linear (Series1)
12
10 ~ . ‘ 0
8 7 . O .
> o 3 6 - i .
4 _ ‘ rs = 0.4958
: p = 0.036657 2 _
O l | l l
0 1 2 3 4 5 Tumour grade
Fig. 16

Patent Application Publication Jun. 10, 2010 Sheet 10 0f 10 US 2010/0142775 A1
T Relation between texture ratio (2.0 [2.5) and SUV
V0 Series‘! --Linear(Seriesm 6 O
5 _
4 _
6
E 2 3 - ’
L? r = -o.5523
2 _ p = 0.026527
0
1 _
0 l T l l l
O 2 4 6 8 1O 12
SUV
Fig. 17
Filtered MediunfCnarseTexture Ratio - Grey Matter
1.03 —
1.02 -
1.01 1 1: MeanSE
a 1 N —MearrSD
g ~ru1ean+SD 5 BBQ _ @ Mean+SE
+ Mean
[1.98 -
119T —‘
0.96 I l |
520 S28 CON
Patiert Groups
Fig. 18

US 2010/0142775 A1
METHOD, APPARATUS AND COMPUTER PROGRAM FOR ANALYSING MEDICAL
IMAGE DATA
FIELD OF THE INVENTION
[0001] The invention relates to image analysis for assisting medical diagnosis or prognosis, and in particular to the analy sis of textural data.
BACKGROUND TO THE INVENTION
[0002] Images of parts of the body are commonly used to assisting With medical diagnosis and prognosis. Images include X-ray images, in particular computed tomography (CT) and mammographic images, and magnetic resonance imaging (MRI) images. Visual inspection of such images can be very effective. HoWever, increasingly, image processing techniques are being employed to enhance the usefulness of these images and the accuracy of diagnosis and prognosis. [0003] For example, colorectal cancer patients entering surveillance programs do not represent a uniform population of equal risk of recurrence. It is desirable to identify predic tive factors that are linked to outcomes in order to alloW modi?cation of surveillance strategies for sub-groups of patients. Of particular interest is the use of imaging tech niques for this purpose. [0004] Some previous studies into the use of CT images have used texture analysis and have been based on segmen tation and classi?cation of visible focal lesions into benign and malignant, and on recognition of different organs using Wavelet techniques and arti?cial neural netWork based deci sion algorithms. See, for example, “Automatic segmentation and classi?cation of diffused liver diseases using Wavelet based texture analysis and neural network”, Mala K, Sadasi vam V., INDICON, 2005 Annual IEEE 2005; 216-219. [0005] HoWever it is more complex and challenging to distinguish diagnostic patient groups from visually normal areas of the liver of patients folloWing resection of colorectal cancer. Previous studies have shoWn potential for hepatic CT texture to differ betWeen normal livers and apparently normal areas of tissue Within livers bearing tumours and may re?ect hepatic vascularity. See, for example, “Texture analysis of CT-images for early detection of liver malignancy”, Mir A. H., Hanmandlu M., Tandon S. N., Biomed Sci Instrum. 1995; 3 l 1213 -7. [0006] As another example, mammographic breast screen ing has resulted in a dramatic increase in the diagnosis of ductal carcinoma in situ (DCIS) among all mammographi cally detected cancers. The detection of DCIS on core biopsy is quite frequently folloWed by evidence of invasion Within the ?nal excision specimen and results in the need of a second operative procedure Which includes axillary lymphadenec tomy. Therefore an effective Way of estimating the likelihood of an invasive focus preoperatively in patients diagnosed With DCIS Would assist in better treatment planning and optimal use of sentinel node biopsy or axillary lymphadenectomy. [0007] In mammography, computer-assisted diagnosis (CAD) is employed for automated detection of micro-calci ?cation clusters and classi?cation of masses as benign or malignant. Computer based mammographic image texture analysis includes density variations Within masses, tWo-step scheme of pixel-level detection, region-level classi?cation, automated feature-based microcalci?cation extraction, gra dient and ?oW-based texture analysis. See, for example, “An
Jun. 10,2010
automatic method to discriminate malignant masses from normal tissue in digital mammograms”, Brake G. M., Karsse meijer N., Hendriks J. H., Phys. Med. Biol. 2000; 45, 2843 2857. The use of computer analysis to characterise rather than detect mammographic abnormalities is more challenging and less Well developed. [0008] The invention seeks to improve upon such tech niques.
SUMMARY OF THE INVENTION
[0009] According to a ?rst aspect of the invention there is provided a method of analysing medical image data to pro duce a biomarker, comprising: [0010] ?ltering the data With a plurality of band-pass ?lters
each having a different bandWidth; [0011] determining a texture parameter from the ?ltered
data from each ?lter; [0012] determining at least one ratio of the texture param
eters for use as a biomarker.
[0013] According to a second aspect of the invention there is provided an apparatus for analysing medical image data to produce a biomarker, comprising: [0014] means for ?ltering medical image data With a plu
rality of band-pass ?lters each having a different band Width;
[0015] means for determining a texture parameter from the ?ltered data from each ?lter;
[0016] means for determining at least one ratio of the tex ture parameters for use as a biomarker.
[0017] The invention provides an improved biomarker. In the context of the invention, the biomarker is a feature of a medical image that may be related to a medical condition and might therefore be referred to as an imaging biomarker. The biomarker may be employed as a diagnostic indicator or a prognostic indicator, for example by comparing the biomar ker With a predetermined threshold. The biomarker can be used as a diagnostic indicator to diagnose a condition of a patient or as a prognostic indicator for a predictive assessment of a condition of a patient. Indeed, according to a third aspect of the invention there is provided a method of diagnosing or predicting a condition of a patient, comprising comparing a biomarker With a threshold, Wherein the biomarker comprises a ratio of texture parameters determined from a medical image. According to a fourth aspect of the invention there is provided an apparatus for diagnosing or predicting a condi tion of a patient, comprising means for comparing a biomar ker With a threshold, Wherein the biomarker comprises a ratio of texture parameters determined from a medical image. [0018] The biomarker has application in, particularly but not exclusively, the evaluation of cancer images, and in par ticular can be used for predictive assessment. Such a biom arker obtained from analysing images of an organ can be indicative of advanced disease and predictive of poor survival in patients. For example, When obtained from a visually nor mal (apparently disease free) CT image of a liver, the biom arker can be predictive of patho-physiology, disease extent (or metastases) and poor survival of a patient folloWing resec tion of colorectal cancer. Consequently, a modi?ed surveil lance strategy may be adopted for such patients. As another example, When obtained from a mammographic image (e.g. digitiZed mammography ?lms), the biomarker can be indica tive of cancer invasion and receptor status Within mammo graphic abnormalities. As another example, When obtained from a CT image of the lungs, the biomarker can be indicative

US 2010/0142775 A1
of the grading or staging of lung nodules and predictive of tumour metabolism in lung carcinoma. As another example, When obtained from a CT image of an oesophagus, the biom arker can be indicative of the extent, spread, grading or stag ing of oesophageal carcinoma and predictive of tumour metabolism. As another example, When obtained from a CT image of the mouth (eg a dental CT image) or a dental radiographic image (eg a digitised dental radiographic image), the biomarker can be indicative of extent, spread, grading or staging of dental carcinoma. [0019] The biomarker also has application in the evaluation of images for a variety of other medical conditions not related to cancer. For example, When obtained from an MRI image of the brain, the biomarker can be indicative of schizophrenia and/ or other brain disorders. As another example, When obtained from a CT image of the lungs, the biomarker can be indicative of pulmonary disorders. [0020] The biomarker can be obtained by analysing con ventional images, and therefore the invention can be easily implemented as an addition to existing image systems. Optionally, the image data may represent one of an X-ray image, in particular a tomography image (e. g. a hepatic, lung oesophagus or dental tomography image) or a mammography image, a magnetic resonance image (eg a brain image) and an ultrasound image. A tomography image may be, for example, a computed tomography (CT) image, Which is also knoWn as a computed axial tomography (CAT) image, or a positron emission tomography (PET) image or a single pho ton emission computed tomography (SPECT) image. The image is usually tWo-dimensional (eg an image slice), but may alternatively be threedimensional (eg an image vol ume). [0021] The band-pass ?lters may differ in only bandWidth and be otherWise identical. In other Words, the data may be ?ltered more than once With the same ?lter tuned to different bandWidths. The ?ltering is described as being performed With a plurality of ?lters having different bandWidths for clarity and conciseness. Optionally, the band-pass ?lters may be Laplacian of Gaussian (LoG) band-pass ?lters. Such a ?lter is advantageous in that it can be tuned easily to provide different bandWidths.
[0022] Optionally, the texture parameter may comprise an indicator of at least one of: mean gray-level intensity; entropy; uniformity. [0023] Use of the terms “means for ?ltering”, “means for determining” and such like is intended to be general rather than speci?c. The invention may be implemented using such separate components. HoWever, it may equally be imple mented using a single component such as an individual pro cessor, digital signal processor (DSP) or central processing unit (CPU). Similarly, the invention could be implemented using a hard-Wired circuit or circuits, such as an application speci?c integrated circuit (ASIC), or by embedded softWare. Indeed, it can also be appreciated that the invention can be implemented using computer program code. According to a further aspect of the present invention, there is therefore provided computer softWare or computer program code adapted to carry out the method described above When pro cessed by a processing means. The computer softWare or computer program code can be carried by a computer read able medium. The medium may be a physical storage medium such as a Read Only Memory (ROM) chip. Alternatively, it may be a disk such as a Digital Versatile Disk (DVD-ROM) or Compact Disk (CD-ROM). It could also be a signal such as an
Jun. 10, 2010
electronic signal over Wires, an optical signal or a radio signal such as to a satellite or the like. The invention also extends to a processor running the softWare or code, eg a computer con?gured to carry out the method described above.
BRIEF DESCRIPTION OF DRAWINGS
[0024] The invention Will noW be described, by Way of example only, With reference to the accompanying draWings Wherein: [0025] FIG. 1 is a How chart of a method of analysing medical image data in accordance With the invention; [0026] FIG. 2 is a block schematic diagram of an apparatus for analysing medical image data in accordance With the invention; [0027] FIG. 3 illustrates spatial and frequency domain rep resentations of a LoG ?lter; [0028] FIG. 4 illustrates a frequency domain representation of a three-dimensional LoG ?lter; [0029] FIG. 5 is a table shoWing the relationship betWeen standard deviation and ?lter Width; [0030] FIG. 6 illustrates a hepatic computed tomography image of a liver, ?ltered With three different bandWidth ?lters, providing ?ne, medium and coarse ?ltering; [0031] FIG. 7 is a table of texture parameter values, and ratios of texture parameter values, of un-enhanced CT images of colorectal cancer patients; [0032] FIG. 8 is a table of mean grey-level texture param eter values, and ratios of texture parameter values, of contrast enhanced CT images of colorectal cancer patients; [0033] FIG. 9 is a graph illustrating a Kaplan-Meier sur vival curve for patients With normal liver appearances on conventional CT but liver relative texture (normalised coarse mean grey-level intensity) values above and beloW a thresh old value of 1.13; [0034] FIG. 10 is graph illustrating the correlation of nor malised coarse mean grey-level intensity With hepatic phos phorylation fraction index (HPFI) for patients With no liver metastases; [0035] FIG. 11 is a graph illustrating a Kaplan-Meier sur vival curve for patients With normal liver appearances on conventional CT but standardised uptake value of glucose (SUV) above and beloW a threshold value of 1.875; [0036] FIG. 12 is a graph illustrating the relationship betWeen relative texture (ratio of ?ne to medium mean grey level intensity) values and degree of invasion for breast cancer patients; [0037] FIG. 13 is a graph illustrating the relationship betWeen relative texture (ratio of ?ne to coarse mean grey level intensity) values and estrogen receptor status (ER); [0038] FIG. 14 is a graph illustrating the relationship betWeen relative texture (ratio of medium to coarse mean grey-level intensity) values and progesterone receptor status (PR); [0039] FIG. 15 is a graph illustrating the relationship betWeen relative texture (normalised coarse uniformity) val ues and tumour stages for non-small cell lung carcinoma patients; [0040] FIG. 16 is a graph illustrating the relationship betWeen standardised uptake value of glucose (SUV) values and tumour stages for non-small cell lung carcinoma patients; [0041] FIG. 17 is graph illustrating the correlation of nor malised coarse entropy With standardised uptake value of glucose (SUV) for non-small cell lung carcinoma patients; and

US 2010/0142775 A1
[0042] FIG. 18 is a box and Whisper plot of entropy calcu lated from medium to coarse texture ratio of three-dimen sional Whole brain grey matter CT images of schizophrenic patients and a control group of patients.
DETAILED DESCRIPTION OF PREFERRED EMBODIMENTS
[0043] Referring to FIG. 1, the method of analysing medi cal image data commences at step 10 by selecting the band Width of a ?lter. At step 12 the image data is ?ltered by the ?lter employing the selected bandWidth. At step 14 a texture parameter is determined from the ?ltered data. How then returns to step 10 Where a different bandWidth is selected and then at step 12 the image data is ?ltered by the ?lter employ ing the different bandWidth, and then at step 14 a texture parameter is determined from the data ?ltered using different bandWidth. Steps 10, 12 and 14 may be repeated any desired number of times. For example, three different bandWidths may be used to provide ?ne, medium and coarse ?ltering and corresponding ?ne, medium and coarse texture parameters. At step 1 6 a ratio is calculated of tWo of the texture parameters corresponding to different ?lter bandWidths, and optionally additional ratios may be calculated using different pairs of the texture parameters. The ratio, or ratios, of texture parameters are delivered for use as a biomarker. At optional step 18, the biomarker may be compared With a predetermined threshold value and an indication generated according to Whether the value of the biomarker is above or beloW the predetermined threshold value. A suitable threshold value can be determined by analysing patient data. [0044] Although FIG. 1 illustrates the image data being ?ltered using different bandWidths sequentially, the ?ltering using different bandWidths may alternatively be performed in parallel. In the speci?cation and claims, the expression “plu rality of bandpass ?lters each having a different bandWidt ” is intended to encompass both ?xed-bandWidth ?lters and a variable bandWidth ?lter, a different bandWidth being regarded as providing a different ?lter.
[0045] Referring to FIG. 2, the apparatus for analysing medical image data comprises a data store 20 for storing the image data. An output of the data store 20 is coupled to an input of a ?lter 22 for ?ltering the image data. A further input of the ?lter 22 is coupled to a bandWidth controller 24. The bandWidth of the ?lter 22 is adaptable under the control of the bandWidth controller 24, thereby enabling the image data to be ?ltered using a plurality of different bandWidths. An output of the ?lter 22 is coupled to an input of a texture parameter determining stage 26, Which for example may be imple mented in a processor. For each bandWidth used by the ?lter 22 for ?ltering the image data, the texture parameter deter mining stage 26 determines a texture parameter from the ?ltered image data and stores the resulting texture parameter in parameter store 28. A ratio calculator 30 is coupled to the parameter store 28 and is adapted to calculate the ratio of tWo of the stored texture parameters corresponding to different ?lter bandWidths, and optionally to calculate additional ratios using different pairs of the stored texture parameters. The ratio calculator 30 provides on an output 32 the ratio, or ratios, of the texture parameters for use as a biomarker. Optionally the output of the ratio calculator 30 may be coupled to a comparator 34 Which is adapted to compare the value of the biomarker With a predetermined threshold, and to generate an indication according to Whether the value of the biomarker is
Jun. 10,2010
above or beloW the predetermined threshold. A suitable threshold value can be determined by analysing patient data. [0046] Although the apparatus illustrated in FIG. 2 com prises a single ?lter Which is adapted to ?lter the image data using different bandWidths sequentially, alternatively a plu rality of ?lters may be used and may operate in parallel, each having a ?xed bandWidth. In the speci?cation and claims, the expression “plurality of band-pass ?lters each having a dif ferent bandWidth” is intended to encompass both ?xed-band Width ?lters and a variable bandWidth ?lter, a different band Width being regarded as providing a different ?lter. [0047] The method steps and the apparatus Will noW be described in more detail for the case of three different ?lter bandWidths corresponding to ?ne, medium and coarse texture parameters. [0048] One type of ?lter that may be used for ?ltering the image data is a Laplacian of Gaussian (LoG) band-pass ?lter. This is a non-orthogonal Wavelet transform. This type of ?lter can be readily tuned so as to selectively extract scale based individual textures such as ?ne, medium and coarse texture. Wavelet transforms also tend to perform better than frequency domain based Fourier transforms, Which lack spatial locali sation. The tWo-dimensional (2-D) Gaussian distribution (G) is given by:
521i (1) C(x. y) = 8 W2
Where (x, y) are the spatial coordinates of the image matrix and sigma, o, is the standard deviation. [0049] The three-dimensional (3-D) Gaussian distribution (G) is given by
x2+y2+z2 C(x. y. z) = a???’
[0050] The Gaussian distribution effectively blurs the image, Wiping out all structures at scales much smaller than the sigma value of the Gaussian distribution. This distribution has the desirable characteristics of being smooth and loca lised in both the spatial and frequency domains and is there fore less likely to introduce any changes that Were not present in the original image. Thus, the Gaussian distribution enables the highlighting of only features of a particular siZe in images corresponding to a particular value. [0051] One reason for using the Laplacian (V2) is that it is the loWest-order orientation-independent (isotropic) differ ential operator Which inherently has less computational bur den and can be used to detect intensity changes in an image that correspond to the Zero-crossings of the ?lter. V2 G is the Laplacian of Gaussian (LoG) ?lter, a circularly symmetric mexican-hat-shaped ?lter Whose distribution in the 2-D and 3-D spatial domains are given by

US 2010/0142775 A1
[0052] FIG. 3 illustrates tWo-dimensional spatial and fre quency domain representations of a LoG ?lter in the special and frequency domain at a standard deviation (0) value of 2 .5. FIG. 4 is a frequency domain representation of the sub-vol ume of the absolute values of a three-dimensional LoG ?lter at a (I value of 1.5. From the mathematical expression of this circularly symmetric ?lter at different values, the number of pixels/voxels representing the Width betWeen the diametri cally opposite Zero-crossing points in this ?lter can be calcu lated. The Width of the ?lter at different O values is obtained by evaluating the LoG spatial distribution along the x and y directions. The Width can be considered as the siZe at Which the structures in the image Will be highlighted and enhanced, Whilst structures beloW this siZe Will become blurred. The loWer the (I value, the smaller is the Width of the ?lter in the spatial domain and the larger is the pass-band region of the ?lter in the frequency domain, highlighting ?ne details or features in the ?ltered image in the spatial domain. Similarly, the higher the (I value, the higher is the Width of the ?lter in the spatial domain; this corresponds to a smaller pass-band region of the ?lter in the frequency domain, highlighting coarse features in the ?ltered image in the spatial domain. The table of FIG. 5 indicates the ?lter Width in pixels correspond ing to several 0 values.
[0053] Other types of band-pass ?lter characteristic may be used instead of LoG, for example Difference of Gaussian (DoG). [0054] In hepatic CT images, ?ne texture may predomi nantly highlight hepatic parenchyma While medium to coarse texture may highlight blood vessels of varying siZe or hepatic tissue response. In mammography images ?ne texture may predominantly highlight micro-calci?cation While medium to coarse texture may highlight calci?cation clusters. In a three dimensional MRI image of the brain or brain volume, ?ne texture may re?ect thinner sensory areas Within the cor tex, medium texture may correspond to fundi of sulci and/or less prominent croWns of gyri, Whiles coarse texture may correspond to prominent croWns of gyri. FIG. 6 illustrates a hepatic computed tomography image of a liver, ?ltered With three different bandWidth ?lters, providing ?ne, medium and coarse ?ltering.
[0055] Filtration can be done in the spatial or frequency domain. In the spatial domain, the ?lter mask is convolved With the image, Which involves intensive computation. It is more ef?cient to employ the ?lter in the frequency domain, as convolution of the ?lter mask and the image in the spatial domain is equivalent to multiplication of the Fourier trans forms of the ?lter mask and the image in the frequency domain. The inverse Fourier transform of the ?ltered spec trum gives the resultant ?ltered image in the spatial domain. Also the accuracy of this ?ltration operation is improved When employed in the frequency domain, as the quantisation errors arising from the convolution of the ?lter, especially for small O values in the spatial domain, Would distort the image. [0056] The texture parameter may be determined from the ?ltered data using a mathematical descriptor such as Mean Grey-Level Intensity, Which is an indicator of average tissue brightness, Entropy (e), Which is an indicator brightness and inhomogeneity (irregularity), and Uniformity (u), Which is an indicator of hoW close the image is to a uniform distribution of grey-levels. Entropy and Uniformity are image parameters that describe the distribution of tissue attenuation and repre sent texture that is generally not visually perceptible.
Jun. 10,2010
[0057] These texture parameters are de?ned mathemati cally as folloWs:
Mean Grey-Level Intensity(m) : i Z [61(X, y)] (5) N (x,y)eR
k (6) Entropy(e) = —Z [P(l)l1Og2[P(l)l
1:1
(7) k
Uniformitym) = Z [p(l)]2 [:1
Where R is the region of interest Within the image, N is the total number of pixels in the region of interest R, I is the number of grey-levels (for example III to k indicates grey level from 1 to k) in the region of interest R, and p(I) the probability of the occurrence of the grey-level I based on the image histograming technique: [0058] The ratio of the texture parameters resulting from the use of different ?lter Widths, for example ?ne to medium, ?ne to coarse and medium to coarse may be determined. Fine to medium texture ratio is calculated using the mathematical expressions (8) to (10) beloW.
Fine to medium texture ratio for mean grey — level intensity: (8)
l — a x, a NmgieRl ( M745]
Fine to medium texture ratio for entropy : (9)
EM» (10)
[P (DU-:05 ]2 Fine to medium texture ratio for uniformity: M» EM»
[0059] Furthermore, the ratios of texture parameters may be normalised With respect to the largest observed texture feature Which corresponds to a ?lter (I value of 2.5. Some examples of normalised ratios of texture parameters for 0:05 (normalised ?ne or ?ne to coarse ratio) and for 0:15 (normalised medium or medium to coarse ratio) are de?ned beloW in expressions (1 l) to (16).
Fine to coarse texture ratio (Normalised fine) for mean grey — (11)
l E Z W", y)0':0.S]
. . (XMER level intensity: i
— [6106, ) I l NWEIER 3’ L7‘ 2.5

US 2010/0142775 A1
-continued
Fine to coarse texture (Normalised ?ne) ratio for entropy : (12)
1
Fine to coarse texture ratio (Normalised fine) for uniformity: (13)
M» EM»
Medium to coarse texture ratio (Normalised medium) for (14)
l W Z W", y)0':1.5]
. . (XMER
mean grey-level intensity: i
— Z [6106, ) I l NWWER 3’ L7‘ 2.5
Medium to coarse texture ratio (Normalised medium) for entropy : (15)
M» EM»
Medium to coarse texture ratio (16)
(Normalised medium) for uniformity: M» EM» 1
[0060] The use of a normalised texture ratio minimises the effects of any variations in CT attenuation values occurring from one patient to another and also reduces the effect of noise on texture quanti?cation. [0061] Each ratio of texture parameters, either normalised or non-normalised, can be used as a diagnostic indicator. [0062] Some results of a study applying the method accord ing to the invention to image data obtained from, ?rstly, colorectal cancer patients and, secondly, breast cancer patients are presented below to illustrate the effectiveness of the method. [0063] For the study of colorectal cancer, data obtained from three patient groups was compared; group A is 15 patients with no tumour, group B is 9 patients without liver metastases, and group C is 8 patients with liver metastases. FIG. 7 is a table of texture parameter values and ratios of texture parameter values of unenhanced CT images of the three groups of patients, from which it can be seen that there is no signi?cant difference between any texture parameter for groups A and B, although for coarse and medium texture images, there is a trend towards higher values for mean grey level intensity and entropy in group C (liver metastases) as compared to groups A and B, reaching statistical signi?cance for coarse texture images (p<0.05, where p is a probability value indicative of statistical signi?cance, and where low values of p indicate a high statistical signi?cance). Greater differentiation of the patient groups was achieved by using ratios of texture parameter values. In particular, ?ne to
Jun. 10, 2010
medium texture parameter ratios were most signi?cant in differentiating the different diagnostic groups. Comparing groups A and C, the most signi?cant difference was obtained for the ratio of ?ne to medium texture using the texture parameter entropy (p:0.0257) whilst the difference in this ratio for mean grey-level intensity was less signi?cant (p:0. 049). For groups B and C, the most signi?cant difference was obtained using the ?ne to medium texture ratio for the texture parameter uniformity (p:0.0143). Entropy also discrimi nated these two groups, with the highest signi?cance obtained using the ?ne to medium texture ratio (p:0.03). [0064] FIG. 8 is a table of mean grey-level texture param eter values and ratios of texture parameter values of contrast enhanced portal phase CT images of the three groups of patients. A typical contrast agent for CT is an iodine based compound. The invention can be applied also to images obtained for other temporal phases. From FIG. 7 it can be seen that liver texture is signi?cantly different in patients with extra-hepatic metastases (Group B) compared to patients with no tumour (Group A) as indicated by higher intensity values on normalised coarse texture (ratio for 0:20 and 2.5, p<0.04) and normalised medium texture images (ratio for 0:15 and 2.5, 0.04<p<0.05). [0065] A normalised mean grey-level coarse texture parameter value greater than 1.13 indicates a likelihood of extra-hepatic metastases ?ve times higher than for patients with lower texture parameter values with a sensitivity of 62.5% and speci?city of 100% (p:0.0035). Kaplan-Meier survival curves for patients with normal hepatic appearances on conventional CT separated by a normalised coarse texture were signi?cantly different (p:0.0074). Reduced survival was found for patients with liver texture values above 1.13. Therefore, a suitable value for the threshold value referred to above is 1.13. FIG. 9 is a graph illustrating a Kaplan-Meier survival curve for patients with a normal liver appearance on conventional CT, with a normalised mean grey-level coarse liver texture parameter value greater than a threshold of 1.13 (broken line) and below 1.13 (solid line). [0066] Furthermore, two related biological correlates for liver texture on portal phase CT in colorectal cancer patients without hepatic metastases were identi?ed as hepatic blood ?ow and glucose metabolism. The hepatic phosphorylation fraction index (HPFI) of glucose which is derived from the ratio of standardised uptake value of glucose (SUV) in the liver obtained from PET and Total Hepatic Perfusion (THP)4combination of arterial (HAP) and portal perfusion (HPP) obtained from perfusion CT was identi?ed as the most possible biological correlate for normalised mean coarse tex ture (r:—0.59, where r is the correlation, p:0.0062, as indi cated by FIG. 10). This texture parameter also correlated inversely with hepatic glucose utilization (SUV: r:—0.587, p:0.007) and positively with hepatic blood ?ow (THP: F0. 512, p:0.021 and HPP: F0451, p:0.046). A statistically signi?cant positive correlation was also observed for norma lised coarse uniformity parameter (HPFI: F0552, p:0.012 and SUV: r:0.468, p:0.038). [0067] For comparison with FIG. 9, FIG. 11 illustrates the corresponding survival curves when hepatic glucose utilisa tion (p:0.045) was used as an indicator, with a hepatic SUV above (solid line) and below (broken line) a threshold value of 1.875. The survival curves in FIG. 11 show less separation than the curves of FIG. 9.
[0068] In the study of breast cancer, a signi?cant relation ship was observed between the ?ne/medium ratio of texture
US 2010/0142775 A1
parameters (for 0:05 and 1.5) and degree of invasion When considering only oblique and lateral projections, as illustrated in FIG. 12 for DCIS only, DCIS and 1C (Invasive carcinoma) only, and 1C only patients. [0069] Furthermore, tWo biological correlates for mammo graphic texture for breast cancer patients Were identi?ed as estrogen receptor status and progesterone receptor status, thereby providing a “texture-molecular” relationship. Fine to coarse texture ratio (ratio for 0:05 and 2.5) shoWed the most signi?cant inverse correlation With estrogen receptor (ER) status (r:—0.7316, p:0.0105) as illustrated in FIG. 13. Medium to coarse texture ratio (ratio for 0:20 and 2.5) shoWed signi?cant inverse correlation With progesterone receptor (PR) status (r:—0.7022, p:0.016) as illustrated in FIG. 14.
[0070] In the study of lung cancer (non-small cell lung carcinoma), a signi?cant relationship Was observed betWeen texture ratios (ratio for 0:15 and 2.5, 0:18 and 2.5 and 0:20 and 2.5) Within lung nodule on CT and tumour stage, With normalised coarse texture quanti?ed as uniformity shoWing greatest indicator of tumour stage (grading) as illus trated in FIG. 15. FIG. 16 illustrates corresponding tumour stage predictability by standardised uptake values of glucose (SUV) in the lung nodule obtained from PET. The tumour stage predictability or disease grading using imaging param eter Was greater for normalised coarse uniformity texture than SUV. This normalised coarse texture also correlated inversely With hepatic glucose utilization (entropy v/ s SUV: r:—0.552, p:0.027iFlG. 17; mean grey-level intensity v/ s SUV: r:—0. 512, p:0.043). [0071] In the study of schizophrenia, a signi?cant relation ship Was observed betWeen the medium/coarse ratio of tex ture parameters (for 0:10 and 1.5) for three-dimensional MRI Whole brain grey matter images in schizophrenic patients versus a control group (mean grey-level intensity, p:0.0271; entropy, p:0.01 14; and uniformity, p:0.03). It Was also found that an entropy value greater than 0.9976 indicated a greater variation in the distribution of grey matter features and predicted patients With schizophrenia (area under the receiver operating characteristiciROC curve:0.783, p:0. 003, sensitivity:80%, speci?city:74%). FIG. 18 shoWs entropy calculated from the medium to coarse texture ratio for patient groups SZO (schizophrenic With presence of PMCl gene expression) SZ8 (schizophrenic Without presence of PMCl gene expression) and CON (a control group). The ratio of medium-to-coarse texture that distinguished the overall group of schizophrenic patients from controls robustly dis tinguished the SZO patient group from controls (mean grey level intensity, p:0.0099; entropy, p:0.0069; and uniformity, p:0.0357). Also the relative medium-to-coarse entropy value exceeding 1.0052, indicated a robust differentiation (greater variation in the distribution of grey matter features) of SZO patients from controls (area under the ROC curve:0.896, p:0.0001, sensitivity:100% and speci?city:83%) [0072] Thus, as described above the biomarker, may be employed to diagnose or predict a condition of a patient and to determine an appropriate program of treatment or a sur veillance strategy. [0073] The method according to the invention may be implemented in softWare on a general purpose computer or on a special purpose computer or in special purpose hardWare.
Jun. 10, 2010
[0074] The biomarker may comprise a single ratio of tex ture parameters, or may comprise more than one such ratio in combination, each ratio employing different measures of tex ture parameter.
1. A method of analysing medical image data to produce a biomarker, comprising:
?ltering the data With a plurality of band-pass ?lters each having a different bandWidth;
determining a texture parameter from the ?ltered data from each ?lter;
determining at least one ratio of the texture parameters for use as the biomarker.
2. A method as claimed in claim 1, Wherein the band-pass ?lters are Laplacian of Gaussian band-pass ?lters.
3. A method as claimed in claim 1, Wherein the texture parameter comprises an indicator of at least one of: mean gray-level intensity; entropy; or uniformity.
4. A method as claimed in claim 1, Wherein the image data represents one of: an X-ray image; a magnetic resonance image; an ultrasound image; a tomography image; a hepatic tomography image; a positron emission tomography image; a single photon emission computed tomography image; or a mammographic image.
5. A method as claimed in claim 1, further comprising employing the biomarker as a diagnostic indicator or a prog nostic indicator.
6. A method as claimed in claim 5, Wherein employing the biomarker as a diagnostic indicator or a prognostic indicator comprises comparing the biomarker With a threshold.
7. A method of diagnosing or predicting a condition of a patient, comprising comparing a biomarker With a threshold, Wherein the biomarker comprises a ratio of texture param eters determined from a medical image.
8. The method of claim 1, Wherein the image data repre sents either a tWo-dimensional or a three-dimensional image.
9. Apparatus for analysing medical image data to produce a biomarker, comprising: means for ?ltering medical image data With a plurality of
band-pass ?lters each having a different bandWidth; means for determining a texture parameter from the ?ltered
data from each ?lter; means for determining at least one ratio of the texture
parameters for use as the biomarker. 10.Apparatus as claimed in claim 9, Wherein the band-pass
?lters are Laplacian of Gaussian band-pass ?lters. 11. Apparatus as claimed in claim 9, comprising means for
determining the texture parameter as an indicator of at least one of: mean gray-level intensity; entropy; or uniformity.
12. Apparatus as claimed in claim 9, comprising means for comparing the biomarker With a threshold.
13. Computer program code adapted to carry out the method of claim 1 When processed by a processing means.
14. A computer readable medium comprising a computer program adapted to perform the method of claim 1.
15. (canceled) 16. (canceled) 17. Apparatus for diagnosing or predicting a condition of a
patient, comprising means for comparing a biomarker With a threshold, Wherein the biomarker comprises a ratio of texture parameters determined from a medical image.
18. (canceled) 19. (canceled)