metal oxide gas sensor array for the detection of diesel fuel in engine oil
TRANSCRIPT

A
bsrdgs©
K
1
tcalcs(ip(taidtdu
f
0d
Available online at www.sciencedirect.com
Sensors and Actuators B 131 (2008) 125–133
Metal oxide gas sensor array for the detection of diesel fuel in engine oil
Simonetta Capone ∗, Marzia Zuppa, Dominique S. Presicce, Luca Francioso,Flavio Casino, Pietro Siciliano
Institute of Microelectronics and Microsystems (CNR-IMM)-Lecce Via Monteroni, 73100 Lecce, Italy
Available online 23 December 2007
bstract
We developed a novel method to detect the presence of unburned diesel fuel in lubricating oil for internal combustion engine. The method isased on the use of an array of different gas microsensors based on metal oxide thin films deposited by sol–gel technique on Si substrates. Theensor array, exposed to the volatile chemical species of different diesel fuel engine oil samples contaminated in different percentages by diesel fuel,esulted to be appreciably sensitive to them. Principal component analysis (PCA) and self-organizing map (SOM) applied to the sensor response
ata set gave a first proof of the sensor array ability to discriminate among the different diesel fuel diluted lubricating oils. Moreover, in order toet information about the headspace composition of the diesel fuel-contaminated engine oils used for gas-sensing tests, we analysed the engine oilamples by static headspace solid phase micro-extraction/gas chromatograph/mass spectrometer (SHS-SPME/GC/MS).2007 Elsevier B.V. All rights reserved.
ocfcioborbtacuinwta
eywords: Contamination by fuel; Engine oil; Gas microsensor
. Introduction
Monitoring of engine oil condition is fundamental in ordero preserve internal combustion engines in cars and other vehi-les. Engine oil makes a film between surfaces of parts movinggainst each other accomplishing in this way different tasks: (a)ubrication, (b) reduction of friction and wear, (c) prevention oforrosion and oxidation, (d) transport and dispersion of heat, (e)uspension of metal debris, (f) dissolution of resinous materialcombustion residues), (g) dispersion of soot content (importantn case of diesel engines), and (h) cleaning. In order to accom-lish its tasks, an engine oil has to preserve its physical propertiessuch as density, viscosity, heat capacity and thermal conduc-ivity) and chemical properties (such as solvency, antiwear,nticorrosion, frictional properties and antioxidant capacity), butnevitably, it gradually deteriorates with use. Causes of degra-ation of engine oil are: (a) oxidation and sedimentation, (b)hermal degradation, (c) corrosion, (d) shearing (oil breakdownue to shear forces), and (d) contamination by suspended insol-
ble matter, dissolved resinous material, water and fuel.Engine oil contamination by unburned fuel is a widely dif-used and largely underestimated phenomenon as compared to
∗ Corresponding author. Tel.: +39 0832 422507; fax: +39 0832 422552.E-mail address: [email protected] (S. Capone).
socasn[
925-4005/$ – see front matter © 2007 Elsevier B.V. All rights reserved.oi:10.1016/j.snb.2007.12.029
ther degradation causes. Fuel can find its way into the lubri-ating oil because of internal leakage in the carburetor. Theuel leaks first into the cylinders, past the rings then into therankcase. Hence, the presence of fuel in engine oil can dilutet and engine oil lubricant ability can be reduced much earlierther degradation causes occur. In this way, the contaminationy unburned fuel becomes the first and more important causesf degradation of engine oil. The presence of fuel in engine oileduces also the flash point of oil (the point at which it willurn), hence contributing to the toxic and hazardous charac-eristics of motor oil waste [1]. At present, there is no deviceble to measure the presence of fuel in lubricant oil. Engine oilondition can be checked by a number of laboratory tests onsed oil samples (together with reference tests on correspond-ng new oil samples) by measurements related to: acidity or baseumber (describing alkalinity), flash point, contamination (byater, glycol, fuel), remaining additive concentration, evalua-
ion of oxidative stability and measurement of particular matter,nd viscosity. However, lab-based oil condition approaches haveignificant time lag and other logistical difficulties. On thether hand, modern instrument panel mounted to some vehi-les showing when it is necessary to change oil are based on
dvanced algorithms taking into account driving parametersuch as, e.g., the elapsed mileage since the last oil change, theumber of cold starts, the oil temperature, and the engine speed2].
126 S. Capone et al. / Sensors and Actuators B 131 (2008) 125–133
age of
tci
tmoted
(pTcMohtcassesetgowbg
2
2
dil
pwtofcpa
2
umrPTmsts
4emsn1cdeftitrtbs
Fig. 1. (a) Cross-section scheme of the device, (b) front view im
Some of these algorithms are supported by sensors measuringhe oil’s permittivity [3], conductivity [4], viscosity (microa-oustic viscosity sensors) [5,6], but all of them do not providenformation about the possible presence of fuel.
In this work we focused the attention on the external con-amination of motor oil by unburned diesel fuel. The standard
ethods to measure the concentration of fuel diluent in engineil are based on distillation [6] or gas chromatography [7], buthey present certain limitation [8]. Recent methods proposedlectrochemical impedance spectroscopy to estimate soot andiesel contamination in engine oil [9].
In this work we propose the use of an array of metal oxideMOX) gas sensors as innovative approach to the analysis ofossible contaminations of engine oil by diluting diesel fuel.his approach goes well with the integration in a novel portable,heap and easy-to-use electronic device. The idea to apply theOX-based gas sensors technology to the detection of lubricant
ils is based on the observation that the higher volatility of theydrocarbon fuel components, as compared to the volatility ofhe engine oil components, produces an headspace of a fuel-ontaminated engine oil richer of the fuel volatile componentss compared to an uncontaminated one. Since MOX-based gasensors are generally sensitive to hydrocarbons, this could con-titute a potential for a gas sensor array to distinguish betweenngine oil samples contaminated by fuel- and not-contaminatedamples. Different engine oil samples contaminated in differ-nt percentages by diesel fuel were prepared and analysed byhe system. Data analysis performed on the sensor responsesave a first proof of the system ability to detect the presencef fuel contamination in lubricating oils. The sensor testingas also supported by chemical analytical analysis carried outy static headspace solid phase micro-extraction/gas chromato-raph/mass spectrometer (SHS-SPME/GC/MS).
. Materials and methods
.1. Measurement procedure
As preliminary check of system performance, two genericifferent types of commercially available engine oils (labeledn the following as A and B) were tested. By adding suitableiquid amounts of diesel fuel, different not-used engine oil sam-
egad
the realized sensor, and (c) sensor bonded onto TO-39 support.
les contaminated with 0.1%, 5%, and 10% (v/v) of diesel fuelere obtained. In particular, for each fuel contamination level,
he engine oil contamination was made into a volumetric flaskf 50 ml. Next, 20 ml vials were filled with 10 ml of oil takenrom the flask. Uncontaminated engine oil samples were alsoonsidered for comparison. All the prepared engine oil sam-les were analysed both by SHS-SPME/GC/MS and gas sensorrray.
.2. Gas sensor array
An array of eight metal oxides-based gas sensors have beensed for the analysis of the different engine oil samples. Theodulation of the gas-sensing properties of the array was
ealized by considering different gas-sensing layers (undoped,t-, Pd-, Rh-doped SnO2, In2O3 and mixed In2O3–SnO2).hese sensing elements have been synthesized by the sol–gelethod [10] and deposited by spin coating onto 2 mm × 2 mm
ilicon substrates equipped by Pt heater and interdigitated elec-rodes. In Fig. 1 some details of the realized microsensors arehown.
The sensors, working at a constant temperature of 350–00 ◦C, were put into a suitable airtight test chamber. Theirlectrical current signals (under constant polarization) wereonitored under exposure to the headspace of the engine oil
amples contaminated in controlled way by diesel fuel and underext recovery in dry air. The total flow was kept constant at00 sccm. The experimental setup used for the gas sensor testingonsists of a mass flow controller (MFC) and a dry air cylin-er from which a constant air flow is drawn by the use of twolectrovalves, first into the vial, where the liquid phase of theuel is in equilibrium with the vapour phase, and next into theest chamber for sensor recovering in dry air. In this way dur-ng the measuring period the sample volatiles are stripped fromhe vial into the test chamber by the carrier gas and the sensoresponses acquired; next, the vial is isolated in order to restorehe headspace composition meanwhile the sensors recover toaseline values. During the tests, the vial was kept at a con-tant room temperature by a thermostatic tank. Fig. 2 shows the
xperimental apparatus for the electrical characterization of theas sensor array towards the volatiles of engine oil samples (a)nd a typical sensor electrical signal acquired by using the aboveescribed measurement mode (b).
S. Capone et al. / Sensors and Actuators B 131 (2008) 125–133 127
F nsors de.
2
fpfS(becigIsHt7
iTtb3s
3
3
ta
ig. 2. (a) Experimental apparatus for the electrical characterization of the gas seignal acquired by using a dynamic stripping of headspace as measurement mo
.3. HS-SPME/GC/MS method
A new SHS-SPME/GC/MS method has been optimizedor the qualitative determination of volatile diesel fuel com-onents into the engine oil samples. They were analysedor the qualitative determination of volatile compounds byHS-SPME/GC/MS. SPME 75 �m CAR (carboxen)-PDMSpolydimethylsiloxane), 100 �m PDMS and 50/30 �m divinyl-enzene/carboxen/PDMS fibers were used and exposed tongine oil sample in 20 ml gastight vials at 21 ◦C in order tohoose the best SPME fiber. After this, one fiber was desorbedn a split/splitless injector, equipped with deactivated SPMElass inserts, and analyses were carried out on a 30 m × 250 �mD × 0.25 �m HP INNOVAX polyethyleneglycol column. A GC
ystem HP 6890 Series, Agilent Technologies, was coupled withP 5973 mass selective detector, Agilent Technologies. Injec-ion was split 100:1 with 5-min relay time. GC conditions were:5 ◦C for 10 min, 180 ◦C at 5 ◦C/min, then 6 min at 180 ◦C;
apma
array towards the volatiles of engine oil samples and (b) typical sensor electrical
njector temperature was 250 ◦C, helium flow was 1 ml/min.ransfer line was held at 260 ◦C. Spectra were produced in
he electron impact mode at 70 eV. Compounds were identifiedy comparison with NIST reference spectra. Mass range was0–350 amu, solvent delay time was 4 min, threshold 150 andcan rate 4.45 scan/s.
. Results and discussion
.1. Gas sensor analysis
The first explanatory gas-sensing tests were carried out onwo generic different types of commercial engine oils (labeleds A and B). In Fig. 3a the dynamic responses of the 8-gas sensors
rray to oil A contaminated with 5% diesel fuel are shown. Asreviously underlined, the array was exposed alternatively to theixture dry air/oil vapours and solely to the dry air (10 min dryir/oil vapours + 20 min dry air). An increase in conductance of

128 S. Capone et al. / Sensors and Actu
F5t
tonArFirIprcstio
ssapociefd
std
dtcfstsa(
cphdcd
tsftisignal. In this case the features are the approximation coef-ficients related to the lowest frequency components of thesignal.
ig. 3. (a) Dynamic responses of the sensor array to oil A contaminated with% of diesel fuel and (b) mean of sensor responses (defined as Ivapours/Iair) vs.he percentage of diesel fuel in engine oil samples.
he sensors, when exposed to the mixture fresh air/oil vapour wasbserved for all the tested engine oil samples both uncontami-ated and contaminated by diesel fuel in different percentages.fterwards, a reversible recovery at the conductance equilib-
ium value was observed, when the array was exposed to dry air.or each oil sample, the vial headspace was sampled more times
n order to test the measurement repeatability. Here, the sensoresponse was defined as the relative parameter Ivapours/Iair, wherevapours and Iair are the steady-state electrical current values inresence of engine oil vapours and in dry air, respectively. Theesults demonstrated that the sensor responses Ivapours/Iair remainonstant within the experimental errors. By calculating for eachensor the mean of the repeated responses, we also found thathe sensor response increases when the percentage of contam-nation by fuel is increased (Fig. 3b). Analogous results werebtained for oil samples B.
The composition of the vial headspace of each engine oilample constitutes the “chemical pattern” of this ambient con-isting of volatile chemical species coming both from lubricantnd fuel. Due to the higher volatility of fuel components as com-ared to the volatility of engine oil components, the headspacef an engine oil contaminated by fuel will be rich in volatileompounds of fuel. The concentration of the fuel volatiles will
ncrease at increasing the level of fuel contamination into thengine oil. Hence, due to a diversified headspace enrichment ofuel chemical species in engine oil samples contaminated withifferent percentage of fuel, we expected an ability of the gasFa
ators B 131 (2008) 125–133
ensor array to distinguish the different “chemical patterns” ofhe differently contaminated engine oils, by applying suitableata analysis techniques.
In this work we applied the following typical steps forata analysis on sensor responses: (1) signal pre-processingo remove noise signal and frequency components where driftontamination is present; (2) feature extraction to extract use-ul information less redundant than the original data set and topeed up processing and pattern classification; (3) normalisationo remove as much as possible any concentration effects in theample; (4) Application of principal component analysis (PCA)nd self-organizing maps (SOM) to analyse the data structure;5) Classification based on support vector machines (SVM).
Signal pre-processing was performed by means of dis-rete wavelet transform (DWT). DWT provides a multi-scalerocessing analysis where the signal is split into low- andigh-frequency components at different frequency bands withifferent resolutions. Once the signal components, where driftontamination was present, were selected and discarded, therifting signal was recovered to subsequently data analysis.
Two different feature extraction methods were consideredo check if the system’s capability to discriminate the differentamples depends also on the method of extracting parametersrom the sensor signals. A first method considered the rela-ive parameters Ivapours/Iair as feature set. A second methods based on discrete wavelet transform analysis of the sensor
ig. 4. PCA score plot for oil A based as extracted feature on: (a) the DWTpproximation coefficients and (b) the relative parameter Ivapours/Iair.

S. Capone et al. / Sensors and Actu
Fa
Ps
vdbrmPpadS(litotp
apc
eowfswccimtmasdTnfucBaacause a false detection of fuel contamination. The complexity ofthe data in the specific application may make difficult the dataclustering process.
ig. 5. PCA score plot for oil B based as extracted feature on: (a) the DWTpproximation coefficients and (b) the relative parameter Ivapours/Iair.
Next, different kinds of analysis were carried out by usingCA and neural networks such as self-organizing maps andupport vector machine (SVM).
The PCA analysis is purely qualitative and it is used only forisualization purposes. The discrimination among the differentiesel-contaminated engine oil samples is evident in Fig. 4a and, where the PCA results for the engine oil samples labeled A areeported. In particular, we performed PCA by projecting the nor-alized data onto the first three principal components. In eachCA score plots the data clusters related to the engine oil sam-les contaminated with 0.1%, 5%, and 10% (v/v) of diesel fuelre separated from the uncontaminated engine oil. Moreover, airection of increasing of the percentage of fuel can be found.imilar results were obtained for engine oil samples labeled BFig. 5a and b). In fact, also the samples of oil B with differentevels of diesel contamination can be distinguished. They resultn placed progression along a preferential direction of fuel con-amination increasing and separated from the uncontaminatedil samples. However, for this oil B, the data cluster relatedo the uncontaminated oil sample does not seem to follow thisrogression.
PCA performed on the whole data set of oils A and B showed
n interesting data structure (Fig. 6). Looking at PCA scorelot based on DWT approximation coefficients (Fig. 6a) wean observe that there is only one direction along which all theFD
ators B 131 (2008) 125–133 129
ngine oil samples contaminated with an increasing percentagef diesel fuel are progressively distributed. Moreover, areas, inhich oil samples of both types A and B with the same level of
uel contamination are placed, can be marked off. Also in PCAcore plot based on the relative parameters Ivapours/Iair (Fig. 6b)e can identify some areas associated with a fixed level of fuel
ontamination. In this case, two different directions of fuel per-entage increasing, one for oil A and the other for oil B, can bedentified. For a fixed percentage of fuel in the liquid engine oil
atrix, also different concentrations of fuel volatile species inhe engine oil headspace due to different viscosities of the oil
atrix, are supposable. Nevertheless, in both explanatory PCAnalysis, data clusters seem to arrange according to a geometrictructure reflecting the different fuel contamination level and theifferent headspace composition of engine oil of different types.aking into account that it is desirable that the system recog-izes the presence of fuel in the lubricating oil independentlyrom the type of oil, such geometry in data structure could beseful for the definition of a classification algorithm. However, itan be noticed that only the cluster related to uncontaminated oilplaces itself not closed to the uncontaminated oil A, but in an
rea of fuel-contaminated oils. Even if this may be imputable towrong contamination or some experimental problems, it could
ig. 6. PCA score plot for oils A and B based as extracted feature on: (a) theWT approximations coefficients and (b) the relative parameter Ivapours/Iair.
1 Actu
lcscccavc[bTiwmEntBtcft
tuSoihrcaAac
batleFwmtocadAtc
itboeh
tttcMcd
pt
Fo
30 S. Capone et al. / Sensors and
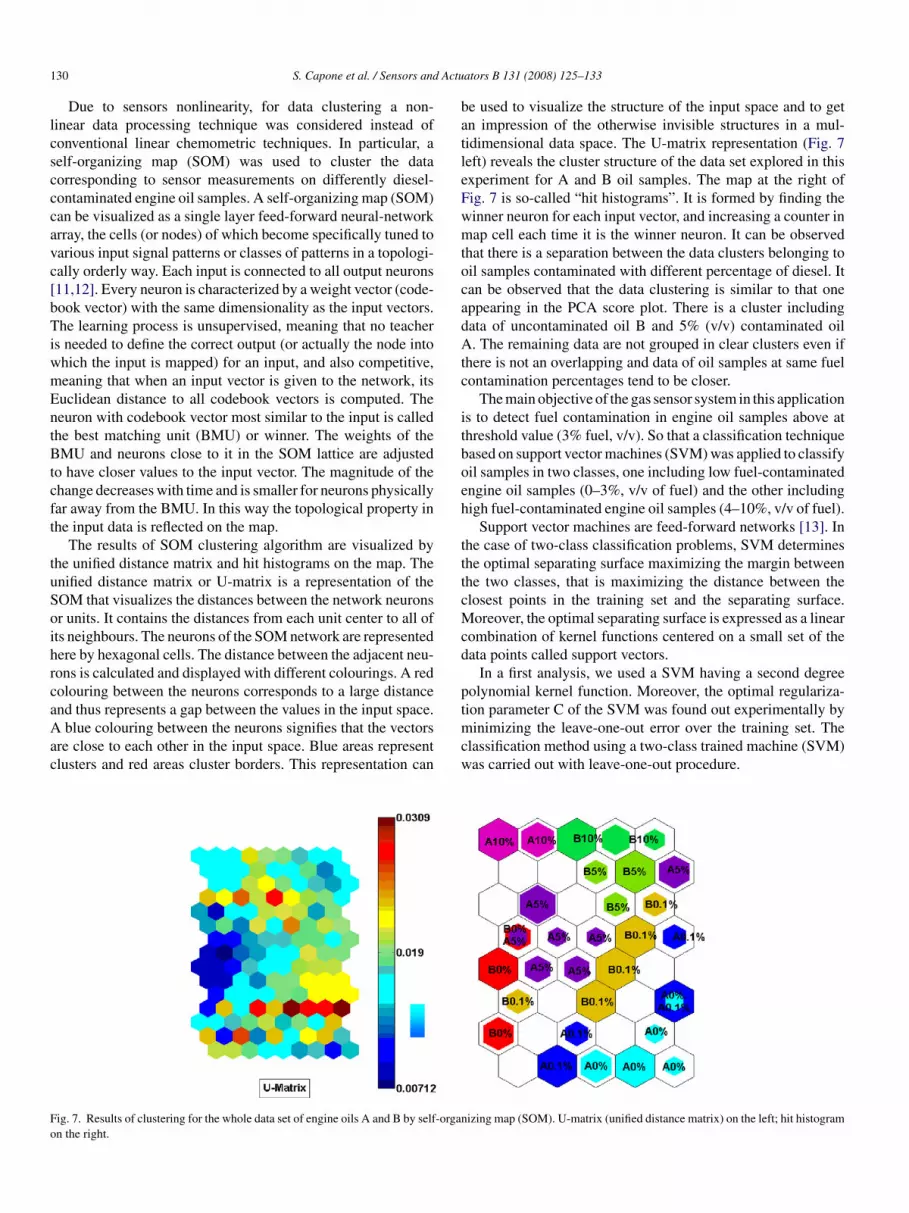
Due to sensors nonlinearity, for data clustering a non-inear data processing technique was considered instead ofonventional linear chemometric techniques. In particular, aelf-organizing map (SOM) was used to cluster the dataorresponding to sensor measurements on differently diesel-ontaminated engine oil samples. A self-organizing map (SOM)an be visualized as a single layer feed-forward neural-networkrray, the cells (or nodes) of which become specifically tuned toarious input signal patterns or classes of patterns in a topologi-ally orderly way. Each input is connected to all output neurons11,12]. Every neuron is characterized by a weight vector (code-ook vector) with the same dimensionality as the input vectors.he learning process is unsupervised, meaning that no teacher
s needed to define the correct output (or actually the node intohich the input is mapped) for an input, and also competitive,eaning that when an input vector is given to the network, itsuclidean distance to all codebook vectors is computed. Theeuron with codebook vector most similar to the input is calledhe best matching unit (BMU) or winner. The weights of theMU and neurons close to it in the SOM lattice are adjusted
o have closer values to the input vector. The magnitude of thehange decreases with time and is smaller for neurons physicallyar away from the BMU. In this way the topological property inhe input data is reflected on the map.
The results of SOM clustering algorithm are visualized byhe unified distance matrix and hit histograms on the map. Thenified distance matrix or U-matrix is a representation of theOM that visualizes the distances between the network neuronsr units. It contains the distances from each unit center to all ofts neighbours. The neurons of the SOM network are representedere by hexagonal cells. The distance between the adjacent neu-ons is calculated and displayed with different colourings. A redolouring between the neurons corresponds to a large distancend thus represents a gap between the values in the input space.
blue colouring between the neurons signifies that the vectorsre close to each other in the input space. Blue areas representlusters and red areas cluster borders. This representation can
mcw
ig. 7. Results of clustering for the whole data set of engine oils A and B by self-organn the right.
ators B 131 (2008) 125–133
e used to visualize the structure of the input space and to getn impression of the otherwise invisible structures in a mul-idimensional data space. The U-matrix representation (Fig. 7eft) reveals the cluster structure of the data set explored in thisxperiment for A and B oil samples. The map at the right ofig. 7 is so-called “hit histograms”. It is formed by finding theinner neuron for each input vector, and increasing a counter inap cell each time it is the winner neuron. It can be observed
hat there is a separation between the data clusters belonging toil samples contaminated with different percentage of diesel. Itan be observed that the data clustering is similar to that oneppearing in the PCA score plot. There is a cluster includingata of uncontaminated oil B and 5% (v/v) contaminated oil. The remaining data are not grouped in clear clusters even if
here is not an overlapping and data of oil samples at same fuelontamination percentages tend to be closer.
The main objective of the gas sensor system in this applications to detect fuel contamination in engine oil samples above athreshold value (3% fuel, v/v). So that a classification techniqueased on support vector machines (SVM) was applied to classifyil samples in two classes, one including low fuel-contaminatedngine oil samples (0–3%, v/v of fuel) and the other includingigh fuel-contaminated engine oil samples (4–10%, v/v of fuel).
Support vector machines are feed-forward networks [13]. Inhe case of two-class classification problems, SVM determineshe optimal separating surface maximizing the margin betweenhe two classes, that is maximizing the distance between thelosest points in the training set and the separating surface.oreover, the optimal separating surface is expressed as a linear
ombination of kernel functions centered on a small set of theata points called support vectors.
In a first analysis, we used a SVM having a second degreeolynomial kernel function. Moreover, the optimal regulariza-ion parameter C of the SVM was found out experimentally by
inimizing the leave-one-out error over the training set. Thelassification method using a two-class trained machine (SVM)as carried out with leave-one-out procedure.
izing map (SOM). U-matrix (unified distance matrix) on the left; hit histogram

S. Capone et al. / Sensors and Actuators B 131 (2008) 125–133 131
Fo
sHwoI
itdpwbc
3
fPd
Fl
Fp
tc(mvFclvus
B
ig. 8. Overlapping of chromatograms of 5% diesel fuel-contaminated engineil analysed with different fibers.
In case of classification of engine oil samples belonging to aame oil matrix (oils A or B), all data were correctly classified.owever, if the train data set belongs to a class of engine oilhile the test data set belongs to another class of engine oil, theil samples contaminated at 5% (v/v) of fuel were misclassified.n this case misclassification rate was 42%.
Therefore, the results of classification confirm a difficultyn the generalization of the classification procedure if differentypes of engine oils are analysed. The misclassification may beue to a certain effect of the different chemical and physicalroperties of the various kinds of engine oil. In future work itill try to improve the classification performance, for exampley selecting the suitable sensors more sensitive to diesel fuelhemical components using the information of GC/MS analysis.
.2. SHS-SPME/GC/MS analysis
Different fibers were compared for the determination of diesel
uel-contaminated engine oils. SPME 75 �m CAR (carboxen)-DMS (polydimethylsiloxane), 100 �m PDMS and 50/30 �mivinylbenzene/carboxen/PDMS fibers were used and exposedig. 9. Comparison of peak average area of volatile compounds in A and Babeled engine oils.
Bitt
Fe
ig. 10. Comparison of peak average area of decane in A engine oil at differentercentages of diesel fuel contamination.
o engine oil sample in 20 ml gastight vials at 21 ◦C in order tohoose the best SPME fiber. A 75 �m CAR (carboxen)-PDMSpolydimethylsiloxane) (black code, Supelco) fiber was experi-entally found to be the fiber that is apt to determine different
olatile compounds in diesel fuel-contaminated engine oil. Inig. 8 we report the overlapping of chromatograms of 5% fuel-ontaminated engine oil analysed with different fibers. The blackine chromatogram highlights a good resolution of peaks ofolatile compounds in the headspace of the sample with these of black fiber. Moreover the black fiber seems to be moreensible and with a low detection limit.
Next, we analysed two different kinds of oil, labeled A and. In Fig. 9, the different composition of engine oils A andare reported, in fact there is no p-xylene in oil B. After the
dentification of the typical volatile compounds of the uncon-aminated A and B engine oils samples, as shown in this figure,he composition of the engine oil samples contaminated with
ig. 11. Comparison of peak average area of some volatile compounds in Bngine oil at different percentages of diesel fuel contamination.

1 Actu
dvaeeiebpe
hfFuobirr
4
dgfataoot
otdp
ast
ptppimo
dcIooe
r
A
Fpe
R
[
[
[
[
B
SvNaowaa
32 S. Capone et al. / Sensors and
ifferent percentages of diesel fuel have been carried out. Someolatile compounds as decane, toluene, ethylbenzene, p-xylene,nd o-xylene were chosen as markers of contamination and, asxpected, it has been found that, in particular for the decane, thethylbenzene and the o-xylene, the concentration increases whenncreasing the percentage of contamination by diesel fuel in thengine oil B. The trend not increasing, observed for toluene, cane due probably to the saturation of the absorption of this com-ound by the fiber. The same results have been observed with Angine oil, as reported (Figs. 10 and 11).
A different composition found by GC/MS analysis in theeadspace of the two kinds of engine oil confirms the dif-erent response of the sensor array to these oils, shown inig. 6. In fact, in PCs space the data clusters related to thencontaminated oils A and B are separated between them. More-ver, a composition richer in species typical of fuel, foundy GC/MS analysis, in engine oil samples contaminated byncreasing percentage of fuel reflects into the separation of theelated data clusters in the PCA score plot based on the sensoresponses.
. Conclusions
A novel method for analysing the contamination by unburnediesel fuel in engine oils based on an array of resistive type MOXas sensors was evaluated here. The results showed that differentuel-contaminated engine oils can be discriminated by the sensorrray. However, a lot of work has to be done in order to optimizehe sensor array configuration for this application. The sensorrray seems to have an intrinsic capability to detect the presencef fuel in engine oil, but a wider set of data on different types ofils are necessary in order to test the effective performance ofhe sensor array.
Therefore, next work will be addressed to study the effectf engine oil matrix on the detection of fuel contamination byhe system. At this aim, a systematic measurement protocol onifferent certified categories of commercial engine oils, will belanned.
The engine oil ageing with mileage will also be taken intoccount by considering used engine oil samples in order totudy how the other causes of oil degradation may influencehe detection of fuel in oil matrix.
This approach looks forward to the development of a novelortable, cheap and easy-to-use electronic device for automo-ive applications. Work is in progress in order to design suchortable electronic device to be used off-board by taking a sam-le of engine oil from the oil sump and carrying out the analysisn garage. Next efforts will be devoted to develop a system to
easure the level of contamination of engine oil by fuel also forn-board automotive application.
Moreover, in this work a new analytical method has beeneveloped for the qualitative determination of diesel fuel-ontaminated engine oil with SHS-SPME–GC/MS technique.
ndeed, some volatile compounds have been individuated inrder to discriminate different contaminated samples of engineil. The SHS-SPME–GC/MS method also discriminated differ-nt matrix of engine oil.astaj
ators B 131 (2008) 125–133
Future work will also consider data fusion between sensoresponses and gas chromatographic data.
cknowledgment
This work was fully funded by Italian Government MIURAR Project “Messa a punto di un sistema di rivelazione dellaresenza di carburante nell’olio motore in sistemi meccanicindotermici”.
eferences
[1] T. Rauckyte, D.J. Hargreaves, Z. Pawlak, Determination of heavy metalsand volatile aromatic compounds in used engine oils and sludges, Fuel 85(2006) 481–485.
[2] European Patent Application, EP 1 363 123 A2, Bulletin 2003/47, Applica-tion number: 03076292.6, Method for predicting engine oil contamination,Applicant: Delphi Technologies, Inc. Troy, MI 48007, US (November 19,2003).
[3] E. Irion, K. Land, T. Gurtler, M. Klein, Oil-quality prediction and oil-level detection with the Temic QLT-sensor leads to variable maintenanceintervals, SAE, Tech. Paper 970 847.
[4] S.S. Wang, Road tests of oil condition sensor and sensing technique, Sens.Actuator B 73 (2/3) (2001) 106–111.
[5] B. Jakoby, M. Scherer, M. Buskies, H. Eisenschmid, An automotive engineoil viscosity sensor, IEEE Sens. J. 3 (5) (2003) 562–568.
[6] A. Agoston, C. Otsch, B. Jakoby, Viscosity sensors for engine oil conditionmonitoring—application and interpretation of results, Sens. Actuator A 121(2005) 327–332.
[7] ASTM D322, Standard Testing Method for Diesel Fuel Diluent in UsedDiesel Fuel Engine Oils by Distillation, American Society for Testing andMaterials, Philadelphia, PA, 1980.
[8] M. Ichikawa, N. Nonaka, M. Nomura, I. Takada, S. Ishimori, J. Anal. Appl.Pyrolysis 32 (1995) 233–242.
[9] C. Ulrich, H. Petersson, H. Sundgren, F. Bjorefors, C. Krantz-Rulcker,Simultaneous estimation of soot and diesel contamination in engine oilusing electrochemical impedance spectroscopy, Sens. Actuator B 127(2007) 613–618.
10] M. Epifani, R. Dıaz, J. Arbiol, P. Siciliano, J.R. Morante, Solution syn-thesis of thin films in the SnO2–In2O3 system: a case study of the mixingof sol–gel and metal-organic solution processes, Chem. Mater. 18 (2006)840–846.
11] S. Haykin, 9. Self-organizing maps, in: Neural Networks—A Comprehen-sive Foundation, 2nd edition, Prentice-Hall, 1999, ISBN 0-13-908385-5.
12] S. Marco, A. Ortega, A. Pardo, J. Samitier, Gas identification with tin oxidesensor array and self-organizing maps: adaptive correction of sensor drifts,IEEE Trans. Instrum. Meas. 47 (1) (1998).
13] C. Distante, N. Ancona, P. Siciliano, Support vector machines for olfactorysignals recognition, Sens. Actuator B 88 (2003) 30–39.
iographies
imonetta Capone (born in 1970) completed her university studies at the Uni-ersity of Lecce and she get her degree in physics (summa cum laude) in 1996.ext she attended regularly the PhD course in physics at the University of Lecce
nd in 2000 she get PhD degree by discussing an experimental thesis on metalxides based gas sensors for applications in electronic nose. From 2002 sheorks as researcher in permanent position at the Institute for Microelectronic
nd Microsystems (IMM-CNR) in Lecce. Her principal interests regard the char-cterization of novel nanostructured materials for applications as gas sensors
nd the development of innovative miniaturized devices based on multisensorystems for applications in the control of air quality and industrial combus-ion processes, environmental monitoring and in the control of the food qualitynd safety. She is co-author of about 50 scientific publications on internationalournals, 1 book chapter, numerous conferences proceedings and presentations
Actu
ts
MSEid
DUcCG“Sea
LsPte(
iScacm
Fwissor
P1Uirently a senior member of the National Council of Research in Lecce, where he
S. Capone et al. / Sensors and
o international conferences. She is involved in many national and Europeancientific projects.
arzia Zuppa received her degree in physics in 2001 from University of Lecce.he is a PhD student in Energetic System and Environment at the Innovationngineering Department of the University of Lecce. Her current research interest
s in the field of signal processing for chemical sensor data of miniaturizedevices for environment quality control.
ominique S. Presicce received her degree in chemistry with full marks at theniversity of Bari (Italy) on March 1998 with experimental thesis on analytical
hemistry in collaboration with the Institute of Toxins and Mycotoxins of theNR (National Research Council), Bari. She attended Venezia Tecnologie ENIroup (Marghera, Venice, Italy) for stage and research about the project on
Recovery of metals and recycle of the same”, by electrolitic depositions duringeptember–November 1999. She took a PhD degree in “Energetic systems andnvironment” and she had a collaboration with the Institute of Microsystemsnd Microelectronics.
uca Francioso received the degree in physics in April 2001 at the Univer-
ity of Lecce (Italy) and he pursued in the same university the engineeringh D degree in March 2006 with a thesis on silicon technologies applicationso automotive gas sensors. Since June 2001 he joined the Institute for Micro-lectronic and Microsystems Institute of the Italian National Research CouncilC.N.R.-I.M.M.) in Lecce (Italy) devoted to research activity in the field of sil-
hoSi
ators B 131 (2008) 125–133 133
con micromachined systems, thin film gas sensor and fabrication processes.ince February 2002 he is in the position of researcher, devoted to microma-hining silicon technology fabrication and MEMS nanostructures. He’s authornd co-author of more than 35 scientific journal publications and internationalonferences proceedings in the field of combustion monitoring sensors, sensorsicrofabrication processes and thin film sensors integration strategies.
lavio Casino born in 1969 is a qualified mechanic technician. Since 1994 heorks at the Institute for Microelectronics and Microsystems (I.M.M.-C.N.R.)
n Lecce. His activity regards the technical assistance during laboratory mea-urements and in the design and realization of mechanic components for vacuumystems and whole apparatus for the electrical and/or optical characterizationf gas and liquid sensors. He is expert in the facilities and security regulationselated to storage of gas cylinders and gas transport through pipeline systems.
ietro Siciliano, physicist, senior researcher, received his degree in physics in985 from the University of Lecce. He took his PhD in physics in 1989 at theniversity of Bari. During the first years of activities he was involved in research
n the field of electrical characterisation of semiconductors devices. He is cur-
as been working for many years in the field of preparation and characterisationf thin film for gas sensor and multisensing systems, being in charge of theensors and Microsystems Group. At the moment he is Director of IMM-CNR
n the Department of Lecce.