metabolomic analysis of atlantic blue crab, callinectes sapidus, hemolymph following oxidative...
TRANSCRIPT

1
Metabolomic Analysis of Atlantic Blue Crab, Callinectes sapidus, Hemolymph Following 1
Oxidative Stress 2
3
Tracey B. Schock1, David A. Stancyk2, Lindy Thibodeaux2, Karen G. Burnett2, Louis E. 4
Burnett2, Arezue F. B. Boroujerdi1, Daniel W. Bearden1 5
6
1National Institute of Standards and Technology, Analytical Chemistry Division, Hollings 7
Marine Laboratory, Charleston, SC 29412 8
2Grice Marine Laboratory, College of Charleston, Charleston, SC 29412 9
10
Corresponding Author 11
Daniel W. Bearden 12 National Institute of Standards and Technology 13 Analytical Chemistry Division 14 Hollings Marine Laboratory 15 331 Ft. Johnson Rd. 16 Charleston, SC 29412 17 [email protected] 18 19
Abbreviated title: Blue Crab Hemolymph NMR-based Metabolomics 20
21
Acknowledgments 22
We acknowledge the support of the Hollings Marine Laboratory NMR Facility. The report is 23
based in part upon research supported by the National Science Foundation under grants IOS-24
0725245 and DBI-0244007. 25
26

2
Abstract 27
The Atlantic blue crab, Callinectes sapidus, is an economically, ecologically and 28
recreationally valuable decapod crustacean that inhabits estuaries along the Atlantic and 29
Gulf coasts of the United States. In their natural environment, blue crabs are subjected to 30
many stressors including anthropogenic contaminants, viruses and bacteria. Bacterial 31
infection results in the depression of oxygen uptake, and impairs normal metabolic 32
function in a manner that has not yet been fully elucidated. Our laboratory is developing 33
NMR-based metabolomic tools for environmental research to discover metabolomic 34
biomarkers of stress in marine organisms. We have used NMR spectroscopy to compare 35
the response of the crab metabolome to depression of aerobic metabolism by injection of 36
Vibrio campbellii, versus elevation of aerobic metabolism by treatment with 2,4-37
dinitrophenol (DNP), a known uncoupler of oxidative phosphorylation. The corresponding 38
NMR spectral variations between crab treatments were evaluated using chemometric tools 39
for pattern recognition and biomarker identification, including principle components 40
analysis (PCA) and partial least-squares (PLS) analysis. Significant metabolic changes 41
were identified in crab hemolymph 30 min after injection with V. campbellii. Glucose, 42
considered a reliable indicator for biological stress in crustaceans, provided the largest 43
variation in the metabolome. While biological variability and/or tight regulation of the 44
hemolymph masked subtle metabolic changes at individual time-points, metabolic 45
trajectory analysis revealed clear differences between the two modes of oxidative stress, 46
providing insight into the biochemical pathways involved. 47
Keywords: Metabolomics, Metabonomics, NMR, Environmental, Blue crab, Oxidative 48
stress, Callinectes sapidus, Hemolymph 49
3
Introduction 50
51
Metabolomics is a systematic study of the endogenous, small-molecule metabolites involved in 52
specific biological processes, providing an assessment of the physiological status of an organism 53
Metabolomic analysis is currently applied in medicine, toxicology and environmental sciences. 54
The development of metabolomics as an environmental research tool holds great promise for 55
contributions to environmental risk analysis (Ekman et al., 2008), discovery of new biological 56
insights (Bundy et al., 2002), and for developing environmental system models (Viant, 2008, 57
Bundy et al., 2008). Here we have applied NMR-based metabolomics to assess the response of 58
the Atlantic blue crab, Callinectes sapidus, to different oxidative stresses. 59
60
The Atlantic blue crab, Callinectes sapidus, is economically, ecologically, and recreationally 61
valuable along the Atlantic and Gulf coasts of the United States. The blue crab population is 62
currently declining due to heavy fishing, pollution and slowly warming waters (Zohar et al., 63
2008). Methods for evaluating the health of these crustaceans can provide vital data for natural 64
resource managers who are charged with maintaining robust natural populations of blue crabs. 65
Such assessments of crustacean health also reflect coastal ecosystem health and may serve as 66
early warning indicators of ecosystem failure. 67
68
In the wild, crabs are constantly exposed to anthropogenic (toxicants from pollution) and natural 69
(predation, virus and bacteria) stressors. Bacteria are abundant in the ocean reaching ~109 70
culturable bacteria L-1 seawater (Fuhrman, 1999) and are found in 75% of “unstressed” healthy 71
crabs that are considered marketable. Many of the bacteria that infect crabs are of the Vibrio 72
4
species (Welsh and Sizemore, 1985). Burnett et al. (2006) determined that crabs injected with 73
Vibrio campbellii displayed a 43% decline in the overall flux of oxygen into the crab within 30 74
min to 1.5 h post injection. This decrease in oxygen uptake was associated with a significant 75
reduction in oxygenation of hemolymph at the gills. The reduced oxygen uptake may be a 76
consequence of the crab’s immune response, in which hemocytes rapidly aggregate in the 77
presence of foreign particles. These aggregates become trapped in the fine vasculature of the gill, 78
where they melanize and consequently compromise the ability of the gill to exchange gases and 79
take up ions (Martin et al., 2000). Long term effects may result in reduced survival performances 80
such as migration, feeding and predator avoidance, with an increased effect when organisms are 81
located in hypoxic environments. 82
83
In contrast to the effects of bacterial stress, exposure of C. sapidus to a chemical uncoupler of 84
oxidative phosphorylation, inhibiting the production of ATP, resulted in an increase of oxygen 85
uptake (Fox and Rao, 1978). Environmental contaminants such as 2,4-dinitrophenol (DNP) and 86
pentachlorophenate (PCP) cause this toxic biochemical effect. Tjeerdema et al. (1991) used in 87
vivo 31P NMR and gas chromatography (GC) to show that injection of PCP in the foot muscle of 88
red abalone (Haliotis rufescens) led to an accumulation of tricarboxylic acid (TCA) cycle 89
intermediates (citrate, succinate and malate) and glycolytic products (lactate, alanine, and 90
glycerol 3- phosphate). Chemical pollutants, such as DNP and PCP, are capable of affecting a 91
marine organisms’ normal metabolic function (Martello et al., 2000). 92
93
In the present study we tested the hypothesis that changes in aerobic metabolism will exhibit the 94
different modes of action associated with bacterial infection versus chemical uncoupling of 95

5
oxidative phosphorylation in crab hemolymph. The corresponding NMR spectral variations 96
between individual crabs were investigated using chemometric tools for pattern recognition and 97
biomarker identification, including principal components analysis (PCA) and partial least-98
squares analysis (PLS). 99
100
Methods 101
102
Test Animals and Preparation 103
Adult male blue crabs (80-140 g) were trapped daily in tidal creeks feeding Charleston Harbor, 104
Charleston, SC, from June through the end of July 2008. Crabs were held and kept alive at the 105
Hollings Marine Laboratory in recirculating seawater at 30 parts per thousand (ppt) (w/v) salinity 106
and 20-22 °C with a 12 hour light cycle for at least 3 days and no longer than 10 days prior to 107
experimentation. Frozen squid (bait or consumption grade, depending on availability) was fed to 108
the crabs on a daily basis, but food was withheld at least 24 h prior to the experiment. 109
110
Figure 1 provides a timeline for the experiment design. Twenty four hours prior to the 111
experiment, each crab was prepared for experimentation by drilling a 1.6 mm port through the 112
carapace over the heart for test injections and two 1.6 mm ports over the pericardium from which 113
hemolymph could be drawn. The ports were covered with latex to prevent infection. The crabs 114
were weighed and then placed into individual holding tanks with 1.5 L well-aerated 30 ppt (w/v) 115
seawater and a thin layer of sterilized gravel where they would remain throughout the 116
experiment. Immediately following preparation, a sample of hemolymph was extracted from a 117
pericardial port to assess baseline hemocyte counts and culturable bacteria for each crab (Macey 118

6
et al., 2008). Approximately 30% of the sampled crabs had detectable levels of culturable 119
bacteria and were not used in the experiment, although hemolymph was collected for 120
comparison. Four hours after preparation (t= -20 h in our protocol), a baseline hemolymph 121
sample was taken for NMR analysis and processed as described below. 122
123
2,4 – Dinitrophenol (DNP) Preparation and Dosage 124
A 2 g L−1 stock solution of DNP (Sigma-Aldrich, CAS:51-28-5) was prepared in 10 mmol L−1 125
HEPES 2.5 % (w/v) saline, pH 6.9. Crabs were injected with 3 µL DNP stock solution g−1 crab, 126
which delivered a final dose of 6 µg DNP g−1 crab. This dose was previously used by Fox and 127
Roa (1978) and is assessed for effectiveness in the experiment below. Control animals received 128
an injection of 1 µL g−1 crab of 10 mmol L-1 HEPES 2.5% (w/v) saline adjusted to pH 7.5. 129
Injection volumes never exceeded 450 µL. 130
131
Oxygen Uptake Analysis 132
To corroborate the analysis of Fox and Rao (1978) and examine the in vivo oxidative stress 133
response due to DNP exposure, oxygen uptake was measured in blue crabs following injection of 134
saline or DNP. Six crabs, not otherwise involved in the metabolomic study, were prepared for 135
injection as described previously and placed in individual containers 24 h before 136
experimentation. At the start of the experiment, an individual crab was placed in a flow-through 137
1.8 L circular, plexiglass respirometry chamber (17 cm wide, 8 cm high) lined with sterile 138
gravel, covered and left undisturbed for 2 h during which time seawater (30% oxygen saturation, 139
30 ppt salinity) was passed through the chamber. The chamber was then opened and the crab was 140
injected with the appropriate dose of saline or DNP directly into the ventricle. The chamber was 141
7
resealed, and oxygen uptake was measured continuously for 4 h at 25°C. The Po2 of seawater 142
entering and leaving the chamber was measured every 10 s using an oxygen electrode (Yellow 143
Springs Instruments, Yellow Springs, OH, USA) and a Sable System (Las Vegas, NV, USA) 144
data acquisition system. Filtered seawater entering the chamber was saturated with 30% oxygen 145
(31 kPa) to ensure that the oxygen pressure within the chamber did not drop below 80% air 146
saturation (16.5 kPa) when an animal was present in the chamber. Flow rates typically ranged 147
between 80 and 150 mL min−1. This procedure was repeated for each of the six crabs. 148
149
Vibrio campbellii Preparation and Dosage 150
Vibrio campbellii was prepared for injection as per Macey et al. (2008). From a frozen working 151
stock, V. campbellii was streaked onto tryptic soy agar (TSA) plates supplemented with 2.0% 152
NaCl (w/v), 100 µg mL-1 kanamycin A (Sigma-Aldrich) and 5 µg mL-1 chloramphenicol (Sigma-153
Aldrich) and grown overnight at 25°C. Bacteria from the streaked plate were resuspended in 5 ml 154
of sterile 10 mmol L-1 HEPES 2.5% (w/v) saline and adjusted to an optical density (OD) of 0.1 ± 155
0.005 at 540 nm, which equals a density of 1 × 10⁸ colony forming units (CFU) (Mikulski et al., 156
2000). Crabs were injected with 2.5 × 10⁴ V. campbellii g-1 crab. This dose assumes a 157
hemolymph volume of 0.25 mL g-1 body weight (Gleeson and Zubkoff, 1977), thus achieving a 158
circulating dose of 1 × 10⁵ colony-forming units of bacteria g-1 crab weight (Burnett et al., 2006). 159
This bacterial dose is approximately 1/25th of the LD50 of V. campbellii for C. sapidus (6.25 × 160
105 g-1 ), which is high enough to cause a significant depression of the oxygen consumption rate 161
and low enough to minimize the risk of mortality from infection during this experiment (Burnett 162
et al., 2006; Thibodeaux et al., submitted). 163
164

8
Intracardiac Injections of Treatments and Experimental Procedure 165
Crabs selected for metabolomics measurements, collected over a three week period, were 166
randomly assigned one of the following individual treatments: (1) Control: 1 µL g-1 crab HEPES 167
buffered saline (n=7), (2) DNP: approximately 6 µg g-1 crab DNP (n=8), or (3) Vibrio: 2.5 × 10⁴ 168
Vibrio campbellii g-1 crab (n=8) (Table 1). At approximately 24 h after preparation, the 169
designated treatments were injected directly into the ventricle of the heart to ensure rapid 170
distribution throughout the circulatory system (Figure 1). Hemolymph samples were taken over a 171
time course of 24 h post-injection, with sampling at t= -20 h (baseline samples, 4 h after crab 172
preparation), t= 30 min, t= 2 h and t= 4 h for each crab. At each sampling time point, 173
approximately 1 ml of hemolymph was withdrawn and placed in a microcentrifuge tube 174
containing 100 µl of 0.6 mmol L-1 hippurate in H2O as an internal standard. The sample was 175
immediately centrifuged at 16,000 × g for 15 s at 4°C to pellet hemocytes. The supernatant was 176
transferred to a centrifuge filter tube (Millipore™ Amicon Ultra-4 30K NMWL) to clot at room 177
temperature for 10 min. The tube was centrifuged at 5,100 × g for 10 min at 4°C. If a sufficient 178
volume did not pass through the filter, the clotted hemolymph was mixed with a spatula and spun 179
again for 5 min. The filtrate was flash frozen in liquid nitrogen, lyophilized and stored at -40°C 180
until analysis. Remaining clotted hemolymph was washed from the filter twice with 500 µL of 181
3:1 (v/v) methanol:H2O, and frozen at -40°C, but not analyzed in this report. 182
183
NMR Sample Preparation 184
A total of 102 (Table 1) lyophilized crab hemolymph samples were rehydrated with 1.0 mL 99.9 185
atom % D2O containing 1.0 mmol L-1 sodium 3-trimethylsilyl-2,2,3,3-d4-propionate (TMSP, 186
CAS: 24493-21-8), an internal chemical shift standard. Besides the baseline, treatment and 187
9
control samples, the sample set also included baseline samples from crabs with field bacterial 188
infection (n=10). Six hundred microliters of each sample was analyzed by NMR. 189
190
NMR Spectroscopy 191
NMR spectra of crab hemolymph samples were measured at a temperature of 305 K using a 192
Bruker Avance II 700 MHz spectrometer fitted with a cryogenically cooled probe. The data were 193
acquired with 65536 real data points across a spectral width of 14 ppm. Spectra were acquired 194
with a one-dimensional pulse sequence for water suppression based on the standard noesy 195
(noesypr1d) pulse sequence with 16 steady-state scans, 80 transients, a mixing time of 100 ms 196
and 3 s of relaxation delay for a total repetition time of 6.34 s. The spectra were processed by 197
multiplying the free induction decay by an exponential line broadening function of 0.3 Hz and 198
the data were zero-filled to 65536 complex points prior to Fourier transformation. Manual 199
phasing, baseline correction and calibration of the standard TMSP peak at 0.000 ppm were 200
performed. Peaks were assigned by comparison to chemical shift databases (Cui et al., 2008, 201
Ulrich et al., 2008) including an in-house compiled database, as well as, the SBASE-1-1-2 202
database included in AMIX (3.8.3), a Bruker software program for statistical and spectroscopic 203
analyses. Metabolite identification was confirmed by 2D 1H-13C heteronuclear single quantum 204
correlation (HSQC). 205
206
Data Analysis 207
Control Samples 208
Multivariate analysis was performed on the NMR spectra of the control (saline injected) crab 209
hemolymph samples (n=21) by separating the spectra into 1960 bins (0.005 ppm bin size) with 210
10
the exclusion of water (4.7 to 5.2 ppm) and the olefinic and aromatic region (5.3-10 ppm). 211
Further exclusions include the peaks at 3.97 ppm (hippuric acid, added as an internal standard) 212
and 3.25 ppm (trimethylamine-N-oxide (TMAO)), as well as the glycerol region (3.44-3.68 213
ppm). Thus, the reported analysis used a total of 953 bins. 214
215
Baseline Samples (Uninfected vs. Field-Infected) 216
The baseline hemolymph samples (t=-20 h) from uninfected crabs (n=22) were compared against 217
the baseline samples from field-infected crabs (n=9) using principal components analysis (PCA). 218
The exclusion parameters from above were applied in the analysis and statistically significant 219
differences of the PC scores of uninfected versus infected baseline samples were determined 220
using a two-tailed, unequal variance Student’s t-test (α= 0.05). 221
222
Challenge Samples 223
The hemolymph from crabs challenged with Vibrio and DNP injection were then analyzed by 224
time point (30 min, 2 h and 4h) against the corresponding saline injected controls by PCA. All 225
PCA exclusions from above were applied and a total of 953 bins were analyzed. Statistically 226
significant differences of the PC scores of challenges versus control at each time point were 227
determined using a Student’s t-test (α= 0.05). 228
229
Trajectory Analysis 230
Following the previous PC analysis, response trajectories were generated for male blue crabs 231
using cross validated partial least-squares analysis (PLS) within AMIX. All crabs (7 saline, 7 232
DNP and 8 Vibrio injected), including the baseline hemolymph samples (t= -20 h, n=22), were 233

11
incorporated in the analysis and the Y-table was populated with the time of hemolymph 234
sampling. The same exclusions as stated above were used in the analysis. A three-component 235
model was found optimal using cross validation. The mean and standard error were calculated 236
from the scores of each challenge at all time points. 237
238
Results and Discussion 239
240
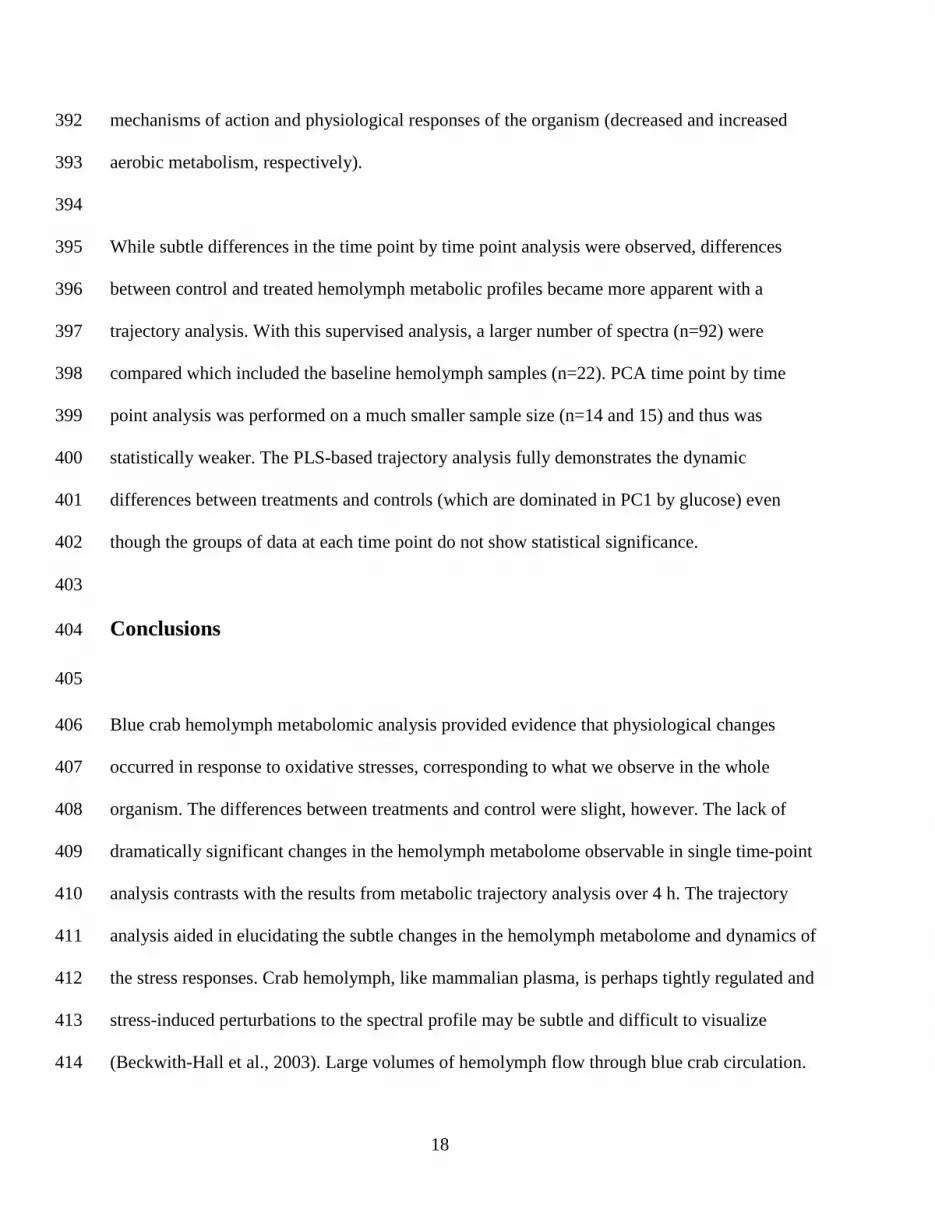
Because this is the first NMR-based metabolomic study of a marine decapod crustacean, it was 241
necessary to develop methods for preparing viscous, protein rich crab hemolymph samples 242
suitable for NMR analysis. Several variations were tested: with or without pelleting the 243
hemocytes, with or without centrifuge filtration (2 types), with or without hemolymph clotting, 244
and with or without lyophilization. Centrifuge filtration tubes yielded the best NMR samples by 245
removing large proteins and lipids that overlapped and masked many small metabolite NMR 246
signals (Figure 2). Deproteinization of serum samples by filtration has been used frequently to 247
prepare samples for metabolomics (Viant et al., 2003), although some investigators still prefer to 248
use pure serum and suppress protein signals by using the Carr-Purcell-Meiboom-Gill (CPMG) 249
NMR pulse sequence (Tiziani et al., 2008). However, CPMG pulse creates difficulties in 250
suppressing water and leads to distorted baselines due to spin-spin coupling resulting in 251
unsuitable spectra. The filtration technique yielded quality NMR data for analysis. 252
253
Effect of 2,4-Dinitrophenol on Oxygen Uptake 254
Measurement of oxygen consumption not only indicates overall metabolic rate, but also provides 255
an indication of stress conditions. The in vivo oxidative stress response due to DNP exposure in 256
12
C. sapidus was demonstrated before starting the trials. Oxygen uptake in all crabs was not 257
statistically different from one another preceding injection (Student’s t-test; α=0.05, p=0.512). 258
Injection of DNP caused a significant and sustained elevation in oxygen uptake over 4 h 259
compared to saline-injected crabs (Figure 3; two-way repeated measures ANOVA; α=0.05, 260
p<0.001). Oxygen uptake in DNP-injected crabs was elevated by 42% above saline-injected 261
crabs after only 20 min and remained elevated for 4 h after injection. 262
263
NMR Analysis 264
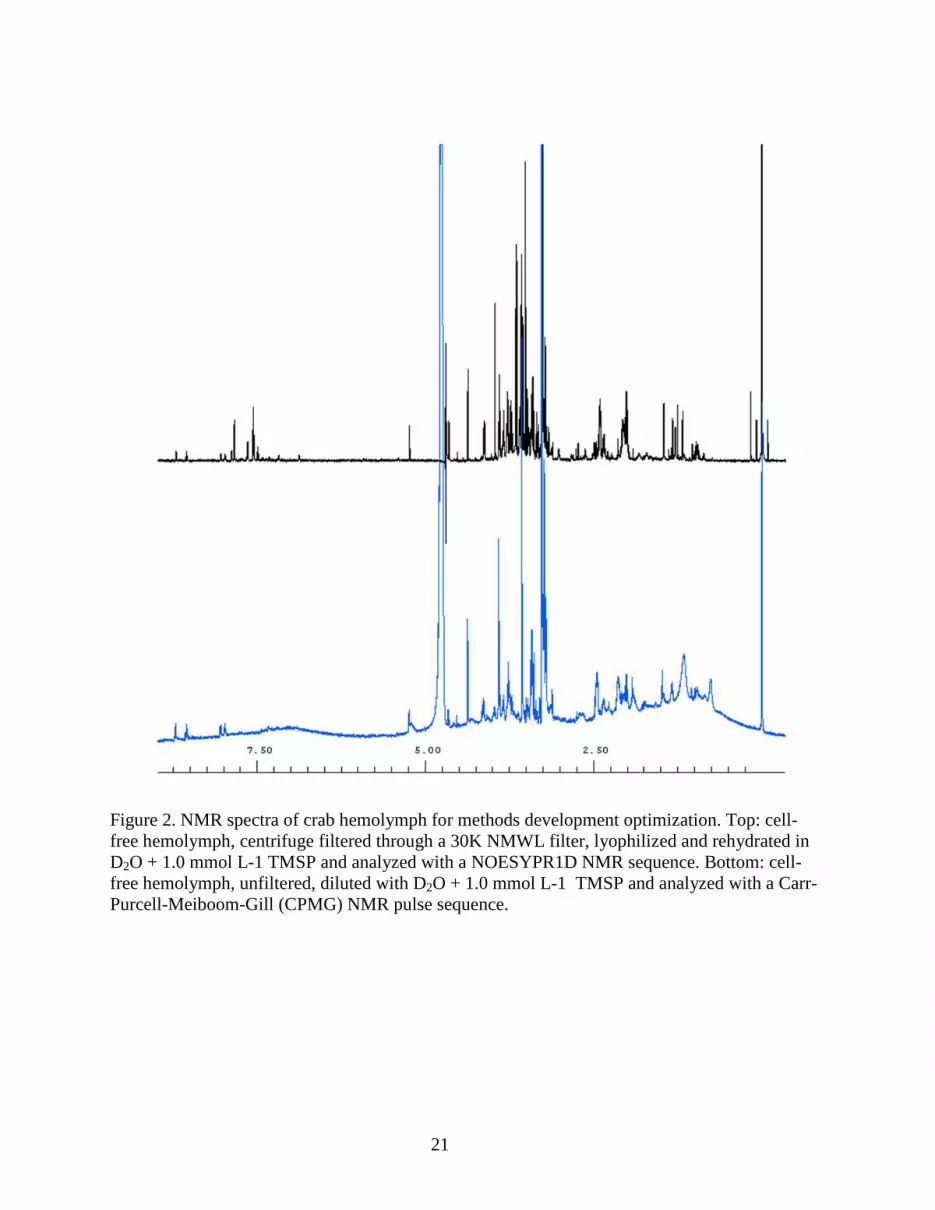
NMR spectra of C. sapidus hemolymph contained a large number of metabolite peaks (Figure 4) 265
including amino acids (e.g. alanine and glutamine), organic acids (e.g. acetate and 3-266
hydroxybutyrate), carbohydrates (e.g. glucose), glycolytic products (e.g. lactate), and organic 267
osmolytes (e.g. betaine and TMAO). Several peaks within the spectra shift from hemolymph 268
sample to hemolymph sample which is presumably caused by small changes in pH or ionic 269
strength. Shifting peaks may have been avoided by rehydration of the lyophilized hemolymph 270
with a phosphate buffer to maintain a common pH, but even then, pH related shifts are known to 271
occur. Our starting samples were highly saline, as expected for hemolymph from a marine 272
organism, resulting in large proton pulse widths. We decided not to rehydrate in buffer since it 273
would further increase the salt concentration, degrading instrument performance. 274
275
Statistical Analysis 276
Control Samples 277
There was great individual biological variation from crab to crab. Statistical analysis of the 278
multivariate loadings of control (saline injected) samples (n=21) provided evidence that several 279

13
metabolites varied in concentration as the experiment progressed; this analysis included the 280
exclusion of water (4.7 to 5.2 ppm) and the olefinic and aromatic region (5.3-10 ppm) where few 281
peaks were observed. Outlying metabolite bins within the control samples required several more 282
exclusions in order to develop a compact control group for the loadings so that intense peaks did 283
not dominate the analysis: peaks at 3.97 ppm (hippuric acid, added as an internal standard) and 284
3.25 ppm (trimethylamine-N-oxide (TMAO)), as well as the glycerol region (3.44-3.68 ppm) 285
which contains a shifting glycine peak. All spectra for the field infected crabs and crab #103 286
were not included in the analysis; crab #103 was left out specifically due to elevated levels of 287
lactate throughout the study. 288
289
Baseline Samples (Uninfected vs. Field-Infected) 290
A comparison of the baseline samples (t= -20 h) from field infected and uninfected crabs 291
revealed a significant separation (p=0.04) in the scores plot of PC1 (Figure 5). In this analysis, 292
crab #87 (field infected) was excluded due to a very high concentration of acetate. The explained 293
variance (39.9%) for PC1 was driven by an increase in lactate in the bacteremic crabs, according 294
to the loadings (Figure 5). This suggests that the infected crabs are utilizing anaerobic 295
mechanisms of metabolism for energy production. Scholnick et al. (2006) reported that Vibrio-296
injected shrimp (Litopenaeus vannamei) experience a large depression in aerobic metabolism 297
and a small but significant increase in anaerobic metabolism as judged by the accumulation of 298
lactate in the tissues of injected shrimp. Unfortunately, employing lactate as a biomarker of 299
bacteremia alone may not be practical given that the situation may be similar to oxygen depletion 300
in organisms in hypoxic environments or exercising crabs with hypoxic tissues. However, lactate 301

14
may be an excellent common marker of metabolic depression in environmentally stressed 302
crustaceans. 303
304
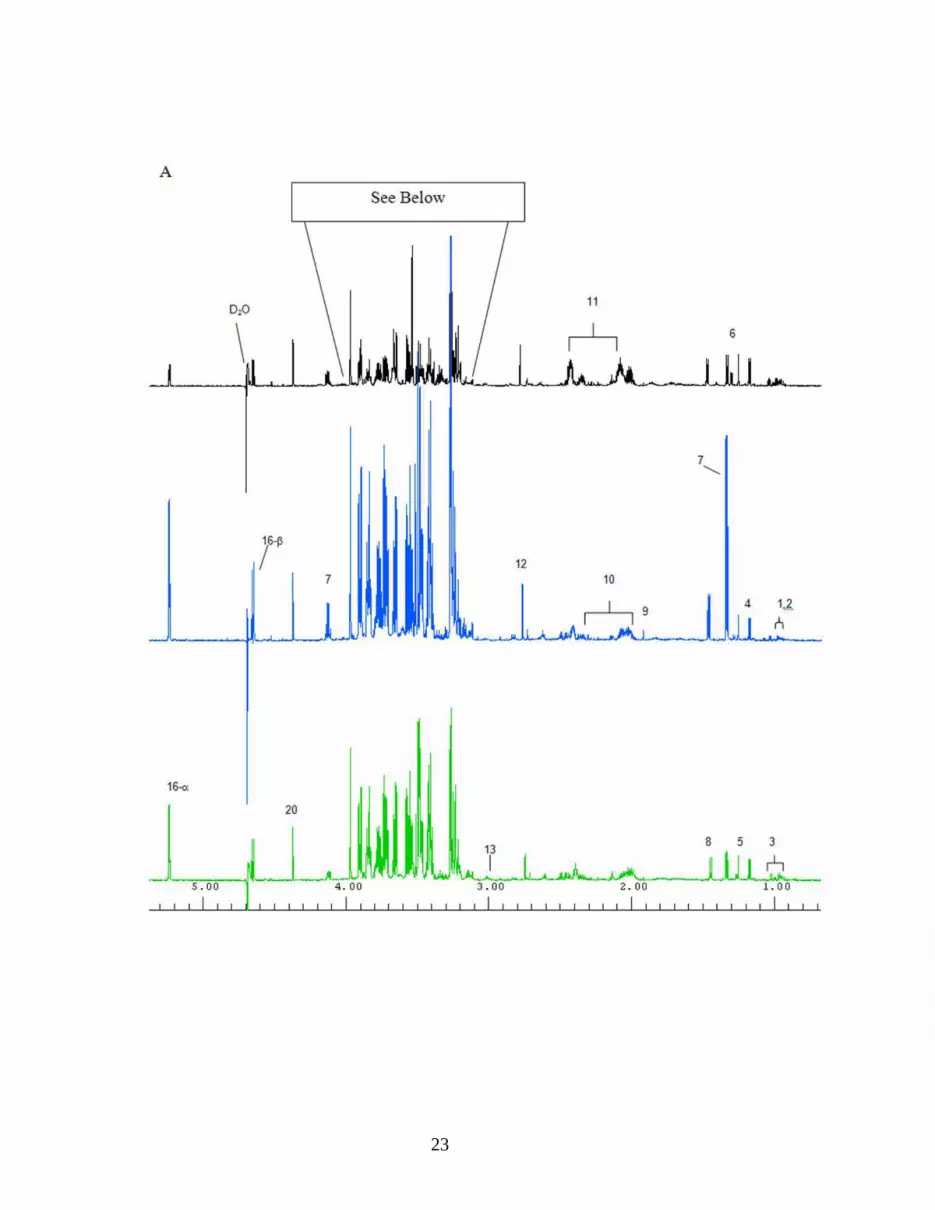
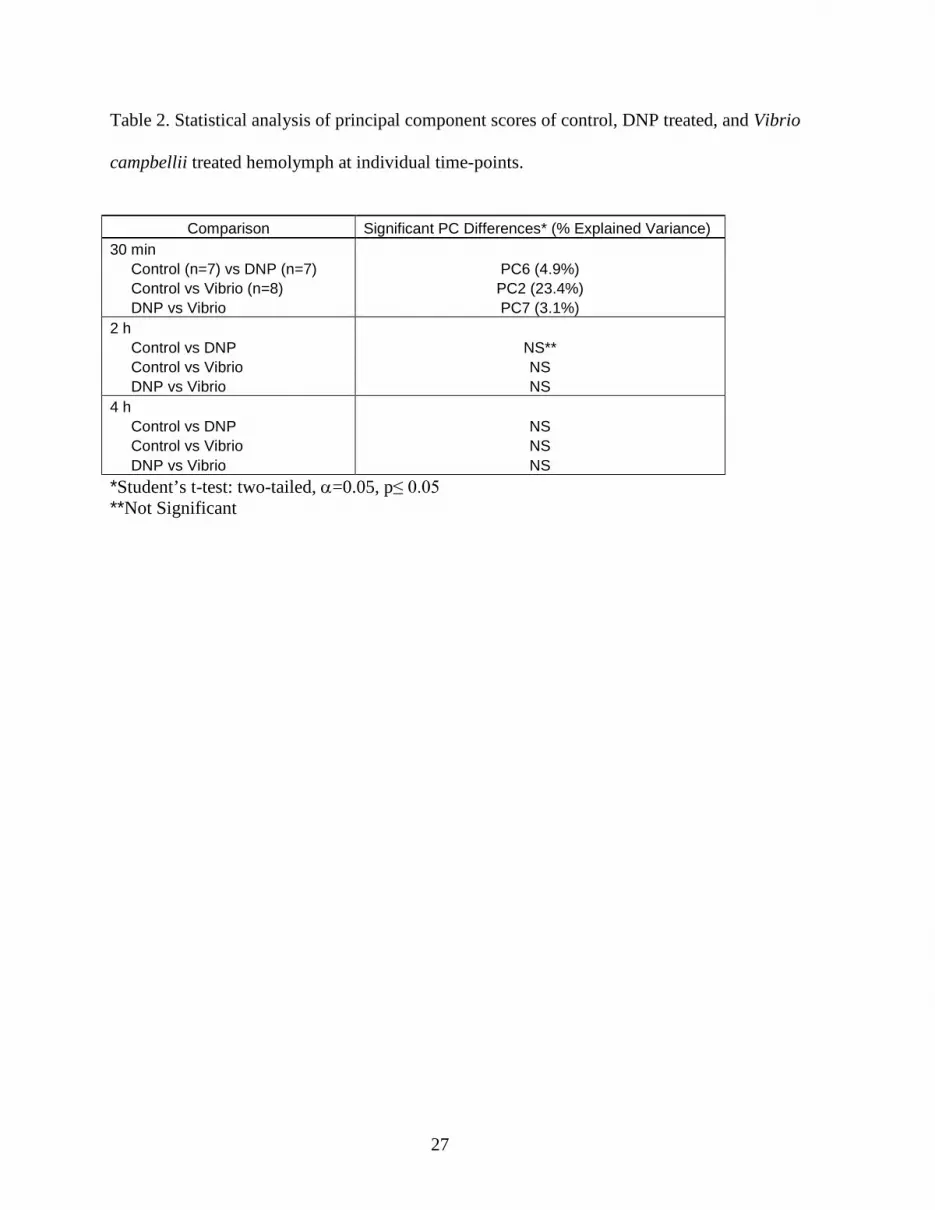
Challenge Samples 305
The DNP and Vibrio-injected treatment groups were analyzed against the corresponding control 306
group (saline-injected) at each time point. A scores plot from the PCA of control versus Vibrio 307
injected hemolymph samples at 30 min is shown in Figure 6. Significant differences were found 308
in PC2 (α=0.05; p=0.04) between control and Vibrio treated hemolymph spectra, in PC6 309
(p=0.02) between the control and DNP treated hemolymph spectra, and in PC7 (p=0.01) between 310
the challenge groups (Table 2). Analysis of the loadings showed that the significant PC2 311
variation between control and Vibrio-injected crabs can be attributed primarily to an increase in 312
glucose production. Environmental stress and infection have been shown to cause elevation of 313
glucose levels (Eddy et al., 2007, Hall and van Ham, 1998). Lorenzon et al.(1997) reported an 314
increase in hemolymph glucose in several crustacean taxa following injection of 315
lipopolysaccharide (LPS). LPS triggers the release of crustacean hyperglycemic hormone leading 316
to disturbances in the regulation of carbohydrate metabolism (Lorenzon et al., 1997). 317
318
The significant differences in PC6 and PC7 between the control group and DNP and between 319
DNP and Vibrio, respectively, were primarily due to increases in lactate, most likely caused by a 320
switch to anaerobic metabolism. However, these PCs explained only a small percentage of the 321
variance (4.9 and 3.1%, respectively). 322
323

15
Hemolymph samples taken at 2 h and 4 h from Vibrio and DNP injected crabs clustered in the 324
same multivariate space as the controls in this time-point by time-point analysis. There were no 325
significant differences in any of the PCs, implying the samples have similar metabolite profiles 326
relative to the considerable biological variation between environmentally sampled crabs. We 327
hypothesize that the similarity of the metabolite profiles at 2 h and 4 h for Vibrio-injected 328
hemolymph and controls can be attributed to the fact that crustaceans injected with bacteria or 329
foreign materials rapidly clear more than 90% of the exogenous particles from their hemolymph 330
within the first 10 min following injection (Holman et al., 2004, Macey et al., 2008). A majority 331
of intact bacteria have been found to accumulate in the lymphoid organ in the Pacific white 332
shrimp, Litopenaeus vannamei (Burgents et al., 2005); however, crabs do not contain lymphoid 333
organs. It is believed that the bacteria are engulfed and degraded in the hepatopancreas and/or 334
phagocytized in the gill by hemocytes (Martin et al., 2000, Burnett et al., 2006, Macey et al., 335
2008); thus a lack of significant differences in the hemolymph in the PC’s is not profound in the 336
4 h experiment reported here. 337
338
Injection of DNP triggers elevated oxygen uptake rates over 4 h compared to saline injected 339
control crabs (µmol g-1 h-1) (Figure 3). This observed effect is consistent with the mechanism of 340
action for DNP, which binds to mitochondrial membrane proteins, uncoupling oxidative 341
pathways from ATP production (Edsall, 1934). Fox and Roa (1978) demonstrated that the 342
resulting decrease in ATP pools has multiple downstream effects on hepatopancreas enzymes of 343
C. sapidus including inhibition of carbohydrate metabolism, energy production, lipid 344
metabolism, ion transport and protein metabolism. These impaired mechanisms should be 345
reflected in metabolomic differences in the hemolymph of DNP injected crabs compared to 346
16
control crabs. The lack of significant changes in the metabolome of these two groups suggests 347
that there may be rapid compensation of hemolymph, or that the primary effects are in other 348
tissues, or that we are not sampling a large enough population to observe subtle changes in the 349
metabolic profiles. 350
351
Trajectory Analysis 352
Metabolic trajectories were assessed using a supervised multivariate technique, PLS, with cross 353
validation. This analysis follows the metabolic profile in time and shows compositional changes 354
in response to each treatment. The direction and magnitude of the movement of the profile can 355
provide information on the mode of action of a chemical or disease (Keun et al., 2004). Figure 7 356
shows the changes in the metabolic profiles of hemolymph from the treatment and control groups 357
with time. Baseline hemolymph samples were included in this analysis and exhibited high 358
individual variability, but the large number of baseline samples (n= 22) results in a compact 359
‘phenotypic anchor’ for the trajectories. The individual variability of the baseline samples may 360
indicate that the 4 h (from t= -24 h until t= -20 h) equilibration time may not have been sufficient 361
for the crabs to become quiescent after the initial carapace preparation. Sampling baseline 362
hemolymph may be more appropriate immediately before the challenge injection (t=0), 24 hours 363
after preparation. However, an alternative explanation is that this variation may be primarily due 364
to intrinsic biological variability in the wild caught crab population. It has been suggested that 365
laboratory stabilization increases metabolic variability, masking the metabolic changes 366
associated with applied stresses (Hines et al., 2007) and sampling directly from an unregulated 367
environment provides more informative metabolic profiles due to natural stresses (i.e. hypoxia, 368
pollution). 369
17
370
Paths have been sketched to illustrate the dynamics of the control and the treatment groups over 371
the 4 h experiment duration. These paths represent trajectories through PC space as the 372
experiment progresses. The metabolic response seen in the control hemolymph is an indication 373
of the sensitivity of NMR-based metabolomics. The presumably benign control treatment 374
showed a physiological response to the minimal physical handling during injection of the 375
treatments, a vindication for the absolute necessity of controls in biological studies. The 376
trajectories for control and Vibrio-injected crabs have a similar shape and direction and seem to 377
reach equilibrium at 2-4 h on a PC1 v. PC2 map (Figure 7). The parallel paths suggest that the 378
bacterial injections and control injections elicited similar effects on the crabs’ system. However, 379
the magnitude differences in the trajectories indicate a difference in response to the injections. 380
This is confirmed with statistical analysis of PC1 scores between control and Vibrio (Table 3) 381
showing significant differences at 30 min (p=0.05) and 2 h (p=0.05), and a nearly significant 382
difference at 4 h (p=0.09). The variation from the bacterial injection in PC1 can be attributed 383
primarily to a change in glucose. A significant difference was also observed at the 30 min time 384
point of the DNP injected hemolymph trajectory when compared to the controls (p=0.03). The 385
path of this trajectory, however, has a different geometry than the control and Vibrio treated 386
hemolymph trajectories, providing evidence of different mechanisms of action. Additionally, the 387
velocity in the downward direction of the DNP treated hemolymph trajectory at 2 and 4 h 388
indicates a continuing physiological response, whereas the trajectories for the control and Vibrio 389
challenge seem to stabilize around the 2 and 4 h time points. This analysis confirms that the crab 390
hemolymph metabolic responses to Vibrio and DNP treatment conform to the known 391
18
mechanisms of action and physiological responses of the organism (decreased and increased 392
aerobic metabolism, respectively). 393
394
While subtle differences in the time point by time point analysis were observed, differences 395
between control and treated hemolymph metabolic profiles became more apparent with a 396
trajectory analysis. With this supervised analysis, a larger number of spectra (n=92) were 397
compared which included the baseline hemolymph samples (n=22). PCA time point by time 398
point analysis was performed on a much smaller sample size (n=14 and 15) and thus was 399
statistically weaker. The PLS-based trajectory analysis fully demonstrates the dynamic 400
differences between treatments and controls (which are dominated in PC1 by glucose) even 401
though the groups of data at each time point do not show statistical significance. 402
403
Conclusions 404
405
Blue crab hemolymph metabolomic analysis provided evidence that physiological changes 406
occurred in response to oxidative stresses, corresponding to what we observe in the whole 407
organism. The differences between treatments and control were slight, however. The lack of 408
dramatically significant changes in the hemolymph metabolome observable in single time-point 409
analysis contrasts with the results from metabolic trajectory analysis over 4 h. The trajectory 410
analysis aided in elucidating the subtle changes in the hemolymph metabolome and dynamics of 411
the stress responses. Crab hemolymph, like mammalian plasma, is perhaps tightly regulated and 412
stress-induced perturbations to the spectral profile may be subtle and difficult to visualize 413
(Beckwith-Hall et al., 2003). Large volumes of hemolymph flow through blue crab circulation. 414

19
The cardiac output of resting crabs is 151 mL kg -1 min-1 (Booth et al., 1982) and this flow rate 415
transports the hemolymph rapidly to organs that are involved in hemolymph homeostasis. A 416
more significant metabolic response may be observed in the metabolic fluctuations in organs and 417
tissues. 418
419
Disclaimer 420
421
Commercial equipment or materials are identified in this paper to specify adequately the 422
experimental procedure. Such identification does not imply recommendation or endorsement by 423
NIST, nor does it imply that the materials or equipment identified are necessarily the best 424
available for the purpose. 425
426
427
428
429

20
Figure 1. Experimental design of blue crab oxidative stress NMR metabolomic study. Table 1. Blue crab NMR metabolomic samples
Field Infected
Vibrio Injected
DNP Injected Control Injected (Control)
Total
Number of crabs
10 8 8 7 33
Number of NMR samples (4 time points)
10 32 32 28 102
21
Figure 2. NMR spectra of crab hemolymph for methods development optimization. Top: cell-free hemolymph, centrifuge filtered through a 30K NMWL filter, lyophilized and rehydrated in D2O + 1.0 mmol L-1 TMSP and analyzed with a NOESYPR1D NMR sequence. Bottom: cell-free hemolymph, unfiltered, diluted with D2O + 1.0 mmol L-1 TMSP and analyzed with a Carr-Purcell-Meiboom-Gill (CPMG) NMR pulse sequence.

22
Figure 3. Oxygen uptake in C. sapidus following injection of 2,4-dinitrophenol (6 µg g−1 crab; closed circles) or control (control=open circles). Oxygen uptake was measured at 25°C using flow-through respirometry. Values represent averages over 20 min time intervals for 6 animals ± SEM. There was a significant treatment effect on oxygen uptake following injection (two-way repeated measures ANOVA; p<0.001). * indicates a significant difference in oxygen uptake between treatments at individual timepoints (Holm-Sidak post-hoc comparisons; p<0.005).
23

24
Figure 4. Representative one-dimensional 1H NMR spectra of hemolymph from individual atlantic blue crabs sampled at 4 h. A: Top: control treated hemolymph. Middle: DNP treated hemolymph. Bottom: Vibrio campbellii treated hemolymph. B: Expanded region of the control treated hemolymph spectrum. Key to spectrum: 1. isoleucine, 2. leucine, 3. valine, 4. 3-hydroxybutyrate, 5. unidentified metabolite 6. threonine, 7. lactate, 8. alanine, 9. acetate, 10. proline, 11. glutamine, 12. hypotaurine, 13. lysine, 14. TMAO, 15. betaine, 16. glucose, 17. glycine, 18. glycerol, 19. hippurate (internal standard), 20. homarine.

25
Figure 5. Scores plot from the PCA of baseline hemolymph samples from healthy (♦) and field (■) infected crabs. The ellipses respresent the 80% confidence interval of each group. Bottom: Loadings plot of the PCA scores. The ellipses highlight the metabolite bins causing the most variation in PC1.
26
Figure 6. Scores plot from the PCA of control (●) versus Vibrio campbellii (▲) samples showing significant separation in PC2 (p= 0.04) at 30 minutes post-injection. The ellipses represent the 80% confidence interval of each group.
27
Table 2. Statistical analysis of principal component scores of control, DNP treated, and Vibrio
campbellii treated hemolymph at individual time-points.
Comparison Significant PC Differences* (% Explained Variance)
30 min Control (n=7) vs DNP (n=7) PC6 (4.9%) Control vs Vibrio (n=8) PC2 (23.4%) DNP vs Vibrio PC7 (3.1%) 2 h Control vs DNP NS** Control vs Vibrio NS DNP vs Vibrio NS 4 h Control vs DNP NS Control vs Vibrio NS DNP vs Vibrio NS *Student’s t-test: two-tailed, α=0.05, p≤ 0.05 **Not Significant

28
Figu
re 7
. Tra
ject
ory
anal
ysis
of b
lue
crab
hem
olym
ph N
MR
dat
a ob
tain
ed a
fter c
halle
nge
with
con
trol (
●) (n
=7),
DN
P (♦
) (n=
7),
and
Vibr
io c
ampb
ellii
(▲) (
n=8)
. ■=
base
line
hem
olym
ph sa
mpl
es (n
=22)
. Err
or b
ars r
epre
sent
± 1
stan
dard
err
or fo
r eac
h tim
e po
int a
vera
ge. T
he h
and-
draw
n tra
ject
orie
s dis
play
the
path
of t
he m
etab
olic
pro
files
in re
spon
se to
cha
lleng
e.

29
Table 3. Statistical assessment of principal component scores of control, DNP treated, and Vibrio
campbellii treated hemolymph in trajectory analysis. Bold-underlined: p-value ≤ 0.05, Bold-
italic: p-value > 0.05 and < 0.09
Comparison PC1 p-values PC2 p-values 30 min Control (n=7) vs DNP (n=7) 0.03 0.11 Control vs Vibrio (n=8) 0.05 0.52 DNP vs Vibrio 0.92 0.17 2 h Control vs DNP 0.29 0.49 Control vs Vibrio 0.05 0.42 DNP vs Vibrio 0.32 0.89 4 h Control vs DNP 0.26 0.8 Control vs Vibrio 0.09 0.38 DNP vs Vibrio 0.56 0.18
*Student’s t-test: unequal variances, two-tailed, α=0.05
30
References BECKWITH-HALL, B. M., THOMPSON, N. A., NICHOLSON, J. K., LINDON, J. C. &
HOLMES, E. (2003) A metabonomic investigation of hepatotoxicity using diffusion-edited 1H NMR spectroscopy of blood serum. Analyst, 128, 814-8.
BOOTH, C. E., MCMAHON, B. R. & W, P. A. (1982) Oxygen uptake and the potentiating effects of increased hemolymph lactate on oxygen transport during exercise in the blue crab Callinectes sapidus. Journal of Comparative Physiology, 148, 111-121.
BUNDY, J. G., LENZ, E. M., BAILEY, N. J., GAVAGHAN, C. L., SVENDSEN, C., SPURGEON, D., HANKARD, P. K., OSBORN, D., WEEKS, J. M., TRAUGER, S. A., SPEIR, P., SANDERS, I., LINDON, J. C., NICHOLSON, J. K. & TANG, H. (2002) Metabonomic assessment of toxicity of 4-fluoroaniline, 3,5-difluoroaniline and 2-fluoro-4-methylaniline to the earthworm Eisenia veneta (Rosa): identification of new endogenous biomarkers. Environ Toxicol Chem, 21, 1966-72.
BUNDY, J. G., SIDHU, J. K., RANA, F., SPURGEON, D. J., SVENDSEN, C., WREN, J. F., STURZENBAUM, S. R., MORGAN, A. J. & KILLE, P. (2008) 'Systems toxicology' approach identifies coordinated metabolic responses to copper in a terrestrial non-model invertebrate, the earthworm Lumbricus rubellus. BMC Biol, 6, 25.
BURGENTS, J. E., BURNETT, L. E., STABB, E. V. & BURNETT, K. G. (2005) Localization and bacteriostasis of Vibrio introduced into the Pacific white shrimp, Litopenaeus vannamei. Dev Comp Immunol, 29, 681-91.
BURNETT, L. E., HOLMAN, J. D., JORGENSEN, D. D., IKERD, J. L. & BURNETT, K. G. (2006) Immune defense reduces respiratory fitness in Callinectes sapidus, the Atlantic blue crab. Biol Bull, 211, 50-7.
CUI, Q., LEWIS, I. A., HEGEMAN, A. D., ANDERSON, M. E., LI, J., SCHULTE, C. F., WESTLER, W. M., EGHBALNIA, H. R., SUSSMAN, M. R. & MARKLEY, J. L. (2008) Metabolite identification via the Madison Metabolomics Consortium Database. Nat Biotechnol, 26, 162-4.
EDDY, F., POWELL, A., GREGORY, S., NUNAN, L. M., LIGHTNER, D. V., DYSON, P. J., ROWLEY, A. F. & SHIELDS, R. J. (2007) A novel bacterial disease of the European shore crab, Carcinus maenas molecular pathology and epidemiology. Microbiology, 153, 2839-49.
EDSALL, G. (1934) Biological actions of dinitrophenol and related compounds: a review. New England Journal of Medicine, 211, 385.
EKMAN, D. R., TENG, Q., VILLENEUVE, D. L., KAHL, M. D., JENSEN, K. M., DURHAN, E. J., ANKLEY, G. T. & COLLETTE, T. W. (2008) Investigating compensation and

31
recovery of fathead minnow (Pimephales promelas) exposed to 17alpha-ethynylestradiol with metabolite profiling. Environ Sci Technol, 42, 4188-94.
FOX, F. R. & RAO, K. R. (1978) Effects of sodium pentachlorophenate and 2,4-Dinitrophenol on hapatopancreatic enzymes in the blue crab, Callinectes sapidus. , New York, Plenum Press.
FUHRMAN, J. A. (1999) Marine viruses and their biogeochemical and ecological effects. Nature, 399, 541-8.
GLEESON, R. A. & ZUBKOFF, P. L. (1977) The determination of hemolymph volume in the blue crab, Callinectes sapidus, utilizing 14C-thiocyanate. Comp Biochem Physiol A 56, 411-413.
HALL, M. R. & VAN HAM, E. H. (1998) The effects of different types of stress on blood glucose in the giant tiger prawn Penaeus monodon. Journal of the World Aquaculture Society, 29, 290-299.
HINES, A., OLADIRAN, G. S., BIGNELL, J. P., STENTIFORD, G. D. & VIANT, M. R. (2007) Direct sampling of organisms from the field and knowledge of their phenotype: key recommendations for environmental metabolomics. Environ Sci Technol, 41, 3375-81.
HOLMAN, J. D., BURNETT, K. G. & BURNETT, L. E. (2004) Effects of hypercapnic hypoxia on the clearance of Vibrio campbellii in the Atlantic blue crab, Callinectes sapidus Rathbun. Biol Bull, 206, 188-96.
KEUN, H. C., EBBELS, T. M., BOLLARD, M. E., BECKONERT, O., ANTTI, H., HOLMES, E., LINDON, J. C. & NICHOLSON, J. K. (2004) Geometric trajectory analysis of metabolic responses to toxicity can define treatment specific profiles. Chem Res Toxicol, 17, 579-87.
LORENZON, S., GIULIANINI, P. G. & FERRERO, E. A. (1997) Lipopolysaccharide-induced hyperglycemia is mediated by CHH release in crustaceans. Gen Comp Endocrinol, 108, 395-405.
MACEY, B. M., RATHBURN, C. K., THIBODEAUX, L. K., BURNETT, L. E. & BURNETT, K. G. (2008) Clearance of Vibrio campbellii injected into the hemolymph of Callinectes sapidus, the Atlantic blue crab: The effects of prior exposure to bacteria and environmental hypoxia. Fish Shellfish Immunol, 25, 718-30.
MARTELLO, L. B., FRIEDMAN, C. S. & TJEERDEMA, R. S. (2000) Combined effects of pentachlorophenol and salinity stress on phagocytic and chemotactic function in two species of abalone. Aquat Toxicol, 49, 213-225.
MARTIN, G. G., QUINTERO, M., QUIGLEY, M. & KHOSROVIAN, H. (2000) Elimination of sequestered material from the gills of decapod crustaceans. Journal of Crustacean Biology, 20, 209-217.

32
MIKULSKI, C. M., BURNETT, L. E. & BURNETT, K. G. (2000) The effects of hypercapnic hypoxia on the survival of shrimp challenged with Vibrio parahaemolyticus. Journal of Shellfish Research, 19, 301-311.
SCHOLNICK, D. A., BURNETT, K. G. & BURNETT, L. E. (2006) Impact of exposure to bacteria on metabolism in the penaeid shrimp Litopenaeus vannamei. Biol Bull, 211, 44-9.
TIZIANI, S., EMWAS, A. H., LODI, A., LUDWIG, C., BUNCE, C. M., VIANT, M. R. & GUNTHER, U. L. (2008) Optimized metabolite extraction from blood serum for 1H nuclear magnetic resonance spectroscopy. Anal Biochem, 377, 16-23.
TJEERDEMA, R. S., FAN, T. W., HIGASHI, R. M. & CROSBY, D. G. (1991) Sublethal effects of pentachlorophenol in the abalone (Haliotis rufescens) as measured by in vivo 31P NMR spectroscopy. J Biochem Toxicol, 6, 45-56.
ULRICH, E. L., AKUTSU, H., DORELEIJERS, J. F., HARANO, Y., IOANNIDIS, Y. E., LIN, J., LIVNY, M., MADING, S., MAZIUK, D., MILLER, Z., NAKATANI, E., SCHULTE, C. F., TOLMIE, D. E., KENT WENGER, R., YAO, H. & MARKLEY, J. L. (2008) BioMagResBank. Nucleic Acids Res, 36, D402-8.
VIANT, M. R. (2008) Recent developments in environmental metabolomics. Mol Biosyst, 4, 980-6.
VIANT, M. R., ROSENBLUM, E. S. & TIEERDEMA, R. S. (2003) NMR-based metabolomics: a powerful approach for characterizing the effects of environmental stressors on organism health. Environ Sci Technol, 37, 4982-9.
WELSH, P. C. & SIZEMORE, R. K. (1985) Incidence of bacteremia in stressed and unstressed populations of the blue crab, Callinectes sapidus. Appl Environ Microbiol, 50, 420-5.
ZOHAR, Y., HINES, A. H., ZMORA, O., JOHNSON, E. G., LIPCIUS, R. N., SEITZ, R. D., EGGLESTON, D. B., PLACE, A. R., SCHOTT, E. J., STUBBLEFIELD, J. D. & CHUNG, J. S. (2008) The Chesapeake Bay blue crab (Callinectes sapidus): A multidisciplinary approach to responsible stock replenishment. Reviews in Fisheries Science, 16, 24-34.