mercury and freon: temperature emulation and management for server systems
TRANSCRIPT
Mercury and Freon: Temperature Emulation andManagement for Server Systems ∗
Taliver HeathDept. of Computer Science
Rutgers [email protected]
Ana Paula CentenoDept. of Computer Science
Rutgers [email protected]
Pradeep GeorgeDept. of Mechanical Engineering
Rutgers [email protected]
Luiz RamosDept. of Computer Science
Rutgers [email protected]
Yogesh JaluriaDept. of Mechanical Engineering
Rutgers [email protected]
Ricardo BianchiniDept. of Computer Science
Rutgers [email protected]
AbstractPower densities have been increasing rapidly at all levels of serversystems. To counter the high temperatures resulting from these den-sities, systems researchers have recently started work on softwa-re-based thermal management. Unfortunately, research in this newarea has been hindered by the limitations imposed by simulatorsand real measurements. In this paper, we introduce Mercury, a soft-ware suite that avoids these limitations by accurately emulatingtemperatures based on simple layout, hardware, and component-utilization data. Most importantly, Mercury runs the entire softwarestack natively, enables repeatable experiments, and allows the studyof thermal emergencies without harming hardware reliability. Wevalidate Mercury using real measurements and a widely used com-mercial simulator. We use Mercury to develop Freon, a system thatmanages thermal emergencies in a server cluster without unneces-sary performance degradation. Mercury will soon become availablefrom http://www.darklab.rutgers.edu.
Categories and Subject Descriptors D.4 [Operating systems]:Miscellaneous
General Terms Design, experimentation
Keywords Temperature modeling, thermal management, energyconservation, server clusters
1. IntroductionPower densities have been increasing rapidly at all levels of serversystems, from individual devices to server enclosures to machinerooms. For example, modern microprocessors, high-performance
∗ This research has been supported by NSF under grant #CCR-0238182(CAREER award).
Permission to make digital or hard copies of all or part of this work for personal orclassroom use is granted without fee provided that copies are not made or distributedfor profit or commercial advantage and that copies bear this notice and the full citationon the first page. To copy otherwise, to republish, to post on servers or to redistributeto lists, requires prior specific permission and/or a fee.
ASPLOS’06 October 21–25, 2006, San Jose, California, USA.Copyright c© 2006 ACM 1-59593-451-0/06/0010. . . $5.00
disk drives, blade server enclosures, and highly populated computerracks exhibit power densities that have never been seen before.These increasing densities are due to increasingly power-hungryhardware components, decreasing form factors, and tighter pack-ing. High power densities entail high temperatures that now mustbe countered by substantial cooling infrastructures. In fact, whenhundreds, sometimes thousands, of these components are rackedclose together in machine rooms, appropriate cooling becomes themain concern.
The reason for this concern is that high temperatures decreasethe reliability of the affected components to the point that they startto behave unpredictably or fail altogether. Even when componentsdo not misbehave, operation outside the range of acceptable tem-peratures causes mean times between failures (MTBFs) to decreaseexponentially [1, 7]. Several factors may cause high temperatures:hot spots at the top sections of computer racks, poor design of thecooling infrastructure or air distribution system, failed fans or airconditioners, accidental overload due to hardware upgrades, or de-graded operation during brownouts. We refer to these problems as“thermal emergencies”. Some of these emergencies may go unde-tected for a long time, generating corresponding losses in reliabilityand, when components eventually fail, performance.
Recognizing this state of affairs, systems researchers have re-cently started work on software-based thermal management. Speci-fically, researchers from Duke University and Hewlett-Packardhave examined temperature-aware workload placement policiesfor data centers, using modeling and a commercial simulator [21].Another effort has begun investigating temperature-aware disk-scheduling policies, using thermal models and detailed simulationsof disk drives [12, 16]. Rohou and Smith have implemented andexperimentally evaluated the throttling of activity-intensive tasksto control processor temperature [26]. Taking a different approach,Weissel and Bellosa have studied the throttling of energy-intensivetasks to control processor temperature in multi-tier services [32].
Despite these early initiatives, the infrastructure for software-based thermal management research severely hampers new efforts.In particular, both real temperature experiments and temperaturesimulators have several deficiencies. Working with real systemsrequires heavy instrumentation with (internal or external) sensorscollecting temperature information for every hardware componentand air space of interest. Hardware sensors with low resolution andpoor precision make matters worse. Furthermore, the environment
106
where the experiments take place needs to be isolated from unre-lated computations or even trivial “external thermal disruptions”,such as somebody opening the door and walking into the machineroom. Under these conditions, it is very difficult to produce repeat-able experiments. Worst of all, real experiments are inappropriatefor studying thermal emergencies. The reason is that repeatedly in-ducing emergencies to exercise some piece of thermal managementcode may significantly decrease the reliability of the hardware.
In contrast, temperature simulators do not require instrumenta-tion or environment isolation. Further, several production-qualitysimulators are available commercially, e.g. Fluent [9]. Unfortu-nately, these simulators are typically expensive and may take sev-eral hours to days to simulate a realistic system. Worst of all, thesesimulators are not capable of executing applications or any typeof systems software; they typically compute steady-state tempera-tures based on a fixed power consumption for each hardware com-ponent. Other simulators, such as HotSpot [30], do execute appli-cations (bypassing the systems software) but only model the pro-cessor, rather than the entire system.
To counter these problems, we introduce Mercury, a softwaresuite that emulates system and component temperatures in single-node or clustered systems in a repeatable fashion. As inputs, Mer-cury takes simple heat flow, air flow, and hardware information, aswell as dynamic component utilizations. To enable thermal man-agement research, the emulation is performed at a coarse grain andseeks to approximate real temperatures to within a few degreeswhile providing trend-accurate thermal behavior. Although this issometimes unnecessary, users can improve accuracy by calibratingthe inputs with a few real measurements or short simulations.
Mercury provides the same interface to user-level software asreal thermal sensors, so it can be linked with systems software toprovide temperature information in real time. In fact, in our ap-proach the entire software stack runs natively (without noticeableperformance degradation) and can make calls to Mercury on-line,as if it were probing real hardware sensors. Our suite also providesmechanisms for explicitly changing temperatures and other emu-lation parameters at run time, allowing the simulation of thermalemergencies. For example, one can increase the inlet air temper-ature midway through a run to mimic the failure of an air con-ditioner. Finally, Mercury is capable of computing temperaturesfrom component-utilization traces, which allows for fine-tuning ofparameters without actually running the system software. In fact,replicating these traces allows Mercury to emulate large cluster in-stallations, even when the user’s real system is much smaller.
We validate Mercury using measurements and simulations of areal server. The comparison against Fluent, a widely used commer-cial simulator, demonstrates that we can approximate steady-statetemperatures to within 0.5oC, after calibrating the inputs providedto Mercury. The comparison against the real measurements showsthat dynamic temperature variations are closely emulated by oursystem as well. We have found emulated temperatures within 1oCof the running system, again after a short calibration phase.
We are using Mercury to investigate policies for managing ther-mal emergencies without excessive (throughput) performance de-gradation. In particular, we are developing Freon, a system thatmanages component temperatures in a server cluster fronted by aload balancer. The main goal of Freon is to manage thermal emer-gencies without using the traditional approach of turning off theaffected servers. Turning servers off may degrade throughput un-necessarily during high-load periods. Given the direct relationshipbetween energy consumption and temperature, as an extension ofFreon, we also develop a policy that combines energy conservationand thermal management. Interestingly, the combined policy doesturn servers off when this is predicted not to degrade throughput.
To accomplish its goals, Freon constantly monitors tempera-tures and dynamically adjusts the request distribution policy usedby the load balancer in response to thermal emergencies. By ma-nipulating the load balancer decisions, Freon directs less load tohot servers than to other servers. Using our emulation suite, wehave been able to completely develop, debug, and evaluate Freon.
In summary, this paper makes two main contributions:
• We propose Mercury, a temperature emulation suite. Mercurysimplifies the physical world, trading off a little accuracy (atmost 1oC in our experiments) for native software stack execu-tion, experiment repeatability, and the ability to study thermalemergencies; and
• We propose Freon, a system for managing thermal emergen-cies without unnecessary performance degradation in a servercluster. In the context of Freon, we propose the first policy tocombine energy and thermal management in server clusters.
The remainder of the paper is organized as follows. The nextsection describes the details of the Mercury suite. Section 3presents our validation experiments. Section 4 describes the Freonpolicies. Section 5 demonstrates the use of Mercury in the Freonevaluation. Section 6 overviews the related work. Finally, Section7 discusses our conclusions and the limitations of our current im-plementations.
2. The Mercury SuiteIn this section we describe the physical model that Mercury em-ulates, overview the Mercury inputs and emulation approach, anddetail our current implementation.
2.1 Physics
Modeling heat transfer and air flow accurately is a complex pro-position. To create a very accurate simulation from basic properties,Mechanical Engineering tools must simulate everything from wallroughness to fluctuations of the air density to the detailed propertiesof the air flow. We believe that this level of detail is unnecessaryfor most software-based thermal management research, so we havesimplified our model of the physical world to a few basic equations.This is the key insight behind Mercury.
Basic terminology. Since many systems researchers are unfamil-iar with engineering and physics terminology, we will first definesome basic concepts. The temperature of an object is a measureof the internal energy present in that object. Temperature is typi-cally measured in degrees Celsius or Kelvin. Heat is energy that istransferred between two objects or between an object and its en-vironment. Heat is measured in the same units as energy, such asJoules or Wh.
Conservation of energy. One of the most basic equations in heattransfer is the conservation of energy, which translates into the con-servation of heat in our case. There are two sources of heat for anobject in our system: it converts power into heat while it performswork, and it may gain (lose) heat from (to) its environment. Thiscan be expressed as:
Qgained = Qtransfer + Qcomponent (1)
where Qtransfer is the amount of heat transferred from/to thecomponent during a period of time and Qcomponent is the amountof heat produced by performing work during a period of time. Nextwe define these two quantities in turn.
Newton’s law of cooling. Heat is transferred in direct proportionto the temperature difference between objects or between an objectand its environment. More formally:
Qtransfer,1→2 = k × (T1 − T2) × time (2)
107
Disk Platters
Disk Shell
Disk Air
CPU
CPU Air
Power Supply
Power Supply Air
Motherboard
Void Space Air
(a)
Inlet
Void Space Air
Disk Air Power Supply Air
CPU Air
Exhaust
Disk Air Downstream Power Supply Air Downstream
CPU Air Downstream
(b)
AC
Machine 1 Machine 2 Machine 3 Machine 4
Cluster Exhaust
(c)
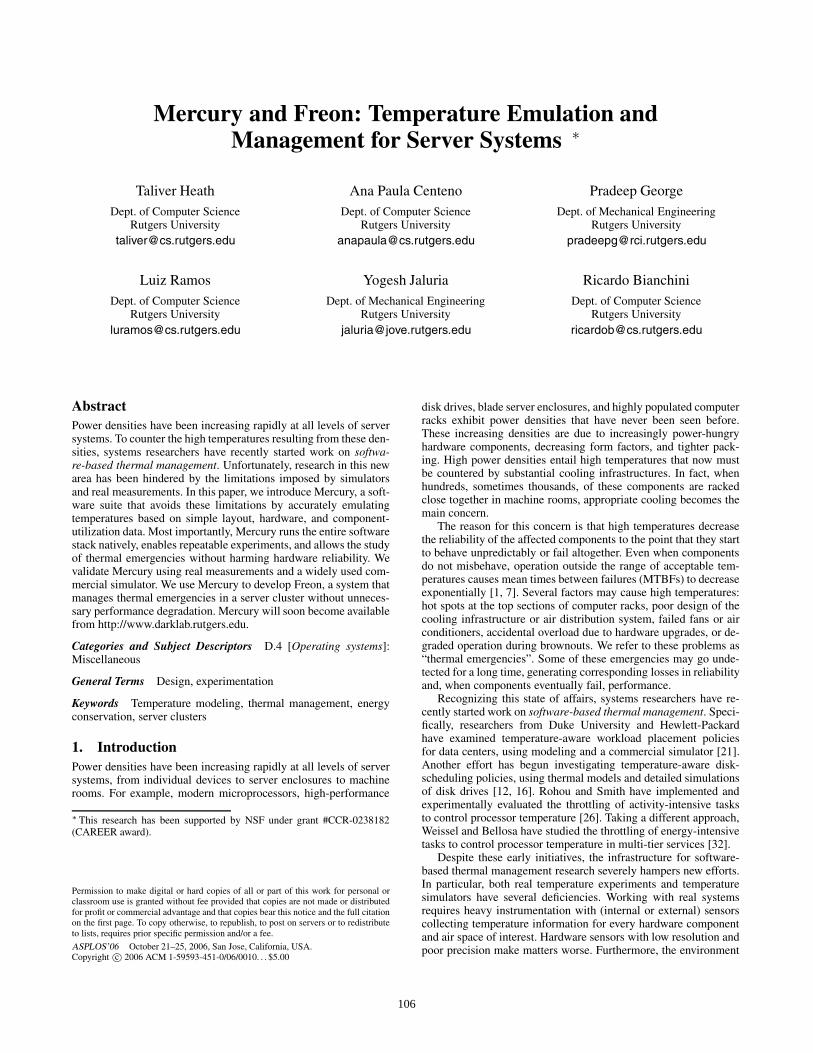
Figure 1. Example intra-machine heat-flow (a), intra-machine air-flow (b), and inter-machine air-flow (c) graphs.
where Qtransfer,1→2 is the amount of heat transferred betweenobjects 1 and 2 or between object 1 and its environment during aperiod of time, T1 and T2 are their current temperatures, and k is aconstant that embodies the heat transfer coefficient and the surfacearea of the object. The k constant can be approximated by experi-ment, simulation, or rough numerical approximation using typicalengineering equations. However, in reality, k can vary with tem-perature and air-flow rates. We assume that k is constant in ourmodeling because the extra accuracy of a variable k would not jus-tify the complexity involved in instantiating it for all temperaturesand rates.
Energy equivalent. The heat produced by a component essentiallycorresponds to the energy it consumes, so we define it as:
Qcomponent = P (utilization) × time (3)
where P (utilization) represents the average power consumed bythe component as a function of its utilization.
For the components that we have studied in detail so far, a sim-ple linear formulation has correctly approximated the real powerconsumption:
P (utilization) = Pbase + utilization × (Pmax − Pbase) (4)
where Pbase is the power consumption when the component is idleand Pmax is the consumption when the component is fully utilized.
Researchers have used similar high-level formulations to modelmodern processors and server-style DRAM subsystems [8]. How-ever, our default formulation can be easily replaced by a more so-phisticated one for components that do not exhibit a linear rela-tionship between high-level utilization and power consumption. Forexample, we have an alternate formulation for QCPU that is basedon hardware performance counters. (Although our descriptions andresults assume the default formulation, we do discuss this alternateformulation in Section 2.3.)
Heat capacity. Finally, since pressures and volumes in our sys-tem are assumed constant, the temperature of an object is directlyproportional to its internal energy. More formally, we define theobject’s temperature variation as:
ΔT =1
m c× ΔQ (5)
where m is the mass of the object and c is its specific heat capacity.
2.2 Inputs and Temperature Emulation
Mercury takes three groups of inputs: heat- and air-flow graphs de-scribing the layout of the hardware and the air circulation, con-
stants describing the physical properties and the power consump-tion of the hardware components, and dynamic component utiliza-tions. Next, we describe these groups and how Mercury uses them.
Graphs. At its heart, Mercury is a coarse-grained finite elementanalyzer. The elements are specified as vertices on a graph, andthe edges represent either air-flow or heat-flow properties. Morespecifically, Mercury uses three input graphs: an inter-componentheat-flow graph, an intra-machine air-flow graph, and possibly aninter-machine air-flow graph for clustered systems. The heat-flowgraphs are undirected, since the direction of heat flow is solelydependent upon the difference in temperature between each pair ofcomponents. The air-flow graphs are directed, since fans physicallymove air from one point to another in the system.
Figure 1 presents one example of each type of graph. Figure1(a) shows a heat-flow graph for the real server we use to validateMercury in this paper. The figure includes vertices for the CPU,the disk, the power supply, and the motherboard, as well as theair around each of these components. As suggested by this figure,Mercury computes a single temperature for an entire hardwarecomponent, which again is sufficient for whole-system thermalmanagement research. Figure 1(b) shows the intra-machine air-flow for the same server. In this case, vertices represent air regions,such as inlet air and the air that flows over the CPU. Finally,Figure 1(c) shows an inter-machine air flow graph for a smallcluster of four machines. The vertices here represent inlet and outletair regions for each machine, the cold air coming from the airconditioner, and the hot air to be chilled. The graph representsthe ideal situation in which there is no air recirculation acrossthe machines. Recirculation and rack layout effects can also berepresented using more complex graphs.
Constants. The discussion above has not detailed how the inputgraphs’ edges are labeled. To label the edges of the heat-flow graphand instantiate the equations described in the previous subsection,Mercury takes as input the heat transfer coefficients, the compo-nents’ specific heat capacities, and the components’ surface areasand masses. The air-flow edges are labeled with the fraction ofair that flows from one vertex to another. For example, the air-flow edge from the “Disk Air Downstream” vertex to the “CPUAir” vertex in Figure 1(b) specifies how much of the air that flowsover the disk flows over the CPU as well. (Because some modernfans change speeds dynamically, we need a way to adjust the air-flow fractions accordingly. The thermal emergency tool describedin Section 2.3 can be used for this purpose.) Besides these con-
108
stants, the inlet air temperatures, fan speeds, and maximum andbase power consumptions for every component must be provided.
There are several ways to find these constants. The heat transferproperties of a component are sometimes provided by the manu-facturer (as they are in the case of the Intel CPUs). One may alsouse a fine-grained engineering tool to determine the heat- and air-flow constants. In some cases, the values may also be found usingvarious engineering equations for forced convection [24].
Determining the constants using any of the previous methodscan be time consuming and quite difficult for a computer scientistwithout a background in Mechanical Engineering. Thus, it is of-ten useful to have a calibration phase, where a single, isolated ma-chine is tested as fully as possible, and then the heat- and air-flowconstants are tuned until the emulated readings match the calibra-tion experiment. Since temperature changes are second-order ef-fects on the constants in our system, the constants that result fromthis process may be relied upon for reasonable changes in temper-ature (ΔT < 40oC) for a given air flow [24].
A final set of input constants relate to the power consump-tion of the different components. In particular, Mercury needs theidle and maximum power consumptions of every component ofinterest. These values can be determined using microbenchmarksthat exercise each component, power measurement infrastructure,and standard fitting techniques. The components’ data sheets maysometimes provide this information, although they often exagger-ate maximum power consumptions.
Component utilizations. When Mercury is running, it monitorsall the component utilizations in the real system, which are used todetermine the amount of power that each component is consumingaccording to Equation 4.
Emulation. Using discrete time-steps, Mercury does three forms ofgraph traversals: the first computes inter-component heat flow; thesecond computes intra-machine air movement and temperatures;and the third computes inter-machine air movement and tempera-tures. The heat-flow traversals use the equations from the previoussubsection, the input constants, and the dynamic component uti-lizations. The air-flow traversals assume a perfect mixing of the aircoming from different machines (in case of a cluster), and comput-ing temperatures using a weighted average of the incoming-edgeair temperatures and fractions for every air-region vertex. All tem-peratures can be queried by running applications or the systemssoftware to make thermal management decisions.
2.3 Implementation
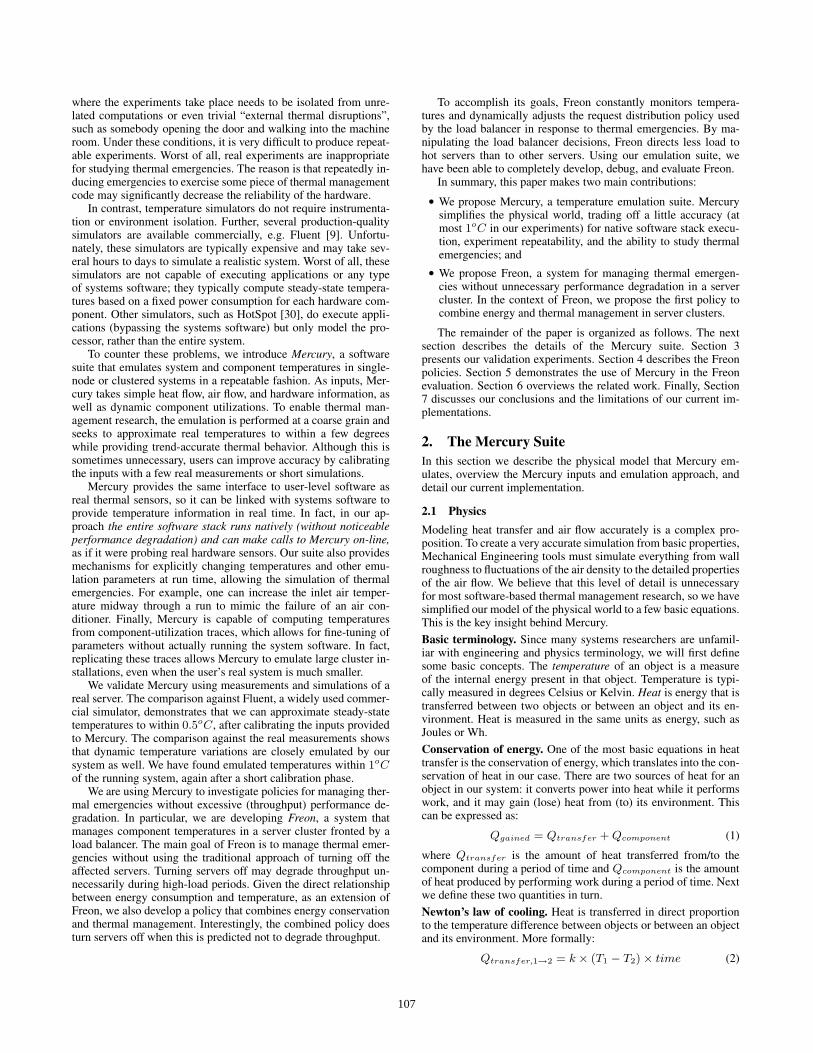
The Mercury suite comprises four pieces of software: the solver, aset of component monitoring daemons, a few “sensor” library calls,and a tool for generating thermal emergencies explicitly. Figure 2overviews the suite and the relationships between its parts.
Solver. The solver is the part of the suite that actually computestemperatures using finite-element analysis. It runs on a separatemachine and receives component utilizations from a trace file orfrom the monitoring daemons. If the utilizations come from a file,i.e. the system is run offline, the end result is another file containingall the usage and temperature information for each component inthe system over time. If the utilizations come from the monitoringdaemons on-line, the applications or system software can query thesolver for temperatures. Regardless of where the utilizations comefrom, the solver computes temperatures at regular intervals; oneiteration per second by default. All objects and air regions start theemulation at a user-defined initial air temperature.
As a point of reference, the solver takes roughly 100 µsec onaverage to compute each iteration, when using a trace file and thegraphs of Figure 1. Because the solver runs on a separate machine,it could execute for a large number of iterations at a time, thereby
Figure 2. Overview of the Mercury suite.
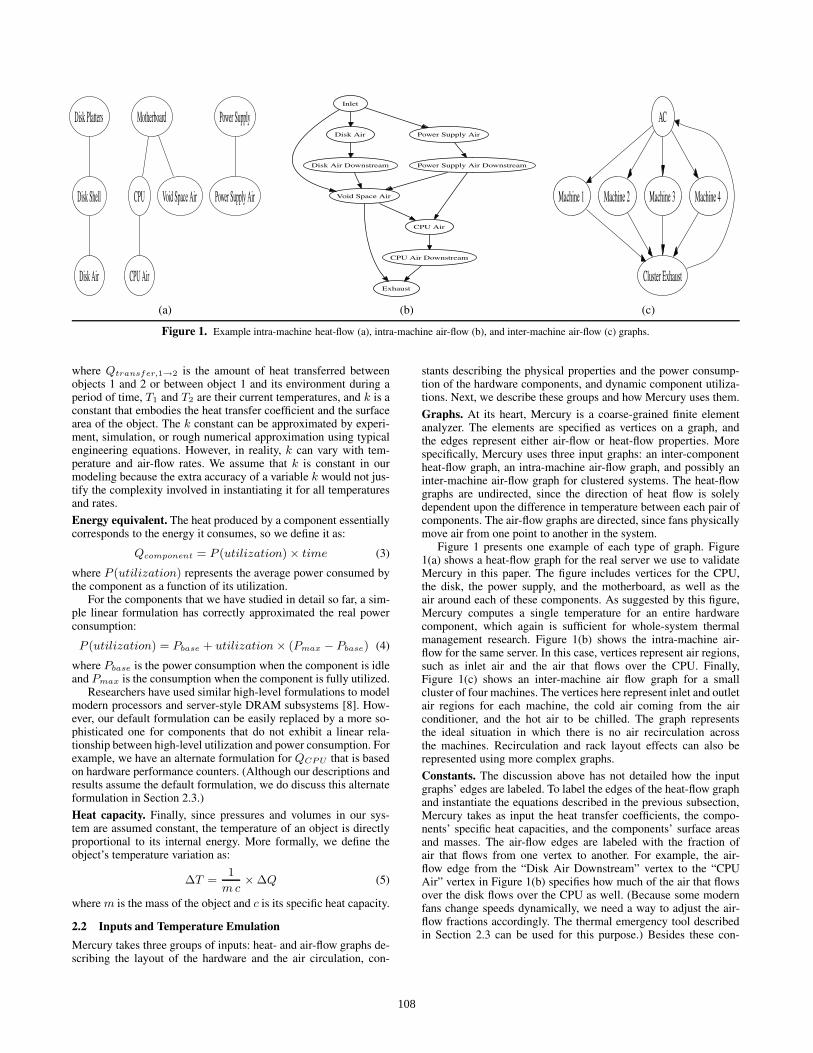
int sd;float temp;sd = opensensor("solvermachine", 8367, "disk");temp = readsensor(sd);closesensor(sd);
Figure 3. An example use of the library calls.
providing greater accuracy. However, as we demonstrate in Section3, our default setting is enough to produce temperatures that areaccurate to within 1oC. The thermal emergency tool can force thesolver to set temperatures to user-defined values at any time.
The user can specify the input graphs to the solver using ourmodified version of the language dot [10]. Our modificationsmainly involved changing its syntax to allow the specification ofair fractions, component masses, etc. Besides being simple, thelanguage enables freely available programs to draw the graphs forvisualizing the system.
Monitoring daemon. The monitor daemon, called monitord,periodically samples the utilization of the components of the ma-chine on which it is running and reports that information to thesolver. The components considered are the CPU(s), disk(s), andnetwork interface(s) and their utilization information is computedfrom /proc. The frequency of utilization updates sent to the solveris a tunable parameter set to 1 second by default. Our current im-plementation uses 128-byte UDP messages to update the solver.
Sensor library. Applications and system software can use Mercurythrough a simple runtime library API comprised by three calls:opensensor(), readsensor(), and closesensor().The call opensensor() takes as parameters the address of themachine running the solver, the port number at that machine, andthe component of which we want the temperature. It returns a filedescriptor that can then be read with readsensor(). The readcall involves communication with the solver to get the emulatedsensor reading. The call closesensor() closes the sensor. Withthis interface, the programmer can treat Mercury as a regular, localsensor device. Figure 3 illustrates the use of these three calls toread the temperature of the local disk.
Our current UDP implementation of readsensor() has anaverage response time of 300 µsec. This result compares favorablywith the latency of some real temperature sensors [2]. For instance,the Mercury response time is substantially lower than the averageaccess time of the real thermal sensor in our SCSI disks, 500 µsec.
Thermal emergency tool. To simulate temperature emergen-cies and other environmental changes, we created a tool calledfiddle. Fiddle can force the solver to change any constant or
109
#!/bin/bashsleep 100fiddle machine1 temperature inlet 30sleep 200fiddle machine1 temperature inlet 21.6
Figure 4. An example fiddle script.
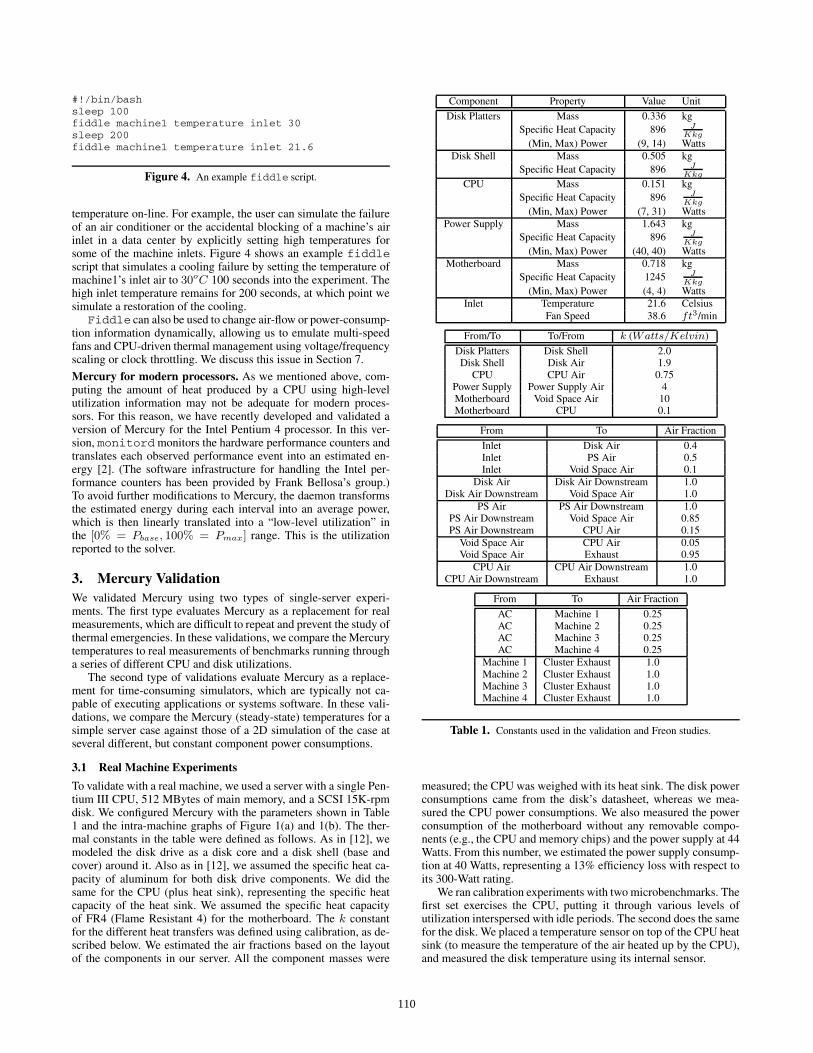
temperature on-line. For example, the user can simulate the failureof an air conditioner or the accidental blocking of a machine’s airinlet in a data center by explicitly setting high temperatures forsome of the machine inlets. Figure 4 shows an example fiddlescript that simulates a cooling failure by setting the temperature ofmachine1’s inlet air to 30oC 100 seconds into the experiment. Thehigh inlet temperature remains for 200 seconds, at which point wesimulate a restoration of the cooling.
Fiddle can also be used to change air-flow or power-consump-tion information dynamically, allowing us to emulate multi-speedfans and CPU-driven thermal management using voltage/frequencyscaling or clock throttling. We discuss this issue in Section 7.
Mercury for modern processors. As we mentioned above, com-puting the amount of heat produced by a CPU using high-levelutilization information may not be adequate for modern proces-sors. For this reason, we have recently developed and validated aversion of Mercury for the Intel Pentium 4 processor. In this ver-sion, monitord monitors the hardware performance counters andtranslates each observed performance event into an estimated en-ergy [2]. (The software infrastructure for handling the Intel per-formance counters has been provided by Frank Bellosa’s group.)To avoid further modifications to Mercury, the daemon transformsthe estimated energy during each interval into an average power,which is then linearly translated into a “low-level utilization” inthe [0% = Pbase, 100% = Pmax] range. This is the utilizationreported to the solver.
3. Mercury ValidationWe validated Mercury using two types of single-server experi-ments. The first type evaluates Mercury as a replacement for realmeasurements, which are difficult to repeat and prevent the study ofthermal emergencies. In these validations, we compare the Mercurytemperatures to real measurements of benchmarks running througha series of different CPU and disk utilizations.
The second type of validations evaluate Mercury as a replace-ment for time-consuming simulators, which are typically not ca-pable of executing applications or systems software. In these vali-dations, we compare the Mercury (steady-state) temperatures for asimple server case against those of a 2D simulation of the case atseveral different, but constant component power consumptions.
3.1 Real Machine Experiments
To validate with a real machine, we used a server with a single Pen-tium III CPU, 512 MBytes of main memory, and a SCSI 15K-rpmdisk. We configured Mercury with the parameters shown in Table1 and the intra-machine graphs of Figure 1(a) and 1(b). The ther-mal constants in the table were defined as follows. As in [12], wemodeled the disk drive as a disk core and a disk shell (base andcover) around it. Also as in [12], we assumed the specific heat ca-pacity of aluminum for both disk drive components. We did thesame for the CPU (plus heat sink), representing the specific heatcapacity of the heat sink. We assumed the specific heat capacityof FR4 (Flame Resistant 4) for the motherboard. The k constantfor the different heat transfers was defined using calibration, as de-scribed below. We estimated the air fractions based on the layoutof the components in our server. All the component masses were
Component Property Value Unit
Disk Platters Mass 0.336 kgSpecific Heat Capacity 896 J
Kkg(Min, Max) Power (9, 14) Watts
Disk Shell Mass 0.505 kgSpecific Heat Capacity 896 J
Kkg
CPU Mass 0.151 kgSpecific Heat Capacity 896 J
Kkg(Min, Max) Power (7, 31) Watts
Power Supply Mass 1.643 kgSpecific Heat Capacity 896 J
Kkg(Min, Max) Power (40, 40) Watts
Motherboard Mass 0.718 kgSpecific Heat Capacity 1245 J
Kkg(Min, Max) Power (4, 4) Watts
Inlet Temperature 21.6 CelsiusFan Speed 38.6 ft3/min
From/To To/From k (Watts/Kelvin)
Disk Platters Disk Shell 2.0Disk Shell Disk Air 1.9
CPU CPU Air 0.75Power Supply Power Supply Air 4Motherboard Void Space Air 10Motherboard CPU 0.1
From To Air Fraction
Inlet Disk Air 0.4Inlet PS Air 0.5Inlet Void Space Air 0.1
Disk Air Disk Air Downstream 1.0Disk Air Downstream Void Space Air 1.0
PS Air PS Air Downstream 1.0PS Air Downstream Void Space Air 0.85PS Air Downstream CPU Air 0.15
Void Space Air CPU Air 0.05Void Space Air Exhaust 0.95
CPU Air CPU Air Downstream 1.0CPU Air Downstream Exhaust 1.0
From To Air Fraction
AC Machine 1 0.25AC Machine 2 0.25AC Machine 3 0.25AC Machine 4 0.25
Machine 1 Cluster Exhaust 1.0Machine 2 Cluster Exhaust 1.0Machine 3 Cluster Exhaust 1.0Machine 4 Cluster Exhaust 1.0
Table 1. Constants used in the validation and Freon studies.
measured; the CPU was weighed with its heat sink. The disk powerconsumptions came from the disk’s datasheet, whereas we mea-sured the CPU power consumptions. We also measured the powerconsumption of the motherboard without any removable compo-nents (e.g., the CPU and memory chips) and the power supply at 44Watts. From this number, we estimated the power supply consump-tion at 40 Watts, representing a 13% efficiency loss with respect toits 300-Watt rating.
We ran calibration experiments with two microbenchmarks. Thefirst set exercises the CPU, putting it through various levels ofutilization interspersed with idle periods. The second does the samefor the disk. We placed a temperature sensor on top of the CPU heatsink (to measure the temperature of the air heated up by the CPU),and measured the disk temperature using its internal sensor.
110
0
20
40
60
80
100
0 2000 4000 6000 8000 10000 12000 14000 20
25
30
35
40
Per
cent
Util
izat
ion
Tem
pera
ture
(C
)
Time (Seconds)
CPU UtilEmulated
Real
Figure 5. Calibrating Mercury for CPU usage and temperature.
0
20
40
60
80
100
0 2000 4000 6000 8000 10000 12000 14000 20
25
30
35
40
Per
cent
Util
izat
ion
Tem
pera
ture
(C
)
Time (Seconds)
Disk UtilEmulated
Real
Figure 6. Calibrating Mercury for disk usage and temperature.
0
20
40
60
80
100
0 500 1000 1500 2000 2500 3000 3500 4000 4500 5000 20
25
30
35
40
Per
cent
Util
izat
ion
Tem
pera
ture
(C
)
Time (Seconds)
CPU UtilEmulated
Real
Figure 7. Real-system CPU air validation.
0
20
40
60
80
100
0 500 1000 1500 2000 2500 3000 3500 4000 4500 5000 20
25
30
35
40
Per
cent
Util
izat
ion
Tem
pera
ture
(C
)
Time (Seconds)
Disk UtilEmulated
Real
Figure 8. Real-system disk validation.
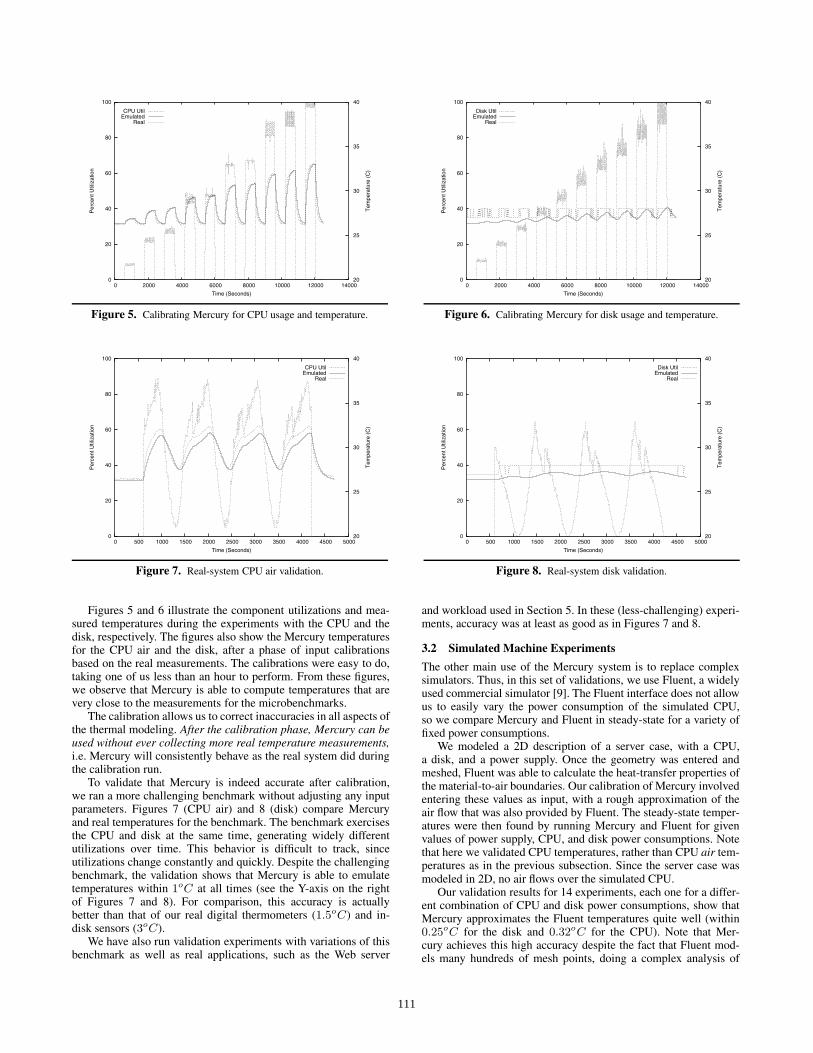
Figures 5 and 6 illustrate the component utilizations and mea-sured temperatures during the experiments with the CPU and thedisk, respectively. The figures also show the Mercury temperaturesfor the CPU air and the disk, after a phase of input calibrationsbased on the real measurements. The calibrations were easy to do,taking one of us less than an hour to perform. From these figures,we observe that Mercury is able to compute temperatures that arevery close to the measurements for the microbenchmarks.
The calibration allows us to correct inaccuracies in all aspects ofthe thermal modeling. After the calibration phase, Mercury can beused without ever collecting more real temperature measurements,i.e. Mercury will consistently behave as the real system did duringthe calibration run.
To validate that Mercury is indeed accurate after calibration,we ran a more challenging benchmark without adjusting any inputparameters. Figures 7 (CPU air) and 8 (disk) compare Mercuryand real temperatures for the benchmark. The benchmark exercisesthe CPU and disk at the same time, generating widely differentutilizations over time. This behavior is difficult to track, sinceutilizations change constantly and quickly. Despite the challengingbenchmark, the validation shows that Mercury is able to emulatetemperatures within 1oC at all times (see the Y-axis on the rightof Figures 7 and 8). For comparison, this accuracy is actuallybetter than that of our real digital thermometers (1.5oC) and in-disk sensors (3oC).
We have also run validation experiments with variations of thisbenchmark as well as real applications, such as the Web server
and workload used in Section 5. In these (less-challenging) experi-ments, accuracy was at least as good as in Figures 7 and 8.
3.2 Simulated Machine Experiments
The other main use of the Mercury system is to replace complexsimulators. Thus, in this set of validations, we use Fluent, a widelyused commercial simulator [9]. The Fluent interface does not allowus to easily vary the power consumption of the simulated CPU,so we compare Mercury and Fluent in steady-state for a variety offixed power consumptions.
We modeled a 2D description of a server case, with a CPU,a disk, and a power supply. Once the geometry was entered andmeshed, Fluent was able to calculate the heat-transfer properties ofthe material-to-air boundaries. Our calibration of Mercury involvedentering these values as input, with a rough approximation of theair flow that was also provided by Fluent. The steady-state temper-atures were then found by running Mercury and Fluent for givenvalues of power supply, CPU, and disk power consumptions. Notethat here we validated CPU temperatures, rather than CPU air tem-peratures as in the previous subsection. Since the server case wasmodeled in 2D, no air flows over the simulated CPU.
Our validation results for 14 experiments, each one for a differ-ent combination of CPU and disk power consumptions, show thatMercury approximates the Fluent temperatures quite well (within0.25oC for the disk and 0.32oC for the CPU). Note that Mer-cury achieves this high accuracy despite the fact that Fluent mod-els many hundreds of mesh points, doing a complex analysis of
111
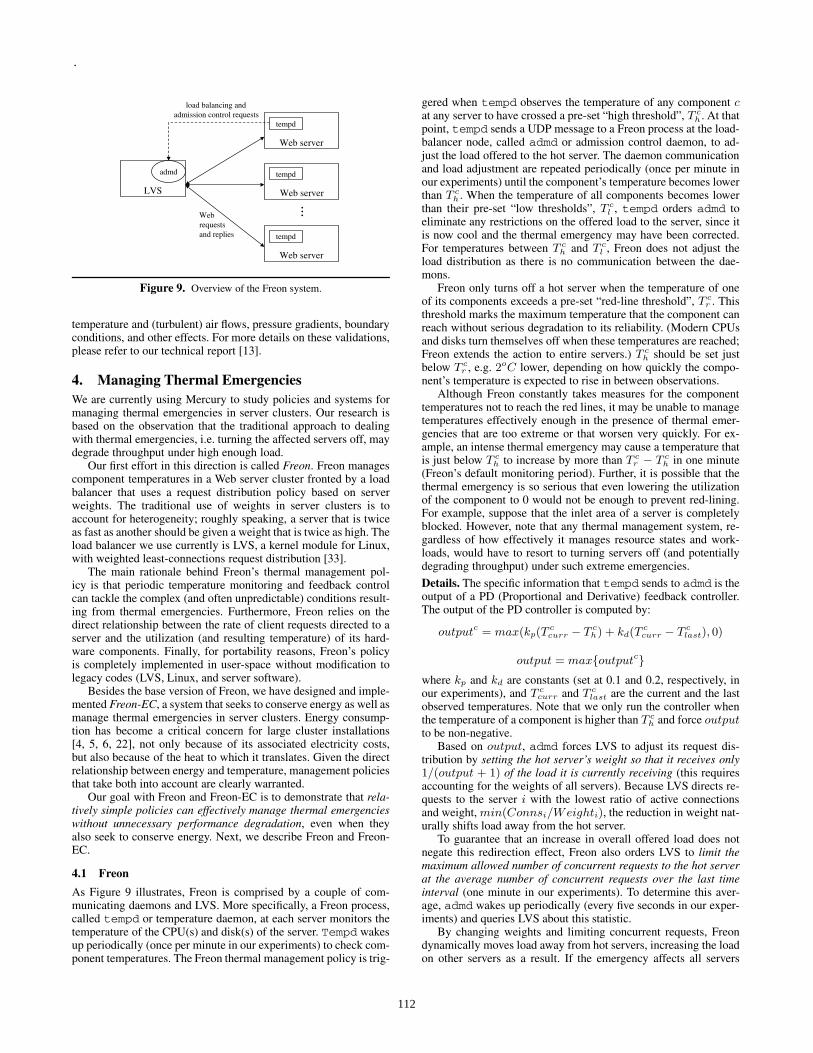
Figure 9. Overview of the Freon system.
temperature and (turbulent) air flows, pressure gradients, boundaryconditions, and other effects. For more details on these validations,please refer to our technical report [13].
4. Managing Thermal EmergenciesWe are currently using Mercury to study policies and systems formanaging thermal emergencies in server clusters. Our research isbased on the observation that the traditional approach to dealingwith thermal emergencies, i.e. turning the affected servers off, maydegrade throughput under high enough load.
Our first effort in this direction is called Freon. Freon managescomponent temperatures in a Web server cluster fronted by a loadbalancer that uses a request distribution policy based on serverweights. The traditional use of weights in server clusters is toaccount for heterogeneity; roughly speaking, a server that is twiceas fast as another should be given a weight that is twice as high. Theload balancer we use currently is LVS, a kernel module for Linux,with weighted least-connections request distribution [33].
The main rationale behind Freon’s thermal management pol-icy is that periodic temperature monitoring and feedback controlcan tackle the complex (and often unpredictable) conditions result-ing from thermal emergencies. Furthermore, Freon relies on thedirect relationship between the rate of client requests directed to aserver and the utilization (and resulting temperature) of its hard-ware components. Finally, for portability reasons, Freon’s policyis completely implemented in user-space without modification tolegacy codes (LVS, Linux, and server software).
Besides the base version of Freon, we have designed and imple-mented Freon-EC, a system that seeks to conserve energy as well asmanage thermal emergencies in server clusters. Energy consump-tion has become a critical concern for large cluster installations[4, 5, 6, 22], not only because of its associated electricity costs,but also because of the heat to which it translates. Given the directrelationship between energy and temperature, management policiesthat take both into account are clearly warranted.
Our goal with Freon and Freon-EC is to demonstrate that rela-tively simple policies can effectively manage thermal emergencieswithout unnecessary performance degradation, even when theyalso seek to conserve energy. Next, we describe Freon and Freon-EC.
4.1 Freon
As Figure 9 illustrates, Freon is comprised by a couple of com-municating daemons and LVS. More specifically, a Freon process,called tempd or temperature daemon, at each server monitors thetemperature of the CPU(s) and disk(s) of the server. Tempd wakesup periodically (once per minute in our experiments) to check com-ponent temperatures. The Freon thermal management policy is trig-
gered when tempd observes the temperature of any component cat any server to have crossed a pre-set “high threshold”, T c
h . At thatpoint, tempd sends a UDP message to a Freon process at the load-balancer node, called admd or admission control daemon, to ad-just the load offered to the hot server. The daemon communicationand load adjustment are repeated periodically (once per minute inour experiments) until the component’s temperature becomes lowerthan T c
h . When the temperature of all components becomes lowerthan their pre-set “low thresholds”, T c
l , tempd orders admd toeliminate any restrictions on the offered load to the server, since itis now cool and the thermal emergency may have been corrected.For temperatures between T c
h and T cl , Freon does not adjust the
load distribution as there is no communication between the dae-mons.
Freon only turns off a hot server when the temperature of oneof its components exceeds a pre-set “red-line threshold”, T c
r . Thisthreshold marks the maximum temperature that the component canreach without serious degradation to its reliability. (Modern CPUsand disks turn themselves off when these temperatures are reached;Freon extends the action to entire servers.) T c
h should be set justbelow T c
r , e.g. 2oC lower, depending on how quickly the compo-nent’s temperature is expected to rise in between observations.
Although Freon constantly takes measures for the componenttemperatures not to reach the red lines, it may be unable to managetemperatures effectively enough in the presence of thermal emer-gencies that are too extreme or that worsen very quickly. For ex-ample, an intense thermal emergency may cause a temperature thatis just below T c
h to increase by more than T cr − T c
h in one minute(Freon’s default monitoring period). Further, it is possible that thethermal emergency is so serious that even lowering the utilizationof the component to 0 would not be enough to prevent red-lining.For example, suppose that the inlet area of a server is completelyblocked. However, note that any thermal management system, re-gardless of how effectively it manages resource states and work-loads, would have to resort to turning servers off (and potentiallydegrading throughput) under such extreme emergencies.
Details. The specific information that tempd sends to admd is theoutput of a PD (Proportional and Derivative) feedback controller.The output of the PD controller is computed by:
outputc = max(kp(Tccurr − T c
h) + kd(Tccurr − T c
last), 0)
output = max{outputc}where kp and kd are constants (set at 0.1 and 0.2, respectively, inour experiments), and T c
curr and T clast are the current and the last
observed temperatures. Note that we only run the controller whenthe temperature of a component is higher than T c
h and force outputto be non-negative.
Based on output, admd forces LVS to adjust its request dis-tribution by setting the hot server’s weight so that it receives only1/(output + 1) of the load it is currently receiving (this requiresaccounting for the weights of all servers). Because LVS directs re-quests to the server i with the lowest ratio of active connectionsand weight, min(Connsi/Weighti), the reduction in weight nat-urally shifts load away from the hot server.
To guarantee that an increase in overall offered load does notnegate this redirection effect, Freon also orders LVS to limit themaximum allowed number of concurrent requests to the hot serverat the average number of concurrent requests over the last timeinterval (one minute in our experiments). To determine this aver-age, admd wakes up periodically (every five seconds in our exper-iments) and queries LVS about this statistic.
By changing weights and limiting concurrent requests, Freondynamically moves load away from hot servers, increasing the loadon other servers as a result. If the emergency affects all servers
112
while (1) {receive utilization and temperature info from tempd;
if (need to add a server) and (at least one server is off)in round-robin fashion, select a region that (a) has at
least one server that is off, and (b) preferably isnot under an emergency;
turn on a server from the selected region;
if (temperature of c just became > T ch
)increment count of emergencies in region;if (all servers in the cluster need to be active)
apply Freon’s base thermal policy;else
if (cannot remove a server)turn on a server chosen like above;
turn off the hot server;else
if (temperature of c just became < T cl )
decrement count of emergencies in region;apply Freon’s base thermal policy;
if (can still remove servers)turn off as many servers as possible in increasing
order of current processing capacity;}
Figure 10. Pseudo-code of admd in Freon-EC.
or the unaffected servers cannot handle the entire offered load,requests are unavoidably lost.
Finally, note that, under light load, Freon could completely ex-clude a hot server from the load distribution, allowing it to cool fast.However, this could make it difficult for Freon to control temper-atures smoothly when the server eventually needs to be reincludedto service a moderate or high offered load. (This is equivalent tothe problem of overloading newly added nodes in least-connectionscheduling.) Despite this difficulty, Freon-EC does turn nodes offunder light enough load to conserve energy, as we shall see next.
4.2 Freon-EC
Freon-EC combines energy conservation and thermal management.This combination is interesting since, for best results, energy mustplay a part in thermal management decisions and vice-versa. Toconserve energy, Freon-EC turns off as many servers as it can with-out degrading performance, as in [4, 6, 14, 22, 25, 27]. However,unlike these and all other previous works in cluster reconfigura-tion, Freon-EC selects the servers that should be on/off accordingto their temperatures and physical locations in the room. In partic-ular, Freon-EC associates each server with a physical “region” ofthe room. We define the regions such that common thermal emer-gencies will likely affect all servers of a region. For example, anintuitive scheme for a room with two air conditioners would createtwo regions, one for each half of the servers closest to an air condi-tioner. The failure of an air conditioner would most strongly affectthe servers in its associated region.
With respect to thermal management, Freon-EC uses Freon’sbase policy when all servers are needed to avoid degrading per-formance. When this is not the case, Freon-EC actually turns hotservers off, replacing them with servers that are potentially unaf-fected by the emergency, i.e. from different regions, if possible.
Details. Freon-EC has the same structure as Freon. Further, inFreon-EC, tempd still sends feedback controller outputs to admdwhen a component’s temperature exceeds T c
h . However, tempdalso sends utilization information to admd periodically (once perminute in our experiments). With this information, admd imple-ments the pseudo-code in Figure 10.
Turning off a server involves instructing LVS to stop using theserver, waiting for its current connections to terminate, and thenshutting it down. Turning on a server involves booting it up, waitingfor it to be ready to accept connections, and instructing LVS tostart using the server. Because turning on a server takes quite sometime, Freon-EC projects the current utilization of each component(averaged across all servers in the cluster) into the future, when theoverall load on the cluster appears to be increasing. Specifically,Freon-EC projects utilizations two observation intervals into thefuture, assuming that load will increase linearly until then.
The decision of whether to add or remove servers from the ac-tive cluster configuration is based on these projected componentutilizations. We add a server when the projected utilization of anycomponent is higher than a threshold, Uh (70% in our experi-ments). Looking at the current (rather than projected) utilization,Freon-EC removes servers when the removal would still leave theaverage utilization of all components lower than another threshold,Ul (60% in our experiments). Pinheiro et al. [22] used a similarapproach to cluster reconfiguration. Recently, Chen et al. [5] pro-posed a more sophisticated approach to cluster reconfiguration thatconsiders multiple costs (not just energy costs) and response times(instead of throughput). Furthermore, practical deployments haveto consider the location and management of servers that should notbe turned off if possible, such as database servers. These consider-ations can be incorporated into Freon-EC.
4.3 Freon vs CPU Thermal Management
It is important to compare Freon with thermal management tech-niques for locally controlling the temperature of the CPU, such asthrottling or scaling voltage/frequency [2, 3, 26, 30]. In a servercluster with least-connections load balancing, these techniques mayproduce a load distribution effect similar to Freon’s. Next, we de-scribe the advantages of the Freon approach.
Interestingly, Freon does implement a form of throttling byreducing the amount of load directed to hot servers and, as a result,reducing their CPU utilizations. Because throttling is performedby the load balancer rather than the hot CPUs themselves, we callthis approach “remote throttling”. The main advantages of remotethrottling are that it does not require hardware or operating systemsupport and it allows the throttling of other components besides theCPU, such as disks and network interfaces.
Voltage/frequency scaling is effective at controlling temperaturefor CPU-bound computations. However, scaling voltage/frequencydown slows the processing of interrupts, which can severely de-grade the throughput achievable by the server. In addition, CPUstypically support only a limited set of voltages and frequencies. Re-mote throttling is more flexible; it can generate a wide spectrum ofCPU power consumptions from idle to maximum power (albeit atthe maximum voltage/frequency). Moreover, unlike remote throt-tling, scaling requires hardware and possibly software support anddoes not apply to components other than the CPU.
Finally, high-level thermal management systems can leverageinformation about the workload, the temperature of multiple hard-ware components (as in Freon and Freon-EC), the intensity of thecurrent and projected load on the cluster (as in Freon-EC), and thephysical location of different servers (as in Freon-EC). So far, wehave not leveraged the characteristics of the workload. For exam-ple, in the face of a hot CPU, the system could distribute requestsin such a way that only memory or I/O-bound requests were sent toit. Lower weights and connection limits would only be used if thisstrategy did not reduce the CPU temperature enough. The currentversion of Freon does not implement this two-stage policy becauseLVS does not support content-aware request distribution. We willconsider content-aware load balancers in our future work.
113
20
30
40
50
60
70
0 500 1000 1500 2000
CPU
tem
pera
ture
(C)
time (seconds)
m1m2m3m4
0
20
40
60
80
100
0 500 1000 1500 2000
CPU
utiliz
atio
n (%
)
time (seconds)
m1m2m3m4
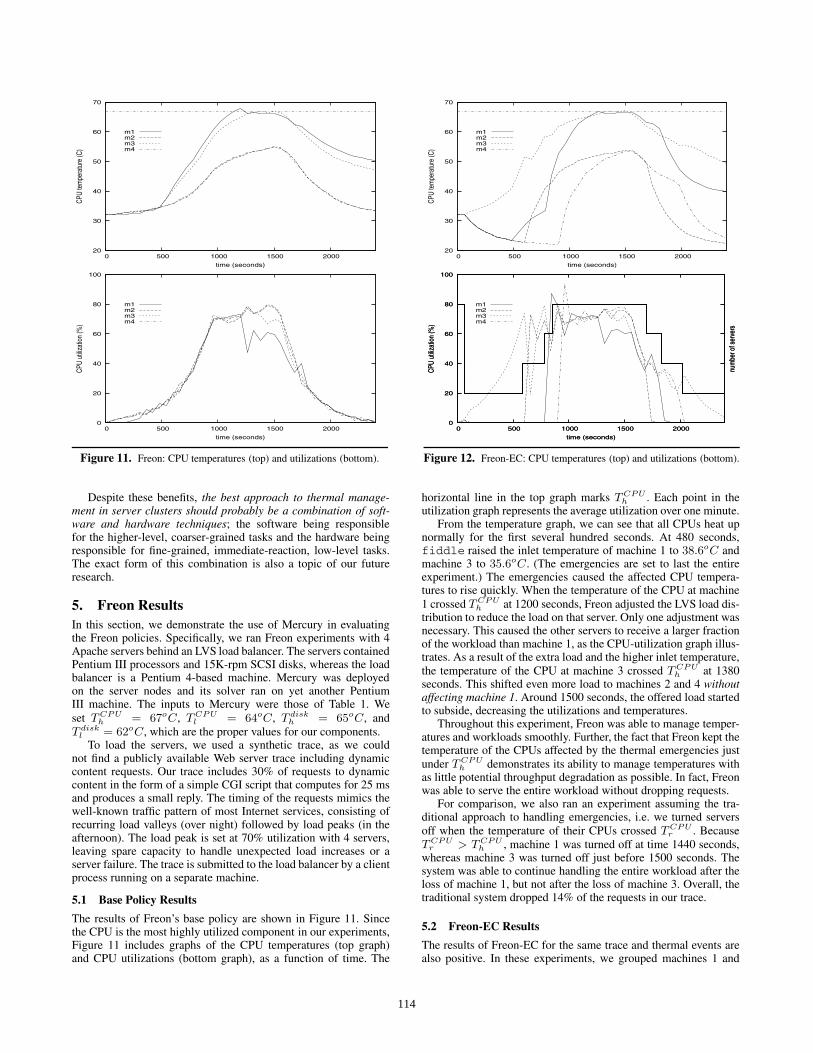
Figure 11. Freon: CPU temperatures (top) and utilizations (bottom).
20
30
40
50
60
70
0 500 1000 1500 2000
CPU
tem
pera
ture
(C)
time (seconds)
m1m2m3m4
0
20
40
60
80
100
0 500 1000 1500 2000CP
U ut
ilizat
ion
(%)
num
ber o
f ser
vers
time (seconds)
m1m2m3m4
0
20
40
60
80
100
0 500 1000 1500 2000CP
U ut
ilizat
ion
(%)
num
ber o
f ser
vers
time (seconds)
Figure 12. Freon-EC: CPU temperatures (top) and utilizations (bottom).
Despite these benefits, the best approach to thermal manage-ment in server clusters should probably be a combination of soft-ware and hardware techniques; the software being responsiblefor the higher-level, coarser-grained tasks and the hardware beingresponsible for fine-grained, immediate-reaction, low-level tasks.The exact form of this combination is also a topic of our futureresearch.
5. Freon ResultsIn this section, we demonstrate the use of Mercury in evaluatingthe Freon policies. Specifically, we ran Freon experiments with 4Apache servers behind an LVS load balancer. The servers containedPentium III processors and 15K-rpm SCSI disks, whereas the loadbalancer is a Pentium 4-based machine. Mercury was deployedon the server nodes and its solver ran on yet another PentiumIII machine. The inputs to Mercury were those of Table 1. Weset T CPU
h = 67oC, T CPUl = 64oC, T disk
h = 65oC, andT disk
l = 62oC, which are the proper values for our components.To load the servers, we used a synthetic trace, as we could
not find a publicly available Web server trace including dynamiccontent requests. Our trace includes 30% of requests to dynamiccontent in the form of a simple CGI script that computes for 25 msand produces a small reply. The timing of the requests mimics thewell-known traffic pattern of most Internet services, consisting ofrecurring load valleys (over night) followed by load peaks (in theafternoon). The load peak is set at 70% utilization with 4 servers,leaving spare capacity to handle unexpected load increases or aserver failure. The trace is submitted to the load balancer by a clientprocess running on a separate machine.
5.1 Base Policy Results
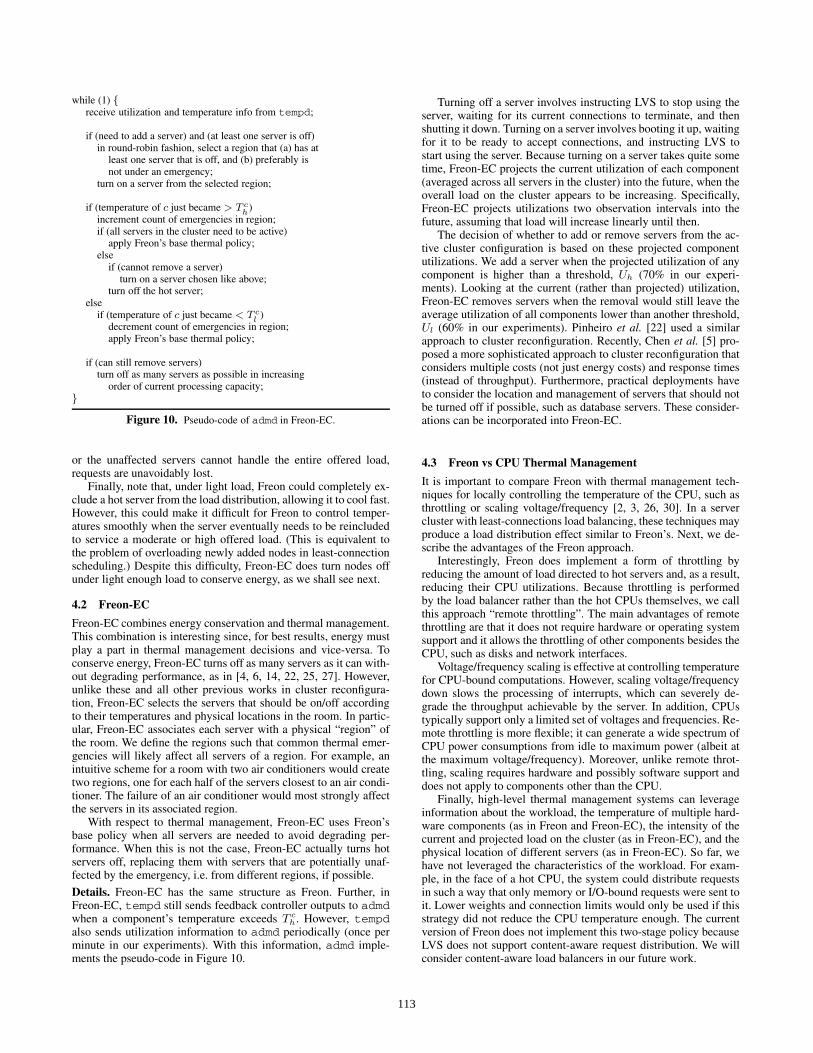
The results of Freon’s base policy are shown in Figure 11. Sincethe CPU is the most highly utilized component in our experiments,Figure 11 includes graphs of the CPU temperatures (top graph)and CPU utilizations (bottom graph), as a function of time. The
horizontal line in the top graph marks T CPUh . Each point in the
utilization graph represents the average utilization over one minute.From the temperature graph, we can see that all CPUs heat up
normally for the first several hundred seconds. At 480 seconds,fiddle raised the inlet temperature of machine 1 to 38.6oC andmachine 3 to 35.6oC. (The emergencies are set to last the entireexperiment.) The emergencies caused the affected CPU tempera-tures to rise quickly. When the temperature of the CPU at machine1 crossed T CPU
h at 1200 seconds, Freon adjusted the LVS load dis-tribution to reduce the load on that server. Only one adjustment wasnecessary. This caused the other servers to receive a larger fractionof the workload than machine 1, as the CPU-utilization graph illus-trates. As a result of the extra load and the higher inlet temperature,the temperature of the CPU at machine 3 crossed T CPU
h at 1380seconds. This shifted even more load to machines 2 and 4 withoutaffecting machine 1. Around 1500 seconds, the offered load startedto subside, decreasing the utilizations and temperatures.
Throughout this experiment, Freon was able to manage temper-atures and workloads smoothly. Further, the fact that Freon kept thetemperature of the CPUs affected by the thermal emergencies justunder T CPU
h demonstrates its ability to manage temperatures withas little potential throughput degradation as possible. In fact, Freonwas able to serve the entire workload without dropping requests.
For comparison, we also ran an experiment assuming the tra-ditional approach to handling emergencies, i.e. we turned serversoff when the temperature of their CPUs crossed T CPU
r . BecauseT CPU
r > T CPUh , machine 1 was turned off at time 1440 seconds,
whereas machine 3 was turned off just before 1500 seconds. Thesystem was able to continue handling the entire workload after theloss of machine 1, but not after the loss of machine 3. Overall, thetraditional system dropped 14% of the requests in our trace.
5.2 Freon-EC Results
The results of Freon-EC for the same trace and thermal events arealso positive. In these experiments, we grouped machines 1 and
114
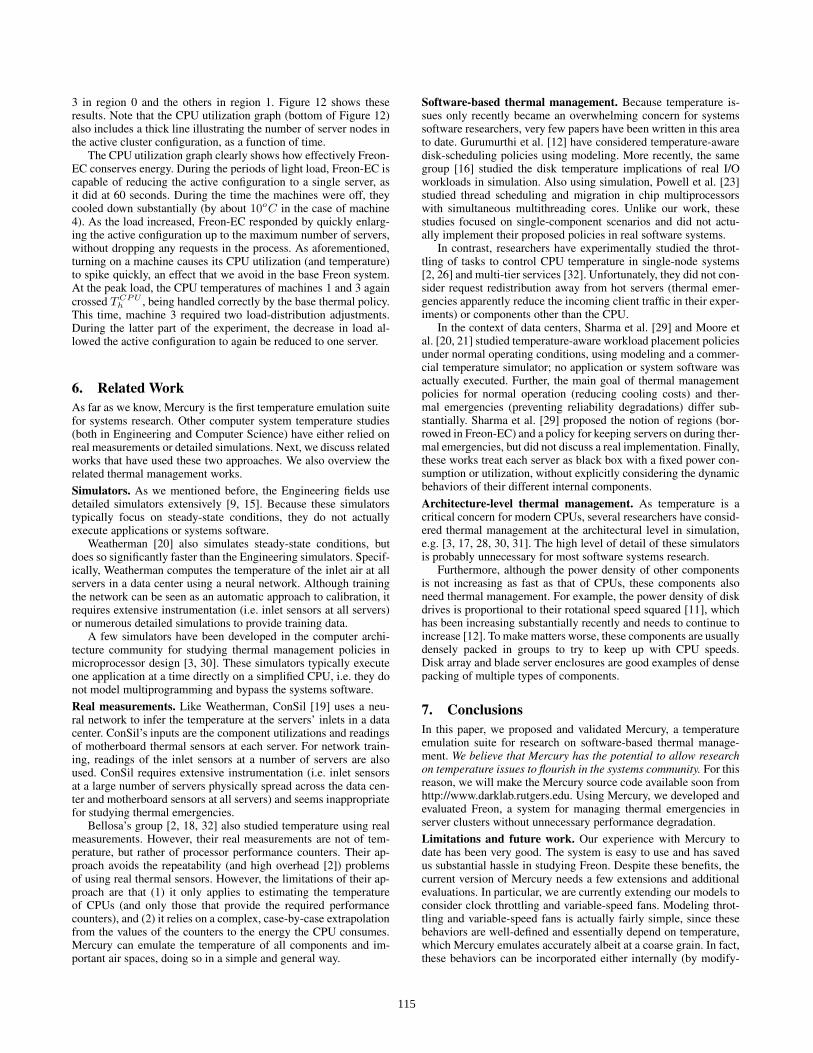
3 in region 0 and the others in region 1. Figure 12 shows theseresults. Note that the CPU utilization graph (bottom of Figure 12)also includes a thick line illustrating the number of server nodes inthe active cluster configuration, as a function of time.
The CPU utilization graph clearly shows how effectively Freon-EC conserves energy. During the periods of light load, Freon-EC iscapable of reducing the active configuration to a single server, asit did at 60 seconds. During the time the machines were off, theycooled down substantially (by about 10oC in the case of machine4). As the load increased, Freon-EC responded by quickly enlarg-ing the active configuration up to the maximum number of servers,without dropping any requests in the process. As aforementioned,turning on a machine causes its CPU utilization (and temperature)to spike quickly, an effect that we avoid in the base Freon system.At the peak load, the CPU temperatures of machines 1 and 3 againcrossed T CPU
h , being handled correctly by the base thermal policy.This time, machine 3 required two load-distribution adjustments.During the latter part of the experiment, the decrease in load al-lowed the active configuration to again be reduced to one server.
6. Related WorkAs far as we know, Mercury is the first temperature emulation suitefor systems research. Other computer system temperature studies(both in Engineering and Computer Science) have either relied onreal measurements or detailed simulations. Next, we discuss relatedworks that have used these two approaches. We also overview therelated thermal management works.
Simulators. As we mentioned before, the Engineering fields usedetailed simulators extensively [9, 15]. Because these simulatorstypically focus on steady-state conditions, they do not actuallyexecute applications or systems software.
Weatherman [20] also simulates steady-state conditions, butdoes so significantly faster than the Engineering simulators. Specif-ically, Weatherman computes the temperature of the inlet air at allservers in a data center using a neural network. Although trainingthe network can be seen as an automatic approach to calibration, itrequires extensive instrumentation (i.e. inlet sensors at all servers)or numerous detailed simulations to provide training data.
A few simulators have been developed in the computer archi-tecture community for studying thermal management policies inmicroprocessor design [3, 30]. These simulators typically executeone application at a time directly on a simplified CPU, i.e. they donot model multiprogramming and bypass the systems software.
Real measurements. Like Weatherman, ConSil [19] uses a neu-ral network to infer the temperature at the servers’ inlets in a datacenter. ConSil’s inputs are the component utilizations and readingsof motherboard thermal sensors at each server. For network train-ing, readings of the inlet sensors at a number of servers are alsoused. ConSil requires extensive instrumentation (i.e. inlet sensorsat a large number of servers physically spread across the data cen-ter and motherboard sensors at all servers) and seems inappropriatefor studying thermal emergencies.
Bellosa’s group [2, 18, 32] also studied temperature using realmeasurements. However, their real measurements are not of tem-perature, but rather of processor performance counters. Their ap-proach avoids the repeatability (and high overhead [2]) problemsof using real thermal sensors. However, the limitations of their ap-proach are that (1) it only applies to estimating the temperatureof CPUs (and only those that provide the required performancecounters), and (2) it relies on a complex, case-by-case extrapolationfrom the values of the counters to the energy the CPU consumes.Mercury can emulate the temperature of all components and im-portant air spaces, doing so in a simple and general way.
Software-based thermal management. Because temperature is-sues only recently became an overwhelming concern for systemssoftware researchers, very few papers have been written in this areato date. Gurumurthi et al. [12] have considered temperature-awaredisk-scheduling policies using modeling. More recently, the samegroup [16] studied the disk temperature implications of real I/Oworkloads in simulation. Also using simulation, Powell et al. [23]studied thread scheduling and migration in chip multiprocessorswith simultaneous multithreading cores. Unlike our work, thesestudies focused on single-component scenarios and did not actu-ally implement their proposed policies in real software systems.
In contrast, researchers have experimentally studied the throt-tling of tasks to control CPU temperature in single-node systems[2, 26] and multi-tier services [32]. Unfortunately, they did not con-sider request redistribution away from hot servers (thermal emer-gencies apparently reduce the incoming client traffic in their exper-iments) or components other than the CPU.
In the context of data centers, Sharma et al. [29] and Moore etal. [20, 21] studied temperature-aware workload placement policiesunder normal operating conditions, using modeling and a commer-cial temperature simulator; no application or system software wasactually executed. Further, the main goal of thermal managementpolicies for normal operation (reducing cooling costs) and ther-mal emergencies (preventing reliability degradations) differ sub-stantially. Sharma et al. [29] proposed the notion of regions (bor-rowed in Freon-EC) and a policy for keeping servers on during ther-mal emergencies, but did not discuss a real implementation. Finally,these works treat each server as black box with a fixed power con-sumption or utilization, without explicitly considering the dynamicbehaviors of their different internal components.
Architecture-level thermal management. As temperature is acritical concern for modern CPUs, several researchers have consid-ered thermal management at the architectural level in simulation,e.g. [3, 17, 28, 30, 31]. The high level of detail of these simulatorsis probably unnecessary for most software systems research.
Furthermore, although the power density of other componentsis not increasing as fast as that of CPUs, these components alsoneed thermal management. For example, the power density of diskdrives is proportional to their rotational speed squared [11], whichhas been increasing substantially recently and needs to continue toincrease [12]. To make matters worse, these components are usuallydensely packed in groups to try to keep up with CPU speeds.Disk array and blade server enclosures are good examples of densepacking of multiple types of components.
7. ConclusionsIn this paper, we proposed and validated Mercury, a temperatureemulation suite for research on software-based thermal manage-ment. We believe that Mercury has the potential to allow researchon temperature issues to flourish in the systems community. For thisreason, we will make the Mercury source code available soon fromhttp://www.darklab.rutgers.edu. Using Mercury, we developed andevaluated Freon, a system for managing thermal emergencies inserver clusters without unnecessary performance degradation.
Limitations and future work. Our experience with Mercury todate has been very good. The system is easy to use and has savedus substantial hassle in studying Freon. Despite these benefits, thecurrent version of Mercury needs a few extensions and additionalevaluations. In particular, we are currently extending our models toconsider clock throttling and variable-speed fans. Modeling throt-tling and variable-speed fans is actually fairly simple, since thesebehaviors are well-defined and essentially depend on temperature,which Mercury emulates accurately albeit at a coarse grain. In fact,these behaviors can be incorporated either internally (by modify-
115
ing the Mercury code) or externally (via fiddle). We also plan tostudy the emulation of chip multiprocessors, which will probablyhave to be done in two levels, for each core and the entire chip.
Our real implementation of Freon demonstrated that relativelysimple policies and systems can effectively manage thermal emer-gencies. However, the current version of Freon also needs a fewextensions. In particular, Freon needs to be extended to deal withmulti-tier services and to include other policies. We are currentlyaddressing these extensions, as well as considering ways to com-bine Freon with CPU-driven thermal management.
Acknowledgements
We would like to thank Frank Bellosa, Enrique V. Carrera, SteveDropsho, Cosmin Rusu, and the anonymous reviewers for com-ments that helped improve this paper significantly. We are also in-debted to Frank Bellosa, Andreas Merkel, and Simon Kellner forsharing their performance-counter infrastructure with us. Finally,we thank Enrique V. Carrera and Diego Nogueira who contributedto the early stages of this work.
References[1] D. Anderson, J. Dykes, and E. Riedel. More than an Interface – SCSI
vs. ATA. In Proceedings of FAST, March 2003.
[2] F. Bellosa, S. Kellner, M. Waitz, and A. Weissel. Event-Driven EnergyAccounting of Dynamic Thermal Management. In Proceedings ofCOLP, September 2003.
[3] D. Brooks and M. Martonosi. Dynamic Thermal Managementfor High-Performance Microprocessors. In Proceedings of HPCA,January 2001.
[4] J. Chase, D. Anderson, P. Thackar, A. Vahdat, and R. Boyle.Managing Energy and Server Resources in Hosting Centers. InProceedings of SOSP, October 2001.
[5] Y. Chen, A. Das, W. Qin, A. Sivasubramaniam, Q. Wang, andN. Gautam. Managing Server Energy and Operational Costs inHosting Centers. In Proceedings of Sigmetrics, June 2005.
[6] E. N. Elnozahy, M. Kistler, and R. Rajamony. Energy-Efficient ServerClusters. In Proceedings of PACS, February 2002.
[7] Ericsson Microelectronics. Reliability Aspects on Power Supplies.Technical Report Design Note 002, April 2000.
[8] W. Felter, K. Rajamani, T. Keller, and C. Rusu. A Performance-Conserving Approach for Reducing Peak Power Consumption inServer Systems. In Proceedings of ICS, June 2005.
[9] Fluent. Fluent: The Right Answer in CFD. http://www.fluent.com/-index.htm.
[10] E. Gansner, E. Koutsofios, and S. North. Drawing Graphs with Dot.http://www.graphviz.org/Documentation/dotguide.pdf.
[11] S. Gurumurthi, A. Sivasubramaniam, M. Kandemir, and H. Franke.DRPM: Dynamic Speed Control for Power Management in ServerClass Disks. In Proceedings of ISCA, June 2003.
[12] S. Gurumurthi, A. Sivasubramaniam, and V. Natarajan. Disk DriveRoadmap from the Thermal Perspective: A Case for DynamicThermal Management. In Proceedings of ISCA, June 2005.
[13] T. Heath, A. P. Centeno, P. George, L. Ramos, Y. Jaluria, andR. Bianchini. Mercury and Freon: Temperature Emulation andManagement for Server Systems. Technical Report DCS-TR-596,Department of Computer Science, Rutgers University, January 2006,Revised July 2006.
[14] T. Heath, B. Diniz, E. V. Carrera, W. Meira Jr., and R. Bianchini. En-ergy Conservation in Heterogeneous Server Clusters. In Proceedingsof PPoPP, June 2005.
[15] T. Icoz and Y. Jaluria. Numerical Simulation of Boundary Conditionsand the Onset of Instability in Natural Convection Due to Protruding
Thermal Sources in an Open Rectangular Channel. Numerical HeatTransfer, 48:831–847, 2005.
[16] Y. Kim, S. Gurumurthi, and A. Sivasubramaniam. Understandingthe Performance-Temperature Interactions in Disk I/O of ServerWorkloads. In Proceedings of HPCA, February 2006.
[17] Y. Li, D. Brooks, Z. Hu, and K. Skadron. Performance, Energy,and Thermal Considerations for SMT and CMP Architectures. InProceedings of HPCA, February 2005.
[18] A. Merkel and F. Bellosa. Balancing Power Consumption inMultiprocessor Systems. In Proceedings of Eurosys, April 2006.
[19] J. Moore, J. Chase, and P. Ranganathan. ConSil: Low-Cost ThermalMapping of Data Centers. In Proceedings of SysML, June 2006.
[20] J. Moore, J. Chase, and P. Ranganathan. Weatherman: Automated,Online, and Predictive Thermal Mapping and Management for DataCenters. In Proceedings of ICAC, June 2006.
[21] J. Moore, J. Chase, P. Ranganathan, and R. Sharma. MakingScheduling Cool: Temperature-Aware Resource Assignment in DataCenters. In Proceedings of USENIX, April 2005.
[22] E. Pinheiro, R. Bianchini, E. Carrera, and T. Heath. DynamicCluster Reconfiguration for Power and Performance. In L. Benini,M. Kandemir, and J. Ramanujam, editors, Compilers and OperatingSystems for Low Power. Kluwer Academic Publishers, August 2003.Earlier version published in Proceedings of COLP 2001, September2001.
[23] M. Powell, M. Gomaa, and T. N. Vijaykumar. Heat-and-Run:Leveraging SMT and CMP to Manage Power Density Through theOperating System. In Proceedings of ASPLOS, October 2004.
[24] F. K. Price. Heat Transfer and Fluid Flow Data Books. GeniumPublishing Corp., 1990.
[25] K. Rajamani and C. Lefurgy. On Evaluating Request-DistributionSchemes for Saving Energy in Server Clusters. In Proceedings ofISPASS, March 2003.
[26] E. Rohou and M. D. Smith. Dynamically Managing ProcessorTemperature and Power. In Proceedings of FDO, November 1999.
[27] C. Rusu, A. Ferreira, C. Scordino, A. Watson, R. Melhem, andD. Mosse. Energy-Efficient Real-Time Heterogeneous ServerClusters. In Proceedings of RTAS, April 2006.
[28] L. Shang, L.-S. Peh, A. Kumar, and N. Jha. Characterization andManagement of On-Chip Networks. In Proceedings of Micro,December 2004.
[29] R. Sharma, C. Bash, C. Patel, R. Friedrich, and J. Chase. Balanceof Power: Dynamic Thermal Management for Internet Data Centers.IEEE Internet Computing, 9(1), January 2005.
[30] K. Skadron, M. Stan, W. Huang, S. Velusamy, K. Sankaranarayanan,and D. Tarjan. Temperature-Aware Microarchitecture. In Proceedingsof ISCA, June 2003.
[31] J. Srinivasan, S. Adve, P. Bose, and J. Rivers. The Case for LifetimeReliability-Aware Microprocessors. In Proceedings of ISCA, June2004.
[32] A. Weissel and F. Bellosa. Dynamic Thermal Management forDistributed Systems. In Proceedings of TACS, June 2004.
[33] W. Zhang. Linux Virtual Server for Scalable Network Services. InProceedings of the Linux Symposium, July 2000.
116