measurements of the acceleration due to gravity at the gravity laboratory of the national institute...
TRANSCRIPT

1
Istituto Nazionale di Ricerca Metrologica
G. D’Agostino(1), S. Desogus(1), A. Germak(1), C. Origlia(1), D. Quagliotti (1), G. Celli(2) and O. Francis(3)
MEASUREMENTS OF THE ACCELERATION DUE TO GRAVITY
AT THE GRAVITY LABORATORY OF THE NATIONAL INSTITUTE OF METROLOGICAL RESEARCH
TURIN (ITALY)
T.R. 33 October 2006
(1) National Institute of Metrological Research INRIM, Italy (2) European Center for Geodynamics and Seismology ECGS, Luxembourg (3) University of Luxembourg, Luxembourg
Technical Report I.N.RI.M.

2
ABSTRACT The work hereafter described was carried out during the period October-November, 2005 by the National Institute of Metrological Research (INRIM), formerly Institute of Metrology G.Colonnetti (IMGC-CNR), and in June, 2006 by the European Center for Geodynamics and Seismology (ECGS), Luxemburg.
The experimental results of the measurement of the acceleration due to gravity carried out at the Gravity Laboratory of INRIM are reported.
The estimate of the absolute acceleration due to gravity together with the vertical gradient are reported. The observation site at the Gravity Laboratory of INRIM is available as a reference absolute station for a gravity net.
Absolute measurements were performed by INRIM with the new transportable ballistic gravimeter, the IMGC-02. The measurement apparatus and the measurement uncertainty are shortly described.
Relative measurements were performed by ECGS with the spring gravimeter Scintrex CG5#008.
The measurement traceability is assured because the IMGC-02 adopts length and time standards traceable to the national standards. It participates to the International Comparisons of Absolute Gravimeters (ICAGs) organized by the Bureau International des Poids et Mesures (BIPM) to assure the declared level of uncertainty. The CG5#008 measurement scale is calibrated with another absolute gravimeter, the FG5-216.

3
CAPTIONS INDEX ABSTRACT ..................................................................................................................... 2
CAPTIONS INDEX ......................................................................................................... 3
TABLES and FIGURE INDEX ....................................................................................... 4
1 INTRODUCTION ..................................................................................................... 5
2 DESCRIPTION OF THE IMGC-02 .......................................................................... 6
2.1 Measurement method .......................................................................................... 6
2.2 Measurement apparatus ....................................................................................... 6
3 MEASUREMENT UNCERTAINTY ........................................................................ 9
3.1 The instrumental uncertainty of the IMGC-02 .................................................... 9
4 EXPERIMENTAL RESULTS ................................................................................. 11
4.1 INRIM observation site ..................................................................................... 11
4.2 Measurement sessions ....................................................................................... 12
4.3 Vertical gradient ................................................................................................ 18
REFERENCES ............................................................................................................... 20

4
FIGURES and TABLES INDEX Figure 1.1: The new absolute gravimeter IMGC-02 at the INRIM Gravity Laboratory . 5
Figure 1.2: The relative spring gravimeter Scintrex CG5#008 ....................................... 6
Figure 2.1: Schematic layout of the IMGC-02 Absolute Gravimeter ............................. 7
Figure 2.2: GravisoftM 1.0 - manager front panel .......................................................... 8
Figure 2.3: GravisoftPP 1.0 - post-processing front panel ............................................. 8
Table 3: Instrumental uncertainty of the IMGC-02 absolute gravimeter ...................... 10
Figure 4.1: Basement-plan of the INRIM Dynamometric section and detail of the gravity laboratory with the observation point (dimensions in centimeters) ............ 11
Figure 4.2a: Density frequency of measurements (Oct 26, Nov 2) ................................ 12
Figure 4.2b: Density frequency of measurements (Nov 7, 8, 10) ................................... 13
Figure 4.2c: Density frequency of measurements (Nov 22, 23, 28) ............................... 14
Figure 4.3: Measurement results obtained during the eight sessions ............................ 15
Figure 4.4: Observation sessions retained for the estimate of the mean value ............. 15
Table 4.1: Measurement uncertainty of the IMGC-02 absolute gravimeter at INRIM Gravity Laboratory .................................................................................................. 16
Table 4.2: Experimental results at the Gravity Laboratory of INRIM ........................... 17
Table 4.3: Apparatus setup at the Gravity Laboratory of INRIM .................................. 17
Figure 4.5: Gravity field along the vertical at the Gravity Laboratory of INRIM......... 19
5
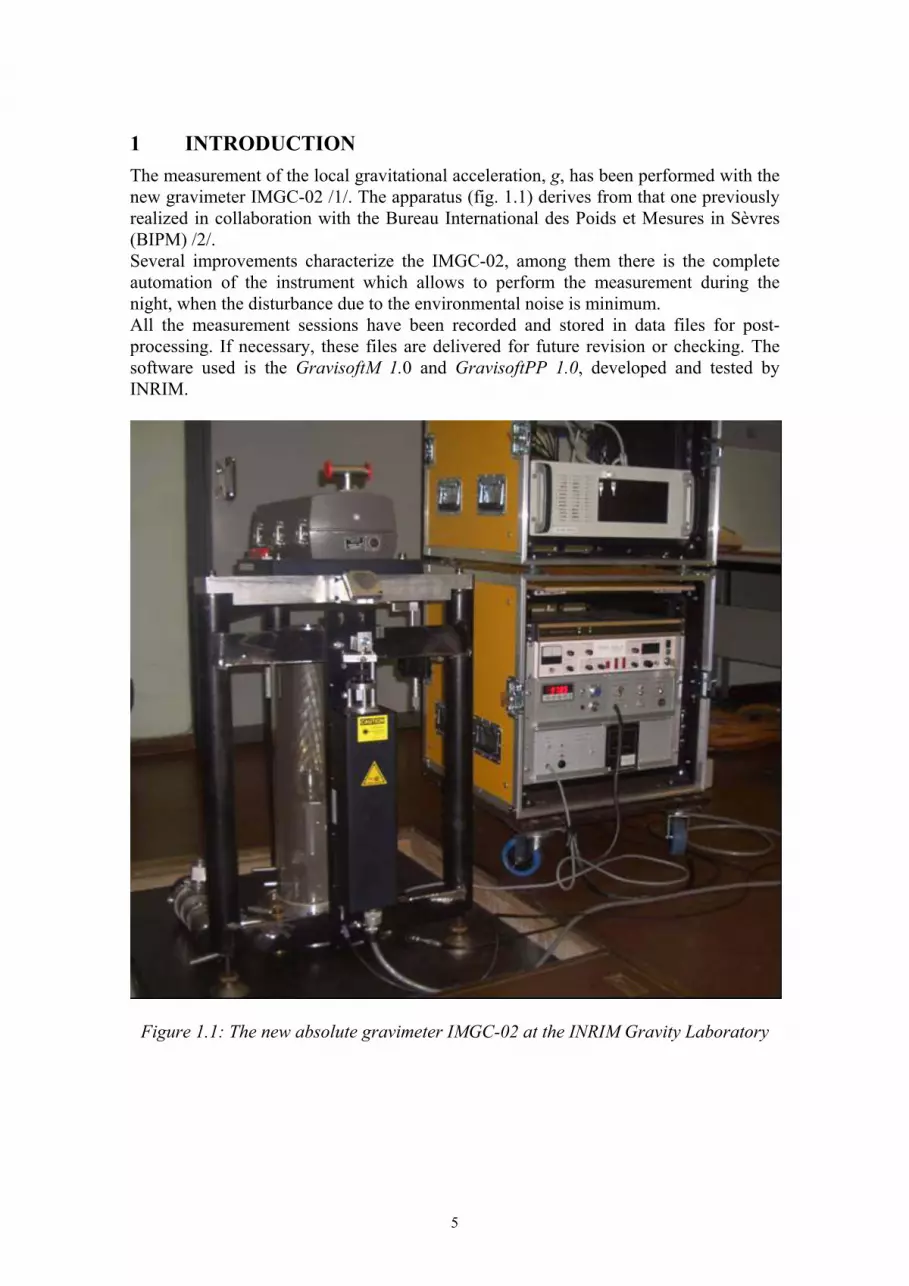
1 INTRODUCTION The measurement of the local gravitational acceleration, g, has been performed with the new gravimeter IMGC-02 /1/. The apparatus (fig. 1.1) derives from that one previously realized in collaboration with the Bureau International des Poids et Mesures in Sèvres (BIPM) /2/. Several improvements characterize the IMGC-02, among them there is the complete automation of the instrument which allows to perform the measurement during the night, when the disturbance due to the environmental noise is minimum. All the measurement sessions have been recorded and stored in data files for post-processing. If necessary, these files are delivered for future revision or checking. The software used is the GravisoftM 1.0 and GravisoftPP 1.0, developed and tested by INRIM.
Figure 1.1: The new absolute gravimeter IMGC-02 at the INRIM Gravity Laboratory

6
The vertical gradient was estimated with gravity data acquired with the relative spring gravimeter Scintrex CG5#008 (fig. 1.2). The gradient is used to transfer the absolute gravity value from the reference height, where it is estimated, to any other height. This allows either to compare the results obtained with instruments measuring at different heights and to transfer the absolute gravity value to the height of the sensor of a relative gravimeter which can be used to transfer the measurement outside the Laboratory.
Figure 1.2: The relative spring gravimeter Scintrex CG5#008
2 DESCRIPTION OF THE IMGC-02 2.1 MEASUREMENT METHOD
The acceleration due to gravity is measured by tracking the vertical trajectory of a test-mass which is thrown up in vacuum. The IMGC-02 absoulte gravimeter adopts the symmetric rise and falling method, where both the rise and falling trajectory of the test-mass is recorded. The trajectory reconstruction is performed by an optical interferometer. The raw data consists in an array where each element represents the time correspondent to the passage through equally spaced levels (or stations). An equation of motion is fitted to the raw data in a total least-squares adjustment. One of the estimating parameters is the acceleration experienced by the test-mass during its flight. A measurement session consists of about 2000 launches. To assure the estimated measurement uncertainty, the g value is obtained by averaging those launches which fulfill accepting criteria. 2.2 MEASUREMENT APPARATUS
A schematic layout of the apparatus is showed in fig. 2.1. The basic parts of the instrument are a Mach-Zehnder interferometer /3/ and a long-period (about 25 s) seismometer. The radiation of a stabilised He-Ne laser is used as the length standard.

7
The inertial mass of the seismometer supports a cube-corner reflector, which is the reference mirror of the interferometer. The moving mirror of the interferometer is also a cube-corner retro-reflector and is directly subjected to the free falling motion. It is thrown upwards vertically by means of a launch pad in a vacuum chamber (about 1 × 10⁻³ Pa). A number of interference fringes emerging from the interferometer are detected by a photo-multiplier. The output signal is sampled by a high speed waveform digitizer synchronized to a Rb oscillator, used as the time standard. Equidistant stations are selected by counting a constant integer number of interference fringes (at present 1024); in particular consecutive stations are separated by a distance d = 1024⋅λ/2, being λ the wavelength of the laser radiation. The so called local fit method is used to time the interference signal /4/. In particular the time is computed by fitting the equation model of the interference of monochromatic waves to the interference fringe which corresponds to the selected station. As already mentioned, the space-time coordinates are processed in a least-squares algorithm, where a suitable equation model is fitted to the measured trajectory. Each throw gives an estimated g value. A personal computer runs the measurement. The pad launch is triggered only if the apparatus is found to be ready. In particular the software checks the pad launch state (loaded or unloaded), the laser state (locked or unlocked). Environmental parameters such as the local barometric pressure and the temperature are acquired each launch.
launch chamber
frame
laser
seismometer
photo-detector
electronics
computer
interferometer
Figure 2.1: Schematic layout of the IMGC-02 Absolute Gravimeter
The software used includes (i) the manager GravisoftM 1.0 (fig. 2.2) for driving the instrument and storing the measurement data and (ii) the post-processing GravisoftPP 1.0 (fig. 2.3) for elaborating the data-files. These programs were developed and tested on the LabVIEW7.0® platform. Geophysical corrections are applied: (i) the Earth tides and Ocean loading are computed with the ETGTAB, version 3.0, which uses the tidal potential development of

8
Cartwright-Tayler-Edden (1973), (ii) the polar motion correction is computed starting from the daily pole coordinates x and y (rad) obtained from the International Earth Rotation Service (IERS). The measured gravity is normalized to a nominal pressure, taking into account a barometric factor Bf = 0.30 × 10⁻⁸ m⋅s-2⋅mbar-1, as recommended by the IAG 1983 resolution n.9. Instrumental corrections are also applied: (i) the diffraction correction and the (ii) laser beam verticality. The g value associated to every measurement station is estimated as mean value of n measurements carried out (after applying the above mentioned corrections) and it is reported to a specific height from the floor surface. The expanded uncertainty of the g value is also given, according to the method of combination of uncertainties suggested by the ISO GUM guide /5/.
Figure 2.2: GravisoftM 1.0 - manager front panel
Figure 2.3: GravisoftPP 1.0 - post-processing front panel

9
3 MEASUREMENT UNCERTAINTY The uncertainty associated to the g measurement is calculated combining the contributions of uncertainty of the IMGC-02 absolute gravimeter, called the instrumental uncertainty to the contribution of uncertainty depending from the observation site. 3.1 THE INSTRUMENTAL UNCERTAINTY OF THE IMGC-02
It has to be underlined that it is possible that some unrecognized effect is not present in the current measurement uncertainty budget. For this reason the uncertainty assessment can be subjected to future revision. Influence factors which are characteristic of the instrument are: vacuum level, non-uniform magnetic field, temperature gradient, electrostatic attraction, mass distribution, laser beam verticality, air gap modulation, length standard, time standard, retro-reflector balancing, radiation pressure and reference height. Tab. 3 reports the quantitative assessment of the effect of every disturbing factor. The expanded uncertainty at the 95% confidence level (coverage factor k = 2.10 and 19 degrees of freedom) is estimated to be U = 8.1 × 10⁻⁸ m⋅s-2. The measurement uncertainty results from the combination of the instrument uncertainty with influence factors that are dependent from the observation site: Coriolis force, floor recoil and geophysical effects such as local barometric pressure, gravity tides, ocean loading and polar motion. Uncertainty tables, related to the observation site, are attached to the experimental results below described.

10
Influence parameters, x i
Value Unit u i or a iType A,
s i
Type B, a i
Correction ∆g
Type of distribution
Equivalent variance
Sensitivity coefficients
Contribution to the
variance
Degrees of
freedom, ν i
Equivalent standard
uncertainty
Drag effect negligible
Outgassing effect negligible
Non-uniform magnetic field effect negligible
Temperature gradient effect m·s-2 ±1.5E-09 1.5E-09 U 1.1E-18 1.0E+00 1.1E-18 10 1.1E-09
Effect for Electrostatic negligible
Mass distribution effect m·s-2 ±5.0E-09 5.0E-09 rectangular 8.3E-18 1.0E+00 8.3E-18 10 2.9E-09Laser beam verticality correction 6.6E-09 m·s-2 ±2.1E-09 2.1E-09 6.6E-09 rectangular 1.5E-18 1.0E+00 1.5E-18 15 1.2E-09
Air gap modulation effect negligible
Laser accuracy effect m·s-2 1.0E-09 1.0E-09 1.0E-18 1.0E+00 1.0E-18 30 1.0E-09
Index of refraction effect negligible
Beam divergence correction 1.14E-07 m·s-2 1.1E-08 1.1E-08 1.14E-07 1.2E-16 1.0E+00 1.2E-16 10 1.1E-08
Beam share effect unknown unknown
Clock effect m·s-2 6.0E-09 6.0E-09 rectangular 3.6E-17 1.0E+00 3.6E-17 30 6.0E-09
Finges timing effect negligible
Finite value of speed of light effect negligible
Retroreflector balancing 0.0E+00 m ±1.0E-04 1.0E-04 rectangular 3.3E-09 6.3E-04 1.3E-15 15 3.6E-08
Radiation Pressure effect negligible
Reference height 5.2E-01 m ±5.0E-04 5.0E-04 rectangular 8.3E-08 3.0E-06 7.5E-19 30 8.7E-10
1.21E-07 m·s-2 1.5E-15 m2·s-4
3.8E-08 m·s-2
19
95%
2.10
8.1E-08 m·s-2
8.2E-09
Expanded uncertainty, U = ku
Relative expanded uncertainty, U rel = U/g
Degrees of freedom, ν eff (Welch-Satterthwaite formula)
Variance
Combined standard uncertainty, u
Confidence level, p
Coverage factor, k (calculated with t-Student)
Table 3: Instrumental uncertainty of the IMGC-02 absolute gravimeter

11
4 EXPERIMENTAL RESULTS The experimental results here reported are from measurements performed at the INRIM Gravity Laboratory during the period October-November, 2005. The data are from observations in which no identifiable instrumental problems were present. Moreover the instrumental and geophysical biases are removed and some rejecting criteria are applied to eliminate possible outliers. 4.1 INRIM OBSERVATION SITE
The observation site is located on the laboratory at the basement of the Dynamometric section of INRIM /6/. The position of the measurement point, referred to the room coordinates, is showed on the plan of the building (fig. 5.1). The temperature inside the room is stabilized better than ±0.5 °C. The geographic coordinates are 45.0170° N latitude, 7.6427 E longitude, and elevation 236 m. A granite block (80×80 cm) is lodged at the top of a concrete pillar which is positioned inside a concrete isolated bathtub. The pillar has a volume of about 2.5 m3 and a mass of about 5000 kg. Moreover a layer of sand insulates the pillar from the ground.
Figure 4.1: Basement-plan of the INRIM Dynamometric section and detail of the gravity laboratory with the observation point (dimensions in centimeters)
120
120

12
4.2 MEASUREMENT SESSIONS
The measurement survey consisted of eight measurement sessions. The measured data are filtered by applying rejecting criteria. The most critical factor is the visibility variation of the interference signal during the trajectory, which highlights an horizontal motion of the test-mass. The effect due to the Coriolis force and the beam share are minimized by rejecting those launches with a decrease of fringe visibility bigger that 10%. Outliers are found by applying the Chauvenet criterion to the estimating parameters such as the vertical gradient, the friction of residual air and to the measured g value. The final gravity value is obtained by averaging the retained trajectories. The density frequency graphs for each observation session are showed in fig. 4.2a-b-c.
-160 -120 -80 -40 0 40 80 120 160
0
20
40
60
80
100
120
140
160date: 26 Oct
gm = 980 534 196.8 × 10⁻⁸ ms-2
s(g) = 34.8 × 10⁻⁸ ms-2
s(gm) = 1.7 × 10⁻⁸ ms-2
n = 407
dens
ity fr
eque
ncy
/ ×10
4 m-1s2
(g - gm) ×10-8 m⋅s-2
-150 -100 -50 0 50 100 1500
20
40
60
80
100
120
140
160
gm = 980 534 199.0 × 10⁻⁸ ms-2
s(g) = 37.2 × 10⁻⁸ ms-2
s(gm) = 1.5 × 10⁻⁸ ms-2
n = 573
date: 2 Nov
dens
ity fr
eque
ncy
/ ×10
4 m-1s2
(g - gm) ×10-8 m⋅s-2
Figure 4.2a: Density frequency of measurements (Oct 26, Nov 2)

13
-150 -100 -50 0 50 100 150
0
20
40
60
80
100
120
140
160
gm = 980 534 186.6 × 10⁻⁸ ms-2
s(g) = 36.6 × 10⁻⁸ ms-2
s(gm) = 1.5 × 10⁻⁸ ms-2
n = 600
date: 7 Nov
dens
ity fr
eque
ncy
/ ×10
4 m-1s2
(g - gm) ×10-8 m⋅s-2
-150 -100 -50 0 50 100 150
0
20
40
60
80
100
120
140
160
gm = 980 534 193.9 × 10⁻⁸ ms-2
s(g) = 35.2 × 10⁻⁸ ms-2
s(gm) = 1.4 × 10⁻⁸ ms-2
n = 641
date: 8 Nov
dens
ity fr
eque
ncy
/ ×10
4 m-1s2
(g - gm) ×10-8 m⋅s-2
-160 -120 -80 -40 0 40 80 120 1600
20
40
60
80
100
120
140
160gm = 980 534 196.0 × 10⁻⁸ ms-2
s(g) = 37.1 × 10⁻⁸ ms-2
s(gm) = 1.9 × 10⁻⁸ ms-2
n = 369
date: 10 Nov
dens
ity fr
eque
ncy
/ ×10
4 m-1s2
(g - gm) ×10-8 m⋅s-2
Figure 4.2b: Density frequency of measurements (Nov 7, 8, 10)

14
-150 -100 -50 0 50 100 150
0
20
40
60
80
100
120
140
160
gm = 980 534 193.5 × 10⁻⁸ ms-2
s(g) = 35.2 × 10⁻⁸ ms-2
s(gm) = 2.0 × 10⁻⁸ ms-2
n = 320
date: 22 Nov
dens
ity fr
eque
ncy
/ ×10
4 m-1s2
(g - gm) ×10-8 m⋅s-2
-150 -100 -50 0 50 100 150
0
20
40
60
80
100
120
140
160
gm = 980 534 199.5 × 10⁻⁸ ms-2
s(g) = 39.4 × 10⁻⁸ ms-2
s(gm) = 1.8 × 10⁻⁸ ms-2
n = 487
date: 23 Nov
dens
ity fr
eque
ncy
/ ×10
4 m-1s2
(g - gm) ×10-8 m⋅s-2
-150 -100 -50 0 50 100 150
0
20
40
60
80
100
120
140
160
gm = 980 534 198.9 × 10⁻⁸ ms-2
s(g) = 42.7 × 10⁻⁸ ms-2
s(gm) = 2.3 × 10⁻⁸ ms-2
n = 352
date: 28 Nov
dens
ity fr
eque
ncy
/ ×10
4 m-1s2
(g - gm) ×10-8 m⋅s-2
Figure 4.2c: Density frequency of measurements (Nov 22, 23, 28)

15
The time series are reported in fig. 4.3. They give an idea of the measurement reproducibility achievable with the IMGC-02 at the INRIM Gravity Laboratory. The error bars represent the expanded uncertainty of the measurement U (p = 95%). They are computed by removing from the budget influence parameters that can’t change during an observation period (distribution of instrumental masses, beam divergence and retroreflector balancing).
26 O
ct
2 Nov
7 Nov
8 Nov
10 N
ov
22 N
ov
23 N
ov
28 N
ov
175
180
185
190
195
200
205
210
215
g - 9
80 5
34 0
00 µ
Gal
Figure 4.3: Measurement results obtained during the eight sessions
The result obtained on November, 7 is an outlyer (Chauvenet criterion), therefore it is removed from the population. The final results are reported in fig. 4.4.
26 O
ct
2 No
v
8 No
v
10 N
ov
22 N
ov
23 N
ov
28 N
ov
175
180
185
190
195
200
205
210
215
g - 9
80 5
34 0
00 ×
10-8 /
m⋅s
-2
Figure 4.4: Observation sessions retained for the estimate of the mean value
Thep measurement uncertainty budget (tab. 4.1) includes the instrumental uncertainty reported in tab. 3.1. Finally tab. 4.3.1 reports the most important experimental results. Other information concerning the apparatus setup is reported on tab. 4.3.2.

16
Table 4.1: Measurement uncertainty of the IMGC-02 absolute gravimeter at INRIM Gravity Laboratory
Influence parameters, x i
Value Unit u i or a iType A,
s i
Type B, a i
Correction ∆g
Type of distribution
Equivalent variance
Sensitivity coefficients
Contribution to the variance Degrees of
freedom, ν i
Equivalent standard
uncertainty
Instrument uncertainty m·s-2 3.8E-08 3.8E-08 1.5E-15 1.00E+00 1.5E-15 19 3.8E-08
Coriolis effect m·s-2 ±2,6E-08 2.6E-08 rectangular 2.3E-16 1.00E+00 2.3E-16 10 1.5E-08Floor recoil effect negligibleBarometric pressure correction 3E-08 m·s-2 ±1,0E-08 1.0E-08 3.0E-08 rectangular 3.3E-17 1.00E+00 3.3E-17 15 5.8E-09
Tide correction 6E-07 m·s-2 3.0E-09 3.0E-09 6.0E-07 9.0E-18 1.00E+00 9.0E-18 15 3.0E-09Ocean loading correction 1E-07 m·s-2 2.0E-09 2.0E-09 1.0E-07 4.0E-18 1.00E+00 4.0E-18 15 2.0E-09
Polar motion correction 3E-09 m·s-3 negligible 3.0E-09
Standard deviation of the mean value m·s-2 6.0E-09 6.0E-09 3.6E-17 1.00E+00 3.6E-17 3277 6.0E-09
Corr. 7.3E-07 m·s-2 1.8E-15 m2·s-4
4.2E-08 m·s-2
27
95%2.06
8.7E-08 m·s-2
8.8E-09
Variance
Expanded uncertainty, U = kuRelative expanded uncertainty, U rel = U/g
Degrees of freedom, ν eff
(Welch-Satterthwaite formula)
Combined standard uncertainty, u
Confidence level, pCoverage factor, k (calculated with t-Student)
∑=
≈N
ii gugu
1
22 )()(
∑=i
i
eff
yuyuνν
)()( 44
ii x
gc∆∆
= )()( 222iii xucgu =

17
Table 4.2: Experimental results at the Gravity Laboratory of INRIM Instrument orientation Laser body to Sud direction
Fitting Model Laser modulation and resonance frequency of the inertial reference
Fringe visibility threshold fvt = 10% Waveform digitizer sampling frequency Sf = 50 MHz Laser wavelength λl = 632.991 212 58 × 10-9m Clock frequency fc = 10 000 000. 0 000 Hz Vertical gradient input γ = 0.000 002 700 s-2 Rise station number nrs = 350 Leaved upper stations nsl = 20 Laser modulation frequency flm = 1 165.2 Hz Resonance frequency of the inertial reference fir = 22.2 Hz Instrumental height hinst = 0.326 7 m
Table 4.3: Apparatus setup at the Gravity Laboratory of INRIM
Observation Station: Gravity Laboratory of INRIM Dates 2005, Oct 26; Nov 2-8-10-22-23-28 Geodetic longitude λ = 7.6427° Geodetic latitude ϕ = 45.0170° Topographic elevation HT = 236 m Nominal pressure at the observation site PN = 985.2 mbar
Measurement parameters Total measurement time Tm = 129 h Observation rate mr = 120 h-1 Measurement drift md = 0.03 (u = 0.09) × 10-8 m·s-2 / day Total executed throws net = 15 460 Total processed and stored throws nps = 13 187 Temperature range T = (20.0 ÷ 31.7)°C
Corrections Laser beam verticality correction ∆gbv = +0.6 × 10⁻⁸ m·s-2 Laser beam divergence correction ∆gbd = +11.4 × 10⁻⁸ m·s-2 Polar motion correction (average) ∆gpm = -0.3 × 10⁻⁸ m·s-2 Tide and ocean loading correction (average) ∆gtol = -20.8 × 10⁻⁸ m·s-2 Local barometric pressure correction (average) ∆gbp = +3.4 × 10⁻⁸ m·s-2
Results Corrected mean g value gmv = 980 534 196.8 × 10⁻⁸ m·s-2 Reference height href = 0.517 0 m Number of throws accepted for the average n = 3278 Experimental standard deviation sg = 37.0 × 10⁻⁸ m·s-2 Experimental standard deviation of the mean value sgm = 0.6 × 10⁻⁸ m·s-2 Measurement combined uncertainty ugm = 4.2 × 10⁻⁸ m·s-2 Measurement expanded uncertainty (p = 95%, ν = 33, k = 2.04) Ugm = 8.7 × 10⁻⁸ m·s-2
Vertical gradient (ECGS data) within (30 ÷ 130) cm γ = 0.264 5 (u = 0.0006) × 10-8 ms-2/mm

18
Summarizing, the estimate of the acceleration due to gravity at the INRIM Gravity Laboratory during the period October ÷ November 2005, measured with the IMGC-02 gravimeter at 517.0 mm from the floor is:
g = (980 534 196.8 ± 8.7) µGal The expanded uncertainty U is computed according to the ISO-GUM, taking into account all the contributions.
4.3 VERTICAL GRADIENT
The sensor height of the relative spring gravimeter Scintrex CG5#008 from its base level is 105.0 mm. The vertical gradient γ was estimated by measuring the gravity variation between two levels, h1 = 279.0 mm and h2 = 1304.0 mm. γ is computed by fitting the following equation model to the experimental data:
kthg +⋅+⋅= αγ
where γ is the vertical gradient, h is the level, α is the instrumental drift, t is the acquisition time and k is the offset. The estimated vertical gradient was found to be 810)0006.0(2645.0 −×−=γ ms-2/mm (where the number in parentheses is the standard uncertainty). The gravity value along the vertical is computed starting from the acceleration measured at the reference height of the IMGC-02 absolute gravimeter, 02−IMGCh = 517 mm:
( ) hghg IMGC ∆⋅+= − γ02
where
02−−=∆ IMGChhh
The relevant uncertainty is:
22202 γuhuu
IMGCgg ⋅∆+=−
Fig. 4.5 reports the gravity value and its expanded uncertainty (U95%, k =2). For convenience the g value is also referred at a level of 30 mm and 1300 mm. It is worth to underline that the use of the vertical gradient outside the measurement levels (30 mm and 1300 mm) could introduce unexpected errors.

19
0 200 400 600 800 1000 1200 1400
3950.0
4000.0
4050.0
4100.0
4150.0
4200.0
4250.0
4300.0
4350.0g (h = 30 mm) = 980 534 325.6 × 10⁻⁸ ms-2
g (h = 1 300 mm) = 980 533 989.7 × 10⁻⁸ ms-2
gIMGC-02 (h = 517 mm) = 980 534 196.8 × 10⁻⁸ ms-2
gR = 980530000.0 × 10-8 ms-2
γ = -0.2645 (0.0006) × 10-8 ms-2/ mm
(g - g R
) × 1
0-8 /
ms-2
height / mm
0 200 400 600 800 1000 1200 14008.60
8.65
8.70
8.75
8.80
Ug (
95%
) × 1
0-8 /
ms-2
height / mm
Figure 4.5: Gravity field along the vertical at the Gravity Laboratory of INRIM

20
REFERENCES [1] D’Agostino,G., “Development and metrological characterisation of a new
transportable absolute gravimeter”, PhD thesis, Polytechnic of Turin, Italy, 2005.
[2] Cerutti,G., Cannizzo,L., Sakuma,A., Hostache, J., “A transportable apparatus for absolute gravity measurements”, In: VDI-Berichte n. 212, 1974: p. 49.
[3] Germak,A., Desogus,S., Origlia,C., “Interferometer for the IMGC rise-and-fall absolute gravimeter", In: Metrologia, Special issue on gravimetry, Bureau International des Poids Mesures, BIPM, Pavillon De Breteuil, F-92312, Sèvres Cedex, France, 2002, Vol. 39, Nr. 5, pp. 471-475.
[4] D’Agostino,G., Germak,A., Desogus,S., Barbato,G. “A Method to Estimate the Time-Position Coordinates of a Free-Falling Test-Mass in Absolute Grvimetry”, In: Metrologia Vol. 42, No. 4, pp. 233-238, August 2005.
[5] “Guide to the Expression of Uncertainty in Measurement”, BIPM, IEC, ISCC, ISO, IUPAC, IUPAP, OIML, ISO, 1993.
[6] Germak,A., “Description of the IMGC Gravity laboratory in Turin, Italy”, In : Cahiers du Centre Européen de Géodynamique et de Séismologie, Vol. 26, International Comparison of Absolute Gravimeters in Walferdange (Luxembourg) of November 2003, Nov. 2003, Ed. by O. Francis and T. van Dam, Luxembourg, pp. 37-42.