measurements and two-dimensional computer simulations of the hygrothermal performance of a wood...
TRANSCRIPT
http://www.nrc-cnrc.gc.ca/irc
Measurements and two-dimensional computer simulations of the
hygrothermal performance of a wood frame wall
N R C C - 4 1 0 7 9 G e v i n g , S . ; K a r a g i o z i s , A . N . ; S a l o n v a a r a , M .
A p r i l 1 9 9 7 A version of this document is published in / Une version de ce document se trouve dans: Journal of Thermal Insulation and Building Envelopes, 20, April, pp. 301-319, April 01, 1997
The material in this document is covered by the provisions of the Copyright Act, by Canadian laws, policies, regulations and international agreements. Such provisions serve to identify the information source and, in specific instances, to prohibit reproduction of materials without written permission. For more information visit http://laws.justice.gc.ca/en/showtdm/cs/C-42 Les renseignements dans ce document sont protégés par la Loi sur le droit d'auteur, par les lois, les politiques et les règlements du Canada et des accords internationaux. Ces dispositions permettent d'identifier la source de l'information et, dans certains cas, d'interdire la copie de documents sans permission écrite. Pour obtenir de plus amples renseignements : http://lois.justice.gc.ca/fr/showtdm/cs/C-42

Measurements and Two-DimensionalComputer Simulations of theH ygrothermal Performance
of a Wood Frame Wall
STIG GEVING*Department of Building and Construction Engineering
The Norwegian University of Science and Technology (NTNU)Alfred Getz v 3, N-7034
Trondheim, Norway
ACHILLES KARAGIOZISNational Research Council Canada
Institute Jar Research in ConstructionBuilding Performance Laboratory
Montreal Road, Bldg. M-24Ottawa, ant. K1A OR6, Canada
MlKAELSALONVAARAVTT Building Technology
Building PhysicsPo. Box 1804
FIN-02044 VTT, Pinland
ABSTRAcr: Knowledge of the expected long-term performance of buildingenvelopes subjected to simultaneous heat and moisture transport is critical during thedesign stage. In the past thirty years researchers have concentrated their efforts inextensive laboratory experiments. These experiments have been expensive as well astime consuming to conduct due to the slow moisture transport phenomena. Thispaper critically investigates a set of experimental results generated from laboratory
*Author to whom correspondence should be addressed.
J. THERMAL INSUL. AND BLDG. ENVS. Volume 20- April 1997 301
1065-2744/97/04 0301-19 $10.00/0©1997 Technomic Publishing Co., Inc.
300 Canada Mortgage
haust air side, or both. This is necessary to ensure that the ventilation airsupplied, or induced, into a house will be adequately distributed through allrooms. Accordingly, builders, designers, and mechanical contractors mustmake adequate provision for ventilation air distribution ductwork in newhouse construction and large renovation activities where mechanical ventilation is necessary.
Although distribution is a significant consideration in the design and installation of ventilation systems, other important factors such as energy efficiency, occupant comfort, and ease of operation must also be considered.
A full report on this research project is available from the Canadian Housing Information Centre.
The Canadian Housing Information CentreCanada Mortgage and Housing Corporation700 Montreal RoadOttawa, OntarioKIA OP7
Telephone: (613) 748-2367FAX: (613) 748-2098
NarE FROM THE EDITOR
The following technical note describes the same project from a researchperspective. By placing these two notes next to each other we have providedthe reader with a much broader perspective on this new and challenging areaof building systems performance.
302 STIG GevING, ACHILLES KARAGIQZIS AND MIKAEL SALONVAARA
controlled measurements on a wood frame wall construction, by employing a stateof the art hygrothermal model. The analysis was carried out using the LATENITEmodel, a three-dimensional heat and moisture transport program tailored specificallyfor building envelope investigations. For the present simulations this model wasadapted for two-dimensional conditions and hourly hygrothermal performanceswere predicted for a laboratory instrumented wood frame wall section. Theinvestigation showed three main advantages of combining measurements andsimulations. By carrying out simulations early in the design stage of laboratoryexperiments the experimental design will probably yield better quantification ofdata, placement and types of sensors, and assessment ofworkmanship influences, etc.Measurements can calibrate, adapt, or check calculated results. Finally, simulationscan be performed to explain and interpret experimental results. Marrying experiments and modeling allows researchers to generate effective hygrothermal performance guidelines.
KEY WORDS: wood frame waU, moisture transport, laboratory experiments,hygrothermal model.
INTRODUCTION
HYGRaTHERMAL (COMBINED HEAT, air, and moisture) performance ofbuilding envelopes dictates to a large extent the durability and service
life of the building envelope. Deterioration can occur in various forms, i.e.,surface damage discolourization by efflorescence, ageing processes, chemicaldamages, moisture induced salt migration, structural cracking due to thermal and moisture gradients, corrosion of steel, and mould or bacteriagrowth.
An extensive amount of literature exits on laboratory testing of variousbuilding envelope systems such as Thue et a!. [1]. Unfortunately, a limitedamount of consistent information can be extracted for moisture controldesign guidelines. One reason is that to date a reliable measurement probefor moisture content is not widely available. Indeed in most experimentation, oni y few spot moisture content measurements are made and these areusually associated with rather high levels of uncertainty. Furthermore, inalmost all experimental building envelope studies, modeling has not beenused in the design of the experiments. This has resulted in improper positioning of moisture and temperature sensors and documentation of theworkmanship defects or non-idealities.
Recently, hygrothermal models have been used in many interesting building envelope applications [2]. The hygrothermal performance of woodframe walls has been investigated by the use of simulations in several publications, but most of these have employed a one-dimensional approach.Tsongas et a!. [3] analysed the moisture performance of different woodframe wall designs in different climate situations using a one-dimensional
Compufer Simuu,tions qf the Hygrothermal Performatue qf a Wood Frame Wall 303
heat and moisture model. Hagentoft and Harderup [4] investigated theimportance of a vapor retarder and air leakage of a wood frame wall withcellulose loose flll insulation, also employing a one-dimensional model.Only a few two-dimensional simulations of the heat-air and moisturebehavior of wood frame structure exist such as [5] where the effect ofexflltration on the hygrothermal behavior was investigated.
In this project, a critical analysis is performed on a particular laboratoryexperiment of a wood frame construction wall, employing a state of the arthygrothermal model. The LATENITE three-dimensional model wasemployed to critically review the measured hygrothermal performance ofthe wood frame construction wall. The LATENITE research model allowstreatment of the building envelope system with coupled heat and moisturetransport via diffusion and natural and forced convective air transport, capillary, and gravity flow mechanisms. This model permits the "capturing" ofthe various systems and subsystems anomalies of the building envelope andcan be employed in analysis of laboratory experimental hygrothermalresults. In this paper, the moisture content, and temperature distributions atvarious locations in the wall were critically compared between laboratorymeasurement and two-dimensional computer simulations.
DESCRIPTION OF WALL EXPERIMENTS
This section gives a brief description of experiments conducted byBigseth [6] to determine the hygrothermal performance of highly insulatedwood frame walls. Tests were performed on six different wood frame wallsin climatic chambers that were exposed to a sequence of winter conditionswith cold external climate interrupted with short warm periods for a duration of sixty-eight days. In this investigation only one of the constructionswas modeled. The wall system modeled was air- and vapor-tight on allboundades, so any moisture movement within the wall assembly was due tointernal redistribution only. This wall is not a typical construction, but isdesigned for laboratory experiments.
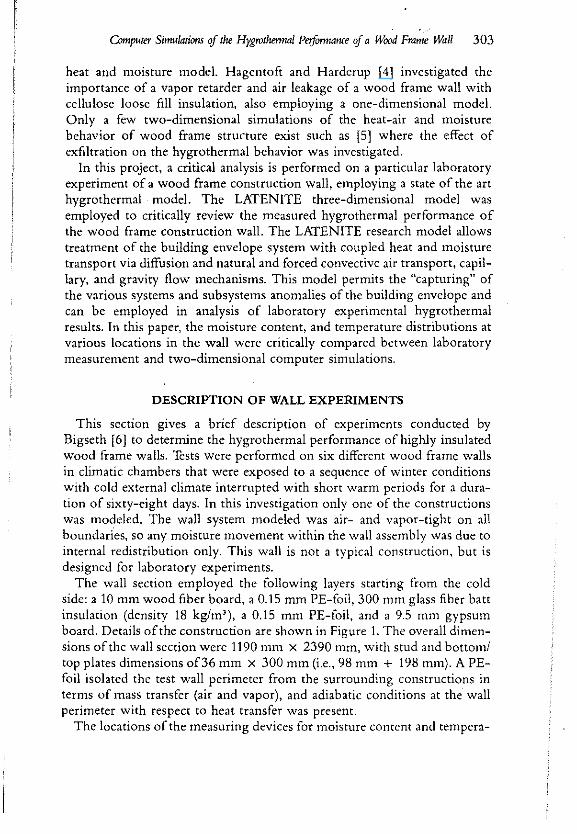
The wall section employed the following layers starting from the coldside: a 10 mm wood fiber board, a 0.15 mm PE-foil, 300 mm glass fiber battinsulation (density 18 kg/m'), a 0.15 mm PE-foil, and a 9.5 mm gypsumboard. Details of the construction are shown in Figure 1. The overall dimensions of the wall section were 1190 mm X 2390 mm, with stud and bottom/top plates dimensions 006 mm X 300 mm (i.e., 98 mm + 198 mm). A PEfoil isolated the test wall perimeter from the surrounding constructions interms of mass transfer (air and vapor), and adiabatic conditions at the wallperimeter with respect to heat transfer was present.
The locations of the measuring devices for moisture content and tempera-
304 5TlG GEVING, ACHillES KARAGIOZIS AND MlKAEl SALONVAARA
36x98 nun +36xl98 mm spruce lumber (top plate)10 nun wood fiber board
0.15 mm PE·foil
300 nun glass fiber batt insulation
9.5 mm gypsum board
Figure 1. Top part of the wall section (wood fiber board on cold side).
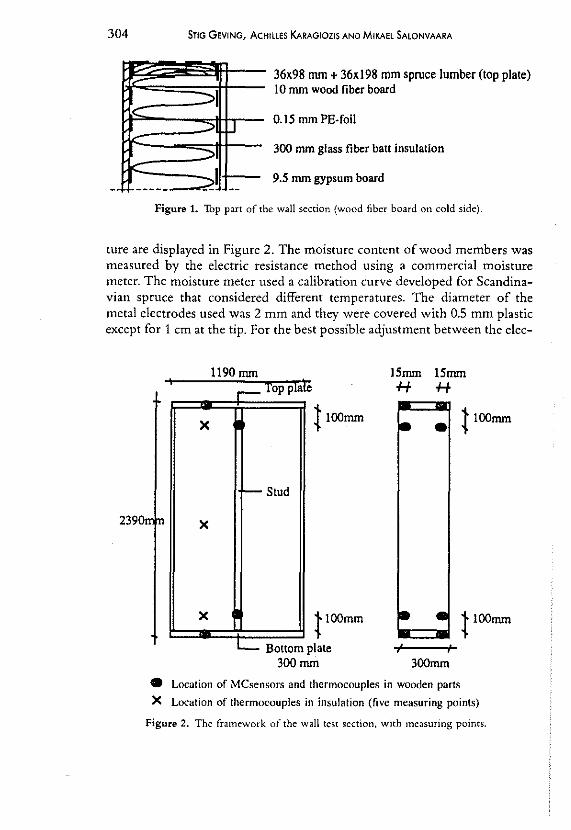
ture are displayed in Figure 2. The moisture content of wood members wasmeasured by the electric resistance method using a commercial moisturemeter. The moisture meter used a calibration curve developed for Scandinavian spruce that considered different temperatures. The diameter of themetal electrodes used was 2 mm and they were covered with 0.5 mm plasticexcept for 1 em at the tip. For the best possible adjustment between the e1ec-
15nunH
2390n In
x
x
1190 nunr-- Top plale
tloomm
~Stud
15mmH
• tloomm
x t100mm
L- Bottom plate300 nun
t loomm
300mm
• Location of MCsensors and thermocouples in wooden parts
X Location of thermocouples in insulation (five measuring points)
Figure 2. The framework of the wall test section, with measuring points.
Compuf<r Simulations if the HygrothemuJl Performame if a Wood Frame Wall' 305
•i
4mmfIOmmCOLDSIDE
.. SPRUCEMeasurement area
MOIS11JRI! ELECTRODE
,•
I ,3nun 13.5 nun
WARM36mm SIDE
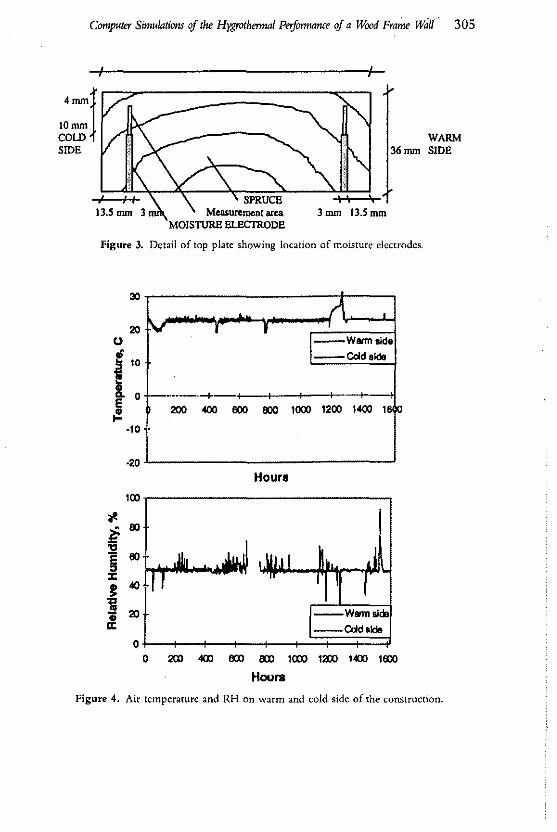
Figure 3. Detail of top plate showing location of moisture electrodes.
30
20
·20
L t'\ •-v I r \--warrn side
--CoIdaldo
f------.-+ I I I I -+-~
200 «Xl 600 600 1000 1200 1«Xl 16 10
'-
Hours
100r----------------,
--WllI1l1a1do__CoIdald8
ot--+--+----+-->--~:::;=::::;::::=:::.Jo 200 ~ 600 600 1~12001~1600
Houl1l
Figure 4. Air temperature and RH on warm and cold side of the construction.
306 STIG GEVING, ACHILLES KARAGIOZIS AND MIKAEl SAlONVAARA
Table 1. Vapor permeance of foil and board materials.
Material
Gypsum boardWood fiber boardPE-foil
Thickne!>s[mml
9.510
0.15
Vapor Permeance[kg/m' PO'sl
2.5' 10- 9
3.63. 10- 10
3.11 . 10- 12
trades and the material, the holes were drilled slightly smaller than thethickness of the electrodes. The top plate, the bottom plate, and the studswere instrumented for moisture and temperature measurements on the coldas well as the warm sides of the construction. The locations of the moistureelectrodes in the top plate are shown in Figure 3. The temperature profl1e inthe insulation was measured with rake of five thermocouples at the top,middle, and bottom section of the insulation layer. Measurements in thewood members were logged manually about every second day, while thetemperatures in the insulation were logged automatically every hour.
The climate condition on the warm side was maintained at approximately23°C and 50% relative humidity during the whole period. The cold sidewas kept constant for most of the time at about -15°C and between 70 and90% RH. This cold climate was interrupted by two warmer periods of oneweek each in duration when the temperature was raised to approximately3°C. In addition, there were short periods with temperature increases lasting only for a few hours due to defrosting requirements of the coolingequipment. The air temperature and relative humidity were logged hourlyon both sides of the construction. The time dependent boundary conditionson warm and cold side are shown in Figure 4.
The vapor permeance of the foil and board materials was measured withthe cup method (50%-94.1 % RH), see Table 1.
DESCRIPTION OF MODEL
A detailed description of the LATENITE version 1.0 hygrothermal modelis given by Karagiozis [7], Salonvaara and Karagiozis [8], and Hens [2], andonly a brief overview is presented here with regard to the additional featuresimbedded in version 1.2. The moisture transport potentials used in themodel are moisture content and vapor pressure; for energy transport,temperature is used.
The LATENITE 1.2 model has been recently upgraded to include porousair flow through insulation and cracks by solving a subset of the NavierStokes equations: Darcy's equations. In addition, the solution domain has
Omtpurer Simulations of the Hygrothermal Peiformaru:e of a Wood Frame Wall 307
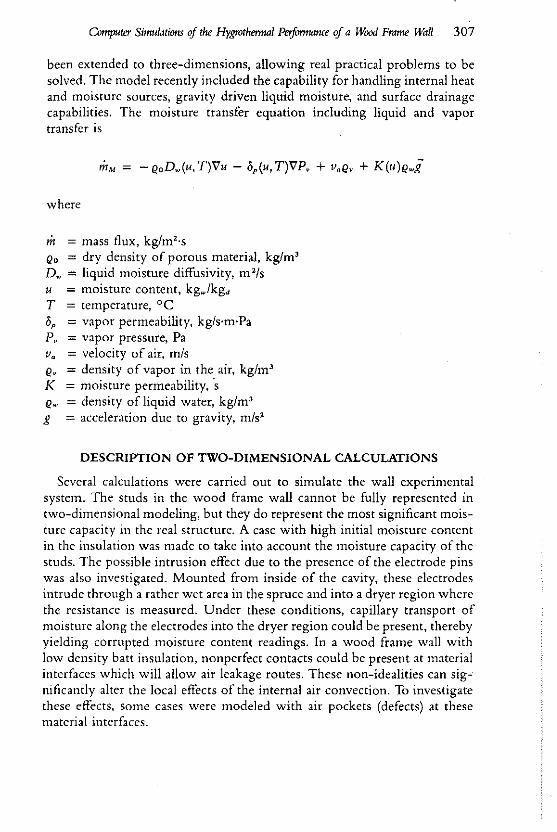
been extended to three-dimensions, allowing real practical problems to besolved. The model recently included the capability for handling internal heatand moisture sources, gravity driven liquid moisture, and surface drainagecapabilities. The moisture transfer equation including liquid and vaportransfer is
where
m = mass flux, kg/m"sQo = dry density of porous material, kg/m'D w ::::: liquid moisture diffusivitYI m 2/SU ::::: moisture content, kgw/kgd
T ::::: temperature, °Cop = vapor permeability, kg/s·m·PaPv = vapor pressure, Pav" ::::: velocity of air, mlsQ. = density of vapor in the air, kg/m'K = moisture permeability, 'sQw = density of liquid water, kg/m'g = acceleration due to gravity, m/s2
DESCRIPTION OF TWO-DIMENSIONAL CALCULATIONS
Several calculations were carried out to simulate the wall experimentalsystem. The studs in the wood frame wall cannot be fully represented intwo-dimensional modeling, but they do represent the most significant moisture capacity in the real structure. A case with high initial moisture contentin the insulation was made to take into account the moisture capacity of thestuds. The possible intrusion effect due to the presence of the electrode pinswas also investigated. Mounted from inside of the cavity, these electrodesintrude through a rather wet area in the spruce and into a dryer region wherethe resistance is measured. Under these conditions, capillary transport ofmoisture along the electrodes into the dryer region could be present, therebyyielding corrupted moisture content readings. In a wood frame wall withlow density batt insulation, nonperfect contacts could be present at materialinterfaces which will allow air leakage routes. These non-idealities can significantly alter the local effects of the internal air convection. To investigatethese effects, some cases were modeled with air pockets (defects) at thesematerial interfaces.
308 STIG GEVING, ACHILLES KARAGIOZIS AND MlKAEl SALONVAARA
Boundary Conditions
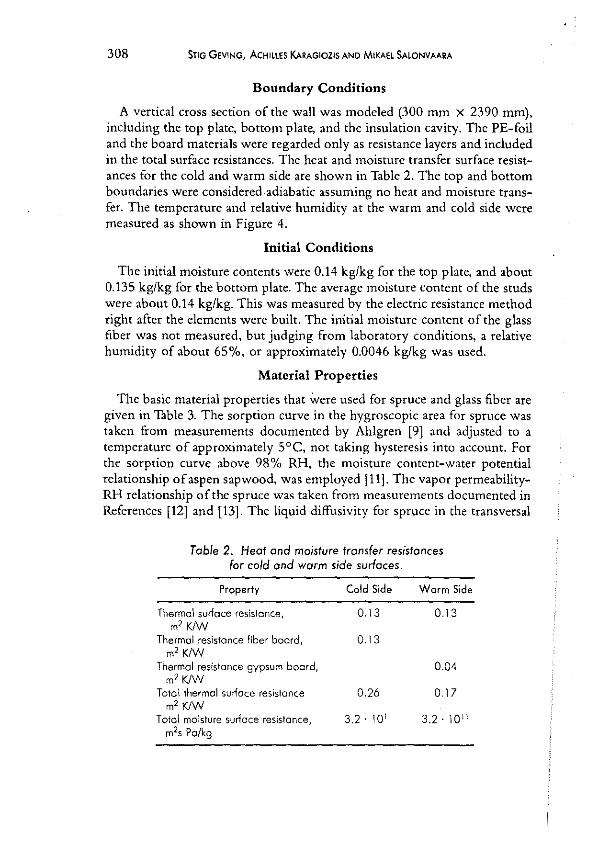
A vertical cross section of the wall was modeled (300 mm X 2390 mm),including the top plate, bottom plate, and the insulation cavity. The PE-foiland the board materials were regarded only as resistance layers and includedin the total surface resistances. The heat and moisture transfer surface resistances for the cold and warm side are shown in Table 2. The top and bottomboundaries were considered adiabatic assuming no heat and moisture transfer. The temperature and relative humidity at the warm and cold side weremeasured as shown in Figure 4.
Initial Conditions
The initial moisture contents were 0.14 kg/kg for the top plate, and about0.135 kg/kg for the bottom plate. The average moisture content of the studswere about 0.14 kg/kg. This was measured by the electric resistance methodright after the elements were built. The initial moisture content of the glassfiber was not measured, but judging from laboratory conditions, a relativehumidity of about 65%, or apptoximately 0.0046 kg/kg was used.
Material Properties
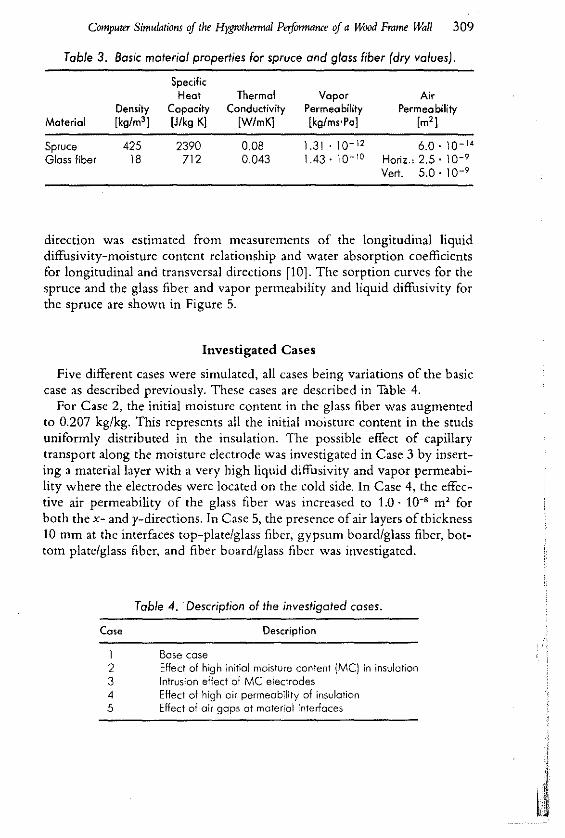
The basic material properties that were used for spruce and glass fIber arcgiven in Table 3. The sorption curve in the hygroscopic area for spruce wastaken from measurements documented by Ahlgren [9] and adjusted to atemperature of approximately SoC, not taking hysteresis into account. Forthe sorption curve above 98% RH, the moisture content-water potentialrelationship ofaspen sapwood, was employed [11]. The vapor permeabilityRH relationship of the spruce was taken from measurements documented inReferences [12] and [13]. The liquid diffusivity for spruce in the transversal
Table 2. Heat and moisture transfer resistancesfor cold and warm side surfaces.
Property Cold Side Warm Side
Thermal surface resistance, 0.13 0.13m' KlW
Thermal resistance fiber board, 0.13m' K/W
Thermal resistance gypsum board, 0.04m' KlW
Total thermal surface resistance 0.26 o 17m' KlW
T010\ moisture surface resistance, 3.2' 10" 3.2,10"m2s Po/kg
Compuli!T Simulations of the Hygrothermal PeiformtlYlle of a Wood Frame Wall 309
Table 3. Basic material properties for spruce and glass fiber (dry values).
Material
SpruceGlass fiber
Density[kg/m']
42518
SpecificHeat
Capacity(J/kg K]
2390712
ThermalConductivity
[W/mK]
0.080.043
VaporPermeability[kg/ms·Pe]
1.31.10- 12
1.43' 10- 10
AirPermeability
[m']
6.0' 10- 14
Horiz.• 2.5 . 10- 9
Vert. 5.0' 10-9
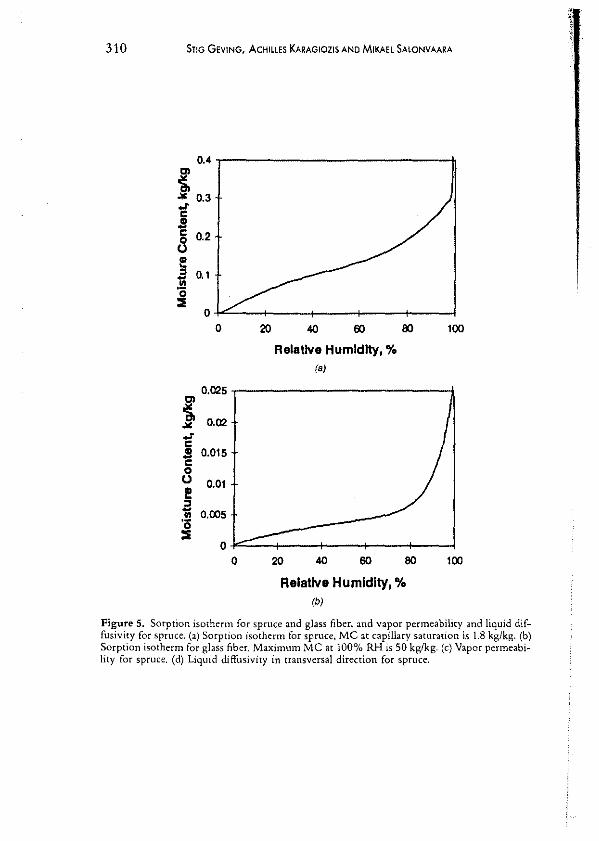
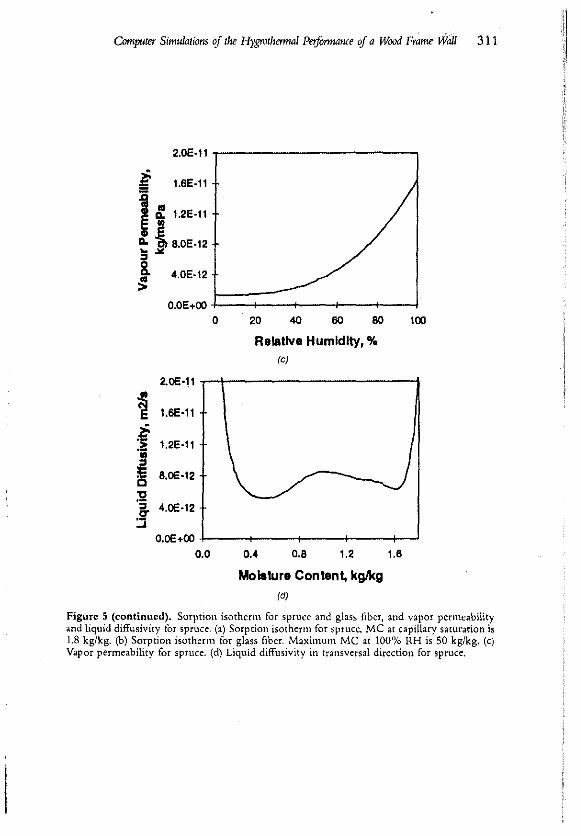
direction was estimated from measurements of the longitudinal liquiddiffusivity-moisturc content relationship and water absorption coefficientsfor longitudinal and transversal directions [10]. The sorption curves for thespruce and the glass fiber and vapor permeability and liquid diffusivity forthe spruce are shown in Figure 5.
Investigated Cases
Five different cases were simulated, all cases being variations of the basicClse as described previously. These cases arc described in Table 4.
For Case 2, the initial moisture content in the glass fiber was augmentedto 0.207 kg/kg. This represents all the initial moisture content in the studsuniformly distributed in the insulation. The possible effect of capillarytransport along the moisture electrode was investigated in Case 3 by inserting a material layer with a very high liquid diffusivity and vapor permeability where the electrodes were located on the cold side. In Case 4, the effective air permeability of the glass fiber was increased to 1.0· 10-' m' forboth the x- and y-directions. In Case 5, the presence ofair layers of thickness10 mm at the interfaces top-plate/glass fiber, gypsum board/glass fiber, bottom plate/glass fiber. and fiber board/glass flber was investigated.
Table 4. Description of the investigated cases.
Case Description
1 Base case2 Effect of high initial moisture content (MC) in insulation3 Intrusion effect of Me electrodes4 Effect of high air permeability aT insulation5 Effect of air gaps at material interfaces
310 5TI0 GEVING, ACHILLES KARAGIOZIS AND MIKAEl SAlONVAARA
0.4
J0.3
l 0.2<3l'!" 0.1~
.!!:i
00 20 <40 60 eo 100
Relative Humidity, 0/0(aJ
0.025
~ 0.02...oJ'CS 0.015c00 0.01I!!
"~ 0.005II'0::i
00 20 <40 eo eo 100
Relative Humidity, 0/0(b)
Figure 5. Sorption isotherm for spruce and glass fiber, and vapor permeability and liquid diffusivity for spruce. (a) Sorption isotherm for spruce, Me at capillary saturation is 1.8 kgJkg. (b)Sorption isotherm for glass fIber. Maximum Me at 100% RH is 50 kg/kg. (c) Vapor permeability for spruce. (d) Liquid diffusivity in transversal direction for spruce.
Ccmputer SimuWtions oj the Hygrothermal Performame oj a Wood Frame WaIl 311
10020 40 60 60
Relative Humidity, "(e!
O,OE+oo l:=::;=::::::--+---+--Jo
2,oE·ll ~----------.....,
~ 1.6E·ll.QI:. 1,2E·l1
': !6.0E"2
"~ 4,OE·12>
2.0E·1.1
~ l.eE·l1
:~ 1,2E·ll..~Q
8.0E·12
:2" 4,OE·12
~O.OE+OO
0.0 0.4 0,6 1,2 1.6
Moisture Content, kglkg(d)
Figure 5 (continued). Sorption isotherm for spruce and glass fiber, and vapor permeabilityand liquid diffusivity for spruce. (a) Sorption isotherm for spruce, Me at capillary saturation is1.8 kg/kg. (b) Sorption isotherm for glass ftber. Maximum Me at 100% RH is 50 kg/kg. (c)Vapor permeability for spruce. (d) Liquid diffusivity in transversal direction for spruce.
312 STIG GEVING, ACHilLES KARAGIOZIS AND MIKAEL SALONVAARA
RESULTS AND DISCUSSION
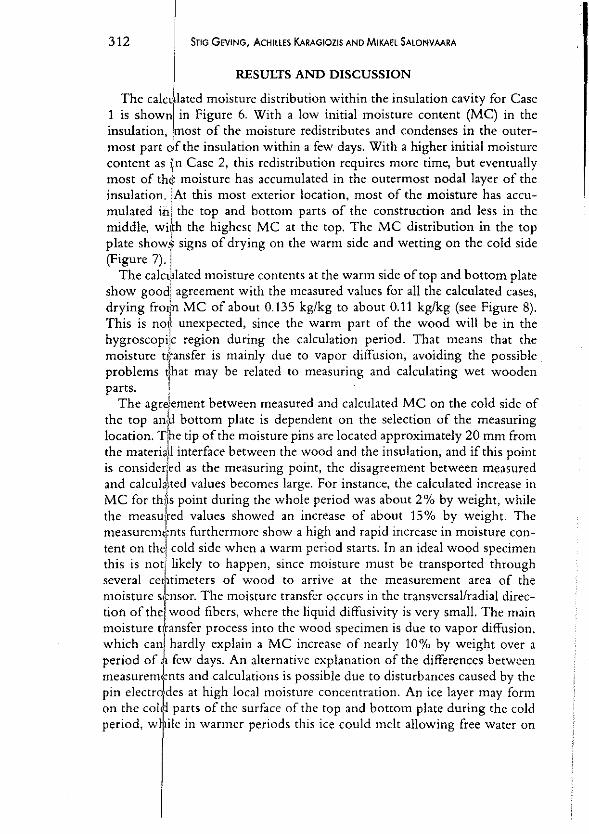
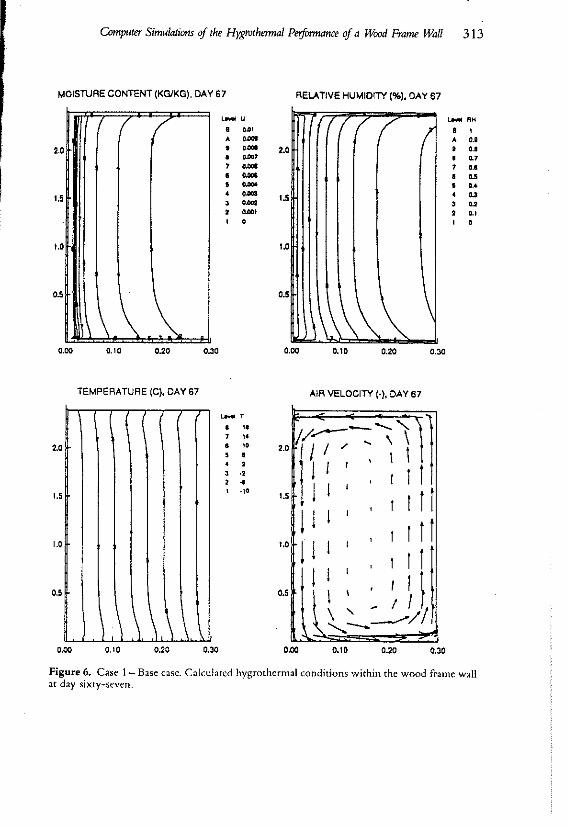
The calc lated moisture distribution within the insulation cavity for Case1 is shown in Figure 6. With a low initial moisture content (MC) in theinsulation'lIDost of the moisture redistributes and condenses in the outermost part 9f the insulation within a few days. With a higher initial moisturecontent as 1)n Case 2, this redistribution requires more time, but eventuallymost of th~ moisture has accumulated in the outermost nodal layer of theinsulation. IAt this most exterior location, most of the moisture has accu-,mulated ini the top and bottom parts of the construction and less in themiddle, wi,lh the highest MC at the top. The MC distribution in the topplate showf signs of drying on the warm side and wetting on the cold side(Figure 7).1
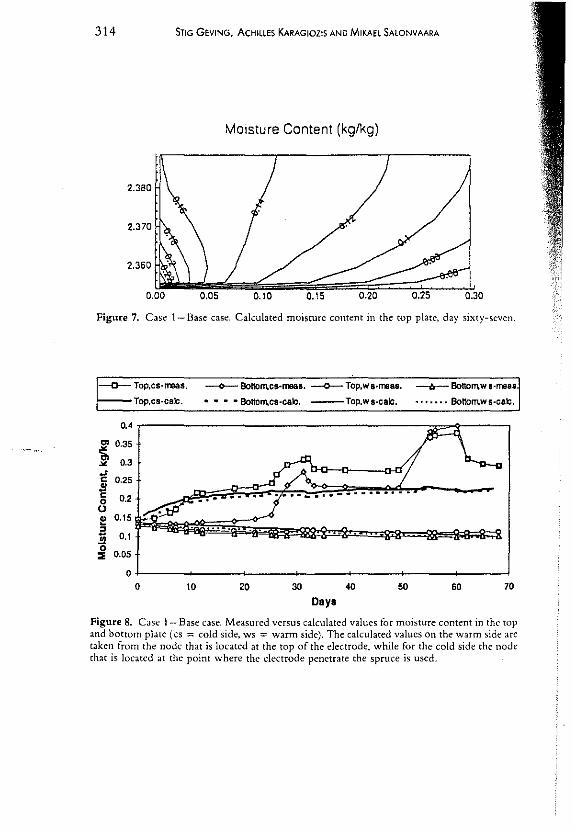
The calct!l}ated moisture contents at the warm side of top and bottom plateshow goodl agreement with the measured values for all the calculated cases,drying frolln MC of about 0.135 kg/kg to about 0.11 kg/kg (see Figure 8).This is no* unexpected, since the warm part of the wood will be in thehygroscopijc region during the calculation period. That means that themoisture tl[ansfer is mainly due to vapor diffusion, avoiding the possibleproblems rlhat may be related to measuring and calculating wet woodenparts. j ,
The agrelement between measured and calculated MC on the cold side ofthe top an~d bottom plate is dependent on the selection of the measuringlocation. Tihe tip of the moisture pins are located approximately 20 mm fromthe materia~l interface between the wood and the insulation, and if this pointis consideded as the measuring point, the disagreement between measuredand calcula1ted values becomes large. For instance, the calculated increase inMC for thils point during the whole period was about 2% by weight, whilethe measured values showed an increase of about 15% by weight. ThemeasuremJcnts furthermore show a high and rapid increase in moisture content on th ' cold side when a warm period starts. In an ideal wood specimen,this is noti likely to happen, since moisture must be transported throughseveral cettimeters of wood to arrive at the measurement area of rhemoisture s i nsor. The moisture transfer occurs in the transversal/radial direction of thelwood fibers, where the liquid diffusivity is very small. The mainmoisture t ansfer process into the wood specimen is due to vapor diffusion,which can hardly explain a MC increase of nearly 10% by weight over aperiod of few days. An alternative explanation of the differences betweenmeasurem nts and calculations is possible due to disturbances caused by thepin electro des at high local moisture concentration. An ice layer may formon the col parts of the surface of the top and bottom plate during the coldperiod, wile in warmer periods this ice could melt allowing free water on
Computer Simulations of the Hy,grothermal Peiformaru:e of a Wood Frame Wall 313
MOISTURE CONTENT (KG/KG), DAY 67 RELATIVE HUMIDITY (%1. DAV 87
,..
I..
/ /CO.,,,
II 0.01A ,.001I· ",.o 0.00', ,...o ...·-o ,..-, ,...• 0.001I ,
,..
1.5
1••
f 1/ /I
""" ,.o I
A 0.8
• a.'· .,, u
• u, 0.4
• D.3, ..· .,I ,
•.5 ..5
•.00 0.10 .~. 0.30 •.00 0.10 •.20 0.30
••5
,.•
1.5
I.•
•.5
TEMPERATURE Ie). DAV 87
\\\\\\
""'"o ", "o ", .• •, .,• •I -10
AIR VELOCITY ('), DAY 67
,.. /ITI
~l ~~:l11.5 I, r I I!
I J I I , r I I!I.. I J I I
I ' r I IJ I \ . , 1 1~,~/lrl-----.---/
0.00 0,10 0.20 0.30 •.00 0.10 0.20 0.30
Figure 6. Case 1- Base cas.e. Calculated hygrothermal conditions within the wood frame wallat day sixty-seven.
0.300.250.200.\50.10
MOisture Content (kg/kg)
5T1G GEVING, ACHILLES KARAGIOZ1$ AND MIKAEL SALONVAARA314
Figure 7. Case 1-Base case. Calculated moisture content in the top plate, day sixty-seven.
----0- Top,cs·rreas.
Top,cs·calc.
--<l'-- Bottol1\cs-meas. --0-- Top,W8·me8S.
• • • • Botlorncs-calo. ---Top,ws-calc.
--lr- Bottoll\w s-men••••••• Bottom,ws-calc•
0,4
~0.35
" 0.3Jc 0.25
~ 0.200e 0.15
~ 0.10
0.05::E
00 10
..."'....
20 30 40 50 60 70
Oays
Figure 8. Case 1- Base case. Measured versus calculated values for moisture content in the topand bottom plate (cs = cold side, ws ::= warm side). The calculated values on the warm side aretaken from the node that is located at the top of the electrode, while for the cold side the nodechat is located at the point where the electrode penetrate the spruce is used.
Computer Simuwtions if the Hy,grothermal Peifommru:e if a Wood Frame Wall 315
the wooden surfaces. Since the pin electrode intrudes through this wet area,it is possible that water is sucked into the pin opening at the interface between the electrode and wood causing high MC values.
The difference between calculated and measured moisture content at thebottom plate may also have other causes, one being dripping moistureagainst the PE-foil. Under freezing conditions a thin ice layer is formed onthe PE-foil. As soon as the temperatures increase above O°C this ice layerwill melt, and water may run <;lown the PE-foil and excessively moisten thebottom plate. The form of the measured curves (Figure 8), in fact, shows thata sudden moisture load appears at the bottom plate when the outsidetemperature passes through O°C. At the same time, the sudden moistureload of the top plate cannot be explained through this hypothesis.
According to this conjecture, the measuring point on the cold side couldactually be located at the wooden surface where the electrode pins intrudefrom the insulation cavity side. The agreement between measured andcalculated values of MC for the cold side is good aecording to this hypothesis, as seen in Figure 8. The agreement is best for the top plate, while thebottom plate shows a higher MC at the beginning of the simulation. Thecalculated peak MC during the warm periods are not so distinct as themeasured values.
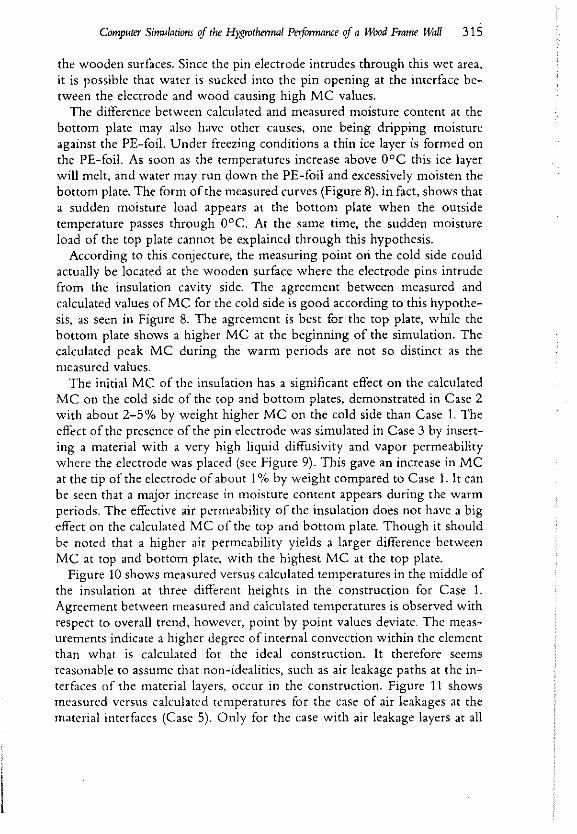
The initial Me of the insulation has a significant effect on the calculatedMC on the cold side of the top and bottom plates, demonstrated in Case 2with about 2-5% by weight higher MC on the cold side than Case 1. Theeffect of the presence of the pin electrode was simulated in Case 3 by inserting a material with a very high liquid diffusivity and vapor permeabilitywhere the electrode was placed (see Figure 9). This gave an increase in MCat the tip of the electrode of about 1% by weight compared to Case 1. It canbe seen that a major increase in moisture content appears during the warmperiods. The effective air permeability of the insulation does not have a bigeffect on the calculated MC of the top and bottom plate. Though it shouldbe noted that a higher air permeability yields a larger difference betweenMC at top and bottom plate, with the highest MC at the top plate.
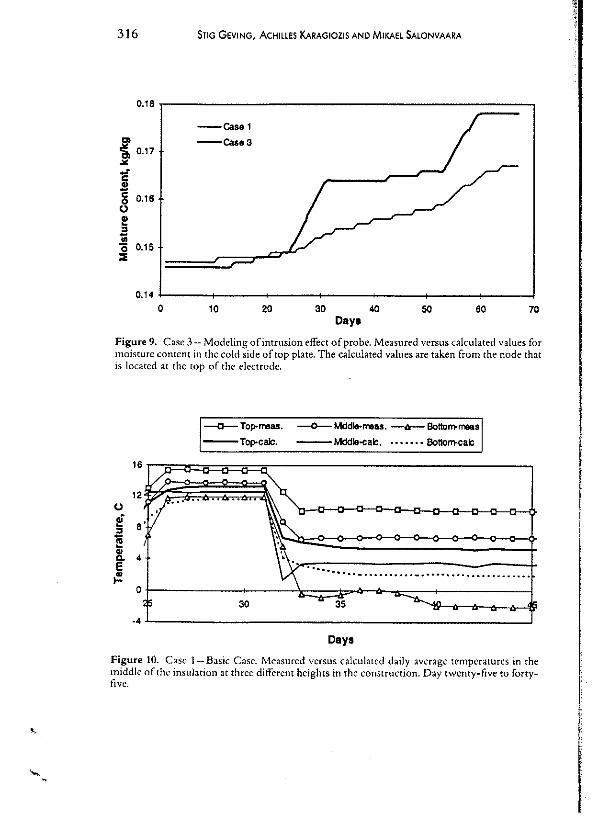
Figure 10 shows measured versus calculated temperatures in the middle ofthe insulation at three different heights in the construction for Case 1.Agreement between measured and calculated temperatures is observed withrespect to overall trend, however, point by point values deviate. The measurements indicate a higher degree of internal convection within the elementthan what is calculated for the ideal construction. It therefore seemsreasonable to assume that non-idealities, such as air leakage paths at the interfaces of the material layers, occur in the construction. Figure 11 showsmeasured versus calculated temperatures for the case of air leakages at thematerial interfaces (Case 5). Only for the case with air leakage layers at all
316 5T1G GEVING, ACHILLES KARAGIOZIS AND MlKAEL SALONVAARA
0.18
~ 0.17...oJ'c.!lc 0.160(.)
e:J~..0 0.15~
0.14
0
--Case 1
--CaseS
10 20 soDaya
40 50 60 70
Figure 9. Case 3 - Modeling ofintrusion effect ofprobe. Measured versus calculated values formoisture content in the cold side of top plate. The calculated values are taken from the node thatis located at the top of the electrode.
-0- Top-rreas.
-Top-calc.~Mddle-rreas. --b-- Bottom-f'l"l8lls
---Mddle-calc. • •••••• Bottom-cae
\\>~.... -_---I-~ _ .
16
'2(.)
.,;~ 6
~..Co 4e~
0
·4
30 35
Daya
--...... ..
'.
Figure 10. Case 1- Basic Case. Measured versus calculated daily average temperatures in themiddle of the insulation at three different heights in the construction. Day twenty-five to fonyfive.
CompUf£r Simulotions of the Hr.grothermo{ Per[ormaJ1(e of a Wood Frame Wall 317
---TOp-calc.
--a-Toponas.
---Mddle-ealc. . •••••• Bottom-calc
-0-- Mddl&-rreas. --tr- BotlO~mees
20
15()
,;- 10
J 5
o
·5
~ ,'\-,
~/'."""'.'\~ 30 "'35. --...-" ............... .. -..............
Day.
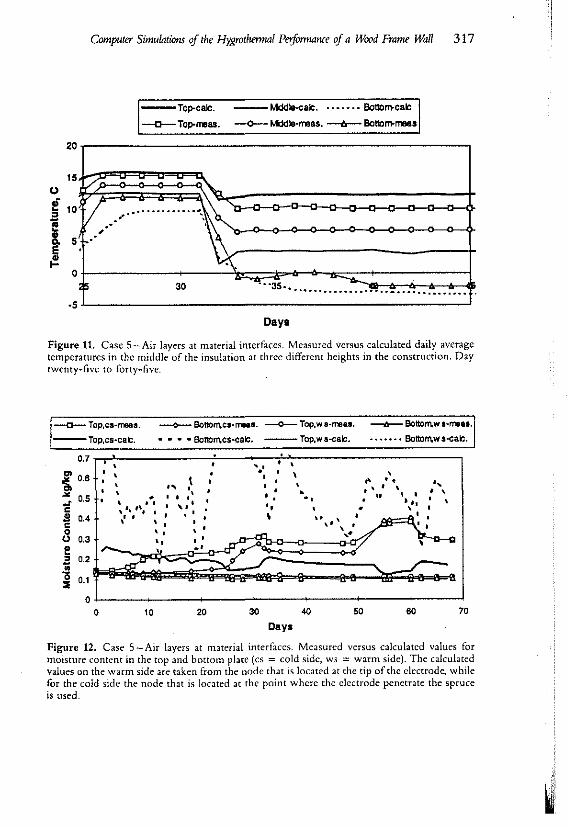
Figure 11. Case 5-Air layers at material interfaces. Measured versus calculated daily averagetemperatures in the middle of the insulation at three different heights in the construction. Daytwenty-five to forty-five.
1
-0-- Top,cs-mees.
---TOP,cs-cac.
--0-- BotlOrT\cs-rn'MIs. --0-- Top,we-meas.
• BoltOrT\cs-calC. ---Top,ws-calc.~BottolT\w••mea'·1• •••••• Bottotl\ws-ealc. I
0.•,,
0.5,
•, .,, '. ,l. I •0.' .' . •.,
0.31-- '.
"0.2~ .
Days
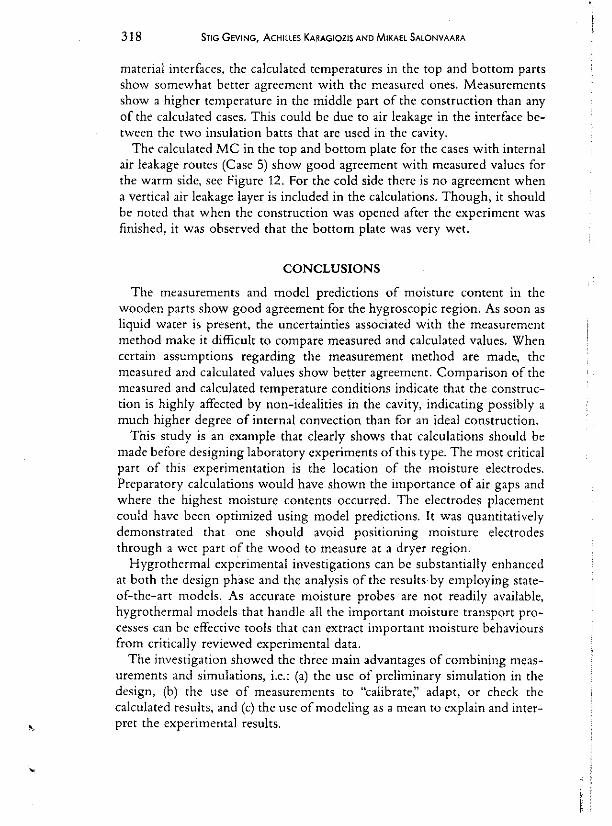
Figure 12. Case 5 - Air layers at material interfaces. Measured versus calculated values formoisture content in the top and bottom place (cs = cold side, ws = warm side). The calculatedvalues on the warm side are taken from the node that is located at the tip ofthc electrode. whilefor the cold side the node that is located at the point where the electrode penetrate the spruceis used,
318 STIG GEVING, ACHILLES KARAGIOZIS AND MIKAEL SALONVAARA
'.
material interfaces, the calculated temperatures in the top and bottom partsshow somewhat better agreement with the measured ones. Measurementsshow a higher temperature in the middle part of the construction than anyof the calculated cases. This could be due to air leakage in the interface between the two insulation hatts that are used in the cavity.
The calculated MC in the top and bottom plate for the cases with internalair leakage routes (Case 5) show good agreement with measured values forthe warm side, sec Figure 12. For the cold side there is no agreement whena vertical air leakage layer is included in the calculations. Though, it shouldbe noted that w hen the construction was opened after the experiment wasfinished, it was observed that the bottom plate was very wet.
CONCLUSIONS
The measurements and model predictions of moisture content in thewooden parts show good agreement for the hygroscopic region. As soon asliquid water is present, the uncertainties associated with the measurementmethod make it difficult to compare measured and calculated values. Whencertain assumptions regarding the measurement method are made, themeasured and calculated values show be~ter agreement. Comparison of themeasured and calculated temperature conditions indicate that the construction is highly affected by non-idealities in the cavity, indicating possibly amuch higher degree of internal convection than for an ideal construction.
This study is an example that clearly shows that calculations should bemade before designing laboratory experiments of this type. The most criticalpart of this experimentation is the location of the moisture electrodes.Preparatory calculations would have shown the importance of air gaps andwhere the highest moisture contents occurred. The electrodes placementcould have been optimized using model predictions. It was quantitativelydemonstrated that one should avoid positioning moisture electrodesthrough a wet part of the wood to measure at a dryer region.
Hygrothermal experimental investigations can be substantially enhancedat both the design phase and the analysis of the results by employing stateof-the-art models. As accurate moisture probes are not readily available,hygrothermal models that handle all the important moisture transport processes can be effective tools that can extract important moisture behavioursfrom critically reviewed experimental data.
The investigation showed the three main advantages of combining measurements and simulations, i.e.: (a) the use of preliminary simulation in thedesign, (b) the use of measurements to "calibrate;' adapt, or check thecalculated results, and (c) the use of modeling as a mean to explain and interpret the experimental results.
Computer Simuwtions <if the Hygrothermal J'eiformatue <if a Wood Frame Wall
REFERENCES
319
1. Thue, J. V. et aL 1996. "Wood Frame Walls in Cold Climate-Vapour BarrierRequirements:' J. Thermal Insul. and Bldg. Envs" ApriL
2. Hens, H. 1996. "Final Report Task 1. Modelling Common Exercises. SummaryReports:' International Energy Conservation in Buildings and CommunitySystems, Annex 24 Heat, Air and Moisture Transport in New and Retrofitted BuildingEnvelope Parts (HAMTIE).
3. Tsongas, G., D. Burch, C. Roos and M. Cunningham. "A Parametric Study ofWall Moisture Contents Using a Variable Indoor Relative Humidity Version of"MOIST" Transient Heat and Moisture Model," Proceedings of the Sixth ThermalPeiformance of the Exterior Envelopes of Building Conference, Dec. 4-8, Clearwater,Florida, pp. 307-319.
4. Hagentoft, C. E. and E. Harderup. 1996. "Moisture Conditions in a North Facing Wall with Cellulose Loose Fill Insulation: Construction With and WithoutVapor Retarder and Air Leakage:']. Thermal Ins"l. and Bldg. Evns., 19:228-243.
5. Ojanen, 'T. and K. Kumaran. 1996. "Effect of Exftltration on the HygrothermalBehaviour of a Residential Wall Assembly;'). Thermal lnsul. and Bldg. Envs"19:215-227.
6. Bigseth, L. 1994. "Moisture and Temperature Conditions in Highly InsulatedBuilding Constructions (in Norwegian)." M. Sc. thesis, Norwegian Institute ofTechnology, Dept. of Building and Construction Engineering, Trondheim,Norway.
7. Karagiozis, A. 1993. "Overview of the' 2-D Hygrothermal Heat-MoistureTransport Model LATENITE;' Internal Report, National Research CouncilCanada, Institute for Research in Construction, Ottawa, Canada.
8. Salonvaara, M. and A. Karagiozis. 1994. "Moisture Transport in Building Envelopes Using an Approximate Factorization Solution Method?' CFD Society ofCanada, Toronto, Canada.
9. Ahlgren, L. 1972. "Moisture Fixation in Porous Building Materials," Report 36,Div. of Building Technology. Lund Institute of Technology, Sweden.
10. Kumaran, M. K. 1996. "Material Properties, Final Report Task 3," InternationalEnergy Agency, Energy Conservation in Buildings and Community Systems,Annex 24 Heat, Air and Moisture Transport in New and Retrofitted BuildingEnvelope Pans (HAMTIE). Laboratorium Bouwfysica, K.U.-Leuven. Belgium.
11. Cloutier, A. and Y. Fortin. 1991. "Moisture Content-Water Potential Relation~
ship of Wood from Saturated to Dry Conditions." Wood Science and uchnology,25:263-280.
12. Tveit. A. 1966. "Measurements of Moisture Sorption and Moisture Permeabilityof Porous Materials;' Norwegian Building Research Institute, Oslo, Norway.
13. Time, B. 1995. "Water Vapour Permeability Measurements of Spruce, CupMeasurements:' Work Report No.4, Norwegian Institute of Technology, Dept.of Building and Construction Engineering, Trondheim, Norway.