characterization of the hygrothermal performance of wall systems
TRANSCRIPT
http://irc.nrc-cnrc.gc.ca
C h a r a c t e r i z a t i o n o f t h e h y g r o t h e r m a l p e r f o r m a n c e o f w a l l s y s t e m s
I R C - O R A L - 8 5 4
M a r e f , W . ; M a n n i n g , M . ; R o u s s e a u , M . ; L e i , W .
A version of this document is published in / Une version de ce document se trouve dans: ASHRAE Seminar 29 – Moisture Management Concerns in Commercial and Residential Buildings, New York, USA, Jan. 21, 2008, pp. 1-83
The material in this document is covered by the provisions of the Copyright Act, by Canadian laws, policies, regulations and international agreements. Such provisions serve to identify the information source and, in specific instances, to prohibit reproduction of materials without written permission. For more information visit http://laws.justice.gc.ca/en/showtdm/cs/C-42
Les renseignements dans ce document sont protégés par la Loi sur le droit d'auteur, par les lois, les politiques et les règlements du Canada et des accords internationaux. Ces dispositions permettent d'identifier la source de l'information et, dans certains cas, d'interdire la copie de documents sans permission écrite. Pour obtenir de plus amples renseignements :
http://lois.justice.gc.ca/fr/showtdm/cs/C-42

Characterization of the Hygrothermal Performance of Wall Systems
W. Maref, M. Manning , M. Rousseau & W. Lei
ASHRAE Seminar 29- Moisture Management Concerns in Commercial and Residential Buildings, New York, USA, January 21, 2008
Slide 2
Team
K. Abdulghani W. Lei M. Manning W. Maref
M. Nicholls T. Aubin M. Rousseau R. Berzins

Slide 3
Outline
• Background• Field Exposure of Wall Facility (FEWF)-BES• Results and Discussion• Summary• Future Work

Slide 4
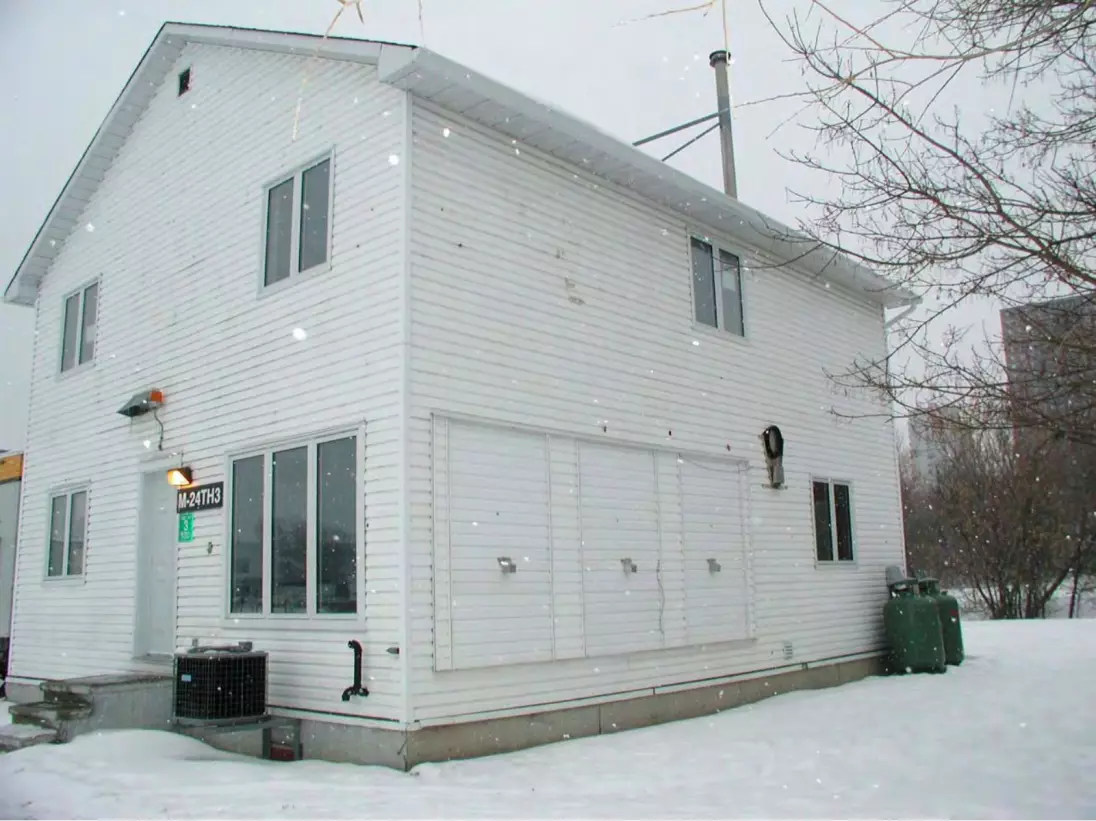
Ventilation and Wall Research House Facility
2. FIELD EXPOSURE OF WALL FACILITY –(FEWF) BES
Study & compare traditional & innovative BE strategies
1. VENTILATION, HEATING AND COOLING FACILITY- IE
Study & compare traditional & innovative ventilation, heating & cooling strategies
Slide 5
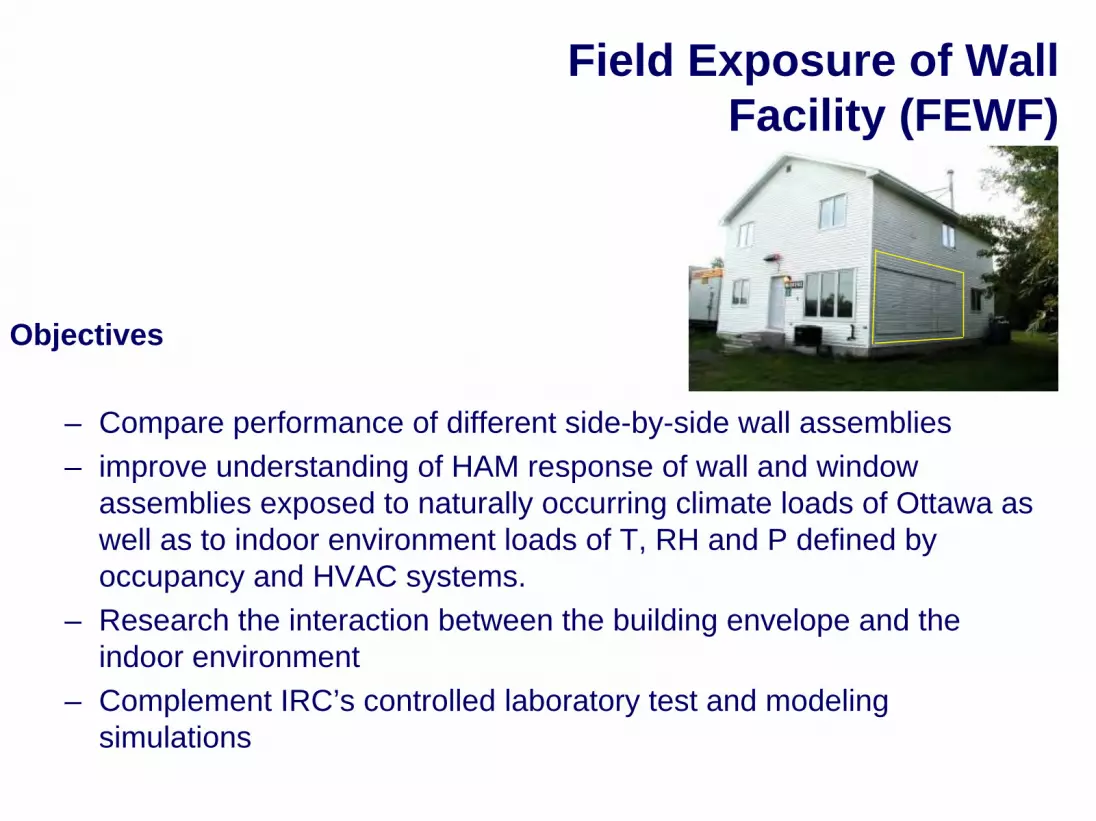
Field Exposure of Wall Facility (FEWF)
Objectives
– Compare performance of different side-by-side wall assemblies – improve understanding of HAM response of wall and window
assemblies exposed to naturally occurring climate loads of Ottawa as well as to indoor environment loads of T, RH and P defined by occupancy and HVAC systems.
– Research the interaction between the building envelope and the indoor environment
– Complement IRC’s controlled laboratory test and modeling simulations
Slide 6
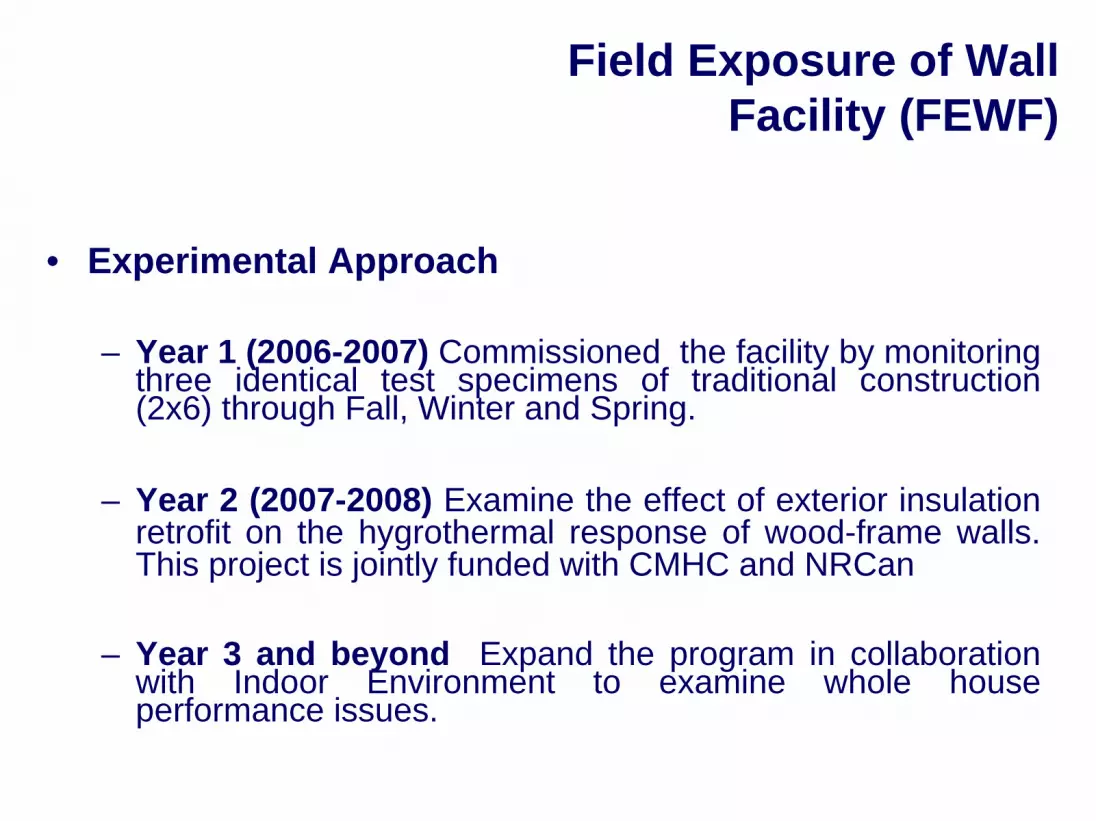
Field Exposure of Wall Facility (FEWF)
• Experimental Approach
– Year 1 (2006-2007) Commissioned the facility by monitoring three identical test specimens of traditional construction (2x6) through Fall, Winter and Spring.
– Year 2 (2007-2008) Examine the effect of exterior insulation retrofit on the hygrothermal response of wood-frame walls. This project is jointly funded with CMHC and NRCan
– Year 3 and beyond Expand the program in collaboration with Indoor Environment to examine whole house performance issues.

Slide 7
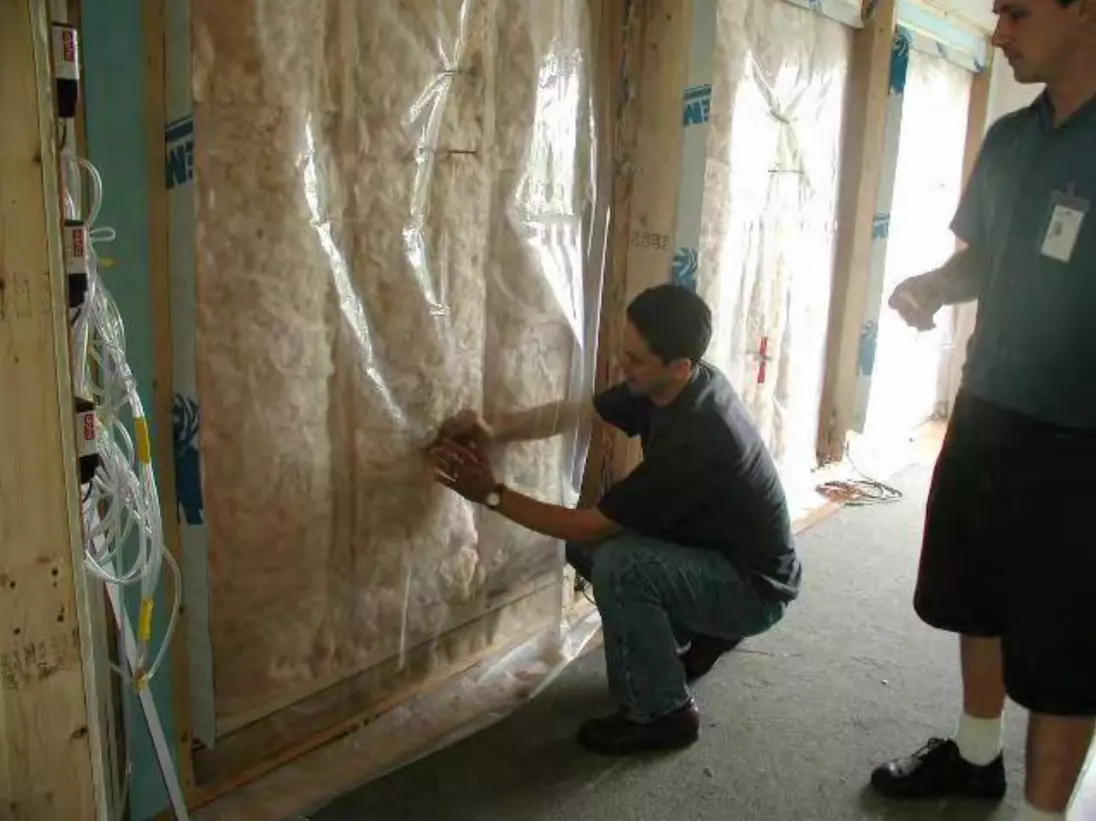
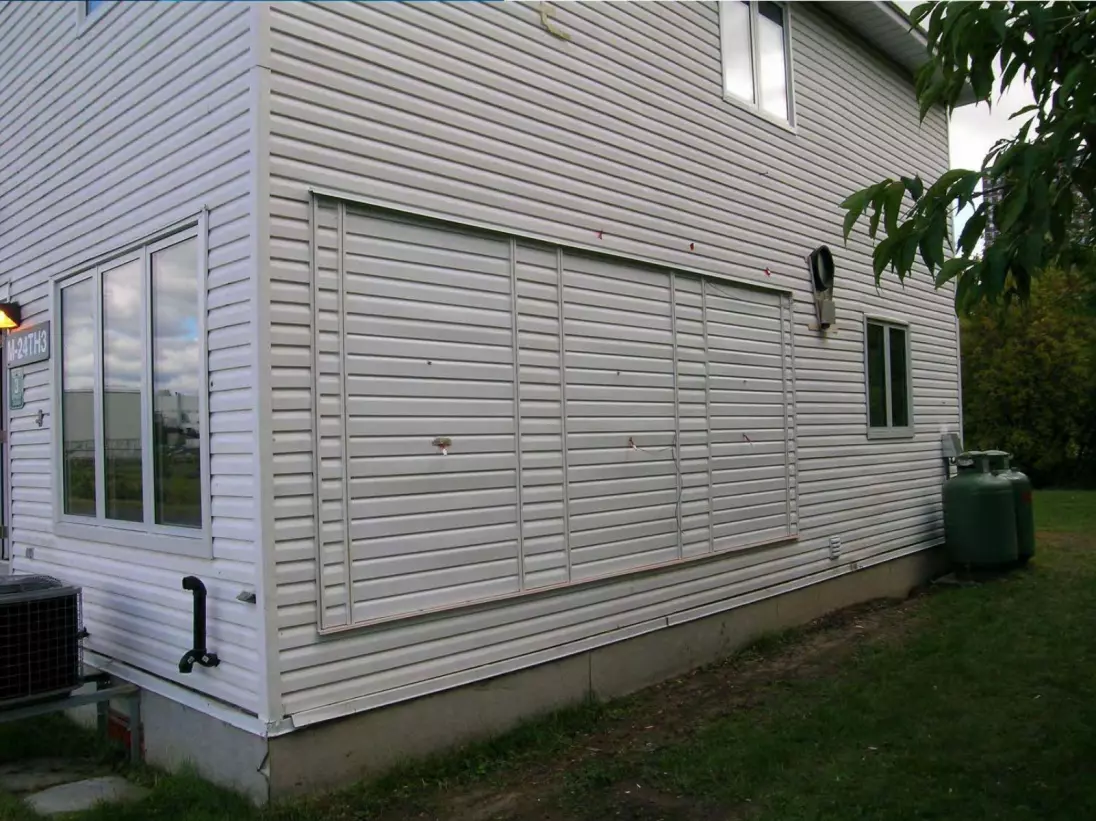
South facade
Instred w
Instrumented window
Instrumented window
Test frame designed to provide the largest possible free bay for placement of several test specimens
Max. 19 ft available
Stack casing location
North facade
West facade

Slide 8
Field Exposure of Walls Facility (FEWF)

Slide 9
Slide 10
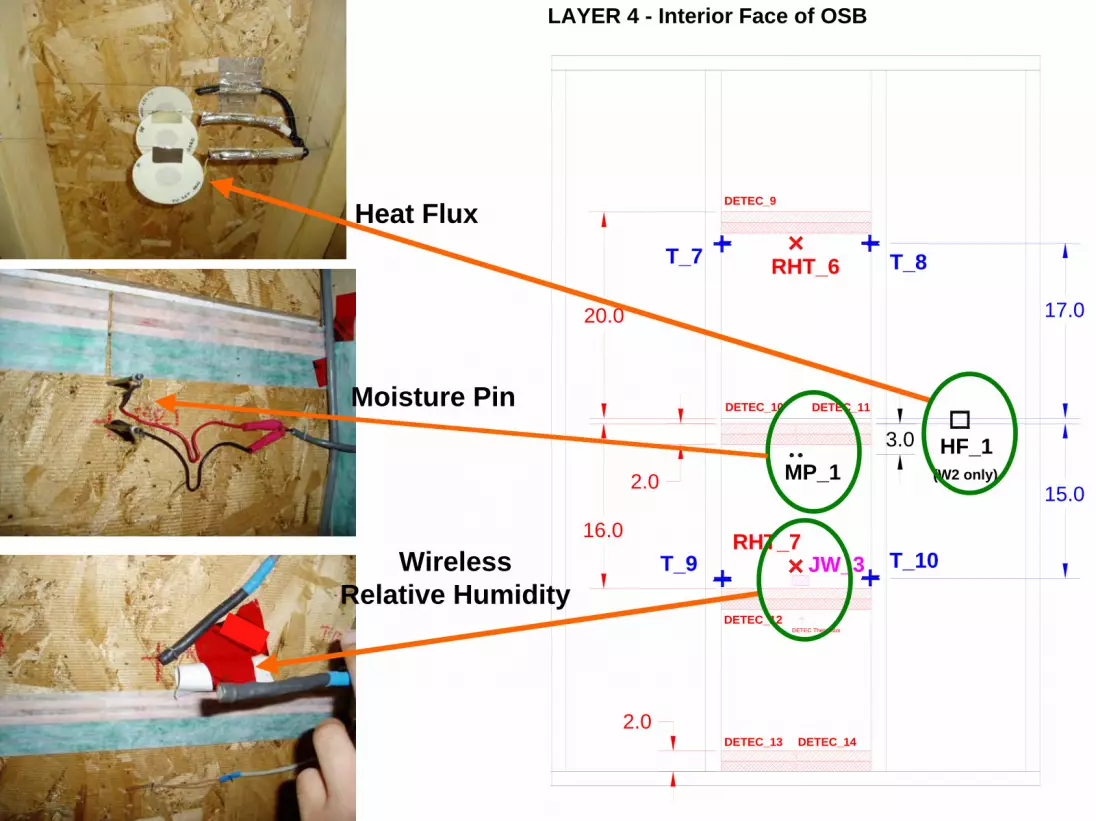
DETEC_9
DETEC_11
T_10
T_8
16.0T_9
RHT_7
DETEC_14DETEC_13
DETEC_12
MP_12.0
DETEC_10
T_7 RHT_6
15.0
2.0
20.0 17.0
3.0
LAYER 4 - Interior Face of OSB
HF_1(W2 only)
JW_3
DETEC Thermistor
Heat Flux
Moisture Pin
WirelessRelative Humidity

Slide 11
14.0
7.0DETEC_17
DETEC_16
MP_3
LAYER 5 - Stud Cavity
DETEC_15
MP_2
HF_2 (W2 only)
Moisture Pin
Slide 12
Slide 13
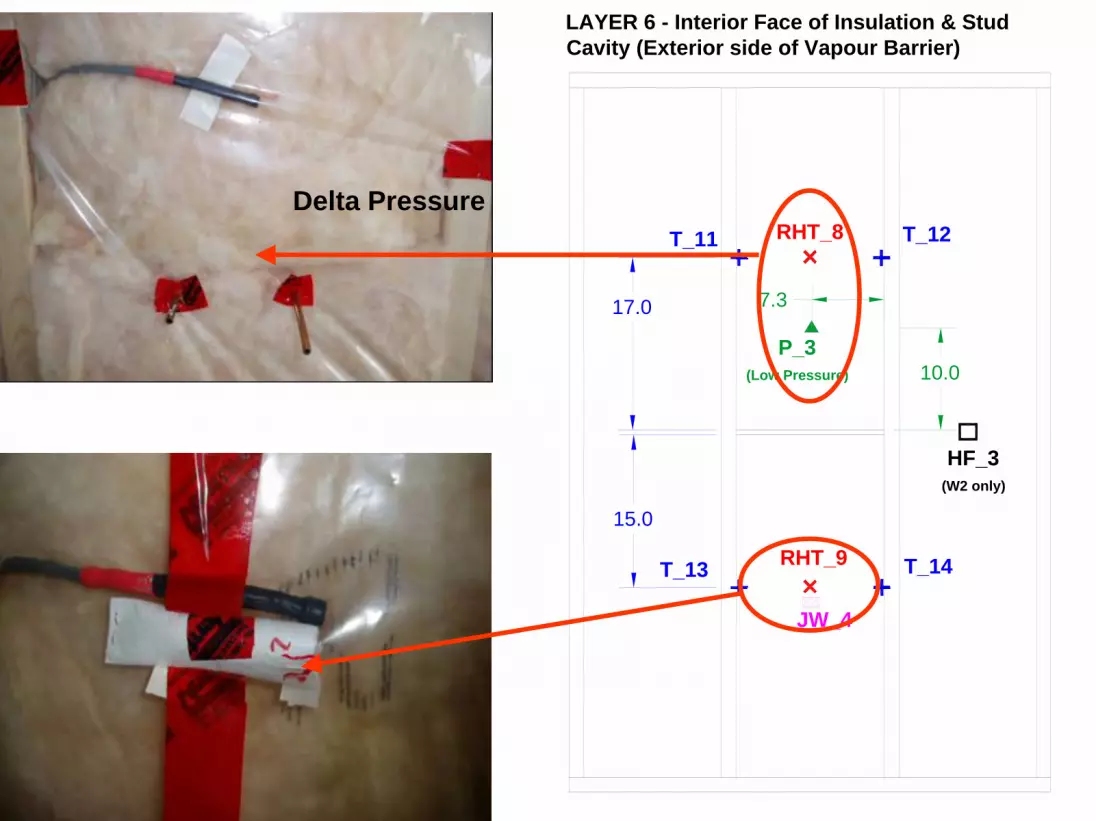
RHT_9
15.0
T_13 T_14
17.0
T_11 RHT_8 T_12
LAYER 6 - Interior Face of Insulation & Stud Cavity (Exterior side of Vapour Barrier)
P_3 (Low Pressure)
7.3
10.0
HF_3(W2 only)
JW_4
Delta Pressure

Slide 14
LAYER 7 - Interior Face of Drywall
17.0
15.0
T_18T_17
RHT_10 (air)
T_16T_15
7.0
T_19 (W2 and W3 only)
Thermocouple

Slide 15
W3W2 W1
Slide 16
Slide 17

Slide 18
Experimental Approach
• Challenging the wall experimental begins:– Stage 1- Create air leakage path and monitor under
naturally occurring int. and ext. conditions on two of three specimens (1 week)

Slide 19
DrywallW1 W2 W3

Slide 20
Air Leakage Path

Slide 21
• Challenging the wall experimental begins:– Stage 1- Create air leakage path and monitor under
naturally occurring int. and ext. conditions on two of three specimens (1 week)
– Stage 2- Increase indoor RH to 70% and induce 5 Pa positive pressure while air leak is present in two specimens, for a certain period of time

Slide 22
DrywallW1 W2 W3

Slide 23
Conditioning Chamber on the Room Side
W1 W2 W3

Slide 24
Wall specimen
EXT.INT.
Conditioning chamber
Moisture-laden air exfiltration

Slide 25
• Challenging the wall experimental begins:– Stage 1- Create air leakage path and monitor under
naturally occurring int. and ext. conditions on two of three specimens (1 week)
– Stage 2- Increase indoor RH to 70% and induce 5 Pa positive pressure while air leak is present in two specimens, for a certain period of time
– Stage 3- Return to naturally occurring conditions to monitor drying. Disassemble the indoor chamber

Slide 26
Results

Slide 27
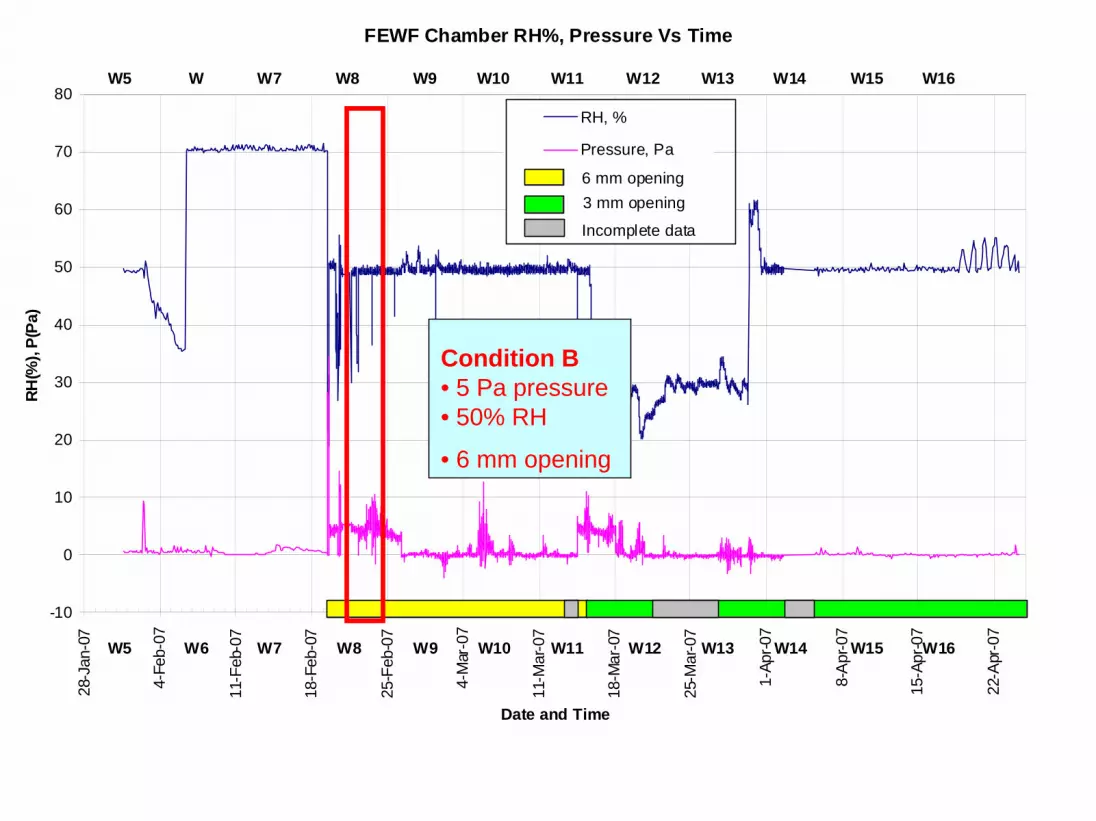
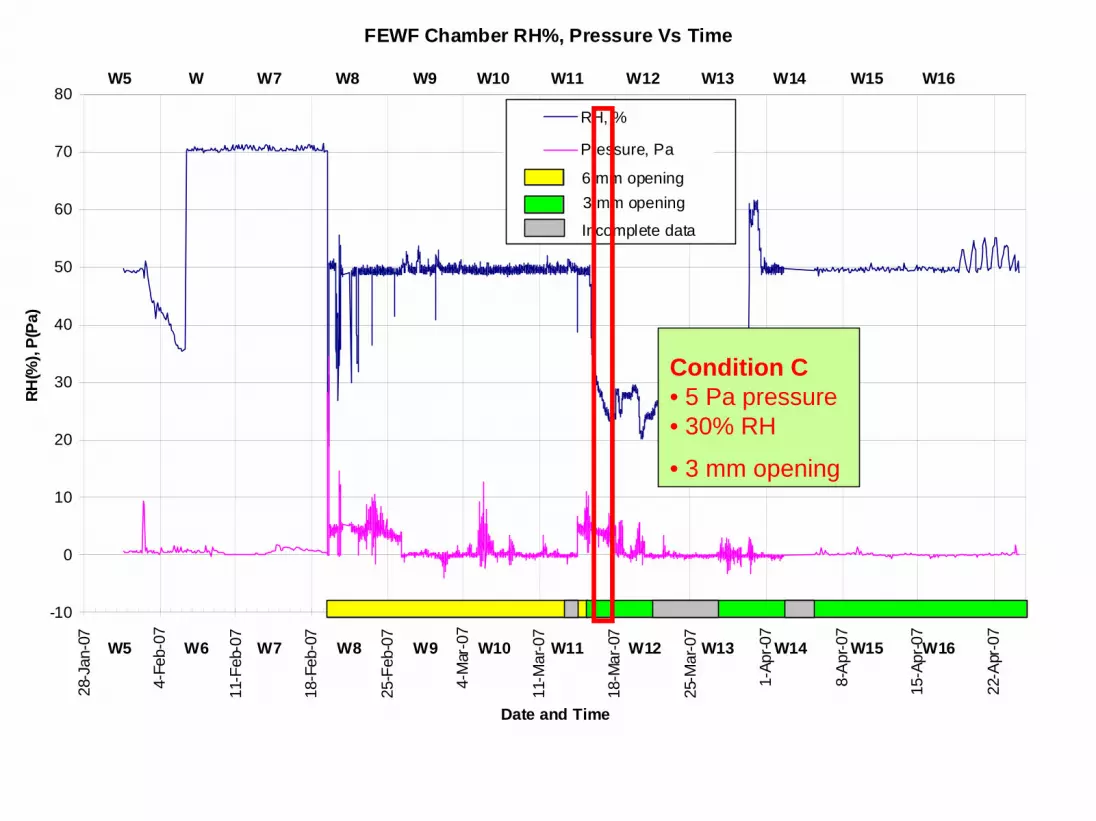
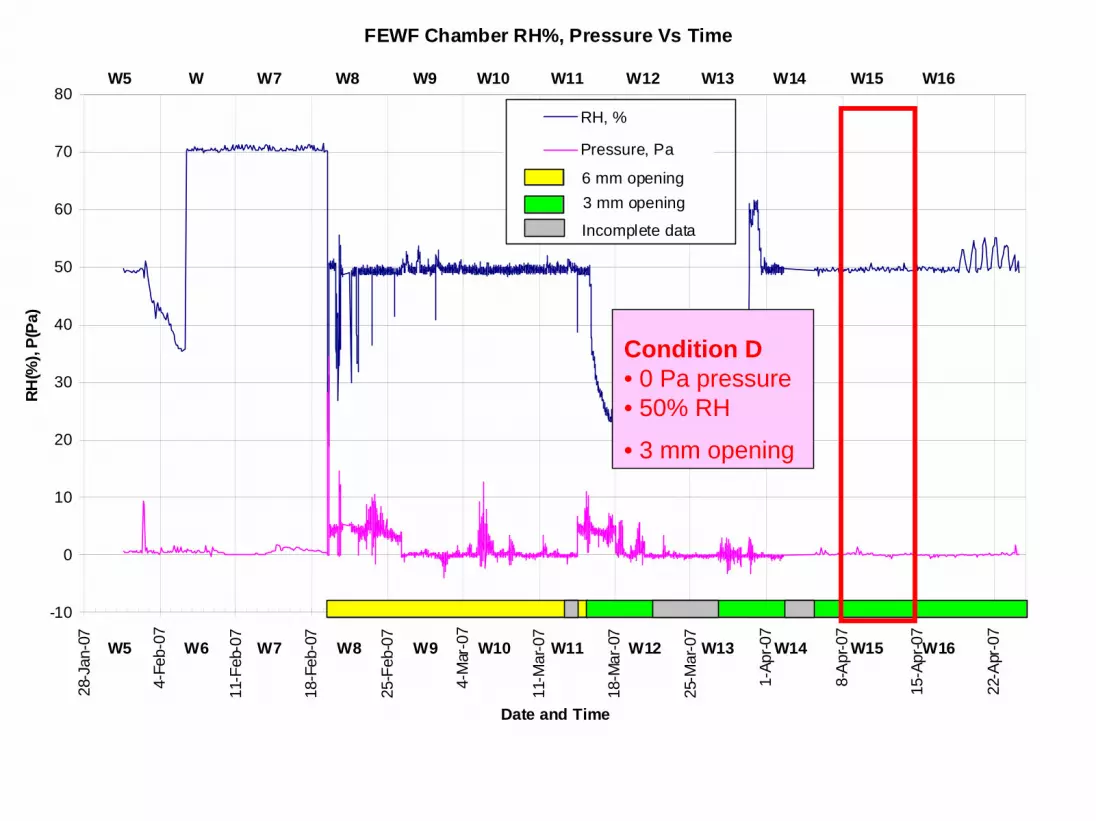
FEWF Chamber RH%, Pressure Vs Time
-10
0
10
20
30
40
50
60
70
8028
-Jan
-07
4-Fe
b-07
11-F
eb-0
7
18-F
eb-0
7
25-F
eb-0
7
4-M
ar-0
7
11-M
ar-0
7
18-M
ar-0
7
25-M
ar-0
7
1-Ap
r-07
8-Ap
r-07
15-A
pr-0
7
22-A
pr-0
7
Date and Time
RH(%
), P(
Pa)
RH, %
Pressure, Pa
W5 W6 W7 W8 W9 W10 W11 W12 W13 W14 W15 W16
W5 W W7 W8 W9 W10 W11 W12 W13 W14 W15 W16
6 mm opening 3 mm opening
Incomplete data

Slide 28
FEWF Chamber RH%, Pressure Vs Time
-10
0
10
20
30
40
50
60
70
8028
-Jan
-07
4-Fe
b-07
11-F
eb-0
7
18-F
eb-0
7
25-F
eb-0
7
4-M
ar-0
7
11-M
ar-0
7
18-M
ar-0
7
25-M
ar-0
7
1-Ap
r-07
8-Ap
r-07
15-A
pr-0
7
22-A
pr-0
7
Date and Time
RH(%
), P(
Pa)
RH, %
Pressure, Pa
W5 W6 W7 W8 W9 W10 W11 W12 W13 W14 W15 W16
W5 W W7 W8 W9 W10 W11 W12 W13 W14 W15 W16
6 mm opening 3 mm opening
Incomplete data
Condition A• 0 Pa pressure• 70% RH
• No opening
Slide 29
FEWF Chamber RH%, Pressure Vs Time
-10
0
10
20
30
40
50
60
70
8028
-Jan
-07
4-Fe
b-07
11-F
eb-0
7
18-F
eb-0
7
25-F
eb-0
7
4-M
ar-0
7
11-M
ar-0
7
18-M
ar-0
7
25-M
ar-0
7
1-Ap
r-07
8-Ap
r-07
15-A
pr-0
7
22-A
pr-0
7
Date and Time
RH(%
), P(
Pa)
RH, %
Pressure, Pa
W5 W6 W7 W8 W9 W10 W11 W12 W13 W14 W15 W16
W5 W W7 W8 W9 W10 W11 W12 W13 W14 W15 W16
6 mm opening 3 mm opening
Incomplete data
Condition B• 5 Pa pressure• 50% RH
• 6 mm opening
Slide 30
FEWF Chamber RH%, Pressure Vs Time
-10
0
10
20
30
40
50
60
70
8028
-Jan
-07
4-Fe
b-07
11-F
eb-0
7
18-F
eb-0
7
25-F
eb-0
7
4-M
ar-0
7
11-M
ar-0
7
18-M
ar-0
7
25-M
ar-0
7
1-Ap
r-07
8-Ap
r-07
15-A
pr-0
7
22-A
pr-0
7
Date and Time
RH(%
), P(
Pa)
RH, %
Pressure, Pa
W5 W6 W7 W8 W9 W10 W11 W12 W13 W14 W15 W16
W5 W W7 W8 W9 W10 W11 W12 W13 W14 W15 W16
6 mm opening 3 mm opening
Incomplete data
Condition C• 5 Pa pressure• 30% RH
• 3 mm opening
Slide 31
FEWF Chamber RH%, Pressure Vs Time
-10
0
10
20
30
40
50
60
70
8028
-Jan
-07
4-Fe
b-07
11-F
eb-0
7
18-F
eb-0
7
25-F
eb-0
7
4-M
ar-0
7
11-M
ar-0
7
18-M
ar-0
7
25-M
ar-0
7
1-Ap
r-07
8-Ap
r-07
15-A
pr-0
7
22-A
pr-0
7
Date and Time
RH(%
), P(
Pa)
RH, %
Pressure, Pa
W5 W6 W7 W8 W9 W10 W11 W12 W13 W14 W15 W16
W5 W W7 W8 W9 W10 W11 W12 W13 W14 W15 W16
6 mm opening 3 mm opening
Incomplete data
Condition D• 0 Pa pressure• 50% RH
• 3 mm opening
Slide 32
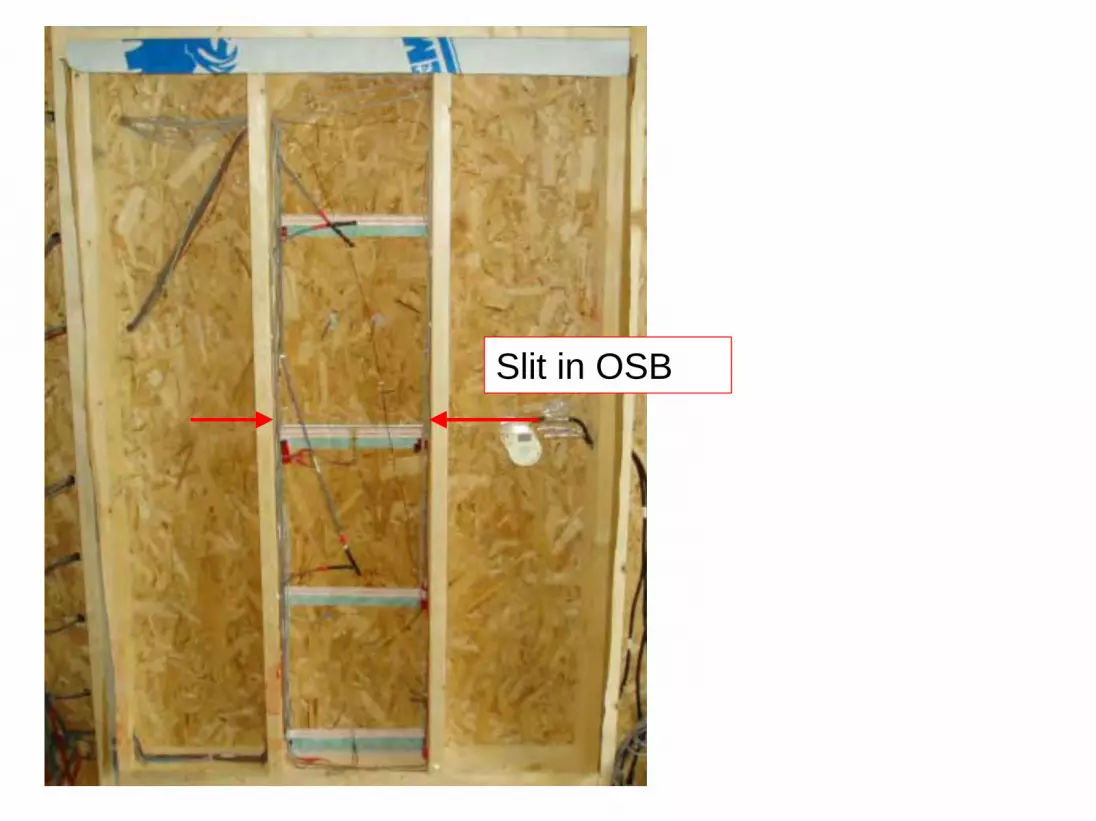
Slit in OSB

Slide 33
Diagram for Moisture Detection Tape Locations on the interior of the OSB
Slit in OSB
Slide 34
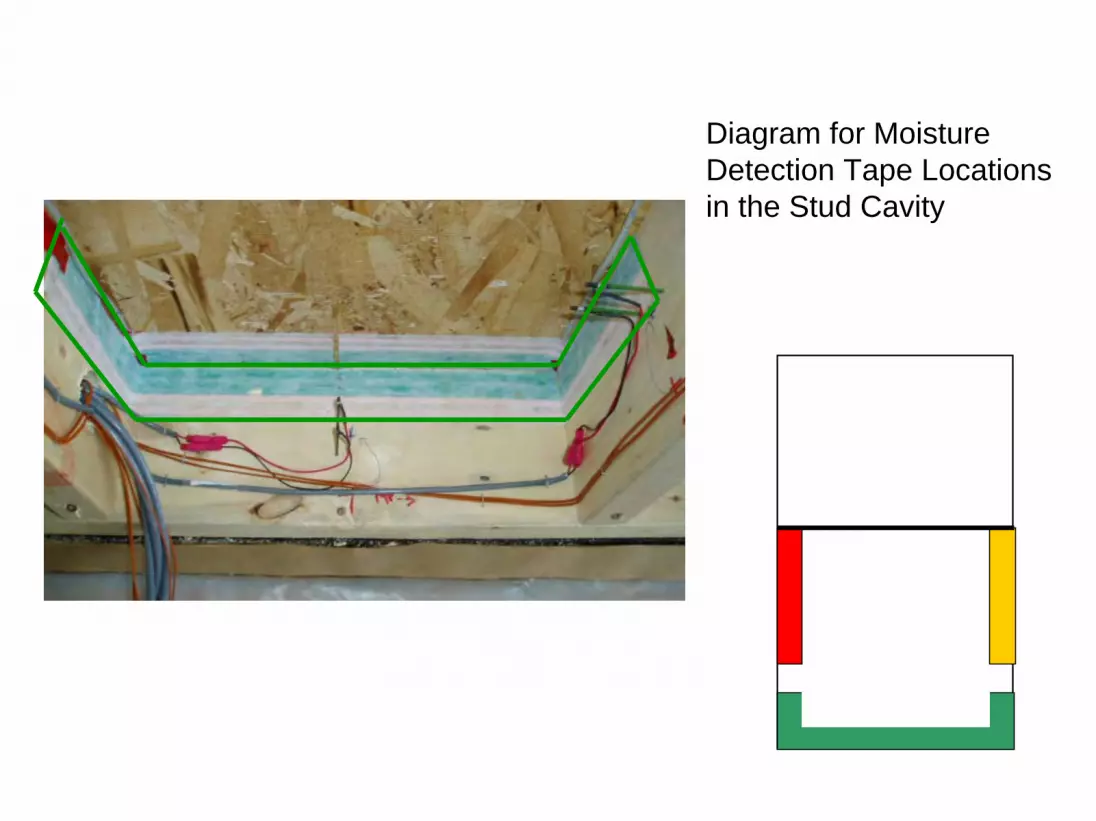
Diagram for Moisture Detection Tape Locations in the Stud Cavity

Slide 35
Exterior
Interior
Vinyl SidingSheathing MembraneOSB
Stud Cavity with Fiberglass Insulation
Vapour BarrierDrywall
Material
P1 P2 P3 P Chamber
Reference for all Pressure Sensors: Room Interior
Pressure Tap Locations
+ve pressure = pressure at the tap location is higher than the pressure in the room

Slide 36
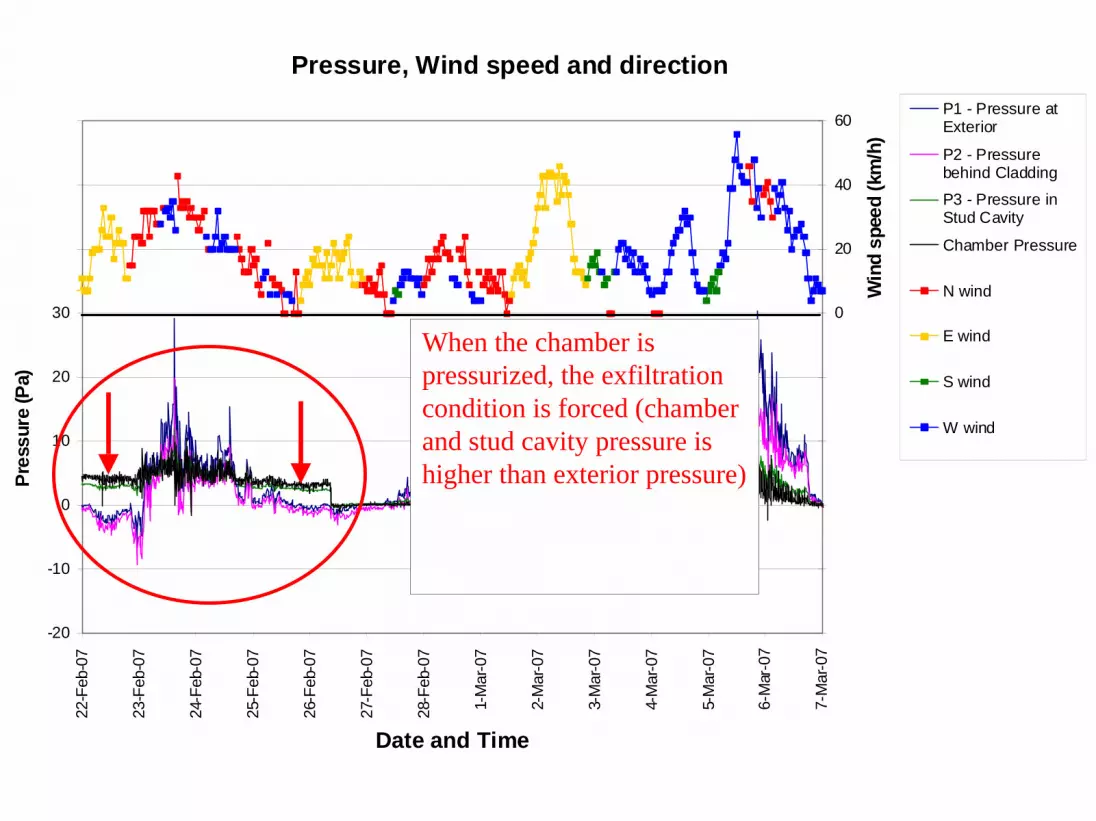
Pressure, Wind speed and direction
-20
-10
0
10
20
30
40
50
60
22-F
eb-0
7
23-F
eb-0
7
24-F
eb-0
7
25-F
eb-0
7
26-F
eb-0
7
27-F
eb-0
7
28-F
eb-0
7
1-M
ar-0
7
2-M
ar-0
7
3-M
ar-0
7
4-M
ar-0
7
5-M
ar-0
7
6-M
ar-0
7
7-M
ar-0
7
Date and Time
Pres
sure
(Pa)
-100
-80
-60
-40
-20
0
20
40
60
Win
d sp
eed
(km
/h)
P1 - Pressure atExterior
P2 - Pressurebehind Cladding
P3 - Pressure inStud Cavity
Chamber Pressure
N wind
E wind
S wind
W wind
Wind speed data is from the Ottawa Airport

Slide 37
Pressure, Wind speed and direction
-20
-10
0
10
20
30
40
50
60
22-F
eb-0
7
23-F
eb-0
7
24-F
eb-0
7
25-F
eb-0
7
26-F
eb-0
7
27-F
eb-0
7
28-F
eb-0
7
1-M
ar-0
7
2-M
ar-0
7
3-M
ar-0
7
4-M
ar-0
7
5-M
ar-0
7
6-M
ar-0
7
7-M
ar-0
7
Date and Time
Pres
sure
(Pa)
-100
-80
-60
-40
-20
0
20
40
60
Win
d sp
eed
(km
/h)
P1 - Pressure atExterior
P2 - Pressurebehind Cladding
P3 - Pressure inStud Cavity
Chamber Pressure
N wind
E wind
S wind
W wind
Wind from the West causes +ve pressures and infiltration

Slide 38
Pressure, Wind speed and direction
-20
-10
0
10
20
30
40
50
60
22-F
eb-0
7
23-F
eb-0
7
24-F
eb-0
7
25-F
eb-0
7
26-F
eb-0
7
27-F
eb-0
7
28-F
eb-0
7
1-M
ar-0
7
2-M
ar-0
7
3-M
ar-0
7
4-M
ar-0
7
5-M
ar-0
7
6-M
ar-0
7
7-M
ar-0
7
Date and Time
Pres
sure
(Pa)
-100
-80
-60
-40
-20
0
20
40
60
Win
d sp
eed
(km
/h)
P1 - Pressure atExterior
P2 - Pressurebehind Cladding
P3 - Pressure inStud Cavity
Chamber Pressure
N wind
E wind
S wind
W wind
Wind from the East causes –ve pressures and exfiltration
Slide 39
Pressure, Wind speed and direction
-20
-10
0
10
20
30
40
50
60
22-F
eb-0
7
23-F
eb-0
7
24-F
eb-0
7
25-F
eb-0
7
26-F
eb-0
7
27-F
eb-0
7
28-F
eb-0
7
1-M
ar-0
7
2-M
ar-0
7
3-M
ar-0
7
4-M
ar-0
7
5-M
ar-0
7
6-M
ar-0
7
7-M
ar-0
7
Date and Time
Pres
sure
(Pa)
-100
-80
-60
-40
-20
0
20
40
60
Win
d sp
eed
(km
/h)
P1 - Pressure atExterior
P2 - Pressurebehind Cladding
P3 - Pressure inStud Cavity
Chamber Pressure
N wind
E wind
S wind
W wind
When the chamber is pressurized, the exfiltration condition is forced (chamber and stud cavity pressure is higher than exterior pressure)

Slide 40
Pressure, Wind speed and direction
-20
-10
0
10
20
30
40
50
60
22-F
eb-0
7
23-F
eb-0
7
24-F
eb-0
7
25-F
eb-0
7
26-F
eb-0
7
27-F
eb-0
7
28-F
eb-0
7
1-M
ar-0
7
2-M
ar-0
7
3-M
ar-0
7
4-M
ar-0
7
5-M
ar-0
7
6-M
ar-0
7
7-M
ar-0
7
Date and Time
Pres
sure
(Pa)
-100
-80
-60
-40
-20
0
20
40
60
Win
d sp
eed
(km
/h)
P1 - Pressure atExterior
P2 - Pressurebehind Cladding
P3 - Pressure inStud Cavity
Chamber Pressure
N wind
E wind
S wind
W wind
When the chamber is pressurized, the exfiltration condition is forced (chamber and stud cavity pressure is higher than exterior pressure)
Except when +ve pressures from North and West winds negate the effect.
Slide 41
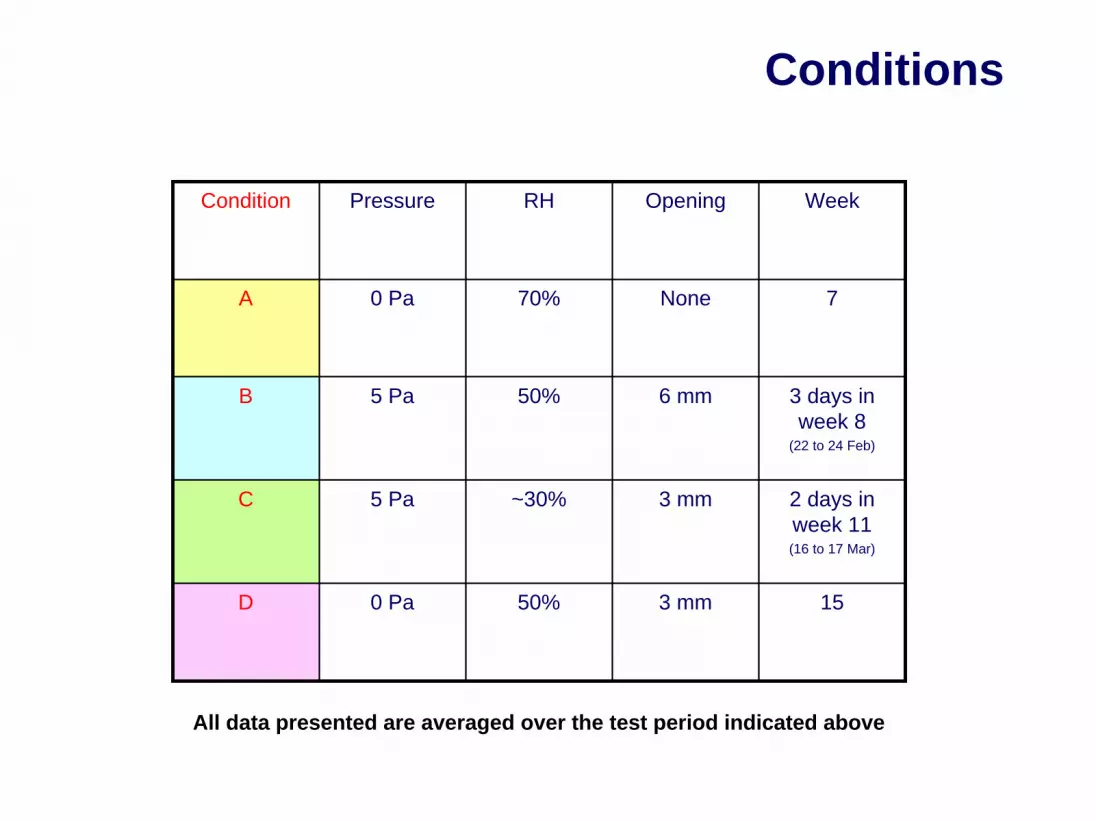
Conditions
Condition Pressure RH Opening Week
A 0 Pa 70% None 7
B 5 Pa 50% 6 mm 3 days in week 8
(22 to 24 Feb)
C 5 Pa ~30% 3 mm 2 days in week 11(16 to 17 Mar)
D 0 Pa 50% 3 mm 15
All data presented are averaged over the test period indicated above

Slide 42
Moisture Content - Wall 2 Interior OSB
0%
5%
10%
15%
20%
25%
30%
35%
40%
28-J
an-0
7
4-Fe
b-07
11-F
eb-0
7
18-F
eb-0
7
25-F
eb-0
7
4-M
ar-0
7
11-M
ar-0
7
18-M
ar-0
7
25-M
ar-0
7
1-Ap
r-07
8-Ap
r-07
15-A
pr-0
7
22-A
pr-0
7
Date and Time
Moi
stur
e Co
nten
t (%
)
209MC210MC211MC212MC213MC214MC
Slit in OSB

Slide 43
Moisture Content - Wall 2 Interior OSB
0%
5%
10%
15%
20%
25%
30%
35%
40%28
-Jan
-07
4-Fe
b-07
11-F
eb-0
7
18-F
eb-0
7
25-F
eb-0
7
4-M
ar-0
7
11-M
ar-0
7
18-M
ar-0
7
25-M
ar-0
7
1-Ap
r-07
8-Ap
r-07
15-A
pr-0
7
22-A
pr-0
7
Date and Time
Moi
stur
e Co
nten
t (%
)
212MC
Slit in OSB
Slide 44
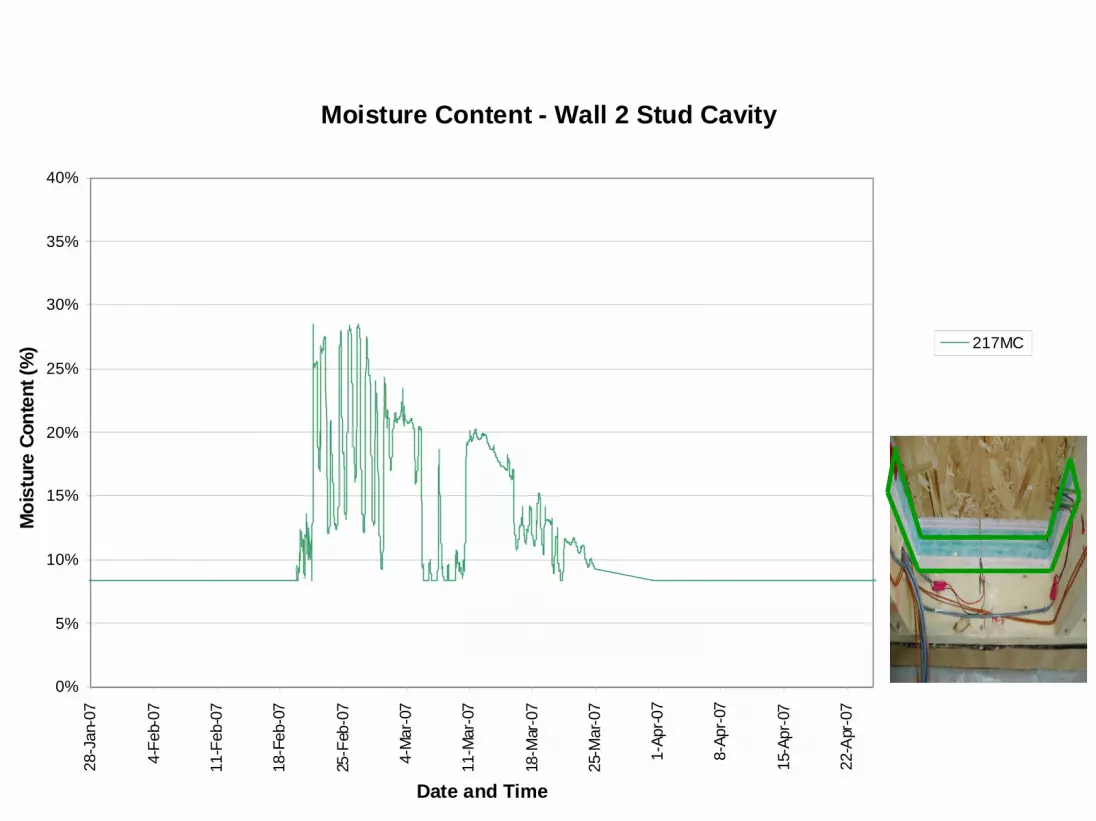
Moisture Content - Wall 2 Stud Cavity
0%
5%
10%
15%
20%
25%
30%
35%
40%
28-J
an-0
7
4-Fe
b-07
11-F
eb-0
7
18-F
eb-0
7
25-F
eb-0
7
4-M
ar-0
7
11-M
ar-0
7
18-M
ar-0
7
25-M
ar-0
7
1-Ap
r-07
8-Ap
r-07
15-A
pr-0
7
22-A
pr-0
7
Date and Time
Moi
stur
e Co
nten
t (%
) 217MC
Slide 45
Interior / Intérieur
Exterior / Extérieur
6
7
1
5
23
4
Layer
Plastic Air/Vapour BarrierDrywall
Vinyl SidingSheathing Membrane
Stud Cavity with Fiberglass Insulation
OSB
Material
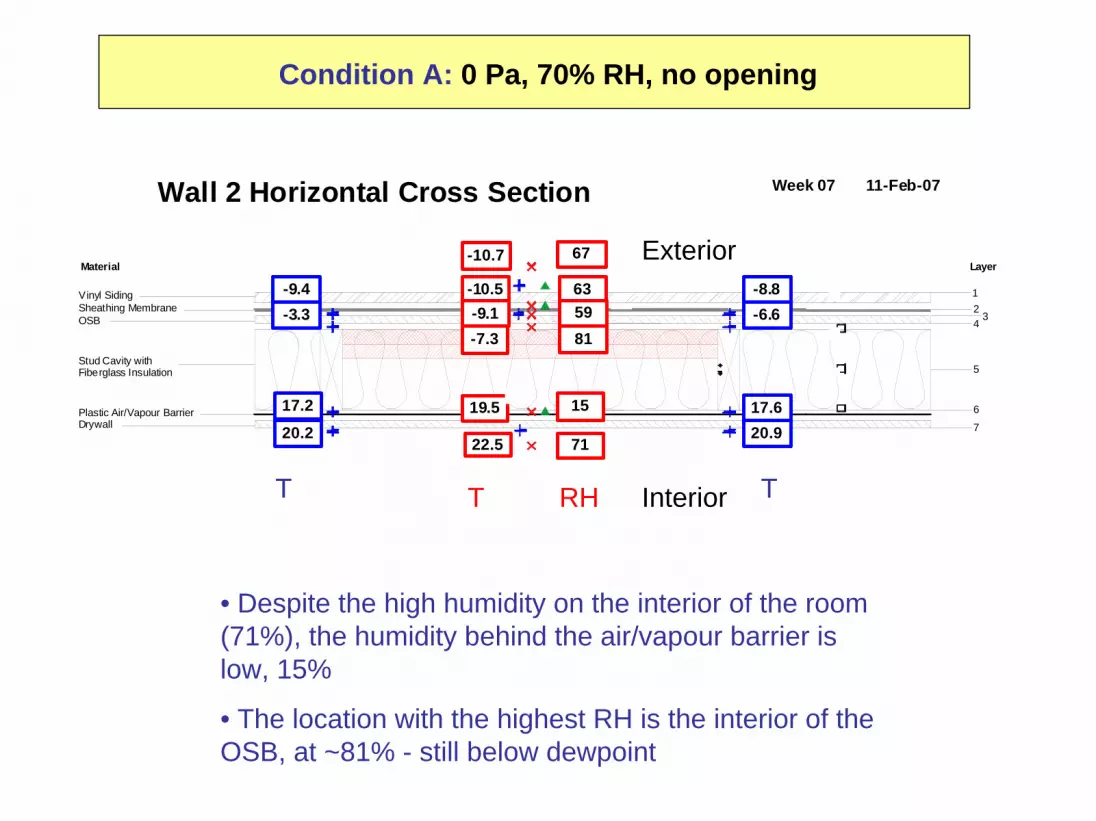
Wall 2 Horizontal Cross Section
-10.7 67
63-10.559-9.181-7.3
1519.5
7122.5
-9.4 -8.8-3.3 -6.6
17.2 17.620.2 20.9
Week 07 11-Feb-07
Condition A: 0 Pa, 70% RH, no opening
• Despite the high humidity on the interior of the room (71%), the humidity behind the air/vapour barrier is low, 15%
• The location with the highest RH is the interior of the OSB, at ~81% - still below dewpoint
T RHT TInterior
Exterior

Slide 46
-15
-10
-5
0
5
10
15
20
25
0 2 4 6 8 1 0 1 2 1 4
Tem
pera
ture
(°C) W2 T
W3 T
DewPoint of Room Air
viny
l sid
ing
WR
B
OSB
stud
cav
ity w
ith
fiber
glas
s
air /
vap
our b
arrie
rdr
ywal
l
• The dewpoint of room air is ~17°C, a condition met by temperatures partway through the insulation
• The interior of the wall remains dry due to being well sealed
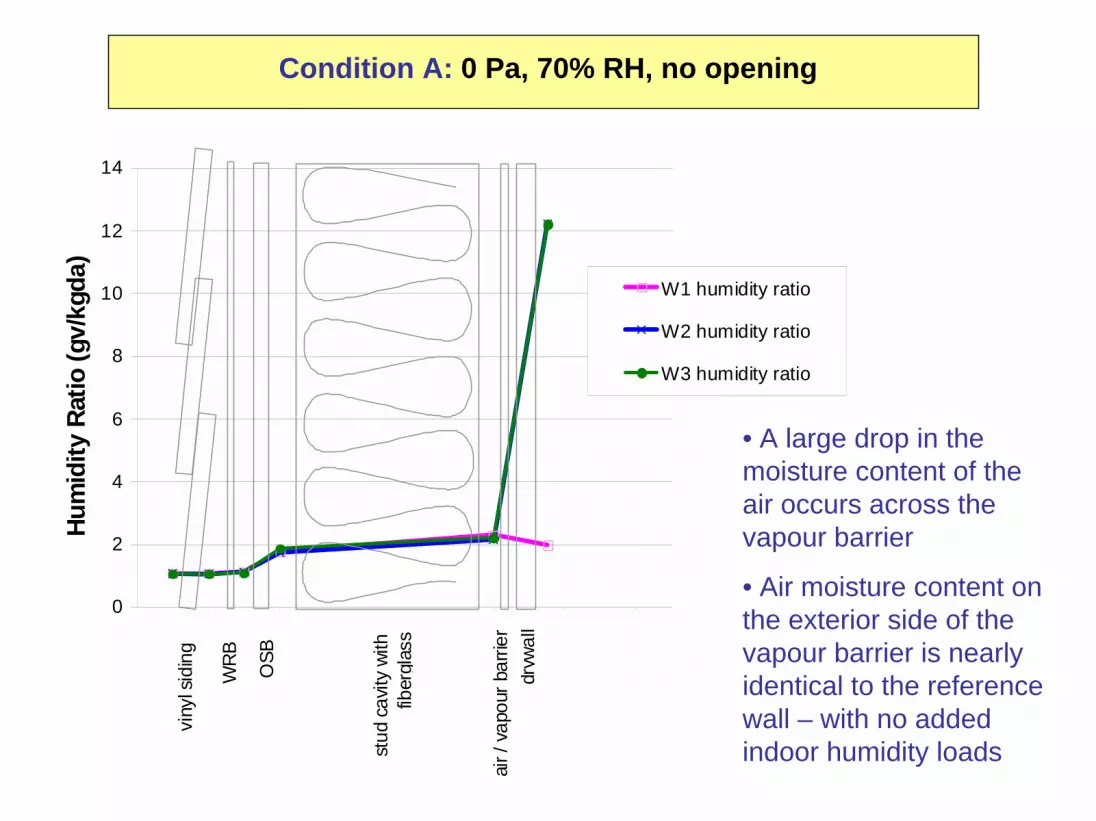
Condition A: 0 Pa, 70% RH, no opening
Slide 47
0
2
4
6
8
10
12
14
0 2 4 6 8 1 0 1 2 14
Hum
idity
Rat
io (g
v/kg
da)
W1 humidity ratio
W2 humidity ratio
W3 humidity ratio
viny
l sid
ing
WR
B
OSB
stud
cav
ity w
ith
fiber
glas
s
air /
vap
our b
arrie
rdr
ywal
l
• A large drop in the moisture content of the air occurs across the vapour barrier
• Air moisture content on the exterior side of the vapour barrier is nearly identical to the reference wall – with no added indoor humidity loads
Condition A: 0 Pa, 70% RH, no opening
Slide 48
Pressure, Wind speed and direction
-20
-10
0
10
20
30
40
50
60
11-F
eb-0
7
12-F
eb-0
7
13-F
eb-0
7
14-F
eb-0
7
15-F
eb-0
7
16-F
eb-0
7
17-F
eb-0
7
18-F
eb-0
7
19-F
eb-0
7Date and Time
Pres
sure
(Pa)
-100
-80
-60
-40
-20
0
20
40
60
Win
d sp
eed
(km
/h)
P1 - Pressure atExteriorP2 - PressureBehind Cladding
P3 - Pressure inStud Cavity
Chamber Pressure
N wind
E wind
S wind
W wind
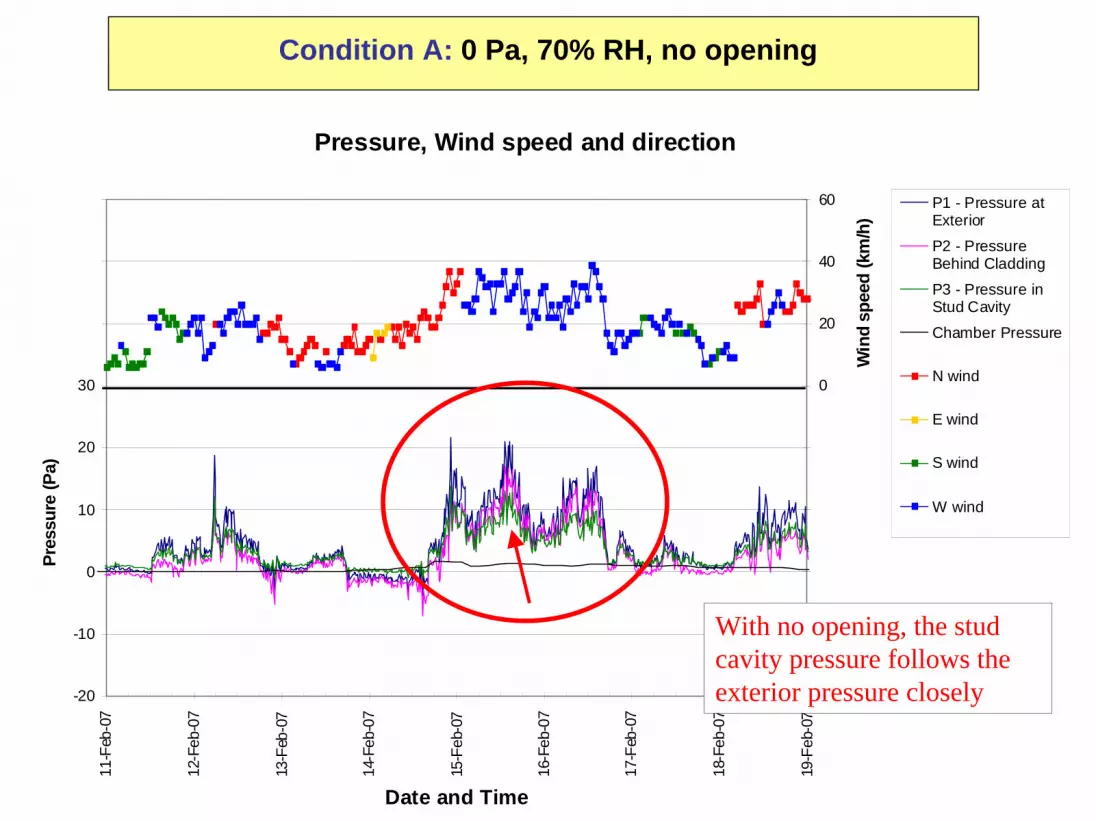
Condition A: 0 Pa, 70% RH, no opening
With no opening, the stud cavity pressure follows the exterior pressure closely

Slide 49
FEWF Wall 2 - Interior of OSB - Layer 4 - Liquid
0
20000
40000
60000
80000
100000
120000
2/10/070:00
2/11/070:00
2/12/070:00
2/13/070:00
2/14/070:00
2/15/070:00
2/16/070:00
2/17/070:00
2/18/070:00
2/19/070:00
Date and Time
Resi
stan
ce (k
⎝)
209L
210L
211L
212L
213L
214L
11-Feb-07
Res
ista
nce
(kΩ
)Condition A: 0 Pa, 70% RH, no opening
• The interior surface of the OSB remains dry at all moisture detection tape locations
Slit in OSB
Slide 50
Interior / Intérieur
Exterior / Extérieur
6
7
1
5
23
4
Layer
Plastic Air/Vapour BarrierDrywall
Vinyl SidingSheathing Membrane
Stud Cavity with Fiberglass Insulation
OSB
Material
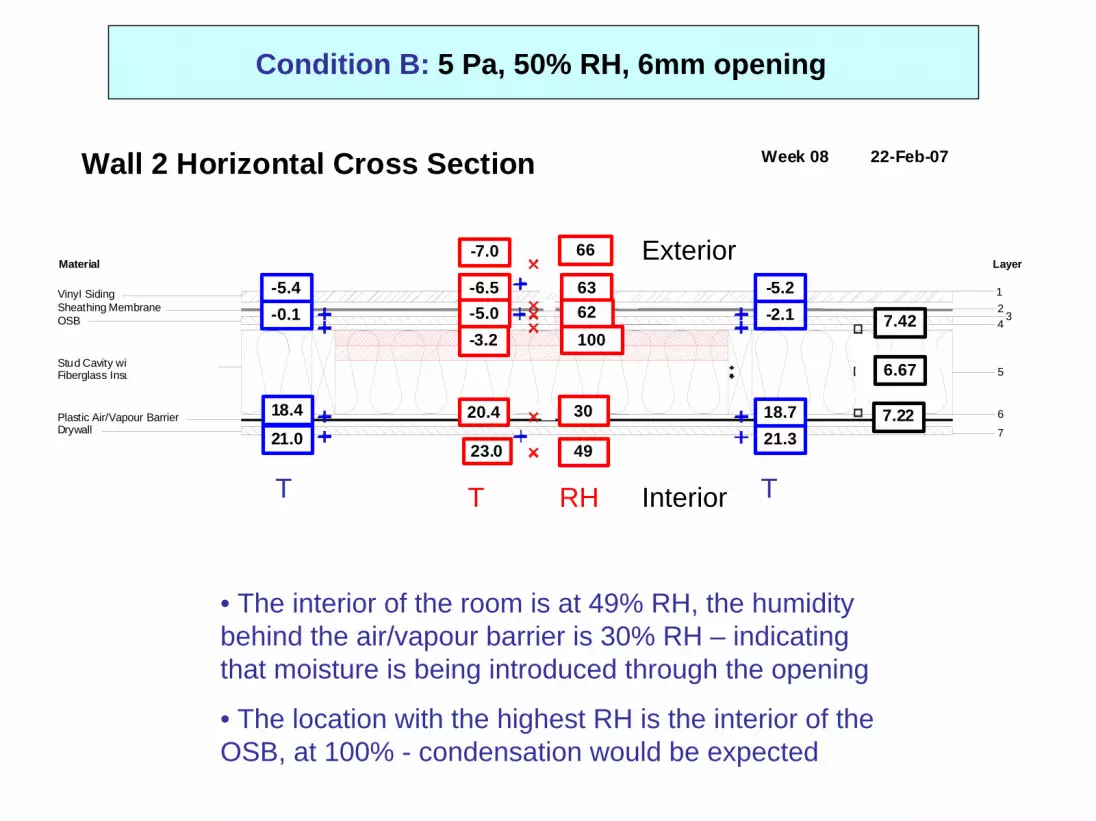
Wall 2 Horizontal Cross Section
-7.0 66
63-6.562-5.0100-3.2
3020.4
4923.0
-5.4 -5.2-0.1 -2.1
18.4 18.721.0 21.3
7.42
6.67
7.22
Week 08 22-Feb-07
Interior
Exterior
Condition B: 5 Pa, 50% RH, 6mm opening
• The interior of the room is at 49% RH, the humidity behind the air/vapour barrier is 30% RH – indicating that moisture is being introduced through the opening
• The location with the highest RH is the interior of the OSB, at 100% - condensation would be expected
T RHT T
Slide 51
-10
-5
0
5
10
15
20
25
0 2 4 6 8 1 0 1 2 14Tem
pera
ture
(°C)
W2 T
W3 T
Dewpoint of Room Air
vinyl
sid
ing
WR
B
OSB
stud
cav
ity w
ith
fiber
glas
s
air /
vap
our b
arrie
rdr
ywal
l
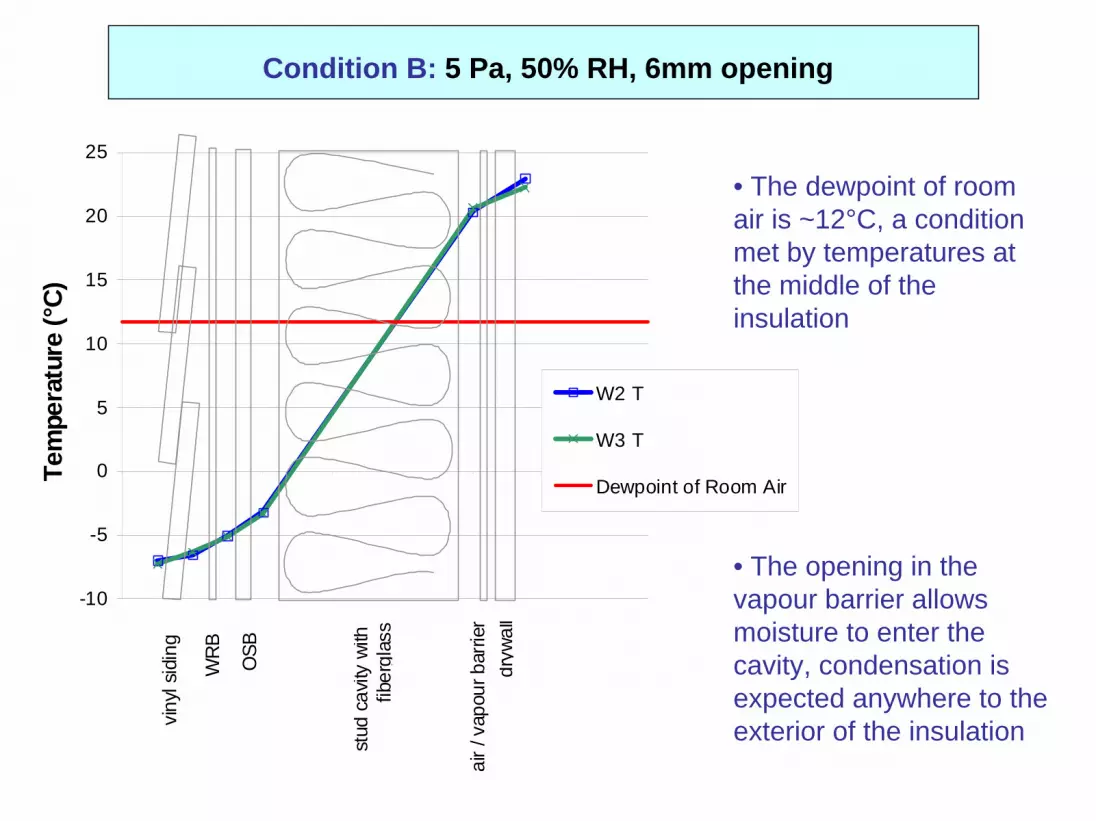
• The dewpoint of room air is ~12°C, a condition met by temperatures at the middle of the insulation
• The opening in the vapour barrier allows moisture to enter the cavity, condensation is expected anywhere to the exterior of the insulation
Condition B: 5 Pa, 50% RH, 6mm opening
Slide 52
0
1
2
3
4
5
6
7
8
9
10
0 2 4 6 8 1 0 1 2 14
Hum
idity
Rat
io (g
v/kg
da)
W1 humidity ratio
W2 humidity ratio
W3 humidity ratio
viny
l sid
ing
WR
B
OSB
stud
cav
ity w
ith
fiber
glas
s
air /
vap
our b
arrie
rdr
ywal
l
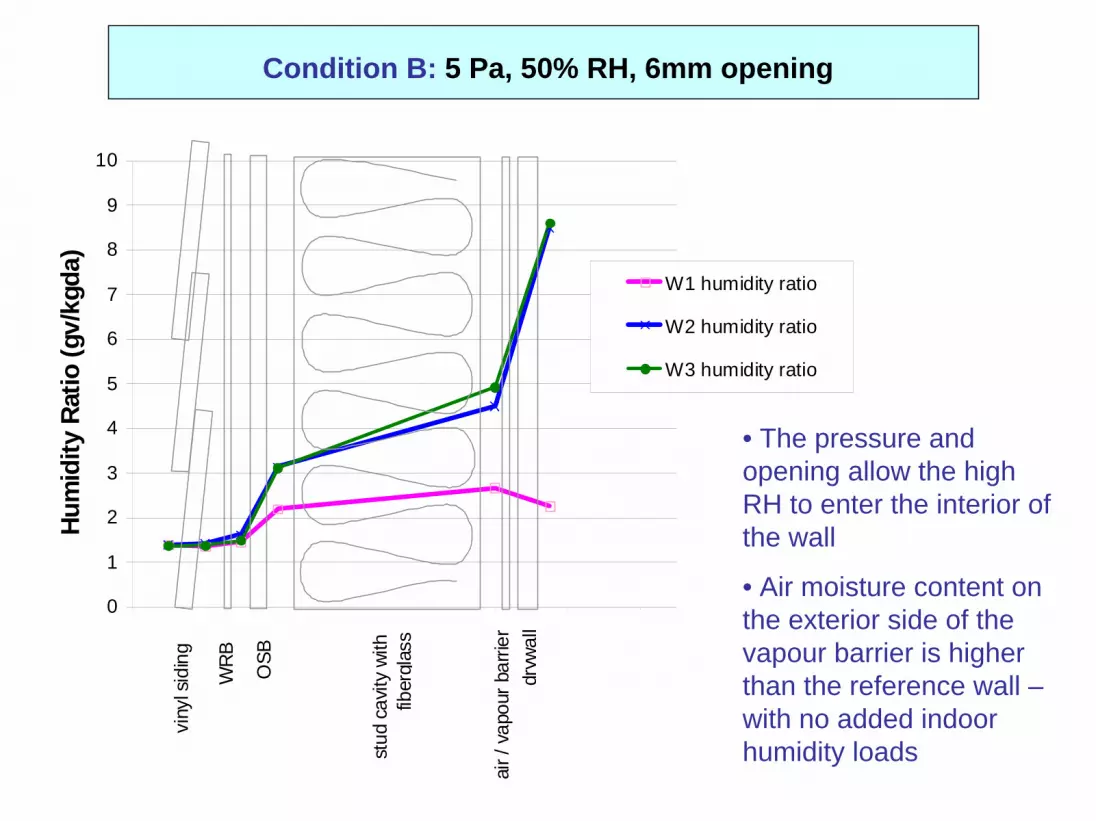
• The pressure and opening allow the high RH to enter the interior of the wall
• Air moisture content on the exterior side of the vapour barrier is higher than the reference wall –with no added indoor humidity loads
Condition B: 5 Pa, 50% RH, 6mm opening
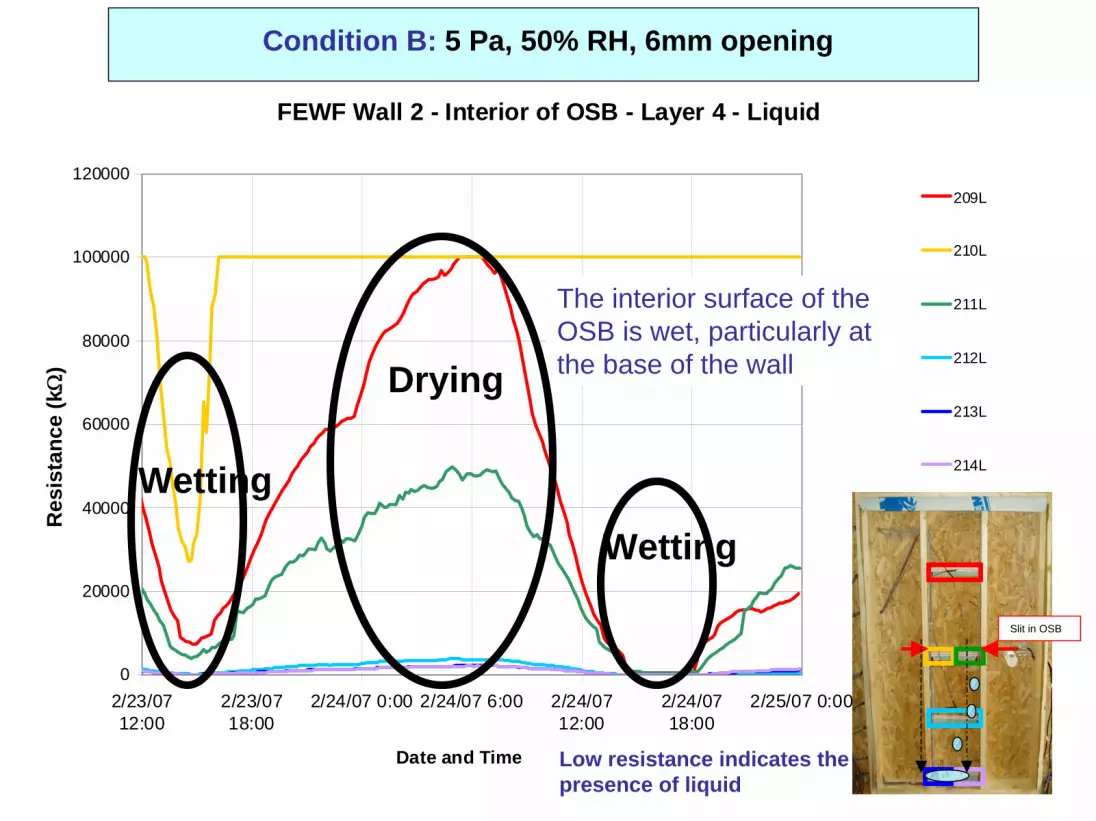
Slide 53
FEWF Wall 2 - Interior of OSB - Layer 4 - Liquid
0
20000
40000
60000
80000
100000
120000
2/23/0712:00
2/23/0718:00
2/24/07 0:00 2/24/07 6:00 2/24/0712:00
2/24/0718:00
2/25/07 0:00
Date and Time
Resi
stan
ce (k
⎠)
209L
210L
211L
212L
213L
214L
Res
ista
nce
(kΩ
)Condition B: 5 Pa, 50% RH, 6mm opening
The interior surface of the OSB is wet, particularly at the base of the wall
Low resistance indicates the presence of liquid
Slit in OSB
Drying
Wetting
Wetting

Slide 54
Pressure, Wind speed and direction
-20
-10
0
10
20
30
40
50
60
23-Feb-0712:00
23-Feb-0718:00
24-Feb-070:00
24-Feb-076:00
24-Feb-0712:00
24-Feb-0718:00
25-Feb-070:00
Date and Time
Pres
sure
(Pa)
-100
-80
-60
-40
-20
0
20
40
60
Win
d sp
eed
(km
/h) P1 - Pressure at
Exterior
P2 - PressureBehind Cladding
P3 - Pressure inStud Cavity
Chamber Pressure
N wind
E wind
S wind
W wind
Condition B: 5 Pa, 50% RH, 6mm opening
For a large portion of the Condition B period, wind pressure balanced the applied 5 Pa chamber pressure.

Slide 55
Pressure, Wind speed and direction
-20
-10
0
10
20
30
40
50
60
23-Feb-0712:00
23-Feb-0718:00
24-Feb-070:00
24-Feb-076:00
24-Feb-0712:00
24-Feb-0718:00
25-Feb-070:00
Date and Time
Pres
sure
(Pa)
-100
-80
-60
-40
-20
0
20
40
60
Win
d sp
eed
(km
/h) P1 - Pressure at
Exterior
P2 - PressureBehind Cladding
P3 - Pressure inStud Cavity
Chamber Pressure
N wind
E wind
S wind
W wind
Condition B: 5 Pa, 50% RH, 6mm opening
In two instances, the exterior pressure dropped below the chamber pressure, allowing exfiltration, and corresponding to the wetting patterns

Slide 56
Moisture Content - Wall 2 Interior OSB
0%
5%
10%
15%
20%
25%
30%
35%
40%
2/23/07 12:00 2/23/07 18:00 2/24/07 0:00 2/24/07 6:00 2/24/07 12:00 2/24/07 18:00 2/25/07 0:00
Date and Time
Moi
stur
e Co
nten
t (%
)
209MC210MC211MC212MC213MC214MC
Condition B: 5 Pa, 50% RH, 6mm opening
Slit in OSB

Slide 57
FEWF Wall 2 - Stud - Layer 5 - Liquid
0
20000
40000
60000
80000
100000
120000
2/23/0712:00
2/23/0718:00
2/24/07 0:00 2/24/07 6:00 2/24/0712:00
2/24/0718:00
2/25/07 0:00
Date and Time
Resi
stan
ce (k
¬)
215L
216L
217L
Res
ista
nce
(kΩ
)Condition B: 5 Pa, 50% RH, 6mm opening
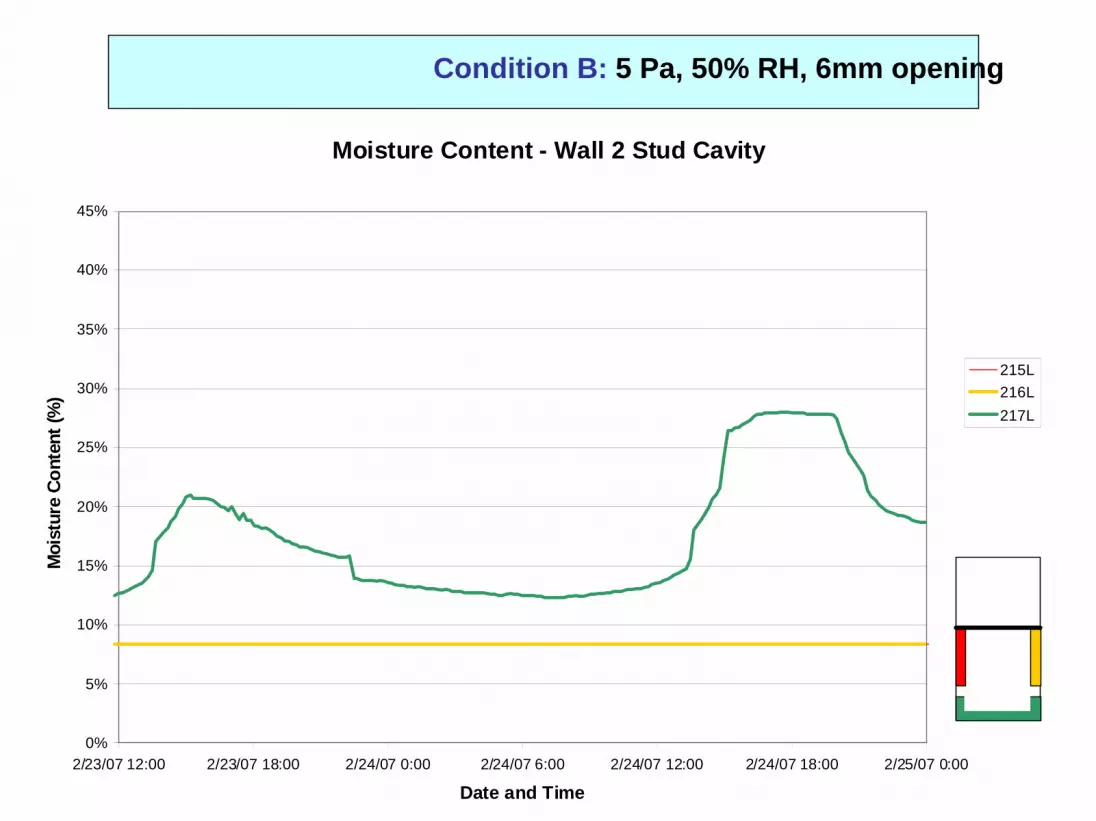
Low resistance indicates the presence of liquid at the base of the stud cavity
Slide 58
Condition B: 5 Pa, 50% RH, 6mm opening
Moisture Content - Wall 2 Stud Cavity
0%
5%
10%
15%
20%
25%
30%
35%
40%
45%
2/23/07 12:00 2/23/07 18:00 2/24/07 0:00 2/24/07 6:00 2/24/07 12:00 2/24/07 18:00 2/25/07 0:00
Date and Time
Moi
stur
e Co
nten
t (%
)
215L216L217L
Slide 59
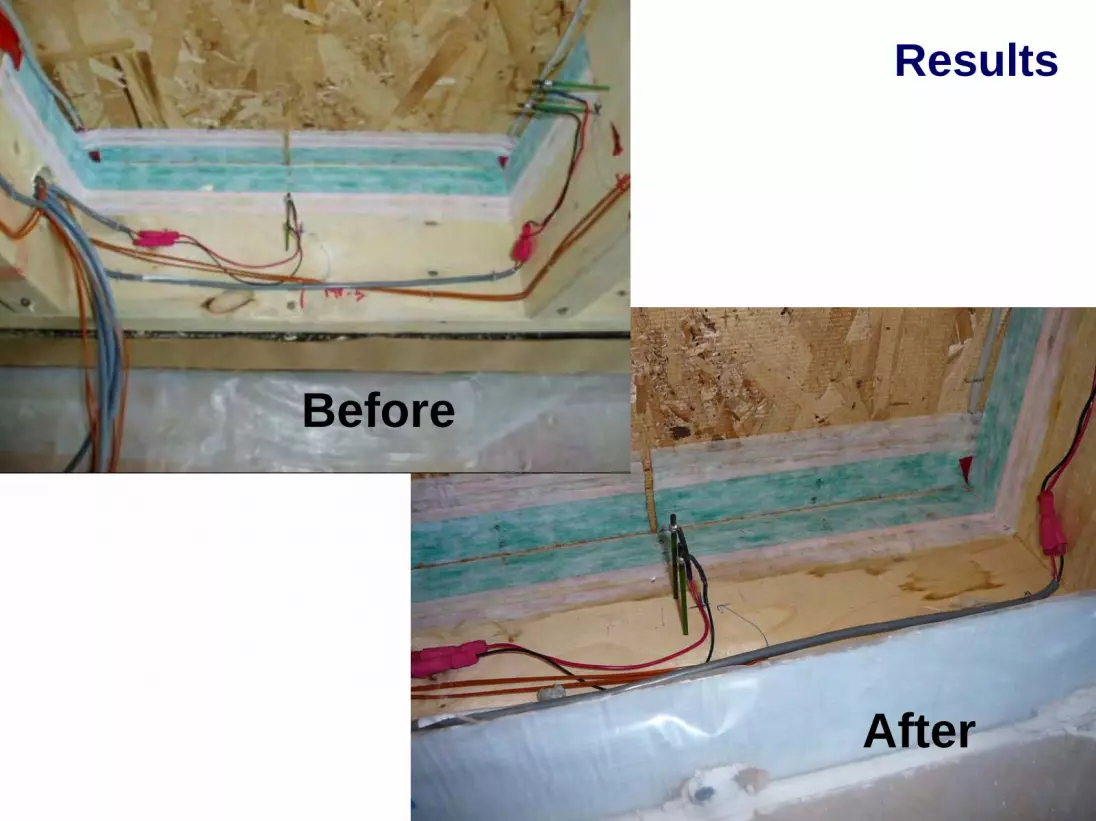
Results
After
Before
Slide 60
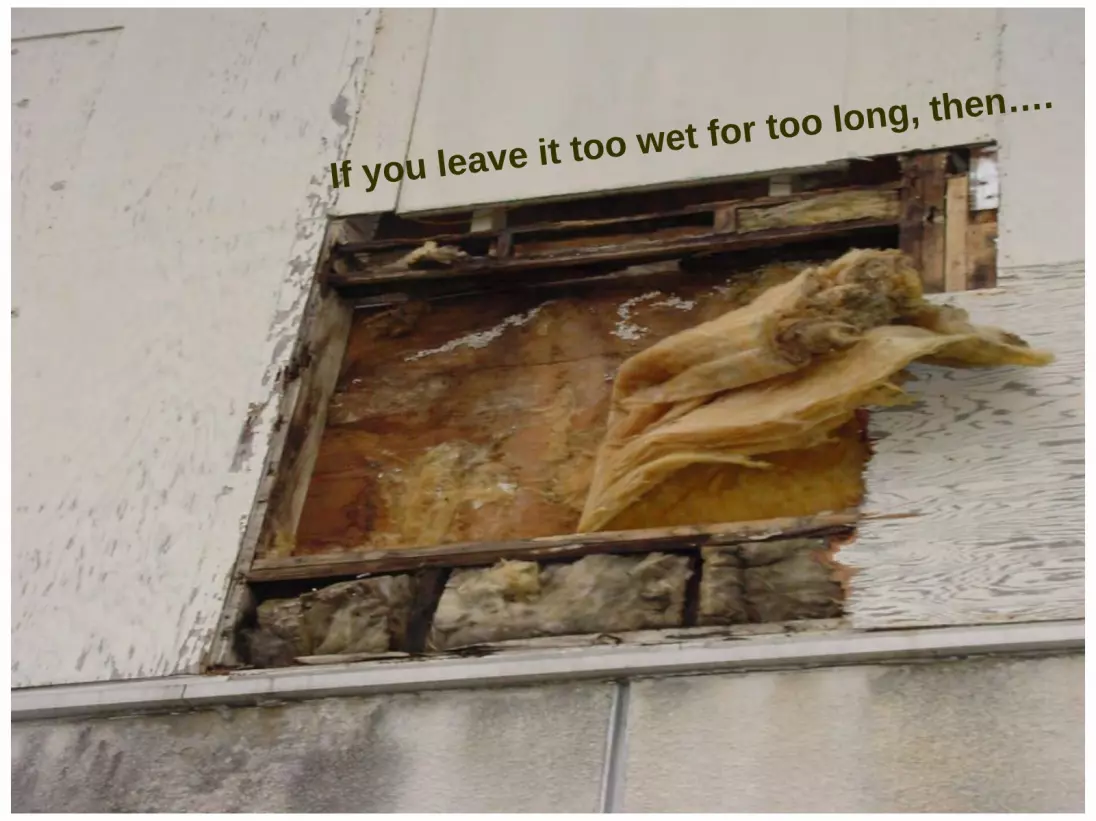
If you leave it too wet for too long, then….

Slide 61
Interior / Intérieur
Exterior / Extérieur
6
7
1
5
23
4
Layer
Plastic Air/Vapour BarrierDrywall
Vinyl SidingSheathing Membrane
Stud Cavity with Fiberglass Insulation
OSB
Material
Wall 2 Horizontal Cross Section
-5.1 70
65-4.367-2.9100-0.9
2920.8
2723.0
-3.1 -3.01.5 0.3
18.8 19.321.2 21.4
6.91
6.20
6.72
Week 11 16-Mar-07
Condition C: 5 Pa, 30% RH, 3mm opening
• The interior of the room is at 27% RH, the humidity behind the air/vapour barrier is 29% RH – indicating that moisture is being introduced through the opening
• The location with the highest RH is the interior of the OSB, at 100% - condensation would be expected
Interior
Exterior
T RHT T

Slide 62
-10
-5
0
5
10
15
20
25
0 2 4 6 8 10 1 2 1 4Tem
pera
ture
(°C)
W2 T
W3 T
Dewpoint of Room Air
viny
l sid
ing
WR
B
OS
B
stud
cav
ity w
ith
fiber
glas
s
air /
vap
our b
arrie
rdr
ywal
l
•The dewpoint of room air is ~4°C, a condition met by temperatures towards the outside of the insulation
• The opening in the vapour barrier allows moisture to enter the cavity, condensation is expected at the OSB
Condition C: 5 Pa, 30% RH, 3mm opening

Slide 63
0
1
2
3
4
5
6
7
8
9
10
0 2 4 6 8 1 0 1 2 14
Hum
idity
Rat
io (g
v/kg
da)
W1 humidity ratio
W2 humidity ratio
W3 humidity ratio
viny
l sid
ing
WR
B
OSB
stud
cav
ity w
ith
fiber
glas
s
air /
vap
our b
arrie
rdr
ywal
l
• The pressure and opening allow the humidity to enter the interior of the wall
• Air moisture content on the exterior side of the vapour barrier is higher than the reference wall –with no added indoor humidity loads
Condition C: 5 Pa, 30% RH, 3mm opening

Slide 64
Pressure, Wind speed and direction
-20
-10
0
10
20
30
40
50
60
16-Mar-070:00
16-Mar-076:00
16-Mar-0712:00
16-Mar-0718:00
17-Mar-070:00
17-Mar-076:00
17-Mar-0712:00
17-Mar-0718:00
18-Mar-070:00
Date and Time
Pres
sure
(Pa)
-100
-80
-60
-40
-20
0
20
40
60
Win
d sp
eed
(km
/h)
P1 - Pressure atExteriorP2 - PressureBehind CladdingP3 - Pressure inStud CavityChamber Pressure
N wind
E wind
S wind
W wind
Condition C: 5 Pa, 30% RH, 3mm opening
East winds for the majority of Condition C, kept exterior pressures low and allowed the Chamber and Stud Cavity Pressures to remain above the Exterior Pressure, creating an exfiltration condition

Slide 65
Pressure, Wind speed and direction
-20
-10
0
10
20
30
40
50
60
16-Mar-070:00
16-Mar-076:00
16-Mar-0712:00
16-Mar-0718:00
17-Mar-070:00
17-Mar-076:00
17-Mar-0712:00
17-Mar-0718:00
18-Mar-070:00
Date and Time
Pres
sure
(Pa)
-100
-80
-60
-40
-20
0
20
40
60
Win
d sp
eed
(km
/h)
P1 - Pressure atExteriorP2 - PressureBehind CladdingP3 - Pressure inStud CavityChamber Pressure
N wind
E wind
S wind
W wind
Condition C: 5 Pa, 30% RH, 3mm opening
A change in wind direction towards the end of Condition C brought exterior pressure conditions close to stud cavity and chamber pressure.

Slide 66
FEWF Wall 2 - Interior of OSB - Layer 4 - Liquid
0
20000
40000
60000
80000
100000
120000
3/16/070:00
3/16/076:00
3/16/0712:00
3/16/0718:00
3/17/070:00
3/17/076:00
3/17/0712:00
3/17/0718:00
3/18/070:00
Date and Time
Resi
stan
ce (k
)
209L
210L
211L
212L
213L
214L
Condition C: 5 Pa, 30% RH, 3mm opening
The interior surface of the OSB is wet, particularly at the base of the wall
Res
ista
nce
(kΩ
)
Slit in OSB

Slide 67
FEWF Wall 2 - Stud - Layer 5 - Liquid
0
20000
40000
60000
80000
100000
120000
3/16/070:00
3/16/076:00
3/16/0712:00
3/16/0718:00
3/17/070:00
3/17/076:00
3/17/0712:00
3/17/0718:00
3/18/070:00
Date and Time
Resi
stan
ce (k
)
215L
216L
217L
Condition C: 5 Pa, 30% RH, 3mm opening
Low resistance indicates the presence of liquid at the base of the stud cavity
Res
ista
nce
(kΩ
)

Slide 68
Interior / Intérieur
Exterior / Extérieur
6
7
1
5
23
4
Layer
Plastic Air/Vapour BarrierDrywall
Vinyl SidingSheathing Membrane
Stud Cavity with Fiberglass Insulation
OSB
Material
Wall 2 Horizontal Cross Section
2.6 75
692.8673.5764.6
2721.0
5023.0
3.0 3.36.5 4.6
19.3 19.421.3 21.5
5.15
4.59
5.08
Week 15 08-Apr-07
Condition D: 0 Pa, 50% RH, 3mm opening
• The interior of the room is at 50% RH, the humidity behind the air/vapour barrier is 27% RH
•The location with the highest RH is the interior of the OSB, at 76% (likely due to the lack of a pressure driving force for exfiltration, and warmer exterior temperatures)
Interior
Exterior
T RHT T
Slide 69
0
5
10
15
20
25
0 2 4 6 8 1 0 1 2 1 4
Tem
pera
ture
(°C)
W2 T
W3 T
Dewpoint of Room Air
viny
l sid
ing
WR
B
OSB
stud
cav
ity w
ith
fiber
glas
s in
sula
tion
air /
vap
our b
arrie
rdr
ywal
l
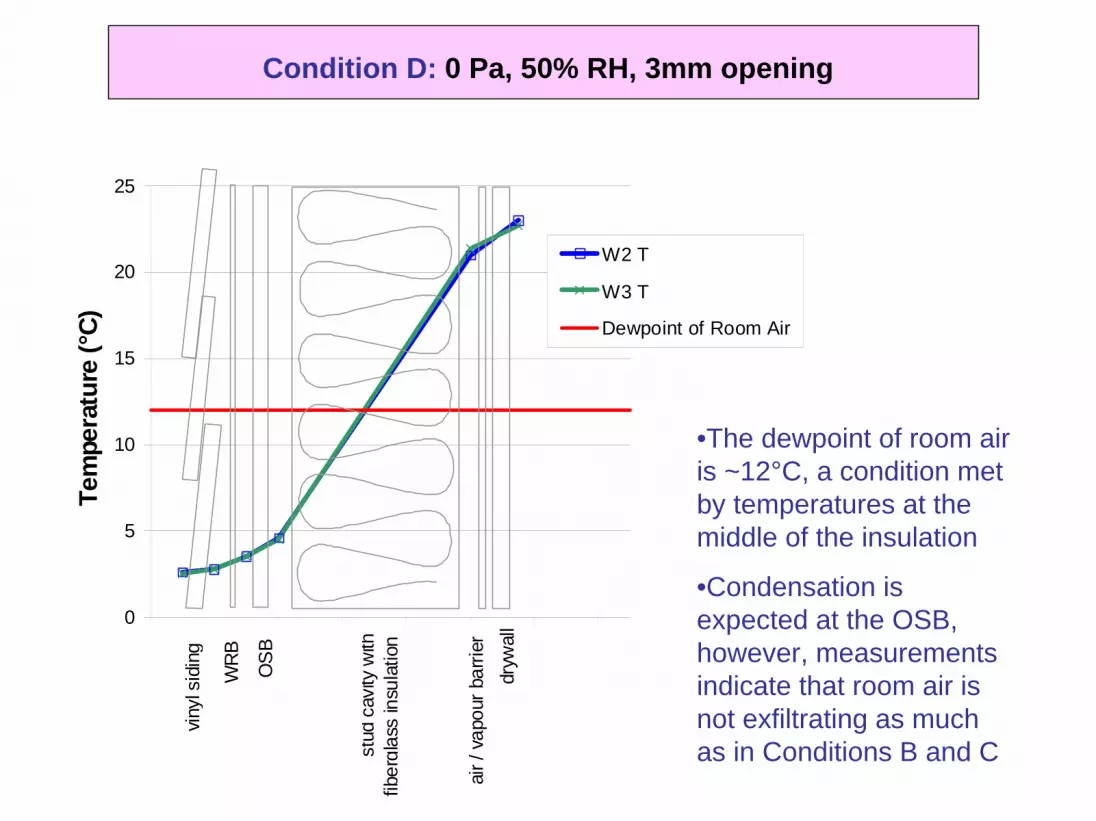
•The dewpoint of room air is ~12°C, a condition met by temperatures at the middle of the insulation
•Condensation is expected at the OSB, however, measurements indicate that room air is not exfiltrating as much as in Conditions B and C
Condition D: 0 Pa, 50% RH, 3mm opening

Slide 70
0
1
2
3
4
5
6
7
8
9
10
0 2 4 6 8 1 0 1 2 14
Hum
idity
Rat
io (g
v/kg
da)
W1 humidity ratio
W2 humidity ratio
W3 humidity ratio
viny
l sid
ing
WR
B
OSB
stud
cav
ity w
ith
fiber
glas
s
air /
vap
our b
arrie
rdr
ywal
l
• While the air moisture content on the exterior side of the vapour barrier is higher than the reference wall, the effect is not as pronounced as Conditions B and C –where interior pressure was applied
Condition D: 0 Pa, 50% RH, 3mm opening
Slide 71
Pressure, Wind speed and direction
-20
-10
0
10
20
30
40
50
60
8-Apr-07 9-Apr-07 10-Apr-07 11-Apr-07 12-Apr-07 13-Apr-07 14-Apr-07 15-Apr-07
Date and Time
Pres
sure
(Pa)
-100
-80
-60
-40
-20
0
20
40
60
Win
d sp
eed
(km
/h)
P1 - Pressure atExteriorP2 - PressureBehind CladdingP3 - Pressure inStud CavityChamberPressureN wind
E wind
S wind
W wind
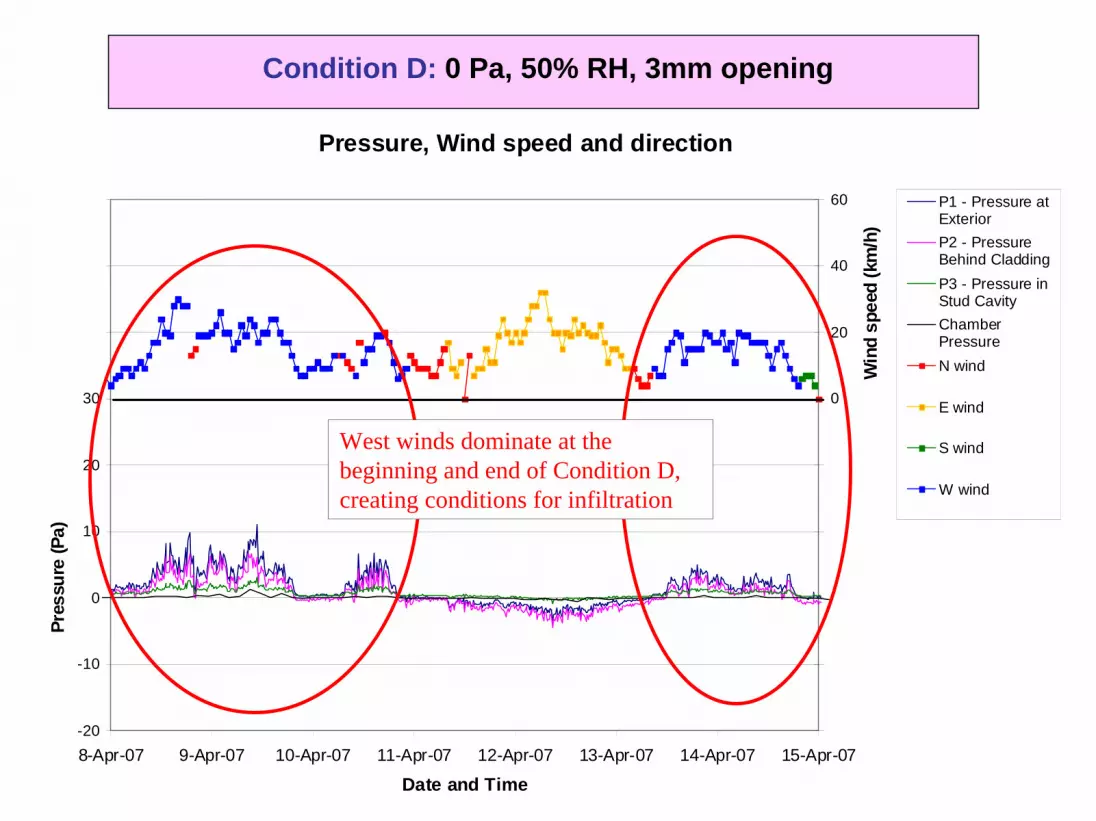
Condition D: 0 Pa, 50% RH, 3mm opening
West winds dominate at the beginning and end of Condition D, creating conditions for infiltration

Slide 72
Pressure, Wind speed and direction
-20
-10
0
10
20
30
40
50
60
8-Apr-07 9-Apr-07 10-Apr-07 11-Apr-07 12-Apr-07 13-Apr-07 14-Apr-07 15-Apr-07
Date and Time
Pres
sure
(Pa)
-100
-80
-60
-40
-20
0
20
40
60
Win
d sp
eed
(km
/h)
P1 - Pressure atExteriorP2 - PressureBehind CladdingP3 - Pressure inStud CavityChamberPressureN wind
E wind
S wind
W wind
Condition D: 0 Pa, 50% RH, 3mm opening
East winds cause the exterior pressure to be below the interior pressure, resulting in exfiltration conditions
Slide 73
FEWF Wall 2 - Interior of OSB - Layer 4 - Liquid
0
20000
40000
60000
80000
100000
120000
4/8/070:00
4/9/070:00
4/10/070:00
4/11/070:00
4/12/070:00
4/13/070:00
4/14/070:00
4/15/070:00
Date and Time
Resi
stan
ce (k
)
209L
210L
211L
212L
213L
214L
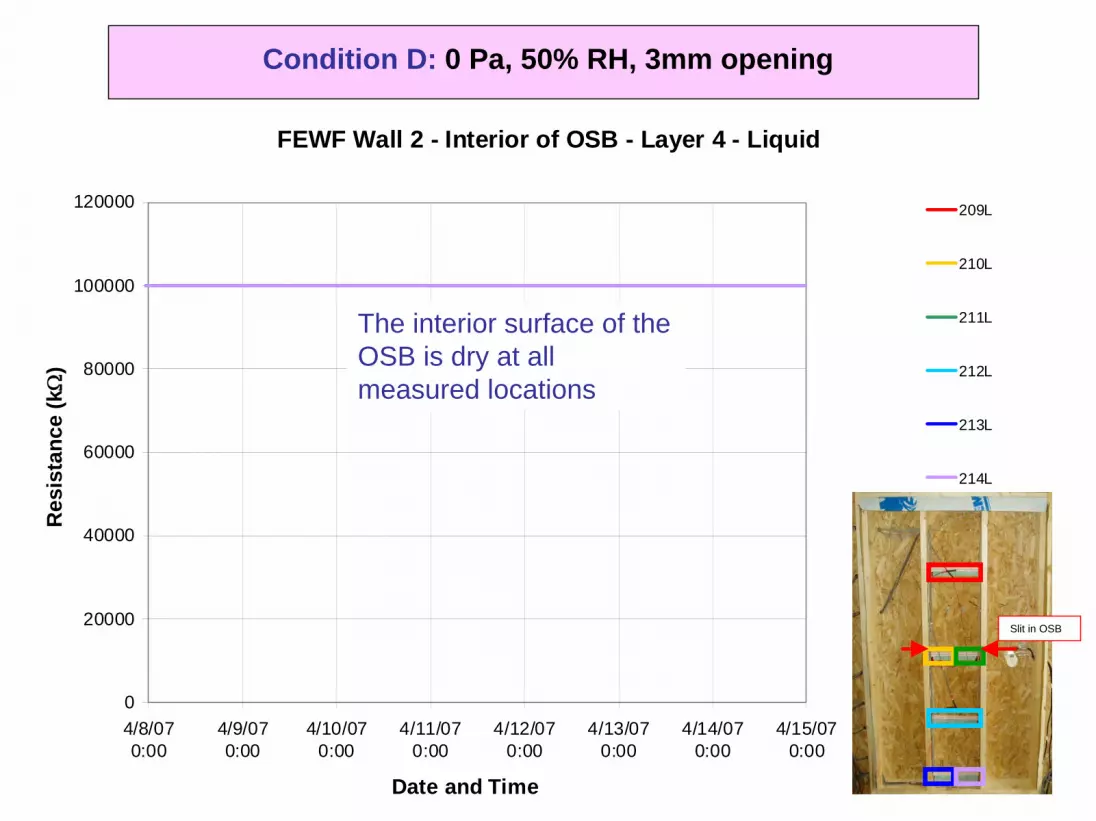
Condition D: 0 Pa, 50% RH, 3mm opening
The interior surface of the OSB is dry at all measured locations
Res
ista
nce
(kΩ
)
Slit in OSB
Slide 74
FEWF Wall 2 - Stud - Layer 5 - Liquid
0
20000
40000
60000
80000
100000
120000
4/8/070:00
4/9/070:00
4/10/070:00
4/11/070:00
4/12/070:00
4/13/070:00
4/14/070:00
4/15/070:00
Date and Time
Resi
stan
ce (k
)
215L
216L
217L
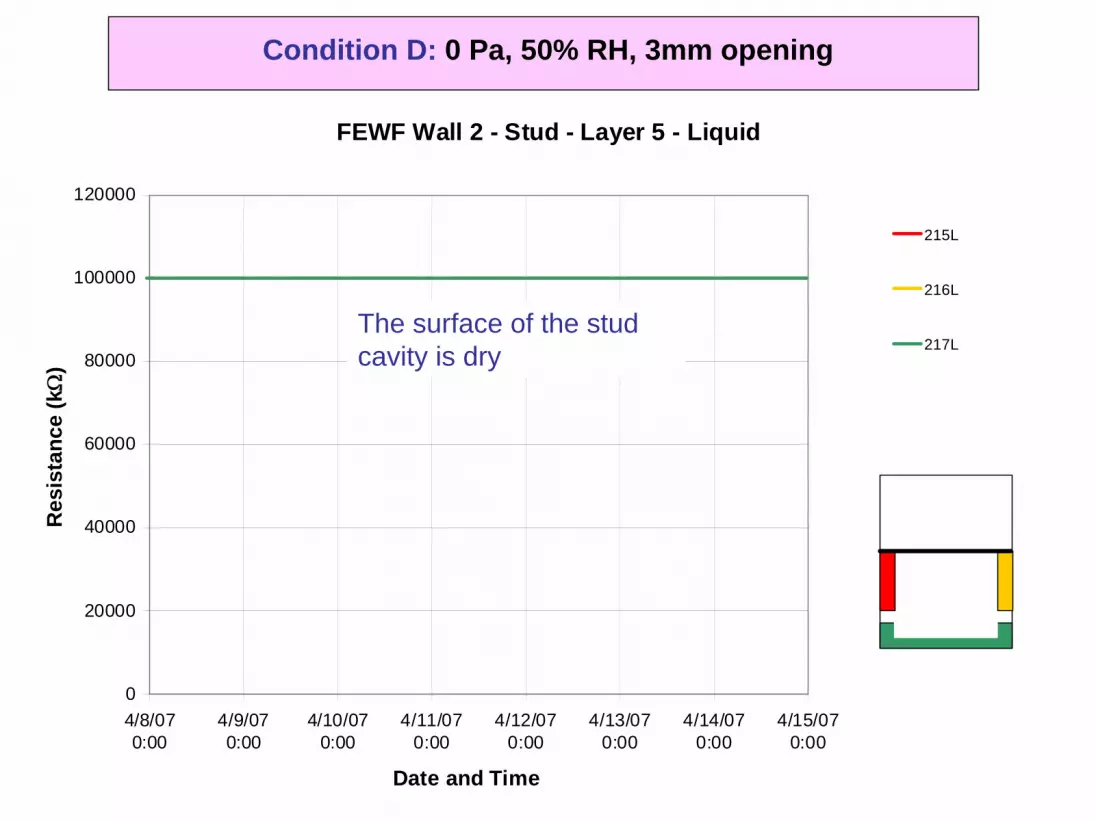
Condition D: 0 Pa, 50% RH, 3mm openingR
esis
tanc
e (kΩ
)
The surface of the stud cavity is dry

Slide 75
SUMMARY
• We looked at risk of condensation due to exfiltration (wetting) combined with infiltration (drying)
• Looked at the importance of wind speed and directions and orientation of the envelope.
• Wind from West causes +ve pressures and infiltration• Wind from East causes –ve pressures and exfiltration• When the chamber is pressurized the exfiltration cdt is forced
(Chamber & Stud cavity pressure is higher than ext pressure) except when +ve from N & W winds negate the effect.
• If we have to look for long time period the exfiltration cdt, we have to pressurized the chamber more than 35 Pa.
• Experimental results will be used to benchmark the HAM hygIRC 1D.

Slide 76
Plans for this Winter and Spring
• Context:– Focus on two energy retrofit scenarios for
exterior walls• The question to investigate:
– What is the effect of the properties of thermal insulation installed on the exterior of an existing R20 wall on the wetting and drying potential of that assembly, particularly when air leakage is involved?
Slide 77
Adding thermal insulation on the exterior of an insulated stud cavity wall can …
• Reduce thermal bridging at the framing ☺• Raise the temperature of that cavity, during cold
weather, resulting in lower potential for condensation in stud cavity ☺
• Reduce the drying potential to the exterior ☹• Promote mould growth in a wet cavity as the
cavity stays warmer over longer periods of the year ☹
Slide 78
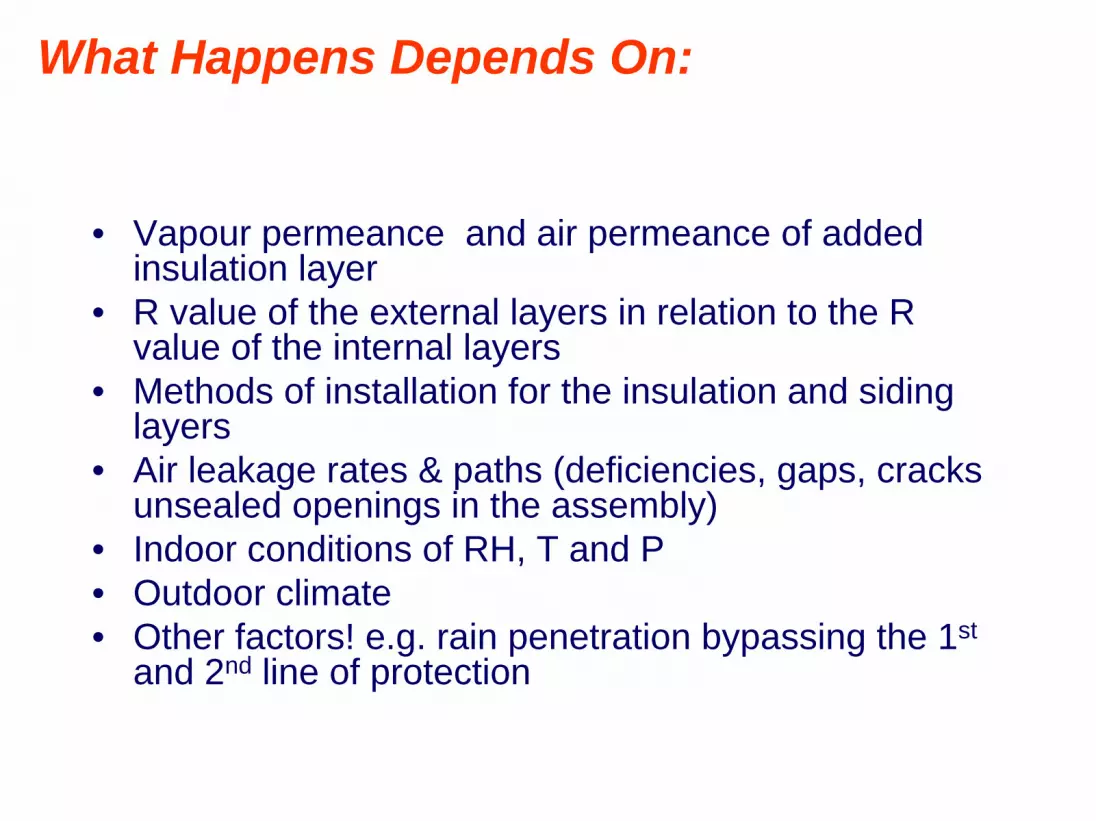
What Happens Depends On:
• Vapour permeance and air permeance of added insulation layer
• R value of the external layers in relation to the R value of the internal layers
• Methods of installation for the insulation and siding layers
• Air leakage rates & paths (deficiencies, gaps, cracks unsealed openings in the assembly)
• Indoor conditions of RH, T and P• Outdoor climate• Other factors! e.g. rain penetration bypassing the 1st
and 2nd line of protection

Slide 79
Exterior Interior
R20 2X6 typical
construction
Addition of a Low Air and Vapour Permeance
Insulation
Addition of a High Air and Vapour Permeance Insulation
& sheathing membrane
The 3 Test Specimens – Vertical Section View

Slide 80
Interior
Detail BDetail A
Wall 1 Wall 2 Wall 3 Wall 1 – No exterior insulation Wall 2 – Lower Air and Vapour
PermeanceWall 3 – Higher Air and Vapour Permeance
•Vinyl Siding•Sheathing Membrane (Tyvek)•OSB•2x6 Stud Cavity with Fiberglass Insulation•Plastic Air/Vapour Barrier•Drywall
•Vinyl Siding•2 in. XPS Rigid Foam Insulation, 24 in. wide sections installed horizontally, butt joints taped•Sheathing Membrane (Tyvek)•OSB•2x6 Stud Cavity with Fiberglass Insulation•Plastic Air/Vapour Barrier•Drywall
•Vinyl Siding•Sheathing Membrane (Tyvek)•¾ in. x 1½ in. Vertical Strapping @ 16 in. (400 mm) o.c. mounted on blocks, with 2.5 in. Mineral Fibre Insulation Batts installed horizontally•Sheathing Membrane (Tyvek)•OSB•2x6 Stud Cavity with Fiberglass Insulation•Plastic Air/Vapour Barrier•Drywall
Plan View of the Test Specimens in Test BayExterior
Interior
Indoor chamber with controlled RH and P
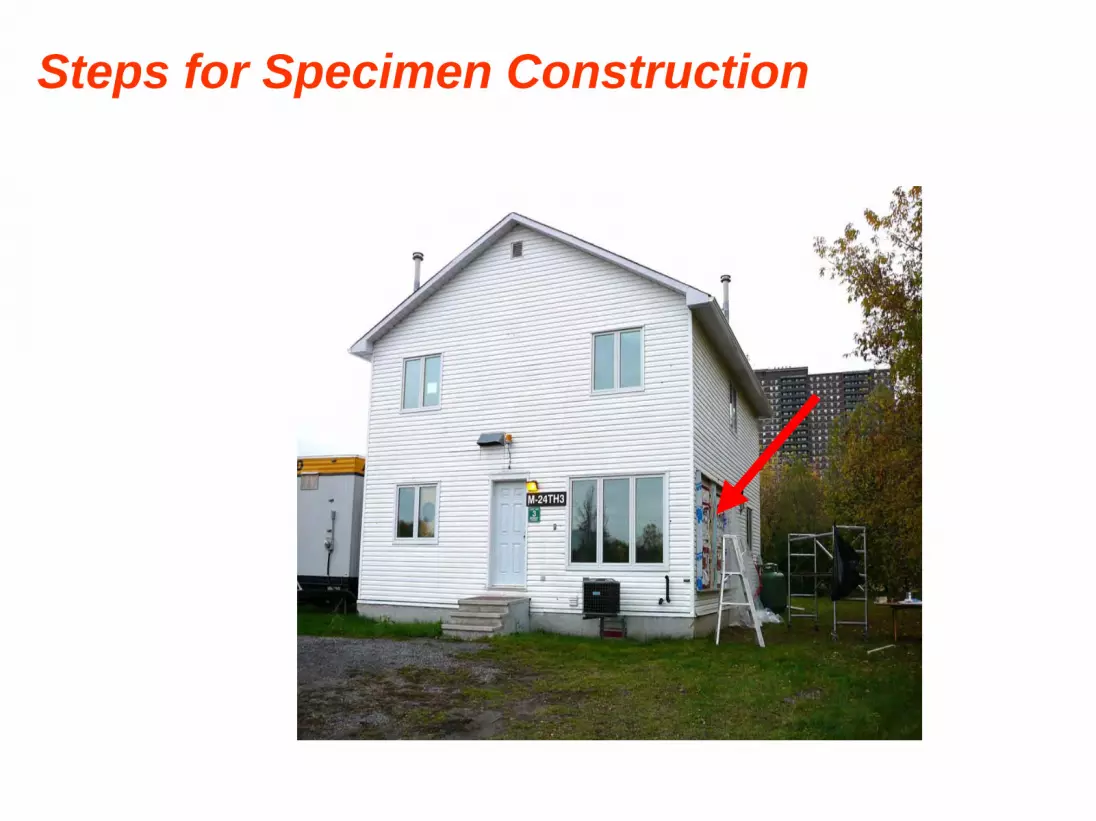
Slide 81
Steps for Specimen Construction

Slide 82
THANK YOU

Slide 83http://irc.nrc-cnrc.gc.ca/bes/facilities/fieldex_e.html
Lab-EEEF Field-FEWF
HAM Model-hygIRC 1D
Dr. Wahid [email protected]
Tel. 1-613-993 5709