mathematical methodology to predict energy generation of grid connected pv power plants in india
TRANSCRIPT
Current World Environment Vol. 11(1), 156-166 (2016)
Mathematical Methodology to Predict Energy Generation of Grid Connected PV Power Plants in India
SuPraVa Chakraborty* and PradIP kuMar Sadhu
1Department of Electrical Engineering, Indian School of Mines, Dhanbad, Jharkhand - 826004, India.
http://dx.doi.org/10.12944/CWE.11.1.20
(Received: December 28, 2016; Accepted: March 13, 2016)
abStraCt
This paper presents a reliable mathematical methodology to predict the energy generation from grid connected Photovoltaic plant of different technologies in India. Energy generation of different commercially used PV technologies in different locations of India is predicted using proposed mathematical method. This results show a decisive study to choose the best PV technology for particular location of India. Predicted energy generation is validated with the monthly generation for the whole year of 2014 from operational PV power plants of different technologies. Predicted generation is in good co-relation with the actual real time generation and Capacity Utilization Factor (CUF) of the PV plants.
key words: Mathematical Method; PV Power Plant; Energy generation; CUF.
IntroduCtIon
Climate change and global warming are the result of enormous fossil fuel technology dependency. Renewable energy technologies are the solution of climate change mitigation1
and increasing electric power demand. Abundant accessibility of solar energy in daytime is making it a reliable source of renewable energy. Solar thermal and solar photovoltaic (PV) are the two well known technologies to convert solar energy into useful energy. In solar thermal technology heat of sun is used for increasing the temperature of air, water or any heat absorbing material without using an intermediate electric circuitry. In PV technology sunlight is directly converted to electricity using PV modules. Utilization of different photon absorption material and different constructional design created different types of solar PV technologies, i.e. Crystalline Silicon(C-Si), Thin Film and Disk type solar PV technology etc. Modular design, long life-time, low maintenance, easy install ability and environment friendly power generation are the reason behind PV modules increasing popularity.
The performance of PV module, in broad sense PV system is strongly dependent
on solar radiation, ambient temperature, cell temperature, and local climate conditions2-7. But the manufactures provide the parameters of PV modules only in the standard testing conditions (STC i.e. Irradiance=1000W/m2, Temperature=25°C and Air-mass=1.5G). These parameters of PV module at STC do not reflect its performance in actual operating conditions and can lead to an overestimation of the production. Thus, correct PV module selection and accurate prediction of energy output from PV module is solely dependent on reliable knowledge and understanding of the PV module performance under different operating conditions.
Rough estimation of the average energy produced by the PV power plants can be provided through estimation of global irradiance. Goh and Tan8 developed statistical forecasting of solar data using time series model. Since then number of research work is available on forecasting solar irradiance9-
16. But, considerably lesser number of literatures present in predicting the actual output of PV power plant. Some literatures are available for estimation on field performance of standalone PV array system7, 17. Also some power efficiency models18-23 can predict the average performance of a PV system under variable climatic-conditions.
157 ChAkRABoRTy & SADhU, Curr. World Environ., Vol. 11(1), 156-166 (2016)
Neural networks model is more complicated one which uses various inputs such as the solar radiation, ambient temperature, and module temperature24, 25. The design of neural network model is based on trial and error processes and requires past experience for successful implementation. Most of the above mentioned models require either detailed data18-23 and complicated to use24, 25. These limitations of the mentioned literatures are barrier in easy manipulation of the system performance.
The objective of this paper is to present a simple but accurate model for estimation of the energy production from PV plants based on different type of PV technology. This model is applicable to any location of India to choose the best suitable technology for that specific location. Application of the finding of the paper through energy supply planning is helpful to make the energy generation economic and environment friendly. The scope of this study is to relate the location and Solar energy to study the potential of the location for different types of solar PV plants. Prospective practical users of this model are people from energy industry, energy planners, engineers, city planners, and climate concern citizens.
In four stages the research is presented here. In section 2 material and mathematical methods used for the research are described. Section 3.1 presents the monthly energy generation and CUF study of real-time data for the whole year of 2014 of PV power plants of different technology. In section 3.2 the validation of mathematical method with the real-time energy output of four operating PV power plants of different PV technologies under the scheme of NTPC (National Thermal Power Corporation) Vidyut Vyapar Nigam Ltd. (NVVN) are presented.
Methodology developed Methodology used in this work consists of three different steps. They are concisely discussed as follows: (a) PV technology Selection. (b) Development of mathematical method to predict the energy production form different PV power plants based on different PV technology, situated in different location of India. (c) Collection of location detail, secondary data of energy generation and Capacity
Utilization Factor (CUF) of operating PV power plants under the NVVN scheme for the whole year of 2014. The mathematical model for estimating the power generation from PV power plant is validated with the PV power plants data under NVNN scheme.
Selection of PV technology Selection of appropriate PV technology is the key for success of any PV power project. In laboratory scale, many new PV technologies are available such as organic solar cell, dye sensitized solar cells etc, but they are not used commercially for PV power plant. hence Mono Crystalline Silicon (Mono C-Si), Poly Crystalline Silicon (Poly C-Si), amorphous Silicon (a-Si), CIGS, CdTe PV technologies from reputed manufacturers are considered which are widely used for commercial PV power plant projects. Specifications of the selected PV technologies are collected from their datasheets. Required specifications of the selected PV technologies are enlisted in Table 1.
Mathematical model to predict the energy Generation output of PV module is dependent on the meteorological parameters mainly on insolation and ambient temperature. Energy outputs for fixed lilted modules are evaluated different technology PV modules. Mathematical modelling is represented below:
Solar radiation on tilted PV array In NREL website the long-term published data of solar radiation and other meteorological parameters are available as hourly average values on horizontal surface for different grid points of India. The solar radiation on a tilted PV array is the main input parameter for the design of the PV system. According to the Liu and Jordan formula using the hourly beam and diffuse radiation on a horizontal surface, the total radiation on a tilted PV array (at angle b) for a given latitude f can be evaluated:
...(1)
Ib hourly beam radiation on a horizontal surface.Id hourly diffuse radiation on a horizontal surface.rb, rd and rr are known as conversion factors for beam, diffuse and reflected components, respectively.
158ChAkRABoRTy & SADhU, Curr. World Environ., Vol. 11(1), 156-166 (2016)
r is the reflection coefficient of the ground (0.2 and 0.6 for non-snow-covered and snow-covered ground, respectively).
...(2)
...(3)
...(4)
...(5)
...(6)
q1 is angle of incidence, qz zenith angle, f Latitude Angle, b Tilt Angle, g Azimuth Angle, d Solar Declination Angle, w hour Angle.
Insolation on tilted surface, ...(7)
RS Sunrise time, SS Sunset time.Daily PV array output is the summation of the hourly energy output.
Equivalent full sun-shine hours on tilted surface No of hours for which the intensity of solar radiation incident at a place is kept constant at its peak value of 1 kW/m2 is known as equivalent hours of full sunshine ( eth ). When insolation on tilted unit area surface is expressed by TI kWh/m2/day, then it can be expressed as constant peak value of solar radiation of 1 kW/m2 incident on a receiving surface for hours, then will be equal to hours/day. The expression is given by Eq. (7)
...(8)
eth is Equivalent full sun-shine hours on tilted surface.
TI is Insolation on tilted surface in kWh/m2/day.
PV Panel output after temperature correction The output of PV module is dependent on solar radiation and the operating temperature of PV module. Rise in the PV operating temperature with respect to STC condition, reduces the energy output from PV module. operating temperature of PV module can be calculated by means of ambient temperature, incident solar irradiance on PV module at given location and Nominal operating Cell Temperature (NoCT) of the particular technology.
...(9)
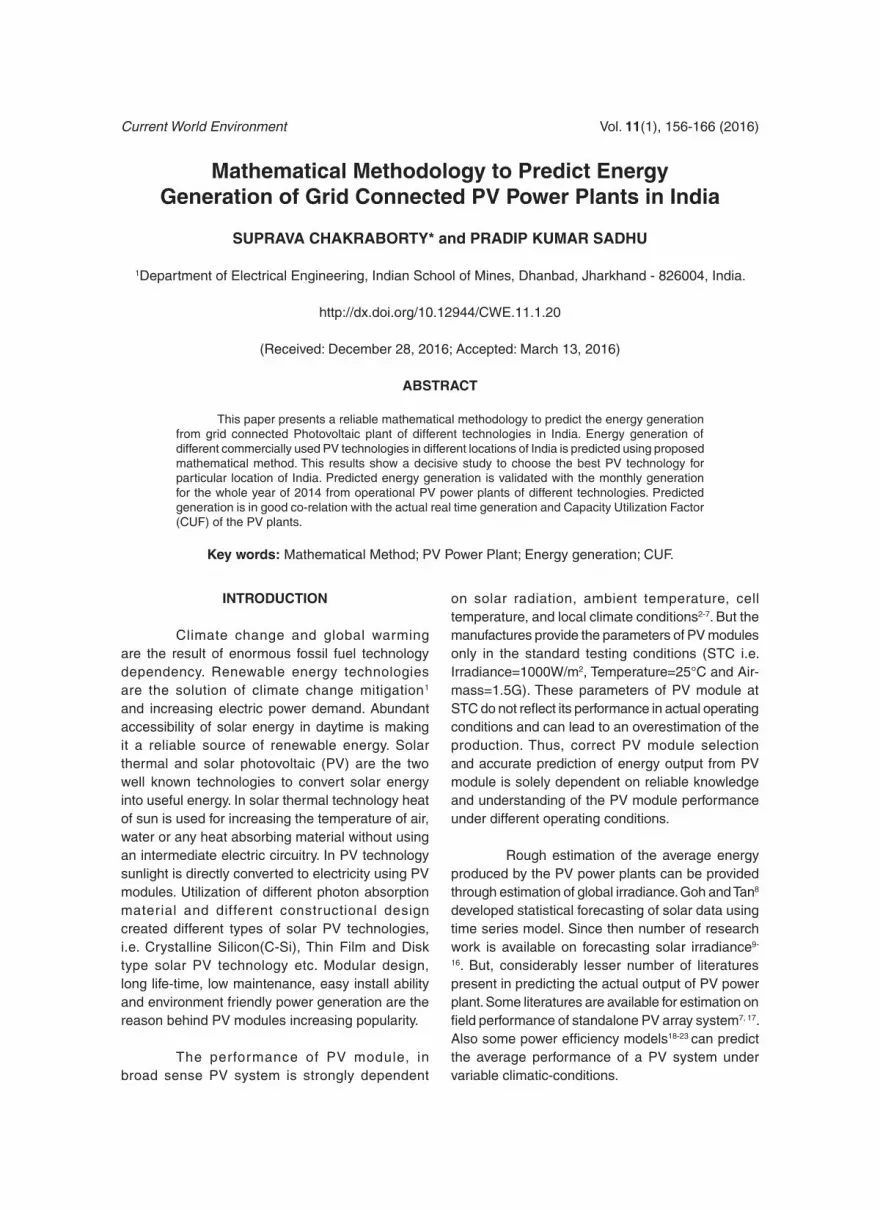
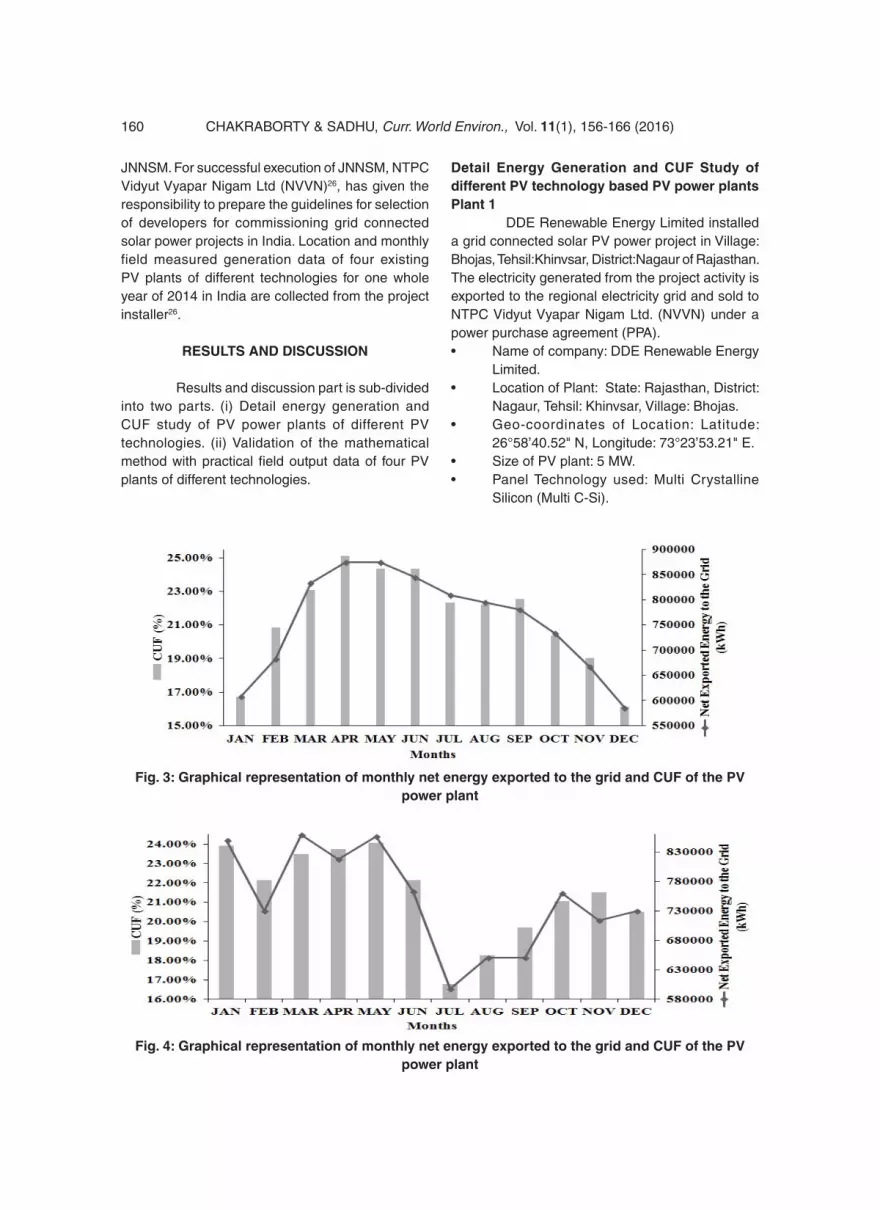
Fig. 1: Graphical representation of monthly net energy exported to the grid and CuF of the PV power plant
159 ChAkRABoRTy & SADhU, Curr. World Environ., Vol. 11(1), 156-166 (2016)
table 1: technical Specifications of Selected PV modules
PV Manufacturer Model no PStC (W) temp Coefficient noCttechnology name of Power (%/°C) (°C)
Mono-crystalline helios Solar helios Solar 420 0.41 45 9T6-420 Poly-crystalline Conergy PE-300 300 0.43 47a-Si Sungen SG-hN105-GG 100 0.268 40.28 International LimitedCIGS Stion STo-150 150 0.26 45.6CdTe First Solar FS-385 85 0.25 45
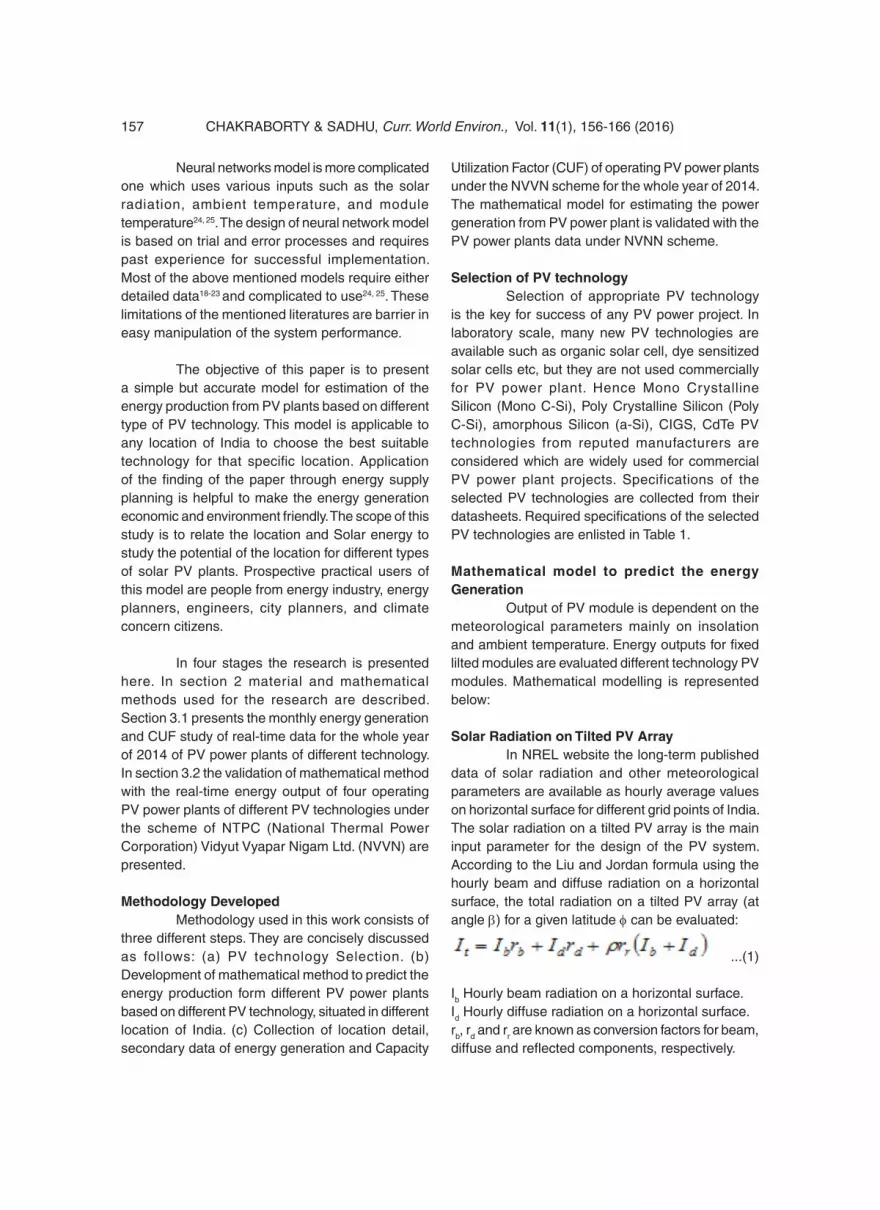
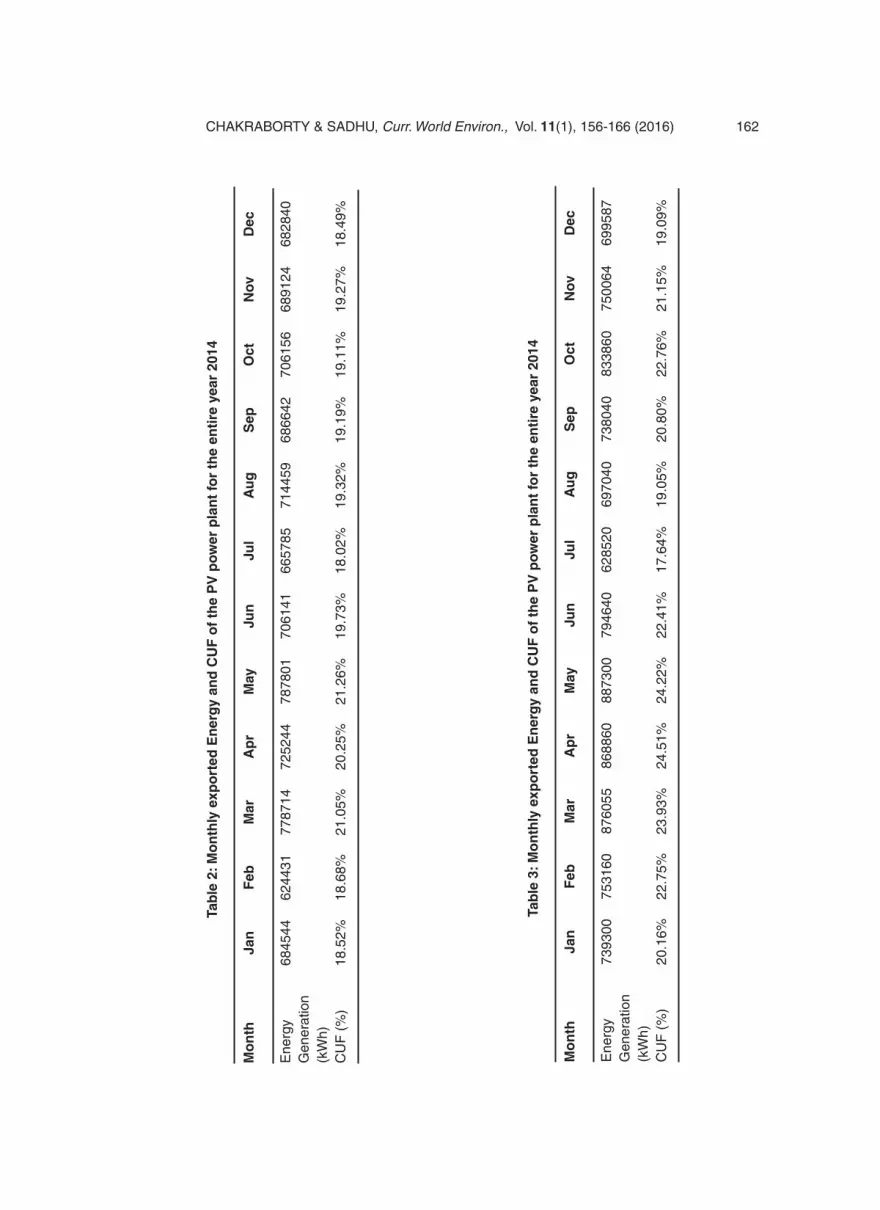
Fig. 2: Graphical representation of monthly net energy exported to the grid and CuF of the PV power plant
otcP is Panel output after temperature correction, mP is Power output at STC, aT is ambient Temperature in °C. NOCT is Nominal operat ing Cel l Temperature, tI is Irradiance in W/m2, STCT is the temperature of the PV module at STC in °C, γ is Temperature coefficient of Power for PV panel in %/°C.
Generated Energy from PV Plant feed to the Grid
...(10)
PVPE is Energy output from PV plant, fD is dust factor in %, fH is humidity factor in %, lW is Wiring losses in %, lm is Mismatch losses in %,
invη is inverter efficiency in %.
Capacity utilization Factor Sometimes investors or developers use the Capacity Utilization Factor (CUF) to compare the plant’s performance. The CUF does not take into account any environmental factor like variation of irradiance from one year to another or degradation of the panels. CUF for a single day is defined as
...(11)
IP is Installed Capacity of PV Plant.
Collected data of Solar PV Projects in India Under the scheme of Jawaharlal Nehru National Solar Mission (JNNSM) numbers of Solar PV plants are already installed in India and many other are going to be installed to fulfil the target of
160 ChAkRABoRTy & SADhU, Curr. World Environ., Vol. 11(1), 156-166 (2016)
Fig. 3: Graphical representation of monthly net energy exported to the grid and CuF of the PV power plant
Fig. 4: Graphical representation of monthly net energy exported to the grid and CuF of the PV power plant
JNNSM. For successful execution of JNNSM, NTPC Vidyut Vyapar Nigam Ltd (NVVN)26, has given the responsibility to prepare the guidelines for selection of developers for commissioning grid connected solar power projects in India. Location and monthly field measured generation data of four existing PV plants of different technologies for one whole year of 2014 in India are collected from the project installer26.
rESultS and dISCuSSIon
Results and discussion part is sub-divided into two parts. (i) Detail energy generation and CUF study of PV power plants of different PV technologies. (ii) Validation of the mathematical method with practical field output data of four PV plants of different technologies.
detail Energy Generation and CuF Study of different PV technology based PV power plants Plant 1 DDE Renewable Energy Limited installed a grid connected solar PV power project in Village: Bhojas, Tehsil:khinvsar, District:Nagaur of Rajasthan. The electricity generated from the project activity is exported to the regional electricity grid and sold to NTPC Vidyut Vyapar Nigam Ltd. (NVVN) under a power purchase agreement (PPA). • Nameofcompany:DDERenewableEnergy
Limited.• LocationofPlant:State:Rajasthan,District:
Nagaur, Tehsil: khinvsar, Village: Bhojas.• Geo-coordinates of Location: Latitude:
26°58’40.52" N, Longitude: 73°23’53.21" E.• SizeofPVplant:5MW.• PanelTechnology used: Multi Crystalline
Silicon (Multi C-Si).

161 ChAkRABoRTy & SADhU, Curr. World Environ., Vol. 11(1), 156-166 (2016)
Monthly Energy exported from the PV plant and CUF of the plant for the entire year 2014 are indicated in table 2.
Maximum and minimum exported energy to the grid from the PV power plant is found in the month of May and February with a value of 787801 kWh and 624431 kWh respectively. Maximum CUF is found in the month of May with a value of 21.26% and minimum is found in the month of July with a value of 18.02%. Graphical representation of these two parameters is shown in Figure 1.• Annual(Intheyear2014)EnergyExported
to the grid: 8451881 kWh.• AnnualaverageCUF(%):19.41%.
Plant 2 Shree Saibaba Green Power Private Limited (SSGPPL) installed a 5MW grid interactive solar PV power plant (SPV) at Gondhri village of Latur district in the State of Maharashtra. • Name of company: Shree Saibaba Green
Power Private Limited.• LocationofPlant:State:Maharashtra,District:
Latur, Tehsil: Ausa, Village: Gondhri.• SizeofPVplant:5MW.• PanelTechnologyused:AmorphousSilicon
Technology.
Monthly Energy exported from the PV plant and CUF of the plant for the entire year 2014 are indicated in table 3.
Maximum and minimum exported energy to the grid from the PV power plant is found in the month of May and July with a value of 887300 kWh and 628520 kWh respectively. Maximum CUF is found in the month of April with a value of 24.51% and minimum is found in the month of July with a value of 17.64%. Graphical representation of these two parameters is shown in Figure 2.• Annual(Intheyear2014)EnergyExported
to the grid: 9266426 kWh.• AnnualaverageCUF(%):21.54%.
Plant 3 Alex Spectrum Radiation Private Limited (ASRPL) under Jawaharlal Nehru National Solar Mission (JNNSM) with NTPC Vidyut Vyapar Nigam Limited (NVVN), installed 5 MW Solar PV power
project at Bikaner, India. • Nameofcompany:AlexSpectrumRadiation
Private Limited.• LocationofPlant:TheProjectisproposedto
be setup at Nokha Daiya village in Bikaner District of Rajasthan.
• Geo-coordinates of Location: Latitude:28°08’16.51"N, Longitude: 72°57’48.99" E.
• SizeofPVplant:5MW.• PanelTechnologyused:CadmiumTelluride.
Monthly Energy exported from the PV plant and CUF of the plant for the entire year 2014 are indicated in table 4.
Maximum and minimum exported energy to the grid from the PV power plant is found in the month of May and December with a value of 874467 kWh and 585138kWh respectively. Maximum CUF is found in the month of April with a value of 25.12% and minimum is found in the month of December with a value of 16.13%.Graphical representation of these two parameters are shown in Figure 3.• Annual(Intheyear2014)EnergyExported
to the grid: 9085599 kWh.• AnnualaverageCUF(%):21.43%.
Plant 4 Saisudhir Energy Limited (SSEL) developed a 5MW solar PV power plant (SPV) at T. Veerapuram village of Anantapur district in the State of Andhra Pradesh. For the proposed PV plant 38,400 numbers of 145 Wp PV modules are installed to generate 5 MWp power.
• Nameofcompany:SaisudhirEnergyLimited(SSEL).
• Location of Plant: State: Andhra Pradesh,District: Anantapur, Taluk: Raydurg, Village: T. Veerapuram.
• Geo-coordinates of Location: Latitude:14Ú45’41.97" N, Longitude: 76Ú57’03.86" E.
• SizeofPVplant:5MW.• PanelTechnologyused:CISThinfilm.
Monthly Energy exported from the PV plant and CUF of the plant for the entire year 2014 are indicated in table 5.
162ChAkRABoRTy & SADhU, Curr. World Environ., Vol. 11(1), 156-166 (2016)
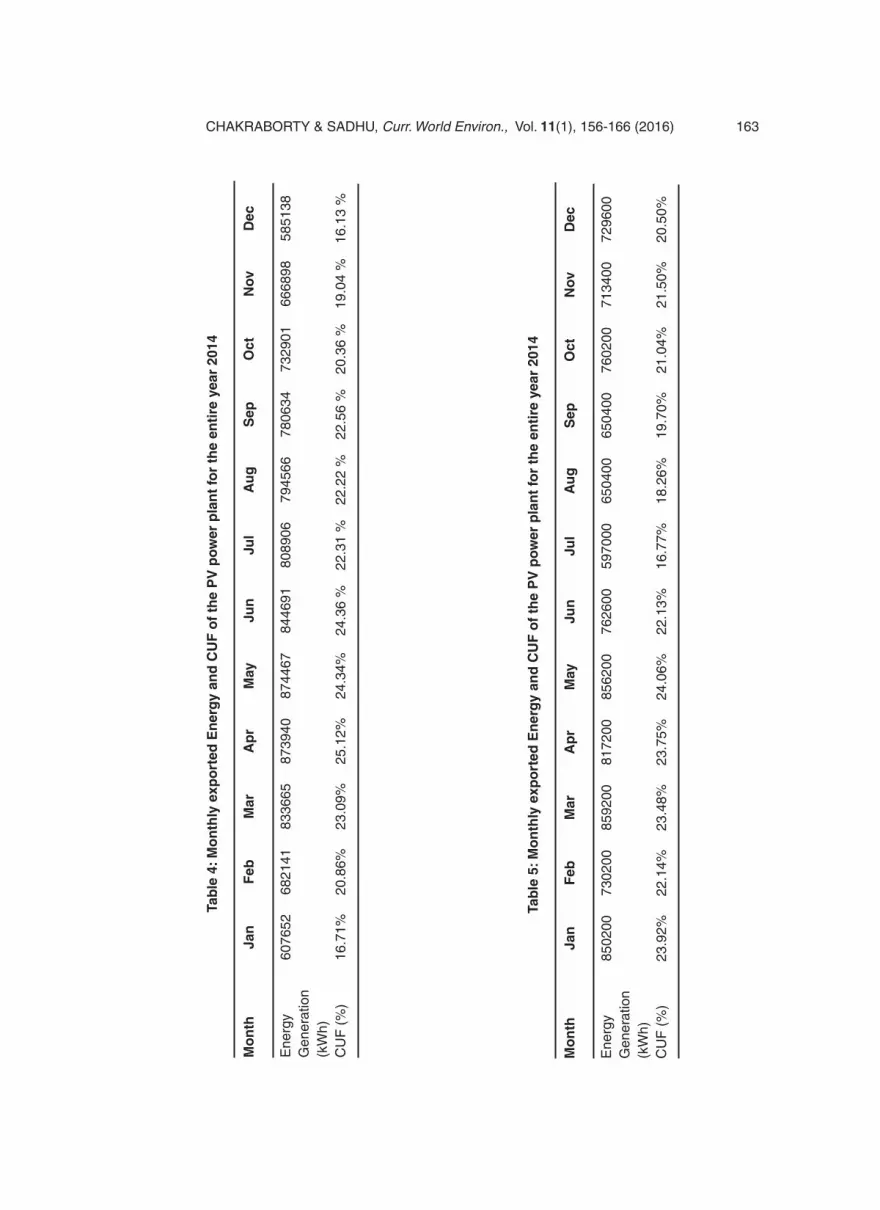
tab
le 2
: Mo
nth
ly e
xpo
rted
En
erg
y an
d C
uF
of
the
PV
po
wer
pla
nt
for
the
enti
re y
ear
2014
Mo
nth
Ja
n
Feb
M
ar
ap
r M
ay
Jun
Ju
l a
ug
S
ep
oct
n
ov
dec
Ene
rgy
68
4544
62
4431
77
8714
72
5244
78
7801
70
6141
66
5785
71
4459
68
6642
70
6156
68
9124
68
2840
Gen
erat
ion
(kW
h)
CU
F (
%)
18.5
2%
18.6
8%
21.0
5%
20.2
5%
21.2
6%
19.7
3%
18.0
2%
19.3
2%
19.1
9%
19.1
1%
19.2
7%
18.4
9%
tab
le 3
: Mo
nth
ly e
xpo
rted
En
erg
y an
d C
uF
of
the
PV
po
wer
pla
nt
for
the
enti
re y
ear
2014
Mo
nth
Ja
n
Feb
M
ar
ap
r M
ay
Jun
Ju
l a
ug
S
ep
oct
n
ov
dec
Ene
rgy
73
9300
75
3160
87
6055
86
8860
88
7300
79
4640
62
8520
69
7040
73
8040
83
3860
75
0064
69
9587
Gen
erat
ion
(kW
h)C
UF
(%
) 20
.16%
22
.75%
23
.93%
24
.51%
24
.22%
22
.41%
17
.64%
19
.05%
20
.80%
22
.76%
21
.15%
19
.09%
163ChAkRABoRTy & SADhU, Curr. World Environ., Vol. 11(1), 156-166 (2016)
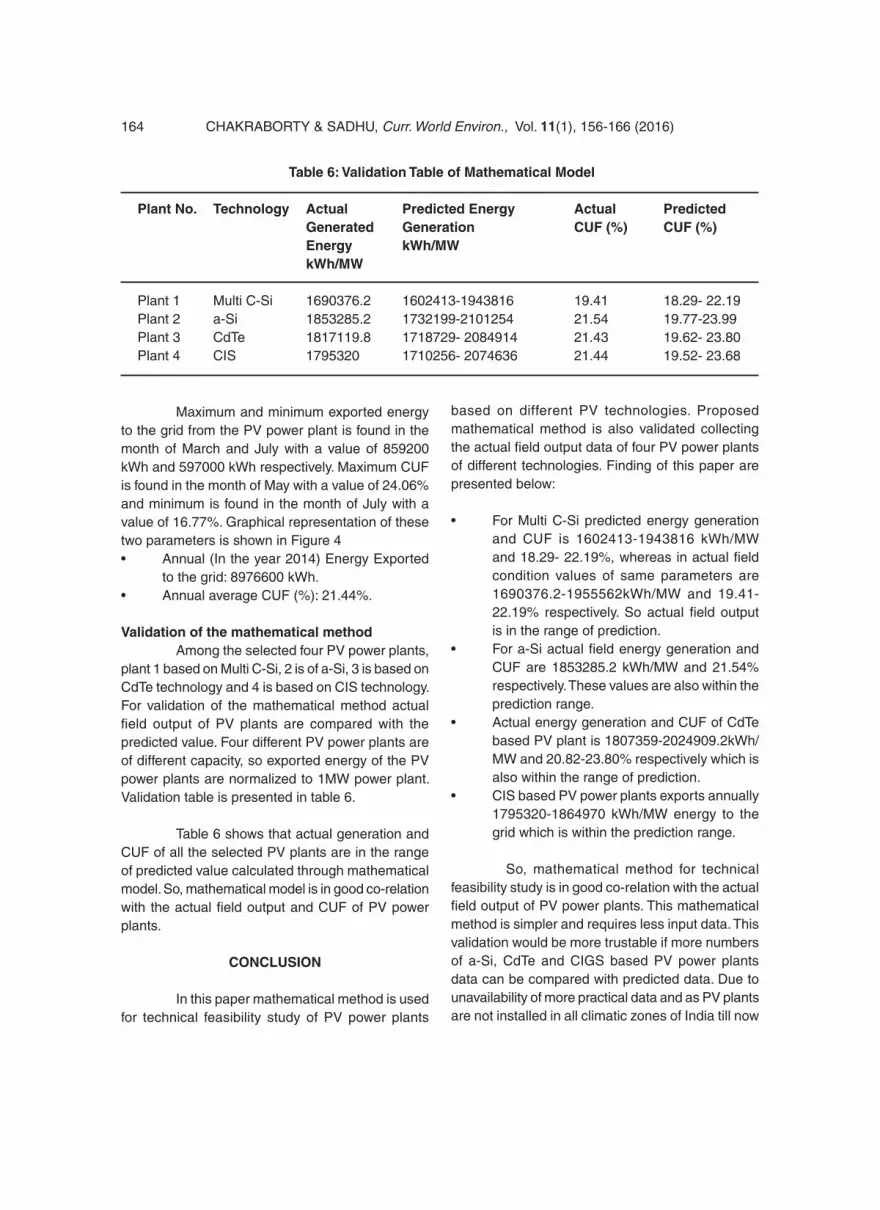
tab
le 4
: Mo
nth
ly e
xpo
rted
En
erg
y an
d C
uF
of
the
PV
po
wer
pla
nt
for
the
enti
re y
ear
2014
Mo
nth
Ja
n
Feb
M
ar
ap
r M
ay
Jun
Ju
l a
ug
S
ep
oct
n
ov
dec
Ene
rgy
60
7652
68
2141
83
3665
87
3940
87
4467
84
4691
80
8906
79
4566
78
0634
73
2901
66
6898
58
5138
Gen
erat
ion
(kW
h)C
UF
(%
) 16
.71%
20
.86%
23
.09%
25
.12%
24
.34%
24
.36
%
22.3
1 %
22
.22
%
22.5
6 %
20
.36
%
19.0
4 %
16
.13
%
tab
le 5
: Mo
nth
ly e
xpo
rted
En
erg
y an
d C
uF
of
the
PV
po
wer
pla
nt
for
the
enti
re y
ear
2014
Mo
nth
Ja
n
Feb
M
ar
ap
r M
ay
Jun
Ju
l a
ug
S
ep
oct
n
ov
dec
Ene
rgy
85
0200
73
0200
85
9200
81
7200
85
6200
76
2600
59
7000
65
0400
65
0400
76
0200
71
3400
72
9600
Gen
erat
ion
(kW
h)C
UF
(%
) 23
.92%
22
.14%
23
.48%
23
.75%
24
.06%
22
.13%
16
.77%
18
.26%
19
.70%
21
.04%
21
.50%
20
.50%
164 ChAkRABoRTy & SADhU, Curr. World Environ., Vol. 11(1), 156-166 (2016)
table 6: Validation table of Mathematical Model
Plant no. technology actual Predicted Energy actual Predicted Generated Generation CuF (%) CuF (%) Energy kWh/MW kWh/MW Plant 1 Multi C-Si 1690376.2 1602413-1943816 19.41 18.29- 22.19Plant 2 a-Si 1853285.2 1732199-2101254 21.54 19.77-23.99Plant 3 CdTe 1817119.8 1718729- 2084914 21.43 19.62- 23.80Plant 4 CIS 1795320 1710256- 2074636 21.44 19.52- 23.68
Maximum and minimum exported energy to the grid from the PV power plant is found in the month of March and July with a value of 859200 kWh and 597000 kWh respectively. Maximum CUF is found in the month of May with a value of 24.06% and minimum is found in the month of July with a value of 16.77%. Graphical representation of these two parameters is shown in Figure 4• Annual(Intheyear2014)EnergyExported
to the grid: 8976600 kWh.• AnnualaverageCUF(%):21.44%.
Validation of the mathematical method Among the selected four PV power plants, plant 1 based on Multi C-Si, 2 is of a-Si, 3 is based on CdTe technology and 4 is based on CIS technology. For validation of the mathematical method actual field output of PV plants are compared with the predicted value. Four different PV power plants are of different capacity, so exported energy of the PV power plants are normalized to 1MW power plant. Validation table is presented in table 6.
Table 6 shows that actual generation and CUF of all the selected PV plants are in the range of predicted value calculated through mathematical model. So, mathematical model is in good co-relation with the actual field output and CUF of PV power plants.
ConCluSIon
In this paper mathematical method is used for technical feasibility study of PV power plants
based on different PV technologies. Proposed mathematical method is also validated collecting the actual field output data of four PV power plants of different technologies. Finding of this paper are presented below:
• ForMultiC-Sipredictedenergygenerationand CUF is 1602413-1943816 kWh/MW and 18.29- 22.19%, whereas in actual field condition values of same parameters are 1690376.2-1955562kWh/MW and 19.41-22.19% respectively. So actual field output is in the range of prediction.
• Fora-SiactualfieldenergygenerationandCUF are 1853285.2 kWh/MW and 21.54% respectively. These values are also within the prediction range.
• ActualenergygenerationandCUFofCdTebased PV plant is 1807359-2024909.2kWh/MW and 20.82-23.80% respectively which is also within the range of prediction.
• CISbasedPVpowerplantsexportsannually1795320-1864970 kWh/MW energy to the grid which is within the prediction range.
So, mathematical method for technical feasibility study is in good co-relation with the actual field output of PV power plants. This mathematical method is simpler and requires less input data. This validation would be more trustable if more numbers of a-Si, CdTe and CIGS based PV power plants data can be compared with predicted data. Due to unavailability of more practical data and as PV plants are not installed in all climatic zones of India till now
165ChAkRABoRTy & SADhU, Curr. World Environ., Vol. 11(1), 156-166 (2016)
,so further validation in all climatic zones are not possible now. Though the ministry has future plans for installation of PV power plants all over India. Then
much better validation of the mathematical method will be possible.
rEFErEnCES
1. Dahlquist, E., Thorin, E. and yan, J., Alternative pathways to a fossil-fuel free energy system in the Mälardalen region of Sweden, International Journal of Energy Research, 31(12): 1226-1236, 2007.
2. Chakraborty, S., Sadhu, P. and Pal, N., Technical mapping of solar PV for ISM-an approach toward green campus, Energy Science & Engineering, 3(3), 196-206, (2015).
3. Chakraborty, S., Sadhu, P. and Pal, N., New Location Selection Criterions for Solar PV Power Plant, International Journal of Renewable Energy Research, 4(4): 1020-1030 (2014).
4. huld, T., Súri, M. and Dunlop, E., Geographical variation of the conversion efficiency of crystalline silicon photovoltaic modules in Europe, Prog. Photovolt: Res. Appl., 16(7), 595-607 (2008).
5. Nfah, E., Ngundam, J. and Tchinda, R., Modelling of solar/diesel/battery hybrid power systems for far-north Cameroon, Renewable Energy, 32(5): 832-844 (2007).
6. Durisch, W., Tille, D., Wörz, A. and Plapp, W., Characterisation of photovoltaic generators, Applied Energy, 65(1-4): 273-284: (2000).
7. Sasitharanuwat, A., Rakwichian, W., ketjoy, N. and yammen, S., Performance evaluation of a 10kWp PV power system prototype for isolated building in Thailand, Renewable Energy, 32(8): 1288-1300 (2007).
8. Goh, T. and Tan, k., Stochastic modeling and forecasting of solar radiation data, Solar Energy, 19(6): 755-757 (1977).
9. Sfetsos, A. and Coonick, A., Univariate and multivariate forecasting of hourly solar radiation with artificial intelligence techniques, Solar Energy, 68(2): 169-178 (2000).
10. hontoria, L., Aguilera, J. and Zufiria, P., Generation of hourly irradiation synthetic series using the neural network multilayer perceptron, Solar Energy, 72(5): 441-446 (2002).
11. Cao, S. and Cao, J., Forecast of solar irradiance using recurrent neural networks combined with wavelet analysis, Applied Thermal Engineering, 25(2-3): 161-172 (2005).
12. Mellit, A., Benghanem, M. and kalogirou, S., An adaptive wavelet-network model for forecasting daily total solar-radiation, Applied Energy, 83(7): 705-722 (2006).
13. Mellit, A., kalogirou, S., Shaari, S., Salhi, h. and hadj Arab, A., Methodology for predicting sequences of mean monthly clearness index and daily solar radiation data in remote areas: Application for sizing a stand-alone PV system, Renewable Energy, 33(7): 1570-1590 (2008).
14. hocaoðlu, F., Gerek, Ö. and kurban, M., hourly solar radiation forecasting using optimal coefficient 2-D linear filters and feed-forward neural networks, Solar Energy, 82(8): 714-726 (2008).
15. Reikard, G., Predicting solar radiation at high resolutions: A comparison of time series forecasts, Solar Energy, 83(3): 342-349 (2009).
16. Ayompe, L., Duffy, A., McCormack, S. and Conlon, M., Validated real-time energy models for small-scale grid-connected PV-systems, Energy, 35(10): 4086-4091 (2010).
17. Zhou, W., yang, h. and Fang, Z., A novel model for photovoltaic array performance prediction, Applied Energy, 84(12): 1187-1198 (2007).
18. Joyce, A., Rodrigues, C. and Manso, R., Modelling a PV system, Renewable Energy, 22(1-3): 275-280 (2001).
19. hove, T., A method for predicting long-term average performance of photovoltaic systems, Renewable Energy, 21(2): 207-229 (2000).
20. Evans, D., Simplified method for predicting photovoltaic array output, Solar Energy, 27(6): 555-560 (1981).
21. De Soto, W., klein, S. and Beckman, W., Improvement and validation of a model for

166 ChAkRABoRTy & SADhU, Curr. World Environ., Vol. 11(1), 156-166 (2016)
photovoltaic array performance, Solar Energy, 80(1): 78-88 (2006).
22. Chang, T., output energy of a photovoltaic module mounted on a single-axis tracking system, Applied Energy, 86(10): 2071-2078 (2009).
23. Celik, A. and Acikgoz, N., Modelling and experimental verification of the operating current of mono-crystalline photovoltaic modules using four- and five-parameter models, Applied Energy, 84(1): 1-15 (2007).
24. Ashraf, I. and Chandra, A., Artificial neural network based models for forecasting electricity generation of grid connected solar PV power plant, International Journal of Global Energy, 21(1/2): 119-125 (2004).
25. Sulaiman, S., Rahman, T. and Musirin, I., Partial Evolutionary ANN for output Prediction of a Grid-Connected Photovoltaic System, IJCEE, 40-45 (2009).
26. Nvvn.co.in, (2015). NVVN Ltd. [online] Available at: http://nvvn.co.in/ [Accessed 1 oct. 2015].