massive hybridization and species concepts, insights from watersnakes
TRANSCRIPT
2
TABLE OF CONTENTS
Page
ACKNOWLEDGMENTS ................................................................................................. 1
LIST OF TABLES ............................................................................................................. 6
LIST OF FIGURES ........................................................................................................... 7
Section
INTRODUCTION ..................................................................................................... ……9
Background on Nerodia fasciata and N. sipedon ...................................................... 11
Contact Zones between Nerodia fasciata and N. sipedon in the Carolinas ............... 15
Rationale for this Project ........................................................................................... 19
Objectives .................................................................................................................. 20
Specific Questions...................................................................................................... 21
SITES AND SAMPLES ................................................................................................... 26
Study sites ................................................................................................................. 26
Collecting and Handling of Snakes............................................................................. 26
MORPHOLOGICAL SECTION ..................................................................................... 28
Material and Methods ................................................................................................ 28
Color Pattern ......................................................................................................... 28
Scutellation............................................................................................................ 28
Body Proportions .................................................................................................. 28
Meristic Results ......................................................................................................... 31
Morphometric Results................................................................................................ 42
Sexual Dimorphism............................................................................................... 42
Group Differences................................................................................................. 47
Hybrid Index Results ................................................................................................ 47
Head Shape ........................................................................................................... 50
Color Pattern ......................................................................................................... 50
Discriminant Function Analysis.................................................................................. 53
Summary ................................................................................................................... 62
3 Section Page
GENETIC SECTION ....................................................................................................... 64
Material and Methods ................................................................................................ 64
Background of the AFLP Method......................................................................... 64
Restriction ............................................................................................................. 66
Ligation .............................................................................................................. 67
Preselective Amplification.................................................................................... 68
Selective Amplification......................................................................................... 69
Analysis of Gels .................................................................................................... 69
Primary Markers ................................................................................................... 70
Secondary Markers ............................................................................................... 75
Results ........................................................................................................................ 77
Frequency of Species Markers .............................................................................. 77
Genetic Analysis of the Contact Zone .................................................................. 79
Contact Zone fasciata (cf)..................................................................................... 79
Contact Zone sipedon (cs)..................................................................................... 81
Phenetic Hybrids from the Contact Zone (x) ........................................................ 83
Frequencies of Genotypes amont Phenetic Groups from the Contact Zone
(cf, cs, x).............................................................................................................. 83
Distribution of Heterozygotes in Backcrosses of F1 Hybrids to Parental Species 85
Summary ................................................................................................................... 86
GEOGRAPHIC SECTION .............................................................................................. 88
Primary Study Areas ................................................................................................... 90
Area 1 – Coastal Lowland Between the Chesapeake Bay, Virginia, and the
Albemarle Sound, North Carolina ...................................................................... 90
Area 2 – Coastal Zone of the Peninsula Between the Albermarle and Pamlico
Sounds; Dare and Hyde Counties, North Carolina ............................................. 93
Area 3 - Middle/Lower Tar and Roanoke Rivers; Nash, Edgecombe, Wilson, Pitt,
Greene, Beaufort, Martin, Bertie, and Halifax Counties, North Carolina .......... 95
Area 4 - Fayetteville and Fort Bragg Area; Cumberland and Harnett Counties,
North Carolina..................................................................................................... 98
4 Section Page
Area 5 - Southern Pines; Moore Co., North Carolina......................................... 100
Area 6 – Augusta, Aiken, and the Savannah River Site; Georgia and
South Carolina................................................................................................... 102
Additional Study Areas ............................................................................................. 105
Area 7 – Holts Lake, Johnston Co., North Carolina ........................................... 105
Other Sites Near the Contact Zone ..................................................................... 105
Other Sites Distant from the Contact Zone......................................................... 105
DISCUSSION ................................................................................................................. 107
Morphological Section............................................................................................. 107
Meristic Data....................................................................................................... 107
Number of Ventral Scales (VEN), Postocular Scales (PO), and Reductions
of Dorsal Scale Rows (SR10, Red21/19, Tred10/8/6) ................................ 107
Number of Dorsal and Lateral Bands (DBa, Lba) ........................................ 109
Number of Complete Crossbands Dorsally (CBa)........................................ 110
Morphometric Data ............................................................................................. 111
Cephalic Proportions..................................................................................... 111
Eye Size......................................................................................................... 112
Hybrid Index Data............................................................................................... 113
Shape of Ventral Spots and Prominence of Postocular Stripe (SV, PS)....... 113
Head Shape (AnCR, StCR, SpCR) ............................................................... 114
Distribution of Phenotypes.................................................................................. 115
Genetic Section ......................................................................................................... 116
Efficacy of Genetic Markers ............................................................................... 116
Distribution of Genetic Markers ......................................................................... 116
Distribution of Hybrid Genotypes....................................................................... 118
Cryptic Introgression........................................................................................... 119
Ecological Section.................................................................................................... 120
Salinity ................................................................................................................ 121
Temperature ........................................................................................................ 125
Topography and Water Current .......................................................................... 127
5 Section Page
Eastern Contact Zone (Atlantic Coastal Plain) ............................................. 128
Southern Contact Zone (Lower Gulf Coastal Plain)..................................... 130
Western Contact Zone (Mississippi River Valley......................................... 131
Systematic Implications for Nerodia sipedon and N. fasciata................................. 134
Species Concepts................................................................................................. 134
Phylogeny............................................................................................................ 135
Paleoherpetological Aspects .................................................................................... 137
CONCLUSIONS............................................................................................................ 141
LITERATURE CITED .................................................................................................. 143
APPENDICES ............................................................................................................... 167
1. DEFINITION OF MORPHOLOGICAL CHARACTERS................................... 167
Color Pattern ....................................................................................................... 167
Scutellation.......................................................................................................... 169
Body Proportions ................................................................................................ 170
2. SPECIMENS EXAMINED .................................................................................. 173
3. AFLP PROTOCOL.............................................................................................. 184
Restriction Ligation............................................................................................. 184
Preselective Amplification.................................................................................. 185
Selective Amplification....................................................................................... 186
Applied AFLP Oligonucleotides......................................................................... 187
9
INTRODUCTION
The origin of new species can often be promoted by natural selection over several generations.
Speciation involves the splitting of a population and the subsequent divergence into independent
lineages by the accumulation of favorable mutations and recombinants (Mayr, 1970). Because these
processes usually span more generations than an interested investigator can follow, scientists rely on
studying the patterns of variation within and among contemporaneous populations or between different
taxa in order to infer mechanisms of speciation (Coyne, 1992; Harrison, 1993). Hybridization and
introgression are two such patterns of special interest.
Hybridization is the interbreeding between two taxa, usually closely related species. In the recent
literature, the term hybridization has been applied in a broader context, referring to the offspring of two
genetically distinct forms, and hence it could also include intergradation, which is the interbreeding of
two subspecies (e.g., Hewitt, 1989). Harrison (1990) and Arnold (1997) modified Woodruff’s (1973)
definition of hybridization to “the interbreeding of individuals from two populations, or groups of
populations, which are distinguishable on the basis of one or more heritable characters.” Moreover,
hybrids include interbreeding between F1 hybrids, as well as the backcrosses between hybrids and their
parental species or later-generation hybrids. Such individuals should be recognizable by being
heterozygous for at least one of the diagnosable features of their parental species revealed by
intermediacy in morphological characters or heterozygosity in molecular ones. The presence of
different species-specific markers from genetic systems with dominant inheritance also can indicate
hybridization. The dynamic aspect of hybridization events is termed introgression, which refers to the
movement of genes mediated by backcrossing between two species or genetically well-distinguished
populations (Avise, 1994). As a consequence of permanent introgression, hybrids may constitute a
significant proportion of individuals in a contact area between two species, thereby developing a hybrid
zone. The presence of hybrid zones conflicts with the traditional Biological Species Concept (see
Mayr, 1963, 1970), under which two species should be reproductively isolated from each other. They
represent an evolutionary window by revealing aspects of ecology, behavior, genetics and geography
that contribute to speciation processes (Harrison, 1990).
How such hybrid zones originated and how long they persist are questions the evolutionary
biologist addresses. Is a contact zone between two putative closely related taxa or morphs secondary,
wherein allopatrically evolved species meet and hybridize, or is it primary, where populations diverge
into separate lineages along an environmental gradient (a parapatric process) but remain reproductively
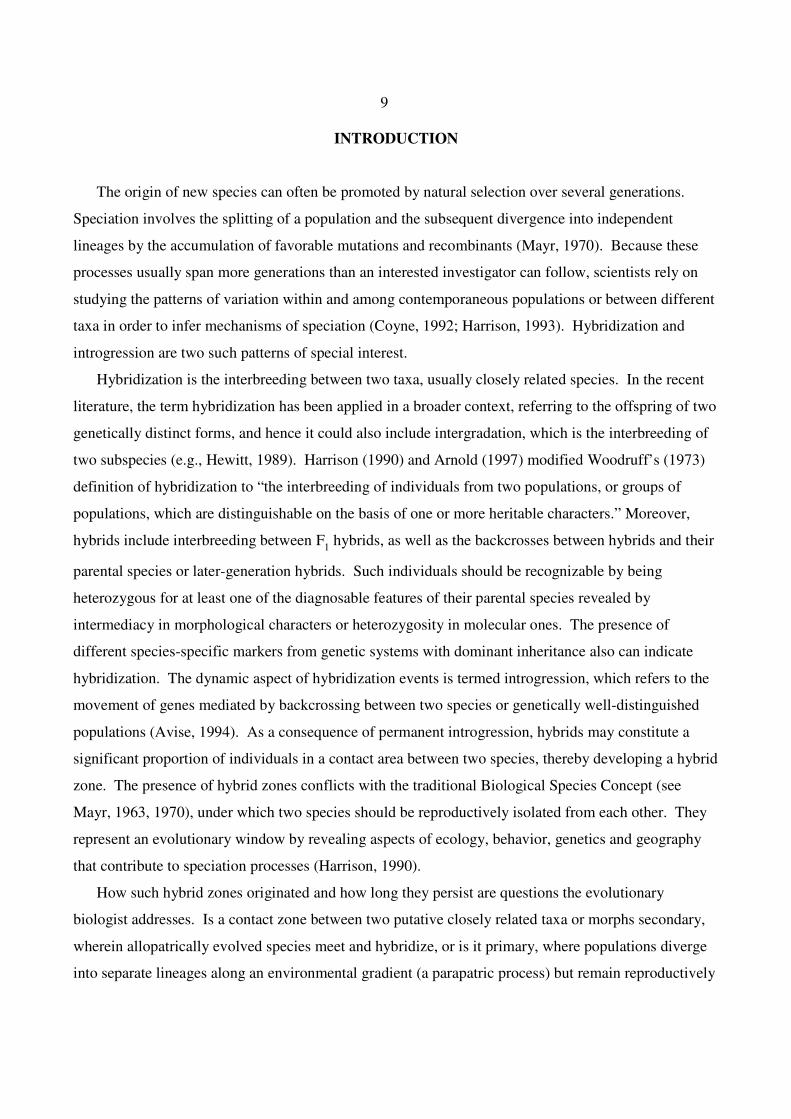
16
F
IG. 2
. D
istr
ibut
ion
of N
ero
dia
sip
edo
n a
nd N
. fa
scia
ta i
n N
orth
Car
olin
a as
kno
wn
at t
he i
niti
atio
n of
thi
s pr
ojec
t (1
995)
. The
w
hite
zon
e re
pres
ents
are
as f
rom
whi
ch r
ecor
ds o
f ei
ther
spe
cies
are
mis
sing
. Cro
ss-h
atch
ing
deno
tes
area
s w
here
hyb
rid
zone
s or
sy
mpa
try
have
pre
viou
sly
been
doc
umen
ted
(see
text
). I
n-te
xt r
efer
red
site
s ar
e (1
) R
ichm
ond
Co.
; (2
) M
oore
Co.
; (3)
Gre
envi
lle,
P
itt C
o.; (
4) P
asqu
otan
k C
o.; (
5) C
amde
n C
o.;
(6)
Phe
lps
Lak
e, W
ashi
ngto
n C
o.;
(7)
Nor
tham
pton
Co.
; (8
) H
ertf
ord
Co.
; (9)
S
hack
lefo
rd B
ank;
(10
) C
arte
r et
Co.
; (1
1) G
arne
r C
reek
, Mar
tin
Co.
; (1
2) H
olts
Lak
e, J
ohns
ton
Co.
(13
) L
ake
Wac
cam
aw,
Col
umbu
s C
o. M
aps
from
‘R
epti
les
of N
orth
Car
olin
a’ (
Pal
mer
and
Bra
swel
l, 1
995)
ser
ved
to o
utli
ne t
he i
niti
al r
ange
lim
its.
The
F
all
Zon
e ex
tend
s ap
prox
imat
ely
30–5
0 km
fro
m t
he u
pper
bou
ndar
y to
war
d th
e co
ast
(ada
pted
fro
m C
onan
t [1
963]
; Cla
y, O
rr,
and
Stu
art
[197
5]).
26
SITES AND SAMPLES
Study Sites.__Collection of specimens was concentrated around known and anticipated sites of
sympatry near the Fall Zone and the Atlantic Coast of the Carolinas and adjacent states as follows: (1)
environs of Augusta in Richmond County, GA, and boundary between Aiken and Edgefield counties,
SC; (2) Southern Pines, Moore County, NC; (3) Holts Lake, Johnston County, NC; (4) Greenville area,
Pitt and Edgecombe counties, NC; (5) Fayetteville to Cambro Pond, Cumberland and Harnett counties;
(6) Elizabeth City area, Camden and Pasquotank counties, NC; (7) lower Roanoke River near Oak City,
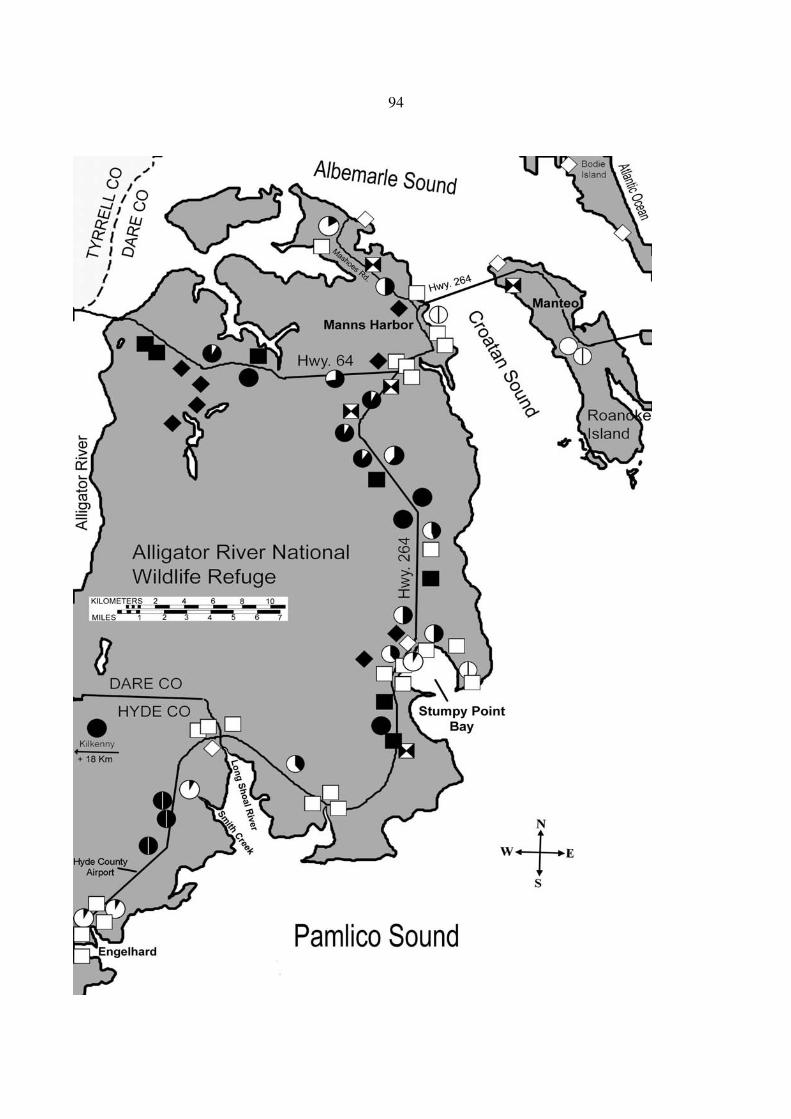
Martin County, NC; and (8) a coastal contact area along highway 264 through Alligator River National
Wildlife Refuge in Dare and Hyde counties, NC. The latter serves to investigate the influence of a
salinity ecotone to separate Nerodia sipedon from N. fasciata. See the GEOGRAPHIC SECTION for
maps showing these collection sites, except Holts Lake (3), which is displayed in Figure 2.
Due to time constraints, reevaluation of the published hybrid zone on Shackleford Bank and nearby
mainland, Carteret County (Fig. 2), was not attempted. In an effort to reduce the distributional gaps
between the ranges of both species, specimens were also collected from localities along potential
contact zones between those mentioned above. However, unfavorable habitat and adverse weather
conditions limited the collecting success. Putative pure specimens were collected from a distance of
more than 25 km of any known hybrid zone or sympatry area (= distant sites). For example, multiple
specimens of Nerodia sipedon were collected at (1) Pohick Recreational Area, Fairfax County, VA; (2)
Mountain Lake Biological Station, Giles, and nearby localities in Craig, Franklin, and Bland counties,
western VA; (3) Tidewater area between the Great Dismal Swamp, Suffolk County, and the City of
Virginia Beach, VA; and (4) Tar River Reservoir Lake and Falls Battle Park, Nash County, NC.
Multiple N. fasciata were acquired from (1) Gardner Creek (lower Roanoke River) near Jamesville,
Martin County, NC; (2) Lake Waccamaw, Columbus County, NC; (3) Jamestown, Berkeley County,
SC; (4) Savannah River Site, Aiken and Barnwell counties, SC; and (5) localities in Sarasota and
Manatee counties, FL. Distant sipedon-sites (3) and (4), as well as a distant fasciata-site (4) are
displayed in the GEOGRAPHIC SECTION, whereas distant fasciata-sites (1) and (2) are shown in
Figure 2. A list of all snakes with locality data is presented in Appendix 2.
Collecting and Handling of Snakes.__From 1995 to 1999, approximately 330 specimens were
collected from selected sympatric and allopatric populations. Diurnal collecting of snakes began after
their emergence from hibernation in March and April. By mid-May, collecting usually became more
28
MORPHOLOGICAL SECTION
MATERIALS AND METHODS
Forty morphological characters describing features of color pattern, body proportions, head shape,
and scutellation were recorded from each specimen. Characters were selected that have been used as
primary diagnostic features or were frequently found to distinguish Nerodia fasciata and N. sipedon
(Clay, 1938; Conant, 1963; Schwaner and Mount, 1976; Behler and King, 1979; Blaney and Blaney,
1979; Seyle, 1980; Morris, 1987; Behler and King, 1979; Conant and Collins, 1991). Other characters
were selected based upon a study by the author of another natricine snake (Mebert, 1993). For
illustrations and definitions of characters, see list and figures 32-35 in Appendix 1.
Color Pattern.__Features of color pattern were evaluated, including: (1) prominence of postocular
stripe; (2) prominence of shadow spots between the dorsal interspaces; (3) serration of dorsal bands and
lateral blotches; (4) shape of ventral markings; (5) numbers of ventral scutes covered or touched by the
extension of lateral bands/blotches; (6) number of complete dorsal bands; total number of (7) dorsal
and (8) lateral blotches; (9) mean width of dorsolateral bands; (10) mean width of light interspaces
across the first 10 crossbands or lateral blotches. Characters (9) and (10) were measured as the number
of scales covered by the bands, or interspaces respectively, along the suture with the ventral scales.
Characters 1–4 were evaluated with a modified hybrid index of Anderson (1949) using a scale from 1
(typical Nerodia sipedon) to 5 (typical N. fasciata).
A few diagnostic pattern characters for Nerodia sipedon williamengelsi (Conant and Lazell, 1973)
were measured as well. However, low sample size (n = 13) and extensive variation, especially among
snakes collected from the subspecies’ contact area with N. fasciata, rendered the measurements of
minimal value in this analysis.
Scutellation.__Aspects of scutellation were examined, including: (11) number of postocular, (12)
ventral, (13) preventral, and (14) subcaudal scales; (15) identity of supralabial scales contacting the
eye; (16) number of dorsal scale rows at the 10th ventral scute; (17), (18), (19) reduction pattern of
dorsal scale rows on trunk and (20), (21), (22) on tail, recorded as ventral or subcaudal level where
reduction occurred. Many characters associated with the scale reduction pattern, such as scale row
additions and identity of scale row being reduced, were recorded only for the preliminary sample (n =
115) due to time constraints.
Body Proportions.__Features of body proportions were measured, namely: (23) height and (24)
width of rostral scale; (25) eye diameter; (26) maximum distance between the lateral surfaces of the
34
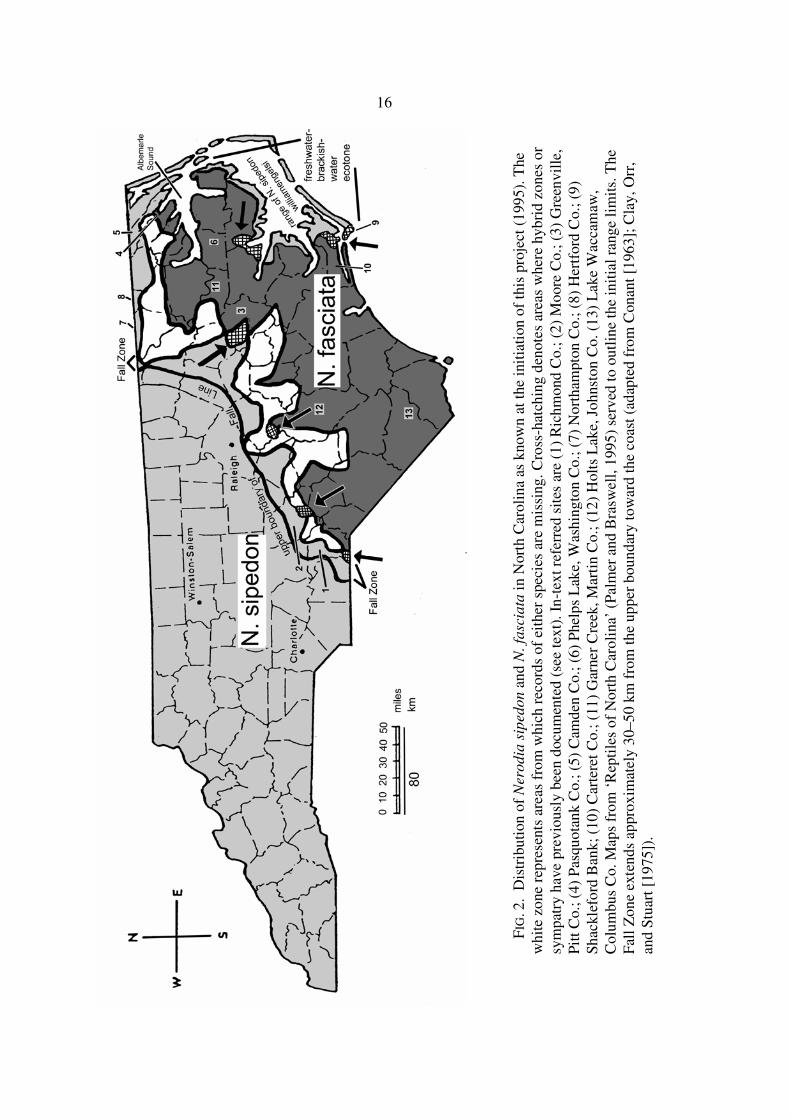
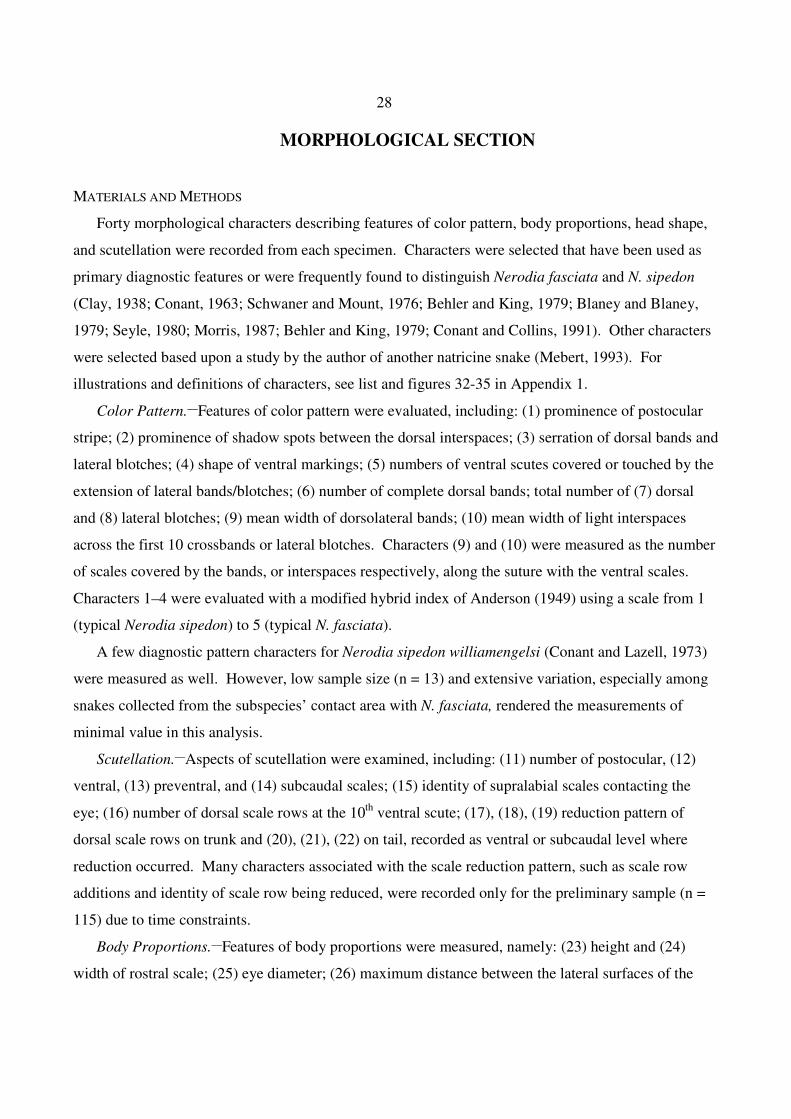
FIG. 3. Distribution of CBa (A) and VLBa (B) among phenetic groups. Groups are: cf and cs for phenetic Nerodia fasciata and N. sipedon, respectively from the contact zone; f and s for distant N.
fasciata and N. sipedon, respectively, from an area > 25 km from the contact zone; and x for phenetic intermediates between f and s. Values exceeding a studentized residual of + 3.64 at a significance level of 0.05 are considered outliers and marked as asterisks.
A
B
10
20
30
40
0
10
15
20
25
30
35
VL
Ba
CB
a
49
JawL
10 20 30 40 50 60
Ro
H
1
2
3
4
5
6
s __________
cs ___ ___ ___
x ....................
cf __.__.__.__.
f __..__..__..__
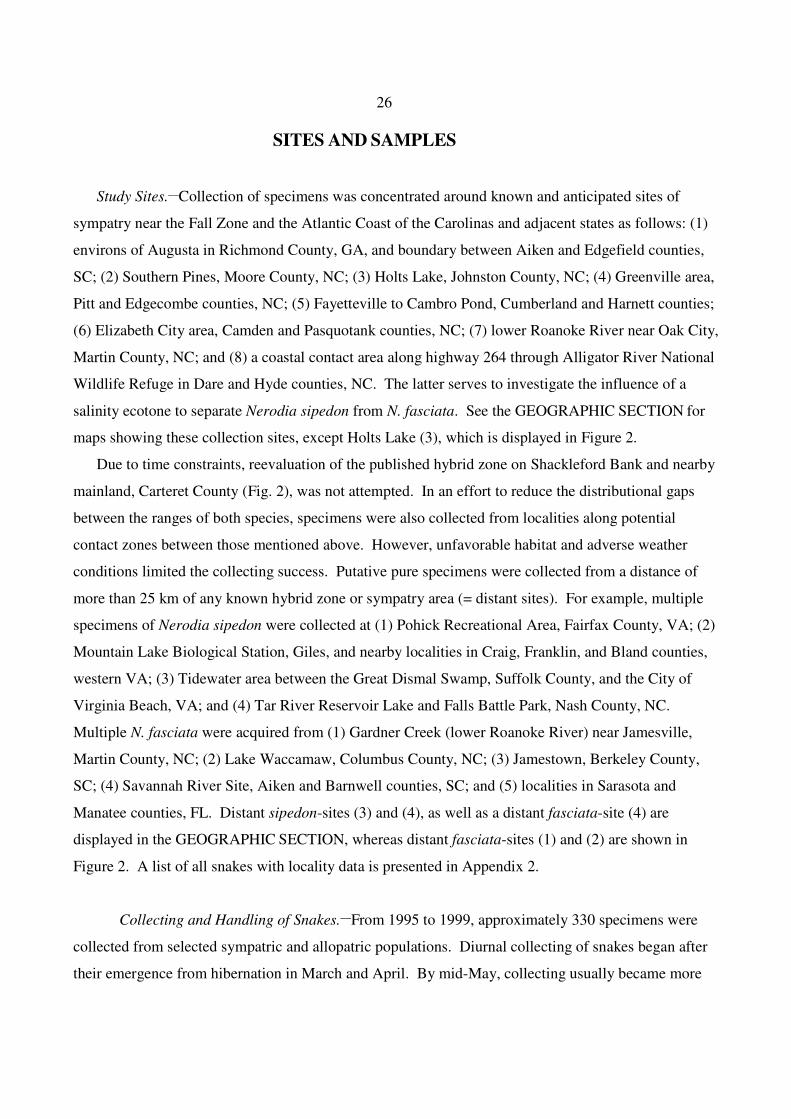
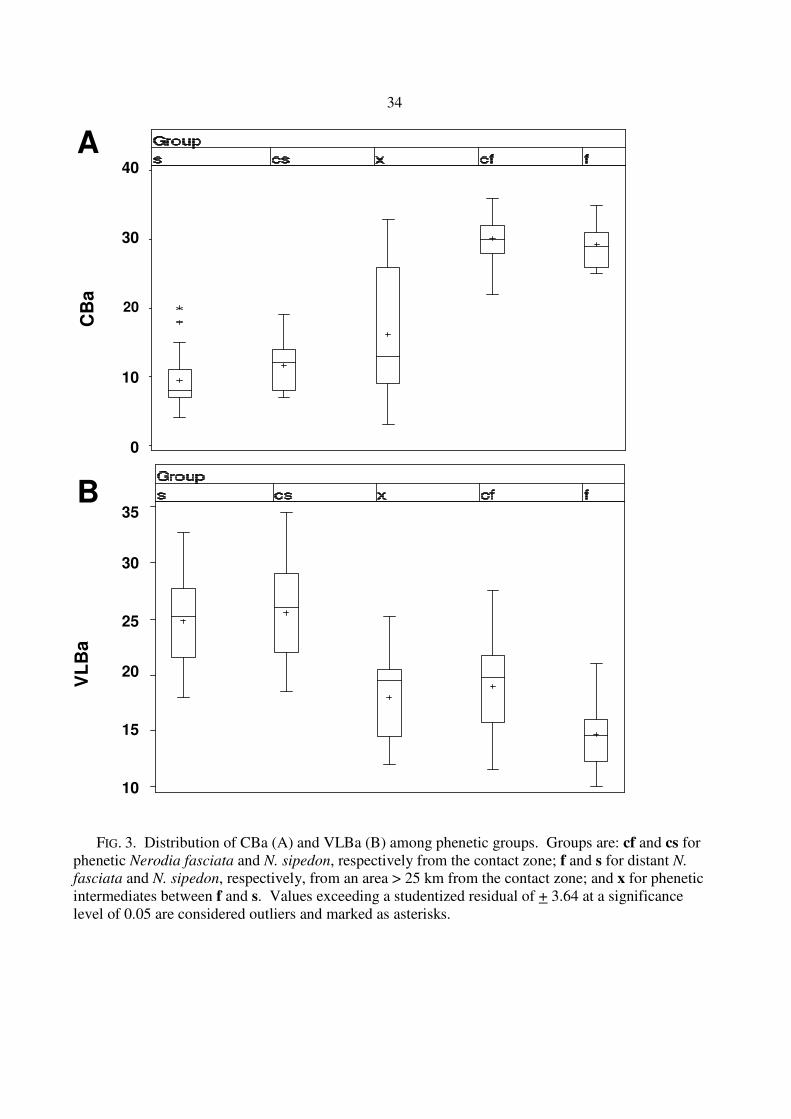
FIG. 6. Relationship of RoH on JawL in mm (A) and distribution of reTail (SVL/Tail) among phenetic groups and sexes. Phenetic groups are: cf and cs for phenetic Nerodia fasciata and N.
sipedon, respectively from the contact zone; f and s for distant N. fasciata and N. sipedon, respectively, from an area > 25 km away from the contact zone; and x for phenetic intermediates between f and s. Values exceeding a studentized residual of + 3.64 at a significance level of 0.05 are considered outliers and marked as asterisks.
reT
ail
A
4.5
4.0
3.5
3.0
2.5
2.0
B
58
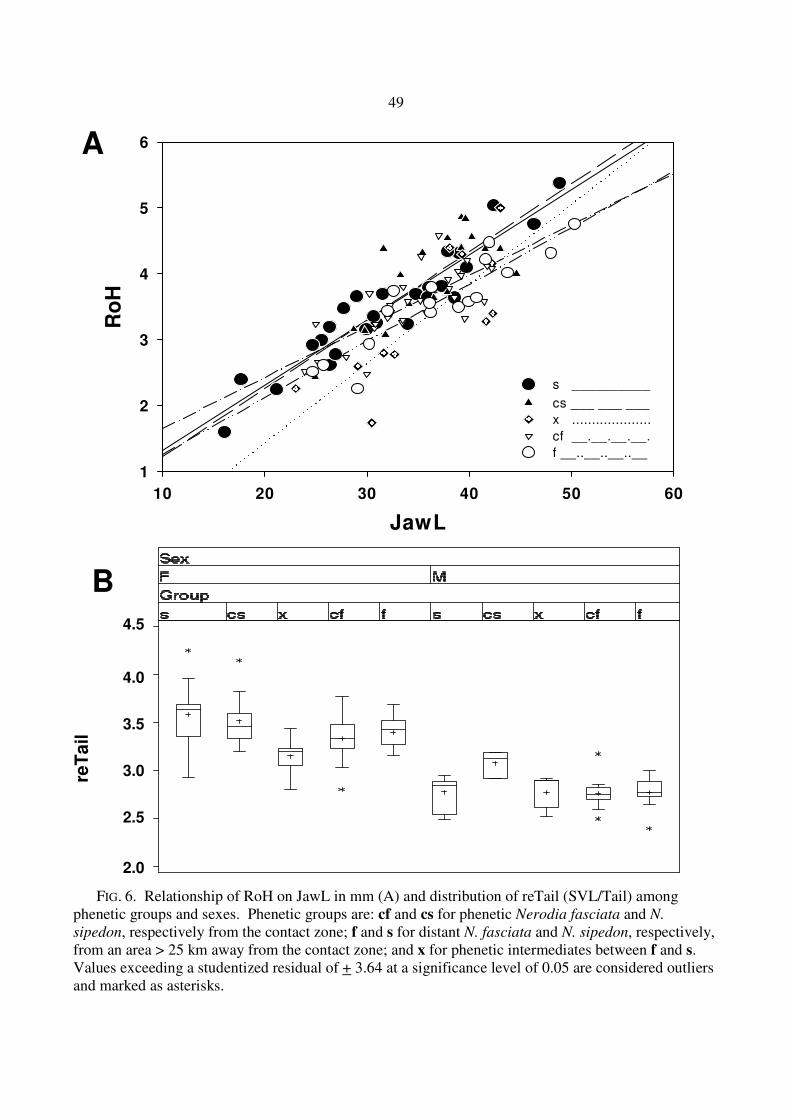
alternating posterior dorsal/lateral blotches in N. sipedon. An extension of the delineation by an
additional 25 km toward the previously presumed “pure” species’ ranges would incorporate those
populations into the contact zone boundaries that exhibit a morphological indication of introgression.
Similar results from the genetic analysis corroborate these morphological findings (see GEOGRAPHIC
SECTION).
-3
-2
-1
0
1
2
3
4
-4-3-2-10123
-4-3-2-101234
C1.3
C1.1
C1.2
s
cs
x
cf
f
FIG 10. Distributions of canonical scores from DFA1 based on three components of meristic
characters. Groups are: cf and cs for phenetic Nerodia fasciata and N. sipedon, respectively from the contact zone; f and s for distant N. fasciata and N. sipedon, respectively, from an area > 25 km from the contact zone; and x for phenetic intermediates between f and s.
64
GENETIC SECTION
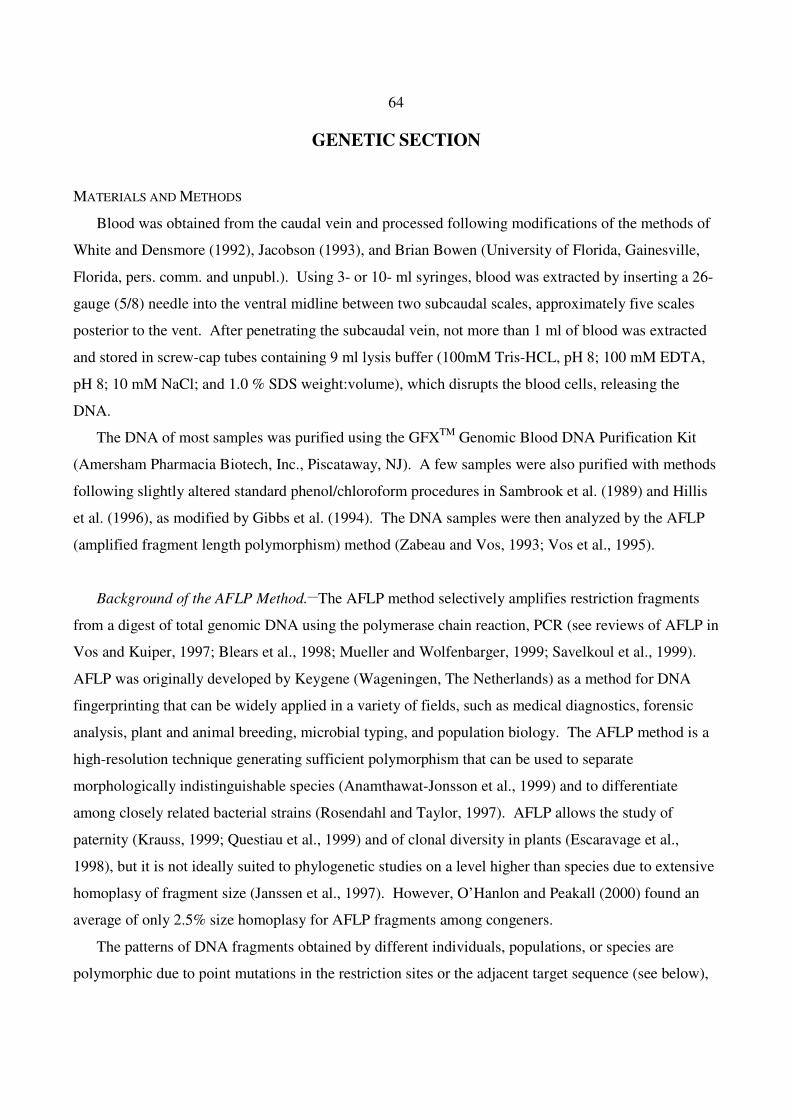
MATERIALS AND METHODS
Blood was obtained from the caudal vein and processed following modifications of the methods of
White and Densmore (1992), Jacobson (1993), and Brian Bowen (University of Florida, Gainesville,
Florida, pers. comm. and unpubl.). Using 3- or 10- ml syringes, blood was extracted by inserting a 26-
gauge (5/8) needle into the ventral midline between two subcaudal scales, approximately five scales
posterior to the vent. After penetrating the subcaudal vein, not more than 1 ml of blood was extracted
and stored in screw-cap tubes containing 9 ml lysis buffer (100mM Tris-HCL, pH 8; 100 mM EDTA,
pH 8; 10 mM NaCl; and 1.0 % SDS weight:volume), which disrupts the blood cells, releasing the
DNA.
The DNA of most samples was purified using the GFXTM Genomic Blood DNA Purification Kit
(Amersham Pharmacia Biotech, Inc., Piscataway, NJ). A few samples were also purified with methods
following slightly altered standard phenol/chloroform procedures in Sambrook et al. (1989) and Hillis
et al. (1996), as modified by Gibbs et al. (1994). The DNA samples were then analyzed by the AFLP
(amplified fragment length polymorphism) method (Zabeau and Vos, 1993; Vos et al., 1995).
Background of the AFLP Method.__The AFLP method selectively amplifies restriction fragments
from a digest of total genomic DNA using the polymerase chain reaction, PCR (see reviews of AFLP in
Vos and Kuiper, 1997; Blears et al., 1998; Mueller and Wolfenbarger, 1999; Savelkoul et al., 1999).
AFLP was originally developed by Keygene (Wageningen, The Netherlands) as a method for DNA
fingerprinting that can be widely applied in a variety of fields, such as medical diagnostics, forensic
analysis, plant and animal breeding, microbial typing, and population biology. The AFLP method is a
high-resolution technique generating sufficient polymorphism that can be used to separate
morphologically indistinguishable species (Anamthawat-Jonsson et al., 1999) and to differentiate
among closely related bacterial strains (Rosendahl and Taylor, 1997). AFLP allows the study of
paternity (Krauss, 1999; Questiau et al., 1999) and of clonal diversity in plants (Escaravage et al.,
1998), but it is not ideally suited to phylogenetic studies on a level higher than species due to extensive
homoplasy of fragment size (Janssen et al., 1997). However, O’Hanlon and Peakall (2000) found an
average of only 2.5% size homoplasy for AFLP fragments among congeners.
The patterns of DNA fragments obtained by different individuals, populations, or species are
polymorphic due to point mutations in the restriction sites or the adjacent target sequence (see below),
74
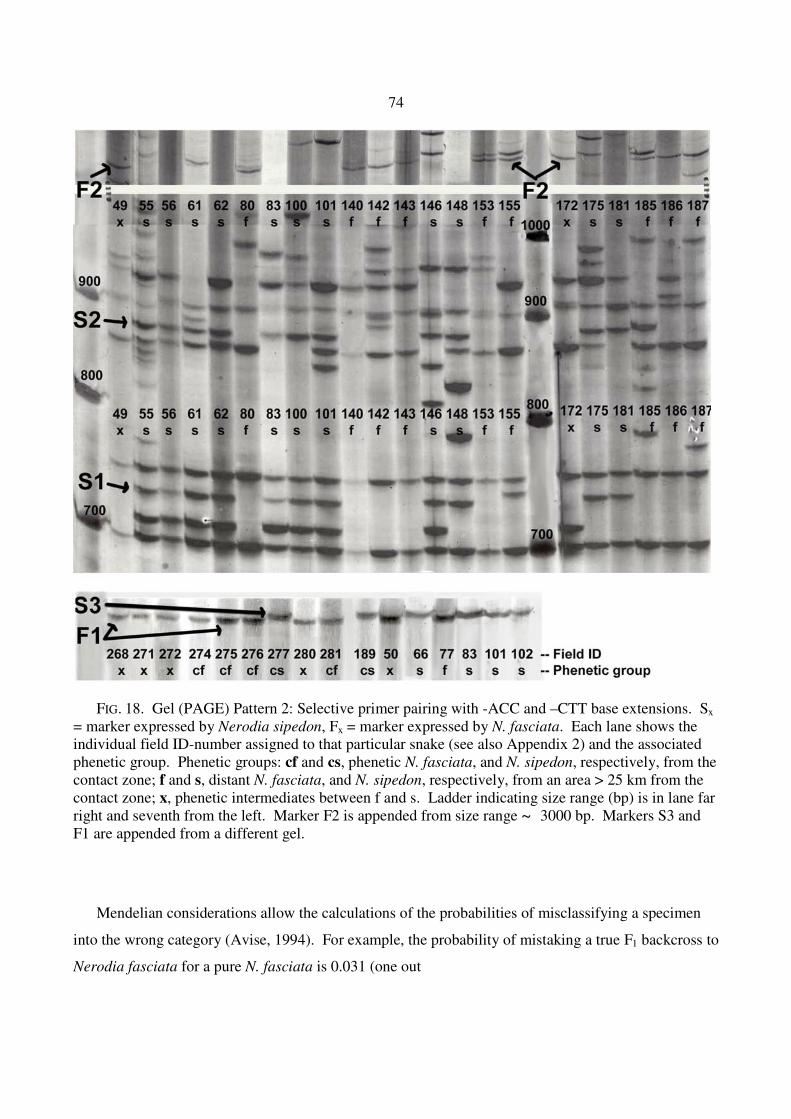
FIG. 18. Gel (PAGE) Pattern 2: Selective primer pairing with -ACC and –CTT base extensions. Sx = marker expressed by Nerodia sipedon, Fx = marker expressed by N. fasciata. Each lane shows the individual field ID-number assigned to that particular snake (see also Appendix 2) and the associated phenetic group. Phenetic groups: cf and cs, phenetic N. fasciata, and N. sipedon, respectively, from the contact zone; f and s, distant N. fasciata, and N. sipedon, respectively, from an area > 25 km from the contact zone; x, phenetic intermediates between f and s. Ladder indicating size range (bp) is in lane far right and seventh from the left. Marker F2 is appended from size range ~ 3000 bp. Markers S3 and F1 are appended from a different gel.
Mendelian considerations allow the calculations of the probabilities of misclassifying a specimen
into the wrong category (Avise, 1994). For example, the probability of mistaking a true F1 backcross to
Nerodia fasciata for a pure N. fasciata is 0.031 (one out
86
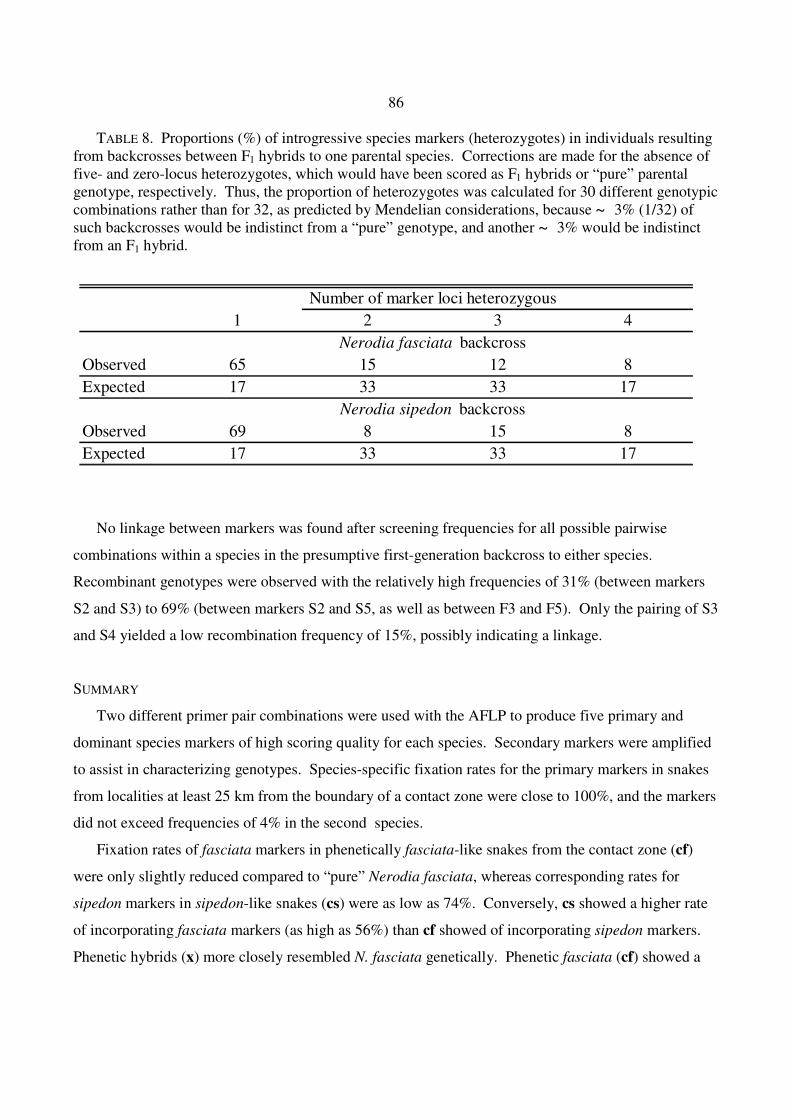
TABLE 8. Proportions (%) of introgressive species markers (heterozygotes) in individuals resulting from backcrosses between F1 hybrids to one parental species. Corrections are made for the absence of five- and zero-locus heterozygotes, which would have been scored as F1 hybrids or “pure” parental genotype, respectively. Thus, the proportion of heterozygotes was calculated for 30 different genotypic combinations rather than for 32, as predicted by Mendelian considerations, because ~ 3% (1/32) of such backcrosses would be indistinct from a “pure” genotype, and another ~ 3% would be indistinct from an F1 hybrid.
No linkage between markers was found after screening frequencies for all possible pairwise
combinations within a species in the presumptive first-generation backcross to either species.
Recombinant genotypes were observed with the relatively high frequencies of 31% (between markers
S2 and S3) to 69% (between markers S2 and S5, as well as between F3 and F5). Only the pairing of S3
and S4 yielded a low recombination frequency of 15%, possibly indicating a linkage.
SUMMARY
Two different primer pair combinations were used with the AFLP to produce five primary and
dominant species markers of high scoring quality for each species. Secondary markers were amplified
to assist in characterizing genotypes. Species-specific fixation rates for the primary markers in snakes
from localities at least 25 km from the boundary of a contact zone were close to 100%, and the markers
did not exceed frequencies of 4% in the second species.
Fixation rates of fasciata markers in phenetically fasciata-like snakes from the contact zone (cf)
were only slightly reduced compared to “pure” Nerodia fasciata, whereas corresponding rates for
sipedon markers in sipedon-like snakes (cs) were as low as 74%. Conversely, cs showed a higher rate
of incorporating fasciata markers (as high as 56%) than cf showed of incorporating sipedon markers.
Phenetic hybrids (x) more closely resembled N. fasciata genetically. Phenetic fasciata (cf) showed a
1 2 3 4
Observed 65 15 12 8
Expected 17 33 33 17
Observed 69 8 15 8
Expected 17 33 33 17
Number of marker loci heterozygous
Nerodia sipedon backcross
Nerodia fasciata backcross
88
GEOGRAPHIC SECTION
This section describes the phenotypes and genotypes of Nerodia sipedon and N. fasciata in and near
their contact zone in the Carolinas. Epithets (sipedon or fasciata) are used to refer to species-typical
attributes of genetic or morphological characters. For this discussion, snakes were categorized in
several ways. First, phenotypes of individuals were compared using traditional diagnostic features of
color pattern (dorsal banding pattern, postocular stripe, and ventral pattern: Blanchard, 1925; Clay,
1938; Conant, 1963; Conant and Collins, 1991). The expressions “phenetic fasciata” and “phenetic
sipedon” (fasciata-like or sipedon-like, respectively) refer to this traditional classification system.
Second, phenotypes were compared with canonical variable scores resulting from three
discriminant function analyses (DFA1-DFA3). The first components (canonical variables) of the three
DFAs describe overall morphological expression and allow allocation of individuals to the nominal
species with which they share the greatest morphological similarity (Fig. 9; Table 5). Redundant,
hybrid-index, and sexually dimorphic characters were excluded from the DFAs because of low sample
sizes and non-normal distribution of values. In addition, the only fully diagnostic morphological
character for the Carolinas, the number of complete dorsal crossbands (CBa), was removed from the
DFA because it exerted a disproportionately large influence in determining group allocation and thus
masked the influence of other characters. For example, an individual with a sipedon-like dorsal
banding pattern (CBa) may have been classified as N. sipedon, even though most other characters
placed it closer to N. fasciata. Presumably phenetic classification based on many characters is more
reliable than classification based on a single character. The scores of DFA2 (C2.1) and DFA3 (C3.1)
therefore are preferred because they combine the largest number of meristic and morphometric
characters. Missing C2.1 or C3.1 scores were complemented with meristic scores of DFA1 (C1.1). All
three DFAs are comparable, as the ventral extension of lateral bands (VLBa) and the number of ventral
scales (VPV) showed the strongest correlations with the first component of each DFA. DFA scores
and a list of specimens, localities and genotypes are listed in Appendix 2.
Third, genotypes were compared with presence/absence data from 10 primary diagnostic species
markers (five markers for each species). The two genetic markers with the highest number of scored
snakes (S49: n = 253; S53: n = 263) were selected from the set of secondary markers to screen for
potential heterozygous (hybrid) conditions in loci of snakes that otherwise appeared to represent a
”pure” species based on the 10 primary markers only (see GENETIC SECTION). Such snakes would
be classified as later-generation hybrids and exhibit low levels of introgression.
94
107
DISCUSSION
MORPHOLOGICAL SECTION
Although many of the morphological characters showed significantly different distributions
between Nerodia sipedon and N. fasciata from the Carolinas, they do not qualify as diagnostic features
(with the exception of Cba, see below). In the following discussion the interspecific and intraspecific
variation of morphological characters is compared to that found in other studies and is interpreted in
regard to their possible underlying biological bases. These interspecific differences are discussed in an
ecological context, which is related to the geographic location of the hybrid zone.
Meristic Data
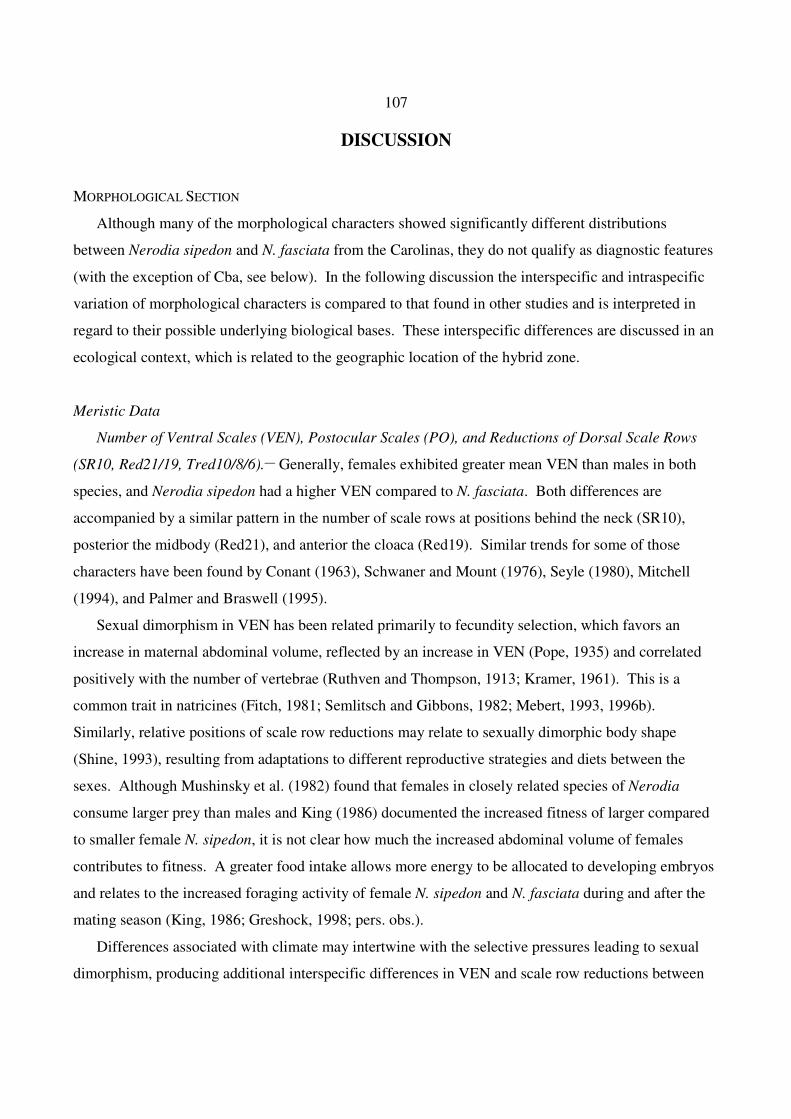
Number of Ventral Scales (VEN), Postocular Scales (PO), and Reductions of Dorsal Scale Rows
(SR10, Red21/19, Tred10/8/6).__ Generally, females exhibited greater mean VEN than males in both
species, and Nerodia sipedon had a higher VEN compared to N. fasciata. Both differences are
accompanied by a similar pattern in the number of scale rows at positions behind the neck (SR10),
posterior the midbody (Red21), and anterior the cloaca (Red19). Similar trends for some of those
characters have been found by Conant (1963), Schwaner and Mount (1976), Seyle (1980), Mitchell
(1994), and Palmer and Braswell (1995).
Sexual dimorphism in VEN has been related primarily to fecundity selection, which favors an
increase in maternal abdominal volume, reflected by an increase in VEN (Pope, 1935) and correlated
positively with the number of vertebrae (Ruthven and Thompson, 1913; Kramer, 1961). This is a
common trait in natricines (Fitch, 1981; Semlitsch and Gibbons, 1982; Mebert, 1993, 1996b).
Similarly, relative positions of scale row reductions may relate to sexually dimorphic body shape
(Shine, 1993), resulting from adaptations to different reproductive strategies and diets between the
sexes. Although Mushinsky et al. (1982) found that females in closely related species of Nerodia
consume larger prey than males and King (1986) documented the increased fitness of larger compared
to smaller female N. sipedon, it is not clear how much the increased abdominal volume of females
contributes to fitness. A greater food intake allows more energy to be allocated to developing embryos
and relates to the increased foraging activity of female N. sipedon and N. fasciata during and after the
mating season (King, 1986; Greshock, 1998; pers. obs.).
Differences associated with climate may intertwine with the selective pressures leading to sexual
dimorphism, producing additional interspecific differences in VEN and scale row reductions between
125
(0.5-10.6 ppt) on the other side. Six hours later, such salinity values change again, due to tidal
movement. Nonetheless, the barrier presented by salinity gradients appears to be particularly effective,
creating the narrowest hybrid zone in this study (< 3 km).
Temperature
Interspecific differences in temperature tolerance are related to geographic range and features of the
habitat, suggesting an adaptive basis of thermal tolerances (Lillywhite, 1987). Nerodia sipedon
occupies a colder climate in northern or mountainous regions. Physiological adaptation to cool
temperature in N. sipedon has been observed by Blem and Blem (1990), as it acclimates more rapidly
to varying temperatures than its congener N. taxispilota. No comparable data are available for N.
fasciata.
Some experimental and observational data indicate that Nerodia sipedon prefers a lower mean
temperature (25oC) than N. fasciata (27-28oC) (Mushinsky et al., 1980; Michot, 1981; Blem and Blem,
1990). However, other studies reported a preferred temperature for N. sipedon of 28 oC, similar to that
of N. fasciata (Kitchell, 1969; Lutterschmidt and Reinert, 1990). Furthermore, Mushinsky et al. (1980)
found that monthly profiles of body temperatures in N. fasciata from Louisiana closely reflect the
changes of temperatures of water in which the majority of individuals were captured. In both species,
individuals shuttle between air and water, selecting the warmer medium (Brown, 1940; Osgood, 1970),
thus influencing diurnal and nocturnal activity (Swanson, 1952; pers. obs.).
In temperate regions, Nerodia sipedon may thermoregulate and forage under suboptimal thermal
conditions due to prey availability, predator avoidance, feeding status, dehydration risk, mating season
and location (e.g., Huey et al., 1989; Knowles and Weigl, 1990; Dalrymple et al., 1991). For example,
N. sipedon emerges within days of the snowmelt in Canada (Scribner and Weatherhead, 1994) and has
been observed to be active at temperatures as low as 13.0oC (Mitchell, 1994), 11.0oC (this study),
10.0oC (Brown, 1940), and entering water of 5.0oC (King, 1986). Active N. fasciata have not been
recorded at such low temperatures (Mushinsky et al., 1980; Michot, 1981; this study). Hence, N.
fasciata may be intolerant of cooler temperatures during the active season, thus limiting its expansion
into the range of N. sipedon.
Although mean annual air temperature is only one measure of the temperatures experienced by
snakes in a given area, it correlates positively with body temperature in snakes (Gregory, 1984;
Mushinsky et al., 1980). Hence, annual average air temperature is used as a simple index of
temperature regime in an area. The northern limit of the range of Nerodia fasciata in North Carolina
134
the Tar River drainage in northern North Carolina (Area 3) is consistent with a gradual transition of
topography.
Although hypotheses about the role of ecological variables and their morphological correlates in
determining the position of the hybrid zones require experimental testing (Reinert, 1993), the
concordance between transitions of environmental features and genetic species markers strongly
suggest a causal relationship. This is unlike the tension zone or dynamic equilibrium model, in which
hybrids are less fit and selection is balanced against dispersal, producing a hybrid zone of constant
width, located in regions of low population densities (Barton, 1979; Harrison, 1993). However, the
possible selection against increased hybridization in certain backcrosses may fit the tension zone
model. The environmental data underlying the contact zones, and the selection for and against
different hybrid genotypes correspond to the Evolutionary Novelty Model proposed by Arnold (1997).
SYSTEMATIC IMPLICATIONS FOR NERODIA SIPEDON AND N. FASCIATA
Species Concepts
One of the objectives in this study was to determine which species concept best describes the
relationship between Nerodia fasciata and N. sipedon. First, the primary genetic species markers with
nearly 100% fixation rates produced with the AFLP method fulfill the requirement of the Phylogenetic
Species Concept (Cracraft, 1983) by demonstrating diagnosable characters clearly distinguishing two
species. All N. sipedon from localities outside the contact zone were unified by at least five diagnostic
species markers, including individuals from localities as distant as Pohick Bay Regional Park, Fairfax
Co., VA; Augusta, GA; Manteo, Roanoke Island, Dare Co., NC; and Grapefield, Bland Co., VA. N.
fasciata was also identified by at least five diagnosable genetic markers that unify individuals from
north of the Albemarle Sound, NC, to those from Sarasota Co., FL. There was a transition between
these species markers across a relatively narrow hybrid zone that varied between 5-70 km in width.
The reliability of these species markers was not tested on specimens outside the study area (the
southeastern US), but the high frequency of secondary species markers corroborates the validity of the
primary genetic species markers and is consistent with substantial divergence between N. fasciata and
N. sipedon (Mebert, 2008).
Second, despite the new genetic evidence supporting the specific status of Nerodia fasciata and N.
sipedon, substantial gene flow between those species in the Carolinas confirms previously suspected
introgression based on morphological intermediacy (e.g., Conant, 1963; Schwaner et al., 1976; Blaney
and Blaney, 1979). However, unbalanced genotype frequencies (deviation from Hardy Weinberg
136
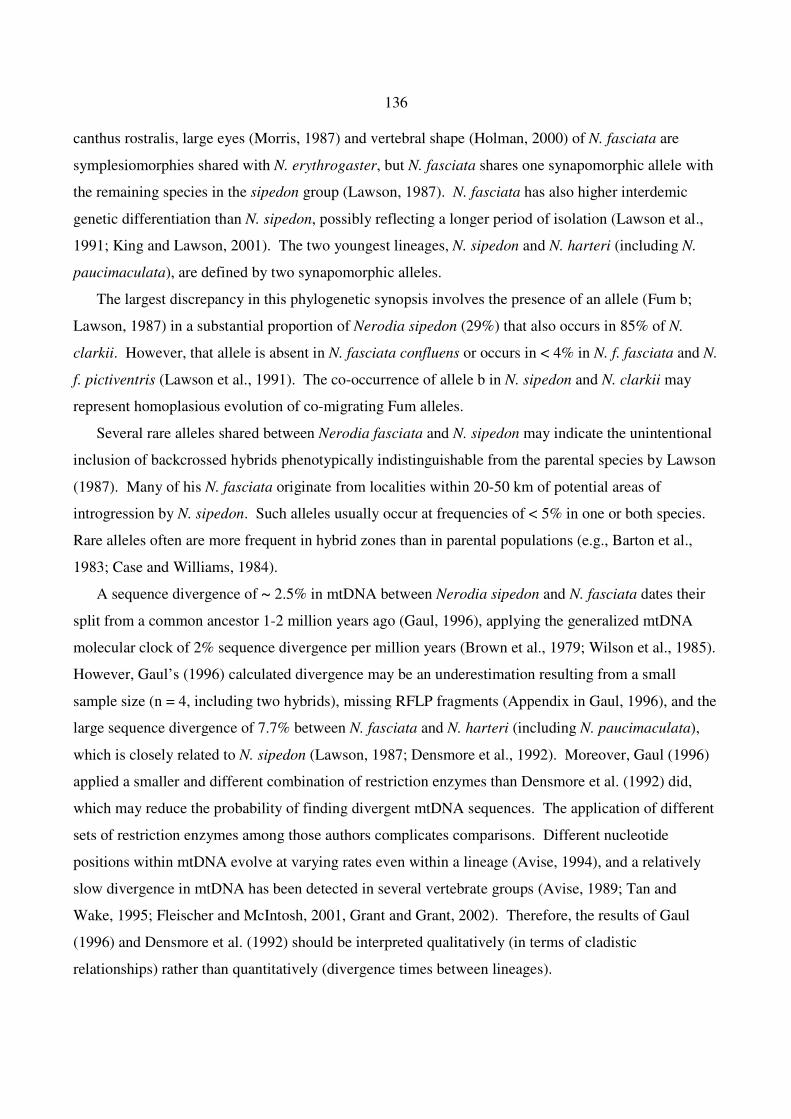
canthus rostralis, large eyes (Morris, 1987) and vertebral shape (Holman, 2000) of N. fasciata are
symplesiomorphies shared with N. erythrogaster, but N. fasciata shares one synapomorphic allele with
the remaining species in the sipedon group (Lawson, 1987). N. fasciata has also higher interdemic
genetic differentiation than N. sipedon, possibly reflecting a longer period of isolation (Lawson et al.,
1991; King and Lawson, 2001). The two youngest lineages, N. sipedon and N. harteri (including N.
paucimaculata), are defined by two synapomorphic alleles.
The largest discrepancy in this phylogenetic synopsis involves the presence of an allele (Fum b;
Lawson, 1987) in a substantial proportion of Nerodia sipedon (29%) that also occurs in 85% of N.
clarkii. However, that allele is absent in N. fasciata confluens or occurs in < 4% in N. f. fasciata and N.
f. pictiventris (Lawson et al., 1991). The co-occurrence of allele b in N. sipedon and N. clarkii may
represent homoplasious evolution of co-migrating Fum alleles.
Several rare alleles shared between Nerodia fasciata and N. sipedon may indicate the unintentional
inclusion of backcrossed hybrids phenotypically indistinguishable from the parental species by Lawson
(1987). Many of his N. fasciata originate from localities within 20-50 km of potential areas of
introgression by N. sipedon. Such alleles usually occur at frequencies of < 5% in one or both species.
Rare alleles often are more frequent in hybrid zones than in parental populations (e.g., Barton et al.,
1983; Case and Williams, 1984).
A sequence divergence of ~ 2.5% in mtDNA between Nerodia sipedon and N. fasciata dates their
split from a common ancestor 1-2 million years ago (Gaul, 1996), applying the generalized mtDNA
molecular clock of 2% sequence divergence per million years (Brown et al., 1979; Wilson et al., 1985).
However, Gaul’s (1996) calculated divergence may be an underestimation resulting from a small
sample size (n = 4, including two hybrids), missing RFLP fragments (Appendix in Gaul, 1996), and the
large sequence divergence of 7.7% between N. fasciata and N. harteri (including N. paucimaculata),
which is closely related to N. sipedon (Lawson, 1987; Densmore et al., 1992). Moreover, Gaul (1996)
applied a smaller and different combination of restriction enzymes than Densmore et al. (1992) did,
which may reduce the probability of finding divergent mtDNA sequences. The application of different
sets of restriction enzymes among those authors complicates comparisons. Different nucleotide
positions within mtDNA evolve at varying rates even within a lineage (Avise, 1994), and a relatively
slow divergence in mtDNA has been detected in several vertebrate groups (Avise, 1989; Tan and
Wake, 1995; Fleischer and McIntosh, 2001, Grant and Grant, 2002). Therefore, the results of Gaul
(1996) and Densmore et al. (1992) should be interpreted qualitatively (in terms of cladistic
relationships) rather than quantitatively (divergence times between lineages).
169
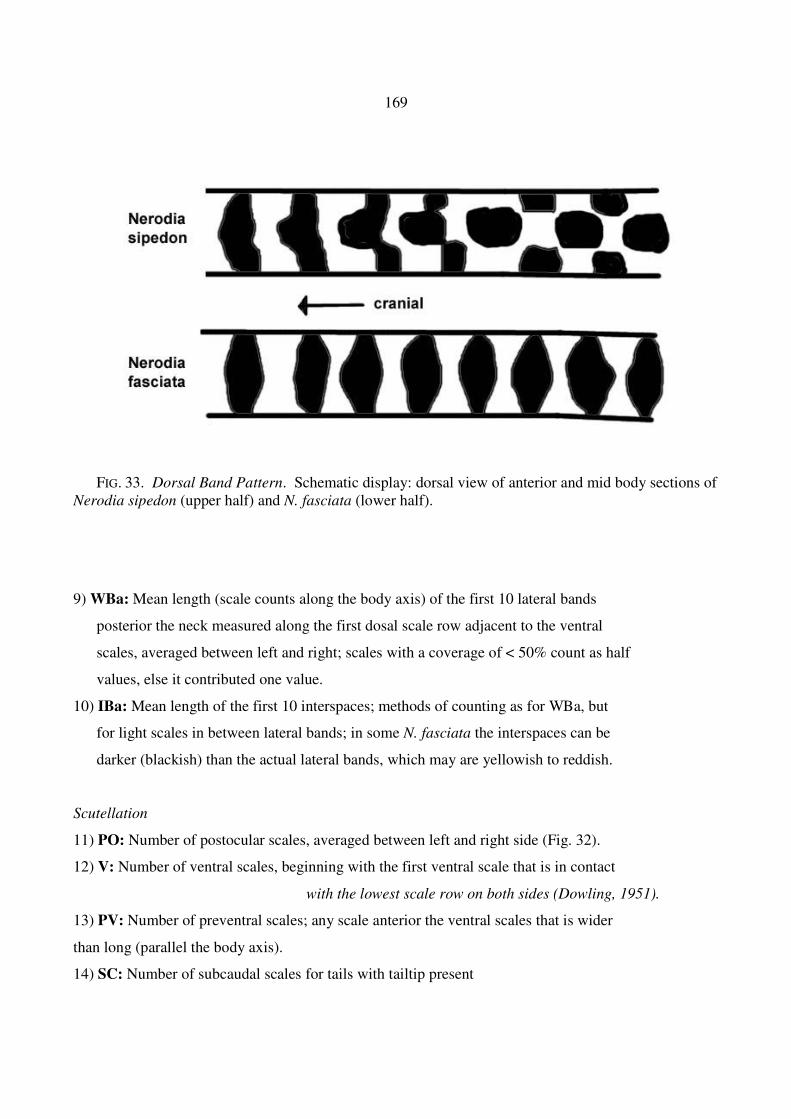
FIG. 33. Dorsal Band Pattern. Schematic display: dorsal view of anterior and mid body sections of Nerodia sipedon (upper half) and N. fasciata (lower half).
9) WBa: Mean length (scale counts along the body axis) of the first 10 lateral bands
posterior the neck measured along the first dosal scale row adjacent to the ventral
scales, averaged between left and right; scales with a coverage of < 50% count as half
values, else it contributed one value.
10) IBa: Mean length of the first 10 interspaces; methods of counting as for WBa, but
for light scales in between lateral bands; in some N. fasciata the interspaces can be
darker (blackish) than the actual lateral bands, which may are yellowish to reddish.
Scutellation
11) PO: Number of postocular scales, averaged between left and right side (Fig. 32).
12) V: Number of ventral scales, beginning with the first ventral scale that is in contact
with the lowest scale row on both sides (Dowling, 1951).
13) PV: Number of preventral scales; any scale anterior the ventral scales that is wider
than long (parallel the body axis).
14) SC: Number of subcaudal scales for tails with tailtip present