masseter muscle volume measured using ultrasonography and its relationship with facial morphology
TRANSCRIPT
Introduction
Certain parameters of masticatory musclefunction have been shown to correlate with facialmorphology, including electromyographic activity(Ahlgren, 1966; Ingervall and Thilander, 1974;Lowe and Takada, 1984; Ueda et al., 1998) andocclusal force (Sassouni, 1969; Ringqvist, 1973;Ingervall and Helkimo, 1978; Proffit et al., 1983).These investigators have found that stronger, moreactive muscles are associated with a tendency toparallelism of the jaws and other features of theshort face syndrome (Opdebeeck and Bell, 1978).
With the advent of modern imaging techniques,it has become possible to measure the size of themasticatory muscles in vivo. Weijs and Hillen(1984a, 1986) correlated the cross-sectional areaof the masticatory muscles in males with skullshape, using computer tomography (CT), havingpreviously demonstrated that muscle cross-sectional areas were proportional to their corres-ponding physiological cross-sections (Weijs andHillen, 1984b). Large masseter and medialpterygoid muscle areas were associated withsubjects possessing small gonial angles and long
European Journal of Orthodontics 21 (1999) 659–670 1999 European Orthodontic Society
Masseter muscle volume measured using
ultrasonography and its relationship with
facial morphology
Philip C. M. Benington*, John E. Gardener** and Nigel P. Hunt****Department of Orthodontics, Glasgow Dental Hospital and School, **Department of MedicalPhysics, University College, London and ***Department of Orthodontics, Eastman Dental Institutefor Oral Health Care Sciences, University of London, UK
SUMMARY The aims of this study were to measure the volume, cross-sectional area, thick-ness, width, and length of contracted masseter muscles in a sample of adults, four malesand six females, using three-dimensional (3D) ultrasonography, and to correlate thesemeasurements with the variations in facial morphology of the sample. The scans werecarried out bilaterally using a hand-held probe carrying a magnetic positional sensor, whichenabled a computer to reconstruct the images into a 3D array of slices. Measurements weremade by the computer from the reconstructed images using specially written software.Cephalometric analysis initially involved seven angular, eight linear, and two proportionalvariables, but as these were strongly inter-dependent, the variables were reduced to fourprincipal components prior to statistical comparison with the mean muscle variables.
The values found for muscle volume, cross-sectional area, and thickness were broadlyconsistent with those of previous investigators. Volume showed a significant, negative cor-relation with mandibular inclination including gonial angle (P ≤ 0.001), and a significant,positive correlation with total posterior face height and ramus height (P ≤ 0.001), and lowerposterior face height percentage (P ≤ 0.01). Weaker correlations were found for length andthickness.
While the results support existing evidence that large masticatory muscles are asso-ciated with brachycephalism and vice versa, a cautious interpretation is necessary in viewof the small sample size. The 3D ultrasonography system is at an experimental stage andrequires further development and evaluation.
mandibles. Gionhaku and Lowe (1989) calculatedmasseter and medial pterygoid muscle volumes,and cross-sectional areas from CT scans of adultmales with obstructive sleep apnoea. Massetermuscle volume showed a negative correlationwith the steepness of the mandibular plane andthe size of the gonial angle, and a positive cor-relation with posterior face height, ramus height,and the ratio of ramus height to anterior faceheight. Eckhardt and Harzer (1993) used CT to measure the volume of masseter, medial and lateral pterygoids, genioglossus, and tonguemuscles. They concluded that an increasingvolume of masseter muscle in subjects rangingfrom 12 to 39 years of age was related to ananterior growth direction of the mandible.
Magnetic resonance imaging (MRI) was usedby Hannam and Wood (1989) who found acorrelation between the cross-sectional area ofmasseter and bi-zygomatic width in 22 adultsmales. Van Spronsen et al. (1991), also usingMRI, found positive, significant correlationsbetween a linear combination of several trans-verse skull dimensions, and the maximal cross-sectional areas of the temporalis and massetermuscles.
Ultrasonography (US) has been used by anumber of investigators to measure massetermuscle. Raadsheer et al. (1994) compared bothUS and MRI in the measurement of mid-bellymasseter muscle thickness and showed US to bean accurate and reproducible imaging technique.Kiliaridis and Kalebo (1991) correlated massetermuscle thickness with certain transverse facialmeasurements taken from standardized photo-graphs. Bakke et al. (1992) found a negativecorrelation between maximal thickness of thesuperficial portion of the human masseter muscleand anterior face height, vertical jaw relation-ship, and mandibular inclination. Ruf et al.(1994) found that masseter thickness and widthcorrelated only weakly with small facial widthand jaw divergence measurements taken fromphotographs of females. Kubota et al. (1998)found mean masseter muscle thickness to bepositively correlated with mandibular ramusheight, and the thickness of the alveolar processand mandibular symphysis, and negativelycorrelated with mandibular inclination.
Although linear and area measurements ofisolated masticatory muscle cross-sections havealready been shown to correlate with facialvariables, the sites at which they have been takenhave varied between investigators, making directcomparisons difficult. The volume of a muscle is a more comprehensive representation of itsoverall dimensions, taking into account its cross-section as well as its length. Masseter musclelength might be expected to correlate with facialform, since mandibular ramus height has beenshown to vary with the vertical dimension of the face, being increased in short-faced subjects(Schendel et al., 1976; Opdebeeck and Bell,1978).
No study has been published to date in whichmuscle volume has been measured using US,although it is a non-invasive imaging technique,and has the advantages over CT and MRI of beingrelatively inexpensive and less complicated touse. This is partly because US has lagged behindthese other techniques in establishing practical3D visualization due to problems associated withacquiring and displaying 3D sets of data. Onesuch problem is the background texture con-tained in US images, which is referred to as‘speckle’, and is produced by a variety of effects,including acoustic interference. In addition, USgenerates non-zero signals only on local gradientsof the acoustic properties, so that the essentialcharacter of the image is discontinuous. Theseproblems and some of their possible solutionshave been outlined by Gardener (1991).
A number of diagnostic applications of 3D UShave been described in the literature. Hell et al.(1993) reported on a 3D US diagnostic tool formaxillofacial surgery, and subsequently producedimages of the vascular structures of the neck usinga probe guidance device to produce equidistantand parallel 2D US images (Hell, 1995). Thissystem is apparently capable of volume measure-ments. The masseter is a superficially placed,quadrate muscle and, therefore, well suited toUS scanning. The aims of this study were tomeasure masseter muscle volume on a smallsample of subjects using a quantitative 3D US system developed by Gardener (1991) and to investigate its relationship with facialmorphology.
660 P. C. M. BENINGTON ET AL.
Subjects and methods
The sample consisted of four males and sixfemales, all of whom were patients attending the orthognathic surgery planning clinic at theEastman Dental Hospital, London. They wereall post-adolescent with intact dentitions, nomarked jaw asymmetries, and no history oforthodontic treatment or orthognathic surgery.The age range for the females was 15 years 7 months to 31 years 8 months, and for the males20 years 11 months to 26 years 7 months. The subjects were selected to include a range ofskeletal jaw discrepancies, both in the antero-posterior and vertical dimensions. Selection wasbased on examination of the subjects’ lateralskull cephalograms, taken with the teeth inocclusion.
Ultrasonography
All scans were carried out in the Ultrasonog-raphy Department of the Middlesex Hospital,London by one of the authors (JEG), using areal-time scanner (Acuson 128TM, AcusonCorporation, Mountain View, CA) with a 38-mmwide, 7 MHz linear probe. The subjects wereplaced in a supine position, with their headsturned sideways to provide good access for theprobe. A 2-mm thick stand-off (Geliperm WetTM,Geistlich-Pharma, Wolhusen, Switzerland) wasplaced directly over the masseter region, with USgel applied to both surfaces. The subjects wereinstructed to keep their heads still and clenchtheir back teeth together during scan registration.
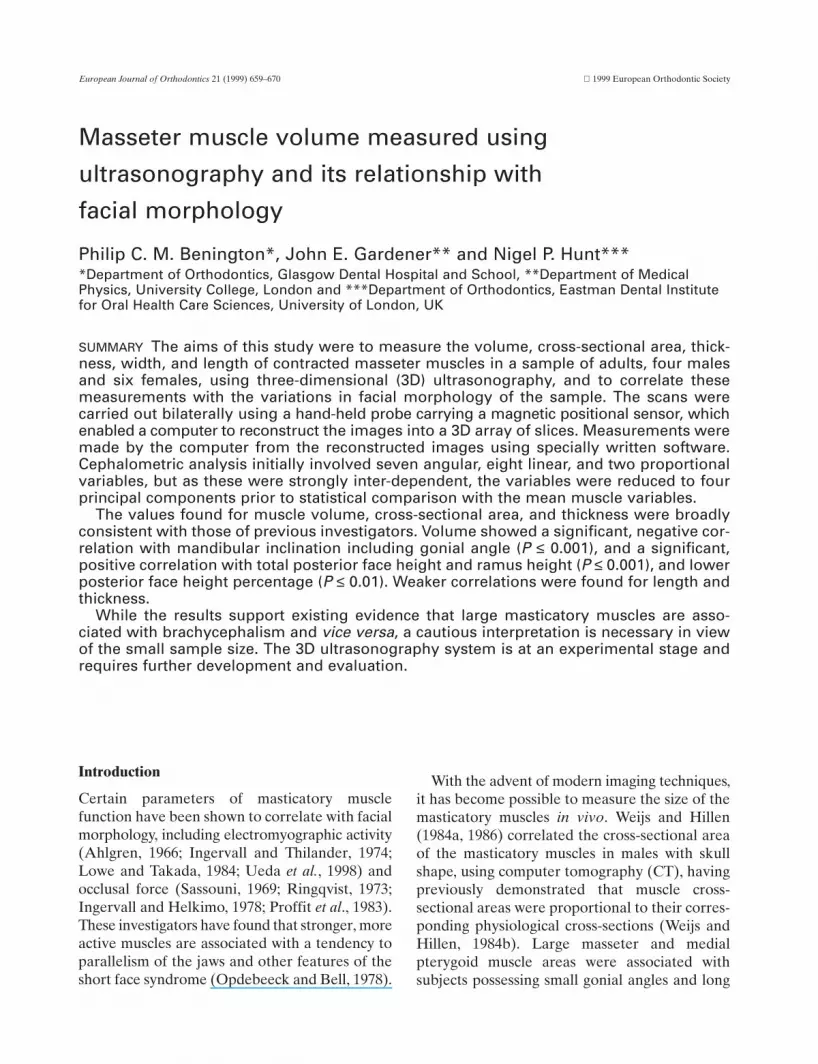
The angle of the probe during scanning wasadjusted to produce the strongest echo from themandibular ramus, achieved when the scan planewas perpendicular to its surface (Kiliaridis andKalebo, 1991). In order to register the scanplanes at right angles to the long axis of themuscle, the probe was visually orientated at anestimated 30 degrees to the Frankfort plane. Thiswas consistent with the technique of Weijs andHillen (1984b) and van Spronsen et al. (1991).The orientation of the probe was maintainedmanually, while the full length of the muscle wasscanned from origin to insertion. Although earlyscans relied on a single sweep of the probe to
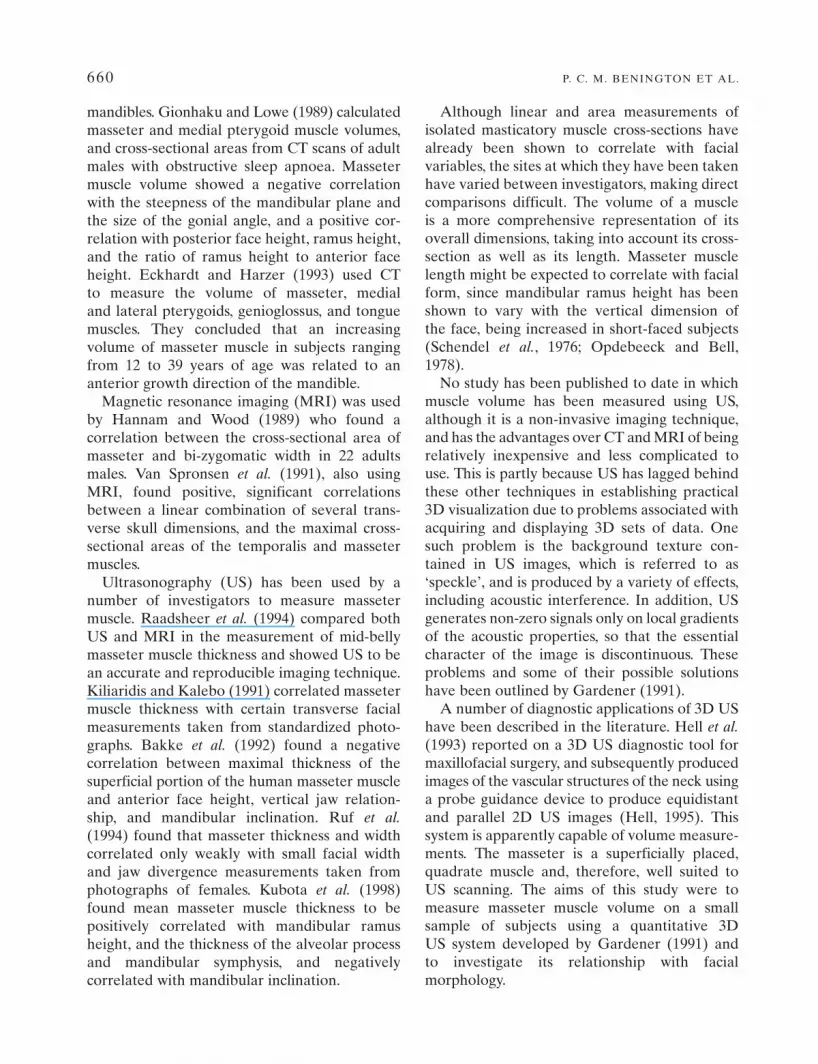
capture as much of the muscle width as possible(Figure 1), later images were produced usingmultiple parallel scan sweeps (Figure 2). In thesecases, the first sweep was carried out as for asingle sweep scan, following which the computersoftware enabled parallel displacements of thesweep to fill in any missed portions of theanterior and posterior muscle borders.
Three-dimensional data acquisition was bymeans of a specially developed system (Gardener,1991), based on a video frame grabber (TheHarlequinTM, Quintek Ltd, Westbury-on-Trym,Bristol, UK) linked to a computer, which allowedvideo images to be stored at the update rates of most US scanners. The scans were recorded as
MASSETER MUSCLE VOLUME AND FACIAL MORPHOLOGY 661
Figure 1 Ultrasound image of masseter registered using asingle scan sweep. A small section of the muscle has notbeen imaged due to the probe being of inadequate width.
Figure 2 Ultrasound image of masseter registered usingtwo parallel scan sweeps. A more complete image has beenproduced than would have been possible using only a singlesweep.

a series of slices using positional informationfrom a magnetic 3D sensor attached to the USprobe. This enabled each component of thesignal to be assigned its correct position in 3D image space. The images were reconstructedby the computer into an array of typically, 128 × 128 × 100 voxels and displayed as a seriesof consecutive ‘slices’ at intervals of 1.56 mm ona 3D workstation (Linney et al., 1989).
To enable the computer to identify the imagearea composed of muscle, thresholding wasemployed to adjust the ultrasonic signal level inorder to achieve optimal visualization of thoseelements of the image to be judged as masseter.The boundaries of masseter were then manuallyoutlined on alternate slices using a cursor (Figure3). Where sections of the images were missing orpoorly defined, an estimated boundary wasinserted. The interval between outlined imageswas thus 3.12 mm. When reconstructing thecomplete muscle image the computer inter-polated the muscle contour in between slices.Each slice, therefore, represented a volume ofmuscle equal to its cross-sectional area multi-plied by the slice interval. The complete array ofdelineated slices representing the 3D muscleimage was then displayed, and could be rotatedand viewed in all three planes of space, as couldselected individual slices or sections of theimage.
Muscle measurements
Volume measurement was based on a count ofthe number of 3D image volume elements(voxels) selected to represent the muscle, ratherthan using approximate geometric methods. Thisselection, or segmentation, was based upon themanual outlining process described above, whichresulted in a proportion of the voxels beinglabelled as comprising the muscle volume. Thevoxel count was effected automatically by thecomputer software and allowed volume meas-urement to within an accuracy of 1 mm3. Musclelength was computed by positioning a cursor atthe top and bottom of the array of slices on thevisual display unit (VDU), parallel with the longaxis of the muscle image (Figure 4). The remain-ing measurements were made from the mid-bellyportion of the muscle images (Figure 4), sincethis was found to be the most clearly defined. To calculate the mean mid-belly cross-sectionalarea, the volume of a five-slice section of themuscle image, equidistant from either end of the complete image, was divided by five timesthe slice thickness. To measure the mean mid-belly thickness (medio-laterally) and width(antero-posteriorly), three alternate slices from
662 P. C. M. BENINGTON ET AL.
Figure 3 Masseter scan on which the muscle boundary hasbeen delineated using a cursor. This enabled the areacomposed of muscle to be identified by the computer. Anestimated boundary has been inserted where the muscleimage is incomplete at its anterior border.
Figure 4 Diagrammatic representation of masseter imageconsisting of an array of delineated muscle ‘slices’. Volumemeasurement was computed from the total number ofvoxels occupied by the muscle image. Muscle length wasmeasured by the computer between cursors A and B, placedat the top and bottom of the image, in line with its long axis.The five darkly-shaded slices in the middle of the arrayrepresent those from which cross-sectional area, thickness,and width were calculated.

the middle five-slice section were viewed indi-vidually in cross-section and measured using theVDU cursors (Figure 5).
Cephalometry
Standardized lateral skull radiographs weretaken for all subjects with the Frankfort planehorizontal and the teeth in occlusion. The land-marks were digitized and a cephalometric analysiscarried out by the computer consisting of sevenangular, eight linear and two proportionalvariables (Figures 6 and 7). The variables wereselected so that the different dimensions of thefacial skeleton were described by groups of inter-related angular and linear measurements, whichwere then reduced to four principal componentsby means of a principal component analysis.
Sources of error
The US system was subject to errors inherent inthe scanning technique, the image reconstructionprocess and the image measurement method.The orientation of the probe was maintainedmanually during scan registration. Kiliaridis andKalebo (1991) stressed the importance of achiev-ing scan planes perpendicular to the ramus of themandible to minimize the possibility of erron-eously large muscle thickness measurements.Cross-sectional area and width measurements
would also be affected in this study by angulardeviations in probe position.
On the majority of scans, most of the width ofthe muscle was contained within the single swept
MASSETER MUSCLE VOLUME AND FACIAL MORPHOLOGY 663
Figure 5 Three alternate slices from the middle five-slicesection of each muscle image were measured individually.Muscle thickness was recorded as the mean distancebetween points A and B at the antero-posterior midpoint of the muscle cross-section. Similarly, muscle width wasmeasured by placing cursors at opposite ends of the samecross-sections.
Figure 6 Angular variables used in the principal compon-ent analysis: SNA, SNB, SN–Max, SN–Mand, Max–Mand,SN–Ar–Me, Ar–Go–Me. Max = maxillary plane (ANS–PNS); Mand = mandibular plane (Me–Go).
Figure 7 Linear variables used in the principal componentanalysis: Ar–Go, Go–Pg, R1–R2, R3–R4, TAFH (the sumof SN–Max and Max–Me, perpendicular to Max), TPFH(the sum of S–Max and Max–Go, perpendicular to Max),UADH (UE–Max, perpendicular to Max), UPDH (UM–Max, perpendicular to Max). Proportional variables:LAFH/TAFH, LPFH/TPFH. Points R1–R4 are taken fromRicketts et al. (1972).
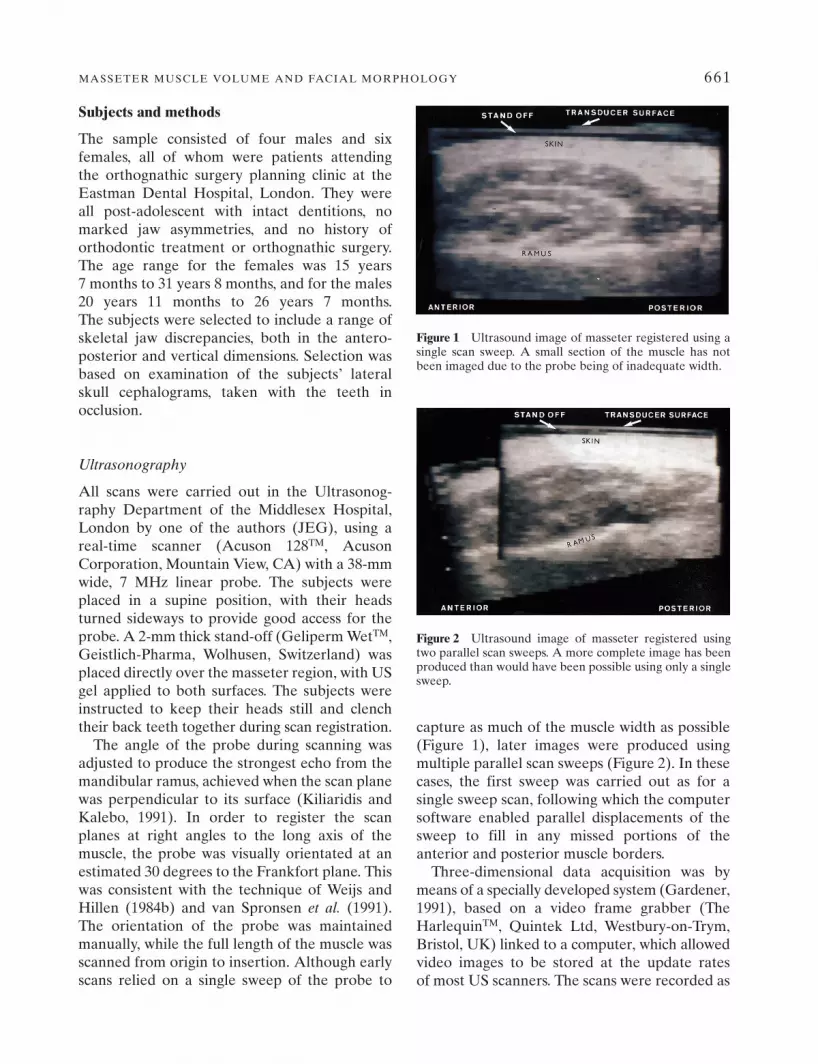
volume, but in some cases the muscle boundarieslay outside the transducer field, and boundarydefinition was frequently poor, even within the field of view. This latter problem is commonwith US and was due to poor reflection of USfrom edges parallel to the muscle boundary. Todetermine the error in muscle measurement,eight muscle image reconstructions were repeateda minimum of 1 week later, and the standardDahlberg error (Dahlberg, 1940) and coefficientof reliability (Houston, 1983) calculated (Table 1).
Results
The results of the cephalometric analysis areshown in Table 2, and the eigenvalues of thecorrelation matrix of the principal componentanalysis in Table 3. The principal components arearranged in descending order of variance, thefirst nine accounting for the total variance in the original data. As the first four accounted formost of the variance (88 per cent) with the
664 P. C. M. BENINGTON ET AL.
Table 1 Error of the method.
Masseter variable Dahlberg Coefficienterror (Se) of reliability
Volume (cm3) 0.93 0.92Cross-sectional area (cm2) 0.21 0.96Thickness (mm) 1.96 0.50Width (mm) 2.03 0.82Length (mm) 0.99 0.98
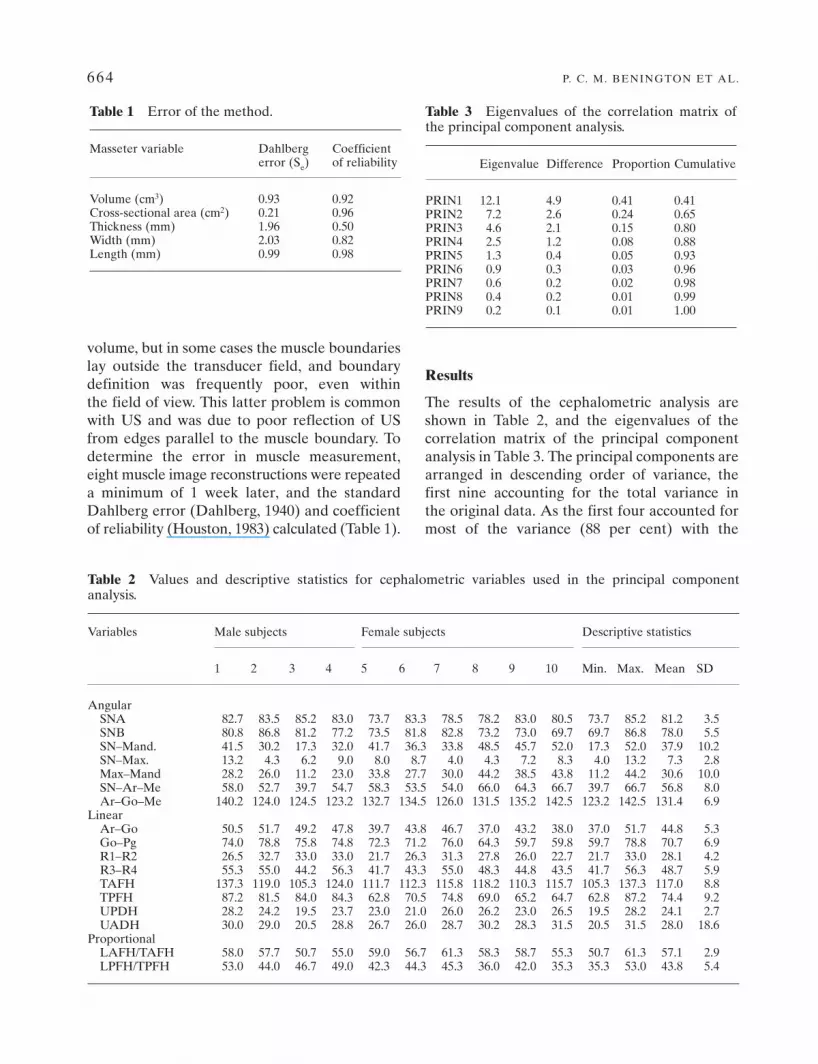
Table 2 Values and descriptive statistics for cephalometric variables used in the principal componentanalysis.
Variables Male subjects Female subjects Descriptive statistics
1 2 3 4 5 6 7 8 9 10 Min. Max. Mean SD
AngularSNA 82.7 83.5 85.2 83.0 73.7 83.3 78.5 78.2 83.0 80.5 73.7 85.2 81.2 3.5SNB 80.8 86.8 81.2 77.2 73.5 81.8 82.8 73.2 73.0 69.7 69.7 86.8 78.0 5.5SN–Mand. 41.5 30.2 17.3 32.0 41.7 36.3 33.8 48.5 45.7 52.0 17.3 52.0 37.9 10.2SN–Max. 13.2 4.3 6.2 9.0 8.0 8.7 4.0 4.3 7.2 8.3 4.0 13.2 7.3 2.8Max–Mand 28.2 26.0 11.2 23.0 33.8 27.7 30.0 44.2 38.5 43.8 11.2 44.2 30.6 10.0SN–Ar–Me 58.0 52.7 39.7 54.7 58.3 53.5 54.0 66.0 64.3 66.7 39.7 66.7 56.8 8.0Ar–Go–Me 140.2 124.0 124.5 123.2 132.7 134.5 126.0 131.5 135.2 142.5 123.2 142.5 131.4 6.9
LinearAr–Go 50.5 51.7 49.2 47.8 39.7 43.8 46.7 37.0 43.2 38.0 37.0 51.7 44.8 5.3Go–Pg 74.0 78.8 75.8 74.8 72.3 71.2 76.0 64.3 59.7 59.8 59.7 78.8 70.7 6.9R1–R2 26.5 32.7 33.0 33.0 21.7 26.3 31.3 27.8 26.0 22.7 21.7 33.0 28.1 4.2R3–R4 55.3 55.0 44.2 56.3 41.7 43.3 55.0 48.3 44.8 43.5 41.7 56.3 48.7 5.9TAFH 137.3 119.0 105.3 124.0 111.7 112.3 115.8 118.2 110.3 115.7 105.3 137.3 117.0 8.8TPFH 87.2 81.5 84.0 84.3 62.8 70.5 74.8 69.0 65.2 64.7 62.8 87.2 74.4 9.2UPDH 28.2 24.2 19.5 23.7 23.0 21.0 26.0 26.2 23.0 26.5 19.5 28.2 24.1 2.7UADH 30.0 29.0 20.5 28.8 26.7 26.0 28.7 30.2 28.3 31.5 20.5 31.5 28.0 18.6
ProportionalLAFH/TAFH 58.0 57.7 50.7 55.0 59.0 56.7 61.3 58.3 58.7 55.3 50.7 61.3 57.1 2.9LPFH/TPFH 53.0 44.0 46.7 49.0 42.3 44.3 45.3 36.0 42.0 35.3 35.3 53.0 43.8 5.4
Table 3 Eigenvalues of the correlation matrix ofthe principal component analysis.
Eigenvalue Difference Proportion Cumulative
PRIN1 12.1 4.9 0.41 0.41PRIN2 7.2 2.6 0.24 0.65PRIN3 4.6 2.1 0.15 0.80PRIN4 2.5 1.2 0.08 0.88PRIN5 1.3 0.4 0.05 0.93PRIN6 0.9 0.3 0.03 0.96PRIN7 0.6 0.2 0.02 0.98PRIN8 0.4 0.2 0.01 0.99PRIN9 0.2 0.1 0.01 1.00

remainder adding little more than 10 per cent to the cumulative total, comparative statisticalanalysis was limited to the first four principalcomponents.
The eigenvectors of the first four principalcomponents are given in Table 4. The variance of the first principal component was largelyaccounted for by the negatively weighted angularmeasurements SN–Mand and Max–Mand (man-dibular inclination) and the positively weightedlinear measurements Ar–Go (ramus height) andtotal posterior face height (TPFH). Smaller con-tributions were provided by negatively loadedangles SN–Ar–Me and Ar–Go–Me (gonial angle).
The variance of the second component showeda large positively weighted contribution from thetotal anterior face height (TAFH), the maxillaryposterior dentoalveolar height (UPDH) and
the width of the mandibular ramus (R1–R2). The third component showed a large negativeloading for the angle SNB and the mandibularbody length (Go–Pg). By far the largest weightingfor the fourth component was from the inclinationof the maxilla to the cranial base (SN–Max), witha lesser contribution from the positively weightedgonial angle and the negatively weighted ramusheight.
The masseter muscle measurements for malesand females are recorded in Table 5. To deter-mine whether or not a correlation existedbetween facial morphology and masseter size,Spearman’s rank correlation coefficients werecalculated between the first four principalcomponents of the cephalometric variables andeach of the muscle variables, and between theproportional cephalometric variables and themuscle variables (Table 6). To test for any sig-nificant differences between the muscle volumesor cross-sectional areas in males and females,Wilcoxon’s two-sample rank sum test was used.However, this proved non-significant for both ofthese variables.
Discussion
Several investigators have attempted to measuremasseter muscle size using imaging techniques.US has been used to measure thickness(Kiliaridis and Kalebo, 1991; Bakke et al., 1992;Raadsheer et al., 1994; Ruf et al., 1994; Kubota et al., 1998), width (Ruf et al., 1994) and cross-sectional area (Ruf et al., 1994; Close et al., 1995).Cross-sectional area has also been measured
MASSETER MUSCLE VOLUME AND FACIAL MORPHOLOGY 665
Table 4 Eigenvector coefficients of cephalometric variables for the first four principal components.
Angular PRIN1 PRIN2 PRIN3 PRIN4 Linear PRIN1 PRIN2 PRIN3 PRIN4variable variable
SNA 0.17 0.07 0.22 0.12 Ar–Go 0.31 0.11 –0.03 0.10SNB 0.24 –0.06 –0.39 –0.02 Go–Pg 0.21 0.10 –0.24 –0.01SN–Mand –0.35 0.19 –0.07 0.00 R1–R2 0.23 0.27 –0.13 –0.24SN–Max –0.03 0.21 0.06 0.50 R3–R4 0.15 0.09 0.11 –0.31Max–Mand –0.30 0.09 –0.09 –0.14 TAFH 0.05 0.35 –0.09 0.03SN–Ar–Me –0.25 0.19 –0.07 –0.09 TPFH 0.31 0.15 0.11 –0.01Ar–Go–Me –0.24 0.16 –0.01 0.29 UPDH –0.11 0.30 –0.15 –0.14
UADH 0.10 0.05 –0.09 0.44
Table 5 Descriptive statistics for masseter musclevariables.
Masseter variable Min. Max. Mean SD
MalesVolume (cm3) 16.1 32.7 23.0 7.1Cross-sectional area (cm2) 3.6 5.7 4.6 9.8Thickness (mm) 9.6 13.1 11.1 1.3Width (mm) 36.0 45.3 40.8 4.3Length (mm) 45.9 62.0 53.8 5.8
FemalesVolume (cm3) 10.4 12.6 11.3 0.8Cross-sectional area (cm2) 2.2 3.5 3.1 0.4Thickness (mm) 7.3 10.9 9.5 1.2Width (mm) 26.8 38.8 34.2 4.1Length (mm) 39.1 62.2 46.5 8.2

using MRI (Hannam and Wood, 1989; vanSpronsen et al., 1991; Raadsheer et al., 1994) andCT (Weijs and Hillen, 1984a, 1986; Gionhakuand Lowe, 1989; Xu et al., 1994). Volume wasmeasured using CT by Gionhaku and Lowe(1989), Xu et al. (1994) and Matsushima et al.(1998). No report has been published to date of masseter volume measurement using US.
Ultrasonography
The scanning, reconstruction and display tech-niques used in this study represent only the firststage of 3D US capabilities. New techniques arecurrently being developed that will particularlybenefit facial studies. These include improvedscan ‘registration’ and ‘compounding’ to visual-ize the muscle structures more clearly, thus mini-mizing the distortion artefacts common to all UStechniques. This, in turn, will allow developmentof better ‘segmentation’ methods for math-ematically delineating the muscle boundaries. Inaddition, state-of-the-art hardware will allowmore rapid scan collection in greater volumes.
‘Compounding’ refers to scanning tissues frommore than one angle, thereby minimizing well-known US effects such as ‘drop-out’, which cancause indistinct rendering of organ boundaries.‘Registration’ refers to the process whereby theimages produced by multiple passes over thetissue from different directions are brought intoaccurate alignment. Several effects can causemisalignment, including scanner precision, tissuemovement, and differences of sound velocities.Precise registration is essential in compoundedscanning. ‘Segmentation’ refers to the process ofdefining the boundaries of images of organs. Themuscle tissue may be segmented independentlyin cross-section and length. Automated or semi-automated methods could provide more reliableestimates of organ dimensions in the future,although the development of US segmentation isstill at an early stage.
The system used in this study requires furtherevaluation to test its accuracy at data acquisition.An error study of repeated muscle scans wouldhelp to clarify this, as well as a calibration testusing ‘phantom’ muscles of known volumes,similar to the method used by Xu et al. (1994). Acomparison of US muscle volume measurementswith those derived from CT or MRI scans of thesame subjects would be valuable.
Subjects and methods
The experimental nature of the 3D US systemused in this study made scan registration, imagereconstruction, and measurements time consum-ing, thus limiting the sample size. Subjects withsevere malocclusions were selected because cor-relations are more likely to be revealed betweenfacial morphology and masseter size if there is alarge variance in the data.
In this study only clenched muscle scans wereregistered, since image boundary definition for muscles in the relaxed state was found to beinadequate to allow accurate segmentation. Inaddition, it was found by Raadsheer et al. (1994)and Kiliaridis and Kalebo (1991) that the trans-ducer tends to compress relaxed muscles, result-ing in erroneously small thickness measurementsand making them less reproducible than clenchedscans. The evidence as to whether contracted or
666 P. C. M. BENINGTON ET AL.
Table 6 Spearman’s rank correlation coefficient (r).
(A) Principal components and muscular variables.
PRIN1 PRIN2 PRIN3 PRIN4
Volume (cm2) 0.92*** 0.11 –0.10 –0.20Cross–sectional area (cm2) 0.62 0.33 0.28 –0.13Thickness (mm) 0.39 0.40 0.19 0.05Width (mm) 0.51 0.09 –0.08 –0.52Length (mm) 0.76* 0.18 0.29 –0.18
*P ≤ 0.05; ***P ≤ 0.001.
(B) Proportional cephalometric and muscular variables.
LAFH/TAFH LPFH/TPFH
Volume (cm2) –0.38 0.77**Cross–sectional area (cm2) –0.53 0.48Thickness (mm) –0.63* 0.33Width (mm) –0.04 0.26Length (mm) –0.47 0.54
*P ≤ 0.05; **P ≤ 0.01.

relaxed muscles correlate more closely with facialform is conflicting. Weijs and Hillen (1984a), vanSpronsen et al. (1991), and Kiliaridis and Kalebo(1991) showed significance with measurementsfrom relaxed muscle images, while Weijs andHillen (1986), Hannam and Wood (1989), andGionhaku and Lowe (1989) did not specify themuscle state during scanning. Bakke et al. (1992)stressed the importance of clenched musclemeasurements, finding correlations with certaincephalometric variables, and Kubota et al. (1998)found significant correlations with masseterthickness in both the relaxed and clenched states.
Results
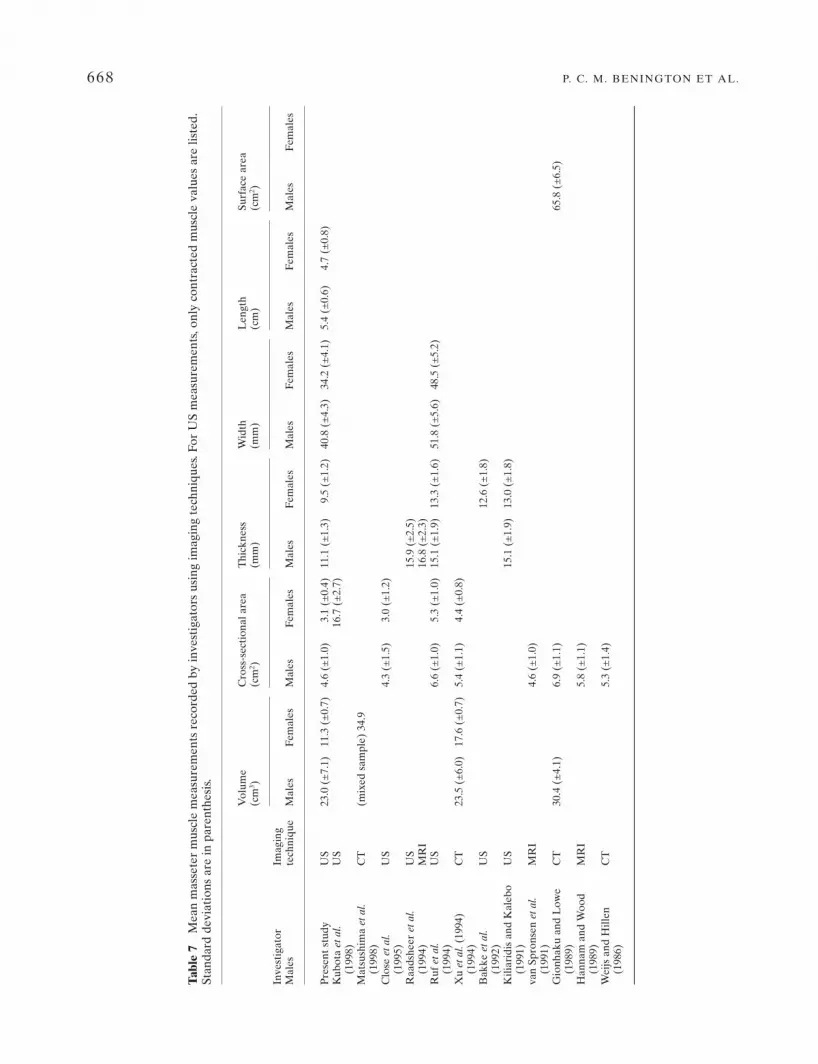
Table 7 lists the measurement values recorded in this study along with those of previousinvestigators. The mean masseter muscle volumefor males was 23.0 ± 7.1 cm3. This is less than the value of Gionhaku and Lowe (1989), but incloser agreement with that of Xu et al. (1994).Matsushima et al. (1998) measured the volume ofmasseter muscle using CT in a mixed sex sampleand recorded a mean value of 34.9 cm3. Themean volume for females was 11.3 ± 0.7 cm3,which is considerably less than that found by Xuet al. (1994). This might be due to the high pro-portion of long facial types among the femalesscanned in this study (see Table 2). Previous workhas suggested that masseter size was reduced insubjects with long faces. Although Xu et al.(1994) did not carry out a cephalometric analysisof their subjects, their larger sample size (25 females) may have possessed a more normaldistribution of facial variance, reflected in amore normal mean masseter volume.
The mean cross-sectional area value for malesof 4.6 ± 1.0 cm2 found in this study is broadlyconsistent with that of previous investigators(Hannam and Wood, 1989, and van Spronsen et al., 1991, using MRI; Weijs and Hillen, 1984b,and Xu et al., 1994, using CT; Close et al., 1995,using US). Gionhaku and Lowe (1989) recordeda considerably larger figure for males using CT,but as they reported, the scan planes in theirstudy were registered parallel to the Frankfortplane and this may have resulted in largermeasurements.
The mean muscle thickness values were 11.1 ±1.3 mm for males and 9.5 ± 1.2 mm for females inthis study. These are less than those found byKiliaridis and Kalebo (1991), Bakke et al. (1992),Raadsheer et al. (1994), Ruf et al. (1994), andKubota et al. (1998). This may be because, in thisinvestigation, thickness was measured at theantero-posterior midpoint of the muscle belly.Previous investigators have measured at the pointof estimated maximum thickness (Kiliaridis andKalebo, 1991; Raadsheer et al., 1994; Ruf et al.,1994) or recorded the mean of several measure-ments along the width of the muscle belly(Kubota et al., 1998). Although Bakke et al.(1992) also measured thickness at the antero-posterior midpoint, their measurements weretaken at the level where the muscle wasestimated to be most bulky. In this study, threealternate slices from the middle of the musclebelly were selected, since this region was foundto be the most clearly defined and, therefore, themost accurately measurable.
The mean values found in this study for musclewidth were 40.8 ± 4.3 mm for males and 34.2 ±4.1 mm for females. Ruf et al. (1994) used US tomeasure masseter width parallel to the occlusalplane and recorded larger figures than these, buttheir measurements may have been taken fromoblique scan planes, since Hannam and Wood(1989) found that the functional occlusal planewas not perpendicular to the long axis of mas-seter muscle. Ultrasound image measurements arealso prone to systematic errors at the boundarydefinition stage due to the phenomenon of ‘pointspreading’, where a relatively thick line on theimage display represents what is actually a sharptissue boundary. In this study, the muscle boundarywas demarcated for measurement purposes com-pletely within the image boundary line. Some otherinvestigators may have partly or completelyincluded the image boundary line in their measure-ments, resulting in comparatively larger values.
Male muscle measurements tended to belarger than female muscle measurements. Thelack of significance of Wilcoxon’s rank sumcoefficient for cross-sectional area and volume isprobably best explained by the small sample size.This observed difference may be partly the resultof natural sexual dimorphism, but has probably
MASSETER MUSCLE VOLUME AND FACIAL MORPHOLOGY 667
668 P. C. M. BENINGTON ET AL.
Tabl
e 7
Mea
n m
asse
ter
mus
cle
mea
sure
men
ts r
ecor
ded
by in
vest
igat
ors
usin
g im
agin
g te
chni
ques
. For
US
mea
sure
men
ts, o
nly
cont
ract
ed m
uscl
e va
lues
are
list
ed.
Stan
dard
dev
iati
ons
are
in p
aren
thes
is.
Vol
ume
Cro
ss-s
ecti
onal
are
a T
hick
ness
W
idth
L
engt
h Su
rfac
e ar
ea
Inve
stig
ator
Imag
ing
(cm
3 )(c
m2 )
(mm
)(m
m)
(cm
)(c
m2 )
Mal
este
chni
que
Mal
esFe
mal
esM
ales
Fem
ales
Mal
esFe
mal
esM
ales
Fem
ales
Mal
esFe
mal
esM
ales
Fem
ales
Pre
sent
stu
dyU
S23
.0 (
±7.
1)11
.3 (
±0.
7)4.
6 (±
1.0)
3.1
(±0.
4)11
.1 (
±1.
3)9.
5 (±
1.2)
40.8
(±
4.3)
34.2
(±
4.1)
5.4
(±0.
6)4.
7 (±
0.8)
Kub
ota
et a
l.U
S16
.7 (
±2.
7)(1
998)
Mat
sush
ima
et a
l.C
T(m
ixed
sam
ple)
34.
9(1
998)
Clo
se e
t al.
US
4.3
(±1.
5)3.
0 (±
1.2)
(199
5)R
aads
heer
et a
l.U
S15
.9 (
±2.
5)(1
994)
MR
I16
.8 (
±2.
3)R
uf e
t al.
US
6.6
(±1.
0)5.
3 (±
1.0)
15.1
(±
1.9)
13.3
(±
1.6)
51.8
(±
5.6)
48.5
(±
5.2)
(199
4)X
u et
al.
(199
4)C
T23
.5 (
±6.
0)17
.6 (
±0.
7)5.
4 (±
1.1)
4.4
(±0.
8)(1
994)
Bak
ke e
t al.
US
12.6
(±
1.8)
(199
2)K
iliar
idis
and
Kal
ebo
US
15.1
(±
1.9)
13.0
(±
1.8)
(199
1)va
n Sp
rons
en e
t al.
MR
I4.
6 (±
1.0)
(199
1)G
ionh
aku
and
Low
e C
T30
.4 (
±4.
1)6.
9 (±
1.1)
65.8
(±
6.5)
(198
9)H
anna
m a
nd W
ood
MR
I5.
8 (±
1.1)
(198
9)W
eijs
and
Hill
en
CT
5.3
(±1.
4)(1
986)
been accentuated by the difference in facialmorphology between the sexes in this study. Themales had a tendency to short face features,while the females had long face characteristics.Kiliaridis and Kalebo (1991), in a sample of 20males and 20 females, found significantly largervalues for masseter thickness in males.
Spearman’s rank correlation coefficient wasused to relate each of the five muscle variables tothe four principal components of facial form andthe two proportional variables (LAFH/TAFH,LPFH/TPFH). The first principal componentshowed a significant, positive correlation withmasseter muscle volume (r = 0.92, P ≤ 0.001) and muscle length (r = 0.76, P ≤ 0.05), whileLPFH/TPFH correlated significantly andpositively with volume (r = 0.77, P ≤ 0.01). Thisindicates a negative correlation of massetermuscle volume and length with mandibularinclination, including gonial angle, and a positivecorrelation with mandibular ramus height andtotal posterior face height. These findings areconsistent with those of previous investigators.Gionhaku and Lowe (1989) found negativecorrelations for masseter muscle volume withmandibular plane and gonial angles, and apositive correlation with posterior face heightand ramus height, while Eckhardt and Harzer(1993) found that ‘increasing volume of massetercorrelated with an anterior growth direction’.
LAFH/TAFH correlated negatively withmuscle thickness (r = –0.63, P ≤ 0.05). Thin mas-seters were associated, therefore, with subjectspossessing long faces. Kiliaridis and Kalebo(1991) found that women with thin massetershad proportionately longer faces, while Bakke et al. (1992) found negative correlations abovethe 95 per cent confidence level between thecontracted thickness of masseter and the heightof the face and jaws, mandibular inclination andvertical jaw relationship.
The correlation of muscle length with the firstprincipal component found in this study reflectsthe tendency for short-faced subjects to possesslarge posterior face heights (Opdebeeck andBell, 1978). No significant correlations werefound for muscle width or cross-sectional areawith any of the facial variables, but this may be areflection of the small sample size.
Conclusions
The following conclusions were drawn from thestudy.
1. The specialized computer software used forUS image reconstruction enabled 3D measure-ments to be made of masseter muscle includ-ing volume. However, comparison with otheraccepted standards, namely CT and MRI, aswell as further calibration, is necessary toestablish the effectiveness of the system.
2. Discrepancies between the muscle measure-ment values in this study and those found byother investigators may be due to disparitiesbetween the samples, differences in the loca-tion of muscle measurement points, and theuse of different imaging techniques by differ-ent investigators.
3. In the subjects studied, statistical analysisshowed that a steeply inclined mandibularplane, a small posterior face height, and anincreased gonial angle were strongly relatedto short, thin masseter muscles of low volume.Long, thick muscles of high volume wererelated to the converse features. These resultsmust be interpreted with caution in view ofthe small sample size.
4. The 3D US system was acceptable to patientsand relatively straightforward to use, butrequires further development to overcomesome of the problems inherent in acoustic imag-ing, in particular organ boundary definition.
Address for correspondence
Professor N. P. HuntOrthodontic DepartmentEastman Dental Institute256 Gray’s Inn RoadLondon WC1X 8LD, UK
Acknowledgements
We wish to express our sincere thanks toProfessor W. R. Lees, for permitting use of theultrasound scanner at the Middlesex Hospital,London, and to Dr J. Bulman, for help with thestatistics. Mr A. J. Hart kindly wrote the cephalo-metric digitization program.
MASSETER MUSCLE VOLUME AND FACIAL MORPHOLOGY 669

References
Ahlgren J 1966 Mechanism of mastication. A quantitativecinematographic and electromyographic study of masti-catory movements in children, with special reference toocclusion of the teeth. Acta Odontologica Scandinavica24 (Suppl. 44): 1–109
Bakke M, Tuxen A, Vilmann P, Jensen B R, Vilmann A,Toft M 1992 Ultrasound image of human massetermuscle related to bite force, electromyography, facialmorphology, and occlusal factors. Scandinavian Journalof Dental Research 100: 165–171
Close P J, Stokes M J, L’Estrange P R, Rowell J 1995Ultrasonography of masseter muscle size in normalyoung adults. Journal of Oral Rehabilitation 22: 129–134
Dahlberg, G 1940 Statistical methods for medical andbiological students. Interscience Publications, New York
Eckardt L, Harzer W 1993 Computertomographic volumeregistration of jaw and tongue muscles in considerationof relationship between function of muscles and skeletalconfiguration. European Journal of Orthodontics 15: 442(Abstract)
Gardener J E 1991 Three-dimensional imaging of softtissues using ultrasound. 3D Imaging for Medicine. IEEColloquium digest 91/083: Institute of Electrical Engineers,London
Gionhaku N, Lowe A A 1989 Relationship between jawmuscle volume and craniofacial form. Journal of DentalResearch 68: 805–809
Hannam A G, Wood W W 1989 Relationships between thesize and spatial morphology of human masseter andmedial pterygoid muscles, the craniofacial skeleton, andjaw biomechanics. American Journal of Physical Anthro-pology 80: 429–445
Hell B 1995 3D Sonography. International Journal of Oraland Maxillofacial Surgery 24: 84–89
Hell B, Walter F A, Schreiber St., Blase H, Bielke G,Meindl St., Stein G 1993 Three-dimensional ultrasonog-raphy in maxillofacial surgery. International Journal ofOral and Maxillofacial Surgery 22: 173–177
Houston W J B 1983 The analysis of errors in orthodonticmeasurements. American Journal Orthodontics 83:382–390
Ingervall B, Helkimo E 1978 Masticatory muscle force andfacial morphology. Archives of Oral Biology 23: 203–206
Ingervall B, Thilander B 1974 Relation between facialmorphology and activity of the masticatory muscles.Journal of Oral Rehabilitation 1: 131–147
Kiliaridis S, Kalebo P 1991 Masseter muscle thicknessmeasured by ultrasonography and its relation to facialmorphology. Journal of Dental Research 70: 1262–1265
Kubota M, Nakano H, Sanjo I, Satoh K, Sanjo T, KamegaiT, Ishikawa F 1998 Maxillofacial morphology andmasseter muscle thickness in adults. European Journal ofOrthodontics 20: 535–542
Linney A D, Grindrod S R, Arridge S R, Moss J P 1989 Three-dimensional visualisation of computerised
tomography and laser scan data for the simulation ofmaxillo-facial surgery. Medical Informatics 14: 109–121
Lowe A A, Takada K 1984 Association between anteriortemporal, masseter, and orbicularis oris muscle activityand craniofacial morphology in children. AmericanJournal of Orthodontics 86: 319–330
Matsushima S, et al. 1998 Relationship between the volumeof masticatory muscles and dentofacial morphology.European Journal of Orthodontics 20: 475–476
Opdebeeck H, Bell W H 1978 The short face syndrome.American Journal of Orthodontics 73: 499–511
Proffit W R, Fields H W, Nixon W L 1983 Occlusal forces innormal- and long-face adults. Journal of Dental Research62: 566–571
Raadsheer M C, Eijden T M G J, van Spronsen P H, vanGinkel F C, Kiliaridis S, Prahl-Andersen B 1994 A com-parison of human masseter muscle thickness measuredby ultrasonography and magnetic resonance imaging.Archives of Oral Biology 39: 1079–1084
Ricketts R, Bench R W, Hilgeis J J, Schulhof R 1972 An overview of computerised cephalometrics. AmericanJournal of Orthodontics 61: 1–28
Ringqvist M 1973 Isometric bite force and its relation todimensions of the facial skeleton. Acta OdontologicaScandinavica 31: 35–42
Ruf S, Pancherz H, Kirschbaum M 1994 Gesichts-morphologie, Grosse und Aktivität des Musculusmasseter. Fortschritte der Kieferorthopädie 23: 219–227
Sassouni V 1969 A classification of skeletal facial types.American Journal of Orthodontics 55: 109–123
Schendel S A, Eisenfeld J, Bell W H, Epker B N,Mishelevich D J 1976 The long face syndrome: verticalmaxillary excess. American Journal of Orthodontics 70:398–408
Ueda H M, Ishizuka Y, Miyamoto K, Morimoto N, Tanne K1998 Relationship between masticatory muscle activityand vertical craniofacial morphology. Angle Ortho-dontist 68: 233–238
van Spronsen, P H, Weijs W A, Valk J, Prahl-Andersen B,van Ginkel F C 1991 Relationships between jaw musclecross-sections and craniofacial morphology in normaladults, studied with magnetic resonance imaging. Euro-pean Journal of Orthodontics 13: 351–361
Weijs W A, Hillen B 1984a Relationships between masti-catory muscle cross-section and skull shape. Journal ofDental Research 63: 1154–1157
Weijs W A, Hillen B 1984b The relationship between thephysiological cross-section of the human jaw muscles andtheir cross-sectional area in computer tomograms. ActaAnatomica 118: 129–138
Weijs W A, Hillen B 1986 Correlation between the cross-sectional area of the jaw muscles and craniofacial sizeand shape. American Journal of Physical Anthropology70: 423–431
Xu J A, Yuasa K, Kanda S 1994 Quantitative analysis ofmasticatory muscles using computed tomography. Dento-maxillofacial Radiography 23: 154–158
670 P. C. M. BENINGTON ET AL.