mapping cellular data service network infrastructure via geo-intent inference
TRANSCRIPT

Mapping Cellular Data Service Network Infrastructure viaGeo-intent Inference
Gyan Ranjan∗, Ram Keralapura†, Supranamaya Ranjan†, Joshua Robinson† and Zhi-Li Zhang∗
∗University of Minnesota, Twin Cities, MN and †Narus Inc., Sunnyvale, CA
AbstractDespite the rapid growth in cellular data traffic, weknow very little about the operational cellular data ser-vice network (CDSN) infrastructure. For example, howare the core IP network elements distributed over thecellular network substrate such as basestations? Suchknowledge and understanding not only can provide crit-ical insight into the evolution of the CDSN infrastruc-ture, but can also guide the development of innova-tive (e.g. location-aware) services and applications. Inthis paper we propose and explore a novel approach formapping the CDSN infrastructure via explicit user geo-intent. The intuition behind the proposed approach isto exploit specific geo-locations (i.e. geo-intent) con-tained in user queries to location-based services, andcorrelate them with basestation id’s and gateway IPaddresses to geo-map the CDSN infrastructure. To in-vestigate the validity of our approach, we employ data(RADIUS/RADA data sessions and application sessions)collected at the core IP network inside a CDSN. We de-velop heuristics for identifying user geo-intent and forgeo-mapping the CDSN infrastructure — in particular,the basestations and IP NAS gateways — and evaluatetheir efficacy using a subset of basestations with ground-truth GPS locations. Our findings not only shed usefullight on the CDSN infrastructure, but also have impli-cations in the design of effective location-aware servicesand applications.
1. INTRODUCTIONWith wide adoption of smart phones and other mobile
devices, cellular data traffic has grown tremendously inthe past few years. This growth will be further precipi-tated by the increasing popularity of newer generationsof smart-phones and mobile devices such as iPhones,Android phones and iPads. As in the case of wirelineservices, cellular data traffic will likely surpass the voicetraffic in the not-so-distant future. Despite this tremen-dous growth, there have been relatively few studies onthe (operational) cellular data service network (CDSN)infrastructure. Apart from various articles, papers anddocumentations on the architectural design and com-
ponent engineering (e.g. 3G network standards), weknow little, for example, about the topology and geo-graphical distribution of IP network elements over thecellular network substrate such as basestations. Thechallenges in conducting measurement-based mappingof operational cellular data service networks (CDSNs)can be attributed, in part, to the fact that these net-works are generally “closed”, unlike most of the tradi-tional Internet infrastructure. In other words, activeprobing (e.g. traceroute) from outside typically elic-its no response from the internal network elements of aCDSN. Conducting active probing from mobile devicesin general does not help much either, as IP addressesassigned to the end users’ devices are often private IPaddresses [3]: the only IP addresses visible to the out-side world are the IP addresses of exit routers of theCDSNs. With the rapid growth in cellular data traffic,gaining a better understanding of the CDSN infrastruc-ture — especially the geo-spatial relationships of theIP network overlaid on top of the cellular (basestation)network substrate — is imperative. Such understandingcan not only provide insights into the evolution and ex-pansion of existing (and future) CDSNs, but also helpguide the development and deployment of innovativelocation-aware services and applications that cater tomobile users (see more discussion on this in a latterpart of this section).
In this paper we propose and explore a novel ap-proach to map the CDSN infrastructure via (explicit)user geo-intent. By geo-intent, we mean (explicit) geo-location information specified by users while submittingqueries to certain services (e.g. weather or map ser-vices), in which they explicitly seek information regard-ing a specific location. Such geo-intent may be associ-ated with the target of a user query, or the source (i.e.the user’s own location). The basic intuition behind ourapproach is two-fold: i) mobile users often explicitly ex-press their geo-intent when performing certain location-specific queries; and ii) their explicit geo-intent is oftenlocal, namely related to a location in close vicinity oftheir current location, e.g. a restaurant nearby or the lo-cal weather. Such queries will occur more frequently as
1

more users adopt GPS-enabled smart phone and utilizelocation-based services or apps on their mobile devices.By correlating the user geo-intent expressed in location-specific queries with information regarding the CDSNinfrastructure, e.g. the basestation a mobile device iscurrently associated with or the (first-hop) IP gatewayaddress (such information may be obtained from mobiledevices1), we can geo-map the CDSN infrastructure.
To investigate whether — and to what extent — ourproposed approach can help geo-map the CDSN in-frastructure, we employ two sources of data collectedat a link inside the (wired) backbone IP network ofa CDSN. The first data source comprises of the RA-DIUS/RADA packet data sessions which contain thebasestation id’s (BSIDs) and anonymized user id’s; thesecond data source is collections of application sessionswhich contain URLs extracted from HTTP headers and(anonymized) user id’s. Two datasets (containing datafrom both sources), collected roughly ten months apart,are used for our study. For a subset of BSIDs, we alsohave the ground-truth GPS locations. We start witha list of geographical identifiers (e.g. zip-code, street,city, state, GPS coordinates etc.) and mine the URLdatasets to extract location-specific services/apps in or-der to identify user queries that likely express explicitgeo-intent. We find that the most prevalent type of geo-intent queries in our datasets are zip-code containingweather queries in which users seek weather informa-tion for the location specified by a zip-code. In otherwords, zip-codes in these queries represent explicit usergeo-intent (target locations of interest). Hence, in thispaper we focus our investigation on the efficacy of uti-lizing zip-codes in weather queries for geo-mapping theCDSN infrastructure.
While zip-code containing weather queries representa small percentage of all URLs, the collection of bases-tations seeing such zip-code queries (i.e. around whichsuch queries originate) constitute more than 20% of thetotal basestations contained in our datasets. Using thebasestation with ground-truth GPS locations which alsosee zip-code queries, we evaluate the efficacy of geo-mapping the CDSN infrastructure using zip-codes asuser geo-intent2. We find that we can geo-localize morethan 50% of these basestations within 3.9 km and morethan 75% of them within 6.1 km (alternatively, within
1For example, some smart phone mobile operating systems,e.g. Window Mobile OS, provide certain APIs via which theBSID of the basestation a mobile device is associated with,the gateway IP address as well as the IP address assignedto the mobile device can be obtained.2Thus the accuracy and granularity of geo-mapping areroughly at the level of zip-codes which is a considerable im-provement over, for instance, some publicly available infor-mation about basestations, e.g. the SID database [2] whichprovides geo-location of base-stations at the granularity ofstate(s) in the U.S.
one or a few neighboring zip-code areas). The accuracyand coverage vary with the population density: withinlarge metropolitan areas in the US, we can improve theaccuracy to within 1.5−2 km for most basestations dueto smaller zip-code areas and more users; while for ruralareas (sparsely populated) or highway corridors (highuser mobility), the accuracy is poorer due to large zip-code areas and/or noisy, non-local zip-codes queried forby users. Based on these observations we develop effec-tive heuristics which exploit user geo-intent as well asuser mobility for geo-mapping not only those basesta-tions which see zip-code queries, but also those basesta-tions which do not see any zip-code queries but insteadare associated with users who issue geo-intent queries ata neighboring basestation within a short period of time.Finally, we extract the IP addresses (of mobile devices,NAS gateways, IP home-agents etc.) in the datasetsand study the geo-spatial distribution of IP networkelements within the CDSN infrastructure, using the in-ferred (and ground-truth) locations of the basestations.The results and their implications are discussed below.
Our findings not only confirm the validity of our pro-posed approach for geo-mapping the CDSN infrastruc-ture using user geo-intent, but also shed light on someinteresting aspects of the CDSN infrastructure, espe-cially the geo-spatial relation between IP network el-ements (NAS gateways and IP home-agents) and thebasestation substrate. In contrast to the number ofbasestations (more than 80,000 in our datasets), thenumber of NAS gateways and home-agents is far smaller(less than 100). Further, each NAS gateway (or IPhome-agent) covers a large geographical region (typi-cally spanning multiple states in US) and a large num-ber of basestations (spanning multiple SIDs). Multi-ple gateways or home-agents may also cover similar re-gions, likely for load-balancing and reliability. Our ob-servations have important implications. For example,with the rapid increase in cellular data traffic (for in-stance, compared with the first dataset, we see a multi-fold increase in diurnal traffic volume in the seconddataset collected ten months later), IP networks withinthe CDSN infrastructure are likely to — and need to— undergo drastic expansion and evolution to meet thegrowing user demand. Our results also provide a plausi-ble explanation why attempting to geo-localize mobileusers/devices based on externally visible IP addresses(of exit routers) does not yield reliable results (cf. [3]),and may be futile apart from perhaps geo-localizingwithin a large geographical region. In a similar vein, de-ploying “location-aware” content distribution servicesoutside CDSNs, which attempt to reduce latency by dis-tributing content locally, may not be very effective atpresent. To better cater to mobile users in fine-grainedgeography (e.g. within a state or metropolitan area),such services may have to be deployed inside CDSNs.
2
Last but not the least, we remark that one limita-tion of our datasets is that it does not contain manymobile users with GPS-enabled devices; thus we iden-tify only a small set of geo-intent queries (for a coupleof location-based services) which contain GPS coordi-nates coming from GPS-enabled mobile devices. Usingthis small set of GPS coordinate geo-intent data, weshow that we can geo-map the associated basestationswith far finer granularity and better accuracy (withina few hundred meters to 1 km). With the increasingpopularity of newer generations of GPS-enabled smartphones and mobile devices, we expect our methodologyto yield better results than those reported here.
The remainder of the paper is organized as follows.In §1.1 we will briefly discuss the related work. In §2 weprovide some background on the CDSN infrastructureand describe the datasets. In §3 we present our method-ology for identifying and extracting geo-intent, and in§4 we investigate the efficacy of geo-localizing bases-tations using zip-code geo-intent. We develop severalgeo-mapping heuristics in §5. In §6 we study the geo-spatial distributions of the IP network elements withinthe CDSN infrastructure, and the paper is concluded in§7.
1.1 Related WorkMuch of the existing work on localization in cellu-
lar networks has focused primarily on geo-locating mo-bile users or devices via signal strength based methods(e.g. triangulation) using known locations of cell towers(basestations). For a very recent study on this topic andrelated work, see [9] and the references therein. In con-trast, we attempt to address the problem the other wayaround, namely, utilizing user geo-intent to map theCDSN infrastructure. The notion of user geo-intent hasbeen proposed and studied recently in a different con-text, web search, with the goal to return search resultsthat are more relevant to user queries. For instance,in [4], the authors analyze search queries from users,and classify them into explicit geo-intent and non-geo-intent queries.
In [8], the authors go one step further to extract (im-plicit) geographical information that can plausibly iden-tify users’ locations. Our work adopts a similar notionof (explicit) geo-intent and applies it to geo-map theCDSN infrastructure.
Trestian et al [7] correlate user-location (at the gran-ularity of basestations) and application interests overtime. In their analysis of user mobility patterns, theyfind that many users tend to move around one or a fewlocation “hot-spots” (e.g. residence, office, or a coffee-shop). This finding indicates that a majority of users’geo-intent is likely local to their locations. The studyin [3] cited earlier collects the IP addresses assigned tomobile devices as well as the IP addresses (likely those
of exit routers or NAS gateways) which appear as sourceIP addresses in the queries sent to a web server underthe authors’ control, and uses them to locate mobiledevices by geo-localizing the IP addresses.; only to findthat the geo-mapping results using these IP addressesare very coarse-grained and often unreliable. Our studyshows that the core IP network is “sparsely” distributedover the dense and geographically dispersed (see fig.1(a)) cellular network substrate, thus providing a plau-sible explanation for their findings.
2. PRELIMINARIES AND DATASETS
2.1 CDSN InfrastructureIn the traditional layered network architecture terms,
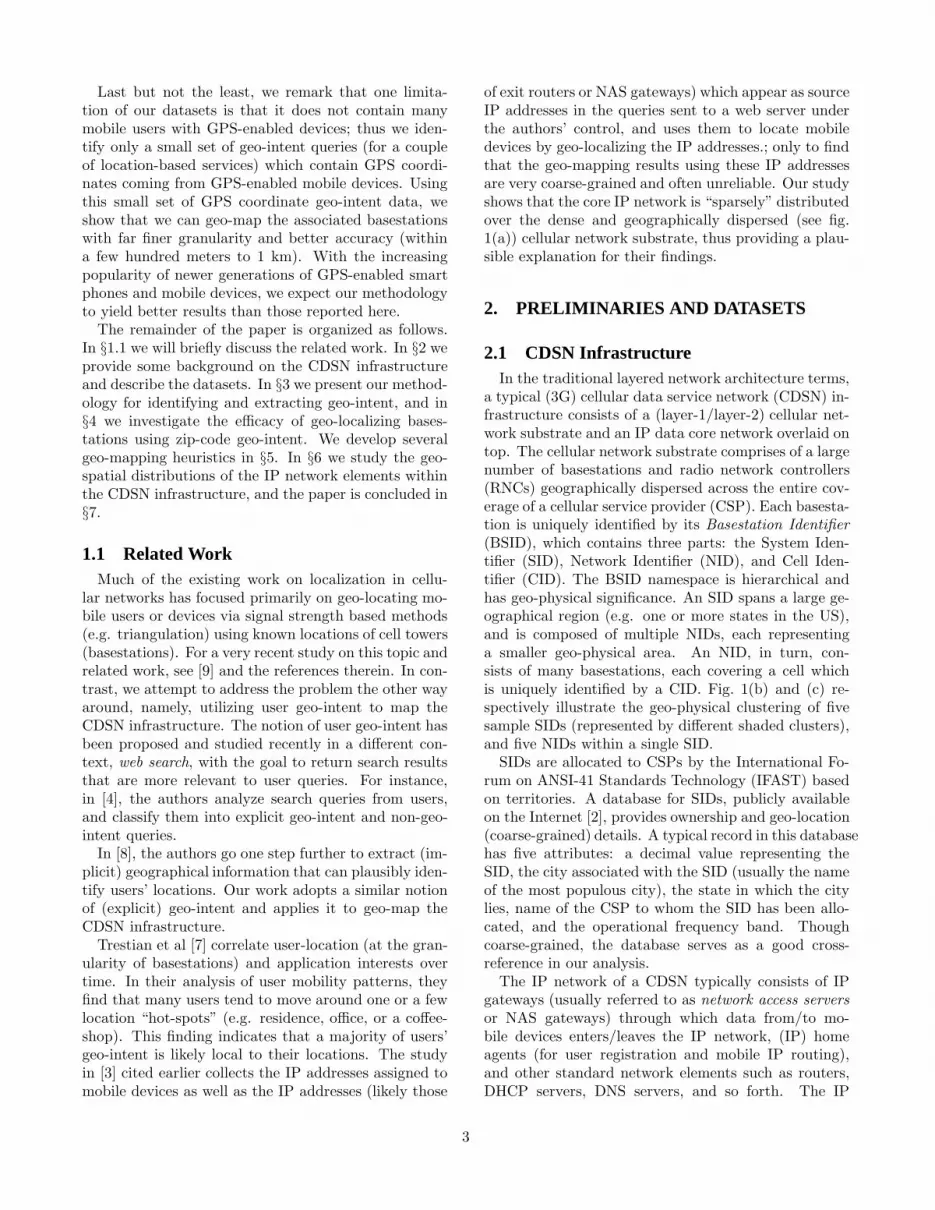
a typical (3G) cellular data service network (CDSN) in-frastructure consists of a (layer-1/layer-2) cellular net-work substrate and an IP data core network overlaid ontop. The cellular network substrate comprises of a largenumber of basestations and radio network controllers(RNCs) geographically dispersed across the entire cov-erage of a cellular service provider (CSP). Each basesta-tion is uniquely identified by its Basestation Identifier(BSID), which contains three parts: the System Iden-tifier (SID), Network Identifier (NID), and Cell Iden-tifier (CID). The BSID namespace is hierarchical andhas geo-physical significance. An SID spans a large ge-ographical region (e.g. one or more states in the US),and is composed of multiple NIDs, each representinga smaller geo-physical area. An NID, in turn, con-sists of many basestations, each covering a cell whichis uniquely identified by a CID. Fig. 1(b) and (c) re-spectively illustrate the geo-physical clustering of fivesample SIDs (represented by different shaded clusters),and five NIDs within a single SID.
SIDs are allocated to CSPs by the International Fo-rum on ANSI-41 Standards Technology (IFAST) basedon territories. A database for SIDs, publicly availableon the Internet [2], provides ownership and geo-location(coarse-grained) details. A typical record in this databasehas five attributes: a decimal value representing theSID, the city associated with the SID (usually the nameof the most populous city), the state in which the citylies, name of the CSP to whom the SID has been allo-cated, and the operational frequency band. Thoughcoarse-grained, the database serves as a good cross-reference in our analysis.
The IP network of a CDSN typically consists of IPgateways (usually referred to as network access serversor NAS gateways) through which data from/to mo-bile devices enters/leaves the IP network, (IP) homeagents (for user registration and mobile IP routing),and other standard network elements such as routers,DHCP servers, DNS servers, and so forth. The IP
3

−120 −110 −100 −90 −80 −7025
30
35
40
45
50
−120 −110 −100 −90 −80 −7025
30
35
40
45
50
−92 −91 −90 −89 −88 −8742
42.5
43
43.5
44
44.5
45
(a) US mainland (b) Five sample SIDs (c) Five NIDs within an SID
Figure 1: Illustration of geo-physical clustering of BSID’s at SID/SID-NID level (Ground-truth set).
Table 1: User and traffic volume statistics.Dataset (time) Users Duration #Pkt.&App. Sess.
I (Oct 2008) 2 M 7 days 24 M & 110 MII (Jul 2009) 1.7 M 1 day 13 M & 147 M
network also includes a number of RADIUS/RADA 3
servers for authenticating users, and for logging userdata access activities for billing and accounting pur-poses.
2.2 DatasetsTwo datasets are used in our study, which are col-
lected at a link inside the core IP network of a largeNorth American cellular 3G service provider. The firstdataset (henceforth referred to as Dataset I) was col-lected during a week-long period in October, 2008, andthe second dataset (Dataset II) was collected over asingle day in July, 2009. Table 1 summarizes overallstatistics regarding Datasets I and II. Both datasets areanonymized packet traces. Each dataset consists of twosources of data: RADIUS/RADA packet data sessions,and application sessions. The RADIUS/RADA packetdata sessions contain records of user activities such asthe beginning and end times of a user’s data session,the (anonymized) user id, the basestations (BSIDs) theuser’s mobile device is associated with during the datasession etc. The application sessions records are theHTTP headers of users’ Internet activities. We corre-late the records from the two data-sources on the basisof the anonymized IP address in an HTTP applicationsession, and match the HTTP timestamp such that itis between two consecutive RADA START and STOPmessages, in the RADIUS/RADA packet data sessions.The URLs accessed in HTTP application sessions areextracted for identifying geo-intent queries. The BSIDsand (anonymized) user ids are extracted from the RA-DIUS/RADA packet data sessions. We primarily ex-ploit the HTTP URLs, BSIDs and (anonymized) user
3RADIUS stands for the Remote Authentication Dial InUser Service protocol [6, 5], and RADA stands for the Ra-dius Authenticated Device Access protocol. Both are usedto provide centralized Authentication, Authorization, andAccounting (AAA) management.
ids, for geo-mapping the CDSN infrastructure. To ver-ify and validate our geo-intent based mapping approach,we also utilize a collection of basestations for whichwe have the ground-truth GPS locations. Recall fromfig. 1(a), the basestations in our ground-truth set arewidely distributed across the US mainland and providean extensive and representative set for verifying andvalidating the results obtained in our study.
3. EXPLICIT GEO-INTENT OF USERSThis work explores whether we can exploit “explicit
geo-intent” of mobile users to learn the CDSN infras-tructure, i.e. the physical locations of basestations andthe IP data network elements. We define explicit geo-intent as location information contained in queries sub-mitted by users to certain services (e.g. weather or mapservices) in which they seek information regarding aspecific location. Such geo-intent in user queries mayeither be associated with the current (source) locationof a user (e.g. locate-me type of features) or her targetlocation of user (e.g. weather lookups for a region ofinterest).
One of the greatest challenges faced in this approachis that the geo-intent expressed in a user’s query is en-coded in a format meaningful for specific services andtherefore varies from one service to the other. To ad-dress this issue, careful service-specific analysis is re-quired to extract relevant explicit geo-intent from userqueries. In §3.1, we describe our heuristics for doingthis. Next, in §3.2, we focus on the most dominant type,namely zip-codes contained in weather-related queries,which are primarily associated with the target locationsof users’ geo-intent. Lastly, in §3.3, we discuss the rele-vance of GPS-like information observed in our datasetsand identify the cases when it is relevant and useful.
3.1 Extracting Explicit Geo-intentWe employ a set of heuristics to identify and extract
geo-intent from the HTTP URLs in our datasets. Ourobjective is to find a set of services seen in our URLtrace with a geo-intent format that can be automaticallyextracted, giving us a mapping between URL and thegeo-intent expressed in that URL. Through a manualprocess of identifying a set of location-specific keywords,
4
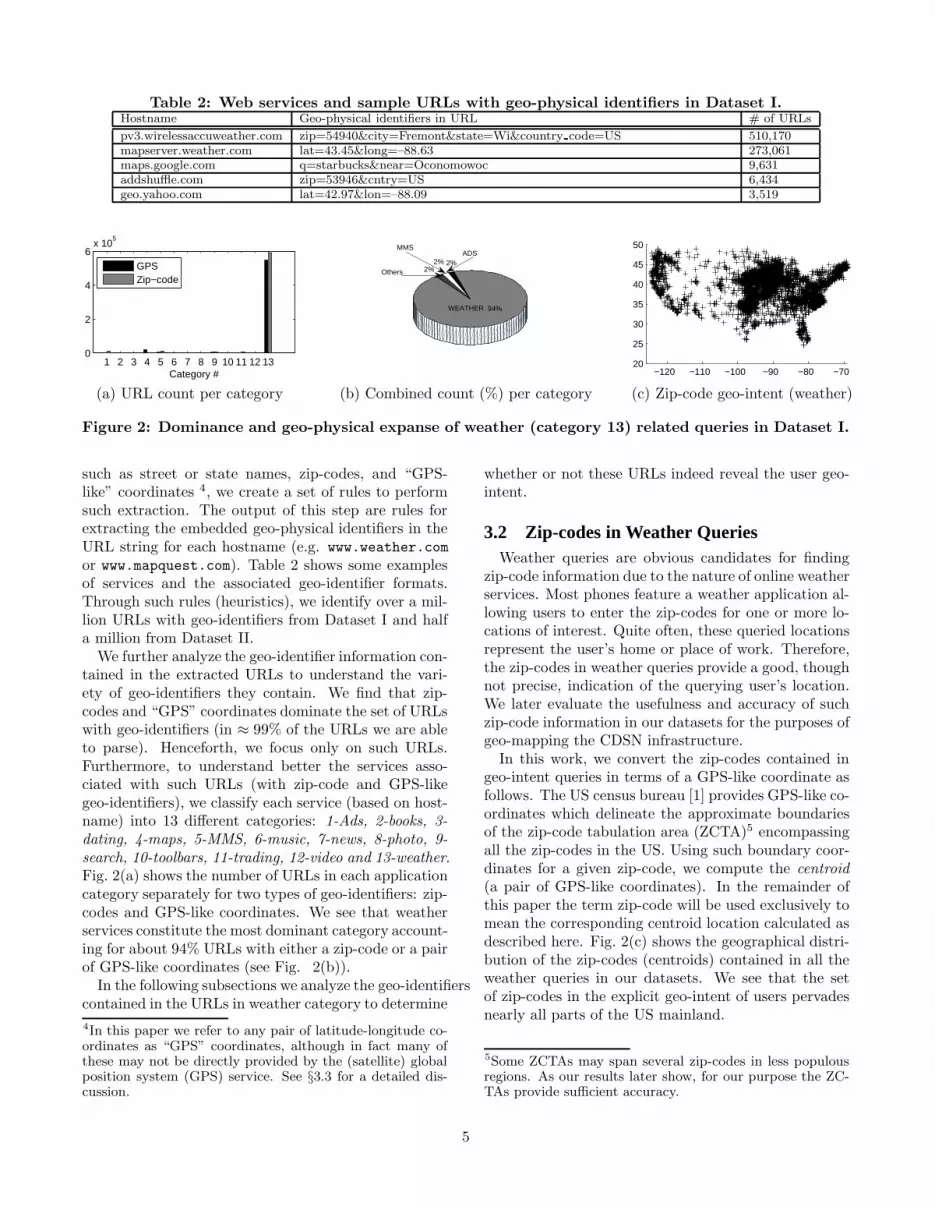
Table 2: Web services and sample URLs with geo-physical identifiers in Dataset I.Hostname Geo-physical identifiers in URL # of URLs
pv3.wirelessaccuweather.com zip=54940&city=Fremont&state=Wi&country code=US 510,170mapserver.weather.com lat=43.45&long=–88.63 273,061maps.google.com q=starbucks&near=Oconomowoc 9,631addshuffle.com zip=53946&cntry=US 6,434geo.yahoo.com lat=42.97&lon=–88.09 3,519
1 2 3 4 5 6 7 8 9 10 11 12 130
2
4
6x 10
5
Category #
GPSZip−code
94%
2%2%2%
WEATHER
Others
ADSMMS
−120 −110 −100 −90 −80 −7020
25
30
35
40
45
50
(a) URL count per category (b) Combined count (%) per category (c) Zip-code geo-intent (weather)
Figure 2: Dominance and geo-physical expanse of weather (category 13) related queries in Dataset I.
such as street or state names, zip-codes, and “GPS-like” coordinates 4, we create a set of rules to performsuch extraction. The output of this step are rules forextracting the embedded geo-physical identifiers in theURL string for each hostname (e.g. www.weather.com
or www.mapquest.com). Table 2 shows some examplesof services and the associated geo-identifier formats.Through such rules (heuristics), we identify over a mil-lion URLs with geo-identifiers from Dataset I and halfa million from Dataset II.
We further analyze the geo-identifier information con-tained in the extracted URLs to understand the vari-ety of geo-identifiers they contain. We find that zip-codes and “GPS” coordinates dominate the set of URLswith geo-identifiers (in ≈ 99% of the URLs we are ableto parse). Henceforth, we focus only on such URLs.Furthermore, to understand better the services asso-ciated with such URLs (with zip-code and GPS-likegeo-identifiers), we classify each service (based on host-name) into 13 different categories: 1-Ads, 2-books, 3-dating, 4-maps, 5-MMS, 6-music, 7-news, 8-photo, 9-search, 10-toolbars, 11-trading, 12-video and 13-weather.Fig. 2(a) shows the number of URLs in each applicationcategory separately for two types of geo-identifiers: zip-codes and GPS-like coordinates. We see that weatherservices constitute the most dominant category account-ing for about 94% URLs with either a zip-code or a pairof GPS-like coordinates (see Fig. 2(b)).
In the following subsections we analyze the geo-identifierscontained in the URLs in weather category to determine
4In this paper we refer to any pair of latitude-longitude co-ordinates as “GPS” coordinates, although in fact many ofthese may not be directly provided by the (satellite) globalposition system (GPS) service. See §3.3 for a detailed dis-cussion.
whether or not these URLs indeed reveal the user geo-intent.
3.2 Zip-codes in Weather QueriesWeather queries are obvious candidates for finding
zip-code information due to the nature of online weatherservices. Most phones feature a weather application al-lowing users to enter the zip-codes for one or more lo-cations of interest. Quite often, these queried locationsrepresent the user’s home or place of work. Therefore,the zip-codes in weather queries provide a good, thoughnot precise, indication of the querying user’s location.We later evaluate the usefulness and accuracy of suchzip-code information in our datasets for the purposes ofgeo-mapping the CDSN infrastructure.
In this work, we convert the zip-codes contained ingeo-intent queries in terms of a GPS-like coordinate asfollows. The US census bureau [1] provides GPS-like co-ordinates which delineate the approximate boundariesof the zip-code tabulation area (ZCTA)5 encompassingall the zip-codes in the US. Using such boundary coor-dinates for a given zip-code, we compute the centroid(a pair of GPS-like coordinates). In the remainder ofthis paper the term zip-code will be used exclusively tomean the corresponding centroid location calculated asdescribed here. Fig. 2(c) shows the geographical distri-bution of the zip-codes (centroids) contained in all theweather queries in our datasets. We see that the setof zip-codes in the explicit geo-intent of users pervadesnearly all parts of the US mainland.
5Some ZCTAs may span several zip-codes in less populousregions. As our results later show, for our purpose the ZC-TAs provide sufficient accuracy.
5
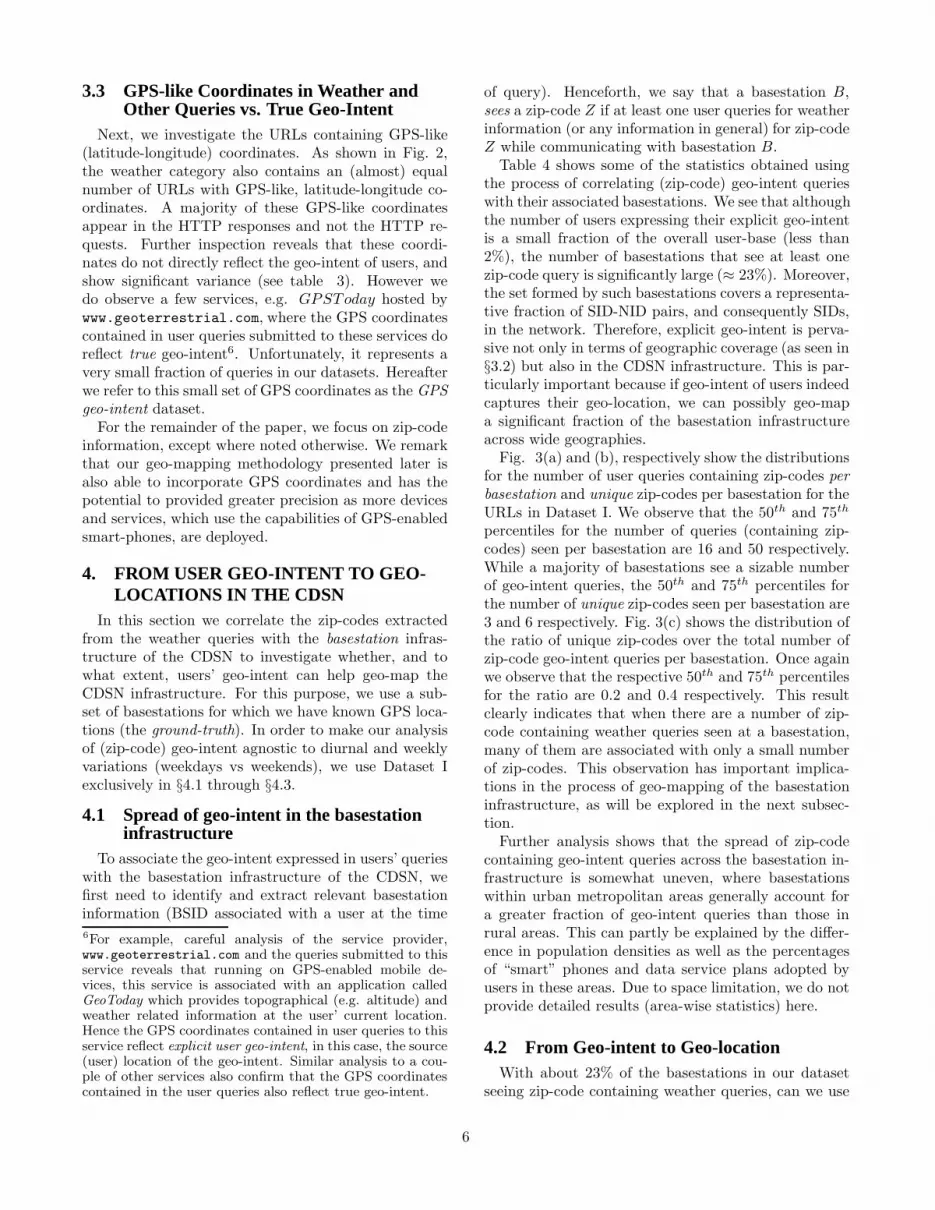
3.3 GPS-like Coordinates in Weather andOther Queries vs. True Geo-Intent
Next, we investigate the URLs containing GPS-like(latitude-longitude) coordinates. As shown in Fig. 2,the weather category also contains an (almost) equalnumber of URLs with GPS-like, latitude-longitude co-ordinates. A majority of these GPS-like coordinatesappear in the HTTP responses and not the HTTP re-quests. Further inspection reveals that these coordi-nates do not directly reflect the geo-intent of users, andshow significant variance (see table 3). However wedo observe a few services, e.g. GPSToday hosted bywww.geoterrestrial.com, where the GPS coordinatescontained in user queries submitted to these services doreflect true geo-intent6. Unfortunately, it represents avery small fraction of queries in our datasets. Hereafterwe refer to this small set of GPS coordinates as the GPSgeo-intent dataset.
For the remainder of the paper, we focus on zip-codeinformation, except where noted otherwise. We remarkthat our geo-mapping methodology presented later isalso able to incorporate GPS coordinates and has thepotential to provided greater precision as more devicesand services, which use the capabilities of GPS-enabledsmart-phones, are deployed.
4. FROM USER GEO-INTENT TO GEO-LOCATIONS IN THE CDSN
In this section we correlate the zip-codes extractedfrom the weather queries with the basestation infras-tructure of the CDSN to investigate whether, and towhat extent, users’ geo-intent can help geo-map theCDSN infrastructure. For this purpose, we use a sub-set of basestations for which we have known GPS loca-tions (the ground-truth). In order to make our analysisof (zip-code) geo-intent agnostic to diurnal and weeklyvariations (weekdays vs weekends), we use Dataset Iexclusively in §4.1 through §4.3.
4.1 Spread of geo-intent in the basestationinfrastructure
To associate the geo-intent expressed in users’ querieswith the basestation infrastructure of the CDSN, wefirst need to identify and extract relevant basestationinformation (BSID associated with a user at the time
6For example, careful analysis of the service provider,www.geoterrestrial.com and the queries submitted to thisservice reveals that running on GPS-enabled mobile de-vices, this service is associated with an application calledGeoToday which provides topographical (e.g. altitude) andweather related information at the user’ current location.Hence the GPS coordinates contained in user queries to thisservice reflect explicit user geo-intent, in this case, the source(user) location of the geo-intent. Similar analysis to a cou-ple of other services also confirm that the GPS coordinatescontained in the user queries also reflect true geo-intent.
of query). Henceforth, we say that a basestation B,sees a zip-code Z if at least one user queries for weatherinformation (or any information in general) for zip-codeZ while communicating with basestation B.
Table 4 shows some of the statistics obtained usingthe process of correlating (zip-code) geo-intent querieswith their associated basestations. We see that althoughthe number of users expressing their explicit geo-intentis a small fraction of the overall user-base (less than2%), the number of basestations that see at least onezip-code query is significantly large (≈ 23%). Moreover,the set formed by such basestations covers a representa-tive fraction of SID-NID pairs, and consequently SIDs,in the network. Therefore, explicit geo-intent is perva-sive not only in terms of geographic coverage (as seen in§3.2) but also in the CDSN infrastructure. This is par-ticularly important because if geo-intent of users indeedcaptures their geo-location, we can possibly geo-mapa significant fraction of the basestation infrastructureacross wide geographies.
Fig. 3(a) and (b), respectively show the distributionsfor the number of user queries containing zip-codes perbasestation and unique zip-codes per basestation for theURLs in Dataset I. We observe that the 50th and 75th
percentiles for the number of queries (containing zip-codes) seen per basestation are 16 and 50 respectively.While a majority of basestations see a sizable numberof geo-intent queries, the 50th and 75th percentiles forthe number of unique zip-codes seen per basestation are3 and 6 respectively. Fig. 3(c) shows the distribution ofthe ratio of unique zip-codes over the total number ofzip-code geo-intent queries per basestation. Once againwe observe that the respective 50th and 75th percentilesfor the ratio are 0.2 and 0.4 respectively. This resultclearly indicates that when there are a number of zip-code containing weather queries seen at a basestation,many of them are associated with only a small numberof zip-codes. This observation has important implica-tions in the process of geo-mapping of the basestationinfrastructure, as will be explored in the next subsec-tion.
Further analysis shows that the spread of zip-codecontaining geo-intent queries across the basestation in-frastructure is somewhat uneven, where basestationswithin urban metropolitan areas generally account fora greater fraction of geo-intent queries than those inrural areas. This can partly be explained by the differ-ence in population densities as well as the percentagesof “smart” phones and data service plans adopted byusers in these areas. Due to space limitation, we do notprovide detailed results (area-wise statistics) here.
4.2 From Geo-intent to Geo-locationWith about 23% of the basestations in our dataset
seeing zip-code containing weather queries, can we use
6
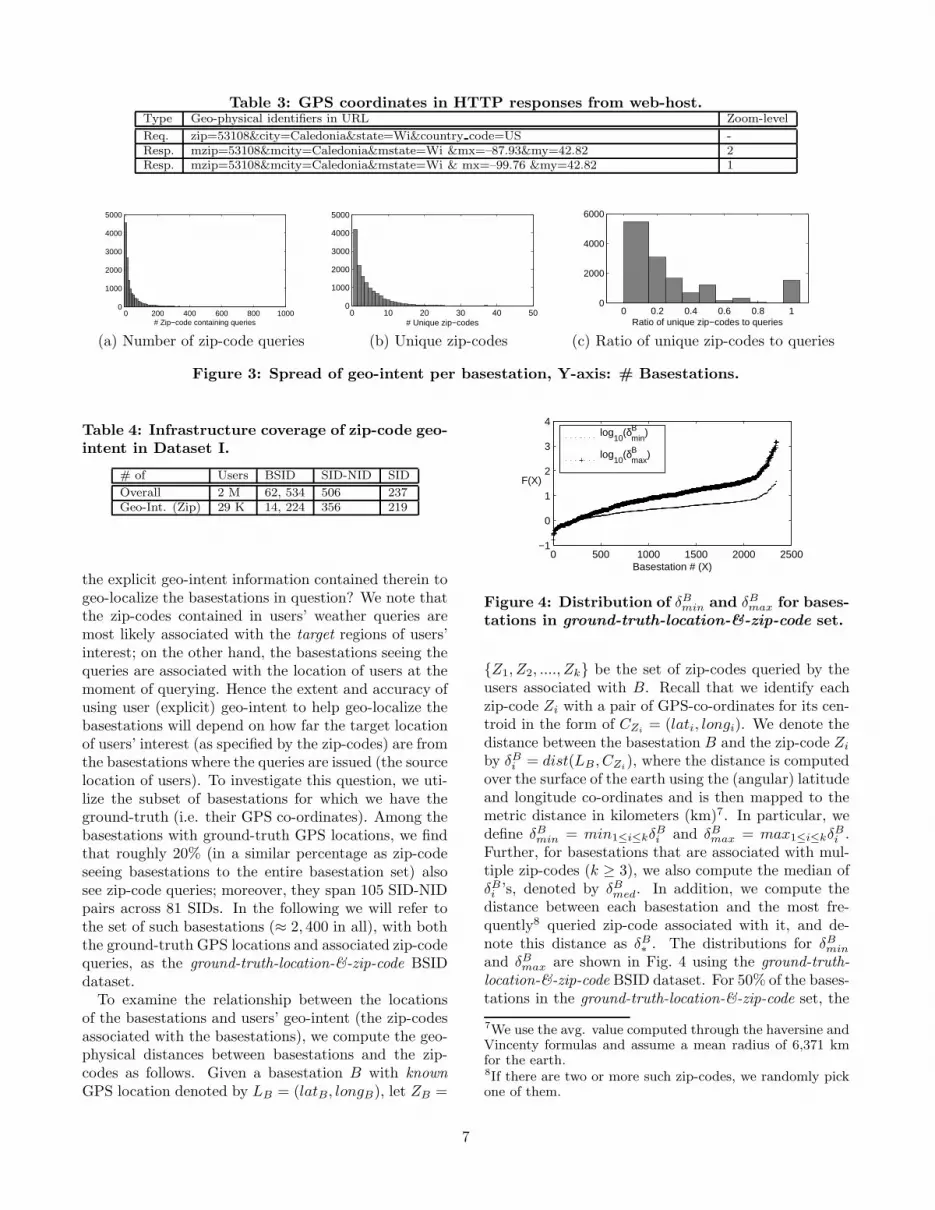
Table 3: GPS coordinates in HTTP responses from web-host.Type Geo-physical identifiers in URL Zoom-level
Req. zip=53108&city=Caledonia&state=Wi&country code=US -Resp. mzip=53108&mcity=Caledonia&mstate=Wi &mx=–87.93&my=42.82 2Resp. mzip=53108&mcity=Caledonia&mstate=Wi & mx=–99.76 &my=42.82 1
0 200 400 600 800 10000
1000
2000
3000
4000
5000
# Zip−code containing queries0 10 20 30 40 50
0
1000
2000
3000
4000
5000
# Unique zip−codes0 0.2 0.4 0.6 0.8 1
0
2000
4000
6000
Ratio of unique zip−codes to queries
(a) Number of zip-code queries (b) Unique zip-codes (c) Ratio of unique zip-codes to queries
Figure 3: Spread of geo-intent per basestation, Y-axis: # Basestations.
Table 4: Infrastructure coverage of zip-code geo-intent in Dataset I.
# of Users BSID SID-NID SID
Overall 2 M 62, 534 506 237Geo-Int. (Zip) 29 K 14, 224 356 219
the explicit geo-intent information contained therein togeo-localize the basestations in question? We note thatthe zip-codes contained in users’ weather queries aremost likely associated with the target regions of users’interest; on the other hand, the basestations seeing thequeries are associated with the location of users at themoment of querying. Hence the extent and accuracy ofusing user (explicit) geo-intent to help geo-localize thebasestations will depend on how far the target locationof users’ interest (as specified by the zip-codes) are fromthe basestations where the queries are issued (the sourcelocation of users). To investigate this question, we uti-lize the subset of basestations for which we have theground-truth (i.e. their GPS co-ordinates). Among thebasestations with ground-truth GPS locations, we findthat roughly 20% (in a similar percentage as zip-codeseeing basestations to the entire basestation set) alsosee zip-code queries; moreover, they span 105 SID-NIDpairs across 81 SIDs. In the following we will refer tothe set of such basestations (≈ 2, 400 in all), with boththe ground-truth GPS locations and associated zip-codequeries, as the ground-truth-location-&-zip-code BSIDdataset.
To examine the relationship between the locationsof the basestations and users’ geo-intent (the zip-codesassociated with the basestations), we compute the geo-physical distances between basestations and the zip-codes as follows. Given a basestation B with knownGPS location denoted by LB = (latB, longB), let ZB =
0 500 1000 1500 2000 2500−1
0
1
2
3
4
Basestation # (X)
log
10(δB
min)
log10
(δBmax
)
F(X)
Figure 4: Distribution of δBmin and δB
max for bases-tations in ground-truth-location-&-zip-code set.
{Z1, Z2, ...., Zk} be the set of zip-codes queried by theusers associated with B. Recall that we identify eachzip-code Zi with a pair of GPS-co-ordinates for its cen-troid in the form of CZi
= (lati, longi). We denote thedistance between the basestation B and the zip-code Zi
by δBi = dist(LB, CZi
), where the distance is computedover the surface of the earth using the (angular) latitudeand longitude co-ordinates and is then mapped to themetric distance in kilometers (km)7. In particular, wedefine δB
min = min1≤i≤kδBi and δB
max = max1≤i≤kδBi .
Further, for basestations that are associated with mul-tiple zip-codes (k ≥ 3), we also compute the median ofδBi ’s, denoted by δB
med. In addition, we compute thedistance between each basestation and the most fre-quently8 queried zip-code associated with it, and de-note this distance as δB
∗ . The distributions for δBmin
and δBmax are shown in Fig. 4 using the ground-truth-
location-&-zip-code BSID dataset. For 50% of the bases-tations in the ground-truth-location-&-zip-code set, the
7We use the avg. value computed through the haversine andVincenty formulas and assume a mean radius of 6,371 kmfor the earth.8If there are two or more such zip-codes, we randomly pickone of them.
7
−88.1 −88.05 −88 −87.95 −87.9 −87.8542.95
43
43.05
43.1
43.15
43.2
−88.1 −88.05 −88 −87.95 −87.9 −87.8542.95
43
43.05
43.1
43.15
43.2
(a) Voronoi partitioning (b) Delaunay (sub) graph
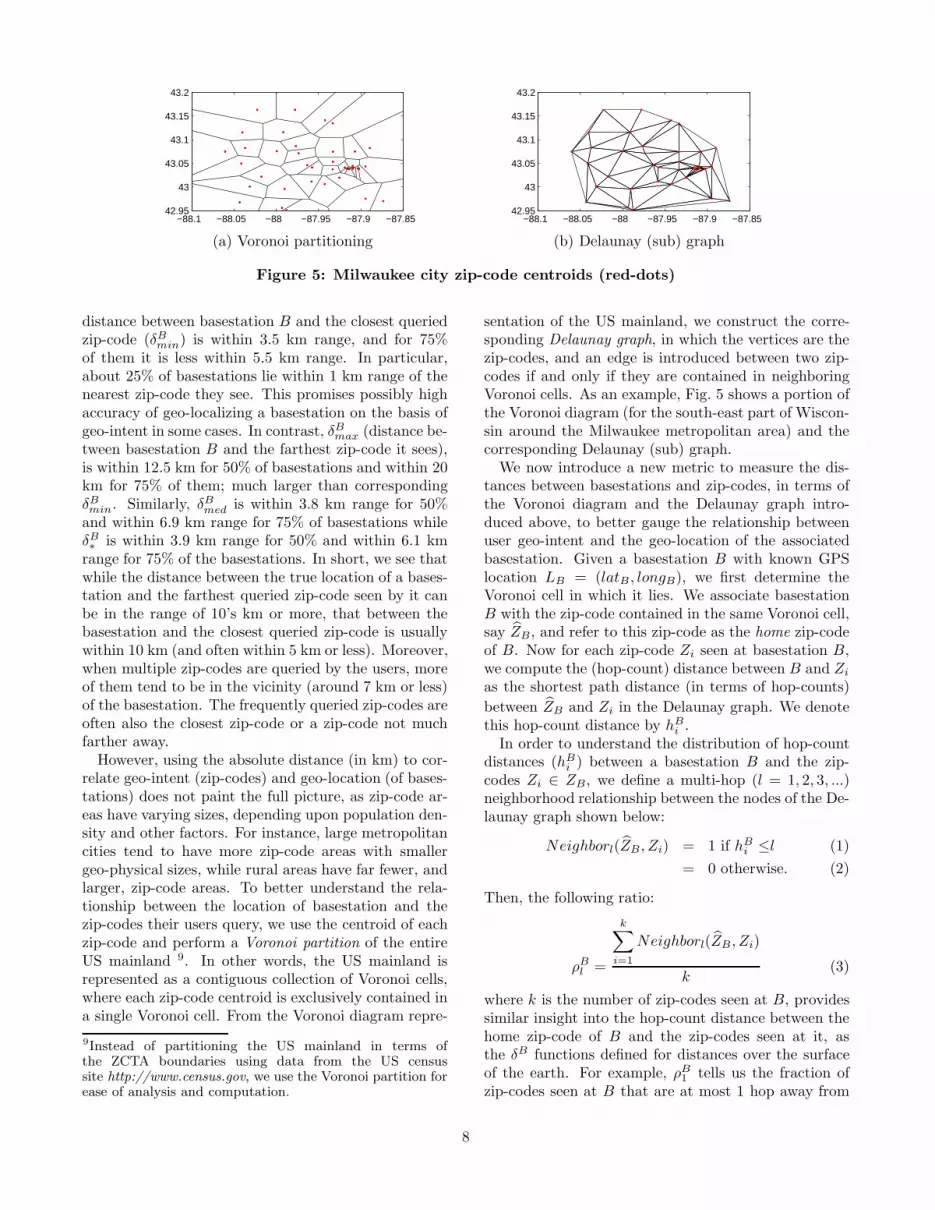
Figure 5: Milwaukee city zip-code centroids (red-dots)
distance between basestation B and the closest queriedzip-code (δB
min) is within 3.5 km range, and for 75%of them it is less within 5.5 km range. In particular,about 25% of basestations lie within 1 km range of thenearest zip-code they see. This promises possibly highaccuracy of geo-localizing a basestation on the basis ofgeo-intent in some cases. In contrast, δB
max (distance be-tween basestation B and the farthest zip-code it sees),is within 12.5 km for 50% of basestations and within 20km for 75% of them; much larger than correspondingδBmin. Similarly, δB
med is within 3.8 km range for 50%and within 6.9 km range for 75% of basestations whileδB∗ is within 3.9 km range for 50% and within 6.1 km
range for 75% of the basestations. In short, we see thatwhile the distance between the true location of a bases-tation and the farthest queried zip-code seen by it canbe in the range of 10’s km or more, that between thebasestation and the closest queried zip-code is usuallywithin 10 km (and often within 5 km or less). Moreover,when multiple zip-codes are queried by the users, moreof them tend to be in the vicinity (around 7 km or less)of the basestation. The frequently queried zip-codes areoften also the closest zip-code or a zip-code not muchfarther away.
However, using the absolute distance (in km) to cor-relate geo-intent (zip-codes) and geo-location (of bases-tations) does not paint the full picture, as zip-code ar-eas have varying sizes, depending upon population den-sity and other factors. For instance, large metropolitancities tend to have more zip-code areas with smallergeo-physical sizes, while rural areas have far fewer, andlarger, zip-code areas. To better understand the rela-tionship between the location of basestation and thezip-codes their users query, we use the centroid of eachzip-code and perform a Voronoi partition of the entireUS mainland 9. In other words, the US mainland isrepresented as a contiguous collection of Voronoi cells,where each zip-code centroid is exclusively contained ina single Voronoi cell. From the Voronoi diagram repre-
9Instead of partitioning the US mainland in terms ofthe ZCTA boundaries using data from the US censussite http://www.census.gov, we use the Voronoi partition forease of analysis and computation.
sentation of the US mainland, we construct the corre-sponding Delaunay graph, in which the vertices are thezip-codes, and an edge is introduced between two zip-codes if and only if they are contained in neighboringVoronoi cells. As an example, Fig. 5 shows a portion ofthe Voronoi diagram (for the south-east part of Wiscon-sin around the Milwaukee metropolitan area) and thecorresponding Delaunay (sub) graph.
We now introduce a new metric to measure the dis-tances between basestations and zip-codes, in terms ofthe Voronoi diagram and the Delaunay graph intro-duced above, to better gauge the relationship betweenuser geo-intent and the geo-location of the associatedbasestation. Given a basestation B with known GPSlocation LB = (latB, longB), we first determine theVoronoi cell in which it lies. We associate basestationB with the zip-code contained in the same Voronoi cell,say ZB, and refer to this zip-code as the home zip-codeof B. Now for each zip-code Zi seen at basestation B,we compute the (hop-count) distance between B and Zi
as the shortest path distance (in terms of hop-counts)
between ZB and Zi in the Delaunay graph. We denotethis hop-count distance by hB
i .In order to understand the distribution of hop-count
distances (hBi ) between a basestation B and the zip-
codes Zi ∈ ZB, we define a multi-hop (l = 1, 2, 3, ...)neighborhood relationship between the nodes of the De-launay graph shown below:
Neighborl(ZB, Zi) = 1 if hBi ≤l (1)
= 0 otherwise. (2)
Then, the following ratio:
ρBl =
k∑
i=1
Neighborl(ZB, Zi)
k(3)
where k is the number of zip-codes seen at B, providessimilar insight into the hop-count distance between thehome zip-code of B and the zip-codes seen at it, asthe δB functions defined for distances over the surfaceof the earth. For example, ρB
1tells us the fraction of
zip-codes seen at B that are at most 1 hop away from
8
0 0.2 0.4 0.6 0.8 1 1.20
200
400
600
800
1000
1200
ρ1B(X)
F(X)
0 0.2 0.4 0.6 0.8 1 1.20
200
400
600
800
1000
1200
ρ2B(X)
F(X)
0 0.2 0.4 0.6 0.8 1 1.20
200
400
600
800
1000
1200
ρ3B(X)
F(X)
(a) 1 hop (b) 2 hops (c) 3 hops
Figure 6: No. of basestations (Y-axis) with X (fraction) of assoc. zip-codes at most l hops away.
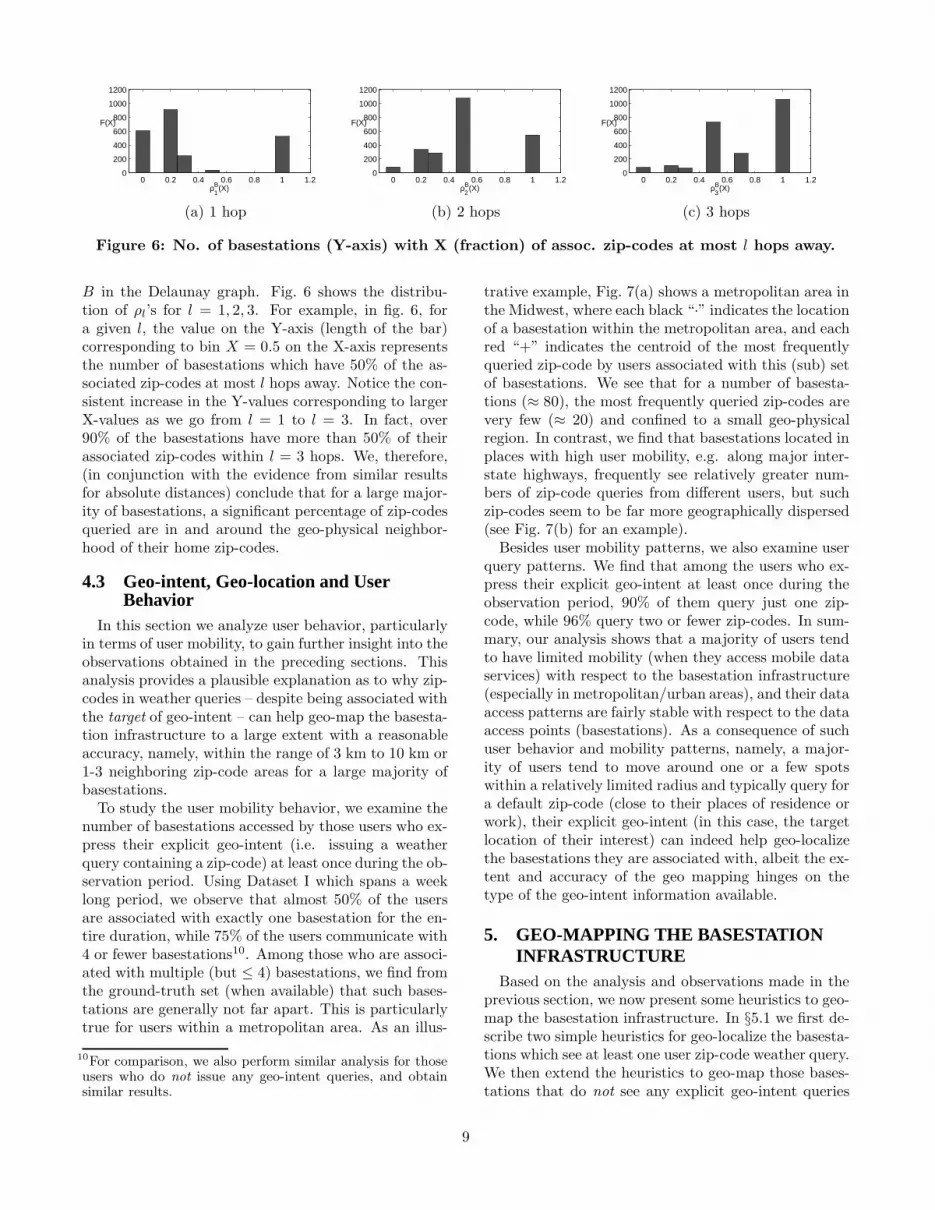
B in the Delaunay graph. Fig. 6 shows the distribu-tion of ρl’s for l = 1, 2, 3. For example, in fig. 6, fora given l, the value on the Y-axis (length of the bar)corresponding to bin X = 0.5 on the X-axis representsthe number of basestations which have 50% of the as-sociated zip-codes at most l hops away. Notice the con-sistent increase in the Y-values corresponding to largerX-values as we go from l = 1 to l = 3. In fact, over90% of the basestations have more than 50% of theirassociated zip-codes within l = 3 hops. We, therefore,(in conjunction with the evidence from similar resultsfor absolute distances) conclude that for a large major-ity of basestations, a significant percentage of zip-codesqueried are in and around the geo-physical neighbor-hood of their home zip-codes.
4.3 Geo-intent, Geo-location and UserBehavior
In this section we analyze user behavior, particularlyin terms of user mobility, to gain further insight into theobservations obtained in the preceding sections. Thisanalysis provides a plausible explanation as to why zip-codes in weather queries – despite being associated withthe target of geo-intent – can help geo-map the basesta-tion infrastructure to a large extent with a reasonableaccuracy, namely, within the range of 3 km to 10 km or1-3 neighboring zip-code areas for a large majority ofbasestations.
To study the user mobility behavior, we examine thenumber of basestations accessed by those users who ex-press their explicit geo-intent (i.e. issuing a weatherquery containing a zip-code) at least once during the ob-servation period. Using Dataset I which spans a weeklong period, we observe that almost 50% of the usersare associated with exactly one basestation for the en-tire duration, while 75% of the users communicate with4 or fewer basestations10. Among those who are associ-ated with multiple (but ≤ 4) basestations, we find fromthe ground-truth set (when available) that such bases-tations are generally not far apart. This is particularlytrue for users within a metropolitan area. As an illus-
10For comparison, we also perform similar analysis for thoseusers who do not issue any geo-intent queries, and obtainsimilar results.
trative example, Fig. 7(a) shows a metropolitan area inthe Midwest, where each black “·” indicates the locationof a basestation within the metropolitan area, and eachred “+” indicates the centroid of the most frequentlyqueried zip-code by users associated with this (sub) setof basestations. We see that for a number of basesta-tions (≈ 80), the most frequently queried zip-codes arevery few (≈ 20) and confined to a small geo-physicalregion. In contrast, we find that basestations located inplaces with high user mobility, e.g. along major inter-state highways, frequently see relatively greater num-bers of zip-code queries from different users, but suchzip-codes seem to be far more geographically dispersed(see Fig. 7(b) for an example).
Besides user mobility patterns, we also examine userquery patterns. We find that among the users who ex-press their explicit geo-intent at least once during theobservation period, 90% of them query just one zip-code, while 96% query two or fewer zip-codes. In sum-mary, our analysis shows that a majority of users tendto have limited mobility (when they access mobile dataservices) with respect to the basestation infrastructure(especially in metropolitan/urban areas), and their dataaccess patterns are fairly stable with respect to the dataaccess points (basestations). As a consequence of suchuser behavior and mobility patterns, namely, a major-ity of users tend to move around one or a few spotswithin a relatively limited radius and typically query fora default zip-code (close to their places of residence orwork), their explicit geo-intent (in this case, the targetlocation of their interest) can indeed help geo-localizethe basestations they are associated with, albeit the ex-tent and accuracy of the geo mapping hinges on thetype of the geo-intent information available.
5. GEO-MAPPING THE BASESTATIONINFRASTRUCTURE
Based on the analysis and observations made in theprevious section, we now present some heuristics to geo-map the basestation infrastructure. In §5.1 we first de-scribe two simple heuristics for geo-localize the basesta-tions which see at least one user zip-code weather query.We then extend the heuristics to geo-map those bases-tations that do not see any explicit geo-intent queries
9

−88 −87.95 −87.9 −87.85 −87.843
43.05
43.1
43.15
−91 −90 −89 −88 −8743
43.5
44
44.5
45
(a) Metropolitan area (b) Highway area
Figure 7: Most frequently queried zip-codes (red “+”) seen at (sub) set of basestations (black “·”).
0 10 20 30 40 50 600
0.2
0.4
0.6
0.8
1
Error distance in km (X)
F(X)
0 50 100 1500
0.2
0.4
0.6
0.8
1
Error distance in km (X)
F(X)
0 1 2 3 4 5 6 7 80
100
200
300
400
Hot−count distance (X)
F(X)
(a) Dist. Err. (MV-scheme) (b) Dist. Err. (DNC-scheme) (c) Hop-count Err. (DNC-scheme)
Figure 8: Error incurred in direct geo-mapping compared to the ground-truth set.
but share the user base with those that do, by exploitinguser movement over short time intervals. The evalua-tion results are presented in § 5.2. As a proof of concept,we will also present some results obtained from simi-lar analysis applied to the GPS co-ordinates related toa particular service (www.geoterrestrial.com) fromDataset II in §5.3.
5.1 Geo-Mapping HeuristicsDirect Geo-mapping via Geo-Intent. For thosebasestations which see at least one zip-code containingweather query, we directly geo-localize them using theuser explicit geo-intent by means of the following twosimple heuristics.
Given a basestation B, let ZB = {Z1, Z2, ..., Zk} bethe set of valid zip-codes queried by its users UB ={U1, U2, ..., Ul}. The first heuristic, the Majority Vot-ing (MV) scheme, selects the most probable location (orlocations) from all possible zip-code locations (Zi)’s asfollows: Each user Ui ∈ UB has one simple vote. Recallthat a given user Ui may query the same zip-code Zj
multiple times. In order to prevent such frequent votersfrom skewing the vote count, we permit a user to voteonly once. Also, a given user Ui may possibly querymultiple zip-codes from the set ZB. In such cases, wesplit the simple vote of Ui either equally or proportion-ally among all the zip-codes s/he queries. For example,if Ui queries zip-code Z1 thrice and Z2 twice, in equalvote-splitting, both zip-codes receive 0.5 votes from Ui
while in proportional vote-splitting, Z1 receives 0.6 voteand Z2 receives 0.4 vote from Ui. The winner of the elec-tion, i.e. the zip-code receiving most votes, is chosen asthe most probable geo-location for the basestation B.When there are multiple winners (ties), all of them arechosen as probable locations (with equal probability).
The second heuristic, the Dense Neighborhood Clus-tering (DNC) scheme, uses both the frequencies of zip-codes queried as well as the neighborhood relationshipamong the zip-codes. Given the Delaunay graph of theUS mainland, the zip-codes in ZB induce a subgraph,denoted by GZ(B), with vertices Zi, 1 ≤ i ≤ k, andthere is an edge between Zi and Zj if and only if thezip-code areas they represent border each other. Fur-thermore, we assign each node Zi a weight wi equalto the votes received by it during the Majority Vot-ing scheme above. In general, the subgraph GZ(B)consists of multiple connected components, C1, . . . , Cm,where 1 ≤ m ≤ k (k = |ZB|), each a probable can-didate for the location of B. For each Cp, we definew(Cp) =
∑Zi∈Cp
w(Zi). We select the component Cp
with the largest w(Cp) as the probable location (a con-nected zip-code neighborhood) for the basestation B.We note that in the special case where m = k, i.e.GZ(B) consists of k disjoint vertices, this scheme re-duces to Majority Voting. A further refinement of thisheuristic also filters out cases where the total weightw(Cp) of the winner component is too small (below athreshold) and GZ(B) consists of mostly disconnected
10
vertices that are spread over a large geographical area.In such cases, the heuristic simply labels the location ofB as “undecided” instead.Indirect Geo-mapping based on User Mobility.The direct geo-mapping via geo-intent helps geo-localizearound 20% of the basestations in our datasets. Tomap other basestations, those not mapped during di-rect geo-mapping due to lack of geo-intent queries, weexploit user movement. To do so, we introduce thebasestation-user-mobility graph, GM , where the verticesare the basestations (BSIDs) and an edge e = (Bi, Bj)is introduced between two vertices Bi and Bj if at leastone user11 accesses both of them (regardless of order)within a short interval of time ∆T (say 5 minutes).Given GM thus defined, let Bmapped denote the set ofbasestations geo-located via the two direct geo-mappingheuristics described above, and Bunmapped be the setof unmapped basestations. For each basestation B ∈Bunmapped, if it is connected to some basestation B ∈Bmapped via some paths, we define h(B, B) as the short-est path distance (hop-count) from B to B. Then,let h(B,Bmapped) = minB∈Bmapped
h(B, B). Note that
h(B,Bmapped) = ∞ if B is not connected to any B ∈Bmapped.
In our datasets, we have about 22% basestations inBunmapped that are connected to at least one basestationin Bmapped at a 1-hop distance (i.e. h(B,Bmapped) = 1).Hence, we geo-localize them first by exploiting theirconnectivities to the basestations in Bmapped. The chal-lenge here is to map the connectivity in GM to geo-locations or zip-code neighborhoods in the Delaunaygraph of US zip-codes. To control the mapping accuracyof a basestation B ∈ Bunmapped, we introduce two pa-rameters, the hop-count threshold d, and the (mapped)neighborhood size s. For any B ∈ Bunmapped such thath(B,Bmapped) ≤ d and it is connected to at least s
basestations in Bmapped that are at most d hops awayfrom B, we geo-localize B by constructing a connectedzip-code neighborhood in the Delaunay graph of zip-codes. Let Nd(B) be the set of home zip-codes of the(directly mapped) basestations B’s in Bmapped that areat most d-hops away from B (note that |Nd(B)| ≥
s). Using the centroids of ZB’s, we construct a con-
vex hull HB, covering all ZB’s, as the most probablegeo-location for B. Alternatively, we construct a con-nected zip-code neighborhood (subgraph), also denotedby HB , which is formed by the zip-codes whose cen-troids fall within the convex hull HB. We refer to HB
as the inferred zip-code neighborhood for basestation
11More generally, for each edge e = (Bi, Bj), we count thenumber of users associated with both B1 and B2 within ashort time interval ∆T , and filter out edges that have a verysmall common user count to prevent spurious connectionsdue to noisy data. If a lot of users access Bi and Bj withina short interval they are likely close to each other
B.
5.2 Evaluation and ValidationTo evaluate the efficacy of our heuristics for geo-
mapping the basestation infrastructure, we use the col-lection of basestations with ground-truth GPS locations.In particular, we use the basestations in the ground-truth-&-zip-code set for Dataset II to evaluate the twodirect geo-mapping heuristics. Then, we use the otherbasestations in the ground truth set, which do not seezip-code queries by their users, in both Dataset I andDataset II to evaluate the indirect mapping heuristics.
Using the ground-truth-&-zip-code basestation datasetfrom Dataset II, Fig. 8(a) shows the distribution ofgeo-mapping errors, namely, the distance between theinferred location and the ground-truth location, usingthe Majority Voting heuristic. In case of multiple in-ferred locations (zip-codes) available for a basestation,we compute the error for each inferred location. Weobserve that the 50th and 75th percentiles are around3.9 and 6.1 km respectively (Dataset II), quite similarto what we observed for δB
min in Dataset I ( see § 4.2).For the Dense Neighborhood Clustering heuristic, we
measure the errors in terms of both absolute distanceand hop-count. For a basestation B, let C(B) be theinferred zip-code neighborhood. We compute the cen-troid of C(B) and use the distance (ground-truth GPSlocation) between B and the centroid as the absolutedistance error. In terms of hop-count distance error,we use the home zip-code ZB of the basestation B, andcompute the (shortest distance) hop-count from ZB to
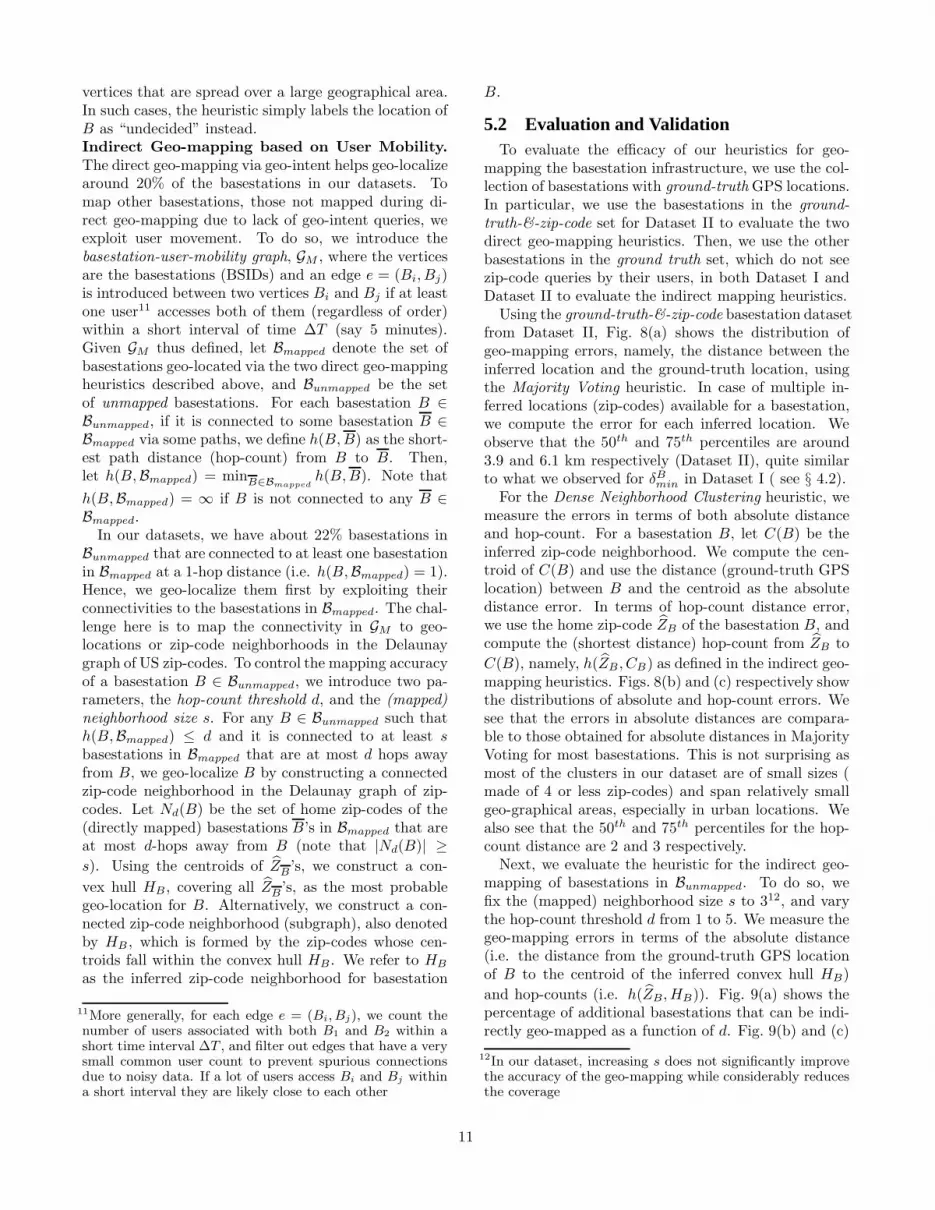
C(B), namely, h(ZB, CB) as defined in the indirect geo-mapping heuristics. Figs. 8(b) and (c) respectively showthe distributions of absolute and hop-count errors. Wesee that the errors in absolute distances are compara-ble to those obtained for absolute distances in MajorityVoting for most basestations. This is not surprising asmost of the clusters in our dataset are of small sizes (made of 4 or less zip-codes) and span relatively smallgeo-graphical areas, especially in urban locations. Wealso see that the 50th and 75th percentiles for the hop-count distance are 2 and 3 respectively.
Next, we evaluate the heuristic for the indirect geo-mapping of basestations in Bunmapped. To do so, wefix the (mapped) neighborhood size s to 312, and varythe hop-count threshold d from 1 to 5. We measure thegeo-mapping errors in terms of the absolute distance(i.e. the distance from the ground-truth GPS locationof B to the centroid of the inferred convex hull HB)
and hop-counts (i.e. h(ZB, HB)). Fig. 9(a) shows thepercentage of additional basestations that can be indi-rectly geo-mapped as a function of d. Fig. 9(b) and (c)
12In our dataset, increasing s does not significantly improvethe accuracy of the geo-mapping while considerably reducesthe coverage
11
1 2 3 4 5500
1000
1500
2000
Hop−counts (X)
# Indirectly inferred
F(X)
0 50 100 150 2000
0.2
0.4
0.6
0.8
1
Distance from center of convex hull (X)
F(X)
0 1 2 3 4 5 60
200
400
600
800
Hop−count distance (X)
F(X)
(a) No. of unmapped BSID’s covered (b) Dist. Err. (DNC-scheme) (c) Hop-count Err. (DNC-scheme)
Figure 9: Coverage and error incurred in indirect geo-mapping compared to the ground-truth set.
0 1 2 3 4 5 60
1
2
3
4
5
6
Distance from population center
Err(X)
0 5 10 15 20 25 300
5
10
15
20
25
30
Distance from population center (X)
Err(X)
0 5 10 15 20 25 300
100
200
300
400
500
600
Distance from population center (X)
Err(X)
(a) Metropolitan area (b) Urban area (c) Highway
Figure 10: Relationship between population and basestation density and error in geo-mapping.
show the distributions of absolute distance errors andhop-count errors, respectively. We see that the errorsincurred go up in terms of distances, even though hop-counts go up only by a few hops. The reason for thisis that the edges in user mobility graph cover long dis-tances in highway areas. Add to it, the long distancesbetween the vertices of the convex hull HB in such ar-eas due to far apart zip-codes. Even for small valuesof d and s, the error incurred in such areas is high.In contrast, in urban areas, users cannot travel verylong distances in short intervals of time. This meansshorter edges in the mobility graph. Also, zip-codesin such areas are geo-physically close to each other. Acombination of the two results in relatively lower errorin urban areas for the indirect method both in termsof hop-counts (usually 1 − 3) as well as absolute error(5 − 10 km or less). This helps us realize our objectiveof geo-localizing basestations in Bunmapped at city levelgranularities.
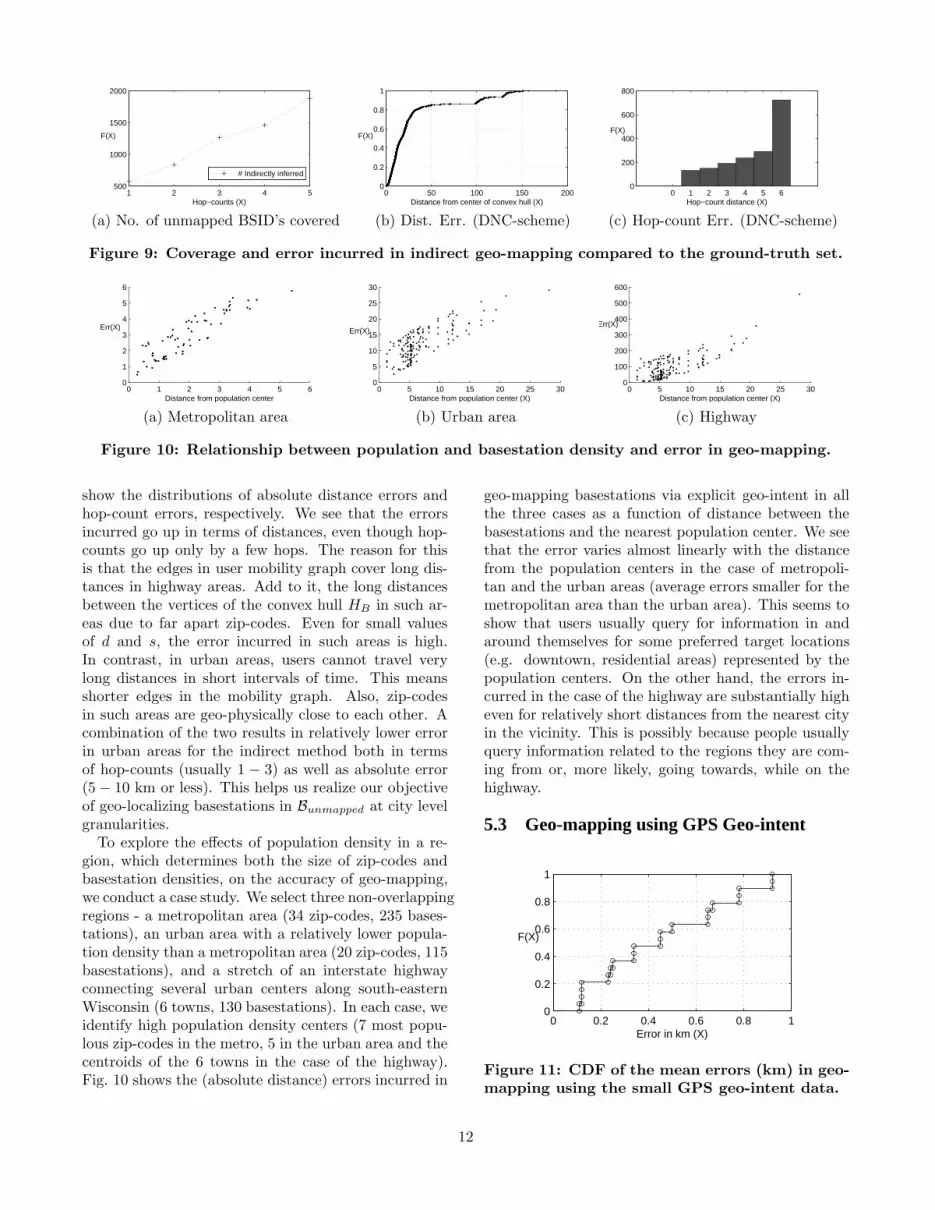
To explore the effects of population density in a re-gion, which determines both the size of zip-codes andbasestation densities, on the accuracy of geo-mapping,we conduct a case study. We select three non-overlappingregions - a metropolitan area (34 zip-codes, 235 bases-tations), an urban area with a relatively lower popula-tion density than a metropolitan area (20 zip-codes, 115basestations), and a stretch of an interstate highwayconnecting several urban centers along south-easternWisconsin (6 towns, 130 basestations). In each case, weidentify high population density centers (7 most popu-lous zip-codes in the metro, 5 in the urban area and thecentroids of the 6 towns in the case of the highway).Fig. 10 shows the (absolute distance) errors incurred in
geo-mapping basestations via explicit geo-intent in allthe three cases as a function of distance between thebasestations and the nearest population center. We seethat the error varies almost linearly with the distancefrom the population centers in the case of metropoli-tan and the urban areas (average errors smaller for themetropolitan area than the urban area). This seems toshow that users usually query for information in andaround themselves for some preferred target locations(e.g. downtown, residential areas) represented by thepopulation centers. On the other hand, the errors in-curred in the case of the highway are substantially higheven for relatively short distances from the nearest cityin the vicinity. This is possibly because people usuallyquery information related to the regions they are com-ing from or, more likely, going towards, while on thehighway.
5.3 Geo-mapping using GPS Geo-intent
0 0.2 0.4 0.6 0.8 10
0.2
0.4
0.6
0.8
1
Error in km (X)
F(X)
Figure 11: CDF of the mean errors (km) in geo-mapping using the small GPS geo-intent data.
12

−130 −120 −110 −100 −90 −80 −70 −6025
30
35
40
45
50
−130 −120 −110 −100 −90 −80 −70 −6025
30
35
40
45
50
−130 −120 −110 −100 −90 −80 −70 −6025
30
35
40
45
50
(a) (b) (c)
Figure 12: Geo-physical coverage of NAS gateways.
Lastly, we use the small GPS geo-intent dataset dis-cussed in section §3.3 to illustrate the efficacy of our ap-proach when GPS-based geo-intent (in particular, whenthe GPS coordinates are associated with the source(user) locations of the geo-intent. We extend the directgeo-mapping heuristics from §5.1 to the case of GPScoordinates, and apply tessellation and density estima-tion to geo-localize basestations by computing a (small)neighborhood area (rectangular cell) as their most prob-able locations. Due to the space limitation, the detailsare omitted. Fig. 11 shows the mean distance (error)between the ground-truth and the inferred (centroid)locations of the two dozen basestations in the smallGPS geo-intent dataset (and for which we have theground-truth locations). We see that the overall ac-curacy is within 0.5 - 1 km. Hence we believe that withthe increasing popularity of newer generations of GPS-enabled smart phones and location-aware services, geo-mapping based on user geo-intent will yield more accu-rate results than what can be obtained using zip-codesalone.
6. IP INFRASTRUCTURE IN THE CDSNIn this section we examine the IP network infrastruc-
ture in the CDSN with the help of inferred (and ground-truth) locations for the set of geo-mapped basestations.Our goal is two-fold: i) to infer and understand the re-lationship (e.g. the geo-spatial distribution) of the IPnetwork elements with the basestation substrate, andii) to investigate whether we can geo-map the networkelements in the CDSN to some degree. Here, we usethe packet data sessions to extract the relevant rela-tionships. Recall, the RADIUS/RADA packets con-tain basestation ids. In addition, they also contain fourtypes of IP addresses of interest to us13. They are:framed IP addresses (assigned to end users’ devices);the RADIUS/RADA server IP addresses (assigned toservers responsible for authenticating a user’s session),IP addresses of NAS gateways (gateway servers to theIP data distribution backbone network in the CSDN)
13Note that since the data is collected through passive mea-surement, we do not have IP addresses of IP routers, DNSservers, etc., and we are unable to conduct active measure-ments in the CDSN.
and IP addresses of home-agents (servers that maintaincertain user information e.g. user registration, creden-tials, and current locations for mobile IP routing).
Not surprisingly, a predominant majority of the IPaddresses in the datasets are framed IP addresses. Theymostly come from the private address realm of the IPspace; this is consistent with the findings in [3] wherethe authors collect and analyze the IP addresses seenat the end users’ devices. The framed IP addressesappear to be assigned randomly from the private ad-dress ranges agnostic to the geo-location of the bases-tations. The number of the other three IP addressesare far smaller: both NAS gateways and home-agentIP addresses number within 100, and RADIUS/RADAservers below 10 – in stark contrast to the number ofbasestations (in tens of thousands). As the NAS gate-ways and home-agents are more likely to correlate withuser/basestation locations, in the following we explorethe geo-spatial distribution of these IP addresses andtheir relation to the basestation infrastructure.
For each NAS gateway/home-agent IP address, weextract all the BSIDs which appear in the same RA-DIUS/RADA data packets containing the said IP ad-dress – these basestations are where the user data ses-sions originate. Hence each IP address (NAS gate-way server or home-agent) is associated with a col-lection of basestations. We study the geo-spatial dis-tribution of these basestations to investigate whetherthere is any significant geo-spatial correlation betweenthe NAS gateways/home agents and locations of thebasestations. We further analyze the relationships be-tween NAS gateways by clustering them based on thenumber of basestations they share in common, i.e. thesize of intersection between the basestation collectionsassociated with the two NAS gateway IP addresses.
As representative examples, Fig. 12 depicts the geo-spatial distribution of the basestations associated withthree different NAS gateways. We observe that theseNAS gateways cover rather large geographical areas (span-ning multiple states, and in terms of the basestationinfrastructure, multiple SIDs). These areas are typi-cally contiguous (as in Figs. 12 (a) and (b)), but some-times can be disparate too (as in Fig. 12(c)). Further-more, two or more NAS gateways may share a large
13
overlapping set of basestations; it appears that thesegateways serve the same large geographical region forload-balancing. We also performed similar analysis forhome-agent IP addresses (where we also take into ac-count the user activities to account for user mobilityand roaming). We find that each home-agent IP ad-dress also covers a large geographical region, and multi-ple home-agents may cover the same or similar regionsfor load-balancing. Due to space limitation, we do notprovide these results here.
In summary, we find that in contrast to the basesta-tion infrastructure, the numbers of NAS gateways andhome-agents are far smaller. While these gateways/home-agents are geo-spatially distributed, each covers a largegeographical region spanning multiple states and corre-sponds to a large collection of the basestations in theCDSN substrate. Our findings point to several chal-lenges in attempting to geo-map the CDSN infrastruc-ture from the outside (cf. [3]), and in deploying location-aware content distribution services outside the CDSN toserve users inside the CDSN.
Last but not the least, we remark that comparingthe two datasets collected about 10 months apart, weobserve that the amount of cellular data activity andtraffic has grown tremendously: for instance, the num-bers of data sessions and application sessions increasedover 3 and 10 times, respectively (see table 1). More-over, the number of cellular data users have also in-creased considerably. With the increasing popularity ofnew generations of smart phones, the growth in cellulardata traffic will further spur expansion of the IP net-works within cellular service provider networks, and wemay see more finer-grain geographic coverage to bet-ter cater to the growing user demand within a CSDNinfrastructure.
7. CONCLUSION AND FUTURE WORKIn this paper we put forth a novel approach for map-
ping the CDSN infrastructure via (explicit) user geo-intent, which circumvents the challenges plaguing con-ventional approaches (e.g. active probing). The intu-ition behind the proposed approach is to exploit spe-cific geo-locations (i.e. geo-intent) contained in userqueries to location-based services, and correlate themwith basestation id’s and gateway IP addresses to geo-map the CDSN infrastructure. To investigate whether— and to what extent — our approach can help geo-map the CDSN infrastructure, we employed the data(RADIUS/RADA packet data sessions and HTTP ap-plication sessions) collected at the core IP network in-side a CDSN. We developed heuristics for identifyinguser geo-intent to geo-map the CDSN infrastructure —in particular, the basestations and IP NAS gateways —and evaluated their efficacy using a subset of basesta-tions with known ground-truth GPS locations. Using
zip-codes contained in user weather queries, we demon-strated that a large portion of basestations can be geo-mapped within a 3.9 − 6.1 km range in general andwithin 1.5 − 2 km range in densely populated urbanareas. Furthermore, the geo-mapping accuracy is farbetter (often within 1 km) in large metro-areas withdense population and smaller zip-code areas. Using theinferred and ground-truth GSP locations of the bases-tations, we also examined the geo-spatial distributionof IP network elements such as NAS gateways and IPhome-agents, and their relationship to the cellular net-work substrate.
With growing popularity of newer generations of GPS-enabled smart phones and increasing prevalence of location-specific and location-aware services and apps, we ex-pect our geo-intent based mapping approach to yieldmore precise results, as was illustrated using a small setof user geo-intent queries with GPS coordinates in ourdatasets.
Given the unprecedented growth in cellular data traf-fic, mapping the CDSN infrastructure is a critical stepin understanding how to best expand and evolve theCDSN infrastructure to better meet growing user de-mands, and to guide the development and deploymentof innovative location-aware services and applicationsthat cater to mobile users and devices. Our study isonly an initial step in this direction and much addi-tional research is still sorely needed.
8. REFERENCES[1] http://www.census.gov.[2] http://www.roamingzone.com.[3] M. Balakrishnan, I. Mohomed, and
V. Ramasubramanian, Where’s that phone?Geolocating IP addresses on 3g networks, Proc. ofACM Internet Measurement Conference (2009).
[4] Q. Gan, J. Attenberg, A. Markowetz, and T. Suel,Analysis of geographic queries in a search enginelog, Proc. of LocWeb (2008).
[5] C. Rigney, RADIUS accounting, Internet RFC2866 (2000).
[6] C. Rigney, S. Willens, A. Rubens, andW. Simpson, Remote authentication dial in userservice (RADIUS), Internet RFC 2865 (2000).
[7] I. Trestian, S. Ranjan, A. Kuzmanovic, andA. Nucci, Measuring serendipity: Connectingpeople, locations and interest in a mobile 3Gnetwork, Proc. of ACM Internet MeasurementConference (2009).
[8] X. Yi, H. Raghavan, and C. Leggetter, Discoveringuser’s specific geo intention in web search, Proc. ofWorld Wide Web (2009).
[9] H. Zang, F. Baccelli, and J. C. Bolot, Bayesianinference for localization in cellular networks, Proc.of IEEE INFOCOM 2010, March 2010.
14