manoeuvring aerodynamics - defense technical information
TRANSCRIPT
AGARD-CP-497
C)i~
wAGARADVISORY GROUP FOR AEROSPACE RESEARCH & DEVELOPMENT7 RUE ANCELLE 92200 NEUILLY SUR SEINE FRANCE
AD-A245 302
AGARD CONFERENCE PROCEEDINGS 497
Manoeuvring Aerodynamics(La Manoeuvrabilitd par I&odynamique)
DTIC'- CTE
JAtl 2 3 1392
Papers presented and discussions held at the Fluid Dynamics PanelSpecialists' Meeting held in Toulouse, France, lst-2nd May 1991.
NORTH ATLANTIC TREATY ORGANIZATIONT7is dOcument eo n oippzo vdTtr public r oc.1 and "I; itsd_.bucn i3uninite.
Published November 1991
Distribution and Availability on Back Cover
AGARD-CP-497
ADVISORY GROUJP FOR AEROSPACE RESEARCH & DEVELOPMENT7 RUE ANCELLE 92200 NEUILLY SUR SEINE FRANCE
AGARD CONIFERIENCE PROCEEDINGS 497
Manoeuvring Aerodynamics ACCesion For
DTT~
D- D __t
A-14
Papers presented and discussions held at the Fluid Dynamics PanelSpecialists' Meeting held in Toulouse. France, lst-2nd May 1991.
- North Atlantic Treaty OrganizationOrganisation du Trait do rAtlantique Nord
92-0181792 1 22 051 no.
The Mission of AGARD
According to its Charter, the mission of AGARD is to bru.g together the leading personalities of the NATO nations in the fieldsof science and technology relating to aerospace for the following purposes:
- Recommending effective ways for the member nations to use their research and development capabilities for the
common benefit of the NATO community;
- Providing scientific and technical advice and assistance to the Military Committee in the field of aerospace research anddevelopment (with particular regard to its military application);
- Continuously stimulating advances in the aerospace sciences relevant to strengthening the common defence posture:
- Improving the co-operation among member nations in aerospace research and development:
- Exchange of scientific and technical information;
- Providing assistance to member nations for the purpose of increasing their scientific and technical potential:
- Rendering scientific and technical assistance, as requested, to other NATO bodies and to member nations in connectionwith research and development problems in the aerospace field.
The highest authority within AGARD is the National Delegates Board consisting of officially appointed senior representativesfrom each member nation. The mission of AGARD is carried out through the Panels which are composed of experts appointedby the National Delegates, the Consultant and Exchange Programme and the Aerospace Applications Studies Programme. Thcresults of AGARD work are reported to the member nations and the NATO Authorities through the AGARD series ofpublications of which this is one.
Participation in AGARD activities is by invitation only and is normally limited to citizens of the NATO nations.
The content of this publication has been reproduceddirectly from material supplied by AGARD or the authors.
Published November 1991
Copyright O AGARD 1991All Rights Reserved
ISBN 92-835-0643-X
Printed by Spraised Pinting Servicev Limited40 higwfl Lwe, Loughuon, Esex IGIO 37Z
.. . .iiii. . .
Recent Publications ofthe Fluid Dynamics Panel
AGARDOGRAPHS (AG)
Experimental Techniques in the Field of Low Density AerodynamicsAGARD AG-318 (E), April 1991
Techniques Expimentales Li~es i l'Airodynazmque i Busse DensitiAGARD AG-3 18 (FR), April 1990
A Survey of Measurements and Measuring Techniques in Rapidly Distorted Compressible Turbulent Boundary LayersAGARD AG-315, May 1989
Reynolds Number Effects in Transonic FlowsAGARD AG-303. December 1988
Three Dimensional Grid Generation for Complex Configurations - Recent ProgressAGARD AG-309, March 1988
REPORTS (R)
Aircraft Dynamics at High Angles of Attack: Experiments and ModellingAGARD R-776, Special Course Notes, March 1991
Inverse Methods in Airfoil Design for Aeronautical and Turbomachinery ApplicationsAGARD R-780, Special Course Notes, November 1990
Aerodynanics of RotorcraftAGARD R-78 1, Special Course Notes, November 1990
Three-Dimensional Supersonic/Hypersonic Flows Including SeparationAGARD R-764, Special Course Notes. January 1990
Advances in Cryogenic Wind Tunnel TechnologyAGARD R-774. Special Course Notes. November 1989
ADVISORY REPORTS (AR)
Appraisal of the Suitability of Turbulence Models in Flow CalculationsAGARD AR-29 1, Technical Status Review, July 1991
Rotary-Balance Testing for Aircraft DynamicsAGARD AR-265. Report of WG 11, December 1990
Calculation of 3D Separated Turbulent Flows in Boundary Layer LimitAGARD AR-255, Report of WGIO, May 1990
Adaptive Wind Tunnel Wal& Technology and ApplicationsAGARD AR-269. Report of WG 12. April 1990
CONFERENCE PROCEEDINGS (CP)
Vortex Flow AerodynamicsAGARD CP-494. July 19~91
Misie~ AerodynamicsAGARD CP-493. October 1990
Aerodynamics of Combat Aircraft Controls and of Ground EffectsAGARD CP-465, April 1990
Computational Methods for Aerodynamic Design (Inverse) and OptimizationAGARD CP-463, March 1990
Application of Mash Generation to Complex 3-D ConiguatoonsAGARD CP-464. March 1990
T.
Fluid Dyuais of Three-Dimeniouial Turbulent Shear Flows and Transition
AGARD CP-43 7, December 198
Aerodynamific Data Accuracy and Quality: Requirements and Capabilities in Wind Tune Testing
AGARDL CP-429. July 1988
Aerodynaics of Hypersonic Lifting Vehicles
AGARD CP-428, November 1987
Aerodynamnic and Related Hydrodynamic Studies Using Water Facilities
AGARI) CP-413, June 1987
Applications of Computationial Fluid Dynamics in Aeronautics
AGARD CP-4 12. November 1986
Store Airtraine AerodynamicsAGAI*D CP-389. August 1986
Unsteady Aerodynamics - Fundamentals and Applications to Aircraft Dynamics
AGARD CP-386. November 1985
Aerodynamics and Acoustics of PropellersAGARD CP-366. February 1985
Improvement of Aerodynamsic Performance through Boundary Layer Control and High Lift Systems
AGARD CP-365, August 1984
Wind Tunnels and Testing Techniques
AGARD CP-348, February 1984
Aerodynamics of Vortical Type Flows in Three Dimensions
AGARD CP-342. July 1983
Missile AerodynamicsAGARD CP-336. February 1983
Prediction of Aerodynamic Loads on RotoreraftAGARD CP-334, September 1982
Wall Interference in Wind Tunnels
AGARD CP-335. September 1982
Fluid Dyssanics of Jets with Applications to V/STOL
AGARD CP-308, January 1982
Aerodynamics of Power Plant InstallationAGARD CP-30 1, September 1981
Computation Of Viscous hislacCMInteractionsAGARD CP-29 1, February 1981
Subsisuic,1Trimsule Configuration Aerodynatiics
AGARD CP-285. September 1980
Turbulenst Dousdary Layer Experiments, Theory and Modelling
AGARD CP-27 1, January 1980
Aerodyniakl Characteristics of Controls
AGARD CP-262. September 1979
High Amile of Attak AerodynaimncsAGARD CP-247, January 1979
Dymai Stability ParametersAGARD CP-23S, November 1978
Unsteady AerodyamicsAGARD CP-227, February 1978
LOaN-Tbds*TrookimAGARD CP-224, Ocer 1~
9 77
Foreword
This is the third FDP meeting in the general area of Aerodynamics for Aircraft Dynamics. following the successful meetings inGdttingen, Germany. in May 1985 (AGARD CP 386) and in Athens, Greece, in May 1978 (AGARD CP 235). The themereflects the growing interest in rapid, large-amplitude maneuvers of agile combat aircraft at high angles of attack and treats theunsteady, separated, vortical and often non-linear flows representative of such conditions. Developments in the pertinentanalytical, computational and experimental design and prediction methods, techniques for vortex flow control, importance oftime-dependent phenomena and the need for advanced dynamic experiments in wind tunnels are all reported on and therelevant aerodynamic data are presented. It is hoped that this information will significantly improve our understanding of thebasic unsteady aerodynamics required for better prediction of the dynamic behavior of aircraft maneuvering at high angles ofattack.
This conference is technically associated with two other recent activities of the Fluid Dynamics Panel, a Special Course on-Aircraft Dynamics at High Angles of Attack - Experiments and Modelling" given at NASA Langley Research Center. UnitedStates, and at the von Kirmin Institute for Fluid Dynamics, Belgium, in April 1991 (AGARD R 776). and the recentlycompleted FDP Working Group 11 on Rotary-Balance Testing for Aircraft Dynamics (AGARD AR 265); the reader may wishto consult the appropriate publications for more information in the general area of the conference.
All papers for this symposium were obtained by invitation. There was no general call for papers. Unfortunately, because oftravel restrictions imposed during the Persian Gulf War, one of the organizations most active in the Maneuvering Aerodynamicstechnical area, NASA, was not able to be represented. Therefore, of the 19 invited papers, the two NASA papers (Papers No. Iand 4) were withdrawn. In the place of Paper No. 1. opening comments by the chairman of the meeting were expanded. and forPaper No.4, a video was presented showing recent flight tests of the X-31A experimental airplane. The original numberingsystem for the papers in the symposium program has been retained to avoid any confusion.
The organization of this volume warrants a brief comment. Usually. the symposium proceedings are published as soon after thesymposium as possible, and at a later date, a Technical Evaluation Report on the meetings published as a stand-alone report. Inthe present case, we were fortunate to have a Technical Evaluator who not only did a superb job but also did it very quickly, andso, it is possible to include his report with the conference proceedings. It is hoped that this combination will make the presentvolume even more valuable and, for those who want an abbreviated review of the meeting and the related discussi ns, theTechnical Evaluation Report (TER) can be used as a condensed version of the symposium. It may also serve as a guide to helpthe reader focus on specific papers he may be interested in reading in more detail.
The TER includes an Executive Summary which is an assessment of the meeting as a whole, a review of the individual papersthat were presented, and finally, a summary of the Round Table Discussion that followed the presentation of the papers.Following the Technical Evaluation Report are the presented papers in their entirety and a manuscript of the Round TableDiscussion.
Dr KJ. Orlik-RiickemannProgram Chairman
v
Avant-Propos
Cc symposium est la troisie~me reunion organisee par le Panel AGARD de la Dynamique des Fluides dans le domaine del'aerodynamnique pour ]a dynamnique de vol des aetonefs. Elie fait suite aux reunions tr~.s fructucuses qui ant cu. lieu A (3duingenen Allensagne au mois de mai 1985 (AGARD CP 386) et A Athenes en Grece au mois de mai 1978 (AGARD CP 235). Letlsme temoigne de rIntanit croissant qui est porti aux manoeuvres rapides et de grande amplitude effectuies par les avians decombhat a grande manoeuvrabilitei a grands angles d'attaque. 11 traitc des ecoulements instationnaires decolles. tourbillonnaireset souvent non-lindaires qui sont representatifs de telles conditions. Ce volume rend compte des developpements ricents en ccqui concerne lea mitlsodes pertinentes d'analyse. de calcul, de concepts expenmentaux et de prediction, sins. que destechniques de contr6le des 6coulements tourbillonnaires. l'importance des phenomnines disebroniques et le besoin d'essaisdynansiques en soufflerie de niveau avance, avec presentation des donnees a~rodynamiques approprices. Ces informationsdevraient pernsettre une meilleure comnprihension des ilements de base de Userodynamnique instationnaire n~eessalresal'ans~Iioration de la pnidiction du coinportement dynamique des acronefs manoeuvrant aux grands angles d'attaque.
La conference est associc du point de vue technique A deux autres aetivitis recentes du Panel. un cours sp~cial sur -Ladynamiquc de vol des a~ronefs aux grands angles d'attaque - expirimentation et niodelisation" organisfe au NASA Langleyresearch center. USA, et a lInstitut von Kirmain de Ia Dynamique des Fluides en Belgique au mois d'Avril 1991 (AGiARDR776), et les travaux recents du groupe de travail I I sur "Les essais a Ia balance rotative pour la dynanique de vol" (AGARDAR 265). Le lecteur souhtaitant obtenir de plus amples informations concernant ces domaines devrait consulter lespublications approprices.
Toutes lea communications presentees lora du symposium ant it remises sur invitation. 11 n'a pas 6t6 lance d'appel apublications. Maiheureusement, en raison des restrictions de diplacement impos~es lora de Ia guerre du Golfe. I'une desorganisasions Ira plus actives dans le domaine de la manocuvrabiliti par l'adrodynamique. la NASA. n's pas Pu envoyer derepresentaist a la reunion. Par consequent, les 2 communications de Ia NASA sur Ira 19 appelees (les presentations Nos. I et 4)ont diii etre retirees. Lea observations preliminaires du President ont eti developpees pour combler Ia lacune die Is prerniin:presentation et en cc qui concerne la presentation No. 4, un film video sur les essais en vol recents de l'avion experimental X-31A asew projete. Le syst~mc die numirotation des presentations adopti pour Ie programmed du symposium a 46t retenu pouriviter t011w possiblii de confusion.
Le plan deccc volume merite une explication bive. Normalement, le compte-rendu d'un symposium est Publi dans; lea plusbreft dilais, suivi. a une date uoithrieure et de facon independante. d'un rapport d'evaluation technique. Dana le ens present. et Anotre grand bottheur. ce rapport a etc redige par un ivaluaieur technique qul a non seulement fait un escellent travail. mais quil'a fait tres rapidement, cc qui nous a pennis de I'inclure au conipte rendu du symposium. Nous esperons que cette presentationdouble ajouteraitla valcur du present volume et que le rapport d'6valustion technique (TER) repondra aux attentes de ceux quicherchent une revue abregee du symposium et des discussions s'y rattachant, en tant que version condensc de Is conference. lIpourra aussi servir de guide au lecteur. en I'aidant a identifier certaines communications qui meritersient une attentionparticuliire die sa part.
Le TER comprend un tiesum qui sert hala fois. d'eaiuation globale de Is reunion. de revue des presentations individuelles et.enfin. 0 sommaire des discussions qui ont Cu lieu lts die la table ronde quit a clo)tuni cette manifestation. Le rapportd'6valuation technique cit suivii des communications pnisent~es en version int~grale et le manuscrnt des discussions de Ia tableronde.
Dr KJ. Orlik-Rdckemann
Vi[
.... -.. .. ..... .. ...
Fluid Dynamics Panel
Chairman: Dr Wi. McCroskey Deputy Chairman: Professor Ir i.W.Slooff
Senior Staff Scientist National Aerospace Laboratory NLR
US Army Aerofiightdynamics Directorate Anthony Fokkerweg 2
Mail Stop N 2 58-I 10-59 CM Amsterdam
NASA Ames Research Center The Netherlands
Moffett Field. CA 94(035-10199United States
PROGRAMME COMMITME
D~r K.J.Orlik-Riickemnann(Chairman) Professor Dr T.Ytrehus
Applied Aerodynamics Laboratory Division of Applied Mechanics
Institute for Aerospace Research The University of Trondheim
NRC. Bldg M-lO The Norwegian Inst. of Technology
Montreal Road N-7034 Trondheim - NTH
Ottawa K IA 0R6 Norway
CanadaProfessor Dr C.Ciray
Prof. R. Decuypere Aeronautical Eng. Department
Ecole Royale Militaire Middle East Technical University
Chaire de Micanique Appliqu~e lnbnib Bulvan PK: 06531
Avenue de [a Renaissance 30 Ankara
1040 Brussels Turkey
Belgium Dr D.Woodward
M. lI*ng. en Chef B. Masure Superintendent AE2
STCAN/BA Experimental Aerodynamics and
8 Bd Victor Applications Div. (F)
00303 Paris Armies X80 Building
France Royal Aerospace EstablishmentFamborough, Hants GU 14 6Th
DipI. Ing. P.W. Sacher United Kingdom
Messerschmitt-Bblkow-Blohm GmbH
FEll Dr K.L. Kushman
Postfach 80 11 60 Director of Technology
8000 Miinehen 80 AEDC/DOTGermany Arnold AFB , TN 37389-5000
United States
Dr Ing. G. BucciantiniAlenia-Aeritalia & Selenia Sp.A. Dr WJ. McCroskey
Settore Aeronautica Senior Staff Scientist
Gruppo Aerei Difesa US Army Aeroflightdynamics% Directorate
C.P. 432 Mail Stop N258-1
10100 Torino NASA Ames Research Center
Italy Moffett Field. CA 9403 5-1099United States
PANEL EXECUTIVE
Dr W. Goodrich
MIall. E..pr. Ma"hiUS mi CaladaAGARD-CY1'AN AGARD-NATOAtttr FDP Executive Attn: FDP Executive7, rue Aneile Unit 2155192200 Neuillysr-Seilc Apo AE 09777France
Tel: 33 (1) 47 38 57 75Telex: 610176 (Frnce)
Telefa: 33 (1) 4738 57
Vil
Contents
Recent Publications of the Fluid Dynamics Panel i
Foreword iv
Avant-Propos vi
Fluid Dynamics Panel vii
Reference
Technical Evaluation Report TERby G.N. Malcolm
SESSION I - HIGH ANGLE-OF-AlTACK AERODYNAMICS - IChairman: K.i. Orlik-Ruickemann
Paper I withdrawn
X-31 Enhancement of Aerodynamics for Maneuvering beyond Stall 2by H. Ross
Aerodynamic and Flowfleld Hysteresis of Slender Wing Aircraft Undergoing Large-Amplitude 3Motions
by R.C. Nelson, A.S. Arena. Jr and SA. Thompson
SESSION 11 - HIGH ANGLE-OF-AUTACK AERODYNAMICS - IIChairman: P.W.Sactier
Paper 4 withdrawn
Prediction of Aerodynamic Phenomena Limiting Aircraft Manoeuvrability 5by A. Ferretti. A. Bartoli and A. Salvatore
Parametric Effects of some Aircraft Components on High-Alpha Aerodynamic Characteristics 6by L. Visintini, R. Pertile and A. Mentasti
SESSION Ini - DYNAMIC EXPERIMENTS - IChairman: M.E.fleyers
Non-Unear Nirloods Hypersurface Representaton - a Time Domain Perspective 7by J.E. Jenkins and E.S. Hanif
Analysis of Unsteady Force, Pressure and Flow-VIsualization Data for a Pitching Straked 8Wing Model at High Angles of Attack
by A.M. Cunningham, Jr and R.LG. den Boer
Measuremoent of Derivatives due to Acceleration I Heave and Skdesp 9by C.O. O'Leary, B. Weir and J.M. Walker
iii -
Reference
SESSION IV - DYNAMIC EXPERIMENTS - 11Chairman: R.A. Verbrugge
Wind Tunnel Force Measurements and Visualization on a 60-Degree Delta Wing in Oscillation, 10Stepwise Motion and Gusts
by P.-A. Torlund
Caractirnsation de Phknomeknes Aerodynamiques Instationnaires ak Grande Incidence I1Ipar0. Rentier
Scale Model Measurements of Fin Buffet due to Vortex Bursting on F/A-IS8 12by CA. Martin and D.H. Thompson
X-31, Discussion of Steady State and Rotary Derivatives 13by W. Kraus
Use of a Stepwise Regression Techniques and Kinematic Compatibility for the Analysis of 14EAP Flight Data
by A.R. Perkins
SESSION V - STABILITY AND CONTROLChairman: D. Muhthopp
Aerodynamic Control of Fighter Aircraft by Manipulation of Forebody Vortices 15by G.N. Malcolm and T.T. Ng
Forebody Vortex Control Aeromechanics 16by R.W. Guyton. R.F. Osborn and S.P.LeMay
Dynamic Wind Tunnel Tests on Control of Forebody Vortices with Suction 17by Al. Ross. E.B.Jcfferies and O.F. Edwards
Transformation of Flightmechanical Design Requirements for Modem Fighters into 18Aerodynamic Characteristics*
by P. Mangold
Aeroservoelastic Stability of Aircraft at High Incidence" 19by J. Becker
Round Table Discussion RTD
Contribution froin the Fh~t Mechanics Panel.~Cotrihutia from the Structures and Materials Panel.
ix
TER-I
TECHNICAL EVALUATION REPORT
Mr. G. N. Malcolm, Technical EvaluatorEidetics International, Inc.
3415 Lomita Blvd. 4Torrance, CA 90505 USA
1.0 EXECUTIVE SUMMARY (C) Expmded Aerodynamic Dat Base
The purpose of this symposium, as suggested by its - Analytical and computationaltitle. "Maneuvering Aerodynamics," was to present a predictions generally not availablevariety of technical papers with a focus on aerodynamics - Reliance on experimental methodsand related subjects that are important to improve the - Increasingroleof dynamic dataability of fighter aircraft and missiles to maneuver - Both oscillatory and rotaryeffectively in combat Implied in this theme is a experiments neededparticular emphasis on high-angle-of-attack - lnterferenceeffectsaerodynamics. Complex motions
- Linear vs nonlinear techniques1.1 Introduction - Better understanding of flow physics(detailed flow measurements)
The organizer and chairman of the symposium, Dr. K. - Effects of Re, M, rotation rates, etc.J. Orlik-Rilckemann, set the tone of the meeting with - Correlation with flight (sub-scale and full-scale)his opening background comments. He identified anumber of technical elements that will require special (D) Enhanced Aerodynamic Controlsattention in the future in order to meet the challenges ofthe 1990's and beyond with more advanced and highly - Conventional controls ineffectiveagile aircraft and missiles. - Forebody blowing (jets, slots), suction
- Forebody strakes (conformal, flat, chines, etc.)A summary of his opening comments is appropriate - Moving canard surfaceshere to set the tone for the following review and - Leading-edge blowingdiscussion. Dr. Orlik-RtIckemann suggests the - Active controlsfollowing topics to be considered in our future efforts toadvance the state of the technology for maneuvering (D) Unorthodox Configurationsaircraft, which implies high angle of attack rapidmaneuvers. - Strong configuration dependence
- Canines (closely coupled)(A) Flying At High Angles of Attack and Non-Zero -ree-surfce configurations
Sideslip - High-fineness ratio fuselageand fobelodies
- Strongly separated flows - Highly-swept wings-Foebody and bading-edge vortces - Vertical tail(s) - tail buffet- Vortex burst, flow interactions,
and buffet (E) Mathematical Modelling- Unsteady flow, time gs- Asymmetric flows - Prediction of dynamic behavior- Aerodynamic cross-couping - Aircaft design and/or modifications- Strong nonlinearities - Design of flight control systems
- Input o flight simulators(B) Performing Rapid Angular Motions - Planning flight tests
- Estimation of aerodynamic- =igh g U 3 re- La1ro-aphumd moioM- Trmsaet w While not all of these are addressed in this symposium,
MOdi ed aerodymic effects many of them are subjects of active research and will beDynati lift and stUll discussed in th symposium review and commentary.- F ebody ex como- Lig ed flow coaol 1.2 Conference Summary- eperimenta ad
COaiNm iethods The range of subjects presented in this symposium
TER-2
suggests that there is a broad technology base that must beginning with experiments and related computationsbe addressed in order to develop fighter aircraft and using simple configurations. Until recently, there wasweapons that will have improved agility and a lack of complete understanding of the aerodynarmics ofmaneuverability. Agility is often associated only with even simple configurations undergoing the high rates ofmaneuvering in the post-stall flight regime. While the rotation associated with high-agifity maneuvers.post-stall regime is an important part of an enhancedflight envelope and, perhaps, the regime we know the As outlined by the symposium chairman, there areleast about, it is not the only arena of interest, many areas that will require increased emphasis if we areImproved combat tactics that rely on increased control to achieve the goal of increased agility for present andpower and, therefore, increased maneuverability or future fighter aircraft. Understanding high angle-of-agility are not solely dependent upon the ability to attack flows, both steady and unsteady components, isoperate in the post-stall regime. Current aircraft are essential. There are many organizations who aregenerally limited to angles of attack below their performing experimental and computational researchmaximum lift capability because of a lack of programs to increase our understanding of thelateral/directional stability or controllability in yaw or fundamental flow physics, and in particular, of thepitch. There are exceptions, but all existing fighter impact of high rate motions on the interaction of theaircraft lack controllability at high angles of attack configuration and the surrounding flowfield. There arebecause of the ineffectiveness of conventional controls, several papers in this symposium on studyingIf this envelope can be expanded to angles of attack near aerodynamic phenomena associated with simple delta-maximum lift, and if there is also adequate control type wing planforms undergoing high-amplitude pitchpower for increased maneuverability, significant tactical and roll motions, using flow visualization and force andadvantage in combat will be realized. pressure measurements. Papers 3, 8, and 10 provide
some very good insight into the complex time-The symposium covered a broad range of topics grouped dependent flowfields that must be appreciated. Theinto the following categories for discussion in the effects of time lags associated with vortex breakdownreview of the individual papers: (1) Basic are especially important. Delays in the flowfieldExperiments/Basic Research Configurations with High response to airframe motions must be accounted for inAmplitude Motions, (2) Forced-Oscillation and Rotary- modeling the aerodynamics for simulation and forBalance Test Techniques, (3) Experiments on prediction of flight characteristics.Operational / Experimental Aircraft Configurations, (4)Aerodynamic Prediction and Parameter Estimation Experiments with simple models must be continued forMethods, (5) Forebody Vortex Control Technology, (6) acquiring the basic understanding essential for theFlight Mechanics and Structr-es Considerations, and (7) development of adequate prediction methods and forFlight Tests of the X-31 A. It is also convenient to use assessing the magnitude of the unsteady or time-lagthis grouping as a famework for the review comments effects. It is also important to expand these effo.is toon the meeting as a whole. more realistic configurations, where there are more
complex interactive flowfields wit% vortices fromIn the past, static and dynamic wind tunnel tests using forebodies, wing leading-edge extensions or canards, andsmall-amplitude oscillation techniques were sufficient to the wing.determine the aerodynamic characteristics of aircraftconfigurations under development. The primary purpose 1.2.2 Forced-Oscillation and Rotary-Balance Testfor forced-oscillation tests was to determine dynamic Techniquesstability characteristics. This was in an era where theobjective was to acquire a high rmained turn rate aW a One of the requirements for acquiring appropriate data tolow zLV&n turn radius and to have dynamic stability represent the dynamic as well as static aerodynamics issufficient to damp any perturbations to the steady to be able to perform the proper wind tunnelmotion. Modern combat tactics, however, place more experiments. The development of new test techniquesemphasis on maneuverability and achieving mWdW r and test facilities is essential in order to determine theiau wa turn rate and the ability to point and appropriate parameters. This is reflected in the increasedshoot, not necessarily to close on the target horn a rear emphasis to perform dynamic experiments besides theposition, where sustained turn rate and small turn radius standard small-amplitude forced-oscillation rotationalwere the key factors. The potenial for using modern motions around the pitch, roll, and yaw axes to acquireweapons such as all-aspect IR missiles from neary any dynamic stability derivatives.position requires an aircraft that can change themaneuver plane at will aid can acquire the twget before Many researchers have developed capabilities for high-his opponent. The maneuvers to accomplish this amplitude ramp motions in pitch (Papers 3, 8, and 10require a greatly expanded flight envelope and are examples) mulatef rapid pitch-up and pitch-downaerodynamic cwool capability. nm e . Others hoe developed lar-anplitude roll
1.2.1 Basic ExpaimenuffieReach Configurlg~gijn oscillation rigs to determine the tonlinea roll responsecharacteristics to high-amplitude and high-rae roll
In order to ap ecate the aeodytmic plmumes that motions (Paper 3 and 7). Them is also increasingam f ID the succsul development of highly interest in the effects of unsteady aerodynamicagile siroll it is necemay io acq isF a fuasneatal components associsted widt ih rates of change ofknowledg of Me fluid mechanics associated with this angle of atack and side a ad or the so-calednigt regime. This cm but be acemplished by trauslational or plunging effects (Paper No. 9 is an
TER-3
example). For conventional maneuvers at low angles of presented in Paper No. 9, and recent experimentsattack, the rotational effects. i.e., pitch rate (q) and yaw conducted with rotry-balance apparatuses are presentedrate (r) are considered to overshadow the unsteady & and in Papers 6 and 11. The effects of component buildup
effects and they can be ignored it,. simulation models. and an attempt to simulate higher Reynolds number onThis does not appear to be the case for the more a trainer configuration in a rotary motion are describedaggressive maneuvers associated with high-agility in Paper No. 6. A unique rotary-balance apparatusaircraft. Testing capability to acquire the unsteady which also measures oscillatory terms is discussed ineffects directly are being developed. Paper No. 11.
With the importance of nonlinear terms (variation of the 1.2.3 Experiments on Operational/Experimentalaerodynamic coefficients with angle of attack and AircraftConfigrationssideslip and rotation rates), it is more important todevelop testing techniques that are close to producing Unsteady aerodynamics associated with high angle ofthe motions of interest, where superposition of attack flight conditions can have an impact on theindividual experiments assuming linearity can no longer structural integrity of an aircraft as well as itsbe used. This also presents formidable problems in performance. Configurations with twin vertical tailshow to mathematically represent the aerodynamic suffer from rather severe buffeting driven by thereactions, both for data reduction purposes and for unsteady flowfield produced by bursting vortices frominclusion in aerodynamic models for simulation. One the wing leading-edge extensions. The F/A-18 is theof the most difficult challenges is to model the time-lag best know example of this problem. While a fix hasresponses of the aerodynamic coefficients to the airframe been adopted for the F/A-18, it is important tomotion variables. These are dependent upon motion understand the fluid mechanics of this phenomenon andfrequency and amplitude, and often contain hysteresis how to avoid it in future aircraft. Research is ongoing,effects. Developing techniques for measuring dynamic including flow visualization and unsteady force andhysteresis effects and modeling them properly are one of pressure measurements to determine the importantthe toughest challenges of the future, but in the new era factors that influence the magnitude and frequency of theof h'ghly nonlinear aerodynamics the challenge must be unsteady loads. Paper No. 12 reviews wind tunnel andniet if we are to reliably determine the aerodynamic water tunnel experiments on the F/A-18 providing someresponse of future fighter configurations. insig' on the LEX burst phenomena and the
relationship to tail buffeting.In addition to the unsteady aerodynamics, steady The X-3 IA experimental aircraft developed by Rockwellaerodynamics in the presence of a pure rotational ternaexnal a id by omotion about the velocity vector (loaded roll) or a Interational and MBB is now in the initial stages ofrolling motion around the flight path are also of prime flight testing. Paper No. 13 provides a thoroughinterest. In the past, a conventional maneuver to discussion of the design process and wind tunnel testingchange the maneuver plane would be to pitch down to that has been conducted in order to support thenear zero angle of attack, where roll capability is development of this unique airplane. This aircraft wasmaximum, roll to the desired roll position or bank developed specifically to demonstrate the technicalangle and then pitch up to the appropriate angle of feasibility and tactical utility of high AOAattack to either bold a target in view or to turn. In a maneuvering.high-agility aircraft, this maneuver would beaccomplished by rolling directly around the velocity 1.2.4 Aerodynamic Prediction and Parametervector without decreasing angle of attack. This motion Estimation Methodsis essentially the same motion as a spin motion, exceptit is controlled rather than out-of-control. The The prediction of the aerodynamic characteristics ofrotational flowfield is the same, an cn be reproduced fighter aircraft at high angles of attack is a difficult task.in the wind tunel by a tamy-alane apparatus. While some CFD methods have shown success incomputing the steady flow characteristics around actualRotary-balance experiments were used primarily in the aircraft configurations such as the NASA study of thepast to determine the aerodynamic coefficients of aircraft F/A-18, there are no reliable computational methods toconfigurations in a spin motion in order to predict calculate the highly separated flows associated withequilibrium spin conditions and spin recovery aircraft at high angles of attack, particularly unsteady ortechniques. This apparatus is nOw a key experimental rate dependent flowfields. Many researchers areapparatus to ascertain the aerodynamics of a controlled working to develop methods that can be used inloaded roll maneuver. The aerodynamic coefficients are preliminary design to estimate the aerodynamic forcestypically very nonlinear with rotation rate in roll around and moments associated with high angles of attack.the velocity vector and cannot be determined properly in One of the challenges is to accommodate thea rotational motion around the airplane body axes. This complexity of separated and vortex flows, even for statictest technique is in active use in many NATO countries, cases. An even more complex problem is how toAGARD Advisory Report 265 documenting the work represent the dynamic effects, particularly since theseby AGARD Working Group 11 on Rotary-Balance effects are more prominent than ever before, because ofTesting for Aircraft Dynamics describes in detail the the high rotation rates associated with increased &ity-apparatuses and test methods of all of the participating type motions. Papers No. 5 and 7 discuss some of thecountries, problems aid proposed methods for dealing with them.
Paper No. 14 describes an investigation of a method toA discussion of new forced-oscillation tast techniques is extract nonlinear aerodynanic coefficients from flight
TER-4
test data, which will be required if we am to be able to be ignored. At high angles of attack withcompare flight test derived aerodynamics to wind-tunnel accompanying high rates of motion, the dynamic termstest results or predictions, cannot be ignored. It is difficult to predict the flight
mechanics behavior based solely on static aerodynamic1.2.5 Forebody Vortex Control coefficients when, in fact, the actual flight behavior is
heavily dependent on dynamic contributions andControllability requirements at high angles of attack automatic control system augmentations to the basic(high AOA) are difficult to meet with conventional aerodynamics. It has become increasingly important forcontrol surfaces. Other techniques are being evaluated the aerodynamicist, the flight mechanicist and thefor increased control power at high AOA, such as thriust developer of the automatic flight control system tovectoring and forebody vortex control. One of the work together in the preliminary design andpotential advantages of forebody vortex control is that development stages.the forebody vortices become stronger as angle of attackincreases in contrast to the available control power from It has also become imperative to includeconventional control surfaces such as the rudder which aeroservoeastic effects in the evaluation of the stabilityis decreasing. One of the requirements for a highly of an airframe at high angles of attack. Methodsagile aircraft at high angles of attack is robust yaw employed for low angles of attack which depend oncontrol, which translates into robust roll control around linear unsteady aerodynamic theory associated with levelthe velocity vector. Several methods of vortex control flight will not be adequate. Paper No. 19 discusses aare described in this symposium in Papers 15, 16 and possible methodology to predict nonlinear17 including pneunatic techniques such as blowing and aeroservoelastic contributions.suction and rotatable miniaturized forebody tip stakes.
The state of the art of forebody vortex control isadvancing rapidly. Forebody strakes and possibly 1.2.7 Flight Tests of the X-31Ablowing slots or jets are planned for flight evaluation inthe future on the NASA F/A-18 HARV. Full-scale A review of the development of the X-31A flightwind tunnel tests are in progress at NASA Ames on an simulation and an update of the flight test program wasF/A-I8 aircraft in the Ames 80 x 120-ft wind tunnel to presented in Paper No. 2. Performance levels wereevaluate not only the baseline aerodynamic discussed and the dependency of the combat benefits oncharacteristics at full-scale Reynolds numbers, but to high agility and accompanying high angle of attackmeasure tf aerodynamic forces and moments created by flight are evaluated. This program will provide anforebody strakes, forebody aft blowing jets and opportunity to compare flight test and wind tunneltangential slots. Sub-scale wind tunnel tests are results in a flight regime that has never been comparedcontinuing as well with several configurations including before. Essential will be the ability to record andthe F/A-18, F-16, X-29A and generic configurations to analyze flight test data that can be used to compare tofurther advance the state of forebody vortex technology. predictions, where they exist, and wind tunnel data. ItThis area of research has significant interest in many is not clear how well dynamic data can be extracted fromNATO countries because of its potential benefits for X-31A flight tests. Nor is it clear whether the X-31Ahigh angle of aUack control. flight simulation model has incorporated the appropriate
dynamic terms associated with the free-flight motions.Thrust vectoring is another means of producing pitch Careful analysis of the flight test data for dynamic data,and yaw control power and this technique was discussed particularly time lags and hysteresis, should be done tobriefly in the context of its application to the X-31A shed some light on how important these terms really areexperimental aircraft in Paper No. 2. Flight tests are in full-scale flight.also underway at present with the F/A-18 HARV atNASA Ames Dryden Flight Research Center toinvestigate the 'benefits of thrust vectoring. A 1.2.8 General Commentsmodification to the flight test airplane provides forthrust vectoring both in pitch and yaw. It seems likely There is widespread interest in "maneuveringthat some combination of forebody vortex control and aerodynamics" and all of the technology disciplines thatthrust vectoring will be used in the future for the relate to highly agile aircraft. This symposium focusedrequired levels of controllability. primarily on the aerodynamic aspects of highly agile
aircraft and was very timely and very valuable. The1.2.6 Flight Mechanics and Structural Considerations next generation of aircraft will likely include
specifications for significantly increased agility, bothPapers were invited from the AGARD Flight Mechanics for offensive and defensive combat tactics. It will bePanel and the Structures and Materials Panel to discuss very important that the aircraft designer have as muchthe impact of increased maneuverability requirements on information available to him as possible during thethese two technology areas. Papers 18 and 19 discuss early stages of development. Continuing the process ofthese subjects. One of the problems is to transform the sharing technology in this area through timelyflight mechanics design requirements into aerodynamic symposia or, perhaps, working group activities shouldcharacteristics, particularly with the inclusion of result in the ability to design better aircraft in thedominant dynamic effectLs. In the pst, many of the future. AGARD symposia such as this should bedynamic terms were sufficiently small compared to the continued, at least every three years, to support thestatic tenms in the equations of motion that they could process of developing improved prediction and
TER-5
experimental methods pertinent to high-angle-of-attack, no hysteresis and the forces and pressures fluctuated inhigh-maneuverability flight, phase with the pitching motion, the reason being that
the leading edge vortex burst locations were aft of the2.0 REVIEW OF PRESENTED PAPERS wing trailing-edge. For the wing oscillations from 20
to 600 large overshoots compared to the steady stateThe conference program and presentations were values of normal force and upper surface suctiongenerally organized around three general topics, (1) High pressures were observed on the upstroke and largeAngle of Attack Aerodynamics, (2) Dynamic undershoots on the downstroke. The amount ofExperiments, and (3) Stability and Control. The overshoot increases with increased frequency ofprimary purpose of this technical review is not to oscillation. The paper shows detailed pressuresystematically critique each paper and pass judgement distributions in both chordwise and spanwise directionson its relative quality or importance. The real purpose with oscillation amplitude, illustrating the movementis to point out the more relevant points made by each of the vortex core position with model motion.paper in the overall context of "maneuveringaerodynamics" including the relation of the papers to The experiments conducted on the 800 delta wingeach other, and to offer some comments and discussion revealed important information about the causes of wingrelated to the open session following the formal rock motions. Experiments show that the variation ofpresentation of the papers. the leading edge vortex core position above the wing
with roll angle varies considerably comparing a staticIn this review, each of the papers will be discussed wing to one undergoing roll oscillations. The dynamicbriefly but not in the same order as they were presented, positions of the vortices exhibit a time lag phenomenonThe purpose is not to critique or judge them which account for hysteresis effects. The position ofcomparatively, but to provide a brief summary of the the vortex above the wing greatly affects the wingcontents to make the technical evaluation reasonably pressure distribution and, consequently, the rollingself-contained. An attempt is made to group them more moment. The time lag in the normal position (aboveclosely by subject and to provide a general view of the the wing) of the wing vortices with respect to the staticwork that has been performed, position is the primary cause for wing rock. Since
wing rock can occur when vortex breakdown is behind2.1 Basic Experiments/Research Configura- the wing, vortex breakdown is not the cause of wing
tions with High Amplitude Motions rock. In fact, it is observed that vortex breakdownactually provides a damping moment, resulting in the
Papers were presented by three authors with the basic required damping to limit the buildup in rol oscillationobjective of understanding the flow physics on simple amplitude.delta or double-delta wing configurations undergoinghigh amplitude oscillatory motions either in pitch orroll. Paper No. 10. by Torlund (FFA, Sweden) also
investigates the effects of pitch motions on a deltaPaper N_ 3. by Nelson, Arena and Thompson wing. He conducted wind tunnel experiments(Notre Dame University, USA) examined the measuring forces and moments and using flowfundamental flow dynamics in wind tunnel tests of a visualization on a 600 delta wing in oscillation andsimple 700 delta wing undergoing pitch oscillations stepwise motions and in gusts. Time histories andfrom 00 to 600 and an 800 delta wing undergoing a limit aerodynamic derivatives of the normal force and pitchingcycle roll oscillation (wing rock). The experiments moment were measured for the oscillatory motions inprovided measurements of aerodynamic loads, surface pitch with 40 and 80 amplitudes at 00 to 350 angle ofpressures, and flow visualization with measurements of attack. Stepwise motions up to 900 angle of attackvortex position and vortex breakdown location as a with both positive and negative steps of 20 starting atfunction of the model motion. The primary pupose 100 angle of attack and the full 900 in one step were alsowas to understand the relationship between the motion investigated. Responses to the stepwise motions wereof the model and the characteristics of the flowfield in compared to those predicted from the results of theresponse to the motion. The pitch experiments were oscillation tests. They correspond well for low anglesdesigned to investigate hysres in the positions of the of attack but differ significantly at moderate to highleading edge vortex cores and vortex breakdown angles of attack. Long time delays (up to 30 to 40locations relative to static locations observed on chord pamages of the flow) in the formation of theConfigurations undergoing large-amplitude oscillatory lemding-edge vortices and in the accompanying normalmotions. Previous work had concluded that for force and pitching moment result when the dynamiconsody moions, where breakdown is not prent, " motion passes the angle of attack when the vortex bumaerodynamic characteristics behave in a quasi-static location reaches the model apex at a steady statemanner. However, for ranges of amplitudes where condition. The amount of the delay is stronglybreakdown is present over the wing, hysteretic behavior depeudeat on the reduced frequency of the motion.is observed resulting in substantial overshoot in theaeodynamic forces for oscillatory or Iransient pitching Results from gut experiments were compared to resultsmaneavers. The interest in this phenomenon is to from the stpwise modons and similar time delays werelobly exloit the ir ed lift for increased soft. observed. The combination of these two experiments
The resita of thes expernts showed Me pitch pmvide the potential for mean to separate I and qoscillations over a rap ui of 30' produced visually effects. Rla apper to be relatively independent of
1F
TER-6
Reynolds number differences. A more detailed the RAE for the measurement of derivatives due towiderstanding of the effects of the time delays, suchas acceleration in heave and sideslip, or & and 0hysteresis, can be obtained by consulting the paper. derivatives. Wind tunnel tests were performed with theThe important message from these experiments is the two RAE High Incidence Research Models (HIRM Iappreciation of the long time delays that re encountered and 2). The paper describes in some detail the rig, thein high amplitude motions that cannot be predicted on models, and the initial tests and discusses the testthe basis of small amplitude oscillatory data. The results. The requirement for such a rig is based on thenonlinearities and hysteresis effects can only be assessed fact that with swept and delta wing configurationsby testing the model in the angle of attack and rotation flying at high angles of attack, there is an increasedrate combinations that are of interest. importance of A in determining the directional stability
characteristics. Rotational experiments, such as thePaper No. 3.. by Cunningham (General Dynamics, traditional forced-oscillation experiments, where theUSA) and den Boer (NLR, Netherlands) is the latest model is oscillated in pitch or yaw motions cannotpaper in a series dealing with the results from an separate the effects of acceleration and rotation. Aextensive and detailed set of experiments in the NLR2.25m x 3.0m Low Speed Tunnel on a pitching snaked- separate heaving or sideslip motion rig is required towing (double-delta with 76- and 40 sweep) model. The measure h and effects.model was oscillated about mean angles of attackranging from -4* to 48* with amplitudes varying from The paper describes the operational features of the rig20 to 180, including some experiments at sideslip angles and demonstrates its capability with a presentation ofof -50 and +5°. Force, pressures and flow visualization aerodynamic data on HIRM 1 and HIRM 2. For thesedata were obtained. A unique method of simultaneouslydisplaying pressure and flow visualization data was used configurations, & effects are small for angles of attackto enhance the understanding of the flow physics, up to 160 regardless of the reduced frequency. At higherparticularly the relationship between the off-surface angles & effects are significant but decrease inflowfield and the surface pressures, during the magnitude with increasing frequency. At angles ofoscillatory motions. A large matrix of mean incidence, attack up to 250 the effects are minor but at higheramplitude and frequencies were tested to provide for angles, similar to &, the effects are larger but decreasesystematically separating the effects of each of theseparameters. The regions of linear and nonlinear force with increased oscillation frequency. The paperand moment development and the reasons for the discusses the effects of the foreplanes (canards) and thedifferences related to the vortex formation and vertical tail (fim). Comparisons are made between (1)breakdown are clearly shown. the results from typical "rotary" experiments which
In the mid-incidence range of angle of attack from 80 to provide combined and inseparable acceleration and rate
38*, lag in vortex bursting on pitch-up or the derivatives, and (2) the individual acceleration and ratepersistence of vortex burst on pitch-down was shown to derivatives determined from translational oscillationsignificantly affect the pressure distributions and experiments and "whirling-arm" experiments,resulting forces and moments, including evidence of respectively. For thes experiments, it was concludedhysteresis with angle of attack variations. For the high that effects are more important at high angles ofincidence range from 220 to 500, the persistence of attack than for low angles of attack. Seriousvortex burst to angles of attack beyond static stall wasshown to be responsible for dynmic lift overshoot with consideration should be given to including thesepitch up and persistence of stalled flow was responsible acceleration derivatives in aerodynamic mathematicalfor dynamic lift undershoot for pitch down. Tests at models of combat aircraft for simulation and for flightnon-zero sideslip revealed interesting nonlinear effectson rolling moment coefficient This paper presents an Panr No. by Visintini, Pertile, and Mentastiexuemely detailed explanation of the relationship of the (AerMacchi, Italy) is a review of wind tunnel test daflowfield to the surface pressures and faces for a wide on an advanced trainer configuration with the papose ofmatrix of pitching motion variables and should be read defining and understanding the aerodynamics associatdin detail to fully appreciate the complexity of the with high angles of attack (to 900) including effects offlowfields that we must deal with. model component buildup and fordbody fieness ratio
and cross section shape. Examples are also presentedrelated to complexities of high angle of attack wind2.2 Forced-Oscillatiom and Rotary.Balauce tunnel testing, including forebody symmetries and
Test Techniques problems of simulating Reynolds number with artificial
transition strips. Both static and rotary-balance testThree papes were presented describing experiences with reults a disued.a new forced-oscillation appnatus at the RAE and thechallenges of measuring Serodynic data on rotary Compnet biidup (or breakdown) tests showed thebalace ris a AeMachi ad ONERA. deendence of static stability in pitch on the LEX and
body -shelves" and the imnpotnce of the ftebody shapeZbMrL..J. by o'Lwy and Weir (RAE, UK), oa directional stability. Rotary data showed twopreaea sd discusses a new sclbay rig developed at distinct ae for ft way amodynalic coeffcients vay
TER-7
with angle of attack. In the 20 to 400 range the and high rates. The utilization of these results inaerodynamic data show regular and fairly iear behavior aerodynamic modelling is also discossed.with rotation rates, which means the aerodynamic wind- 2axis roll characteristics can be reasonably well 2.3 Experiments on Operational/Experi-represented by roil damping derivatives, at least at mental Aircraft Configurationsrotation rates near zero. Above 450 AOA, however, thewind-axis rolling moment is highly unstable and Two papers were presented describing experiments onnonlinear, dominated by forebody vorex instabiity and the F/A-18 and the X-31A configurations over a largecouplings with natural forebody vortex asymmetry. angle of attack range. The discussions include both
water tunnel and wind tunnel results.The primary effects of forebody shape on roil dampingappear at angles of attack from approximately 50 ° to Paer No. 12, by Martin and Thompson (ARL,70r. In general, the main contribution to high AOA Australia) reviews wind tunnel tests to investigate thebehavior has been identified'and for the class of shapes characteristics of tail buffet on the F/A-18 due toof this study the forebody shape is of utmost bursting of the leading-edge extension (LEX) vorticesimportance only above 400 AOA. Large couplings and water tunnel tests to visualize the LEX vorticesoccur between sideslip, rotation, and longitudinal bursting phenomena with and without a LEX fence,aerodynamic coefficients. For this class of airplane, it comparing burst location with measurements from windappears that a forebody of circular cross section leads to tunnel and flights tests and to determine the effect ofminimum pitching moment coupling with sideslip engine inlet flow rate on the LEX vortex burst location.angle and roil rate.
The wind tunnel tests used surface mounted pressureUtilizing transition strips to simulate high Reynolds transducers on the wing below the LEX vortex burstnumber flows on fighter-class aircraft models at high location and on the fin (vertical tail) to measure theangles of attack has been investigated and variations in magnitude and frequency of the pressure fluctuationsthe wind tunnel data for common coefficients is associated with burst phenomena. The burst vortexsubstantial. A methodology needs to be developed to contains energy over a moderately narrow frequencymake use of this capability and to be able to rely on it. range and the center frequency is linearly proportional toMost tests are done on the rotary balance without any the free stream velocity. The vortex burst locationtype of transition strips, moves forward and the burst pressure field frequency
decreases with increasing angle of attack. The burstHowever, most tests provide data obtained at Reynolds frequency also changes when the fin is removed,number that are much lower than flight and the showing that the burst characteristics are sensitive toexperimenter needs to be cautious in the manner in the downstream pressure field, i.e., whether the fin iswhich they are extrapolated to flight test. Moe work there or not. Fin bending mode response is stronglyneeds to be done, in general, to understand if and how coupled to the burst frequency with maximum fintransitions strips can be used to simulate higher response occurring when the burst frequency is close toReynolds number conditions, particularly at high angles the natural frequency in bending of the fin.of attack where the forebody plays a dominant role.
With the LEX fence in place, the amplitude of thePaper No. .1 by Renier (ONERA, France) unsteady pressures was reduced significanty, while thediscusses two apparatuses used at ONERA in Lille to energy is spread over a wider frequency range, resultingperform dynamic tests at high angles of attack. One is in reduced fin response. Flow visualization showedthe unique rotary-balance system which can prvide the there is little difference in the location of vortex burstusual rotary-balance data with constant angle of attack but that there is a second vortex emanating from theand sideslip, i.e., pure rotational motion about the wind leading edge of the LEX in the vicinity of the fence.axis and also oscillatory data by using the capability to These two vortices interact aid burst simultaneously.incline the rotational axis of the appartus with respectto the wind axis, thereby producing a sinusoidal Water tunnel tests on a 1/48-scale F/A-IS modeloscitin in angle of attack and aidust in conjunction confirmed the location of LEX vortex burst with anglewith the rotational motion. This pwodoes unsteady of attack and also showed that the amount of flow imtoforces and mmnta in the presence of aeady force ad the engine inlet can also have an effect on the vortexmoment contributions resulting from the rotation burst location, with the vortex burst location movingamnd the velocity vector. This techlique provides an aft with d inlet flow.alternative approach to the conventional forcd-oscillation teat rigs where the Mnready aerodynamics EUUj&4L by Kraus (MBB, Germany) disusesrnsult from small-amplitude ocillation. in a planar some of the eary configuration definition work for themotion, similar to that discussed in the paper by X-31 aircrat and experimenul aircraft developed byOey. Rockwell and MBB to explore the hig-uigleo-atta k
area pertment to highly agile or supesmaneuvuableA second appaam sle of prnuing aW amlnude fig.hts of the futue. The paper reviews mslts fromosculations or ramp motions in pitch, yaw, or rol was static and dynumic wind tunld teab whe a largealso described. The aplication of this ippaa s In matrix of configuratio componentsa W systematicallyinvestigat dynmic aeodyonlc effecta of motions evaluated. This akctat is deipnd to have namalteld to thm eapsed from hhly agile aircraft acrodymmic atabity daveoughot the angle of ackwhith will renk i hio anles of amck and sldeft re (upto 700) except for low anle of attack wh
TER-8
it is statically unstable in pitch for performanc reasons primary motion variables and their time derivatives, andIn some critical regions in which the natural stability the dependent variable is one of t six force andcannot be achieved, artificial stability is provided by moment coefficients. No assumptions are mademoving control surfaces with sufficient motion regarding the linearity of the response to the motionremaining to provide sufficient control power for variables. This study concentrates on body-axis rollingmaneuvers. Static wind tunnel tests were conducted on motions. The properties of the hypersurface model area wide variety of configurations with many different studied using Hanfrs dynamic force and moment datawings, tails, canards, vertical fins, ventral fins, from a rolling delta wing model which contain strongforebodl s, and nose and inlet strakes. The effects of all nonlinear effects.of these configuration variations are discussed.
A preliminary analysis of static and oscillatory roil dataDynamic tests, consisting of rotary-balance and free- from the 65 delta wing experiments at 30" angle ofspinning tests at NASA Langley were also condicted to attack indicates that despite the absence of staticevaluate the stability characteristics in a rotational hysteresis (in the variation of rolling moment with rollmotion and comparisom were made between predictions angle) the corresponding hypersurface model (inof spin motions based on rotary balance data and those mathematical form) must acknowledge the presence ofobserved in the free-spin tests. In the normal flight at least two critical points in the static rolling momentregime the aircraft is well-damped in roll and yaw. curve (at roll angles of +/-70) which corresponds to aAbove stall, about 400 AOA, roll and yaw stability rapid movement of the leeward wing vortex-breakdowndecrease and become undamped, resulting in the position to the trailing edge. The results also indicatepossibility of departure above 60" AOA with an that a hypersurface in at least four dimensional spaceunaugmented airplane. However, with roll input (roll angle and its two first derivatives and rollingcontrols, the autorotative moments can be counteracted. moment) is required to fully represent the rollingThe only known spin condition is at an AOA wound response for the case studied. Additional tests will need86*. Comparisons between predicted spin characteristics to be studied to assess the impact of the critical points.and those observed in the free-flight motion in the spin An extensive set of forced-oscillation tests will be runtunnel showed very similar behavior. Effects of wing by Hanff in the Wright Laboratory 7 x 10-ft Subsonictrailing-edge flap deflection and canard settings on the Aerodynamic Research Lab (SARL) tunnel in June ofspin characteristics are also noted. 1991.
2.4 Aerodynamic Prediction and Parameter aher No.5. by Ferretti, Bartoli, and SalvatoreEstimation Methods (Aeritali, Italy) addresses the problem of prediction of
some of the aerodynamic phenomena leading toTwo papers describing work on prediction of nonlinear degradation of aircraft performance in the high subsonicaerodynamic characteristics, including unsteady effects at regime. The study focuses on two kinds of wings,high angles of attack and one paper describing a new those with moderate sweep angles and those with greaterapproach to parameter identification methodology than 600 sweep (delta wings). The moderately sweptapplicable to the nonlinear regime of high-angle-of- wing represents the case with "attached flow" degradingattack flight ae discussed. to separated when shock-boundary layer interactions
occur, and the delta wing represents "vortical flow"Paper No- 2, by Jenkins (WIFIGC, USA) and (separated flow at the leading edge) whose onset,Hanff (JAR, Canada) addressed the problem of how to development, amd bursting is ruled by the surmundingrepresent the highly nonlinear and unsteady airloads flowfield. In both cases, however, the effects on aircraftexperienced by aircraft configurations undergoing large aerodynamic characteristics are felt as buffeting, loss ofamplitude motions. In this particular study, roll control power, and uncommanded pitch, yaw, and rolloscillations are the focus. The study presents results motions up to the limit of the aircraft operationalfrom a theoretical investigation and experiments cnvelqe.conducted on a 65* delta wing in high-amplitude rolloscillations. Non-linear aerodynamic response This paper presents the approach to both of thesemodelling for flight mechanics analyses requires that the problems by AMenia Aeromnatica. For the conventionaloscillatory data be formulated for arbituy (unknown wing of moderate sweep, it is well known that trailingapron) motions. This study focuses on establishing edge divergence (a change in the trailing edge presuthe relationship between die nonlinear indvsial respos and an increase in the boundary-layer thickness) marksmodel (the time domain model developed by Tobak, the onset of unsteady effects such as buffeting.Chapman and Schiff) and the reaction hypermiface Prediction of the occurrence of triling edge divergencemodel proped by Hanff. Bth methodcanl tole would enale a prediction of onset of buffet. Analysisaerodynamic hysteresis effect. Both Ism cfain of wind U=n mresure data has lead to a critia thatadvantages to the flight mechanicist and the can be used to predict buffet The basis of theaerodyimnicist inerested in fandnemal physical prediction method is to utilize available computtinalphenomens. TW objective de this poper wa to show code tat can predict de ps-F distritios over theit t hypermurlbe mode it, in W% a special cas of wing at sasonmale coat ad within a mam i amount
dhe inicalreics modeL of time
7W emctam hype=m~ .1rsss th aoerodymic For deWt wings, fawing realistic mndead leadinrepum as a sw bm in a mpe deaed by a s o edges, roitm f amattid flow o w cal atuthpmtmm a e U indeemiam vaable mdi de leadin edg ha bean *A t to do mab -m
.J_
TER-9
for early loss of linearity in the aerodynamic forebody vortices can be Maniplaed and r
coefficients. From wind tunnel tests a relationship yawing moments can be controiled with either leewardbetween the bound pressure level on the leading edge side blowing jets similar to the generic fighter or withand the onset of vortical flow has been shown. With longitudinal slots near the tip of the forebody on eitherthe provision that additional studies are needed to side near the maximum half-boeadth. Both techniquescorrela wind unel with flight results, an engineering control the vortices by controlling local separation.tool has been developed to allow prediction of vorical Small tip-mounted strakes that rotate as a pair aroundflow onset by the use of theoretical codes. Further the longitudinal axis of the model also showed theanalyses are being carried out to discover relations potential for precise control of the vortices withbetween vortex breakdown and pressure levels on the miniaturized strakes. The key to generating largewing. controllable yawing moments is to locate the controlled
devices for interfering with the natural forebody flow asPa -No. 14 by Perkins (BAe, UK) describes an close to the forebody apex as possible.investigation into the capabilities and accuracy of anequation error method of aerodynamic parameter EaeLN.LJt.L by Guyton, Osborn, and LeMayidentification using stepwise regression techniques. (WL/FIMM. USA) reviewed recent wind tunnelExamples are shown from flight results from responses experiments on X-29A, F-16, and a generic chineof the British Aerospace Experimental Aircraft Program forebody configuration with a cropped 550 delta wing(EAP). Derivatives extracted from flight data of EAP using forebody blowing as the technique for controllingshow good agreement with wind tunnel experiments, the forebody vortices. Experiments conducted on a 1/3-The disadvantages of an equation error method can be scale X-29A model with jets blowing aft from a leewardminimized by having accurately measured flight data, side location approximately 0.5 forebody diameters aftmeaning having high quality flight instrumentation. of the apex and about 1350 radially from the windwardAn evaluation was performed using simulated responses side showed yawing moments in a direction coincidingand the method can extract non-linear aerodynamics. with the side on which the jet was placed, similar toThe effect of typical instrunentation errors and noise on previous experiments on a generic fighter configurationthe simulated responses gives a reduction in accuracy of and the F/A-18 discussed in Paper No. 15. Theextracted derivatives. The methods of extracting non- behavior of the yawing moment with sideslip in thelinear aerodynamics ae described. One advantage of this presence of blowing was encouraging, demonstratingmethod over the well-known Maximum Likelihood high levels of yaw moment control up to sideslipmethod is that the structure of the aerodynamic model angles of 100.does not need to be defined initially, nonlinear effectscan be accommodated, and large quantities of data can be A 1/15-scale F-16 model was tested with blowing jetspocessed, an the leeward sides and slots on the sides of the
forebody to produce a slotted jet flow tangential to theThe equation error method using stepwise regression model surface in the circumferential direon. Contrwarytechniques has been shown to work successfully for to other data on the X-29A with blowing jets and withanalysis of flight data from the EAP aircrafL Given other data on the generic fighter and F/A-18, a rightsufficient flight data with adequate information contem, blowing jet produced a left yawing moment and vicethe full nonlinear aerodynamic characteristics can be versa. It is not clear why there is a difference on anextracted f&iMy accurately. F-16. This bears further investigation, with some flow
visualization.2.5 Forebody Vortex Control Technology
A generic fighter with a 550 cropped delta wing and aThree papers were presented reviewing recent work on chine-shaped forebody more like the expected U. S.the development of various methodsf forebody vortex Advanced Tactical Fighter configuration was chosen tocontrol for enhancing the controllability of fighter investigate the potential control power when theaircraft in the medium to high angle of attack range, configuration does not have the cirular or elliptical
c sen typical f today's figtr cmnfigumtibW nLg.[B by Malcolm and Ng reviewed some Blowing on the forebody configuration was notwork performed by Eidetics International, including successful in gnerating yaw control power alone.win mndel tma s on a ger fighter configunum and With this type of configuration there is much higherwater tuamel teats on an F/A-18 model. The generic potential for influencing rolling moment and pitchingfighte configuraion was teed with foirtody atralis monent than oan Convenionil configurations.mad foruody blowing je. The review showed theeffects of depIoyig small strakes near tip of the bWL-&,4L by Ross, Jeffer s and Edwardsmodel farebady. a ttagen-ogive configuration with (RAE, UK) describes experitents on a UK reserchbenign tMu of 4A Lop yawing mosest could be ainraft confslgismo Hih laid ace Resemeb Modelgusr id ei ther 6edd, in Iprorio to te dotrod (HMN), uas tweody suction for contualling theheght. loiwisig Je(blowing ul kiorawardtme dl poaition and strength of the orebody vorices.to theIsasbdym efamc on teb', s'Ade) mt also Similarly to forebody blowing, fembody suctonpduc e a g mmyo (lre n h c he t controlling boMdey layerIpmI by a fully defisable udde ) at mest stao, delayfmt i on the side where mtel ins-e -at. s ntostved Te atin esoiem, whm not dMised
ft asit a l owing cosmelsam6 M very ao inWar msel witht P/A-18 medal ebed th l tfrt efthe quied melm p iss d f sid sm
i4
-_.--
TER-1O
flow rates. The suction holes are mounted fighters, some of the important design features havesymmeuically on the leeward side of the forebody very changed, pariculaly maximum lift mad usable angles ofclose to the tip, a key to making the suction technique attack, which means that the static and dynamicwork so well. lateraldirectionl derivatives are dominated by forebodyResults show that very small suction coefficients can vortices from the nos. straks or canard.influence the vortices and the yawing moment One of the conclusions is that because of the complexsignificantly, and the direction of the yawing moment aerodynamic effects at high angles of attack it will begenerated corresponds to the side on which suction necessary to design the "buic configuration" by someoccs, optimization loops. During the design process
specialists from the flight mechanics disciplines,Experiments on a free-to-yaw rig in the wind tunnel are aerodynamics, flight control law designers and overalldiscussed with demonstrations showing that with design depsstuents have to font a close team in order toalternating left and right suction, the yawing motion at end up with a welt-balanced design. Themoderate and high angles of attack can be fully communication lines between these groups must becontrolled without the rudder. established early and kept open in order to avoid costly
and tm-cemm difficulties in later design phaes.2.6 Special Papers from the Flight
Mechanics Panel, and Structures and Eanms.&J1. by Becker (MBB, Germany) discussesMaterials Panel a possible methodology to predict aeroservoelastic
stability of ma aircraft at high angles of attack includingTwo papers were presented from non-Fluid Dynamics nonlinear aerodynamic effects. Using linear unsteadyPanel sponsored authors. One, sponsored by the Flight aerodynamic theory associated with level flightMechanics Panel concerns the transformation of flight conditions to predict aeroservoelastic and fluttermechanics design requirements of modern fighters into calculations for medium to high angle of attackaerodynamic characteristics. The other is a paper conditions could be in serious error since effects ofsponsored by the Structures and Materials Panel related separated flow and leading edge vortices are notto the aeroservoelastic stability of aircraft at high accounted for. These effects may be introduced into theincidence. aeroseiioelastic analysis using a correction method and
measured unsteady pressure distributions from windSfaUr No- IL by Mangold (Donier, Germany) is a tunnel tests. The correction method is described. An
discussion of the requirements and difficulties in example for illustration and from which wind tunnelmeeting those requirements to take the desired flight data were used is a half model of tactical fighter typemechanics characteristics, including handling qualities, aircraft with a dela wing, a foreplane and half a fuselageaility, maneuverability, controllability, etc. and relate installed at the wind tunnel wall. Experimental resultsthese to defiaeble aerodynamic characteristics that the are reviewed and an interprettion with application topreliminary designer can incorporate into his design. the prediction method is discussed. Some of theThis is particularly difficult for an aircraft that will be conclusions include (1) effects of high incidenceheavily augmented by the flight control system for unsteady aerodynamics on the open loop chracteristicsstability, especially at the preliminary design stage of low frequency elastic modes are small and thesince the flight control system will not have yet been increase in aerodynamic elastic mode damping withdesigned. To be successful in achieving optimum incidence effects may have reduced the increase in modeperformance and superior handling qualities it ii excitation, (2) effects of high incidence unsteadynecessary to define a set of flight mechanics criteria aerodynamics on higher frequency elastic modes arewhich properly translate the most important flight large, (3) prediction method for high incidence unsteadymechanics requiements into modynmic requiraers. aerodynamics is validated by wind tunnel tests, and
(4) high incidence aerodynamic effects have to beThis paper reviews some of the ideas presented by the considered in aeraservoelastic stability predictions.author in an AOARD FMP Symposium on FlyingQualities in Quebec, Camna in October 1990 and 2.7 Flight Tests of the X-31Asclvidies of AGARDIFiP Workng Group 17. One ofthe fundamental promises for development of new Paprg. - by Ross (MBB, Germany), evencriteria is dot smaic derivatives Winne am am suffcient dough the fis paper to be psemed following doto characterie the behavior of an sicraft in a highly meeting chairmaa opening rnmiks, is an amaeuverable sare at high angles of attack, epecially aper to discuss last because it is the fWe flyingto maintain dynamic stability. It is necessay to laboratory to ine many of the phenomenaconider dynme deivativ r coefficients lke roll mad discussd is a d previom ppr. The pimary roleyaw dmang. Agility amound the velocity vector at of the X-31A is to demonstrae the teccal feaibilityhWO angles of attack ismily a mser of yaw ad ml and tactical utility of high AOA and past-stallcamal l r pou" m"re 1, an rudder Control maneuvering. Simulation musA have shown tiePo aid Yw impmnc of (1) aimd der tha men w m
ad (2) no sei aim of ml, Wich cm nly beCrJIs sb A Clidyu m 0 lOnr adequae a a actiles by Wq aing ad accedf do so a mi.a e o d s mj maI np abmw. e In stsicii malb of mow" and digha Combat
*s~~~isni~f 411ycme1ka l P6s11411" sinulnin stadim, dshe u kvity of the acMWng rationgles of stink consten wis pwwlsaty ad Ran to lb manm dawn eagec c bn at
TER-I I
stall maneuvering indicates that the increased benefit Paper No. 6 by Visintini showed some results fromabove 600 AOA becomes small, suggesting that a experiments conducted at AcrMacchi where transitionmaximum trim capability in pitch to 70 AOA is strips were employed to simulate transit"on on thesufficienL Pitch down capability is of critical forebory. Results showed poor repeatabiiy and a highin rnce to allow transition back to the higher speed dependency on where the strips were placed. It iscnvewl It is also important to have pure aerodynamic apparent that the guidelines for how and where to userecovery in case of failure of the thrust vectoring transtion strips for application to high angles of attacksystem. Yaw control power becomes dominant at high are not clear. Comments from the floor includedangles of atack sod body-axis roll less important. The observations " many wind umd tests we conductedflight control system must take care of the proper at Reynolds numbers where the flow is transitiond and,blending of control in the yaw and roll axes with angle therefore, very sensitive to small differences inof attack, including the contribution from thrust Reynolds numbers. Test results at low Reynoldsvectorng, numbers where the boundary layer is laminar, for
example on forebodies, often have the smne behavior asThe more important acrodynamic characteristics of the tests conducted at high Reynolds numbers where theX-31A we summarized incuding the effectiveness ofthe boundary layer is turbulent. Artificial transition maycanads in producing pitching moments, the benefits of force the aerodynamic results to be even less comparabledtust vectoring in yaw to assist the control inputs from to high Reynolds number results. In order to fixthe rudder at high angles of attack and the demonstration transition strips and know whether they ae effective andthat sufficient roll power (body-axis) can be generated correct. ont needs to know the answer for the ful-scalethroughout the AOA range by differential trailing-edge case, information that is often lacking. Vortex flowswing flap deflections, generated by sharp leading edges are shown to be
relatively independent of Reynolds number. However,Performance levels are reviewed including velocity this may not always be the case. Caution wasvector roil rates, turn rate, turn radius, minimum-time expressed using the example of a noeboom mountedheading reversals, etc. and comparisons are made to chine whose separated flow vortex affects the vortexconventional fighter aircraft. Flight test status was flow immediately aft on the forebody. The overalldiscussed Aircraft I had performed 25 flights up to mid flowfields, even though they may be similar at theApril. Thrust vetorig vanes have beon installed and strake location, may not be independent of Reynoldswill be tested with deflections in May, 1991. number, in which case we may see something quitePenetration into the post-stall regime is scheduled for different in flight than on the ground in ground-basedthe last half of 1991. test facilities. Little is known about the dependency of
dynamic effects on proper use of transition stripsprimarily because few, if any, expeiments have been
3.0 Review of Round Table DIsCUSSION performed with transition strips. With the model inmotion, the location of transition is continuously
Following presentation of the papers, a Round Table changing. It is not clear whether time-varying naturalDiscussion was conducted with participants' transition can be approximated by a fixed transitionconvibutions r rde and trancibed. The trsa ion strp.of th RTD follows the pper. The discussion wasinit" and promped by several peed P muen orquestions pemtd by the meeting tehnical evaator 3.2 Time Lag Effects - How to determine Inand comments by the symposium chairman. The wind tunnel and flight tests and bow tofolowing topics were diusnd: icorporate into aerodynamic models for
simulation?3.1 Reynolds Number Effects - How to
simulate In the wind tunel?A suggestion wa made to account for time lags in a
The question of how to evauiate Reynolds number linear sene by treating the aerodynamic reaction an aeffects is not new no is it peculiar to maneuvering taufer function which would requ re dynamic t s toaerodymosics. However, methods have be umsed or define the transfer finction. In th nonlinear sense,wind tunnel tats, primarily for testin models with including the history effects, we me forced to look atattsched flow, simulate bomdary layer tramsition by indiclal response or bypersurface type models. Thiscareful placement of traiton strips consisting of makes the problem more difficult for the flightvarious simes of grit on the surface of the wing, ner the mechanics people. twqg shme they can no iner useleandg ede, and on ario fuselage ad empamage small perturbtIons or derivatives in the equtions ofcomponents. Thmemchaklqus have poven so be very motion. it was also pohed out tha the measuredsful in arifici-ly -I i8 a Iminar boundary layer aoliamltes in wind mmd atm occur at relatively
ad causing it to trliion to mmuem flow as if it high raw, and in some cams at rates which mu highewis esprIenit m-d 'am eitint hgher Reynold than thom eterPP by fall-scie aircraft. Howev,nufmbers con"atoe whh fuglacee f lght ie quWetion de hge rats ame nit iconIstent with thoseis how do we ds ml highe Ryo lds mI with experienced by coNtom st hces. Tre flight mechanicsam of flw- ar* o tns a h m s of people hm a difficult doe is I vo-1 dm-ogaack wit hmsmd flows sA jimicoly, how do we lUai m imo k dnluln modal, particulaly thedesl with simuiatig t proper flow on aic rt -m -maled wit rm motiom becmause of thebebt ? kdIF cy n the specific modo hisauy.
TER-12
3.3 Effects of~t di ? 3.6 What is the role of CFD is Computlgthe aerodynamics due to high-rate
Generally, it was felt that these effects are increasingly motions?important with higher angles of attack. Recentexperiments have shown that the aerodynamic m calculations have experienced good success in
coefficients dependent on translational or heaving recent years in computing the flow characteristics of
motions can be significant. Simulation aerodynamic fomebodics and wing leading-edge extensions, and to
math models often provide for these terms, but soni degree the entire aircraft at moderate angles of
historically the aerodynamicist has not been able attack including toparated flows These have, for te
provide the individual component values. Increased most part, been steady flows. The time has come to
emphasis is being placed on developing testing begin the task of calculating unsteady flows and thereappamtses to acquire sepsuely, the ue derivatives and appears to be some optimism that this can be done,
the time-dependent derivatives, such as Cmq and Ca& particularly for the type of maneuvers that have beenoCnrand C4 associated with highly maneuverable aircraft-
An AGARD meeting addressing unsteady aerodynamicsThere is also a recognition that the development of will be held in October, 1991 in San Diego, withcriteria to predict departure from controlled flight must expectations that the role of CFD for unsteadyconsider more than just static aerodynamic coefficients. aerodynamics computations will be addressed.Criteria developed in the past such as Cnbdyn, which,Sinfact, does not contain any dynamic terms, andothers 3.7 Does the aircraft designer and thewhich assumed snall angles of attack are no longer aerodynamics test community understandadequate. Dynamic tewms must be included in order to each other's needs?predict the departure tendencies of modern fighteraircrafL An additional problem is how to include the It is not clear that the communication link is welleffects of control system inputs in a highly augmented established. Perhaps just as important is theaircraft, particularly in the early design stages before the communication between the preliminary designer anddetails of the flight control laws are known. the flight mechanicist. It is more important than ever
before that these two groups work together in the early
3.4 Effects of dynamic lift on moderately stages of aircraft definition. AGARD symposi such as
swept wings? this one can help to forge the link between the varioustechnical disciplines.
Extensive research has been done on dynamic lift of 3.8 How applicable are forebody vortextwo-dimensional airfoils, and more recently on highly control methods to forebodies withswept delta wings with substaptial leading edge etices chinesaped cross sections?to investigate three-dimensional effects of highamplitude high rate ramp motions. There does not Most experiments to date have dealt with forebodiesseem to be much data on moderately swept wings, for Mot experimenla o dat crve det w h iesexample from 300 to 50. Since most fighter aircraft with either cicular or elliptic cross sections. Chine-have moderately swept wings, there would seem to be shaped foreohdies, representative of advanced figheneed for more infonation on how to exploit dynamic aorfig ns, have a shpr i side edge that will providelift for configurations more like actual full-scale aircraft. samredione and peadps more stable lcratin forThe data on highly swept wings is pertinent to wing separation. With the fixed location for flow sepaatlonkading-edge extensions and some experiments have the question is which forebody vortex control methods
been done with double delta wings which represent t will work, if any, successfully and which ones will not.
cae of moderately swept wing with a rLEX Research with these types of configurations has justbegun, It is expected that the forebody vortices will bemore difficult to manipulate than for a smooth fbrebody
3.S What are the chances of getting feedback surface.from flight test results related to timelag effects? 3.9 Ia it likely that forebody vortex control
and thrust vectoring can be used in aThe X-31A may provide an opportunity to measure complementary arrangement?time-lag effects from ftll-scale flight tests, but it is notclear whether the flight mats dmt e planed will, in It is unlikely tt forebody vortex control only will be
fact, be able to determine time lag effects. It would used unless there is a need only for yaw control andppea that the expected respons of the X-31A to there is no need for additional pitch control. Them ae
conl inaputs or to ammeady aerodynmic inputs do not significant tventages to each, but they we not direct
mmmdt time lags ae liely to he signifcant. MBB competitms for all flight conditions. Fremody vortex
-gest that we wait for flight test results to mess corl is notalet icabl to lw angle of N O a d to
shak ex se r-and Iame. Flight dWa I-l don low q condtions. Depending on the specific tclmiquethe F-16 seMet yearn #go identified ime lag effects, ted to control de vortices, it may or may not be
lrt"I'ily aft n is On a whici praompted some of the d P V, Ide1ta the availability of engine bleed air. Thustcvrtreuchat Omawa Dysic by Coninglissa. vectn only works if the engine a is g Lmu of
I
TER- 13
control werust be considered if thrust vectoring is FAdetics Interationa in the Ames 7 x lO-ft wind tunnellost due to an engine ouL At this point in time, there to measure effects of jet and slot blowing andis room for both techniques to be considered. miniaturized tip strakes. Tests will also be conducted
with the 6%-scale model on a rotary-balance apparatuswith forebody blowing.
3.10 What are Reynolds number and rate(dynamic) effects on forebody vortex 3.11 What is accessibility of flight testcontrol? data?
Neither of these effects have been evaluated yet. All too frequently, there is a tendency to developReynolds number effects will be explored with the full- elaborate flight test programs but once the airplane is inscale F/A-18 tests now under way in the NASA-Ames the air the program often runs short of funds to fully80 x 120-ft wind tunnel, where three forebody vortex exploit the opportunities to get detailed flight test datacontrol techniques will be tested: blowing jets, blowing that can be of significant benefit to the researchslot and conformal strakes. Subscale experiments with a community. There needs to be additional emphasis on6%-scale model of the F/A-18 will be conducted by making maximum use of our flight test vehicles.
2-1
X-'! ENHANCEMENT of AERODYNAMICSfor MANEUVERING beyond STALL
Hannes RossDeutsche Aerospace/Military DivisionMesserschmitt-1B6lkow-Blohm GmbH
P.O.Box 80 11 60D-8000 Munchen 80
I. Intduction
Current fighter aircraft are generally limited to angles of attack (AOA) below their maximum lift capability(Alpha clmax). Pilot inputs and hence aircraft maneuvering become usually limited when approaching the stalllimited (Fig. 1-1).
Primary reason for this situation are the degrading aerodynamic lateral/directional characteristics and reducedcontrol power in the high AOA regime, often resulting in uncontrolled maneuvers/departures/spins. Someaircraft have for these reasons reduced roll control inputs as well as Aileron-/Rudder-Interconnect (ARI) systemsinstalled to avoid uncoordinated flight conditions at higher AOA. Others have limitations as to the number ofconsecutive rolls they are allowed to fly even in the conventional AOA regime to prevent uncontrollable pitch-up/Beta excursions due to inertia coupling and engine gyroscopic moments.
In the last ten years new efforts have started to improve control capability in this flight regime. F-14, F-15 andF- 18 have demonstrated AOA excursions up to about 65 degrees and the Su-27 and MIG-29 have performedimpressive pitch maneuvers even exceeding AOA's of 90 degrees. However, all of the above mentionedmaneuvers are performed in the pitch plane with little or no capability left for role control around the velocityvector.
A number of experimental aircraft programs have been initiated to explore the high AOA and the poststallregime to broaden the knowledge base. The flight test objectives range from basic understanding andinvestigation of aerodynamic flow phenomena (X-29, a/c no. 2 high AOA test vehicle, F-18 High Angle ofAttack Research Vehicle/HARV to the incorporation of thrust vectoring capability (HARV) and finally to thedemonstration of technical feasibility and tactical utility of high AOA maneuvering (X-3 I A).
2. Tactical POST-STALL (PST) Maneuverina
2.1 Combat Simulation Results
Numerous manned and computerized close in combat (CIC) simulations have been performed since the late1970ies and - assuming all-aspect IR missiles and guns - have shown a dominance of head-on encounters withincreasing importance of
attained (rather than sustained) turn rate (ATR)small attained radius of turn (ART) Fig. 2-I.
CIC simulations performed with a/c with/without AOA limits showed a very impressive improvement of 2 to 3in combat capability as defined by
time to first sottime in firing positionkill probabilitytime in disadvantage position etc.
These results were achieved in one on one and multi bogy situations showing similar trends (Fig. 2-2).
The basic quesions/bade-offs
c a CIC be avoided by beyond visual range attack andcun aircraft mneuveability be offseUdecreased or eves be relaxed by improved missile off-bofesightcqlillty and imploved missile maavembility have of corse been investigted and led to the well knownanwer dat
i
2-2
CIC can not be avoided, in particular in an outnumbered situation where multitarget (BVR) capability is arequi- rement
high off boresight capability (> 60") is difficult-to achieve because of fire control and missile flightperformance limitations and result in a significant reduction of single shot kill probability (SSKP)
High ATR's and ART's are therefore essential performance characteristics for a future fighter designed for BVRand CIC.
Looking at the well known Rate of Turn vs Mach Number plot (Fig. 2-3) it becomes immediately evident thatARTs can only be improved by approaching and exceeding the stall limit.
2.2 IST Maneuv r/Dm anuiremnts
Maneuver/Design Requirements have been derived by statistical analysis of manned and digital combatsimulations. The Mach-Altitude envelope in which PST maneuvers were observed is identified in Figure 2-4.PST entry is limited by the maximum dynamic pressure which in combination with the CL max results in themaximum allowable load factor of the aircraft. PST maneuvers have been performed up to altitudes of 7 In anddown to speeds below Mach 0. 1.
Sensitivity of the exchange ratio to the maximum allowable angle of attack during PST maneuvering indicatesthat the increase in benefit above 60 degrees angle of attack becomes small. Thus a maximum trim capability upto 70 degrees has been suggested. Figure 2-5 shows an AOA frequency distribution during PST maneuveringwhich is in good agreement with the sensitivity analysis.
The control power requirements in terms of acceleration capability around the body axis in pitch, role and yaware shown in figure 2-6. For unstable configurations the pitch down capability is of critical importance to allow aquick recovery from PST attitudes to transition back into the higher speed envelope. Also a pure aerodynamicrecovery must be possible in case the thrust vectoring system fails to operate.
Roll control power requirements around the body axis can be relaxed with higher angle of attack because largebody axis roll angles would immediately result in excessive angles of sideslip which cannot be tolerated.
Yaw control power becomes more dominant with increasing angle of attack. At 90 degrees angle of attack theroll around the velocity vector is identical to a pure yawing maneuver. However, the available yaw capability athigh angles of attack is determined by the (constant) side force from thrust vectoring.
tlhe need for thrust vectoring support to achieve tactical relevant maneuvering capability in the high AOA
regime requires that the propulsion system is working at all times. Therefore sufficient airflow as well as engineinlet comparability throughout the angle of attack and sideslip regime must be insured. The engine should allowfull throttle operations throughout the PST regime. The thrust to weight ratio of the aircraft should exceed avalue ofone (SLS) which is satisfied by most modem conf..,urations.
Another important aspect is that the flight control system mechanization must allow to control the roll aroundthe velocity vector by a stick command only. Therefore the flight control system must take care of propermixing of body axis roll and yaw as a function of AOA.
Given a "normal" thrust/weight ratio of more than I at sealevel it was found that a thrust deflection of about 10 -12 degrees should be sufficient to satisfy the maneuver requirements, provided that the basic aerodynamicdesign has reasonable longitudinal and lateral directional characteristics. Nozzle deflection characteristics interms of deflection velocity and deflection rates must be compatible with those of erodynanic surfaces.
3. The X-31A. a Denamnsdtr" for tN Technical Feasibility and Tadkl utility ofPST Manjeurhwg
3.1
In May 1986 the Defense Advance Research Agency (DARPA) and the German Ministry of Defense signed anMOA to develope two aircraft and to demonstrate in flight the technical feasibility of poststall maneuvering. The
2-3
aircraft was designated X-31A and became the first vehicle in the famous series of X"-planes to be developedinternationally. Figure 3-1 identifies the major external and internal characteristics of the X-31A. The deltacanard configuration is powered by a single G.E. F 404 engine. The aerodynamic configuration integrates thedesign requirements for excellent supersonic performance combined with unprecedented subsonic high angle ofattack maneuvering capability. The belley inlet with a drooping lower lip is particularly suited for high angle ofattack operation. The long coupled all movable canard reduces aircraft stability and thereby improves subsonicand supersonic performance. Together with the trailing edge flaps it also provides pitch moments for trim,stability and control. The canard deflection is scheduled such that it will not stall considering trim and controlinputs. Leading edge flaps improve lateral/directional stability characteristics, in particular in the high angle ofattack regime and also the maneuver performance at lower angles of attack.
The most dominant external feature which distinguishes this aircraft from other delta canard configurations arethe three thrust vectoring vanes mounted to the aft fuselage of the aircraft which allow thrust vectoring in thepitch and yaw axis.
As might be expected for a low cost program the aircraft has been designed and built using a lot of excistingstructural and subsystem components (e.g. canopy and windshield, landing gear ECS, hydraulic, electric,propulsion system etc.).
To further improve the simplicity of the design and manufacturing process the aircraft has a dry wing.
3.2 Aerodynamic Characteristics
Figure 3-2 shows a smooth lift curve versus angle of attack distribution with a maximum lift coefficient of about1. 1 at 30 degrees angle of attack which is reduced to .6 at 70 degrees angle of attack.
Figure 3-3 shows the incremental pitching moment capability of the trailing edge flap vs. angle of attack. Inparticular the pitch down capability is markedly decreased. The pitching moments due to canard deflection areshown on Figure 3-4 and indicate that by deflecting the canard into the wind a significant pitch down momentcan be achieved. Figure 3-5 shows the combined pitch control power of canard and trailing edge. It clearlyindicates that the critical area is at high angle of attack where the pitch down capability is about 40% of theremaining pitch-up control power. The X-31 has been designed considering a requirement that the aircraft has tobe recoverable from high angle of attack even without the assistance of the thrust vectoring system, i.e.considering failure or malfunction of the thrust vectoring system or an engine flame-out. This required a carefuldevelopment and fine tuning of the aerodynamic characteristics as well as the proper CG location.
Sufficient roll control power can be generated throughout the angle of attack range by differential trailing edgeflap deflection.
The incremental yawing moment due to rudder deflection (Figure 3-6) indicates that above 40 degrees angle ofattack the remaining control power is insufficient to satisfy trim, stability and control power requirements.
A comparison of the control power requirements for tactical maneuvering as defined in Fig. 2-6 vs the availablevalues shows that these can be achieved if aerodynamic and thrust vectoring capability in pitch and yaw arecombined. Body axis roll requirements are satisfied without T.V. augmentation (Fig.3-7).
3.3Thrudste ringstm
Fig. 3-8 shows the principal arrangement of the thrust vectoring system. It consists of three vanes which aremounted to the aft airframe structure and can be deflected around a fixed hingeline. Simultaneous deflectionallows the adjustment of the vanes to the plume size resulting from a variation of power setting (Fig. 3-9) andMach/alitudes. The combination of two vanes deflected into the jet, - the remaining vane deflected outward-,allows to vary the direction and magnitude of the sideforce component in pitch and yaw. Deflectioncharacteristics ate incorporated into the control laws. When the thrust vectoring system is engaged, controlcomandes are distributed by the FCS between aerodynamic surfaces and T.V. vanes considering theireffectiveness.
The starctural design of the thrnst vectoring system consists of a light weigt/temperalum resistmtCubonCarton vane mounted to a metal structure with lugs for the hingeline and the actuator aaC nent. The
o4
2-4
vanes are covered by a metal roof which is designed to carry the aero loads when the vanes are deflectedoutward (up to 60 degrees) to improve the deceleration capability of the aircraft.
Consistent with the design requirements and aerodynamic characteristics the thrust vectoring system is used toimprove stabilization and control power in the pitch axis at low q/high AOA. Due to the single engine aircraftconfiguration no augmentation is possible in the roll axis. Because of the insufficient rudder effectiveness in theAOA regime above 40 degrees trim, stabilization and control augmentation is provided by the thrust vectoringsystem in the yaw axis (Fig. 3-10).
It should be noted the total control power available from aerodynamic surfaces and/or thrust vectoring devicesmust consider the requirements to compensate inertia coupling effects as well as engine gyroscopic momentsthroughout the angle of attack range.
3.4A erformnceFigure 3-11 shows a typical example of the roll control capabilty around the velocity vector versus angle ofattack. The rolling velocity is a function of Mach-number and altitude and as one can see there is a substantialcapability available at high angles of attack.
Figure 3-12 shows the envelope expansion with respect to turn rate capability at low mach numbers if the stalllimit can be exceeded. Obviously the amount of performance improvement is depending on the plane ofmaneuvering which in this particular case is horizontal. Two other extremes are identified in Figure 3-13 wherethe maneuvering is performed in a vertical plane. In this case the maximum performance is achieved in theupper point of a vertical loop and the minimum performance is achieved at the bottom of a vertical loop. Thedifferences in performance are due to the impact of the earth gravity.
The hedged areas identify the optimum angle of attack to achieve a maximum turn rate at a given mach numberaltitude condition. The vertical topline represents maximum achievable instantaneous performance.
A typical clinical PST maneuver is shown in Fig. 3-14. This particular maneuver requires a 180 degree headingreversal in the minimum amount of time with the constraint to come hack at the same altitude and approximatelythe same speed. Figure 3-15 shows a comparison of this very maneuver as flown in manned simulations with anaircraft with unlimited angle of attack capability (up to 70 degrees), and an aircraft 1; -i to 30 degrees angleof attack. The starting mach numbers are about the same and so are the end m.,h numbers. The unlimited air-craft achieves a considerably smaller radius of turn and higher turn rate- below M=.2 which in total results in ashorter time to perform this maneuver and, if performed proptrly in an aircombat situation potentially in apositional advantage. Fig. 3-16 shows time histories for a PST maneuver.
The envelope of the X-31 (Fig. 3-17) with respect to the conventional Verformauce i, limited by an angle ofattack of 30 degrees on the left hand side, a max. altitude line of 40 Kft, a max. Mach number of 0.9 and amax.line of 800 lbs/sq.ft. Overlapping is the envelope in which PST maneuvers can be performed. There is a rollcontrol limit to the left hand side which needs to be explored during flight testing, since the X-31 does not havea roll control augmentation. The engine limit is resulting from a time limit for fixed throttle positions and alsoneeds further exploration as well. The maximum mach number for PST maneuvers is currently identified as 0.7.Again, this limit needs to be investigated by flight tests and could be varying to higher and/or lower machnumbers. Entry into PST from high q/Mach numbers is limited by a q-line at which the structural limit of 9 g isreached at CLmax.
4. FlghtTsttStaus
Up to mid-April 199125 flights with about the same number of flight-ours have been flown with the twoaircraft (Fig. 4-1). Most of the flights have been performed with aircraft 1. After demonstrating the systemoperation flights were dedicated to investigate handling qualities throughout the conventional flight regime up to0.9 mach number and 40.000 ft altitude. Testing of flight loads and flutter tests are in process.
The thrust vectoring vanes have been mounted on the aircraft and flown on aircraft no. I since flight no. 10 in afixed position. Ground test of the vanes at various powersettings and various deflections into the jet haveverified the basic concept in terms of loads and temperatures. Initial flights with moving vanes to check thedeflection laws as defined in the control law package will commence in May. Penetration into the PST regime isscheduled for the second half of 1991.
2-5
5. lnm r:t
X-31 has matured from a concept to 2 flying Demonstrator a/cpredicted high AOA performance meets or exceeds design goalsThe integrated propulsion and multi-axis thrust vectoring control system are essential for high AOAmaneuvering. Structural integrity of the T.V. system has been verified by ground tests.Exploration of the conventional envelope as a prerequisite to PST flights is in progress.Flight testing of the T.V. system will start by June followed by penetration into the PST flight regime in thesecond half of 1991.
.4
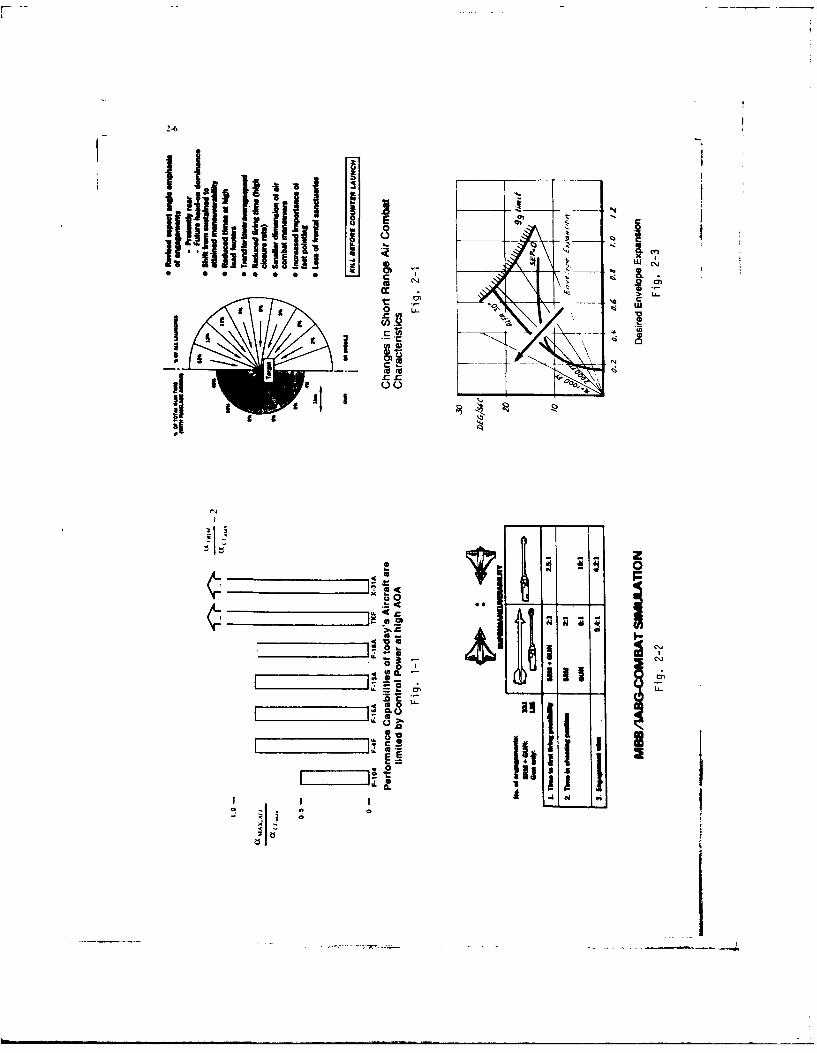
2-6
ac
r i,, I - _
x - nC0 7
to I.., ~~ L.|I.
g 1 0 L. WC
2 0.
U U- 0
.-$U- 4- -
I I 0 0 t
g I
1t I- -
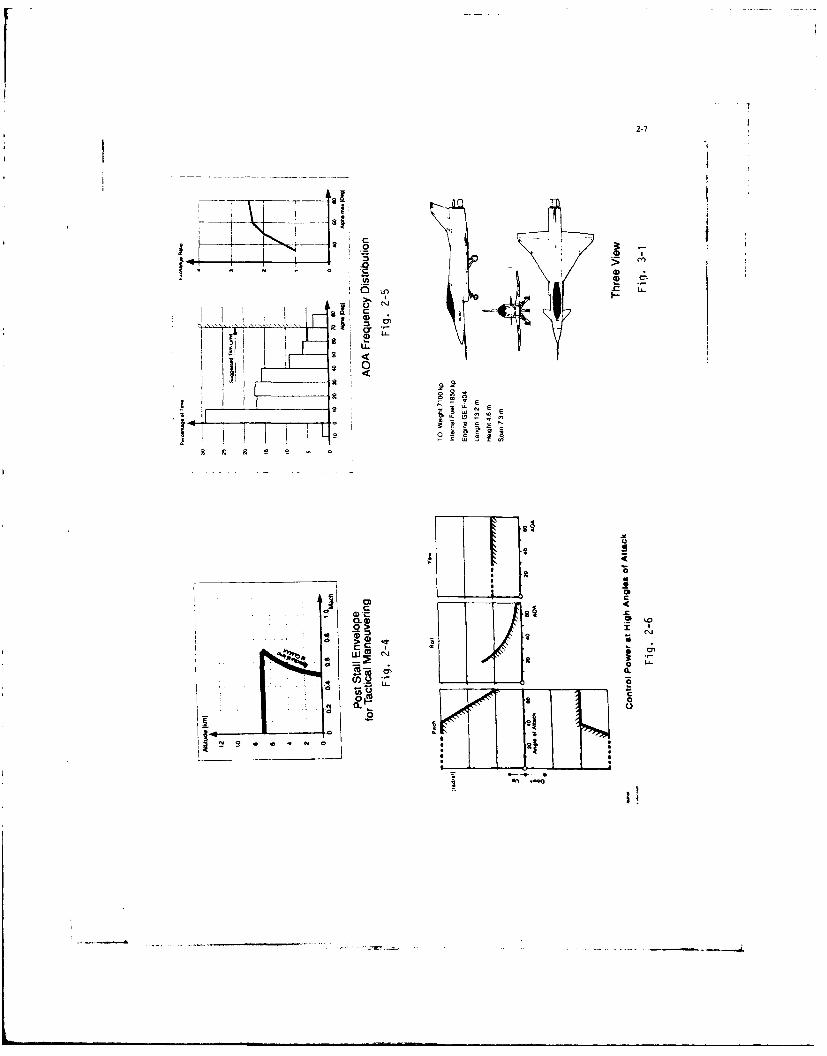
2-7
0 -
:3* ci
cc
0 5C4 Ri
_____ _____ _ *
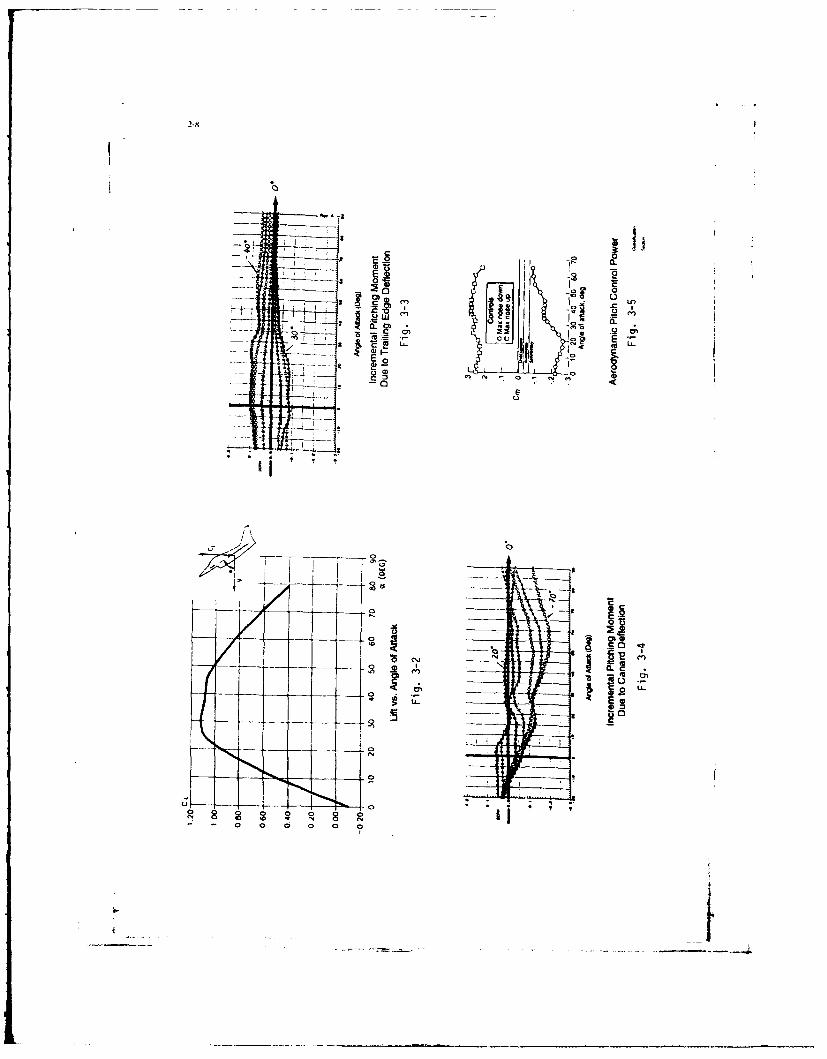
00
W. . -
I -2.9 2 o
CjC
7 .- ~. ISO
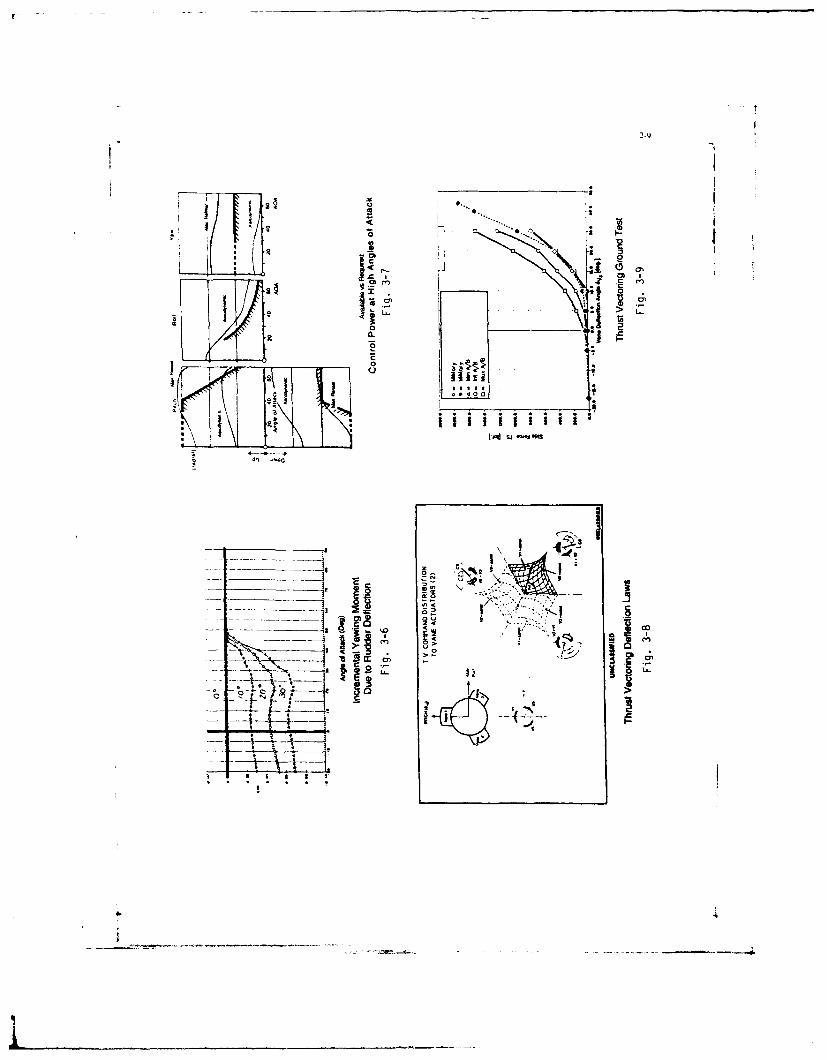
2-9
Uf
o
iL
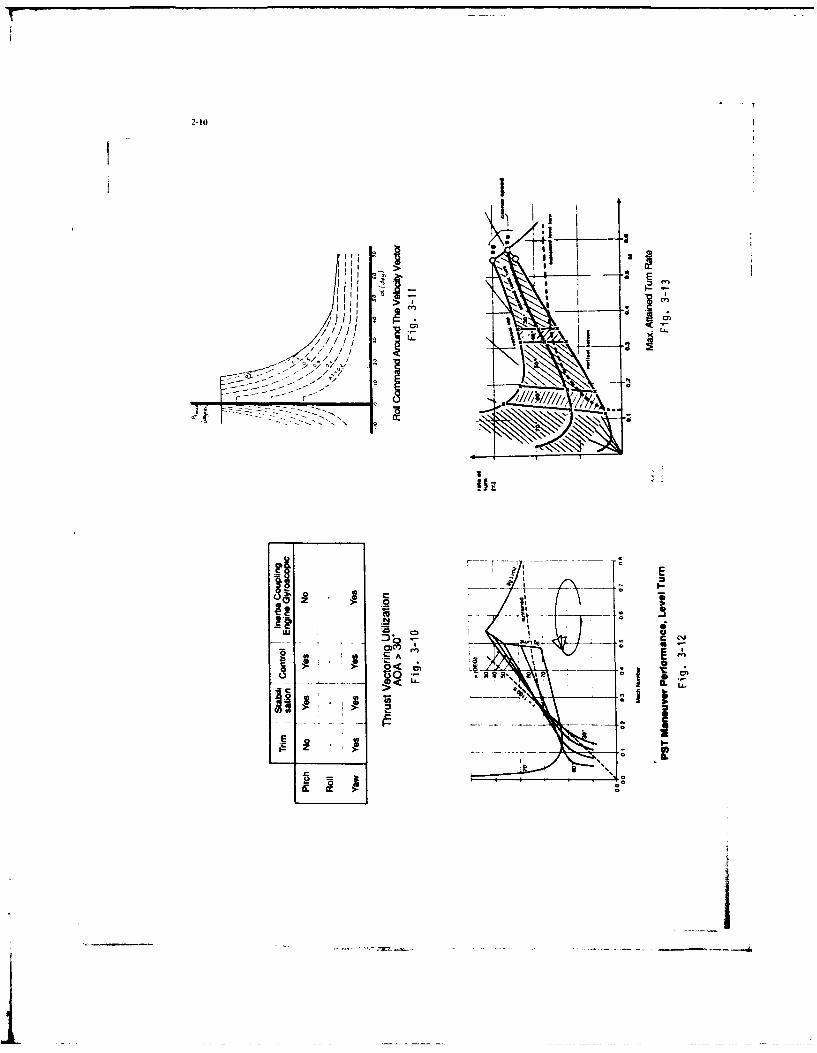
2-10
II
>1i
la
II 2
i /l " ~~
I oI
°z :,, 11£l
.. . . . .
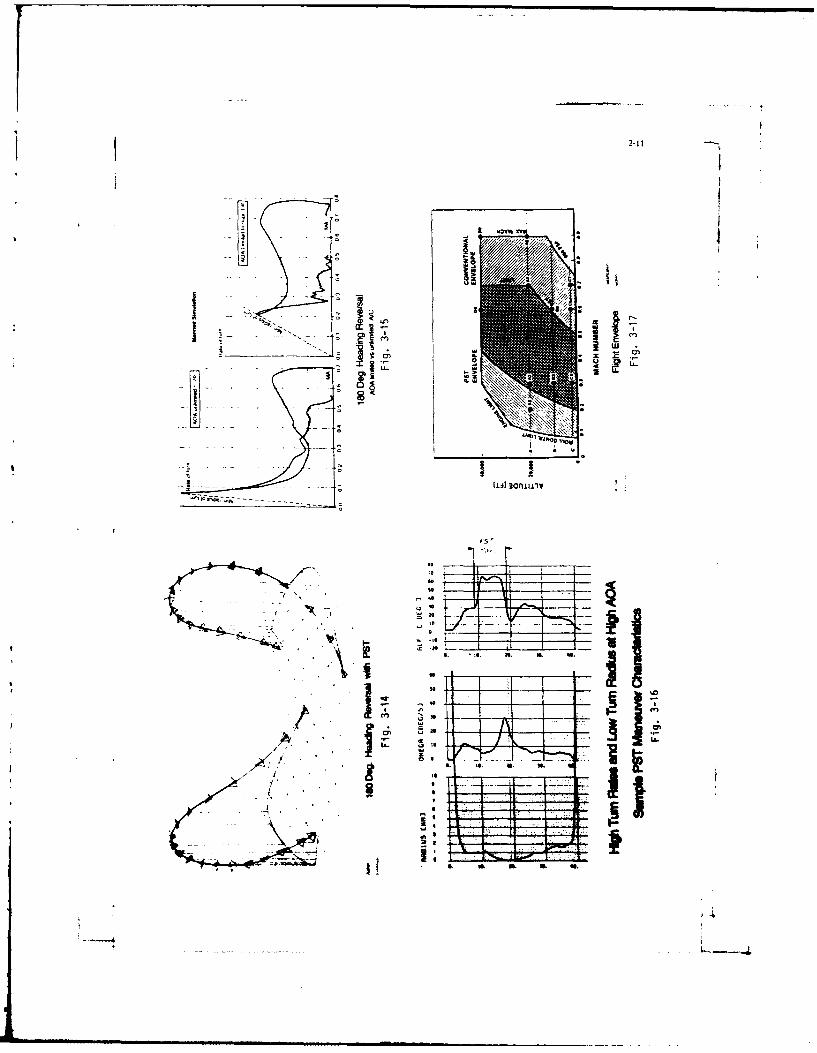
2-11
Ifj;) ~II~lag
-77 '~
IL IL S. I ,

2-12
a/c a/'c2 Total
Numberaof Flights 22 3 25
Flight Timve NOrs 22 2.7 24.7
Max. MaCh/Ali 0,9 /40kIdt
Max. KIAS qkot) 367
Max AOA(dsg) 20
Max.struct. loadf.(g) 5
Flutter-, Loadls-, and H.Q. Tests ongoing
First Government Pilot Evaluation Flights successfully completed
X-31 Flight Test Status22.Apri 1991
Fig. 4-1
AERODYNAMIC AND FLOWFIELD HYSTERESIS OF SLENDER WING* AIRCRAFT UNDERGOING LARGE-AMPLITUDE MOTIONS
* by
Robert C. Nelson, Andrew S. Arena Jr. and Scott A. ThompsonDeparmnt of Aerosp-c and Mechanical Engineering
University of Notre DameNotre Dame, Indiana 46556
United States of America
ABSTRACT INTRODUCTION
The implication of maneuvers through large-angles-of- The flow field surrounding a slender aircraft at large-incidence is discussed by examining the unsteady aerodynamic assgles-of-rncidence is dominated by dhe v ricenerated onloads, surface pressures. vortical position and breakdown on the forebody, leading edge extensions, wing and controlslender, flat plate delta wings. Two examples of large amplitude surfaces. The leeward wake structure can be extremelyunsteady motions are presented. First, the unsteady complicated due to the interactions between the various vortices.characteristics of a 70 degree swept delta wing undergoing pitch The aerodynanmic forces created by such complicated flowoscillation froms 0 to 60 degrees is examined. Data is presented patterns are in general nonlinear. In order to understand andthat shows the relationship between vortex breakdown and t predict the moton of aircraft in this nonlinear region, newovershoot and undershoot of the aerodynamic loads and surface mathematical formulations for the aerodynamic models muss bepressure distribution. The second example examines the leading developed and an improved understanding of the relationshipedge vortical flow over an 80 degree swept wing undergoing a between the separated flow field and the aerodynamic loadslimit cycle roll oscillation commonly called wing rock. needs to be establiahed. Methods fort modelling the nonlinear
aerodynamics are just starting to be dveloped.1.2
In addition.NOMENCLATURE experiments are being conducted to provide issforation on the
unsteady aerodynamic characteristics of slender aircraftS~mbolsmaneuvering at large angles of attack.3412
b Win spa, in(cm)The unsteady motion of a delta wing results in aRoo chordpa, in (cm) modification of the flow field in response to the maneuver. This
c Rot cordin cm)can result in delays of flow separation and vortex formation atf Pitching frequency, Hz low-angles-of-attack, and changer in vortex location and the
lv Rotational moment of inertia onset of breakdown at higher-angles-of-sntack. Duringks Reduced frequency, ks = 2trfc/1J, oscillatory or periodic motions, a hysteresis develops in theL Roll moment positions of the vortex came and the vortex brealudown relative toLac Roll moment due to aerodynamic forces the static locattions. Due to the hysteresis in the flow field, themetcutig Roll moment due to bearing friction is a corresponding modificati of the aeodynamic loads on the
P Pressure, psi (Pa) delta wing. The results presened inthe following section areP_, Freestream static pressure, psi (Pa) used to show the importance of flow field hysteresis in eitherf
vortex position or breakdown on the unsteady loas and surfaceQ_, Freestrtsm dynamic pressure, psi (Pa), Q,,=pU_
2 /2 pressure distributions of simple delta wing lanforms.S Local semi-span length, in (cm) Ashley, Katz, Jare*h and Vaneek have recently
S Wing area, in2. (cm
2) published a paper summarizing the current state of unsteady
t Time (sec) swept wing aerodynamics research. Theroretical, computational,
U,,,, ~ ~ ~ ~ ~ ~ ~ ~ n aretemvlct.f/ ms erodynamic force and moments is described. Ashley. etx Choedwise position, measured from she wing apex, al., concluded that for unsteady pitching maneuvers where
in (cm) . vortex breakdown is not present the aerodynamic characteristicsy Spanwise position, measured from the wtng behave in aquai-static mannter. However, for ranges of moion
cnterline, in (cm) where breakdown is presen over the wing, hysteretic behavioryl Left vortex spanwise: location variable is observed.yr Right vortex spanwise location variable At high-angles-of-attack. the leadin edge: vortices canZi Left vortex normal location variable undergo a transition known as vomex bradwn, which canr Right vortex normal location variable causesa loss of both lift and nose-down pitching mroment.
cx Agle f ataelt degUnsteady swept wing aerodynamsics at very high-angles-of-al ngl ofsnak, egatoack are characterized by hysteretic behavior typically for* Roll Angle, deg ranges of incidenice precluding vortex breakdown, hysteresis
A5 Fresr- air dytnamic viscosity, lbf s/ff2 (kg/in t) effects are not as pronounced. A substantial overshoot in theaerodynamic forces is typically seen for aeillastwy or transient
p Fn -stea air density, slugs/ft3 (lcghn3) pisching maneuvers Fora dyanmically pitelen wing it may be
possible to exploit tis o.sotor delay die detriimal effects
h~3YiI~Il3Flying at highangles-of-attack is intrinsically anusedflgtregie, and as such aIesas of the
CL Lift cefficenett unsteady aerodynamics of swep wings is of value. AnCl Roll tmoment coefficient tudests" of these dynatic, high-angle-of-sntackCp Pressure coefficient, Cp -(PW-P_,/) phenomen on saf tc cerni aft h the hean andRe Reynolds numsber, based on root chord, ReVpU.,c4t uc f stae o ft asis tw M a 9 s Nop wing = alc uing
obanthe n~syhigh lift confidient, Is a MRio, militarya 338111141 suato gain an expande cmbat maneuverng
en to es is.uch an tudms.". Maneuvers such as nose- infinlity, refers solfstsuayeu odtion p? tigdvkesyv c iqmg-sgs-ftp Refers to condition at p v im a up 5Aae antiCW 1011011dsdau 110011h s ability 10
1andcip the1 dynasic ta.c Of fiawl. lla die vaseuver.
effective flightc coasyses oatbedevelpd7W Mervwin refe isv t --am ;3;; f
lartraaleofa~astedymamO rn h nind n
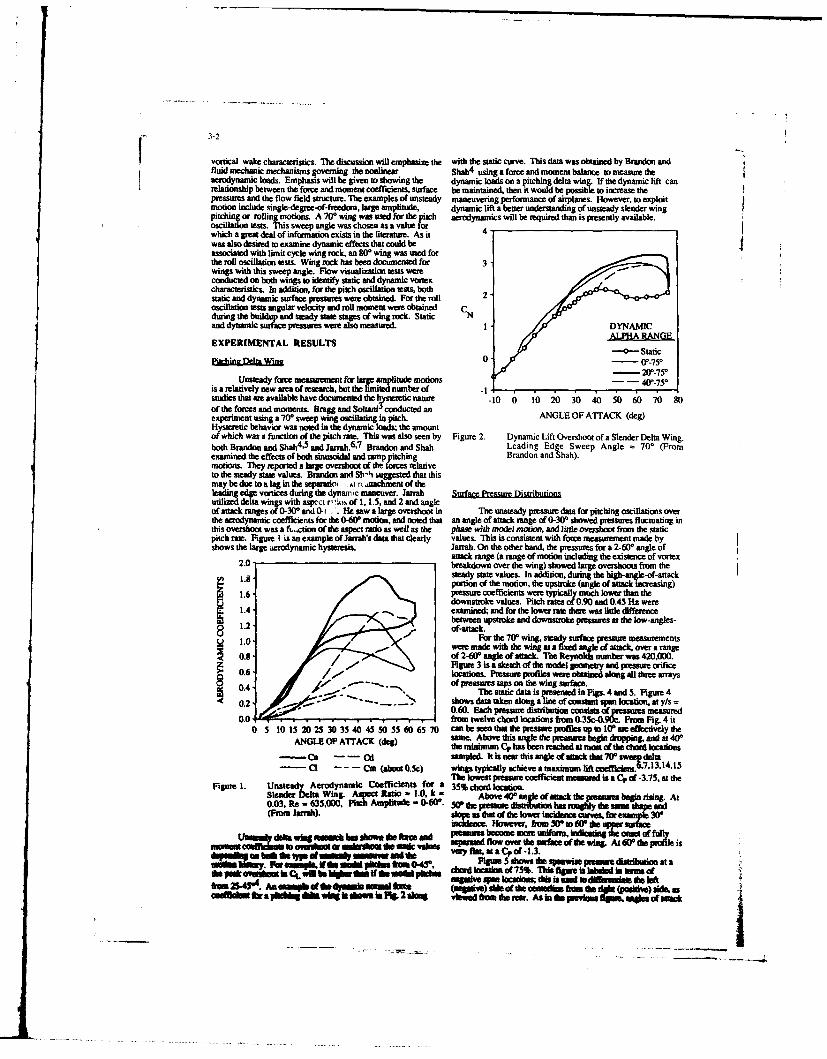
votcw ak.~edaatetcs.Thdscion willemsize th ihdesttccre Thsodamsoted by Brandon and
relationship between the force and moment coefficiens, surface be maintained, then it would be possible to increase thepressure and the flow field structure. The examples of unsteady maneuvering performance of airplanes. However, to exploitmotion include single-degree-of-freedtxn, large amplitude, dynamic lift a better understanding of unsteady slender wingpitchiing or rilling motions. A 7O* wing wan used for the tciaerodynamics will be required than is presently available.oscillation tests. This sweep angle was chosen as a value____________________which a great deal of information exists in the literaue. As it 4was also desired to examine dynamic effects that could beassociated with limit cycle wing rock, an 800 wing was used forthe roll oscillation tests. Wing rock has been documented for 3-wings with this sweep angle. Flow visualization tests wereconducted on both wings to identify static and dynamic vortexcharacteftstics. In addition, for the pitch oscillation tests bothstatic and dynamic surface pressre were obtained. For the roll 2oscillation tests angular velocity and roll moment were obtainedduring the buildup) and steady tase staes of wing rock. Static Cand dynamic surface psessures were also measured.I YAU
EXPERIMENTAL RESULTS
Pitching Deha Wing 0- (-5, - 20'75-
Unsteady forc meastrement for lag amplitude motions - -44)r-750is arelatively new are of research, but the limite numbe of -Istudies that ame available have documented the hIrtsc nature -10 0 ;0 20 30 40 50 60 70 80of theforces and momnents. Brapg and Soltani'conducted anexperiment using a 700 sweep wing oscillating in pitch. ANGLE OF ATTACK (deg)Hysteretic behavior was noted in the dynamic loads, the amountof which was a function of tie pitch rate. This was also seen by Figure 2. Dynamic Lift Overshoot of a Slender Delta Wing.both Brandon and Shas 4
-5 and Jarah.6 1 Brandon and Shah Leading Edge Sweep Angle =700 (From
examined the effects of both sinusokda and ramp pitching Brandon and Shah).motions They reported a large overshoot of the forme relativeto the steady state values. Brandon and Sb- s uggested that thismay bedue to slag indie separatioa ..u n .taclunentoftheleading edge vortices during the dynarr ic maneuver. Jattsls fm rsur isrbuinutilized delta wings with aspct~ r,!ios of 1, 1.5, and 2 and angleof attack ranges of 0.300 and 0- o . lie saw a large overshoot in The unsteady pressure data for pitching oscillations overthe aerodynamic coefficients for the 0.60 motion, and noted that an angle of attack range of 0-301 showed pressures fluctuating isthis overshoot was a fL.,cton of die aspect ratio as well as die phase with model motion, and little ovrshoot from the staticpitch rate. Figure I is an example of Isarraj's data that clearly values. This is consistent with force measurement made byshows the large aerodynamic hysteresis. Jarrah. On the other hand, the pressures for a 2-600 angle of
attack range (a range of motion including the existence of vortex2.0 breakdown over the wing) showed large overshoots fromi e
I.S.steady State values. In addition, during the high-angie-of-attack1.8 portion of the motion, the upstroke (angle of attack increasing)
1.6- pressure coefficients were typically muc lower than thedownstroke values. Pitch rates of 0.90 and 0.45 Hz: were
S1.4 -, examined, and for the lower rate there was little differencebetween upstroke and downstroke presstres at the low-angles-
8 1.2 of..=LS1.0 For m the 700 wing, steady surface pressure measurements
weremad wih te wng t afixed angle of attack over a range0.9of 2-6W angle of attack. The Reynolds number was 420,000.
Figur l 3 is a ec of the model geonmetry and pressure orifice0.6 locations. Pressure profiles were olitased along all three arrays0.4- -- , of pressures raps on the wing surface.
0.4 ~The static data is presented in Figs. 4 and 3. Figure 4~ 0.2 ,,,~.-...shows data taken along a line of constans span location at y/s=
0. o0.60. Each pressure distribution consists of pesrsmeasuted0.01 , firom twelve chord locations frotm 0.35c-0.;0.Fiuns Fig. 4 it
0 5 10 15 20 25 3035340 45 50 55 60 65 70 can be sawntht depressure prfsei up 1s00e effectvelytheANGLE OF ArTACK (de) sam Above this angle the presu-es Wei diupin and at 440*
the minimumh qp has been reached a most of the dhad locations- Ot1 -- sampled. It is near this angle of snack dot 7t0 sweelt~a
Cl -- Cm (about0.3c) wings typically achieve a maximum lf wfccL71.417The lowest pressure coefficient nmeasured is a Cp of -3.75, at the
Figure 1. Unsteady Aerodynamic Coefficientts fo a 35% chordlocation.Slender Delta Wing. AsetRatio -1.0, k - Above 400an-'- ofattack the psm begin rising. At0.03, Re - 635,000, Plach Atmplituide - 0-60. 5V the presure dsrbto uroughly t h aeie and(From J111,a11). dp sooftelower incidence curves, fir easi&3(
itiec.However, Berns 50 to 6Or th rsufcpeubome mtome wuniun, lahefisig osactoffully
moss e -luMn ;Io , .N-a thepuseI flow over tie suaic of die wing. Atd0 the* profile is~q..hpmI I NoE~ t dthe va, flatata Cpof -1.3.
U~ 7. wo~l.V~m ~ p~aftm04r, I5'8 5 dshmo the a--mwn dxa itrbuion; assado Paku it chorb~a ~ ~ ~~ ms d loion of 751b. Thlflg si labeled in Enof
hin CI5~ P~d4 ~ h -ingalw Wam locations; ide is sod mso sff i pt isin; a pka~g f win h eN I aa vie ia te we. As in th pmvku ft molat as
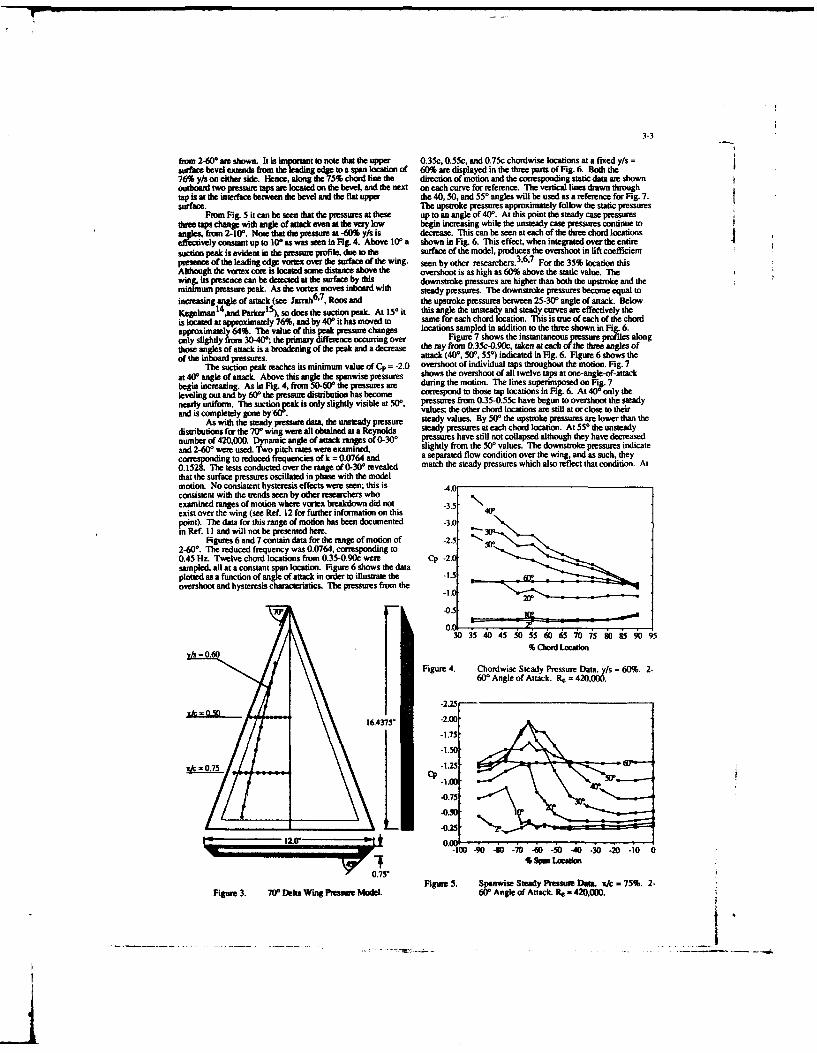
3-3
frm 2-60 are shown. It is important to note that the upper 0.35c, 0.55c, and 0.75c chordwise locations at a fixed y/s =surface bevel extends from the leading edge to a span location of 60% ae displayed in the three parts of Fig. 6. Both the76% y/s on either side. Hence, along the 75% chord line the direction of motion and the corresponding static data are shownoutboard two pressure taps anre located on the beveL and the next on each curve for reference. The vertical lines drawn throughtap is at the interface between the bevel and the flat upper the 40, 50, and 550 angles will be used as a reference for Fig. 7.surface. The upstroke pressures approximately follow the static pressures
Froe. Fig. 5 it can be sen that the pres-sres at these up to an angle of 400. At this point the steady case pressurestm taps change with angle of alack even at the very low begin increasing while the unsteady case pressures continue toangles, from 2-100. Note that th pressure at -60% y/s is decrease. This can be seen at each of the three chord locationseffectively constant up to l0 as was seen in Fig. 4. Above 10a shown in Fig. 6. Thiseffect, whenintegratedovertheentiresuction peak is evident in the p essure profile, due to the surface of the model, produces the overshoot in lift coefficientpresence of the leading edge voex over the surface of the wing. seen by other researchers.
3'6 1
7 For the 35% location this
Although the vortex core is located some distance above the overshoot is as high as 60% above the static value. Thewi. its presence can be detected at the surface by this downstroke pressures an higher than both the upstroke and theminimum pressure peak. As the vortex moves inboard with steady pressures. The downstroke pressures become equal toincreasing angle of attack (see Jarrah
6'7
, Roos and the upstroke pressures between 25-300 angle of attack. BelowKegelman
14,and ParkerlS), so does the suction peal. At 150 it this angle the unsteady and steady curves are effectively the
is located at approximately 76%, and by 400 it has moved to same for each chortd location. This is rte of each of the chordapproximaely 64%. The value of this peak pressure changes locations sampled in addition to the three shown in Fig. 6.only slightly from 30400; the primary difference occurring over Figure 7 shows the instantaneous pressure profiles alongthose angles of attack is a broadening of the peak and a decrease the ray from 0.35c-0.90c, taken at each of the three angles ofof te inboard pr . attack (40
, 500, 55) indicated in Fig. 6. Figure 6 shows the
The suction peak reaches its minimum value of Cp = -2.0 overshoot of individual taps throughout the motion. Fig. 7at 400 angle of attack. Above this angle the spanwise pressures shows the overshoot of all twelve taps at one-angle-of-attackbegin increasing. As in Fig. 4. from 50-60 the pressures ae during the motion. The lines superimposed on Fig.7leveling out and by 60 , the presse distribution has become correspond to those tap locations in Fig. 6. At 400 only thenearly uniform. The suction peak is only slightly visible at 50
, pressures from 0.35-0.55c have begun to overshoot the steadyand is completely gone by 6r. values; the other chord locations an still at or close to their
As with te steady pressure dat, the unsteady pressure steady values. By 500 the upstroke pressures an lower than thedismbudions for the 700 wing were all obtained at a Reynolds steady pressures at each chord location. At 550 the unsteady
number of 420,000. Dynamic angle of attack ranges of 0-300 pressures have still not collapsed although they have decreasedand 2-600 were used. Two pitch rates were examined, slightly from the 500 values. The downstroke pressures indicatecorsodng to reduced frequencies of k = 0.0764 and a separated flow condition over the wing, and as such, they0.1528. The tests conducted over the range Of 0-300 revealed match the steady pressures which also reflect that condition. At
that the surface pressures oscillated in phase with the modelmotion. No consistent hysteresis effects were seen; this is -4.0consistent with the trends seen by other researchers whoexamined ranges of motion where vortex breakdown did not -3.5, 40"exist over the wing (see Ref. 12 for further information on thispoint). The data for this range of motion has been documented -3.0in Ref. I I and will not be presented here.
Figures 6 and 7 contain data for the range of motion of -2.52-600. The reduced frequency was 0.0764, coresponding to0.45 Hz. Twelve chord locations from 0.35-0.90c were Cp -2.0sampled, all at a constant span location. Figure 6 shows the dataplotted as a function of angle of attack in order to ilustrate the -1.5overshoot and hysteresis characteristics. The pressures from the -. 0
" -03).
0.0-30 35 40 45 50 55 60 5 70 75 80 85 90 95
= 0.60 Chord Locatonv s= 0.60 " '
Figure 4. Chordwise Steady Pressure Data. y/s = 60%. 2-600 Angle of Attack. Re = 420.000.
-2.25
16.4375" -2.00
0-1.75-
1.0 o.4'
• -0.75
-100 -90 4I)--0 - 5O4 0 -40 -30 -20 -10 0% Span Loc46io
0.7.rFigure 5. Spnwise Steady Pressure Data. s/c = 75%. 2-
Figure 3. 700 Delta Wing Pressure Model. 600 Angle of Attack. Re = 420,000.
___I
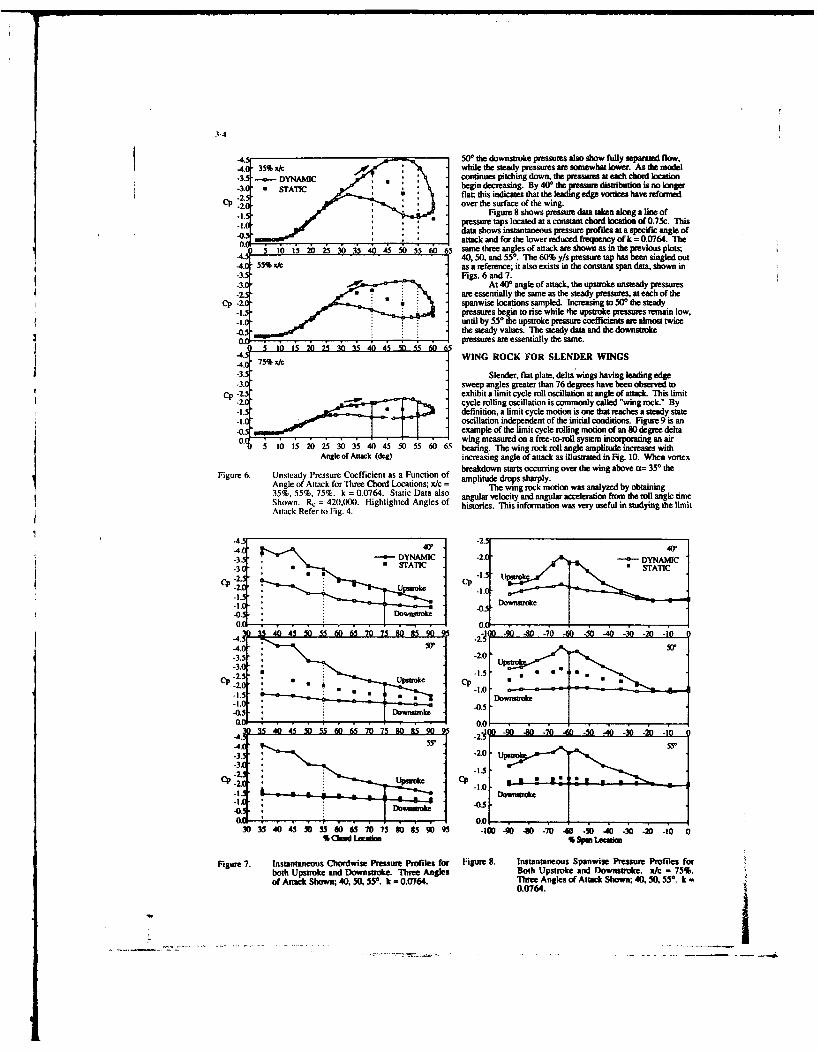
3-4
500 the downstroke pressures also show fully separaatd flow.-4.( 35% s/c while the steady pressures are somewhat lower. As the model-3. DYNAMIC , - continues pitching down, the pressues at each chord location
-3.( STATIC j ' begin decreasing. By 40* die prssr distribution is no longer-2.: flat, this indicates that the leading edge vortices have reformed
CP -over the surface of the wing.Figure 8 shows pressure data taken along a line of
pressure taps located at a costnt chard location of 0.75c. Thisdata shows instantaneous pressure profies at a specific angle ofattack and for the lower reduced frequency of k = 0.0764. The
40 5 10 15 20 30 5 4 j5 5b 55 65 same three angles of attack am shown as in the previous plots;- 4. 40,50, and 550
. The 60% y/s pressure tap has been singled out
-4. 55% x as a reference; it also exists in the constant span data, shown in-3.! Figs. 6 and 7.-3.W At 40* angle of attack. the upstroke unswady pressures
are essentially the same as the steady pressures, at each of theCp - spanwise locations sampled. Increasing to 500 the steady
-1. pressures begin to rise while the upstroke pressures remain low,unil by 55° the upstroke pressure coefficients are almost twice
-0. the steady values. The steady data and the downst, kepressures are essentially the same.
j 2 5 10 '5 40 45 5D 55 6 6'-4. 5% xc WING ROCK FOR SLENDER WINGS
-3. Slender, flat plate, delta'wings having leading edge-3. sweep angles greater than 76 degrees have been observed to
Cp exhibit a limit cycle roll oscillation at angle of attack. This limitI2.h b cycle rolling oscillation is commonly called "wing rock." Bydefinition, a limit cycle motion is one that reaches a steady stateoscillation independent of the initial conditions. Figure 9 is an
-0.1 example of the limit cycle rolling motion of an 80 degree delta0 wing measured on a free-to-roll system incorporating an air
5 10 15 20 25 30 35 40 45 50 55 60 65 bearing. The wing rock roll angle amplitude increases withAngle of Attack (deg) increasing angle of snack as illustrated in Fig. 10. When vortex
breakdown starts occurring over the wing above ot= 350 theFigure 6. Unsteady Pressure Coefficient as a Function of amplitude drops sharply.
Angle of Attack for Three Chord Locations; x/c = The wing rock motion was analyzed by obtaining35%, 55%, 75%. k = 0.0764. Static Data also angular velocity and angular acceleration from the roll angle timeShown. Re = 420,000. Highlighted Angles of histoiaes. This information was very useful in studying the limitAttack Refer to Fig. 4.
-. •-2.5
-4 Or
3 ' DYNAMC -20 -
2 . .,
-2 U --O-1. . Dowasuoke
-2 -2.0-.
__ 0.040 354, 0 5SO 06SO 7S 509o -l 90 . -80 .7 -60 -. 50 40 -Q -20 -o 0
% c~w ee i %t 8pm teesuim
Figure 7. Instantaneous Cliortwise Pressure Profiles for Figure 8. Irnatantneous Spanwise Pressure Profiles forboth Upstroke and Downtroke. Three Angles Both Upstroke and Downasrke. sic = 75%.of Anack Shown; 40, 50, 5?. k =0.0764. Three Angles of Attack Shown;,40. 50.55?. k ,,
0.0764.
-- 3.
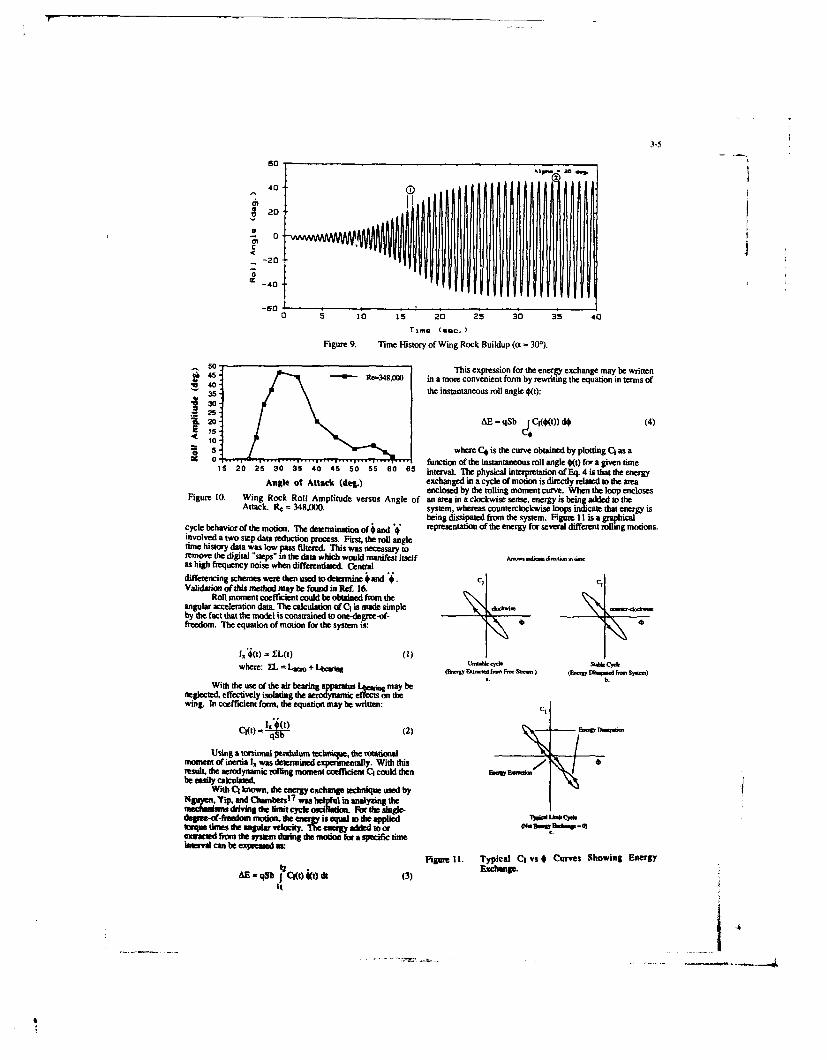
3-5
40
0c
S20
02
-600 5 10 15 20 25 30 35 40
Time (sec. )
Figure 9. Time Flistory of Wing Rock Buildup (a =300).
45 This expression for the energy exchange may be written5~ 45 -U ReO-348MtX in a mote convenient form by rewriting the equation in terms of
1. 40.
35- the instantaneous roll angle t):
__ __ ___2o-__ __ AE = qSb jC(O(t)) d4 (4)
5 ~where C. is the curve obtained by plotting C, asa0is...... funiction ote insataems oll angle t)for agiven tme1520 25 30 35 40 45 50 55 60 65 interval. The physical interpretation ofSq. 4 isthat the efergy
Angle ot Attack (deg.) exchanged in a cycle of motion is directly related to the areaenclosed by the rolling moment can. When the loop encloses
Figure 1. Wing Rock Roll Amplitude versus Angle of an area in a clockwise sense. energy is being added to theAttack. Re 3.48g(Xo. system, whereas counterclockwise loops indicate that energy is
being dissipated from the system. Figur Ill s a graphicalcycle behavior of the motion The determinaton of* and representation of the energy for several different rolling motions.involved a two step data reduction process. Firat the roll angletime history data was low pass filtered. This was necessary toremove the digital "steps" in the data which would manifest itself An~ m'as htight frequency noise when differetiated Central
differencin g seheie qw-e then used to daeerine i andm C, cValidation of this method may he found in Ref. 16.
Roll moment coefficient ouald be obtained fromt theangular acceleration data. The calculation of C1 is made simple - oby the fact that the model is constrained to one-degree-of-Nfreedom. The equation of motion for the system is:
where: IL - Lwo + Lben (E6 %fmm --I-) ~M-0 D t- k Y-)b.
With the use of the air hearing apparatus rn may beneglected, effectively isolating the aerodynamic ison thewing. In coefficient form, the equation may be written: C,
CO q b (2) ~t..Using a torsional pendulum technique, the rotational
momtent of inertia l,, was determined experbnentally. With this7result. the serodynamic rolling moment coefficient Cj could then a-* Bwtbe esoiy calculatd
With CQ known, the energy exchange technique used byN= 'an at .0ChrbM7wa Wi analyzing the
depee-of-fhsedon motion, die is equal vi die appliedUwqoe times die angular veocit~y energy addled to or VNW .Hh0-0eamacied frnm the ssem doting theomotion for a specific timeInurwal can be expee as
Figure 11. Typical Ci vs 4 Cum&e Showing EnergyAE qSb I C() t) d (3)
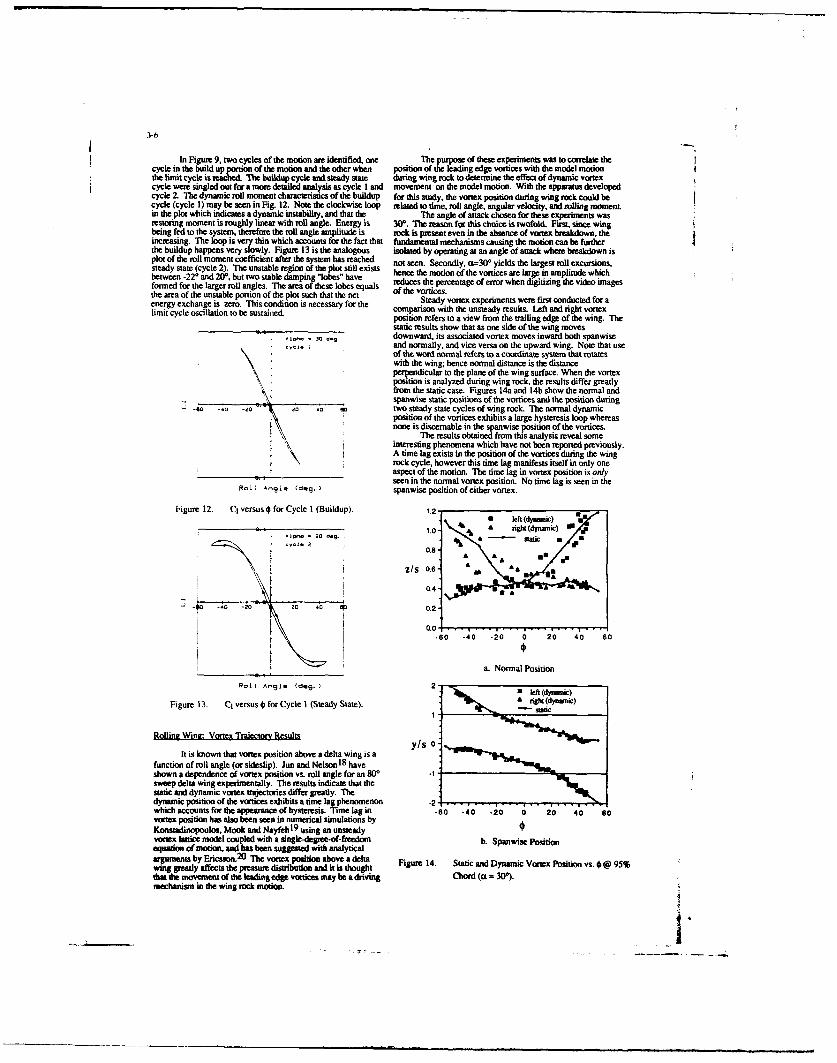
3-6
In Figure 9, two cycles of the motion are identified, one The purpose of these expeiments was to correlate thecycle in the build up portion of the motion and the other when position of the leading edge vortices with the model motionthe limit cycle is reached. The buildup cycle and steady state during wing rock to determine the effect of dynamic vortexcycle were singled out for a more detailed analysis as cycle I and movement on the model motion. With the apparatus developedcycle 2. The dynamic roll moment characteristics of the buildup for this study, the vortex position during wing rock could becycle (cycle I) may be seen in Fig. 12. Note the clockwise loop related to time, roll angle, angular velocity, and rolling moment.in the plot which indicates a dynamic instability, and that the The angle of attack chosen for these experiments wasrestoring moment is roughly linear with roll angle. Energy is 300. The reason for this choice is twofold. Fst, since wingbeing fed to the system, therefore the roll angle amplitude is rock is present even in the absence of vortex breakdown, theincreasing. The loop is very thin which accounts for the fact that fundamental mechanisms causing the motion can be further ithe buildup happens very slowly. Figure 13 is the analogous isolated by operating at an angle of attack where breakdown isplot of the roll moment coefficient after the system has reached not sen. Secondly, a=30* yields the largest roll excursions.steady state (cycle 2). The unstable region of the plot still exists hen teon o-he v ies are larges amli hchbetween -220 and 20r , but two stable damping "lobes" have hence the motion of the vortices are large in amplitude whichformed for the larger roll angles. The area of these lobes equals reduces the percentage of error when digitizing the video imagesthe area of the unstable portion of the plot such that the net of the vortices.energy exchange is zero. This condition is necessary for the Steady vortex experiments were first conducted for alimit cycle oscillation to be sustaiite. comparison with the unsteady results. Left and right vortex
position refers to a view from the trailing edge of the wing. Thestatic results show that as one side of the wing moves
- ,downward, its associated vortex moves inward both spanwiseand normally, and vice versa on the upward wing. Note that useof the word normal refers to a coordinate system that rotateswith the wing; hence normal distance is the distanceperpendicular to the plane of the wing surface. When the vortexposition is analyzed during wing rock, the results differ greatlyfrom the static case. Figures 14a and 14b show the normal andspanwise static positions of the vortices and the position during
- -0 -o -Z' 20 ,0 g, two steady state cycles of wing rock. Thenormaldynamicposition of the vortices exhibits a large hysteresis loop whereasnone is discernable in the spanwise position of the vortices.
The results obtained from this analysis reveal someIinteresting phenomena which have not been reported previously.I A time lag exists in the position of the vortices during the wing
rock cycle, however this time lag manifests itself in only oneaspect of the motion. The time lag in vortex position is onlyseen in the normal vortex position. No time lag is seen in the
Rol Angl. (dog.) spanwis position ofeither vortex.
Figure 12. Ct versus for Cycle I (Buildup). 1.2.Is left(=ly)amic
___ ___ __ ___ _& £ s1dyn c)"
0 .a isr a .
Y. . 2 a £ sttc u
,ZISO.6-
0.4- A 46s
00.2
0.0-60 -40 .20 0 20 40 60
a. Normal Position
Roll An.9 le (d9.) 2 U eft-dysrn)
lef gg.(ynaiinc)Figure 13. Ci versus 0 for Cycle I (Steady State). _.d (dynamic)
Rollint Wine: Vortex Trlaiectorv Results
It is known that vortex position above delta wing is afunction of roll angle (or sideslip). Jun and Nelson
18 have
shown a dependence of vortex position vs. roll angle for an 800 -1sweep delta wing experimentally. The results indicate that thestatic and dynamic vortex trajectories differ greatly. Thedynamic position of the vortices exhibits a time lag phenomenon -2 ,which accounts for the appearance of hysteresis. Tne lag in .60 .40 -20 0 20 40 sovortex position has also been seen in numerical simulations byKonstadinopoulos, Mook and Nayfeh 19
using an unsteadyvoritx lattice model coupled with a single-degree-of-freedom b. Spanwise Positionequao of motion, and has been suggested with analyticalargumnts by Ericson.
20 The vortex poastion above a delta Figure 14. Static and Dynamic Vortex Position vs. €@ 95%
wing Seady affects the pressure distribution and it is thoughtdt the movement of the leading edge v ces may be a driving Chord (ot = 30*).mechanism in the wing rock motion.
_ _ _ _ _ _- I ,
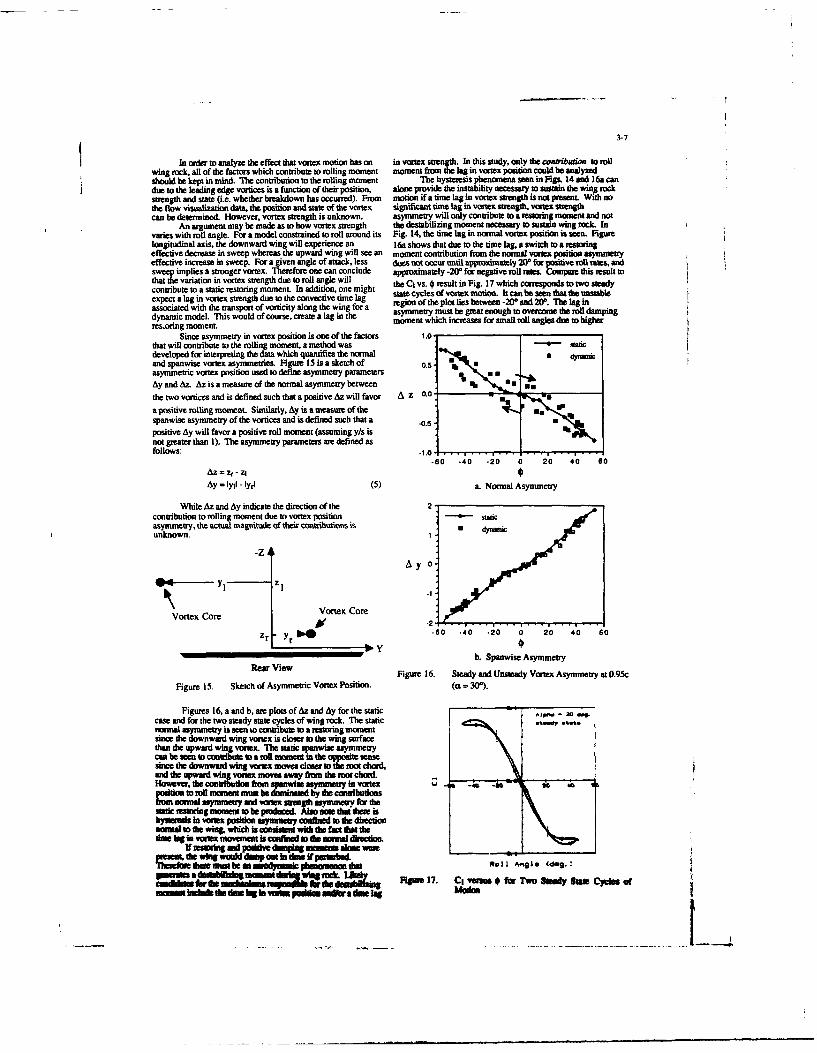
3-7
In ordler to analyze the effect that vortex motio has on in vortex strength. In this study, only die coatribiawn to rullwing rock, all of the factors which contribute to rolling moment moment fronm the lag in vortex position could be analyzedshouild be kept in mind. Mle contribution to t rolling moment The hysteresis phenomena see in Figs. 14 and 16a candue to the leading edge vortices is a function of their position, alonie provide the instability necessary to sustain the wing rockstrength and state (i.e. whether breakdown has occurred). From motion ifsa time lag in vortex strength is not Present With nothe flow visurt ization data, the position and state of the vortex significant time lag in vortex strength, vortex strengthcan be determined. However, vortex strength is unknown. asymmetry will only contribute tosa restoring moment and not
An argument may be made as to how vortex strength the destabilizing moment necessary to susrasn wing rock. Invaries with roll angle. For a model constrained to roll around its Fig. 14, the time lag in notrmal vortex position is seen. Figurelongitudinal axis, the downward wing will experience an lds shows that due to the time lag, a switch to a restoringeffective decrease in sweep whereas the upward wing will see an moment contribution from the normal vortex position asymmeryeffective increase in sweep. For a given angle of attack, less does not occur Until approimately 20' for posit roll ates, andsweep implies a stronger vortex. Therefore one can conclude approximately -2Or for negative roil rates. Compere t result tothat the variation in vortexstrength due to roll angle will eCv.ruliiglwihcrsp dtow teycontribute tosa static restoring moment. In addition, one might tae cycs o reute motiog. 1t whcan coresend tha tw ustaleexpect s lag in vortex strength due to the convective time lag sae ylso otxmto.I a ese htteusdassociated with the transport of vorticity along the wing for a region of the plot lies between -200 and 200. The lag indynamic model. This would of course, create s lag in the asymmetry must he great enough to overcome the rol dampingres~oring moment, moment which increases for small roll angles due to higher
Since asymmetry in vortex position is one of the factors 1.0.,that will contribute to the roiling moment, a method was Staticdeveloped for interpreting the data which quantifies the normal * dy.siand spanwise vortex asymmetries. Figur 15 is a sketch of os ~asymmetric vortex position used to defneaymtypreesAy and Az. Az is ameasure of the normal asymmetry between andie two vortices and is defined such that apositive Azwillfavor AZ 0.0-
a positive rolling moment. Similarly, Ay is a measure of thespanwise asymmetry of the vortices and is defined such that a -.positive Ay will favor a positive roll momen (assuming y/s isnot greater than 1). Mme asymmetry parameters are defined as
-80 -40 -20 0 20 40 s0Az = Z'- r
Ay = lyll - lI (a . Normal Asynmmery
Whle At and Ay indicate the direction of the 2'contribution so roiling moment due to vortex position - saicasymmtry, the actual miagtnitude of their conributions it * yoiiunknown.1
-ZAAy 0-
Vorte CoreVortex Core
zr y .60 .40 .20 0 20 40 so
b. Spanwise AsymmetryRear View Figure Id. Steady and Unsteay Vortex Asymmetry at 0.95c
Figure 15. Sketch of Asymmetric Vortex Position. (a 300).
Figures 16, aand b, are plots of Az and Ay for the static rAil" 2D d.41.case and for the two steady state cycles of wing rock. The static .~**normal asymmetry is seen to conusibt w a reatoingnmomnent ....sim the downward wing vortex is clowe so the wing surfacethan the upward wing vortex. The static apanwise asymmetrycan be see to crustibtite to a roll momn t nie. opposite senA=nc the downward wing vortex moue closer to the root chad.and dhe upward wIn vorte moves awy fron the rootchord. -
Howeverth from spnieay try in vortexaion oRo moment musst be =is~m by d ietirbudons
anomlasymmetry no umsex str g- asymtmetry for thestatic testoring moment wn be im e Also tam tiat there ishIt al $in vottax poiink ssin conflated to die directionnomal to die win& =1 whbI cna-n with die fact dieat diete lagu in we movement is coalbsed aD di wmada diretion.
If 11uxi 9 d p810t10 Thnlga e A Mewr
~rediv mu ben uys~ bm nui Rotl I Angie (dog..
er IdewRod ss th dlsh F m 17. C1 verma* for Two Steady Stat Cyelas ofaarthhs thehm up~ a m
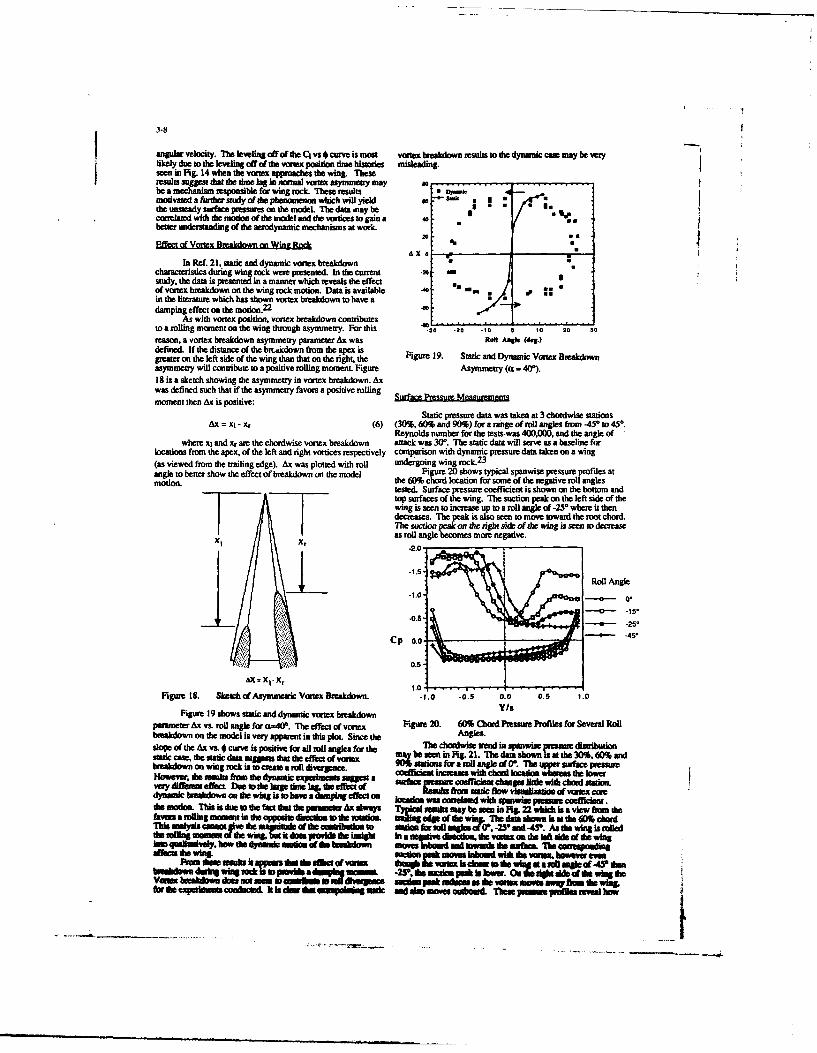
3,11
anguilar velocity. The leveling off of die Q~ vs~ curve is most vortex breakdown results to die dynamic cue may he very-likely due to doe leveling off of tie vortex position time histories misleading.seen in Fig. 14 when the vortex approasches the wing. Theseresults suggest that the time lag in nornal vortex asymmetry may ihe a mechanism responsible for wing rock. These results .4inovated a futrther study of the phenomenon which will yield soUthe unted saac ixres on the moe. "emaa.ay be
coreltd.th d.tonoh mode=l adthe dti. to gain a 40 Ibetter tindessttanding of die aerodynamic mechanisms at work. -
Efec of Vortx Breakdown on Wins Pock % a
In Ref. 21, static and dynamic vortex breakdown 6charaicteristics; during wing rock were presnted In the current at20study, the data is presented in a manner which reveals the effect 40of votex breakdown on the wing rock motion. Data is available -P*
in the literature, which has shown vortex breakdown to have a 5
damping effect on die mrxtion.22At with vortex position, vortex breakdown contributes________
to arolling moment on the wing through asymmetry. For this 410 3 -20 -is 3 0 2 0reason, a vortex brekdwn asymmetry paramter Ax was Rodt Mgle (deg.)defined. If the distance of the brtokdown from die apex isgreaser on the left side of tire wing than that on the right, the Fiur 19. Static arid Dynsamtic Vorte Breakdownasymmetry will contribute to a positive rolling moment. Figure Asymmetry (ra = 40r).18 is a sketch showing the asymmetry in vortex breakdown. Axwas defined such that if the asymmetry favors a positive rottlingmoment then Ax is positive: facPrsueM srmnt
Static pressure data was taken at 3 chortiwise stationsAx = xI - x, (6) (30%, 60% anid 90%) form range of roil angles from -450 to 450
Reynolds number for the tests-was 400,000, and the angle ofwhere xi and xr are the choudwise vortex breakdown attack was W00 The static data will serve assa baseline for
locations from the apex, of the left and right vortices respectively comparison with dynamic pressure data taken on a wing(as viewed from the trailing edge). Ax was plotted with roll undergoing wing sock. 23
angle to better show the effect of breakdown on the model Figure 20 shows typical sparowise pressure profiles atmotion. the 60% chord location for some of the negative roli angles
tested. Surface pressure coefficient is shown on the bottom andtop surfaces of the wing. The suction peak on the left side of thewing is seen to increase up to a roll angle of -23* where is thendecreaes The peak is also seen to move toward the roo chord.Thbe suction peak an &cr right side of the ing is seen to deceaseas roil angle becomes more negative.
Roll Angle
-9 - -25'
Figure 1I. Sketchof Asymmetric Vortex Breakdown. -o -05 0.0 0.5 1.0
Figure 19 shows static and dynamic vortex breakdown V/S
parameter Ax vs. roll angle for cs=400 The effect of vortex Fiur 20. 60% Chord Press=r Profiles for Several Rollbreakdown on the model is very apparent in this plam Sinc the Angles.dlope of the Ax v&. 4Curve is positive for all rol angles for thie The chortiwise trend in slsawiae rresaum: distributionstatic case, die static data sgpss thtteefc fvre may be seen in Fig. 21. The dams shown isat the 30%, 60% andbreakdown on wing rock is to creasesa roll divergence. 901A suiona for a ro" angle of I. The uppoer surface Press=r
a coeffiient increses wish chord woa ioneses dft lowersuydffemuseffec. DueItodie laredineblgdie ffetf stui rsu= m oeM ei5cktam U wewt P5rt saindynamsic brealitown on die win is so have a damping effectan kuon. wit correlatc lw vis"Haeprase offi"Centthenu I n. 'fisadue so, die fact doet die peue Ax always Typical nsults may be seen in fg 22 wh is a view froim duefaves a rolling momntsin doe oppoite thres h deroeo iirailla of dow edata swnisat dieW dcudl71inalysicnwptheas aidshU& o tlh =W on to Sudon xml=l s~ 06, -250 ad -450. As die wing is solled
do roln ly. h w n inml itme. of te hakgl ~in tseto sh vorte on the Wah aide af the wingIran qn w~ey, ow o d W~mibtowMOM an the surfac e emprd
affem doe wing. soctions pusames Mtond with die woa owvrwFiun6 mnias t af *w d cam ot f vart d tmh va is lsiroou w n as k eof 4P than
b Wait a&Atv wing rock is soitvit Magn heot pak bn 1104111. Os 111104011110 wig haYates kreshim desa shee n r in W Sai sve ge 10"Cla pik adesas die OMam mom dogh.th i
fari I', eselnaeahcsdIsi u mq m gac and sa oe wed hs spflseell
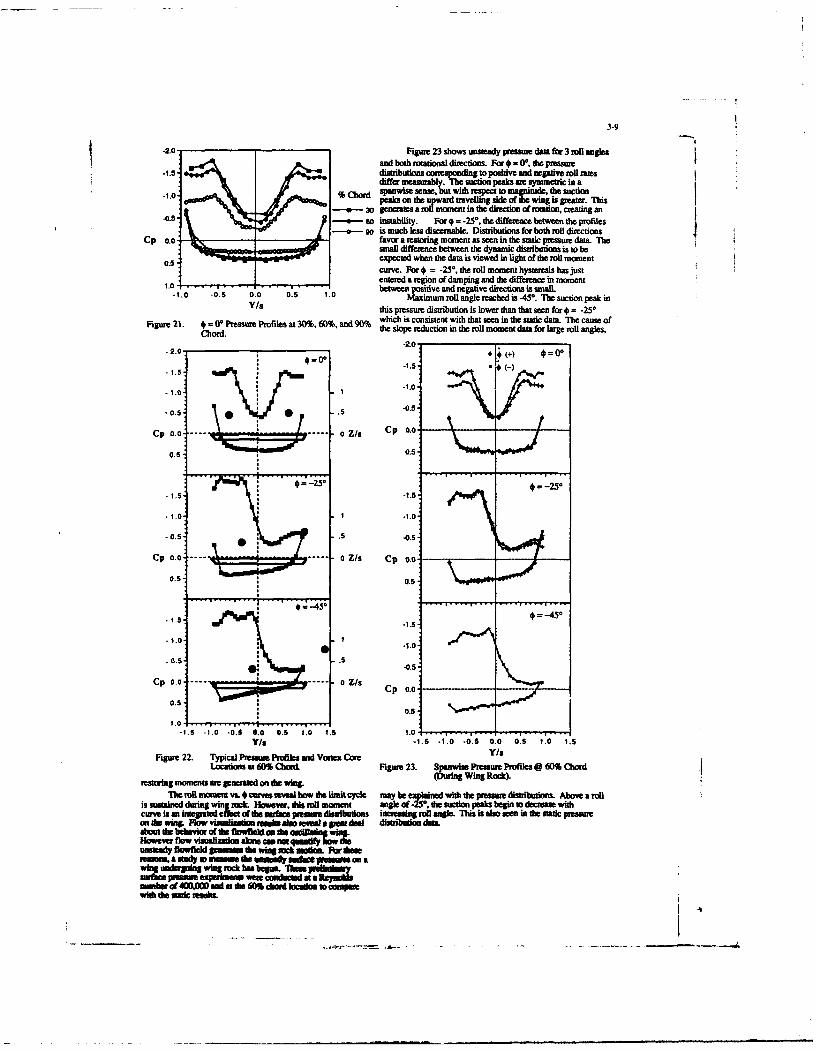
3-9
-2.0 Figurl~ e 23 shows unsteady easure dam for3 toll angles
and bothl rotational directions. For* *. the piesaure-1.5 distribution oresponding topsiie in egativerolai
d10 ie rAsrably. ah uto pasw ymmetric in a-1.0 s C o genceate ut alnwsith diectomanitdn, ireautionga
teuward taveling d o hengsgreaer. This.05 ~- s o insaility. For I = -25o, the difference between die prefiles
-- 90-g is much less discernable. Distributions for both roll directionsCp o.01 favor a:esorn monment as seen in the static pressure data. The
Small difrnebetween the dynamic distribuitions is to be0.5 expected when the data is viewed in light of the roll moment
curve. For -250, the rol moment hysteresis has justentered a region of damping and the difference in moment1.0 between positive and negative directions is small.
1.0 -0.5 0.0 0.5 1 .0 Maximumroiliangle reached is-4. The suction peak inY/a this presure distribution is lower than that seen for e = -25*
Figut 2. -09 resureProflesat 0%,0%,and90% which is consistent with that seen in the static data. The cause ofFi Ceho 00Psre. drils t ~ te slope reduction i the mol moment data for large roll angles,
-2-.00
-1.5 (-1.5
-1.0-1.0
-0.5 .5-0.5
Cp 0.0
Cp .5 0 Zs Cp0.0
.1.5 -1.5
-- 1.0
-0.5 .5 .
0.5 0.5
i.0 .
.1. 0 0 - 0-- -- 0- 05 -- 1. 1.5 1p.0 ' ' r
.a -1. -1. -0. 00. 050 105 IS .
Fiue2. Typical Preasure Prfilesanmd Voex__or Y/aLocation& at 60% Chord. Figure 23. S~ia Presaure Profiles 0 60% Chord
restoring momenta are generamd on the wing. = g e)The. roll moment vs. 4 crves wvea how dhe limit cycle may be explained with the pressire distributins. Above atroll
isssandduigirc However, thia roll moment angle of 25-. dhe auction -eli begin In ecease Withcurvethe asefaofehe -S, distribustions incesing roll angle. Thas is als seen in the satice pressure
oma tin&sg lwvsdnsmi u ea ua~ distribution dataabow doe beevior of doe flowfleld on te ulaba~However flow visualization i s m nt; =* Wfunamady flowfield gamom dke wing raek motion. Pw 6e
msmerd00,00 ad a 60M cha ben ieeo pwdi tlth sulta.
3-10
CONCLSIONSwing and the rolling wing. Howeveir, fal tePitchting wingCONCLSIONSthese uniady effects appeared to be a Val=a breakdown
The Pitching tesM conducted over an angle of attack daninated Phensnemtat is, for ranges of motion 'whate-Fn of 0-30' showed very little hysteretic behavior. The breakdown did not occur the hysteresis eflects weresurface Pressures oscillated in phase with the model motion, and consideesly less pminounced. in contst, hysteresis effectsreachied minimum Value as the wing reached its maximum angle were clearly evident in die inlling wing results, even without theOf attack. Thie pressures showed litl deviation from the static occurrence of breakdown.value during the unsteady motion. These trends were apparentfor beoe reduced ftequencies tested, and no apparent ACKNOWLEDGEMENTSdifference existed due to the change in Pitch rate. The pressurdata was amesn hoave simtilar peiendaaceritics as normal This research was sponsoted by:. the University of Noteforce data obtained fron die itraur. Dame DeparunentDeospc and miechanical giecngFor the larger pitching range of 2-W0, larg overshoots NASA Lagley Research Cne.Hamplon, VA. under grantin the usteady pressure coefficient were seen. The unsteady NAG- 1-727; NASA Ames Research center Moffett Field, CA,Pressures follow the steady pressures Ont the upstroke, then under rant NCA2-406 and the United States Air Force Officecontinue to decrease an angle Of attack increases for an additional of Scientific Research under grant AiF3SR-90.032l1.10-IS". On the downstroke. the uppier surface cotinuies toshow full separation to an angle of attack where, fur the steady REFERENCES
cae coherent leading edge vortices exist. This results in anundershoot of the downstroke Pressures relative to the steady I. Hariff. E. S., "Non-linear Representation of Aerodynamicspressures. When this is considered along with die larg of Wing Rock of Slender Delta Wings," AL4AA-85-overshoot On the upstroke, a significant hysteresis is observed 1831, Aug. 1985.for the unsteady pressures, with upstroke pressure coefficients 2. Hasiff, E. S. and Jenkins, S. B., "Large-Amplitude [Eigh-beinguashigh as 2.5times the dotensuroke values. Th7& data Rat Roll Experiments on a Delta and Double Deltawas also seen to qualitatively compare with the normal force data Wing," AIAA-90.0224, Jan. 1990.fra wing of similar aspect ratio. 3. Bragg, M.L B., and Soltani, M. R., "An Experimental StudyThe constant chardl data showed similar trends as the of the Effect of Asymmectrical Vortex Bursting on aconstant span data. Large: hysteresis loops were seen at span Pitching Delta Wing", AIAA-88-4334, August, 1988.locations at or near the suction peak. Th ticdt " wed thi 4. Branidoni, J. M., and Shah, G. Kt, "Effect of Largesuton peak to exist from 60-70% of the local semi-span, Amplitude Pitching Motions on the Unsteadydpnding on the angle of attack. This was also the case for the Aerodynamic Characteristics of Flait-Plat Wings!,,dynamic motion, where a hysteresis was seen in the suction AIAA-88-433 1. August, 1988.peak; the location of the peak was seen to he a function of th 5. Brandon, J. M., and Shah, G. H., "Unsteady Aerodynamicdirection of instantaneous model motion. Characteristics of a Fighter Mokdel Undergoing Large-Dynamic Rl moment results reveal hysteresis loops in Amplitude Pitching Motion at High Angles of Attack",buidup, steady state, and damping cycles of the wing rock AIAA-90-0309, January, 1990.motion. Th~e dynamic roll moment data arm very helpful in 6& Jan'ah, Ni A. M8., "Unsteady Aerodynamics of Delta Wingsanalyzing the wing rock motion. Flow visualization experiments Performing Maneuvers to High Angle of Attack", Ph.D.were conducted to determine the contribution of vortex position Dissertation, Stanford University, Decesmber, 198s8to the roll moments geertng wing sock in she absence of 7. Jarrali, Ni A. M8., "Low-Speed Wind-Tunnel Investigationvotex breakdown. Staicresults; indicate that the vortex on the Of How about Delta Wiings, Oscillating in Pitch to Vetydownward wing moves cloer to the wing and the root chord Hfigh Angle of Attack", AIM-890295, January, 1989.while the vortex on the upper wing moves away from the 8. Cunningham. A. K. Jr., den Boer, R. G., Dogger, C. S.suWac of the wing and the root chord. Dynamic results reveal a G.. Geurts, E. G.M.L, Persoona, A. J., Retel. A. P., and
hysteresis in vortex position with roll angle. When the normal Zwaan, R. L. "Unsteady Low-Speed Wind Tunnel Testand apanwise Postion amaayeeaaey. tehsrsiofaSardDlaWing, I Pitch (PartsIwas found to be entirely in the normal Position to the wing. No hrug V)" A1 WA -1 ia 188hysteresis was found in spanwise pstion. The hysteresis in 9. Cunningham, A. 88. Jr., "A Critique ofteEprmnanormal Position favors a destahllizig contribution to the rollAeoyaiDisBefranOcltngtakdWgmoment on the wing. When the motion of the vortices was a H i cDt An w " for ynancang namerica ndanlysed further by plotting position Ws thie, it was found that Physica Aspects, of Aeoynmoimo uicC al ani
the hysteresis was generated by a time lag There is no timei lag State University, January, 1989.associated with the spanwise position of die vortices. 10. Thompson, S. A., Batill, S. M8., and Nelson, R. C.,When the model was held fixed at sero rol angle, no "Unsteay Surface Pressure Distributions On A Deltaorxpoiinasymmetry was obevdfor any angl of atak WigUdron Large Am litudeiihigMtin-nvsiaeinthis study. The vore poi"nwsfud ob IA9 31 I au 7 19..hhi oin"fucto o rl angle (sidealip). For each static roll angl thre 1. Tlionspson. S. A., Batill .m., antd Nelson, R. C., -Deltexists a unique vortex Position. Vortex "iftol at rst-roll Wring Surface Pressures for High Angle of Attackwhich is seen on forebodies, was not expeine by the Maneuvers", AMA.90-2813, Aupt 1990.Waweep debr wing. 12. AshlY, IL, lK"tzJ., arrsh, M. A. K.adVaneck, T.,Fromn the results obtained in this study, a mechanism "nsed Aerodyniamic kA"inof Delta Wings forcontributing to the destabilizing moment necessary to sustain the Low and Hfigh Angles SfteCk , proceedings fiomwing rock motion appears to be the timge lag In the normal votex International Symposium on Nonsteady Fluid Dyssamics,Position . Thie destabilizing momsent must be great enough to June, 1990.overcome the stabilizng effect of roll damping, for the 13. McKernan, John F., "An Investigation of die Breakdownoscillation to grow in amplitude. The destabilizing Rl moment o h edn deVr~e naDlsWn tHghysereis as oun tocorelae wth he with t aAngles of Attaicks", Master's Thesis, 'University ofcontribution to a restoring moment in the normal vortex position Notre Dame, January, 1913.which supports th hpothss Th detblzng m t n 14. Rons, F. W., and Kegelman, J. T., "An Experimentalthe steady state are bSaaced by damnping farces after the swsitch InvestipaiodSwes-Angle Influece onDelta-Wingto a resasrin; moment has occurred. thus sustaining the steady R1om .AMLA-90.038, January, 1990.state osellittuon It i= be tased however that - investigation 15. Parker, A. 0., "Aerodynamic Chsaracis ofSeneint the dyname chicaristie of vonex mtemog sanaeg Wi with Shar Loathing Bdg. A eie w",ic o nnde
was "not uctled la dis suy. iks igniacatna lag usla Of Aircaft, Val. 13, March, 1W7M pp. 161-168.in vorse tre ngth seYsusan ft hM Y also contrbute ando 16. Amenok A. S. Jr., "An Experimtisl uy aide Nonlinear.dmshilihigiistlniug nessery 10 sustain wing rock. Win Rock Plietwinism", MS Tk~ss UnlVurlry ofThi11 1--1rel Wndesigned lotudny thecouipoesaof NofDau.A l l9MOantsue unted eraf woo dedae 17. Nguyen, L T, Sh nIOaiseI . I'= CqakbtL It indiscmbing o s WIsp"AIAA.1.was seen that: hyssual effea se d for bai the plitching 11113, Angu 1961.
~~3 -1 1 "
18. Jun, Y. W. and Nelson, R. C., "Leading Edge VortexDynamics on a Delta Wing Undergoing a Wing RockMotion", AIAA-87-0332, January 1987.
19. Konstadinopoulus, P., Mook, D. T. and Nayfeh, A. H.,"Subsonic Wing Rock of Slender Delta Wings", Journalof Aircraft, Vol. 22, No. 3, March 1985.
20. Ericsson, L. E., "The Fluid Mechanics of Slender WingRock", Journal of Aircraft, Vol. 21, No. 5, May 1984.
21. Arena, A. S. Jr., and Nelson R. C., "The Effect ofAsymmetric Vortex Wake Characteristics on a SlenderDelta Wing Undergoing Wing Rock Motion", AIAA-89-3348, August 1989.
22. Arena, A. S. Jr., and Nelson, R. C., and Schiff, L. B.,"An Experimental Study of the Nonlinear DynamicPhenomenon Known as Wing Rock", AIAA-90-2812,August, 1990.
23. Arena, A. S. Jr.. and Nelson, R. C., "Unsteady SurfacePressure Measurements on a Slender Delta WingUndergoing Limit Cycle Wing Rock", AIAA-91-0434,January, 1991.
s-1 -
PREDICTION OF AERODYNAMIC PHENOMENA LIMITINGAIRCRAFT MANOEUVRABILITY
by
A.Ferretti A.Bartoli A.Salvatore
Alenia AeronauticaCorso March. 4110146 Torino
Italy
SUMMARY
The following paper presents the synthesis The accurate prediction of the onset of
of recent experiences concerning the this boundary, as well as the intensity ofeffects of shock induced separation on the involved phenomena is therefore of
conventional airplanes flying at high paramount importance for both types of
subsonic speeds. Efforts have been aircrafts. This paper presents the Alenia
concentrated in Alenia in -ynthetizing a Aeronautica approach to the problem.prediction criterion for detecting onset ofthe wing aerodynamic phenomena leading tobuffet and mishandling of such airplanes.CompariSon of mishandling and buffet onset CONVENTIONA WING PLANFORMSenvelopes theoretically derived with thoseexperimentally measured on an airplane is Generalitiesgiven evidencing the consistency of themethodology.For non conventional, higly swept wings In fig.1 an outline of the effects that
featuring leading edge vortical flow at wing flow separation could lead on an
high subsonic speed and moderate angle of airplane, both in terms of structure
attack,the analysis of wind tunnel results vibration and rigid body modes affecting
has allowed the definition of a prediction stability and control is given as an
criterion for transition from attached to example. Buffet and mishandling boundaries
vortical flow . are assessed through extensive testing of
This change in the wing flow structure is instrumented prototypes collecting data of
responsible for remarkable non linearities different nature. Accelerometers located in
in the aerodynamic coefficients of the various position: wing tip, pilot's seat,
aircraft and could limit manoeuvrability in aircraft centre of gravity, together to
certain areas of the flight .nvc'lope. pilot's rating provide a base for
Efforts in implementing these roncepts in assessment of buffet levels.the aerodynamic design process of such wing Outputs of inertial platform give evidence
planforms are stressed as well as the need of rigid body nodes such as pitch, and roll
for further studies concerning a deeper dynamic oscillations. In fig.2 an example
understanding of the fluid dynamic of flight registrations concerning topic
conditions ruling the vortex break down. parameter is presented. The analysis ofthese kind of results allows definition ofthe boundaries presented in fig.l.
mmRUCTION A defense aircraft has to operate withinthese boundaries up to angle of attack for
This paper addressees the problem of wich maximum usable lift is reached. Topredicting e of the aerodynamic this concern the presence of progressive
Phenomn leading to degradation of deterioration of handling qualities, suchperfo in the high subsonic as that presented in fig.l, is well
regime. judged by the pilots that can easilyTwo kinds of wing planform are considered: recognize, through the feeling of athose with moderate leading edge m P vibrational level or mild pitch and roll
angle and those swept at angles greater oscillations, when the operational limitsthan 60 (delta wings). Distinction between of their aircrafts are near to be reached.
the two planforme is dUe to the different For transport type aircrafts the buffet
flow structure developing on the boundary is s Iortant a parameter as
correspndin wings: the former being drag is since the maximum cruising lift
obarsateria by -attached flow" coefficient is limited by the requirementdegradating in separated one when heavy to maintain a 1.3 margin to buffet onset.shook boundary layer interaction ocu; The cruise lift coefficient for maximumthe latter being characterised by -vortioei aerodynamic efficiency increases with wingflow- (serated flow at the load" )e sp) c ratior if the buffet boundary is notwhose onset, doelosmet and burst is high h t .mantain this mrgi then
ruled by the surrounding aircraft flow the Nil. potential of the wing aspect ratiofield. can not be utilised. Furthers- for thisIn both cames, however, the effects on kind of aircraft as Well theai-raft &era characteristics are felt as shacteristia at ogle of attac beoyoqbuffetl, lee at cotrol Powr, buffet-oeet ust be known at least to
=0= 4 Itch, ya, roll mctions UP to limit, by the - ef avionics ad flightlimit & ft Operational 40-lPe. control system, from reaching conditiomsG e transomic mamoeurability Is 0e of wa dangr situation such as pitch-upthe soet imoranet revasizensit for mya1 e be enountered.defense aizmaft. coast takimg pan at Al=h the meet of separation ea three
en""ad %A*h le"atsor inOdtto dimnsi onal wing can be predicted today byh big antamed no attained tu" tame theoretical *oft@g, 2 I*& to
V f mo ma tamnst aircraft idsmtifieateA= of buffet omet novelspeO at bilk ,ee4VhIet, .=ft safll in the proect, podigtiem of
p"440". w 1jg ed by the = eeroin excitatien after sssratim Isin .still a Very congiLated task. -
5-2
The asseasment of separation intensity Analysis of such responses allows to(buffet) in still based on model test in identify the following topics:wind tunnel.Particular test techniques such as unsteadypressure measurements and wing-root banding -Suction peak development in the leadingmoment have been developed in the past; the edge area (pressure pick ups A.,C) as soonanalysis of this kind of data allows as the incidence is increased: T-tl.
assessment on the severity of buffet eventhough the dependency from Reynolds number -Development of a shock wave for .4<x/CS.5
still represents a risk factor in their (pressure pick ups E,F) at moderate Alphas
applicability to full scale airplane. T:t2.
Description of these techniques go beyond This is well represented by therecompression exhibited by transducer F andine scope of the present paper o the corresponding expansion evidenced byinthe following, example of theoretical trndcrEoaigannresinRh
predictions of buffet/mishandling onset and transducer E denoting an increase in Machcomparison with experimental results will number ahead of the shock (Ml): as greater
be given after having reviewed some of the Ml, as stronger the normal shock, as lowertransonic flow peculiarities useful in the 2. It is important to note that despite a
understanding of the prediction techniques. shock wave is acting on the dynamictransducers E and F, a "static" response isgiven up to a certain event as it will bedescribed in the following.
Critical fluid dynamic conditions for flow
separation -Constant level of T.E. pressure(transducer H located at x/c-0.98) up to acertain Alpha value: T-t3. This value
It is well known that strong shock- corresponds to the maximum strength of theturblent boundary layer interaction shock wave acting across transducers E and(that is of practical interest on today's F. A further increase in angle of attackaircrafts) is the cause for onset of flow causes divergence in T.E. pressureseparation on airfoils and wing sections. evidenced by recompression towards lessPlenty of bibliography is available on the positive pressure levels and finally onsetsubject, however it is useful to recall the of a dynamic response at T-t4.nature of shock-induced separation in orderto explicit the conditions for which it As a matter of fact now, after the T.E.occurs and those for wich its effects are pressure has diverged, oscillations on thefelt. In fig.3 (from ref.l) the classical signals of transducers C,D,X,F and H itselftransonic flow evolution over an airfoil are evident.and downstream, along its wake, are On the contrary in the leading edge ares asketched at increasing a values, progressive build-up of the suction peakFirst occurrence of shock-induced takes place (transducers A and 8) withoutseparation occurs between stag" I and It evidence of dynamic oscillations up to thein form of a separation bubble at thefo maximum a reached during the wind-up turnof the shock. Increase of incidence causes manoeuvre, Note that when reaching athe growing of the bubble end of the characterized by T-t4 the sustaining of theboundary layer tickness at the trailing turn rate at constant velocity is not moreedge (T.E.) that in turn effects the possible, the amount of thrust available bypressure distribution along the wake as the engine at a fixed setting balances theshown in fig. 3 at stage 1II. A change in aerodynamic drag and a further increase inT.E. pressure (divergence) takes place in drag due to lift causes the airplane toordAr to self adapt to the far downstream start a deceleration as evidenced in thepressure and this causes a response in ths lowering of Mach number at almost constantcirculation with associated lose of altitudo in fig. 5a.linearity in the related forces and moments Contemporaneously a mild mishandling of thecoefficient. aircraft is evidenced by the oscillationsThis is a well established understanding in the roll rate at an angle of attackamong aerodynamicists, however T.E. diver- immediately after the T.E. divergence andgence not only. marks the onset of progressive degradation of flying qualitiesseparation effects on the wing section occurs at higher angle of attack, afterconsidered in terms of "kinks" in the the maximm usable load factor is reached,sectional forces and moment coefficients, as depicted in the high roll rate presentedit will also mark the onset of unsteady in the bottom portion of fig. 5a.effects such as buffeting. An explanation In the same figure the time hystory of twoof this can be sought considering the accelerometers located in the wing tip andfluctuations in the magnitude of the pilot's seat is presented, giving evidenceoverall loading excited by ths separated of the correlation between T.E. divergenceflow via the T.R. pressure. and buffet onset.Reoent experiences gained in Alenia through In fig.Sb correlation of the onset offlight testing of an instrun e ailane mishandling and buffet is given with theprove this concept. In fig.4 a layout of longitudinal characteristics of thepressure transducers of dynamic type on a airplane. Loss of linearity in the liftwing soction of a defense aircraft is coefficient(Cl) versus angle of attack ispresented. Transducers were glued on the clearly visible for a-a(t4). At thewing uger surface and faird with rumor corre-spo, ing Cl a breek in the pitchingdiss in order to reduce the interfernce moeit coefficient is evidenced as well
due to their protubermne (about I mm.) to iwlring a variation in loadinga reasonably leve. distribution spemise and vbordise an theTypical qus steady manowevors (rolleroaslter and wind up tae) all11I n
collection of preesure data throughout the wing =eion m a bit of Importance in theflight elope. correlation with Phemena felt by thea tim bystorf fl t permeter (N, aircraft as a whole: seleoti a of a WingAufto 3)eipesr epos sg ni PeM location more outward would havefig. a mnoere str at M close implied for th wim an early o urremu
to o.o. of 'r.E. dim tin term of time ad
I.. ... .. . - -, -...
5-3
therefore angle of attack) with respect to The availability of a suitable 2D/3D codethose characterising the buffet ongst able to predict transonic flow withenvelop, of the aircraft, boundary layer interaction at a reliableSumrising the T.E. divergence of a level is a key factor now.selected wing section marks precisely the Powerful 2D/3D avier-Stokes and Euleronset of loan of linearity in the solvers coupled to boundary layer routinesaerodynamic coefficients, felt as a mild have been developed recently. Theirmishandling, and the onset of dynamic applicability to engineering problem is aresponse in the wing flow field, felt as a matter of different nature: budget and timedynamic response of the airplane etructure. constraints. More offenly they are appliedKey factors in predicting onset of in the verification step, when a finalmishandling and buffet phenomena of an geometry has to be assessed. Cheaper andairplane are therefore the accurate simpler methods are widely applied in theprediction of these fluid dynamic aerodynamic design process when differentcharacteristics and the identification of a geomtries have to be evaluated at awing span section representative of the reasonable cost and within a limited amountspreading of the phenomenon to such an of time. In fig.8 an example of pressureextent to be felt by the airplane, distributions computed on a wing by a full
potential code adopting a conservativePrediction of T.E. diveruence scheme are presented.
In fig.9 the buffet/mishandling onsetenvelope obtained by utilizing the above
A massive amount of experimental data mentioned code and the criterium of fig.7concerning either 2D and 3D experiments on is presented in comparison to flight testsweept wings in wind tunnel have been data evidencing the reliability of theanalyzed. Their applicability to full-scale methodology set up.aircraft has been assessed through Definition of these boundaries is nowcomparisons with flight measured data. In feasible at a relatively low cost duringfig.6 from Ref.2 a comparison between wind the early phase of aircraft developmenttunnel and flight pressure data relevant when different airfoil shapes have to beto a wing section is presented giving evaluated and wing geometricalevidence of a good agreement. Results were characteristics as thickness, twist andcollected in wind tunnel with the camber distributions optimized. on the"transition free" technique. contrary,prdiction of further flowTransition strips (carborundum grits of a degradation and consequent aircraftselected diameter) are usually located at a response has to rely today on testing offew % of the model wing sections providing scaled models in wind tunnel.boundary layer transition from laminar toturbolent at the same location that occurson the airplane; however their presence canbe detrimental if the correct interaction NON CONVENTIONAL WING PLANPORMS: DELTAbetween shock wave and turbolent boundary AND DOIBLE DELTA WINGSlayer has to be simulated in wind tunnel.For such case an "aft transition" (ref.3) Generalitiessuch as that provided by the absence oftransition strips asures the right shock Very highly swept wings have the potentialwave strength and position on the wing to achieve low drag at supersonic liftingsection considered, as demonstrated in conditions by virtue of keeping the leadingfig.6. edge at an angle of sweepback greater thanHaving asesed the level of confidence in the angle weak shock wave makes with thethe wind tunnel predictions a deep analysis freastrem at corresponding Mach numbersof pressure data has been carried out (subsonic leading edge).aiming at developing a prediction criterion This peculiarity, however, is coupled tofor T.E. divergence (rif.4). Following the the well known proneness of highly sweptvaluable studies performed by Haines and wings to develop leading edge (L.E.) vortexBateman in early investigations about separation and increse in drag due to lift.shock induced separation, a locus At a given sweepback angle, as sharper theidentifying local Kach number ahead Of L.E. as lower the angle of attack at whichscock wave (Ml) and position along the the vortex will develop suddenly.chord at wich this shock takes place when This characteristic is not typical ofdivergee (up to a certain amount) occurs, supersonic regime only; in fact L.E.has been defined . separation and vortex formationIn fig.7 evidence of such locus is given characterizes low aspect retio , highlyfor different geometries. The results swept wings in subsonic regime go well.presented hare are either from 2D and 3D Experimental studies have shown that evenexperiments; in the 3D case consistency in at low angl of attack the Ove echairfoil geometry With respect to the 2D wings separates at the leading edge andcase wa assured, rolls up into spiral vortex. A sketch ofThe agreement between 2D and 3D correlation schcmlxfo stuurisgvn nexhibited in fig.7 implies that in spite fig.; flw atta ent lines ve beenof wing seep, twist, aspect and taper cerwed inboard of the vortex sheets endratioe the flow behaves a in the 20 came indUate that the air is drawn over the21to te conditions leading to r.R. vortex and accelerated downward. The
and pvided that the fuselage presence of the vortices induces strongefeot be smal(a in the wing ootloard local suction peaks Which remlt in an
eal). Increase in lift, usually referred to ascarrelatim diselcees its value in vortex lift, relative to that ordited by
ssociating the pbisical pbenmnon of T.R. lineer theory. "di effect in l ist IsGiveresee to the shook streat and deelerele in em oean to LnOrseS theposition that determine It; the section law lift coefficient tpCal Of UeN aspectgeometa influencing these two last ratio wing, and it a m instaoafteesperamt'e thet are suitable te be smseouvrem at high Ml* of atteok typtelpurdied by C oedo. at least befere the a military aircraft. the dshagein leadi
tn
oritieal vale In ?.a. diverges"e bee aseasited to vo0te lift can ge inlocmrred. alter the PLItabing abet eauterist-i
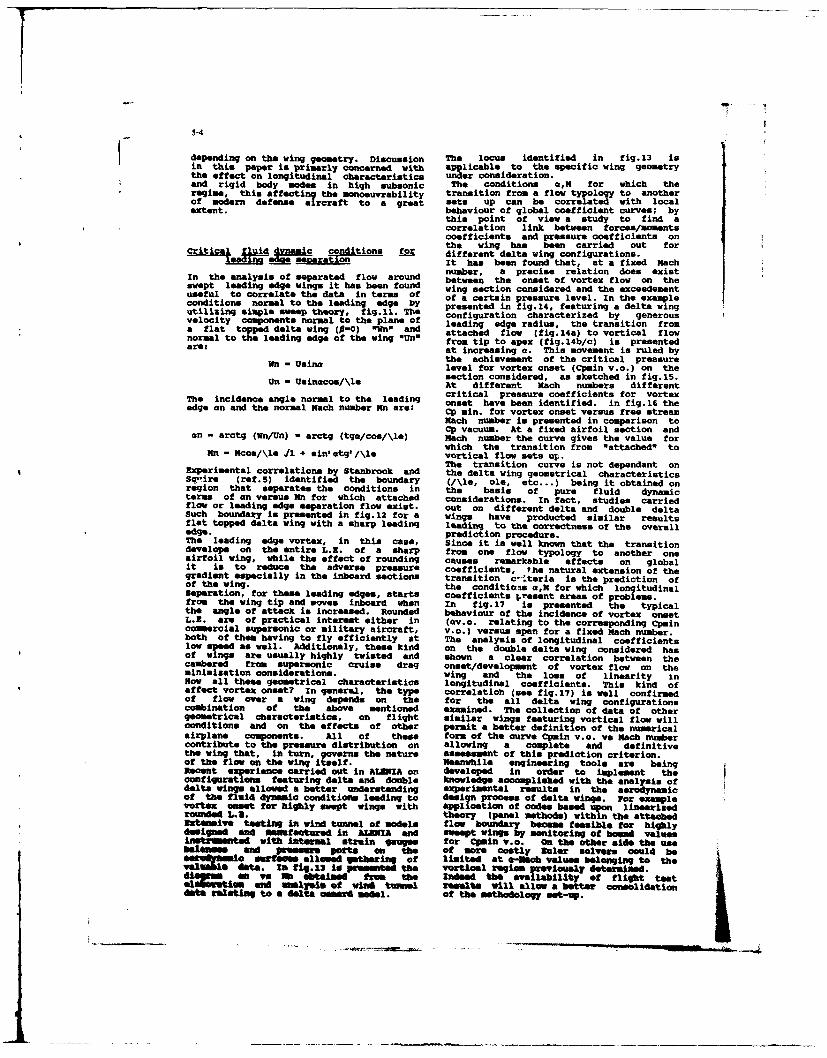
5.4
depending on the wing geometry. DiScussion The locus identified in fig.13 isin this paper is primarly concerned with applicable to the specific wing geometrythe effect on longitudinal characteristics under consideration.and rigid body modes in high subsonic The conditions a,K for which theregimn, this affecting the monoeuvrability transition from a flow typology to anotherof modern defense aircraft to a great sets up can be correlated with localextent, behaviour of global coefficient curves; by
this point of view a study to find acorrelation link between forces/mmentscoefficients and pressure coefficients onthe wing has been carried out for
onations f different delta wing configurations.It has been found that, at a fixed Kachnumber, a precise relation does existIn the analysis of separated flow around between the onset of vortex flow on the
swept leading edge wings it has been found wing section considered and the exceedementuseful to correlate the data in terms of of a certain pressure level. In the exampleconditions normal to the leading edge by presented in fig.14, featuring a delta wingutilizing simple sweep theory, fig.ll. The configuration characterized by generousvelocity components normal to the plans of leadng edge radius, the transition froma flat topped delta wing (P-0) -Mn" and attached flow (fig.14a) to vortical flownormal to the leading edge of the wing "Un" from tip to apex (fi 14b/c) is presentedare: at increasing a. This movement is ruled by
the achievement of the critical pressureon - Usin level for vortex onset (Cpmin v.o.) on thesection considered, as sketched in fig.15.
Un - Usinacoa/\le At different Mach numbers differentcritical pressure coefficients for vortexThe incidence angle normal to the leading onset have been identified, in fig. 16 the
edge an and the normal Mach number Mn are: Cp min. for vortex onset versus free stream
Mach number is presented in comparison toCp vacuum. At a fixed airfoil section andan - arctg (Mn/Un) - arctg (tga/cos/\le) Mach number the curve gives the value forwhich the transition from "attached" toMn - coa/\le J1 + sinl atq'/\le vortical flow sets up.The transition curve is not dependant on
Experimental correlations by Stanbrook and the delta wing geometrical characteristicsSq-,re (rat.5) identified the boundary (/\Is, ole, etc...) being it obtained onregion that separates the conditions in the basis of pure fluid dynamicterms of an versus Mn for which attached considerations. In fact, studies carriedflow or leading edge separation flow exist. out on different delta and double deltaSuch boundary is presented in fig.12 for a wings have producted similar resultsflat topped delta wing with a sharp leading loading to the correctness of the overalledge. prediction procedure.The leading edge vortex, in this case, Since it in well known that the transitiondevelops on the entire L.E. of a sharp from one flow typology to another oneairfoil wing, while the effect of rounding causes remarkable effects on globalit is to reduce the adverse pressure coefficients, the natural extension of thegradient especially in the inboard sections transition c-Iteria is the prediction ofof the wing. the conditions aN for which longitudinalSeparation, for these leading edges, starts coefficients present areas of problems.from the wing tip and woven inboard when In fig.17 is presented the typicalthe angle of attack is increased. Rounded behaviour of the incidence of vortex onsetL.R. are of practical interest either in (av.o. relating to the corresponding Cpmincomercial supersonic or military aircraft, v.o.) versus span for a fixed Kach number.both of them having to fly efficiently at The analysis of longitudinal coefficientslow se as well. Additionaly, these kind on the double delta wing considered hasof w are usually highly twisted and shown a clear correlation between thecambered from supersonic cruise drag onset/development of vortex flow on theminimization considerations. wing and the loss of linearity inNow all thee geomtrical characteristics longitudinal coefficients. This kind ofaffect vortex onset? In general, the type correlatioh (see fig. 17) is well confirmedof flow over a wing depends on the for the all delta wing configurationscombination of the above mentioned examined. The collection of data of othergeometrical charactoristics, on flight similar wings featuring vortical flow willconditions and on the effects of other permit a better definition of the numericalairplane coponents. All of these form of the curve Cp in v.o. ve Mach numbercontribute to the pressure distribution on allowing a complete and definitivethe wing that, in turn, governs the nature assssmnt of this prediction criterion.of the flow on the wing itself. Meanwhile engineering tools are beingRecent experience carried out in ALRUIA on developed in order to implement thefeaturing delta and double knowledge accomplished with the analysis ofdelta wings al e a better Understanding experimental resulta in the aerodynamicof the fluid dynamic conditions leading to design process of delta wings. For examplevortex onset for highly swap wings with application of codes based upon linearisedrounid 1.. theory (panel methods) within the attached3xtagsive testing in wind tunnel of models flow boundary become feasible for highlydesigned and sonsfeotured in ALI and sweept wing" by Monitoring of bound valuesinstramonted with Internal strain gouges for C10ifl v * . On the other side the usebaimtase and ptesmomt pofts on the Of more costly uler solvers could be
AMIo rtA alle-ed be g of limited at eO-fth values belonging to theVolu e daa. f lg. l3 is - IIthe vortical region previmmaly determined.
dAl imem we of Obtaind from the Indeed the oailability Of flight testelmersfttift md SMlym Of wiND tweI remlts will allow a better Consolidationdat relating to a delta aee a I. of the methodology set-Ip.
_ _ _
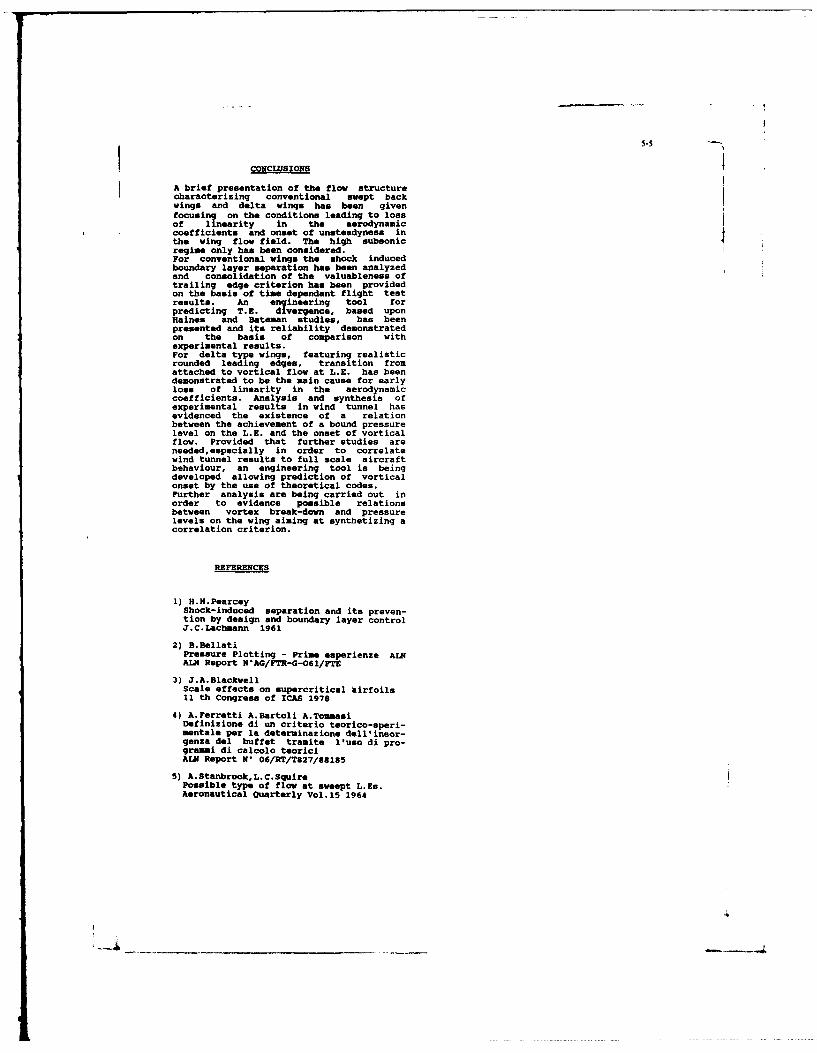
5-5
CONCLUSIONS
A brief presentation of the flow structurecharacterizing conventional swept backwings and delta wings has been givenfocusing on the conditions leading to lossof linearity in the aerodynamiccoefficients and onset of unsteadyness inthe wing flow field. The high subsonicregime only has been considered.For conventional wings the shock inducedboundary layer separation has been analyzedand consolidation of the valuableness oftrailing edge criterion has been providedon the basis of time dependent flight testresults. An engineering tool forpredicting T.E. divergence, based uponHaines and Bateman studies, has beenpresented and its reliability demonstratedon the basis of comparison withexperimental results.For delta type wings, featuring realisticrounded leading edges, transition fromattached to vortical flow at L.E. has beendemonstrated to be the main cause for earlyloss of linearity in the aerodynamiccoefficients. Analysis and synthesis ofexperimental results in wind tunnel hasevidenced the existence of a relationbetween the achievement of a bound pressurelevel on the L.E. and the onset of vorticalflow. Provided that further studies areneeded,especially in order to correlatewind tunnel results to full scale aircraftbehaviour, an engineering tool is beingdeveloped allowing prediction of vorticalonset by the use of theoretical codes.Further analysis are being carried out inorder to evidence possible relationsbetween vortex break-down and pressurelevels on the wing aiming at synthetizing acorrelation criterion.
REFERENCES
1) H.H.PearceyShock-induced separation and its preven-tion by design and boundary layer controlJ.C.Lachmann 1961
2) B.BellatiPressure Plotting - Prime esperienze ALNALN Report N-AG/FTR-G-O61/FTE
3) J.A.BlackwellScale effects on supercritical airfoils11 th Congress of ICAS 1978
4) A.Ferretti A.Bartoli A.TommasiDefinizione di un criterio teorico-speri-mentale par la deteruinazione dell'insor-genzs del buffet tramite luso di pro-grammi di calcolo teoriciALM Report N 06/RT/T827/88185
5) A.Stenbrook,L.C.SquirePossible type of flow at swoept L.Es.Aeronautical Quarterly Vol.15 1964
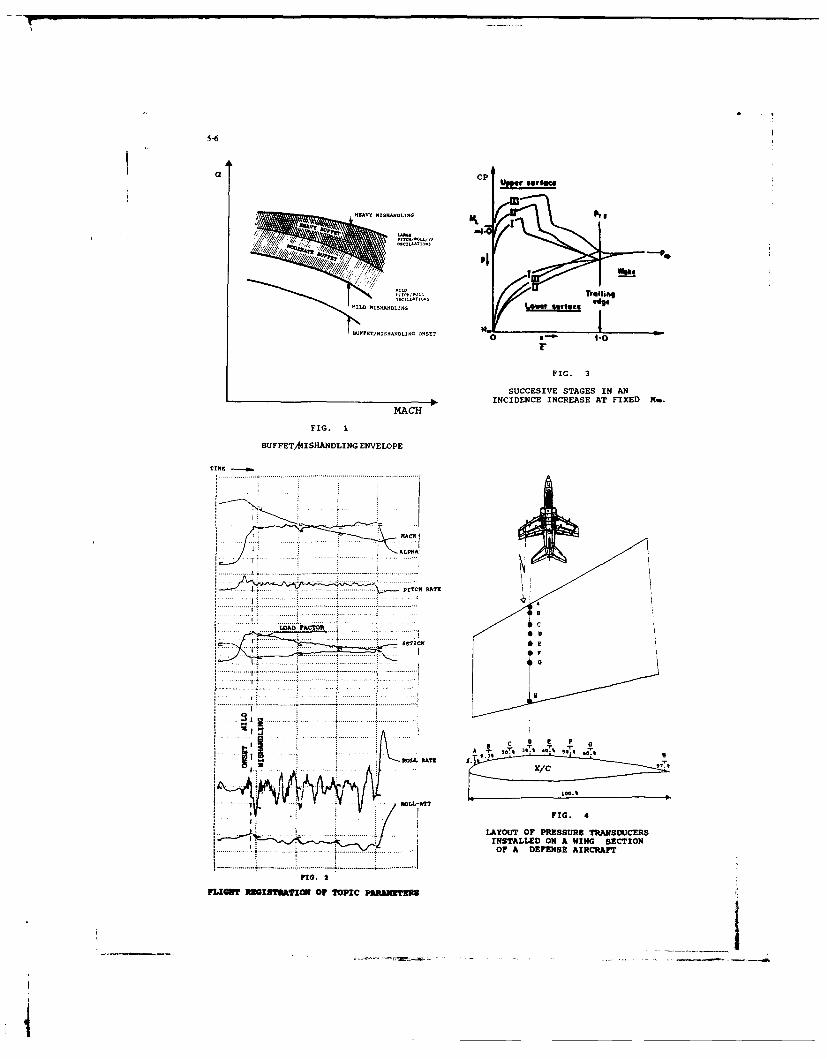
5-6
C, CP Uppor ,eROLL
.ILD AISNANDLOOOstlc
surPET/NISMOJOOLINC ONSET
r
FIG. 3
SUCCESIVE STAGES IN ANINCIDENCE INCREASE AT FIXED M..
MACHFIG. I
BUFFET/,4ISHANDLING ENVELOPE
ALPA,
PTRRATE
WAo F06CTOR
c 8, F G
A M%@' 0 .0 *g'
X/C *.
nt.L-A? 0.
LAYOUT OF PRESSURE TRANSDUJCERSINSTALLED ON A WING SECTION
-t ......... .OF A DEFENSE AIRCRAFT
riG. 2
FLIGHT RUSIST3ATION OF TOPIC PAIN WTE3S
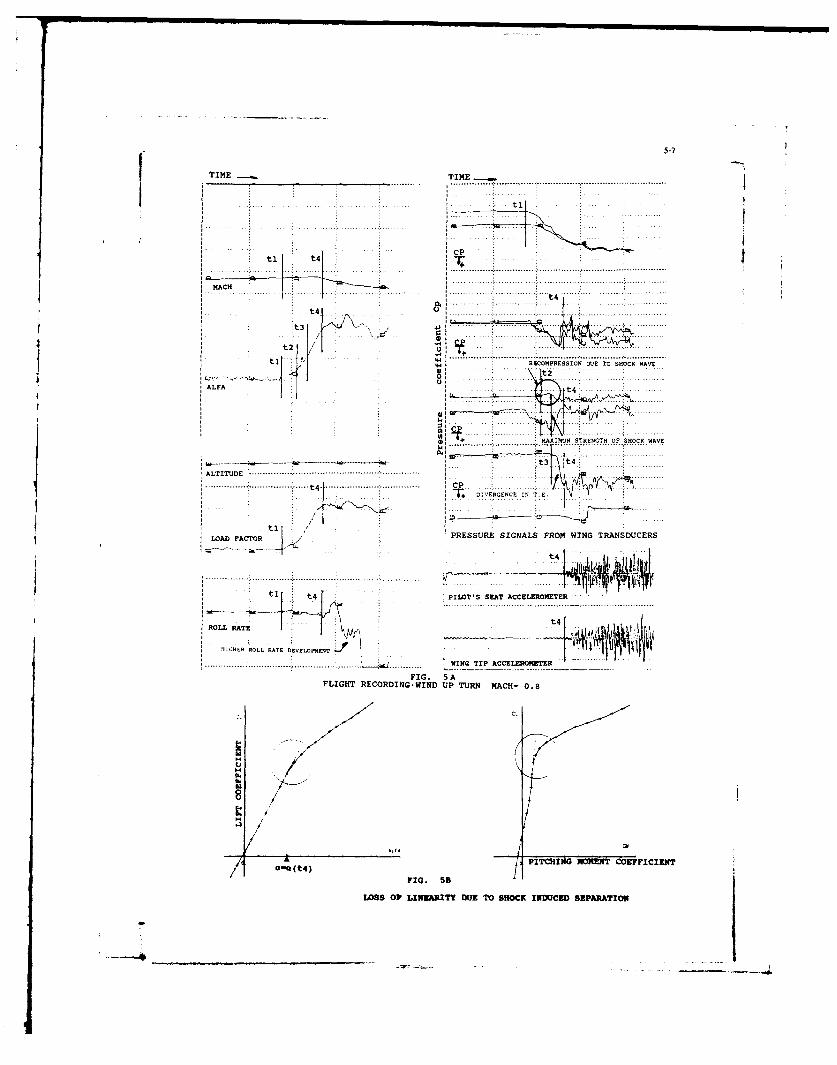
5-7
TIME TIME
..A..... ............. ........... ........
t4
tl t4
. . . . . . . . . . . . . . . . . .... t..2.... . . .... .... .. .. .. . .. ..I .
t ... . . . . . . . . . . . . . .. . . . . . . . . . . . . . ...
LZ~rF+T
4 i, A IN DE TCOF SHOCK WAVE
tLF tC IEREC I
U. ILT *S EATACELEOMTE
......... MAIU TR NSDU CK E
PITCHIN EOMEN :ONFFCIEN
0@(tt4
tiS OP LINEAIT ET AHCKDCEOEDERAATO
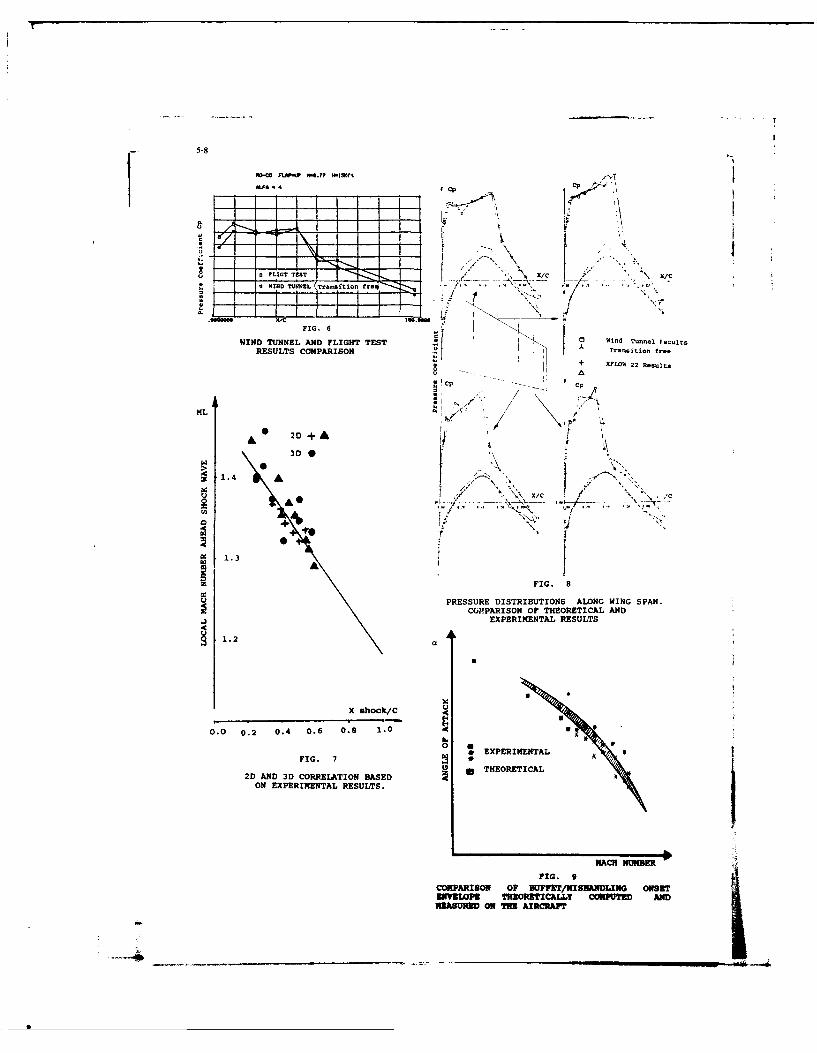
- 5-8
t,,-C F-~P- . --7*-
f -"ALFA 4 t p
I T A FLIGHT TEST. WI15 ND U Traion r..)
_____-0 See
FIG. 6'
WIND TUNNEL AND FLIGHT TEST WTransition freeRESULTS COMPARISON Trn, it+ .
+ XFWW 22 Raaiilt.
ML 7' /. °I ,;
A 2D +A I:3
1.4 A"'
1.3
I FIG. 8
PRESSURE DISTRIBUTIONS ALONG WING SPAN.
COPRSN FTEREIA N
~EXPERIMENTAL RESULTS1.2 a
10 0.2 0.4 0.6 0.8 1.0
. EXPERIMNAFIG. 7 E
2D AND 3D CORRELATION BASED I C THEORETICAL
ON EXPERIMENTAL RESULTS.
FIG. 9 NCIl[mE
COMPARISON OF BUFFEiT/INI 8SADLING ONSETZPZLODPS THEORETICALLY CONPUTED ANDX]LSF9 ON THE AIRCRAFT
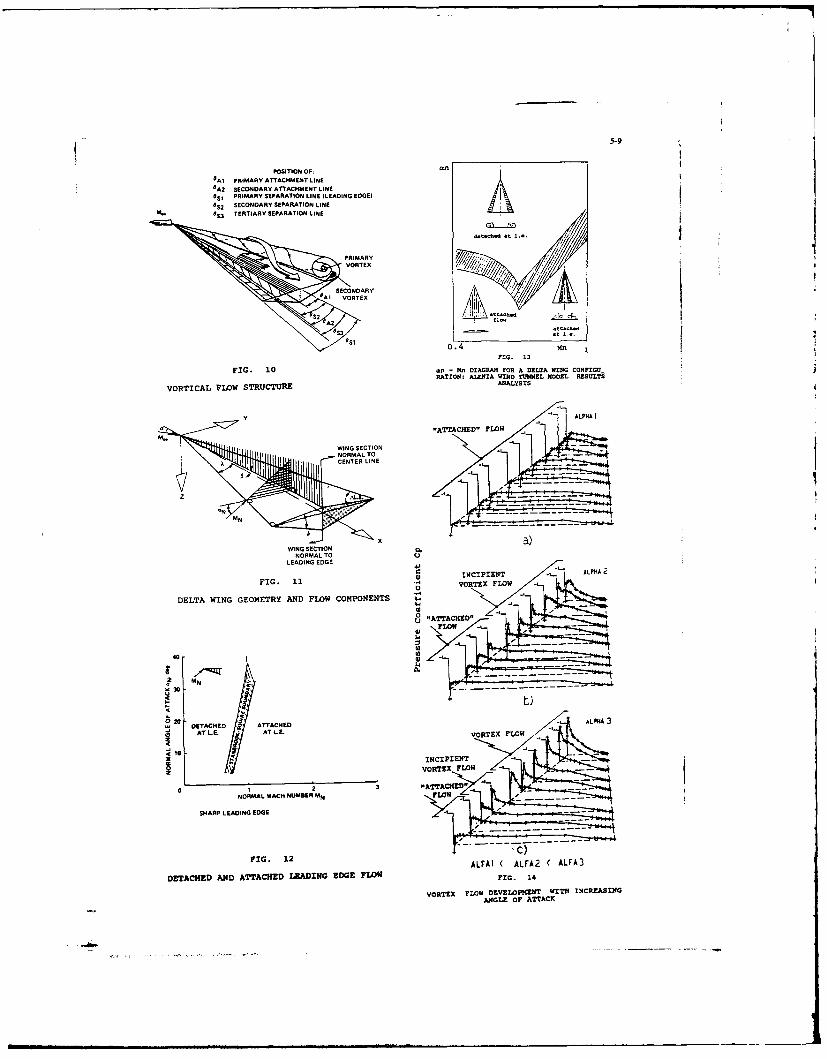
5-9
POSITION OF:
:A1 PRIMARY ATTACHMENT LINE
A2 SECONDARY ATTACHMENT LINE
*5I PRIMARY SEPARATION LINE (LEADING EDGE)
8S2 SECONDARY SEPARATION LINEM- . TERTIARY SEPARATION LINE
PRIMARYVORTEX
SECONDARYA1VORTEX
0.4 1nFIG. 13
FIG. 10 an - Mn DIAGRAM FOR A DELTA WING CONFIGURATIONI ALENIA WIND TUNNEL MODEL RESULTS
VORTICAL FLOW STRUCTURE ANALYSTS
-ATTACHED" FLOW
WING SECTION
NORMAL TO ULEADI NG EDGE Ia. _
.E INCIPINT ALPHA
FIG. 11' ORTEX FLOW - I
NU
DELTA WING GEOMETRY ANG FLOW COMPONENTS
LEAIN EDGAEN EE j44
£0-
MN
FIG 12ALFI (ALF2 < AL HA3
DETACHED j ATTACHEDAT LE . AT LE. VORTEX FLOW
l1o2 ~INCIPIENT4 - -
VORTEX FLOW -
0 2 -ATTACHET"ANORMAL MACH NUMBER MN FLOW -
SHARP LEADING EDGE
FIG. 12 ALFAl ALFA2 (ALFA3
DETACHED AND ATTACHED LEADING EDGE FLOW FIG. 14
VORTEX FLOW DEVELOPm WITM INCREASINGANGLE OF ATTACK
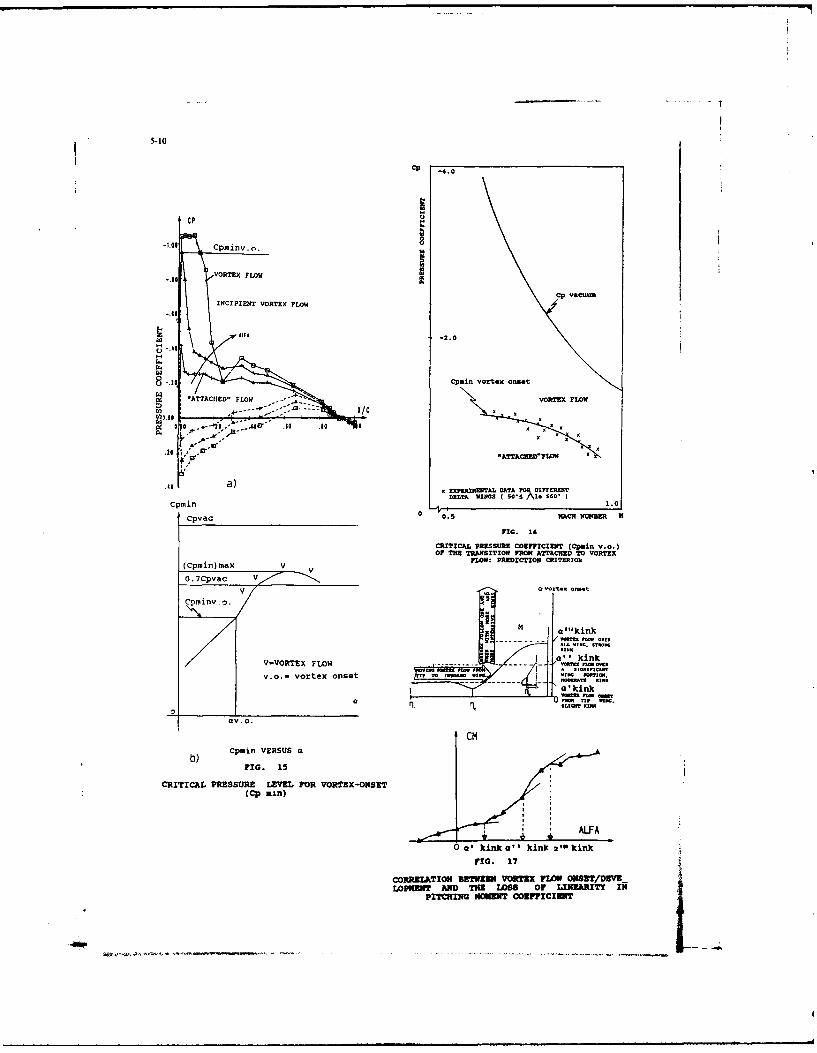
5-10
ICETVORTEX FLOW
-2.0Cp
vac'n=
-.4'
w -. a A TAC H4E D' FLOW --- - : i: /l~aVORTEX FO
.24 erFO
a)xEXPERXJ4ENTAL DATA TOlDIFRT
Cpmin DELTA WINGS ( 50~ A. 960' ) .
Cpvac 0 f 0 . 5 MAC NURE
FIG. 14
CRITICAL PRESSURE COEFFICIENIT (Cpain V.a.)OF THE TRANSITION PRON ATTACHED TO VORTEX
FWQW: PREDICTION CRITERION
0.7Cpac avortee -nst
M allkink
V-VORTEX FLOW a kink- ~ X
v.0.- vortex onset w" flwi Cm.Te
b) Cpmin VERSUS a
FIG. 15
CRITICAL PRESSURE LEVEL FOR VORTEIX-ONSET(Cp min)
0Oat kink a' Ikink m kink
FIG. 17
CORRELATION BEwEEN VORTEX FLOW ONSET/OuVE-W~pNENT AND TilE LOU 0F LINEARITY IN
pITCING NOUDIT COEFFICIENT
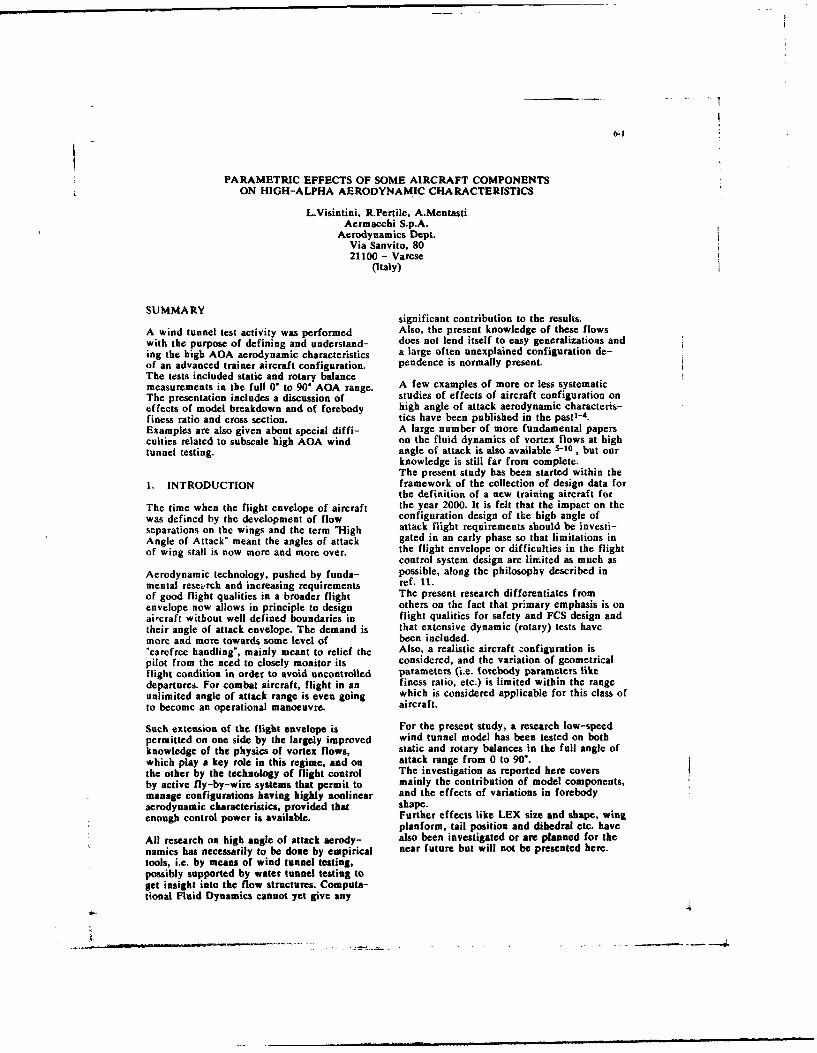
6-1
PARAMETRIC EFFECTS OF SOME AIRCRAFT COMPONENTSON HIGH-ALPHA AERODYNAMIC CHARACTERISTICS
L.Visintini, R.Pertile, A.MentastiAermacchi S.p.A.
Aerodynamics Dept.Via Sanvito, 8021100 - Varese
(Italy)
SUMMARY significant contribution to the results.A wind tunnel test activity was performed Also, the present knowledge of these flowswith the purpose of defining and understand- does not lend itself to easy generalizations anding the high AOA aerodynamic characteristics a large often unexplained configuration de-of an advanced trainer aircraft configuration. pendence is normally present.The tests included static and rotary balancemeasurements in the full 0" to 90' AOA range. A few examples of more or less systematicThe presentation includes a discussion of studies of effects of aircraft configuration oneffects of model breakdown and of forebody high angle of attack aerodynamic characteris-finess ratio and cross section. tics have been published in the pastl- 4 .Examples are also given about special diffi- A large number of more fundamental papersculties related to subscale high AOA wind on the fluid dynamics of vortex flows at hightunnel testing. angle of attack is also available 5-10, but our
knowledge is still far from complete.The present study has been started within the
1. INTRODUCTION framework of the collection of design data forthe definition of a new training aircraft for
The time when the flight envelope of aircraft the year 2000. It is felt that the impact on thewas defined by the development of flow configuration design of the high angle ofseparations on the wings and the term "High attack flight requirements should be investi-Angle of Attack" meant the angles of attack gated in an early phase so that limitations inof wing stall is now more and more over. the flight envelope or difficulties in the flight
control system design are limited as much asAerodynamic technology, pushed by funda- possible, along the philosophy described inmental rescrch and increasing requirements ref. 11.of good flight qualities in a broader flight The present research differentiates fromenvelope now allows in principle to design others on the fact that primary emphasis is onaircraft without well defined boundaries in flight qualities for safety and FCS design andtheir angle of attack envelope. The demand is that extensive dynamic (rotary) tests havemore and more towards some level of been included."carefree handling", mainly meant to relief the Also, a realistic aircraft configuration ispilot from the need to closely monitor its considered, and the variation of geometricalflight condition in order to avoid uncontrolled parameters (i.e. forebody parameters likedepartures. For combat aircraft, flight in an finess ratio, etc.) is limited within the rangeunlimited angle of attack range is even going which is considered applicable for this class ofto become an operational manoeuvre, aircraft.
Such extension of the flight envelope is For the present study, a research low-speedpermitted on one side by the largely improved wind tunnel model has been tested on bothknowledge of the physics of vortex flows, static and rotary balances in the full angle ofwhich play a key role in this regime, and on attack range from 0 to 90".the other by the technology of flight control The investigation as reported here coversby active fly-by-wire systems that permit to mainly the contribution of model components,manage configurations having highly nonlinear and the effects of variations in forebodyaerodynamic characteristics, provided that shape.enough control power is available. Further effects like LEX size and shape, wing
planform, tail position and dihedral etc. haveAll research on high angle of attack aerody- also been investigated or are planned for thenamics has necessarily to be done by empirical near future but will not be presented here.tools, i.e. by means of wind tunnel testing,possibly supported by water tunnel testing toget insight into the flow structures. Computa-tional Fluid Dynamics cannot yet give any
6-2
The analysis of results has been aimed to a) model buildup, in order to identify theidentify the main effects on the parameters main contributors to each aerodynamicwhich are considered to be of larger import- coefficient and to the main non linea-ance for high AOA flight. But since no simple rities.criterium exists in order to establish a In order to limit the number of configur-figure-of-merit of the different configur- ations to be tested and the number ofations, a planned next step of this research "interference" terms to be analyzed, thewill include modelling of the aerodynamics of following build-up sequence has beensome of the tested configurations and making chosen:off-line simulations in order to compare final - body + fin 1flight qualities. J wing contribution
- wing-body + fin 1 t
2. TEST DESCRIPTION - wing-body + LEX]+ fin "shelves" contrib.
2.1 Model datum configuration - wing body + LEXI]l
The model used for the research is + body shelves + iidepicted in fig. 1. It is representative of an fin iT contributionearly preliminary study of the advanced - complete jtrainer aircraft mentioned above in 1:9 scale. b) forebody shape. A set of 6 differentIt is an F-16 type configuration featuring low forebodies have been tested, featuringwing with LEX's, ventral inlet of high aspect variations of cross section (circular,ratio, all moving horizontal tailplanes sup- elliptic, flattened), slenderness ratio andported by fuselage "shelves", single central fin. apex angle (figs. 2-3). Of course theThe wing has movable leading edge droops change in shape had to be limited to thewhich can be scheduled with AOA and full fore part because of the need to blend thespan flaperons in two sections. shape to the existing fuselage.The model is somewhat simplified in geometry Also the range of parameters tested is notin order to allow high modularity and very large and was limited to whatinterchangeability of forebody (ahead of the considered realistically feasible on thecockpit), LEX's, wings, body shelves, tailplane actual aircraft. For this reason it was notand fin. expected to see any of the "extremes" that
have been shown in the past by basicFor the purpose of .,e test a reference research on this topic.configuration had to be defined.On the basis of the rationale described in thefollowing section 4.1 the reference configur- 2.3 Testsation features leading edge drooped 30" andtailplane at +30" (full nose down control). This The tests have been performed in Aermacchiconfiguration is considered as representative low speed wind tunnel at a wind velocity ofof flight at angles above 25+30 when droop about 50 m/sec giving a chord Reynoldsis deflected for optimum drag polar and flight number of 1.1 Million.qualities, and tailplane is deflected by FCS for Three different setups have been used:recovery to lower angles of attack. Flaps are - a static balance with ventral strut support,set at 0" because of the small contribution to used for tests up to 40" AOA;pitching moment and adverse effects on flight - a static balance with rear sting support, forqualities, tests between 45 to 90" AOA;Preliminary tests have supported these as- - the Aermacehi rotary balance' 2- 13 , usedsumptions. for tests in rotary conditions and using a
rear sting for o < a < 45' and a dorsal stingThe datum configuration also features a for 45"< C <90-.
flattened ("shark") forebody shape, this being The test matrix included normally:the choice initially made for the reference - in static conditions, t sweeps at 0' and 10"aircraft. of sideslip and # sweepp at 20' to 90"All data reported in the following analysis will incidence with 4" to 5" alpha step, plusrefer to the above defined configuration if not some effects of control deflection;explicity stated. - in rotary conditions tests at the same angles
of attack as above at zero sideslip. Effectof sideslip has been analyzed in a limited
2.2 Configuration variables way on the datum configuration only.
The investigation presented here covers thefollowing configurations variables:
- i
6-3 =
3. EXPERIMENTAL DIFFICULTIES OF coupling occurs which often makes interpreta-
HIGH-AOA TESTING tion of the results difficult, specially whentrying to assess stability derivatives about
3.1 Reynolds number simulation zero.
High angle of attack aerodynamics is domi- In particular the two effects (flow asymmetrynated by vortex flows originating from and natural asymmetry) are not additive. Whatseparation lines which are often located on the normally occurs is that for large asymmetricsmooth surfaces of forebodies, canopies, etc. flow conditions the flow effect dominates overAlthough vortex flows in themselves are very natural asymmetry and anti-symmetric datalittle sensitive to Reynolds number, the type are obtained as expected. For low sideslip orand position of separation lines may be rotation the natural asymmetry dominates.strongly affected, thus creating "indirect" scale Transition from one flow condition to theeffects according to the definition of ref. 14. other may occur either progressively (fig. 7)When testing at subscale Reynolds number of or abruptly (fig. 8) at different positive orabout 1.1 Millions referred to chord or negative values of sideslip or rotation accord-300+3S0o00 referred to forebody width, it is ing to the sense of the natural asymmetry.observed that most separation lines of the Thus the effects of natural asymmetry cannotforebody originate from laminar separations be represented by simple zero shifts and(subcritical flow). At full scale it is expected cannot be subtracted by simply averaging outthat most separations will originate from data for positive and negative sideslip orturbulent separations. rotation.For this reason it was decided to fix transitionon the forcbody sides by using two longitudi-nal rows of small cylinders (1.5 mm diam, .25 4. CRITERIA FOR ANALYSISmm height).The position of such rows is chosen on the 4.1 Aircraft design criteriabasis of flow visualizations to be in front ofthe laminar separation line at any combination Criteria for analysis of wind tunnel resultsof angle of attack and sideslip to be tested. must be based on aircraft design requirements.The effectiveness of such transition strips is The design requirement tentatively considereddramatic. Fig.5 shows as an example effects for the advanced training aircraft underon roll damping from rotary balance tests of consideration are relatively "modest' comparedthe datum configuration. to some other fighter application b, * never-It is assumed that the presence of transition theless represent a significant challenge com-strips should force the correct flow 'structure' pared to the past. Such criteria can beand only "direct' Reynolds effect should summarized in the following:remain. - the aircraft must be controllable andIn any case the presence of transition may be manoeuvrable up to maximum lift angle ofthe source of other testing difficulties. Fig. 6 attack of approx. 30;shows the story of four test repeats on the - the aircraft must be safely recoverablerotary balance after transition strip replace- from exceedances of this limit without lossment or modification. It is evident that of control;asymmetries, irregularities or wear of the - as a consequence, even if an angle ofstrips are biased by the natural asymmetry of attack limiter will be required in the FCSthe flow with unpredictable even though such limit will not have to be mandatory,understandable results. in order to avoid undue limitations in the
aircraft agility at angles of attack lowerthan 30'.
3.2 Coupling between natural asymmetries andasymmetric flow conditions
4.2 Static longitudinal coefficientsIt is a well documented fact that all slenderforebodies have an angle of attack range The main criterion for longitudinal character-where natural asymmetries (i.e. asymmetric istics is that the configuration will need toforces in a nominally symmetric flow condi- have available negative pitching moment attion) arise 5.8 Such asymmetries create two any angle of attack at full nose down controlskind of difficulties. First they are of random in order to guarantee recovery from highnature and can be triggered by small flow and AOA overshoots. In the worst condition themodel irregularities which are rarely repeat- pitching moment should include contributionsable. from sideslip and roll rate. The requiredSecondly when testiag for effects of atymmet- margin shall take account of the inertiaric flow (sideslip or rotation) a complex coupling and nose up contribution form intake
mass flow and will guarantee a given value ofpitch acceleration.
6-4
In the present report, the effect of sideslip has drop and minimum between 30 and 50' whichbeen quantified in terms of change of pitching is due to adverse yaw induced at the tail bymoment for 20' of sideslip. the asymmetric position and bursting of the
wing and LEX's wake and vortices. At higherAOA the body shows a rapid increase of
4.3 Static latero-directional coefficients directional stability which becomes veryThe data have been analyzed for the following strong.aspects: Presence of wings and LEX's greatly reduce- natural asymmetries, which should be this stability which still remains positive or
limited; neutral up to 90" AOA.- stability derivatives ca, and ct, at small Lateral stability (fig. 12) shows in the 20 to
sideslip angles (jp i < s), which are 30' range a marked reduction due to therepresentative of departure tendencies; progressive bursting of wing and LEX vor-
- available control power in roll and yaw. tices. In this range lateral stability was shownFor this analysis roll and yaw coefficients are to be adversely affected by horizontal tailexpressed in body axes. presence and deflection, possibly leading to
reversal at 30 to 35".At higher AOA lateral stability is only
4.4 Rotary data produced by body fin and marginally modi-fied by wing and remains fairly linear and
Aermacchi experience with many aircraft constant.designs strongly supports the importance ofroll damping for aircraft stability at high 5.1.3 Rotary dataangle of attack, and this position is nowwidely accepted by many different investiga- Rotary data of the configuration show twotors 11,13,15 distinct ranges. In the 20 to 40' AOA range
the data show a regular and fairly linearFor the present quick look to results, rotary behaviour which can be represented by rollbalance data have been analyzed in terms of damping derivatives at least in a range ofroll damping around wind axis. rotation rates around zero.
Above 45' AOA the behaviour is highlyunstable and non linear and is dominated by
5. RESULTS the forebody instability and couplings withnatural asymmetries.
It is clearly impossible, within the space In the lower AOA range it is fairly easy toavailable, to give a systematic presentation of define and interpret the contribution of eachall the large amount of results. In the component (fig. 13).following, attention is drawn only to the most The body+fin has a negligible contribution tosignificant findings related to the parameters roll damping up to 32' AOA, steadilyidentified in section 4 and to rotary data increasing later up to about 40% of the total.whose availability in the literature is much The wing itself, which obviously gives mostlimited. of the contribution up to 20* AOA, shows
autorotation at 24° . This autorotation is5.1 Model breakdown postponed to 32' and virtually eliminated (zero
damping) by the presence of the LEX's, this5.1.1 Static longitudinal coefficients effect being clearly very similar to the
beneficial effect of LEX's on maximum lift.No unexpected findings. The minimum values The horizontal tail has an unexpected highof the pitching "recovery" moments (fig. 9) damping contribution which is evident both atwhich are normally seen between 30 and 70* 20 to 28' and 36 to 42, but is not able tocan be attributed in large part to the presence offset the zero damping situation at 32' AOA.of the LEX. But its contribution is signifi-cantly offset by other configuration compo- The typical behaviour in the higher (50" tonents like the so called body "shelves'. 80') AOA range is represented is fig. 14An important contribution of sideslip to the which shows the situation at 60'.pitching moment (,d¢c,,,) is present. It is Here the main contribution comes from thedominated by the body and marginally body which shows a highly unstable behaviouraffected by the presence of the wing (fig. 10). which, similarly to the poitive static direc-
tional stability, is mainly the effect of an5.1.2 Static latero-directional coefficients abrupt switch in between two anti-symmetri-
cal flow states.Asymmetries at zero sidelip ae concentrated In a crude way, since a positive rotationin the 45' to 75' range and are only creates a positive local sideslip at the fore-attributable to the body with some reductions body, the positive side force created bydue to wings and LEX's. (fig. 11) sideslip, which explains the high directionalDirectional stability (fig. 12) shows the typical stability, also explains the high positive
6-5
autootation. vortices with wing/LEX flow. At higher AOA IThe other model components have also a forebody vortices are burst before reachingsignificant contribution, mainly in reducing the wing. In any case the influence is notthe maximum autorotative rolling moment, large, with some detrimental effect due to thewith the exception of the tail which acts in longest flat nose.the opposite way. But in any case the final At these moderate angles of attack (3040')
result is not qualitatively different from the all forebodies show a tendency to roll reversalbody alone, at high sideslip. The onset of this reversal is
strongly dependent on forebody shape and isdelayed for the circular ones (fig. 21).
5.2 Forebody geometry effects5.2.3 Rotary data
5.2.1 Static longitudinal coefficientsThe effect on ill damping of forebody shape
Forebody shape shows a significant effect on seems to be concentrated in the 50" to 70"pitching moment at 40 to 90' AOA (fig. 15). AOA range, which coincides with the range ofDifferences may be as large as dCr - .2. important natural asymmetries. Within thisShapes creating more lift and consequently range large rolling moments are generated butmore pitch up moment are the flattened ones also the interpretation of results is made more('shark" or elliptic) while the circular ones are difficult by the high sensitivity to anycreating the least lift and pitching moment. disturbance leading to low test repeatibility.
Most forebodies show a large instability, withImportant cross coupling effects also occur the exception of the bluff circular nose and,due to forebody shape. partially, of the elliptic and long circular onesLarge positive cc.,, effects occur in the range (fig. 22). On this topic the testing was not24 to 70' AOA (fig. 16). Positive pitching conclusive and the problem will have to bemoments as high as 0.3 may be created by the addressed again in the future.flattened or longer noses, the lowest being the The most interesting and unexpected findingshortest circular forebody. Similar couplings was the effect of roll rate on pitching momentare created by rotation (fig. 17). already mentioned in section 5.2.1 (fig. 17).All these effects are very important to be As already noted above in sect. 5.1.3, thistaken into account for the design of safety effect hints that, at these attitudes, forcesmargin for high AOA recovery, for simulation created by the forebody depend, in a firstand spin prediction. approximation, only on the local flow direc-
tion and thus rotation can somewhat be traded5.2.2 Static latero-directional coefficients with sideslip. This is also supported by some
tests at sideslip which clearly show a horizon-The onset of natural asymmetries (fig. 18) is tal shift of the curves: the change in thein the range of 30 to 45' for all forebodies. It induced sideslip at the nose corresponding tooccurs earlier for the flattened noses, though the shift in rotation rate (4 to 7') correlatesnot in fully systematic way. The extent of the well with the geometric sideslip (fig. 23).asymmetries, which may be as large as .06 inCn, does not show a definite correlation withforebody shape, this being explainable with 6. CONCLUSIONStheir random nature which would require astatistical approach. The present research was very useful inAsymmetries disappear above 70' AOA. highlighting the main features of the aerody-Directional stability at small sideslip (fig. 19) namic behaviour at high AOA of the con-is only influenced in a similar range of 40' to figuration of concern, identifying its sources90' AOA. All forebodis show a steep increase and some margins of change and correlating itin stability at about 50' AOA with the circular with typical behaviours of this clas ofnoses coming a little earlier than the flattened geometries.ones. What is mainly evident from the results In particular the following points can beis that the high apparent stability in these summarized.conditions is mainly due to an abrupt switch a) High AOA testing has some inherentbetween two asymmetric states of the flow difficulties that require careful attention,which is induced by sideslip (fig. 20). When with particular reference to Reynoldsthis state is reached further changes in sideslip nunober simulation which appears to behave an unstable response and no stable state vital in order to obtain results applicableexist outside # - & 6' approx. to the fall scale aircraft.Differently from directional stability lateral b) The main contributions to high AOAstability at small sideslip (ig. 19) is in- behaviour have been identified. For thisfluenced only between 30 and SO'. This is class of configuration forebody shape isprobably explained by the fact that this of the utmost importance only above 40'influence is creaed by interaction of forebody AOA.
- ~. ... --.
6-6c) Fairly large values of natural asymmetries 8) J.M.Brandon, D.G.Murri, LT.Nguyen -
have been found. The onset angle of such Experimental Study of Forebody Ge-
asymmetries seems to correlate well with ometry on High Angle of Attack Staticpublished results (fig. 24) and Dynamic Stability and Control
d) Large couplings between sideslip and ICAS-86 Paper 5.4.1rotation and longitudinal aerodynamic 9) R.M.Hall - Influence of Reynoldscoefficients (pitching moment in particu- Number on Forebody Side Forces for alar) have been shown. These effects have 3.5 Diameter Tangent-ogive Bodiesto be taken into account for the design of AIAA Paper 87-2274safety margins for pitch recovery and for 10) R.C.Ward, J.Ketz - Boundary Layercorrect prediction of flight behaviour at Separation and the Vortex Structuresthese attitudes. Around an Inclined Body of Revolution
e) For a configuration of this class a AIAA Paper 87-2276forebody of circular cross section seems 11) P.Mangold - Integration of Handlingto be largely preferable, leading to quality aspects into the Aerodynamicminimum pitching moment and cm,,, and Design of Modern Unstable Fighterscm,,, couplings, maintaining positive di- AGARD FMP Meeting on FLight Qua-rectional stability above 50" AOA, no roll lities,reversal at high sideslip. Ottawa, 1990The possibility to achieve positive roll 12) R.Marazzi, D.Malara, M.Lucehesini, S.Co-damping could not be definitely demon- moretto, F.Pacori - Use of a Small Scalestrated by the tests. Wind Tunnel and Model Shop at Aero-Increasing forebody finess ratio shows nautica Macchi as an Industrial Tooldetrimental effects, as expected. AGARD CP-348, Sept. 1983
Further tests will be required to investigate 13) Rotary Balance Testing for Aircraftthe effects of forebody apex blunting and Dynamicsappendages like small strakes for further AGARD AR-265, Dec. 1990improvement of the behaviour. 14) Boundary Layer Simulation and Control
in Wind TunnelsREFERENCES AGARD AR-224, 1988
15) J.R.Chody, J.Hodgkinson, A.M.Skow -1) H.John, W.Krans - High Angle of Attack Combat Aircraft Control RequirementsCharacteristics of Different Fighter Configur- for Agilityations AGARD CP-465, 1989AGARD CP247
2) A.M.Skow, G.E.Erickson - ModernFighter Aircraft Design for High Angleof Attack ManoeuveringAGARD LS121
3) G.Wedekind - Influence of ConfigurationComponents of Statically Unstable Com-bat Aircraft on the Aerodynamic Designfor High Angles of AttackAGARD LS121
4) A.M.Skow, A.Titiriga, W.A.Moore -Forebody-Wing Vortex Interactions andtheir influence on Departure and SpinResistanceAGARD CF247
5) E.R.Keener, G.T.Chapman - Onset ofAerodynamic Side Forces at Zero Sideslipon Symmetric Forebodies at high Anglesof AttackAIAA Paper 74-770
6) G.E.Erickson, W.P.Gilbert - Experimentalinvestigation of Forebody and WingLeading Edge Vortex interactions at highAmgs of AttackAGARD CP-342, 1983
7) D.J.Peake, M.TobSk - Three dimensionalflows about Simple Components at Angleof AttackAGARD L121
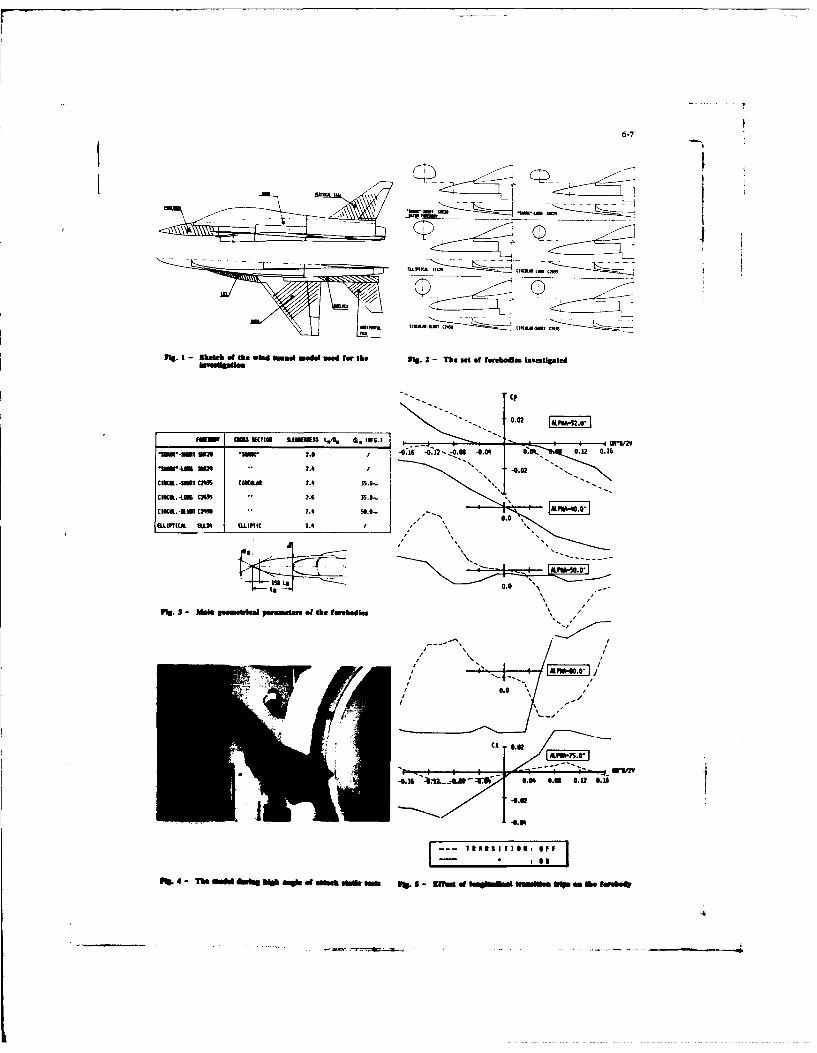
ti .1jtj$~s6-7
Flu. I - sholds of the Wind tond me"is used for the Fig. 2 - The set of twmbedls Iuvestipted
C?
0.02 _____
FO CReS ECTION SIENIES 1/% 4. (Kt.)
* *mm 2.0 J.01 -O 408 -OA 00j 6o. 0.12 0. A-sm44. Im 2.4 -00
Cl0E. -MnT 024% CIKUA 2.4 35.0..
C 0CI. 3OI C 2.6 15.0,.
CSCU.I-KUIT 0005 2.0 50.0-
ELLIPTICAL SULM ItIJOIC 1.0
Pig. 3 - Nalm gsomeiuleal poseus st e he feesbedls o/ , ,
-0.5 12...4U~U 0.04 0.0 0.12 0.15
[ T suI 131 11: :F F
Pi.4 Thlb mood &wbft sw* of albeb; de "a =%a. or -OSIa Wommmg tri a&~5db &I~ UPS u
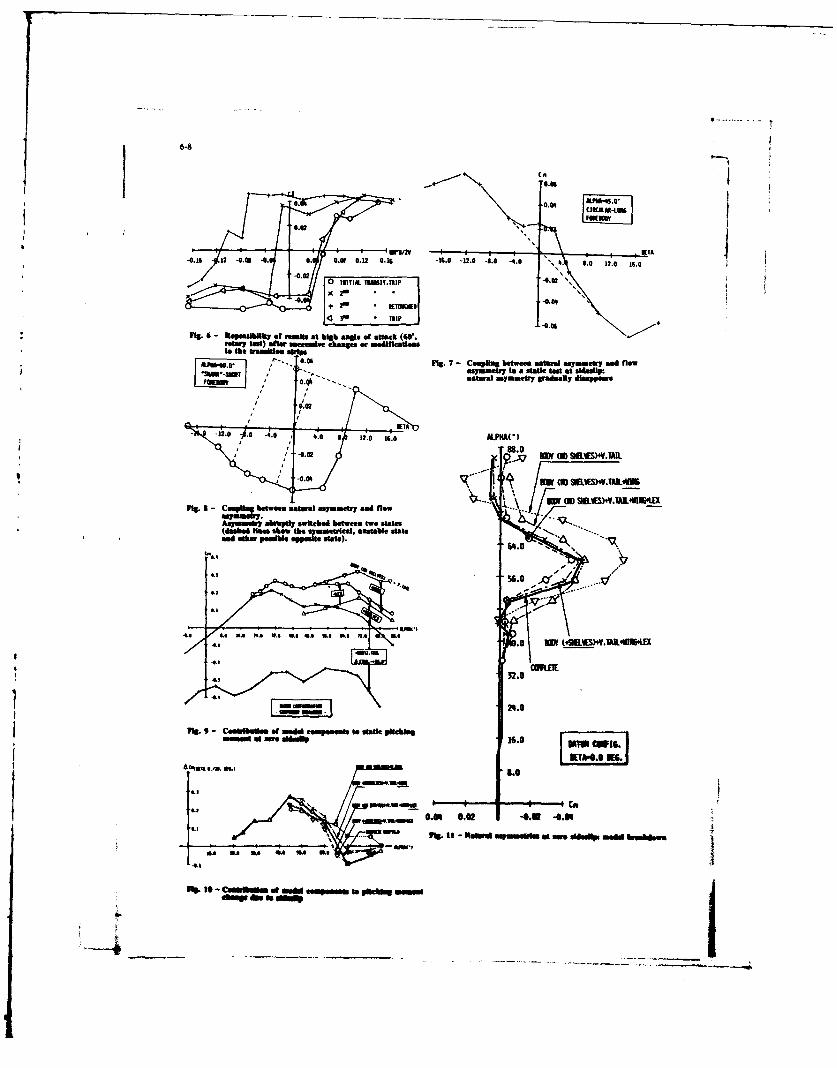
6-8
4. 8.0 12.0 16.0
-0.04
-. 06 . .Fl. -oeasllity of flwing at hWhageofate 4.
Nial Om) a smane mteeha or .oilfleed.o
'- 0.06 Fig. 7 - Coupling between aatua.,a asymmetry and fnowIsum~yB a asaut test at sdsp:L~~J / o4~--. antee d aymer paaly ilaappeao
.02.
4 88.0 3~).TI4l
IVW (3 SB.WS)WAL4154flEP1g. 1 - Ceaplia betwoea natural aaymsetry and nlow....
Asmar aept witeliad between two statusdahda. how th1ymta, amable date-
M56.0 .Q
I'*~. ILI (49.W.SILI 4" 0.0 WO .0 0.
32.0
L .,.
PFW 9 C Na -~u of aid bomgoeeab to stall lifthingaiveo disp 16.0 IMM CMI
I KA-.6K6
4.10..0I 00 0.88 41.011
W~or" at Mr dCom Stod maidhmr 7~mn ohelgm
to- mw ofs"cmestea eesa"
[--4a _a_
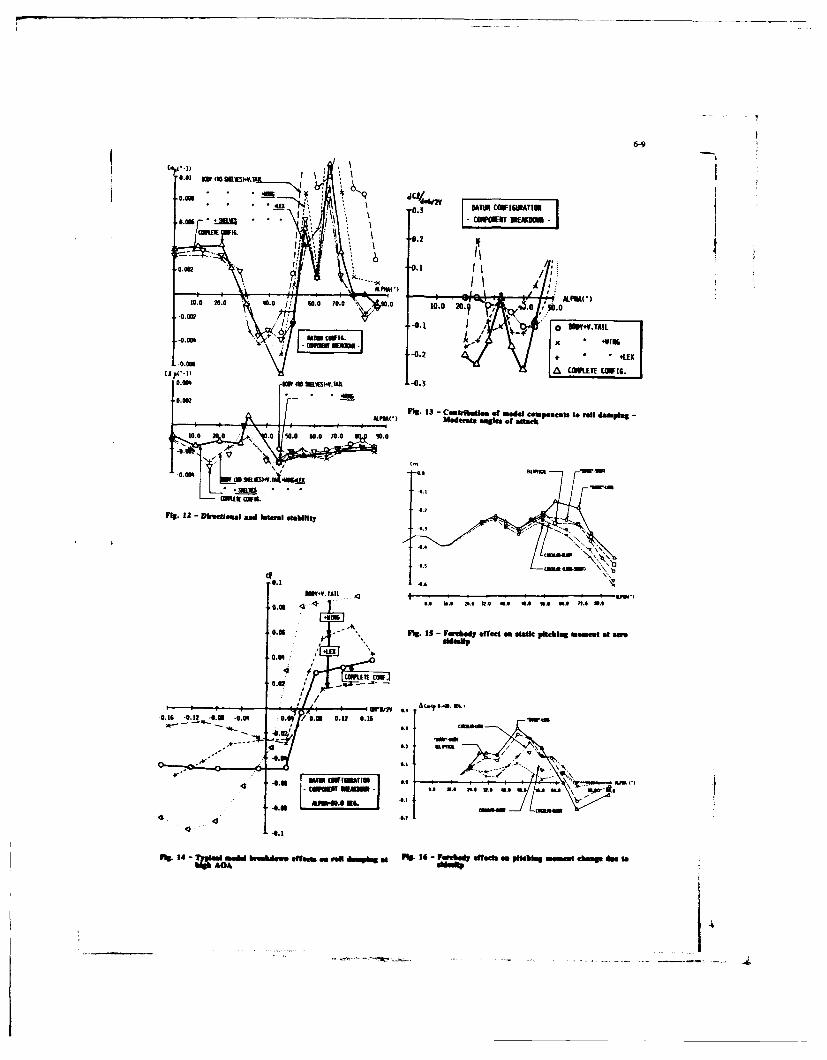
6-9
Ci
0.0 0. 0 J 00 0 27a2 0
-0.2 I+.0'0 APN xI
10040~ . 0.0 0.0 70.0 ma. - 1.0 2j.
inu 44Mo.
Fig.~~~0. +2 - *feoaeJadEaXlstbl
00.-w( amm a -. 3
-0.002
0.16 ~ ~ -PAV Moert moo. 13 ma fe t- atack thigmmeta
10.0 ~ ~ .0 0 , 7. 9.
0 00 3 j3 .I 4 * E
- -12 - 01 o - 000 0.0 lat 0.al 0.12 am
0. .1U/
I W -V .1 M:L a m*C.n inE *.6 1.6 1.$ m * 4.4 .6 e 500 Me MI ' '
4.16 -0.1m -00 . 00 .2 0
4 4? a
4K
nal. m4 Ir- A twim ai hnd., affecla so ra dAmg at g.4- wbiffhdat - llagm memet ha u a at
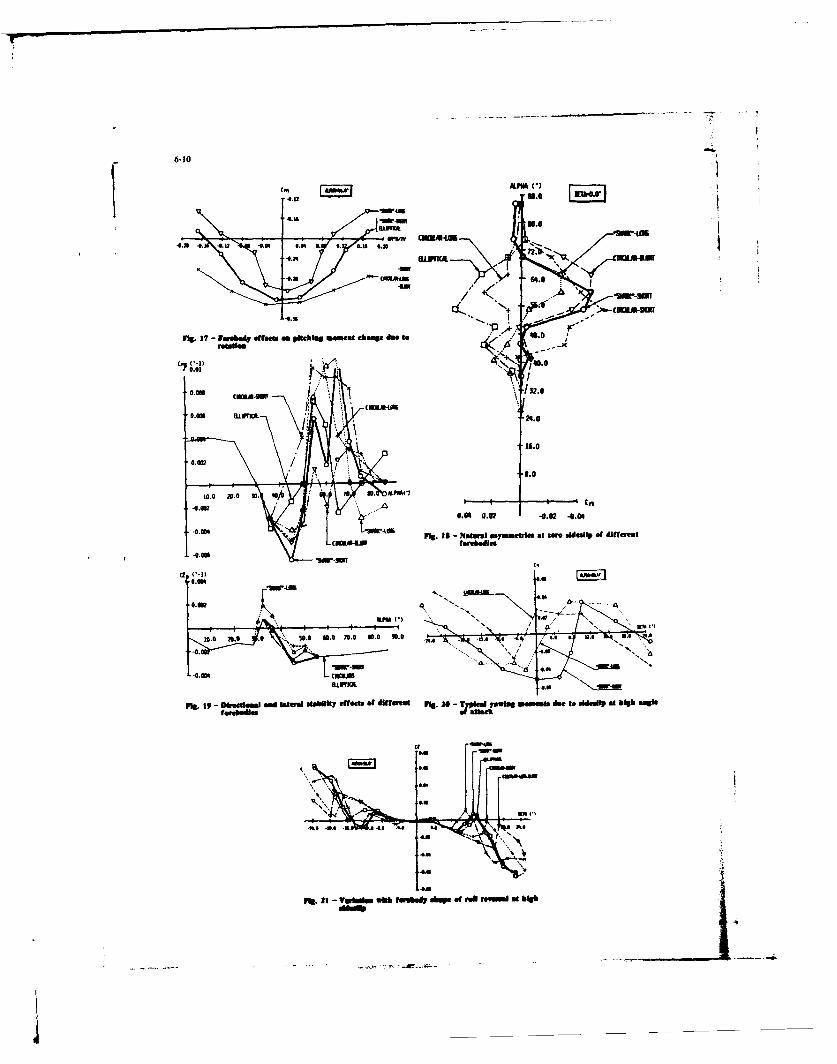
-6-10
mIU.0 L~
80.0
4.101 4. -LU .0 0.0 6. 0. 0.16 0.5
64.0
Fi.17 - Vua.=j off"". puhbugms i~ t~Ihowg d" to ' 1. .
WO-11)15.0
(MOu4 3.0
10.0 20.0 30 7 0 . AP'I( ti to
0.04 0.02 -0.02 -0.04
F1g. 12 - AW amdeU at two sideallp of diffirent
.. ON
10.0 2M.e .I* so.0* . 0.0 111.0 90. 0. . .
1g. 19 - Dtirtthi nalmd hIstm gsauity effects of doff~ t g 0- -m~jwag n do to dialip at high aogle
&A
d&W*
4*4
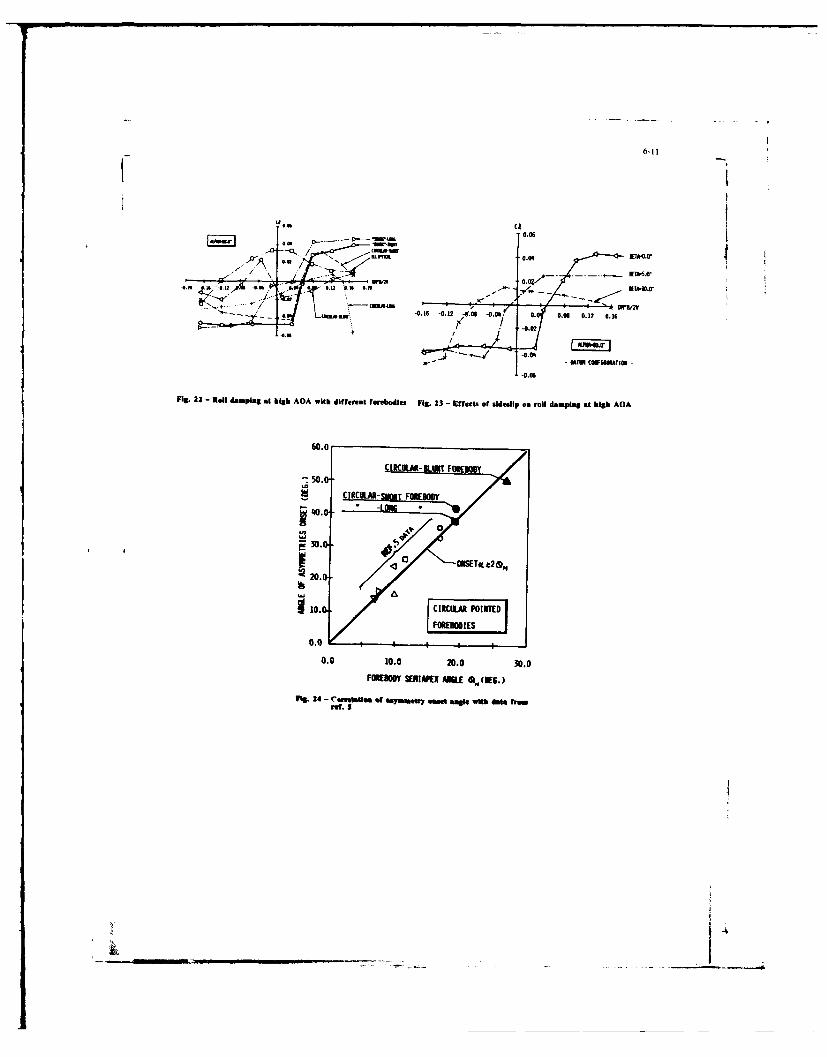
6-11
-0.06
0. 0. 6 -. 2 9-0.0 7 3 0. 00 .2 01FO"TS"aPXASE ~CE.
Fig.24- ~ooa~aios 1 asnuoy ana agle ithd -0a.02
ftf.V SW6ATO
_ _ _ _ _ _ _ _ _ _ _ _ _ _0 . 1 -
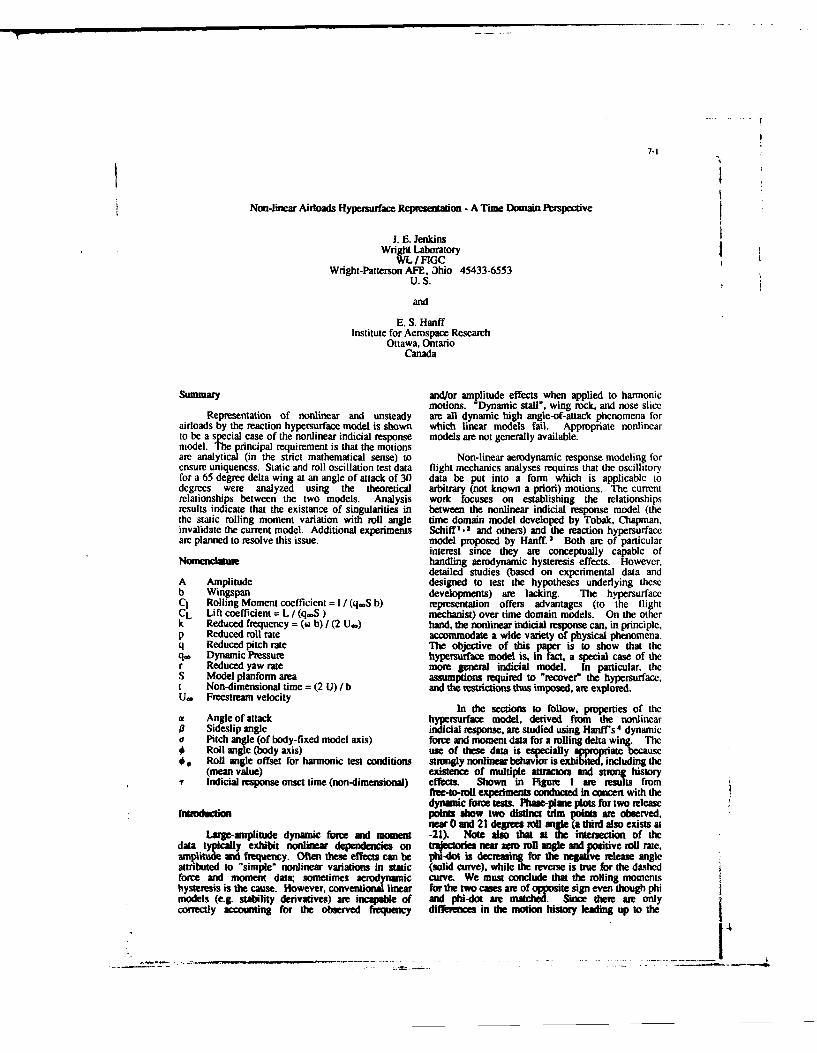
7-1
Non-linear Aidoads Hypersurface Repreenation - A Time Domain Perspective
J. I,. JenkinsWright Laboratory
WL / FIGCWright-Patterson AFE, Jhio 45433-6553U.S.
and
E. S. HanffInstitute for Aerospace Research
Ottawa, OntarioCanada
Summary and/or amplitude effects when applied to harmonicmotions. "Dynamic stall", wing rock, and nose slice
Representation of nonlinear and unsteady are all dynamic high angle-of-attack phenomena forairloads by the reaction hypersurface model is shown which linear models fail. Appropriate nonlinearto be a special case of the nonlinear indicial response models are not generally available.model. The principal requirement is that the motionsare analytical (in the strict mathematical sense) to Non-linear aerodynamic response modeling forensure uniqueness. Static and roll oscillation test data flight mechanics analyses requires that the oscillitoryfor a 65 degree delta wing at an angle of attack of 30 data be put into a form which is applicable todegrees were analyzed using the theoretical arbitrary (not known a priori) motions. The currentrelationships between the two models. Analysis work focuses on establishing the relationshipsresults indicate that the existane of singularities in between the nonlinear indicial response model (thethe static rolling moment variation with roll angle time domain model developed by Tobak, Chapman,invalidate the current model. Additional experiments Schiff ,2 and others) and the reaction hypersurfaceare planned to resolve this issue. model proposed by Hanff. 3 Both are of particular
interest since they are conceptually capable ofNomenclature handling aerodynamic hysteresis effects. However,
detailed studies (based on experimental data andA Amplitude designed to test the hypotheses underlying theseb Wingspan developments) are lacking. The hypersurfaceC! Rolling Moment coefficient = I / (q.S b) representation offers advantages (to the flightCL Lift coefficient L/ (q.S) mechanist) over time domain models. On the otherk Reduced frequency = (w b) / (2 U-) hand, the nonlinear indicial response can, in principle,p Reduced roll rate accommodate a wide variety of physical phenomena.q Reduced pitch rate The objective of this paper is to show that theq. Dynamic Pressure hypersurface model is, in fact, a special case of ther Reduced yaw rate more general indicial model. In particular, theS Model planfonn area assumptions required to "recover" the hypersurface,t Non-dimensional time = (2 U) / b and the restrictions thus imposed, are explored.U. Freestmam velocity
In the sections to follow, properties of theo Angle of attack hypersurface model, derived from the nonlinear0 Sideslip angle indicial response, are studied using Hanfrs 4 dynamica Pitch angle (of body-fixed model axis) force and moment data for a rolling delta wing. The
Roll angle (body axis) use of these data is especially appropriate because00 Roll angle offset for harmonic test conditions strongly nonlinear behavior is exhibited, including the
(mean value) existence of multiple atuacts and strong history7 Indicial response onset time (non-dimensional) effects. Shown in Figure I are results from
free-to-oll experimems conducted in concert with thedynamic fore test& Phae-plane plots for two release
broducion points show two distinct trim points are observed,near 0 and 21 degrees roll angle (a third also exists at
Larp-ampitude dynamic fore and moment -21). Note also that at the intersection of thedata typically exhibit nonlinear dependencies on t near aero roll angle and positive roll rate,amplitude and frequency. Often these effects can be ph-fdot is decreasing for the negative release angleattmbuted to "simple" nonlinear variations in static (solid curve), while the reverse is true for the dashedforce and moment data; sometimes aerodynamic curve. We must conclude that the rolling momentshysteresis is the cause. However, conventional linear for the two cases are of opposite sign even though phimodels (e.g. stability derivatives) are incapable of and phi-dot are matched. Since there ame onlycorrectly accounting for the observed frequency differences in the motion history leading up to the
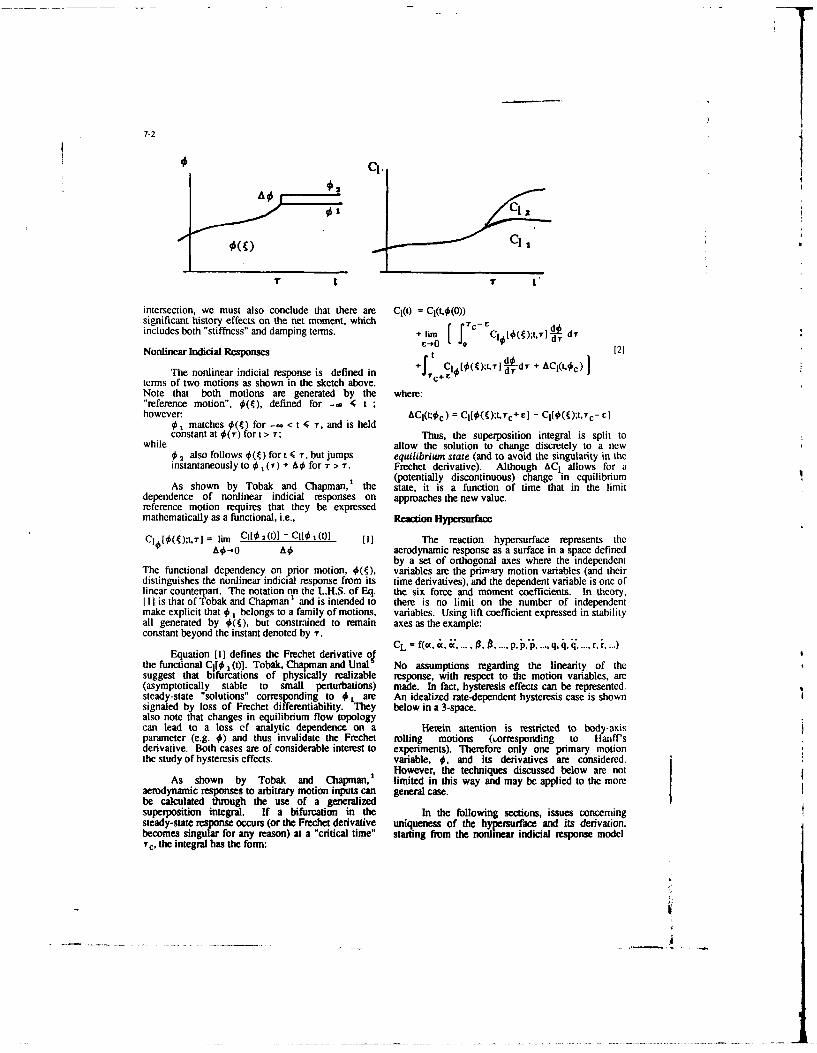
7-2
intersection, we must also conclude that there are CI(t) = C1(t,(0))significant history effects on the net moment, which re_includes both "stiffness" and damping terms. + lim [J d'
e- O -d[Nonlinear Indicial Responses t d [2
The nonlinear indicial response is defined in +il dT ' + Cl(t.'c)]
terms of two motions as shown in the sketch above.Note that both motions are generated by the where:"reference motion", 0( ), defined for -. 4 t ;however ACI(t;Oc) =CI[O(4);t, c+ l - Cl[0(4);t,Tc-C]
0 matches 0(4) for -M < t 4 T, and is heldconstant at O(T) fort> T; Thus, the superposition integral is split to
while allow the solution to change discretely to a newa2 also follows 0(t) for t 4 T, but jumps equilibrium state (and to avoid the singularity in the
instantaneously to 4 1 (r) + AO for T > r. Frechet derivative). Although ACI allows for a(potentially discontinuous) change in equilibrium
As shown by Tobak and Chapman,' the state, it is a function of time that in the limitdependence of nonlinear indicial responses on approaches the new value.reference motion requires that they be expressedmathematically as a functional, i.e., Reaction Hypertuface
()10 lim Cl 2 (t)] - Cl[ 1 (t)] [] The reaction hypersurface represents theAO-,0 AO aerodynamic response as a surface in a space defined
by a set of orthogonal axes where the independentThe functional dependency on prior motion, 0( ), variables are the primary motion variables (and theirdistinguishes the nonlinear indicial response from its time derivatives), and the dependent variable is one oflinear counterpart. The notation on the L.H.S. of Eq. the six force and moment coefficients. In theory,[11 is that of Tobak and Chapman' and is intended to there is no limit on the number of independentmake explicit that 0 , belongs to a family of motions, variables. Using lift coefficient expressed in stabilityall generated by *(g), but constrained to remain axes as the example:constant beyond the instant denoted by T.
Equation [1 defines the Frechet derivative of CL=f(cr,4, .I, .p, qqj,
the functional C1i 0 1 (t)]. Tobak, Chapman and Unal s No assumptions regarding the linearity of thesuggest that bifurcations of physically realizable response, with respect to the motion variables, are(asymptotically stable to small perturbations) made. In fact, hysteresis effects can be represented.steady-state "solutions" corresponding to 4 1 are An idealized rate-dependent hysteresis case is shownsignaled by loss of Frechet differentiability. They below in a 3-space.also note that changes in equilibrium flow topologycan lead to a loss ef analytic dependence on a Herein attention is restricted to body-axisparameter (e.g. 0) and thus invalidate the Frechet rolling motions (Lorresponding to Hanfl'sderivative. Both cases are of considerable interest to experiments). Therefore only one primary motionthe study of hysteresis effects. variable, 4,, and its derivatives are considered.
However, the techniques discussed below are notAs shown by Tobak and Chapman,' limited in this way and may be applied to the more
aerodynamic responses to arbitrary motion inputs can general case.be calculated through the use of a generalizedsuperposition integral. If a bifurcation in the In the following sections, issues concemingsteady-state response occurs (or the Frechet derivative uniqueness of the hypersurface and its derivation,becomes singular for any reason) at a "critical time" starting from the nonlinear indicial response model
c' the integral has the form:
S|
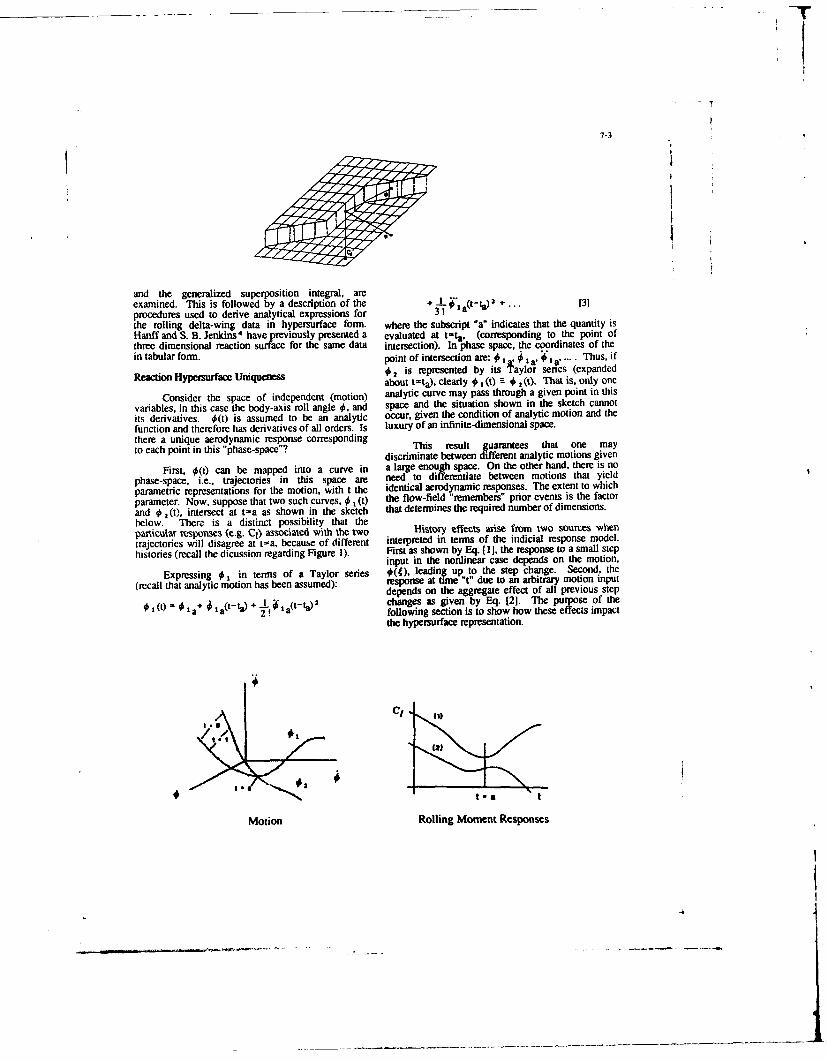
7-3
and the generalized superposition integral, areexamined. This is followed by a description of the L'a(t-19 )2 +procedures used to derive analytical expressions for 3!the rolling delta-wing data in hypersurface form. where the subscript "a" indicates that the quantity isHanff and S. B. Jenkins 4 have previously presented a evaluated at t-ta, (corresponding to the point ofthree dimensional reaction surface for the same data intersection). In phase space, the coordinates of thein tabular form. point of intersection are: *0 1 ,' 1 , a 1 , .... Thus, if
Reaction Hypersurface Unqueness 2 is represented by its aylor senes (expanded
about t=ta), clearly 0 1(t) - 2 (t). That is, only one
Consider the space of independent (motion) analytic curve may pass through a given point in this
variables, in this case the body-axis roll angle 0, and space and the situation shown in the sketch cannot
its derivatives. 0(t) is assumed to be an analytic occur, given the condition of analytic motion and the
function and therefore has derivatives of all orders. Is luxury of an infinite-dimensional space.there a unique aerodynamic response correspondingtoechpin nths"pae-pc"? This result guarantees that one mayto each point in this "phase-space? .discriminate between different analytic motions given
First, #(t) can be mapped into a curve in a large enough space. On the other hand, there is no
phase-space, i.e., trajectories in this space are need to differentiate between motions that yield
parametric representations for the motion, with t the identical aerodynamic responses. The extent to which
parameter. Now, suppose that two such curves, 0 1 (t) the flow-field "remembers" prior events is the factor
and 0 2 (t), intersect at t=a as shown in the sketch that determines the required number of dimensions.
below. There is a distinct possibility that theparticular esponses (e.g. CI) associated with the two History effects arise from two sources when
trajectories will disagree at t-a, because of different interpreted in terms of the indicial response model.
histories (recall the dicussion regarding Figure 1). First as shown by Eq. [1], the response to a small stepinput in the nonlinear case depends on the motion,
Expressing 0 1 in terms of a Taylor series 0(4), leading up to the step change. Second, the
(recall that analytic motion has been assumed): response at time "t" due to an arbitrary motion inputdepends on the aggregate effect of all previous step
1)(t) 1 a+ a(ta) +_! W,'a(t-ta)2 changes as given by Eq. [2]. The purpose of the2! following section is to show how these effects impact
the hypersurface representation.
Cl h
t-a t
Motion Rolling Moment Responses
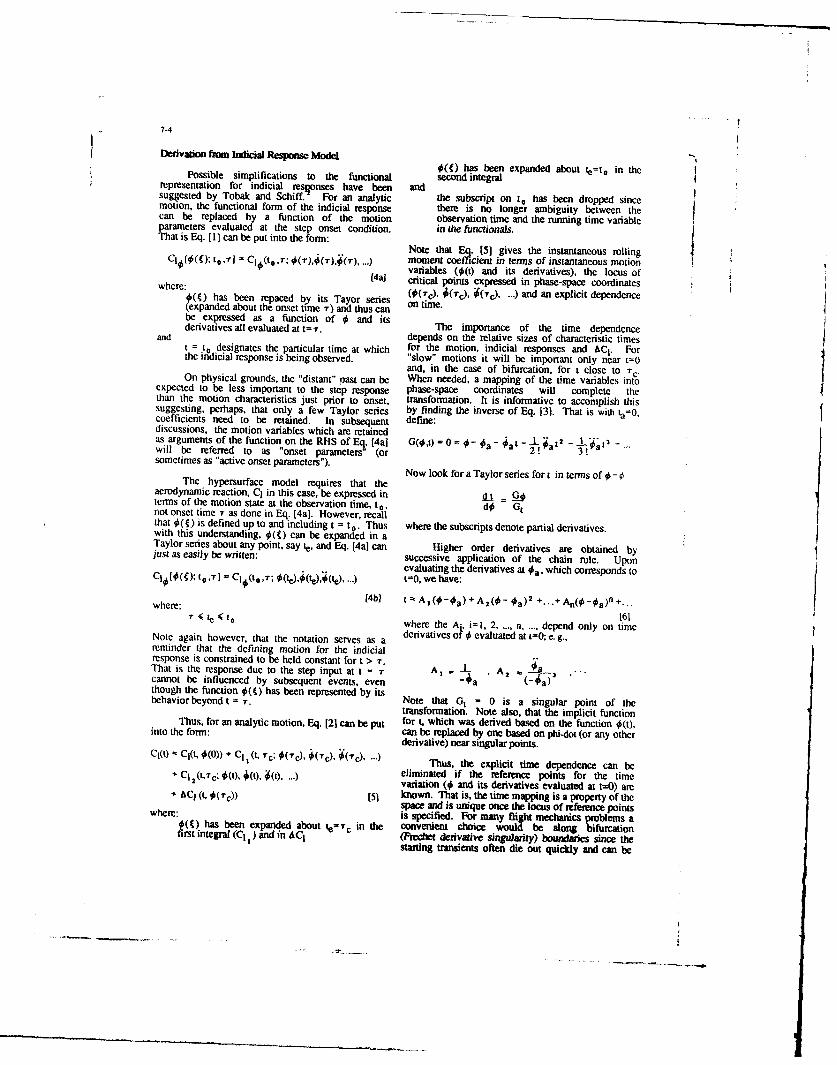
-7-4
Derivation frn Indicial Response Model0(f) has been expanded about ie=t o in thePossible simplifications to the functional second integralrepresentation for indicial resgonses have been andsuggested by Tobak and Schiff. For an analytic the subscript on to has been dropped sincemotion, the functional form of the indicial response there is no longer ambiguity between thecan be replaced by a function of the motion observation time and the running time variableparameters evaluated at the step onset condition. in the functionals.That is Eq. [1] can be put into the form: Note that Eq. [5] gives the instantaneous rollingC o C(t,r; '( ) ) moment coefficient in terms of instantaneous motion10 variables ((t) and its derivatives), the locus of
4a] critical points expressed in phase-space coordinateswhere:()i (O(Tc), 4('c), (c) ...) and an explicit dependence0(g) has been repaced by its Tayor series on time.(expanded about the onset time T) and thus canbe expressed as a function of 0 and itsderivatives all evaluated at t=1. The importance of the time dependenceand depends on the relative sizes of characteristic timest = to designates the particular time at which for the motion, indicial responses and AC1. Forthe indicial response is being observed. "slow" motions it will be important only near t=0
and, in the case of bifurcation, for t close to 7c .On physical grounds, the "distant" past can be When needed, a mapping of the time variables intoexpected to be less important to the step response phase-space coordinates will complete thethan the motion characteristics just prior to onset, transformation. It is informative to accomplish thissuggesting, perhaps, that only a few Taylor series by finding the inverse of Eq. 13]. That is with ta-0,coefficients need to be retained. In subsequent define:discussions, the motion variables which are retainedas arguments of the function on the RHS of Eq. 14al G(O,0 = 0 = 0 - Oa t - 1 t2 - 3will be referred to as "onset parameters" (or 2! a ! a t
sometimes as "active onset parameters").
Now look for a Taylor series for t in terms of 0 -The hypersurface model requires that the
aerodynamic reaction, Cl in this case, be expressed interms of the motion state at the observation time, to, dO Gtnot onset time r as done in Eq. [4a]. However, recallthat 0( ) is defined up to and including t = t .. Thus where the subscripts denote partial derivatives.with this understanding. 0( ) can be expanded in aTaylor series about any point, say te , and Eq. [4a] can Higher order derivatives are obtained byjust as easily be written: successive application of the chain rule. Upon
evaluating the derivatives at 0., which corresponds toC14O4(f); to ,T] = Cl(tt. 0 (, (te)J(, ...) t=0, we have:
where: [4b] t , A,(0-#a) +A 2(- #a) 2 +...+ An(-_a)n+7 < 1,< 1, 61
1' < (t where the A, i=l, 2 ... ... , depend only on timeNote again however, that the notation serves as a derivatives of 0 evaluated at t-0; e. g.,reminder that the defining motion for the indicia]response is constrained to be held constant for t > T.That is the response due to the step input att = r Al = , -A2 -cannot be influenced by subsequent events, even 4 a (- a) "though the function 0(4) has been represented by itsbehavior beyond t = T. Note that Gt = 0 is a singular point of the
transformation. Note also, that the implicit functionThus, for an analytic motion, Eq. [21 can be put for t, which was derived based on the function 0(t),into the form: can be replaced by one based on phi-dot (or any otherderivative) near singular points.
C(t) 'C1(t, (0)) + C I (t. C (C). (Tc), "c), Thus, the explicit time dependence can be" Ci (t,Tc; 0(t 0,(t),.. eliminated if the reference points for the time
2 ) variation (# and its derivatives evaluated at t=0) are" AC) (t, k(d)) [51 known. That is, the time mapping is a property of thespace and is unique once the locus of reference pointswhere: is specified. For many flight mechanics problems aw (g) has been expanded about t
e=Tc in the convenient choice would be along bifurcationfirst integral (C1 I
) and in ACi (Frechet derivative singularity) boundaries since thestarting transients often die out quickly and can be
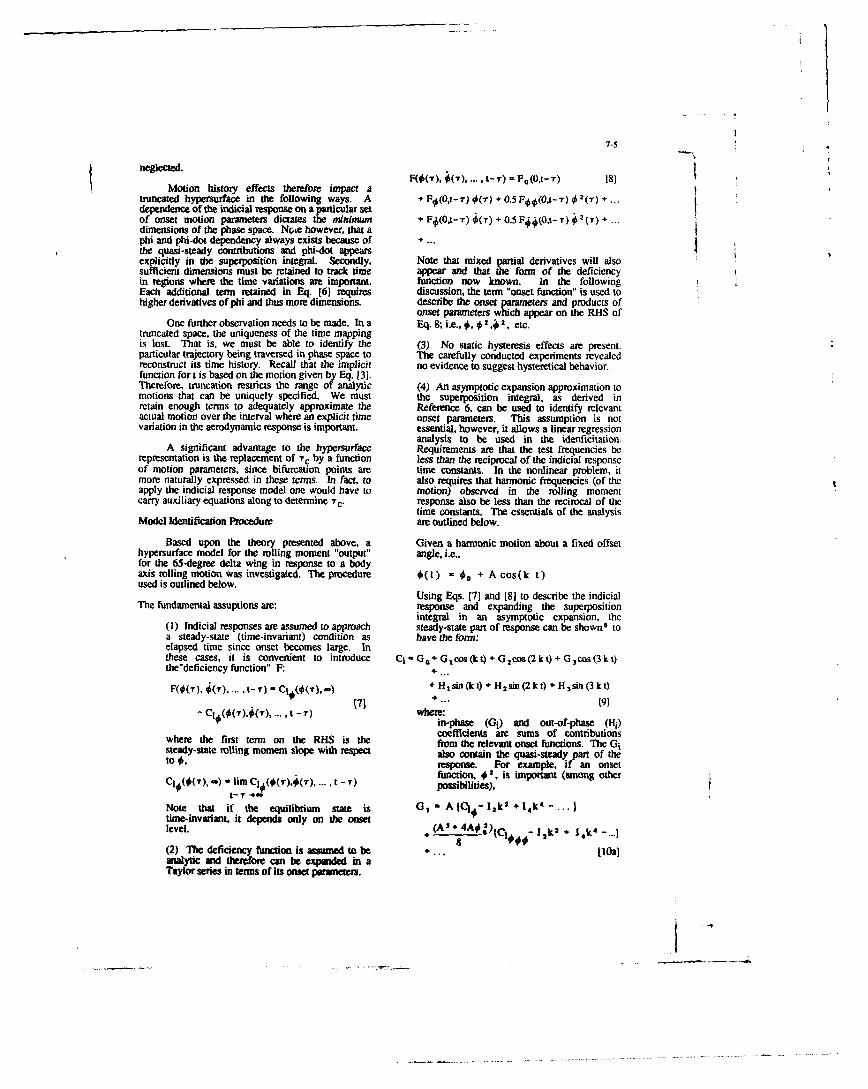
7-5
neglected.F(#('), (7) .. - (O,t-') 81
Motion history effects therefore impact atruncated hypersurface in the following ways. A + FO(Ot- r) O(r) + 0.SF .(Ot-T) (-) +dependence of the indicial response on a particular setof onset motion parameters dictates the runimum + FJ(0t-T) (T)+ 0.5F4(0,1-T) 2(T) +dimensions of the phase space. Note however, that aphi and phi-dot dependency always exists because of ...the quasi-steady contributions and phi-dot appearsexplicly in the superposition integral. Secondly, Note that mixed partial derivatives will alsosufficient dimensions must be retained to track time appear and that the form of the deficiencyin regions where the time variations are important. function now known. In the followingEach additional term retained in Eq. (6] requires discussion, the term "onset function" is used tohigher derivatives of phi and thus more dimensions. describe the onset parameters and products of
onset parameters which appear on the RHS ofOne further observation needs to be made. In a Eq. 8; i.e., 2, 2. 2 , etc.
truncated space, the uniqueness of the time mappingis lost. That is, we must be able to identify the (3) No static hysteresis effects are present.particular trajectory being traversed in phase space to The carefully conducted experiments revealedreconstruct its time history. Recall that the implicit no evidence to suggest hysteretical behavior.function for t is based on the motion given by Eq. 13).Therefore, truncation restricts the range of analytic (4) An asymptotic expansion approximation tomotions that can be uniquely specified. We must the superposition integral, as derived inretain enough terms to adequately approximate the Reference 6, can be used to identify relevantactual motion over the interval where an explicit time onset parameters. This assumption is notvariation in the aerodynamic response is important. essential, however, it allows a linear regression
analysis to be used in the idenficitation.A significant advantage to the hypersurface Requirements are that the test frequencies berepresentation is the replacement of "rc by a function less than the reciprocal of the indicial responseof motion parameters, since bifurcation points are time constants. In the nonlinear problem, itmore naturally expressed in these terms. In fact, to also requires that harmonic frequencies (of theapply the indicial response model one would have to motion) observed in the rolling momentcarry auxiliary equations along to determine T c. response also be less than the recirocal of the
time constants. The essentials of the analysisModel Identification Procedure are outlined below.
Based upon the theory presented above, a Given a harmonic motion about a fixed offsethypersurface model for the rolling moment "output" angle, i.e.,for the 65-degree delta wing in response to a bodyaxis rolling motion was investigated. The procedure 0(t) s + A cos(k t)used is outlined below.
Using Eqs. [7] and [8] to describe the indicialThe fundamental assuptions are: response and expanding the superposition
integral in an asymptotic expansion, the(I) Indicial responses are assumed to approach steady-state part of response can be shown' toa steady-state (time-invariant) condition as have the form:elapsed time since onset becomes large. Inthese cases, it is convenient to introduce C1 G , cos0)*G cos(2kt)+G 3 cos(3kt)the"deficiency function" F:
F(¢(r),(). t-T) " C(O(-r),) + Htsin (k t) H2sin (2 k t) + H 3 sin (3 k Q
r'71 + . 191.t -T) where:
in-phase (0i) and out-of-phase (Hi)coefficients are sums of contributions
where the first term on the RHS is the from the relevant onset functions. The Gisteady-state rolling moment slope with respect also contain the quasi-steady part of theto #, response. For example, if an onset
function, #2, is important (among other-) - lim C1O(#(7),#(7).. t - 7) possibilities),
Note that if the equilibrium state is G, - AICI,-Ik1 + 'A 4 ... }time-invariant, it depends only on the onsetlevel. + (A I 4A#
(2) The deficiency function is assued to be +... [Oalanalytic and therefore can be expanded in aTaylor series in terms of its onset parameters.
.~ ~ ~ ... ... ....
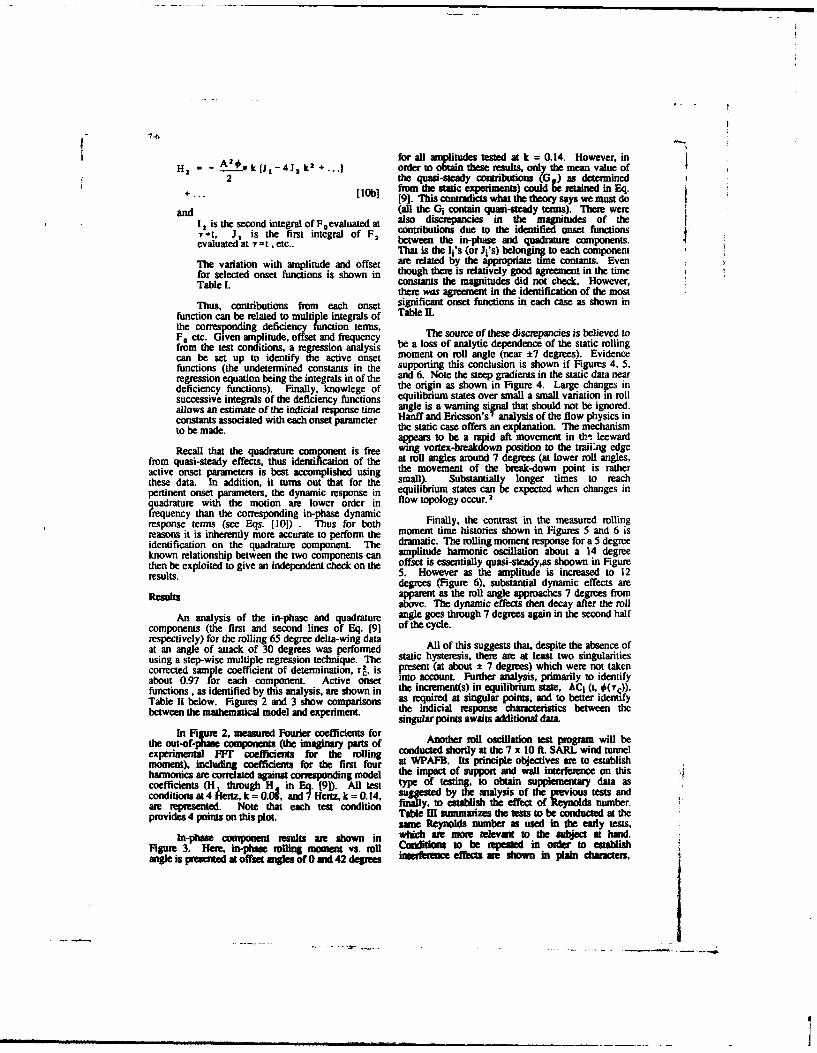
7-6
for all amplitudes tested at k = 0.14. However, inH, * - A.±o k (Jr - 4J, k2 +... order to obtain these results. only the mean value of
2 the quasi-sady contributios () a determinedmfro the static exprimens) could etained in Eq.
[l0b] [9]. This contradicts what the theorysays we must doand (all the Gi contain quasi-stedy terms). Ther were
l2 is the seond integral of Foevaluated at also discrepancies in the magnudes of theT1t, I is the first integral of F contributions due to the identified onset functionsevaluated at 7= t , ietc.. o between the in-phase and quadrature components.
That is the li's (or Ji's) belonging to each componentThe variation with amplitude and offset are related by the appropriate time contants. Evenfor selected onset functions is shown in though there is relatively good agreement in the timeTable I. constants the magnitudes did not check. However,
there wus agreement in the identification of the mostThus, contributions from each onset significant onset functions in each case as shown in
function can be related to multiple integrals of Table IIthe corresponding deficiency function terms,F, etc. Given amplitude, offset and frequency The source of these discrepancies is believed tofrom the test conditions, a regression analysis be a loss of analytic dependence of the static rollingcan be set up to identify the active onset moment on roll angle (near ±7 degrees). Evidencefunctions (the undetermined constants in the supporting this conclusion is shown if Figures 4, 5,regression equation being the integrals in of the and 6. Note the steep gradients in the static data neardeficiency functions). Finally, knowlege of the origin as shown in Figure 4. Large changes insuccessive integrals of the deficiency functions equilibrium states over small a small variation in rollallows an estimate of the indicial response time angle is a warning signal that should not be ignored.constants associated with each onset parameter Hanff and Ericsson's7 analysis of the flow physics into be made. the static case offers an explanation. The mechanism
appears to be a rapid aft movement in th- leewardRecall that the quadrature component is free wing vortex-brakdown position to the trai~ng edge
from quasi-steady effects, thus identification of the at roll angles around 7 degrees (at lower roll angles,active onset parameters is best accomplished using the movement of the break-down point is ratherthese data. In addition, it turns out that for the small). Substantially longer times to reachpertinent onset parameters, the dynamic response in equilibrium states can be expected when changes inquadrature with the motion ar lower order in flow topology occur. 2
frequency than the corresponding in-phase dynamicresponse terms (see Eqs. 1101) . Thus for both Finally, the contrast in the measured rollingreasons it is inherently more accurate to perform the moment time histories shown in Figures 5 and 6 isidentification on the quadrature component. The dramatic. The rolling moment response for a 5 degreeknown relationship between the two components can amplitude harmonic oscillation about a 14 degreethen be exploited to give an independent check on the offset is essentially quasi-steadyas shoown in Figureresults. 5. However as the amplitude is increased to 12
degrees (Figure 6), substantial dynamic effects areResults apparent as the roll angle approaches 7 degrees from
above. The dynamic effects then decay after the rollAn analysis of the in-phase and quadrature angle goes through 7 degrees again in the second half
components (the first and second lines of Eq. [91 of the cycle.respectively) for the rolling 65 degree delta-wing dataat an angle of attack of 30 degrees was performed All of this suggests that, despite the absence ofusing a step-wise multiple regression technique. The static hysteresis, there are at least two singularitiescorrected sample coefficient of determination, r , is present (at about ± 7 degrees) which were not takenabout 0.97 for each component. Active onset into account. Further analysis, primarily to identifyfunctions, as identified by this analysis, are shown in the increment(s) in equilibrium state., ACI (t, #(T)),Table I1 below. Figures 2 and 3 show comparisons as required at singular points, and to better identifybetween the mathematical model and experiment. the indicial response chaMcterstics between the
singular points awaits additional data.In Figure 2, measured Fourier coefficients for
the out-of-pha components (the imaginary parts of Another roll oscillation test program will beexperimental FFr coefficients for the rolling conducted shortly at the 7 x 10 ft. SARL wind tunnelmoment), including coefficients for the first four at WPAFB. Its principle objectives are to establishharmonics am correlated against coreponding model the impact of support and wall interference on thiscoefficients (H throgh H in Eu. [9]). All test type of testing, to obtain supplementary data asconditions at 4 hertz, k = 0.A, a Jd Hertz, k = 0.14, Mgsted by the analysis of the previous tests andare represented. Note that each test Condition Tfally, to establish the effect of Reynolds number.Provides 4 pointsl summarizes the tests to e conducted at thesame Reynolds number as used in the early tests,
In-phase component results are shown in which ae more relevant to the subject at hand.Figure 3. Her, in-phase rolling moment vs. rol C nditM to be repeated in order to etabishangle is presented at offset angles of 0 md 42 degrees intrferece effects ae hawn in plain characters,
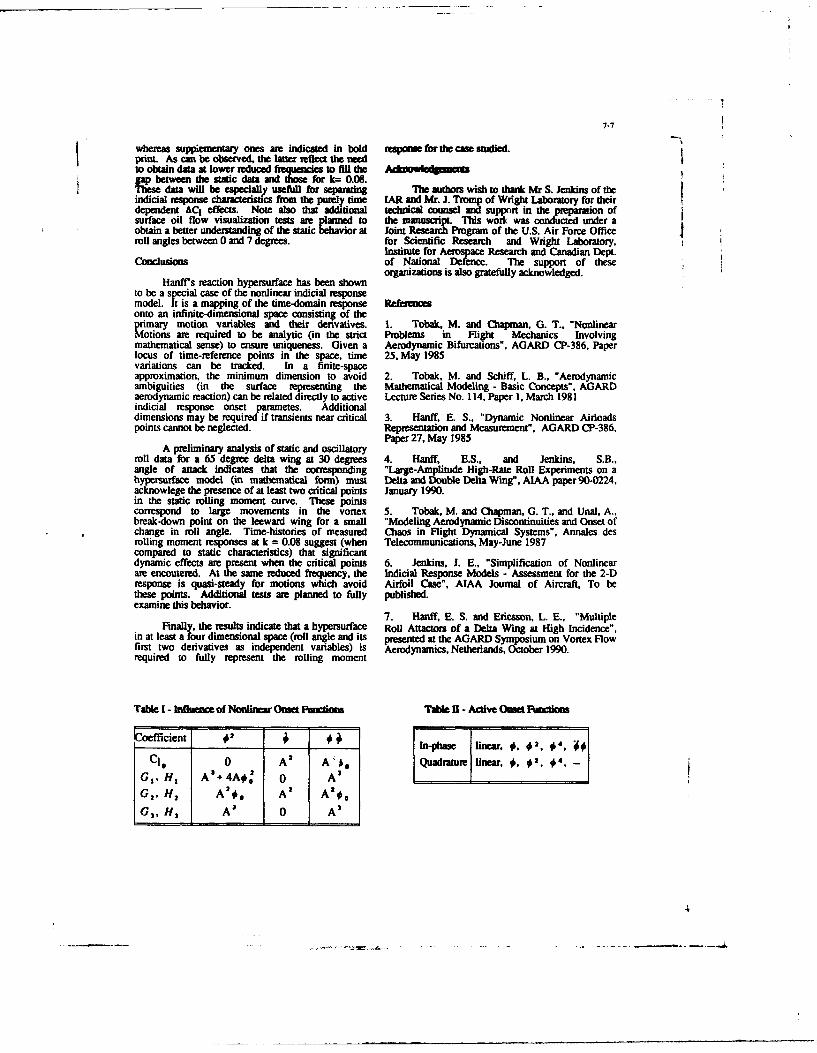
7-7
whereas suppiementary ones are indicated in bold respome for the case studied.print. As can be observed, the latter reflect the needto obtain data at lower reduced frequencies to fill thegap between the static data and those for k= 0.08.These data will be especially usefull for separating The authors wish to thank Mr S. Jenkins of theindicial response characteristics frm the purely time JAR and Mr. J. Tromp of Wright Laboratory for theirdependent ACI effects. Note also that additional technical counsel and support in the preparation ofsurface oil flow visualization tests are planned to the manuscript. This work was conducted under aobtain a better understanding of the static behavior at Joint Research Program of the U.S. Air Force Officeroll angles between 0 and 7 degrees. for Scientific Research and Wright Laboratory,
Institute for Aerospace Research and Canadian Dept.Conclusions of National Defence. The support of these
organizations is also gratefully acknowledged.Hanff's reaction hypersurface has been shown
to be a special case of the nonlinear indicial responsemodel. It is a mapping of the time-domain response Rernsonto an infinite-dimensional space consisting of theprimary motion variables and their derivatives. 1. Tobak, M. and Chapman, G. T., "NonlinearMotions are required to be analytic (in the strict Problems in Flight Mechanics Involvingmathematical sense) to ensure uniqueness. Given a Aerodynamic Bifurcations", AGARD CP-386, Paperlocus of time-reference points in the space, time 25, May 1985variations can be tracked. In a finite-spaceapproximation, the minimum dimension to avoid 2. Tobak, M. and Schiff, L. B., "Aerodynamicambiguities (in the surface representing the Mathematical Modeling - Basic Concepts". AGARDaerodynamic reaction) can be related directly to active Lecture Series No. 114, Paper 1, March 1981indicial response onset parametes. Additionaldimensions may be required if transients near critical 3. Haniff, E. S., "Dynamic Nonlinear Airdoadspoints cannot be neglected. Representation and Measurement". AGARD CP-386,
Paper 27, May 1985A preliminary analysis of static and oscillatory
roll data for a 65 degree delta wing at 30 degrees 4. Haniff, E.S., and Jenkins, S.B.,angle of attack indicates that the corresponding "Large-Amplitude High-Rate Roll Experiments on ahypersurface model (in mathematical form) must Delta and Double Delta Wing", AIAA paper 90-0224,acknowlege the presence of at least two critical points January 1990.in the static rolling moment curve. These pointscorrespond to large movements in the vortex 5. Tobak, M. and Chapman, G. T., and Unal, A..break-down point on the leeward wing for a small "Modeling Aerodynamic Discontinuities and Onset ofchange in roll angle. Time-histories of measured Chaos in Flight Dynamical Systems", Annales desroiling moment responses at k = 0.08 suggest (when Telecommunications, May-June 1987compared to static characteristics) that significantdynamic effects are present when the critical points 6. Jenkins, J. E., "Simplification of Nonlinearare encoutered. At the same reduced frequency, the Indicial Response Models - Assessment for the 2-Dresponse is quasi-steady for motions which avoid Airfoil Case", AIAA Journal of Aircraft, To bethese points. Additional tests ar planned to fully published.examine this behavior.
7. Hanff, E. S. and Ericsson, L. E., "MultipleFinally, the results indicate that a hypersurface Roll Attactors of a Delta Wing at High Incidence",
in at least a four dimensional space (roll angle and its presented at the AGARD Symposium on Vortex Flowfirst two derivatives as independent variables) is Aerodynamics, Netherlands, October 1990.required to fully represent the rolling moment
TaMe I - Influence of Nonlinear Onset Fuimed Tablc 1 - Active Onset Functian
kofficient ___2_ #__ ___ In-phase linear, 0. #2 . 4 4
Cl A 0 A2 A'* Quadratue linear, , 4, -,_GH, A + 4A#: 0 A 3
G 2 . H, A 2a#, A 2 A 2 #0
G, H, As 0 A 3
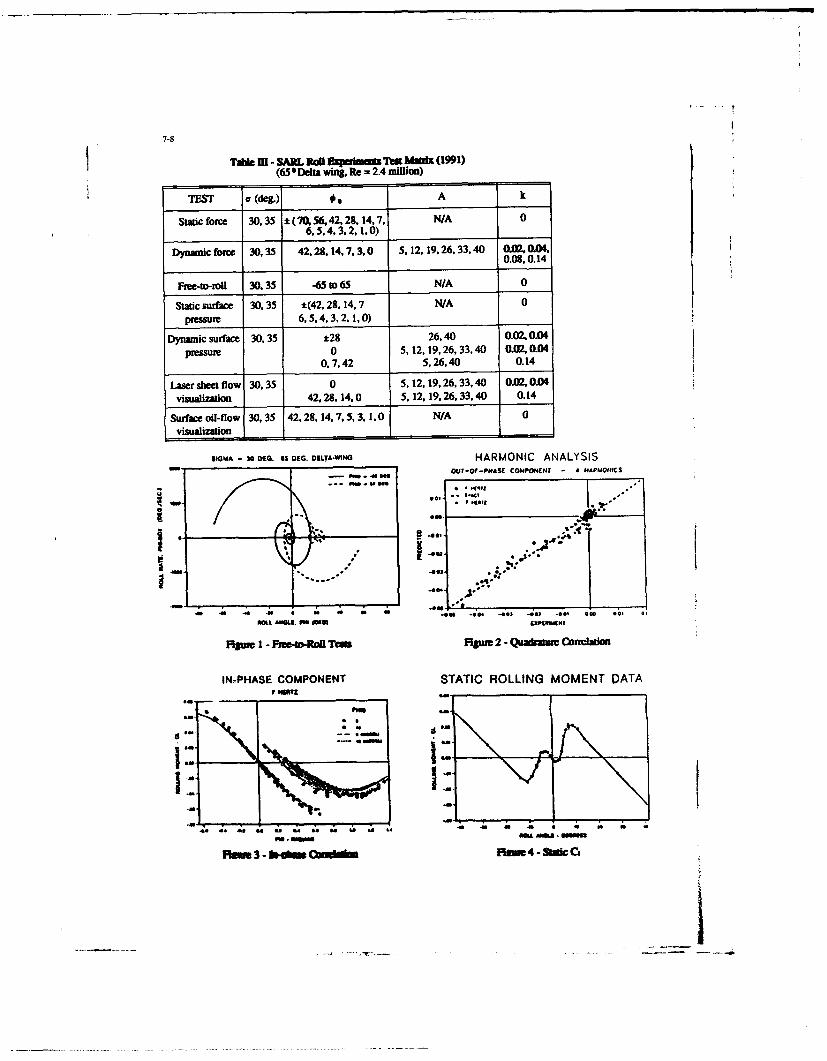
7-8
Tue MI - SAIL Rail OWupmesTest Malft (1991)(654Delta wing. Re = 2.4 million)
TESI' a(de&.) #A k
Static force 30,35 1 (70.56,42.28,14.,. N/A 06,5,4,3.2,1.0)
Dynamnic fozu 30,35 42,28,14.7.3.0 5,12,19,26,33.40 0.02,0.4.0.08,0.14
Free-to-roU 30.35 -65 to 65 N/A 0
Static surface 30.35 *(42,2S. 14,7 N/A 0pressure 6.,4,3,2.1,0)
Dynamic surface 30,35 ±28 26,40 0=020.04pressure 0 5.,12, 19,26,33.40 0112,0.04
0.7,42 5,26,40 0.14
Laser sheet flow 30.35 0 5, 12, 19,26.33.40 0=020.04Visualization 42.28, 140 5, 12, 19,26, 33.40 0.14
Surfacecoff-flow 30,35 42.28,147,5.3,1,0 N/A 0visualization I___t
SIGMA - 30 060. 65 GIG. DELTA.WAING HARMONIC ANALYSISOI-Gf-PHASC COMPONEWJ - NAPUOtlICS
-Go
a a .a9,116a 4 -- 03 40*2 4*0. W **
fsurc I - Fne--itol Tet Fg=i 2 - Qualratu C~ndian
IN.PHASE COMPONENT STATIC ROLLING MOMENT DATA'sval
dd
3 3- abH"4960 Fm~= 4 4- Staf Q
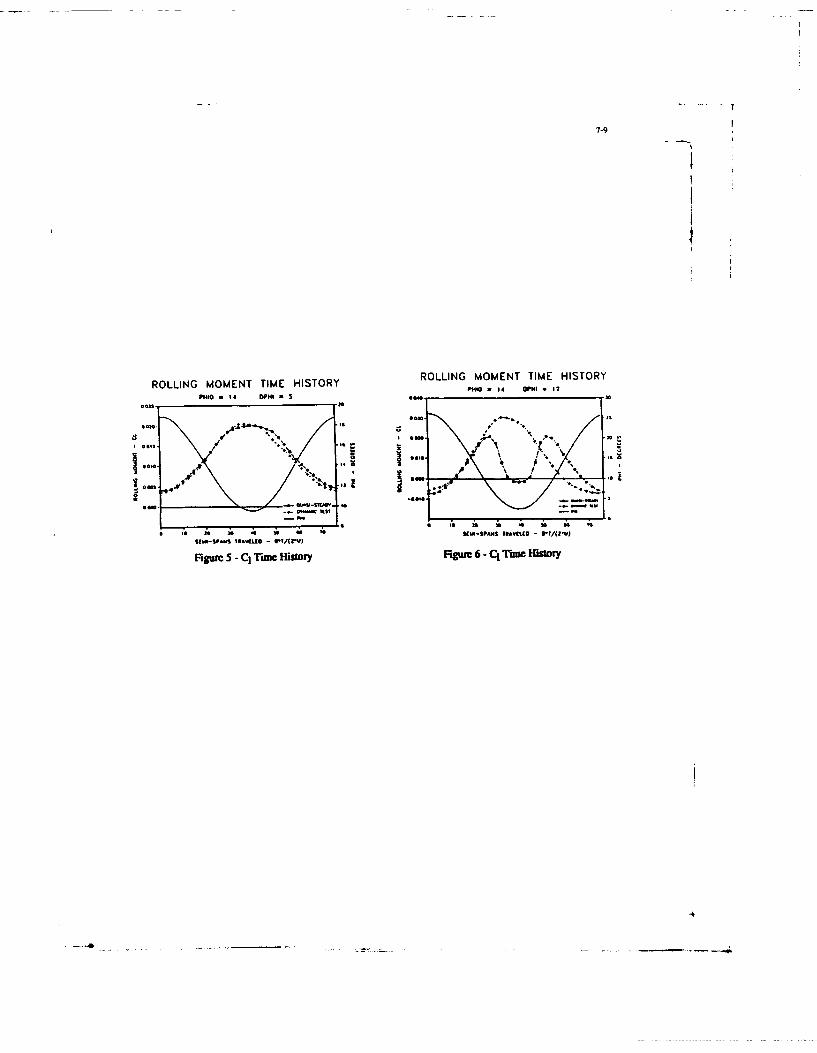
7-9
ROLLING MOMENT TIME HISTORY ROLLING MOMENT TIME HISTORYPHIC 14 IAH 5H =
PHIO.14"1 DPIS. __ __ __ __ __ __ _2 _
* an
** I(IP.: **WII
- ..:am~
Figure5 - Cj Tum thsory Figur 6 -C1 lMm Hislofy
8-1
ANALYSIS OF UNSTEADY FORCE, PRESSURE AND FLOW-VISUALIZATION DATAFOR A PUCING STRAKED WING MODEL AT HIGH ANGLES OF ATTACK
by
A.M.CumainsgbjJr R.G.den BoerGeneral Dynamics National Aerospace Laboratory (NLR)Fort Worth Anthony Fokkerweg 2Texas 1059 CM Amsterdam
The Netherlands
11HM peculiar to straked wing plan-forms, subjectto bursting and stalled conditions at high
Results are presented and discussed for incidences and high pitch rates.the low speed test of a straked wing modeloscillating in pitch that was conducted In order to better understand theduring 1986 at the National Aerospace Labo- development of unsteady air loads for theseratory of The Netherlands in cooperation fighters maneuvering beyond stall, a lowwith General Dynamics. The model was oscil- speed wind tunnel test of an oscillatinglated about mean angles of attack ranging straked wing model was performed during 1986from -4 dog to 48 dog with amplitudes vary- in a cooperative program between Generaling from 2 dog to 18 deg for a maximum Dynamics and the National Aerospace Labora-incidence range of -8 dog to 50 dog. It was tory (NLR) of The Netherlands.
4 The testing
also oscillated in pitch at side slip angles was funded by the Air Force Wright Researchof +5 dog and -5 deg. Force, pressure and and Development Center using the model thatflow-visualization data were recorded, was designed and built at NLR with fundsprocessed and documented in a final report provided by General Dynamics and NLR.and stored on digital and analog magnetictapes. This paper presents a brief descrip- Several papers have been written de-tion of the model and test program, in scribing both the 1986 test and subse?"g1addition to the steady and unsteady aerody- analyses of the results of that test.
,.°
namic characteristics. Steady and unsteady This paper is a follow-on to Reference 8pressure and flow-visualization data are with the purpose of providing a betterused to provide a better understanding of understanding of the non-linear aerodynamicthe phenomena observed in the aerodynamic phenomena described in that reference.characteristics. Particular emphasis is Particular emphasis will be placed on theplaced on the nature of dynamic vortex nature of dynamic vortex structure interplaystructure interplay with the forces and with aerodynamic forces experienced by themoments for symmetric flows. These concepts straked wing model. Unsteady pressure dataare then used to gain insight to the devel- will be used to provide the link betweenopments of asymmetric forces and moments for flow-visualization and force data for sym-the model pitching at side-slip. metric pitching motions. These concepts
will then be used to gain insight to the1.0 INRuOoUCTION developments -f asymmetric forces and mo-
ments for the model pitching at side-slip.Post stall maneuvering capability Emphasis will be placed on the flow regimes
requirements for fighter aircraft are becom- that are dominated by vortex, burst vortexing a distinct possibility as emphasized in and/or stalled flows on either the windwardrecent research proqram being conducted by or leeward wings or both.NASA, U.S. Air Force, U.S. Navy and DARPA.Two basic classes of hi-AOA maneuvers have 2.0 MODEL AND TRW PROGUAevolved: (1) a low-speed rapid turn withhigh decelerations going into the turn anl The full-span model shown in Figure 1high accelerations coming out of the turn;1 was instrumented with a six-component bal-
and (2) a rapil pitch-point fire maneuver at ance, 42 in-situ pressure transducers, ninehigher speeds." The first type of maneuver vertical accelerometers and an angle-of-is akin to a whammerheadw stall where as the attack sensor. Boundary layer transitionsecond is a pitch-pulse similar to that was not fixed on the model. The model wasdemonstrated by Pouqachov in a Russian Su-27 mounted on the dynamic support system alsoat the Paris Air Show in 1989, nicknamed the shown in Figure 1 with the capability of*Cobra" maneuver. maximum amplitudes of 1 18 deg (36 dog peak-
to-peak) and maximum frequencies of 16 hzAlthough aerodynamic loads encountered (limited to ±2 dog amplitude). The total
in low speed rapid turns would be small, incidence range was from -8 dog to 50 dogthose produced during rapid pointing maneu- with the capability of statically yawing thevwrs at higher speeds would be significant model and support system as indicated inand highly dynamic. Moreover, the dynamic Figure 1. Flow-visualization of the vortexaerodynamic loads in the letter case would structure was accomplished with smoke injec-be quite different from sustained maneuver tion from the model nose with laser lightloads in both magnitude and character. sheet illumination. For unsteady flows, theHysteresis effects in forces and moments as laser sheet was pulsed in phase with modelwell as dynamic overshoots of steady maxi mu motion to provide illumination at a fixedforces are typical of the differences. Nany model incidence during the cycle. The laserof the current fighter aircraft which have light sheet was positioned at each of thethe potential to perform such maneuvers are spenwise pressure sections so as to providestroked wing configurations as exemplified a spatial correlation between pressure andby the F-16, F-i8, NiG-29, and Su-27. Thus, flow-visualization data.the unsteady aerodynamic loads on theseaircraft would be prodoced by vortex flows Force, pressure and flow-visualization
date were obtained for a wide variety ofCopyright 0 1991 by General Dynamics Corpo- static and dynamic conditions at incidencesration. All rights reserved. Printed by up to S0 deg and are fully documented inMMD with permission. Refermnces 4 and S. The tests were conduct-
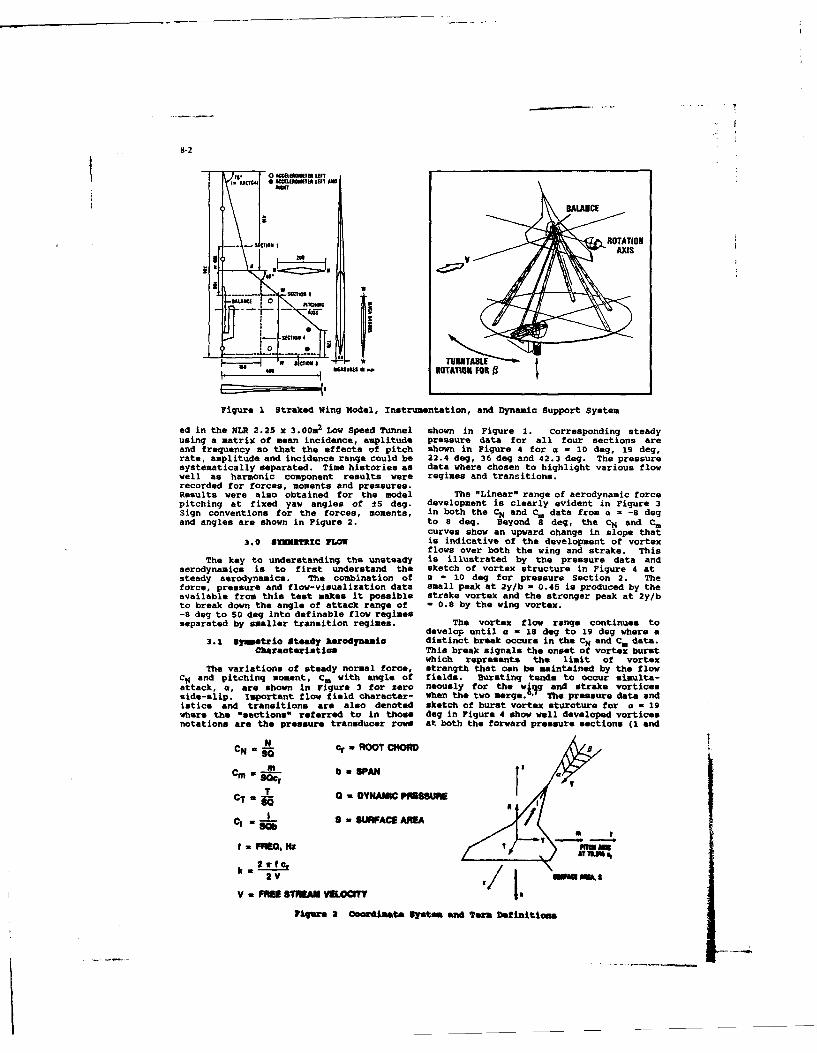
8-2
, . O 10ci 11M1I1 LFTDE1aIL 0 M UIHUETII LEFT AND
BALANCE
ROTATION-,W
I AXIS
""anc 0
v
.0
4" 1 UIHI - ROTATION FOR
Figure 1 Straked Wing Model, Instrumentation, and Dynamic Support System
ed in the NLR 2.25 x 3.00m2 Low Speed Tunnel shown in Figure 1. corresponding steadyusing a matrix of mean incidence, amplitude pressure data for all four sections areand frequency so that the effects of pitch shown in Figure 4 for a = 10 deg, 19 deg,rate, amplitude and incidence range could be 22.4 deg, 36 deg and 42.3 deg. The pressuresystematically separated. Time histories as data where chosen to highlight various flowwell as harmonic component results were regimes and transitions.recorded for forces, moments and pressures.Results were also obtained for the model rho "Linear" range of aerodynamic forcepitching at fixed yaw angles of ±5 deg. development is clearly evident in Figure 3Sign conventions for the forces, moments, in both the CN and C. data from a = -8 degand angles are shown in Figure 2. to 8 deg. Beyond S deg, the CN and CE
curves show an upward change in slope that
3.0 8Tun TRIC LOW is indicative of the development of vortexflows over both the wing and strake. This
The key to understanding the unsteady is illustrated by the pressure data andaerodynamics is to first understand the sketch of vortex structure in Figure 4 atsteady aerodynamics. The combination of a 1 10 deg for pressure Section 2. Theforce, pressure and flow-visualization data small peak at 2y/b - 0.45 is produced by theavailable from this test makes it possible strake vortex and the stronger peak at 2y/bto break down the angle of attack range of - 0.8 by the wing vortex.-8 deg to 50 deg into definable flow regimesseparated by smaller transition regimes. The vortex flow range continues to
develop until a - 18 dog to 19 dog where a3.1 Symetric Nteady Aorodymemio distinct break occurs in the CN and C. data.
babraoteristias This break signals the onset of vortex burstwhich represents the limit of vortex
The variations of steady normal force, strength that can be maintained by the flowC1 and pitching moment, Cm with angle of fields. Bursting tends to occur aimulta-attack, a, are shown in Fgure 3 for zero neously for the wig and strake vorticesside-slip. Important flow field character- when the two merge.-, The pressure data andistics and transitions are also denoted sketch of burst vortex sturcture for a - 19where the "sections" referred to in those deg in Figure 4 show well developed vorticesnotations are the pressure transducer rows at both the forward pressure sections (1 and
N cr ROOT CORDCN-So
C m & b- SPAN
TCT Q DYNAMIC PRUESSUREC I, SURFACE ARFA/
F1110 H1 = Af , FR O , He
,m,--
2k V 2 N/ a.
V ,FT 5TPAM VELOCITY
719ge 2 Oomdirata 11Yetes si Torn Definitions
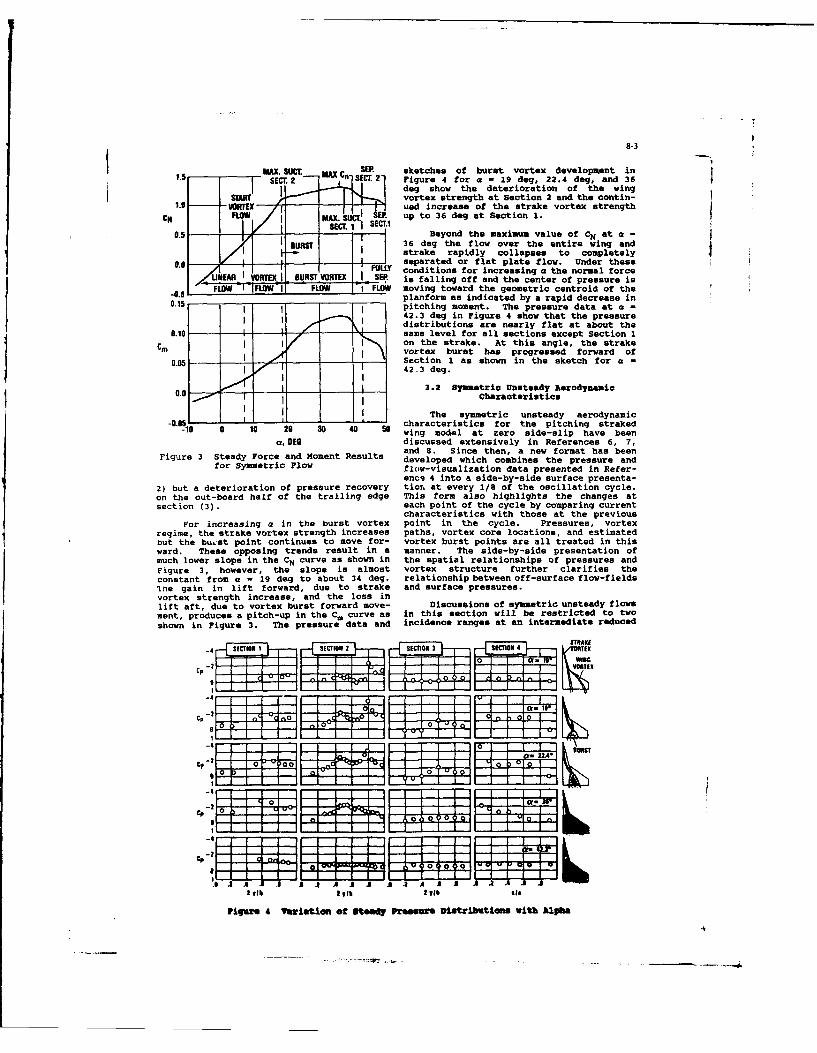
8-3
AX SUCE SEP, sketches of burst vortex development in
SECT. 2 .2 Figure 4 for a - 19 deg, 22.4 deg, and 36deg show the deterioration of the wing
SMAT vortex strength at Section 2 and the contin-1.8 -VORTEX I ued increase of the strake vortex strength
CN FEPW ,E up to 36 deg at Section 1.0. -"-, s, .I Beyond the.maximum, value of CN at a
BS 36 deg the flow over the entire wing andstrke apily collapses to completely
F iJ separated or flat plate tlow. Under these0.0 conditions for increasing a the normal forceEAR _VORTEX B URST.VORTEX SEP is falling off and the center of pressure is
F IFLOW- FLOW l FLOW moving toward the geometric centroid of the-.5 planform as indicated by a rapid decrease in
0.15 Ipitching moment. The pressure data at a -42.3 deg in Figure 4 show that the pressure
0 I% distributions are nearly flat at about the0. same level for all sections except Section 1
Cm i i on the strake. At this angle, the strakevortex burst has progressed forward of
0.05 Section 1 as shown in the sketch for a -
0 3.21 Symmetric Unsteady Aerodynaic0.0 / " iICharacteristics
-0.0 The symmetric unsteady aerodynamicIso characteristics for the pitching straked0 10 20 30 wing model at zero side-slip have been
a, pEG discussed extensively in References 6, 7,and r. Since then, a new format has been
Figure 3 Steady Force and Moment Results developed which combines the pressure andfor symmetrtc Flow flow-visualizatlon data presented in Refer-
ence 4 into a side-by-side surface present -2) but a deterioration of pressure recovery thor at every 1/8 of the oscillation cycle.on the out-board half of the trailng edge This form also highlights the changes atsection (3). each point of the cycle by comparing currentcharacteristics with those at the previous
For in ng a in the burst vortex point in the cycle. Pressures, vortexregime, the streke vortex strength increases paths, vortex core locations, and estimatedbut the bust point continues to move for- vortex burst points are all treated in thisward. These opposing trends result in a manner. The side-by-side presentation of
much lower slope in the cN curve as shown in the spatial relationships of pressures andFigure 3, however, the slope is almost vortex structure further clarifies theconstant from a - 19 deg to About 34 de E. relationship between off-surface flow-fieldsline gain in lift forward, due to straks and surface pressures.vortex strength increase, and the loss inlift aft, due to vortex burst forward move- Discussions of symmetric unsteady flowsment, produces a pitch-up in kh Cm curve as in this section will be restricted to twoshown in Figure 3. The preshsure" data and incidence ranges at an intermediate reduced
- L.4 .4 ,4VORTEXc E - N ti I t
I I P I 0
O IIIcf. I
-1 I O -0 - .fp- [ b , i d o [ [ _ O 'q I - -7 --- o L, o o/o I I I, O I Jil T ul I I .
-4 0
;I Eti I l F "
L1 , ,.-I L J .-L-II4-2J J II _ I '-I, I 1 al .21' A' 1 A A A 2 A,, l A A ,A
I fib~ooI 291 21 al ^
,1 ur 4 ft'1io of ftad prssr D II iibuion wit h ...
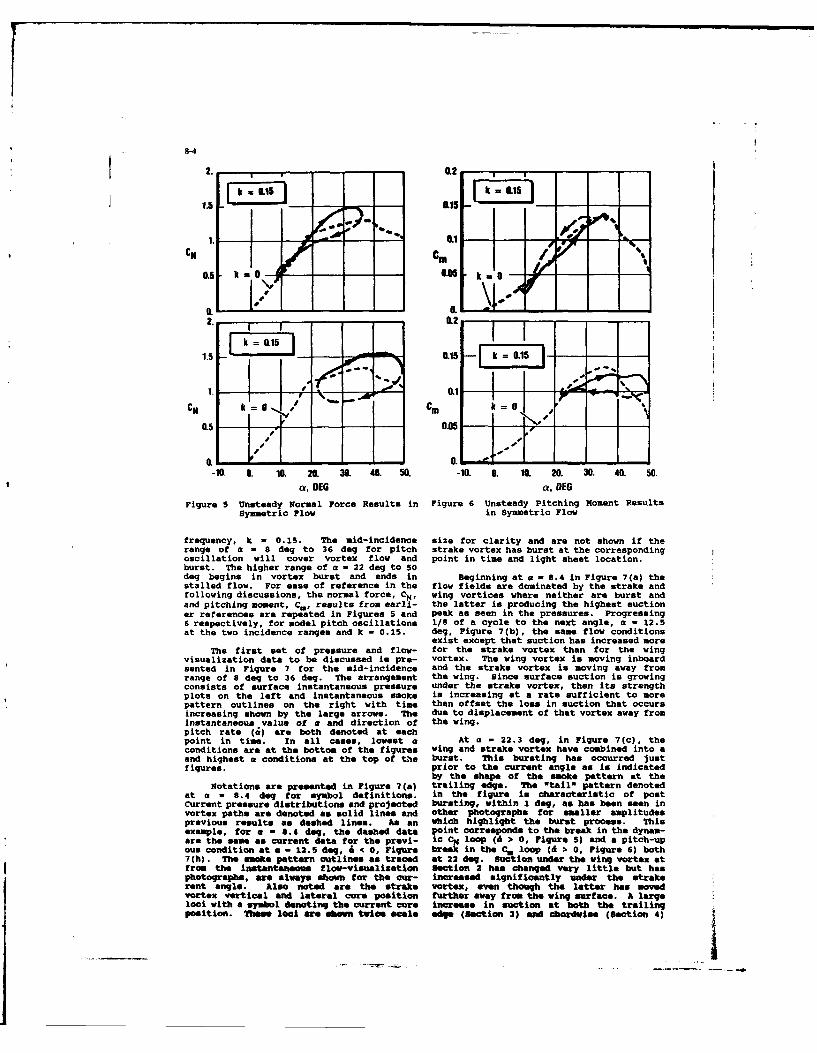
8-4
2. 0.2
k. 061
IILI
0.5 -k 1 0.05 - k 0,15 - -
2. &2.1.5 WO. Mom.15 k
CN k Cm k 0
O. J. * 0"1 . -
-10. IL 10. 20. 30. 40. 50. -10. . 10. 20. 30. 40. 50.a, DEG a. DEG
Figure 5 Unsteady Normal Force Results in Figure 6 Unsteady Pitching Moment ResultsSymmetric Flow in Symmetric Flow
frequency, k - 0.15. The mid-incidence size for clarity and are not shown if therange of a - 8 deg to 36 deg for pitch strake vortex has burst at the correspondingoscillation will cover vortex flow and point in time and light sheet location.burst. The higher range of a - 22 deg to 50deg begins in vortex burst and ends in Beginning at a - 8.4 in Figure 7(s) thestalled flow. For ease of reference in the flow fields are dominated by the strake andfollowing discussions, the normal force, CN, wing vortices where neither are burst andand pitching moment, Cm, results from earli- the latter is producing the highest suctioner references are repeated in Figures 5 and peak as seen in the pressures. Progressing6 respectively, for model pitch oscillations 1/8 of a cycle to the next angle, a - 12.5at the two incidence ranges and k - 0.15. deg, Figure 7(b), the same flow conditions
exist except that suction has increased moreThe first set of pressure and flow- for the strake vortex than for the wing
visualization data to be discussed is pre- vortex. The wing vortex is moving inboardsented in Figure 7 for the aid-incidence and the strake vortex is moving away fromrange of 8 deg to 36 dog. The arrangement the wing. since surface suction is growingconsists of surface instantaneous pressure under the strake vortex, then its strengthplots on the left and instantaneous smoke is increasing at a rate sufficient to morepattern outlines on the right with time than offset the loss in suction that occursincreasing shown by the large arrows. The due to displacement of that vortex away frominstantaneous value of a and direction of the wing.pitch rate (i) are both denoted at eachpoint in time. In all cases, lowest a At a - 22.3 dog, in Figure 7(c), theconditions are at the bottom of the figures wing and strake vortex have combined into aand highest a conditions at the top of te burst. This bursting has occurred justfigures. prior to the current angle as is indicated
by the shape of the smoke pattern at theNotations are presented in Fiqure 7(:) trailing edge. The "tail" pattern denoted
at a 8 5.4 dog for symbol definitons, in the figure is characteristic of postCurrent pressure distributions and projected bursting, within I dog, as has been seen invortex paths are denoted as solid lines and other photograph* for smaller amplitudesprevious results as dashed lines. As an which highlight the burst process. Thisexample, for e - 8.4 dug, the dashed data point corresponds to the break in the dynam-are the same as current data for the previ- ic CM loop (6 > 0, Figure 5) and a pitch-upous condition at a - 12.5 6e, & < 0, Figure break in the Ca loop (d > 0, Figure 6) both7(h). The smoke pattern outlines as traced at 22 dog. Suction under the ving vortex atfrom the instantaneous flov-visualiation Section 2 has changed very little but hasphotographs, are always shown for the cur- increased significantly under the strokerent angle. Also noted are the strake vortex, even though the latter has movedvortex vertical and lateral core position further away from the wing surface. A largeloci with a symbol denoting the current core increase in suction at both the trailingposition. Thes loci are abs twice sale edge (Section 3) end cbordwise (Section 4) j
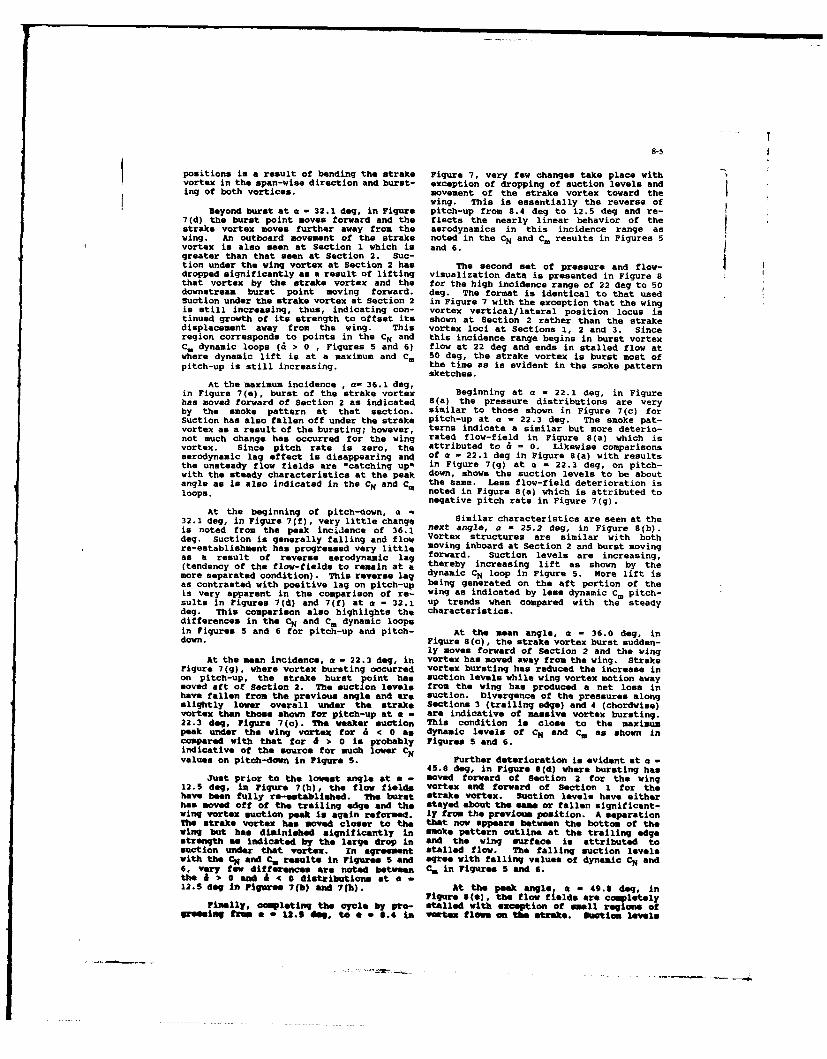
8-5
positions is a result of bending the strake Figure 7, very few changes take place withvortex in the span-wise direction and burst- exception of dropping of suction levels and iing of both vortices. movement of the strake vortex toward the
wing. This is essentially the reverse ofBeyond burst at a - 32.1 deg, in Figure pitch-up from 8.4 deg to 12.5 deg and re-
7(d) the burst point moves forward and the flects the nearly linear behavior of thestrake vortex moves further away from the aerodynamics in this incidence range aswing. An outboard movement of the strake noted in the CN and C, results in Figures 5vortex is also seen at Section I which is and 6.greater than that seen at Section 2. Suc-tion under the wing vortex at Section 2 has The second set of pressure and flow-dropped significantly as a result of lifting visualization data is presented in Figure 8that vortex by the strake vortex and the for the high incidence range of 22 deg to 50downstream burst point moving forward. deg. The format is identical to that usedSuction under the strake vortex at Section 2 in Figure 7 with the exception that the wingis still increasing, thus, indicating con- vortex vertical/lateral position locus istinued growth of its strength to offset its shown at Section 2 rather than the strakedisplacement away from the wing. This vortex loci at Sections 1, 2 and 3. Sinceregion corresponds to points in the CN and this incidence range begins in burst vortexC. dynamic loops (i > 0 , Figures 5 and 6) flow at 22 deg and ends in stalled flow atwhere dynamic lift is at a maximum and Cm 50 deg, the strake vortex is burst most ofpitch-up is still increasing, the time as is evident in the smoke pattern
sketches.At the maximum incidence , a- 36.1 deg,
in Figure 7(e), burst of the strake vortex Beginning at a - 22.1 deg, in Figurehas moved forward of Section 2 as indicated 8(a) the pressure distributions are veryby the smoke pattern at that section. similar to those shown in Figure 7(c) forSuction has also fallen off under the strake pitch-up at a = 22.3 deg. The smoke pat-vortex as a result of the bursting; however, terns indicate a similar but more deterio-not much change has occurred for the wing rated flow-field in Figure 8(a) which isvortex. Since pitch rate is zero, the attributed to & - 0. Likewise comparisonsaerodynamic lag effect is disappearing and of a - 22.1 deg in Figure 8(a) with resultsthe unsteady flow fields are "catching up" in Figure 7(g) at a - 22.3 deg, on pitch-with the steady characteristics at the peak down, shows the suction levels to be aboutangle as is also indicated in the CN and C, the same. Less flow-field deterioration isloops. noted in Figure 8(a) which is attributed tonegative pitch rate in Figure 7(g).
At the beginning of pitch-down, a -32.1 deg, in Figure 7(f), very little change Similar characteristics are seen at theis noted from the peak incidence of 36.1 next angle, a - 25.2 deg, in Figure 8(b).deg. Suction is generally falling and flow Vortex structures are similar with bothre-establishment has progressed very little moving inboard at Section 2 and burst movingas a result of reverse aerodynamic lag forward. Suction levels are increasing,(tendency of the flow-fields to remain at a thereby increasing lift as shown by themore separated condition). This reverse lag dynamic CN loop in Figure 5. More lift isas contrasted with positive lag on pitch-up being generated on the aft portion of theis very apparent in the comparison of re- wing as indicated by less dynamic Cm pitch-sults in Figures 7(d) and 7(f) at a - 32.1 up trends when compared with the steadydeg. This comparison also highlights the characteristics.differences In the CN and Cm dynamic loopsin Figures 5 and 6 for pitch-up and pitch- At the mean angle, a - 36.0 deg, indown. Figure 8(c), the strake vortex burst sudden-
ly moves forward of Section 2 and the wingAt the mean incidence, a - 22.3 dog, in vortex has moved away from the wing. Strake
Figure 7(g), where vortex bursting occurred vortex bursting has reduced the increase inon pitch-up, the strake burst point has suction levels while wing vortex motion awaymoved aft of Section 2. The suction levels from the wing has produced a net loss inhave fallen from the previous angle and are suction. Divergence of the pressures alongslightly lower overall under the strake Sections 3 (trailing edge) and 4 (chordwise)vortex than those shown for pitch-up at a - are indicative of massive vortex bursting.22.3 dog, Figure 7(c). The weaker suction This condition is close to the maximumpeak under the wing vortex for & < 0 as dynamic levels of CN and C. as shown incompared with that for & > 0 is probably Figures 5 and 6.indicative of the source for much lower CNvalues on pitch-down in Figure 5. Further deterioration in evident at a
45.8 deg, in Figure 8(d) where bursting hasJust prior to the lowest angle at a - moved forward of Section 2 for the wing
12.5 deg, in Figure 7(h), the flow fields vortex and forward of Section 1 for thehave been fully re-established. The burst Strake vortex. Suction levels have eitherhas moved off of the trailing edge and the stayed about the sam or fallen significant-wing vortex suction peak Is again reformed. ly from the previous position. A separationThe strake vortex has moved closer to the that now appears between the bottom of thewing but has diminished significantly In smoke pattern outline at the trailing edgestrength as indicated by the large drop In and the wing surface is attributed tosuction under that vortex. In agreement stalled flow. The falling suction levelswith the CN and C, results in Figures 5 and agree with falling values of dynamic CN and6, very few differences are noted between C in Figures 5 and 6.the A > 0 And & < 0 distributions at a .12.S dog In Figures 7(b) and 7(h). At the peak angle, a - 49.6 dog, in
Figure 9(0), the flow fields are completelyFlnally, cOMpleting the cycle by pro- stlled with exception of mll regions of
greeieig fr .S 12- , 96 1 - 6.4 in vttelx flWM an the Strake. Suction levels
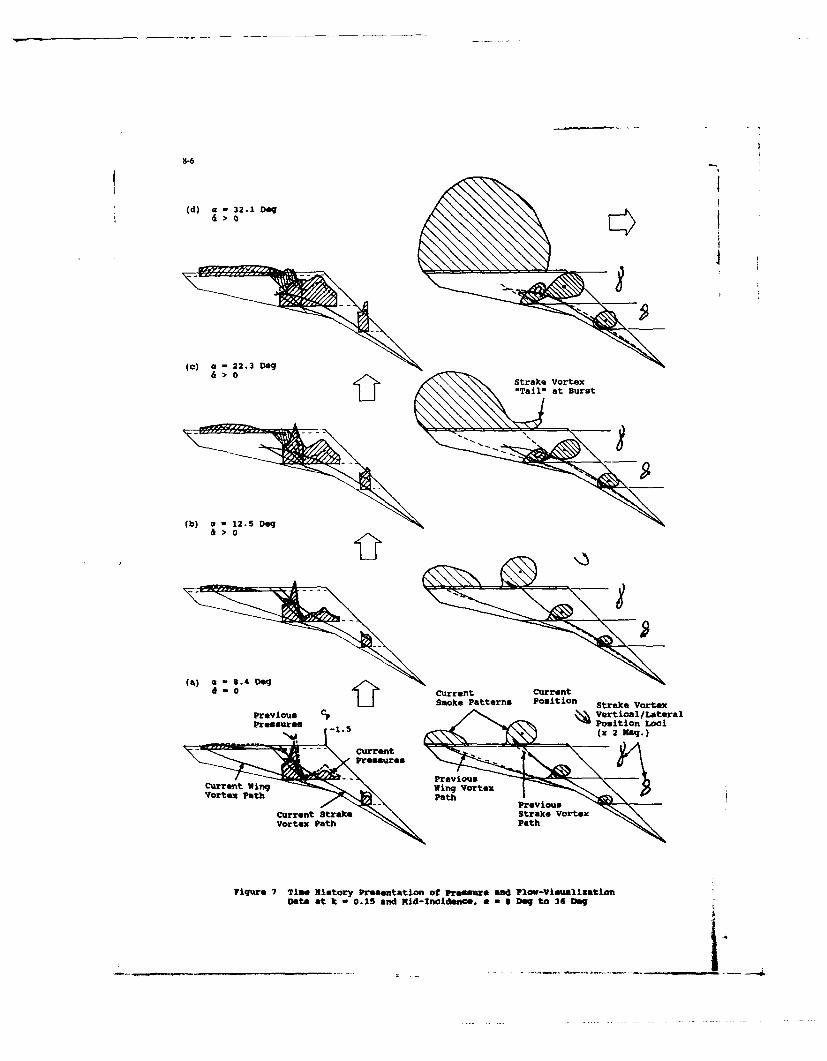
8-6
Strake VortexVorth aat Burtt
D(ta at 12. Deg5adMdIniec.a=U e o3
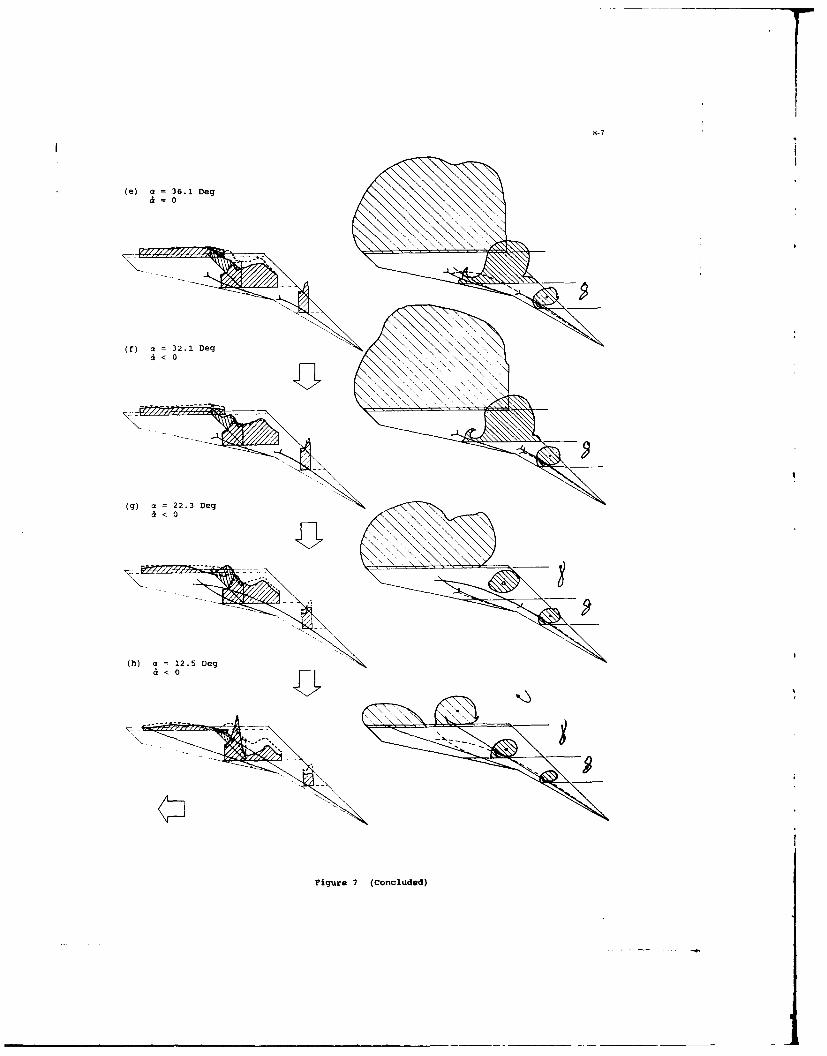
8-7
(e) a 36. 1 Deg0
(f) a 32.1 Deg< 0
(g) a 22.3 Deg< 0
(h) a 12.5 Deg< 0
'7 - - ---------
Figure 7 (Concluded)
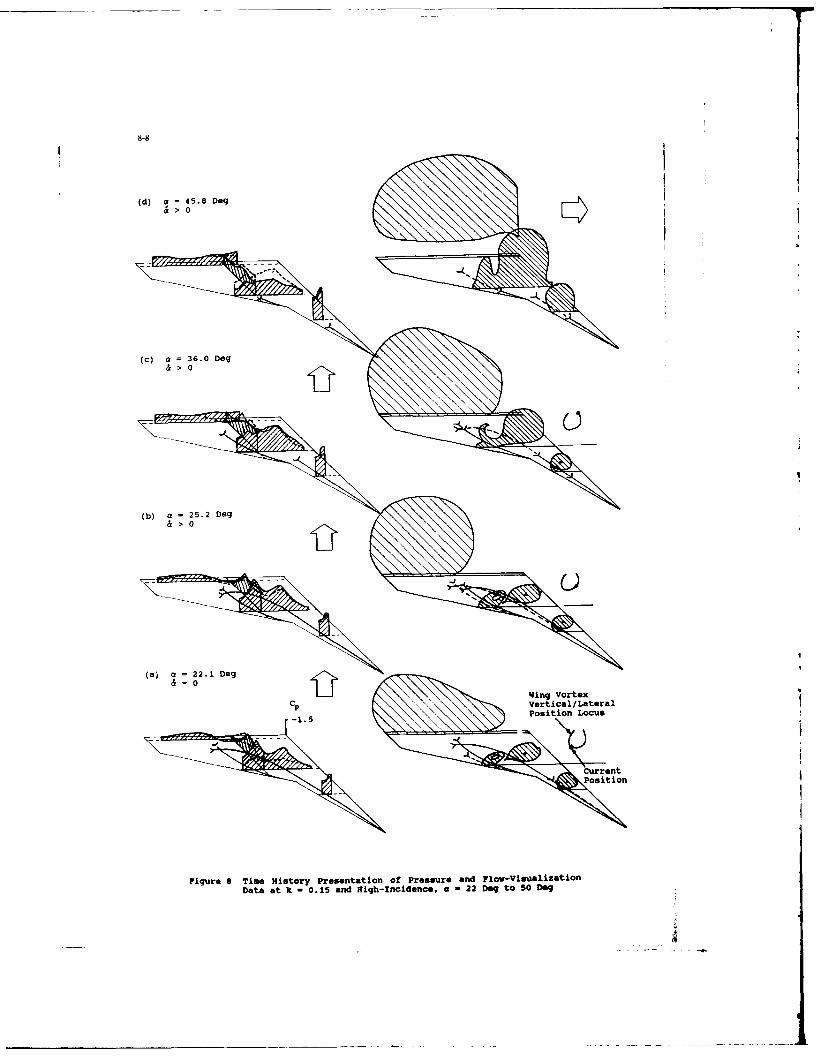
8-8
(d) 4 5. 8 De
Fiur 0 iehsoyPeetto fPesr n ~VV~~i~if
Data at 36k D0.5ad9g-I~dnO 2 o o5
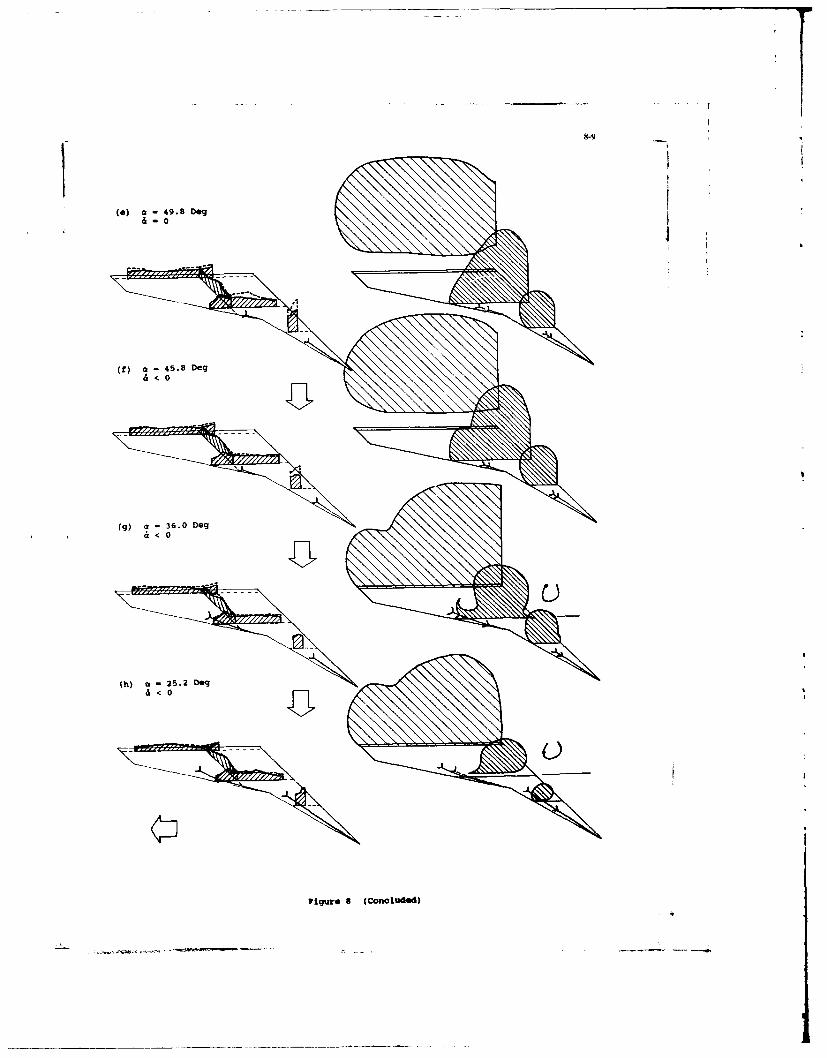
8-9
M 45.8 De
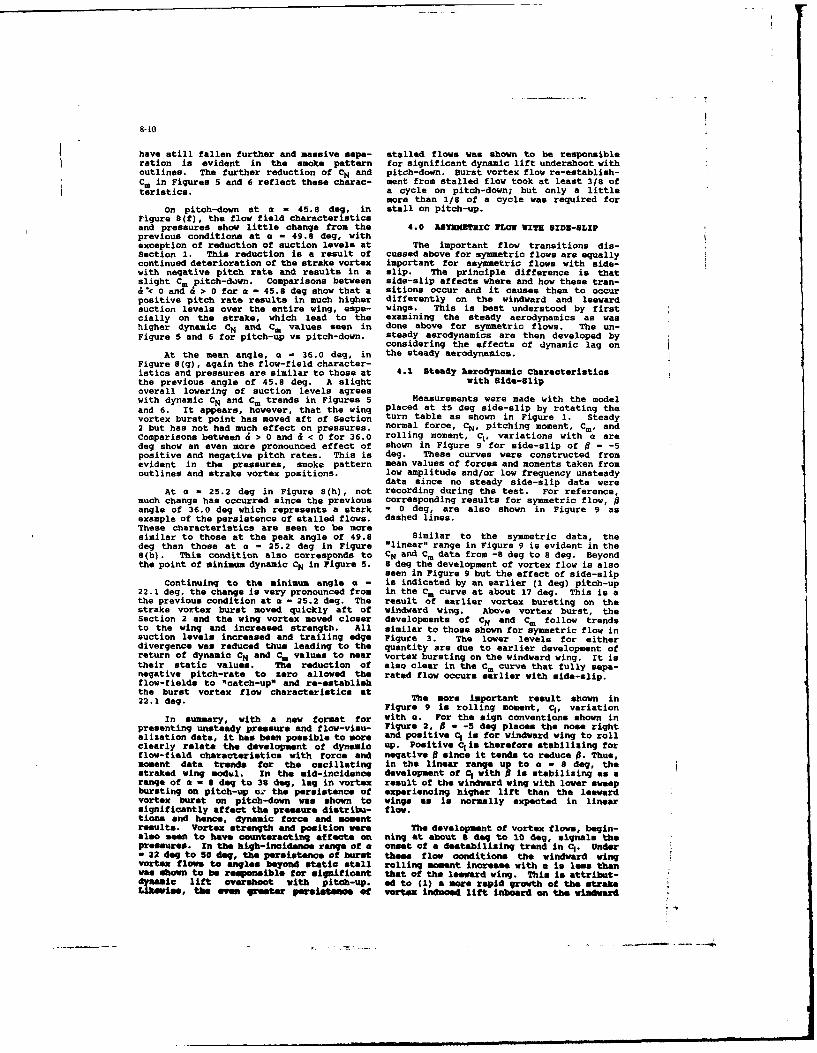
have still fallen further and massive sepe- stalled flows was shown to be responsibleration is evident in the amok* pattern for significant dynamic lift undershoot withoutlines. The further reduction of CN and pitch-down. Burst vortex flow re-establish-C. in Figures 5 end 6 reflect these charac- ment from stalled flow took at least 3/8 ofteristics. a cycle on pitch-down; but only a little
more than 1/8 of a cycle was required forOn pitch-down at a - 45.8 deg, in stall on pitch-up.
Figure 8(f), the flow field characteristicsand pressures show little change from the 4.0 A IaUMGuIC FLOW WITH SIDE-SLIPprevious conditions at a - 49.8 dog, withexception of reduction of suction levels at The important flow transitions dis-Section 1. This reduction is a result of cussed above for symmetric flows are equallycontinued deterioration of the strake vortex important for asymmetric flows with side-with negative pitch rate and results in a slip. The principle difference is thatslight C. pitch-down. Comparisons between side-slip affects where and how these tran-a< 0 and & > 0 for a - 45.8 dog show that a sitions occur and it causes them to occurpositive pitch rate results in much higher differently on the windward and leewardsuction levels over the entire wing, espe- wings. This is best understood by firstcially on the strake, which lead to the examining the steady aerodynamics as washigher dynamic CN and Cm values seen in done above for symmetric flows. The un-Figure 5 and 6 for pitch-up vs pitch-down. steady aerodynamics are then developed by
considering the effects of dynamic lag onAt the mean angle, a = 36.0 deg, in the steady aerodynamics.
Figure 8(g), again the flow-field character-istics and pressures are similar to those at 4.1 Steady Aerodynamic Characteristicsthe previous angle of 45.8 deg. A slight with Side-Slipoverall lowering of suction levels agreeswith dynamic CN and Cm trends in Figures 5 Measurements were made with the modeland 6. It appears, however, that the wing placed at ±5 deg side-slip by rotating thevortex burst point has moved aft of Section turn table as shown in Figure 1. Steady2 but has not had much effect on pressures. normal force, CN, pitching moment, Cm, andcomparisons between & > 0 and & < 0 for 36.0 rolling moment, C1, variations with a aredeg show an even more pronounced effect of shown in Figure 9 for side-slip of 8 - -5positive and negative pitch rates. This is deg. These curves were constructed fromevident in the pressures, smoke pattern mean values of forces and moments taken fromoutlines and strake vortex positions. low amplitude and/or low frequency unsteady
data since no steady side-slip data wereAt a - 25.2 deg in Figure 8(h), not recording during the test. For reference,
much change has occurred since the previous corresponding results for symmetric flow, 0angle of 36.0 deg which represents a stark - 0 deg, are also shown in Figure 9 asexample of the persistence of stalled flows, dashed lines.These characteristics are seen to be moresimilar to those at the peak angle of 49.8 Similar to the symmetric data, thedeg than those at a - 25.2 dog in Figure "linear" range in Figure 9 is evident in the8(b). This condition also corresponds to CN and Cm data from -8 deg to 8 deg. Beyondthe point of minimum dynamic CN in Figure 5. 8 deg the development of vortex flow is also
seen in Figure 9 but the effect of side-slipcontinuing to the minimum angle a - is indicated by an earlier (I deg) pitch-up
22.1 deg, the change is very pronounced from in the Cm curve at about 17 deg. This is athe previous condition at a - 25.2 dog. The result of earlier vortex bursting on thestrake vortex burst moved quickly aft of windward wing. Above vortex burst, theSection 2 and the wing vortex moved closer developments of CN and C. follow trendsto the wing and increased strength. All similar to those shown for symmetric flow insuction levels increased and trailing edge Figure 3. The lower levels for eitherdivergence was reduced thus leading to the quantity are due to earlier development ofreturn of dynamic CN and Cm values to near vortex bursting on the windward wing. It istheir static values. The reduction of also clear in the Cm curve that fully sops-negative pitch-rate to zero allowed the rated flow occurs earlier with side-slip.flow-fields to "catch-up* and re-establishthe burst vortex flow characteristics at22.1 dog. The sore important result shown in
Figure 9 is rolling moment, C1 , variation
In summary, with a new format for with a. For the sign conventions shown inpresenting unsteady pressure and flow-visu- Figure 2, 0 - -5 dog places the nose rightalization data, it has been possible to more and positive C1 is for windward wing to rollclearly relate the development of dynamic up. Positive Cio therefore stabilizing forflow-field characteristics with force and negative 0 since it tends to reduce P. Thus,moment data trends for the oscillating in the linear range up to a - 8 dog, thestraked wing sodul. In the mid-incidence development of Ci with 0 is stabilizing as arange of a - S deg to 38 dog, lag in vortex result of the windward wing with lower sweepbursting on pitch-up oz the persistence of experiencing higher lift than the leewardvortex burst on pitch-down was shown to wings as is normally expected in linearsignificantly affect the pressure diatribu- flow.tions and hence, dynamic force and momentresults. Vortex strength and position were The development of vortex flows, begin-also seen to have counteracting effects on ning at about 8 deg to 10 dog, signals thepressures. In the high-incidence range of a onset of a destabilizing trend in C1. Under- 22 deg to So dog, the persistence of burst these flow conditions the windward wingvortex flows to angles beyond static stall rolling moment increase with a is less thanwas shown to be responmible for significant that of the leeward wing. This is attribut-
ic lift overshoot with pitch-up. ed to (1) a more rapid growth of the strakel ,the eve ater PeseIatOm" et vortex induced lift inboard on the windward
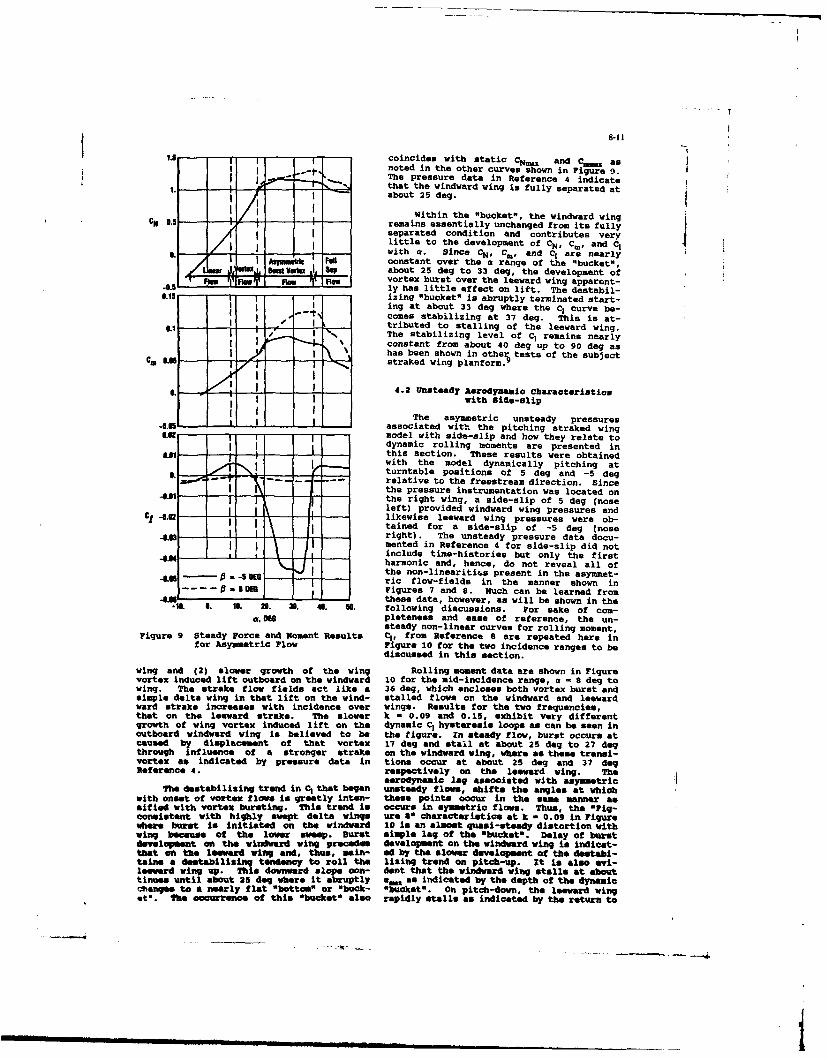
I coincides with static CN. and C.Ua
noted in the other curves shown in Figure 9..- The pressure data in Reference 4 indicate
-I /that the windward wing is fully separated at- about 25 dog.i iWithin the *bucket", the windward wing
CM 0.5 ' I - remains essentially unchanged from its fullyi [ separated condition and contributes verylittle to the development of CN, Cm, and C!with . Since O N, Cm, and C, are nearlyconstant over the a range of the "bucket",
L saw J'"t Mg wV, up+ about 25 deg to 33 deg, the development of__F_ Rvortex burst over the leeward wing apparent-
-0.5 ly has little effect on lift. The destabil-5izing "bucket" is abruptly terminated start-
0.16I 1 --~flIng at about 33 dog where the C, curve be-ll comes stabilizing at 37 de. This is at-
tributed to stalling of the leeward wing.0.1 f ;,W . ,.,, The stabilizing level of C, remains nearly. constant from about 40 dog up to 90 dog an
har been shown in othe teats of the subjectC, DA straked wing planforme
I .-~, - - -4.2 Unsteady Aerodynamic Characteristics5 -t I with Side-SlipI I I
The asymmetric unsteady pressures4.M- I . associated with the pitching atraked wing". 1 -r model with side-slip and how they relate to
dynamic rolling moments are presented inthis section. These results were obtainedwith the model dynamically pitching at
L- - turntable positions of 5 deg and -5 degIL- relative to the freestream direction. Since
the pressure instrumentation was located on"4"81' - - ] the right wing, a side-slip of 5 dog (noseleft) provided windward wing pressures and
- likewise leeward wing pressures were ob-I tained for a side-slip of -5 deg (nose.A .1 - right). The unsteady pressure data docu-
mented in Reference 4 for side-slip did notASK include time-histories but only the first
*. ' -I harmonic and, hence, do not reveal all of-M I the non-lineariti~s present in the asymmet-
-to -ric flow-fields in the manner shown in. DED Figures 7 and S. Much can be learned from. these data, however, as will be shown in the
-1. a. i n. 38. 46. 50. following discussions. For sake of com-a. M pleteness and ease of reference, the un-
steady non-linear curves for rolling moment,Figure 9 Steady Force and Moment Results C1, from Reference 8 are repeated here in
for Asymetric Flow Figure 10 for the two incidence ranges to bediscussed in this section.
wing and (2) slower growth of the wing Rolling moment data are shown in Figurevortex induced lift outboard on the windward 10 for the mid-incidence range, a - 8 dog towing. The strike flow fields act like a 36 dog, which encloses both vortex burst andsimple delta wing in that lift on the wind- stalled flows on the windward and leewardward strake increases with incidence over wing*. Results for the two frequencies,that on the leeward strake. The slower k - 0.09 and 0.15, exhibit very differentgrowth of wing vortex induced lift on the dynamic C, hysteresis loops as can be seen inoutboard windward wing is believed to be the figure. In steady flow, burst occurs atcaused by displacement of that vortex 17 deg and stall at about 25 deg to 27 dogthrough influence of a stronger strake on the windward wing, where as these transi-vortex as indicated by pressure data in tions occur at about 25 deg and 37 dogReference 4. respectively on the leeward wing. The
aerodynamic lag associated with esymmetricThe e stabilizing trend in C that began unsteady flows, shifts the angles at whichwith onset of vortex flows is greatly inten- these points occur in the same manner assified with vortex bursting. This trend is occurs in symmetric flows. Thus, the "Fig-consistent with highly swept delta wing8 ure 8" characteristics at k - 0.09 in Figurewhere bl-rt is initiated on the windward 10 is an almoet quasi-steady distortion withwin, because of the lower sweep. urst simple lag of the -bucketo. Delay of burstdevelopm"t an the windward wing precedes development on the windward wing is indicet-that an the leeWr wing and, thus, main- ed by the slower development of the destabl-tames a eetabillsing tendency to roll the lising trend on pitch-up. It is also evi-leeward wing up. This downward slope con- dent that the windward wing stalls at abouttine" until about 25 deog where it abruptly e as indicated by the depth ot the dynamiccbang"e to a nearly flat *bottom" or "buck- -bcket-. On pitch-down, the leeward winget". Tbe occurrec ot this -bucket" also rapidly stalls as indicated by the return to
i m i -- -* ----m !
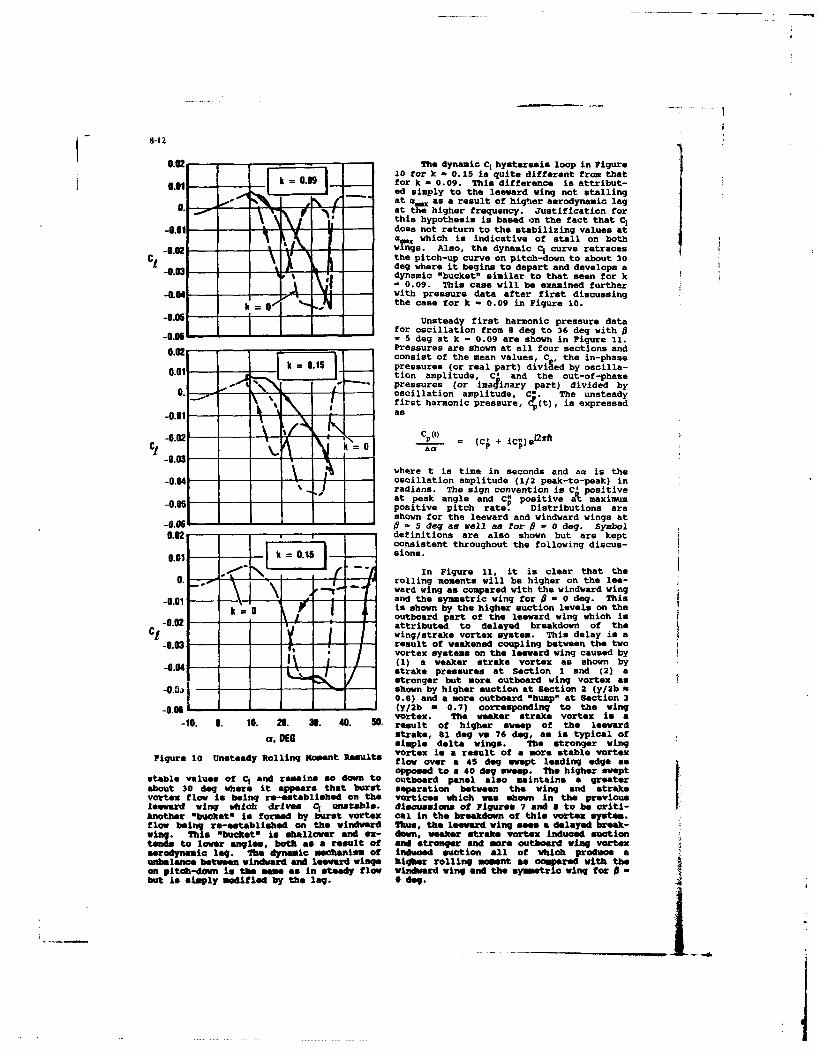
i 8-12
0.02 The dynamic CI hysteresis loop in Figure10 for k - 0.15 is quite different from that
.k 0. - for k - 0.09. This difference is attribut-ad simply to the leeward wing not stalling
- at a. as a result of higher aerodynamic lag9. - . I at the higher frequency. Justification for
this hypothesis is based on the fact that C,-. ot -does not return to the stabilizing values at
a which is indicative of stall on both-00 wvy-.gs. Also, the dynamic C, curve retraces11 the pitch-up curve on pitch-down to about 30
0.03 deg where it begins to depart and develops a, dynamic "bucket" similar to that seen for k.. =j - 0.09. This case will be examined further-0.04 with pressure data after first discussing= •the case for k - 0.09 in Figure 10.
-0.05 iUnsteady first harmonic pressure data
for oscillation from 8 dog to 36 deg with 0-0.06 = 5 deg at k - 0.09 are shown in Figure 11.
Pressures are shown at all four sections and0.02 consist of the mean values, C , the in-phase
k =k0.15 1 pressures (or real part) diviged by oscilla-0.01 - tion amplitude, C' and the out-of-phase
- pressures (or Imajinary part) divided byO._, o-__- oscillation amplitude, C". The unsteady
% first harmonic pressure, c(t), is expressedas
-0.0 C PW CA
d00 ahere t is time in seconds and Ac is the
-0.04 oscillation amplitude (1/2 peak-to-peak) in% . radians. The sign convention is C' positive
-- at peak angle and C" positive at maximum-0.05 positive pitch rate. Distributions are
shown for the leeward and windward wings at-O.6 - , 5 deg as well as for O - 0 deg. Symbol0.02 - , definitions are also shown but are kept
consistent throughout the following discus-0.01 k 0.15 sions.
In Figure 11, it is clear that the0. - rolling moments will be higher on the lee-
-0.01 - - ward wing as compared with the windward wing-0.01 -and the symmetric wing for 0 - 0 dogj. This
k 0 is shown by the higher suction levels on the
k I 0 outboard part of the leeward wing which is-0.02 - - attributed to delayed breakdown of theC1 wing/strake vortex system. This delay is a
-0.03 ,result of weakened coupling between the twovortex systems on the leeward wing caused by
-- j (1) a weaker strake vortex as shown by-0.04 strake pressures at section 1 and (2) a
stronger but more outboard wing vortex as-0. 0 shown by higher suction at Section 2 (y/2b a
0.8) and a more outboard "hump" at Section 3-0.n (y/2b a 0.7) corresponding to the wing
vortex. The weaker strake vortex is a-10. 0. 10. 26. 36. 40. 50. result of higher sweep of the leeward
o, DEG Strake, 81 dong va 76 dog, as is typical ofsimple delta wings. The stronger wingvOrtex in a result of a more stable vortexFigure 10 Unsteady Rolling Moment Results flow over a 45 deg swept leading edge asopposed to a 40 dog sweep. The higher swept
stable values of C, and remains s down to outboard panel also maintains a greaterabout 30 dog where it appears that burst separation between the wing and strakevortex flow is being re-established on the vortices which was shown in the previousleeward wing which drives utatabls. disoussions of Figures 7 and a to be criti-Another "bucket- is formed by buret vortex cal in the breakdown of this vortex system.flow being re-established on the windward Thus, the leeward wing sees a delayed break-wing. This bucket is shallower and ex- down, weaker strake vortex induced suctiontends to lower angles, both as a result of and stronger and more outboard wing vortexaerodynamic lag. fhte dynamic mechanism of induced suction all of which produce aunbalance between windward and leward wings higher rolling moment as compared with theon pitch-down is the some as in steady flow windward wing and the symmetric wing forbut is simply modified by the lag. 0 dog.
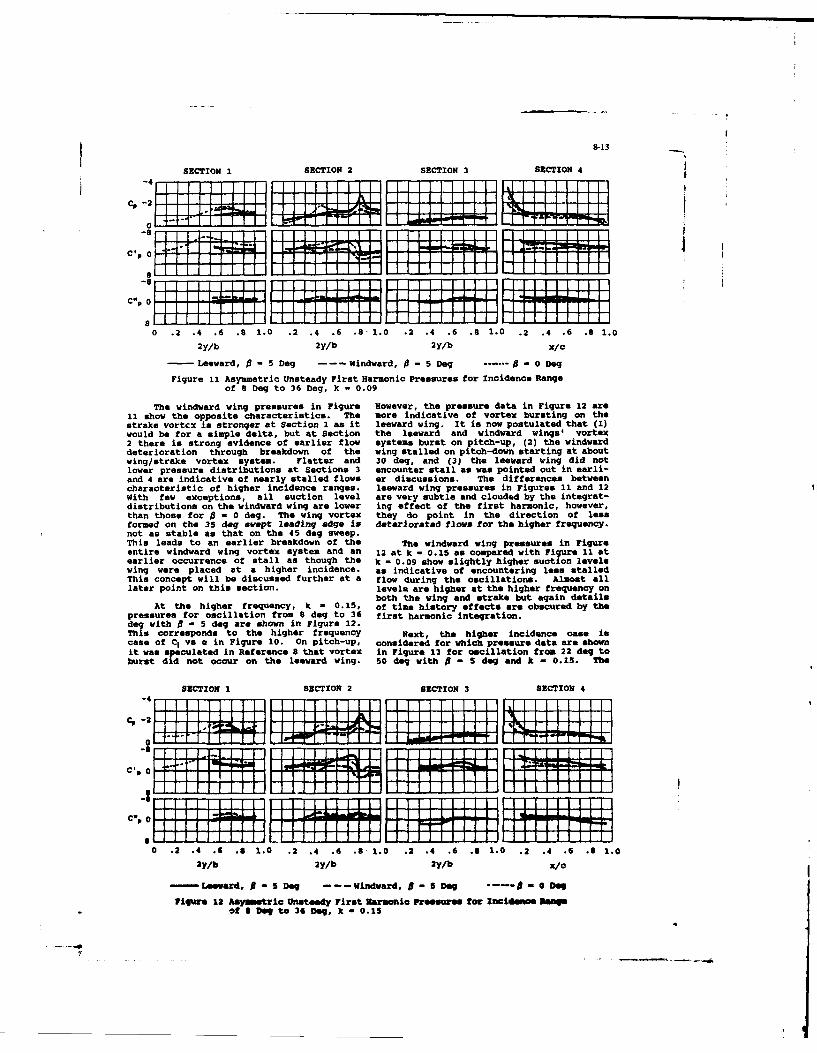
SECTION 1 SECTION 2 SECTION 3 SECTION 4 -
-4
CP -2
C.- IL I. . . .. . I I 1 .1
S ee ar , 5 Dog -- W n w r , D - Dog 5 = o
. ... o D g to 3 Dog,, = 0. 09 ' . . . ... , , l0 .2 .4 .6 .8 1.0 .2 .4 .6 .8" 1.0 .2 .4 .6 .8 1.0 .2 .4 .6 .8 1.0
2y/b 2y/b 2y/b x/c
-Leeward, - 5 Dg ---- Windward, -5 Dog .... - 0 eg
Figure 11 Asyrmmetric Unsteady First Harmonic Pressures for incidence Range
of 8 Dog to 36 Dog, k - 0.09
The windward wing pressures in Figure However, the pressure data in Figure 12 are11 show the opposite characteristics. The more indicative of vortex bursting on thestrake vortex is stronger at Section I aa it leeward wing. It is now postulated that (1)would be for a simple delta, but at Section the leeward and windward wings vortex2 there is strong evidence of earlier flow systems burst on pitch-up, (2) the windwarddeterioration through breakdown of the wing stalled on pitch-down starting at aboutwing/strake vortex system. Flatter and 30 dog, and (3) the leeward wing did notlower pressure distributions at Sections 3 encounter stall as was pointed out in earli-and 4 are indicative of nearly stalled flows er discussions. The differences betweencharacteristic of higher incidence ranges. leeward wing pressures in Figures 11 and 12With few exceptions, all suction level are very subtle and clouded by the integrat-distributions on the windward wing are lower ing effect of the first harmonic, however,than those for 0 - 0 deg. The wing vortex they do point in the direction of lessformed on the 35 dog swept leading edge is deteriorated flows for the higher frequency.not as stable as that on the 45 deg sweep.This leads to an earlier breakdown of the The windward wing pressures in Figureentire windward wing vortex system and an 12 at k - 0.15 as compared with Figure 11 atearlier occurrence of stall as though the k - 0.09 show slightly higher suction levelswing were placed at a higher incidence, as indicative of encountering less stalledThis concept will be discussed further at a flow during the oscillations. Almost alllater point on this section. levels are higher at the higher frequency on
both the wing and strake but again detailsAt the higher frequency, k - 0.15, of time history effects are obscured by the
pressures for oscillation from 8 deg to 36 first harmonic integration.deg with 5 - 5 dog are shown in Figure 12.This corresponds to the higher frequency Next, the higher incidence case iscase of C, vs a in Figure 10. On pitch-up, considered for which pressure data are shownit was speculated in Reference 8 that vortex in Figure 13 for oscillation from 22 deg toburst did not occur on the leeward wing. 50 deg with I - S dog and k - 0.15. The
asTION I SECTION 2 SECTION 3 SECTION 4
-4 ......... III II III
0 7 1"
0- .2 . 4.. 6 . 1. 0 .2 .4 . 5 . 2 4 . . . 0 .2 :4 . . .0
-LeL-D ew --L
of° I- e T I I Ir I
0 .2 .4 .6 .8 1.0 .2 .4 .6 .8 1.0 .2 .4 .6 .8 .0 .2 .4 .6 .$ .0
y/b 2y/b y/b X/c
- Ie -r d, - 5 Dog - - - W id ard , 5 D og .. . - 0o Dow
F 1i W a 1 2 A m a e ft o U n s t e d y F i r s t Har m n i c P r e s s r e fo r In ci d 8 0 0 A M P
of I Degl to 36 og, k - 0.15
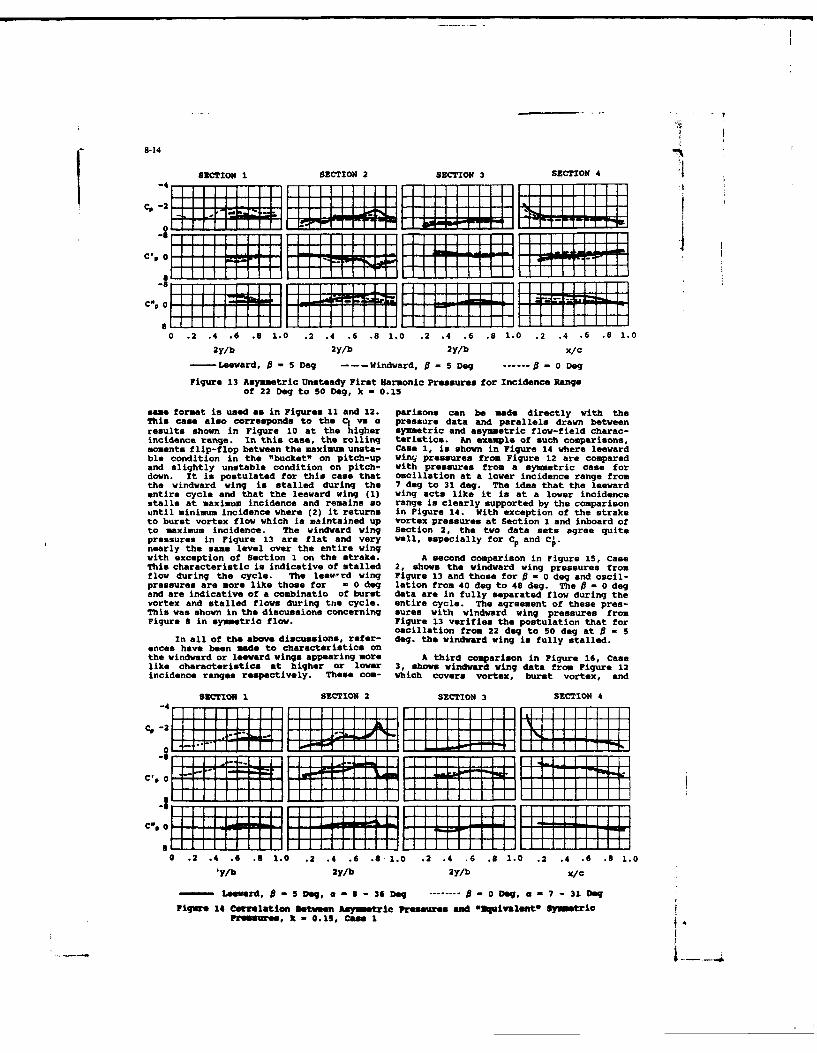
- 8-14
SECTION 1 SECTION 2 SECTION 3 SECTION 4
-4
0P . I I I I 0 .6 I1 . . 2 I . 6 .I 1 . 0.1.
"= -L eeLo"ard, [: :I I g --: nda:,-oe -O e
/ i~~Ez_!j I J: I h
Fiue1-Aymti U -ted Firs Hroic prsue: or Icidence, Sn i g II
: ' :'i~~l L ' " ll lL " I
of 22wrd Deg o 50 inrd Deg .... 0 0.15
same format is used as in Figures 11 and 12. parisons can be made directly with theThis case also corresponds to the C, ve a pressure data and parallels drawn betweenresults shown in Figure 10 at the higher symmetric and asymmetric flow-field charac-incidence range. in this case, the rolling teristics. An example of much comparisons,moments flip-flop between the maximum unsta- Case 1, is shown in Figure 14 where leewardble condition in the "bucket" on pitch-up winqj pressures from Figure 12 are comparedand slightly unstable condition on pitch- with pressures from a symmetric case fordown. It is postulated for this case that oscillation at a lower incidence range from
the windward wing is stalled during the 7 deg to 31 dog. The idea that the leewardentire cycle and that the leeward wing (1) wing acts like it is at a lower incidencestals at maximum incidence and remains so range is clearly supported by the comparisonuntil minimum incidence where (2) it returns in Figure 14. With exception of the straketo burst vortex flow which is maintained up vortex pressures at Section 1 and inboard ofto maximum incidence. The windward wing Section 2, the two data Bets agree guitepressures in Figure 13 are flat and very well, especially for CP and C;nearly the same level over the entire wingwith exception of Section 1 on the strake. A second comparison in Figure 15, CaseThis characteristic is indicative of stalled 2, shows the windward wing pressures fromflow during the cycle. The leewrd wing Figure 13 and those for Pl - 0 deg and oscil-pressures are more like those for - 0 deg lation from 40 deg to 48 deg. The . - 0 degand are indicative of a combinatio of burst data are in fully eeparated flow during thevortex and stalled flows during tfie cycle, entire cycle. The agreement of these pres-This was shown in the discussions concerning auras with windward wing pressures fromFigure 8 in symmetric flow. Figure 13 verifies the postulation that for
oscillation from 22 deg to 50 deg at P - 5In all of the above discussions, refer- deg. the windward wing is fully stalled.
ences have been made to characteristics onthe windward or leeward wings appearing more A third comparison in Figure 16, Caselike characteristics at higher or lower 3, shows windward wing data from Figure 12incidence ranges respectively. Theee COM- which covers vortex, burst vortex, and
SECTION I SUCTION4 2 SECTION 3 SECTION 4-4 = 1-.I
Co -2
0 .2 .4 .6 .8 1.0 .2 .4 .6 .8 1.0 .2 .4 .6 .8 1.0 .2 .4 .6 .8 1.0
ty/b 2y/b 2y/b X,'c
Leeaxi ind e T eindward w -e5iDeg,on-3 eg ... . o Deg,a e 7-31rDeg
Fipure 14 Correlation 3 etween Asymmetric Pressures arid orquipalnd' SymmetricPrewe res, k -0.15, Case
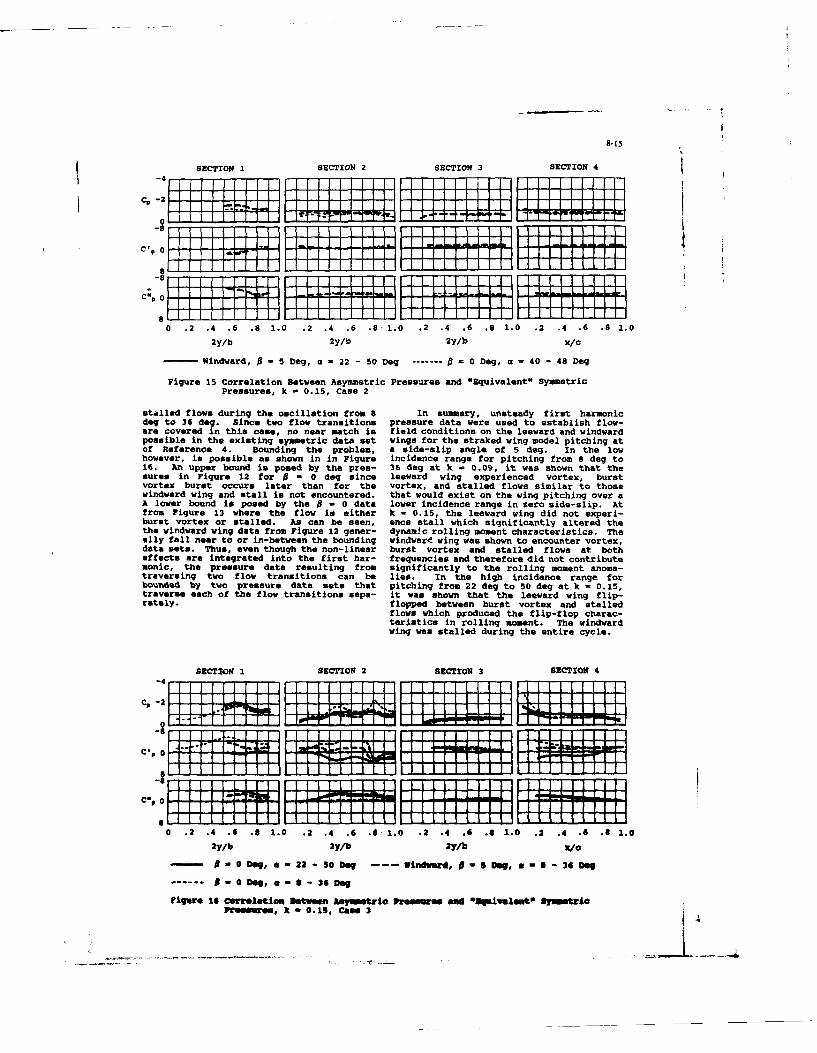
8-15
SECTION I SECTION 2 SECTION 3 SECTION 4
0.2I .4 .6 .8. .2 .4 .6I .81.0 .2t .4' .6 .81.0 .2I .4I I .I .81
Cresure, --I 0I ." A aLL I
' i~~~r IIi-/1 1 1 1
sl f L-1 dring th onis0 .2 .4 .6 .8 1.0 .2 .4 .6 .8 1.0 .2 .4 .6 .8 1.0 .2 . 6 .8 1.0
2y/b 2y/b 2y/b X/C
- windward, -5 Dog, a - 22 - 50 Deg ------- 0 - 0 Dog, a - 40 -48 Dog
Figure 15 correlation Between Asymmetric Pressures and "Equivalent" Sym-metricPressures, k - 0.15, Case 2
stalled flown during the oscillation from 8 In summary, unsteady first harmonicdeg to 36 dog. Since two flow transitions pressure data were used to establish flow-are covered in this case, no near match is field conditions on the leeward and windwardposoible in the existing symmetric data set wings for the straked wing model pitching atof Reference 4. Bounding the problem, a side-slip angle of 5 dog. In the lowhowever, is possible as shown in in Figure incidence range for pitching from 8 deg to16. An upper bound is posed by the pres- 36 deg at k - 0.09, it was shown that thesure$ in Figure 12 for 0 - 0 dog since leeward wing experienced vortex, burstvortex burst occurs later than for the vortex, and stalled flows similar to thosewindward wing and stall is not encountered. that would exist on the wing pitching over aA lower bound is posed by the 5 - 0 data lower incidence range in zero side-slip. Atfrom Figure 13 where the flow is either k = 0.15, the leeward wing did not experi-burst vortex or stalled. As can be seen, ence stall which significantly altered thethe windward wing data from Figure 12 goner- dynamic rolling moment characteristics. Theally fall near to or in-between the bounding windward wing was shown to encounter vortex,data sets. Thus, even though the non-linear burst vortex and stalled flows at botheffects are integrated into the first her- frequencies and therefore did not contributemonic, the pressure data resulting from significantly to the rolling moment anoma-traversing two flow transitions can be les. In the high incidence range forbounded by two pressure data sets that pitching from 22 deg to 50 deg at k - 0.15,traverse each of the flow transitions sops- it was shown that the leeward wing flip-rately. flopped between burst vortex and stalled
flows which produced the flip-flop charac-teristics in rolling moment. The windwardwing was stalled during the entire cycle.
SECTION 1 SECTION 2 SECTION 3 SECTION 4
-4
1"4I -2 LI .L 1--.L ,_ _ -: 1. 1 1 J. 11
J -L . : I LI l11 110C- '"F-11" . ".. .
"~~ "L L !1C, -.
0 .2J .4 .6 .01 .0 .2 .4 .6 .8l 1.0 .2 .4 .6 .8 1.0 .2J .4 .6 .8l 2.0
27/b 27/b 27/b /
A- -DO eg, a - 22 So Dog --- I /nf , 0- 5 Dog, a - I - 36 Do
...... -- ODg, e-e- 361
tigure 16 Co" lation SetCeen Ametric Pregemoms M eivslentO Sy3 otriPrleesree, k -0.15, Come 2
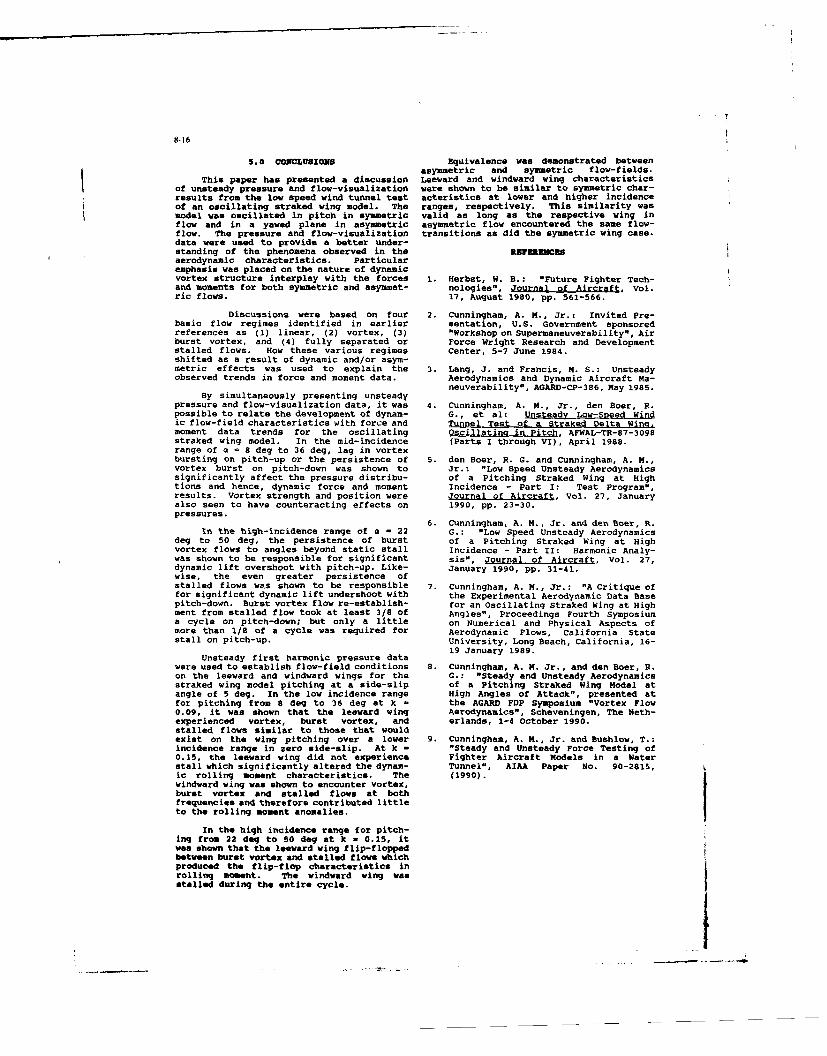
8-16
5 .0 CONCLUBION8 Equivalence was demonstrated betweenasymmetric and symmetric flow-fields.
This paper has presented a discussion Leeward and windward wing characteristicsof unsteady pressure and flow-visualization were shown to be similar to symmetric char-results from the low speed wind tunnel test acteristics at lower and higher incidence
of an oscillating straked wing model. The ranges, respectively. This similarity wasmodel was oscillated in pitch in symmetric valid as long as the respective wing inflow and in a yawed plane in asymmetric asymmetric flow encountered the same flow-flow. The pressure and flow-visualization transitions as did the symmetric wing case.data were used to provide a better under-standing of the phenomena observed in the RaZERMc9saerodynamic characteristics. Particularemphasis was placed on the nature of dynamicvortex structure interplay with the forces 1. Herbst, W. B.: "Future Fighter Tech-and moments for both symmetric and asymmet- nologies", Journal of Aircraft, Vol.ric flows. 17, August 1980, pp. 561-566.
Discussions were based on four 2. Cunningham, A. M., Jr.: Invited Pre-basic flow regimes identified in earlier sentation, U.S. Government sponsoredreferences as (1) linear, (2) vortex, (3) "Workshop on Supermaneuverability", Airburst vortex, and (4) fully separated or Force Wright Research and Developmentstalled flows. How these various regimes Center, 5-7 June 1984.shifted as a result of dynamic and/or asym-metric effects was used to explain the 3. Lang, J. and Francis, M. S.: Unsteadyobserved trends in force and moment data. Aerodynamics and Dynamic Aircraft Ma-
neuverability", AGARD-CP-386, May 1985.By simultaneously presenting unsteadypressure and flow-visualization data, it was 4. Cunningham, A. M., Jr., den Boer, R.possible to relate the development of dynam- G., et al: Unsteady Low-Speed Windic flow-field characteristics with force and Tunnel Test of a Straked Delta Wing.moment data trends for the oscillating Oscillatina in Pitch, AFWAL-TR-87-3098straked wing model. In the mid-incidence (Parts I through VI), April 1988.range of a = 8 deg to 36 deg, lag in vortexbursting on pitch-up or the persistence of 5. den Boer, R. G. and Cunningham, A. M.,vortex burst on pitch-down was shown to Jr.: "Low Speed Unsteady Aerodynamicssignificantly affect the pressure distribu- of a Pitching Straked Wing at Hightions and hence, dynamic force and moment Incidence - Part I: Test Program",results. Vortex strength and position were Journal of Aircraft, Vol. 27, Januaryalso seen to have counteracting effects on 1990, pp. 23-30.pressures.
6. Cunningham, A. M., Jr. and den Boer, R.in the high-incidence range of a = 22 G.: "Low Speed Unsteady Aerodynamics
deg to 50 deg, the persistence of burst of a Pitching Straked Wing at Highvortex flows to angles beyond static stall Incidence - Part II: Harmonic Analy-was shown to be responsible for significant sis", Journal of Aircraft, Vol. 27,dynamic lift overshoot with pitch-up. Like- January 1990, pp. 31-41.wise, the even greater persistence ofstalled flows was shown to be responsible 7. Cunningham, A. M., Jr.: "A Critique offor significant dynamic lift undershoot with the Experimental Aerodynamic Data Basepitch-down. Burst vortex flow re-establish- for an Oscillating Straked Wing at Highment from stalled flow took at least 3/8 of Angles", Proceedings Fourth Symposiuma cycle on pitch-down; but only a little on Numerical and Physical Aspects ofmore than 1/8 of a cycle was required for Aerodynamic Flows, California Statestall on pitch-up. University, Long Beach, California, 16-
19 January 1989.Unsteady first harmonic pressure
data
were used to establish flow-field conditions 5. Cunningham, A. M. Jr., and den Boer, R.on the leeward and windward wings for the G.: "Steady and Unsteady Aerodynamicsstraked wing model pitching at a side-slip of a Pitching Straked Wing Model atangle of 5 deg. In the low incidence range High Angles of Attack", presented atfor pitching from 8 deg to 36 deg at k - the AGARD FDP Symposium "Vortex Flow0.09, it was shown that the leeward wing Aerodynamics", Scheveningen, The Neth-experienced vortex, burst vortex, and erlands, 1-4 October 1990.stalled flows similar to those that wouldexist on the wing pitching over a lower 9. Cunningham, A. M., Jr. and Bushlow, T.:incidence range in zero side-slip. At k - "Steady and Unsteady Force Testing of0.15, the leeward wing did not experience Fighter Aircraft Models in a Waterstall which significantly altered the dynam- Tunnel", AIAA Paper No. 90-2815,ic rolling moment characteristics. The (1990).windward wing was shown to encounter vortex,burst vortex and stalled flows at bothfrequencies and therefore contributed littleto the rolling moment anomalies.
In the high incidence range for pitch-ing from 22 deg to 50 deg at k - 0.15, itwas shown that the leeward wing flip-floppedbetween burst vortex and stalled flows whichproduced the flip-flop characteristics inrolling moment. The windward wing wasstalled during the entire cycle.
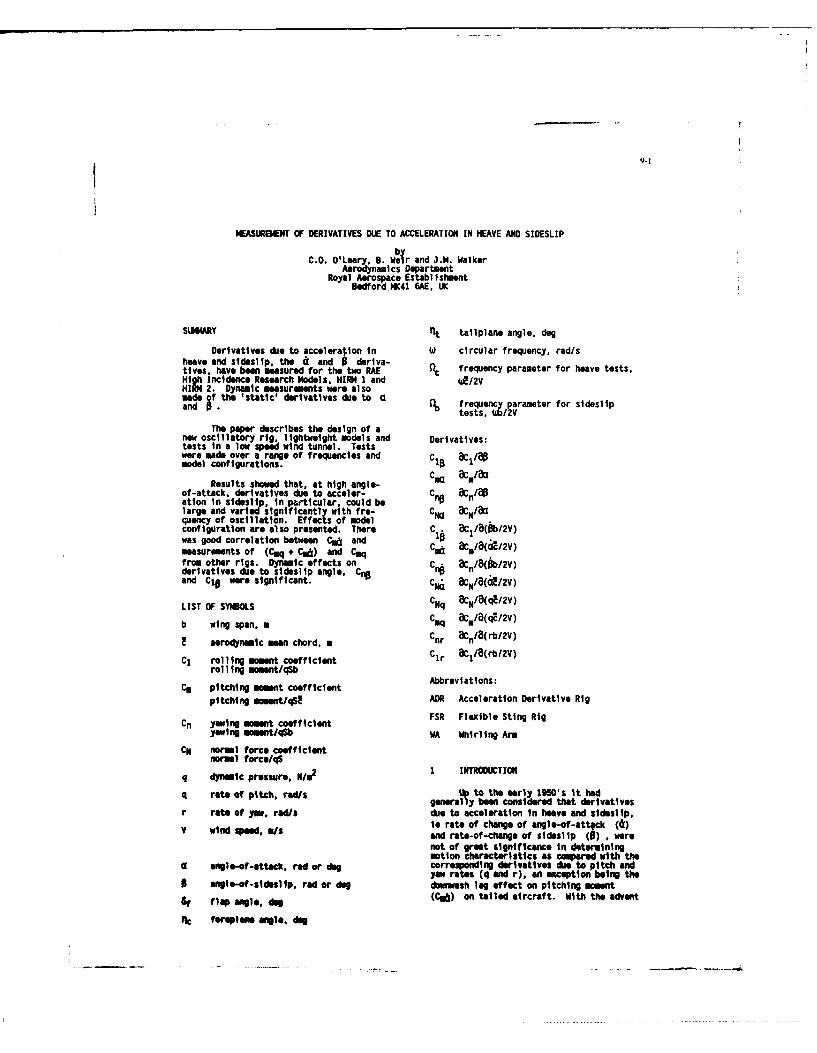
9-1
MEASUREMENT OF DERIVATIVES DUE TO ACCELERATION IN HEAVE AND SIDESLIP
C.O. O'Leary. B. W~r and J.M. WalkerAerodynamics Department
Royal Aerospace EstablishmentBedford W41 6AE. IK
SlIMMARY t tailplane angle. deg
Derivatives due to acceleration In (A circular frequency, radlsheave and sideslip, the dl and 0 deriva-tives, have been measured for the two RAE~ - f frequency parameter for heave tests,High Incidence Research Models, HIRM I and Uf2VHIN 2. Dynamic measurements were alsomade ~fthe 'static' derivatives due to a rqecprmtrfrsdsi
tests. k/2VThe paper describes the design of a
now oscillatory rig, lightweight models and Derivatives:tests in a low speed wind tunnel. Testswere made over a range of frequencies and CIO &c1/80model configurations.
Results showed that, at high angle- 1(1 UC/
of-attack, derivatives due to acceler- Cn BC /88ation in sideslip, In particular, could belarge and varied significantly with fre- CncI BC/ 3'quency of oscillation. Effects of modelconfiguration are also presented. There C 1 c 8 /Vwas good correlation between Cd and 1 ,ai~/Vmeasurements of (Cmq + Cod) and Cuq CIad C*822from other rigs. Dynamic effects on Cn. B;(PIVderivatives due to sideslip angle, CnpOiand CIO were significant. CM& & 8(I8/2V)
LIST OF SYMMOS CNq BCN/ 8 4c/2V)
b wing span, m Cmq aC*/8toE/2V)
I aerodynamic man chord, * Cnr &Cn /(rbI2V)
CI rolling momen coefficient CIr &I 18(rb/2V)
rollIIng moent/qSbCm pitching moment coefficient Abbreviations:
pitching moment/qS2 ADR Acceleration Derivative Rig
Cn yawing moment coefficient FSR Flexible Sting Rigyawing moment/q~b WA Whirling Arm
CM normal force coefficientnoml force/qS
q dynamic pressure, N/m2 1 INTROCUICTION
q rate of pitc,. radis Up~ to the early 1950's it hadgeneral ly been considered that derivatives
r rate of yaw. red/s due to acceleration in heave and sideslip.V wid seed*, ~ie rate of change of angle-of-att4ck (6)V win Wood a/sand rate-of-change of sideslip (0) , were
not of greet significance in diuterminingmotion characteristics as compared with the
(I angle-of-attack, red or dog corresponding derivatives dee to pitch andyaw rates (q and r), an exception being the
3 ngle-of-sideslip, red or dog da -sh lag effect on pitching moment
6f flap angle, deg (Cg&) on tailed aircraft. With the advent
Qc fereplane angle, dog
9-2
of swept and delta wings it became apparent presented on the effects of frequency andthat the J derivatives in particular were configuration and are correlated with data
significant in the prediction of lateral- from other sources.directional stability characteristics at 2 DESIGN CONSIDERATIONShigh angle-of-attack. Attempts were made
to measure B derivatives in wind tunnels In designing the rig there were twowith some success
1 2.3, but these early main objectives:
Innovative tests in the 1950's were notcontinued because of the belief that future 1. For optimum accuracy of measure-combat aircraft would be stand-off missile ent it was necessary to maximise thelaunchers with no reuirement for ratio of aerodynamic to inertial
manoeuvring at high angle-of-attack. In forces acting on the balance.
later years there was renewed interest in 2. To allow tests over a range of
4 derivatives4. and it was concluded' frequency parameter, the rig requiredthat for swept and delta wing aircraft at a support structure of high rig dity.The active components of the rig also
high angle-of-attack the B derivatives needed to be of high stiffness/weightwere large and significant. Since It is ratio so that the lowest natural fre-
niot possible to separate the effects of yaw quency of the rig was significantlyhigher than the maximum oscillation
rate and sideslip rate (r and B) in con- frequency.
ventional rotary forced-oscillation tests, The first objective could only besome mathematical models use the combined attained by use of purpose-built lightderivatives such as (Cnr - C Cosa) and models. Conventional wind-tunnel modelstesae s sully giveasoCnable Crcom)n were unsuitable. Fortuitously, lightthese usually give reasonabla reamnt models of the HIF44 l and HIM 2, had beenbetween actual and predicted flight charac- built for tests on a Whirling Arm (WA)teristicsf. However, this approximation facility. These models have wing spans ofmay not be appropriate in all cases. In iproximately 1.2 a and a mass of onlyRef 5 it is stated that the "use of rotary W kg, compared with 60 kg for the same sizeforced oscillation data to represent conventional models. Naturally, strengthderivatives due to pure angular rates is of the modal was limited by the construc-erroneous at high angles-of-attack'. While tion method and materials used, but for lowthis may be a rather sweeping statement, speed tests the normal force limit ofsince B effects would also be dependent 1000 N was sufficient. The model wason manoeuvre and configuration, there is an designed for sting mounting with accom-
modation for a strain gauge balance, whichobvious need to determine i and I suited the present application.derivatives to improve the prediction ofaircraft flight characteristics. It may be A rigid support structure in the form
possible to calculate approximate values of twin quadrants (Fig 1) is a feature ofusing flow-field-lag theory' but the 13ft x 9ft Low Speed Wind Tunnel at RAEreliability is questionable. A mll- Bedford and suited the requirements of theamplitude oscillatory rig is an obvious present rig. Design of the sting and
xp lmethod. balance, the oscillating mechanism and theexperimental echoice of power source required most
consideration.At RAE Bedford a mlti-degree-of-
freedom oscillatory rig or Flexible Sting Existng strain gauge balances wereRig 7 (FSR) has been developed and operated not sufficienly sensitive for measurementover many years. Rotary derivatives are of model loads at the relatively low windroutinely measured and although models are speeds envisaged (a 30 m/s) . The appli-oscillated in heave and sideslip, deriva- cation called for a light, sensitive five-
tives due to i and 6 are not accurately coponent balance (axial force excluded).determined due to masking by inertial The requirement for the sting was for loweffects from the conventional, rather mass and hih stiffness to minimise deflec-heavy, wind-tunnel models tested on the tion under nertial and aerodynamicrI However, with the development of nw loading.
I construction techniques using strong,lightweight mterials, It became possible To obtain the qired amplitudes ofto ake combat aircraft models of span angle-of-attack and sideslip (±2) the1-1.5 a, weighing less than 6 kg but able specification for aplitude and frequencyto sustain a normal force of 1000 N. Since of motion was ±10 m at 4Hz and ±30 m atthe oscillation frequency could not be 6 Hz. The test angle-of-attack range wasvaried on the existing oscillatory rig, specified as 0* to 40". It became apparent(which was a umitable for tostin that the most practicable method ofightweight mdls), a new ineorable rig satisfying these requirements was to mount
was dsgned for the masurement of deriva- a rotary power source on the sting carriagetives de acceleration In heave and and mechanically convert the rotary motionsideslip. Into linear oscillatory otion. he most
appropriate, and available, power sourcewas a hydraulic motor, since It was rola-
the r=, el m c and medgls, o tively compact and the pum could be accom-tntei tests mde on tim represetattve modeted outside the wind-tunnel workingt aircraft m s.Reslts aresecton.
9-3
A description of the Acceleration leading eo sweep of 5O*. Flaperons shownoAf)Ares lotei o of5"Ilprn hwDerivative Rig (AO) resulting from the were set at zero for theSe tests. Bothabove requirmentso is given in the models have a rectangular section fuselagefollowing section. with rounded corners which blends into a
circular section nose forward of the3 DESCRIPTION OF RIG AND DATA foreplanes. Principal dimensions and
ACQUISITION SYSTEM moment reference centres are given inFigs 3 and 4.
The min component of the rT du seownfin Figs I and 2. is a model suppr sting The models were manufactured fromwhich can be oscillated In heave or lightweight materials, principally a close-sideslip. Forces acting on the mdel are call foam with an external skin consistingmeasured by a strain gauge balance which Is of a fibre-glass 'scrim' of thicknessIntegral to the sting. The flared down- varying between 0.2 m and 0.4 o. Thestream end of the sting is mounted on a balance housing Is a thin-walled aluminiumswinging arm assebly which converts a tube. Control surface settings arerotational shaft drive to translational discretely adjustable. Each model weighsharmonic motion usig a 'scotch yoke' less than 6 kg.slider-tn-a-slot mechanism shown In Fig 2.Amplitude of the motion Is varied by 5 METHOD OF TESTadjusting the throw of the slider within alimit of ±50 me. The slot Is aligned in Before testing In the wind tunnel,the horizontal plane for heave motion and the accelerometer was calibrated dynami-in the vertical plane for sideslipping caly against a master iostrument on amotion. Change of alignment Is platform driven by an eloCtro-agnoticaccoeplished by rotating the whole swinging vibrator. The calibration factor wasarm asseebly througo 90. The sleeve checked over a range of frequencies andmounting for the swinging arms fits over amplitudes. The strain gauge balance wasthe shaft housing and Is bolted to the calibrated by static loading in the usualhousing in either of the two positions, way and first order balance InteractionsThe shaft is driven by a hydraulic motor were removed.whose speed is controlled by a servo valve.Maximum oscillation frequencies are 4 Hz at With the modal fitted to the balance,an amplitude of 50 am and 6 Hz at 30 m signals due to Inertial loading wereamplitude. A hydraulic power pack, cancelled, wind off, at the required testsituated outside the working section of the frequencies and amplitudes using thetunnel, supplies the motor with fluid at accelerometer tare controls on the mixing1500 psi pressure via a rigid pipe and unit. For the actual tests, wind-on dataswivel joint linkage as shown In Fig 1. was further corrected by subtractingThe le assamly is mounted on a carriage residual wind-off signals at the same fre-which is traversed along the twin support quency and amplitude. Maximum angularquadrants to vary model angle-of-attack. deflection of the model due to stingFor the current tests anglo-of-attack was bending was 0.2* at 4 Hz, ±50 m amplitude.limited to 42".
Amplitude of oscillation was setModel motion is measured with an manually by adjusting the throw on the
accelerometer In the model, the sensitive slider, and frequency was set by adjustingaxis being aligned in the appropriate the speed of the hydraulic motor to thedirection for the test. The signal Is also required value.used to cancel outputs of the strain gaugebalance due to Inertial loading. HIRS 1 and HIR 2 were both tested in
the heaving and sideslippi modes for aThe data acquisition system is simi- range of frequencies, ampll ds and model
lar to that used for FSR tests7 . Strain configurations. However, most of the2auge blance and accelerometer signrals are results presented in this paper are limitedamplified and filtered using matched 20 Hz to three frequencies at maximum amplitude.filtrs. In addition, phase lags are The lowest hoave and sideslip frequncyIntroduced in the strain gauge signals so parameters were similar to tho of the
as to match the acceleromter to better short period and dutch roll oscillations ofthan I.2 over the frency range of the a typical combat aircraft. Wind speeds,tests. Interactions are elimined within determined by strength limitations of thea signal mixingunit. After conversion to rig and models, were 25 m/s for the heavedigital for the In-phase nd in-quadrature tests and 30 m/s for sideslipping tests.omponnts of the signals re determined Reynolds number. based on ao m men
using a discrete Famrler transform and the chord ws apprximtely one million.coponents are normllsod with respect to Transition trips w not Used on eitherthe reference accleromtr signal model. The normlisd in-phase and in-
quadrature cappnents of the signals were4 E IPTION OF ELS converted to derivatives In b axes,
using the appropriate calibration factorsGeneral arrangments of HI 1 end and freen s as shown In the Appendix.
2ar I Fgsand4.espec- Although al five belance signals weretively. HINN 1 Is a t SUmo rfac con- recorded for both heeving an sideslIppingfiguration with a wing of supercritical tests, results are presen'd only for nor-section and control surfaces of s~etrcal ml force and pitchi ngl mamn In thesection. The vim leading edge is meept at heaving mode, end Yaing omn and rolling
te2thandci l md0m in t stideli ing made. Data forangle-of-attack tests, Him 2 is tyical cross copling derivaves have not, asof a delta-¢anard agile fighter with a wing yet, been analysed.
9-4
Since the resultt were to be corre- vortex flow over the wings due to P andlated with results from tests with the FSRno attept was made to Include the still secondly, thre is a lag of stdwash at thair duping, or virtual Inertia', in the fin. It Is probable that the former is themeasureents by shrouding the model for major contributor to C1 while thewind-off tests. This may be included in latter has most effect on Cro . Thefuture tests.
effects of configurp'ion will be addressed6 RESULTS AND DISCUSSION more fully in a later section. It is again
6.1 Effects of frequency apparent that, as for the a derivatives,increase in frequency diminishes the
Effects of frequency on the normal effects of 0 , as found in previous work2force and pitching moment derivatives due at similar frequency parameters.to 1 , CN& and Cm are shown in Fig 5for HIRN 1. Effects of frequency on the direc-
tional and lateral 'static' derivativesResults are presented for frequencies C and C10 for HIRM 2 are also signifi-
of 2 Hz, 3 Hz and 4 Hz giving frequency caht (Fig 6). Up to I = 3D directionalparameters, k (- /2V) of 0.097, 0.145 stability Cn8 is reduced by increasingand 0.194. Aml itude of oscillation was frequency, aproximately 4 reduction±50 m. In terms of perturbation In angle- between values for highest and lowest fre-of-attack, the amplitudes were ±1.5', ±2.2" quencies at a - 0" . For 32' < U ( 38°
and ±2.9" respectively, the negative excursion in Cn is greaterat low frequency. When the model wastested with the fin off (not presented)
At angles-of-attack up to 16' both there was negligible frequency effect onthe 4 derivatives are small for all fre- C at low a , indicating that increasingquencies but at higher angles-of-attack the frequency reduces fin effectiveness. Earlyeffect of frequency is significant. For NASA testsZ on a 60 swoep delta modelN- 0.097 there are significant ecur- showed that Cno was at a maximum forstons frm zro which are progressively 0.12. The lateral stability deriva-
timinished as frequency increases toIc - 0.145 and 0.194. Previous tests" tive C1 is not affected by frequency athave shown that flow separates on part of Iow angle-of-attack but for 1 > 28' therethe wing surface at I a 17' and the is a much greater loss in stability (moreeffect of the transition phase to fully positive) at lower frequency. Similarstalled flow is evident on both derivatives effects were noted in the work of Ref 2.for 17" ' U ( 25' . There are alsoincreases in magnitude at the highest The effect of amplitude at a comonangles-of-attack tested. The magnitude of frequency is shown InFig 7, for thethese derivatives depends on the lag In the derivatives C& (HIRN ). C* anddevelopment of lift on the foreplane. wing (HIRN 2). Results are shown foP aeplitualsand tailplane as angle-of-attack varies and of 30 m (6a - ±1 7') and 5 mm
, in particular, will also be (6U - 2.9") at k - 0.194 for C&
influenced by the lag in downwash at the and % - 0.465 for the lateral deriva-tail. As shown in Fig 5, these effects are tives. In each case the effect of anpli-reduced as frequency is increased. tudo is small. For amplitudes less than
30 me measurement accuracy was degraded.Except for Fig 7, all results presented in
Effects on the longitudinal 'static' the paper relate to 50 m amplitude.derivatives, CNa and CM , are alsoshown in Fig 5. Increasing frequency 6.2 Effects of configurationcauses some reduction in CNa and a posi-tive shift in Cna . Again, sharp changes 6.2.1 Effects of foreplanes on ( deriva-in magnitude for 16' < ( < 20' diminish tives for 14 2as frequency increases.
Effects of frequency on the lateral The effect of the presence of fore-derivatives Cr, C . Cno and CI for planes on CM& and CM& is shown in Fig 8the canar-confi red MIRN 2 are shown in for (k - 0.14 . For angles-of-attack upFig 6. As for the heave tests, oscillation to (I - 28' , CH Is small and negativeaplitude was SO - a reults are pro- with and without foreplanes, but for_ented for frequecy pariters 28" < ' < 42' the derivative is relatively
g(hbl) of 0.233, 0.349 and 0.465. large and positive, with some reduction dueCore spding ane-hd eli9 ~to the presence of foreplanes. With
foreplanes on, Cmn is positive at low atptO a-25' the i derivatives (as for HIR 1, Fig 5) but for 0 > 28,
are relatively smell with little frequency when CIg becomes large, there is aeffect. For % - 0.233 there are thenrapid increases In both derivatives but significant shift to negative values whichinc-eass an prgessively less at the Is increased by the removal of foreplanes.higher frequenCies. It is ptI*I that Also noticeable Is a positive ucursion inthere ae w min contributions to thesederivatives: firstly, there Is a lag in the
9-5
tests with the FSR, C1a and Cm areCn at a U 19" which is only present with measured as in-phase terms whereas In testsforeplanes on. Overall, foreplanes tend to with the AIR they are measured as in-
reduce 11 effects on HIR4 2. quadrature terms during heaving motion.Thus the measurements are made In differentkinematic states. At high angl*-of-attack,
6.2.2 Effect of foreplanes on 6 deriva- the presence of large areas of separated
tives for HIRM 2 flow may have dynamic effects which couldcause the apparent discrepancies between
The effect of foreplanes on Cn6 the different sets of data.
and C i s shown In Fig 9 for Corresponding comparisons are made% - 0.233 . Up to U - 25- Cn i is for the lateral derivatives Cnn and Cconstant at about 0.1 for both configur- of HRI4 2 In Fig 12. There istesonableatonsant t aut 0.frapidy b th conftgagreement between the three sets of resultsations but incres rapidly with U1 too xetta IRrslsidctreach a peak of 0.8, foreplanes on, for Cn except that A)R results indicate
C1 = 36" . With foreplanes off there is a greater directional instability (more nnga-substantial increase in CnO for C1 > 16. tve) for 28" < 35' . Differences nTrends in the variation of C* are siri- measurements of CIO are more dramatic.
Sideslip frequency has a major effect on
Tar with a rapid increase in magnitude as the magnitude of this derivative ata increases beyond 25-. Here againforeplanes have the effect of reducing the high (I , as discussed in section 6.1 andmagnitude of the derivative at high angle- shown again in Fig 12. However, the lossof-attack. A possible explanation for in lateral stability, is a positive shiftthese effects Is that the foreplane wakes in CIO , is much less according to FSRreduce the lateral flow lag through results at a similar value of 0 . Resultsinteraction with the wing vortices, from static tests agree fairly closely with
ADR results for the lowest frequency,6.2.3 Effect of fin on 6 derivatives for % - 0.233 but are less negative than FSR
HIRM 2 data, a feature which was noticed In pre-
As shown in Fig 10, the fin makes a vious tests on a swept wing model'. Thekinematics of FSR and ADR lateral tests is
major contribution to Cn. • There is a similar to longitudinal tests so that CR
small positive Increment due to the fin at and CIO are measured as in-phase termsI
low UE , but for d > 25" Ci" is markedly during yawing oscillations with the FSR and
increased when the fin Is on. In contrast as in-quadrature terms In a sideslippingoscillation with the ADR. The results inthere is little fin effect on C1 , where Fig 12 indicate that there is a strong
the magnitude of both fin-on and fin-off dynamic effect on CIO at high angle-of-measurements are small at low a but attack and also that measurement techniqueincrease rapidly for C1 > 28" . These Is significant.results suggest that lag of sidewash overthe fin is the major source of Cri but 6.3.2 Derivatives due to d and
translational flow lag effects on the Cg for HIRN I is compared withwings, unaffected by the presence of the (Ceq + Cod ) from FSR tests and Cwq fromfin, cause large Increases in -CI6 athigh U1 WA tests's in Fig 13. In a WA test the
model is fixed to the end of a beam andwhirled about a horizontal axis. The
6.3 Comoarison with static and other model travels In a static annular testoscillatory data channel, wings in the vertical plane. Such
a test allows measurement of forces due to6.3.1 Derivatives due to U and B rate of pitch only as opposed to a rotary
Acceleration Derivative Rig (AIR) pitching test In a wind tunnel (FSR) where
measurements of CM and Ca for HIM 1 forces due to q and d cannot beare coared with results from static and separated. The measurements show that Cmqoscillatory tests in Fig 11. The latter is fairly constant at approximately -6 upwere obtained with the FSR which Is to the highest test angl-of-attack of 28"routinely used to measure derivatives atRAE,' . With this rig the derivatives and the fluctuations in (Caq + C) for
were determined from a pitching oscil- a > 16' are due to variation In CE&lation, as opposed to a heaving oscillationin AIR tests. In the case of the AOR andFSR results, colprlsons are made for siit- For HtRM 2, the damping-in-yawtar values of lic 'Static' CIa and derivative (Cnr -C4 cos U) and the crossCa were determined from the slopes ofCN and Cm against ae. -of-attack. All draping (CIr -Cj* cos U) from FSR tests"tests were made at a similar Reynoldsnubr. There Is reasonable agreement are compared. in Fig 14, with Cn0 Cos abetween the three sets of results for and C1* cos a respectively from AORU (20" but at high a the AORImeasure-ment of CU Is greeter. In pitching
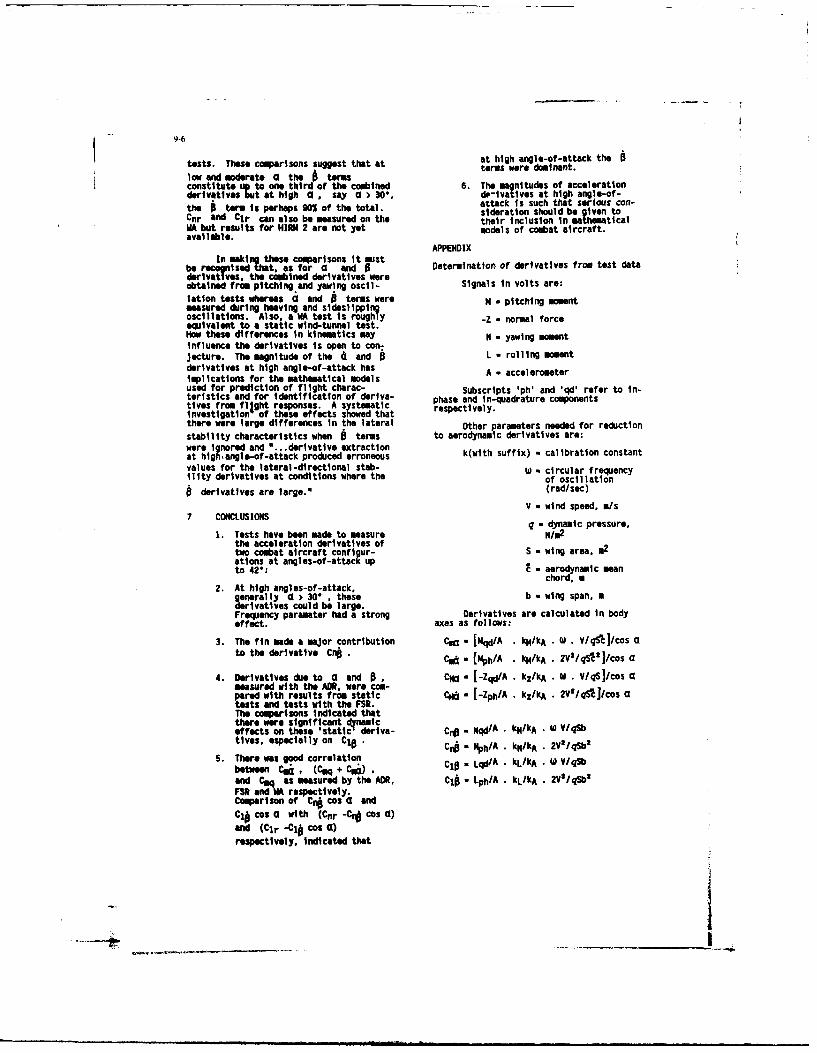
tss Tat high angle-of-attack the
tests. These comparisons suggest that at terms were dominant.low and moderate G the 0 termsconstitute to one third of the combined 6. The magnitudes of accelerationderivatives but at high U , say U > 30%, de-ivatives at high angle-of-the B ter is perhaps S0% of the totl. attack Is such that serious con-"o sideration should be given toCnr and Cir can also be measured on the their inclusion In wathematicalWA but results for HIRN 2 are not yet models of coabat aircraft.available.
APPENDIXIn making these comparisons It must
be recognised that, as for a and B Determination of derivatives from test dataderivatives, the combined derivatives wereobtained from pitching and yawing oscil- Signls In volts are:
lation tests whereas U and i terms were M - pitching momentmeasured during heaving and sideslippinoscillations. Also, a WA test is roughly -Z - normal forceequivalent to a static wind-tunnel test.How these differences in kinematics may N - yawing momentInfluence the derivatives is open to con-jecture. The magnitude of the 4I and B L - rolling momentderivatives at high angle-of-attack has1:plications for the mathematical modelsused for prediction of flight charac- Subscripts 'ph' and lqd' refer to In-teristics and for identification of deriva- phase and in-quadrature componentstives from flight responses. A systematic respectively.Investigation of these effects showed thatthere were large differences in the lateral Other parameters needed for reductionstability characteristics when 6 terms to aerodynamic derivatives are:were ignored and ".. .derivative extractionat high, angle-of-attack produced erroneous k(with suffix) - calibration constant
values for the lateral-directional stab- W - circular frequencyility derivatives at conditions where the of osci llation
derivatives are large.x (rad/sec)
V -wind speed. mIs7CONCLUSIONS q - dynamic pressure,
1. Tests have been made to measure Him2
the acceleration derivatives oftwo combat aircraft configur- S - wing area, m
2
ations at angles-of-attack upto 42' c t aerodynamic mean
chord, m2. At high angles-of-attack,
generally U > 30' , these b -wing span, mderivatives could be large.Frequency paramter had a strong Derivatives are calculated In bodyeffect. axes as follows:
3. The fin made a major contribution Cra - [Mqd/A . kM/kA (. • V/qS]/cos ato the derivative Cno . Cmd - [1ph/A • k14/kA . 2V/qtj/cos
4. Derivatives due to a and 0 , CNa - [-Zqd/A . kzlkA W -• ViqS]/cos Imeasured with the ADR, were com-pared with results from static C - [-Zph/A • kz/kA • 2V1/qS1]lcos atests end tests with the FSR.The comperisons indicated thatthere were significant dcrnamtceffects on these 'static deriva- Cno - Nqd/A . kNI/kA W Ii ViqSbtives, especially on CIO . CnA - NphlA • kN/kA • 2V 2iqSb2
5. There was good correlation kL/kA W V/QU
between CA , (Cmq + Cn) .Ci . Lqd/Aand Cm as measured by the ADR, C16 - LphlA . kLIkA . 2V2/qSb 2
FSR and M respectively.Coperi son of Cr# cos ( andCIO cos a with (Cnr - COS 0)and (CIr -C16 cOS a)respectively, indicated that
_________
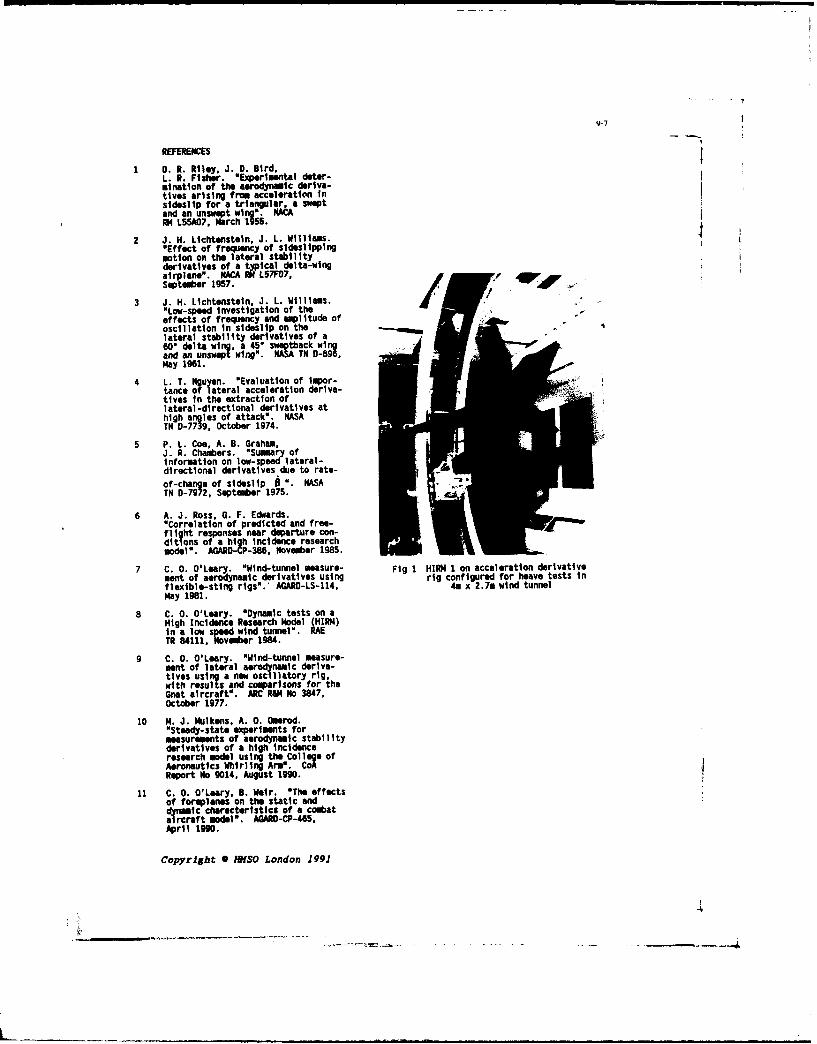
9-7
REFERENCES
L. R. Riley, J. D. Bird,1. A. Fisher. "Experimental deter-mination of the aerodynamic deriva-tives arising from acceleration insideslip for a triangular, a sweptand an unswept wing. NACARM L55A07, March 1955.
2 J. H. Lichtenstein. J. L. Williams."Effect of frequency of sideslippingmotion on the lateral stability
derivatives of a t ical delta-wingairplane'. NACA ML57F07,September 1957.
3 J. H. Lichtenstein, J. L. Williams." Low-speed investigation of theeffects of frequency and amplitude ofoscillation In sideslip on thelateral stability derivatives of a60" delta wing a 45" swptback wingand an unslept wing'. NASA TN D-896,may 1961.
4 L. T. Nguyen. "Evaluation of impor-tance of lateral acceleration deriva-tives in the extraction oflateral-directional derivatives athigh angles of attack". NASATN D-7739, October 1974.
5 P. L. Coo, A. B. Graham,J. R. Chabers. "Summary ofinformation on low-speed lateral-directional derivatives due to rate-
of-change of sideslip 5 ". NASATN D-7972, September 1975.
6 A. J. Ross, G. F. Edwards."Correlation of predicted and free-flight responses near departure con-ditions of a high incidence researchmodel". AGARD-CP-386, November 1985.
7 C. 0. O'Leary. "Wind-tunnel measure- Fig 1 HIRM 1 on acceleration derivativement of aerodynamic derivatives using rig configured for heave tests inflexible-sting rigs".' AGARD-LS-114, 4m x 2.7m wind tunnelmay 1981.
8 C. 0. O'Leary. "Dynamic tests on aHigh Incidence Research Model (HIRM)in a low speed wind tunnel". RAETR 84111, Novemer 1984.
9 C. 0. O'Leary. "Wind-tunnel measure-ment of lateral aerodynamic deriva-tives using a now oscillatory rig.with results and comparisons for theGnat aircraft". ARC R&M No 3847,October 1977.
10 N. J. Iulkens, A. 0. O erod."Steady-state experiments formeasurements of aerodynamic stabilityderivatives of a high incidenceresearch model using the College ofAeronautics Whirling Anm. CoAReport No 9014, August 1990.
11 C. 0. O'Leary, B. Weir. "The effectsof foreplanes on the static anddynamic chracteristics of a combataircraft model". AGARD-CP-465,April 1990.
Copyright 0 IINSO London 1991
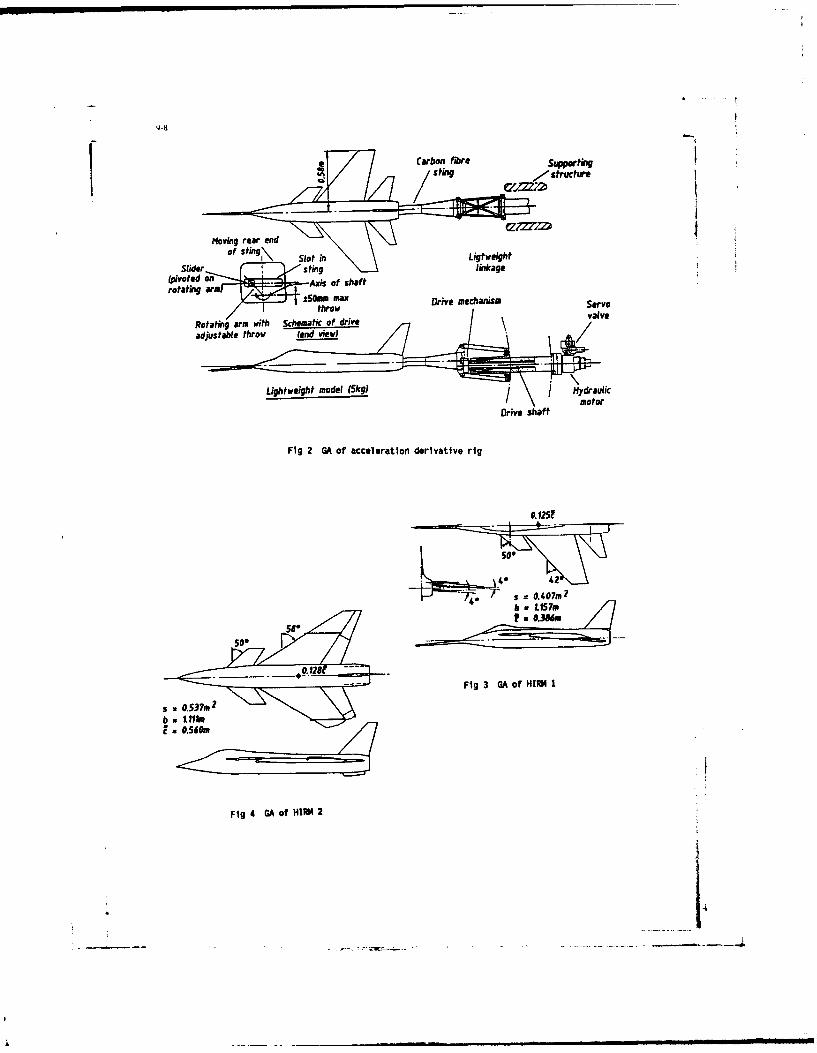
9-8Carbon fibre SUPpotig
of st \ slot in Ligt weightSlidr stng Iinkage
(pivoted onAxsoshf
rotaing rm Cm max Drive mechanism
Rotating arm with Schematicof drivevaeadjustable throw (end view)
Lightweight model (kg) / j Hydraulic
Drive shaft
Fig 2 GA of acceleration derivative rig
0.1251
42
580~ 0.38do
~Fig 3 GA of 141WMtI
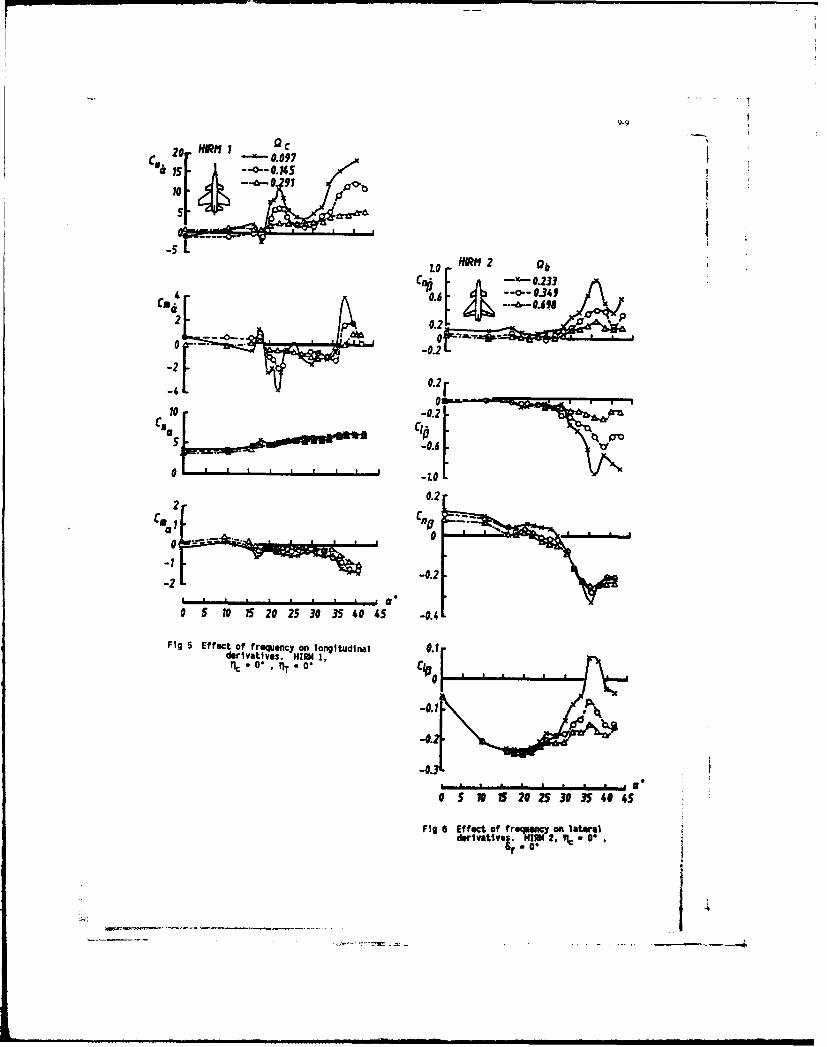
9-9
CC
Cy. 20 HEM 0.09
0. 01V0 -0.20,
_-to
deiatvs.NRM1
flC * V 0.2
00
f 0
-024
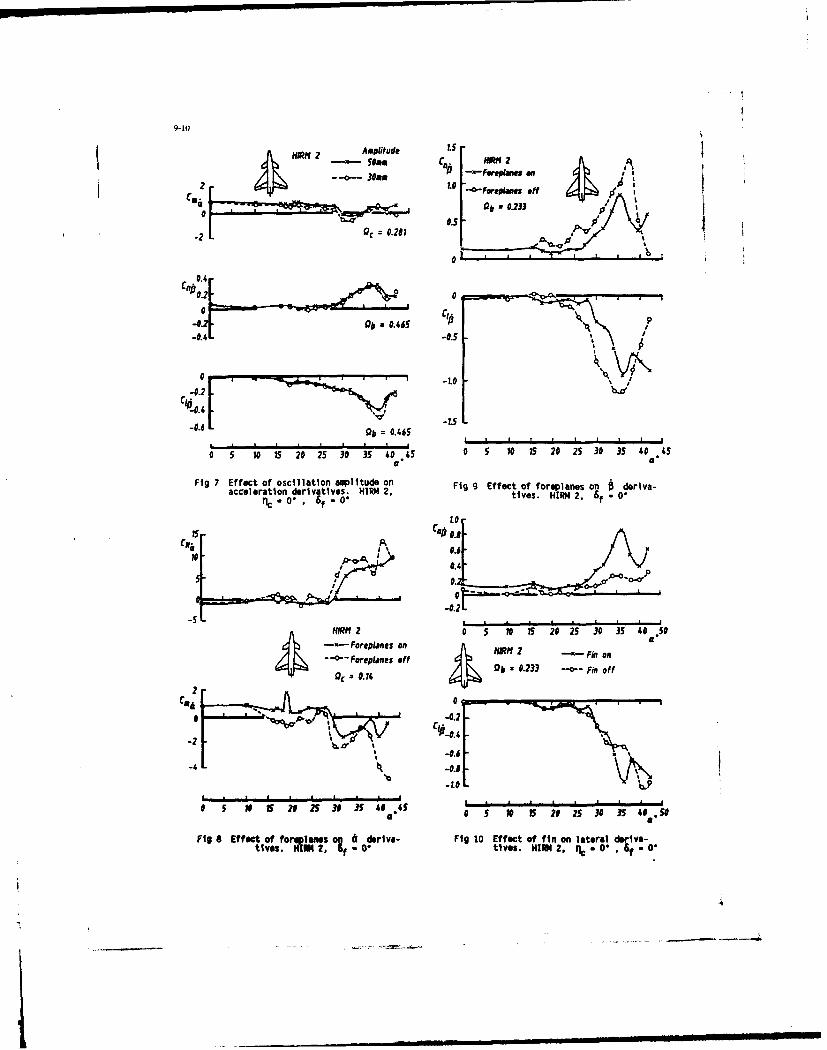
9-l0
HJ112 Amptitude Lr
o ----- , .-- a-- 303 ,- o , af en,Cmi Ift NFeorepmes off j
Ob 0.233
- c ,.0.281 0.
0
00' " p-I .0
0.4C 0 2 0 *O' 0 D
.- Qb 0.465 1 q
16 15 20 2S 30 3 40 a.5 0 5 10 IS 20 25 30 35 40 45
Fig 7 Effect of oscillation aplitude on Fig g Effect of foreplanes on deriva-
acceleration derivatives. HIRM 2, tives. HIRI 2, 8f 0
nc o .o . f 02
" ~~t,-I
"-1Felae 1 f Ab 1 0..6..---n
I PVA0.0.5
0.,
-0.2
A HIR 2 P 0 5 15 20 25 30 35 40 .50-- Foreplanes oW11 2 - Fiaa0 Foreplnes :of f 6023 i f9 C a .14 0. 3 0 - i
Ca. 0 _ _ _ _ _ _ _ _ _ _ _ _ _ _ _
o 0 -0.2
-0.
-0.5
* S V IS 29 25 39 35 406.45 0 S It 15 29 25 30 35 49 .50
Fig 8 Effect of forplanes 1 deriva- Fig 10 Effect of fin on lateral dera-t vo,. " o 2. f O " tives. IN 2, nc " O" , -
i: . l iI I II I l lmI ImI III II Il
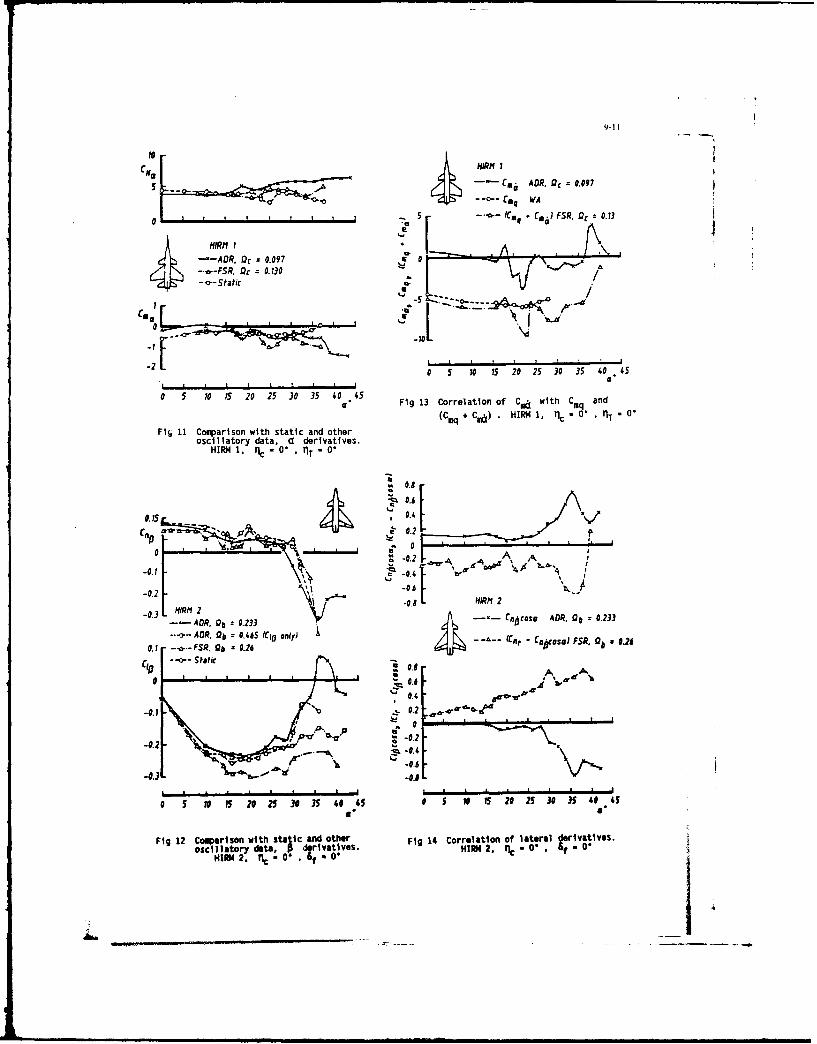
9-I1
10C,6 A. HIR1N I
_---C. ADR. Oc 0.097
0 I t I I 5 ..e.- Cmq Caj~) FSR. Dc 0.13
HIRM I L .~ 1~.A. FRQ,0l-- ADR. Oc z 0.097 a-o-.-FSR. Dc = 0.130
C6 0
' 'I-10
02 5 0 5 2105 20 25 10 0 3 40 45
a" Fig 13 Correlation of Ca with Caq and
(CaI + Cma) . HIR 1, 1c 0* , T
Fl6 11 Comparison with static and otheroscillatory data, ( derivatives.HIRM4 1, n~c -0* ,IT -0
•
.. 0.8
0.6
0.15
-0.2,- -06-ol-.2 o~ AR 2 "F. HIRM 2- H R, l .3 -- Cn~jcoso ADR, O1b 0.233
-- AOR, Ob 0.233. C. A R, Qbh 0.465 (C1 only) -- - r ACn osa . Ob 0.2
0.1 -.. FSR, 0b * 0.26
CIO -.,o-- Static 0.8
-0.1~ 0.2
-0.2 0.21A. A .. 6.......... ...............................
0 5 20 Ze 25 30 J 40 45 0 S 10 I5 20 25 30 JS 40 45
Fig 12 Coparison with sta&ic and other Fig 14 Correlation of lateral erivatives.oscillatory data, p derivatives. HIRM 2. r1 O , 0 *HII 4 2, 0. " f O . 0. fO
WIND TUNNEL FORCE NEAURENENTB AND VISUALIZATION ON A 60-DEGREE DELTA WING IN OSCILLATION, STEPWZBZ NOTION AND GUSTS
Per-Ake TorlundFFA, The Aeronautical Research Institute of Sweden
P.O.Box 11021, S-16111 Bromma, Sweden
Abstract cr root chord (m)f frequency (Hz)
A 60-degree delta wing has been tested k reduced frequency = mfcr/Uwin pitching motion in FFA's low-speed Re Reynolds numberwind tunnel L2 at the Royal Institute U. free stream velocity (m/s)of Technology. Harmonic oscillation q. free stream dynamic pressure (Pa)tests with 4* and 80 amplitude at 0 to a angle of attack (*)350 angle of attack were carried aE equivalent angle of attackout.The reduced frequency was between aE=a+a*r (0).003 and .195 . Both dynamic r angle of gust generator wings (0)
aerodynamic derivatives and timehistories of the normal force and Subscriptspitching moment were recorded.The same model was also tested in a s static conditionsstepwise motion up to 90* angle of q rotation derivativeattack. The steps were positive and a angle of attack rate derivativenegative with 20* amplitude startingevery 10*, also steps over the full I. Introduction900 were made. The angle of attackrates were chosen to correspond to the The requirements for maneuverabilityoscillation tests, the maximum being in fighter aircraft is, like always,360*/s and the acceleration 13500 increasing. Recent trends include1/s2. The tunnel speed was 57 m/s in post-stall maneuvering to high anglesmost cases and the centerlins chord of attack and relaxed staticwas .5 m. stability. This leads to high pitchThe response to the step motion was rates in a part of the envelope wherecompared to the response predicted traditional dynamic derivatives mayfrom the results of the oscillation not be sufficient to model thetests.These coincide fairly well at response of the aircaft.low angle of attack whereas large In order to get a better physicaldiscrepancies are evident at moderate understanding of these high angle ofangle of attack. Long time delays are attack, dynamic flow phenomena aseen when the dynamic motion passes series of low speed wind tunnel teststhe angle of attack where the vortex have been conducted at FFA. A largeburst reaches the apex at steady state part of these tests were carried outconditions. with a schematic delta wing model withSome visualization of vortex burst 60 degree sweep. Some of the reasonsposition in the oscillation and for this choice of model is; astepwise motion tests were made with relatively simple interpretation ofsmoke and Schlieren optics and visualizations and an aspect ratiocorrelated to the force measurements. comparable to modern fighters.The 60 degree delta wing has also been Several types of tests were carriedtested in a recently completed gust out including harmonic pitchinggenerator. Force measurements for motion, stepwise pitching motion andgusts compared to step motion in pitch gusts in pitch.show the same long timedelays.Comparing gust and step 1I. Experimental Techniaue and Setupresponse during the motion gives thepossibility to separate & and q Wind Tunneleffects.
The tests were carried out in FFA'sNmenclature low speed wind tunnel L2 at the Royal
Institute of Technology in Stockholm.a constant see aZ The wind tunnel has a closed circuitCH pitching moment coefficont with a 2x2 ml test section with cutcm normal force coefficient corners giving a 3.6 m3 cross section.mac mean aerodynamic chord (m) The maximum speed is aproxmatly 6S
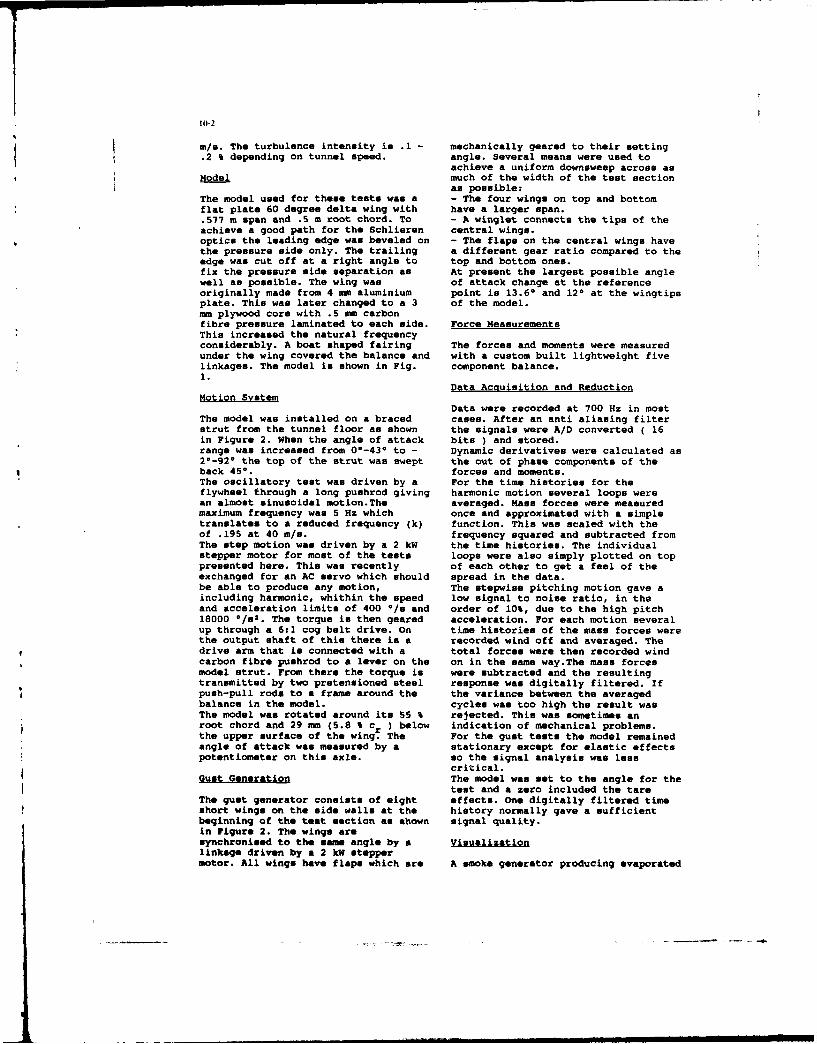
10-2
M/s. The turbulence intensity is .1 - mechanically geared to their setting.2 % depending on tunnel speed. angle. Several means were used to
achieve a uniform downsweep across asSModel much of the width of the test section
I as possible:The model used for these tests was a - The four wings on top and bottom
flat plate 60 degree delta wing with have a larger span..577 m span and .5 m root chord. To - A winglet connects the tips of theachieve a good path for the Schlieren central wings.optics the leading edge was beveled on - The flaps on the central wings havethe pressure side only. The trailing a different gear ratio compared to theedge was cut off at a right angle to top and bottom ones.fix the pressure side separation as At present the largest possible anglewell as possible. The wing was of attack change at the referenceoriginally made from 4 mm aluminium point is 13.60 and 120 at the wingtipsplate. This was later changed to a 3 of the model.mm plywood core with .5 mm carbonfibre pressure laminated to each side. Force MeasurementsThis increased the natural frequencyconsiderably. A boat shaped fairing The forces and moments were measuredunder the wing covered the balance and with a custom built lightweight fivelinkages. The model is shown in Fig. component balance.1.
Data Acauisition and ReductionMotion System
Data were recorded at 700 Hz in mostThe model was installed on a braced cases. After an anti aliasing filterstrut from the tunnel floor as shown the signals were A/D converted ( 16in Figure 2. When the angle of attack bits ) and stored.range was increased from 00-430 to - Dynamic derivatives were calculated as2*-92* the top of the strut was swept the out of phase components of theback 450. forces and moments.The oscillatory test was driven by a For the time histories for theflywheel through a long pushrod giving harmonic motion several loops werean almost sinusoidal motion.The averaged. Mass forces were measuredmaximum frequency was 5 Hz which once and approximated with a simpletranslates to a reduced frequency (k) function. This was scaled with theof .195 at 40 m/s. frequency squared and subtracted fromThe step motion was driven by a 2 kW the time histories. The individualstepper motor for most of the tests loops were also simply plotted on toppresented here. This was recently of each other to get a feel of theexchanged for an AC servo which should spread in the data.be able to produce any motion, The stepwise pitching motion gave aincluding harmonic, whithin the speed low signal to noise ratio, in theand acceleration limits of 400 °/s and order of 10%, due to the high pitch18000 */s1 . The torque is then geared acceleration. For each motion severalup through a 61l cog belt drive. On time histories of the mass forces werethe output shaft of this there is a recorded wind off and averaged. Thedrive arm that is connected with a total forces were then recorded windcarbon fibre pushrod to a lever on the on in the same way.The mass forcesmodel strut. From there the torque is were subtracted and the resultingtransmitted by two pretensioned steel response was digitally filtered. Ifpush-pull rods to a frame around the the variance between the averagedbalance in the model, cycles was too high the result wasThe model was rotated around its 55 % rejected. This was sometimes anroot chord and 29 mm (5.8 % cr ) below indication of mechanical problems.the upper surface of the wing. The For the gust tests the model remainedangle of attack was measured by a stationary except for elastic effectspotentiometer on this axle. so the signal analysis was less
critical.Gust Generation The model was set to the angle for the
test and a zero included the tareThe gust generator consists of eight effects. One digitally filtered timeshort wings on the side walls at the history normally gave a sufficientbeginning of the test section as shown signal quality.in Figure 2. The wings aresynchronised to the same angle by a Visualizationlinkage driven by a 2 kW steppermotor. All wings have flaps which are A smoke generator producing evaporated
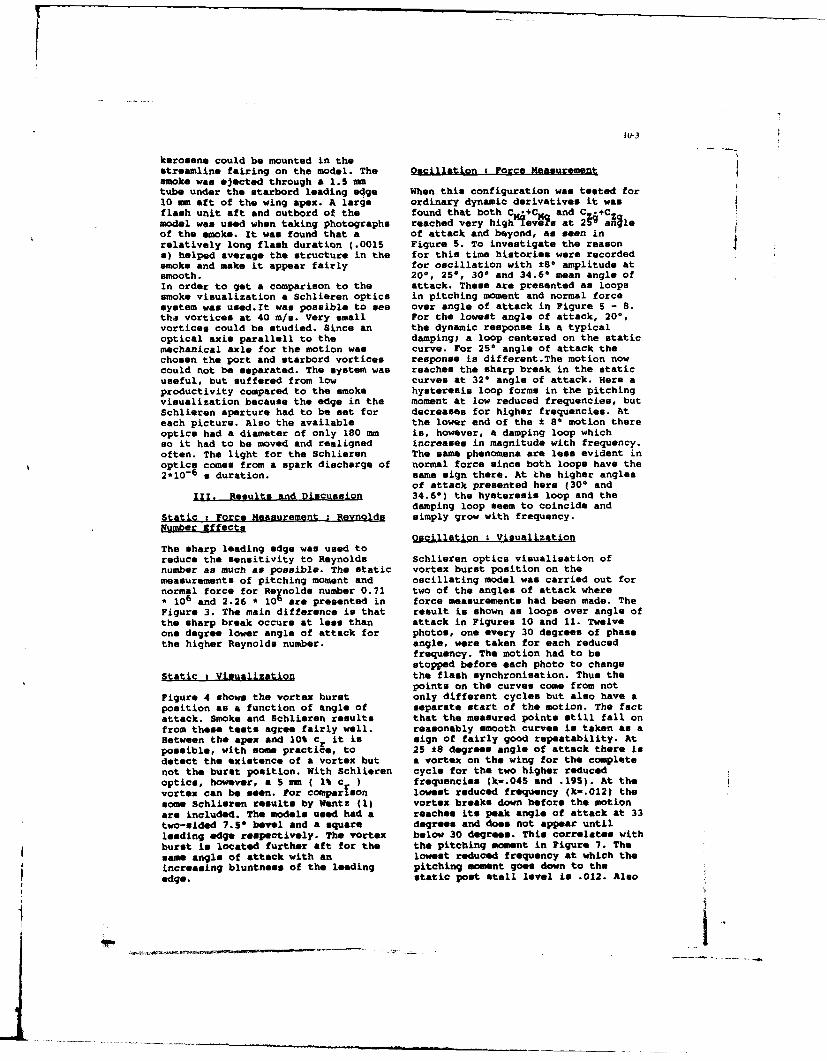
10-3
kerosene could be mounted in thestreamline fairing on the model. The Oscillation : Force Measurementsmoke was ejected through a 1.5 mmtube under the starbord leading edge When this configuration was tested for10 sm aft of the wing apex. A large ordinary dynamic derivatives it wasflash unit aft and outbord of the found that both C - C-, and Cmodel was used when taking photographs reached very high-Zeve at 2 1. aleof the smoke. It was found that a of attack and beyond, as seen inrelatively long flash duration (.0015 Figure 5. To investigate the reasona) helped average the structure in the for this time histories were recordedsmoke and make it appear fairly for oscillation with *8
° amplitude atsmooth. 200, 250, 30* and 34.61 mean angle ofIn order to get a comparison to the attack. These are presented as loopssmoke visualization a Schlieren optics in pitching moment and normal forcesystem was used.It was possible to see over angle of attack in Figure 5 - 8.tha vortices at 40 m/s. Very small For the lowest angle of attack, 20°,vortices could be studied. Since an the dynamic response is a typicaloptical axis parallell to the damping; a loop centered on the staticmechanical axle for the motion was curve. For 25° angle of attack thechosen the port and starbord vortices response is different.The motion nowcould not be separated. The system was reaches the sharp break in the staticuseful, but suffered from low curves at 32* angle of attack. Here aproductivity compared to the smoke hysteresis loop forms in the pitchingvisualization because the edge in the moment at low reduced frequencies, butSchlieren aperture had to be set for decreases for higher frequencies. Ateach picture. Also the available the lower end of the * 8 0 motion thereoptics had a diameter of only 180 an is, however, a damping loop whichso it had to be moved and realigned increases in magnitude with frequency.often. The light for the Schlieren The same phenomena are less evident inoptics comes from a spark discharge of normal force since both loops have the2*10 - 6 s duration. same sign there. At the higher angles
of attack presented here (304 andIII. Results and Discussion 34.60) the hysteresis loop and the
damping loop seem to coincide andStatic ; Force Measurement , Reynolds simply grow with frequency.Number Kffects
Oscillation : VisualizationThe sharp leading edge was used toreduce the sensitivity to Reynolds Schlieren optics visualisation ofnumber as much as possible. The static vortex burst position on themeasurements of pitching moment and oscillating model was carried out fornormal force for Reynolds number 0.71 two of the angles of attack where. 106 and 2.26 * 101 are presented in force measurements had been made. TheFigure 3. The main difference is that result is shown as loops over angle ofthe sharp break occurs at less than attack in Figures 10 and 11. Twelveone degree lower angle of attack for photos, one every 30 degrees of phasethe higher Reynolds number. angle, were taken for each reduced
frequency. The motion had to bestopped before each photo to change
Static : Visualization the flash synchronisation. Thus thepoints on the curves come from not
Figure 4 shows the vortex burst only different cycles but also have aposition as a function of angle of separate start of the motion. The factattack. Smoke and Schlieren results that the measured points still fall onfrom these tests agree fairly well. reasonably smooth curves is taken as aBetween the apex and 10% cr it is sign of fairly good repeatability. Atpossible, with some practice, to 25 *8 degrees angle of attack there isdetect the existence of a vortex but a vortex on the wing for the completenot the burst position. With Schlieren cycle for the two higher reducedoptics, however, a 5 mm ( 1% c ) frequencies (k-.04S and .195). At thevortex can be seen. For comparfson lowest reduced frequency (k-.012) thesome Schlieren results by Wentz (1) vortex breaks down before the motionare included. The models used had a reaches its peak angle of attack at 33two-sided 7.SO bevel and a square degrees and does not appear untilleading edge respectively. The vortex below 30 degrees. This correlates withburst is located further aft for the the pitching moment in Figure 7. Thesame angle of attack with an lowest reduced frequency at which theincreasing bluntness of the leading pitching moment goes down to theedge. static post stall level is .012. Also
A~-,~p.TC~aE9S~f'i
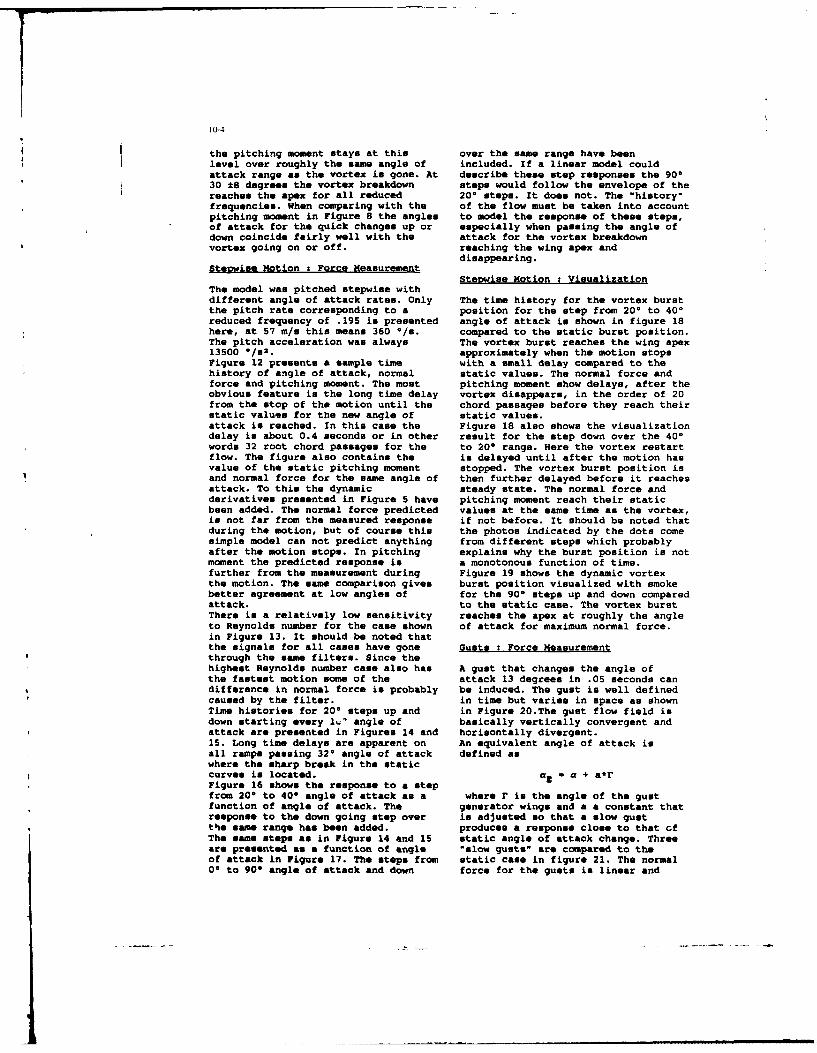
10-4
the pitching moment stays at this over the same range have beenlevel over roughly the same angle of included. If a linear model couldattack range as the vortex is gone. At describe these step responses the 90*30 ±8 degrees the vortex breakdown steps would follow the envelope of thereaches the apex for all reduced 200 stops. It does not. The "history"frequencies. When comparing with the of the flow must be taken into accountpitching moment in Figure 8 the angles to model the response of these steps,of attack for the quick changes up or especially when passing the angle ofdown coincide fairly well with the attack for the vortex breakdownvortex going on or off. reaching the wing apex and
disappearing.Stepwise Motion : Force Measurement
Stepwise Motion ; VisualizationThe model was pitched stepwise withdifferent angle of attack rates. Only The time history for the vortex burstthe pitch rate corresponding to a position for the step from 20* to 40°
reduced frequency of .195 is presented angle of attack is shown in figure 18here, at 57 m/s this means 360 Oe. compared to the static burst position.The pitch acceleration was always The vortex burst reaches the wing apex13500 */s2 . approximately when the motion stopsFigure 12 presents a sample time with a small delay compared to thehistory of angle of attack, normal static values. The normal force andforce and pitching moment. The most pitching moment show delays, after theobvious feature is the long time delay vortex disappears, in the order of 20from the stop of the motion until the chord passages before they reach theirstatic values for the new angle of static values.attack is reached. In this case the Figure 18 also shows the visualizationdelay is about 0.4 seconds or in other result for the step down over the 40"words 32 root chord passages for the to 20" range. Here the vortex restartflow. The figure also contains the is delayed until after the motion hasvalue of the static pitching moment stopped. The vortex burst position isand normal force for the same angle of then further delayed before it reachesattack. To this the dynamic steady state. The normal force andderivatives presented in Figure 5 have pitching moment reach their staticbeen added. The normal force predicted values at the same time as the vortex,is not far from the measured response if not before. It should be noted thatduring the motion, but of course this the photos indicated by the dots comesimple model can not predict anything from different steps which probablyafter the motion stops. In pitching explains why the burst position is notmoment the predicted response is a monotonous function of time.further from the measurement during Figure 19 shows the dynamic vortexthe motion. The same comparison gives burst position visualized with smokebetter agreement at low angles of for the 90 steps up and down comparedattack. to the static case. The vortex burstThere is a relatively low sensitivity reaches the apex at roughly the angleto Reynolds number for the case shown of attack for maximum normal force.in Figure 13. It should be noted thatthe signals for all cases have gone Gusts : Force Measurementthrough the same filters. Since thehighest Reynolds number case also has A gust that changes the angle ofthe fastest motion some of the attack 13 degrees in .05 seconds candifference in normal force is probably be induced. The gust is well definedcaused by the filter. in time but varies in space as shownTime histories for 200 steps up and in Figure 20.The gust flow field isdown starting every l&' angle of basically vertically convergent andattack are presented in Figures 14 and horisontally divergent.15. Long time delays are apparent on An equivalent angle of attack isall ramps passing 320 angle of attack defined aswhere the sharp break in the staticcurves is located, a. . a + a*FFigure 16 shows the response to a stepfrom 20" to 40° angle of attack as a where r in the angle of the gustfunction of angle of attack. The generator wings and a a constant thatresponse to the down going step over is adjusted so that a slow gustthe same range has been added. produces a response close to that ofThe same steps as in Figure 14 and 15 static angle of attack change. Threeare presented as a function of angle "slow gusts" are compared to theof attack in Figure 17. The steps from static case in figure 21. The normal00 to 900 angle of attack and down force for the gusts is linear and
10-5
close to the static values. The Referencespitching moment coincides with thestatic curve for zero gust generator 1 Wentz, W.H.,"Wind Tunnelangle, but falls below it at both Investigations of Vortex Breakdown onends. Slender Sharp-Edged Wings", NASA CR-Figure 22 presents the time histories 98737.for three positive gusts compared to 2 Wolffelt,K.W.,"Investigation of thesteps over the same a ranges and with Movement of Vortex Burst Position withthe same speed.The 15.50 to 28.50 case Dynamically Changing Angle of Attackonly shows significant difference for a Schematic Delta Wing in a Waterduring the motion. This should be Tunnel With Correlation to Similarmainly the difference between & and q Studies in a Wind Tunnel",AGARD-CP-response. If the difference in a 413, 1986, pp.2 7-1-27-8.between the front and aft end of the 3 Bragg,M.B., andmodel is disregarded the gust produces Soltani,M.R,"Measured Forces andan a only. For the 21.5* to 34.5" and Moments on a Delta Wing During Pitch-28.5* to 41.5" cases there are some Up",Journal of Aircraft, Vol.27,No.3,differences during the motion that may 1990 pp. 262-267.be due to the lack of rotation for thegust. The time delays after the motionare roughly the same for the gusts andthe steps.The same observations hold for thenegative gusts in figure 23.The comparison between gust and stepmotion during the actual motion ishighlighted in figures 24 and 25 wherethe same cases are plotted over angleof attack.
IV, Conclusions
A 60 degree schematic delta wing hasbeen tested in oscillation, stepwisemotion and gusts.Both the static results and theresponse to stepwise pitching arerelativly insensitive to Reynoldsnumber in the .7 to 2.3 million range.This configuration has a sharp breakin both pitching moment and normalforce at 32 degrees angle of attack.By visualization with smoke andSchlieren optics this has beencorrelated to the vortex reaching thewing apex and disappearing.When passing this angle of attack upor down dynamically, time delays inthe forces, sometimes as long as 30to 40 chord passages of the flow, aremeasured especially when the motionstops a few degrees after the criticalangle.Time delays are seen for gusts as wellas for oscillation in pitch andstepwise pitching motion.These time delays have correlated withdelays in vortex breakdown in allcases where good visualization havebeen achieved. The delays in theforces can, however, be much longer.Comparing stepwise pitching motionwith gusts can separate a and qderivatives. The limited angle ofattack range of the gust generator(130) limits the study of time historyeffects though.
Ii
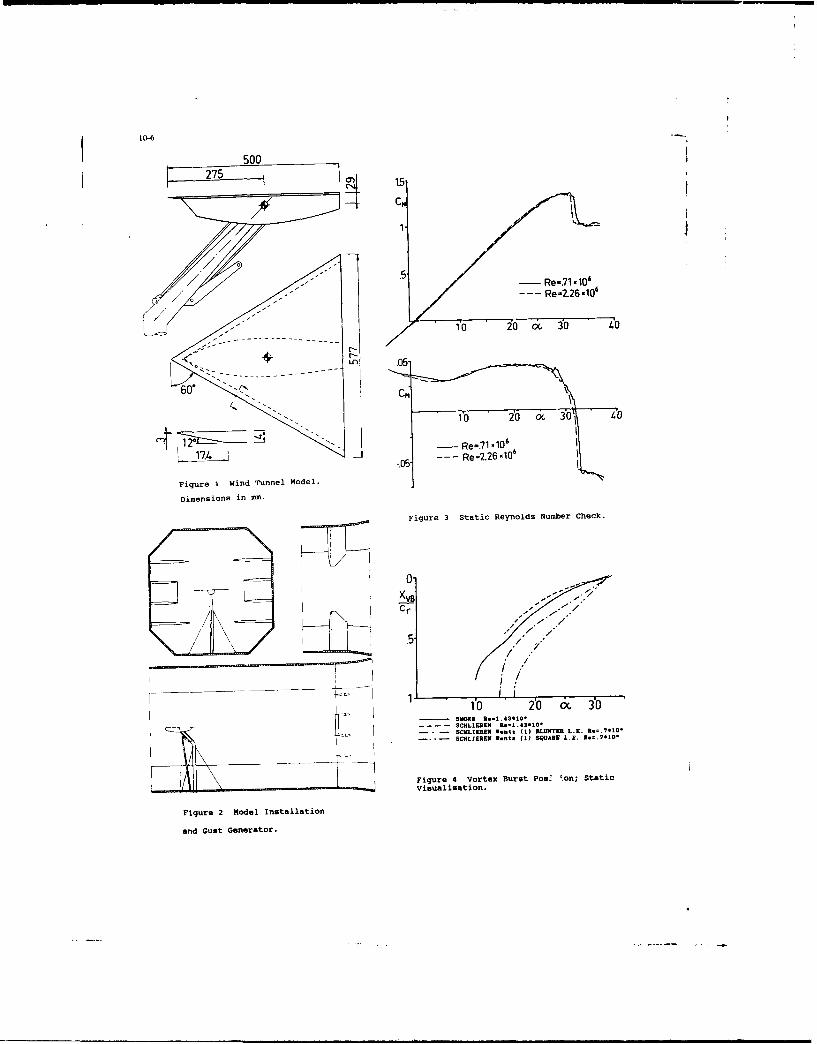
10-625 50
500L _27 -__ n
C
/ < -. 7110
Re-/2' / 0
1 10 2 -&10,
Figure I worte Bunnet Model-;Stti
Figure 2 Modelc ReynldsNulbrtionk
and Gut Genrat0r
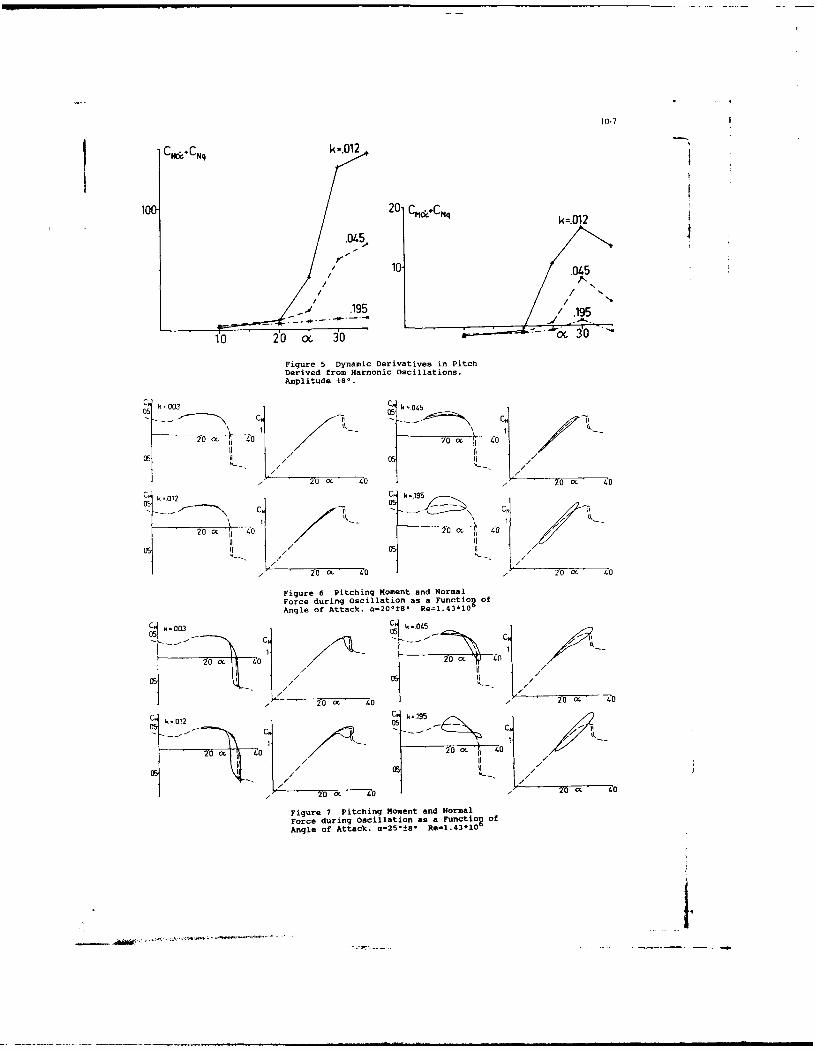
10-7
C&. CNq k=.012
10& 20 Cm*CMq k=.012
.045,
10 .045/ ,
/ /
jq/ .15!_ .J y..
1,10 2'0 (x 30
Figure 5 Dynamic Derivatives in PitchDerived from Harmonic Oscillations.Amplitude ±8*.
C k-003 C'k-045
20 (X /.0 2o -I 1o
5 5II
_ k012. /Ck1C C .k LC191kI -
10 40 1 /20 m 40
Figure 6 Pitching Moment and Normal
Force during oscillation as a Functio of
Angle of Attack. a=200±8 "
Re=l.43*10
C' k-.003 k -0.5
- 'C IoI - - ---- - - -,, ,
/ 20 (x" 40 /- 20To -M -0
5 C,
20~ 1. /20cc. 40
k-02 5k=9
-T -0, -To- /O 1
Figure 7 Pitching Moment and NormalForce during oscillation as a Functiono
Angle of Attack. a-25*W Re-l.43*1Pof
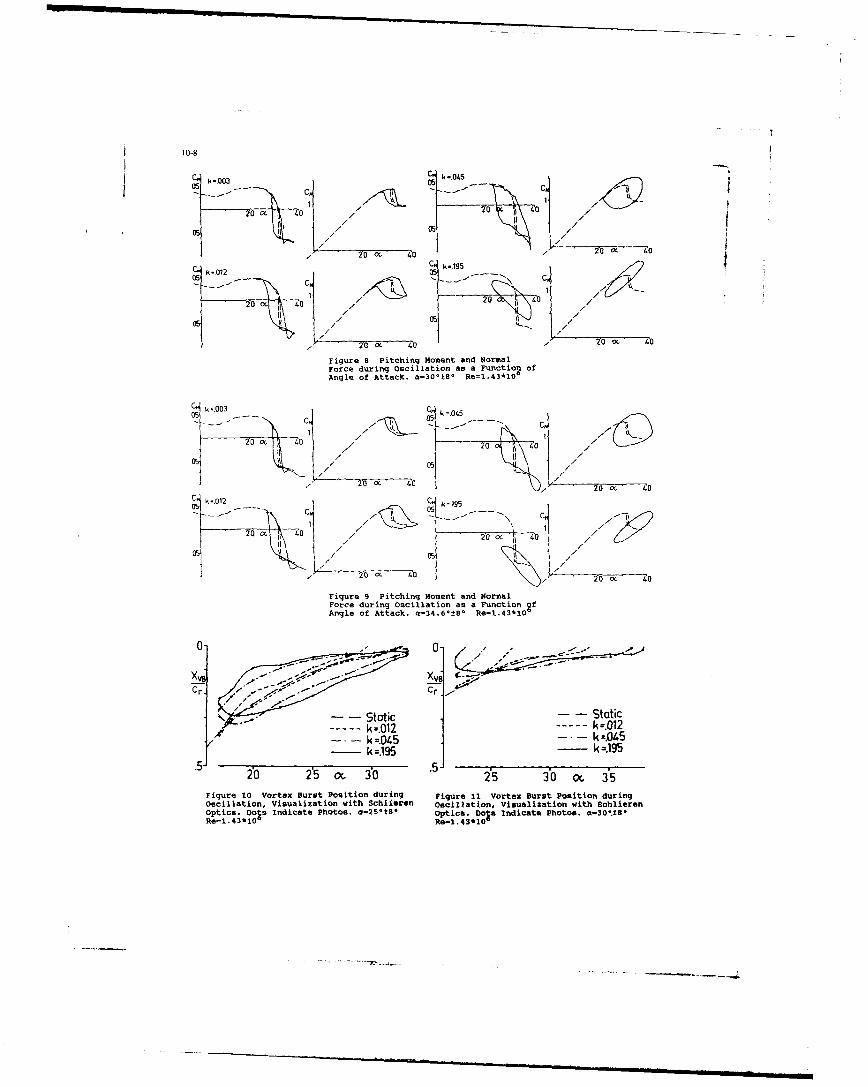
k * .003 - 0 5--I
1. m
20 140
10~ 40 C. k-19 40
C'k-,012 -5 --- C
1 tk10 0/o& :
20Cc 140 20 140 / L
Figure 8 Pitching Moment and NormalForce during Oscillation as a Functiog ofAngle of Attack. a-304±80 Re=1.43*1O
C k-,003 c, k 045
0 5 C ' 0 5 C m0G 01 / /- /-Z0 0
5"l / 05/
70 o 40 -m 4
05 k-01 C C, k=195
2-0 40 40 /0 20x -400
Figure 9 Pitching Moment and Normalforce during Oscillation as a Function ?Angle of Attack. 0=34.6-t8- Re=l.43*10
0--
XV8 '-i
Cr..-'
Static Statick.1 ka.072k~~ =.4 k =.045
- k=.195 - =a195
.5- b 2 3b.5. i5 0
Figure 00 Vertex Burst Position during Figure 11 Vortex Burst Position duringOscillation, Visualization with Schlieren Oscillation, Visualization with Schlierenoptics. Dols Indicate Photos. a-25*t8 optics. Do a Indicate Photos. a-30- 18.Re-1.43*10 Re-1.43*101
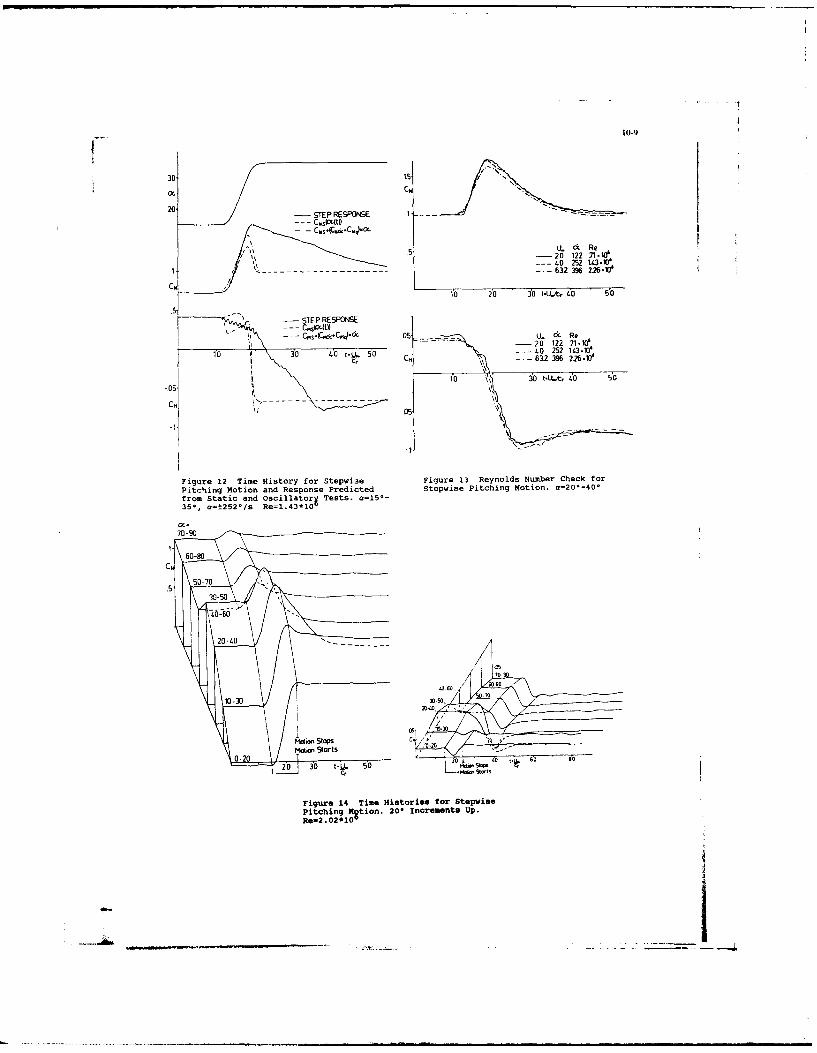
10-9
OL C.
U. citRe-20 122 .71.10UP
-- 4 252 13E'--632 396 226 V,
10 20 30 t-U..t. 40 5'0
C r.4& 05 U.. & Re.
1'0 3' 0 40 t-L.!. 50 - -40 252 t43-10'Cr --- 62 396 2.26 10'
- 10 3btL~t O S
-.05
05
Figure 12 Time History for Stepwise Figure 13 Reynolds Number Check f or
Pitching Notion and Response Predicted stepwise Pitching Motion. a=20*-40*from Static and Oscillatorx Tests. a=15--35-, a=:252 /a Re=1.43*10~
20300.1500
40u-60TmeHsorc fo tevs
20cin -4o020Icrmnt p
Re-2 .02D1
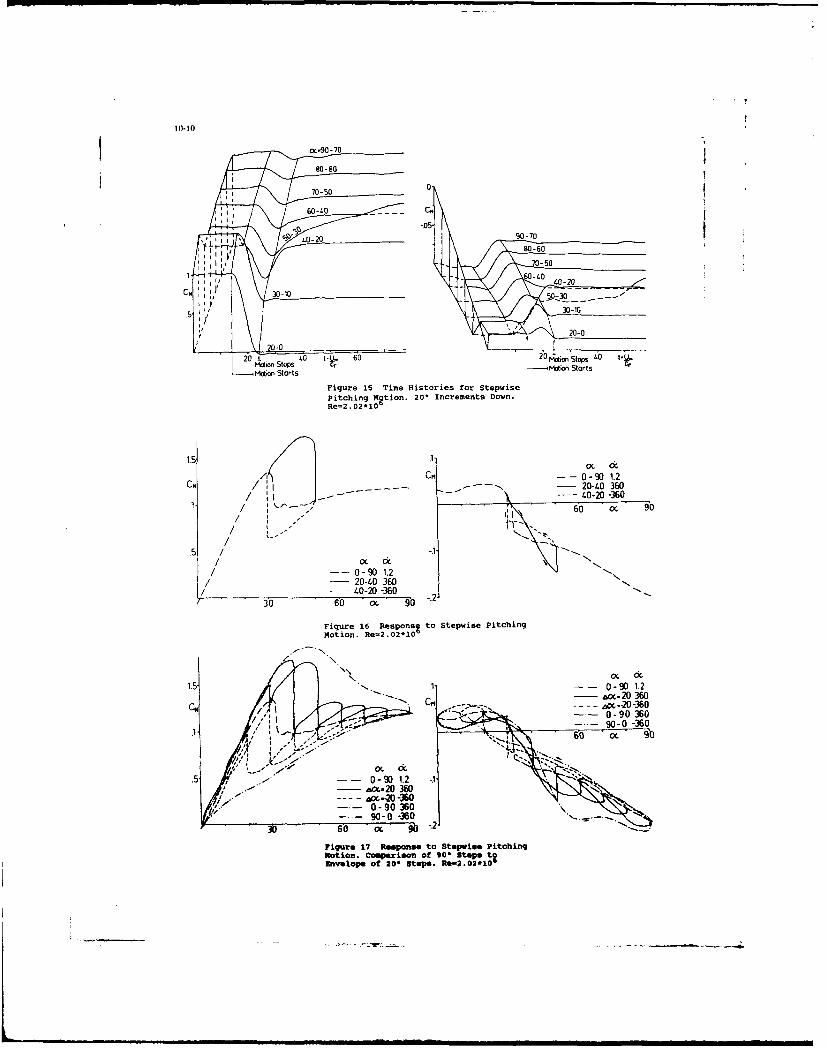
10-10
830-10
70-0-0
20040 CmI. 6 0~ stp'~ t..
W ichn -ain 20Icrmns o
A CM -- 0-80-1./ I ...- - - - -~---- 70- 2-/006
H60 ---40-20 30
.5 /30i10
-- 0-92010-- 201 360
0 4 q 60 Moio 90op -.2L
Figure 16 Teipme Hitoriteswfor Sttching
Moio. - 2.02*10 !
1.5 . .O
Ct4 20-40 360- *o40-200-360
20-0 36040-0 -360
Figure 17 Responue to Stepwise Pitching
Moinoeof t. Re-2.02*1 O
CH Ar Cax-2 -360
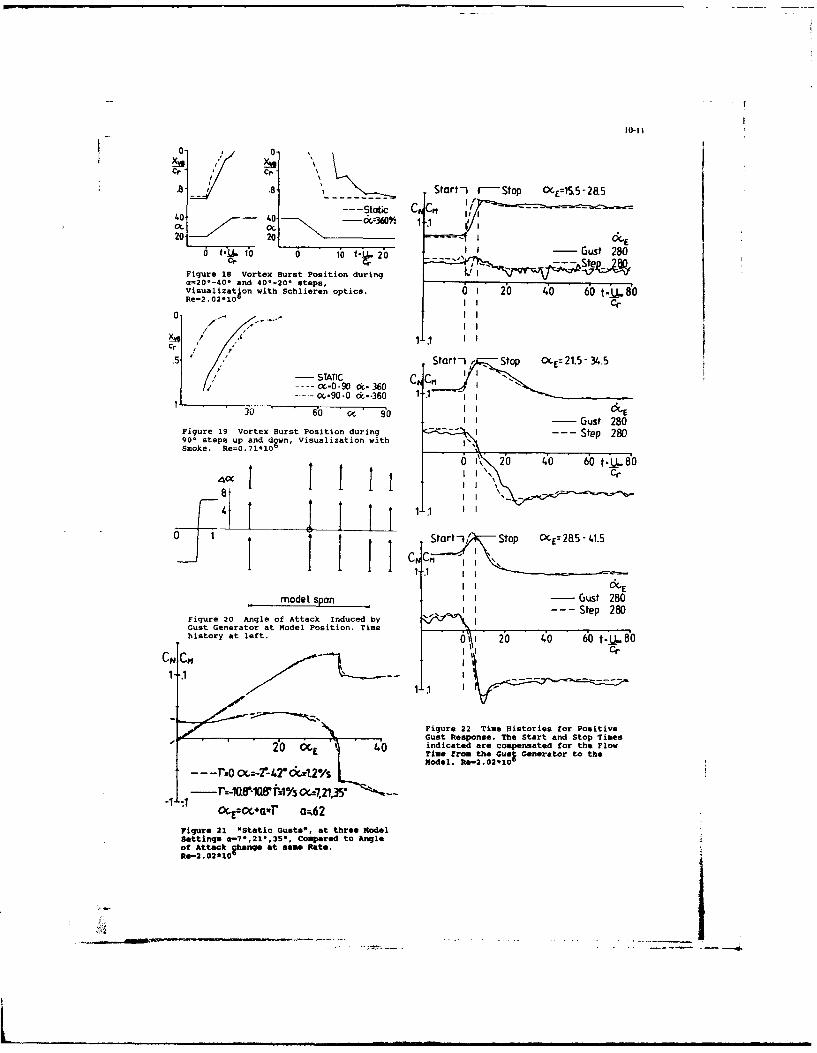
Cr Cr
0'A- Start-I r-Stop OCEl55M
-static C' If -40 40 &z60 1 .120
20
0 f-10 0 10 NUjJ. 20 Gut-8cr Cr tr
Figure 18 vortex Burst Position during ____________________
a=20--40- and 40'-20- steps,Visualization with Schlieren optics. 6i 2'0 40 60 t-j .80Re-2.02*10 L
IIr
.5 Start Stop OCE 2 .5 3.o-09 21. 3605
STATIC C'C"- - - m-90-0 cd--360 1 .
I I Gust 280Figure 19 Vortex Burst Position during -I Step 280900 steps up and dgwn, Visualization withSmoke. Re=O .71*10
2 i 20 4.0 60 t..U!.80
i I Start -i Stop CE= 28.5 41.5
modeLI span II- Gust 280-- -Step 280
Figure 20 Angle of Attack Induced byGutGenerator atModel Position. Time
history at left. n 20 40 60 t..U!.8
c"~I. CM CI-
Figure 22 Time Histories for PositiveGust Response. The Start and Stop Times
- 0 1 40 indicated are compensated for the Flow20 M Time from the Gual Generator to theModel. Re-2.02*1O
- -- rzo Ix=-2-42O ck,=12*/s
-r-1 ar 108 NilYs 0a, 21,35'-1 1 E~~'4Uxr a;62
Figure 21 "Static Gusts-, at three ModelSettingsa -7*,211,35-, compared to Angleof Attack 1hange at same Rate.Ue-2 . O2*1
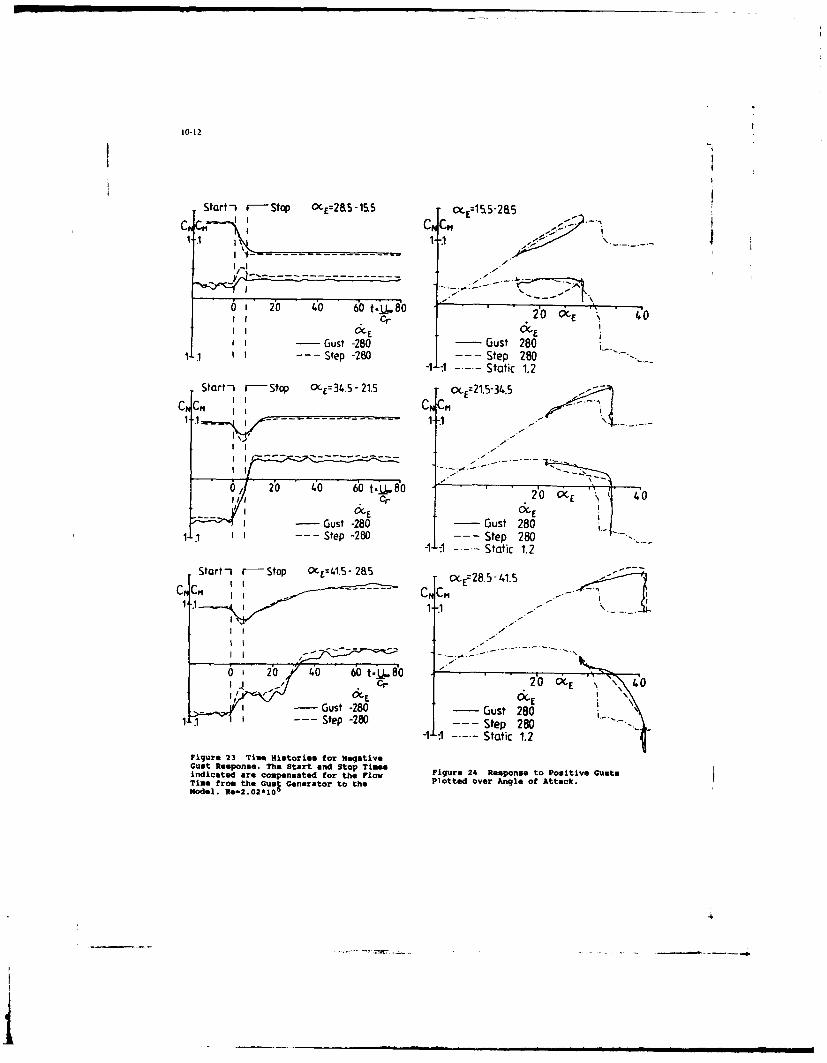
10-12
Starti r--Stp OCE 2&S -5,lM=15-
~~u 'w 6 ~~8 0fE \ 40
Gust -2- Gust 280Step-280Step 280
- I - - Static 1.2Start i r--Stop CE=~34.5 -21.5 - - -.-34
C14 CmCN CM
0, 20 40 60 t -LL.8 20cr 2001-E40
Gust -2- Gust 280Step-280Step 280
-1+ -- Static 1.2
Start-i r--Stop OCE= 41.5 2a5 XE=2 8 .5 4 1 .5 --
1. 1. 2b -Ot 6
0r 2' 20 40 600MEQC &E ~ 4
IGust -280 -Gust 280-- -Step -280 -1tepi~ 280
Figure 23 Tine Hlistorian for NegativeGust Response. The Start and Stop Timeindicated are compensated for the flow Figure 24 Response to Positive GustsTine from the G.. Generator to the Plotted over Angle of Attack.Model. go-2.O2*lO
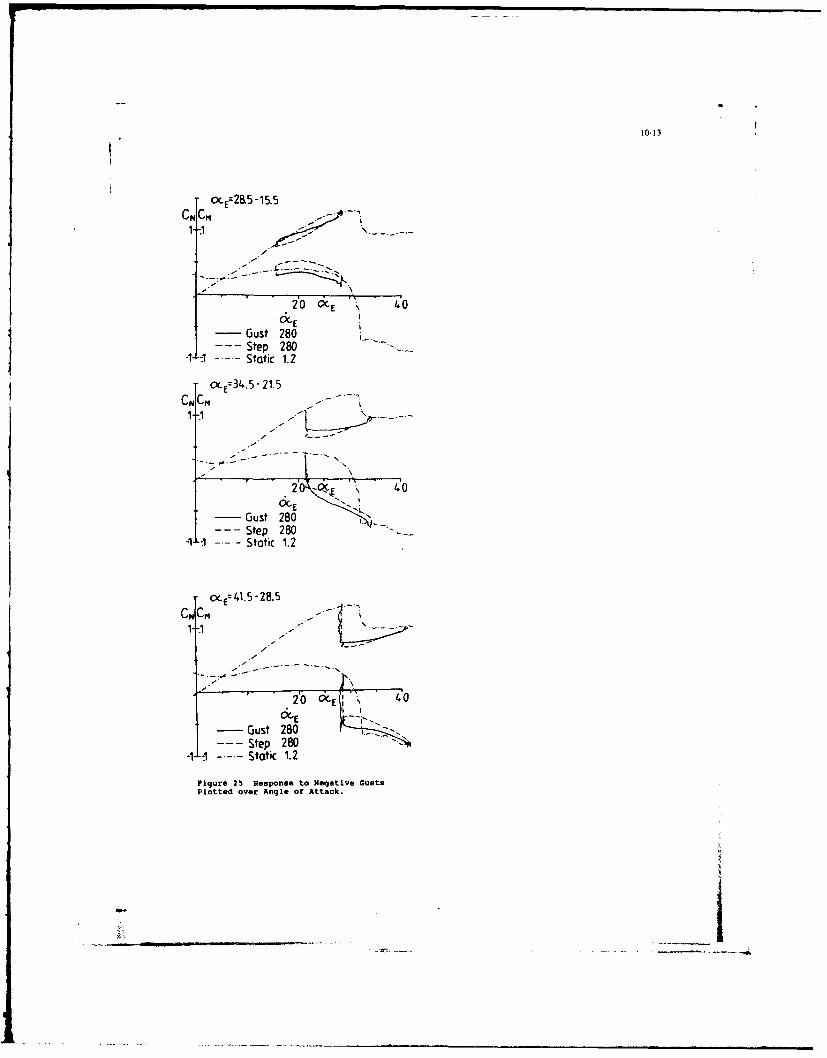
10-13
ME2 &S -15.5
20 OCE \ 40
Gust 280-1J--- Static 1.2
C X 34. - 21.5- --
1. 1
2'1 40OCE
Gust 280- - -Step 280 -
-1-1 -- Static 1.2
CN CM _.-
8- E
-Gust 280Step 280
-1~ -- Static 1.2
Figure 25 Response to Negative GustsPlotted over Angle of Attack.
W.,
Caractdrisation do phdnamones adrodynauiques instationnalree& grands incidence
by0. RenierONERA-INFL
5, Boulevard Paul Painlevd59000 Lille
France
Rlsumi L'expos6 comportera donc uneprdsentation de ces moyens d'essais;
I1 eat dtabli qua le manoeuvres des rdsultats illustreront ledynamiques d'un avion d'armes I grands potentiel de ces outils de simulationincidence sont le sibge de ph6noalnes dynamique et lea techniques dea6rodynamiques instationnairee do mod6lisation seront aborddes.grande amplitude. Ceux-ci ne peuventOtre nigligds dis quo l'on veut Abstractmaintenir et optimiser le contrOle dumouvement et des attitudes de Dynamic manoeuvers of an aircraft atl'a6ronef. high angles of attack are known to be
the origin of unsteady, largeCertaines installations de soufflerie amplitude aerodynamic phenomena. Thesepermettent de caractdriser ces effete phenomena cannot be neglected if theinstationnaires. La balance rotative control of aircraft attitudes andde 1'IMFL, on soumettant une maquette movements has to be optimized.d'avion & un mouvement coniqueoscillatoire a ddJA permis de mesurer Such unsteady effects can bel'effet de larges variations characterized on specific wind-tunneld'incidence et de ddrapage sur test facilities. Already effects ofdiffdrentes gdomitries d'avions. Un large incidence and sideslipmodble mathomatique & base de variations of various aircraftfonctions de transfert permet de geometries have been measured on therendre compte do fagon satisfaisante IMFL rotary balance during oscillatoryde ces phdnotnes. coning motions. They have been globaly
taken into account in mathematicalL'IMFL et dot6 depuis peu d'un moyon models using transfer functions.d'essai original dane une soufflerisbasso vitesse. Calui-ci permet do An original test apparatus has beenrdaliser des fouvements angulaires set up in the IMFL low speeddynamiques divers at varis on tangage wind-tunnel. Various dynamic pitchet/ou en lacet d'un adronef autour do andlor yaw motions can be carried outson centre do gravitd. notament des on an aircraft model i sinusoidal ormouvements poriodiques sinusoidaux, constant angular rate motions ordes rampes do vitesse. Il permet typical pointing manoeuver attitudeencore do simuler l'6volution rdelle evolution. The large performance ofdo l'assiette longitudinale do l'avion this apparatus (low level of airstreamdo combat lore d'une manoeuvre do perturbation, high angular speedpointage. Los performances do cette -60001s) allows to characterize andinstallation (discr~tion analyze small and large amplitude,aerodynamique, vitosse angulaire 600 high angles of attack aerodynamicdeg/sec) en font unm yon dlessai phenomena.priviligi6 pour l'tude et Itcaractinisation do* phmninlnes in the proposed paper those tootadrodynamiques do petite ou grand. facilities will be described, theiramplitude A grande incidence, en dynamic simulation potentialities willcomplemtarit& avec I& balance be illustrated by some results androtative. modelisation techniques used will be
__ _ _ _ _
approached. adrodynamique important en module etdont l'orientation, pouvant Otre
Notations choisie dana un domaine plus grand,permet des modifications importantes
B incidence, d~rapage de la trajectoire, diminue ls rayon deT 04 angles d'Euler virage. ce qui constitue un avantageC1C, C.~ coefficients certain en combat adrien.
adrodynamiquss de momentde oulstangage, lacet En contrapartie, l'incursion aux
C5, CY, Cz coefficients grandes incidences prdsente deuxadrodynamiques de force inconvdnients majeurs :uneaxiale, latdrale, normals augmentation significative de Ia
a. B. vitesses de variation trainde qui induit une forted'incidence do:ldt et de diminution de Ia vitesse donc deddrapage d13/dt l'dnergie totals de l'a~ronef
01 0 vitesse et accdldration l'apparition d'instabilitdsangulaires deldt, d2O/dt2 adrodynamiques coincidant avec Ia
I angle entre les vecteurs perte partielle ou totals d'efficacitdrotation Q et vitesse de certaines gouvernesadrodynamique V conventionnelles.
Introduction L'6mergence de gouvernes momnsconventionnelles (canards,
L'extenaion du domains de vol des strakes,... ) associde A des commandesavions d'armes, souci permanent des de vol 6labor~es permet ls maintienavionneurs, a longiemps 6td freinde d'un contrble relatif des attitudes depar les frontidres naturelles de l'ahronef A grands incidence.l'a~rodynamique :existence de non M~annoins, pour qus la perte d'Onergielinftsritds, pertes de stabilitd sur totals ne constitue pas une entravecertains axes, d~collement des r~dhibitoire, lea excursions au del&dcoulements sur lea surfaces de du ddcrochage doivent rester braves cecontr~le ou sur la voilure complfts. qui signifie que la dynamique de
telles manoeuvres eat trba inportante.Les syst~nea de controls de l'avion(cossnandes de vol Olectriques) Touts 6tude pr~liminaire pour prftparerpermettent de surmonter certains de l'avion super manoeuvrsnt pasasra doncces obstacles :attdnuer lea effets par la caractdrisation du comportementnon lindaires, contrbler lea a~rodynamique selon des sollicitationsinstabilit~s, etc ... nouvelles dana un domains plut~t
subsoniqus. aux grandes et trbsCe contrOls nWest possible que si le grandes incidences, at notamment A desconportement adrodynamiqus dana Is variations rapides de Ilincidence etdomains de vol a pu Otre caractdrisd du dorapage. et At des vitesses dede fsgon suffisaiunent fine, selon lea rouliseat de tangage dlevdes.diffdrentes sollicitationssusceptibles d'@tre rencontrdes en L'objet de cat expos6 st de pr~sentervol. Des noyens dlessais diffdrents lea apports sur ce sujet d6velopphasaint alors necessaires pour traduire autour de deux noyes d'essaislea effets de mouvements angulaires, spdcifiques en soufflerie de l'IMPL:de Ia variation dincidence, du Mach, la balance rotative et Is nouveaude Ia turbulence... montage dynamique ddnomm6 'pqr' . La
cinftmatique de ces moyans d'essaisAujourd'hui l'ambition affichge des permet Ia rdalisation deavionneurs set d'6tendre au del& du sollicitations dynainiques end6crochage Is domaino du vol contrOli. particulier cur lee variables
incidence, d6rapage at vitesse deLe principal avantage attendu set tangage avec des amplitudes et desl'obtention d'un vecteur force normal. fr~quences qui peuvent Otre tr~s
11-3
importantes. comportements et Ilinfluence desdivers parambtres sur ceux-ci. Les
Aprbs un rappel du contexte dans comportements sont quantifids par unlequel sont menees les 6tudes grandes nombre iimitd de variables globalesincidences a V'D4L. et tine cosine i'attitude moyenne, la durdedescription rapide de chaque montage d'un tour de vrille stabilise lset de sa cindmatique, des rdsultats nombre de tours de vrille avantobtenus sont prasentes et analys~s. rdcupdration,etc. Des variables plusDiffdrentes approchee de moddlisation qualitative. prdcisent Is nature desdes r~sultats sont prapos~es at agitations perturbant ls mouvement oudiscutees et des confrontations avec encore le type de sortie de vrilie.des essais en vol illustrdes.
11 y a une quinzaine dlanndes seetLee grands incidence. A l'II~L fait sentir Ie besoin dlanalyser de
fagon plus precise et plusLes Otudes en mecanique du vol quantitative is phenomene de laddcrochd sont historiquement li~es A vrille. Cleat donc en ce sens qu'a etdIs miss en oeuvre de la soufflerie developpe un dispositif tournant deverticals A i'I)4FL en 1966 (fig. 1). mesures d'efforts globaux sur maquetteCette soufflerie eat dite de Ivrille' en souffleris, appeld balancecar sile persist l'obssrvation de tele rotative. Ceile-ci et dquipee d'unmouvemente eur des maquettes d'avions certain nombre de degree de libertede dimension typiqus 1 sihtre, lances aseocies aux critbres servant Amanueliement dane Ia veins et dont Is caractdriser un mouvement de vrille:poids et equilibre par lee forces I'attitude moyenne. l'angle d'assietteaerodynamiques generees par is courant latdrale, is taux de rotation, Is capd'air ascendant pilatd en vitesse par relatif (calage angulaire de laun operateur. Le diam~tre de Is veins maquette dane is repbre tournant), ie-ouverte- etant de 4 metres, ii et rayon de vrille, Ie taux d'agitatians,possible d'anaiyser certains figure par un angie entre lee vecteuremouvemente transitoires :changenent vent et rotation generant lore dud'Oquilibre. sortie de vrille induite mouvement dee variations periodiquspar des instabilites ou par un de i'incidence et du derapage,braquage radio pilott des gouvernes, d'amplitude variable Cfig.2).influence. dee conditions initials.
Cette approche cinematiqus devaitCe sont plus de 200 configurations de psrnettrs de retrouver, en simulant unmaquette. d'avions qui ant et6 testees mouvement de vrille etabiliseen soufflerie pour des besoins de ldg&rement oscillatoire, 1*6quilibrecertification. de recherche de entre lea moments d'inertis et leeconsignee pour recuperer ie vol moments aerodynamiques mssures par I&contr~iC, pour determiner des balance. Ce montage justifiait alorsdiepositife de secours ou encore pour pleinement l'appellation de montage deproposer des msodificatians Isimulation dynamique". La figure 3.ageometriques. Des etude. parametriques iliustre I ce titre la nature desant egalement etc siene our des evolutions de l'incidence at dumaquettes modulablee pour corner derapage au cours d'une vriile echeilei'influencs du centrage. des surfaces 1 et cells reproduites par isdes gouvernes, du d~centrage lateral montage.ou encore i'impact des virure.d'avant-corps, do quills sous De fait cette installation trouva unfuselage,etc. Cleat par ia variete des cr~neau d'utiiisation beaucoup plusetudes et des configurations etudies large quo celui circonecrit & isque s sont forge Is savoir faire et vrille. En effet ia cinematique persistla reputation de 1'Ctabiissement. une exploration asset exhaustive des
effete adrodynamique. induits par IsL'ensemble dee rdsultats acquis rotation dane un large domainsd~crivent esuentiollesent des d'incidence at do dirapage. Die lor.
11-4
ce montage eat utilis6 pour gendrer retour a veins ouverte, circulaire dedes bases de donndes de coefficients 4 mitres de diambtre. La vitesse dea~rodynamiques globaux. Ces bases ont vent est limitde A 40m/s. Ladtd dane Ie cadre d'etudea gdnerales cindmatique permet de positionner uneexploitdes de fagon k construire un maquette dane un large domainemodble mathdmatique de representation dincidence ddrapage (fig.5). Lades efforts adrodynamiquea. A partir rotation de la balance poutde I& 11 eat possible de rdaliser des sleffectuer A une frkquence voisine desimulations numdriques du vol de 2 Hz. L'originalitd de cetteVavion et d'6tudier la senaibilitd installation tient en ce quedes rksultats A divers parambtres. l'ensemble des parties tournantes peut
Otre inclind d'un angle 1. limitt A 20Le souci de confronter lee rdsultats degree par rapport A is direction dutrouvds ainsi par la simulation A Ia vent infini amont. II en results querealite a conduit l'IMFL & dkvelopper ls mouvenent coniqus classique (leades moyens expdrimentaux permettant de parambtrs incidence, derspage, tauxrdaliser des essais en vol de de rotation sont constants dans Iemaquettes et de restituer temps) devient conique oscillatoirequantitativement l'ktat et lea d~s que le parsnbtre I eat non nulcoefficients akrodynamiques de l'avion (incidence et ddrapage varientau coura du vol. L'inatrumentstion des cycliquenent et en quadrature au coursmaquettes en capteurs d'un tour avec une amplitude I. ; leaaccdldromdtriques et gyromdtriques. at taux de rotation demeurent constantsde Is station en moyens optiques fixes (fig.6)).a permis d'Ctudier Is mouvement devrille d'une ulaquette dane la C'est cette particularitd qui.souffisrie verticale sinai quo des utiliede A faible incidence, noustrajectoires A forte dynamique de permet d'identifier sur cette seuletangage d'une maquette non motorisde installation et A l'aide d'essaiscatapultee dana Ie laboratoire d'etude appropries lea parambtres de stabilitdde perte de contrOle et des grandes d'un modbe lindaire: Cq, C*...incidences (fig.4). Cl5 +CjB'sina etc... (fig.?)
ParallL&lenent d'autres moyens de Aux incidences superieures, lea essaiscaractdrisation sarodynanique ont §te coniques oscillatoires mettent endeveloppes. L'dtude des mouvenents dvidence l'invalidite de l'hypothesed'echappde en roulia (vwing-rock,) eat de lin~aritd et 1'apparition desaujourd'hui faisable par l'adaptation phdnomknss d'hyateresis lids auxd'un dispositif sur Is. balance instabilitds des ecoulements, ou aurotative. Enfin, l'dtude des retard A leur etablissement, et dontmouvementa h forte dynaique de is d~crochage dynamique eat unetangage eat aujourd'hui rdalissble A illustration (fig.8).l'aide d'un moyen d'easaia nouveauappelO *pqr' at installd dana Ces phenombnes sont maintenant biensoufflerie horizontale base vitesse connue. Et bien qua 1V6coulement soitds l'IMPL. de nature diffkrente entre lea cas bi-
et tri-dimensionnels, lea courbesLa balance rotative de III M caractdristiques de lVOvolution des
coefficients de force normals C. et deNoue avone eu l'occaaion d'6voquer ce moment de tangage C., meaur~s aur unsmoyen d'eassais dynanmique et so sue en flbche lore de tale essaiscontribution done l'identification des sont tout A fait aiWilairea A cellesparambtree do atabilit4 dynamique A obtenues depuis is caractdrisationfaible incidence. Rappelons en d'un prof il bi- dimensionnel enqusiques lignes lee principales oscillation de tangage (fig.9).caractdriatiquea de ce diapositif.Celui-ci eat inatalld done issoufflerie verticals do lIMFL, I La balance rotative de l'INFL a donc
OtO cOnque pour simuler notamment des trajectoire.mouveMents de type vrille. Leparam~tre A, angle entre lee vecteurs Si Ia balance rotative constitue unrotation et vitesse correspond, pour moyen privilogi6 de caractdrisationun mauvement de maquette & centre de adrodynamique A grande incidence, iigravitd immobile a I'amplitude des prdsente une cet-taine limIteagitations coupl~es (a ; 3) as dutilisation. Par ddfinition, lesuperposant au mouvement moyen mouvement conique privildgie enstationnaire do la vrille. premier lieu Ia rotation autour d'un
axe proche du vent: n-., taux deHlaig ce param~tre est aussi par roulis adrodynamique. En fonction ded~finition une variable a~rodynamique. l'incidence, il so projettera solon pIl peut donc Otre calculd A tout ou r, taux de roulis et do lacet,instant au cours d'ui essai en vol de exprimes en axes avion et qu'ilvrille do l'avion. La figure 10 privil~gie donc par rapport A laprdsente l'Avolution du couple (o:,X) vitesse do tangage dont Ilobtentionau cours d'une vrille qui so stabilise nWest possible quo ci on met laapr~s agitations A une incidence naquette en d~rapage.moyenne do 4Q0 environ ; le param~treI est alors voisin de 2' ce qui Par ailleurs, los variations coupl~estradult un r~gino tr~s ldg~rement d'incidence ddrapage, obtenues enloscillatoire. Hais il faut notor quo mouvement conique oscillatoirodane toute la phase doentrde en vrillo induisent des effete adrodynamiquesI tend vers 900 co qui correspond A un qui no sont g~ndralement c~parablesmouvement do tangage pur A cabrer, quo qu'aux faibles incidences.le pilote donno A l'avion pour allerchercher l'incidence do ddcrochage. Enfin lee effets do montage,Puis par l'action du gauchissement et interaction maquotto- dispositifdo la direction Ie mouvemont do peuvent en particulior etre source Arotation en roulis et en lacot dovient grando incidence du decrochagepr~pond~rant ;lI parambtre I diminue. prdmaturd des surfaces portantes,Hais dane touto la phase transitoiro, surtout dams 1e domaine des faibleslea amplitudes des variations vitesses (V'<4Omfs).d'incidence et do I sont trbsimportantos at la valour limits 1-201 L'dtude il y a une dizaine d'anndesde la balance rotative Oct trbs d'un dispositif do soufflerielargement ddpassie. collicitant une maquetto selon lee 3
axes p q et r a montrd la difficultOIl y a quolques dizaines d'anndes d'interprdtation des r~cultats de1'entrde en vrillo do l'avion mesures du fait d'une discrdtionconctituait Ia premihre incursion sarodynamique insufficanto du montage.-involontaire- dams le domaine desgrandes incidences. Si aujourd'hui Le montage dynamique 'pqr"ello nWest provoqude volontairementquo pour des bosomns do certification C'est pour ces raisons quo l'IMFL aou pour l'acrobatie a~rienne, olle dotd sa soufflerie horizontale bassoWn demeuro pas moins int~rossanto & vitesse d'un outil do simulationdtudier car 11 y a une bonne dynamique orient6 yore lasimilitude entre la dynamique do caractdrisation adrodynamique d'unol'entrdo on vrille et cello d'une maquette lore de mouvoments a fortemanoeuvre do type pointage do l'axe dynauaique do tangage (q., - 6000/9) etavion ou d'un deed-tour dessind do fagon & minimisor lestri-dimensionnol. La figure 11 interactions avec la maquottoprisonte 1'Avolution tewporelle de I (fig.12).au cours d'une telle manoeuvre(simulde). L'incidence a 6t6 limitfie & Co montage roproduit cin~matiquemontW5. La valour do I reste 6lovde et lee degrds do libortds associts aux
proche do 906 lo long de Ia angles d'Euler coura me nt utilis~s on
m~canique du vol. Lea angles Y (cap) eat donc multiple:et 0 (assiette latdrale) sontajustables male constants au cours - En statique, la caractdrisation danad'un essai. Le degrd 6 (assiette un trbs large domaine d'incidencelongitudinale) eat motorisd. (-l00*<a;<1000 ), pour des d6rapagesLensemble eat installd dane la infdrieurs A 250 peut @tre rdalis delsoufflerie horizontale de l'IMFL, de dans d'excellentes conditionsdiambtre 2.4 m~tres, en -onfiguration adrodynsmiquee. En particulier au diveine ouverts. La maquette eat montde de 400 le bras en fibre de carbonepar un dard arri~re, son centre de sort totalement du champ de Is veinegravitd eat immobile. L'ensemble a 6td d'expdrience de Is soufflerie.dessind de fagon A rejeter hors veinslee 6l6ments *lourds' du dispositif. - L'identification de certainsL'utilisation de matdriaux composites, parambtrea de stabilitd A faibleA la fois ldgers et rigidee pour lee incidence ((x<250) eat possible. Desparties mobiles (bras et dard) a termee cosmic (Cq+C..) , (Cnr-CB.cosi)permis d'obtenir des performances tout peuvent Otre calculds pour diffdre-itesA fait intdressantee. See valeurs de Ilincidence, par descaractdristiques sont lea suivantes: sollicitations de type harmonique
-250 < T < +25~ d'amplitude mod~rde en q (Wi) ou en r-l5* < 0 < 105 ('.-90
0 < 9 < 1000
/0'1 < 500*/s Il faut noter que ls centre de gravitd/0"/ < 50000/a de ls maquette deneurant fixe dans Is
V < S0m/e veins, l'6criture d'une eccdldrationfrdquence ler mode structural: 13.5 Hz nulle en ce point r(g)-0 conduit A des(masse typique maquette: 3.5 Kg) relations intrinsaques entre les
variables a~rodynamiques et enLa motorisation de l'aze en 0 eat particulier entre 13', ai, p et rassur~e par un vdrin rotatif B'+rcosi-psina-0hydraulique capable d'accdldrations et Comme pour lea essais sur balancede vitesaea Olevdes. rotative, soumie A Ia nene contrainte,
ce montage n'apporte pas IaLea possibilitgs cindmatiques de ce possibilitd de d~coupler lee effets dediapositif peuvent Atre illustrdes par p~r et B'. Par contre, il r~alise uneIa figure 13, donnant lee relations sollicitation diff~rente A l'int~rieurentre lea angles d'Euler Y 0 et 0 et de cette relation et A ce titre eatlea angles a et b. tout A fait compldmentairs du montage
tournant puiaqu'il permet parIl apparait qus: combinaison des types d'ssaie.
d'augzaenter lee pracisione eur deux-touts variation de 0 induit une des parambtres identifiables
variation d'incidence etlou du CiP+CjA.sini. Cjr-CjB.cosa: ainai queddrapags quele que soisnt Y et 0 ; lilluietre la figure 14.
- A 0 nul, le domains -90*<cs'c100*. - Lea effete inatationnairee des-250<8<250 peut Otre explord en variations d'incidence peuvent Otrevariations d'incidsnce & iso ddrapage. caractdrisda.Dane ce cas, on a la relation q-a' ;I
Le diepositif de pilotage du mouvement- # gal A 9o*, incidence at a dtd d~termind de fagon I imposer une
ddrapage sont 6chang~s sinai que Lea loi 8(t) quelconque dana la limits de
taux de lacet St de tangags. r St B' ls bands peasants de l'ensemblssont lids par la relation r-31 at lea actionneur+ partis mobils+ maqustts.sffets de ces parambtrs psuvsnt Atrs En particulier peuvent 6tre rdalisdeecaract~rishs jusqu'A 250 d'incidence. (fig.15)
Le champ dItude offert par cs montage -des lois sinusoidales J.
11-7
S(t) -0.+Bmsin2iwft. lors de tele essie.
ees valeurs de Om et de f, amplitude Sur la balance rotative, la rotation
et frdquence de la sollicitation sont en cap des parties tournantes estsoumises aux seules contraintest continue et r~gulitre, lea effortsI0'../- 27rf0m< 5000 /s et /0',./- pulsds de la gravit# Otant compenass41r2f2OH< 50000/s et dane la limite du par tine r~gulation de la viteessed~battement dieponible: -l000<0<l00*. autour d'tine valeur nominale. LesLe choix d'tine amplitude faible (1 A frdquencee propree de l'ensemble,20) et d'tine fr~quence de l'ordre de identifi~es au pr~alable A chaque5Hz correspond A tine sollicitation campagne d'essai, sont gdneralementtypique de dispositif en oscillations sup~rietires h 15 Hz et donc auxforcdes. En limitant Ia fr~quence A fr~quences des phdnombnes1Hz des oscillations de tangage de instationnaires qui nous intdreesent.tr~e grande amplitude (1000) peuvent La sollicitation dtant pdriodique,Otre obtenues. l'Elimination des fr~quences
structuralee st aisdment rdalis~e par- des lois de type ramps e-8e t, tin traitement FFT.0'=constante.
Stir le montage "pqr', le motivement eatCes eesais sont plus sdv~res quo lee contr~ld par tin syst~me de pilotage dopr~c~dents au sens ot, pour obtenir l'actionneur hydraulique, prenant entine vitesee de tangage 0' conetante compte des informations de pression,stir l'intervalle 101,02] le plus large de vitesse et de position angulaire.possible, il faut utiliser La commands d'un mouvement donnd st1'acc~l~ration maximale 0 lore des obtenue en appliquant A l'entr6e de cephases de mise en vitesse et de systbme Ia consigne 8,(t) A suivre. Led~cdl~ration avant arrat. mouvement effectivement rdalisEs prend
en compte la fonction de transfert de- des lois quelconques 0 (t). l'ensemble.
Ceilee-ci peuvent Etre choisies de Il s'ensuit qu'A tine loi demand~e 0fagon A reproduire l'historiqus de sinusoldale correspond tine loi1'incidence d'une manoeuvre de type effective sensiblement de m~me type,pointage de l'axe avion A grands mais pouvant comporter de l~g~resincidence et retour aui vol normal. Des distorsions sous forme d'harmoniquss,essais en vol d'une maquette d'avions faibles en amplitude mais non nulles,d'armes, rdalisds dans lee et qui eont mesurdes par la balance.laboratoires de lIIFL ont permis de Traduites sous forms d'ondilationsproduire des excursions A grande rdsiduelles, selos diminuontdynamique de tangage, par braquage A ldgbrement la pr~cision de la mesurecabrer, puis & piquer des 6levons at car il set d~licat de supprimer pardes canards, dont l'Evolution typique traitement ces fr~quences qui peuventde lVincidence eat tout A fait @tre faibles at traduire tine rdalitdreproductible stir Ie montage lpqr' adrodynamique.(fig.3b).
Le traitement des essais de typeTraitement des essais ramps, oti plus g~ndralement de ceux
pour lesquels tine loi quelconque eatLe traitement des essais provenant de prograusnde, slapparente A celui qu'onmontages de simulation dynamique applique A des essais en vol. Unn~cessits tine attention particulibre. filtrage passe bas, A tine friquenceQuelles soisat produites par tine quail faut d~terminer en fonction desbalance rotative oi tin montage pqr., raise structurales du montage et deslea mesures soat g~ndralement rdponses h des sollicitationsentAch~es do bruit. parasites, harmoniquss pr~alables, constituecorrespondents A des modes structuraix l'approche souhaitable.des montages, fortement sollicitds
Lors d'essais sur des montages l'actionneur. fournit tine informationdynamiques en soufflerie, laprocddure d'attitude 0, qui a dtd comparde a desclassique de traitement par diffdrence informations gyromitriques etentre tin essai lavec vent, et tin essai accdldromhtriques en provenance de lacindmatiquement similaire loans vent' maquette. Les capteurs embarquhs (deuxnWest pas rigoureuse. En effet, des accdldrombtres en "ZO, situds aefforts aarodynamiques faibles peuvent i'avant et & llarribre, et tinrdsulter d'un mouvement rapide de la gyrambtre en tangage) prhsentent desmaquette dana l1air au repos. Ceci signaux corrdlds, mais ldgbrementW'est particulibrement sensible que ddphashs par rapport A l'informationstir lea mesures de moments, dane Ie de position. Ce ddcalage met encas o6X le c.g. de la maquette eat Ovidence la d~formation 61astique demaintenu immnobile. l'ensemble bras+ dard. Il traduit tin
dcart pouvant atteindre environ 2on substitue A cette proc~dure celle degr~e entre l'attitide indiquhe etqui consiste A caictiler lea efforts celle r~elle de ia maquette lora d'uninduits par lee forces de gravitE et essai sinusoidal d'amplitude 150 et ded'inertie qui, retranchds aux efforts frhqtience 1 Hz.mesurhs lore d'un essai avec vent,font apparaltre la seule contribution La souplesse du montage est donc aahrodynamique. intdgrer dane le traitenent de la
nesure. Deux d~marches sont poesibles:Cette dhmarche, tout A faitrigoureuse. ndcessite au prdalable une 1- instrumenter la maquette (Aidentification pr~cise des parties laide d'une instrumentationpeshes par la balance :centre de Idgbre de fagon A limiterpeade, moments d'inertie. Cette l'ajout de masse et donc laidentification eat possible A l'aide diminution de la frhquence duidu moyen d'essais lui-mme, par des premier mode structural)essais sans vent approprihs.
2- d~terminer par Ie calcul, pourCette d~uarche eat indispensable pour chaque maquette. la d~formationbe traitement des essais stir le dynamique de l'ensemble desmontage "pqr'. En effet, ia parties mobiles en fonction dureproductibilitd rigoureuse de mouvement et des effortsl'historique 0 (t), aui cours d'un mestirhes par Ia balance.essai, n'est pas assurde coimne pour labalance rotative, par des liaisons Analyse des essaiscindmatiques intrinsbques. Le systbmede pilotage du mouvement eat influencE Une fois effectu~e la phase depar la charge arodynamique lore de traiteteent de mestires, laIlessai avec vent. et on relhve lore reconnaissance des phhnombnesde mouvements de type *rampe" de instationnaires et rhalisde parldgers Ecarts de vitesse 6' pour la Vanalyse des coefficientsn~ne pbsition 0. adrodynamiques globaux et la recherche
des parambtres influents. Cosine dfijALe montage "pqr" off re tine bonne Evoqud plus beut, les phdnombne.discrdtion adrodynamique du fait d'un dynamiques observe stir des maquettesmontage de Ia maquette par dard de l'avion couplet relivent de la siearribre notaimment. En contre partie, nature quo cciii aujourd'hui bienle bras semi elliptique, reprenant en reconnus stur des profileson milieu llombase dui dard, objet de bi-dimensionnels. Rappelons ici leemotivemente mples ot rapid.., eat caractdristiques lee plus marqtsdessujet A des d~formations d'autamt quo dopuis lee figures 8.16 et 17,be couple inoteur set appliqu# A tine relatives & des essais stir balanceextrhmith dui bras, l'autre Etant libre rotative.en rotation. La recopie do positionangulaire, placde A proximit# de La variation rapide d'incidonce stir
11-9
tine maquette davion induit des essais coniques oscillatoires devariations de farce de portance et de meme amplitude. Bien que lea
moment de tangage. tr4 m importantes en mouvaments sojent de naturemodule at dont l-azplitude ddpeaci: du cindmatiquement diffdrente,seas de variation de 1Viacidence, de l'apparition de phenombnasl'amplitude at de la frdquence de la instationnaires de grandesollicitation et de 11incidence amplitude se produit dbsmoyenne autour de laquelle soat Ilincidence de dicrochageeffectuds lea essais.La figure 8 atatique. on notera 6galementprdsente l'influence de lVamplitide at 1'inversion de Ia stabilitd ende Vincidence moyenne stir tne tangage (donnde par le seas deg~om~trie d'avion A aile en flkche, la parcours des essais)figure 16 cella dea l'incidence moyannestir tine maquatte d'avion A voilure 2- l'effet dea trbs grande amplitudedelta at Ia figure 17 celle de la (A-30*) lora d'un essai & 1 Hzfrequence stir tine plaque delta. On (fig.19)coastata que:
3- l'effet de detix sollicitations1- l'influence des variations de type 'rampe", rdalisant
d'incidenca eat significative l'una, le parcours [00,600] andhs que l'incidence franchit la incidence, l'autre le parcourslimite de decrochage statique ;inverse (fig.20). La vitesse de
tangage eat comparable A cella2- l'amplitude du phdnombne crolt dea lessai prdcedent A environ
avec l'amplitude des 300 d'incidence. 11 eatoscillations at avec leur intdreasant dea notar qua leafr~quence ;effets instationnairas darts ce
cas sont encore plus importants.3- la mont~e rapida en incidence a En partictilier la rampe an
pour affat dea prolonger la incidence d~croissante necaractaristique atatique bien ati rejoint pas la caracteristiquedel& de Vincidance dea atatique avant la fin ded~crochage statique. l'esaai. Ceci souligne tine fois
de plus l'importanca deComae pour tin profil, le phdnombne l'historique ca~t) dana Ieapparalt directemant pilot6 par Ia comportement de 1'Acotilement stirvitasse de variation d'incidenca. lea surfaces portantes de laCette similitude semble indiquer une maquette.faible d~pendance des coefficientslongitudinaix via-k-via dut derapage at Las caract~ristiques lat~ralas, atides taux de rotations p at r travers des coefficients globaux Cy.ndceasairemant non nula lora des Cl at Ca prdsentent tine plus grandeessais coniques oscillatoires at doac Ir4sistance" h l'analyse. IsausA Ia nature halicoldale cia d'assaio stir la balance rotative. lea1'6coulestent moyen autour de la effets conitigu~s dea l'incidence et dutmaquette. d~rapage viennent so superposer A ceux
aupposis dea p,r at 3' at compliquantLes figures 18 h 20 pr~santent lea ainsi l'interpr~tation des courbestracds d'essais issue dut montage cosine cellas dea la figure 21.dynamique lpqr,. rialis~s stir tinemaquette d'avion I voilure delta.Elias illustrent reapectivement: Nod~lisation
I- 1'effet d'incidencs moyenne lore L'analyse des effets instationnairesdlessais simusoldaux, stir lee coefficients adrodynsaiquesd'amplitude 10. Cos courbes globaux assurds stir ia balancepeuvont stre compr~es & cellos rotative come stir le montage 'pqr' a
doa la figure 18 relative I des donc nontrA Is r~le pr~pond~rant. en
itI-to
$ ce qui concerne lea caractdristiques depend de l'incidence at delongitudinales. do la vitesse do l'amplitude. 11 apparalt donc quevariation d'incidence W'. La I'approche do la moddlisation do condifficultd d'analyse des effets par fonction do tranafert oatcaractdristiques latdrales nous arnbne onvisageable.a faire quelquea hypothbses af ind'Olabarer une donude mains Lea courbos do la figure 23.a sont'hermdtique* A la comprihension. relatives aux contributions
instationnairos en moment do roulisOn fait donc l1hypothese quo les AM, tracdes pour diffdronts easais eneffete purement instationnaires fonction du ddrapaga. La parallelismo(induite par Ia variation rapide do a qua l'on oat naturellement enclin Aou 3) viannent s'ajouter A ceux dtablir entre les coefficientsmesurds lore do sollicitatione tranavoreaux at la variable S' nestationnaires. Cotta hypothee pormot pas do mottro ici an dvidenced'additivitd des effete nous parmot do fagon aussi claire l'influence desd'6crire qua Ia contribution diffdrants paramltree eur Leeinstationnaire AUi pout btra calcul~rn contributions latdrales. A colapar plusiours ralsons sont possiblee: non
validitA do 1'hypoth~se d'additivitdACi-Ci global - Cimdl tainwr des effete adradynamiques; influonce
simultan~e de plusiours variablesLa partia stationnairo doit donc: avoir aerodynamiques a, b, 31, p, r....dtd caractdrisde at moddlisde parailleurs do fagon & traduire les La tracd d'essais. n~cessairement eneffete statiquos (incidence, ddrapage, nambro limit4, dane un plan (ACi,S) nogauvernes) ainsi quo les effete do la donna qu'uno vue trop parcollairo dorotation statiannairo (tormes induits l'information cantenue dane l'ensonblepar la vitoso do roulis en ropbro des ssais. line autra approcheadrodynamiqus). consiste A projatar la base do donn6es
dane un espace A plusioura dimsensioneLa traitemant des easais coniques (Aia2,)at & visualiseroscillatoires s'appuie donc our different. plans (ACi,B') end'autraa essais, atatiquee, at parametrant lee autros variables. Laconique. non oscillatoires, fournis figure 23.b prisante La contributionpar le me mayan d'assai. Par contra inatationnaire AMl en fonction do 8'.La traitement des essaie oscillatoiree pour toue lea easais do faibledu montage "pqr' fait niceasairemont amplitude 1-20 at pour differentosappal A des esais stationnaires qui valours do l'Iincidence moyanno a. Catno peuvent Stre faurnie par La mme eclairage particulior souligne lainstallation. d6pendance "attendual & la vito... do
variation do dirapaga 81, tout onL'dlaboration d'une done traduisant faisant apparaltre l'influence do lalVeffet purement instationnaire a dtd valour moyanno do l'incidenco.realise, pour lee coefficientslongitudinaux at latdraux. La figure Cotta approche, tell. qu'elle a 6t622 pr6sento la trac~s des ici rdaliaeo, enlhve tout. notioncontributions instationnaires ACt et teaporelle & l'analyao. Celle-ci poutACm pour diff~rents essais conique. cependant *tre introduite paroscillatoiras en fonction de l'adjonctiom parmi lee variables do lal'incidence. d~rivde teaporelle des quantitds ACi.
L'hypoth~se d'additivitd ne gamble pas oddlisation par interpolationOtre remiss en cause our cescarect6ristiques longitudinalee. dm0sw nous lVavons dit plus baut, LaChaque essai presento la form d'une msoddlisation des effetecourbo fermC. sensiblement elliptique inetationnaires pout Otre approchdedont la dimension et Ilinclinaison par ass fonctions do transfert. Avant
de divolopper ce point, citons tine diffdrentes variables pormetautre possibilitd originals, qui pout d'envisager pour lea caractdristiquesOtre envisagde die l'instant oft tine longitudinales la moddlisation de cesbase de donndes linstationuaires' contributions par une fonction deimportantee peut Gtre obtenue. Eloa transfort H dont lVentrie sera laconsists A approximer les effete vitesse de variation d'incidence W.instationnaires qui apparaissent Is et dont lee diffdrente paramitreslong d'une trajoctoire de l'avion, peuvent dipondre des variablescaractdriuis par son ftat adrodynamiques reconnues canalsairodynamique sensibilisantos (incidence, I_-.)xtr(ag, 3,p, q .8 j... ) ot do sa d~rive, ainsi que des gouvornes.par coux qtii sont gdndrds au coursd'essais coniques oscillatoires Considdrons tine fonction do transfert'tangents" (incidence et ddrapago simple du premier ordro. Lorsquefoyese amplitude, vitesse de l'incidence eat faible, cotto fonctionrotation) at qui sont calculi. aui s rdduit A tin terms do gain qui nWestPoint de tangonco par interpolation autre quo le paramitre do stabilitddepuis des essais coniques Cj.. dun modble linisiro. Auxoscillatoires voisins disponibles dans incidences plus dlevdes la constantsla base de donndes (figure 24) de temps do la fonction H eat non
nulls et pormet do traduire 1eCette approche no fait pee apparaltro dicalago temporal ontro la variation
e xplicitement Ia notion do temps, d'incidonce ot l'offet instationnaire.autrement que par la prise on comptedes dirivdes a' et 0'. Un raisonnoment idontique petit Otre
conduit stir les caractdristiquosElle pr~sents naturellement tine instationnaires latirales encertaine restriction puisqu'elle substituant A W' le terms S'. Mais laconsiste A projotor l'dtat do l'avion, comploxitd du phdnombne en lat~raldifini dan. tin espace A n dimensions limits les possibilitdssur tine hypersurfaco dont lee d'identification d'une fonction HEquations sont cellos des liaisons 61aboris.cindmatiques do la balance rotative.
La figure 25 qui prisente laDo mime, en s'appuyant stir la restitution d'un essai coniquesimilitude dun motivement de l'adronef oscillatoire par tin tel modbls,avec tine rotation conique oscillatoire comparde A la assure des coefficientsslo privildgie lee mouvoments do globatix Cz et Cm illustre 1. fondementnature hdlicoldals (vrillos, tonneaux) do Ia structure do la fonction Nati d~triment do coux ott la vitesse do choisie.tangage devient importanto (ressource,dipointago axe avion). Corrdlation avoc: lee phinominee
inutatiomaaires I dcholle avionCotte approche a par contre l'avantagode no pas faire appel A tins structure Le probl~me do la validation desde modble particulibre et do calculer mesuros effectudes stir tine maquotto Alee efforts airodynamiquos directement dchelle riduite, st do lourdspuis lee mesurem. Actuellement & transposition aui phdnombns A grandeurlitde. l1intigration does base do ndell. a trouvi tine illustration pardonndes doessais issue du montage 1'ezploitation doassais en vol dodynamique "pqr" dovrait permettre vrilles do l'avion conuidiridilargir le domino do validiti do ce etffisaomont instrumnti pour quo soittype do modilisation. possible la restitution do lVonsemble'
des variables et des coefficientsNodilisatiom par factiam de transfert airodynamiques ati coure du vol.
La figure 26 prdsonte l'ivolition deL'analyse des contributions Ilincidonce au coure d'um mouvemeont do
instationnaires et IPinfluence des vrille stabilieie qui comports des
1 1-12
a gitations importantes dont avec ceux bien, connum relevda sour des
vaplituide peout atteindre 2O*. Par prof ile bi-dimensionnols ot dont leailleura ont 6td trachea aui cours dui dhcrochage dynamique conatitue tinetemps lea hvolutions du coefficient de ilustration.force normale Cz iaau du vol et decelul calculh par ls modble. Dana tin L'importance des effetacaa il a'agit d'un modble inatationnaires confirme la nhceasit6ahrodynazaique stationnaire de l'avion, de leur pris en compte dana tin modbiedana l'autre caa d'un modbie d'dvolution du vol de l'avion. Laahrodynainique instationnaire, modbles modlisation ahrodynamique globale desidentifiha depuis lea essais sur la phhnombnes pout Otre rhaliahe stir leabalance rotative. caracthristiques longitudinales at
l'approche par fonction de tranafert AIl apparalt dtine part que lea effete coefficienta non constants constitueinatationnaires en vol sont importants tine dhsnarche satiafaisante. Leur priseen module et d'autre part que la prise en compte a permis de rdduire de fagonen compte de ces contributions significative lea dcarta modhle-mesireinatationnaires mestirhes en soufflerie aux cotira d'esaaia A l'hchelle avionpermettent de rhduire singulibrement de vrille, confirmant par ailletirs lalea 6carts avec le vol. rhalit6 des phhnombnea inatationnaires
stir I'avion.Conclusion et perspectives
Lea caracthriatiques instationnaireaL'exteasion dui domains de vol des lathralea meaurhes stir balanceavions d'armes et Ia recherche dtine rotative sont plts difficiles Amanoeuvrabilith ot d'tin contr~le plus analyser en raison de l1influence delarge condtiit nhceaaairement lea plusietirs variables hvoltiantmhcaniciens dti vol A a'inthresser aux simultanhuent. Lea sollicitations pltishvohtitions de l'ahronef A grande puree (en dhrapage. en incidence)incidence, dvolutiona pouvant faciliteraient laura comprdhension.presenter tine grands dynamique stir leediffirentes variables caracthriaant Les dhvsloppsmenta ozphrimsntauxlh6tat de l'avion. actuellement envisages concernent is
nouveau montage dynaisique 'pqr'.Dana ce contexts, lea montages de L'utilisation dun dard coud*simulation dynanique de souffleris permettra do solliciter tine maquetteprhsentent tin grand inthrht pour la on dhrapage & grande incidence. Lacaracthrisation des phhnombnes motorisation dui degrh do libert& *adrodynamiqies, indispensables pour (axe do rotilis) donnera ia possibilithprhdire 1e conportement de l'avion do rhaliser des hvolutions plus"pianetir et l'hiaboration des complexes en derapage. Le montagecossandes do vol exploitant tout is justifiera pleinement son non (*pqr*)potential adrodynamiqie do iah6ronef. par is rdalisation do sollicitationa
salon coo trois axes (ati lieu de deuxAvec lea moyena d'eaaais quo sont la actuollement).balance rotativo et depuis peti lsmontage dynamique "pqr,. lIMFL of fre Outre l'aahlioration des prochdurescette possibilith. en privilagiant d'easais (not&ame nt par la pris enpour I'un. lea sollicitations on compte par Is calcul des ddforuhes dui6coulmsnt moysn hdlicoldal (taux do montage sous charges). csttsroulisa srodynamique important) at installation pourrait Atre utiiish@ enpour l'autre la simulation dos contr~eactifl pour tine simulation domouvements A forte dynamique do la trajectoirs. clest & dire entangage. imposant lea variations d'attitude
qui respactent l'hquation do moment doL'analyse do* eesais imatationnaires. tangage CBq'-M).rhalisha stir des maquettes d'avionsinontre la similitude do* phmnombnes L'utilisation d'une maquetto dont lea
gouvernos sont motorisdes devra
perrnottre de valider une loi docomands pour la rdalisation dunetrajoctoire (Evolution a(t)) donnde.
Enf in 10 d~veloppement des essais onvol do maquettes *ora poursuivi. af indo permottre. A l16chello do lamaquotto la validation dun modbl.adrodynmique dlabor&. Cettevalidation a'appuio our la corrdlationontro 10 comportefont obsorvE on volet celul prdvu par Is simulation.
Bibliographie
"The phenomenon of dynamic stall'Mac Croskoy W.J.'JKI LS 1981-4
'Etudo do synthbeo grandos incidences'D. TriotrantRapport ONERA/IMFL n* 88/23
MHanouvrabilitd dos avions d'armes Agrando incidence"F. Doscatoiro - 0. RonierRapport ONERA/IMPL n0 88/16
"Rdcents d~voloppemonts dos techniquesde simulation dynamiquo appliques AVlidentification des parambtros destabilitd,D.Tristrant -0. RoniorAgard CP 386 GOttingon 1985
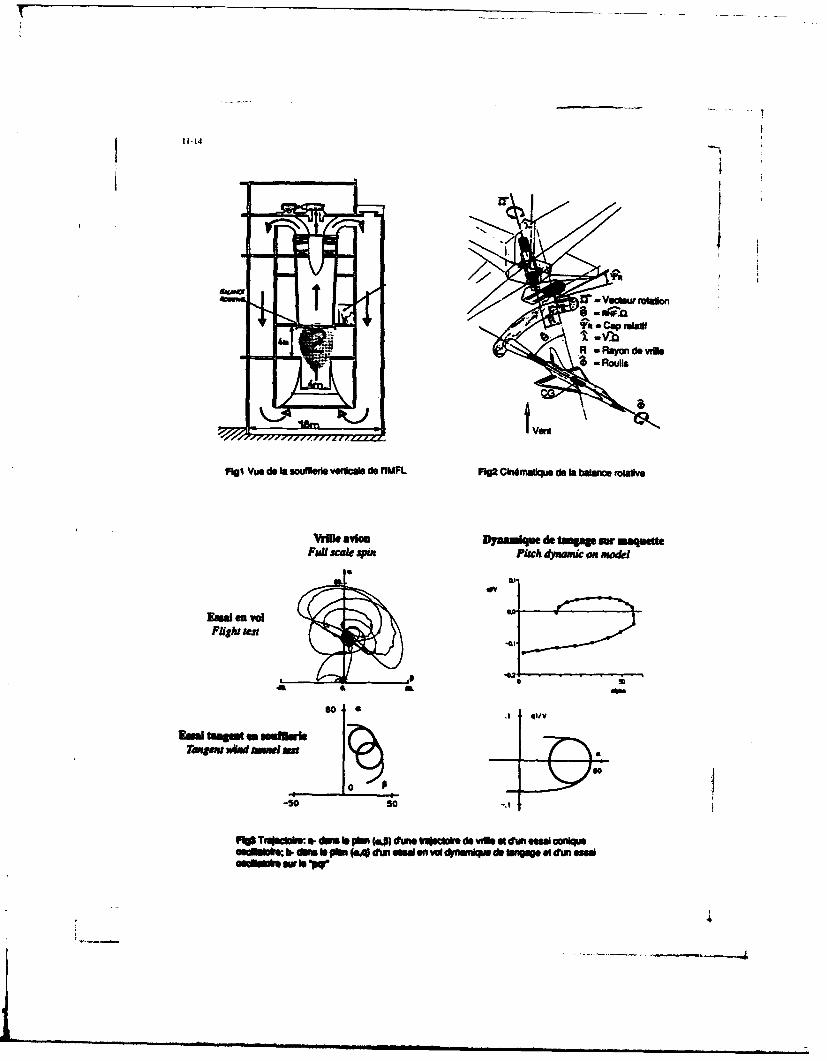
11-14
RN - ayn o q
F191 Vue do la uufle vwelaS do I'IMFL Pig Ch6met doa sbalance fowve
VWl avIOU Dyaamlqns de tump sr nm eFul scale onu Pitch dynami on model
sal an yolFlight tesr
.1 411V
-50 so .1
rip TrONCMam: G- dun bs plmn(&) suns ivamib de viftstdim s"idor4AuNOMsUUI; b.duimIspi n(.4 di d en old*nsiVq*ds n~os el daml
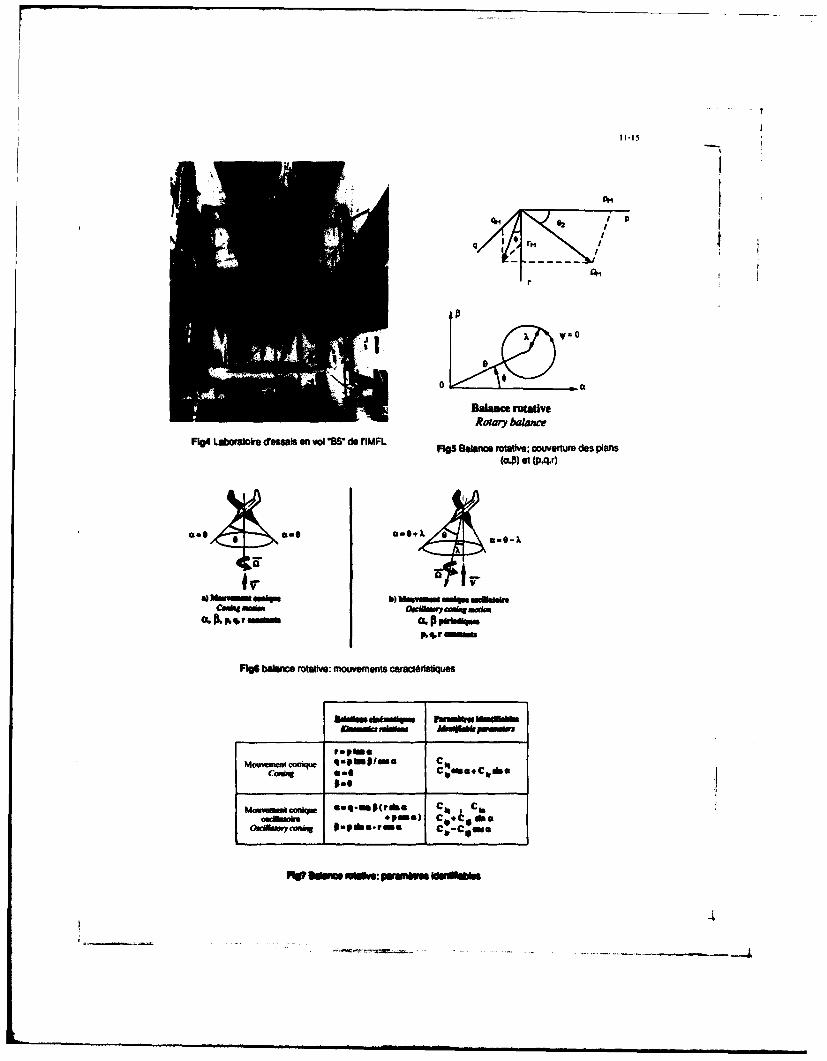
IH
- ~ 0*Balancrotatve
Roary bakaneF194 Ldworaoe dessais on vol "W do riMFL F195 Balmnce rotv; ouverture des plans
(.P) at (pq~r)
06 p. r umo
FloS balanc rotati: motvernents, caract6tisues
adadm.om~ r --
COR~w as pc
mvcomic e Itm.aCft I
h lauwmlo *u. Pcr os C:+C doOA*MWYC-9 frl*eme) C -C out
MV eUim ume: Io a"I~
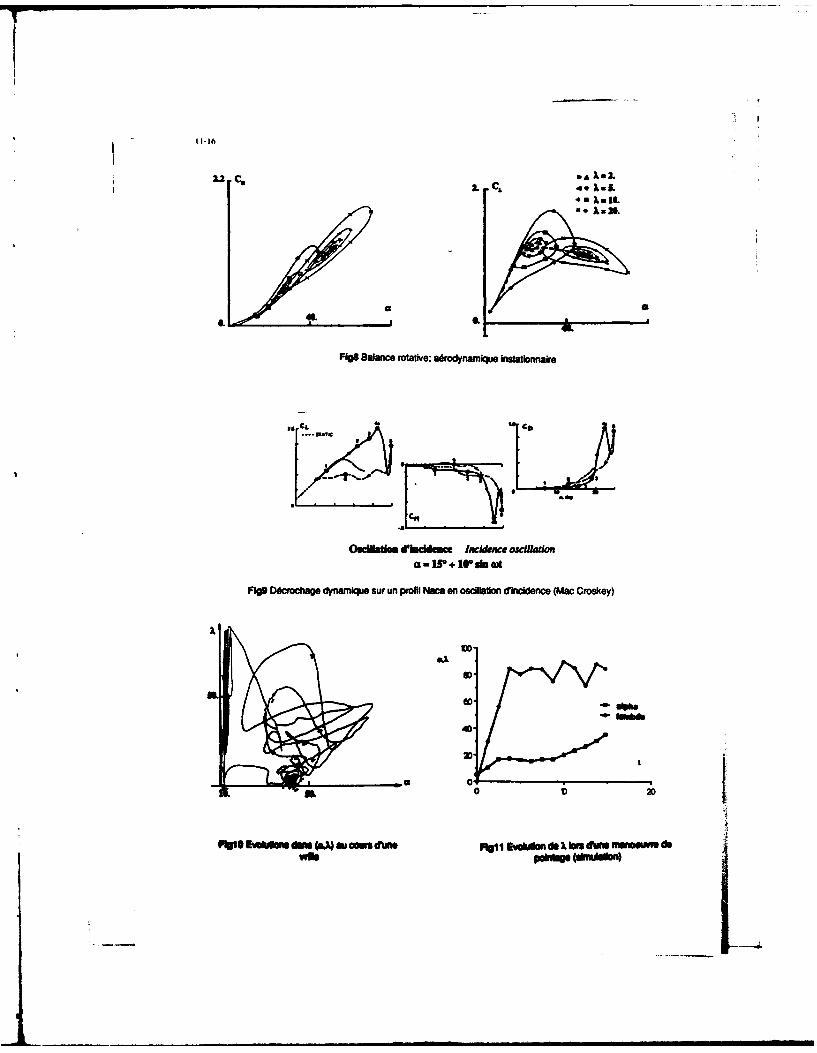
2L2C C
2. CL . ILiL
a*L.
FWg Balanc rotatIve; a6rodynaml nft oionnalre
Omdlatie. dibdise Irjciene oscilltionam , 1+ W do at
FWg Dicrochage dynamlqu sur un profil Naca en oscilltmo dincience (Mae CrosceY)
40.
OU 00
MinS Evkt ds E..L ou oa dunepl PI EvWfhin do Ib dImsA mmwwm dswib poMW (d*Mim)
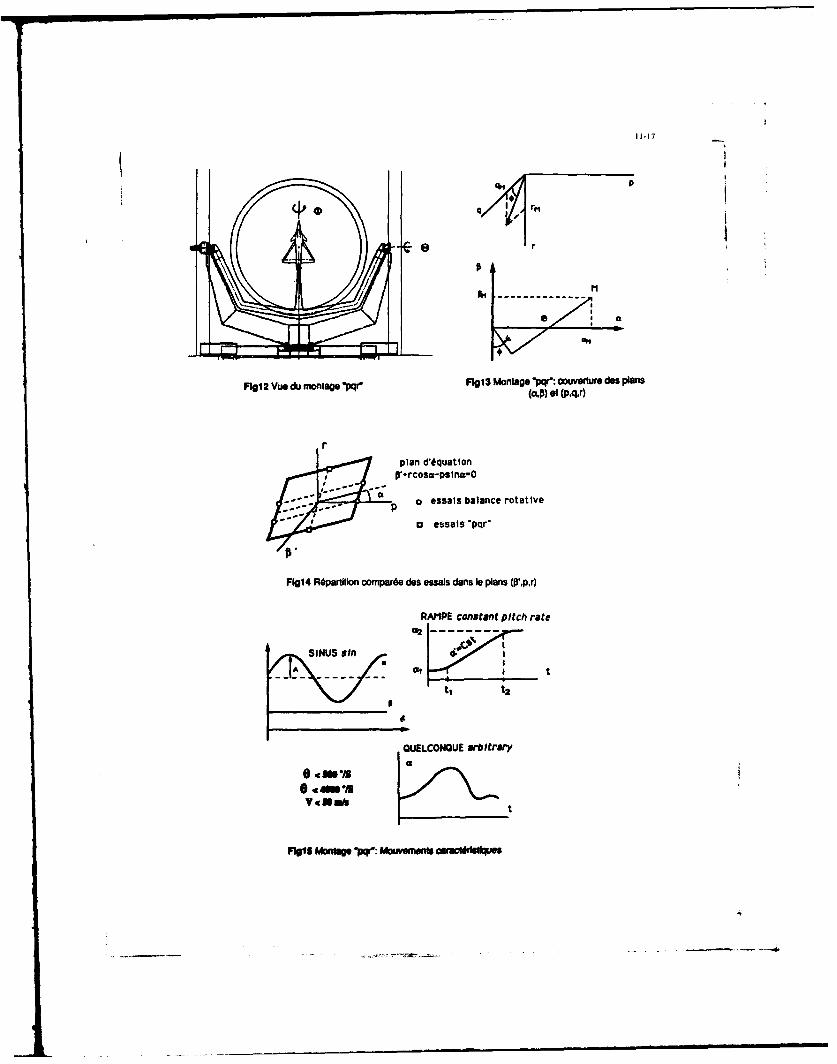
-1-1
MM
rr
plan d*6quatianF~c -slnaL-O
- - a essats balance rotative
aesl pqr'
Flgl4 Rdpaltifon comparie des essais dans Is plans (O',p,r)
RAIIPE COnstant Pitch rate
C4 t
tI t2
QUELCONQUE arbitrary
Flo$5 Montage 1w: Mouvements Cas:c6ide6m
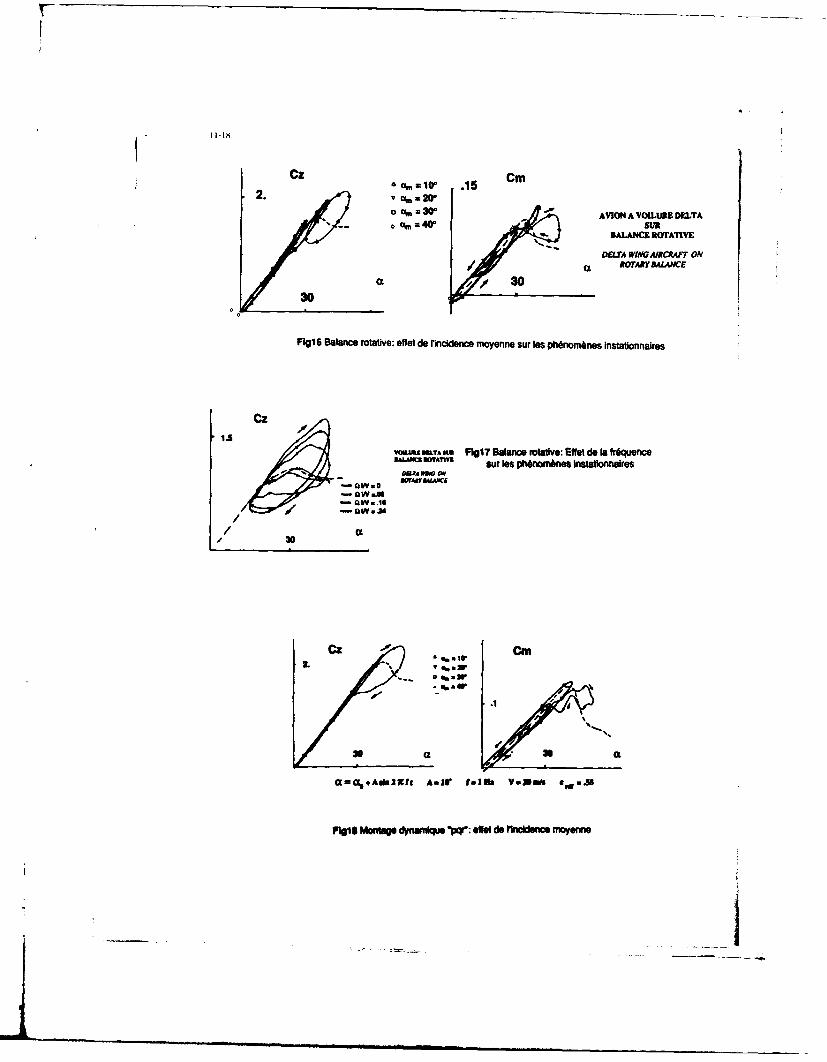
II-IV
2. v% 0o %p a*3 AVION A VOILURE DELTA
/ 1. BALAN~CE ROTATIVE
DELTA WU AIRCRAFT ON/l ROTARY BALANCE
ot 3030
FWgI6 Balance rotative: offet do rincidonco moyanno Sur loS phnononS Instatlonnairos
v~u*Im.TSW FlI7 Balancerotative: Efit do Ia frqunCOSur Ins ph6nontnes knsationnalreS
"A *16
-QW..N
a W :.I
Flo$s Mont dynun*lqu *W: allo do flnoldnce moyann
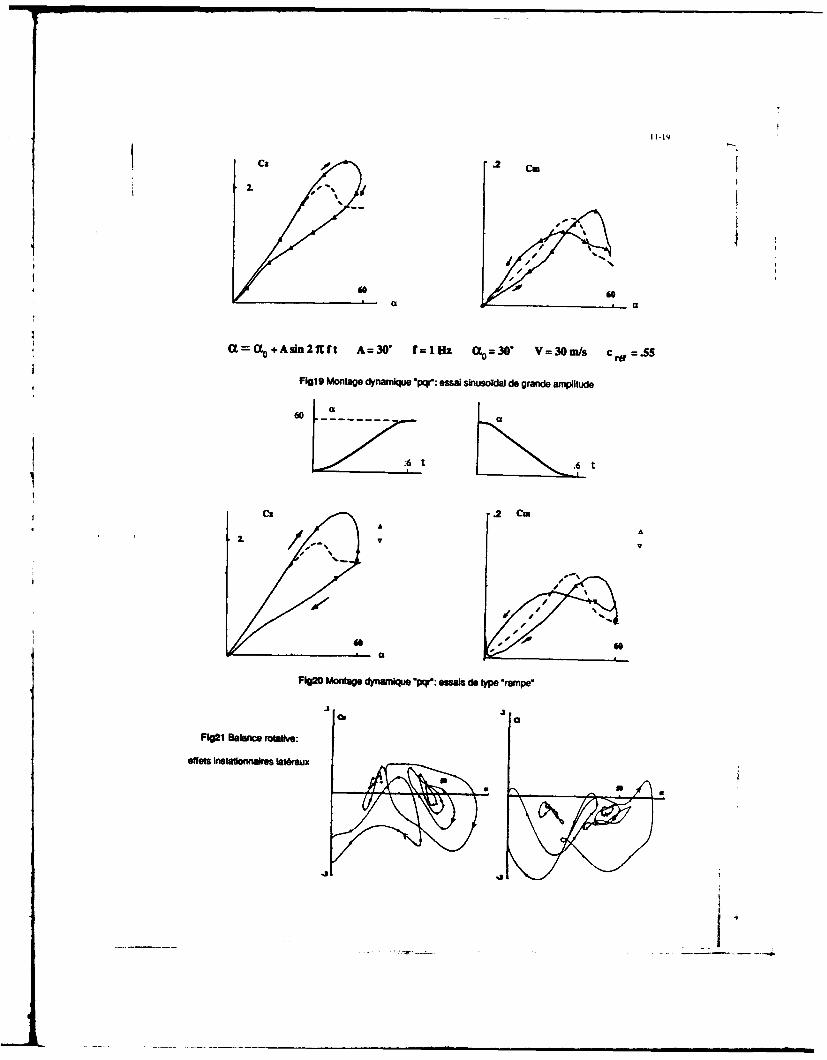
aa Cm
a= ao+Ashin21Xf A=30 f =IHz ao 0 W V 30 i/s c Of=.5
Soli9 Montage dynamilus 'pqr: essal sinusoidal de grands amplitude
.6t .6 t
C: .2 Cm
al
FJlg2l Balance rotative:
effets lnstalonnalres letlteux
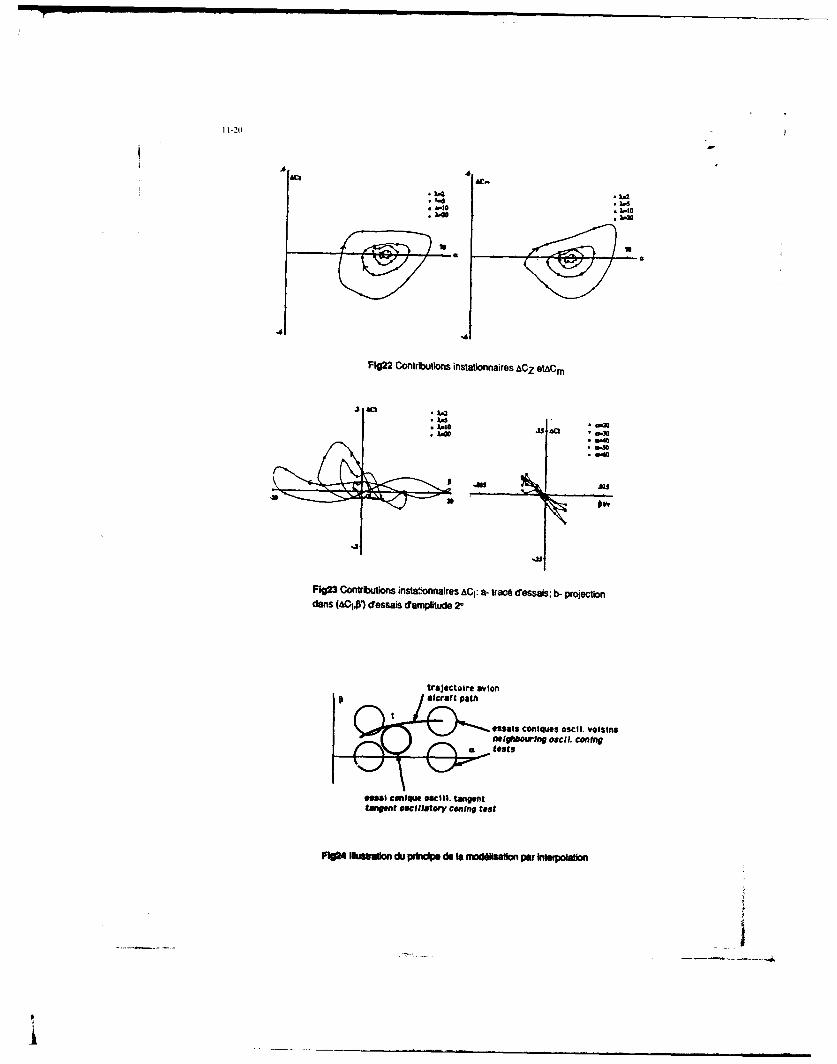
1 1-20)
. 4 X
Fig22 Contrbi~ons insiationnaires aCZ elaCm
umS is4 "3
ape~
Fie=3 Contrbutions insta:!*onnaires ACI: a- tr ac@ Cressais; b- projectiondarns (4C1.p) dressais cramplitude 2o
trajectolre avlon
mets1 cofliques aselI. voIlins
nam) Cofilgu OSCIl). tangenttagent eaCiIlate'V coning test
F%24 MuWgw du prkwcdp do Is maodillton per kntqiolsu
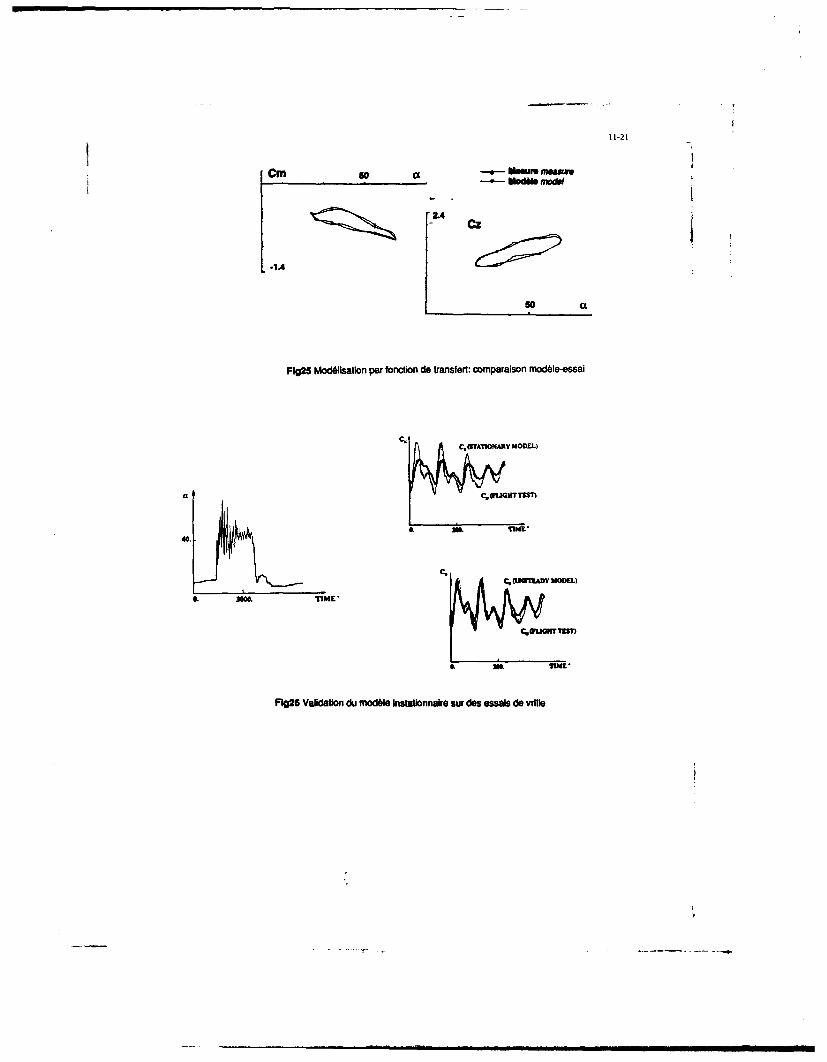
11-21
Cm so (X u mMao
cz
-IA
so cx
FIg25 Modlsation par fonction do tranSfert: oomparaison modble-essai
C.
4 C.tUTINARYMODEL)
3M,
0. 300. TIME
FWg26 Valdatlon du mocibl. instationnaire sur des essals do ville
12-1
SCALE MODEL MEASUREMENTS OF FIN BUFFETDUE TO VORTEX BURSTING ON F/A-la1
by
C. A. Martin and D. H. Thompson
AERONAUTICAL RESEARCH LABORATORYDEFENCE SCIENCE AND TECHNOLOGY ORGANISATION
MELBOURNE, AUSTRALIA
Summary 2 Wind Tunnel Tests
Tests have been carried out On Scale models of the F/ A-is 2.1 Model, Test Equipment and Testin a wind-tunnel and in a water tunnel to investigate the Poeuecharacteristics of tail buffet due to bursting of the wingleading edge extension (LIX) vortices. The wind-tunnel A 1/9th scals model of the F/A-is airc~aft wasprogrmme covered the measurement of unsteadyr surface constructed at the Aeronautical Research Laboratory forpressures and accelerations at the tall of a 1/9th scale testing in the Laboratory's low-epeed wind tunnel.model, for case with and without the LEX fences fitted. Cuarbn fibre was used extensivel for fabrication of theFlow viaualstion of the vortex behaviour was carried out fuselage and flying surfaces. All flying surfaces wereusing smoke and a lser light sheet. Fxtensive flow reinforced with high tensile aluminium spars, which alsovismalleation teats were also carried out on a 1/48th scale formed the structural sub-frame and load attachmentmodel in a water tunnel to investigate the effects of engine points of the model.intake flo and of the LIX fence on bums characteristics. For the present investigation, a wing with fixed-leadingVarious asets of these test programmesn are covered in edge (LA.) flp deflection of 34* was designed. This L.E.
this , flap angle corresponds to the flap setting for flight atangles of attack greater than 260 and Mach numbers les
thn0.6.I Introduction Jbor the purposes of this investigation, the port vertical
The sever buf eprene at the talof the F/A-is stabilizer was provided with three pair of pressuredueto ortx uriinpinaC~ toapeo eei rbe tappings. Each pair consisted of tappings located at the
dthato vanotxcursin ircaf ani exmpl vogric Roblem same spanwise and chordwlse stan but on opposing
thnat a ocu acat whionlsofach . Aplo bsvo ntial ost sides of the fin. This arrangement allowed for thegeneraten lift at ig h ges f/ att ack.eesubstnta meusureftent of differential pressure across the fin. Aredutlin inbfet n the F/A- suacthe iev eadin l presur tapping on the outboard side of the fin wasintaige eeson thes uppe surifacte otea wfild located alongside a fin tip accelerometer. Two surface
edgeextnsins LIX.) t moifythevortcalfla fild, mounted pressurs transducers were positioned on the portConsiderable research is being carried out to udrtn :pe ufc utblwtepsto ftevrethe nature of vortex breakdown and also to characteruse, biurs.Tpwure Jutpig ando trapsinsue oatieonrte
for the F/A-1S, the resulting prmuare field and Its burst The Figure tapnsadtas.crlctosa
influence on structural respn. Then mn delgee mone1na.ic/olri i aAt the Aeronautical Research Laboratory the physical Thmoewamundon itholrgvaasx
component strain ga~ balance. AlD output =gnals fromminsume undarlying vortex breakdown are being the transiducers we recorded and analysed on a Waveteinvestigated using a number of approahe, luhn 80ta Feet Fourier Transform (FIT) Analyser. Prior to thecomputational methods anad wind anid water tUunel tests, all transducers wee calibrated against a Dlgquartfacilities. Reoserch bee been reported in Referene [11 on a pressure reflerence of known accuracy and checked forcomputational i"nesigaio Of Vortex breakdOWn In a flow thaermal drift All tances were foud to be Within 1%situatien with simple boundary conditions. kn this paper of coim cetfct values. Manufacturrsresults from iestlgations of vortex breakdown an ca3lbratio ceatikiae values wr used for eli datawidtune and water-tunnel imodals of the F/A-is are reduction during the test.discussed. The wid-tunnel pregrawe covire the The tests we conducted In the ARL 2.1im by 2.1m
massuremant of unsteady Pewsers and fin vibratons for lope wind~ tomse at velocities of 30 6o W0.Wow,cae with and withoout the LXX facs fitted. Flow coreponding to a dynamic pressur rus of 250 to 22w
viemelksi of a the vort behaviou was carrie cut using pe Mai Reyne"d numbers froms 0.54 X log to 1.6 X 101amok. and how k gh eL. The water une based an doe mean aerdynamic chord of the model.instlgale wsed beth dye said hydrep bubbletarhaifus to limdfj the antl 1pes1111, o the vrebshdowa Of tAhe V01 andleu e to hesAlip the01111111 o 10111111 Iflat few0 sad tohe de of the LBX hcimam tnr 40I babhuster Dame at doe chaps in thewast flow 6S an vrs I I er dolilk of themoel tes" ane given to 9idrfee f2M eu Ill
- 12-2
2.2 Frequency Characteristics of the When the fins are removed, the burst location moves aft,
Unsteady Pressure Field in the for a given angle of attack, and the burst frequency
Vortex Burst increases.2.3 Fin Response to Buffet Excitation
Unsteady pressure measurements from two transducers
mounted on the port wing surface, and from a pressure Using a single accelerometer mounted as shown in
transducer and an accelerometer mounted on the port fin, Figure 1, measurements were made of the port fin
see Figure 1, were analysed to determine the frequency acceleration response to identify the conditions for
characteristics of the vortex burst. mazinum excitation. Surface pressure measurements were
Typical Power Spectral Density (PSD) results are Zino made at a presure port located close to the
presented in Figures 2 to 5 for an angle of attack of 26.8* accelerometer. The pressure was transmitted through a
and for a range of tunnel speeds. The PSD plots are the 0.6 mi I.D. plastic tube to a transducer located on the
average of 30 ensembles. The results show that the fuselage inboard of the fin.
pressure field due to the vortex burt contains energy over Prior to the wind-tunnel programme, vibration tests
a moderately nar-w frequency band. The band width were carried out on the model fin to establish its
and centre frequency differ slightly between the wing structural characteristics. Only the primary bending mode
surface and fin locations. However, the overall frequency was investigated. The results of these tests are presented
content is seen to be a strong function of tunnel speed. in Figure 10. It should be noted that the model fin
The centre of the energy band for the r surface pressure structure was not specifically designed to match full scale
transducer was located visually using the snalyser cursor stiffness or structural dynamic characteristics. However,
and the results are presented as a function of tunnel speed since the frequency of the primary bending mode of 68 Hs
for a range of angles of attack in Figure 6. The centre lies within the range of frequencies that occur in the
frequency increases linearly with increasing tunnel speed, vortex burst of the 1/9th scale model at normal tunnel
and the gradient increases with decreasing angle of attack, speeds, excitation of the fin would be expected.
Flow visualisation tests and wing surface unsteady In general, the magnitude of the fin response will
pressure measurements were carried out on the model depend upon the temporal and the spatial distribution of
with the fins removed as well as with the fins in place. energy in the presure field relative to the fin structural
The position of the vortex bust was defined for a range of modes, and also on the free stream dynamic pressures.
argles of attack by the introduction of a smoke filament The temporal distribution of energy in the pressure field
jugst belowttck the n ction of theforward tipoe and was discussed in Section 2.2 where it was shown that thejust below the junction of the fow ad tiof the LEX end centre frequency of the energy associated with the vortex
the fuelage. Results of the flow vishalletion studies were burst is a linear function of tunnel free stream velocity
recorded on video tape. Figure shows thath fins end also varies with angle of attack as well as with vortexremoved, the vortex burst point moves further aft for the burst position. The instrumentation was not sufficiently
same angle of attack, while the frequen nr shows extensive to allow simultaneous pressure measurements tothat the centre frequency of the burst increases
(Figuires). These changes, due to removal of the fins, be made across the fin surface. Consequently the influence
shows th t he e u t reriss we tie t of the spatial distribution of the pressure field has not yetshows that the vortex burst hast tk esneivto been determined.
the downstream pressure field. Te deteriney
From the. dsta, which comve only a few &ri of To account for the effects of free stream dynamic
attack, the vortex burst position and the irst frequency pressure the measurements of pressure and acceleration at
show significant correlation. However, both parameters the fin tip have been normalised with respect to dynamic
are also functions of angle of attack. At this stg, the pressure. In Figures 11 and 12 the value of the normalised
underlying dependencies are not yet understood. Further presure, measured from the PSD curves at the fin natural
work is being carried out on simple delta wings to provide frequency, and the peak normalised acceleration response
a better understanding of the relationships between the show a similar variation with speed. From
angle of attack and the burst characteristics, such as burst these figures, the peak fin responses occur between 85 and
position and burt frequency. 40 m/e for the 25.8 angie of attack case, and at around
Time correlation calculations were carried out on the 40 m/sec for the 31.5" ansl of attack case. Note that
signals from the two wing surface preure transducers these data ae measured at 5 m/nsec interals and so the
which wer located 100 mm apart In a stremaiwie Pek locations cannot be established accurately. Baed onthe frequency scaling results give in Figure 6, the tumel
direction. Tei crastom was cwuoter by Spplig u free stream velocities at which the pek pressurewhich had preioua been obtaned from w 4tumng frequency matches the fin natural frequency of Hs arn,Fowri Uadr Of thirty ensmbie. The rar ing 35 m/n for 2&" angle of attack, and 40 m/rn for 31.5'
corriertron plot Provides th estimte of the deming sagle of attack. Thes rsults indicate that when the
freqlat in th prm id a n estimate or t d the efct of dynamdc pressure Is tabn Iato aecount, the
fescIthpressure field vloiy Thd alo an estimate fthe maxium aeimalsed fin response occurs when thepmr okl ctuve ties otin" f The f po esrmt frequency of the peek Pressure add and the in natural
speo cer wih he obtanbeen the pron freqecy -n aPPrKWmt* Match Peak aCCati Osecity in s uarm i Figur e to be fiel ce-- the free at the tip of the f, obtained firee time hlstorlss, wan oftem veloi ty k the sas nt 24" anile of bttac ad the order of 120 'g' In the conditions of mzdmmm
0.3 tm lty vocity fe 2 ." a.ahl of Mtack. excitation. This correspo to a A tip ampiatde of 640.29fre stram elocty or 1.5'sag of ttak. t the ben heedin bas c dUel. Theqte
,a nmry, anaflsis of the surface pses ws a nbdrofura a s go. Th l
mm smtshow that with iWcasiing Siag of atteck, distribution of Wi ao o hb
thevlerte-beretloatiotlme fesww andtheburst lM9mo Hoever, faotbar o dof l i i
v -a &e treqiscy wadconveciodn velociy d e . presse - di ol hwai e rqvs to d6 Issanitude of "hi NiNULem
12-3
2.4 Memuremnent with Wing LEX brekdown on msured diretly. In dvtion mt fi w
Fence Fitted pattedn we reorded an videtalp. Cnvanti l photography w- ud to provide higher quality images in
With the LEX fence fitted the pressure measurements s casem.indicated a marked change In the vortex buret unsteadypmmue ild. The magnitudes of the unsteady pramr, 3.2 Effect of Engine Inlet Flowsar reduced significantly, Figure 13, while the mrgy isdistributed over a wider frequency band. The modified On the F/A-la, the engine inlets are located beneathprure field produces sigficantly reduced fin response, the LEX/wing leading-edge Juncfon, and so theas shown by the results in Figure 14 for an an&le of attack poseibity exists that Row into the inlets might influenceof 26." and varying sideslip sugle. the behaviour of the vortex ahove the LIX in this region.
Flow vigsulon mesuremnts showed little change Teasts were wried out in the water tunnel to explore thisin the logitudinal location of the vortex burst with the possibility. Vortex breakdown positions were measured forfence in place, although the vertical location and general various inlet flow rates, and the results are shown inshape of the burnt region was altered slightly. Feeding Figure 16. The inlet flow rate is scaled using the ratiosmoke into the flow beneath the LEX and using a V,/Vo, where V is the mean velocity through the inlet andcross-flow la light sheat confirmed the existence of a V is the freestram velocity. Examination of F/A-issecond vrtikal structure emanating from the leading edge fl'lht record showed that during a typical period of sirextension alongside the fence, Figure 15. The second combat manoeuvring, lating for some 100 second@ at fullstructure interacts with the primary vortex and also throttle, the arcraft operated at angles of attack greaterexhibits bursting. Further investigations are needed to than 15", and at estimated inlet velocity ratios geaterprovide a complete explanation for then flow interactions, than 3.0 for more than 50% of the manoeuvring period.and for the significant reduction in the resuting presure For nearly 20% of the period, the estimated velocity ratiofield. Complementary flow visualleation results obtained exceeded 4.0, and the peak value was about 5.5. Figure 16in a water tunnel awe described in Section 3. shows that the inlet flow does have an effect on the axial
position of vortex breakdown, tending to shift itdownstream. The downstream shift increases with inlet
3 Water Tunnel Tests velocity ratio until, at a velocity ratio of 8.1, the shift isabout 20% of the model length.
3.1 Model, Test Equipment, and Test The effect of engine inlet flow on the overall flowProcedures structure in the LEX region was investigated in more
detail by injeting dye through ports in the starboardA 1/48 scae model of the F/A-18 was used for the fuwe4 side beneath the LEX and ahead of the inlets.
wate tunnel tests. A standard plastic hobby kit wa Dye was also injected through a port beneath the LEXprovided with surfisce dye ports and the eanine inlets were leading edge, outboard of the engine inlet. Figure 17connected to a suction pump through Individual flow shows dye patterns obtaied for various Inlet flow rates, atmeters and valves. The wing leading-edge and he age oattack o0.it no fow into tee,trailing-edge flaps could be fixed at various deflection an angle ;f attck of 30.V. With no Bow into the inlet,setting and the horisontal tail surfaces could be locked at there is a region of complex fow beneath the LIX. Dyeam desired de t angle. LEX fences could bso be fron the fuselage ports move forward along the fuselageattached to the model side to the LEX apex, up around the apex and into the
attached to thero te prt enmodehLLEThe tests were carried out in the ARL Flight L -X vortex core. Dye om the port beneath the L X
Mechanics Branch horsontal-flow water tunnel, which has leing-edge moves outboard beneath the LEX, aounda test section 390 mm wide, 510 mm deep, and 1.52 m the leading-edge and into the vortex stem.atsong. Th 0 model w imounede, 10 onm deep, and For a velocity ratio of 2.48, the separate d regianlon. The model was mounted inveted an a sting and beneath the LEX has disappeared. Dye from all theC-trut, and poltioned in ptca yw fuselage de porms donstream and into the splitter
or Bowtely-cogtrolsd iqC mo foom slot or Into the inlet Itsef. The vortex breakdown hasib elow subat , o lbe feed des rorn shfted downseam, and the -A v ee, upstream of the
prsured uppa l could he neted thrnoh porte br kdown, has been dAe.ued downwards to le roughlypositioned at locatlos. around the model ne, on the totnLXuers*c.
fuselage sides ahead of the engine inlets, just baath each Prael to ti LEX upp1r de hbe.LZX apex, and on the LIX upper and lower surfaces. - a vediogt ratdo of 8.1 dye rom the pet. t hathFlow pattern wan also vlold whg the electrolytic ~the LEX lesding e is s a l Into the yo n . At hbl hgeneration of nnall hydrogen gas bubbles from a cathode gnAt m rat ohe eain of ihdroae b thbistrip beneath ach LIX leading edge to act as fow tracers. ahead of ah dy part the normal upward Aw ron
General Illumination of the model and dye patterns wa the LX lading-edge does nt occur. In fact, fuid pemepro d by nps benath and In fat of thetest section. A light shet generated by a las beneath down around the LIX adbedp frow the nw to the
the test section we usd in conjunction with the hydrogenbable to lunuate Sow patterns in a crossow plm.
Video c nas provided side, plan, and cr4s-ow plansv s of th model A PC-asd b.ae pml-amgi r systam
-qhe and store video kmhue rn which Iode aglof attack and the Position of Am features such avre
12-4
The effect of inlet fow at an inlet velocity ratio Of 8. To investigae further the behaviour of the Row in theat other anle of attac is shown in Figures IS to 21. At vicinity of the fence, the hydrogen bubble technique was
an angle 1. attack o 1 ', Figure is and 9, the vrta used, in conjunction with law shad Illuminatio- In
core is deflected inboard and the vortex breakdown has typical case, Figure 27 shows successive sections through
shifted from a position just ahead of and outboard of the the hydrogen bubble sheets as the light shee is moved
fin leading-edge at V,/Vo = 0, to a position behind and downstream pat the fence lcation Nea the forward end
inboard of the leading- edge. At an angle Of attack Of of the fence, the vortex cro ection is typical of that
25.4, Figure 20 and 21, the corresponding shift in vortex above a delta wing. The sheet of luid eparating firom the
breakdown position Is from just aft of the wing leading edge rols up smoothly into a spiral vortex aboveleadingedge / LEX junction to just ahead of the fin the LIX and inboard of the leadin adge. Further
Isading-edge. downstream, in the vicinity of the fence mid-chord, a kink
Flow into the engine inlet, by modifying the flow develops in the eparated het. This kink develop into apatterns beneath the LEX, may be causing Iocal changes second vortex, of the same onse as the main LEX vortexto the effective spanwise camber of the LEX. It has been The second vortex moves inboard and upwads over theshown in wind tunnel Reaferencel5 and water tunnel main vortex, then downwards on the inboard side of theReference[6] tests that increasing the sparnwise camber of main vortex. Ultimately, the two vortices marge Them
a delta wing shifts the vortex breakdown position results parallel the obeervations made usIng amoke in the
downstream. It is possible that a simiar mechanism is wind tunnel teats described above. The interaction
producing the results observed for the LEX vortex in the between the two vortices accounts for the kinks that
present tests, develop in the LEX vortex core upstream of the
The effect of inlet flow on the position of vortex breakdown when the fences are fitted, and also for the
breakdown may be significant in relation to wind tunnel slight outboard displacement of the LEX vortex core. The
testing. Most wind tunnel tests of the F/A-is have been interaction of the two vortices may affect the frequency of
performed using flow-through inlets. The water tunnel any unsteady ow component downstream of the
tests described here have shown that it may be necessary breakdown, and may thus contribute to the effectivenessto simulate inlet flows to model accurately the behaviour of the fences in reducing fin vibration. The techniquesof LEX vortex breakdown in the wind tunnel. At ARL, used in the flow visualization tests described here did not
appropriate comparative wind tunnel tests with inlet flow allow the detection of any such frequency changes.
simulation are planned to check on this point. When attempting to measure the vortex breakdownposition with fences on, it was found that, for a small
3.3 Effect of LEX Fences angle of attack range, the breakdown was not clearlydefined by dye injected at the LEX apex. The dye
As shown in Figure 22, the fitting of the LEX fences filament in the vortex core appeared to deflect and spreadhas little effect on the vortex breakdown axial position, out into a curved sheet, without displaying the usualconfirming the wind tunnel test results described above, clearly defined stagnation point at breakdown.However, the fences do modify the vortex system To study this flow in moe detail, dye was injectedstructure to some wxtent, particularly at angles of attack through a hole on the LEX underside at about the sam
in the range 15" - 30". Figures 23 to 26 show chordwise position as the fence. This dye passed outboardcomparative fence-off and fence-on side and plan views for beneath the LIX, upwrds around the LIX leadin-edgetwo angles of attack. At an angle of attack of 19.5", and into the second vortex. Dye was also injected throughFigures 23 and 24, the fence causes the development of a a hole on the LIX upper surface upstream of the fence.alight spiral In the vortex core, which is deflected initlaly Dye from thin hole passed downstream amn the L.Xupward and inboard, then downward and outboard. The upper surface and into the second vortex. Some asmplbreakdown itself is shifted outboard slightly. At an angle of the flow patterns observed ace shown in Figure 26. Itof attack of 25.4", Figurve 25 and 26, the vortex core kink was found that the principal breakdown was in factcaused by the %e is stil present but is les apparent occurring in the second vortex, and that the deflectionthan at the Iowa angle of attack, and spreading of the main vortex core dye was due to the
For angle of attack up to about 27', with breakdown core deflecting and 'smaring' around the breakdown inoccurring close to or downstream of the fence position, the the second vortex. This Sow pattern was observed cearlyphysical appearance of the breakdown is altered by the at reitively low fow velocities (about 30 mm/a), and for
addition of the fences. With the fe(ncm off, the breakdown an angle of attack ran of about I'- 22. At higheris clearly defined as a sudden deformation and expansion velocities, d0fusles and i ning of the dye flamsn madeof the core dye Wment. With the feaces fitted, the it impeesible to distinguish which vorte brohe down fAit.breakdown appears Me distinct, with a mre gradual Howee r, breakdown of the second vortex mi account forthiclaing of the con dye flsmst upstream of the the change appearance of the LIX vortex breakdownbreakdown proper (FIgur 231 and 25.) caused by the fitting of the fence.
Thi it appear tA the famurable flect on findynamic lading produced by the fences is not the resultof any mador exial shift In vorta breakdown position, butrather in due to a chaep in the natere of the flmdowstream of the breakdown, combined with a dightlateral sat is the position of the breakdown,' at least atthe how amn of attach.
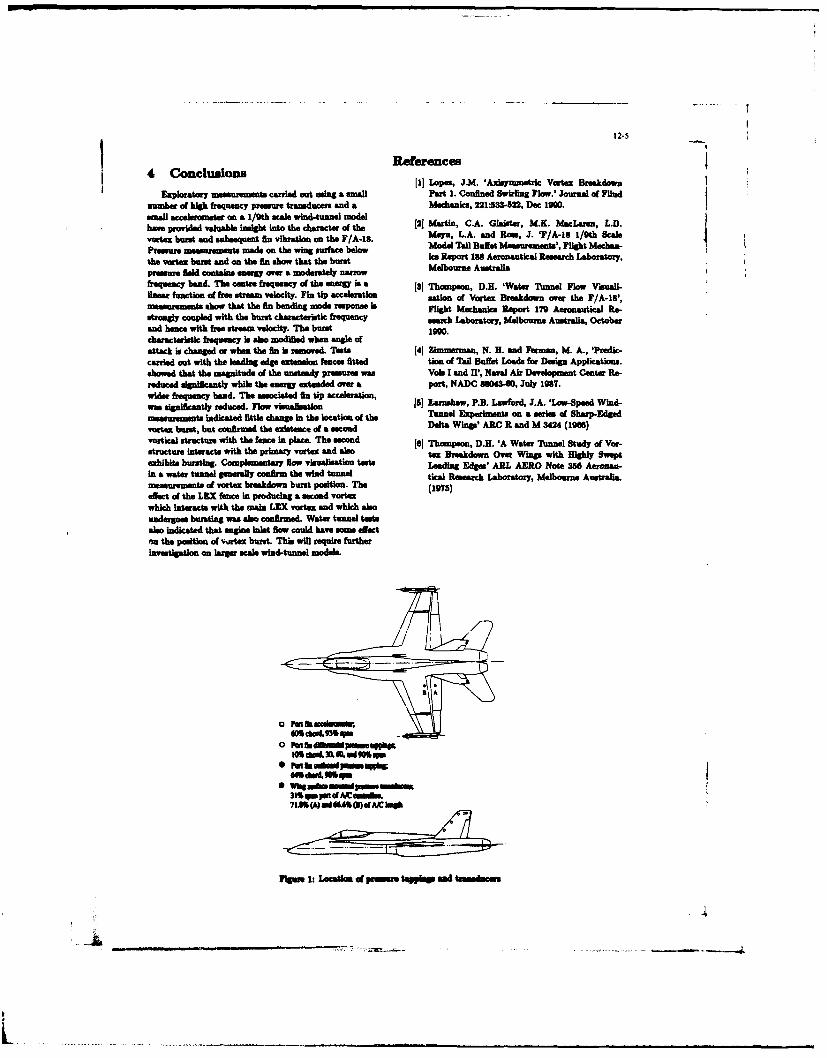
12-5
4 Concuslons ReferencesExploratory measurements carried out =isg a sBall Part 1. Confined Swirling Flow.' Journal of Flind
number of high frequency presure traneducers and a Mechanics, 221:533-522, Dec 1900.small accelerometer an a 1/9th scale wind-tunnel model (1MriCA iitr .. Mc-eLDha- prvie vau bleisght int th chr c of [thatneA GaaeMK McaeLDvortex burst and subsequent ain vibration on the F/A-ls. Maya, L.A. and Rone, J. -F/A-iS 1/9th Scale
Pressure measurements me on the wing surface below Model Tell Buffet Msureints, Flight Mecha-
pressurealfid contais energy ove a moderatel narrow Mebourne Australiafrequency band. The centre frequency of the energy is a [3] Thompson, D.H. 'Water Tunnel Flow Visua&ilineair function of free stream velocity. Fin tip acleratin sation of Vortext Breakdown over the F/A-is',measurements show that the fin bading mnode respoeis Flight Mechanics Report 179 Aeronautical Re-strongly coupled with the bunst characteristic frequency search Laatry, Melbourne Australa. Octoberand Issnce with free streamn velocity. The burst 190.characteristic freuency is als modified when anU& Ofattack is changed or when the fin is removed. Teats 14] Zimomerman, N. H. and Ferman, M. A., 'Predc-carried out with the leading edge extension fencea fitted tion of Tall Buffetk Loas for Deaign Applications.showed thast the magnitude of the unsteady presurea was Vole I and WI, Naval Air Development Center Re.reduced significantly while the energy extended ove a port, NADC 890"34, July 1967.wider, frequency bend. The isesociatedi fin tip acceleration, [5 ashwP..afoJA.'wSedWi-was significantly reduced. Flow visualisation 11LrsoPB a~d .. 'o-pe idmeasurements inicated little chang in the location of the Tunnel Experiments on a series of Sharp-Fdgedvortez burnt, but confirmed the existence of a second Delta Wings' ARC l and M 3424 (1966)vartical structure with the fence in place. The second [e1 Thomsn, D.H. 'A Water Tunnel Study of Vbr-structure itets with the primiary vortex and also tueadown Over Wings with Highly Sweptexhibits bursting. Coamplemnstary flow visualisation teats Leading Ede' AlL AFRO Note 356 Aeronan-ina water tunnel generally confirm the wind tunnel tical Research Laboratory, Melbourne Australia.mesurements of vortex breakdown burst position. The (95effect of the LEX fence in producing a second vortewhich interacts with the main LEX vortex and which alsoundergoes bursting was also confirmed. Water tunnel testsalso indicated that engie it Raow could have some electn the position of v.irtux burst. This will require further
investigation on larger scale wind-tunnel models.
0 Pinfrefieaw Uppie
Flgn1:leatlen a eemti n tasic
31%qwwt~fAmvdk
L _ _e~t0aA~r
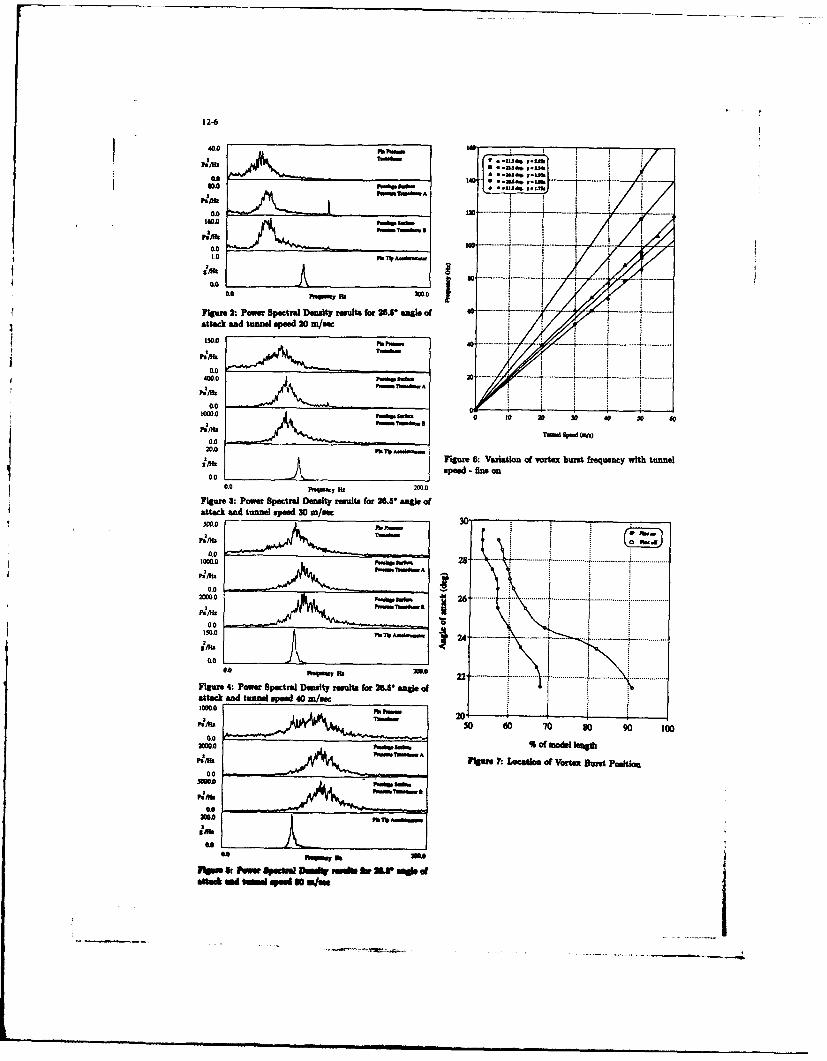
12-6
$0.0 * Sf W.2 .2J
10.0* 3J *h
0 .0
20.0
0. If
Fe2: Pwer Spc D enuty result for .Vamooeof soattack and tunnel speed 20 rn/sec150.0 PP ~
0.0
ftbw .0 0 t0 20 30 40 50 40
P.0. Td OPW Ow)
20.0 f~
Flgure 6: VarItOn of -14te burnt frequency with tunnel0M.0 sped -osan
0.0 I%"-ky Hz 2M.0_____________________
Figum : POPPer Spectr&l Density reults for 26.3 angle oft attack and tun"~ speed 30 rn/ec
000
Pb
20.0
10.0
24os. ....... ....;......... .... ......... . .......
fture4:Paw pesissJ Dinit' rw fr 265-& ofatac end tam speed 4() rn/se
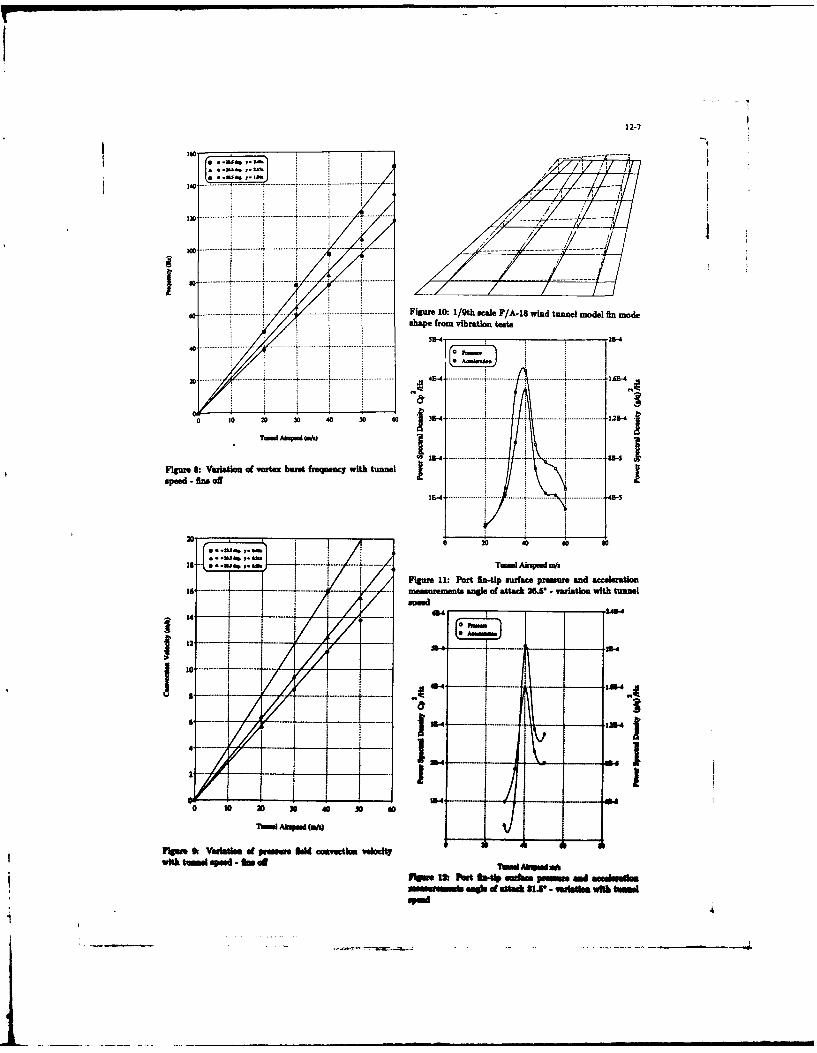
12-7
160
-- - -.- - - - -
10 ....- 4- - - - ------
.. . .... T - -- l------- I
Figure ~ ~ ~ ~ ~ ~ shp 6:o vibration tferesbrtfrtecswt une
35-4 25-5
0 ~ ~ 10 20 40 40 so00 ......... ...... . ................... 2
Fiur 8:inrmt eglem of attacx burst frequency with tunnel...... -- U----- -- 4.....
spe - -V off_
II uan Akpee u~
Fillr II: Por in-t i surfacie pres . mian aceleration1 meas~ureents anl of attac 6.V varitio wMl tunel
4 - 4
~rr- r3C .~I - -
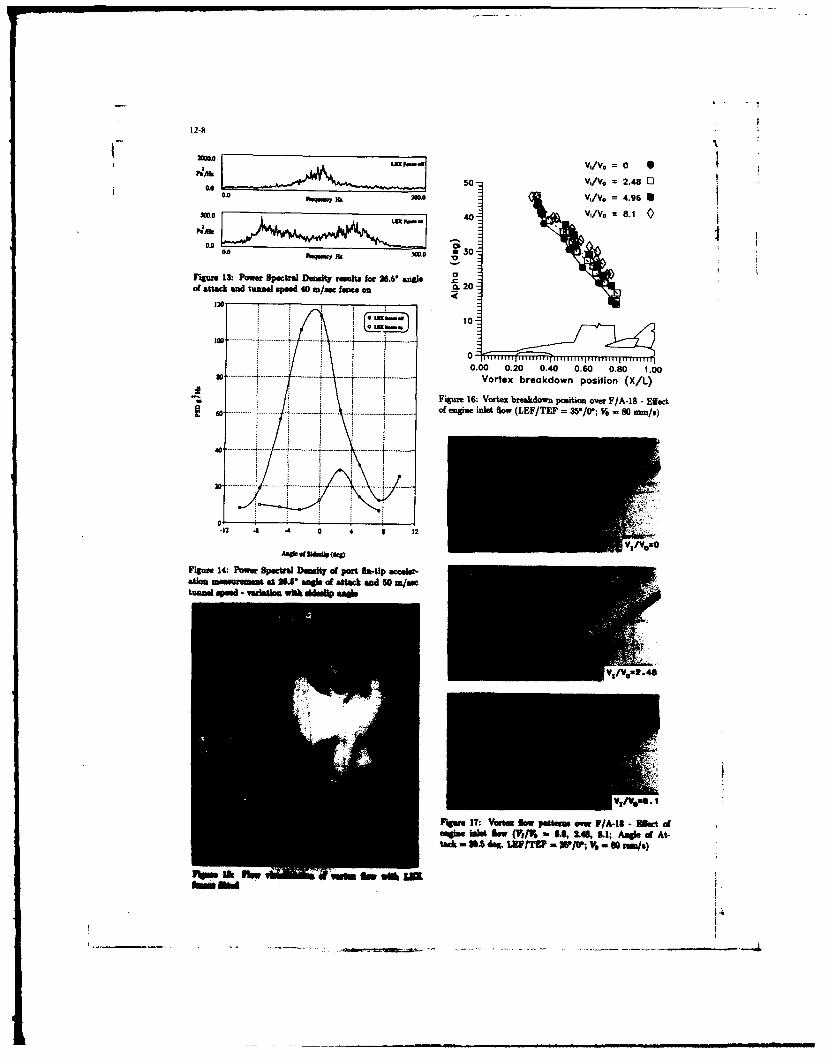
12-8
Lz0A .A. vt/vo =0
I.~1 0V/V = 2.4 10.0 lkbO ,V = 4.96 U
301 A 4 V/V. = 8.1 I
010 so0 3
Figure 13: Power Spectral Demmity faults for 28.6* an&Jof attack end tunnul sped 40 rn/ec fence on L. 20
20C
101
I0.00 0.20 0.40 0.60 0.80 1.00--- ----- ....... ----- Vortex breakdown position (X/L)
Figure 16: Vortex breakdown position over F/A-18 - Effect............... ......... of engine inlet flow (LEF/TEF 351/0; V -o mm/a)
.12 4 -4 0 4 12I
Figure 14: Pomer Spectral Dealt of port fin-tip ecceler-atlas inemummt at 2U' &ag& of atak and 50 ra/mectunne W" - Winath W& it me "o
V /Von.I
- V,/Ve -IFgur IT: Vortex a petterue ow F/A-1 -6 W~edt-fgina imlet 16w (Y11% 0.0, 2.48, 6.1; Am&l of At-
tAc -363 deew IZFJW - IF/B'; Yq 00 rim/a)
rem A rw so i
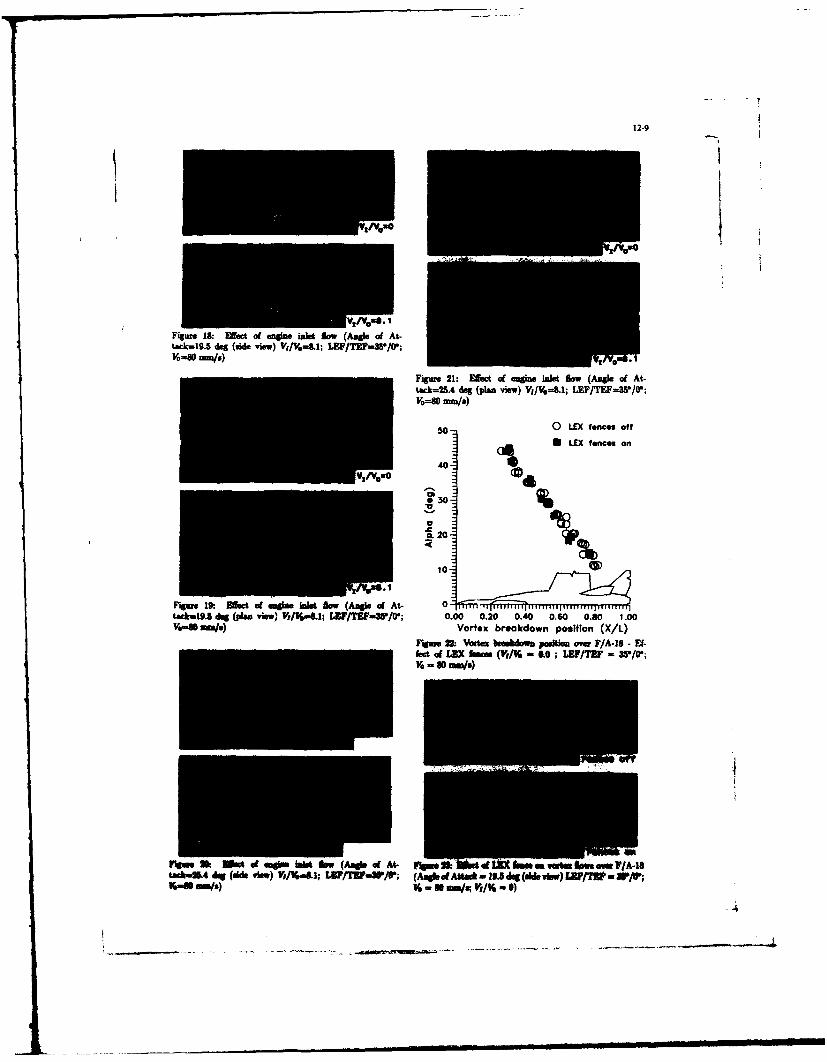
12-9
Figur IS: Eled of engine inist Saw (An&l of At-tsck=19.5 des (side view) V/%V=&1; LEF/TE7F.W/o0;Vo-SO DUDl/§) ~
Figure 21: Mfeet of engine inle Sow (An&l of At-tack=25.4 deg (plan vimw) V/V.8.; LEFIEF=W/01;V0=803 mm/a)
s0 0 LEX fences off
UO LEX fences on
40 Is
*30
Figuu19. Wed ofi gemusinle lo (A agle of At 0..... I UT IITrfV"TT ptac-19lU6 egant view) MiVo...1; LBI/TEFW /0IO; 0.00 0.20 0.40 0.60 0.80 L.00v,'-M =40/) Vortex breakdown position (X/L)
Figure UJ Vortex hseehiaa positon ome F/A-IS - Ef-fedt of LMX Asses (V,/% u,; LEFITEF 3W/o
Vrgm Sk 864 of anle W A A (As&l of At- F~ h2 tOf IkX imO ort et floe amIA-l6tack-26A dg (d&e A-e) V,/lM-&; L3F/TW=W~p; (aldA~c P e deve)LPl
Is-U mn/s) ~= MxIS;f V,/I - 0)
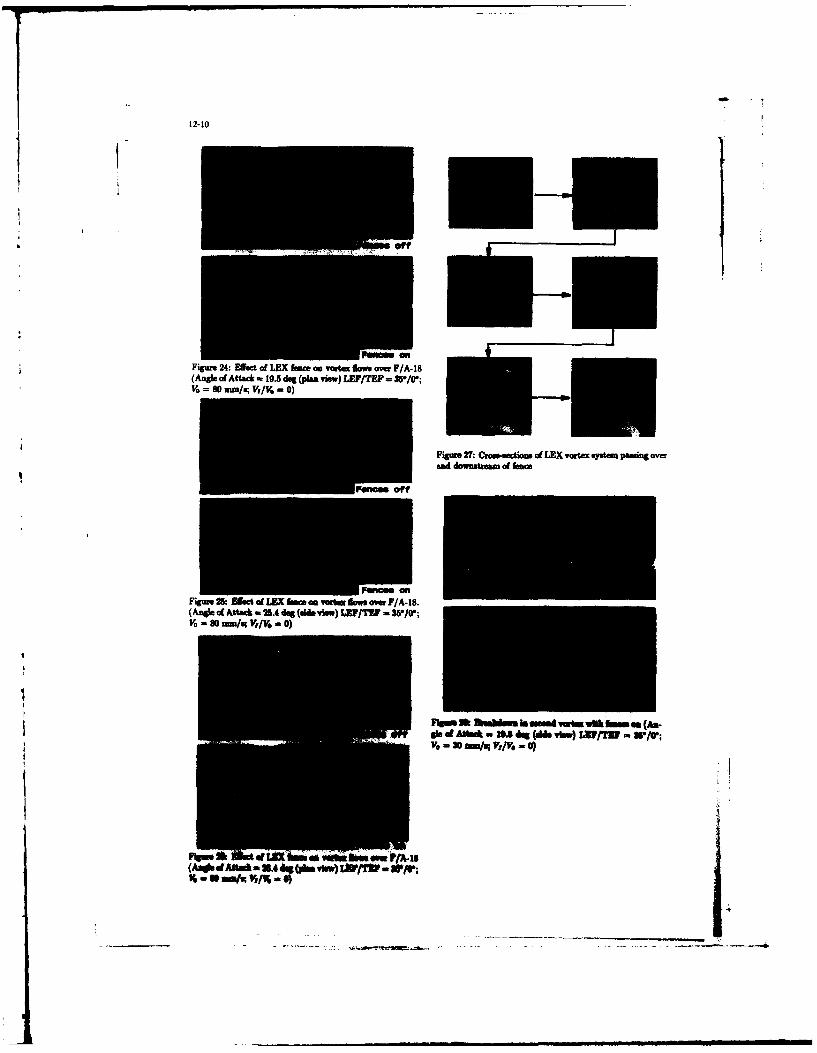
12-10
it-n
Figure 24: fect of LEX f.om on vortex lows" over F/A-is(An&l of Attack - 19.5 dog (pla view) LEF/TEF - W1/O;VO = 80 mm/i; V,/o - 0)
Oi
Fgin 27- Crosectioms of LEX vortexs ystun passing overand downstrem of fenc
Figure 25: Bledt of LBX 5mm an ve b towove F/A-is.:(Anglef Atta*c= 25A dog ("iew.) LZP/TEl IPVO 80 U Am V,/G -0)
FU kmw hmmd varl wfth amms (An-gled1 MAw IU f.td ("ie-le) LITIl - *4V0 =20 aMa/si V,/W, 0)
FIPS- or Liz *wsImam et/vis
13-I
X-31, DISCUSSION OF STEADY STATE AND ROTARY DERIVATIVES
by j
W. KrausMBB Flugzeuge, Postfach 801160,
8000 Munchen 80, Germany
1. INTRODUCTION
The X-31A high agility airplane has been designed to operate withexcellent aerodynamic qualities not only in the normal flightregime, but also at high angles of attack. The aircraft has beendesigned to have natural aerodynamic stability about all threeaxis in the entire angle of attack range - except at small angleof attack, where the aircraft is unstable in pitch for performancereasons. In some critical regions in which the natural stabilitycannot be attained, the control power required to achievestability is provided to the appropriate axis by artificialcontrol, still leaving sufficient control power for maneuvers.
In a basic wind tunnel development program, a configuration hasbeen tailored which fulfills most of the demanded requirements byaerodynamic means. Both the results and the way how these resultswere obtained will be presented in this paper.
Besides this static behavior, each aircraft has dynamic charac-teristics, which decide whether or not the airplane will diverge.Additional wind tunnel tests has been conducted in a spin tunnelto evaluate these characteristics. An analysis of the data ispresented including steady state spin modes.
2. BASIC CONFIGURATION DRVELOP NT PROGRAM IN THE WIND TUNNEL
At the very beginning of the post stall adventure stands a basicpaper reporting on studies to identify proper high angle of attackconfigurations [1]. This basic research started with a modular mo-del in a low speed wind tunnel (see Fig. 1). Several types ofwings, tails, strakes and control surfaces were analysed and fi-nally yielded the delta canard configuration as an optimum balancebetween modern fighter design in the supersonic region and poststall capability at low subsonic speed, as shown in (1]. The con-figuration was developed for the EFA / J90 fighter program includ-ing the post stall features, which later on in the program werecancelled for cost reasons. Basic problems during this time werethought to be mainly directional and lateral stability and suffi-cient control power at high angles of attack. Problems in direc-tional stability arise from the vertical tail being in separatedflow behind the fuselage above a = 40". Lateral stability of deltawing configurations is lost in the region of maximum lift when theleading edge vortices are bursting asymmetrically at sideslip ang-les (see Fig. 2 and 3), causing instable behavior until the air-flow on both wings has separated. The loss of control power is ageneral problem due to flow separation on the whole configuration- separated flow on the controls will reduce their effectivenessdown to the effect of removing their impingement area (impactarea) out of the flow.
13-2
This post stall development work is summarized in a paper pre-sented by myself in 1980 (2). Based on this early work, the X-31program was started in 1985 by Rockwell and MBB in a joint venturewhich led to a wind tunnel development program to fine tune theexisting delta canard configuration. This fine tuning will be de-scribed in the following. Since appropriate theoretical tools werenot available, the aerodynamic configuration development for the Jhigh angle of attack region was entirely based on wind tunnelwork. Fig. 4 gives a survey of models and wind tunnels used. Forthe basic development the low speed force model (1/5 scale) wastested mainly in the low speed wind tunnel in Emmen, Switzerland,which has a test section of 5 * 7 meters. A photo of this model inthe tunnel can be seen in Fig. 5, showing the model in an invertedposition at high angle of attack during evaluation of theinfluence of the sting support system.
To improve some of the configuration's unfavorable characteristicsthe use of strakes as flow controllers was contemplated. This wasbased on results found in a research work by Hummel (4], who exa-mined the influence of strakes (as flow controller for vortexflow) on basic delta wing configurations. These strakes were nownot only used at the wing apex region but also at the fuselagenose, body side and shoulder region. To check out all possibi-lities to influence the flow about the configuration, a set ofnose, body, fuselage and intake strakes was defined. In addition,different wings and tails (different in size as well as positionand shape), including ventral fins and winglets, were consideredto improve the configuration. A survey of these devices is pre-sented in Fig. 6.
A detailed description of all devices is shown in Figs. 7 - 10.
Fig. 7 different vertical fins, including ventrals
Fig. 8 different wing configurations, including wingstrakes and winglets
Fig. 9, 10 different body, nose and inlet strakes
All the different means to improve the configuration could not betested for all possible control variations. So a critical controlconfiguration was determined as a baseline on which improvementwas carried out. From earlier testing on the EFA / J90 configu-ration (2] it was known that the critical case for lateral anddirectional stability occurs at angles of attack between 30" < a <50'. The canard should then be in an unloaded position to minimizevortex interaction with the wing, which is then maximally loaded(* = 30") or even separated (a = 50") in this region (a roughschedule for a canard control law was found to be -a = Scan; thismeans the canard should be rotated into the freestream flow direc-tion). Also it was known that the leading edge flaps should be atmaximum down deflection to shift flow separation on the wing tohigher angles of attack.
This gives the following control settings for the configurationselection process
a = 40" angle of attackScan - -40" canard deflection (I.e. down)Sle = -40" leading edge flap deflection (down)Ste - 0. trailing ege flap deflection
13-3
61e = -40 (streamwise) was found to be the most effective deflec-tion angle and 6te = 0* was chosen because the trailing edge flapdeflection doesn't influence lateral and directional stabilitygreatly. Also, judging from earlier test experience, a yaw angleof = 5" proved to be acceptable to establish the lateral anddirectional stability derivatives.
Note:
Not the sideslip derivatives Cnp and Clp are given in all fol-lowing figures, but the the sideslip coefficients Cnp=S and C18=5at sideslip angle P = 5" together with the zero values CnB=0 andCl 0 , which is for comparison purposes just as good as the deri-vafives and gives the advantage to show the behavior of the coef-ficients at P = 0* as well.
In the following the influence of nose and body strakes, verticaltails and ventrals is discussed step by step.
Nose strakes :
Four different nose strakes were used : forward and backward posi-tion and for both positions an upper and lower location (see Fig.9, strakes RS9, RSI0, RS11 AND RSl2).
Nose strakes are well known to improve directional stability atangles of attack higher than 40', but their benefit is very sen-sitive to location. They are acting in two ways :
1. improving deviation of the yawing moment for the =case which is caused by an asymmetric shedding of the nosevortices (the nose strakes fix these vortices symmetrically tothe fuselage)
2. for sideslip cases the nose vortices can be fixed by thestrakes, generating a stabilizing moment at the nose. This maybe dangerous in some cases, because this moment gives an auto-rotative contribution to the dynamic characteristics andtherefore, has to be validated later on in the spin tunnel.
Both reactions can be achieved (see Fig. 11 and 12). The deviationfrom zero for the P = 0* case is removed for all four positions.The most benificial strake location for the sideslip case 0 + 0',however, is the backward downward position RSl2. Here directionalstability is attained for all a > 40". For lateral stability theforward position gives best results, though the influence is notvery strong. The impact on pitching moment is too small to beshown here.
The best solution RS12 is kept for all further tests.
Body strakes
As proposed by Hummel (4), a body strake was mounted behind thecanopy at the fuselage shoulder (see Fig. 9), and will be referredto as RSl4. Fig. 13 shows a small improvement of the directionalstability in respect of the instability jump at a - 40' and asmall decrease in roll stability at the same angle of attack. How-ever, pitch characteristics are smoothed out at stall conditionsabove maximum lift (see Fig. 14).
-I ..
13-4
There is another position for such a strake to correct the un-favorable lateral stability, namely in the diverter region, aswill be shown later after optimizing vertical tails.
Increased vertical tail and ventrals
Fig. 9 shows the baseline vertical tail S27, a tail increased inspan by 30% (S28) and the increased tail in most backward position(S34). As can be expected, with increasing span and backward posi-tion, directional stability improves and lateral stability is notaffected. This gives in combination with the optimum nose strakeconfiguration RS12 a remarkable improvement in directional stabi-lity and good lateral characteristics (see Fig. 15). A furtherimprovement occurs with the addition of ventral fins to the S34fin, named now S35 (see Fig. 9 for geometry and Fig. 16 for aero-dynamic coefficients).
Up to now the best configuration has the following equipment,
which from now on is called New Baseline
- RS12 nose strake
- S35 vertical tail with increased span in aft positionand ventral fin
- no body strake
The task now was to find an optimum position for the body strake.
Ontimization of body strake location
The body strake should retain the good pitch characteristics shownbefore and additionally provide good lateral and directional sta-bility, as shown by Hummel [4]. Therefore the location was optimi-zed with possible locations in the fuselage region between canardand wing in longitudinal direction and intake and canopy in verti-cal direction. The idea was to fix separation of the cross flow inthis region at the fuselage side wall in the same manner as withthe nose strakes in the nose region.
The results of the variation are shown in Figs. 17 to 20. From alllocations in the region described above the position just belowthe diverter (at the upper edge of the intake side wall, see Fig.6), named intake strake RS16, was the best one with respect tolateral and directional stability (Fig. 17). Pitch characteris-tics, Fig. 18 , are still to be improved.
Further search finally led to a combination of the intake strakeRS16 with the forward part of the original body strake RSl3, nowcalled RS18 and an additionally mounted mini wing strake WS. (Thismini wing strake is not a wing strake as usual (producing a strongvortex interaction with the wing leading edge vortex); it is morea sharp edge (flow controller) to fix the separation of the flow.Large strake areas will also fix the separation, but will give un-favorable strong pitch up characteristics due to the interferencewith the wing vortex).
The combination of strakes described above gave the best compro-mise for lateral, directional and longitudinal stability (see Fig.19 and 20).
13-5
So the finally selected strak. configuration R820 consists of:
RS12 nose strake, (back, down)
• RS16 intake strake
RS18 forward part of body strake
WS mini wing strake
The different strakes are mainly acting as follows:
- nose strake : improves directional stability for a > 40°
- intake strake : cures lateral stability for 30" < a < 40 °
- body strake : smoothes jump in Cma characteristicsfor 30 ° < a < 40*
- mini wing strake : fine tuning for all problems
Selected configuration :
The improvements found for the critical control settings shouldnow of course be also beneficial for other control settings andfor different yaw angles. Figs. 21 and 22 show these different yawangles and it is obvious that the principle behavior is not chan-ged. Even if we look at P - polars ranging from -20" to +20' forseveral critical values, totally stable behavior can be found inlateral motion, and for directional stability stable behavior isgiven at least between -5° < P < +5°, as is shown in the detailedanalysis in (3].
Fig. 23 shows that even for a leading flap edge setting of 61e0* stable behavior is achieved in lateral and directional stabi-lity for relevant canard settings with respect to angle of attack,e.g.:
6can stable behavior(canard setting) a - regime
Cn Cl(yaw) (roll)
-20" 0*< a < 22" 5" < a < 22-30" 0"< a < 70" 5* < a < 70-35" 0"< a < 70" 5" < a < 70-43" 0"< a < 70" 5" < a < 70-50" 37"< a < 70' 35" < a < 70"
This shows that a possible trim schedule in respect of goodlateral and directional stability (here for the case 6te =0*,61e - 0) is roughly between 6 C n - -a and -a/2, as statedalready above. Even canard settings different from this controlschedule (for maneuver cases) do not lead to a loss of stability.
13-6
Trim schedules -
Trim schedules are dictated by the pitch instability margin andthe pitch characteristics of the configuration and strongly in-fluence the following items
-control power about all axis(especially about pitch, with the vital question for enoughrecovery moment from high angles of attack
- directional and lateral stability
- maximum trimmed lift coefficient
- trim drag
The necessary aerodynamic recovery moment in pitch from highangles of attack limits the maximum possible pitch instabilitymargin as well as the maximum possible deflection rate of canardand flaps. A limit for the maximum instability margin is alsogiven by the flight control system. On the other side the pitchinstability should be high enough to meet the requested perfor-mance demands in the subsonic region - higher instability giveslower trim drag.
Besides chcosing the pitch instability level, the designer canincluence the pitch characteristics over angle of attack by meansof adding strakes or changing wing shape, fuselage contour, stabi-lizers etc.
All this has to be balanced very carefully now to find the overallbest configuration for the post stall and conventional performancerequirements. This is of course a complicated and lengthy processand beyond the scope of this paper. So only the final optimumcontrol law and the appropriate behavior of stability and controlabout all axis will be presented. A detailed discussion of theoptimization process can be found in the analysis paper [3].
The final optimum trim schedule or control law for canard, leadingand trailing edge flaps is plotted in Fig. 24. The leading edgeflap is continuously deflected down with increasing angle of at-tack until the maximum deflection of 40" is reached at maximumlift. The canard is held at zero position until 20' angle of at-tack to allow the trailing edge flaps to be used to improve trimdrag and maximum trimmed lift. From a = 20" on, the trailing edgeflaps are brought back to zero position and the canard is conti-nuously deflected downwards in direction of the free flow to redu-ce load both on canard and wing for optimum conditions for lateraland directional stability at high angles of attack.
Figs. 25 now depicts the result for the trimmed Cma curve andFig. 26 for the directional and lateral stability - which isstable in the whole angle of attack region! The trimming was donewith the canard, keeping leading and trailing edge flap in zeroposition. Fig. 27 illustrates the improvement in leading edge flapdeflection and Fig. 28 shows the penalties incurred by using thetrailing edge flaps which are deflected in the angle of attackregion 0* < a < 30".
In Figs. 29 and 30 the roll control power available for trimmedconditions is presented. The yaw control power is shown in Figs.31 and 32. Both controls arrt fulfilling the desired maneuver
_ _ _ i
13-7
requirements for a fighter aircraft, see [5], when using someadditional control power in yaw from a vector nozzle.
Finally it is shown in Fig. 33 in the so called "Weissman Plot"(where the lateral control departure parameter LCDP is plottedversus the directional dynamic stability CnBdvn) that up to 65'
Weissman Plot gives the design engineer a first idea how a con-
figuration will behave regardless of the configuration being proneto spin or not. However clear statements with respect to departurebehavior can only be drawn by including the influence of dynamiccharacteristics.
3. DYNAMC BZHAVIOR AND SPIN NODEs
To evaluate dynamic characteristics, wind tunnel tests on the baseof a rotary balance measurement were conducted in the Langley Re-search Center's 20 foot Spin Tunnel. They helped to establish thedevelopmental aircraft's steady state high angle of attack staticand rotational aerodynamic characteristics. Data were obtained fora 1 / 7.5 scale model through an angle of attack range of 0* < a< 90" to define the aircraft's steady-state aerodynamic characte-ristics, both static and rotational, including the influence ofsideslip, control deflections, speed brakes and thrust vanes. Aphotograph of the rotory balance apparatus installed in the Lang-ley Spin Tunnel is shown in Fig. 34. An analysis of the data ispresented in [7] and [8), including steady-state spin modes, pre-dicted using the method described in [6]. A summary of these in-vestigations is given in the following.
Discussion of dynamic characteristics
As shown above, the X-31A is behaving extremely well in terms ofstatic lateral and directional stability; for both the airplane isstable or at least neutral in the whole angle of attack regime fortrimmed flight. Also control power about roll and yaw axes isavailable up to 90" angle of attack. Serious statements withrespect to departure behavior, however, can only be made when thethe influence of dynamic characteristics is included.
Lateral characteristics
The influence of rotation on the rolling moment characteristics ofthe basic airplane shows that in normal flight regime the airplaneis highly damped in roll (see Figs. 35 and 36). As stall is ap-proached, the level of damping decreases. After stall the configu-ration becomes autorotative in roll, remaining so through 60".Above 60" the rolling moment is neutral to slightly propelling, asis the case for most airplanes. These characteristics indicatethat departures from controlled flight are possible for the un-augmented airframe. In conjunction with a flight control system,this, however, will be no problem as long ar sufficient roll cont-rol power is available - and the X-31A provides good roll power bymeans of ailerons (differential trailing edge flaps) throughoutthe whole angle of attack regime. As can be expected, controleffectiveness decreases at higher angles of attack, but somecontrol power is still maintained up to 90".
For a critical case, say a - 40', the test results of the lateralrotational derivatives are given with and without roll control
.. .m m m-m"' m im( m m mm
13-8
input (see Fig. 39). As can be seen, the existing roll power islarge enough to stop a possible motion about the roll axis.
Directional characteristics
The basic airplane is damped in yaw through 40" angle of attack.At 45*, it becomes neutral and at 50" slightly propelling andremains autorotative up to 70". Above 70" it is damped again, see(8]. The presence of the canard, however, has a major influence onthe damping produced above 50' angle of attack. Especially fortrim deflections, the autorotative regions are significantlyreduced. The values for the complete configuration are shown inFigs. 37 and 38.
Figs. 35 and 37 are showing - besides the rotary derivativeC1 /(flb/2V) measured in the spin tunnel - theoretically estimatedderivatives, indicated as "SNAKE Dataset", which fit quite wellwith the experimental data. In the conventional angle of attackregion 0* < a < 20" a linear panel method was used, as is shown in(9]. Above maximum lift, a semi empirical method was used.
Predicted soin modes L
Rotary balance aerodynamic data can be used to predict steady-state spin modes at any specific attitude for a given set ofmasses and inertias. An outline of the method and the historicalbackground are presented in [6]. For steady state spins to occur,the aerodynamic pitching, rolling and yawing moments must balancetheir respective inertial moments. A propelling aeL dynamic momentmust exist in order to maintain the airplane's rotation, the rol-ling moment being the primary driving term at low angles of at-tack, with the yawing moment becoming the dominant propellingcomponent as angle of attack increases to the flat spin modes.
Since an erect rotating airplane always produces a nose up iner-tial moment, nose down aerodynamic pitching moments must exist tobalance it and hence permit a spin. For airplanes with unstable orrelaxed pitch stability (unstable at low a and becoming more andmore stable at high a), such as the X-31A, this condition may notbe satisfied over a large portion of the angle of attack range forcertain control deflections, thereby limiting possible spin modes.Fig. 40 presents the spin modes calculated for the X-31A (7],[8]) at the weights and inertias corresponding to a basic missionloading with 60% internal fuel. No spin modes are predicted with-out lateral or directional control inputs for any normal canard orsymmetrical trailing edge flap deflection. However, an extendedcanard setting of 6qan = -70", which is not used by the flightcontrol system, exhibits a moderately fast flat spin at 84" angleof attack of 2.7 seconds per turn. This is due to the propellingyawing moments this canard setting generates above 75" angle ofattack.
Asymmetric trailing edge flap deflections are very effective atthe spin attitude because of the adverse yaw they are capable ofgenerating. Surface deflections against the spin produce a flatspin mode (at 85, to 87* angle of attack and 1.7 to 2.8 secondsper turn) for all canard deflections between 0* and -701, ex-hibiting the fastes turn rates. The roll control surfaces, againdue to their yawing moment effectiveness, when deflected with thespin, result in a no spin condition.
-AL
13-9
Generally it is not possible to predict actual recovery charac-teristics from these results since it is not known how readily theairplane will move from equilibrium spin condition for one controlsetting to a no spin condition for another. The actual sufficiencyof recoveries can only be determined through dynamic testing andlarge six degree of freedom analytical calculations.
Comparison with experimentally determined spin modes
Spin modes that were experimentally determined from free spinningtests of a dynamically scaled model of the X-31A in the LangleySpin Tunnel are compared with the predicted spin modes in Fig. 41.Experience has shown that the full scale airplane will either havea steady spin as predicted, or it will have an oscillatory spinmode whose average values of angle of attack and turn rate willequal the predicted steady values. Also, in some extreme cases,the oscillatory motions will be so severe that the airplane cannotstabilize in the spin. As shown in Fig. 41, there is excellentagreement between the experimental and predicted spins. For theX-31A, the experimental spin with pro spin rudder and ailerons for-60" canard setting is oscillatory, with the average angle ofattack nearly equal to the angle of attack of the calculated spin.
The free spinning model tests showed that neutralizing the canard,again with ailerons deflected against the spin and pro spin rud-der, produces a steady, flat ipin mode (88" angle of attack at 2.0seconds per turn) that agrees well with the predicted steady spin(87" at 2.4 seconds per turn). Deflecting the ailerons with thespin produces no spin mode, as is predicted.
4. CONCLUSION
The configuration exhibits positive pitching moments over almostthe entire tested angle of attack range with neutral controls,which commensurates with the intended relaxed pitch stability.Below stall, the X-31A exhibits good lateral directional staticstability and is well damped in roll and yaw. As stall is ap-proached, lateral stability is reduced and the aircraft becomespropelling in roll. If the aircraft is rolling about its bodyaxis, difficulties can be encountered in terminating the roll ratein the 30' to 50" angle of attack region until large sideslipangles are attained. This situation is not approached if theaircraft rolls about the wind axis, which at high angle of attackis the only possible and significant maneuver. Fortunately, theexisting control laws will ensure that the aircraft does roll onlyabout the velocity vector.
The vehicle is highly damped in yaw through 40" angle of attack.However in the region of 50" angle of attack the damping isslightly reduced and a small zero sideslip yawing moment offsetcan be observed as well. Negative canard deflections generallyresult in an increase in yaw damping up to stall, but the samedeflections have an adverse effect as angle of attack is furtherincreased.
As is normally the case, the effectiveness of the aerodynamiccontrols is reduced between 0 c a < 90. Nevertheless, a goodlevel of longitudinal and lateral control power is availablethroughout the whole angle of attack range. The directionalcontrol provided by the rudder, however, is relatively ineffective
'i4
13-10
beyond 45" angle of attack - the reason for the configurationhaving a vector nozzle.
Movement of the trailing edge flap has large influence on the rollcharacteristics. Deflecting the trailing edge flap negatively, toproduce a nose up pitching moment, significantly decreases thepropelling moments, whereas the opposite is the case when the flapis deflected in a positive direction. Unfortunately, because ofthe relaxed pitch stability, a positive deflection is likely to becommanded at high angle of attack.
The aircraft probably has only one spin mode which is flat(a - 86", 2.3 sec/turn). The yawing moment associated with thelateral control above 60' angle of attack is the parameter mostresponsible for this spin mode and for recovery. Spinning does notappear to be a problem with this configuration due to the lateralcontrol effectiveness as well as the presently envisaged controllaws that attempt to keep the aircraft from attaining spin angleof attack, and that may limit the available lateral control atsuch attitudes by giving priority to pitch control.
References
(1] John H., Kraus W.High Angle of Attack Characteristics of Different FighterConfigurationsSymposium on High A.O.A. Aerodynamics, AGARD4-6 Oct. 1978, Sandefjord, Norway
[2] Kraus W.Delta Canard Configuration at High Angle of Attack12th ICAS Congress12-17 Oct. 1980, Muinchen
[3] Kraus W.Analysis of Test Phase 13, P20-SNAKE (X-31) Low Speed WindTunnel Tests in EamenMOB TN SNAKE/R/lO12 Dec. 1985
(4) Hummel D.Untersuchungen zur Rollatabilitit von Tragflugeln bei groPenAnstellwinkolnTeil I - 4TU Braunschweig, Berichtsnr. 79/4, 80/3, 81/2, 83/31979 - 1983
(5] Kraus W., Przibilla H., Haux U.Stability and Control for High Angle of Attack ManeuveringAGARD 7NP-Symposium : Criteria for Handling Qualities of(CP 333) Military AircraftPort Worth, Texas USA19. - 22. Apr. 1982
[6) bihrle W., Barnhart B.Spin Prediction TechniquesJournal of Aircraft, Vol. 20, No. 2Feb. 1983
I *
13-11
[7] Dickes E., Barnhart B.
An Aerodynamic Math Model of the SNAKE (X31) Airplane forSimulation of Flight MotionsBAR 86-10Sep. 1986
[8] Dickes E.Analysis of Static and Rotational Aerodynamics at High Angleof Attack for the X-31A AircraftBAR 88-1June 1988
(9] Sacher P., Kraus W., Kunz R.Computational Aerodynamic Design Tools and Techniques Usedat Fighter DevelopmentAGARD Symposium : The Use of Computers as a Design Tool(CP 280)Neubiberg, Germany3. - 6. Sept. 1979
. . ....
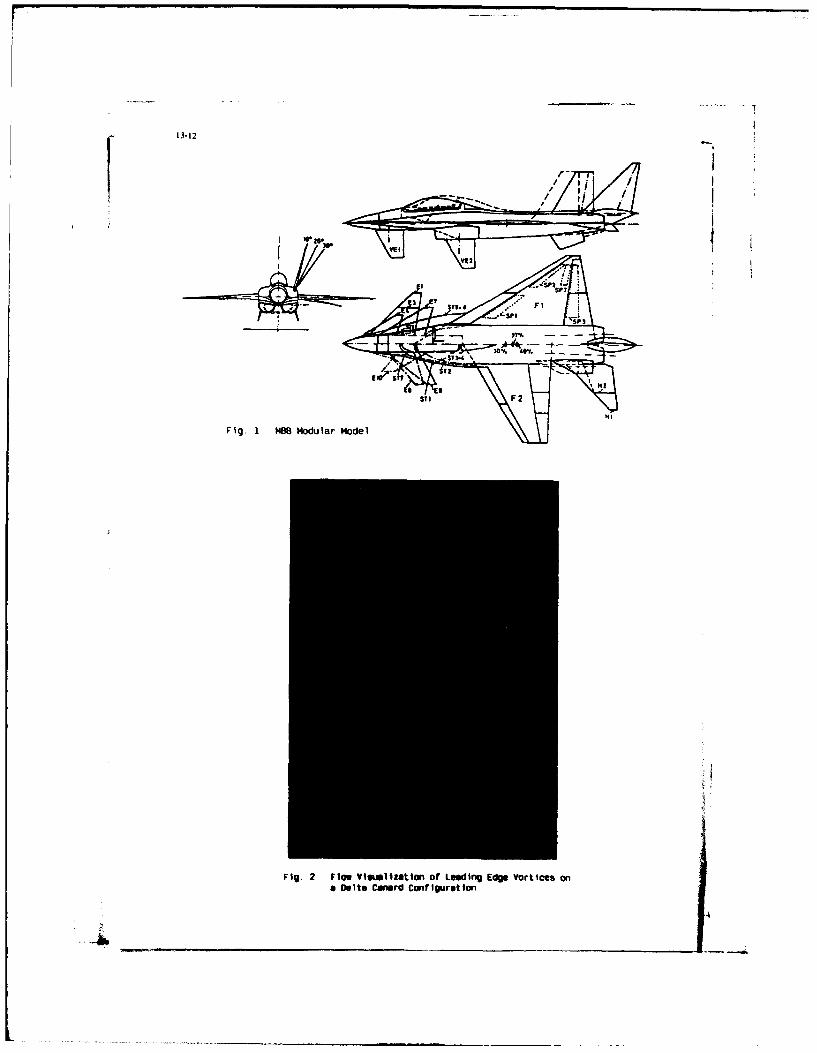
- 13-12
F~g. 2 n~ viml~zatton or Eedn di otcso
a~ ~ Det IaadCn~grt
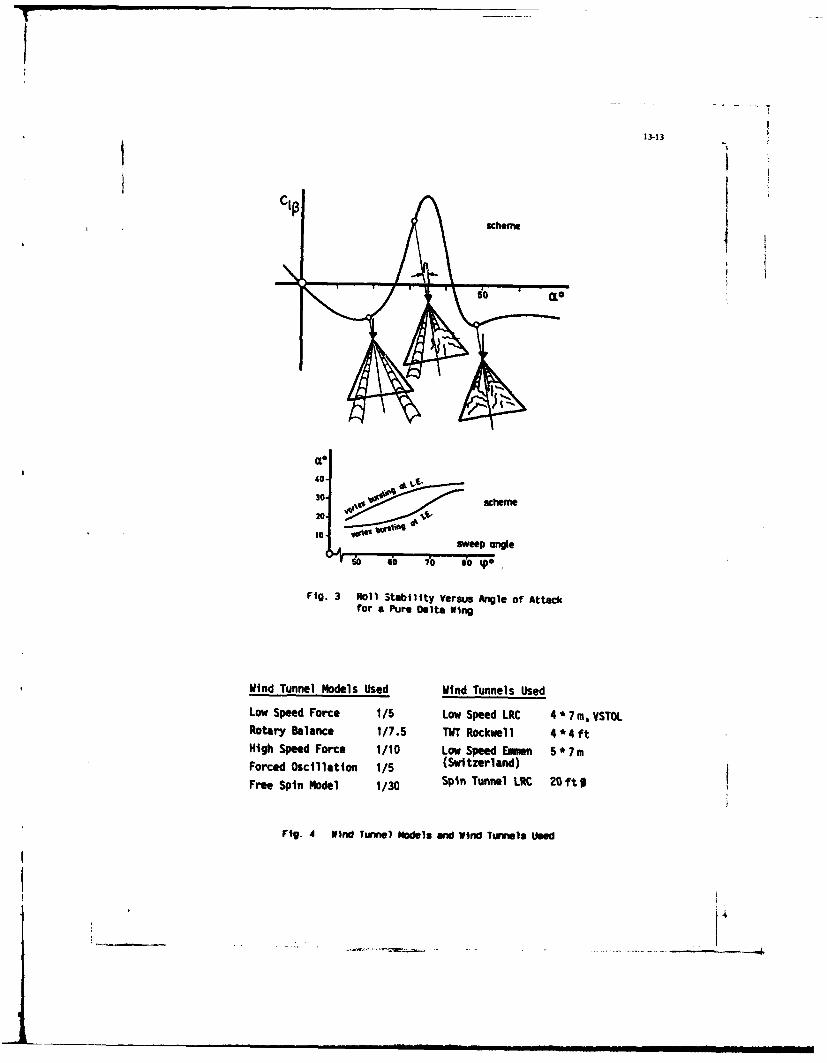
CI
Ci
scheme
3050
sweep angle5o 60o fo Io 1po
Fig. 3 Roll Stability Versus Angle of Attackfor a Pure oelta wing
Wind Tunnel Models Used Wind Tunnels Used
Low Speed Force 1/5 Low Speed LRC 4* 7 mVSTOLRotary Balance 1/7.5 TWT Rockwell 4*4ftHigh Speed Force 1/10 Low Speed Emen 5*7mForced Oscillation 1/5 (Switzerland)
Free Spin Model 1/30 Spin Tunnel LRC 20ftp
fig. 4 Wind Tunnel Models and Wind Turiels Used
________
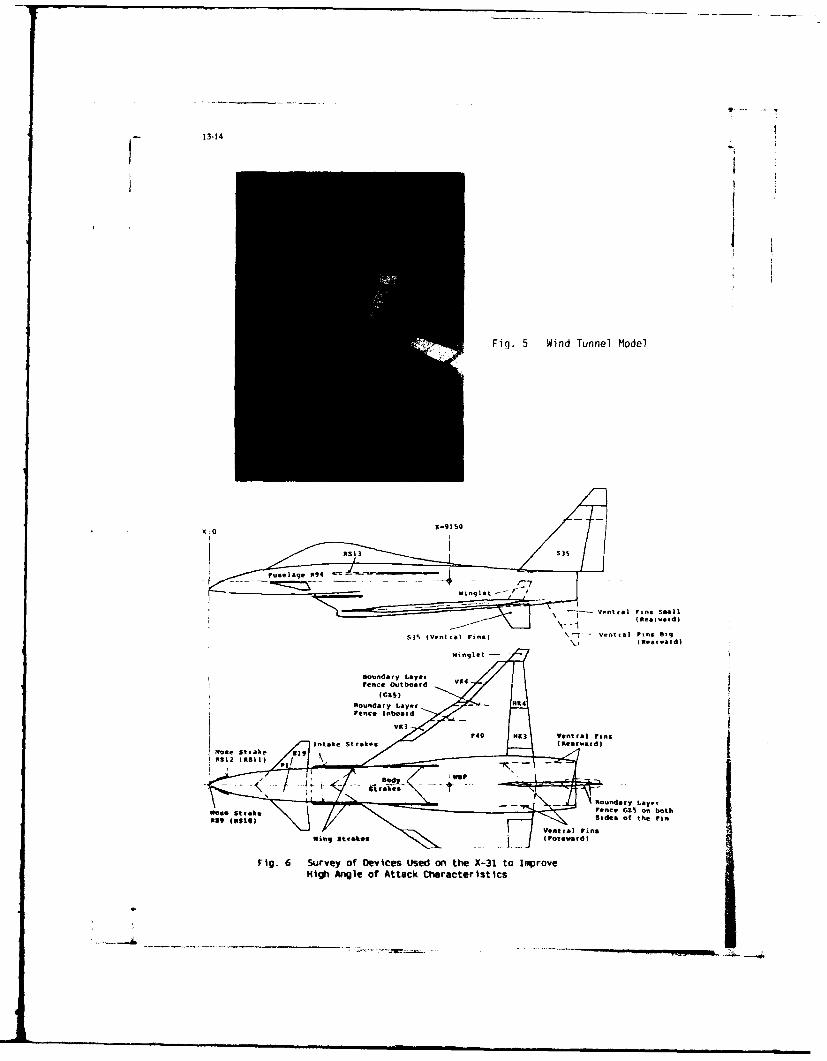
- 13-14
Fig. 5 Wind Tunnel Model
s35 (Vetra Ventra Fins rnBi
-:n , , - f n u d r y L a e
Fenc tGZa on bo
Ightae oa Attak Caraceritic
-~C Gn 5
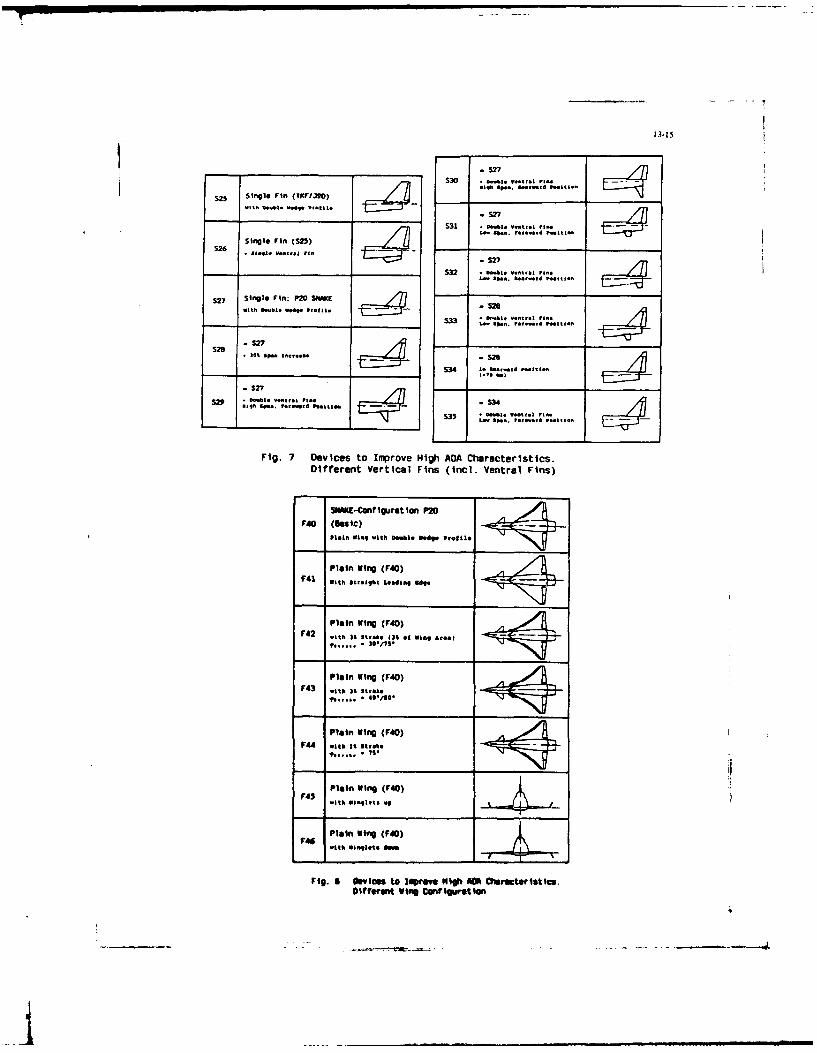
13-15
525 S1ngle Fin (TKFI3J) _______
S31 1 o..u. vnt..1 It..Loa i, f-WSed IItl-
Single Fin (T5) E4
227
S32 * Doubt V.n1,1 r*i. _
Lo *. a.. .nd Pofitiof
S27 Single Fin: P20 SNOKE /7J
with ftubl , PIroe. S 320
S33 l V..t.t Ti..__,_____t______________ ofenad noot C.on
528 * o p- ncee
5 3 4 J. i ma c.d P nS2 6te
$ 27S29 • ... -. "..... ... -
L a h p. . S 34e i .tt O f l- -
1-v Op., P.-dv lto
Fig. 7 Devices to Improve High ADA Characteristics.Different Vertical Fins (incl. Ventral Fins)
SNAKE-Configurat ion P20
F40 (Basir)P101. W1 with D"b0 wede Pgofi*
Plain Wing (F40)
F4, With It'ctiht we.ding ad"
Plain Wing (F40)F42 vith 30 stshe 4t of wie Areal
.. . 10i /7S*
Plain Wing (F40)F43 .tth Is ltiake
Plain Wing (F40)
F44 ith is stDSo*
e ... . 11
Plain King (F40)w45 Mitii ts. up
F46 Plain Wing (F40)with viDMIt8 t
Fig. S Oetess to Iproe High JOt Characteristics.Differant Wing Conflglratlon
- m emmmmmm me mmlmmm
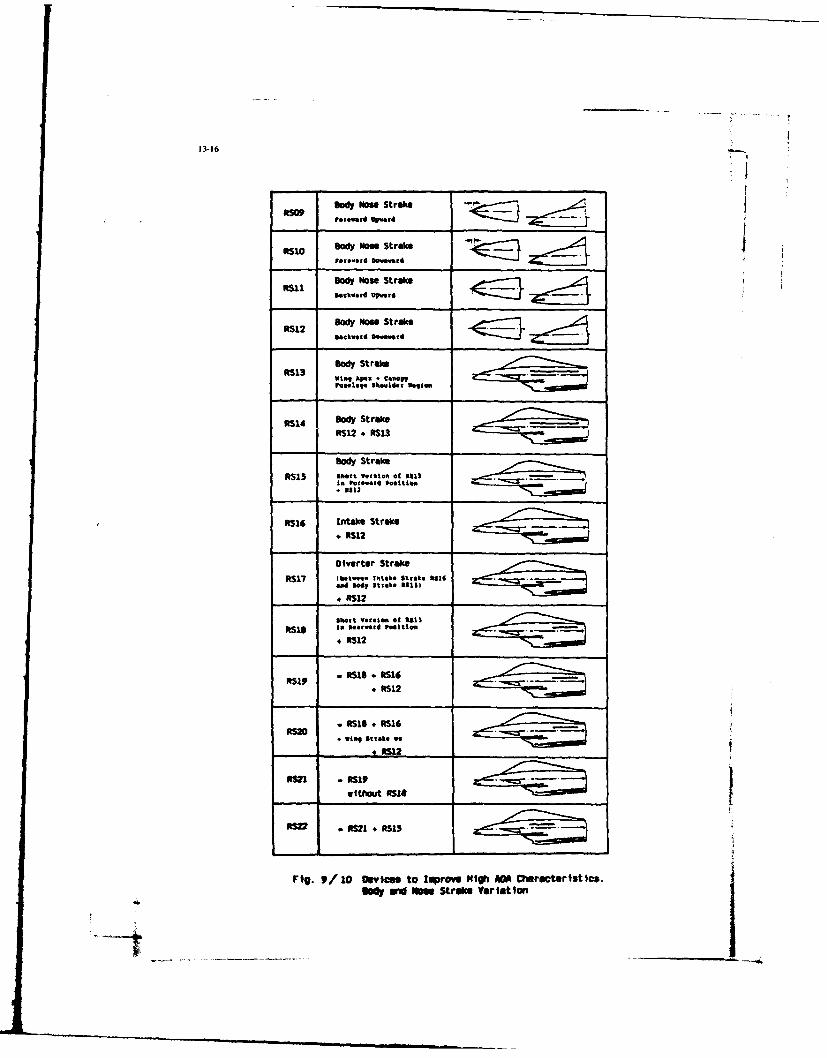
13-16
MS0O Body NOsO Stroke
fort-ord Downard
Body Nose Stroke , -.m1
Iekvnrd Upord
backward Oown ned
Body Stroke
R513 Wing &"ap - CanopTssnle" s older eIssO
R4 Body StrikeRS12 * RS13
Body Stromke
RS15 Short tor"n o1 R%23in qoQ.f.fd "sitiLr
R51 Intake Strike
RS12Olverter Stroke
30IeT 3 itfih* Si ld Soten idy Sik: a )o
* RS12 _ __SI_ _ _ _
OSle is r.aSI2o poition
*o Ru * RSI 6 15'
+ S12
* SS + RS016
Wiung Sfs...W
without RSl4
0522 * a521 + RS15
Fig. 9/10 DevicaS to Improve High AO Chractertstics.
rte Nov Stroke Variation
iI
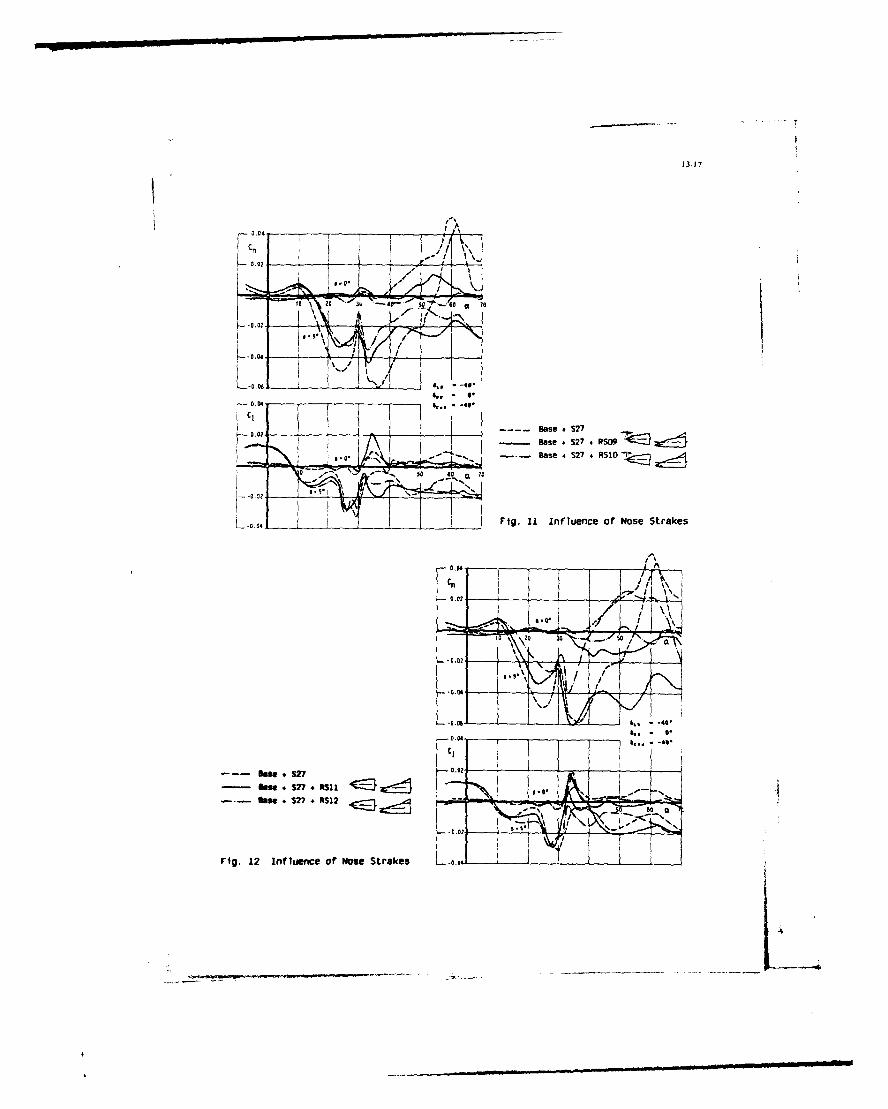
13-17
0.02
LO2A 777, -
K002 J~V 'iiiL I ~I --- Base * S27 RS91
______Base 4S27 R0
304 ~ 70Base * 527 + RS 1
___ Fig. 11 Influence of' Nose Strakes
Sfles # 52? * RS12 __
Fig. 12 Influence of Nose Strakes L~i
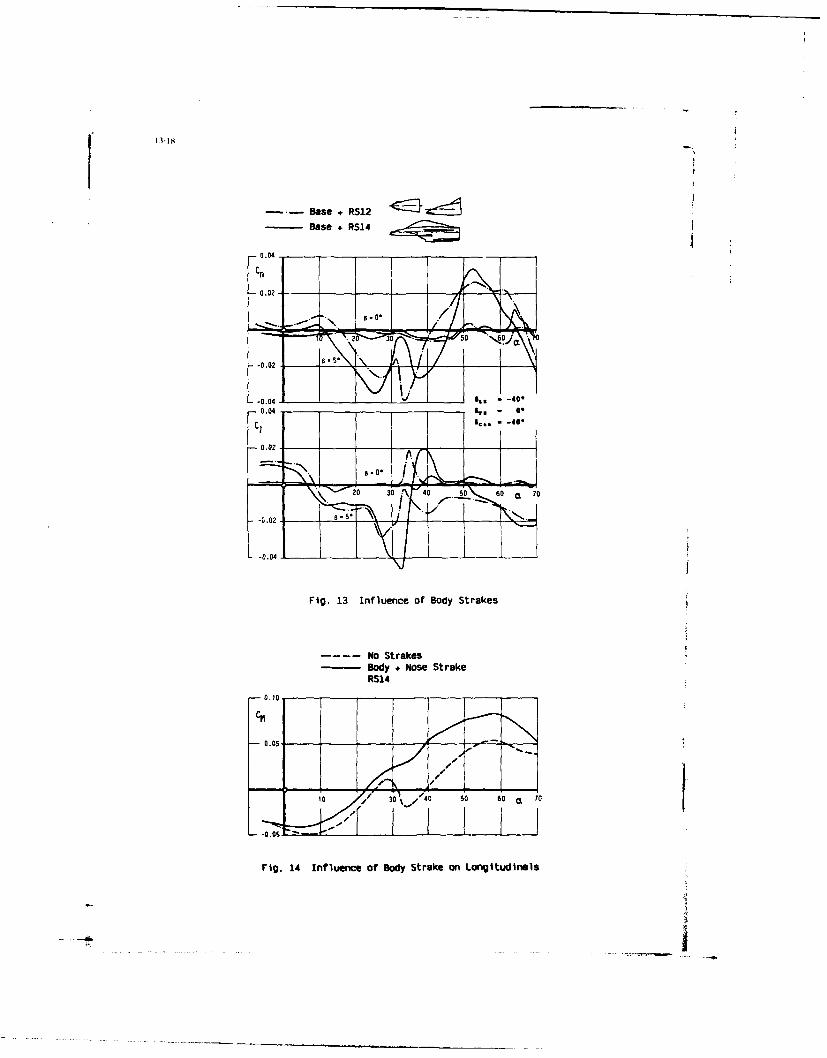
Bas + S1
Base + RS14
0.04
Ff 2 3n - 50 0
-0.02 -
i -T5
-0.04 a___ I . . -
C,0.04 - .64c
0.02 __ - __ I
-0.02.
-0.04 _____
Fig. 13 Influence of Body Strokes
No Strokes-Body + Nose Stroke
RS14
CM
0.05 - -
Fig. 14 Influence of BoyStroke an Longitudinal$
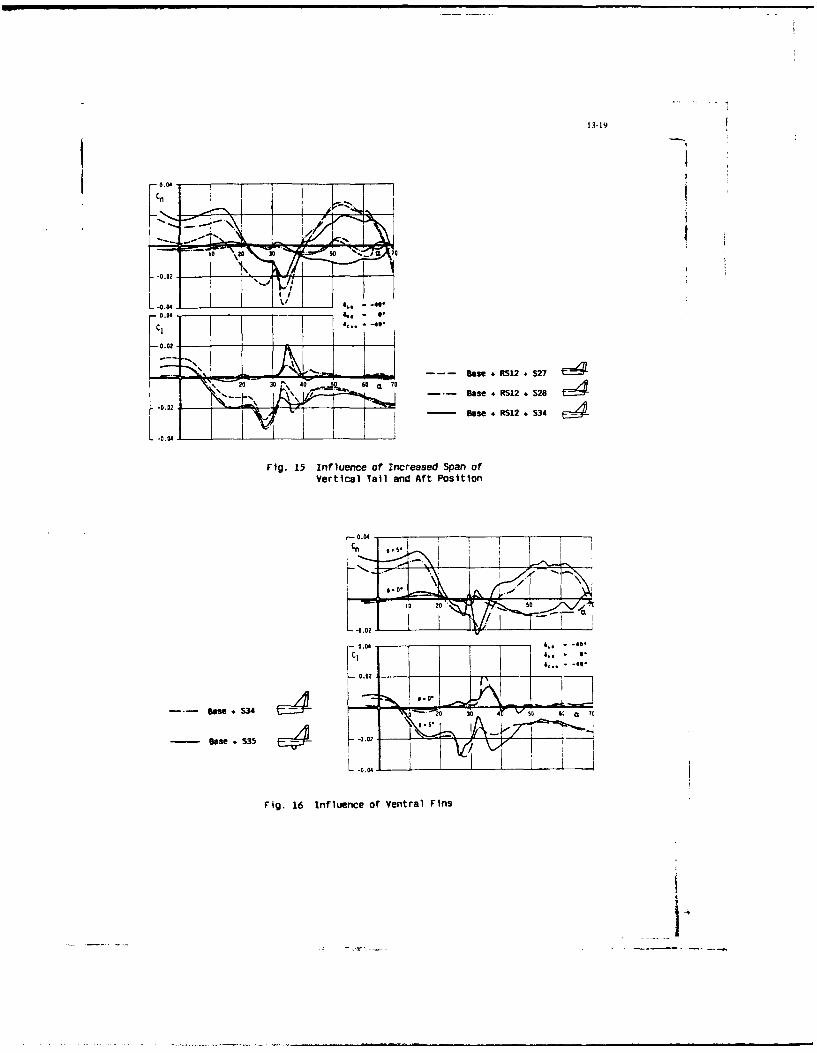
13-19
10 2~0 0soig . 70
-i- -tBase +RS12 S2730 1 40 60 Ct 70 Base +RS12,2
- Base RS12 S34
Fig. 15 Influence of increased Span ofVertical Tail and Aft Position
mesa ~ ~ ~ .0 -3 ~0 o
-~~~ mae4 3
6.000
Fig.~' 16Ifuec f etalFn
7-V
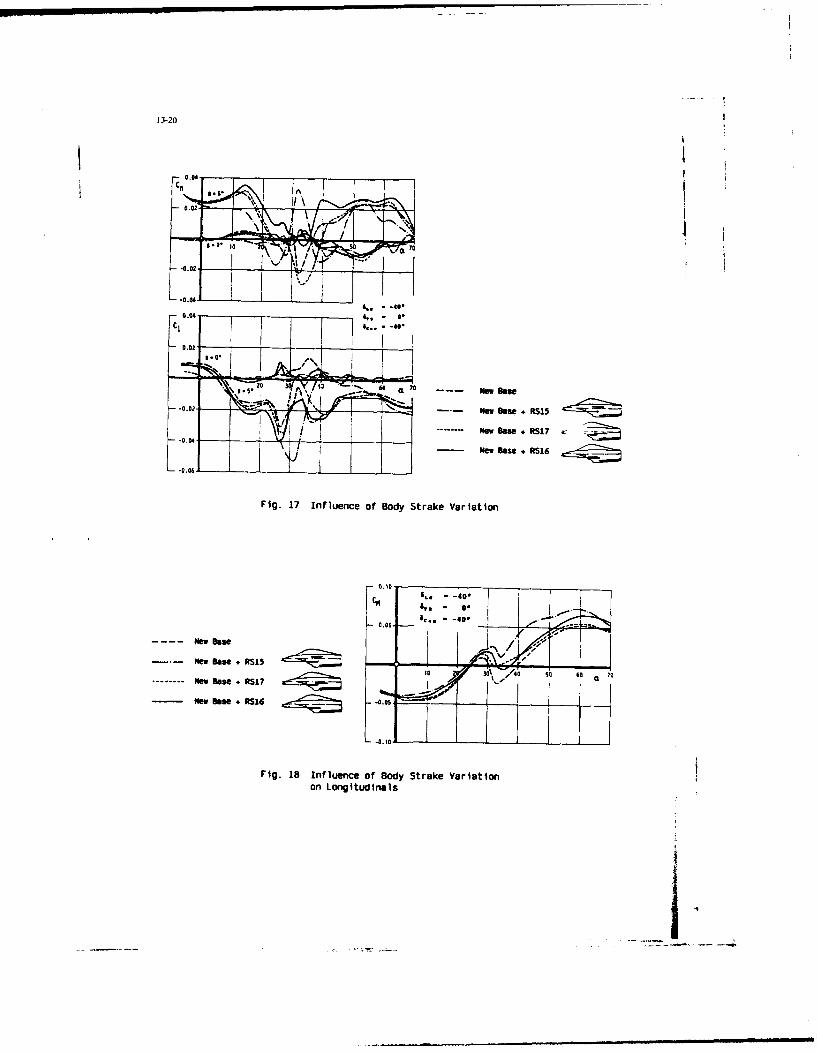
13-20
-0.02-' ,
-0.04-
0.14 -40.
----- New Base,+RS17
-New Base +RS16
Fig. 17 Influence of Body Strake Variation
new Base 4 RS15;
Ne----fw Base,* RS17 .- -
- N. Base + RS16 .. 6 ~ -
Fig. 18 Influence of Body Strake Variationon Longitudinals
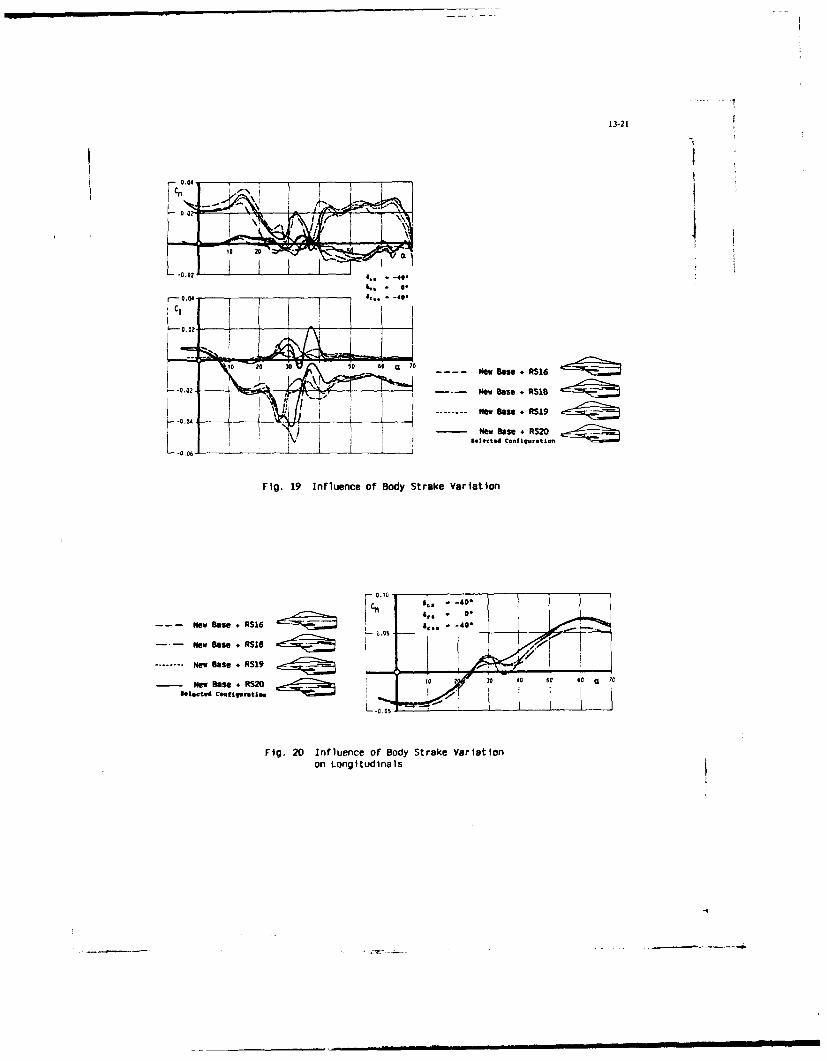
13-21
- 6X
10 a 3 - - - - mew Base + RS1B
-0 .0 2 .; I N e w B s e + R S I G
New Bwase +RS20
Fig. 19 Influence of Body Strake Variation
Now flse +RS16 I*New Base + RSIS !75
Ne... w Base + RS19
New Base +RS20 to ? 30 do so 6o0 7
Fig. 20 Influence of Body Strake Variationon Longitudinals
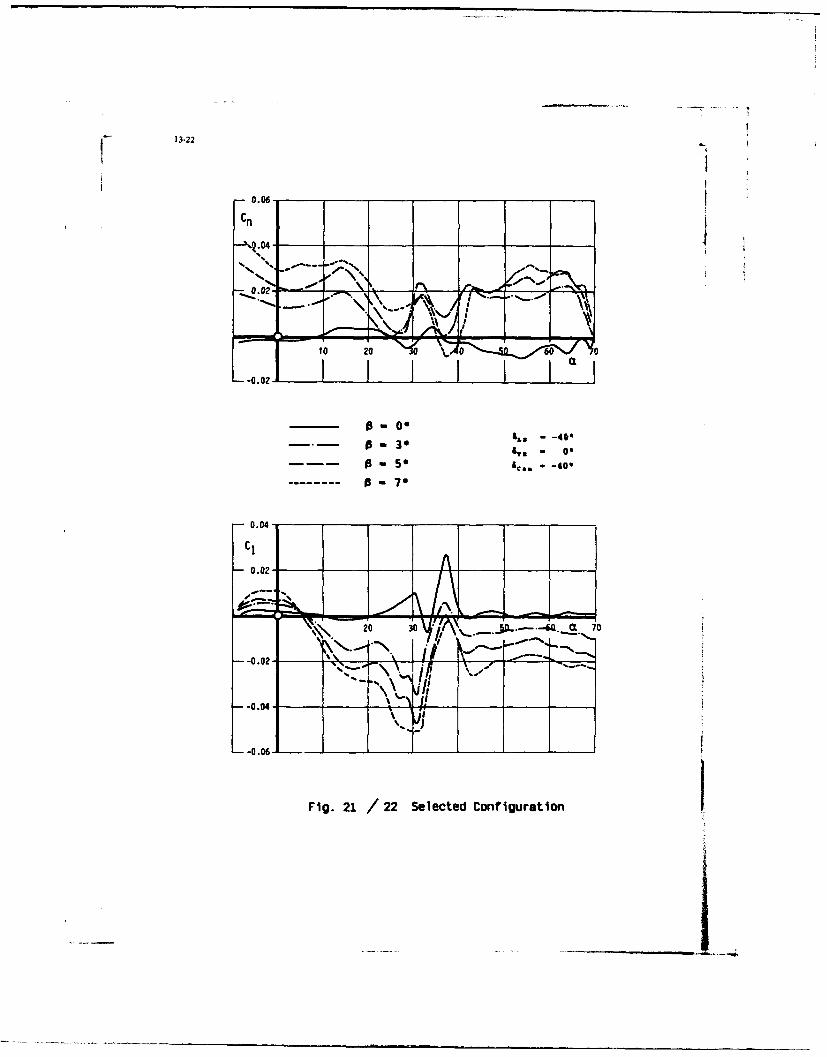
13-22
0.06.
Cn
-\Q.040 - -
p 0 -- 4
1 0 - 50 0y 60 N
0.02-
is0 30 its -4 70
-0.04-
CI A
0.02-)
-- 0.026
Fig. 21 /22 Selected Configuration
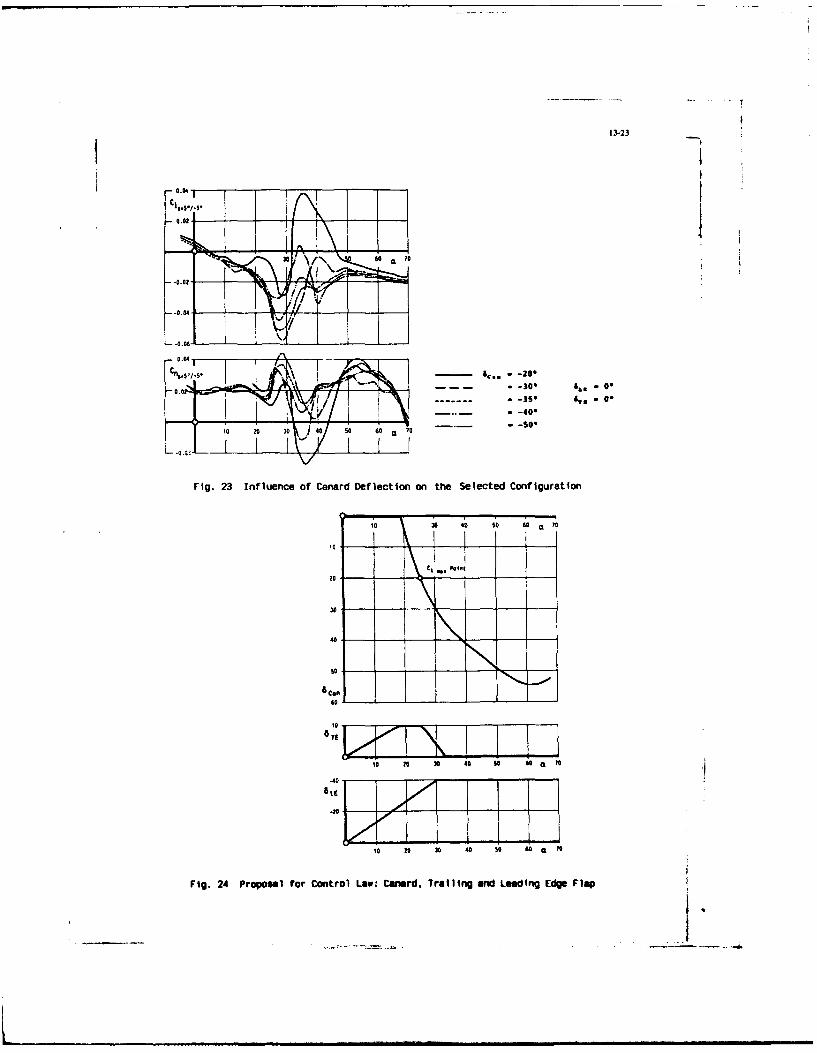
- T
13-23
-. 0 2
1\
--. 0 I,
-- 0.04 1-S0
F/o so., .k -\ l,\.-o. ',.. - o
IooL 02 i l -30'
10 j7 6 0 70
Fig. 23 Influence of Canard Deflection on the Selected Configuration
2 0 60 SO 6 0 L 0
.,lil
205O-
30
C.
6Go
o
4-
10 20 x0 40 so 66 at 1
rig. 24 Proposal for Control Law: Canard, Trailing and Leading Edge Flop
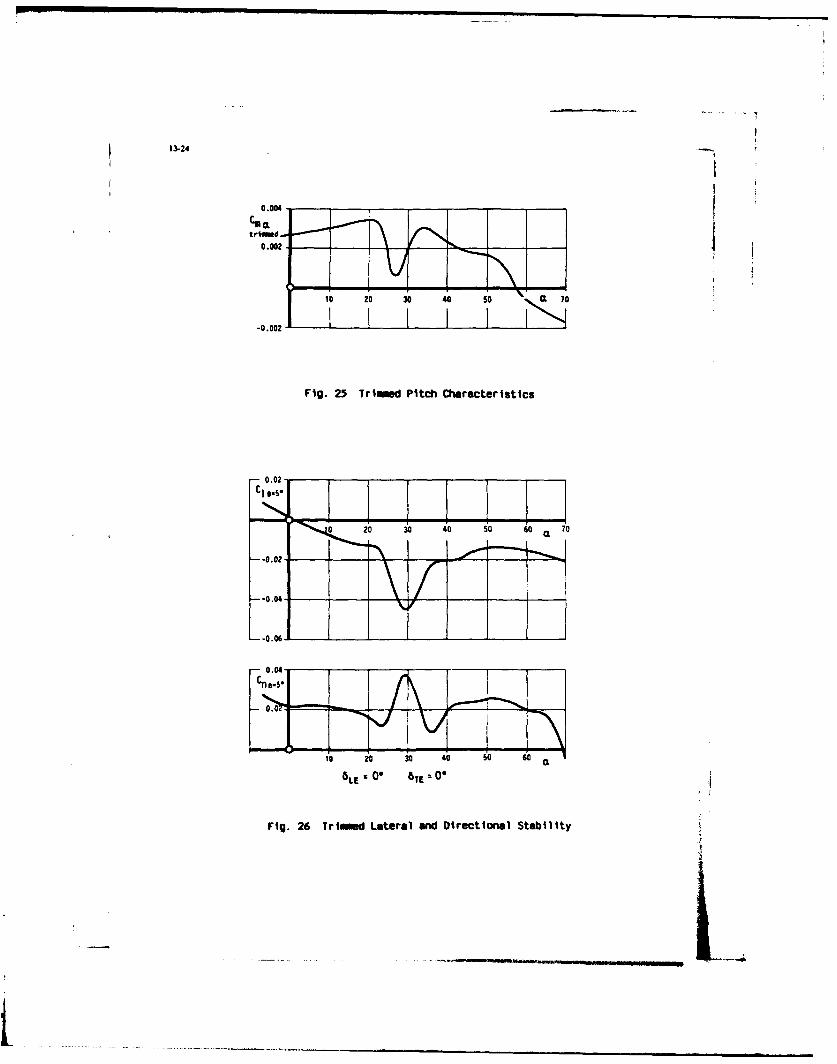
13-24
10 20 30 40 s0 CL 70
-0.002r1 I I
Fig. 25 Trimmed Pitch Characteristics
0 20 30 40 so 60 a 70
1~
0 *E02
-i0.026 TtndLaea adDretoa Stbly
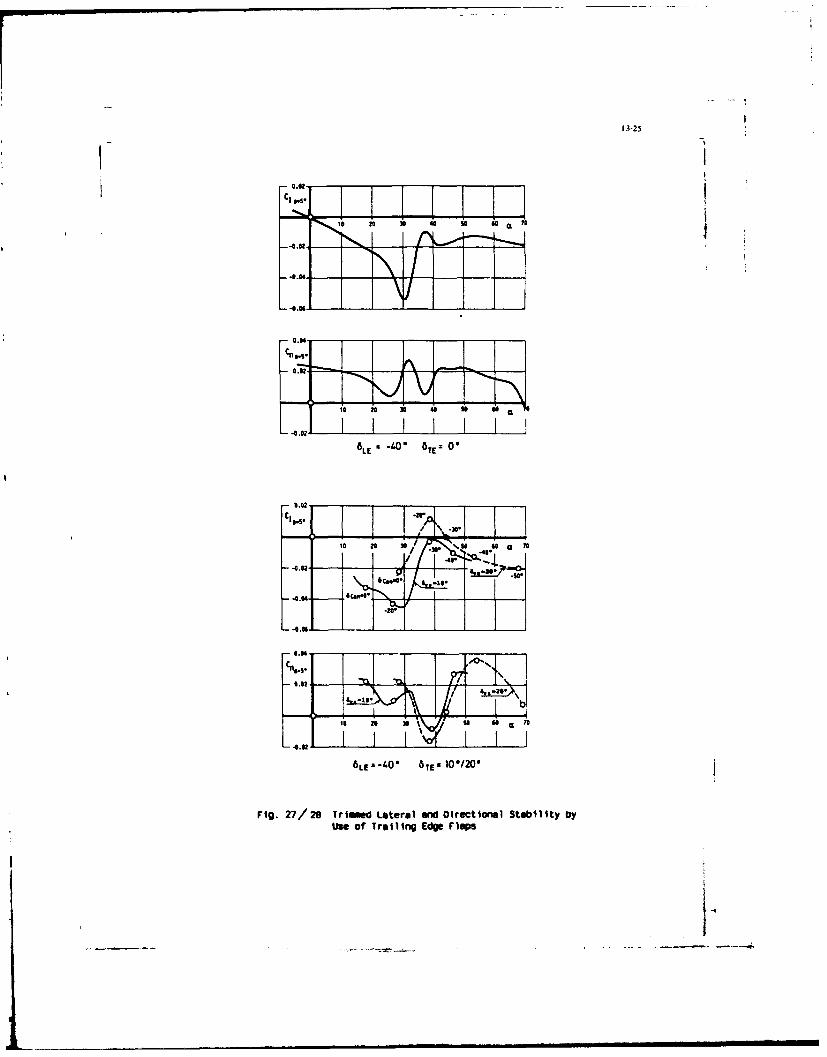
13-25
I0 2 0 40 so 0 C 0
L0021 1 - I I I6
LE z '~ 5TE= 0'
~1-I_1S 20 10 5 44 72
-QI.'
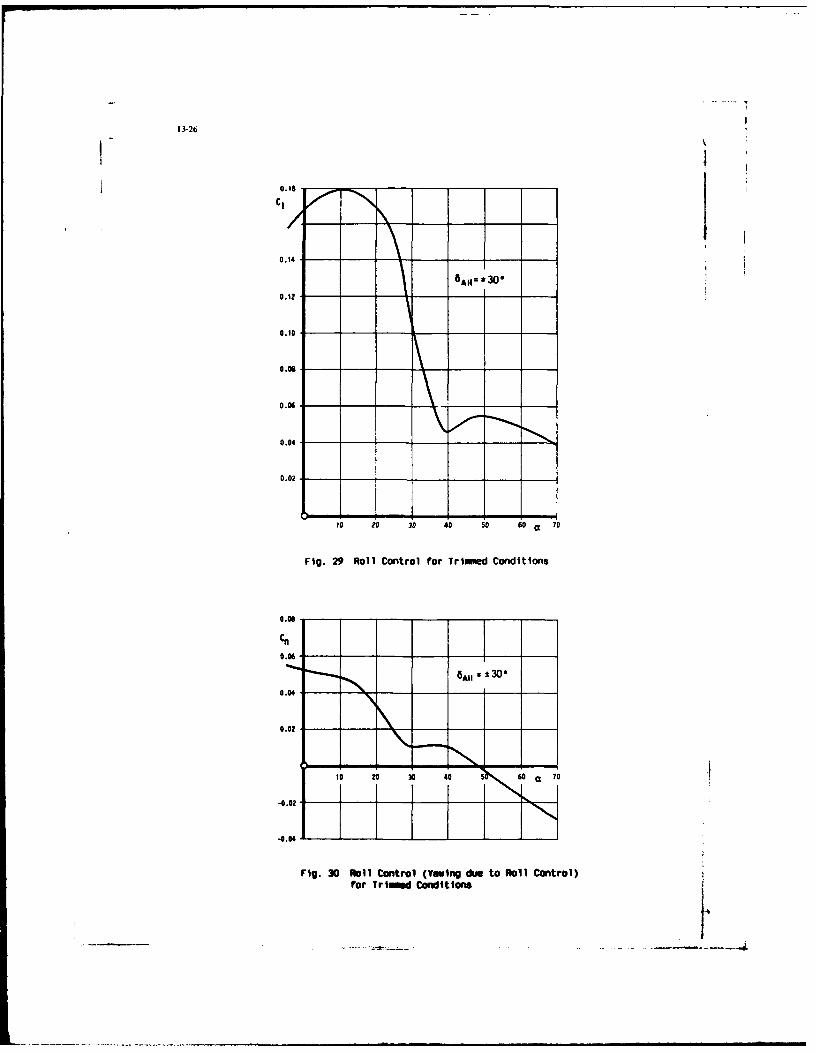
13-26
0.16 -
C,
0.14 - -
0.10
0.10 --
0.06 _
0.04 ___ ___
0.042___ ___
to 20 30 40 so 60~ 70
Fig. 29 Roll Control for Trime Conditions
0.06 9
0.06 - - _
8A1 *300
0.04
10 20 30 40 5 60 CL70
-0.02,
-0.04 -. _
Fig. 30 Roll Control (Yawing due to Roll Control)
for Trimmed Conditions
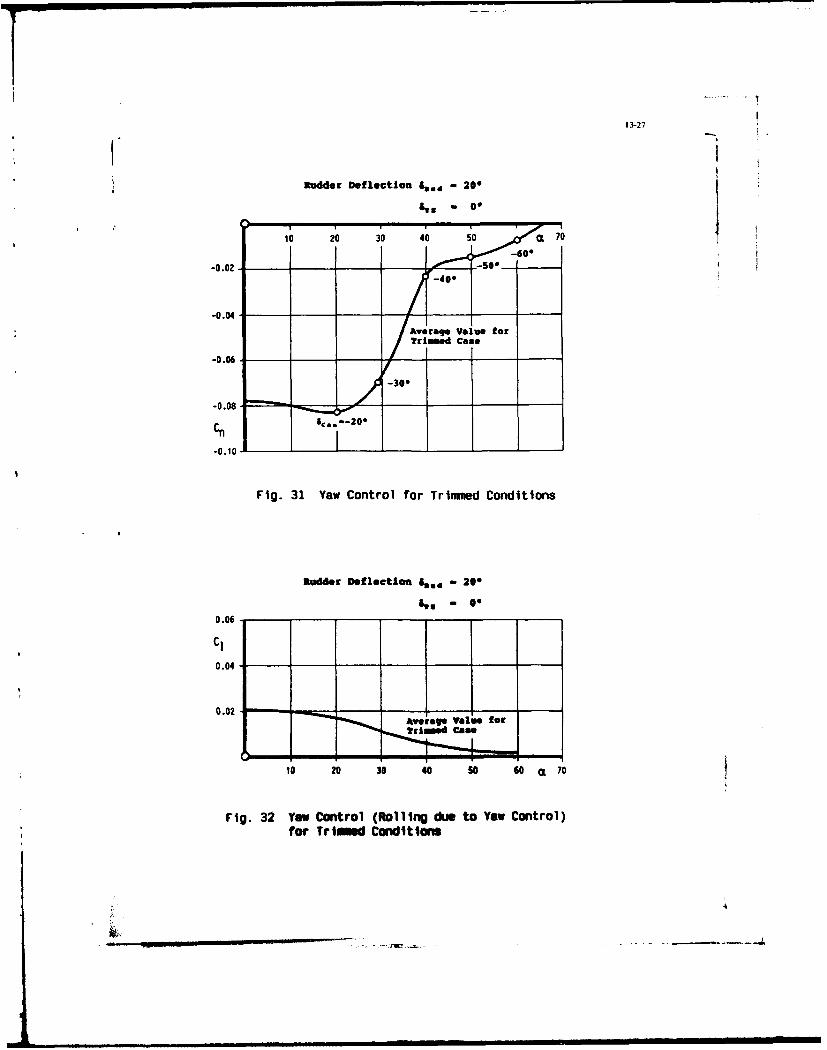
13-27
Rudder Deflection 46.4 - 200
Av. - 00
10 ;0 ;0 4 0OC 70
-O.OZj Q0* / -600
-0.04
-0.02 -4H
-So
Avrem value for-0.06 / r-edC8
-0.08 / -0
-0.10
Fi g. 31 Yaw Control for Trin tmed Conditions
Ruddir Deflection &,, - 200I.- 00
0.06
C,
0.04
0.02A'verage V816e fee
10 20 30 40 SO 60 CL 70
Fig. 32 Yaw Control (Rolling due to Yaw Control)for Trimmd Conditions
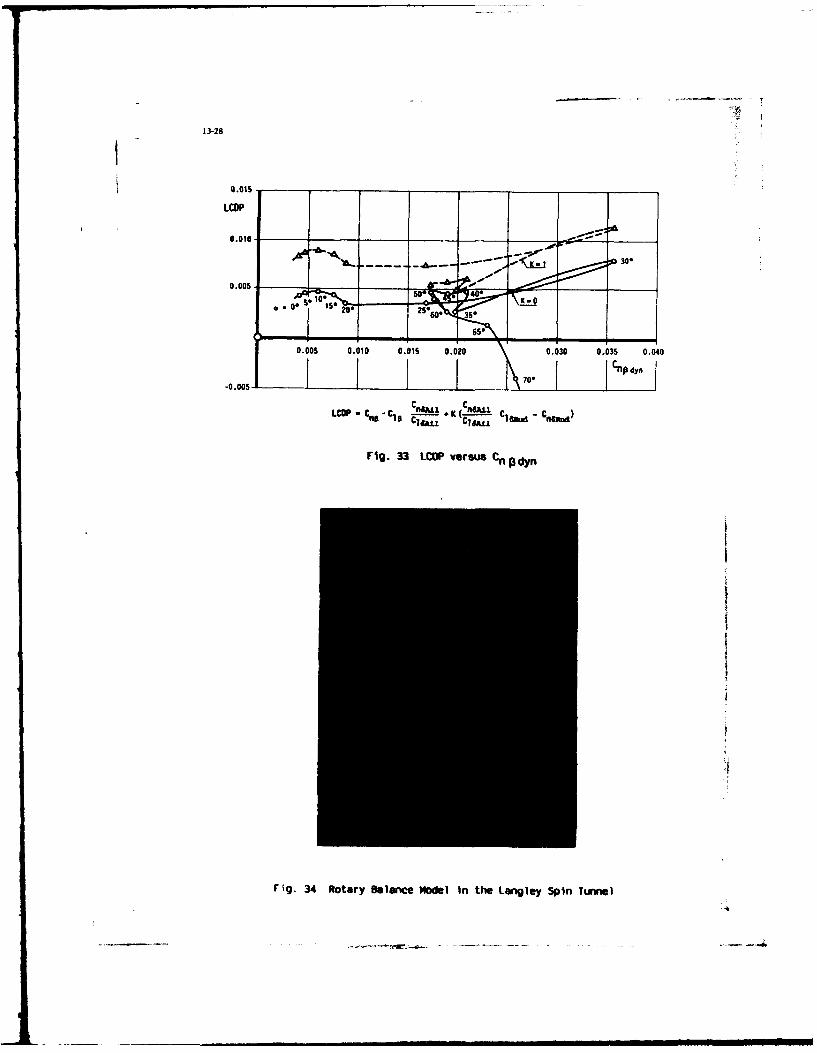
13-28
0.015 S___ ____ __
UCP
0.010 _____
35**
-0.005-71
Fi0. 33-0 ICP er
LC-C ,0C" +K(n L Sn - --. 4.d
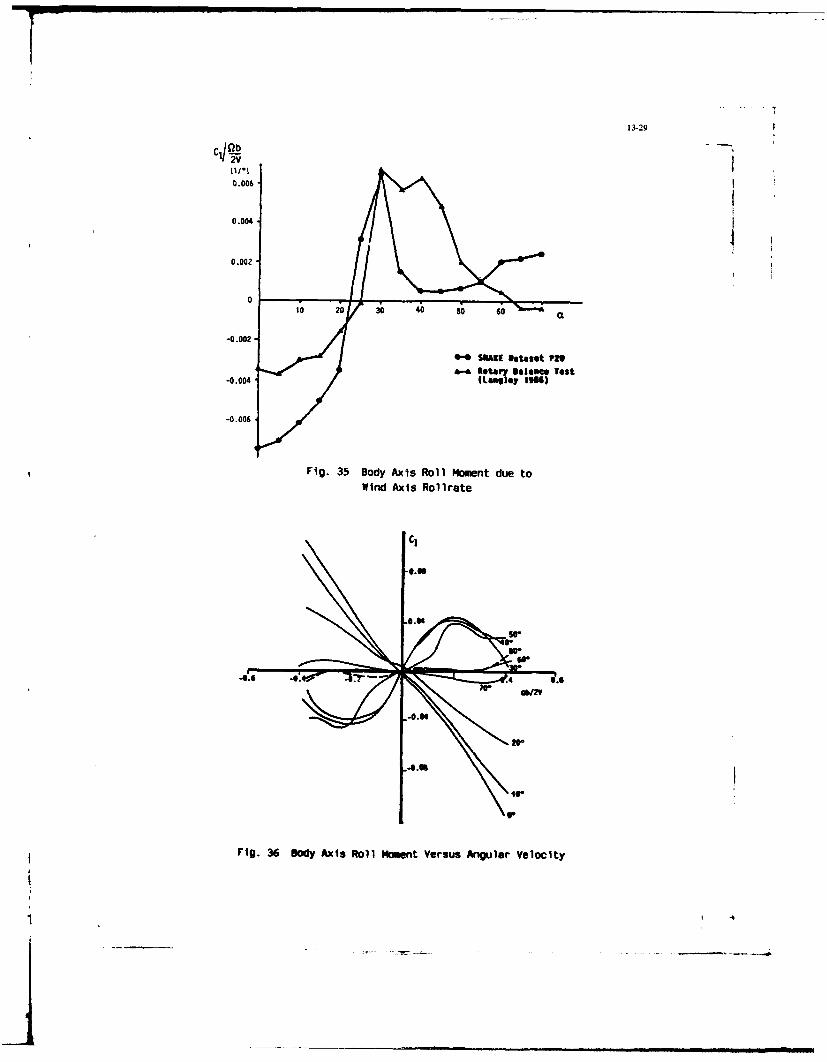
13-29
0.006
0.004
-0.002
-0.
-0.002
Fig. 35 Body Axis Roll Moment due toWind Axis Rolirate
C,
S..
Fig. 36 Body Axis Roll Momnt Versus Angular Velocity
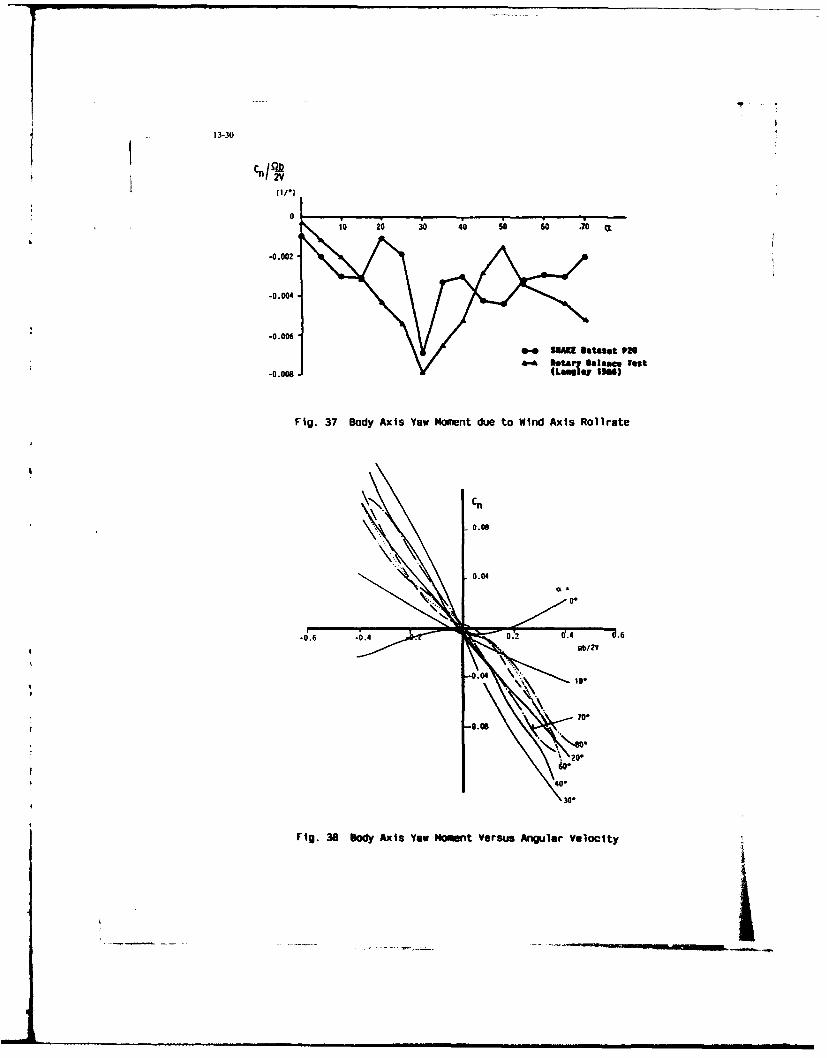
I 13-30
010 20 30 40 so 60 A1 OL
-0.002
-0.004
-0.006
-0.008 -rI M
Fig. 37 Body Axis Yaw Moment due to Wind Axis Rolirate
0.06*
rig 3sBod Axs Yw Mmen VesusAnglarVelcit
-0.641111 0.2 d. 0i
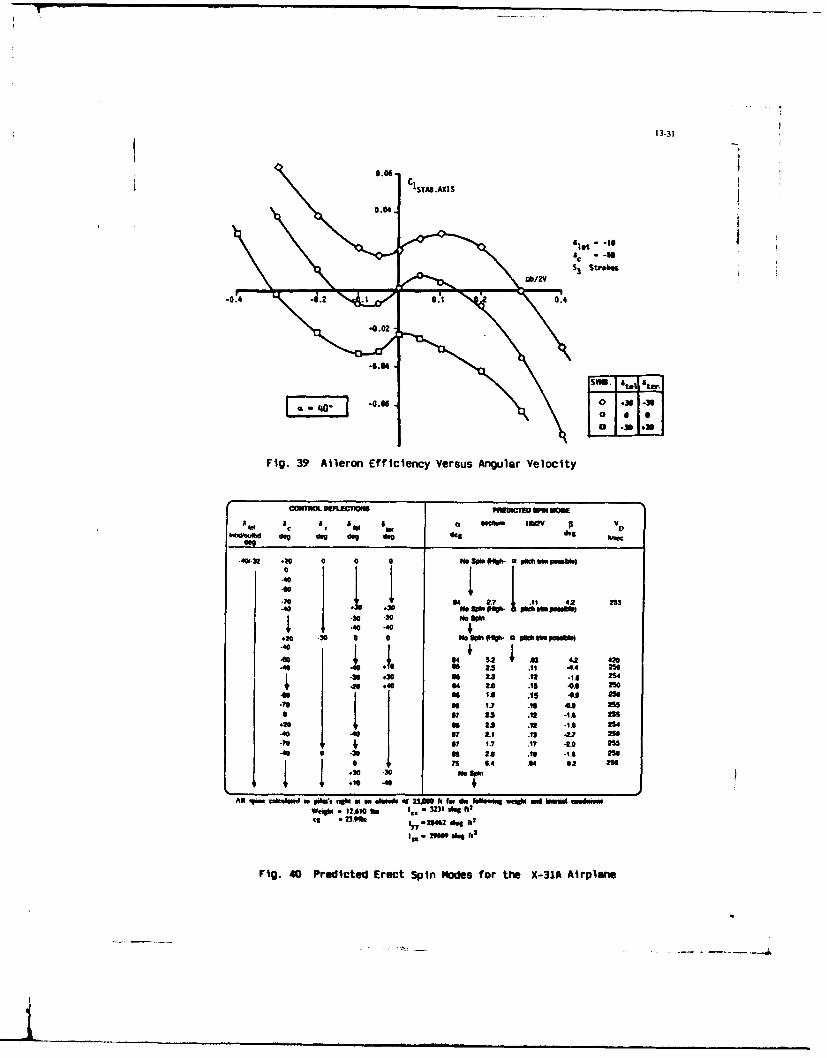
13-31
tC0.6 C STAI.AXI
S
0.04
6 to
41et
-14
S 3 Strok"
-0.4 .0 0 0 N4-1g01 2 .4
-0.00
jlw. A t.1 ter I
ii.0 4
b6"-
[ b. M0.0 -0.0- 0 . -3
I
I
52* M 42
Fig. 39 Aileron Efficiency Versus Angular Velocity
COm"MLoORIVECION2 P .IEOI¢11m I .4
r " l do es Cel Ww
-W-32 .20 0 0 0 me son "oh- 2 1 2 m *1
.70 2.7 1 .15 42 25
-- 0 0 m Spin'
440 -40 6 22 .22 -2. 2
.20 .30 a 1.7 .17 "4,0 255
40 I 1 II I Ol
- 40 1 65 23 .11 4. 256
.30 27 3 .2 -. 0 2S
-.40 .40.15 -0. 2-70 127 .7 .16 -- 255-40 -40 .1 LJI .10 -17. 2
, 1 6t .4 .Ad 02 2"
30 -30 no sone
ANl V c p lqe mI Vi ' Ag a4 on oftot ofM (J0I %wr dm IJoq weiN wd WWeilw 12AIbe k in. - 231 *a ft2
It. 2w9 .1.1 l
rig. 40 Predicted Erect Spin Modes for the X-31A Airplane
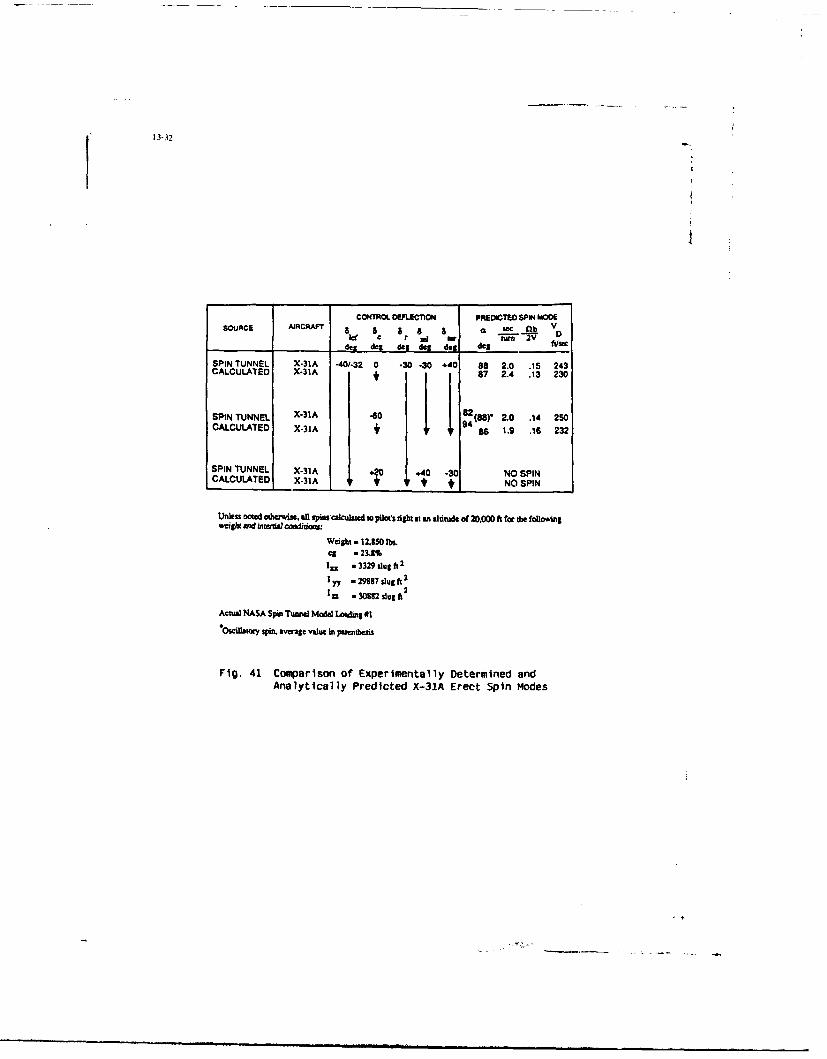
13-32
CONTROL OFLECTlION PREDICTED SPIN MODESOURCE AIRCRAFT b &r 8 & a See . D
ad C F ~ zwn2deg deg de- deg d79 deg
SPIN TUNNEL X-31A .401-32 0 -30 -30 440 88 2.0 .15 243CALCULATED X-31A 4 87 2.4 .13 230
SPIN TUNNEL X-31A -60 82 (ea 2.0 14 250CALCULATED X-31A + 94 g6 1.9 .16 232
SPIN TUNNEL X-3A at) !40 30 NO SPNCALCULATED X-31A TjO I40 * 30 NO SPIN
Unless ROW o6awif. A1 apins'calculated t pi o nght at an altitde of 20.000 ft for the followinga'eg and snrtua condition:
Weight - 12.150 Ibs.Cg - 23.8%IXx - 3329 Slug ft2
1 y - 298P slug t2
lzn = 3082 slug ft
Actual NASA Spin Tunnel Model Loading #1
"Oscillatory spn aveage value in pmenthe
Fig. 41 Comparison of Experimentally Determined andAnalytically Predicted X-31A Erect Spin modes
14-1
USE OF STEPWISE REGRESSION TECHNIQUES ANDKINEMATIC COMPATIBILITY FOR THE
ANALYSIS OF EAP FLIGHT DATAby
A R PerkinsSenior Aerodynamici st
British Aerospace (Military Aircraft) LtdWarton Aerodrome
Preston
LancashirePR4 lAXEngland
Summary 1. INTRODUCTION
This paper describes an investigation into thecapabilities and accuracy of an equation error This paper describes an investigation into themethod of aerodynamic parameter identification capabilities and accuracy of an equation errorusing stepwise regression techniques. The method of aerodynamic parameter identificationresults of the method are presented for flight using stepwise regression techniques. The resultsresponses of the British Aerospace EAP aircraft of the method are presented for both simulated andwhich has multiple control surfaces and high flight responses of the British Aerospace EAPlevels of longitudinal Instability together with aircraft. The flight data analysed includes highlysignificant non-linearities in the aerodynamic data. dynamic manoeuvres up to the incidence limit onThe benefit of kinematic compatibility processing the aircraft of 30 .of the flight data is also presented. The EAP flightresponses are analysed up to an incidence of 300 The importance of processing the flight data tousing a technique for joining together several ensure kinematic compatibility is described whichmanoeuvres to form larger databases for analysis. is an essential first step prior to parameterThe derivatives extracted by these techniques identification.agree in general with the results of the windtunnel measurements.
S Reference area 2. FEATURES OF THE EAP AIRCRAFTb Reference spanc Mean aerodynamic chordCI Coefficient of rolling moment The Experimental Aircraft Programme wasCm Coefficient of pitching moment conceived In 1983 to design and build aCn Coefficient of yawing moment demonstrator aircraft for a wide range of newCs Coefficient of axial force technologies.Cy Coefficient of side forceCa Coefficient of normal force The EAP aircraft configuration was chosen primarilyEAP Experimental Aircraft Programme for an air to air role with a secondary ground attackg acceleration due to gravity capability. These requirements dictate a designIxx Moment of inertia about x axis having high levels of subsonic and supersonicI" Moment of inertia about y axis performance. The resulting configuration has aIzz Moment of inertia about z axis large cranked delta wing with a close coupledliz Cross product of inertia foreplane, Figure 1.M Mass (kg)n axial acceleration The aircraft has a high level of longitudinalny lateral acceleration instability and highly non-linear aerodynamicnz normal acceleration characteristics. The pitch control surfaces are four
P roll rate flaps and the all moving foreplane. The lateralq pitch rate controls are the use of differential flap and rudder.r yaw ratep roll acceleration The EAP aircraft was designed to feature carefreeq pitch acceleration manoeuvring a, 1 g protection when flying in the fullr yaw acceleration control laws mode. This gives a wide range ofu Flight path velocity y axis possible manoeuvres with the unrestricted use ofv Flight path velocity y axis full roll, pitch and yaw controls.w Flight path velocity z axis
angle of incidence During the flight testing of the EAP aircraft theangle of sideslip cleared flight envelope was rapidly expanded using
4 differential flap conventional flight test data gathering manoeuvres8 symmetric flap which are essentially small perturbation inputs11 foreplane angle designed to excite a particular mode in the aircraftC rudder angle response.o pitch attitude# roll attitude In order to clear the aircraft to its maximum# yaw attitude incidence limits a high incidence flight test
p air density programme was flown. An anti spin parachute and
Derivatives of coefficients with respect to state and gantry was fitted to the aircraft in order to be able
control surface variables are denoted by the to recover the aircraft in the event of a departureconvention, and spin.
CoeMcient,e&-d*v v595w These high incidence flight trials were highly
for example, successful with the aircraft remaining in control andwithin its incidence limits despite some very severe
6a. pilot inputs.
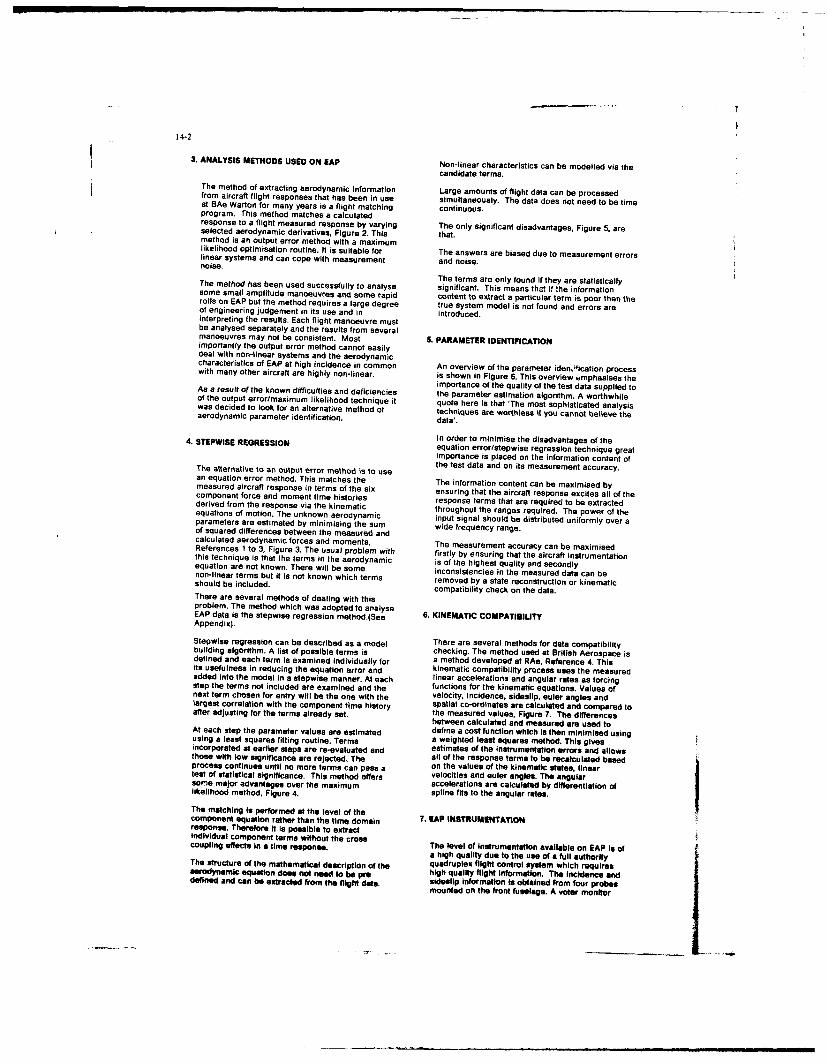
14-2
3, ANALYSIS METHODS USED ON EAP Non-linear characteristics can be modelled via thecandidate terms.
The method of extracting aerodynamic information Large amounts of flight data can be processedfrom aircraft flight responses that has been in use simultaneously. The data does not need to be timeat BAe Warton for many years is a flight matching continuous.program. This method matches a calculatedresponse to a flight measured response by varying The only significant disadvantages, Figure 5, areselected aerodynamic derivatives, Figure 2. This that.method is an output error method with a maximumlikelihood optimisation routine. It is suitable for The answers are biased due to measurement errorslinear systems and can cope with measurement and noise.noise,
The terms are only found if they are statisticallyThe method has been used successfully to analyse significant. This means that if the informationsome small amplitude manoeuvres and some rapid content to extract a particular term is poor then therolls on EAP but the method requires a large degree true system model is not found and errors areof engineering judgement in its use and in introduced.interpreting the results. Each flight manoeuvre mustbe analysed separately and the results from severalmanoeuvres may not be consistent. Most 5. PARAMETER IDENTIFICATIONimportantly the output error method cannot easilydeal with non-linear systems and the aerodynamiccharacteristics of EAP at high incidence in common An overview of the parameter iden,;fication processwith many other aircraft are highly non-linear, is shown in Figure 6. This overview emphasises the
importance of the quality of the test data supplied toAs a result of the known difficulties and deficiencies the parameter estimation algorithm. A worthwhileof the output error/maximum likelihood technique it quote here is that 'The most sophisticated analysiswas decided to look for an alternative method of techniques are worthless if you cannot believe theaerodynamic parameter identification, data'.
In order to minimise the disadvantages of the4. STEPWISE REGRESSION equation error/stepwise regression technique greatimportance is placed on the information content ofthe test data and on its measurement accuracy.
The alternative to an output error method is to usean equation error method. This matches the The information content can be maximised bymeasured aircraft response in terms of the six ensuring that the aircraft response excites all of thecomponent force and moment time histories response terms that are required to be extractedderived from the response via the kinematic throughout the ranges required. The power of theequations of motion. The unknown aerodynamic input signal should be distributed uniformly over aparameters are estimated by minimising the sum wide frequency range.of squared differences between the measured andcalculated aerodynamic forces and moments, The measurement accuracy can be maximisedReferences I to 3, Figure 3. The usual problem with firstly by ensuring that the aircraft instrumentationthis technique is that the terms in the aerodynamic is of the highest quality and secondlyequation are not known. There will be some inconsistencies In the measured data can benon-linear terms but it is not known which terms removed by a state reconstruction or kinematicshould be included, compatibility check on the data.There are several methods of dealing with thisproblem. The method which was adopted to analyseEAP data is the stepwise regression method.(See 6. KINEMATIC COMPATIBILITYAppendix).
Stepwise regression can be described as a model There are several methods for data compatibilitybuilding algorithm. A list of possible terms Is checking. The method used at British Aerospace isdefined and each term is examined individually for a method developed at RAe, Reference 4. Thisits usefulness in reducing the equation error and kinematic compatibility process uses the measuredadded into the model in a stepwise manner. At each linear accelerations and angular rates as forcingstep the terms not included are examined and the functions for the kinematic equations. Values ofnext term chosen for entry will be the one with the velocity, incidence, sideslip, euler angles andlargest correlation with the component time history spatial co-ordinates are calculated and compared toafter adjusting for the terms already set. the measured values, Figure 7. The differencesbetween calculated and measured are used toAt each step the parameter values are estimated define a cost function which is then minimised usingusing a least squares fitting routine. Terms a weighted least squares method, This givesincorporated at earlier steps are re-evaluted and estimates of the Instrumentation errors and allowsthose with low significance are rejected. The all of the response terms to be recalculated basedprocess continues until no more terms can pass a on the values of the kinematic states, lineartest of statistical significance. This method offers velocities and euler angles. The angular
some major advantages over the maximum accelerations are calculated by differentiation oflikelihood method, Figure 4. spline fits to the angular rates.
The matching is performed at the level of thecomponent equation rather than the time domain T. rAP INSTRUMENTATIONresponse. Therefore it Is possible to extractIndividual component terms without the crosscoupling effects in a time response, The level of instrumentation available on EAP Is of
a high quality due to the use of a full authorityThe structure of the mathematical description of the quadruplex flight control system which requiresaerodynamic equation does not need to be Pre high quality flight information, The incidence anddefined and can be extracted from the fnight dste sideslip information Is obtained from four probes
mounted on the front fuselage. A voter monitor
14-3
system ensures that any incorrect information is linear aerodynamic model. This enables adiscarded. The linear accelerations and angular comparison to be made with the results of the flightrates are obtained from high quality Aircraft Motion matching program using maximum likelihood,Sensor Units. Figure 13.
A number of EAP test manoeuvres were analysed The flight matching result analyses the manoeuvresusing the kinematic compatibility program. This separately whereas the stepwise regressionanalysis indicated the levels of Instrumentation analysis is done using the data from botherrors. The noise levels on the instrumentation manoeuvres. The results show a good agreementwere estimated by subtracting the smoothed between stepwise regression and maximumcompatible response from the raw flight data plus likelihood methods.instrumentation error. The noise levels were thenanalysed to determine the standard'deviations andauto correlation factors which are shown in Figure 11. EAP FLIGHT DATA LONGITUDINAL8. In general the noise levels are low on all termsexcept the lateral accelerometer. The linearacceleration data is basically raw instrumentation In order to extract the longitudinal aerodynamicwhereas the other signals all have structural characteristics of EAP at high incidence the aircraftcoupling attenuation filters. The linear dynamic response data during the high incidenceaccelerations, yaw and pitch rates are close to test flying of EAP was analysed. These manoeuvreswhite noise whereas the roll rate, incidence and were not specifically designed for parametersideslip have a large degree of colouring in the identification and consist of combinations of fullnoise levels. pitch and lateral stick. The flight data from 10
different manoeuvres was added together lookingat data over 20 * of incidence. The resulting dataset
8. VALIDATION STEPWISE REGRESSION consisted of 1000 data points covering 63 secondsof flight. This dataset was analysed using stepwiseregression.
In order to assess the capability of stepwise
regression the method was applied to a simulated The pitching moment characteristics of EAPresponse where the aerodynamics are known and measured in the wind tunnel vary with incidence,the level of non linearity of the aerodynamic flap angle and foreplane angle. Pitching momentstructure can be varied. This validation process derivative values with incidence are principally aprovided essential information on the use of function of incidence and flap angle, similarly for thestepwise regression and it was possible to flap power. This large block of flight data wasdemonstrate: analysed in several different ways in order to obtain
consistent results.The method can extract non-linear aerodynamics Figure 14 shows the results of a spline analysisfrom EAP simulated responses. Figure 9 shows a using constants over t * incidence intervals. Alsosimulated pitch response analysed. shown are the results from a partitioned data
The effect of typical instrumentation errors and analysis using I * data partitions over the same
noise on the simulated responses gives a reduction range. The two different methods are giving very
in accuracy of the extracted derivatives, similar results.
The effect of kinematically processing the simulated In order to extract the non-linearity of the pitching
responses with offset errors and noise is to improve moment derivatives with flap angle a uniform
the accuracy of the extracted derivatives, Figure 10. excitation of the aircraft using the flaps is requiredthroughout the incidence range. The data content inthe flight data analysed, Figure 15, shows that there
9. NON LINEAR SYSTEMS is only a limited range of control surface deflectionsat any given incidence with the majority of datapoints close to the trimmed values.
In order to extract the non-linear aerodynamics The analysis was repeated using data partitioningusing stepwise regression there are two basictechniques. The first technique analyses the with flap angle and spline fitting with incidence,
non-linear behaviour as a series of spline basis Figure 16. The control surface range analysed is 0*
functions. These spline functions are piecewise to t5c flap angle from 21* to 25* incidence and 06
polynomials and can be set as piecewise to 20* flap angle from 24 * to 28* incidence. A
constantslinear or quadratic functions, Figure 1t. comparison is made with the EAP aerodynamic
The spline functions are defined at discrete values dataset which is shown as a single derivative value
of the non-linear variable. at the trimmed value of control angles. Thederivatives extracted for longitudinal stability and
The second technique analyses the non-linear control power agree in general with the results ofbehaviour in one variable by partitioning the data the wind tunnel based aerodynamic dataset.
with respect to that variable and only analysing the
data within that data partition, Figure 12. This hasthe advantage of being simple and allows 12. CONCLUSIONSno,;-linearty in a second variable to be determinedusing a spline analysis within the partitioned data.The disad antage of partitioning is that the number The application of an equation error method ofof data points analysed is reduced. parameter Identification using stepwise regression
techniques has been used to successfully analyse
10. EAP FLIGHT DATA LATERAL flight data from the EAP aircraft.
Given sufficient flight data with an adequateinformation content full non-linear aerodynamicTwo different types of lateral data gathering characteristics ran be extracted.
manoeuvre were used on EAP. A dutch rollmanoeuvre generated by yaw control principallyexcites sidelip and a small perturbation lateralstick input with a timing relationship of 3-2-1-1 whichprincipally excites the aircraft in roll. Since thesemanoeuvres are small perturbation over a smallincidence range they can be analysed assuming a
-- -- m, . ... . I lkd-Ill Nil - n -
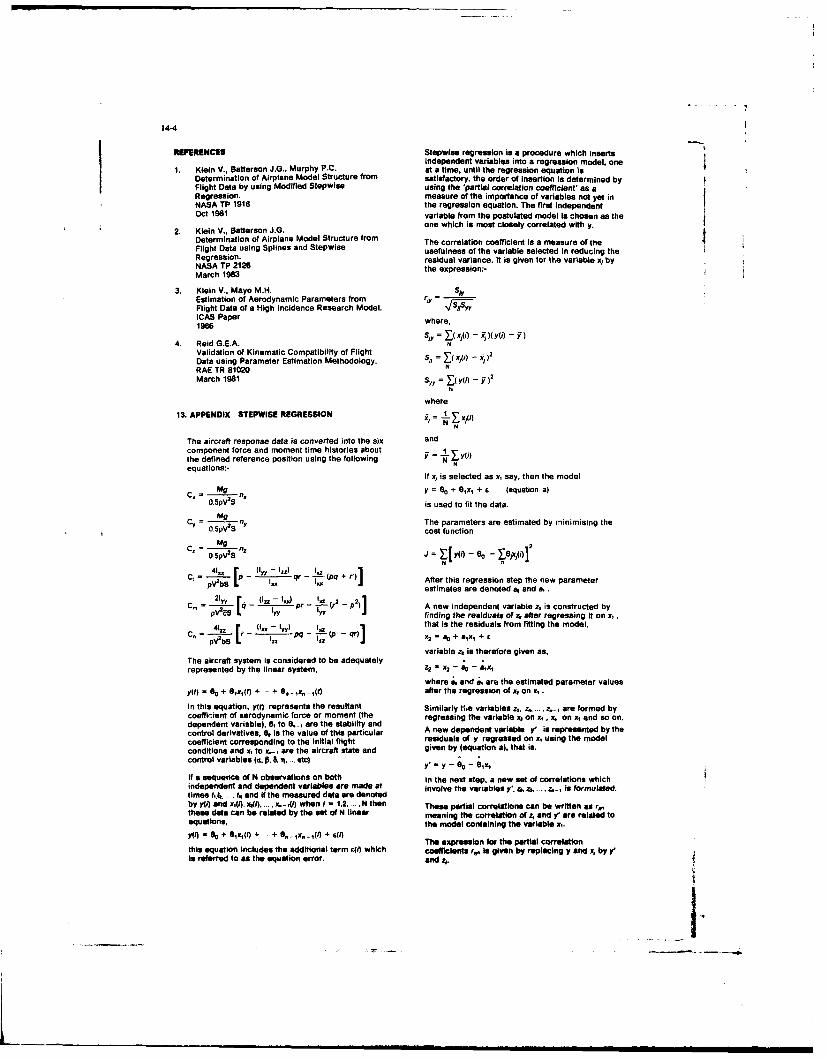
14-4
REFERENCES Stepwise regression is a procedure which insertsindependent variables into a regression model, one
Klein V., Batterson J.G., Murphy P.C. at a time, until the regression equation isDetermination of Airplane Model Structure from satisfactory. the order of insertion is determined byFlight Data by using Modified Stepwise using the 'partial correlation coefficient' as aRegression. measure of the importance of variables not yet inNASA TP 1916 the regression equation. The first independentOct 1961 variable from the postulated model is chosen as the
2. Klein V., Batterson J.G. one which is moat closely correlated with y.
Determination of Airplane Model Structure from The correlation coefficient Is a measure of the
Flight Data using Splines and Stepwise usefulness of the variable selected In reducing theRegression, residual variance. It is given for the variable x, byNASA TP 2126 the expression:-March 1903
3. Klein V.. Mayo M.H. SlyEstimation of Aerodynamic Parameters from r,Flight Data of a High Incidence Research Model.ICAS Paper where,1986
4. Reid G.E.A. N
Validation of Kinematic Compatibility of Flight
Data using Parameter Estimation Methodology. S' = .(xji) - . )2
RAE TR 81020 N
March 1981 S= (yD ) - 9r),N
where
13. APPENDIX STEPWISE REGRESSION i1 --m
N
The aircraft response data is converted into the six andcomponent force and moment time histories about _the defined reference position using the following Y(0equations:- N
If x, is selected as x, say. then the model
C = M.U n. Y = 8o + 0,X + E (equation a)
0.5pV2
S is used to fit the data.
= 0 M.g ny The parameters are estimated by minimising thecost function
C 5PV2S nz
PVSP- qr - To( + r). After this regression step the new parameter
S2restimates are denoted a. and a,.= 2S rc/-(lIul .!-'i.2-P2) A new independent variable z, is constructed by
0-L i l1 finding the residuals of x, after regressing it on x,.
C .r (in - Iyy) p , 1 that is the residuals from fitting the model.
pV2bS 1 - X2 ' SO +aSX, + &
variable z= is therefore given as.
The aircraft system is considered to be adequately
represented by the linear system. - 5s - 5 ;-where i. and a, are the estimated parameter values
ytn - 0 + 6,xj(t) + .. + on -Ix, - I(t) after the regression of x, on x,.
In this equation, Y(tl represents the resultant Similarly the variables z,, &. ,,-, are formed bycoefficient of aerodynamic force or moment (the regressing the variable x on x, , x. on x, and so on.dependent variable), 80, to 8, are the stability andcontrol derivatives, 9. Is the value of this particular A new dependent variable y' is represented by the
coefficient corresponding to the initial flight residuals of y regressed on x, using the model
conditions and x, to x6, are the aircraft state and given by (equation a). that is.
control variables (. p. 8.. . e"y -e-
If a sequence of N observations on both In the next step, a new Set of correlations whichindependent and dependent variables are made at involve the variables y'. a, a,..., z,,-,is formulaed.times ki. . t1. and if the measured data are denoted
by A4l and x,(f), x(i).- -) when I - 1.2,.... N then These partial correlations can be written as r,these di can e related by the set of N linear meaning the correlation of z, and y' are related toequations, the model containing the variable x,.vt- e= + Ojaq~l) + -. + 6,,-,a,-.(t) + ,,(f
The expression for the parial correlationthis equation includes the additional term n(/) which coefficInts rv Is give~n by relng y anid a, by y" '
Is referred to as the equation error. end N iy
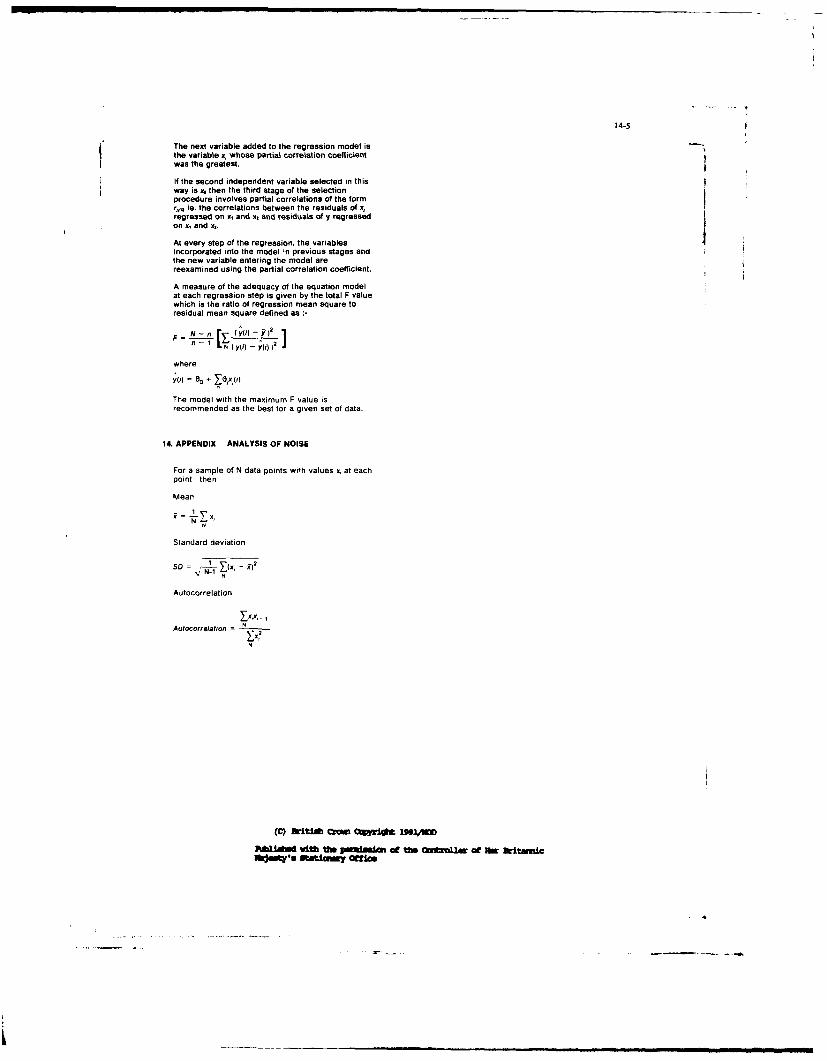
14-5
The next variable added to the regression model isthe variable x, whose partial correlation coefficientwas the greatest.
If the second independent variable selected in thisway is . then the third stage of the selectionprocedure involves partial correlations of the formr is. the correlations between the residuals of x,regressed on x, and x, and residuals of y regressedon x, and x2.At every step of the regression, the variables
incorporated into the model in previous stages andthe new variable entering the model arereexamined using the partial correlation coefficient.
A measure of the adequacy of the equation modelat each regression step is given by the total F valuewhich is the ratio of regression mean square toresidual mean square defined as
F N -.n rv- (y() - i )2Nn ILil-l
2
L N (yli) - y(i) I'
where;I) = e0 , Yexy)
The model with the maximum F value isrecommended as the best for a given set of data.
14. APPENDIX ANALYSIS OF NOISE
For a sample of N data points with values x, at eachpoint i then
Mean
Standard deviation
SD = _ N-! X(X, -W)2
Autocorrelation
Autocorrelaton = N
(C) ftt"I Cmu C*ro ]"V=
P011111IIwith tft P1111111int at M C*OUW of Bw Witmill1lilk fy tftiCMT Offlm
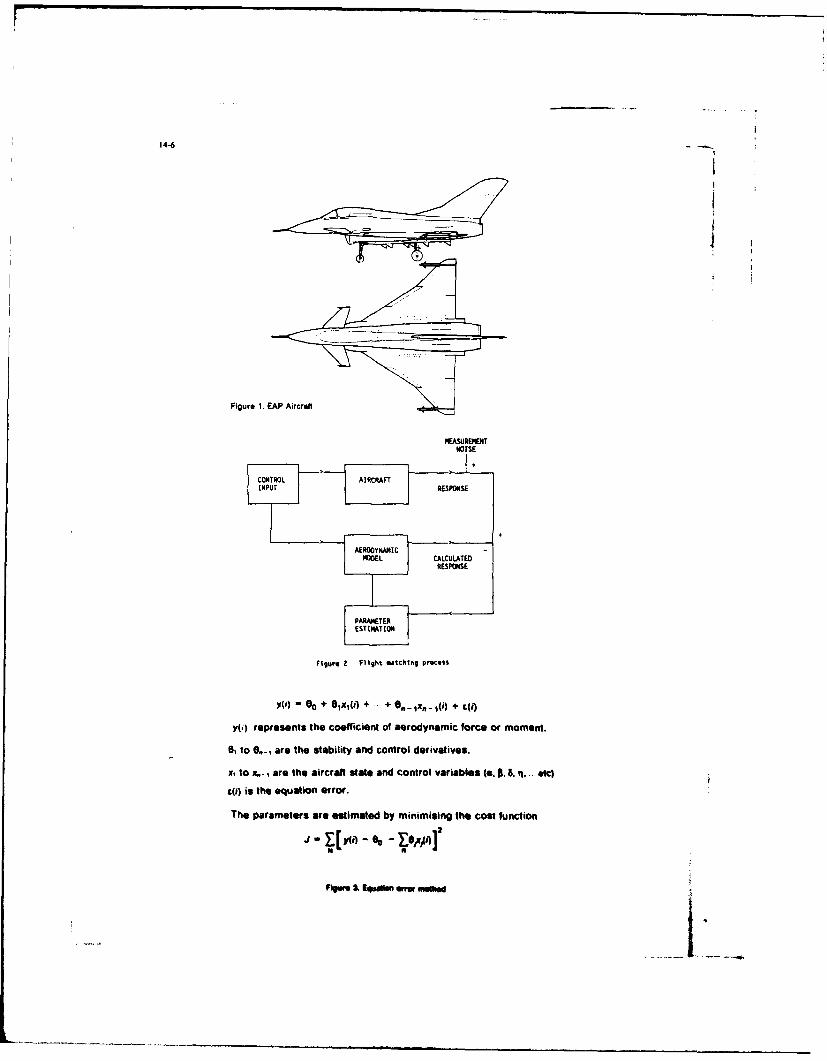
14-6
Figure 1. EAP Aircraft
MEASUREMENTNOISE
CONTROL AIRCRAFTINPUT RESPONSE
AERODYNAM4ICMNOEL CALCULATED
RESPONSE
PARAEE
Figure 2 Flight matching process
=W 0o + *1X(I) + - + 'On - Xj - (i) + E(i)
y(i) represents the coefficient of aerodynamic force or moment.
0, to 8, are the stability and control derivatives.
xto x.-, are the aircraft state and Control variables (a. P, 5,.flt... etc)
iti) is the equation error.
The parameters are estimated by minimising the cost function
so~f S. U Edeli tw.sk
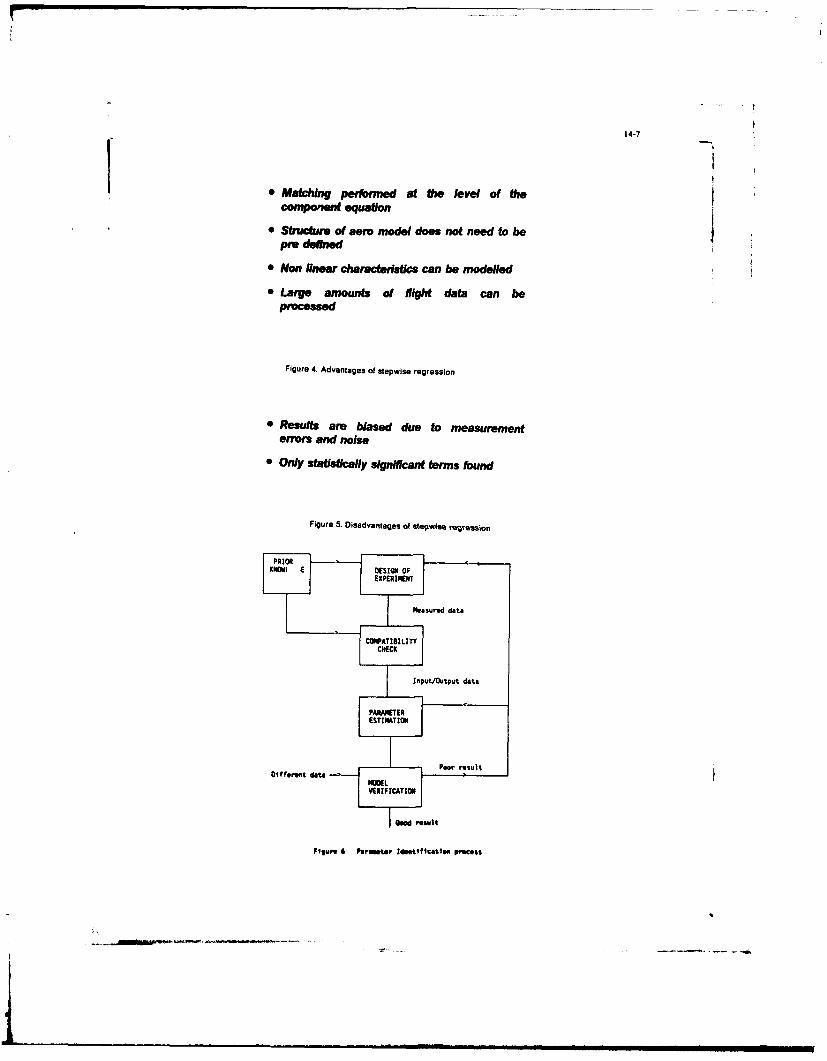
14-7
* MatchIng pernned at fte level of thecomponent equation
* Stuctur. of aero model does not need to bepro defned
" Plon linear characteristics can be modeilled
" Large amounts of Nlight data can be
Figure 4. Advantages of stepwise regression
* Results are biased due to measurementerrors and noise
" Only statistcally signifcant teams found
Figure 5. Disadvantages of stepwes regression
PRIORKNIR I DESIGN OF
EXPERIMENT
Measured data
COMPATIBILITYCHECK
input/output data
PARAMETERfESTIMATIONI
Peer resultDi ffreot data
PKIEL
VERIFICATION
Geed result
Figure 6 Paraeter Idetfication ieces,
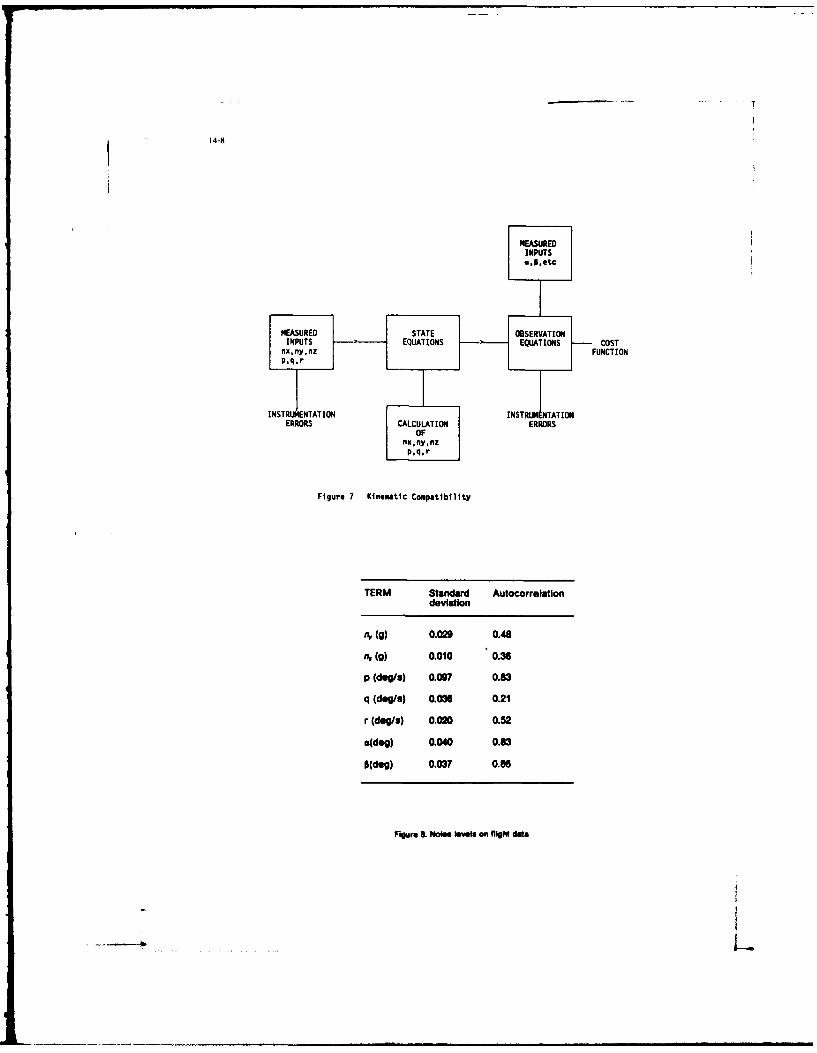
14-8
MEASVREOINPUTSu.S.etc
MEASURED STATE OBSERVATIONINPUTS EQUATIONS EQUATIONS COST
nx ny,nz FUNCTIONp,q.rI
I RMNTTO INSTRUN TATIONERRORS CLUAINERRORS
Figure 7 Kinematic Compatbility
TERM Standard Autocoirelationdeviation
N~ (g) 0.029 0.48
n.(g) 0.010 0.36
p (dog/a) 0.097 0.83
q (dog/a) 0.036 0.21
r (dog/a) 0.020 0.52
*(dog) 0.040 0.83
0(deg) 0.03? 0.86
Figure SNalee levels ani flighi data
-4L
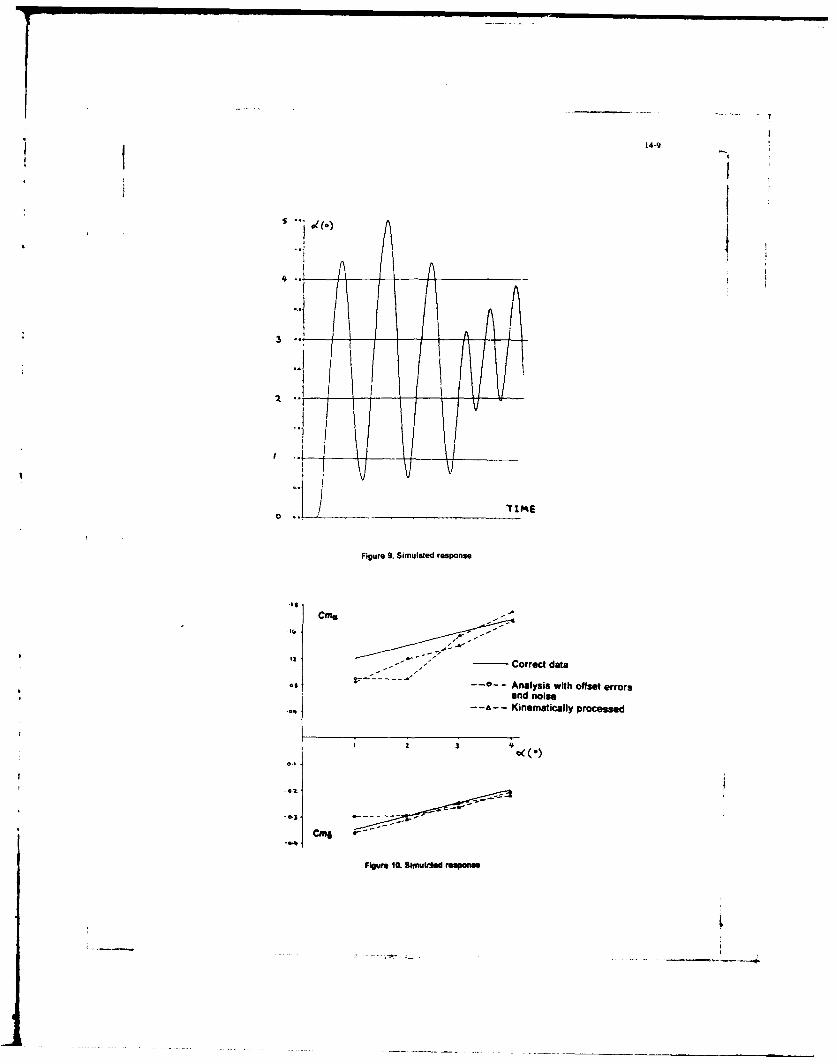
qT
14-9
44
TIM
Figure 9. Simulated response
- Correct data
on - -Analysis with offset errorsand noise
-Kinematically processed
Cn
F"gt Wa. Skm~b1 response
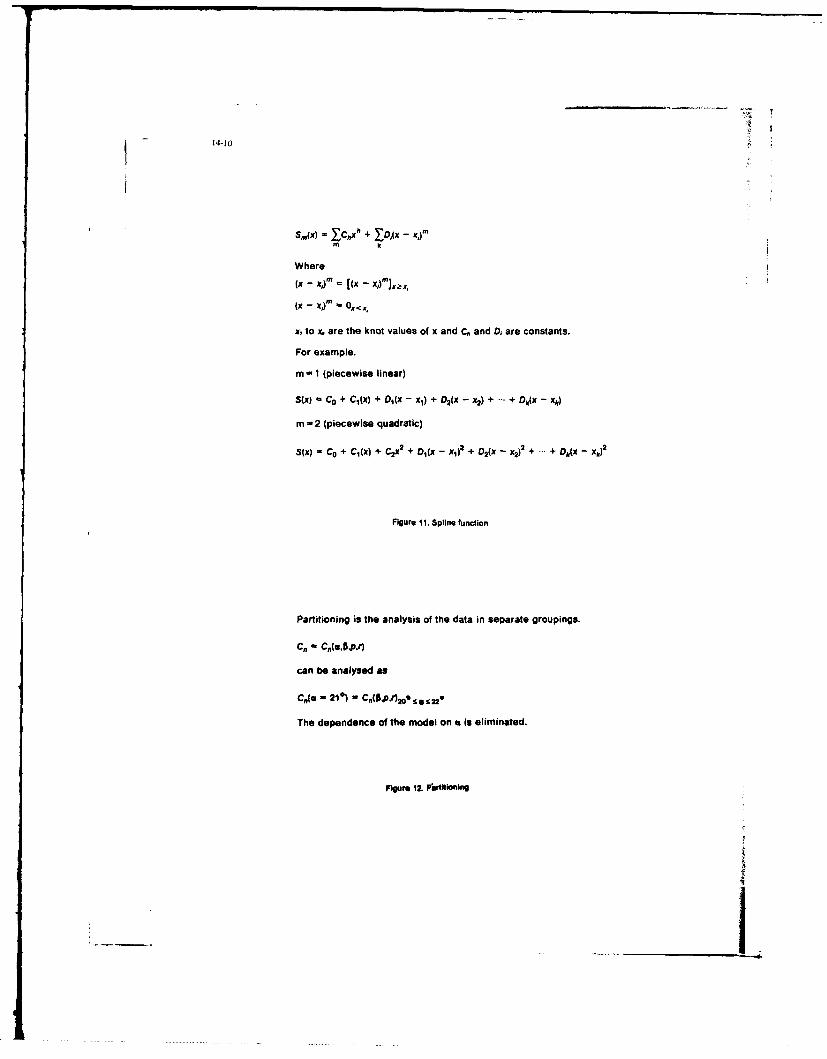
14-10
SM(x) Y_,= + YD,(. ,t
m k
Where
(x - V x- f)z
(- xj)ff "'
x, to X. are the knot values of x and C. and A, are constants.
For example.
m -11 (piecewise linear)
S(x) -C 0 + C1(x) + Dj(x - x1) + D2(x - x2) + - + D(x - xkr)
m - 2 (piecewise quadratic)
SMx - CO + C1(X) + C2X 2 + DI(x - x1)2 + D2(x - jt,2 + -+ ,x-x,)
Figure 11. Spline function
Partitioning is the analysis of the data in separate groupings.
C., - C"(6.P6pur
can be analysed as
C -(c 21) Cf= p)0 r 2
The dependence of the model on a Is eliminated.
Figure 12. Fewtitlonlng
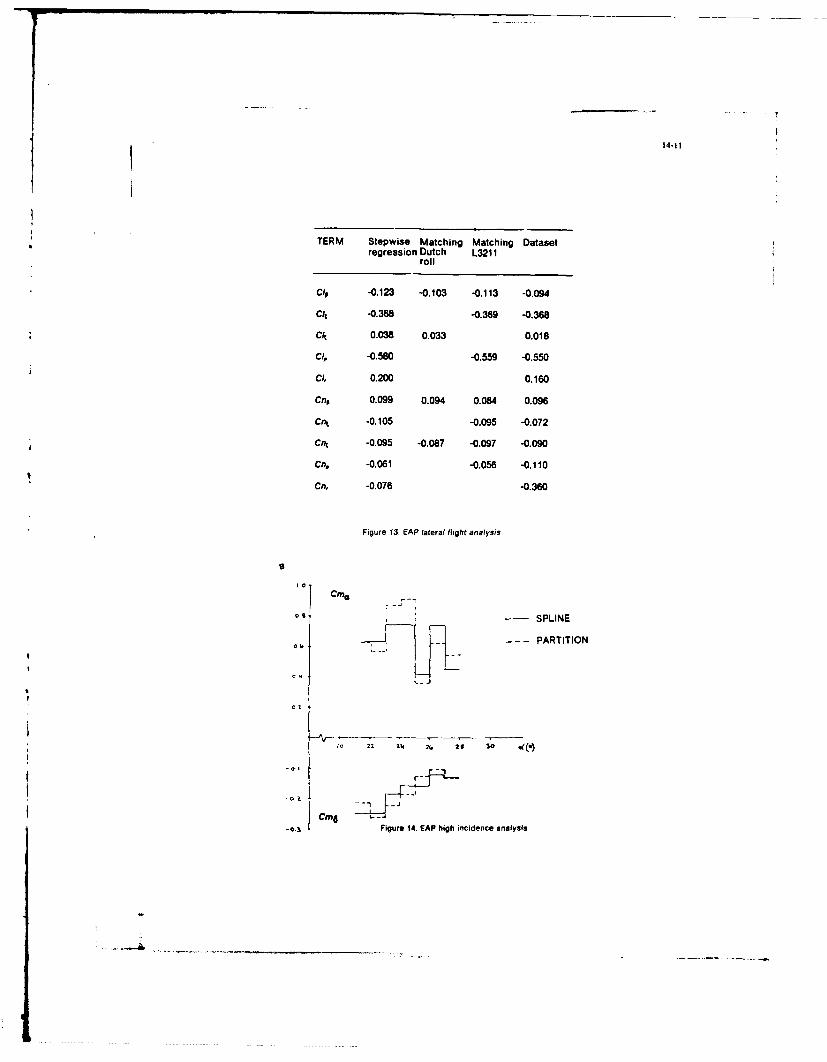
!T
14-11
TERM Stepwise Matching Matching Datasetregression Dutch L3211
roll
C1, -0.123 -0.103 -0.113 -0.094
Ch -0.368 -0.369 -0.368
Cht 0.038 0.033 0.018
CI, -0.580 -0.559 -0.550
C1, 0.200 0.160
Cn, 0.099 0.094 0.084 0.096
Cnt -0.105 -0.095 -0.072
Cn1 -0.095 -0.087 -0.097 -0.090
Cn, -0.061 -0.056 -0.110
Cn, -0.076 -0.360
Figure 13. EAP lateral flight analysis
tO
CmG
a - SPLINE
- - - - PARTITION
Cmr -0 z
:11Figure 14. EAP high incidence analysis
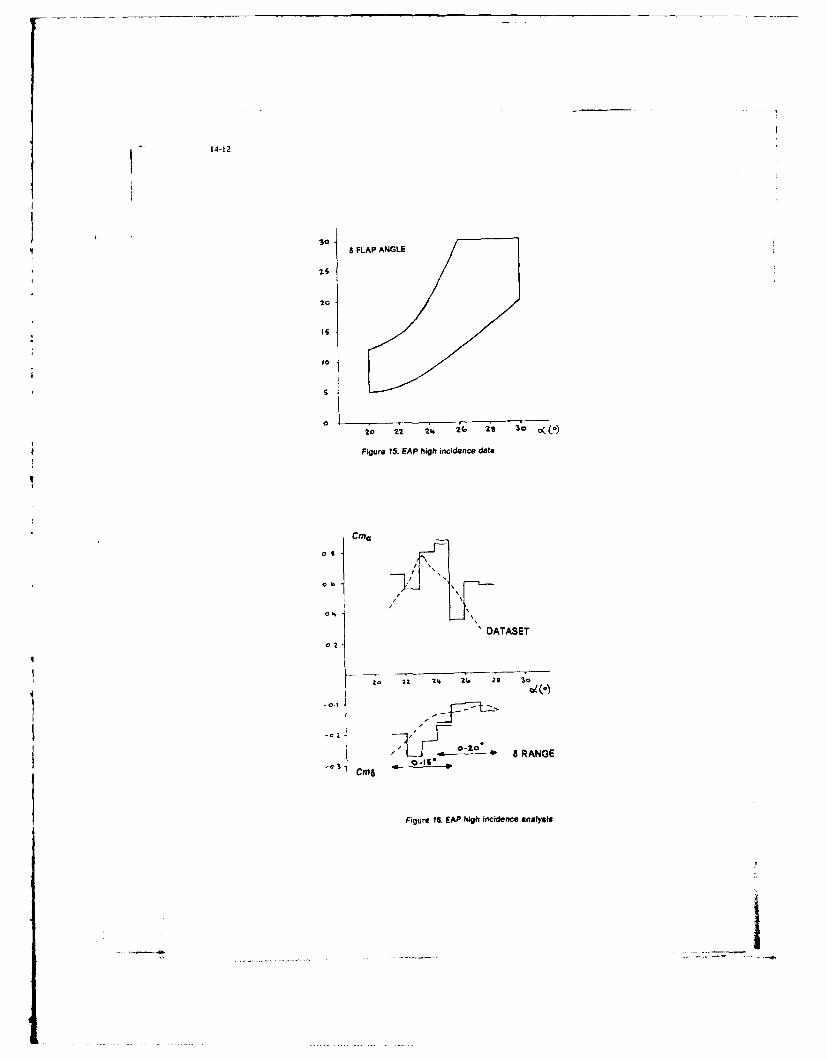
14-12
3o8 FLAP ANGLE
20
I0
Figure 15. EAP high incidence data
Cme
0 •S
•DATASET
Z. 21 24 21. 20 'o
-01-
,-o 6 RANGE
Cma 110
Figure I6. EAP high incidence analyssl
1 5-I
AERODYNAMIC CONTROL OF FIGHTER AIRCRAFTBY
MANIPULATION OF FOREBODY VORTICES
Gerald N. Malcolm and T. Terry NgEidetics International, Inc.
3415 Lomita B':d.Torrance, CA 90505
U.S.A.
SUMMARY 1.0 INTRODUCTION
Methods of enhancing aircraft controllability The flight envelope of current aircraftand maneuverability at high angles of attack by has been limited at least in part bymanipulating the forebody vortices are controllability problems at high angles ofdiscussed. Pneumatic control methods attack, typically represented by suddenincluding jet blowing, slot blowing, and departures in roll and yaw and, in some cases,suction, and mechanical control methods using by pitchup or deep-stall. Reducedforebody and nose-tip strakes are reviewed, controllability places undesirable limiL on theThe potential of various control devices in maneuverability and controllability of thecontrolling the forebody flow and, thus, aircraft and, in some cases, leads toproviding controlled yawing moments at high uncontrolled flight modes such as spin. Th-angles of attack are illustrated using wind typical flowfield around a modern fightertunnel results from a generic fighter and water aircraft at moderate-to-high angles of attack istunnel results from an F/A-18. dominated by vortices. The presence of highly
energetic vortices can and has been utilized to1MENOATURF greatly enhance the performance of aircraft.
These complex vortex flows can, however,Aref reference wing area become erratic as the angle of attack is
Smomentum coefficient of blowing increased and eventually contribute to degradedcontrol capability. If there are means to locally
rhVj/qooAref control these vortex flows on the aircraft, oneCn yawing moment coefficient should be able to utilize this powerful force
input to enhance the overall aircraftd forebody base diameter controllability.hsT strake height Recent research efforts on fighter-type
aircraft have indicated that some of the mostls strake length promising methods for vortex control areih mass flow rate of the blowing jet or slot movable forebody strakes and blowing and
suction on the forebody surface. The strakes
qo free-stream dynamic pressure are either fixed to the forebody to enhance the
Vj average exit velocity of the blowing jet stability characteristics, or deployed actively toprovide additional control. The use of a fixed
or slot pair of forebody strakes attached symmetrically(1 angle of attack to the forebody (e.g., Refs. 1 through 4) has
been shown to be effective in forcing naturally1 angle of sideslip occurring asymmetric vortices at zero sideslip
* angle from the windward meridian at high angles of attack to be symmetric. Thelarge forebody sideforces and resulting yawing
15-2
moments are, therefore, either reduced addresses the use of a rotatable nose-tipsignificantly or eliminated. Stahl5 demonstrates perturbation in the form of an elliptic tip as athat, instead of a pair of strakes, a single large control device. Predictable and repeatable side-strake deployed along the leeward meridian of force with nose-tip roll was obtained even atthe entire forebody can also maintain vortex relatively moderate angles of attack and sideslipsymmetry. Ng6 shows that, possibly due to angles as large as 150.the dominating effect of the flow at the nose tip One of the main practical concerns onon the vortex flow, similar effects can be using movable strakes on the forebody is that,achieved by a small sn'ake which extends over depending on the physical size and mechanicalonly a small portion of the tip region. complexity, they may present unacceptable
Actively deployed forebody strakes interference on the radar operation. Thus,have been investigated as a potential means for pneumatic forebody vortex control has alsoenhancing high angle of attack controllability. been studied extensively as an alternativeSome examples of the investigations are shown method of providing yaw control at high anglesin Refs. 7 and 8. Murri and Rao7 studied the of attack. Investigations of forebody blowingeffectiveness of hinged deflectable strakes on a techniques to control the forebody vortexconical forebody in providing controlled orientation have been conducted in both wateryawing moments for a generic fighter and wind tunnel experiments8, 17-19 whereconfiguration at high angles of attack. Malcolm asymmetric forebody vortices were switched inet a18 used a different form of deployable orientation by blowing under the high vortex.strakes which pivoted out of a tangent-oglve Two main forms of blowing have been studied:forebody about a hinge point with the strakes (1) blowing from a localized jet and
staying normal to the local surfaces. Several (2) blowing from a tangential slot.different strake lengths were tested. It was The study by Malcolm et a18 on afound that strakes extending over only a generic fighter configuration shows thatportion of the forebody were sufficient to controlled yawing moments of variousprovide similar control as longer strakes. magnitudes can be produced by blowing either
Large, asymmetrically deployed forward or aft from a localized jet. They alsostrakes create, in effect, a significantly found an extremely effective synergistic effectasymmetrical forebody geometry and would of simultaneously blowing tangentially forwardnaturally be expected to produce yawing on one side and aft on the other, which cannotmoments, even at zero sideslip. In practice, be achieved with either individual blowinghowever, the size of the control devices is a scheme alone. Rosen and Davis 18 studied thekey issue. Many numerical and experimental effect of jet blowing on the forebody of thestudies (e.g., Refs. 9 - 13) have demonstrated X-29 configuration numerically, againthat, under suitable conditions, a small demonstrating the effectiveness of forward andperturbation at the tip region can lead to large aft blowing in controlling the forebody flow.asymmetries in the forebody flow and, Tavella et a119 show that similar control can betherefore, large yawing moments. For obtained on an F-18 configuration by blowinginstance, the control devices used in two recent from a tangential slot along the fuselage.studies3,14 were substantially smaller in size One question of interest is how thethan the strakes used by Mumti and Rao7 and various forms of vortex control actuallyMalcolmet gig Zifliac at 113 studied the effect function. While there is no doubt more thanof tip geometry on the vortex flow over a one means by which the vortex flow can beslender body of revolution. Variable nose-tip controlled and that a sufficiently strongasymmetries in the form of a small deployable perturbation can significantly alter the forebodycylinder and rotatable machined flats were flow, there may be certain fundamentalfound to be highly effective in producing mechanisms that are common to various controlcontrolled sideforces, although the emphasis of concepts such as jet blowing, slot blowing,the study was more on the effect of suction, and strakes. The understanding ofperturbations than control. The study by these mechanisms will likely lead to theperturbat tal 14ontrohe sthand, direly development of more effective means of vortexMoskovitz et all 4, on the other hand, directly control.
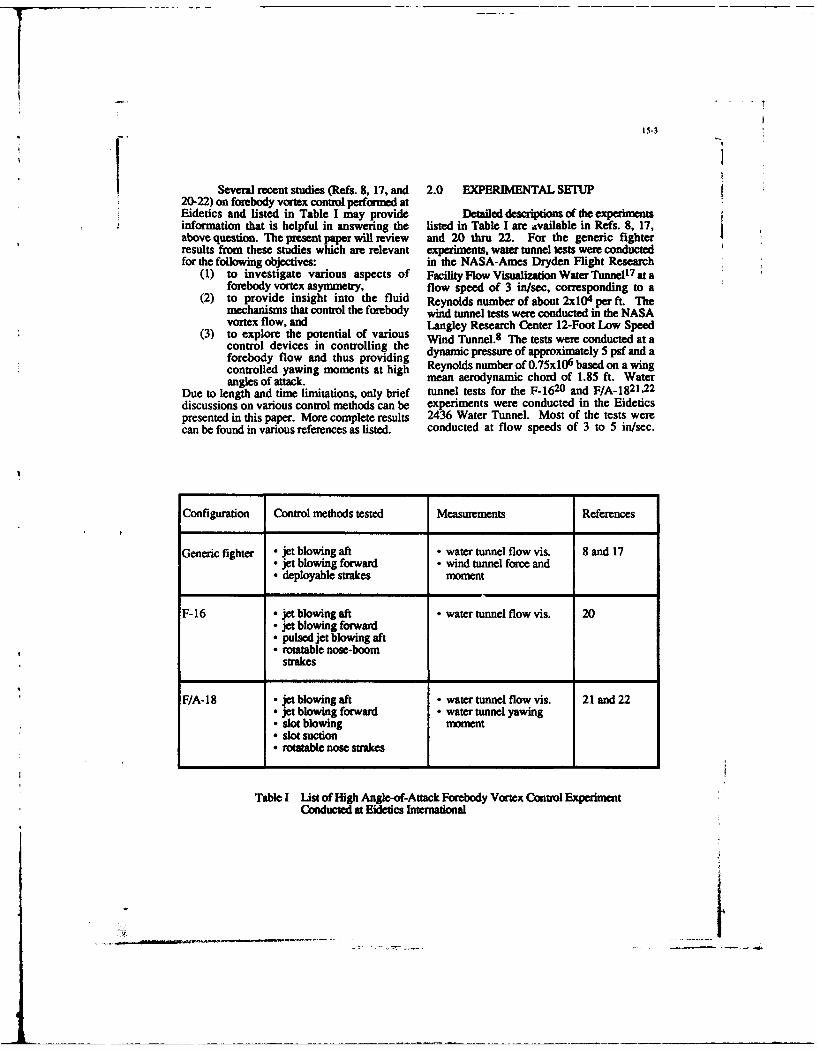
15-3
Several recent studies (Refs. 8, 17, and 2.0 EXPERIMENTAL SETUP20-22) on forebody vortex control performed atEidetics and listed in Table I may provide Detailed descriptions of the experimentsinformation that is helpful in answering the listed in Table I are dvailable in Refs. 8, 17,above question. The present paper will review and 20 thru 22. For the generic fighterresults from these studies which are relevant experiments, water tunnel tests were conductedfor the following objectives: in the NASA-Ames Dryden Flight Research
(1) to investigate various aspects of Facility Flow Visualization Water Tunne,17 at aforebody vortex asymmetry, flow speed of 3 in/sec, corresponding to a
(2) to provide insight into the fluid Reynolds number of about 2x10⁴ per ft. Themechanisms that control the forebody wind tunnel tests were conducted in the NASAvortex flow, and Langley Research Center 12-Foot Low Speed
(3) to explore the potential of various Wind Tunnel. 8 The tests were conducted at acontrol devices in controlling the dynamic pressure of approximately 5 psf and aforebody flow and thus providing ynoldcnprer of apprximae on andiacontrolled yawing moments at high Reynolds number of 0.75x10 6 based on a wingangles of attack. mean aerodynamic chord of 1.85 ft. Water
Due to length and time limitations, only brief tunnel tests for the F-16 20 and F/A-18 21,22
discussions on various control methods can be experiments were conducted in the Eideticspresented in this paper. More complete results 2436 Water Tunnel. Most of the tests werecan be found in various references as listed, conducted at flow speeds of 3 to 5 in/sec.
Configuration Control methods tested Measurements References
Generic fighter - jet blowing aft • water tunnel flow vis. 8 and 17* jet blowing forward - wind tunnel force and- deployable strakes moment
F-16 * jet blowingaft - water tunnel flow vis. 20- jet blowing forward• pulsed jet blowing aft- rotatable nose-boom
strakes
F/A-18 * jet blowing aft • water tunnel flow vis. 21 and 22* jet blowing forward - water tunnel yawing- slot blowing moment* slot suction- rotatable nose strakes
Table I List of High Angle-of-Attack Forebody Vortex Control ExperimentConducted at Eidetics International
t1
! 15-4
For the F/A-18 experiment, in addition to flow separation location, with a high vortex alwaysvisualization, yawing moment measure associated with an early separation and vicewere performed with a strain gage sting. versa. The results demonstrate that theThe wind tunnel model of the generic magiuefaviblcotlsrvaedyfighter is shonn Fig. 1. The water tunnel the aiu otolbevre smcymodel is basicalys~imia except being smaller inraewthhenlefatw utoheatin smz. Two models were used for the F-16 that the strength of the foreody vortices andexperiment: (1) a 1/20th-scale full model and their potential for large asymmetry also
(2) a 1/10th-scale forebody section model increases with a.shown in Fig. 2. For the F/A-18 experiments, For a - 550 t 600, the forebody flowtwo models were used: (1) a 1(32nd-scale full is naturally asymmetric. For the 6% F/A-18model and (2) a 6%-scale forebody section model, without blowing the naturalmodel. The 1/32nd-scale model was disturbances favor a left-vortex-high flowconstructed to accommodate only the nozzle configuration which is associated with anblowing. The 6%-scale model had several earlier flow separation on the left side.different nose pieces which accommodate Blowing underneath the right vortex delays thedifferent methods of control including nozzle separation on the right side and moves the rightblowing, slot blowing, slot suction, and a vortex even closer to the surface while therotatable nose-tip strake system as shown in opposite happens on the left. The non-blowingFig. 3. asymmetry is, therefore, enhanced and the
right-pointing moment increased. On the other3.0 FOREBODY VORTEX CONTROL USING hand, blowing underneath the left vortexPNEUMATIC METHODS moves the left vortex closer to the surface. The
Results of pneumatic forebody vortex non-blowing asymmetry and the right-yawingcontrol--jet blowing, slot blowing, and suction moment are, therefore, reduced and eventually--will be discussed. reversed.
For a - 600 to 650, the baseline flow is3.1 Visuaiaon of the Effect of --- a- characterized by a "bi-stable" condition.Forebody Flow Control on the Vortex Fiow Figure 4b shows the response of the flow to
blowing at a = 600. The photos were taken in3.1.1 J time sequence to demonstrate the "bi-stable"
nature of the flow. Starting from the upper leftThe general effects of blowing aft photo (Photo i), which shows a high left
underneath a forebody vortex are to delay the forebody vortex without blowing, the resultsseparation and move the vortex closer to the show that the vortex orientation is not alteredsurface. Correspondingly, the separation on by blowing underneath the left vortex at C =
the opposite side is advanced and the vortex is 0.1 lx10 3 (Photo ii) - When CIis increased tomoved farther off the surface. The induced 0.41x10 3 , as in Photo iii, the vortex pattern isasymmetry results in a higher suction on the switched from an originally left-vortex-highblowing side and, thus, a yawing moment orientation in Photo i to a right-vortex-hightowards the same side. The effectiveness and orientation. The observation is that, dependingnature of the control depends strongly on the on which side blowing is administered, theangles of attack and sideslip which dictate the forebody vortex flow can be switched betweennature of the baseline flow. Results of the F/A- two stable, asymmetric states which are18 study will be used for illustration. essentially the mior image of each other. The
For a - 350 to 550, the baseline F/A-18 vortex pattern, once switched from oneforebody flow is symmetric. As demonstrated configuration to the other, will stay essentiallyin Fig. 4a, by blowing under the right vortex at in the new pattern with the blowing off as in500 angle of attack, it can be deduced that Photo iv with the exception being that theblowing under either vortex perturbs the degree of asymmetry is slightly higher if thevortical flow from a symmetric confiPration blowing is left on. While it is difficult tointo various degrees of asymmetry. Altering mantain a syrmueic vortex pattern by blowingthe vortex position by blowing also alters the on one side only, an almost-symmetric flow
~15-5
can be maintained by blowing simultaneously which is directly related to the pulsingand approximately evenly on both sides. Even frequency. For high enough reducedvery minute changes in the blowing rates, frequencies, however, the vortex patternhowever, will result in a large flow asymmetry. becomes essentially steady as a result of theThis demonstrates that a slight asymmetry can time-lag effects associated with the vortices andindeed cause the flow to assume one of the the separation. The results show that thestable but asymmetric states. As demonstrated primary function of blowing is the controllingby results of simultaneous blowing on both of flow separation. At the initiation ofsides, the role of a small unavoidable model blowing, the separated boundary layergeometric asymmetry seems mainly to bias the reattaches due to the entrainment from theflow pattern towards one of the asymmetric blowing jet along the surface. The blowing-states, even when the blowing is symmetrically side vortex responds to the change in theapplied to both sides. A sufficiently large separation location and readjusts to a positiontransient perturbation such as a large sideslip closer to the surface and farther toward thechange or blowing can switch the flow from leeward side. The interaction between the twoone state to another. vortices causes the primary separation on the
The overall results on jet blowing other side to advance to the windward side anddemonstrate that sizable vortex asymmetry can the vortex to move farther from the surface.be generated by aft blowing with relatively low When the blowing is pulsed at ablowing rates, typically less than IxlO-3, even sufficiently high rate, the vortices will beat large sideslip angles. Tests performed with "locked" into a fixed position due to the time-the aft set of nozzles show that the control is lag of the vortex response. From the flowsignificantly less effective when compared with visualization results, it is evident that the time-the blowing nozzles closer to the tip of the lag associated with flow separation is decidedlynose. The blowing needed to produce a given shorter than that associated with vortexvortex asymmetry could be ten times higher. position. Even when pulsed at a relatively high
A strong coupling between the rate, the separation on the blowing side willforebody and the LEX vortices can be respond essentially immediately to changes inobserved. A high forebody vortex on one side the blowing condition. The separation on theis associated with a delayed LEX vortex non-blowing side, on the other hand, remainsbreakdown on the same side. Thus, at zero essentially steady. This is because the changesideslip, a positive (right wing down) rolling in separation location on the non-blowing sidemoment would be induced whenever a positive is controlled by the changing vortex rather than(nose right) yawing moment is generated and the vortex bein; controlled by altering thevice versa. That is, the yaw and roll moments separation location as on the blowing side.would be such that a coordinated turn is Thus the net result of pulsed blowing (atproduced with blowing, sufficiently high frequencies) is that the vortex
pair and the separation at the non-blowing side3.1.2 Pulsed Jet lWn2 Aft become steady due to the time-lag effect, even
though the separation on the blowing side isDue to the time-lag effect, pulsing the oscillating at the blowing frequency.
blowing jet can potentially reduce the blowing Whether pulsed blowing offers anyrequired to produce a given yawing moment. advantages over steady blowing is not clear atThat is, it may not be necessary to maintain this point. While a similar vortex pattern cansteady blowing in order to produce a desired be maintained with a lower average blowingvortex pattern because one may be able to space rate with pulsed blowing than steady blowing,the pulses by a period which is shorter than the part of the benefit in the form of controlledtime it takes for the vortices to reposition yawing moment may be lost due to the periodicthemselves aft the blowing s azpw reversion of the separation on the blowing side
The effet of pulsed blowing on the to the non-blowing condition. A certainforebody flow was demonstrated in the F-16 fractional loss in the maximum yawingStdy.7 Below a certain pulse uen ,the moment, howeveru be an acceptable trade-vortex pmern shows a f fluctuaton, off in certain app= due to die potetaleduction in Wlowing qient
15-6
3.1.3 letBlowing 3.1.4.1 Aftl SI
Based on results of the generic fighter, Blowing from the aft slot has onlyF-16, and F/A-18 studies (Refs. 8, 17, 20-22), minor effects on the primary vortex trajectorythe effect of forward blowing is strongly throughout the angle of attack range tested.dependent on the model attitude, blowing rate, Off-surface visualization reveals that from thisand position of the blowing nozzle. The fluid blowing position, most of the blowing jet ismechanics of forward blowing is not entirely being entrained after separation into the LEXunderstood at this point. There seems to be vortex. Since the vorticity generated at thetwo primary effects of forward blowing. Near leading edge of the LEX predominates in mostthe nozzle exit where the jet velocity is high, situations, the effect of the blowing jet on theentrainment effect dominates. Farther away LEX vortex (most noticeably the breakdownfrom the exit, the jet is slowed down by the location) is relatively small. At higher anglesstreamwise flow and a stagnation zone of attack (>-50°), the blowing slot was locateddevelops. The effect of blowing depends after the normal flow separation location andstrongly on the blowing rate and the angle of the blowing becomes less effectiveattack. Surface dye flow visualization shows
At low-to-moderate blowing rates and that the primary effect of slot blowing is towhen tV natural separation location is far delay the flow separation on the blowing side.leeward such as at low angles of attack, the The effect increases progressively with theaccelerated flow around this zone creates a blowing rate. Thus even though the vortexsuction region and a yawing moment towards trajectory is not altered, at zero sideslip
the blowing side may be expected. At high conditions a yawing moment towards theblowing side is expected. This is in basic
angles of attack where die natural separation is agreement with previous numerical andfar windward, forward blowing basically experimental studies reported in Ref. 19. Thepromotes early separation at low-to-moderate results in Ref. 19, however, show that theblowing rates and a yawing moment away from separation on the blowing side can be delayedthe blowing side is expected. One point of much farther than was possible in the presentinterest at all angles of attack is that while the experiment. In addition, a much stronger effectlocal separation location is significantly altered on the vortex trajectory than the presentat any blowing rate, the vortex position does experiment was observed. This may be partlynot change significantly until at higher blowing a result of the rather large difference inrates where the blowing jet can reach the region Reynolds numbers between the two studies.close to the apex. Under this condition, the The computation in Ref. 19 was done at avortex on the blowing side is lifted from the Reynolds number of 11.52x10 6 (turbulent) andsurface and a yawing moment away from the the water tunnel results were obtained atblowing side maa result. Reynolds number of less than lx05 (laminar).
At high blowing rates, entrainment Another potentially significant difference is thateffect of the blowing jet dominates and the computation in Ref. 19 always starts with aseparation is delayed on the blowing side. In nat sym ic vortex pattern, while in thethis case the effect of forward blowing is present case the vortices can be highlysimilar to that of aft blowing. That is, a asymmetric even in the absence of blowing.yawing moment increment toward the blowing 3.1.4.2side is generated.
3.1.4 MSIgil Unlike blowing from the aft slot,blowing from the forward slot has a strong
The effect of blowing tangentially from effect on the vortex trajectory. At sufficientlya slot along the side of the forebody will be high blowing rates, the vortex on the blowingillustrated using the F/A-IS water tunnel id moves close to the surface while theresults. opposite happens on the non-blowing side.
The control boom effecthv at a lower angle
15-7
of attack (-30*) compared with jet blowing demonstrate the effectiveness of various(-35O), although the location of the blowing pneumatic methods in producing controllednozzle is probably a major factor. The effect of forces and moments. The main emphasis wasblowing is strongly dependent on the axial on the concepts of blowing in the forms of a jetlocation due to significant variations in local and a slot.flow conditions along the blowing slotcompared with the case of the aft slot. 3.2.1 Transient and TmopDlehavir
An example of the flow visualizationresults is shown in Fig. 5 for ot = 500. Due to the slow testing speed of theBlowing does not have a strong effect on the water tunnel, certain transient and temporalvortices at C= 0.83x10⁻³ . Surface flow behaviors are readily revealed by the yawingvisualization, however, reveals that flow moment measurements. Figure 6 shows anseparation is significantly delayed. At CA -- example of the yawing moment history at t =1.32Y 10-3, blowing essentially eliminates the 500 for the F/A-18 when blowing on the rightseparation on the blowing side very near the tip side. The results reveal that the yawingregion and the flow separates at the leewardmeridian. The planform view reveals that the moment can he highly unsteady, and that aportion of the vortex at the apex region is large transient over-shoot in the yawingeliminated and a new vortex reforms at a moment can occur when a perturbation (in theslightly aft region. Appreciable changes in the form of a jet in this case) is imposed orvortex trajectory were observed with the removed.blowing-side vortex being at the low position. Above at of about 600, flowThe separated shear layer can be seen to visualization reveals that the flow becomes "bi-become unstable and roll up into individual stable". The yawing moment at at = 600vortices which interact with the forebody becomes more steady. The yawing momentvortices farther downstream can he switched between two essentially steady
values by blowing, and keeping the blowing on3.1.5 S2 after switching only changes the yawing
For the FIA-18 experiment, suction was moment by a relatively small amount.in the form of a slot along the 135* windward 3.2.2 Mi-Avers Behaviorsmeridian. While no attempt was made tooptimize the geometry of the slot, several slotlengths were tested and the control was found The steady-state, time-average yawingto be effective even with a relatively short slot moment for the F/A-i1 at a = 50° is plotted in(approximately 0.25" in length) if the slot is Fig. 7 as a function of the blowing coefficientlocated close to the tip. At at = 30* and 500 for slot blowing, jet blowing in the aftand no sideslip, a very low suction rate (C < direction, and jet blowing in the forward0.3xlO"A, based on the average velocity at the direction. Positive Ct represents blowing onslot) was needed to effect the maximum the right side, while -t represents blowing onasymmetry in the vortex flow pattern for the the left side. The results show that withoutrespective angles of attack. The results show blowing the flow over the jet-blowing model isthat the control is effective even at relative large mostly symmetric, while the slot-blowingsideslip angles (>20*), thou.h higher suction model shows a moderate negative yawingrates are needed to effect similar changes in the moment. This is in agreement with the flowvortex pattern compared with the no sideslip vi eton results in which the slot-blowingconditions. model shows a right-vortex-high configuration
3.2 Farces and Moments Generated by without blowing. This is probably due to aea a small geoetric asymnetry in the slot locations
on left and right sides of the forebody.Te experimental results described in Figure 7 shows that for both the slot
the following sections are intended to blowing and jet blowing in the aft direction, a
i4
yawing moment towards the blowing side is the vortices. The effect of varying the blowingproduced while the opposite is true for jet rate on either side is demonstrated. Increasingblowing in the forward direction. This is again blowing produces increased yawing moment inin agreement with the flow visualization results the direction of the side on which blowingwhich show that the slot blowing and jet aft- occurs. While the effects of blowing left andblowing delay separation and move the vortex right are not exactly mirror images, the effectson the blowing side towards the surface, while are very similar. The yawing momentforward blowing enhances separation on the produced by a 300 rudder deflection is plottedblowing side. The results also show that slot in the same figure for comparison. It can beblowing is the most effective in producing seen that blowing starts to generate sizeablecontrolled yawing moments at steady-state yawing moments when the rudder begins toconditions. Of the three blowing schemes, it lose its effectiveness at about 300 angle ofproduces the highest magnitude of yawing attack. The Cg required to generate amoment at a given blowing coefficient and the maximum yawing moment similar to the 300highest attainable yawing moment. The jet rudder at x = 00 is about 7.5xl0-. and is aboutforward-blowing is the least effective in these 30xlO-3 in order to generate a yawing momentregards. wice that of the rudder. While these blowing
Examples of the wind tunnel results of coefficients are rather high, the water tunnelblowing aft on the generic fighter are shown in results of the F/A-18 demonstrate that aFigs. 8 - 11 (from Ref. 8). Figure 8 shows the substantial reduction in the blowingcase for the generic fighter (Fig. 1) with a clean requirement can be achieved (as much as anforebody. Blowing is implemented on the right order of magnitude) by moving the blowingand left sides individually at different rates. nozzle closer to the tip and by optimizing theThe natural asymmetry for the non-blowing nozzle locations and geometry.case is oriented to produce a positive yawing An indication of the effectiveness ofmoment, which coincides with a vortex pattern blowing with different sideslip angles is shownwhere the right side vortex is closest to the in Fig. 10. The case shown is for an angle offorebody, thereby providing a higher suction attack of 600. The progression of increasedforce in the nose-right direction. By blowing yawing moment with blowing rate in theon the right side, the already asymmetriccondition is enhanced and the asymmetry direction of blowing seems to hold reasonablypersists to even higher angles of attack than for well with sideslip angles to at least 200. The
the non-blowing case. Blowing on the left side significance of the results shown in this figureof the forebody is effective in changing the is that with blowing on the appropriate side, ayawing moment in the opposite direction, but is yawing moment can be generated that willnot effective in completely overcoming the overcome the negative directional stabilitynatural asymmetry for all angles of attack. which is evident without blowing, i.e., Cn isNote also that the blowing coefficient needed is negative for positive P. With blowing it ishigh compmed with that of theF/A-18. This is possible, for example to generate positive Cndue primarily to the mote aft location of the for positive p.nozzles on the generic fighter. Figure 11 shows the case for blowing
It would appear that the most effective forward on the left and blowing aft on the righttechnique for utilizing blowing to provide at Ct - 0.03. Forward blowing can be seen toeffective and controllable variation of the b 0.03. oard bowing can seenutoyawing moment would be to start with a begeneratingyawingmomentsevenhtmuchbaseline configuration which has a yawing lower angles of attack than aft blowing. There
moment inherently near zero through the angle appears to be some significant influence atof attack range and to perturb the moment away angles of attack as low as 100. Blowingfrom zero. Figure 9 shows a case wher the forward on the left side alone produces aforebody was modified with symmetrically moment to the left. At lower blowing rates,mounted nose strkes 1.Od in lemgth, 0.03d in blowing forward produced a moment in aheight at# - 1050, which was found in earlier direction opposite to the blowing side, as wastes results to be an effective strake geometry seen for the F-18 configuration in Fig. 7. Itand placement to minimize the asymmetry of
L-
15-9
appears that from this nozzle location a low extended to full height, the moment is reversed.blowing rate causes premature separation and, It appears that between a strake height of 0.04dtherefore, a force away from the blowing side and 0.08d, the behavior of the forebodyand higher blowing rates delay separation and vortices are changed and the vortex pattern iscreate a suction force on the direction of the reversed.blowing side. Blowing aft on the right side Hence, the effect of a strake on thealone produces a moment to the right. The forebody flow is strongly dependent on themost interesting result is the result of height. It can be conjectured that at very smallcombining these two blowing schemes to blow heights, the strake delays separation on the sidesimultaneously. The initial presumption would where it is deployed by tripping the boundary
layer and causing transition. This allows thebe that the resulting moment would be a value flow to maintain a higher suction on the samethat would be between the values for each of side of the body, with the vortex positionedthe two individual results. Figure 11, closer to the body than the vortex on thehowever, shows that the moment generated by opposite side. At large heights, separationforward blowing on t:e left is enhanced occurs essentially at the edge of the strake,significantly in the same direction by blowing thereby causing the separation to be closer toaft on the right instead of being modified in the the windward side than the separation on thedirection of aft blowing alone. In fact, it opposite side. This results in the vortex on theappears that the magnitude of the additional side with the strake being farther off the bodymoment created by the aft blowing is nearly than the one on the clean side, therebyequal to the magnitude of the aft blowing alone, producing a forebody sideforce and yawing
but the direction is reversed. There is an moment contribution in a direction opposite tothe side with the strake. The height of the
extremely effective synergistic effect of the strake where this "crossover" occurs is,simultaneous blowing which cannot be undoubtedly, fairly sensitive to the Reynoldsachieved with either individual blowing scheme number. The flow on the forebody for thesealone. tests is undoubtedly laminar near the tip and
transitional over the rest of the body and, thus,4.0 FOREBODY FLOW CONTROL a small strake can be very effective in causingUSING FOREBODY STRAKES transition of the boundary layer from laminar to
turbulent. Disturbances to the boundary layerAn asymmetric pair of strakes can flow and the immediate flowfield by snakes for
produce asymmetries so that yawing moments a full-scale configuration, where the boundarycan be produced to enhance aircraft layer is fully turbulent for all but the tip region,controllability. The effectiveness of the control may have a significantly different resulL Thedepends on the size, geometry, and position of effect of a strake should also be dependent onthe strakes. Figure 12 shows the effect of the local boundary layer thickness and the
location of the strake relative to the naturalvarying the height of the mtrake. The baseline separation location which is sumigly dependentconfiguration (no strakes) is plotted for on the angles of attack and sideslip.reference. Results for three different strake Overall, the wind tunnel results showheights are shown: 0.02d, 0.04d, and 0.08d that yawing moments of different magnitudesfor both left and right sides. The yawing and directions can be generated by extendingmoment data show near mirror images for left the strake to different heights. The primaryor right strakes of the same heights. The most function of the strake is controlling the
significant information is the behavior of the separation location. In practice, the requiredyawing moment with the various strake sm of the stake is an IMWt consderaion,heights. For example, at ox - 450 the direction The following semtion will discuss the resultsof the yawing moment for the smallest strake of another control device based on ottable,height (0.02d) on the left is to the left. When miniature nose-tip makes.
the snake height is increase to 0.04d, themommt is still to the left but decreased. When
U
15-10
5.0 FOREBODY FLOW CONTROL asymmetry of the baseline flow. The naturalUSING ROTATABLE, MINIATURE NOSE- asymmetry can be reduced or increased by aTIP STRAKES small amount by moving the stakes to differentpositions. Ile effect of the strakes, however,5.1 rThlei nose-tip strake shapes s apparently not sufficiently strong towere shown in Fig. 3. Tests were conducted overcome the natural asymmetry and forced thewith a single-strake and with a pair of strakes. flow into a symmetric state even when theThe dual strakes are fixed at +75* from the strakes are deployed symmetrically. While awindward side of the model (as shown in Fig. symmetric vortex pattern cannot be induced by3) and are rotated as a pair maintaining the 150* placing the strakes statically at any position,separation angle. The single-strake is rotated due to the time lag effect, a quasi-steadywith the zero reference coinciding with the symmetric pattern can be maintained bystrake on the windward side of the model, oscillating the strakes rapidly about a
symmetric position.5.2 Visualization of the Effect of the Overall, flow visualizationStrakes on the Vortex Flow demonstrated that the nose-tip strakes provide
similar kinds of control on the forebodyThe flow visualization results show that vortices as many other control methods such as
the rotatable nose-tip/boom strakes on the F- 16 large deployable strakes and blowing. Theand F/A- 18 start having a noticeable effect on control is effective over wide ranges of sideslipthe forebody vortices at a's above 300. The (00 to >20P) and angles of attack ( -30 to 650effect is dependent on the angle of attack and or higher). The vortices can be manipulatedthe nature of the baseline flow. Results from into different patterns by rotating the strakes todifferent angular positions.the F/A-18 experiments will be used asexamples. 5.3 Yawing Moments Generated byth
From a - 300 to 600, rotating the N Yan e nstmkts on the F/A-IS to different positions canchange the vortical flow from a symmetric The main purpose of the yawingconfiguration into various degrees of moment results is to quantify the controllingasymmetry. At any angle of attack, there effect of the nose-tip strakes. In addition to theappears to be a maximum attainable vortex dual-strake, a single-strake was tested to aid inasymmetry. The magnitude of available the understanding of the control mechanism.control, as revealed by the maximum attainable For the single-strake, the zero roll angle wasvortex asymmetry, is the same for the left and defined as when the strake is at the windwardright sides and increases with the angle of meridian (% = 00). For the dual-strake, the zeroattack. Figure 13 shows examples of the position was when the strakes wereresults at t - 500 for the dual strakes with no symmetrically located at * =±+750.sideslip which demonstrate the various degrees The single-strake results are shown inof vortex asymmetry that can be achieved. As Fig. 14. At a = 50 the yawing momentshown in Fig. 13, a symmetric deployment of essentially switches between two extremethe strakes in general results in a symmetric values. The moment direction switchingpair of forebody vortices. When the strakes are occurs over very narrow angular rangesrotated to an asymmetric configuration, the side centered approximately about four roll angles:with a strake closer to the windward meridian 0 a, 60, 180, and 300o. When the strake isis associated with a vortex closer to the located at #'s from 00 to ±600, the yawingforebody which implies a yawing moment moment generated is toward the side with thepointing towards the same side. The control snake. For the other angles, the yawingis effective even at a sideslip angle of 200. moment generated is away from the side with
For cr's above about 60, the baseline the stake. Flow visualization reveals that atvortex flow becomes bi-stable. The stakes do at - 500 with the single-strake in place thehave an effect on the degree of vortex
15-11
vortex flow tends to assume one of two tip is altered. The specific workingasymmetric states, although symmetric flow mechanisms of the methods are describedcan be maintained by carefully placing the below.strake at the four roll angles where the momentswitches signs. Apparently, the single-strake 6.1.1 JetBlowing
creates rather sizable asymmetric disturbancesat most rotational angles and thus the flow is The primary function of jet blowing is the
'locked" into highly asymmetric states. The controlling of flow separation by entrainment.As sketched in Fig. 16a, at the initiation of
yawing moment at ot = 400 varies more blowing, the separated boundary layergradually with nose-tip roll angle and with reattaches due to the entrainment from thesmaller amplitude, providing an easier task to blowing jet along the surface. The blowing-hold yawing moment at zero. side vortex responds to the change in the
separation location and readjusts to a positionAs shown in Fig. 15, the yawing closer to the surface and farther toward the
moment generated by the dual-strake behaves leeward side. The interaction in the form ofvastly different from that of the single-strake. mutual entrainment near the apex regionWhile the maximum yawing moments that can between the two vortices causes the primarybe generated are similar in magnitude to that of separation on the other side to advance to thethe single-strake, the dual-strake moment varies windward side and the vortex to move farthermuch more gradually with the nose-tip roll from the surface. Unfortunately, with a fixedangle. That is, the second strake has a blowing nozzle it is impossible to maintain thesignificant modulating effect on the first strake. absolute optimal relationship between theAbove a of about 600, flow visualization blowing jet and the separated flow throughoutreveals that the flow becomes "bi-stable". the entire range of operation since theResults at ax = 60' show that the yawing separation location changes with angles ofmoment can be controlled by the nose-tip roll attack and sideslip and the blowing rate. Thus,angle but to a much lesser degree. A the position and the direction of the fixedsymmetric flow cannot be maintained with the nozzle would necessarily have to bestrakes deployed symmetrically. The behaviors compromised for the operating conditions ofof the single- and dual-strake yawing moments interest. Furthermore, the maximum attainableat different nose-tip roll angle are explained in vortex asymmetry is limited by the angulardetail in Ref. 21. location of the blowing nozzle which places a
limit on how far the separation can be delayed.6.0 DISCUSSIONS
6.1.2 Slot BlowingImplications of the observed results on
the flow asymmetries and various aspects of Slot blowing operates on the principlethe control methods will be discussed in this of circulation control. As depicted in Fig. 16b,section. Advantages and limitations of the blowing energizes the flow near the surface socontrol methods will be described and that it is more capable of overcoming thecompared. adverse pressure gradient. The separation on
the blowing side is therefore delayed. The6.1 Mechanisms of Vortex Control resultant changes in vortex strength and
trajectory then determine the eventual flowThe various methods of vortex control asymmetry.
all work on the principle of producing a forced Blowing from the aft slot location,asymmetry or a biased natural asymmetry. while effective in controlling the local flowCommon to all the methods tested is that very separation, does not affect the vortices at theeffective control on the vortex asymmetry can region where their interaction is the strongest.be obtained by controlling the separation near The changes imposed in the aft location also do
not result in changes upstream of the region.the tip region. In essence, the flow pattern is Blowing from the forward slot, on the othermodified so that the effective geometry of the
I
15-12
hand, effects changes in the region where strakes essentially dictate that a large portion ofvortex interaction is the strongest and where the the forebody flow separates at the leadingflow has a predominating effect on the vortex edges of the strakes. The small nose-tiptrajectory. The disturbance created in this strakes, on the other hand, can behave muchregion also propagates along the entire vortex. like the vortex generators on many existingThus the forward slot position is more effective aircraft wings. As depicted in Fig. 16d, one offrom a pure aerodynamic standpoint, the perceived functions of the strakes is to
Blowing from a fixed slot has the same generate small vortices which energize thelimitation as jet blowing, i.e., an absolute boundary layer farther aft to delay flowoptimal relationship between the blowing slot separation. While the deflectable strake has aand the separation location cannot be fixed hinge-line, the nose-tip strakes are free tomaintained throughout the angle of attack and rotate to any angular position. This allows thesideslip ranges. Care must also be taken in nose-tip strakes to be positioned moreshaping the slot to prevent the onset of shear optimally relative to the forebody vortices andflow instability which results in the separation locations for a wider range of anglesdegeneration of the jet sheet into individual of attack and sideslip, especially if the left andvortex filaments, right strakes can be made to rotate
independently.6.1.3 Sucion One important question is how small
the strakes can be and still be effective as aAs depicted in Fig. 16c, suction works control device. Small nose-tip devices such as
on the principle of circulation control which those in Refs. 13 and 14 produce very littlemeans a high-energy boundary layer flow is vorticity of their own. They seem to functionmaintained by pulling the high-speed flow mainly by providing a bias to the flowtoward the surface. Thus it functions in many asymmetry near the tip region and, thus, wouldways similar to slot blowing. With the present function most effectively when the forebodyslot arrangement, the suction required to effect flow is at or near the naturally asymmetrica large vortex asymmetry is very low and the regime. Large forebody devices such as thecontrol is effective even at relatively large strakes used in Refs. 7 and 8 do producesideslip (>200). sizable vorticity locally. Thus, one would
While suction from a slot was tested in expect these devices to be effective inthis study and was shown to be very controlling the forebody flow over a widerpromising, other forms of suction may be range of flow conditions when compared withpotentially more effective. Continuous suction the miniature devices. One of the determiningthiough a porous surface had been shown to factors on the size of the strakes is operationalprovide a similar degree of control at a much requirements such as anticipated angles oflower suction rate (Ref. 23). Optimizing the attack and sideslip.location of the porous surface can furtherreduce the suction requirement. A distributed 6.2 Comparison of the Different Methodssucton is also likely to be effective over a wide of Forebodv Vortex Controlrange of angles of attack and sideslip. Moreimportantly, the suction requirement decreases The advantages and limitations of eachrapidly with increasing Reynolds number (Ref. of the control methods will be discussed in this23). Thus, at actual flight conditions, the section. One important point to bear in mindsuction level may be extremely low. is, especially in the cases of the suction and
rotatable strakes, none of the methods tested6.1.4 Forebod/Nose-Tip Strakes has been optimized. The discussions are
therefore based only on presently availableThe rotatable nose-tip strakes are results.
intended to influence directly only a smallregion near the tip of the forebody where the 6.2.1 Overall Effeciv. sflow plays a predominating role in controllingthe vortex position, while large strakes directly One of the main differences among theaffect a much larger region aft of the tip. Large control methods tested is their overall
I
15-13
effectiveness over an extreme wide range of suction. Slot blowing and especially suctionangles of attack and sideslip. In this regard, will probably result in very small modificationsthe rotatable nose-tip strake seems to offer a to the external surface of the forebody. Inpotential advantage. Among the pneumatic comparison to the pneumatic methods, thecontrol methods tested, suction is perhaps more forebody strakes will consist of more movingeffective due to the relatively non-localized parts both external and internal of the forebodyeffect of suction on the boundary layer. The which may present more interference on otherslot and jet blowing are somewhat more aircraft operations. Miniaturization of therestrictive since the fixed locations of the slots system is thus a key priority. In this regard,and the blowing nozzles cannot maintain an the rotatable nose-tip strakes concept wouldoptimal relationship with the flow separation seem promising.location throughout a wide range of operatingconditions. Nevertheless, all the methods 6.3 Comparison of Various Yaw Controltested were shown to be capable of functioning Methodseffectively over a fairly wide range of angles ofattack and sideslip. To put the requirements for forebody
blowing and the resulting yaw control moment6.2.2 Blowing/Suction Requirements for into perspective compared to other means ofPneumatic Control yaw control including 1) conventional rudder
control, 2) thrust vectoring, and 3) reactionWhile there may be many other jets on the forebody, a typical flight case will
potential sources of blowing and suction, be used for illustration. We will assume anengine-bleed is assumed to be the source-of- aircraft in the F/A-18 class with regard to size,choice for the present discussion. The present thrust, wing area etc. We will evaluate theresults show that the Cg requirements for the magnitude of the yawing moment that can beslot and the jet blowing are well within the generated at an altitude of 15,000 ft at M=0.3.limits of practicality. For the surface suction The example of forebody control by blowingmethod, assuming that the suction is available will be based on an aft blowing jet near the tipfrom an ejector pump arrangement with the of the forebody, as discussed in Section 3.1.engine-bleed as the power source and that the Based on the results discussed ir, this paper andavailable suction is about half the magnitude of others, we will assume that a yawing momentthe corresponding engine-bleed, the suction coefficient that is equal in magnitude to that of arequiremert is also low enough to be practical. fully-deflected rudder at a =0 (Cn = 0.03 inIt remains to be verified in future studies Fig. 9 for a generic fighter) can be generated bywhether the values of the blowing and suction blowing with an aft-facing jet with a blowingcoefficients obtained in sub-scale water and owinwind tunnel tests are directly applicable to flight Also, for comparison to thrustconditions. vectoring, we will assume that the maximum
thrust available from the two engines at6.2.3 System Complexity and Intrusiveness 15,000 ft is 1/2 of the thrust available at seaon Other Operations level (32,000 lbs), i.e., T=16,000 lbs. The
four options to be considered for yaw controlThe blowing and suction systems are the following:
should consist of very few moving parts. Thephysical sizes, both internal and external of the 1) Rudderforebody, are the main considerations. The 2) Thrust vectoringnozzle blowing is likely to have the simplest 3) Forebody thrust reaction jetsinternal plumbing system and small external (normal to forebody surface)dimensions. The need to maintain desired 4) Forebody pneumatic vortex controlforms of blowing and suction distributions (with jets tangen.ia to forebody surfacewould likely result in certain complexities in the blowing in the aft direction)plumbing systems for slot blowing and
15-14
Referring to Fig. 17 the contributions to 2) Thrust Vectoring to match the rudderthe yawing moments (YM) for the various (deflection angle of 4.780) (Fig. 17b)control schemes are illustrated. Note that theyawing moment for vortex control in Fig. 17d (YM) TV = (T sin 0) XT = (16,000) (sinis expressed as a linear variation with the 4.780) (27) = 36,000 ft-lbsblowing coefficient, Cg, which can berewritten as shown to express the yawing 3) Reaction Jets (Fig. 17c)moment as a multiplying factor or augmentationratio times the yawing moment generated by the (YM) Ru = m Vj XN = (0.88/32.2) (1100)same mass flow from a reaction- jet (33) = 986 ft-lbsperpendicular to the forebody surface shown inFig. 17c. The size of this factor, KA, is 4) Vortex Manipulation for Control (Fig. 17d)dependent upon the effectiveness of theblowing scheme, i.e. its effectiveness in (YM) VMC = CnvMc q*,Ab = (0.03) (75)generating an asymmetric flow resulting in a (400) (40) = 36,000 ft-lbsyawing moment. We will now show anumerical comparison between these four In comparison to the level of theexamples at a typical flight condition where the yawing moment available from the rudderfollowing parameter values are appropriate: deflection of 36,000 ft-lbs, thrust vectoring at
full thrust would require approximately a 4.78'h = 15,000 ft (altitude) deflection. The yawing moment generated byM = 0.3 (Mach number) vortex control compared to that from theV = 330 ft/sec (flight velocity) r- ztion control jet is a factor of 36,000/986 orq- = 75 lbs/ft2 (based on h and V) 36.5 times larger. That is,
A = 400 ft2 (wing area)b = 40 ft (wing span) (YM)vMC _ 36,000/986 = 36.5T = 16,000 lbs (thrust) KA - (YM)RJXN = 33 ft (nose distance from cg)XT = 27 ft (tail distance from cg) Therefore, for the same blowing coefficient, jet
blowing to manipulate the forebody vorticesWith the assumed blowing coefficient can be 36.5 times more effective than simply
of CVi = 0.001, the corresponding mass flow using the jets as a reaction jet thruster.rate ri is calculated from To put the blowing requirement of 0.88
lbs/sec into perspective, the engine bleed rates_2Y that are available for the F- 18's F404 engine at
C9 = q.,A an altitude of 15,000 feet at 80% throttle is(Vj = jet velocity (sonic), 1100 ft/sec) approximately 4 lbs/sec per engine. Not all
= Cgq.A _ would be available for a forebody blowing1 ( ( system, but some percentage could possibly be
(.001) (75) (4 =) used. As seen above, the maximum mass flow1100 = rate that might be required for a yaw control
0.0272 slugs/sec or 0.88 lbm/sec moment at least as large as the rudder'smaximum contribution, is a total of 0.88
If we now substitute the numerical data lbs/sec or 0.44 lbs/sec per engine. In otherinto the equations shown in Fig. 17, we can words, a blowing rate on the order of 10% ofevaluate the respective contributions of each of the available bleed air would be adequate tothe schemes: produce a yawing moment of 36,000 ft-lbs at
1) Rudder (Fig. 17a) the flight conditions used in this example. The(YM)R =Cn RUD q,.Ab = (0.03) (75) most demanding case for a real combat
situation might be as much as Mach 0.6 at the(400) (40) = 36,000 ft-lbs same altitude or higher. Since the '-tss flow
:+
15-15
requirements for a given blowing coefficient, of a modern fighter further enhances the controlCg, increase with q., increasing the Mach effectiveness by providing a long moment arm.number to M--0.6 from 0.3 would increase the 3. In terms of blowing and suctionmass flow requirements by a factor of 4 or requirements and/or mechanical complexity,approximately 40% of the available bleed air, most of the methods tested would seem at leastan amount which may still be an achievable potentially practical. Each method, however,mass flow rate. offers its own advantages and disadvantages,
This comparison shows the viability of and there is probably no single method whichthe forebody vortex control compared to other is the best for all situations. The optimal
method for a given application is, perhapsmethods. It is also possible that the blowing obvio depinen on the pissionrequirements could be met by an independent obviously, dependent on the missiononboard pressure system, at least for short duty requirements, physical limitations, and thecycles, and engine bleed would not necessarily particular configuration.be the only choice for a blowing source. 4. Regardless of which particular
form, the control is most effective when7.0 SUMMARY AND CONCLUSIONS applied at the region close to the tip of the
forebody. In essence, the flow pattern at theSeveral methods of controlling the tip region is modified so that the effective
forebody flow at moderate-to-high angles of geometry of the tip is altered.attack were studied in water and wind tunnelexperiments. The results can be summarized as 8.0 ACKNOWLEDGEMENTSfollows: 1. The methods were shown to be Support for the F/A-i8 study iseffective over a wide range of angles of attack provided by NASA-Ames Research Centerand sideslip. The characteristics of the control under Contract NAS2-13155. The technicaldepend strongly on the baseline vortical flow monitor is Dr. Lewis Schiff. Support for thewhich can take on several different forms as generic fighter and F-16 studies was provideddictated by the aircraft attitudes and the by the US Air Force Wright Research andpresence of external perturbations. Development Center, WPAFB, Ohio under
preenc e epiContract F33615-86-C-3623. The technical2. The experiments demonstrated that monitors are Mr. Stan Lash and Mr. Dieterall the methods tested work basically on the Multhopp of the Flight Controls Branch, andprinciple of separation control. The Mr. Russell Osborne and Mr. Robert Guytonmechanisms: blowing, suction, and vortex of the Aeromechanics Branch.generators, have been well-proven forapplications on conventional aircraft wings for 9.0 REFERENCESseparation control. Applications of the controlmethods on the forebody flow, at least from a 1. Chapman, G.T., Keener, E.R., andpure aerodynamic standpoint, enable many of Malcolm, G.N., "Asymmetricthe control methods that are impractical on the Aerodynamic Forces on Aircraftwings to become potentially practical on the Forebodies at High Angles of Attack -forebody. Compared with the wings, control Some Design Guides," AGARD CP-on the forebody is required over a much 199, Conference on Stall/Spin
Problems of Military Aircraft, Rhodesmaller area and, thus, physical requirements Saint Genese, Belgium, Nov. 1975.such as blowing and suction rates, and size and 2. Skow, A.M. and Titiriga, A., "Aweight should be much smaller. The presence Survey of Analytical and Experimentalof two closely spaced vortices around the Techniques to Predict Aircraft Dynamicforebody enhances the effectiveness since Characteristics at High Angles ofcontrolling the separation also controls the Attack," AGARD CP-235, Conferencevortices which can significantly increase the on Dynamic Stability Parameters,available control forces. The lengthy forebody Athens, Greece, May 1978.
+: ...
~-T
15-16
3. Headley, J.W., "Analysis of Wind Control the Asymmetric Flowfield onTunnel Data Pertaining to High Angle Forebodies at Large Angles of Attack,"of Attack Aerodynamics," AFFDL-TR- AIAA-90-0068, Jan. 1990.78-94, Vol. I, July 1978. 15. Skow, A.M., Moore, W.A., and
4. Hall, R. M., Erickson, G.E., Straka, Lorincz, D.J., "Forebody VortexW.A., Peters, S.E., Maines, B.H., Blowing - A Novel Concept to EnhanceFox, M.C., Haies, J.E., and LeMay, the Departure/Spin RecoveryS.P., "Impact of Nose-Probe Chines Characteristics of Fighter Aircraft,"on the Vortex Flows about the F-16C," AGARD CP-262, Conference onAIAA-90-0386, Jan. 1990. Aerodynamics of Controls, Naples,
5. Stahl, W., "Suppression of Asymmetry Italy, May 1979.of the Vortex Flow Behind a Circular 16. Moore, W.A., Skow, A.M., andCone at High Incidence," AIAA Paper Lorincz, D.J., "Control of the89-3372-CP, Aug. 1989. Forebody Vortex Orientation by
6. Ng, T. T., "The Effect of a Single- Asymmetric Air Injection - Applicationstrake on the Forebody Vortex to Enhance Departure/Spin Recovery,"Asymmetry," J. of Aircraft, Vol. 27, AIAA Paper No. 80-0173, Jan. 1980.No. 9, Sept. 1990, pp. 844-846. 17. Malcolm, G.N. and Skow, A.M.,
7. Murri, D.G. and Rao, D.M., "Enhanced Controllability Through"Exploratory Studies of Actuated Vortex Manipulation on Fighter AircraftForebody Strakes for Yaw Control at at High Angles of Attack," AIAA PaperHigh Angles of Attack," AIAA Paper No. 86-2277-CP, Aug. 1986.No. 87-2557-CP, August 1987. 18. Rosen, B. and Davis, W., "Numerical
8. Malcolm, G.N., Ng, T.T., Lewis, Study of Asymmetric Air Injection toL.C., and Murri, D.G., "Development Control High Angle-of-Attackof Non-Conventional Control Methods Forebody Vortices on the X-29for High Angle of Attack Flight Using Aircraft," AIAA Paper 90-3004, Aug.Vortex Manipulation," AIAA Paper 89- 1990.2192, July - Aug. 1989. 19. Tavella, D.A., Schiff, L.B., and
9. Moskovitz, C., Hall, R., and Cummings, R.M.,"Pneumatic VorticalDeJarnette, F., "Effects of Surface Flow Control at High Angles ofPerturbations on the Asymmetric Attack," AIAA Paper No. 90-0098,Vortex Flow Over a Slender Body," Jan. 1990.AIAA Paper 88-0483, Jan. 1988. 20. Ng, T.T., "Application of Forebody
10. Degani, D. and Schiff, L.B., Blowing for Vortex Manipulation on"Numerical Simulation of the Effect of the F-16," Eidetics Technical Report,Spatial Disturbances on Vortex 1989. Prepared for the U.S. Air ForceAsymmetry," AIAA Paper 89-0340, under Contract No. F33615-86-3623.Jan. 1989. 21. Ng, T. T. and Malcolm, G. N.,
11. Degani, D., "Numerical Investigation "Aerodynamic Control Using Forebodyof the Origin of Vortex Asymmetry," Strakes," AIAA Paper No. 91-0618,AlAA Paper No. 90-0593, Jan. 1990. Jan. 1991.
12. Harwich, P., Hall, R., and Hemsch, 22. Ng, T.T. and Malcolm, G.N.,M., "Navier-Stokes Computations of "Aerodynamic Control Using ForebodyVortex Asymmetries Controlled by Blowing and Suction," AIAA PaperSmall Surface Imperfections," AIAA No. 91-0619, Jan. 1991.Paper 90-0385, Jan. 1990. 23. Schlichting, H., Bounda La=
13. Zilliac, G., Degani, D., and M. Tobak, 3h=, McGraw-Hill Book Company."Asymmetric Vortices on a SlenderBody of Revolution," AIAA-90-0388,Jan. 1990.
14. Moskovitz, C., Hall, R., andDeJarnette, F., "ExperimentalInvestigation of a New Device to
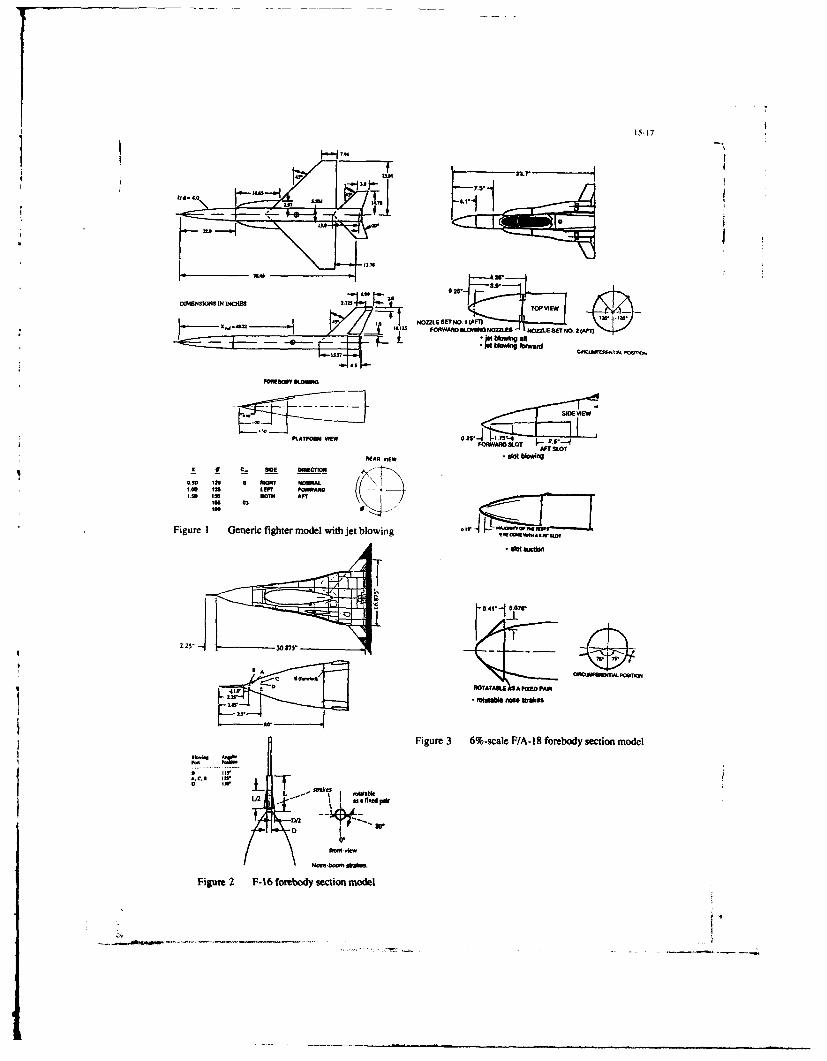
15-17
00 25
DI, IONSIIN INOW , t4._ -W r
NOZZLE SET NOCEI W -S
L FORWARD OWING O NO
PLATFORM VIEW .54JI.-
FOWR LT AFT SLOT
REAR bl EW S WowingQSIE 0UmaeyfmO
0.50 250 0 3JKfl Room**'00 is LEFT OWARV
.50 a A T5 S
] Fgue 6-salFig-ure boy ecio mdeII
SFigur Generic fighter model with jet blowing
r jl ;- ROTATAS A APXED PAIf
Figure 3 6%-scale F/A-lB forebody section model
A.C. 1
D IN
D/2
0.
Nom se '
Figure 2 F-16 forebody section model
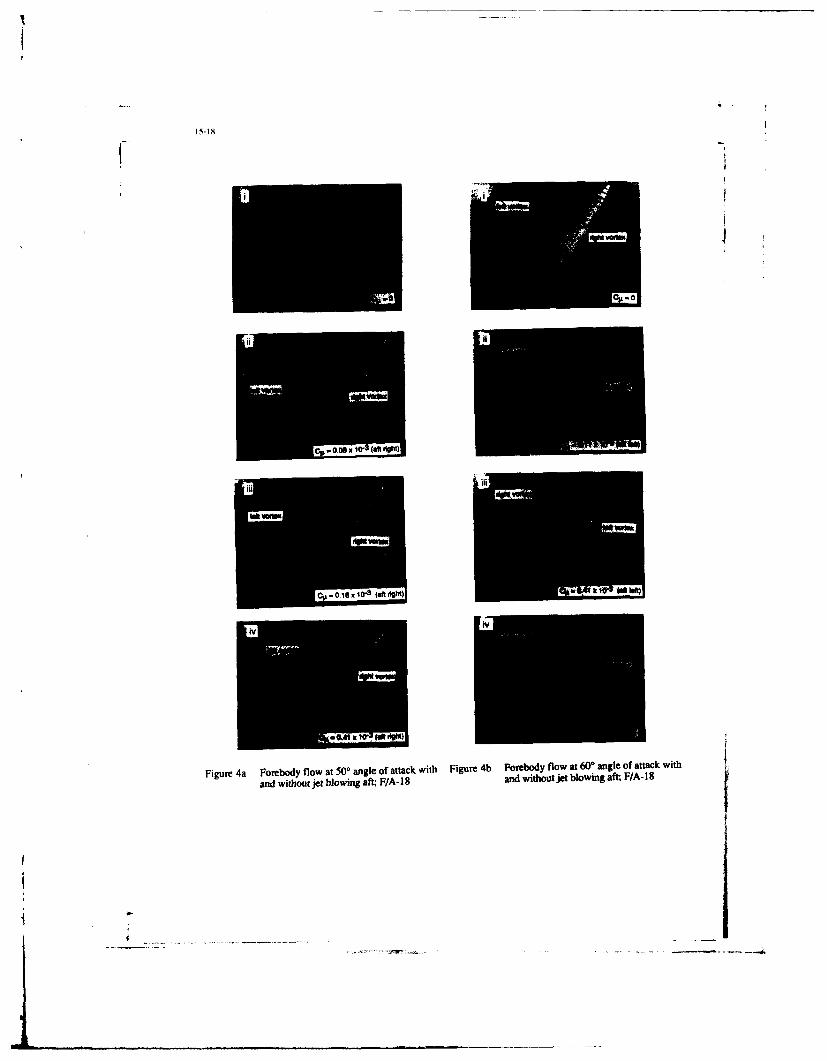
15-18
- .0
Im
- 0.16 x 10⁻³ (t dIgh)
tam -ivv
Figure 4a Forebody flow at 50' angle of attack with Figure 4b Forebody flow at 60o angle of attack with
and without jet blowing aft; F/A- 18 and without jet blowing aft F/A- 18
4i'
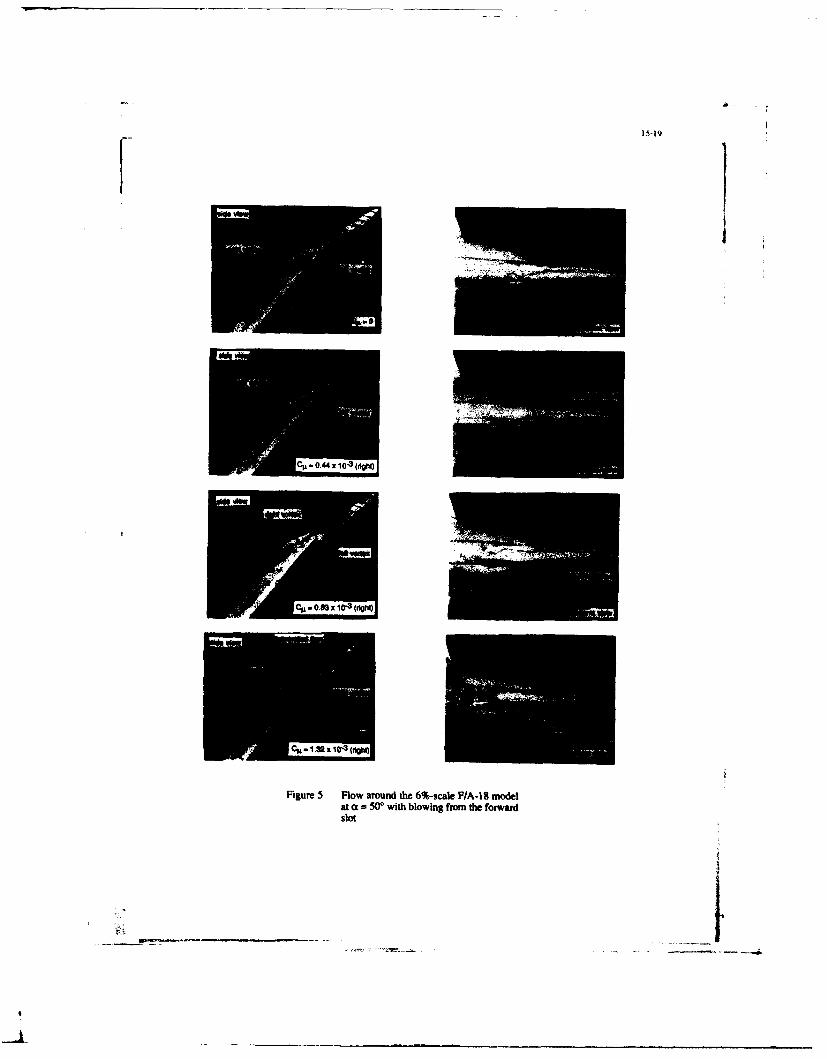
15-19
CI. 0,44 X 10⁻³ (rlgM)i
CIL. 0.03 x 10.3 (dg)
Figure 5 Flow around the 6%-scale F/A-1S modelat a = 0° with blowing from the forwardslot
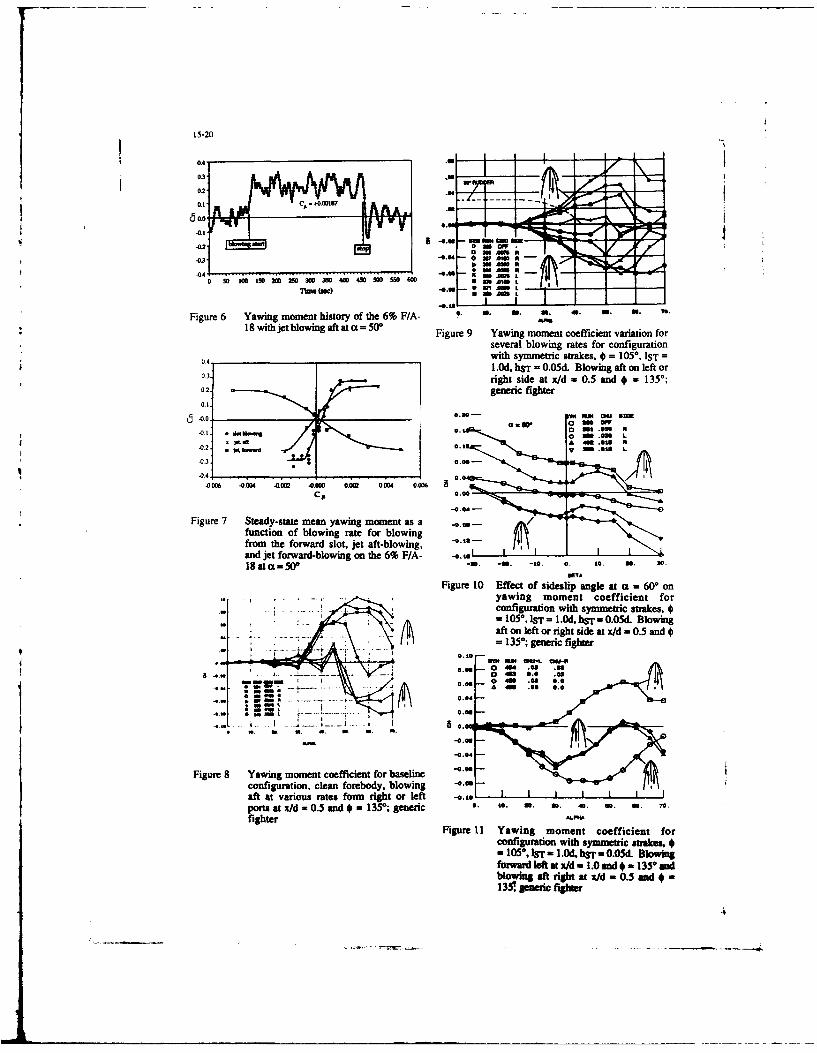
15-20 -4-- --
03 00 ew -4s 5050.2jj.jj
03 righ sid atxd=05an 300.2 geei fighter
Fig.re6 Yawing.450 mom histor of 55 the 0 6%5A . M s . 0 0
Figure 9 StaysaemaYawing moment asffcin aaito ofunction ofoin blowin rate forfblowing
fro theh forwardi slots je aft-blowng, Sa=and 1jet forward-blowingoonnthef6%oF/A-f-oor
af nf rright side at x/d z; 0.5 and 15*0.10 generic fighter
----. 0,80
. .0 1 Am OW Sim-
-O.Fgur 1100 Yawing2 moment coefficientfor
Figuonigraio wit syeametrict starYwigkmmetsfuntio oflr blowing rate0for Blowingand jet forward-leowat on=the.6%nd/A- 30. i
blowung afEfe t ightli atgl at - 5 -mnd
35* generic fighter
.4,4
. 4-- --- 0~ -- 40.
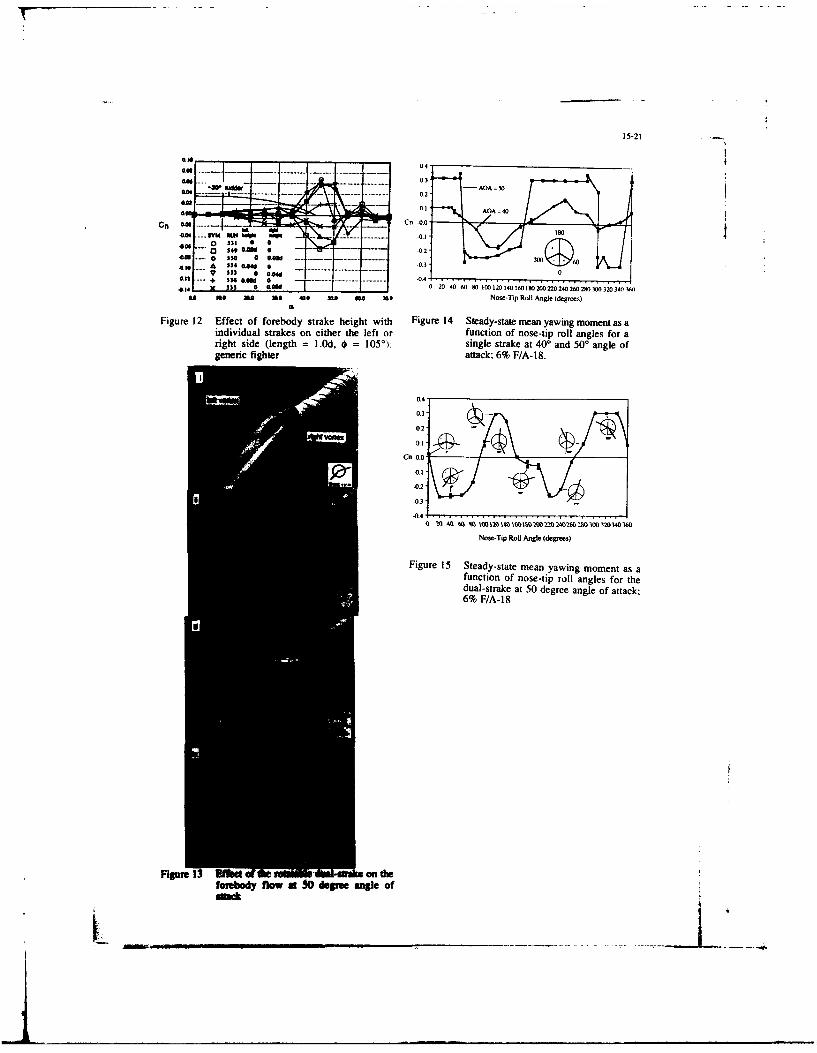
15-21
44U. _W M M Hsu -... ........ -0.21O
ana
00 00 41 04 412i0050202l206251023 0
---- Ti R3 Angl (d gres
0 a03,-0I1 3 OO .
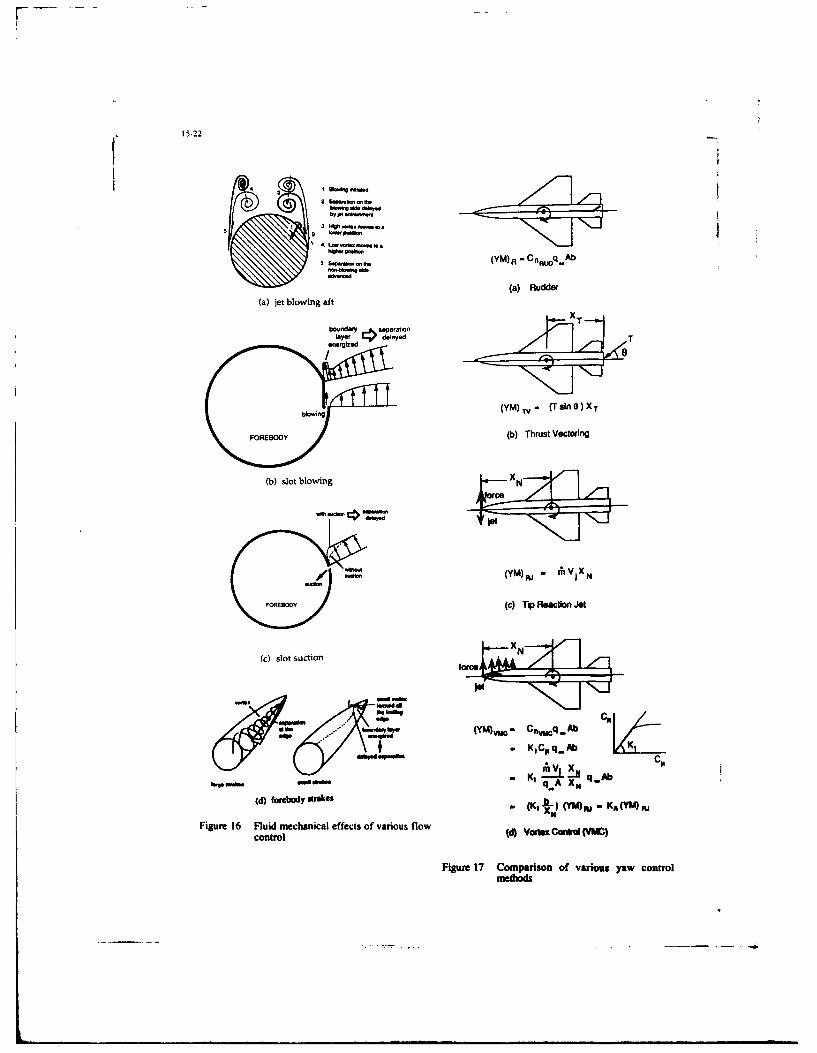
4 3 1
.. Wd.
(a)bb keklo i g f (a) Rudder
(a) sot blowingf
bO~ftafy j, Seprrce
rblonn (YM) T ( i 0) IXT
:FORSOY () Thrus ecting
() slot bltowigl
foce
0-al. IsdV
I,~~ NAL~ i( F:O-FEB-O:D] (c) iqRxdo Je
() sotod suien - KXN Y ~ j, a
Figure ~ ~ ~ ~ ~ ~ '" 16 Fli"ehnclefcsofvrosfo .~~kI
control
Fiu"1 omaiof aiu conro
16-I
FOREBODY VORTEX CONTROL AEROMECHANICS
Robert W. GuytonRussell F. OsbornScott P. Leiay
United States Air Force
Wright LaboratoryWL/FIMM
Wright-Patterson Air Force Bane, Ohio 45433
Summary
Forebody vortex flow characteristics a continuing program within the USAF Flightare discussed in terms of the forebody Dynamics Directorate. References 8 throughflowfield aerodynamics and the impact of 15 represent the highlights of documentsthis flow on the resulting forces and generated on forebody vortex control inmoments that limit combat maneuverability, past years.Teat results are presented for several Chined forebodies are beginning topneumatic forebody vortex control designs appear on modern combat aircraft,applied to a 1/8 scale X-29 model, 1/16 particularly those designed for use by thescale F-16 model, and a 55 degree cropped United States Air Force, because of thedelta/chined forebody model representative desire to keep aircraft missionof future fighter configurations. survivability high by keeping the airframe
rad r signature low. The drawing in Figure3 depicts a typical chined forebody shapethat has been the subject of several recent
Introduction experimental aerodynamic investigations.The flowfield generated by this forebody
Forebody generated vortices on the geometry consists of a pair of strongleeward side of an air combat aircraft can symmetrical vortices shed along each chineproduce forces that dominate air vehicle line that persist to very high angles-of-trajectory control and adversely impact attack. At intermediate agles-of-attackflight stability in the region beyond wing the forebody and wing vortices comminglestall. For the purposes of analysis and (Figure 4), resulting in limited availablediscussion, forebody geometries can be maximum lift and lift-to-drag performance,separated into two categories; those that in addition to producing zero sidesliphave cylindrical or elliptical cross rolling and yawing moments of considerablesections typical of the F-5 and F-15 magnitude. At very high incidences theaircraft, and chined shapes which are lifting chined forebody produces a largeappearing on modern fighter aircraft such destabilizing nose-up pitching moment whichas the YF-22 and YF-23. must be counteracted by large tail
The aerodynamics generated by the two surfaces.types of forebody architectures are quite Chined forebody vortex flow controldifferent. The elliptical/cylindrical research is just currently getting a goodshapes generate a hi-stable pair of start. The information available in thisvortices at high incidence (Figure 1) that area is limited in scope and covers onlyproduce asymmetric forebody forces and basic concepts and ideas supported bymoments that change sign and magnitude with experiments with models having featuresangle-of-attack. References I through 7 similar to next generation fighterdescribe in detail the basic aerodynamics aircraft. Basic research has shown thatof rounded forebodies having different forebody controls can produce large rollingcross-section, fineness ratios, planform moments as well as effectively control wingand profile shapes. The forebody and forehody chine vortex interactions thatcontribution to the overall aircraft limit maneuverability potential. Researchaerodynamics at high angles-of-attack is beginning on pneumatic and mechanicaldepends heavily on these shape parameters. concepts that either alter the chine vortexFigure 2 from reference I graphically trajectory or prematurely burst theillustrates the swing in yawing moment forebody chins vortex.coefficient experienced by the F-SFaircraft as it traverses through the highmagle-of-atta.ck flight region. The Wind Tunnel Testsbehaviour of seSro ideslip yawing momentsis determined by factors such as forebody Following is a discussion of pneumaticl. h, cross sectional shape, nose apex forebody vortex control asromechanice basedag e, mall surface imperfections at the on developmental research programs"as as I, d donstram surfaces. sponsored by the Wright ILborstories.
Precise control of forebody vortex The majority of the material presentedasymmetries on elliptical/cylindrical addresses cylindrical/elliptical forebodyshapes at high incidence can produce vortex control techniques, since this areaaircraft yawing momento equal to or greater of research has received the moat emphasisis magnitude than those produced by the in the past two years. A limited amount ofrudder operating at low angles-of-attank. material for chimed forebodies is presentedRaploiting this phenomena for the purpose for configurations having features similar
__ of increased air combat maneuverability is to next generation fighter aircraft.
16-2
X-29 Configuration beta (+ or - 3.0 degrees) the blowing jetprovided a constant yawing moment
The objective of these wind tunnel increment. Beyond this sideslip range, the
tests was to apply the Malcolm forebody increment decayed and eventually reversed
vortex control designs (Reference 10) to sign. Figure 10 shows the differences inthe X-29 configuration in order to bridge the vortex positions between left jet and
the gap from generic configurations to an right jet blowing observed at a=45.0
optimized high performance fighter degrees and 6=8.0 degrees. With the right
configuration. The ground rules for the jet blowing the right forebody vortex was
design followed guidelines for a system pulled down closer to the surface as beforethat would be practical to implement at in the zero beta case. However, with theminimum cost. Therefore the designs left jet blowing an unexpected result wasreflect simplicity and should not be obtained. The left forebody vortexconsidered optimal. position was unchanged while the right
Wind tunnel tests were conducted using forebody vortex was pulled closer to thethe USAF 1/8 scale X-29 model shown in surface an if the right jet were blowing.Figure 5. Tests on the full model were This can be explained in terms of the wellconducted in the Grumman Aerospace 7'xlO' documented sideslip behaviour of primaryLow Speed Wind Tunnel at Mach=0.5 and at vortex separation lines (Reference 5) on
atmospheric pressure. Angle-of-attack and horizontal ellipse forebodies and thesideslip were varied from 0.0 to 44.0 and - importance of the jet location to these10.0 to 5.0 degrees respectively, separation lines. When the left(leeward)Aerodynamic force and moment data were vortex separation advances to a positionobtained in these tests. Tests on the low on the forebody due to increasedforebody model shown in Figure 6 were sideslip, it moves beyond the influence ofconducted in the Aeromechanics Divisions' the left jet. At the same time, the2'x2' Trisonic Wind Tunnel at Uach=0.3 at right(windward) separation line is delayed0.5 atmospheres pressure. Angle-of-attack to a point high on the forebody by theand sideslip were varied from 0.0 to 45.0 sideslip condition and moves into theand from 0.0 to +10.0 degrees, region influenced by the left jet. Inrespectively. Laser light sheet flow other words, the windward vortex can bevisualizations were obtained to add a more manipulated with either jet because thethorough understanding of the full model primary separation line is close to bothresults. Both of these models were jets.modified for forebody jet blowing and all Jet Blowing at Strake Cornerforebody controllers/effectors were Figure 11 shows the body axis yawinginterchangeable between the models, moment versus angle-of-attack with jets
Results are presented for tangential pointed at the strake trailing edge for
forebody jet blowing with the nozzles blowing either the right or the left jet atlocated axially at 0.5 diameters from the CIIU=0.010. The small increments below 5.0
nose apex and radially at the 135 degree degrees angle-of-attack are attributed tolocation. The pertinent features from the jet exit momentum being pointed atthree variations on this nozzle placement nearly right angles to the fuselage axis.are discussed. Force and moment data are As the angle-of-attack was increased,presented in conjunction with flow adequate directional control was generatedvisualizations to explain how the changes in the 15 to 35 degree ADA range. Above 40in the forebody vortex flowfield relate to degrees the increments decayed to zero andforces generated by forebody blowing. The trends indicate a sign reversal at evensense of direction for the flow higher angles-of-attack. Visualioationsvisualization discussion is from an (not shown) revealed that the baseline caseupstream view looking down the nose of the had strong symmetric nose strake vorticesmodel. Annotations on the data plots positioned close to the body surface. Withrefer to a cockpit perspective, the left jet blowing at CMU=0.010 the left
Single Jet Blowing Aft nose strake vortex was displaced up andFigure 7 shows the body axis yawing away from the surface. The deficit in
moment versus angle-of-attack for various vortex suction pressure on the blowing sideblowing rates of either the left or right results in a yawing moment away from the
jet pointed tangentially aft. The blowing side.magnitude of yawing moment generated Dual Jets Blowing Aft
became adequate for directional control Figure 12 shows the body axis yawingabove 40 degrees AOA for CMV=0.0105. Data moment versus sideslip obtained at 44.0for the various blowing rates show that the degrees angle-of-attack with dual jetsyawing moment response was largely pointed tangentially aft. The jets-offproportional to the blowing rate. Figure 8 data indicate sero or slightly wanderingshows a representation of the changes in directional stability at this angle-of-vortex positions observed in the forebody attack. With both jets blowingvisualisatione at 46 degrees angle of simultaneously at CMUL=0.007, theattack. The visualizations showed that directional stability was improved beyondwithout blowing the forebody vortices were the stability level observed at 0.0 degreesin a nearly symmetric pattern. With the angle-of-attack. Figure 13 presents the
left jet turned on to CMU=O.OO the flow visualizations obtained at 45 degreesforebody vortices were in a highly ADA and zero sideslip. Thesesymmetric pattern with te left side visualizations show that both vortices werevortex pulled down close to the surface. strengthened and pulled down close to theThe lower pressures induced on the blowing surface. This augments the naturalside of the forebody result in a yawing stability which exists for this forebody atoment towards the blowing side. intermediate angles-of-attack. The
Peculiar characteristics for his stability increment is also effected by theblowing arrsagemet were observed at decay of the leeward jet effectiveness withsideslip coedittoes. FigurS W ShoIs the sideslip as observed in Figures g and 10body axis yawing moment versas sideslip aboe.engle at 44 degree* DA. At low values of
16-3
F-16 Configuration 0.0115 respectively. In general,
asymmetric blowing at this location isA low-speed wind tunnel test was approximately 1/3 as effective as the
conducted to examine the prospects of using asymmetric nosetip nozzle blowing.blowing to influence the forebody flowfield Slot Blowingon a 1/16 scale F-16C model. The goal in Symmetric slot blowing is veryapplying blowing was to improve the effective in producing a nose-down pitchinglateral-directional stability and control moment at high angles-of-attack. As showncharacteristics of the F-16 at angles of in Figure 17, blowing at a Cp of 0.00125attack greater than 30*, and it was hoped per side increases the nose-down pitchingthat blowing might provide a means with moment coefficient by 0.12 at an angle ofwhich to alleviate the "deep-stall" attack of 52". The increase in noee-downphenomenon the aircraft experiences in the pitching moment remains relatively constant55" to 70" angle of attack range caused by up to 30" angle of attack, and thenan inadequate amount of nose-down pitch increases with increasing angle of attack.power. Figure 14 shows the model At this blowing rate the aircraft's lateralinstallation in the NASA Langley
7'xlO' HST stability characteristics are not affected.
Wind Tunnel. Higher blowing rates reduce the nose-downA 1/15 scale F-16C blowing forebody was pitch authority and undesirable yawing
fabricated and mated to an existing model moments are generated. The blowing rate ofmodified to incorporate both jet nozzle and 0.00125 per side was the lowest that couldtangential slot blowing. Two pairs of be accurately metered, and therefore thesymmetric jet blowing nozzles were located minimum blowing rate required to producealong the forebody as shown in Figure 15, this nose-down effect is not known. Lowerwith one pair being close to the tip of the blowing rates may be capable of producingaircraft's nosecone and the other farther the same or even larger nose down pitchingaft near the radar bulkhead, and a pair of moments.blowing slots was placed symmetrically on The low rate symmetric tangential slotthe radome. The blowing slots were blowing produces a nose-down pitchingdesigned so that a sheet of fluid was moment due to a reduction in the liftproduced tangential to the forebody in generated on the forebody. Tangentialorder to control the forebody boundary blowing causes the boundary layer to remainlayer. attached farther around the leeward side of
The wind tunnel test was conducted at a the forebody resulting in delayed flowfreestream Mach number of 0.4 and the angle separation. This delay in separationof attack was varied between 0* and 56". inhibits the development of the forebodyAt angles of attack of 30", 3" and 40" vortices, causing the observed reduction inbeta polars were acquired for sideslip forebody lift.angles of -20" to 20*. The data consisted Asymmetric slot blowing is also very
of 5-component force and moment data and effective in altering the vortex flowfieldsome limited laser light sheet flow patterns, producing a combination ofvisualization data acquired using natural effects. Blowing at the minimum Ci offlow condensation. The test was performed approximately 0.0007 on the starboard sideat the NASA Langley 7ft x lOft High Speed results in a positive yawing momentTunnel. Figure 15 shows a photograph of coefficient of 0.04 at angles of attackthe tunnel installation, greater than 25" as shown in Figure 18.
Jet Nozzle Blowing The amount of yawing moment generatedThe most successful jet nozzle blowing decreases as the blowing rate is increased,
occurred with the nosetip nozzles located as in the symmetric blowing case. Again,at FS 0.333. At the maximum angle of the minimum blowing rate required toattack of 52", symmetric blowing (blowing produce the effect was not determined dueequally on both sides) at a Cp of 0.00625 to test equipment restrictions.produces an increase in the nose down It is interesting to note that the twopitching moment coefficient of 0.05. mechanisms which control the forebody
Asymmetric blowing (blowing on one side flowfield produce similar fluid dynamiconly) with the nosetip nozzles produces effects, but there means of achieving themlarge yawing moments at 0* sideslip as are different. Asymmetric tangential slotshown in Figure 15. Blowing at a C0s of blowing produces a yawing moment opposite0.0082 from the starboard side nozzle that of asymmetric jet nozale blowing forproduces a negative yawing moment blowing on the same side. Slot blowingcoefficient of more than 0.06 at 52" angle causes the flow to remain attached (on theof attack. At lower blowing rates, less blowing side) farther around the forebodyyawing moment is generated. It is due to the Coanda effect, and jet nozzleinteresting to note that by blowing on the blowing causes the flow to remain attachedright-hand side of the forebody a nose left (on the non-blowing side) due jetmoment is generated. The right side entrainment effects produced by the blowingblowing jet displaces the forebody vortex nozzle. Each mechanism also displaces theon the right-hand side to a position forebody vortex opposite the side on whichfarther away frm the fuselage. The the flow stays attached.blowing jet also causes the flow on theleft hand side to stay attached to a pointfarther around the forebody due to the Chined Forebody Jet Moasle Blowingentrainment effect of the blowing jet onthe right. This combination of effectsproduces a substantial side force to the A water tunnel study was conducted toleft. determine the effects of blowing on the
At FS 3.000, several jet nossle blowing forebody chine/wing vortex interaction on adirections were investigated. The optimal 0.04 scale generic fighter configurationdirection was a 90' noesle pointed directly having a 55* cropped delta wing and slenderaft into the LEX vortex core. Asyetric fuselage forebody with chine-like strokes.blowing produces yawing moment coefficients Tests were porformod in the Aerimechamie"
- of 0.02 and 0.03 for Cp's of 0.00625 and Divisions' 2ft x 2ft Hydrodyamic Facility.
.. ....
16-4
The freestream Reynolds number was 12,5W moved aft.based upon the mean aerodynamic chord. Theangle of attack was varied between 9" and The entraining effect of the blowing
36" for angles of sideslip of 0* and 5. jet causes the chine vortex to bepulledJet blowing coefficient based upon wing upward and away from the wing vortex,reference area was varied between 0.01 and thereby delaying vortex interaction and in0.03. The wing and chine vortices were turn vortex breakdown. In Figure 24, thevisualized using colored dyes, and still position of the blowing jet plume with
photography and video tape were used to respect to the wing and chines vortices is
record the data. shown for Cp='0.03 and 15 degrees angle-of-A 0.04 scale water tunnel model was attack case.
used in this experiment and is shown in Asymmetric Blowing
Figure 19. The model had a flat plate, Asysetric blowing (blowing on one side
untwisted, and uncambered 556 cropped delta only) was more effective in altering thewing with sharp leading edges beveled at vortex flowfield than symmetric blowing.
45* from the bottom surface. The wing had Blowing asymmetrically at a Cp of 0.03
an aspect ratio of 1.8 and a wing taper successfully decoupled the vortexarea of 0.2. Sharp chine-like strakes were interaction and delayed vortex breakdown onattached to the sides of the fuselage the blowing side up to an angle of attackforebody in the wing plane, and were of 36", the limit of the investigation. Inbeveled in the same manner as the main Figure 26, asymmetric blowing at a Cp ofwing. Jet blowing nozzles were positioned 0.03 is compared to the baseline case at an
at several longitudinal locations along the angle-of-attack of 30". On the side withchined forebody as shown in Figure 20. blowing, vortex breakdown does not occurFour blowing ports were located on each above the wing surface and the location ofside of the fuselage at x/1 = 0.03, 0.26, vortex interaction moves aft to the wing0.44, and 0.64. All the blowing ports, trailing. In addition, on the side with no
except for the one at x/l = 0.03, could blowing the position of vortex breakdown isaccept any one of a series of blowing jet farther forward than the baseline case.nozzles which could be oriented in any This forward movement of the breakdowndirection. location was more prominent at the lower
Baseline Flow angles-of-attack. Also, cross-flow on theThe strakes produced a strong forebody lower part of the fuselage was observed
vortex system which interacted with the from the non-blowing to the blowing side as
wing vortex. This simulated rather well a result of jet entrainment. Blowing onthe vortex interaction of a more complex, one side alters the potential flowfieldblended chine forebody/wing configuration which produces an effective sideslip
like those exhibited on the ATF prototypes condition. This condition contributes toYF-22 and YF-23. At the lowest angle of the large asymmetries observed withattack, a = 9*, the wing and chine vortices asymmetric blowing. A more detailed
are fully developed and no vortex discussion of this test can be found ininteraction or vortex breakdown occurs as Reference 17.shown in Figure 21. As the angle of attackincreases, the wing and chine vortices Chined Forebody Slot Blowingbegin to interact with each other an.vortex breakdown, which first develops in The testing was done at low subsonic
the wake of the model, moves forward toward speed, and the effectiveness of slot
the trailing edge of the wing. The blowing at the chine line was deduced fromrelative velocities induced by one vortex upper surface pressure measurements on thesystem on the other cause the chine wing panels. Figure 28 shows the details
vortices to be pulled down and underneath of the model and the locations of the
the wing vortices. At first this vortex surface pressure instrumentation. Model
interaction is favorable, in that vortex pressures at thirty degrees angle-of-breakdown moves aft, but then leads to attack, with and without symmetric slotinstabilities which promote vortex blowing are presented in Figure 27. As can
breakdown as illustrated in Figure 22. le seen in Figure 27, slot blowingAn exhaustive matrix of locations and eliminates the asymmetry in the upper
positions were investigated in order to surface baseline pressure distribution ondetermine the optimal blowing the right wing panel caused by a forward
configuration. Only data from the optimal wing vortex breakdown position. The fullblowing configuration in presented in this extent of symmetric slot blowing effects atpaper. This configuration consists of a high incidence can be seen in Figure 28 in
jet nossle positioned at the second blowing terms of the local normal forceport located slightly above the approximate coefficient. The wing apex load ismid-point of the strake (x/l = 0.26). The uniformly reduced, and the normal force at
jet nosele was angled 30" aft from the the mid and aft wing stations developsfuselage normal, and 20" upward with symmetrically with angle-of-attack in
respect tp the wing plane. marked contrast to the non-blowing case.
Symmetric Blowing Increasing the blowing momentum coefficient
Blowing symmetrically at a C# of 0.03 effectively increases the chine vortexper nossle successfully decoupled the wine strength as would be expected. However,
and chine vortices and delayed vortex the development of an effective chined
breakdown up to an angle of attack of 30'. forebody pneumatic flow control system isIn Figure 23, a symmetric blowing case in predicated on the fact that blowing
compared with the baseline case at an angle coefficient magnitudes are less than
of attack of 24*. The vortex interaction CUU=0.0. Blowing rates significantlyand breakdown locations for the wing and higher than this level would be difficultchine vortices sove significantly aft. to implement on an actual aircraft because
Applying blowing at a lower Cp of 0.01 per of engine bleed constraints. Keep in mind
sowleis also effective, but to a lesser that the chined forebody flow control
degree. At this reduced blowing rate reults are for exploratory concepts, and
vortex breakdw amd interactiom cam be that the slot eise sad location have not
____ i,_
16-5
been optimized. The elevated blowing rates Ackrowledgementsrequired to produce these results can bereduced to acceptable levels through a The authors would like to gratefully
concentrated system design optimization acknowledge the Aeromechanics Division's
effort. Mechanical Instrumentation Group for the
The effect of chined forebody blowing design and fabrication of the models used
on aircraft rolling moment at high angle- in these tests. Support by the
of-attack is generated by blowing a single Aeromechanics Division's Aero Optics Group
slot on either side of the forebody. A in obtaining flow visualization data is
comparison of pressure distributions at also greatly appreciated. The flow
a=30' with alternate left and right chine visualization tests were conducted by Mr.
blowing is presented in Figure 29. The William Gillard and Capt. Frank Luria of
resulting non-symmetrical wing pressure the Aeromechanics Division. The quantity
distribution at both the center and aft and quality of these results were obtained
model stations will generate a tolling through the dedicated efforts of the wind
moment in the direction of the unblown tunnel test crews from the Wrightslot. The sectional rolling moment Laboratory's Trisonic Facility and
characteristics, Figure 30, indicate the Hydrodynamic Facility, the Grumman
effective lateral control potential of one- Aerospace Low Speed Wind Tunnel, the NASA
side slot blowing in the post-stall angle- Langely High Speed Tunnel, and the General
of-attack flight region. Low speed Dynamics Fort Worth Division.
visualizations with the left slot blowingare shown in Figure 31 for 40 degreesangle-of-attack. Unstructured separated List of References
flow exists on the unblown side, whilestrong wing and forebody vortices persist 1. Osborn, R. F. and Headly J. W.,on the blown side as a result increased "Analysis of Wind Tunnel Data Pertaining to
vortex strength and delayed vortex High Angle-of-Attack Aerodynamics",AFFDL-
interaction. Further details of these TR-78-94, July 1978.
results are presented in Reference 18. 2. Rogers, L. W. and Erickson . E.,
Conclusions "Vortex Flow Correllation", AFWAL-TR-80-
3143, January 1981.
Pneumatic forebody vortex flow controlis an effective means of providing 3. Coe, P. L. and Chambers, J. R.,
aerodynamic stability and control and "Asymmetric Lateral-Directional
improved maneuverability at intermediate Characteristics of Pointed Bodies of
through high angles-of-attack. The lack of Revolution at High Angles-of-Attack", NASA
moving surfaces makes pneumatic forebody TND-7095, November 1972.
control concepts attractive for applicationon the new generation of survivable fighter 4. Carr, P. C. and Gilbert, W. P.,aircraft. Through concentrated system "Effects of Fuselage Forebody Geometry on
design optimization, required blowing rates Low-Speed Lateral-Directional
are reduced to a fraction ,f available Characteristics of Twin-Tail Fighter Model
engine compressor bleed typically used for at High Angles of Attack", NASA TP-1592,environmental controls and auxilliary 1979.
subsystem power. Concentrated designoptimization efforts at Wright-Patterson 5. Brandon, J. M. and Nguyen, L. T.,
Air Force Base are indicating three-fold "Experimental Study of Effects of Forebody
improvement in aerodynamic effectiveness at Geometry on High Angle-of-Attack Stability"even lower blowing rates. , AIAA 86-0331, January 1988.
The status of pneumatic forebodyvortex control technology is progressing 8. Keener, E. R. and Chapman, G. T.,
from basic research investigations to "Onset of Aerodynamic Side Forces at Zerodevelopmental programs on specific system Sideslip on Symmetric Forebodies at Highfighter aircraft with flight demonstration Angles of Attack", AIAA 74-770, Augustpotential. Expanded parametrice in these 1974.developmental investigations are broadeningthe application beyond that of high angle- 7. Turelli, R. R., "An Experimentalof-attack rudder power augmentation. Large Investigation of Steady Asymmetric Vortexinfluences in static stability, roll Shedding From a Slender Body of Revolution
control, and pitch control are evident from at High Angles-of-Attack",these results. Future investigations will USAF/AFIT/GAE/AA/77D-15 Air Force Institute
undoubtedly trade focus between basic and of Technology, December 1977.
developmental programs, with increasedemphasis on scale effects and angular rate 8. Skow, A. M. and Peaks, D. J., "Controlaeromechanics. of the Forebody Vortex Orientation by
Asymmetric Air Injection", AGARD-CP-262-24,May 1979.
9. Malcolm, G. N. and Skow, A. W.,"Enhanced Controllability Through VortexManipulation on Fighter Aircraft at High
Angles of Attack", AIAA 86-2277-CP, Augustlowe.
10. Malcolm, G. N., Ng, T. T., Lewis, L.C. and Murri, D. G., "Development of Non-Conventional Control Methods For High Angleof Attack Flight Using VortexManipulation", AIAA 89-2192-CP, 19M.
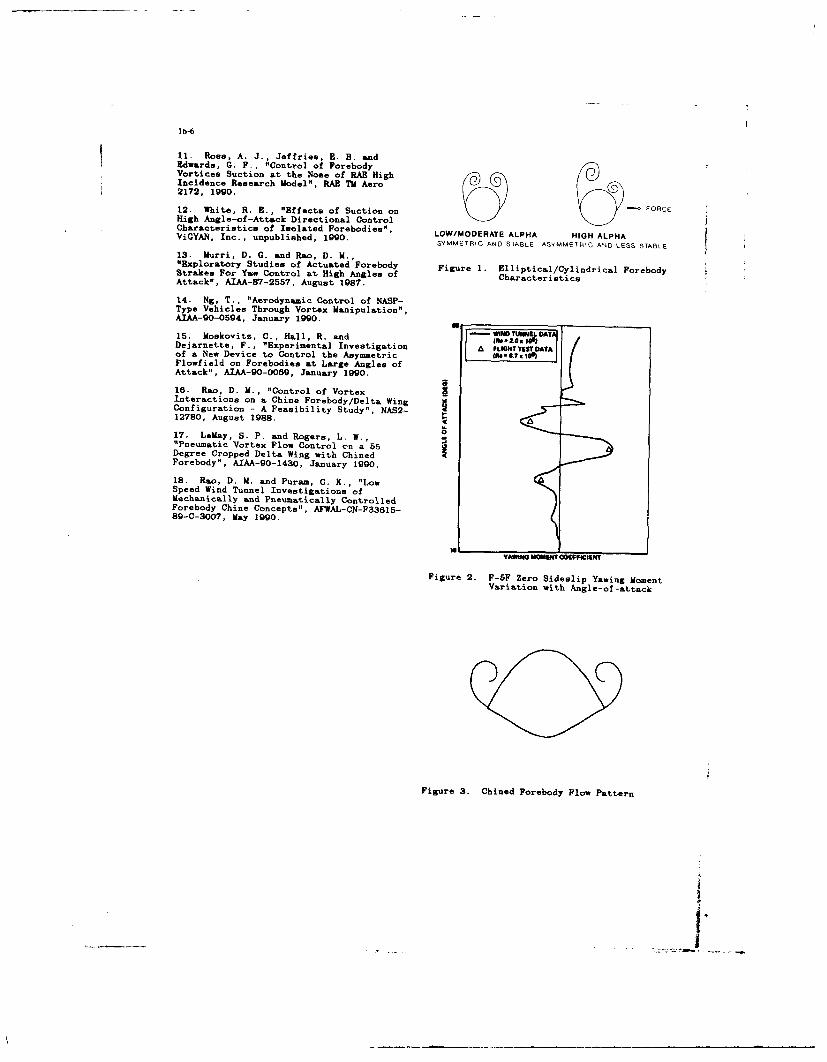
16b-6
11. Rose, A. J., Jeffries, E. B. andEdwards, G. F., "Control of ForebodyVortices Suction at the None of RAE HighIncidence Research Model"
. RAE TM Aero
2172, 1990.
12. White, R. E., "Effects of Suction on FORCE
High Angle-of-Attack Directional ControlCharacteristics of Isolated Forebodjes",ViGYAN, Inc., unpublished, 1990. LOW/MODERATE ALPHA HIGH ALPHA
SYMMETWIO AND STABLE ASYMMETRIC AND LESS STABLE
13. Murri, D. G. and Rao, D. M.,"Exploratory Studies of Actuated Forebody Figure 1. Elliptical/Cylindrical ForebodyStrakes For Yaw Control at High Angles of CharacteristicsAttack", AIAA-87-2557, August 1987.
14. Ng, T., "Aerodynamic Control of NASP-Type Vehicles Through Vortex Manipulation",AIAA-90-0594, January 1990.
15. Moskovitz, C., Hall, R. and ,.D.jr'ADADejarnette, F., "Experimental Investigation A FL" TESTOATAIof a New Device to Control the AsymmetricFlowfield on Forebodies at Large Angles ofAttack", AIAA-90-0069, January 1990.
16. Rao, D. M., "Control of VortexInteractions on a Chine Forebody/Delta WingConfiguration - A Feasibility Study", NAS2~12780, August 1988.
17. LeMay, S. P. and Rogers, L. W.,"Pneumatic Vortex Flow Control cn a 55Degree Cropped Delta Wing with ChinedForebody", AIAA-90-1430, January 1990.
18. Rao, D. M. and Puram, C. K., "LowSpeed Wind Tunnel Investigations ofMechanically and Pneumatically ControlledForebody Chine Concepts", AFWAL-CN-F33615-89-C-3007, May 1990.
YVMIW MNImGT (OOfCFIENT
Figure 2. F-SF Zero Sideslip Yawing MomentVariation with Angle-of-attack
Figure 3. Chined Forebody Flow Pattern
i
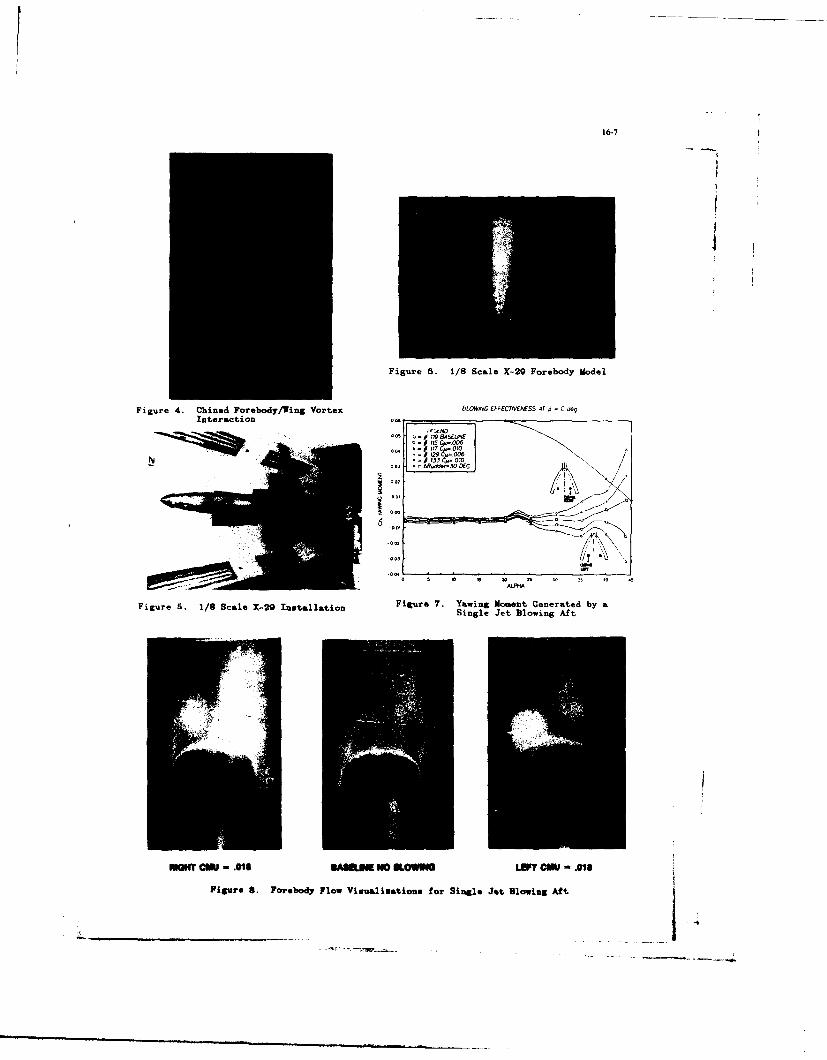
16-7
Figure 6. 1/8 Scale X-29 Forebody Model
Figure 4. Chined Forebody/Wing Vortex BLOWNOG EFFECTIV'MS5 4 AT = 0 deg~
Interaction .
S 003
-003 ."'
Figure S. 1/8 Scale X-29 Iatallation Figure 7. Yawing Moment Generated by aSingle Jet Blowing Aft
MOWMK~Uu.4s Ueum NoL UI LEFT CU- .018Figure S. Forebody Flow Visualisations for Single Jet Blowing Aftj
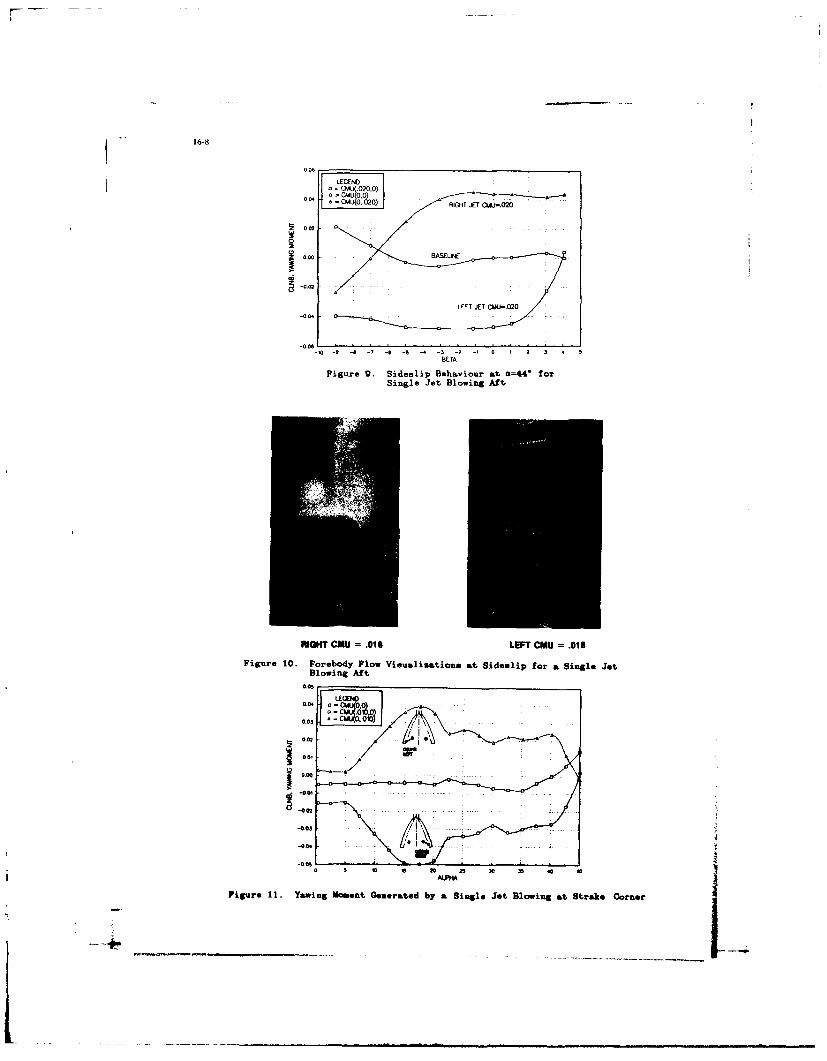
16-8
LEGENDCMU( 020.0)
00 2.Ct0U) IGHT JET OA-020
002
-0.02
1FT= E CM =0
-0.06-10 - -7 - -5 -4 -3 -2 -1 0 2 3 4 5
Figure 9. Sideslip Behaviour at U=44' forSingle Jet Blowing Aft
RIGHT CMU .018 LEFT CMU =.018
Figure 10. Forebody Flow Visualisations at Sideslip for aSingle jetBlowing Aft
.402
-00
-00,0.02e 6 2528 .
Figure 11.- Yawing Moment Generated by a Single Jet Blowing at Strekae Corner1
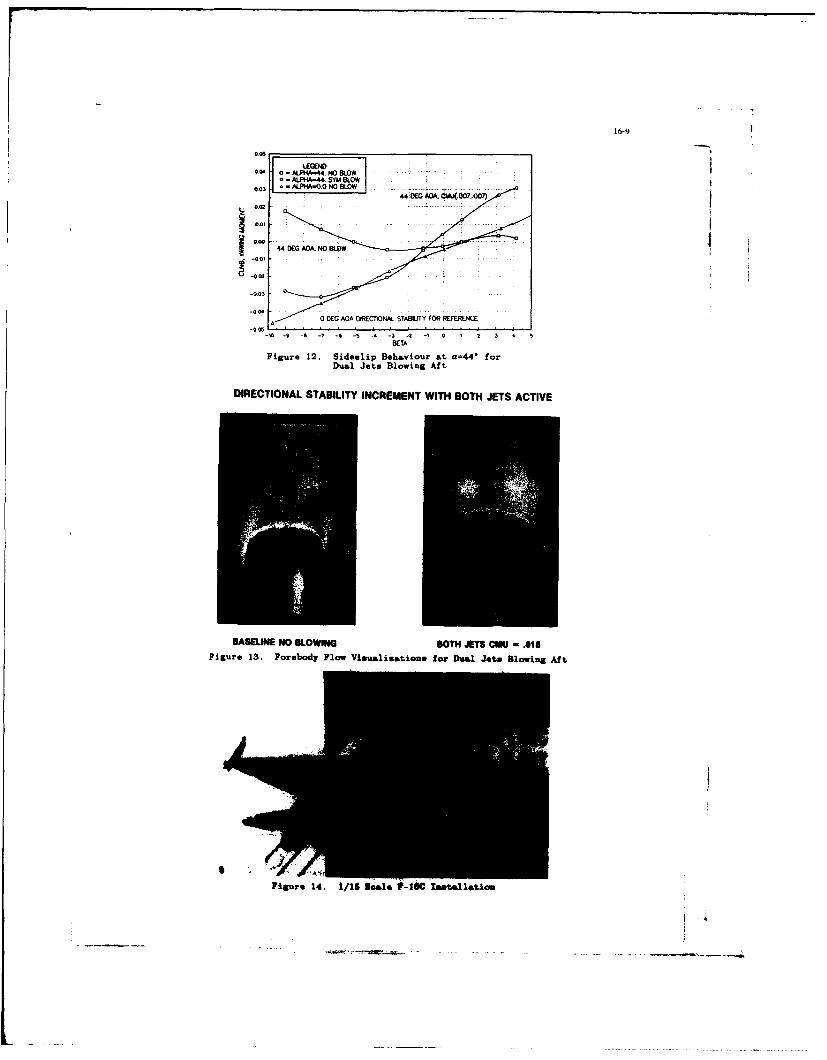
16-9
0 4 0 E APA-4 NO BLDW
-003 AN-. OSO
00
-00. ~0 DEC AOA DRECTIONAk S TA I TfY FOR REFERENCE
-10 -0 -6 -, -S -5 - 1- -2 -1 0 1 2 3 0 5
BETA
Figure 12. Sideslip Behaviour at a=44* forDual Jets Blowinog Aft
DIRECTIONAL STABILITY INCREMENT WITH BOTH JETS ACTIVE
BASELINE NO SLOWNe BOTH JETS CUU - .018Figure 13. Forebody Flow Visulimations, for Dual Jets Slowing Aft
Figure 14. t16 IQal t-10C Lmtallation
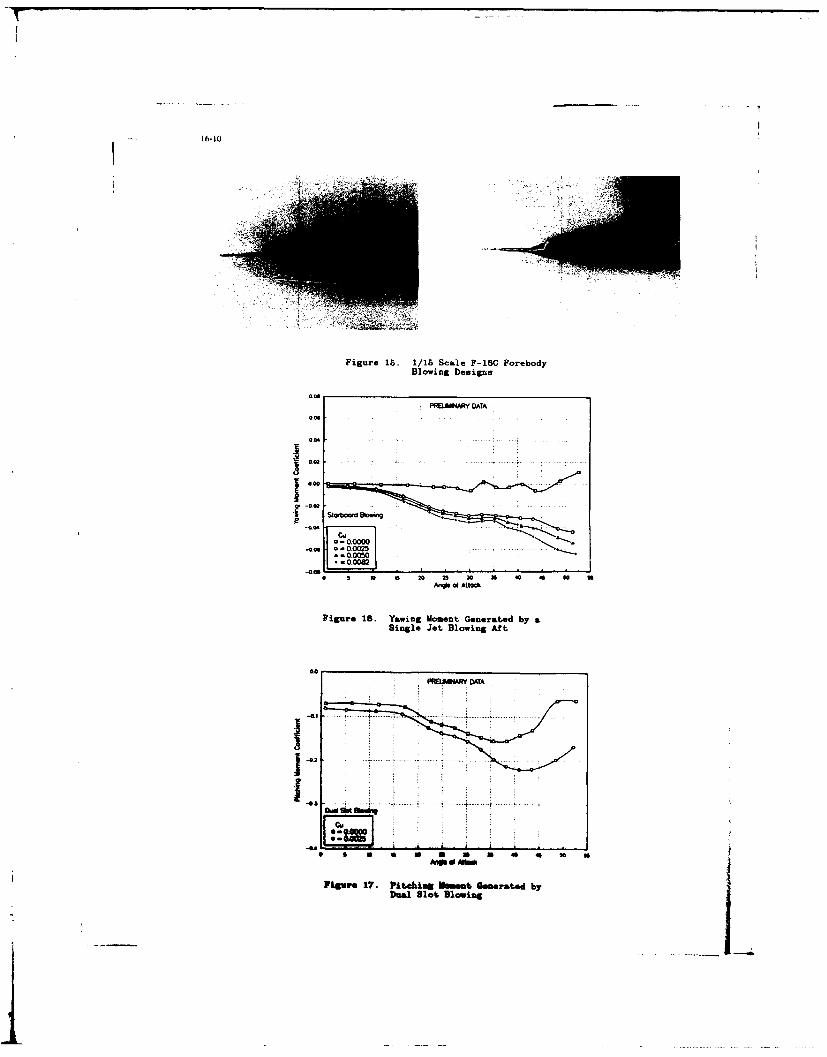
Figure 1S. 1/15 Scale F-I&C ForebodyBlowing D~esigns
0.01
0-0000
0:0. o0025.-0,0050
a S a 0 20 25 30 36 40 a0 so WAnoe of Attack
Figure 18. Yawing Moment Generated by aSingle Jet Blowing Aft
PWRaNR DATA
J.3 - . ..
Pisa"e 17. Pitcbtag bbsat Geserat,.d byDeal Slot slowing
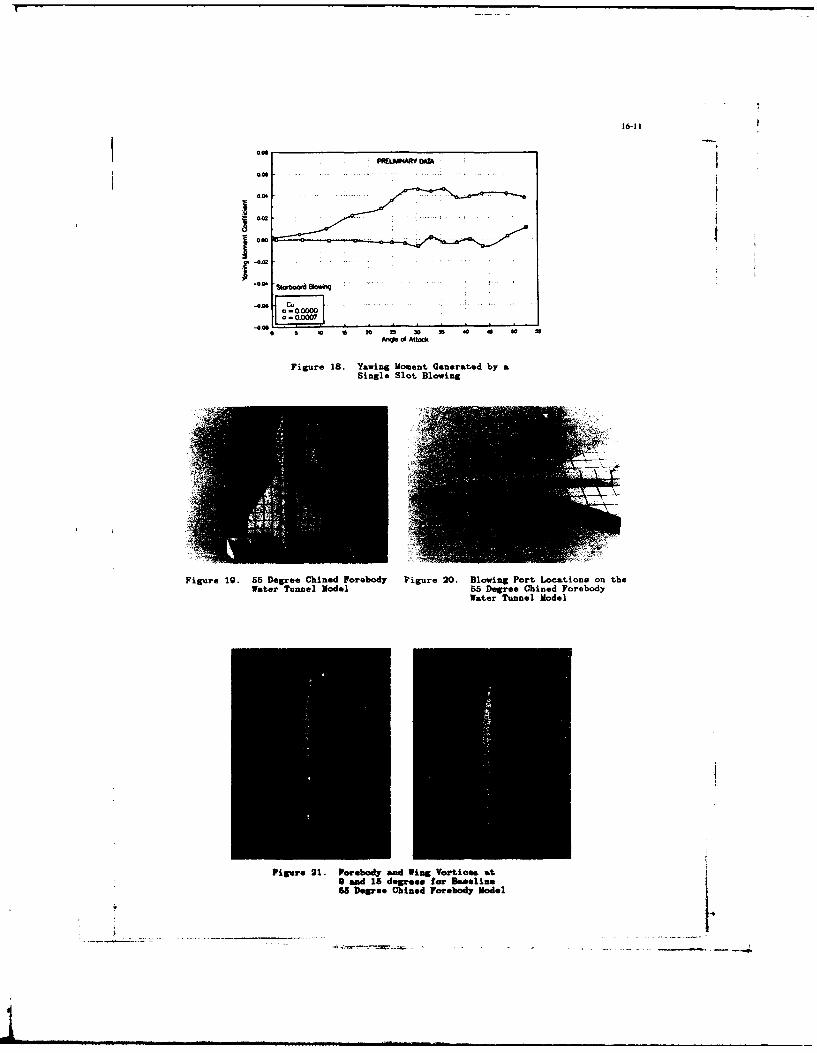
16-11
C.O.
Sttboaltd SIOVAIg
a000 - 0 i g00000 5 so
Ao~le of AttaCk
Figure 18. Yawing Moment Generated by aSingle Slot Blowing
Figure 19. 55 Degree Chined Forabody Figure 20. Blowing Port Locations on theWater Tunnel Model 55 Degree Chined Forebody
Water Tunnel Model
Figure 21. Porebody and Wing Vortices. at
0 and 15 deWgreu for Baeline55 Degree Obined Forebody Model
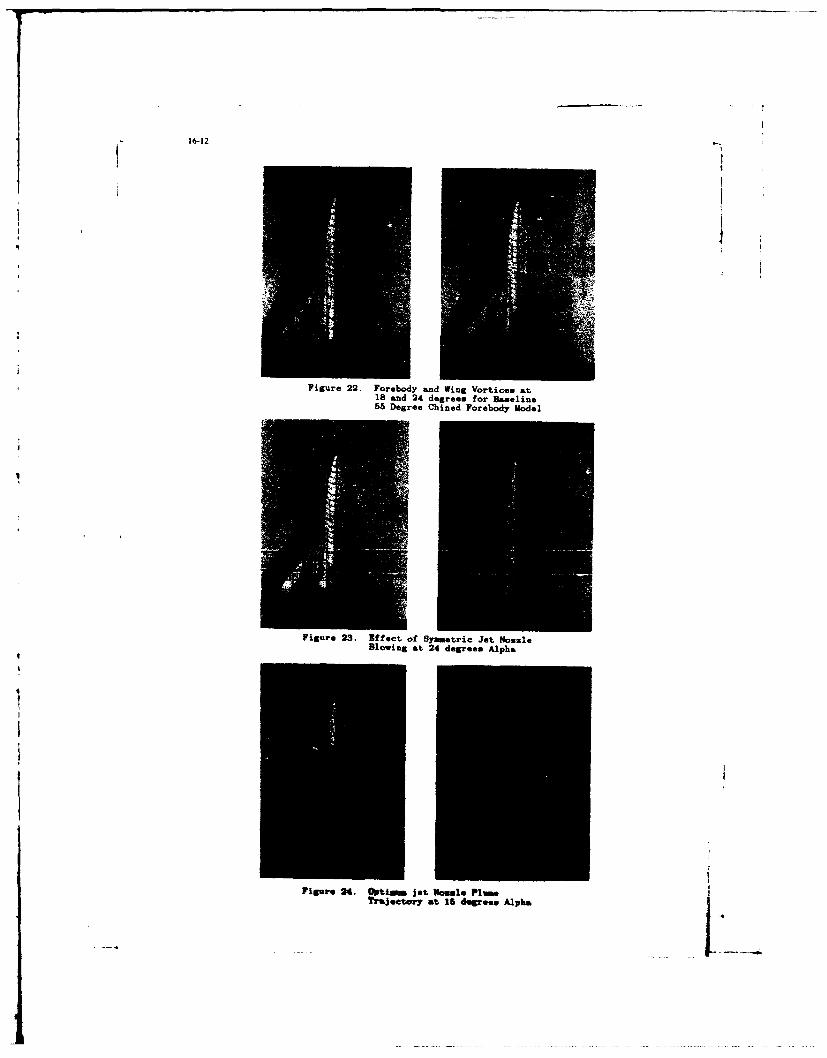
- 16-12
Figure 22. Forebody and Wing Vortices at18 and 24 degrees for Baseline55 Degree Chined Forebody Model
Figure 23. EffeOct of Symmetric Jet NozzleBlowing at 24 degrees Alpha
Figure 34. Optimmi jet Nasals Plumetrajectory at 15 degrees Alpha
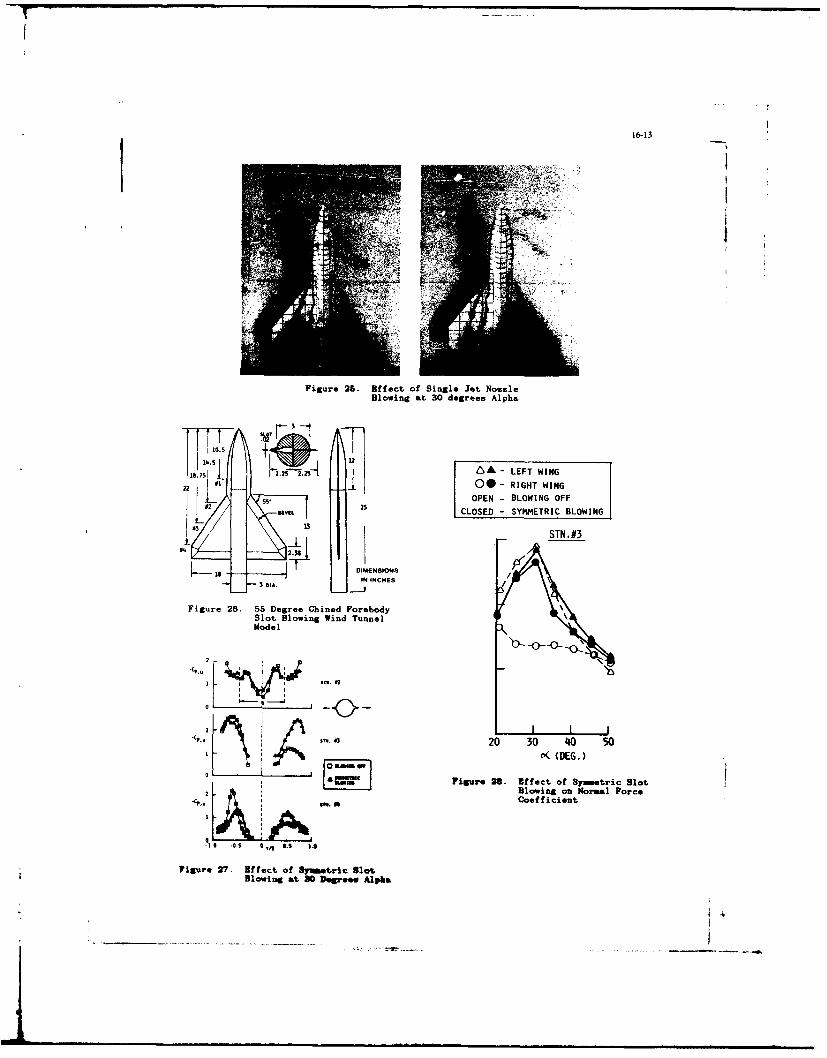
16-13
Figure 26. Eff ect of Single Jet NozzleBlowing at 30 degrees Alpha
I i 12
1 - LEFT WING
22 00 - RIGHT WING02 25OPEN - BLOWING OFF
CLOSED - SYMMETRIC BLOWING
94 ~SIN.#
DIMENSIONS
5 DIA t IIN INCHES
Figure 26. 55 Degree Chined ForebodySlot Blowing Wind TunnelModel
0320 30 40 50amem o( (DEG.)
o= Figure 2.Effect of Syemitric SlotBlowing on Normal Force
-1.0 -0.O'. 1.9
Figure 27. Ef fect of Symtric SlotBlowing at 30 Degree. Alpha
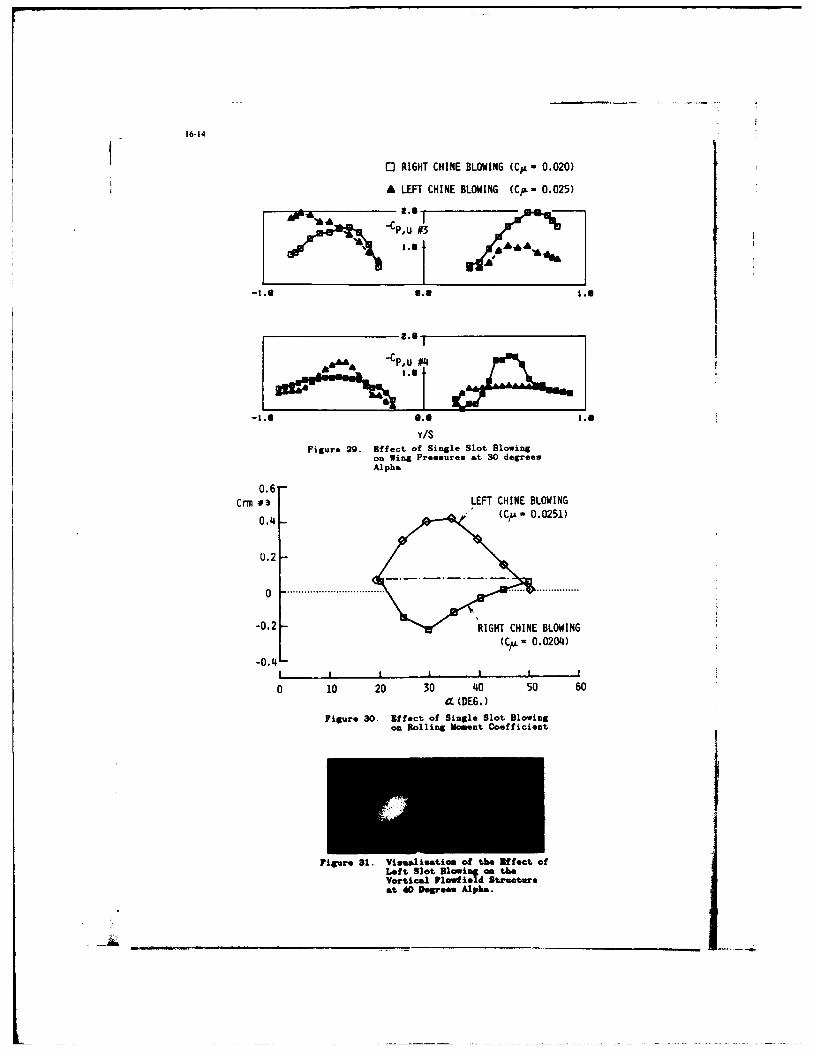
16-14
0" RIGHT CHINE BLOWING (C,% 0.020)
A LEFT CHINE BLOWING (Cp- 0.025)
1. a Cp*
-CP,U
6.8 1.6
Y/S
Figure 29. Effect of Single Slot Blowingon Wing Pressures at 30 degreesAlpha
0.6 -Crm #3 LEFT CHINE BLOWING
-0.2 - RIGHT CHINE BLOWING
(C , - 0.0204)
-0.4-, I I I ,II
0 10 20 30 40 50 60t% (DEG.)
Figure 30. Effect of Single Slot Blowingon Rolling Moment Coefficient
Figure 31. Vimealisatiom of the Mffect ofLeft Slot lowin am theVortical Flolf1d Structureat 40 Degrees Alpha.
17-I
DYNAMIC WIND TUNNEL TESTS ON CONTROL OF
FOREBODY VORTICES WITH SUCTION
by
A. Jean RossE. B. Jefferies
Geraldine F. Edwards
Aerodynamis DepartmentRoyal Aerospace Establishment
Farnbomugh, Hampshire GU14 6TD, United Kingdom
SUMMARY . The lightweight model with the short forebody hasbeen successfully controlled on a free-to-yaw rig, using
Extensive static and dynamic experiments have been angle of sideslip as feedback to a control law for minimisingmade in low speed wind tunnels to investigate the possibility the error between actual and demanded sideslip. Flow ratesof using the yawing moment due to asymmetric forebody to the port and starboard holes are controlled differentiallyvortices for control at high angles of attack. The relative by needle valves with servo actuators, which move accord-positions of the two vortices arising near the nose apex can ing to the output of the control law. The experiment isbe changed by applying differential suction through two described in Section 4. and responses for several levels ofsmall holes very near the tip. The resulting forces and control authority are compared.moments measured in static tests have been analysed forthe effects of forebody diameter and slenderness ratio. The Investigation of the aerodynamic lags betweenRAE High Incidence Research Model has been controlled change in flow rates to change in sideforce and yawingsuccessfully on a free-to-yaw rig, indicating that the system moment has been made on a simple missile configuration,could be used in flight. However, it could be expected that using the large forebody mounted on a cylindrical afterbody.there are significant lags in the generation of the aero- The actuators controlling the flow rates were moved sinus-dynamic forces and moments. Experiments have been oidally, so that the phase shift of the yawing moment,conducted on a simple misie model mounted on a sling rig, measured by strain-gauge balance, could be analysed. Ato measure the responses in yawing moment and sideforce second-order response characteristic has been derived indue to sinusoidal variation over a range of frequencies of Section 5, which gives an equivalent lag of less than 0.1 s,flow rates through the suction holes. The implications of model scale.these results for the proposed free-flight model tests arealso discussed. The results are being used to design an active control
system for the free-flight model of HIRMI, aiming to main-I INTRODUCTION tain roll about the velocity axis at angles of attack near 30 °
by minimising rate of yaw about the velocity axis. ThisThe concept of using suction through small holes near control system will be added to the existing Departure
the nose apex to control the vortices on a forebody at high Prevention System s, which has been flown successfully.angle of attack is being explored in a research programme The same nose cone, needle valves and actuators used inusing the High Incidence Research Model, HIRMI, static the wind-tunnel models will be fitted in the free-flight model,and dynamic wind-tunnel tests on a misile- ype model' and suction applied via a small electric pump. It may alsohaving given promising results. The lightweight model of be possible to mount a free-flight model on a free-to-yaw rigHIRMI has been teated
2, with a series of undmoped fore- in the 24ft Tunnel at RAE Famborough, to make furtherbodies designed to replace the original forebody. and checks on scaling effects.results from static wind-tunnel tests In the RAE Bedford13ft x 91 Tunnel are described first. It has also been 2 DESCRIPTION OF MODELS AND TESTSpossible to obtain some data on a model the same size asthe free-flight model, ie 9/4 times the size of the lightweight The 4/9-scale lightweight model (M2206) of the free-model, in the RAE Fariborough Sm Tunnel. flight version of HIRMI has been used for the static and
dynamic tests in the RAE 131t x 9f Wend Tunnel. The GAThese results show that large sideforces and yawing (Fig I) shows the drooped forebody and the lag of the
moments ae present for angles o attack above 30*, and undrooped forebodlee. The original probe has beenthese can be changed progressively by increasing flow replaced by a sharp conical nose, which has two small holesrates through either th port or starboard hole at the nose. of approximately 0.75 mm diameter, 7 mm beck from the tipThe maimium value of sldeforce and yawing moent are situated 300 down from the top plane of symmetry, aslnited by the cond4iton that one of the asymmetric vortices sketched in Fig 2. Flow rates are applied via suctionis on the terbody surface, so Inrasin flow rate further through thes holes, there being two sparate chamberscannot dhange the asymmetry. The resulls for several inside the forebody connected independently to the suctionorebodes are discused In Section 3. and rnIg factors pump.
for the effect of flody diameter and slenderness ratioae derived for comparison with resub from the free-flight The same nose cone was used on al the forebodlesmod. it w alo found that the ares sraing factor for flow tested on M2206, and also on M2149 (free-flight modelrate nee to be related to nose geomety, rather than scale) tested in the Sm Tunnel. Four undrooped forebodeswIng aram. in order to obtain the corred range of effective- have been tested on M2206. but the size of the forebody for
" of ontrol. M2142 is between these for both length and diamater, asshown In Fig 3a. The parameters defining the geometries
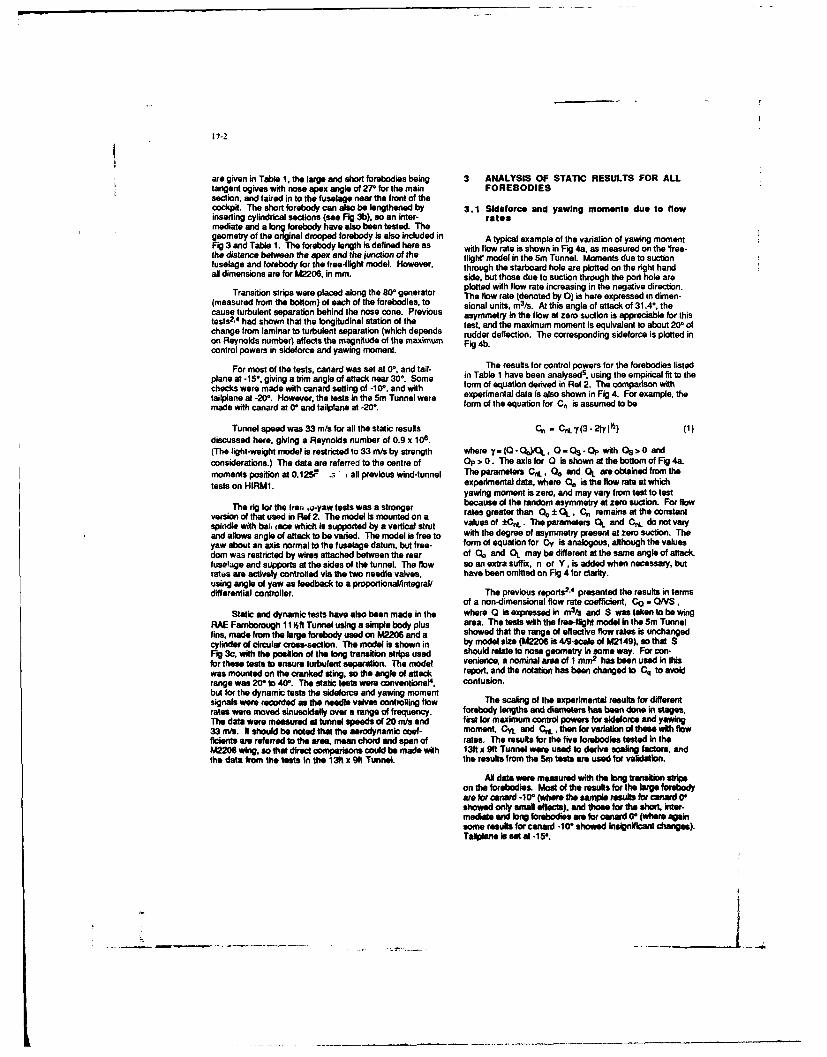
17-2
are given in Table 1, the large and short forebodies being 3 ANALYSIS OF STATIC RESULTS FOR ALLtangent ogives with nose apex angle of 27* for the main FOREBODIESsection, and faired in to the fuselage near the front of thecockpit. The short forebody can also be lengthened by 3.1 Sldeforce and yawing moments due to flowinserting cylindrical sections (see Fig 3b), so an inter- ratesmediate and a long forebody have also been tested. Thegeometry of the original drooped forebody is also included in A typical example of the variation of yawing momentFig 3 and Table 1. The forebody length is defined here as with flow rate is shown in Fig 4a, as measured on the Iree-the distance between the apex and the junction of the flight' model in the 5m Tunnel. Moments due to suctionfuselage and forebody for the free-flight model. However, through the starboard hole are plotted on the right handall dimensions are for M2206, in mm. side, but those due to suction through the port hole are
plotted with flow rate increasing in the negative direction.Transition strips were placed along the 800 generator The flow rate (denoted by 0) is here expressed in dimen-
(measured from the bottom) of each of the forebodles. to sional units, m3/s. At this angle of attack of 31.4 °, thecause turbulent separation behind the nose cone. Previous asymmetry in the flow at zero suction is appreciable for thistests
2,4 had shown that the longitudinal station of the test, and the maximum moment is equivalent to about 20* ofchange from laminar to turbulent separation (which depends rudder deflection. The corresponding sideforce is plotted inon Reynolds number) affects the magnitude of the maximum Fig 4b.control powers in sideforce and yawing moment.
For most of the tests, canard was set at 00, and tail- The results for control powers for the forebodies listedplane at -15*, giving a trim angle of attack near 300. Some in Table 1 have been analysed
s , using the empirical fit to thechecks were made with canard setting of -100
, and with form of equation derived in Ref 2. The comparison withtailplane at -200. However, the tests in the Sm Tunnel were experimental data is also shown in Fig 4. For example, themade with canard at 00 and tailptane at -20. form of the equation for Cn is assumed to be
Tunnel speed was 33 m/s for all the static results C-n C& y (3 -217 11) (t)discussed here, giving a Reynolds number of 0.9 x 10⁶.(The light-weight model is restricted to 33 m/s by strength where I - (O -O.YQL, O -Os -Op with QS > 0 andconsiderations.) The data are referred to the centre of Op > 0. The axis for Q is shown at the bottom of Fig 4a.moments position at 0.1 25F .3 all previous wind-tunnel The parameters CL, 0. and OL are obtained from the
tests on HIRMI. experimental data, where 00 is the flow rate at whichyawing moment is zero. and may vary from test to test
The rig for the free a-yaw tests was a stron because of the random asymmetry at zero suction. For flowTheri fe te re , awtets asa trnger rates greater than 00 ± QL , Cn remains at the constantversion of that used in Ref 2. The model is mounted on aspindle with ba, ace which is supported by a vertical strut values of ±CnL . The parameters QL and C& do not varyand alows angle of attack to be varied. The model is free to with the degree of asymmetry present at zero suction. Theyaw about an axis normal to the fuselage datum, but free- form of equation for Cy is analogous, although the valuesdona was restricted by wires attached between the rear of 00 and QL may be different at the same angle of attackfuselage and supports at the sides of the tunnel. The flow so an extra suffix, n or Y, is added when necessary, butrates ae actively controlled via the two needle valves, have been omitted on Fig 4 for clarity.using angle of yaw as feedback to a proportionalintegral/differential controller. The previous reports2,4 presented the results in terms
of a non-dimensional flow rate coefficiont, CO - 0/VS,Static and dynamic tests have also been made in the where 0 is expressed in m
3/s and S was taen to be wingRAE Farborough 11 Vift Tunnel using a simple body plus area. The tests with the free-flight model in the 5m Tunnelfins, made from the large forebody used oi M2206 and a showed that the range of effective flow rates is unchangedcylinder of circular cross-section. The model is shown in by model size (M2206 is 4/9-scale of M2149), so that SFig 3c, with the position of the long transition strips used should relate to nose geometry in some way. For con-for thes tests to ensure turbulent separation. The model vennce, a nominal area of I mm2 has been used in thiswas mounted on the cranked sting, so the angle of attock report, and the notation has been changed to Cq to avoidrange was 200 to 40*. The static tests were conventional
4 , confusion.but for the dynamic tests the sideforce and yawing momentsignals were recorded as the needle valves controlling flow The scaling of the experimental results for differentrates were moved sinusoidally over a range of frequency. forebody lengths and diameters has been done n stages,The data were measured at tunnel speeds of 20 m/s and first for maximum control powers for sideforce and yawing33 m/s. it should be noted that the aerodynamic coef- moment, CyL and CrL ,then for variation ofthese with flowflelents are referred to the area, men chord and span of rates. The results for the five forebodles tested in theMN226 wing, so that direct comparisons could be made with 13ft x 9ift Tunnel were used to derive scaling factor, andthe data from the tests In the 1311 x 9f Tunnel. the results from the Sm tests am used far validation.
Al data were measured with the long transition strpson the forebodies. Most of the results for the large forabodyare for canard -10 (where the sample results for canard 0*showed only aeal effects), and those for the short. inter-mediate and long forabodles ae for canard G* (where againsome results for canard -10" showed Insignificant changes).Tallipan is set at -15-.
17-3
3.1.1 Maximum aldeforce and yawing than predicted. Alternatively, the same levels are obtainedmoment at angles of attack approximately 10 lower.
The experimental results show that flow rates of 3.1.2 Variation of sldeforce and yawing3.3 x 10
-s m3/s (Cq - 1.0 for V - 33 ms) through either moment with flow rate
port or starboard hole give the maximum effects, so that thevalues of CYL and CnL are determined. Previous experi- As stated above, a representative area of 1 mm
2 has
ments on the asymmetries present for bodies alone (eg been used instead of wing area to derive flow rate coef-Ref 6). indicate that the maximum sideforce and yawing ficient, denoted by C. instead of CO used in Refs 2 and 4.moment coefficients, when referred to body cross-sectional The factor between the two is given byarea, are dependent on nose apex angle (unchanged), andon slenderness ratio (. i/d where length' has to be defined Cq = 0.407 C o x 108 (2)for an aircraft configuration). The equivalent length hasbeen suggested as that ahead of any lifting surface, so e/d The maximum slopes of Cy and C n with Cq are importantis approximately the same for the large and short fore- parameters, and are proportional to Cy./Cay and CnL/CqLbodies. The results for these were used first to check the respectively (see equation (1)). Values were evaluated asdependence on cross-sectional area, the ratio being 0.4t5 functions of angle of attack from the results for the largefor these two forebodies. and short forebodies. The two sets of data in Fig 7a indicate
that a factor dependent on d3
is appropriate to obtain theThe sideforces for M2206 are referred to wing area, so scaling, of which d
2 applies to Cy. so QI.y is assumed tothe data for CyL of the large forebody have been scaled by be scaled by d
1. However, the corresponding results for
the ratio of cross-sectional areas, 0.415, and compared C n collapse with the factor d2 , as shown in Fig 7b ie no
with data for the short forebody. The two sets of data scale scaling factor is required on 01n for yawing moment.
very well over the angle of attack range 22.7* < a < 350 as s
shown in Fig S, so the ratio of d2
may be used, l a factor The variation of the slopes with forebody length,of 1.33 on the data for the short forebody to compare withdata for the free flight model M2149. The unflagged shown for a - 30.9* in Fig 7c, gives a similar value of 1.12
symbols refer to results obtained from variation of flow rate for the factor between forebody length ratios of 4.3 and 4.5at constant angle of attack, and the flagged symbols refer as derived in Fig 6, so no further correction is required.to results from maximum flow rates as angle of attackvaried. The corresponding factored results from the tests on
the free-flight model in the Sm Tunnel are also shown in
The yawing moments are referred to (wing area) x Figs 7a&b, and a similar difference to that shown in Fig 5 is
(wing span), but the corresponding results (Fig 5b) for maxi- apparent, except for the result at a. - 31.4 measured
mum yawing moment indicate that the scaling factor is d2
while varying flow rates, where the value of CqL is signifi-rather than d
3, although there is a consistent small change cantly lower than that derived during sideslip runs.
in the difference with angle of attack for 22.7 < at < 33,
The The approximate results derived for the free-flightmoment arm for the maximum sideforce is shown in Fg 5c, model, on the basis of scaled values of CnL used with theand the force is seen to act near a constant position for approximate formula from equation (1), are compared withE - 26.80, 28.9, 30.90. ie the range of interest for the free- experimental data in Fig 8 for the range 27.4 < a 33.5
.
flight experiments, with CnL/Cy ., 0.47. This moment arm The values of 00 were tWen from the 5 m results. Thefrom the centre of gravity (at Station 850), is 548 mm, and is under-estimate of maximum moment, and thus of the slope,close to the front of the cockpit, as shown by the sketch of is again obvious, but the trends with flow rate and with anglethe forebodies on the vertical scale, of attack are adequately represented. Note in particular
that the flow rates at which the maximum effects areThe results for the short, intermediate and long tore- reached are independent of model size, ie the results
bodies were used to obtain a factor to account for forebody collapse with Cq based on nose or hole size, but would notlength/diameter ratio. It was found that the length' defini- collapse with C0 based on wing area (which wouldtion required to give the same e/d for the large and short introduce a factor of 5.06 on the slope of the empiricalforebodles was the length ahead of the mean centre of resupressure for the maximum control powers. The variations of r ts at zeo Cn).maximum sideforce and yawing moment with O'Id for
, - 26.8, 30.90 and 35
° are shown in Fig 6, together with 3.2 Rolling and pitching momenta
the factored results for the large forebody (flagged sym- Application of flow rates causes changes to rolling andbols). it is possible to derive approximate linear variations pitching moments, and results are discussed in Ref 5, withfor the two lower angles of attack, in order to be able to examples in Ref 2. Rolling moment is rather rrsatic the typeinterpolate for the freeflight model. A moan factor of 1.12 is of variation with flow rates depending on both angle ofindicated to account for the slightly larger value of '/d - 4.5 attack and forebody length. it has not been possible to findrelative to that of 4.3 for the short forebody. an approximate formula to represent rolling moment, but the
magnitudes appear to be small enough to be controlled by aThus the resulta for the maximum sideforce and yaw- roll-demand sytem.
ing moments due to the short forebody should be factoredby 1.33 x 1.12 . 1.5 to obtain results for comparison with For ptchkng moment, there isa local minimum st thethose for the free-light forebody. The invorse of this factor flow rate corresponding to now-zero sidefore and yawinghas bon used with the result from the Sm Tunnrl to obtain moment (ie for symmetric flow). As asymmetry develops onthe comparson shosw in Fig 5. (The flagged symbols refer iter side, the induced pressure distribution causes ato data measured duing eldelip leats.) It appears that the pkch-tqx which reaches a maximum before maximum side-magnitudes of sideforce and yawing moment are greater force or yawing moment occurs. The p ich-up moment Is
then reduced as the extreme asymmetry (one vortex on the
L _
17-4
surface of the forebody) is approached. Thus it is apparent but overshoots to -r before settling to an oscillatorythat pitching moments for configurations which develop response about zero, with an amplitude less than 1
°. The
asymmetric flows are likely to be random in magnitude, port needle valve is almost fully open, and the starboardaccording to the degree of asymmetry present during the nearly closed, but the model may be held at near-zero side-test. slip indefinitely, as shown by the remaining 25 s of record.
The pressure transducers do not show the small amplitude3.3 Effects of sideslip oscillations, possibly due to lags caused by the tubing
between the chambers and the transducers.All the forebodies have been tested in sideslip,
between ±40, and significant nonlinearities were measured The second set of responses are for maximum flowon the large forebody. Small levels of flow rate caused rate coefficient of 022, so the gains have al been reducedsignificant changes to sideforce and yawing moment due to to about 70% of their original values. The initial ' m and issideslip, and results are discussed in Ret 4. The results for not shown, and the demand for zero sideslip occurs atthe short and free-flight forebodies
s are less sensitive to 6.5 s. Again the model returns to near-zero sideslip very
flow rate, and it is possible to derive linear mathematical quidly, within 0.5 s, but the overshoot is reduced. Themodels, with the derivatives Cyp and Cnp approximately residual oscillation is st'll present, of lower frequency butindependent of flow rate. similar amplitude. The final needle valve positions are
unchanged, but the differential pressures are smaller,4 DYNAMIC TESTS ON A FREE-TO-YAW RIG consistent with the lower flow rates.
A new vertical strut has been made to support the When the maximum available flow rate is reducedmodel on the free-to-yaw rig, to give a more rigid rig than further, to a coefficient of 0.08, the controller does not havethat described in Re 2. The model is mounted on a spindle sufficient power to hold the model at near zero sideslip afterwith bearings, the spindle being normal to the fuselage axis, the demand for zero, but a steady position of about 5* isand the angle of attack can be adjusted to various constant reached, with port needle valve open, and starboard needlesettings. Restraint wires between the rear of the fuselage valve shut. If the flow rate is reduced to zero, the modeland the tunnel walls prevent the model yawg through large diverges to the maximum 6 because of the asymmetricangles, and initial experiments were made with -4
° freedom, yawing moment, and is restrained by the starboard wire
later increased to ±61. The short forebody was used on the becoming taut.model for the results described here, and a ventral fin wasadded to give near-neutral static stability in yaw, as Some experiments were also made with differentdescribed in Ref 2. values of gains, but no significant improvement was found.
Intermediate values of demanded sideslip angle could alsoThe needle valves and actuators were mounted inside be held, but it was difficult to achieve large negative angles.
the model, the port and starboard servos being controlledby computer. The proportiona/integraiVdifferential con- These responses indicate that the flow rates can betroller was implemented on an analogue computer, which controlled actively, and that the control powers generatedwas situated outside the tunnel so that the gains Kc, KI, by differential flow rates are sufficient to overcome theK0 could be adjusted easily. A block diagram of the system asymmetric moment. The design of a control law for theis shown in Fig 9. Angle of sideslip was used as the feed- free-flight model Is nearing completion, and is to be added toback signal, and the error between actual and demanded the existing Departure Prevention System
3 already tested
angle of sideslip was minimnsed by changing the flow rates on HIRM1. The aim is to make the model roll about thethrough the port and starboard holes differentilally. it was velocity axis at high angles of attack near 30., so the 'enor'also possible to change the values of the gains on the signal (r cos a - p sin a) is being minimised, using differ-proportional, differential and integral components by adjust- ental flow rates to overcome the asymmetric forces anding the maximum flow rate available, although the relative moments. The induced rolling moments are being controlledratios remained unchanged. by the lateral control law for roll demand, and the induced
pitching moment should be compensated by the pitchSome responses obtained at a - 30*. V . 20 s, demand law. The control laws are being implemented on the
are shown in Fig 10, where tfh maximum flow rate is being digital computer developed for HEWF
.reduced in steps, Fig 10a-d. The ine scales shown refer toarbitrarily chosen initial times, for e"se of reference. The S DYNAMIC TESTS TO MEASURE AERO-response of the model is given by the angle of sideslip, and DYNAMIC LAGSthe output of the conifoar shoutd be zero for steady condi-tions. The position of the port and starboard servos were One of the problems "cely to cause difficulty in usingmonitored, and it should be noted that the 'doed' to lopen' acthielycontrolled vortices to generate forces anddirections on the vertical axis we opposite. The some is moments Is that of aerodynamic t ie the total time takenafto true for the dferenlel pressures measured in the port for te votlioes to motveto a new position after the flowand staboard nose chambers, so the esponses appear to rs heve been changed, and for the resulting change inbe similar rather an mirror mge. pressure distribution on the aircraft. The current data
acquisition system In the 131 x 9ft tunnel is imilementedThe firt st of responses on the left hand side digtally, and it was dificult to obtain analogue sigrals
(Fig I0s) am for a maximum flow rate ellcoin' of abut dlrectiy. However, it has been possible to tea a sinple0.3 through either port or starboard hole. Inlialy, the model misae-e model (Fi 3), made oa the large forebodyis being controlled to zero angle of ideal1p, waiM higher flow mounted on a cylindical aflerbody, in the RAE Famboroughrat through fte port hobs then satboad in order to maintain 1 litlt Tunnel. The model had been made In order to investi-zeroyewingmrnen g At t-4s.alldemdin Mangleof gitethe ffss oflfidngtransition onthecoM lpowerside is awpood to the sym, I lgnani lage than du to fieW res, td It had been slow. that the lWi of
the 60 aellos wtlh the hIt e. This detad is held lore aid yating momen genraledm we ombleon unif the mode has eeiM ten i ws cha.ge Wess"Ito wit tse on HIffI. Typical mLft atml in Fig 11 forzeWoabout I - s10. 11emoe siryponderyqldady, 3..30., V-20Wdand33m/s,wherrfernceas nd
.. .... .-- -.,- -mm _ .-.-
17-5
length are those of HIRMI. Further details of the static data Nfaregiven+ R 4.N 24 N'I+ 980 N - F(Q s - Op) for V =33 m /s , (3b)
It may be observed that the maximum control powersand the asymmetries at zero flow rate are similar for the two or. expressed in reduced time. tV/speeds, but the variations with flow rate are different,particularly for flow rate through the port hole. Extensive N"+ 0.64 N'+ 0.295 N - F(0S -Qp) for V - 20 m/s, (4a)investigation was made of the 'kink' near 0' - 0.1 on theportside, which is apparent at V-33ms, butnotobvious N+Q.28N'+O.135N = F(Os-Qp)for V = 33mM, (4b)at V - 20 m/s. The magnitude of the discontinuity wasaffected by the length of the transition strips, but could not The values of amplitude ratio obtained from thesebe eliminated, so these results are for the same transition transfer functions agreed wells with the experimental resultsstrips as on HIRMI, which gave the minimum kink. The at V 33 MIs but the results at V -20 ms were scattered,slope of C11 - v - C. near zero C. is also affected by tunnel so were not so convincing.speed. even though transition is fixed on the forebody.
The most likely cause of the results not collapsing withThe experimental technique used was to drive the reduced frequency is the change of slope dCnldCq noted
needle valves differentially with a sinusoidal demand, over arange of frequencies, for a demand amplitude smaller than in Fig 11, as this slope must be related to the frequency ofthe limits indicated by the static tests, as shown in Fig 11. the response. The ratio of reduced damping to reducedThe relative phase of yawing moment and demand was frequency is approximately the same, (0.64/0.295 =measured with a differential analysar, and analogue records 0.28/0.135 in equation (4), as indicated by the intercept onof demand, sideforce, yawing moment, nose chamber the vertical axis on Fig 13, but it is difficult to interpret thispressures, and actuator positions were taken. Separate generally. However, it is encouraging to note that bothbench tests were also conducted to obtain phases between transfer functions indicate a 'lag' of less than 0.1 s in thedemand and actuator positions, and between demand and responses to a step input, Fig 14, and this includes any lagpressures, of the strain-gauge balance. The smaller damping at the
higher speed leads to a 28% overshoot, but both responsesThe servos which drive the actuators have nonlinear are within ±10% of the final value by t = 0.16 s.
response characteristics, and analysis of the phase shiftsbetween demand and servos shown in Fig 12 does not yield The equivalent lag of about 0.1 . may be scaled forfirst or second-order lags. However, it the assumption is model size and tunnel speed by the factor V/c , to givemade that the response of yawing moment to flow rate is t* - 6 aerosec for both 20 m/s and 33 m/s. This is com-near-linear over the range of flow rate% used, then thecorresponding phase shift is the difference between those parable to the time taken for vortex breakdown over aplotted in Fig 12. The port and starboard servos are moved slender wing to be overcome by suction through a probedifferentially, so a mean phase shift. 8M, between demand placed in the vortex core ahead of the trailing edge, asand servo has been chosen. The measured phase shifts measured by Parmenter and Rockwell7 . The time taken tobetween demand and yawing moment, at the two speeds of re-establish the vortex was dependent on suction level and20 m/s and 33 m/s, were unsteady, so about ten readings probe position, varying between 2 aerosec for very highwere taken at each frequency. Consecutive readingsoccasionally gave extreme maxima and minima, so were suction rates to above 10 aerosec for probe positionsrejected, and the scatter in data is shown by the remaining behind the wing.maximum and minimum readings plotted in Fig 12. The meanvariations of 8DN with frequency, f . at intervals of 0.5 Hz It would seem sufficient to use a first-order lag in thewere chosen as shown, to derive the phase shift generation of control powers for mathematical models of the
sbetween y moment and s aerodynamic forces and moments used for the design ofyawing flight control laws, since the frequencies are high. This lagposition. is in addition to any lags introduced by the actuator system,
which must be modelled separately.The variation of the parameter (f cot 8) with f2
indicates the order of the equation of motion (or transfer 6 CONCLUSIONSfunction); a constant value indicates a simple lag, and alinear variation indicates a second-order system. The The results from static and dynamic wind-tunnel tests
oin the use of suction at the nose to control forebodyresults for V - 20 m/s and 30 mls are both remarkably linear vortices are sufficiently encouraging to warrant an(see Fig 13), but do not collapse with reduced frequency, experiment in free flight using the existing HIRMI dropwhere frequency has been expressed in radians/s, ro - 2sf, model. The magnitudes of the maximum yawing momentand factored by 9/V to give reduced frequency. (Aero- and sideforce have been shown to be determined bydynamic mean chord has been chosen as representative forebody geometry (diameter and slenderness ratio for
Them dmeang d freeency thse s sentatorde given apex angle), and appear to be independent of thelength). The dampin and frequencynof the soon-ordr w n"rig ai configuration. The variation of control powerssystems may be derived from these linear variations, to with flow rates is suitable for use in an active control law,give the response equations for yawing moment, N, although nonlinear, and the associated rolling and pitchingassuming that the response time of the strain-gauge moments should be alleviated by demand-type control lawsbalance is negligible in roll and pitch. The scaling of flow rates with model size
determined from these tests indicate that control power isdependent on the nose geometry, so full-scale aircraft
N+ MN +790N = FP S -Qp)for V - 20m/s , (3a) would require similar levelstothose used on the models.
__ _
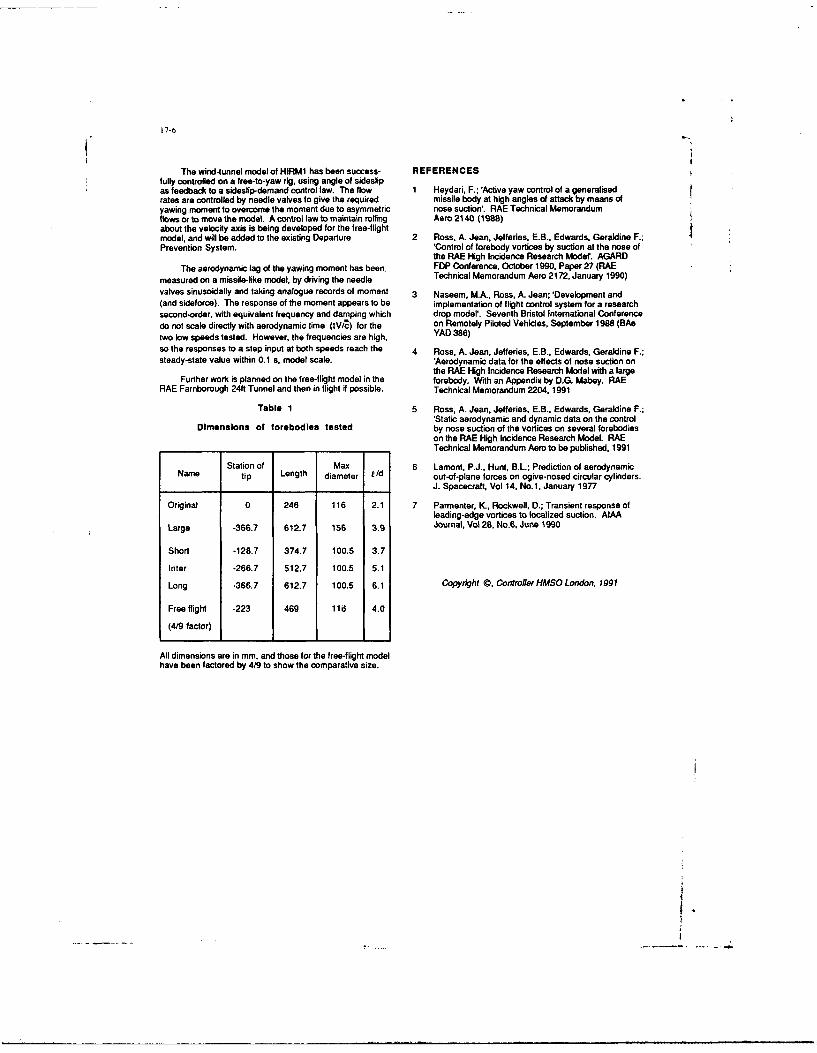
17-6
The wind-tunnel model of HIRMI has been success- REFERENCESfully controlled on a free-to-yaw rig, using angle of sideslipas feedback to a sideslip-demand control law. The flow 1 Heydari. F.; 'Active yaw control of a generalisedrates are controlled by needle valves to give the required missile body at high angles of attack by means ofyawing moment to overcome the moment due to asymmetric nose suction'. RAE Technical Memorandumflows or to move the model. A control law to maintain rolling Aero 2140 (1988)about the velocity axis is being developed for the free-flightmodel, and will be added to the existing Departure 2 Ross. A. Jean, Jefferies, E.B., Edwards. Geraldine F.;Prevention System. 'Control of forebody vortices by suction at the nose of
the RAE High Incidence Research Model'. AGARDThe aerodynamic lag of the yawing moment has been FDP Conference, October 1990, Paper 27 (RAE
measured on a missile-like model, by driving the needle Technical Memorandum Aero 2172, January 1990)
valves sinusoidally and taking analogue records of moment 3 Naseem, M.A., Ross, A. Jean; 'Development and(and sideforce). The response of the moment appears to be implementation of flight control system for a researchsecond-order, with equivalent frequency and damping which drop model'. Seventh Bristol International Conferencedo not scale directly with aerodynamic time (tV/r) for the on Remotely Piloted Vehicles, September 1988 (BAetwo low speeds tested. However, the frequencies are high, YAD 386)
so the responses to a step input at both speeds reach the 4 Ross, A. Jean, Jefferies, E.B., Edwards, Geraldine F.;steady-state value within 0.1 a, model scale. 'Aerodynamic data for the effects of nose suction on
the RAE High Incidence Research Model with a largeFurther work is planned on the free-flight model in the forebody. With an Appendix by D.G. Mabey. RAE
RAE Farnborough 24ft Tunnel and then in flight if possible. Technical Memorandum 2204, 1991
Table 1 5 Ross, A. Jean, Jefferies, E.B., Edwards, Geraldine F.;'Static aerodynamic and dynamic data on the control
Dimensions of forebodles tested by nose suction of the vortices on several forebodieson the RAE High Incidence Research Model. RAETechnical Memorandum Aero to be published, 1991
Station of Max 6 Lamont, P.J., Hunt, B.L.; Prediction of aerodynamicName tip Length diameter f/d out-of-plane forces on ogive-nosed circular cylinders.
J. Spacecraft, Vol 14, No.1, January 1977
Original 0 246 116 2.1 7 Parmenter, K., Rockwell, D.; Transient response ofleading-edge vortices to localized suction. AIAA
Large -366.7 612.7 156 3.9 Journal, Vol 28, No.6, June 1990
Short -128.7 374.7 100.5 3.7
Inter -266.7 512.7 100.5 5.1
Long -366.7 612.7 100.5 6.1 Copyright ©, Controller HMSO London, 1991
Free flight -223 469 116 4.0
(4/9 factor)
All dimensions are in mm, and those for the free-flight modelhave been factored by 4/9 to show the comparative size.
j.
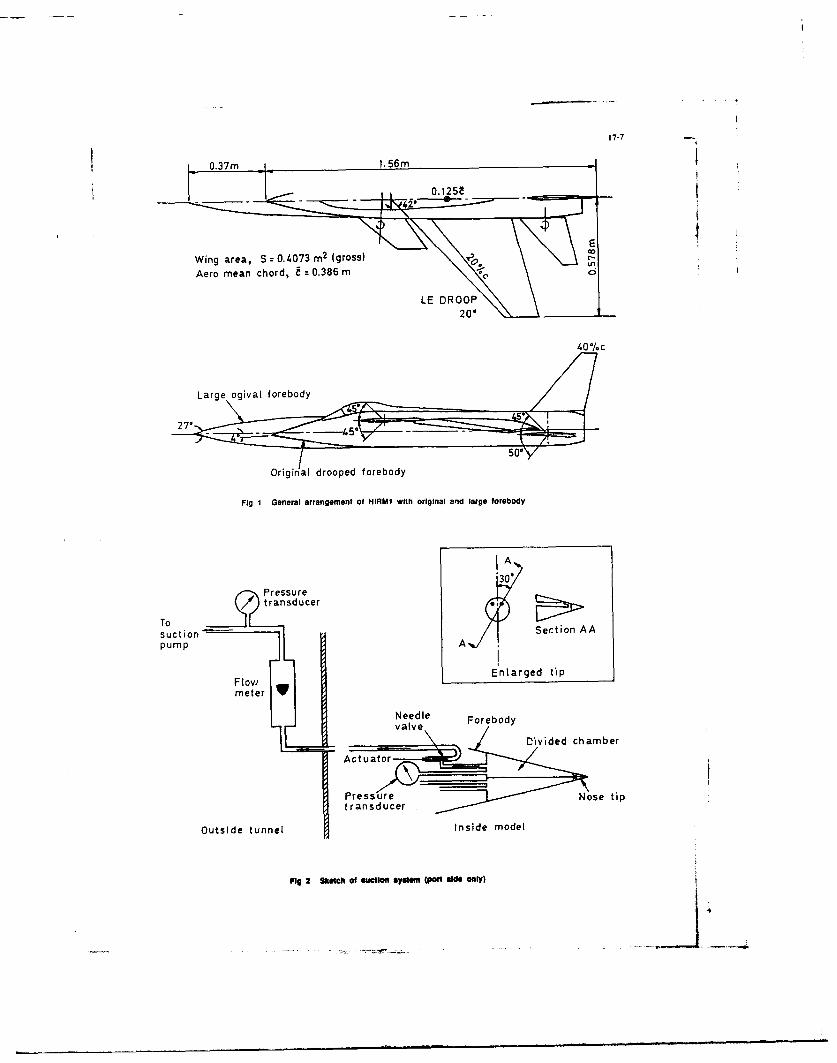
17-7
0.37m I1.56m
0.125Z
Wing area, S 0. 4073 m2 (gross) r
Aero mean chord, 0.386 m 1C
LE DROOP$20'
Original drooped forebody
Fig 1 General arrangement of IIIRMI with original and large forebody
IA30'
/Pressuref30To
transducer
suction -1Section AApump A
Flo E nlarged tip
mee jNeedle Forebody
Divided chamber
Outside tunnjel trndcr Inside model
Fig 2 SketchI of SW~IM O n s (POrt WAdS onl1Y)
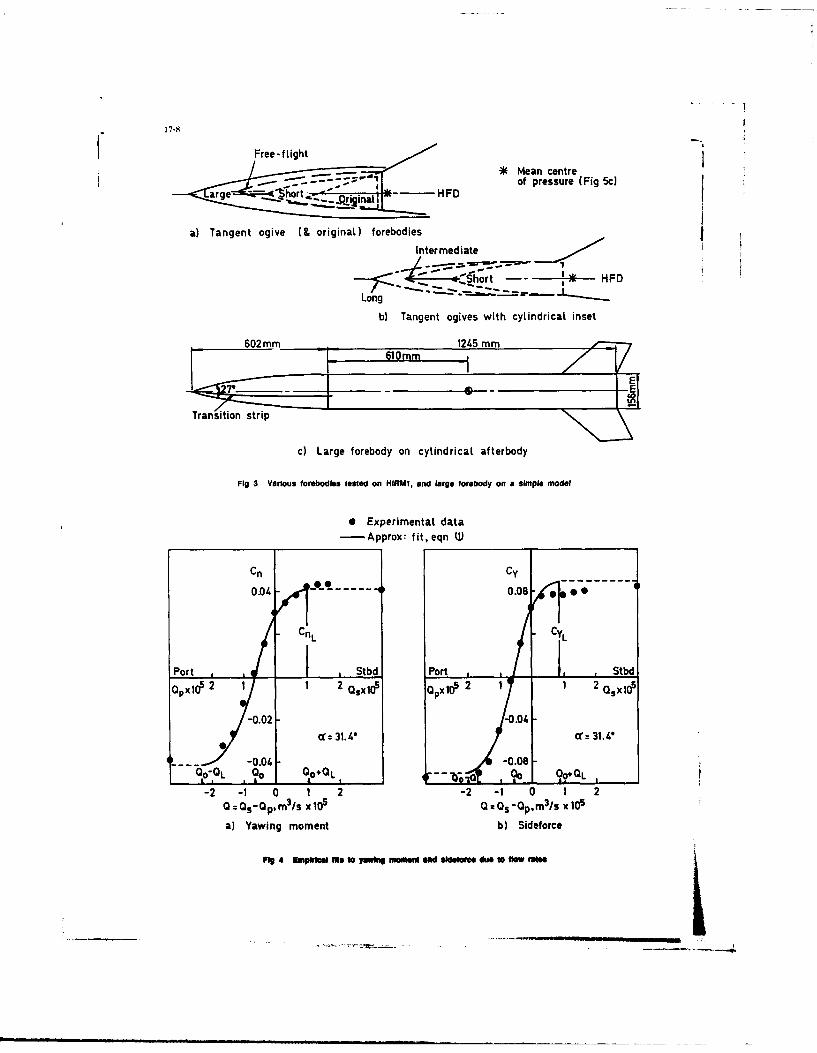
1 7-8t
Fre-f~h ~ *Mean centre
arg - Iof pressure (Fig SO)
a) Tangent ogive (.originat) forebodiesIntermediate
-- - -*r- HFD
b) Tangent ogives with cyLindricaL inset
602mM mm 125 mmT
E
Trnition strip
0I Large forebody on cylindricaL afterbody
Fig 3 Various forebodles tested on HIRMI, and large forebody on a simple model
0 Experimental data-Approx. fit, eqn W1
Cn Cy
0.44;OT @ --- 1 0.08 1 41
CnL Cy L
Port , - I .Stbd Port .A I IStbd
PX1O 2 1 1 2 QSXK0 0~x00 2 1 1 2 QXW
-0.02 -0.04 -
l - 0 0 1. -rz
3 . *0.08 -C 1 4
00L 10 qoL - 0 Q0 LA, o AOQC.0A
-2 -1 0 1 2 -2 -1 0 t 2Q0 C:0p, mI/s x 10 0 QOS -QI, m3 s x 105
a) Yawing moment b) Sideforce
Fig 4 lbai*Mles 20s toi a RgcOMM and elODotec dale to flow rmis
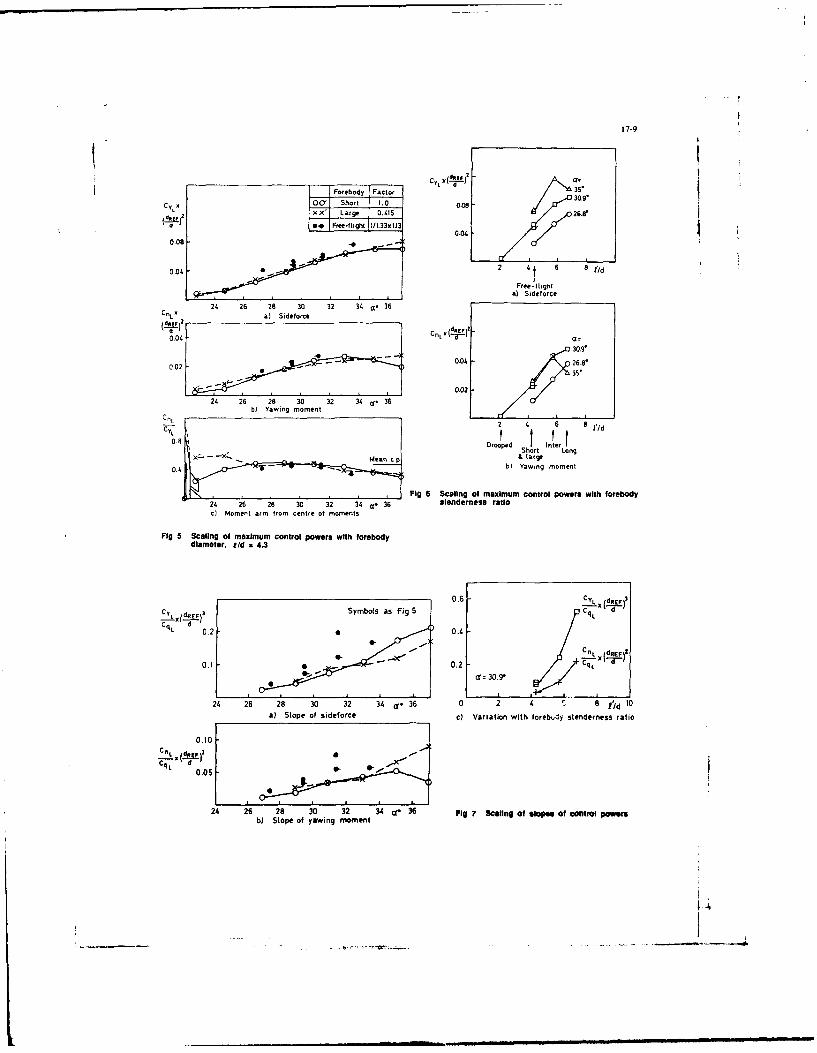
17-9
Forebody Factor C35o(U)30.9'
CYXoa Short 1.0 coo2x Lage 0.. 26.fV
8 *4 Free-flight t1/t.33o 113
0.08 -
0.01. 2 - 6 8 Pd
Free- flighta) Side) orce
21. 26 28 30 32 34 036C'LO a) Sideforce
0.04F) -n - -T a -- 001 68
30.Y
0.02- 03S 6
--0.02 L t 5
21. 26 28 30 32 34 or- 36b) Yawing moment
CnL 2 1. 6 8
0.8 Drooped SotInter LonXMean c p & large
0.1. b)..h Yawing moment
_______________________________________Fig 6 Scaling of maximum control powers with forebody'21. 26 28 30 32 34. cf 36 sienderness ratioc) Moment arm from centre of moments
FIg 5 Scaling of maximum control powera with forebodydiamelter. R/d 4.3
0.6 -CnL X dtREF
C4L d 0.2- 0.4.
002.1 d
24. 26 28 30 32 3 4 aC-3 6 0 2 1. 8 d1a) Slope of sideforCe c) Variation with foreb~dy stenderness ratio
n 0.10 -
C 0.05
21. 26 28 30 32 cr 36 Fig 7 Scalng of Map" of Control pwersb) Slope of yawing momntt
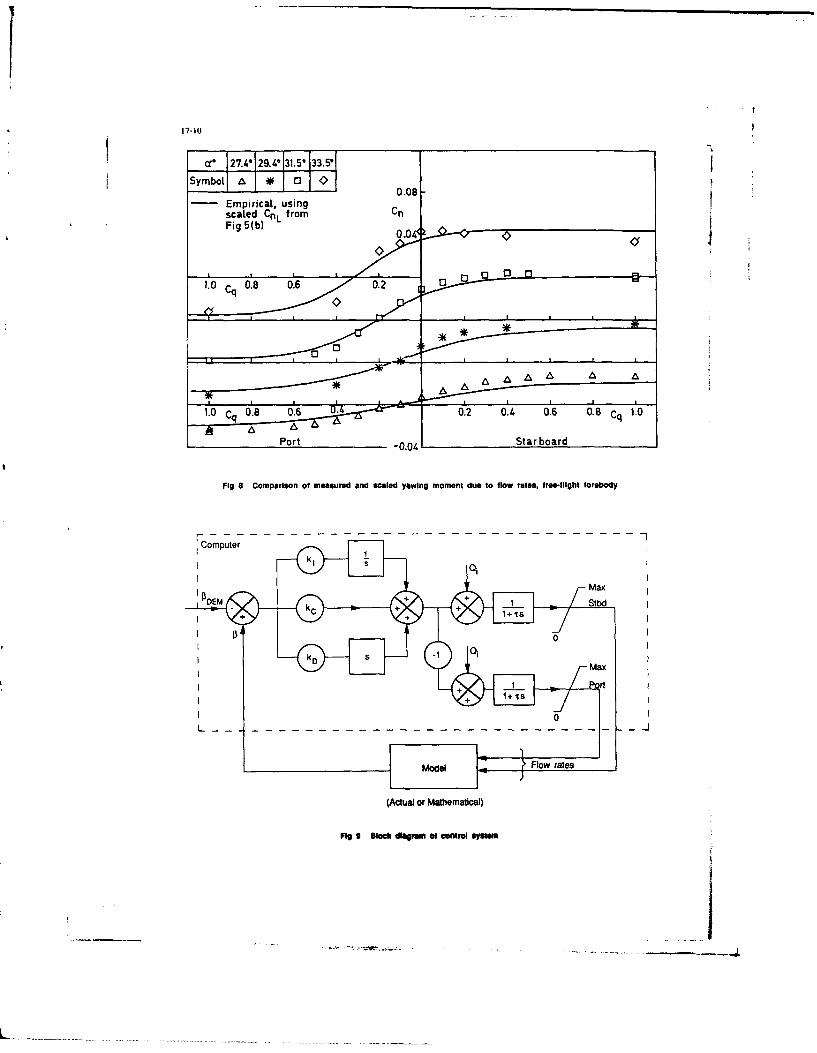
17-10
Fig 5(b)00
1 0 c. 0.8 0.6 0.2. 0 Oa 0* - C -
Fig 8 Comparison of measured and Scaled yawing moment due to flow rates, free-flight forobody
r - - - - --- - - - - - - - - - - - - - - - - - 1
Computeratemtial
Fg0slakdarmO eirlsse
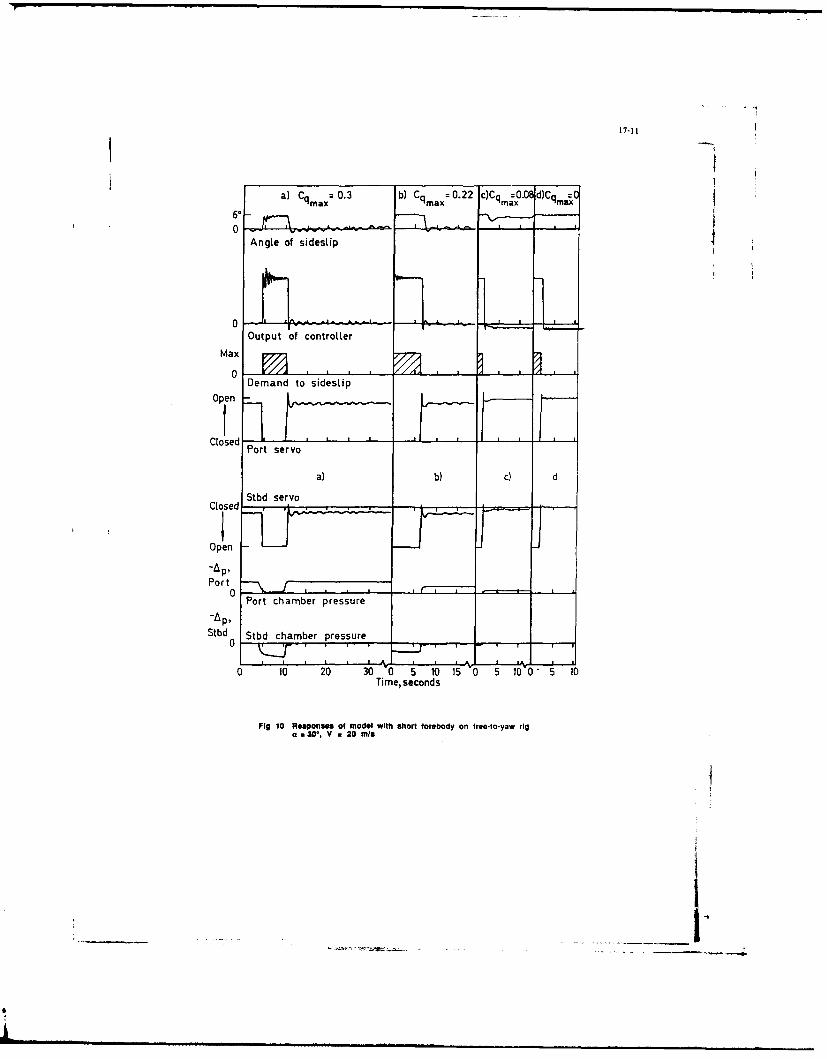
17-11
a) = 0.3 b) Cq 0.22 c)CqmaO.O d)Cqm=CCma x Cmax= ax a
0Angte of sidestip ,
0AOutput of controller
Max0Demand to sidestip
Open
Closed -Port servo
a) c) d
Stbd servoC osed
Open
Port0
Port chamber pressure-Ap,
Stbd Stbd chamber pressure0 -. . .--.--.. .
10 20 30 1015055 10Time, seconds
Fig 10 Responses of model with short forebody on free-to-yaw rig= 30%
, V * 20 rll
Ct
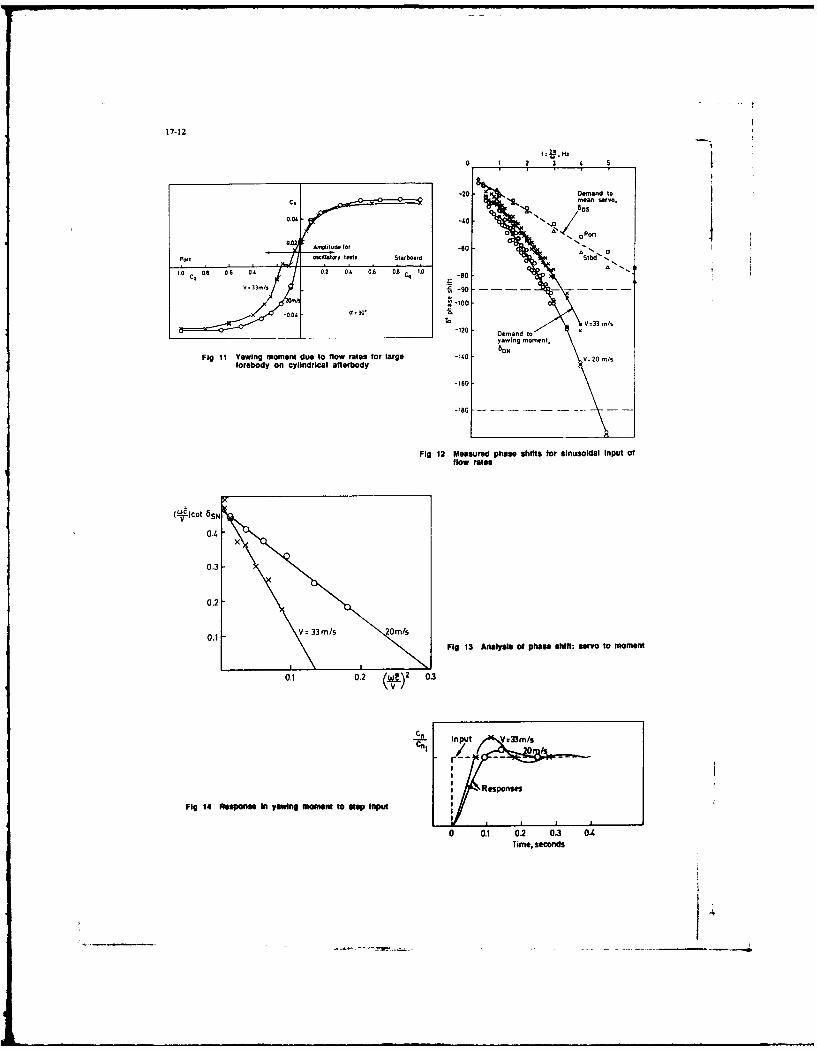
17-12
0 1 2 3 S
-20 Demand toC. mean sarno.
800
0.02)
Apuefr-60 N
Por 7 j 7 1110oy toots Starboard ~StP 0
V 3. -90D
S -100
of 30'3 I
-120 Demand to xV3 /
yawing moment.800
Fig 11 Yawing momeni due to flow rate$ for large -140 -V= 20 m/sforebody on cylindrical afterbody
-160
-180 - - - - -
Fig 12 Measured phase shifts for sinusoldal Input offlow rais
x
0.3
0.2
0.1 \ V 33m/s 2m/s
Fig 13 Analysis of phias Shift: servo to moment
0.1 0.2 WI2 03
n Input Vo33m/s
Responses
Fig 14 Response InI yawing moment to stop input
0 0.1 0.2 0.3 OATime, secodrfs
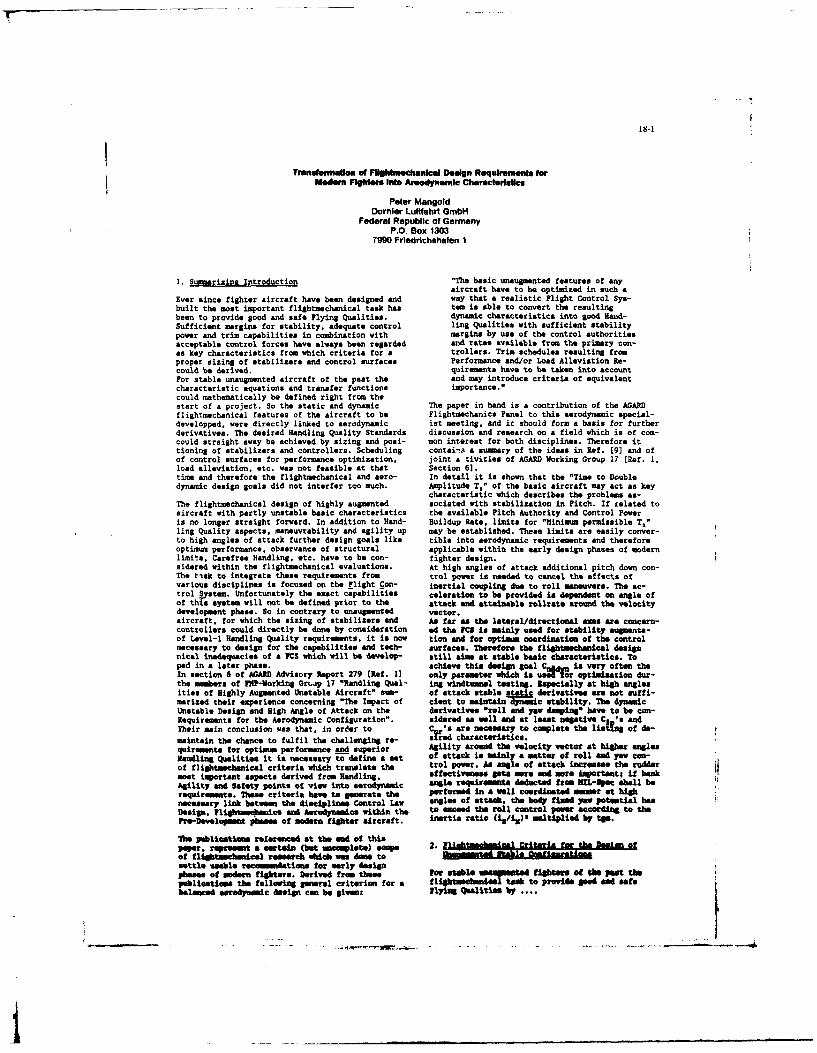
T-
18-1
Trandonmedon of Fightumechanical DesIgn Requirements forModen Fighters into Areodynamic Chercterlstlcs
Peter MangoldDornier Lufahrt GmbH
Federal Republic of GermanyP.O. Box 1303
7990 Friedrichahafen 1
1. Summarizing Introduction "The basic unaugmented features of anyaircraft have to be optimized in such a
Ever since fighter aircraft have been designed and way that a realistic Flight Control Sys-built the most important flightnechanical task has tem is able to convert the resultingbeen to provide good and safe Flying Qualities. dynamic characteristics into good Hand-Sufficient margins for stability, adequate control ling Qualities with sufficient stabilitypower and trim capabilities in combination with margins by use of the control authoritiesacceptable control forces have always been regarded and rates available from the primary con-as key characteristics from which criteria for a trollers. Trim schedules resulting fromproper sizing of stabilizers and control surfaces Performance and/or Load Alleviation Re-could be derived. quirements have to be taken into accountFor stable unaugmented aircraft of the past the and may introduce criteria of equivalentcharacteristic equations and transfer functions importance."could mathematically be defined right from thestart of a project. So the static and dynamic The paper in hand is a contribution of the AGARDflightmechanical features of the aircraft to be Flightmechanics Panel to this aerodynamic special-developped, were directly linked to aerodynamic ist meeting, and it should form a basis for furtherderivatives. The desired Handling Quality Standards discussion and research on a field which is of con-could straight away be achieved by sizing and posi- mon interest for both disciplines. Therefore ittioning of stabilizers and controllers. Scheduling contains a summary of the ideas in Ref. [9] and ofof control surfaces for performance optimization, joint a:tivities of MARD Working Group 17 [Ref. 1,load alleviation, etc. was not feasible at that Section 61.time and therefore the flightmechanical and aero- In detail it is shown that the "Time to Doubledynamic design goals did not interfer too much. Amplitude T," of the basic aircraft may act as key
characteristic which describes the problem as-The flightmechanical design of highly augmented sociated with stabilization in Pitch. If related toaircraft with partly unstable basic characteristics the available Pitch Authority and Control Poweris no longer straight forward. In addition to Hand- Buildup Rate. limits for "Hinimum permissible T,"ling Quality aspects, maneuvrability and agility up may be established. These limits are easily conver-to high angles of attack further design goals like tible into aerodynamic requirements and thereforeoptimum performance, observance of structural applicable within the early design phases of modernlimits, Carefree Handling. etc. have to be con- fighter design.siderd within the flightmechanical evaluations. At high angles of attack additional pitch down con-The tvsk to integrate these requirements from trol power is needed to cancel the effects ofvarious disciplines is focused on the Flight Con- inertial coupling due to roll maneuvers. The ao-trol System. Unfortunately the exact capabilities celeration to be provided is dependent on angle ofof this system will not be defined prior to the attack and attainable rollrate around the velocitydevelopment phase. So in contrary to unaugmented vector.aircraft, for which the sizing of stabilizers and As far as the lateral/directional amm are concern-controllers could directly be done by consideration ed the nC is mainly used for stability augmenta-of Level-I Handling Quality requirements. it is now tion and for optimm coordination of the controlnecessary to design for the capabilities and t*ch- surfaces. Therefore the fliShtamsaohical designnical inadequscies of a FCS which will be develop- still aim at stable basic characteristics. Toped in a later phase. achieve this design goal Cnedam is very often theIn section 6 of AGARD Advisory Report 279 Ref. 1] only parmter which is used-for optimization dur-the ambers of FlP-Working GrCmp 17 "Handling Qual- ing windtumnel testing. lapecially at bigh anglesities of Highly Augmented Unstable Aircraft" a01- of attack stable stic derivatives are not suffi-marized their experience concerning "The Impact of cient to maintain dynamic stability. The dynamicUnstable Design and High Angle of Attack on the derivatives "roll and yaw da8mg have to be con-Requiremnts for the Aerodynamic Configuration". sidered as well and at least negative C 's andTheir main conclusion was that, in order to Cnor'a are necessary to complete the lishng of de-maintain the chance to fulfil the challenging re- ared characteristics.qutirmnts for optimum performance and superior Agility around the velocity vector at hi AnglesHandling Qualities it is necessary to define a eat of attack is mainly a matter of roll and yaw con-of flightchanical criteria which translate the trol power. As Angle of attack increases the ruddermet important aspects derived from Handling. effectiveness gets more and mte imortant it beckAgility and Safety points of view into aerodynamic angle requirmets deducted from IIL-Ipec shall berequirement. These criteria have to generate the performed in a well coordinated ummer at hihnecessary link between the disciplines Control .aw angles of attack, the body fixed yaw potential hasDesign, FlieamewoAmmica and Aerodynamics within the to emceed the toll control power according to theFre-oeolopmt phases of modern fighter aircraft. inertia ratio (iy/ 3 ) m unltilied by toe.
Itbp lsalica fs renc4 at the ad of thispeer, relemSet a eWtM (bet Uesclet) scope 2. hLe f& elli, of
of flightmoclmiicel research which s mdam to N OV o111911settle usable reomendations for early designphases of madam fighters. Derived frm these Foe stable "mullited fi r of the past the
balene aerodynamic design can be given: 1171g Qualities
pf-at d
. ......
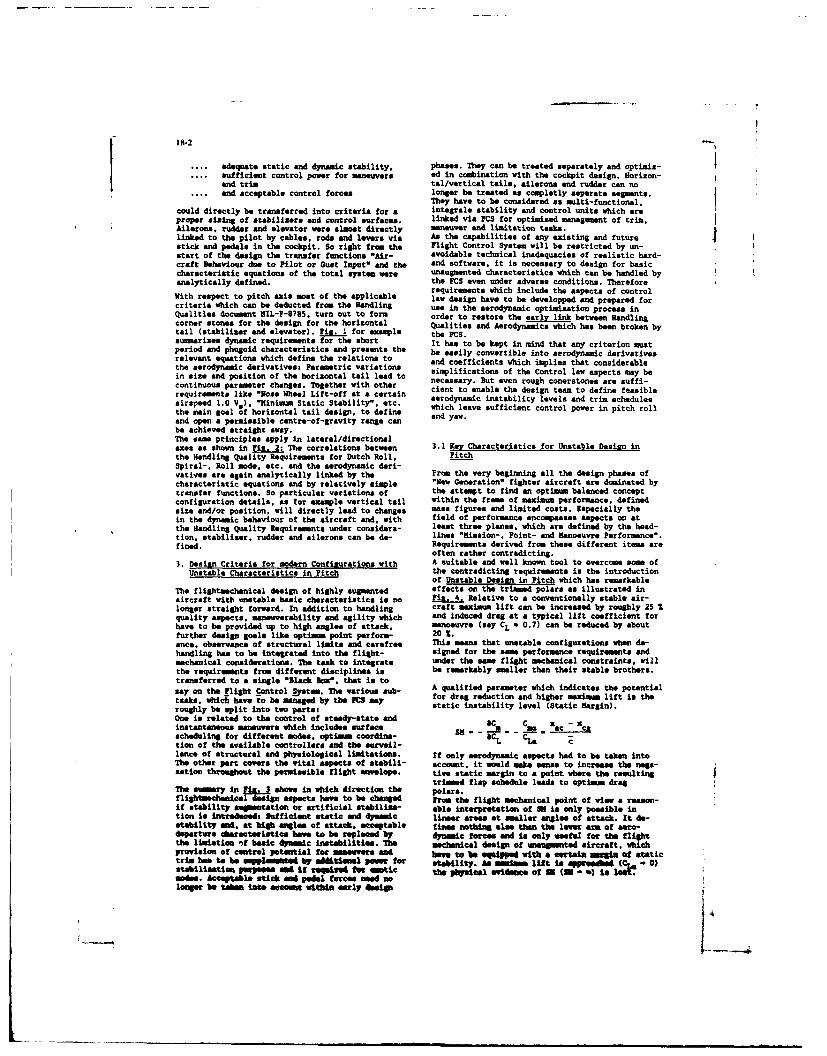
18-2
.... adequate static and dynamic stability, phases. They can be treated separately and optimiz-
.... sufficient control power for maneuvers ed in combination with the cockpit design. Horizon-and trim tal/vertical tails, ailerons and rudder can noAnd acceptable control forces longer be treated as completly saperste segment*.
They have to be considered as multi-functional,could directly be transferred into criteria for a integrale stability and control units which areproper siaing of stabilizer* and control surfaces, linked via PCI for optimized management of trim.Ailerons. rudder and elevator were almost directly maneuver and limitation tasks.linked to the pilot by cables, rods and levers via As the capabilities of any existing and futurestick and pedals in the cockpit. So right from the Flight Control System will be restricted by un-start of the design the transfer functions "Air- avoidable technical inadequacies of realistic hard-craft Behaviour due to Pilot or Gust Input" and the and software, it is necessary to design for basiccharacteristic equations of the total system were unaugmented characteristics which can be handled byanalytically defined. the PC$ even under adverse conditions. Therefore
requirements which include the aspects of controlWith respect to pitch axis most of the applicable law design have to be developped and prepared forcriteria which can be deducted from the Handling use in the aerodynamic optimization process inQualities document NIL-1-$785, turn out to form order to restore the early li between Handlingcorner stones for the design for the horizontal Qualities and Aerodynamics which has been broken bytail (stabilizer and elevator). Pig. I for example the PCS.summarizes dynamic requirements for the short It has to be kept in mind that any criterion mustperiod and phuSoid characteristics and presents the be easily convertible into aerodynamic derivativesrelevant equations which define the relations to and coefficients which implies that considerablethe aerodynamic derivatives: Parametric variationsin size end position of the horizontal tail lead to sisplifications of the Control law aspects may be
in sze nd osiion f te hrizntaltai led t necessary. But even rough conerstones are suffi-continuous parameter changes. Tolother with other c e able t e sgn termtone asiblerequirements like "Nose Wheel Lift-off at a certain cient to enable the design team to define feasibleairspeed 1.0 V.) . "Minimum Static Stability". etc. which leave sufficient control power in pitch roll
the mein goal of horizontal tail design, to define sd yaw.and open a permissible centre-of-gravity range can
be achieved straight away.The same principles apply in lateral/directionalaxes as shown in Piz. 2. The correlations between 3.1 Key Characteristics for Unstable Design inthe Handling Quality Requirements for Dutch Roll, PitchSpiral-. Roll mode. etc. and the aerodynamic deri-vatives are again analytically linked by the Prom the very beginning all the design phases ofcharacteristic equations and by relatively simple "New Generation" fighter aircraft are dominated bytransfer functions. So particular variations of the attempt to find an optimum balanced conceptconfiguration details, as for example vertical tail within the frame of maximum performance, definedsize and/or position, will directly lead to changes mass figures and limited costs. Especially thein the dynamic behaviour of the aircraft and, with field of performance encopaaaes aspects on atthe Handling Quality Requirements under considers- least three planes, which are defined by the head-tion, stabilizer, rudder and ailerons can be de- lines "Mission-, Point- and Manoeuvre Performance
" .
fined. Requirements derived from these different items areoften rather contradicting.
3. =etsn Criteria for modern Confisurations with A suitable and well known tool to overcome so ofUnstable Chracteristics in Pitch the contradicting requirements is the introduction
of Unstable Desian in Pitch which has remarkableThe flightaechenical design of highly augmented effects on the trimmed polars as illustrated inaircraft with unstable basic characteristics is no Fig.4 Relative to a conventionally stable air-longer straight forward. In addition to handling craft maximum lift can be increased by roughly 25 %quality aspects, maneuverability and agility which and induced drag at a typical lift coefficient forhave to be provided up to high angles of attack, manoeuvre (asy CL 0.7) can be reduced by aboutfurther design goals like optimm point perform- 20 %.ance, observance of structural limits and carefree This means that unstable configurations when de-handling has to be integrated into the flight- signed for the so performance requirements andmechanical considerations. The task to integrate under the same flight mechanical constraints, willthe requir mto from different disciplines is be remarkably smaller than their stable brothers.transferred to a single "Black Box'. that is to
say on the Flight Control ystem. The various sub- A qualified parameter which indicates the potential
tasks, which have to be managed by the PC3 my for drag reduction and higher maximum lift is theroughly be split into two parts static instability level (Static Margin).
One is related to the control of steady-state andinstantaneous maneuvers which includes surface m Ca _ a Cascheduling for different modes. optimm coordin- - - - - C -tion of the available controllers and the surveil-lance of structural and physiological limitations. If only aerodynamic aspects had to be taken intoThe other part covers the vital aspects of stabili- account. it would make sense to increase the nasa-zation throughout the permissible flight anvelope. tive static margin to a point whm the resulting
trimmed flap schedule leads to optimum dragThe ummry i JU 3 oms n whch irecionthe polars.
flightmschoodcal aesign spects have to be changed Prom the flight mechanical point of view a reason-if stability amntation or artificial stabilisa- able interpretation of SH is only posaible intion is instroeed: Sufficient static and dynamic linear areas at smaller anglea of attack. It de-stability a., at U& angles of attack, acceptable fime nothing else than the lever arm of &ero-departure Aaracte istice have to be replaced by dynooic fore" and is only useful for the flightthe limiation if basic dynmic instabilities. The mechanical design of uneum nted aircraft, whichprovision of control potmeial for mosere end have to be eqipped With a certal mar of statictrim ha to be sm nped by aditimal pit for stbility. As m a lift is approodbd ( - 0)stabilization -inpes a d f regpie tor n tic the ftlyial evidence of = (N .') is 1:modes. Acceptable stick m pedal fore" ued mlonge be tom late Aco nt Vituis erly desil
18-3
Aerodynaic parameters which allow a flightmachani- 3.2 Criterion for Maiu Dynamic Instability in
cal interpretation even at high anglee of attack Pitch
are summarized in Fig. 5 (flightnechanics special-ists are talking of 'Aerodynamic Key Characteris- The discussion in the previous section has shown
tics- in this context). The typical Cy versus a that criteria based on relationships betweenplots with curves for "zero" and "fulT nose down" saxinu permissible dynamic instabilities T. and
controls point out that one limiting factor for the required control authority and reaction could
unstable design will be given by the definition of be helpful tools for the aerodynamic design even in
a necessary pitch recovery moment which above all very early design phases. Concrete steps which have
has to guarantee a safe return from high angle-of- to be taken in order to generate such boundaries
attack manoeuvres, are described in [R3f. 9]. Based on parametricThe basic desian instability is defined by the de- attempts to optimize control law parameters forrivative C. It will be chosen at low and medium different dynamic instability levels the "T.-Cri-
angle of attack to cover the performance require- terion" shown in Fig. 8 was evaluated and proposed
ments. This instability has to be checked against for use in the design and optimization process of
the capabilities of the Flight Control System. The unstable combat aircraft.
same applies to the allowable pitch-un C,,,. at The procedure which lead to the boundaries in thetwo graphs considered simplified but realistic
higher angles of attack ln trimmed conditions. hardware assumptions including requirements and
methods which are normally used within a thoroughUnfortunately neither the static instability SN nor Control Law Design. In detail the following prin-
the pitching moment derivative C. are sufficient ciples have been taken into account (for further
to describe the dynamic problems associated with information see section 4.2 of [Ref. 9]):the stabilization of unstable configurations. Ac-cording to the equations of fi. 1 and 11 the high- - Typical control law structure for fighter type
ly dynamic short period motion of any aircraft is aircraft providing a pitch rate command/atti-dependent on much more factors as for smple tude hold platformmoment of inertia, damping derivatives. wing area.mean aerodynamic chord and dynamic pressure. All - Hardware assumptions for sensors, actuators.
these parameters contribute to a "Tim to Double filters etc.
Amlitude" T. during which, with controls fixed.the aircraft will double a distortion in angle of - Lvel-I Handling Quality requirements forattack. As the simplified schematic graph of fit. 6 Cat. A (i.e. Combat) flight phases(pitching moment versus time) shows, it is essen-
tial to counteract this aperiodic movement by an - Ride Quality aspectsappropriate control input. Build-up rate andmagnitude N of the stabilizins mment must be large - Criteria for sufficient stability margins of
enoue.h to stop and reverse the sign of pitch accel- the Control law designeration so that the aircraft returns to its origi-
nal, trimed condition. The Tim Delay T between - Data bandwidth of modern fighters derived from
disturbance input and stabilizing control reaction the requiraments for the European Fighter Air-
can be identified as a further important parameter craft (see Fin. 9 and 10).which will increase the problems of control lav
design if it exceeds certain values. Starting from general data of modern fighters re-
So the key characteristics for unstable design in presented by three different tail concepts, the
pitch may be summarized, as done in Fiz. 7: relevant aerodynamic parameters. Nachnumber anddynamic pressure have been varied in order to
- Static Margin SN or Cu for the aerodyna- achieve different val as in Time-to-Double Ampli-
micists tude Ta . In a socorA step the control law para-mters have been defined by optimizer strategy in
- Time to Double Amplitude T., Maimum Pitch accordance with the handling quality and stability
Control Noment M and Build-up Rate A. Time requirements; simulated flights with test inputsDelay Tt for the control law designers and have been performed in order to evaluate the re-flightmechanics people quired control authority and control reaction.
The results in Piz. $ confirm that it is possible
As stated above it is necessary that control law to generate limiting functions "Rcwm ini um
people and aerodynamicits can communicate and un- Pitch Authority" (i.e. Acceleration 9) and "Recoum-
derstand each other in order to end up with a well mended inimum Pitch Control Reaction" (i.e. Wbalanced design. So once dynamic limits for T. have versus "Tim to Double Amplitude T3".been identified they have to be translated intoaerodynamic characteristics. A good approximation As Ta decreases the required cotrl authority and
for the transcendental relation between T and the rate increases rapidly. Especially for smller
aerodynamic derivatives is presented in ita.11. Hach-nimbers the continuous lines are limited bysharp edges which mark the point where the safe
As far as the control power is concerned it is ne- stability margins (Phase and Gain margins) can no
cessary to sun-up the authority and control reac- longer be achieved.
tion available from all primary pitch controllers. Differences fomd for the different tail concepts
This can be done by the following simple algebraic can be neglected. So the limits shown in the two
equations: diagram should be valid for all modern fighterconfigurations with a mas density PL >SO ad a
" Control Authority in terms of Pitch accelera- control system with an equivalent overall time de-
tion: lay of Tt - 0.02 a.
n for larger time delays no increase in the required
0 " - .il control poser would be necessary if the overallt m I I -u 'im time delay excemis 0.02 a. The sharp edges for in-
sufficient Phase and gain margins. however he" Control eaction: then to be shifted towards hi&r Ta values.
A futh.er anlySis of shr e that configura-n tions with Time-teo-Doobl < 0.2 a may met be
" i. lui" feasible for a prodmtin aircraft. bw a mallnforble eore ering T (caused by sens-
n is the rmbo of all reliable primary cnrol- dynamic uwcertainties for exemple) wmuld requirelra limitations d e to h1g mat. sad load excessive additional control power and/or wouldrestrictions have to be considered.
hurt the necessary stability margins. This does not ... a three view drawing with characteristicmean that such an aircraft cannot be realized or geometric dataequipped with reasonable handling qualities (seefor example X-29). But the statment does point out ... a typical combat mass including thethat such a high dynamic design instability intro- radius of inertiaduce a lot of risk which does not pay-off and thatduri development and operation major difficulties ... rough (Datcom) estimates of the dynamicwith respect to safety and handling may be encoun- derivativestered.
... Static Lift and Pitching noent coef-3.3 !!!licatin of the T.-Criterion within the ficients or derivatives versus angle of
Aerodynamic Design Process. Rane of Validity attack for different control settings(inci. maiu symtric deflections)
In order to end up with concrete "application
rules" for the T.-Criterion, it is necessary to ... asumption of attainable deflectionhave a look on typical (aerodynamic) data of modern ratesfighters and their influence on the basic dynamicbehaviour of the aircraft. As most of the data (Fig. 13) is required anyway inInspits of the challenging requirements which have order to fix the basic static instability-level andbeen formulated for future fighters based on the to optimize the trim schedules for performanceEuropean 3enario, it is astonishing that solutions purposes in a first step, the amount of additionalbased on all tail concepts have been proposed. The work to be done to check the dynamic instabilityconfigurations, which are roughly sketched in ziz. levels is small. Via the static derivatives and9, are all equipped with relatively low aspect C in trimmed flight conditions and the Pitch--
ratio wings (A < 3) and the common understanding (own i.e. most Critical) Control Power availableof the design teams has been that an unstable de- from all primary controllers it is possible to
sign together with a horizontal tail (aft-tail, compute To and the pitch acceleration capability Uvector nozzle, canard) is needed to achieve a high by the equations given in Pig. 8 and 11. A compari-performnce standard and agility. son with the boundaries of the criterion (ha. 14)identifies problematic areas and recommendations
The table of Fiz. 10 summarizes typical data for for further improvement of the configurations maythese configurations including geometrical, aero- be given as indicated. The same procedure is ap-dynamical and masslinertia characteristics, which plicable for the required pitch control reactionshould be valid for a preliminary dynamic analysis (Fig. 15) which can be computed via the pitch con-in the subsonic region up to -ximmze lift. - The trol effectiveness (derivatives in trimmed condi-first line of the table shows that the design in- tions) of all primary controllers.stabilities (static margin SM) of the tailed air-craft are considerably larger than that of the As already stated in section 3.2. the boundaries oftailless configuration. This is due to requirements the T,-criterion presented in Fig. are only veri-concerning the pitch recovery margin (section 3.4) fied forwhich for tailless concept is hard to achieve to-gather with an unstable design. ... fighter type aircraft with a data band-In order to get some deeper insight into the dyna- width shown in Fig. ,mic effects of the data presented, it is necessaryto have a look at the equations which determine the ... Combat Flight Phases,location of the short period roots in the complexplane and the key parameter T.. fig. 11 illustrates ... and a Pitch Rate Comand/Attitude Holdthat the positions of the two unstable roots are type control system with the hardware as-defined by two major parts: (C.0) settles the line sumptions described in [Ref. 9].of sym etry from which the two aperiodic roots a,and a will separate once static stability is lost. For other aircraft, flight phasee and control eye-This lirst part is influenced by the lift curve tame it is necessary to examine the validity of theslope Cu and by the dynamic derivatives but it is specific numbers. But nevertheless it is worthwhilenot dependent on the design instability, to rerun the procedure for the evaluation of theThe shift of the roots on the geal Axis is dominat- criterion described In [Ref. 9] and a modificationad by the term v.3 and therefore directly related of the boundaries. tuned to updated requirements
to should be as easy as the application of the crite-it tM'data from figL1 are analysed by the rion itself.dynamic equations of Fa. 11 it gets evident thatthe relatively high mass density of the configura- 3.4 Wirs for Pitch Recovery from High Angles oftions V ) 70 (50 for tailless aircraft) diminishes A ckthe influe of the dynspic aerodynac deriva-tives and the lift curv slope considerably. This The minimmus pitch recovery control power which hasgeneral trend is confirmed in FigJ1 where start- to be installed at high angles-of-attack near CL.xing from reference values parmtric variations of cannot only be defined by sufficient nose down ac-the longitudinal derivatives and their inflence on coloration which has to provide a safe return from"Time to Double Amplitude" are investigated for a awuvers near stall. A more detailed analysis ofsemple aircraft. Reference values end data band- the problem leads to the conclusion that the re-width to be n;eoted for the Low Speed region, are quired nose down control power can roughly be splitindicated. into two parts (Fit. 16):So with respect to the aerodynmc derivatives thekey paramter T, will mainly be altered by Cos. C,, 1) basic demnd for stabilization. for counteract-is of minor impottence but should be considered. ing gusta And for sufficient pitch handlingThe beeuuidth of the dynamic derivative@ my in any qualities during high angle-of-attack usnau-case be nlecte.4, versWith thsoe gmeric re"ets in Mid it is rathereasy to involve the T -criterion into the normal 2) additional control poser for increased agilityazeroynic deed eQ Optimizatie process eas at high aftles-of-attak.shem in the diwpm M .. Jt1 . All Informs-tim, ned for a first assest of the flight- The basic demand, which has to be provided in theamebhedical feasibility of a Pr wod 4frtiu nose-ip as well as in the nose-down direction.in pitch as - ... could Probably be fi by a t T,- nChats. The cerion prevented In a . hauvrt
18-5
is based on handling quality requirements of CAT.A divergence usually occurs if the C-coefficiant oe-flight phases, which are not applicable for high comes negative. As shown in (Ref. 7) many of theangle of attack maneuvers. So the whole criterion terms, contained in C are usually small enough tohas to be recalculated on a modified basis which be neglected. The result of the evaluation leads tohas not be done up to now. the conclusion that directional divergence is like-
ly to occur, if
As a rule of thumb the required pitch accelerationcould be fixed at about t = ±0.3 rad/s3. This mar- Igin which should be designed for in any case, is Cnodyn - Cno " cog asupported by several simulation studies and recentwork within several fighter projects. approaches zero or gets negative. This tendency was
Additional pitch control power for increased agil- checked against the behaviour of several combat
ity at high angles-of-attack is directly combined aircraft and the correlation turned out to be fair-
with the requirements for maximum roll rate in this ly good. So it has become common use for prelimina-
region. The sketch on the lefthand side of Fis. 16 ry design to set a certain minimum positive margin
shows that any roll rate around the velocity vector for Cnd to make sure that spin tendency at high
is combined with a pitch-up momsent. The aircraft angles-of-attack is excluded.
acts like a dumb-bell and the resulting inertialcoupling produces a nose-up acceleration which is Meanwhile many papers have been published (see forgiven by: example [Ref. 4 and 6]) where the clear evidence
was pronounced that some key phenomena of moderns*C si " e* 2a fighters are not covered by the criterion. In
IC examining the data used by Weisman it was found in
So beneath the basic recovery margin additional [Ref. 4] that some important design features have
pitch down control power is needed to counteract changed since the criterion was developed. Espe-
the inertial coupling during roll maneuvers. As cially maximum lift and usable angle of attack havesoon as the angle-of-attack for maximum lift (i.e. shifted to considerably higher values ( mac x: 20"
roughly the location of minimum nose down control 3 30) which implies that the static and dynamicpower) is known it is possible to draw a design lateral/ directional derivatives are now dominatedchart of required pitch down acceleration versus by forebody vortices from nose, strakes or canard.roll rate, as shown on the righthand side ofFia. 16. The fix of a roll rate requirement at a For the older aircraft the dynamic data were ofcertain calibrated airspeed leads us straight for- minor influence and the departure characteristicsvard towards the nose down recovery margin in terms in Weisman's correlation were dominated by theof or pitching moment coefficient tCo which static derivatives. - High angle of attack charac-has to be installed. It is important to point out teristics of modern aircraft are more dependent onthat a certain loss in pitching moment due to dif- the dynamic derivatives which are heavily influenc-ferential flaps has to be taken into account; this ed by forebody geometry.leads to the slightly transverse line in the design In spite of the fact that configurations and usablechart if the recovery moment is defined to be de- flight envelopes have changed the characteristicrived from the configuration with all pitch con- equation of Fia. 18 is still valid:trols deflected fully down. Stable behaviour may be expected if all the coef-
ficients B. C, D and 9 are positive and if the3.5 esian Criteria for Lateral/Directional Routh-discriminant (CeB-D)%D-gil keeps larger than
tzero.A rough estimation shows that according to the geo-
Considerations about requirements for the lateral/- metric. mass an inertia figures of typical moderndirectional basic characteristics have to start fighters (Fig. 10 with radius of inertia ix " 1.5,with the evidence that an unstable design in i, - 3.41 span - 10 m) the folloving characteristicroll/yaw will not lead to such remarkable gains in values may be assumed (see Fig. 19):performance as a destabilization in pitch. Further-more a dynamically unstable aircraft in pitch and - mass density: me ) 80yaw may multiply the complexity of the flight con-trol syste and hence is not very likely to pay - inertia ratio@: K, * 0.1 K,z 0.5off.The consequence is that at low as well as at high - flightmechanical time: t F ( 0.1angles-of-ettck the design should aim towardscoefficients and derivatives which produce at least Furthermore the results of various windtunnel testsindifferent roota in the dynamic analysis (slightly show that ...unstable spiral mode excluded).The critical area for low angle-of-attack charac- ... Cy will always stay negativeteristics may be found at high supersonic Machnmbers. In the region of maim dynemic pressure ... Ctr will always stay positivethe elastic factors usually diminish the stabiliz- (Cfr - CL. Cr > 1.0 at Ct,")ing contribution of the vertical tail.
For the low speed/high angle-of-attack region Keeping these assumptions in mind the DESIGN RULESstable directional/lateral derivatives (%, -C11) for the aerodynemicists are straight forward (Fi.with moth behaviour versus sideslip, avoiuence f 19 bottom):yaw and roll departure tendenciee, eufficientmargin for spin resistance and effective rudder/ e Avoid utorotation tendency (C8 ( 0) androll control power highlight the optimization maintain yaw damping (C. ,. 0) In order togoals. keep the A-coefficient .1 the characteristicTo ase s departwe and spin reistance the equation greater than "zero*.*Dynmic Directienal Stability Parameter" Cnp
and the 5tateral Control Deperture Parmomter" DP * Coo mst be kept larger than zero as this
have been prepan - a predietion method by parsiter dominates the C-coefficient.
Usammen (see Rsf. 2.3.41. Ine resulting Ueimm CI"tRoiaslf.vb" irscnid-Criterion (tabe from Chtf. 31) In na 1 penteCoet ,xs it hr Cri oudrflea re1o6s of stableadbehavirin ably larger than 1.0, it is essmtial to main-the Cri -LaP lt n. s itbell h bole tain C.p > 0 with negative Ctp and only6K
0esiZ,
03jl9amc t it I slightly' itive Co st 40.).
18-6
In addition to these design guidelines it is im-portant to emphasize that ...
=no CIO ts a
0 Nonlinearities and Hysteresis Effects versus must be satisfied. Be~ause of is ) i good rollsideslip have to be avoided, performance at high angles may only be achieved if
sufficient yaw control power can be provided.
This is necessary, because the sideslip sensorswill not be very accurate, especially at higher The summary of all the discussions above is pro-angles of attack. In consequence it is extremely sented in Fin. 22 showing a possible "design chart"difficult or even impossible to schedule the con- for yaw and roll controllers at high angles-of-trol laws in order to cope with such aerodynamic attack. The diagram (body fixed yawing moment ver-inadequacies, sus body fixed rolling moment) contains the line ofThe fundamental evidence of this section however is coordination (defined by the equation above) and anthe need, to include the dynamic derivatives into arbitrary minimum requirement for Cn end C, (de-the design considerations for modern fighters as ducted from Fig. 21). The example assumes that theearly as possible by adequate dynamic windtunnel aileron and/or flaperons at high angles-of-attacktests. produce an adverse yaw/roll characteristic. Start-
ing from this characteristic it is now necessary to3.6 Design Rules for Lateral/Directional Con- meet the coordination line above the requirement by
trollers providing the appropriate yaw control power. Itgets evident that this does not only require a cer-
The essential factors which influence the control tain yawing moment Cn but also an C -C, characte-power requirements in roll and yaw may directly be ristic of the yaw controller. Once the yaw/rolldeducted from MIL-Spec., as for example from re- control behaviour is fixed by configuration detailsquirements for "Time to Bank". Engine failure dur- it is of no use to increase the yaw potential bey-ing Take-off" end "Take-off/Landing in Crosswind". ond the "line of coordination". The capabilitiesControl power for stabilization or stability aug- for a well coordinated roll maneuver will not im-mentation of the lateral/directional axis is depen- prove.dent on the chosen basic stability characteristics,as discussed above. But as long as no excessiveinstability in roll or yaw has to be covered, the 4. Conclusionscontrol power defined by the conventional criteriashould be sufficient. Recent experience in the design of highly augmented
The capability to initiate and maintain coordinated modern fighter aircraft with basically unstablerolls at high angles-of-attack represents a major characteristics in pitch has shown, that the earlypoint of interest especially for future fighter integration of flightmechanical requirements into
aircraft with high agility in this part of the the aerodynamic optimization process is mandatory.flight envelope. Already during preliminary design Maximum allowable instabilities and control powerphases these aspects may be covered. Fi. 20 il- requirements. will set remarkable constraints tolustrates within three sketches in the time domain the freedom of aerodynamic design and influencethe essential parameters: essential components of the aircraft. Because of
the complex aerodynamic effects at high angles-of-The desired roll performance of an aircraft may be attack it will be necessary to approach the "basicsufficiently described by the Roll Time Constant configuration" by some optimization loops. DuringTR, the maximum Roll Rate PMAX and a "Time to Bank the whole process specialists from flightmechanics,to 0 degrees". Host of the control law designs try aerodynamics and overall design departments have toto avoid sideslip and therefore prefer a well co- form a close team in order to end up with an excel-ordinated roll around the velocity vector, lent well-balanced design.So the "pitch recovery margin" which has to be pro- Furthermore the discussions have shown that thevided according to the discussion in chapter 3.4 requirements, presented in the sections above, aresets the first corner stone by defining the maximum up to now not finally settled and they my not bepermissible roll rate PVWA (roll rate around the applicable for other aircraft projects withoutvelocity vector) due to inertial coupling compensa- previous examination. The specific boundaries andtion. numbers within the criteria will have to be in-From the applicable Handling Quality Documents dividually tuned to the design goals of the project(f.e. NIL-F-8785C) recommended "Level-l"-value for under consideration. Especially the diagrams of the"Time-to-Bank" and "Rolltime-Constants" may be de- T,-Criterion can easily be updated and revised ifpicted for the essential flight conditions. These the procedure in [Ref. 9] is run with Handling/Ridecharacteristics are linked by the simple-equation Quality end Stability Requirements of current in-
terest.
a(t) - pv " (t - TR (1 - a -t/TR)) It is proven, however, that a set of criteria whichrepresents a platform of coion discussion for thespecialist groups "Aerodynamicists", "Mlight-
and so the "required" Pv my be checked against mechanics" and "Control-Law Designers" within earlythe "permissible" definJy the pitch recovery phases of a new fighter project can be and must bemargin installed, established in order to avoid unexpected, time con-
swing and costly difficulties in later designIn a second sty the required angular acceleration phases.around the velocity vector which is necessary toinitiate the coordinated roll mmn r may simplybe defined as: 7. Nomenlatur
P B, C. D. E Coefficients of characteristic aqua-4. - tion. NeFig.JI
-tlq. b Wing span
Fa. 21 points out how the roll acceleration re- % (-I Drag Coefficientquirmnt has to be tranfered into body ans. The c NI Now Aerodynami Chord
definition of agle-of-attach and calibrated air- C 1- Lift Coefficientepd /dpn i of ees . heref-a the agliktd isi- [red'] Lift de to Deflection of Pitch Con-9POV6/4P e~ In, om. Ont the agility is re- ttollerquired, leads to the deduction of the body fI ered-' Lift Cve Sloperoll and yow aontrol power re r mmats. law [red-1) Lift &0 to lA0 Of Atet PAtfurther analysis shos that for any coordinated (red"' Lift des to pitce ve t aroll monner oent the relation
18-7
C, (red-'] Rolling Moment Coefficient (BodyFixed)
Cip red-l] Rolling Moment due to Sideslip 8. ReferencesCic [red
-']
Rudder efficiency( red-'] Rolling Moment due to Roll Rate [Ref. 11 H. Wfnnenberg et al.Cir [red'] Rolling Moment dua to Yaw Rate Handling Qualities of HighlyC, E-1 Pitching Moment Coefficient Augmented Unstable AircraftCred-&) Efficiency of Pitch Controller AGARD Advisory Report AR-279
C (red-'] Pitching Moment derivativeCm& (r
ed-'] Pitching Moment due to Anle of [Ref. 21 Weisman RobertAttack Rate Criteria for Predicting Spin
C (q (rad'] Pitching Moment duo to Pitch Rate Susceptibility of Fighter Type Air-Cn 1-] Yawing Momant Coefficient (Body craft
Fixed) ASD-TR-72-48, June 1972Cred-&] Directional Stabilityd [red') Spin Resistance Parameter (Def. [Ref. 3] Beaufrere, H.
sedy. Flight Plan Development for a Jointsee Fin. 17) NASA/Navy High Angle of AttackC Cred] Yawing Moment due to Roll Rate Plight Test ProgramCn (rad-I] YawingMoment due to Yaw Rate Gruman Contract No. NASA 2965nC red-'] Rudder efficiency March 1983
-1 Sideforce coefficient (Body Fixed)C frdZ] Sideforce due to Sideslip (Ref. 41 J.R. Chody, J. Hougkinson, A. Skew[red-') Sideforce due to Roll Rate Combat Aircraft Control Requirements(red'] Sidaforce due to Yaw Rate for AgilityHx (m Altitde AGARD Symposium "Aerodynamics ofi [ml Radii of Inertia (Body Fixed) Coebat Aircraft..."i l (B]yMadrid, 2. - 5.10.1989. CP 465
(Ref.5] Military Specifications[-] Ratios of Inertia (see Fig. 11/18) Flying Qualities of Piloted AirP Lateral Control Departure Parameter Vehicles NIL-F-8785C
(see in ) [Ref. 6] P. Mangold. G. WedekindM (m/s Pitching Moment Build-up Rate Integration of Aerodynamic, Perform-A I-] Ptchig omer Bance, Stability and Control Require-ma N-] Mach Number ments into the Design Process ofp m dog/s] Roll Rate Modern Fighter Aircraft Configura-
q [deg/al Pitch Rate Body Fixed tions AGARD, LS 153r (deg/al Yaw Rate (Ref. 7] N.V. GreerS (m] Reference Areaa [m] Half Span Summary of Directional Divergencea Is-'] Short Period Roots Characteristics of Several High Per-SM [ ] Static Margin formance Aircraft Configurations
tF )s] Plightmechanical Time (Fi. 18) NASA-TN D-6993, Nov. 1972T, (.] Time-to-Double AmplitudeTR Wa] Roll Tim Constant [Ref. 8] P. Mangold/G. WedekindTt 'ls Time Delay "Inflight Thrust Vectoring" at (a] Time Further Degree of Freedom in theV [m/s] Airspeed Aerodynamic/Flightmechanical DesignXcg % El Centre of gravity "f Modern Fighter Aircraft'ac % El Aerodynamic centre AGARD CP 465, Madrid 1989a (dog] Angle of Attack
[ deg] Angle of Sideslip [Ref. 9] P. Mangold1 -1 Damping Ratio Integration of Handling Quality[deg] Rudder Deflection Aspects into the Aerodynamic Designn (dog] Deflection of Pitch Controller of Modern Unstable FightersO (deg] Pitch Attitude FMP-Symposium AGARD: Flying8 (red/s] Pitch Acceleration Qualities Quebec. 15. - 18.10.1990
(rad/s3l Pitch Control Reaction (see Fig. 8)* Cdegi Bank Angle
ML 1-1 Mass Density (sea Fin, 11)P s [-] Masa Density (see Fix. 1)p (kg/m] Density
t (rad/al Frequencyw* (rad/] Undamped Frequency
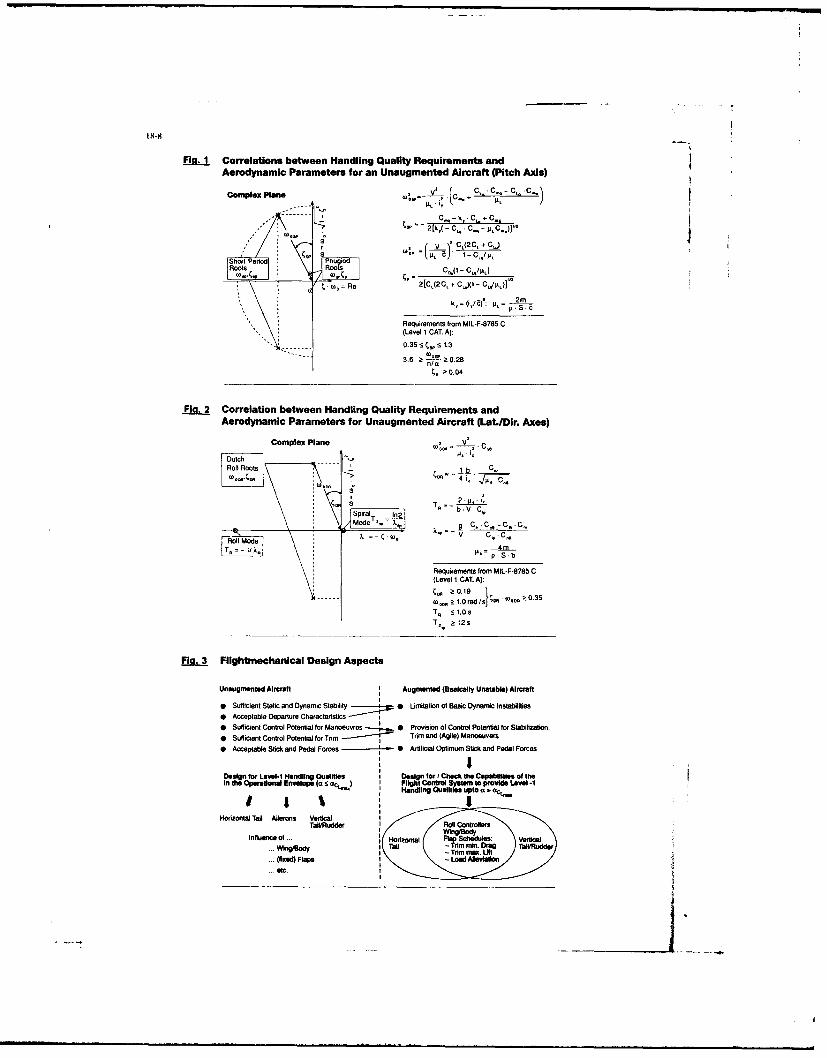
Fig. Correlations between Handling Quality Requirements andAerodynamic Parameters for an Unaugmented Aircraft (Pitch Axis)
Complex Plane C , - C '-
Vr CL(2CL +C
Short R 1-C /PLRot Rot C,( - C /JAJ
Sw= Re 2[C,(2C, +CJ)(t - C~Lyg)]"
I'L = i p S a 3
Requirements from MIL-F-8785 C(Level 1 CAT. A):
0.35!; C 0 1.3
3.6 0-~~ .28
p 2!0.04
!I2 Correlation between Handling Quality Requirements andAerodynamic Parameters for Unaugmented Aircraft (Lat.IDir. Axes)
Complex Planeo
Dutch 0
Roll Roots . ise41i
T,, -
=Sp- V* C-Mod X--)
Requirements from MIL-F-8785 C(Level 1 CAT. A):
~ 0.19----- _ 2 ,1e/sl wneou z!0.35
T2, 12 s
Fla Flightmechanlcal Design Aspects
Unsugmentad Aircraft Augmented (Basically Unstable) Aircraft
" Sufficient Static and Dynamic Stability -4-- C Limitation of Basic Dynamic Instabiltihes* Acceptable Departure Characteristics* Sufficient Control Potenrtial for Manoeuvres;.-.. Provision of Contro Potential tor Stabilization,* Sufficient Control Potetil for Trim ----- Trimt end (Agile) Menoeuvers
o Accetlable Stic and Pedal Forces -' . Artificial Optimum Stick and Pedal Forces
Desig for Level-I Handilin Qualities t Design fori C tecthe capabilities of theIn the operalioinal Env=p (a 5 ac._) FihCntl sto provide Level-I1
Handllg Ou I teuto . o0.-
Hocizontal Tell Ailerons VeticalTallRudder IRoilCotler
sotoa Fo Schedules: Verticalwtiffrene of t oioall -1 TSm . DmTti min.iifixed) Flaps I Lod Alleviaion
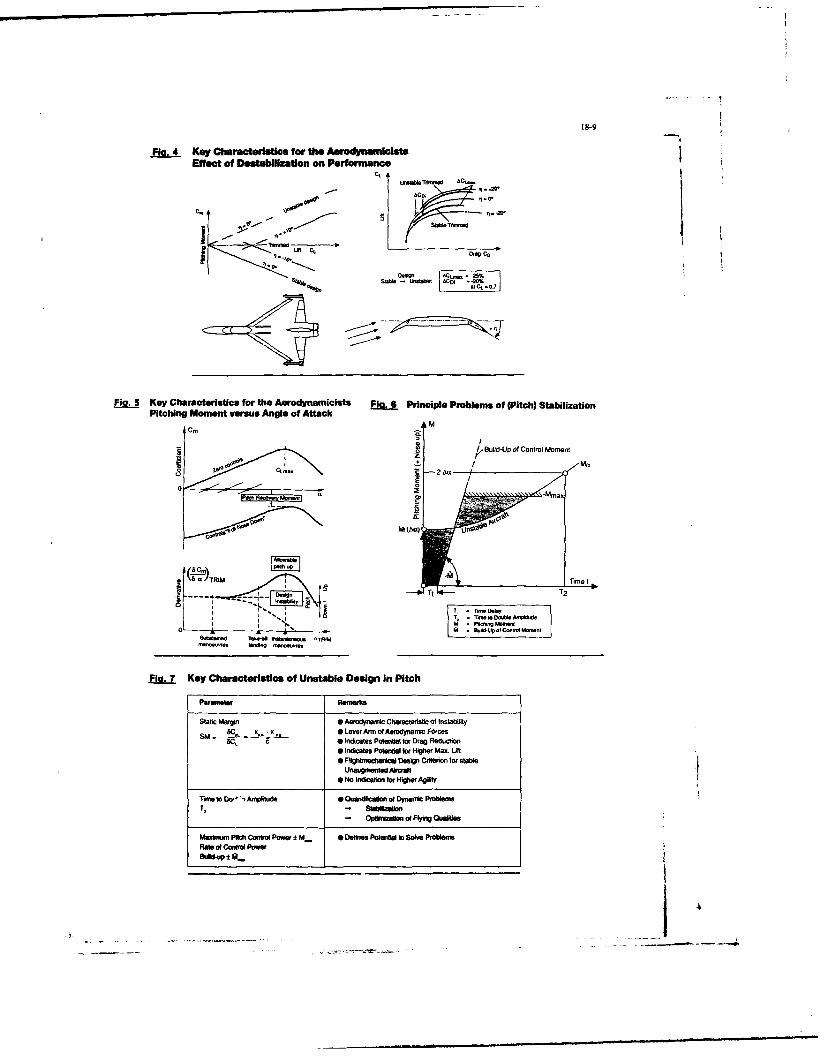
M89
Fjo.4 Key Characteristics for th. eroya ltEffect of Destablization on Performance
st" LV.U.W d
Fin. Key Characteristics for the Aerodynarnicists Fl. Principle Problems of (Pitch) StabilizationPitching Moment versus Angle of Attack
M1Cm
S I Build-Up of Control Moment-5-
0 SMa8 c_2o. 4~1e~te.~
8Cso
C~ ~ ~ ~ ~~..... Ftgttefuia Desmg tiiro trsa
o.- B." 0 .1M M-
- OpWnzaao FligQulfe
M 8iestPiC, n Poe kxMkaDties potential for SraineuioneeIndiate ofetil Cfnoo PohewerUfFMd~nip± Ong rteinfr ii
Unau~rwLo :knf
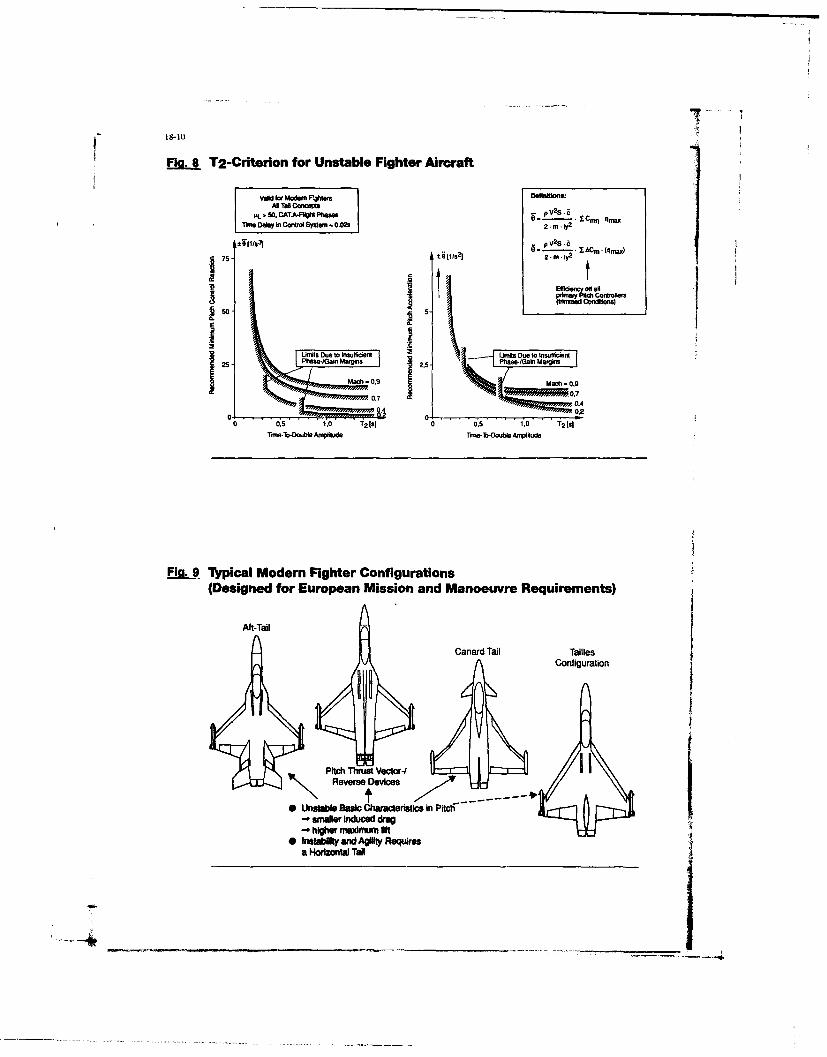
- 18-10
Fla. 8 T2-Criterion for Unstable Fighter Aircraft
PL . 50. CAT +-49M PhasespV 2S~a xCM If
75 - 12-m*iY
e -50
M 0.5 -, 0.9s 0 M.5 1. 12.9
Fig.~~~ 9 zwma
Mdr Fgtr ofguain
(Designed for European Mission and Manoeuvre Requirements)
Af - alC anard Tail Tailles
Configuration
tt
* Unstabl Basic Charactenis in Pitch* nde ndcdda
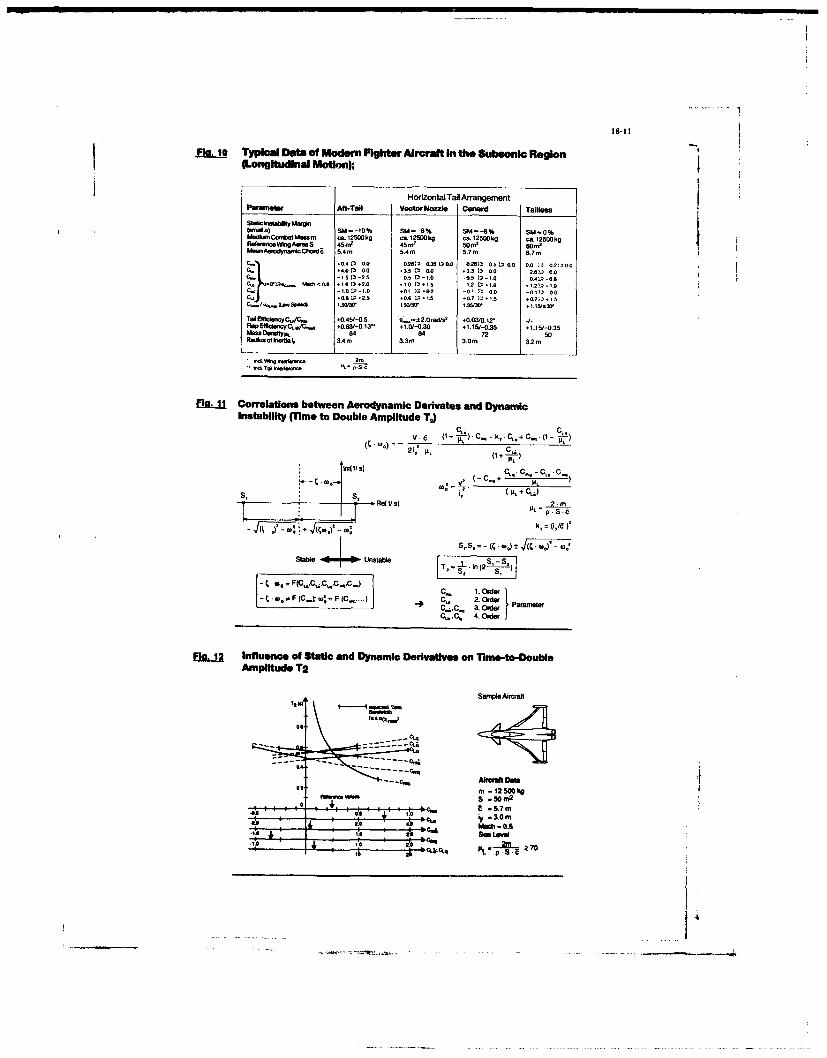
ISOWN
Fig i Typica Dafta of modemn Fighter Aircraft In the Subsonic Region(Longitudinal Mogaon);
Horizontal Tail ArrangementParmmebar Aft-Tail Vector Nozzle Canard Tailless
Wsm) SM-10% SM- 8% OM--B% 854-0%
= "djm.Caelasm ca.125M kg ca. 12500ko ca 12500kg 08.1250kg.esoc=nAe'sS 45m' 45o1 s0m' 00 m,M~neoy. .Zo0s8 5.4. 5.4. 5.710 6.7.
_44. _0 .35 ED0Z .3 31)00 2.8D) 0.0,51 .5 -0.50 1- 1.0 -0.5 53-,.0 -0AD)-OS
).Or.... U.S 0.6 .11 D0.2.0 :. D -15 1.2 D1.9 .1.2D.,t9.0. ED - 0 .01 D 00 -0.1 M 0.0 -071y 0o
C1.0.8 L5-.5 .0.6 L53- .5 .0.7 135. 0.- ..
Ta1Efflviewy0 C, 1 10.46t-0.5 '0...-±2.Orad/s2 +0.03/0.12' -I
=E=~uty. 84 84 72 5Rai.ako of el 3. 3.30.n 3.0.0 3.2.
OS. 8%. W4.1o. Sf
Fla. 11 Correlations between Aerodynami~c Derivates and DynamicInstability MTme to Double Amplitude I,)
V. E (I + -)C_ - k, - r* +C..6 I
OYo)= (i, C, + - .- C -)
S, , (II ~ j
P.S-d
Stable Unstable n 2 3,-,
F( (~C~e,.k C. C 2:OSe
C a4 Order f1.06
Flai1 Inluence of Static and Dynamic Derivaties on Time-to-DoubleAmplitude T2
-~~Md -0-.------
___ ___ _ m Le5WVi
S om
CL. Mach - 0.6
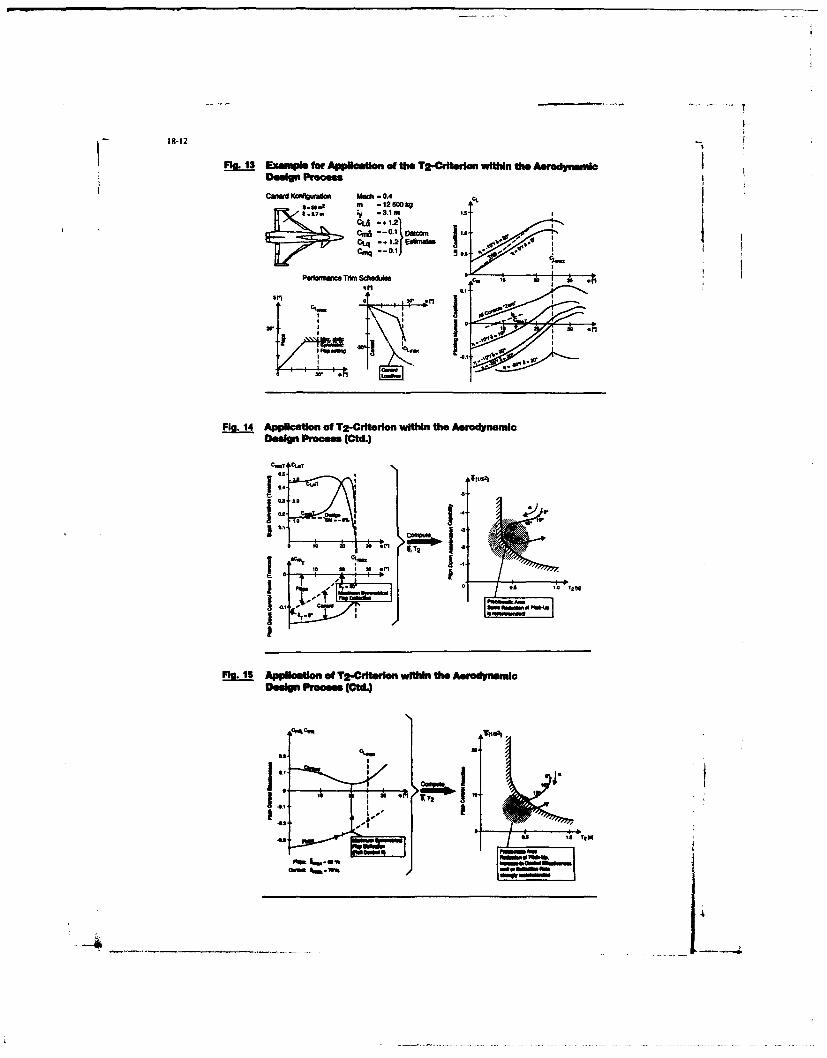
18-12
Flu. I1 xapl for Appication of the T2-Crlteron within the AerodynamIc
mmdKOVaoo M~h 0.4-, m 12 500 kq
CLa -+1.2
C,.-01
PerbIo 0 30 elWiw
C ,~
0
Fig. 14 Application of 12-Criterion within the AerodynamicDesign process (Ctd.)
C..T 'C1.
04 I
4.1I 04 T204 - -,
n 1 30 rI
ILM
41
1*. I.:OI-m %Mw
I I
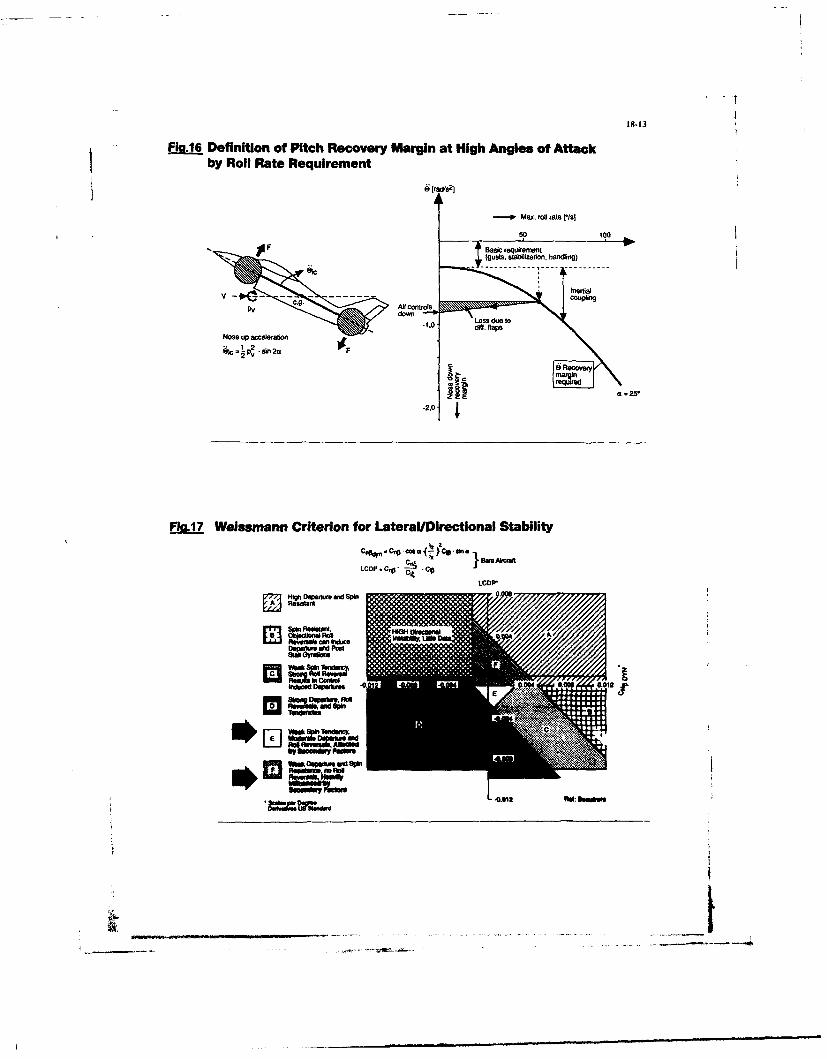
18-13
Fi.16 Definition of Pitch Recovery Margin at High Angles of Attackby Roll Rate Requirement
-.~Max. roll rate t~s]
IFBasic reqrulreilet(gusts, staitizafion, harding)
down .
Nose up acceleration
2
z 2 a -251
Jn? Weissmann Criterion for Lateral/Directional Stability
LCnP.Cn* -C-1 C~ b
HliR fleetr and SPin
p a ___H ONS. A
Shueg Dapsie. Roll1
V4 SpnT~ucFE] 0 ~
LU ResTw n RolR~aom~w s 6.r...
no: asI*
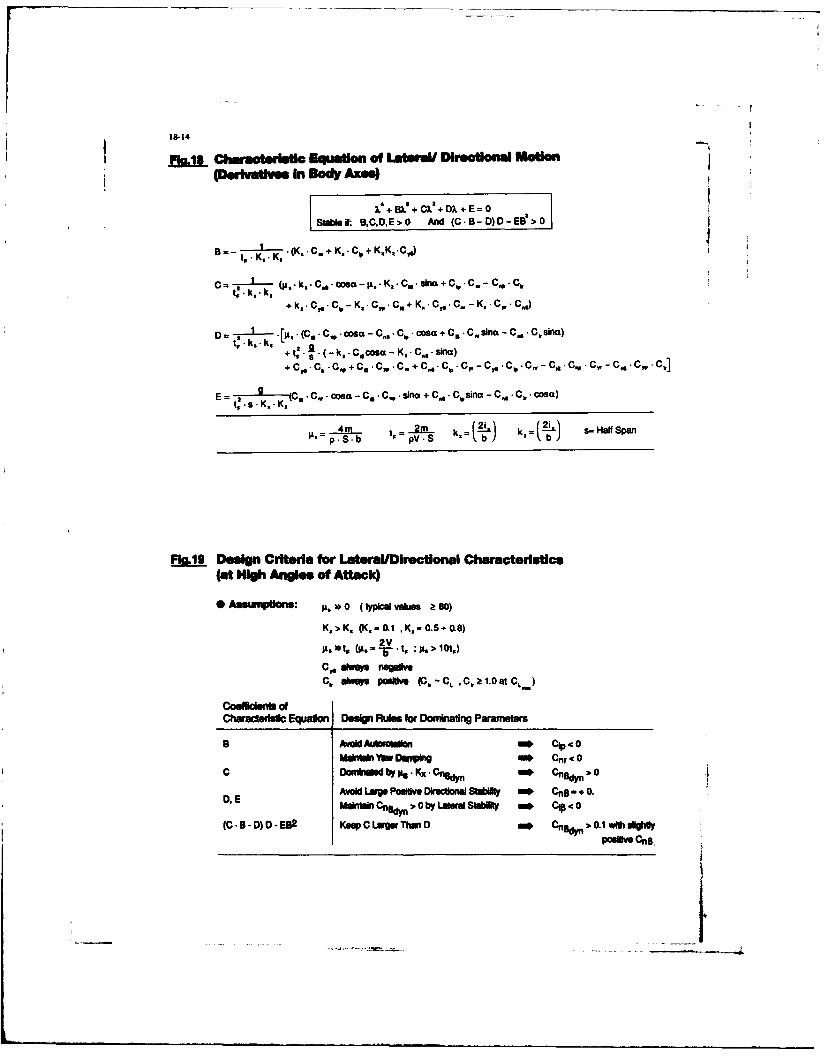
18-14
pDervatves In Body Axes)
Suaif: B,C.DE>O And (C. B-D)D-EB>0
+ Kv C1 +KKC,
C=--' (It. k. C, osa- p. -K. .C, *she + C, C.-C-Ch1: .k.*k -k.-Ce.
+ k, -Ce CI-kK. Ce - C.K. i -K C,, slnu)
D+I. Cm . C,, oC.a C., C, C, + Cosa + C, - Csn - 1 C, - C~ .,C. C ,, C,
~~~ .Cff-ou-Cs-CV.-siflu+C4-C6 sina-C ,-CCosU)
4*~I m 2M~ k.= (-2i k, I(-2i) s- Half SWa
!W-9 Design Criteria for Lateral/Dlrect~na Characterdstcs(at High Angles of Attack)
Aeeupfens: p. *0 WicW ak,"lj k 8SO)
K,>K. (1C,-O1 ,K.-O.S+ 0.8)
CO ala~ nsgdveC, alay positiv P(C, , C, z 1.0 at C'-)
Cos iul OfOwhdaclsltio Equton Dehiwi Rule for Dorniating Parametei
*AvoidAW*orolion M.Cip -COM I td Yaw OVIAg 1 l Cnr<0
C Dafl*Iod by p -Kx Cnhdyn -0 ndy
D, E Avoid Lags Poitve Directional St~iliy wo Cnj -. 0.M-1 19Cndyn > 0 by LeeaStdfty Cpc 0
(C.U.D)D-ES2 KOW C LegrThen D m* Cnadyn >0.1 wmithiVPOW"iv CnGs
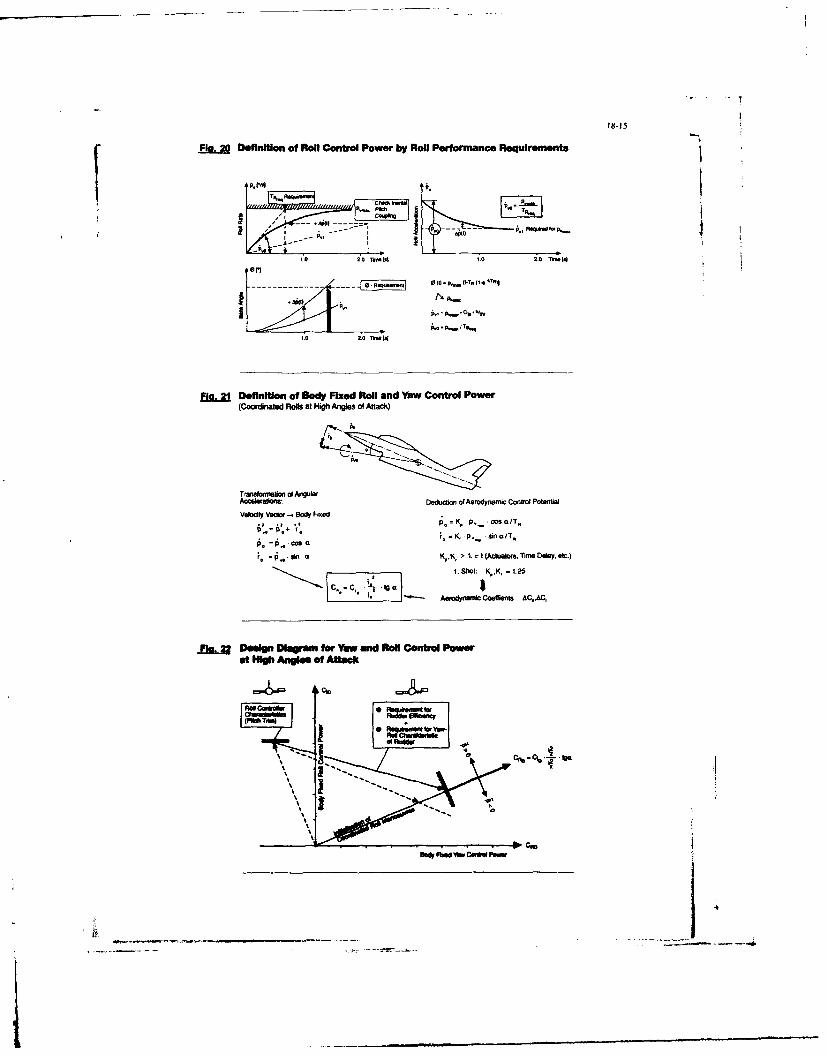
18-15
Fla.~ Definition of Poll Control Power by Roll Perfonnanoe Reaulrmet
I p0., - .- p
1.0 2.0 l~eT 1 . . -
Fla. 21 Definition of Body Fixed Roll and Yaw Control Power(Cooriated Rota at High Angles of Attack)
T,'anskalntion of AngularAcceleraions: Doction of Asrodynarnic control Potentia
Velocity Vector- Body F'ixed sof..................... p0 K, P._ sinioIT.
I. Shot K,K, . 1. 25
2.~ Aercidynamic Coeflenta AC.Aq
flDealgn Digrm for Yaw and Rol Control Powerat HNgh Angles of Attack
Pendvi Amc PegCI
Rodf:edr.- -I -I
19- -
ABROSERVOELASTIC STABILITY OF AIRCRAFT
AT HIGH INCIDENCEby
3uergen Becker
NR GmbH FE273P.O. Box 80 11 60D-8000 Manchen 80
SUMMART
The aeroservoelastic stability of a fighter type aircraft is investigated athigh angle of attack. The effects of nonlinear, incidence dependent unsteadyaerodynamic forces of elastic modes and of control surface deflections on thestructural coupling are demonstrated for low and high subsonic speeds for differentincidences. The difference of open loop frequency response functions calculated withlinear and with high angle of attack unsteady aerodynamics documents the necessity ofintroduction of high incidence effects for aeroservoelastic stability calculations.Nonlinear effects are introduced using unsteady pressures of windtunnel experiments onan oscillating model by correcting of theoretical pressures.
1. INTRODUCTIOR4
This contribution describes a possible way to pred-ct the aeroservoelasticstability of an aircraft at high incidence including nonlinear aerodynamic effects.The design of flight control laws for modern aircraft is very much influenced byaeroservoelastic members to alleviate structural coupling effects. Notch filters oractive feedbacks of local elastic accelerations or rates have to be optimized inorder to give minimum structural coupling together with minimum acceptable effects onaircraft handling and on flutter phase and gain margins without violating requiredstability limits. The design of the notch filters or of the active feedback controllaws is in general based on an analytical dynamic model which includes thedescription of flight and structural dynamics together with unsteady aerodynamicforces of the elastic vibration modes and of control surface deflections. A specificproblem area concerning layout of filters or control loops arises especially at highincidence, high dynamic pressure flight conditions since the unsteady aerodynamicforces which especially in case of unstable aircraft configurations play an importantrole for the stability margins of elastic modes compared to those on groundconditions.
The problem stems from the fact that theoretical unsteady aerodynamics fromlinear theory which have anyhow to be applied do not include high incidenceaerodynamic effects, effects of flow separation or related nonlinear aerodynamicbehaviour. The investigation is performed on a typical Delta Canard fighter aircraftsimilar to the configuration shown in Fig. 1.
2. STABILITY CRITERIA
For stability assessments of the aircraft with Flight Control System (FCS)criteria from the following NIL-Specs are applied:
1) FLIGHT CONTROL SYSTEM, NIL-F-94900(USAF)2) AIRPLANE STRENGTH AND RIGIDITY VIURATION FLUTTER AND DIVERGENCE, NIL-A-88708(AS)
The military specifications for aircraft with FCS contain gain and phase marginrequirements for the open loop frequency responses for the rigid dynamics in thefrequency range of the modes N from 0.06 1 fa
< first aeroelastic mode which are in
the range of minimum to maximum operational speed 6 do gain and 45 degree phasemargin and at limit aicspeed V, 4.5 do gain and 30 degree phase margin. NIL-F-9490Drequires for th. mode trequncaes fa > first elastic mode 8 do and 60 degrees phasemargin in the operational range and 6 do and 45 degrees phase margin for VL.
Special requirements for mode frequencies f > first elastic mode may beformulated which take into account uncertainties in the prediction of unsteadyaerodynamic forces at extreme flight conditions. Especially if actively controlledconfigurations are concerned, which are unstable. For these configurations the flightclearance has to be based upon prediction for open loop response functions, sincein flight testing cannot be the basis.
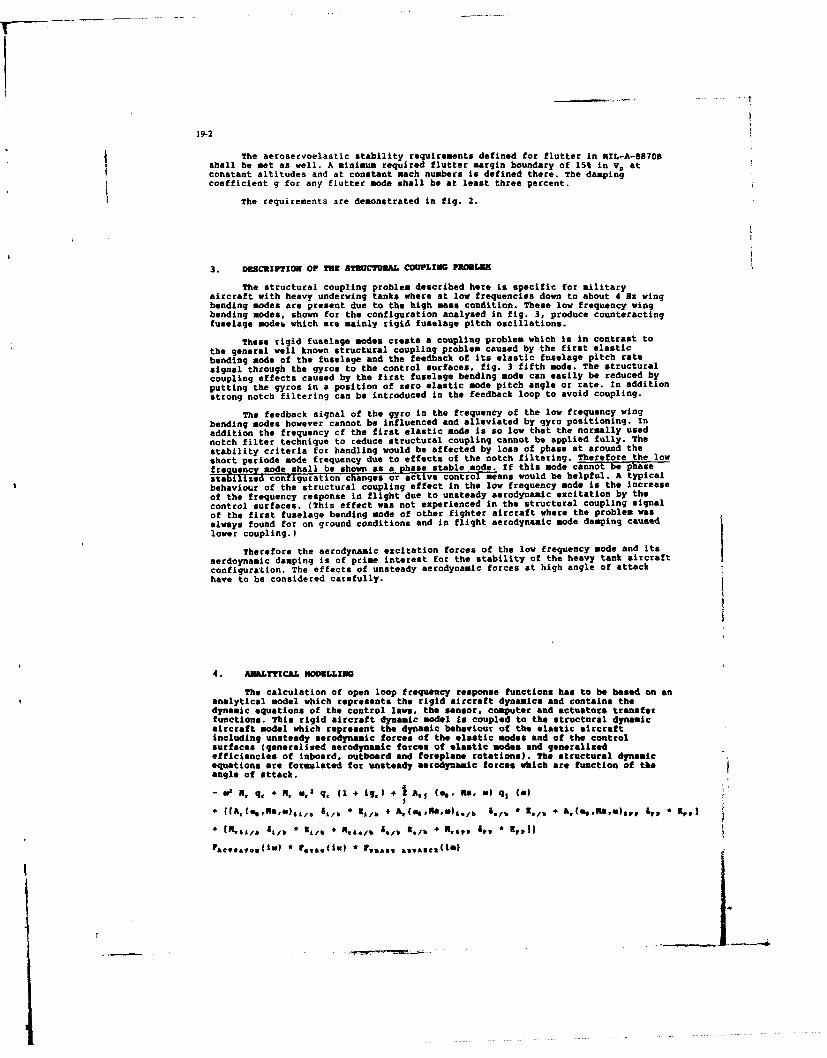
19-2
The aeroservoelastic stability requirements defined for flutter in NIL-A-88708shall be met as well. A minimum required flutter margin boundary of 15% in V, atconstant altitudes and at constant nach numbers is defined there. The dampingcoefficient g for any flutter mode shall be at least three percent.
The requirements are demonstrated in fig. 2.
3. DEBCRIPTIOU OF TS STRUCTURAL COUPLING PaUGLER
The structural coupling problem described here is specific for militaryaircraft with heavy underving tanks where at low frequencies down to about 4 Hz wingbending modes are present due to the high mass condition. These low frequency wing
bending modes, shown for the configuration analysed in fig. 3, produce counteractingfuselage medek which are mainly rigid fuselage pitch oscillations.
These rigid fuselage modes create a coupling problem which is in contrast to
the general well known structural coupling problem caused by the first elastic
bending mode of the fuselage and the feedback of its elastic fuselage pitch rate
signal through the gyros to the control surfaces, fig. 3 fifth mode. The structural
coupling effects caused by the first fuselage bending mode can easily be reduced byputting the gyros in a position of zero elastic mode pitch angle or rate. In addition
strong notch filtering can be introduced in the feedback loop to avoid coupling.
The feedback signal of the gyro in the frequency of the low frequency wing
bending modes however cannot be influenced and alleviated by gyro positioning. In
addition the frequency of the first elastic mode is so low that the normally used
notch filter technique to reduce structural coupling cannot be applied fully. The
stability criteria for handling would be affected by loss of phase at around the
short periode mode frequency due to effects of the notch filtering. Therefore the low
freuency mode shall be shown as a hae stable mode. If this mode cannot be phase
stabilized configuration changes or active control means would be helpful. A typical
behaviour of the structural coupling effect in the low frequency mode is the increase
of the frequency response in flight due to unsteady aerodynamic excitation by the
control surfaces. (This effect was not experienced in the structural coupling signal
of the first fuselage bending mode of other fighter aircraft where the problem was
always found for on ground conditions and in flight aerodynamic mode damping caused
lower coupling.)
Therefore the aerodynamic excitation forces of the low frequency mode and its
aerdoynamic damping is of prime interest for the stability of the heavy tank aircraft
configuration. The effects of unsteady aerodynamic forces at high angle of attack
have to be considered carefully.
4. ANALYTICAL MODELLING
The calculation of open loop frequency response functions has to be based on an
analytical model which represents the rigid aircraft dynamics and contains thedynamic equations of the control laws, the sensor, computer and actuators transferfunctions. This rigid aircraft dynamic model is coupled to the structural dynamicaircraft model which represent the dynamic behaviour of the elastic aircraftincluding unsteady aerodynamic forces of the elastic nodes and of the controlsurfaces (generalised aerodynamic forces of elastic modes and generalizedefficiencies of inboard, outboard and foreplane rotations). The structural dynamic
equations are formulated for unsteady aerodynamic forces which are function of theangle of attack.
- X. N, q, +R, a.' (1 + ig,} + I Ax (e, Na. ) q (m)
+ *IA,(,a),},, b * Kil + Av(WRa&m )Sa,/b .fb * 4/b + A,(,atm,,ar KIP ) Ep
*rN., /b " K C/ + X £*/ /b 3./b * K.6t pt *5 RI11
,aeseaot(il C Fdjeo(iC) * r,5 ass asvsncom)
L4
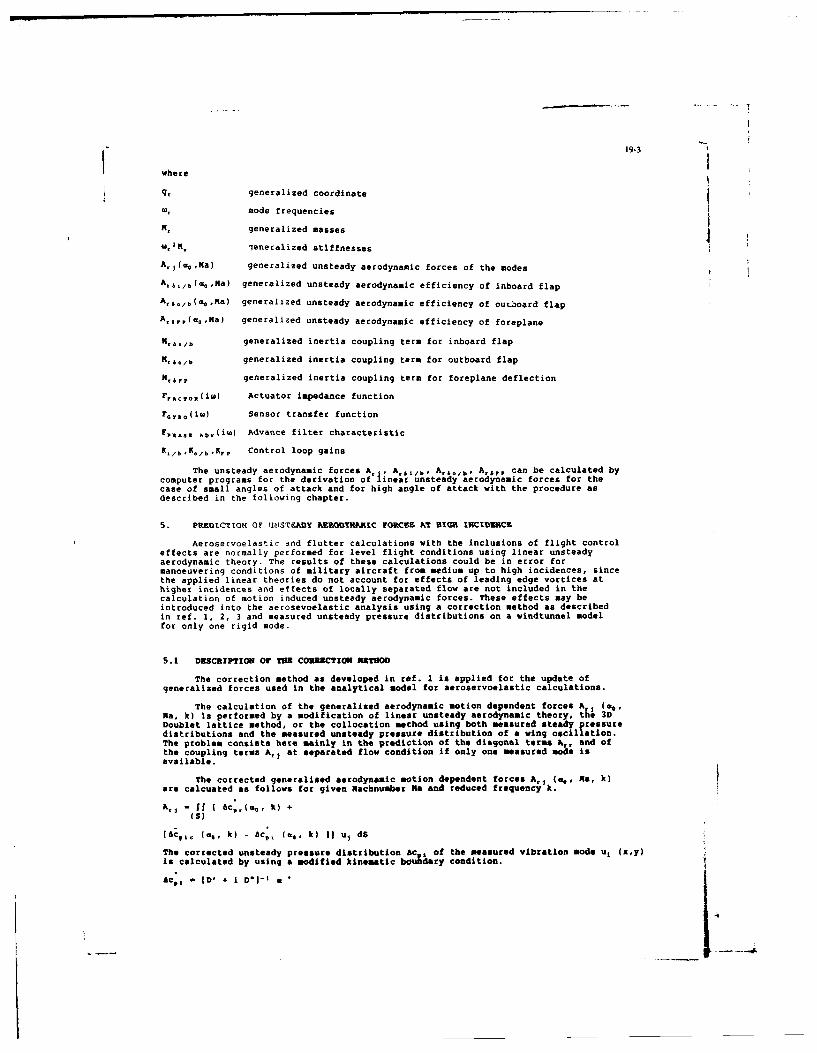
19-3
where
q, generalized coordinate
mode frequencies
Nr generalized masses
2raKv ieneralized stiffnesses1
A,,(a 0,Ma) generalized unsteady aerodynamic forces of the modes
Al i/b(GMa) generalized unsteady aerodynamic efficiency of inboard flap
A.6o/0(%,Ma) generalized unsteady aerodynamic efficiency of outboard flap
A. ,4 p(mMa) generalized unsteady aerodynamic efficiency of foreplane
K, &t/b generalized inertia coupling term for inboard flap
M,&o/b generalized inertia coupling term for outboard flap
M, rPV generalized inertia coupling term for foreplane deflection
FrACTo(i() Actuator impedance function
rGYMo(iw) Sensor transfer function
FPSAsU A5v(im) Advance filter characteristic
5L/bKo/b r P Control loop gains
The unsteady aerodynamic forces A * A, b/b, Aro/b, A. 6 ., can be calculated bycomputer programs for the derivation ofilnear unsteady aerodynamic forces for thecase of small angles of attack and for high angle of attack with the procedure asdescribed in the following chapter.
5. PREUMCTtON OF UST Y SARQUThYMIC fGUCAS AT BXGR IUCIDUKCK
Aerosecvoelastic and flutter calculations with the inclusions of flight controleffects are normally performed for level flight conditions using linear unsteadyaerodynamic theory. The results of these calculations could be in error formanoeuvering conditions of military aircraft from medium up to high incidences, sincethe applied linear theories do not account for effects of leading edge vortices athigher incidences and effects of locally separated flow are not included in thecalculation of motion induced unsteady aerodynamic forces. These effects may beintroduced into the aerosevoelastic analysis using a correction method as describedin ref. 1, 2, 3 and measured unsteady pressure distributions on a windtunnel modelfor only one rigid mode.
5.1 DESCRIPTION OF TKE CORUCTION 351OD
The correction method as developed in rof. 1 is applied for the update ofgeneralized forces used in the analytical model for aeroservoelastic calculations.
The calculation of the generalized aerodynamic notion dependent forces A,1 (G,Na, k) is performed by a modification of linear unsteady aerodynamic theory, the 3DDoublet lattice method, or the collocation method using both measured steady pressuredistributions and the measured unsteady pressure distribution of a wing oscillation.The problem consists here mainly in the prediction of the diagonal terms Az, and ofthe coupling terms A,, at separated flow condition if only one measured mode isavailable.
The corrected generalised aerodynamic motion dependent forces Ar, (a,, Na, k)are calcuated as follows for given Nachnumber Ha and reduced frequency k.
A,1 - 55 1 Sc,,(%, k) +
(S)
(c, 1, (.,, k) - 6cj (a., k) 1) u, dS
The corrected unsteady pressure distribution 6cj of the measured vibration sode u, (x,y)Is calculated by using a modified kinematic boundary condition.
Ac,, * [' i DI'-
a
19-4
where
D1 + iD' is the matrix of aerodynamic influence coefficients.
a " U - + " - u + i k Z i
U. ax
The local velocity U. + a. is calulated from local Machnumber and speed of sound.
U. + 5. (x, y) - a (x, y) Ma (x, y)
K1+ ci) 1
The local speed of sound a (x, y) - KRT is derived from adiabatic compression.
From the difference between measured and corrected unsteady pressure distribution of
the measured vibration mode an additive correction term
[hacp, - Ac,]
is known, which for the formulation of arbitrary vibration modes is assumed to be
independent of the mode.
The corrected pressure distribution for arbitrary mode shapes uj are then calculated
by
acp - to' + i D"1-'o, + facpc + Acp]
In general the measured motion induced pressure contains a contribution of the
fluctuating pressure at the reduced frequency of the harmonic oscillation k. The
contribution Ac" (k) may be approximatively extracted from the static measurement.
Therefore the measured unsteady pressure can be corrected.
ac,, (k) - [6c., (k) + Ac5 j (k) - C.c (k)
5.2 WIZDTUMUNL MODEL DESCRIPTION
The windtunnel tests were performed on a 1/7 scaled half model of a tactical
fighter type aircraft. The model configuration included a delta wing, a foreplane and
half a fuselage installed at the windtunnel wall (fig. 4). The wing and foreplane
were very stiff, machined out of steel.
The fuselage was fixed to the turn table by means of a large rigid cylindricalpart locked when incidence was reached by a set of hydraulic brakes (fig. 5). The
fuselage contained two hydraulic rotating actuators. The first one aligned with theforeplane axis, allowed to give static foreplane deflections while the second onealigned with the fuselage center line provided roll excitation of the wing.
The different measurements performed were: steady and unsteady pressure fields,
steady and unsteady roll moment, accelerations on the wing. The model was equippedwith 67 pressure pick-ups, 67 steady pressure tappings, 7 accelerometers, 3 strain
gauge bridges. The steady and unsteady pressure pick-ups pairs were distributed along
four wing sections on the upper surface and, in a smaller number, alng three wingsections on the lower surface.
Tests were performed using sinusoidal wing roll excitation. After conditioning
and switching, amplifying and filtering at a cut-off frequency choosen between onceand twice the excitation frequency, the signals were digitalized at a sampling rateof eight times the excitation frequency. Fourier analysis was performed, modulus andphase of each signal, normalized to the amplitude of the roll oscillation werecomputed at the excitation frequency, giving unsteady pressure coefficients.
Tests were performed for different Mach numbers and angles of attack includingbuffeting situations. The Mach number ranged from 0.3 to 0.95, incidence ranged from
0 to 40 degrees, decreasing as Mach number increased: 40 degrees at M - 0.3, 10
degrees at R - 0.85 and 0.9, 8 degrees at M - 0.95.
S.3 MEASURED QUASISTRADY PURSSMUE DISTRIOUTIOS
The quasisteady pressure distributions are demonstrated for some characteristicconditions in fig. 7 for the upper and lover wing surface separately. There are 7spenwise sections shown for upper and lower side, 5 are corresponding to real
measurement sections. The values at y/s - 0.3 and 0.15 are interpolated.
I
19-5
Mach 0.8, zero incidence
The pressure distribution at upper and lower side shown in fig. 7 above is
typical for subsonic flow, upper and lower side pressures are similar in amplitude,
no transonic effects are apparent. The applicability of linear subsonic theory may be
reasonable for this condition.
Mach 0.9, zero incidence
The pressure distribution at the wing upper side is characterised by transoniceffects, visible in the spanwise sections y/s - 0.5, 0.75, 0.9, 0.95, possibly due toa shock located at about midchord.
The lower side shows less effects and is similar to the M - 0.8 results.
Mach 0.8. a - 8.0 deg.
Strong changes can be observed in the u side pressure distribution if thestatic incidence is increased from 0 to 8.0 aegrees indicating a strong nonlinearbehaviour of the quasisteady forces with incidence. High effects due to a leadingedge vortex are present for the inner wing resulting in high pressure peaks, evenchanges in pressure sign are observed at y/s - 0.S.
The lower side pressures are less effected, especially for inner wing sections,however outer wing sections show a decrease in amplitude compared to zero incidenceresults.
Similar strong leading edge vortex effects are observed also at each 0.9 atinner wing sections in the upper side pressure distribution.
The strong increase of the outer wing trailing edge pressures compared to zeroincidence results observed at a - 8.0 deg. upper side gives an indication of anincrease in mode excitation if the behaviour is extrapolated to pressure for outboardflap rotation.
Conclusions from quasisteady pressures:
- A, very strong nonlinear behaviour of quasisteady pressure distributions atwing upper side with static incidence is observed both for Mach 0.8 and Mach 0.9. Thelower side pressures are less affected by static incidence and remain almost
unaffected from 6.5 degrees on.
- Outer wing trailing edge pressures show an increase compared to zeroincidence results, indicating higher excitation forces if extrapolated for instanceto outboard flap rotation both for M - 0.8 and M - 0.9 and incidences greater thanzero.
5.4 DESCRIPTION OF MOSURED UNSTEADY PRESSURB DISTRIBUTION DUE TO HARNONIC WINGROLL OSCILLATIONS
5.4.1 RACE 0.8 RESULTS
The pressure distributions due to harmonic wing roll are demonstrated for theupper and lower side of the wing in real and imaginary part of the unsteady pressureupper side in fig. 8.
c,. (x, y, k) - c,. (x, y, k) + i c,. (x, y, k)
()' and ()' for real and imaginary partk - 2sfs/V reduced frequency (a - 0.821 m)f - 10 oz.
Static incidence 8.0 degrees
Strong nonlinear effects with incidence are found in general for the innerupper wing leading edge corresponding to leading edge vortex effects and also for theouter wing sections strong a dependent effects occur in the real and imaginary partof the unsteady pressures. The lower side pressure distributions are less influenced.Only one example is demonstrated here for 6.0 degrees and Mach 0.8.
Conclusions of the unsteady results
- Similar strong nonlinear effects with static incidence as observed forquasisteady pressures are present in unsteady upper side pressures due to harmic wingroll oscillations. The modulus of the unsteady pressures is increased at incidences3.5 to 8.0 degrees at the inner wing leading edge region and at the trailing edgeouter wing region in real and imaginary part. The lower side unsteady pressures areless affected by static incidence.
-"t~l Ill IIIp ; ... _ _ K ..----.
19-6
5.4.2 ACH 0.3 RESULTS
The unsteady pressure distributions due to the wing roll oscillation wereevaluated for different static incidences from a - 12.5 up to 40 degrees and rollnotion frequencies 6, 12 and 18 Ha for the clean wing configuration for wing upperand lower side. Some results are shown in fig. 8 and 9 for 12.5 degrees and25 degrees.
Influence of frequency
The imaginary part of the upper side -ressure distribution changes almostlinearely with frequency in the measured frequency range 6 - 18 Hz. All typicalleading edge vortex effects are repeated with different frequency for different highstatic incidences.
Influence of static incidences
The increase in the amplitude of the upper side outer wing imaginary parts ofthe pressure distributicn at high incidence compared to zero incidence or lineartheory gives indication of an increase in elatic model damping at least for the firstwing elastic bending mode.
There is also the indication that the aerodynamic damping of elastic modes willbe present up to 40 degrees of incidence, since all imaginary parts of the pressuredistribution for all high a conditions up to 40 degrees 47 are of significantamplitude and increase linearely with frequency. Therefore no loss of damping may beexpected also for other modes than the rigid wing roll mode.
But higher mode excitation due to an inboard / outboard flap rotation might beexpected due to the increase of trailing edge real and imaginary pressures found atall high incidences.
5.6 GENERALIZED AHRODYNAUIC FORCES AT HIGH INCIDENCE
Two aerodynamic magnitudes are essential for the aeroservoelastic stabilitynamely:
1. The generalized control surface efficiencies2. The aerodynamic mode damping
For the structural configuration treated the generalized aerodynamic damping ofthe low frequency elastic total aircraft modes and the generalized inboard andoutboard flaperon unsteady efficiencies will cause the most interesting couplingeffects in flight.
In order to clarify the influence of the static incidence on the controlsurface efficiencies and mode dampings comparisons are demonstrated in tables 2 to 17showing theoretical values indicated by (a - 0 deg) and corresponding correctedvalues for a - 25 degrees at Mach 0.4 and for Mach 0.8 and 0.9 at a - 6.5 and8 degrees.
Control surface efficiencies:
For Mach 0.4 both for the inboard and outboard flap the correction causes ingeneral an increase in the magnitude of the real part of the control surface
efficiencies of about 10% - 48% of the theoretical value depending on the normalmode, see table 2 to 4. The unsteady hinge moments of outboard flap is stronglyincreased by about 35%. The imaginary parts of the efficiencies are also stronglychanged.
The effects on unsteady outboard efficiencies are even higher at Mach 0.8 a -6.5 and 8 degrees as demonstrated in table 7 to 10. Factors up to 1.7 are presentdepending on the mode. The effects are smaller at Mach 0.9 a - 7.5 deg, factors up to1.35 are found compared to linear theory, see table 16.
Aerodynamic mode damping
Comparison of corrected and theoretical generalized forces for the first andsecond elastic mode are shown in table 5, 6 for Nach 0.4, in table 11, 12, 13 and 14for Mach 0.8 and in table 15, 16, 17 for Mach 0.9.
[
19-7
At Mach 0.4, 25 deg the imaginary part of the second elastic mode is increasedby a factor of 1.25.
At Mach 0.8, 6.5 degrees the imaginary part of the second elastic mode isincreased by a factor of 1.7 (table 13), at Mach 0.8, 8 degrees the factor is also1.7 (table 14).
At Mach 0.9, 7.5 degrees the imaginary part of the second elastic mode isincreased by a factor of 1.3.
It is noted that the aerodynamic mode damping is proportional to the imaginarypart of the generalized force.
6. PROOF OF THE PREDICTION METHOD
The validation of the prediction method has been performed earlier in ref. 2and 3 using windtunnel measurements on a trapezoidal wing.
The corrected pressure distribution Ac of a not measured mode j is predictedfrom a measured mode i according to chapter 5.1
Sp(ib.)i = ac5 (iw),1 + {Ac5,(i&)) - 6cpi(iW)E• xp. ,(iw)
where
acp(iw)3 pure theoretical pressure of the notmeasured mode j
dc5 (i)), pure theoretical pressure of the measuredmode i
AcP(iw),.,P experimental pressure of the measured mode i
.,(x,y ic) incidence distribution of the not measuredmode j
. (x,y,iw) incidence distribution of the measured mode i
tcp(iw)' corrected pressure distribution of the notmeasured mode j
The windtunnel measurements on the trapezoidal wing have been performed for a pitchand roll motion, see fig. 11.
For instance the corrected (predicted) pressure distribution of a pitch oscillationfrom a roll oscillation is
SC 5 5 ,tch(iw) = Sc5 5 1 ,:5 (iw) + Sc551 (iw) l+ik(x-X,iky
Acp D1
= cp R5
1 1 Xp. - itoil1
or the corrected pressure distribution of a roll oscillation from a pitch oscillation
is
ikyCpo(i) = Scp,,,(is) + 6cp P(ic) l+ik(x-x)
Fig. 11 demonstrates the comparison between theoretical and measured results of awing roll motion with predicted pressures from wing pitch motion pressures. Theresult fully validates the correction method for subsonic speeds.
dcpj - [D'+iD"L-' a* - Acp - Acpi*
- u ',- + ikfj + - L-Uj . x U. y
is simplified because the influences of local velocity components were shown to beof minor influence for low subsonic flow.
The validation the method using transsonic model results could not be performed
in a consistent manner for high subsonic speeds since only one vibration mode, wing
roll was tested.
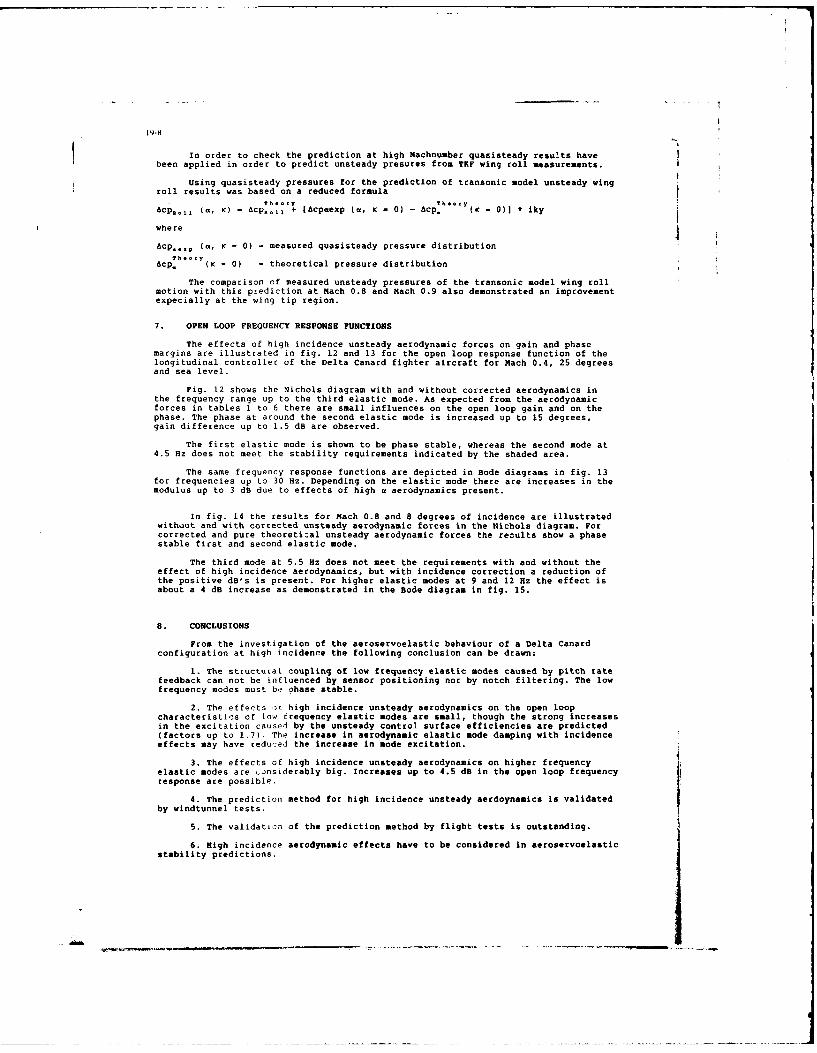
In order to check the prediction at high Machnumber quasisteady results havebeen applied in order to predict unsteady presures from TKF wing roll measurements.
Using quasisteady pressures for the prediction of transonic model unsteady wing
roll results was based on a reduced formulaTh -oy Theo..y
ACPRoll (a, K) - ACPRo1
+ [acpsexp (a, K - 0) - cp (K - 0)] * iky
where
Acp-,op (a, K = 0) = measured quasisteady pressure distribution
Theoryacp. (K - 0) - theoretical pressure distribution
The comparison of measured unsteady pressures of the transonic model wing rollmotion with this prediction at Mach 0.8 and Mach 0.9 also demonstrated an improvementexpecially at the wing tip region.
7. OPEN LOOP FREQUENCY RESPONSE FUNCTIONS
The effects of high incidence unsteady aerodynamic forces on gain and phasemargins are illustrated in fig. 12 and 13 for the open loop response function of thelongitudinal controller of the Delta Canard fighter aircraft for Mach 0.4, 25 degreesand sea level.
Fig. 12 shows the Nichols diagram with and without corrected aerodynamics inthe frequency range up to the third elastic mode. As expected from the aerodynamicforces in tables I to 6 there are small influences on the open loop gain and on thephase. The phase at around the second elastic mode is increased up to 15 degrees,gain difference up to 1.5 dB are observed.
The first elastic mode is shown to be phase stable, whereas the second mode at4.5 Hz does not meet the stability requirements indicated by the shaded area.
The same frequency response functions are depicted in Bode diagrams in fig. 13for frequencies up to 30 Hz. Depending on the elastic mode there are increases in themodulus up to 3 dB due to effects of high a aerodynamics present.
In fig. 14 the results for Mach 0.8 and 8 degrees of incidence are illustratedwithout and with corrected unsteady aerodynamic forces in the Nichols diagram. Forcorrected and pure theoretizal unsteady aerodynamic forces the rezults show a phasestable first and second elastic mode.
The third mode at 5.5 Hz does not meet the requirements with and without theeffect of high incidence aerodynamics, but with incidence correction a reduction ofthe positive dB's is present. For higher elastic modes at 9 and 12 Hz the effect isabout a 4 dB increase as demonstrated in the Bode diagram in fig. 15.
8. CONCLUSIONS
From the investigation of the aeroservoelastic behaviour of a Delta Canardconfiguration at high incidence the following conclusion can be drawn:
I. The structurat coupling of low frequency elastic modes caused by pitch ratefeedback can not be influenced by sensor positioning nor by notch filtering. The lowfrequency modes must b-? ohase stable.
2. The effects or high incidence unsteady aerodynamics on the open loopcharacteristics of low frequency elastic modes are small, though the strong increasesin the excitation caused by the unsteady control surface efficiencies are predicted(factors up to 1.7). The increase in aerodynamic elastic mode damping with incidenceeffects may have reduce.] the increase in mode excitation.
3. The effects of high incidence unsteady aerodynamics on higher frequencyelastic modes are jnsiderably big. Increases up to 4.5 dB in the open loop frequencyresponse are possible.
4. The prediction method for high incidence unsteady aerdoynamics is validated
by windtunnel tests.
5. The validation of the prediction method by flight tests is outstanding.
6. High incidence aerodynamic effects have to be considered in aeroservoelasticstability predictions.
19-9
9. RFERENCES
1. J. BeckerDewegungsinduzierte Luftkrtfte bei abgeldster Strdaung und ihre Obertragung aufdie Ermittlung der Strukturresponse1983
2. J. Becker , F. Wei$, U. WeitzPrediction of unsteady aerodynamic forces at static incidenceMBB/LKE292/5/R/1570, March 1986
3. Zingel, H.Experimental Investigation and Semiempirical Prediction of a low Aspect RatioTrapezoidal Wing Due to Flow Separation.AGARD-Specialsists Meeting on Aircraft Dynamic Loads Due to Flow SeparationSorrento, Italy, 1990
4. J. Becker, A. GravelleSome results of experimental and analytical buffeting investigations on a Deltawing.Second International Symposium on Aeroelasticity and Structural DynamicsApril 1-3 1985, Aachen
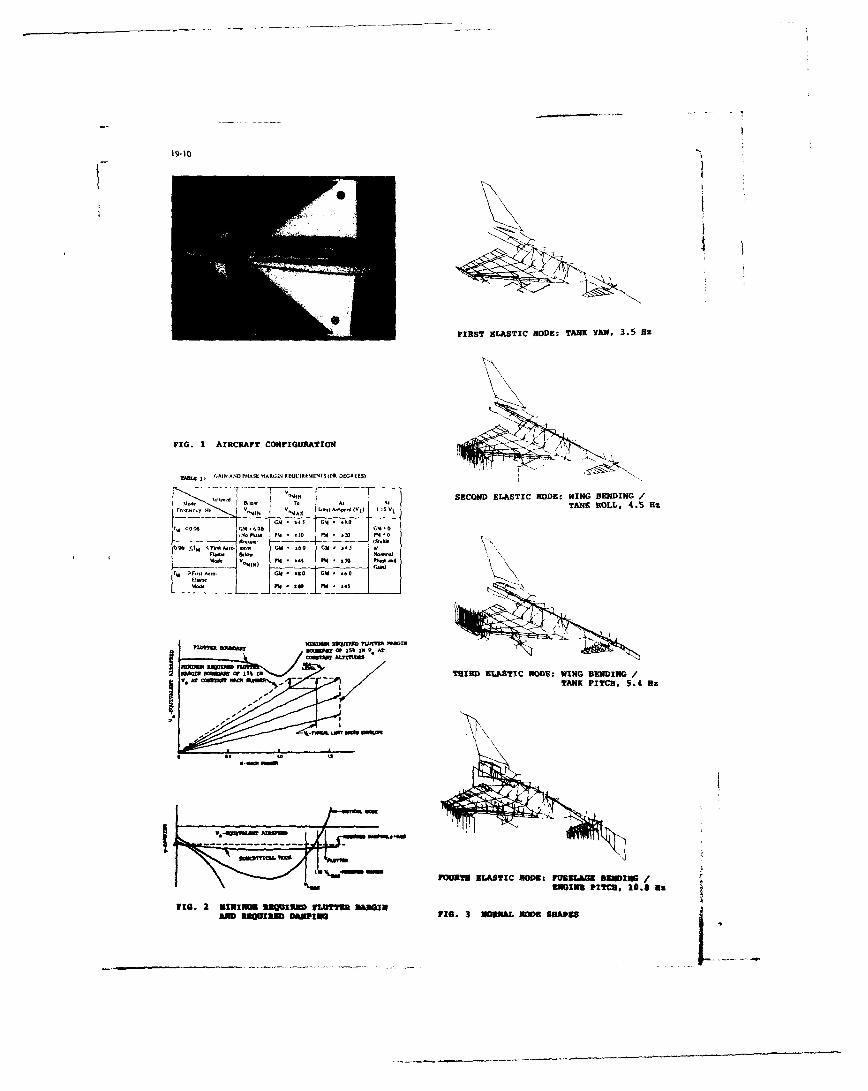
FIRST ELASTIC NODE: TANK YAM, 3.5 uz
FIG. 1 AIRCRAFT coNFI[GuRATION
r~n r;*IRNDO ILASk MARCIN REQtIREMERT34III. DEGRUSI
.MI SECOND ELASTIC MODE: WING BENDING/40. ~ t T. A. A,
rN0.0' H, V-4M AIX L-, kmnRCW (VO1
( 15 TANK ROLL, 4 45 liz
r5 -G-4 GM.O% 0 O
IS M PSI . 30 PSI . 20 P4.0
"I ,(ShOW'Job ( . (vwI CM ,AO Ci '6 ;
w0. v-MN Pk.6 P04.oF 0 P% d
r1),,,.,o -M 0ITGCM *116
Ill"" 0 1"% 1 1 A
x~wxoe o 5%A in THRD ELASTIC NODE- WING SENDINGV. i co"" Pw omeRN.J"TANK PITCH, 5.4 Hz
FEM EASTIC NOOK: FUSELAGE BOINGLow ENGINE PITCH, 10.8 as
FIa. 2 stIsni NEOigma FLUTTE DaNwlEAMD EUQUIEN pASPp FIG. 3 NOENAL NODE SHAPES
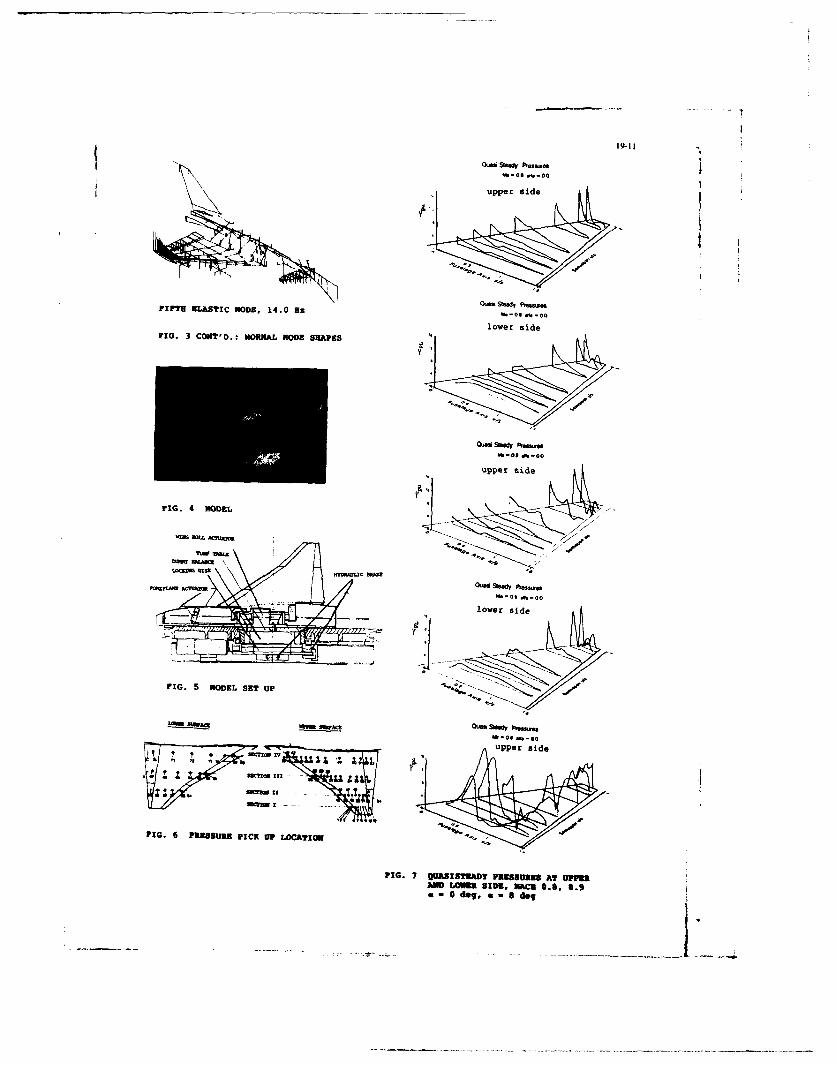
A%-Of ft0
lower sideFIG. 3 CON'D.: NORMAL MODE SnAPSS
Ou- SmWdy fteums
upper sd
FIG. 5 MODEL STU
IWm MOL - - S"d 'w,
FI. 5 MODLn PICK UP LCT~
LONIRVAWa m" WA LonE SOEY RACE0.6 0.a - d.. a-0 M40,
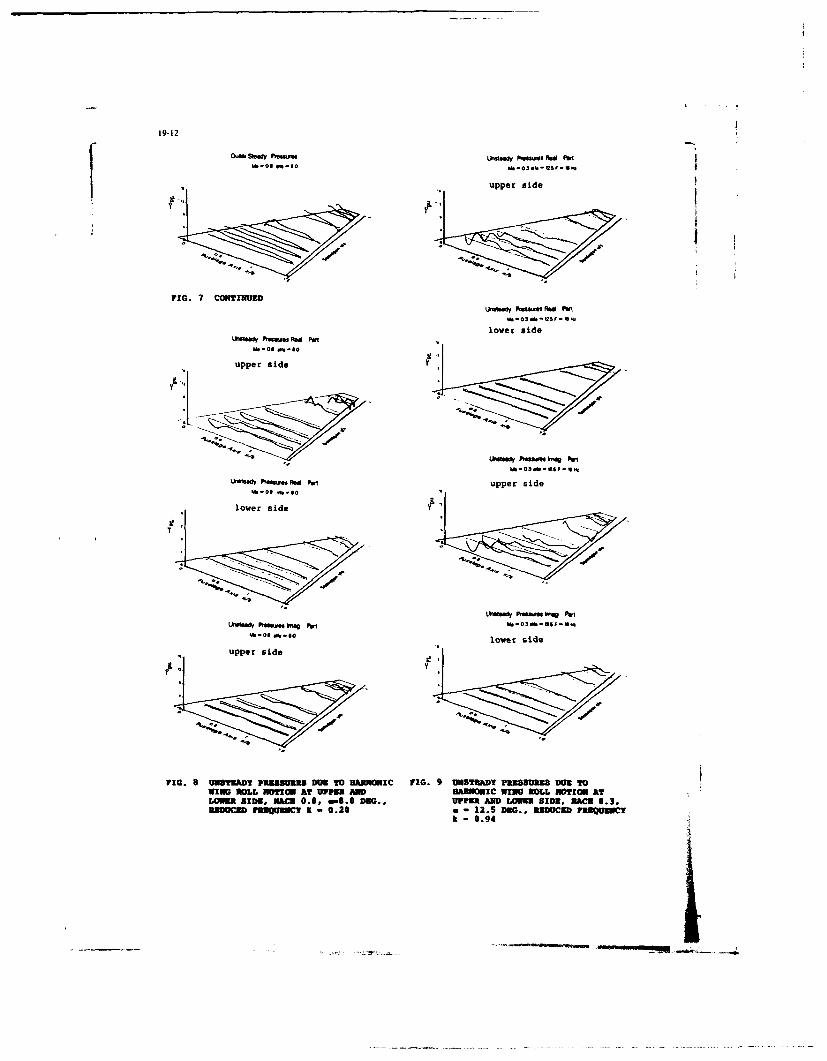
19-12
~I~~dy~&D ~Mnbdy Notuns P418 PanW-08 Ws-so W03 S4-csOP S'
FIG. 7 CONTINUED-mm PiW d Art
lover side-ms ftesiwm Rsd Pan
upper side
"IeoaIe An""" Port
uste6p ftiuemeoo Pm upr d
~O t*Olower side
FIG. 8 INSTEADY PRUSIER DWE TO RNOWIC FIG. 9 UNSTEADY PEESmI~S DUE TOWIMNO OLL NOTION AT UPPER AND EARNONIC WING ROLL NOTION ATLOWS. SIDE, FACE 0.5, 0-8.0 ONG., UPPER AND LOWER SIDE, RACE 0.3.
REDUCED y xEGRC - 0.20 s-12.S DE., REDUCED PEEQUPCYk-0.94
. ... ..
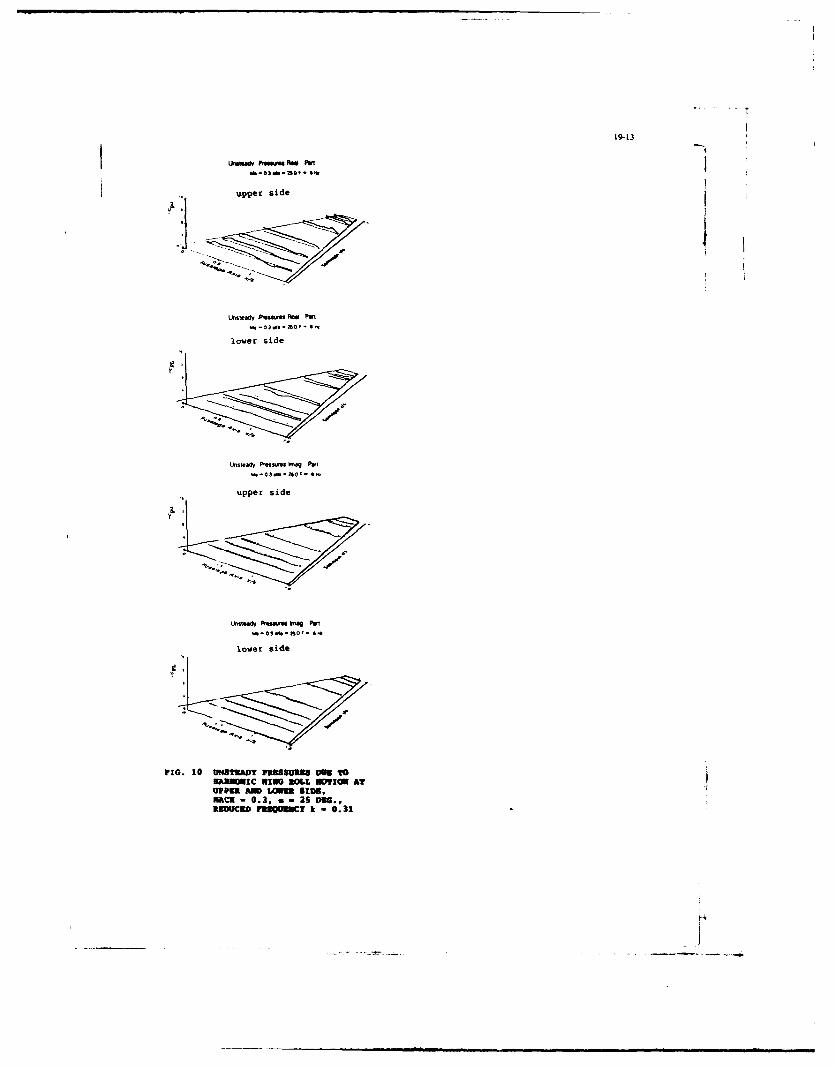
T
19-13
Llr ftmmts PO o
y& upper side
Lkst.ady Pwsses dPon
lower side
4
Unstwady P,.SSu hWs g PaI
upper side
-nef ftsamm"~ Pa"-O .- 504 6G-
lower side
FIG. 10 UNBTMAD PaRSU3B MRE TODNOIC MING ROLL NOU AT
UPPM AmD LmmE sing,RAcn - 0.3, a - 25 MU.,
REUCD FamUUINCY k -0.31
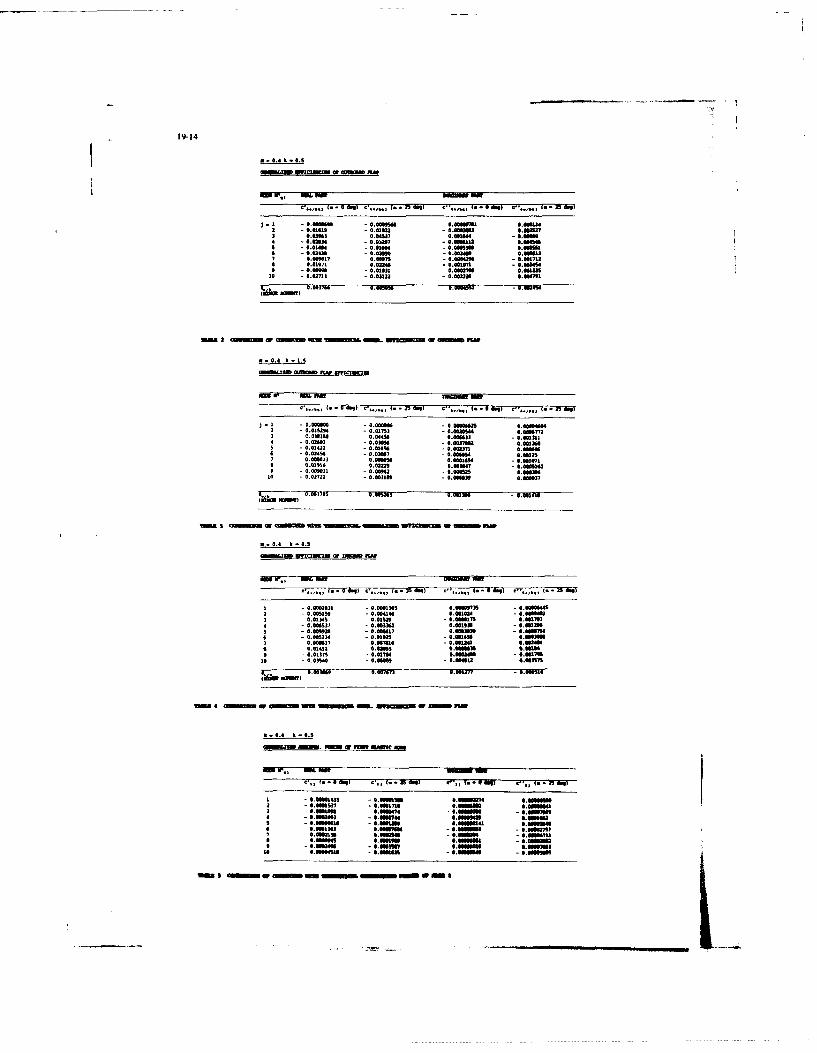
19-14
0~0.44 k 0.9
in 0093800 N0m ,5*.oG
- 5 0.000499 0.00994 0. 000s00 .4036 -4 024n3 004am .00144 cum004 0. o34 -00,0 -0.0031 00004
7 8 007 07 0.001021 - 001714 0147 0034 M* Nun07 .03
10 -0.03713 -. u~ 1033 0 30 0 40479
0 00700 005"4 0 0000 -0.03
Wma 2 wmw or uy mmspoa.r4 n
0.0.4 k-.
m3 C.m010 0W110. 45 W3Wl
4 G0 m 0.3 ::00408 U01360
5 0.0144 -2 0.014 0030444 0.6m0773 .30100o 0.945 000. 3 - .031
0 0403 0.08m4 O.000104 6003071
9 034=4 I'c 017900007 0004410 0.02721 0.0031"5 0=3900 000037
N.4.4 4-4.
0 *9 C"1-1 9 d" .... .. a , ...
- m 0 00030MNI 0 N810 0.00974 -00004
3 0.01344 0039 .00174 010
4 -0 0037 - 0 03302 4.090-0803
6 Z 0 030 0004-0.01S011496 .0307 0 0007 300o10e 000"4 4003000
0 0.01411 64300 .00003 0140
08,83114 0104 0.0ma27 - .0040
0.4 .00jwCl A
OEM"= M=r or flOr mgic m
oft3 - -
.", f. - 0 ftf %, I 35 ft) e., 0. 9 3 0., 0f
9.81431 040087 0m0000
00009 Ml00000043
0 Muf 0 8403 - 684409008 0403600"1 820000011 00300 000N00030 40000 00000O. mu 00000000000 1
0 0 00044 40 0 600000 40000098 0ml *'SWIM N 840="00004
30 0080440 40063 - 060000 0000400
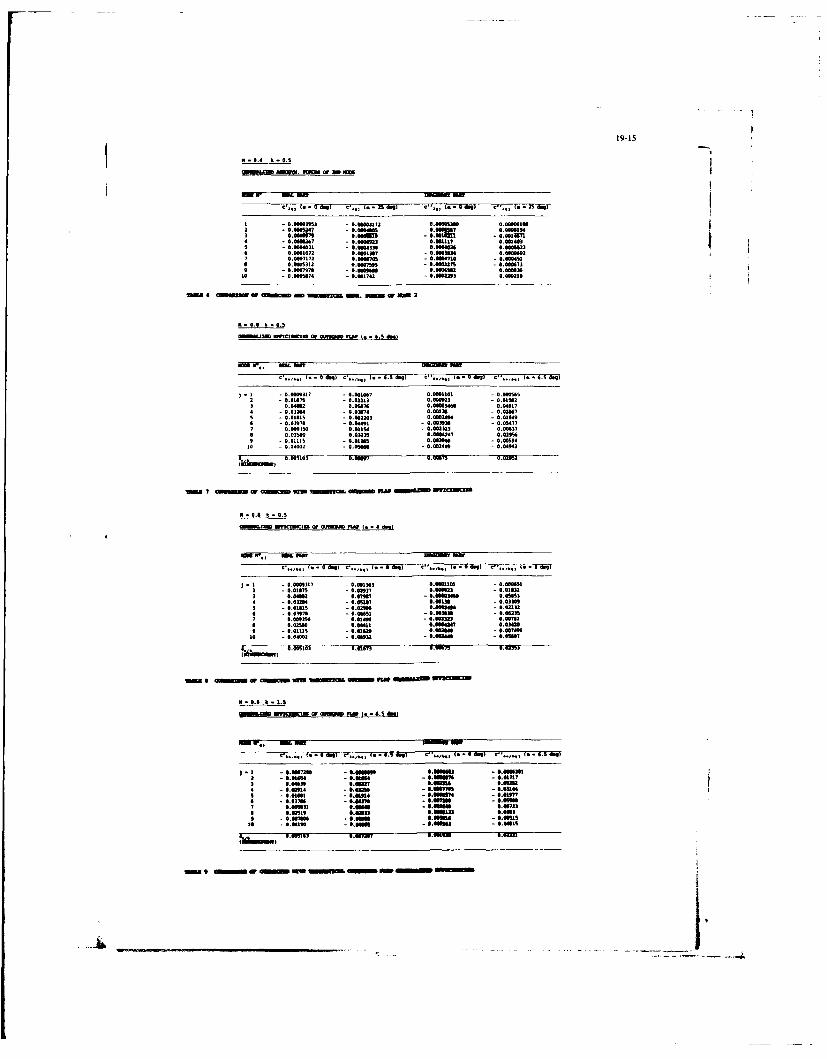
19-15
400 OftNO
(- -~ 3 0 d.91 ' 1. 5 an) 0.* .0 dg-- C-,., I.200 )
- m00605 0 0000317 0.08005300 00000163 000547 000405000007000600 0006w .gom -004M
4 4.0000967 -00040923 "117 0000
000107 0
0.6 0 .. 40614in.36 .~n 000 106.6 OAI. . 0.5 to0
1 000 971 4.00044 I.-650 .,M, .0 05
:: -000037 0.01007 0.01000 000603
0 0.62.074-00000 0.010 a - .02 4 -0.37 0.00174 - 00280
NAM - 0.07470oo aw oooeaNN -.040 m 0.0070 0007
.. . k 0.5 45 .05 .003000
6OMI 0.0 r4 0.023 5 0an)37 035
..... 4.4 1. 0 .0..00N6 .5 9 c ....00 0. 04543 4.&
1 0.0.0009.17 0 000565
- ' 7 ini w m m o n 0. n .0 U17
"1 0007 0535olm u: . sU~6 oora 0. 000249 0. - 064
6 0.0" a 7.Coag f.0 9 0.,30039A 0. OS477 5
7 0.0001 MA 0,10 0.00202 0. 006570 0040030 0 07007 0.06000 0.000549 mil 00384 0030 0.0010 0030
S0 0011 -0 0059 0.0662400 .200 0050 0005 -0.001970 0.002
S -000005 - 0 0036 0 00301 0.000810 -0. 0400 27 0902 0:00006 - 0.0000
0007 0. "IN7 0. 03353
ma 0isI m. 88849 m.621n U2
0.0097 ""1-.1U6663
7 0 009 P.4
90 4.8.~ . 032 4.' . 0. oe .50
21 - 6629 - .006060 0. ""1"3 0. 0349 -604 -086000.Ron 100 -. 007496
to 0006 -0,0693 .03449 -0.667 0 6003 0. M 0660 0 40 0.073
6m o u 6 mmria 004 .now 6uua 06012x000
M 0J 065363 oa~p a 1 6.s ant
ONS 0. 00m
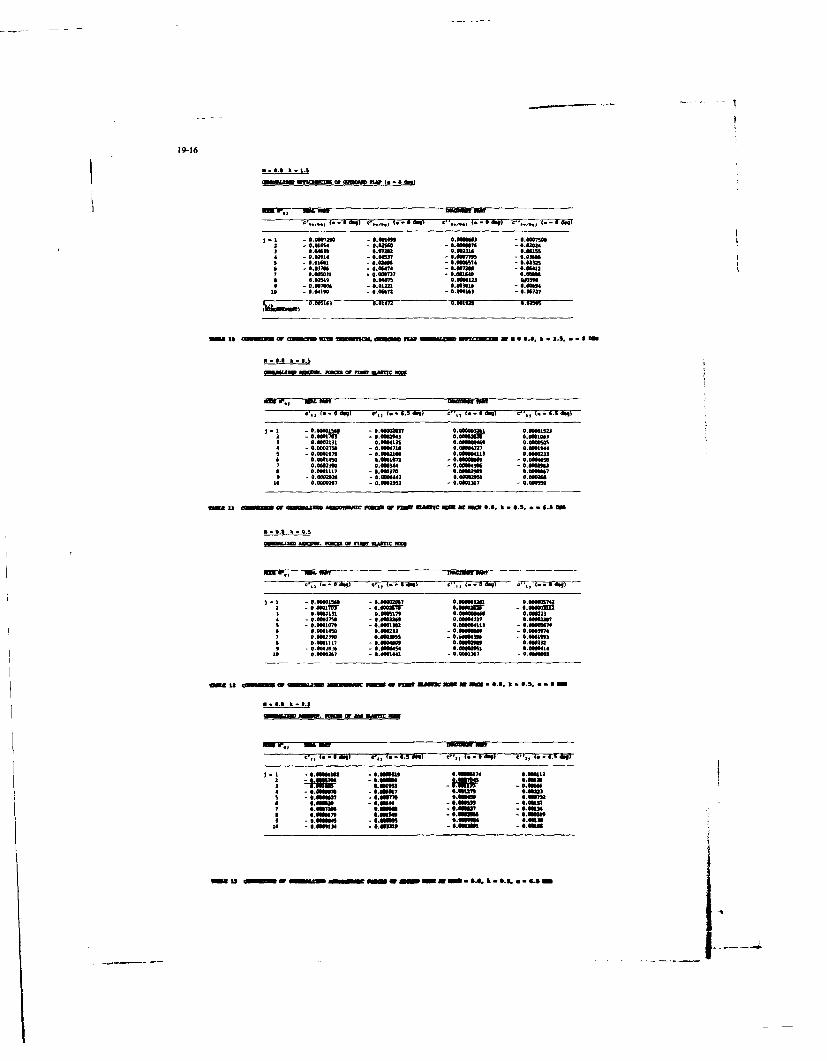
19-16
MW. 0.1am
I- fts 4" ftm Taw
S-1 am Me 0 6726 - .040 .6663 - 00075002 - .0104 :Nn"206 -::086663 .2
S 041n 0.67M0 0.001""" 0 001554 ZI060 -00.5G7 -6.0770 -06o6"6 60061 -66261 0.00 7 -. 02525
6 -0. 03706 G- " 6. 74 - 0.607260 -. 604121 0.66063 Q .06037 0.0016"0 0660n
0 062S13 0.67 0.606613 II3590.076 -601221 0.08101, - 0=0060 001" 0. 006n 0.6003 -. 67.
P.O k- 0360 8
- .- 0 061561 - ) 0 dog)07 0.66030 0. CIS2
2 - 6017W7 - 0002143 N.0026 .00103 0.002M3 0064135 .6000 40060534 - 00 3 m 0 00"718 :060727 4.0119445 0.0001072 - 6 06216 0.060003i 0 060336 8 145. 0.0063671 - 0.606 m - 6 000005
6 6.0661117 - 000370 S.6ON0 0006076 0. 000262 0 0000463 0.0 016 0.01
16 0 000267 6 000293 - 0.66117 0Z06055
0 6., t. -60 60 6" 4 a ij
2 - .U .Osr@oomr N.0OooollO 9.60612131 0.660175 .6601 0 006726 6.0067S@ -00020 6060727 66620s 017 16 0.0066411 mum0in76 6.000451 0 66033 -06.6 06 S.6 0603M77 606021 6M023 - 0.66630606056 0:066l)07 ::O" ON=66 60616 403
O 00003. - 0004 6.06296 06010 .00.267 O- 6 40000 - .66137 0 6155
"a L2 COMII 60 .3M MOUC 60c cW Flow~ -MM A - 0.6. 1 O .S. . 4
660060 AND174 6.60112 N"N:mm -R-
3I U0 #o lam?0 6.066 6666 0000 6.6127 .66M2
6 u 66606 066 0" 606.-6.01077 II.O7200 906 $.sum7 -00026* Z"66679 006016 0.08"M6 - 01010 os i 6.00" CMM*I7966 a6sun
10 6600636 CO3MO - .01010 - 6:406
13 0 0 60m ONOMIPIW-M W I 0 - 6., It - .0. .L M 0
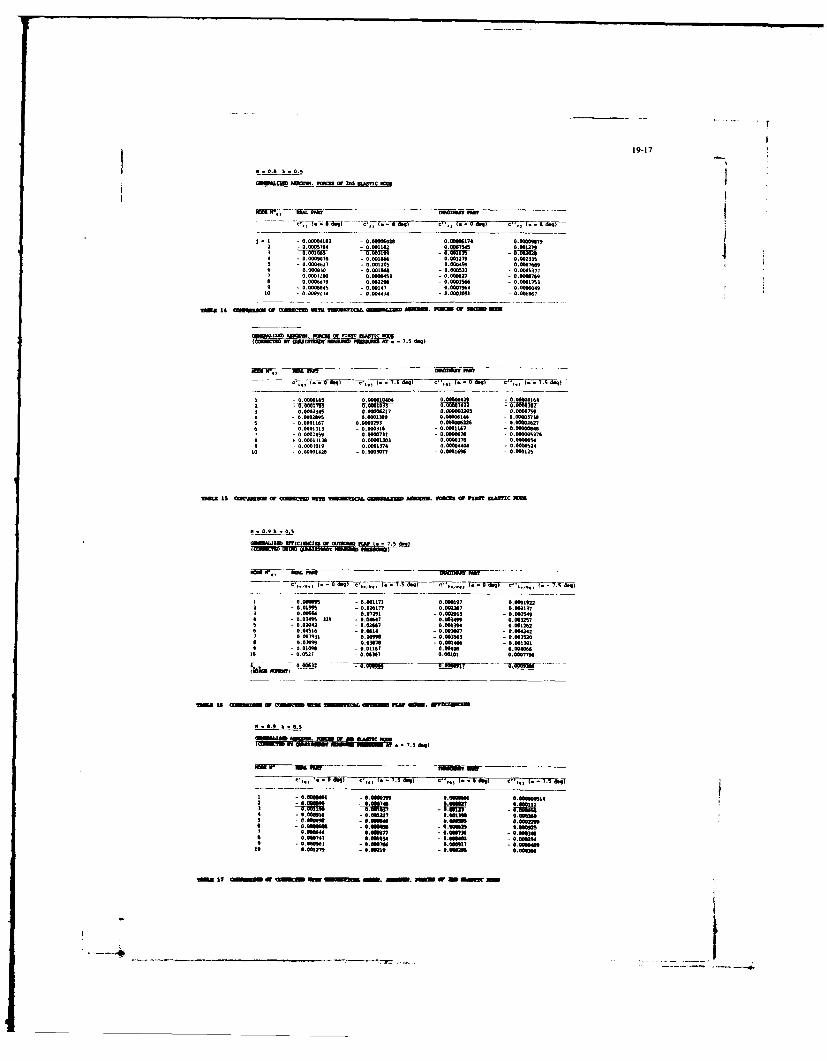
19-17
l0I0 4 0 oa ia 7 0 .0062 000617 NOMA
4 -I -000004183 - 0001 0.000619 0.0002939- 0.000504 0.0012020045 0.0 040269
3 0.000,200 0. 0000453 0.0o00w 0.0003wa 0.0006679 0. 002200 0 000306" 0. 00013530 0 0000045 a 00103 0 007064 0.0004
.10S).' .. 0000IM mCI
Novi 4 093 00101
"M 4Q £cofO -OIS 0.00m0 0.000010400 000 .00000425 w0.0000016
3 000004 -~l 0.002 7 . 0.00020 000)
5 -0.000165 0.0009040 0.00000220 0.006022
6 0.00101 - 0.000316 - .010 s .OOOI : ..01)0 00010 000069 .0406
0 0. 00011 0000000000029 22 0. 00005262II 0000)12 - 0.00037 0 0069 .002
0080N 9 0003
)19.000 030050030 ODM276
0 89 *. MOIRA 30 009 0000378 0.000m" 1*,~*
I 0N0OW50 00134 0000193 0.000192to 0.01995 - 0.00307 0 .005283 0.000125
0~ ~ ~~ : - .09537- .44 000099 .03S0.03=2 -00260 NOW139 00000
0 . 00450 0. 0021 003913 -0.004I4"0.003 0.009 - .056-000350
O 0.009 0.0000.046 0.0910S1O .0.0204 - .0147 0.000 0.04620 0 02 02 00 133 001 .0036
I. 001__ _._143w0024
0.6 0.9.0
00. 0.0 "0 .. 083 0 0.00!1 0.. 003
0 000 0005123 0 0. 000347 0152604 0.031 0*70 066 00 t000 00101 000740 009
'Wal llmw am or A
0.000M COMM OMM-0-0000.
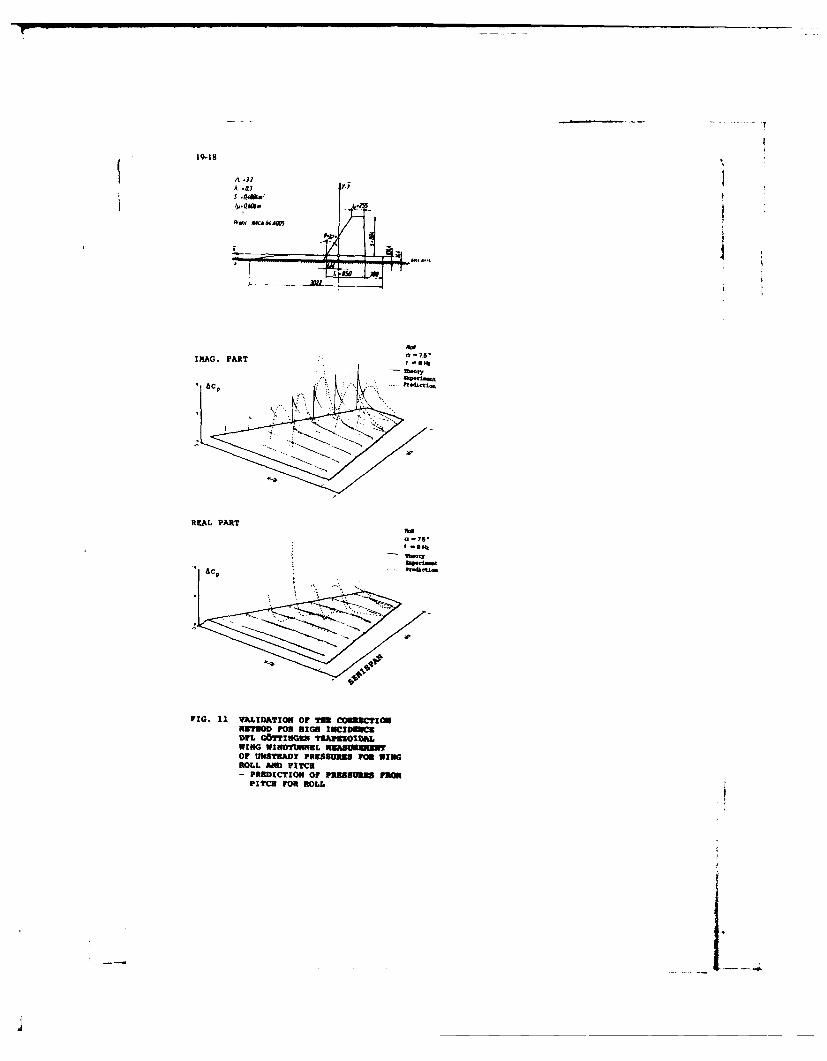
19-18
IPLAG. PART 0:76'
RKPAL PART
0: 75-f 8Fk
FIG. 11 VALIDATION OF Ift COMMCPON
NEIWOD FOR RIGS INCIDUCDPI. GOYVxiNOR ?UAPUSOIohLWING WINDTUWWRL IN&ASURNOr UNSTEADY PmSUuSS POrn WINGROLL AND PITCH
-PRRDICYION OF PRESSURES PRIORPITCH FOR ROLL
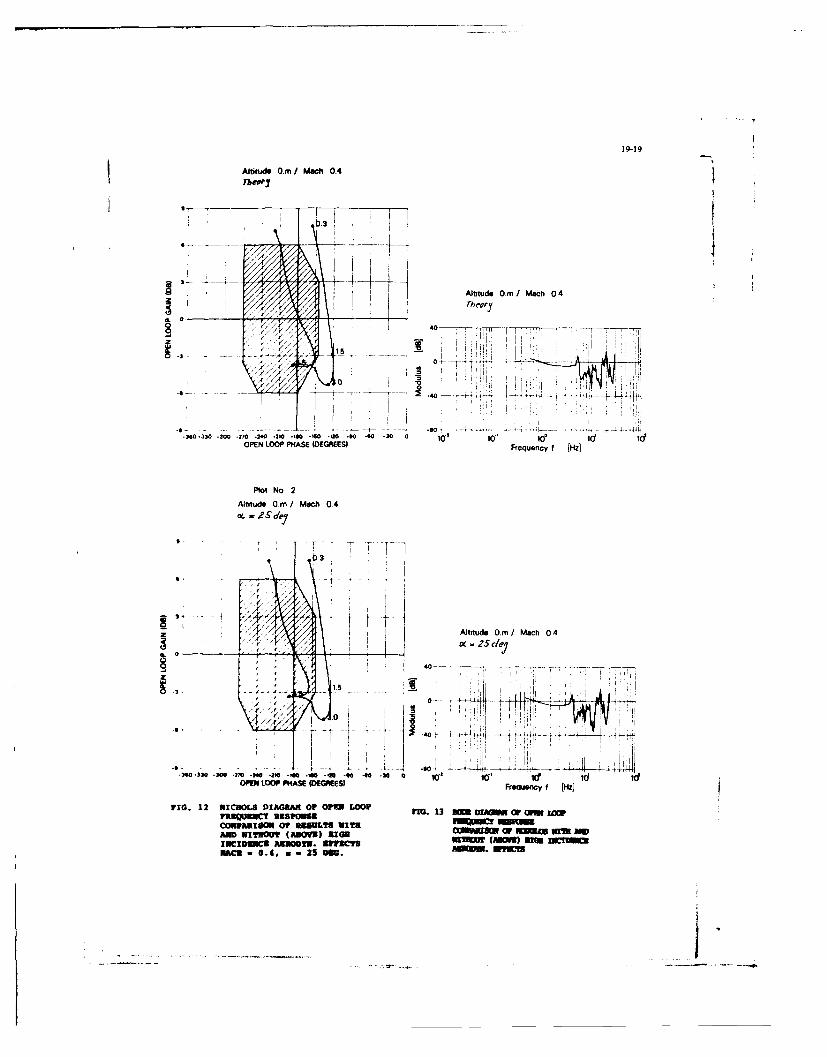
19-19
Altitude 0.ml Mach 0.4
z Altitude 0.mI Mach 04
____ rheor
-30-33 30 70- .2 - 20 .* - -20- 50 " -6- 30 0
OPEN LOOP PH-ASE (DEGREES) Feunyt[z
Plot No 2
Altitude 0 m /Mecti 0.4
b3
F "[$- ;Altitud Om/Mach0 4
0-40---
2-No0 .210 .*a0 -'80 V.0-0 -0 .3 C303000* M .0OPEN 1.O13 P14ASE (DEGREES) Id ~z
r1G. 12 NICHOLS DIAGUAN or op= Loop .- rFUUQUUIC1 U3SPMNG.1 m IMI r MmCOPARION 0?p mmULY WITH MNUWAN uxIaou. (ADMV) Lieu __EIt=( HH=HMjIMCzIOnca ASDYN. 3?FlH WIN (MOM3) Em CMACH - 0.4, . 25 Dec. Nom. mpf
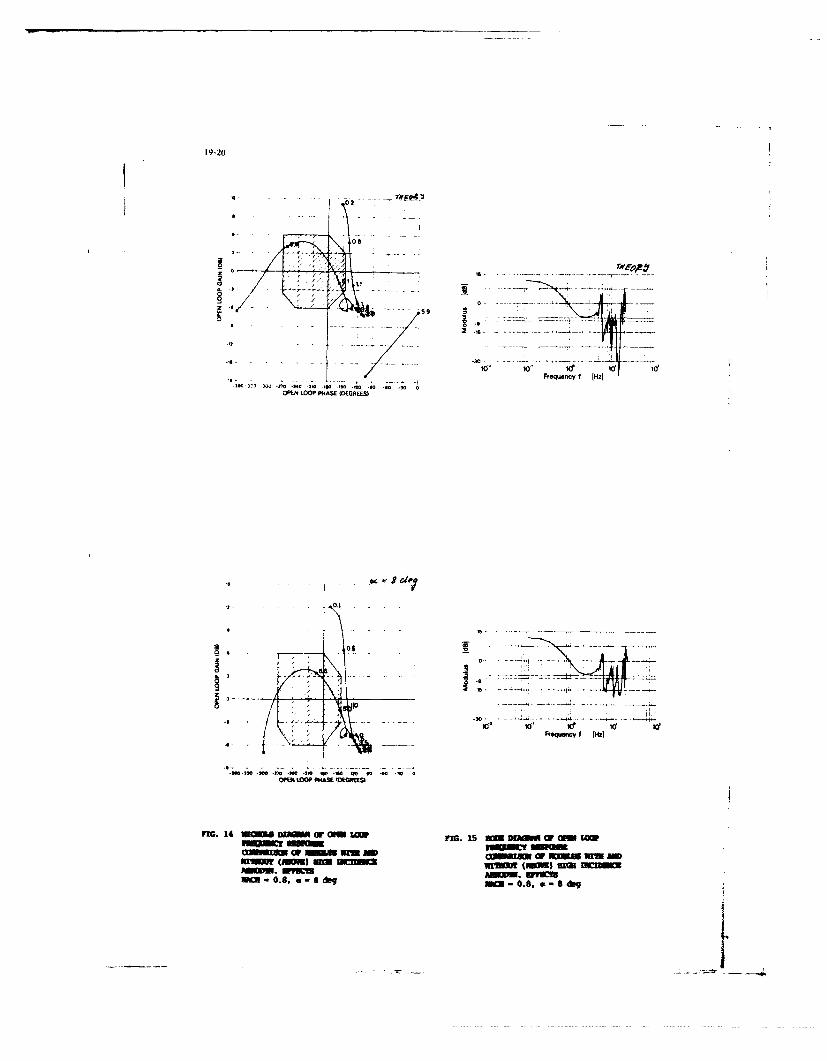
19-20
30 -'0 #0 40 -0 30
OPEN LOOP PHASE (DEGREES)
14wj- f mzi o
- ~~ or ur
XmN. m LIMErsNM -0 ., MM .8 8I&
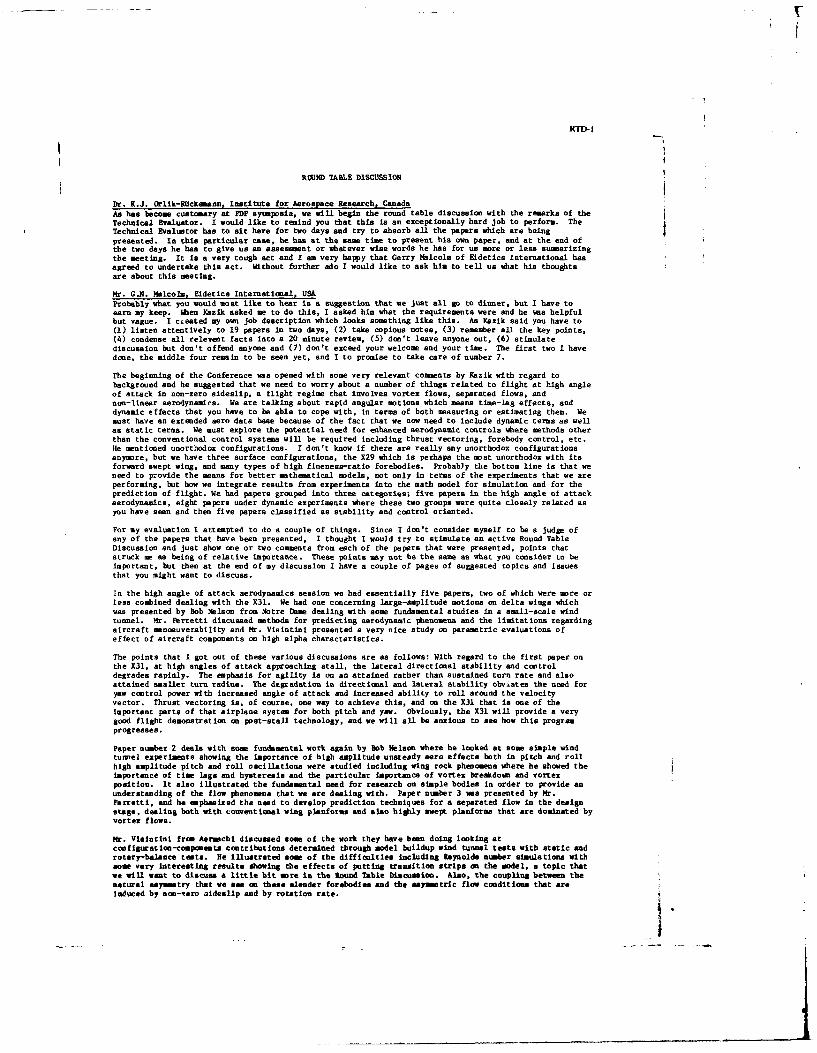
RTD- i
ROUND TABLE DISCUSSION
Dr. K.J. Orlik-RUckemann, Institute for Aerospace Research. CanadaAs has become customary at PDP sytmposia, we will begin the round table discussion with the remarks of theTechnical Evaluator. I would like to remind you that this is an exceptionally hard job to perform. TheTechnical Evaluator has to sit here for two days and try to absorb all the papers which are beingpresented. In this particular rase, h has at the same time to present his ova paper, and at the end of
the two days he has to give us an assessment or whatever wise words he has for us more or less summarizingthe meeting. It is a very tough act and I am very happy that Gerry Malcolm of Eldetics International hasagreed to undertake this act. Without further ado I would like to ask him to tell us what his thoughtsare about this meeting.
Mr. G.N. Malcolm. Eldetics International, USAProbably what you would most like to hear is a suggestion that we just all go to dinner, but I have toearn my keep. Then razik asked me to do this, I asked him what the requirements were and he was helpfulbut vague. I cieated my own job description which looks something like this. As Kazik said you have to(1) listen attentively to 19 papers in two days, (2) take copious notes, (3) remember all the key points,(4) condense all relevent facts into a 20 minute review, (5) don't leave anyone out, (6) stimulatediscussion but don't offend anyone and (7) don't exceed your welcome and your time. The first two I havedone, the middle four remain to be seen yet, and I to promise to take care of number 7.
The beginning of the Conference was opened with some very relevant comments by azik with regard tobackground and he suggested that we need to worry about a number of things related to flight at high angleof attack in non-zero sideslip, a flight regime that involves vortex flows, separated flows, andnon-linear aerodynamics. We are talking about rapid angular motions which means time-lag effects, anddynamic effects that you have to be able to cope with, in terms of both measuring or estimating them. Wemust have an extended aero data base because of the fact that we now need to include dynamic terms as wellas static terms. We must explore the potential need for enhanced aerodynamic controls where methods otherthan the conventional control systems will be required including thrust vectoring, forebody control, etc.He mentioned unorthodox configurations. I don't know if there are really any unorthodox configurationsanymore, but we have three surface configurations, the X29 which is perhaps the most unorthodox with itsforward swept wing, and many types of high fineness-ratio forebodies. Probably the bottom line is that weneed to provide the means for better methematical models, not only in terms of the experiments that we areperforming, but bow we integrate results from experiments into the math model for simulation and for theprediction of flight. We had papers grouped into three categories; five papers in the high angle of attackaerodynamics, eight papers under dynamic experiments where these two groups were quite closely related asyou have seen and then five papers classified as stability and control oriented.
For my evaluation 1 attempted to do a couple of things. Since I don't consider myself to be a judge ofany of the papers that have been presented, I thought I would try to stimulate an active Round TableDiscussion and just show one or two comments from each of the papers that were presented, points thatstruck me as being of relative importance. These points may not be the same as what you consider to beImportant, but then at the end of my discussion I have a couple of pages of suggested topics and issuesthat you sight want to discuss.
In the high angle of attack aerodynamics session we had essentially five papers, two of which were more orless combined dealing with the X31. We had one concerning large-amplitude motions on delta wings whichwas presented by Bob Nelson from Notre Dame dealing with some fundamental studies in a small-scale windtunnel. Mr. Ferretti discussed methoda for predicting aerodynamic phenomena and the limitations regardingaircraft nenoeuverability and Mr. Visintini presented a very nice study on parametric evaluations ofeffect of aircraft components on high alpha characteristics.
The points that I got out of these various discussions are as follows: With regard to the first paper onthe X31, at high angles of attack approaching stall, the lateral directional stability and controldegrades rapidly. The emphasis for agility is on an attained rather than sustained turn rate and alsoattained smaller turn radius. The degradation in directional and lateral stability obviates the need foryaw control power with increased angle of attack and increased ability to roll around the velocityvector. Thrust vectoring is, of course, one way to achieve this, and on the X31 that is one of theimportant parts of that airplaoe system for both pitch and yaw. Obviously, the X31 will provide a verygood flight demonstration on post-stall technology, and we will all be anxious to see how this programprogresses.
Paper number 2 deals with some fundamental work again by Bob Nelson where he looked at some simple windtunnel experiments showing the importance of high amplitude unsteady aero effects both in pitch and rollhigh amplitude pitch and roll oscillations were studied including wing rock phenomena where he showed theimportance of time lags and hysteresis and the particular Importance of vortex breakdown and vortexposition. It also illustrated the fundamental need for research on simple bodies in order to provide anunderstanding of the flow phenomena that we are dealing with. Paper number 3 was presented by Mr.Ferretti, and he enphasized the need to develop prediction techniques for a separated flow in the designstage, dealing both with conventional wing planforms and also highly swept planforme that are dominated byvortex flows.
Mr. Visintini from Aarmschi discussed som of the work they have been doing looking atconfiguratton-components contributions determined through model buildup wind tunnel tests with static androtary-balance tests. He Illustrated sown of the difficulties ncluding Reynolds number simulations withsome very Interesting results showing the effects of putting traneition strips on the model, a topic thatwe will want to discuss a little bit more in the Round Table Discussion. Also, the coupling between thenatural asymmetry that we see on these slender forebodies and the asymetric flow conditions that areinduced by non-'.ero sideslip and by rotation rate. I
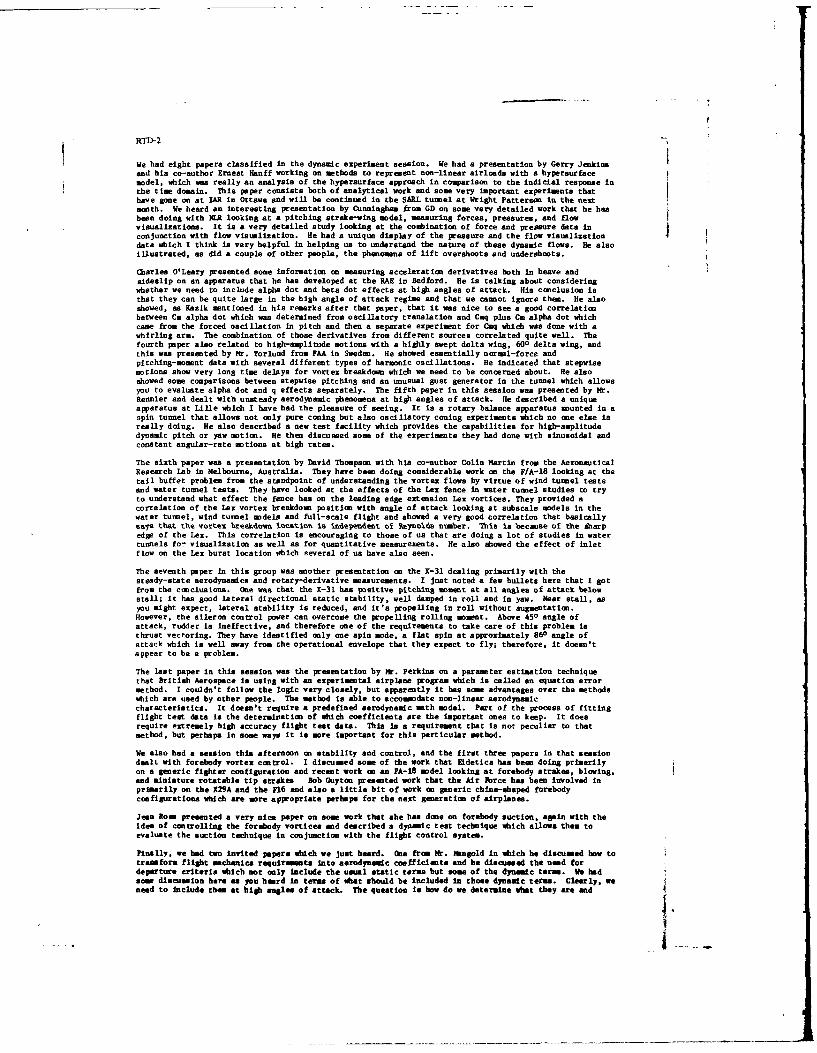
RTD-2
We had eight papers classified in the dynamic experiment session. We had a presentation by Gerry Jenkins
and his co-author Ernest Hanff working on methods to represent non-linear airloade with a hypersurfacemodel, which was really an analysis of the hypersurface approach in comparison to the indicial response inthe time domain. This paper consists both of analytical work and some very important experiments thathave gone on at IAR in Ottawa and will be continued in the SARL tu nel at Wright Patters in the next
month. We heard an interesting presentation by Cunningham from GD on some very detailed work that he hasbeen doing with NLR looking at a pitching strake-wing model, measuring forces, pressures, and flowvisualizations. It is a very detailed study looking at the combination of force and pressure data inconjunction with flow visualization. He had a unique display of the pressure and the flow visualizationdata which I think is very helpful in helping us to understand the nature of these dynamic flows. He alsoillustrated, as did a couple of other people, the phenomena of lift overshoots and underehoots.
Charles O'Leary presented some information on measuring acceleration derivatives both in heave andsideslip on an apparatus that he has developed at the RAE in Bedford. He is talking about consideringwhether we need to include alpha dot and beta dot effects at high angles of attack. His conclusion isthat they can be quite large in the high angle of attack regime and that we cannot ignore them. He alsoshowed, as Kazik mentioned in his remarks after that paper, that it was nice to see a good correlationbetween Cm alpha dot which was determined from oscillatory translation and Cmq plus Cm alpha dot whichcame from the forced oscillation in pitch and then a separate experiment for Cmq which was done with awhirling arm. The combination of those derivatives from different sources correlated quite well. Thefourth paper also related to high-amplitude motions with a highly swept delta wing, 600 delta wing, andthis was presented by Mr. Torlund from FAA in Sweden. He showed essentially normel-force andpitching-moment data with several different types of harmonic oscillations. He indicated that stepwisemotions show very long time delays for vortex breakdown which we need to be concerned about. He alsoshowed some comparisons between stepwise pitching and an unusual gust generator in the tunnel which allowsyou to evaluate alpha dot and q effects separately. The fifth paper in this session was presented by Mr.Reaner and dealt with unsteady aerodynamic phenomena at high angles of attack. He described a uniqueapparatus at LIUe which I have had the pleasure of seeing. It is a rotary balance apparatus mounted in aspin tunnel that allows not only pure coning but also oscillatory coning experiments which no one else isreally doing. He also described a new test facility which provides the capabilities for high-amplitudedynamic pitch or yaw motion. He then discussed some of the experiments they had done with sinusoidal andconstant angular-rate motions at high rates.
The sixth paper was a preaentation by David Thompson with his co-author Colin Martin from the AeronauticalResearch Lab in Melbourne, Australia. They have been doing considerable work on the F/A-18 looking at thetall buffet problem from the standpoint of understanding the vortex flows by virtue of wind tuonel testsand water tunel tests. They have looked at the effects of the Lex fence in water tuonel studies to tryto understand what effect the fence has on the leading edge extension Lax vortices. They provided acorrelation of the Lax vortex breakdoee position with angle of attack looking at subscale models in thewater tunnel, wind tunel models and full-scale flight and showed a very good correlation that basicallysays that the vortex breakdown location is ndependent of Reynolda number. This is because of the sharpedge of the Lax. This correlation is encouraging to those of us that are doing a lot of studies in watertunnels for visualization as well as for quantitative measurements. He also showed the effect of inletflow on the Lex burst location which several of us have also seen.
The seventh paper in this group was another presentation on the X-31 dealing primarily with thesteady-state aerodynamics and rotary-derivative measurements. I just noted a few bullets here that I gotfrom the conclusions. One was that the X-31 has positive pitching moment at all angles of attack belowstall; it has good lateral directional static stability, well damped in roll and in yaw. Near stall, asyou might expect, lateral stability is reduced, and it's propelling in roll without augmentation.However, the aileron control power can overcome the propelling rolling moment. Above 450 angle ofattack, rudder is ineffective, and therefore one of the requirements to take care of this problem isthrust vectoring. They have identified only one spin mode, a flat spin at approximately 860 angle ofattack which is well away from the operational envelope that they expect to fly; therefore, it doesn'tappear to be a problem.
The last paper in this session was the presentation by Mr. Perkins on a parameter estimation techniquethat British Aerospace is using with an experimental airplane program which is called an equation errormethod. I couldn't follow the logic very closely, but apparently it has some advantages over the methodswhich are used by other people. The method Is able to accomeodate non-linear aerodynamiccharacteristics. It doesn't require a predefined aerodynamic meth model. Part of the process of fittingfliSht test data is the determination of shich coefficients are the important ones to keep. It doesrequire extremely high accuracy flight test data. This Is a requirement that is not peculiar to thatmethod, but perhaps in some ways it is more important for this particular method.
We also had a session this afternoon on stability and control, and the first three papers in that sessiondealt with forebody vortex control. I discussed sowe of the work that Hdetics has been doing primarilyon a generic fighter configuration and recent work on an PA-18 model looking at forebody strokes, blowing,and miniature rotatable tip strskes. Bob Guyton presented work that the Air Force has been involved inprimarily on the X29A and the n16 and also a little bit of work on generic chine-shaped forebodyconfigurations which are more appropriate perhaps for the next generation of airplanes.
Jean Rosm presented a very nice paper on some work that she has done on forebody suction, again with theidea of controlling the forebody vortices end described a dysamic test technique which allows them toevaluate the suction technique in conjunction with the flight control system.
Finally, we bad two invited papers which we just heard. Oee from Mr. Mhugold in which he discussed how totranform flight mechanics requirents into aerodynamic coefficients and he discussed the need fordeparture criteria which not only include the usual static ters but some of the dynamic terms. We hadsoe discussion here as you heard in terms of what should be included in those dynamic terms. Clearly, weneed to include them at high anles of attack. The question is how do we determine what they are end b,
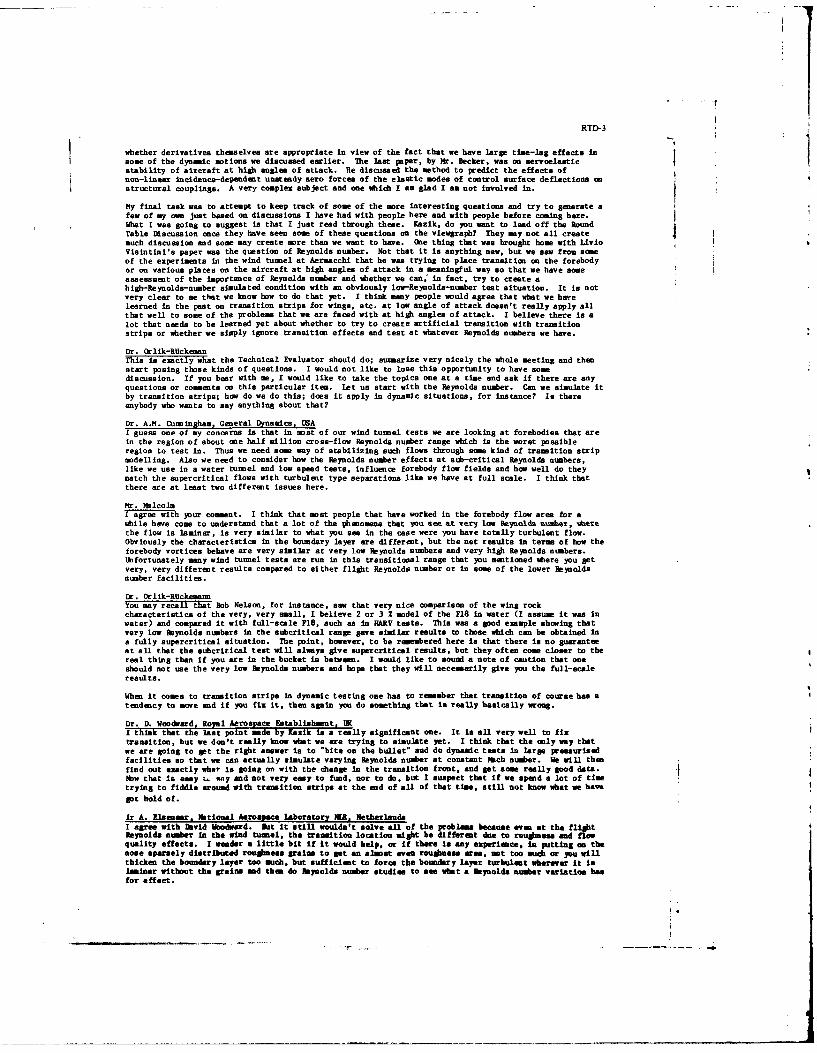
RTD-3
whether derivatives theselves are appropriate in view of the fact that we have large tie-lag effects insome of the dynamic motions we discussed earlier. The last paper, by Mr. Becker, was on servoelasticstability of aircraft at high angles of attack. He discussed the method to predict the effects of
non-linear incidence-dependent unsteady aero forces of the elastic modes of control surface deflections onstructural couplings. A very complex subject and one which I as glad I an not involved In.
My final task was to attempt to keep track of soe of the more interesting questions and try to generate afew of my own just based on discussions I have had with people here and with people before coming here.What I was going to suggest is that I just read through these. Kazik, do you want to lead off the RoundTable Discussion once they have seen some of these questions on the viewgraph? They may not all createmuch discussion and some may create more than we want to have. Doe thing that was brought home with LivioVisintini's paper was the question of Reynolds number. Not that it is anything new, but we saw from someof the experiments in the wind tunnel at Aermacchi that he was trying to place transition on the forebodyor on various places on the aircraft at high angles of attack in a meaningful way so that we have someassessest of the importance of Reynolds number and whether we can, in fact, try to create ahigh-Reynolds-number sisulated condition with an obviously low-Reynolds-number test situation. It is notvery clear to me that we know how to do that yet. I think many people would agree that what we havelearned in the past on transition strips for wings, etc. at low angle of attack doesn't really apply allthat well to some of the problems that we are faced with at high angles of attack. I believe there is alot that needs to be learned yet about whether to try to create artificial transition with transitionstrips or whether we simply ignore transition effects and test at whatever Reynolds numbers we have.
Dr. Orlik-RUckemanThis is exactly what the Technical Evaluator should do; suamarize very nicely the whole meeting and thenstart posing those kinds of questions. I would not like to lose this opportunity to have somediscussion. If you beer with me, I would like to take the topics one at a time and ask if there are anyquestions or coents on this particular Item. let us start with the Reynolds number. Can we simulate itby transition strips; how do we do this; does it apply in dynamic situations, for instance? Is thereanybody who wants to say anything about that?
Dr. A.M. Cunningham, General Dynamics. USAI guess one of my concerns i that in most of our wind tumel tests we are looking at forebodies that arein the region of about one half milion cross-flow Reynolds number range which is the worst possibleregion to test In. Thus we need some way of stabilizing such flows through some kind of transition stripmodelling. Also we need to consider how the Reynolds number effects at sub-critical Reynolds numbers,like we use in a water tunnel and low speed tests, influence forebody flow fields and how well do theymatch the supercritical flows with turbulent type separations like we have at full scale. I think thatthere are at least two different issues here.
Mr. MalcolmI agree with your comnt. I think that most people that have worked in the forebody flow area for awhile have come to understand that a lot of the phenomena that you see at very low Reynolds sumber, *barethe flow is laminar, is very similar to what you see in the case were you have totally turbulent flow.Obviously the characteristics in the boundary layer are different, but the net results in terms of how theforebody vortices behave are very similar at very low Reynolds numbers and very high Reynolds numbers.Unfortunately many wind tunel tests are run in this transitional range that you mentioned where you getvery, very different results compared to either flight Reynolds number or in some of the lower Reynoldsnumber facilities.
Dr. Orlik-RUckemanoYou may recall that Bob Nelson, for instance, saw that very nice comparison of the wing rockcharacteristics of the very, very small, I believe 2 or 3 2 model of the P18 in water (I assume it was inwater) and compared it with full-scale F18, such as in HARV tests. This was a good example showing thatvery low Reynolds numbers in the subcritical range gave similar results to those which can be obtained ina fully supercritical situation. The point, however, to be remembered here is that there is no guaranteeat aU1 that the subcritical test will always give supercritical results, but they often come closer to thereal thing than if you are in the bucket in between. I would like to sound a note of caution that oneshould not use the very low Reynolds numbers and hope that they will necessarily give you the full-scaleresults.
When it comes to transition strips in dynamic testing one has to remember that transition of course has atendency to mwe and if you fix it, then again you do something that is really basically wrong.
Dr. D. Woodsard, Rosl Aerospace EStblishment 1KI think that the last point -de by Kazik is a really significant one. It is all very well to fixtransition, but we don't really know what we are trying to simulate yet. I think that the only way thatwe are going to get the right answer is to "bite on the bullet" and do dynamic tests in large pressurizedfacilities so that we can actually simulate varying Reynolds number at constant 16ch number. We will thenfind out exactly whet is going on with the change in the transition front, and get soe really good data.New that is easy L, may and not very easy to fund, nor to do, but I suspect that if we spend a lot of timetrying to fiddle around with tramition stripe at the mad of all of that time, still not know what we have
got hold of.
Ir A. I nsar, National Aerospace laboratory NIR, NetherlandsI agree with David Woodward. But It still wouldn't solve all of the problems because vgy at the flightReynolds number In the wind tumil, the transition location night be different due to roughness and flowquality effects. I weedar a little bit if it would help, or if there is any experience, in putting on thenose sparsely distributed roughness grains to get an almost even rouShness are, not too much or you willthicken the boundary layer too such, but sufficient to force the boundary layer turbulent wherever it Islainar without the raise and them do Reynolds number studies to see what a Reynolds number variation hasfor affect.
I,
RTD-4
Dr. EG. Bradley. Jr. * General Dr1-_ic. USALet -me t aid a little bit to the cUplexity and lack of understanding in this area. There wva a timeas a young engineer, I would have bet my paycheck that sharp leading edgea are Insensitive to Reynoldumber. I have had some recent experiences that would sake ee doubt that somewhat. We actually tested
very sharp leading-edge chines on a nose probe, for exaple, quite thoroughly both dynamically and In awind tunnel, statically, and we were disappointed in flight tests and the effects that were noted. Thisis the case of a very sharp-edge vortex flow which influences the larger, developed vortex flow andperhaps the nose separation. It is a very, very complex problem end I an not sure that there is a simplesolution.
Hr. MalcolmI think that we all would agree with that.
We have had a lot of discussion about time-lag effects In this particular flight regime that we are in,both in terms of appropriate wind tunnel test techmiques and also how we incorporate these into theaerodynamic math models. Probably as important, at least in the long term, can we measure these inflight? We have a number of high angle of attack, high manoeuver rate flight programs, such as the F/A-18HARV, the X-31; is there going to be sowe way to get feedback from theme flight tests that will tell ussore about the importance of the time-lag effects? It is not an easy problem and I an not a flight testengineer. Perhaps someone who is dealing with flight tests would like to sake some coments either oneway or another. Also, people who are having to deal with simulations obviously are faced with the problemof how to deal with the time-lag problem, how to put these coefficients in in terms of a time varying anda history dependent manner. Any comments from the flour?
Mr. J.E. Jenkins. Wright Patterso APE, USAWith regard to the tme effects, even in a linear sense, one possibility would be to pick up on an ideathat Etkin proposed quite some time ago. That is, to treat the aerodynamic reaction as a transferfunction. This would require dynamic tests in order to define these transfer functions, but you couldhandle in theory significant time-lags in that way. In the non-linear sense, including the historyeffects, I think we are forced to look at the hypersurface or indicial response type of ,sodels. That
makes the problem much sore difficult for the flight mechanics people because you can't use theseall-perturbetion equations of motion any longer.
Dr. Dr lik-flckeman
One of the reasons why we are obtaining dynamic derivatives is so that we can correctly formlate thevarious control laws and design control systems. An associated question is, "do we need to incorporatethe various time-lag effects in our control iaws' and control systems?".
Dr. L. Visintini, Aeracchi, ItalyI have just a short comment. I think that the range of pitching rates shown in the various experiments isvery wide, we have seen numbers up to .2 or .5 in qc/v. in the recet AGARD FDP short course at NASA
Langley Research Center we have seen that the most realistic values for manaeuvring aircraft are limitedto something like .03 or .05. So, I think that lag effects that should be considered for modellIng ormanosuvring prediction should be the ones coming from just those levels of pitch rate. Probably large
pitch rates induce very large lags that may not be meaningful for manoeuvring aerodynamics.
Dr. Orlik RUckemannThank you for your comment, however, I would like to recall that the point was mede during the maeting
that these higher reduced rates are of interest when you discuss the dynamic behavior of controlsurfaces. So there Is still some application of these rates.
Mr. WlcolaFor the next question we perhaps already know the answer, "Do we need to include alpha dot and beta doteffects?" I believe that there have been enough studies done already to show that they can be important,certainly Charis O'leary's experiments have shown the importance. Probably the only reason that they
haven't been included in the past is just the difficulty of actually determining what they areexperimentally and certainly analytically. But perhaps with the addition of rigs such as Charles' andothers who are begining to look at the translational effects, we'll know sore about the beta dot ad
alpha dot effects, in the future and they can be included in the simulation model. Any comments?
Mr. C.O. O'Leary. Royal Aros~ace Establishment. OK
I got the impression, from the discussion with Kazik after his lecture, that Peter Mangold was saying thatthey weren't too significant because the aircraft control system was designed such that beta dot effectswere suppressed. But this pre-supposes that the actual aerodynamic controls are working properly, andthey can be effective, but what if the aerodynamic controls become Ineffective in a particular situation,then you are going to get your betadot whether you like it or not. I wonder whether you have a coent onthat.
Mr. MalcolmPeter Rcussed the need for better criteria at high angle of attack and the need for incorporatingdynamic derivatives or coefficients, as the case say be. The other problem is having to do an analysis interms of, say for emsple, the departure criteria on an airplane that is unstable, you can't just do ananalysis on the bare airframe, you have to somehow include the effects of flight control system which ofcourse, in the early design stage hasn't been established yet. So, I think the criteria that are beingused by aircraft designers, Ca beta dyn, and so forth, as he said, are really not adequate any sore. wehave to have a better understanding of hat kind of term to include and where we get them end how wedetermine them at that point in the aircraft design. 1hether beta dot and alpha dot effects re importantat the design stage or definition of control system, I do sot know; I as not the right one to anwerthat. Peter sents to sake a cougit.
II,
RTD-5
Mr. P. M Ingold, ikrier Luftf-hrt, ermanyYes I want to make a comeent on this question. Things which I have spoken about in my paper are thedesign criteria for the very early stage of an aircraft. So I didn't want to say that these alpha dot &odbeta dot effects shouldn't be included in the simulation model, which after all represents the realbehavior of the augmented aircraft. In fact, we are using these alphadot and betadot derivatives if theyare available. In longitudinal otion, for eample, we have these alpha dot and q derivatives separatedfor the simulation model by an empirical method. We flight mechanics people would, of course, appreciateit if the aerodynamcist could provide us with more confident data.
So, in summary we are using these derivatives in simulation. Up to now the aerodynamicist did not cowe upwith confidnt data. Due to my experience in the augmented fighter business, I must say, that theaugmented system is not very sensitive to variations in these derivatives.
Of importance, however, are the time-lag effects. Here I am not sure if things that we are measuring nowor you are measuring now, are of great importance for flight mechanics. ost of the tests sean duringthis meeting have been done with rotary movements. If you look at a real flight and to the manceuvers apilot is doing, you see that he Is intiating a manoeuver and then he stops at an angle of attack. He flysfor some time, then ha is pitching down. Our Swedish colleague, Mr. Torlund, showed some results fromsuch manoeuvers. These manoeuvers will be of interest to the flight mechanics people. The problem is,how to include these effects in the simulations because you know when you initiate your manoeuver, but youdon't know where you will stop it, so you cannot really model this effect because the magnitudes ofdynamic Forces and Momants are dependent on the time histories of the whole movement in the past. It willbe very difficult.
Dr. Orlik RUckemannYou are referring to the ramp-type manoeuver, especially a very fast one. There are several rigsavailable now in the NATO commuity which can produce data showing very large time-lag effects which canbe measured with those rigs. I would also like to make a coment regarding the effect of the dotderivatives on our ability to predict the dynamic behavior of aircraft. This does not necessarily meandeparture or something like this, but just how would the aircraft react to various disturbances. It hasbeen shown by several different organizations in the last 10 years or so, that the separation of the dotderivatives from their forced-oscillation counterpart is quite an essential requirement to make thosepreditions correctly. In other words, if you just use, for example, the q plus alpha dot derivativeinstead of the q derivative and then put the alpha dot derivative equal to zero, you get in many casesquite an incorrect prediction. For that, of course, you must be at an angle of attack high enough so thatthe dot derivatives are of a significant magnitude. Of course, as long as they are very smeall it does notmake any difference.
Dr. CueeinjthAnother thing that has always concerned me is if you have a g-liited aircraft and are conducting adynamic manoeuver, you will have a significant normal force overshoot, and your flight control systemG-1miter must be able to recognize what is coming up before it gets there. This needs to be included inthe flight control system for safety purposes.
Mr. MalcolmNow I will go back to the one that we skipped. We have seen a lot of data in the last several years onthe effects of dynamic lift on two-dimensional airfoils. We are beginning to see more and moreexperiments and analysis on very highly swept delta wings, 600 and greater. But I haven't seen verysuch about lower sweep. For a typical existing aircraft wing sweep, 250 to 450
. I wonder if there isvery such research going on anywhere looking at the effects of the moderate sweep. Is there anyone whowould care to consent on that?
Dr. Orlik RlckmmaonThere has been a NASA Langley investigation which included rectangular wings as well. It seems that theeffect of dynamic lift was different, but still there.
Dr. CunninghamI tavebendineg some work on lower sweep wings, but not an low as 450
. However, our strake-delta wing
was 760-400. looking at the more complex planforma with double sweep where two differeant types ofvortical flow syeemsa (low sweep and high sweep) interact you have an added problem. This is especiallytrue for the FI8 and the P16.
Mr. MlcolmWe n---"eeI' ave some feedback from flight tests. Will we be able to get sm feedback from high ratemanoetwer flight tests that are going to be done in the near future to sees@ whether we are doing theright experiments, whether we are measuring the right quantities for simulation and flight testprediction? Will anyone commt, for the X31, on the type of data they expect to get that will shed somelight on sme of these time-lag problems at high-rate conditions and in full scale?
TIM t. A bothLdwayt aboutti yar. Then we should be able to substantiate results with flight testdata end we should be able and in a position to preset facts rather than talking about speculations atthis point In time.
Mr. MlcolmI gnome point I wa trying to set at is, "are we deaigming flight tests in such a way that we will beatls to dtereine thee kinds of effects?". We know that they exist at least in sub-scale experimenta.The question is will we be able to meamee those from full-scmle flight tests in a way that we an learnsomething from that?
, _ _..,ll ~ ~ ..:: :,,, _ _ _ _ - _2 _ _ _ _ _ _ -.. .. .. .. . . ...--.... ....... .. . .. ...... ... . ... .... .. . .. . .. . . . .
RTD-6
nF hould, in answer to your question. We definitely should take more flight test data for theseeffects. I wanted to commnt that what really turned Dr. Cunningham on to this area some time back wasflight data from the n6. We recorded the hysteresis effect and have flight data. That was what tweakedour interest in doing some sore research about six years ago.
Mr. MalcolmI have Snother consmment on this, and I don't think that anyone would disagree. I believe that AGARD shouldagressively continue to promote technology exchange in this area. It is obviously an area which has a lotof interest, a lot of relevance to aircraft that are flying now and probably more importantly for futureaircraft. I certainly, as an evaluator, would like to encourage AGARD to continue these kinds of meetings.
Dr. Drlik RickemannVery good point. Professor Slooff?
Prof. Ir. J.W. S10off. National Aerospace Laboratory NLR, NetherlandsWhat I am going to say does not apply to any of the dots over there, but it may also apply to all ofthee. A point I was missing - it is not a question or issue that fits into the picture from your pointof view - is the question to what extent can we expect to make use of CFD-type methods in this area, ifnot now, then perhaps in the more distant future. I have heard very little on that. Ch, I see I was tooearly. You address your point on your next viewfoll.
Mr. MalcolmONiolyhere are a lot of advances being made in computing steady flows with CFD methods. A lot ofwork is done at NASA Ames and NASA Langley, at least these are the ones I am most familiar with, but thereis obviously some work going on in Europe in this area. They have been very successful in calculatingforebody flows and extanding that gradually back over the entire airplane. Obviously, doing this in ahigh rate eanneuver Is a differnt question. I don't know if there are any CFD people in the group herewho want to comat on the problems involved in doing that and how soon we might expect to see peopledoing those kind of computations.
Dr. Orlik RilckemannI think we have only recently started considering the possibility of running some rotary CFD calculationswhich by the nature of things are of a quasi-steady rather than of an unsteady type. As I understand It,no unsteady CFD calculations on complete configuration. have yet been made.
Mr. E. Waggoner, NASA Langley. USAI would like to make a comment. I think we have made essential progress during the last years tocalculate high angle of attack cases in steady flow, the time has now come to attack the unsteadyproblems. I think this is possible, especially those manoeuvers which have been mentioned here which arenot really oscillatory, ramp-type manoeuvers and so this can now be attacked with computational methods,for example, for delta wings etc. I would encourage our people to do this.
Dr. Orlik RickemannI am very happy to hear that. We have about 10 minutes left for the discussion, so could we press onplease.
Dr. W.J. MaCoskey. NASA Ames Research Canter, USAI Just wanted to advertise a forthcoming conference by our sister panel, Structures and Materials. On 6 -11 October in San Diego, will be a specialists meeting entitled "Unsteady Aerodynamics andAeroelasticity". As you can guess from the title there is unsteady aerodynamics in that. It ieaeroelasticity oriented, but it is my understanding that there will be som attempts to address thepotential for CFD in this area, if not actual results presented at that meeting.
Mr. MalcolmTEt is-good to hear. We have several questions left. I an not sure what the priority ought to be. Whydon't we just go through them one at a time and if someone wants to make a comment, they can, and if not,we'll go on. We have actually touched on the second one probably in the discussion we have had already interm ow to include dynamics effects in preliminary design and what the penalties are if you don't.If an-nQ wants to comment on that they are welcome to. The third one actually am Peter Mangold mentioneda "omenL ago. Does the wind tunnel test commnty or does the aerodynaciat, in a sense, understand theneeds of the aircraft designer, perhaps in terms of what are the important aerodynamic coefficients toinclude, particularly in the preliminary design stage. I don't know the answer to that. Perhaps thereneeds to be closer contacts between flight test people or the ero mechanics people and the aerodynamicist.
Dr. Orlik RUckisnaOne of my min cosiderations whea organizing these meetings has always been to do that in such a way thatthe specialists from the different walks of life have a chance to talk to each other, and I hope that wewill continue doing it in this way. I think it was very interesting for us to hear Mr. Mangold's remarksthis afternoon.
Mr. MalolmTlihae -acouple of questions related to forebody vortex control. Most of the work that has bae done todote has bean on a more or lae conventional forebodles, if you will, with circular and ellipticalcrom-sections, where you can have a high influence over the separation location by either blowing orusima miniature strakes ad so forth. oe question is how applicable w e m of the" techniques tochine-shaped fotebodies. We m one ent on it today In Bob Guyton's talk, looking at a pmeric chineconfiguration where separntiou is relatively wall fixed due to the sharp edit. I think that probably someof the tech.iques that we have bee looking at wiU work and am will not o the mext generation offorebodis. That is an important issue to keep in front of us, I believe. Also, Is forebody vortexcontrol in competition with thrust vectoring or is it considered to be omplmntary, particularly for low
RTD-7
control? Does anyone want to comment on that? My own view is that they can and probably will becomplementary. One won't be used in place of the other. I believe that they both have a place. Ibelieve that eventually on the HARV configuration, for example, you will see both of these n operation.As has been mentioned before, they are now in the beginning stages of flying HAkR with the paddles forthrust vectoring and they are doing some full-scale wind tunnel tests at NASA Ames now to evaluate bothblowing and also the Langley conformal atrakes. It is planned to flight test with both of these syatemsIn operation, eventually, so this may be an opportunity to see how these two unique controls effectors canbe used in conjunction with one another.
Dr. Orllk RUckesannI would like to add to this that the only reason why there were no specific papers addressing the questionof thrust vectoring In this meeting is that, of course, the meeting was about aerodynamics of manoeuveringaircraft. Certainly I agree with the rest of what you said. The two techniques most likely will becomevery complementary in nature. Also I would like to add that thrust vectoring is a technique which will besoon proven in flight, whereas forebody vortex control methods are being so far developed and looked intoIn a research environment only so far.
Mr. nalcolm
Relate to that is the last bullet, and I will come back to the next to the last one in a moment, and thatis the obvious need for understanding the effect of Reynolds number on forebody vortex control and also toevaluate it in non-steady conditions, either in high rate motions that might be produced by some of thehigh-rate pitch or yaw motions or in particular, on the rotary balance. We are golng to be doing someexperiments on a sub-scale FIB in the Ames 7 by 10 on a rotary balance to look at the effects of forebodyblowing in the presence of a rotational motion. There is not a whole lot known yet about the dependencyon that technique on rotation rates, so I think that we need to know more in that area. Finally, with thevarious flight program that are on-going, including for a short time at least, the X29A at NASA Drydenand also the F18 HARV and the X31, the question arises as to how accessible is the flight data going to beto those of us who are trying to understand high angle of attack, high rate ntion data. Hopefully, eventhough these are taking place in various organizations, we will have access to that data as it becomesavailable. It will help us to do our job better. Any other comments? I know that we are about to runout of time.
Dr. CunninghamOn your last bullet on the chart about the dynamic effects of forebody vortex control, it is interestingthat when we fix our static stability problems by straightening up our forebody flow fields, we sometimesget into a dynamic problem. You can't fix everything, so I think It is good to emphasize that If forebodyvortex control works statically it may not necessarily work dynamically or vice verse.
Mr. Malcolm
Well, we certainly need to know.
Dr. BradleyI would just like to make one coment. We seem to have a propensity in the Unlted States for sis-managingthese flight programe. We develop special flight vehicles, the X29, X31 and AFTI. By the time we getthe in the air. we have spent all the money and we never have enough money to do the sufficient flighttesting to get detailed data. I would just like to raise the flag here. You who have a lot of influencewith the money sources should straighten that out.
Mr. MalcolmI agree.
Dr. Orlik RUckemenLet us close this discussion on this note. Let us be optimistic that we can really affect the powers thatbe in this direction. I would like now to thank very such our Technical Evaluator, Gerry Malcolm for avery wall done job. I would like to thank all the authors who participated in this meting for thecareful preparation of their material and written versions of their papers. Finally, I would like tothank the session chairmen who did a good job in keeping everything on course and on time. With this Iwould now like to call on the Panel Chairman to close the meeting.
Dr. Mkcrakay
Th Joyofbwing Panel Chairmen In that you get in the last words. So I will take the prerogative to justamplify Dr. Bradley's coment. Often when the data are acquired there is no money left ever to analyzethan and disseminate then. According to the time table, and AGARD i reknowned for keeping the schedule,it is all over and we are all on the bus. So, I will just make a few remarks that relate to our bus ridein. bit first, thanks to YAFik, for his Herculean efforts in putting together this program and agein aspecial thanks for Mr. Melcolm for sitting in as Technical Ealuator and doing such a fine job. I wouldlike also to may on behalf of the Panel, we appreciate the contributions of Mr. Mangold of the FlightMechanics Panel ead Mr. Decker representing the Structures and Meterials Panel. On behalf of the Panel Iwant to epress sain our appreciation to organizations and individuals here in France who made this allpossible: The French AGARD Dlegation, Sup'Aero, our host, Aerospetiale, Airbus Industrie, end OMIRA, ndin particular, Monsieur Sergeant who had the task of running up and down and keeping all of theaudiovisual working. Again Mr. Bouquet and Monsieur and Modeme Dujarric for their efforts.
Go. essential part of this meting is the task of the translators, and I don't really know how they doit. Let us express our appreciation to Wdemoiselle Celie, Modame Couedc and onsieur de iUffiac. We doappreciate the job that you do. I particularly appreciate and understand probably better than mat, theeffort of our Panel Eecutive and his wife, Dr. end Mrs. Goodrich and our secretary, Mademselle tivault.
As I amid at the conclusion of the Specialists Meting on Adverse Wiather, please translate thi wesrfeeling and applause into favorable coemments back to your msagent about the value of AG D. We apeak at futurs attractions. I would like to show the viesgraph of our forthcoming meeting, that will be
44
RTrD-8
the fall symposium on "herodynamic Engine Airframe Intertion". I wili just reiterate the fanl meetingby the Structures and Mikteri
1sl Panel. 6 to 11 October ili, on "Unsteady Aerodynamics and
Aroelasticity'. Then we have two symposia next year on Rypersonlcs in Torino, on High Lift SystemAerodynamics in Canada, and two special course@ that will be put on in connection with the von FarmnInstitute. Finally, I would like to just shm you a quick video about the meting In Fort Worth.
-~ I
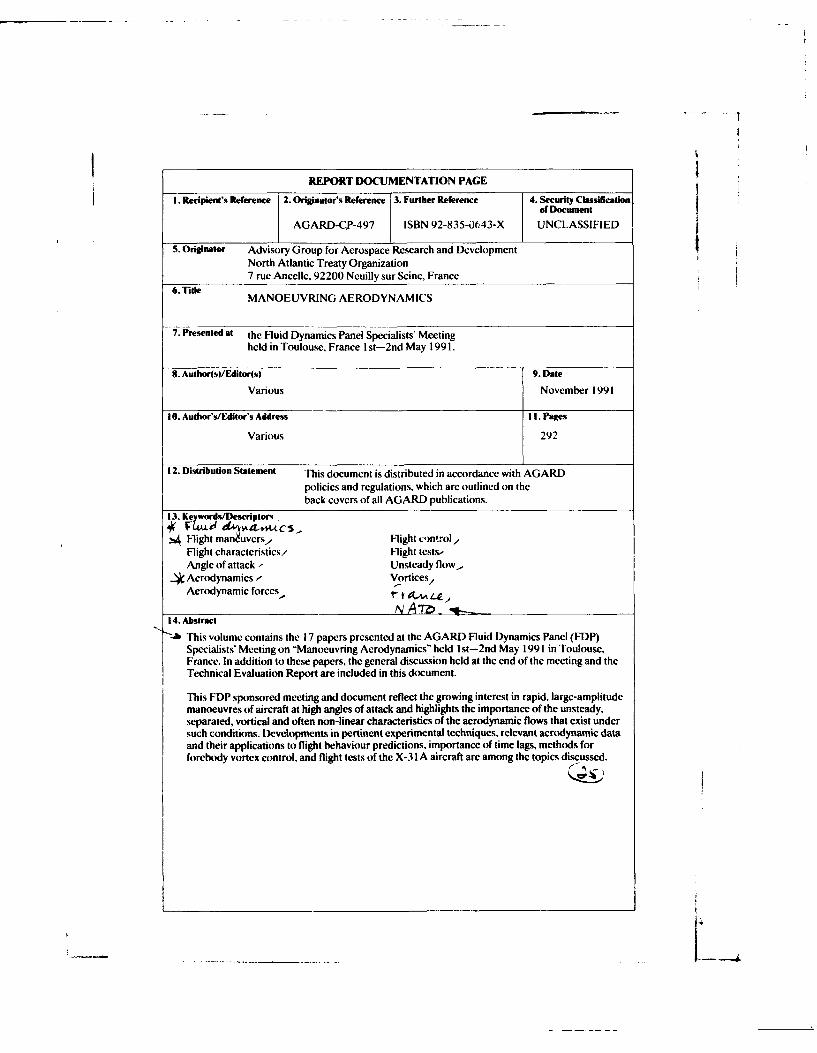
- T
~REPORT DOCUMENTATION PAGE
I. Recipient's Reference 2. Originator's Reference 3. Further Reference 4. Security Classificationof DocumentAGARD-CP-497 ISBN 92-835-0(,,43- UNCLASSIFIED
5. Originator Advisory Group for Aerospace Research and DevelopmentNorth Atlantic Treaty Organization
7 rue Ancelle, 92200 Neuilly sur Seine, France
6. TitleMANOEUVRING AERODYNAMICS
7. Pre eted at the Fluid Dynamics Panel Specialists' Meetingheld in Toulouse, France I st-2nd May 199 1.
8. Author(s)/Editor(s) 9. Date
Various November 1991
10. Author's/Editor's Address II. Pages
Various 292
12. Distribution Statement This document is distributed in accordance with AGARD
policies and regulations, which are outlined on theback covers of all AGARD publications.
13. Keywords/Desriptons
Flight manuvcrs/ Flight control,Flight characteristics/ Flight tests-Angle of attack Unsteady flow,
_. Aerodynamics Vortices/Aerodynamic forces t- t 4 .A.
14. Abstract., This volume contains the 17 papers presented at the AGARD Fluid Dynamics Panel (FDP)
Specialists' Meeting on "Manoeuvring Aerodynamics" held I st-2nd May 1991 in Toulouse,France. In addition to these papers, the general discussion held at the end of the meeting and theTechnical Evaluation Report are included in this document.
This FDP sponsored meeting and document reflect the growing interest in rapid, large-amplitudemanoeuvres of aircraft at high angles of attack and highlights the importance of the unsteady.separated. vortical and often non-linear characteristics of the aerodynamic flows that exist undersuch conditions. Developments in pertinent experimental techniques, relevant aerodynamic dataand their applications to flight behaviour predictions, importance of time lags, methods forforebody vortcx control, and flight tests of the X-3 IA aircraft are among the topics disc ussed.
att A,
Y y
U==
A E 4E
Ln c
0 0 0
0 0 c. u
f~l -r'0 5
UI~fl
d. <
; -, 8 1
;4. r.
FLI w
E- u
'o - b E- -
E.-E
E -E 2 E 0 -
72 r- r
E.2
u 00)c
79 t ~ o>~i
NATO +OTAN7RUE ANCELLE -92200 NEUILLY-SUR-SEINE DIFIISION DES PUDLICAMMNSi
FRANCE AGARD NON CLASSOFIEKST6Mphone (1),17.3817.00 TMu 610 176
Tilacapis (1)47.38.57."9
L.AGARI) ne ddtien:a de stocks de s publications. dans un but de distrbuion jenerale i r'adrese ci-dessus. La diffusion inutiale despulctosde l'AGAR eat effeetue aupris des pays mesubres de cet orassauo par I'Aterm~daire des Centre Nationaux de
Ditrbution suivants. A l'exception des Etna-Unis, ces centres disposent pairfo~ad'exeniplairesadditonnemdans lea cas contraire, on pent
CENTRES DE DIFFUSION NATIONAUXALLEMAGNE ISLANDE
Fachinfonnationszentrum, Director of AviationKaulsruhe c/o FlugradD-75 14 Eggenstein-Leopoldshaen 2 Reykjavik
BELGIQUE ITALIECoordonnateur AGARD-VSL Aeronautics MilitareEtat-Major do la Force Airiennec Ufficio del Delegate Naziosale aflAGARDQuiartier Reine Elisabeth Aeropoito Pratica di MarcRue drEvoe.e 1140 Bruxelles 00040 Pomezis (Rosma)
CANADA LUXEMBOURGDirecteur du Service de Rem ttet Sjimoqss Vos, BelgiqueMinistiere dcoIs Defense Natonalren NORVEGEOtt&aa.Ontsio KIA 1312 Norwegian Defence Research Establishment
DANEMARK Attn: BabboteketDanish Defence Research Board P..-X23 iloVed Idrachiparken 4N207Kde2 100 Copenhagen 0 PAYS-OAS
ESPAGNE Netherlands Delegation to AGARDINTA(AGRD ubliatins)National Aerospace Laboratory NLRINTA(AGRD ubliatins)Kluyverweg IPintorRsals3 229HSDef
28008 Madrid 69SefPORTUGAL
E-TATS-UNIS, Portuguese National Coordinator to AGARDNational Aeronautics and Space Administration Gabinete do Estudos e ProgramasLangley Research Center CLAFAM/S 19 Base do, AifragideHampton. Virginia 23665 Affragido
FRANCE 2700 AmadoraO.N.E.RA (Direction) ROVAUME UNI29, Avenue do Is Division Leclerc Defence Research Information Centre92320, Chiilon sons Bagneux Kensigern House
65 Brown StreetGRECE Gagw0 E
Hellenic Air Force Gagw0 ESenm&~ddsca LibasyTUROUJE
LibrryMiN Savanna Baglsan1 (MSB)Dekelia Air Force Base ARGE Daire Balkth&(ARGE)Dekelia. AghenTGA 1010 Anskara
LE CENTRE NATIONAL DE DISTRIBUTION DES ETATS-UNIS (NASA) NE DETIENT PAS DE STOCKSDES PUBLICATIONS AGARI) ET LES DEMANDES DEXEMPLAIRES DOIVENT ETRE ADRESSEES DIRECTEMENT
AU SERVICE NATIONAL TECHNIQUE DE LINFORMA1ION (NTIS) DONT LADRESSE SUIT.AGENCIES DE VENTE
Natioinal Teclaticul Intformation Service ESA/infowmation Retrieval Service 7Te British Libratry~NTIS European "qme Ageicy Documnt Supl DivisionW8 d10, ruse Mario Nikia Boson SPA, W=heb
Spieel= 2 6 75015S Patis West Yoqkhre LS23 7B0
I amm Amde otcinuie hesoude .dedocuaMmAGARDyossprissm dfataaulfStivstmier
- -r-sapui i AGARD fial dons lea jourssax s urants;Se-w-ld pd To&," aAW~OMeport (STAR) O Renus Bports Asaonuesinuaad Indtex (RAMI)
ve pelNASA~lesiias~caia t NainaTchnl bdonnon. Service
001C.C. 2Wr~.r~~.~I
.20,44eae Eutwb Om~wL~r~m~ £m "Menl
NATO OTAN
7 RUE ANCELLE -92200 NEUILLY-SUR-SEINE DISTRIBUTION OF UNCLASSIFIED
FRANCE AGARD PUBLICATIONS
Telephone (1)47.38.57.00 -Telex 610 176Telefax (1)47.38.57.99 ____________________________
AGARD does NOT hold stocks of AGARD publications at the above address for Bneral distribution. Initial distribution of AGARDpublications is made to AGARD Member Nations through the following National Distribution Centres. Further copies are sometimesavailable from these Centres (except in the United States), but if not may be purchased in Microfiche or Photocopy form from the SalesAgencies listed below.
NATIONAL DISTRIBU TION CENTRESBELGIUM LUXE.MBOURG
Coordonnateur AGARD - VSL See BelgiumEtat-Major dc la Force Aeienine-
Poman Fees PidR
flIAC ANational AefonatiCS and t,NLRCA N IJI I space Administration 7 1
NASA41INational Aeronautics and OfiilBsnsSpace Administration Penalty for Private Us. S=s
DEN, Washington, DC. spEciAL rFown CLASS MAJL ..tablishment
'RA -DF N :r to AGARD
ATTN,, DTIC-DAlD./ YCE C 1 :CAMERONW ETATT:CN BLDG 5S
GER? ALEXI'liDFRTI VA 22:30461 45
A.. ..... ~Milli Savunma Baikarthf (MSB)Scientific and l'echnicplI Library AAtJE Daire Ba~kanlifp (ARGE)Dekclia Air Force Base AnkaraIDekeiia. Athens TGA 10 10
UNITED KINGDOMICEL.AND Defence Rcsearth Information Centre
Director of Aviation Kentigemn Housec/o Flugrad 65 Brown StreetRcykjavik Glasgow 02 8EX
ITALY -oatc biacUNITED STATESP oatcaMltr National Aeronautics and Space Administration (NASA)Uffi cio del Delegato Nazionale aJ'AGARD Langley Research CenterAc, -porto Pratica. di Marc MWS 180(00, 1 Pomezia (Roma) Hampton, Virginia 23665
THE UNITED STATES NATIONAL DISTRIBUTION CENTRE (NASA) DOES NOT HOLDSTOCKS OF AGARD PUBLICATIONS, AND APPLICATIONS FOR CO PIES SHOULD BE MADE
DIRECT TO THE NATIONAL TECHNICAL INFORMATION SERVICE (NTS) AT THE ADDRESS BELOW.SALES AGENCIES
National Technical ESA/Informattion Retieval' Service The British LibraryInformation Serice (NTIS) European Space Agency Document Supl Centre
*5285 Port Royal Road 10, rue Mario Nikis Boston Spa, WeterbySpringfield, Virginia 22161 75015 Paris West Yorkshire LS23 7110
*United States France United Kingdom
Requests for microfiches or photocopies of AGARD documents (including requests to NTS) should includeteword 'AGARD' and theAGARD serial number (for example AGARD-AG-31 5). Collateral information such as title and publication date is desiraible. Note thatAGARI) Reports and Advisory Reports should be specified ssAGARD-R-nnn and AGARD-AR-ninn, respectively. Full bibliograsphicial
references and abstracts of AGARD publications are given in the following Journals:Scientific and Technical Aerospace Rerts (SA)Government RprsAnncm tsand Index (ORAMl)
publish(ST AR) NAASinii n e aublished by teNational Technical Information ServicepublatnDiishdNAAintii a Tec cal phINformHatio Divsio Srnield1
NAS Heduarteirs Nfl) Vigna 26Washin ton C. 20546 UnitnJ. Statest Inited Cates (also available online in the "TS Bibliogiraphic
bastabmseor on CD-ROM)
*Printed by Spedaksmd Printing Se'~ies LbmlWd40 ChiwEil Lne, Loughtoph EWX ItIIO3JTZ