management reform renaissance of a strong oyo
TRANSCRIPT
Annual Report 2002January 1, 2002 to December 31, 2002
OYO Corporation
Management Reform Renaissance of a Strong OYO
www.oyo.co.jp
OYO Corporation, established in 1957, is Japan’s foremost provider ofgeo-engineering services, incorporating near-surface investigations andcivil engineering consulting. The OYO Group also makes and sellsseismometers and other related geo-instruments, as well as geophones,hydrophones, and other devices for oil and natural gas exploration.
The corporation first expanded overseas in 1980, with the establish-ment of a US subsidiary. We now have a broad network of subsidiaries andaffiliates in the United States, providing a wide diversity of products andservices. The OYO Group also extends to the United Kingdom, France,Russia and Malaysia.
We are answering our customers’ requirements through our “SolutionBusiness” approach and are active in developing new markets with aflexible attitude as to methods: R&D, M&A, joint venturing (notably innatural disaster risk management and risk engineering) etc.
CONTENTSFinancial Highlights .......................................................................................... 1Message to Our Shareholders ........................................................................... 2Management Reform and the “Renaissance of a Strong OYO” ..................... 4Financial Section ............................................................................................... 11Board of Directors, Officers and Corporate Auditors ...................................... 30Corporate Data .................................................................................................. 30OYO’s Major Subsidiaries and Affiliates ......................................................... 31
O Y O C O R P O R A T I O N
¥28,012316(343)(423)
¥ 10.0n/a
¥61,97555,626
Financial Highlights
(Millions of Yen)
2002
¥31,786833
(1,755)(1,070)
¥ 12.5n/a
¥63,78257,069
2001 2002
(Thousands ofU.S. Dollars*)
Non-consolidated Financial HighlightsFor the Year:
Net salesOperating incomeLoss before income taxesNet lossCash dividends per share (Yen, U.S. Dollar)Dividend payout ratio (%)
At Year-End:Total assetsTotal shareholders’ equity
$233,5302,633(2,858)(3,523)
$ 0.08n/a
$516,671463,747
* The U.S. Dollar amounts in this annual report are translated from Japanese Yen, for convenience only, at therate of ¥119.95 = U.S. $1, the approximate rate of exchange on December 31, 2002.
1
¥50,355522(561)(751)
¥71,99754,370
(Millions of Yen)
2002
¥51,8011,148(1,312)(1,004)
¥73,42055,749
2001 2002
(Thousands ofU.S. Dollars*)
Consolidated Financial HighlightsFor the Year:
Net salesOperating incomeLoss before income taxesNet loss
At Year-End:Total assetsTotal shareholders’ equity
$419,8014,355(4,679)(6,260)
$600,221453,267
OYO CorporationYears ended December 31, 2001 and 2002
O Y O C O R P O R A T I O N
In the financial year to end-December2002, the Japanese economy was markedby a strong deflationary tone as capitalexpenditure and consumption expenditurewere depressed and financial institutionswere dealing with their Non-PerformingLoan problems with unemployment rising.The domestic business environment foryour company was difficult with PublicWorks Expenditure lower and private sec-tor capex weak and competition for orderswas severe.
Your senior management endeav-ored to win orders, reduce costs and secureprofitability in the domestic market place.
Overseas a new range of products received intensive marketing.In these circumstances, while the disaster prevention, environmental and
management and maintenance businesses saw increased orders received, theimportant domestic local authority and private sector businesses saw orders downsharply. Consolidated turnover was ¥50.3bn down 2.8 % yoy (year on year).Furthermore the sharp fall in share prices led to losses on investment securitiesand a loss on the sale of TrueTime, Inc. A pre-tax loss of ¥0.6bn (prior year loss¥1.3bn) and a net loss of ¥0.8bn (prior year loss ¥1.0bn) were reported. In these cir-cumstances the proposed final dividend is ¥3.75 (prior year ¥6.25) for a full yeardividend of ¥10.0 (prior year ¥12.5).
In fiscal 2003/04 government construction investment is expected todecline by another just less than 10 % for the third year running. The constructionmarket-related is therefore going to contract further. In this situation your seniormanagement is determined to achieve a change in the corporate results trend andincrease shareholder value under the slogan “Renaissance of a Strong OYO”. Aspart of this senior management policy, there is an across-the-board reform and re-organization in personnel management procedures, lowering of the average age ofmanagement and reduction in personnel costs in line with market developments.With this personnel reform and promotion of new businesses, your senior manage-ment is endeavoring to achieve the “Strong OYO Renaissance”.
My Board and I look forward to your future loyal support based on anunderstanding of our long term prospects as described in this annual report.
March 27, 2003
O Y O C O R P O R A T I O N
2
Message to Our Shareholders
Moriyuki Taya, President
Moriyuki Taya, President
3
O Y O C O R P O R A T I O N
Management Reform and the “Renaissance of a Strong OYO”
— achieving higher operating profits from lower turnover —
The market related to construction is pursuing a contractionary course in view of thesevere fiscal difficulties of government squeezing Public Works Expenditure and ofthe depressed level of private sector activity. In these circumstances, OYO launchedthe medium term corporate reform plan “OYO Revolution 21” last financial year.
That plan was a radical attempt to deal with the adverse environmentforeseen at the time by changing the business culture of OYO and achieving prof-itable growth. However, during financial 2002 the market environment proved tobe even tougher than foreseen and despite the measures taken market contractionled to the sixth consecutive year of lower operating profits.
In the face of this serious situation, the OYO Group must cope with thelikely difficulties of 2003 by further reform of the organization structure, personneland business practices. Despite falling turnover, operating profit must be securedand this is the basis of the “Renaissance of a Strong OYO” project.
Declining Demand and Excess Supply
Unfortunately the results for financial 2002 did not meet targets and consolidatedturnover was down 2.8 % yoy and operating profit was down 54.5 % yoy and bothwere very poor. The main impact was in the domestic Japanese business, wherelocal authorities in particular have reduced Public Works Expenditure. Centralgovernment and private sector construction weakness created added pressure andorders received during the year were ¥25.6bn down 14.8 % yoy.
The environment is extremely bad and there is a clear shake-out occurringin the market. It is considered likely that these condition will continue with con-struction expenditure likely to continue to decline over the next few years.
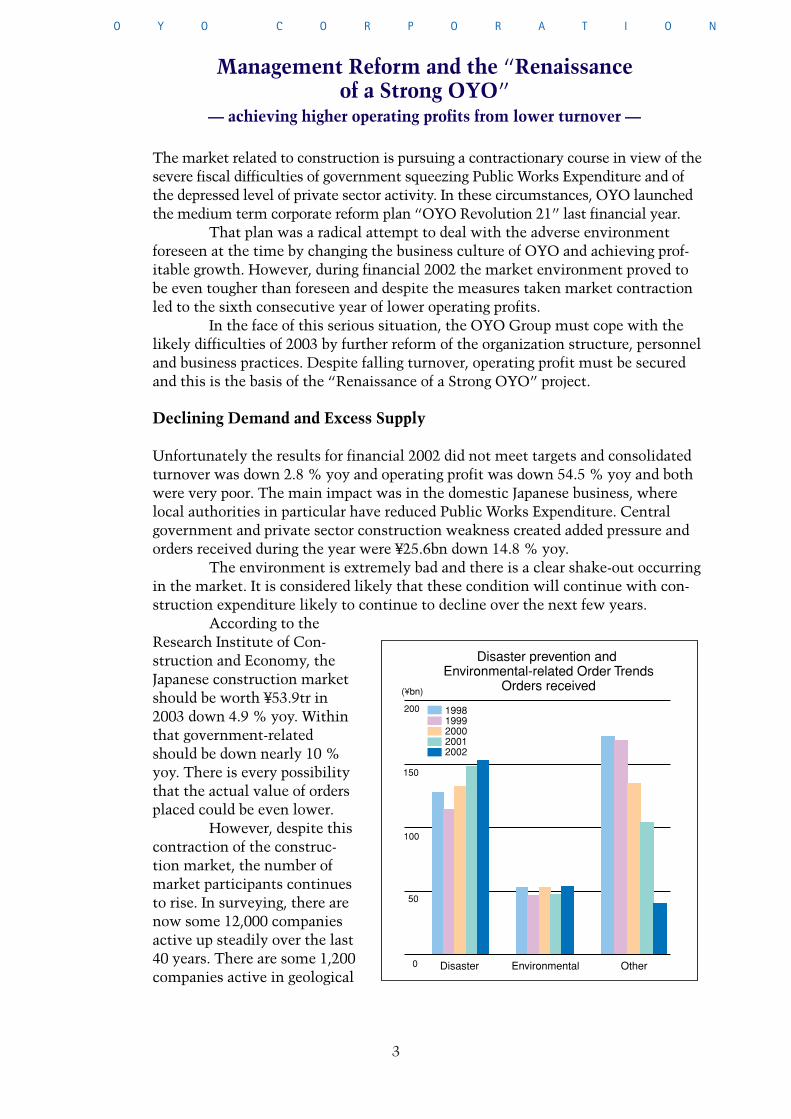
According to theResearch Institute of Con-struction and Economy, theJapanese construction marketshould be worth ¥53.9tr in2003 down 4.9 % yoy. Withinthat government-relatedshould be down nearly 10 %yoy. There is every possibilitythat the actual value of ordersplaced could be even lower.
However, despite thiscontraction of the construc-tion market, the number ofmarket participants continuesto rise. In surveying, there arenow some 12,000 companiesactive up steadily over the last40 years. There are some 1,200companies active in geological
50
100
150
200
0
19981999200020012002
Disaster Environmental Other
(¥bn)
Disaster prevention and Environmental-related Order Trends
Orders received
investigation work and some 3,700 companies active in construction consulting.This means a spiral of vicious competition for survival in an over-supplied yetdeclining market.
One particular point to note is that within this overall decline the emphasisof Public Works Expenditure is moving from construction per se to disaster preven-tion, environmental-related and management and maintenance. In the domesticJapanese market as seen from the perspective of the OYO Group parent company theproportion of Geo-engineering Services received was disaster prevention and environ-mental-related 60.9 % in 2001 and 84.1 % in 2002. However, in the domestic con-struction market overall construction per se is still very much the largest element.Nevertheless, Japan Society of Civil Engineers envisages an important reversal ofthis relationship in the overall market composition in 2010.
A further significant development is that the function demanded from con-struction consultants is changing. Popular opinion is becoming critical of wastefulPublic Works Expenditure and consequently consultants are becoming partners andadvisors. From the planning and implementation to the management and mainte-nance of a project it is necessary to have outside professional support to ensure andimprove the overall cost efficiency.
This trend is fundamentally favorable to OYO in that it is a company strongin technology and integrated management skills. In fact in 2002 technology relatedproposals accepted were up 27 % yoy by volume and 30 % yoy by value. By type ofwork, boring, instrument logging etc and simple run-of-the-mill jobs were downsharply while analysis, design and solution providing jobs were up markedly.
Expanding the Share of the Existing Market
As above, in the existing market disaster prevention and environmental-related arebecoming more important. This increasing share of more specialized business must bemade the basis for a change in the profit structure of the OYO business. Although theproposal based order flow is increasing, the old designated company tendering stillforms the lion’s share of the construction market and it is necessary to continue to winorders there with competitive costing. It was therefore decided that a reduction in over-all personnel costs was absolutely vital and the necessary steps are being taken.
For financial 2003 the projections for OYO parent company in the domesticJapanese market are orders received ¥25.5bn flat yoy, turnover ¥25.0bn down 10.7 %yoy reflecting the sharp fall in orders received in 2002 and operating profit ¥0.6bn up90.5 % yoy reflecting personnel cost and other cost reductions. Within a shrinkingmarket the objective is to hold the orders received level and through the reduction incosts across the board raise the operating profit as the top management objective ofthe year. This is being achieved by two strategies.
Strategy 1. Expanding Market Share in Existing MarketsMarketing efforts will concentrate on disaster prevention, environmental-relatedand management and maintenance where demand is growing. In disaster preven-tion the work with the Cabinet Office on the revised outlook for the predicted
4
O Y O C O R P O R A T I O N
5
O Y O C O R P O R A T I O N
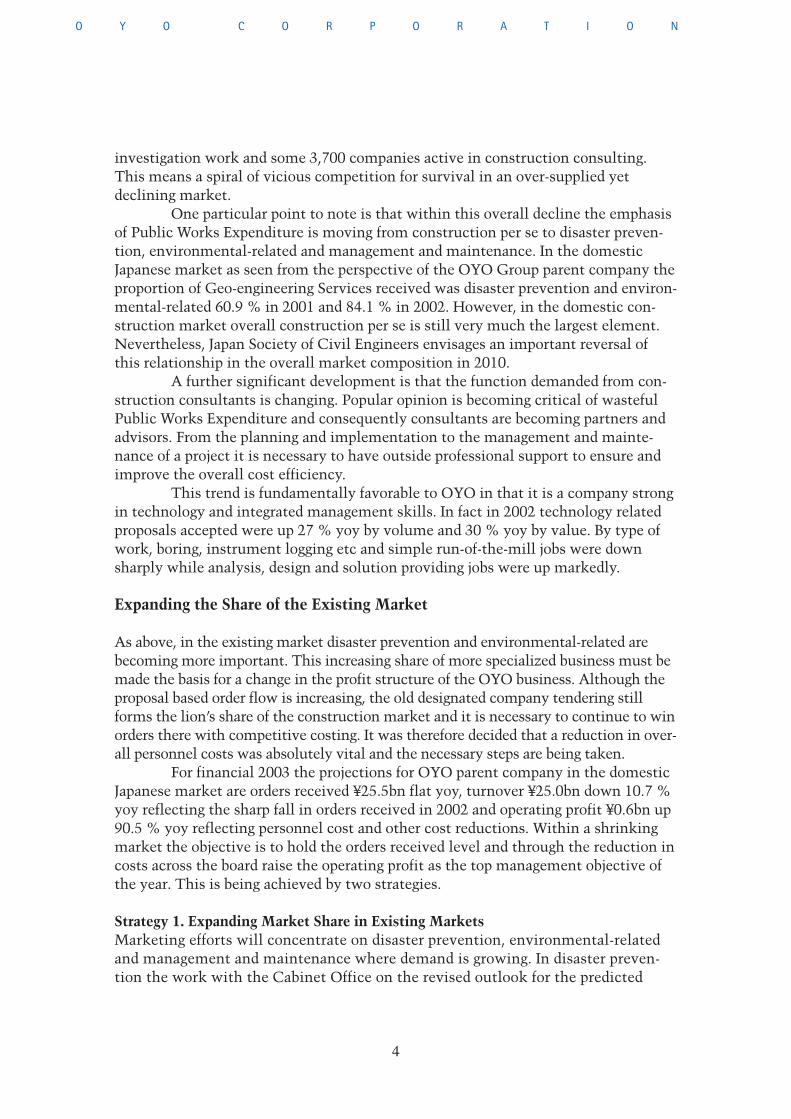
Tokai Earthquake and Tokai-Nankai Earthquake is being notched up to AreaEarthquake Disaster Prevention Planning work. In total on-the-spot check-typemaintenance work for tunnels, dikes and road surfaces, in precise remote sur-face movement measurement and analysis there is the Permanent ScattererInterferometry Synthetic Aperture Radar, PSInSAR, technology product and inreal time disaster monitoring systems, the i-SENSOR product, the clear OYOtechnical strength in new products is being exploited. In environmental-relatedwork in contamination of ground soil and ground water in particular the sub-sidiary NS Environmental Science Consultant and the affiliate Engineering &Risk Services are joining the marketing effort. The development of new privatesector client accounts and of the property departments of government min-istries and agency accounts is being pursued. The new Proposal System based ontechnical excellence is a support to OYO and higher rates of proposals requestedand accepted are being pursued also.
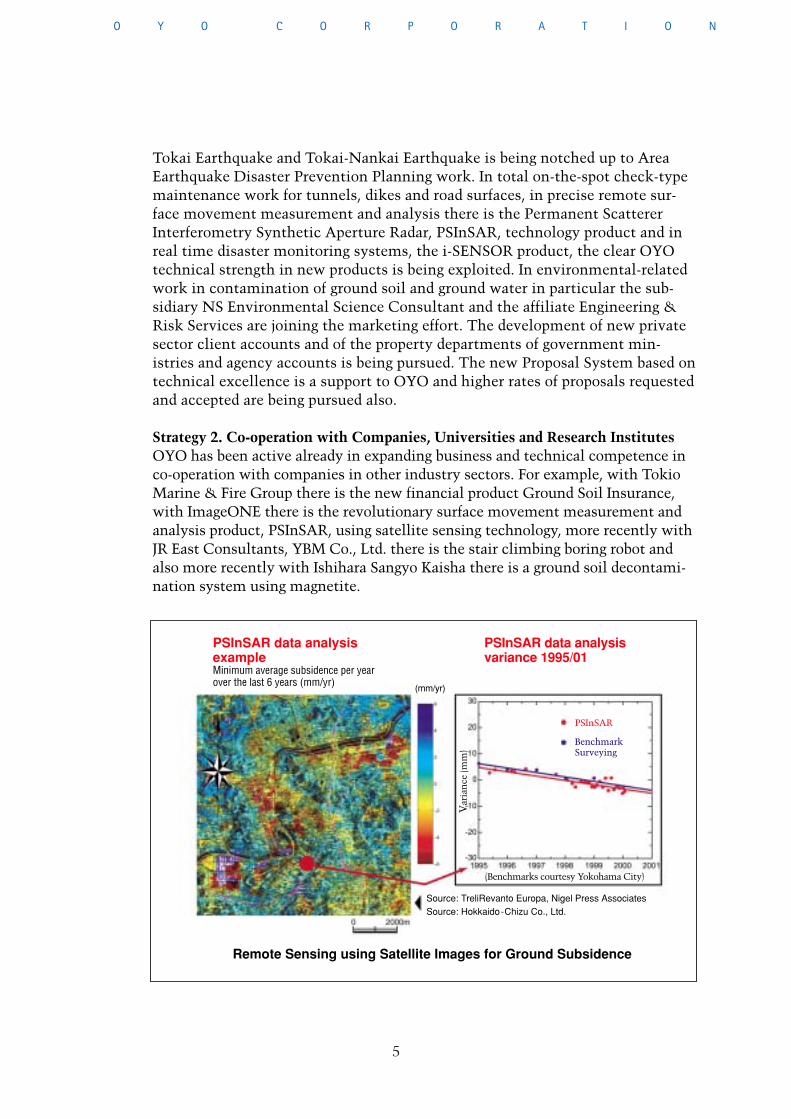
Strategy 2. Co-operation with Companies, Universities and Research InstitutesOYO has been active already in expanding business and technical competence inco-operation with companies in other industry sectors. For example, with TokioMarine & Fire Group there is the new financial product Ground Soil Insurance,with ImageONE there is the revolutionary surface movement measurement andanalysis product, PSInSAR, using satellite sensing technology, more recently withJR East Consultants, YBM Co., Ltd. there is the stair climbing boring robot andalso more recently with Ishihara Sangyo Kaisha there is a ground soil decontami-nation system using magnetite.
PSInSAR data analysisexampleMinimum average subsidence per yearover the last 6 years (mm/yr)
PSInSAR data analysisvariance 1995/01
Source: TreliRevanto Europa, Nigel Press AssociatesSource: Hokkaido-Chizu Co., Ltd.
PSInSAR
BenchmarkSurveying
(Benchmarks courtesy Yokohama City)
Remote Sensing using Satellite Images for Ground Subsidence
(mm/yr)
Var
ianc
e (m
m)
Differentiation in DisasterPrevention and Environmental-related and M&M
In order to compete successfully indisaster prevention, environmental-related and management and mainte-nance (M&M) there must be clearproduct and service differentiationbased on technology R&D. A typicalexample is the use of radio in theremote sensing applications of datacollection and analysis. In a commer-cial agreement with Image One, OYOhas developed radio-related productsin surface feature and geological analy-sis, ground variation analysis, environmental monitoring etc.
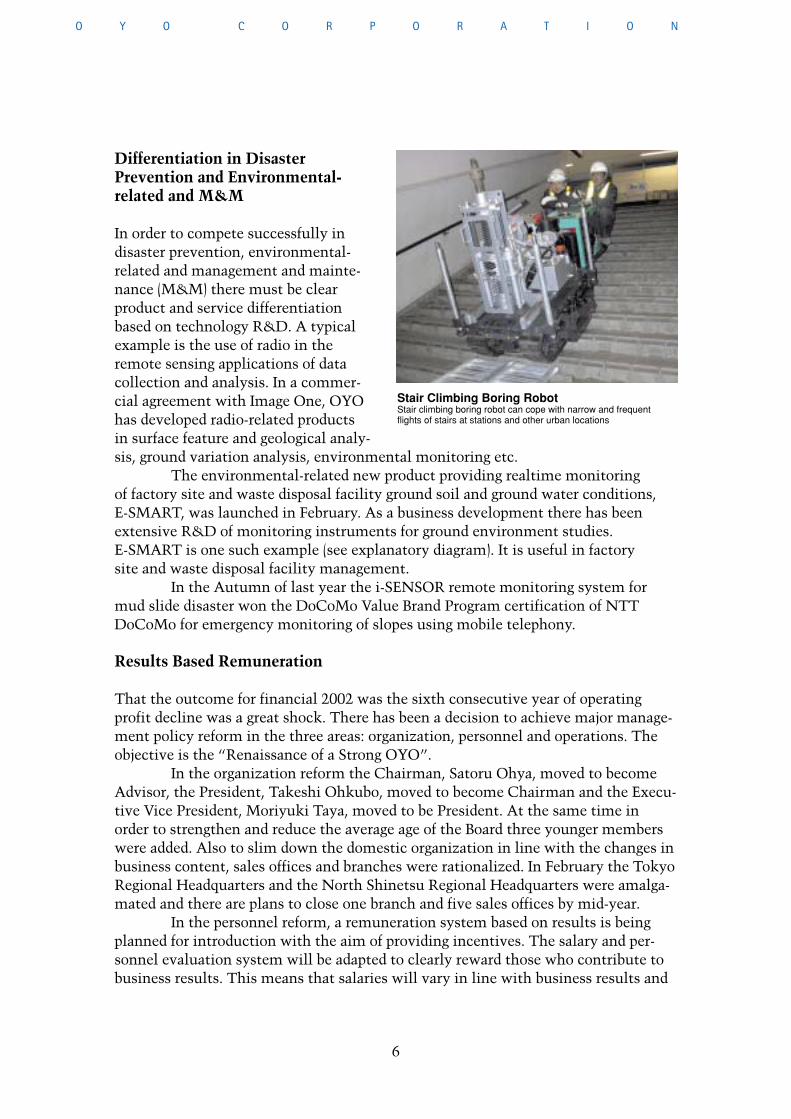
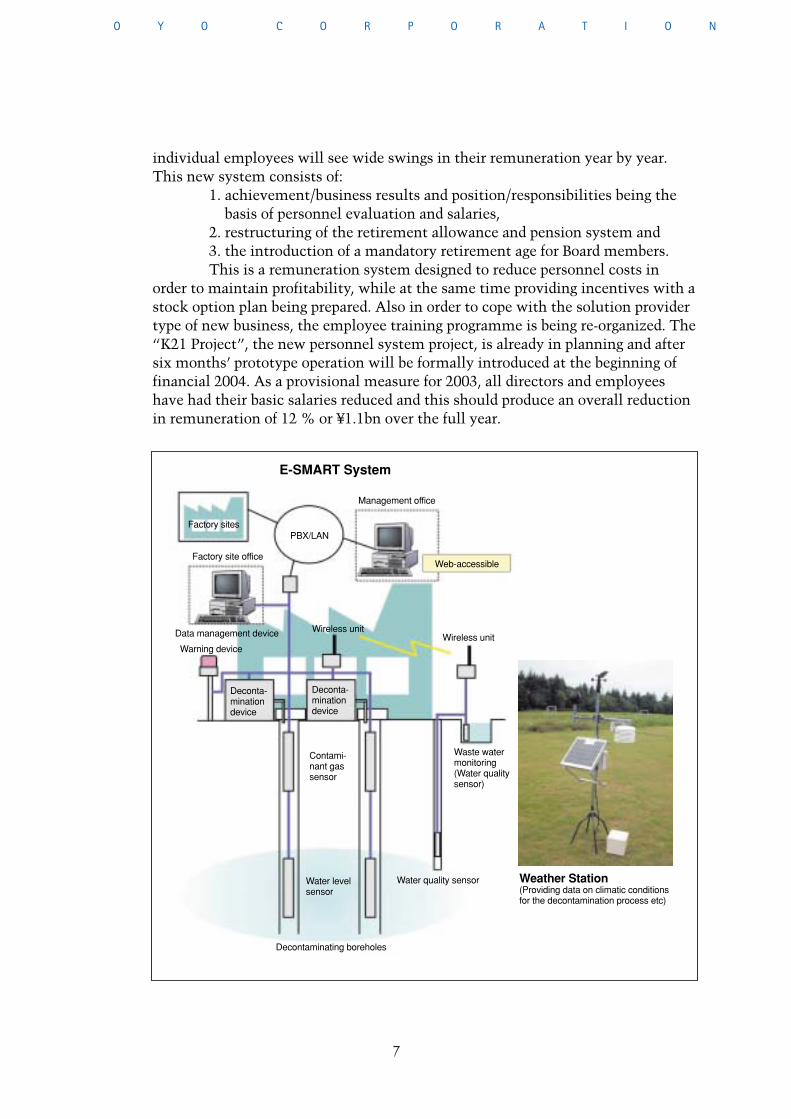
The environmental-related new product providing realtime monitoringof factory site and waste disposal facility ground soil and ground water conditions,E-SMART, was launched in February. As a business development there has beenextensive R&D of monitoring instruments for ground environment studies.E-SMART is one such example (see explanatory diagram). It is useful in factorysite and waste disposal facility management.
In the Autumn of last year the i-SENSOR remote monitoring system formud slide disaster won the DoCoMo Value Brand Program certification of NTTDoCoMo for emergency monitoring of slopes using mobile telephony.
Results Based Remuneration
That the outcome for financial 2002 was the sixth consecutive year of operatingprofit decline was a great shock. There has been a decision to achieve major manage-ment policy reform in the three areas: organization, personnel and operations. Theobjective is the “Renaissance of a Strong OYO”.
In the organization reform the Chairman, Satoru Ohya, moved to becomeAdvisor, the President, Takeshi Ohkubo, moved to become Chairman and the Execu-tive Vice President, Moriyuki Taya, moved to be President. At the same time inorder to strengthen and reduce the average age of the Board three younger memberswere added. Also to slim down the domestic organization in line with the changes inbusiness content, sales offices and branches were rationalized. In February the TokyoRegional Headquarters and the North Shinetsu Regional Headquarters were amalga-mated and there are plans to close one branch and five sales offices by mid-year.
In the personnel reform, a remuneration system based on results is beingplanned for introduction with the aim of providing incentives. The salary and per-sonnel evaluation system will be adapted to clearly reward those who contribute tobusiness results. This means that salaries will vary in line with business results and
6
O Y O C O R P O R A T I O N
Stair Climbing Boring RobotStair climbing boring robot can cope with narrow and frequentflights of stairs at stations and other urban locations
7
O Y O C O R P O R A T I O N
individual employees will see wide swings in their remuneration year by year.This new system consists of:
1. achievement/business results and position/responsibilities being the basis of personnel evaluation and salaries,
2. restructuring of the retirement allowance and pension system and 3. the introduction of a mandatory retirement age for Board members. This is a remuneration system designed to reduce personnel costs in
order to maintain profitability, while at the same time providing incentives with astock option plan being prepared. Also in order to cope with the solution providertype of new business, the employee training programme is being re-organized. The“K21 Project”, the new personnel system project, is already in planning and aftersix months’ prototype operation will be formally introduced at the beginning offinancial 2004. As a provisional measure for 2003, all directors and employeeshave had their basic salaries reduced and this should produce an overall reductionin remuneration of 12 % or ¥1.1bn over the full year.
Management office
Web-accessible
Factory sitesPBX/LAN
Factory site office
Data management device
Warning device
Wireless unitWireless unit
Deconta-minationdevice
Deconta-minationdevice
Contami-nant gassensor
Water levelsensor
Decontaminating boreholes
Waste watermonitoring(Water qualitysensor)
Water quality sensor
E-SMART System
Weather Station(Providing data on climatic conditionsfor the decontamination process etc)
8
O Y O C O R P O R A T I O N
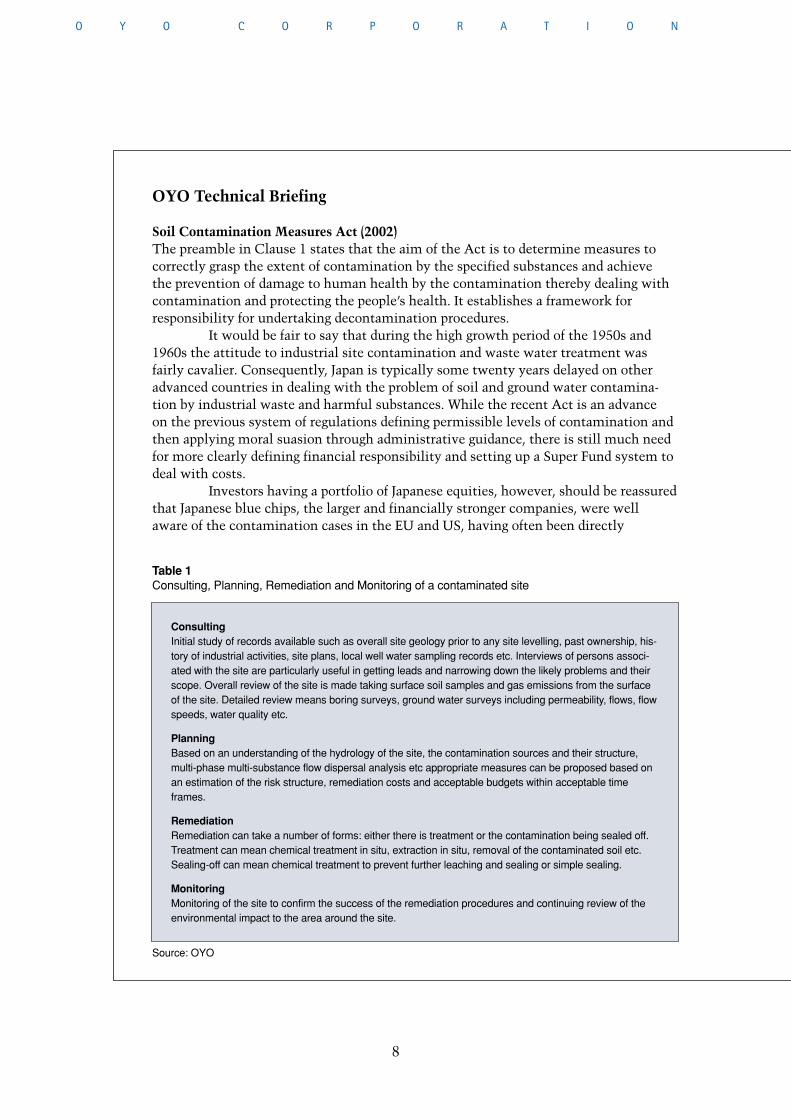
Table 1Consulting, Planning, Remediation and Monitoring of a contaminated site
ConsultingInitial study of records available such as overall site geology prior to any site levelling, past ownership, his-tory of industrial activities, site plans, local well water sampling records etc. Interviews of persons associ-ated with the site are particularly useful in getting leads and narrowing down the likely problems and theirscope. Overall review of the site is made taking surface soil samples and gas emissions from the surfaceof the site. Detailed review means boring surveys, ground water surveys including permeability, flows, flowspeeds, water quality etc.
PlanningBased on an understanding of the hydrology of the site, the contamination sources and their structure,multi-phase multi-substance flow dispersal analysis etc appropriate measures can be proposed based onan estimation of the risk structure, remediation costs and acceptable budgets within acceptable timeframes.
RemediationRemediation can take a number of forms: either there is treatment or the contamination being sealed off.Treatment can mean chemical treatment in situ, extraction in situ, removal of the contaminated soil etc.Sealing-off can mean chemical treatment to prevent further leaching and sealing or simple sealing.
MonitoringMonitoring of the site to confirm the success of the remediation procedures and continuing review of theenvironmental impact to the area around the site.
Source: OYO
OYO Technical Briefing
Soil Contamination Measures Act (2002)The preamble in Clause 1 states that the aim of the Act is to determine measures tocorrectly grasp the extent of contamination by the specified substances and achievethe prevention of damage to human health by the contamination thereby dealing withcontamination and protecting the people’s health. It establishes a framework forresponsibility for undertaking decontamination procedures.
It would be fair to say that during the high growth period of the 1950s and1960s the attitude to industrial site contamination and waste water treatment wasfairly cavalier. Consequently, Japan is typically some twenty years delayed on otheradvanced countries in dealing with the problem of soil and ground water contamina-tion by industrial waste and harmful substances. While the recent Act is an advanceon the previous system of regulations defining permissible levels of contamination andthen applying moral suasion through administrative guidance, there is still much needfor more clearly defining financial responsibility and setting up a Super Fund system todeal with costs.
Investors having a portfolio of Japanese equities, however, should be reassuredthat Japanese blue chips, the larger and financially stronger companies, were wellaware of the contamination cases in the EU and US, having often been directly
Industry Cases
Wood and wood products 3
Vehicle maintenance 3
Amusement facilities 2
Construction materials wholesaling 2
Retail other 2
Car parking 1
Coal mining 1
Leather and hide products 1
Local authorities 1
Metal mining 1
Plant installation 1
Other 143
Total 1,154
9
O Y O C O R P O R A T I O N
involved via their overseas subsidiaries. In Japan they have dealt with the problemsince the late 1980s on a voluntary basis and in advance of any specific legalrequirement as such. This was on account of their unwillingness to risk adversepublicity given a public opinion very sensitive to contamination issues.
Therefore it is best to understand that the major companies in chemicals,electricals, metal products etc have made strenuous efforts to clean up their sitesand present Environmental Reports and PRTR information in order to avoid beingthe butt of media criticism. Such information can be viewed on blue chip corporatewebsites and is a good indication of sound corporate governance in the environ-mental arena. However, smaller and financially weaker companies can represent an investment risk.
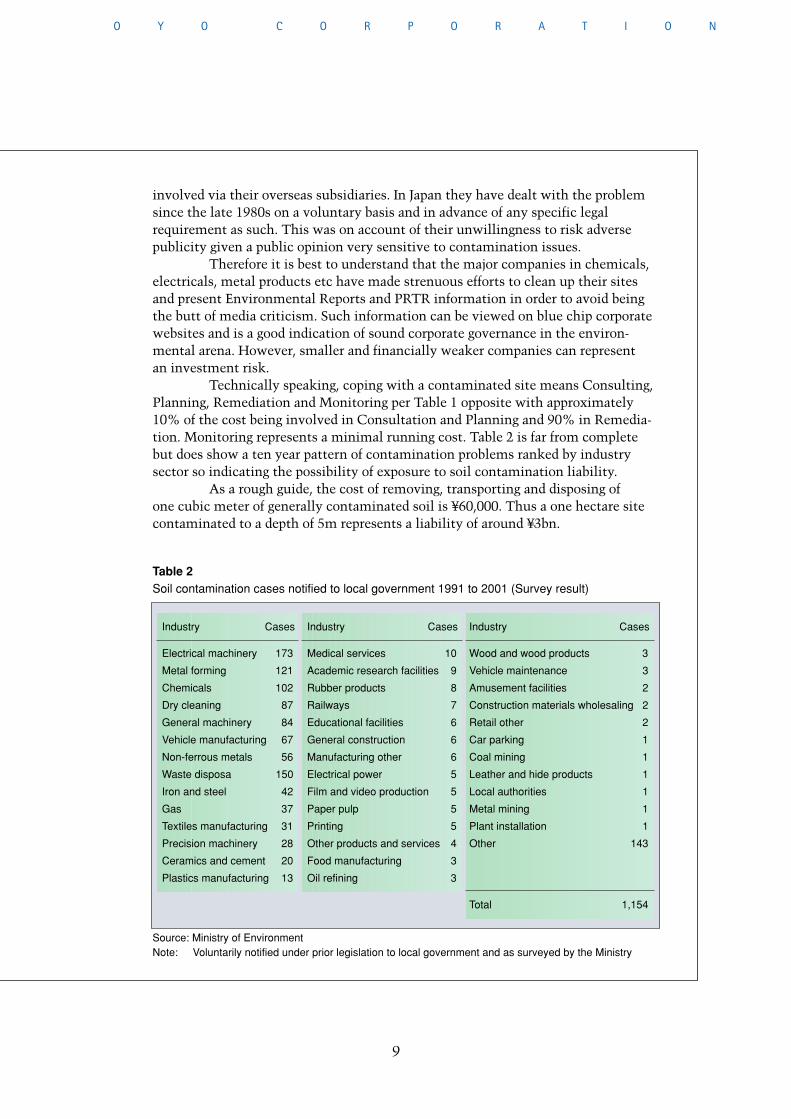
Technically speaking, coping with a contaminated site means Consulting,Planning, Remediation and Monitoring per Table 1 opposite with approximately10% of the cost being involved in Consultation and Planning and 90% in Remedia-tion. Monitoring represents a minimal running cost. Table 2 is far from completebut does show a ten year pattern of contamination problems ranked by industrysector so indicating the possibility of exposure to soil contamination liability.
As a rough guide, the cost of removing, transporting and disposing of one cubic meter of generally contaminated soil is ¥60,000. Thus a one hectare sitecontaminated to a depth of 5m represents a liability of around ¥3bn.
Table 2Soil contamination cases notified to local government 1991 to 2001 (Survey result)
Industry Cases
Electrical machinery 173
Metal forming 121
Chemicals 102
Dry cleaning 87
General machinery 84
Vehicle manufacturing 67
Non-ferrous metals 56
Waste disposa 150
Iron and steel 42
Gas 37
Textiles manufacturing 31
Precision machinery 28
Ceramics and cement 20
Plastics manufacturing 13
Industry Cases
Medical services 10
Academic research facilities 9
Rubber products 8
Railways 7
Educational facilities 6
General construction 6
Manufacturing other 6
Electrical power 5
Film and video production 5
Paper pulp 5
Printing 5
Other products and services 4
Food manufacturing 3
Oil refining 3
Source: Ministry of EnvironmentNote: Voluntarily notified under prior legislation to local government and as surveyed by the Ministry
10
O Y O C O R P O R A T I O N
In operations reform, the operating system is being restructured, the costaccounting system updated and ISO management systems for product quality andenvironmental control are being introduced.
In-house and External Venturing ¥1.0bn being Invested
An early start is to be made to encouraging new ventures via an in-house venturesystem and the setting up of a venture fund. Over five years, out of the ¥1.0bn totalinvestment fund, ¥0.3bn will be invested in in-company ventures and ¥0.7bn inexternal ventures.
As one part of the organizational reforms, an office was established to han-dle ventures and management planning. This new Management Planning Office willbe responsible for setting up the in-company ventures and act as a clearing house forexternal venture proposals. In particular the new provisions for academia/industryco-operation for the commercial development of university research into new tech-nology will be exploited by the Office. That is also true for commercial agreementsand M&A opportunities with companies operating in other industry sectors.
Improving Profitability with Group Management Efficiency
The OYO parent company accounted for just over 55 % of consolidated turnover infinancial 2002 and it is vital not only to improve its contribution to consolidatedaccounts but to improve Group management efficiency. This is an important targetfor financial 2003. This means applying greater business selection and focussing inthe Group and business criteria need major revision in order to raise subsidiaryresults.
For the domestic subsidiaries, instrumentation technology services are han-dled by OYO Geo-monitoring, which is being made the focal point for managementresources and currently outsourced instruments are to be manufactured in-house.OYO International which has reported losses for several years on the poor trend ofbusiness in South East Asia is to wind up its Singapore local subsidiary.
On the other hand the joint venture with RMS of the US, OYO RMS, andthe joint venture with Kajima Corporation, Engineering & Risk Services, in riskmanagement and risk engineering respectively are seeing a steady favorable trendand together in financial 2002 reported a net profit of ¥54m so contributing to con-solidated results. Both the President of OYO RMS, Takashi Kanemori, and the Presi-dent of Engineering & Risk Services, Akira Ando, stress the importance of “thebenefit of venturing with a partner and responding to market requirements”.
Among overseas subsidiaries, TrueTime was sold to Symmetricom of the USin an equity plus cash transaction in October of last year. It is the intention to pursuethis policy of appropriate evaluation of profitability and technology among the over-seas subsidiaries.
11
Financial Section
CONTENTSFinancial Review .................................... . 12Consolidated Financial Statements ........ 14Balance Sheets ........................................ 14Statements of Income ............................ 16Statements of Shareholders’ Equity ...... 17Statements of Cash Flows ..................... 18Notes to Financial Statements .............. 19Auditor’s Report ..................................... 29
O Y O C O R P O R A T I O N
12
FINANCIAL REVIEW
O Y O C O R P O R A T I O N
2001 20021998 1999 2000
51.5 50.4
57.6
51.8
Net Sales(Billions of yen)
0.5
-1.0-0.8
-0.5
0.8
-0.9%
(Billions of yen, %) (Billions of yen, %)
Operating Income andOperating Margin
Net Income andNet Margin
1.3
0.5
1.8
1.1
2.8
Years ending December2001 20021998 1999 2000
Years ending December2001 20021998 1999 2000
Years ending December
4.9%
3.4%
1.5%
2.5%
51.8
2.2%
1.0%
-1.9%
1.0%
-1.5%
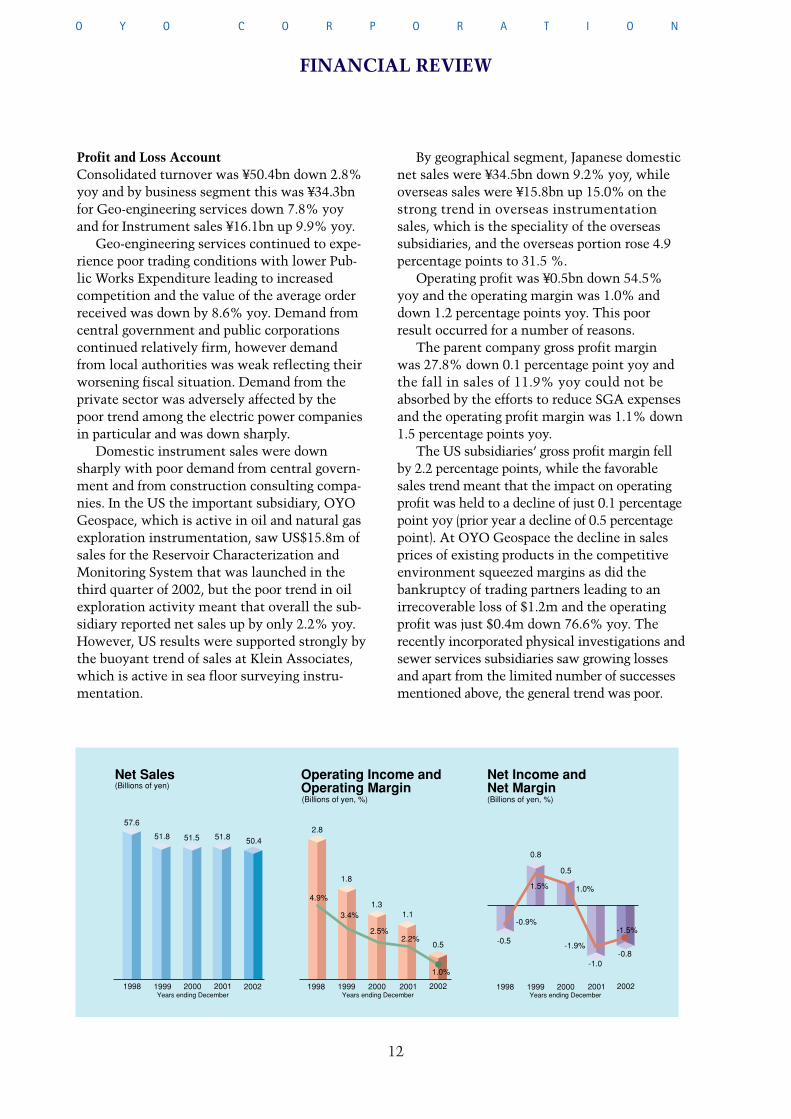
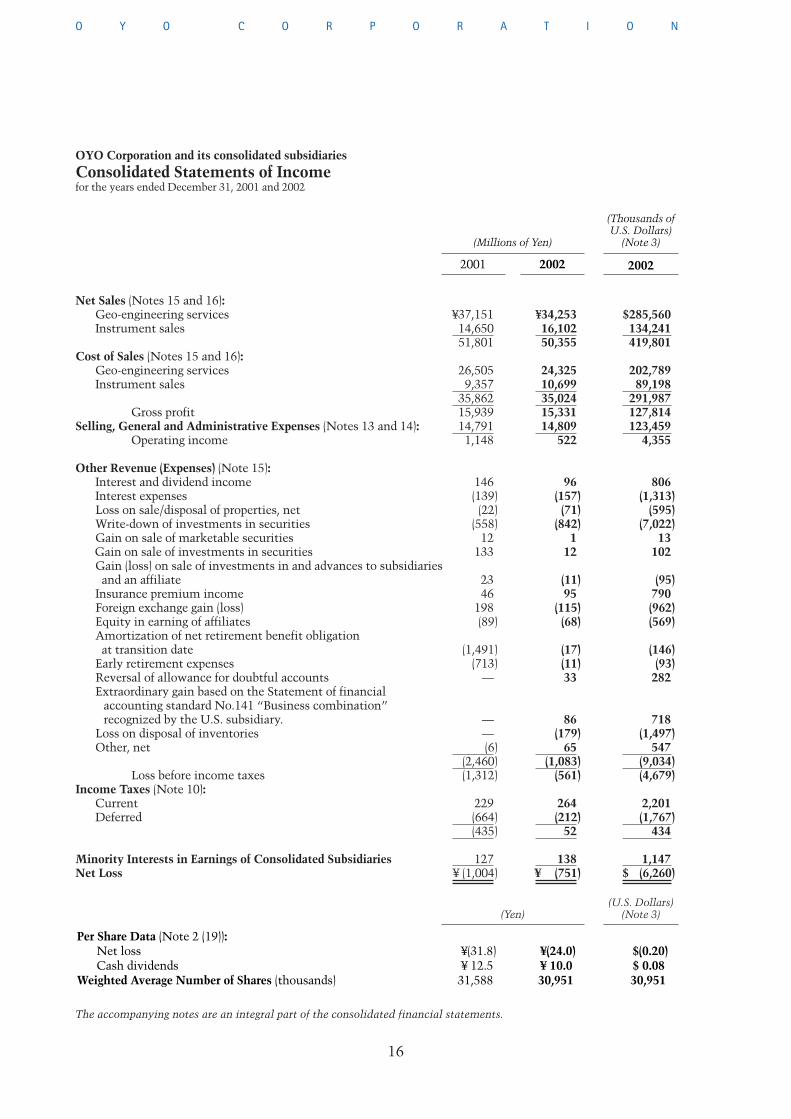
Profit and Loss AccountConsolidated turnover was ¥50.4bn down 2.8%yoy and by business segment this was ¥34.3bnfor Geo-engineering services down 7.8% yoyand for Instrument sales ¥16.1bn up 9.9% yoy.
Geo-engineering services continued to expe-rience poor trading conditions with lower Pub-lic Works Expenditure leading to increasedcompetition and the value of the average orderreceived was down by 8.6% yoy. Demand fromcentral government and public corporationscontinued relatively firm, however demandfrom local authorities was weak reflecting theirworsening fiscal situation. Demand from theprivate sector was adversely affected by thepoor trend among the electric power companiesin particular and was down sharply.
Domestic instrument sales were downsharply with poor demand from central govern-ment and from construction consulting compa-nies. In the US the important subsidiary, OYOGeospace, which is active in oil and natural gasexploration instrumentation, saw US$15.8m ofsales for the Reservoir Characterization andMonitoring System that was launched in thethird quarter of 2002, but the poor trend in oilexploration activity meant that overall the sub-sidiary reported net sales up by only 2.2% yoy.However, US results were supported strongly bythe buoyant trend of sales at Klein Associates,which is active in sea floor surveying instru-mentation.
By geographical segment, Japanese domesticnet sales were ¥34.5bn down 9.2% yoy, whileoverseas sales were ¥15.8bn up 15.0% on thestrong trend in overseas instrumentationsales, which is the speciality of the overseassubsidiaries, and the overseas portion rose 4.9percentage points to 31.5 %.
Operating profit was ¥0.5bn down 54.5%yoy and the operating margin was 1.0% anddown 1.2 percentage points yoy. This poorresult occurred for a number of reasons.
The parent company gross profit marginwas 27.8% down 0.1 percentage point yoy andthe fall in sales of 11.9% yoy could not beabsorbed by the efforts to reduce SGA expensesand the operating profit margin was 1.1% down1.5 percentage points yoy.
The US subsidiaries’ gross profit margin fellby 2.2 percentage points, while the favorablesales trend meant that the impact on operatingprofit was held to a decline of just 0.1 percentagepoint yoy (prior year a decline of 0.5 percentagepoint). At OYO Geospace the decline in salesprices of existing products in the competitiveenvironment squeezed margins as did thebankruptcy of trading partners leading to anirrecoverable loss of $1.2m and the operatingprofit was just $0.4m down 76.6% yoy. Therecently incorporated physical investigations andsewer services subsidiaries saw growing lossesand apart from the limited number of successesmentioned above, the general trend was poor.
13
O Y O C O R P O R A T I O N
1.71.6
2.0 2.0
(Billions of yen)R&D Expenditure Net Income per Share
(Yen)ROE and ROA
0.7%
-1.3% -1.0%
-0.9%
1.3%0.8%
-1.7%-1.4%
-0.7%
1.0%
ROE
ROA
15.5
-17.0
-24.0
23.6
2001 20021998 1999 2000Years ending December
2001 20021998 1999 2000Years ending December
2001 20021998 1999 2000Years ending December
1.8
-31.8
(%)
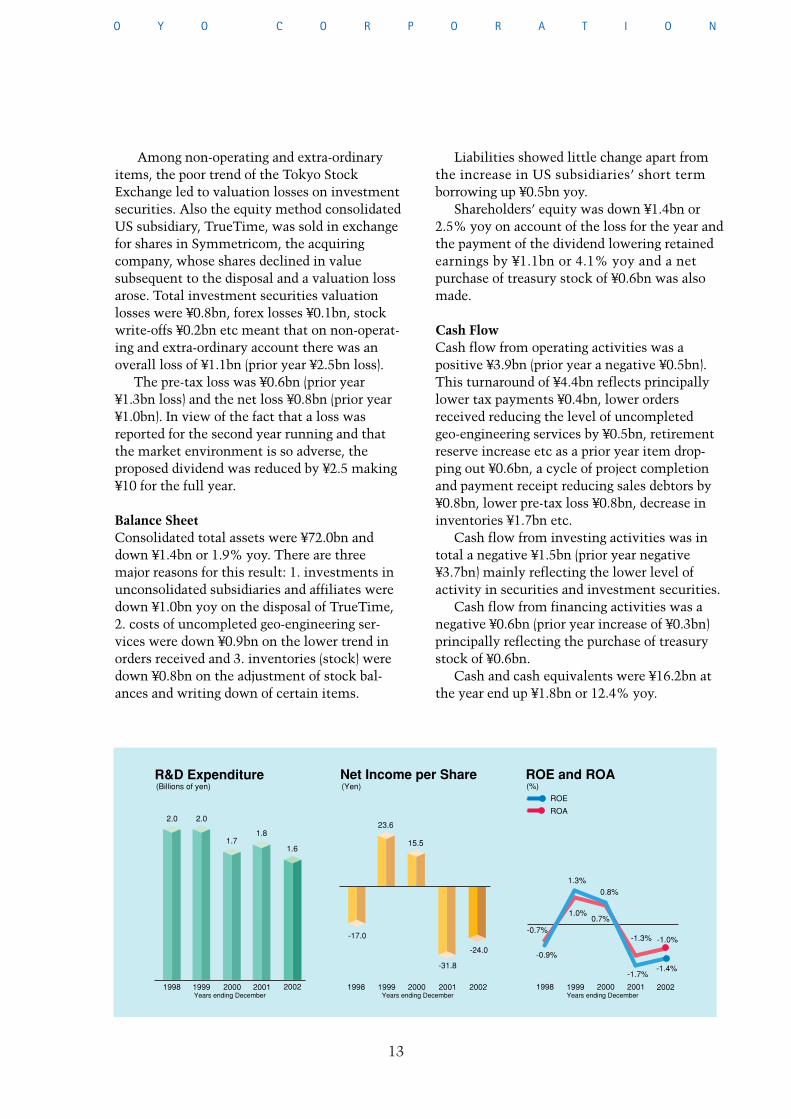
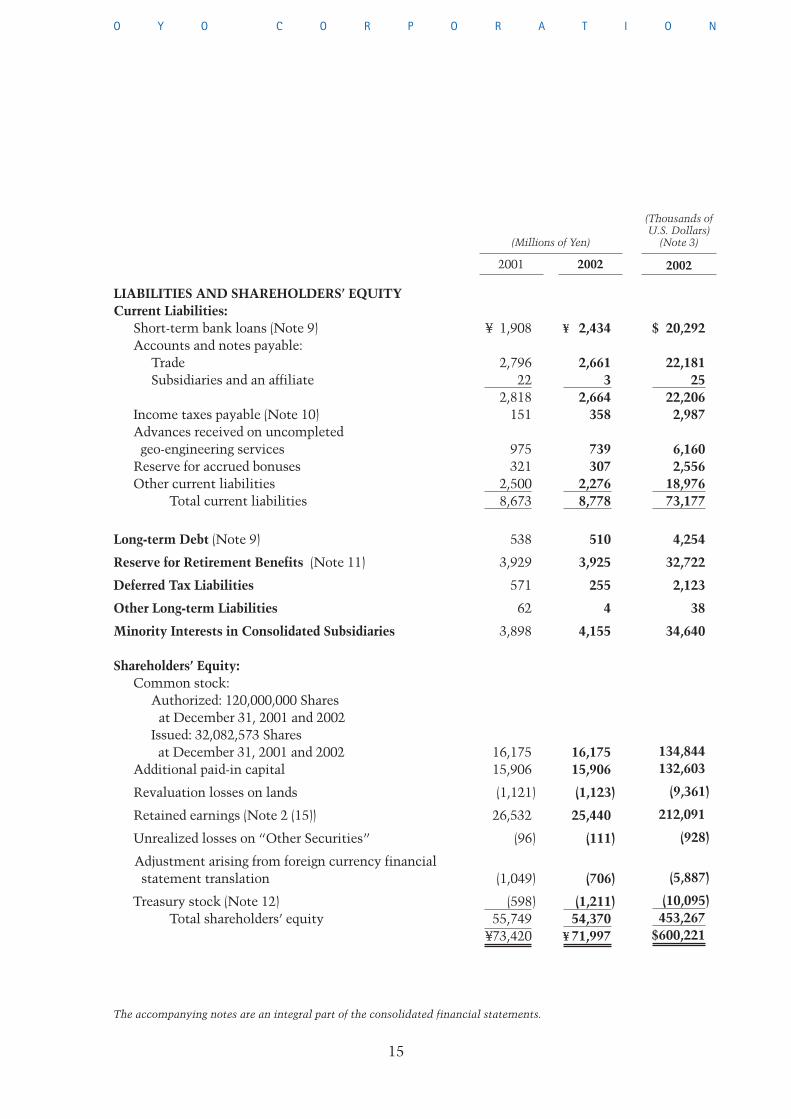
Liabilities showed little change apart fromthe increase in US subsidiaries’ short termborrowing up ¥0.5bn yoy.
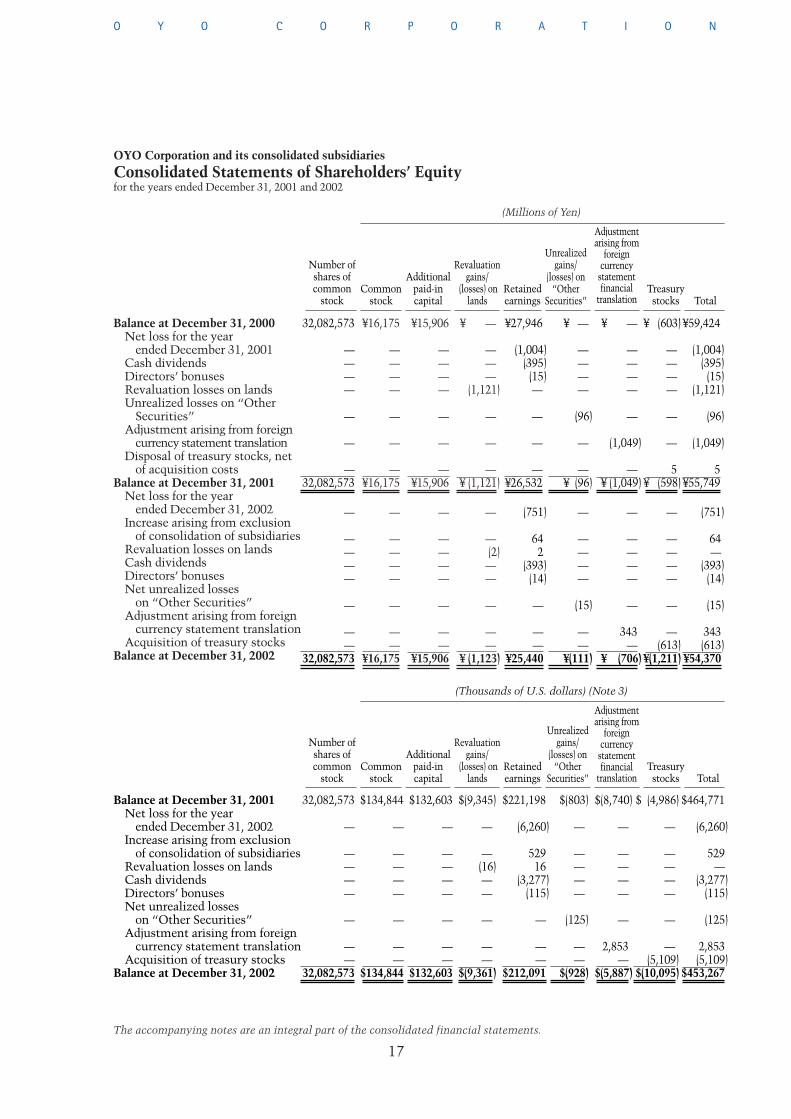
Shareholders’ equity was down ¥1.4bn or2.5% yoy on account of the loss for the year andthe payment of the dividend lowering retainedearnings by ¥1.1bn or 4.1% yoy and a netpurchase of treasury stock of ¥0.6bn was alsomade.
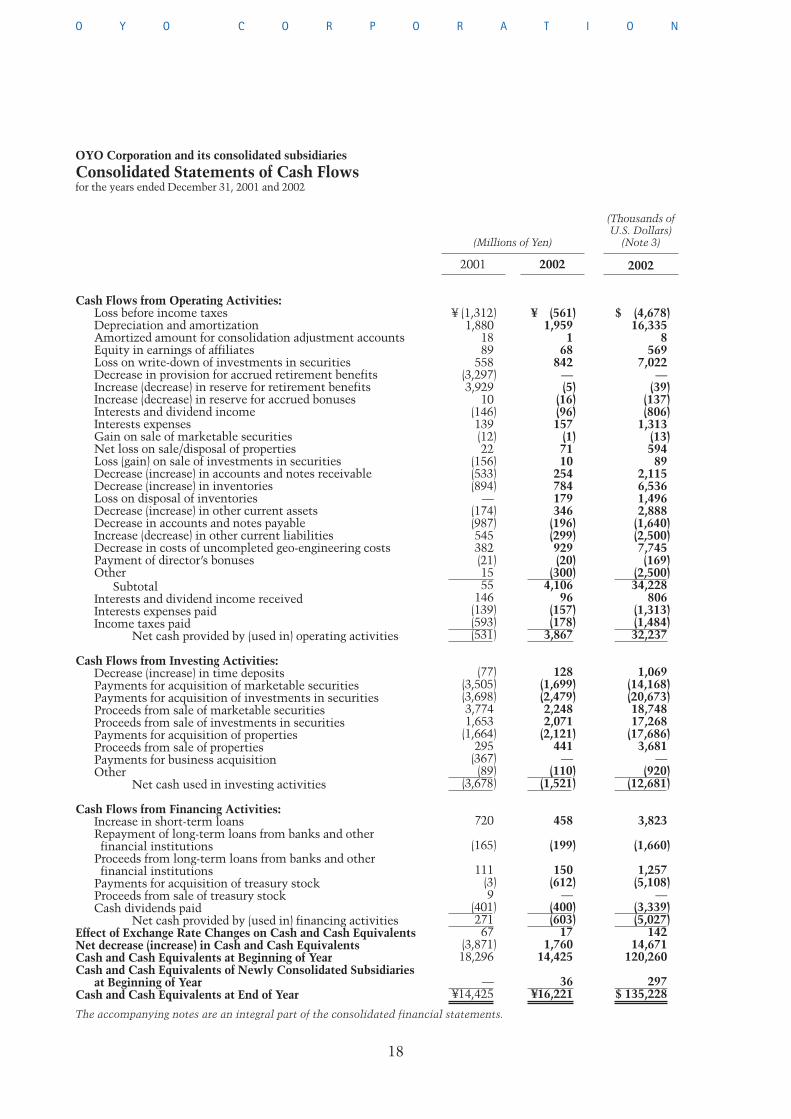
Cash FlowCash flow from operating activities was apositive ¥3.9bn (prior year a negative ¥0.5bn).This turnaround of ¥4.4bn reflects principallylower tax payments ¥0.4bn, lower ordersreceived reducing the level of uncompletedgeo-engineering services by ¥0.5bn, retirementreserve increase etc as a prior year item drop-ping out ¥0.6bn, a cycle of project completionand payment receipt reducing sales debtors by¥0.8bn, lower pre-tax loss ¥0.8bn, decrease ininventories ¥1.7bn etc.
Cash flow from investing activities was intotal a negative ¥1.5bn (prior year negative¥3.7bn) mainly reflecting the lower level ofactivity in securities and investment securities.
Cash flow from financing activities was anegative ¥0.6bn (prior year increase of ¥0.3bn)principally reflecting the purchase of treasurystock of ¥0.6bn.
Cash and cash equivalents were ¥16.2bn atthe year end up ¥1.8bn or 12.4% yoy.
Among non-operating and extra-ordinaryitems, the poor trend of the Tokyo StockExchange led to valuation losses on investmentsecurities. Also the equity method consolidatedUS subsidiary, TrueTime, was sold in exchangefor shares in Symmetricom, the acquiringcompany, whose shares declined in valuesubsequent to the disposal and a valuation lossarose. Total investment securities valuationlosses were ¥0.8bn, forex losses ¥0.1bn, stockwrite-offs ¥0.2bn etc meant that on non-operat-ing and extra-ordinary account there was anoverall loss of ¥1.1bn (prior year ¥2.5bn loss).
The pre-tax loss was ¥0.6bn (prior year¥1.3bn loss) and the net loss ¥0.8bn (prior year¥1.0bn). In view of the fact that a loss wasreported for the second year running and thatthe market environment is so adverse, theproposed dividend was reduced by ¥2.5 making¥10 for the full year.
Balance SheetConsolidated total assets were ¥72.0bn anddown ¥1.4bn or 1.9% yoy. There are threemajor reasons for this result: 1. investments inunconsolidated subsidiaries and affiliates weredown ¥1.0bn yoy on the disposal of TrueTime,2. costs of uncompleted geo-engineering ser-vices were down ¥0.9bn on the lower trend inorders received and 3. inventories (stock) weredown ¥0.8bn on the adjustment of stock bal-ances and writing down of certain items.
14
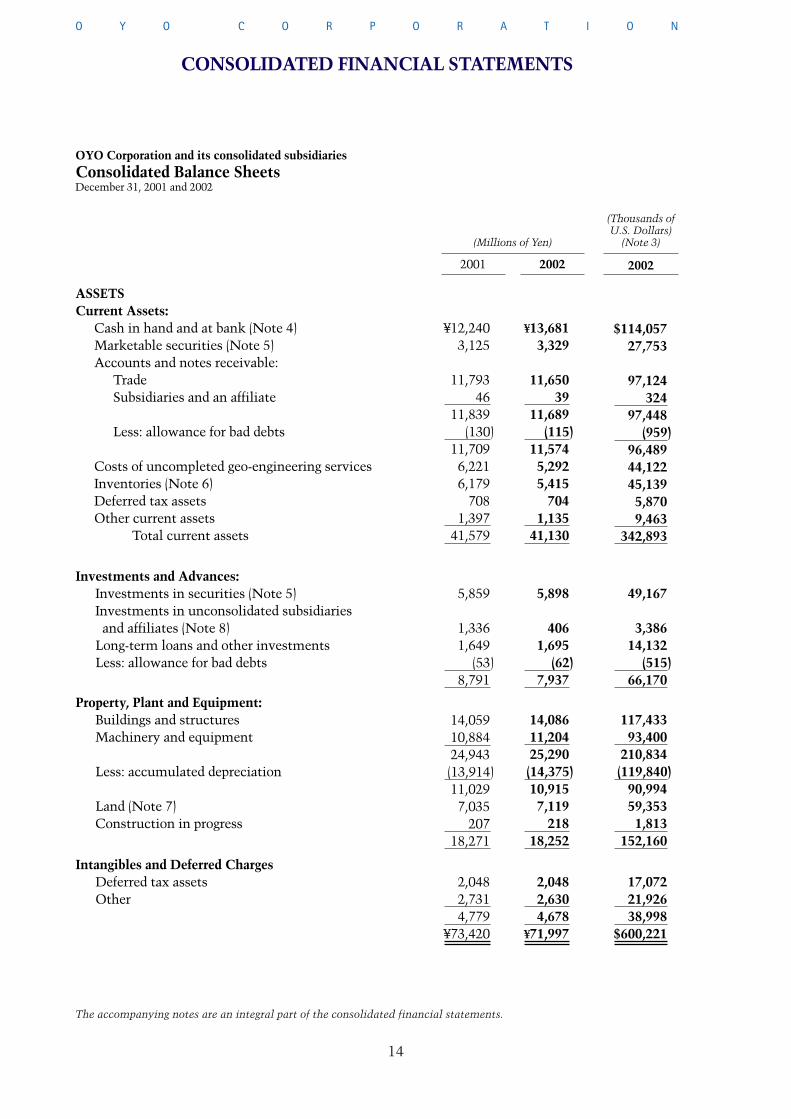
CONSOLIDATED FINANCIAL STATEMENTS
OYO Corporation and its consolidated subsidiariesConsolidated Balance SheetsDecember 31, 2001 and 2002
¥13,681 3,329
11,650 39
11,689 (115)
11,574 5,292 5,415
704 1,135
41,130
ASSETSCurrent Assets:
Cash in hand and at bank (Note 4)Marketable securities (Note 5)Accounts and notes receivable:
TradeSubsidiaries and an affiliate
Less: allowance for bad debts
Costs of uncompleted geo-engineering servicesInventories (Note 6)Deferred tax assetsOther current assets
Total current assets
Investments and Advances:Investments in securities (Note 5)Investments in unconsolidated subsidiaries and affiliates (Note 8)
Long-term loans and other investmentsLess: allowance for bad debts
Property, Plant and Equipment:Buildings and structuresMachinery and equipment
Less: accumulated depreciation
Land (Note 7)Construction in progress
5,898
406 1,695
(62)7,937
14,086 11,204 25,290 (14,375)10,915 7,119
218 18,252
¥12,240 3,125
11,793 46
11,839 (130)
11,709 6,221 6,179
708 1,397
41,579
5,859
1,336 1,649
(53)8,791
14,059 10,884 24,943 (13,914)11,029 7,035
207 18,271
$114,057 27,753
97,124 324
97,448 (959)
96,489 44,122 45,139 5,870 9,463
342,893
49,167
3,386 14,132
(515)66,170
117,433 93,400
210,834 (119,840)
90,994 59,353 1,813
152,160
Intangibles and Deferred ChargesDeferred tax assetsOther
2,048 2,630 4,678
¥71,997
2,048 2,731 4,779
¥73,420
17,072 21,926 38,998
$600,221
The accompanying notes are an integral part of the consolidated financial statements.
(Millions of Yen)
2002 2002
(Thousands ofU.S. Dollars)
(Note 3)
2001
O Y O C O R P O R A T I O N
15
¥ 2,434
2,661 3
2,664 358
739 307
2,276 8,778
510
3,925
255
4
4,155
16,175 15,906
(1,123)
25,440
(111)
(706)
(1,211)54,370
¥ 71,997
LIABILITIES AND SHAREHOLDERS’ EQUITYCurrent Liabilities:
Short-term bank loans (Note 9)Accounts and notes payable:
TradeSubsidiaries and an affiliate
Income taxes payable (Note 10)Advances received on uncompleted geo-engineering services
Reserve for accrued bonusesOther current liabilities
Total current liabilities
Long-term Debt (Note 9)
Reserve for Retirement Benefits (Note 11)
Deferred Tax Liabilities
Other Long-term Liabilities
Minority Interests in Consolidated Subsidiaries
Shareholders’ Equity:Common stock:
Authorized: 120,000,000 Shares at December 31, 2001 and 2002
Issued: 32,082,573 Shares at December 31, 2001 and 2002
Additional paid-in capital
Revaluation losses on lands
Retained earnings (Note 2 (15))
Unrealized losses on “Other Securities”
Adjustment arising from foreign currency financialstatement translation
Treasury stock (Note 12)Total shareholders’ equity
¥ 1,908
2,796 22
2,818151
975 321
2,500 8,673
538
3,929
571
62
3,898
16,17515,906
(1,121)
26,532
(96)
(1,049)
(598)55,749
¥73,420
$ 20,292
22,181 25
22,206 2,987
6,160 2,556
18,976 73,177
4,254
32,722
2,123
38
34,640
134,844 132,603
(9,361)
212,091
(928)
(5,887)
(10,095)453,267
$600,221
(Millions of Yen)
2002 2002
(Thousands ofU.S. Dollars)
(Note 3)
2001
O Y O C O R P O R A T I O N
The accompanying notes are an integral part of the consolidated financial statements.
(Yen)
16
¥34,253 16,102 50,355
24,325 10,699 35,024 15,331 14,809
522
96 (157)(71)
(842)1
12
(11)95
(115)(68)
(17)(11)33
86 (179)
65 (1,083)
(561)
264 (212)
52
138 ¥ (751)
OYO Corporation and its consolidated subsidiariesConsolidated Statements of Incomefor the years ended December 31, 2001 and 2002
Net Sales (Notes 15 and 16):Geo-engineering servicesInstrument sales
Cost of Sales (Notes 15 and 16):Geo-engineering servicesInstrument sales
Gross profitSelling, General and Administrative Expenses (Notes 13 and 14):
Operating income
Other Revenue (Expenses) (Note 15):Interest and dividend incomeInterest expensesLoss on sale/disposal of properties, netWrite-down of investments in securitiesGain on sale of marketable securitiesGain on sale of investments in securitiesGain (loss) on sale of investments in and advances to subsidiaries and an affiliate
Insurance premium incomeForeign exchange gain (loss)Equity in earning of affiliatesAmortization of net retirement benefit obligationat transition date
Early retirement expensesReversal of allowance for doubtful accountsExtraordinary gain based on the Statement of financial
accounting standard No.141 “Business combination”recognized by the U.S. subsidiary.
Loss on disposal of inventoriesOther, net
Loss before income taxesIncome Taxes (Note 10):
CurrentDeferred
Minority Interests in Earnings of Consolidated SubsidiariesNet Loss
$285,560 134,241 419,801
202,789 89,198
291,987 127,814 123,459
4,355
806 (1,313)
(595)(7,022)
13 102
(95)790 (962)(569)
(146)(93)
282
718 (1,497)
547 (9,034)(4,679)
2,201 (1,767)
434
1,147 $ (6,260)
¥37,151 14,650 51,801
26,505 9,357
35,862 15,939 14,791 1,148
146 (139)(22)
(558)12
133
23 46
198 (89)
(1,491)(713)
—
— — (6)
(2,460)(1,312)
229 (664)(435)
127 ¥ (1,004)
(U.S. Dollars)(Note 3)
Per Share Data (Note 2 (19)):Net lossCash dividends
Weighted Average Number of Shares (thousands)
¥(24.0)¥ 10.030,951
$(0.20)$ 0.0830,951
The accompanying notes are an integral part of the consolidated financial statements.
(Millions of Yen)
2002 2002
(Thousands ofU.S. Dollars)
(Note 3)
2001
O Y O C O R P O R A T I O N
¥(31.8)¥ 12.5
31,588
17
OYO Corporation and its consolidated subsidiariesConsolidated Statements of Shareholders’ Equityfor the years ended December 31, 2001 and 2002
¥16,175
————
—
—
—¥16,175
—
————
—
——
¥16,175
Balance at December 31, 2000Net loss for the year
ended December 31, 2001Cash dividendsDirectors’ bonusesRevaluation losses on landsUnrealized losses on “Other
Securities”Adjustment arising from foreign
currency statement translationDisposal of treasury stocks, net
of acquisition costsBalance at December 31, 2001
Net loss for the year ended December 31, 2002
Increase arising from exclusion of consolidation of subsidiaries
Revaluation losses on lands Cash dividendsDirectors’ bonusesNet unrealized losses
on “Other Securities”Adjustment arising from foreign
currency statement translationAcquisition of treasury stocks
Balance at December 31, 2002
The accompanying notes are an integral part of the consolidated financial statements.
¥15,906
————
—
—
—¥15,906
—
————
—
——
¥15,906
¥ —
———
(1,121)
—
—
—¥ (1,121)
—
—(2)——
—
——
¥ (1,123)
(Millions of Yen)
Revaluationgains/
(losses) onlands
Additionalpaid-incapital
Commonstock
Number ofshares ofcommon
stock
32,082,573
————
—
—
—32,082,573
—
————
—
——
32,082,573
O Y O C O R P O R A T I O N
¥ (603)
— ———
—
—
5¥ (598)
—
— ———
—
—(613)
¥(1,211)
¥59,424
(1,004)(395)(15)
(1,121)
(96)
(1,049)
5¥55,749
(751)
64 —
(393)(14)
(15)
343(613)
¥54,370
TotalTreasurystocks
¥27,946
(1,004)(395)(15)—
—
—
—¥26,532
(751)
64 2
(393)(14)
—
——
¥25,440
¥ —
— ———
(96)
—
—¥ (96)
—
— ———
(15)
——
¥(111)
Unrealizedgains/
(losses) on“Other
Securities”Retainedearnings
¥ —
— ———
—
(1,049)
—¥ (1,049)
—
— ———
—
343—
¥ (706)
Adjustmentarising from
foreign currency
statementfinancial
translation
$134,844
—
————
—
——
$134,844
Balance at December 31, 2001Net loss for the year
ended December 31, 2002Increase arising from exclusion
of consolidation of subsidiariesRevaluation losses on lands Cash dividendsDirectors’ bonusesNet unrealized losses
on “Other Securities”Adjustment arising from foreign
currency statement translationAcquisition of treasury stocks
Balance at December 31, 2002
$132,603
—
————
—
——
$132,603
$(9,345)
—
—(16)——
—
——
$(9,361)
(Thousands of U.S. dollars) (Note 3)
Revaluationgains/
(losses) onlands
Additionalpaid-incapital
Commonstock
Number ofshares ofcommon
stock
32,082,573
—
————
—
——
32,082,573
$ (4,986)
—
————
—
—(5,109)
$(10,095)
$464,771
(6,260)
529—
(3,277)(115)
(125)
2,853(5,109)
$453,267
TotalTreasurystocks
$221,198
(6,260)
52916
(3,277)(115)
—
——
$212,091
$(803)
—
————
(125)
——
$(928)
Unrealizedgains/
(losses) on“Other
Securities”Retainedearnings
$(8,740)
—
————
—
2,853—
$(5,887)
Adjustmentarising from
foreign currency
statementfinancial
translation
18
OYO Corporation and its consolidated subsidiariesConsolidated Statements of Cash Flowsfor the years ended December 31, 2001 and 2002
¥ (561)1,959
1 68
842 — (5)
(16)(96)157
(1)7110
254 784 179 346
(196)(299)929 (20)
(300)4,106
96 (157)(178)
3,867
128(1,699)(2,479)2,248 2,071
(2,121)441
— (110)
(1,521)
458
(199)
150 (612)
— (400)(603)
171,760
14,425
36¥16,221
Cash Flows from Operating Activities:Loss before income taxes Depreciation and amortizationAmortized amount for consolidation adjustment accountsEquity in earnings of affiliatesLoss on write-down of investments in securitiesDecrease in provision for accrued retirement benefitsIncrease (decrease) in reserve for retirement benefitsIncrease (decrease) in reserve for accrued bonusesInterests and dividend incomeInterests expensesGain on sale of marketable securitiesNet loss on sale/disposal of properties Loss (gain) on sale of investments in securitiesDecrease (increase) in accounts and notes receivableDecrease (increase) in inventoriesLoss on disposal of inventoriesDecrease (increase) in other current assetsDecrease in accounts and notes payableIncrease (decrease) in other current liabilitiesDecrease in costs of uncompleted geo-engineering costsPayment of director’s bonusesOther
SubtotalInterests and dividend income receivedInterests expenses paidIncome taxes paid
Net cash provided by (used in) operating activities
Cash Flows from Investing Activities:Decrease (increase) in time depositsPayments for acquisition of marketable securitiesPayments for acquisition of investments in securitiesProceeds from sale of marketable securitiesProceeds from sale of investments in securitiesPayments for acquisition of propertiesProceeds from sale of propertiesPayments for business acquisitionOther
Net cash used in investing activities
Cash Flows from Financing Activities:Increase in short-term loansRepayment of long-term loans from banks and other financial institutions
Proceeds from long-term loans from banks and other financial institutions
Payments for acquisition of treasury stockProceeds from sale of treasury stock Cash dividends paid
Net cash provided by (used in) financing activities Effect of Exchange Rate Changes on Cash and Cash Equivalents Net decrease (increase) in Cash and Cash Equivalents Cash and Cash Equivalents at Beginning of YearCash and Cash Equivalents of Newly Consolidated Subsidiaries
at Beginning of YearCash and Cash Equivalents at End of Year
The accompanying notes are an integral part of the consolidated financial statements.
¥ (1,312)1,880
18 89
558 (3,297)3,929
10 (146)139 (12)22
(156)(533)(894)
— (174)(987)545 382 (21)15 55
146 (139)(593)(531)
(77) (3,505) (3,698) 3,774 1,653
(1,664) 295
(367) (89)
(3,678)
720
(165)
111 (3)9
(401)27167
(3,871)18,296
— ¥14,425
$ (4,678)16,335
8 569
7,022 —
(39)(137)(806)
1,313 (13)59489
2,115 6,536 1,496 2,888
(1,640)(2,500)7,745 (169)
(2,500)34,228
806 (1,313)(1,484)32,237
1,069(14,168)(20,673)18,748 17,268
(17,686)3,681
— (920)
(12,681)
3,823
(1,660)
1,257 (5,108)
— (3,339)(5,027)
14214,671
120,260
297 $ 135,228
(Millions of Yen)
2002 2002
(Thousands ofU.S. Dollars)
(Note 3)
2001
O Y O C O R P O R A T I O N
19
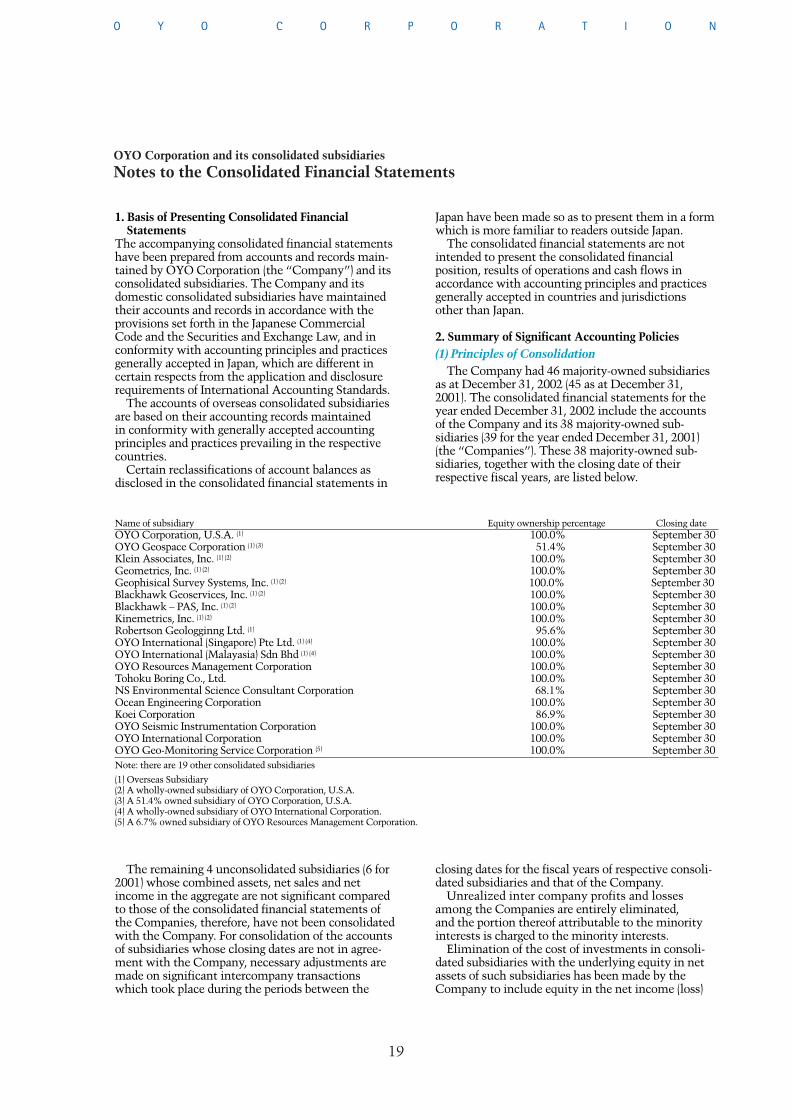
OYO Corporation and its consolidated subsidiariesNotes to the Consolidated Financial Statements
Name of subsidiary Equity ownership percentage Closing dateOYO Corporation, U.S.A. (1) 100.0% September 30OYO Geospace Corporation (1) (3) 51.4% September 30Klein Associates, Inc. (1) (2) 100.0% September 30Geometrics, Inc. (1) (2) 100.0% September 30Geophisical Survey Systems, Inc. (1) (2) 100.0% September 30Blackhawk Geoservices, Inc. (1) (2) 100.0% September 30Blackhawk – PAS, Inc. (1) (2) 100.0% September 30Kinemetrics, Inc. (1) (2) 100.0% September 30Robertson Geologginng Ltd. (1) 95.6% September 30OYO International (Singapore) Pte Ltd. (1) (4) 100.0% September 30OYO International (Malayasia) Sdn Bhd (1) (4) 100.0% September 30OYO Resources Management Corporation 100.0% September 30Tohoku Boring Co., Ltd. 100.0% September 30NS Environmental Science Consultant Corporation 68.1% September 30Ocean Engineering Corporation 100.0% September 30Koei Corporation 86.9% September 30OYO Seismic Instrumentation Corporation 100.0% September 30OYO International Corporation 100.0% September 30OYO Geo-Monitoring Service Corporation (5) 100.0% September 30Note: there are 19 other consolidated subsidiaries
(1) Overseas Subsidiary(2) A wholly-owned subsidiary of OYO Corporation, U.S.A.(3) A 51.4% owned subsidiary of OYO Corporation, U.S.A.(4) A wholly-owned subsidiary of OYO International Corporation.(5) A 6.7% owned subsidiary of OYO Resources Management Corporation.
Japan have been made so as to present them in a formwhich is more familiar to readers outside Japan.
The consolidated financial statements are notintended to present the consolidated financial position, results of operations and cash flows inaccordance with accounting principles and practicesgenerally accepted in countries and jurisdictionsother than Japan.
2. Summary of Significant Accounting Policies(1) Principles of Consolidation
The Company had 46 majority-owned subsidiariesas at December 31, 2002 (45 as at December 31,2001). The consolidated financial statements for theyear ended December 31, 2002 include the accountsof the Company and its 38 majority-owned sub-sidiaries (39 for the year ended December 31, 2001)(the “Companies”). These 38 majority-owned sub-sidiaries, together with the closing date of theirrespective fiscal years, are listed below.
O Y O C O R P O R A T I O N
The remaining 4 unconsolidated subsidiaries (6 for2001) whose combined assets, net sales and netincome in the aggregate are not significant comparedto those of the consolidated financial statements ofthe Companies, therefore, have not been consolidatedwith the Company. For consolidation of the accountsof subsidiaries whose closing dates are not in agree-ment with the Company, necessary adjustments aremade on significant intercompany transactionswhich took place during the periods between the
closing dates for the fiscal years of respective consoli-dated subsidiaries and that of the Company.
Unrealized inter company profits and lossesamong the Companies are entirely eliminated, and the portion thereof attributable to the minorityinterests is charged to the minority interests.
Elimination of the cost of investments in consoli-dated subsidiaries with the underlying equity in netassets of such subsidiaries has been made by theCompany to include equity in the net income (loss)
1. Basis of Presenting Consolidated Financial Statements
The accompanying consolidated financial statementshave been prepared from accounts and records main-tained by OYO Corporation (the “Company”) and itsconsolidated subsidiaries. The Company and itsdomestic consolidated subsidiaries have maintainedtheir accounts and records in accordance with theprovisions set forth in the Japanese CommercialCode and the Securities and Exchange Law, and inconformity with accounting principles and practicesgenerally accepted in Japan, which are different incertain respects from the application and disclosurerequirements of International Accounting Standards.
The accounts of overseas consolidated subsidiariesare based on their accounting records maintained in conformity with generally accepted accountingprinciples and practices prevailing in the respectivecountries.
Certain reclassifications of account balances asdisclosed in the consolidated financial statements in
20
of subsidiaries earned subsequent to the acquisition ofeach block of shares. Any difference between the costof an investment in a subsidiary and the amount ofunderlying equity in net assets of the subsidiary istreated as an asset or a liability, as the case may be,and amortized over a period of five years on a straight-line basis.(2) Accounting for Investments in Unconsolidated
Subsidiaries and AffiliatesThe Company had 4 unconsolidated subsidiaries(majority-owned) (6 for 2001) and 3 affiliates (meaningthe companies’ equity interest of which are owned 20percent to 50 percent) (4 for 2001). The equity methodis applied to the investments in 3 major affiliates (4 for 2001) since investments in the remainingunconsolidated subsidiaries and affiliate are not mate-rial for the consolidated financial statements.
The affiliates are listed below:
Equityownership
Name of company percentage Closing date
Iris Instrument S.A. 49% December 31
OYO RMS Corporation 50% September 30
Engineering & Risk Services Corporation 50% March 31
Note: In October 2002, OYO Corporation U.S.A., a wholly owned subsidiary of the Company, sold all of its shareholdings in TrueTime, Inc. (affiliate under the equity method until 2001), to Symmetricom, Inc.
The investments in the remaining unconsolidatedsubsidiaries and affiliate are carried at cost or less.(3) Translation of Foreign CurrencyRevenue and expense items arising from transactionsdenominated in foreign currencies are translated intoJapanese yen in general at the rates effective at therespective transaction dates.
Foreign currencies and short-term receivables andpayables denominated in foreign currencies are trans-lated into Japanese yen at the current exchange rateprevailing at the respective balance sheet dates andthe resulting translation gain or loss is included indetermination of net income for the year.
Long-term receivables and payables denominated inforeign currencies including investments in overseasunconsolidated subsidiaries and affiliates are trans-lated at the historical rates prevailing at the transac-tion dates.
In translating the financial statements of sub-sidiaries or affiliates stated in foreign currencies intoyen, for purposes of consolidation with the Companyor for application of the equity method, all assets andliabilities are translated at current exchange rates,while capital stock and retained earnings are trans-lated at historical exchange rates. All revenue andexpense items for the year are translated at currentexchange rates.
The net difference arising from the translation ofthe foreign currency financial statements is shown as“Adjustments on Foreign Currency Statement Trans-lation” in the accompanying consolidated balancesheets.
(4) Cash and Cash EquivalentsCash and cash equivalents in the consolidated state-ments of cash flows are composed of cash in hand,bank deposits able to be withdrawn on demand andshort-term investments with an original maturity ofthree months or less and which represent a minorrisk of fluctuations in value.(5) Sales Recognition of Geo-engineering ServiceThe Company’s primary business is to engage in geo-engineering services. The geo-engineering services ofthe Company, except for certain large-scale and long-term geo-engineering service contracts, are accountedfor by the “completed contract method” under whichthe net sales and the related cost of sales for the com-pleted contracts are recognized when the services arecompleted. The revenue for certain large-scale andlong-term geo-engineering service contracts, the geo-engineering service term of which is over one yearand the contract amount of which is ¥100 millionand over, are accounted for by the “percentage-of-completion method.” The accumulated cost ofuncompleted geo-engineering services is shown as“Costs of uncompleted geo-engineering services” andthe related advances received on uncompleted geo-engineering services are shown as “Advancesreceived on uncompleted geo-engineering services”in the accompanying consolidated balance sheets.(6) Costs of Uncompleted Geo-engineering Services“Costs of uncompleted geo-engineering services” arestated at cost of each individual project basis.(7) InventoriesCosts of uncompleted geo-engineering services arestated at cost being determined by the individuallyidentified cost method. Finished products and mer-chandise, raw materials, and work-in-process of theCompany are stated at cost being determined by theaverage method, and those of principal subsidiariesare stated at the lower of cost or market being deter-mined by the first-in-first-out method.
When the net realizable value of certain items ofinventories is substantially less than the carryingvalue (cost), and the decline of value is not expectedto be recovered in the near future, appropriate write-downs are recorded on such items. (8) Valuation of SecuritiesUntil the year ended December 31, 2000, securitieswith market quotations were valued at the lower ofcost or market value, and securities without marketquotations are valued at cost, cost being determinedby the moving average method. Additionally, appro-priate write-downs were recorded for securities with-out market quotations in cases where their value haddeclined substantially and such impairments of thevalue are not deemed to be temporary.
However, effective from the year ended December31, 2001, the valuation method for securities changedto the following:
Subsidiaries and affiliates are stated at cost, costbeing determined by the moving average method
“Other Securities” (with market quotations) arestated at market value determined using the closing
O Y O C O R P O R A T I O N
21
market price on the balance sheet date. Unrealizedgains/losses are included directly in shareholders’equity. Cost of securities sold is determined by themoving average method.
“Other Securities” (without market quotations) arestated at cost, cost being determined by the movingaverage method.(9) Property, Plant and EquipmentDepreciation of buildings (excluding leaseholdimprovements and auxiliary facilities attached tobuildings) held by the company and its domestic con-solidated subsidiaries are computed by the straight-line method, and depreciation for the other propertyand equipment held by the company and its domesticconsolidated subsidiaries are computed by the declining-balance method, at rates based upon theestimated useful lives of assets which are prescribedby the Japanese income tax laws. The range of usefullives is principally from 2 to 50 years for buildingsand structures and 2 to 15 years for machinery andequipment.
Depreciation of property, plant and equipment heldby overseas consolidated subsidiaries mainly com-puted by the straight-line method.
The cost of property and equipment retired or oth-erwise disposed of and accumulated depreciation inrespect thereof are eliminated from the relatedaccounts, and the resulting gain or loss is reflected inincome.
Normal repairs and maintenance, including minorrenewals and improvements, are charged to incomeas incurred.(10) Amortization of Intangible AssetsGoodwill is amortized uniformly over certain periods(15 or 40 years), depending on the accounting stan-dards in the country where the subsidiary is located.Computer software for internal use is amortized uni-formly over 5 years by the straight-line method.Other intangible fixed assets are amortized by thestraight-line method.(11) Accounting for Finance LeaseFinance leases other than those which are deemed totransfer the ownership of the leased assets to lesseesare accounted for by the method similar to thatapplicable to ordinary operating leases.(12) Income TaxesIncome taxes of the Company and its domestic sub-sidiaries consist of corporate income taxes, localinhabitant taxes and enterprise taxes.
The Company and its domestic subsidiariesadopted deferred tax accounting in accordance withthe amended regulations for preparation of consoli-dated financial statements. Income taxes were determined using the asset and liability approach,whereby deferred tax assets and liabilities were recog-nized in respect of temporary differences between thetax basis of assets and liabilities and those as reportedin the consolidated financial statements.
(13) Recognition of Certain Accrued ExpensesThe Company and domestic consolidated subsidiariesprovided for doubtful accounts. The amount providedis determined by applying a percentage based on pastactual bad debt loss experience to the balance of totalreceivables, plus provision for specific amountsdeemed necessary to cover possible losses on an indi-vidual account basis. Overseas consolidated sub-sidiaries make amount deemed necessary to coverpossible losses estimated on an individual accountbasis.
Accrued bonuses to employees is provided for at theamount estimated to be payable by the Company andits domestic consolidated subsidiaries in the future.
Overseas consolidated subsidiaries do not record anyaccrued bonuses since there are no bonus paymentsprogram in those overseas consolidated subsidiaries.(14) Reserve for Retirement BenefitUntil the ended December 31, 2000, the Companyrecords accrued retirement benefits to employees at anamount equivalent to 100% of the benefits that wouldhave been payable by the Company (determined bythe Company’s internal rules), if all employees hadretired voluntarily at the balance sheet date, less thebalance of found assets accumulated by the qualifiedfunded pension plan.
Effective from the year ended December 31, 2001,accrued retirement benefits are provided based on theamount of the projected benefit obligation less the fairvalue of the pension plan assets at the end of the fiscalyear.
The Company and its domestic consolidated sub-sidiaries each maintain a defined benefit tax-qualifiedpension plan and lump-sum severance payment. Forsome employees, the Company makes premiumretirement payments that are not treated as retirementbenefit obligations under the new standards for retire-ment benefit accounting.(15) Appropriation of Retained EarningsUnder the Japanese Commercial Code and the Arti-cles of Incorporation of the Company, the plan forappropriation of retained earnings (including cash divi-dend payments) proposed by the Board of Directorsshould be approved by the shareholders’ meetingwhich must be held within three months after the endof each financial year. The appropriation of retainedearnings reflected in the accompanying consolidatedstatements of shareholders’ equity represents theresults of such appropriations which are applicable tothe immediately preceding financial year but wereapproved by the shareholders’ meeting and disposed ofduring this year.
Dividends are paid to shareholders on the sharehold-ers’ register at the end of each financial year. As is cus-tomary practice in Japan, the payment of bonuses todirectors is made out of retained earnings instead ofbeing charged to income of the year, which constitutesa part of appropriations cited above.
O Y O C O R P O R A T I O N
(16) Accounting Standard for Computer SoftwareOn the accompanying Balance Sheet, software costsare classified in a software account, included within“Intangibles and Deferred Charges – Other.” Thesecosts are being amortized, using the straight-linemethod, over their estimated useful lives (5 years), asdetermined by the Company.(17) Accounting Standard for Financial InstrumentsEffective from the year ended December 31, 2001, theCompany adopted the accounting standard for finan-cial instruments (“Views on Establishment ofAccounting Standards for Financial Instruments,”issued by the Business Accounting DeliberationCouncil on January 22, 1999). Under the new stan-dard, securities redeemable within one year should belisted as “Marketable securities” under “CurrentAssets,” and “Other securities” should be listed as“Investments in securities.” Accordingly, at thebeginning of the period the Company transferred atotal of ¥2,342 million ($17,760 thousand) from“Marketable securities” under “Current Assets” to“Investments in Securities.”
As a result of this change, “Income/(loss) beforeincome taxes” increased by ¥25 million ($187 thou-sand) and, as a result of revaluing “Other securities”to fair market value, an unrealized loss of ¥96 million($730 thousand) was reported as a separate compo-nent of “Shareholders’ Equity,” net of income taxes.Additionally, the value of “Marketable securities”declined by ¥7 million ($52 thousand), “Deferred taxassets” (current) increased by ¥3 million ($21 thou-sand), “Investments in Securities” decreased by ¥159million ($1,207 thousand) and “Deferred tax assets”(fixed) increased by ¥67 million ($507 thousand). (18) Accounting Standard for Foreign Currency
Transactions, etc.Effective from the year ended December 31, 2001, theCompany adopted the revised accounting standardfor foreign currency transactions (“Views on Revisionof Accounting Standards for Foreign Currency Trans-actions, etc.” issued by the Business AccountingDeliberation Council on October 22, 1999). Thischange had no material effect on the Company’sStatement of Income. However, from 2001, the for-
22
O Y O C O R P O R A T I O N
eign currency adjustment, included within “Assets”in 2000, was included as a separate component of“Shareholders’ Equity” and as part of the “MinorityInterests in Consolidated Subsidiaries.”(19) Net Income Per ShareNet income per share of common stock is based uponthe weighted average number of shares of commonstock outstanding during each year, appropriatelyadjusted for subsequent stock splits of commonstock.
Since there is no dilutive effect of convertiblebonds and bonds with warrants on net income pershare, such information is not required to be dis-closed.
3. U.S. Dollar AmountsThe Company maintains its accounting records inJapanese yen. The dollar amounts included in theconsolidated financial statements and notes theretorepresent the arithmetical results of translating yento dollars on the basis of ¥119.95=U.S.$1, the approxi-mate exchange rate at the latest balance sheet date ofDecember 31, 2002. The inclusion of such dollaramounts is solely for convenience and is notintended to imply that yen amounts have been orcould be converted, realized or settled in dollars at¥119.95=U.S.$1 or at any other rate.
4. Cash and Cash Equivalents“Cash and cash equivalents” can be reconciled to“Cash in hand and at bank” as follows:
Cash in hand and at bankSecurities
Time deposits with a term of over 3 months
Securities investment trust instruments with maturity of more than 3 months
Cash and cash equivalents
¥13,6813,329
17,010
(71)
(718)¥16,221
$ 114,057 27,753
141,810
(591)
(5,991) $135,228
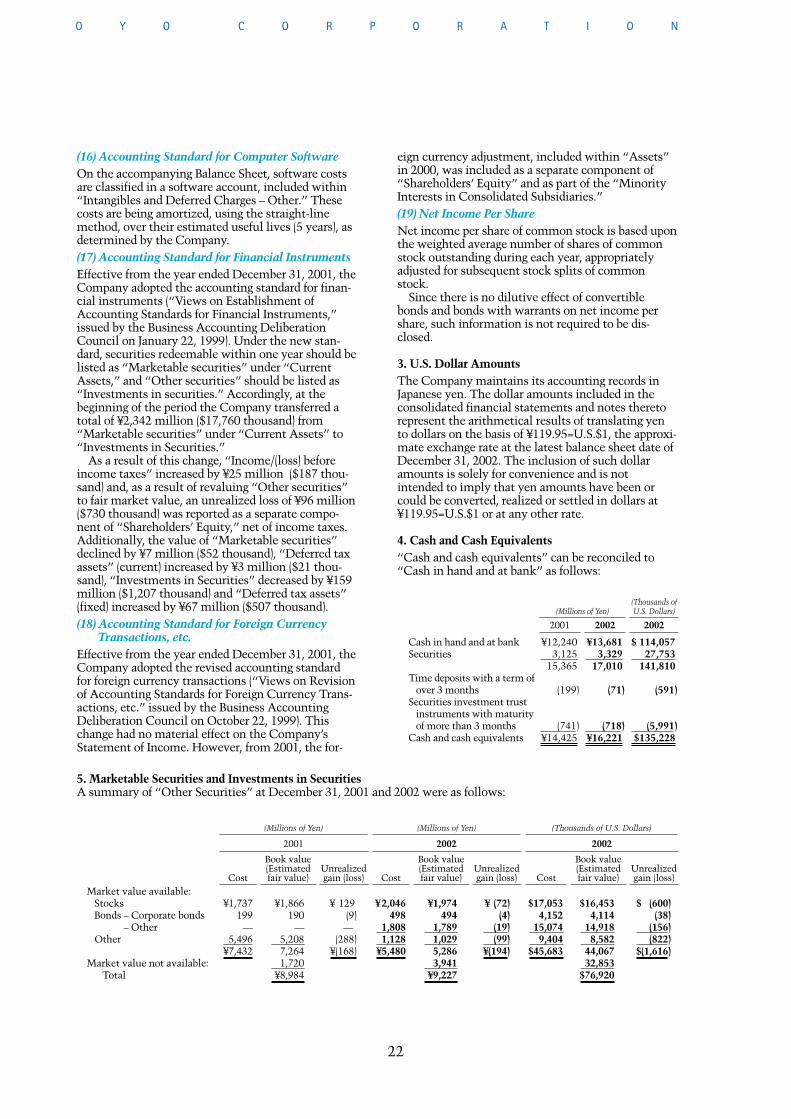
5. Marketable Securities and Investments in SecuritiesA summary of “Other Securities” at December 31, 2001 and 2002 were as follows:
20022001 2002
(Millions of Yen)(Thousands ofU.S. Dollars)
¥12,2403,125
15,365
(199)
(741)¥14,425
Market value available:StocksBonds – Corporate bonds
– OtherOther
Market value not available:Total
2001
(Millions of Yen)
Cost
Book value (Estimated fair value)
Unrealizedgain (loss)
¥1,737 199
—5,496
¥7,432
¥1,866 190
—5,208 7,264 1,720
¥8,984
¥ 129 (9)
—(288)
¥(168)
2002
(Millions of Yen)
Cost
Book value (Estimated fair value)
Unrealizedgain (loss)
¥2,046 498
1,808 1,128
¥5,480
¥1,974 494
1,7891,029 5,2863,941
¥9,227
¥ (72)(4)
(19)(99)
¥(194)
2002
(Thousands of U.S. Dollars)
Cost
Book value (Estimated fair value)
Unrealizedgain (loss)
$17,053 4,152
15,0749,404
$45,683
$16,453 4,114
14,918 8,582
44,067 32,853
$76,920
$ (600)(38)
(156)(822)
$(1,616)
23
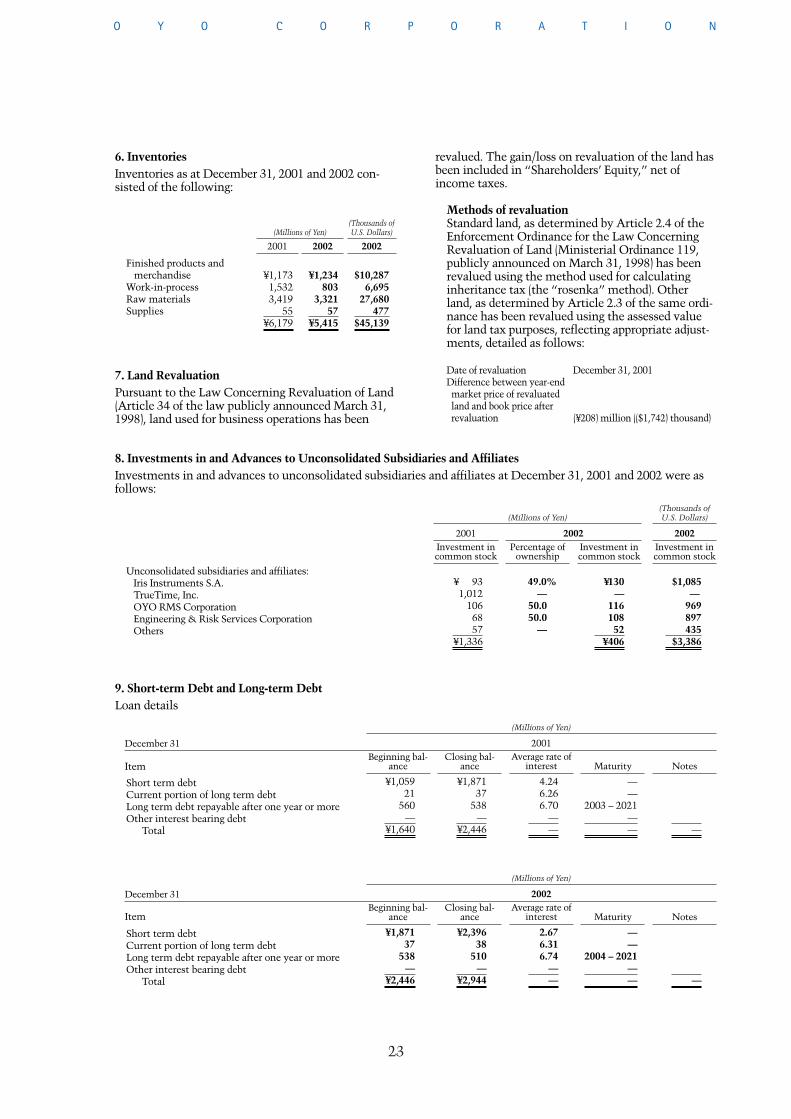
7. Land RevaluationPursuant to the Law Concerning Revaluation of Land(Article 34 of the law publicly announced March 31,1998), land used for business operations has been
¥ 931,012
1066857
¥1,336
¥130 —
116 108 52
¥406
$1,085—
969897435
$3,386
20022001 2002
(Millions of Yen)(Thousands ofU.S. Dollars)
Investment incommon stock
Investment incommon stock
Percentage ofownership
49.0%—
50.050.0
—
Investment incommon stock
6. InventoriesInventories as at December 31, 2001 and 2002 con-sisted of the following:
revalued. The gain/loss on revaluation of the land hasbeen included in “Shareholders’ Equity,” net ofincome taxes.
Methods of revaluation Standard land, as determined by Article 2.4 of theEnforcement Ordinance for the Law ConcerningRevaluation of Land (Ministerial Ordinance 119,publicly announced on March 31, 1998) has beenrevalued using the method used for calculatinginheritance tax (the “rosenka” method). Otherland, as determined by Article 2.3 of the same ordi-nance has been revalued using the assessed valuefor land tax purposes, reflecting appropriate adjust-ments, detailed as follows:
Date of revaluation December 31, 2001 Difference between year-end market price of revaluated land and book price after revaluation (¥208) million (($1,742) thousand)
O Y O C O R P O R A T I O N
Unconsolidated subsidiaries and affiliates:Iris Instruments S.A.TrueTime, Inc.OYO RMS CorporationEngineering & Risk Services CorporationOthers
¥1,87137
538—
¥2,446
——
2003 – 2021—— —
2001
(Millions of Yen)
NotesMaturityAverage rate of
interest
4.246.266.70
——
Closing bal-ance
Short term debtCurrent portion of long term debtLong term debt repayable after one year or moreOther interest bearing debt
Total
¥1,05921
560—
¥1,640
Beginning bal-ance Item
December 31
Finished products and merchandise
Work-in-processRaw materialsSupplies
¥1,234 803
3,32157
¥5,415
$10,287 6,695
27,680 477
$45,139
20022001 2002
(Millions of Yen)(Thousands ofU.S. Dollars)
¥1,1731,5323,419
55¥6,179
¥2,39638
510—
¥2,944
——
2004 – 2021—— —
2002
(Millions of Yen)
NotesMaturityAverage rate of
interest
2.676.316.74
——
Closing bal-ance
Short term debtCurrent portion of long term debtLong term debt repayable after one year or moreOther interest bearing debt
Total
¥1,871 37
538—
¥2,446
Beginning bal-ance Item
December 31
8. Investments in and Advances to Unconsolidated Subsidiaries and AffiliatesInvestments in and advances to unconsolidated subsidiaries and affiliates at December 31, 2001 and 2002 were asfollows:
9. Short-term Debt and Long-term DebtLoan details
24
O Y O C O R P O R A T I O N
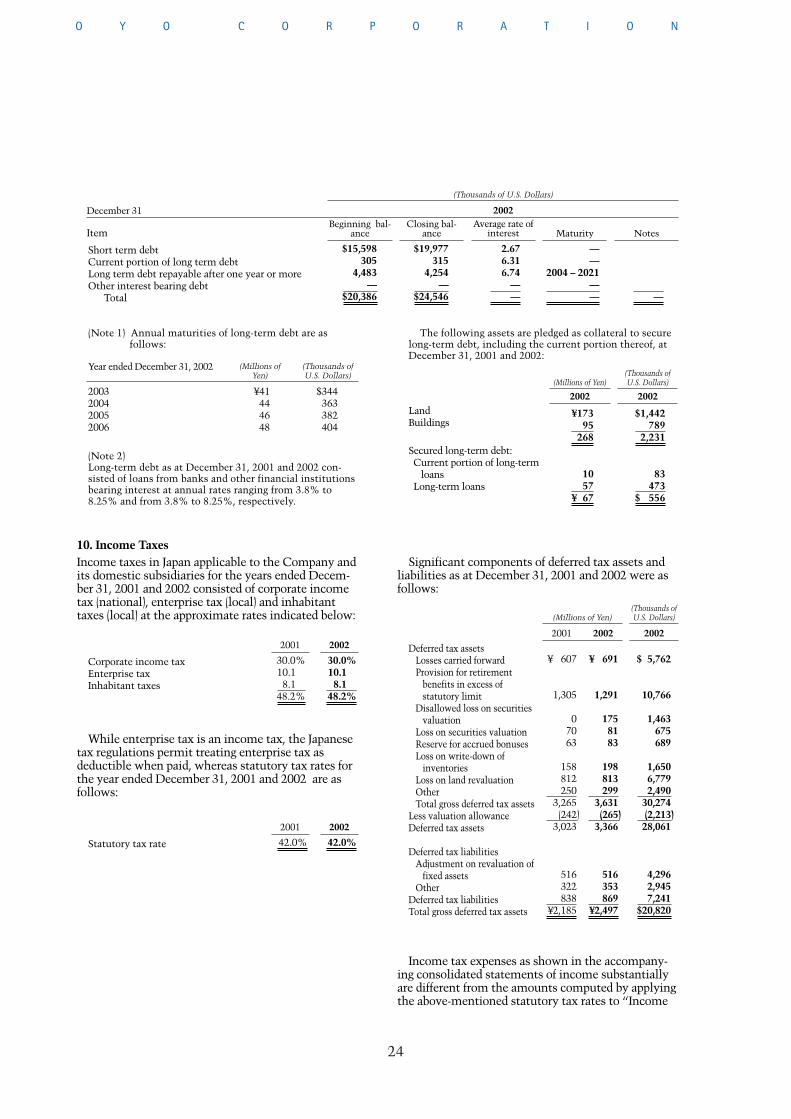
Income tax expenses as shown in the accompany-ing consolidated statements of income substantiallyare different from the amounts computed by applyingthe above-mentioned statutory tax rates to “Income
While enterprise tax is an income tax, the Japanesetax regulations permit treating enterprise tax asdeductible when paid, whereas statutory tax rates forthe year ended December 31, 2001 and 2002 are asfollows:
¥ 691
1,291
175 81 83
198 813 299
3,631 (265)
3,366
516 353 869
¥2,497
Deferred tax assetsLosses carried forwardProvision for retirement
benefits in excess of statutory limit
Disallowed loss on securities valuation
Loss on securities valuation Reserve for accrued bonusesLoss on write-down of
inventoriesLoss on land revaluationOtherTotal gross deferred tax assets
Less valuation allowanceDeferred tax assets
Deferred tax liabilities Adjustment on revaluation of
fixed assetsOther
Deferred tax liabilities Total gross deferred tax assets
$ 5,762
10,766
1,463675 689
1,650 6,779 2,490
30,274 (2,213)
28,061
4,296 2,945 7,241
$20,820
Significant components of deferred tax assets andliabilities as at December 31, 2001 and 2002 were asfollows:
30.0%10.18.1
48.2%
20022001
30.0%10.18.1
48.2%
Corporate income taxEnterprise taxInhabitant taxes
42.0%
20022001
42.0%Statutory tax rate
(Thousands ofU.S. Dollars)(Millions of Yen)
¥ 607
1,305
0 70 63
158 812 250
3,265 (242)
3,023
516 322 838
¥2,185
2001 20022002
10. Income TaxesIncome taxes in Japan applicable to the Company andits domestic subsidiaries for the years ended Decem-ber 31, 2001 and 2002 consisted of corporate incometax (national), enterprise tax (local) and inhabitanttaxes (local) at the approximate rates indicated below:
$19,977 315
4,254 —
$24,546
——
2004 – 2021—— —
2002
(Thousands of U.S. Dollars)
NotesMaturityAverage rate of
interest
2.676.316.74
——
Closing bal-ance
Short term debtCurrent portion of long term debtLong term debt repayable after one year or moreOther interest bearing debt
Total
$15,598305
4,483 —
$20,386
Beginning bal-anceItem
(Note 1) Annual maturities of long-term debt are as follows:
Year ended December 31, 2002
¥41444648
$344363382404
(Thousands ofU.S. Dollars)
(Millions ofYen)
2003200420052006
(Note 2) Long-term debt as at December 31, 2001 and 2002 con-sisted of loans from banks and other financial institutionsbearing interest at annual rates ranging from 3.8% to8.25% and from 3.8% to 8.25%, respectively.
December 31
LandBuildings
Secured long-term debt:Current portion of long-term
loansLong-term loans
¥173 95
268
1057
¥ 67
$1,442 789
2,231
83473
$ 556
2002 2002
(Millions of Yen)(Thousands ofU.S. Dollars)
The following assets are pledged as collateral to securelong-term debt, including the current portion thereof, atDecember 31, 2001 and 2002:
25
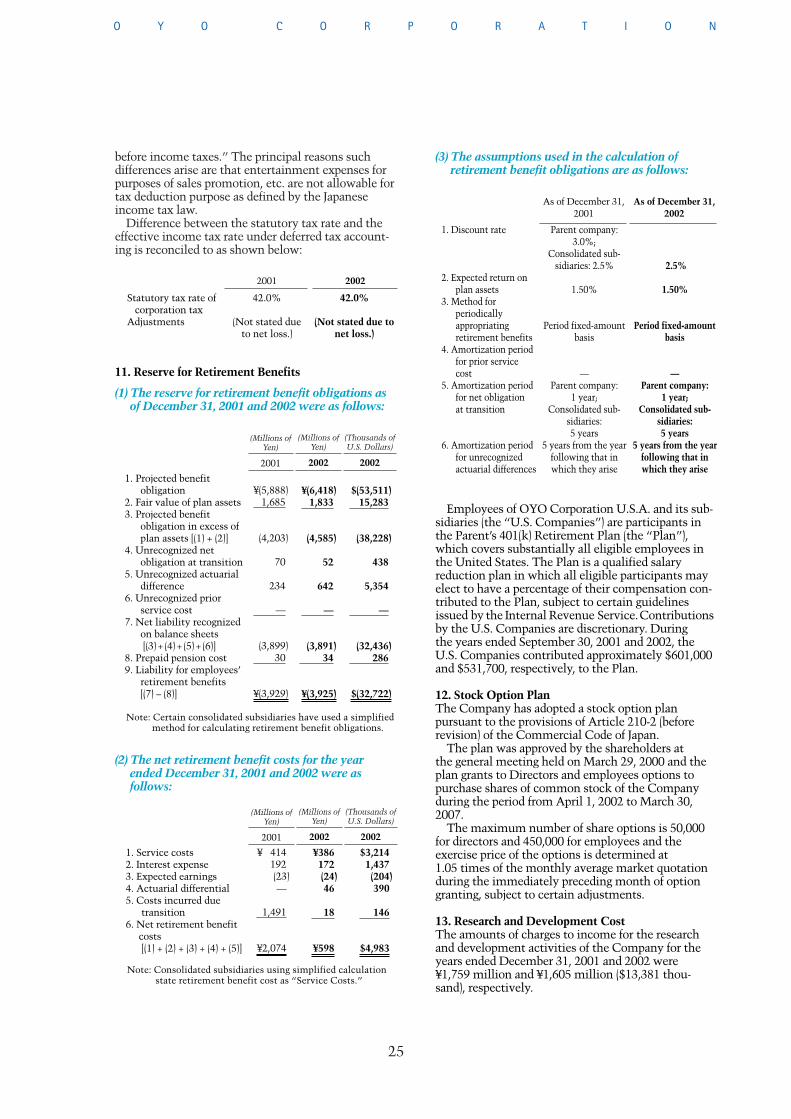
before income taxes.” The principal reasons such differences arise are that entertainment expenses forpurposes of sales promotion, etc. are not allowable fortax deduction purpose as defined by the Japaneseincome tax law.
Difference between the statutory tax rate and theeffective income tax rate under deferred tax account-ing is reconciled to as shown below:
O Y O C O R P O R A T I O N
Statutory tax rate of corporation tax
Adjustments
42.0%
(Not stated due tonet loss.)
11. Reserve for Retirement Benefits
(1) The reserve for retirement benefit obligations as of December 31, 2001 and 2002 were as follows:
(2) The net retirement benefit costs for the year ended December 31, 2001 and 2002 were as follows:
(3) The assumptions used in the calculation of retirement benefit obligations are as follows:
1. Projected benefit obligation
2. Fair value of plan assets3. Projected benefit
obligation in excess of plan assets [(1) + (2)]
4. Unrecognized net obligation at transition
5. Unrecognized actuarial difference
6. Unrecognized prior service cost
7. Net liability recognized on balance sheets[(3)+ (4)+ (5)+ (6)]
8. Prepaid pension cost9. Liability for employees’
retirement benefits[(7) – (8)]
$(53,511)15,283
(38,228)
438
5,354
—
(32,436)286
$(32,722)
(Millions ofYen)
(Thousands of U.S. Dollars)
2002
¥(6,418)1,833
(4,585)
52
642
—
(3,891)34
¥(3,925)
2002
42.0%
(Not stated dueto net loss.)
2001 2002
Note: Certain consolidated subsidiaries have used a simplified method for calculating retirement benefit obligations.
1. Discount rate
2. Expected return on plan assets
3. Method for periodically appropriating retirement benefits
4. Amortization period for prior service cost
5. Amortization period for net obligation at transition
6. Amortization period for unrecognized actuarial differences
2.5%
1.50%
Period fixed-amountbasis
—Parent company:
1 year;Consolidated sub-
sidiaries: 5 years
5 years from the yearfollowing that inwhich they arise
As of December 31,2002
Employees of OYO Corporation U.S.A. and its sub-sidiaries (the “U.S. Companies”) are participants inthe Parent’s 401(k) Retirement Plan (the “Plan”),which covers substantially all eligible employees inthe United States. The Plan is a qualified salaryreduction plan in which all eligible participants mayelect to have a percentage of their compensation con-tributed to the Plan, subject to certain guidelinesissued by the Internal Revenue Service.Contributionsby the U.S. Companies are discretionary. During the years ended September 30, 2001 and 2002, theU.S. Companies contributed approximately $601,000and $531,700, respectively, to the Plan.
12. Stock Option PlanThe Company has adopted a stock option plan pursuant to the provisions of Article 210-2 (beforerevision) of the Commercial Code of Japan.
The plan was approved by the shareholders at the general meeting held on March 29, 2000 and theplan grants to Directors and employees options topurchase shares of common stock of the Companyduring the period from April 1, 2002 to March 30,2007.
The maximum number of share options is 50,000for directors and 450,000 for employees and the exercise price of the options is determined at 1.05 times of the monthly average market quotationduring the immediately preceding month of optiongranting, subject to certain adjustments.
13. Research and Development CostThe amounts of charges to income for the researchand development activities of the Company for theyears ended December 31, 2001 and 2002 were¥1,759 million and ¥1,605 million ($13,381 thou-sand), respectively.
(Millions ofYen)
2001
¥(5,888)1,685
(4,203)
70
234
—
(3,899)30
¥(3,929)
1. Service costs2. Interest expense 3. Expected earnings 4. Actuarial differential5. Costs incurred due
transition6. Net retirement benefit
costs[(1) + (2) + (3) + (4) + (5)]
$3,2141,437(204)390
146
$4,983
(Millions ofYen)
(Thousands of U.S. Dollars)
2002
¥386172(24)46
18
¥598
2002
(Millions ofYen)
2001
¥ 414 192 (23)—
1,491
¥2,074
Note: Consolidated subsidiaries using simplified calculation state retirement benefit cost as “Service Costs.”
Parent company:3.0%;
Consolidated sub-sidiaries: 2.5%
1.50%
Period fixed-amountbasis
—Parent company:
1 year;Consolidated sub-
sidiaries: 5 years
5 years from the yearfollowing that inwhich they arise
As of December 31,2001
26
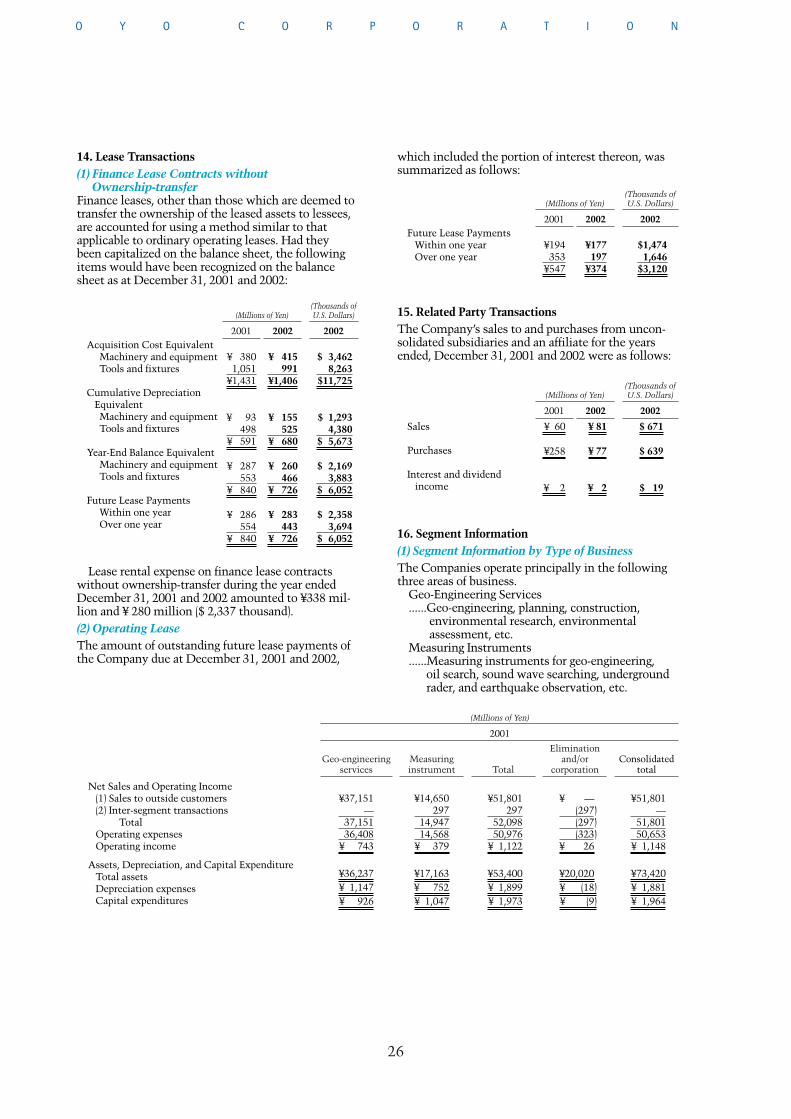
Eliminationand/or
corporationTotalMeasuringinstrument
Geo-engineeringservices
¥37,151—
37,15136,408
¥ 743
¥36,237¥ 1,147¥ 926
¥14,650297
14,94714,568
¥ 379
¥17,163¥ 752¥ 1,047
¥51,801297
52,09850,976
¥ 1,122
¥53,400¥ 1,899¥ 1,973
¥ —(297)(297)(323)
¥ 26
¥20,020¥ (18)¥ (9)
Net Sales and Operating Income(1) Sales to outside customers(2) Inter-segment transactions
TotalOperating expensesOperating income
Assets, Depreciation, and Capital ExpenditureTotal assetsDepreciation expensesCapital expenditures
(Millions of Yen)
2001
Consolidatedtotal
¥51,801—
51,80150,653
¥ 1,148
¥73,420¥ 1,881¥ 1,964
O Y O C O R P O R A T I O N
15. Related Party TransactionsThe Company’s sales to and purchases from uncon-solidated subsidiaries and an affiliate for the yearsended, December 31, 2001 and 2002 were as follows:
16. Segment Information(1) Segment Information by Type of BusinessThe Companies operate principally in the followingthree areas of business.
Geo-Engineering Services......Geo-engineering, planning, construction,
environmental research, environmental assessment, etc.
Measuring Instruments......Measuring instruments for geo-engineering,
oil search, sound wave searching, underground rader, and earthquake observation, etc.
14. Lease Transactions(1) Finance Lease Contracts without
Ownership-transferFinance leases, other than those which are deemed totransfer the ownership of the leased assets to lessees,are accounted for using a method similar to thatapplicable to ordinary operating leases. Had theybeen capitalized on the balance sheet, the followingitems would have been recognized on the balancesheet as at December 31, 2001 and 2002:
Acquisition Cost EquivalentMachinery and equipmentTools and fixtures
Cumulative Depreciation EquivalentMachinery and equipmentTools and fixtures
Year-End Balance EquivalentMachinery and equipmentTools and fixtures
Future Lease PaymentsWithin one yearOver one year
¥ 3801,051
¥1,431
¥ 93498
¥ 591
¥ 287553
¥ 840
¥ 286554
¥ 840
$ 3,4628,263
$11,725
$ 1,2934,380
$ 5,673
$ 2,1693,883
$ 6,052
$ 2,3583,694
$ 6,052
2001
(Millions of Yen)(Thousands of U.S. Dollars)
2002
¥ 415991
¥1,406
¥ 155525
¥ 680
¥ 260466
¥ 726
¥ 283443
¥ 726
2002
Future Lease PaymentsWithin one yearOver one year
¥194353
¥547
$1,4741,646
$3,120
2001
(Thousands ofU.S. Dollars)
2002
¥177197
¥374
2002
(Millions of Yen)
Sales
Purchases
Interest and dividendincome
¥ 60
¥258
¥ 2
$ 671
$ 639
$ 19
2001
(Thousands ofU.S. Dollars)
2002
¥ 81
¥ 77
¥ 2
2002
(Millions of Yen)
Lease rental expense on finance lease contractswithout ownership-transfer during the year endedDecember 31, 2001 and 2002 amounted to ¥338 mil-lion and ¥ 280 million ($ 2,337 thousand).(2) Operating LeaseThe amount of outstanding future lease payments ofthe Company due at December 31, 2001 and 2002,
which included the portion of interest thereon, wassummarized as follows:
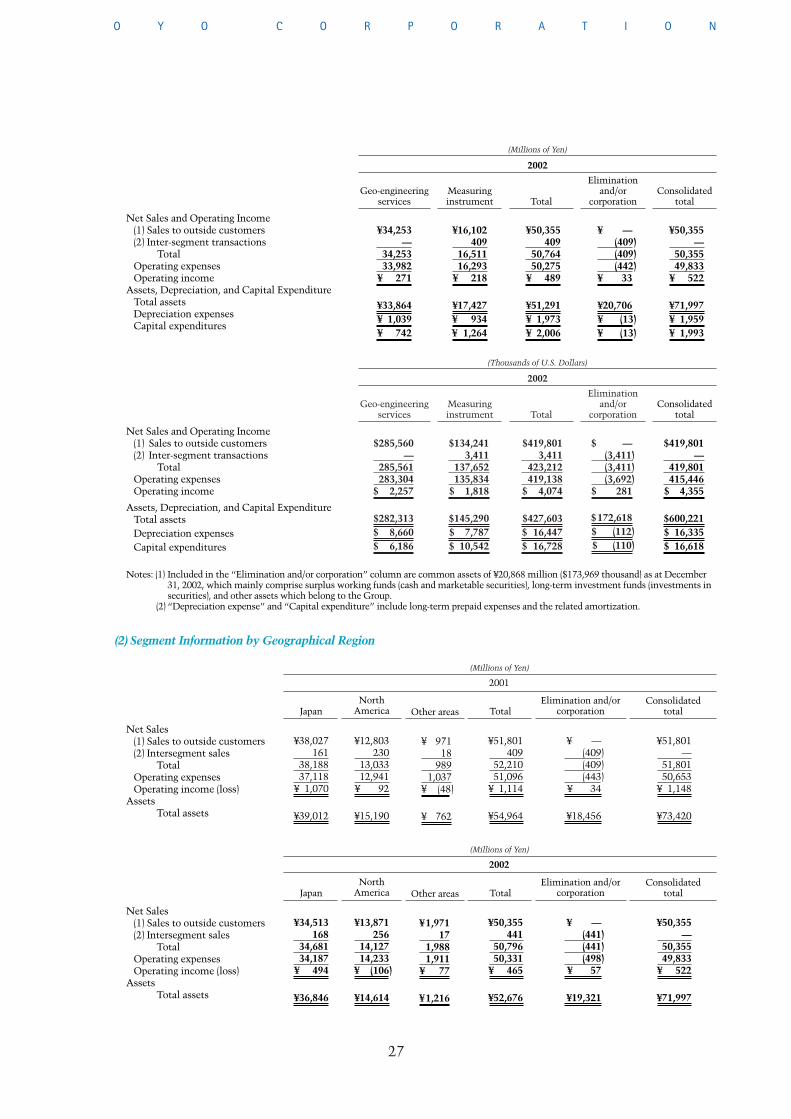
2002
27
Eliminationand/or
corporationTotalMeasuringinstrument
Geo-engineeringservices
$285,560—
285,561283,304
$ 2,257
$282,313$ 8,660$ 6,186
$134,2413,411
137,652135,834
$ 1,818
$145,290$ 7,787$ 10,542
$419,8013,411
423,212419,138
$ 4,074
$427,603$ 16,447$ 16,728
$ —(3,411)(3,411)(3,692)
$ 281
$172,618$ (112)$ (110)
Net Sales and Operating Income(1) Sales to outside customers(2) Inter-segment transactions
TotalOperating expensesOperating income
Assets, Depreciation, and Capital ExpenditureTotal assetsDepreciation expensesCapital expenditures
(Thousands of U.S. Dollars)
Consolidatedtotal
$419,801—
419,801415,446
$ 4,355
$600,221$ 16,335$ 16,618
O Y O C O R P O R A T I O N
(Millions of Yen)
Consolidatedtotal
Eliminationand/or
corporationTotalMeasuringinstrument
Geo-engineeringservices
¥34,253—
34,25333,982
¥ 271
¥33,864¥ 1,039¥ 742
¥16,102409
16,51116,293
¥ 218
¥17,427¥ 934¥ 1,264
¥50,355409
50,76450,275
¥ 489
¥51,291¥ 1,973¥ 2,006
¥ —(409)(409)(442)
¥ 33
¥20,706¥ (13)¥ (13)
¥50,355—
50,35549,833
¥ 522
¥71,997¥ 1,959¥ 1,993
2002
Net Sales and Operating Income(1) Sales to outside customers(2) Inter-segment transactions
TotalOperating expensesOperating income
Assets, Depreciation, and Capital ExpenditureTotal assetsDepreciation expensesCapital expenditures
Notes: (1) Included in the “Elimination and/or corporation” column are common assets of ¥20,868 million ($173,969 thousand) as at December 31, 2002, which mainly comprise surplus working funds (cash and marketable securities), long-term investment funds (investments in securities), and other assets which belong to the Group.
(2) “Depreciation expense” and “Capital expenditure” include long-term prepaid expenses and the related amortization.
Consolidated total
Elimination and/orcorporationTotal
NorthAmericaJapan
¥34,513168
34,68134,187
¥ 494
¥36,846
¥13,871256
14,12714,233
¥ (106)
¥14,614
¥50,355441
50,79650,331
¥ 465
¥52,676
¥ —(441)(441)(498)
¥ 57
¥19,321
¥50,355—
50,35549,833
¥ 522
¥71,997
Net Sales(1) Sales to outside customers(2) Intersegment sales
TotalOperating expensesOperating income (loss)
AssetsTotal assets
(Millions of Yen)
2002
Other areas
¥1,97117
1,9881,911
¥ 77
¥1,216
Consolidated total
Elimination and/orcorporationTotal
NorthAmericaJapan
¥38,027161
38,18837,118
¥ 1,070
¥39,012
¥12,803230
13,03312,941
¥ 92
¥15,190
¥51,801409
52,21051,096
¥ 1,114
¥54,964
¥ —(409)(409)(443)
¥ 34
¥18,456
¥51,801—
51,80150,653
¥ 1,148
¥73,420
Net Sales(1) Sales to outside customers(2) Intersegment sales
TotalOperating expensesOperating income (loss)
AssetsTotal assets
(Millions of Yen)
2001
Other areas
¥ 97118
9891,037
¥ (48)
¥ 762
(2) Segment Information by Geographical Region
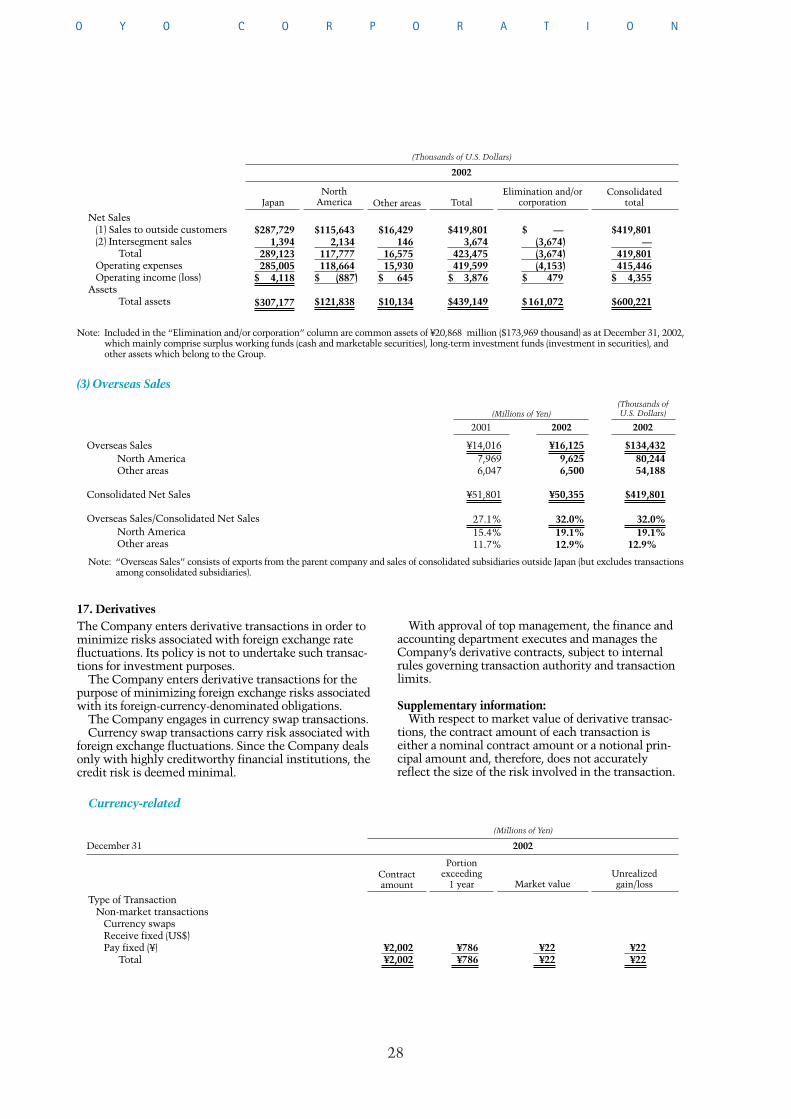
28
O Y O C O R P O R A T I O N
¥786¥786
¥22¥22
¥22¥22
Type of TransactionNon-market transactions
Currency swaps Receive fixed (US$) Pay fixed (¥)
Total
(Millions of Yen)
2002
¥2,002¥2,002
Unrealizedgain/lossMarket value
Portionexceeding
1 yearContract amount
December 31
17. Derivatives The Company enters derivative transactions in order tominimize risks associated with foreign exchange ratefluctuations. Its policy is not to undertake such transac-tions for investment purposes.
The Company enters derivative transactions for thepurpose of minimizing foreign exchange risks associatedwith its foreign-currency-denominated obligations.
The Company engages in currency swap transactions.Currency swap transactions carry risk associated with
foreign exchange fluctuations. Since the Company dealsonly with highly creditworthy financial institutions, thecredit risk is deemed minimal.
With approval of top management, the finance andaccounting department executes and manages theCompany’s derivative contracts, subject to internalrules governing transaction authority and transactionlimits.
Supplementary information:With respect to market value of derivative transac-
tions, the contract amount of each transaction iseither a nominal contract amount or a notional prin-cipal amount and, therefore, does not accuratelyreflect the size of the risk involved in the transaction.
Overseas SalesNorth AmericaOther areas
Consolidated Net Sales
Overseas Sales/Consolidated Net SalesNorth AmericaOther areas
¥16,1259,6256,500
¥50,355
32.0%19.1%12.9%
¥14,0167,9696,047
¥51,801
27.1%15.4%11.7%
$134,43280,24454,188
$419,801
32.0%19.1%
12.9%
20022001 2002(Millions of Yen)
(Thousands ofU.S. Dollars)
Note: “Overseas Sales” consists of exports from the parent company and sales of consolidated subsidiaries outside Japan (but excludes transactions among consolidated subsidiaries).
(3) Overseas Sales
$287,7291,394
289,123285,005
$ 4,118
$307,177
$115,6432,134
117,777118,664
$ (887)
$121,838
$419,8013,674
423,475419,599
$ 3,876
$439,149
$ —(3,674)(3,674)(4,153)
$ 479
$161,072
$419,801—
419,801415,446
$ 4,355
$600,221
Net Sales(1) Sales to outside customers(2) Intersegment sales
TotalOperating expensesOperating income (loss)
AssetsTotal assets
(Thousands of U.S. Dollars)
2002
$16,429146
16,57515,930
$ 645
$10,134
Consolidated total
Elimination and/orcorporationTotal
NorthAmericaJapan Other areas
Note: Included in the “Elimination and/or corporation” column are common assets of ¥20,868 million ($173,969 thousand) as at December 31, 2002, which mainly comprise surplus working funds (cash and marketable securities), long-term investment funds (investment in securities), and other assets which belong to the Group.
Currency-related
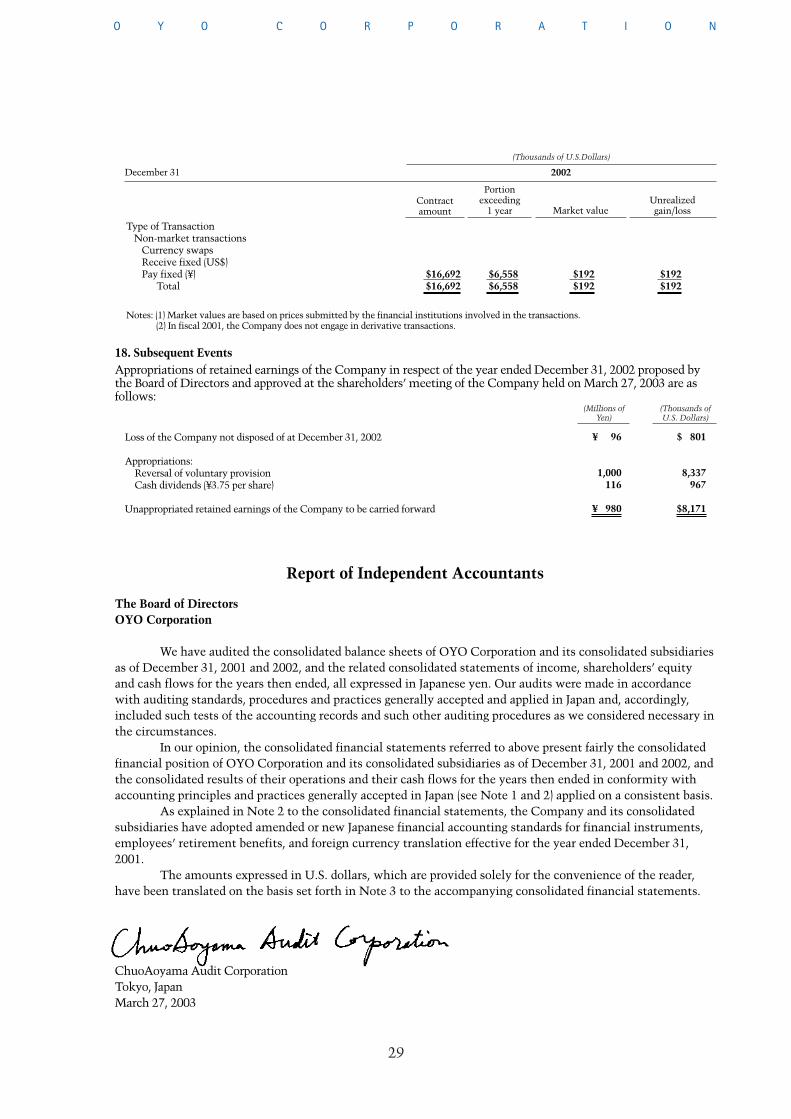
29
Report of Independent Accountants
The Board of DirectorsOYO Corporation
We have audited the consolidated balance sheets of OYO Corporation and its consolidated subsidiariesas of December 31, 2001 and 2002, and the related consolidated statements of income, shareholders’ equity and cash flows for the years then ended, all expressed in Japanese yen. Our audits were made in accordancewith auditing standards, procedures and practices generally accepted and applied in Japan and, accordingly,included such tests of the accounting records and such other auditing procedures as we considered necessary inthe circumstances.
In our opinion, the consolidated financial statements referred to above present fairly the consolidatedfinancial position of OYO Corporation and its consolidated subsidiaries as of December 31, 2001 and 2002, andthe consolidated results of their operations and their cash flows for the years then ended in conformity withaccounting principles and practices generally accepted in Japan (see Note 1 and 2) applied on a consistent basis.
As explained in Note 2 to the consolidated financial statements, the Company and its consolidatedsubsidiaries have adopted amended or new Japanese financial accounting standards for financial instruments,employees’ retirement benefits, and foreign currency translation effective for the year ended December 31,2001.
The amounts expressed in U.S. dollars, which are provided solely for the convenience of the reader,have been translated on the basis set forth in Note 3 to the accompanying consolidated financial statements.
ChuoAoyama Audit CorporationTokyo, JapanMarch 27, 2003
O Y O C O R P O R A T I O N
Loss of the Company not disposed of at December 31, 2002
Appropriations:Reversal of voluntary provisionCash dividends (¥3.75 per share)
Unappropriated retained earnings of the Company to be carried forward
¥ 96
1,000116
¥ 980
$ 801
8,337967
$8,171
(Millions ofYen)
(Thousands ofU.S. Dollars)
$6,558$6,558
$192$192
$192$192
Type of TransactionNon-market transactions
Currency swaps Receive fixed (US$) Pay fixed (¥)
Total
(Thousands of U.S.Dollars)
2002
$16,692$16,692
Unrealizedgain/lossMarket value
Portionexceeding
1 yearContract amount
December 31
Notes: (1) Market values are based on prices submitted by the financial institutions involved in the transactions.(2) In fiscal 2001, the Company does not engage in derivative transactions.
18. Subsequent Events Appropriations of retained earnings of the Company in respect of the year ended December 31, 2002 proposed bythe Board of Directors and approved at the shareholders’ meeting of the Company held on March 27, 2003 are asfollows:
Corporate Data
30
Board of Directors, Officers and Corporate Auditors
Chairman of The Board*Takeshi Ohkubo
President* Moriyuki Taya
Director and Senior Executive OfficersNaobumi DaiboKatsuhiko KobayashiTomofumi NakamuraTateo Suzuki
Director and Executive OfficersHideo WakasaKiyoshi MamiyaTsuneaki IwasakiMitsuru Honjo
Standing Corporate AuditorYuhei Kono
Corporate AuditorsMasato OhtaSatoru Morikawa
Senior Executive OfficerYukihiko Okabe
Executive OfficersKeiji TonouchiHiroshi Takita Keiichi HirataMasayoshi ShibukiKenji YoshinagaAkihiko NakagamiYuichi MitsuoYoshinori MaedaKoji KawamotoKazuhiko SasakiMasaru NaritaTakashi TokushigeKazunori NishidaTadashi YoshiokaYasunori ShojiTakeichiro OhhashiYoshinori Sone
*Representative Director
(as of April 1, 2003)
IncorporatedMay 2, 1957
Paid-in capital¥16,174,600 thousand (U.S.$134,844 thousand)
Number of employees1,156 (as of December 31, 2002)
Number of sales offices63 (as of April 1, 2003)
ListingThe Tokyo Stock Exchange (First Section)
Code number9755
Number of shareholders12,007 (as of December 31, 2002)
Shares of common stock issued and outstanding32,082,573 (as of December 31, 2002)
Trading unit100 shares
Financial yearJanuary 1 to December 31
Annual shareholders’ meetingMarch
Transfer agentTokyo Securities Transfer Agent Co. Ltd.5-1, Marunouchi 1-chome, Chiyoda-ku, Tokyo 100-0005Tel: 03-3212-4611
Auditor ChuoAoyama Audit Corporation2-5, Kasumigaseki 3-chome, Chiyoda-ku, Tokyo 100-6088Tel: 03-5532-3200
O Y O C O R P O R A T I O N
Head Office2-6 Kudan-kita 4-chome, Chiyoda-ku, Tokyo 102-0073, JapanTel: +81-3-3234-0811Fax: +81-3-3263-6854URL:http://www.oyo.co.jpE-mail: [email protected]
[Subsidiaries]
OYO Resources Management Corporation Chiyoda-ku, Tokyo, Japan(Sale of software & hardware productsfor geological & environmental inves-tigation, temporary personnel agency,nonlife insurance agency)URL:http://www.oyorm.co.jp
Tohoku Boring Co., LtdSendai, Miyagi, Japan(Geological investigation, landslip prevention and well drilling)
NS Environmental Science Consultant CorporationMinato-ku, Tokyo, Japan (Environmental surveys and environmental assessment)URL:http://www.ns–kankyo.co.jp
Ocean Engineering CorporationBunkyo-ku, Tokyo, Japan (Marine surveying and investigation)URL:http://www1.odn.ne.jp/ocean_engE-mail: [email protected]
Koei CorporationShinjuku-ku, Tokyo, Japan(Civil engineering services relateddesign,surveying and investigation and project management)URL:http://www.koei–ds.co.jp
OYO Seismic Instrumentation CorporationSaitama, Saitama, Japan (Sale of seismometers) and saismologi-cal instrumentation servicesURL:http://www.oyosi.co.jp
OYO International CorporationChiyoda-ku, Tokyo, Japan (Geotechnical, environmental and disaster prevention engineering services)E-mail: [email protected]
OYO Geo-monitoring Service CorporationKawaguchi, Saitama, Japan (Geo-monitoring service and instru-ments rental)URL:http://www.oyoks.co.jp
31
[Overseas Subsidiaries]
OYO International(Malaysia) Sdn. Bhd.Selangor, Malaysia(Geotechnical and environmentalengineering services)E-mail: [email protected]
OYO Corporation U.S.A.Pasadena,California, U.S.A.(Holding company of US & UK operating subsidiaries)
Klein Associates, Inc.Salem, New Hampshire , U.S.A.(Manufacturing and sale of sonarsystems for marine investigation)URL:http://www.kleinsonar.comE-mail: [email protected]
Kinemetrics, Inc.Pasadena,California, U.S.A.(Manufacturing and sale of seismome-ters, strong motion seismometers andseismic observation systems)URL:http://www.kinemetrics.comE-mail: [email protected]
Blackhawk-PAS, Inc.Greenville, South Carolina, U.S.A.(Sewer pipe inspection, evaluation,and assessment)URL:http://www.blackhawk-pas.com
Geometrics, Inc.San Jose, California, U.S.A.(Manufacturing and sale of geophysical instruments)URL:http://www.geometrics.comE-mail: [email protected]
Blackhawk GeoServices, Inc.Golden, Colorado, U.S.A.(Geophysical services)URL:http://www.blackhawkgeo.comE-mail: [email protected]
Geophysical Survey Systems, Inc.North Salem, New Hampshire, U.S.A.(Manufacturing and sale of groundpenetrating radar systems)URL:http://www.geophysical.comE-mail: [email protected]
OYO Geospace CorporationStafford, Texas, U.S.A.(Holding company of the oil explo-ration instruments subsidiaries)URL:http://www.geospacelp.comE-mail: [email protected]
Robertson Geologging LimitedDeganwy, Conwy, U.K.(Manufacturing and sale of slimholelogging systems)URL:http://www.geologging.comE-mail: [email protected]
[Affiliates]
OYO RMS CorporationMinato-ku, Tokyo, Japan (Damage risk evaluation and riskmanagement for earthquake andtyphoon disasters)URL:http://www.oyorms.co.jpE-mail: [email protected]
Engineering & Risk Services CorporationMinato-ku, Tokyo, Japan (Natural disaster engineering andrisk analyzing services) and environ-mental site assessmentURL:http://www.ers-co.co.jpE-mail: webmaster@ers–co.co.jp
[Overseas Affiliates]
IRIS Instruments S.A.Orleans, France(Manufacturing and sale of geophysical instruments)URL:http://www.iris-instruments.comE-mail: [email protected]
OYO’s Major Subsidiaries and Affiliates
O Y O C O R P O R A T I O N
*
*
*
*
*
*
* Japanese only
Printed in Japan
OYO Corporationwww.oyo.co.jp